UNITED STATES
SECURITIES AND EXCHANGE COMMISSION
Washington, D.C. 20549
FORM N-CSRS
CERTIFIED SHAREHOLDER REPORT OF REGISTERED MANAGEMENT
INVESTMENT COMPANIES
Investment Company Act file number: 811-08399
PIMCO Variable Insurance Trust
(Exact name of registrant as specified in charter)
840 Newport Center Drive, Newport Beach, CA 92660
(Address of principal executive offices)
John P. Hardaway
Treasurer
PIMCO Funds
840 Newport Center Drive
Newport Beach, CA 92660
(Name and address of agent for service)
Copies to:
Brendan C. Fox
Dechert LLP
1775 I Street, N.W.
Washington, D.C. 20006
Registrant’s telephone number, including area code: (866) 746-2606
Date of fiscal year end: December 31
Date of reporting period: January 1, 2007 to June 30, 2007
Form N-CSR is to be used by management investment companies to file reports with the Commission not later than 10 days after the transmission to stockholders of any report that is required to be transmitted to stockholders under Rule 30e-1 under the Investment Company Act of 1940 (17 CFR 270.30e-1). The Commission may use the information provided on Form N-CSR in its regulatory, disclosure review, inspection, and policymaking roles.
A registrant is required to disclose the information specified by Form N-CSR, and the Commission will make this information public. A registrant is not required to respond to the collection of information contained in Form N-CSR unless the Form displays a currently valid Office of Management and Budget (“OMB”) control number. Please direct comments concerning the accuracy of the information collection burden estimate and any suggestions for reducing the burden to Secretary, Securities and Exchange Commission, 450 Fifth Street, NW, Washington, DC 20549-0609. The OMB has reviewed this collection of information under the clearance requirements of 44 U.S.C. § 3507.
Item 1. Reports to Shareholders.
The following is a copy of the report transmitted to shareholders pursuant to Rule 30e-1 under the Investment Company Act of 1940, as amended (the “1940 Act”) (17 CFR 270.30e-1).
| | • | | PIMCO Variable Insurance Trust All Asset Portfolio Administrative Class |
| | • | | PIMCO Variable Insurance Trust All Asset Portfolio Institutional Class |
| | • | | PIMCO Variable Insurance Trust All Asset Portfolio Advisor Class |
| | • | | PIMCO Variable Insurance Trust All Asset Portfolio Class M |
| | • | | PIMCO Variable Insurance Trust CommodityRealReturn Portfolio Administrative Class |
| | • | | PIMCO Variable Insurance Trust CommodityRealReturn Portfolio Advisor Class |
| | • | | PIMCO Variable Insurance Trust Emerging Markets Bond Portfolio Administrative Class |
| | • | | PIMCO Variable Insurance Trust Emerging Markets Bond Portfolio Advisor Class |
| | • | | PIMCO Variable Insurance Trust Foreign Bond Portfolio (U.S. Dollar-Hedged) Administrative Class |
| | • | | PIMCO Variable Insurance Trust Foreign Bond Portfolio (U.S. Dollar-Hedged) Institutional Class |
| | • | | PIMCO Variable Insurance Trust Global Bond Portfolio (Unhedged) Administrative Class |
| | • | | PIMCO Variable Insurance Trust Global Bond Portfolio (Unhedged) Institutional Class |
| | • | | PIMCO Variable Insurance Trust Global Bond Portfolio (Unhedged) Advisor Class |
| | • | | PIMCO Variable Insurance Trust High Yield Portfolio Administrative Class |
| | • | | PIMCO Variable Insurance Trust High Yield Portfolio Institutional Class |
| | • | | PIMCO Variable Insurance Trust High Yield Portfolio Advisor Class |
| | • | | PIMCO Variable Insurance Trust Long-Term U.S. Government Portfolio Administrative Class |
| | • | | PIMCO Variable Insurance Trust Long-Term U.S. Government Portfolio Institutional Class |
| | • | | PIMCO Variable Insurance Trust Low Duration Portfolio Administrative Class |
| | • | | PIMCO Variable Insurance Trust Low Duration Portfolio Institutional Class |
| | • | | PIMCO Variable Insurance Trust Low Duration Portfolio Advisor Class |
| | • | | PIMCO Variable Insurance Trust Money Market Portfolio Administrative Class |
| | • | | PIMCO Variable Insurance Trust Money Market Portfolio Institutional Class |
| | • | | PIMCO Variable Insurance Trust Real Return Portfolio Administrative Class |
| | • | | PIMCO Variable Insurance Trust Real Return Portfolio Institutional Class |
| | • | | PIMCO Variable Insurance Trust Real Return Portfolio Advisor Class |
| | • | | PIMCO Variable Insurance Trust RealEstateRealReturn Strategy Portfolio Administrative Class |
| | • | | PIMCO Variable Insurance Trust Short-Term Portfolio Administrative Class |
| | • | | PIMCO Variable Insurance Trust Short-Term Portfolio Institutional Class |
| | • | | PIMCO Variable Insurance Trust Small Cap StocksPLUS® TR Portfolio Administrative Class |
| | • | | PIMCO Variable Insurance Trust Small Cap StocksPLUS® TR Portfolio Advisor Class |
| | • | | PIMCO Variable Insurance Trust StocksPLUS® Growth and Income Portfolio Administrative Class |
| | • | | PIMCO Variable Insurance Trust StocksPLUS® Growth and Income Portfolio Institutional Class |
| | • | | PIMCO Variable Insurance Trust StocksPLUS® Total Return Portfolio Administrative Class |
| | • | | PIMCO Variable Insurance Trust Total Return Portfolio Administrative Class |
| | • | | PIMCO Variable Insurance Trust Total Return Portfolio Institutional Class |
| | • | | PIMCO Variable Insurance Trust Total Return Portfolio Advisor Class |
| | • | | PIMCO Variable Insurance Trust Total Return Portfolio II Administrative Class |
| | • | | PIMCO Variable Insurance Trust Total Return Portfolio II Institutional Class |

Table of Contents
This material is authorized for use only when preceded or accompanied by the current PIMCO Variable Insurance Trust (the “Trust”) prospectus. Investors should consider the investment objectives, risks, charges and expenses of this Trust carefully before investing. Ask your financial professional to explain all charges that may apply. This and other information is contained in the Trust’s prospectus. The variable product prospectus may be obtained by contacting your Investment Consultant. Please read the Trust and variable product prospectus carefully before you invest or send money.
Chairman’s Letter
Dear PIMCO Variable Insurance Trust Shareholder:
It is our pleasure to present to you the semiannual report for the PIMCO Variable Insurance Trust, covering the six-month period ended June 30, 2007. The PIMCO Variable Insurance Trust’s net assets were $8.68 billion at June 30, 2007, as compared to $7.76 billion at December 31, 2006.
Highlights of the financial markets during the reporting period include:
| | n | | Economic data during the first quarter of 2007 pointed to slower growth, which heightened market expectations for a decrease in the Federal Funds Rate. By the second quarter, economic data, such as employment statistics, provided little indication of economic weakness, causing expectations of a decrease in the Federal Funds Rate to unwind and U.S. interest rates to move higher. Interest rates in Europe and the U.K. also rose over the period as central banks raised their key lending rates due to inflation concerns. The benchmark ten-year U.S. Treasury yielded 5.03% as of June 30, 2007, or 0.32% higher than at the beginning of the year. |
| | n | | Most bonds generally returned much of their gains from earlier in the year as worldwide growth and capital flows drove interest rates higher in the second quarter. Increased risk aversion in global financial markets, due in part to subprime mortgage worries in the U.S., also contributed to the rise in interest rates. The Lehman Brothers Aggregate Bond Index, which includes Treasury, investment-grade corporate and mortgage-backed securities, returned 0.98% for the six-month period. |
| | n | | Locally issued emerging market (“EM”) bonds posted positive returns for the reporting period. Yields on these bonds declined and the local currencies in which they are denominated generally gained, amid increasing investor awareness, strong economic growth and surging capital inflows. External EM bonds (debt instruments issued by emerging markets countries and typically denominated in U.S. dollars) lagged behind local EM bonds (debt instruments issued by emerging markets countries and denominated in the currency of the issuer), as external EM bonds tend to trade more in-line with U.S. Treasuries. |
| | n | | Treasury Inflation-Protected Securities (“TIPS”) outpaced nominal bonds (non-inflation linked bonds) for the first part of the year and all but the longest maturity TIPS outperformed in the second quarter as high gasoline prices drove higher inflation accruals. Commodities, as represented by the Dow Jones-AIG Commodity Total Return Index, returned 4.46% for the period. Equities, as measured by the S&P 500 Index and the Russell 2000 Index, returned 6.96% and 6.45%, respectively, for the period. |
On the following pages, please find specific details as to the Portfolio’s total return investment performance and a discussion of those factors that affected performance.
Thank you for the trust you have placed in us. We will continue to work diligently to serve your investment needs.
Sincerely,

Brent R. Harris
Chairman, PIMCO Variable Insurance Trust
July 31, 2007
| | | | | | |
| | Semiannual Report | | June 30, 2007 | | 1 |
Important Information About the Portfolio
PIMCO Variable Insurance Trust (the “Trust”) is an open-end management investment company currently consisting of twenty separate investment portfolios, including the All Asset Portfolio (the “Portfolio”). The Portfolio is only available as a funding vehicle under variable life insurance policies or variable annuity contracts issued by insurance companies (“Variable Contracts”). Individuals may not purchase shares of the Portfolio directly. Shares of the Portfolio also may be sold to qualified pension and retirement plans outside of the separate account context.
The Portfolio is a “fund of funds,” which is a term used to describe mutual funds that pursue their investment objective by investing in other mutual funds instead of investing directly in stocks or bonds of other issuers. Under normal circumstances, the Portfolio invests substantially all of its assets in Institutional Class shares of PIMCO Funds, an affiliated open-end investment company, except the All Asset and All Asset All Authority Funds (“Underlying Funds”).
Among the principal risks of investing in the Portfolio are allocation risk, Underlying Fund risk and issuer non-diversification risk. The Portfolio also is indirectly subject to the risks of the Underlying Funds, which may include, but are not limited to, the following: interest rate risk, credit risk, high yield risk, market risk, issuer risk, variable dividends risk, liquidity risk, derivatives risk, commodity risk, equity risk, mortgage risk, non-U.S. investment risk, real estate risk, emerging markets risk, currency risk, issuer non-diversification risk, leveraging risk, small company risk, management risk, California state-specific risk, New York state-specific risk, tax risk, and subsidiary risk. A complete description of these risks is contained in the Portfolio’s prospectus. An Underlying Fund may use derivative instruments for hedging purposes or as part of an investment strategy. Use of these instruments may involve certain costs and risks such as liquidity risk, interest rate risk, market risk, credit risk, management risk and the risk that the Underlying Fund could not close out a position when it would be most advantageous to do so. An Underlying Fund investing in derivatives could lose more than the principal amount invested in these instruments. An Underlying Fund’s investment in non-U.S. securities may entail risk due to non-U.S. economic and political developments; this risk may be increased when investing in emerging markets.
The cost of investing in the Portfolio will generally be higher than the cost of investing in a mutual fund that invests directly in individual stocks and bonds. By investing in the Portfolio, an investor will indirectly bear fees and expenses charged by the Underlying Funds in addition to the Portfolio’s direct fees and expenses.
On the performance summary page in this Semiannual Report, the Total Return Investment Performance table measures performance assuming that all dividend and capital gain distributions were reinvested.
An investment in the Portfolio is not a deposit of a bank and is not guaranteed or insured by the Federal Deposit Insurance Corporation or any other government agency. It is possible to lose money on investments in the Portfolio.
PIMCO has adopted written proxy voting policies and procedures (“Proxy Policy”) as required by Rule 206(4)-6 under the Investment Advisers Act of 1940, as amended. The Proxy Policy has been adopted by the Trust as the policies and procedures that PIMCO will use when voting proxies on behalf of the Portfolio. A description of the policies and procedures that PIMCO uses to vote proxies relating to portfolio securities of the Portfolio, and information about how the Portfolio voted proxies relating to portfolio securities held during the most recent twelve-month period ended June 30, are available without charge, upon request, by calling the Trust at 1-866-746-2606 and on the Portfolio’s website at www.pimco.com.
The Portfolio files its complete schedule of portfolio holdings with the SEC for the first and third quarters of each fiscal year on Form N-Q. A copy of the Trust’s Form N-Q is also available on the SEC’s website at http://www.sec.gov and may be reviewed and copied at the SEC’s Public Reference Room in Washington D.C. Information on the operation of the Public Reference Room may be obtained by calling 1-800-SEC-0330, and is available without charge, upon request, by calling the Trust at 1-866-746-2606 and on the Portfolio’s website at www.pimco.com.
PIMCO Variable Insurance Trust is distributed by Allianz Global Investors Distributors LLC, 1345 Avenue of the Americas, New York, NY 10105.
| | | | |
| 2 | | PIMCO Variable Insurance Trust | | |
The following disclosure provides important information regarding the Portfolio’s Expense Example (“Example” or “Expense Example”), which appears in this Semiannual Report. Please refer to this information when reviewing the Expense Example for the Portfolio.
Example
As a shareholder of the Portfolio, you incur two types of costs: (1) transaction costs and (2) ongoing costs, including advisory and administrative fees; distribution and/or service (12b-1) fees (Administrative Class, Advisor Class and Class M only); and other Portfolio expenses. The Example is intended to help you understand your ongoing costs (in dollars) of investing in the Portfolio and to compare these costs with the ongoing costs of investing in other mutual funds. The Expense Example does not reflect any fees or other expenses imposed by the Variable Contracts. If it did, the expenses reflected in the Expense Example would be higher. The Example is based on an investment of $1,000 invested at the beginning of the period and held for the entire period indicated, which is from January 1, 2007 to June 30, 2007.
Actual Expenses
The information in the table under the heading “Actual Performance” provides information about actual account values and actual expenses. You may use the information in these columns, together with the amount you invested, to estimate the expenses that you paid over the period. Simply divide your account value by $1,000 (for example, an $8,600 account value divided by $1,000 = $8.60), then multiply the result by the number in the row titled “Expenses Paid During Period” to estimate the expenses you paid on your account during this period.
Hypothetical Example for Comparison Purposes
The information in the table under the heading “Hypothetical Performance (5% return before expenses)” provides information about hypothetical account values and hypothetical expenses based on the Portfolio’s actual expense ratio and an assumed rate of return of 5% per year before expenses, which is not the Portfolio’s actual return. The hypothetical account values and expenses may not be used to estimate the actual ending account balance or expenses you paid for the period. You may use this information to compare the ongoing costs of investing in the Portfolio and other portfolios. To do so, compare this 5% hypothetical example with the 5% hypothetical examples that appear in the shareholder reports of the other portfolios.
Please note that the expenses shown in the table are meant to highlight your ongoing costs only and do not reflect any transactional costs. Therefore, the information under the heading “Hypothetical Performance (5% return before expenses)” is useful in comparing ongoing costs only, and will not help you determine the relative total costs of owning different portfolios. In addition, if these transactional costs were included, your costs would have been higher.
The expense ratio may vary period to period because of various factors, such as an increase in expenses not covered by the advisory and administrative fees (such as expenses of the trustees and their counsel, litigation expense and interest expense).
| | | | | | |
| | Semiannual Report | | June 30, 2007 | | 3 |
PIMCO All Asset Portfolio
Cumulative Returns Through June 30, 2007
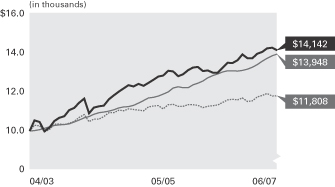
$10,000 invested at the beginning of the first full month following the inception date of the Portfolio’s Administrative Class.
PIMCO Funds Allocation‡
| | |
Floating Income Fund | | 19.7% |
Real Return Asset Fund | | 14.9% |
Developing Local Markets Fund | | 12.4% |
Emerging Local Bond Fund | | 11.2% |
CommodityRealReturn Strategy Fund® | | 9.0% |
Real Return Fund | | 6.8% |
Long-Term U.S. Government Fund | | 5.7% |
Other | | 20.3% |
| | ‡ | % of Total Investments as of 06/30/2007 |
| | | | | | | | |
| Average Annual Total Return for the period ended June 30, 2007 | | |
| | | | | 6 Months* | | 1 Year | | Portfolio
Inception
(04/30/03) |
 | | PIMCO All Asset Portfolio Administrative Class | | 2.98% | | 8.92% | | 8.67% |
 | | Lehman Brothers U.S. TIPS: 1-10 Year Index± | | 2.49% | | 4.19% | | 4.07% |
 | | CPI + 500 Basis Points±± | | 5.84% | | 7.93% | | 8.31% |
All Portfolio returns are net of fees and expenses.
* Cumulative return.
Performance quoted represents past performance. Past performance is no guarantee of future results. Investment return and principal value will fluctuate so the Portfolio shares, when redeemed, may be worth more or less than their original cost. The Portfolio’s performance does not reflect the deduction of additional charges and expenses imposed in connection with investing in Variable Contracts, which will reduce returns. Current performance may be lower or higher than the performance data quoted. Performance data current to the most recent month-end is available by calling (800) 927-4648.
± Lehman Brothers U.S. TIPS: 1-10 Year Index is an unmanaged index comprised of U.S. Treasury Inflation-Protected Securities having a maturity of at least 1 year and less than 10 years. It is not possible to invest directly in the index. The index does not reflect deductions for fees and expenses.
±± CPI + 500 Basis Points benchmark is created by adding 5% to the annual percentage change in the Consumer Price Index (“CPI”). This index reflects non-seasonally adjusted returns. The CPI is an unmanaged index representing the rate of inflation of the U.S. consumer prices as determined by the U.S. Department of Labor, Bureau of Labor Statistics. There can be no guarantee that the CPI or other indices will reflect the exact level of inflation at any given time. It is not possible to invest directly in the index. The index does not reflect deductions for fees and expenses.
| | | | | | |
| Expense Example | | Actual Performance | | Hypothetical Performance |
| | | | | (5% return before expenses) |
Beginning Account Value (01/01/07) | | $ | 1,000.00 | | $ | 1,000.00 |
Ending Account Value (06/30/07) | | $ | 1,029.76 | | $ | 1,021.94 |
Expenses Paid During Period† | | $ | 2.89 | | $ | 2.88 |
† Expenses are equal to the Portfolio’s Administrative Class annualized expense ratio of 0.575%, multiplied by the average account value over the period, multiplied by 181/365 (to reflect the one-half year period). The expense ratio excludes the expenses of the Underlying Funds, which based upon the allocation of the Portfolio’s assets among the Underlying Funds are indirectly borne by the shareholders of the Portfolio. The Underlying Fund Expenses are currently capped at 0.64%. Overall fees and expenses of investing in the Portfolio will be higher because the example does not reflect Variable Contract fees and expenses.
Please refer to page 3 herein for an explanation of the information presented in the above Expense Example.
Portfolio Insights
| » | | The PIMCO All Asset Portfolio seeks to achieve its investment objective by investing under normal circumstances substantially all of its assets in Institutional Class shares of the PIMCO Funds, an affiliated open-end investment company, except the PIMCO All Asset and PIMCO All Asset All Authority Funds. |
| » | | Significant exposure to short-term strategies, particularly through the PIMCO Floating Income Fund, contributed to performance as the PIMCO Floating Income Fund returned 2.62% net of fees during the period. |
| » | | Although any exposure to Real Estate Investment Trusts (“REITs”) would detract from performance, as the Dow Jones Wilshire REIT Index returned -5.97% during the period, negligible exposure was a positive asset allocation decision. |
| » | | Exposure to equity strategies benefited performance due to strong returns domestically and internationally. However, reduced equity exposure in the Portfolio was not a positive asset allocation decision. |
| » | | Large exposure to developing local market bonds contributed to performance as the asset class benefited from continued capital inflows and strong economic fundamentals. |
| » | | Large exposure to Treasury Inflation-Protected Securities (“TIPS”) detracted from performance as real yields rose. |
| » | | Minimal exposure to convertibles detracted from returns as the asset class had positive performance. |
| | | | |
| 4 | | PIMCO Variable Insurance Trust | | |
Financial Highlights All Asset Portfolio
| | | | | | | | | | | | | | | | | | | | |
| Selected per Share Data for the Year or Period Ended: | | 06/30/2007+ | | | 12/31/2006 | | | 12/31/2005 | | | 12/31/2004 | | | 04/30/2003-12/31/2003 | |
| | | | | |
Administrative Class | | | | | | | | | | | | | | | | | | | | |
Net asset value beginning of year or period | | $ | 11.67 | | | $ | 11.81 | | | $ | 11.62 | | | $ | 10.77 | | | $ | 10.00 | |
Net investment income (a) | | | 0.26 | | | | 0.63 | | | | 0.83 | | | | 1.50 | | | | 0.53 | |
Net realized/unrealized gain (loss) on investments (a) | | | 0.09 | | | | (0.10 | ) | | | (0.11 | ) | | | (0.27 | ) | | | 0.54 | |
Total income from investment operations | | | 0.35 | | | | 0.53 | | | | 0.72 | | | | 1.23 | | | | 1.07 | |
Dividends from net investment income | | | (0.29 | ) | | | (0.64 | ) | | | (0.49 | ) | | | (0.37 | ) | | | (0.30 | ) |
Distributions from net realized capital gains | | | 0.00 | | | | (0.03 | ) | | | (0.04 | ) | | | (0.01 | ) | | | 0.00 | |
Total distributions | | | (0.29 | ) | | | (0.67 | ) | | | (0.53 | ) | | | (0.38 | ) | | | (0.30 | ) |
Net asset value end of year or period | | $ | 11.73 | | | $ | 11.67 | | | $ | 11.81 | | | $ | 11.62 | | | $ | 10.77 | |
Total return | | | 2.98 | % | | | 4.66 | % | | | 6.23 | % | | | 11.49 | % | | | 10.79 | % |
Net assets end of year or period (000s) | | $ | 258,604 | | | $ | 251,076 | | | $ | 251,482 | | | $ | 102,183 | | | $ | 1,017 | |
Ratio of expenses to average net assets | | | 0.575 | %*(c)(f) | | | 0.585 | %(c)(e) | | | 0.59 | %(c)(d) | | | 0.57 | %(c)(d) | | | 0.60 | %*(b)(c) |
Ratio of expenses to average net assets excluding interest expense | | | 0.575 | %*(c)(f) | | | 0.585 | %(c)(e) | | | 0.59 | %(c)(d) | | | 0.57 | %(c)(d) | | | 0.60 | %*(b)(c) |
Ratio of net investment income to average net assets | | | 4.43 | %* | | | 5.39 | % | | | 6.98 | % | | | 13.02 | % | | | 7.56 | %* |
Portfolio turnover rate | | | 48 | % | | | 66 | % | | | 75 | % | | | 93 | % | | | 136 | % |
+ Unaudited
* Annualized
(a) Per share amounts based on average number of shares outstanding during the period.
(b) If the investment manager had not reimbursed expenses, the ratio of expenses to average net assets would have been 10.92%.
(c) Ratio of expenses to average net assets excluding underlying Funds’ expenses in which the Portfolio invests.
(d) If the investment manager had not reimbursed expenses, the ratio of expenses to average net assets would have been 0.60%.
(e) Effective October 1, 2006, the advisory fee was reduced to 0.175%.
(f) If the investment manager had not reimbursed expenses, the ratio of expenses to average net assets would have been 0.585%.
| | | | | | |
| See Accompanying Notes | | Semiannual Report | | June 30, 2007 | | 5 |
Statement of Assets and Liabilities All Asset Portfolio
| | | | |
| (Amounts in thousands, except per share amounts) | | June 30, 2007
(Unaudited) | |
| |
Assets: | | | | |
Investments in affiliates, at value | | $ | 1,125,710 | |
Repurchase agreements, at value | | | 4,111 | |
Cash | | | 1 | |
Receivable for investments in affiliates sold | | | 9,423 | |
Receivable for Portfolio shares sold | | | 2,631 | |
Interest and dividends receivable | | | 2 | |
Interest and dividends receivable from affiliates | | | 5,016 | |
Manager reimbursement receivable | | | 31 | |
| | | | 1,146,925 | |
| |
Liabilities: | | | | |
Payable for investments in affiliates purchased | | $ | 16,789 | |
Payable for Portfolio shares redeemed | | | 69 | |
Accrued investment advisory fee | | | 163 | |
Accrued administration fee | | | 233 | |
Accrued distribution fee | | | 168 | |
Accrued servicing fee | | | 30 | |
| | | | 17,452 | |
| |
Net Assets | | $ | 1,129,473 | |
| |
Net Assets Consist of: | | | | |
Paid in capital | | $ | 1,125,794 | |
Undistributed net investment income | | | 4,112 | |
Accumulated undistributed net realized (loss) | | | (7,260 | ) |
Net unrealized appreciation | | | 6,827 | |
| | | $ | 1,129,473 | |
| |
Net Assets: | | | | |
Institutional Class | | $ | 291 | |
Administrative Class | | | 258,604 | |
Advisor Class | | | 822,338 | |
Class M | | | 48,240 | |
| |
Shares Issued and Outstanding: | | | | |
Institutional Class | | | 25 | |
Administrative Class | | | 22,035 | |
Advisor Class | | | 69,990 | |
Class M | | | 4,106 | |
| |
Net Asset Value and Redemption Price Per Share (Net Asset Per Share Outstanding) | | | | |
Institutional Class | | $ | 11.74 | |
Administrative Class | | | 11.73 | |
Advisor Class | | | 11.74 | |
Class M | | | 11.74 | |
| |
Cost of Investments in Affiliates Owned | | $ | 1,118,883 | |
Cost of Repurchase Agreements Owned | | $ | 4,111 | |
| | | | |
| 6 | | PIMCO Variable Insurance Trust | | See Accompanying Notes |
Statement of Operations All Asset Portfolio
| | | | |
| (Amounts in thousands) | | Six Months Ended June 30, 2007 (Unaudited) | |
| |
| Investment Income: | | | | |
Interest | | $ | 99 | |
Dividends from affiliate investments | | | 24,338 | |
Total Income | | | 24,437 | |
| |
Expenses: | | | | |
Investment advisory fees | | | 831 | |
Administration fees | | | 1,187 | |
Servicing fees – Administrative Class | | | 187 | |
Distribution and/or servicing fees – Advisor Class | | | 813 | |
Distribution and/or servicing fees – Class M | | | 111 | |
Total Expenses | | | 3,129 | |
Reimbursement by Manager | | | (45 | ) |
Net Expenses | | | 3,084 | |
| |
Net Investment Income | | | 21,353 | |
| |
Net Realized and Unrealized Gain (Loss): | | | | |
Net realized (loss) on affiliate investments | | | (1,069 | ) |
Net change in unrealized appreciation on affiliate investments | | | 5,843 | |
Net Gain | | | 4,774 | |
| |
Net Increase in Net Assets Resulting from Operations | | $ | 26,127 | |
| | | | | | |
| See Accompanying Notes | | Semiannual Report | | June 30, 2007 | | 7 |
Statements of Changes in Net Assets All Asset Portfolio
| | | | | | | | |
| (Amounts in thousands) | | Six Months Ended June 30, 2007 (Unaudited) | | | Year Ended December 31, 2006 | |
| | |
| Increase in Net Assets from: | | | | | | | | |
| | |
Operations: | | | | | | | | |
Net investment income | | $ | 21,353 | | | $ | 32,372 | |
Net realized (loss) on affiliate investments | | | (1,069 | ) | | | (7,977 | ) |
Net capital gain distributions received from Underlying Funds | | | 0 | | | | 2,277 | |
Net change in unrealized appreciation on affiliate investments | | | 5,843 | | | | 3,148 | |
Net increase resulting from operations | | | 26,127 | | | | 29,820 | |
| | |
Distributions to Shareholders: | | | | | | | | |
From net investment income | | | | | | | | |
Institutional Class | | | (7 | ) | | | (2 | ) |
Administrative Class | | | (6,179 | ) | | | (13,550 | ) |
Advisor Class | | | (17,050 | ) | | | (15,816 | ) |
Class M | | | (1,079 | ) | | | (3,041 | ) |
From net realized capital gains | | | | | | | | |
Institutional Class | | | 0 | | | | 0 | |
Administrative Class | | | 0 | | | | (622 | ) |
Advisor Class | | | 0 | | | | (1,205 | ) |
Class M | | | 0 | | | | (139 | ) |
| | |
Total Distributions | | | (24,315 | ) | | | (34,375 | ) |
| | |
Portfolio Share Transactions: | | | | | | | | |
Receipts for shares sold | | | | | | | | |
Institutional Class | | | 294 | | | | 73 | |
Administrative Class | | | 25,388 | | | | 60,956 | |
Advisor Class | | | 304,743 | | | | 485,456 | |
Class M | | | 5,550 | | | | 15,354 | |
Issued as reinvestment of distributions | | | | | | | | |
Institutional Class | | | 7 | | | | 3 | |
Administrative Class | | | 6,179 | | | | 14,172 | |
Advisor Class | | | 17,050 | | | | 17,022 | |
Class M | | | 1,079 | | | | 3,180 | |
Cost of shares redeemed | | | | | | | | |
Institutional Class | | | (83 | ) | | | 0 | |
Administrative Class | | | (25,052 | ) | | | (72,158 | ) |
Advisor Class | | | (1,505 | ) | | | (7,990 | ) |
Class M | | | (13,565 | ) | | | (30,245 | ) |
Net increase resulting from Portfolio share transactions | | | 320,085 | | | | 485,823 | |
| | |
Total Increase in Net Assets | | | 321,897 | | | | 481,268 | |
| | |
Net Assets: | | | | | | | | |
Beginning of period | | | 807,576 | | | | 326,308 | |
End of period* | | $ | 1,129,473 | | | $ | 807,576 | |
| | |
*Including undistributed net investment income of: | | $ | 4,112 | | | $ | 7,074 | |
| | | | |
| 8 | | PIMCO Variable Insurance Trust | | See Accompanying Notes |
| | |
| |
| Schedule of Investments All Asset Portfolio (a) | | June 30, 2007 (Unaudited) |
| | | | | | | | |
| | | | | SHARES | | | | VALUE (000S) |
| PIMCO FUNDS (b) 99.7% | | |
CommodityRealReturn Strategy Fund® | | | | 7,268,477 | | $ | | 102,122 |
Convertible Fund | | | | 589,376 | | | | 8,434 |
Developing Local Markets Fund | | | | 12,645,454 | | | | 139,732 |
Diversified Income Fund | | | | 4,446,275 | | | | 48,242 |
Emerging Local Bond Fund | | | | 12,272,617 | | | | 126,285 |
Emerging Markets Bond Fund | | | | 1,580,326 | | | | 17,241 |
Floating Income Fund | | | | 21,146,569 | | | | 222,251 |
Foreign Bond Fund (Unhedged) | | | | 87,682 | | | | 862 |
Fundamental IndexPLUS™ Fund | | | | 2,578,927 | | | | 29,709 |
Fundamental IndexPLUS™ TR Fund | | | | 3,313,300 | | | | 35,817 |
GNMA Fund | | | | 261,736 | | | | 2,856 |
High Yield Fund | | | | 669,256 | | | | 6,539 |
Income Fund | | | | 368,140 | | | | 3,619 |
International StocksPLUS® TR Strategy Fund (Unhedged) | | | | 379,112 | | | | 3,969 |
| | | | | | | | |
| | | | | SHARES | | | | VALUE (000S) |
International StocksPLUS® TR Strategy Fund (U.S.Dollar-Hedged) | | | | 2,537,938 | | $ | | 31,927 |
Long-Term U.S. Government Fund | | | | 6,413,670 | | | | 65,163 |
Low Duration Fund | | | | 130,601 | | | | 1,280 |
Real Return Asset Fund | | | | 15,807,400 | | | | 168,665 |
Real Return Fund | | | | 7,279,172 | | | | 76,577 |
RealEstateRealReturn Strategy Fund | | | | 291,240 | | | | 1,899 |
Short-Term Fund | | | | 364,763 | | | | 3,619 |
Small Cap StocksPLUS® TR Strategy Fund | | | | 173,830 | | | | 1,877 |
StocksPLUS® Fund | | | | 158,184 | | | | 1,830 |
StocksPLUS® Total Return Fund | | | | 561,247 | | | | 6,836 |
Total Return Fund | | | | 360,250 | | | | 3,660 |
Total Return Mortgage Fund | | | | 1,397,281 | | | | 14,699 |
| | | | | | | | |
Total PIMCO Funds (Cost $1,118,883) | | | | 1,125,710 |
| | | | | | | | |
| | | | | | | | | |
| | | | | PRINCIPAL AMOUNT
(000S) | | | | VALUE (000S) | |
| SHORT-TERM INSTRUMENTS 0.3% | |
| |
| REPURCHASE AGREEMENTS 0.3% | |
| State Street Bank and Trust Co. | | | | | |
4.900% due 07/02/2007 | | $ | | 4,111 | | $ | | 4,111 | |
| | | | | | | | | |
(Dated 06/29/2007. Collateralized by Fannie Mae 3.250% due 08/15/2008 valued at $4,197. Repurchase proceeds are $4,113.) | |
Total Short-Term Instruments
(Cost $4,111) | | 4,111 | |
| | | | | | | | | |
| |
| |
Total Investments 100.0%
(Cost $1,122,994) | | $ | | 1,129,821 | |
| |
| Other Assets and Liabilities (Net) (0.0%) | | | | (348 | ) |
| | | | | | | | | |
| Net Assets 100.0% | | | | | | $ | | 1,129,473 | |
| | | | | | | | | |
Notes to Schedule of Investments
(a) The All Asset Portfolio is investing in shares of affiliated Funds.
(b) Institutional Class Shares of each PIMCO Fund.
| | | | | | |
| See Accompanying Notes | | Semiannual Report | | June 30, 2007 | | 9 |
Notes to Financial Statements
1. ORGANIZATION
The All Asset Portfolio (the “Portfolio”) is a series of the PIMCO Variable Insurance Trust (the “Trust”). The Trust is registered under the Investment Company Act of 1940 (the “Act”), as amended, as an open-end management investment company organized as a Delaware business trust on October 3, 1997. The Portfolio offers four classes of shares: Institutional, Administrative, Advisor, and Class M. Information presented on these financial statements pertains to the Administrative Class of the Portfolio. Certain detailed financial information for the Institutional Class, Advisor Class and Class M is provided separately and is available upon request. The Trust is designed to be used as an investment vehicle by Separate Accounts of insurance companies that fund variable annuity contracts and variable life insurance policies and by qualified pension and retirement plans.
The Portfolio may invest a portion of its assets in certain affiliated underlying investment funds (the “Underlying Funds” or “Acquired Funds”). The Portfolio’s combined investments in the Fundamental IndexPLUS™, Fundamental IndexPLUS™ TR, International StocksPLUS® TR Strategy (U.S. Dollar-Hedged), International StocksPLUS® TR Strategy (Unhedged), Small Cap StocksPLUS® TR, StocksPLUS® and StocksPLUS® Total Return Funds normally will not exceed 50% of its total assets. In addition, the Portfolio’s combined investments in the CommodityRealReturn Strategy, Real Return, Real Return Asset and RealEstateRealReturn Strategy Funds normally will not exceed 75% of its total assets. The Portfolio’s investment in a particular Underlying Fund normally will not exceed 50% of its total assets.
The Portfolio’s assets are not allocated according to a predetermined blend of shares of the Underlying Funds. Instead, when making allocation decisions among the Underlying Funds, the Portfolio’s asset allocation sub-adviser considers various quantitative and qualitative data relating to the U.S. and foreign economies and securities markets. These data include projected growth trends in the U.S. and foreign economies, forecasts for interest rates and the relationship between short- and long-term interest rates (yield curve), current and projected trends in inflation, relative valuation levels in the equity and fixed income markets and various industrial sectors, information relating to business cycles, borrowing needs and the cost of capital, political trends data relating to trade balances and labor information. The Portfolio’s asset allocation sub-adviser has the flexibility to reallocate the Portfolio’s assets among any or all of the Underlying Funds based on its ongoing analyses of the equity, fixed income and commodity markets, although these shifts are not expected to be large or frequent in nature. The Portfolio is non-diversified, which means that it may concentrate its assets in a smaller number of Underlying Funds than a diversified fund.
2. SIGNIFICANT ACCOUNTING POLICIES
The following is a summary of significant accounting policies consistently followed by the Portfolio in the preparation of its financial statements in conformity with accounting principles generally accepted in the United States of America (“GAAP”). The preparation of financial statements in accordance with GAAP requires management to make estimates and assumptions that affect the reported amounts and disclosures on the financial statements. Actual results could differ from those estimates.
(a) Security Valuation Investments in funds within the PIMCO Funds are valued at their net asset value as reported by the Underlying Funds.
(b) Securities Transactions and Investment Income Securities transactions are recorded as of the trade date for financial reporting purposes. Securities purchased or sold on a when-issued or delayed-delivery basis may be settled a month or more after the trade date. Realized gains and losses from securities sold are recorded on the identified cost basis. Dividend income is recorded on the
ex-dividend date. Interest income, adjusted for the accretion of discounts and amortization of premiums, is recorded on the accrual basis.
(c) Dividends and Distributions to Shareholders Dividends from net investment income, if any, are declared and distributed to shareholders quarterly. Net realized capital gains earned by the Portfolio, if any, will be distributed no less frequently than once each year.
Income dividends and capital gain distributions are determined in accordance with income tax regulations which may differ from GAAP. Differences between tax regulations and GAAP may change the fiscal year when income and capital items are recognized for tax and GAAP purposes. Examples of events that give rise to timing differences include wash sales, straddles, net operating losses and capital loss carryforwards. Further, the character of investment income and capital gains may be different for certain transactions under the two methods of accounting. Examples of characterization differences include the treatment of mortgage paydowns, swaps, foreign currency transactions and contingent debt instruments. As a result, income dividends and capital gain distributions declared during a fiscal period may differ significantly from the net investment income and realized capital gain reported on the Portfolio’s annual financial statements presented under GAAP.
Distributions classified as a tax basis return of capital, if any, are reflected on the accompanying Statements of Changes in Net Assets and have been reclassified to paid in capital. In addition, other amounts have been reclassified between undistributed net investment income, accumulated undistributed net realized gains or losses and/or paid in capital to more appropriately conform financial accounting to tax characterizations of dividend distributions.
(d) Multiclass Operations Each class offered by the Portfolio has equal rights as to assets and voting privileges (except that shareholders of a class have exclusive voting rights regarding any matter relating solely to that class of shares). Income and non-class specific expenses of the Portfolio are allocated daily to each class of shares based on the relative value of settled shares. Realized and unrealized capital gains and losses of the Portfolio are allocated daily to each class of shares based on the relative net assets of each class. Class specific expenses, where applicable, currently include administrative, distribution and servicing fees.
(e) Repurchase Agreements The Portfolio may engage in repurchase transactions. Under the terms of a typical repurchase agreement, the Portfolio takes possession of an underlying debt obligation (collateral) subject to an obligation of the seller to repurchase, and the Portfolio to resell, the obligation at an agreed-upon price and time. The underlying securities for all repurchase agreements are held in safekeeping at the Portfolio’s custodian or designated subcustodians under tri-party repurchase agreements. The market value of the collateral must be equal to or exceed the total amount of the repurchase obligations, including interest. Securities purchased under repurchase agreements are reflected as an asset on the Statement of Assets and Liabilities. Generally, in the event of counterparty default, the Portfolio has the right to use the collateral to offset losses incurred. If the counterparty should default, the Portfolio will seek to sell the securities which it holds as collateral. This could involve procedural costs or delays in addition to a loss on the securities if their value should fall below their repurchase price.
(f) New Accounting Policies In July 2006, the Financial Accounting Standards Board (“FASB”) issued Interpretation No. 48, “Accounting for Uncertainty in Income Taxes—an Interpretation of FASB Statement No. 109” (the “Interpretation”). The Interpretation became effective for the Portfolio on June 29, 2007. Management has evaluated the application of the Interpretation in relation to the Portfolio and has concluded that no single filing position or combination of
| | | | |
| 10 | | PIMCO Variable Insurance Trust | | |
| | |
| |
| | | June 30, 2007 (Unaudited) |
filing positions identified as uncertain tax positions required the accrual of a tax liability in the accounting records of the Portfolio for the period ending June 30, 2007. Management will monitor all existing filing positions and future filing positions in light of the Interpretation and evaluate the need for any future tax accruals and financial statement disclosures as warranted.
In September 2006, the FASB issued Statement of Financial Accounting Standards No. 157, “Fair Value Measurements” (the “Statement”). The Statement is effective for fiscal years beginning after November 15, 2007 and will require expanded disclosure about fair value measurements, separately for each major category of assets and liabilities, that enables shareholders to assess the inputs used to develop those measurements, and for recurring fair value measurements using significant unobservable inputs the effect of the measurements on changes in net assets for the reporting period. Management is currently evaluating the application of the Statement to the Portfolio and will provide additional information in relation to the Statement on the Portfolio’s annual financial statements for the period ending December 31, 2007.
3. FEES AND EXPENSES
(a) Investment Advisory Fee Pacific Investment Management Company LLC (“PIMCO”) is a majority-owned subsidiary of Allianz Global Investors of America L.P. (“AGI”), and serves as investment adviser (the “Adviser”) to the Trust, pursuant to an investment advisory contract. The Adviser receives a monthly fee from the Portfolio, at an annual rate based on average daily net assets. The Advisory Fee for all classes is charged at an annual rate of 0.175%.
Research Affiliates, LLC (“Research Affiliates”) serves as the asset allocation sub-adviser and selects the Underlying Funds in which the Portfolio invests. PIMCO pays a fee to Research Affiliates at an annual rate of 0.175% based on average daily net assets of the Portfolio.
(b) Administration Fee PIMCO serves as administrator (the “Administrator”), and provides administrative services to the Trust for which it receives a monthly administrative fee based on each share class’s average daily net assets. As the Administrator, PIMCO bears the costs of various third-party services, including audit, custodial, portfolio accounting, legal, transfer agency and printing costs. The Administration Fee for all classes is charged at the annual rate of 0.25%.
(c) Distribution and Servicing Fees Allianz Global Investors Distributors LLC (“AGID”) is an indirect wholly-owned subsidiary of AGI and serves as the distributor (the “Distributor”) of the Trust’s shares. The Trust is permitted to reimburse AGID on a quarterly basis, out of the Administrative Class assets of the Portfolio in the amount of 0.15% on an annual basis of the average daily net assets of that class, for payments made to financial intermediaries that provide services in connection with the distribution of shares or administration of plans or programs that use Portfolio shares as their funding medium. The effective rate paid to AGID was 0.15% during the current fiscal year.
The Trust has adopted separate Distribution Plans for the Advisor Class and Class M shares of the Portfolio. The Distribution Plans have been adopted pursuant to Rule 12b-1 under the Act. The Distribution Plans permit payments for expenses in connection with the distribution and marketing of Advisor Class and Class M shares and/or the provision of shareholder services to Advisor Class and Class M shareholders which permits the Portfolio to make total payments at an annual rate of 0.25% of its average daily net assets attributable to its Advisor Class and Class M shares. The Trust has also adopted Administrative Services Plans (“Service Plans”) for the Class M shares of the Portfolio. The Service Plans allows the
Portfolio to use its Class M assets to compensate or reimburse financial intermediaries that provide services relating to Class M shares which permits the Portfolio to make total payments at an annual rate of 0.20% of its average daily net assets attributable to its Class M shares.
(d) Portfolio Expenses The Trust is responsible for the following expenses: (i) salaries and other compensation of any of the Trust’s executive officers and employees who are not officers, directors, stockholders or employees of PIMCO or its subsidiaries or affiliates; (ii) taxes and governmental fees; (iii) brokerage fees and commissions and other portfolio transaction expenses; (iv) the costs of borrowing money, including interest expenses and bank overdraft charges; (v) fees and expenses of the Trustees who are not “interested persons” of PIMCO or the Trust, and any counsel retained exclusively for their benefit; (vi) extraordinary expenses, including costs of litigation and indemnification expenses; (vii) organization expenses and (viii) any expenses allocated or allocable to a specific class of shares, which include service fees payable with respect to the Administrative Class Shares, and may include certain other expenses as permitted by the Trust’s Multiple Class Plan adopted pursuant to Rule 18f-3 under the Act and subject to review and approval by the Trustees. The ratio of expenses to average net assets per share class, as disclosed in the Financial Highlights, may differ from the annual portfolio operating expenses per share class as disclosed in the Prospectus for the reasons set forth above.
Effective April 1, 2007, each Trustee, other than those affiliated with PIMCO or its affiliates, receives an annual retainer of $15,000, plus $2,375 for each Board of Trustees meeting attended in person, $500 for each committee meeting attended and $750 for each Board of Trustees meeting attended telephonically, plus reimbursement of related expenses. In addition, the audit committee chair receives an additional annual retainer of $2,000 and each other committee chair receives an additional annual retainer of $500. These expenses are allocated on a pro-rata basis to the various portfolios of the Trust according to their respective net assets. The Trust pays no compensation directly to any Trustee or any other officer who is affiliated with the Administrator, all of whom receive remuneration for their services to the Trust from the Administrator or its affiliates. Prior to April 1, 2007, each Trustee, other than those affiliated with PIMCO or its affiliates, received an annual retainer of $15,000 plus $2,000 for each Board of Trustees meeting attended ($500 for each special meeting attended), plus reimbursement of related expenses. The Audit Committee Chairman received an annual retainer of $1,500 and the Governance Committee Chairman received an annual retainer of $500. In addition, each member of a committee received $500 for each committee meeting attended.
(e) Acquired Fund Fees and Expenses The Underlying Fund Expenses for the Portfolio are based upon an allocation of the Portfolio’s assets among the Underlying Funds and upon the total annual operating expenses of the Institutional Class shares of these Underlying Funds. Underlying Fund Expenses will vary with changes in the expenses of the Underlying Funds, as well as allocation of the Portfolio’s assets.
PIMCO has contractually agreed, for the Portfolio’s current fiscal year, to reduce its advisory fee to the extent that the Acquired Fund Fees and Expenses attributable to advisory and administrative fees exceed 0.64% of the total assets invested in Underlying Funds. The waiver is reflected in the Statement of Operations as a component of Reimbursement by Manager. For the period ended June 30, 2007, the amount was $45,332. PIMCO may recoup these waivers in future periods, not exceeding three years, provided total expenses, including such recoupment, do not exceed the annual expense limit. As of June 30, 2007, the recoverable amount to the Administrator was $81,026.
| | | | | | |
| | Semiannual Report | | June 30, 2007 | | 11 |
Notes to Financial Statements (Cont.)
4. RELATED PARTY TRANSACTIONS
The Advisor, Administrator, and Distributor are related parties as defined by FAS 57, Related Party Disclosures. Fees payable to these parties are disclosed in Note 3.
The All Asset Portfolio invests substantially all of its assets in Institutional Class shares of PIMCO Funds, an affiliated open-end investment company. The Underlying Funds are considered to be affiliated with the Portfolio. The table below shows the transactions in and earnings from investments in these affiliated Funds for the period ended June 30, 2007 (amounts in thousands):
| | | | | | | | | | | | | | | | | | | | | | | |
| Underlying Funds | | Market Value 12/31/2006 | | Purchases at Cost | | Proceeds from Sales | | Unrealized Appreciation (Depreciation) | | | Market Value 6/30/2007 | | Dividend Income | | Net Capital and Realized Gain
(Loss) | |
Convertible Fund | | $ | 1,351 | | $ | 6,967 | | $ | 0 | | $ | 258 | | | $ | 8,434 | | $ | 15 | | $ | 0 | |
Developing Local Markets Fund | | | 92,781 | | | 59,318 | | | 15,272 | | | 5,598 | | | | 139,732 | | | 2,343 | | | (50 | ) |
Diversified Income Fund | | | 10,826 | | | 51,300 | | | 12,520 | | | (1,267 | ) | | | 48,242 | | | 1,006 | | | (200 | ) |
Emerging Local Bond Fund | | | 0 | | | 123,827 | | | 138 | | | 2,601 | | | | 126,285 | | | 1,737 | | | (5 | ) |
Emerging Markets Bond Fund | | | 32,346 | | | 842 | | | 15,795 | | | 563 | | | | 17,241 | | | 842 | | | 148 | |
Floating Income Fund | | | 223,808 | | | 187,752 | | | 188,313 | | | 1,339 | | | | 222,251 | | | 8,175 | | | 94 | |
Foreign Bond Fund (Unhedged) | | | 877 | | | 15 | | | 0 | | | (7 | ) | | | 862 | | | 15 | | | 0 | |
Fundamental IndexPLUS™ Fund | | | 21,485 | | | 10,115 | | | 3,471 | | | 902 | | | | 29,709 | | | 101 | | | 138 | |
Fundamental IndexPLUS™ TR Fund | | | 29,493 | | | 4,605 | | | 0 | | | 795 | | | | 35,817 | | | 103 | | | 0 | |
GNMA Fund | | | 2,815 | | | 72 | | | 0 | | | (17 | ) | | | 2,856 | | | 72 | | | 0 | |
High Yield Fund | | | 25,812 | | | 996 | | | 20,125 | | | 157 | | | | 6,539 | | | 867 | | | 187 | |
Income Fund | | | 0 | | | 3,703 | | | 0 | | | (84 | ) | | | 3,619 | | | 37 | | | 0 | |
International StocksPLUS® TR Strategy Fund (Unhedged) | | | 1,138 | | | 2,662 | | | 0 | | | 150 | | | | 3,969 | | | 48 | | | 0 | |
International StocksPLUS® TR Strategy Fund
(U.S. Dollar-Hedged) | | | 29,781 | | | 336 | | | 0 | | | 1,763 | | | | 31,927 | | | 336 | | | 0 | |
Long-Term U.S. Government Fund | | | 10,595 | | | 96,296 | | | 41,674 | | | (566 | ) | | | 65,163 | | | 564 | | | 541 | |
Low Duration Fund | | | 20,641 | | | 18,385 | | | 37,450 | | | 1 | | | | 1,280 | | | 407 | | | (250 | ) |
Real Return Asset Fund | | | 99,339 | | | 136,338 | | | 64,587 | | | (2,898 | ) | | | 168,665 | | | 2,807 | | | 948 | |
Real Return Fund | | | 51,460 | | | 42,705 | | | 17,008 | | | (1,167 | ) | | | 76,577 | | | 1,488 | | | (147 | ) |
RealEstateRealReturn Strategy Fund | | | 2,066 | | | 85 | | | 0 | | | (480 | ) | | | 1,899 | | | 85 | | | 0 | |
Short-Term Fund | | | 3,622 | | | 809 | | | 797 | | | (14 | ) | | | 3,619 | | | 87 | | | (1 | ) |
Small Cap StocksPLUS® TR Fund | | | 0 | | | 1,881 | | | 0 | | | (3 | ) | | | 1,877 | | | 4 | | | 0 | |
StocksPLUS® Fund | | | 1,719 | | | 42 | | | 0 | | | 117 | | | | 1,830 | | | 42 | | | 0 | |
StocksPLUS® Total Return Fund | | | 6,570 | | | 37 | | | 0 | | | 7 | | | | 6,836 | | | 37 | | | 0 | |
Total Return Fund | | | 18,875 | | | 449 | | | 15,206 | | | (123 | ) | | | 3,660 | | | 450 | | | (374 | ) |
Total Return Mortgage Fund | | | 3,782 | | | 11,065 | | | 0 | | | (166 | ) | | | 14,699 | | | 299 | | | 0 | |
CommodityRealReturn Strategy Fund® | | | 115,847 | | | 11,589 | | | 25,927 | | | (632 | ) | | | 102,122 | | | 2,371 | | | (2,098 | ) |
Totals | | $ | 807,029 | | $ | 772,191 | | $ | 458,283 | | $ | 6,827 | | | $ | 1,125,710 | | $ | 24,338 | | $ | (1,069 | ) |
5. GUARANTEES AND INDEMNIFICATIONS
Under the Trust’s organizational documents, each Trustee, officer, employee or other agent of the Trust (including the Trust’s investment manager) is indemnified, to the extent permitted by the Act, against certain liabilities that may arise out of performance of their duties to the Portfolio. Additionally, in the normal course of business, the Portfolio enters into contracts that contain a variety of indemnification clauses. The Portfolio’s maximum exposure under these arrangements is unknown as this would involve future claims that may be made against the Portfolio that have not yet occurred. However, the Portfolio has not had prior claims or losses pursuant to these contracts and believes the risk of loss to be remote.
6. PURCHASES AND SALES OF SECURITIES
The length of time the Portfolio has held a particular security is not generally a consideration in investment decisions. A change in the securities held by the
Portfolio is known as “portfolio turnover”. The Portfolio may engage in frequent
and active trading of portfolio securities to achieve its investment objective, particularly during periods of volatile market movements. High portfolio turnover (e.g., over 100%) involves correspondingly greater expenses to the Portfolio, including brokerage commissions or dealer mark-ups and other transaction costs on the sale of securities and reinvestments in other securities. Such sales may also result in realization of taxable capital gains, including short-term capital gains (which are generally taxed at ordinary income tax rates). The trading costs and tax effects associated with portfolio turnover may adversely affect the Portfolio’s performance.
Purchases and sales of securities (excluding short-term investments) for the period ended June 30, 2007, were as follows (amounts in thousands):
| | | | | | | | | | | | |
| U.S. Government/Agency | | | | All Other |
| Purchases | | Sales | | | | Purchases | | Sales |
| $ | 0 | | $ | 0 | | | | $ | 772,191 | | $ | 458,283 |
| | | | |
| 12 | | PIMCO Variable Insurance Trust | | |
| | |
| |
| | | June 30, 2007 (Unaudited) |
7. SHARES OF BENEFICIAL INTEREST
The Portfolio may issue an unlimited number of shares of beneficial interest with a $0.001 par value. Changes in shares of beneficial interest were as follows (shares and amounts in thousands):
| | | | | | | | | | | | | | | | |
| | | | | Six Months Ended 06/30/2007 | | | Year Ended 12/31/2006 | |
| | | | | Shares | | | Amount | | | Shares | | | Amount | |
| | | | | |
Receipts for shares sold | | | | | | | | | | | | | | | | |
Institutional Class | | | | 25 | | | $ | 294 | | | 6 | | | $ | 73 | |
Administrative Class | | | | 2,142 | | | | 25,388 | | | 5,177 | | | | 60,956 | |
Advisor Class | | | | 25,760 | | | | 304,743 | | | 41,500 | | | | 485,456 | |
Class M | | | | 468 | | | | 5,550 | | | 1,306 | | | | 15,354 | |
Issued as reinvestment of distributions | | | | | | | | | | | | | | | | |
Institutional Class | | | | 1 | | | | 7 | | | 0 | | | | 3 | |
Administrative Class | | | | 525 | | | | 6,179 | | | 1,218 | | | | 14,172 | |
Advisor Class | | | | 1,449 | | | | 17,050 | | | 1,455 | | | | 17,022 | |
Class M | | | | 92 | | | | 1,079 | | | 273 | | | | 3,180 | |
Cost of shares redeemed | | | | | | | | | | | | | | | | |
Institutional Class | | | | (7 | ) | | | (83 | ) | | 0 | | | | 0 | |
Administrative Class | | | | (2,130 | ) | | | (25,052 | ) | | (6,181 | ) | | | (72,158 | ) |
Advisor Class | | | | (129 | ) | | | (1,505 | ) | | (676 | ) | | | (7,990 | ) |
Class M | | | | (595 | ) | | | (13,565 | ) | | (2,587 | ) | | | (30,245 | ) |
Net increase resulting from Portfolio share transactions | | | | 27,601 | | | $ | 320,085 | | | 41,491 | | | $ | 485,823 | |
The following schedule shows the number of shareholders each owning 5% or more of the Portfolio and the total percentage of the Portfolio held by such shareholders:
| | | | | | |
| | | | | Number of Shareholders | | % of Portfolio Held |
Institutional Class | | | | 1 | | 95 |
Administrative Class | | | | 3 | | 91 |
Advisor Class | | | | 2 | | 97 |
Class M | | | | 3 | | 94 |
8. REGULATORY AND LITIGATION MATTERS
Since February 2004, PIMCO, Allianz Global Investors of America L.P. (PIMCO’s parent company), AGID, and certain of their affiliates, including the PIMCO Funds (another series of funds managed by PIMCO), the Allianz Funds (formerly known as PIMCO Funds: Multi-Manager Series (another series of funds managed by affiliates of PIMCO)), certain Trustees of the Trust (in their capacity as Trustees of the PIMCO Funds or the Allianz Funds) and certain employees of PIMCO, have been named as defendants in fifteen lawsuits filed in various jurisdictions. Eleven of those lawsuits concern “market timing,” and they have been transferred to and consolidated for pre-trial proceedings in a multi-district litigation proceeding in the U.S. District Court for the District of Maryland; the other four lawsuits concern “revenue sharing” and have been consolidated into a single action in the U.S. District Court for the District of Connecticut. The lawsuits have been commenced as putative class actions on behalf of investors who purchased, held or redeemed shares of the various series of the PIMCO Funds and the Allianz Funds during specified periods, or as derivative actions on behalf of the PIMCO Funds and the Allianz Funds.
The market timing actions in the District of Maryland generally allege that certain hedge funds were allowed to engage in “market timing” in certain funds of the PIMCO Funds and the Allianz Funds and this alleged activity was not disclosed.
Pursuant to tolling agreements entered into with the derivative and class action
plaintiffs, PIMCO, certain PIMCO Funds Trustees, and certain employees of PIMCO who were previously named as defendants have all been dropped as defendants in the market timing actions; the plaintiffs continue to assert claims on behalf of the shareholders of the PIMCO Funds or on behalf of the PIMCO Funds itself against other defendants. By order dated November 3, 2005, the U.S. District Court for the District of Maryland granted the PIMCO Funds’ motion to dismiss claims asserted against it in a consolidated amended complaint where the PIMCO Funds were named, in the complaint, as a nominal defendant. The revenue sharing action in the District of Connecticut generally alleges that fund assets were inappropriately used to pay brokers to promote funds of the PIMCO Funds and the Allianz Funds, including directing fund brokerage transactions to such brokers, and that such alleged arrangements were not fully disclosed to shareholders. On August 11, 2005, the U.S. District Court for the District of Connecticut conducted a hearing on defendants’ motion to dismiss the consolidated amended complaint in the revenue sharing action but has not yet ruled on the motion to dismiss. The market timing and revenue sharing lawsuits seek, among other things, unspecified compensatory damages plus interest and, in some cases, punitive damages, the rescission of investment advisory contracts, the return of fees paid under those contracts and restitution.
Two nearly identical class action civil complaints have been filed in August 2005, in the Northern District of Illinois Eastern Division, alleging that the plaintiffs each purchased and sold a 10-year Treasury note futures contract and suffered damages from an alleged shortage when PIMCO held both physical and futures positions in 10-year Treasury notes for its client accounts. The two actions have been consolidated into one action, and the two separate complaints have been replaced by a consolidated complaint. PIMCO is a named defendant, and PIMCO Funds has been added as a defendant, to the consolidated action. PIMCO strongly believes the complaint is without merit and intends to vigorously defend itself.
In April 2006, certain portfolios of the Trust and certain other funds managed by PIMCO were served in an adversary proceeding brought by the Official Committee of Asbestos Claimants of G-I Holdings, Inc. in G-I Holdings, Inc.’s bankruptcy in the District of New Jersey. In July 2004, PIMCO was named in this lawsuit and remains a defendant. The plaintiff seeks to recover for the bankruptcy estate assets that were transferred by the predecessor entity of G-I Holdings, Inc. to a wholly-owned subsidiary in 1994. The subsidiary has since issued notes, of which certain portfolios of the Trust and certain other funds managed by PIMCO are alleged to be holders. The complaint alleges that in 2000, more than two hundred noteholders—including certain portfolios of the Trust and certain other funds managed by PIMCO—were granted a second priority lien on the assets of the subsidiary in exchange for their consent to a refinancing transaction and the granting of a first priority lien to the lending banks. The plaintiff is seeking invalidation of the lien in favor of the noteholders and/or the value of the lien. On June 21, 2006, the District of New Jersey overturned the Bankruptcy Court’s decision granting permission to file the adversary proceeding and remanded the matter to the Bankruptcy Court for further proceedings. Following a motion to reconsider, the District Court upheld its remand on August 7, 2006, and instructed the Bankruptcy Court to conduct a “cost-benefit” analysis of the Committee’s claims, including the claims against the noteholders. The Bankruptcy Court held a status conference on October 25, 2006 and set a briefing schedule relating to this cost-benefit analysis.
The foregoing speaks only as of the date of this report. It is possible that these matters and/or other developments resulting from these matters could result in increased portfolio redemptions or other adverse consequences to the Portfolio. However, PIMCO and AGID believe that these matters are not likely to have a material adverse effect on the Portfolio or on PIMCO’s or AGID’s ability to perform their respective investment advisory or distribution services relating to the Portfolio.
| | | | | | |
| | Semiannual Report | | June 30, 2007 | | 13 |
Notes to Financial Statements (Cont.)
9. FEDERAL INCOME TAX MATTERS
The Portfolio intends to qualify as a regulated investment company under sub-chapter M of the Internal Revenue Code (the “Code”) and distribute all of its taxable income and net realized gains, if applicable, to shareholders. Accordingly, no provision for Federal income taxes has been made.
To the extent the Portfolio invests in the CommodityRealReturn Strategy Fund® (the “CRRS Fund”), an Underlying Fund, this Portfolio may be subject to additional tax risk.
One of the requirements for favorable tax treatment as a regulated investment company under the Code is that the Fund derive at least 90% of its gross income from certain qualifying sources of income. The IRS has issued a revenue ruling which holds that income derived from commodity index-linked swaps is not qualifying income under Subchapter M of the Code. Subsequently, the IRS issued a private letter ruling to the CRRS Fund in which the IRS specifically concluded that income from certain commodity index-linked notes is qualifying income. In addition, the IRS issued another private letter ruling to the CRRS Fund in which the IRS specifically concluded that income derived from the CRRS Fund’s investment in
the Subsidiary, which invests primarily in commodity index-linked swaps, will also constitute qualifying income to the CRRS Fund. Based on such rulings, the CRRS Fund will continue to seek to gain exposure to the commodity markets primarily through investments in commodity-linked notes and through investments in its subsidiary.
Please refer to the prospectus for the Separate Account and Variable Contract for information regarding federal income tax treatment of distributions to the Separate Account.
As of June 30, 2007, the aggregate cost of investments was the same for federal income tax and financial statement purposes. The net unrealized appreciation (depreciation) of investment securities for federal income tax purposes is as follows (amount in thousands):
| | | | |
Aggregate Gross Unrealized Appreciation | | Aggregate Gross Unrealized (Depreciation) | | Net Unrealized Appreciation |
$ 14,251 | | $ (7,424) | | $ 6,827 |
| | | | |
| 14 | | PIMCO Variable Insurance Trust | | |
| | |
| |
Privacy Policy* | | (Unaudited) |
The Funds consider customer privacy to be a fundamental aspect of their relationships with shareholders and are committed to maintaining the confidentiality, integrity and security of their current, prospective and former shareholders’ personal information. To ensure their shareholders’ privacy, the Funds have developed policies that are designed to protect this confidentiality, while allowing shareholder needs to be served.
Obtaining Personal Information
In the course of providing shareholders with products and services, the Funds and certain service providers to the Funds, such as the Funds’ investment advisers (“Advisers”), may obtain non-public personal information about shareholders, which may come from sources such as account applications and other forms, from other written, electronic or verbal correspondence, from shareholder transactions, from a shareholder’s brokerage or financial advisory firm, financial adviser or consultant, and/or from information captured on the Funds’ internet web sites.
Respecting Your Privacy
As a matter of policy, the Funds do not disclose any personal or account information provided by shareholders or gathered by the Funds to non-affiliated third parties, except as required or permitted by law or as necessary for such third parties to perform their agreements with respect to the Funds. As is common in the industry, non-affiliated companies may from time to time be used to provide certain services, such as preparing and mailing prospectuses, reports, account statements and other information, conducting research on shareholder satisfaction and gathering shareholder proxies. A Fund’s Distributor may also retain non-affiliated companies to market the Fund’s shares or products which use the Fund’s shares and enter into joint marketing agreements with other companies. These companies may have access to a shareholder’s personal and account information, but are permitted to use this information solely to provide the specific service or as otherwise permitted by law. In most cases, the shareholders will be clients of a third party, but the Funds may also provide a shareholder’s personal and account information to the shareholder’s respective brokerage or financial advisory firm.
Sharing Information with Third Parties
The Funds reserve the right to disclose or report personal information to non-affiliated third parties, in limited circumstances, where the Funds believe in good faith that disclosure is required under law to cooperate with regulators or law enforcement authorities, to protect their rights or property or upon reasonable request by any Fund in which a shareholder has chosen to invest. In addition, the Funds may disclose information about a shareholder’s accounts to a non-affiliated third party with the consent of the shareholder.
Sharing Information with Affiliates
The Funds may share shareholder information with their affiliates in connection with servicing their shareholders’ accounts or to provide shareholders with information about products and services that the Funds or their Advisers, principal underwriters or their affiliates (“Service Affiliates”) believe may be of interest to such shareholders. The information that the Funds share may include, for example, a shareholder’s participation in one of the Funds or in other investment programs sponsored by a Service Affiliate, a shareholder’s ownership of certain types of accounts (such as IRAs), or other data about a shareholder’s accounts. The Funds’ Service Affiliates, in turn, are not permitted to share shareholder information with non-affiliated entities, except as required or permitted by law.
Procedures to Safeguard Private Information
The Funds take seriously the obligation to safeguard shareholder non-public personal information. In addition to this policy, the Funds have also implemented procedures that are designed to restrict access to a shareholder’s non-public personal information only to internal personnel who need to know that information in order to provide products or services to such shareholders. In order to guard a shareholder’s non-public personal information, physical, electronic and procedural safeguards are in place.
* This Privacy Policy applies to the following entities: PIMCO Funds, PIMCO Variable Insurance Trust, PCM Fund, Inc. and PIMCO Strategic Global Government Fund, Inc. (collectively, the “Funds”).
| | | | | | |
| | Semiannual Report | | June 30, 2007 | | 15 |
Investment Adviser and Administrator
Pacific Investment Management Company LLC
840 Newport Center Drive
Newport Beach, California 92660
Investment Sub-Adviser
Research Affiliates, LLC
800 E. Colorado Boulevard
Pasadena, California 91101
Distributor
Allianz Global Investors Distributors LLC
1345 Avenue of the Americas
New York, New York 10105
Custodian
State Street Bank & Trust Company
801 Pennsylvania
Kansas City, Missouri 64105
Transfer Agent
Boston Financial Data Services–Midwest
330 W. 9th Street
Kansas City, Missouri 64105
Legal Counsel
Dechert LLP
1775 I Street, N.W.
Washington, D.C. 20006
Independent Registered Public Accounting Firm
PricewaterhouseCoopers LLP
1055 Broadway
Kansas City, Missouri 64105
P I M C O

Table of Contents
This material is authorized for use only when preceded or accompanied by the current PIMCO Variable Insurance Trust (the “Trust”) prospectus. Investors should consider the investment objectives, risks, charges and expenses of this Trust carefully before investing. Ask your financial professional to explain all charges that may apply. This and other information is contained in the Trust’s prospectus. The variable product prospectus may be obtained by contacting your Investment Consultant. Please read the Trust and variable product prospectus carefully before you invest or send money.
Chairman’s Letter
Dear PIMCO Variable Insurance Trust Shareholder:
It is our pleasure to present to you the semiannual report for the PIMCO Variable Insurance Trust, covering the six-month period ended June 30, 2007. The PIMCO Variable Insurance Trust’s net assets were $8.68 billion at June 30, 2007, as compared to $7.76 billion at December 31, 2006.
Highlights of the financial markets during the reporting period include:
| | n | | Economic data during the first quarter of 2007 pointed to slower growth, which heightened market expectations for a decrease in the Federal Funds Rate. By the second quarter, economic data, such as employment statistics, provided little indication of economic weakness, causing expectations of a decrease in the Federal Funds Rate to unwind and U.S. interest rates to move higher. Interest rates in Europe and the U.K. also rose over the period as central banks raised their key lending rates due to inflation concerns. The benchmark ten-year U.S. Treasury yielded 5.03% as of June 30, 2007, or 0.32% higher than at the beginning of the year. |
| | n | | Most bonds generally returned much of their gains from earlier in the year as worldwide growth and capital flows drove interest rates higher in the second quarter. Increased risk aversion in global financial markets, due in part to subprime mortgage worries in the U.S., also contributed to the rise in interest rates. The Lehman Brothers Aggregate Bond Index, which includes Treasury, investment-grade corporate and mortgage-backed securities, returned 0.98% for the six-month period. |
| | n | | Locally issued emerging market (“EM”) bonds posted positive returns for the reporting period. Yields on these bonds declined and the local currencies in which they are denominated generally gained, amid increasing investor awareness, strong economic growth and surging capital inflows. External EM bonds (debt instruments issued by emerging markets countries and typically denominated in U.S. dollars) lagged behind local EM bonds (debt instruments issued by emerging markets countries and denominated in the currency of the issuer), as external EM bonds tend to trade more in-line with U.S. Treasuries. |
| | n | | Treasury Inflation-Protected Securities (“TIPS”) outpaced nominal bonds (non-inflation linked bonds) for the first part of the year and all but the longest maturity TIPS outperformed in the second quarter as high gasoline prices drove higher inflation accruals. Commodities, as represented by the Dow Jones-AIG Commodity Total Return Index, returned 4.46% for the period. Equities, as measured by the S&P 500 Index and the Russell 2000 Index, returned 6.96% and 6.45%, respectively, for the period. |
On the following pages, please find specific details as to the Portfolio’s total return investment performance and a discussion of those factors that affected performance.
Thank you for the trust you have placed in us. We will continue to work diligently to serve your investment needs.
Sincerely,

Brent R. Harris
Chairman, PIMCO Variable Insurance Trust
July 31, 2007
| | | | | | |
| | Semiannual Report | | June 30, 2007 | | 1 |
Important Information About the Portfolio
PIMCO Variable Insurance Trust (the “Trust”) is an open-end management investment company currently consisting of twenty separate investment portfolios, including the All Asset Portfolio (the “Portfolio”). The Portfolio is only available as a funding vehicle under variable life insurance policies or variable annuity contracts issued by insurance companies (“Variable Contracts”). Individuals may not purchase shares of the Portfolio directly. Shares of the Portfolio also may be sold to qualified pension and retirement plans outside of the separate account context.
The Portfolio is a “fund of funds,” which is a term used to describe mutual funds that pursue their investment objective by investing in other mutual funds instead of investing directly in stocks or bonds of other issuers. Under normal circumstances, the Portfolio invests substantially all of its assets in Institutional Class shares of PIMCO Funds, an affiliated open-end investment company, except the All Asset and All Asset All Authority Funds (“Underlying Funds”).
Among the principal risks of investing in the Portfolio are allocation risk, Underlying Fund risk and issuer non-diversification risk. The Portfolio also is indirectly subject to the risks of the Underlying Funds, which may include, but are not limited to, the following: interest rate risk, credit risk, high yield risk, market risk, issuer risk, variable dividends risk, liquidity risk, derivatives risk, commodity risk, equity risk, mortgage risk, non-U.S. investment risk, real estate risk, emerging markets risk, currency risk, issuer non-diversification risk, leveraging risk, small company risk, management risk, California state-specific risk, New York state-specific risk, tax risk, and subsidiary risk. A complete description of these risks is contained in the Portfolio’s prospectus. An Underlying Fund may use derivative instruments for hedging purposes or as part of an investment strategy. Use of these instruments may involve certain costs and risks such as liquidity risk, interest rate risk, market risk, credit risk, management risk and the risk that the Underlying Fund could not close out a position when it would be most advantageous to do so. An Underlying Fund investing in derivatives could lose more than the principal amount invested in these instruments. An Underlying Fund’s investment in non-U.S. securities may entail risk due to non-U.S. economic and political developments; this risk may be increased when investing in emerging markets.
The cost of investing in the Portfolio will generally be higher than the cost of investing in a mutual fund that invests directly in individual stocks and bonds. By investing in the Portfolio, an investor will indirectly bear fees and expenses charged by the Underlying Funds in addition to the Portfolio’s direct fees and expenses.
On the performance summary page in this Semiannual Report, the Total Return Investment Performance table measures performance assuming that all dividend and capital gain distributions were reinvested.
An investment in the Portfolio is not a deposit of a bank and is not guaranteed or insured by the Federal Deposit Insurance Corporation or any other government agency. It is possible to lose money on investments in the Portfolio.
PIMCO has adopted written proxy voting policies and procedures (“Proxy Policy”) as required by Rule 206(4)-6 under the Investment Advisers Act of 1940, as amended. The Proxy Policy has been adopted by the Trust as the policies and procedures that PIMCO will use when voting proxies on behalf of the Portfolio. A description of the policies and procedures that PIMCO uses to vote proxies relating to portfolio securities of the Portfolio, and information about how the Portfolio voted proxies relating to portfolio securities held during the most recent twelve-month period ended June 30, are available without charge, upon request, by calling the Trust at 1-866-746-2606 and on the Portfolio’s website at www.pimco.com.
The Portfolio files its complete schedule of portfolio holdings with the SEC for the first and third quarters of each fiscal year on Form N-Q. A copy of the Trust’s Form N-Q is also available on the SEC’s website at http://www.sec.gov and may be reviewed and copied at the SEC’s Public Reference Room in Washington D.C. Information on the operation of the Public Reference Room may be obtained by calling 1-800-SEC-0330, and is available without charge, upon request, by calling the Trust at 1-866-746-2606 and on the Portfolio’s website at www.pimco.com.
PIMCO Variable Insurance Trust is distributed by Allianz Global Investors Distributors LLC, 1345 Avenue of the Americas, New York, NY 10105.
| | | | |
| 2 | | PIMCO Variable Insurance Trust | | |
The following disclosure provides important information regarding the Portfolio’s Expense Example (“Example” or “Expense Example”), which appears in this Semiannual Report. Please refer to this information when reviewing the Expense Example for the Portfolio.
Example
As a shareholder of the Portfolio, you incur two types of costs: (1) transaction costs and (2) ongoing costs, including advisory and administrative fees; distribution and/or service (12b-1) fees (Administrative Class, Advisor Class and Class M only); and other Portfolio expenses. The Example is intended to help you understand your ongoing costs (in dollars) of investing in the Portfolio and to compare these costs with the ongoing costs of investing in other mutual funds. The Expense Example does not reflect any fees or other expenses imposed by the Variable Contracts. If it did, the expenses reflected in the Expense Example would be higher. The Example is based on an investment of $1,000 invested at the beginning of the period and held for the entire period indicated, which is from January 1, 2007 to June 30, 2007.
Actual Expenses
The information in the table under the heading “Actual Performance” provides information about actual account values and actual expenses. You may use the information in these columns, together with the amount you invested, to estimate the expenses that you paid over the period. Simply divide your account value by $1,000 (for example, an $8,600 account value divided by $1,000 = $8.60), then multiply the result by the number in the row titled “Expenses Paid During Period” to estimate the expenses you paid on your account during this period.
Hypothetical Example for Comparison Purposes
The information in the table under the heading “Hypothetical Performance (5% return before expenses)” provides information about hypothetical account values and hypothetical expenses based on the Portfolio’s actual expense ratio and an assumed rate of return of 5% per year before expenses, which is not the Portfolio’s actual return. The hypothetical account values and expenses may not be used to estimate the actual ending account balance or expenses you paid for the period. You may use this information to compare the ongoing costs of investing in the Portfolio and other portfolios. To do so, compare this 5% hypothetical example with the 5% hypothetical examples that appear in the shareholder reports of the other portfolios.
Please note that the expenses shown in the table are meant to highlight your ongoing costs only and do not reflect any transactional costs. Therefore, the information under the heading “Hypothetical Performance (5% return before expenses)” is useful in comparing ongoing costs only, and will not help you determine the relative total costs of owning different portfolios. In addition, if these transactional costs were included, your costs would have been higher.
The expense ratio may vary period to period because of various factors, such as an increase in expenses not covered by the advisory and administrative fees (such as expenses of the trustees and their counsel, litigation expense and interest expense).
| | | | | | |
| | Semiannual Report | | June 30, 2007 | | 3 |
PIMCO All Asset Portfolio
Cumulative Returns Through June 30, 2007
$10,000 invested at the end of the nearest month to the inception date of the Portfolio’s Institutional Class.
PIMCO Funds Allocation‡
| | |
Floating Income Fund | | 19.7% |
Real Return Asset Fund | | 14.9% |
Developing Local Markets Fund | | 12.4% |
Emerging Local Bond Fund | | 11.2% |
CommodityRealReturn Strategy Fund® | | 9.0% |
Real Return Fund | | 6.8% |
Long-Term U.S. Government Fund | | 5.7% |
Other | | 20.3% |
| | ‡ | % of Total Investments as of 06/30/2007 |
| | | | | | | | |
| Average Annual Total Return for the period ended June 30, 2007 |
| | | | | 6 Months* | | 1 Year | | Portfolio
Inception
(01/31/06) |

| | PIMCO All Asset Portfolio Institutional Class | | 2.99% | | 9.05% | | 4.80% |

| | Lehman Brothers U.S. TIPS: 1-10 Year Index± | | 2.49% | | 4.19% | | 4.01% |
 | | CPI + 500 Basis Points±± | | 5.84% | | 7.93% | | 8.88% |
All Portfolio returns are net of fees and expenses.
* Cumulative return.
Performance quoted represents past performance. Past performance is no guarantee of future results. Investment return and principal value will fluctuate so the Portfolio shares, when redeemed, may be worth more or less than their original cost. The Portfolio’s performance does not reflect the deduction of additional charges and expenses imposed in connection with investing in Variable Contracts, which will reduce returns. Current performance may be lower or higher than the performance data quoted. Performance data current to the most recent month-end is available by calling (800) 927-4648.
± Lehman Brothers U.S. TIPS: 1-10 Year Index is an unmanaged index comprised of U.S. Treasury Inflation-Protected Securities having a maturity of at least 1 year and less than 10 years. It is not possible to invest directly in the index. The index does not reflect deductions for fees and expenses.
±± CPI + 500 Basis Points benchmark is created by adding 5% to the annual percentage change in the Consumer Price Index (“CPI”). This index reflects non-seasonally adjusted returns. The CPI is an unmanaged index representing the rate of inflation of the U.S. consumer prices as determined by the U.S. Department of Labor, Bureau of Labor Statistics. There can be no guarantee that the CPI or other indices will reflect the exact level of inflation at any given time. It is not possible to invest directly in the index. The index does not reflect deductions for fees and expenses.
| | | | | | |
| Expense Example | | Actual Performance | | Hypothetical Performance |
| | | | | (5% return before expenses) |
Beginning Account Value (01/01/07) | | $ | 1,000.00 | | $ | 1,000.00 |
Ending Account Value (06/30/07) | | $ | 1,029.90 | | $ | 1,022.69 |
Expenses Paid During Period† | | $ | 2.14 | | $ | 2.13 |
† Expenses are equal to the Portfolio’s Institutional Class annualized expense ratio of 0.425%, multiplied by the average account value over the period, multiplied by 181/365 (to reflect the one-half year period). The expense ratio excludes the expenses of the Underlying Funds, which based upon the allocation of the Portfolio’s assets among the Underlying Funds are indirectly borne by the shareholders of the Portfolio. The Underlying Fund Expenses are currently capped at 0.64%. Overall fees and expenses of investing in the Portfolio will be higher because the example does not reflect Variable Contract fees and expenses.
Please refer to page 3 herein for an explanation of the information presented in the above Expense Example.
Portfolio Insights
| » | | The PIMCO All Asset Portfolio seeks to achieve its investment objective by investing under normal circumstances substantially all of its assets in Institutional Class shares of the PIMCO Funds, an affiliated open-end investment company, except the PIMCO All Asset and PIMCO All Asset All Authority Funds. |
| » | | Significant exposure to short-term strategies, particularly through the PIMCO Floating Income Fund, contributed to performance as the PIMCO Floating Income Fund returned 2.62% net of fees during the period. |
| » | | Although any exposure to Real Estate Investment Trusts (“REITs”) would detract from performance, as the Dow Jones Wilshire REIT Index returned -5.97% during the period, negligible exposure was a positive asset allocation decision. |
| » | | Exposure to equity strategies benefited performance due to strong returns domestically and internationally. However, reduced equity exposure in the Portfolio was not a positive asset allocation decision. |
| » | | Large exposure to developing local market bonds contributed to performance as the asset class benefited from continued capital inflows and strong economic fundamentals. |
| » | | Large exposure to Treasury Inflation-Protected Securities (“TIPS”) detracted from performance as real yields rose. |
| » | | Minimal exposure to convertibles detracted from returns as the asset class had positive performance. |
| | | | |
| 4 | | PIMCO Variable Insurance Trust | | |
Financial Highlights All Asset Portfolio
| | | | | | | | |
| Selected per Share Data for the Period Ended: | | 06/30/2007+ | | | 01/31/2006-12/31/2006 | |
| | |
Institutional Class | | | | | | | | |
Net asset value beginning of period | | $ | 11.68 | | | $ | 11.93 | |
Net investment income (a) | | | 0.30 | | | | 1.17 | |
Net realized/unrealized gain (loss) on investments (a) | | | 0.05 | | | | (0.74 | ) |
Total income from investment operations | | | 0.35 | | | | 0.43 | |
Dividends from net investment income | | | (0.29 | ) | | | (0.65 | ) |
Distributions from net realized capital gains | | | 0.00 | | | | (0.03 | ) |
Total distributions | | | (0.29 | ) | | | (0.68 | ) |
Net asset value end of period | | $ | 11.74 | | | $ | 11.68 | |
Total return | | | 2.99 | % | | | 3.73 | % |
Net assets end of period (000s) | | $ | 291 | | | $ | 74 | |
Ratio of expenses to average net assets | | | 0.425 | %*(b)(d) | | | 0.425 | %*(b)(c) |
Ratio of expenses to average net assets excluding interest expense | | | 0.425 | %*(b)(d) | | | 0.425 | %*(b)(c) |
Ratio of net investment income to average net assets | | | 5.01 | %* | | | 10.65 | %* |
Portfolio turnover rate | | | 48 | % | | | 66 | % |
+ Unaudited
* Annualized
(a) Per share amounts based on average number of shares outstanding during the period.
(b) Ratio of expenses to average net assets excluding underlying Funds' expenses in which the Portfolio invests.
(c) Effective October 1, 2006, the advisory fee was reduced to 0.175%.
(d) If the investment manager had not reimbursed expenses, the ratio of expenses to average net assets would have been 0.435%.
| | | | | | |
| See Accompanying Notes | | Semiannual Report | | June 30, 2007 | | 5 |
Statement of Assets and Liabilities All Asset Portfolio
| | | | |
| (Amounts in thousands, except per share amounts) | | June 30, 2007
(Unaudited) | |
| |
Assets: | | | | |
Investments in affiliates, at value | | $ | 1,125,710 | |
Repurchase agreements, at value | | | 4,111 | |
Cash | | | 1 | |
Receivable for investments in affiliates sold | | | 9,423 | |
Receivable for Portfolio shares sold | | | 2,631 | |
Interest and dividends receivable | | | 2 | |
Interest and dividends receivable from affiliates | | | 5,016 | |
Manager reimbursement receivable | | | 31 | |
| | | | 1,146,925 | |
| |
Liabilities: | | | | |
Payable for investments in affiliates purchased | | $ | 16,789 | |
Payable for Portfolio shares redeemed | | | 69 | |
Accrued investment advisory fee | | | 163 | |
Accrued administration fee | | | 233 | |
Accrued distribution fee | | | 168 | |
Accrued servicing fee | | | 30 | |
| | | | 17,452 | |
| |
Net Assets | | $ | 1,129,473 | |
| |
Net Assets Consist of: | | | | |
Paid in capital | | $ | 1,125,794 | |
Undistributed net investment income | | | 4,112 | |
Accumulated undistributed net realized (loss) | | | (7,260 | ) |
Net unrealized appreciation | | | 6,827 | |
| | | $ | 1,129,473 | |
| |
Net Assets: | | | | |
Institutional Class | | $ | 291 | |
Administrative Class | | | 258,604 | |
Advisor Class | | | 822,338 | |
Class M | | | 48,240 | |
| |
Shares Issued and Outstanding: | | | | |
Institutional Class | | | 25 | |
Administrative Class | | | 22,035 | |
Advisor Class | | | 69,990 | |
Class M | | | 4,106 | |
| |
Net Asset Value and Redemption Price Per Share (Net Asset Per Share Outstanding) | | | | |
Institutional Class | | $ | 11.74 | |
Administrative Class | | | 11.73 | |
Advisor Class | | | 11.74 | |
Class M | | | 11.74 | |
| |
Cost of Investments in Affiliates Owned | | $ | 1,118,883 | |
Cost of Repurchase Agreements Owned | | $ | 4,111 | |
| | | | |
| 6 | | PIMCO Variable Insurance Trust | | See Accompanying Notes |
Statement of Operations All Asset Portfolio
| | | | |
| (Amounts in thousands) | | Six Months Ended June 30, 2007 (Unaudited) | |
| |
| Investment Income: | | | | |
Interest | | $ | 99 | |
Dividends from affiliate investments | | | 24,338 | |
Total Income | | | 24,437 | |
| |
Expenses: | | | | |
Investment advisory fees | | | 831 | |
Administration fees | | | 1,187 | |
Servicing fees – Administrative Class | | | 187 | |
Distribution and/or servicing fees – Advisor Class | | | 813 | |
Distribution and/or servicing fees – Class M | | | 111 | |
Total Expenses | | | 3,129 | |
Reimbursement by Manager | | | (45 | ) |
Net Expenses | | | 3,084 | |
| |
Net Investment Income | | | 21,353 | |
| |
Net Realized and Unrealized Gain (Loss): | | | | |
Net realized (loss) on affiliate investments | | | (1,069 | ) |
Net change in unrealized appreciation on affiliate investments | | | 5,843 | |
Net Gain | | | 4,774 | |
| |
Net Increase in Net Assets Resulting from Operations | | $ | 26,127 | |
| | | | | | |
| See Accompanying Notes | | Semiannual Report | | June 30, 2007 | | 7 |
Statements of Changes in Net Assets All Asset Portfolio
| | | | | | | | |
| (Amounts in thousands) | | Six Months Ended June 30, 2007 (Unaudited) | | | Year Ended December 31, 2006 | |
| | |
| Increase in Net Assets from: | | | | | | | | |
| | |
Operations: | | | | | | | | |
Net investment income | | $ | 21,353 | | | $ | 32,372 | |
Net realized (loss) on affiliate investments | | | (1,069 | ) | | | (7,977 | ) |
Net capital gain distributions received from Underlying Funds | | | 0 | | | | 2,277 | |
Net change in unrealized appreciation on affiliate investments | | | 5,843 | | | | 3,148 | |
Net increase resulting from operations | | | 26,127 | | | | 29,820 | |
| | |
Distributions to Shareholders: | | | | | | | | |
From net investment income | | | | | | | | |
Institutional Class | | | (7 | ) | | | (2 | ) |
Administrative Class | | | (6,179 | ) | | | (13,550 | ) |
Advisor Class | | | (17,050 | ) | | | (15,816 | ) |
Class M | | | (1,079 | ) | | | (3,041 | ) |
From net realized capital gains | | | | | | | | |
Institutional Class | | | 0 | | | | 0 | |
Administrative Class | | | 0 | | | | (622 | ) |
Advisor Class | | | 0 | | | | (1,205 | ) |
Class M | | | 0 | | | | (139 | ) |
| | |
Total Distributions | | | (24,315 | ) | | | (34,375 | ) |
| | |
Portfolio Share Transactions: | | | | | | | | |
Receipts for shares sold | | | | | | | | |
Institutional Class | | | 294 | | | | 73 | |
Administrative Class | | | 25,388 | | | | 60,956 | |
Advisor Class | | | 304,743 | | | | 485,456 | |
Class M | | | 5,550 | | | | 15,354 | |
Issued as reinvestment of distributions | | | | | | | | |
Institutional Class | | | 7 | | | | 3 | |
Administrative Class | | | 6,179 | | | | 14,172 | |
Advisor Class | | | 17,050 | | | | 17,022 | |
Class M | | | 1,079 | | | | 3,180 | |
Cost of shares redeemed | | | | | | | | |
Institutional Class | | | (83 | ) | | | 0 | |
Administrative Class | | | (25,052 | ) | | | (72,158 | ) |
Advisor Class | | | (1,505 | ) | | | (7,990 | ) |
Class M | | | (13,565 | ) | | | (30,245 | ) |
Net increase resulting from Portfolio share transactions | | | 320,085 | | | | 485,823 | |
| | |
Total Increase in Net Assets | | | 321,897 | | | | 481,268 | |
| | |
Net Assets: | | | | | | | | |
Beginning of period | | | 807,576 | | | | 326,308 | |
End of period* | | $ | 1,129,473 | | | $ | 807,576 | |
| | |
*Including undistributed net investment income of: | | $ | 4,112 | | | $ | 7,074 | |
| | | | |
| 8 | | PIMCO Variable Insurance Trust | | See Accompanying Notes |
| | |
| |
| Schedule of Investments All Asset Portfolio (a) | | June 30, 2007 (Unaudited) |
| | | | | | | | |
| | | | | SHARES | | | | VALUE (000S) |
| PIMCO FUNDS (b) 99.7% | | |
CommodityRealReturn Strategy Fund® | | | | 7,268,477 | | $ | | 102,122 |
Convertible Fund | | | | 589,376 | | | | 8,434 |
Developing Local Markets Fund | | | | 12,645,454 | | | | 139,732 |
Diversified Income Fund | | | | 4,446,275 | | | | 48,242 |
Emerging Local Bond Fund | | | | 12,272,617 | | | | 126,285 |
Emerging Markets Bond Fund | | | | 1,580,326 | | | | 17,241 |
Floating Income Fund | | | | 21,146,569 | | | | 222,251 |
Foreign Bond Fund (Unhedged) | | | | 87,682 | | | | 862 |
Fundamental IndexPLUS™ Fund | | | | 2,578,927 | | | | 29,709 |
Fundamental IndexPLUS™ TR Fund | | | | 3,313,300 | | | | 35,817 |
GNMA Fund | | | | 261,736 | | | | 2,856 |
High Yield Fund | | | | 669,256 | | | | 6,539 |
Income Fund | | | | 368,140 | | | | 3,619 |
International StocksPLUS® TR Strategy Fund (Unhedged) | | | | 379,112 | | | | 3,969 |
| | | | | | | | |
| | | | | SHARES | | | | VALUE (000S) |
International StocksPLUS® TR Strategy Fund (U.S.Dollar-Hedged) | | | | 2,537,938 | | $ | | 31,927 |
Long-Term U.S. Government Fund | | | | 6,413,670 | | | | 65,163 |
Low Duration Fund | | | | 130,601 | | | | 1,280 |
Real Return Asset Fund | | | | 15,807,400 | | | | 168,665 |
Real Return Fund | | | | 7,279,172 | | | | 76,577 |
RealEstateRealReturn Strategy Fund | | | | 291,240 | | | | 1,899 |
Short-Term Fund | | | | 364,763 | | | | 3,619 |
Small Cap StocksPLUS® TR Strategy Fund | | | | 173,830 | | | | 1,877 |
StocksPLUS® Fund | | | | 158,184 | | | | 1,830 |
StocksPLUS® Total Return Fund | | | | 561,247 | | | | 6,836 |
Total Return Fund | | | | 360,250 | | | | 3,660 |
Total Return Mortgage Fund | | | | 1,397,281 | | | | 14,699 |
| | | | | | | | |
Total PIMCO Funds (Cost $1,118,883) | | | | 1,125,710 |
| | | | | | | | |
| | | | | | | | | |
| | | | | PRINCIPAL AMOUNT
(000S) | | | | VALUE (000S) | |
| SHORT-TERM INSTRUMENTS 0.3% | |
| |
| REPURCHASE AGREEMENTS 0.3% | |
| State Street Bank and Trust Co. | | | | | |
4.900% due 07/02/2007 | | $ | | 4,111 | | $ | | 4,111 | |
| | | | | | | | | |
(Dated 06/29/2007. Collateralized by Fannie Mae 3.250% due 08/15/2008 valued at $4,197. Repurchase proceeds are $4,113.) | |
Total Short-Term Instruments
(Cost $4,111) | | 4,111 | |
| | | | | | | | | |
| |
| |
| Total Investments 100.0% (Cost $1,122,994) | | | | | | $ | | 1,129,821 | |
| |
| Other Assets and Liabilities (Net) (0.0%) | | | | (348 | ) |
| | | | | | | | | |
| Net Assets 100.0% | | | | | | $ | | 1,129,473 | |
| | | | | | | | | |
Notes to Schedule of Investments
(a) The All Asset Portfolio is investing in shares of affiliated Funds.
(b) Institutional Class Shares of each PIMCO Fund.
| | | | | | |
| See Accompanying Notes | | Semiannual Report | | June 30, 2007 | | 9 |
Notes to Financial Statements
1. ORGANIZATION
The All Asset Portfolio (the “Portfolio”) is a series of the PIMCO Variable Insurance Trust (the “Trust”). The Trust is registered under the Investment Company Act of 1940 (the “Act”), as amended, as an open-end management investment company organized as a Delaware business trust on October 3, 1997. The Portfolio offers four classes of shares: Institutional, Administrative, Advisor, and Class M. Information presented on these financial statements pertains to the Institutional Class of the Portfolio. Certain detailed financial information for the Administrative Class, Advisor Class and Class M is provided separately and is available upon request. The Trust is designed to be used as an investment vehicle by Separate Accounts of insurance companies that fund variable annuity contracts and variable life insurance policies and by qualified pension and retirement plans.
The Portfolio may invest a portion of its assets in certain affiliated underlying investment funds (the “Underlying Funds” or “Acquired Funds”). The Portfolio’s combined investments in the Fundamental IndexPLUS™, Fundamental IndexPLUS™ TR, International StocksPLUS® TR Strategy (U.S. Dollar-Hedged), International StocksPLUS® TR Strategy (Unhedged), Small Cap StocksPLUS® TR, StocksPLUS® and StocksPLUS® Total Return Funds normally will not exceed 50% of its total assets. In addition, the Portfolio’s combined investments in the CommodityRealReturn Strategy, Real Return, Real Return Asset and RealEstateRealReturn Strategy Funds normally will not exceed 75% of its total assets. The Portfolio’s investment in a particular Underlying Fund normally will not exceed 50% of its total assets.
The Portfolio’s assets are not allocated according to a predetermined blend of shares of the Underlying Funds. Instead, when making allocation decisions among the Underlying Funds, the Portfolio’s asset allocation sub-adviser considers various quantitative and qualitative data relating to the U.S. and foreign economies and securities markets. These data include projected growth trends in the U.S. and foreign economies, forecasts for interest rates and the relationship between short- and long-term interest rates (yield curve), current and projected trends in inflation, relative valuation levels in the equity and fixed income markets and various industrial sectors, information relating to business cycles, borrowing needs and the cost of capital, political trends data relating to trade balances and labor information. The Portfolio’s asset allocation sub-adviser has the flexibility to reallocate the Portfolio’s assets among any or all of the Underlying Funds based on its ongoing analyses of the equity, fixed income and commodity markets, although these shifts are not expected to be large or frequent in nature. The Portfolio is non-diversified, which means that it may concentrate its assets in a smaller number of Underlying Funds than a diversified fund.
2. SIGNIFICANT ACCOUNTING POLICIES
The following is a summary of significant accounting policies consistently followed by the Portfolio in the preparation of its financial statements in conformity with accounting principles generally accepted in the United States of America (“GAAP”). The preparation of financial statements in accordance with GAAP requires management to make estimates and assumptions that affect the reported amounts and disclosures on the financial statements. Actual results could differ from those estimates.
(a) Security Valuation Investments in funds within the PIMCO Funds are valued at their net asset value as reported by the Underlying Funds.
(b) Securities Transactions and Investment Income Securities transactions are recorded as of the trade date for financial reporting purposes. Securities purchased or sold on a when-issued or delayed-delivery basis may be settled a month or more after the trade date. Realized gains and losses from securities sold are recorded on the identified cost basis. Dividend income is recorded on the ex-dividend date. Interest income, adjusted for the accretion of discounts and
amortization of premiums, is recorded on the accrual basis.
(c) Dividends and Distributions to Shareholders Dividends from net investment income, if any, are declared and distributed to shareholders quarterly. Net realized capital gains earned by the Portfolio, if any, will be distributed no less frequently than once each year.
Income dividends and capital gain distributions are determined in accordance with income tax regulations which may differ from GAAP. Differences between tax regulations and GAAP may change the fiscal year when income and capital items are recognized for tax and GAAP purposes. Examples of events that give rise to timing differences include wash sales, straddles, net operating losses and capital loss carryforwards. Further, the character of investment income and capital gains may be different for certain transactions under the two methods of accounting. Examples of characterization differences include the treatment of mortgage paydowns, swaps, foreign currency transactions and contingent debt instruments. As a result, income dividends and capital gain distributions declared during a fiscal period may differ significantly from the net investment income and realized capital gain reported on the Portfolio’s annual financial statements presented under GAAP.
Distributions classified as a tax basis return of capital, if any, are reflected on the accompanying Statements of Changes in Net Assets and have been reclassified to paid in capital. In addition, other amounts have been reclassified between undistributed net investment income, accumulated undistributed net realized gains or losses and/or paid in capital to more appropriately conform financial accounting to tax characterizations of dividend distributions.
(d) Multiclass Operations Each class offered by the Portfolio has equal rights as to assets and voting privileges (except that shareholders of a class have exclusive voting rights regarding any matter relating solely to that class of shares). Income and non-class specific expenses of the Portfolio are allocated daily to each class of shares based on the relative value of settled shares. Realized and unrealized capital gains and losses of the Portfolio are allocated daily to each class of shares based on the relative net assets of each class. Class specific expenses, where applicable, currently include administrative, distribution and servicing fees.
(e) Repurchase Agreements The Portfolio may engage in repurchase transactions. Under the terms of a typical repurchase agreement, the Portfolio takes possession of an underlying debt obligation (collateral) subject to an obligation of the seller to repurchase, and the Portfolio to resell, the obligation at an agreed-upon price and time. The underlying securities for all repurchase agreements are held in safekeeping at the Portfolio’s custodian or designated subcustodians under tri-party repurchase agreements. The market value of the collateral must be equal to or exceed the total amount of the repurchase obligations, including interest. Securities purchased under repurchase agreements are reflected as an asset on the Statement of Assets and Liabilities. Generally, in the event of counterparty default, the Portfolio has the right to use the collateral to offset losses incurred. If the counterparty should default, the Portfolio will seek to sell the securities which it holds as collateral. This could involve procedural costs or delays in addition to a loss on the securities if their value should fall below their repurchase price.
(f) New Accounting Policies In July 2006, the Financial Accounting Standards Board (“FASB”) issued Interpretation No. 48, “Accounting for Uncertainty in Income Taxes—an Interpretation of FASB Statement No. 109” (the “Interpretation”). The Interpretation became effective for the Portfolio on June 29, 2007. Management has evaluated the application of the Interpretation in relation to the Portfolio and has concluded that no single filing position or combination of
| | | | |
| 10 | | PIMCO Variable Insurance Trust | | |
| | |
| |
| | | June 30, 2007 (Unaudited) |
filing positions identified as uncertain tax positions required the accrual of a tax liability in the accounting records of the Portfolio for the period ending June 30, 2007. Management will monitor all existing filing positions and future filing positions in light of the Interpretation and evaluate the need for any future tax accruals and financial statement disclosures as warranted.
In September 2006, the FASB issued Statement of Financial Accounting Standards No. 157, “Fair Value Measurements” (the “Statement”). The Statement is effective for fiscal years beginning after November 15, 2007 and will require expanded disclosure about fair value measurements, separately for each major category of assets and liabilities, that enables shareholders to assess the inputs used to develop those measurements, and for recurring fair value measurements using significant unobservable inputs the effect of the measurements on changes in net assets for the reporting period. Management is currently evaluating the application of the Statement to the Portfolio and will provide additional information in relation to the Statement on the Portfolio’s annual financial statements for the period ending December 31, 2007.
3. FEES AND EXPENSES
(a) Investment Advisory Fee Pacific Investment Management Company LLC (“PIMCO”) is a majority-owned subsidiary of Allianz Global Investors of America L.P. (“AGI”), and serves as investment adviser (the “Adviser”) to the Trust, pursuant to an investment advisory contract. The Adviser receives a monthly fee from the Portfolio, at an annual rate based on average daily net assets. The Advisory Fee for all classes is charged at an annual rate of 0.175%.
Research Affiliates, LLC (“Research Affiliates”) serves as the asset allocation sub-adviser and selects the Underlying Funds in which the Portfolio invests. PIMCO pays a fee to Research Affiliates at an annual rate of 0.175% based on average daily net assets of the Portfolio.
(b) Administration Fee PIMCO serves as administrator (the “Administrator”), and provides administrative services to the Trust for which it receives a monthly administrative fee based on each share class’s average daily net assets. As the Administrator, PIMCO bears the costs of various third-party services, including audit, custodial, portfolio accounting, legal, transfer agency and printing costs. The Administration Fee for all classes is charged at the annual rate of 0.25%.
(c) Distribution and Servicing Fees Allianz Global Investors Distributors LLC (“AGID”) is an indirect wholly-owned subsidiary of AGI and serves as the distributor (the “Distributor”) of the Trust’s shares. The Trust is permitted to reimburse AGID on a quarterly basis, out of the Administrative Class assets of the Portfolio in the amount of 0.15% on an annual basis of the average daily net assets of that class, for payments made to financial intermediaries that provide services in connection with the distribution of shares or administration of plans or programs that use Portfolio shares as their funding medium. The effective rate paid to AGID was 0.15% during the current fiscal year.
The Trust has adopted separate Distribution Plans for the Advisor Class and Class M shares of the Portfolio. The Distribution Plans have been adopted pursuant to Rule 12b-1 under the Act. The Distribution Plans permit payments for expenses in connection with the distribution and marketing of Advisor Class and Class M shares and/or the provision of shareholder services to Advisor Class and Class M shareholders which permits the Portfolio to make total payments at an annual rate of 0.25% of its average daily net assets attributable to its Advisor Class and Class M shares. The Trust has also adopted Administrative Services Plans (“Service Plans”) for the Class M shares of the Portfolio. The Service Plans allows the
Portfolio to use its Class M assets to compensate or reimburse financial intermediaries that provide services relating to Class M shares which permits the Portfolio to make total payments at an annual rate of 0.20% of its average daily net assets attributable to its Class M shares.
(d) Portfolio Expenses The Trust is responsible for the following expenses: (i) salaries and other compensation of any of the Trust’s executive officers and employees who are not officers, directors, stockholders or employees of PIMCO or its subsidiaries or affiliates; (ii) taxes and governmental fees; (iii) brokerage fees and commissions and other portfolio transaction expenses; (iv) the costs of borrowing money, including interest expenses and bank overdraft charges; (v) fees and expenses of the Trustees who are not “interested persons” of PIMCO or the Trust, and any counsel retained exclusively for their benefit; (vi) extraordinary expenses, including costs of litigation and indemnification expenses; (vii) organization expenses and (viii) any expenses allocated or allocable to a specific class of shares, which include service fees payable with respect to the Administrative Class Shares, and may include certain other expenses as permitted by the Trust’s Multiple Class Plan adopted pursuant to Rule 18f-3 under the Act and subject to review and approval by the Trustees. The ratio of expenses to average net assets per share class, as disclosed in the Financial Highlights, may differ from the annual portfolio operating expenses per share class as disclosed in the Prospectus for the reasons set forth above.
Effective April 1, 2007, each Trustee, other than those affiliated with PIMCO or its affiliates, receives an annual retainer of $15,000, plus $2,375 for each Board of Trustees meeting attended in person, $500 for each committee meeting attended and $750 for each Board of Trustees meeting attended telephonically, plus reimbursement of related expenses. In addition, the audit committee chair receives an additional annual retainer of $2,000 and each other committee chair receives an additional annual retainer of $500. These expenses are allocated on a pro-rata basis to the various portfolios of the Trust according to their respective net assets. The Trust pays no compensation directly to any Trustee or any other officer who is affiliated with the Administrator, all of whom receive remuneration for their services to the Trust from the Administrator or its affiliates. Prior to April 1, 2007, each Trustee, other than those affiliated with PIMCO or its affiliates, received an annual retainer of $15,000 plus $2,000 for each Board of Trustees meeting attended ($500 for each special meeting attended), plus reimbursement of related expenses. The Audit Committee Chairman received an annual retainer of $1,500 and the Governance Committee Chairman received an annual retainer of $500. In addition, each member of a committee received $500 for each committee meeting attended.
(e) Acquired Fund Fees and Expenses The Underlying Fund Expenses for the Portfolio are based upon an allocation of the Portfolio’s assets among the Underlying Funds and upon the total annual operating expenses of the Institutional Class shares of these Underlying Funds. Underlying Fund Expenses will vary with changes in the expenses of the Underlying Funds, as well as allocation of the Portfolio’s assets.
PIMCO has contractually agreed, for the Portfolio’s current fiscal year, to reduce its advisory fee to the extent that the Acquired Fund Fees and Expenses attributable to advisory and administrative fees exceed 0.64% of the total assets invested in Underlying Funds. The waiver is reflected in the Statement of Operations as a component of Reimbursement by Manager. For the period ended June 30, 2007, the amount was $45,332. PIMCO may recoup these waivers in future periods, not exceeding three years, provided total expenses, including such recoupment, do not exceed the annual expense limit. As of June 30, 2007, the recoverable amount to the Administrator was $81,026.
| | | | | | |
| | Semiannual Report | | June 30, 2007 | | 11 |
Notes to Financial Statements (Cont.)
4. RELATED PARTY TRANSACTIONS
The Advisor, Administrator, and Distributor are related parties as defined by FAS 57, Related Party Disclosures. Fees payable to these parties are disclosed in Note 3.
The All Asset Portfolio invests substantially all of its assets in Institutional Class shares of PIMCO Funds, an affiliated open-end investment company. The Underlying Funds are considered to be affiliated with the Portfolio. The table below shows the transactions in and earnings from investments in these affiliated Funds for the period ended June 30, 2007 (amounts in thousands):
| | | | | | | | | | | | | | | | | | | | | | | |
| Underlying Funds | | Market Value 12/31/2006 | | Purchases at Cost | | Proceeds from Sales | | Unrealized Appreciation (Depreciation) | | | Market Value 6/30/2007 | | Dividend Income | | Net Capital and Realized Gain
(Loss) | |
Convertible Fund | | $ | 1,351 | | $ | 6,967 | | $ | 0 | | $ | 258 | | | $ | 8,434 | | $ | 15 | | $ | 0 | |
Developing Local Markets Fund | | | 92,781 | | | 59,318 | | | 15,272 | | | 5,598 | | | | 139,732 | | | 2,343 | | | (50 | ) |
Diversified Income Fund | | | 10,826 | | | 51,300 | | | 12,520 | | | (1,267 | ) | | | 48,242 | | | 1,006 | | | (200 | ) |
Emerging Local Bond Fund | | | 0 | | | 123,827 | | | 138 | | | 2,601 | | | | 126,285 | | | 1,737 | | | (5 | ) |
Emerging Markets Bond Fund | | | 32,346 | | | 842 | | | 15,795 | | | 563 | | | | 17,241 | | | 842 | | | 148 | |
Floating Income Fund | | | 223,808 | | | 187,752 | | | 188,313 | | | 1,339 | | | | 222,251 | | | 8,175 | | | 94 | |
Foreign Bond Fund (Unhedged) | | | 877 | | | 15 | | | 0 | | | (7 | ) | | | 862 | | | 15 | | | 0 | |
Fundamental IndexPLUS™ Fund | | | 21,485 | | | 10,115 | | | 3,471 | | | 902 | | | | 29,709 | | | 101 | | | 138 | |
Fundamental IndexPLUS™ TR Fund | | | 29,493 | | | 4,605 | | | 0 | | | 795 | | | | 35,817 | | | 103 | | | 0 | |
GNMA Fund | | | 2,815 | | | 72 | | | 0 | | | (17 | ) | | | 2,856 | | | 72 | | | 0 | |
High Yield Fund | | | 25,812 | | | 996 | | | 20,125 | | | 157 | | | | 6,539 | | | 867 | | | 187 | |
Income Fund | | | 0 | | | 3,703 | | | 0 | | | (84 | ) | | | 3,619 | | | 37 | | | 0 | |
International StocksPLUS® TR Strategy Fund (Unhedged) | | | 1,138 | | | 2,662 | | | 0 | | | 150 | | | | 3,969 | | | 48 | | | 0 | |
International StocksPLUS® TR Strategy Fund
(U.S. Dollar-Hedged) | | | 29,781 | | | 336 | | | 0 | | | 1,763 | | | | 31,927 | | | 336 | | | 0 | |
Long-Term U.S. Government Fund | | | 10,595 | | | 96,296 | | | 41,674 | | | (566 | ) | | | 65,163 | | | 564 | | | 541 | |
Low Duration Fund | | | 20,641 | | | 18,385 | | | 37,450 | | | 1 | | | | 1,280 | | | 407 | | | (250 | ) |
Real Return Asset Fund | | | 99,339 | | | 136,338 | | | 64,587 | | | (2,898 | ) | | | 168,665 | | | 2,807 | | | 948 | |
Real Return Fund | | | 51,460 | | | 42,705 | | | 17,008 | | | (1,167 | ) | | | 76,577 | | | 1,488 | | | (147 | ) |
RealEstateRealReturn Strategy Fund | | | 2,066 | | | 85 | | | 0 | | | (480 | ) | | | 1,899 | | | 85 | | | 0 | |
Short-Term Fund | | | 3,622 | | | 809 | | | 797 | | | (14 | ) | | | 3,619 | | | 87 | | | (1 | ) |
Small Cap StocksPLUS® TR Fund | | | 0 | | | 1,881 | | | 0 | | | (3 | ) | | | 1,877 | | | 4 | | | 0 | |
StocksPLUS® Fund | | | 1,719 | | | 42 | | | 0 | | | 117 | | | | 1,830 | | | 42 | | | 0 | |
StocksPLUS® Total Return Fund | | | 6,570 | | | 37 | | | 0 | | | 7 | | | | 6,836 | | | 37 | | | 0 | |
Total Return Fund | | | 18,875 | | | 449 | | | 15,206 | | | (123 | ) | | | 3,660 | | | 450 | | | (374 | ) |
Total Return Mortgage Fund | | | 3,782 | | | 11,065 | | | 0 | | | (166 | ) | | | 14,699 | | | 299 | | | 0 | |
CommodityRealReturn Strategy Fund® | | | 115,847 | | | 11,589 | | | 25,927 | | | (632 | ) | | | 102,122 | | | 2,371 | | | (2,098 | ) |
Totals | | $ | 807,029 | | $ | 772,191 | | $ | 458,283 | | $ | 6,827 | | | $ | 1,125,710 | | $ | 24,338 | | $ | (1,069 | ) |
5. GUARANTEES AND INDEMNIFICATIONS
Under the Trust’s organizational documents, each Trustee, officer, employee or other agent of the Trust (including the Trust’s investment manager) is indemnified, to the extent permitted by the Act, against certain liabilities that may arise out of performance of their duties to the Portfolio. Additionally, in the normal course of business, the Portfolio enters into contracts that contain a variety of indemnification clauses. The Portfolio’s maximum exposure under these arrangements is unknown as this would involve future claims that may be made against the Portfolio that have not yet occurred. However, the Portfolio has not had prior claims or losses pursuant to these contracts and believes the risk of loss to be remote.
6. PURCHASES AND SALES OF SECURITIES
The length of time the Portfolio has held a particular security is not generally a consideration in investment decisions. A change in the securities held by the
Portfolio is known as “portfolio turnover”. The Portfolio may engage in frequent
and active trading of portfolio securities to achieve its investment objective, particularly during periods of volatile market movements. High portfolio turnover (e.g., over 100%) involves correspondingly greater expenses to the Portfolio, including brokerage commissions or dealer mark-ups and other transaction costs on the sale of securities and reinvestments in other securities. Such sales may also result in realization of taxable capital gains, including short-term capital gains (which are generally taxed at ordinary income tax rates). The trading costs and tax effects associated with portfolio turnover may adversely affect the Portfolio’s performance.
Purchases and sales of securities (excluding short-term investments) for the period ended June 30, 2007, were as follows (amounts in thousands):
| | | | | | | | | | | | |
| U.S. Government/Agency | | | | All Other |
| Purchases | | Sales | | | | Purchases | | Sales |
| $ | 0 | | $ | 0 | | | | $ | 772,191 | | $ | 458,283 |
| | | | |
| 12 | | PIMCO Variable Insurance Trust | | |
| | |
| |
| | | June 30, 2007 (Unaudited) |
7. SHARES OF BENEFICIAL INTEREST
The Portfolio may issue an unlimited number of shares of beneficial interest with a $0.001 par value. Changes in shares of beneficial interest were as follows (shares and amounts in thousands):
| | | | | | | | | | | | | | | | |
| | | | | Six Months Ended 06/30/2007 | | | Year Ended 12/31/2006 | |
| | | | | Shares | | | Amount | | | Shares | | | Amount | |
| | | | | |
Receipts for shares sold | | | | | | | | | | | | | | | | |
Institutional Class | | | | 25 | | | $ | 294 | | | 6 | | | $ | 73 | |
Administrative Class | | | | 2,142 | | | | 25,388 | | | 5,177 | | | | 60,956 | |
Advisor Class | | | | 25,760 | | | | 304,743 | | | 41,500 | | | | 485,456 | |
Class M | | | | 468 | | | | 5,550 | | | 1,306 | | | | 15,354 | |
Issued as reinvestment of distributions | | | | | | | | | | | | | | | | |
Institutional Class | | | | 1 | | | | 7 | | | 0 | | | | 3 | |
Administrative Class | | | | 525 | | | | 6,179 | | | 1,218 | | | | 14,172 | |
Advisor Class | | | | 1,449 | | | | 17,050 | | | 1,455 | | | | 17,022 | |
Class M | | | | 92 | | | | 1,079 | | | 273 | | | | 3,180 | |
Cost of shares redeemed | | | | | | | | | | | | | | | | |
Institutional Class | | | | (7 | ) | | | (83 | ) | | 0 | | | | 0 | |
Administrative Class | | | | (2,130 | ) | | | (25,052 | ) | | (6,181 | ) | | | (72,158 | ) |
Advisor Class | | | | (129 | ) | | | (1,505 | ) | | (676 | ) | | | (7,990 | ) |
Class M | | | | (595 | ) | | | (13,565 | ) | | (2,587 | ) | | | (30,245 | ) |
Net increase resulting from Portfolio share transactions | | | | 27,601 | | | $ | 320,085 | | | 41,491 | | | $ | 485,823 | |
The following schedule shows the number of shareholders each owning 5% or more of the Portfolio and the total percentage of the Portfolio held by such shareholders:
| | | | | | |
| | | | | Number of Shareholders | | % of Portfolio Held |
Institutional Class | | | | 1 | | 95 |
Administrative Class | | | | 3 | | 91 |
Advisor Class | | | | 2 | | 97 |
Class M | | | | 3 | | 94 |
8. REGULATORY AND LITIGATION MATTERS
Since February 2004, PIMCO, Allianz Global Investors of America L.P. (PIMCO’s parent company), AGID, and certain of their affiliates, including the PIMCO Funds (another series of funds managed by PIMCO), the Allianz Funds (formerly known as PIMCO Funds: Multi-Manager Series (another series of funds managed by affiliates of PIMCO)), certain Trustees of the Trust (in their capacity as Trustees of the PIMCO Funds or the Allianz Funds) and certain employees of PIMCO, have been named as defendants in fifteen lawsuits filed in various jurisdictions. Eleven of those lawsuits concern “market timing,” and they have been transferred to and consolidated for pre-trial proceedings in a multi-district litigation proceeding in the U.S. District Court for the District of Maryland; the other four lawsuits concern “revenue sharing” and have been consolidated into a single action in the U.S. District Court for the District of Connecticut. The lawsuits have been commenced as putative class actions on behalf of investors who purchased, held or redeemed shares of the various series of the PIMCO Funds and the Allianz Funds during specified periods, or as derivative actions on behalf of the PIMCO Funds and the Allianz Funds.
The market timing actions in the District of Maryland generally allege that certain hedge funds were allowed to engage in “market timing” in certain funds of the PIMCO Funds and the Allianz Funds and this alleged activity was not disclosed.
Pursuant to tolling agreements entered into with the derivative and class action
plaintiffs, PIMCO, certain PIMCO Funds Trustees, and certain employees of PIMCO who were previously named as defendants have all been dropped as defendants in the market timing actions; the plaintiffs continue to assert claims on behalf of the shareholders of the PIMCO Funds or on behalf of the PIMCO Funds itself against other defendants. By order dated November 3, 2005, the U.S. District Court for the District of Maryland granted the PIMCO Funds’ motion to dismiss claims asserted against it in a consolidated amended complaint where the PIMCO Funds were named, in the complaint, as a nominal defendant. The revenue sharing action in the District of Connecticut generally alleges that fund assets were inappropriately used to pay brokers to promote funds of the PIMCO Funds and the Allianz Funds, including directing fund brokerage transactions to such brokers, and that such alleged arrangements were not fully disclosed to shareholders. On August 11, 2005, the U.S. District Court for the District of Connecticut conducted a hearing on defendants’ motion to dismiss the consolidated amended complaint in the revenue sharing action but has not yet ruled on the motion to dismiss. The market timing and revenue sharing lawsuits seek, among other things, unspecified compensatory damages plus interest and, in some cases, punitive damages, the rescission of investment advisory contracts, the return of fees paid under those contracts and restitution.
Two nearly identical class action civil complaints have been filed in August 2005, in the Northern District of Illinois Eastern Division, alleging that the plaintiffs each purchased and sold a 10-year Treasury note futures contract and suffered damages from an alleged shortage when PIMCO held both physical and futures positions in 10-year Treasury notes for its client accounts. The two actions have been consolidated into one action, and the two separate complaints have been replaced by a consolidated complaint. PIMCO is a named defendant, and PIMCO Funds has been added as a defendant, to the consolidated action. PIMCO strongly believes the complaint is without merit and intends to vigorously defend itself.
In April 2006, certain portfolios of the Trust and certain other funds managed by PIMCO were served in an adversary proceeding brought by the Official Committee of Asbestos Claimants of G-I Holdings, Inc. in G-I Holdings, Inc.’s bankruptcy in the District of New Jersey. In July 2004, PIMCO was named in this lawsuit and remains a defendant. The plaintiff seeks to recover for the bankruptcy estate assets that were transferred by the predecessor entity of G-I Holdings, Inc. to a wholly-owned subsidiary in 1994. The subsidiary has since issued notes, of which certain portfolios of the Trust and certain other funds managed by PIMCO are alleged to be holders. The complaint alleges that in 2000, more than two hundred noteholders—including certain portfolios of the Trust and certain other funds managed by PIMCO—were granted a second priority lien on the assets of the subsidiary in exchange for their consent to a refinancing transaction and the granting of a first priority lien to the lending banks. The plaintiff is seeking invalidation of the lien in favor of the noteholders and/or the value of the lien. On June 21, 2006, the District of New Jersey overturned the Bankruptcy Court’s decision granting permission to file the adversary proceeding and remanded the matter to the Bankruptcy Court for further proceedings. Following a motion to reconsider, the District Court upheld its remand on August 7, 2006, and instructed the Bankruptcy Court to conduct a “cost-benefit” analysis of the Committee’s claims, including the claims against the noteholders. The Bankruptcy Court held a status conference on October 25, 2006 and set a briefing schedule relating to this cost-benefit analysis.
The foregoing speaks only as of the date of this report. It is possible that these matters and/or other developments resulting from these matters could result in increased portfolio redemptions or other adverse consequences to the Portfolio. However, PIMCO and AGID believe that these matters are not likely to have a material adverse effect on the Portfolio or on PIMCO’s or AGID’s ability to perform their respective investment advisory or distribution services relating to the Portfolio.
| | | | | | |
| | Semiannual Report | | June 30, 2007 | | 13 |
Notes to Financial Statements (Cont.)
9. FEDERAL INCOME TAX MATTERS
The Portfolio intends to qualify as a regulated investment company under sub-chapter M of the Internal Revenue Code (the “Code”) and distribute all of its taxable income and net realized gains, if applicable, to shareholders. Accordingly, no provision for Federal income taxes has been made.
To the extent the Portfolio invests in the CommodityRealReturn Strategy Fund® (the “CRRS Fund”), an Underlying Fund, this Portfolio may be subject to additional tax risk.
One of the requirements for favorable tax treatment as a regulated investment company under the Code is that the Fund derive at least 90% of its gross income from certain qualifying sources of income. The IRS has issued a revenue ruling which holds that income derived from commodity index-linked swaps is not qualifying income under Subchapter M of the Code. Subsequently, the IRS issued a private letter ruling to the CRRS Fund in which the IRS specifically concluded that income from certain commodity index-linked notes is qualifying income. In addition, the IRS issued another private letter ruling to the CRRS Fund in which the IRS specifically concluded that income derived from the CRRS Fund’s investment in
the Subsidiary, which invests primarily in commodity index-linked swaps, will also constitute qualifying income to the CRRS Fund. Based on such rulings, the CRRS Fund will continue to seek to gain exposure to the commodity markets primarily through investments in commodity-linked notes and through investments in its subsidiary.
Please refer to the prospectus for the Separate Account and Variable Contract for information regarding federal income tax treatment of distributions to the Separate Account.
As of June 30, 2007, the aggregate cost of investments was the same for federal income tax and financial statement purposes. The net unrealized appreciation (depreciation) of investment securities for federal income tax purposes is as follows (amount in thousands):
| | | | |
Aggregate Gross Unrealized Appreciation | | Aggregate Gross Unrealized (Depreciation) | | Net Unrealized Appreciation |
$ 14,251 | | $ (7,424) | | $ 6,827 |
| | | | |
| 14 | | PIMCO Variable Insurance Trust | | |
| | |
| |
Privacy Policy* | | (Unaudited) |
The Funds consider customer privacy to be a fundamental aspect of their relationships with shareholders and are committed to maintaining the confidentiality, integrity and security of their current, prospective and former shareholders’ personal information. To ensure their shareholders’ privacy, the Funds have developed policies that are designed to protect this confidentiality, while allowing shareholder needs to be served.
Obtaining Personal Information
In the course of providing shareholders with products and services, the Funds and certain service providers to the Funds, such as the Funds’ investment advisers (“Advisers”), may obtain non-public personal information about shareholders, which may come from sources such as account applications and other forms, from other written, electronic or verbal correspondence, from shareholder transactions, from a shareholder’s brokerage or financial advisory firm, financial adviser or consultant, and/or from information captured on the Funds’ internet web sites.
Respecting Your Privacy
As a matter of policy, the Funds do not disclose any personal or account information provided by shareholders or gathered by the Funds to non-affiliated third parties, except as required or permitted by law or as necessary for such third parties to perform their agreements with respect to the Funds. As is common in the industry, non-affiliated companies may from time to time be used to provide certain services, such as preparing and mailing prospectuses, reports, account statements and other information, conducting research on shareholder satisfaction and gathering shareholder proxies. A Fund’s Distributor may also retain non-affiliated companies to market the Fund’s shares or products which use the Fund’s shares and enter into joint marketing agreements with other companies. These companies may have access to a shareholder’s personal and account information, but are permitted to use this information solely to provide the specific service or as otherwise permitted by law. In most cases, the shareholders will be clients of a third party, but the Funds may also provide a shareholder’s personal and account information to the shareholder’s respective brokerage or financial advisory firm.
Sharing Information with Third Parties
The Funds reserve the right to disclose or report personal information to non-affiliated third parties, in limited circumstances, where the Funds believe in good faith that disclosure is required under law to cooperate with regulators or law enforcement authorities, to protect their rights or property or upon reasonable request by any Fund in which a shareholder has chosen to invest. In addition, the Funds may disclose information about a shareholder’s accounts to a non-affiliated third party with the consent of the shareholder.
Sharing Information with Affiliates
The Funds may share shareholder information with their affiliates in connection with servicing their shareholders’ accounts or to provide shareholders with information about products and services that the Funds or their Advisers, principal underwriters or their affiliates (“Service Affiliates”) believe may be of interest to such shareholders. The information that the Funds share may include, for example, a shareholder’s participation in one of the Funds or in other investment programs sponsored by a Service Affiliate, a shareholder’s ownership of certain types of accounts (such as IRAs), or other data about a shareholder’s accounts. The Funds’ Service Affiliates, in turn, are not permitted to share shareholder information with non-affiliated entities, except as required or permitted by law.
Procedures to Safeguard Private Information
The Funds take seriously the obligation to safeguard shareholder non-public personal information. In addition to this policy, the Funds have also implemented procedures that are designed to restrict access to a shareholder’s non-public personal information only to internal personnel who need to know that information in order to provide products or services to such shareholders. In order to guard a shareholder’s non-public personal information, physical, electronic and procedural safeguards are in place.
* This Privacy Policy applies to the following entities: PIMCO Funds, PIMCO Variable Insurance Trust, PCM Fund, Inc. and PIMCO Strategic Global Government Fund, Inc. (collectively, the “Funds”).
| | | | | | |
| | Semiannual Report | | June 30, 2007 | | 15 |
Investment Adviser and Administrator
Pacific Investment Management Company LLC
840 Newport Center Drive
Newport Beach, California 92660
Investment Sub-Adviser
Research Affiliates, LLC
800 E. Colorado Boulevard
Pasadena, California 91101
Distributor
Allianz Global Investors Distributors LLC
1345 Avenue of the Americas
New York, New York 10105
Custodian
State Street Bank & Trust Company
801 Pennsylvania
Kansas City, Missouri 64105
Transfer Agent
Boston Financial Data Services–Midwest
330 W. 9th Street
Kansas City, Missouri 64105
Legal Counsel
Dechert LLP
1775 I Street, N.W.
Washington, D.C. 20006
Independent Registered Public Accounting Firm
PricewaterhouseCoopers LLP
1055 Broadway
Kansas City, Missouri 64105
P I M C O

Table of Contents
This material is authorized for use only when preceded or accompanied by the current PIMCO Variable Insurance Trust (the “Trust”) prospectus. Investors should consider the investment objectives, risks, charges and expenses of this Trust carefully before investing. Ask your financial professional to explain all charges that may apply. This and other information is contained in the Trust’s prospectus. The variable product prospectus may be obtained by contacting your Investment Consultant. Please read the Trust and variable product prospectus carefully before you invest or send money.
Chairman’s Letter
Dear PIMCO Variable Insurance Trust Shareholder:
It is our pleasure to present to you the semiannual report for the PIMCO Variable Insurance Trust, covering the six-month period ended June 30, 2007. The PIMCO Variable Insurance Trust’s net assets were $8.68 billion at June 30, 2007, as compared to $7.76 billion at December 31, 2006.
Highlights of the financial markets during the reporting period include:
| | n | | Economic data during the first quarter of 2007 pointed to slower growth, which heightened market expectations for a decrease in the Federal Funds Rate. By the second quarter, economic data, such as employment statistics, provided little indication of economic weakness, causing expectations of a decrease in the Federal Funds Rate to unwind and U.S. interest rates to move higher. Interest rates in Europe and the U.K. also rose over the period as central banks raised their key lending rates due to inflation concerns. The benchmark ten-year U.S. Treasury yielded 5.03% as of June 30, 2007, or 0.32% higher than at the beginning of the year. |
| | n | | Most bonds generally returned much of their gains from earlier in the year as worldwide growth and capital flows drove interest rates higher in the second quarter. Increased risk aversion in global financial markets, due in part to subprime mortgage worries in the U.S., also contributed to the rise in interest rates. The Lehman Brothers Aggregate Bond Index, which includes Treasury, investment-grade corporate and mortgage-backed securities, returned 0.98% for the six-month period. |
| | n | | Locally issued emerging market (“EM”) bonds posted positive returns for the reporting period. Yields on these bonds declined and the local currencies in which they are denominated generally gained, amid increasing investor awareness, strong economic growth and surging capital inflows. External EM bonds (debt instruments issued by emerging markets countries and typically denominated in U.S. dollars) lagged behind local EM bonds (debt instruments issued by emerging markets countries and denominated in the currency of the issuer), as external EM bonds tend to trade more in-line with U.S. Treasuries. |
| | n | | Treasury Inflation-Protected Securities (“TIPS”) outpaced nominal bonds (non-inflation linked bonds) for the first part of the year and all but the longest maturity TIPS outperformed in the second quarter as high gasoline prices drove higher inflation accruals. Commodities, as represented by the Dow Jones-AIG Commodity Total Return Index, returned 4.46% for the period. Equities, as measured by the S&P 500 Index and the Russell 2000 Index, returned 6.96% and 6.45%, respectively, for the period. |
On the following pages, please find specific details as to the Portfolio’s total return investment performance and a discussion of those factors that affected performance.
Thank you for the trust you have placed in us. We will continue to work diligently to serve your investment needs.
Sincerely,

Brent R. Harris
Chairman, PIMCO Variable Insurance Trust
July 31, 2007
| | | | | | |
| | Semiannual Report | | June 30, 2007 | | 1 |
Important Information About the Portfolio
PIMCO Variable Insurance Trust (the “Trust”) is an open-end management investment company currently consisting of twenty separate investment portfolios, including the All Asset Portfolio (the “Portfolio”). The Portfolio is only available as a funding vehicle under variable life insurance policies or variable annuity contracts issued by insurance companies (“Variable Contracts”). Individuals may not purchase shares of the Portfolio directly. Shares of the Portfolio also may be sold to qualified pension and retirement plans outside of the separate account context.
The Portfolio is a “fund of funds,” which is a term used to describe mutual funds that pursue their investment objective by investing in other mutual funds instead of investing directly in stocks or bonds of other issuers. Under normal circumstances, the Portfolio invests substantially all of its assets in Institutional Class shares of PIMCO Funds, an affiliated open-end investment company, except the All Asset and All Asset All Authority Funds (“Underlying Funds”).
Among the principal risks of investing in the Portfolio are allocation risk, Underlying Fund risk and issuer non-diversification risk. The Portfolio also is indirectly subject to the risks of the Underlying Funds, which may include, but are not limited to, the following: interest rate risk, credit risk, high yield risk, market risk, issuer risk, variable dividends risk, liquidity risk, derivatives risk, commodity risk, equity risk, mortgage risk, non-U.S. investment risk, real estate risk, emerging markets risk, currency risk, issuer non-diversification risk, leveraging risk, small company risk, management risk, California state-specific risk, New York state-specific risk, tax risk, and subsidiary risk. A complete description of these risks is contained in the Portfolio’s prospectus. An Underlying Fund may use derivative instruments for hedging purposes or as part of an investment strategy. Use of these instruments may involve certain costs and risks such as liquidity risk, interest rate risk, market risk, credit risk, management risk and the risk that the Underlying Fund could not close out a position when it would be most advantageous to do so. An Underlying Fund investing in derivatives could lose more than the principal amount invested in these instruments. An Underlying Fund’s investment in non-U.S. securities may entail risk due to non-U.S. economic and political developments; this risk may be increased when investing in emerging markets.
The cost of investing in the Portfolio will generally be higher than the cost of investing in a mutual fund that invests directly in individual stocks and bonds. By investing in the Portfolio, an investor will indirectly bear fees and expenses charged by the Underlying Funds in addition to the Portfolio’s direct fees and expenses.
On the performance summary page in this Semiannual Report, the Total Return Investment Performance table measures performance assuming that all dividend and capital gain distributions were reinvested.
An investment in the Portfolio is not a deposit of a bank and is not guaranteed or insured by the Federal Deposit Insurance Corporation or any other government agency. It is possible to lose money on investments in the Portfolio.
PIMCO has adopted written proxy voting policies and procedures (“Proxy Policy”) as required by Rule 206(4)-6 under the Investment Advisers Act of 1940, as amended. The Proxy Policy has been adopted by the Trust as the policies and procedures that PIMCO will use when voting proxies on behalf of the Portfolio. A description of the policies and procedures that PIMCO uses to vote proxies relating to portfolio securities of the Portfolio, and information about how the Portfolio voted proxies relating to portfolio securities held during the most recent twelve-month period ended June 30, are available without charge, upon request, by calling the Trust at 1-866-746-2606 and on the Portfolio’s website at www.pimco.com.
The Portfolio files its complete schedule of portfolio holdings with the SEC for the first and third quarters of each fiscal year on Form N-Q. A copy of the Trust’s Form N-Q is also available on the SEC’s website at http://www.sec.gov and may be reviewed and copied at the SEC’s Public Reference Room in Washington D.C. Information on the operation of the Public Reference Room may be obtained by calling 1-800-SEC-0330, and is available without charge, upon request, by calling the Trust at 1-866-746-2606 and on the Portfolio’s website at www.pimco.com.
PIMCO Variable Insurance Trust is distributed by Allianz Global Investors Distributors LLC, 1345 Avenue of the Americas, New York, NY 10105.
| | | | |
| 2 | | PIMCO Variable Insurance Trust | | |
The following disclosure provides important information regarding the Portfolio’s Expense Example (“Example” or “Expense Example”), which appears in this Semiannual Report. Please refer to this information when reviewing the Expense Example for the Portfolio.
Example
As a shareholder of the Portfolio, you incur two types of costs: (1) transaction costs and (2) ongoing costs, including advisory and administrative fees; distribution and/or service (12b-1) fees (Administrative Class, Advisor Class and Class M only); and other Portfolio expenses. The Example is intended to help you understand your ongoing costs (in dollars) of investing in the Portfolio and to compare these costs with the ongoing costs of investing in other mutual funds. The Expense Example does not reflect any fees or other expenses imposed by the Variable Contracts. If it did, the expenses reflected in the Expense Example would be higher. The Example is based on an investment of $1,000 invested at the beginning of the period and held for the entire period indicated, which is from January 1, 2007 to June 30, 2007.
Actual Expenses
The information in the table under the heading “Actual Performance” provides information about actual account values and actual expenses. You may use the information in these columns, together with the amount you invested, to estimate the expenses that you paid over the period. Simply divide your account value by $1,000 (for example, an $8,600 account value divided by $1,000 = $8.60), then multiply the result by the number in the row titled “Expenses Paid During Period” to estimate the expenses you paid on your account during this period.
Hypothetical Example for Comparison Purposes
The information in the table under the heading “Hypothetical Performance (5% return before expenses)” provides information about hypothetical account values and hypothetical expenses based on the Portfolio’s actual expense ratio and an assumed rate of return of 5% per year before expenses, which is not the Portfolio’s actual return. The hypothetical account values and expenses may not be used to estimate the actual ending account balance or expenses you paid for the period. You may use this information to compare the ongoing costs of investing in the Portfolio and other portfolios. To do so, compare this 5% hypothetical example with the 5% hypothetical examples that appear in the shareholder reports of the other portfolios.
Please note that the expenses shown in the table are meant to highlight your ongoing costs only and do not reflect any transactional costs. Therefore, the information under the heading “Hypothetical Performance (5% return before expenses)” is useful in comparing ongoing costs only, and will not help you determine the relative total costs of owning different portfolios. In addition, if these transactional costs were included, your costs would have been higher.
The expense ratio may vary period to period because of various factors, such as an increase in expenses not covered by the advisory and administrative fees (such as expenses of the trustees and their counsel, litigation expense and interest expense).
| | | | | | |
| | Semiannual Report | | June 30, 2007 | | 3 |
PIMCO All Asset Portfolio
Cumulative Returns Through June 30, 2007
$10,000 invested at the beginning of the first full month following the inception date of the Portfolio’s Advisor Class.
PIMCO Funds Allocation‡
| | |
Floating Income Fund | | 19.7% |
Real Return Asset Fund | | 14.9% |
Developing Local Markets Fund | | 12.4% |
Emerging Local Bond Fund | | 11.2% |
CommodityRealReturn Strategy Fund® | | 9.0% |
Real Return Fund | | 6.8% |
Long-Term U.S. Government Fund | | 5.7% |
Other | | 20.3% |
| | ‡ | % of Total Investments as of 06/30/2007 |
| | | | | | | | |
| Average Annual Total Return for the period ended June 30, 2007 |
| | | | | 6 Months* | | 1 Year | | Portfolio
Inception
(04/30/04) |
 | | PIMCO All Asset Portfolio Advisor Class | | 2.88% | | 8.83% | | 8.40% |
 | | Lehman Brothers U.S. TIPS: 1-10 Year Index± | | 2.49% | | 4.19% | | 3.82% |
 | | CPI + 500 Basis Points±± | | 5.84% | | 7.93% | | 8.57% |
All Portfolio returns are net of fees and expenses.
* Cumulative return.
Performance quoted represents past performance. Past performance is no guarantee of future results. Investment return and principal value will fluctuate so the Portfolio shares, when redeemed, may be worth more or less than their original cost. The Portfolio’s performance does not reflect the deduction of additional charges and expenses imposed in connection with investing in Variable Contracts, which will reduce returns. Current performance may be lower or higher than the performance data quoted. Performance data current to the most recent month-end is available by calling (800) 927-4648.
± Lehman Brothers U.S. TIPS: 1-10 Year Index is an unmanaged index comprised of U.S. Treasury Inflation-Protected Securities having a maturity of at least 1 year and less than 10 years. It is not possible to invest directly in the index. The index does not reflect deductions for fees and expenses.
±± CPI + 500 Basis Points benchmark is created by adding 5% to the annual percentage change in the Consumer Price Index (“CPI”). This index reflects non-seasonally adjusted returns. The CPI is an unmanaged index representing the rate of inflation of the U.S. consumer prices as determined by the U.S. Department of Labor, Bureau of Labor Statistics. There can be no guarantee that the CPI or other indices will reflect the exact level of inflation at any given time. It is not possible to invest directly in the index. The index does not reflect deductions for fees and expenses.
| | | | | | |
| Expense Example | | Actual Performance | | Hypothetical Performance |
| | | | | (5% return before expenses) |
Beginning Account Value (01/01/07) | | $ | 1,000.00 | | $ | 1,000.00 |
Ending Account Value (06/30/07) | | $ | 1,028.78 | | $ | 1,021.45 |
Expenses Paid During Period† | | $ | 3.40 | | $ | 3.38 |
† Expenses are equal to the Portfolio’s Advisor Class annualized expense ratio of 0.675%, multiplied by the average account value over the period, multiplied by 181/365 (to reflect the one-half year period). The expense ratio excludes the expenses of the Underlying Funds, which based upon the allocation of the Portfolio’s assets among the Underlying Funds are indirectly borne by the shareholders of the Portfolio. The Underlying Fund Expenses are currently capped at 0.64%. Overall fees and expenses of investing in the Portfolio will be higher because the example does not reflect Variable Contract fees and expenses.
Please refer to page 3 herein for an explanation of the information presented in the above Expense Example.
Portfolio Insights
| » | | The PIMCO All Asset Portfolio seeks to achieve its investment objective by investing under normal circumstances substantially all of its assets in Institutional Class shares of the PIMCO Funds, an affiliated open-end investment company, except the PIMCO All Asset and PIMCO All Asset All Authority Funds. |
| » | | Significant exposure to short-term strategies, particularly through the PIMCO Floating Income Fund, contributed to performance as the PIMCO Floating Income Fund returned 2.62% net of fees during the period. |
| » | | Although any exposure to Real Estate Investment Trusts (“REITs”) would detract from performance, as the Dow Jones Wilshire REIT Index returned -5.97% during the period, negligible exposure was a positive asset allocation decision. |
| » | | Exposure to equity strategies benefited performance due to strong returns domestically and internationally. However, reduced equity exposure in the Portfolio was not a positive asset allocation decision. |
| » | | Large exposure to developing local market bonds contributed to performance as the asset class benefited from continued capital inflows and strong economic fundamentals. |
| » | | Large exposure to Treasury Inflation-Protected Securities (“TIPS”) detracted from performance as real yields rose. |
| » | | Minimal exposure to convertibles detracted from returns as the asset class had positive performance. |
| | | | |
| 4 | | PIMCO Variable Insurance Trust | | |
Financial Highlights All Asset Portfolio
| | | | | | | | | | | | | | | | |
| Selected per Share Data for the Year or Period Ended: | | 06/30/2007+ | | | 12/31/2006 | | | 12/31/2005 | | | 04/30/2004-12/31/2004 | |
| | | | |
Advisor Class | | | | | | | | | | | | | | | | |
Net asset value beginning of year or period | | $ | 11.68 | | | $ | 11.82 | | | $ | 11.64 | | | $ | 10.59 | |
Net investment income (a) | | | 0.27 | | | | 1.05 | | | | 1.63 | | | | 0.52 | |
Net realized/unrealized gain (loss) on investments (a) | | | 0.07 | | | | (0.53 | ) | | | (0.93 | ) | | | 0.87 | |
Total income from investment operations | | | 0.34 | | | | 0.52 | | | | 0.70 | | | | 1.39 | |
Dividends from net investment income | | | (0.28 | ) | | | (0.63 | ) | | | (0.48 | ) | | | (0.33 | ) |
Distributions from net realized capital gains | | | 0.00 | | | | (0.03 | ) | | | (0.04 | ) | | | (0.01 | ) |
Total distributions | | | (0.28 | ) | | | (0.66 | ) | | | (0.52 | ) | | | (0.34 | ) |
Net asset value end of year or period | | $ | 11.74 | | | $ | 11.68 | | | $ | 11.82 | | | $ | 11.64 | |
Total return | | | 2.88 | % | | | 4.56 | % | | | 6.03 | % | | | 13.18 | % |
Net assets end of year or period (000s) | | $ | 822,338 | | | $ | 501,498 | | | $ | 7,461 | | | $ | 11 | |
Ratio of expenses to average net assets | | | 0.675 | %*(b)(e) | | | 0.685 | %(b)(d) | | | 0.70 | %(b) | | | 0.67 | %*(b)(c) |
Ratio of expenses to average net assets excluding interest expense | | | 0.675 | %*(b)(e) | | | 0.685 | %(b)(d) | | | 0.70 | %(b) | | | 0.67 | %*(b)(c) |
Ratio of net investment income to average net assets | | | 4.52 | %* | | | 8.84 | % | | | 13.67 | % | | | 6.96 | %* |
Portfolio turnover rate | | | 48 | % | | | 66 | % | | | 75 | % | | | 93 | % |
+ Unaudited
* Annualized
(a) Per share amounts based on average number of shares outstanding during the period.
(b) Ratio of expenses to average net assets excluding underlying Funds’ expenses in which the Portfolio invests.
(c) If the investment manager had not reimbursed expenses, the ratio of expenses to average net assets would have been 0.70%.
(d) Effective October 1, 2006, the advisory fee was reduced to 0.175%.
(e) If the investment manager had not reimbursed expenses, the ratio of expenses to average net assets would have been 0.685%.
| | | | | | |
| See Accompanying Notes | | Semiannual Report | | June 30, 2007 | | 5 |
Statement of Assets and Liabilities All Asset Portfolio
| | | | |
| (Amounts in thousands, except per share amounts) | | June 30, 2007
(Unaudited) | |
| |
Assets: | | | | |
Investments in affiliates, at value | | $ | 1,125,710 | |
Repurchase agreements, at value | | | 4,111 | |
Cash | | | 1 | |
Receivable for investments in affiliates sold | | | 9,423 | |
Receivable for Portfolio shares sold | | | 2,631 | |
Interest and dividends receivable | | | 2 | |
Interest and dividends receivable from affiliates | | | 5,016 | |
Manager reimbursement receivable | | | 31 | |
| | | | 1,146,925 | |
| |
Liabilities: | | | | |
Payable for investments in affiliates purchased | | $ | 16,789 | |
Payable for Portfolio shares redeemed | | | 69 | |
Accrued investment advisory fee | | | 163 | |
Accrued administration fee | | | 233 | |
Accrued distribution fee | | | 168 | |
Accrued servicing fee | | | 30 | |
| | | | 17,452 | |
| |
Net Assets | | $ | 1,129,473 | |
| |
Net Assets Consist of: | | | | |
Paid in capital | | $ | 1,125,794 | |
Undistributed net investment income | | | 4,112 | |
Accumulated undistributed net realized (loss) | | | (7,260 | ) |
Net unrealized appreciation | | | 6,827 | |
| | | $ | 1,129,473 | |
| |
Net Assets: | | | | |
Institutional Class | | $ | 291 | |
Administrative Class | | | 258,604 | |
Advisor Class | | | 822,338 | |
Class M | | | 48,240 | |
| |
Shares Issued and Outstanding: | | | | |
Institutional Class | | | 25 | |
Administrative Class | | | 22,035 | |
Advisor Class | | | 69,990 | |
Class M | | | 4,106 | |
| |
Net Asset Value and Redemption Price Per Share (Net Asset Per Share Outstanding) | | | | |
Institutional Class | | $ | 11.74 | |
Administrative Class | | | 11.73 | |
Advisor Class | | | 11.74 | |
Class M | | | 11.74 | |
| |
Cost of Investments in Affiliates Owned | | $ | 1,118,883 | |
Cost of Repurchase Agreements Owned | | $ | 4,111 | |
| | | | |
| 6 | | PIMCO Variable Insurance Trust | | See Accompanying Notes |
Statement of Operations All Asset Portfolio
| | | | |
| (Amounts in thousands) | | Six Months Ended June 30, 2007 (Unaudited) | |
| |
| Investment Income: | | | | |
Interest | | $ | 99 | |
Dividends from affiliate investments | | | 24,338 | |
Total Income | | | 24,437 | |
| |
Expenses: | | | | |
Investment advisory fees | | | 831 | |
Administration fees | | | 1,187 | |
Servicing fees – Administrative Class | | | 187 | |
Distribution and/or servicing fees – Advisor Class | | | 813 | |
Distribution and/or servicing fees – Class M | | | 111 | |
Total Expenses | | | 3,129 | |
Reimbursement by Manager | | | (45 | ) |
Net Expenses | | | 3,084 | |
| |
Net Investment Income | | | 21,353 | |
| |
Net Realized and Unrealized Gain (Loss): | | | | |
Net realized (loss) on affiliate investments | | | (1,069 | ) |
Net change in unrealized appreciation on affiliate investments | | | 5,843 | |
Net Gain | | | 4,774 | |
| |
Net Increase in Net Assets Resulting from Operations | | $ | 26,127 | |
| | | | | | |
| See Accompanying Notes | | Semiannual Report | | June 30, 2007 | | 7 |
Statements of Changes in Net Assets All Asset Portfolio
| | | | | | | | |
| (Amounts in thousands) | | Six Months Ended June 30, 2007 (Unaudited) | | | Year Ended December 31, 2006 | |
| | |
| Increase in Net Assets from: | | | | | | | | |
| | |
Operations: | | | | | | | | |
Net investment income | | $ | 21,353 | | | $ | 32,372 | |
Net realized (loss) on affiliate investments | | | (1,069 | ) | | | (7,977 | ) |
Net capital gain distributions received from Underlying Funds | | | 0 | | | | 2,277 | |
Net change in unrealized appreciation on affiliate investments | | | 5,843 | | | | 3,148 | |
Net increase resulting from operations | | | 26,127 | | | | 29,820 | |
| | |
Distributions to Shareholders: | | | | | | | | |
From net investment income | | | | | | | | |
Institutional Class | | | (7 | ) | | | (2 | ) |
Administrative Class | | | (6,179 | ) | | | (13,550 | ) |
Advisor Class | | | (17,050 | ) | | | (15,816 | ) |
Class M | | | (1,079 | ) | | | (3,041 | ) |
From net realized capital gains | �� | | | | | | | |
Institutional Class | | | 0 | | | | 0 | |
Administrative Class | | | 0 | | | | (622 | ) |
Advisor Class | | | 0 | | | | (1,205 | ) |
Class M | | | 0 | | | | (139 | ) |
| | |
Total Distributions | | | (24,315 | ) | | | (34,375 | ) |
| | |
Portfolio Share Transactions: | | | | | | | | |
Receipts for shares sold | | | | | | | | |
Institutional Class | | | 294 | | | | 73 | |
Administrative Class | | | 25,388 | | | | 60,956 | |
Advisor Class | | | 304,743 | | | | 485,456 | |
Class M | | | 5,550 | | | | 15,354 | |
Issued as reinvestment of distributions | | | | | | | | |
Institutional Class | | | 7 | | | | 3 | |
Administrative Class | | | 6,179 | | | | 14,172 | |
Advisor Class | | | 17,050 | | | | 17,022 | |
Class M | | | 1,079 | | | | 3,180 | |
Cost of shares redeemed | | | | | | | | |
Institutional Class | | | (83 | ) | | | 0 | |
Administrative Class | | | (25,052 | ) | | | (72,158 | ) |
Advisor Class | | | (1,505 | ) | | | (7,990 | ) |
Class M | | | (13,565 | ) | | | (30,245 | ) |
Net increase resulting from Portfolio share transactions | | | 320,085 | | | | 485,823 | |
| | |
Total Increase in Net Assets | | | 321,897 | | | | 481,268 | |
| | |
Net Assets: | | | | | | | | |
Beginning of period | | | 807,576 | | | | 326,308 | |
End of period* | | $ | 1,129,473 | | | $ | 807,576 | |
| | |
*Including undistributed net investment income of: | | $ | 4,112 | | | $ | 7,074 | |
| | | | |
| 8 | | PIMCO Variable Insurance Trust | | See Accompanying Notes |
| | |
| |
| Schedule of Investments All Asset Portfolio (a) | | June 30, 2007 (Unaudited) |
| | | | | | | | |
| | | | | SHARES | | | | VALUE (000S) |
| PIMCO FUNDS (b) 99.7% | | |
CommodityRealReturn Strategy Fund® | | | | 7,268,477 | | $ | | 102,122 |
Convertible Fund | | | | 589,376 | | | | 8,434 |
Developing Local Markets Fund | | | | 12,645,454 | | | | 139,732 |
Diversified Income Fund | | | | 4,446,275 | | | | 48,242 |
Emerging Local Bond Fund | | | | 12,272,617 | | | | 126,285 |
Emerging Markets Bond Fund | | | | 1,580,326 | | | | 17,241 |
Floating Income Fund | | | | 21,146,569 | | | | 222,251 |
Foreign Bond Fund (Unhedged) | | | | 87,682 | | | | 862 |
Fundamental IndexPLUS™ Fund | | | | 2,578,927 | | | | 29,709 |
Fundamental IndexPLUS™ TR Fund | | | | 3,313,300 | | | | 35,817 |
GNMA Fund | | | | 261,736 | | | | 2,856 |
High Yield Fund | | | | 669,256 | | | | 6,539 |
Income Fund | | | | 368,140 | | | | 3,619 |
International StocksPLUS® TR Strategy Fund (Unhedged) | | | | 379,112 | | | | 3,969 |
| | | | | | | | |
| | | | | SHARES | | | | VALUE (000S) |
International StocksPLUS® TR Strategy Fund (U.S.Dollar-Hedged) | | | | 2,537,938 | | $ | | 31,927 |
Long-Term U.S. Government Fund | | | | 6,413,670 | | | | 65,163 |
Low Duration Fund | | | | 130,601 | | | | 1,280 |
Real Return Asset Fund | | | | 15,807,400 | | | | 168,665 |
Real Return Fund | | | | 7,279,172 | | | | 76,577 |
RealEstateRealReturn Strategy Fund | | | | 291,240 | | | | 1,899 |
Short-Term Fund | | | | 364,763 | | | | 3,619 |
Small Cap StocksPLUS® TR Strategy Fund | | | | 173,830 | | | | 1,877 |
StocksPLUS® Fund | | | | 158,184 | | | | 1,830 |
StocksPLUS® Total Return Fund | | | | 561,247 | | | | 6,836 |
Total Return Fund | | | | 360,250 | | | | 3,660 |
Total Return Mortgage Fund | | | | 1,397,281 | | | | 14,699 |
| | | | | | | | |
Total PIMCO Funds (Cost $1,118,883) | | | | 1,125,710 |
| | | | | | | | |
| | | | | | | | | |
| | | | | PRINCIPAL AMOUNT
(000S) | | | | VALUE (000S) | |
| SHORT-TERM INSTRUMENTS 0.3% | |
| |
| REPURCHASE AGREEMENTS 0.3% | |
| State Street Bank and Trust Co. | | | | | |
4.900% due 07/02/2007 | | $ | | 4,111 | | $ | | 4,111 | |
| | | | | | | | | |
(Dated 06/29/2007. Collateralized by Fannie Mae 3.250% due 08/15/2008 valued at $4,197. Repurchase proceeds are $4,113.) | |
Total Short-Term Instruments
(Cost $4,111) | | 4,111 | |
| | | | | | | | | |
| |
| |
| Total Investments 100.0% (Cost $1,122,994) | | | | | | $ | | 1,129,821 | |
| |
| Other Assets and Liabilities (Net) (0.0%) | | | | (348 | ) |
| | | | | | | | | |
| Net Assets 100.0% | | | | | | $ | | 1,129,473 | |
| | | | | | | | | |
Notes to Schedule of Investments
(a) The All Asset Portfolio is investing in shares of affiliated Funds.
(b) Institutional Class Shares of each PIMCO Fund.
| | | | | | |
| See Accompanying Notes | | Semiannual Report | | June 30, 2007 | | 9 |
Notes to Financial Statements
1. ORGANIZATION
The All Asset Portfolio (the “Portfolio”) is a series of the PIMCO Variable Insurance Trust (the “Trust”). The Trust is registered under the Investment Company Act of 1940 (the “Act”), as amended, as an open-end management investment company organized as a Delaware business trust on October 3, 1997. The Portfolio offers four classes of shares: Institutional, Administrative, Advisor, and Class M. Information presented on these financial statements pertains to the Advisor Class of the Portfolio. Certain detailed financial information for the Institutional Class, Administrative Class and Class M is provided separately and is available upon request. The Trust is designed to be used as an investment vehicle by Separate Accounts of insurance companies that fund variable annuity contracts and variable life insurance policies and by qualified pension and retirement plans.
The Portfolio may invest a portion of its assets in certain affiliated underlying investment funds (the “Underlying Funds” or “Acquired Funds”). The Portfolio’s combined investments in the Fundamental IndexPLUS™, Fundamental IndexPLUS™ TR, International StocksPLUS® TR Strategy (U.S. Dollar-Hedged), International StocksPLUS® TR Strategy (Unhedged), Small Cap StocksPLUS® TR, StocksPLUS® and StocksPLUS® Total Return Funds normally will not exceed 50% of its total assets. In addition, the Portfolio’s combined investments in the CommodityRealReturn Strategy, Real Return, Real Return Asset and RealEstateRealReturn Strategy Funds normally will not exceed 75% of its total assets. The Portfolio’s investment in a particular Underlying Fund normally will not exceed 50% of its total assets.
The Portfolio’s assets are not allocated according to a predetermined blend of shares of the Underlying Funds. Instead, when making allocation decisions among the Underlying Funds, the Portfolio’s asset allocation sub-adviser considers various quantitative and qualitative data relating to the U.S. and foreign economies and securities markets. These data include projected growth trends in the U.S. and foreign economies, forecasts for interest rates and the relationship between short- and long-term interest rates (yield curve), current and projected trends in inflation, relative valuation levels in the equity and fixed income markets and various industrial sectors, information relating to business cycles, borrowing needs and the cost of capital, political trends data relating to trade balances and labor information. The Portfolio’s asset allocation sub-adviser has the flexibility to reallocate the Portfolio’s assets among any or all of the Underlying Funds based on its ongoing analyses of the equity, fixed income and commodity markets, although these shifts are not expected to be large or frequent in nature. The Portfolio is non-diversified, which means that it may concentrate its assets in a smaller number of Underlying Funds than a diversified fund.
2. SIGNIFICANT ACCOUNTING POLICIES
The following is a summary of significant accounting policies consistently followed by the Portfolio in the preparation of its financial statements in conformity with accounting principles generally accepted in the United States of America (“GAAP”). The preparation of financial statements in accordance with GAAP requires management to make estimates and assumptions that affect the reported amounts and disclosures on the financial statements. Actual results could differ from those estimates.
(a) Security Valuation Investments in funds within the PIMCO Funds are valued at their net asset value as reported by the Underlying Funds.
(b) Securities Transactions and Investment Income Securities transactions are recorded as of the trade date for financial reporting purposes. Securities purchased or sold on a when-issued or delayed-delivery basis may be settled a month or more after the trade date. Realized gains and losses from securities sold are recorded on the identified cost basis. Dividend income is recorded on the
ex-dividend date. Interest income, adjusted for the accretion of discounts and amortization of premiums, is recorded on the accrual basis.
(c) Dividends and Distributions to Shareholders Dividends from net investment income, if any, are declared and distributed to shareholders quarterly. Net realized capital gains earned by the Portfolio, if any, will be distributed no less frequently than once each year.
Income dividends and capital gain distributions are determined in accordance with income tax regulations which may differ from GAAP. Differences between tax regulations and GAAP may change the fiscal year when income and capital items are recognized for tax and GAAP purposes. Examples of events that give rise to timing differences include wash sales, straddles, net operating losses and capital loss carryforwards. Further, the character of investment income and capital gains may be different for certain transactions under the two methods of accounting. Examples of characterization differences include the treatment of mortgage paydowns, swaps, foreign currency transactions and contingent debt instruments. As a result, income dividends and capital gain distributions declared during a fiscal period may differ significantly from the net investment income and realized capital gain reported on the Portfolio’s annual financial statements presented under GAAP.
Distributions classified as a tax basis return of capital, if any, are reflected on the accompanying Statements of Changes in Net Assets and have been reclassified to paid in capital. In addition, other amounts have been reclassified between undistributed net investment income, accumulated undistributed net realized gains or losses and/or paid in capital to more appropriately conform financial accounting to tax characterizations of dividend distributions.
(d) Multiclass Operations Each class offered by the Portfolio has equal rights as to assets and voting privileges (except that shareholders of a class have exclusive voting rights regarding any matter relating solely to that class of shares). Income and non-class specific expenses of the Portfolio are allocated daily to each class of shares based on the relative value of settled shares. Realized and unrealized capital gains and losses of the Portfolio are allocated daily to each class of shares based on the relative net assets of each class. Class specific expenses, where applicable, currently include administrative, distribution and servicing fees.
(e) Repurchase Agreements The Portfolio may engage in repurchase transactions. Under the terms of a typical repurchase agreement, the Portfolio takes possession of an underlying debt obligation (collateral) subject to an obligation of the seller to repurchase, and the Portfolio to resell, the obligation at an agreed-upon price and time. The underlying securities for all repurchase agreements are held in safekeeping at the Portfolio’s custodian or designated subcustodians under tri-party repurchase agreements. The market value of the collateral must be equal to or exceed the total amount of the repurchase obligations, including interest. Securities purchased under repurchase agreements are reflected as an asset on the Statement of Assets and Liabilities. Generally, in the event of counterparty default, the Portfolio has the right to use the collateral to offset losses incurred. If the counterparty should default, the Portfolio will seek to sell the securities which it holds as collateral. This could involve procedural costs or delays in addition to a loss on the securities if their value should fall below their repurchase price.
(f) New Accounting Policies In July 2006, the Financial Accounting Standards Board (“FASB”) issued Interpretation No. 48, “Accounting for Uncertainty in Income Taxes—an Interpretation of FASB Statement No. 109” (the “Interpretation”). The Interpretation became effective for the Portfolio on June 29, 2007. Management has evaluated the application of the Interpretation in relation to the Portfolio and has concluded that no single filing position or combination of
| | | | |
| 10 | | PIMCO Variable Insurance Trust | | |
| | |
| |
| | | June 30, 2007 (Unaudited) |
filing positions identified as uncertain tax positions required the accrual of a tax liability in the accounting records of the Portfolio for the period ending June 30, 2007. Management will monitor all existing filing positions and future filing positions in light of the Interpretation and evaluate the need for any future tax accruals and financial statement disclosures as warranted.
In September 2006, the FASB issued Statement of Financial Accounting Standards No. 157, “Fair Value Measurements” (the “Statement”). The Statement is effective for fiscal years beginning after November 15, 2007 and will require expanded disclosure about fair value measurements, separately for each major category of assets and liabilities, that enables shareholders to assess the inputs used to develop those measurements, and for recurring fair value measurements using significant unobservable inputs the effect of the measurements on changes in net assets for the reporting period. Management is currently evaluating the application of the Statement to the Portfolio and will provide additional information in relation to the Statement on the Portfolio’s annual financial statements for the period ending December 31, 2007.
3. FEES AND EXPENSES
(a) Investment Advisory Fee Pacific Investment Management Company LLC (“PIMCO”) is a majority-owned subsidiary of Allianz Global Investors of America L.P. (“AGI”), and serves as investment adviser (the “Adviser”) to the Trust, pursuant to an investment advisory contract. The Adviser receives a monthly fee from the Portfolio, at an annual rate based on average daily net assets. The Advisory Fee for all classes is charged at an annual rate of 0.175%.
Research Affiliates, LLC (“Research Affiliates”) serves as the asset allocation sub-adviser and selects the Underlying Funds in which the Portfolio invests. PIMCO pays a fee to Research Affiliates at an annual rate of 0.175% based on average daily net assets of the Portfolio.
(b) Administration Fee PIMCO serves as administrator (the “Administrator”), and provides administrative services to the Trust for which it receives a monthly administrative fee based on each share class’s average daily net assets. As the Administrator, PIMCO bears the costs of various third-party services, including audit, custodial, portfolio accounting, legal, transfer agency and printing costs. The Administration Fee for all classes is charged at the annual rate of 0.25%.
(c) Distribution and Servicing Fees Allianz Global Investors Distributors LLC (“AGID”) is an indirect wholly-owned subsidiary of AGI and serves as the distributor (the “Distributor”) of the Trust’s shares. The Trust is permitted to reimburse AGID on a quarterly basis, out of the Administrative Class assets of the Portfolio in the amount of 0.15% on an annual basis of the average daily net assets of that class, for payments made to financial intermediaries that provide services in connection with the distribution of shares or administration of plans or programs that use Portfolio shares as their funding medium. The effective rate paid to AGID was 0.15% during the current fiscal year.
The Trust has adopted separate Distribution Plans for the Advisor Class and Class M shares of the Portfolio. The Distribution Plans have been adopted pursuant to Rule 12b-1 under the Act. The Distribution Plans permit payments for expenses in connection with the distribution and marketing of Advisor Class and Class M shares and/or the provision of shareholder services to Advisor Class and Class M shareholders which permits the Portfolio to make total payments at an annual rate of 0.25% of its average daily net assets attributable to its Advisor Class and Class M shares. The Trust has also adopted Administrative Services Plans (“Service Plans”) for the Class M shares of the Portfolio. The Service Plans allows the
Portfolio to use its Class M assets to compensate or reimburse financial intermediaries that provide services relating to Class M shares which permits the Portfolio to make total payments at an annual rate of 0.20% of its average daily net assets attributable to its Class M shares.
(d) Portfolio Expenses The Trust is responsible for the following expenses: (i) salaries and other compensation of any of the Trust’s executive officers and employees who are not officers, directors, stockholders or employees of PIMCO or its subsidiaries or affiliates; (ii) taxes and governmental fees; (iii) brokerage fees and commissions and other portfolio transaction expenses; (iv) the costs of borrowing money, including interest expenses and bank overdraft charges; (v) fees and expenses of the Trustees who are not “interested persons” of PIMCO or the Trust, and any counsel retained exclusively for their benefit; (vi) extraordinary expenses, including costs of litigation and indemnification expenses; (vii) organization expenses and (viii) any expenses allocated or allocable to a specific class of shares, which include service fees payable with respect to the Administrative Class Shares, and may include certain other expenses as permitted by the Trust’s Multiple Class Plan adopted pursuant to Rule 18f-3 under the Act and subject to review and approval by the Trustees. The ratio of expenses to average net assets per share class, as disclosed in the Financial Highlights, may differ from the annual portfolio operating expenses per share class as disclosed in the Prospectus for the reasons set forth above.
Effective April 1, 2007, each Trustee, other than those affiliated with PIMCO or its affiliates, receives an annual retainer of $15,000, plus $2,375 for each Board of Trustees meeting attended in person, $500 for each committee meeting attended and $750 for each Board of Trustees meeting attended telephonically, plus reimbursement of related expenses. In addition, the audit committee chair receives an additional annual retainer of $2,000 and each other committee chair receives an additional annual retainer of $500. These expenses are allocated on a pro-rata basis to the various portfolios of the Trust according to their respective net assets. The Trust pays no compensation directly to any Trustee or any other officer who is affiliated with the Administrator, all of whom receive remuneration for their services to the Trust from the Administrator or its affiliates. Prior to April 1, 2007, each Trustee, other than those affiliated with PIMCO or its affiliates, received an annual retainer of $15,000 plus $2,000 for each Board of Trustees meeting attended ($500 for each special meeting attended), plus reimbursement of related expenses. The Audit Committee Chairman received an annual retainer of $1,500 and the Governance Committee Chairman received an annual retainer of $500. In addition, each member of a committee received $500 for each committee meeting attended.
(e) Acquired Fund Fees and Expenses The Underlying Fund Expenses for the Portfolio are based upon an allocation of the Portfolio’s assets among the Underlying Funds and upon the total annual operating expenses of the Institutional Class shares of these Underlying Funds. Underlying Fund Expenses will vary with changes in the expenses of the Underlying Funds, as well as allocation of the Portfolio’s assets.
PIMCO has contractually agreed, for the Portfolio’s current fiscal year, to reduce its advisory fee to the extent that the Acquired Fund Fees and Expenses attributable to advisory and administrative fees exceed 0.64% of the total assets invested in Underlying Funds. The waiver is reflected in the Statement of Operations as a component of Reimbursement by Manager. For the period ended June 30, 2007, the amount was $45,332. PIMCO may recoup these waivers in future periods, not exceeding three years, provided total expenses, including such recoupment, do not exceed the annual expense limit. As of June 30, 2007, the recoverable amount to the Administrator was $81,026.
| | | | | | |
| | Semiannual Report | | June 30, 2007 | | 11 |
Notes to Financial Statements (Cont.)
4. RELATED PARTY TRANSACTIONS
The Advisor, Administrator, and Distributor are related parties as defined by FAS 57, Related Party Disclosures. Fees payable to these parties are disclosed in Note 3.
The All Asset Portfolio invests substantially all of its assets in Institutional Class shares of PIMCO Funds, an affiliated open-end investment company. The Underlying Funds are considered to be affiliated with the Portfolio. The table below shows the transactions in and earnings from investments in these affiliated Funds for the period ended June 30, 2007 (amounts in thousands):
| | | | | | | | | | | | | | | | | | | | | | | |
| Underlying Funds | | Market Value 12/31/2006 | | Purchases at Cost | | Proceeds from Sales | | Unrealized Appreciation (Depreciation) | | | Market Value 6/30/2007 | | Dividend Income | | Net Capital and Realized Gain
(Loss) | |
Convertible Fund | | $ | 1,351 | | $ | 6,967 | | $ | 0 | | $ | 258 | | | $ | 8,434 | | $ | 15 | | $ | 0 | |
Developing Local Markets Fund | | | 92,781 | | | 59,318 | | | 15,272 | | | 5,598 | | | | 139,732 | | | 2,343 | | | (50 | ) |
Diversified Income Fund | | | 10,826 | | | 51,300 | | | 12,520 | | | (1,267 | ) | | | 48,242 | | | 1,006 | | | (200 | ) |
Emerging Local Bond Fund | | | 0 | | | 123,827 | | | 138 | | | 2,601 | | | | 126,285 | | | 1,737 | | | (5 | ) |
Emerging Markets Bond Fund | | | 32,346 | | | 842 | | | 15,795 | | | 563 | | | | 17,241 | | | 842 | | | 148 | |
Floating Income Fund | | | 223,808 | | | 187,752 | | | 188,313 | | | 1,339 | | | | 222,251 | | | 8,175 | | | 94 | |
Foreign Bond Fund (Unhedged) | | | 877 | | | 15 | | | 0 | | | (7 | ) | | | 862 | | | 15 | | | 0 | |
Fundamental IndexPLUS™ Fund | | | 21,485 | | | 10,115 | | | 3,471 | | | 902 | | | | 29,709 | | | 101 | | | 138 | |
Fundamental IndexPLUS™ TR Fund | | | 29,493 | | | 4,605 | | | 0 | | | 795 | | | | 35,817 | | | 103 | | | 0 | |
GNMA Fund | | | 2,815 | | | 72 | | | 0 | | | (17 | ) | | | 2,856 | | | 72 | | | 0 | |
High Yield Fund | | | 25,812 | | | 996 | | | 20,125 | | | 157 | | | | 6,539 | | | 867 | | | 187 | |
Income Fund | | | 0 | | | 3,703 | | | 0 | | | (84 | ) | | | 3,619 | | | 37 | | | 0 | |
International StocksPLUS® TR Strategy Fund (Unhedged) | | | 1,138 | | | 2,662 | | | 0 | | | 150 | | | | 3,969 | | | 48 | | | 0 | |
International StocksPLUS® TR Strategy Fund
(U.S. Dollar-Hedged) | | | 29,781 | | | 336 | | | 0 | | | 1,763 | | | | 31,927 | | | 336 | | | 0 | |
Long-Term U.S. Government Fund | | | 10,595 | | | 96,296 | | | 41,674 | | | (566 | ) | | | 65,163 | | | 564 | | | 541 | |
Low Duration Fund | | | 20,641 | | | 18,385 | | | 37,450 | | | 1 | | | | 1,280 | | | 407 | | | (250 | ) |
Real Return Asset Fund | | | 99,339 | | | 136,338 | | | 64,587 | | | (2,898 | ) | | | 168,665 | | | 2,807 | | | 948 | |
Real Return Fund | | | 51,460 | | | 42,705 | | | 17,008 | | | (1,167 | ) | | | 76,577 | | | 1,488 | | | (147 | ) |
RealEstateRealReturn Strategy Fund | | | 2,066 | | | 85 | | | 0 | | | (480 | ) | | | 1,899 | | | 85 | | | 0 | |
Short-Term Fund | | | 3,622 | | | 809 | | | 797 | | | (14 | ) | | | 3,619 | | | 87 | | | (1 | ) |
Small Cap StocksPLUS® TR Fund | | | 0 | | | 1,881 | | | 0 | | | (3 | ) | | | 1,877 | | | 4 | | | 0 | |
StocksPLUS® Fund | | | 1,719 | | | 42 | | | 0 | | | 117 | | | | 1,830 | | | 42 | | | 0 | |
StocksPLUS® Total Return Fund | | | 6,570 | | | 37 | | | 0 | | | 7 | | | | 6,836 | | | 37 | | | 0 | |
Total Return Fund | | | 18,875 | | | 449 | | | 15,206 | | | (123 | ) | | | 3,660 | | | 450 | | | (374 | ) |
Total Return Mortgage Fund | | | 3,782 | | | 11,065 | | | 0 | | | (166 | ) | | | 14,699 | | | 299 | | | 0 | |
CommodityRealReturn Strategy Fund® | | | 115,847 | | | 11,589 | | | 25,927 | | | (632 | ) | | | 102,122 | | | 2,371 | | | (2,098 | ) |
Totals | | $ | 807,029 | | $ | 772,191 | | $ | 458,283 | | $ | 6,827 | | | $ | 1,125,710 | | $ | 24,338 | | $ | (1,069 | ) |
5. GUARANTEES AND INDEMNIFICATIONS
Under the Trust’s organizational documents, each Trustee, officer, employee or other agent of the Trust (including the Trust’s investment manager) is indemnified, to the extent permitted by the Act, against certain liabilities that may arise out of performance of their duties to the Portfolio. Additionally, in the normal course of business, the Portfolio enters into contracts that contain a variety of indemnification clauses. The Portfolio’s maximum exposure under these arrangements is unknown as this would involve future claims that may be made against the Portfolio that have not yet occurred. However, the Portfolio has not had prior claims or losses pursuant to these contracts and believes the risk of loss to be remote.
6. PURCHASES AND SALES OF SECURITIES
The length of time the Portfolio has held a particular security is not generally a consideration in investment decisions. A change in the securities held by the
Portfolio is known as “portfolio turnover”. The Portfolio may engage in frequent
and active trading of portfolio securities to achieve its investment objective, particularly during periods of volatile market movements. High portfolio turnover (e.g., over 100%) involves correspondingly greater expenses to the Portfolio, including brokerage commissions or dealer mark-ups and other transaction costs on the sale of securities and reinvestments in other securities. Such sales may also result in realization of taxable capital gains, including short-term capital gains (which are generally taxed at ordinary income tax rates). The trading costs and tax effects associated with portfolio turnover may adversely affect the Portfolio’s performance.
Purchases and sales of securities (excluding short-term investments) for the period ended June 30, 2007, were as follows (amounts in thousands):
| | | | | | | | | | | | |
| U.S. Government/Agency | | | | All Other |
| Purchases | | Sales | | | | Purchases | | Sales |
| $ | 0 | | $ | 0 | | | | $ | 772,191 | | $ | 458,283 |
| | | | |
| 12 | | PIMCO Variable Insurance Trust | | |
| | |
| |
| | | June 30, 2007 (Unaudited) |
7. SHARES OF BENEFICIAL INTEREST
The Portfolio may issue an unlimited number of shares of beneficial interest with a $0.001 par value. Changes in shares of beneficial interest were as follows (shares and amounts in thousands):
| | | | | | | | | | | | | | | | |
| | | | | Six Months Ended 06/30/2007 | | | Year Ended 12/31/2006 | |
| | | | | Shares | | | Amount | | | Shares | | | Amount | |
| | | | | |
Receipts for shares sold | | | | | | | | | | | | | | | | |
Institutional Class | | | | 25 | | | $ | 294 | | | 6 | | | $ | 73 | |
Administrative Class | | | | 2,142 | | | | 25,388 | | | 5,177 | | | | 60,956 | |
Advisor Class | | | | 25,760 | | | | 304,743 | | | 41,500 | | | | 485,456 | |
Class M | | | | 468 | | | | 5,550 | | | 1,306 | | | | 15,354 | |
Issued as reinvestment of distributions | | | | | | | | | | | | | | | | |
Institutional Class | | | | 1 | | | | 7 | | | 0 | | | | 3 | |
Administrative Class | | | | 525 | | | | 6,179 | | | 1,218 | | | | 14,172 | |
Advisor Class | | | | 1,449 | | | | 17,050 | | | 1,455 | | | | 17,022 | |
Class M | | | | 92 | | | | 1,079 | | | 273 | | | | 3,180 | |
Cost of shares redeemed | | | | | | | | | | | | | | | | |
Institutional Class | | | | (7 | ) | | | (83 | ) | | 0 | | | | 0 | |
Administrative Class | | | | (2,130 | ) | | | (25,052 | ) | | (6,181 | ) | | | (72,158 | ) |
Advisor Class | | | | (129 | ) | | | (1,505 | ) | | (676 | ) | | | (7,990 | ) |
Class M | | | | (595 | ) | | | (13,565 | ) | | (2,587 | ) | | | (30,245 | ) |
Net increase resulting from Portfolio share transactions | | | | 27,601 | | | $ | 320,085 | | | 41,491 | | | $ | 485,823 | |
The following schedule shows the number of shareholders each owning 5% or more of the Portfolio and the total percentage of the Portfolio held by such shareholders:
| | | | | | |
| | | | | Number of Shareholders | | % of Portfolio Held |
Institutional Class | | | | 1 | | 95 |
Administrative Class | | | | 3 | | 91 |
Advisor Class | | | | 2 | | 97 |
Class M | | | | 3 | | 94 |
8. REGULATORY AND LITIGATION MATTERS
Since February 2004, PIMCO, Allianz Global Investors of America L.P. (PIMCO’s parent company), AGID, and certain of their affiliates, including the PIMCO Funds (another series of funds managed by PIMCO), the Allianz Funds (formerly known as PIMCO Funds: Multi-Manager Series (another series of funds managed by affiliates of PIMCO)), certain Trustees of the Trust (in their capacity as Trustees of the PIMCO Funds or the Allianz Funds) and certain employees of PIMCO, have been named as defendants in fifteen lawsuits filed in various jurisdictions. Eleven of those lawsuits concern “market timing,” and they have been transferred to and consolidated for pre-trial proceedings in a multi-district litigation proceeding in the U.S. District Court for the District of Maryland; the other four lawsuits concern “revenue sharing” and have been consolidated into a single action in the U.S. District Court for the District of Connecticut. The lawsuits have been commenced as putative class actions on behalf of investors who purchased, held or redeemed shares of the various series of the PIMCO Funds and the Allianz Funds during specified periods, or as derivative actions on behalf of the PIMCO Funds and the Allianz Funds.
The market timing actions in the District of Maryland generally allege that certain hedge funds were allowed to engage in “market timing” in certain funds of the PIMCO Funds and the Allianz Funds and this alleged activity was not disclosed.
Pursuant to tolling agreements entered into with the derivative and class action
plaintiffs, PIMCO, certain PIMCO Funds Trustees, and certain employees of PIMCO who were previously named as defendants have all been dropped as defendants in the market timing actions; the plaintiffs continue to assert claims on behalf of the shareholders of the PIMCO Funds or on behalf of the PIMCO Funds itself against other defendants. By order dated November 3, 2005, the U.S. District Court for the District of Maryland granted the PIMCO Funds’ motion to dismiss claims asserted against it in a consolidated amended complaint where the PIMCO Funds were named, in the complaint, as a nominal defendant. The revenue sharing action in the District of Connecticut generally alleges that fund assets were inappropriately used to pay brokers to promote funds of the PIMCO Funds and the Allianz Funds, including directing fund brokerage transactions to such brokers, and that such alleged arrangements were not fully disclosed to shareholders. On August 11, 2005, the U.S. District Court for the District of Connecticut conducted a hearing on defendants’ motion to dismiss the consolidated amended complaint in the revenue sharing action but has not yet ruled on the motion to dismiss. The market timing and revenue sharing lawsuits seek, among other things, unspecified compensatory damages plus interest and, in some cases, punitive damages, the rescission of investment advisory contracts, the return of fees paid under those contracts and restitution.
Two nearly identical class action civil complaints have been filed in August 2005, in the Northern District of Illinois Eastern Division, alleging that the plaintiffs each purchased and sold a 10-year Treasury note futures contract and suffered damages from an alleged shortage when PIMCO held both physical and futures positions in 10-year Treasury notes for its client accounts. The two actions have been consolidated into one action, and the two separate complaints have been replaced by a consolidated complaint. PIMCO is a named defendant, and PIMCO Funds has been added as a defendant, to the consolidated action. PIMCO strongly believes the complaint is without merit and intends to vigorously defend itself.
In April 2006, certain portfolios of the Trust and certain other funds managed by PIMCO were served in an adversary proceeding brought by the Official Committee of Asbestos Claimants of G-I Holdings, Inc. in G-I Holdings, Inc.’s bankruptcy in the District of New Jersey. In July 2004, PIMCO was named in this lawsuit and remains a defendant. The plaintiff seeks to recover for the bankruptcy estate assets that were transferred by the predecessor entity of G-I Holdings, Inc. to a wholly-owned subsidiary in 1994. The subsidiary has since issued notes, of which certain portfolios of the Trust and certain other funds managed by PIMCO are alleged to be holders. The complaint alleges that in 2000, more than two hundred noteholders—including certain portfolios of the Trust and certain other funds managed by PIMCO—were granted a second priority lien on the assets of the subsidiary in exchange for their consent to a refinancing transaction and the granting of a first priority lien to the lending banks. The plaintiff is seeking invalidation of the lien in favor of the noteholders and/or the value of the lien. On June 21, 2006, the District of New Jersey overturned the Bankruptcy Court’s decision granting permission to file the adversary proceeding and remanded the matter to the Bankruptcy Court for further proceedings. Following a motion to reconsider, the District Court upheld its remand on August 7, 2006, and instructed the Bankruptcy Court to conduct a “cost-benefit” analysis of the Committee’s claims, including the claims against the noteholders. The Bankruptcy Court held a status conference on October 25, 2006 and set a briefing schedule relating to this cost-benefit analysis.
The foregoing speaks only as of the date of this report. It is possible that these matters and/or other developments resulting from these matters could result in increased portfolio redemptions or other adverse consequences to the Portfolio. However, PIMCO and AGID believe that these matters are not likely to have a material adverse effect on the Portfolio or on PIMCO’s or AGID’s ability to perform their respective investment advisory or distribution services relating to the Portfolio.
| | | | | | |
| | Semiannual Report | | June 30, 2007 | | 13 |
Notes to Financial Statements (Cont.)
9. FEDERAL INCOME TAX MATTERS
The Portfolio intends to qualify as a regulated investment company under sub-chapter M of the Internal Revenue Code (the “Code”) and distribute all of its taxable income and net realized gains, if applicable, to shareholders. Accordingly, no provision for Federal income taxes has been made.
To the extent the Portfolio invests in the CommodityRealReturn Strategy Fund® (the “CRRS Fund”), an Underlying Fund, this Portfolio may be subject to additional tax risk.
One of the requirements for favorable tax treatment as a regulated investment company under the Code is that the Fund derive at least 90% of its gross income from certain qualifying sources of income. The IRS has issued a revenue ruling which holds that income derived from commodity index-linked swaps is not qualifying income under Subchapter M of the Code. Subsequently, the IRS issued a private letter ruling to the CRRS Fund in which the IRS specifically concluded that income from certain commodity index-linked notes is qualifying income. In addition, the IRS issued another private letter ruling to the CRRS Fund in which the IRS specifically concluded that income derived from the CRRS Fund’s investment in
the Subsidiary, which invests primarily in commodity index-linked swaps, will also constitute qualifying income to the CRRS Fund. Based on such rulings, the CRRS Fund will continue to seek to gain exposure to the commodity markets primarily through investments in commodity-linked notes and through investments in its subsidiary.
Please refer to the prospectus for the Separate Account and Variable Contract for information regarding federal income tax treatment of distributions to the Separate Account.
As of June 30, 2007, the aggregate cost of investments was the same for federal income tax and financial statement purposes. The net unrealized appreciation (depreciation) of investment securities for federal income tax purposes is as follows (amount in thousands):
| | | | |
Aggregate Gross Unrealized Appreciation | | Aggregate Gross Unrealized (Depreciation) | | Net Unrealized Appreciation |
$ 14,251 | | $ (7,424) | | $ 6,827 |
| | | | |
| 14 | | PIMCO Variable Insurance Trust | | |
| | |
| |
Privacy Policy* | | (Unaudited) |
The Funds consider customer privacy to be a fundamental aspect of their relationships with shareholders and are committed to maintaining the confidentiality, integrity and security of their current, prospective and former shareholders’ personal information. To ensure their shareholders’ privacy, the Funds have developed policies that are designed to protect this confidentiality, while allowing shareholder needs to be served.
Obtaining Personal Information
In the course of providing shareholders with products and services, the Funds and certain service providers to the Funds, such as the Funds’ investment advisers (“Advisers”), may obtain non-public personal information about shareholders, which may come from sources such as account applications and other forms, from other written, electronic or verbal correspondence, from shareholder transactions, from a shareholder’s brokerage or financial advisory firm, financial adviser or consultant, and/or from information captured on the Funds’ internet web sites.
Respecting Your Privacy
As a matter of policy, the Funds do not disclose any personal or account information provided by shareholders or gathered by the Funds to non-affiliated third parties, except as required or permitted by law or as necessary for such third parties to perform their agreements with respect to the Funds. As is common in the industry, non-affiliated companies may from time to time be used to provide certain services, such as preparing and mailing prospectuses, reports, account statements and other information, conducting research on shareholder satisfaction and gathering shareholder proxies. A Fund’s Distributor may also retain non-affiliated companies to market the Fund’s shares or products which use the Fund’s shares and enter into joint marketing agreements with other companies. These companies may have access to a shareholder’s personal and account information, but are permitted to use this information solely to provide the specific service or as otherwise permitted by law. In most cases, the shareholders will be clients of a third party, but the Funds may also provide a shareholder’s personal and account information to the shareholder’s respective brokerage or financial advisory firm.
Sharing Information with Third Parties
The Funds reserve the right to disclose or report personal information to non-affiliated third parties, in limited circumstances, where the Funds believe in good faith that disclosure is required under law to cooperate with regulators or law enforcement authorities, to protect their rights or property or upon reasonable request by any Fund in which a shareholder has chosen to invest. In addition, the Funds may disclose information about a shareholder’s accounts to a non-affiliated third party with the consent of the shareholder.
Sharing Information with Affiliates
The Funds may share shareholder information with their affiliates in connection with servicing their shareholders’ accounts or to provide shareholders with information about products and services that the Funds or their Advisers, principal underwriters or their affiliates (“Service Affiliates”) believe may be of interest to such shareholders. The information that the Funds share may include, for example, a shareholder’s participation in one of the Funds or in other investment programs sponsored by a Service Affiliate, a shareholder’s ownership of certain types of accounts (such as IRAs), or other data about a shareholder’s accounts. The Funds’ Service Affiliates, in turn, are not permitted to share shareholder information with non-affiliated entities, except as required or permitted by law.
Procedures to Safeguard Private Information
The Funds take seriously the obligation to safeguard shareholder non-public personal information. In addition to this policy, the Funds have also implemented procedures that are designed to restrict access to a shareholder’s non-public personal information only to internal personnel who need to know that information in order to provide products or services to such shareholders. In order to guard a shareholder’s non-public personal information, physical, electronic and procedural safeguards are in place.
* This Privacy Policy applies to the following entities: PIMCO Funds, PIMCO Variable Insurance Trust, PCM Fund, Inc. and PIMCO Strategic Global Government Fund, Inc. (collectively, the “Funds”).
| | | | | | |
| | Semiannual Report | | June 30, 2007 | | 15 |
Investment Adviser and Administrator
Pacific Investment Management Company LLC
840 Newport Center Drive
Newport Beach, California 92660
Investment Sub-Adviser
Research Affiliates, LLC
800 E. Colorado Boulevard
Pasadena, California 91101
Distributor
Allianz Global Investors Distributors LLC
1345 Avenue of the Americas
New York, New York 10105
Custodian
State Street Bank & Trust Company
801 Pennsylvania
Kansas City, Missouri 64105
Transfer Agent
Boston Financial Data Services–Midwest
330 W. 9th Street
Kansas City, Missouri 64105
Legal Counsel
Dechert LLP
1775 I Street, N.W.
Washington, D.C. 20006
Independent Registered Public Accounting Firm
PricewaterhouseCoopers LLP
1055 Broadway
Kansas City, Missouri 64105
P I M C O

Table of Contents
This material is authorized for use only when preceded or accompanied by the current PIMCO Variable Insurance Trust (the “Trust”) prospectus. Investors should consider the investment objectives, risks, charges and expenses of this Trust carefully before investing. Ask your financial professional to explain all charges that may apply. This and other information is contained in the Trust’s prospectus. The variable product prospectus may be obtained by contacting your Investment Consultant. Please read the Trust and variable product prospectus carefully before you invest or send money.
Chairman’s Letter
Dear PIMCO Variable Insurance Trust Shareholder:
It is our pleasure to present to you the semiannual report for the PIMCO Variable Insurance Trust, covering the six-month period ended June 30, 2007. The PIMCO Variable Insurance Trust’s net assets were $8.68 billion at June 30, 2007, as compared to $7.76 billion at December 31, 2006.
Highlights of the financial markets during the reporting period include:
| | n | | Economic data during the first quarter of 2007 pointed to slower growth, which heightened market expectations for a decrease in the Federal Funds Rate. By the second quarter, economic data, such as employment statistics, provided little indication of economic weakness, causing expectations of a decrease in the Federal Funds Rate to unwind and U.S. interest rates to move higher. Interest rates in Europe and the U.K. also rose over the period as central banks raised their key lending rates due to inflation concerns. The benchmark ten-year U.S. Treasury yielded 5.03% as of June 30, 2007, or 0.32% higher than at the beginning of the year. |
| | n | | Most bonds generally returned much of their gains from earlier in the year as worldwide growth and capital flows drove interest rates higher in the second quarter. Increased risk aversion in global financial markets, due in part to subprime mortgage worries in the U.S., also contributed to the rise in interest rates. The Lehman Brothers Aggregate Bond Index, which includes Treasury, investment-grade corporate and mortgage-backed securities, returned 0.98% for the six-month period. |
| | n | | Locally issued emerging market (“EM”) bonds posted positive returns for the reporting period. Yields on these bonds declined and the local currencies in which they are denominated generally gained, amid increasing investor awareness, strong economic growth and surging capital inflows. External EM bonds (debt instruments issued by emerging markets countries and typically denominated in U.S. dollars) lagged behind local EM bonds (debt instruments issued by emerging markets countries and denominated in the currency of the issuer), as external EM bonds tend to trade more in-line with U.S. Treasuries. |
| | n | | Treasury Inflation-Protected Securities (“TIPS”) outpaced nominal bonds (non-inflation linked bonds) for the first part of the year and all but the longest maturity TIPS outperformed in the second quarter as high gasoline prices drove higher inflation accruals. Commodities, as represented by the Dow Jones-AIG Commodity Total Return Index, returned 4.46% for the period. Equities, as measured by the S&P 500 Index and the Russell 2000 Index, returned 6.96% and 6.45%, respectively, for the period. |
On the following pages, please find specific details as to the Portfolio’s total return investment performance and a discussion of those factors that affected performance.
Thank you for the trust you have placed in us. We will continue to work diligently to serve your investment needs.
Sincerely,

Brent R. Harris
Chairman, PIMCO Variable Insurance Trust
July 31, 2007
| | | | | | |
| | Semiannual Report | | June 30, 2007 | | 1 |
Important Information About the Portfolio
PIMCO Variable Insurance Trust (the “Trust”) is an open-end management investment company currently consisting of twenty separate investment portfolios, including the All Asset Portfolio (the “Portfolio”). The Portfolio is only available as a funding vehicle under variable life insurance policies or variable annuity contracts issued by insurance companies (“Variable Contracts”). Individuals may not purchase shares of the Portfolio directly. Shares of the Portfolio also may be sold to qualified pension and retirement plans outside of the separate account context.
The Portfolio is a “fund of funds,” which is a term used to describe mutual funds that pursue their investment objective by investing in other mutual funds instead of investing directly in stocks or bonds of other issuers. Under normal circumstances, the Portfolio invests substantially all of its assets in Institutional Class shares of PIMCO Funds, an affiliated open-end investment company, except the All Asset and All Asset All Authority Funds (“Underlying Funds”).
Among the principal risks of investing in the Portfolio are allocation risk, Underlying Fund risk and issuer non-diversification risk. The Portfolio also is indirectly subject to the risks of the Underlying Funds, which may include, but are not limited to, the following: interest rate risk, credit risk, high yield risk, market risk, issuer risk, variable dividends risk, liquidity risk, derivatives risk, commodity risk, equity risk, mortgage risk, non-U.S. investment risk, real estate risk, emerging markets risk, currency risk, issuer non-diversification risk, leveraging risk, small company risk, management risk, California state-specific risk, New York state-specific risk, tax risk, and subsidiary risk. A complete description of these risks is contained in the Portfolio’s prospectus. An Underlying Fund may use derivative instruments for hedging purposes or as part of an investment strategy. Use of these instruments may involve certain costs and risks such as liquidity risk, interest rate risk, market risk, credit risk, management risk and the risk that the Underlying Fund could not close out a position when it would be most advantageous to do so. An Underlying Fund investing in derivatives could lose more than the principal amount invested in these instruments. An Underlying Fund’s investment in non-U.S. securities may entail risk due to non-U.S. economic and political developments; this risk may be increased when investing in emerging markets.
The cost of investing in the Portfolio will generally be higher than the cost of investing in a mutual fund that invests directly in individual stocks and bonds. By investing in the Portfolio, an investor will indirectly bear fees and expenses charged by the Underlying Funds in addition to the Portfolio’s direct fees and expenses.
On the performance summary page in this Semiannual Report, the Total Return Investment Performance table measures performance assuming that all dividend and capital gain distributions were reinvested.
An investment in the Portfolio is not a deposit of a bank and is not guaranteed or insured by the Federal Deposit Insurance Corporation or any other government agency. It is possible to lose money on investments in the Portfolio.
PIMCO has adopted written proxy voting policies and procedures (“Proxy Policy”) as required by Rule 206(4)-6 under the Investment Advisers Act of 1940, as amended. The Proxy Policy has been adopted by the Trust as the policies and procedures that PIMCO will use when voting proxies on behalf of the Portfolio. A description of the policies and procedures that PIMCO uses to vote proxies relating to portfolio securities of the Portfolio, and information about how the Portfolio voted proxies relating to portfolio securities held during the most recent twelve-month period ended June 30, are available without charge, upon request, by calling the Trust at 1-866-746-2606 and on the Portfolio’s website at www.pimco.com.
The Portfolio files its complete schedule of portfolio holdings with the SEC for the first and third quarters of each fiscal year on Form N-Q. A copy of the Trust’s Form N-Q is also available on the SEC’s website at http://www.sec.gov and may be reviewed and copied at the SEC’s Public Reference Room in Washington D.C. Information on the operation of the Public Reference Room may be obtained by calling 1-800-SEC-0330, and is available without charge, upon request, by calling the Trust at 1-866-746-2606 and on the Portfolio’s website at www.pimco.com.
PIMCO Variable Insurance Trust is distributed by Allianz Global Investors Distributors LLC, 1345 Avenue of the Americas, New York, NY 10105.
| | | | |
| 2 | | PIMCO Variable Insurance Trust | | |
The following disclosure provides important information regarding the Portfolio’s Expense Example (“Example” or “Expense Example”), which appears in this Semiannual Report. Please refer to this information when reviewing the Expense Example for the Portfolio.
Example
As a shareholder of the Portfolio, you incur two types of costs: (1) transaction costs and (2) ongoing costs, including advisory and administrative fees; distribution and/or service (12b-1) fees (Administrative Class, Advisor Class and Class M only); and other Portfolio expenses. The Example is intended to help you understand your ongoing costs (in dollars) of investing in the Portfolio and to compare these costs with the ongoing costs of investing in other mutual funds. The Expense Example does not reflect any fees or other expenses imposed by the Variable Contracts. If it did, the expenses reflected in the Expense Example would be higher. The Example is based on an investment of $1,000 invested at the beginning of the period and held for the entire period indicated, which is from January 1, 2007 to June 30, 2007.
Actual Expenses
The information in the table under the heading “Actual Performance” provides information about actual account values and actual expenses. You may use the information in these columns, together with the amount you invested, to estimate the expenses that you paid over the period. Simply divide your account value by $1,000 (for example, an $8,600 account value divided by $1,000 = $8.60), then multiply the result by the number in the row titled “Expenses Paid During Period” to estimate the expenses you paid on your account during this period.
Hypothetical Example for Comparison Purposes
The information in the table under the heading “Hypothetical Performance (5% return before expenses)” provides information about hypothetical account values and hypothetical expenses based on the Portfolio’s actual expense ratio and an assumed rate of return of 5% per year before expenses, which is not the Portfolio’s actual return. The hypothetical account values and expenses may not be used to estimate the actual ending account balance or expenses you paid for the period. You may use this information to compare the ongoing costs of investing in the Portfolio and other portfolios. To do so, compare this 5% hypothetical example with the 5% hypothetical examples that appear in the shareholder reports of the other portfolios.
Please note that the expenses shown in the table are meant to highlight your ongoing costs only and do not reflect any transactional costs. Therefore, the information under the heading “Hypothetical Performance (5% return before expenses)” is useful in comparing ongoing costs only, and will not help you determine the relative total costs of owning different portfolios. In addition, if these transactional costs were included, your costs would have been higher.
The expense ratio may vary period to period because of various factors, such as an increase in expenses not covered by the advisory and administrative fees (such as expenses of the trustees and their counsel, litigation expense and interest expense).
| | | | | | |
| | Semiannual Report | | June 30, 2007 | | 3 |
PIMCO All Asset Portfolio
Cumulative Returns Through June 30, 2007
$10,000 invested at the beginning of the first full month following the inception date of the Portfolio’s Class M.
PIMCO Funds Allocation‡
| | |
Floating Income Fund | | 19.7% |
Real Return Asset Fund | | 14.9% |
Developing Local Markets Fund | | 12.4% |
Emerging Local Bond Fund | | 11.2% |
CommodityRealReturn Strategy Fund® | | 9.0% |
Real Return Fund | | 6.8% |
Long-Term U.S. Government Fund | | 5.7% |
Other | | 20.3% |
| | ‡ | % of Total Investments as of 06/30/2007 |
| | | | | | | | |
| Average Annual Total Return for the period ended June 30, 2007 |
| | | | | 6 Months* | | 1 Year | | Portfolio
Inception
(04/30/04) |
 | | PIMCO All Asset Portfolio Class M | | 2.75% | | 8.60% | | 8.16% |
 | | Lehman Brothers U.S. TIPS: 1-10 Year Index± | | 2.49% | | 4.19% | | 3.82% |
 | | CPI + 500 Basis Points±± | | 5.84% | | 7.93% | | 8.57% |
All Portfolio returns are net of fees and expenses.
* Cumulative return.
Performance quoted represents past performance. Past performance is no guarantee of future results. Investment return and principal value will fluctuate so the Portfolio shares, when redeemed, may be worth more or less than their original cost. The Portfolio’s performance does not reflect the deduction of additional charges and expenses imposed in connection with investing in Variable Contracts, which will reduce returns. Current performance may be lower or higher than the performance data quoted. Performance data current to the most recent month-end is available by calling (800) 927-4648.
± Lehman Brothers U.S. TIPS: 1-10 Year Index is an unmanaged index comprised of U.S. Treasury Inflation-Protected Securities having a maturity of at least 1 year and less than 10 years. It is not possible to invest directly in the index. The index does not reflect deductions for fees and expenses.
±± CPI + 500 Basis Points benchmark is created by adding 5% to the annual percentage change in the Consumer Price Index (“CPI”). This index reflects non-seasonally adjusted returns. The CPI is an unmanaged index representing the rate of inflation of the U.S. consumer prices as determined by the U.S. Department of Labor, Bureau of Labor Statistics. There can be no guarantee that the CPI or other indices will reflect the exact level of inflation at any given time. It is not possible to invest directly in the index. The index does not reflect deductions for fees and expenses.
| | | | | | |
| Expense Example | | Actual Performance | | Hypothetical Performance |
| | | | | (5% return before expenses) |
Beginning Account Value (01/01/07) | | $ | 1,000.00 | | $ | 1,000.00 |
Ending Account Value (06/30/07) | | $ | 1,027.52 | | $ | 1,020.46 |
Expenses Paid During Period† | | $ | 4.40 | | $ | 4.38 |
† Expenses are equal to the Portfolio’s Class M annualized expense ratio of 0.875%, multiplied by the average account value over the period, multiplied by 181/365 (to reflect the one-half year period). The expense ratio excludes the expenses of the Underlying Funds, which based upon the allocation of the Portfolio’s assets among the Underlying Funds are indirectly borne by the shareholders of the Portfolio. The Underlying Fund Expenses are currently capped at 0.64%. Overall fees and expenses of investing in the Portfolio will be higher because the example does not reflect Variable Contract fees and expenses.
Please refer to page 3 herein for an explanation of the information presented in the above Expense Example.
Portfolio Insights
| » | | The PIMCO All Asset Portfolio seeks to achieve its investment objective by investing under normal circumstances substantially all of its assets in Institutional Class shares of the PIMCO Funds, an affiliated open-end investment company, except the PIMCO All Asset and PIMCO All Asset All Authority Funds. |
| » | | Significant exposure to short-term strategies, particularly through the PIMCO Floating Income Fund, contributed to performance as the PIMCO Floating Income Fund returned 2.62% net of fees during the period. |
| » | | Although any exposure to Real Estate Investment Trusts (“REITs”) would detract from performance, as the Dow Jones Wilshire REIT Index returned -5.97% during the period, negligible exposure was a positive asset allocation decision. |
| » | | Exposure to equity strategies benefited performance due to strong returns domestically and internationally. However, reduced equity exposure in the Portfolio was not a positive asset allocation decision. |
| » | | Large exposure to developing local market bonds contributed to performance as the asset class benefited from continued capital inflows and strong economic fundamentals. |
| » | | Large exposure to Treasury Inflation-Protected Securities (“TIPS”) detracted from performance as real yields rose. |
| » | | Minimal exposure to convertibles detracted from returns as the asset class had positive performance. |
| | | | |
| 4 | | PIMCO Variable Insurance Trust | | |
Financial Highlights All Asset Portfolio
| | | | | | | | | | | | | | | | |
| Selected per Share Data for the Year or Period Ended: | | 06/30/2007+ | | | 12/31/2006 | | | 12/31/2005 | | | 04/30/2004-12/31/2004 | |
| | | | |
Class M | | | | | | | | | | | | | | | | |
Net asset value beginning of year or period | | $ | 11.68 | | | $ | 11.80 | | | $ | 11.60 | | | $ | 10.59 | |
Net investment income (a) | | | 0.24 | | | | 0.57 | | | | 0.85 | | | | 0.96 | |
Net realized/unrealized gain (loss) on investments (a) | | | 0.08 | | | | (0.07 | ) | | | (0.16 | ) | | | 0.39 | |
Total income from investment operations | | | 0.32 | | | | 0.50 | | | | 0.69 | | | | 1.35 | |
Dividends from net investment income | | | (0.26 | ) | | | (0.59 | ) | | | (0.45 | ) | | | (0.33 | ) |
Distributions from net realized capital gains | | | 0.00 | | | | (0.03 | ) | | | (0.04 | ) | | | (0.01 | ) |
Total distributions | | | (0.26 | ) | | | (0.62 | ) | | | (0.49 | ) | | | (0.34 | ) |
Net asset value end of year or period | | $ | 11.74 | | | $ | 11.68 | | | $ | 11.80 | | | $ | 11.60 | |
Total return | | | 2.75 | % | | | 4.36 | % | | | 5.94 | % | | | 12.85 | % |
Net assets end of year or period (000s) | | $ | 48,240 | | | $ | 54,928 | | | $ | 67,365 | | | $ | 18,345 | |
Ratio of expenses to average net assets | | | 0.875 | %*(b)(e) | | | 0.885 | %(b)(d) | | | 0.89 | %(b)(c) | | | 0.87 | %*(b)(c) |
Ratio of expenses to average net assets excluding interest expense | | | 0.875 | %*(b)(e) | | | 0.885 | %(b)(d) | | | 0.89 | %(b)(c) | | | 0.87 | %*(b)(c) |
Ratio of net investment income to average net assets | | | 4.07 | %* | | | 4.84 | % | | | 7.16 | % | | | 12.66 | %* |
Portfolio turnover rate | | | 48 | % | | | 66 | % | | | 75 | % | | | 93 | % |
+ Unaudited
* Annualized
(a) Per share amounts based on average number of shares outstanding during the period.
(b) Ratio of expenses to average net assets excluding underlying Funds’ expenses in which the Portfolio invests.
(c) If the investment manager had not reimbursed expenses, the ratio of expenses to average net assets would have been 0.90%.
(d) Effective October 1, 2006, the advisory fee was reduced to 0.175%.
(e) If the investment manager had not reimbursed expenses, the ratio of expenses to average net assets would have been 0.885%.
| | | | | | |
| See Accompanying Notes | | Semiannual Report | | June 30, 2007 | | 5 |
Statement of Assets and Liabilities All Asset Portfolio
| | | | |
| (Amounts in thousands, except per share amounts) | | June 30, 2007
(Unaudited) | |
| |
Assets: | | | | |
Investments in affiliates, at value | | $ | 1,125,710 | |
Repurchase agreements, at value | | | 4,111 | |
Cash | | | 1 | |
Receivable for investments in affiliates sold | | | 9,423 | |
Receivable for Portfolio shares sold | | | 2,631 | |
Interest and dividends receivable | | | 2 | |
Interest and dividends receivable from affiliates | | | 5,016 | |
Manager reimbursement receivable | | | 31 | |
| | | | 1,146,925 | |
| |
Liabilities: | | | | |
Payable for investments in affiliates purchased | | $ | 16,789 | |
Payable for Portfolio shares redeemed | | | 69 | |
Accrued investment advisory fee | | | 163 | |
Accrued administration fee | | | 233 | |
Accrued distribution fee | | | 168 | |
Accrued servicing fee | | | 30 | |
| | | | 17,452 | |
| |
Net Assets | | $ | 1,129,473 | |
| |
Net Assets Consist of: | | | | |
Paid in capital | | $ | 1,125,794 | |
Undistributed net investment income | | | 4,112 | |
Accumulated undistributed net realized (loss) | | | (7,260 | ) |
Net unrealized appreciation | | | 6,827 | |
| | | $ | 1,129,473 | |
| |
Net Assets: | | | | |
Institutional Class | | $ | 291 | |
Administrative Class | | | 258,604 | |
Advisor Class | | | 822,338 | |
Class M | | | 48,240 | |
| |
Shares Issued and Outstanding: | | | | |
Institutional Class | | | 25 | |
Administrative Class | | | 22,035 | |
Advisor Class | | | 69,990 | |
Class M | | | 4,106 | |
| |
Net Asset Value and Redemption Price Per Share (Net Asset Per Share Outstanding) | | | | |
Institutional Class | | $ | 11.74 | |
Administrative Class | | | 11.73 | |
Advisor Class | | | 11.74 | |
Class M | | | 11.74 | |
| |
Cost of Investments in Affiliates Owned | | $ | 1,118,883 | |
Cost of Repurchase Agreements Owned | | $ | 4,111 | |
| | | | |
| 6 | | PIMCO Variable Insurance Trust | | See Accompanying Notes |
Statement of Operations All Asset Portfolio
| | | | |
| (Amounts in thousands) | | Six Months Ended June 30, 2007 (Unaudited) | |
| |
| Investment Income: | | | | |
Interest | | $ | 99 | |
Dividends from affiliate investments | | | 24,338 | |
Total Income | | | 24,437 | |
| |
Expenses: | | | | |
Investment advisory fees | | | 831 | |
Administration fees | | | 1,187 | |
Servicing fees – Administrative Class | | | 187 | |
Distribution and/or servicing fees – Advisor Class | | | 813 | |
Distribution and/or servicing fees – Class M | | | 111 | |
Total Expenses | | | 3,129 | |
Reimbursement by Manager | | | (45 | ) |
Net Expenses | | | 3,084 | |
| |
Net Investment Income | | | 21,353 | |
| |
Net Realized and Unrealized Gain (Loss): | | | | |
Net realized (loss) on affiliate investments | | | (1,069 | ) |
Net change in unrealized appreciation on affiliate investments | | | 5,843 | |
Net Gain | | | 4,774 | |
| |
Net Increase in Net Assets Resulting from Operations | | $ | 26,127 | |
| | | | | | |
| See Accompanying Notes | | Semiannual Report | | June 30, 2007 | | 7 |
Statements of Changes in Net Assets All Asset Portfolio
| | | | | | | | |
| (Amounts in thousands) | | Six Months Ended June 30, 2007 (Unaudited) | | | Year Ended December 31, 2006 | |
| | |
| Increase in Net Assets from: | | | | | | | | |
| | |
Operations: | | | | | | | | |
Net investment income | | $ | 21,353 | | | $ | 32,372 | |
Net realized (loss) on affiliate investments | | | (1,069 | ) | | | (7,977 | ) |
Net capital gain distributions received from Underlying Funds | | | 0 | | | | 2,277 | |
Net change in unrealized appreciation on affiliate investments | | | 5,843 | | | | 3,148 | |
Net increase resulting from operations | | | 26,127 | | | | 29,820 | |
| | |
Distributions to Shareholders: | | | | | | | | |
From net investment income | | | | | | | | |
Institutional Class | | | (7 | ) | | | (2 | ) |
Administrative Class | | | (6,179 | ) | | | (13,550 | ) |
Advisor Class | | | (17,050 | ) | | | (15,816 | ) |
Class M | | | (1,079 | ) | | | (3,041 | ) |
From net realized capital gains | | | | | | | | |
Institutional Class | | | 0 | | | | 0 | |
Administrative Class | | | 0 | | | | (622 | ) |
Advisor Class | | | 0 | | | | (1,205 | ) |
Class M | | | 0 | | | | (139 | ) |
| | |
Total Distributions | | | (24,315 | ) | | | (34,375 | ) |
| | |
Portfolio Share Transactions: | | | | | | | | |
Receipts for shares sold | | | | | | | | |
Institutional Class | | | 294 | | | | 73 | |
Administrative Class | | | 25,388 | | | | 60,956 | |
Advisor Class | | | 304,743 | | | | 485,456 | |
Class M | | | 5,550 | | | | 15,354 | |
Issued as reinvestment of distributions | | | | | | | | |
Institutional Class | | | 7 | | | | 3 | |
Administrative Class | | | 6,179 | | | | 14,172 | |
Advisor Class | | | 17,050 | | | | 17,022 | |
Class M | | | 1,079 | | | | 3,180 | |
Cost of shares redeemed | | | | | | | | |
Institutional Class | | | (83 | ) | | | 0 | |
Administrative Class | | | (25,052 | ) | | | (72,158 | ) |
Advisor Class | | | (1,505 | ) | | | (7,990 | ) |
Class M | | | (13,565 | ) | | | (30,245 | ) |
Net increase resulting from Portfolio share transactions | | | 320,085 | | | | 485,823 | |
| | |
Total Increase in Net Assets | | | 321,897 | | | | 481,268 | |
| | |
Net Assets: | | | | | | | | |
Beginning of period | | | 807,576 | | | | 326,308 | |
End of period* | | $ | 1,129,473 | | | $ | 807,576 | |
| | |
*Including undistributed net investment income of: | | $ | 4,112 | | | $ | 7,074 | |
| | | | |
| 8 | | PIMCO Variable Insurance Trust | | See Accompanying Notes |
| | |
| |
| Schedule of Investments All Asset Portfolio (a) | | June 30, 2007 (Unaudited) |
| | | | | | | | |
| | | | | SHARES | | | | VALUE (000S) |
| PIMCO FUNDS (b) 99.7% | | |
CommodityRealReturn Strategy Fund® | | | | 7,268,477 | | $ | | 102,122 |
Convertible Fund | | | | 589,376 | | | | 8,434 |
Developing Local Markets Fund | | | | 12,645,454 | | | | 139,732 |
Diversified Income Fund | | | | 4,446,275 | | | | 48,242 |
Emerging Local Bond Fund | | | | 12,272,617 | | | | 126,285 |
Emerging Markets Bond Fund | | | | 1,580,326 | | | | 17,241 |
Floating Income Fund | | | | 21,146,569 | | | | 222,251 |
Foreign Bond Fund (Unhedged) | | | | 87,682 | | | | 862 |
Fundamental IndexPLUS™ Fund | | | | 2,578,927 | | | | 29,709 |
Fundamental IndexPLUS™ TR Fund | | | | 3,313,300 | | | | 35,817 |
GNMA Fund | | | | 261,736 | | | | 2,856 |
High Yield Fund | | | | 669,256 | | | | 6,539 |
Income Fund | | | | 368,140 | | | | 3,619 |
International StocksPLUS® TR Strategy Fund (Unhedged) | | | | 379,112 | | | | 3,969 |
| | | | | | | | |
| | | | | SHARES | | | | VALUE (000S) |
International StocksPLUS® TR Strategy Fund (U.S.Dollar-Hedged) | | | | 2,537,938 | | $ | | 31,927 |
Long-Term U.S. Government Fund | | | | 6,413,670 | | | | 65,163 |
Low Duration Fund | | | | 130,601 | | | | 1,280 |
Real Return Asset Fund | | | | 15,807,400 | | | | 168,665 |
Real Return Fund | | | | 7,279,172 | | | | 76,577 |
RealEstateRealReturn Strategy Fund | | | | 291,240 | | | | 1,899 |
Short-Term Fund | | | | 364,763 | | | | 3,619 |
Small Cap StocksPLUS® TR Strategy Fund | | | | 173,830 | | | | 1,877 |
StocksPLUS® Fund | | | | 158,184 | | | | 1,830 |
StocksPLUS® Total Return Fund | | | | 561,247 | | | | 6,836 |
Total Return Fund | | | | 360,250 | | | | 3,660 |
Total Return Mortgage Fund | | | | 1,397,281 | | | | 14,699 |
| | | | | | | | |
Total PIMCO Funds (Cost $1,118,883) | | | | 1,125,710 |
| | | | | | | | |
| | | | | | | | | |
| | | | | PRINCIPAL AMOUNT
(000S) | | | | VALUE (000S) | |
| SHORT-TERM INSTRUMENTS 0.3% | |
| |
| REPURCHASE AGREEMENTS 0.3% | |
| State Street Bank and Trust Co. | | | | | |
4.900% due 07/02/2007 | | $ | | 4,111 | | $ | | 4,111 | |
| | | | | | | | | |
(Dated 06/29/2007. Collateralized by Fannie Mae 3.250% due 08/15/2008 valued at $4,197. Repurchase proceeds are $4,113.) | |
Total Short-Term Instruments
(Cost $4,111) | | 4,111 | |
| | | | | | | | | |
| |
| |
| Total Investments 100.0% (Cost $1,122,994) | | | | | | $ | | 1,129,821 | |
| |
| Other Assets and Liabilities (Net) (0.0%) | | | | (348 | ) |
| | | | | | | | | |
| Net Assets 100.0% | | | | | | $ | | 1,129,473 | |
| | | | | | | | | |
Notes to Schedule of Investments
(a) The All Asset Portfolio is investing in shares of affiliated Funds.
(b) Institutional Class Shares of each PIMCO Fund.
| | | | | | |
| See Accompanying Notes | | Semiannual Report | | June 30, 2007 | | 9 |
Notes to Financial Statements
1. ORGANIZATION
The All Asset Portfolio (the “Portfolio”) is a series of the PIMCO Variable Insurance Trust (the “Trust”). The Trust is registered under the Investment Company Act of 1940 (the “Act”), as amended, as an open-end management investment company organized as a Delaware business trust on October 3, 1997. The Portfolio offers four classes of shares: Institutional, Administrative, Advisor, and Class M. Information presented on these financial statements pertains to the Class M of the Portfolio. Certain detailed financial information for the Institutional Class, Advisor Class and Administrative Class is provided separately and is available upon request. The Trust is designed to be used as an investment vehicle by Separate Accounts of insurance companies that fund variable annuity contracts and variable life insurance policies and by qualified pension and retirement plans.
The Portfolio may invest a portion of its assets in certain affiliated underlying investment funds (the “Underlying Funds” or “Acquired Funds”). The Portfolio’s combined investments in the Fundamental IndexPLUS™, Fundamental IndexPLUS™ TR, International StocksPLUS® TR Strategy (U.S. Dollar-Hedged), International StocksPLUS® TR Strategy (Unhedged), Small Cap StocksPLUS® TR, StocksPLUS® and StocksPLUS® Total Return Funds normally will not exceed 50% of its total assets. In addition, the Portfolio’s combined investments in the CommodityRealReturn Strategy, Real Return, Real Return Asset and RealEstateRealReturn Strategy Funds normally will not exceed 75% of its total assets. The Portfolio’s investment in a particular Underlying Fund normally will not exceed 50% of its total assets.
The Portfolio’s assets are not allocated according to a predetermined blend of shares of the Underlying Funds. Instead, when making allocation decisions among the Underlying Funds, the Portfolio’s asset allocation sub-adviser considers various quantitative and qualitative data relating to the U.S. and foreign economies and securities markets. These data include projected growth trends in the U.S. and foreign economies, forecasts for interest rates and the relationship between short- and long-term interest rates (yield curve), current and projected trends in inflation, relative valuation levels in the equity and fixed income markets and various industrial sectors, information relating to business cycles, borrowing needs and the cost of capital, political trends data relating to trade balances and labor information. The Portfolio’s asset allocation sub-adviser has the flexibility to reallocate the Portfolio’s assets among any or all of the Underlying Funds based on its ongoing analyses of the equity, fixed income and commodity markets, although these shifts are not expected to be large or frequent in nature. The Portfolio is non-diversified, which means that it may concentrate its assets in a smaller number of Underlying Funds than a diversified fund.
2. SIGNIFICANT ACCOUNTING POLICIES
The following is a summary of significant accounting policies consistently followed by the Portfolio in the preparation of its financial statements in conformity with accounting principles generally accepted in the United States of America (“GAAP”). The preparation of financial statements in accordance with GAAP requires management to make estimates and assumptions that affect the reported amounts and disclosures on the financial statements. Actual results could differ from those estimates.
(a) Security Valuation Investments in funds within the PIMCO Funds are valued at their net asset value as reported by the Underlying Funds.
(b) Securities Transactions and Investment Income Securities transactions are recorded as of the trade date for financial reporting purposes. Securities purchased or sold on a when-issued or delayed-delivery basis may be settled a month or more after the trade date. Realized gains and losses from securities sold are recorded on the identified cost basis. Dividend income is recorded on the
ex-dividend date. Interest income, adjusted for the accretion of discounts and amortization of premiums, is recorded on the accrual basis.
(c) Dividends and Distributions to Shareholders Dividends from net investment income, if any, are declared and distributed to shareholders quarterly. Net realized capital gains earned by the Portfolio, if any, will be distributed no less frequently than once each year.
Income dividends and capital gain distributions are determined in accordance with income tax regulations which may differ from GAAP. Differences between tax regulations and GAAP may change the fiscal year when income and capital items are recognized for tax and GAAP purposes. Examples of events that give rise to timing differences include wash sales, straddles, net operating losses and capital loss carryforwards. Further, the character of investment income and capital gains may be different for certain transactions under the two methods of accounting. Examples of characterization differences include the treatment of mortgage paydowns, swaps, foreign currency transactions and contingent debt instruments. As a result, income dividends and capital gain distributions declared during a fiscal period may differ significantly from the net investment income and realized capital gain reported on the Portfolio’s annual financial statements presented under GAAP.
Distributions classified as a tax basis return of capital, if any, are reflected on the accompanying Statements of Changes in Net Assets and have been reclassified to paid in capital. In addition, other amounts have been reclassified between undistributed net investment income, accumulated undistributed net realized gains or losses and/or paid in capital to more appropriately conform financial accounting to tax characterizations of dividend distributions.
(d) Multiclass Operations Each class offered by the Portfolio has equal rights as to assets and voting privileges (except that shareholders of a class have exclusive voting rights regarding any matter relating solely to that class of shares). Income and non-class specific expenses of the Portfolio are allocated daily to each class of shares based on the relative value of settled shares. Realized and unrealized capital gains and losses of the Portfolio are allocated daily to each class of shares based on the relative net assets of each class. Class specific expenses, where applicable, currently include administrative, distribution and servicing fees.
(e) Repurchase Agreements The Portfolio may engage in repurchase transactions. Under the terms of a typical repurchase agreement, the Portfolio takes possession of an underlying debt obligation (collateral) subject to an obligation of the seller to repurchase, and the Portfolio to resell, the obligation at an agreed-upon price and time. The underlying securities for all repurchase agreements are held in safekeeping at the Portfolio’s custodian or designated subcustodians under tri-party repurchase agreements. The market value of the collateral must be equal to or exceed the total amount of the repurchase obligations, including interest. Securities purchased under repurchase agreements are reflected as an asset on the Statement of Assets and Liabilities. Generally, in the event of counterparty default, the Portfolio has the right to use the collateral to offset losses incurred. If the counterparty should default, the Portfolio will seek to sell the securities which it holds as collateral. This could involve procedural costs or delays in addition to a loss on the securities if their value should fall below their repurchase price.
(f) New Accounting Policies In July 2006, the Financial Accounting Standards Board (“FASB”) issued Interpretation No. 48, “Accounting for Uncertainty in Income Taxes—an Interpretation of FASB Statement No. 109” (the “Interpretation”). The Interpretation became effective for the Portfolio on June 29, 2007. Management has evaluated the application of the Interpretation in relation to the Portfolio and has concluded that no single filing position or combination of
| | | | |
| 10 | | PIMCO Variable Insurance Trust | | |
| | |
| |
| | | June 30, 2007 (Unaudited) |
filing positions identified as uncertain tax positions required the accrual of a tax liability in the accounting records of the Portfolio for the period ending June 30, 2007. Management will monitor all existing filing positions and future filing positions in light of the Interpretation and evaluate the need for any future tax accruals and financial statement disclosures as warranted.
In September 2006, the FASB issued Statement of Financial Accounting Standards No. 157, “Fair Value Measurements” (the “Statement”). The Statement is effective for fiscal years beginning after November 15, 2007 and will require expanded disclosure about fair value measurements, separately for each major category of assets and liabilities, that enables shareholders to assess the inputs used to develop those measurements, and for recurring fair value measurements using significant unobservable inputs the effect of the measurements on changes in net assets for the reporting period. Management is currently evaluating the application of the Statement to the Portfolio and will provide additional information in relation to the Statement on the Portfolio’s annual financial statements for the period ending December 31, 2007.
3. FEES AND EXPENSES
(a) Investment Advisory Fee Pacific Investment Management Company LLC (“PIMCO”) is a majority-owned subsidiary of Allianz Global Investors of America L.P. (“AGI”), and serves as investment adviser (the “Adviser”) to the Trust, pursuant to an investment advisory contract. The Adviser receives a monthly fee from the Portfolio, at an annual rate based on average daily net assets. The Advisory Fee for all classes is charged at an annual rate of 0.175%.
Research Affiliates, LLC (“Research Affiliates”) serves as the asset allocation sub-adviser and selects the Underlying Funds in which the Portfolio invests. PIMCO pays a fee to Research Affiliates at an annual rate of 0.175% based on average daily net assets of the Portfolio.
(b) Administration Fee PIMCO serves as administrator (the “Administrator”), and provides administrative services to the Trust for which it receives a monthly administrative fee based on each share class’s average daily net assets. As the Administrator, PIMCO bears the costs of various third-party services, including audit, custodial, portfolio accounting, legal, transfer agency and printing costs. The Administration Fee for all classes is charged at the annual rate of 0.25%.
(c) Distribution and Servicing Fees Allianz Global Investors Distributors LLC (“AGID”) is an indirect wholly-owned subsidiary of AGI and serves as the distributor (the “Distributor”) of the Trust’s shares. The Trust is permitted to reimburse AGID on a quarterly basis, out of the Administrative Class assets of the Portfolio in the amount of 0.15% on an annual basis of the average daily net assets of that class, for payments made to financial intermediaries that provide services in connection with the distribution of shares or administration of plans or programs that use Portfolio shares as their funding medium. The effective rate paid to AGID was 0.15% during the current fiscal year.
The Trust has adopted separate Distribution Plans for the Advisor Class and Class M shares of the Portfolio. The Distribution Plans have been adopted pursuant to Rule 12b-1 under the Act. The Distribution Plans permit payments for expenses in connection with the distribution and marketing of Advisor Class and Class M shares and/or the provision of shareholder services to Advisor Class and Class M shareholders which permits the Portfolio to make total payments at an annual rate of 0.25% of its average daily net assets attributable to its Advisor Class and Class M shares. The Trust has also adopted Administrative Services Plans (“Service Plans”) for the Class M shares of the Portfolio. The Service Plans allows the
Portfolio to use its Class M assets to compensate or reimburse financial intermediaries that provide services relating to Class M shares which permits the Portfolio to make total payments at an annual rate of 0.20% of its average daily net assets attributable to its Class M shares.
(d) Portfolio Expenses The Trust is responsible for the following expenses: (i) salaries and other compensation of any of the Trust’s executive officers and employees who are not officers, directors, stockholders or employees of PIMCO or its subsidiaries or affiliates; (ii) taxes and governmental fees; (iii) brokerage fees and commissions and other portfolio transaction expenses; (iv) the costs of borrowing money, including interest expenses and bank overdraft charges; (v) fees and expenses of the Trustees who are not “interested persons” of PIMCO or the Trust, and any counsel retained exclusively for their benefit; (vi) extraordinary expenses, including costs of litigation and indemnification expenses; (vii) organization expenses and (viii) any expenses allocated or allocable to a specific class of shares, which include service fees payable with respect to the Administrative Class Shares, and may include certain other expenses as permitted by the Trust’s Multiple Class Plan adopted pursuant to Rule 18f-3 under the Act and subject to review and approval by the Trustees. The ratio of expenses to average net assets per share class, as disclosed in the Financial Highlights, may differ from the annual portfolio operating expenses per share class as disclosed in the Prospectus for the reasons set forth above.
Effective April 1, 2007, each Trustee, other than those affiliated with PIMCO or its affiliates, receives an annual retainer of $15,000, plus $2,375 for each Board of Trustees meeting attended in person, $500 for each committee meeting attended and $750 for each Board of Trustees meeting attended telephonically, plus reimbursement of related expenses. In addition, the audit committee chair receives an additional annual retainer of $2,000 and each other committee chair receives an additional annual retainer of $500. These expenses are allocated on a pro-rata basis to the various portfolios of the Trust according to their respective net assets. The Trust pays no compensation directly to any Trustee or any other officer who is affiliated with the Administrator, all of whom receive remuneration for their services to the Trust from the Administrator or its affiliates. Prior to April 1, 2007, each Trustee, other than those affiliated with PIMCO or its affiliates, received an annual retainer of $15,000 plus $2,000 for each Board of Trustees meeting attended ($500 for each special meeting attended), plus reimbursement of related expenses. The Audit Committee Chairman received an annual retainer of $1,500 and the Governance Committee Chairman received an annual retainer of $500. In addition, each member of a committee received $500 for each committee meeting attended.
(e) Acquired Fund Fees and Expenses The Underlying Fund Expenses for the Portfolio are based upon an allocation of the Portfolio’s assets among the Underlying Funds and upon the total annual operating expenses of the Institutional Class shares of these Underlying Funds. Underlying Fund Expenses will vary with changes in the expenses of the Underlying Funds, as well as allocation of the Portfolio’s assets.
PIMCO has contractually agreed, for the Portfolio’s current fiscal year, to reduce its advisory fee to the extent that the Acquired Fund Fees and Expenses attributable to advisory and administrative fees exceed 0.64% of the total assets invested in Underlying Funds. The waiver is reflected in the Statement of Operations as a component of Reimbursement by Manager. For the period ended June 30, 2007, the amount was $45,332. PIMCO may recoup these waivers in future periods, not exceeding three years, provided total expenses, including such recoupment, do not exceed the annual expense limit. As of June 30, 2007, the recoverable amount to the Administrator was $81,026.
| | | | | | |
| | Semiannual Report | | June 30, 2007 | | 11 |
Notes to Financial Statements (Cont.)
4. RELATED PARTY TRANSACTIONS
The Advisor, Administrator, and Distributor are related parties as defined by FAS 57, Related Party Disclosures. Fees payable to these parties are disclosed in Note 3.
The All Asset Portfolio invests substantially all of its assets in Institutional Class shares of PIMCO Funds, an affiliated open-end investment company. The Underlying Funds are considered to be affiliated with the Portfolio. The table below shows the transactions in and earnings from investments in these affiliated Funds for the period ended June 30, 2007 (amounts in thousands):
| | | | | | | | | | | | | | | | | | | | | | | |
| Underlying Funds | | Market Value 12/31/2006 | | Purchases at Cost | | Proceeds from Sales | | Unrealized Appreciation (Depreciation) | | | Market Value 6/30/2007 | | Dividend Income | | Net Capital and Realized Gain
(Loss) | |
Convertible Fund | | $ | 1,351 | | $ | 6,967 | | $ | 0 | | $ | 258 | | | $ | 8,434 | | $ | 15 | | $ | 0 | |
Developing Local Markets Fund | | | 92,781 | | | 59,318 | | | 15,272 | | | 5,598 | | | | 139,732 | | | 2,343 | | | (50 | ) |
Diversified Income Fund | | | 10,826 | | | 51,300 | | | 12,520 | | | (1,267 | ) | | | 48,242 | | | 1,006 | | | (200 | ) |
Emerging Local Bond Fund | | | 0 | | | 123,827 | | | 138 | | | 2,601 | | | | 126,285 | | | 1,737 | | | (5 | ) |
Emerging Markets Bond Fund | | | 32,346 | | | 842 | | | 15,795 | | | 563 | | | | 17,241 | | | 842 | | | 148 | |
Floating Income Fund | | | 223,808 | | | 187,752 | | | 188,313 | | | 1,339 | | | | 222,251 | | | 8,175 | | | 94 | |
Foreign Bond Fund (Unhedged) | | | 877 | | | 15 | | | 0 | | | (7 | ) | | | 862 | | | 15 | | | 0 | |
Fundamental IndexPLUS™ Fund | | | 21,485 | | | 10,115 | | | 3,471 | | | 902 | | | | 29,709 | | | 101 | | | 138 | |
Fundamental IndexPLUS™ TR Fund | | | 29,493 | | | 4,605 | | | 0 | | | 795 | | | | 35,817 | | | 103 | | | 0 | |
GNMA Fund | | | 2,815 | | | 72 | | | 0 | | | (17 | ) | | | 2,856 | | | 72 | | | 0 | |
High Yield Fund | | | 25,812 | | | 996 | | | 20,125 | | | 157 | | | | 6,539 | | | 867 | | | 187 | |
Income Fund | | | 0 | | | 3,703 | | | 0 | | | (84 | ) | | | 3,619 | | | 37 | | | 0 | |
International StocksPLUS® TR Strategy Fund (Unhedged) | | | 1,138 | | | 2,662 | | | 0 | | | 150 | | | | 3,969 | | | 48 | | | 0 | |
International StocksPLUS® TR Strategy Fund
(U.S. Dollar-Hedged) | | | 29,781 | | | 336 | | | 0 | | | 1,763 | | | | 31,927 | | | 336 | | | 0 | |
Long-Term U.S. Government Fund | | | 10,595 | | | 96,296 | | | 41,674 | | | (566 | ) | | | 65,163 | | | 564 | | | 541 | |
Low Duration Fund | | | 20,641 | | | 18,385 | | | 37,450 | | | 1 | | | | 1,280 | | | 407 | | | (250 | ) |
Real Return Asset Fund | | | 99,339 | | | 136,338 | | | 64,587 | | | (2,898 | ) | | | 168,665 | | | 2,807 | | | 948 | |
Real Return Fund | | | 51,460 | | | 42,705 | | | 17,008 | | | (1,167 | ) | | | 76,577 | | | 1,488 | | | (147 | ) |
RealEstateRealReturn Strategy Fund | | | 2,066 | | | 85 | | | 0 | | | (480 | ) | | | 1,899 | | | 85 | | | 0 | |
Short-Term Fund | | | 3,622 | | | 809 | | | 797 | | | (14 | ) | | | 3,619 | | | 87 | | | (1 | ) |
Small Cap StocksPLUS® TR Fund | | | 0 | | | 1,881 | | | 0 | | | (3 | ) | | | 1,877 | | | 4 | | | 0 | |
StocksPLUS® Fund | | | 1,719 | | | 42 | | | 0 | | | 117 | | | | 1,830 | | | 42 | | | 0 | |
StocksPLUS® Total Return Fund | | | 6,570 | | | 37 | | | 0 | | | 7 | | | | 6,836 | | | 37 | | | 0 | |
Total Return Fund | | | 18,875 | | | 449 | | | 15,206 | | | (123 | ) | | | 3,660 | | | 450 | | | (374 | ) |
Total Return Mortgage Fund | | | 3,782 | | | 11,065 | | | 0 | | | (166 | ) | | | 14,699 | | | 299 | | | 0 | |
CommodityRealReturn Strategy Fund® | | | 115,847 | | | 11,589 | | | 25,927 | | | (632 | ) | | | 102,122 | | | 2,371 | | | (2,098 | ) |
Totals | | $ | 807,029 | | $ | 772,191 | | $ | 458,283 | | $ | 6,827 | | | $ | 1,125,710 | | $ | 24,338 | | $ | (1,069 | ) |
5. GUARANTEES AND INDEMNIFICATIONS
Under the Trust’s organizational documents, each Trustee, officer, employee or other agent of the Trust (including the Trust’s investment manager) is indemnified, to the extent permitted by the Act, against certain liabilities that may arise out of performance of their duties to the Portfolio. Additionally, in the normal course of business, the Portfolio enters into contracts that contain a variety of indemnification clauses. The Portfolio’s maximum exposure under these arrangements is unknown as this would involve future claims that may be made against the Portfolio that have not yet occurred. However, the Portfolio has not had prior claims or losses pursuant to these contracts and believes the risk of loss to be remote.
6. PURCHASES AND SALES OF SECURITIES
The length of time the Portfolio has held a particular security is not generally a consideration in investment decisions. A change in the securities held by the
Portfolio is known as “portfolio turnover”. The Portfolio may engage in frequent
and active trading of portfolio securities to achieve its investment objective, particularly during periods of volatile market movements. High portfolio turnover (e.g., over 100%) involves correspondingly greater expenses to the Portfolio, including brokerage commissions or dealer mark-ups and other transaction costs on the sale of securities and reinvestments in other securities. Such sales may also result in realization of taxable capital gains, including short-term capital gains (which are generally taxed at ordinary income tax rates). The trading costs and tax effects associated with portfolio turnover may adversely affect the Portfolio’s performance.
Purchases and sales of securities (excluding short-term investments) for the period ended June 30, 2007, were as follows (amounts in thousands):
| | | | | | | | | | | | |
| U.S. Government/Agency | | | | All Other |
| Purchases | | Sales | | | | Purchases | | Sales |
| $ | 0 | | $ | 0 | | | | $ | 772,191 | | $ | 458,283 |
| | | | |
| 12 | | PIMCO Variable Insurance Trust | | |
| | |
| |
| | | June 30, 2007 (Unaudited) |
7. SHARES OF BENEFICIAL INTEREST
The Portfolio may issue an unlimited number of shares of beneficial interest with a $0.001 par value. Changes in shares of beneficial interest were as follows (shares and amounts in thousands):
| | | | | | | | | | | | | | | | |
| | | | | Six Months Ended 06/30/2007 | | | Year Ended 12/31/2006 | |
| | | | | Shares | | | Amount | | | Shares | | | Amount | |
| | | | | |
Receipts for shares sold | | | | | | | | | | | | | | | | |
Institutional Class | | | | 25 | | | $ | 294 | | | 6 | | | $ | 73 | |
Administrative Class | | | | 2,142 | | | | 25,388 | | | 5,177 | | | | 60,956 | |
Advisor Class | | | | 25,760 | | | | 304,743 | | | 41,500 | | | | 485,456 | |
Class M | | | | 468 | | | | 5,550 | | | 1,306 | | | | 15,354 | |
Issued as reinvestment of distributions | | | | | | | | | | | | | | | | |
Institutional Class | | | | 1 | | | | 7 | | | 0 | | | | 3 | |
Administrative Class | | | | 525 | | | | 6,179 | | | 1,218 | | | | 14,172 | |
Advisor Class | | | | 1,449 | | | | 17,050 | | | 1,455 | | | | 17,022 | |
Class M | | | | 92 | | | | 1,079 | | | 273 | | | | 3,180 | |
Cost of shares redeemed | | | | | | | | | | | | | | | | |
Institutional Class | | | | (7 | ) | | | (83 | ) | | 0 | | | | 0 | |
Administrative Class | | | | (2,130 | ) | | | (25,052 | ) | | (6,181 | ) | | | (72,158 | ) |
Advisor Class | | | | (129 | ) | | | (1,505 | ) | | (676 | ) | | | (7,990 | ) |
Class M | | | | (595 | ) | | | (13,565 | ) | | (2,587 | ) | | | (30,245 | ) |
Net increase resulting from Portfolio share transactions | | | | 27,601 | | | $ | 320,085 | | | 41,491 | | | $ | 485,823 | |
The following schedule shows the number of shareholders each owning 5% or more of the Portfolio and the total percentage of the Portfolio held by such shareholders:
| | | | | | |
| | | | | Number of Shareholders | | % of Portfolio Held |
Institutional Class | | | | 1 | | 95 |
Administrative Class | | | | 3 | | 91 |
Advisor Class | | | | 2 | | 97 |
Class M | | | | 3 | | 94 |
8. REGULATORY AND LITIGATION MATTERS
Since February 2004, PIMCO, Allianz Global Investors of America L.P. (PIMCO’s parent company), AGID, and certain of their affiliates, including the PIMCO Funds (another series of funds managed by PIMCO), the Allianz Funds (formerly known as PIMCO Funds: Multi-Manager Series (another series of funds managed by affiliates of PIMCO)), certain Trustees of the Trust (in their capacity as Trustees of the PIMCO Funds or the Allianz Funds) and certain employees of PIMCO, have been named as defendants in fifteen lawsuits filed in various jurisdictions. Eleven of those lawsuits concern “market timing,” and they have been transferred to and consolidated for pre-trial proceedings in a multi-district litigation proceeding in the U.S. District Court for the District of Maryland; the other four lawsuits concern “revenue sharing” and have been consolidated into a single action in the U.S. District Court for the District of Connecticut. The lawsuits have been commenced as putative class actions on behalf of investors who purchased, held or redeemed shares of the various series of the PIMCO Funds and the Allianz Funds during specified periods, or as derivative actions on behalf of the PIMCO Funds and the Allianz Funds.
The market timing actions in the District of Maryland generally allege that certain hedge funds were allowed to engage in “market timing” in certain funds of the PIMCO Funds and the Allianz Funds and this alleged activity was not disclosed.
Pursuant to tolling agreements entered into with the derivative and class action
plaintiffs, PIMCO, certain PIMCO Funds Trustees, and certain employees of PIMCO who were previously named as defendants have all been dropped as defendants in the market timing actions; the plaintiffs continue to assert claims on behalf of the shareholders of the PIMCO Funds or on behalf of the PIMCO Funds itself against other defendants. By order dated November 3, 2005, the U.S. District Court for the District of Maryland granted the PIMCO Funds’ motion to dismiss claims asserted against it in a consolidated amended complaint where the PIMCO Funds were named, in the complaint, as a nominal defendant. The revenue sharing action in the District of Connecticut generally alleges that fund assets were inappropriately used to pay brokers to promote funds of the PIMCO Funds and the Allianz Funds, including directing fund brokerage transactions to such brokers, and that such alleged arrangements were not fully disclosed to shareholders. On August 11, 2005, the U.S. District Court for the District of Connecticut conducted a hearing on defendants’ motion to dismiss the consolidated amended complaint in the revenue sharing action but has not yet ruled on the motion to dismiss. The market timing and revenue sharing lawsuits seek, among other things, unspecified compensatory damages plus interest and, in some cases, punitive damages, the rescission of investment advisory contracts, the return of fees paid under those contracts and restitution.
Two nearly identical class action civil complaints have been filed in August 2005, in the Northern District of Illinois Eastern Division, alleging that the plaintiffs each purchased and sold a 10-year Treasury note futures contract and suffered damages from an alleged shortage when PIMCO held both physical and futures positions in 10-year Treasury notes for its client accounts. The two actions have been consolidated into one action, and the two separate complaints have been replaced by a consolidated complaint. PIMCO is a named defendant, and PIMCO Funds has been added as a defendant, to the consolidated action. PIMCO strongly believes the complaint is without merit and intends to vigorously defend itself.
In April 2006, certain portfolios of the Trust and certain other funds managed by PIMCO were served in an adversary proceeding brought by the Official Committee of Asbestos Claimants of G-I Holdings, Inc. in G-I Holdings, Inc.’s bankruptcy in the District of New Jersey. In July 2004, PIMCO was named in this lawsuit and remains a defendant. The plaintiff seeks to recover for the bankruptcy estate assets that were transferred by the predecessor entity of G-I Holdings, Inc. to a wholly-owned subsidiary in 1994. The subsidiary has since issued notes, of which certain portfolios of the Trust and certain other funds managed by PIMCO are alleged to be holders. The complaint alleges that in 2000, more than two hundred noteholders—including certain portfolios of the Trust and certain other funds managed by PIMCO—were granted a second priority lien on the assets of the subsidiary in exchange for their consent to a refinancing transaction and the granting of a first priority lien to the lending banks. The plaintiff is seeking invalidation of the lien in favor of the noteholders and/or the value of the lien. On June 21, 2006, the District of New Jersey overturned the Bankruptcy Court’s decision granting permission to file the adversary proceeding and remanded the matter to the Bankruptcy Court for further proceedings. Following a motion to reconsider, the District Court upheld its remand on August 7, 2006, and instructed the Bankruptcy Court to conduct a “cost-benefit” analysis of the Committee’s claims, including the claims against the noteholders. The Bankruptcy Court held a status conference on October 25, 2006 and set a briefing schedule relating to this cost-benefit analysis.
The foregoing speaks only as of the date of this report. It is possible that these matters and/or other developments resulting from these matters could result in increased portfolio redemptions or other adverse consequences to the Portfolio. However, PIMCO and AGID believe that these matters are not likely to have a material adverse effect on the Portfolio or on PIMCO’s or AGID’s ability to perform their respective investment advisory or distribution services relating to the Portfolio.
| | | | | | |
| | Semiannual Report | | June 30, 2007 | | 13 |
Notes to Financial Statements (Cont.)
9. FEDERAL INCOME TAX MATTERS
The Portfolio intends to qualify as a regulated investment company under sub-chapter M of the Internal Revenue Code (the “Code”) and distribute all of its taxable income and net realized gains, if applicable, to shareholders. Accordingly, no provision for Federal income taxes has been made.
To the extent the Portfolio invests in the CommodityRealReturn Strategy Fund® (the “CRRS Fund”), an Underlying Fund, this Portfolio may be subject to additional tax risk.
One of the requirements for favorable tax treatment as a regulated investment company under the Code is that the Fund derive at least 90% of its gross income from certain qualifying sources of income. The IRS has issued a revenue ruling which holds that income derived from commodity index-linked swaps is not qualifying income under Subchapter M of the Code. Subsequently, the IRS issued a private letter ruling to the CRRS Fund in which the IRS specifically concluded that income from certain commodity index-linked notes is qualifying income. In addition, the IRS issued another private letter ruling to the CRRS Fund in which the IRS specifically concluded that income derived from the CRRS Fund’s investment in
the Subsidiary, which invests primarily in commodity index-linked swaps, will also constitute qualifying income to the CRRS Fund. Based on such rulings, the CRRS Fund will continue to seek to gain exposure to the commodity markets primarily through investments in commodity-linked notes and through investments in its subsidiary.
Please refer to the prospectus for the Separate Account and Variable Contract for information regarding federal income tax treatment of distributions to the Separate Account.
As of June 30, 2007, the aggregate cost of investments was the same for federal income tax and financial statement purposes. The net unrealized appreciation (depreciation) of investment securities for federal income tax purposes is as follows (amount in thousands):
| | | | |
Aggregate Gross Unrealized Appreciation | | Aggregate Gross Unrealized (Depreciation) | | Net Unrealized Appreciation |
$ 14,251 | | $ (7,424) | | $ 6,827 |
| | | | |
| 14 | | PIMCO Variable Insurance Trust | | |
| | |
| |
Privacy Policy* | | (Unaudited) |
The Funds consider customer privacy to be a fundamental aspect of their relationships with shareholders and are committed to maintaining the confidentiality, integrity and security of their current, prospective and former shareholders’ personal information. To ensure their shareholders’ privacy, the Funds have developed policies that are designed to protect this confidentiality, while allowing shareholder needs to be served.
Obtaining Personal Information
In the course of providing shareholders with products and services, the Funds and certain service providers to the Funds, such as the Funds’ investment advisers (“Advisers”), may obtain non-public personal information about shareholders, which may come from sources such as account applications and other forms, from other written, electronic or verbal correspondence, from shareholder transactions, from a shareholder’s brokerage or financial advisory firm, financial adviser or consultant, and/or from information captured on the Funds’ internet web sites.
Respecting Your Privacy
As a matter of policy, the Funds do not disclose any personal or account information provided by shareholders or gathered by the Funds to non-affiliated third parties, except as required or permitted by law or as necessary for such third parties to perform their agreements with respect to the Funds. As is common in the industry, non-affiliated companies may from time to time be used to provide certain services, such as preparing and mailing prospectuses, reports, account statements and other information, conducting research on shareholder satisfaction and gathering shareholder proxies. A Fund’s Distributor may also retain non-affiliated companies to market the Fund’s shares or products which use the Fund’s shares and enter into joint marketing agreements with other companies. These companies may have access to a shareholder’s personal and account information, but are permitted to use this information solely to provide the specific service or as otherwise permitted by law. In most cases, the shareholders will be clients of a third party, but the Funds may also provide a shareholder’s personal and account information to the shareholder’s respective brokerage or financial advisory firm.
Sharing Information with Third Parties
The Funds reserve the right to disclose or report personal information to non-affiliated third parties, in limited circumstances, where the Funds believe in good faith that disclosure is required under law to cooperate with regulators or law enforcement authorities, to protect their rights or property or upon reasonable request by any Fund in which a shareholder has chosen to invest. In addition, the Funds may disclose information about a shareholder’s accounts to a non-affiliated third party with the consent of the shareholder.
Sharing Information with Affiliates
The Funds may share shareholder information with their affiliates in connection with servicing their shareholders’ accounts or to provide shareholders with information about products and services that the Funds or their Advisers, principal underwriters or their affiliates (“Service Affiliates”) believe may be of interest to such shareholders. The information that the Funds share may include, for example, a shareholder’s participation in one of the Funds or in other investment programs sponsored by a Service Affiliate, a shareholder’s ownership of certain types of accounts (such as IRAs), or other data about a shareholder’s accounts. The Funds’ Service Affiliates, in turn, are not permitted to share shareholder information with non-affiliated entities, except as required or permitted by law.
Procedures to Safeguard Private Information
The Funds take seriously the obligation to safeguard shareholder non-public personal information. In addition to this policy, the Funds have also implemented procedures that are designed to restrict access to a shareholder’s non-public personal information only to internal personnel who need to know that information in order to provide products or services to such shareholders. In order to guard a shareholder’s non-public personal information, physical, electronic and procedural safeguards are in place.
* This Privacy Policy applies to the following entities: PIMCO Funds, PIMCO Variable Insurance Trust, PCM Fund, Inc. and PIMCO Strategic Global Government Fund, Inc. (collectively, the “Funds”).
| | | | | | |
| | Semiannual Report | | June 30, 2007 | | 15 |
Investment Adviser and Administrator
Pacific Investment Management Company LLC
840 Newport Center Drive
Newport Beach, California 92660
Investment Sub-Adviser
Research Affiliates, LLC
800 E. Colorado Boulevard
Pasadena, California 91101
Distributor
Allianz Global Investors Distributors LLC
1345 Avenue of the Americas
New York, New York 10105
Custodian
State Street Bank & Trust Company
801 Pennsylvania
Kansas City, Missouri 64105
Transfer Agent
Boston Financial Data Services–Midwest
330 W. 9th Street
Kansas City, Missouri 64105
Legal Counsel
Dechert LLP
1775 I Street, N.W.
Washington, D.C. 20006
Independent Registered Public Accounting Firm
PricewaterhouseCoopers LLP
1055 Broadway
Kansas City, Missouri 64105
P I M C O

Table of Contents
This material is authorized for use only when preceded or accompanied by the current PIMCO Variable Insurance Trust (the “Trust”) prospectus. Investors should consider the investment objectives, risks, charges and expenses of this Trust carefully before investing. Ask your financial professional to explain all charges that may apply. This and other information is contained in the Trust’s prospectus. The variable product prospectus may be obtained by contacting your Investment Consultant. Please read the Trust and variable product prospectus carefully before you invest or send money.
Chairman’s Letter
Dear PIMCO Variable Insurance Trust Shareholder:
It is our pleasure to present to you the semiannual report for the PIMCO Variable Insurance Trust, covering the six-month period ended June 30, 2007. The PIMCO Variable Insurance Trust’s net assets were $8.68 billion at June 30, 2007, as compared to $7.76 billion at December 31, 2006.
Highlights of the financial markets during the reporting period include:
| | n | | Economic data during the first quarter of 2007 pointed to slower growth, which heightened market expectations for a decrease in the Federal Funds Rate. By the second quarter, economic data, such as employment statistics, provided little indication of economic weakness, causing expectations of a decrease in the Federal Funds Rate to unwind and U.S. interest rates to move higher. Interest rates in Europe and the U.K. also rose over the period as central banks raised their key lending rates due to inflation concerns. The benchmark ten-year U.S. Treasury yielded 5.03% as of June 30, 2007, or 0.32% higher than at the beginning of the year. |
| | n | | Most bonds generally returned much of their gains from earlier in the year as worldwide growth and capital flows drove interest rates higher in the second quarter. Increased risk aversion in global financial markets, due in part to subprime mortgage worries in the U.S., also contributed to the rise in interest rates. The Lehman Brothers Aggregate Bond Index, which includes Treasury, investment-grade corporate and mortgage-backed securities, returned 0.98% for the six-month period. |
| | n | | Locally issued emerging market (“EM”) bonds posted positive returns for the reporting period. Yields on these bonds declined and the local currencies in which they are denominated generally gained, amid increasing investor awareness, strong economic growth and surging capital inflows. External EM bonds (debt instruments issued by emerging markets countries and typically denominated in U.S. dollars) lagged behind local EM bonds (debt instruments issued by emerging markets countries and denominated in the currency of the issuer), as external EM bonds tend to trade more in-line with U.S. Treasuries. |
| | n | | Treasury Inflation-Protected Securities (“TIPS”) outpaced nominal bonds (non-inflation linked bonds) for the first part of the year and all but the longest maturity TIPS outperformed in the second quarter as high gasoline prices drove higher inflation accruals. Commodities, as represented by the Dow Jones-AIG Commodity Total Return Index, returned 4.46% for the period. Equities, as measured by the S&P 500 Index and the Russell 2000 Index, returned 6.96% and 6.45%, respectively, for the period. |
On the following pages, please find specific details as to the Portfolio’s total return investment performance and a discussion of those factors that affected performance.
Thank you for the trust you have placed in us. We will continue to work diligently to serve your investment needs.
Sincerely,
Brent R. Harris
Chairman, PIMCO Variable Insurance Trust
July 31, 2007
| | | | | | |
| | Semiannual Report | | June 30, 2007 | | 1 |
Important Information About the Portfolio
PIMCO Variable Insurance Trust (the “Trust”) is an open-end management investment company currently consisting of twenty separate investment portfolios, including the CommodityRealReturn™ Strategy Portfolio (the “Portfolio”). The Portfolio is only available as a funding vehicle under variable life insurance policies or variable annuity contracts issued by insurance companies (“Variable Contracts”). Individuals may not purchase shares of the Portfolio directly. Shares of the Portfolio also may be sold to qualified pension and retirement plans outside of the separate account context.
We believe that bond funds have an important role to play in a well diversified investment portfolio. It is important to note, however, that in an environment where interest rates may trend upward, rising rates would negatively impact the performance of most bond funds, and fixed-income securities held by a fund are likely to decrease in value. The price volatility of fixed-income securities can also increase during periods of rising interest rates resulting in increased losses to a fund. Bond funds and individual bonds with a longer duration (a measure of the expected life of a security) tend to be more sensitive to changes in interest rates, usually making them more volatile than securities or funds with shorter durations.
The Portfolio may be subject to various risks in addition to those described above. Some of these risks may include, but are not limited to, the following: credit risk, high yield risk, market risk, issuer risk, liquidity risk, derivatives risk, commodity risk, equity risk, mortgage risk, non-U.S. investment risk, emerging markets risk, currency risk, issuer non-diversification risk, leveraging risk, management risk, tax risk, and subsidiary risk. A complete description of these risks is contained in the Portfolio’s prospectus. The Portfolio may use derivative instruments as part of an investment strategy, as described below, or for hedging purposes. Use of these instruments may involve certain costs and risks such as liquidity risk, interest rate risk, market risk, credit risk, management risk and the risk that the Portfolio could not close out a position when it would be most advantageous to do so. Because the Portfolio may invest in derivatives, it could lose more than the principal amount invested in these instruments. Investing in non-U.S. securities may entail risk due to non-U.S. economic and political developments; this risk may be increased when investing in emerging markets.
The Portfolio is intended for long-term investors and an investment in the Portfolio should be no more than a small part of a typical diversified portfolio. The Portfolio’s share price is expected to be more volatile than that of other funds.
The Portfolio will seek to gain exposure to the commodity markets primarily through investments in leveraged or unleveraged commodity index-linked notes, which are derivative debt instruments with principal and/or coupon payments linked to the performance of commodity indices, and through investments in the PIMCO Cayman Commodity Portfolio I Ltd. (the “Subsidiary”), a wholly-owned subsidiary (as discussed below). The Portfolio may also invest in commodity-linked notes with principal and/or coupon payments linked to the value of particular commodities or commodity futures contracts, or a subset of commodities or commodities future contracts. These notes are sometimes referred to as “structured notes” because the terms of these notes may be structured by the issuer and the purchaser of the notes. The value of these notes will rise or fall in response to changes in the underlying commodity or related index of investments. These notes expose the Portfolio economically to movements in commodity prices. The value of commodity-linked derivative instruments may be affected by changes in overall market movements, changes in interest rates, or factors affecting a particular industry or commodity, such as drought, floods, weather, livestock disease, embargoes, tariffs, and international economic, political and regulatory developments. These notes also are subject to risks, such as credit, market and interest rate risks, that in general affect the values of debt securities. In addition, these notes are often leveraged, increasing the volatility of each note’s market value relative to changes in the underlying commodity, commodity futures contract or commodity index. Therefore, at maturity of the note, the Portfolio may receive more or less principal than it originally invested. The Portfolio might receive interest payments on the note that are more or less than the stated coupon interest payments. The Portfolio may also gain exposure to the commodity markets indirectly by investing in its Subsidiary, which will primarily invest in different commodity-linked derivative instruments than the Portfolio, including swap agreements, commodity options, futures and options on futures.
On the performance summary page in this Semiannual Report, the Total Return Investment Performance table measures performance assuming that all dividend and capital gain distributions were reinvested.
An investment in the Portfolio is not a deposit of a bank and is not guaranteed or insured by the Federal Deposit Insurance Corporation or any other government agency. It is possible to lose money on investments in the Portfolio.
PIMCO has adopted written proxy voting policies and procedures (“Proxy Policy”) as required by Rule 206(4)-6 under the Investment Advisers Act of 1940, as amended. The Proxy Policy has been adopted by the Trust as the policies and procedures that PIMCO will use when voting proxies on behalf of the Portfolio. A description of the policies and procedures that PIMCO uses to vote proxies relating to portfolio securities of the Portfolio, and information about how the Portfolio voted proxies relating to portfolio securities held during the most recent twelve-month period ended June 30, are available without charge, upon request, by calling the Trust at 1-866-746-2606 and on the Portfolio’s website at www.pimco.com.
| | | | |
| 2 | | PIMCO Variable Insurance Trust | | |
The Portfolio files its complete schedule of portfolio holdings with the SEC for the first and third quarters of each fiscal year on Form N-Q. A copy of the Trust’s Form N-Q is also available on the SEC’s website at http://www.sec.gov and may be reviewed and copied at the SEC’s Public Reference Room in Washington D.C. Information on the operation of the Public Reference Room may be obtained by calling 1-800-SEC-0330, and is available without charge, upon request, by calling the Trust at 1-866-746-2606 and on the Portfolio’s website at www.pimco.com.
PIMCO Variable Insurance Trust is distributed by Allianz Global Investors Distributors LLC, 1345 Avenue of the Americas, New York, NY 10105.
The following disclosure provides important information regarding the Portfolio’s Expense Example (“Example” or “Expense Example”), which appears in this Semiannual Report. Please refer to this information when reviewing the Expense Example for the Portfolio.
Example
As a shareholder of the Portfolio, you incur two types of costs: (1) transaction costs and (2) ongoing costs, including advisory and administrative fees; distribution and/or service (12b-1) fees (Administrative and Advisor Class only); and other Portfolio expenses. The Example is intended to help you understand your ongoing costs (in dollars) of investing in the Portfolio and to compare these costs with the ongoing costs of investing in other mutual funds. The Expense Example does not reflect any fees or other expenses imposed by the Variable Contracts. If it did, the expenses reflected in the Expense Example would be higher. The Example is based on an investment of $1,000 invested at the beginning of the period and held for the entire period indicated, which is from January 1, 2007 to June 30, 2007.
Actual Expenses
The information in the table under the heading “Actual Performance” provides information about actual account values and actual expenses. You may use the information in these columns, together with the amount you invested, to estimate the expenses that you paid over the period. Simply divide your account value by $1,000 (for example, an $8,600 account value divided by $1,000 = $8.60), then multiply the result by the number in the row titled “Expenses Paid During Period” to estimate the expenses you paid on your account during this period.
Hypothetical Example for Comparison Purposes
The information in the table under the heading “Hypothetical Performance (5% return before expenses)” provides information about hypothetical account values and hypothetical expenses based on the Portfolio’s actual expense ratio and an assumed rate of return of 5% per year before expenses, which is not the Portfolio’s actual return. The hypothetical account values and expenses may not be used to estimate the actual ending account balance or expenses you paid for the period. You may use this information to compare the ongoing costs of investing in the Portfolio and other portfolios. To do so, compare this 5% hypothetical example with the 5% hypothetical examples that appear in the shareholder reports of the other portfolios.
Please note that the expenses shown in the table are meant to highlight your ongoing costs only and do not reflect any transactional costs. Therefore, the information under the heading “Hypothetical Performance (5% return before expenses)” is useful in comparing ongoing costs only, and will not help you determine the relative total costs of owning different portfolios. In addition, if these transactional costs were included, your costs would have been higher.
The expense ratio may vary period to period because of various factors, such as an increase in expenses not covered by the advisory and administrative fees (such as expenses of the trustees and their counsel, litigation expense and interest expense).
| | | | | | |
| | Semiannual Report | | June 30, 2007 | | 3 |
PIMCO CommodityRealReturn™ Strategy Portfolio
Cumulative Returns Through June 30, 2007
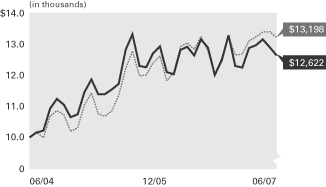
$10,000 invested at the beginning of the first full month following the inception date of the Portfolio’s Administrative Class.
Allocation Breakdown‡
| | |
U.S. Treasury Obligations | | 48.0% |
Short-Term Instruments | | 29.9% |
Commodity Index-Linked Notes | | 11.1% |
U.S. Government Agencies | | 5.3% |
Corporate Bonds & Notes | | 3.0% |
Other | | 2.7% |
| | ‡ | % of Total Investments as of 06/30/2007 |
| | | | | | | | |
| Average Annual Total Return for the period ended June 30, 2007 |
| | | | | 6 Months* | | 1 Year | | Portfolio
Inception
(06/30/04) |
| | PIMCO CommodityRealReturnTM Strategy Portfolio Administrative Class | | 2.70% | | -0.03% | | 8.07% |
| | Dow Jones-AIG Commodity Total Return Index± | | 4.46% | | 2.94% | | 9.70% |
All Portfolio returns are net of fees and expenses.
* Cumulative return.
Performance quoted represents past performance. Past performance is no guarantee of future results. Investment return and principal value will fluctuate so the Portfolio shares, when redeemed, may be worth more or less than their original cost. The Portfolio’s performance does not reflect the deduction of additional charges and expenses imposed in connection with investing in Variable Contracts, which will reduce returns. Current performance may be lower or higher than the performance data quoted. Performance data current to the most recent month-end is available by calling (800) 927-4648.
± Dow Jones-AIG Commodity Total Return Index is an unmanaged index composed of futures contracts on 19 physical commodities. The index is designed to be a highly liquid and diversified benchmark for commodities as an asset class. It is not possible to invest directly in the index. The index does not reflect deductions for fees and expenses.
| | | | | | |
| Expense Example | | Actual Performance | | Hypothetical Performance |
| | | | | (5% return before expenses) |
Beginning Account Value (01/01/07) | | $ | 1,000.00 | | $ | 1,000.00 |
Ending Account Value (06/30/07) | | $ | 1,026.97 | | $ | 1,020.58 |
Expenses Paid During Period† | | $ | 4.27 | | $ | 4.26 |
† Expenses are equal to the Portfolio’s Administrative Class annualized expense ratio of 0.85%, multiplied by the average account value over the period, multiplied by 181/365 (to reflect the one-half year period). Overall fees and expenses of investing in the Portfolio will be higher because the example does not reflect Variable Contract fees and expenses.
Please refer to page 3 herein for an explanation of the information presented in the above Expense Example.
Portfolio Insights
» | | The PIMCO CommodityRealReturn™ Strategy Portfolio seeks to achieve its investment objective by investing under normal circumstances primarily in commodity-linked derivative instruments backed by a portfolio of inflation-indexed securities and other fixed-income instruments. |
| » | | Commodities generally gained during the period, which enhanced total return performance of the Portfolio. |
| » | | The Portfolio’s use of Treasury Inflation-Protected Securities (“TIPS”) as collateral was negative for performance in the first half of the year as TIPS underperformed the assumed Treasury Bill collateral rate embedded in the Dow Jones-AIG Commodity Total Return Index. |
| » | | Above-index U.S. real duration in the first half of the period was positive for performance as real yields decreased. Below-index U.S. real duration in the second half of the period was also positive for performance as real yields increased. |
| » | | An emphasis on nominal bonds in the Eurozone benefited performance as nominal bonds outperformed inflation-linked bonds in the region. |
| » | | Modest exposure to U.K. nominal bonds was negative for performance due to rising interest rates and a tightening bias from the Bank of England. |
| » | | Holdings of mortgage-backed securities detracted from performance as mortgage spreads widened. |
| | | | |
| 4 | | PIMCO Variable Insurance Trust | | |
Financial Highlights CommodityRealReturn™ Strategy Portfolio
| | | | | | | | | | | | | | | | |
| Selected per Share Data for the Year or Period Ended: | | 06/30/2007+ | | | 12/31/2006 | | | 12/31/2005 | | | 06/30/2004-12/31/2004 | |
| | | | |
Administrative Class | | | | | | | | | | | | | | | | |
Net asset value beginning of year or period | | $ | 11.31 | | | $ | 12.25 | | | $ | 10.49 | | | $ | 10.00 | |
Net investment income (a) | | | 0.23 | | | | 0.42 | | | | 0.35 | | | | 0.07 | |
Net realized/unrealized gain (loss) on investments (a) | | | 0.08 | | | | (0.80 | ) | | | 1.64 | | | | 0.58 | |
Total income (loss) from investment operations | | | 0.31 | | | | (0.38 | ) | | | 1.99 | | | | 0.65 | |
Dividends from net investment income | | | (0.20 | ) | | | (0.51 | ) | | | (0.22 | ) | | | 0.00 | |
Distributions from net realized capital gains | | | 0.00 | | | | (0.05 | ) | | | (0.01 | ) | | | (0.16 | ) |
Total distributions | | | (0.20 | ) | | | (0.56 | ) | | | (0.23 | ) | | | (0.16 | ) |
Net asset value end of year or period | | $ | 11.42 | | | $ | 11.31 | | | $ | 12.25 | | | $ | 10.49 | |
Total return | | | 2.70 | % | | | (3.10 | )% | | | 19.08 | % | | | 6.51 | % |
Net assets end of year or period (000s) | | $ | 220,065 | | | $ | 180,810 | | | $ | 106,943 | | | $ | 3,358 | |
Ratio of expenses to average net assets | | | 0.85 | %*(c) | | | 0.93 | % | | | 0.89 | % | | | 0.90 | %*(b) |
Ratio of expenses to average net assets excluding interest expense | | | 0.85 | %*(c) | | | 0.93 | % | | | 0.89 | % | | | 0.89 | %*(b) |
Ratio of net investment income to average net assets | | | 3.94 | %* | | | 3.48 | % | | | 2.92 | % | | | 1.36 | %* |
Portfolio turnover rate | | | 489 | % | | | 993 | % | | | 1415 | % | | | 700 | % |
+ Unaudited
* Annualized
(a) Per share amounts based on average number of shares outstanding during the period.
(b) If the investment manager had not reimbursed expenses, the ratio of expenses to average net assets would have been 1.58%.
(c) If the investment manager had not reimbursed expenses, the ratio of expenses to average net assets would have been 0.94%.
| | | | | | |
| See Accompanying Notes | | Semiannual Report | | June 30, 2007 | | 5 |
Consolidated Statement of Assets and Liabilities CommodityRealReturn™ Strategy Portfolio
| | | | |
| (Amounts in thousands, except per share amounts) | | June 30, 2007
(Unaudited) | |
| | | | |
| |
| Assets: | | | | |
Investments, at value | | $ | 483,723 | |
Cash | | | 394 | |
Foreign currency, at value | | | 1,058 | |
Receivable for investments sold | | | 2,022 | |
Receivable for investments sold on a delayed-delivery basis | | | 199 | |
Receivable for Portfolio shares sold | | | 1,055 | |
Interest and dividends receivable | | | 753 | |
Variation margin receivable | | | 5 | |
Swap premiums paid | | | 406 | |
Unrealized appreciation on foreign currency contracts | | | 38 | |
Unrealized appreciation on swap agreements | | | 1,027 | |
Other assets | | | 23 | |
| | | | 490,703 | |
| |
Liabilities: | | | | |
Payable for investments purchased | | $ | 12,097 | |
Payable for investments purchased on a delayed-delivery basis | | | 235,316 | |
Payable for Portfolio shares redeemed | | | 3,599 | |
Payable for short sales | | | 2,031 | |
Written options outstanding | | | 188 | |
Accrued investment advisory fee | | | 104 | |
Accrued administration fee | | | 53 | |
Accrued distribution fee | | | 3 | |
Accrued servicing fee | | | 31 | |
Variation margin payable | | | 231 | |
Recoupment payable to Manager | | | 3 | |
Swap premiums received | | | 1,420 | |
Unrealized depreciation on foreign currency contracts | | | 38 | |
Unrealized depreciation on swap agreements | | | 529 | |
Other liabilities | | | 624 | |
| | | | 256,267 | |
| |
Net Assets | | $ | 234,436 | |
| |
Net Assets Consist of: | | | | |
Paid in capital | | $ | 242,206 | |
Undistributed net investment income | | | 4,277 | |
Accumulated undistributed net realized (loss) | | | (17,947 | ) |
Net unrealized appreciation | | | 5,900 | |
| | | $ | 234,436 | |
| |
Net Assets: | | | | |
Administrative Class | | $ | 220,065 | |
Advisor Class | | | 14,371 | |
| |
Shares Issued and Outstanding: | | | | |
Administrative Class | | | 19,275 | |
Advisor Class | | | 1,259 | |
| |
Net Asset Value and Redemption Price Per Share (Net Asset Per Share Outstanding) | | | | |
Administrative Class | | $ | 11.42 | |
Advisor Class | | | 11.41 | |
| |
Cost of Investments Owned | | $ | 477,460 | |
Cost of Foreign Currency Held | | $ | 1,055 | |
Proceeds Received on Short Sales | | $ | 2,020 | |
Premiums Received on Written Options | | $ | 242 | |
| | | | |
| 6 | | PIMCO Variable Insurance Trust | | See Accompanying Notes |
Consolidated Statement of Operations CommodityRealReturn™ Strategy Portfolio
| | | | |
| (Amounts in thousands) | | Six Months Ended
June 30, 2007
(Unaudited) | |
| |
| Investment Income: | | | | |
Interest | | $ | 5,022 | |
Miscellaneous income | | | 2 | |
Total Income | | | 5,024 | |
| |
Expenses: | | | | |
Investment advisory fees | | | 550 | |
Administration fees | | | 276 | |
Servicing fees – Administrative Class | | | 149 | |
Distribution and/or servicing fees – Advisor Class | | | 11 | |
Trustees’ fees | | | 2 | |
Interest expense | | | 2 | |
Miscellaneous expense | | | 4 | |
Total Expenses | | | 994 | |
Reimbursement by Manager | | | (100 | ) |
Net Expenses | | | 894 | |
| |
Net Investment Income | | | 4,130 | |
| |
Net Realized and Unrealized Gain (Loss): | | | | |
Net realized (loss) on investments | | | (8,904 | ) |
Net realized (loss) on futures contracts, written options and swaps | | | (1,147 | ) |
Net realized (loss) on foreign currency transactions | | | (112 | ) |
Net change in unrealized appreciation on investments | | | 10,392 | |
Net change in unrealized appreciation on futures contracts, written options and swaps | | | 730 | |
Net change in unrealized appreciation on translation of assets and liabilities denominated in foreign currencies | | | 87 | |
Net Gain | | | 1,046 | |
| |
Net Increase in Net Assets Resulting from Operations | | $ | 5,176 | |
| | | | | | |
| See Accompanying Notes | | Semiannual Report | | June 30, 2007 | | 7 |
Consolidated Statements of Changes in Net Assets CommodityRealReturn™ Strategy Portfolio
| | | | | | | | |
| (Amounts in thousands) | | Six Months Ended
June 30, 2007
(Unaudited) | | | Year Ended
December 31, 2006 | |
| | |
| Increase (Decrease) in Net Assets from: | | | | | | | | |
| | |
Operations: | | | | | | | | |
Net investment income | | $ | 4,130 | | | $ | 5,377 | |
Net realized (loss) | | | (10,163 | ) | | | (5,027 | ) |
Net change in unrealized appreciation (depreciation) | | | 11,209 | | | | (4,505 | ) |
Net increase (decrease) resulting from operations | | | 5,176 | | | | (4,155 | ) |
| | |
Distributions to Shareholders: | | | | | | | | |
From net investment income | | | | | | | | |
Administrative Class | | | (3,557 | ) | | | (7,218 | ) |
Advisor Class | | | (165 | ) | | | (176 | ) |
From net realized capital gains | | | | | | | | |
Administrative Class | | | 0 | | | | (705 | ) |
Advisor Class | | | 0 | | | | (23 | ) |
| | |
Total Distributions | | | (3,722 | ) | | | (8,122 | ) |
| | |
Portfolio Share Transactions: | | | | | | | | |
Receipts for shares sold | | | | | | | | |
Administrative Class | | | 53,682 | | | | 138,795 | |
Advisor Class | | | 9,592 | | | | 7,074 | |
Issued as reinvestment of distributions | | | | | | | | |
Administrative Class | | | 3,557 | | | | 7,849 | |
Advisor Class | | | 165 | | | | 199 | |
Cost of shares redeemed | | | | | | | | |
Administrative Class | | | (19,591 | ) | | | (60,877 | ) |
Advisor Class | | | (1,317 | ) | | | (812 | ) |
Net increase resulting from Portfolio share transactions | | | 46,088 | | | | 92,228 | |
| | |
Total Increase in Net Assets | | | 47,542 | | | | 79,951 | |
| | |
Net Assets: | | | | | | | | |
Beginning of period | | | 186,894 | | | | 106,943 | |
End of period* | | $ | 234,436 | | | $ | 186,894 | |
| | |
*Including undistributed net investment income of: | | $ | 4,277 | | | $ | 3,869 | |
| | | | |
| 8 | | PIMCO Variable Insurance Trust | | See Accompanying Notes |
| | |
| |
| Consolidated Schedule of Investments CommodityRealReturn™ Strategy Portfolio | | June 30, 2007 (Unaudited) |
| | | | | | | | |
| | | | | PRINCIPAL
AMOUNT
(000S) | | | | VALUE
(000S) |
| CORPORATE BONDS & NOTES 6.1% |
|
| BANKING & FINANCE 4.7% |
| American Express Credit Corp. |
5.380% due 03/02/2009 | | $ | | 800 | | $ | | 801 |
| |
| Atlantic & Western Re Ltd. |
11.599% due 01/09/2009 | | | | 300 | | | | 303 |
| |
| Bank of America Corp. |
5.510% due 02/17/2009 | | | | 900 | | | | 902 |
| |
| C10 Capital SPV Ltd. |
6.722% due 12/31/2049 | | | | 100 | | | | 98 |
| |
| CIT Group, Inc. |
5.505% due 01/30/2009 | | | | 900 | | | | 899 |
| |
| Citigroup Funding, Inc. |
5.320% due 04/23/2009 | | | | 1,000 | | | | 1,001 |
| |
| Citigroup, Inc. |
5.390% due 12/28/2009 | | | | 800 | | | | 801 |
| |
| Credit Agricole S.A. |
5.360% due 05/28/2009 | | | | 1,100 | | | | 1,101 |
| |
| Ford Motor Credit Co. |
6.190% due 09/28/2007 | | | | 200 | | | | 200 |
| |
| General Electric Capital Corp. |
5.400% due 12/12/2008 | | | | 100 | | | | 100 |
| |
| Goldman Sachs Group, Inc. |
5.400% due 12/23/2008 | | | | 900 | | | | 900 |
5.450% due 12/22/2008 | | | | 1,000 | | | | 1,001 |
| |
| Morgan Stanley |
5.467% due 02/09/2009 | | | | 900 | | | | 901 |
| |
| Mystic Re Ltd. |
15.360% due 06/07/2011 | | | | 500 | | | | 501 |
| |
| Rabobank Nederland |
5.376% due 01/15/2009 | | | | 100 | | | | 100 |
| |
| Residential Reinsurance 2007 Ltd. |
12.610% due 06/07/2010 | | | | 500 | | | | 501 |
| |
| Spinnaker Capital Ltd. |
16.860% due 06/15/2008 | | | | 300 | | | | 300 |
| |
| Unicredit Luxembourg Finance S.A. |
5.405% due 10/24/2008 | | | | 200 | | | | 200 |
| |
| Wachovia Bank N.A. |
5.430% due 12/02/2010 | | | | 400 | | | | 400 |
| | | | | | | | |
| | | | | | | | 11,010 |
| | | | | | | | |
|
| INDUSTRIALS 0.6% |
| Caesars Entertainment, Inc. |
8.875% due 09/15/2008 | | | | 300 | | | | 309 |
| |
| Mandalay Resort Group |
6.500% due 07/31/2009 | | | | 1,000 | | | | 1,005 |
| | | | | | | | |
| | | | | | | | 1,314 |
| | | | | | | | |
|
| UTILITIES 0.8% |
| AT&T, Inc. |
5.456% due 02/05/2010 | | | | 900 | | | | 902 |
| |
| BellSouth Corp. |
4.240% due 04/26/2008 | | | | 1,100 | | | | 1,090 |
| | | | | | | | |
| | | | | | | | 1,992 |
| | | | | | | | |
Total Corporate Bonds & Notes
(Cost $14,319) | | 14,316 |
| | | | | | | | |
| | | | | | | | |
| CONVERTIBLE BONDS & NOTES 0.5% |
| Chesapeake Energy Corp. |
2.500% due 05/15/2037 | | | | 1,200 | | | | 1,230 |
| | | | | | | | |
Total Convertible Bonds & Notes
(Cost $1,209) | | 1,230 |
| | | | | | | | |
| | | | | | | | |
| | | | | PRINCIPAL
AMOUNT
(000S) | | | | VALUE
(000S) |
| COMMODITY INDEX-LINKED NOTES 22.9% |
| Bank of America N.A. |
5.190% due 10/22/2007 | | $ | | 3,000 | | $ | | 3,707 |
| |
| Bear Stearns Cos., Inc. |
0.000% due 10/19/2007 (j) | | | | 3,000 | | | | 3,445 |
| |
| Calyon Financial, Inc. |
0.000% due 07/16/2007 | | | | 3,000 | | | | 2,888 |
| |
| Commonwealth Bank of Australia |
5.060% due 07/21/2008 | | | | 3,000 | | | | 2,734 |
| |
| Credit Suisse First Boston |
5.255% due 01/14/2008 (j) | | | | 5,300 | | | | 6,545 |
| |
| Eksportfinans ASA |
0.000% due 06/18/2008 | | | | 3,500 | | | | 3,268 |
| |
| Landesbank Baden-Wurttemberg |
0.000% due 10/25/2007 | | | | 3,000 | | | | 3,615 |
| |
| Merrill Lynch & Co., Inc. |
5.360% due 03/24/2008 | | | | 2,000 | | | | 2,131 |
| |
| Morgan Stanley |
0.000% due 02/06/2008 (j) | | | | 13,000 | | | | 15,027 |
| |
| Natixis Financial Products, Inc. |
5.157% due 05/09/2008 | | | | 4,000 | | | | 3,892 |
| |
| Svensk ExportKredit AB |
0.000% due 05/19/2008 | | | | 2,000 | | | | 1,870 |
| |
| UBS AG |
0.000% due 03/12/2008 | | | | 4,000 | | | | 4,444 |
| | | | | | | | |
Total Commodity Index-Linked Notes
(Cost $48,800) | | 53,566 |
| | | | | | | | |
| | | | | | | | |
| U.S. GOVERNMENT AGENCIES 10.9% |
| Fannie Mae |
4.187% due 11/01/2034 | | | | 260 | | | | 258 |
4.673% due 05/25/2035 | | | | 300 | | | | 296 |
5.500% due 09/01/2035 - 07/01/2037 | | | | 12,562 | | | | 12,118 |
5.670% due 05/25/2042 | | | | 25 | | | | 25 |
5.950% due 02/25/2044 | | | | 140 | | | | 140 |
6.000% due 07/01/2034 - 07/01/2037 | | | | 850 | | | | 842 |
6.227% due 03/01/2044 - 10/01/2044 | | | | 610 | | | | 617 |
| |
| Freddie Mac |
4.000% due 03/15/2023 - 10/15/2023 | | | | 123 | | | | 121 |
4.500% due 05/15/2017 | | | | 69 | | | | 67 |
4.550% due 01/01/2034 | | | | 48 | | | | 47 |
5.000% due 02/15/2020 | | | | 825 | | | | 813 |
5.470% due 07/15/2019 - 10/15/2020 | | | | 4,600 | | | | 4,596 |
5.500% due 05/15/2016 | | | | 1,275 | | | | 1,275 |
5.550% due 07/15/2037 | | | | 4,000 | | | | 4,000 |
5.580% due 08/25/2031 | | | | 5 | | | | 5 |
6.227% due 02/25/2045 | | | | 306 | | | | 305 |
| | | | | | | | |
Total U.S. Government Agencies
(Cost $25,547) | | 25,525 |
| | | | | | | | |
| | | | | | | | |
| U.S. TREASURY OBLIGATIONS 99.0% |
| Treasury Inflation Protected Securities (b) |
0.875% due 04/15/2010 | | | | 19,512 | | | | 18,536 |
1.625% due 01/15/2015 | | | | 544 | | | | 506 |
1.875% due 07/15/2013 | | | | 4,637 | | | | 4,449 |
1.875% due 07/15/2015 | | | | 11,533 | | | | 10,902 |
2.000% due 04/15/2012 | | | | 6,653 | | | | 6,459 |
2.000% due 01/15/2014 | | | | 9,892 | | | | 9,510 |
2.000% due 07/15/2014 | | | | 11,570 | | | | 11,110 |
2.000% due 01/15/2016 | | | | 22,918 | | | | 21,767 |
2.000% due 01/15/2026 | | | | 18,837 | | | | 17,068 |
2.375% due 04/15/2011 | | | | 18,309 | | | | 18,115 |
| | | | | | | | |
| | | | | PRINCIPAL
AMOUNT
(000S) | | | | VALUE
(000S) |
2.375% due 01/15/2017 | | $ | | 14,831 | | $ | | 14,485 |
2.375% due 01/15/2025 | | | | 26,104 | | | | 25,109 |
2.375% due 01/15/2027 | | | | 10,917 | | | | 10,488 |
3.000% due 07/15/2012 | | | | 12,707 | | | | 12,957 |
3.625% due 01/15/2008 | | | | 257 | | | | 257 |
3.625% due 04/15/2028 | | | | 12,713 | | | | 14,733 |
3.875% due 01/15/2009 | | | | 13,422 | | | | 13,640 |
3.875% due 04/15/2029 | | | | 6,570 | | | | 7,934 |
4.250% due 01/15/2010 | | | | 12,343 | | | | 12,814 |
| |
| U.S. Treasury Notes |
4.500% due 02/28/2011 | | | | 100 | | | | 99 |
4.500% due 11/15/2015 | | | | 600 | | | | 579 |
4.625% due 02/15/2017 | | | | 600 | | | | 581 |
| | | | | | | | |
Total U.S. Treasury Obligations
(Cost $230,571) | | 232,098 |
| | | | | | | | |
| | | | | | | | |
| MORTGAGE-BACKED SECURITIES 1.7% |
| Bear Stearns Mortgage Funding Trust |
5.390% due 02/25/2037 | | | | 737 | | | | 738 |
| |
| Citigroup Mortgage Loan Trust, Inc. |
4.700% due 12/25/2035 | | | | 425 | | | | 417 |
| |
| Countrywide Home Loan Mortgage Pass-Through Trust |
3.786% due 11/19/2033 | | | | 36 | | | | 34 |
| |
| First Horizon Alternative Mortgage Securities |
4.732% due 06/25/2034 | | | | 50 | | | | 50 |
| |
| Greenpoint Mortgage Funding Trust |
5.400% due 01/25/2047 | | | | 868 | | | | 868 |
5.590% due 11/25/2045 | | | | 35 | | | | 35 |
| |
| Harborview Mortgage Loan Trust |
5.560% due 03/19/2037 | | | | 146 | | | | 147 |
| |
| MASTR Adjustable Rate Mortgages Trust |
3.786% due 11/21/2034 | | | | 100 | | | | 98 |
| |
| Residential Accredit Loans, Inc. |
6.389% due 09/25/2045 | | | | 435 | | | | 439 |
| |
| Structured Adjustable Rate Mortgage Loan Trust |
4.580% due 02/25/2034 | | | | 77 | | | | 77 |
6.429% due 01/25/2035 | | | | 46 | | | | 46 |
| |
| Wachovia Bank Commercial Mortgage Trust |
5.400% due 06/15/2020 | | | | 1,100 | | | | 1,100 |
| | | | | | | | |
Total Mortgage-Backed Securities
(Cost $4,047) | | 4,049 |
| | | | | | | | |
| | | | | | | | |
| ASSET-BACKED SECURITIES 3.1% |
| ACE Securities Corp. |
5.430% due 10/25/2035 | | | | 26 | | | | 26 |
| |
| Argent Securities, Inc. |
5.390% due 04/25/2036 | | | | 40 | | | | 40 |
5.400% due 03/25/2036 | | | | 41 | | | | 41 |
| |
| Bear Stearns Asset-Backed Securities, Inc. |
5.520% due 09/25/2034 | | | | 11 | | | | 11 |
| |
| Carrington Mortgage Loan Trust |
5.640% due 10/25/2035 | | | | 729 | | | | 732 |
| |
| Citigroup Mortgage Loan Trust, Inc. |
5.380% due 01/25/2037 | | | | 608 | | | | 608 |
5.400% due 12/25/2035 | | | | 59 | | | | 59 |
| |
| Countrywide Asset-Backed Certificates |
5.390% due 07/25/2036 | | | | 26 | | | | 26 |
5.390% due 09/25/2036 | | | | 45 | | | | 45 |
5.450% due 07/25/2036 | | | | 20 | | | | 20 |
| |
| First Franklin Mortgage Loan Asset-Backed Certificates |
5.360% due 01/25/2038 | | | | 740 | | | | 740 |
5.410% due 01/25/2036 | | | | 109 | | | | 109 |
| |
| GSAMP Trust |
5.390% due 12/25/2036 | | | | 660 | | | | 660 |
5.430% due 11/25/2035 | | | | 14 | | | | 14 |
| |
| | | | | | |
| See Accompanying Notes | | Semiannual Report | | June 30, 2007 | | 9 |
| | |
| |
| Consolidated Schedule of Investments CommodityRealReturn™ Strategy Portfolio (Cont.) | | |
| | | | | | | | |
| | | | | PRINCIPAL
AMOUNT
(000S) | | | | VALUE
(000S) |
| Home Equity Asset Trust |
5.400% due 05/25/2036 | | $ | | 41 | | $ | | 41 |
5.430% due 02/25/2036 | | | | 14 | | | | 14 |
| |
| HSI Asset Securitization Corp. Trust |
5.400% due 12/25/2035 | | | | 38 | | | | 38 |
| |
| Indymac Residential Asset-Backed Trust |
5.410% due 03/25/2036 | | | | 84 | | | | 84 |
5.420% due 03/25/2036 | | | | 15 | | | | 15 |
| |
| Lehman XS Trust |
5.400% due 04/25/2046 | | | | 143 | | | | 143 |
5.400% due 07/25/2046 | | | | 101 | | | | 101 |
| |
| Long Beach Mortgage Loan Trust |
5.400% due 02/25/2036 | | | | 15 | | | | 15 |
| |
| Merrill Lynch Mortgage Investors, Inc. |
5.400% due 01/25/2037 | | | | 11 | | | | 11 |
| |
| Morgan Stanley ABS Capital I |
5.370% due 11/25/2036 | | | | 1,320 | | | | 1,321 |
| |
| Nelnet Student Loan Trust |
5.445% due 07/25/2016 | | | | 55 | | | | 55 |
| |
| Nomura Asset Acceptance Corp. |
5.460% due 01/25/2036 | | | | 26 | | | | 26 |
| |
| Option One Mortgage Loan Trust |
5.370% due 01/25/2037 | | | | 657 | | | | 657 |
| |
| Residential Asset Mortgage Products, Inc. |
5.400% due 01/25/2036 | | | | 5 | | | | 5 |
| |
| Residential Funding Mortgage Securities II, Inc. |
5.460% due 09/25/2035 | | | | 35 | | | | 35 |
| |
| Securitized Asset-Backed Receivables LLC Trust |
5.390% due 10/25/2035 | | | | 12 | | | | 12 |
| |
| Soundview Home Equity Loan Trust |
5.390% due 03/25/2036 | | | | 5 | | | | 5 |
| |
| Specialty Underwriting & Residential Finance |
5.380% due 01/25/2038 | | | | 830 | | | | 830 |
| |
| Structured Asset Securities Corp. |
5.450% due 12/25/2035 | | | | 77 | | | | 77 |
| |
| USAA Auto Owner Trust |
5.030% due 11/17/2008 | | | | 9 | | | | 9 |
| |
| Washington Mutual Asset-Backed Certificates |
5.370% due 01/25/2037 | | | | 699 | | | | 700 |
| | | | | | | | |
Total Asset-Backed Securities
(Cost $7,321) | | 7,325 |
| | | | | | | | |
|
| FOREIGN CURRENCY-DENOMINATED ISSUES 0.5% |
| United Kingdom Gilt Inflation Linked Bond |
2.500% due 05/20/2009 | | GBP | | 200 | | | | 1,033 |
| | | | | | | | |
Total Foreign Currency-Denominated Issues (Cost $1,001) | | 1,033 |
| | | | | | | | |
|
| SHORT-TERM INSTRUMENTS 61.6% |
|
| CERTIFICATES OF DEPOSIT 3.2% |
| Abbey National Treasury Services PLC |
5.270% due 07/02/2008 | | $ | | 1,600 | | | | 1,601 |
| |
| BNP Paribas |
5.262% due 07/03/2008 | | | | 500 | | | | 500 |
| |
| Calyon Financial, Inc. |
5.340% due 01/16/2009 | | | | 800 | | | | 800 |
| |
| | | | | | | | |
| | | | | PRINCIPAL
AMOUNT
(000S) | | | | VALUE
(000S) |
| Nordea Bank Finland PLC |
5.282% due 12/01/2008 | | $ | | 1,100 | | $ | | 1,100 |
5.308% due 04/09/2009 | | | | 600 | | | | 600 |
| |
| Royal Bank of Scotland Group PLC |
5.265% due 03/26/2008 | | | | 1,000 | | | | 1,000 |
| |
| Skandinav Enskilda BK |
5.350% due 02/13/2009 | | | | 900 | | | | 901 |
| |
| Societe Generale NY |
5.270% due 03/26/2008 | | | | 1,000 | | | | 1,000 |
| | | | | | | | |
| | | | | | | | 7,502 |
| | | | | | | | |
| | | | | | | | |
| COMMERCIAL PAPER 53.3% |
| ANZ National International Ltd. |
5.250% due 09/19/2007 | | | | 6,600 | | | | 6,521 |
| |
| Bank of America Corp. |
5.210% due 10/04/2007 | | | | 800 | | | | 794 |
| |
| Bank of Ireland |
5.165% due 11/08/2007 | | | | 4,400 | | | | 4,316 |
5.230% due 11/08/2007 | | | | 2,300 | | | | 2,283 |
| |
| Barclays U.S. Funding Corp. |
5.235% due 09/26/2007 | | | | 4,300 | | | | 4,269 |
5.240% due 09/26/2007 | | | | 3,000 | | | | 2,977 |
| |
| CBA (de) Finance |
5.230% due 09/28/2007 | | | | 100 | | | | 100 |
5.260% due 09/28/2007 | | | | 300 | | | | 296 |
| |
| Dexia Delaware LLC |
5.220% due 09/21/2007 | | | | 1,100 | | | | 1,100 |
5.225% due 09/21/2007 | | | | 600 | | | | 597 |
5.240% due 09/21/2007 | | | | 5,900 | | | | 5,831 |
| |
| DnB NORBank ASA |
5.225% due 10/12/2007 | | | | 4,600 | | | | 4,600 |
5.350% due 10/12/2007 | | | | 400 | | | | 400 |
| |
| Fannie Mae |
5.080% due 07/02/2007 | | | | 400 | | | | 400 |
| |
| Fortis Funding LLC |
5.255% due 09/05/2007 | | | | 1,100 | | | | 1,097 |
5.275% due 09/05/2007 | | | | 6,500 | | | | 6,480 |
| |
| Freddie Mac |
4.800% due 07/02/2007 | | | | 11,800 | | | | 11,800 |
| |
| General Electric Capital Corp. |
5.200% due 11/06/2007 | | | | 1,900 | | | | 1,892 |
| |
| HBOS Treasury Services PLC |
5.225% due 11/13/2007 | | | | 400 | | | | 400 |
5.230% due 09/21/2007 | | | | 200 | | | | 199 |
5.235% due 11/13/2007 | | | | 4,500 | | | | 4,463 |
5.245% due 11/13/2007 | | | | 400 | | | | 395 |
5.250% due 09/21/2007 | | | | 600 | | | | 593 |
5.255% due 11/13/2007 | | | | 1,400 | | | | 1,381 |
| |
| Natixis S.A. |
5.230% due 09/21/2007 | | | | 400 | | | | 397 |
5.240% due 09/21/2007 | | | | 6,600 | | | | 6,575 |
| |
| Rabobank USA Financial Corp. |
5.330% due 07/26/2007 | | | | 2,000 | | | | 2,000 |
| |
| San Paolo IMI U.S. Financial Co. |
5.330% due 08/08/2007 | | | | 6,400 | | | | 6,400 |
| |
| Santander Hispano Finance Delaware |
5.250% due 09/26/2007 | | | | 400 | | | | 395 |
| |
| | | | | | | | | |
| | | | | PRINCIPAL
AMOUNT
(000S) | | | | VALUE
(000S) | |
| Societe Generale NY | |
5.195% due 11/26/2007 | | $ | | 700 | | $ | | 696 | |
5.210% due 11/26/2007 | | | | 100 | | | | 98 | |
5.225% due 11/26/2007 | | | | 2,200 | | | | 2,188 | |
5.240% due 11/26/2007 | | | | 1,800 | | | | 1,779 | |
5.245% due 11/26/2007 | | | | 2,100 | | | | 2,075 | |
| | |
| Stadshypoket Delaware, Inc. | |
5.230% due 09/11/2007 | | | | 400 | | | | 397 | |
| | |
| Statens Bostadsfin Bank | |
5.255% due 09/14/2007 | | | | 7,100 | | | | 7,021 | |
| | |
| Svenska Handelsbanken, Inc. | |
5.185% due 10/09/2007 | | | | 400 | | | | 400 | |
5.203% due 10/09/2007 | | | | 300 | | | | 298 | |
| | |
| Swedbank AB | |
5.225% due 09/06/2007 | | | | 6,600 | | | | 6,565 | |
| | |
| TotalFinaElf Capital S.A. | |
5.340% due 07/02/2007 | | | | 6,800 | | | | 6,800 | |
| | |
| UBS Finance Delaware LLC | |
5.230% due 10/23/2007 | | | | 500 | | | | 498 | |
| | |
| Unicredito Italiano SpA | |
5.185% due 01/22/2008 | | | | 2,100 | | | | 2,054 | |
5.200% due 01/22/2008 | | | | 4,400 | | | | 4,324 | |
| | |
| Westpac Banking Corp. | |
5.195% due 11/05/2007 | | | | 800 | | | | 796 | |
5.200% due 11/05/2007 | | | | 10,200 | | | | 10,153 | |
| | | | | | | | | |
| | | | | | | | 125,093 | |
| | | | | | | | | |
| | | | | | | | | |
| REPURCHASE AGREEMENTS 2.3% | |
| Lehman Brothers, Inc. | |
4.000% due 07/02/2007 | | | | 4,700 | | | | 4,700 | |
(Dated 06/29/2007. Collateralized by U.S. Treasury Inflation Protected Securities 3.625% due 01/15/2008 valued at $4,799. Repurchase proceeds are $4,702.) | |
| | |
| State Street Bank and Trust Co. | |
4.900% due 07/02/2007 | | | | 404 | | | | 404 | |
(Dated 06/29/2007. Collateralized by Fannie Mae 3.250% due 08/15/2008 valued at $416. Repurchase proceeds are $404.) | |
4.900% due 07/02/2007 | | | | 216 | | | | 216 | |
(Dated 06/29/2007. Collateralized by Federal Home Loan Bank 4.125% due 10/19/2007 valued at $221. Repurchase proceeds are $216.) | |
| | | | | | | | | |
| | | | | | | | 5,320 | |
| | | | | | | | | |
| | | | | | | | | |
| U.S. TREASURY BILLS 2.8% | |
4.571% due 08/30/2007 - 09/13/2007 (a)(c)(d)(f) | | | | 6,630 | | | | 6,567 | |
| | | | | | | | | |
Total Short-Term Instruments
(Cost $144,503) | | 144,482 | |
| | | | | | | | | |
| |
| PURCHASED OPTIONS (h) 0.0% | |
(Cost $142) | | | | | | | | 99 | |
| |
Total Investments (e) 206.3%
(Cost $477,460) | | $ | | 483,723 | |
| | | | | | | | | |
Written Options (i) (0.1%)
(Premiums $242) | | | | (188 | ) |
| |
| Other Assets and Liabilities (Net) (106.2%) | | (249,099 | ) |
| | | | | | | | | |
| Net Assets 100.0% | | | | | | $ | | 234,436 | |
| | | | | | | | | |
| | | | |
| 10 | | PIMCO Variable Insurance Trust | | See Accompanying Notes |
| | |
| |
| | | June 30, 2007 (Unaudited) |
Notes to Schedule of Investments (amounts in thousands*, except number of contracts):
* A zero balance may reflect actual amounts rounding to less than one thousand.
(a) Coupon represents a weighted average rate.
(b) Principal amount of security is adjusted for inflation.
(c) Securities with an aggregate market value of $990 have been pledged as collateral for swap and swaption contracts on June 30, 2007.
(d) Securities with an aggregate market value of $534 have been pledged as collateral for delayed-delivery securities on June 30, 2007.
(e) As of June 30, 2007, portfolio securities with an aggregate value of $65,003 were valued in good faith and pursuant to the guidelines established by the Board of Trustees.
(f) Securities with an aggregate market value of $752 have been segregated with the custodian to cover margin requirements for the following open futures contracts on June 30, 2007:
| | | | | | | | | | |
| Description | | Type | | Expiration
Month | | # of
Contracts | | Unrealized
Appreciation/
(Depreciation) | |
90-Day Euribor December Futures | | Long | | 12/2008 | | 17 | | $ | (5 | ) |
90-Day Euribor June Futures | | Long | | 06/2009 | | 17 | | | (4 | ) |
90-Day Euribor March Futures | | Long | | 03/2009 | | 17 | | | (5 | ) |
90-Day Euribor September Futures | | Long | | 09/2008 | | 17 | | | (5 | ) |
90-Day Euro December Futures | | Long | | 12/2007 | | 8 | | | (7 | ) |
90-Day Euro December Futures | | Long | | 12/2008 | | 45 | | | (23 | ) |
90-Day Euro June Futures | | Long | | 06/2008 | | 37 | | | (43 | ) |
90-Day Euro June Futures | | Long | | 06/2009 | | 27 | | | 3 | |
90-Day Euro March Futures | | Short | | 03/2008 | | 12 | | | 15 | |
90-Day Euro March Futures | | Long | | 03/2009 | | 57 | | | (1 | ) |
90-Day Euro September Futures | | Long | | 09/2008 | | 5 | | | 1 | |
Japan Government 10-Year Bond September Futures | | Long | | 09/2007 | | 2 | | | 3 | |
U.S. Treasury 5-Year Note September Futures | | Short | | 09/2007 | | 83 | | | (23 | ) |
U.S. Treasury 10-Year Note September Futures | | Short | | 09/2007 | | 24 | | | (33 | ) |
U.S. Treasury 30-Year Bond September Futures | | Short | | 09/2007 | | 175 | | | 146 | |
United Kingdom 90-Day LIBOR Sterling Interest Rate June Futures | | Long | | 06/2008 | | 121 | | | (205 | ) |
United Kingdom 90-Day LIBOR Sterling Interest Rate March Futures | | Long | | 03/2008 | | 64 | | | (123 | ) |
| | | | | | | | | | |
| | | | | | | | $ | (309 | ) |
| | | | | | | | | | |
(g) Swap agreements outstanding on June 30, 2007:
Commodity Swaps
| | | | | | | | | | | | | | | | | |
| Counterparty | | Type | | Commodity Exchange | | Pay/Receive
Commodity Exchange | | Fixed Price
Per Unit | | Expiration
Date | | Units | | Unrealized
Appreciation/
(Depreciation) | |
Barclays Bank PLC | | Short | | LMEX Aluminum Hg Futures | | Receive | | $ | 2,670.000 | | 12/15/2008 | | 1 | | $ | (14 | ) |
Barclays Bank PLC | | Long | | LMEX Aluminum Hg Futures | | Pay | | | 2,300.000 | | 12/13/2010 | | 1 | | | 76 | |
Morgan Stanley | | Long | | ICEX Brent Crude Futures | | Pay | | | 66.000 | | 11/14/2012 | | 31 | | | 64 | |
Morgan Stanley | | Short | | NYMEX Crude Oil Futures | | Receive | | | 67.700 | | 11/19/2012 | | 31 | | | (75 | ) |
| | | | | | | | | | | | | | | | | |
| | | | | | | | | | | | | | | $ | 51 | |
| | | | | | | | | | | | | | | | | |
Credit Default Swaps
| | | | | | | | | | | | | | | |
| Counterparty | | Reference Entity | | Buy/Sell
Protection (1) | | (Pay)/Receive
Fixed Rate | | Expiration
Date | | Notional
Amount | | Unrealized
(Depreciation) | |
Credit Suisse First Boston | | Chesapeake Energy Corp. 6.875% due 01/15/2016 | | Sell | | 0.970% | | 06/20/2012 | | $ | 100 | | $ | (1 | ) |
Credit Suisse First Boston | | Chesapeake Energy Corp. 6.875% due 01/15/2016 | | Sell | | 1.010% | | 06/20/2012 | | | 300 | | | (3 | ) |
Morgan Stanley | | Russia Government International Bond 7.500% due 03/31/2030 | | Sell | | 0.260% | | 12/20/2007 | | | 2,000 | | | 0 | |
| | | | | | | | | | | | | | | |
| | | | | | | | | | | | | $ | (4 | ) |
| | | | | | | | | | | | | | | |
(1) If the Portfolio is a seller of protection and a credit event occurs, as defined under the terms of that particular swap agreement, the Portfolio will pay to the buyer of the protection an amount up to the notional value of the swap and in certain instances, take delivery of the security.
| | | | | | |
| See Accompanying Notes | | Semiannual Report | | June 30, 2007 | | 11 |
Consolidated Schedule of Investments CommodityRealReturn™ Strategy Portfolio (Cont.)
Interest Rate Swaps
| | | | | | | | | | | | | | | |
| Counterparty | | Floating Rate Index | | Pay/Receive
Floating Rate | | Fixed
Rate | | Expiration
Date | | Notional Amount | | Unrealized
Appreciation/
(Depreciation) | |
Citibank N.A. | | 6-Month Australian Bank Bill | | Pay | | 6.500% | | 01/15/2010 | | AUD | 800 | | $ | (6 | ) |
Deutsche Bank AG | | 6-Month Australian Bank Bill | | Pay | | 6.500% | | 01/15/2010 | | | 2,500 | | | (17 | ) |
Deutsche Bank AG | | 6-Month Australian Bank Bill | | Pay | | 7.000% | | 06/15/2010 | | | 8,500 | | | (9 | ) |
Royal Bank of Canada | | 6-Month Australian Bank Bill | | Pay | | 6.500% | | 01/15/2010 | | | 1,600 | | | (10 | ) |
Royal Bank of Canada | | 3-Month Canadian Bank Bill | | Receive | | 5.500% | | 06/20/2017 | | CAD | 3,300 | | | 0 | |
Barclays Bank PLC | | 5-Year French CPI Ex Tobacco Daily Reference Index | | Pay | | 2.103% | | 10/15/2010 | | EUR | 500 | | | 7 | |
BNP Paribas Bank | | 5-Year French CPI Ex Tobacco Daily Reference Index | | Pay | | 2.040% | | 02/21/2011 | | | 1,700 | | | 12 | |
BNP Paribas Bank | | 5-Year French CPI Ex Tobacco Daily Reference Index | | Pay | | 1.988% | | 12/15/2011 | | | 900 | | | (4 | ) |
Goldman Sachs & Co. | | 5-Year French CPI Ex Tobacco Daily Reference Index | | Pay | | 1.976% | | 12/15/2011 | | | 5,400 | | | (16 | ) |
JPMorgan Chase & Co. | | 5-Year French CPI Ex Tobacco Daily Reference Index | | Pay | | 2.028% | | 10/15/2011 | | | 600 | | | 3 | |
JPMorgan Chase & Co. | | 5-Year French CPI Ex Tobacco Daily Reference Index | | Pay | | 1.973% | | 12/15/2011 | | | 1,200 | | | (6 | ) |
JPMorgan Chase & Co. | | 5-Year French CPI Ex Tobacco Daily Reference Index | | Pay | | 1.958% | | 04/10/2012 | | | 700 | | | (7 | ) |
JPMorgan Chase & Co. | | 5-Year French CPI Ex Tobacco Daily Reference Index | | Pay | | 2.353% | | 10/15/2016 | | | 300 | | | 2 | |
Morgan Stanley | | 6-Month EUR-LIBOR | | Receive | | 4.000% | | 06/15/2017 | | | 200 | | | 19 | |
UBS Warburg LLC | | 5-Year French CPI Ex Tobacco Daily Reference Index | | Pay | | 2.095% | | 10/15/2011 | | | 1,100 | | | 11 | |
UBS Warburg LLC | | Eurostat Eurozone HICP Ex Tobacco Unrevised Series NSA Index | | Receive | | 2.275% | | 10/15/2016 | | | 400 | | | 1 | |
UBS Warburg LLC | | 5-Year French CPI Ex Tobacco Daily Reference Index | | Pay | | 2.350% | | 10/15/2016 | | | 400 | | | 2 | |
Barclays Bank PLC | | 6-Month GBP-LIBOR | | Pay | | 5.000% | | 06/15/2009 | | GBP | 2,800 | | | (103 | ) |
Barclays Bank PLC | | 6-Month GBP-LIBOR | | Receive | | 4.000% | | 12/15/2035 | | | 1,200 | | | 93 | |
Credit Suisse First Boston | | 6-Month GBP-LIBOR | | Pay | | 5.000% | | 09/15/2010 | | | 1,600 | | | (73 | ) |
Credit Suisse First Boston | | 6-Month GBP-LIBOR | | Receive | | 4.000% | | 12/15/2035 | | | 600 | | | 45 | |
Goldman Sachs & Co. | | 6-Month GBP-LIBOR | | Receive | | 5.000% | | 09/15/2015 | | | 500 | | | 48 | |
HSBC Bank USA | | 6-Month GBP-LIBOR | | Receive | | 4.250% | | 06/12/2036 | | | 300 | | | 76 | |
JPMorgan Chase & Co. | | 6-Month GBP-LIBOR | | Pay | | 5.000% | | 06/15/2008 | | | 100 | | | (2 | ) |
Royal Bank of Scotland Group PLC | | 6-Month GBP-LIBOR | | Pay | | 5.000% | | 09/15/2010 | | | 2,000 | | | (90 | ) |
Morgan Stanley | | 6-Month JPY-LIBOR | | Pay | | 1.000% | | 03/18/2009 | | JPY | 600,000 | | | (1 | ) |
Barclays Bank PLC | | 28-Day Mexico Interbank TIIE Banxico | | Pay | | 8.330% | | 02/14/2017 | | MXN | 2,100 | | | 3 | |
Citibank N.A. | | 28-Day Mexico Interbank TIIE Banxico | | Pay | | 8.170% | | 11/04/2016 | | | 8,600 | | | 3 | |
Goldman Sachs & Co. | | 28-Day Mexico Interbank TIIE Banxico | | Pay | | 8.170% | | 11/04/2016 | | | 4,000 | | | 3 | |
Merrill Lynch & Co., Inc. | | 28-Day Mexico Interbank TIIE Banxico | | Pay | | 8.170% | | 11/04/2016 | | | 3,700 | | | 3 | |
Barclays Bank PLC | | 3-Month USD-LIBOR | | Pay | | 5.000% | | 12/19/2009 | | $ | 900 | | | (1 | ) |
Barclays Bank PLC | | 3-Month USD-LIBOR | | Pay | | 5.000% | | 12/19/2012 | | | 2,500 | | | 8 | |
Deutsche Bank AG | | 3-Month USD-LIBOR | | Pay | | 5.000% | | 12/19/2009 | | | 9,000 | | | 19 | |
Deutsche Bank AG | | 3-Month USD-LIBOR | | Pay | | 5.000% | | 12/19/2012 | | | 3,600 | | | 5 | |
Deutsche Bank AG | | 3-Month USD-LIBOR | | Pay | | 5.000% | | 12/19/2017 | | | 6,950 | | | 49 | |
Deutsche Bank AG | | 3-Month USD-LIBOR | | Receive | | 5.000% | | 12/20/2021 | | | 1,800 | | | 9 | |
Deutsche Bank AG | | 3-Month USD-LIBOR | | Receive | | 5.000% | | 12/20/2026 | | | 1,800 | | | 3 | |
Deutsche Bank AG | | 3-Month USD-LIBOR | | Pay | | 5.000% | | 12/19/2037 | | | 2,300 | | | 28 | |
Goldman Sachs & Co. | | 3-Month USD-LIBOR | | Pay | | 5.000% | | 12/19/2009 | | | 500 | | | (1 | ) |
Goldman Sachs & Co. | | 3-Month USD-LIBOR | | Receive | | 5.000% | | 06/20/2014 | | | 300 | | | 11 | |
Lehman Brothers, Inc. | | 3-Month USD-LIBOR | | Pay | | 5.000% | | 12/19/2012 | | | 400 | | | 1 | |
Morgan Stanley | | 3-Month USD-LIBOR | | Pay | | 5.000% | | 12/19/2037 | | | 1,600 | | | 26 | |
Royal Bank of Scotland Group PLC | | 3-Month USD-LIBOR | | Pay | | 5.000% | | 12/19/2012 | | | 1,300 | | | 5 | |
UBS Warburg LLC | | 3-Month USD-LIBOR | | Pay | | 5.000% | | 06/18/2009 | | | 17,000 | | | (5 | ) |
UBS Warburg LLC | | 3-Month USD-LIBOR | | Receive | | 5.000% | | 12/19/2017 | | | 700 | | | (9 | ) |
| | | | | | | | | | | | | | | |
| | | | | | | | | | | | | $ | 135 | |
| | | | | | | | | | | | | | | |
Total Return Swaps
| | | | | | | | | | | | | | |
| Counterparty | | Type | | Receive Total Return | | Pay | | Expiration
Date | | # of
Contracts | | Unrealized
Appreciation/
(Depreciation) | |
AIG International Inc. | | Long | | Dow Jones-AIG Commodity Index Total Return | | 3-Month U.S. Treasury Bill rate plus a specified spread | | 07/27/2007 | | 61,983 | | $ | 78 | |
Morgan Stanley | | Long | | Dow Jones-AIG Commodity Index Total Return | | 3-Month U.S. Treasury Bill rate plus a specified spread | | 07/27/2007 | | 246,854 | | | 314 | |
Morgan Stanley | | Short | | Dow Jones-AIG Commodity Index Total Return | | 3-Month U.S. Treasury Bill rate plus a specified spread | | 07/27/2007 | | 60,115 | | | (76 | ) |
| | | | | | | | | | | | | | |
| | | | | | | | | | | | $ | 316 | |
| | | | | | | | | | | | | | |
(h) Purchased options outstanding on June 30, 2007:
Options on Exchange-Traded Futures Contracts
| | | | | | | | | | | | | |
| Description | | Exercise
Price | | Expiration
Date | | # of
Contracts | | Cost | | Value |
Call - CBOT U.S. Treasury 5-Year Note September Futures | | $ | 106.000 | | 08/24/2007 | | 51 | | $ | 1 | | $ | 2 |
Call - CBOT U.S. Treasury 30-Year Bond September Futures | | | 118.000 | | 08/24/2007 | | 248 | | | 5 | | | 4 |
Put - CBOT U.S. Treasury 10-Year Note September Futures | | | 101.000 | | 08/24/2007 | | 95 | | | 2 | | | 3 |
Put - CME 90-Day Euro September Futures | | | 91.500 | | 09/17/2007 | | 50 | | | 0 | | | 0 |
Put - CME 90-Day Euro September Futures | | | 92.000 | | 09/17/2007 | | 1 | | | 0 | | | 0 |
| | | | | | | | | | | | | |
| | | | | | | | | $ | 8 | | $ | 9 |
| | | | | | | | | | | | | |
| | | | |
| 12 | | PIMCO Variable Insurance Trust | | See Accompanying Notes |
| | |
| |
| | | June 30, 2007 (Unaudited) |
Interest Rate Swaptions
| | | | | | | | | | | | | | | | | | | |
| Description | | Counterparty | | Floating Rate Index | | Pay/Receive
Floating Rate | | Exercise
Rate | | Expiration
Date | | Notional
Amount | | Cost | | Value |
Call - OTC 2-Year Interest Rate Swap | | Royal Bank of Scotland Group PLC | | 3-Month USD-LIBOR | | Pay | | 4.750% | | 03/31/2008 | | $ | 6,000 | | $ | 34 | | $ | 7 |
Call - OTC 2-Year Interest Rate Swap | | Royal Bank of Scotland Group PLC | | 3-Month USD-LIBOR | | Pay | | 4.750% | | 09/26/2008 | | | 1,000 | | | 5 | | | 2 |
| | | | | | | | | | | | | | | | | | | |
| | | | | | | | | | | | | | | $ | 39 | | $ | 9 |
| | | | | | | | | | | | | | | | | | | |
Foreign Currency Options
| | | | | | | | | | | | | |
| Description | | Exercise
Price | | Expiration
Date | | Notional
Amount | | Cost | | Value |
Call - OTC Euro versus U.S. dollar | | $ | 1.353 | | 06/26/2008 | | EUR 1,100 | | $ | 35 | | $ | 41 |
Put - OTC Euro versus U.S. dollar | | | 1.353 | | 06/26/2008 | | 1,100 | | | 34 | | | 28 |
| | | | | | | | | | | | | |
| | | | | | | | | $ | 69 | | $ | 69 |
| | | | | | | | | | | | | |
Options on Securities
| | | | | | | | | | | | | | |
| Description | | Strike
Price | | Expiration
Date | | Notional
Amount | | Cost | | Value |
Put - OTC Treasury Inflation Protected Securities 0.875% due 04/15/2010 | | $ | 87.000 | | 08/21/2007 | | $ | 20,000 | | $ | 5 | | $ | 0 |
Put - OTC Treasury Inflation Protected Securities 2.000% due 01/15/2014 | | | 81.000 | | 09/20/2007 | | | 8,000 | | | 2 | | | 0 |
Put - OTC Treasury Inflation Protected Securities 2.000% due 01/15/2026 | | | 61.000 | | 09/20/2007 | | | 18,000 | | | 4 | | | 0 |
Put - OTC Treasury Inflation Protected Securities 2.375% due 04/15/2011 | | | 89.000 | | 08/21/2007 | | | 20,000 | | | 5 | | | 0 |
Put - OTC Treasury Inflation Protected Securities 2.375% due 01/15/2017 | | | 71.000 | | 09/27/2007 | | | 10,000 | | | 2 | | | 0 |
Put - OTC Treasury Inflation Protected Securities 2.375% due 01/15/2025 | | | 64.000 | | 07/25/2007 | | | 25,000 | | | 6 | | | 0 |
Put - OTC Treasury Inflation Protected Securities 3.875% due 01/15/2009 | | | 87.531 | | 09/27/2007 | | | 10,000 | | | 2 | | | 0 |
| | | | | | | | | | | | | | |
| | | | | | | | | | $ | 26 | | $ | 0 |
| | | | | | | | | | | | | | |
Straddle Options
| | | | | | | | | | | | | | | |
| Description | | Counterparty | | Exercise
Price (2) | | Expiration
Date | | Notional
Amount | | Cost (2) | | Value |
Call & Put - OTC U.S. dollar versus Swiss franc Forward Delta Neutral Straddle | | JPMorgan Chase & Co. | | CHF 0.000 | | 09/26/2007 | | $ | 5,400 | | $ | 0 | | $ | 9 |
Call & Put - OTC U.S. dollar versus Swiss franc Forward Delta Neutral Straddle | | Royal Bank of Scotland Group PLC | | 0.000 | | 09/26/2007 | | | 1,000 | | | 0 | | | 3 |
| | | | | | | | | | | | | | | |
| | | | | | | | | | | $ | 0 | | $ | 12 |
| | | | | | | | | | | | | | | |
(2) Exercise price and final cost determined on a future date, based upon implied volatility parameters.
(i) Written options outstanding on June 30, 2007:
Options on Exchange-Traded Futures Contracts
| | | | | | | | | | | | | |
| Description | | Exercise
Price | | Expiration
Date | | # of
Contracts | | Premium | | Value |
Call - CBOT U.S. Treasury 10-Year Note September Futures | | $ | 106.000 | | 08/24/2007 | | 56 | | $ | 15 | | $ | 34 |
Call - CBOT U.S. Treasury 10-Year Note September Futures | | | 109.000 | | 08/24/2007 | | 36 | | | 4 | | | 2 |
Call - CBOT U.S. Treasury 30-Year Bond September Futures | | | 109.000 | | 08/24/2007 | | 25 | | | 8 | | | 16 |
Call - OTC Dow Jones - AIG Commodity Index Total Return Futures | | | 191.000 | | 01/22/2008 | | 700,000 | | | 16 | | | 11 |
Call - OTC Dow Jones - AIG Commodity Index Total Return Futures | | | 230.000 | | 10/19/2010 | | 1,000,000 | | | 43 | | | 35 |
Put - CBOT U.S. Treasury 10-Year Note September Futures | | | 103.000 | | 08/24/2007 | | 56 | | | 16 | | | 6 |
Put - OTC Dow Jones - AIG Commodity Index Total Return Futures | | | 144.000 | | 01/22/2008 | | 700,000 | | | 22 | | | 5 |
Put - OTC Dow Jones - AIG Commodity Index Total Return Futures | | | 150.000 | | 10/19/2010 | | 1,000,000 | | | 82 | | | 67 |
| | | | | | | | | | | | | |
| | | | | | | | | $ | 206 | | $ | 176 |
| | | | | | | | | | | | | |
Interest Rate Swaptions
| | | | | | | | | | | | | | | | | | | |
| Description | | Counterparty | | Floating Rate Index | | Pay/Receive
Floating Rate | | Exercise
Rate | | Expiration
Date | | Notional
Amount | | Premium | | Value |
Call - OTC 5-Year Interest Rate Swap | | Royal Bank of Scotland Group PLC | | 3-Month USD-LIBOR | | Receive | | 4.950% | | 03/31/2008 | | $ | 2,000 | | $ | 25 | | $ | 7 |
Call - OTC 5-Year Interest Rate Swap | | Royal Bank of Scotland Group PLC | | 3-Month USD-LIBOR | | Receive | | 4.950% | | 09/26/2008 | | | 1,000 | | | 11 | | | 5 |
| | | | | | | | | | | | | | | | | | | |
| | | | | | | | | | | | | | | $ | 36 | | $ | 12 |
| | | | | | | | | | | | | | | | | | | |
(j) Restricted securities as of June 30, 2007:
| | | | | | | | | | | | | | |
| Issuer Description | | Coupon | | Maturity
Date | | Acquisition
Date | | Cost | | Market
Value | | Market Value
as Percentage
of Net Assets |
Bear Stearns Cos., Inc. | | 0.000% | | 10/19/2007 | | 06/22/2007 | | $ | 3,000 | | $ | 3,445 | | 1.47% |
Credit Suisse First Boston | | 5.255% | | 01/14/2008 | | 01/05/2007 | | | 5,300 | | | 6,546 | | 2.79% |
Morgan Stanley | | 0.000% | | 02/06/2008 | | 01/25/2007 | | | 13,000 | | | 15,027 | | 6.41% |
| | | | | | | | | | | | | | |
| | | | | | | | $ | 21,300 | | $ | 25,018 | | 10.67% |
| | | | | | | | | | | | | | |
| | | | | | |
| See Accompanying Notes | | Semiannual Report | | June 30, 2007 | | 13 |
| | |
| |
| Consolidated Schedule of Investments CommodityRealReturn™ Strategy Portfolio (Cont.) | | June 30, 2007 (Unaudited) |
(k) Short sales outstanding on June 30, 2007:
| | | | | | | | | | | | | |
| Description | | Coupon | | Maturity
Date | | Principal
Amount | | Proceeds | | Value (3) |
Treasury Inflation Protected Securities | | 2.375% | | 01/15/2017 | | $ | 103 | | $ | 100 | | $ | 101 |
Treasury Inflation Protected Securities | | 2.500% | | 07/15/2016 | | | 1,951 | | | 1,920 | | | 1,930 |
| | | | | | | | | | | | | |
| | | | | | | | | $ | 2,020 | | $ | 2,031 |
| | | | | | | | | | | | | |
(3) Market value includes $1 of interest payable on short sales.
(l) Foreign currency contracts outstanding on June 30, 2007:
| | | | | | | | | | | | | | | | | |
| Type | | Currency | | Principal
Amount
Covered by
Contract | | Settlement
Month | | Unrealized
Appreciation | | Unrealized
(Depreciation) | | | Net Unrealized
Appreciation/
(Depreciation) | |
Sell | | AUD | | 1 | | 07/2007 | | $ | 0 | | $ | 0 | | | $ | 0 | |
Buy | | BRL | | 1,096 | | 10/2007 | | | 1 | | | (4 | ) | | | (3 | ) |
Sell | | CAD | | 148 | | 08/2007 | | | 0 | | | (1 | ) | | | (1 | ) |
Sell | | CHF | | 222 | | 09/2007 | | | 0 | | | 0 | | | | 0 | |
Buy | | CNY | | 16,113 | | 01/2008 | | | 11 | | | 0 | | | | 11 | |
Buy | | | | 18,891 | | 03/2008 | | | 0 | | | (14 | ) | | | (14 | ) |
Buy | | | | 1,182 | | 03/2009 | | | 0 | | | 0 | | | | 0 | |
Sell | | EUR | | 458 | | 07/2007 | | | 0 | | | (6 | ) | | | (6 | ) |
Sell | | GBP | | 888 | | 08/2007 | | | 0 | | | (9 | ) | | | (9 | ) |
Sell | | JPY | | 17,760 | | 07/2007 | | | 2 | | | 0 | | | | 2 | |
Buy | | KRW | | 35,197 | | 07/2007 | | | 0 | | | 0 | | | | 0 | |
Buy | | | | 487,662 | | 09/2007 | | | 2 | | | 0 | | | | 2 | |
Buy | | MXN | | 4,936 | | 09/2007 | | | 1 | | | (1 | ) | | | 0 | |
Buy | | | | 1,222 | | 03/2008 | | | 1 | | | 0 | | | | 1 | |
Buy | | PLN | | 1,599 | | 09/2007 | | | 10 | | | 0 | | | | 10 | |
Buy | | RUB | | 14,607 | | 01/2008 | | | 5 | | | 0 | | | | 5 | |
Buy | | SGD | | 810 | | 07/2007 | | | 2 | | | 0 | | | | 2 | |
Sell | | | | 810 | | 07/2007 | | | 0 | | | (3 | ) | | | (3 | ) |
Buy | | | | 58 | | 08/2007 | | | 0 | | | 0 | | | | 0 | |
Buy | | | | 806 | | 10/2007 | | | 3 | | | 0 | | | | 3 | |
| | | | | | | | | | | | | | | | | |
| | | | | | | | $ | 38 | | $ | (38 | ) | | $ | 0 | |
| | | | | | | | | | | | | | | | | |
| | | | |
| 14 | | PIMCO Variable Insurance Trust | | See Accompanying Notes |
| | |
| |
| Notes to Financial Statements | | June 30, 2007 (Unaudited) |
1. ORGANIZATION
The CommodityRealReturn™ Strategy Portfolio (the “Portfolio”) is a series of the PIMCO Variable Insurance Trust (the “Trust”). The Trust is registered under the Investment Company Act of 1940 (the “Act”), as amended, as an open-end management investment company organized as a Delaware business trust on October 3, 1997. The Portfolio offers two classes of shares: Administrative and Advisor. Information presented on these financial statements pertains to the Administrative Class of the Portfolio. Certain detailed financial information for the Advisor Class is provided separately and is available upon request. The Trust is designed to be used as an investment vehicle by Separate Accounts of insurance companies that fund variable annuity contracts and variable life insurance policies and by qualified pension and retirement plans.
2. SIGNIFICANT ACCOUNTING POLICIES
The following is a summary of significant accounting policies consistently followed by the Portfolio in the preparation of its financial statements in conformity with accounting principles generally accepted in the United States of America (“GAAP”). The preparation of financial statements in accordance with GAAP requires management to make estimates and assumptions that affect the reported amounts and disclosures on the financial statements. Actual results could differ from those estimates.
(a) Security Valuation Portfolio securities are valued as of the close of regular trading (normally 4:00 p.m., Eastern Time) on each day that the New York Stock Exchange (“NYSE”) is open. Portfolio securities and other assets for which market quotes are readily available are stated at market value. Market value is generally determined on the basis of last reported sales prices, or if no sales are reported, based on quotes obtained from a quotation reporting system, established market makers, or pricing services. Fixed-income securities and non-exchange traded derivatives are normally valued on the basis of quotes obtained from brokers and dealers or pricing services. Prices obtained from independent pricing services use information provided by market makers or estimates of market values obtained from yield data relating to investments or securities with similar characteristics. Certain fixed income securities purchased on a delayed-delivery basis are marked to market daily until settlement at the forward settlement date. Short-term investments having a maturity of 60 days or less are generally valued at amortized cost. Exchange traded options, futures and options on futures are valued at the settlement price determined by the relevant exchange. With respect to any portion of the Portfolio’s assets that are invested in one or more open end management investment companies, the Portfolio’s net asset value (“NAV”) will be calculated based upon the NAVs of such investments.
Investments initially valued in currencies other than the U.S. dollar are converted to the U.S. dollar using exchange rates obtained from pricing services. As a result, the NAV of the Portfolio’s securities may be affected by changes in the value of currencies in relation to the U.S. dollar. The value of securities traded in markets outside the United States or denominated in currencies other than the U.S. dollar may be affected significantly on a day that the NYSE is closed and an investor is not able to purchase, redeem or exchange shares.
Securities and other assets for which market quotes are not readily available are valued at fair value as determined in good faith by the Board of Trustees or persons acting at their direction. The Board of Trustees has adopted methods for valuing securities and other assets in circumstances where market quotes are not readily available, and has delegated to Pacific Investment Management Company LLC (“PIMCO”) the responsibility for applying the valuation methods. In the event that market quotes are not readily available, and the security or asset cannot be valued pursuant to one of the valuation methods, the value of the security or asset will be determined in good faith by the Valuation Committee of the Board of Trustees, generally based upon recommendations provided by PIMCO.
Market quotes are considered not readily available in circumstances where there is an absence of current or reliable market-based data (e.g., trade information, bid/asked information, broker quotes), including where events occur after the close of the relevant market, but prior to the close of regular trading, that materially affect the values of the Portfolio’s securities or assets. In addition, market quotes are considered not readily available when, due to extraordinary circumstances, the exchanges or markets on which the securities trade, do not open for trading for the entire day and no other market prices are available. The Board has delegated to PIMCO the responsibility for monitoring significant events that may materially affect the values of the Portfolio’s securities or assets and for determining whether the value of the applicable securities or assets should be re-evaluated in light of such significant events.
When the Portfolio uses fair value pricing to determine its NAV, securities will not be priced on the basis of quotations from the primary market in which they are traded, but rather may be priced by another method that the Board of Trustees or persons acting at their direction believe accurately reflects fair value. The Trust’s policy is intended to result in a calculation of the Portfolio’s NAV that fairly reflects security values as of the time of pricing. However, fair values determined by the Board of Trustees or persons acting at their direction may not accurately reflect the price that the Portfolio could obtain for a security if it were to dispose of that security as of the time of pricing. Because foreign securities can trade on non-business days of the Portfolio, the NAV of the Portfolio may change on days when shareholders will not be able to purchase or redeem Portfolio shares. The prices used by the Portfolio may differ from the value that would be realized if the securities were sold and the differences could be material to the financial statements.
(b) Securities Transactions and Investment Income Securities transactions are recorded as of the trade date for financial reporting purposes. Securities purchased or sold on a when-issued or delayed-delivery basis may be settled a month or more after the trade date. Realized gains and losses from securities sold are recorded on the identified cost basis. Dividend income is recorded on the ex-dividend date, except certain dividends from foreign securities where the ex-dividend date may have passed, which are recorded as soon as the Portfolio is informed of the ex-dividend date. Interest income, adjusted for the accretion of discounts and amortization of premiums, is recorded on the accrual basis. Paydown gains and losses on mortgage-related and other asset-backed securities are recorded as components of interest income on the Statement of Operations.
(c) Delayed-Delivery Transactions The Portfolio may purchase or sell securities on a delayed-delivery basis. These transactions involve a commitment by the Portfolio to purchase or sell securities for a predetermined price or yield, with payment and delivery taking place beyond the customary settlement period. When delayed-delivery purchases are outstanding, the Portfolio will designate liquid assets in an amount sufficient to meet the purchase price. When purchasing a security on a delayed-delivery basis, the Portfolio assumes the rights and risks of ownership of the security, including the risk of price and yield fluctuations, and takes such fluctuations into account when determining its net asset value. The Portfolio may dispose of or renegotiate a delayed-delivery transaction after it is entered into, and may sell when-issued securities before they are delivered, which may result in a capital gain or loss. When the Portfolio has sold a security on a delayed-delivery basis, the Portfolio does not participate in future gains and losses with respect to the security.
(d) Dividends and Distributions to Shareholders Dividends from net investment income, if any, are declared and distributed to shareholders quarterly. Net realized capital gains earned by the Portfolio, if any, will be distributed no less frequently than once each year.
Income dividends and capital gain distributions are determined in accordance with income tax regulations which may differ from GAAP. Differences between tax regulations and GAAP may change the fiscal year when income and capital items
| | | | | | |
| | Semiannual Report | | June 30, 2007 | | 15 |
Notes to Financial Statements (Cont.)
are recognized for tax and GAAP purposes. Examples of events that give rise to timing differences include wash sales, straddles, net operating losses and capital loss carryforwards. Further, the character of investment income and capital gains may be different for certain transactions under the two methods of accounting. Examples of characterization differences include the treatment of mortgage paydowns, swaps, foreign currency transactions and contingent debt instruments. As a result, income dividends and capital gain distributions declared during a fiscal period may differ significantly from the net investment income and realized capital gain reported on the Portfolio’s annual financial statements presented under GAAP.
Distributions classified as a tax basis return of capital, if any, are reflected on the accompanying Statements of Changes in Net Assets and have been reclassified to paid in capital. In addition, other amounts have been reclassified between undistributed net investment income, accumulated undistributed net realized gains or losses and/or paid in capital to more appropriately conform financial accounting to tax characterizations of dividend distributions.
(e) Multiclass Operations Each class offered by the Portfolio has equal rights as to assets and voting privileges (except that shareholders of a class have exclusive voting rights regarding any matter relating solely to that class of shares). Income and non-class specific expenses of the Portfolio are allocated daily to each class of shares based on the relative value of settled shares. Realized and unrealized capital gains and losses of the Portfolio are allocated daily to each class of shares based on the relative net assets of each class. Class specific expenses, where applicable, currently include administrative, distribution and servicing fees.
(f) Foreign Currency The functional and reporting currency for the Portfolio is the U.S. dollar. The market values of foreign securities, currency holdings and other assets and liabilities are translated into U.S. dollars based on the current exchange rates each business day. Fluctuations in the value of currency holdings and other assets and liabilities resulting from changes in exchange rates are recorded as unrealized foreign currency gains or losses. Realized gains or losses and unrealized appreciation or depreciation on investment securities and income and expenses are translated on the respective dates of such transactions. The effects of changes in foreign currency exchange rates on investments in securities are not segregated on the Statement of Operations from the effects of changes in market prices of those securities, but are included with the net realized and unrealized gain or loss on investment securities.
| | | | | | |
|
| Non-U.S. currency symbols utilized throughout the report are defined as follows: |
| AUD | | Australian Dollar | | JPY | | Japanese Yen |
| BRL | | Brazilian Real | | KRW | | South Korean Won |
| CAD | | Canadian Dollar | | MXN | | Mexican Peso |
| CHF | | Swiss Franc | | PLN | | Polish Zloty |
| CNY | | Chinese Yuan Renminbi | | RUB | | Russian Ruble |
| EUR | | Euro | | SGD | | Singapore Dollar |
| GBP | | Great British Pound | | | | |
(g) Foreign Currency Transactions The Portfolio may enter into foreign currency contracts in connection with settling planned purchases or sales of securities, to hedge the currency exposure associated with some or all of the Portfolio’s securities or as a part of an investment strategy. A foreign currency contract is an agreement between two parties to buy and sell a currency at a set price on a future date. The market value of a foreign currency contract fluctuates with changes in foreign currency exchange rates. Foreign currency contracts are marked to market daily and the change in value is recorded by the Portfolio as an
unrealized gain or loss. Realized gains or losses equal to the difference between the value of the contract at the time it was opened and the value at the time it was closed are recorded upon delivery or receipt of the currency. These contracts may involve market risk in excess of the unrealized gain or loss reflected on the Statement of Assets and Liabilities. In addition, the Portfolio could be exposed to risk if the counterparties are unable to meet the terms of the contracts or if the value of the currency changes unfavorably to the U.S. dollar.
(h) Futures Contracts The Portfolio may enter into futures contracts. The Portfolio may use futures contracts to manage its exposure to the securities markets or to movements in interest rates and currency values. The primary risks associated with the use of futures contracts are the imperfect correlation between the change in market value of the securities held by the Portfolio and the prices of futures contracts, the possibility of an illiquid market, and the inability of the counterparty to meet the terms of the contract. Futures contracts are valued based upon their quoted daily settlement prices. Upon entering into a futures contract, the Portfolio is required to deposit with its futures broker, an amount of cash or U.S. Government and Agency Obligations in accordance with the initial margin requirements of the broker or exchange. Futures contracts are marked to market daily and an appropriate payable or receivable for the change in value (“variation margin”) is recorded by the Portfolio. Gains or losses are recognized but not considered realized until the contracts expire or are closed. Futures contracts involve, to varying degrees, risk of loss in excess of the variation margin disclosed on the Statement of Assets and Liabilities.
(i) Inflation-Indexed Bonds The Portfolio may invest in inflation-indexed bonds. Inflation-indexed bonds are fixed-income securities whose principal value is periodically adjusted to the rate of inflation. The interest rate on these bonds is generally fixed at issuance at a rate lower than typical bonds. Over the life of an inflation-indexed bond, however, interest will be paid based on a principal value, which is adjusted for inflation. Any increase in the principal amount of an inflation-indexed bond will be included as interest income on the Statement of Operations, even though investors do not receive their principal until maturity.
(j) Options Contracts The Portfolio may write call and put options on futures, swaps, securities or currencies it owns or in which it may invest. Writing put options tends to increase the Portfolio’s exposure to the underlying instrument. Writing call options tends to decrease the Portfolio’s exposure to the underlying instrument. When the Portfolio writes a call or put option, an amount equal to the premium received is recorded as a liability and subsequently marked to market to reflect the current value of the option written. These liabilities are reflected as written options outstanding on the Statement of Assets and Liabilities. Certain options may be written with premiums to be determined on a future date. The premiums for these options are based upon implied volatility parameters at specified terms. Premiums received from writing options which expire are treated as realized gains. Premiums received from writing options which are exercised or closed are added to the proceeds or offset against amounts paid on the underlying future, swap, security or currency transaction to determine the realized gain or loss. The Portfolio as a writer of an option has no control over whether the underlying future, swap, security or currency may be sold (call) or purchased (put) and as a result bears the market risk of an unfavorable change in the price of the future, swap, security or currency underlying the written option. There is the risk the Portfolio may not be able to enter into a closing transaction because of an illiquid market.
The Portfolio may also purchase put and call options. Purchasing call options tends to increase the Portfolio’s exposure to the underlying instrument. Purchasing put options tends to decrease the Portfolio’s exposure to the underlying instrument. The Portfolio pays a premium which is included on the Statement of Assets and Liabilities as an investment and subsequently marked to market to reflect the current value of the option. Premiums paid for purchasing options which expire are
| | | | |
| 16 | | PIMCO Variable Insurance Trust | | |
| | |
| |
| | | June 30, 2007 (Unaudited) |
treated as realized losses. Certain options may be purchased with premiums to be determined on a future date. The premiums for these options are based upon implied volatility parameters at specified terms. The risk associated with purchasing put and call options is limited to the premium paid. Premiums paid for purchasing options which are exercised or closed are added to the amounts paid or offset against the proceeds on the underlying future, swap, security or currency transaction to determine the realized gain or loss.
(k) Repurchase Agreements The Portfolio may engage in repurchase transactions. Under the terms of a typical repurchase agreement, the Portfolio takes possession of an underlying debt obligation (collateral) subject to an obligation of the seller to repurchase, and the Portfolio to resell, the obligation at an agreed-upon price and time. The underlying securities for all repurchase agreements are held in safekeeping at the Portfolio’s custodian or designated subcustodians under tri-party repurchase agreements. The market value of the collateral must be equal to or exceed the total amount of the repurchase obligations, including interest. Securities purchased under repurchase agreements are reflected as an asset on the Statement of Assets and Liabilities. Generally, in the event of counterparty default, the Portfolio has the right to use the collateral to offset losses incurred. If the counterparty should default, the Portfolio will seek to sell the securities which it holds as collateral. This could involve procedural costs or delays in addition to a loss on the securities if their value should fall below their repurchase price.
(l) Inverse Floating Rate Transactions—Residual Interest Municipal Bonds (“RIBs”)/Residual Interest Tax Exempt Bonds (“RITEs”) The Portfolio may invest in RIBs and RITEs (“Inverse Floaters”). Inverse Floaters are created via a master trust agreement between a broker-dealer, acting as trustor and liquidity provider, and an investment bank, acting as trustee and tender agent. The master trust agreement defines the terms for each trust series; with each series being established by the transfer of long-term, fixed-rate municipal bonds (“Fixed Rate Bonds”) to the trustee to be held and provide for the creation, execution and delivery of floater certificates (“Floating Rate Notes”) and Inverse Floaters. Floating Rate Notes are liquid notes that are issued with a short-term variable rate typically linked to the LIBOR, subject to limitations, for some duration. After interest income is paid on the Floating Rate Notes at current rates, the residual income from the Fixed Rate Bonds is paid to the Inverse Floaters. Inverse Floaters are issued with a coupon that fluctuates inversely with the Floating Rate Notes’ referenced rate, subject to certain limitations. Therefore, rising short-term rates result in lower income for the Inverse Floaters and vice versa.
Floating Rate Notes are generally remarketed to municipal money market funds. Inverse Floaters are acquired by either tax-exempt municipal bond funds or trusts, or other parties interested in potentially higher yielding tax-exempt securities. Inverse Floaters may also be acquired for the purpose of increasing leverage. Floating Rate Note holders typically have the option to tender their notes to the liquidity provider for redemption at par at each reset date. The Inverse Floater holders have the option to (i) require the Floating Rate Note holders to tender their notes at par, and (ii) require the liquidity provider to transfer the Fixed Rate Bonds to the Inverse Floater holders. The holders of Inverse Floaters bear substantially all of the downside investment risk associated with the underlying Fixed Rate Bonds, and also benefit from a disproportionate amount of the potential appreciation of the underlying Fixed Rate Bonds’ value. Inverse Floaters may be more volatile and less liquid than other municipal bonds of comparable maturity.
Inverse Floaters may be acquired with or without first transferring to the trustor the Fixed Rate Bonds that were utilized to create the trust series. Inverse Floaters acquired without a transfer of Fixed Rate Bonds are recognized as purchases of securities as outlined in Note 2(b). Statement of Financial Accounting Standards No. 140—Accounting for Transfers and Servicing of Financial Assets and Extinguishments of Liabilities (“FAS No. 140”), governs the standards for accounting for securitizations and other transfers of financial assets. If there is a
transfer of Fixed Rate Bonds and it meets sale criteria under FAS No. 140, a Portfolio records a sale of the Fixed Rate Bonds and a purchase of the Inverse Floaters. The cash received from the Inverse Floaters is then recorded as interest income in the Statement of Operations.
If the transfer of Fixed Rate Bonds does not meet sale criteria under FAS No. 140, a Portfolio accounts for the transaction described above as a secured borrowing by including the Fixed Rate Bonds in its Schedule of Investments, and recording the Floating Rate Notes as a liability under the caption “Payable for floating rate notes” in the Portfolio’s Statement of Assets and Liabilities. In a secured borrowing transaction, cash received from the Inverse Floaters is not recorded as interest income. Instead, a Portfolio records interest income related to the Fixed Rate Bonds and interest expense related to the Floating Rate Notes, the net of which is equal to the cash received from the Inverse Floaters acquired by the Portfolio. Thus, while a Portfolio’s reported total income, net expenses, and net expense ratio are generally higher for investments in Inverse Floaters acquired via a secured borrowing, the method of acquiring Inverse Floaters does not result in differences for reported cash flows, net asset value or total return.
(m) Restricted Securities The Portfolio may invest in securities that are subject to legal or contractual restrictions on resale. These securities generally may be resold in transactions exempt from registration or to the public if the securities are registered. Disposal of these securities may involve time-consuming negotiations and expenses, and prompt sale at an acceptable price may be difficult. Securities acquired under the provisions of Rule 144A can only be traded between qualified institutional investors. The Board of Trustees considers 144A securities to be liquid.
(n) Short Sales The Portfolio may enter into short sales transactions. A short sale is a transaction in which the Portfolio sells securities it does not own in anticipation of a decline in the market price of the securities. Securities sold in short sale transactions and interest payable on such securities, if any, are reflected as a liability on the Statement of Assets and Liabilities. The Portfolio is obligated to deliver securities at the market price at the time the short position is closed. Possible losses from short sales may be unlimited, whereas losses from purchases cannot exceed the total amount invested.
(o) Swap Agreements The Portfolio may invest in swap agreements. Swap transactions are privately negotiated agreements between the Portfolio and a counterparty to exchange or swap investment cash flows, assets, or market-linked returns at specified, future intervals. The Portfolio may enter into interest rate, total return, forward spread-lock, credit default, and other forms of swap agreements to manage its exposure to interest rates and credit risk. In connection with these agreements, securities may be identified as collateral in accordance with the terms of the respective swap agreements.
Interest rate swap agreements involve the exchange by the Portfolio with another party of their respective commitments to pay or receive interest, e.g., an exchange of floating rate payments for fixed rate payments with respect to the notional amount of principal. Certain forms of interest rate swap agreements may include: (i) interest rate caps, under which, in return for a premium, one party agrees to make payments to the other to the extent that interest rates exceed a specified rate, or “cap”, (ii) interest rate floors, under which, in return for a premium, one party agrees to make payments to the other to the extent that interest rates fall below a specified rate, or “floor”, or (iii) interest rate collars, under which a party sells a cap and purchases a floor or vice versa in an attempt to protect itself against interest rate movements exceeding given minimum or maximum levels.
Total return swap agreements involve commitments to pay interest in exchange for a market-linked return, both based on notional amounts. To the extent the total return of the security or index underlying the transaction exceeds or falls short of the offsetting interest rate obligation, the Portfolio will receive a payment from or make a payment to the counterparty.
| | | | | | |
| | Semiannual Report | | June 30, 2007 | | 17 |
Notes to Financial Statements (Cont.)
Forward spread-lock swap agreements involve commitments to pay or receive a settlement amount calculated as the difference between the swap spread and a fixed spread, multiplied by the notional amount times the duration of the swap. The swap spread is the difference between the benchmark swap rate (market rate) and the specific Treasury rate.
Credit default swap agreements involve one party making a stream of payments to another party in exchange for the right to receive a specified return in the event of a default by a third party, typically corporate issues or sovereign issues of an emerging country, on its obligation. The Portfolio may use credit default swaps to provide a measure of protection against defaults of the issuers (i.e., to reduce risk where the Portfolio owns or has exposure to the sovereign issuer) or to take an active long or short position with respect to the likelihood of a particular issuer’s default. As a seller of protection, the Portfolio generally receives an upfront payment or a fixed rate of income throughout the term of the swap provided that there is no credit event. If the Portfolio is a seller of protection and a credit event occurs, as defined under the terms of that particular swap agreement, the Portfolio will pay to the buyer of the protection an amount up to the notional value of the swap and in certain instances take delivery of the security. As the seller, the Portfolio would effectively add leverage to its portfolio because, in addition to its total net assets, the Portfolio would be subject to investment exposure on the notional amount of the swap. As a buyer of protection, the Portfolio generally receives an amount up to the notional value of the swap if a credit event occurs. The treatment of credit default swaps and other swap agreements that provide for contingent, non-periodic, bullet-type payments as “notional principal contracts” for U.S. federal income tax purposes is uncertain. Were the U.S. Internal Revenue Service (“IRS”) to take the position that a credit default swap or other bullet-type swap is not a “notional principal contract” for U.S. federal income tax purposes, payments received by the Portfolio from such investments might be subject to U.S. excise or income taxes.
Swaps are marked to market daily based upon quotations from market makers and the change in value, if any, is recorded as unrealized gain or loss on the Statement of Operations. Payments received or made at the beginning of the measurement period are reflected as such on the Statement of Assets and Liabilities. These upfront payments are recorded as realized gain or loss on the Statement of Operations upon termination or maturity of the swap. A liquidation payment received or made at the termination of the swap is recorded as realized gain or loss on the Statement of Operations. Net periodic payments received or paid by the Portfolio are included as part of realized gain or loss on the Statement of Operations. Entering into these agreements involves, to varying degrees, elements of credit, market and documentation risk in excess of the amounts recognized on the Statement of Assets and Liabilities. Such risks involve the possibility that there will be no liquid market for these agreements, that the counterparty to the agreements may default on its obligation to perform or disagree as to the meaning of contractual terms in the agreements and that there may be unfavorable changes in interest rates.
(p) Commodities Index-Linked/Structured Notes The Portfolio invests in structured notes whose value is based on the price movements of a commodity index. The structured notes are often leveraged, increasing the volatility of each note’s value relative to the change in the underlying linked financial element. The value of these notes will rise and fall in response to changes in the underlying commodity index. Structured notes may entail a greater degree of market risk than other types of debt securities because the investor bears the risk of the underlying commodity index. Structured notes may also be more volatile, less liquid, and more difficult to accurately price than less complex securities or more traditional debt securities. Fluctuations in value of the structured notes are recorded as unrealized gains and losses on the accompanying financial statements. Net payments are recorded as net realized gains and losses. These notes are subject to prepayment, credit and interest risks. The Portfolio has the option to request
prepayment from the issuer. At maturity, or when a note is sold, the Portfolio records a realized gain or loss. At June 30, 2007, the value of these securities comprised 22.9% of the Portfolio’s net assets and resulted in unrealized appreciation of $4,766,210.
(q) Mortgage-Related and Other Asset-Backed Securities The Portfolio may invest in mortgage-related or other asset-backed securities. These securities include mortgage pass-through securities, collateralized mortgage obligations (“CMOs”), commercial mortgage-backed securities, mortgage dollar rolls, CMO residuals, stripped mortgage-backed securities (“SMBSs”) and other securities that directly or indirectly represent a participation in, or are secured by and payable from, mortgage loans on real property. The value of some mortgage-related or asset-backed securities may be particularly sensitive to changes in prevailing interest rates. Early repayment of principal on some mortgage-related securities may expose the Portfolio to a lower rate of return upon reinvestment of principal. The value of these securities may fluctuate in response to the market’s perception of the creditworthiness of the issuers. Additionally, although mortgages and mortgage-related securities are generally supported by some form of government or private guarantee and/or insurance, there is no assurance that private guarantors or insurers will meet their obligations.
(r) U.S. Government Agencies or Government-Sponsored Enterprises Securities issued by U.S. Government agencies or government-sponsored enterprises may not be guaranteed by the U.S. Treasury. The Government National Mortgage Association (“GNMA” or “Ginnie Mae”), a wholly owned U.S. Government corporation, is authorized to guarantee, with the full faith and credit of the U.S. Government, the timely payment of principal and interest on securities issued by institutions approved by GNMA and backed by pools of mortgages insured by the Federal Housing Administration or guaranteed by the Department of Veterans Affairs. Government-related guarantors (i.e., not backed by the full faith and credit of the U.S. Government) include the Federal National Mortgage Association (“FNMA” or “Fannie Mae”) and the Federal Home Loan Mortgage Corporation (“FHLMC” or “Freddie Mac”). Pass-through securities issued by FNMA are guaranteed as to timely payment of principal and interest by FNMA but are not backed by the full faith and credit of the U.S. Government. FHLMC guarantees the timely payment of interest and ultimate collection of principal, but its participation certificates are not backed by the full faith and credit of the U.S. Government.
(s) New Accounting Policies In July 2006, the Financial Accounting Standards Board (“FASB”) issued Interpretation No. 48, “Accounting for Uncertainty in Income Taxes—an Interpretation of FASB Statement No. 109” (the “Interpretation”). The Interpretation became effective for the Portfolio on June 29, 2007. Management has evaluated the application of the Interpretation in relation to the Portfolio and has concluded that no single filing position or combination of filing positions identified as uncertain tax positions required the accrual of a tax liability in the accounting records of the Portfolio for the period ending June 30, 2007. Management will monitor all existing filing positions and future filing positions in light of the Interpretation and evaluate the need for any future tax accruals and financial statement disclosures as warranted.
In September 2006, the FASB issued Statement of Financial Accounting Standards No. 157, “Fair Value Measurements” (the “Statement”). The Statement is effective for fiscal years beginning after November 15, 2007 and will require expanded disclosure about fair value measurements, separately for each major category of assets and liabilities, that enables shareholders to assess the inputs used to develop those measurements, and for recurring fair value measurements using significant unobservable inputs the effect of the measurements on changes in net assets for the reporting period. Management is currently evaluating the application of the Statement to the Portfolio and will provide additional information in relation to the Statement on the Portfolio’s annual financial statements for the period ending December 31, 2007.
| | | | |
| 18 | | PIMCO Variable Insurance Trust | | |
| | |
| |
| | | June 30, 2007 (Unaudited) |
3. BASIS FOR CONSOLIDATION OF THE PIMCO COMMODITYREALRETURN™ STRATEGY PORTFOLIO
The PIMCO Cayman Commodity Portfolio I Ltd. (the “Subsidiary”), a Cayman Islands exempted company, was incorporated on July 21, 2006 as a wholly owned subsidiary acting as an investment vehicle for the Portfolio in order to effect certain investments for the Portfolio consistent with the Portfolio’s investment objectives and policies specified in its prospectus and statement of additional information. A subscription agreement was entered into between the Portfolio and the Subsidiary on August 1, 2006, comprising the entire issued share capital of the Subsidiary with the intent that the Portfolio will remain the sole shareholder and retain all rights. Under the Articles of Association of the Subsidiary, shares issued by the Subsidiary confer upon a shareholder the right to receive notice of, to attend and to vote at general meetings of the Subsidiary and shall confer upon the shareholder rights in a winding-up or repayment of capital and the right to participate in the profits or assets of the Subsidiary. As of June 30, 2007, net assets of the Portfolio were approximately $234 million, of which approximately $16 million, or roughly 6.8%, represented the Portfolio’s ownership of all issued shares and voting rights of the Subsidiary.
4. FEES AND EXPENSES
(a) Investment Advisory Fee PIMCO is a majority-owned subsidiary of Allianz Global Investors of America L.P. (“AGI”), and serves as investment adviser (the “Adviser”) to the Trust, pursuant to an investment advisory contract. The Adviser receives a monthly fee from the Portfolio, at an annual rate based on average daily net assets. The Advisory Fee for all classes is charged at an annual rate of 0.49%.
(b) Administration Fee PIMCO serves as administrator (the “Administrator”), and provides administrative services to the Trust for which it receives a monthly administrative fee based on each share class’s average daily net assets. As the Administrator, PIMCO bears the costs of various third-party services, including audit, custodial, portfolio accounting, legal, transfer agency and printing costs. The Administration Fee for all classes is charged at the annual rate of 0.25%.
(c) Distribution and Servicing Fees Allianz Global Investors Distributors LLC (“AGID”) is an indirect wholly-owned subsidiary of AGI and serves as the distributor (the “Distributor”) of the Trust’s shares. The Trust is permitted to reimburse AGID on a quarterly basis, out of the Administrative Class assets of the Portfolio in the amount of 0.15% on an annual basis of the average daily net assets of that class, for payments made to financial intermediaries that provide services in connection with the distribution of shares or administration of plans or programs that use Portfolio shares as their funding medium. The effective rate paid to AGID was 0.15% during the current fiscal year.
The Trust has adopted a Distribution Plan, for the Advisor Class shares of the Portfolio (the “Plan”). The Plan has been adopted pursuant to Rule 12b-1 under the Act. The Plan permits payments for expenses in connection with the distribution and marketing of Advisor Class shares and/or the provision of shareholder services to Advisor Class shareholders. The Plan permits the Portfolio to make total payments at an annual rate of 0.25% of its average daily net assets attributable to its Advisor Class shares.
(d) Portfolio Expenses The Trust is responsible for the following expenses: (i) salaries and other compensation of any of the Trust’s executive officers and employees who are not officers, directors, stockholders or employees of PIMCO or its subsidiaries or affiliates; (ii) taxes and governmental fees; (iii) brokerage fees and commissions and other portfolio transaction expenses; (iv) the costs of borrowing money, including interest expenses and bank overdraft charges; (v) fees and expenses of the Trustees who are not “interested persons” of PIMCO or the Trust, and any counsel retained exclusively for their benefit; (vi) extraordinary expenses, including costs of litigation and indemnification expenses;
(vii) organization expenses and (viii) any expenses allocated or allocable to a specific class of shares, which include service fees payable with respect to the Administrative Class Shares, and may include certain other expenses as permitted by the Trust’s Multiple Class Plan adopted pursuant to Rule 18f-3 under the Act and subject to review and approval by the Trustees. The ratio of expenses to average net assets per share class, as disclosed in the Financial Highlights, may differ from the annual portfolio operating expenses per share class as disclosed in the Prospectus for the reasons set forth above.
Effective April 1, 2007, each Trustee, other than those affiliated with PIMCO or its affiliates, receives an annual retainer of $15,000, plus $2,375 for each Board of Trustees meeting attended in person, $500 for each committee meeting attended and $750 for each Board of Trustees meeting attended telephonically, plus reimbursement of related expenses. In addition, the audit committee chair receives an additional annual retainer of $2,000 and each other committee chair receives an additional annual retainer of $500. These expenses are allocated on a pro-rata basis to the various portfolios of the Trust according to their respective net assets. The Trust pays no compensation directly to any Trustee or any other officer who is affiliated with the Administrator, all of whom receive remuneration for their services to the Trust from the Administrator or its affiliates. Prior to April 1, 2007, each Trustee, other than those affiliated with PIMCO or its affiliates, received an annual retainer of $15,000 plus $2,000 for each Board of Trustees meeting attended ($500 for each special meeting attended), plus reimbursement of related expenses. The Audit Committee Chairman received an annual retainer of $1,500 and the Governance Committee Chairman received an annual retainer of $500. In addition, each member of a committee received $500 for each committee meeting attended.
(e) Expense Limitation PIMCO has contractually agreed to reduce total annual portfolio operating expenses for the Portfolio by waiving a portion of its administrative fee or reimbursing the Portfolio, to the extent that they would exceed, due to the payment of organizational expenses and pro rata Trustees’ fees, the sum of such Portfolio’s advisory fee, service fees, distribution fees (with respect to Advisor Class only), administrative fees and other expenses borne by the Portfolio not covered by the administrative fee as described above (other than organizational expenses and pro rata Trustees’ fees), plus 0.49 basis points. PIMCO may recoup these waivers and reimbursements for a period not exceeding three years, provided that total expenses, including such recoupment, do not exceed the annual expense limit. As of June 30, 2007, the recoverable amount to the Administrator was $1,758.
(f) Acquired Fund Fees and Expenses The Subsidiary has entered into a separate contract with PIMCO for the management of the Subsidiary’s portfolio pursuant to which the Subsidiary pays PIMCO a management fee and administration fee at the annual rates of 0.49% and 0.20%, respectively, of its net assets. PIMCO has contractually agreed to waive the advisory fee and the administration fee it receives from the Portfolio in an amount equal to the advisory fee and administration fee, respectively, paid to PIMCO by the Subsidiary. This waiver may not be terminated by PIMCO and will remain in effect for as long as PIMCO’s contract with the Subsidiary is in place. The waiver is reflected in the Statement of Operations as a component of Reimbursement by Manager. For the period ended June 30, 2007, the amount was $100,253.
5. RELATED PARTY TRANSACTIONS
The Adviser, Administrator, and Distributor are related parties as defined by FAS 57, Related Party Disclosures. Fees payable to these parties are disclosed in Note 3.
| | | | | | |
| | Semiannual Report | | June 30, 2007 | | 19 |
Notes to Financial Statements (Cont.)
6. GUARANTEES AND INDEMNIFICATIONS
Under the Trust’s organizational documents, each Trustee, officer, employee or other agent of the Trust (including the Trust’s investment manager) is indemnified, to the extent permitted by the Act, against certain liabilities that may arise out of performance of their duties to the Portfolio. Additionally, in the normal course of business, the Portfolio enters into contracts that contain a variety of indemnification clauses. The Portfolio’s maximum exposure under these arrangements is unknown as this would involve future claims that may be made against the Portfolio that have not yet occurred. However, the Portfolio has not had prior claims or losses pursuant to these contracts and believes the risk of loss to be remote.
7. PURCHASES AND SALES OF SECURITIES
The length of time the Portfolio has held a particular security is not generally a consideration in investment decisions. A change in the securities held by the Portfolio is known as “portfolio turnover”. The Portfolio may engage in frequent and active trading of portfolio securities to achieve its investment objective, particularly during periods of volatile market movements. High portfolio turnover (e.g., over 100%) involves correspondingly greater expenses to the Portfolio, including brokerage commissions or dealer mark-ups and other transaction costs on the sale of securities and reinvestments in other securities. Such sales may also result in realization of taxable capital gains, including short-term capital gains (which are generally taxed at ordinary income tax rates). The trading costs and tax effects associated with portfolio turnover may adversely affect the Portfolio’s performance.
Purchases and sales of securities (excluding short-term investments) for the period ended June 30, 2007, were as follows (amounts in thousands):
| | | | | | | | | | | | |
| U.S. Government/Agency | | | | All Other |
| Purchases | | Sales | | | | Purchases | | Sales |
| $ | 1,485,087 | | $ | 1,443,588 | | | | $ | 84,138 | | $ | 52,868 |
8. TRANSACTIONS IN WRITTEN CALL AND PUT OPTIONS
Transactions in written call and put options were as follows (amounts in thousands, except for number of contracts):
| | | | | | | | | | | | | |
| | | | | # of
Contracts | | | Notional
Amount
in $ | | | Premium | |
Balance at 12/31/2006 | | | | 2,000,034 | | | $ | 13,200 | | | $ | 218 | |
Sales | | | | 1,400,297 | | | | 3,000 | | | | 160 | |
Closing Buys | | | | 0 | | | | (9,000 | ) | | | (74 | ) |
Expirations | | | | (158 | ) | | | (4,200 | ) | | | (62 | ) |
Exercised | | | | 0 | | | | 0 | | | | 0 | |
Balance at 06/30/2007 | | | | 3,400,173 | | | $ | 3,000 | | | $ | 242 | |
9. SHARES OF BENEFICIAL INTEREST
The Portfolio may issue an unlimited number of shares of beneficial interest with a $0.001 par value. Changes in shares of beneficial interest were as follows (shares and amounts in thousands):
| | | | | | | | | | | | |
| | | | | Six Months Ended
06/30/2007 | | Year Ended
12/31/2006 |
| | | | | Shares | | Amount | | Shares | | Amount |
| | | | | |
Receipts for shares sold | | | | | | | | | | | | |
Administrative Class | | | | 4,675 | | $ | 53,682 | | 11,598 | | $ | 138,795 |
Advisor Class | | | | 823 | | | 9,592 | | 588 | | | 7,074 |
| | | | | | | | | | | | | | | | |
| | | | | Six Months Ended
06/30/2007 | | | Year Ended
12/31/2006 | |
| | | | | Shares | | | Amount | | | Shares | | | Amount | |
Issued as reinvestment of distributions | | | | | | | | | | | | | | | | |
Administrative Class | | | | 307 | | | $ | 3,557 | | | 689 | | | $ | 7,849 | |
Advisor Class | | | | 14 | | | | 165 | | | 18 | | | | 199 | |
Cost of shares redeemed | | | | | | | | | | | | | | | | |
Administrative Class | | | | (1,699 | ) | | | (19,591 | ) | | (5,022 | ) | | | (60,877 | ) |
Advisor Class | | | | (116 | ) | | | (1,317 | ) | | (68 | ) | | | (812 | ) |
Net increase resulting from Portfolio share transactions | | | | 4,004 | | | $ | 46,088 | | | 7,803 | | | $ | 92,228 | |
The following schedule shows the number of shareholders each owning 5% or more of the Portfolio and the total percentage of the Portfolio held by such shareholders:
| | | | | | |
| | | | | Number of Shareholders | | % of Portfolio Held |
Administrative Class | | | | 5 | | 84 |
Advisor Class | | | | 5 | | 100 |
10. REGULATORY AND LITIGATION MATTERS
Since February 2004, PIMCO, Allianz Global Investors of America L.P. (PIMCO’s parent company), AGID, and certain of their affiliates, including the PIMCO Funds (another series of funds managed by PIMCO), the Allianz Funds (formerly known as PIMCO Funds: Multi-Manager Series (another series of funds managed by affiliates of PIMCO)), certain Trustees of the Trust (in their capacity as Trustees of the PIMCO Funds or the Allianz Funds) and certain employees of PIMCO, have been named as defendants in fifteen lawsuits filed in various jurisdictions. Eleven of those lawsuits concern “market timing,” and they have been transferred to and consolidated for pre-trial proceedings in a multi-district litigation proceeding in the U.S. District Court for the District of Maryland; the other four lawsuits concern “revenue sharing” and have been consolidated into a single action in the U.S. District Court for the District of Connecticut. The lawsuits have been commenced as putative class actions on behalf of investors who purchased, held or redeemed shares of the various series of the PIMCO Funds and the Allianz Funds during specified periods, or as derivative actions on behalf of the PIMCO Funds and the Allianz Funds.
The market timing actions in the District of Maryland generally allege that certain hedge funds were allowed to engage in “market timing” in certain funds of the PIMCO Funds and the Allianz Funds and this alleged activity was not disclosed. Pursuant to tolling agreements entered into with the derivative and class action plaintiffs, PIMCO, certain PIMCO Funds Trustees, and certain employees of PIMCO who were previously named as defendants have all been dropped as defendants in the market timing actions; the plaintiffs continue to assert claims on behalf of the shareholders of the PIMCO Funds or on behalf of the PIMCO Funds itself against other defendants. By order dated November 3, 2005, the U.S. District Court for the District of Maryland granted the PIMCO Funds’ motion to dismiss claims asserted against it in a consolidated amended complaint where the PIMCO Funds were named, in the complaint, as a nominal defendant. The revenue sharing action in the District of Connecticut generally alleges that fund assets were inappropriately used to pay brokers to promote funds of the PIMCO Funds and the Allianz Funds, including directing fund brokerage transactions to such brokers, and that such alleged arrangements were not fully disclosed to shareholders. On August 11, 2005, the U.S. District Court for the District of Connecticut conducted a hearing on defendants’ motion to dismiss the consolidated amended complaint in the revenue sharing action but has not yet ruled on the motion to dismiss. The market timing and revenue sharing lawsuits seek, among other things, unspecified compensatory damages plus interest and, in some cases, punitive damages, the rescission of
| | | | |
| 20 | | PIMCO Variable Insurance Trust | | |
| | |
| |
| | | June 30, 2007 (Unaudited) |
investment advisory contracts, the return of fees paid under those contracts and restitution.
Two nearly identical class action civil complaints have been filed in August 2005, in the Northern District of Illinois Eastern Division, alleging that the plaintiffs each purchased and sold a 10-year Treasury note futures contract and suffered damages from an alleged shortage when PIMCO held both physical and futures positions in 10-year Treasury notes for its client accounts. The two actions have been consolidated into one action, and the two separate complaints have been replaced by a consolidated complaint. PIMCO is a named defendant, and PIMCO Funds has been added as a defendant, to the consolidated action. PIMCO strongly believes the complaint is without merit and intends to vigorously defend itself.
In April 2006, certain portfolios of the Trust and certain other funds managed by PIMCO were served in an adversary proceeding brought by the Official Committee of Asbestos Claimants of G-I Holdings, Inc. in G-I Holdings, Inc.’s bankruptcy in the District of New Jersey. In July 2004, PIMCO was named in this lawsuit and remains a defendant. The plaintiff seeks to recover for the bankruptcy estate assets that were transferred by the predecessor entity of G-I Holdings, Inc. to a wholly-owned subsidiary in 1994. The subsidiary has since issued notes, of which certain portfolios of the Trust and certain other funds managed by PIMCO are alleged to be holders. The complaint alleges that in 2000, more than two hundred noteholders—including certain portfolios of the Trust and certain other funds managed by PIMCO—were granted a second priority lien on the assets of the subsidiary in exchange for their consent to a refinancing transaction and the granting of a first priority lien to the lending banks. The plaintiff is seeking invalidation of the lien in favor of the noteholders and/or the value of the lien. On June 21, 2006, the District of New Jersey overturned the Bankruptcy Court’s decision granting permission to file the adversary proceeding and remanded the matter to the Bankruptcy Court for further proceedings. Following a motion to reconsider, the District Court upheld its remand on August 7, 2006, and instructed the Bankruptcy Court to conduct a “cost-benefit” analysis of the Committee’s claims, including the claims against the noteholders. The Bankruptcy Court held a status conference on October 25, 2006 and set a briefing schedule relating to this cost-benefit analysis.
The foregoing speaks only as of the date of this report. It is possible that these matters and/or other developments resulting from these matters could result in increased portfolio redemptions or other adverse consequences to the Portfolio. However, PIMCO and AGID believe that these matters are not likely to have a material adverse effect on the Portfolio or on PIMCO’s or AGID’s ability to perform their respective investment advisory or distribution services relating to the Portfolio.
11. FEDERAL INCOME TAX MATTERS
The Portfolio intends to qualify as a regulated investment company under sub-chapter M of the Internal Revenue Code (the “Code”) and distribute all of its taxable income and net realized gains, if applicable, to shareholders. Accordingly, no provision for Federal income taxes has been made.
The Portfolio may gain exposure to the commodities markets primarily through index-linked notes, and may invest in other commodity-linked derivative instruments, including commodity swap agreements, options, futures contracts, options on futures contracts and foreign funds investing in similar commodity-linked derivatives.
One of the requirements for favorable tax treatment as a regulated investment company under the Code is that the Portfolio derive at least 90% of its gross income from certain qualifying sources of income. The IRS issued a revenue ruling which holds that income derived from commodity index-linked swaps is not qualifying income under Subchapter M of the Code. Subsequently, the IRS issued a private letter ruling to the Portfolio in which the IRS specifically concluded that income from certain commodity index-linked notes is qualifying income. In addition, the IRS issued another private letter ruling to the Portfolio in which the IRS specifically concluded that income derived from the Portfolio’s investment in the Subsidiary, which invests primarily in commodity index-linked swaps, will also constitute qualifying income to the Portfolio. Based on such rulings, the Portfolio will continue to seek to gain exposure to the commodity markets primarily through investments in commodity-linked notes and through investments in its subsidiary.
Please refer to the prospectus for the Separate Account and Variable Contract for information regarding federal income tax treatment of distributions to the Separate Account.
As of June 30, 2007, the aggregate cost of investments was the same for federal income tax and financial statement purposes. The net unrealized appreciation (depreciation) of investment securities for federal income tax purposes is as follows (amount in thousands):
| | | | |
Aggregate
Gross
Unrealized
Appreciation | | Aggregate
Gross
Unrealized
(Depreciation) | | Net
Unrealized
Appreciation |
$ 7,230 | | $ (967) | | $ 6,263 |
| | | | | | |
| | Semiannual Report | | June 30, 2007 | | 21 |
| | |
| |
Privacy Policy* | | (Unaudited) |
The Funds consider customer privacy to be a fundamental aspect of their relationships with shareholders and are committed to maintaining the confidentiality, integrity and security of their current, prospective and former shareholders’ personal information. To ensure their shareholders’ privacy, the Funds have developed policies that are designed to protect this confidentiality, while allowing shareholder needs to be served.
Obtaining Personal Information
In the course of providing shareholders with products and services, the Funds and certain service providers to the Funds, such as the Funds’ investment advisers (“Advisers”), may obtain non-public personal information about shareholders, which may come from sources such as account applications and other forms, from other written, electronic or verbal correspondence, from shareholder transactions, from a shareholder’s brokerage or financial advisory firm, financial adviser or consultant, and/or from information captured on the Funds’ internet web sites.
Respecting Your Privacy
As a matter of policy, the Funds do not disclose any personal or account information provided by shareholders or gathered by the Funds to non-affiliated third parties, except as required or permitted by law or as necessary for such third parties to perform their agreements with respect to the Funds. As is common in the industry, non-affiliated companies may from time to time be used to provide certain services, such as preparing and mailing prospectuses, reports, account statements and other information, conducting research on shareholder satisfaction and gathering shareholder proxies. A Fund’s Distributor may also retain non-affiliated companies to market the Fund’s shares or products which use the Fund’s shares and enter into joint marketing agreements with other companies. These companies may have access to a shareholder’s personal and account information, but are permitted to use this information solely to provide the specific service or as otherwise permitted by law. In most cases, the shareholders will be clients of a third party, but the Funds may also provide a shareholder’s personal and account information to the shareholder’s respective brokerage or financial advisory firm.
Sharing Information with Third Parties
The Funds reserve the right to disclose or report personal information to non-affiliated third parties, in limited circumstances, where the Funds believe in good faith that disclosure is required under law to cooperate with regulators or law enforcement authorities, to protect their rights or property or upon reasonable request by any Fund in which a shareholder has chosen to invest. In addition, the Funds may disclose information about a shareholder’s accounts to a non-affiliated third party with the consent of the shareholder.
Sharing Information with Affiliates
The Funds may share shareholder information with their affiliates in connection with servicing their shareholders’ accounts or to provide shareholders with information about products and services that the Funds or their Advisers, principal underwriters or their affiliates (“Service Affiliates”) believe may be of interest to such shareholders. The information that the Funds share may include, for example, a shareholder’s participation in one of the Funds or in other investment programs sponsored by a Service Affiliate, a shareholder’s ownership of certain types of accounts (such as IRAs), or other data about a shareholder’s accounts. The Funds’ Service Affiliates, in turn, are not permitted to share shareholder information with non-affiliated entities, except as required or permitted by law.
Procedures to Safeguard Private Information
The Funds take seriously the obligation to safeguard shareholder non-public personal information. In addition to this policy, the Funds have also implemented procedures that are designed to restrict access to a shareholder’s non-public personal information only to internal personnel who need to know that information in order to provide products or services to such shareholders. In order to guard a shareholder’s non-public personal information, physical, electronic and procedural safeguards are in place.
* This Privacy Policy applies to the following entities: PIMCO Funds, PIMCO Variable Insurance Trust, PCM Fund, Inc. and PIMCO Strategic Global Government Fund, Inc. (collectively, the “Funds”).
| | | | |
| 22 | | PIMCO Variable Insurance Trust | | |
Investment Adviser and Administrator
Pacific Investment Management Company LLC
840 Newport Center Drive
Newport Beach, California 92660
Distributor
Allianz Global Investors Distributors LLC
1345 Avenue of the Americas
New York, New York 10105
Custodian
State Street Bank & Trust Company
801 Pennsylvania
Kansas City, Missouri 64105
Transfer Agent
Boston Financial Data Services–Midwest
330 W. 9th Street
Kansas City, Missouri 64105
Legal Counsel
Dechert LLP
1775 I Street, N.W.
Washington, D.C. 20006
Independent Registered Public Accounting Firm
PricewaterhouseCoopers LLP
1055 Broadway
Kansas City, Missouri 64105
P I M C O

Table of Contents
This material is authorized for use only when preceded or accompanied by the current PIMCO Variable Insurance Trust (the “Trust”) prospectus. Investors should consider the investment objectives, risks, charges and expenses of this Trust carefully before investing. Ask your financial professional to explain all charges that may apply. This and other information is contained in the Trust’s prospectus. The variable product prospectus may be obtained by contacting your Investment Consultant. Please read the Trust and variable product prospectus carefully before you invest or send money.
Chairman’s Letter
Dear PIMCO Variable Insurance Trust Shareholder:
It is our pleasure to present to you the semiannual report for the PIMCO Variable Insurance Trust, covering the six-month period ended June 30, 2007. The PIMCO Variable Insurance Trust’s net assets were $8.68 billion at June 30, 2007, as compared to $7.76 billion at December 31, 2006.
Highlights of the financial markets during the reporting period include:
| | n | | Economic data during the first quarter of 2007 pointed to slower growth, which heightened market expectations for a decrease in the Federal Funds Rate. By the second quarter, economic data, such as employment statistics, provided little indication of economic weakness, causing expectations of a decrease in the Federal Funds Rate to unwind and U.S. interest rates to move higher. Interest rates in Europe and the U.K. also rose over the period as central banks raised their key lending rates due to inflation concerns. The benchmark ten-year U.S. Treasury yielded 5.03% as of June 30, 2007, or 0.32% higher than at the beginning of the year. |
| | n | | Most bonds generally returned much of their gains from earlier in the year as worldwide growth and capital flows drove interest rates higher in the second quarter. Increased risk aversion in global financial markets, due in part to subprime mortgage worries in the U.S., also contributed to the rise in interest rates. The Lehman Brothers Aggregate Bond Index, which includes Treasury, investment-grade corporate and mortgage-backed securities, returned 0.98% for the six-month period. |
| | n | | Locally issued emerging market (“EM”) bonds posted positive returns for the reporting period. Yields on these bonds declined and the local currencies in which they are denominated generally gained, amid increasing investor awareness, strong economic growth and surging capital inflows. External EM bonds (debt instruments issued by emerging markets countries and typically denominated in U.S. dollars) lagged behind local EM bonds (debt instruments issued by emerging markets countries and denominated in the currency of the issuer), as external EM bonds tend to trade more in-line with U.S. Treasuries. |
| | n | | Treasury Inflation-Protected Securities (“TIPS”) outpaced nominal bonds (non-inflation linked bonds) for the first part of the year and all but the longest maturity TIPS outperformed in the second quarter as high gasoline prices drove higher inflation accruals. Commodities, as represented by the Dow Jones-AIG Commodity Total Return Index, returned 4.46% for the period. Equities, as measured by the S&P 500 Index and the Russell 2000 Index, returned 6.96% and 6.45%, respectively, for the period. |
On the following pages, please find specific details as to the Portfolio’s total return investment performance and a discussion of those factors that affected performance.
Thank you for the trust you have placed in us. We will continue to work diligently to serve your investment needs.
Sincerely,
Brent R. Harris
Chairman, PIMCO Variable Insurance Trust
July 31, 2007
| | | | | | |
| | Semiannual Report | | June 30, 2007 | | 1 |
Important Information About the Portfolio
PIMCO Variable Insurance Trust (the “Trust”) is an open-end management investment company currently consisting of twenty separate investment portfolios, including the CommodityRealReturn™ Strategy Portfolio (the “Portfolio”). The Portfolio is only available as a funding vehicle under variable life insurance policies or variable annuity contracts issued by insurance companies (“Variable Contracts”). Individuals may not purchase shares of the Portfolio directly. Shares of the Portfolio also may be sold to qualified pension and retirement plans outside of the separate account context.
We believe that bond funds have an important role to play in a well diversified investment portfolio. It is important to note, however, that in an environment where interest rates may trend upward, rising rates would negatively impact the performance of most bond funds, and fixed-income securities held by a fund are likely to decrease in value. The price volatility of fixed-income securities can also increase during periods of rising interest rates resulting in increased losses to a fund. Bond funds and individual bonds with a longer duration (a measure of the expected life of a security) tend to be more sensitive to changes in interest rates, usually making them more volatile than securities or funds with shorter durations.
The Portfolio may be subject to various risks in addition to those described above. Some of these risks may include, but are not limited to, the following: credit risk, high yield risk, market risk, issuer risk, liquidity risk, derivatives risk, commodity risk, equity risk, mortgage risk, non-U.S. investment risk, emerging markets risk, currency risk, issuer non-diversification risk, leveraging risk, management risk, tax risk, and subsidiary risk. A complete description of these risks is contained in the Portfolio’s prospectus. The Portfolio may use derivative instruments as part of an investment strategy, as described below, or for hedging purposes. Use of these instruments may involve certain costs and risks such as liquidity risk, interest rate risk, market risk, credit risk, management risk and the risk that the Portfolio could not close out a position when it would be most advantageous to do so. Because the Portfolio may invest in derivatives, it could lose more than the principal amount invested in these instruments. Investing in non-U.S. securities may entail risk due to non-U.S. economic and political developments; this risk may be increased when investing in emerging markets.
The Portfolio is intended for long-term investors and an investment in the Portfolio should be no more than a small part of a typical diversified portfolio. The Portfolio’s share price is expected to be more volatile than that of other funds.
The Portfolio will seek to gain exposure to the commodity markets primarily through investments in leveraged or unleveraged commodity index-linked notes, which are derivative debt instruments with principal and/or coupon payments linked to the performance of commodity indices, and through investments in the PIMCO Cayman Commodity Portfolio I Ltd. (the “Subsidiary”), a wholly-owned subsidiary (as discussed below). The Portfolio may also invest in commodity-linked notes with principal and/or coupon payments linked to the value of particular commodities or commodity futures contracts, or a subset of commodities or commodities future contracts. These notes are sometimes referred to as “structured notes” because the terms of these notes may be structured by the issuer and the purchaser of the notes. The value of these notes will rise or fall in response to changes in the underlying commodity or related index of investments. These notes expose the Portfolio economically to movements in commodity prices. The value of commodity-linked derivative instruments may be affected by changes in overall market movements, changes in interest rates, or factors affecting a particular industry or commodity, such as drought, floods, weather, livestock disease, embargoes, tariffs, and international economic, political and regulatory developments. These notes also are subject to risks, such as credit, market and interest rate risks, that in general affect the values of debt securities. In addition, these notes are often leveraged, increasing the volatility of each note’s market value relative to changes in the underlying commodity, commodity futures contract or commodity index. Therefore, at maturity of the note, the Portfolio may receive more or less principal than it originally invested. The Portfolio might receive interest payments on the note that are more or less than the stated coupon interest payments. The Portfolio may also gain exposure to the commodity markets indirectly by investing in its Subsidiary, which will primarily invest in different commodity-linked derivative instruments than the Portfolio, including swap agreements, commodity options, futures and options on futures.
On the performance summary page in this Semiannual Report, the Total Return Investment Performance table measures performance assuming that all dividend and capital gain distributions were reinvested.
An investment in the Portfolio is not a deposit of a bank and is not guaranteed or insured by the Federal Deposit Insurance Corporation or any other government agency. It is possible to lose money on investments in the Portfolio.
PIMCO has adopted written proxy voting policies and procedures (“Proxy Policy”) as required by Rule 206(4)-6 under the Investment Advisers Act of 1940, as amended. The Proxy Policy has been adopted by the Trust as the policies and procedures that PIMCO will use when voting proxies on behalf of the Portfolio. A description of the policies and procedures that PIMCO uses to vote proxies relating to portfolio securities of the Portfolio, and information about how the Portfolio voted proxies relating to portfolio securities held during the most recent twelve-month period ended June 30, are available without charge, upon request, by calling the Trust at 1-866-746-2606 and on the Portfolio’s website at www.pimco.com.
| | | | |
| 2 | | PIMCO Variable Insurance Trust | | |
The Portfolio files its complete schedule of portfolio holdings with the SEC for the first and third quarters of each fiscal year on Form N-Q. A copy of the Trust’s Form N-Q is also available on the SEC’s website at http://www.sec.gov and may be reviewed and copied at the SEC’s Public Reference Room in Washington D.C. Information on the operation of the Public Reference Room may be obtained by calling 1-800-SEC-0330, and is available without charge, upon request, by calling the Trust at 1-866-746-2606 and on the Portfolio’s website at www.pimco.com.
PIMCO Variable Insurance Trust is distributed by Allianz Global Investors Distributors LLC, 1345 Avenue of the Americas, New York, NY 10105.
The following disclosure provides important information regarding the Portfolio’s Expense Example (“Example” or “Expense Example”), which appears in this Semiannual Report. Please refer to this information when reviewing the Expense Example for the Portfolio.
Example
As a shareholder of the Portfolio, you incur two types of costs: (1) transaction costs and (2) ongoing costs, including advisory and administrative fees; distribution and/or service (12b-1) fees (Administrative and Advisor Class only); and other Portfolio expenses. The Example is intended to help you understand your ongoing costs (in dollars) of investing in the Portfolio and to compare these costs with the ongoing costs of investing in other mutual funds. The Expense Example does not reflect any fees or other expenses imposed by the Variable Contracts. If it did, the expenses reflected in the Expense Example would be higher. The Example is based on an investment of $1,000 invested at the beginning of the period and held for the entire period indicated, which is from January 1, 2007 to June 30, 2007.
Actual Expenses
The information in the table under the heading “Actual Performance” provides information about actual account values and actual expenses. You may use the information in these columns, together with the amount you invested, to estimate the expenses that you paid over the period. Simply divide your account value by $1,000 (for example, an $8,600 account value divided by $1,000 = $8.60), then multiply the result by the number in the row titled “Expenses Paid During Period” to estimate the expenses you paid on your account during this period.
Hypothetical Example for Comparison Purposes
The information in the table under the heading “Hypothetical Performance (5% return before expenses)” provides information about hypothetical account values and hypothetical expenses based on the Portfolio’s actual expense ratio and an assumed rate of return of 5% per year before expenses, which is not the Portfolio’s actual return. The hypothetical account values and expenses may not be used to estimate the actual ending account balance or expenses you paid for the period. You may use this information to compare the ongoing costs of investing in the Portfolio and other portfolios. To do so, compare this 5% hypothetical example with the 5% hypothetical examples that appear in the shareholder reports of the other portfolios.
Please note that the expenses shown in the table are meant to highlight your ongoing costs only and do not reflect any transactional costs. Therefore, the information under the heading “Hypothetical Performance (5% return before expenses)” is useful in comparing ongoing costs only, and will not help you determine the relative total costs of owning different portfolios. In addition, if these transactional costs were included, your costs would have been higher.
The expense ratio may vary period to period because of various factors, such as an increase in expenses not covered by the advisory and administrative fees (such as expenses of the trustees and their counsel, litigation expense and interest expense).
| | | | | | |
| | Semiannual Report | | June 30, 2007 | | 3 |
PIMCO CommodityRealReturn™ Strategy Portfolio
Cumulative Returns Through June 30, 2007
$10,000 invested at the beginning of the first full month following the inception date of the Portfolio’s Advisor Class.
Allocation Breakdown‡
| | |
U.S. Treasury Obligations | | 48.0% |
Short-Term Instruments | | 29.9% |
Commodity Index-
Linked Notes | | 11.1% |
U.S. Government Agencies | | 5.3% |
Corporate Bonds & Notes | | 3.0% |
Other | | 2.7% |
| | ‡ | % of Total Investments as of 06/30/2007 |
| | | | | | | | |
| Average Annual Total Return for the period ended June 30, 2007 |
| | | | | 6 Months* | | 1 Year | | Portfolio
Inception
(02/28/06) |
| | PIMCO CommodityRealReturn™ Strategy Portfolio Advisor Class | | 2.62% | | -0.18% | | 3.11% |
| | Dow Jones-AIG Commodity Total Return Index± | | 4.46% | | 2.94% | | 8.64% |
All Portfolio returns are net of fees and expenses.
* Cumulative return.
Performance quoted represents past performance. Past performance is no guarantee of future results. Investment return and principal value will fluctuate so the Portfolio shares, when redeemed, may be worth more or less than their original cost. The Portfolio’s performance does not reflect the deduction of additional charges and expenses imposed in connection with investing in Variable Contracts, which will reduce returns. Current performance may be lower or higher than the performance data quoted. Performance data current to the most recent month-end is available by calling (800) 927-4648.
± Dow Jones-AIG Commodity Total Return Index is an unmanaged index composed of futures contracts on 19 physical commodities. The index is designed to be a highly liquid and diversified benchmark for commodities as an asset class. It is not possible to invest directly in the index. The index does not reflect deductions for fees and expenses.
| | | | | | |
| Expense Example | | Actual Performance | | Hypothetical Performance |
| | | | | (5% return before expenses) |
Beginning Account Value (01/01/07) | | $ | 1,000.00 | | $ | 1,000.00 |
Ending Account Value (06/30/07) | | $ | 1,026.23 | | $ | 1,020.08 |
Expenses Paid During Period† | | $ | 4.77 | | $ | 4.76 |
† Expenses are equal to the Portfolio’s Advisor Class annualized expense ratio of 0.95%, multiplied by the average account value over the period, multiplied by 181/365 (to reflect the one-half year period). Overall fees and expenses of investing in the Portfolio will be higher because the example does not reflect Variable Contract fees and expenses.
Please refer to page 3 herein for an explanation of the information presented in the above Expense Example.
Portfolio Insights
» | | The PIMCO CommodityRealReturn™ Strategy Portfolio seeks to achieve its investment objective by investing under normal circumstances primarily in commodity-linked derivative instruments backed by a portfolio of inflation-indexed securities and other fixed-income instruments. |
| » | | Commodities generally gained during the period, which enhanced total return performance of the Portfolio. |
| » | | The Portfolio’s use of Treasury Inflation-Protected Securities (“TIPS”) as collateral was negative for performance in the first half of the year as TIPS underperformed the assumed Treasury Bill collateral rate embedded in the Dow Jones-AIG Commodity Total Return Index. |
| » | | Above-index U.S. real duration in the first half of the period was positive for performance as real yields decreased. Below-index U.S. real duration in the second half of the period was also positive for performance as real yields increased. |
| » | | An emphasis on nominal bonds in the Eurozone benefited performance as nominal bonds outperformed inflation-linked bonds in the region. |
| » | | Modest exposure to U.K. nominal bonds was negative for performance due to rising interest rates and a tightening bias from the Bank of England. |
| » | | Holdings of mortgage-backed securities detracted from performance as mortgage spreads widened. |
| | | | |
| 4 | | PIMCO Variable Insurance Trust | | |
Financial Highlights CommodityRealReturn™ Strategy Portfolio
| | | | | | | | |
| Selected per Share Data for the Period Ended: | | 06/30/2007+ | | | 02/28/2006-12/31/2006 | |
| | |
Advisor Class | | | | | | | | |
Net asset value beginning of period | | $ | 11.30 | | | $ | 11.68 | |
Net investment income (a) | | | 0.22 | | | | 0.34 | |
Net realized/unrealized gain (loss) on investments (a) | | | 0.08 | | | | (0.16 | ) |
Total income from investment operations | | | 0.30 | | | | 0.18 | |
Dividends from net investment income | | | (0.19 | ) | | | (0.51 | ) |
Distributions from net realized capital gains | | | 0.00 | | | | (0.05 | ) |
Total distributions | | | (0.19 | ) | | | (0.56 | ) |
Net asset value end of period | | $ | 11.41 | | | $ | 11.30 | |
Total return | | | 2.62 | % | | | 1.51 | % |
Net assets end of period (000s) | | $ | 14,371 | | | $ | 6,084 | |
Ratio of expenses to average net assets | | | 0.95 | %*(b) | | | 1.03 | %* |
Ratio of expenses to average net assets excluding interest expense | | | 0.95 | %*(b) | | | 1.03 | %* |
Ratio of net investment income to average net assets | | | 3.89 | %* | | | 3.50 | %* |
Portfolio turnover rate | | | 489 | % | | | 993 | % |
+ Unaudited
* Annualized
(a) Per share amounts based on average number of shares outstanding during the period.
(b) If the investment manager had not reimbursed expenses, the ratio of expenses to average net assets would have been 1.04%.
| | | | | | |
| See Accompanying Notes | | Semiannual Report | | June 30, 2007 | | 5 |
Consolidated Statement of Assets and Liabilities CommodityRealReturn™ Strategy Portfolio
| | | | |
| (Amounts in thousands, except per share amounts) | | June 30, 2007
(Unaudited) | |
| | | | |
| |
| Assets: | | | | |
Investments, at value | | $ | 483,723 | |
Cash | | | 394 | |
Foreign currency, at value | | | 1,058 | |
Receivable for investments sold | | | 2,022 | |
Receivable for investments sold on a delayed-delivery basis | | | 199 | |
Receivable for Portfolio shares sold | | | 1,055 | |
Interest and dividends receivable | | | 753 | |
Variation margin receivable | | | 5 | |
Swap premiums paid | | | 406 | |
Unrealized appreciation on foreign currency contracts | | | 38 | |
Unrealized appreciation on swap agreements | | | 1,027 | |
Other assets | | | 23 | |
| | | | 490,703 | |
| |
Liabilities: | | | | |
Payable for investments purchased | | $ | 12,097 | |
Payable for investments purchased on a delayed-delivery basis | | | 235,316 | |
Payable for Portfolio shares redeemed | | | 3,599 | |
Payable for short sales | | | 2,031 | |
Written options outstanding | | | 188 | |
Accrued investment advisory fee | | | 104 | |
Accrued administration fee | | | 53 | |
Accrued distribution fee | | | 3 | |
Accrued servicing fee | | | 31 | |
Variation margin payable | | | 231 | |
Recoupment payable to Manager | | | 3 | |
Swap premiums received | | | 1,420 | |
Unrealized depreciation on foreign currency contracts | | | 38 | |
Unrealized depreciation on swap agreements | | | 529 | |
Other liabilities | | | 624 | |
| | | | 256,267 | |
| |
Net Assets | | $ | 234,436 | |
| |
Net Assets Consist of: | | | | |
Paid in capital | | $ | 242,206 | |
Undistributed net investment income | | | 4,277 | |
Accumulated undistributed net realized (loss) | | | (17,947 | ) |
Net unrealized appreciation | | | 5,900 | |
| | | $ | 234,436 | |
| |
Net Assets: | | | | |
Administrative Class | | $ | 220,065 | |
Advisor Class | | | 14,371 | |
| |
Shares Issued and Outstanding: | | | | |
Administrative Class | | | 19,275 | |
Advisor Class | | | 1,259 | |
| |
Net Asset Value and Redemption Price Per Share (Net Asset Per Share Outstanding) | | | | |
Administrative Class | | $ | 11.42 | |
Advisor Class | | | 11.41 | |
| |
Cost of Investments Owned | | $ | 477,460 | |
Cost of Foreign Currency Held | | $ | 1,055 | |
Proceeds Received on Short Sales | | $ | 2,020 | |
Premiums Received on Written Options | | $ | 242 | |
| | | | |
| 6 | | PIMCO Variable Insurance Trust | | See Accompanying Notes |
Consolidated Statement of Operations CommodityRealReturn™ Strategy Portfolio
| | | | |
| (Amounts in thousands) | | Six Months Ended
June 30, 2007
(Unaudited) | |
| |
| Investment Income: | | | | |
Interest | | $ | 5,022 | |
Miscellaneous income | | | 2 | |
Total Income | | | 5,024 | |
| |
Expenses: | | | | |
Investment advisory fees | | | 550 | |
Administration fees | | | 276 | |
Servicing fees – Administrative Class | | | 149 | |
Distribution and/or servicing fees – Advisor Class | | | 11 | |
Trustees’ fees | | | 2 | |
Interest expense | | | 2 | |
Miscellaneous expense | | | 4 | |
Total Expenses | | | 994 | |
Reimbursement by Manager | | | (100 | ) |
Net Expenses | | | 894 | |
| |
Net Investment Income | | | 4,130 | |
| |
Net Realized and Unrealized Gain (Loss): | | | | |
Net realized (loss) on investments | | | (8,904 | ) |
Net realized (loss) on futures contracts, written options and swaps | | | (1,147 | ) |
Net realized (loss) on foreign currency transactions | | | (112 | ) |
Net change in unrealized appreciation on investments | | | 10,392 | |
Net change in unrealized appreciation on futures contracts, written options and swaps | | | 730 | |
Net change in unrealized appreciation on translation of assets and liabilities denominated in foreign currencies | | | 87 | |
Net Gain | | | 1,046 | |
| |
Net Increase in Net Assets Resulting from Operations | | $ | 5,176 | |
| | | | | | |
| See Accompanying Notes | | Semiannual Report | | June 30, 2007 | | 7 |
Consolidated Statements of Changes in Net Assets CommodityRealReturn™ Strategy Portfolio
| | | | | | | | |
| (Amounts in thousands) | | Six Months Ended
June 30, 2007
(Unaudited) | | | Year Ended
December 31, 2006 | |
| | |
| Increase (Decrease) in Net Assets from: | | | | | | | | |
| | |
Operations: | | | | | | | | |
Net investment income | | $ | 4,130 | | | $ | 5,377 | |
Net realized (loss) | | | (10,163 | ) | | | (5,027 | ) |
Net change in unrealized appreciation (depreciation) | | | 11,209 | | | | (4,505 | ) |
Net increase (decrease) resulting from operations | | | 5,176 | | | | (4,155 | ) |
| | |
Distributions to Shareholders: | | | | | | | | |
From net investment income | | | | | | | | |
Administrative Class | | | (3,557 | ) | | | (7,218 | ) |
Advisor Class | | | (165 | ) | | | (176 | ) |
From net realized capital gains | | | | | | | | |
Administrative Class | | | 0 | | | | (705 | ) |
Advisor Class | | | 0 | | | | (23 | ) |
| | |
Total Distributions | | | (3,722 | ) | | | (8,122 | ) |
| | |
Portfolio Share Transactions: | | | | | | | | |
Receipts for shares sold | | | | | | | | |
Administrative Class | | | 53,682 | | | | 138,795 | |
Advisor Class | | | 9,592 | | | | 7,074 | |
Issued as reinvestment of distributions | | | | | | | | |
Administrative Class | | | 3,557 | | | | 7,849 | |
Advisor Class | | | 165 | | | | 199 | |
Cost of shares redeemed | | | | | | | | |
Administrative Class | | | (19,591 | ) | | | (60,877 | ) |
Advisor Class | | | (1,317 | ) | | | (812 | ) |
Net increase resulting from Portfolio share transactions | | | 46,088 | | | | 92,228 | |
| | |
Total Increase in Net Assets | | | 47,542 | | | | 79,951 | |
| | |
Net Assets: | | | | | | | | |
Beginning of period | | | 186,894 | | | | 106,943 | |
End of period* | | $ | 234,436 | | | $ | 186,894 | |
| | |
*Including undistributed net investment income of: | | $ | 4,277 | | | $ | 3,869 | |
| | | | |
| 8 | | PIMCO Variable Insurance Trust | | See Accompanying Notes |
| | |
| |
| Consolidated Schedule of Investments CommodityRealReturn™ Strategy Portfolio | | June 30, 2007 (Unaudited) |
| | | | | | | | |
| | | | | PRINCIPAL
AMOUNT
(000S) | | | | VALUE
(000S) |
| CORPORATE BONDS & NOTES 6.1% |
|
| BANKING & FINANCE 4.7% |
| American Express Credit Corp. |
5.380% due 03/02/2009 | | $ | | 800 | | $ | | 801 |
| |
| Atlantic & Western Re Ltd. |
11.599% due 01/09/2009 | | | | 300 | | | | 303 |
| |
| Bank of America Corp. |
5.510% due 02/17/2009 | | | | 900 | | | | 902 |
| |
| C10 Capital SPV Ltd. |
6.722% due 12/31/2049 | | | | 100 | | | | 98 |
| |
| CIT Group, Inc. |
5.505% due 01/30/2009 | | | | 900 | | | | 899 |
| |
| Citigroup Funding, Inc. |
5.320% due 04/23/2009 | | | | 1,000 | | | | 1,001 |
| |
| Citigroup, Inc. |
5.390% due 12/28/2009 | | | | 800 | | | | 801 |
| |
| Credit Agricole S.A. |
5.360% due 05/28/2009 | | | | 1,100 | | | | 1,101 |
| |
| Ford Motor Credit Co. |
6.190% due 09/28/2007 | | | | 200 | | | | 200 |
| |
| General Electric Capital Corp. |
5.400% due 12/12/2008 | | | | 100 | | | | 100 |
| |
| Goldman Sachs Group, Inc. |
5.400% due 12/23/2008 | | | | 900 | | | | 900 |
5.450% due 12/22/2008 | | | | 1,000 | | | | 1,001 |
| |
| Morgan Stanley |
5.467% due 02/09/2009 | | | | 900 | | | | 901 |
| |
| Mystic Re Ltd. |
15.360% due 06/07/2011 | | | | 500 | | | | 501 |
| |
| Rabobank Nederland |
5.376% due 01/15/2009 | | | | 100 | | | | 100 |
| |
| Residential Reinsurance 2007 Ltd. |
12.610% due 06/07/2010 | | | | 500 | | | | 501 |
| |
| Spinnaker Capital Ltd. |
16.860% due 06/15/2008 | | | | 300 | | | | 300 |
| |
| Unicredit Luxembourg Finance S.A. |
5.405% due 10/24/2008 | | | | 200 | | | | 200 |
| |
| Wachovia Bank N.A. |
5.430% due 12/02/2010 | | | | 400 | | | | 400 |
| | | | | | | | |
| | | | | | | | 11,010 |
| | | | | | | | |
|
| INDUSTRIALS 0.6% |
| Caesars Entertainment, Inc. |
8.875% due 09/15/2008 | | | | 300 | | | | 309 |
| |
| Mandalay Resort Group |
6.500% due 07/31/2009 | | | | 1,000 | | | | 1,005 |
| | | | | | | | |
| | | | | | | | 1,314 |
| | | | | | | | |
|
| UTILITIES 0.8% |
| AT&T, Inc. |
5.456% due 02/05/2010 | | | | 900 | | | | 902 |
| |
| BellSouth Corp. |
4.240% due 04/26/2008 | | | | 1,100 | | | | 1,090 |
| | | | | | | | |
| | | | | | | | 1,992 |
| | | | | | | | |
Total Corporate Bonds & Notes
(Cost $14,319) | | 14,316 |
| | | | | | | | |
| | | | | | | | |
| CONVERTIBLE BONDS & NOTES 0.5% |
| Chesapeake Energy Corp. |
2.500% due 05/15/2037 | | | | 1,200 | | | | 1,230 |
| | | | | | | | |
Total Convertible Bonds & Notes
(Cost $1,209) | | 1,230 |
| | | | | | | | |
| | | | | | | | |
| | | | | PRINCIPAL
AMOUNT
(000S) | | | | VALUE
(000S) |
| COMMODITY INDEX-LINKED NOTES 22.9% |
| Bank of America N.A. |
5.190% due 10/22/2007 | | $ | | 3,000 | | $ | | 3,707 |
| |
| Bear Stearns Cos., Inc. |
0.000% due 10/19/2007 (j) | | | | 3,000 | | | | 3,445 |
| |
| Calyon Financial, Inc. |
0.000% due 07/16/2007 | | | | 3,000 | | | | 2,888 |
| |
| Commonwealth Bank of Australia |
5.060% due 07/21/2008 | | | | 3,000 | | | | 2,734 |
| |
| Credit Suisse First Boston |
5.255% due 01/14/2008 (j) | | | | 5,300 | | | | 6,545 |
| |
| Eksportfinans ASA |
0.000% due 06/18/2008 | | | | 3,500 | | | | 3,268 |
| |
| Landesbank Baden-Wurttemberg |
0.000% due 10/25/2007 | | | | 3,000 | | | | 3,615 |
| |
| Merrill Lynch & Co., Inc. |
5.360% due 03/24/2008 | | | | 2,000 | | | | 2,131 |
| |
| Morgan Stanley |
0.000% due 02/06/2008 (j) | | | | 13,000 | | | | 15,027 |
| |
| Natixis Financial Products, Inc. |
5.157% due 05/09/2008 | | | | 4,000 | | | | 3,892 |
| |
| Svensk ExportKredit AB |
0.000% due 05/19/2008 | | | | 2,000 | | | | 1,870 |
| |
| UBS AG |
0.000% due 03/12/2008 | | | | 4,000 | | | | 4,444 |
| | | | | | | | |
Total Commodity Index-Linked Notes
(Cost $48,800) | | 53,566 |
| | | | | | | | |
| | | | | | | | |
| U.S. GOVERNMENT AGENCIES 10.9% |
| Fannie Mae |
4.187% due 11/01/2034 | | | | 260 | | | | 258 |
4.673% due 05/25/2035 | | | | 300 | | | | 296 |
5.500% due 09/01/2035 - 07/01/2037 | | | | 12,562 | | | | 12,118 |
5.670% due 05/25/2042 | | | | 25 | | | | 25 |
5.950% due 02/25/2044 | | | | 140 | | | | 140 |
6.000% due 07/01/2034 - 07/01/2037 | | | | 850 | | | | 842 |
6.227% due 03/01/2044 - 10/01/2044 | | | | 610 | | | | 617 |
| |
| Freddie Mac |
4.000% due 03/15/2023 - 10/15/2023 | | | | 123 | | | | 121 |
4.500% due 05/15/2017 | | | | 69 | | | | 67 |
4.550% due 01/01/2034 | | | | 48 | | | | 47 |
5.000% due 02/15/2020 | | | | 825 | | | | 813 |
5.470% due 07/15/2019 - 10/15/2020 | | | | 4,600 | | | | 4,596 |
5.500% due 05/15/2016 | | | | 1,275 | | | | 1,275 |
5.550% due 07/15/2037 | | | | 4,000 | | | | 4,000 |
5.580% due 08/25/2031 | | | | 5 | | | | 5 |
6.227% due 02/25/2045 | | | | 306 | | | | 305 |
| | | | | | | | |
Total U.S. Government Agencies
(Cost $25,547) | | 25,525 |
| | | | | | | | |
| | | | | | | | |
| U.S. TREASURY OBLIGATIONS 99.0% |
| Treasury Inflation Protected Securities (b) |
0.875% due 04/15/2010 | | | | 19,512 | | | | 18,536 |
1.625% due 01/15/2015 | | | | 544 | | | | 506 |
1.875% due 07/15/2013 | | | | 4,637 | | | | 4,449 |
1.875% due 07/15/2015 | | | | 11,533 | | | | 10,902 |
2.000% due 04/15/2012 | | | | 6,653 | | | | 6,459 |
2.000% due 01/15/2014 | | | | 9,892 | | | | 9,510 |
2.000% due 07/15/2014 | | | | 11,570 | | | | 11,110 |
2.000% due 01/15/2016 | | | | 22,918 | | | | 21,767 |
2.000% due 01/15/2026 | | | | 18,837 | | | | 17,068 |
2.375% due 04/15/2011 | | | | 18,309 | | | | 18,115 |
| | | | | | | | |
| | | | | PRINCIPAL
AMOUNT
(000S) | | | | VALUE
(000S) |
2.375% due 01/15/2017 | | $ | | 14,831 | | $ | | 14,485 |
2.375% due 01/15/2025 | | | | 26,104 | | | | 25,109 |
2.375% due 01/15/2027 | | | | 10,917 | | | | 10,488 |
3.000% due 07/15/2012 | | | | 12,707 | | | | 12,957 |
3.625% due 01/15/2008 | | | | 257 | | | | 257 |
3.625% due 04/15/2028 | | | | 12,713 | | | | 14,733 |
3.875% due 01/15/2009 | | | | 13,422 | | | | 13,640 |
3.875% due 04/15/2029 | | | | 6,570 | | | | 7,934 |
4.250% due 01/15/2010 | | | | 12,343 | | | | 12,814 |
| |
| U.S. Treasury Notes |
4.500% due 02/28/2011 | | | | 100 | | | | 99 |
4.500% due 11/15/2015 | | | | 600 | | | | 579 |
4.625% due 02/15/2017 | | | | 600 | | | | 581 |
| | | | | | | | |
Total U.S. Treasury Obligations
(Cost $230,571) | | 232,098 |
| | | | | | | | |
| | | | | | | | |
| MORTGAGE-BACKED SECURITIES 1.7% |
| Bear Stearns Mortgage Funding Trust |
5.390% due 02/25/2037 | | | | 737 | | | | 738 |
| |
| Citigroup Mortgage Loan Trust, Inc. |
4.700% due 12/25/2035 | | | | 425 | | | | 417 |
| |
| Countrywide Home Loan Mortgage Pass-Through Trust |
3.786% due 11/19/2033 | | | | 36 | | | | 34 |
| |
| First Horizon Alternative Mortgage Securities |
4.732% due 06/25/2034 | | | | 50 | | | | 50 |
| |
| Greenpoint Mortgage Funding Trust |
5.400% due 01/25/2047 | | | | 868 | | | | 868 |
5.590% due 11/25/2045 | | | | 35 | | | | 35 |
| |
| Harborview Mortgage Loan Trust |
5.560% due 03/19/2037 | | | | 146 | | | | 147 |
| |
| MASTR Adjustable Rate Mortgages Trust |
3.786% due 11/21/2034 | | | | 100 | | | | 98 |
| |
| Residential Accredit Loans, Inc. |
6.389% due 09/25/2045 | | | | 435 | | | | 439 |
| |
| Structured Adjustable Rate Mortgage Loan Trust |
4.580% due 02/25/2034 | | | | 77 | | | | 77 |
6.429% due 01/25/2035 | | | | 46 | | | | 46 |
| |
| Wachovia Bank Commercial Mortgage Trust |
5.400% due 06/15/2020 | | | | 1,100 | | | | 1,100 |
| | | | | | | | |
Total Mortgage-Backed Securities
(Cost $4,047) | | 4,049 |
| | | | | | | | |
| | | | | | | | |
| ASSET-BACKED SECURITIES 3.1% |
| ACE Securities Corp. |
5.430% due 10/25/2035 | | | | 26 | | | | 26 |
| |
| Argent Securities, Inc. |
5.390% due 04/25/2036 | | | | 40 | | | | 40 |
5.400% due 03/25/2036 | | | | 41 | | | | 41 |
| |
| Bear Stearns Asset-Backed Securities, Inc. |
5.520% due 09/25/2034 | | | | 11 | | | | 11 |
| |
| Carrington Mortgage Loan Trust |
5.640% due 10/25/2035 | | | | 729 | | | | 732 |
| |
| Citigroup Mortgage Loan Trust, Inc. |
5.380% due 01/25/2037 | | | | 608 | | | | 608 |
5.400% due 12/25/2035 | | | | 59 | | | | 59 |
| |
| Countrywide Asset-Backed Certificates |
5.390% due 07/25/2036 | | | | 26 | | | | 26 |
5.390% due 09/25/2036 | | | | 45 | | | | 45 |
5.450% due 07/25/2036 | | | | 20 | | | | 20 |
| |
| First Franklin Mortgage Loan Asset-Backed Certificates |
5.360% due 01/25/2038 | | | | 740 | | | | 740 |
5.410% due 01/25/2036 | | | | 109 | | | | 109 |
| |
| GSAMP Trust |
5.390% due 12/25/2036 | | | | 660 | | | | 660 |
5.430% due 11/25/2035 | | | | 14 | | | | 14 |
| |
| | | | | | |
| See Accompanying Notes | | Semiannual Report | | June 30, 2007 | | 9 |
| | |
| |
| Consolidated Schedule of Investments CommodityRealReturn™ Strategy Portfolio (Cont.) | | |
| | | | | | | | |
| | | | | PRINCIPAL
AMOUNT
(000S) | | | | VALUE
(000S) |
| Home Equity Asset Trust |
5.400% due 05/25/2036 | | $ | | 41 | | $ | | 41 |
5.430% due 02/25/2036 | | | | 14 | | | | 14 |
| |
| HSI Asset Securitization Corp. Trust |
5.400% due 12/25/2035 | | | | 38 | | | | 38 |
| |
| Indymac Residential Asset-Backed Trust |
5.410% due 03/25/2036 | | | | 84 | | | | 84 |
5.420% due 03/25/2036 | | | | 15 | | | | 15 |
| |
| Lehman XS Trust |
5.400% due 04/25/2046 | | | | 143 | | | | 143 |
5.400% due 07/25/2046 | | | | 101 | | | | 101 |
| |
| Long Beach Mortgage Loan Trust |
5.400% due 02/25/2036 | | | | 15 | | | | 15 |
| |
| Merrill Lynch Mortgage Investors, Inc. |
5.400% due 01/25/2037 | | | | 11 | | | | 11 |
| |
| Morgan Stanley ABS Capital I |
5.370% due 11/25/2036 | | | | 1,320 | | | | 1,321 |
| |
| Nelnet Student Loan Trust |
5.445% due 07/25/2016 | | | | 55 | | | | 55 |
| |
| Nomura Asset Acceptance Corp. |
5.460% due 01/25/2036 | | | | 26 | | | | 26 |
| |
| Option One Mortgage Loan Trust |
5.370% due 01/25/2037 | | | | 657 | | | | 657 |
| |
| Residential Asset Mortgage Products, Inc. |
5.400% due 01/25/2036 | | | | 5 | | | | 5 |
| |
| Residential Funding Mortgage Securities II, Inc. |
5.460% due 09/25/2035 | | | | 35 | | | | 35 |
| |
| Securitized Asset-Backed Receivables LLC Trust |
5.390% due 10/25/2035 | | | | 12 | | | | 12 |
| |
| Soundview Home Equity Loan Trust |
5.390% due 03/25/2036 | | | | 5 | | | | 5 |
| |
| Specialty Underwriting & Residential Finance |
5.380% due 01/25/2038 | | | | 830 | | | | 830 |
| |
| Structured Asset Securities Corp. |
5.450% due 12/25/2035 | | | | 77 | | | | 77 |
| |
| USAA Auto Owner Trust |
5.030% due 11/17/2008 | | | | 9 | | | | 9 |
| |
| Washington Mutual Asset-Backed Certificates |
5.370% due 01/25/2037 | | | | 699 | | | | 700 |
| | | | | | | | |
Total Asset-Backed Securities
(Cost $7,321) | | 7,325 |
| | | | | | | | |
|
| FOREIGN CURRENCY-DENOMINATED ISSUES 0.5% |
| United Kingdom Gilt Inflation Linked Bond |
2.500% due 05/20/2009 | | GBP | | 200 | | | | 1,033 |
| | | | | | | | |
Total Foreign Currency-Denominated Issues (Cost $1,001) | | 1,033 |
| | | | | | | | |
|
| SHORT-TERM INSTRUMENTS 61.6% |
|
| CERTIFICATES OF DEPOSIT 3.2% |
| Abbey National Treasury Services PLC |
5.270% due 07/02/2008 | | $ | | 1,600 | | | | 1,601 |
| |
| BNP Paribas |
5.262% due 07/03/2008 | | | | 500 | | | | 500 |
| |
| Calyon Financial, Inc. |
5.340% due 01/16/2009 | | | | 800 | | | | 800 |
| |
| | | | | | | | |
| | | | | PRINCIPAL
AMOUNT
(000S) | | | | VALUE
(000S) |
| Nordea Bank Finland PLC |
5.282% due 12/01/2008 | | $ | | 1,100 | | $ | | 1,100 |
5.308% due 04/09/2009 | | | | 600 | | | | 600 |
| |
| Royal Bank of Scotland Group PLC |
5.265% due 03/26/2008 | | | | 1,000 | | | | 1,000 |
| |
| Skandinav Enskilda BK |
5.350% due 02/13/2009 | | | | 900 | | | | 901 |
| |
| Societe Generale NY |
5.270% due 03/26/2008 | | | | 1,000 | | | | 1,000 |
| | | | | | | | |
| | | | | | | | 7,502 |
| | | | | | | | |
| | | | | | | | |
| COMMERCIAL PAPER 53.3% |
| ANZ National International Ltd. |
5.250% due 09/19/2007 | | | | 6,600 | | | | 6,521 |
| |
| Bank of America Corp. |
5.210% due 10/04/2007 | | | | 800 | | | | 794 |
| |
| Bank of Ireland |
5.165% due 11/08/2007 | | | | 4,400 | | | | 4,316 |
5.230% due 11/08/2007 | | | | 2,300 | | | | 2,283 |
| |
| Barclays U.S. Funding Corp. |
5.235% due 09/26/2007 | | | | 4,300 | | | | 4,269 |
5.240% due 09/26/2007 | | | | 3,000 | | | | 2,977 |
| |
| CBA (de) Finance |
5.230% due 09/28/2007 | | | | 100 | | | | 100 |
5.260% due 09/28/2007 | | | | 300 | | | | 296 |
| |
| Dexia Delaware LLC |
5.220% due 09/21/2007 | | | | 1,100 | | | | 1,100 |
5.225% due 09/21/2007 | | | | 600 | | | | 597 |
5.240% due 09/21/2007 | | | | 5,900 | | | | 5,831 |
| |
| DnB NORBank ASA |
5.225% due 10/12/2007 | | | | 4,600 | | | | 4,600 |
5.350% due 10/12/2007 | | | | 400 | | | | 400 |
| |
| Fannie Mae |
5.080% due 07/02/2007 | | | | 400 | | | | 400 |
| |
| Fortis Funding LLC |
5.255% due 09/05/2007 | | | | 1,100 | | | | 1,097 |
5.275% due 09/05/2007 | | | | 6,500 | | | | 6,480 |
| |
| Freddie Mac |
4.800% due 07/02/2007 | | | | 11,800 | | | | 11,800 |
| |
| General Electric Capital Corp. |
5.200% due 11/06/2007 | | | | 1,900 | | | | 1,892 |
| |
| HBOS Treasury Services PLC |
5.225% due 11/13/2007 | | | | 400 | | | | 400 |
5.230% due 09/21/2007 | | | | 200 | | | | 199 |
5.235% due 11/13/2007 | | | | 4,500 | | | | 4,463 |
5.245% due 11/13/2007 | | | | 400 | | | | 395 |
5.250% due 09/21/2007 | | | | 600 | | | | 593 |
5.255% due 11/13/2007 | | | | 1,400 | | | | 1,381 |
| |
| Natixis S.A. |
5.230% due 09/21/2007 | | | | 400 | | | | 397 |
5.240% due 09/21/2007 | | | | 6,600 | | | | 6,575 |
| |
| Rabobank USA Financial Corp. |
5.330% due 07/26/2007 | | | | 2,000 | | | | 2,000 |
| |
| San Paolo IMI U.S. Financial Co. |
5.330% due 08/08/2007 | | | | 6,400 | | | | 6,400 |
| |
| Santander Hispano Finance Delaware |
5.250% due 09/26/2007 | | | | 400 | | | | 395 |
| |
| | | | | | | | | |
| | | | | PRINCIPAL
AMOUNT
(000S) | | | | VALUE
(000S) | |
| Societe Generale NY | |
5.195% due 11/26/2007 | | $ | | 700 | | $ | | 696 | |
5.210% due 11/26/2007 | | | | 100 | | | | 98 | |
5.225% due 11/26/2007 | | | | 2,200 | | | | 2,188 | |
5.240% due 11/26/2007 | | | | 1,800 | | | | 1,779 | |
5.245% due 11/26/2007 | | | | 2,100 | | | | 2,075 | |
| | |
| Stadshypoket Delaware, Inc. | |
5.230% due 09/11/2007 | | | | 400 | | | | 397 | |
| | |
| Statens Bostadsfin Bank | |
5.255% due 09/14/2007 | | | | 7,100 | | | | 7,021 | |
| | |
| Svenska Handelsbanken, Inc. | |
5.185% due 10/09/2007 | | | | 400 | | | | 400 | |
5.203% due 10/09/2007 | | | | 300 | | | | 298 | |
| | |
| Swedbank AB | |
5.225% due 09/06/2007 | | | | 6,600 | | | | 6,565 | |
| | |
| TotalFinaElf Capital S.A. | |
5.340% due 07/02/2007 | | | | 6,800 | | | | 6,800 | |
| | |
| UBS Finance Delaware LLC | |
5.230% due 10/23/2007 | | | | 500 | | | | 498 | |
| | |
| Unicredito Italiano SpA | |
5.185% due 01/22/2008 | | | | 2,100 | | | | 2,054 | |
5.200% due 01/22/2008 | | | | 4,400 | | | | 4,324 | |
| | |
| Westpac Banking Corp. | |
5.195% due 11/05/2007 | | | | 800 | | | | 796 | |
5.200% due 11/05/2007 | | | | 10,200 | | | | 10,153 | |
| | | | | | | | | |
| | | | | | | | 125,093 | |
| | | | | | | | | |
| | | | | | | | | |
| REPURCHASE AGREEMENTS 2.3% | |
| Lehman Brothers, Inc. | |
4.000% due 07/02/2007 | | | | 4,700 | | | | 4,700 | |
(Dated 06/29/2007. Collateralized by U.S. Treasury Inflation Protected Securities 3.625% due 01/15/2008 valued at $4,799. Repurchase proceeds are $4,702.) | |
| | |
| State Street Bank and Trust Co. | |
4.900% due 07/02/2007 | | | | 404 | | | | 404 | |
(Dated 06/29/2007. Collateralized by Fannie Mae 3.250% due 08/15/2008 valued at $416. Repurchase proceeds are $404.) | |
4.900% due 07/02/2007 | | | | 216 | | | | 216 | |
(Dated 06/29/2007. Collateralized by Federal Home Loan Bank 4.125% due 10/19/2007 valued at $221. Repurchase proceeds are $216.) | |
| | | | | | | | | |
| | | | | | | | 5,320 | |
| | | | | | | | | |
| | | | | | | | | |
| U.S. TREASURY BILLS 2.8% | |
4.571% due 08/30/2007 - 09/13/2007 (a)(c)(d)(f) | | | | 6,630 | | | | 6,567 | |
| | | | | | | | | |
Total Short-Term Instruments
(Cost $144,503) | | 144,482 | |
| | | | | | | | | |
| |
| PURCHASED OPTIONS (h) 0.0% | |
(Cost $142) | | | | | | | | 99 | |
| |
Total Investments (e) 206.3%
(Cost $477,460) | | $ | | 483,723 | |
| | | | | | | | | |
Written Options (i) (0.1%)
(Premiums $242) | | | | (188 | ) |
| |
| Other Assets and Liabilities (Net) (106.2%) | | (249,099 | ) |
| | | | | | | | | |
| Net Assets 100.0% | | | | | | $ | | 234,436 | |
| | | | | | | | | |
| | | | |
| 10 | | PIMCO Variable Insurance Trust | | See Accompanying Notes |
| | |
| |
| | | June 30, 2007 (Unaudited) |
Notes to Schedule of Investments (amounts in thousands*, except number of contracts):
* A zero balance may reflect actual amounts rounding to less than one thousand.
(a) Coupon represents a weighted average rate.
(b) Principal amount of security is adjusted for inflation.
(c) Securities with an aggregate market value of $990 have been pledged as collateral for swap and swaption contracts on June 30, 2007.
(d) Securities with an aggregate market value of $534 have been pledged as collateral for delayed-delivery securities on June 30, 2007.
(e) As of June 30, 2007, portfolio securities with an aggregate value of $65,003 were valued in good faith and pursuant to the guidelines established by the Board of Trustees.
(f) Securities with an aggregate market value of $752 have been segregated with the custodian to cover margin requirements for the following open futures contracts on June 30, 2007:
| | | | | | | | | | |
| Description | | Type | | Expiration
Month | | # of
Contracts | | Unrealized
Appreciation/
(Depreciation) | |
90-Day Euribor December Futures | | Long | | 12/2008 | | 17 | | $ | (5 | ) |
90-Day Euribor June Futures | | Long | | 06/2009 | | 17 | | | (4 | ) |
90-Day Euribor March Futures | | Long | | 03/2009 | | 17 | | | (5 | ) |
90-Day Euribor September Futures | | Long | | 09/2008 | | 17 | | | (5 | ) |
90-Day Euro December Futures | | Long | | 12/2007 | | 8 | | | (7 | ) |
90-Day Euro December Futures | | Long | | 12/2008 | | 45 | | | (23 | ) |
90-Day Euro June Futures | | Long | | 06/2008 | | 37 | | | (43 | ) |
90-Day Euro June Futures | | Long | | 06/2009 | | 27 | | | 3 | |
90-Day Euro March Futures | | Short | | 03/2008 | | 12 | | | 15 | |
90-Day Euro March Futures | | Long | | 03/2009 | | 57 | | | (1 | ) |
90-Day Euro September Futures | | Long | | 09/2008 | | 5 | | | 1 | |
Japan Government 10-Year Bond September Futures | | Long | | 09/2007 | | 2 | | | 3 | |
U.S. Treasury 5-Year Note September Futures | | Short | | 09/2007 | | 83 | | | (23 | ) |
U.S. Treasury 10-Year Note September Futures | | Short | | 09/2007 | | 24 | | | (33 | ) |
U.S. Treasury 30-Year Bond September Futures | | Short | | 09/2007 | | 175 | | | 146 | |
United Kingdom 90-Day LIBOR Sterling Interest Rate June Futures | | Long | | 06/2008 | | 121 | | | (205 | ) |
United Kingdom 90-Day LIBOR Sterling Interest Rate March Futures | | Long | | 03/2008 | | 64 | | | (123 | ) |
| | | | | | | | | | |
| | | | | | | | $ | (309 | ) |
| | | | | | | | | | |
(g) Swap agreements outstanding on June 30, 2007:
Commodity Swaps
| | | | | | | | | | | | | | | | | |
| Counterparty | | Type | | Commodity Exchange | | Pay/Receive
Commodity Exchange | | Fixed Price
Per Unit | | Expiration
Date | | Units | | Unrealized
Appreciation/
(Depreciation) | |
Barclays Bank PLC | | Short | | LMEX Aluminum Hg Futures | | Receive | | $ | 2,670.000 | | 12/15/2008 | | 1 | | $ | (14 | ) |
Barclays Bank PLC | | Long | | LMEX Aluminum Hg Futures | | Pay | | | 2,300.000 | | 12/13/2010 | | 1 | | | 76 | |
Morgan Stanley | | Long | | ICEX Brent Crude Futures | | Pay | | | 66.000 | | 11/14/2012 | | 31 | | | 64 | |
Morgan Stanley | | Short | | NYMEX Crude Oil Futures | | Receive | | | 67.700 | | 11/19/2012 | | 31 | | | (75 | ) |
| | | | | | | | | | | | | | | | | |
| | | | | | | | | | | | | | | $ | 51 | |
| | | | | | | | | | | | | | | | | |
Credit Default Swaps
| | | | | | | | | | | | | | | |
| Counterparty | | Reference Entity | | Buy/Sell
Protection (1) | | (Pay)/Receive
Fixed Rate | | Expiration
Date | | Notional
Amount | | Unrealized
(Depreciation) | |
Credit Suisse First Boston | | Chesapeake Energy Corp. 6.875% due 01/15/2016 | | Sell | | 0.970% | | 06/20/2012 | | $ | 100 | | $ | (1 | ) |
Credit Suisse First Boston | | Chesapeake Energy Corp. 6.875% due 01/15/2016 | | Sell | | 1.010% | | 06/20/2012 | | | 300 | | | (3 | ) |
Morgan Stanley | | Russia Government International Bond 7.500% due 03/31/2030 | | Sell | | 0.260% | | 12/20/2007 | | | 2,000 | | | 0 | |
| | | | | | | | | | | | | | | |
| | | | | | | | | | | | | $ | (4 | ) |
| | | | | | | | | | | | | | | |
(1) If the Portfolio is a seller of protection and a credit event occurs, as defined under the terms of that particular swap agreement, the Portfolio will pay to the buyer of the protection an amount up to the notional value of the swap and in certain instances, take delivery of the security.
| | | | | | |
| See Accompanying Notes | | Semiannual Report | | June 30, 2007 | | 11 |
Consolidated Schedule of Investments CommodityRealReturn™ Strategy Portfolio (Cont.)
Interest Rate Swaps
| | | | | | | | | | | | | | | |
| Counterparty | | Floating Rate Index | | Pay/Receive
Floating Rate | | Fixed
Rate | | Expiration
Date | | Notional Amount | | Unrealized
Appreciation/
(Depreciation) | |
Citibank N.A. | | 6-Month Australian Bank Bill | | Pay | | 6.500% | | 01/15/2010 | | AUD | 800 | | $ | (6 | ) |
Deutsche Bank AG | | 6-Month Australian Bank Bill | | Pay | | 6.500% | | 01/15/2010 | | | 2,500 | | | (17 | ) |
Deutsche Bank AG | | 6-Month Australian Bank Bill | | Pay | | 7.000% | | 06/15/2010 | | | 8,500 | | | (9 | ) |
Royal Bank of Canada | | 6-Month Australian Bank Bill | | Pay | | 6.500% | | 01/15/2010 | | | 1,600 | | | (10 | ) |
Royal Bank of Canada | | 3-Month Canadian Bank Bill | | Receive | | 5.500% | | 06/20/2017 | | CAD | 3,300 | | | 0 | |
Barclays Bank PLC | | 5-Year French CPI Ex Tobacco Daily Reference Index | | Pay | | 2.103% | | 10/15/2010 | | EUR | 500 | | | 7 | |
BNP Paribas Bank | | 5-Year French CPI Ex Tobacco Daily Reference Index | | Pay | | 2.040% | | 02/21/2011 | | | 1,700 | | | 12 | |
BNP Paribas Bank | | 5-Year French CPI Ex Tobacco Daily Reference Index | | Pay | | 1.988% | | 12/15/2011 | | | 900 | | | (4 | ) |
Goldman Sachs & Co. | | 5-Year French CPI Ex Tobacco Daily Reference Index | | Pay | | 1.976% | | 12/15/2011 | | | 5,400 | | | (16 | ) |
JPMorgan Chase & Co. | | 5-Year French CPI Ex Tobacco Daily Reference Index | | Pay | | 2.028% | | 10/15/2011 | | | 600 | | | 3 | |
JPMorgan Chase & Co. | | 5-Year French CPI Ex Tobacco Daily Reference Index | | Pay | | 1.973% | | 12/15/2011 | | | 1,200 | | | (6 | ) |
JPMorgan Chase & Co. | | 5-Year French CPI Ex Tobacco Daily Reference Index | | Pay | | 1.958% | | 04/10/2012 | | | 700 | | | (7 | ) |
JPMorgan Chase & Co. | | 5-Year French CPI Ex Tobacco Daily Reference Index | | Pay | | 2.353% | | 10/15/2016 | | | 300 | | | 2 | |
Morgan Stanley | | 6-Month EUR-LIBOR | | Receive | | 4.000% | | 06/15/2017 | | | 200 | | | 19 | |
UBS Warburg LLC | | 5-Year French CPI Ex Tobacco Daily Reference Index | | Pay | | 2.095% | | 10/15/2011 | | | 1,100 | | | 11 | |
UBS Warburg LLC | | Eurostat Eurozone HICP Ex Tobacco Unrevised Series NSA Index | | Receive | | 2.275% | | 10/15/2016 | | | 400 | | | 1 | |
UBS Warburg LLC | | 5-Year French CPI Ex Tobacco Daily Reference Index | | Pay | | 2.350% | | 10/15/2016 | | | 400 | | | 2 | |
Barclays Bank PLC | | 6-Month GBP-LIBOR | | Pay | | 5.000% | | 06/15/2009 | | GBP | 2,800 | | | (103 | ) |
Barclays Bank PLC | | 6-Month GBP-LIBOR | | Receive | | 4.000% | | 12/15/2035 | | | 1,200 | | | 93 | |
Credit Suisse First Boston | | 6-Month GBP-LIBOR | | Pay | | 5.000% | | 09/15/2010 | | | 1,600 | | | (73 | ) |
Credit Suisse First Boston | | 6-Month GBP-LIBOR | | Receive | | 4.000% | | 12/15/2035 | | | 600 | | | 45 | |
Goldman Sachs & Co. | | 6-Month GBP-LIBOR | | Receive | | 5.000% | | 09/15/2015 | | | 500 | | | 48 | |
HSBC Bank USA | | 6-Month GBP-LIBOR | | Receive | | 4.250% | | 06/12/2036 | | | 300 | | | 76 | |
JPMorgan Chase & Co. | | 6-Month GBP-LIBOR | | Pay | | 5.000% | | 06/15/2008 | | | 100 | | | (2 | ) |
Royal Bank of Scotland Group PLC | | 6-Month GBP-LIBOR | | Pay | | 5.000% | | 09/15/2010 | | | 2,000 | | | (90 | ) |
Morgan Stanley | | 6-Month JPY-LIBOR | | Pay | | 1.000% | | 03/18/2009 | | JPY | 600,000 | | | (1 | ) |
Barclays Bank PLC | | 28-Day Mexico Interbank TIIE Banxico | | Pay | | 8.330% | | 02/14/2017 | | MXN | 2,100 | | | 3 | |
Citibank N.A. | | 28-Day Mexico Interbank TIIE Banxico | | Pay | | 8.170% | | 11/04/2016 | | | 8,600 | | | 3 | |
Goldman Sachs & Co. | | 28-Day Mexico Interbank TIIE Banxico | | Pay | | 8.170% | | 11/04/2016 | | | 4,000 | | | 3 | |
Merrill Lynch & Co., Inc. | | 28-Day Mexico Interbank TIIE Banxico | | Pay | | 8.170% | | 11/04/2016 | | | 3,700 | | | 3 | |
Barclays Bank PLC | | 3-Month USD-LIBOR | | Pay | | 5.000% | | 12/19/2009 | | $ | 900 | | | (1 | ) |
Barclays Bank PLC | | 3-Month USD-LIBOR | | Pay | | 5.000% | | 12/19/2012 | | | 2,500 | | | 8 | |
Deutsche Bank AG | | 3-Month USD-LIBOR | | Pay | | 5.000% | | 12/19/2009 | | | 9,000 | | | 19 | |
Deutsche Bank AG | | 3-Month USD-LIBOR | | Pay | | 5.000% | | 12/19/2012 | | | 3,600 | | | 5 | |
Deutsche Bank AG | | 3-Month USD-LIBOR | | Pay | | 5.000% | | 12/19/2017 | | | 6,950 | | | 49 | |
Deutsche Bank AG | | 3-Month USD-LIBOR | | Receive | | 5.000% | | 12/20/2021 | | | 1,800 | | | 9 | |
Deutsche Bank AG | | 3-Month USD-LIBOR | | Receive | | 5.000% | | 12/20/2026 | | | 1,800 | | | 3 | |
Deutsche Bank AG | | 3-Month USD-LIBOR | | Pay | | 5.000% | | 12/19/2037 | | | 2,300 | | | 28 | |
Goldman Sachs & Co. | | 3-Month USD-LIBOR | | Pay | | 5.000% | | 12/19/2009 | | | 500 | | | (1 | ) |
Goldman Sachs & Co. | | 3-Month USD-LIBOR | | Receive | | 5.000% | | 06/20/2014 | | | 300 | | | 11 | |
Lehman Brothers, Inc. | | 3-Month USD-LIBOR | | Pay | | 5.000% | | 12/19/2012 | | | 400 | | | 1 | |
Morgan Stanley | | 3-Month USD-LIBOR | | Pay | | 5.000% | | 12/19/2037 | | | 1,600 | | | 26 | |
Royal Bank of Scotland Group PLC | | 3-Month USD-LIBOR | | Pay | | 5.000% | | 12/19/2012 | | | 1,300 | | | 5 | |
UBS Warburg LLC | | 3-Month USD-LIBOR | | Pay | | 5.000% | | 06/18/2009 | | | 17,000 | | | (5 | ) |
UBS Warburg LLC | | 3-Month USD-LIBOR | | Receive | | 5.000% | | 12/19/2017 | | | 700 | | | (9 | ) |
| | | | | | | | | | | | | | | |
| | | | | | | | | | | | | $ | 135 | |
| | | | | | | | | | | | | | | |
Total Return Swaps
| | | | | | | | | | | | | | |
| Counterparty | | Type | | Receive Total Return | | Pay | | Expiration
Date | | # of
Contracts | | Unrealized
Appreciation/
(Depreciation) | |
AIG International Inc. | | Long | | Dow Jones-AIG Commodity Index Total Return | | 3-Month U.S. Treasury Bill rate plus a specified spread | | 07/27/2007 | | 61,983 | | $ | 78 | |
Morgan Stanley | | Long | | Dow Jones-AIG Commodity Index Total Return | | 3-Month U.S. Treasury Bill rate plus a specified spread | | 07/27/2007 | | 246,854 | | | 314 | |
Morgan Stanley | | Short | | Dow Jones-AIG Commodity Index Total Return | | 3-Month U.S. Treasury Bill rate plus a specified spread | | 07/27/2007 | | 60,115 | | | (76 | ) |
| | | | | | | | | | | | | | |
| | | | | | | | | | | | $ | 316 | |
| | | | | | | | | | | | | | |
(h) Purchased options outstanding on June 30, 2007:
Options on Exchange-Traded Futures Contracts
| | | | | | | | | | | | | |
| Description | | Exercise
Price | | Expiration
Date | | # of
Contracts | | Cost | | Value |
Call - CBOT U.S. Treasury 5-Year Note September Futures | | $ | 106.000 | | 08/24/2007 | | 51 | | $ | 1 | | $ | 2 |
Call - CBOT U.S. Treasury 30-Year Bond September Futures | | | 118.000 | | 08/24/2007 | | 248 | | | 5 | | | 4 |
Put - CBOT U.S. Treasury 10-Year Note September Futures | | | 101.000 | | 08/24/2007 | | 95 | | | 2 | | | 3 |
Put - CME 90-Day Euro September Futures | | | 91.500 | | 09/17/2007 | | 50 | | | 0 | | | 0 |
Put - CME 90-Day Euro September Futures | | | 92.000 | | 09/17/2007 | | 1 | | | 0 | | | 0 |
| | | | | | | | | | | | | |
| | | | | | | | | $ | 8 | | $ | 9 |
| | | | | | | | | | | | | |
| | | | |
| 12 | | PIMCO Variable Insurance Trust | | See Accompanying Notes |
| | |
| |
| | | June 30, 2007 (Unaudited) |
Interest Rate Swaptions
| | | | | | | | | | | | | | | | | | | |
| Description | | Counterparty | | Floating Rate Index | | Pay/Receive
Floating Rate | | Exercise
Rate | | Expiration
Date | | Notional
Amount | | Cost | | Value |
Call - OTC 2-Year Interest Rate Swap | | Royal Bank of Scotland Group PLC | | 3-Month USD-LIBOR | | Pay | | 4.750% | | 03/31/2008 | | $ | 6,000 | | $ | 34 | | $ | 7 |
Call - OTC 2-Year Interest Rate Swap | | Royal Bank of Scotland Group PLC | | 3-Month USD-LIBOR | | Pay | | 4.750% | | 09/26/2008 | | | 1,000 | | | 5 | | | 2 |
| | | | | | | | | | | | | | | | | | | |
| | | | | | | | | | | | | | | $ | 39 | | $ | 9 |
| | | | | | | | | | | | | | | | | | | |
Foreign Currency Options
| | | | | | | | | | | | | |
| Description | | Exercise
Price | | Expiration
Date | | Notional
Amount | | Cost | | Value |
Call - OTC Euro versus U.S. dollar | | $ | 1.353 | | 06/26/2008 | | EUR 1,100 | | $ | 35 | | $ | 41 |
Put - OTC Euro versus U.S. dollar | | | 1.353 | | 06/26/2008 | | 1,100 | | | 34 | | | 28 |
| | | | | | | | | | | | | |
| | | | | | | | | $ | 69 | | $ | 69 |
| | | | | | | | | | | | | |
Options on Securities
| | | | | | | | | | | | | | |
| Description | | Strike
Price | | Expiration
Date | | Notional
Amount | | Cost | | Value |
Put - OTC Treasury Inflation Protected Securities 0.875% due 04/15/2010 | | $ | 87.000 | | 08/21/2007 | | $ | 20,000 | | $ | 5 | | $ | 0 |
Put - OTC Treasury Inflation Protected Securities 2.000% due 01/15/2014 | | | 81.000 | | 09/20/2007 | | | 8,000 | | | 2 | | | 0 |
Put - OTC Treasury Inflation Protected Securities 2.000% due 01/15/2026 | | | 61.000 | | 09/20/2007 | | | 18,000 | | | 4 | | | 0 |
Put - OTC Treasury Inflation Protected Securities 2.375% due 04/15/2011 | | | 89.000 | | 08/21/2007 | | | 20,000 | | | 5 | | | 0 |
Put - OTC Treasury Inflation Protected Securities 2.375% due 01/15/2017 | | | 71.000 | | 09/27/2007 | | | 10,000 | | | 2 | | | 0 |
Put - OTC Treasury Inflation Protected Securities 2.375% due 01/15/2025 | | | 64.000 | | 07/25/2007 | | | 25,000 | | | 6 | | | 0 |
Put - OTC Treasury Inflation Protected Securities 3.875% due 01/15/2009 | | | 87.531 | | 09/27/2007 | | | 10,000 | | | 2 | | | 0 |
| | | | | | | | | | | | | | |
| | | | | | | | | | $ | 26 | | $ | 0 |
| | | | | | | | | | | | | | |
Straddle Options
| | | | | | | | | | | | | | | |
| Description | | Counterparty | | Exercise
Price (2) | | Expiration
Date | | Notional
Amount | | Cost (2) | | Value |
Call & Put - OTC U.S. dollar versus Swiss franc Forward Delta Neutral Straddle | | JPMorgan Chase & Co. | | CHF 0.000 | | 09/26/2007 | | $ | 5,400 | | $ | 0 | | $ | 9 |
Call & Put - OTC U.S. dollar versus Swiss franc Forward Delta Neutral Straddle | | Royal Bank of Scotland Group PLC | | 0.000 | | 09/26/2007 | | | 1,000 | | | 0 | | | 3 |
| | | | | | | | | | | | | | | |
| | | | | | | | | | | $ | 0 | | $ | 12 |
| | | | | | | | | | | | | | | |
(2) Exercise price and final cost determined on a future date, based upon implied volatility parameters.
(i) Written options outstanding on June 30, 2007:
Options on Exchange-Traded Futures Contracts
| | | | | | | | | | | | | |
| Description | | Exercise
Price | | Expiration
Date | | # of
Contracts | | Premium | | Value |
Call - CBOT U.S. Treasury 10-Year Note September Futures | | $ | 106.000 | | 08/24/2007 | | 56 | | $ | 15 | | $ | 34 |
Call - CBOT U.S. Treasury 10-Year Note September Futures | | | 109.000 | | 08/24/2007 | | 36 | | | 4 | | | 2 |
Call - CBOT U.S. Treasury 30-Year Bond September Futures | | | 109.000 | | 08/24/2007 | | 25 | | | 8 | | | 16 |
Call - OTC Dow Jones - AIG Commodity Index Total Return Futures | | | 191.000 | | 01/22/2008 | | 700,000 | | | 16 | | | 11 |
Call - OTC Dow Jones - AIG Commodity Index Total Return Futures | | | 230.000 | | 10/19/2010 | | 1,000,000 | | | 43 | | | 35 |
Put - CBOT U.S. Treasury 10-Year Note September Futures | | | 103.000 | | 08/24/2007 | | 56 | | | 16 | | | 6 |
Put - OTC Dow Jones - AIG Commodity Index Total Return Futures | | | 144.000 | | 01/22/2008 | | 700,000 | | | 22 | | | 5 |
Put - OTC Dow Jones - AIG Commodity Index Total Return Futures | | | 150.000 | | 10/19/2010 | | 1,000,000 | | | 82 | | | 67 |
| | | | | | | | | | | | | |
| | | | | | | | | $ | 206 | | $ | 176 |
| | | | | | | | | | | | | |
Interest Rate Swaptions
| | | | | | | | | | | | | | | | | | | |
| Description | | Counterparty | | Floating Rate Index | | Pay/Receive
Floating Rate | | Exercise
Rate | | Expiration
Date | | Notional
Amount | | Premium | | Value |
Call - OTC 5-Year Interest Rate Swap | | Royal Bank of Scotland Group PLC | | 3-Month USD-LIBOR | | Receive | | 4.950% | | 03/31/2008 | | $ | 2,000 | | $ | 25 | | $ | 7 |
Call - OTC 5-Year Interest Rate Swap | | Royal Bank of Scotland Group PLC | | 3-Month USD-LIBOR | | Receive | | 4.950% | | 09/26/2008 | | | 1,000 | | | 11 | | | 5 |
| | | | | | | | | | | | | | | | | | | |
| | | | | | | | | | | | | | | $ | 36 | | $ | 12 |
| | | | | | | | | | | | | | | | | | | |
(j) Restricted securities as of June 30, 2007:
| | | | | | | | | | | | | | |
| Issuer Description | | Coupon | | Maturity
Date | | Acquisition
Date | | Cost | | Market
Value | | Market Value
as Percentage
of Net Assets |
Bear Stearns Cos., Inc. | | 0.000% | | 10/19/2007 | | 06/22/2007 | | $ | 3,000 | | $ | 3,445 | | 1.47% |
Credit Suisse First Boston | | 5.255% | | 01/14/2008 | | 01/05/2007 | | | 5,300 | | | 6,546 | | 2.79% |
Morgan Stanley | | 0.000% | | 02/06/2008 | | 01/25/2007 | | | 13,000 | | | 15,027 | | 6.41% |
| | | | | | | | | | | | | | |
| | | | | | | | $ | 21,300 | | $ | 25,018 | | 10.67% |
| | | | | | | | | | | | | | |
| | | | | | |
| See Accompanying Notes | | Semiannual Report | | June 30, 2007 | | 13 |
| | |
| |
| Consolidated Schedule of Investments CommodityRealReturn™ Strategy Portfolio (Cont.) | | June 30, 2007 (Unaudited) |
(k) Short sales outstanding on June 30, 2007:
| | | | | | | | | | | | | |
| Description | | Coupon | | Maturity
Date | | Principal
Amount | | Proceeds | | Value (3) |
Treasury Inflation Protected Securities | | 2.375% | | 01/15/2017 | | $ | 103 | | $ | 100 | | $ | 101 |
Treasury Inflation Protected Securities | | 2.500% | | 07/15/2016 | | | 1,951 | | | 1,920 | | | 1,930 |
| | | | | | | | | | | | | |
| | | | | | | | | $ | 2,020 | | $ | 2,031 |
| | | | | | | | | | | | | |
(3) Market value includes $1 of interest payable on short sales.
(l) Foreign currency contracts outstanding on June 30, 2007:
| | | | | | | | | | | | | | | | | |
| Type | | Currency | | Principal
Amount
Covered by
Contract | | Settlement
Month | | Unrealized
Appreciation | | Unrealized
(Depreciation) | | | Net Unrealized
Appreciation/
(Depreciation) | |
Sell | | AUD | | 1 | | 07/2007 | | $ | 0 | | $ | 0 | | | $ | 0 | |
Buy | | BRL | | 1,096 | | 10/2007 | | | 1 | | | (4 | ) | | | (3 | ) |
Sell | | CAD | | 148 | | 08/2007 | | | 0 | | | (1 | ) | | | (1 | ) |
Sell | | CHF | | 222 | | 09/2007 | | | 0 | | | 0 | | | | 0 | |
Buy | | CNY | | 16,113 | | 01/2008 | | | 11 | | | 0 | | | | 11 | |
Buy | | | | 18,891 | | 03/2008 | | | 0 | | | (14 | ) | | | (14 | ) |
Buy | | | | 1,182 | | 03/2009 | | | 0 | | | 0 | | | | 0 | |
Sell | | EUR | | 458 | | 07/2007 | | | 0 | | | (6 | ) | | | (6 | ) |
Sell | | GBP | | 888 | | 08/2007 | | | 0 | | | (9 | ) | | | (9 | ) |
Sell | | JPY | | 17,760 | | 07/2007 | | | 2 | | | 0 | | | | 2 | |
Buy | | KRW | | 35,197 | | 07/2007 | | | 0 | | | 0 | | | | 0 | |
Buy | | | | 487,662 | | 09/2007 | | | 2 | | | 0 | | | | 2 | |
Buy | | MXN | | 4,936 | | 09/2007 | | | 1 | | | (1 | ) | | | 0 | |
Buy | | | | 1,222 | | 03/2008 | | | 1 | | | 0 | | | | 1 | |
Buy | | PLN | | 1,599 | | 09/2007 | | | 10 | | | 0 | | | | 10 | |
Buy | | RUB | | 14,607 | | 01/2008 | | | 5 | | | 0 | | | | 5 | |
Buy | | SGD | | 810 | | 07/2007 | | | 2 | | | 0 | | | | 2 | |
Sell | | | | 810 | | 07/2007 | | | 0 | | | (3 | ) | | | (3 | ) |
Buy | | | | 58 | | 08/2007 | | | 0 | | | 0 | | | | 0 | |
Buy | | | | 806 | | 10/2007 | | | 3 | | | 0 | | | | 3 | |
| | | | | | | | | | | | | | | | | |
| | | | | | | | $ | 38 | | $ | (38 | ) | | $ | 0 | |
| | | | | | | | | | | | | | | | | |
| | | | |
| 14 | | PIMCO Variable Insurance Trust | | See Accompanying Notes |
| | |
| |
| Notes to Financial Statements | | June 30, 2007 (Unaudited) |
1. ORGANIZATION
The CommodityRealReturn™ Strategy Portfolio (the “Portfolio”) is a series of the PIMCO Variable Insurance Trust (the “Trust”). The Trust is registered under the Investment Company Act of 1940 (the “Act”), as amended, as an open-end management investment company organized as a Delaware business trust on October 3, 1997. The Portfolio offers two classes of shares: Administrative and Advisor. Information presented on these financial statements pertains to the Advisor Class of the Portfolio. Certain detailed financial information for the Administrative Class is provided separately and is available upon request. The Trust is designed to be used as an investment vehicle by Separate Accounts of insurance companies that fund variable annuity contracts and variable life insurance policies and by qualified pension and retirement plans.
2. SIGNIFICANT ACCOUNTING POLICIES
The following is a summary of significant accounting policies consistently followed by the Portfolio in the preparation of its financial statements in conformity with accounting principles generally accepted in the United States of America (“GAAP”). The preparation of financial statements in accordance with GAAP requires management to make estimates and assumptions that affect the reported amounts and disclosures on the financial statements. Actual results could differ from those estimates.
(a) Security Valuation Portfolio securities are valued as of the close of regular trading (normally 4:00 p.m., Eastern Time) on each day that the New York Stock Exchange (“NYSE���) is open. Portfolio securities and other assets for which market quotes are readily available are stated at market value. Market value is generally determined on the basis of last reported sales prices, or if no sales are reported, based on quotes obtained from a quotation reporting system, established market makers, or pricing services. Fixed-income securities and non-exchange traded derivatives are normally valued on the basis of quotes obtained from brokers and dealers or pricing services. Prices obtained from independent pricing services use information provided by market makers or estimates of market values obtained from yield data relating to investments or securities with similar characteristics. Certain fixed income securities purchased on a delayed-delivery basis are marked to market daily until settlement at the forward settlement date. Short-term investments having a maturity of 60 days or less are generally valued at amortized cost. Exchange traded options, futures and options on futures are valued at the settlement price determined by the relevant exchange. With respect to any portion of the Portfolio’s assets that are invested in one or more open end management investment companies, the Portfolio’s net asset value (“NAV”) will be calculated based upon the NAVs of such investments.
Investments initially valued in currencies other than the U.S. dollar are converted to the U.S. dollar using exchange rates obtained from pricing services. As a result, the NAV of the Portfolio’s securities may be affected by changes in the value of currencies in relation to the U.S. dollar. The value of securities traded in markets outside the United States or denominated in currencies other than the U.S. dollar may be affected significantly on a day that the NYSE is closed and an investor is not able to purchase, redeem or exchange shares.
Securities and other assets for which market quotes are not readily available are valued at fair value as determined in good faith by the Board of Trustees or persons acting at their direction. The Board of Trustees has adopted methods for valuing securities and other assets in circumstances where market quotes are not readily available, and has delegated to Pacific Investment Management Company LLC (“PIMCO”) the responsibility for applying the valuation methods. In the event that market quotes are not readily available, and the security or asset cannot be valued pursuant to one of the valuation methods, the value of the security or asset will be determined in good faith by the Valuation Committee of the Board of Trustees, generally based upon recommendations provided by PIMCO.
Market quotes are considered not readily available in circumstances where there is an absence of current or reliable market-based data (e.g., trade information, bid/asked information, broker quotes), including where events occur after the close of the relevant market, but prior to the close of regular trading, that materially affect the values of the Portfolio’s securities or assets. In addition, market quotes are considered not readily available when, due to extraordinary circumstances, the exchanges or markets on which the securities trade, do not open for trading for the entire day and no other market prices are available. The Board has delegated to PIMCO the responsibility for monitoring significant events that may materially affect the values of the Portfolio’s securities or assets and for determining whether the value of the applicable securities or assets should be re-evaluated in light of such significant events.
When the Portfolio uses fair value pricing to determine its NAV, securities will not be priced on the basis of quotations from the primary market in which they are traded, but rather may be priced by another method that the Board of Trustees or persons acting at their direction believe accurately reflects fair value. The Trust’s policy is intended to result in a calculation of the Portfolio’s NAV that fairly reflects security values as of the time of pricing. However, fair values determined by the Board of Trustees or persons acting at their direction may not accurately reflect the price that the Portfolio could obtain for a security if it were to dispose of that security as of the time of pricing. Because foreign securities can trade on non-business days of the Portfolio, the NAV of the Portfolio may change on days when shareholders will not be able to purchase or redeem Portfolio shares. The prices used by the Portfolio may differ from the value that would be realized if the securities were sold and the differences could be material to the financial statements.
(b) Securities Transactions and Investment Income Securities transactions are recorded as of the trade date for financial reporting purposes. Securities purchased or sold on a when-issued or delayed-delivery basis may be settled a month or more after the trade date. Realized gains and losses from securities sold are recorded on the identified cost basis. Dividend income is recorded on the ex-dividend date, except certain dividends from foreign securities where the ex-dividend date may have passed, which are recorded as soon as the Portfolio is informed of the ex-dividend date. Interest income, adjusted for the accretion of discounts and amortization of premiums, is recorded on the accrual basis. Paydown gains and losses on mortgage-related and other asset-backed securities are recorded as components of interest income on the Statement of Operations.
(c) Delayed-Delivery Transactions The Portfolio may purchase or sell securities on a delayed-delivery basis. These transactions involve a commitment by the Portfolio to purchase or sell securities for a predetermined price or yield, with payment and delivery taking place beyond the customary settlement period. When delayed-delivery purchases are outstanding, the Portfolio will designate liquid assets in an amount sufficient to meet the purchase price. When purchasing a security on a delayed-delivery basis, the Portfolio assumes the rights and risks of ownership of the security, including the risk of price and yield fluctuations, and takes such fluctuations into account when determining its net asset value. The Portfolio may dispose of or renegotiate a delayed-delivery transaction after it is entered into, and may sell when-issued securities before they are delivered, which may result in a capital gain or loss. When the Portfolio has sold a security on a delayed-delivery basis, the Portfolio does not participate in future gains and losses with respect to the security.
(d) Dividends and Distributions to Shareholders Dividends from net investment income, if any, are declared and distributed to shareholders quarterly. Net realized capital gains earned by the Portfolio, if any, will be distributed no less frequently than once each year.
Income dividends and capital gain distributions are determined in accordance with income tax regulations which may differ from GAAP. Differences between tax regulations and GAAP may change the fiscal year when income and capital items
| | | | | | |
| | Semiannual Report | | June 30, 2007 | | 15 |
Notes to Financial Statements (Cont.)
are recognized for tax and GAAP purposes. Examples of events that give rise to timing differences include wash sales, straddles, net operating losses and capital loss carryforwards. Further, the character of investment income and capital gains may be different for certain transactions under the two methods of accounting. Examples of characterization differences include the treatment of mortgage paydowns, swaps, foreign currency transactions and contingent debt instruments. As a result, income dividends and capital gain distributions declared during a fiscal period may differ significantly from the net investment income and realized capital gain reported on the Portfolio’s annual financial statements presented under GAAP.
Distributions classified as a tax basis return of capital, if any, are reflected on the accompanying Statements of Changes in Net Assets and have been reclassified to paid in capital. In addition, other amounts have been reclassified between undistributed net investment income, accumulated undistributed net realized gains or losses and/or paid in capital to more appropriately conform financial accounting to tax characterizations of dividend distributions.
(e) Multiclass Operations Each class offered by the Portfolio has equal rights as to assets and voting privileges (except that shareholders of a class have exclusive voting rights regarding any matter relating solely to that class of shares). Income and non-class specific expenses of the Portfolio are allocated daily to each class of shares based on the relative value of settled shares. Realized and unrealized capital gains and losses of the Portfolio are allocated daily to each class of shares based on the relative net assets of each class. Class specific expenses, where applicable, currently include administrative, distribution and servicing fees.
(f) Foreign Currency The functional and reporting currency for the Portfolio is the U.S. dollar. The market values of foreign securities, currency holdings and other assets and liabilities are translated into U.S. dollars based on the current exchange rates each business day. Fluctuations in the value of currency holdings and other assets and liabilities resulting from changes in exchange rates are recorded as unrealized foreign currency gains or losses. Realized gains or losses and unrealized appreciation or depreciation on investment securities and income and expenses are translated on the respective dates of such transactions. The effects of changes in foreign currency exchange rates on investments in securities are not segregated on the Statement of Operations from the effects of changes in market prices of those securities, but are included with the net realized and unrealized gain or loss on investment securities.
| | | | | | |
|
| Non-U.S. currency symbols utilized throughout the report are defined as follows: |
| AUD | | Australian Dollar | | JPY | | Japanese Yen |
| BRL | | Brazilian Real | | KRW | | South Korean Won |
| CAD | | Canadian Dollar | | MXN | | Mexican Peso |
| CHF | | Swiss Franc | | PLN | | Polish Zloty |
| CNY | | Chinese Yuan Renminbi | | RUB | | Russian Ruble |
| EUR | | Euro | | SGD | | Singapore Dollar |
| GBP | | Great British Pound | | | | |
(g) Foreign Currency Transactions The Portfolio may enter into foreign currency contracts in connection with settling planned purchases or sales of securities, to hedge the currency exposure associated with some or all of the Portfolio’s securities or as a part of an investment strategy. A foreign currency contract is an agreement between two parties to buy and sell a currency at a set price on a future date. The market value of a foreign currency contract fluctuates with changes in foreign currency exchange rates. Foreign currency contracts are marked to market daily and the change in value is recorded by the Portfolio as an
unrealized gain or loss. Realized gains or losses equal to the difference between the value of the contract at the time it was opened and the value at the time it was closed are recorded upon delivery or receipt of the currency. These contracts may involve market risk in excess of the unrealized gain or loss reflected on the Statement of Assets and Liabilities. In addition, the Portfolio could be exposed to risk if the counterparties are unable to meet the terms of the contracts or if the value of the currency changes unfavorably to the U.S. dollar.
(h) Futures Contracts The Portfolio may enter into futures contracts. The Portfolio may use futures contracts to manage its exposure to the securities markets or to movements in interest rates and currency values. The primary risks associated with the use of futures contracts are the imperfect correlation between the change in market value of the securities held by the Portfolio and the prices of futures contracts, the possibility of an illiquid market, and the inability of the counterparty to meet the terms of the contract. Futures contracts are valued based upon their quoted daily settlement prices. Upon entering into a futures contract, the Portfolio is required to deposit with its futures broker, an amount of cash or U.S. Government and Agency Obligations in accordance with the initial margin requirements of the broker or exchange. Futures contracts are marked to market daily and an appropriate payable or receivable for the change in value (“variation margin”) is recorded by the Portfolio. Gains or losses are recognized but not considered realized until the contracts expire or are closed. Futures contracts involve, to varying degrees, risk of loss in excess of the variation margin disclosed on the Statement of Assets and Liabilities.
(i) Inflation-Indexed Bonds The Portfolio may invest in inflation-indexed bonds. Inflation-indexed bonds are fixed-income securities whose principal value is periodically adjusted to the rate of inflation. The interest rate on these bonds is generally fixed at issuance at a rate lower than typical bonds. Over the life of an inflation-indexed bond, however, interest will be paid based on a principal value, which is adjusted for inflation. Any increase in the principal amount of an inflation-indexed bond will be included as interest income on the Statement of Operations, even though investors do not receive their principal until maturity.
(j) Options Contracts The Portfolio may write call and put options on futures, swaps, securities or currencies it owns or in which it may invest. Writing put options tends to increase the Portfolio’s exposure to the underlying instrument. Writing call options tends to decrease the Portfolio’s exposure to the underlying instrument. When the Portfolio writes a call or put option, an amount equal to the premium received is recorded as a liability and subsequently marked to market to reflect the current value of the option written. These liabilities are reflected as written options outstanding on the Statement of Assets and Liabilities. Certain options may be written with premiums to be determined on a future date. The premiums for these options are based upon implied volatility parameters at specified terms. Premiums received from writing options which expire are treated as realized gains. Premiums received from writing options which are exercised or closed are added to the proceeds or offset against amounts paid on the underlying future, swap, security or currency transaction to determine the realized gain or loss. The Portfolio as a writer of an option has no control over whether the underlying future, swap, security or currency may be sold (call) or purchased (put) and as a result bears the market risk of an unfavorable change in the price of the future, swap, security or currency underlying the written option. There is the risk the Portfolio may not be able to enter into a closing transaction because of an illiquid market.
The Portfolio may also purchase put and call options. Purchasing call options tends to increase the Portfolio’s exposure to the underlying instrument. Purchasing put options tends to decrease the Portfolio’s exposure to the underlying instrument. The Portfolio pays a premium which is included on the Statement of Assets and Liabilities as an investment and subsequently marked to market to reflect the current value of the option. Premiums paid for purchasing options which expire are
| | | | |
| 16 | | PIMCO Variable Insurance Trust | | |
| | |
| |
| | | June 30, 2007 (Unaudited) |
treated as realized losses. Certain options may be purchased with premiums to be determined on a future date. The premiums for these options are based upon implied volatility parameters at specified terms. The risk associated with purchasing put and call options is limited to the premium paid. Premiums paid for purchasing options which are exercised or closed are added to the amounts paid or offset against the proceeds on the underlying future, swap, security or currency transaction to determine the realized gain or loss.
(k) Repurchase Agreements The Portfolio may engage in repurchase transactions. Under the terms of a typical repurchase agreement, the Portfolio takes possession of an underlying debt obligation (collateral) subject to an obligation of the seller to repurchase, and the Portfolio to resell, the obligation at an agreed-upon price and time. The underlying securities for all repurchase agreements are held in safekeeping at the Portfolio’s custodian or designated subcustodians under tri-party repurchase agreements. The market value of the collateral must be equal to or exceed the total amount of the repurchase obligations, including interest. Securities purchased under repurchase agreements are reflected as an asset on the Statement of Assets and Liabilities. Generally, in the event of counterparty default, the Portfolio has the right to use the collateral to offset losses incurred. If the counterparty should default, the Portfolio will seek to sell the securities which it holds as collateral. This could involve procedural costs or delays in addition to a loss on the securities if their value should fall below their repurchase price.
(l) Inverse Floating Rate Transactions—Residual Interest Municipal Bonds (“RIBs”)/Residual Interest Tax Exempt Bonds (“RITEs”) The Portfolio may invest in RIBs and RITEs (“Inverse Floaters”). Inverse Floaters are created via a master trust agreement between a broker-dealer, acting as trustor and liquidity provider, and an investment bank, acting as trustee and tender agent. The master trust agreement defines the terms for each trust series; with each series being established by the transfer of long-term, fixed-rate municipal bonds (“Fixed Rate Bonds”) to the trustee to be held and provide for the creation, execution and delivery of floater certificates (“Floating Rate Notes”) and Inverse Floaters. Floating Rate Notes are liquid notes that are issued with a short-term variable rate typically linked to the LIBOR, subject to limitations, for some duration. After interest income is paid on the Floating Rate Notes at current rates, the residual income from the Fixed Rate Bonds is paid to the Inverse Floaters. Inverse Floaters are issued with a coupon that fluctuates inversely with the Floating Rate Notes’ referenced rate, subject to certain limitations. Therefore, rising short-term rates result in lower income for the Inverse Floaters and vice versa.
Floating Rate Notes are generally remarketed to municipal money market funds. Inverse Floaters are acquired by either tax-exempt municipal bond funds or trusts, or other parties interested in potentially higher yielding tax-exempt securities. Inverse Floaters may also be acquired for the purpose of increasing leverage. Floating Rate Note holders typically have the option to tender their notes to the liquidity provider for redemption at par at each reset date. The Inverse Floater holders have the option to (i) require the Floating Rate Note holders to tender their notes at par, and (ii) require the liquidity provider to transfer the Fixed Rate Bonds to the Inverse Floater holders. The holders of Inverse Floaters bear substantially all of the downside investment risk associated with the underlying Fixed Rate Bonds, and also benefit from a disproportionate amount of the potential appreciation of the underlying Fixed Rate Bonds’ value. Inverse Floaters may be more volatile and less liquid than other municipal bonds of comparable maturity.
Inverse Floaters may be acquired with or without first transferring to the trustor the Fixed Rate Bonds that were utilized to create the trust series. Inverse Floaters acquired without a transfer of Fixed Rate Bonds are recognized as purchases of securities as outlined in Note 2(b). Statement of Financial Accounting Standards No. 140—Accounting for Transfers and Servicing of Financial Assets and Extinguishments of Liabilities (“FAS No. 140”), governs the standards for accounting for securitizations and other transfers of financial assets. If there is a
transfer of Fixed Rate Bonds and it meets sale criteria under FAS No. 140, a Portfolio records a sale of the Fixed Rate Bonds and a purchase of the Inverse Floaters. The cash received from the Inverse Floaters is then recorded as interest income in the Statement of Operations.
If the transfer of Fixed Rate Bonds does not meet sale criteria under FAS No. 140, a Portfolio accounts for the transaction described above as a secured borrowing by including the Fixed Rate Bonds in its Schedule of Investments, and recording the Floating Rate Notes as a liability under the caption “Payable for floating rate notes” in the Portfolio’s Statement of Assets and Liabilities. In a secured borrowing transaction, cash received from the Inverse Floaters is not recorded as interest income. Instead, a Portfolio records interest income related to the Fixed Rate Bonds and interest expense related to the Floating Rate Notes, the net of which is equal to the cash received from the Inverse Floaters acquired by the Portfolio. Thus, while a Portfolio’s reported total income, net expenses, and net expense ratio are generally higher for investments in Inverse Floaters acquired via a secured borrowing, the method of acquiring Inverse Floaters does not result in differences for reported cash flows, net asset value or total return.
(m) Restricted Securities The Portfolio may invest in securities that are subject to legal or contractual restrictions on resale. These securities generally may be resold in transactions exempt from registration or to the public if the securities are registered. Disposal of these securities may involve time-consuming negotiations and expenses, and prompt sale at an acceptable price may be difficult. Securities acquired under the provisions of Rule 144A can only be traded between qualified institutional investors. The Board of Trustees considers 144A securities to be liquid.
(n) Short Sales The Portfolio may enter into short sales transactions. A short sale is a transaction in which the Portfolio sells securities it does not own in anticipation of a decline in the market price of the securities. Securities sold in short sale transactions and interest payable on such securities, if any, are reflected as a liability on the Statement of Assets and Liabilities. The Portfolio is obligated to deliver securities at the market price at the time the short position is closed. Possible losses from short sales may be unlimited, whereas losses from purchases cannot exceed the total amount invested.
(o) Swap Agreements The Portfolio may invest in swap agreements. Swap transactions are privately negotiated agreements between the Portfolio and a counterparty to exchange or swap investment cash flows, assets, or market-linked returns at specified, future intervals. The Portfolio may enter into interest rate, total return, forward spread-lock, credit default, and other forms of swap agreements to manage its exposure to interest rates and credit risk. In connection with these agreements, securities may be identified as collateral in accordance with the terms of the respective swap agreements.
Interest rate swap agreements involve the exchange by the Portfolio with another party of their respective commitments to pay or receive interest, e.g., an exchange of floating rate payments for fixed rate payments with respect to the notional amount of principal. Certain forms of interest rate swap agreements may include: (i) interest rate caps, under which, in return for a premium, one party agrees to make payments to the other to the extent that interest rates exceed a specified rate, or “cap”, (ii) interest rate floors, under which, in return for a premium, one party agrees to make payments to the other to the extent that interest rates fall below a specified rate, or “floor”, or (iii) interest rate collars, under which a party sells a cap and purchases a floor or vice versa in an attempt to protect itself against interest rate movements exceeding given minimum or maximum levels.
Total return swap agreements involve commitments to pay interest in exchange for a market-linked return, both based on notional amounts. To the extent the total return of the security or index underlying the transaction exceeds or falls short of the offsetting interest rate obligation, the Portfolio will receive a payment from or make a payment to the counterparty.
| | | | | | |
| | Semiannual Report | | June 30, 2007 | | 17 |
Notes to Financial Statements (Cont.)
Forward spread-lock swap agreements involve commitments to pay or receive a settlement amount calculated as the difference between the swap spread and a fixed spread, multiplied by the notional amount times the duration of the swap. The swap spread is the difference between the benchmark swap rate (market rate) and the specific Treasury rate.
Credit default swap agreements involve one party making a stream of payments to another party in exchange for the right to receive a specified return in the event of a default by a third party, typically corporate issues or sovereign issues of an emerging country, on its obligation. The Portfolio may use credit default swaps to provide a measure of protection against defaults of the issuers (i.e., to reduce risk where the Portfolio owns or has exposure to the sovereign issuer) or to take an active long or short position with respect to the likelihood of a particular issuer’s default. As a seller of protection, the Portfolio generally receives an upfront payment or a fixed rate of income throughout the term of the swap provided that there is no credit event. If the Portfolio is a seller of protection and a credit event occurs, as defined under the terms of that particular swap agreement, the Portfolio will pay to the buyer of the protection an amount up to the notional value of the swap and in certain instances take delivery of the security. As the seller, the Portfolio would effectively add leverage to its portfolio because, in addition to its total net assets, the Portfolio would be subject to investment exposure on the notional amount of the swap. As a buyer of protection, the Portfolio generally receives an amount up to the notional value of the swap if a credit event occurs. The treatment of credit default swaps and other swap agreements that provide for contingent, non-periodic, bullet-type payments as “notional principal contracts” for U.S. federal income tax purposes is uncertain. Were the U.S. Internal Revenue Service (“IRS”) to take the position that a credit default swap or other bullet-type swap is not a “notional principal contract” for U.S. federal income tax purposes, payments received by the Portfolio from such investments might be subject to U.S. excise or income taxes.
��
Swaps are marked to market daily based upon quotations from market makers and the change in value, if any, is recorded as unrealized gain or loss on the Statement of Operations. Payments received or made at the beginning of the measurement period are reflected as such on the Statement of Assets and Liabilities. These upfront payments are recorded as realized gain or loss on the Statement of Operations upon termination or maturity of the swap. A liquidation payment received or made at the termination of the swap is recorded as realized gain or loss on the Statement of Operations. Net periodic payments received or paid by the Portfolio are included as part of realized gain or loss on the Statement of Operations. Entering into these agreements involves, to varying degrees, elements of credit, market and documentation risk in excess of the amounts recognized on the Statement of Assets and Liabilities. Such risks involve the possibility that there will be no liquid market for these agreements, that the counterparty to the agreements may default on its obligation to perform or disagree as to the meaning of contractual terms in the agreements and that there may be unfavorable changes in interest rates.
(p) Commodities Index-Linked/Structured Notes The Portfolio invests in structured notes whose value is based on the price movements of a commodity index. The structured notes are often leveraged, increasing the volatility of each note’s value relative to the change in the underlying linked financial element. The value of these notes will rise and fall in response to changes in the underlying commodity index. Structured notes may entail a greater degree of market risk than other types of debt securities because the investor bears the risk of the underlying commodity index. Structured notes may also be more volatile, less liquid, and more difficult to accurately price than less complex securities or more traditional debt securities. Fluctuations in value of the structured notes are recorded as unrealized gains and losses on the accompanying financial statements. Net payments are recorded as net realized gains and losses. These notes are subject to prepayment, credit and interest risks. The Portfolio has the option to request
prepayment from the issuer. At maturity, or when a note is sold, the Portfolio records a realized gain or loss. At June 30, 2007, the value of these securities comprised 22.9% of the Portfolio’s net assets and resulted in unrealized appreciation of $4,766,210.
(q) Mortgage-Related and Other Asset-Backed Securities The Portfolio may invest in mortgage-related or other asset-backed securities. These securities include mortgage pass-through securities, collateralized mortgage obligations (“CMOs”), commercial mortgage-backed securities, mortgage dollar rolls, CMO residuals, stripped mortgage-backed securities (“SMBSs”) and other securities that directly or indirectly represent a participation in, or are secured by and payable from, mortgage loans on real property. The value of some mortgage-related or asset-backed securities may be particularly sensitive to changes in prevailing interest rates. Early repayment of principal on some mortgage-related securities may expose the Portfolio to a lower rate of return upon reinvestment of principal. The value of these securities may fluctuate in response to the market’s perception of the creditworthiness of the issuers. Additionally, although mortgages and mortgage-related securities are generally supported by some form of government or private guarantee and/or insurance, there is no assurance that private guarantors or insurers will meet their obligations.
(r) U.S. Government Agencies or Government-Sponsored Enterprises Securities issued by U.S. Government agencies or government-sponsored enterprises may not be guaranteed by the U.S. Treasury. The Government National Mortgage Association (“GNMA” or “Ginnie Mae”), a wholly owned U.S. Government corporation, is authorized to guarantee, with the full faith and credit of the U.S. Government, the timely payment of principal and interest on securities issued by institutions approved by GNMA and backed by pools of mortgages insured by the Federal Housing Administration or guaranteed by the Department of Veterans Affairs. Government-related guarantors (i.e., not backed by the full faith and credit of the U.S. Government) include the Federal National Mortgage Association (“FNMA” or “Fannie Mae”) and the Federal Home Loan Mortgage Corporation (“FHLMC” or “Freddie Mac”). Pass-through securities issued by FNMA are guaranteed as to timely payment of principal and interest by FNMA but are not backed by the full faith and credit of the U.S. Government. FHLMC guarantees the timely payment of interest and ultimate collection of principal, but its participation certificates are not backed by the full faith and credit of the U.S. Government.
(s) New Accounting Policies In July 2006, the Financial Accounting Standards Board (“FASB”) issued Interpretation No. 48, “Accounting for Uncertainty in Income Taxes—an Interpretation of FASB Statement No. 109” (the “Interpretation”). The Interpretation became effective for the Portfolio on June 29, 2007. Management has evaluated the application of the Interpretation in relation to the Portfolio and has concluded that no single filing position or combination of filing positions identified as uncertain tax positions required the accrual of a tax liability in the accounting records of the Portfolio for the period ending June 30, 2007. Management will monitor all existing filing positions and future filing positions in light of the Interpretation and evaluate the need for any future tax accruals and financial statement disclosures as warranted.
In September 2006, the FASB issued Statement of Financial Accounting Standards No. 157, “Fair Value Measurements” (the “Statement”). The Statement is effective for fiscal years beginning after November 15, 2007 and will require expanded disclosure about fair value measurements, separately for each major category of assets and liabilities, that enables shareholders to assess the inputs used to develop those measurements, and for recurring fair value measurements using significant unobservable inputs the effect of the measurements on changes in net assets for the reporting period. Management is currently evaluating the application of the Statement to the Portfolio and will provide additional information in relation to the Statement on the Portfolio’s annual financial statements for the period ending December 31, 2007.
| | | | |
| 18 | | PIMCO Variable Insurance Trust | | |
| | |
| |
| | | June 30, 2007 (Unaudited) |
3. BASIS FOR CONSOLIDATION OF THE PIMCO COMMODITYREALRETURN™ STRATEGY PORTFOLIO
The PIMCO Cayman Commodity Portfolio I Ltd. (the “Subsidiary”), a Cayman Islands exempted company, was incorporated on July 21, 2006 as a wholly owned subsidiary acting as an investment vehicle for the Portfolio in order to effect certain investments for the Portfolio consistent with the Portfolio’s investment objectives and policies specified in its prospectus and statement of additional information. A subscription agreement was entered into between the Portfolio and the Subsidiary on August 1, 2006, comprising the entire issued share capital of the Subsidiary with the intent that the Portfolio will remain the sole shareholder and retain all rights. Under the Articles of Association of the Subsidiary, shares issued by the Subsidiary confer upon a shareholder the right to receive notice of, to attend and to vote at general meetings of the Subsidiary and shall confer upon the shareholder rights in a winding-up or repayment of capital and the right to participate in the profits or assets of the Subsidiary. As of June 30, 2007, net assets of the Portfolio were approximately $234 million, of which approximately $16 million, or roughly 6.8%, represented the Portfolio’s ownership of all issued shares and voting rights of the Subsidiary.
4. FEES AND EXPENSES
(a) Investment Advisory Fee PIMCO is a majority-owned subsidiary of Allianz Global Investors of America L.P. (“AGI”), and serves as investment adviser (the “Adviser”) to the Trust, pursuant to an investment advisory contract. The Adviser receives a monthly fee from the Portfolio, at an annual rate based on average daily net assets. The Advisory Fee for all classes is charged at an annual rate of 0.49%.
(b) Administration Fee PIMCO serves as administrator (the “Administrator”), and provides administrative services to the Trust for which it receives a monthly administrative fee based on each share class’s average daily net assets. As the Administrator, PIMCO bears the costs of various third-party services, including audit, custodial, portfolio accounting, legal, transfer agency and printing costs. The Administration Fee for all classes is charged at the annual rate of 0.25%.
(c) Distribution and Servicing Fees Allianz Global Investors Distributors LLC (“AGID”) is an indirect wholly-owned subsidiary of AGI and serves as the distributor (the “Distributor”) of the Trust’s shares. The Trust is permitted to reimburse AGID on a quarterly basis, out of the Administrative Class assets of the Portfolio in the amount of 0.15% on an annual basis of the average daily net assets of that class, for payments made to financial intermediaries that provide services in connection with the distribution of shares or administration of plans or programs that use Portfolio shares as their funding medium. The effective rate paid to AGID was 0.15% during the current fiscal year.
The Trust has adopted a Distribution Plan, for the Advisor Class shares of the Portfolio (the “Plan”). The Plan has been adopted pursuant to Rule 12b-1 under the Act. The Plan permits payments for expenses in connection with the distribution and marketing of Advisor Class shares and/or the provision of shareholder services to Advisor Class shareholders. The Plan permits the Portfolio to make total payments at an annual rate of 0.25% of its average daily net assets attributable to its Advisor Class shares.
(d) Portfolio Expenses The Trust is responsible for the following expenses: (i) salaries and other compensation of any of the Trust’s executive officers and employees who are not officers, directors, stockholders or employees of PIMCO or its subsidiaries or affiliates; (ii) taxes and governmental fees; (iii) brokerage fees and commissions and other portfolio transaction expenses; (iv) the costs of borrowing money, including interest expenses and bank overdraft charges; (v) fees and expenses of the Trustees who are not “interested persons” of PIMCO or the Trust, and any counsel retained exclusively for their benefit; (vi) extraordinary expenses, including costs of litigation and indemnification expenses;
(vii) organization expenses and (viii) any expenses allocated or allocable to a specific class of shares, which include service fees payable with respect to the Administrative Class Shares, and may include certain other expenses as permitted by the Trust’s Multiple Class Plan adopted pursuant to Rule 18f-3 under the Act and subject to review and approval by the Trustees. The ratio of expenses to average net assets per share class, as disclosed in the Financial Highlights, may differ from the annual portfolio operating expenses per share class as disclosed in the Prospectus for the reasons set forth above.
Effective April 1, 2007, each Trustee, other than those affiliated with PIMCO or its affiliates, receives an annual retainer of $15,000, plus $2,375 for each Board of Trustees meeting attended in person, $500 for each committee meeting attended and $750 for each Board of Trustees meeting attended telephonically, plus reimbursement of related expenses. In addition, the audit committee chair receives an additional annual retainer of $2,000 and each other committee chair receives an additional annual retainer of $500. These expenses are allocated on a pro-rata basis to the various portfolios of the Trust according to their respective net assets. The Trust pays no compensation directly to any Trustee or any other officer who is affiliated with the Administrator, all of whom receive remuneration for their services to the Trust from the Administrator or its affiliates. Prior to April 1, 2007, each Trustee, other than those affiliated with PIMCO or its affiliates, received an annual retainer of $15,000 plus $2,000 for each Board of Trustees meeting attended ($500 for each special meeting attended), plus reimbursement of related expenses. The Audit Committee Chairman received an annual retainer of $1,500 and the Governance Committee Chairman received an annual retainer of $500. In addition, each member of a committee received $500 for each committee meeting attended.
(e) Expense Limitation PIMCO has contractually agreed to reduce total annual portfolio operating expenses for the Portfolio by waiving a portion of its administrative fee or reimbursing the Portfolio, to the extent that they would exceed, due to the payment of organizational expenses and pro rata Trustees’ fees, the sum of such Portfolio’s advisory fee, service fees, distribution fees (with respect to Advisor Class only), administrative fees and other expenses borne by the Portfolio not covered by the administrative fee as described above (other than organizational expenses and pro rata Trustees’ fees), plus 0.49 basis points. PIMCO may recoup these waivers and reimbursements for a period not exceeding three years, provided that total expenses, including such recoupment, do not exceed the annual expense limit. As of June 30, 2007, the recoverable amount to the Administrator was $1,758.
(f) Acquired Fund Fees and Expenses The Subsidiary has entered into a separate contract with PIMCO for the management of the Subsidiary’s portfolio pursuant to which the Subsidiary pays PIMCO a management fee and administration fee at the annual rates of 0.49% and 0.20%, respectively, of its net assets. PIMCO has contractually agreed to waive the advisory fee and the administration fee it receives from the Portfolio in an amount equal to the advisory fee and administration fee, respectively, paid to PIMCO by the Subsidiary. This waiver may not be terminated by PIMCO and will remain in effect for as long as PIMCO’s contract with the Subsidiary is in place. The waiver is reflected in the Statement of Operations as a component of Reimbursement by Manager. For the period ended June 30, 2007, the amount was $100,253.
5. RELATED PARTY TRANSACTIONS
The Adviser, Administrator, and Distributor are related parties as defined by FAS 57, Related Party Disclosures. Fees payable to these parties are disclosed in Note 3.
| | | | | | |
| | Semiannual Report | | June 30, 2007 | | 19 |
Notes to Financial Statements (Cont.)
6. GUARANTEES AND INDEMNIFICATIONS
Under the Trust’s organizational documents, each Trustee, officer, employee or other agent of the Trust (including the Trust’s investment manager) is indemnified, to the extent permitted by the Act, against certain liabilities that may arise out of performance of their duties to the Portfolio. Additionally, in the normal course of business, the Portfolio enters into contracts that contain a variety of indemnification clauses. The Portfolio’s maximum exposure under these arrangements is unknown as this would involve future claims that may be made against the Portfolio that have not yet occurred. However, the Portfolio has not had prior claims or losses pursuant to these contracts and believes the risk of loss to be remote.
7. PURCHASES AND SALES OF SECURITIES
The length of time the Portfolio has held a particular security is not generally a consideration in investment decisions. A change in the securities held by the Portfolio is known as “portfolio turnover”. The Portfolio may engage in frequent and active trading of portfolio securities to achieve its investment objective, particularly during periods of volatile market movements. High portfolio turnover (e.g., over 100%) involves correspondingly greater expenses to the Portfolio, including brokerage commissions or dealer mark-ups and other transaction costs on the sale of securities and reinvestments in other securities. Such sales may also result in realization of taxable capital gains, including short-term capital gains (which are generally taxed at ordinary income tax rates). The trading costs and tax effects associated with portfolio turnover may adversely affect the Portfolio’s performance.
Purchases and sales of securities (excluding short-term investments) for the period ended June 30, 2007, were as follows (amounts in thousands):
| | | | | | | | | | | | |
| U.S. Government/Agency | | | | All Other |
| Purchases | | Sales | | | | Purchases | | Sales |
| $ | 1,485,087 | | $ | 1,443,588 | | | | $ | 84,138 | | $ | 52,868 |
8. TRANSACTIONS IN WRITTEN CALL AND PUT OPTIONS
Transactions in written call and put options were as follows (amounts in thousands, except for number of contracts):
| | | | | | | | | | | | | |
| | | | | # of
Contracts | | | Notional
Amount
in $ | | | Premium | |
Balance at 12/31/2006 | | | | 2,000,034 | | | $ | 13,200 | | | $ | 218 | |
Sales | | | | 1,400,297 | | | | 3,000 | | | | 160 | |
Closing Buys | | | | 0 | | | | (9,000 | ) | | | (74 | ) |
Expirations | | | | (158 | ) | | | (4,200 | ) | | | (62 | ) |
Exercised | | | | 0 | | | | 0 | | | | 0 | |
Balance at 06/30/2007 | | | | 3,400,173 | | | $ | 3,000 | | | $ | 242 | |
9. SHARES OF BENEFICIAL INTEREST
The Portfolio may issue an unlimited number of shares of beneficial interest with a $0.001 par value. Changes in shares of beneficial interest were as follows (shares and amounts in thousands):
| | | | | | | | | | | | |
| | | | | Six Months Ended
06/30/2007 | | Year Ended
12/31/2006 |
| | | | | Shares | | Amount | | Shares | | Amount |
| | | | | |
Receipts for shares sold | | | | | | | | | | | | |
Administrative Class | | | | 4,675 | | $ | 53,682 | | 11,598 | | $ | 138,795 |
Advisor Class | | | | 823 | | | 9,592 | | 588 | | | 7,074 |
| | | | | | | | | | | | | | | | |
| | | | | Six Months Ended
06/30/2007 | | | Year Ended
12/31/2006 | |
| | | | | Shares | | | Amount | | | Shares | | | Amount | |
Issued as reinvestment of distributions | | | | | | | | | | | | | | | | |
Administrative Class | | | | 307 | | | $ | 3,557 | | | 689 | | | $ | 7,849 | |
Advisor Class | | | | 14 | | | | 165 | | | 18 | | | | 199 | |
Cost of shares redeemed | | | | | | | | | | | | | | | | |
Administrative Class | | | | (1,699 | ) | | | (19,591 | ) | | (5,022 | ) | | | (60,877 | ) |
Advisor Class | | | | (116 | ) | | | (1,317 | ) | | (68 | ) | | | (812 | ) |
Net increase resulting from Portfolio share transactions | | | | 4,004 | | | $ | 46,088 | | | 7,803 | | | $ | 92,228 | |
The following schedule shows the number of shareholders each owning 5% or more of the Portfolio and the total percentage of the Portfolio held by such shareholders:
| | | | | | |
| | | | | Number of Shareholders | | % of Portfolio Held |
Administrative Class | | | | 5 | | 84 |
Advisor Class | | | | 5 | | 100 |
10. REGULATORY AND LITIGATION MATTERS
Since February 2004, PIMCO, Allianz Global Investors of America L.P. (PIMCO’s parent company), AGID, and certain of their affiliates, including the PIMCO Funds (another series of funds managed by PIMCO), the Allianz Funds (formerly known as PIMCO Funds: Multi-Manager Series (another series of funds managed by affiliates of PIMCO)), certain Trustees of the Trust (in their capacity as Trustees of the PIMCO Funds or the Allianz Funds) and certain employees of PIMCO, have been named as defendants in fifteen lawsuits filed in various jurisdictions. Eleven of those lawsuits concern “market timing,” and they have been transferred to and consolidated for pre-trial proceedings in a multi-district litigation proceeding in the U.S. District Court for the District of Maryland; the other four lawsuits concern “revenue sharing” and have been consolidated into a single action in the U.S. District Court for the District of Connecticut. The lawsuits have been commenced as putative class actions on behalf of investors who purchased, held or redeemed shares of the various series of the PIMCO Funds and the Allianz Funds during specified periods, or as derivative actions on behalf of the PIMCO Funds and the Allianz Funds.
The market timing actions in the District of Maryland generally allege that certain hedge funds were allowed to engage in “market timing” in certain funds of the PIMCO Funds and the Allianz Funds and this alleged activity was not disclosed. Pursuant to tolling agreements entered into with the derivative and class action plaintiffs, PIMCO, certain PIMCO Funds Trustees, and certain employees of PIMCO who were previously named as defendants have all been dropped as defendants in the market timing actions; the plaintiffs continue to assert claims on behalf of the shareholders of the PIMCO Funds or on behalf of the PIMCO Funds itself against other defendants. By order dated November 3, 2005, the U.S. District Court for the District of Maryland granted the PIMCO Funds’ motion to dismiss claims asserted against it in a consolidated amended complaint where the PIMCO Funds were named, in the complaint, as a nominal defendant. The revenue sharing action in the District of Connecticut generally alleges that fund assets were inappropriately used to pay brokers to promote funds of the PIMCO Funds and the Allianz Funds, including directing fund brokerage transactions to such brokers, and that such alleged arrangements were not fully disclosed to shareholders. On August 11, 2005, the U.S. District Court for the District of Connecticut conducted a hearing on defendants’ motion to dismiss the consolidated amended complaint in the revenue sharing action but has not yet ruled on the motion to dismiss. The market timing and revenue sharing lawsuits seek, among other things, unspecified compensatory damages plus interest and, in some cases, punitive damages, the rescission of
| | | | |
| 20 | | PIMCO Variable Insurance Trust | | |
| | |
| |
| | | June 30, 2007 (Unaudited) |
investment advisory contracts, the return of fees paid under those contracts and restitution.
Two nearly identical class action civil complaints have been filed in August 2005, in the Northern District of Illinois Eastern Division, alleging that the plaintiffs each purchased and sold a 10-year Treasury note futures contract and suffered damages from an alleged shortage when PIMCO held both physical and futures positions in 10-year Treasury notes for its client accounts. The two actions have been consolidated into one action, and the two separate complaints have been replaced by a consolidated complaint. PIMCO is a named defendant, and PIMCO Funds has been added as a defendant, to the consolidated action. PIMCO strongly believes the complaint is without merit and intends to vigorously defend itself.
In April 2006, certain portfolios of the Trust and certain other funds managed by PIMCO were served in an adversary proceeding brought by the Official Committee of Asbestos Claimants of G-I Holdings, Inc. in G-I Holdings, Inc.’s bankruptcy in the District of New Jersey. In July 2004, PIMCO was named in this lawsuit and remains a defendant. The plaintiff seeks to recover for the bankruptcy estate assets that were transferred by the predecessor entity of G-I Holdings, Inc. to a wholly-owned subsidiary in 1994. The subsidiary has since issued notes, of which certain portfolios of the Trust and certain other funds managed by PIMCO are alleged to be holders. The complaint alleges that in 2000, more than two hundred noteholders—including certain portfolios of the Trust and certain other funds managed by PIMCO—were granted a second priority lien on the assets of the subsidiary in exchange for their consent to a refinancing transaction and the granting of a first priority lien to the lending banks. The plaintiff is seeking invalidation of the lien in favor of the noteholders and/or the value of the lien. On June 21, 2006, the District of New Jersey overturned the Bankruptcy Court’s decision granting permission to file the adversary proceeding and remanded the matter to the Bankruptcy Court for further proceedings. Following a motion to reconsider, the District Court upheld its remand on August 7, 2006, and instructed the Bankruptcy Court to conduct a “cost-benefit” analysis of the Committee’s claims, including the claims against the noteholders. The Bankruptcy Court held a status conference on October 25, 2006 and set a briefing schedule relating to this cost-benefit analysis.
The foregoing speaks only as of the date of this report. It is possible that these matters and/or other developments resulting from these matters could result in increased portfolio redemptions or other adverse consequences to the Portfolio. However, PIMCO and AGID believe that these matters are not likely to have a material adverse effect on the Portfolio or on PIMCO’s or AGID’s ability to perform their respective investment advisory or distribution services relating to the Portfolio.
11. FEDERAL INCOME TAX MATTERS
The Portfolio intends to qualify as a regulated investment company under sub-chapter M of the Internal Revenue Code (the “Code”) and distribute all of its taxable income and net realized gains, if applicable, to shareholders. Accordingly, no provision for Federal income taxes has been made.
The Portfolio may gain exposure to the commodities markets primarily through index-linked notes, and may invest in other commodity-linked derivative instruments, including commodity swap agreements, options, futures contracts, options on futures contracts and foreign funds investing in similar commodity-linked derivatives.
One of the requirements for favorable tax treatment as a regulated investment company under the Code is that the Portfolio derive at least 90% of its gross income from certain qualifying sources of income. The IRS issued a revenue ruling which holds that income derived from commodity index-linked swaps is not qualifying income under Subchapter M of the Code. Subsequently, the IRS issued a private letter ruling to the Portfolio in which the IRS specifically concluded that income from certain commodity index-linked notes is qualifying income. In addition, the IRS issued another private letter ruling to the Portfolio in which the IRS specifically concluded that income derived from the Portfolio’s investment in the Subsidiary, which invests primarily in commodity index-linked swaps, will also constitute qualifying income to the Portfolio. Based on such rulings, the Portfolio will continue to seek to gain exposure to the commodity markets primarily through investments in commodity-linked notes and through investments in its subsidiary.
Please refer to the prospectus for the Separate Account and Variable Contract for information regarding federal income tax treatment of distributions to the Separate Account.
As of June 30, 2007, the aggregate cost of investments was the same for federal income tax and financial statement purposes. The net unrealized appreciation (depreciation) of investment securities for federal income tax purposes is as follows (amount in thousands):
| | | | |
Aggregate
Gross
Unrealized
Appreciation | | Aggregate
Gross
Unrealized
(Depreciation) | | Net
Unrealized
Appreciation |
$ 7,230 | | $ (967) | | $ 6,263 |
| | | | | | |
| | Semiannual Report | | June 30, 2007 | | 21 |
| | |
| |
Privacy Policy* | | (Unaudited) |
The Funds consider customer privacy to be a fundamental aspect of their relationships with shareholders and are committed to maintaining the confidentiality, integrity and security of their current, prospective and former shareholders’ personal information. To ensure their shareholders’ privacy, the Funds have developed policies that are designed to protect this confidentiality, while allowing shareholder needs to be served.
Obtaining Personal Information
In the course of providing shareholders with products and services, the Funds and certain service providers to the Funds, such as the Funds’ investment advisers (“Advisers”), may obtain non-public personal information about shareholders, which may come from sources such as account applications and other forms, from other written, electronic or verbal correspondence, from shareholder transactions, from a shareholder’s brokerage or financial advisory firm, financial adviser or consultant, and/or from information captured on the Funds’ internet web sites.
Respecting Your Privacy
As a matter of policy, the Funds do not disclose any personal or account information provided by shareholders or gathered by the Funds to non-affiliated third parties, except as required or permitted by law or as necessary for such third parties to perform their agreements with respect to the Funds. As is common in the industry, non-affiliated companies may from time to time be used to provide certain services, such as preparing and mailing prospectuses, reports, account statements and other information, conducting research on shareholder satisfaction and gathering shareholder proxies. A Fund’s Distributor may also retain non-affiliated companies to market the Fund’s shares or products which use the Fund’s shares and enter into joint marketing agreements with other companies. These companies may have access to a shareholder’s personal and account information, but are permitted to use this information solely to provide the specific service or as otherwise permitted by law. In most cases, the shareholders will be clients of a third party, but the Funds may also provide a shareholder’s personal and account information to the shareholder’s respective brokerage or financial advisory firm.
Sharing Information with Third Parties
The Funds reserve the right to disclose or report personal information to non-affiliated third parties, in limited circumstances, where the Funds believe in good faith that disclosure is required under law to cooperate with regulators or law enforcement authorities, to protect their rights or property or upon reasonable request by any Fund in which a shareholder has chosen to invest. In addition, the Funds may disclose information about a shareholder’s accounts to a non-affiliated third party with the consent of the shareholder.
Sharing Information with Affiliates
The Funds may share shareholder information with their affiliates in connection with servicing their shareholders’ accounts or to provide shareholders with information about products and services that the Funds or their Advisers, principal underwriters or their affiliates (“Service Affiliates”) believe may be of interest to such shareholders. The information that the Funds share may include, for example, a shareholder’s participation in one of the Funds or in other investment programs sponsored by a Service Affiliate, a shareholder’s ownership of certain types of accounts (such as IRAs), or other data about a shareholder’s accounts. The Funds’ Service Affiliates, in turn, are not permitted to share shareholder information with non-affiliated entities, except as required or permitted by law.
Procedures to Safeguard Private Information
The Funds take seriously the obligation to safeguard shareholder non-public personal information. In addition to this policy, the Funds have also implemented procedures that are designed to restrict access to a shareholder’s non-public personal information only to internal personnel who need to know that information in order to provide products or services to such shareholders. In order to guard a shareholder’s non-public personal information, physical, electronic and procedural safeguards are in place.
* This Privacy Policy applies to the following entities: PIMCO Funds, PIMCO Variable Insurance Trust, PCM Fund, Inc. and PIMCO Strategic Global Government Fund, Inc. (collectively, the “Funds”).
| | | | |
| 22 | | PIMCO Variable Insurance Trust | | |
Investment Adviser and Administrator
Pacific Investment Management Company LLC
840 Newport Center Drive
Newport Beach, California 92660
Distributor
Allianz Global Investors Distributors LLC
1345 Avenue of the Americas
New York, New York 10105
Custodian
State Street Bank & Trust Company
801 Pennsylvania
Kansas City, Missouri 64105
Transfer Agent
Boston Financial Data Services–Midwest
330 W. 9th Street
Kansas City, Missouri 64105
Legal Counsel
Dechert LLP
1775 I Street, N.W.
Washington, D.C. 20006
Independent Registered Public Accounting Firm
PricewaterhouseCoopers LLP
1055 Broadway
Kansas City, Missouri 64105
P I M C O

Table of Contents
This material is authorized for use only when preceded or accompanied by the current PIMCO Variable Insurance Trust (the “Trust”) prospectus. Investors should consider the investment objectives, risks, charges and expenses of this Trust carefully before investing. Ask your financial professional to explain all charges that may apply. This and other information is contained in the Trust’s prospectus. The variable product prospectus may be obtained by contacting your Investment Consultant. Please read the Trust and variable product prospectus carefully before you invest or send money.
Chairman’s Letter
Dear PIMCO Variable Insurance Trust Shareholder:
It is our pleasure to present to you the semiannual report for the PIMCO Variable Insurance Trust, covering the six-month period ended June 30, 2007. The PIMCO Variable Insurance Trust’s net assets were $8.68 billion at June 30, 2007, as compared to $7.76 billion at December 31, 2006.
Highlights of the financial markets during the reporting period include:
| | n | | Economic data during the first quarter of 2007 pointed to slower growth, which heightened market expectations for a decrease in the Federal Funds Rate. By the second quarter, economic data, such as employment statistics, provided little indication of economic weakness, causing expectations of a decrease in the Federal Funds Rate to unwind and U.S. interest rates to move higher. Interest rates in Europe and the U.K. also rose over the period as central banks raised their key lending rates due to inflation concerns. The benchmark ten-year U.S. Treasury yielded 5.03% as of June 30, 2007, or 0.32% higher than at the beginning of the year. |
| | n | | Most bonds generally returned much of their gains from earlier in the year as worldwide growth and capital flows drove interest rates higher in the second quarter. Increased risk aversion in global financial markets, due in part to subprime mortgage worries in the U.S., also contributed to the rise in interest rates. The Lehman Brothers Aggregate Bond Index, which includes Treasury, investment-grade corporate and mortgage-backed securities, returned 0.98% for the six-month period. |
| | n | | Locally issued emerging market (“EM”) bonds posted positive returns for the reporting period. Yields on these bonds declined and the local currencies in which they are denominated generally gained, amid increasing investor awareness, strong economic growth and surging capital inflows. External EM bonds (debt instruments issued by emerging markets countries and typically denominated in U.S. dollars) lagged behind local EM bonds (debt instruments issued by emerging markets countries and denominated in the currency of the issuer), as external EM bonds tend to trade more in-line with U.S. Treasuries. |
| | n | | Treasury Inflation-Protected Securities (“TIPS”) outpaced nominal bonds (non-inflation linked bonds) for the first part of the year and all but the longest maturity TIPS outperformed in the second quarter as high gasoline prices drove higher inflation accruals. Commodities, as represented by the Dow Jones-AIG Commodity Total Return Index, returned 4.46% for the period. Equities, as measured by the S&P 500 Index and the Russell 2000 Index, returned 6.96% and 6.45%, respectively, for the period. |
On the following pages, please find specific details as to the Portfolio’s total return investment performance and a discussion of those factors that affected performance.
Thank you for the trust you have placed in us. We will continue to work diligently to serve your investment needs.
Sincerely,
Brent R. Harris
Chairman, PIMCO Variable Insurance Trust
July 31, 2007
| | | | | | |
| | Semiannual Report | | June 30, 2007 | | 1 |
Important Information About the Portfolio
PIMCO Variable Insurance Trust (the “Trust”) is an open-end management investment company currently consisting of twenty separate investment portfolios, including the Emerging Markets Bond Portfolio (the “Portfolio”). The Portfolio is only available as a funding vehicle under variable life insurance policies or variable annuity contracts issued by insurance companies (“Variable Contracts”). Individuals may not purchase shares of the Portfolio directly. Shares of the Portfolio also may be sold to qualified pension and retirement plans outside of the separate account context.
We believe that bond funds have an important role to play in a well diversified investment portfolio. It is important to note, however, that in an environment where interest rates may trend upward, rising rates would negatively impact the performance of most bond funds, and fixed-income securities held by a fund are likely to decrease in value. The price volatility of fixed-income securities can also increase during periods of rising interest rates resulting in increased losses to a fund. Bond funds and individual bonds with a longer duration (a measure of the expected life of a security) tend to be more sensitive to changes in interest rates, usually making them more volatile than securities or funds with shorter durations.
The Portfolio may be subject to various risks in addition to those described above. Some of these risks may include, but are not limited to, the following: credit risk, high yield risk, market risk, issuer risk, liquidity risk, derivatives risk, mortgage risk, non-U.S. investment risk, emerging markets risk, currency risk, issuer non-diversification risk, leveraging risk and management risk. A complete description of these risks is contained in the Portfolio’s prospectus. The Portfolio may use derivative instruments for hedging purposes or as part of an investment strategy. Use of these instruments may involve certain costs and risks such as liquidity risk, interest rate risk, market risk, credit risk, management risk and the risk that the Portfolio could not close out a position when it would be most advantageous to do so. Because the Portfolio may invest in derivatives, it could lose more than the principal amount invested in these instruments. Investing in non-U.S. securities may entail risk due to non-U.S. economic and political developments; this risk may be increased when investing in emerging markets.
On the performance summary page in this Semiannual Report, the Total Return Investment Performance table measures performance assuming that all dividend and capital gain distributions were reinvested.
An investment in the Portfolio is not a deposit of a bank and is not guaranteed or insured by the Federal Deposit Insurance Corporation or any other government agency. It is possible to lose money on investments in the Portfolio.
PIMCO has adopted written proxy voting policies and procedures (“Proxy Policy”) as required by Rule 206(4)-6 under the Investment Advisers Act of 1940, as amended. The Proxy Policy has been adopted by the Trust as the policies and procedures that PIMCO will use when voting proxies on behalf of the Portfolio. A description of the policies and procedures that PIMCO uses to vote proxies relating to portfolio securities of the Portfolio, and information about how the Portfolio voted proxies relating to portfolio securities held during the most recent twelve-month period ended June 30, are available without charge, upon request, by calling the Trust at 1-866-746-2606 and on the Portfolio’s website at www.pimco.com.
The Portfolio files its complete schedule of portfolio holdings with the SEC for the first and third quarters of each fiscal year on Form N-Q. A copy of the Trust’s Form N-Q is also available on the SEC’s website at http://www.sec.gov and may be reviewed and copied at the SEC’s Public Reference Room in Washington D.C. Information on the operation of the Public Reference Room may be obtained by calling 1-800-SEC-0330, and is available without charge, upon request, by calling the Trust at 1-866-746-2606 and on the Portfolio’s website at www.pimco.com.
PIMCO Variable Insurance Trust is distributed by Allianz Global Investors Distributors LLC, 1345 Avenue of the Americas, New York, NY 10105.
| | | | |
| 2 | | PIMCO Variable Insurance Trust | | |
The following disclosure provides important information regarding the Portfolio’s Expense Example (“Example” or “Expense Example”), which appears in this Semiannual Report. Please refer to this information when reviewing the Expense Example for the Portfolio.
Example
As a shareholder of the Portfolio, you incur two types of costs: (1) transaction costs and (2) ongoing costs, including advisory and administrative fees; distribution and/or service (12b-1) fees (Administrative and Advisor Class only); and other Portfolio expenses. The Example is intended to help you understand your ongoing costs (in dollars) of investing in the Portfolio and to compare these costs with the ongoing costs of investing in other mutual funds. The Expense Example does not reflect any fees or other expenses imposed by the Variable Contracts. If it did, the expenses reflected in the Expense Example would be higher. The Example is based on an investment of $1,000 invested at the beginning of the period and held for the entire period indicated, which is from January 1, 2007 to June 30, 2007.
Actual Expenses
The information in the table under the heading “Actual Performance” provides information about actual account values and actual expenses. You may use the information in these columns, together with the amount you invested, to estimate the expenses that you paid over the period. Simply divide your account value by $1,000 (for example, an $8,600 account value divided by $1,000 = $8.60), then multiply the result by the number in the row titled “Expenses Paid During Period” to estimate the expenses you paid on your account during this period.
Hypothetical Example for Comparison Purposes
The information in the table under the heading “Hypothetical Performance (5% return before expenses)” provides information about hypothetical account values and hypothetical expenses based on the Portfolio’s actual expense ratio and an assumed rate of return of 5% per year before expenses, which is not the Portfolio’s actual return. The hypothetical account values and expenses may not be used to estimate the actual ending account balance or expenses you paid for the period. You may use this information to compare the ongoing costs of investing in the Portfolio and other portfolios. To do so, compare this 5% hypothetical example with the 5% hypothetical examples that appear in the shareholder reports of the other portfolios.
Please note that the expenses shown in the table are meant to highlight your ongoing costs only and do not reflect any transactional costs. Therefore, the information under the heading “Hypothetical Performance (5% return before expenses)” is useful in comparing ongoing costs only, and will not help you determine the relative total costs of owning different portfolios. In addition, if these transactional costs were included, your costs would have been higher.
The expense ratio may vary period to period because of various factors, such as an increase in expenses not covered by the advisory and administrative fees (such as expenses of the trustees and their counsel, litigation expense and interest expense).
| | | | | | |
| | Semiannual Report | | June 30, 2007 | | 3 |
PIMCO Emerging Markets Bond Portfolio
Cumulative Returns Through June 30, 2007
$10,000 invested at the beginning of the first full month following the inception date of the Portfolio’s Administrative Class.
Allocation Breakdown‡
| | |
Russia | | 19.9% |
Short-Term Instruments | | 18.0% |
Brazil | | 17.9% |
Mexico | | 7.7% |
Venezuela | | 5.7% |
Other | | 30.8% |
| | ‡ | % of Total Investments as of 06/30/2007 |
| | | | | | | | |
| Average Annual Total Return for the period ended June 30, 2007 |
| | | | | 6 Months* | | 1 Year | | Portfolio
Inception
(09/30/02) |
| | PIMCO Emerging Markets Bond Portfolio Administrative Class | | 1.50% | | 12.35% | | 17.08% |
| | JPMorgan Emerging Markets Bond Index Global± | | 0.94% | | 11.68% | | 14.98% |
All Portfolio returns are net of fees and expenses.
* Cumulative return.
Performance quoted represents past performance. Past performance is no guarantee of future results. Investment return and principal value will fluctuate so the Portfolio shares, when redeemed, may be worth more or less than their original cost. The Portfolio’s performance does not reflect the deduction of additional charges and expenses imposed in connection with investing in Variable Contracts, which will reduce returns. Current performance may be lower or higher than the performance data quoted. Performance data current to the most recent month-end is available by calling (800) 927-4648.
± JPMorgan Emerging Markets Bond Index Global is an unmanaged index which tracks total returns for U.S. dollar denominated debt instruments issued by emerging market sovereign and quasi-sovereign entities, Brady bonds, loans, Eurobonds and local market instruments. It is not possible to invest directly in the index. The index does not reflect deductions for fees and expenses.
| | | | | | |
| Expense Example | | Actual Performance | | Hypothetical Performance |
| | | | | (5% return before expenses) |
Beginning Account Value (01/01/07) | | $ | 1,000.00 | | $ | 1,000.00 |
Ending Account Value (06/30/07) | | $ | 1,015.01 | | $ | 1,019.64 |
Expenses Paid During Period† | | $ | 5.20 | | $ | 5.21 |
† Expenses are equal to the Portfolio’s Administrative Class annualized expense ratio of 1.04%, multiplied by the average account value over the period, multiplied by 181/365 (to reflect the one-half year period). Overall fees and expenses of investing in the Portfolio will be higher because the example does not reflect Variable Contract fees and expenses.
Please refer to page 3 herein for an explanation of the information presented in the above Expense Example.
Portfolio Insights
| » | | The PIMCO Emerging Markets Bond Portfolio seeks to achieve its investment objective by investing under normal circumstances at least 80% of its assets in fixed-income instruments of issuers that economically are tied to countries with emerging securities markets, which may be represented by forwards or derivatives, such as options, futures contracts, or swap agreements. |
| » | | An overweight position in Brazil benefited performance. The JPMorgan EMBIG Brazil sub-index returned 3.1% for the period, outperforming the broader emerging markets sector, as represented by the JPMorgan EMBIG Index, which returned 0.9% for the same period. |
| » | | An underweight to Venezuela helped relative performance. The JPMorgan EMBIG Venezuela sub-index declined 10.1% for the period. |
| » | | An overweight position in Russia detracted from relative performance. However, emphasizing Russian corporate bonds helped performance as corporates outperformed sovereign bonds during the period. |
| » | | A tactical allocation in emerging markets currencies benefited performance as these currencies strengthened against the U.S. dollar over the period. |
| » | | Off-benchmark allocations to emerging local markets helped the Portfolio’s performance as emerging markets local bonds, represented by the JPMorgan GBI EM Global Diversified Index, outperformed emerging markets external debt, represented by the JPMorgan Emerging Markets Bond Index Global, in the first half of the year. |
| » | | An underweight to Ecuador detracted from performance as Ecuador spreads tightened during the period. |
| » | | An underweight to Turkey detracted from performance. The JPMorgan EMBIG Turkey sub-index returned 3.2% for the period, outperforming the broader emerging markets sector, as represented by the JPMorgan EMBIG Index. |
| | | | |
| 4 | | PIMCO Variable Insurance Trust | | |
Financial Highlights Emerging Markets Bond Portfolio
| | | | | | | | | | | | | | | | | | | | | | | | |
| Selected per Share Data for the Year or Period Ended: | | 06/30/2007+ | | | 12/31/2006 | | | 12/31/2005 | | | 12/31/2004 | | | 12/31/2003 | | | 09/30/2002-12/31/2002 | |
| | | | | | |
Administrative Class | | | | | | | | | | | | | | | | | | | | | | | | |
Net asset value beginning of year or period | | $ | 13.96 | | | $ | 13.66 | | | $ | 13.21 | | | $ | 12.97 | | | $ | 11.48 | | | $ | 10.00 | |
Net investment income (a) | | | 0.36 | | | | 0.70 | | | | 0.67 | | | | 0.48 | | | | 0.62 | | | | 0.18 | |
Net realized/unrealized gain (loss) on investments (a) | | | (0.14 | ) | | | 0.52 | | | | 0.71 | | | | 1.03 | | | | 2.90 | | | | 1.48 | |
Total income from investment operations | | | 0.22 | | | | 1.22 | | | | 1.38 | | | | 1.51 | | | | 3.52 | | | | 1.66 | |
Dividends from net investment income | | | (0.40 | ) | | | (0.73 | ) | | | (0.68 | ) | | | (0.51 | ) | | | (0.65 | ) | | | (0.18 | ) |
Distributions from net realized capital gains | | | 0.00 | | | | (0.19 | ) | | | (0.25 | ) | | | (0.76 | ) | | | (1.38 | ) | | | 0.00 | |
Total distributions | | | (0.40 | ) | | | (0.92 | ) | | | (0.93 | ) | | | (1.27 | ) | | | (2.03 | ) | | | (0.18 | ) |
Net asset value end of year or period | | $ | 13.78 | | | $ | 13.96 | | | $ | 13.66 | | | $ | 13.21 | | | $ | 12.97 | | | $ | 11.48 | |
Total return | | | 1.50 | % | | | 9.25 | % | | | 10.75 | % | | | 12.11 | % | | | 31.64 | % | | | 16.65 | % |
Net assets end of year or period (000s) | | $ | 191,611 | | | $ | 207,298 | | | $ | 133,142 | | | $ | 64,598 | | | $ | 50,954 | | | $ | 32,767 | |
Ratio of expenses to average net assets | | | 1.04 | %* | | | 1.00 | % | | | 1.00 | % | | | 1.01 | % | | | 1.04 | % | | | 1.02 | %*(b) |
Ratio of expenses to average net assets excluding interest expense | | | 1.04 | %* | | | 1.00 | % | | | 1.00 | % | | | 1.00 | % | | | 1.00 | % | | | 1.00 | %*(b) |
Ratio of net investment income to average net assets | | | 5.19 | %* | | | 5.15 | % | | | 5.01 | % | | | 3.70 | % | | | 4.78 | % | | | 6.58 | %* |
Portfolio turnover rate | | | 100 | % | | | 283 | % | | | 242 | % | | | 484 | % | | | 451 | % | | | 91 | % |
+ Unaudited
* Annualized
(a) Per share amounts based on average number of shares outstanding during the period.
(b) If the investment manager had not reimbursed expenses, the ratio of expenses to average net assets would have been 1.11%.
| | | | | | |
| See Accompanying Notes | | Semiannual Report | | June 30, 2007 | | 5 |
Statement of Assets and Liabilities Emerging Markets Bond Portfolio
| | | |
| (Amounts in thousands, except per share amounts) | | June 30, 2007 |
| | | (Unaudited) |
| |
Assets: | | | |
Investments, at value | | $ | 191,377 |
Cash | | | 94 |
Foreign currency, at value | | | 166 |
Receivable for investments sold | | | 3,483 |
Receivable for Portfolio shares sold | | | 69 |
Interest and dividends receivable | | | 3,435 |
Variation margin receivable | | | 24 |
Swap premiums paid | | | 400 |
Unrealized appreciation on foreign currency contracts | | | 229 |
Unrealized appreciation on swap agreements | | | 2,038 |
| | | | 201,315 |
| |
Liabilities: | | | |
Payable for investments purchased | | $ | 1,670 |
Payable for investments purchased on a delayed-delivery basis | | | 4,860 |
Payable for Portfolio shares redeemed | | | 330 |
Payable for short sales | | | 631 |
Written options outstanding | | | 645 |
Dividends payable | | | 1 |
Accrued investment advisory fee | | | 72 |
Accrued administration fee | | | 64 |
Accrued servicing fee | | | 22 |
Swap premiums received | | | 655 |
Unrealized depreciation on foreign currency contracts | | | 42 |
Unrealized depreciation on swap agreements | | | 75 |
Other liabilities | | | 17 |
| | | | 9,084 |
| |
Net Assets | | $ | 192,231 |
| |
Net Assets Consist of: | | | |
Paid in capital | | $ | 178,681 |
Undistributed net investment income | | | 1,904 |
Accumulated undistributed net realized gain | | | 6,426 |
Net unrealized appreciation | | | 5,220 |
| | | $ | 192,231 |
| |
Net Assets: | | | |
Administrative Class | | | 191,611 |
Advisor Class | | | 620 |
| |
Shares Issued and Outstanding: | | | |
Administrative Class | | | 13,908 |
Advisor Class | | | 45 |
| |
Net Asset Value and Redemption Price Per Share (Net Asset Per Share Outstanding) | | | |
Administrative Class | | $ | 13.78 |
Advisor Class | | | 13.78 |
| |
Cost of Investments Owned | | $ | 189,066 |
Cost of Foreign Currency Held | | $ | 166 |
Proceeds Received on Short Sales | | $ | 620 |
Premiums Received on Written Options | | $ | 1,500 |
| | | | |
| 6 | | PIMCO Variable Insurance Trust | | See Accompanying Notes |
Statement of Operations Emerging Markets Bond Portfolio
| | | | |
| (Amounts in thousands) | | Six Months Ended
June 30, 2007 | |
| | | (Unaudited) | |
| |
| Investment Income: | | | | |
Interest, net of foreign taxes* | | $ | 6,283 | |
Total Income | | | 6,283 | |
| |
Expenses: | | | | |
Investment advisory fees | | | 451 | |
Administration fees | | | 401 | |
Servicing fees – Administrative Class | | | 150 | |
Distribution and/or servicing fees – Advisor Class | | | 1 | |
Trustees’ fees | | | 2 | |
Interest expense | | | 5 | |
Miscellaneous expense | | | 42 | |
Total Expenses | | | 1,052 | |
| |
Net Investment Income | | | 5,231 | |
| |
Net Realized and Unrealized Gain (Loss): | | | | |
Net realized gain on investments | | | 2,813 | |
Net realized gain on futures contracts, written options and swaps | | | 29 | |
Net realized gain on foreign currency transactions | | | 248 | |
Net change in unrealized (depreciation) on investments | | | (5,157 | ) |
Net change in unrealized appreciation on futures contracts, written options and swaps | | | 335 | |
Net change in unrealized appreciation on translation of assets and liabilities denominated in foreign currencies | | | 101 | |
Net (Loss) | | | (1,631 | ) |
| |
Net Increase in Net Assets Resulting from Operations | | $ | 3,600 | |
| |
*Foreign tax withholding | | $ | 16 | |
| | | | | | |
| See Accompanying Notes | | Semiannual Report | | June 30, 2007 | | 7 |
Statements of Changes in Net Assets Emerging Markets Bond Portfolio
| | | | | | | | |
| (Amounts in thousands) | | Six Months Ended
June 30, 2007 | | | Year Ended
December 31, 2006 | |
| | | (Unaudited) | | | | |
| | |
| Increase (Decrease) in Net Assets from: | | | | | | | | |
| | |
Operations: | | | | | | | | |
Net investment income | | $ | 5,231 | | | $ | 8,825 | |
Net realized gain | | | 3,090 | | | | 4,766 | |
Net change in unrealized appreciation (depreciation) | | | (4,721 | ) | | | 2,492 | |
Net increase resulting from operations | | | 3,600 | | | | 16,083 | |
| | |
Distributions to Shareholders: | | | | | | | | |
From net investment income | | | | | | | | |
Administrative Class | | | (5,654 | ) | | | (9,150 | ) |
Advisor Class | | | (16 | ) | | | (8 | ) |
From net realized capital gains | | | | | | | | |
Administrative Class | | | 0 | | | | (2,742 | ) |
Advisor Class | | | 0 | | | | (6 | ) |
| | |
Total Distributions | | | (5,670 | ) | | | (11,906 | ) |
| | |
Portfolio Share Transactions: | | | | | | | | |
Receipts for shares sold | | | | | | | | |
Administrative Class | | | 30,794 | | | | 97,460 | |
Advisor Class | | | 260 | | | | 481 | |
Issued as reinvestment of distributions | | | | | | | | |
Administrative Class | | | 5,653 | | | | 11,892 | |
Advisor Class | | | 16 | | | | 14 | |
Cost of shares redeemed | | | | | | | | |
Administrative Class | | | (50,072 | ) | | | (39,361 | ) |
Advisor Class | | | (117 | ) | | | (38 | ) |
Net increase (decrease) resulting from Portfolio share transactions | | | (13,466 | ) | | | 70,448 | |
| | |
Total Increase (Decrease) in Net Assets | | | (15,536 | ) | | | 74,625 | |
| | |
Net Assets: | | | | | | | | |
Beginning of period | | | 207,767 | | | | 133,142 | |
End of period* | | $ | 192,231 | | | $ | 207,767 | |
| | |
*Including undistributed net investment income of: | | $ | 1,904 | | | $ | 2,343 | |
| | | | |
| 8 | | PIMCO Variable Insurance Trust | | See Accompanying Notes |
| | |
| |
| Schedule of Investments Emerging Markets Bond Portfolio | | June 30, 2007 (Unaudited) |
| | | | | | | | |
| | | | | PRINCIPAL
AMOUNT
(000S) | | | | VALUE
(000S) |
| ARGENTINA 4.0% | | | | | | | | |
| Argentina Bonos | | | | | | | | |
5.475% due 08/03/2012 | | $ | | 10,690 | | $ | | 7,639 |
| | | | | | | | |
Total Argentina (Cost $7,590) | | | | 7,639 |
| | | | | | | | |
|
| BERMUDA 0.3% | | | | | | | | |
| BW Group Ltd. | | | | | | | | |
6.625% due 06/28/2017 | | $ | | 480 | | | | 482 |
| | | | | | | | |
Total Bermuda (Cost $477) | | | | | | 482 |
| | | | | | | | |
|
| BRAZIL 17.9% | | | | | | | | |
| Brazil Notas do Tesouro Nacional Series B |
6.000% due 05/15/2017 | | BRL | | 1,100 | | | | 920 |
| |
| Brazil Notas do Tesouro Nacional Series F | | |
10.000% due 01/01/2017 | | | | 7,490 | | | | 3,730 |
| |
| Brazilian Government International Bond | | |
7.125% due 01/20/2037 | | $ | | 1,770 | | | | 1,916 |
7.875% due 03/07/2015 | | | | 3,625 | | | | 4,018 |
8.250% due 01/20/2034 | | | | 5,690 | | | | 7,002 |
8.750% due 02/04/2025 | | | | 1,700 | | | | 2,108 |
8.875% due 04/15/2024 | | | | 350 | | | | 437 |
10.125% due 05/15/2027 | | | | 1,740 | | | | 2,458 |
10.250% due 01/10/2028 | | BRL | | 1,100 | | | | 636 |
| |
| Brazilian Government International CPI Linked Bond | | |
10.000% due 01/01/2012 | | | | 14,180 | | | | 7,143 |
| |
| CSN Islands VII Corp. | | |
10.750% due 09/12/2008 | | $ | | 200 | | | | 210 |
| |
| Embraer Overseas Ltd. | | |
6.375% due 01/24/2017 | | | | 300 | | | | 295 |
| |
| Empresa Energetica de Sergipe and Sociedade Anonima de Eletrificaao da Paraiba |
10.500% due 07/19/2013 | | | | 200 | | | | 223 |
| |
| ISA Capital do Brasil S.A. | | |
7.875% due 01/30/2012 | | | | 300 | | | | 307 |
8.800% due 01/30/2017 | | | | 700 | | | | 751 |
| |
| Vale Overseas Ltd. | | |
6.250% due 01/23/2017 | | | | 500 | | | | 498 |
6.875% due 11/21/2036 | | | | 1,700 | | | | 1,713 |
| | | | | | | | |
Total Brazil (Cost $31,273) | | | | | | 34,365 |
| | | | | | | | |
|
| CAYMAN ISLANDS 0.1% | | | | |
| Petrobras International Finance Co. | | |
6.125% due 10/06/2016 | | $ | | 250 | | | | 246 |
| | | | | | | | |
Total Cayman Islands (Cost $242) | | | | 246 |
| | | | | | | | |
|
| CHILE 1.8% | | | | | | | | |
| Chile Government International Bond | | |
5.625% due 07/23/2007 | | $ | | 915 | | | | 917 |
| |
| CODELCO, Inc. | | |
5.625% due 09/21/2035 | | | | 200 | | | | 185 |
6.150% due 10/24/2036 | | | | 2,200 | | | | 2,161 |
| |
| Empresa Nacional de Electricidad S.A. | | |
8.350% due 08/01/2013 | | | | 200 | | | | 224 |
| | | | | | | | |
Total Chile (Cost $3,633) | | | | | | 3,487 |
| | | | | | | | |
|
| CHINA 0.6% | | | | | | | | |
| Citic Resources Finance Ltd. | | |
6.750% due 05/15/2014 | | $ | | 200 | | | | 194 |
| |
| Export-Import Bank of China | | |
4.875% due 07/21/2015 | | | | 550 | | | | 520 |
| |
| | | | | | | | |
| | | | | PRINCIPAL
AMOUNT
(000S) | | | | VALUE
(000S) |
| Sino-Forest Corp. | | |
9.125% due 08/17/2011 | | $ | | 500 | | $ | | 532 |
| | | | | | | | |
Total China (Cost $1,272) | | | | | | 1,246 |
| | | | | | | | |
|
| COLOMBIA 3.5% | | |
| Colombia Government International Bond | | |
7.375% due 01/27/2017 | | $ | | 1,500 | | | | 1,630 |
7.375% due 09/18/2037 | | | | 930 | | | | 1,034 |
8.250% due 12/22/2014 | | | | 2,825 | | | | 3,174 |
10.000% due 01/23/2012 | | | | 100 | | | | 116 |
10.375% due 01/28/2033 | | | | 225 | | | | 333 |
10.750% due 01/15/2013 | | | | 400 | | | | 490 |
| | | | | | | | |
Total Colombia (Cost $6,500) | | | | 6,777 |
| | | | | | | | |
|
| ECUADOR 0.3% | | | | | | | | |
| Ecuador Government International Bond | | |
10.000% due 08/15/2030 | | $ | | 700 | | | | 590 |
| | | | | | | | |
Total Ecuador (Cost $590) | | | | 590 |
| | | | | | | | |
|
| EGYPT 0.3% | | | | | | | | |
| Petroleum Export Ltd. | | |
5.265% due 06/15/2011 | | $ | | 498 | | | | 486 |
| | | | | | | | |
Total Egypt (Cost $496) | | | | 486 |
| | | | | | | | |
|
| EL SALVADOR 0.4% | | | | | | | | |
| AES El Salvador Trust | | |
6.750% due 02/01/2016 | | $ | | 700 | | | | 696 |
| |
| El Salvador Government International Bond |
8.500% due 07/25/2011 | | | | 150 | | | | 167 |
| | | | | | | | |
Total El Salvador (Cost $843) | | | | 863 |
| | | | | | | | |
|
| GUATEMALA 0.3% | | | | | | | | |
| Guatemala Government Bond | | |
9.250% due 08/01/2013 | | $ | | 570 | | | | 656 |
| | | | | | | | |
Total Guatemala (Cost $570) | | | | 656 |
| | | | | | | | |
|
| INDIA 0.4% | | | | | | | | |
| ICICI Bank Ltd. | | |
5.750% due 01/12/2012 | | $ | | 700 | | | | 688 |
| | | | | | | | |
Total India (Cost $699) | | | | 688 |
| | | | | | | | |
|
| INDONESIA 1.1% | | | | | | | | |
| Indonesia Government International Bond | | |
6.875% due 03/09/2017 | | $ | | 1,200 | | | | 1,245 |
| |
| Majapahit Holding BV | | |
7.250% due 06/28/2017 | | | | 400 | | | | 401 |
7.875% due 06/29/2037 | | | | 400 | | | | 403 |
| | | | | | | | |
Total Indonesia (Cost $1,979) | | | | 2,049 |
| | | | | | | | |
|
| KAZAKHSTAN 1.9% | | | | | | | | |
| ATF Bank JSC | | |
9.000% due 05/11/2016 | | $ | | 150 | | | | 160 |
| |
| HSBK Europe BV | | |
7.750% due 05/13/2013 | | | | 100 | | | | 103 |
| |
| Intergas Finance BV | | |
6.375% due 05/14/2017 | | | | 300 | | | | 288 |
6.875% due 11/04/2011 | | | | 600 | | | | 611 |
| |
| Kazakhstan Temir Zholy Finance BV | | |
6.500% due 05/11/2011 | | | | 300 | | | | 302 |
| |
| Kazkommerts International BV | | |
8.500% due 04/16/2013 | | | | 225 | | | | 230 |
| |
| | | | | | | | |
| | | | | PRINCIPAL
AMOUNT
(000S) | | | | VALUE
(000S) |
| Tengizchevroil Finance Co. SARL | | |
6.124% due 11/15/2014 | | $ | | 2,000 | | $ | | 1,965 |
| | | | | | | | |
Total Kazakhstan (Cost $3,707) | | | | 3,659 |
| | | | | | | | |
|
| MALAYSIA 0.6% | | | | | | | | |
| Malaysia Government International Bond | | |
7.500% due 07/15/2011 | | $ | | 325 | | | | 348 |
8.750% due 06/01/2009 | | | | 120 | | | | 127 |
| |
| Petronas Capital Ltd. | | |
7.000% due 05/22/2012 | | | | 325 | | | | 344 |
| |
| Tenaga Nasional Bhd. | | |
7.500% due 11/01/2025 | | | | 250 | | | | 279 |
| |
| TNB Capital L Ltd. | | |
5.250% due 05/05/2015 | | | | 100 | | | | 97 |
| | | | | | | | |
Total Malaysia (Cost $1,232) | | | | 1,195 |
| | | | | | | | |
|
| MEXICO 7.6% | | | | | | | | |
| America Movil SAB de C.V. | | |
5.500% due 03/01/2014 | | $ | | 200 | | | | 196 |
5.750% due 01/15/2015 | | | | 200 | | | | 198 |
8.460% due 12/18/2036 | | MXN | | 5,400 | | | | 510 |
| |
| Banco Mercantil del Norte S.A. | | |
5.875% due 02/17/2014 | | $ | | 145 | | | | 146 |
| |
| C5 Capital SPV Ltd. | | |
6.196% due 12/01/2049 | | | | 100 | | | | 99 |
| |
| C8 Capital SPV Ltd. | | |
6.640% due 12/31/2049 | | | | 100 | | | | 99 |
| |
| C10 Capital SPV Ltd. | | |
6.722% due 12/31/2049 | | | | 600 | | | | 586 |
| |
| Desarrolladora Homex S.A. de C.V. | | |
7.500% due 09/28/2015 | | | | 1,500 | | | | 1,560 |
| |
| Hipotecaria Su Casita S.A. | | |
8.500% due 10/04/2016 | | | | 100 | | | | 106 |
| |
| Mexico Government International Bond | | |
5.625% due 01/15/2017 | | | | 438 | | | | 430 |
6.750% due 09/27/2034 | | | | 4,180 | | | | 4,468 |
7.500% due 04/08/2033 | | | | 2,460 | | | | 2,857 |
| |
| Pemex Project Funding Master Trust | | |
6.625% due 06/15/2035 | | | | 250 | | | | 254 |
8.000% due 11/15/2011 | | | | 250 | | | | 272 |
8.625% due 02/01/2022 | | | | 1,200 | | | | 1,482 |
9.250% due 03/30/2018 | | | | 977 | | | | 1,219 |
| |
| Vitro SAB de C.V. | | |
8.625% due 02/01/2012 | | | | 150 | | | | 153 |
9.125% due 02/01/2017 | | | | 50 | | | | 51 |
| | | | | | | | |
Total Mexico (Cost $14,507) | | | | 14,686 |
| | | | | | | | |
|
| PAKISTAN 0.8% | | | | | | | | |
| Pakistan Government International Bond | | |
7.125% due 03/31/2016 | | $ | | 1,550 | | | | 1,542 |
| | | | | | | | |
Total Pakistan (Cost $1,536) | | | | 1,542 |
| | | | | | | | |
|
| PANAMA 4.7% | | | | | | | | |
| Panama Government International Bond | | |
6.700% due 01/26/2036 | | $ | | 600 | | | | 615 |
7.125% due 01/29/2026 | | | | 2,165 | | | | 2,317 |
7.250% due 03/15/2015 | | | | 1,150 | | | | 1,236 |
8.875% due 09/30/2027 | | | | 780 | | | | 985 |
9.375% due 07/23/2012 | | | | 2,910 | | | | 3,346 |
9.375% due 04/01/2029 | | | | 200 | | | | 266 |
9.625% due 02/08/2011 | | | | 210 | | | | 236 |
| | | | | | | | |
Total Panama (Cost $8,740) | | | | 9,001 |
| | | | | | | | |
|
| | | | | | |
| See Accompanying Notes | | Semiannual Report | | June 30, 2007 | | 9 |
Schedule of Investments Emerging Markets Bond Portfolio (Cont.)
| | | | | | | | |
| | | | | PRINCIPAL
AMOUNT
(000S) | | | | VALUE
(000S) |
| PERU 1.9% | | |
| Peru Government International Bond | | |
6.550% due 03/14/2037 | | $ | | 1,583 | | $ | | 1,595 |
7.350% due 07/21/2025 | | | | 500 | | | | 559 |
8.375% due 05/03/2016 | | | | 555 | | | | 648 |
9.125% due 01/15/2008 | | | | 650 | | | | 660 |
| |
| Southern Copper Corp. | | |
7.500% due 07/27/2035 | | | | 100 | | | | 107 |
| | | | | | | | |
Total Peru (Cost $3,509) | | | | | | 3,569 |
| | | | | | | | |
|
| QATAR 0.1% | | | | | | | | |
| Ras Laffan Liquefied Natural Gas Co. Ltd. II |
5.298% due 09/30/2020 | | $ | | 250 | | | | 234 |
| | | | | | | | |
Total Qatar (Cost $250) | | | | | | | | 234 |
| | | | | | | | |
|
| RUSSIA 19.8% | | | | | | | | |
| Gaz Capital for Gazprom | | |
5.440% due 11/02/2017 | | EUR | | 300 | | | | 394 |
5.875% due 06/01/2015 | | | | 200 | | | | 273 |
6.212% due 11/22/2016 | | $ | | 1,200 | | | | 1,172 |
8.625% due 04/28/2034 | | | | 3,000 | | | | 3,752 |
| |
| Gazinvest Luxembourg S.A. for Gazprombank |
7.250% due 10/30/2008 | | | | 1,000 | | | | 1,021 |
| |
| Gazprom International S.A. |
7.201% due 02/01/2020 | | | | 811 | | | | 838 |
| |
| Mobile Telesystems Finance S.A. |
8.000% due 01/28/2012 | | | | 150 | | | | 155 |
| |
| Morgan Stanley Bank AG for OAO Gazprom |
9.625% due 03/01/2013 | | | | 6,810 | | | | 7,908 |
| |
RSHB Capital AG S.A. for OJSC Russian Agricultural Bank |
6.299% due 05/15/2017 | | | | 190 | | | | 186 |
7.175% due 05/16/2013 | | | | 1,900 | | | | 1,984 |
| |
| Russia Government International Bond |
7.500% due 03/31/2030 | | | | 10,134 | | | | 11,178 |
| |
| Sistema Finance S.A. |
10.250% due 04/14/2008 | | | | 500 | | | | 517 |
| |
| TNK-BP Finance S.A. |
6.125% due 03/20/2012 | | | | 200 | | | | 196 |
6.625% due 03/20/2017 | | | | 1,700 | | | | 1,651 |
7.500% due 07/18/2016 | | | | 2,700 | | | | 2,790 |
| |
| TransCapitalInvest Ltd. for OJSC AK Transneft |
6.103% due 06/27/2012 | | | | 700 | | | | 703 |
| |
UBS Luxembourg S.A. for OJSC Vimpel Communications |
8.375% due 10/22/2011 | | | | 350 | | | | 368 |
| |
| UBS Luxembourg S.A. for Sberbank |
6.230% due 02/11/2015 | | | | 1,000 | | | | 1,004 |
| |
| VTB Capital S.A. for Vneshtorgbank |
5.955% due 08/01/2008 | | | | 1,000 | | | | 1,002 |
6.110% due 09/21/2007 | | | | 1,000 | | | | 1,001 |
| | | | | | | | |
Total Russia (Cost $38,404) | | | | | | 38,093 |
| | | | | | | | |
|
| SOUTH AFRICA 1.6% | | | | |
| South Africa Government International Bond |
5.250% due 05/16/2013 | | EUR | | 400 | | | | 546 |
5.875% due 05/30/2022 | | $ | | 1,430 | | | | 1,402 |
6.500% due 06/02/2014 | | | | 750 | | | | 774 |
7.375% due 04/25/2012 | | | | 310 | | | | 330 |
| | | | | | | | |
Total South Africa (Cost $3,017) | | | | 3,052 |
| | | | | | | | |
|
| | | | | | | | |
| | | | | PRINCIPAL
AMOUNT
(000S) | | | | VALUE
(000S) |
| SOUTH KOREA 0.1% | | | | | | |
| Industrial Bank of Korea | | |
4.000% due 05/19/2014 | | $ | | 110 | | $ | | 107 |
| |
| Korea Development Bank |
5.750% due 09/10/2013 | | | | 15 | | | | 15 |
| |
| KT Corp. |
4.875% due 07/15/2015 | | | | 100 | | | | 94 |
| | | | | | | | |
Total South Korea (Cost $223) | | | | 216 |
| | | | | | | | |
|
| TRINIDAD AND TOBAGO 0.4% | | |
| Petroleum Co. of Trinidad & Tobago Ltd. | | |
6.000% due 05/08/2022 | | $ | | 700 | | | | 683 |
| | | | | | | | |
Total Trinidad and Tobago (Cost $697) | | 683 |
| | | | | | | | |
|
| TUNISIA 0.9% | | |
| Banque Centrale de Tunisie | | |
4.750% due 04/07/2011 | | EUR | | 500 | | | | 673 |
7.375% due 04/25/2012 | | $ | | 1,050 | | | | 1,125 |
| | | | | | | | |
Total Tunisia (Cost $1,736) | | | | 1,798 |
| | | | | | | | |
|
| UKRAINE 2.1% | | |
| Ukraine Government International Bond | | |
4.950% due 10/13/2015 | | EUR | | 300 | | | | 382 |
6.385% due 06/26/2012 | | $ | | 300 | | | | 302 |
6.875% due 03/04/2011 | | | | 700 | | | | 717 |
7.650% due 06/11/2013 | | | | 1,300 | | | | 1,379 |
8.775% due 08/05/2009 | | | | 1,150 | | | | 1,222 |
| | | | | | | | |
Total Ukraine (Cost $3,877) | | | | 4,002 |
| | | | | | | | |
|
| UNITED STATES 0.3% | | |
|
| BANK LOAN OBLIGATIONS 0.0% |
| Kingdom of Morocco | | |
6.344% due 01/05/2009 | | $ | | 100 | | | | 101 |
| | | | | | | | |
|
| CORPORATE BONDS & NOTES 0.3% |
| Freeport-McMoRan Copper & Gold, Inc. | | |
8.375% due 04/01/2017 | | | | 52 | | | | 56 |
| |
| Hyundai Motor Manufacturing Alabama LLC |
5.300% due 12/19/2008 | | | | 500 | | | | 496 |
| | | | | | | | |
| | | | | | | | 552 |
| | | | | | | | |
Total United States (Cost $649) | | | | 653 |
| | | | | | | | |
|
| URUGUAY 1.8% | | |
| Uruguay Government International Bond | | |
3.700% due 06/26/2037 | | UYU | | 4,504 | | | | 185 |
5.000% due 09/14/2018 (b) | | 6,216 | | | | 293 |
7.625% due 03/21/2036 | | $ | | 300 | | | | 330 |
8.000% due 11/18/2022 | | | | 2,121 | | | | 2,366 |
9.250% due 05/17/2017 | | | | 200 | | | | 240 |
| | | | | | | | |
Total Uruguay (Cost $3,278) | | 3,414 |
| | | | | | | | |
|
| VENEZUELA 5.6% | | |
| Petroleos de Venezuela S.A. | | |
5.250% due 04/12/2017 | | $ | | 300 | | | | 228 |
5.375% due 04/12/2027 | | | | 600 | | | | 399 |
| |
| Venezuela Government International Bond |
5.375% due 08/07/2010 | | | | 3,850 | | | | 3,638 |
5.750% due 02/26/2016 | | | | 770 | | | | 655 |
6.000% due 12/09/2020 | | | | 1,900 | | | | 1,542 |
6.355% due 04/20/2011 | | | | 1,200 | | | | 1,167 |
7.650% due 04/21/2025 | | | | 325 | | | | 298 |
8.500% due 10/08/2014 | | | | 500 | | | | 508 |
| | | | | | | | | |
| | | | | PRINCIPAL
AMOUNT
(000S) | | | | VALUE
(000S) | |
9.375% due 01/13/2034 | | $ | | 350 | | $ | | 366 | |
10.750% due 09/19/2013 | | | | 1,850 | | | | 2,059 | |
| | | | | | | | | |
Total Venezuela (Cost $11,396) | | 10,860 | |
| | | | | | | | | |
| |
| VIETNAM 0.1% | | | |
| Socialist Republic of Vietnam | | | |
6.875% due 01/15/2016 | | $ | | 100 | | | | 104 | |
| | | | | | | | | |
Total Vietnam (Cost $98) | | 104 | |
| | | | | | | | | |
| |
| SHORT-TERM INSTRUMENTS 17.9% | |
| |
| COMMERCIAL PAPER 16.2% | |
| Danske Corp. | | | |
5.205% due 10/12/2007 | | $ | | 3,800 | | | | 3,759 | |
| | |
| HBOS Treasury Services PLC | |
5.250% due 09/21/2007 | | | | 9,100 | | | | 8,989 | |
| | |
| Societe Generale NY | |
5.210% due 11/26/2007 | | | | 1,600 | | | | 1,583 | |
5.245% due 11/26/2007 | | | | 4,200 | | | | 4,149 | |
| | |
| TotalFinaElf Capital S.A. | |
5.340% due 07/02/2007 | | | | 1,300 | | | | 1,300 | |
| | |
| UBS Finance Delaware LLC | |
5.230% due 10/23/2007 | | | | 5,800 | | | | 5,773 | |
| | |
| Westpac Banking Corp. | |
5.165% due 11/05/2007 | | | | 3,800 | | | | 3,729 | |
| | |
| Westpac Trust Securities NZ Ltd. | |
5.260% due 10/19/2007 | | | | 2,000 | | | | 1,976 | |
| | | | | | | | | |
| | | | | | | | 31,258 | |
| | | | | | | | | |
| |
| REPURCHASE AGREEMENTS 1.2% | |
| State Street Bank and Trust Co. | | | |
4.900% due 07/02/2007 | | | | 2,264 | | | | 2,264 | |
| | | | | | | | | |
(Dated 06/29/2007. Collateralized by Fannie Mae 3.250% due 08/15/2008 valued at $2,311. Repurchase proceeds are $2,265.) | |
| |
| U.S. TREASURY BILLS 0.5% | |
4.646% due 09/13/2007 (a)(c)(d) | | 955 | | | | 944 | |
| | | | | | | | | |
Total Short-Term Instruments
(Cost $34,479) | | | | 34,466 | |
| | | | | | | | | |
| |
| PURCHASED OPTIONS (f) 0.3% | |
| (Cost $1,567) | | | | | | | | 576 | |
| |
Total Investments 99.5% (Cost $189,066) | | $ | | 191,377 | |
| |
| Written Options (g) (0.3%) (Premiums $1,500) | | | | | | | | (645 | ) |
| |
| Other Assets and Liabilities (Net) 0.8% | | 1,499 | |
| | | | | | | | | |
| Net Assets 100.0% | | | | | | $ | | 192,231 | |
| | | | | | | | | |
| | | | |
| 10 | | PIMCO Variable Insurance Trust | | See Accompanying Notes |
| | |
| |
| | | June 30, 2007 (Unaudited) |
Notes to Schedule of Investments (amounts in thousands*, except number of contracts):
* A zero balance may reflect actual amounts rounding to less than one thousand.
(a) Coupon represents a weighted average rate.
(b) Principal amount of security is adjusted for inflation.
(c) Securities with an aggregate market value of $494 have been pledged as collateral for swap and swaption contracts on June 30, 2007.
(d) Securities with an aggregate market value of $450 have been segregated with the custodian to cover margin requirements for the following open futures contracts on June 30, 2007:
| | | | | | | | | | |
| Description | | Type | | Expiration
Month | | # of
Contracts | | Unrealized
(Depreciation) | |
90-Day Eurodollar December Futures | | Long | | 12/2007 | | 274 | | $ | (131 | ) |
| | | | | | | | | | |
(e) Swap agreements outstanding on June 30, 2007:
Credit Default Swaps
| | | | | | | | | | | | | | | | |
| Counterparty | | Reference Entity | | Buy/Sell
Protection (1) | | (Pay)/Receive
Fixed Rate | | | Expiration
Date | | Notional
Amount | | Unrealized
Appreciation/
(Depreciation) | |
Barclays Bank PLC | | Ukraine Government International Bond 7.650% due 06/11/2013 | | Sell | | 1.700% | | | 03/20/2011 | | $ | 500 | | $ | 13 | |
Barclays Bank PLC | | Multiple Reference Entities of Gazprom | | Sell | | 0.940% | | | 05/20/2011 | | | 2,500 | | | 41 | |
Barclays Bank PLC | | Russia Government International Bond 7.500% due 03/31/2030 | | Sell | | 1.650% | | | 07/20/2011 | | | 800 | | | 42 | |
Barclays Bank PLC | | Brazilian Government International Bond 12.250% due 03/06/2030 | | Sell | | 1.360% | | | 08/20/2011 | | | 1,000 | | | 32 | |
Barclays Bank PLC | | Indonesia Government International Bond 6.750% due 03/10/2014 | | Sell | | 1.700% | | | 09/20/2011 | | | 1,000 | | | 30 | |
Barclays Bank PLC | | Indonesia Government International Bond 6.750% due 03/10/2014 | | Sell | | 1.400% | | | 12/20/2011 | | | 500 | | | 9 | |
Barclays Bank PLC | | Indonesia Government International Bond 6.750% due 03/10/2014 | | Sell | | 2.320% | | | 12/20/2016 | | | 1,000 | | | 49 | |
Citibank N.A. | | Indonesia Government International Bond 6.750% due 03/10/2014 | | Sell | | 1.580% | | | 12/20/2011 | | | 100 | | | 2 | |
Citibank N.A. | | Indonesia Government International Bond 6.750% due 03/10/2014 | | Sell | | 2.290% | | | 12/20/2016 | | | 200 | | | 9 | |
Deutsche Bank AG | | Uruguay Government International Bond 7.875% due 01/15/2033 | | Sell | | 1.050% | | | 01/20/2012 | | | 1,000 | | | 9 | |
Deutsche Bank AG | | Dow Jones CDX N.A. EM7 Index | | Sell | | 1.250% | | | 06/20/2012 | | | 2,000 | | | (9 | ) |
JPMorgan Chase & Co. | | Indonesia Government International Bond 6.750% due 03/10/2014 | | Sell | | 2.050% | | | 09/20/2011 | | | 750 | | | 32 | |
JPMorgan Chase & Co. | | Mexico Government International Bond 11.500% due 05/15/2026 | | Sell | | 2.840% | | | 01/04/2013 | | | 1,600 | | | 210 | |
JPMorgan Chase & Co. | | Multiple Reference Entities of Gazprom | | Sell | | 1.500% | | | 04/20/2016 | | | 1,000 | | | 48 | |
JPMorgan Chase & Co. | | Petroleos Mexicanos 9.500% due 09/15/2027 | | Sell | | 1.130% | | | 04/20/2016 | | | 1,400 | | | 53 | |
JPMorgan Chase & Co. | | CEMEX SAB de C.V. 9.625% due 10/01/2009 | | Sell | | 1.050% | | | 12/20/2016 | | | 500 | | | 3 | |
Lehman Brothers, Inc. | | Brazilian Government International Bond 12.250% due 03/06/2030 | | Sell | | 1.770% | | | 06/20/2011 | | | 500 | | | 21 | |
Lehman Brothers, Inc. | | Petroleos Mexicanos 9.500% due 09/15/2027 | | Sell | | 0.800% | | | 07/20/2011 | | | 261 | | | 4 | |
Lehman Brothers, Inc. | | Dow Jones CDX N.A. EM6 Index | | Sell | | 1.400% | | | 12/20/2011 | | | 9,200 | | | 51 | |
Lehman Brothers, Inc. | | Indonesia Government International Bond 6.750% due 03/10/2014 | | Sell | | 1.520% | | | 12/20/2011 | | | 1,000 | | | 22 | |
Lehman Brothers, Inc. | | Ukraine Government International Bond 7.650% due 06/11/2013 | | Sell | | 1.400% | | | 05/20/2012 | | | 1,000 | | | 6 | |
Lehman Brothers, Inc. | | Dow Jones CDX N.A. EM7 Index | | Sell | | 1.250% | | | 06/20/2012 | | | 13,500 | | | (57 | ) |
Lehman Brothers, Inc. | | Brazilian Government International Bond 12.250% due 03/06/2030 | | Sell | | 2.020% | | | 07/20/2013 | | | 290 | | | 20 | |
Lehman Brothers, Inc. | | Russia Government International Bond 7.500% due 03/31/2030 | | Sell | | 2.550% | | | 03/20/2014 | | | 350 | | | 42 | |
Lehman Brothers, Inc. | | Multiple Reference Entities of Gazprom | | Sell | | 1.330% | | | 03/20/2016 | | | 1,000 | | | 37 | |
Lehman Brothers, Inc. | | Brazilian Government International Bond 12.250% due 03/06/2030 | | Sell | | 1.510% | | | 08/20/2016 | | | 500 | | | 19 | |
Lehman Brothers, Inc. | | Ukraine Government International Bond 7.650% due 06/11/2013 | | Sell | | 2.060% | | | 05/20/2017 | | | 400 | | | 2 | |
Merrill Lynch & Co., Inc. | | Ukraine Government International Bond 7.650% due 06/11/2013 | | Sell | | 1.500% | | | 01/20/2012 | | | 500 | | | 8 | |
Merrill Lynch & Co., Inc. | | Russia Government International Bond 7.500% due 03/31/2030 | | Sell | | 3.160% | | | 10/02/2013 | | | 450 | | | 66 | |
Merrill Lynch & Co., Inc. | | Russia Government International Bond 7.500% due 03/31/2030 | | Sell | | 2.310% | | | 01/21/2014 | | | 525 | | | 56 | |
Morgan Stanley | | Colombia Government International Bond 10.375% due 01/28/2033 | | Sell | | 0.760% | | | 03/20/2010 | | | 250 | | | 2 | |
Morgan Stanley | | Multiple Reference Entities of Gazprom | | Sell | | 1.050% | | | 04/20/2011 | | | 1,000 | | | 21 | |
Morgan Stanley | | Peru Government International Bond 8.750% due 11/21/2033 | | Sell | | 1.220% | | | 10/20/2011 | | | 500 | | | 13 | |
Morgan Stanley | | Ukraine Government International Bond 7.650% due 06/11/2013 | | Sell | | 1.600% | | | 01/20/2012 | | | 100 | | | 2 | |
Morgan Stanley | | Ukraine Government International Bond 7.650% due 06/11/2013 | | Buy | | (1.590% | ) | | 04/20/2012 | | | 500 | | | 4 | |
Morgan Stanley | | Brazilian Government International Bond 12.250% due 03/06/2030 | | Sell | | 2.100% | | | 08/20/2016 | | | 250 | | | 20 | |
Morgan Stanley | | Multiple Reference Entities of Gazprom | | Sell | | 1.350% | | | 08/20/2016 | | | 1,000 | | | 40 | |
Royal Bank of Scotland
Group PLC | | Indonesia Government International Bond 6.750% due 03/10/2014 | | Sell | | 1.525% | | | 12/20/2011 | | | 1,400 | | | 32 | |
Royal Bank of Scotland
Group PLC | | Indonesia Government International Bond 6.750% due 03/10/2014 | | Sell | | 2.385% | | | 09/20/2016 | | | 200 | | | 11 | |
Royal Bank of Scotland
Group PLC | | Indonesia Government International Bond 6.750% due 03/10/2014 | | Sell | | 2.480% | | | 09/20/2016 | | | 1,000 | | | 61 | |
Royal Bank of Scotland Group PLC | | Indonesia Government International Bond 6.750% due 03/10/2014 | | Sell | | 2.345% | | | 12/20/2016 | | | 100 | | | 5 | |
UBS Warburg LLC | | Brazilian Government International Bond 12.250% due 03/06/2030 | | Sell | | 1.870% | | | 06/20/2011 | | | 200 | | | 9 | |
UBS Warburg LLC | | Multiple Reference Entities of Gazprom | | Sell | | 0.945% | | | 10/20/2011 | | | 4,000 | | | 70 | |
UBS Warburg LLC | | Colombia Government International Bond 10.375% due 01/28/2033 | | Sell | | 1.070% | | | 01/20/2012 | | | 1,000 | | | 17 | |
UBS Warburg LLC | | Ukraine Government International Bond 7.650% due 06/11/2013 | | Sell | | 1.480% | | | 03/20/2012 | | | 1,000 | | | 12 | |
UBS Warburg LLC | | Mexico Government International Bond 7.500% due 04/08/2033 | | Sell | | 0.695% | | | 01/20/2017 | | | 300 | | | 6 | |
| | | | | | | | | | | | | | $ | 1,195 | |
| | | | | | | | | | | | | | | | |
| | | | | | |
| See Accompanying Notes | | Semiannual Report | | June 30, 2007 | | 11 |
Schedule of Investments Emerging Markets Bond Portfolio (Cont.)
Schedule of Investments Emerging Markets Bond Portfolio (Cont.)
(1) If the Portfolio is a seller of protection and a credit event occurs, as defined under the terms of that particular swap agreement, the Portfolio will pay to the buyer of the protection an amount up to the notional value of the swap and in certain instances, take delivery of the security. As a buyer of protection, the Portfolio will generally receive from the seller of protection an amount up to the notional amount of the swap if a credit event occurs.
Interest Rate Swaps
| | | | | | | | | | | | | | | |
| Counterparty | | Floating Rate Index | | Pay/Receive
Floating Rate | | Fixed Rate | | Expiration
Date | | Notional
Amount | | Unrealized
Appreciation/
(Depreciation) | |
Merrill Lynch & Co., Inc. | | BRL-CDI-Compounded | | Pay | | 15.160% | | 01/02/2009 | | BRL | 700 | | $ | 23 | |
Merrill Lynch & Co., Inc. | | BRL-CDI-Compounded | | Pay | | 13.840% | | 01/04/2010 | | | 4,600 | | | 141 | |
Morgan Stanley | | BRL-CDI-Compounded | | Pay | | 12.780% | | 01/04/2010 | | | 2,700 | | | 51 | |
Barclays Bank PLC | | 28-Day Mexico Interbank TIIE Banxico | | Pay | | 8.780% | | 08/03/2016 | | MXN | 3,400 | | | 14 | |
Citibank N.A. | | 28-Day Mexico Interbank TIIE Banxico | | Pay | | 8.770% | | 08/03/2016 | | | 3,400 | | | 14 | |
Citibank N.A. | | 28-Day Mexico Interbank TIIE Banxico | | Pay | | 8.720% | | 09/05/2016 | | | 86,100 | | | 207 | |
Citibank N.A. | | 28-Day Mexico Interbank TIIE Banxico | | Pay | | 8.900% | | 09/22/2016 | | | 22,000 | | | 106 | |
Citibank N.A. | | 28-Day Mexico Interbank TIIE Banxico | | Pay | | 8.170% | | 11/04/2016 | | | 7,000 | | | 11 | |
Goldman Sachs & Co. | | 28-Day Mexico Interbank TIIE Banxico | | Pay | | 8.865% | | 09/12/2016 | | | 5,000 | | | 24 | |
Goldman Sachs & Co. | | 28-Day Mexico Interbank TIIE Banxico | | Pay | | 8.170% | | 11/04/2016 | | | 10,000 | | | (9 | ) |
JPMorgan Chase & Co. | | 28-Day Mexico Interbank TIIE Banxico | | Pay | | 8.910% | | 07/26/2016 | | | 13,000 | | | 65 | |
Merrill Lynch & Co., Inc. | | 28-Day Mexico Interbank TIIE Banxico | | Pay | | 8.720% | | 09/05/2016 | | | 11,000 | | | 29 | |
Morgan Stanley | | 28-Day Mexico Interbank TIIE Banxico | | Pay | | 9.920% | | 08/12/2015 | | | 2,000 | | | 21 | |
Deutsche Bank AG | | 3-Month USD-LIBOR | | Pay | | 5.000% | | 12/19/2017 | | $ | 10,600 | | | 66 | |
Lehman Brothers, Inc. | | 3-Month USD-LIBOR | | Pay | | 5.000% | | 12/19/2017 | | | 600 | | | 5 | |
| | | | | | | | | | | | | $ | 768 | |
| | | | | | | | | | | | | | | |
(f) Purchased options outstanding on June 30, 2007:
Options on Exchange-Traded Futures Contracts
| | | | | | | | | | | | | |
| Description | | Exercise
Price | | Expiration
Date | | # of
Contracts | | Cost | | Value |
Put - CME 90-Day Eurodollar September Futures | | $ | 90.750 | | 09/17/2007 | | 65 | | $ | 1 | | $ | 0 |
| | | | | | | | | | | | | |
Interest Rate Swaptions
| | | | | | | | | | | | | | | | | | | |
| Description | | Counterparty | | Floating Rate
Index | | Pay/Receive
Floating Rate | | Exercise
Rate | | Expiration
Date | | Notional
Amount | | Cost | | Value |
Call - OTC 2-Year Interest Rate Swap | | Lehman Brothers, Inc. | | 3-Month USD-LIBOR | | Pay | | 4.750% | | 09/26/2008 | | $ | 293,000 | | $ | 1,566 | | $ | 576 |
| | | | | | | | | | | | | | | | | | | |
(g) Written options outstanding on June 30, 2007:
Interest Rate Swaptions
| | | | | | | | | | | | | | | | | | | |
| Description | | Counterparty | | Floating Rate Index | | Pay/Receive
Floating Rate | | Exercise
Rate | | Expiration
Date | | Notional
Amount | | Premium | | Value |
Call - OTC 5-Year Interest Rate Swap | | Lehman Brothers, Inc. | | 3-Month USD-LIBOR | | Receive | | 4.950% | | 09/26/2008 | | $ | 128,000 | | $ | 1,500 | | $ | 645 |
| | | | | | | | | | | | | | | | | | | |
(h) Short sales outstanding on June 30, 2007:
| | | | | | | | | | | | | |
| Description | | Coupon | | Maturity
Date | | Principal
Amount | | Proceeds | | Value (2) |
Ecuador Government International Bond | | 10.000% | | 08/15/2030 | | $ | 700 | | $ | 620 | | $ | 631 |
| | | | | | | | | | | | | |
(2) Market value includes $32 of interest payable on short sales.
(i) Foreign currency contracts outstanding on June 30, 2007:
| | | | | | | | | | | | | | | | | |
| Type | | Currency | | Principal
Amount
Covered by
Contract | | Settlement
Month | | Unrealized
Appreciation | | Unrealized
(Depreciation) | | | Net Unrealized
Appreciation/
(Depreciation) | |
Buy | | BRL | | 4,497 | | 03/2008 | | $ | 124 | | $ | 0 | | | $ | 124 | |
Buy | | CLP | | 30,502 | | 11/2007 | | | 2 | | | 0 | | | | 2 | |
Buy | | | | 50,032 | | 03/2008 | | | 0 | | | 0 | | | | 0 | |
Buy | | CNY | | 896 | | 09/2007 | | | 3 | | | 0 | | | | 3 | |
Buy | | | | 155 | | 12/2007 | | | 0 | | | 0 | | | | 0 | |
Buy | | | | 5,553 | | 01/2008 | | | 0 | | | (5 | ) | | | (5 | ) |
Buy | | COP | | 45,180 | | 03/2008 | | | 2 | | | 0 | | | | 2 | |
Buy | | CZK | | 861 | | 03/2008 | | | 0 | | | (1 | ) | | | (1 | ) |
Sell | | EUR | | 1,710 | | 07/2007 | | | 0 | | | (22 | ) | | | (22 | ) |
Buy | | IDR | | 1,373,299 | | 07/2007 | | | 1 | | | 0 | | | | 1 | |
Sell | | | | 1,373,299 | | 07/2007 | | | 0 | | | (2 | ) | | | (2 | ) |
| | | | |
| 12 | | PIMCO Variable Insurance Trust | | See Accompanying Notes |
| | |
| |
| | | June 30, 2007 (Unaudited) |
| | | | | | | | | | | | | | | | | |
| Type | | Currency | | Principal
Amount
Covered by
Contract | | Settlement
Month | | Unrealized
Appreciation | | Unrealized
(Depreciation) | | | Net Unrealized
Appreciation/
(Depreciation) | |
Buy | | IDR | | 3,359,122 | | 08/2007 | | $ | 3 | | $ | 0 | | | $ | 3 | |
Buy | | | | 1,373,299 | | 10/2007 | | | 1 | | | 0 | | | | 1 | |
Buy | | ILS | | 85 | | 12/2007 | | | 0 | | | 0 | | | | 0 | |
Buy | | INR | | 1,143 | | 08/2007 | | | 1 | | | 0 | | | | 1 | |
Buy | | | | 7,939 | | 10/2007 | | | 1 | | | 0 | | | | 1 | |
Buy | | | | 890 | | 11/2007 | | | 0 | | | 0 | | | | 0 | |
Buy | | KRW | | 17,200 | | 07/2007 | | | 0 | | | 0 | | | | 0 | |
Buy | | | | 58,626 | | 08/2007 | | | 0 | | | 0 | | | | 0 | |
Buy | | | | 314,285 | | 09/2007 | | | 5 | | | 0 | | | | 5 | |
Buy | | | | 269,181 | | 11/2007 | | | 2 | | | 0 | | | | 2 | |
Buy | | MXN | | 2,185 | | 03/2008 | | | 5 | | | 0 | | | | 5 | |
Buy | | MYR | | 557 | | 07/2007 | | | 1 | | | 0 | | | | 1 | |
Sell | | | | 557 | | 07/2007 | | | 0 | | | 0 | | | | 0 | |
Buy | | | | 557 | | 10/2007 | | | 0 | | | 0 | | | | 0 | |
Buy | | PLN | | 1,301 | | 09/2007 | | | 13 | | | 0 | | | | 13 | |
Buy | | | | 358 | | 03/2008 | | | 0 | | | (1 | ) | | | (1 | ) |
Buy | | RUB | | 30,930 | | 09/2007 | | | 39 | | | 0 | | | | 39 | |
Buy | | | | 3,740 | | 11/2007 | | | 5 | | | 0 | | | | 5 | |
Buy | | | | 22,275 | | 12/2007 | | | 19 | | | 0 | | | | 19 | |
Buy | | SGD | | 271 | | 07/2007 | | | 0 | | | (1 | ) | | | (1 | ) |
Sell | | | | 129 | | 07/2007 | | | 0 | | | (1 | ) | | | (1 | ) |
Buy | | | | 288 | | 08/2007 | | | 0 | | | (3 | ) | | | (3 | ) |
Buy | | | | 336 | | 10/2007 | | | 1 | | | (1 | ) | | | 0 | |
Buy | | | | 438 | | 11/2007 | | | 0 | | | (3 | ) | | | (3 | ) |
Buy | | SKK | | 1,079 | | 03/2008 | | | 0 | | | 0 | | | | 0 | |
Buy | | ZAR | | 4,284 | | 09/2007 | | | 1 | | | (2 | ) | | | (1 | ) |
| | | | | | | | | | | | | | | | | |
| | | | | | | | $ | 229 | | $ | (42 | ) | | $ | 187 | |
| | | | | | | | | | | | | | | | | |
| | | | | | |
| See Accompanying Notes | | Semiannual Report | | June 30, 2007 | | 13 |
Notes to Financial Statements
1. ORGANIZATION
The Emerging Markets Bond Portfolio (the “Portfolio”) is a series of the PIMCO Variable Insurance Trust (the “Trust”). The Trust is registered under the Investment Company Act of 1940 (the “Act”), as amended, as an open-end management investment company organized as a Delaware business trust on October 3, 1997. The Portfolio offers two classes of shares: Administrative and Advisor. Information presented on these financial statements pertains to the Administrative Class of the Portfolio. Certain detailed financial information for the Advisor Class is provided separately and is available upon request. The Trust is designed to be used as an investment vehicle by Separate Accounts of insurance companies that fund variable annuity contracts and variable life insurance policies and by qualified pension and retirement plans.
2. SIGNIFICANT ACCOUNTING POLICIES
The following is a summary of significant accounting policies consistently followed by the Portfolio in the preparation of its financial statements in conformity with accounting principles generally accepted in the United States of America (“GAAP”). The preparation of financial statements in accordance with GAAP requires management to make estimates and assumptions that affect the reported amounts and disclosures on the financial statements. Actual results could differ from those estimates.
(a) Security Valuation Portfolio securities are valued as of the close of regular trading (normally 4:00 p.m., Eastern Time) on each day that the New York Stock Exchange (“NYSE”) is open. Portfolio securities and other assets for which market quotes are readily available are stated at market value. Market value is generally determined on the basis of last reported sales prices, or if no sales are reported, based on quotes obtained from a quotation reporting system, established market makers, or pricing services. Fixed-income securities and non-exchange traded derivatives are normally valued on the basis of quotes obtained from brokers and dealers or pricing services. Prices obtained from independent pricing services use information provided by market makers or estimates of market values obtained from yield data relating to investments or securities with similar characteristics. Certain fixed income securities purchased on a delayed-delivery basis are marked to market daily until settlement at the forward settlement date. Short-term investments having a maturity of 60 days or less are generally valued at amortized cost. Exchange traded options, futures and options on futures are valued at the settlement price determined by the relevant exchange. With respect to any portion of the Portfolio’s assets that are invested in one or more open end management investment companies, the Portfolio’s net asset value (“NAV”) will be calculated based upon the NAVs of such investments.
Investments initially valued in currencies other than the U.S. dollar are converted to the U.S. dollar using exchange rates obtained from pricing services. As a result, the NAV of the Portfolio’s securities may be affected by changes in the value of currencies in relation to the U.S. dollar. The value of securities traded in markets outside the United States or denominated in currencies other than the U.S. dollar may be affected significantly on a day that the NYSE is closed and an investor is not able to purchase, redeem or exchange shares.
Securities and other assets for which market quotes are not readily available are valued at fair value as determined in good faith by the Board of Trustees or persons acting at their direction. The Board of Trustees has adopted methods for valuing securities and other assets in circumstances where market quotes are not readily available, and has delegated to Pacific Investment Management Company LLC (“PIMCO”) the responsibility for applying the valuation methods. In the event that market quotes are not readily available, and the security or asset cannot be valued pursuant to one of the valuation methods, the value of the security or asset will be determined in good faith by the Valuation Committee of the Board of Trustees, generally based upon recommendations provided by PIMCO.
Market quotes are considered not readily available in circumstances where there is an absence of current or reliable market-based data (e.g., trade information, bid/asked information, broker quotes), including where events occur after the close of the relevant market, but prior to the close of regular trading, that materially affect the values of the Portfolio’s securities or assets. In addition, market quotes are considered not readily available when, due to extraordinary circumstances, the exchanges or markets on which the securities trade, do not open for trading for the entire day and no other market prices are available. The Board has delegated to PIMCO the responsibility for monitoring significant events that may materially affect the values of the Portfolio’s securities or assets and for determining whether the value of the applicable securities or assets should be re-evaluated in light of such significant events.
When the Portfolio uses fair value pricing to determine its NAV, securities will not be priced on the basis of quotations from the primary market in which they are traded, but rather may be priced by another method that the Board of Trustees or persons acting at their direction believe accurately reflects fair value. The Trust’s policy is intended to result in a calculation of the Portfolio’s NAV that fairly reflects security values as of the time of pricing. However, fair values determined by the Board of Trustees or persons acting at their direction may not accurately reflect the price that the Portfolio could obtain for a security if it were to dispose of that security as of the time of pricing. Because foreign securities can trade on non-business days of the Portfolio, the NAV of the Portfolio may change on days when shareholders will not be able to purchase or redeem Portfolio shares. The prices used by the Portfolio may differ from the value that would be realized if the securities were sold and the differences could be material to the financial statements.
(b) Securities Transactions and Investment Income Securities transactions are recorded as of the trade date for financial reporting purposes. Securities purchased or sold on a when-issued or delayed-delivery basis may be settled a month or more after the trade date. Realized gains and losses from securities sold are recorded on the identified cost basis. Dividend income is recorded on the ex-dividend date, except certain dividends from foreign securities where the ex-dividend date may have passed, which are recorded as soon as the Portfolio is informed of the ex-dividend date. Interest income, adjusted for the accretion of discounts and amortization of premiums, is recorded on the accrual basis. Paydown gains and losses on mortgage-related and other asset-backed securities are recorded as components of interest income on the Statement of Operations.
(c) Delayed-Delivery Transactions The Portfolio may purchase or sell securities on a delayed-delivery basis. These transactions involve a commitment by the Portfolio to purchase or sell securities for a predetermined price or yield, with payment and delivery taking place beyond the customary settlement period. When delayed-delivery purchases are outstanding, the Portfolio will designate liquid assets in an amount sufficient to meet the purchase price. When purchasing a security on a delayed-delivery basis, the Portfolio assumes the rights and risks of ownership of the security, including the risk of price and yield fluctuations, and takes such fluctuations into account when determining its net asset value. The Portfolio may dispose of or renegotiate a delayed-delivery transaction after it is entered into, and may sell when-issued securities before they are delivered, which may result in a capital gain or loss. When the Portfolio has sold a security on a delayed-delivery basis, the Portfolio does not participate in future gains and losses with respect to the security.
(d) Dividends and Distributions to Shareholders Dividends from net investment income, if any, are declared daily and distributed to shareholders monthly. Net realized capital gains earned by the Portfolio, if any, will be distributed no less frequently than once each year.
Income dividends and capital gain distributions are determined in accordance with income tax regulations which may differ from GAAP. Differences between tax
| | | | |
| 14 | | PIMCO Variable Insurance Trust | | |
| | |
| |
| | | June 30, 2007 (Unaudited) |
regulations and GAAP may change the fiscal year when income and capital items are recognized for tax and GAAP purposes. Examples of events that give rise to timing differences include wash sales, straddles, net operating losses and capital loss carryforwards. Further, the character of investment income and capital gains may be different for certain transactions under the two methods of accounting. Examples of characterization differences include the treatment of mortgage paydowns, swaps, foreign currency transactions and contingent debt instruments. As a result, income dividends and capital gain distributions declared during a fiscal period may differ significantly from the net investment income and realized capital gain reported on the Portfolio’s annual financial statements presented under GAAP.
Distributions classified as a tax basis return of capital, if any, are reflected on the accompanying Statements of Changes in Net Assets and have been reclassified to paid in capital. In addition, other amounts have been reclassified between undistributed net investment income, accumulated undistributed net realized gains or losses and/or paid in capital to more appropriately conform financial accounting to tax characterizations of dividend distributions.
(e) Multiclass Operations Each class offered by the Portfolio has equal rights as to assets and voting privileges (except that shareholders of a class have exclusive voting rights regarding any matter relating solely to that class of shares). Income and non-class specific expenses of the Portfolio are allocated daily to each class of shares based on the relative value of settled shares. Realized and unrealized capital gains and losses of the Portfolio are allocated daily to each class of shares based on the relative net assets of each class. Class specific expenses, where applicable, currently include administrative, distribution and servicing fees.
(f) Foreign Currency The functional and reporting currency for the Portfolio is the U.S. dollar. The market values of foreign securities, currency holdings and other assets and liabilities are translated into U.S. dollars based on the current exchange rates each business day. Fluctuations in the value of currency holdings and other assets and liabilities resulting from changes in exchange rates are recorded as unrealized foreign currency gains or losses. Realized gains or losses and unrealized appreciation or depreciation on investment securities and income and expenses are translated on the respective dates of such transactions. The effects of changes in foreign currency exchange rates on investments in securities are not segregated on the Statement of Operations from the effects of changes in market prices of those securities, but are included with the net realized and unrealized gain or loss on investment securities.
| | | | | | |
|
| Non-U.S. currency symbols utilized throughout the report are defined as follows: |
| BRL | | Brazilian Real | | KRW | | South Korean Won |
| CLP | | Chilean Peso | | MXN | | Mexican Peso |
| CNY | | Chinese Yuan Renminbi | | MYR | | Malaysian Ringgit |
| COP | | Colombian Peso | | PLN | | Polish Zloty |
| CZK | | Czech Koruna | | RUB | | Russian Ruble |
| EUR | | Euro | | SGD | | Singapore Dollar |
| IDR | | Indonesian Rupiah | | SKK | | Slovakia Koruna |
| ILS | | Israeli Shekel | | UYU | | Uruguay Peso |
| INR | | Indian Rupee | | ZAR | | South African Rand |
(g) Foreign Currency Transactions The Portfolio may enter into foreign currency contracts in connection with settling planned purchases or sales of securities, to hedge the currency exposure associated with some or all of the Portfolio’s securities or as a part of an investment strategy. A foreign currency contract is an agreement between two parties to buy and sell a currency at a set price on a future date. The market value of a foreign currency contract fluctuates
with changes in foreign currency exchange rates. Foreign currency contracts are marked to market daily and the change in value is recorded by the Portfolio as an unrealized gain or loss. Realized gains or losses equal to the difference between the value of the contract at the time it was opened and the value at the time it was closed are recorded upon delivery or receipt of the currency. These contracts may involve market risk in excess of the unrealized gain or loss reflected on the Statement of Assets and Liabilities. In addition, the Portfolio could be exposed to risk if the counterparties are unable to meet the terms of the contracts or if the value of the currency changes unfavorably to the U.S. dollar.
(h) Futures Contracts The Portfolio may enter into futures contracts. The Portfolio may use futures contracts to manage its exposure to the securities markets or to movements in interest rates and currency values. The primary risks associated with the use of futures contracts are the imperfect correlation between the change in market value of the securities held by the Portfolio and the prices of futures contracts, the possibility of an illiquid market, and the inability of the counterparty to meet the terms of the contract. Futures contracts are valued based upon their quoted daily settlement prices. Upon entering into a futures contract, the Portfolio is required to deposit with its futures broker, an amount of cash or U.S. Government and Agency Obligations in accordance with the initial margin requirements of the broker or exchange. Futures contracts are marked to market daily and an appropriate payable or receivable for the change in value (“variation margin”) is recorded by the Portfolio. Gains or losses are recognized but not considered realized until the contracts expire or are closed. Futures contracts involve, to varying degrees, risk of loss in excess of the variation margin disclosed on the Statement of Assets and Liabilities.
(i) Inflation-Indexed Bonds The Portfolio may invest in inflation-indexed bonds. Inflation-indexed bonds are fixed-income securities whose principal value is periodically adjusted to the rate of inflation. The interest rate on these bonds is generally fixed at issuance at a rate lower than typical bonds. Over the life of an inflation-indexed bond, however, interest will be paid based on a principal value, which is adjusted for inflation. Any increase in the principal amount of an inflation-indexed bond will be included as interest income on the Statement of Operations, even though investors do not receive their principal until maturity.
(j) Options Contracts The Portfolio may write call and put options on futures, swaps, securities or currencies it owns or in which it may invest. Writing put options tends to increase the Portfolio’s exposure to the underlying instrument. Writing call options tends to decrease the Portfolio’s exposure to the underlying instrument. When the Portfolio writes a call or put option, an amount equal to the premium received is recorded as a liability and subsequently marked to market to reflect the current value of the option written. These liabilities are reflected as written options outstanding on the Statement of Assets and Liabilities. Certain options may be written with premiums to be determined on a future date. The premiums for these options are based upon implied volatility parameters at specified terms. Premiums received from writing options which expire are treated as realized gains. Premiums received from writing options which are exercised or closed are added to the proceeds or offset against amounts paid on the underlying future, swap, security or currency transaction to determine the realized gain or loss. The Portfolio as a writer of an option has no control over whether the underlying future, swap, security or currency may be sold (call) or purchased (put) and as a result bears the market risk of an unfavorable change in the price of the future, swap, security or currency underlying the written option. There is the risk the Portfolio may not be able to enter into a closing transaction because of an illiquid market.
The Portfolio may also purchase put and call options. Purchasing call options tends to increase the Portfolio’s exposure to the underlying instrument. Purchasing put options tends to decrease the Portfolio’s exposure to the underlying instrument. The Portfolio pays a premium which is included on the Statement of Assets and Liabilities as an investment and subsequently marked to market to reflect the
| | | | | | |
| | Semiannual Report | | June 30, 2007 | | 15 |
Notes to Financial Statements (Cont.)
current value of the option. Premiums paid for purchasing options which expire are treated as realized losses. Certain options may be purchased with premiums to be determined on a future date. The premiums for these options are based upon implied volatility parameters at specified terms. The risk associated with purchasing put and call options is limited to the premium paid. Premiums paid for purchasing options which are exercised or closed are added to the amounts paid or offset against the proceeds on the underlying future, swap, security or currency transaction to determine the realized gain or loss.
(k) Repurchase Agreements The Portfolio may engage in repurchase transactions. Under the terms of a typical repurchase agreement, the Portfolio takes possession of an underlying debt obligation (collateral) subject to an obligation of the seller to repurchase, and the Portfolio to resell, the obligation at an agreed-upon price and time. The underlying securities for all repurchase agreements are held in safekeeping at the Portfolio’s custodian or designated subcustodians under tri-party repurchase agreements. The market value of the collateral must be equal to or exceed the total amount of the repurchase obligations, including interest. Securities purchased under repurchase agreements are reflected as an asset on the Statement of Assets and Liabilities. Generally, in the event of counterparty default, the Portfolio has the right to use the collateral to offset losses incurred. If the counterparty should default, the Portfolio will seek to sell the securities which it holds as collateral. This could involve procedural costs or delays in addition to a loss on the securities if their value should fall below their repurchase price.
(l) Inverse Floating Rate Transactions—Residual Interest Municipal Bonds (“RIBs”)/Residual Interest Tax Exempt Bonds (“RITEs”) The Portfolio may invest in RIBs and RITEs (“Inverse Floaters”). Inverse Floaters are created via a master trust agreement between a broker-dealer, acting as trustor and liquidity provider, and an investment bank, acting as trustee and tender agent. The master trust agreement defines the terms for each trust series; with each series being established by the transfer of long-term, fixed-rate municipal bonds (“Fixed Rate Bonds”) to the trustee to be held and provide for the creation, execution and delivery of floater certificates (“Floating Rate Notes”) and Inverse Floaters. Floating Rate Notes are liquid notes that are issued with a short-term variable rate typically linked to the LIBOR, subject to limitations, for some duration. After interest income is paid on the Floating Rate Notes at current rates, the residual income from the Fixed Rate Bonds is paid to the Inverse Floaters. Inverse Floaters are issued with a coupon that fluctuates inversely with the Floating Rate Notes’ referenced rate, subject to certain limitations. Therefore, rising short-term rates result in lower income for the Inverse Floaters and vice versa.
Floating Rate Notes are generally remarketed to municipal money market funds. Inverse Floaters are acquired by either tax-exempt municipal bond funds or trusts, or other parties interested in potentially higher yielding tax-exempt securities. Inverse Floaters may also be acquired for the purpose of increasing leverage. Floating Rate Note holders typically have the option to tender their notes to the liquidity provider for redemption at par at each reset date. The Inverse Floater holders have the option to (i) require the Floating Rate Note holders to tender their notes at par, and (ii) require the liquidity provider to transfer the Fixed Rate Bonds to the Inverse Floater holders. The holders of Inverse Floaters bear substantially all of the downside investment risk associated with the underlying Fixed Rate Bonds, and also benefit from a disproportionate amount of the potential appreciation of the underlying Fixed Rate Bonds’ value. Inverse Floaters may be more volatile and less liquid than other municipal bonds of comparable maturity.
Inverse Floaters may be acquired with or without first transferring to the trustor the Fixed Rate Bonds that were utilized to create the trust series. Inverse Floaters acquired without a transfer of Fixed Rate Bonds are recognized as purchases of securities as outlined in Note 2(b). Statement of Financial Accounting Standards No. 140—Accounting for Transfers and Servicing of Financial Assets and
Extinguishments of Liabilities (“FAS No. 140”), governs the standards for accounting for securitizations and other transfers of financial assets. If there is a transfer of Fixed Rate Bonds and it meets sale criteria under FAS No. 140, a Portfolio records a sale of the Fixed Rate Bonds and a purchase of the Inverse Floaters. The cash received from the Inverse Floaters is then recorded as interest income in the Statement of Operations.
If the transfer of Fixed Rate Bonds does not meet sale criteria under FAS No. 140, a Portfolio accounts for the transaction described above as a secured borrowing by including the Fixed Rate Bonds in its Schedule of Investments, and recording the Floating Rate Notes as a liability under the caption “Payable for floating rate notes” in the Portfolio’s Statement of Assets and Liabilities. In a secured borrowing transaction, cash received from the Inverse Floaters is not recorded as interest income. Instead, a Portfolio records interest income related to the Fixed Rate Bonds and interest expense related to the Floating Rate Notes, the net of which is equal to the cash received from the Inverse Floaters acquired by the Portfolio. Thus, while a Portfolio’s reported total income, net expenses, and net expense ratio are generally higher for investments in Inverse Floaters acquired via a secured borrowing, the method of acquiring Inverse Floaters does not result in differences for reported cash flows, net asset value or total return.
(m) Short Sales The Portfolio may enter into short sales transactions. A short sale is a transaction in which the Portfolio sells securities it does not own in anticipation of a decline in the market price of the securities. Securities sold in short sale transactions and interest payable on such securities, if any, are reflected as a liability on the Statement of Assets and Liabilities. The Portfolio is obligated to deliver securities at the market price at the time the short position is closed. Possible losses from short sales may be unlimited, whereas losses from purchases cannot exceed the total amount invested.
(n) Swap Agreements The Portfolio may invest in swap agreements. Swap transactions are privately negotiated agreements between the Portfolio and a counterparty to exchange or swap investment cash flows, assets, or market-linked returns at specified, future intervals. The Portfolio may enter into interest rate, total return, forward spread-lock, credit default, and other forms of swap agreements to manage its exposure to interest rates and credit risk. In connection with these agreements, securities may be identified as collateral in accordance with the terms of the respective swap agreements.
Interest rate swap agreements involve the exchange by the Portfolio with another party of their respective commitments to pay or receive interest, e.g., an exchange of floating rate payments for fixed rate payments with respect to the notional amount of principal. Certain forms of interest rate swap agreements may include: (i) interest rate caps, under which, in return for a premium, one party agrees to make payments to the other to the extent that interest rates exceed a specified rate, or “cap”, (ii) interest rate floors, under which, in return for a premium, one party agrees to make payments to the other to the extent that interest rates fall below a specified rate, or “floor”, or (iii) interest rate collars, under which a party sells a cap and purchases a floor or vice versa in an attempt to protect itself against interest rate movements exceeding given minimum or maximum levels.
Total return swap agreements involve commitments to pay interest in exchange for a market-linked return, both based on notional amounts. To the extent the total return of the security or index underlying the transaction exceeds or falls short of the offsetting interest rate obligation, the Portfolio will receive a payment from or make a payment to the counterparty.
Forward spread-lock swap agreements involve commitments to pay or receive a settlement amount calculated as the difference between the swap spread and a fixed spread, multiplied by the notional amount times the duration of the swap. The swap spread is the difference between the benchmark swap rate (market rate) and the specific Treasury rate.
| | | | |
| 16 | | PIMCO Variable Insurance Trust | | |
| | |
| |
| | | June 30, 2007 (Unaudited) |
Credit default swap agreements involve one party making a stream of payments to another party in exchange for the right to receive a specified return in the event of a default by a third party, typically corporate issues or sovereign issues of an emerging country, on its obligation. The Portfolio may use credit default swaps to provide a measure of protection against defaults of the issuers (i.e., to reduce risk where the Portfolio owns or has exposure to the sovereign issuer) or to take an active long or short position with respect to the likelihood of a particular issuer’s default. As a seller of protection, the Portfolio generally receives an upfront payment or a fixed rate of income throughout the term of the swap provided that there is no credit event. If the Portfolio is a seller of protection and a credit event occurs, as defined under the terms of that particular swap agreement, the Portfolio will pay to the buyer of the protection an amount up to the notional value of the swap and in certain instances take delivery of the security. As the seller, the Portfolio would effectively add leverage to its portfolio because, in addition to its total net assets, the Portfolio would be subject to investment exposure on the notional amount of the swap. As a buyer of protection, the Portfolio generally receives an amount up to the notional value of the swap if a credit event occurs. The treatment of credit default swaps and other swap agreements that provide for contingent, non-periodic, bullet-type payments as “notional principal contracts” for U.S. federal income tax purposes is uncertain. Were the U.S. Internal Revenue Service (“IRS”) to take the position that a credit default swap or other bullet-type swap is not a “notional principal contract” for U.S. federal income tax purposes, payments received by the Portfolio from such investments might be subject to U.S. excise or income taxes.
Swaps are marked to market daily based upon quotations from market makers and the change in value, if any, is recorded as unrealized gain or loss on the Statement of Operations. Payments received or made at the beginning of the measurement period are reflected as such on the Statement of Assets and Liabilities. These upfront payments are recorded as realized gain or loss on the Statement of Operations upon termination or maturity of the swap. A liquidation payment received or made at the termination of the swap is recorded as realized gain or loss on the Statement of Operations. Net periodic payments received or paid by the Portfolio are included as part of realized gain or loss on the Statement of Operations. Entering into these agreements involves, to varying degrees, elements of credit, market and documentation risk in excess of the amounts recognized on the Statement of Assets and Liabilities. Such risks involve the possibility that there will be no liquid market for these agreements, that the counterparty to the agreements may default on its obligation to perform or disagree as to the meaning of contractual terms in the agreements and that there may be unfavorable changes in interest rates.
(o) Loan Participations and Assignments The Portfolio may invest in direct debt instruments which are interests in amounts owned by corporate, governmental, or other borrowers to lenders or lending syndicates. The Portfolio’s investments in loans may be in the form of participations in loans or assignments of all or a portion of loans from third parties. A loan is often administered by a bank or other financial institution (the “lender”) that acts as agent for all holders. The agent administers the terms of the loan, as specified in the loan agreement. When investing in a loan participation, the Portfolio has the right to receive payments of principal, interest and any fees to which it is entitled only from the lender selling the loan agreement and only upon receipt by the lender of payments from the borrower. The Portfolio generally has no right to enforce compliance with the terms of the loan agreement with the borrower. As a result, the Portfolio may be subject to the credit risk of both the borrower and the lender that is selling the loan agreement. When the Portfolio purchases assignments from lenders it acquires direct rights against the borrower of the loan. At the end of the period June 30, 2007, the Portfolio had no unfunded loan commitments.
(p) U.S. Government Agencies or Government-Sponsored Enterprises Securities issued by U.S. Government agencies or government-sponsored enterprises may not be guaranteed by the U.S. Treasury. The
Government National Mortgage Association (“GNMA” or “Ginnie Mae”), a wholly owned U.S. Government corporation, is authorized to guarantee, with the full faith and credit of the U.S. Government, the timely payment of principal and interest on securities issued by institutions approved by GNMA and backed by pools of mortgages insured by the Federal Housing Administration or guaranteed by the Department of Veterans Affairs. Government-related guarantors (i.e., not backed by the full faith and credit of the U.S. Government) include the Federal National Mortgage Association (“FNMA” or “Fannie Mae”) and the Federal Home Loan Mortgage Corporation (“FHLMC” or “Freddie Mac”). Pass-through securities issued by FNMA are guaranteed as to timely payment of principal and interest by FNMA but are not backed by the full faith and credit of the U.S. Government. FHLMC guarantees the timely payment of interest and ultimate collection of principal, but its participation certificates are not backed by the full faith and credit of the U.S. Government.
(q) New Accounting Policies In July 2006, the Financial Accounting Standards Board (“FASB”) issued Interpretation No. 48, “Accounting for Uncertainty in Income Taxes—an Interpretation of FASB Statement No. 109” (the “Interpretation”). The Interpretation became effective for the Portfolio on June 29, 2007. Management has evaluated the application of the Interpretation in relation to the Portfolio and has concluded that no single filing position or combination of filing positions identified as uncertain tax positions required the accrual of a tax liability in the accounting records of the Portfolio for the period ending June 30, 2007. Management will monitor all existing filing positions and future filing positions in light of the Interpretation and evaluate the need for any future tax accruals and financial statement disclosures as warranted.
In September 2006, the FASB issued Statement of Financial Accounting Standards No. 157, “Fair Value Measurements” (the “Statement”). The Statement is effective for fiscal years beginning after November 15, 2007 and will require expanded disclosure about fair value measurements, separately for each major category of assets and liabilities, that enables shareholders to assess the inputs used to develop those measurements, and for recurring fair value measurements using significant unobservable inputs the effect of the measurements on changes in net assets for the reporting period. Management is currently evaluating the application of the Statement to the Portfolio and will provide additional information in relation to the Statement on the Portfolio’s annual financial statements for the period ending December 31, 2007.
3. FEES AND EXPENSES
(a) Investment Advisory Fee PIMCO is a majority-owned subsidiary of Allianz Global Investors of America L.P. (“AGI”), and serves as investment adviser (the “Adviser”) to the Trust, pursuant to an investment advisory contract. The Adviser receives a monthly fee from the Portfolio, at an annual rate based on average daily net assets. The Advisory Fee for all classes is charged at an annual rate of 0.45%.
(b) Administration Fee PIMCO serves as administrator (the “Administrator”), and provides administrative services to the Trust for which it receives a monthly administrative fee based on each share class’s average daily net assets. As the Administrator, PIMCO bears the costs of various third-party services, including audit, custodial, portfolio accounting, legal, transfer agency and printing costs. The Administration Fee for all classes is charged at the annual rate of 0.40%.
(c) Distribution and Servicing Fees Allianz Global Investors Distributors LLC (“AGID”) is an indirect wholly-owned subsidiary of AGI and serves as the distributor (the “Distributor”) of the Trust’s shares. The Trust is permitted to reimburse AGID on a quarterly basis, out of the Administrative Class assets of the Portfolio in the amount of 0.15% on an annual basis of the average daily net assets of that class, for payments made to financial intermediaries that provide services in connection with the distribution of shares or administration of plans or
| | | | | | |
| | Semiannual Report | | June 30, 2007 | | 17 |
Notes to Financial Statements (Cont.)
programs that use Portfolio shares as their funding medium. The effective rate paid to AGID was 0.15% during the current fiscal year.
The Trust has adopted a Distribution Plan, for the Advisor Class shares of the Portfolio (the “Plan”). The Plan has been adopted pursuant to Rule 12b-1 under the Act. The Plan permits payments for expenses in connection with the distribution and marketing of Advisor Class shares and/or the provision of shareholder services to Advisor Class shareholders. The Plan permits the Portfolio to make total payments at an annual rate of 0.25% of its average daily net assets attributable to its Advisor Class shares.
(d) Portfolio Expenses The Trust is responsible for the following expenses: (i) salaries and other compensation of any of the Trust’s executive officers and employees who are not officers, directors, stockholders or employees of PIMCO or its subsidiaries or affiliates; (ii) taxes and governmental fees; (iii) brokerage fees and commissions and other portfolio transaction expenses; (iv) the costs of borrowing money, including interest expenses and bank overdraft charges; (v) fees and expenses of the Trustees who are not “interested persons” of PIMCO or the Trust, and any counsel retained exclusively for their benefit; (vi) extraordinary expenses, including costs of litigation and indemnification expenses; (vii) organization expenses and (viii) any expenses allocated or allocable to a specific class of shares, which include service fees payable with respect to the Administrative Class Shares, and may include certain other expenses as permitted by the Trust’s Multiple Class Plan adopted pursuant to Rule 18f-3 under the Act and subject to review and approval by the Trustees. The ratio of expenses to average net assets per share class, as disclosed in the Financial Highlights, may differ from the annual portfolio operating expenses per share class as disclosed in the Prospectus for the reasons set forth above.
Effective April 1, 2007, each Trustee, other than those affiliated with PIMCO or its affiliates, receives an annual retainer of $15,000, plus $2,375 for each Board of Trustees meeting attended in person, $500 for each committee meeting attended and $750 for each Board of Trustees meeting attended telephonically, plus reimbursement of related expenses. In addition, the audit committee chair receives an additional annual retainer of $2,000 and each other committee chair receives an additional annual retainer of $500. These expenses are allocated on a pro-rata basis to the various portfolios of the Trust according to their respective net assets. The Trust pays no compensation directly to any Trustee or any other officer who is affiliated with the Administrator, all of whom receive remuneration for their services to the Trust from the Administrator or its affiliates. Prior to April 1, 2007, each Trustee, other than those affiliated with PIMCO or its affiliates, received an annual retainer of $15,000 plus $2,000 for each Board of Trustees meeting attended ($500 for each special meeting attended), plus reimbursement of related expenses. The Audit Committee Chairman received an annual retainer of $1,500 and the Governance Committee Chairman received an annual retainer of $500. In addition, each member of a committee received $500 for each committee meeting attended.
4. RELATED PARTY TRANSACTIONS
The Adviser, Administrator, and Distributor are related parties as defined by FAS 57, Related Party Disclosures. Fees payable to these parties are disclosed in Note 3.
5. GUARANTEES AND INDEMNIFICATIONS
Under the Trust’s organizational documents, each Trustee, officer, employee or other agent of the Trust (including the Trust’s investment manager) is indemnified, to the extent permitted by the Act, against certain liabilities that may arise out of performance of their duties to the Portfolio. Additionally, in the normal course of business, the Portfolio enters into contracts that contain a variety of indemnification clauses. The Portfolio’s maximum exposure under these arrangements is unknown as this would involve future claims that may be made against the Portfolio that have
not yet occurred. However, the Portfolio has not had prior claims or losses pursuant to these contracts and believes the risk of loss to be remote.
6. PURCHASES AND SALES OF SECURITIES
The length of time the Portfolio has held a particular security is not generally a consideration in investment decisions. A change in the securities held by the Portfolio is known as “portfolio turnover”. The Portfolio may engage in frequent and active trading of portfolio securities to achieve its investment objective, particularly during periods of volatile market movements. High portfolio turnover (e.g., over 100%) involves correspondingly greater expenses to the Portfolio, including brokerage commissions or dealer mark-ups and other transaction costs on the sale of securities and reinvestments in other securities. Such sales may also result in realization of taxable capital gains, including short-term capital gains (which are generally taxed at ordinary income tax rates). The trading costs and tax effects associated with portfolio turnover may adversely affect the Portfolio’s performance.
Purchases and sales of securities (excluding short-term investments) for the period ended June 30, 2007, were as follows (amounts in thousands):
| | | | | | | | | | | | |
| U.S. Government/Agency | | | | All Other |
| Purchases | | Sales | | | | Purchases | | Sales |
| $ | 0 | | $ | 0 | | | | $ | 173,928 | | $ | 188,317 |
7. TRANSACTIONS IN WRITTEN CALL AND PUT OPTIONS
Transactions in written call and put options were as follows (amounts in thousands, except for number of contracts):
| | | | | | | | |
| | | | | Notional
Amount
in $ | | Premium |
Balance at 12/31/2006 | | | | $ | 0 | | $ | 0 |
Sales | | | | | 128,000 | | | 1,500 |
Closing Buys | | | | | 0 | | | 0 |
Expirations | | | | | 0 | | | 0 |
Exercised | | | | | 0 | | | 0 |
Balance at 06/30/2007 | | | | $ | 128,000 | | $ | 1,500 |
8. SHARES OF BENEFICIAL INTEREST
The Portfolio may issue an unlimited number of shares of beneficial interest with a $0.001 par value. Changes in shares of beneficial interest were as follows (shares and amounts in thousands):
| | | | | | | | | | | | | | | | |
| | | | | Six Months Ended
06/30/2007 | | | Year Ended
12/31/2006 | |
| | | | | Shares | | | Amount | | | Shares | | | Amount | |
| | | | | |
Receipts for shares sold | | | | | | | | | | | | | | | | |
Administrative Class | | | | 2,205 | | | $ | 30,794 | | | 7,144 | | | $ | 97,460 | |
Advisor Class | | | | 18 | | | | 260 | | | 36 | | | | 481 | |
Issued as reinvestment of distributions | | | | | | | | | | | | | | | | |
Administrative Class | | | | 405 | | | | 5,653 | | | 865 | | | | 11,892 | |
Advisor Class | | | | 1 | | | | 16 | | | 1 | | | | 14 | |
Cost of shares redeemed | | | | | | | | | | | | | | | | |
Administrative Class | | | | (3,555 | ) | | | (50,072 | ) | | (2,902 | ) | | | (39,361 | ) |
Advisor Class | | | | (8 | ) | | | (117 | ) | | (3 | ) | | | (38 | ) |
Net increase (decrease) resulting from Portfolio share transactions | | | | (934 | ) | | $ | (13,466 | ) | | 5,141 | | | $ | 70,448 | |
| | | | |
| 18 | | PIMCO Variable Insurance Trust | | |
| | |
| |
| | | June 30, 2007 (Unaudited) |
The following schedule shows the number of shareholders each owning 5% or more of the Portfolio and the total percentage of the Portfolio held by such shareholders:
| | | | | | |
| | | | | Number of Shareholders | | % of Portfolio Held |
Administrative Class | | | | 6 | | 97 |
Advisor Class | | | | 1 | | 93 |
9. REGULATORY AND LITIGATION MATTERS
Since February 2004, PIMCO, Allianz Global Investors of America L.P. (PIMCO’s parent company), AGID, and certain of their affiliates, including the PIMCO Funds (another series of funds managed by PIMCO), the Allianz Funds (formerly known as PIMCO Funds: Multi-Manager Series (another series of funds managed by affiliates of PIMCO)), certain Trustees of the Trust (in their capacity as Trustees of the PIMCO Funds or the Allianz Funds) and certain employees of PIMCO, have been named as defendants in fifteen lawsuits filed in various jurisdictions. Eleven of those lawsuits concern “market timing,” and they have been transferred to and consolidated for pre-trial proceedings in a multi-district litigation proceeding in the U.S. District Court for the District of Maryland; the other four lawsuits concern “revenue sharing” and have been consolidated into a single action in the U.S. District Court for the District of Connecticut. The lawsuits have been commenced as putative class actions on behalf of investors who purchased, held or redeemed shares of the various series of the PIMCO Funds and the Allianz Funds during specified periods, or as derivative actions on behalf of the PIMCO Funds and the Allianz Funds.
The market timing actions in the District of Maryland generally allege that certain hedge funds were allowed to engage in “market timing” in certain funds of the PIMCO Funds and the Allianz Funds and this alleged activity was not disclosed. Pursuant to tolling agreements entered into with the derivative and class action plaintiffs, PIMCO, certain PIMCO Funds Trustees, and certain employees of PIMCO who were previously named as defendants have all been dropped as defendants in the market timing actions; the plaintiffs continue to assert claims on behalf of the shareholders of the PIMCO Funds or on behalf of the PIMCO Funds itself against other defendants. By order dated November 3, 2005, the U.S. District Court for the District of Maryland granted the PIMCO Funds’ motion to dismiss claims asserted against it in a consolidated amended complaint where the PIMCO Funds were named, in the complaint, as a nominal defendant. The revenue sharing action in the District of Connecticut generally alleges that fund assets were inappropriately used to pay brokers to promote funds of the PIMCO Funds and the Allianz Funds, including directing fund brokerage transactions to such brokers, and that such alleged arrangements were not fully disclosed to shareholders. On August 11, 2005, the U.S. District Court for the District of Connecticut conducted a hearing on defendants’ motion to dismiss the consolidated amended complaint in the revenue sharing action but has not yet ruled on the motion to dismiss. The market timing and revenue sharing lawsuits seek, among other things, unspecified compensatory damages plus interest and, in some cases, punitive damages, the rescission of investment advisory contracts, the return of fees paid under those contracts and restitution.
Two nearly identical class action civil complaints have been filed in August 2005, in the Northern District of Illinois Eastern Division, alleging that the plaintiffs each purchased and sold a 10-year Treasury note futures contract and suffered damages from an alleged shortage when PIMCO held both physical and futures positions in
10-year Treasury notes for its client accounts. The two actions have been consolidated into one action, and the two separate complaints have been replaced by a consolidated complaint. PIMCO is a named defendant, and PIMCO Funds has been added as a defendant, to the consolidated action. PIMCO strongly believes the complaint is without merit and intends to vigorously defend itself.
In April 2006, certain portfolios of the Trust and certain other funds managed by PIMCO were served in an adversary proceeding brought by the Official Committee of Asbestos Claimants of G-I Holdings, Inc. in G-I Holdings, Inc.’s bankruptcy in the District of New Jersey. In July 2004, PIMCO was named in this lawsuit and remains a defendant. The plaintiff seeks to recover for the bankruptcy estate assets that were transferred by the predecessor entity of G-I Holdings, Inc. to a wholly-owned subsidiary in 1994. The subsidiary has since issued notes, of which certain portfolios of the Trust and certain other funds managed by PIMCO are alleged to be holders. The complaint alleges that in 2000, more than two hundred noteholders—including certain portfolios of the Trust and certain other funds managed by PIMCO—were granted a second priority lien on the assets of the subsidiary in exchange for their consent to a refinancing transaction and the granting of a first priority lien to the lending banks. The plaintiff is seeking invalidation of the lien in favor of the noteholders and/or the value of the lien. On June 21, 2006, the District of New Jersey overturned the Bankruptcy Court’s decision granting permission to file the adversary proceeding and remanded the matter to the Bankruptcy Court for further proceedings. Following a motion to reconsider, the District Court upheld its remand on August 7, 2006, and instructed the Bankruptcy Court to conduct a “cost-benefit” analysis of the Committee’s claims, including the claims against the noteholders. The Bankruptcy Court held a status conference on October 25, 2006 and set a briefing schedule relating to this cost-benefit analysis.
The foregoing speaks only as of the date of this report. It is possible that these matters and/or other developments resulting from these matters could result in increased portfolio redemptions or other adverse consequences to the Portfolio. However, PIMCO and AGID believe that these matters are not likely to have a material adverse effect on the Portfolio or on PIMCO’s or AGID’s ability to perform their respective investment advisory or distribution services relating to the Portfolio.
10. FEDERAL INCOME TAX MATTERS
The Portfolio intends to qualify as a regulated investment company under sub-chapter M of the Internal Revenue Code (the “Code”) and distribute all of its taxable income and net realized gains, if applicable, to shareholders. Accordingly, no provision for Federal income taxes has been made.
As of June 30, 2007, the aggregate cost of investments was the same for federal income tax and financial statement purposes. The net unrealized appreciation (depreciation) of investment securities for federal income tax purposes is as follows (amount in thousands):
| | | | |
Aggregate
Gross
Unrealized
Appreciation | | Aggregate
Gross
Unrealized
(Depreciation) | | Net
Unrealized
Appreciation |
$ 5,037 | | $ (2,726) | | $ 2,311 |
| | | | | | |
| | Semiannual Report | | June 30, 2007 | | 19 |
| | |
| |
Privacy Policy* | | (Unaudited) |
The Funds consider customer privacy to be a fundamental aspect of their relationships with shareholders and are committed to maintaining the confidentiality, integrity and security of their current, prospective and former shareholders’ personal information. To ensure their shareholders’ privacy, the Funds have developed policies that are designed to protect this confidentiality, while allowing shareholder needs to be served.
Obtaining Personal Information
In the course of providing shareholders with products and services, the Funds and certain service providers to the Funds, such as the Funds’ investment advisers (“Advisers”), may obtain non-public personal information about shareholders, which may come from sources such as account applications and other forms, from other written, electronic or verbal correspondence, from shareholder transactions, from a shareholder’s brokerage or financial advisory firm, financial adviser or consultant, and/or from information captured on the Funds’ internet web sites.
Respecting Your Privacy
As a matter of policy, the Funds do not disclose any personal or account information provided by shareholders or gathered by the Funds to non-affiliated third parties, except as required or permitted by law or as necessary for such third parties to perform their agreements with respect to the Funds. As is common in the industry, non-affiliated companies may from time to time be used to provide certain services, such as preparing and mailing prospectuses, reports, account statements and other information, conducting research on shareholder satisfaction and gathering shareholder proxies. A Fund’s Distributor may also retain non-affiliated companies to market the Fund’s shares or products which use the Fund’s shares and enter into joint marketing agreements with other companies. These companies may have access to a shareholder’s personal and account information, but are permitted to use this information solely to provide the specific service or as otherwise permitted by law. In most cases, the shareholders will be clients of a third party, but the Funds may also provide a shareholder’s personal and account information to the shareholder’s respective brokerage or financial advisory firm.
Sharing Information with Third Parties
The Funds reserve the right to disclose or report personal information to non-affiliated third parties, in limited circumstances, where the Funds believe in good faith that disclosure is required under law to cooperate with regulators or law enforcement authorities, to protect their rights or property or upon reasonable request by any Fund in which a shareholder has chosen to invest. In addition, the Funds may disclose information about a shareholder’s accounts to a non-affiliated third party with the consent of the shareholder.
Sharing Information with Affiliates
The Funds may share shareholder information with their affiliates in connection with servicing their shareholders’ accounts or to provide shareholders with information about products and services that the Funds or their Advisers, principal underwriters or their affiliates (“Service Affiliates”) believe may be of interest to such shareholders. The information that the Funds share may include, for example, a shareholder’s participation in one of the Funds or in other investment programs sponsored by a Service Affiliate, a shareholder’s ownership of certain types of accounts (such as IRAs), or other data about a shareholder’s accounts. The Funds’ Service Affiliates, in turn, are not permitted to share shareholder information with non-affiliated entities, except as required or permitted by law.
Procedures to Safeguard Private Information
The Funds take seriously the obligation to safeguard shareholder non-public personal information. In addition to this policy, the Funds have also implemented procedures that are designed to restrict access to a shareholder’s non-public personal information only to internal personnel who need to know that information in order to provide products or services to such shareholders. In order to guard a shareholder’s non-public personal information, physical, electronic and procedural safeguards are in place.
* This Privacy Policy applies to the following entities: PIMCO Funds, PIMCO Variable Insurance Trust, PCM Fund, Inc. and PIMCO Strategic Global Government Fund, Inc. (collectively, the “Funds”).
| | | | |
| 20 | | PIMCO Variable Insurance Trust | | |
Investment Adviser and Administrator
Pacific Investment Management Company LLC
840 Newport Center Drive
Newport Beach, California 92660
Distributor
Allianz Global Investors Distributors LLC
1345 Avenue of the Americas
New York, New York 10105
Custodian
State Street Bank & Trust Company
801 Pennsylvania
Kansas City, Missouri 64105
Transfer Agent
Boston Financial Data Services–Midwest
330 W. 9th Street
Kansas City, Missouri 64105
Legal Counsel
Dechert LLP
1775 I Street, N.W.
Washington, D.C. 20006
Independent Registered Public Accounting Firm
PricewaterhouseCoopers LLP
1055 Broadway
Kansas City, Missouri 64105
P I M C O

Table of Contents
This material is authorized for use only when preceded or accompanied by the current PIMCO Variable Insurance Trust (the “Trust”) prospectus. Investors should consider the investment objectives, risks, charges and expenses of this Trust carefully before investing. Ask your financial professional to explain all charges that may apply. This and other information is contained in the Trust’s prospectus. The variable product prospectus may be obtained by contacting your Investment Consultant. Please read the Trust and variable product prospectus carefully before you invest or send money.
Chairman’s Letter
Dear PIMCO Variable Insurance Trust Shareholder:
It is our pleasure to present to you the semiannual report for the PIMCO Variable Insurance Trust, covering the six-month period ended June 30, 2007. The PIMCO Variable Insurance Trust’s net assets were $8.68 billion at June 30, 2007, as compared to $7.76 billion at December 31, 2006.
Highlights of the financial markets during the reporting period include:
| | n | | Economic data during the first quarter of 2007 pointed to slower growth, which heightened market expectations for a decrease in the Federal Funds Rate. By the second quarter, economic data, such as employment statistics, provided little indication of economic weakness, causing expectations of a decrease in the Federal Funds Rate to unwind and U.S. interest rates to move higher. Interest rates in Europe and the U.K. also rose over the period as central banks raised their key lending rates due to inflation concerns. The benchmark ten-year U.S. Treasury yielded 5.03% as of June 30, 2007, or 0.32% higher than at the beginning of the year. |
| | n | | Most bonds generally returned much of their gains from earlier in the year as worldwide growth and capital flows drove interest rates higher in the second quarter. Increased risk aversion in global financial markets, due in part to subprime mortgage worries in the U.S., also contributed to the rise in interest rates. The Lehman Brothers Aggregate Bond Index, which includes Treasury, investment-grade corporate and mortgage-backed securities, returned 0.98% for the six-month period. |
| | n | | Locally issued emerging market (“EM”) bonds posted positive returns for the reporting period. Yields on these bonds declined and the local currencies in which they are denominated generally gained, amid increasing investor awareness, strong economic growth and surging capital inflows. External EM bonds (debt instruments issued by emerging markets countries and typically denominated in U.S. dollars) lagged behind local EM bonds (debt instruments issued by emerging markets countries and denominated in the currency of the issuer), as external EM bonds tend to trade more in-line with U.S. Treasuries. |
| | n | | Treasury Inflation-Protected Securities (“TIPS”) outpaced nominal bonds (non-inflation linked bonds) for the first part of the year and all but the longest maturity TIPS outperformed in the second quarter as high gasoline prices drove higher inflation accruals. Commodities, as represented by the Dow Jones-AIG Commodity Total Return Index, returned 4.46% for the period. Equities, as measured by the S&P 500 Index and the Russell 2000 Index, returned 6.96% and 6.45%, respectively, for the period. |
On the following pages, please find specific details as to the Portfolio’s total return investment performance and a discussion of those factors that affected performance.
Thank you for the trust you have placed in us. We will continue to work diligently to serve your investment needs.
Sincerely,
Brent R. Harris
Chairman, PIMCO Variable Insurance Trust
July 31, 2007
| | | | | | |
| | Semiannual Report | | June 30, 2007 | | 1 |
Important Information About the Portfolio
PIMCO Variable Insurance Trust (the “Trust”) is an open-end management investment company currently consisting of twenty separate investment portfolios, including the Emerging Markets Bond Portfolio (the “Portfolio”). The Portfolio is only available as a funding vehicle under variable life insurance policies or variable annuity contracts issued by insurance companies (“Variable Contracts”). Individuals may not purchase shares of the Portfolio directly. Shares of the Portfolio also may be sold to qualified pension and retirement plans outside of the separate account context.
We believe that bond funds have an important role to play in a well diversified investment portfolio. It is important to note, however, that in an environment where interest rates may trend upward, rising rates would negatively impact the performance of most bond funds, and fixed-income securities held by a fund are likely to decrease in value. The price volatility of fixed-income securities can also increase during periods of rising interest rates resulting in increased losses to a fund. Bond funds and individual bonds with a longer duration (a measure of the expected life of a security) tend to be more sensitive to changes in interest rates, usually making them more volatile than securities or funds with shorter durations.
The Portfolio may be subject to various risks in addition to those described above. Some of these risks may include, but are not limited to, the following: credit risk, high yield risk, market risk, issuer risk, liquidity risk, derivatives risk, mortgage risk, non-U.S. investment risk, emerging markets risk, currency risk, issuer non-diversification risk, leveraging risk and management risk. A complete description of these risks is contained in the Portfolio’s prospectus. The Portfolio may use derivative instruments for hedging purposes or as part of an investment strategy. Use of these instruments may involve certain costs and risks such as liquidity risk, interest rate risk, market risk, credit risk, management risk and the risk that the Portfolio could not close out a position when it would be most advantageous to do so. Because the Portfolio may invest in derivatives, it could lose more than the principal amount invested in these instruments. Investing in non-U.S. securities may entail risk due to non-U.S. economic and political developments; this risk may be increased when investing in emerging markets.
On the performance summary page in this Semiannual Report, the Total Return Investment Performance table measures performance assuming that all dividend and capital gain distributions were reinvested.
An investment in the Portfolio is not a deposit of a bank and is not guaranteed or insured by the Federal Deposit Insurance Corporation or any other government agency. It is possible to lose money on investments in the Portfolio.
PIMCO has adopted written proxy voting policies and procedures (“Proxy Policy”) as required by Rule 206(4)-6 under the Investment Advisers Act of 1940, as amended. The Proxy Policy has been adopted by the Trust as the policies and procedures that PIMCO will use when voting proxies on behalf of the Portfolio. A description of the policies and procedures that PIMCO uses to vote proxies relating to portfolio securities of the Portfolio, and information about how the Portfolio voted proxies relating to portfolio securities held during the most recent twelve-month period ended June 30, are available without charge, upon request, by calling the Trust at 1-866-746-2606 and on the Portfolio’s website at www.pimco.com.
The Portfolio files its complete schedule of portfolio holdings with the SEC for the first and third quarters of each fiscal year on Form N-Q. A copy of the Trust’s Form N-Q is also available on the SEC’s website at http://www.sec.gov and may be reviewed and copied at the SEC’s Public Reference Room in Washington D.C. Information on the operation of the Public Reference Room may be obtained by calling 1-800-SEC-0330, and is available without charge, upon request, by calling the Trust at 1-866-746-2606 and on the Portfolio’s website at www.pimco.com.
PIMCO Variable Insurance Trust is distributed by Allianz Global Investors Distributors LLC, 1345 Avenue of the Americas, New York, NY 10105.
| | | | |
| 2 | | PIMCO Variable Insurance Trust | | |
The following disclosure provides important information regarding the Portfolio’s Expense Example (“Example” or “Expense Example”), which appears in this Semiannual Report. Please refer to this information when reviewing the Expense Example for the Portfolio.
Example
As a shareholder of the Portfolio, you incur two types of costs: (1) transaction costs and (2) ongoing costs, including advisory and administrative fees; distribution and/or service (12b-1) fees (Administrative and Advisor Class only); and other Portfolio expenses. The Example is intended to help you understand your ongoing costs (in dollars) of investing in the Portfolio and to compare these costs with the ongoing costs of investing in other mutual funds. The Expense Example does not reflect any fees or other expenses imposed by the Variable Contracts. If it did, the expenses reflected in the Expense Example would be higher. The Example is based on an investment of $1,000 invested at the beginning of the period and held for the entire period indicated, which is from January 1, 2007 to June 30, 2007.
Actual Expenses
The information in the table under the heading “Actual Performance” provides information about actual account values and actual expenses. You may use the information in these columns, together with the amount you invested, to estimate the expenses that you paid over the period. Simply divide your account value by $1,000 (for example, an $8,600 account value divided by $1,000 = $8.60), then multiply the result by the number in the row titled “Expenses Paid During Period” to estimate the expenses you paid on your account during this period.
Hypothetical Example for Comparison Purposes
The information in the table under the heading “Hypothetical Performance (5% return before expenses)” provides information about hypothetical account values and hypothetical expenses based on the Portfolio’s actual expense ratio and an assumed rate of return of 5% per year before expenses, which is not the Portfolio’s actual return. The hypothetical account values and expenses may not be used to estimate the actual ending account balance or expenses you paid for the period. You may use this information to compare the ongoing costs of investing in the Portfolio and other portfolios. To do so, compare this 5% hypothetical example with the 5% hypothetical examples that appear in the shareholder reports of the other portfolios.
Please note that the expenses shown in the table are meant to highlight your ongoing costs only and do not reflect any transactional costs. Therefore, the information under the heading “Hypothetical Performance (5% return before expenses)” is useful in comparing ongoing costs only, and will not help you determine the relative total costs of owning different portfolios. In addition, if these transactional costs were included, your costs would have been higher.
The expense ratio may vary period to period because of various factors, such as an increase in expenses not covered by the advisory and administrative fees (such as expenses of the trustees and their counsel, litigation expense and interest expense).
| | | | | | |
| | Semiannual Report | | June 30, 2007 | | 3 |
PIMCO Emerging Markets Bond Portfolio
Cumulative Returns Through June 30, 2007
$10,000 invested at the beginning of the first full month following the inception date of the Portfolio’s Advisor Class.
Allocation Breakdown‡
| | |
Russia | | 19.9% |
Short-Term Instruments | | 18.0% |
Brazil | | 17.9% |
Mexico | | 7.7% |
Venezuela | | 5.7% |
Other | | 30.8% |
| | ‡ | % of Total Investments as of 06/30/2007 |
| | | | | | | | |
| Average Annual Total Return for the period ended June 30, 2007 |
| | | | | 6 Months* | | 1 Year | | Portfolio
Inception
(03/31/06) |
| | PIMCO Emerging Markets Bond Portfolio Advisor Class | | 1.45% | | 12.24% | | 7.82% |
| | JPMorgan Emerging Markets Bond Index Global± | | 0.94% | | 11.68% | | 7.38% |
All Portfolio returns are net of fees and expenses.
* Cumulative return.
Performance quoted represents past performance. Past performance is no guarantee of future results. Investment return and principal value will fluctuate so the Portfolio shares, when redeemed, may be worth more or less than their original cost. The Portfolio’s performance does not reflect the deduction of additional charges and expenses imposed in connection with investing in Variable Contracts, which will reduce returns. Current performance may be lower or higher than the performance data quoted. Performance data current to the most recent month-end is available by calling (800) 927-4648.
± JPMorgan Emerging Markets Bond Index Global is an unmanaged index which tracks total returns for U.S. dollar denominated debt instruments issued by emerging market sovereign and quasi-sovereign entities, Brady bonds, loans, Eurobonds and local market instruments. It is not possible to invest directly in the index. The index does not reflect deductions for fees and expenses.
| | | | | | |
| Expense Example | | Actual Performance | | Hypothetical Performance |
| | | | | (5% return before expenses) |
Beginning Account Value (01/01/07) | | $ | 1,000.00 | | $ | 1,000.00 |
Ending Account Value (06/30/07) | | $ | 1,014.52 | | $ | 1,019.09 |
Expenses Paid During Period† | | $ | 5.74 | | $ | 5.76 |
† Expenses are equal to the Portfolio’s Advisor Class annualized expense ratio of 1.15%, multiplied by the average account value over the period, multiplied by 181/365 (to reflect the one-half year period). Overall fees and expenses of investing in the Portfolio will be higher because the example does not reflect Variable Contract fees and expenses.
Please refer to page 3 herein for an explanation of the information presented in the above Expense Example.
Portfolio Insights
| » | | The PIMCO Emerging Markets Bond Portfolio seeks to achieve its investment objective by investing under normal circumstances at least 80% of its assets in fixed-income instruments of issuers that economically are tied to countries with emerging securities markets, which may be represented by forwards or derivatives, such as options, futures contracts, or swap agreements. |
| » | | An overweight position in Brazil benefited performance. The JPMorgan EMBIG Brazil sub-index returned 3.1% for the period, outperforming the broader emerging markets sector, as represented by the JPMorgan EMBIG Index, which returned 0.9% for the same period. |
| » | | An underweight to Venezuela helped relative performance. The JPMorgan EMBIG Venezuela sub-index declined 10.1% for the period. |
| » | | An overweight position in Russia detracted from relative performance. However, emphasizing Russian corporate bonds helped performance as corporates outperformed sovereign bonds during the period. |
| » | | A tactical allocation in emerging markets currencies benefited performance as these currencies strengthened against the U.S. dollar over the period. |
| » | | Off-benchmark allocations to emerging local markets helped the Portfolio’s performance as emerging markets local bonds, represented by the JPMorgan GBI EM Global Diversified Index, outperformed emerging markets external debt, represented by the JPMorgan Emerging Markets Bond Index Global, in the first half of the year. |
| » | | An underweight to Ecuador detracted from performance as Ecuador spreads tightened during the period. |
| » | | An underweight to Turkey detracted from performance. The JPMorgan EMBIG Turkey sub-index returned 3.2% for the period, outperforming the broader emerging markets sector, as represented by the JPMorgan EMBIG Index. |
| | | | |
| 4 | | PIMCO Variable Insurance Trust | | |
Financial Highlights Emerging Markets Bond Portfolio
| | | | | | | | |
| Selected per Share Data for the Period Ended: | | 06/30/2007+ | | | 03/31/2006-12/31/2006 | |
| | |
Advisor Class | | | | | | | | |
Net asset value beginning of period | | $ | 13.96 | | | $ | 13.59 | |
Net investment income (a) | | | 0.35 | | | | 0.52 | |
Net realized/unrealized gain (loss) on investments (a) | | | (0.15 | ) | | | 0.58 | |
Total income from investment operations | | | 0.20 | | | | 1.10 | |
Dividends from net investment income | | | (0.38 | ) | | | (0.54 | ) |
Distributions from net realized capital gains | | | 0.00 | | | | (0.19 | ) |
Total distributions | | | (0.38 | ) | | | (0.73 | ) |
Net asset value end of period | | $ | 13.78 | | | $ | 13.96 | |
Total return | | | 1.45 | % | | | 8.30 | % |
Net assets end of year or period (000s) | | $ | 620 | | | $ | 469 | |
Ratio of expenses to average net assets | | | 1.15 | %* | | | 1.10 | %* |
Ratio of expenses to average net assets excluding interest expense | | | 1.15 | %* | | | 1.10 | %* |
Ratio of net investment income to average net assets | | | 5.10 | %* | | | 4.99 | %* |
Portfolio turnover rate | | | 100 | % | | | 283 | % |
+ Unaudited
* Annualized
(a) Per share amounts based on average number of shares outstanding during the period.
| | | | | | |
| See Accompanying Notes | | Semiannual Report | | June 30, 2007 | | 5 |
Statement of Assets and Liabilities Emerging Markets Bond Portfolio
| | | |
| (Amounts in thousands, except per share amounts) | | June 30, 2007 |
| | | (Unaudited) |
| |
Assets: | | | |
Investments, at value | | $ | 191,377 |
Cash | | | 94 |
Foreign currency, at value | | | 166 |
Receivable for investments sold | | | 3,483 |
Receivable for Portfolio shares sold | | | 69 |
Interest and dividends receivable | | | 3,435 |
Variation margin receivable | | | 24 |
Swap premiums paid | | | 400 |
Unrealized appreciation on foreign currency contracts | | | 229 |
Unrealized appreciation on swap agreements | | | 2,038 |
| | | | 201,315 |
| |
Liabilities: | | | |
Payable for investments purchased | | $ | 1,670 |
Payable for investments purchased on a delayed-delivery basis | | | 4,860 |
Payable for Portfolio shares redeemed | | | 330 |
Payable for short sales | | | 631 |
Written options outstanding | | | 645 |
Dividends payable | | | 1 |
Accrued investment advisory fee | | | 72 |
Accrued administration fee | | | 64 |
Accrued servicing fee | | | 22 |
Swap premiums received | | | 655 |
Unrealized depreciation on foreign currency contracts | | | 42 |
Unrealized depreciation on swap agreements | | | 75 |
Other liabilities | | | 17 |
| | | | 9,084 |
| |
Net Assets | | $ | 192,231 |
| |
Net Assets Consist of: | | | |
Paid in capital | | $ | 178,681 |
Undistributed net investment income | | | 1,904 |
Accumulated undistributed net realized gain | | | 6,426 |
Net unrealized appreciation | | | 5,220 |
| | | $ | 192,231 |
| |
Net Assets: | | | |
Administrative Class | | | 191,611 |
Advisor Class | | | 620 |
| |
Shares Issued and Outstanding: | | | |
Administrative Class | | | 13,908 |
Advisor Class | | | 45 |
| |
Net Asset Value and Redemption Price Per Share (Net Asset Per Share Outstanding) | | | |
Administrative Class | | $ | 13.78 |
Advisor Class | | | 13.78 |
| |
Cost of Investments Owned | | $ | 189,066 |
Cost of Foreign Currency Held | | $ | 166 |
Proceeds Received on Short Sales | | $ | 620 |
Premiums Received on Written Options | | $ | 1,500 |
| | | | |
| 6 | | PIMCO Variable Insurance Trust | | See Accompanying Notes |
Statement of Operations Emerging Markets Bond Portfolio
| | | | |
| (Amounts in thousands) | | Six Months Ended
June 30, 2007 | |
| | | (Unaudited) | |
| |
| Investment Income: | | | | |
Interest, net of foreign taxes* | | $ | 6,283 | |
Total Income | | | 6,283 | |
| |
Expenses: | | | | |
Investment advisory fees | | | 451 | |
Administration fees | | | 401 | |
Servicing fees – Administrative Class | | | 150 | |
Distribution and/or servicing fees – Advisor Class | | | 1 | |
Trustees’ fees | | | 2 | |
Interest expense | | | 5 | |
Miscellaneous expense | | | 42 | |
Total Expenses | | | 1,052 | |
| |
Net Investment Income | | | 5,231 | |
| |
Net Realized and Unrealized Gain (Loss): | | | | |
Net realized gain on investments | | | 2,813 | |
Net realized gain on futures contracts, written options and swaps | | | 29 | |
Net realized gain on foreign currency transactions | | | 248 | |
Net change in unrealized (depreciation) on investments | | | (5,157 | ) |
Net change in unrealized appreciation on futures contracts, written options and swaps | | | 335 | |
Net change in unrealized appreciation on translation of assets and liabilities denominated in foreign currencies | | | 101 | |
Net (Loss) | | | (1,631 | ) |
| |
Net Increase in Net Assets Resulting from Operations | | $ | 3,600 | |
| |
*Foreign tax withholding | | $ | 16 | |
| | | | | | |
| See Accompanying Notes | | Semiannual Report | | June 30, 2007 | | 7 |
Statements of Changes in Net Assets Emerging Markets Bond Portfolio
| | | | | | | | |
| (Amounts in thousands) | | Six Months Ended
June 30, 2007 | | | Year Ended
December 31, 2006 | |
| | | (Unaudited) | | | | |
| | |
| Increase (Decrease) in Net Assets from: | | | | | | | | |
| | |
Operations: | | | | | | | | |
Net investment income | | $ | 5,231 | | | $ | 8,825 | |
Net realized gain | | | 3,090 | | | | 4,766 | |
Net change in unrealized appreciation (depreciation) | | | (4,721 | ) | | | 2,492 | |
Net increase resulting from operations | | | 3,600 | | | | 16,083 | |
| | |
Distributions to Shareholders: | | | | | | | | |
From net investment income | | | | | | | | |
Administrative Class | | | (5,654 | ) | | | (9,150 | ) |
Advisor Class | | | (16 | ) | | | (8 | ) |
From net realized capital gains | | | | | | | | |
Administrative Class | | | 0 | | | | (2,742 | ) |
Advisor Class | | | 0 | | | | (6 | ) |
| | |
Total Distributions | | | (5,670 | ) | | | (11,906 | ) |
| | |
Portfolio Share Transactions: | | | | | | | | |
Receipts for shares sold | | | | | | | | |
Administrative Class | | | 30,794 | | | | 97,460 | |
Advisor Class | | | 260 | | | | 481 | |
Issued as reinvestment of distributions | | | | | | | | |
Administrative Class | | | 5,653 | | | | 11,892 | |
Advisor Class | | | 16 | | | | 14 | |
Cost of shares redeemed | | | | | | | | |
Administrative Class | | | (50,072 | ) | | | (39,361 | ) |
Advisor Class | | | (117 | ) | | | (38 | ) |
Net increase (decrease) resulting from Portfolio share transactions | | | (13,466 | ) | | | 70,448 | |
| | |
Total Increase (Decrease) in Net Assets | | | (15,536 | ) | | | 74,625 | |
| | |
Net Assets: | | | | | | | | |
Beginning of period | | | 207,767 | | | | 133,142 | |
End of period* | | $ | 192,231 | | | $ | 207,767 | |
| | |
*Including undistributed net investment income of: | | $ | 1,904 | | | $ | 2,343 | |
| | | | |
| 8 | | PIMCO Variable Insurance Trust | | See Accompanying Notes |
| | |
| |
| Schedule of Investments Emerging Markets Bond Portfolio | | June 30, 2007 (Unaudited) |
| | | | | | | | |
| | | | | PRINCIPAL
AMOUNT
(000S) | | | | VALUE
(000S) |
| ARGENTINA 4.0% | | | | | | | | |
| Argentina Bonos | | | | | | | | |
5.475% due 08/03/2012 | | $ | | 10,690 | | $ | | 7,639 |
| | | | | | | | |
Total Argentina (Cost $7,590) | | | | 7,639 |
| | | | | | | | |
|
| BERMUDA 0.3% | | | | | | | | |
| BW Group Ltd. | | | | | | | | |
6.625% due 06/28/2017 | | $ | | 480 | | | | 482 |
| | | | | | | | |
Total Bermuda (Cost $477) | | | | | | 482 |
| | | | | | | | |
|
| BRAZIL 17.9% | | | | | | | | |
| Brazil Notas do Tesouro Nacional Series B |
6.000% due 05/15/2017 | | BRL | | 1,100 | | | | 920 |
| |
| Brazil Notas do Tesouro Nacional Series F | | |
10.000% due 01/01/2017 | | | | 7,490 | | | | 3,730 |
| |
| Brazilian Government International Bond | | |
7.125% due 01/20/2037 | | $ | | 1,770 | | | | 1,916 |
7.875% due 03/07/2015 | | | | 3,625 | | | | 4,018 |
8.250% due 01/20/2034 | | | | 5,690 | | | | 7,002 |
8.750% due 02/04/2025 | | | | 1,700 | | | | 2,108 |
8.875% due 04/15/2024 | | | | 350 | | | | 437 |
10.125% due 05/15/2027 | | | | 1,740 | | | | 2,458 |
10.250% due 01/10/2028 | | BRL | | 1,100 | | | | 636 |
| |
| Brazilian Government International CPI Linked Bond | | |
10.000% due 01/01/2012 | | | | 14,180 | | | | 7,143 |
| |
| CSN Islands VII Corp. | | |
10.750% due 09/12/2008 | | $ | | 200 | | | | 210 |
| |
| Embraer Overseas Ltd. | | |
6.375% due 01/24/2017 | | | | 300 | | | | 295 |
| |
| Empresa Energetica de Sergipe and Sociedade Anonima de Eletrificaao da Paraiba |
10.500% due 07/19/2013 | | | | 200 | | | | 223 |
| |
| ISA Capital do Brasil S.A. | | |
7.875% due 01/30/2012 | | | | 300 | | | | 307 |
8.800% due 01/30/2017 | | | | 700 | | | | 751 |
| |
| Vale Overseas Ltd. | | |
6.250% due 01/23/2017 | | | | 500 | | | | 498 |
6.875% due 11/21/2036 | | | | 1,700 | | | | 1,713 |
| | | | | | | | |
Total Brazil (Cost $31,273) | | | | | | 34,365 |
| | | | | | | | |
|
| CAYMAN ISLANDS 0.1% | | | | |
| Petrobras International Finance Co. | | |
6.125% due 10/06/2016 | | $ | | 250 | | | | 246 |
| | | | | | | | |
Total Cayman Islands (Cost $242) | | | | 246 |
| | | | | | | | |
|
| CHILE 1.8% | | | | | | | | |
| Chile Government International Bond | | |
5.625% due 07/23/2007 | | $ | | 915 | | | | 917 |
| |
| CODELCO, Inc. | | |
5.625% due 09/21/2035 | | | | 200 | | | | 185 |
6.150% due 10/24/2036 | | | | 2,200 | | | | 2,161 |
| |
| Empresa Nacional de Electricidad S.A. | | |
8.350% due 08/01/2013 | | | | 200 | | | | 224 |
| | | | | | | | |
Total Chile (Cost $3,633) | | | | | | 3,487 |
| | | | | | | | |
|
| CHINA 0.6% | | | | | | | | |
| Citic Resources Finance Ltd. | | |
6.750% due 05/15/2014 | | $ | | 200 | | | | 194 |
| |
| Export-Import Bank of China | | |
4.875% due 07/21/2015 | | | | 550 | | | | 520 |
| |
| | | | | | | | |
| | | | | PRINCIPAL
AMOUNT
(000S) | | | | VALUE
(000S) |
| Sino-Forest Corp. | | |
9.125% due 08/17/2011 | | $ | | 500 | | $ | | 532 |
| | | | | | | | |
Total China (Cost $1,272) | | | | | | 1,246 |
| | | | | | | | |
|
| COLOMBIA 3.5% | | |
| Colombia Government International Bond | | |
7.375% due 01/27/2017 | | $ | | 1,500 | | | | 1,630 |
7.375% due 09/18/2037 | | | | 930 | | | | 1,034 |
8.250% due 12/22/2014 | | | | 2,825 | | | | 3,174 |
10.000% due 01/23/2012 | | | | 100 | | | | 116 |
10.375% due 01/28/2033 | | | | 225 | | | | 333 |
10.750% due 01/15/2013 | | | | 400 | | | | 490 |
| | | | | | | | |
Total Colombia (Cost $6,500) | | | | 6,777 |
| | | | | | | | |
|
| ECUADOR 0.3% | | | | | | | | |
| Ecuador Government International Bond | | |
10.000% due 08/15/2030 | | $ | | 700 | | | | 590 |
| | | | | | | | |
Total Ecuador (Cost $590) | | | | 590 |
| | | | | | | | |
|
| EGYPT 0.3% | | | | | | | | |
| Petroleum Export Ltd. | | |
5.265% due 06/15/2011 | | $ | | 498 | | | | 486 |
| | | | | | | | |
Total Egypt (Cost $496) | | | | 486 |
| | | | | | | | |
|
| EL SALVADOR 0.4% | | | | | | | | |
| AES El Salvador Trust | | |
6.750% due 02/01/2016 | | $ | | 700 | | | | 696 |
| |
| El Salvador Government International Bond |
8.500% due 07/25/2011 | | | | 150 | | | | 167 |
| | | | | | | | |
Total El Salvador (Cost $843) | | | | 863 |
| | | | | | | | |
|
| GUATEMALA 0.3% | | | | | | | | |
| Guatemala Government Bond | | |
9.250% due 08/01/2013 | | $ | | 570 | | | | 656 |
| | | | | | | | |
Total Guatemala (Cost $570) | | | | 656 |
| | | | | | | | |
|
| INDIA 0.4% | | | | | | | | |
| ICICI Bank Ltd. | | |
5.750% due 01/12/2012 | | $ | | 700 | | | | 688 |
| | | | | | | | |
Total India (Cost $699) | | | | 688 |
| | | | | | | | |
|
| INDONESIA 1.1% | | | | | | | | |
| Indonesia Government International Bond | | |
6.875% due 03/09/2017 | | $ | | 1,200 | | | | 1,245 |
| |
| Majapahit Holding BV | | |
7.250% due 06/28/2017 | | | | 400 | | | | 401 |
7.875% due 06/29/2037 | | | | 400 | | | | 403 |
| | | | | | | | |
Total Indonesia (Cost $1,979) | | | | 2,049 |
| | | | | | | | |
|
| KAZAKHSTAN 1.9% | | | | | | | | |
| ATF Bank JSC | | |
9.000% due 05/11/2016 | | $ | | 150 | | | | 160 |
| |
| HSBK Europe BV | | |
7.750% due 05/13/2013 | | | | 100 | | | | 103 |
| |
| Intergas Finance BV | | |
6.375% due 05/14/2017 | | | | 300 | | | | 288 |
6.875% due 11/04/2011 | | | | 600 | | | | 611 |
| |
| Kazakhstan Temir Zholy Finance BV | | |
6.500% due 05/11/2011 | | | | 300 | | | | 302 |
| |
| Kazkommerts International BV | | |
8.500% due 04/16/2013 | | | | 225 | | | | 230 |
| |
| | | | | | | | |
| | | | | PRINCIPAL
AMOUNT
(000S) | | | | VALUE
(000S) |
| Tengizchevroil Finance Co. SARL | | |
6.124% due 11/15/2014 | | $ | | 2,000 | | $ | | 1,965 |
| | | | | | | | |
Total Kazakhstan (Cost $3,707) | | | | 3,659 |
| | | | | | | | |
|
| MALAYSIA 0.6% | | | | | | | | |
| Malaysia Government International Bond | | |
7.500% due 07/15/2011 | | $ | | 325 | | | | 348 |
8.750% due 06/01/2009 | | | | 120 | | | | 127 |
| |
| Petronas Capital Ltd. | | |
7.000% due 05/22/2012 | | | | 325 | | | | 344 |
| |
| Tenaga Nasional Bhd. | | |
7.500% due 11/01/2025 | | | | 250 | | | | 279 |
| |
| TNB Capital L Ltd. | | |
5.250% due 05/05/2015 | | | | 100 | | | | 97 |
| | | | | | | | |
Total Malaysia (Cost $1,232) | | | | 1,195 |
| | | | | | | | |
|
| MEXICO 7.6% | | | | | | | | |
| America Movil SAB de C.V. | | |
5.500% due 03/01/2014 | | $ | | 200 | | | | 196 |
5.750% due 01/15/2015 | | | | 200 | | | | 198 |
8.460% due 12/18/2036 | | MXN | | 5,400 | | | | 510 |
| |
| Banco Mercantil del Norte S.A. | | |
5.875% due 02/17/2014 | | $ | | 145 | | | | 146 |
| |
| C5 Capital SPV Ltd. | | |
6.196% due 12/01/2049 | | | | 100 | | | | 99 |
| |
| C8 Capital SPV Ltd. | | |
6.640% due 12/31/2049 | | | | 100 | | | | 99 |
| |
| C10 Capital SPV Ltd. | | |
6.722% due 12/31/2049 | | | | 600 | | | | 586 |
| |
| Desarrolladora Homex S.A. de C.V. | | |
7.500% due 09/28/2015 | | | | 1,500 | | | | 1,560 |
| |
| Hipotecaria Su Casita S.A. | | |
8.500% due 10/04/2016 | | | | 100 | | | | 106 |
| |
| Mexico Government International Bond | | |
5.625% due 01/15/2017 | | | | 438 | | | | 430 |
6.750% due 09/27/2034 | | | | 4,180 | | | | 4,468 |
7.500% due 04/08/2033 | | | | 2,460 | | | | 2,857 |
| |
| Pemex Project Funding Master Trust | | |
6.625% due 06/15/2035 | | | | 250 | | | | 254 |
8.000% due 11/15/2011 | | | | 250 | | | | 272 |
8.625% due 02/01/2022 | | | | 1,200 | | | | 1,482 |
9.250% due 03/30/2018 | | | | 977 | | | | 1,219 |
| |
| Vitro SAB de C.V. | | |
8.625% due 02/01/2012 | | | | 150 | | | | 153 |
9.125% due 02/01/2017 | | | | 50 | | | | 51 |
| | | | | | | | |
Total Mexico (Cost $14,507) | | | | 14,686 |
| | | | | | | | |
|
| PAKISTAN 0.8% | | | | | | | | |
| Pakistan Government International Bond | | |
7.125% due 03/31/2016 | | $ | | 1,550 | | | | 1,542 |
| | | | | | | | |
Total Pakistan (Cost $1,536) | | | | 1,542 |
| | | | | | | | |
|
| PANAMA 4.7% | | | | | | | | |
| Panama Government International Bond | | |
6.700% due 01/26/2036 | | $ | | 600 | | | | 615 |
7.125% due 01/29/2026 | | | | 2,165 | | | | 2,317 |
7.250% due 03/15/2015 | | | | 1,150 | | | | 1,236 |
8.875% due 09/30/2027 | | | | 780 | | | | 985 |
9.375% due 07/23/2012 | | | | 2,910 | | | | 3,346 |
9.375% due 04/01/2029 | | | | 200 | | | | 266 |
9.625% due 02/08/2011 | | | | 210 | | | | 236 |
| | | | | | | | |
Total Panama (Cost $8,740) | | | | 9,001 |
| | | | | | | | |
|
| | | | | | |
| See Accompanying Notes | | Semiannual Report | | June 30, 2007 | | 9 |
Schedule of Investments Emerging Markets Bond Portfolio (Cont.)
| | | | | | | | |
| | | | | PRINCIPAL
AMOUNT
(000S) | | | | VALUE
(000S) |
| PERU 1.9% | | |
| Peru Government International Bond | | |
6.550% due 03/14/2037 | | $ | | 1,583 | | $ | | 1,595 |
7.350% due 07/21/2025 | | | | 500 | | | | 559 |
8.375% due 05/03/2016 | | | | 555 | | | | 648 |
9.125% due 01/15/2008 | | | | 650 | | | | 660 |
| |
| Southern Copper Corp. | | |
7.500% due 07/27/2035 | | | | 100 | | | | 107 |
| | | | | | | | |
Total Peru (Cost $3,509) | | | | | | 3,569 |
| | | | | | | | |
|
| QATAR 0.1% | | | | | | | | |
| Ras Laffan Liquefied Natural Gas Co. Ltd. II |
5.298% due 09/30/2020 | | $ | | 250 | | | | 234 |
| | | | | | | | |
Total Qatar (Cost $250) | | | | | | | | 234 |
| | | | | | | | |
|
| RUSSIA 19.8% | | | | | | | | |
| Gaz Capital for Gazprom | | |
5.440% due 11/02/2017 | | EUR | | 300 | | | | 394 |
5.875% due 06/01/2015 | | | | 200 | | | | 273 |
6.212% due 11/22/2016 | | $ | | 1,200 | | | | 1,172 |
8.625% due 04/28/2034 | | | | 3,000 | | | | 3,752 |
| |
| Gazinvest Luxembourg S.A. for Gazprombank |
7.250% due 10/30/2008 | | | | 1,000 | | | | 1,021 |
| |
| Gazprom International S.A. |
7.201% due 02/01/2020 | | | | 811 | | | | 838 |
| |
| Mobile Telesystems Finance S.A. |
8.000% due 01/28/2012 | | | | 150 | | | | 155 |
| |
| Morgan Stanley Bank AG for OAO Gazprom |
9.625% due 03/01/2013 | | | | 6,810 | | | | 7,908 |
| |
RSHB Capital AG S.A. for OJSC Russian Agricultural Bank |
6.299% due 05/15/2017 | | | | 190 | | | | 186 |
7.175% due 05/16/2013 | | | | 1,900 | | | | 1,984 |
| |
| Russia Government International Bond |
7.500% due 03/31/2030 | | | | 10,134 | | | | 11,178 |
| |
| Sistema Finance S.A. |
10.250% due 04/14/2008 | | | | 500 | | | | 517 |
| |
| TNK-BP Finance S.A. |
6.125% due 03/20/2012 | | | | 200 | | | | 196 |
6.625% due 03/20/2017 | | | | 1,700 | | | | 1,651 |
7.500% due 07/18/2016 | | | | 2,700 | | | | 2,790 |
| |
| TransCapitalInvest Ltd. for OJSC AK Transneft |
6.103% due 06/27/2012 | | | | 700 | | | | 703 |
| |
UBS Luxembourg S.A. for OJSC Vimpel Communications |
8.375% due 10/22/2011 | | | | 350 | | | | 368 |
| |
| UBS Luxembourg S.A. for Sberbank |
6.230% due 02/11/2015 | | | | 1,000 | | | | 1,004 |
| |
| VTB Capital S.A. for Vneshtorgbank |
5.955% due 08/01/2008 | | | | 1,000 | | | | 1,002 |
6.110% due 09/21/2007 | | | | 1,000 | | | | 1,001 |
| | | | | | | | |
Total Russia (Cost $38,404) | | | | | | 38,093 |
| | | | | | | | |
|
| SOUTH AFRICA 1.6% | | | | |
| South Africa Government International Bond |
5.250% due 05/16/2013 | | EUR | | 400 | | | | 546 |
5.875% due 05/30/2022 | | $ | | 1,430 | | | | 1,402 |
6.500% due 06/02/2014 | | | | 750 | | | | 774 |
7.375% due 04/25/2012 | | | | 310 | | | | 330 |
| | | | | | | | |
Total South Africa (Cost $3,017) | | | | 3,052 |
| | | | | | | | |
|
| | | | | | | | |
| | | | | PRINCIPAL
AMOUNT
(000S) | | | | VALUE
(000S) |
| SOUTH KOREA 0.1% | | | | | | |
| Industrial Bank of Korea | | |
4.000% due 05/19/2014 | | $ | | 110 | | $ | | 107 |
| |
| Korea Development Bank |
5.750% due 09/10/2013 | | | | 15 | | | | 15 |
| |
| KT Corp. |
4.875% due 07/15/2015 | | | | 100 | | | | 94 |
| | | | | | | | |
Total South Korea (Cost $223) | | | | 216 |
| | | | | | | | |
|
| TRINIDAD AND TOBAGO 0.4% | | |
| Petroleum Co. of Trinidad & Tobago Ltd. | | |
6.000% due 05/08/2022 | | $ | | 700 | | | | 683 |
| | | | | | | | |
Total Trinidad and Tobago (Cost $697) | | 683 |
| | | | | | | | |
|
| TUNISIA 0.9% | | |
| Banque Centrale de Tunisie | | |
4.750% due 04/07/2011 | | EUR | | 500 | | | | 673 |
7.375% due 04/25/2012 | | $ | | 1,050 | | | | 1,125 |
| | | | | | | | |
Total Tunisia (Cost $1,736) | | | | 1,798 |
| | | | | | | | |
|
| UKRAINE 2.1% | | |
| Ukraine Government International Bond | | |
4.950% due 10/13/2015 | | EUR | | 300 | | | | 382 |
6.385% due 06/26/2012 | | $ | | 300 | | | | 302 |
6.875% due 03/04/2011 | | | | 700 | | | | 717 |
7.650% due 06/11/2013 | | | | 1,300 | | | | 1,379 |
8.775% due 08/05/2009 | | | | 1,150 | | | | 1,222 |
| | | | | | | | |
Total Ukraine (Cost $3,877) | | | | 4,002 |
| | | | | | | | |
|
| UNITED STATES 0.3% | | |
|
| BANK LOAN OBLIGATIONS 0.0% |
| Kingdom of Morocco | | |
6.344% due 01/05/2009 | | $ | | 100 | | | | 101 |
| | | | | | | | |
|
| CORPORATE BONDS & NOTES 0.3% |
| Freeport-McMoRan Copper & Gold, Inc. | | |
8.375% due 04/01/2017 | | | | 52 | | | | 56 |
| |
| Hyundai Motor Manufacturing Alabama LLC |
5.300% due 12/19/2008 | | | | 500 | | | | 496 |
| | | | | | | | |
| | | | | | | | 552 |
| | | | | | | | |
Total United States (Cost $649) | | | | 653 |
| | | | | | | | |
|
| URUGUAY 1.8% | | |
| Uruguay Government International Bond | | |
3.700% due 06/26/2037 | | UYU | | 4,504 | | | | 185 |
5.000% due 09/14/2018 (b) | | 6,216 | | | | 293 |
7.625% due 03/21/2036 | | $ | | 300 | | | | 330 |
8.000% due 11/18/2022 | | | | 2,121 | | | | 2,366 |
9.250% due 05/17/2017 | | | | 200 | | | | 240 |
| | | | | | | | |
Total Uruguay (Cost $3,278) | | 3,414 |
| | | | | | | | |
|
| VENEZUELA 5.6% | | |
| Petroleos de Venezuela S.A. | | |
5.250% due 04/12/2017 | | $ | | 300 | | | | 228 |
5.375% due 04/12/2027 | | | | 600 | | | | 399 |
| |
| Venezuela Government International Bond |
5.375% due 08/07/2010 | | | | 3,850 | | | | 3,638 |
5.750% due 02/26/2016 | | | | 770 | | | | 655 |
6.000% due 12/09/2020 | | | | 1,900 | | | | 1,542 |
6.355% due 04/20/2011 | | | | 1,200 | | | | 1,167 |
7.650% due 04/21/2025 | | | | 325 | | | | 298 |
8.500% due 10/08/2014 | | | | 500 | | | | 508 |
| | | | | | | | | |
| | | | | PRINCIPAL
AMOUNT
(000S) | | | | VALUE
(000S) | |
9.375% due 01/13/2034 | | $ | | 350 | | $ | | 366 | |
10.750% due 09/19/2013 | | | | 1,850 | | | | 2,059 | |
| | | | | | | | | |
Total Venezuela (Cost $11,396) | | 10,860 | |
| | | | | | | | | |
| |
| VIETNAM 0.1% | | | |
| Socialist Republic of Vietnam | | | |
6.875% due 01/15/2016 | | $ | | 100 | | | | 104 | |
| | | | | | | | | |
Total Vietnam (Cost $98) | | 104 | |
| | | | | | | | | |
| |
| SHORT-TERM INSTRUMENTS 17.9% | |
| |
| COMMERCIAL PAPER 16.2% | |
| Danske Corp. | | | |
5.205% due 10/12/2007 | | $ | | 3,800 | | | | 3,759 | |
| | |
| HBOS Treasury Services PLC | |
5.250% due 09/21/2007 | | | | 9,100 | | | | 8,989 | |
| | |
| Societe Generale NY | |
5.210% due 11/26/2007 | | | | 1,600 | | | | 1,583 | |
5.245% due 11/26/2007 | | | | 4,200 | | | | 4,149 | |
| | |
| TotalFinaElf Capital S.A. | |
5.340% due 07/02/2007 | | | | 1,300 | | | | 1,300 | |
| | |
| UBS Finance Delaware LLC | |
5.230% due 10/23/2007 | | | | 5,800 | | | | 5,773 | |
| | |
| Westpac Banking Corp. | |
5.165% due 11/05/2007 | | | | 3,800 | | | | 3,729 | |
| | |
| Westpac Trust Securities NZ Ltd. | |
5.260% due 10/19/2007 | | | | 2,000 | | | | 1,976 | |
| | | | | | | | | |
| | | | | | | | 31,258 | |
| | | | | | | | | |
| |
| REPURCHASE AGREEMENTS 1.2% | |
| State Street Bank and Trust Co. | | | |
4.900% due 07/02/2007 | | | | 2,264 | | | | 2,264 | |
| | | | | | | | | |
(Dated 06/29/2007. Collateralized by Fannie Mae 3.250% due 08/15/2008 valued at $2,311. Repurchase proceeds are $2,265.) | |
| |
| U.S. TREASURY BILLS 0.5% | |
4.646% due 09/13/2007 (a)(c)(d) | | 955 | | | | 944 | |
| | | | | | | | | |
Total Short-Term Instruments
(Cost $34,479) | | | | 34,466 | |
| | | | | | | | | |
| |
| PURCHASED OPTIONS (f) 0.3% | |
| (Cost $1,567) | | | | | | | | 576 | |
| |
Total Investments 99.5% (Cost $189,066) | | $ | | 191,377 | |
| |
| Written Options (g) (0.3%) (Premiums $1,500) | | | | | | | | (645 | ) |
| |
| Other Assets and Liabilities (Net) 0.8% | | 1,499 | |
| | | | | | | | | |
| Net Assets 100.0% | | | | | | $ | | 192,231 | |
| | | | | | | | | |
| | | | |
| 10 | | PIMCO Variable Insurance Trust | | See Accompanying Notes |
| | |
| |
| | | June 30, 2007 (Unaudited) |
Notes to Schedule of Investments (amounts in thousands*, except number of contracts):
* A zero balance may reflect actual amounts rounding to less than one thousand.
(a) Coupon represents a weighted average rate.
(b) Principal amount of security is adjusted for inflation.
(c) Securities with an aggregate market value of $494 have been pledged as collateral for swap and swaption contracts on June 30, 2007.
(d) Securities with an aggregate market value of $450 have been segregated with the custodian to cover margin requirements for the following open futures contracts on June 30, 2007:
| | | | | | | | | | |
| Description | | Type | | Expiration
Month | | # of
Contracts | | Unrealized
(Depreciation) | |
90-Day Eurodollar December Futures | | Long | | 12/2007 | | 274 | | $ | (131 | ) |
| | | | | | | | | | |
(e) Swap agreements outstanding on June 30, 2007:
Credit Default Swaps
| | | | | | | | | | | | | | | | |
| Counterparty | | Reference Entity | | Buy/Sell
Protection (1) | | (Pay)/Receive
Fixed Rate | | | Expiration
Date | | Notional
Amount | | Unrealized
Appreciation/
(Depreciation) | |
Barclays Bank PLC | | Ukraine Government International Bond 7.650% due 06/11/2013 | | Sell | | 1.700% | | | 03/20/2011 | | $ | 500 | | $ | 13 | |
Barclays Bank PLC | | Multiple Reference Entities of Gazprom | | Sell | | 0.940% | | | 05/20/2011 | | | 2,500 | | | 41 | |
Barclays Bank PLC | | Russia Government International Bond 7.500% due 03/31/2030 | | Sell | | 1.650% | | | 07/20/2011 | | | 800 | | | 42 | |
Barclays Bank PLC | | Brazilian Government International Bond 12.250% due 03/06/2030 | | Sell | | 1.360% | | | 08/20/2011 | | | 1,000 | | | 32 | |
Barclays Bank PLC | | Indonesia Government International Bond 6.750% due 03/10/2014 | | Sell | | 1.700% | | | 09/20/2011 | | | 1,000 | | | 30 | |
Barclays Bank PLC | | Indonesia Government International Bond 6.750% due 03/10/2014 | | Sell | | 1.400% | | | 12/20/2011 | | | 500 | | | 9 | |
Barclays Bank PLC | | Indonesia Government International Bond 6.750% due 03/10/2014 | | Sell | | 2.320% | | | 12/20/2016 | | | 1,000 | | | 49 | |
Citibank N.A. | | Indonesia Government International Bond 6.750% due 03/10/2014 | | Sell | | 1.580% | | | 12/20/2011 | | | 100 | | | 2 | |
Citibank N.A. | | Indonesia Government International Bond 6.750% due 03/10/2014 | | Sell | | 2.290% | | | 12/20/2016 | | | 200 | | | 9 | |
Deutsche Bank AG | | Uruguay Government International Bond 7.875% due 01/15/2033 | | Sell | | 1.050% | | | 01/20/2012 | | | 1,000 | | | 9 | |
Deutsche Bank AG | | Dow Jones CDX N.A. EM7 Index | | Sell | | 1.250% | | | 06/20/2012 | | | 2,000 | | | (9 | ) |
JPMorgan Chase & Co. | | Indonesia Government International Bond 6.750% due 03/10/2014 | | Sell | | 2.050% | | | 09/20/2011 | | | 750 | | | 32 | |
JPMorgan Chase & Co. | | Mexico Government International Bond 11.500% due 05/15/2026 | | Sell | | 2.840% | | | 01/04/2013 | | | 1,600 | | | 210 | |
JPMorgan Chase & Co. | | Multiple Reference Entities of Gazprom | | Sell | | 1.500% | | | 04/20/2016 | | | 1,000 | | | 48 | |
JPMorgan Chase & Co. | | Petroleos Mexicanos 9.500% due 09/15/2027 | | Sell | | 1.130% | | | 04/20/2016 | | | 1,400 | | | 53 | |
JPMorgan Chase & Co. | | CEMEX SAB de C.V. 9.625% due 10/01/2009 | | Sell | | 1.050% | | | 12/20/2016 | | | 500 | | | 3 | |
Lehman Brothers, Inc. | | Brazilian Government International Bond 12.250% due 03/06/2030 | | Sell | | 1.770% | | | 06/20/2011 | | | 500 | | | 21 | |
Lehman Brothers, Inc. | | Petroleos Mexicanos 9.500% due 09/15/2027 | | Sell | | 0.800% | | | 07/20/2011 | | | 261 | | | 4 | |
Lehman Brothers, Inc. | | Dow Jones CDX N.A. EM6 Index | | Sell | | 1.400% | | | 12/20/2011 | | | 9,200 | | | 51 | |
Lehman Brothers, Inc. | | Indonesia Government International Bond 6.750% due 03/10/2014 | | Sell | | 1.520% | | | 12/20/2011 | | | 1,000 | | | 22 | |
Lehman Brothers, Inc. | | Ukraine Government International Bond 7.650% due 06/11/2013 | | Sell | | 1.400% | | | 05/20/2012 | | | 1,000 | | | 6 | |
Lehman Brothers, Inc. | | Dow Jones CDX N.A. EM7 Index | | Sell | | 1.250% | | | 06/20/2012 | | | 13,500 | | | (57 | ) |
Lehman Brothers, Inc. | | Brazilian Government International Bond 12.250% due 03/06/2030 | | Sell | | 2.020% | | | 07/20/2013 | | | 290 | | | 20 | |
Lehman Brothers, Inc. | | Russia Government International Bond 7.500% due 03/31/2030 | | Sell | | 2.550% | | | 03/20/2014 | | | 350 | | | 42 | |
Lehman Brothers, Inc. | | Multiple Reference Entities of Gazprom | | Sell | | 1.330% | | | 03/20/2016 | | | 1,000 | | | 37 | |
Lehman Brothers, Inc. | | Brazilian Government International Bond 12.250% due 03/06/2030 | | Sell | | 1.510% | | | 08/20/2016 | | | 500 | | | 19 | |
Lehman Brothers, Inc. | | Ukraine Government International Bond 7.650% due 06/11/2013 | | Sell | | 2.060% | | | 05/20/2017 | | | 400 | | | 2 | |
Merrill Lynch & Co., Inc. | | Ukraine Government International Bond 7.650% due 06/11/2013 | | Sell | | 1.500% | | | 01/20/2012 | | | 500 | | | 8 | |
Merrill Lynch & Co., Inc. | | Russia Government International Bond 7.500% due 03/31/2030 | | Sell | | 3.160% | | | 10/02/2013 | | | 450 | | | 66 | |
Merrill Lynch & Co., Inc. | | Russia Government International Bond 7.500% due 03/31/2030 | | Sell | | 2.310% | | | 01/21/2014 | | | 525 | | | 56 | |
Morgan Stanley | | Colombia Government International Bond 10.375% due 01/28/2033 | | Sell | | 0.760% | | | 03/20/2010 | | | 250 | | | 2 | |
Morgan Stanley | | Multiple Reference Entities of Gazprom | | Sell | | 1.050% | | | 04/20/2011 | | | 1,000 | | | 21 | |
Morgan Stanley | | Peru Government International Bond 8.750% due 11/21/2033 | | Sell | | 1.220% | | | 10/20/2011 | | | 500 | | | 13 | |
Morgan Stanley | | Ukraine Government International Bond 7.650% due 06/11/2013 | | Sell | | 1.600% | | | 01/20/2012 | | | 100 | | | 2 | |
Morgan Stanley | | Ukraine Government International Bond 7.650% due 06/11/2013 | | Buy | | (1.590% | ) | | 04/20/2012 | | | 500 | | | 4 | |
Morgan Stanley | | Brazilian Government International Bond 12.250% due 03/06/2030 | | Sell | | 2.100% | | | 08/20/2016 | | | 250 | | | 20 | |
Morgan Stanley | | Multiple Reference Entities of Gazprom | | Sell | | 1.350% | | | 08/20/2016 | | | 1,000 | | | 40 | |
Royal Bank of Scotland
Group PLC | | Indonesia Government International Bond 6.750% due 03/10/2014 | | Sell | | 1.525% | | | 12/20/2011 | | | 1,400 | | | 32 | |
Royal Bank of Scotland
Group PLC | | Indonesia Government International Bond 6.750% due 03/10/2014 | | Sell | | 2.385% | | | 09/20/2016 | | | 200 | | | 11 | |
Royal Bank of Scotland
Group PLC | | Indonesia Government International Bond 6.750% due 03/10/2014 | | Sell | | 2.480% | | | 09/20/2016 | | | 1,000 | | | 61 | |
Royal Bank of Scotland Group PLC | | Indonesia Government International Bond 6.750% due 03/10/2014 | | Sell | | 2.345% | | | 12/20/2016 | | | 100 | | | 5 | |
UBS Warburg LLC | | Brazilian Government International Bond 12.250% due 03/06/2030 | | Sell | | 1.870% | | | 06/20/2011 | | | 200 | | | 9 | |
UBS Warburg LLC | | Multiple Reference Entities of Gazprom | | Sell | | 0.945% | | | 10/20/2011 | | | 4,000 | | | 70 | |
UBS Warburg LLC | | Colombia Government International Bond 10.375% due 01/28/2033 | | Sell | | 1.070% | | | 01/20/2012 | | | 1,000 | | | 17 | |
UBS Warburg LLC | | Ukraine Government International Bond 7.650% due 06/11/2013 | | Sell | | 1.480% | | | 03/20/2012 | | | 1,000 | | | 12 | |
UBS Warburg LLC | | Mexico Government International Bond 7.500% due 04/08/2033 | | Sell | | 0.695% | | | 01/20/2017 | | | 300 | | | 6 | |
| | | | | | | | | | | | | | $ | 1,195 | |
| | | | | | | | | | | | | | | | |
| | | | | | |
| See Accompanying Notes | | Semiannual Report | | June 30, 2007 | | 11 |
Schedule of Investments Emerging Markets Bond Portfolio (Cont.)
Schedule of Investments Emerging Markets Bond Portfolio (Cont.)
(1) If the Portfolio is a seller of protection and a credit event occurs, as defined under the terms of that particular swap agreement, the Portfolio will pay to the buyer of the protection an amount up to the notional value of the swap and in certain instances, take delivery of the security. As a buyer of protection, the Portfolio will generally receive from the seller of protection an amount up to the notional amount of the swap if a credit event occurs.
Interest Rate Swaps
| | | | | | | | | | | | | | | |
| Counterparty | | Floating Rate Index | | Pay/Receive
Floating Rate | | Fixed Rate | | Expiration
Date | | Notional
Amount | | Unrealized
Appreciation/
(Depreciation) | |
Merrill Lynch & Co., Inc. | | BRL-CDI-Compounded | | Pay | | 15.160% | | 01/02/2009 | | BRL | 700 | | $ | 23 | |
Merrill Lynch & Co., Inc. | | BRL-CDI-Compounded | | Pay | | 13.840% | | 01/04/2010 | | | 4,600 | | | 141 | |
Morgan Stanley | | BRL-CDI-Compounded | | Pay | | 12.780% | | 01/04/2010 | | | 2,700 | | | 51 | |
Barclays Bank PLC | | 28-Day Mexico Interbank TIIE Banxico | | Pay | | 8.780% | | 08/03/2016 | | MXN | 3,400 | | | 14 | |
Citibank N.A. | | 28-Day Mexico Interbank TIIE Banxico | | Pay | | 8.770% | | 08/03/2016 | | | 3,400 | | | 14 | |
Citibank N.A. | | 28-Day Mexico Interbank TIIE Banxico | | Pay | | 8.720% | | 09/05/2016 | | | 86,100 | | | 207 | |
Citibank N.A. | | 28-Day Mexico Interbank TIIE Banxico | | Pay | | 8.900% | | 09/22/2016 | | | 22,000 | | | 106 | |
Citibank N.A. | | 28-Day Mexico Interbank TIIE Banxico | | Pay | | 8.170% | | 11/04/2016 | | | 7,000 | | | 11 | |
Goldman Sachs & Co. | | 28-Day Mexico Interbank TIIE Banxico | | Pay | | 8.865% | | 09/12/2016 | | | 5,000 | | | 24 | |
Goldman Sachs & Co. | | 28-Day Mexico Interbank TIIE Banxico | | Pay | | 8.170% | | 11/04/2016 | | | 10,000 | | | (9 | ) |
JPMorgan Chase & Co. | | 28-Day Mexico Interbank TIIE Banxico | | Pay | | 8.910% | | 07/26/2016 | | | 13,000 | | | 65 | |
Merrill Lynch & Co., Inc. | | 28-Day Mexico Interbank TIIE Banxico | | Pay | | 8.720% | | 09/05/2016 | | | 11,000 | | | 29 | |
Morgan Stanley | | 28-Day Mexico Interbank TIIE Banxico | | Pay | | 9.920% | | 08/12/2015 | | | 2,000 | | | 21 | |
Deutsche Bank AG | | 3-Month USD-LIBOR | | Pay | | 5.000% | | 12/19/2017 | | $ | 10,600 | | | 66 | |
Lehman Brothers, Inc. | | 3-Month USD-LIBOR | | Pay | | 5.000% | | 12/19/2017 | | | 600 | | | 5 | |
| | | | | | | | | | | | | $ | 768 | |
| | | | | | | | | | | | | | | |
(f) Purchased options outstanding on June 30, 2007:
Options on Exchange-Traded Futures Contracts
| | | | | | | | | | | | | |
| Description | | Exercise
Price | | Expiration
Date | | # of
Contracts | | Cost | | Value |
Put - CME 90-Day Eurodollar September Futures | | $ | 90.750 | | 09/17/2007 | | 65 | | $ | 1 | | $ | 0 |
| | | | | | | | | | | | | |
Interest Rate Swaptions
| | | | | | | | | | | | | | | | | | | |
| Description | | Counterparty | | Floating Rate
Index | | Pay/Receive
Floating Rate | | Exercise
Rate | | Expiration
Date | | Notional
Amount | | Cost | | Value |
Call - OTC 2-Year Interest Rate Swap | | Lehman Brothers, Inc. | | 3-Month USD-LIBOR | | Pay | | 4.750% | | 09/26/2008 | | $ | 293,000 | | $ | 1,566 | | $ | 576 |
| | | | | | | | | | | | | | | | | | | |
(g) Written options outstanding on June 30, 2007:
Interest Rate Swaptions
| | | | | | | | | | | | | | | | | | | |
| Description | | Counterparty | | Floating Rate Index | | Pay/Receive
Floating Rate | | Exercise
Rate | | Expiration
Date | | Notional
Amount | | Premium | | Value |
Call - OTC 5-Year Interest Rate Swap | | Lehman Brothers, Inc. | | 3-Month USD-LIBOR | | Receive | | 4.950% | | 09/26/2008 | | $ | 128,000 | | $ | 1,500 | | $ | 645 |
| | | | | | | | | | | | | | | | | | | |
(h) Short sales outstanding on June 30, 2007:
| | | | | | | | | | | | | |
| Description | | Coupon | | Maturity
Date | | Principal
Amount | | Proceeds | | Value (2) |
Ecuador Government International Bond | | 10.000% | | 08/15/2030 | | $ | 700 | | $ | 620 | | $ | 631 |
| | | | | | | | | | | | | |
(2) Market value includes $32 of interest payable on short sales.
(i) Foreign currency contracts outstanding on June 30, 2007:
| | | | | | | | | | | | | | | | | |
| Type | | Currency | | Principal
Amount
Covered by
Contract | | Settlement
Month | | Unrealized
Appreciation | | Unrealized
(Depreciation) | | | Net Unrealized
Appreciation/
(Depreciation) | |
Buy | | BRL | | 4,497 | | 03/2008 | | $ | 124 | | $ | 0 | | | $ | 124 | |
Buy | | CLP | | 30,502 | | 11/2007 | | | 2 | | | 0 | | | | 2 | |
Buy | | | | 50,032 | | 03/2008 | | | 0 | | | 0 | | | | 0 | |
Buy | | CNY | | 896 | | 09/2007 | | | 3 | | | 0 | | | | 3 | |
Buy | | | | 155 | | 12/2007 | | | 0 | | | 0 | | | | 0 | |
Buy | | | | 5,553 | | 01/2008 | | | 0 | | | (5 | ) | | | (5 | ) |
Buy | | COP | | 45,180 | | 03/2008 | | | 2 | | | 0 | | | | 2 | |
Buy | | CZK | | 861 | | 03/2008 | | | 0 | | | (1 | ) | | | (1 | ) |
Sell | | EUR | | 1,710 | | 07/2007 | | | 0 | | | (22 | ) | | | (22 | ) |
Buy | | IDR | | 1,373,299 | | 07/2007 | | | 1 | | | 0 | | | | 1 | |
Sell | | | | 1,373,299 | | 07/2007 | | | 0 | | | (2 | ) | | | (2 | ) |
| | | | |
| 12 | | PIMCO Variable Insurance Trust | | See Accompanying Notes |
| | |
| |
| | | June 30, 2007 (Unaudited) |
| | | | | | | | | | | | | | | | | |
| Type | | Currency | | Principal
Amount
Covered by
Contract | | Settlement
Month | | Unrealized
Appreciation | | Unrealized
(Depreciation) | | | Net Unrealized
Appreciation/
(Depreciation) | |
Buy | | IDR | | 3,359,122 | | 08/2007 | | $ | 3 | | $ | 0 | | | $ | 3 | |
Buy | | | | 1,373,299 | | 10/2007 | | | 1 | | | 0 | | | | 1 | |
Buy | | ILS | | 85 | | 12/2007 | | | 0 | | | 0 | | | | 0 | |
Buy | | INR | | 1,143 | | 08/2007 | | | 1 | | | 0 | | | | 1 | |
Buy | | | | 7,939 | | 10/2007 | | | 1 | | | 0 | | | | 1 | |
Buy | | | | 890 | | 11/2007 | | | 0 | | | 0 | | | | 0 | |
Buy | | KRW | | 17,200 | | 07/2007 | | | 0 | | | 0 | | | | 0 | |
Buy | | | | 58,626 | | 08/2007 | | | 0 | | | 0 | | | | 0 | |
Buy | | | | 314,285 | | 09/2007 | | | 5 | | | 0 | | | | 5 | |
Buy | | | | 269,181 | | 11/2007 | | | 2 | | | 0 | | | | 2 | |
Buy | | MXN | | 2,185 | | 03/2008 | | | 5 | | | 0 | | | | 5 | |
Buy | | MYR | | 557 | | 07/2007 | | | 1 | | | 0 | | | | 1 | |
Sell | | | | 557 | | 07/2007 | | | 0 | | | 0 | | | | 0 | |
Buy | | | | 557 | | 10/2007 | | | 0 | | | 0 | | | | 0 | |
Buy | | PLN | | 1,301 | | 09/2007 | | | 13 | | | 0 | | | | 13 | |
Buy | | | | 358 | | 03/2008 | | | 0 | | | (1 | ) | | | (1 | ) |
Buy | | RUB | | 30,930 | | 09/2007 | | | 39 | | | 0 | | | | 39 | |
Buy | | | | 3,740 | | 11/2007 | | | 5 | | | 0 | | | | 5 | |
Buy | | | | 22,275 | | 12/2007 | | | 19 | | | 0 | | | | 19 | |
Buy | | SGD | | 271 | | 07/2007 | | | 0 | | | (1 | ) | | | (1 | ) |
Sell | | | | 129 | | 07/2007 | | | 0 | | | (1 | ) | | | (1 | ) |
Buy | | | | 288 | | 08/2007 | | | 0 | | | (3 | ) | | | (3 | ) |
Buy | | | | 336 | | 10/2007 | | | 1 | | | (1 | ) | | | 0 | |
Buy | | | | 438 | | 11/2007 | | | 0 | | | (3 | ) | | | (3 | ) |
Buy | | SKK | | 1,079 | | 03/2008 | | | 0 | | | 0 | | | | 0 | |
Buy | | ZAR | | 4,284 | | 09/2007 | | | 1 | | | (2 | ) | | | (1 | ) |
| | | | | | | | | | | | | | | | | |
| | | | | | | | $ | 229 | | $ | (42 | ) | | $ | 187 | |
| | | | | | | | | | | | | | | | | |
| | | | | | |
| See Accompanying Notes | | Semiannual Report | | June 30, 2007 | | 13 |
Notes to Financial Statements
1. ORGANIZATION
The Emerging Markets Bond Portfolio (the “Portfolio”) is a series of the PIMCO Variable Insurance Trust (the “Trust”). The Trust is registered under the Investment Company Act of 1940 (the “Act”), as amended, as an open-end management investment company organized as a Delaware business trust on October 3, 1997. The Portfolio offers two classes of shares: Administrative and Advisor. Information presented on these financial statements pertains to the Advisor Class of the Portfolio. Certain detailed financial information for the Administrative Class is provided separately and is available upon request. The Trust is designed to be used as an investment vehicle by Separate Accounts of insurance companies that fund variable annuity contracts and variable life insurance policies and by qualified pension and retirement plans.
2. SIGNIFICANT ACCOUNTING POLICIES
The following is a summary of significant accounting policies consistently followed by the Portfolio in the preparation of its financial statements in conformity with accounting principles generally accepted in the United States of America (“GAAP”). The preparation of financial statements in accordance with GAAP requires management to make estimates and assumptions that affect the reported amounts and disclosures on the financial statements. Actual results could differ from those estimates.
(a) Security Valuation Portfolio securities are valued as of the close of regular trading (normally 4:00 p.m., Eastern Time) on each day that the New York Stock Exchange (“NYSE”) is open. Portfolio securities and other assets for which market quotes are readily available are stated at market value. Market value is generally determined on the basis of last reported sales prices, or if no sales are reported, based on quotes obtained from a quotation reporting system, established market makers, or pricing services. Fixed-income securities and non-exchange traded derivatives are normally valued on the basis of quotes obtained from brokers and dealers or pricing services. Prices obtained from independent pricing services use information provided by market makers or estimates of market values obtained from yield data relating to investments or securities with similar characteristics. Certain fixed income securities purchased on a delayed-delivery basis are marked to market daily until settlement at the forward settlement date. Short-term investments having a maturity of 60 days or less are generally valued at amortized cost. Exchange traded options, futures and options on futures are valued at the settlement price determined by the relevant exchange. With respect to any portion of the Portfolio’s assets that are invested in one or more open end management investment companies, the Portfolio’s net asset value (“NAV”) will be calculated based upon the NAVs of such investments.
Investments initially valued in currencies other than the U.S. dollar are converted to the U.S. dollar using exchange rates obtained from pricing services. As a result, the NAV of the Portfolio’s securities may be affected by changes in the value of currencies in relation to the U.S. dollar. The value of securities traded in markets outside the United States or denominated in currencies other than the U.S. dollar may be affected significantly on a day that the NYSE is closed and an investor is not able to purchase, redeem or exchange shares.
Securities and other assets for which market quotes are not readily available are valued at fair value as determined in good faith by the Board of Trustees or persons acting at their direction. The Board of Trustees has adopted methods for valuing securities and other assets in circumstances where market quotes are not readily available, and has delegated to Pacific Investment Management Company LLC (“PIMCO”) the responsibility for applying the valuation methods. In the event that market quotes are not readily available, and the security or asset cannot be valued pursuant to one of the valuation methods, the value of the security or asset will be determined in good faith by the Valuation Committee of the Board of Trustees, generally based upon recommendations provided by PIMCO.
Market quotes are considered not readily available in circumstances where there is an absence of current or reliable market-based data (e.g., trade information, bid/asked information, broker quotes), including where events occur after the close of the relevant market, but prior to the close of regular trading, that materially affect the values of the Portfolio’s securities or assets. In addition, market quotes are considered not readily available when, due to extraordinary circumstances, the exchanges or markets on which the securities trade, do not open for trading for the entire day and no other market prices are available. The Board has delegated to PIMCO the responsibility for monitoring significant events that may materially affect the values of the Portfolio’s securities or assets and for determining whether the value of the applicable securities or assets should be re-evaluated in light of such significant events.
When the Portfolio uses fair value pricing to determine its NAV, securities will not be priced on the basis of quotations from the primary market in which they are traded, but rather may be priced by another method that the Board of Trustees or persons acting at their direction believe accurately reflects fair value. The Trust’s policy is intended to result in a calculation of the Portfolio’s NAV that fairly reflects security values as of the time of pricing. However, fair values determined by the Board of Trustees or persons acting at their direction may not accurately reflect the price that the Portfolio could obtain for a security if it were to dispose of that security as of the time of pricing. Because foreign securities can trade on non-business days of the Portfolio, the NAV of the Portfolio may change on days when shareholders will not be able to purchase or redeem Portfolio shares. The prices used by the Portfolio may differ from the value that would be realized if the securities were sold and the differences could be material to the financial statements.
(b) Securities Transactions and Investment Income Securities transactions are recorded as of the trade date for financial reporting purposes. Securities purchased or sold on a when-issued or delayed-delivery basis may be settled a month or more after the trade date. Realized gains and losses from securities sold are recorded on the identified cost basis. Dividend income is recorded on the ex-dividend date, except certain dividends from foreign securities where the ex-dividend date may have passed, which are recorded as soon as the Portfolio is informed of the ex-dividend date. Interest income, adjusted for the accretion of discounts and amortization of premiums, is recorded on the accrual basis. Paydown gains and losses on mortgage-related and other asset-backed securities are recorded as components of interest income on the Statement of Operations.
(c) Delayed-Delivery Transactions The Portfolio may purchase or sell securities on a delayed-delivery basis. These transactions involve a commitment by the Portfolio to purchase or sell securities for a predetermined price or yield, with payment and delivery taking place beyond the customary settlement period. When delayed-delivery purchases are outstanding, the Portfolio will designate liquid assets in an amount sufficient to meet the purchase price. When purchasing a security on a delayed-delivery basis, the Portfolio assumes the rights and risks of ownership of the security, including the risk of price and yield fluctuations, and takes such fluctuations into account when determining its net asset value. The Portfolio may dispose of or renegotiate a delayed-delivery transaction after it is entered into, and may sell when-issued securities before they are delivered, which may result in a capital gain or loss. When the Portfolio has sold a security on a delayed-delivery basis, the Portfolio does not participate in future gains and losses with respect to the security.
(d) Dividends and Distributions to Shareholders Dividends from net investment income, if any, are declared daily and distributed to shareholders monthly. Net realized capital gains earned by the Portfolio, if any, will be distributed no less frequently than once each year.
Income dividends and capital gain distributions are determined in accordance with income tax regulations which may differ from GAAP. Differences between tax
| | | | |
| 14 | | PIMCO Variable Insurance Trust | | |
| | |
| |
| | | June 30, 2007 (Unaudited) |
regulations and GAAP may change the fiscal year when income and capital items are recognized for tax and GAAP purposes. Examples of events that give rise to timing differences include wash sales, straddles, net operating losses and capital loss carryforwards. Further, the character of investment income and capital gains may be different for certain transactions under the two methods of accounting. Examples of characterization differences include the treatment of mortgage paydowns, swaps, foreign currency transactions and contingent debt instruments. As a result, income dividends and capital gain distributions declared during a fiscal period may differ significantly from the net investment income and realized capital gain reported on the Portfolio’s annual financial statements presented under GAAP.
Distributions classified as a tax basis return of capital, if any, are reflected on the accompanying Statements of Changes in Net Assets and have been reclassified to paid in capital. In addition, other amounts have been reclassified between undistributed net investment income, accumulated undistributed net realized gains or losses and/or paid in capital to more appropriately conform financial accounting to tax characterizations of dividend distributions.
(e) Multiclass Operations Each class offered by the Portfolio has equal rights as to assets and voting privileges (except that shareholders of a class have exclusive voting rights regarding any matter relating solely to that class of shares). Income and non-class specific expenses of the Portfolio are allocated daily to each class of shares based on the relative value of settled shares. Realized and unrealized capital gains and losses of the Portfolio are allocated daily to each class of shares based on the relative net assets of each class. Class specific expenses, where applicable, currently include administrative, distribution and servicing fees.
(f) Foreign Currency The functional and reporting currency for the Portfolio is the U.S. dollar. The market values of foreign securities, currency holdings and other assets and liabilities are translated into U.S. dollars based on the current exchange rates each business day. Fluctuations in the value of currency holdings and other assets and liabilities resulting from changes in exchange rates are recorded as unrealized foreign currency gains or losses. Realized gains or losses and unrealized appreciation or depreciation on investment securities and income and expenses are translated on the respective dates of such transactions. The effects of changes in foreign currency exchange rates on investments in securities are not segregated on the Statement of Operations from the effects of changes in market prices of those securities, but are included with the net realized and unrealized gain or loss on investment securities.
| | | | | | |
|
| Non-U.S. currency symbols utilized throughout the report are defined as follows: |
| BRL | | Brazilian Real | | KRW | | South Korean Won |
| CLP | | Chilean Peso | | MXN | | Mexican Peso |
| CNY | | Chinese Yuan Renminbi | | MYR | | Malaysian Ringgit |
| COP | | Colombian Peso | | PLN | | Polish Zloty |
| CZK | | Czech Koruna | | RUB | | Russian Ruble |
| EUR | | Euro | | SGD | | Singapore Dollar |
| IDR | | Indonesian Rupiah | | SKK | | Slovakia Koruna |
| ILS | | Israeli Shekel | | UYU | | Uruguay Peso |
| INR | | Indian Rupee | | ZAR | | South African Rand |
(g) Foreign Currency Transactions The Portfolio may enter into foreign currency contracts in connection with settling planned purchases or sales of securities, to hedge the currency exposure associated with some or all of the Portfolio’s securities or as a part of an investment strategy. A foreign currency contract is an agreement between two parties to buy and sell a currency at a set price on a future date. The market value of a foreign currency contract fluctuates
with changes in foreign currency exchange rates. Foreign currency contracts are marked to market daily and the change in value is recorded by the Portfolio as an unrealized gain or loss. Realized gains or losses equal to the difference between the value of the contract at the time it was opened and the value at the time it was closed are recorded upon delivery or receipt of the currency. These contracts may involve market risk in excess of the unrealized gain or loss reflected on the Statement of Assets and Liabilities. In addition, the Portfolio could be exposed to risk if the counterparties are unable to meet the terms of the contracts or if the value of the currency changes unfavorably to the U.S. dollar.
(h) Futures Contracts The Portfolio may enter into futures contracts. The Portfolio may use futures contracts to manage its exposure to the securities markets or to movements in interest rates and currency values. The primary risks associated with the use of futures contracts are the imperfect correlation between the change in market value of the securities held by the Portfolio and the prices of futures contracts, the possibility of an illiquid market, and the inability of the counterparty to meet the terms of the contract. Futures contracts are valued based upon their quoted daily settlement prices. Upon entering into a futures contract, the Portfolio is required to deposit with its futures broker, an amount of cash or U.S. Government and Agency Obligations in accordance with the initial margin requirements of the broker or exchange. Futures contracts are marked to market daily and an appropriate payable or receivable for the change in value (“variation margin”) is recorded by the Portfolio. Gains or losses are recognized but not considered realized until the contracts expire or are closed. Futures contracts involve, to varying degrees, risk of loss in excess of the variation margin disclosed on the Statement of Assets and Liabilities.
(i) Inflation-Indexed Bonds The Portfolio may invest in inflation-indexed bonds. Inflation-indexed bonds are fixed-income securities whose principal value is periodically adjusted to the rate of inflation. The interest rate on these bonds is generally fixed at issuance at a rate lower than typical bonds. Over the life of an inflation-indexed bond, however, interest will be paid based on a principal value, which is adjusted for inflation. Any increase in the principal amount of an inflation-indexed bond will be included as interest income on the Statement of Operations, even though investors do not receive their principal until maturity.
(j) Options Contracts The Portfolio may write call and put options on futures, swaps, securities or currencies it owns or in which it may invest. Writing put options tends to increase the Portfolio’s exposure to the underlying instrument. Writing call options tends to decrease the Portfolio’s exposure to the underlying instrument. When the Portfolio writes a call or put option, an amount equal to the premium received is recorded as a liability and subsequently marked to market to reflect the current value of the option written. These liabilities are reflected as written options outstanding on the Statement of Assets and Liabilities. Certain options may be written with premiums to be determined on a future date. The premiums for these options are based upon implied volatility parameters at specified terms. Premiums received from writing options which expire are treated as realized gains. Premiums received from writing options which are exercised or closed are added to the proceeds or offset against amounts paid on the underlying future, swap, security or currency transaction to determine the realized gain or loss. The Portfolio as a writer of an option has no control over whether the underlying future, swap, security or currency may be sold (call) or purchased (put) and as a result bears the market risk of an unfavorable change in the price of the future, swap, security or currency underlying the written option. There is the risk the Portfolio may not be able to enter into a closing transaction because of an illiquid market.
The Portfolio may also purchase put and call options. Purchasing call options tends to increase the Portfolio’s exposure to the underlying instrument. Purchasing put options tends to decrease the Portfolio’s exposure to the underlying instrument. The Portfolio pays a premium which is included on the Statement of Assets and Liabilities as an investment and subsequently marked to market to reflect the
| | | | | | |
| | Semiannual Report | | June 30, 2007 | | 15 |
Notes to Financial Statements (Cont.)
current value of the option. Premiums paid for purchasing options which expire are treated as realized losses. Certain options may be purchased with premiums to be determined on a future date. The premiums for these options are based upon implied volatility parameters at specified terms. The risk associated with purchasing put and call options is limited to the premium paid. Premiums paid for purchasing options which are exercised or closed are added to the amounts paid or offset against the proceeds on the underlying future, swap, security or currency transaction to determine the realized gain or loss.
(k) Repurchase Agreements The Portfolio may engage in repurchase transactions. Under the terms of a typical repurchase agreement, the Portfolio takes possession of an underlying debt obligation (collateral) subject to an obligation of the seller to repurchase, and the Portfolio to resell, the obligation at an agreed-upon price and time. The underlying securities for all repurchase agreements are held in safekeeping at the Portfolio’s custodian or designated subcustodians under tri-party repurchase agreements. The market value of the collateral must be equal to or exceed the total amount of the repurchase obligations, including interest. Securities purchased under repurchase agreements are reflected as an asset on the Statement of Assets and Liabilities. Generally, in the event of counterparty default, the Portfolio has the right to use the collateral to offset losses incurred. If the counterparty should default, the Portfolio will seek to sell the securities which it holds as collateral. This could involve procedural costs or delays in addition to a loss on the securities if their value should fall below their repurchase price.
(l) Inverse Floating Rate Transactions—Residual Interest Municipal Bonds (“RIBs”)/Residual Interest Tax Exempt Bonds (“RITEs”) The Portfolio may invest in RIBs and RITEs (“Inverse Floaters”). Inverse Floaters are created via a master trust agreement between a broker-dealer, acting as trustor and liquidity provider, and an investment bank, acting as trustee and tender agent. The master trust agreement defines the terms for each trust series; with each series being established by the transfer of long-term, fixed-rate municipal bonds (“Fixed Rate Bonds”) to the trustee to be held and provide for the creation, execution and delivery of floater certificates (“Floating Rate Notes”) and Inverse Floaters. Floating Rate Notes are liquid notes that are issued with a short-term variable rate typically linked to the LIBOR, subject to limitations, for some duration. After interest income is paid on the Floating Rate Notes at current rates, the residual income from the Fixed Rate Bonds is paid to the Inverse Floaters. Inverse Floaters are issued with a coupon that fluctuates inversely with the Floating Rate Notes’ referenced rate, subject to certain limitations. Therefore, rising short-term rates result in lower income for the Inverse Floaters and vice versa.
Floating Rate Notes are generally remarketed to municipal money market funds. Inverse Floaters are acquired by either tax-exempt municipal bond funds or trusts, or other parties interested in potentially higher yielding tax-exempt securities. Inverse Floaters may also be acquired for the purpose of increasing leverage. Floating Rate Note holders typically have the option to tender their notes to the liquidity provider for redemption at par at each reset date. The Inverse Floater holders have the option to (i) require the Floating Rate Note holders to tender their notes at par, and (ii) require the liquidity provider to transfer the Fixed Rate Bonds to the Inverse Floater holders. The holders of Inverse Floaters bear substantially all of the downside investment risk associated with the underlying Fixed Rate Bonds, and also benefit from a disproportionate amount of the potential appreciation of the underlying Fixed Rate Bonds’ value. Inverse Floaters may be more volatile and less liquid than other municipal bonds of comparable maturity.
Inverse Floaters may be acquired with or without first transferring to the trustor the Fixed Rate Bonds that were utilized to create the trust series. Inverse Floaters acquired without a transfer of Fixed Rate Bonds are recognized as purchases of securities as outlined in Note 2(b). Statement of Financial Accounting Standards No. 140—Accounting for Transfers and Servicing of Financial Assets and
Extinguishments of Liabilities (“FAS No. 140”), governs the standards for accounting for securitizations and other transfers of financial assets. If there is a transfer of Fixed Rate Bonds and it meets sale criteria under FAS No. 140, a Portfolio records a sale of the Fixed Rate Bonds and a purchase of the Inverse Floaters. The cash received from the Inverse Floaters is then recorded as interest income in the Statement of Operations.
If the transfer of Fixed Rate Bonds does not meet sale criteria under FAS No. 140, a Portfolio accounts for the transaction described above as a secured borrowing by including the Fixed Rate Bonds in its Schedule of Investments, and recording the Floating Rate Notes as a liability under the caption “Payable for floating rate notes” in the Portfolio’s Statement of Assets and Liabilities. In a secured borrowing transaction, cash received from the Inverse Floaters is not recorded as interest income. Instead, a Portfolio records interest income related to the Fixed Rate Bonds and interest expense related to the Floating Rate Notes, the net of which is equal to the cash received from the Inverse Floaters acquired by the Portfolio. Thus, while a Portfolio’s reported total income, net expenses, and net expense ratio are generally higher for investments in Inverse Floaters acquired via a secured borrowing, the method of acquiring Inverse Floaters does not result in differences for reported cash flows, net asset value or total return.
(m) Short Sales The Portfolio may enter into short sales transactions. A short sale is a transaction in which the Portfolio sells securities it does not own in anticipation of a decline in the market price of the securities. Securities sold in short sale transactions and interest payable on such securities, if any, are reflected as a liability on the Statement of Assets and Liabilities. The Portfolio is obligated to deliver securities at the market price at the time the short position is closed. Possible losses from short sales may be unlimited, whereas losses from purchases cannot exceed the total amount invested.
(n) Swap Agreements The Portfolio may invest in swap agreements. Swap transactions are privately negotiated agreements between the Portfolio and a counterparty to exchange or swap investment cash flows, assets, or market-linked returns at specified, future intervals. The Portfolio may enter into interest rate, total return, forward spread-lock, credit default, and other forms of swap agreements to manage its exposure to interest rates and credit risk. In connection with these agreements, securities may be identified as collateral in accordance with the terms of the respective swap agreements.
Interest rate swap agreements involve the exchange by the Portfolio with another party of their respective commitments to pay or receive interest, e.g., an exchange of floating rate payments for fixed rate payments with respect to the notional amount of principal. Certain forms of interest rate swap agreements may include: (i) interest rate caps, under which, in return for a premium, one party agrees to make payments to the other to the extent that interest rates exceed a specified rate, or “cap”, (ii) interest rate floors, under which, in return for a premium, one party agrees to make payments to the other to the extent that interest rates fall below a specified rate, or “floor”, or (iii) interest rate collars, under which a party sells a cap and purchases a floor or vice versa in an attempt to protect itself against interest rate movements exceeding given minimum or maximum levels.
Total return swap agreements involve commitments to pay interest in exchange for a market-linked return, both based on notional amounts. To the extent the total return of the security or index underlying the transaction exceeds or falls short of the offsetting interest rate obligation, the Portfolio will receive a payment from or make a payment to the counterparty.
Forward spread-lock swap agreements involve commitments to pay or receive a settlement amount calculated as the difference between the swap spread and a fixed spread, multiplied by the notional amount times the duration of the swap. The swap spread is the difference between the benchmark swap rate (market rate) and the specific Treasury rate.
| | | | |
| 16 | | PIMCO Variable Insurance Trust | | |
| | |
| |
| | | June 30, 2007 (Unaudited) |
Credit default swap agreements involve one party making a stream of payments to another party in exchange for the right to receive a specified return in the event of a default by a third party, typically corporate issues or sovereign issues of an emerging country, on its obligation. The Portfolio may use credit default swaps to provide a measure of protection against defaults of the issuers (i.e., to reduce risk where the Portfolio owns or has exposure to the sovereign issuer) or to take an active long or short position with respect to the likelihood of a particular issuer’s default. As a seller of protection, the Portfolio generally receives an upfront payment or a fixed rate of income throughout the term of the swap provided that there is no credit event. If the Portfolio is a seller of protection and a credit event occurs, as defined under the terms of that particular swap agreement, the Portfolio will pay to the buyer of the protection an amount up to the notional value of the swap and in certain instances take delivery of the security. As the seller, the Portfolio would effectively add leverage to its portfolio because, in addition to its total net assets, the Portfolio would be subject to investment exposure on the notional amount of the swap. As a buyer of protection, the Portfolio generally receives an amount up to the notional value of the swap if a credit event occurs. The treatment of credit default swaps and other swap agreements that provide for contingent, non-periodic, bullet-type payments as “notional principal contracts” for U.S. federal income tax purposes is uncertain. Were the U.S. Internal Revenue Service (“IRS”) to take the position that a credit default swap or other bullet-type swap is not a “notional principal contract” for U.S. federal income tax purposes, payments received by the Portfolio from such investments might be subject to U.S. excise or income taxes.
Swaps are marked to market daily based upon quotations from market makers and the change in value, if any, is recorded as unrealized gain or loss on the Statement of Operations. Payments received or made at the beginning of the measurement period are reflected as such on the Statement of Assets and Liabilities. These upfront payments are recorded as realized gain or loss on the Statement of Operations upon termination or maturity of the swap. A liquidation payment received or made at the termination of the swap is recorded as realized gain or loss on the Statement of Operations. Net periodic payments received or paid by the Portfolio are included as part of realized gain or loss on the Statement of Operations. Entering into these agreements involves, to varying degrees, elements of credit, market and documentation risk in excess of the amounts recognized on the Statement of Assets and Liabilities. Such risks involve the possibility that there will be no liquid market for these agreements, that the counterparty to the agreements may default on its obligation to perform or disagree as to the meaning of contractual terms in the agreements and that there may be unfavorable changes in interest rates.
(o) Loan Participations and Assignments The Portfolio may invest in direct debt instruments which are interests in amounts owned by corporate, governmental, or other borrowers to lenders or lending syndicates. The Portfolio’s investments in loans may be in the form of participations in loans or assignments of all or a portion of loans from third parties. A loan is often administered by a bank or other financial institution (the “lender”) that acts as agent for all holders. The agent administers the terms of the loan, as specified in the loan agreement. When investing in a loan participation, the Portfolio has the right to receive payments of principal, interest and any fees to which it is entitled only from the lender selling the loan agreement and only upon receipt by the lender of payments from the borrower. The Portfolio generally has no right to enforce compliance with the terms of the loan agreement with the borrower. As a result, the Portfolio may be subject to the credit risk of both the borrower and the lender that is selling the loan agreement. When the Portfolio purchases assignments from lenders it acquires direct rights against the borrower of the loan. At the end of the period June 30, 2007, the Portfolio had no unfunded loan commitments.
(p) U.S. Government Agencies or Government-Sponsored Enterprises Securities issued by U.S. Government agencies or government-sponsored enterprises may not be guaranteed by the U.S. Treasury. The
Government National Mortgage Association (“GNMA” or “Ginnie Mae”), a wholly owned U.S. Government corporation, is authorized to guarantee, with the full faith and credit of the U.S. Government, the timely payment of principal and interest on securities issued by institutions approved by GNMA and backed by pools of mortgages insured by the Federal Housing Administration or guaranteed by the Department of Veterans Affairs. Government-related guarantors (i.e., not backed by the full faith and credit of the U.S. Government) include the Federal National Mortgage Association (“FNMA” or “Fannie Mae”) and the Federal Home Loan Mortgage Corporation (“FHLMC” or “Freddie Mac”). Pass-through securities issued by FNMA are guaranteed as to timely payment of principal and interest by FNMA but are not backed by the full faith and credit of the U.S. Government. FHLMC guarantees the timely payment of interest and ultimate collection of principal, but its participation certificates are not backed by the full faith and credit of the U.S. Government.
(q) New Accounting Policies In July 2006, the Financial Accounting Standards Board (“FASB”) issued Interpretation No. 48, “Accounting for Uncertainty in Income Taxes—an Interpretation of FASB Statement No. 109” (the “Interpretation”). The Interpretation became effective for the Portfolio on June 29, 2007. Management has evaluated the application of the Interpretation in relation to the Portfolio and has concluded that no single filing position or combination of filing positions identified as uncertain tax positions required the accrual of a tax liability in the accounting records of the Portfolio for the period ending June 30, 2007. Management will monitor all existing filing positions and future filing positions in light of the Interpretation and evaluate the need for any future tax accruals and financial statement disclosures as warranted.
In September 2006, the FASB issued Statement of Financial Accounting Standards No. 157, “Fair Value Measurements” (the “Statement”). The Statement is effective for fiscal years beginning after November 15, 2007 and will require expanded disclosure about fair value measurements, separately for each major category of assets and liabilities, that enables shareholders to assess the inputs used to develop those measurements, and for recurring fair value measurements using significant unobservable inputs the effect of the measurements on changes in net assets for the reporting period. Management is currently evaluating the application of the Statement to the Portfolio and will provide additional information in relation to the Statement on the Portfolio’s annual financial statements for the period ending December 31, 2007.
3. FEES AND EXPENSES
(a) Investment Advisory Fee PIMCO is a majority-owned subsidiary of Allianz Global Investors of America L.P. (“AGI”), and serves as investment adviser (the “Adviser”) to the Trust, pursuant to an investment advisory contract. The Adviser receives a monthly fee from the Portfolio, at an annual rate based on average daily net assets. The Advisory Fee for all classes is charged at an annual rate of 0.45%.
(b) Administration Fee PIMCO serves as administrator (the “Administrator”), and provides administrative services to the Trust for which it receives a monthly administrative fee based on each share class’s average daily net assets. As the Administrator, PIMCO bears the costs of various third-party services, including audit, custodial, portfolio accounting, legal, transfer agency and printing costs. The Administration Fee for all classes is charged at the annual rate of 0.40%.
(c) Distribution and Servicing Fees Allianz Global Investors Distributors LLC (“AGID”) is an indirect wholly-owned subsidiary of AGI and serves as the distributor (the “Distributor”) of the Trust’s shares. The Trust is permitted to reimburse AGID on a quarterly basis, out of the Administrative Class assets of the Portfolio in the amount of 0.15% on an annual basis of the average daily net assets of that class, for payments made to financial intermediaries that provide services in connection with the distribution of shares or administration of plans or
| | | | | | |
| | Semiannual Report | | June 30, 2007 | | 17 |
Notes to Financial Statements (Cont.)
programs that use Portfolio shares as their funding medium. The effective rate paid to AGID was 0.15% during the current fiscal year.
The Trust has adopted a Distribution Plan, for the Advisor Class shares of the Portfolio (the “Plan”). The Plan has been adopted pursuant to Rule 12b-1 under the Act. The Plan permits payments for expenses in connection with the distribution and marketing of Advisor Class shares and/or the provision of shareholder services to Advisor Class shareholders. The Plan permits the Portfolio to make total payments at an annual rate of 0.25% of its average daily net assets attributable to its Advisor Class shares.
(d) Portfolio Expenses The Trust is responsible for the following expenses: (i) salaries and other compensation of any of the Trust’s executive officers and employees who are not officers, directors, stockholders or employees of PIMCO or its subsidiaries or affiliates; (ii) taxes and governmental fees; (iii) brokerage fees and commissions and other portfolio transaction expenses; (iv) the costs of borrowing money, including interest expenses and bank overdraft charges; (v) fees and expenses of the Trustees who are not “interested persons” of PIMCO or the Trust, and any counsel retained exclusively for their benefit; (vi) extraordinary expenses, including costs of litigation and indemnification expenses; (vii) organization expenses and (viii) any expenses allocated or allocable to a specific class of shares, which include service fees payable with respect to the Administrative Class Shares, and may include certain other expenses as permitted by the Trust’s Multiple Class Plan adopted pursuant to Rule 18f-3 under the Act and subject to review and approval by the Trustees. The ratio of expenses to average net assets per share class, as disclosed in the Financial Highlights, may differ from the annual portfolio operating expenses per share class as disclosed in the Prospectus for the reasons set forth above.
Effective April 1, 2007, each Trustee, other than those affiliated with PIMCO or its affiliates, receives an annual retainer of $15,000, plus $2,375 for each Board of Trustees meeting attended in person, $500 for each committee meeting attended and $750 for each Board of Trustees meeting attended telephonically, plus reimbursement of related expenses. In addition, the audit committee chair receives an additional annual retainer of $2,000 and each other committee chair receives an additional annual retainer of $500. These expenses are allocated on a pro-rata basis to the various portfolios of the Trust according to their respective net assets. The Trust pays no compensation directly to any Trustee or any other officer who is affiliated with the Administrator, all of whom receive remuneration for their services to the Trust from the Administrator or its affiliates. Prior to April 1, 2007, each Trustee, other than those affiliated with PIMCO or its affiliates, received an annual retainer of $15,000 plus $2,000 for each Board of Trustees meeting attended ($500 for each special meeting attended), plus reimbursement of related expenses. The Audit Committee Chairman received an annual retainer of $1,500 and the Governance Committee Chairman received an annual retainer of $500. In addition, each member of a committee received $500 for each committee meeting attended.
4. RELATED PARTY TRANSACTIONS
The Adviser, Administrator, and Distributor are related parties as defined by FAS 57, Related Party Disclosures. Fees payable to these parties are disclosed in Note 3.
5. GUARANTEES AND INDEMNIFICATIONS
Under the Trust’s organizational documents, each Trustee, officer, employee or other agent of the Trust (including the Trust’s investment manager) is indemnified, to the extent permitted by the Act, against certain liabilities that may arise out of performance of their duties to the Portfolio. Additionally, in the normal course of business, the Portfolio enters into contracts that contain a variety of indemnification clauses. The Portfolio’s maximum exposure under these arrangements is unknown as this would involve future claims that may be made against the Portfolio that have
not yet occurred. However, the Portfolio has not had prior claims or losses pursuant to these contracts and believes the risk of loss to be remote.
6. PURCHASES AND SALES OF SECURITIES
The length of time the Portfolio has held a particular security is not generally a consideration in investment decisions. A change in the securities held by the Portfolio is known as “portfolio turnover”. The Portfolio may engage in frequent and active trading of portfolio securities to achieve its investment objective, particularly during periods of volatile market movements. High portfolio turnover (e.g., over 100%) involves correspondingly greater expenses to the Portfolio, including brokerage commissions or dealer mark-ups and other transaction costs on the sale of securities and reinvestments in other securities. Such sales may also result in realization of taxable capital gains, including short-term capital gains (which are generally taxed at ordinary income tax rates). The trading costs and tax effects associated with portfolio turnover may adversely affect the Portfolio’s performance.
Purchases and sales of securities (excluding short-term investments) for the period ended June 30, 2007, were as follows (amounts in thousands):
| | | | | | | | | | | | |
| U.S. Government/Agency | | | | All Other |
| Purchases | | Sales | | | | Purchases | | Sales |
| $ | 0 | | $ | 0 | | | | $ | 173,928 | | $ | 188,317 |
7. TRANSACTIONS IN WRITTEN CALL AND PUT OPTIONS
Transactions in written call and put options were as follows (amounts in thousands, except for number of contracts):
| | | | | | | | |
| | | | | Notional
Amount
in $ | | Premium |
Balance at 12/31/2006 | | | | $ | 0 | | $ | 0 |
Sales | | | | | 128,000 | | | 1,500 |
Closing Buys | | | | | 0 | | | 0 |
Expirations | | | | | 0 | | | 0 |
Exercised | | | | | 0 | | | 0 |
Balance at 06/30/2007 | | | | $ | 128,000 | | $ | 1,500 |
8. SHARES OF BENEFICIAL INTEREST
The Portfolio may issue an unlimited number of shares of beneficial interest with a $0.001 par value. Changes in shares of beneficial interest were as follows (shares and amounts in thousands):
| | | | | | | | | | | | | | | | |
| | | | | Six Months Ended
06/30/2007 | | | Year Ended
12/31/2006 | |
| | | | | Shares | | | Amount | | | Shares | | | Amount | |
| | | | | |
Receipts for shares sold | | | | | | | | | | | | | | | | |
Administrative Class | | | | 2,205 | | | $ | 30,794 | | | 7,144 | | | $ | 97,460 | |
Advisor Class | | | | 18 | | | | 260 | | | 36 | | | | 481 | |
Issued as reinvestment of distributions | | | | | | | | | | | | | | | | |
Administrative Class | | | | 405 | | | | 5,653 | | | 865 | | | | 11,892 | |
Advisor Class | | | | 1 | | | | 16 | | | 1 | | | | 14 | |
Cost of shares redeemed | | | | | | | | | | | | | | | | |
Administrative Class | | | | (3,555 | ) | | | (50,072 | ) | | (2,902 | ) | | | (39,361 | ) |
Advisor Class | | | | (8 | ) | | | (117 | ) | | (3 | ) | | | (38 | ) |
Net increase (decrease) resulting from Portfolio share transactions | | | | (934 | ) | | $ | (13,466 | ) | | 5,141 | | | $ | 70,448 | |
| | | | |
| 18 | | PIMCO Variable Insurance Trust | | |
| | |
| |
| | | June 30, 2007 (Unaudited) |
The following schedule shows the number of shareholders each owning 5% or more of the Portfolio and the total percentage of the Portfolio held by such shareholders:
| | | | | | |
| | | | | Number of Shareholders | | % of Portfolio Held |
Administrative Class | | | | 6 | | 97 |
Advisor Class | | | | 1 | | 93 |
9. REGULATORY AND LITIGATION MATTERS
Since February 2004, PIMCO, Allianz Global Investors of America L.P. (PIMCO’s parent company), AGID, and certain of their affiliates, including the PIMCO Funds (another series of funds managed by PIMCO), the Allianz Funds (formerly known as PIMCO Funds: Multi-Manager Series (another series of funds managed by affiliates of PIMCO)), certain Trustees of the Trust (in their capacity as Trustees of the PIMCO Funds or the Allianz Funds) and certain employees of PIMCO, have been named as defendants in fifteen lawsuits filed in various jurisdictions. Eleven of those lawsuits concern “market timing,” and they have been transferred to and consolidated for pre-trial proceedings in a multi-district litigation proceeding in the U.S. District Court for the District of Maryland; the other four lawsuits concern “revenue sharing” and have been consolidated into a single action in the U.S. District Court for the District of Connecticut. The lawsuits have been commenced as putative class actions on behalf of investors who purchased, held or redeemed shares of the various series of the PIMCO Funds and the Allianz Funds during specified periods, or as derivative actions on behalf of the PIMCO Funds and the Allianz Funds.
The market timing actions in the District of Maryland generally allege that certain hedge funds were allowed to engage in “market timing” in certain funds of the PIMCO Funds and the Allianz Funds and this alleged activity was not disclosed. Pursuant to tolling agreements entered into with the derivative and class action plaintiffs, PIMCO, certain PIMCO Funds Trustees, and certain employees of PIMCO who were previously named as defendants have all been dropped as defendants in the market timing actions; the plaintiffs continue to assert claims on behalf of the shareholders of the PIMCO Funds or on behalf of the PIMCO Funds itself against other defendants. By order dated November 3, 2005, the U.S. District Court for the District of Maryland granted the PIMCO Funds’ motion to dismiss claims asserted against it in a consolidated amended complaint where the PIMCO Funds were named, in the complaint, as a nominal defendant. The revenue sharing action in the District of Connecticut generally alleges that fund assets were inappropriately used to pay brokers to promote funds of the PIMCO Funds and the Allianz Funds, including directing fund brokerage transactions to such brokers, and that such alleged arrangements were not fully disclosed to shareholders. On August 11, 2005, the U.S. District Court for the District of Connecticut conducted a hearing on defendants’ motion to dismiss the consolidated amended complaint in the revenue sharing action but has not yet ruled on the motion to dismiss. The market timing and revenue sharing lawsuits seek, among other things, unspecified compensatory damages plus interest and, in some cases, punitive damages, the rescission of investment advisory contracts, the return of fees paid under those contracts and restitution.
Two nearly identical class action civil complaints have been filed in August 2005, in the Northern District of Illinois Eastern Division, alleging that the plaintiffs each purchased and sold a 10-year Treasury note futures contract and suffered damages from an alleged shortage when PIMCO held both physical and futures positions in
10-year Treasury notes for its client accounts. The two actions have been consolidated into one action, and the two separate complaints have been replaced by a consolidated complaint. PIMCO is a named defendant, and PIMCO Funds has been added as a defendant, to the consolidated action. PIMCO strongly believes the complaint is without merit and intends to vigorously defend itself.
In April 2006, certain portfolios of the Trust and certain other funds managed by PIMCO were served in an adversary proceeding brought by the Official Committee of Asbestos Claimants of G-I Holdings, Inc. in G-I Holdings, Inc.’s bankruptcy in the District of New Jersey. In July 2004, PIMCO was named in this lawsuit and remains a defendant. The plaintiff seeks to recover for the bankruptcy estate assets that were transferred by the predecessor entity of G-I Holdings, Inc. to a wholly-owned subsidiary in 1994. The subsidiary has since issued notes, of which certain portfolios of the Trust and certain other funds managed by PIMCO are alleged to be holders. The complaint alleges that in 2000, more than two hundred noteholders—including certain portfolios of the Trust and certain other funds managed by PIMCO—were granted a second priority lien on the assets of the subsidiary in exchange for their consent to a refinancing transaction and the granting of a first priority lien to the lending banks. The plaintiff is seeking invalidation of the lien in favor of the noteholders and/or the value of the lien. On June 21, 2006, the District of New Jersey overturned the Bankruptcy Court’s decision granting permission to file the adversary proceeding and remanded the matter to the Bankruptcy Court for further proceedings. Following a motion to reconsider, the District Court upheld its remand on August 7, 2006, and instructed the Bankruptcy Court to conduct a “cost-benefit” analysis of the Committee’s claims, including the claims against the noteholders. The Bankruptcy Court held a status conference on October 25, 2006 and set a briefing schedule relating to this cost-benefit analysis.
The foregoing speaks only as of the date of this report. It is possible that these matters and/or other developments resulting from these matters could result in increased portfolio redemptions or other adverse consequences to the Portfolio. However, PIMCO and AGID believe that these matters are not likely to have a material adverse effect on the Portfolio or on PIMCO’s or AGID’s ability to perform their respective investment advisory or distribution services relating to the Portfolio.
10. FEDERAL INCOME TAX MATTERS
The Portfolio intends to qualify as a regulated investment company under sub-chapter M of the Internal Revenue Code (the “Code”) and distribute all of its taxable income and net realized gains, if applicable, to shareholders. Accordingly, no provision for Federal income taxes has been made.
As of June 30, 2007, the aggregate cost of investments was the same for federal income tax and financial statement purposes. The net unrealized appreciation (depreciation) of investment securities for federal income tax purposes is as follows (amount in thousands):
| | | | |
Aggregate
Gross
Unrealized
Appreciation | | Aggregate
Gross
Unrealized
(Depreciation) | | Net
Unrealized
Appreciation |
$ 5,037 | | $ (2,726) | | $ 2,311 |
| | | | | | |
| | Semiannual Report | | June 30, 2007 | | 19 |
| | |
| |
Privacy Policy* | | (Unaudited) |
The Funds consider customer privacy to be a fundamental aspect of their relationships with shareholders and are committed to maintaining the confidentiality, integrity and security of their current, prospective and former shareholders’ personal information. To ensure their shareholders’ privacy, the Funds have developed policies that are designed to protect this confidentiality, while allowing shareholder needs to be served.
Obtaining Personal Information
In the course of providing shareholders with products and services, the Funds and certain service providers to the Funds, such as the Funds’ investment advisers (“Advisers”), may obtain non-public personal information about shareholders, which may come from sources such as account applications and other forms, from other written, electronic or verbal correspondence, from shareholder transactions, from a shareholder’s brokerage or financial advisory firm, financial adviser or consultant, and/or from information captured on the Funds’ internet web sites.
Respecting Your Privacy
As a matter of policy, the Funds do not disclose any personal or account information provided by shareholders or gathered by the Funds to non-affiliated third parties, except as required or permitted by law or as necessary for such third parties to perform their agreements with respect to the Funds. As is common in the industry, non-affiliated companies may from time to time be used to provide certain services, such as preparing and mailing prospectuses, reports, account statements and other information, conducting research on shareholder satisfaction and gathering shareholder proxies. A Fund’s Distributor may also retain non-affiliated companies to market the Fund’s shares or products which use the Fund’s shares and enter into joint marketing agreements with other companies. These companies may have access to a shareholder’s personal and account information, but are permitted to use this information solely to provide the specific service or as otherwise permitted by law. In most cases, the shareholders will be clients of a third party, but the Funds may also provide a shareholder’s personal and account information to the shareholder’s respective brokerage or financial advisory firm.
Sharing Information with Third Parties
The Funds reserve the right to disclose or report personal information to non-affiliated third parties, in limited circumstances, where the Funds believe in good faith that disclosure is required under law to cooperate with regulators or law enforcement authorities, to protect their rights or property or upon reasonable request by any Fund in which a shareholder has chosen to invest. In addition, the Funds may disclose information about a shareholder’s accounts to a non-affiliated third party with the consent of the shareholder.
Sharing Information with Affiliates
The Funds may share shareholder information with their affiliates in connection with servicing their shareholders’ accounts or to provide shareholders with information about products and services that the Funds or their Advisers, principal underwriters or their affiliates (“Service Affiliates”) believe may be of interest to such shareholders. The information that the Funds share may include, for example, a shareholder’s participation in one of the Funds or in other investment programs sponsored by a Service Affiliate, a shareholder’s ownership of certain types of accounts (such as IRAs), or other data about a shareholder’s accounts. The Funds’ Service Affiliates, in turn, are not permitted to share shareholder information with non-affiliated entities, except as required or permitted by law.
Procedures to Safeguard Private Information
The Funds take seriously the obligation to safeguard shareholder non-public personal information. In addition to this policy, the Funds have also implemented procedures that are designed to restrict access to a shareholder’s non-public personal information only to internal personnel who need to know that information in order to provide products or services to such shareholders. In order to guard a shareholder’s non-public personal information, physical, electronic and procedural safeguards are in place.
* This Privacy Policy applies to the following entities: PIMCO Funds, PIMCO Variable Insurance Trust, PCM Fund, Inc. and PIMCO Strategic Global Government Fund, Inc. (collectively, the “Funds”).
| | | | |
| 20 | | PIMCO Variable Insurance Trust | | |
Investment Adviser and Administrator
Pacific Investment Management Company LLC
840 Newport Center Drive
Newport Beach, California 92660
Distributor
Allianz Global Investors Distributors LLC
1345 Avenue of the Americas
New York, New York 10105
Custodian
State Street Bank & Trust Company
801 Pennsylvania
Kansas City, Missouri 64105
Transfer Agent
Boston Financial Data Services–Midwest
330 W. 9th Street
Kansas City, Missouri 64105
Legal Counsel
Dechert LLP
1775 I Street, N.W.
Washington, D.C. 20006
Independent Registered Public Accounting Firm
PricewaterhouseCoopers LLP
1055 Broadway
Kansas City, Missouri 64105
P I M C O

Table of Contents
This material is authorized for use only when preceded or accompanied by the current PIMCO Variable Insurance Trust (the “Trust”) prospectus. Investors should consider the investment objectives, risks, charges and expenses of this Trust carefully before investing. Ask your financial professional to explain all charges that may apply. This and other information is contained in the Trust’s prospectus. The variable product prospectus may be obtained by contacting your Investment Consultant. Please read the Trust and variable product prospectus carefully before you invest or send money.
Chairman’s Letter
Dear PIMCO Variable Insurance Trust Shareholder:
It is our pleasure to present to you the semiannual report for the PIMCO Variable Insurance Trust, covering the six-month period ended June 30, 2007. The PIMCO Variable Insurance Trust’s net assets were $8.68 billion at June 30, 2007, as compared to $7.76 billion at December 31, 2006.
Highlights of the financial markets during the reporting period include:
| | n | | Economic data during the first quarter of 2007 pointed to slower growth, which heightened market expectations for a decrease in the Federal Funds Rate. By the second quarter, economic data, such as employment statistics, provided little indication of economic weakness, causing expectations of a decrease in the Federal Funds Rate to unwind and U.S. interest rates to move higher. Interest rates in Europe and the U.K. also rose over the period as central banks raised their key lending rates due to inflation concerns. The benchmark ten-year U.S. Treasury yielded 5.03% as of June 30, 2007, or 0.32% higher than at the beginning of the year. |
| | n | | Most bonds generally returned much of their gains from earlier in the year as worldwide growth and capital flows drove interest rates higher in the second quarter. Increased risk aversion in global financial markets, due in part to subprime mortgage worries in the U.S., also contributed to the rise in interest rates. The Lehman Brothers Aggregate Bond Index, which includes Treasury, investment-grade corporate and mortgage-backed securities, returned 0.98% for the six-month period. |
| | n | | Locally issued emerging market (“EM”) bonds posted positive returns for the reporting period. Yields on these bonds declined and the local currencies in which they are denominated generally gained, amid increasing investor awareness, strong economic growth and surging capital inflows. External EM bonds (debt instruments issued by emerging markets countries and typically denominated in U.S. dollars) lagged behind local EM bonds (debt instruments issued by emerging markets countries and denominated in the currency of the issuer), as external EM bonds tend to trade more in-line with U.S. Treasuries. |
| | n | | Treasury Inflation-Protected Securities (“TIPS”) outpaced nominal bonds (non-inflation linked bonds) for the first part of the year and all but the longest maturity TIPS outperformed in the second quarter as high gasoline prices drove higher inflation accruals. Commodities, as represented by the Dow Jones-AIG Commodity Total Return Index, returned 4.46% for the period. Equities, as measured by the S&P 500 Index and the Russell 2000 Index, returned 6.96% and 6.45%, respectively, for the period. |
On the following pages, please find specific details as to the Portfolio’s total return investment performance and a discussion of those factors that affected performance.
Thank you for the trust you have placed in us. We will continue to work diligently to serve your investment needs.
Sincerely,
Brent R. Harris
Chairman, PIMCO Variable Insurance Trust
July 31, 2007
| | | | | | |
| | Semiannual Report | | June 30, 2007 | | 1 |
Important Information About the Portfolio
PIMCO Variable Insurance Trust (the “Trust”) is an open-end management investment company currently consisting of twenty separate investment portfolios, including the Foreign Bond Portfolio (U.S. Dollar-Hedged) (the “Portfolio”). The Portfolio is only available as a funding vehicle under variable life insurance policies or variable annuity contracts issued by insurance companies (“Variable Contracts”). Individuals may not purchase shares of the Portfolio directly. Shares of the Portfolio also may be sold to qualified pension and retirement plans outside of the separate account context.
We believe that bond funds have an important role to play in a well diversified investment portfolio. It is important to note, however, that in an environment where interest rates may trend upward, rising rates would negatively impact the performance of most bond funds, and fixed-income securities held by a fund are likely to decrease in value. The price volatility of fixed-income securities can also increase during periods of rising interest rates resulting in increased losses to a fund. Bond funds and individual bonds with a longer duration (a measure of the expected life of a security) tend to be more sensitive to changes in interest rates, usually making them more volatile than securities or funds with shorter durations.
The Portfolio may be subject to various risks in addition to those described above. Some of these risks may include, but are not limited to, the following: credit risk, high yield risk, market risk, issuer risk, liquidity risk, derivatives risk, mortgage risk, non-U.S. investment risk, emerging markets risk, currency risk, issuer non-diversification risk, leveraging risk and management risk. A complete description of these risks is contained in the Portfolio’s prospectus. The Portfolio may use derivative instruments for hedging purposes or as part of an investment strategy. Use of these instruments may involve certain costs and risks such as liquidity risk, interest rate risk, market risk, credit risk, management risk and the risk that the Portfolio could not close out a position when it would be most advantageous to do so. Because the Portfolio may invest in derivatives, it could lose more than the principal amount invested in these instruments. Investing in non-U.S. securities may entail risk due to non-U.S. economic and political developments; this risk may be increased when investing in emerging markets.
On the performance summary page in this Semiannual Report, the Total Return Investment Performance table measures performance assuming that all dividend and capital gain distributions were reinvested.
An investment in the Portfolio is not a deposit of a bank and is not guaranteed or insured by the Federal Deposit Insurance Corporation or any other government agency. It is possible to lose money on investments in the Portfolio.
PIMCO has adopted written proxy voting policies and procedures (“Proxy Policy”) as required by Rule 206(4)-6 under the Investment Advisers Act of 1940, as amended. The Proxy Policy has been adopted by the Trust as the policies and procedures that PIMCO will use when voting proxies on behalf of the Portfolio. A description of the policies and procedures that PIMCO uses to vote proxies relating to portfolio securities of the Portfolio, and information about how the Portfolio voted proxies relating to portfolio securities held during the most recent twelve-month period ended June 30, are available without charge, upon request, by calling the Trust at 1-866-746-2606 and on the Portfolio’s website at www.pimco.com.
The Portfolio files its complete schedule of portfolio holdings with the SEC for the first and third quarters of each fiscal year on Form N-Q. A copy of the Trust’s Form N-Q is also available on the SEC’s website at http://www.sec.gov and may be reviewed and copied at the SEC’s Public Reference Room in Washington D.C. Information on the operation of the Public Reference Room may be obtained by calling 1-800-SEC-0330, and is available without charge, upon request, by calling the Trust at 1-866-746-2606 and on the Portfolio’s website at www.pimco.com.
PIMCO Variable Insurance Trust is distributed by Allianz Global Investors Distributors LLC, 1345 Avenue of the Americas, New York, NY 10105.
| | | | |
| 2 | | PIMCO Variable Insurance Trust | | |
The following disclosure provides important information regarding the Portfolio’s Expense Example (“Example” or “Expense Example”), which appears in this Semiannual Report. Please refer to this information when reviewing the Expense Example for the Portfolio.
Example
As a shareholder of the Portfolio, you incur two types of costs: (1) transaction costs and (2) ongoing costs, including advisory and administrative fees; distribution and/or service (12b-1) fees (Administrative Class only); and other Portfolio expenses. The Example is intended to help you understand your ongoing costs (in dollars) of investing in the Portfolio and to compare these costs with the ongoing costs of investing in other mutual funds. The Expense Example does not reflect any fees or other expenses imposed by the Variable Contracts. If it did, the expenses reflected in the Expense Example would be higher. The Example is based on an investment of $1,000 invested at the beginning of the period and held for the entire period indicated, which is from January 1, 2007 to June 30, 2007.
Actual Expenses
The information in the table under the heading “Actual Performance” provides information about actual account values and actual expenses. You may use the information in these columns, together with the amount you invested, to estimate the expenses that you paid over the period. Simply divide your account value by $1,000 (for example, an $8,600 account value divided by $1,000 = $8.60), then multiply the result by the number in the row titled “Expenses Paid During Period” to estimate the expenses you paid on your account during this period.
Hypothetical Example for Comparison Purposes
The information in the table under the heading “Hypothetical Performance (5% return before expenses)” provides information about hypothetical account values and hypothetical expenses based on the Portfolio’s actual expense ratio and an assumed rate of return of 5% per year before expenses, which is not the Portfolio’s actual return. The hypothetical account values and expenses may not be used to estimate the actual ending account balance or expenses you paid for the period. You may use this information to compare the ongoing costs of investing in the Portfolio and other portfolios. To do so, compare this 5% hypothetical example with the 5% hypothetical examples that appear in the shareholder reports of the other portfolios.
Please note that the expenses shown in the table are meant to highlight your ongoing costs only and do not reflect any transactional costs. Therefore, the information under the heading “Hypothetical Performance (5% return before expenses)” is useful in comparing ongoing costs only, and will not help you determine the relative total costs of owning different portfolios. In addition, if these transactional costs were included, your costs would have been higher.
The expense ratio may vary period to period because of various factors, such as an increase in expenses not covered by the advisory and administrative fees (such as expenses of the trustees and their counsel, litigation expense and interest expense).
| | | | | | |
| | Semiannual Report | | June 30, 2007 | | 3 |
PIMCO Foreign Bond Portfolio (U.S. Dollar-Hedged)
Cumulative Returns Through June 30, 2007
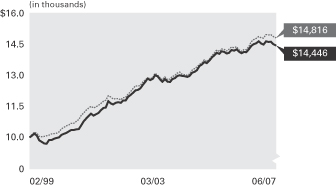
$10,000 invested at the beginning of the first full month following the inception date of the Portfolio’s Administrative Class.
Allocation Breakdown‡
| | |
United States | | 55.3% |
Germany | | 13.5% |
Japan | | 9.7% |
United Kingdom | | 8.4% |
Short-Term Instruments | | 4.5% |
Other | | 8.6% |
| | ‡ | % of Total Investments as of 06/30/2007 |
| | | | | | | | | | |
| Average Annual Total Return for the period ended June 30, 2007 |
| | | | | 6 Months* | | 1 Year | | 5 Years | | Portfolio
Inception
(02/16/99)** |
| | PIMCO Foreign Bond Portfolio (U.S. Dollar-Hedged) Administrative Class | | -0.68% | | 2.25% | | 3.84% | | 4.47% |
| | JPMorgan Government Bond Indices Global Ex-U.S. Index Hedged in USD± | | -0.02% | | 3.97% | | 4.16% | | 4.83% |
All Portfolio returns are net of fees and expenses.
* Cumulative return.
** The Portfolio began operations on 02/16/99. Index comparisons began on 02/28/99.
Performance quoted represents past performance. Past performance is no guarantee of future results. Investment return and principal value will fluctuate so the Portfolio shares, when redeemed, may be worth more or less than their original cost. The Portfolio’s performance does not reflect the deduction of additional charges and expenses imposed in connection with investing in Variable Contracts, which will reduce returns. Current performance may be lower or higher than the performance data quoted. Performance data current to the most recent month-end is available by calling (800) 927-4648.
± JPMorgan Government Bond Indices Global Ex-U.S. Index Hedged in USD is an unmanaged index representative of the total return performance in U.S. dollars on an unhedged basis of major non-U.S. bond markets. It is not possible to invest directly in the index. The index does not reflect deductions for fees and expenses.
| | | | | | |
| Expense Example | | Actual Performance | | Hypothetical Performance |
| | | | | (5% return before expenses) |
Beginning Account Value (01/01/07) | | $ | 1,000.00 | | $ | 1,000.00 |
Ending Account Value (06/30/07) | | $ | 993.23 | | $ | 1,020.33 |
Expenses Paid During Period† | | $ | 4.45 | | $ | 4.51 |
† Expenses are equal to the Portfolio’s Administrative Class annualized expense ratio of 0.90%, multiplied by the average account value over the period, multiplied by 181/365 (to reflect the one-half year period). Overall fees and expenses of investing in the Portfolio will be higher because the example does not reflect Variable Contract fees and expenses.
Please refer to page 3 herein for an explanation of the information presented in the above Expense Example.
Portfolio Insights
| » | | The PIMCO Foreign Bond Portfolio (U.S. Dollar-Hedged) seeks to achieve its investment objective by investing under normal circumstances at least 80% of its assets in fixed-income instruments of issuers located outside the United States, representing at least three foreign countries, which may be represented by futures contracts (including related options) with respect to such securities, and options on such securities. |
| » | | Developed global bonds produced weak returns, with bond yields rising across major markets. |
| » | | Exposure to U.S. shorter maturities, principally through interest rate futures contracts, detracted from performance as yields rose on diminishing expectations of an easing of interest rates by the Federal Reserve. |
| » | | An underweight to U.K. interest rates, notably at the long-end of the yield curve, was positive for returns as U.K. yields rose sharply. |
| » | | An overweight to European interest rates was negative for returns as yields rose due to the region’s growth momentum. |
| » | | An overweight to mortgage-backed securities detracted from returns as mortgage spreads widened. |
| » | | Emerging market currency exposure was positive for returns as these currencies outperformed the U.S. dollar. |
| » | | Global swap spread widening strategies were positive for returns as global swap spreads widened. |
| | | | |
| 4 | | PIMCO Variable Insurance Trust | | |
Financial Highlights Foreign Bond Portfolio (U.S. Dollar-Hedged)
| | | | | | | | | | | | | | | | | | | | | | | | |
| Selected per Share Data for the Year or Period Ended: | | 06/30/2007+ | | | 12/31/2006 | | | 12/31/2005 | | | 12/31/2004 | | | 12/31/2003 | | | 12/31/2002 | |
| | | | | | |
Administrative Class | | | | | | | | | | | | | | | | | | | | | | | | |
Net asset value beginning of year or period | | $ | 10.10 | | | $ | 10.34 | | | $ | 10.15 | | | $ | 10.03 | | | $ | 10.07 | | | $ | 9.69 | |
Net investment income (a) | | | 0.17 | | | | 0.36 | | | | 0.28 | | | | 0.23 | | | | 0.26 | | | | 0.36 | |
Net realized/unrealized gain (loss) on investments (a) | | | (0.23 | ) | | | (0.14 | ) | | | 0.24 | | | | 0.33 | | | | (0.03 | ) | | | 0.42 | |
Total income (loss) from investment operations | | | (0.06 | ) | | | 0.22 | | | | 0.52 | | | | 0.56 | | | | 0.23 | | | | 0.78 | |
Dividends from net investment income | | | (0.17 | ) | | | (0.33 | ) | | | (0.25 | ) | | | (0.21 | ) | | | (0.27 | ) | | | (0.36 | ) |
Distributions from net realized capital gains | | | 0.00 | | | | (0.13 | ) | | | (0.08 | ) | | | (0.23 | ) | | | 0.00 | | | | (0.04 | ) |
Total distributions | | | (0.17 | ) | | | (0.46 | ) | | | (0.33 | ) | | | (0.44 | ) | | | (0.27 | ) | | | (0.40 | ) |
Net asset value end of year or period | | $ | 9.87 | | | $ | 10.10 | | | $ | 10.34 | | | $ | 10.15 | | | $ | 10.03 | | | $ | 10.07 | |
Total return | | | (0.68 | )% | | | 2.19 | % | | | 5.15 | % | | | 5.56 | % | | | 2.26 | % | | | 8.19 | % |
Net assets end of year or period (000s) | | $ | 62,271 | | | $ | 61,193 | | | $ | 49,640 | | | $ | 38,141 | | | $ | 32,355 | | | $ | 16,776 | |
Ratio of expenses to average net assets | | | 0.90 | %* | | | 0.90 | % | | | 0.90 | % | | | 0.90 | % | | | 0.93 | % | | | 0.93 | %(b) |
Ratio of expenses to average net assets excluding interest expense | | | 0.90 | %* | | | 0.90 | % | | | 0.90 | % | | | 0.90 | % | | | 0.90 | % | | | 0.90 | %(b) |
Ratio of net investment income to average net assets | | | 3.41 | %* | | | 3.55 | % | | | 2.70 | % | | | 2.26 | % | | | 2.53 | % | | | 3.67 | % |
Portfolio turnover rate | | | 307 | % | | | 281 | % | | | 453 | % | | | 515 | % | | | 600 | % | | | 321 | % |
+ Unaudited
* Annualized
(a) Per share amounts based on average number of shares outstanding during the period.
(b) If the investment manager had not reimbursed expenses, the ratio of expenses to average net assets would have been 0.94%.
| | | | | | |
| See Accompanying Notes | | Semiannual Report | | June 30, 2007 | | 5 |
Statement of Assets and Liabilities Foreign Bond Portfolio (U.S. Dollar-Hedged)
| | | | |
| (Amounts in thousands, except per share amounts) | | June 30, 2007 | |
| | | (Unaudited) | |
| |
Assets: | | | | |
Investments, at value | | $ | 104,312 | |
Cash | | | 1 | |
Foreign currency, at value | | | 1,305 | |
Receivable for investments sold | | | 9,653 | |
Receivable for Portfolio shares sold | | | 503 | |
Interest and dividends receivable | | | 867 | |
Variation margin receivable | | | 2 | |
Swap premiums paid | | | 1,700 | |
Unrealized appreciation on foreign currency contracts | | | 221 | |
Unrealized appreciation on swap agreements | | | 1,105 | |
| | | | 119,669 | |
| |
Liabilities: | | | | |
Payable for investments purchased | | $ | 32,653 | |
Payable for investments purchased on a delayed-delivery basis | | | 13,648 | |
Payable for Portfolio shares redeemed | | | 123 | |
Payable for short sales | | | 9,370 | |
Written options outstanding | | | 31 | |
Dividends payable | | | 2 | |
Accrued investment advisory fee | | | 13 | |
Accrued administration fee | | | 26 | |
Accrued servicing fee | | | 7 | |
Variation margin payable | | | 63 | |
Swap premiums received | | | 207 | |
Unrealized depreciation on foreign currency contracts | | | 193 | |
Unrealized depreciation on swap agreements | | | 1,048 | |
| | | | 57,384 | |
| |
Net Assets | | $ | 62,285 | |
| |
Net Assets Consist of: | | | | |
Paid in capital | | $ | 63,649 | |
(Overdistributed) net investment income | | | (863 | ) |
Accumulated undistributed net realized (loss) | | | (699 | ) |
Net unrealized appreciation | | | 198 | |
| | | $ | 62,285 | |
| |
Net Assets: | | | | |
Institutional Class | | $ | 14 | |
Administrative Class | | | 62,271 | |
| |
Shares Issued and Outstanding: | | | | |
Institutional Class | | | 1 | |
Administrative Class | | | 6,306 | |
| |
Net Asset Value and Redemption Price Per Share (Net Asset Per Share Outstanding) | | | | |
Institutional Class | | $ | 9.87 | |
Administrative Class | | | 9.87 | |
| |
Cost of Investments Owned | | $ | 104,302 | |
Cost of Foreign Currency Held | | $ | 1,299 | |
Proceeds Received on Short Sales | | $ | 9,611 | |
Premiums Received on Written Options | | $ | 128 | |
| | | | |
| 6 | | PIMCO Variable Insurance Trust | | See Accompanying Notes |
Statement of Operations Foreign Bond Portfolio (U.S. Dollar-Hedged)
| | | | |
| (Amounts in thousands) | | Six Months Ended
June 30, 2007 | |
| | | (Unaudited) | |
| |
| Investment Income: | | | | |
Interest | | $ | 1,326 | |
Dividends | | | 26 | |
Miscellaneous income | | | 1 | |
Total Income | | | 1,353 | |
| |
Expenses: | | | | |
Investment advisory fees | | | 78 | |
Administration fees | | | 156 | |
Servicing fees – Administrative Class | | | 47 | |
Trustees’ fees | | | 1 | |
Total Expenses | | | 282 | |
| |
Net Investment Income | | | 1,071 | |
| |
Net Realized and Unrealized Gain (Loss): | | | | |
Net realized (loss) on investments | | | (424 | ) |
Net realized (loss) on futures contracts, written options and swaps | | | (286 | ) |
Net realized gain on foreign currency transactions | | | 80 | |
Net change in unrealized (depreciation) on investments | | | (1,029 | ) |
Net change in unrealized appreciation on futures contracts, written options and swaps | | | 479 | |
Net change in unrealized (depreciation) on translation of assets and liabilities denominated in foreign currencies | | | (293 | ) |
Net (Loss) | | | (1,473 | ) |
| |
Net (Decrease) in Net Assets Resulting from Operations | | $ | (402 | ) |
| | | | | | |
| See Accompanying Notes | | Semiannual Report | | June 30, 2007 | | 7 |
Statements of Changes in Net Assets Foreign Bond Portfolio (U.S. Dollar-Hedged)
| | | | | | | | |
| (Amounts in thousands) | | Six Months Ended
June 30, 2007 | | | Year Ended
December 31, 2006 | |
| | | (Unaudited) | | | | |
| | |
| Increase (Decrease) in Net Assets from: | | | | | | | | |
| | |
Operations: | | | | | | | | |
Net investment income | | $ | 1,071 | | | $ | 1,924 | |
Net realized (loss) | | | (630 | ) | | | (1,221 | ) |
Net change in unrealized appreciation (depreciation) | | | (843 | ) | | | 491 | |
Net increase (decrease) resulting from operations | | | (402 | ) | | | 1,194 | |
| | |
Distributions to Shareholders: | | | | | | | | |
From net investment income | | | | | | | | |
Institutional Class | | | 0 | | | | (1 | ) |
Administrative Class | | | (1,031 | ) | | | (1,778 | ) |
From net realized capital gains | | | | | | | | |
Administrative Class | | | 0 | | | | (735 | ) |
| | |
Total Distributions | | | (1,031 | ) | | | (2,514 | ) |
| | |
Portfolio Share Transactions: | | | | | | | | |
Receipts for shares sold | | | | | | | | |
Administrative Class | | | 10,804 | | | | 24,018 | |
| Issued as reinvestment of distributions | | | | | | | | |
Institutional Class | | | 0 | | | | 1 | |
Administrative Class | | | 1,029 | | | | 2,512 | |
Cost of shares redeemed | | | | | | | | |
Administrative Class | | | (9,322 | ) | | | (13,658 | ) |
Net increase resulting from Portfolio share transactions | | | 2,511 | | | | 12,873 | |
| | |
Total Increase in Net Assets | | | 1,078 | | | | 11,553 | |
| | |
Net Assets: | | | | | | | | |
Beginning of period | | | 61,207 | | | | 49,654 | |
End of period* | | $ | 62,285 | | | $ | 61,207 | |
| | |
*Including (overdistributed) net investment income of: | | $ | (863 | ) | | $ | (903 | ) |
| | | | |
| 8 | | PIMCO Variable Insurance Trust | | See Accompanying Notes |
| | |
| |
| Schedule of Investments Foreign Bond Portfolio (U.S. Dollar-Hedged) | | June 30, 2007 (Unaudited) |
| | | | | | | | |
| | | | | PRINCIPAL
AMOUNT
(000S) | | | | VALUE
(000S) |
| AUSTRALIA 0.0% |
| Medallion Trust |
5.585% due 07/12/2031 | | $ | | 11 | | $ | | 11 |
| | | | | | | | |
Total Australia (Cost $11) | | 11 |
| | | | | | | | |
| | | | | | | | |
| AUSTRIA 0.9% |
| Austria Government Bond |
3.800% due 10/20/2013 | | EUR | | 100 | | | | 130 |
5.250% due 01/04/2011 | | | | 300 | | | | 415 |
| | | | | | | | |
Total Austria (Cost $437) | | 545 |
| | | | | | | | |
|
| BERMUDA 0.1% |
| Intelsat Bermuda Ltd. |
5.250% due 11/01/2008 | | $ | | 100 | | | | 99 |
| | | | | | | | |
Total Bermuda (Cost $99) | | 99 |
| | | | | | | | |
|
| CANADA 0.4% |
| Province of Ontario Canada |
6.200% due 06/02/2031 | | CAD | | 200 | | | | 220 |
| | | | | | | | |
Total Canada (Cost $220) | | 220 |
| | | | | | | | |
|
| CAYMAN ISLANDS 1.0% |
| Mizuho Finance Cayman Ltd. |
8.375% due 12/29/2049 | | $ | | 200 | | | | 209 |
| |
| MUFG Capital Finance 1 Ltd. |
6.346% due 07/29/2049 | | | | 200 | | | | 197 |
| |
| SMFG Preferred Capital USD 1 Ltd. |
6.078% due 01/29/2049 | | | | 100 | | | | 97 |
| |
| Transocean, Inc. |
5.560% due 09/05/2008 | | | | 100 | | | | 100 |
| | | | | | | | |
Total Cayman Islands (Cost $611) | | 603 |
| | | | | | | | |
|
| DENMARK 0.0% |
| Nykredit Realkredit A/S |
6.000% due 10/01/2029 | | DKK | | 56 | | | | 11 |
| | | | | | | | |
Total Denmark (Cost $6) | | 11 |
| | | | | | | | |
|
| FRANCE 1.7% |
| Credit Agricole S.A. |
6.637% due 05/29/2049 | | $ | | 100 | | | | 97 |
| |
| France Government Bond |
4.000% due 10/25/2009 | | EUR | | 30 | | | | 40 |
5.500% due 04/25/2010 | | | | 110 | | | | 153 |
5.750% due 10/25/2032 | | | | 500 | | | | 775 |
| | | | | | | | |
Total France (Cost $1,057) | | 1,065 |
| | | | | | | | |
|
| GERMANY 22.7% |
| KFW International Finance, Inc. |
1.750% due 03/23/2010 | | JPY | | 11,000 | | | | 91 |
| |
| Republic of Germany |
3.750% due 01/04/2015 | | EUR | | 900 | | | | 1,156 |
4.250% due 07/04/2014 | | | | 900 | | | | 1,196 |
4.500% due 07/04/2009 | | | | 10 | | | | 13 |
4.750% due 07/04/2028 | | | | 30 | | | | 41 |
4.750% due 07/04/2034 | | | | 100 | | | | 136 |
5.000% due 07/04/2012 | | | | 400 | | | | 552 |
5.250% due 07/04/2010 | | | | 1,400 | | | | 1,933 |
5.250% due 01/04/2011 | | | | 2,100 | | | | 2,907 |
5.500% due 01/04/2031 | | | | 100 | | | | 150 |
5.625% due 01/04/2028 | | | | 2,650 | | | | 3,999 |
6.250% due 01/04/2024 | | | | 600 | | | | 955 |
6.500% due 07/04/2027 | | | | 590 | | | | 980 |
| | | | | | | | |
Total Germany (Cost $13,432) | | 14,109 |
| | | | | | | | |
| | | | | | | | |
| | | | | PRINCIPAL
AMOUNT
(000S) | | | | VALUE
(000S) |
| ICELAND 0.2% |
| Glitnir Banki HF |
5.829% due 01/18/2012 | | $ | | 100 | | $ | | 101 |
| | | | | | | | |
Total Iceland (Cost $100) | | 101 |
| | | | | | | | |
| | | | | | | | |
| IRELAND 0.2% |
| Bank of Ireland |
5.370% due 12/19/2008 | | $ | | 100 | | | | 100 |
| | | | | | | | |
Total Ireland (Cost $100) | | 100 |
| | | | | | | | |
| | | | | | | | |
| ITALY 1.3% |
| Italy Buoni Poliennali Del Tesoro |
4.250% due 11/01/2009 | | EUR | | 60 | | | | 81 |
4.500% due 05/01/2009 | | | | 360 | | | | 487 |
5.500% due 11/01/2010 | | | | 110 | | | | 153 |
| |
| Seashell Securities PLC |
4.295% due 07/25/2028 | | | | 77 | | | | 105 |
| | | | | | | | |
Total Italy (Cost $786) | | 826 |
| | | | | | | | |
| | | | | | | | |
| JAPAN 16.3% |
| Bank of Tokyo-Mitsubishi UFJ Ltd. |
3.500% due 12/16/2015 | | EUR | | 100 | | | | 129 |
| |
| Japan Finance Corp. for Municipal Enterprises |
5.875% due 03/14/2011 | | $ | | 80 | | | | 81 |
| |
| Japan Government Bond |
1.500% due 03/20/2014 | | JPY | | 40,000 | | | | 322 |
1.500% due 03/20/2015 | | | | 38,000 | | | | 304 |
1.600% due 06/20/2014 | | | | 240,000 | | | | 1,942 |
1.600% due 09/20/2014 | | | | 60,000 | | | | 485 |
2.300% due 06/20/2035 | | | | 70,000 | | | | 553 |
2.400% due 03/20/2034 | | | | 20,000 | | | | 162 |
2.500% due 09/20/2035 | | | | 160,000 | | | | 1,319 |
2.500% due 06/20/2036 | | | | 160,000 | | | | 1,314 |
| |
| Japanese Government CPI Linked Bond |
0.800% due 12/10/2015 | | | | 39,960 | | | | 315 |
1.000% due 02/28/2016 | | | | 20,000 | | | | 162 |
1.100% due 12/10/2016 | | | | 367,780 | | | | 2,950 |
| |
| Sumitomo Mitsui Banking Corp. |
5.625% due 07/29/2049 | | $ | | 100 | | | | 95 |
| | | | | | | | |
Total Japan (Cost $10,962) | | 10,133 |
| | | | | | | | |
| | | | | | | | |
| JERSEY, CHANNEL ISLANDS 0.1% |
| Haus Ltd. |
4.139% due 12/10/2037 | | EUR | | 32 | | | | 43 |
| | | | | | | | |
Total Jersey, Channel Islands (Cost $31) | | 43 |
| | | | | | | | |
|
| MEXICO 0.2% |
| America Movil SAB de C.V. |
5.460% due 06/27/2008 | | $ | | 100 | | | | 100 |
| | | | | | | | |
Total Mexico (Cost $100) | | 100 |
| | | | | | | | |
| | | | | | | | |
| NETHERLANDS 0.2% |
| Siemens Financieringsmaatschappij NV |
5.410% due 08/14/2009 | | $ | | 100 | | | | 100 |
| | | | | | | | |
Total Netherlands (Cost $100) | | 100 |
| | | | | | | | |
| | | | | | | | |
| RUSSIA 0.3% |
| VTB Capital S.A. for Vneshtorgbank |
5.955% due 08/01/2008 | | $ | | 200 | | | | 200 |
| | | | | | | | |
Total Russia (Cost $200) | | 200 |
| | | | | | | | |
| | | | | | | | |
| | | | | PRINCIPAL
AMOUNT
(000S) | | | | VALUE
(000S) |
| SPAIN 7.2% |
| Santander U.S. Debt S.A. Unipersonal |
5.416% due 02/06/2009 | | $ | | 200 | | $ | | 200 |
5.420% due 11/20/2009 | | | | 100 | | | | 100 |
| |
| Spain Government Bond |
4.000% due 01/31/2010 | | EUR | | 100 | | | | 134 |
4.400% due 01/31/2015 | | | | 1,800 | | | | 2,402 |
5.150% due 07/30/2009 | | | | 1,210 | | | | 1,658 |
| | | | | | | | |
Total Spain (Cost $4,239) | | 4,494 |
| | | | | | | | |
| | | | | | | | |
| UNITED KINGDOM 14.1% |
| HBOS PLC |
5.920% due 09/29/2049 | | $ | | 300 | | | | 282 |
| |
| HSBC Holdings PLC |
6.500% due 05/02/2036 | | | | 400 | | | | 412 |
| |
| Lloyds TSB Bank PLC |
5.562% due 11/29/2049 | | | | 100 | | | | 87 |
5.625% due 07/15/2049 | | EUR | | 40 | | | | 55 |
| |
| Royal Bank of Scotland Group PLC |
5.750% due 07/06/2012 | | $ | | 100 | | | | 100 |
| |
| United Kingdom Gilt |
4.250% due 03/07/2011 | | GBP | | 2,200 | | | | 4,194 |
4.750% due 06/07/2010 | | | | 600 | | | | 1,171 |
4.750% due 09/07/2015 | | | | 700 | | | | 1,334 |
5.000% due 03/07/2008 | | | | 100 | | | | 200 |
5.000% due 03/07/2012 | | | | 500 | | | | 976 |
| | | | | | | | |
Total United Kingdom (Cost $8,679) | | 8,811 |
| | | | | | | | |
| | | | | | | | |
| UNITED STATES 92.5% |
| | | | | | | | |
| ASSET-BACKED SECURITIES 7.4% |
| ACE Securities Corp. |
5.370% due 07/25/2036 | | $ | | 101 | | | | 101 |
5.370% due 08/25/2036 | | | | 122 | | | | 122 |
| |
| Amortizing Residential Collateral Trust |
5.610% due 07/25/2032 | | | | 1 | | | | 1 |
5.670% due 10/25/2031 | | | | 3 | | | | 3 |
| |
| Amresco Residential Securities Mortgage Loan Trust |
6.260% due 06/25/2029 | | | | 1 | | | | 1 |
| |
| Asset-Backed Funding Certificates |
5.380% due 01/25/2037 | | | | 151 | | | | 151 |
| |
| Bear Stearns Asset-Backed Securities, Inc. |
5.390% due 12/25/2036 | | | | 248 | | | | 248 |
| |
| Centex Home Equity |
5.370% due 06/25/2036 | | | | 61 | | | | 61 |
| |
| Citigroup Mortgage Loan Trust, Inc. |
5.370% due 10/25/2036 | | | | 129 | | | | 130 |
| |
| Countrywide Asset-Backed Certificates |
5.370% due 01/25/2037 | | | | 98 | | | | 98 |
5.400% due 06/25/2037 | | | | 265 | | | | 265 |
| |
| CS First Boston Mortgage Securities Corp. |
5.940% due 01/25/2032 | | | | 3 | | | | 2 |
| |
| CSAB Mortgage-Backed Trust |
5.420% due 06/25/2036 | | | | 32 | | | | 32 |
| |
| First Alliance Mortgage Loan Trust |
5.550% due 12/20/2027 | | | | 2 | | | | 2 |
| |
| First Franklin Mortgage Loan Asset-Backed Certificates |
5.370% due 11/25/2036 | | | | 164 | | | | 164 |
| |
| GSR Mortgage Loan Trust |
5.420% due 11/25/2030 | | | | 31 | | | | 31 |
| |
| Honda Auto Receivables Owner Trust |
5.420% due 12/22/2008 | | | | 66 | | | | 66 |
| |
| HSI Asset Securitization Corp. Trust |
5.370% due 12/25/2036 | | | | 169 | | | | 169 |
| |
| | | | | | |
| See Accompanying Notes | | Semiannual Report | | June 30, 2007 | | 9 |
Schedule of Investments Foreign Bond Portfolio (U.S. Dollar-Hedged) (Cont.)
| | | | | | | | |
| | | | | PRINCIPAL
AMOUNT
(000S) | | | | VALUE
(000S) |
| Indymac Residential Asset-Backed Trust |
5.380% due 04/25/2037 | | $ | | 158 | | $ | | 158 |
| |
| IXIS Real Estate Capital Trust |
5.380% due 08/25/2036 | | | | 31 | | | | 31 |
| |
| Long Beach Mortgage Loan Trust |
5.600% due 10/25/2034 | | | | 49 | | | | 49 |
| |
| Merrill Lynch Mortgage Investors, Inc. |
5.390% due 08/25/2036 | | | | 130 | | | | 130 |
| |
| Morgan Stanley ABS Capital I |
5.370% due 09/25/2036 | | | | 141 | | | | 141 |
| |
| Morgan Stanley Home Equity Loans |
5.390% due 02/25/2036 | | | | 114 | | | | 114 |
| |
| New Century Home Equity Loan Trust |
5.490% due 02/25/2036 | | | | 300 | | | | 300 |
| |
| Newcastle Mortgage Securities Trust |
5.390% due 03/25/2036 | | | | 97 | | | | 97 |
| |
| Quest Trust |
5.880% due 06/25/2034 | | | | 5 | | | | 5 |
| |
| Residential Asset Mortgage Products, Inc. |
5.400% due 01/25/2036 | | | | 40 | | | | 40 |
| |
| Residential Asset Securities Corp. |
5.360% due 08/25/2036 | | | | 113 | | | | 114 |
5.820% due 07/25/2032 | | | | 8 | | | | 8 |
| |
| SACO I, Inc. |
5.380% due 05/25/2036 | | | | 31 | | | | 31 |
| |
| Securitized Asset-Backed Receivables LLC Trust |
5.380% due 03/25/2036 | | | | 67 | | | | 67 |
5.400% due 11/25/2036 | | | | 260 | | | | 260 |
| |
| SLM Student Loan Trust |
5.365% due 01/26/2015 | | | | 15 | | | | 15 |
| |
| Soundview Home Equity Loan Trust |
5.400% due 01/25/2037 | | | | 216 | | | | 217 |
| |
| Structured Asset Investment Loan Trust |
5.370% due 05/25/2036 | | | | 176 | | | | 176 |
| |
| Structured Asset Securities Corp. |
5.370% due 10/25/2036 | | | | 148 | | | | 148 |
5.610% due 01/25/2033 | | | | 4 | | | | 4 |
| |
| USAA Auto Owner Trust |
5.337% due 07/11/2008 | | | | 400 | | | | 400 |
| |
| Wells Fargo Home Equity Trust |
5.440% due 12/25/2035 | | | | 77 | | | | 77 |
5.550% due 10/25/2035 | | | | 164 | | | | 164 |
5.560% due 11/25/2035 | | | | 200 | | | | 200 |
| | | | | | | | |
| | | | | | | | 4,593 |
| | | | | | | | |
|
| BANK LOAN OBLIGATIONS 0.5% |
| OAO Rosneft Oil Co. |
6.000% due 09/16/2007 | | | | 300 | | | | 300 |
| | | | | | | | |
|
| CORPORATE BONDS & NOTES 11.9% |
| American Express Credit Corp. |
5.380% due 05/18/2009 | | | | 100 | | | | 100 |
| |
| American International Group, Inc. |
5.360% due 06/23/2008 | | | | 100 | | | | 100 |
| |
| Bear Stearns Cos., Inc. |
5.585% due 01/31/2011 | | | | 200 | | | | 199 |
| |
| BellSouth Corp. |
5.460% due 08/15/2008 | | | | 100 | | | | 100 |
| |
| CenterPoint Energy, Inc. |
5.875% due 06/01/2008 | | | | 100 | | | | 100 |
| |
| Charter One Bank N.A. |
5.405% due 04/24/2009 | | | | 250 | | | | 250 |
| |
| | | | | | | | |
| | | | | PRINCIPAL
AMOUNT
(000S) | | | | VALUE
(000S) |
| CIT Group, Inc. |
5.430% due 02/21/2008 | | $ | | 100 | | $ | | 100 |
| |
| Citigroup, Inc. |
5.400% due 12/26/2008 | | | | 100 | | | | 100 |
| |
| CMS Energy Corp. |
7.500% due 01/15/2009 | | | | 100 | | | | 103 |
| |
| Comcast Corp. |
5.656% due 07/14/2009 | | | | 200 | | | | 200 |
| |
| ConocoPhillips Australia Funding Co. |
5.460% due 04/09/2009 | | | | 200 | | | | 200 |
| |
| CVS Caremark Corp. |
5.750% due 08/15/2011 | | | | 100 | | | | 100 |
| |
| DaimlerChrysler N.A. Holding Corp. |
5.750% due 05/18/2009 | | | | 100 | | | | 100 |
| |
| Dex Media East LLC |
9.875% due 11/15/2009 | | | | 100 | | | | 104 |
| |
| DR Horton, Inc. |
6.000% due 04/15/2011 | | | | 100 | | | | 98 |
| |
| Equistar Chemicals LP |
8.750% due 02/15/2009 | | | | 100 | | | | 104 |
| |
| Ford Motor Credit Co. |
5.800% due 01/12/2009 | | | | 100 | | | | 98 |
6.625% due 06/16/2008 | | | | 100 | | | | 100 |
7.250% due 10/25/2011 | | | | 50 | | | | 48 |
7.800% due 06/01/2012 | | | | 50 | | | | 49 |
8.105% due 01/13/2012 | | | | 200 | | | | 200 |
| |
| Freeport-McMoRan Copper & Gold, Inc. |
8.564% due 04/01/2015 | | | | 100 | | | | 105 |
| |
| General Motors Acceptance Corp. |
6.510% due 09/23/2008 | | | | 100 | | | | 100 |
| |
| GMAC LLC |
6.610% due 05/15/2009 | | | | 100 | | | | 100 |
| |
| Goldman Sachs Group, Inc. |
5.400% due 12/23/2008 | | | | 200 | | | | 200 |
5.450% due 12/22/2008 | | | | 100 | | | | 100 |
| |
| HSBC Finance Corp. |
5.360% due 05/21/2008 | | | | 200 | | | | 200 |
| |
| International Lease Finance Corp. |
5.400% due 02/15/2012 | | | | 100 | | | | 99 |
| |
| iStar Financial, Inc. |
5.150% due 03/01/2012 | | | | 100 | | | | 96 |
| |
| JC Penney Corp., Inc. |
8.000% due 03/01/2010 | | | | 100 | | | | 106 |
| |
| JPMorgan & Co., Inc. CPI Linked Bond |
2.991% due 02/15/2012 | | | | 10 | | | | 11 |
| |
| JPMorgan Chase & Co. |
5.058% due 02/22/2021 | | CAD | | 100 | | | | 91 |
| |
| JPMorgan Chase Capital XXII |
6.450% due 02/02/2037 | | | | 100 | | | | 95 |
| |
| JPMorgan Mortgage Acquisition Corp. |
6.550% due 09/15/2066 | | | | 100 | | | | 97 |
| |
| Kraft Foods, Inc. |
6.250% due 06/01/2012 | | | | 100 | | | | 102 |
| |
| Lehman Brothers Holdings, Inc. |
5.410% due 12/23/2008 | | | | 300 | | | | 300 |
| |
| Mandalay Resort Group |
9.500% due 08/01/2008 | | | | 100 | | | | 104 |
| |
| Merck & Co., Inc. |
4.750% due 03/01/2015 | | | | 100 | | | | 94 |
| |
| Merrill Lynch & Co., Inc. |
5.390% due 12/22/2008 | | | | 300 | | | | 300 |
5.395% due 10/23/2008 | | | | 100 | | | | 100 |
| |
| | | | | | | | |
| | | | | PRINCIPAL
AMOUNT
(000S) | | | | VALUE
(000S) |
| Mizuho JGB Investment LLC |
9.870% due 12/31/2049 | | $ | | 100 | | $ | | 104 |
| |
| Mizuho Preferred Capital Co. LLC |
8.790% due 12/29/2049 | | | | 100 | | | | 103 |
| |
| Morgan Stanley |
5.467% due 02/09/2009 | | | | 200 | | | | 200 |
| |
| Nationwide Health Properties, Inc. |
6.500% due 07/15/2011 | | | | 100 | | | | 102 |
| |
| Newell Rubbermaid, Inc. |
4.000% due 05/01/2010 | | | | 100 | | | | 96 |
| |
| Qwest Capital Funding, Inc. |
6.375% due 07/15/2008 | | | | 100 | | | | 100 |
| |
| Rabobank Capital Funding Trust |
5.254% due 12/29/2049 | | | | 100 | | | | 94 |
| |
| Safeway, Inc. |
4.950% due 08/16/2010 | | | | 100 | | | | 98 |
| |
| SB Treasury Co. LLC |
9.400% due 12/29/2049 | | | | 100 | | | | 104 |
| |
| State Street Capital Trust IV |
6.355% due 06/15/2037 | | | | 100 | | | | 101 |
| |
| Tesoro Corp. |
6.500% due 06/01/2017 | | | | 100 | | | | 98 |
| |
| Time Warner, Inc. |
5.590% due 11/13/2009 | | | | 100 | | | | 100 |
| |
| Toyota Motor Credit Corp. |
5.330% due 10/12/2007 | | | | 100 | | | | 100 |
| |
| TXU Corp. |
6.375% due 01/01/2008 | | | | 100 | | | | 101 |
| |
| U.S. Bancorp |
5.350% due 04/28/2009 | | | | 100 | | | | 100 |
| |
| Valero Energy Corp. |
4.750% due 06/15/2013 | | | | 100 | | | | 95 |
| |
| Wachovia Bank N.A. |
5.400% due 03/23/2009 | | | | 250 | | | | 250 |
| |
| Wal-Mart Stores, Inc. |
5.260% due 06/16/2008 | | | | 100 | | | | 100 |
| |
| Wells Fargo Capital X |
5.950% due 12/15/2036 | | | | 100 | | | | 94 |
| |
| Westpac Banking Corp. |
5.280% due 06/06/2008 | | | | 100 | | | | 100 |
| |
| Xerox Corp. |
9.750% due 01/15/2009 | | | | 200 | | | | 212 |
| | | | | | | | |
| | | | | | | | 7,405 |
| | | | | | | | |
| | | | | | | | |
| MORTGAGE-BACKED SECURITIES 7.6% |
| Banc of America Commercial Mortgage, Inc. |
4.772% due 07/11/2043 | | | | 217 | | | | 214 |
| |
| Banc of America Mortgage Securities, Inc. |
5.000% due 05/25/2034 | | | | 173 | | | | 170 |
| |
| Bear Stearns Alt-A Trust |
5.480% due 02/25/2034 | | | | 232 | | | | 233 |
| |
| Commercial Mortgage Asset Trust |
6.975% due 01/17/2032 | | | | 100 | | | | 106 |
| |
| Countrywide Alternative Loan Trust |
5.530% due 03/20/2046 | | | | 209 | | | | 208 |
5.600% due 02/25/2037 | | | | 155 | | | | 156 |
| |
| Countrywide Home Loan Mortgage Pass-Through Trust |
5.550% due 05/25/2035 | | | | 110 | | | | 110 |
5.640% due 03/25/2035 | | | | 238 | | | | 239 |
5.650% due 02/25/2035 | | | | 31 | | | | 31 |
| |
| CS First Boston Mortgage Securities Corp. |
6.500% due 04/25/2033 | | | | 7 | | | | 7 |
| |
| | | | |
| 10 | | PIMCO Variable Insurance Trust | | See Accompanying Notes |
| | |
| |
| | | June 30, 2007 (Unaudited) |
| | | | | | | | |
| | | | | PRINCIPAL
AMOUNT
(000S) | | | | VALUE
(000S) |
| First Horizon Asset Securities, Inc. |
6.250% due 08/25/2017 | | $ | | 78 | | $ | | 78 |
| |
| GMAC Commercial Mortgage Securities, Inc. |
6.420% due 05/15/2035 | | | | 87 | | | | 88 |
| |
| GMAC Mortgage Corp. Loan Trust |
5.500% due 09/25/2034 | | | | 110 | | | | 109 |
| |
| Greenpoint Mortgage Funding Trust |
5.400% due 01/25/2047 | | | | 289 | | | | 289 |
| |
| Greenwich Capital Commercial Funding Corp. |
5.444% due 03/10/2039 | | | | 200 | | | | 194 |
| |
| Harborview Mortgage Loan Trust |
5.540% due 05/19/2035 | | | | 107 | | | | 107 |
| |
| Indymac Index Mortgage Loan Trust |
5.400% due 07/25/2046 | | | | 29 | | | | 29 |
| |
| JPMorgan Mortgage Trust |
4.500% due 08/25/2019 | | | | 179 | | | | 176 |
| |
| Mellon Residential Funding Corp. |
5.760% due 12/15/2030 | | | | 46 | | | | 46 |
| |
| MLCC Mortgage Investors, Inc. |
5.700% due 03/15/2025 | | | | 13 | | | | 13 |
| |
| Residential Accredit Loans, Inc. |
5.530% due 04/25/2046 | | | | 232 | | | | 232 |
| |
| Structured Asset Mortgage Investments, Inc. |
5.540% due 05/25/2036 | | | | 255 | | | | 255 |
5.610% due 07/19/2034 | | | | 15 | | | | 15 |
5.650% due 09/19/2032 | | | | 14 | | | | 14 |
5.670% due 03/19/2034 | | | | 25 | | | | 25 |
| |
| TBW Mortgage-Backed Pass-Through Certificates |
5.430% due 01/25/2037 | | | | 142 | | | | 142 |
| |
| Thornburg Mortgage Securities Trust |
5.430% due 12/25/2036 | | | | 170 | | | | 170 |
| |
| Wachovia Bank Commercial Mortgage Trust |
5.410% due 09/15/2021 | | | | 229 | | | | 229 |
| |
| Washington Mutual, Inc. |
5.094% due 10/25/2032 | | | | 4 | | | | 4 |
5.474% due 02/27/2034 | | | | 27 | | | | 26 |
5.550% due 04/25/2045 | | | | 35 | | | | 35 |
5.630% due 01/25/2045 | | | | 33 | | | | 33 |
5.860% due 12/25/2027 | | | | 75 | | | | 75 |
6.009% due 06/25/2046 | | | | 144 | | | | 145 |
6.029% due 02/25/2046 | | | | 352 | | | | 352 |
| |
| Wells Fargo Mortgage-Backed Securities Trust |
4.500% due 11/25/2018 | | | | 108 | | | | 105 |
4.950% due 03/25/2036 | | | | 255 | | | | 251 |
5.254% due 04/25/2036 | | | | 69 | | | | 69 |
| | | | | | | | |
| | | | | | | | 4,780 |
| | | | | | | | |
| | | | | | | | |
| MUNICIPAL BONDS & NOTES 0.3% |
| Illinois State Educational Facilities Authority Revenue Bonds, Series 2003 |
5.000% due 07/01/2033 | | | | 95 | | | | 97 |
| |
| Lower Colorado River, Texas Authority Revenue Bonds, (FSA Insured), Series 2003 |
5.000% due 05/15/2023 | | | | 100 | | | | 102 |
| | | | | | | | |
| | | | | | | | 199 |
| | | | | | | | |
|
| | | | | | | | |
| | | | |
SHARES | | | | VALUE
(000S) |
| PREFERRED STOCKS 1.2% |
| DG Funding Trust |
7.600% due 12/31/2049 | | | | 65 | | $ | | 677 |
| |
| Fresenius Medical Care Capital Trust II |
7.875% due 02/01/2008 | | | | 100 | | | | 101 |
| | | | | | | | |
| | | | | | | | 778 |
| | | | | | | | |
|
| | | | | PRINCIPAL
AMOUNT
(000S) | | | | |
| U.S. GOVERNMENT AGENCIES 61.4% |
| Fannie Mae |
4.187% due 11/01/2034 | | $ | | 325 | | | | 322 |
4.673% due 05/25/2035 | | | | 100 | | | | 99 |
4.940% due 12/01/2034 | | | | 48 | | | | 48 |
5.000% due 09/01/2018 - 03/01/2036 | | | | 586 | | | | 554 |
5.440% due 03/25/2034 | | | | 33 | | | | 33 |
5.470% due 08/25/2034 | | | | 27 | | | | 27 |
5.500% due 11/01/2016 - 07/01/2037 | | | | 8,330 | | | | 8,045 |
5.670% due 09/25/2042 | | | | 77 | | | | 78 |
6.000% due 07/01/2037 - 07/25/2044 | | | | 26,050 | | | | 25,770 |
6.227% due 10/01/2044 | | | | 109 | | | | 110 |
| |
| Freddie Mac |
4.500% due 03/15/2016 | | | | 600 | | | | 588 |
4.682% due 03/01/2035 | | | | 402 | | | | 396 |
4.980% due 04/01/2035 | | | | 412 | | | | 404 |
5.000% due 08/15/2020 - 07/15/2025 | | | | 796 | | | | 785 |
5.550% due 07/15/2037 | | | | 400 | | | | 400 |
6.227% due 10/25/2044 | | | | 232 | | | | 234 |
6.530% due 11/26/2012 | | | | 300 | | | | 301 |
7.190% due 02/01/2029 | | | | 27 | | | | 27 |
| |
| Ginnie Mae |
5.375% due 04/20/2028 - 06/20/2030 | | | | 16 | | | | 16 |
5.380% due 05/20/2030 | | | | 5 | | | | 5 |
| | | | | | | | |
| | | | | | | | 38,242 |
| | | | | | | | |
|
| U.S. TREASURY OBLIGATIONS 2.2% |
| U.S. Treasury Bonds |
8.125% due 08/15/2019 | | | | 300 | | | | 380 |
8.875% due 02/15/2019 | | | | 100 | | | | 132 |
| |
| U.S. Treasury Notes |
4.750% due 05/15/2014 | | | | 800 | | | | 790 |
| |
| U.S. Treasury Strips |
0.000% due 11/15/2021 | | | | 100 | | | | 47 |
| | | | | | | | |
| | | | | | | | 1,349 |
| | | | | | | | |
Total United States (Cost $57,980) | | | | 57,646 |
| | | | | | | | |
| | | | | | | | |
| SHORT-TERM INSTRUMENTS 7.5% |
|
| CERTIFICATES OF DEPOSIT 3.0% |
| Barclays Bank PLC |
5.281% due 03/17/2008 | | | | 400 | | | | 400 |
| |
| BNP Paribas |
5.262% due 05/28/2008 | | | | 200 | | | | 200 |
| |
| | | | | | | | | |
| | | | | PRINCIPAL
AMOUNT
(000S) | | | | VALUE
(000S) | |
| Countrywide Funding Corp. | |
5.360% due 08/16/2007 | | $ | | 200 | | $ | | 200 | |
| | |
| Dexia S.A. | |
5.270% due 09/29/2008 | | | | 300 | | | | 300 | |
| | |
| Fortis Bank NY | |
5.265% due 04/28/2008 | | | | 100 | | | | 100 | |
5.300% due 09/30/2008 | | | | 400 | | | | 400 | |
| | |
| Nordea Bank Finland PLC | |
5.308% due 05/28/2008 | | | | 100 | | | | 100 | |
| | |
| Unicredito Italiano NY | |
5.358% due 12/13/2007 | | | | 100 | | | | 100 | |
5.360% due 12/03/2007 | | | | 100 | | | | 100 | |
| | | | | | | | | |
| | | | | | | | 1,900 | |
| | | | | | | | | |
| | | | | | | | | |
| COMMERCIAL PAPER 2.9% | |
| Societe Generale NY | |
5.210% due 11/26/2007 | | | | 1,300 | | | | 1,287 | |
| | |
| UBS Finance Delaware LLC | |
5.350% due 10/23/2007 | | | | 500 | | | | 500 | |
| | | | | | | | | |
| | | | | | | | 1,787 | |
| | | | | | | | | |
| |
| REPURCHASE AGREEMENTS 1.0% | |
| State Street Bank and Trust Co. | |
4.900% due 07/02/2007 | | | | 619 | | | | 619 | |
| | | | | | | | | |
(Dated 06/29/2007. Collateralized by U.S. Treasury Notes 3.625% due 01/15/2010 valued at $636. Repurchase proceeds are $619.) | |
| |
| U.S. TREASURY BILLS 0.6% | |
4.617% due 09/13/2007 (a)(c) | | | | 395 | | | | 391 | |
| | | | | | | | | |
Total Short-Term Instruments
(Cost $4,698) | | 4,697 | |
| | | | | | | | | |
| |
| PURCHASED OPTIONS (e) 0.6% | |
(Cost $454) | | | | 398 | |
| |
| |
Total Investments (b) 167.5%
(Cost $104,302) | | $ | | 104,312 | |
| |
Written Options (f) (0.1%)
(Premiums $128) | | | | (31 | ) |
| |
| Other Assets and Liabilities (Net) (67.4%) | | (41,996 | ) |
| | | | | | | | | |
| Net Assets 100.0% | | | | | | $ | | 62,285 | |
| | | | | | | | | |
Notes to Schedule of Investments (amounts in thousands*, except number of contracts):
* A zero balance may reflect actual amounts rounding to less than one thousand.
(a) Coupon represents a weighted average rate.
(b) As of June 30, 2007, portfolio securities with an aggregate value of $1,007 were valued in good faith and pursuant to the guidelines established by the Board of Trustees.
| | | | | | |
| See Accompanying Notes | | Semiannual Report | | June 30, 2007 | | 11 |
Schedule of Investments Foreign Bond Portfolio (U.S. Dollar-Hedged) (Cont.)
(c) Securities with an aggregate market value of $391 have been segregated with the custodian to cover margin requirements for the following open futures contracts on June 30, 2007:
| | | | | | | | | | |
| Description | | Type | | Expiration
Month | | # of
Contracts | | Unrealized
Appreciation/
(Depreciation) | |
90-Day Eurodollar December Futures | | Long | | 12/2007 | | 17 | | $ | 4 | |
90-Day Eurodollar March Futures | | Long | | 03/2008 | | 13 | | | (8 | ) |
90-Day Eurodollar September Futures | | Short | | 09/2007 | | 2 | | | 3 | |
90-Day Euroyen December Futures | | Long | | 12/2007 | | 19 | | | (4 | ) |
Euro-Bobl 5-Year Note September Futures | | Long | | 09/2007 | | 37 | | | (11 | ) |
Euro-Bund 10-Year Note September Futures | | Long | | 09/2007 | | 97 | | | (75 | ) |
Euro-Bund 10-Year Note September Futures Put Options Strike @ EUR 104.000 | | Long | | 09/2007 | | 8 | | | 0 | |
Euro-Bund 10-Year Note September Futures Put Options Strike @ EUR 106.000 | | Long | | 09/2007 | | 86 | | | 1 | |
Japan Government 10-Year Bond September Futures | | Long | | 09/2007 | | 11 | | | (45 | ) |
U.S. Treasury 10-Year Note September Futures | | Short | | 09/2007 | | 53 | | | (20 | ) |
U.S. Treasury 30-Year Bond September Futures | | Long | | 09/2007 | | 2 | | | 2 | |
United Kingdom 90-Day LIBOR Sterling Interest Rate September Futures | | Long | | 09/2007 | | 12 | | | (12 | ) |
| | | | | | | | | | |
| | | | | | | | $ | (165 | ) |
| | | | | | | | | | |
(d) Swap agreements outstanding on June 30, 2007:
Credit Default Swaps
| | | | | | | | | | | | | | | | |
| Counterparty | | Reference Entity | | Buy/Sell
Protection (1) | | (Pay)/Receive
Fixed Rate | | | Expiration
Date | | Notional
Amount | | Unrealized
Appreciation/
(Depreciation) | |
Barclays Bank PLC | | Dow Jones iTraxx Europe HV6 Index | | Buy | | (0.850% | ) | | 12/20/2016 | | EUR | 300 | | $ | 0 | |
BNP Paribas Bank | | Dow Jones iTraxx Europe HV6 Index | | Buy | | (0.850% | ) | | 12/20/2016 | | | 200 | | | 0 | |
Deutsche Bank AG | | Dow Jones iTraxx Europe HV6 Index | | Buy | | (0.850% | ) | | 12/20/2016 | | | 400 | | | (1 | ) |
Goldman Sachs & Co. | | Dow Jones iTraxx Europe HV6 Index | | Buy | | (0.850% | ) | | 12/20/2016 | | | 100 | | | 0 | |
JPMorgan Chase & Co. | | Dow Jones iTraxx Europe HV6 Index | | Buy | | (0.850% | ) | | 12/20/2016 | | | 200 | | | 0 | |
Deutsche Bank AG | | SOFTBANK Corp. 1.750% due 03/31/2014 | | Sell | | 2.300% | | | 09/20/2007 | | JPY | 13,000 | | | 1 | |
Bank of America | | DR Horton, Inc. 6.000% due 04/15/2011 | | Buy | | (0.890% | ) | | 06/20/2011 | | $ | 100 | | | 2 | |
Bank of America | | GlobalSantaFe Corp. 5.000% due 02/15/2013 | | Buy | | (0.455% | ) | | 06/20/2012 | | | 200 | | | (1 | ) |
Bank of America | | Transocean, Inc. 7.375% due 04/15/2018 | | Buy | | (0.505% | ) | | 06/20/2017 | | | 200 | | | 0 | |
Barclays Bank PLC | | International Lease Finance Corp.
5.400% due 02/15/2012 | | Buy | | (0.170% | ) | | 03/20/2012 | | | 100 | | | 0 | |
Barclays Bank PLC | | Capital One Bank 5.125% due 02/15/2014 | | Buy | | (0.160% | ) | | 06/20/2012 | | | 100 | | | 0 | |
Bear Stearns & Co., Inc. | | Kraft Foods, Inc. 6.250% due 06/01//2012 | | Buy | | (0.170% | ) | | 06/20/2012 | | | 100 | | | 1 | |
Citibank N.A. | | Newell Rubbermaid, Inc. 4.000% due 05/01/2010 | | Buy | | (0.130% | ) | | 06/20/2010 | | | 100 | | | 0 | |
Credit Suisse First Boston | | CenterPoint Energy, Inc. 5.875% due 06/01/2008 | | Buy | | (0.170% | ) | | 06/20/2008 | | | 100 | | | 0 | |
Credit Suisse First Boston | | DaimlerChrysler N.A. Holding Corp. 5.750% due 05/18/2009 | | Buy | | (0.380% | ) | | 06/20/2009 | | | 100 | | | 0 | |
Credit Suisse First Boston | | Safeway, Inc. 4.950% due 08/16/2010 | | Buy | | (0.300% | ) | | 09/20/2010 | | | 100 | | | (1 | ) |
Credit Suisse First Boston | | iStar Financial, Inc. 5.150% due 03/01/2012 | | Buy | | (0.450% | ) | | 03/20/2012 | | | 100 | | | (1 | ) |
Credit Suisse First Boston | | Noble Corp. 5.875% due 06/01/2013 | | Buy | | (0.519% | ) | | 06/20/2012 | | | 200 | | | (1 | ) |
Deutsche Bank AG | | JC Penney Corp., Inc. 8.000% due 03/01/2010 | | Buy | | (0.270% | ) | | 03/20/2010 | | | 100 | | | 0 | |
Deutsche Bank AG | | Nationwide Health Properties, Inc.
6.500% due 07/15/2011 | | Buy | | (0.620% | ) | | 09/20/2011 | | | 100 | | | (1 | ) |
Deutsche Bank AG | | International Paper Co. 5.850% due 10/30/2012 | | Buy | | (0.700% | ) | | 06/20/2017 | | | 100 | | | 0 | |
Goldman Sachs & Co. | | Dow Jones CDX N.A. IG8 Index | | Buy | | (0.600% | ) | | 06/20/2017 | | | 7,000 | | | 41 | |
Goldman Sachs & Co. | | MeadWestvaco Corp. 6.850% due 04/01/2012 | | Buy | | (1.040% | ) | | 06/20/2017 | | | 200 | | | 1 | |
Goldman Sachs & Co. | | Transocean, Inc. 7.375% due 04/15/2018 | | Buy | | (0.500% | ) | | 06/20/2017 | | | 100 | | | 0 | |
HSBC Bank USA | | Russia Government International Bond 7.500% due 03/31/2030 | | Sell | | 0.240% | | | 02/20/2008 | | | 200 | | | 0 | |
HSBC Bank USA | | Ukraine Government International Bond 7.650% due 06/11/2013 | | Sell | | 0.730% | | | 04/20/2009 | | | 100 | | | 0 | |
Lehman Brothers, Inc. | | Ford Motor Credit Co. 7.875% due 06/15/2010 | | Buy | | (2.310% | ) | | 06/20/2010 | | | 100 | | | 1 | |
Lehman Brothers, Inc. | | Brazilian Government International Bond 12.250% due 03/06/2030 | | Sell | | 1.280% | | | 08/20/2011 | | | 2,200 | | | 64 | |
Lehman Brothers, Inc. | | CVS Corp. 5.750% due 08/15/2011 | | Buy | | (0.210% | ) | | 09/20/2011 | | | 100 | | | 0 | |
Lehman Brothers, Inc. | | Valero Energy Corp. 4.750% due 06/15/2013 | | Buy | | (0.410% | ) | | 06/20/2013 | | | 100 | | | 0 | |
Lehman Brothers, Inc. | | Merck & Co., Inc. 4.750% due 03/01/2015 | | Buy | | (0.135% | ) | | 03/20/2015 | | | 100 | | | 0 | |
Morgan Stanley | | Xerox Corp. 9.750% due 01/15/2009 | | Buy | | (0.290% | ) | | 03/20/2009 | | | 100 | | | 0 | |
Royal Bank of Canada | | JPMorgan Chase & Co. 6.750% due 02/01/2011 | | Buy | | (0.310% | ) | | 03/20/2016 | | | 100 | | | 0 | |
Royal Bank of Scotland Group PLC | | Glitnir Banki HF floating rate based on 3-Month USD-LIBOR plus 0.470% due 01/18/2012 | | Buy | | (0.290% | ) | | 03/20/2012 | | | 100 | | | 0 | |
UBS Warburg LLC | | American International Group, Inc.
4.250% due 05/15/2013 | | Sell | | 0.070% | | | 06/20/2008 | | | 300 | | | 0 | |
UBS Warburg LLC | | Lennar Corp. 5.950% due 03/01/2013 | | Buy | | (1.190% | ) | | 06/20/2017 | | | 200 | | | 5 | |
UBS Warburg LLC | | Weyerhaeuser Co. 6.750% due 03/15/2012 | | Buy | | (0.930% | ) | | 06/20/2017 | | | 200 | | | 1 | |
| | | | | | | | | | | | | | | | |
| | | | | | | | | | | | | | $ | 111 | |
| | | | | | | | | | | | | | | | |
(1) If the Portfolio is a seller of protection and a credit event occurs, as defined under the terms of that particular swap agreement, the Portfolio will pay to the buyer of the protection an amount up to the notional value of the swap and in certain instances, take delivery of the security. As a buyer of protection, the Portfolio will generally receive from the seller of protection an amount up to the notional amount of the swap if a credit event occurs.
| | | | |
| 12 | | PIMCO Variable Insurance Trust | | See Accompanying Notes |
| | |
| |
| | | June 30, 2007 (Unaudited) |
Interest Rate Swaps
| | | | | | | | | | | | | | | |
| Counterparty | | Floating Rate Index | | Pay/Receive
Floating Rate | | Fixed
Rate | | Expiration
Date | | Notional
Amount | | Unrealized
Appreciation/
(Depreciation) | |
Citibank N.A. | | 6-Month Australian Bank Bill | | Pay | | 6.500% | | 01/15/2009 | | AUD | 1,500 | | $ | (3 | ) |
Citibank N.A. | | 6-Month Australian Bank Bill | | Pay | | 6.000% | | 06/15/2010 | | | 700 | | | (19 | ) |
Citibank N.A. | | 6-Month Australian Bank Bill | | Receive | | 6.000% | | 06/15/2015 | | | 400 | | | 20 | |
Deutsche Bank AG | | 6-Month Australian Bank Bill | | Pay | | 6.500% | | 01/15/2009 | | | 5,000 | | | (13 | ) |
Deutsche Bank AG | | 6-Month Australian Bank Bill | | Pay | | 6.500% | | 01/15/2010 | | | 1,200 | | | (9 | ) |
Deutsche Bank AG | | 6-Month Australian Bank Bill | | Pay | | 6.000% | | 06/15/2012 | | | 500 | | | (13 | ) |
Deutsche Bank AG | | 6-Month Australian Bank Bill | | Receive | | 6.000% | | 06/15/2017 | | | 300 | | | 14 | |
HSBC Bank USA | | 6-Month Australian Bank Bill | | Pay | | 6.000% | | 06/15/2012 | | | 300 | | | (8 | ) |
HSBC Bank USA | | 6-Month Australian Bank Bill | | Receive | | 6.000% | | 06/15/2017 | | | 200 | | | 9 | |
JPMorgan Chase & Co. | | 6-Month Australian Bank Bill | | Pay | | 6.500% | | 01/15/2010 | | | 500 | | | (3 | ) |
Morgan Stanley | | 6-Month Australian Bank Bill | | Pay | | 6.500% | | 01/15/2009 | | | 2,300 | | | (6 | ) |
Royal Bank of Canada | | 6-Month Australian Bank Bill | | Pay | | 6.500% | | 01/15/2010 | | | 1,500 | | | (10 | ) |
UBS Warburg LLC | | 6-Month Australian Bank Bill | | Pay | | 6.000% | | 06/15/2010 | | | 1,600 | | | (45 | ) |
UBS Warburg LLC | | 6-Month Australian Bank Bill | | Receive | | 6.000% | | 06/15/2015 | | | 1,000 | | | 59 | |
Merrill Lynch & Co., Inc. | | 3-Month Canadian Bank Bill | | Receive | | 5.500% | | 06/20/2017 | | CAD | 400 | | | (1 | ) |
Royal Bank of Canada | | 3-Month Canadian Bank Bill | | Receive | | 5.000% | | 06/15/2015 | | | 200 | | | 3 | |
Citibank N.A. | | 6-Month EUR-LIBOR | | Receive | | 4.000% | | 12/15/2011 | | EUR | 1,600 | | | 3 | |
Citibank N.A. | | 6-Month EUR-LIBOR | | Receive | | 5.000% | | 06/17/2012 | | | 200 | | | 21 | |
Deutsche Bank AG | | 6-Month EUR-LIBOR | | Receive | | 4.000% | | 12/15/2011 | | | 200 | | | 7 | |
Deutsche Bank AG | | 6-Month EUR-LIBOR | | Receive | | 4.000% | | 12/15/2014 | | | 4,880 | | | 216 | |
Goldman Sachs & Co. | | 6-Month EUR-LIBOR | | Pay | | 4.000% | | 06/17/2010 | | | 200 | | | (8 | ) |
Goldman Sachs & Co. | | 5-Year French CPI Ex Tobacco Daily Reference Index | | Pay | | 1.960% | | 03/30/2012 | | | 500 | | | (4 | ) |
Goldman Sachs & Co. | | 6-Month EUR-LIBOR | | Receive | | 5.000% | | 09/19/2012 | | | 800 | | | (3 | ) |
Goldman Sachs & Co. | | 6-Month EUR-LIBOR | | Receive | | 4.000% | | 12/15/2014 | | | 1,900 | | | 114 | |
Goldman Sachs & Co. | | 6-Month EUR-LIBOR | | Receive | | 5.000% | | 03/19/2038 | | | 400 | | | (7 | ) |
HSBC Bank USA | | 6-Month EUR-LIBOR | | Receive | | 4.000% | | 12/15/2014 | | | 500 | | | 22 | |
JPMorgan Chase & Co. | | 6-Month EUR-LIBOR | | Pay | | 4.000% | | 06/17/2010 | | | 200 | | | (14 | ) |
JPMorgan Chase & Co. | | 6-Month EUR-LIBOR | | Receive | | 5.000% | | 06/17/2012 | | | 100 | | | 10 | |
Lehman Brothers, Inc. | | 6-Month EUR-LIBOR | | Pay | | 6.000% | | 06/18/2034 | | | 200 | | | (17 | ) |
Morgan Stanley | | 6-Month EUR-LIBOR | | Pay | | 4.000% | | 06/17/2010 | | | 100 | | | (7 | ) |
Morgan Stanley | | 6-Month EUR-LIBOR | | Receive | | 4.000% | | 12/15/2011 | | | 1,200 | | | 47 | |
Morgan Stanley | | 6-Month EUR-LIBOR | | Receive | | 4.000% | | 06/15/2017 | | | 500 | | | 48 | |
Morgan Stanley | | 6-Month EUR-LIBOR | | Pay | | 6.000% | | 06/18/2034 | | | 800 | | | (21 | ) |
UBS Warburg LLC | | 6-Month EUR-LIBOR | | Pay | | 4.000% | | 06/17/2010 | | | 200 | | | (15 | ) |
Barclays Bank PLC | | 6-Month GBP-LIBOR | | Pay | | 6.000% | | 03/20/2009 | | GBP | 1,700 | | | (19 | ) |
Barclays Bank PLC | | 6-Month GBP-LIBOR | | Pay | | 5.000% | | 09/15/2010 | | | 1,400 | | | (118 | ) |
Barclays Bank PLC | | 6-Month GBP-LIBOR | | Receive | | 5.000% | | 09/15/2015 | | | 400 | | | 52 | |
Barclays Bank PLC | | 6-Month GBP-LIBOR | | Receive | | 4.500% | | 09/15/2017 | | | 1,500 | | | 15 | |
Barclays Bank PLC | | 6-Month GBP-LIBOR | | Pay | | 5.000% | | 06/18/2034 | | | 200 | | | (17 | ) |
Barclays Bank PLC | | 6-Month GBP-LIBOR | | Receive | | 4.000% | | 12/15/2035 | | | 200 | | | 21 | |
Deutsche Bank AG | | 6-Month GBP-LIBOR | | Pay | | 5.000% | | 06/15/2009 | | | 300 | | | (11 | ) |
Deutsche Bank AG | | 6-Month GBP-LIBOR | | Receive | | 4.250% | | 06/12/2036 | | | 100 | | | 26 | |
Goldman Sachs & Co. | | 6-Month GBP-LIBOR | | Receive | | 4.250% | | 06/12/2036 | | | 200 | | | 38 | |
HSBC Bank USA | | 6-Month GBP-LIBOR | | Pay | | 5.000% | | 09/15/2010 | | | 1,400 | | | (125 | ) |
Merrill Lynch & Co., Inc. | | 6-Month GBP-LIBOR | | Pay | | 5.000% | | 09/15/2010 | | | 1,000 | | | (89 | ) |
Morgan Stanley | | 6-Month GBP-LIBOR | | Pay | | 5.000% | | 09/15/2015 | | | 300 | | | (37 | ) |
Goldman Sachs & Co. | | 3-Month Hong Kong Bank Bill | | Receive | | 4.235% | | 12/17/2008 | | HKD | 7,100 | | | 6 | |
Barclays Bank PLC | | 6-Month JPY-LIBOR | | Pay | | 1.000% | | 03/18/2009 | | JPY | 420,000 | | | (7 | ) |
Barclays Bank PLC | | 6-Month JPY-LIBOR | | Receive | | 2.000% | | 12/20/2016 | | | 190,000 | | | (14 | ) |
Barclays Bank PLC | | 6-Month JPY-LIBOR | | Pay | | 2.500% | | 06/20/2036 | | | 20,000 | | | (5 | ) |
Deutsche Bank AG | | 6-Month JPY-LIBOR | | Pay | | 1.000% | | 09/18/2008 | | | 1,040,000 | | | 3 | |
Deutsche Bank AG | | 6-Month JPY-LIBOR | | Pay | | 1.000% | | 03/18/2009 | | | 540,000 | | | (9 | ) |
Deutsche Bank AG | | 6-Month JPY-LIBOR | | Receive | | 2.000% | | 12/20/2016 | | | 50,000 | | | (4 | ) |
Deutsche Bank AG | | 6-Month JPY-LIBOR | | Pay | | 3.000% | | 06/20/2027 | | | 20,000 | | | (1 | ) |
Goldman Sachs & Co. | | 6-Month JPY-LIBOR | | Receive | | 2.020% | | 05/18/2010 | | | 17,000 | | | (3 | ) |
Goldman Sachs & Co. | | 6-Month JPY-LIBOR | | Receive | | 1.300% | | 09/21/2011 | | | 40,000 | | | 3 | |
Goldman Sachs & Co. | | 6-Month JPY-LIBOR | | Receive | | 2.000% | | 12/20/2016 | | | 590,000 | | | (36 | ) |
Morgan Stanley | | 6-Month JPY-LIBOR | | Pay | | 1.000% | | 03/18/2009 | | | 80,000 | | | (1 | ) |
Morgan Stanley | | 6-Month JPY-LIBOR | | Receive | | 2.000% | | 12/20/2013 | | | 130,000 | | | 7 | |
Morgan Stanley | | 6-Month JPY-LIBOR | | Receive | | 2.000% | | 12/20/2016 | | | 220,000 | | | (13 | ) |
UBS Warburg LLC | | 6-Month JPY-LIBOR | | Pay | | 1.000% | | 09/18/2008 | | | 1,560,000 | | | (22 | ) |
UBS Warburg LLC | | 6-Month JPY-LIBOR | | Pay | | 1.000% | | 03/18/2009 | | | 820,000 | | | (15 | ) |
UBS Warburg LLC | | 6-Month JPY-LIBOR | | Receive | | 0.800% | | 03/20/2012 | | | 50,000 | | | (3 | ) |
UBS Warburg LLC | | 6-Month JPY-LIBOR | | Receive | | 2.000% | | 12/20/2013 | | | 190,000 | | | 20 | |
UBS Warburg LLC | | 6-Month JPY-LIBOR | | Receive | | 2.000% | | 12/20/2016 | | | 320,000 | | | (12 | ) |
UBS Warburg LLC | | 6-Month JPY-LIBOR | | Pay | | 3.000% | | 06/20/2027 | | | 20,000 | | | (1 | ) |
UBS Warburg LLC | | 6-Month JPY-LIBOR | | Pay | | 2.500% | | 06/20/2036 | | | 60,000 | | | (15 | ) |
Citibank N.A. | | 28-Day Mexico Interbank TIIE Banxico | | Pay | | 8.170% | | 11/04/2016 | | MXN | 2,000 | | | (2 | ) |
Merrill Lynch & Co., Inc. | | 28-Day Mexico Interbank TIIE Banxico | | Pay | | 8.170% | | 11/04/2016 | | | 4,000 | | | (1 | ) |
Bank of America | | 3-Month USD-LIBOR | | Pay | | 5.000% | | 06/18/2009 | | $ | 5,900 | | | (29 | ) |
Citibank N.A. | | 3-Month USD-LIBOR | | Receive | | 5.000% | | 06/20/2014 | | | 800 | | | 28 | |
Deutsche Bank AG | | 3-Month USD-LIBOR | | Pay | | 5.000% | | 06/18/2009 | | | 22,800 | | | (107 | ) |
Deutsche Bank AG | | 3-Month USD-LIBOR | | Receive | | 5.000% | | 06/20/2014 | | | 200 | | | 7 | |
Lehman Brothers, Inc. | | 3-Month USD-LIBOR | | Receive | | 5.000% | | 12/19/2012 | | | 1,300 | | | (2 | ) |
| | | | | | |
| See Accompanying Notes | | Semiannual Report | | June 30, 2007 | | 13 |
Schedule of Investments Foreign Bond Portfolio (U.S. Dollar-Hedged) (Cont.)
| | | | | | | | | | | | | | | |
| Counterparty | | Floating Rate Index | | Pay/Receive
Floating Rate | | Fixed
Rate | | Expiration
Date | | Notional
Amount | | Unrealized
Appreciation/
(Depreciation) | |
Lehman Brothers, Inc. | | 3-Month USD-LIBOR | | Receive | | 5.000% | | 06/20/2014 | | $ | 4,700 | | $ | 166 | |
Lehman Brothers, Inc. | | 3-Month USD-LIBOR | | Receive | | 5.000% | | 12/19/2017 | | | 800 | | | (6 | ) |
Morgan Stanley | | 3-Month USD-LIBOR | | Pay | | 5.000% | | 06/20/2009 | | | 900 | | | (8 | ) |
Morgan Stanley | | 3-Month USD-LIBOR | | Receive | | 5.000% | | 12/19/2017 | | | 3,300 | | | (22 | ) |
Morgan Stanley | | 3-Month USD-LIBOR | | Pay | | 5.000% | | 12/19/2037 | | | 100 | | | 2 | |
Royal Bank of Scotland Group PLC | | 3-Month USD-LIBOR | | Pay | | 5.000% | | 06/20/2008 | | | 1,000 | | | (1 | ) |
Royal Bank of Scotland Group PLC | | 3-Month USD-LIBOR | | Receive | | 5.000% | | 12/19/2014 | | | 200 | | | (1 | ) |
Royal Bank of Scotland Group PLC | | 3-Month USD-LIBOR | | Receive | | 5.000% | | 12/19/2017 | | | 9,300 | | | (60 | ) |
UBS Warburg LLC | | 3-Month USD-LIBOR | | Receive | | 5.000% | | 12/20/2026 | | | 900 | | | 1 | |
| | | | | | | | | | | | | | | |
| | | | | | | | | | | | | $ | (54 | ) |
| | | | | | | | | | | | | | | |
(e) Purchased options outstanding on June 30, 2007:
Options on Exchange-Traded Futures Contracts
| | | | | | | | | | | | | |
| Description | | Exercise
Price | | Expiration
Date | | # of
Contracts | | Cost | | Value |
Call - CBOT U.S. Treasury 10-Year Note September Futures | | $ | 109.000 | | 08/24/2007 | | 20 | | $ | 0 | | $ | 0 |
| | | | | | | | | | | | | |
Interest Rate Swaptions
| | | | | | | | | | | | | | | | | | | |
| Description | | Counterparty | | Floating Rate Index | | Pay/Receive
Floating Rate | | Exercise
Rate | | Expiration
Date | | Notional
Amount | | Cost | | Value |
Call - OTC 2-Year Interest Rate Swap | | Bank of America | | 3-Month USD-LIBOR | | Pay | | 4.800% | | 08/08/2007 | | $ | 2,000 | | $ | 8 | | $ | 0 |
Call - OTC 2-Year Interest Rate Swap | | Bank of America | | 3-Month USD-LIBOR | | Pay | | 5.000% | | 02/01/2008 | | | 4,600 | | | 18 | | | 8 |
Call - OTC 2-Year Interest Rate Swap | | Bank of America | | 3-Month USD-LIBOR | | Pay | | 4.750% | | 09/26/2008 | | | 4,000 | | | 19 | | | 8 |
Call - OTC 1-Year Interest Rate Swap | | Royal Bank of Scotland Group PLC | | 3-Month USD-LIBOR | | Pay | | 4.850% | | 07/02/2007 | | | 17,200 | | | 45 | | | 0 |
Call - OTC 1-Year Interest Rate Swap | | Royal Bank of Scotland Group PLC | | 3-Month USD-LIBOR | | Pay | | 4.900% | | 08/08/2007 | | | 7,000 | | | 16 | | | 0 |
Call - OTC 2-Year Interest Rate Swap | | Royal Bank of Scotland Group PLC | | 3-Month USD-LIBOR | | Pay | | 5.000% | | 02/01/2008 | | | 2,000 | | | 10 | | | 3 |
Call - OTC 2-Year Interest Rate Swap | | Royal Bank of Scotland Group PLC | | 3-Month USD-LIBOR | | Pay | | 4.750% | | 12/15/2008 | | | 4,500 | | | 15 | | | 10 |
| | | | | | | | | | | | | | | | | | | |
| | | | | | | | | | | | | | | $ | 131 | | $ | 29 |
| | | | | | | | | | | | | | | | | | | |
Foreign Currency Options
| | | | | | | | | | | | | | |
| Description | | Exercise
Price | | Expiration
Date | | Notional
Amount | | Cost | | Value |
Call - OTC Euro versus U.S. dollar | | $ | 1.355 | | 05/21/2008 | | EUR | 1,000 | | $ | 30 | | $ | 34 |
Put - OTC Euro versus U.S. dollar | | | 1.355 | | 05/21/2008 | | | 1,000 | | | 30 | | | 25 |
Call - OTC U.S. dollar versus Japanese yen | | JPY | 120.000 | | 09/26/2007 | | $ | 300 | | | 2 | | | 7 |
Call - OTC U.S. dollar versus Japanese yen | | | 117.900 | | 11/09/2007 | | | 600 | | | 6 | | | 20 |
Call - OTC U.S. dollar versus Japanese yen | | | 117.500 | | 11/19/2007 | | | 300 | | | 3 | | | 11 |
Call - OTC U.S. dollar versus Japanese yen | | | 114.281 | | 12/05/2007 | | | 300 | | | 4 | | | 17 |
Call - OTC U.S. dollar versus Japanese yen | | | 114.650 | | 01/18/2008 | | | 1,000 | | | 33 | | | 52 |
Put - OTC U.S. dollar versus Japanese yen | | | 114.650 | | 01/18/2008 | | | 1,000 | | | 33 | | | 8 |
Call - OTC U.S. dollar versus Japanese yen | | | 121.400 | | 01/23/2008 | | | 500 | | | 5 | | | 7 |
Call - OTC U.S. dollar versus Japanese yen | | | 117.500 | | 03/13/2008 | | | 400 | | | 3 | | | 13 |
Call - OTC U.S. dollar versus Japanese yen | | | 115.950 | | 06/09/2008 | | | 400 | | | 11 | | | 15 |
Put - OTC U.S. dollar versus Japanese yen | | | 115.950 | | 06/09/2008 | | | 400 | | | 10 | | | 8 |
Call - OTC U.S. dollar versus Japanese yen | | | 118.150 | | 06/23/2008 | | | 2,800 | | | 74 | | | 73 |
Put - OTC U.S. dollar versus Japanese yen | | | 118.150 | | 06/23/2008 | | | 2,800 | | | 74 | | | 76 |
| | | | | | | | | | | | | | |
| | | | | | | | | | $ | 318 | | $ | 366 |
| | | | | | | | | | | | | | |
Options on Securities
| | | | | | | | | | | | | | |
| Description | | Strike Price | | Expiration
Date | | Notional
Amount | | Cost | | Value |
Put - OTC Fannie Mae 6.000% due 07/01/2037 | | $ | 91.500 | | 07/05/2007 | | $ | 3,000 | | $ | 0 | | $ | 0 |
Call - OTC Fannie Mae 5.000% due 09/01/2037 | | | 101.125 | | 09/06/2007 | | | 8,000 | | | 1 | | | 1 |
Put - OTC Fannie Mae 5.500% due 08/01/2037 | | | 89.500 | | 08/07/2007 | | | 5,000 | | | 1 | | | 0 |
Put - OTC Fannie Mae 6.000% due 09/01/2037 | | | 92.500 | | 09/06/2007 | | | 23,000 | | | 3 | | | 2 |
Call - OTC Fannie Mae 5.000% due 09/01/2037 | | | 102.438 | | 09/06/2007 | | | 1,460 | | | 0 | | | 0 |
| | | | | | | | | | | | | | |
| | | | | | | | | | $ | 5 | | $ | 3 |
| | | | | | | | | | | | | | |
| | | | |
| 14 | | PIMCO Variable Insurance Trust | | See Accompanying Notes |
| | |
| |
| | | June 30, 2007 (Unaudited) |
(f) Written options outstanding on June 30, 2007:
Interest Rate Swaptions
| | | | | | | | | | | | | | | | | | | |
| Description | | Counterparty | | Floating Rate Index | | Pay/Receive
Floating Rate | | Exercise
Rate | | Expiration
Date | | Notional
Amount | | Premium | | Value |
Call - OTC 5-Year Interest Rate Swap | | Bank of America | | 3-Month USD-LIBOR | | Receive | | 4.900% | | 08/08/2007 | | $ | 1,000 | | $ | 8 | | $ | 0 |
Call - OTC 5-Year Interest Rate Swap | | Bank of America | | 3-Month USD-LIBOR | | Receive | | 5.100% | | 02/01/2008 | | | 2,000 | | | 18 | | | 7 |
Call - OTC 5-Year Interest Rate Swap | | Bank of America | | 3-Month USD-LIBOR | | Receive | | 4.950% | | 09/26/2008 | | | 2,000 | | | 22 | | | 10 |
Call - OTC 5-Year Interest Rate Swap | | Royal Bank of Scotland Group PLC | | 3-Month USD-LIBOR | | Receive | | 4.950% | | 07/02/2007 | | | 3,700 | | | 40 | | | 0 |
Call - OTC 7-Year Interest Rate Swap | | Royal Bank of Scotland Group PLC | | 3-Month USD-LIBOR | | Receive | | 4.900% | | 08/08/2007 | | | 1,200 | | | 14 | | | 0 |
Call - OTC 5-Year Interest Rate Swap | | Royal Bank of Scotland Group PLC | | 3-Month USD-LIBOR | | Receive | | 5.100% | | 02/01/2008 | | | 900 | | | 11 | | | 3 |
Call - OTC 7-Year Interest Rate Swap | | Royal Bank of Scotland Group PLC | | 3-Month USD-LIBOR | | Receive | | 5.000% | | 12/15/2008 | | | 1,500 | | | 15 | | | 11 |
| | | | | | | | | | | | | | | | | | | |
| | | | | | | | | | | | | | | $ | 128 | | $ | 31 |
| | | | | | | | | | | | | | | | | | | |
(g) Short sales outstanding on June 30, 2007:
| | | | | | | | | | | | | |
| Description | | Coupon | | Maturity
Date | | Principal
Amount | | Proceeds | | Value |
Fannie Mae | | 5.000% | | 07/01/2037 | | $ | 10,000 | | $ | 9,611 | | $ | 9,370 |
| | | | | | | | | | | | | |
(h) Foreign currency contracts outstanding on June 30, 2007:
| | | | | | | | | | | | | | | | | |
| Type | | Currency | | Principal
Amount
Covered by
Contract | | Settlement
Month | | Unrealized
Appreciation | | Unrealized
(Depreciation) | | | Net Unrealized
Appreciation/
(Depreciation) | |
Buy | | AUD | | 1,772 | | 07/2007 | | $ | 6 | | $ | 0 | | | $ | 6 | |
Sell | | | | 643 | | 07/2007 | | | 0 | | | (4 | ) | | | (4 | ) |
Buy | | BRL | | 1,256 | | 07/2007 | | | 15 | | | 0 | | | | 15 | |
Sell | | | | 1,256 | | 07/2007 | | | 8 | | | 0 | | | | 8 | |
Buy | | | | 1,021 | | 10/2007 | | | 19 | | | 0 | | | | 19 | |
Buy | | | | 1,571 | | 03/2008 | | | 9 | | | (9 | ) | | | 0 | |
Sell | | CAD | | 518 | | 08/2007 | | | 0 | | | (2 | ) | | | (2 | ) |
Buy | | CLP | | 6,033 | | 11/2007 | | | 0 | | | 0 | | | | 0 | |
Buy | | | | 4,000 | | 03/2008 | | | 0 | | | 0 | | | | 0 | |
Buy | | CNY | | 5,292 | | 11/2007 | | | 3 | | | 0 | | | | 3 | |
Buy | | | | 14,644 | | 01/2008 | | | 0 | | | (9 | ) | | | (9 | ) |
Buy | | DKK | | 32 | | 09/2007 | | | 0 | | | 0 | | | | 0 | |
Sell | | | | 178 | | 09/2007 | | | 0 | | | 0 | | | | 0 | |
Sell | | EUR | | 10,084 | | 07/2007 | | | 0 | | | (132 | ) | | | (132 | ) |
Sell | | GBP | | 2,757 | | 08/2007 | | | 0 | | | (29 | ) | | | (29 | ) |
Buy | | HKD | | 475 | | 07/2007 | | | 0 | | | 0 | | | | 0 | |
Buy | | | | 475 | | 08/2007 | | | 0 | | | 0 | | | | 0 | |
Buy | | JPY | | 41,361 | | 07/2007 | | | 1 | | | 0 | | | | 1 | |
Sell | | | | 1,136,167 | | 07/2007 | | | 131 | | | (1 | ) | | | 130 | |
Buy | | KRW | | 241,826 | | 07/2007 | | | 2 | | | 0 | | | | 2 | |
Buy | | | | 278,085 | | 08/2007 | | | 0 | | | 0 | | | | 0 | |
Buy | | | | 41,181 | | 09/2007 | | | 1 | | | 0 | | | | 1 | |
Buy | | MXN | | 4,263 | | 03/2008 | | | 10 | | | 0 | | | | 10 | |
Buy | | NOK | | 2,097 | | 09/2007 | | | 6 | | | 0 | | | | 6 | |
Sell | | NZD | | 649 | | 07/2007 | | | 0 | | | (5 | ) | | | (5 | ) |
Buy | | PLN | | 555 | | 09/2007 | | | 2 | | | 0 | | | | 2 | |
Buy | | RUB | | 9,889 | | 09/2007 | | | 2 | | | 0 | | | | 2 | |
Buy | | | | 339 | | 11/2007 | | | 0 | | | 0 | | | | 0 | |
Buy | | | | 5,866 | | 12/2007 | | | 1 | | | 0 | | | | 1 | |
Buy | | SEK | | 2,492 | | 09/2007 | | | 4 | | | 0 | | | | 4 | |
Buy | | SGD | | 176 | | 08/2007 | | | 0 | | | (2 | ) | | | (2 | ) |
Buy | | TWD | | 3,534 | | 07/2007 | | | 1 | | | 0 | | | | 1 | |
Buy | | | | 3,534 | | 08/2007 | | | 0 | | | 0 | | | | 0 | |
Buy | | ZAR | | 70 | | 09/2007 | | | 0 | | | 0 | | | | 0 | |
| | | | | | | | | | | | | | | | | |
| | | | | | | | $ | 221 | | $ | (193 | ) | | $ | 28 | |
| | | | | | | | | | | | | | | | | |
| | | | | | |
| See Accompanying Notes | | Semiannual Report | | June 30, 2007 | | 15 |
Notes to Financial Statements
1. ORGANIZATION
The Foreign Bond Portfolio U.S. Dollar-Hedged (the “Portfolio”) is a series of the PIMCO Variable Insurance Trust (the “Trust”). The Trust is registered under the Investment Company Act of 1940 (the “Act”), as amended, as an open-end management investment company organized as a Delaware business trust on October 3, 1997. The Portfolio offers two classes of shares: Institutional and Administrative. Information presented on these financial statements pertains to the Administrative Class of the Portfolio. Certain detailed financial information for the Institutional Class is provided separately and is available upon request. The Trust is designed to be used as an investment vehicle by Separate Accounts of insurance companies that fund variable annuity contracts and variable life insurance policies and by qualified pension and retirement plans.
2. SIGNIFICANT ACCOUNTING POLICIES
The following is a summary of significant accounting policies consistently followed by the Portfolio in the preparation of its financial statements in conformity with accounting principles generally accepted in the United States of America (“GAAP”). The preparation of financial statements in accordance with GAAP requires management to make estimates and assumptions that affect the reported amounts and disclosures on the financial statements. Actual results could differ from those estimates.
(a) Security Valuation Portfolio securities are valued as of the close of regular trading (normally 4:00 p.m., Eastern Time) on each day that the New York Stock Exchange (“NYSE”) is open. Portfolio securities and other assets for which market quotes are readily available are stated at market value. Market value is generally determined on the basis of last reported sales prices, or if no sales are reported, based on quotes obtained from a quotation reporting system, established market makers, or pricing services. Fixed-income securities and non-exchange traded derivatives are normally valued on the basis of quotes obtained from brokers and dealers or pricing services. Prices obtained from independent pricing services use information provided by market makers or estimates of market values obtained from yield data relating to investments or securities with similar characteristics. Certain fixed income securities purchased on a delayed-delivery basis are marked to market daily until settlement at the forward settlement date. Short-term investments having a maturity of 60 days or less are generally valued at amortized cost. Exchange traded options, futures and options on futures are valued at the settlement price determined by the relevant exchange. With respect to any portion of the Portfolio’s assets that are invested in one or more open end management investment companies, the Portfolio’s net asset value (“NAV”) will be calculated based upon the NAVs of such investments.
Investments initially valued in currencies other than the U.S. dollar are converted to the U.S. dollar using exchange rates obtained from pricing services. As a result, the NAV of the Portfolio’s securities may be affected by changes in the value of currencies in relation to the U.S. dollar. The value of securities traded in markets outside the United States or denominated in currencies other than the U.S. dollar may be affected significantly on a day that the NYSE is closed and an investor is not able to purchase, redeem or exchange shares.
Securities and other assets for which market quotes are not readily available are valued at fair value as determined in good faith by the Board of Trustees or persons acting at their direction. The Board of Trustees has adopted methods for valuing securities and other assets in circumstances where market quotes are not readily available, and has delegated to Pacific Investment Management Company LLC (“PIMCO”) the responsibility for applying the valuation methods. In the event that market quotes are not readily available, and the security or asset cannot be valued pursuant to one of the valuation methods, the value of the security or asset will be determined in good faith by the Valuation Committee of the Board of Trustees, generally based upon recommendations provided by PIMCO.
Market quotes are considered not readily available in circumstances where there is an absence of current or reliable market-based data (e.g., trade information, bid/asked information, broker quotes), including where events occur after the close of the relevant market, but prior to the close of regular trading, that materially affect the values of the Portfolio’s securities or assets. In addition, market quotes are considered not readily available when, due to extraordinary circumstances, the exchanges or markets on which the securities trade, do not open for trading for the entire day and no other market prices are available. The Board has delegated to PIMCO the responsibility for monitoring significant events that may materially affect the values of the Portfolio’s securities or assets and for determining whether the value of the applicable securities or assets should be re-evaluated in light of such significant events.
When the Portfolio uses fair value pricing to determine its NAV, securities will not be priced on the basis of quotations from the primary market in which they are traded, but rather may be priced by another method that the Board of Trustees or persons acting at their direction believe accurately reflects fair value. The Trust’s policy is intended to result in a calculation of the Portfolio’s NAV that fairly reflects security values as of the time of pricing. However, fair values determined by the Board of Trustees or persons acting at their direction may not accurately reflect the price that the Portfolio could obtain for a security if it were to dispose of that security as of the time of pricing. Because foreign securities can trade on non-business days of the Portfolio, the NAV of the Portfolio may change on days when shareholders will not be able to purchase or redeem Portfolio shares. The prices used by the Portfolio may differ from the value that would be realized if the securities were sold and the differences could be material to the financial statements.
(b) Securities Transactions and Investment Income Securities transactions are recorded as of the trade date for financial reporting purposes. Securities purchased or sold on a when-issued or delayed-delivery basis may be settled a month or more after the trade date. Realized gains and losses from securities sold are recorded on the identified cost basis. Dividend income is recorded on the ex-dividend date, except certain dividends from foreign securities where the ex-dividend date may have passed, which are recorded as soon as the Portfolio is informed of the ex-dividend date. Interest income, adjusted for the accretion of discounts and amortization of premiums, is recorded on the accrual basis. Paydown gains and losses on mortgage-related and other asset-backed securities are recorded as components of interest income on the Statement of Operations.
(c) Delayed-Delivery Transactions The Portfolio may purchase or sell securities on a delayed-delivery basis. These transactions involve a commitment by the Portfolio to purchase or sell securities for a predetermined price or yield, with payment and delivery taking place beyond the customary settlement period. When delayed-delivery purchases are outstanding, the Portfolio will designate liquid assets in an amount sufficient to meet the purchase price. When purchasing a security on a delayed-delivery basis, the Portfolio assumes the rights and risks of ownership of the security, including the risk of price and yield fluctuations, and takes such fluctuations into account when determining its net asset value. The Portfolio may dispose of or renegotiate a delayed-delivery transaction after it is entered into, and may sell when-issued securities before they are delivered, which may result in a capital gain or loss. When the Portfolio has sold a security on a delayed-delivery basis, the Portfolio does not participate in future gains and losses with respect to the security.
(d) Dividends and Distributions to Shareholders Dividends from net investment income, if any, are declared daily and distributed to shareholders monthly. Net realized capital gains earned by the Portfolio, if any, will be distributed no less frequently than once each year.
Income dividends and capital gain distributions are determined in accordance with income tax regulations which may differ from GAAP. Differences between tax regulations and GAAP may change the fiscal year when income and capital items
| | | | |
| 16 | | PIMCO Variable Insurance Trust | | |
| | |
| |
| | | June 30, 2007 (Unaudited) |
are recognized for tax and GAAP purposes. Examples of events that give rise to timing differences include wash sales, straddles, net operating losses and capital loss carryforwards. Further, the character of investment income and capital gains may be different for certain transactions under the two methods of accounting. Examples of characterization differences include the treatment of mortgage paydowns, swaps, foreign currency transactions and contingent debt instruments. As a result, income dividends and capital gain distributions declared during a fiscal period may differ significantly from the net investment income and realized capital gain reported on the Portfolio’s annual financial statements presented under GAAP.
Distributions classified as a tax basis return of capital, if any, are reflected on the accompanying Statements of Changes in Net Assets and have been reclassified to paid in capital. In addition, other amounts have been reclassified between undistributed net investment income, accumulated undistributed net realized gains or losses and/or paid in capital to more appropriately conform financial accounting to tax characterizations of dividend distributions.
(e) Multiclass Operations Each class offered by the Portfolio has equal rights as to assets and voting privileges (except that shareholders of a class have exclusive voting rights regarding any matter relating solely to that class of shares). Income and non-class specific expenses of the Portfolio are allocated daily to each class of shares based on the relative value of settled shares. Realized and unrealized capital gains and losses of the Portfolio are allocated daily to each class of shares based on the relative net assets of each class. Class specific expenses, where applicable, currently include administrative, distribution and servicing fees.
(f) Foreign Currency The functional and reporting currency for the Portfolio is the U.S. dollar. The market values of foreign securities, currency holdings and other assets and liabilities are translated into U.S. dollars based on the current exchange rates each business day. Fluctuations in the value of currency holdings and other assets and liabilities resulting from changes in exchange rates are recorded as unrealized foreign currency gains or losses. Realized gains or losses and unrealized appreciation or depreciation on investment securities and income and expenses are translated on the respective dates of such transactions. The effects of changes in foreign currency exchange rates on investments in securities are not segregated on the Statement of Operations from the effects of changes in market prices of those securities, but are included with the net realized and unrealized gain or loss on investment securities.
| | | | | | |
|
| Non-U.S. currency symbols utilized throughout the report are defined as follows: |
| AUD | | Australian Dollar | | KRW | | South Korean Won |
| BRL | | Brazilian Real | | MXN | | Mexican Peso |
| CAD | | Canadian Dollar | | NOK | | Norwegian Krone |
| CLP | | Chilean Peso | | NZD | | New Zealand Dollar |
| CNY | | Chinese Yuan Renminbi | | PLN | | Polish Zloty |
| DKK | | Danish Krone | | RUB | | Russian Ruble |
| EUR | | Euro | | SEK | | Swedish Krona |
| GBP | | Great British Pound | | SGD | | Singapore Dollar |
| HKD | | Hong Kong Dollar | | TWD | | Taiwan Dollar |
| JPY | | Japanese Yen | | ZAR | | South African Rand |
(g) Foreign Currency Transactions The Portfolio may enter into foreign currency contracts in connection with settling planned purchases or sales of securities, to hedge the currency exposure associated with some or all of the Portfolio’s securities or as a part of an investment strategy. A foreign currency contract is an agreement between two parties to buy and sell a currency at a set
price on a future date. The market value of a foreign currency contract fluctuates with changes in foreign currency exchange rates. Foreign currency contracts are marked to market daily and the change in value is recorded by the Portfolio as an unrealized gain or loss. Realized gains or losses equal to the difference between the value of the contract at the time it was opened and the value at the time it was closed are recorded upon delivery or receipt of the currency. These contracts may involve market risk in excess of the unrealized gain or loss reflected on the Statement of Assets and Liabilities. In addition, the Portfolio could be exposed to risk if the counterparties are unable to meet the terms of the contracts or if the value of the currency changes unfavorably to the U.S. dollar.
(h) Futures Contracts The Portfolio may enter into futures contracts. The Portfolio may use futures contracts to manage its exposure to the securities markets or to movements in interest rates and currency values. The primary risks associated with the use of futures contracts are the imperfect correlation between the change in market value of the securities held by the Portfolio and the prices of futures contracts, the possibility of an illiquid market, and the inability of the counterparty to meet the terms of the contract. Futures contracts are valued based upon their quoted daily settlement prices. Upon entering into a futures contract, the Portfolio is required to deposit with its futures broker, an amount of cash or U.S. Government and Agency Obligations in accordance with the initial margin requirements of the broker or exchange. Futures contracts are marked to market daily and an appropriate payable or receivable for the change in value (“variation margin”) is recorded by the Portfolio. Gains or losses are recognized but not considered realized until the contracts expire or are closed. Futures contracts involve, to varying degrees, risk of loss in excess of the variation margin disclosed on the Statement of Assets and Liabilities.
(i) Options Contracts The Portfolio may write call and put options on futures, swaps, securities or currencies it owns or in which it may invest. Writing put options tends to increase the Portfolio’s exposure to the underlying instrument. Writing call options tends to decrease the Portfolio’s exposure to the underlying instrument. When the Portfolio writes a call or put option, an amount equal to the premium received is recorded as a liability and subsequently marked to market to reflect the current value of the option written. These liabilities are reflected as written options outstanding on the Statement of Assets and Liabilities. Certain options may be written with premiums to be determined on a future date. The premiums for these options are based upon implied volatility parameters at specified terms. Premiums received from writing options which expire are treated as realized gains. Premiums received from writing options which are exercised or closed are added to the proceeds or offset against amounts paid on the underlying future, swap, security or currency transaction to determine the realized gain or loss. The Portfolio as a writer of an option has no control over whether the underlying future, swap, security or currency may be sold (call) or purchased (put) and as a result bears the market risk of an unfavorable change in the price of the future, swap, security or currency underlying the written option. There is the risk the Portfolio may not be able to enter into a closing transaction because of an illiquid market.
The Portfolio may also purchase put and call options. Purchasing call options tends to increase the Portfolio’s exposure to the underlying instrument. Purchasing put options tends to decrease the Portfolio’s exposure to the underlying instrument. The Portfolio pays a premium which is included on the Statement of Assets and Liabilities as an investment and subsequently marked to market to reflect the current value of the option. Premiums paid for purchasing options which expire are treated as realized losses. Certain options may be purchased with premiums to be determined on a future date. The premiums for these options are based upon implied volatility parameters at specified terms. The risk associated with purchasing put and call options is limited to the premium paid. Premiums paid for purchasing options which are exercised or closed are added to the amounts paid or offset against the proceeds on the underlying future, swap, security or currency transaction to determine the realized gain or loss.
| | | | | | |
| | Semiannual Report | | June 30, 2007 | | 17 |
Notes to Financial Statements (Cont.)
(j) Repurchase Agreements The Portfolio may engage in repurchase transactions. Under the terms of a typical repurchase agreement, the Portfolio takes possession of an underlying debt obligation (collateral) subject to an obligation of the seller to repurchase, and the Portfolio to resell, the obligation at an agreed-upon price and time. The underlying securities for all repurchase agreements are held in safekeeping at the Portfolio’s custodian or designated subcustodians under tri-party repurchase agreements. The market value of the collateral must be equal to or exceed the total amount of the repurchase obligations, including interest. Securities purchased under repurchase agreements are reflected as an asset on the Statement of Assets and Liabilities. Generally, in the event of counterparty default, the Portfolio has the right to use the collateral to offset losses incurred. If the counterparty should default, the Portfolio will seek to sell the securities which it holds as collateral. This could involve procedural costs or delays in addition to a loss on the securities if their value should fall below their repurchase price.
(k) Inverse Floating Rate Transactions—Residual Interest Municipal Bonds (“RIBs”)/Residual Interest Tax Exempt Bonds (“RITEs”) The Portfolio may invest in RIBs and RITEs (“Inverse Floaters”). Inverse Floaters are created via a master trust agreement between a broker-dealer, acting as trustor and liquidity provider, and an investment bank, acting as trustee and tender agent. The master trust agreement defines the terms for each trust series; with each series being established by the transfer of long-term, fixed-rate municipal bonds (“Fixed Rate Bonds”) to the trustee to be held and provide for the creation, execution and delivery of floater certificates (“Floating Rate Notes”) and Inverse Floaters. Floating Rate Notes are liquid notes that are issued with a short-term variable rate typically linked to the LIBOR, subject to limitations, for some duration. After interest income is paid on the Floating Rate Notes at current rates, the residual income from the Fixed Rate Bonds is paid to the Inverse Floaters. Inverse Floaters are issued with a coupon that fluctuates inversely with the Floating Rate Notes’ referenced rate, subject to certain limitations. Therefore, rising short-term rates result in lower income for the Inverse Floaters and vice versa.
Floating Rate Notes are generally remarketed to municipal money market funds. Inverse Floaters are acquired by either tax-exempt municipal bond funds or trusts, or other parties interested in potentially higher yielding tax-exempt securities. Inverse Floaters may also be acquired for the purpose of increasing leverage. Floating Rate Note holders typically have the option to tender their notes to the liquidity provider for redemption at par at each reset date. The Inverse Floater holders have the option to (i) require the Floating Rate Note holders to tender their notes at par, and (ii) require the liquidity provider to transfer the Fixed Rate Bonds to the Inverse Floater holders. The holders of Inverse Floaters bear substantially all of the downside investment risk associated with the underlying Fixed Rate Bonds, and also benefit from a disproportionate amount of the potential appreciation of the underlying Fixed Rate Bonds’ value. Inverse Floaters may be more volatile and less liquid than other municipal bonds of comparable maturity.
Inverse Floaters may be acquired with or without first transferring to the trustor the Fixed Rate Bonds that were utilized to create the trust series. Inverse Floaters acquired without a transfer of Fixed Rate Bonds are recognized as purchases of securities as outlined in Note 2(b). Statement of Financial Accounting Standards No. 140—Accounting for Transfers and Servicing of Financial Assets and Extinguishments of Liabilities (“FAS No. 140”), governs the standards for accounting for securitizations and other transfers of financial assets. If there is a transfer of Fixed Rate Bonds and it meets sale criteria under FAS No. 140, a Portfolio records a sale of the Fixed Rate Bonds and a purchase of the Inverse Floaters. The cash received from the Inverse Floaters is then recorded as interest income in the Statement of Operations.
If the transfer of Fixed Rate Bonds does not meet sale criteria under FAS No. 140, a Portfolio accounts for the transaction described above as a secured borrowing by including the Fixed Rate Bonds in its Schedule of Investments, and recording the
Floating Rate Notes as a liability under the caption “Payable for floating rate notes” in the Portfolio’s Statement of Assets and Liabilities. In a secured borrowing transaction, cash received from the Inverse Floaters is not recorded as interest income. Instead, a Portfolio records interest income related to the Fixed Rate Bonds and interest expense related to the Floating Rate Notes, the net of which is equal to the cash received from the Inverse Floaters acquired by the Portfolio. Thus, while a Portfolio’s reported total income, net expenses, and net expense ratio are generally higher for investments in Inverse Floaters acquired via a secured borrowing, the method of acquiring Inverse Floaters does not result in differences for reported cash flows, net asset value or total return.
(l) Short Sales The Portfolio may enter into short sales transactions. A short sale is a transaction in which the Portfolio sells securities it does not own in anticipation of a decline in the market price of the securities. Securities sold in short sale transactions and interest payable on such securities, if any, are reflected as a liability on the Statement of Assets and Liabilities. The Portfolio is obligated to deliver securities at the market price at the time the short position is closed. Possible losses from short sales may be unlimited, whereas losses from purchases cannot exceed the total amount invested.
(m) Swap Agreements The Portfolio may invest in swap agreements. Swap transactions are privately negotiated agreements between the Portfolio and a counterparty to exchange or swap investment cash flows, assets, or market-linked returns at specified, future intervals. The Portfolio may enter into interest rate, total return, forward spread-lock, credit default, and other forms of swap agreements to manage its exposure to interest rates and credit risk. In connection with these agreements, securities may be identified as collateral in accordance with the terms of the respective swap agreements.
Interest rate swap agreements involve the exchange by the Portfolio with another party of their respective commitments to pay or receive interest, e.g., an exchange of floating rate payments for fixed rate payments with respect to the notional amount of principal. Certain forms of interest rate swap agreements may include: (i) interest rate caps, under which, in return for a premium, one party agrees to make payments to the other to the extent that interest rates exceed a specified rate, or “cap”, (ii) interest rate floors, under which, in return for a premium, one party agrees to make payments to the other to the extent that interest rates fall below a specified rate, or “floor”, or (iii) interest rate collars, under which a party sells a cap and purchases a floor or vice versa in an attempt to protect itself against interest rate movements exceeding given minimum or maximum levels.
Total return swap agreements involve commitments to pay interest in exchange for a market-linked return, both based on notional amounts. To the extent the total return of the security or index underlying the transaction exceeds or falls short of the offsetting interest rate obligation, the Portfolio will receive a payment from or make a payment to the counterparty.
Forward spread-lock swap agreements involve commitments to pay or receive a settlement amount calculated as the difference between the swap spread and a fixed spread, multiplied by the notional amount times the duration of the swap. The swap spread is the difference between the benchmark swap rate (market rate) and the specific Treasury rate.
Credit default swap agreements involve one party making a stream of payments to another party in exchange for the right to receive a specified return in the event of a default by a third party, typically corporate issues or sovereign issues of an emerging country, on its obligation. The Portfolio may use credit default swaps to provide a measure of protection against defaults of the issuers (i.e., to reduce risk where the Portfolio owns or has exposure to the sovereign issuer) or to take an active long or short position with respect to the likelihood of a particular issuer’s default. As a seller of protection, the Portfolio generally receives an upfront
| | | | |
| 18 | | PIMCO Variable Insurance Trust | | |
| | |
| |
| | | June 30, 2007 (Unaudited) |
payment or a fixed rate of income throughout the term of the swap provided that there is no credit event. If the Portfolio is a seller of protection and a credit event occurs, as defined under the terms of that particular swap agreement, the Portfolio will pay to the buyer of the protection an amount up to the notional value of the swap and in certain instances take delivery of the security. As the seller, the Portfolio would effectively add leverage to its portfolio because, in addition to its total net assets, the Portfolio would be subject to investment exposure on the notional amount of the swap. As a buyer of protection, the Portfolio generally receives an amount up to the notional value of the swap if a credit event occurs. The treatment of credit default swaps and other swap agreements that provide for contingent, non-periodic, bullet-type payments as “notional principal contracts” for U.S. federal income tax purposes is uncertain. Were the U.S. Internal Revenue Service (“IRS”) to take the position that a credit default swap or other bullet-type swap is not a “notional principal contract” for U.S. federal income tax purposes, payments received by the Portfolio from such investments might be subject to U.S. excise or income taxes.
Swaps are marked to market daily based upon quotations from market makers and the change in value, if any, is recorded as unrealized gain or loss on the Statement of Operations. Payments received or made at the beginning of the measurement period are reflected as such on the Statement of Assets and Liabilities. These upfront payments are recorded as realized gain or loss on the Statement of Operations upon termination or maturity of the swap. A liquidation payment received or made at the termination of the swap is recorded as realized gain or loss on the Statement of Operations. Net periodic payments received or paid by the Portfolio are included as part of realized gain or loss on the Statement of Operations. Entering into these agreements involves, to varying degrees, elements of credit, market and documentation risk in excess of the amounts recognized on the Statement of Assets and Liabilities. Such risks involve the possibility that there will be no liquid market for these agreements, that the counterparty to the agreements may default on its obligation to perform or disagree as to the meaning of contractual terms in the agreements and that there may be unfavorable changes in interest rates.
(n) Loan Participations and Assignments The Portfolio may invest in direct debt instruments which are interests in amounts owned by corporate, governmental, or other borrowers to lenders or lending syndicates. The Portfolio’s investments in loans may be in the form of participations in loans or assignments of all or a portion of loans from third parties. A loan is often administered by a bank or other financial institution (the “lender”) that acts as agent for all holders. The agent administers the terms of the loan, as specified in the loan agreement. When investing in a loan participation, the Portfolio has the right to receive payments of principal, interest and any fees to which it is entitled only from the lender selling the loan agreement and only upon receipt by the lender of payments from the borrower. The Portfolio generally has no right to enforce compliance with the terms of the loan agreement with the borrower. As a result, the Portfolio may be subject to the credit risk of both the borrower and the lender that is selling the loan agreement. When the Portfolio purchases assignments from lenders it acquires direct rights against the borrower of the loan. At the end of the period June 30, 2007, the Portfolio had no unfunded loan commitments.
(o) Bridge Debt Commitments At the period ended June 30, 2007, the Portfolio had $300,000 in commitments outstanding to fund high yield bridge debt. The Portfolio is entitled to a fee upon the expiration of the commitment period. The bridge debt terms approximate market rates at the time the commitment is entered into.
(p) Mortgage-Related and Other Asset-Backed Securities The Portfolio may invest in mortgage-related or other asset-backed securities. These securities include mortgage pass-through securities, collateralized mortgage obligations (“CMOs”), commercial mortgage-backed securities, mortgage dollar rolls, CMO residuals, stripped mortgage-backed securities (“SMBSs”) and other securities
that directly or indirectly represent a participation in, or are secured by and payable from, mortgage loans on real property. The value of some mortgage-related or asset-backed securities may be particularly sensitive to changes in prevailing interest rates. Early repayment of principal on some mortgage-related securities may expose the Portfolio to a lower rate of return upon reinvestment of principal. The value of these securities may fluctuate in response to the market’s perception of the creditworthiness of the issuers. Additionally, although mortgages and mortgage-related securities are generally supported by some form of government or private guarantee and/or insurance, there is no assurance that private guarantors or insurers will meet their obligations.
(q) U.S. Government Agencies or Government-Sponsored Enterprises Securities issued by U.S. Government agencies or government-sponsored enterprises may not be guaranteed by the U.S. Treasury. The Government National Mortgage Association (“GNMA” or “Ginnie Mae”), a wholly owned U.S. Government corporation, is authorized to guarantee, with the full faith and credit of the U.S. Government, the timely payment of principal and interest on securities issued by institutions approved by GNMA and backed by pools of mortgages insured by the Federal Housing Administration or guaranteed by the Department of Veterans Affairs. Government-related guarantors (i.e., not backed by the full faith and credit of the U.S. Government) include the Federal National Mortgage Association (“FNMA” or “Fannie Mae”) and the Federal Home Loan Mortgage Corporation (“FHLMC” or “Freddie Mac”). Pass-through securities issued by FNMA are guaranteed as to timely payment of principal and interest by FNMA but are not backed by the full faith and credit of the U.S. Government. FHLMC guarantees the timely payment of interest and ultimate collection of principal, but its participation certificates are not backed by the full faith and credit of the U.S. Government.
(r) New Accounting Policies In July 2006, the Financial Accounting Standards Board (“FASB”) issued Interpretation No. 48, “Accounting for Uncertainty in Income Taxes—an Interpretation of FASB Statement No. 109” (the “Interpretation”). The Interpretation became effective for the Portfolio on June 29, 2007. Management has evaluated the application of the Interpretation in relation to the Portfolio and has concluded that no single filing position or combination of filing positions identified as uncertain tax positions required the accrual of a tax liability in the accounting records of the Portfolio for the period ending June 30, 2007. Management will monitor all existing filing positions and future filing positions in light of the Interpretation and evaluate the need for any future tax accruals and financial statement disclosures as warranted.
In September 2006, the FASB issued Statement of Financial Accounting Standards No. 157, “Fair Value Measurements” (the “Statement”). The Statement is effective for fiscal years beginning after November 15, 2007 and will require expanded disclosure about fair value measurements, separately for each major category of assets and liabilities, that enables shareholders to assess the inputs used to develop those measurements, and for recurring fair value measurements using significant unobservable inputs the effect of the measurements on changes in net assets for the reporting period. Management is currently evaluating the application of the Statement to the Portfolio and will provide additional information in relation to the Statement on the Portfolio’s annual financial statements for the period ending December 31, 2007.
3. FEES AND EXPENSES
(a) Investment Advisory Fee PIMCO is a majority-owned subsidiary of Allianz Global Investors of America L.P. (“AGI”), and serves as investment adviser (the “Adviser”) to the Trust, pursuant to an investment advisory contract. The Adviser receives a monthly fee from the Portfolio, at an annual rate based on average daily net assets. The Advisory Fee for all classes is charged at an annual rate of 0.25%.
| | | | | | |
| | Semiannual Report | | June 30, 2007 | | 19 |
Notes to Financial Statements (Cont.)
(b) Administration Fee PIMCO serves as administrator (the “Administrator”), and provides administrative services to the Trust for which it receives a monthly administrative fee based on each share class’s average daily net assets. As the Administrator, PIMCO bears the costs of various third-party services, including audit, custodial, portfolio accounting, legal, transfer agency and printing costs. The Administration Fee for all classes is charged at the annual rate of 0.50%.
(c) Distribution and Servicing Fees Allianz Global Investors Distributors LLC (“AGID”) is an indirect wholly-owned subsidiary of AGI and serves as the distributor (the “Distributor”) of the Trust’s shares. The Trust is permitted to reimburse AGID on a quarterly basis, out of the Administrative Class assets of the Portfolio in the amount of 0.15% on an annual basis of the average daily net assets of that class, for payments made to financial intermediaries that provide services in connection with the distribution of shares or administration of plans or programs that use Portfolio shares as their funding medium. The effective rate paid to AGID was 0.15% during the current fiscal year.
(d) Portfolio Expenses The Trust is responsible for the following expenses: (i) salaries and other compensation of any of the Trust’s executive officers and employees who are not officers, directors, stockholders or employees of PIMCO or its subsidiaries or affiliates; (ii) taxes and governmental fees; (iii) brokerage fees and commissions and other portfolio transaction expenses; (iv) the costs of borrowing money, including interest expenses and bank overdraft charges; (v) fees and expenses of the Trustees who are not “interested persons” of PIMCO or the Trust, and any counsel retained exclusively for their benefit; (vi) extraordinary expenses, including costs of litigation and indemnification expenses; (vii) organization expenses and (viii) any expenses allocated or allocable to a specific class of shares, which include service fees payable with respect to the Administrative Class Shares, and may include certain other expenses as permitted by the Trust’s Multiple Class Plan adopted pursuant to Rule 18f-3 under the Act and subject to review and approval by the Trustees. The ratio of expenses to average net assets per share class, as disclosed in the Financial Highlights, may differ from the annual portfolio operating expenses per share class as disclosed in the Prospectus for the reasons set forth above.
Effective April 1, 2007, each Trustee, other than those affiliated with PIMCO or its affiliates, receives an annual retainer of $15,000, plus $2,375 for each Board of Trustees meeting attended in person, $500 for each committee meeting attended and $750 for each Board of Trustees meeting attended telephonically, plus reimbursement of related expenses. In addition, the audit committee chair receives an additional annual retainer of $2,000 and each other committee chair receives an additional annual retainer of $500. These expenses are allocated on a pro-rata basis to the various portfolios of the Trust according to their respective net assets. The Trust pays no compensation directly to any Trustee or any other officer who is affiliated with the Administrator, all of whom receive remuneration for their services to the Trust from the Administrator or its affiliates. Prior to April 1, 2007, each Trustee, other than those affiliated with PIMCO or its affiliates, received an annual retainer of $15,000 plus $2,000 for each Board of Trustees meeting attended ($500 for each special meeting attended), plus reimbursement of related expenses. The Audit Committee Chairman received an annual retainer of $1,500 and the Governance Committee Chairman received an annual retainer of $500. In addition, each member of a committee received $500 for each committee meeting attended.
4. RELATED PARTY TRANSACTIONS
The Adviser, Administrator, and Distributor are related parties as defined by FAS 57, Related Party Disclosures. Fees payable to these parties are disclosed in Note 3.
5. GUARANTEES AND INDEMNIFICATIONS
Under the Trust’s organizational documents, each Trustee, officer, employee or other agent of the Trust (including the Trust’s investment manager) is indemnified, to the extent permitted by the Act, against certain liabilities that may arise out of performance of their duties to the Portfolio. Additionally, in the normal course of business, the Portfolio enters into contracts that contain a variety of indemnification clauses. The Portfolio’s maximum exposure under these arrangements is unknown as this would involve future claims that may be made against the Portfolio that have not yet occurred. However, the Portfolio has not had prior claims or losses pursuant to these contracts and believes the risk of loss to be remote.
6. PURCHASES AND SALES OF SECURITIES
The length of time the Portfolio has held a particular security is not generally a consideration in investment decisions. A change in the securities held by the Portfolio is known as “portfolio turnover”. The Portfolio may engage in frequent and active trading of portfolio securities to achieve its investment objective, particularly during periods of volatile market movements. High portfolio turnover (e.g., over 100%) involves correspondingly greater expenses to the Portfolio, including brokerage commissions or dealer mark-ups and other transaction costs on the sale of securities and reinvestments in other securities. Such sales may also result in realization of taxable capital gains, including short-term capital gains (which are generally taxed at ordinary income tax rates). The trading costs and tax effects associated with portfolio turnover may adversely affect the Portfolio’s performance.
Purchases and sales of securities (excluding short-term investments) for the period ended June 30, 2007, were as follows (amounts in thousands):
| | | | | | | | | | | | |
| U.S. Government/Agency | | | | All Other |
| Purchases | | Sales | | | | Purchases | | Sales |
| $ | 244,978 | | $ | 245,637 | | | | $ | 62,337 | | $ | 54,812 |
7. TRANSACTIONS IN WRITTEN CALL AND PUT OPTIONS
Transactions in written call and put options were as follows (amounts in thousands, except for number of contracts):
| | | | | | | | | | | | | | |
| | | | | Notional
Amount
in $ | | | Notional
Amount
in GBP | | | Premium | |
Balance at 12/31/2006 | | | | $ | 27,300 | | | GBP | 1,000 | | | $ | 275 | |
Sales | | | | | 7,600 | | | | 0 | | | | 79 | |
Closing Buys | | | | | (22,600 | ) | | | 0 | | | | (207 | ) |
Expirations | | | | | 0 | | | | (1,000 | ) | | | (19 | ) |
Exercised | | | | | 0 | | | | 0 | | | | 0 | |
Balance at 06/30/2007 | | | | $ | 12,300 | | | GBP | 0 | | | $ | 128 | |
| | | | |
| 20 | | PIMCO Variable Insurance Trust | | |
| | |
| |
| | | June 30, 2007 (Unaudited) |
8. SHARES OF BENEFICIAL INTEREST
The Portfolio may issue an unlimited number of shares of beneficial interest with a $0.001 par value. Changes in shares of beneficial interest were as follows (shares and amounts in thousands):
| | | | | | | | | | | | | | | | |
| | | | | Six Months Ended
06/30/2007 | | | Year Ended
12/31/2006 | |
| | | | | Shares | | | Amount | | | Shares | | | Amount | |
| | | | | |
Receipts for shares sold | | | | | | | | | | | | | | | | |
Institutional Class | | | | 0 | | | $ | 0 | | | 0 | | | $ | 0 | |
Administrative Class | | | | 1,076 | | | | 10,804 | | | 2,354 | | | | 24,018 | |
Issued as reinvestment of distributions | | | | | | | | | | | | | | | | |
Institutional Class | | | | 0 | | | | 0 | | | 0 | | | | 1 | |
Administrative Class | | | | 103 | | | | 1,029 | | | 246 | | | | 2,512 | |
Cost of shares redeemed | | | | | | | | | | | | | | | | |
Institutional Class | | | | 0 | | | | 0 | | | 0 | | | | 0 | |
Administrative Class | | | | (933 | ) | | | (9,322 | ) | | (1,340 | ) | | | (13,658 | ) |
Net increase resulting from Portfolio share transactions | | | | 246 | | | $ | 2,511 | | | 1,260 | | | $ | 12,873 | |
The following schedule shows the number of shareholders each owning 5% or more of the Portfolio and the total percentage of the Portfolio held by such shareholders:
| | | | | | |
| | | | | Number of
Shareholders | | % of Portfolio Held |
Institutional Class | | | | 1 | | 100 |
Administrative Class | | | | 5 | | 89 |
9. REGULATORY AND LITIGATION MATTERS
Since February 2004, PIMCO, Allianz Global Investors of America L.P. (PIMCO’s parent company), AGID, and certain of their affiliates, including the PIMCO Funds (another series of funds managed by PIMCO), the Allianz Funds (formerly known as PIMCO Funds: Multi-Manager Series (another series of funds managed by affiliates of PIMCO)), certain Trustees of the Trust (in their capacity as Trustees of the PIMCO Funds or the Allianz Funds) and certain employees of PIMCO, have been named as defendants in fifteen lawsuits filed in various jurisdictions. Eleven of those lawsuits concern “market timing,” and they have been transferred to and consolidated for pre-trial proceedings in a multi-district litigation proceeding in the U.S. District Court for the District of Maryland; the other four lawsuits concern “revenue sharing” and have been consolidated into a single action in the U.S. District Court for the District of Connecticut. The lawsuits have been commenced as putative class actions on behalf of investors who purchased, held or redeemed shares of the various series of the PIMCO Funds and the Allianz Funds during specified periods, or as derivative actions on behalf of the PIMCO Funds and the Allianz Funds.
The market timing actions in the District of Maryland generally allege that certain hedge funds were allowed to engage in “market timing” in certain funds of the PIMCO Funds and the Allianz Funds and this alleged activity was not disclosed. Pursuant to tolling agreements entered into with the derivative and class action plaintiffs, PIMCO, certain PIMCO Funds Trustees, and certain employees of PIMCO who were previously named as defendants have all been dropped as defendants in the market timing actions; the plaintiffs continue to assert claims on behalf of the shareholders of the PIMCO Funds or on behalf of the PIMCO Funds itself against other defendants. By order dated November 3, 2005, the U.S. District Court for the District of Maryland granted the PIMCO Funds’ motion to dismiss claims asserted against it in a consolidated amended complaint where the PIMCO Funds were
named, in the complaint, as a nominal defendant. The revenue sharing action in the District of Connecticut generally alleges that fund assets were inappropriately used to pay brokers to promote funds of the PIMCO Funds and the Allianz Funds, including directing fund brokerage transactions to such brokers, and that such alleged arrangements were not fully disclosed to shareholders. On August 11, 2005, the U.S. District Court for the District of Connecticut conducted a hearing on defendants’ motion to dismiss the consolidated amended complaint in the revenue sharing action but has not yet ruled on the motion to dismiss. The market timing and revenue sharing lawsuits seek, among other things, unspecified compensatory damages plus interest and, in some cases, punitive damages, the rescission of investment advisory contracts, the return of fees paid under those contracts and restitution.
Two nearly identical class action civil complaints have been filed in August 2005, in the Northern District of Illinois Eastern Division, alleging that the plaintiffs each purchased and sold a 10-year Treasury note futures contract and suffered damages from an alleged shortage when PIMCO held both physical and futures positions in 10-year Treasury notes for its client accounts. The two actions have been consolidated into one action, and the two separate complaints have been replaced by a consolidated complaint. PIMCO is a named defendant, and PIMCO Funds has been added as a defendant, to the consolidated action. PIMCO strongly believes the complaint is without merit and intends to vigorously defend itself.
In April 2006, certain portfolios of the Trust and certain other funds managed by PIMCO were served in an adversary proceeding brought by the Official Committee of Asbestos Claimants of G-I Holdings, Inc. in G-I Holdings, Inc.’s bankruptcy in the District of New Jersey. In July 2004, PIMCO was named in this lawsuit and remains a defendant. The plaintiff seeks to recover for the bankruptcy estate assets that were transferred by the predecessor entity of G-I Holdings, Inc. to a wholly-owned subsidiary in 1994. The subsidiary has since issued notes, of which certain portfolios of the Trust and certain other funds managed by PIMCO are alleged to be holders. The complaint alleges that in 2000, more than two hundred noteholders—including certain portfolios of the Trust and certain other funds managed by PIMCO—were granted a second priority lien on the assets of the subsidiary in exchange for their consent to a refinancing transaction and the granting of a first priority lien to the lending banks. The plaintiff is seeking invalidation of the lien in favor of the noteholders and/or the value of the lien. On June 21, 2006, the District of New Jersey overturned the Bankruptcy Court’s decision granting permission to file the adversary proceeding and remanded the matter to the Bankruptcy Court for further proceedings. Following a motion to reconsider, the District Court upheld its remand on August 7, 2006, and instructed the Bankruptcy Court to conduct a “cost-benefit” analysis of the Committee’s claims, including the claims against the noteholders. The Bankruptcy Court held a status conference on October 25, 2006 and set a briefing schedule relating to this cost-benefit analysis.
The foregoing speaks only as of the date of this report. It is possible that these matters and/or other developments resulting from these matters could result in increased portfolio redemptions or other adverse consequences to the Portfolio. However, PIMCO and AGID believe that these matters are not likely to have a material adverse effect on the Portfolio or on PIMCO’s or AGID’s ability to perform their respective investment advisory or distribution services relating to the Portfolio.
10. FEDERAL INCOME TAX MATTERS
The Portfolio intends to qualify as a regulated investment company under sub-chapter M of the Internal Revenue Code (the “Code”) and distribute all of its taxable income and net realized gains, if applicable, to shareholders. Accordingly, no provision for Federal income taxes has been made.
| | | | | | |
| | Semiannual Report | | June 30, 2007 | | 21 |
Notes to Financial Statements (Cont.)
As of June 30, 2007, the aggregate cost of investments was the same for federal income tax and financial statement purposes. The net unrealized appreciation (depreciation) of investment securities for federal income tax purposes is as follows (amount in thousands):
| | | | |
Aggregate
Gross
Unrealized
Appreciation | | Aggregate
Gross
Unrealized
(Depreciation) | | Net
Unrealized
Appreciation |
$ 1,513 | | $ (1,503) | | $ 10 |
| | | | |
| 22 | | PIMCO Variable Insurance Trust | | |
| | |
| |
Privacy Policy* | | (Unaudited) |
The Funds consider customer privacy to be a fundamental aspect of their relationships with shareholders and are committed to maintaining the confidentiality, integrity and security of their current, prospective and former shareholders’ personal information. To ensure their shareholders’ privacy, the Funds have developed policies that are designed to protect this confidentiality, while allowing shareholder needs to be served.
Obtaining Personal Information
In the course of providing shareholders with products and services, the Funds and certain service providers to the Funds, such as the Funds’ investment advisers (“Advisers”), may obtain non-public personal information about shareholders, which may come from sources such as account applications and other forms, from other written, electronic or verbal correspondence, from shareholder transactions, from a shareholder’s brokerage or financial advisory firm, financial adviser or consultant, and/or from information captured on the Funds’ internet web sites.
Respecting Your Privacy
As a matter of policy, the Funds do not disclose any personal or account information provided by shareholders or gathered by the Funds to non-affiliated third parties, except as required or permitted by law or as necessary for such third parties to perform their agreements with respect to the Funds. As is common in the industry, non-affiliated companies may from time to time be used to provide certain services, such as preparing and mailing prospectuses, reports, account statements and other information, conducting research on shareholder satisfaction and gathering shareholder proxies. A Fund’s Distributor may also retain non-affiliated companies to market the Fund’s shares or products which use the Fund’s shares and enter into joint marketing agreements with other companies. These companies may have access to a shareholder’s personal and account information, but are permitted to use this information solely to provide the specific service or as otherwise permitted by law. In most cases, the shareholders will be clients of a third party, but the Funds may also provide a shareholder’s personal and account information to the shareholder’s respective brokerage or financial advisory firm.
Sharing Information with Third Parties
The Funds reserve the right to disclose or report personal information to non-affiliated third parties, in limited circumstances, where the Funds believe in good faith that disclosure is required under law to cooperate with regulators or law enforcement authorities, to protect their rights or property or upon reasonable request by any Fund in which a shareholder has chosen to invest. In addition, the Funds may disclose information about a shareholder’s accounts to a non-affiliated third party with the consent of the shareholder.
Sharing Information with Affiliates
The Funds may share shareholder information with their affiliates in connection with servicing their shareholders’ accounts or to provide shareholders with information about products and services that the Funds or their Advisers, principal underwriters or their affiliates (“Service Affiliates”) believe may be of interest to such shareholders. The information that the Funds share may include, for example, a shareholder’s participation in one of the Funds or in other investment programs sponsored by a Service Affiliate, a shareholder’s ownership of certain types of accounts (such as IRAs), or other data about a shareholder’s accounts. The Funds’ Service Affiliates, in turn, are not permitted to share shareholder information with non-affiliated entities, except as required or permitted by law.
Procedures to Safeguard Private Information
The Funds take seriously the obligation to safeguard shareholder non-public personal information. In addition to this policy, the Funds have also implemented procedures that are designed to restrict access to a shareholder’s non-public personal information only to internal personnel who need to know that information in order to provide products or services to such shareholders. In order to guard a shareholder’s non-public personal information, physical, electronic and procedural safeguards are in place.
* This Privacy Policy applies to the following entities: PIMCO Funds, PIMCO Variable Insurance Trust, PCM Fund, Inc. and PIMCO Strategic Global Government Fund, Inc. (collectively, the “Funds”).
| | | | | | |
| | Semiannual Report | | June 30, 2007 | | 23 |
Investment Adviser and Administrator
Pacific Investment Management Company LLC
840 Newport Center Drive
Newport Beach, California 92660
Distributor
Allianz Global Investors Distributors LLC
1345 Avenue of the Americas
New York, New York 10105
Custodian
State Street Bank & Trust Company
801 Pennsylvania
Kansas City, Missouri 64105
Transfer Agent
Boston Financial Data Services–Midwest
330 W. 9th Street
Kansas City, Missouri 64105
Legal Counsel
Dechert LLP
1775 I Street, N.W.
Washington, D.C. 20006
Independent Registered Public Accounting Firm
PricewaterhouseCoopers LLP
1055 Broadway
Kansas City, Missouri 64105
P I M C O

Table of Contents
This material is authorized for use only when preceded or accompanied by the current PIMCO Variable Insurance Trust (the “Trust”) prospectus. Investors should consider the investment objectives, risks, charges and expenses of this Trust carefully before investing. Ask your financial professional to explain all charges that may apply. This and other information is contained in the Trust’s prospectus. The variable product prospectus may be obtained by contacting your Investment Consultant. Please read the Trust and variable product prospectus carefully before you invest or send money.
Chairman’s Letter
Dear PIMCO Variable Insurance Trust Shareholder:
It is our pleasure to present to you the semiannual report for the PIMCO Variable Insurance Trust, covering the six-month period ended June 30, 2007. The PIMCO Variable Insurance Trust’s net assets were $8.68 billion at June 30, 2007, as compared to $7.76 billion at December 31, 2006.
Highlights of the financial markets during the reporting period include:
| | n | | Economic data during the first quarter of 2007 pointed to slower growth, which heightened market expectations for a decrease in the Federal Funds Rate. By the second quarter, economic data, such as employment statistics, provided little indication of economic weakness, causing expectations of a decrease in the Federal Funds Rate to unwind and U.S. interest rates to move higher. Interest rates in Europe and the U.K. also rose over the period as central banks raised their key lending rates due to inflation concerns. The benchmark ten-year U.S. Treasury yielded 5.03% as of June 30, 2007, or 0.32% higher than at the beginning of the year. |
| | n | | Most bonds generally returned much of their gains from earlier in the year as worldwide growth and capital flows drove interest rates higher in the second quarter. Increased risk aversion in global financial markets, due in part to subprime mortgage worries in the U.S., also contributed to the rise in interest rates. The Lehman Brothers Aggregate Bond Index, which includes Treasury, investment-grade corporate and mortgage-backed securities, returned 0.98% for the six-month period. |
| | n | | Locally issued emerging market (“EM”) bonds posted positive returns for the reporting period. Yields on these bonds declined and the local currencies in which they are denominated generally gained, amid increasing investor awareness, strong economic growth and surging capital inflows. External EM bonds (debt instruments issued by emerging markets countries and typically denominated in U.S. dollars) lagged behind local EM bonds (debt instruments issued by emerging markets countries and denominated in the currency of the issuer), as external EM bonds tend to trade more in-line with U.S. Treasuries. |
| | n | | Treasury Inflation-Protected Securities (“TIPS”) outpaced nominal bonds (non-inflation linked bonds) for the first part of the year and all but the longest maturity TIPS outperformed in the second quarter as high gasoline prices drove higher inflation accruals. Commodities, as represented by the Dow Jones-AIG Commodity Total Return Index, returned 4.46% for the period. Equities, as measured by the S&P 500 Index and the Russell 2000 Index, returned 6.96% and 6.45%, respectively, for the period. |
On the following pages, please find specific details as to the Portfolio’s total return investment performance and a discussion of those factors that affected performance.
Thank you for the trust you have placed in us. We will continue to work diligently to serve your investment needs.
Sincerely,
Brent R. Harris
Chairman, PIMCO Variable Insurance Trust
July 31, 2007
| | | | | | |
| | Semiannual Report | | June 30, 2007 | | 1 |
Important Information About the Portfolio
PIMCO Variable Insurance Trust (the “Trust”) is an open-end management investment company currently consisting of twenty separate investment portfolios, including the Foreign Bond Portfolio (U.S. Dollar-Hedged) (the “Portfolio”). The Portfolio is only available as a funding vehicle under variable life insurance policies or variable annuity contracts issued by insurance companies (“Variable Contracts”). Individuals may not purchase shares of the Portfolio directly. Shares of the Portfolio also may be sold to qualified pension and retirement plans outside of the separate account context.
We believe that bond funds have an important role to play in a well diversified investment portfolio. It is important to note, however, that in an environment where interest rates may trend upward, rising rates would negatively impact the performance of most bond funds, and fixed-income securities held by a fund are likely to decrease in value. The price volatility of fixed-income securities can also increase during periods of rising interest rates resulting in increased losses to a fund. Bond funds and individual bonds with a longer duration (a measure of the expected life of a security) tend to be more sensitive to changes in interest rates, usually making them more volatile than securities or funds with shorter durations.
The Portfolio may be subject to various risks in addition to those described above. Some of these risks may include, but are not limited to, the following: credit risk, high yield risk, market risk, issuer risk, liquidity risk, derivatives risk, mortgage risk, non-U.S. investment risk, emerging markets risk, currency risk, issuer non-diversification risk, leveraging risk and management risk. A complete description of these risks is contained in the Portfolio’s prospectus. The Portfolio may use derivative instruments for hedging purposes or as part of an investment strategy. Use of these instruments may involve certain costs and risks such as liquidity risk, interest rate risk, market risk, credit risk, management risk and the risk that the Portfolio could not close out a position when it would be most advantageous to do so. Because the Portfolio may invest in derivatives, it could lose more than the principal amount invested in these instruments. Investing in non-U.S. securities may entail risk due to non-U.S. economic and political developments; this risk may be increased when investing in emerging markets.
On the performance summary page in this Semiannual Report, the Total Return Investment Performance table measures performance assuming that all dividend and capital gain distributions were reinvested.
An investment in the Portfolio is not a deposit of a bank and is not guaranteed or insured by the Federal Deposit Insurance Corporation or any other government agency. It is possible to lose money on investments in the Portfolio.
PIMCO has adopted written proxy voting policies and procedures (“Proxy Policy”) as required by Rule 206(4)-6 under the Investment Advisers Act of 1940, as amended. The Proxy Policy has been adopted by the Trust as the policies and procedures that PIMCO will use when voting proxies on behalf of the Portfolio. A description of the policies and procedures that PIMCO uses to vote proxies relating to portfolio securities of the Portfolio, and information about how the Portfolio voted proxies relating to portfolio securities held during the most recent twelve-month period ended June 30, are available without charge, upon request, by calling the Trust at 1-866-746-2606 and on the Portfolio’s website at www.pimco.com.
The Portfolio files its complete schedule of portfolio holdings with the SEC for the first and third quarters of each fiscal year on Form N-Q. A copy of the Trust’s Form N-Q is also available on the SEC’s website at http://www.sec.gov and may be reviewed and copied at the SEC’s Public Reference Room in Washington D.C. Information on the operation of the Public Reference Room may be obtained by calling 1-800-SEC-0330, and is available without charge, upon request, by calling the Trust at 1-866-746-2606 and on the Portfolio’s website at www.pimco.com.
PIMCO Variable Insurance Trust is distributed by Allianz Global Investors Distributors LLC, 1345 Avenue of the Americas, New York, NY 10105.
| | | | |
| 2 | | PIMCO Variable Insurance Trust | | |
The following disclosure provides important information regarding the Portfolio’s Expense Example (“Example” or “Expense Example”), which appears in this Semiannual Report. Please refer to this information when reviewing the Expense Example for the Portfolio.
Example
As a shareholder of the Portfolio, you incur two types of costs: (1) transaction costs and (2) ongoing costs, including advisory and administrative fees; distribution and/or service (12b-1) fees (Administrative Class only); and other Portfolio expenses. The Example is intended to help you understand your ongoing costs (in dollars) of investing in the Portfolio and to compare these costs with the ongoing costs of investing in other mutual funds. The Expense Example does not reflect any fees or other expenses imposed by the Variable Contracts. If it did, the expenses reflected in the Expense Example would be higher. The Example is based on an investment of $1,000 invested at the beginning of the period and held for the entire period indicated, which is from January 1, 2007 to June 30, 2007.
Actual Expenses
The information in the table under the heading “Actual Performance” provides information about actual account values and actual expenses. You may use the information in these columns, together with the amount you invested, to estimate the expenses that you paid over the period. Simply divide your account value by $1,000 (for example, an $8,600 account value divided by $1,000 = $8.60), then multiply the result by the number in the row titled “Expenses Paid During Period” to estimate the expenses you paid on your account during this period.
Hypothetical Example for Comparison Purposes
The information in the table under the heading “Hypothetical Performance (5% return before expenses)” provides information about hypothetical account values and hypothetical expenses based on the Portfolio’s actual expense ratio and an assumed rate of return of 5% per year before expenses, which is not the Portfolio’s actual return. The hypothetical account values and expenses may not be used to estimate the actual ending account balance or expenses you paid for the period. You may use this information to compare the ongoing costs of investing in the Portfolio and other portfolios. To do so, compare this 5% hypothetical example with the 5% hypothetical examples that appear in the shareholder reports of the other portfolios.
Please note that the expenses shown in the table are meant to highlight your ongoing costs only and do not reflect any transactional costs. Therefore, the information under the heading “Hypothetical Performance (5% return before expenses)” is useful in comparing ongoing costs only, and will not help you determine the relative total costs of owning different portfolios. In addition, if these transactional costs were included, your costs would have been higher.
The expense ratio may vary period to period because of various factors, such as an increase in expenses not covered by the advisory and administrative fees (such as expenses of the trustees and their counsel, litigation expense and interest expense).
| | | | | | |
| | Semiannual Report | | June 30, 2007 | | 3 |
PIMCO Foreign Bond Portfolio (U.S. Dollar-Hedged)
Cumulative Returns Through June 30, 2007
$10,000 invested at the end of the nearest month to the inception date of the Portfolio’s Institutional Class.
Allocation Breakdown‡
| | |
United States | | 55.3% |
Germany | | 13.5% |
Japan | | 9.7% |
United Kingdom | | 8.4% |
Short-Term Instruments | | 4.5% |
Other | | 8.6% |
| | ‡ | % of Total Investments as of 06/30/2007 |
| | | | | | | | | | |
| Average Annual Total Return for the period ended June 30, 2007 | | |
| | | | | 6 Months* | | 1 Year | | 5 Years | | Portfolio
Inception
(04/10/00)** |
| | PIMCO Foreign Bond Portfolio (U.S. Dollar-Hedged) Institutional Class | | -0.60% | | 2.40% | | 3.98% | | 5.14% |
| | JPMorgan Government Bond Indices Global Ex-U.S. Index Hedged in USD± | | -0.02% | | 3.97% | | 4.16% | | 4.98% |
All Portfolio returns are net of fees and expenses.
* Cumulative return.
** The Portfolio began operations on 04/10/00. Index comparisons began on 03/31/00.
Performance quoted represents past performance. Past performance is no guarantee of future results. Investment return and principal value will fluctuate so the Portfolio shares, when redeemed, may be worth more or less than their original cost. The Portfolio’s performance does not reflect the deduction of additional charges and expenses imposed in connection with investing in Variable Contracts, which will reduce returns. Current performance may be lower or higher than the performance data quoted. Performance data current to the most recent month-end is available by calling (800) 927-4648.
± JPMorgan Government Bond Indices Global Ex-U.S. Index Hedged in USD is an unmanaged index representative of the total return performance in U.S. dollars on an unhedged basis of major non-U.S. bond markets. It is not possible to invest directly in the index. The index does not reflect deductions for fees and expenses.
| | | | | | |
| Expense Example | | Actual Performance | | Hypothetical Performance |
| | | | | (5% return before expenses) |
Beginning Account Value (01/01/07) | | $ | 1,000.00 | | $ | 1,000.00 |
Ending Account Value (06/30/07) | | $ | 994.00 | | $ | 1,021.08 |
Expenses Paid During Period† | | $ | 3.71 | | $ | 3.76 |
† Expenses are equal to the Portfolio’s Institutional Class annualized expense ratio of 0.75%, multiplied by the average account value over the period, multiplied by 181/365 (to reflect the one-half year period). Overall fees and expenses of investing in the Portfolio will be higher because the example does not reflect Variable Contract fees and expenses.
Please refer to page 3 herein for an explanation of the information presented in the above Expense Example.
Portfolio Insights
| » | | The PIMCO Foreign Bond Portfolio (U.S. Dollar-Hedged) seeks to achieve its investment objective by investing under normal circumstances at least 80% of its assets in fixed-income instruments of issuers located outside the United States, representing at least three foreign countries, which may be represented by futures contracts (including related options) with respect to such securities, and options on such securities. |
| » | | Developed global bonds produced weak returns, with bond yields rising across major markets. |
| » | | Exposure to U.S. shorter maturities, principally through interest rate futures contracts, detracted from performance as yields rose on diminishing expectations of an easing of interest rates by the Federal Reserve. |
| » | | An underweight to U.K. interest rates, notably at the long-end of the yield curve, was positive for returns as U.K. yields rose sharply. |
| » | | An overweight to European interest rates was negative for returns as yields rose due to the region’s growth momentum. |
| » | | An overweight to mortgage-backed securities detracted from returns as mortgage spreads widened. |
| » | | Emerging market currency exposure was positive for returns as these currencies outperformed the U.S. dollar. |
| » | | Global swap spread widening strategies were positive for returns as global swap spreads widened. |
| | | | |
| 4 | | PIMCO Variable Insurance Trust | | |
Financial Highlights Foreign Bond Portfolio (U.S. Dollar-Hedged)
| | | | | | | | | | | | | | | | | | | | | | | | |
| Selected per Share Data for the Year or Period Ended: | | 06/30/2007+ | | | 12/31/2006 | | | 12/31/2005 | | | 12/31/2004 | | | 12/31/2003 | | | 12/31/2002 | |
| | | | | | |
Institutional Class | | | | | | | | | | | | | | | | | | | | | | | | |
Net asset value beginning of year or period | | $ | 10.10 | | | $ | 10.34 | | | $ | 10.15 | | | $ | 10.03 | | | $ | 10.07 | | | $ | 9.69 | |
Net investment income (a) | | | 0.18 | | | | 0.38 | | | | 0.29 | | | | 0.24 | | | | 0.27 | | | | 0.32 | |
Net realized/unrealized gain (loss) on investments (a) | | | (0.24 | ) | | | (0.14 | ) | | | 0.24 | | | | 0.33 | | | | (0.03 | ) | | | 0.47 | |
Total income (loss) from investment operations | | | (0.06 | ) | | | 0.24 | | | | 0.53 | | | | 0.57 | | | | 0.24 | | | | 0.79 | |
Dividends from net investment income | | | (0.17 | ) | | | (0.35 | ) | | | (0.26 | ) | | | (0.22 | ) | | | (0.28 | ) | | | (0.37 | ) |
Distributions from net realized capital gains | | | 0.00 | | | | (0.13 | ) | | | (0.08 | ) | | | (0.23 | ) | | | 0.00 | | | | (0.04 | ) |
Total distributions | | | (0.17 | ) | | | (0.48 | ) | | | (0.34 | ) | | | (0.45 | ) | | | (0.28 | ) | | | (0.41 | ) |
Net asset value end of year or period | | $ | 9.87 | | | $ | 10.10 | | | $ | 10.34 | | | $ | 10.15 | | | $ | 10.03 | | | $ | 10.07 | |
Total return | | | (0.60 | )% | | | 2.34 | % | | | 5.28 | % | | | 5.68 | % | | | 2.39 | % | | | 8.36 | % |
Net assets end of year or period (000s) | | $ | 14 | | | $ | 14 | | | $ | 14 | | | $ | 13 | | | $ | 13 | | | $ | 12 | |
Ratio of expenses to average net assets | | | 0.75 | %* | | | 0.75 | % | | | 0.75 | % | | | 0.75 | % | | | 0.78 | % | | | 0.75 | % |
Ratio of expenses to average net assets excluding interest expense | | | 0.75 | %* | | | 0.75 | % | | | 0.75 | % | | | 0.75 | % | | | 0.75 | % | | | 0.75 | % |
Ratio of net investment income to average net assets | | | 3.56 | %* | | | 3.69 | % | | | 2.81 | % | | | 2.37 | % | | | 2.69 | % | | | 3.36 | % |
Portfolio turnover rate | | | 307 | % | | | 281 | % | | | 453 | % | | | 515 | % | | | 600 | % | | | 321 | % |
+ Unaudited
* Annualized
(a) Per share amounts based on average number of shares outstanding during the period.
| | | | | | |
| See Accompanying Notes | | Semiannual Report | | June 30, 2007 | | 5 |
Statement of Assets and Liabilities Foreign Bond Portfolio (U.S. Dollar-Hedged)
| | | | |
| (Amounts in thousands, except per share amounts) | | June 30, 2007 | |
| | | (Unaudited) | |
| |
Assets: | | | | |
Investments, at value | | $ | 104,312 | |
Cash | | | 1 | |
Foreign currency, at value | | | 1,305 | |
Receivable for investments sold | | | 9,653 | |
Receivable for Portfolio shares sold | | | 503 | |
Interest and dividends receivable | | | 867 | |
Variation margin receivable | | | 2 | |
Swap premiums paid | | | 1,700 | |
Unrealized appreciation on foreign currency contracts | | | 221 | |
Unrealized appreciation on swap agreements | | | 1,105 | |
| | | | 119,669 | |
| |
Liabilities: | | | | |
Payable for investments purchased | | $ | 32,653 | |
Payable for investments purchased on a delayed-delivery basis | | | 13,648 | |
Payable for Portfolio shares redeemed | | | 123 | |
Payable for short sales | | | 9,370 | |
Written options outstanding | | | 31 | |
Dividends payable | | | 2 | |
Accrued investment advisory fee | | | 13 | |
Accrued administration fee | | | 26 | |
Accrued servicing fee | | | 7 | |
Variation margin payable | | | 63 | |
Swap premiums received | | | 207 | |
Unrealized depreciation on foreign currency contracts | | | 193 | |
Unrealized depreciation on swap agreements | | | 1,048 | |
| | | | 57,384 | |
| |
Net Assets | | $ | 62,285 | |
| |
Net Assets Consist of: | | | | |
Paid in capital | | $ | 63,649 | |
(Overdistributed) net investment income | | | (863 | ) |
Accumulated undistributed net realized (loss) | | | (699 | ) |
Net unrealized appreciation | | | 198 | |
| | | $ | 62,285 | |
| |
Net Assets: | | | | |
Institutional Class | | $ | 14 | |
Administrative Class | | | 62,271 | |
| |
Shares Issued and Outstanding: | | | | |
Institutional Class | | | 1 | |
Administrative Class | | | 6,306 | |
| |
Net Asset Value and Redemption Price Per Share (Net Asset Per Share Outstanding) | | | | |
Institutional Class | | $ | 9.87 | |
Administrative Class | | | 9.87 | |
| |
Cost of Investments Owned | | $ | 104,302 | |
Cost of Foreign Currency Held | | $ | 1,299 | |
Proceeds Received on Short Sales | | $ | 9,611 | |
Premiums Received on Written Options | | $ | 128 | |
| | | | |
| 6 | | PIMCO Variable Insurance Trust | | See Accompanying Notes |
Statement of Operations Foreign Bond Portfolio (U.S. Dollar-Hedged)
| | | | |
| (Amounts in thousands) | | Six Months Ended
June 30, 2007 | |
| | | (Unaudited) | |
| |
| Investment Income: | | | | |
Interest | | $ | 1,326 | |
Dividends | | | 26 | |
Miscellaneous income | | | 1 | |
Total Income | | | 1,353 | |
| |
Expenses: | | | | |
Investment advisory fees | | | 78 | |
Administration fees | | | 156 | |
Servicing fees – Administrative Class | | | 47 | |
Trustees’ fees | | | 1 | |
Total Expenses | | | 282 | |
| |
Net Investment Income | | | 1,071 | |
| |
Net Realized and Unrealized Gain (Loss): | | | | |
Net realized (loss) on investments | | | (424 | ) |
Net realized (loss) on futures contracts, written options and swaps | | | (286 | ) |
Net realized gain on foreign currency transactions | | | 80 | |
Net change in unrealized (depreciation) on investments | | | (1,029 | ) |
Net change in unrealized appreciation on futures contracts, written options and swaps | | | 479 | |
Net change in unrealized (depreciation) on translation of assets and liabilities denominated in foreign currencies | | | (293 | ) |
Net (Loss) | | | (1,473 | ) |
| |
Net (Decrease) in Net Assets Resulting from Operations | | $ | (402 | ) |
| | | | | | |
| See Accompanying Notes | | Semiannual Report | | June 30, 2007 | | 7 |
Statements of Changes in Net Assets Foreign Bond Portfolio (U.S. Dollar-Hedged)
| | | | | | | | |
| (Amounts in thousands) | | Six Months Ended
June 30, 2007 | | | Year Ended
December 31, 2006 | |
| | | (Unaudited) | | | | |
| | |
| Increase (Decrease) in Net Assets from: | | | | | | | | |
| | |
Operations: | | | | | | | | |
Net investment income | | $ | 1,071 | | | $ | 1,924 | |
Net realized (loss) | | | (630 | ) | | | (1,221 | ) |
Net change in unrealized appreciation (depreciation) | | | (843 | ) | | | 491 | |
Net increase (decrease) resulting from operations | | | (402 | ) | | | 1,194 | |
| | |
Distributions to Shareholders: | | | | | | | | |
From net investment income | | | | | | | | |
Institutional Class | | | 0 | | | | (1 | ) |
Administrative Class | | | (1,031 | ) | | | (1,778 | ) |
From net realized capital gains | | | | | | | | |
Administrative Class | | | 0 | | | | (735 | ) |
| | |
Total Distributions | | | (1,031 | ) | | | (2,514 | ) |
| | |
Portfolio Share Transactions: | | | | | | | | |
Receipts for shares sold | | | | | | | | |
Administrative Class | | | 10,804 | | | | 24,018 | |
| Issued as reinvestment of distributions | | | | | | | | |
Institutional Class | | | 0 | | | | 1 | |
Administrative Class | | | 1,029 | | | | 2,512 | |
Cost of shares redeemed | | | | | | | | |
Administrative Class | | | (9,322 | ) | | | (13,658 | ) |
Net increase resulting from Portfolio share transactions | | | 2,511 | | | | 12,873 | |
| | |
Total Increase in Net Assets | | | 1,078 | | | | 11,553 | |
| | |
Net Assets: | | | | | | | | |
Beginning of period | | | 61,207 | | | | 49,654 | |
End of period* | | $ | 62,285 | | | $ | 61,207 | |
| | |
*Including (overdistributed) net investment income of: | | $ | (863 | ) | | $ | (903 | ) |
| | | | |
| 8 | | PIMCO Variable Insurance Trust | | See Accompanying Notes |
| | |
| |
| Schedule of Investments Foreign Bond Portfolio (U.S. Dollar-Hedged) | | June 30, 2007 (Unaudited) |
| | | | | | | | |
| | | | | PRINCIPAL
AMOUNT
(000S) | | | | VALUE
(000S) |
| AUSTRALIA 0.0% |
| Medallion Trust |
5.585% due 07/12/2031 | | $ | | 11 | | $ | | 11 |
| | | | | | | | |
Total Australia (Cost $11) | | 11 |
| | | | | | | | |
| | | | | | | | |
| AUSTRIA 0.9% |
| Austria Government Bond |
3.800% due 10/20/2013 | | EUR | | 100 | | | | 130 |
5.250% due 01/04/2011 | | | | 300 | | | | 415 |
| | | | | | | | |
Total Austria (Cost $437) | | 545 |
| | | | | | | | |
|
| BERMUDA 0.1% |
| Intelsat Bermuda Ltd. |
5.250% due 11/01/2008 | | $ | | 100 | | | | 99 |
| | | | | | | | |
Total Bermuda (Cost $99) | | 99 |
| | | | | | | | |
|
| CANADA 0.4% |
| Province of Ontario Canada |
6.200% due 06/02/2031 | | CAD | | 200 | | | | 220 |
| | | | | | | | |
Total Canada (Cost $220) | | 220 |
| | | | | | | | |
|
| CAYMAN ISLANDS 1.0% |
| Mizuho Finance Cayman Ltd. |
8.375% due 12/29/2049 | | $ | | 200 | | | | 209 |
| |
| MUFG Capital Finance 1 Ltd. |
6.346% due 07/29/2049 | | | | 200 | | | | 197 |
| |
| SMFG Preferred Capital USD 1 Ltd. |
6.078% due 01/29/2049 | | | | 100 | | | | 97 |
| |
| Transocean, Inc. |
5.560% due 09/05/2008 | | | | 100 | | | | 100 |
| | | | | | | | |
Total Cayman Islands (Cost $611) | | 603 |
| | | | | | | | |
|
| DENMARK 0.0% |
| Nykredit Realkredit A/S |
6.000% due 10/01/2029 | | DKK | | 56 | | | | 11 |
| | | | | | | | |
Total Denmark (Cost $6) | | 11 |
| | | | | | | | |
|
| FRANCE 1.7% |
| Credit Agricole S.A. |
6.637% due 05/29/2049 | | $ | | 100 | | | | 97 |
| |
| France Government Bond |
4.000% due 10/25/2009 | | EUR | | 30 | | | | 40 |
5.500% due 04/25/2010 | | | | 110 | | | | 153 |
5.750% due 10/25/2032 | | | | 500 | | | | 775 |
| | | | | | | | |
Total France (Cost $1,057) | | 1,065 |
| | | | | | | | |
|
| GERMANY 22.7% |
| KFW International Finance, Inc. |
1.750% due 03/23/2010 | | JPY | | 11,000 | | | | 91 |
| |
| Republic of Germany |
3.750% due 01/04/2015 | | EUR | | 900 | | | | 1,156 |
4.250% due 07/04/2014 | | | | 900 | | | | 1,196 |
4.500% due 07/04/2009 | | | | 10 | | | | 13 |
4.750% due 07/04/2028 | | | | 30 | | | | 41 |
4.750% due 07/04/2034 | | | | 100 | | | | 136 |
5.000% due 07/04/2012 | | | | 400 | | | | 552 |
5.250% due 07/04/2010 | | | | 1,400 | | | | 1,933 |
5.250% due 01/04/2011 | | | | 2,100 | | | | 2,907 |
5.500% due 01/04/2031 | | | | 100 | | | | 150 |
5.625% due 01/04/2028 | | | | 2,650 | | | | 3,999 |
6.250% due 01/04/2024 | | | | 600 | | | | 955 |
6.500% due 07/04/2027 | | | | 590 | | | | 980 |
| | | | | | | | |
Total Germany (Cost $13,432) | | 14,109 |
| | | | | | | | |
| | | | | | | | |
| | | | | PRINCIPAL
AMOUNT
(000S) | | | | VALUE
(000S) |
| ICELAND 0.2% |
| Glitnir Banki HF |
5.829% due 01/18/2012 | | $ | | 100 | | $ | | 101 |
| | | | | | | | |
Total Iceland (Cost $100) | | 101 |
| | | | | | | | |
| | | | | | | | |
| IRELAND 0.2% |
| Bank of Ireland |
5.370% due 12/19/2008 | | $ | | 100 | | | | 100 |
| | | | | | | | |
Total Ireland (Cost $100) | | 100 |
| | | | | | | | |
| | | | | | | | |
| ITALY 1.3% |
| Italy Buoni Poliennali Del Tesoro |
4.250% due 11/01/2009 | | EUR | | 60 | | | | 81 |
4.500% due 05/01/2009 | | | | 360 | | | | 487 |
5.500% due 11/01/2010 | | | | 110 | | | | 153 |
| |
| Seashell Securities PLC |
4.295% due 07/25/2028 | | | | 77 | | | | 105 |
| | | | | | | | |
Total Italy (Cost $786) | | 826 |
| | | | | | | | |
| | | | | | | | |
| JAPAN 16.3% |
| Bank of Tokyo-Mitsubishi UFJ Ltd. |
3.500% due 12/16/2015 | | EUR | | 100 | | | | 129 |
| |
| Japan Finance Corp. for Municipal Enterprises |
5.875% due 03/14/2011 | | $ | | 80 | | | | 81 |
| |
| Japan Government Bond |
1.500% due 03/20/2014 | | JPY | | 40,000 | | | | 322 |
1.500% due 03/20/2015 | | | | 38,000 | | | | 304 |
1.600% due 06/20/2014 | | | | 240,000 | | | | 1,942 |
1.600% due 09/20/2014 | | | | 60,000 | | | | 485 |
2.300% due 06/20/2035 | | | | 70,000 | | | | 553 |
2.400% due 03/20/2034 | | | | 20,000 | | | | 162 |
2.500% due 09/20/2035 | | | | 160,000 | | | | 1,319 |
2.500% due 06/20/2036 | | | | 160,000 | | | | 1,314 |
| |
| Japanese Government CPI Linked Bond |
0.800% due 12/10/2015 | | | | 39,960 | | | | 315 |
1.000% due 02/28/2016 | | | | 20,000 | | | | 162 |
1.100% due 12/10/2016 | | | | 367,780 | | | | 2,950 |
| |
| Sumitomo Mitsui Banking Corp. |
5.625% due 07/29/2049 | | $ | | 100 | | | | 95 |
| | | | | | | | |
Total Japan (Cost $10,962) | | 10,133 |
| | | | | | | | |
| | | | | | | | |
| JERSEY, CHANNEL ISLANDS 0.1% |
| Haus Ltd. |
4.139% due 12/10/2037 | | EUR | | 32 | | | | 43 |
| | | | | | | | |
Total Jersey, Channel Islands (Cost $31) | | 43 |
| | | | | | | | |
|
| MEXICO 0.2% |
| America Movil SAB de C.V. |
5.460% due 06/27/2008 | | $ | | 100 | | | | 100 |
| | | | | | | | |
Total Mexico (Cost $100) | | 100 |
| | | | | | | | |
| | | | | | | | |
| NETHERLANDS 0.2% |
| Siemens Financieringsmaatschappij NV |
5.410% due 08/14/2009 | | $ | | 100 | | | | 100 |
| | | | | | | | |
Total Netherlands (Cost $100) | | 100 |
| | | | | | | | |
| | | | | | | | |
| RUSSIA 0.3% |
| VTB Capital S.A. for Vneshtorgbank |
5.955% due 08/01/2008 | | $ | | 200 | | | | 200 |
| | | | | | | | |
Total Russia (Cost $200) | | 200 |
| | | | | | | | |
| | | | | | | | |
| | | | | PRINCIPAL
AMOUNT
(000S) | | | | VALUE
(000S) |
| SPAIN 7.2% |
| Santander U.S. Debt S.A. Unipersonal |
5.416% due 02/06/2009 | | $ | | 200 | | $ | | 200 |
5.420% due 11/20/2009 | | | | 100 | | | | 100 |
| |
| Spain Government Bond |
4.000% due 01/31/2010 | | EUR | | 100 | | | | 134 |
4.400% due 01/31/2015 | | | | 1,800 | | | | 2,402 |
5.150% due 07/30/2009 | | | | 1,210 | | | | 1,658 |
| | | | | | | | |
Total Spain (Cost $4,239) | | 4,494 |
| | | | | | | | |
| | | | | | | | |
| UNITED KINGDOM 14.1% |
| HBOS PLC |
5.920% due 09/29/2049 | | $ | | 300 | | | | 282 |
| |
| HSBC Holdings PLC |
6.500% due 05/02/2036 | | | | 400 | | | | 412 |
| |
| Lloyds TSB Bank PLC |
5.562% due 11/29/2049 | | | | 100 | | | | 87 |
5.625% due 07/15/2049 | | EUR | | 40 | | | | 55 |
| |
| Royal Bank of Scotland Group PLC |
5.750% due 07/06/2012 | | $ | | 100 | | | | 100 |
| |
| United Kingdom Gilt |
4.250% due 03/07/2011 | | GBP | | 2,200 | | | | 4,194 |
4.750% due 06/07/2010 | | | | 600 | | | | 1,171 |
4.750% due 09/07/2015 | | | | 700 | | | | 1,334 |
5.000% due 03/07/2008 | | | | 100 | | | | 200 |
5.000% due 03/07/2012 | | | | 500 | | | | 976 |
| | | | | | | | |
Total United Kingdom (Cost $8,679) | | 8,811 |
| | | | | | | | |
| | | | | | | | |
| UNITED STATES 92.5% |
| | | | | | | | |
| ASSET-BACKED SECURITIES 7.4% |
| ACE Securities Corp. |
5.370% due 07/25/2036 | | $ | | 101 | | | | 101 |
5.370% due 08/25/2036 | | | | 122 | | | | 122 |
| |
| Amortizing Residential Collateral Trust |
5.610% due 07/25/2032 | | | | 1 | | | | 1 |
5.670% due 10/25/2031 | | | | 3 | | | | 3 |
| |
| Amresco Residential Securities Mortgage Loan Trust |
6.260% due 06/25/2029 | | | | 1 | | | | 1 |
| |
| Asset-Backed Funding Certificates |
5.380% due 01/25/2037 | | | | 151 | | | | 151 |
| |
| Bear Stearns Asset-Backed Securities, Inc. |
5.390% due 12/25/2036 | | | | 248 | | | | 248 |
| |
| Centex Home Equity |
5.370% due 06/25/2036 | | | | 61 | | | | 61 |
| |
| Citigroup Mortgage Loan Trust, Inc. |
5.370% due 10/25/2036 | | | | 129 | | | | 130 |
| |
| Countrywide Asset-Backed Certificates |
5.370% due 01/25/2037 | | | | 98 | | | | 98 |
5.400% due 06/25/2037 | | | | 265 | | | | 265 |
| |
| CS First Boston Mortgage Securities Corp. |
5.940% due 01/25/2032 | | | | 3 | | | | 2 |
| |
| CSAB Mortgage-Backed Trust |
5.420% due 06/25/2036 | | | | 32 | | | | 32 |
| |
| First Alliance Mortgage Loan Trust |
5.550% due 12/20/2027 | | | | 2 | | | | 2 |
| |
| First Franklin Mortgage Loan Asset-Backed Certificates |
5.370% due 11/25/2036 | | | | 164 | | | | 164 |
| |
| GSR Mortgage Loan Trust |
5.420% due 11/25/2030 | | | | 31 | | | | 31 |
| |
| Honda Auto Receivables Owner Trust |
5.420% due 12/22/2008 | | | | 66 | | | | 66 |
| |
| HSI Asset Securitization Corp. Trust |
5.370% due 12/25/2036 | | | | 169 | | | | 169 |
| |
| | | | | | |
| See Accompanying Notes | | Semiannual Report | | June 30, 2007 | | 9 |
Schedule of Investments Foreign Bond Portfolio (U.S. Dollar-Hedged) (Cont.)
| | | | | | | | |
| | | | | PRINCIPAL
AMOUNT
(000S) | | | | VALUE
(000S) |
| Indymac Residential Asset-Backed Trust |
5.380% due 04/25/2037 | | $ | | 158 | | $ | | 158 |
| |
| IXIS Real Estate Capital Trust |
5.380% due 08/25/2036 | | | | 31 | | | | 31 |
| |
| Long Beach Mortgage Loan Trust |
5.600% due 10/25/2034 | | | | 49 | | | | 49 |
| |
| Merrill Lynch Mortgage Investors, Inc. |
5.390% due 08/25/2036 | | | | 130 | | | | 130 |
| |
| Morgan Stanley ABS Capital I |
5.370% due 09/25/2036 | | | | 141 | | | | 141 |
| |
| Morgan Stanley Home Equity Loans |
5.390% due 02/25/2036 | | | | 114 | | | | 114 |
| |
| New Century Home Equity Loan Trust |
5.490% due 02/25/2036 | | | | 300 | | | | 300 |
| |
| Newcastle Mortgage Securities Trust |
5.390% due 03/25/2036 | | | | 97 | | | | 97 |
| |
| Quest Trust |
5.880% due 06/25/2034 | | | | 5 | | | | 5 |
| |
| Residential Asset Mortgage Products, Inc. |
5.400% due 01/25/2036 | | | | 40 | | | | 40 |
| |
| Residential Asset Securities Corp. |
5.360% due 08/25/2036 | | | | 113 | | | | 114 |
5.820% due 07/25/2032 | | | | 8 | | | | 8 |
| |
| SACO I, Inc. |
5.380% due 05/25/2036 | | | | 31 | | | | 31 |
| |
| Securitized Asset-Backed Receivables LLC Trust |
5.380% due 03/25/2036 | | | | 67 | | | | 67 |
5.400% due 11/25/2036 | | | | 260 | | | | 260 |
| |
| SLM Student Loan Trust |
5.365% due 01/26/2015 | | | | 15 | | | | 15 |
| |
| Soundview Home Equity Loan Trust |
5.400% due 01/25/2037 | | | | 216 | | | | 217 |
| |
| Structured Asset Investment Loan Trust |
5.370% due 05/25/2036 | | | | 176 | | | | 176 |
| |
| Structured Asset Securities Corp. |
5.370% due 10/25/2036 | | | | 148 | | | | 148 |
5.610% due 01/25/2033 | | | | 4 | | | | 4 |
| |
| USAA Auto Owner Trust |
5.337% due 07/11/2008 | | | | 400 | | | | 400 |
| |
| Wells Fargo Home Equity Trust |
5.440% due 12/25/2035 | | | | 77 | | | | 77 |
5.550% due 10/25/2035 | | | | 164 | | | | 164 |
5.560% due 11/25/2035 | | | | 200 | | | | 200 |
| | | | | | | | |
| | | | | | | | 4,593 |
| | | | | | | | |
|
| BANK LOAN OBLIGATIONS 0.5% |
| OAO Rosneft Oil Co. |
6.000% due 09/16/2007 | | | | 300 | | | | 300 |
| | | | | | | | |
|
| CORPORATE BONDS & NOTES 11.9% |
| American Express Credit Corp. |
5.380% due 05/18/2009 | | | | 100 | | | | 100 |
| |
| American International Group, Inc. |
5.360% due 06/23/2008 | | | | 100 | | | | 100 |
| |
| Bear Stearns Cos., Inc. |
5.585% due 01/31/2011 | | | | 200 | | | | 199 |
| |
| BellSouth Corp. |
5.460% due 08/15/2008 | | | | 100 | | | | 100 |
| |
| CenterPoint Energy, Inc. |
5.875% due 06/01/2008 | | | | 100 | | | | 100 |
| |
| Charter One Bank N.A. |
5.405% due 04/24/2009 | | | | 250 | | | | 250 |
| |
| | | | | | | | |
| | | | | PRINCIPAL
AMOUNT
(000S) | | | | VALUE
(000S) |
| CIT Group, Inc. |
5.430% due 02/21/2008 | | $ | | 100 | | $ | | 100 |
| |
| Citigroup, Inc. |
5.400% due 12/26/2008 | | | | 100 | | | | 100 |
| |
| CMS Energy Corp. |
7.500% due 01/15/2009 | | | | 100 | | | | 103 |
| |
| Comcast Corp. |
5.656% due 07/14/2009 | | | | 200 | | | | 200 |
| |
| ConocoPhillips Australia Funding Co. |
5.460% due 04/09/2009 | | | | 200 | | | | 200 |
| |
| CVS Caremark Corp. |
5.750% due 08/15/2011 | | | | 100 | | | | 100 |
| |
| DaimlerChrysler N.A. Holding Corp. |
5.750% due 05/18/2009 | | | | 100 | | | | 100 |
| |
| Dex Media East LLC |
9.875% due 11/15/2009 | | | | 100 | | | | 104 |
| |
| DR Horton, Inc. |
6.000% due 04/15/2011 | | | | 100 | | | | 98 |
| |
| Equistar Chemicals LP |
8.750% due 02/15/2009 | | | | 100 | | | | 104 |
| |
| Ford Motor Credit Co. |
5.800% due 01/12/2009 | | | | 100 | | | | 98 |
6.625% due 06/16/2008 | | | | 100 | | | | 100 |
7.250% due 10/25/2011 | | | | 50 | | | | 48 |
7.800% due 06/01/2012 | | | | 50 | | | | 49 |
8.105% due 01/13/2012 | | | | 200 | | | | 200 |
| |
| Freeport-McMoRan Copper & Gold, Inc. |
8.564% due 04/01/2015 | | | | 100 | | | | 105 |
| |
| General Motors Acceptance Corp. |
6.510% due 09/23/2008 | | | | 100 | | | | 100 |
| |
| GMAC LLC |
6.610% due 05/15/2009 | | | | 100 | | | | 100 |
| |
| Goldman Sachs Group, Inc. |
5.400% due 12/23/2008 | | | | 200 | | | | 200 |
5.450% due 12/22/2008 | | | | 100 | | | | 100 |
| |
| HSBC Finance Corp. |
5.360% due 05/21/2008 | | | | 200 | | | | 200 |
| |
| International Lease Finance Corp. |
5.400% due 02/15/2012 | | | | 100 | | | | 99 |
| |
| iStar Financial, Inc. |
5.150% due 03/01/2012 | | | | 100 | | | | 96 |
| |
| JC Penney Corp., Inc. |
8.000% due 03/01/2010 | | | | 100 | | | | 106 |
| |
| JPMorgan & Co., Inc. CPI Linked Bond |
2.991% due 02/15/2012 | | | | 10 | | | | 11 |
| |
| JPMorgan Chase & Co. |
5.058% due 02/22/2021 | | CAD | | 100 | | | | 91 |
| |
| JPMorgan Chase Capital XXII |
6.450% due 02/02/2037 | | | | 100 | | | | 95 |
| |
| JPMorgan Mortgage Acquisition Corp. |
6.550% due 09/15/2066 | | | | 100 | | | | 97 |
| |
| Kraft Foods, Inc. |
6.250% due 06/01/2012 | | | | 100 | | | | 102 |
| |
| Lehman Brothers Holdings, Inc. |
5.410% due 12/23/2008 | | | | 300 | | | | 300 |
| |
| Mandalay Resort Group |
9.500% due 08/01/2008 | | | | 100 | | | | 104 |
| |
| Merck & Co., Inc. |
4.750% due 03/01/2015 | | | | 100 | | | | 94 |
| |
| Merrill Lynch & Co., Inc. |
5.390% due 12/22/2008 | | | | 300 | | | | 300 |
5.395% due 10/23/2008 | | | | 100 | | | | 100 |
| |
| | | | | | | | |
| | | | | PRINCIPAL
AMOUNT
(000S) | | | | VALUE
(000S) |
| Mizuho JGB Investment LLC |
9.870% due 12/31/2049 | | $ | | 100 | | $ | | 104 |
| |
| Mizuho Preferred Capital Co. LLC |
8.790% due 12/29/2049 | | | | 100 | | | | 103 |
| |
| Morgan Stanley |
5.467% due 02/09/2009 | | | | 200 | | | | 200 |
| |
| Nationwide Health Properties, Inc. |
6.500% due 07/15/2011 | | | | 100 | | | | 102 |
| |
| Newell Rubbermaid, Inc. |
4.000% due 05/01/2010 | | | | 100 | | | | 96 |
| |
| Qwest Capital Funding, Inc. |
6.375% due 07/15/2008 | | | | 100 | | | | 100 |
| |
| Rabobank Capital Funding Trust |
5.254% due 12/29/2049 | | | | 100 | | | | 94 |
| |
| Safeway, Inc. |
4.950% due 08/16/2010 | | | | 100 | | | | 98 |
| |
| SB Treasury Co. LLC |
9.400% due 12/29/2049 | | | | 100 | | | | 104 |
| |
| State Street Capital Trust IV |
6.355% due 06/15/2037 | | | | 100 | | | | 101 |
| |
| Tesoro Corp. |
6.500% due 06/01/2017 | | | | 100 | | | | 98 |
| |
| Time Warner, Inc. |
5.590% due 11/13/2009 | | | | 100 | | | | 100 |
| |
| Toyota Motor Credit Corp. |
5.330% due 10/12/2007 | | | | 100 | | | | 100 |
| |
| TXU Corp. |
6.375% due 01/01/2008 | | | | 100 | | | | 101 |
| |
| U.S. Bancorp |
5.350% due 04/28/2009 | | | | 100 | | | | 100 |
| |
| Valero Energy Corp. |
4.750% due 06/15/2013 | | | | 100 | | | | 95 |
| |
| Wachovia Bank N.A. |
5.400% due 03/23/2009 | | | | 250 | | | | 250 |
| |
| Wal-Mart Stores, Inc. |
5.260% due 06/16/2008 | | | | 100 | | | | 100 |
| |
| Wells Fargo Capital X |
5.950% due 12/15/2036 | | | | 100 | | | | 94 |
| |
| Westpac Banking Corp. |
5.280% due 06/06/2008 | | | | 100 | | | | 100 |
| |
| Xerox Corp. |
9.750% due 01/15/2009 | | | | 200 | | | | 212 |
| | | | | | | | |
| | | | | | | | 7,405 |
| | | | | | | | |
| | | | | | | | |
| MORTGAGE-BACKED SECURITIES 7.6% |
| Banc of America Commercial Mortgage, Inc. |
4.772% due 07/11/2043 | | | | 217 | | | | 214 |
| |
| Banc of America Mortgage Securities, Inc. |
5.000% due 05/25/2034 | | | | 173 | | | | 170 |
| |
| Bear Stearns Alt-A Trust |
5.480% due 02/25/2034 | | | | 232 | | | | 233 |
| |
| Commercial Mortgage Asset Trust |
6.975% due 01/17/2032 | | | | 100 | | | | 106 |
| |
| Countrywide Alternative Loan Trust |
5.530% due 03/20/2046 | | | | 209 | | | | 208 |
5.600% due 02/25/2037 | | | | 155 | | | | 156 |
| |
| Countrywide Home Loan Mortgage Pass-Through Trust |
5.550% due 05/25/2035 | | | | 110 | | | | 110 |
5.640% due 03/25/2035 | | | | 238 | | | | 239 |
5.650% due 02/25/2035 | | | | 31 | | | | 31 |
| |
| CS First Boston Mortgage Securities Corp. |
6.500% due 04/25/2033 | | | | 7 | | | | 7 |
| |
| | | | |
| 10 | | PIMCO Variable Insurance Trust | | See Accompanying Notes |
| | |
| |
| | | June 30, 2007 (Unaudited) |
| | | | | | | | |
| | | | | PRINCIPAL
AMOUNT
(000S) | | | | VALUE
(000S) |
| First Horizon Asset Securities, Inc. |
6.250% due 08/25/2017 | | $ | | 78 | | $ | | 78 |
| |
| GMAC Commercial Mortgage Securities, Inc. |
6.420% due 05/15/2035 | | | | 87 | | | | 88 |
| |
| GMAC Mortgage Corp. Loan Trust |
5.500% due 09/25/2034 | | | | 110 | | | | 109 |
| |
| Greenpoint Mortgage Funding Trust |
5.400% due 01/25/2047 | | | | 289 | | | | 289 |
| |
| Greenwich Capital Commercial Funding Corp. |
5.444% due 03/10/2039 | | | | 200 | | | | 194 |
| |
| Harborview Mortgage Loan Trust |
5.540% due 05/19/2035 | | | | 107 | | | | 107 |
| |
| Indymac Index Mortgage Loan Trust |
5.400% due 07/25/2046 | | | | 29 | | | | 29 |
| |
| JPMorgan Mortgage Trust |
4.500% due 08/25/2019 | | | | 179 | | | | 176 |
| |
| Mellon Residential Funding Corp. |
5.760% due 12/15/2030 | | | | 46 | | | | 46 |
| |
| MLCC Mortgage Investors, Inc. |
5.700% due 03/15/2025 | | | | 13 | | | | 13 |
| |
| Residential Accredit Loans, Inc. |
5.530% due 04/25/2046 | | | | 232 | | | | 232 |
| |
| Structured Asset Mortgage Investments, Inc. |
5.540% due 05/25/2036 | | | | 255 | | | | 255 |
5.610% due 07/19/2034 | | | | 15 | | | | 15 |
5.650% due 09/19/2032 | | | | 14 | | | | 14 |
5.670% due 03/19/2034 | | | | 25 | | | | 25 |
| |
| TBW Mortgage-Backed Pass-Through Certificates |
5.430% due 01/25/2037 | | | | 142 | | | | 142 |
| |
| Thornburg Mortgage Securities Trust |
5.430% due 12/25/2036 | | | | 170 | | | | 170 |
| |
| Wachovia Bank Commercial Mortgage Trust |
5.410% due 09/15/2021 | | | | 229 | | | | 229 |
| |
| Washington Mutual, Inc. |
5.094% due 10/25/2032 | | | | 4 | | | | 4 |
5.474% due 02/27/2034 | | | | 27 | | | | 26 |
5.550% due 04/25/2045 | | | | 35 | | | | 35 |
5.630% due 01/25/2045 | | | | 33 | | | | 33 |
5.860% due 12/25/2027 | | | | 75 | | | | 75 |
6.009% due 06/25/2046 | | | | 144 | | | | 145 |
6.029% due 02/25/2046 | | | | 352 | | | | 352 |
| |
| Wells Fargo Mortgage-Backed Securities Trust |
4.500% due 11/25/2018 | | | | 108 | | | | 105 |
4.950% due 03/25/2036 | | | | 255 | | | | 251 |
5.254% due 04/25/2036 | | | | 69 | | | | 69 |
| | | | | | | | |
| | | | | | | | 4,780 |
| | | | | | | | |
| | | | | | | | |
| MUNICIPAL BONDS & NOTES 0.3% |
| Illinois State Educational Facilities Authority Revenue Bonds, Series 2003 |
5.000% due 07/01/2033 | | | | 95 | | | | 97 |
| |
| Lower Colorado River, Texas Authority Revenue Bonds, (FSA Insured), Series 2003 |
5.000% due 05/15/2023 | | | | 100 | | | | 102 |
| | | | | | | | |
| | | | | | | | 199 |
| | | | | | | | |
|
| | | | | | | | |
| | | | |
SHARES | | | | VALUE
(000S) |
| PREFERRED STOCKS 1.2% |
| DG Funding Trust |
7.600% due 12/31/2049 | | | | 65 | | $ | | 677 |
| |
| Fresenius Medical Care Capital Trust II |
7.875% due 02/01/2008 | | | | 100 | | | | 101 |
| | | | | | | | |
| | | | | | | | 778 |
| | | | | | | | |
|
| | | | | PRINCIPAL
AMOUNT
(000S) | | | | |
| U.S. GOVERNMENT AGENCIES 61.4% |
| Fannie Mae |
4.187% due 11/01/2034 | | $ | | 325 | | | | 322 |
4.673% due 05/25/2035 | | | | 100 | | | | 99 |
4.940% due 12/01/2034 | | | | 48 | | | | 48 |
5.000% due 09/01/2018 - 03/01/2036 | | | | 586 | | | | 554 |
5.440% due 03/25/2034 | | | | 33 | | | | 33 |
5.470% due 08/25/2034 | | | | 27 | | | | 27 |
5.500% due 11/01/2016 - 07/01/2037 | | | | 8,330 | | | | 8,045 |
5.670% due 09/25/2042 | | | | 77 | | | | 78 |
6.000% due 07/01/2037 - 07/25/2044 | | | | 26,050 | | | | 25,770 |
6.227% due 10/01/2044 | | | | 109 | | | | 110 |
| |
| Freddie Mac |
4.500% due 03/15/2016 | | | | 600 | | | | 588 |
4.682% due 03/01/2035 | | | | 402 | | | | 396 |
4.980% due 04/01/2035 | | | | 412 | | | | 404 |
5.000% due 08/15/2020 - 07/15/2025 | | | | 796 | | | | 785 |
5.550% due 07/15/2037 | | | | 400 | | | | 400 |
6.227% due 10/25/2044 | | | | 232 | | | | 234 |
6.530% due 11/26/2012 | | | | 300 | | | | 301 |
7.190% due 02/01/2029 | | | | 27 | | | | 27 |
| |
| Ginnie Mae |
5.375% due 04/20/2028 - 06/20/2030 | | | | 16 | | | | 16 |
5.380% due 05/20/2030 | | | | 5 | | | | 5 |
| | | | | | | | |
| | | | | | | | 38,242 |
| | | | | | | | |
|
| U.S. TREASURY OBLIGATIONS 2.2% |
| U.S. Treasury Bonds |
8.125% due 08/15/2019 | | | | 300 | | | | 380 |
8.875% due 02/15/2019 | | | | 100 | | | | 132 |
| |
| U.S. Treasury Notes |
4.750% due 05/15/2014 | | | | 800 | | | | 790 |
| |
| U.S. Treasury Strips |
0.000% due 11/15/2021 | | | | 100 | | | | 47 |
| | | | | | | | |
| | | | | | | | 1,349 |
| | | | | | | | |
Total United States (Cost $57,980) | | | | 57,646 |
| | | | | | | | |
| | | | | | | | |
| SHORT-TERM INSTRUMENTS 7.5% |
|
| CERTIFICATES OF DEPOSIT 3.0% |
| Barclays Bank PLC |
5.281% due 03/17/2008 | | | | 400 | | | | 400 |
| |
| BNP Paribas |
5.262% due 05/28/2008 | | | | 200 | | | | 200 |
| |
| | | | | | | | | |
| | | | | PRINCIPAL
AMOUNT
(000S) | | | | VALUE
(000S) | |
| Countrywide Funding Corp. | |
5.360% due 08/16/2007 | | $ | | 200 | | $ | | 200 | |
| | |
| Dexia S.A. | |
5.270% due 09/29/2008 | | | | 300 | | | | 300 | |
| | |
| Fortis Bank NY | |
5.265% due 04/28/2008 | | | | 100 | | | | 100 | |
5.300% due 09/30/2008 | | | | 400 | | | | 400 | |
| | |
| Nordea Bank Finland PLC | |
5.308% due 05/28/2008 | | | | 100 | | | | 100 | |
| | |
| Unicredito Italiano NY | |
5.358% due 12/13/2007 | | | | 100 | | | | 100 | |
5.360% due 12/03/2007 | | | | 100 | | | | 100 | |
| | | | | | | | | |
| | | | | | | | 1,900 | |
| | | | | | | | | |
| | | | | | | | | |
| COMMERCIAL PAPER 2.9% | |
| Societe Generale NY | |
5.210% due 11/26/2007 | | | | 1,300 | | | | 1,287 | |
| | |
| UBS Finance Delaware LLC | |
5.350% due 10/23/2007 | | | | 500 | | | | 500 | |
| | | | | | | | | |
| | | | | | | | 1,787 | |
| | | | | | | | | |
| |
| REPURCHASE AGREEMENTS 1.0% | |
| State Street Bank and Trust Co. | |
4.900% due 07/02/2007 | | | | 619 | | | | 619 | |
| | | | | | | | | |
(Dated 06/29/2007. Collateralized by U.S. Treasury Notes 3.625% due 01/15/2010 valued at $636. Repurchase proceeds are $619.) | |
| |
| U.S. TREASURY BILLS 0.6% | |
4.617% due 09/13/2007 (a)(c) | | | | 395 | | | | 391 | |
| | | | | | | | | |
Total Short-Term Instruments
(Cost $4,698) | | 4,697 | |
| | | | | | | | | |
| |
| PURCHASED OPTIONS (e) 0.6% | |
(Cost $454) | | | | 398 | |
| |
| |
Total Investments (b) 167.5%
(Cost $104,302) | | $ | | 104,312 | |
| |
Written Options (f) (0.1%)
(Premiums $128) | | | | (31 | ) |
| |
| Other Assets and Liabilities (Net) (67.4%) | | (41,996 | ) |
| | | | | | | | | |
| Net Assets 100.0% | | | | | | $ | | 62,285 | |
| | | | | | | | | |
Notes to Schedule of Investments (amounts in thousands*, except number of contracts):
* A zero balance may reflect actual amounts rounding to less than one thousand.
(a) Coupon represents a weighted average rate.
(b) As of June 30, 2007, portfolio securities with an aggregate value of $1,007 were valued in good faith and pursuant to the guidelines established by the Board of Trustees.
| | | | | | |
| See Accompanying Notes | | Semiannual Report | | June 30, 2007 | | 11 |
Schedule of Investments Foreign Bond Portfolio (U.S. Dollar-Hedged) (Cont.)
(c) Securities with an aggregate market value of $391 have been segregated with the custodian to cover margin requirements for the following open futures contracts on June 30, 2007:
| | | | | | | | | | |
| Description | | Type | | Expiration
Month | | # of
Contracts | | Unrealized
Appreciation/
(Depreciation) | |
90-Day Eurodollar December Futures | | Long | | 12/2007 | | 17 | | $ | 4 | |
90-Day Eurodollar March Futures | | Long | | 03/2008 | | 13 | | | (8 | ) |
90-Day Eurodollar September Futures | | Short | | 09/2007 | | 2 | | | 3 | |
90-Day Euroyen December Futures | | Long | | 12/2007 | | 19 | | | (4 | ) |
Euro-Bobl 5-Year Note September Futures | | Long | | 09/2007 | | 37 | | | (11 | ) |
Euro-Bund 10-Year Note September Futures | | Long | | 09/2007 | | 97 | | | (75 | ) |
Euro-Bund 10-Year Note September Futures Put Options Strike @ EUR 104.000 | | Long | | 09/2007 | | 8 | | | 0 | |
Euro-Bund 10-Year Note September Futures Put Options Strike @ EUR 106.000 | | Long | | 09/2007 | | 86 | | | 1 | |
Japan Government 10-Year Bond September Futures | | Long | | 09/2007 | | 11 | | | (45 | ) |
U.S. Treasury 10-Year Note September Futures | | Short | | 09/2007 | | 53 | | | (20 | ) |
U.S. Treasury 30-Year Bond September Futures | | Long | | 09/2007 | | 2 | | | 2 | |
United Kingdom 90-Day LIBOR Sterling Interest Rate September Futures | | Long | | 09/2007 | | 12 | | | (12 | ) |
| | | | | | | | | | |
| | | | | | | | $ | (165 | ) |
| | | | | | | | | | |
(d) Swap agreements outstanding on June 30, 2007:
Credit Default Swaps
| | | | | | | | | | | | | | | | |
| Counterparty | | Reference Entity | | Buy/Sell
Protection (1) | | (Pay)/Receive
Fixed Rate | | | Expiration
Date | | Notional
Amount | | Unrealized
Appreciation/
(Depreciation) | |
Barclays Bank PLC | | Dow Jones iTraxx Europe HV6 Index | | Buy | | (0.850% | ) | | 12/20/2016 | | EUR | 300 | | $ | 0 | |
BNP Paribas Bank | | Dow Jones iTraxx Europe HV6 Index | | Buy | | (0.850% | ) | | 12/20/2016 | | | 200 | | | 0 | |
Deutsche Bank AG | | Dow Jones iTraxx Europe HV6 Index | | Buy | | (0.850% | ) | | 12/20/2016 | | | 400 | | | (1 | ) |
Goldman Sachs & Co. | | Dow Jones iTraxx Europe HV6 Index | | Buy | | (0.850% | ) | | 12/20/2016 | | | 100 | | | 0 | |
JPMorgan Chase & Co. | | Dow Jones iTraxx Europe HV6 Index | | Buy | | (0.850% | ) | | 12/20/2016 | | | 200 | | | 0 | |
Deutsche Bank AG | | SOFTBANK Corp. 1.750% due 03/31/2014 | | Sell | | 2.300% | | | 09/20/2007 | | JPY | 13,000 | | | 1 | |
Bank of America | | DR Horton, Inc. 6.000% due 04/15/2011 | | Buy | | (0.890% | ) | | 06/20/2011 | | $ | 100 | | | 2 | |
Bank of America | | GlobalSantaFe Corp. 5.000% due 02/15/2013 | | Buy | | (0.455% | ) | | 06/20/2012 | | | 200 | | | (1 | ) |
Bank of America | | Transocean, Inc. 7.375% due 04/15/2018 | | Buy | | (0.505% | ) | | 06/20/2017 | | | 200 | | | 0 | |
Barclays Bank PLC | | International Lease Finance Corp.
5.400% due 02/15/2012 | | Buy | | (0.170% | ) | | 03/20/2012 | | | 100 | | | 0 | |
Barclays Bank PLC | | Capital One Bank 5.125% due 02/15/2014 | | Buy | | (0.160% | ) | | 06/20/2012 | | | 100 | | | 0 | |
Bear Stearns & Co., Inc. | | Kraft Foods, Inc. 6.250% due 06/01//2012 | | Buy | | (0.170% | ) | | 06/20/2012 | | | 100 | | | 1 | |
Citibank N.A. | | Newell Rubbermaid, Inc. 4.000% due 05/01/2010 | | Buy | | (0.130% | ) | | 06/20/2010 | | | 100 | | | 0 | |
Credit Suisse First Boston | | CenterPoint Energy, Inc. 5.875% due 06/01/2008 | | Buy | | (0.170% | ) | | 06/20/2008 | | | 100 | | | 0 | |
Credit Suisse First Boston | | DaimlerChrysler N.A. Holding Corp. 5.750% due 05/18/2009 | | Buy | | (0.380% | ) | | 06/20/2009 | | | 100 | | | 0 | |
Credit Suisse First Boston | | Safeway, Inc. 4.950% due 08/16/2010 | | Buy | | (0.300% | ) | | 09/20/2010 | | | 100 | | | (1 | ) |
Credit Suisse First Boston | | iStar Financial, Inc. 5.150% due 03/01/2012 | | Buy | | (0.450% | ) | | 03/20/2012 | | | 100 | | | (1 | ) |
Credit Suisse First Boston | | Noble Corp. 5.875% due 06/01/2013 | | Buy | | (0.519% | ) | | 06/20/2012 | | | 200 | | | (1 | ) |
Deutsche Bank AG | | JC Penney Corp., Inc. 8.000% due 03/01/2010 | | Buy | | (0.270% | ) | | 03/20/2010 | | | 100 | | | 0 | |
Deutsche Bank AG | | Nationwide Health Properties, Inc.
6.500% due 07/15/2011 | | Buy | | (0.620% | ) | | 09/20/2011 | | | 100 | | | (1 | ) |
Deutsche Bank AG | | International Paper Co. 5.850% due 10/30/2012 | | Buy | | (0.700% | ) | | 06/20/2017 | | | 100 | | | 0 | |
Goldman Sachs & Co. | | Dow Jones CDX N.A. IG8 Index | | Buy | | (0.600% | ) | | 06/20/2017 | | | 7,000 | | | 41 | |
Goldman Sachs & Co. | | MeadWestvaco Corp. 6.850% due 04/01/2012 | | Buy | | (1.040% | ) | | 06/20/2017 | | | 200 | | | 1 | |
Goldman Sachs & Co. | | Transocean, Inc. 7.375% due 04/15/2018 | | Buy | | (0.500% | ) | | 06/20/2017 | | | 100 | | | 0 | |
HSBC Bank USA | | Russia Government International Bond 7.500% due 03/31/2030 | | Sell | | 0.240% | | | 02/20/2008 | | | 200 | | | 0 | |
HSBC Bank USA | | Ukraine Government International Bond 7.650% due 06/11/2013 | | Sell | | 0.730% | | | 04/20/2009 | | | 100 | | | 0 | |
Lehman Brothers, Inc. | | Ford Motor Credit Co. 7.875% due 06/15/2010 | | Buy | | (2.310% | ) | | 06/20/2010 | | | 100 | | | 1 | |
Lehman Brothers, Inc. | | Brazilian Government International Bond 12.250% due 03/06/2030 | | Sell | | 1.280% | | | 08/20/2011 | | | 2,200 | | | 64 | |
Lehman Brothers, Inc. | | CVS Corp. 5.750% due 08/15/2011 | | Buy | | (0.210% | ) | | 09/20/2011 | | | 100 | | | 0 | |
Lehman Brothers, Inc. | | Valero Energy Corp. 4.750% due 06/15/2013 | | Buy | | (0.410% | ) | | 06/20/2013 | | | 100 | | | 0 | |
Lehman Brothers, Inc. | | Merck & Co., Inc. 4.750% due 03/01/2015 | | Buy | | (0.135% | ) | | 03/20/2015 | | | 100 | | | 0 | |
Morgan Stanley | | Xerox Corp. 9.750% due 01/15/2009 | | Buy | | (0.290% | ) | | 03/20/2009 | | | 100 | | | 0 | |
Royal Bank of Canada | | JPMorgan Chase & Co. 6.750% due 02/01/2011 | | Buy | | (0.310% | ) | | 03/20/2016 | | | 100 | | | 0 | |
Royal Bank of Scotland Group PLC | | Glitnir Banki HF floating rate based on 3-Month USD-LIBOR plus 0.470% due 01/18/2012 | | Buy | | (0.290% | ) | | 03/20/2012 | | | 100 | | | 0 | |
UBS Warburg LLC | | American International Group, Inc.
4.250% due 05/15/2013 | | Sell | | 0.070% | | | 06/20/2008 | | | 300 | | | 0 | |
UBS Warburg LLC | | Lennar Corp. 5.950% due 03/01/2013 | | Buy | | (1.190% | ) | | 06/20/2017 | | | 200 | | | 5 | |
UBS Warburg LLC | | Weyerhaeuser Co. 6.750% due 03/15/2012 | | Buy | | (0.930% | ) | | 06/20/2017 | | | 200 | | | 1 | |
| | | | | | | | | | | | | | | | |
| | | | | | | | | | | | | | $ | 111 | |
| | | | | | | | | | | | | | | | |
(1) If the Portfolio is a seller of protection and a credit event occurs, as defined under the terms of that particular swap agreement, the Portfolio will pay to the buyer of the protection an amount up to the notional value of the swap and in certain instances, take delivery of the security. As a buyer of protection, the Portfolio will generally receive from the seller of protection an amount up to the notional amount of the swap if a credit event occurs.
| | | | |
| 12 | | PIMCO Variable Insurance Trust | | See Accompanying Notes |
| | |
| |
| | | June 30, 2007 (Unaudited) |
Interest Rate Swaps
| | | | | | | | | | | | | | | |
| Counterparty | | Floating Rate Index | | Pay/Receive
Floating Rate | | Fixed
Rate | | Expiration
Date | | Notional
Amount | | Unrealized
Appreciation/
(Depreciation) | |
Citibank N.A. | | 6-Month Australian Bank Bill | | Pay | | 6.500% | | 01/15/2009 | | AUD | 1,500 | | $ | (3 | ) |
Citibank N.A. | | 6-Month Australian Bank Bill | | Pay | | 6.000% | | 06/15/2010 | | | 700 | | | (19 | ) |
Citibank N.A. | | 6-Month Australian Bank Bill | | Receive | | 6.000% | | 06/15/2015 | | | 400 | | | 20 | |
Deutsche Bank AG | | 6-Month Australian Bank Bill | | Pay | | 6.500% | | 01/15/2009 | | | 5,000 | | | (13 | ) |
Deutsche Bank AG | | 6-Month Australian Bank Bill | | Pay | | 6.500% | | 01/15/2010 | | | 1,200 | | | (9 | ) |
Deutsche Bank AG | | 6-Month Australian Bank Bill | | Pay | | 6.000% | | 06/15/2012 | | | 500 | | | (13 | ) |
Deutsche Bank AG | | 6-Month Australian Bank Bill | | Receive | | 6.000% | | 06/15/2017 | | | 300 | | | 14 | |
HSBC Bank USA | | 6-Month Australian Bank Bill | | Pay | | 6.000% | | 06/15/2012 | | | 300 | | | (8 | ) |
HSBC Bank USA | | 6-Month Australian Bank Bill | | Receive | | 6.000% | | 06/15/2017 | | | 200 | | | 9 | |
JPMorgan Chase & Co. | | 6-Month Australian Bank Bill | | Pay | | 6.500% | | 01/15/2010 | | | 500 | | | (3 | ) |
Morgan Stanley | | 6-Month Australian Bank Bill | | Pay | | 6.500% | | 01/15/2009 | | | 2,300 | | | (6 | ) |
Royal Bank of Canada | | 6-Month Australian Bank Bill | | Pay | | 6.500% | | 01/15/2010 | | | 1,500 | | | (10 | ) |
UBS Warburg LLC | | 6-Month Australian Bank Bill | | Pay | | 6.000% | | 06/15/2010 | | | 1,600 | | | (45 | ) |
UBS Warburg LLC | | 6-Month Australian Bank Bill | | Receive | | 6.000% | | 06/15/2015 | | | 1,000 | | | 59 | |
Merrill Lynch & Co., Inc. | | 3-Month Canadian Bank Bill | | Receive | | 5.500% | | 06/20/2017 | | CAD | 400 | | | (1 | ) |
Royal Bank of Canada | | 3-Month Canadian Bank Bill | | Receive | | 5.000% | | 06/15/2015 | | | 200 | | | 3 | |
Citibank N.A. | | 6-Month EUR-LIBOR | | Receive | | 4.000% | | 12/15/2011 | | EUR | 1,600 | | | 3 | |
Citibank N.A. | | 6-Month EUR-LIBOR | | Receive | | 5.000% | | 06/17/2012 | | | 200 | | | 21 | |
Deutsche Bank AG | | 6-Month EUR-LIBOR | | Receive | | 4.000% | | 12/15/2011 | | | 200 | | | 7 | |
Deutsche Bank AG | | 6-Month EUR-LIBOR | | Receive | | 4.000% | | 12/15/2014 | | | 4,880 | | | 216 | |
Goldman Sachs & Co. | | 6-Month EUR-LIBOR | | Pay | | 4.000% | | 06/17/2010 | | | 200 | | | (8 | ) |
Goldman Sachs & Co. | | 5-Year French CPI Ex Tobacco Daily Reference Index | | Pay | | 1.960% | | 03/30/2012 | | | 500 | | | (4 | ) |
Goldman Sachs & Co. | | 6-Month EUR-LIBOR | | Receive | | 5.000% | | 09/19/2012 | | | 800 | | | (3 | ) |
Goldman Sachs & Co. | | 6-Month EUR-LIBOR | | Receive | | 4.000% | | 12/15/2014 | | | 1,900 | | | 114 | |
Goldman Sachs & Co. | | 6-Month EUR-LIBOR | | Receive | | 5.000% | | 03/19/2038 | | | 400 | | | (7 | ) |
HSBC Bank USA | | 6-Month EUR-LIBOR | | Receive | | 4.000% | | 12/15/2014 | | | 500 | | | 22 | |
JPMorgan Chase & Co. | | 6-Month EUR-LIBOR | | Pay | | 4.000% | | 06/17/2010 | | | 200 | | | (14 | ) |
JPMorgan Chase & Co. | | 6-Month EUR-LIBOR | | Receive | | 5.000% | | 06/17/2012 | | | 100 | | | 10 | |
Lehman Brothers, Inc. | | 6-Month EUR-LIBOR | | Pay | | 6.000% | | 06/18/2034 | | | 200 | | | (17 | ) |
Morgan Stanley | | 6-Month EUR-LIBOR | | Pay | | 4.000% | | 06/17/2010 | | | 100 | | | (7 | ) |
Morgan Stanley | | 6-Month EUR-LIBOR | | Receive | | 4.000% | | 12/15/2011 | | | 1,200 | | | 47 | |
Morgan Stanley | | 6-Month EUR-LIBOR | | Receive | | 4.000% | | 06/15/2017 | | | 500 | | | 48 | |
Morgan Stanley | | 6-Month EUR-LIBOR | | Pay | | 6.000% | | 06/18/2034 | | | 800 | | | (21 | ) |
UBS Warburg LLC | | 6-Month EUR-LIBOR | | Pay | | 4.000% | | 06/17/2010 | | | 200 | | | (15 | ) |
Barclays Bank PLC | | 6-Month GBP-LIBOR | | Pay | | 6.000% | | 03/20/2009 | | GBP | 1,700 | | | (19 | ) |
Barclays Bank PLC | | 6-Month GBP-LIBOR | | Pay | | 5.000% | | 09/15/2010 | | | 1,400 | | | (118 | ) |
Barclays Bank PLC | | 6-Month GBP-LIBOR | | Receive | | 5.000% | | 09/15/2015 | | | 400 | | | 52 | |
Barclays Bank PLC | | 6-Month GBP-LIBOR | | Receive | | 4.500% | | 09/15/2017 | | | 1,500 | | | 15 | |
Barclays Bank PLC | | 6-Month GBP-LIBOR | | Pay | | 5.000% | | 06/18/2034 | | | 200 | | | (17 | ) |
Barclays Bank PLC | | 6-Month GBP-LIBOR | | Receive | | 4.000% | | 12/15/2035 | | | 200 | | | 21 | |
Deutsche Bank AG | | 6-Month GBP-LIBOR | | Pay | | 5.000% | | 06/15/2009 | | | 300 | | | (11 | ) |
Deutsche Bank AG | | 6-Month GBP-LIBOR | | Receive | | 4.250% | | 06/12/2036 | | | 100 | | | 26 | |
Goldman Sachs & Co. | | 6-Month GBP-LIBOR | | Receive | | 4.250% | | 06/12/2036 | | | 200 | | | 38 | |
HSBC Bank USA | | 6-Month GBP-LIBOR | | Pay | | 5.000% | | 09/15/2010 | | | 1,400 | | | (125 | ) |
Merrill Lynch & Co., Inc. | | 6-Month GBP-LIBOR | | Pay | | 5.000% | | 09/15/2010 | | | 1,000 | | | (89 | ) |
Morgan Stanley | | 6-Month GBP-LIBOR | | Pay | | 5.000% | | 09/15/2015 | | | 300 | | | (37 | ) |
Goldman Sachs & Co. | | 3-Month Hong Kong Bank Bill | | Receive | | 4.235% | | 12/17/2008 | | HKD | 7,100 | | | 6 | |
Barclays Bank PLC | | 6-Month JPY-LIBOR | | Pay | | 1.000% | | 03/18/2009 | | JPY | 420,000 | | | (7 | ) |
Barclays Bank PLC | | 6-Month JPY-LIBOR | | Receive | | 2.000% | | 12/20/2016 | | | 190,000 | | | (14 | ) |
Barclays Bank PLC | | 6-Month JPY-LIBOR | | Pay | | 2.500% | | 06/20/2036 | | | 20,000 | | | (5 | ) |
Deutsche Bank AG | | 6-Month JPY-LIBOR | | Pay | | 1.000% | | 09/18/2008 | | | 1,040,000 | | | 3 | |
Deutsche Bank AG | | 6-Month JPY-LIBOR | | Pay | | 1.000% | | 03/18/2009 | | | 540,000 | | | (9 | ) |
Deutsche Bank AG | | 6-Month JPY-LIBOR | | Receive | | 2.000% | | 12/20/2016 | | | 50,000 | | | (4 | ) |
Deutsche Bank AG | | 6-Month JPY-LIBOR | | Pay | | 3.000% | | 06/20/2027 | | | 20,000 | | | (1 | ) |
Goldman Sachs & Co. | | 6-Month JPY-LIBOR | | Receive | | 2.020% | | 05/18/2010 | | | 17,000 | | | (3 | ) |
Goldman Sachs & Co. | | 6-Month JPY-LIBOR | | Receive | | 1.300% | | 09/21/2011 | | | 40,000 | | | 3 | |
Goldman Sachs & Co. | | 6-Month JPY-LIBOR | | Receive | | 2.000% | | 12/20/2016 | | | 590,000 | | | (36 | ) |
Morgan Stanley | | 6-Month JPY-LIBOR | | Pay | | 1.000% | | 03/18/2009 | | | 80,000 | | | (1 | ) |
Morgan Stanley | | 6-Month JPY-LIBOR | | Receive | | 2.000% | | 12/20/2013 | | | 130,000 | | | 7 | |
Morgan Stanley | | 6-Month JPY-LIBOR | | Receive | | 2.000% | | 12/20/2016 | | | 220,000 | | | (13 | ) |
UBS Warburg LLC | | 6-Month JPY-LIBOR | | Pay | | 1.000% | | 09/18/2008 | | | 1,560,000 | | | (22 | ) |
UBS Warburg LLC | | 6-Month JPY-LIBOR | | Pay | | 1.000% | | 03/18/2009 | | | 820,000 | | | (15 | ) |
UBS Warburg LLC | | 6-Month JPY-LIBOR | | Receive | | 0.800% | | 03/20/2012 | | | 50,000 | | | (3 | ) |
UBS Warburg LLC | | 6-Month JPY-LIBOR | | Receive | | 2.000% | | 12/20/2013 | | | 190,000 | | | 20 | |
UBS Warburg LLC | | 6-Month JPY-LIBOR | | Receive | | 2.000% | | 12/20/2016 | | | 320,000 | | | (12 | ) |
UBS Warburg LLC | | 6-Month JPY-LIBOR | | Pay | | 3.000% | | 06/20/2027 | | | 20,000 | | | (1 | ) |
UBS Warburg LLC | | 6-Month JPY-LIBOR | | Pay | | 2.500% | | 06/20/2036 | | | 60,000 | | | (15 | ) |
Citibank N.A. | | 28-Day Mexico Interbank TIIE Banxico | | Pay | | 8.170% | | 11/04/2016 | | MXN | 2,000 | | | (2 | ) |
Merrill Lynch & Co., Inc. | | 28-Day Mexico Interbank TIIE Banxico | | Pay | | 8.170% | | 11/04/2016 | | | 4,000 | | | (1 | ) |
Bank of America | | 3-Month USD-LIBOR | | Pay | | 5.000% | | 06/18/2009 | | $ | 5,900 | | | (29 | ) |
Citibank N.A. | | 3-Month USD-LIBOR | | Receive | | 5.000% | | 06/20/2014 | | | 800 | | | 28 | |
Deutsche Bank AG | | 3-Month USD-LIBOR | | Pay | | 5.000% | | 06/18/2009 | | | 22,800 | | | (107 | ) |
Deutsche Bank AG | | 3-Month USD-LIBOR | | Receive | | 5.000% | | 06/20/2014 | | | 200 | | | 7 | |
Lehman Brothers, Inc. | | 3-Month USD-LIBOR | | Receive | | 5.000% | | 12/19/2012 | | | 1,300 | | | (2 | ) |
| | | | | | |
| See Accompanying Notes | | Semiannual Report | | June 30, 2007 | | 13 |
Schedule of Investments Foreign Bond Portfolio (U.S. Dollar-Hedged) (Cont.)
| | | | | | | | | | | | | | | |
| Counterparty | | Floating Rate Index | | Pay/Receive
Floating Rate | | Fixed
Rate | | Expiration
Date | | Notional
Amount | | Unrealized
Appreciation/
(Depreciation) | |
Lehman Brothers, Inc. | | 3-Month USD-LIBOR | | Receive | | 5.000% | | 06/20/2014 | | $ | 4,700 | | $ | 166 | |
Lehman Brothers, Inc. | | 3-Month USD-LIBOR | | Receive | | 5.000% | | 12/19/2017 | | | 800 | | | (6 | ) |
Morgan Stanley | | 3-Month USD-LIBOR | | Pay | | 5.000% | | 06/20/2009 | | | 900 | | | (8 | ) |
Morgan Stanley | | 3-Month USD-LIBOR | | Receive | | 5.000% | | 12/19/2017 | | | 3,300 | | | (22 | ) |
Morgan Stanley | | 3-Month USD-LIBOR | | Pay | | 5.000% | | 12/19/2037 | | | 100 | | | 2 | |
Royal Bank of Scotland Group PLC | | 3-Month USD-LIBOR | | Pay | | 5.000% | | 06/20/2008 | | | 1,000 | | | (1 | ) |
Royal Bank of Scotland Group PLC | | 3-Month USD-LIBOR | | Receive | | 5.000% | | 12/19/2014 | | | 200 | | | (1 | ) |
Royal Bank of Scotland Group PLC | | 3-Month USD-LIBOR | | Receive | | 5.000% | | 12/19/2017 | | | 9,300 | | | (60 | ) |
UBS Warburg LLC | | 3-Month USD-LIBOR | | Receive | | 5.000% | | 12/20/2026 | | | 900 | | | 1 | |
| | | | | | | | | | | | | | | |
| | | | | | | | | | | | | $ | (54 | ) |
| | | | | | | | | | | | | | | |
(e) Purchased options outstanding on June 30, 2007:
Options on Exchange-Traded Futures Contracts
| | | | | | | | | | | | | |
| Description | | Exercise
Price | | Expiration
Date | | # of
Contracts | | Cost | | Value |
Call - CBOT U.S. Treasury 10-Year Note September Futures | | $ | 109.000 | | 08/24/2007 | | 20 | | $ | 0 | | $ | 0 |
| | | | | | | | | | | | | |
Interest Rate Swaptions
| | | | | | | | | | | | | | | | | | | |
| Description | | Counterparty | | Floating Rate Index | | Pay/Receive
Floating Rate | | Exercise
Rate | | Expiration
Date | | Notional
Amount | | Cost | | Value |
Call - OTC 2-Year Interest Rate Swap | | Bank of America | | 3-Month USD-LIBOR | | Pay | | 4.800% | | 08/08/2007 | | $ | 2,000 | | $ | 8 | | $ | 0 |
Call - OTC 2-Year Interest Rate Swap | | Bank of America | | 3-Month USD-LIBOR | | Pay | | 5.000% | | 02/01/2008 | | | 4,600 | | | 18 | | | 8 |
Call - OTC 2-Year Interest Rate Swap | | Bank of America | | 3-Month USD-LIBOR | | Pay | | 4.750% | | 09/26/2008 | | | 4,000 | | | 19 | | | 8 |
Call - OTC 1-Year Interest Rate Swap | | Royal Bank of Scotland Group PLC | | 3-Month USD-LIBOR | | Pay | | 4.850% | | 07/02/2007 | | | 17,200 | | | 45 | | | 0 |
Call - OTC 1-Year Interest Rate Swap | | Royal Bank of Scotland Group PLC | | 3-Month USD-LIBOR | | Pay | | 4.900% | | 08/08/2007 | | | 7,000 | | | 16 | | | 0 |
Call - OTC 2-Year Interest Rate Swap | | Royal Bank of Scotland Group PLC | | 3-Month USD-LIBOR | | Pay | | 5.000% | | 02/01/2008 | | | 2,000 | | | 10 | | | 3 |
Call - OTC 2-Year Interest Rate Swap | | Royal Bank of Scotland Group PLC | | 3-Month USD-LIBOR | | Pay | | 4.750% | | 12/15/2008 | | | 4,500 | | | 15 | | | 10 |
| | | | | | | | | | | | | | | | | | | |
| | | | | | | | | | | | | | | $ | 131 | | $ | 29 |
| | | | | | | | | | | | | | | | | | | |
Foreign Currency Options
| | | | | | | | | | | | | | |
| Description | | Exercise
Price | | Expiration
Date | | Notional
Amount | | Cost | | Value |
Call - OTC Euro versus U.S. dollar | | $ | 1.355 | | 05/21/2008 | | EUR | 1,000 | | $ | 30 | | $ | 34 |
Put - OTC Euro versus U.S. dollar | | | 1.355 | | 05/21/2008 | | | 1,000 | | | 30 | | | 25 |
Call - OTC U.S. dollar versus Japanese yen | | JPY | 120.000 | | 09/26/2007 | | $ | 300 | | | 2 | | | 7 |
Call - OTC U.S. dollar versus Japanese yen | | | 117.900 | | 11/09/2007 | | | 600 | | | 6 | | | 20 |
Call - OTC U.S. dollar versus Japanese yen | | | 117.500 | | 11/19/2007 | | | 300 | | | 3 | | | 11 |
Call - OTC U.S. dollar versus Japanese yen | | | 114.281 | | 12/05/2007 | | | 300 | | | 4 | | | 17 |
Call - OTC U.S. dollar versus Japanese yen | | | 114.650 | | 01/18/2008 | | | 1,000 | | | 33 | | | 52 |
Put - OTC U.S. dollar versus Japanese yen | | | 114.650 | | 01/18/2008 | | | 1,000 | | | 33 | | | 8 |
Call - OTC U.S. dollar versus Japanese yen | | | 121.400 | | 01/23/2008 | | | 500 | | | 5 | | | 7 |
Call - OTC U.S. dollar versus Japanese yen | | | 117.500 | | 03/13/2008 | | | 400 | | | 3 | | | 13 |
Call - OTC U.S. dollar versus Japanese yen | | | 115.950 | | 06/09/2008 | | | 400 | | | 11 | | | 15 |
Put - OTC U.S. dollar versus Japanese yen | | | 115.950 | | 06/09/2008 | | | 400 | | | 10 | | | 8 |
Call - OTC U.S. dollar versus Japanese yen | | | 118.150 | | 06/23/2008 | | | 2,800 | | | 74 | | | 73 |
Put - OTC U.S. dollar versus Japanese yen | | | 118.150 | | 06/23/2008 | | | 2,800 | | | 74 | | | 76 |
| | | | | | | | | | | | | | |
| | | | | | | | | | $ | 318 | | $ | 366 |
| | | | | | | | | | | | | | |
Options on Securities
| | | | | | | | | | | | | | |
| Description | | Strike Price | | Expiration
Date | | Notional
Amount | | Cost | | Value |
Put - OTC Fannie Mae 6.000% due 07/01/2037 | | $ | 91.500 | | 07/05/2007 | | $ | 3,000 | | $ | 0 | | $ | 0 |
Call - OTC Fannie Mae 5.000% due 09/01/2037 | | | 101.125 | | 09/06/2007 | | | 8,000 | | | 1 | | | 1 |
Put - OTC Fannie Mae 5.500% due 08/01/2037 | | | 89.500 | | 08/07/2007 | | | 5,000 | | | 1 | | | 0 |
Put - OTC Fannie Mae 6.000% due 09/01/2037 | | | 92.500 | | 09/06/2007 | | | 23,000 | | | 3 | | | 2 |
Call - OTC Fannie Mae 5.000% due 09/01/2037 | | | 102.438 | | 09/06/2007 | | | 1,460 | | | 0 | | | 0 |
| | | | | | | | | | | | | | |
| | | | | | | | | | $ | 5 | | $ | 3 |
| | | | | | | | | | | | | | |
| | | | |
| 14 | | PIMCO Variable Insurance Trust | | See Accompanying Notes |
| | |
| |
| | | June 30, 2007 (Unaudited) |
(f) Written options outstanding on June 30, 2007:
Interest Rate Swaptions
| | | | | | | | | | | | | | | | | | | |
| Description | | Counterparty | | Floating Rate Index | | Pay/Receive
Floating Rate | | Exercise
Rate | | Expiration
Date | | Notional
Amount | | Premium | | Value |
Call - OTC 5-Year Interest Rate Swap | | Bank of America | | 3-Month USD-LIBOR | | Receive | | 4.900% | | 08/08/2007 | | $ | 1,000 | | $ | 8 | | $ | 0 |
Call - OTC 5-Year Interest Rate Swap | | Bank of America | | 3-Month USD-LIBOR | | Receive | | 5.100% | | 02/01/2008 | | | 2,000 | | | 18 | | | 7 |
Call - OTC 5-Year Interest Rate Swap | | Bank of America | | 3-Month USD-LIBOR | | Receive | | 4.950% | | 09/26/2008 | | | 2,000 | | | 22 | | | 10 |
Call - OTC 5-Year Interest Rate Swap | | Royal Bank of Scotland Group PLC | | 3-Month USD-LIBOR | | Receive | | 4.950% | | 07/02/2007 | | | 3,700 | | | 40 | | | 0 |
Call - OTC 7-Year Interest Rate Swap | | Royal Bank of Scotland Group PLC | | 3-Month USD-LIBOR | | Receive | | 4.900% | | 08/08/2007 | | | 1,200 | | | 14 | | | 0 |
Call - OTC 5-Year Interest Rate Swap | | Royal Bank of Scotland Group PLC | | 3-Month USD-LIBOR | | Receive | | 5.100% | | 02/01/2008 | | | 900 | | | 11 | | | 3 |
Call - OTC 7-Year Interest Rate Swap | | Royal Bank of Scotland Group PLC | | 3-Month USD-LIBOR | | Receive | | 5.000% | | 12/15/2008 | | | 1,500 | | | 15 | | | 11 |
| | | | | | | | | | | | | | | | | | | |
| | | | | | | | | | | | | | | $ | 128 | | $ | 31 |
| | | | | | | | | | | | | | | | | | | |
(g) Short sales outstanding on June 30, 2007:
| | | | | | | | | | | | | |
| Description | | Coupon | | Maturity
Date | | Principal
Amount | | Proceeds | | Value |
Fannie Mae | | 5.000% | | 07/01/2037 | | $ | 10,000 | | $ | 9,611 | | $ | 9,370 |
| | | | | | | | | | | | | |
(h) Foreign currency contracts outstanding on June 30, 2007:
| | | | | | | | | | | | | | | | | |
| Type | | Currency | | Principal
Amount
Covered by
Contract | | Settlement
Month | | Unrealized
Appreciation | | Unrealized
(Depreciation) | | | Net Unrealized
Appreciation/
(Depreciation) | |
Buy | | AUD | | 1,772 | | 07/2007 | | $ | 6 | | $ | 0 | | | $ | 6 | |
Sell | | | | 643 | | 07/2007 | | | 0 | | | (4 | ) | | | (4 | ) |
Buy | | BRL | | 1,256 | | 07/2007 | | | 15 | | | 0 | | | | 15 | |
Sell | | | | 1,256 | | 07/2007 | | | 8 | | | 0 | | | | 8 | |
Buy | | | | 1,021 | | 10/2007 | | | 19 | | | 0 | | | | 19 | |
Buy | | | | 1,571 | | 03/2008 | | | 9 | | | (9 | ) | | | 0 | |
Sell | | CAD | | 518 | | 08/2007 | | | 0 | | | (2 | ) | | | (2 | ) |
Buy | | CLP | | 6,033 | | 11/2007 | | | 0 | | | 0 | | | | 0 | |
Buy | | | | 4,000 | | 03/2008 | | | 0 | | | 0 | | | | 0 | |
Buy | | CNY | | 5,292 | | 11/2007 | | | 3 | | | 0 | | | | 3 | |
Buy | | | | 14,644 | | 01/2008 | | | 0 | | | (9 | ) | | | (9 | ) |
Buy | | DKK | | 32 | | 09/2007 | | | 0 | | | 0 | | | | 0 | |
Sell | | | | 178 | | 09/2007 | | | 0 | | | 0 | | | | 0 | |
Sell | | EUR | | 10,084 | | 07/2007 | | | 0 | | | (132 | ) | | | (132 | ) |
Sell | | GBP | | 2,757 | | 08/2007 | | | 0 | | | (29 | ) | | | (29 | ) |
Buy | | HKD | | 475 | | 07/2007 | | | 0 | | | 0 | | | | 0 | |
Buy | | | | 475 | | 08/2007 | | | 0 | | | 0 | | | | 0 | |
Buy | | JPY | | 41,361 | | 07/2007 | | | 1 | | | 0 | | | | 1 | |
Sell | | | | 1,136,167 | | 07/2007 | | | 131 | | | (1 | ) | | | 130 | |
Buy | | KRW | | 241,826 | | 07/2007 | | | 2 | | | 0 | | | | 2 | |
Buy | | | | 278,085 | | 08/2007 | | | 0 | | | 0 | | | | 0 | |
Buy | | | | 41,181 | | 09/2007 | | | 1 | | | 0 | | | | 1 | |
Buy | | MXN | | 4,263 | | 03/2008 | | | 10 | | | 0 | | | | 10 | |
Buy | | NOK | | 2,097 | | 09/2007 | | | 6 | | | 0 | | | | 6 | |
Sell | | NZD | | 649 | | 07/2007 | | | 0 | | | (5 | ) | | | (5 | ) |
Buy | | PLN | | 555 | | 09/2007 | | | 2 | | | 0 | | | | 2 | |
Buy | | RUB | | 9,889 | | 09/2007 | | | 2 | | | 0 | | | | 2 | |
Buy | | | | 339 | | 11/2007 | | | 0 | | | 0 | | | | 0 | |
Buy | | | | 5,866 | | 12/2007 | | | 1 | | | 0 | | | | 1 | |
Buy | | SEK | | 2,492 | | 09/2007 | | | 4 | | | 0 | | | | 4 | |
Buy | | SGD | | 176 | | 08/2007 | | | 0 | | | (2 | ) | | | (2 | ) |
Buy | | TWD | | 3,534 | | 07/2007 | | | 1 | | | 0 | | | | 1 | |
Buy | | | | 3,534 | | 08/2007 | | | 0 | | | 0 | | | | 0 | |
Buy | | ZAR | | 70 | | 09/2007 | | | 0 | | | 0 | | | | 0 | |
| | | | | | | | | | | | | | | | | |
| | | | | | | | $ | 221 | | $ | (193 | ) | | $ | 28 | |
| | | | | | | | | | | | | | | | | |
| | | | | | |
| See Accompanying Notes | | Semiannual Report | | June 30, 2007 | | 15 |
Notes to Financial Statements
1. ORGANIZATION
The Foreign Bond Portfolio U.S. Dollar-Hedged (the “Portfolio”) is a series of the PIMCO Variable Insurance Trust (the “Trust”). The Trust is registered under the Investment Company Act of 1940 (the “Act”), as amended, as an open-end management investment company organized as a Delaware business trust on October 3, 1997. The Portfolio offers two classes of shares: Institutional and Administrative. Information presented on these financial statements pertains to the Institutional Class of the Portfolio. Certain detailed financial information for the Administrative Class is provided separately and is available upon request. The Trust is designed to be used as an investment vehicle by Separate Accounts of insurance companies that fund variable annuity contracts and variable life insurance policies and by qualified pension and retirement plans.
2. SIGNIFICANT ACCOUNTING POLICIES
The following is a summary of significant accounting policies consistently followed by the Portfolio in the preparation of its financial statements in conformity with accounting principles generally accepted in the United States of America (“GAAP”). The preparation of financial statements in accordance with GAAP requires management to make estimates and assumptions that affect the reported amounts and disclosures on the financial statements. Actual results could differ from those estimates.
(a) Security Valuation Portfolio securities are valued as of the close of regular trading (normally 4:00 p.m., Eastern Time) on each day that the New York Stock Exchange (“NYSE”) is open. Portfolio securities and other assets for which market quotes are readily available are stated at market value. Market value is generally determined on the basis of last reported sales prices, or if no sales are reported, based on quotes obtained from a quotation reporting system, established market makers, or pricing services. Fixed-income securities and non-exchange traded derivatives are normally valued on the basis of quotes obtained from brokers and dealers or pricing services. Prices obtained from independent pricing services use information provided by market makers or estimates of market values obtained from yield data relating to investments or securities with similar characteristics. Certain fixed income securities purchased on a delayed-delivery basis are marked to market daily until settlement at the forward settlement date. Short-term investments having a maturity of 60 days or less are generally valued at amortized cost. Exchange traded options, futures and options on futures are valued at the settlement price determined by the relevant exchange. With respect to any portion of the Portfolio’s assets that are invested in one or more open end management investment companies, the Portfolio’s net asset value (“NAV”) will be calculated based upon the NAVs of such investments.
Investments initially valued in currencies other than the U.S. dollar are converted to the U.S. dollar using exchange rates obtained from pricing services. As a result, the NAV of the Portfolio’s securities may be affected by changes in the value of currencies in relation to the U.S. dollar. The value of securities traded in markets outside the United States or denominated in currencies other than the U.S. dollar may be affected significantly on a day that the NYSE is closed and an investor is not able to purchase, redeem or exchange shares.
Securities and other assets for which market quotes are not readily available are valued at fair value as determined in good faith by the Board of Trustees or persons acting at their direction. The Board of Trustees has adopted methods for valuing securities and other assets in circumstances where market quotes are not readily available, and has delegated to Pacific Investment Management Company LLC (“PIMCO”) the responsibility for applying the valuation methods. In the event that market quotes are not readily available, and the security or asset cannot be valued pursuant to one of the valuation methods, the value of the security or asset will be determined in good faith by the Valuation Committee of the Board of Trustees, generally based upon recommendations provided by PIMCO.
Market quotes are considered not readily available in circumstances where there is an absence of current or reliable market-based data (e.g., trade information, bid/asked information, broker quotes), including where events occur after the close of the relevant market, but prior to the close of regular trading, that materially affect the values of the Portfolio’s securities or assets. In addition, market quotes are considered not readily available when, due to extraordinary circumstances, the exchanges or markets on which the securities trade, do not open for trading for the entire day and no other market prices are available. The Board has delegated to PIMCO the responsibility for monitoring significant events that may materially affect the values of the Portfolio’s securities or assets and for determining whether the value of the applicable securities or assets should be re-evaluated in light of such significant events.
When the Portfolio uses fair value pricing to determine its NAV, securities will not be priced on the basis of quotations from the primary market in which they are traded, but rather may be priced by another method that the Board of Trustees or persons acting at their direction believe accurately reflects fair value. The Trust’s policy is intended to result in a calculation of the Portfolio’s NAV that fairly reflects security values as of the time of pricing. However, fair values determined by the Board of Trustees or persons acting at their direction may not accurately reflect the price that the Portfolio could obtain for a security if it were to dispose of that security as of the time of pricing. Because foreign securities can trade on non-business days of the Portfolio, the NAV of the Portfolio may change on days when shareholders will not be able to purchase or redeem Portfolio shares. The prices used by the Portfolio may differ from the value that would be realized if the securities were sold and the differences could be material to the financial statements.
(b) Securities Transactions and Investment Income Securities transactions are recorded as of the trade date for financial reporting purposes. Securities purchased or sold on a when-issued or delayed-delivery basis may be settled a month or more after the trade date. Realized gains and losses from securities sold are recorded on the identified cost basis. Dividend income is recorded on the ex-dividend date, except certain dividends from foreign securities where the ex-dividend date may have passed, which are recorded as soon as the Portfolio is informed of the ex-dividend date. Interest income, adjusted for the accretion of discounts and amortization of premiums, is recorded on the accrual basis. Paydown gains and losses on mortgage-related and other asset-backed securities are recorded as components of interest income on the Statement of Operations.
(c) Delayed-Delivery Transactions The Portfolio may purchase or sell securities on a delayed-delivery basis. These transactions involve a commitment by the Portfolio to purchase or sell securities for a predetermined price or yield, with payment and delivery taking place beyond the customary settlement period. When delayed-delivery purchases are outstanding, the Portfolio will designate liquid assets in an amount sufficient to meet the purchase price. When purchasing a security on a delayed-delivery basis, the Portfolio assumes the rights and risks of ownership of the security, including the risk of price and yield fluctuations, and takes such fluctuations into account when determining its net asset value. The Portfolio may dispose of or renegotiate a delayed-delivery transaction after it is entered into, and may sell when-issued securities before they are delivered, which may result in a capital gain or loss. When the Portfolio has sold a security on a delayed-delivery basis, the Portfolio does not participate in future gains and losses with respect to the security.
(d) Dividends and Distributions to Shareholders Dividends from net investment income, if any, are declared daily and distributed to shareholders monthly. Net realized capital gains earned by the Portfolio, if any, will be distributed no less frequently than once each year.
Income dividends and capital gain distributions are determined in accordance with income tax regulations which may differ from GAAP. Differences between tax regulations and GAAP may change the fiscal year when income and capital items
| | | | |
| 16 | | PIMCO Variable Insurance Trust | | |
| | |
| |
| | | June 30, 2007 (Unaudited) |
are recognized for tax and GAAP purposes. Examples of events that give rise to timing differences include wash sales, straddles, net operating losses and capital loss carryforwards. Further, the character of investment income and capital gains may be different for certain transactions under the two methods of accounting. Examples of characterization differences include the treatment of mortgage paydowns, swaps, foreign currency transactions and contingent debt instruments. As a result, income dividends and capital gain distributions declared during a fiscal period may differ significantly from the net investment income and realized capital gain reported on the Portfolio’s annual financial statements presented under GAAP.
Distributions classified as a tax basis return of capital, if any, are reflected on the accompanying Statements of Changes in Net Assets and have been reclassified to paid in capital. In addition, other amounts have been reclassified between undistributed net investment income, accumulated undistributed net realized gains or losses and/or paid in capital to more appropriately conform financial accounting to tax characterizations of dividend distributions.
(e) Multiclass Operations Each class offered by the Portfolio has equal rights as to assets and voting privileges (except that shareholders of a class have exclusive voting rights regarding any matter relating solely to that class of shares). Income and non-class specific expenses of the Portfolio are allocated daily to each class of shares based on the relative value of settled shares. Realized and unrealized capital gains and losses of the Portfolio are allocated daily to each class of shares based on the relative net assets of each class. Class specific expenses, where applicable, currently include administrative, distribution and servicing fees.
(f) Foreign Currency The functional and reporting currency for the Portfolio is the U.S. dollar. The market values of foreign securities, currency holdings and other assets and liabilities are translated into U.S. dollars based on the current exchange rates each business day. Fluctuations in the value of currency holdings and other assets and liabilities resulting from changes in exchange rates are recorded as unrealized foreign currency gains or losses. Realized gains or losses and unrealized appreciation or depreciation on investment securities and income and expenses are translated on the respective dates of such transactions. The effects of changes in foreign currency exchange rates on investments in securities are not segregated on the Statement of Operations from the effects of changes in market prices of those securities, but are included with the net realized and unrealized gain or loss on investment securities.
| | | | | | |
|
| Non-U.S. currency symbols utilized throughout the report are defined as follows: |
| AUD | | Australian Dollar | | KRW | | South Korean Won |
| BRL | | Brazilian Real | | MXN | | Mexican Peso |
| CAD | | Canadian Dollar | | NOK | | Norwegian Krone |
| CLP | | Chilean Peso | | NZD | | New Zealand Dollar |
| CNY | | Chinese Yuan Renminbi | | PLN | | Polish Zloty |
| DKK | | Danish Krone | | RUB | | Russian Ruble |
| EUR | | Euro | | SEK | | Swedish Krona |
| GBP | | Great British Pound | | SGD | | Singapore Dollar |
| HKD | | Hong Kong Dollar | | TWD | | Taiwan Dollar |
| JPY | | Japanese Yen | | ZAR | | South African Rand |
(g) Foreign Currency Transactions The Portfolio may enter into foreign currency contracts in connection with settling planned purchases or sales of securities, to hedge the currency exposure associated with some or all of the Portfolio’s securities or as a part of an investment strategy. A foreign currency contract is an agreement between two parties to buy and sell a currency at a set
price on a future date. The market value of a foreign currency contract fluctuates with changes in foreign currency exchange rates. Foreign currency contracts are marked to market daily and the change in value is recorded by the Portfolio as an unrealized gain or loss. Realized gains or losses equal to the difference between the value of the contract at the time it was opened and the value at the time it was closed are recorded upon delivery or receipt of the currency. These contracts may involve market risk in excess of the unrealized gain or loss reflected on the Statement of Assets and Liabilities. In addition, the Portfolio could be exposed to risk if the counterparties are unable to meet the terms of the contracts or if the value of the currency changes unfavorably to the U.S. dollar.
(h) Futures Contracts The Portfolio may enter into futures contracts. The Portfolio may use futures contracts to manage its exposure to the securities markets or to movements in interest rates and currency values. The primary risks associated with the use of futures contracts are the imperfect correlation between the change in market value of the securities held by the Portfolio and the prices of futures contracts, the possibility of an illiquid market, and the inability of the counterparty to meet the terms of the contract. Futures contracts are valued based upon their quoted daily settlement prices. Upon entering into a futures contract, the Portfolio is required to deposit with its futures broker, an amount of cash or U.S. Government and Agency Obligations in accordance with the initial margin requirements of the broker or exchange. Futures contracts are marked to market daily and an appropriate payable or receivable for the change in value (“variation margin”) is recorded by the Portfolio. Gains or losses are recognized but not considered realized until the contracts expire or are closed. Futures contracts involve, to varying degrees, risk of loss in excess of the variation margin disclosed on the Statement of Assets and Liabilities.
(i) Options Contracts The Portfolio may write call and put options on futures, swaps, securities or currencies it owns or in which it may invest. Writing put options tends to increase the Portfolio’s exposure to the underlying instrument. Writing call options tends to decrease the Portfolio’s exposure to the underlying instrument. When the Portfolio writes a call or put option, an amount equal to the premium received is recorded as a liability and subsequently marked to market to reflect the current value of the option written. These liabilities are reflected as written options outstanding on the Statement of Assets and Liabilities. Certain options may be written with premiums to be determined on a future date. The premiums for these options are based upon implied volatility parameters at specified terms. Premiums received from writing options which expire are treated as realized gains. Premiums received from writing options which are exercised or closed are added to the proceeds or offset against amounts paid on the underlying future, swap, security or currency transaction to determine the realized gain or loss. The Portfolio as a writer of an option has no control over whether the underlying future, swap, security or currency may be sold (call) or purchased (put) and as a result bears the market risk of an unfavorable change in the price of the future, swap, security or currency underlying the written option. There is the risk the Portfolio may not be able to enter into a closing transaction because of an illiquid market.
The Portfolio may also purchase put and call options. Purchasing call options tends to increase the Portfolio’s exposure to the underlying instrument. Purchasing put options tends to decrease the Portfolio’s exposure to the underlying instrument. The Portfolio pays a premium which is included on the Statement of Assets and Liabilities as an investment and subsequently marked to market to reflect the current value of the option. Premiums paid for purchasing options which expire are treated as realized losses. Certain options may be purchased with premiums to be determined on a future date. The premiums for these options are based upon implied volatility parameters at specified terms. The risk associated with purchasing put and call options is limited to the premium paid. Premiums paid for purchasing options which are exercised or closed are added to the amounts paid or offset against the proceeds on the underlying future, swap, security or currency transaction to determine the realized gain or loss.
| | | | | | |
| | Semiannual Report | | June 30, 2007 | | 17 |
Notes to Financial Statements (Cont.)
(j) Repurchase Agreements The Portfolio may engage in repurchase transactions. Under the terms of a typical repurchase agreement, the Portfolio takes possession of an underlying debt obligation (collateral) subject to an obligation of the seller to repurchase, and the Portfolio to resell, the obligation at an agreed-upon price and time. The underlying securities for all repurchase agreements are held in safekeeping at the Portfolio’s custodian or designated subcustodians under tri-party repurchase agreements. The market value of the collateral must be equal to or exceed the total amount of the repurchase obligations, including interest. Securities purchased under repurchase agreements are reflected as an asset on the Statement of Assets and Liabilities. Generally, in the event of counterparty default, the Portfolio has the right to use the collateral to offset losses incurred. If the counterparty should default, the Portfolio will seek to sell the securities which it holds as collateral. This could involve procedural costs or delays in addition to a loss on the securities if their value should fall below their repurchase price.
(k) Inverse Floating Rate Transactions—Residual Interest Municipal Bonds (“RIBs”)/Residual Interest Tax Exempt Bonds (“RITEs”) The Portfolio may invest in RIBs and RITEs (“Inverse Floaters”). Inverse Floaters are created via a master trust agreement between a broker-dealer, acting as trustor and liquidity provider, and an investment bank, acting as trustee and tender agent. The master trust agreement defines the terms for each trust series; with each series being established by the transfer of long-term, fixed-rate municipal bonds (“Fixed Rate Bonds”) to the trustee to be held and provide for the creation, execution and delivery of floater certificates (“Floating Rate Notes”) and Inverse Floaters. Floating Rate Notes are liquid notes that are issued with a short-term variable rate typically linked to the LIBOR, subject to limitations, for some duration. After interest income is paid on the Floating Rate Notes at current rates, the residual income from the Fixed Rate Bonds is paid to the Inverse Floaters. Inverse Floaters are issued with a coupon that fluctuates inversely with the Floating Rate Notes’ referenced rate, subject to certain limitations. Therefore, rising short-term rates result in lower income for the Inverse Floaters and vice versa.
Floating Rate Notes are generally remarketed to municipal money market funds. Inverse Floaters are acquired by either tax-exempt municipal bond funds or trusts, or other parties interested in potentially higher yielding tax-exempt securities. Inverse Floaters may also be acquired for the purpose of increasing leverage. Floating Rate Note holders typically have the option to tender their notes to the liquidity provider for redemption at par at each reset date. The Inverse Floater holders have the option to (i) require the Floating Rate Note holders to tender their notes at par, and (ii) require the liquidity provider to transfer the Fixed Rate Bonds to the Inverse Floater holders. The holders of Inverse Floaters bear substantially all of the downside investment risk associated with the underlying Fixed Rate Bonds, and also benefit from a disproportionate amount of the potential appreciation of the underlying Fixed Rate Bonds’ value. Inverse Floaters may be more volatile and less liquid than other municipal bonds of comparable maturity.
Inverse Floaters may be acquired with or without first transferring to the trustor the Fixed Rate Bonds that were utilized to create the trust series. Inverse Floaters acquired without a transfer of Fixed Rate Bonds are recognized as purchases of securities as outlined in Note 2(b). Statement of Financial Accounting Standards No. 140—Accounting for Transfers and Servicing of Financial Assets and Extinguishments of Liabilities (“FAS No. 140”), governs the standards for accounting for securitizations and other transfers of financial assets. If there is a transfer of Fixed Rate Bonds and it meets sale criteria under FAS No. 140, a Portfolio records a sale of the Fixed Rate Bonds and a purchase of the Inverse Floaters. The cash received from the Inverse Floaters is then recorded as interest income in the Statement of Operations.
If the transfer of Fixed Rate Bonds does not meet sale criteria under FAS No. 140, a Portfolio accounts for the transaction described above as a secured borrowing by including the Fixed Rate Bonds in its Schedule of Investments, and recording the
Floating Rate Notes as a liability under the caption “Payable for floating rate notes” in the Portfolio’s Statement of Assets and Liabilities. In a secured borrowing transaction, cash received from the Inverse Floaters is not recorded as interest income. Instead, a Portfolio records interest income related to the Fixed Rate Bonds and interest expense related to the Floating Rate Notes, the net of which is equal to the cash received from the Inverse Floaters acquired by the Portfolio. Thus, while a Portfolio’s reported total income, net expenses, and net expense ratio are generally higher for investments in Inverse Floaters acquired via a secured borrowing, the method of acquiring Inverse Floaters does not result in differences for reported cash flows, net asset value or total return.
(l) Short Sales The Portfolio may enter into short sales transactions. A short sale is a transaction in which the Portfolio sells securities it does not own in anticipation of a decline in the market price of the securities. Securities sold in short sale transactions and interest payable on such securities, if any, are reflected as a liability on the Statement of Assets and Liabilities. The Portfolio is obligated to deliver securities at the market price at the time the short position is closed. Possible losses from short sales may be unlimited, whereas losses from purchases cannot exceed the total amount invested.
(m) Swap Agreements The Portfolio may invest in swap agreements. Swap transactions are privately negotiated agreements between the Portfolio and a counterparty to exchange or swap investment cash flows, assets, or market-linked returns at specified, future intervals. The Portfolio may enter into interest rate, total return, forward spread-lock, credit default, and other forms of swap agreements to manage its exposure to interest rates and credit risk. In connection with these agreements, securities may be identified as collateral in accordance with the terms of the respective swap agreements.
Interest rate swap agreements involve the exchange by the Portfolio with another party of their respective commitments to pay or receive interest, e.g., an exchange of floating rate payments for fixed rate payments with respect to the notional amount of principal. Certain forms of interest rate swap agreements may include: (i) interest rate caps, under which, in return for a premium, one party agrees to make payments to the other to the extent that interest rates exceed a specified rate, or “cap”, (ii) interest rate floors, under which, in return for a premium, one party agrees to make payments to the other to the extent that interest rates fall below a specified rate, or “floor”, or (iii) interest rate collars, under which a party sells a cap and purchases a floor or vice versa in an attempt to protect itself against interest rate movements exceeding given minimum or maximum levels.
Total return swap agreements involve commitments to pay interest in exchange for a market-linked return, both based on notional amounts. To the extent the total return of the security or index underlying the transaction exceeds or falls short of the offsetting interest rate obligation, the Portfolio will receive a payment from or make a payment to the counterparty.
Forward spread-lock swap agreements involve commitments to pay or receive a settlement amount calculated as the difference between the swap spread and a fixed spread, multiplied by the notional amount times the duration of the swap. The swap spread is the difference between the benchmark swap rate (market rate) and the specific Treasury rate.
Credit default swap agreements involve one party making a stream of payments to another party in exchange for the right to receive a specified return in the event of a default by a third party, typically corporate issues or sovereign issues of an emerging country, on its obligation. The Portfolio may use credit default swaps to provide a measure of protection against defaults of the issuers (i.e., to reduce risk where the Portfolio owns or has exposure to the sovereign issuer) or to take an active long or short position with respect to the likelihood of a particular issuer’s default. As a seller of protection, the Portfolio generally receives an upfront
| | | | |
| 18 | | PIMCO Variable Insurance Trust | | |
| | |
| |
| | | June 30, 2007 (Unaudited) |
payment or a fixed rate of income throughout the term of the swap provided that there is no credit event. If the Portfolio is a seller of protection and a credit event occurs, as defined under the terms of that particular swap agreement, the Portfolio will pay to the buyer of the protection an amount up to the notional value of the swap and in certain instances take delivery of the security. As the seller, the Portfolio would effectively add leverage to its portfolio because, in addition to its total net assets, the Portfolio would be subject to investment exposure on the notional amount of the swap. As a buyer of protection, the Portfolio generally receives an amount up to the notional value of the swap if a credit event occurs. The treatment of credit default swaps and other swap agreements that provide for contingent, non-periodic, bullet-type payments as “notional principal contracts” for U.S. federal income tax purposes is uncertain. Were the U.S. Internal Revenue Service (“IRS”) to take the position that a credit default swap or other bullet-type swap is not a “notional principal contract” for U.S. federal income tax purposes, payments received by the Portfolio from such investments might be subject to U.S. excise or income taxes.
Swaps are marked to market daily based upon quotations from market makers and the change in value, if any, is recorded as unrealized gain or loss on the Statement of Operations. Payments received or made at the beginning of the measurement period are reflected as such on the Statement of Assets and Liabilities. These upfront payments are recorded as realized gain or loss on the Statement of Operations upon termination or maturity of the swap. A liquidation payment received or made at the termination of the swap is recorded as realized gain or loss on the Statement of Operations. Net periodic payments received or paid by the Portfolio are included as part of realized gain or loss on the Statement of Operations. Entering into these agreements involves, to varying degrees, elements of credit, market and documentation risk in excess of the amounts recognized on the Statement of Assets and Liabilities. Such risks involve the possibility that there will be no liquid market for these agreements, that the counterparty to the agreements may default on its obligation to perform or disagree as to the meaning of contractual terms in the agreements and that there may be unfavorable changes in interest rates.
(n) Loan Participations and Assignments The Portfolio may invest in direct debt instruments which are interests in amounts owned by corporate, governmental, or other borrowers to lenders or lending syndicates. The Portfolio’s investments in loans may be in the form of participations in loans or assignments of all or a portion of loans from third parties. A loan is often administered by a bank or other financial institution (the “lender”) that acts as agent for all holders. The agent administers the terms of the loan, as specified in the loan agreement. When investing in a loan participation, the Portfolio has the right to receive payments of principal, interest and any fees to which it is entitled only from the lender selling the loan agreement and only upon receipt by the lender of payments from the borrower. The Portfolio generally has no right to enforce compliance with the terms of the loan agreement with the borrower. As a result, the Portfolio may be subject to the credit risk of both the borrower and the lender that is selling the loan agreement. When the Portfolio purchases assignments from lenders it acquires direct rights against the borrower of the loan. At the end of the period June 30, 2007, the Portfolio had no unfunded loan commitments.
(o) Bridge Debt Commitments At the period ended June 30, 2007, the Portfolio had $300,000 in commitments outstanding to fund high yield bridge debt. The Portfolio is entitled to a fee upon the expiration of the commitment period. The bridge debt terms approximate market rates at the time the commitment is entered into.
(p) Mortgage-Related and Other Asset-Backed Securities The Portfolio may invest in mortgage-related or other asset-backed securities. These securities include mortgage pass-through securities, collateralized mortgage obligations (“CMOs”), commercial mortgage-backed securities, mortgage dollar rolls, CMO residuals, stripped mortgage-backed securities (“SMBSs”) and other securities
that directly or indirectly represent a participation in, or are secured by and payable from, mortgage loans on real property. The value of some mortgage-related or asset-backed securities may be particularly sensitive to changes in prevailing interest rates. Early repayment of principal on some mortgage-related securities may expose the Portfolio to a lower rate of return upon reinvestment of principal. The value of these securities may fluctuate in response to the market’s perception of the creditworthiness of the issuers. Additionally, although mortgages and mortgage-related securities are generally supported by some form of government or private guarantee and/or insurance, there is no assurance that private guarantors or insurers will meet their obligations.
(q) U.S. Government Agencies or Government-Sponsored Enterprises Securities issued by U.S. Government agencies or government-sponsored enterprises may not be guaranteed by the U.S. Treasury. The Government National Mortgage Association (“GNMA” or “Ginnie Mae”), a wholly owned U.S. Government corporation, is authorized to guarantee, with the full faith and credit of the U.S. Government, the timely payment of principal and interest on securities issued by institutions approved by GNMA and backed by pools of mortgages insured by the Federal Housing Administration or guaranteed by the Department of Veterans Affairs. Government-related guarantors (i.e., not backed by the full faith and credit of the U.S. Government) include the Federal National Mortgage Association (“FNMA” or “Fannie Mae”) and the Federal Home Loan Mortgage Corporation (“FHLMC” or “Freddie Mac”). Pass-through securities issued by FNMA are guaranteed as to timely payment of principal and interest by FNMA but are not backed by the full faith and credit of the U.S. Government. FHLMC guarantees the timely payment of interest and ultimate collection of principal, but its participation certificates are not backed by the full faith and credit of the U.S. Government.
(r) New Accounting Policies In July 2006, the Financial Accounting Standards Board (“FASB”) issued Interpretation No. 48, “Accounting for Uncertainty in Income Taxes—an Interpretation of FASB Statement No. 109” (the “Interpretation”). The Interpretation became effective for the Portfolio on June 29, 2007. Management has evaluated the application of the Interpretation in relation to the Portfolio and has concluded that no single filing position or combination of filing positions identified as uncertain tax positions required the accrual of a tax liability in the accounting records of the Portfolio for the period ending June 30, 2007. Management will monitor all existing filing positions and future filing positions in light of the Interpretation and evaluate the need for any future tax accruals and financial statement disclosures as warranted.
In September 2006, the FASB issued Statement of Financial Accounting Standards No. 157, “Fair Value Measurements” (the “Statement”). The Statement is effective for fiscal years beginning after November 15, 2007 and will require expanded disclosure about fair value measurements, separately for each major category of assets and liabilities, that enables shareholders to assess the inputs used to develop those measurements, and for recurring fair value measurements using significant unobservable inputs the effect of the measurements on changes in net assets for the reporting period. Management is currently evaluating the application of the Statement to the Portfolio and will provide additional information in relation to the Statement on the Portfolio’s annual financial statements for the period ending December 31, 2007.
3. FEES AND EXPENSES
(a) Investment Advisory Fee PIMCO is a majority-owned subsidiary of Allianz Global Investors of America L.P. (“AGI”), and serves as investment adviser (the “Adviser”) to the Trust, pursuant to an investment advisory contract. The Adviser receives a monthly fee from the Portfolio, at an annual rate based on average daily net assets. The Advisory Fee for all classes is charged at an annual rate of 0.25%.
| | | | | | |
| | Semiannual Report | | June 30, 2007 | | 19 |
Notes to Financial Statements (Cont.)
(b) Administration Fee PIMCO serves as administrator (the “Administrator”), and provides administrative services to the Trust for which it receives a monthly administrative fee based on each share class’s average daily net assets. As the Administrator, PIMCO bears the costs of various third-party services, including audit, custodial, portfolio accounting, legal, transfer agency and printing costs. The Administration Fee for all classes is charged at the annual rate of 0.50%.
(c) Distribution and Servicing Fees Allianz Global Investors Distributors LLC (“AGID”) is an indirect wholly-owned subsidiary of AGI and serves as the distributor (the “Distributor”) of the Trust’s shares. The Trust is permitted to reimburse AGID on a quarterly basis, out of the Administrative Class assets of the Portfolio in the amount of 0.15% on an annual basis of the average daily net assets of that class, for payments made to financial intermediaries that provide services in connection with the distribution of shares or administration of plans or programs that use Portfolio shares as their funding medium. The effective rate paid to AGID was 0.15% during the current fiscal year.
(d) Portfolio Expenses The Trust is responsible for the following expenses: (i) salaries and other compensation of any of the Trust’s executive officers and employees who are not officers, directors, stockholders or employees of PIMCO or its subsidiaries or affiliates; (ii) taxes and governmental fees; (iii) brokerage fees and commissions and other portfolio transaction expenses; (iv) the costs of borrowing money, including interest expenses and bank overdraft charges; (v) fees and expenses of the Trustees who are not “interested persons” of PIMCO or the Trust, and any counsel retained exclusively for their benefit; (vi) extraordinary expenses, including costs of litigation and indemnification expenses; (vii) organization expenses and (viii) any expenses allocated or allocable to a specific class of shares, which include service fees payable with respect to the Administrative Class Shares, and may include certain other expenses as permitted by the Trust’s Multiple Class Plan adopted pursuant to Rule 18f-3 under the Act and subject to review and approval by the Trustees. The ratio of expenses to average net assets per share class, as disclosed in the Financial Highlights, may differ from the annual portfolio operating expenses per share class as disclosed in the Prospectus for the reasons set forth above.
Effective April 1, 2007, each Trustee, other than those affiliated with PIMCO or its affiliates, receives an annual retainer of $15,000, plus $2,375 for each Board of Trustees meeting attended in person, $500 for each committee meeting attended and $750 for each Board of Trustees meeting attended telephonically, plus reimbursement of related expenses. In addition, the audit committee chair receives an additional annual retainer of $2,000 and each other committee chair receives an additional annual retainer of $500. These expenses are allocated on a pro-rata basis to the various portfolios of the Trust according to their respective net assets. The Trust pays no compensation directly to any Trustee or any other officer who is affiliated with the Administrator, all of whom receive remuneration for their services to the Trust from the Administrator or its affiliates. Prior to April 1, 2007, each Trustee, other than those affiliated with PIMCO or its affiliates, received an annual retainer of $15,000 plus $2,000 for each Board of Trustees meeting attended ($500 for each special meeting attended), plus reimbursement of related expenses. The Audit Committee Chairman received an annual retainer of $1,500 and the Governance Committee Chairman received an annual retainer of $500. In addition, each member of a committee received $500 for each committee meeting attended.
4. RELATED PARTY TRANSACTIONS
The Adviser, Administrator, and Distributor are related parties as defined by FAS 57, Related Party Disclosures. Fees payable to these parties are disclosed in Note 3.
5. GUARANTEES AND INDEMNIFICATIONS
Under the Trust’s organizational documents, each Trustee, officer, employee or other agent of the Trust (including the Trust’s investment manager) is indemnified, to the extent permitted by the Act, against certain liabilities that may arise out of performance of their duties to the Portfolio. Additionally, in the normal course of business, the Portfolio enters into contracts that contain a variety of indemnification clauses. The Portfolio’s maximum exposure under these arrangements is unknown as this would involve future claims that may be made against the Portfolio that have not yet occurred. However, the Portfolio has not had prior claims or losses pursuant to these contracts and believes the risk of loss to be remote.
6. PURCHASES AND SALES OF SECURITIES
The length of time the Portfolio has held a particular security is not generally a consideration in investment decisions. A change in the securities held by the Portfolio is known as “portfolio turnover”. The Portfolio may engage in frequent and active trading of portfolio securities to achieve its investment objective, particularly during periods of volatile market movements. High portfolio turnover (e.g., over 100%) involves correspondingly greater expenses to the Portfolio, including brokerage commissions or dealer mark-ups and other transaction costs on the sale of securities and reinvestments in other securities. Such sales may also result in realization of taxable capital gains, including short-term capital gains (which are generally taxed at ordinary income tax rates). The trading costs and tax effects associated with portfolio turnover may adversely affect the Portfolio’s performance.
Purchases and sales of securities (excluding short-term investments) for the period ended June 30, 2007, were as follows (amounts in thousands):
| | | | | | | | | | | | |
| U.S. Government/Agency | | | | All Other |
| Purchases | | Sales | | | | Purchases | | Sales |
| $ | 244,978 | | $ | 245,637 | | | | $ | 62,337 | | $ | 54,812 |
7. TRANSACTIONS IN WRITTEN CALL AND PUT OPTIONS
Transactions in written call and put options were as follows (amounts in thousands, except for number of contracts):
| | | | | | | | | | | | | | |
| | | | | Notional
Amount
in $ | | | Notional
Amount
in GBP | | | Premium | |
Balance at 12/31/2006 | | | | $ | 27,300 | | | GBP | 1,000 | | | $ | 275 | |
Sales | | | | | 7,600 | | | | 0 | | | | 79 | |
Closing Buys | | | | | (22,600 | ) | | | 0 | | | | (207 | ) |
Expirations | | | | | 0 | | | | (1,000 | ) | | | (19 | ) |
Exercised | | | | | 0 | | | | 0 | | | | 0 | |
Balance at 06/30/2007 | | | | $ | 12,300 | | | GBP | 0 | | | $ | 128 | |
| | | | |
| 20 | | PIMCO Variable Insurance Trust | | |
| | |
| |
| | | June 30, 2007 (Unaudited) |
8. SHARES OF BENEFICIAL INTEREST
The Portfolio may issue an unlimited number of shares of beneficial interest with a $0.001 par value. Changes in shares of beneficial interest were as follows (shares and amounts in thousands):
| | | | | | | | | | | | | | | | |
| | | | | Six Months Ended
06/30/2007 | | | Year Ended
12/31/2006 | |
| | | | | Shares | | | Amount | | | Shares | | | Amount | |
| | | | | |
Receipts for shares sold | | | | | | | | | | | | | | | | |
Institutional Class | | | | 0 | | | $ | 0 | | | 0 | | | $ | 0 | |
Administrative Class | | | | 1,076 | | | | 10,804 | | | 2,354 | | | | 24,018 | |
Issued as reinvestment of distributions | | | | | | | | | | | | | | | | |
Institutional Class | | | | 0 | | | | 0 | | | 0 | | | | 1 | |
Administrative Class | | | | 103 | | | | 1,029 | | | 246 | | | | 2,512 | |
Cost of shares redeemed | | | | | | | | | | | | | | | | |
Institutional Class | | | | 0 | | | | 0 | | | 0 | | | | 0 | |
Administrative Class | | | | (933 | ) | | | (9,322 | ) | | (1,340 | ) | | | (13,658 | ) |
Net increase resulting from Portfolio share transactions | | | | 246 | | | $ | 2,511 | | | 1,260 | | | $ | 12,873 | |
The following schedule shows the number of shareholders each owning 5% or more of the Portfolio and the total percentage of the Portfolio held by such shareholders:
| | | | | | |
| | | | | Number of
Shareholders | | % of Portfolio Held |
Institutional Class | | | | 1 | | 100 |
Administrative Class | | | | 5 | | 89 |
9. REGULATORY AND LITIGATION MATTERS
Since February 2004, PIMCO, Allianz Global Investors of America L.P. (PIMCO’s parent company), AGID, and certain of their affiliates, including the PIMCO Funds (another series of funds managed by PIMCO), the Allianz Funds (formerly known as PIMCO Funds: Multi-Manager Series (another series of funds managed by affiliates of PIMCO)), certain Trustees of the Trust (in their capacity as Trustees of the PIMCO Funds or the Allianz Funds) and certain employees of PIMCO, have been named as defendants in fifteen lawsuits filed in various jurisdictions. Eleven of those lawsuits concern “market timing,” and they have been transferred to and consolidated for pre-trial proceedings in a multi-district litigation proceeding in the U.S. District Court for the District of Maryland; the other four lawsuits concern “revenue sharing” and have been consolidated into a single action in the U.S. District Court for the District of Connecticut. The lawsuits have been commenced as putative class actions on behalf of investors who purchased, held or redeemed shares of the various series of the PIMCO Funds and the Allianz Funds during specified periods, or as derivative actions on behalf of the PIMCO Funds and the Allianz Funds.
The market timing actions in the District of Maryland generally allege that certain hedge funds were allowed to engage in “market timing” in certain funds of the PIMCO Funds and the Allianz Funds and this alleged activity was not disclosed. Pursuant to tolling agreements entered into with the derivative and class action plaintiffs, PIMCO, certain PIMCO Funds Trustees, and certain employees of PIMCO who were previously named as defendants have all been dropped as defendants in the market timing actions; the plaintiffs continue to assert claims on behalf of the shareholders of the PIMCO Funds or on behalf of the PIMCO Funds itself against other defendants. By order dated November 3, 2005, the U.S. District Court for the District of Maryland granted the PIMCO Funds’ motion to dismiss claims asserted against it in a consolidated amended complaint where the PIMCO Funds were
named, in the complaint, as a nominal defendant. The revenue sharing action in the District of Connecticut generally alleges that fund assets were inappropriately used to pay brokers to promote funds of the PIMCO Funds and the Allianz Funds, including directing fund brokerage transactions to such brokers, and that such alleged arrangements were not fully disclosed to shareholders. On August 11, 2005, the U.S. District Court for the District of Connecticut conducted a hearing on defendants’ motion to dismiss the consolidated amended complaint in the revenue sharing action but has not yet ruled on the motion to dismiss. The market timing and revenue sharing lawsuits seek, among other things, unspecified compensatory damages plus interest and, in some cases, punitive damages, the rescission of investment advisory contracts, the return of fees paid under those contracts and restitution.
Two nearly identical class action civil complaints have been filed in August 2005, in the Northern District of Illinois Eastern Division, alleging that the plaintiffs each purchased and sold a 10-year Treasury note futures contract and suffered damages from an alleged shortage when PIMCO held both physical and futures positions in 10-year Treasury notes for its client accounts. The two actions have been consolidated into one action, and the two separate complaints have been replaced by a consolidated complaint. PIMCO is a named defendant, and PIMCO Funds has been added as a defendant, to the consolidated action. PIMCO strongly believes the complaint is without merit and intends to vigorously defend itself.
In April 2006, certain portfolios of the Trust and certain other funds managed by PIMCO were served in an adversary proceeding brought by the Official Committee of Asbestos Claimants of G-I Holdings, Inc. in G-I Holdings, Inc.’s bankruptcy in the District of New Jersey. In July 2004, PIMCO was named in this lawsuit and remains a defendant. The plaintiff seeks to recover for the bankruptcy estate assets that were transferred by the predecessor entity of G-I Holdings, Inc. to a wholly-owned subsidiary in 1994. The subsidiary has since issued notes, of which certain portfolios of the Trust and certain other funds managed by PIMCO are alleged to be holders. The complaint alleges that in 2000, more than two hundred noteholders—including certain portfolios of the Trust and certain other funds managed by PIMCO—were granted a second priority lien on the assets of the subsidiary in exchange for their consent to a refinancing transaction and the granting of a first priority lien to the lending banks. The plaintiff is seeking invalidation of the lien in favor of the noteholders and/or the value of the lien. On June 21, 2006, the District of New Jersey overturned the Bankruptcy Court’s decision granting permission to file the adversary proceeding and remanded the matter to the Bankruptcy Court for further proceedings. Following a motion to reconsider, the District Court upheld its remand on August 7, 2006, and instructed the Bankruptcy Court to conduct a “cost-benefit” analysis of the Committee’s claims, including the claims against the noteholders. The Bankruptcy Court held a status conference on October 25, 2006 and set a briefing schedule relating to this cost-benefit analysis.
The foregoing speaks only as of the date of this report. It is possible that these matters and/or other developments resulting from these matters could result in increased portfolio redemptions or other adverse consequences to the Portfolio. However, PIMCO and AGID believe that these matters are not likely to have a material adverse effect on the Portfolio or on PIMCO’s or AGID’s ability to perform their respective investment advisory or distribution services relating to the Portfolio.
10. FEDERAL INCOME TAX MATTERS
The Portfolio intends to qualify as a regulated investment company under sub-chapter M of the Internal Revenue Code (the “Code”) and distribute all of its taxable income and net realized gains, if applicable, to shareholders. Accordingly, no provision for Federal income taxes has been made.
| | | | | | |
| | Semiannual Report | | June 30, 2007 | | 21 |
Notes to Financial Statements (Cont.)
As of June 30, 2007, the aggregate cost of investments was the same for federal income tax and financial statement purposes. The net unrealized appreciation (depreciation) of investment securities for federal income tax purposes is as follows (amount in thousands):
| | | | |
Aggregate
Gross
Unrealized
Appreciation | | Aggregate
Gross
Unrealized
(Depreciation) | | Net
Unrealized
Appreciation |
$ 1,513 | | $ (1,503) | | $ 10 |
| | | | |
| 22 | | PIMCO Variable Insurance Trust | | |
| | |
| |
Privacy Policy* | | (Unaudited) |
The Funds consider customer privacy to be a fundamental aspect of their relationships with shareholders and are committed to maintaining the confidentiality, integrity and security of their current, prospective and former shareholders’ personal information. To ensure their shareholders’ privacy, the Funds have developed policies that are designed to protect this confidentiality, while allowing shareholder needs to be served.
Obtaining Personal Information
In the course of providing shareholders with products and services, the Funds and certain service providers to the Funds, such as the Funds’ investment advisers (“Advisers”), may obtain non-public personal information about shareholders, which may come from sources such as account applications and other forms, from other written, electronic or verbal correspondence, from shareholder transactions, from a shareholder’s brokerage or financial advisory firm, financial adviser or consultant, and/or from information captured on the Funds’ internet web sites.
Respecting Your Privacy
As a matter of policy, the Funds do not disclose any personal or account information provided by shareholders or gathered by the Funds to non-affiliated third parties, except as required or permitted by law or as necessary for such third parties to perform their agreements with respect to the Funds. As is common in the industry, non-affiliated companies may from time to time be used to provide certain services, such as preparing and mailing prospectuses, reports, account statements and other information, conducting research on shareholder satisfaction and gathering shareholder proxies. A Fund’s Distributor may also retain non-affiliated companies to market the Fund’s shares or products which use the Fund’s shares and enter into joint marketing agreements with other companies. These companies may have access to a shareholder’s personal and account information, but are permitted to use this information solely to provide the specific service or as otherwise permitted by law. In most cases, the shareholders will be clients of a third party, but the Funds may also provide a shareholder’s personal and account information to the shareholder’s respective brokerage or financial advisory firm.
Sharing Information with Third Parties
The Funds reserve the right to disclose or report personal information to non-affiliated third parties, in limited circumstances, where the Funds believe in good faith that disclosure is required under law to cooperate with regulators or law enforcement authorities, to protect their rights or property or upon reasonable request by any Fund in which a shareholder has chosen to invest. In addition, the Funds may disclose information about a shareholder’s accounts to a non-affiliated third party with the consent of the shareholder.
Sharing Information with Affiliates
The Funds may share shareholder information with their affiliates in connection with servicing their shareholders’ accounts or to provide shareholders with information about products and services that the Funds or their Advisers, principal underwriters or their affiliates (“Service Affiliates”) believe may be of interest to such shareholders. The information that the Funds share may include, for example, a shareholder’s participation in one of the Funds or in other investment programs sponsored by a Service Affiliate, a shareholder’s ownership of certain types of accounts (such as IRAs), or other data about a shareholder’s accounts. The Funds’ Service Affiliates, in turn, are not permitted to share shareholder information with non-affiliated entities, except as required or permitted by law.
Procedures to Safeguard Private Information
The Funds take seriously the obligation to safeguard shareholder non-public personal information. In addition to this policy, the Funds have also implemented procedures that are designed to restrict access to a shareholder’s non-public personal information only to internal personnel who need to know that information in order to provide products or services to such shareholders. In order to guard a shareholder’s non-public personal information, physical, electronic and procedural safeguards are in place.
* This Privacy Policy applies to the following entities: PIMCO Funds, PIMCO Variable Insurance Trust, PCM Fund, Inc. and PIMCO Strategic Global Government Fund, Inc. (collectively, the “Funds”).
| | | | | | |
| | Semiannual Report | | June 30, 2007 | | 23 |
Investment Adviser and Administrator
Pacific Investment Management Company LLC
840 Newport Center Drive
Newport Beach, California 92660
Distributor
Allianz Global Investors Distributors LLC
1345 Avenue of the Americas
New York, New York 10105
Custodian
State Street Bank & Trust Company
801 Pennsylvania
Kansas City, Missouri 64105
Transfer Agent
Boston Financial Data Services–Midwest
330 W. 9th Street
Kansas City, Missouri 64105
Legal Counsel
Dechert LLP
1775 I Street, N.W.
Washington, D.C. 20006
Independent Registered Public Accounting Firm
PricewaterhouseCoopers LLP
1055 Broadway
Kansas City, Missouri 64105
P I M C O

Table of Contents
This material is authorized for use only when preceded or accompanied by the current PIMCO Variable Insurance Trust (the “Trust”) prospectus. Investors should consider the investment objectives, risks, charges and expenses of this Trust carefully before investing. Ask your financial professional to explain all charges that may apply. This and other information is contained in the Trust’s prospectus. The variable product prospectus may be obtained by contacting your Investment Consultant. Please read the Trust and variable product prospectus carefully before you invest or send money.
Chairman’s Letter
Dear PIMCO Variable Insurance Trust Shareholder:
It is our pleasure to present to you the semiannual report for the PIMCO Variable Insurance Trust, covering the six-month period ended June 30, 2007. The PIMCO Variable Insurance Trust’s net assets were $8.68 billion at June 30, 2007, as compared to $7.76 billion at December 31, 2006.
Highlights of the financial markets during the reporting period include:
| | n | | Economic data during the first quarter of 2007 pointed to slower growth, which heightened market expectations for a decrease in the Federal Funds Rate. By the second quarter, economic data, such as employment statistics, provided little indication of economic weakness, causing expectations of a decrease in the Federal Funds Rate to unwind and U.S. interest rates to move higher. Interest rates in Europe and the U.K. also rose over the period as central banks raised their key lending rates due to inflation concerns. The benchmark ten-year U.S. Treasury yielded 5.03% as of June 30, 2007, or 0.32% higher than at the beginning of the year. |
| | n | | Most bonds generally returned much of their gains from earlier in the year as worldwide growth and capital flows drove interest rates higher in the second quarter. Increased risk aversion in global financial markets, due in part to subprime mortgage worries in the U.S., also contributed to the rise in interest rates. The Lehman Brothers Aggregate Bond Index, which includes Treasury, investment-grade corporate and mortgage-backed securities, returned 0.98% for the six-month period. |
| | n | | Locally issued emerging market (“EM”) bonds posted positive returns for the reporting period. Yields on these bonds declined and the local currencies in which they are denominated generally gained, amid increasing investor awareness, strong economic growth and surging capital inflows. External EM bonds (debt instruments issued by emerging markets countries and typically denominated in U.S. dollars) lagged behind local EM bonds (debt instruments issued by emerging markets countries and denominated in the currency of the issuer), as external EM bonds tend to trade more in-line with U.S. Treasuries. |
| | n | | Treasury Inflation-Protected Securities (“TIPS”) outpaced nominal bonds (non-inflation linked bonds) for the first part of the year and all but the longest maturity TIPS outperformed in the second quarter as high gasoline prices drove higher inflation accruals. Commodities, as represented by the Dow Jones-AIG Commodity Total Return Index, returned 4.46% for the period. Equities, as measured by the S&P 500 Index and the Russell 2000 Index, returned 6.96% and 6.45%, respectively, for the period. |
On the following pages, please find specific details as to the Portfolio’s total return investment performance and a discussion of those factors that affected performance.
Thank you for the trust you have placed in us. We will continue to work diligently to serve your investment needs.
Sincerely,
Brent R. Harris
Chairman, PIMCO Variable Insurance Trust
July 31, 2007
| | | | | | |
| | Semiannual Report | | June 30, 2007 | | 1 |
Important Information About the Portfolio
PIMCO Variable Insurance Trust (the “Trust”) is an open-end management investment company currently consisting of twenty separate investment portfolios, including the Global Bond Portfolio (Unhedged) (the “Portfolio”). The Portfolio is only available as a funding vehicle under variable life insurance policies or variable annuity contracts issued by insurance companies (“Variable Contracts”). Individuals may not purchase shares of the Portfolio directly. Shares of the Portfolio also may be sold to qualified pension and retirement plans outside of the separate account context.
We believe that bond funds have an important role to play in a well diversified investment portfolio. It is important to note, however, that in an environment where interest rates may trend upward, rising rates would negatively impact the performance of most bond funds, and fixed-income securities held by a fund are likely to decrease in value. The price volatility of fixed-income securities can also increase during periods of rising interest rates resulting in increased losses to a fund. Bond funds and individual bonds with a longer duration (a measure of the expected life of a security) tend to be more sensitive to changes in interest rates, usually making them more volatile than securities or funds with shorter durations.
The Portfolio may be subject to various risks in addition to those described above. Some of these risks may include, but are not limited to, the following: credit risk, high yield risk, market risk, issuer risk, liquidity risk, derivatives risk, mortgage risk, non-U.S. investment risk, emerging markets risk, currency risk, issuer non-diversification risk, leveraging risk and management risk. A complete description of these risks is contained in the Portfolio’s prospectus. The Portfolio may use derivative instruments for hedging purposes or as part of an investment strategy. Use of these instruments may involve certain costs and risks such as liquidity risk, interest rate risk, market risk, credit risk, management risk and the risk that the Portfolio could not close out a position when it would be most advantageous to do so. Because the Portfolio may invest in derivatives, it could lose more than the principal amount invested in these instruments. Investing in non-U.S. securities may entail risk due to non-U.S. economic and political developments; this risk may be increased when investing in emerging markets.
On the performance summary page in this Semiannual Report, the Total Return Investment Performance table measures performance assuming that all dividend and capital gain distributions were reinvested.
An investment in the Portfolio is not a deposit of a bank and is not guaranteed or insured by the Federal Deposit Insurance Corporation or any other government agency. It is possible to lose money on investments in the Portfolio.
PIMCO has adopted written proxy voting policies and procedures (“Proxy Policy”) as required by Rule 206(4)-6 under the Investment Advisers Act of 1940, as amended. The Proxy Policy has been adopted by the Trust as the policies and procedures that PIMCO will use when voting proxies on behalf of the Portfolio. A description of the policies and procedures that PIMCO uses to vote proxies relating to portfolio securities of the Portfolio, and information about how the Portfolio voted proxies relating to portfolio securities held during the most recent twelve-month period ended June 30, are available without charge, upon request, by calling the Trust at 1-866-746-2606 and on the Portfolio’s website at www.pimco.com.
The Portfolio files its complete schedule of portfolio holdings with the SEC for the first and third quarters of each fiscal year on Form N-Q. A copy of the Trust’s Form N-Q is also available on the SEC’s website at http://www.sec.gov and may be reviewed and copied at the SEC’s Public Reference Room in Washington D.C. Information on the operation of the Public Reference Room may be obtained by calling 1-800-SEC-0330, and is available without charge, upon request, by calling the Trust at 1-866-746-2606 and on the Portfolio’s website at www.pimco.com.
PIMCO Variable Insurance Trust is distributed by Allianz Global Investors Distributors LLC, 1345 Avenue of the Americas, New York, NY 10105.
| | | | |
| 2 | | PIMCO Variable Insurance Trust | | |
The following disclosure provides important information regarding the Portfolio’s Expense Example (“Example” or “Expense Example”), which appears in this Semiannual Report. Please refer to this information when reviewing the Expense Example for the Portfolio.
Example
As a shareholder of the Portfolio, you incur two types of costs: (1) transaction costs and (2) ongoing costs, including advisory and administrative fees; distribution and/or service (12b-1) fees (Administrative and Advisor Class only); and other Portfolio expenses. The Example is intended to help you understand your ongoing costs (in dollars) of investing in the Portfolio and to compare these costs with the ongoing costs of investing in other mutual funds. The Expense Example does not reflect any fees or other expenses imposed by the Variable Contracts. If it did, the expenses reflected in the Expense Example would be higher. The Example is based on an investment of $1,000 invested at the beginning of the period and held for the entire period indicated, which is from January 1, 2007 to June 30, 2007.
Actual Expenses
The information in the table under the heading “Actual Performance” provides information about actual account values and actual expenses. You may use the information in these columns, together with the amount you invested, to estimate the expenses that you paid over the period. Simply divide your account value by $1,000 (for example, an $8,600 account value divided by $1,000 = $8.60), then multiply the result by the number in the row titled “Expenses Paid During Period” to estimate the expenses you paid on your account during this period.
Hypothetical Example for Comparison Purposes
The information in the table under the heading “Hypothetical Performance (5% return before expenses)” provides information about hypothetical account values and hypothetical expenses based on the Portfolio’s actual expense ratio and an assumed rate of return of 5% per year before expenses, which is not the Portfolio’s actual return. The hypothetical account values and expenses may not be used to estimate the actual ending account balance or expenses you paid for the period. You may use this information to compare the ongoing costs of investing in the Portfolio and other portfolios. To do so, compare this 5% hypothetical example with the 5% hypothetical examples that appear in the shareholder reports of the other portfolios.
Please note that the expenses shown in the table are meant to highlight your ongoing costs only and do not reflect any transactional costs. Therefore, the information under the heading “Hypothetical Performance (5% return before expenses)” is useful in comparing ongoing costs only, and will not help you determine the relative total costs of owning different portfolios. In addition, if these transactional costs were included, your costs would have been higher.
The expense ratio may vary period to period because of various factors, such as an increase in expenses not covered by the advisory and administrative fees (such as expenses of the trustees and their counsel or litigation expense).
| | | | | | |
| | Semiannual Report | | June 30, 2007 | | 3 |
PIMCO Global Bond Portfolio (Unhedged)
Cumulative Returns Through June 30, 2007
$10,000 invested at the beginning of the first full month following the inception date of the Portfolio’s Administrative Class.
Allocation Breakdown‡
| | |
United States | | 55.5% |
Germany | | 12.6% |
United Kingdom | | 10.1% |
Japan | | 9.1% |
Short-Term Instruments | | 6.1% |
Spain | | 2.9% |
Other | | 3.7% |
| | ‡ | % of Total Investments as of 06/30/2007 |
| | | | | | | | | | |
Average Annual Total Return for the period ended June 30, 2007 |
| | | | | 6 Months* | | 1 Year | | 5 Years | | Portfolio
Inception
(01/10/02)** |
| | PIMCO Global Bond Portfolio (Unhedged) Administrative Class | | -1.10% | | 1.19% | | 5.90% | | 7.32% |
| | JPMorgan Government Bond Indices Global FX New York Index Unhedged in USD± | | -0.43% | | 2.91% | | 6.21% | | 7.42% |
All Portfolio returns are net of fees and expenses.
* Cumulative return.
** The Portfolio began operations on 01/10/02. Index comparisons began on 12/31/01.
Performance quoted represents past performance. Past performance is no guarantee of future results. Investment return and principal value will fluctuate so the Portfolio shares, when redeemed, may be worth more or less than their original cost. The Portfolio’s performance does not reflect the deduction of additional charges and expenses imposed in connection with investing in Variable Contracts, which will reduce returns. Current performance may be lower or higher than the performance data quoted. Performance data current to the most recent month-end is available by calling (800) 927-4648.
± JPMorgan Government Bond Indices Global FX New York Index Unhedged in USD is an unmanaged index representative of the total return performance in U.S. dollars on an unhedged basis of major world bond markets. It is not possible to invest directly in the index. The index does not reflect deduction for fees and expenses.
| | | | | | |
| Expense Example | | Actual Performance | | Hypothetical Performance |
| | | | | (5% return before expenses) |
Beginning Account Value (01/01/07) | | $ | 1,000.00 | | $ | 1,000.00 |
Ending Account Value (06/30/07) | | $ | 988.98 | | $ | 1,020.33 |
Expenses Paid During Period† | | $ | 4.44 | | $ | 4.51 |
† Expenses are equal to the Portfolio’s Administrative Class annualized expense ratio of 0.90%, multiplied by the average account value over the period, multiplied by 181/365 (to reflect the one-half year period). Overall fees and expenses of investing in the Portfolio will be higher because the example does not reflect Variable Contract fees and expenses.
Please refer to page 3 herein for an explanation of the information presented in the above Expense Example.
Portfolio Insights
| » | | The PIMCO Global Bond Portfolio (Unhedged) seeks to achieve its investment objective by investing under normal circumstances at least 80% of its assets in fixed-income instruments of issuers located in at least three countries (one of which may be the United States), which may be represented by futures contracts (including related options) with respect to such securities, and options on such securities. |
| » | | Global unhedged bonds produced weak returns as bond yields rose across major markets. |
| » | | Exposure to U.S. shorter maturities, principally through interest rate futures contracts, detracted from performance as yields rose. |
| » | | An underweight to U.K. interest rates, notably at the long-end of the yield curve, was positive for returns as U.K. yields rose sharply. |
| » | | An overweight to European interest rates was negative for returns as yields rose due to the region’s growth momentum. |
| » | | An overweight to mortgage-backed securities detracted from returns as mortgage spreads widened. |
| » | | Emerging market currency exposure was positive for returns as these currencies outperformed the U.S. dollar. |
| » | | Global swap spread widening strategies were positive for returns as global swap spreads widened. |
| | | | |
| 4 | | PIMCO Variable Insurance Trust | | |
Financial Highlights Global Bond Portfolio (Unhedged)
| | | | | | | | | | | | | | | | | | | | | | | | |
| Selected per Share Data for the Year or Period Ended: | | 06/30/2007+ | | | 12/31/2006 | | | 12/31/2005 | | | 12/31/2004 | | | 12/31/2003 | | | 01/10/2002-12/31/2002 | |
| | | | | | |
| Administrative Class | | | | | | | | | | | | | | | | | | | | | | | | |
Net asset value beginning of year or period | | $ | 12.06 | | | $ | 11.91 | | | $ | 13.27 | | | $ | 13.03 | | | $ | 11.69 | | | $ | 10.00 | |
Net investment income (a) | | | 0.20 | | | | 0.42 | | | | 0.35 | | | | 0.26 | | | | 0.25 | | | | 0.28 | |
Net realized/unrealized gain (loss) on investments (a) | | | (0.33 | ) | | | 0.13 | | | | (1.22 | ) | | | 1.08 | | | | 1.42 | | | | 1.73 | |
Total income (loss) from investment operations | | | (0.13 | ) | | | 0.55 | | | | (0.87 | ) | | | 1.34 | | | | 1.67 | | | | 2.01 | |
Dividends from net investment income | | | (0.19 | ) | | | (0.40 | ) | | | (0.32 | ) | | | (0.24 | ) | | | (0.25 | ) | | | (0.27 | ) |
Distributions from net realized capital gains | | | 0.00 | | | | 0.00 | | | | (0.17 | ) | | | (0.86 | ) | | | (0.08 | ) | | | (0.05 | ) |
Total distributions | | | (0.19 | ) | | | (0.40 | ) | | | (0.49 | ) | | | (1.10 | ) | | | (0.33 | ) | | | (0.32 | ) |
Net asset value end of year or period | | $ | 11.74 | | | $ | 12.06 | | | $ | 11.91 | | | $ | 13.27 | | | $ | 13.03 | | | $ | 11.69 | |
Total return | | | (1.10 | )% | | | 4.63 | % | | | (6.61 | )% | | | 10.60 | % | | | 14.43 | % | | | 20.35 | % |
Net assets end of year or period (000s) | | $ | 201,348 | | | $ | 173,894 | | | $ | 94,214 | | | $ | 41,695 | | | $ | 29,415 | | | $ | 20,456 | |
Ratio of expenses to average net assets | | | 0.90 | %* | | | 0.90 | % | | | 0.90 | % | | | 0.90 | % | | | 0.92 | % | | | 0.90 | %*(b) |
Ratio of expenses to average net assets excluding interest expense | | | 0.90 | %* | | | 0.90 | % | | | 0.90 | % | | | 0.90 | % | | | 0.90 | % | | | 0.90 | %*(b) |
Ratio of net investment income to average net assets | | | 3.31 | %* | | | 3.49 | % | | | 2.82 | % | | | 2.03 | % | | | 2.03 | % | | | 2.65 | %* |
Portfolio turnover rate | | | 277 | % | | | 224 | % | | | 320 | % | | | 319 | % | | | 592 | % | | | 581 | % |
+ Unaudited
* Annualized
(a) Per share amounts based on average number of shares outstanding during the period.
(b) If the investment manager had not reimbursed expenses, the ratio of expenses to average net assets would have been 1.01%.
| | | | | | |
| See Accompanying Notes | | Semiannual Report | | June 30, 2007 | | 5 |
Statement of Assets and Liabilities Global Bond Portfolio (Unhedged)
| | | | |
| (Amounts in thousands, except per share amounts) | | June 30, 2007
(Unaudited) | |
| |
Assets: | | | | |
Investments, at value | | $ | 296,193 | |
Foreign currency, at value | | | 4,357 | |
Receivable for investments sold | | | 25,626 | |
Receivable for Portfolio shares sold | | | 134 | |
Interest and dividends receivable | | | 2,426 | |
Variation margin receivable | | | 98 | |
Swap premiums paid | | | 5,055 | |
Unrealized appreciation on foreign currency contracts | | | 458 | |
Unrealized appreciation on swap agreements | | | 2,768 | |
| | | | 337,115 | |
| |
Liabilities: | | | | |
Payable for investments purchased | | $ | 101,093 | |
Payable for investments purchased on a delayed-delivery basis | | | 5,295 | |
Payable for Portfolio shares redeemed | | | 580 | |
Payable for short sales | | | 24,418 | |
Written options outstanding | | | 123 | |
Accrued investment advisory fee | | | 42 | |
Accrued administration fee | | | 84 | |
Accrued servicing fee | | | 25 | |
Variation margin payable | | | 109 | |
Swap premiums received | | | 583 | |
Unrealized depreciation on foreign currency contracts | | | 589 | |
Unrealized depreciation on swap agreements | | | 2,628 | |
| | | | 135,569 | |
| |
Net Assets | | $ | 201,546 | |
| |
Net Assets Consist of: | | | | |
Paid in capital | | $ | 206,138 | |
(Overdistributed) net investment income | | | (311 | ) |
Accumulated undistributed net realized (loss) | | | (4,303 | ) |
Net unrealized appreciation | | | 22 | |
| | | $ | 201,546 | |
| |
Net Assets: | | | | |
Institutional Class | | $ | 188 | |
Administrative Class | | | 201,348 | |
Advisor Class | | | 10 | |
| |
Shares Issued and Outstanding: | | | | |
Institutional Class | | | 16 | |
Administrative Class | | | 17,147 | |
Advisor Class | | | 1 | |
| |
Net Asset Value and Redemption Price Per Share (Net Asset Per Share Outstanding) | | | | |
Institutional Class | | $ | 11.74 | |
Administrative Class | | | 11.74 | |
Advisor Class | | | 11.74 | |
| |
Cost of Investments Owned | | $ | 296,515 | |
Cost of Foreign Currency Held | | $ | 4,343 | |
Proceeds Received on Short Sales | | $ | 24,631 | |
Premiums Received on Written Options | | $ | 547 | |
| | | | |
| 6 | | PIMCO Variable Insurance Trust | | See Accompanying Notes |
Statement of Operations Global Bond Portfolio (Unhedged)
| | | | |
| (Amounts in thousands) | | Six Months Ended June 30, 2007 (Unaudited) | |
| |
| Investment Income: | | | | |
Interest, net of foreign taxes* | | $ | 3,989 | |
Dividends | | | 23 | |
Miscellaneous income | | | 4 | |
Total Income | | | 4,016 | |
| |
Expenses: | | | | |
Investment advisory fees | | | 237 | |
Administration fees | | | 475 | |
Servicing fees – Administrative Class | | | 142 | |
Trustees’ fees | | | 2 | |
Interest expense | | | 1 | |
Total Expenses | | | 857 | |
| |
Net Investment Income | | | 3,159 | |
| |
Net Realized and Unrealized Gain (Loss): | | | | |
Net realized (loss) on investments | | | (1,909 | ) |
Net realized (loss) on futures contracts, written options and swaps | | | (946 | ) |
Net realized (loss) on foreign currency transactions | | | (1,938 | ) |
Net change in unrealized (depreciation) on investments | | | (2,177 | ) |
Net change in unrealized appreciation on futures contracts, written options and swaps | | | 1,272 | |
Net change in unrealized appreciation on translation of assets and liabilities denominated in foreign currencies | | | 391 | |
Net (Loss) | | | (5,307 | ) |
| |
Net (Decrease) in Net Assets Resulting from Operations | | $ | (2,148 | ) |
| |
*Foreign tax withholding | | $ | 1 | |
| | | | | | |
| See Accompanying Notes | | Semiannual Report | | June 30, 2007 | | 7 |
Statements of Changes in Net Assets Global Bond Portfolio (Unhedged)
| | | | | | | | |
| (Amounts in thousands) | | Six Months Ended June 30, 2007 (Unaudited) | | | Year Ended December 31, 2006 | |
| | |
| Increase (Decrease) in Net Assets from: | | | | | | | | |
| | |
Operations: | | | | | | | | |
Net investment income | | $ | 3,159 | | | $ | 4,817 | |
Net realized gain (loss) | | | (4,793 | ) | | | 1,490 | |
Net change in unrealized (depreciation) | | | (514 | ) | | | (120 | ) |
Net increase (decrease) resulting from operations | | | (2,148 | ) | | | 6,187 | |
| | |
Distributions to Shareholders: | | | | | | | | |
From net investment income | | | | | | | | |
Institutional Class | | | (3 | ) | | | 0 | |
Administrative Class | | | (3,049 | ) | | | (4,594 | ) |
Advisor Class | | | 0 | | | | 0 | |
| | |
Total Distributions | | | (3,052 | ) | | | (4,594 | ) |
| | |
Portfolio Share Transactions: | | | | | | | | |
Receipts for shares sold | | | | | | | | |
Institutional Class | | | 150 | | | | 49 | |
Administrative Class | | | 50,329 | | | | 99,227 | |
Advisor Class | | | 0 | | | | 10 | |
Issued as reinvestment of distributions | | | | | | | | |
Institutional Class | | | 3 | | | | 0 | |
Administrative Class | | | 3,049 | | | | 4,593 | |
Advisor Class | | | 0 | | | | 0 | |
Cost of shares redeemed | | | | | | | | |
Institutional Class | | | (8 | ) | | | (1 | ) |
Administrative Class | | | (20,729 | ) | | | (25,733 | ) |
Advisor Class | | | 0 | | | | 0 | |
Net increase resulting from Portfolio share transactions | | | 32,794 | | | | 78,145 | |
| | |
Total Increase in Net Assets | | | 27,594 | | | | 79,738 | |
| | |
Net Assets: | | | | | | | | |
Beginning of period | | | 173,952 | | | | 94,214 | |
End of period* | | $ | 201,546 | | | $ | 173,952 | |
| | |
*Including (overdistributed) net investment income of: | | $ | (311 | ) | | $ | (418 | ) |
| | | | |
| 8 | | PIMCO Variable Insurance Trust | | See Accompanying Notes |
| | |
| |
| Schedule of Investments Global Bond Portfolio (Unhedged) | | June 30, 2007 (Unaudited) |
| | | | | | | | |
| | | | | PRINCIPAL
AMOUNT
(000S) | | | | VALUE (000S) |
| BELGIUM 0.4% |
| Belgium Government Bond | | | | |
4.250% due 09/28/2014 | | EUR | | 600 | | $ | | 795 |
| | | | | | | | |
Total Belgium (Cost $761) | | | | 795 |
| | | | | | | | |
|
| BERMUDA 0.2% |
| Intelsat Bermuda Ltd. | | | | | | | | |
5.250% due 11/01/2008 | | $ | | 400 | | | | 396 |
| | | | | | | | |
Total Bermuda (Cost $395) | | | | 396 |
| | | | | | | | |
|
| BRAZIL 0.1% |
| Vale Overseas Ltd. | | | | | | | | |
6.250% due 01/11/2016 | | $ | | 300 | | | | 299 |
| | | | | | | | |
Total Brazil (Cost $300) | | | | 299 |
| | | | | | | | |
|
| CANADA 0.5% |
| DaimlerChrysler Canada Finance, Inc. | | | | |
4.850% due 03/30/2009 | | CAD | | 200 | | | | 187 |
| |
| Province of Ontario Canada | | | | |
6.200% due 06/02/2031 | | | | 500 | | | | 550 |
| |
| Rogers Wireless, Inc. | | | | |
7.250% due 12/15/2012 | | $ | | 200 | | | | 211 |
| | | | | | | | |
Total Canada (Cost $939) | | | | 948 |
| | | | | | | | |
|
| CAYMAN ISLANDS 1.0% |
| Mizuho Finance Cayman Ltd. | | | | |
2.116% due 08/29/2049 | | JPY | | 100,000 | | | | 822 |
8.375% due 12/29/2049 | | $ | | 400 | | | | 418 |
| |
| MUFG Capital Finance 1 Ltd. | | | | |
6.346% due 07/29/2049 | | | | 400 | | | | 394 |
| |
| SMFG Preferred Capital USD 1 Ltd. | | | | |
6.078% due 01/29/2049 | | | | 400 | | | | 387 |
| | | | | | | | |
Total Cayman Islands (Cost $2,083) | | | | 2,021 |
| | | | | | | | |
|
| FRANCE 0.8% |
| France Government Bond | | | | |
3.150% due 07/25/2032 (c) | | EUR | | 110 | | | | 170 |
5.750% due 10/25/2032 | | | | 600 | | | | 930 |
6.500% due 04/25/2011 | | | | 300 | | | | 434 |
| | | | | | | | |
Total France (Cost $1,569) | | | | 1,534 |
| | | | | | | | |
|
| GERMANY 18.5% |
| Republic of Germany | | | | |
3.750% due 01/04/2015 | | EUR | | 3,200 | | | | 4,111 |
4.250% due 01/04/2014 | | | | 1,400 | | | | 1,862 |
4.250% due 07/04/2014 | | | | 5,700 | | | | 7,573 |
4.750% due 07/04/2028 | | | | 300 | | | | 407 |
4.750% due 07/04/2034 | | | | 100 | | | | 136 |
5.000% due 07/04/2012 | | | | 3,500 | | | | 4,833 |
5.250% due 01/04/2011 | | | | 5,400 | | | | 7,475 |
5.500% due 01/04/2031 | | | | 400 | | | | 600 |
5.625% due 01/04/2028 | | | | 3,550 | | | | 5,357 |
6.250% due 01/04/2024 | | | | 600 | | | | 955 |
6.250% due 01/04/2030 | | | | 1,300 | | | | 2,124 |
6.500% due 07/04/2027 | | | | 1,100 | | | | 1,826 |
| | | | | | | | |
Total Germany (Cost $36,778) | | | | 37,259 |
| | | | | | | | |
|
| ICELAND 0.2% |
| Glitnir Banki HF | | | | | | | | |
5.618% due 04/20/2010 | | $ | | 500 | | | | 500 |
| | | | | | | | |
Total Iceland (Cost $500) | | | | 500 |
| | | | | | | | |
| | | | | | | | |
| | | | | PRINCIPAL
AMOUNT
(000S) | | | | VALUE (000S) |
| IRELAND 0.2% |
| Bank of Ireland | | | | | | | | |
5.370% due 12/19/2008 | | $ | | 400 | | $ | | 401 |
| | | | | | | | |
Total Ireland (Cost $400) | | 401 |
| | | | | | | | |
|
| ITALY 0.2% |
| Seashell Securities PLC | | | | | | | | |
4.295% due 07/25/2028 | | EUR | | 39 | | | | 52 |
| |
| Siena Mortgages SpA | | | | | | | | |
4.377% due 12/16/2038 | | | | 237 | | | | 323 |
| | | | | | | | |
Total Italy (Cost $332) | | | | 375 |
| | | | | | | | |
|
| JAPAN 13.4% |
| Bank of Tokyo-Mitsubishi UFJ Ltd. | | | | |
3.500% due 12/16/2015 | | EUR | | 100 | | | | 129 |
| |
| Japan Government Bond | | | | |
1.000% due 09/20/2010 | | JPY | | 100,000 | | | | 806 |
1.500% due 03/20/2011 | | | | 620,000 | | | | 5,075 |
1.500% due 03/20/2014 | | | | 30,000 | | | | 241 |
1.600% due 09/20/2013 | | | | 10,000 | | | | 81 |
1.600% due 06/20/2014 | | | | 120,000 | | | | 971 |
1.600% due 09/20/2014 | | | | 120,000 | | | | 969 |
2.300% due 05/20/2030 | | | | 7,000 | | | | 57 |
2.300% due 06/20/2035 | | | | 130,000 | | | | 1,028 |
2.400% due 03/20/2034 | | | | 130,000 | | | | 1,054 |
2.500% due 09/20/2035 | | | | 360,000 | | | | 2,968 |
2.500% due 06/20/2036 | | | | 280,000 | | | | 2,299 |
| |
| Japanese Government CPI Linked Bond |
0.800% due 12/10/2015 | | | | 119,880 | | | | 944 |
1.100% due 12/10/2016 | | | | 1,053,640 | | | | 8,453 |
1.200% due 06/10/2017 | | | | 120,000 | | | | 968 |
| |
| Resona Bank Ltd. | | | | |
5.850% due 09/29/2049 | | $ | | 100 | | | | 96 |
| |
| Sumitomo Mitsui Banking Corp. | | | | |
1.641% due 12/31/2049 | | JPY | | 100,000 | | | | 819 |
5.625% due 07/29/2049 | | $ | | 100 | | | | 95 |
| | | | | | | | |
Total Japan (Cost $28,833) | | | | 27,053 |
| | | | | | | | |
|
| JERSEY, CHANNEL ISLANDS 0.1% |
| HSBC Capital Funding LP | | | | |
9.547% due 12/31/2049 | | $ | | 100 | | | | 110 |
| | | | | | | | |
Total Jersey, Channel Islands
(Cost $112) | | 111 |
| | | | | | | | |
|
| MEXICO 0.1% |
| Pemex Project Funding Master Trust | | | | |
5.750% due 12/15/2015 | | $ | | 100 | | | | 98 |
| | | | | | | | |
Total Mexico (Cost $97) | | | | 98 |
| | | | | | | | |
|
| NETHERLANDS 0.8% |
| Dutch Mortgage-Backed Securities BV | | | | |
4.202% due 10/02/2079 | | EUR | | 969 | | | | 1,317 |
| |
| Netherlands Government Bond | | | | |
4.250% due 07/15/2013 | | | | 200 | | | | 266 |
| |
| Siemens Financieringsmaatschappij NV | | |
5.410% due 08/14/2009 | | $ | | 100 | | | | 100 |
| | | | | | | | |
Total Netherlands (Cost $1,539) | | | | 1,683 |
| | | | | | | | |
|
| NORWAY 0.2% |
| DnB NORBank ASA | | | | | | | | |
5.425% due 10/13/2009 | | $ | | 300 | | | | 300 |
| | | | | | | | |
Total Norway (Cost $300) | | | | 300 |
| | | | | | | | |
| | | | | | | | |
| | | | | PRINCIPAL
AMOUNT
(000S) | | | | VALUE
(000S) |
| RUSSIA 0.2% | | |
| VTB Capital S.A. for Vneshtorgbank | | | | |
5.955% due 08/01/2008 | | $ | | 500 | | $ | | 501 |
| | | | | | | | |
Total Russia (Cost $500) | | | | 501 |
| | | | | | | | |
|
| SPAIN 4.2% | | |
| Santander U.S. Debt S.A. Unipersonal | | |
5.420% due 11/20/2009 | | $ | | 400 | | | | 400 |
| |
| Spain Government Bond | | | | | | | | |
4.750% due 07/30/2014 | | EUR | | 5,000 | | | | 6,844 |
5.150% due 07/30/2009 | | | | 900 | | | | 1,233 |
| | | | | | | | |
Total Spain (Cost $8,097) | | | | 8,477 |
| | | | | | | | |
|
| UNITED KINGDOM 14.8% | | |
| HBOS PLC | | | | | | | | |
5.920% due 09/29/2049 | | $ | | 1,200 | | | | 1,127 |
| |
| Holmes Financing PLC | | | | | | | | |
4.228% due 07/15/2010 | | EUR | | 100 | | | | 135 |
| |
| HSBC Holdings PLC | | | | | | | | |
6.500% due 05/02/2036 | | $ | | 1,200 | | | | 1,237 |
| |
| Punch Taverns Finance Ltd. | | | | |
6.824% due 10/15/2032 (a) | | GBP | | 100 | | | | 201 |
| |
| Royal Bank of Scotland Group PLC | | | | |
5.750% due 07/06/2012 | | $ | | 100 | | | | 100 |
| |
| Tate & Lyle International Finance PLC |
6.125% due 06/15/2011 | | | | 200 | | | | 202 |
| |
| United Kingdom Gilt | | | | |
4.250% due 03/07/2011 | | GBP | | 2,200 | | | | 4,194 |
4.750% due 06/07/2010 | | | | 7,520 | | | | 14,675 |
4.750% due 09/07/2015 | | | | 1,500 | | | | 2,859 |
5.000% due 03/07/2008 | | | | 100 | | | | 200 |
5.000% due 03/07/2012 | | | | 2,500 | | | | 4,877 |
| |
| XL Capital Europe PLC | | | | |
6.500% due 01/15/2012 | | $ | | 100 | | | | 103 |
| | | | | | | | |
Total United Kingdom (Cost $28,717) | | 29,910 |
| | | | | | | | |
|
| UNITED STATES 81.6% |
|
| ASSET-BACKED SECURITIES 7.5% |
| Accredited Mortgage Loan Trust | | | | |
5.360% due 09/25/2036 | | $ | | 373 | | | | 373 |
5.370% due 02/25/2037 | | | | 689 | | | | 690 |
| |
| ACE Securities Corp. |
5.430% due 10/25/2035 | | | | 17 | | | | 17 |
| |
| Amortizing Residential Collateral Trust |
5.610% due 07/25/2032 | | | | 1 | | | | 1 |
5.670% due 10/25/2031 | | | | 3 | | | | 3 |
| |
| Asset-Backed Funding Certificates |
5.380% due 01/25/2037 | | | | 603 | | | | 603 |
| |
| Asset-Backed Securities Corp. Home Equity |
5.370% due 12/25/2036 | | | | 571 | | | | 571 |
| |
| Carrington Mortgage Loan Trust |
5.370% due 12/25/2036 | | | | 680 | | | | 681 |
| |
| Centex Home Equity |
5.370% due 06/25/2036 | | | | 182 | | | | 182 |
| |
| Countrywide Asset-Backed Certificates |
5.350% due 01/25/2046 | | | | 362 | | | | 362 |
5.370% due 05/25/2037 | | | | 1,328 | | | | 1,328 |
| |
| Credit-Based Asset Servicing & Securitization LLC |
5.380% due 11/25/2036 | | | | 655 | | | | 656 |
| |
| CSAB Mortgage-Backed Trust |
5.420% due 06/25/2036 | | | | 97 | | | | 97 |
| |
| | | | | | |
| See Accompanying Notes | | Semiannual Report | | June 30, 2007 | | 9 |
Schedule of Investments Global Bond Portfolio (Unhedged) (Cont.)
| | | | | | | | |
| | | | | PRINCIPAL
AMOUNT
(000S) | | | | VALUE
(000S) |
| CS First Boston Mortgage Securities Corp. |
5.940% due 01/25/2032 | | $ | | 1 | | $ | | 1 |
| |
| First Franklin Mortgage Loan Asset-Backed Certificates |
5.350% due 05/25/2036 | | | | 277 | | | | 277 |
5.360% due 01/25/2038 | | | | 658 | | | | 658 |
| |
| Fremont Home Loan Trust | | | | |
5.370% due 10/25/2036 | | | | 554 | | | | 554 |
| |
| GSAMP Trust | | | | |
5.420% due 01/25/2047 | | | | 721 | | | | 721 |
5.610% due 03/25/2034 | | | | 41 | | | | 41 |
| |
| HSI Asset Securitization Corp. Trust | | | | |
5.370% due 12/25/2036 | | | | 674 | | | | 675 |
| |
| Indymac Residential Asset-Backed Trust |
5.360% due 08/25/2036 | | | | 272 | | | | 272 |
5.380% due 04/25/2037 | | | | 632 | | | | 632 |
| |
| IXIS Real Estate Capital Trust | | | | |
5.380% due 08/25/2036 | | | | 94 | | | | 94 |
| |
| JPMorgan Mortgage Acquisition Corp. | | |
5.370% due 10/25/2036 | | | | 654 | | | | 653 |
| |
| Lehman XS Trust | | | | |
5.400% due 04/25/2046 | | | | 178 | | | | 179 |
5.400% due 07/25/2046 | | | | 354 | | | | 354 |
| |
| Long Beach Mortgage Loan Trust | | | | |
5.380% due 05/25/2046 | | | | 124 | | | | 124 |
| |
| Merrill Lynch Mortgage Investors, Inc. | | |
5.390% due 08/25/2036 | | | | 520 | | | | 521 |
| |
| Morgan Stanley ABS Capital I | | | | |
5.360% due 07/25/2036 | | | | 340 | | | | 340 |
5.390% due 02/25/2036 | | | | 155 | | | | 155 |
| |
| Morgan Stanley Home Equity Loans | | | | |
5.390% due 02/25/2036 | | | | 227 | | | | 227 |
| |
| Option One Mortgage Loan Trust | | | | |
5.390% due 01/25/2036 | | | | 186 | | | | 187 |
| |
| Residential Asset Mortgage Products, Inc. | | |
5.400% due 01/25/2036 | | | | 96 | | | | 96 |
5.400% due 02/25/2036 | | | | 129 | | | | 129 |
| |
| Residential Asset Securities Corp. | | | | |
5.380% due 04/25/2036 | | | | 81 | | | | 81 |
| |
| SACO I, Inc. | | | | |
5.380% due 05/25/2036 | | | | 92 | | | | 92 |
| |
| Saxon Asset Securities Trust | | | | |
5.590% due 01/25/2032 | | | | 2 | | | | 2 |
| |
| Securitized Asset-Backed Receivables LLC Trust |
5.370% due 12/25/2036 | | | | 675 | | | | 675 |
5.380% due 03/25/2036 | | | | 202 | | | | 202 |
| |
| Soundview Home Equity Loan Trust | | | | |
5.430% due 11/25/2035 | | | | 8 | | | | 8 |
| |
| Structured Asset Securities Corp. | | | | |
4.900% due 04/25/2035 | | | | 54 | | | | 54 |
5.720% due 05/25/2034 | | | | 10 | | | | 10 |
| |
| Truman Capital Mortgage Loan Trust |
5.660% due 01/25/2034 | | | | 13 | | | | 13 |
| |
| Washington Mutual Asset-Backed Certificates |
5.380% due 10/25/2036 | | | | 674 | | | | 675 |
| |
| Wells Fargo Home Equity Trust | | | | |
5.440% due 12/25/2035 | | | | 270 | | | | 270 |
5.550% due 10/25/2035 | | | | 546 | | | | 547 |
| | | | | | | | |
| | | | | | | | 15,083 |
| | | | | | | | |
|
| CORPORATE BONDS & NOTES 11.4% | | |
| American Express Credit Corp. | | | | |
5.380% due 03/02/2009 | | | | 400 | | | | 401 |
| |
| | | | | | | | |
| | | | | PRINCIPAL
AMOUNT
(000S) | | | | VALUE
(000S) |
| American International Group, Inc. | | |
4.875% due 03/15/2067 | | EUR | | 200 | | $ | | 257 |
6.250% due 03/15/2037 | | $ | | 100 | | | | 95 |
| |
| AT&T, Inc. | | | | | | | | |
5.450% due 05/15/2008 | | | | 600 | | | | 601 |
| |
| AutoZone, Inc. | | | | | | | | |
5.875% due 10/15/2012 | | | | 100 | | | | 100 |
| |
| Bank of America Corp. |
5.366% due 11/06/2009 | | | | 400 | | | | 400 |
| |
| BellSouth Corp. |
5.200% due 09/15/2014 | | | | 200 | | | | 192 |
| |
| Boston Scientific Corp. |
6.400% due 06/15/2016 | | | | 200 | | | | 195 |
| |
| CenterPoint Energy, Inc. |
5.875% due 06/01/2008 | | | | 200 | | | | 200 |
| |
| Charter One Bank N.A. |
5.405% due 04/24/2009 | | | | 1,000 | | | | 1,001 |
| |
| CIT Group, Inc. |
5.430% due 02/21/2008 | | | | 300 | | | | 300 |
5.470% due 06/08/2009 | | | | 500 | | | | 498 |
5.570% due 05/23/2008 | | | | 100 | | | | 100 |
| |
| Citigroup, Inc. |
5.400% due 12/26/2008 | | | | 400 | | | | 400 |
| |
| CMS Energy Corp. |
6.310% due 01/15/2013 (a) | | 200 | | | | 201 |
7.500% due 01/15/2009 | | | | 200 | | | | 206 |
| |
| CNA Financial Corp. |
6.000% due 08/15/2011 | | | | 200 | | | | 201 |
| |
| ConocoPhillips Australia Funding Co. |
5.460% due 04/09/2009 | | | | 500 | | | | 500 |
| |
| CSX Corp. |
6.300% due 03/15/2012 | | | | 200 | | | | 204 |
| |
| CVS Caremark Corp. |
5.750% due 08/15/2011 | | | | 200 | | | | 200 |
| |
| DaimlerChrysler N.A. Holding Corp. |
5.710% due 03/13/2009 | | | | 600 | | | | 601 |
5.750% due 05/18/2009 | | | | 200 | | | | 201 |
| |
| Dex Media East LLC |
9.875% due 11/15/2009 | | | | 400 | | | | 416 |
| |
| Dominion Resources, Inc. |
5.660% due 09/28/2007 | | | | 100 | | | | 100 |
| |
| DR Horton, Inc. |
6.000% due 04/15/2011 | | | | 200 | | | | 195 |
| |
| El Paso Performance-Linked Trust |
7.750% due 07/15/2011 | | | | 300 | | | | 311 |
| |
| Equistar Chemicals LP |
8.750% due 02/15/2009 | | | | 400 | | | | 416 |
| |
| Fleet National Bank |
0.801% due 07/07/2008 | | JPY | | 30,000 | | | | 244 |
| |
| Ford Motor Credit Co. |
5.800% due 01/12/2009 | | $ | | 200 | | | | 196 |
6.625% due 06/16/2008 | | | | 600 | | | | 600 |
7.250% due 10/25/2011 | | | | 200 | | | | 193 |
8.105% due 01/13/2012 | | | | 500 | | | | 499 |
| |
| Freeport-McMoRan Copper & Gold, Inc. |
8.564% due 04/01/2015 | | | | 400 | | | | 420 |
| |
| General Electric Capital Corp. |
5.460% due 06/15/2009 | | | | 1,300 | | | | 1,304 |
| |
| General Motors Acceptance Corp. |
6.510% due 09/23/2008 | | | | 500 | | | | 500 |
| |
| GMAC LLC |
6.610% due 05/15/2009 | | | | 500 | | | | 500 |
| |
| | | | | | | | |
| | | | | PRINCIPAL
AMOUNT
(000S) | | | | VALUE
(000S) |
| Harrah’s Operating Co., Inc. |
5.956% due 02/08/2008 | | $ | | 100 | | $ | | 100 |
| |
| HJ Heinz Co. |
6.428% due 12/01/2008 | | | | 300 | | | | 303 |
| |
| HJ Heinz Finance Co. | | | | | | | | |
6.000% due 03/15/2012 | | | | 100 | | | | 100 |
| |
| HSBC Finance Corp. | | | | | | | | |
5.450% due 06/19/2009 | | | | 400 | | | | 401 |
5.490% due 09/15/2008 | | | | 100 | | | | 100 |
| |
| International Lease Finance Corp. |
5.350% due 03/01/2012 | | | | 200 | | | | 198 |
5.400% due 02/15/2012 | | | | 200 | | | | 198 |
| |
| iStar Financial, Inc. |
5.150% due 03/01/2012 | | | | 200 | | | | 193 |
| |
| JC Penney Corp., Inc. |
8.000% due 03/01/2010 | | | | 200 | | | | 211 |
| |
| JPMorgan Chase & Co. |
5.058% due 02/22/2021 | | CAD | | 200 | | | | 182 |
| |
| JPMorgan Chase Capital XXII |
6.450% due 02/02/2037 | | $ | | 100 | | | | 95 |
| |
| JPMorgan Mortgage Acquisition Corp. |
6.550% due 09/15/2066 | | | | 400 | | | | 386 |
| |
| Kraft Foods, Inc. |
6.250% due 06/01/2012 | | | | 200 | | | | 204 |
| |
| Mandalay Resort Group |
6.500% due 07/31/2009 | | | | 400 | | | | 402 |
| |
| Merck & Co., Inc. |
4.750% due 03/01/2015 | | | | 200 | | | | 188 |
| |
| Merrill Lynch & Co., Inc. |
5.395% due 10/23/2008 | | | | 200 | | | | 200 |
5.450% due 08/14/2009 | | | | 200 | | | | 200 |
| |
| Mizuho Preferred Capital Co. LLC |
8.790% due 12/29/2049 | | | | 100 | | | | 103 |
| |
| Morgan Stanley |
5.467% due 02/09/2009 | | | | 500 | | | | 501 |
5.809% due 10/18/2016 | | | | 200 | | | | 200 |
| |
| Newell Rubbermaid, Inc. |
4.000% due 05/01/2010 | | | | 200 | | | | 192 |
| |
| Qwest Capital Funding, Inc. |
6.375% due 07/15/2008 | | | | 100 | | | | 101 |
| |
| Rabobank Capital Funding Trust |
5.254% due 12/29/2049 | | | | 400 | | | | 375 |
| |
| Ryder System, Inc. |
5.850% due 11/01/2016 | | | | 200 | | | | 194 |
| |
| Sara Lee Corp. |
6.250% due 09/15/2011 | | | | 200 | | | | 204 |
| |
| SB Treasury Co. LLC |
9.400% due 12/29/2049 | | | | 100 | | | | 103 |
| |
| State Street Capital Trust IV |
6.355% due 06/15/2037 | | | | 500 | | | | 504 |
| |
| Time Warner, Inc. |
5.500% due 11/15/2011 | | | | 200 | | | | 198 |
5.590% due 11/13/2009 | | | | 400 | | | | 401 |
| |
| Tokai Preferred Capital Co. LLC |
9.980% due 12/29/2049 | | | | 300 | | | | 313 |
| |
| Toyota Motor Credit Corp. |
5.330% due 10/12/2007 | | | | 400 | | | | 400 |
| |
| TXU Corp. |
6.375% due 01/01/2008 | | | | 300 | | | | 302 |
| |
| U.S. Bancorp |
5.350% due 04/28/2009 | | | | 300 | | | | 300 |
| |
| Wachovia Bank N.A. |
5.400% due 03/23/2009 | | | | 500 | | | | 500 |
| |
| | | | |
| 10 | | PIMCO Variable Insurance Trust | | See Accompanying Notes |
| | |
| |
| | | June 30, 2007 (Unaudited) |
| | | | | | | | |
| | | | | PRINCIPAL
AMOUNT
(000S) | | | | VALUE
(000S) |
| Wal-Mart Stores, Inc. |
5.260% due 06/16/2008 | | $ | | 400 | | $ | | 400 |
| |
| Wells Fargo Capital X |
5.950% due 12/15/2036 | | | | 200 | | | | 187 |
| |
| Westpac Banking Corp. | | | | | | | | |
5.280% due 06/06/2008 | | | | 400 | | | | 400 |
| |
| Wyeth | | | | | | | | |
6.950% due 03/15/2011 | | | | 200 | | | | 210 |
| |
| Xerox Corp. | | | | | | | | |
9.750% due 01/15/2009 | | | | 200 | | | | 212 |
| | | | | | | | |
| | | | | | | | 22,909 |
| | | | | | | | |
|
| MORTGAGE-BACKED SECURITIES 5.8% | | |
| Banc of America Mortgage Securities, Inc. |
5.000% due 05/25/2034 | | | | 231 | | | | 226 |
| |
| Bear Stearns Commercial Mortgage Securities |
5.430% due 03/15/2019 | | | | 649 | | | | 649 |
| |
| Bear Stearns Mortgage Funding Trust |
5.390% due 02/25/2037 | | | | 737 | | | | 737 |
| |
| CC Mortgage Funding Corp. |
5.500% due 07/25/2036 | | | | 514 | | | | 514 |
| |
| Countrywide Alternative Loan Trust |
5.530% due 03/20/2046 | | | | 348 | | | | 347 |
5.600% due 02/25/2037 | | | | 388 | | | | 389 |
6.185% due 08/25/2036 | | | | 579 | | | | 579 |
| |
| Countrywide Home Loan Mortgage Pass-Through Trust |
5.550% due 05/25/2035 | | | | 258 | | | | 258 |
5.610% due 04/25/2035 | | | | 23 | | | | 23 |
5.640% due 03/25/2035 | | | | 330 | | | | 331 |
5.650% due 02/25/2035 | | | | 31 | | | | 31 |
5.700% due 09/25/2034 | | | | 41 | | | | 41 |
| |
| CS First Boston Mortgage Securities Corp. |
6.500% due 04/25/2033 | | | | 7 | | | | 7 |
| |
| First Horizon Asset Securities, Inc. |
6.250% due 08/25/2017 | | | | 235 | | | | 234 |
| |
| GE Capital Commercial Mortgage Corp. |
4.229% due 12/10/2037 | | | | 507 | | | | 496 |
| |
| GMAC Commercial Mortgage Securities, Inc. |
6.420% due 05/15/2035 | | | | 87 | | | | 88 |
| |
| GMAC Mortgage Corp. Loan Trust |
5.500% due 09/25/2034 | | | | 110 | | | | 109 |
| |
| Greenpoint Mortgage Funding Trust |
5.590% due 11/25/2045 | | | | 35 | | | | 35 |
| |
| Greenwich Capital Commercial Funding Corp. |
5.444% due 03/10/2039 | | | | 800 | | | | 775 |
| |
| GSR Mortgage Loan Trust |
4.538% due 09/25/2035 | | | | 232 | | | | 229 |
5.354% due 06/25/2034 | | | | 50 | | | | 51 |
| |
| Harborview Mortgage Loan Trust |
5.690% due 02/19/2034 | | | | 13 | | | | 13 |
| |
| Indymac Index Mortgage Loan Trust |
5.400% due 07/25/2046 | | | | 87 | | | | 87 |
| |
| JPMorgan Mortgage Trust |
4.768% due 07/25/2035 | | | | 750 | | | | 741 |
| |
| MASTR Asset Securitization Trust |
4.500% due 03/25/2018 | | | | 173 | | | | 169 |
| |
| Mellon Residential Funding Corp. |
5.760% due 12/15/2030 | | | | 46 | | | | 46 |
| |
| Nomura Asset Acceptance Corp. |
5.050% due 10/25/2035 | | | | 69 | | | | 69 |
| |
| Residential Accredit Loans, Inc. |
5.530% due 04/25/2046 | | | | 465 | | | | 465 |
| |
| | | | | | | | |
| | | | | PRINCIPAL
AMOUNT
(000S) | | | | VALUE
(000S) |
| Structured Asset Mortgage Investments, Inc. |
5.540% due 05/25/2036 | | $ | | 509 | | $ | | 510 |
5.610% due 07/19/2034 | | | | 15 | | | | 15 |
5.670% due 03/19/2034 | | | | 25 | | | | 25 |
| |
| Thornburg Mortgage Securities Trust |
5.430% due 12/25/2036 | | | | 681 | | | | 681 |
| |
| Wachovia Bank Commercial Mortgage Trust |
5.410% due 09/15/2021 | | | | 610 | | | | 610 |
| |
| Washington Mutual, Inc. |
5.094% due 10/25/2032 | | | | 4 | | | | 4 |
5.474% due 02/27/2034 | | | | 18 | | | | 18 |
5.590% due 12/25/2045 | | | | 177 | | | | 177 |
5.610% due 10/25/2045 | | | | 93 | | | | 94 |
5.630% due 01/25/2045 | | | | 33 | | | | 33 |
5.640% due 01/25/2045 | | | | 31 | | | | 31 |
5.724% due 07/25/2046 | | | | 563 | | | | 566 |
5.860% due 12/25/2027 | | | | 113 | | | | 113 |
6.429% due 08/25/2042 | | | | 32 | | | | 32 |
| |
| Wells Fargo Mortgage-Backed Securities Trust |
4.500% due 11/25/2018 | | | | 379 | | | | 368 |
4.750% due 10/25/2018 | | | | 218 | | | | 211 |
4.950% due 03/25/2036 | | | | 425 | | | | 419 |
5.254% due 04/25/2036 | | | | 138 | | | | 138 |
| | | | | | | | |
| | | | | | | | 11,784 |
| | | | | | | | |
|
| MUNICIPAL BONDS & NOTES 0.0% | | |
| New York City, New York Transitional Finance Authority Revenue Bonds, Series 2004 |
5.000% due 02/01/2028 | | | | 25 | | | | 26 |
| | | | | | | | |
|
| | | | | SHARES | | | | |
| PREFERRED STOCKS 0.4% | | |
| DG Funding Trust | | | | | | | | |
7.600% due 12/31/2049 | | | | 58 | | | | 604 |
| |
| Fresenius Medical Care Capital Trust II | | |
7.875% due 02/01/2008 | | | | 200 | | | | 202 |
| | | | | | | | |
| | | | | | | | 806 |
| | | | | | | | |
|
| | | | | PRINCIPAL
AMOUNT
(000S) | | | | |
| COMMODITY INDEX-LINKED NOTES 0.5% |
| Morgan Stanley | | | | | | | | |
0.000% due 07/07/2008 | | $ | | 1,000 | | | | 994 |
| | | | | | | | |
|
| U.S. GOVERNMENT AGENCIES 54.8% | | |
| Fannie Mae | | | | | | | | |
4.187% due 11/01/2034 | | | | 325 | | | | 322 |
4.397% due 10/01/2034 | | | | 38 | | | | 38 |
4.940% due 12/01/2034 | | | | 48 | | | | 48 |
5.000% due 11/01/2018 - 03/01/2036 | | | | 796 | | | | 758 |
5.440% due 03/25/2034 | | | | 33 | | | | 33 |
5.470% due 08/25/2034 | | | | 27 | | | | 27 |
5.500% due 10/01/2016 - 07/01/2037 | | | | 22,233 | | | | 21,483 |
5.570% due 06/25/2044 | | | | 29 | | | | 29 |
6.000% due 07/01/2037 - 07/25/2044 | | | | 72,100 | | | | 71,324 |
6.500% due 07/01/2037 | | | | 7,000 | | | | 7,067 |
| |
| Freddie Mac | | | | | | | | |
4.500% due 02/15/2017 - 02/01/2018 | | | | 1,991 | | | | 1,913 |
5.000% due 03/15/2017 | | | | 331 | | | | 327 |
5.500% due 06/01/2035 - 07/01/2037 | | | | 4,657 | | | | 4,497 |
5.550% due 07/15/2037 | | | | 1,400 | | | | 1,400 |
6.000% due 04/15/2036 | | | | 965 | | | | 907 |
6.227% due 10/25/2044 | | | | 193 | | | | 195 |
7.190% due 02/01/2029 | | | | 27 | | | | 27 |
| |
| |
| | | | | | | | |
| | | | | PRINCIPAL
AMOUNT
(000S) | | | | VALUE
(000S) |
| Ginnie Mae | | | | | | | | |
5.125% due 11/20/2024 | | $ | | 6 | | $ | | 7 |
| | | | | | | | |
| | | | | | | | 110,402 |
| | | | | | | | |
|
| U.S. TREASURY OBLIGATIONS 1.2% | | |
| U.S. Treasury Bonds | | | | | | | | |
8.125% due 08/15/2019 | | | | 100 | | | | 127 |
8.750% due 05/15/2017 | | | | 100 | | | | 128 |
8.875% due 02/15/2019 | | | | 200 | | | | 265 |
| |
| U.S. Treasury Notes | | | | | | | | |
4.250% due 11/15/2014 | | | | 1,000 | | | | 954 |
4.625% due 02/29/2012 | | | | 200 | | | | 198 |
4.875% due 01/31/2009 | | | | 100 | | | | 100 |
| |
| U.S. Treasury Strips | | | | | | | | |
0.000% due 05/15/2017 | | | | 430 | | | | 260 |
0.000% due 08/15/2020 | | | | 300 | | | | 151 |
0.000% due 11/15/2021 | | | | 600 | | | | 283 |
| | | | | | | | |
| | | | | | | | 2,466 |
| | | | | | | | |
Total United States (Cost $164,845) | | | | 164,470 |
| | | | | | | | |
|
| SHORT-TERM INSTRUMENTS 9.0% |
|
| CERTIFICATES OF DEPOSIT 2.8% | | |
| Abbey National Treasury Services PLC |
5.270% due 07/02/2008 | | | | 400 | | | | 400 |
| |
| BNP Paribas |
5.262% due 05/28/2008 | | | | 800 | | | | 800 |
| |
| Countrywide Funding Corp. |
5.360% due 08/16/2007 | | | | 700 | | | | 700 |
| |
| Fortis Bank NY |
5.265% due 04/28/2008 | | | | 300 | | | | 300 |
| |
| Nordea Bank Finland PLC |
5.308% due 05/28/2008 | | | | 500 | | | | 501 |
| |
| Societe Generale NY |
5.271% due 06/30/2008 | | | | 1,300 | | | | 1,301 |
| |
| Unicredito Italiano NY |
5.358% due 12/13/2007 | | | | 400 | | | | 400 |
5.358% due 05/06/2008 | | | | 900 | | | | 900 |
5.360% due 12/03/2007 | | | | 300 | | | | 300 |
| | | | | | | | |
| | | | | | | | 5,602 |
| | | | | | | | |
|
| COMMERCIAL PAPER 5.2% | | |
| TotalFinaElf Capital S.A. | | | | | | | | |
5.340% due 07/02/2007 | | | | 4,600 | | | | 4,600 |
| |
| UBS Finance Delaware LLC | | |
5.205% due 10/23/2007 | | | | 300 | | | | 299 |
5.235% due 10/23/2007 | | | | 5,600 | | | | 5,545 |
| | | | | | | | |
| | | | | | | | 10,444 |
| | | | | | | | |
|
| REPURCHASE AGREEMENTS 0.5% | | |
| State Street Bank and Trust Co. | | |
4.900% due 07/02/2007 | | | | 922 | | | | 922 |
| | | | | | | | |
(Dated 06/29/2007. Collateralized by Fannie Mae
3.250% due 08/15/2008 valued at $945. Repurchase proceeds are $922.) |
|
| U.S. TREASURY BILLS 0.5% | | |
4.657% due 08/30/2007 - 09/13/2007 (b)(e) | | | | 1,110 | | | | 1,099 |
| | | | | | | | |
Total Short-Term Instruments
(Cost $18,068) | | | | 18,067 |
| | | | | | | | |
| | | | | | |
| See Accompanying Notes | | Semiannual Report | | June 30, 2007 | | 11 |
Schedule of Investments Global Bond Portfolio (Unhedged) (Cont.)
| | | | | | | | | |
| | | | | | | | | VALUE
(000S) | |
| PURCHASED OPTIONS (g) 0.5% | |
(Cost $1,350) | | $ | | 995 | |
| |
| | | | | | | | | |
Total Investments (d) 147.0%
(Cost $296,515) | | $ | | 296,193 | |
| |
Written Options (h) (0.1%)
(Premiums $547) | | | | | | | | (123 | ) |
| |
| Other Assets and Liabilities (Net) (46.9%) | | (94,524 | ) |
| | | | | | | | | |
| Net Assets 100.0% | | | | | | $ | | 201,546 | |
| | | | | | | | | |
Notes to Schedule of Investments (amounts in thousands*, except number of contracts):
* A zero balance may reflect actual amounts rounding to less than one thousand.
(a) When-issued security.
(b) Coupon represents a weighted average rate.
(c) Principal amount of security is adjusted for inflation.
(d) As of June 30, 2007, portfolio securities with an aggregate value of $2,394 were valued in good faith and pursuant to the guidelines established by the Board of Trustees.
(e) Securities with an aggregate market value of $1,099 have been segregated with the custodian to cover margin requirements for the following open futures contracts on June 30, 2007:
| | | | | | | | | | |
| Description | | Type | | Expiration
Month | | # of
Contracts | | Unrealized
Appreciation/
(Depreciation) | |
90-Day Eurodollar December Futures | | Long | | 12/2007 | | 36 | | $ | 9 | |
90-Day Eurodollar March Futures | | Long | | 03/2008 | | 8 | | | (9 | ) |
90-Day Euroyen December Futures | | Long | | 12/2007 | | 133 | | | (32 | ) |
Euro-Bobl 5-Year Note September Futures | | Long | | 09/2007 | | 146 | | | (50 | ) |
Euro-Bobl 5-Year Note September Futures Put Options
Strike @ EUR 104.000 | | Long | | 09/2007 | | 93 | | | 1 | |
Euro-Bund 10-Year Note September Futures | | Long | | 09/2007 | | 240 | | | (176 | ) |
Euro-Bund 10-Year Note September Futures Put Options
Strike @ EUR 106.000 | | Long | | 09/2007 | | 207 | | | 3 | |
Japan Government 10-Year Bond September Futures | | Long | | 09/2007 | | 34 | | | (132 | ) |
U.S. Treasury 10-Year Note September Futures | | Long | | 09/2007 | | 125 | | | 62 | |
U.S. Treasury 30-Year Bond September Futures | | Long | | 09/2007 | | 32 | | | 33 | |
United Kingdom 90-Day LIBOR Sterling Interest Rate
September Futures | | Long | | 09/2007 | | 34 | | | (36 | ) |
| | | | | | | | | | |
| | | | | | | | $ | (327 | ) |
| | | | | | | | | | |
(f) Swap agreements outstanding on June 30, 2007:
Credit Default Swaps
| | | | | | | | | | | | | | | | |
| Counterparty | | Reference Entity | | Buy/Sell
Protection (1) | | (Pay)/Receive
Fixed Rate | | | Expiration
Date | | Notional
Amount | | Unrealized
Appreciation/
(Depreciation) | |
Barclays Bank PLC | | Dow Jones iTraxx Europe HV6 Index | | Buy | | (0.850% | ) | | 12/20/2016 | | EUR | 800 | | $ | (1 | ) |
BNP Paribas Bank | | Dow Jones iTraxx Europe HV6 Index | | Buy | | (0.850% | ) | | 12/20/2016 | | | 500 | | | 0 | |
Deutsche Bank AG | | Akzo Nobel NV 4.250% due 06/14/2011 | | Buy | | (0.290% | ) | | 06/20/2012 | | | 200 | | | (1 | ) |
Deutsche Bank AG | | Kelda Group PLC 6.625% DUE 04/17/2031 | | Buy | | (0.210% | ) | | 06/20/2012 | | | 200 | | | 0 | |
Deutsche Bank AG | | United Utilities PLC 6.875% due 08/15/2028 | | Buy | | (0.235% | ) | | 06/20/2012 | | | 200 | | | 1 | |
Deutsche Bank AG | | Dow Jones iTraxx Europe HV6 Index | | Buy | | (0.850% | ) | | 12/20/2016 | | | 1,200 | | | (1 | ) |
Goldman Sachs & Co. | | ICI Wilmington, Inc. 5.625% due 12/01/2013 | | Buy | | (0.340% | ) | | 06/20/2012 | | | 200 | | | 0 | |
Goldman Sachs & Co. | | Koninklijke DSM NV 4.000% due 11/10/2015 | | Buy | | (0.365% | ) | | 06/20/2012 | | | 200 | | | (1 | ) |
Goldman Sachs & Co. | | SCA Finans AB 4.500% due 07/15/2015 | | Buy | | (0.250% | ) | | 06/20/2012 | | | 200 | | | 0 | |
Goldman Sachs & Co. | | Dow Jones iTraxx Europe HV6 Index | | Buy | | (0.850% | ) | | 12/20/2016 | | | 100 | | | 0 | |
HSBC Bank USA | | Dow Jones iTraxx Europe HV6 Index | | Buy | | (0.850% | ) | | 12/20/2016 | | | 100 | | | 0 | |
JPMorgan Chase & Co. | | Dow Jones iTraxx Europe HV6 Index | | Buy | | (0.850% | ) | | 12/20/2016 | | | 700 | | | (2 | ) |
Merrill Lynch & Co., Inc. | | Compass Group PLC 6.375% due 05/29/2012 | | Buy | | (0.390% | ) | | 06/20/2012 | | | 200 | | | 0 | |
Deutsche Bank AG | | SOFTBANK Corp. 1.750% due 03/31/2014 | | Sell | | 2.300% | | | 09/20/2007 | | JPY | 47,000 | | | 2 | |
Bank of America | | Lehman Brothers Holdings, Inc. 6.625% due 01/18/2012 | | Sell | | 0.150% | | | 06/20/2008 | | $ | 600 | | | 0 | |
Bank of America | | Merrill Lynch & Co., Inc. 6.000% due 02/17/2009 | | Sell | | 0.150% | | | 06/20/2008 | | | 200 | | | 0 | |
Bank of America | | DR Horton, Inc. 6.000% due 04/15/2011 | | Buy | | (0.890% | ) | | 06/20/2011 | | | 200 | | | 3 | |
Bank of America | | Time Warner, Inc. 5.500% due 11/15/2011 | | Buy | | (0.310% | ) | | 12/20/2011 | | | 200 | | | (1 | ) |
Bank of America | | Transocean, Inc. 7.375% due 04/15/2018 | | Buy | | (0.539% | ) | | 06/20/2017 | | | 100 | | | 0 | |
Bank of America | | Transocean, Inc. 7.375% due 04/15/2018 | | Buy | | (0.505% | ) | | 06/20/2017 | | | 400 | | | (1 | ) |
Barclays Bank PLC | | International Lease Finance Corp. 5.400% due 02/15/2012 | | Buy | | (0.170% | ) | | 03/20/2012 | | | 200 | | | 0 | |
| | | | |
| 12 | | PIMCO Variable Insurance Trust | | See Accompanying Notes |
| | |
| |
| | | June 30, 2007 (Unaudited) |
| | | | | | | | | | | | | | | | |
| Counterparty | | Reference Entity | | Buy/Sell
Protection (1) | | (Pay)/Receive
Fixed Rate | | | Expiration
Date | | Notional
Amount | | Unrealized
Appreciation/
(Depreciation) | |
Barclays Bank PLC | | XL Capital Europe PLC 6.500% due 01/15/2012 | | Buy | | (0.310% | ) | | 03/20/2012 | | $ | 100 | | $ | 0 | |
Barclays Bank PLC | | American Electric Power Co., Inc. 5.250% due 06/01/2015 | | Buy | | (0.100% | ) | | 06/20/2012 | | | 100 | | | 0 | |
Barclays Bank PLC | | Capital One Bank 5.125% due 02/15/2014 | | Buy | | (0.160% | ) | | 06/20/2012 | | | 400 | | | 1 | |
Barclays Bank PLC | | Noble Corp. 5.875% due 06/01/2013 | | Buy | | (0.530% | ) | | 06/20/2012 | | | 100 | | | 0 | |
Bear Stearns & Co., Inc. | | CNA Financial Corp. 6.000% due 08/15/2011 | | Buy | | (0.440% | ) | | 09/20/2011 | | | 100 | | | 0 | |
Bear Stearns & Co., Inc. | | H.J. Heinz Finance Co. 6.000% due 03/15/2012 | | Buy | | (0.370% | ) | | 03/20/2012 | | | 100 | | | 0 | |
Bear Stearns & Co., Inc. | | Kraft Foods, Inc. 6.250% due 06/01//2012 | | Buy | | (0.170% | ) | | 06/20/2012 | | | 200 | | | 1 | |
Bear Stearns & Co., Inc. | | MeadWestvaco Corp. 6.850% due 04/01/2012 | | Buy | | (0.520% | ) | | 06/20/2012 | | | 1,000 | | | 2 | |
Bear Stearns & Co., Inc. | | Weyerhaeuser Co. 6.750% due 03/15/2012 | | Buy | | (0.480% | ) | | 06/20/2012 | | | 1,000 | | | (1 | ) |
Bear Stearns & Co., Inc. | | Ryder System, Inc. 5.850% due 11/01/2016 | | Buy | | (0.460% | ) | | 12/20/2016 | | | 200 | | | 4 | |
Citibank N.A. | | Newell Rubbermaid, Inc. 4.000% due 05/01/2010 | | Buy | | (0.130% | ) | | 06/20/2010 | | | 200 | | | 0 | |
Citibank N.A. | | Nabors Industries, Inc. 5.375% due 08/15/2012 | | Buy | | (0.470% | ) | | 06/20/2012 | | | 100 | | | (1 | ) |
Citibank N.A. | | AutoZone, Inc. 5.875% due 10/15/2012 | | Buy | | (0.680% | ) | | 12/20/2012 | | | 100 | | | (2 | ) |
Credit Suisse First Boston | | CenterPoint Energy, Inc. 5.875% due 06/01/2008 | | Buy | | (0.170% | ) | | 06/20/2008 | | | 200 | | | 0 | |
Credit Suisse First Boston | | DaimlerChrysler N.A. Holding Corp. 5.750% due 05/18/2009 | | Buy | | (0.380% | ) | | 06/20/2009 | | | 200 | | | (1 | ) |
Credit Suisse First Boston | | iStar Financial, Inc. 5.150% due 03/01/2012 | | Buy | | (0.450% | ) | | 03/20/2012 | | | 200 | | | 1 | |
Credit Suisse First Boston | | Noble Corp. 5.875% due 06/01/2013 | | Buy | | (0.530% | ) | | 06/20/2012 | | | 100 | | | 0 | |
Credit Suisse First Boston | | Noble Corp. 5.875% due 06/01/2013 | | Buy | | (0.519% | ) | | 06/20/2012 | | | 300 | | | (1 | ) |
Deutsche Bank AG | | Bear Stearns Cos., Inc. 5.300% due 10/30/2015 | | Sell | | 0.160% | | | 06/20/2008 | | | 300 | | | 0 | |
Deutsche Bank AG | | Goldman Sachs Group, Inc. 6.600% due 01/15/2012 | | Sell | | 0.120% | | | 06/20/2008 | | | 600 | | | 0 | |
Deutsche Bank AG | | Lehman Brothers Holdings, Inc. 6.625% due 01/18/2012 | | Sell | | 0.160% | | | 06/20/2008 | | | 700 | | | 0 | |
Deutsche Bank AG | | JC Penney Corp., Inc. 8.000% due 03/01/2010 | | Buy | | (0.270% | ) | | 03/20/2010 | | | 200 | | | 0 | |
Goldman Sachs & Co. | | Carnival Corp. 6.650% due 01/15/2028 | | Buy | | (0.210% | ) | | 06/20/2012 | | | 100 | | | 0 | |
Goldman Sachs & Co. | | Dow Jones CDX N.A. IG8 Index | | Sell | | 0.350% | | | 06/20/2012 | | | 6,700 | | | (15 | ) |
Goldman Sachs & Co. | | GlobalSantaFe Corp. 5.000% due 02/15/2013 | | Buy | | (0.445% | ) | | 06/20/2012 | | | 300 | | | (1 | ) |
Goldman Sachs & Co. | | Dow Jones CDX N.A. IG8 Index | | Buy | | (0.600% | ) | | 06/20/2017 | | | 26,200 | | | 150 | |
Goldman Sachs & Co. | | International Paper Co. 5.850% due 10/30/2012 | | Buy | | (0.675% | ) | | 06/20/2017 | | | 100 | | | 0 | |
Goldman Sachs & Co. | | MeadWestvaco Corp. 6.850% due 04/01/2012 | | Buy | | (1.040% | ) | | 06/20/2017 | | | 500 | | | 3 | |
HSBC Bank USA | | Russia Government International Bond 7.500% due 03/31/2030 | | Sell | | 0.240% | | | 02/20/2008 | | | 500 | | | 0 | |
HSBC Bank USA | | Ukraine Government International Bond 7.650% due 06/11/2013 | | Sell | | 0.700% | | | 04/20/2009 | | | 400 | | | 2 | |
HSBC Bank USA | | Ukraine Government International Bond 7.650% due 06/11/2013 | | Sell | | 0.730% | | | 04/20/2009 | | | 400 | | | 2 | |
JPMorgan Chase & Co. | | CNA Financial Corp. 6.000% due 08/15/2011 | | Buy | | (0.440% | ) | | 09/20/2011 | | | 100 | | | 0 | |
Lehman Brothers, Inc. | | Ford Motor Credit Co. 7.875% due 06/15/2010 | | Buy | | (2.310% | ) | | 06/20/2010 | | | 200 | | | 0 | |
Lehman Brothers, Inc. | | Wyeth 6.950% due 03/15/2011 | | Buy | | (0.100% | ) | | 03/20/2011 | | | 200 | | | 0 | |
Lehman Brothers, Inc. | | Tate & Lyle International Finance PLC 6.125% due 06/15/2011 | | Buy | | (0.315% | ) | | 06/20/2011 | | | 200 | | | 0 | |
Lehman Brothers, Inc. | | Brazilian Government International Bond 12.250% due 03/06/2030 | | Sell | | 1.280% | | | 08/20/2011 | | | 3,200 | | | 93 | |
Lehman Brothers, Inc. | | Brazilian Government International Bond 12.250% due 03/06/2030 | | Sell | | 1.350% | | | 08/20/2011 | | | 2,300 | | | 73 | |
Lehman Brothers, Inc. | | CVS Corp. 5.750% due 08/15/2011 | | Buy | | (0.210% | ) | | 09/20/2011 | | | 200 | | | 0 | |
Lehman Brothers, Inc. | | Sealed Air Corp. 6.250% due 09/15/2011 | | Buy | | (0.350% | ) | | 09/20/2011 | | | 200 | | | 0 | |
Lehman Brothers, Inc. | | BellSouth Corp. 5.200% due 09/15/2014 | | Buy | | (0.325% | ) | | 09/20/2014 | | | 200 | | | (1 | ) |
Lehman Brothers, Inc. | | Merck & Co., Inc. 4.750% due 03/01/2015 | | Buy | | (0.135% | ) | | 03/20/2015 | | | 200 | | | 1 | |
Merrill Lynch & Co., Inc. | | CSX Corp. 6.300% due 03/15/2012 | | Buy | | (0.230% | ) | | 03/20/2012 | | | 200 | | | 1 | |
Merrill Lynch & Co., Inc. | | International Lease Finance Corp. 5.350% due 03/01/2012 | | Buy | | (0.130% | ) | | 03/20/2012 | | | 200 | | | 0 | |
Morgan Stanley | | Xerox Corp. 9.750% due 01/15/2009 | | Buy | | (0.290% | ) | | 03/20/2009 | | | 200 | | | 0 | |
Morgan Stanley | | Glitnir Banki HF floating rate based on 3-Month USD-LIBOR plus 0.260% due 04/20/2010 | | Buy | | (0.170% | ) | | 06/20/2010 | | | 500 | | | 0 | |
Morgan Stanley | | Weyerhaeuser Co. 6.750% due 03/15/2012 | | Buy | | (0.480% | ) | | 06/20/2012 | | | 1,000 | | | (1 | ) |
Morgan Stanley | | Rogers Wireless, Inc. 7.250% due 12/15/2012 | | Buy | | (0.540% | ) | | 12/20/2012 | | | 200 | | | 0 | |
Morgan Stanley | | Diamond Offshore Drilling, Inc. 4.875% due 07/01/2015 | | Buy | | (0.495% | ) | | 06/20/2017 | | | 100 | | | 0 | |
Royal Bank of Canada | | DaimlerChrysler Canada Finance, Inc. 4.850% due 03/30/2009 | | Buy | | (0.350% | ) | | 06/20/2009 | | | 200 | | | (1 | ) |
Royal Bank of Canada | | JPMorgan Chase & Co. 6.750% due 02/01/2011 | | Buy | | (0.310% | ) | | 03/20/2016 | | | 200 | | | 0 | |
Royal Bank of Scotland Group PLC | | Indonesia Government International Bond 6.750% due 03/10/2014 | | Sell | | 1.280% | | | 12/20/2011 | | | 100 | | | 1 | |
Royal Bank of Scotland Group PLC | | Morgan Stanley floating rate based on 3-Month USD-LIBOR plus 0.450% due 10/18/2016 | | Buy | | (0.320% | ) | | 12/20/2016 | | | 200 | | | 2 | |
UBS Warburg LLC | | American International Group, Inc.
4.250% due 05/15/2013 | | Sell | | 0.070% | | | 06/20/2008 | | | 800 | | | 0 | |
UBS Warburg LLC | | DR Horton, Inc. 5.375% due 06/15/2012 | | Buy | | (1.540% | ) | | 06/20/2017 | | | 200 | | | 12 | |
UBS Warburg LLC | | Lennar Corp. 5.950% due 03/01/2013 | | Buy | | (1.190% | ) | | 06/20/2017 | | | 500 | | | 14 | |
UBS Warburg LLC | | Weyerhaeuser Co. 6.750% due 03/15/2012 | | Buy | | (0.930% | ) | | 06/20/2017 | | | 400 | | | 2 | |
Wachovia Bank N.A. | | GlobalSantaFe Corp. 5.000% due 02/15/2013 | | Buy | | (0.530% | ) | | 06/20/2012 | | | 100 | | | (1 | ) |
Wachovia Bank N.A. | | GlobalSantaFe Corp. 5.000% due 02/15/2013 | | Buy | | (0.520% | ) | | 06/20/2012 | | | 100 | | | (1 | ) |
| | | | | | | | | | | | | | | | |
| | | | | | | | | | | | | | $ | 336 | |
| | | | | | | | | | | | | | | | |
(1) If the Portfolio is a seller of protection and a credit event occurs, as defined under the terms of that particular swap agreement, the Portfolio will pay to the buyer of the protection an amount up to the notional value of the swap and in certain instances, take delivery of the security. As a buyer of protection, the Portfolio will generally receive from the seller of protection an amount up to the notional amount of the swap if a credit event occurs.
| | | | | | |
| See Accompanying Notes | | Semiannual Report | | June 30, 2007 | | 13 |
Schedule of Investments Global Bond Portfolio (Unhedged) (Cont.)
Interest Rate Swaps
| | | | | | | | | | | | | | | |
| Counterparty | | Floating Rate Index | | Pay/Receive
Floating Rate | | Fixed Rate | | Expiration
Date | | Notional
Amount | | Unrealized
Appreciation/
(Depreciation) | |
Citibank N.A. | | 6-Month Australian Bank Bill | | Pay | | 6.500% | | 01/15/2009 | | AUD | 4,600 | | $ | (12 | ) |
Citibank N.A. | | 6-Month Australian Bank Bill | | Pay | | 6.000% | | 06/15/2010 | | | 700 | | | (19 | ) |
Citibank N.A. | | 6-Month Australian Bank Bill | | Receive | | 6.000% | | 06/15/2015 | | | 400 | | | 21 | |
Deutsche Bank AG | | 6-Month Australian Bank Bill | | Pay | | 6.500% | | 01/15/2009 | | | 15,700 | | | (40 | ) |
Deutsche Bank AG | | 6-Month Australian Bank Bill | | Pay | | 6.500% | | 01/15/2010 | | | 7,000 | | | (52 | ) |
Deutsche Bank AG | | 6-Month Australian Bank Bill | | Pay | | 6.000% | | 06/15/2012 | | | 3,900 | | | (99 | ) |
Deutsche Bank AG | | 6-Month Australian Bank Bill | | Receive | | 6.000% | | 06/15/2017 | | | 2,300 | | | 103 | |
HSBC Bank USA | | 6-Month Australian Bank Bill | | Pay | | 6.000% | | 06/15/2012 | | | 3,100 | | | (80 | ) |
HSBC Bank USA | | 6-Month Australian Bank Bill | | Receive | | 6.000% | | 06/15/2017 | | | 1,800 | | | 82 | |
Morgan Stanley | | 6-Month Australian Bank Bill | | Pay | | 6.500% | | 01/15/2009 | | | 7,000 | | | (18 | ) |
Royal Bank of Canada | | 6-Month Australian Bank Bill | | Pay | | 6.500% | | 01/15/2010 | | | 2,400 | | | (18 | ) |
UBS Warburg LLC | | 6-Month Australian Bank Bill | | Pay | | 6.000% | | 06/15/2010 | | | 1,700 | | | (48 | ) |
UBS Warburg LLC | | 6-Month Australian Bank Bill | | Receive | | 6.000% | | 06/15/2015 | | | 1,100 | | | 63 | |
Citibank N.A. | | 3-Month Canadian Bank Bill | | Receive | | 5.000% | | 06/15/2015 | | CAD | 500 | | | 21 | |
Royal Bank of Canada | | 3-Month Canadian Bank Bill | | Receive | | 5.000% | | 06/15/2015 | | | 1,500 | | | 20 | |
Barclays Bank PLC | | 6-Month EUR-LIBOR | | Receive | | 4.000% | | 06/17/2010 | | EUR | 10 | | | 0 | |
Barclays Bank PLC | | 5-Year French CPI Ex Tobacco Daily Reference Index | | Pay | | 1.948% | | 03/15/2012 | | | 900 | | | (23 | ) |
Deutsche Bank AG | | 6-Month EUR-LIBOR | | Receive | | 4.000% | | 12/15/2011 | | | 700 | | | 23 | |
Deutsche Bank AG | | 6-Month EUR-LIBOR | | Receive | | 4.000% | | 12/15/2014 | | | 12,160 | | | 514 | |
Goldman Sachs & Co. | | 6-Month EUR-LIBOR | | Receive | | 5.000% | | 09/19/2012 | | | 2,600 | | | (12 | ) |
Goldman Sachs & Co. | | 6-Month EUR-LIBOR | | Receive | | 4.000% | | 12/15/2014 | | | 7,000 | | | 421 | |
Goldman Sachs & Co. | | 6-Month EUR-LIBOR | | Receive | | 5.000% | | 03/19/2038 | | | 1,400 | | | (26 | ) |
HSBC Bank USA | | 6-Month EUR-LIBOR | | Receive | | 4.000% | | 12/15/2014 | | | 2,300 | | | 102 | |
JPMorgan Chase & Co. | | 6-Month EUR-LIBOR | | Receive | | 5.000% | | 06/17/2012 | | | 900 | | | 75 | |
Lehman Brothers, Inc. | | 6-Month EUR-LIBOR | | Receive | | 4.000% | | 12/15/2014 | | | 600 | | | 43 | |
Lehman Brothers, Inc. | | 6-Month EUR-LIBOR | | Pay | | 6.000% | | 06/18/2034 | | | 700 | | | (58 | ) |
Merrill Lynch & Co., Inc. | | 6-Month EUR-LIBOR | | Pay | | 6.000% | | 06/18/2034 | | | 1,000 | | | (58 | ) |
Morgan Stanley | | 6-Month EUR-LIBOR | | Receive | | 4.000% | | 12/15/2011 | | | 3,300 | | | 130 | |
Morgan Stanley | | 6-Month EUR-LIBOR | | Receive | | 4.000% | | 06/15/2017 | | | 500 | | | 48 | |
Morgan Stanley | | 6-Month EUR-LIBOR | | Pay | | 6.000% | | 06/18/2034 | | | 2,000 | | | (56 | ) |
Royal Bank of Scotland Group PLC | | 5-Year French CPI Ex Tobacco Daily Reference Index | | Pay | | 1.950% | | 03/30/2012 | | | 600 | | | (6 | ) |
Royal Bank of Scotland Group PLC | | 5-Year French CPI Ex Tobacco Daily Reference Index | | Pay | | 1.940% | | 04/10/2012 | | | 600 | | | (7 | ) |
UBS Warburg LLC | | 6-Month EUR-LIBOR | | Pay | | 4.000% | | 06/17/2010 | | | 200 | | | (15 | ) |
Barclays Bank PLC | | 6-Month GBP-LIBOR | | Pay | | 6.000% | | 03/20/2009 | | GBP | 9,800 | | | (110 | ) |
Barclays Bank PLC | | 6-Month GBP-LIBOR | | Pay | | 5.000% | | 09/15/2010 | | | 3,200 | | | (216 | ) |
Barclays Bank PLC | | 6-Month GBP-LIBOR | | Receive | | 5.000% | | 09/15/2015 | | | 600 | | | 78 | |
Barclays Bank PLC | | 6-Month GBP-LIBOR | | Receive | | 4.500% | | 09/15/2017 | | | 4,500 | | | 45 | |
Barclays Bank PLC | | 6-Month GBP-LIBOR | | Receive | | 4.000% | | 12/15/2035 | | | 1,200 | | | 134 | |
Deutsche Bank AG | | 6-Month GBP-LIBOR | | Pay | | 5.000% | | 06/15/2009 | | | 100 | | | (4 | ) |
Deutsche Bank AG | | 6-Month GBP-LIBOR | | Receive | | 4.250% | | 06/12/2036 | | | 200 | | | 52 | |
Goldman Sachs & Co. | | 6-Month GBP-LIBOR | | Receive | | 4.250% | | 06/12/2036 | | | 300 | | | 80 | |
JPMorgan Chase & Co. | | 6-Month GBP-LIBOR | | Receive | | 4.000% | | 12/15/2035 | | | 400 | | | 28 | |
Merrill Lynch & Co., Inc. | | 6-Month GBP-LIBOR | | Pay | | 5.000% | | 09/15/2010 | | | 2,800 | | | (251 | ) |
Morgan Stanley | | 6-Month GBP-LIBOR | | Pay | | 5.000% | | 09/15/2015 | | | 700 | | | (87 | ) |
Goldman Sachs & Co. | | 3-Month Hong Kong Bank Bill | | Receive | | 4.235% | | 12/17/2008 | | HKD | 5,800 | | | 5 | |
Deutsche Bank AG | | 6-Month JPY-LIBOR | | Pay | | 1.000% | | 09/18/2008 | | JPY | 2,060,000 | | | 6 | |
Deutsche Bank AG | | 6-Month JPY-LIBOR | | Pay | | 3.000% | | 06/20/2027 | | | 120,000 | | | (7 | ) |
Goldman Sachs & Co. | | 6-Month JPY-LIBOR | | Receive | | 2.000% | | 12/20/2016 | | | 1,520,000 | | | (93 | ) |
Morgan Stanley | | 6-Month JPY-LIBOR | | Pay | | 1.000% | | 03/18/2009 | | | 20,000 | | | 0 | |
Morgan Stanley | | 6-Month JPY-LIBOR | | Receive | | 2.000% | | 12/20/2016 | | | 1,460,000 | | | (84 | ) |
UBS Warburg LLC | | 6-Month JPY-LIBOR | | Pay | | 1.000% | | 09/18/2008 | | | 2,660,000 | | | (41 | ) |
UBS Warburg LLC | | 6-Month JPY-LIBOR | | Pay | | 1.000% | | 03/18/2009 | | | 2,090,000 | | | (38 | ) |
UBS Warburg LLC | | 6-Month JPY-LIBOR | | Receive | | 0.800% | | 03/20/2012 | | | 50,000 | | | (3 | ) |
UBS Warburg LLC | | 6-Month JPY-LIBOR | | Receive | | 2.000% | | 06/15/2012 | | | 45,000 | | | 11 | |
UBS Warburg LLC | | 6-Month JPY-LIBOR | | Receive | | 2.000% | | 12/20/2013 | | | 420,000 | | | 41 | |
UBS Warburg LLC | | 6-Month JPY-LIBOR | | Receive | | 2.000% | | 12/20/2016 | | | 1,730,000 | | | (70 | ) |
UBS Warburg LLC | | 6-Month JPY-LIBOR | | Pay | | 3.000% | | 06/20/2027 | | | 130,000 | | | (8 | ) |
UBS Warburg LLC | | 6-Month JPY-LIBOR | | Pay | | 2.500% | | 06/20/2036 | | | 380,000 | | | (88 | ) |
Citibank N.A. | | 28-Day Mexico Interbank TIIE Banxico | | Pay | | 8.170% | | 11/04/2016 | | MXN | 5,000 | | | (4 | ) |
Bank of America | | 3-Month USD-LIBOR | | Pay | | 5.000% | | 06/18/2009 | | $ | 18,100 | | | (90 | ) |
Barclays Bank PLC | | 3-Month USD-LIBOR | | Receive | | 5.000% | | 12/19/2017 | | | 4,500 | | | (28 | ) |
Citibank N.A. | | 3-Month USD-LIBOR | | Receive | | 5.000% | | 06/20/2014 | | | 2,000 | | | 71 | |
Deutsche Bank AG | | 3-Month USD-LIBOR | | Pay | | 5.000% | | 06/18/2009 | | | 81,000 | | | (396 | ) |
Deutsche Bank AG | | 3-Month USD-LIBOR | | Receive | | 5.000% | | 12/19/2009 | | | 700 | | | (1 | ) |
Deutsche Bank AG | | 3-Month USD-LIBOR | | Receive | | 5.000% | | 12/19/2012 | | | 700 | | | (1 | ) |
Deutsche Bank AG | | 3-Month USD-LIBOR | | Receive | | 5.000% | | 06/20/2014 | | | 500 | | | 18 | |
Deutsche Bank AG | | 3-Month USD-LIBOR | | Receive | | 5.000% | | 12/19/2017 | | | 1,400 | | | (9 | ) |
Deutsche Bank AG | | 3-Month USD-LIBOR | | Pay | | 5.000% | | 12/19/2037 | | | 800 | | | 10 | |
Goldman Sachs & Co. | | 3-Month USD-LIBOR | | Pay | | 5.500% | | 12/16/2014 | | | 700 | | | (15 | ) |
Lehman Brothers, Inc. | | 3-Month USD-LIBOR | | Receive | | 5.000% | | 06/20/2014 | | | 4,300 | | | 152 | |
Morgan Stanley | | 3-Month USD-LIBOR | | Receive | | 5.000% | | 12/19/2017 | | | 4,700 | | | (31 | ) |
Royal Bank of Scotland Group PLC | | 3-Month USD-LIBOR | | Pay | | 5.000% | | 12/19/2008 | | | 7,300 | | | (36 | ) |
Royal Bank of Scotland Group PLC | | 3-Month USD-LIBOR | | Receive | | 5.000% | | 12/19/2014 | | | 600 | | | (2 | ) |
Royal Bank of Scotland Group PLC | | 3-Month USD-LIBOR | | Receive | | 5.000% | | 12/19/2017 | | | 39,000 | | | (233 | ) |
| | | | | | | | | | | | | | | |
| | | | | | | | | | | | | $ | (196 | ) |
| | | | | | | | | | | | | | | |
| | | | |
| 14 | | PIMCO Variable Insurance Trust | | See Accompanying Notes |
| | |
| |
| | | June 30, 2007 (Unaudited) |
(g) Purchased options outstanding on June 30, 2007:
Interest Rate Swaptions
| | | | | | | | | | | | | | | | | | | |
| Description | | Counterparty | | Floating Rate
Index | | Pay/Receive
Floating Rate | | Exercise
Rate | | Expiration
Date | | Notional
Amount | | Cost | | Value |
Call - OTC 2-Year Interest Rate Swap | | Bank of America | | 3-Month USD-LIBOR | | Pay | | 4.800% | | 08/08/2007 | | $ | 7,000 | | $ | 29 | | $ | 0 |
Call - OTC 2-Year Interest Rate Swap | | Bank of America | | 3-Month USD-LIBOR | | Pay | | 5.000% | | 02/01/2008 | | | 4,600 | | | 18 | | | 7 |
Call - OTC 2-Year Interest Rate Swap | | Bank of America | | 3-Month USD-LIBOR | | Pay | | 4.750% | | 09/26/2008 | | | 5,400 | | | 27 | | | 11 |
Call - OTC 1-Year Interest Rate Swap | | Barclays Bank PLC | | 3-Month USD-LIBOR | | Pay | | 4.750% | | 02/01/2008 | | | 14,000 | | | 40 | | | 4 |
Call - OTC 2-Year Interest Rate Swap | | Lehman Brothers, Inc. | | 3-Month USD-LIBOR | | Pay | | 5.000% | | 12/20/2007 | | | 12,200 | | | 79 | | | 15 |
Call - OTC 1-Year Interest Rate Swap | | Royal Bank of Scotland Group PLC | | 3-Month USD-LIBOR | | Pay | | 4.850% | | 07/02/2007 | | | 42,700 | | | 111 | | | 0 |
Call - OTC 1-Year Interest Rate Swap | | Royal Bank of Scotland Group PLC | | 3-Month USD-LIBOR | | Pay | | 4.900% | | 08/08/2007 | | | 19,900 | | | 45 | | | 0 |
Call - OTC 2-Year Interest Rate Swap | | Royal Bank of Scotland Group PLC | | 3-Month USD-LIBOR | | Pay | | 5.000% | | 02/01/2008 | | | 5,800 | | | 29 | | | 9 |
Call - OTC 2-Year Interest Rate Swap | | Royal Bank of Scotland Group PLC | | 3-Month USD-LIBOR | | Pay | | 4.750% | | 03/31/2008 | | | 22,800 | | | 138 | | | 28 |
Call - OTC 2-Year Interest Rate Swap | | Royal Bank of Scotland Group PLC | | 3-Month USD-LIBOR | | Pay | | 4.750% | | 09/26/2008 | | | 5,400 | | | 19 | | | 11 |
Call - OTC 2-Year Interest Rate Swap | | Royal Bank of Scotland Group PLC | | 3-Month USD-LIBOR | | Pay | | 4.750% | | 12/15/2008 | | | 12,200 | | | 41 | | | 28 |
| | | | | | | | | | | | | | | | | | | |
| | | | | | | | | | | | | | | $ | 576 | | $ | 113 |
| | | | | | | | | | | | | | | | | | | |
Foreign Currency Options
| | | | | | | | | | | | | | |
| Description | | Exercise
Price | | Expiration
Date | | Notional
Amount | | Cost | | Value |
Call - OTC Euro versus U.S. dollar | | | $1.362 | | 05/21/2008 | | EUR | 1,000 | | $ | 31 | | $ | 30 |
Put - OTC Euro versus U.S. dollar | | | 1.362 | | 05/21/2008 | | | 1,000 | | | 30 | | | 29 |
Call - OTC Euro versus U.S. dollar | | | 1.375 | | 05/21/2010 | | | 1,200 | | | 59 | | | 60 |
Call - OTC Euro versus U.S. dollar | | | 1.375 | | 05/21/2010 | | | 1,100 | | | 52 | | | 55 |
Put - OTC Euro versus U.S. dollar | | | 1.375 | | 05/21/2010 | | | 1,100 | | | 52 | | | 50 |
Put - OTC Euro versus U.S. dollar | | | 1.375 | | 05/21/2010 | | | 1,200 | | | 59 | | | 55 |
Call - OTC U.S. dollar versus Japanese yen | | JPY | 120.000 | | 09/26/2007 | | $ | 800 | | | 6 | | | 18 |
Call - OTC U.S. dollar versus Japanese yen | | | 117.900 | | 11/09/2007 | | | 1,600 | | | 17 | | | 54 |
Call - OTC U.S. dollar versus Japanese yen | | | 117.500 | | 11/19/2007 | | | 800 | | | 9 | | | 29 |
Call - OTC U.S. dollar versus Japanese yen | | | 114.281 | | 12/05/2007 | | | 700 | | | 8 | | | 40 |
Call - OTC U.S. dollar versus Japanese yen | | | 114.650 | | 01/18/2008 | | | 2,000 | | | 67 | | | 105 |
Put - OTC U.S. dollar versus Japanese yen | | | 114.650 | | 01/18/2008 | | | 2,000 | | | 67 | | | 17 |
Call - OTC U.S. dollar versus Japanese yen | | | 117.500 | | 03/13/2008 | | | 1,200 | | | 10 | | | 38 |
Call - OTC U.S. dollar versus Japanese yen | | | 115.950 | | 06/09/2008 | | | 3,000 | | | 80 | | | 111 |
Put - OTC U.S. dollar versus Japanese yen | | | 115.950 | | 06/09/2008 | | | 3,000 | | | 80 | | | 58 |
Call - OTC U.S. dollar versus Japanese yen | | | 118.150 | | 06/23/2008 | | | 2,600 | | | 68 | | | 67 |
Put - OTC U.S. dollar versus Japanese yen | | | 118.150 | | 06/23/2008 | | | 2,600 | | | 68 | | | 71 |
| | | | | | | | | | | | | | |
| | | | | | | | | | $ | 763 | | $ | 887 |
| | | | | | | | | | | | | | |
Options on Securities
| | | | | | | | | | | | | | |
| Description | | Strike
Price | | Expiration
Date | | Notional
Amount | | Cost | | Value |
Put - OTC Fannie Mae 5.500% due 08/01/2037 | | $ | 89.500 | | 08/07/2007 | | $ | 21,000 | | $ | 3 | | $ | 0 |
Put - OTC Fannie Mae 6.000% due 09/01/2037 | | | 92.500 | | 09/06/2007 | | | 72,000 | | | 8 | | | 5 |
| | | | | | | | | | | | | | |
| | | | | | | | | | $ | 11 | | $ | 5 |
| | | | | | | | | | | | | | |
Straddle Options
| | | | | | | | | | | | | | | | |
| Description | | Counterparty | | Exercise
Price (2) | | Expiration
Date | | Notional
Amount | | Cost (2) | | Value | |
Call & Put - OTC U.S. dollar versus Japanese yen Forward Delta Neutral Straddle | | Goldman Sachs & Co. | | $ 0.000 | | 09/20/2007 | | $ | 3,900 | | $ | 0 | | $ | (10 | ) |
| | | | | | | | | | | | | | | | |
(2) Exercise price and final cost determined on a future date, based upon implied volatility parameters.
(h) Written options outstanding on June 30, 2007:
Interest Rate Swaptions
| | | | | | | | | | | | | | | | | | | |
| Description | | Counterparty | | Floating Rate Index | | Pay/Receive
Floating Rate | | Exercise
Rate | | Expiration
Date | | Notional
Amount | | Premium | | Value |
Call - OTC 5-Year Interest Rate Swap | | Bank of America | | 3-Month USD-LIBOR | | Receive | | 4.900% | | 08/08/2007 | | $ | 3,000 | | $ | 26 | | $ | 0 |
Call - OTC 5-Year Interest Rate Swap | | Bank of America | | 3-Month USD-LIBOR | | Receive | | 5.100% | | 02/01/2008 | | | 2,000 | | | 18 | | | 7 |
Call - OTC 5-Year Interest Rate Swap | | Bank of America | | 3-Month USD-LIBOR | | Receive | | 4.950% | | 09/26/2008 | | | 2,300 | | | 27 | | | 12 |
Call - OTC 5-Year Interest Rate Swap | | Barclays Bank PLC | | 3-Month USD-LIBOR | | Receive | | 4.900% | | 02/01/2008 | | | 3,100 | | | 39 | | | 7 |
Call - OTC 5-Year Interest Rate Swap | | Lehman Brothers, Inc. | | 3-Month USD-LIBOR | | Receive | | 5.150% | | 12/20/2007 | | | 5,300 | | | 77 | | | 17 |
Call - OTC 5-Year Interest Rate Swap | | Royal Bank of Scotland Group PLC | | 3-Month USD-LIBOR | | Receive | | 4.950% | | 07/02/2007 | | | 9,200 | | | 99 | | | 0 |
Call - OTC 7-Year Interest Rate Swap | | Royal Bank of Scotland Group PLC | | 3-Month USD-LIBOR | | Receive | | 4.900% | | 08/08/2007 | | | 3,300 | | | 38 | | | 0 |
Call - OTC 5-Year Interest Rate Swap | | Royal Bank of Scotland Group PLC | | 3-Month USD-LIBOR | | Receive | | 5.100% | | 02/01/2008 | | | 2,500 | | | 30 | | | 9 |
Call - OTC 5-Year Interest Rate Swap | | Royal Bank of Scotland Group PLC | | 3-Month USD-LIBOR | | Receive | | 4.900% | | 03/31/2008 | | | 9,900 | | | 132 | | | 30 |
Call - OTC 5-Year Interest Rate Swap | | Royal Bank of Scotland Group PLC | | 3-Month USD-LIBOR | | Receive | | 4.950% | | 09/26/2008 | | | 2,400 | | | 20 | | | 12 |
Call - OTC 7-Year Interest Rate Swap | | Royal Bank of Scotland Group PLC | | 3-Month USD-LIBOR | | Receive | | 5.000% | | 12/15/2008 | | | 4,100 | | | 41 | | | 29 |
| | | | | | | | | | | | | | | | | | | |
| | | | | | | | | | | | | | | $ | 547 | | $ | 123 |
| | | | | | | | | | | | | | | | | | | |
| | | | | | |
| See Accompanying Notes | | Semiannual Report | | June 30, 2007 | | 15 |
| | |
| |
| Schedule of Investments Global Bond Portfolio (Unhedged) (Cont.) | | June 30, 2007 (Unaudited) |
(i) Short sales outstanding on June 30, 2007:
| | | | | | | | | | | | | |
| Description | | Coupon | | Maturity
Date | | Principal
Amount | | Proceeds | | Value |
Fannie Mae | | 5.000% | | 07/01/2037 | | $ | 24,000 | | $ | 22,703 | | $ | 22,489 |
Fannie Mae | | 5.500% | | 07/01/2037 | | | 2,000 | | | 1,928 | | | 1,929 |
| | | | | | | | | | | | | |
| | | | | | | | | $ | 24,631 | | $ | 24,418 |
| | | | | | | | | | | | | |
(j) Foreign currency contracts outstanding on June 30, 2007:
| | | | | | | | | | | | | | | | | |
| Type | | Currency | | Principal
Amount
Covered by
Contract | | Settlement
Month | | Unrealized
Appreciation | | Unrealized
(Depreciation) | | | Net
Unrealized
Appreciation/
(Depreciation) | |
Buy | | AUD | | 5,465 | | 07/2007 | | $ | 42 | | $ | 0 | | | $ | 42 | |
Sell | | | | 1,316 | | 07/2007 | | | 0 | | | (9 | ) | | | (9 | ) |
Buy | | BRL | | 2,865 | | 10/2007 | | | 53 | | | 0 | | | | 53 | |
Buy | | | | 1,209 | | 03/2008 | | | 52 | | | 0 | | | | 52 | |
Buy | | CAD | | 2,958 | | 08/2007 | | | 12 | | | 0 | | | | 12 | |
Buy | | CLP | | 6,033 | | 11/2007 | | | 0 | | | 0 | | | | 0 | |
Buy | | | | 10,300 | | 03/2008 | | | 0 | | | 0 | | | | 0 | |
Buy | | CNY | | 17,463 | | 11/2007 | | | 9 | | | 0 | | | | 9 | |
Buy | | | | 43,578 | | 01/2008 | | | 0 | | | (26 | ) | | | (26 | ) |
Buy | | DKK | | 6,472 | | 09/2007 | | | 4 | | | 0 | | | | 4 | |
Buy | | EUR | | 14,841 | | 07/2007 | | | 186 | | | 0 | | | | 186 | |
Sell | | GBP | | 7,298 | | 08/2007 | | | 0 | | | (77 | ) | | | (77 | ) |
Buy | | INR | | 648 | | 11/2007 | | | 0 | | | 0 | | | | 0 | |
Buy | | JPY | | 3,843,259 | | 07/2007 | | | 0 | | | (451 | ) | | | (451 | ) |
Sell | | | | 42,254 | | 07/2007 | | | 0 | | | (1 | ) | | | (1 | ) |
Buy | | KRW | | 760,822 | | 07/2007 | | | 7 | | | 0 | | | | 7 | |
Buy | | | | 916,130 | | 08/2007 | | | 0 | | | 0 | | | | 0 | |
Buy | | | | 39,973 | | 09/2007 | | | 1 | | | 0 | | | | 1 | |
Buy | | MXN | | 12,663 | | 03/2008 | | | 28 | | | 0 | | | | 28 | |
Buy | | NOK | | 6,216 | | 09/2007 | | | 18 | | | 0 | | | | 18 | |
Sell | | NZD | | 1,995 | | 07/2007 | | | 0 | | | (19 | ) | | | (19 | ) |
Buy | | PLN | | 1,692 | | 09/2007 | | | 6 | | | 0 | | | | 6 | |
Buy | | RUB | | 31,071 | | 09/2007 | | | 7 | | | 0 | | | | 7 | |
Buy | | | | 458 | | 11/2007 | | | 1 | | | 0 | | | | 1 | |
Buy | | | | 20,301 | | 12/2007 | | | 3 | | | 0 | | | | 3 | |
Buy | | SEK | | 15,066 | | 09/2007 | | | 26 | | | 0 | | | | 26 | |
Buy | | SGD | | 439 | | 08/2007 | | | 0 | | | (5 | ) | | | (5 | ) |
Buy | | TWD | | 9,248 | | 07/2007 | | | 3 | | | 0 | | | | 3 | |
Buy | | | | 9,248 | | 08/2007 | | | 0 | | | (1 | ) | | | (1 | ) |
Buy | | ZAR | | 97 | | 09/2007 | | | 0 | | | 0 | | | | 0 | |
| | | | | | | | | | | | | | | | | |
| | | | | | | | $ | 458 | | $ | (589 | ) | | $ | (131 | ) |
| | | | | | | | | | | | | | | | | |
| | | | |
| 16 | | PIMCO Variable Insurance Trust | | See Accompanying Notes |
| | |
| |
| Notes to Financial Statements | | June 30, 2007 (Unaudited) |
1. ORGANIZATION
The Global Bond Portfolio (Unhedged) (the “Portfolio”) is a series of the PIMCO Variable Insurance Trust (the “Trust”). The Trust is registered under the Investment Company Act of 1940 (the “Act”), as amended, as an open-end management investment company organized as a Delaware business trust on October 3, 1997. The Portfolio offers three classes of shares: Institutional, Administrative and Advisor. Information presented on these financial statements pertains to the Administrative Class of the Portfolio. Certain detailed financial information for the Institutional Class and Advisor Class is provided separately and is available upon request. The Trust is designed to be used as an investment vehicle by Separate Accounts of insurance companies that fund variable annuity contracts and variable life insurance policies and by qualified pension and retirement plans.
2. SIGNIFICANT ACCOUNTING POLICIES
The following is a summary of significant accounting policies consistently followed by the Portfolio in the preparation of its financial statements in conformity with accounting principles generally accepted in the United States of America (“GAAP”). The preparation of financial statements in accordance with GAAP requires management to make estimates and assumptions that affect the reported amounts and disclosures on the financial statements. Actual results could differ from those estimates.
(a) Security Valuation Portfolio securities are valued as of the close of regular trading (normally 4:00 p.m., Eastern Time) on each day that the New York Stock Exchange (“NYSE”) is open. Portfolio securities and other assets for which market quotes are readily available are stated at market value. Market value is generally determined on the basis of last reported sales prices, or if no sales are reported, based on quotes obtained from a quotation reporting system, established market makers, or pricing services. Fixed-income securities and non-exchange traded derivatives are normally valued on the basis of quotes obtained from brokers and dealers or pricing services. Prices obtained from independent pricing services use information provided by market makers or estimates of market values obtained from yield data relating to investments or securities with similar characteristics. Certain fixed income securities purchased on a delayed-delivery basis are marked to market daily until settlement at the forward settlement date. Short-term investments having a maturity of 60 days or less are generally valued at amortized cost. Exchange traded options, futures and options on futures are valued at the settlement price determined by the relevant exchange. With respect to any portion of the Portfolio’s assets that are invested in one or more open end management investment companies, the Portfolio’s net asset value (“NAV”) will be calculated based upon the NAVs of such investments.
Investments initially valued in currencies other than the U.S. dollar are converted to the U.S. dollar using exchange rates obtained from pricing services. As a result, the NAV of the Portfolio’s securities may be affected by changes in the value of currencies in relation to the U.S. dollar. The value of securities traded in markets outside the United States or denominated in currencies other than the U.S. dollar may be affected significantly on a day that the NYSE is closed and an investor is not able to purchase, redeem or exchange shares.
Securities and other assets for which market quotes are not readily available are valued at fair value as determined in good faith by the Board of Trustees or persons acting at their direction. The Board of Trustees has adopted methods for valuing securities and other assets in circumstances where market quotes are not readily available, and has delegated to Pacific Investment Management Company LLC (“PIMCO”) the responsibility for applying the valuation methods. In the event that market quotes are not readily available, and the security or asset cannot be valued pursuant to one of the valuation methods, the value of the security or asset will be determined in good faith by the Valuation Committee of the Board of Trustees, generally based upon recommendations provided by PIMCO.
Market quotes are considered not readily available in circumstances where there is an absence of current or reliable market-based data (e.g., trade information, bid/asked information, broker quotes), including where events occur after the close of the relevant market, but prior to the close of regular trading, that materially affect the values of the Portfolio’s securities or assets. In addition, market quotes are considered not readily available when, due to extraordinary circumstances, the exchanges or markets on which the securities trade, do not open for trading for the entire day and no other market prices are available. The Board has delegated to PIMCO the responsibility for monitoring significant events that may materially affect the values of the Portfolio’s securities or assets and for determining whether the value of the applicable securities or assets should be re-evaluated in light of such significant events.
When the Portfolio uses fair value pricing to determine its NAV, securities will not be priced on the basis of quotations from the primary market in which they are traded, but rather may be priced by another method that the Board of Trustees or persons acting at their direction believe accurately reflects fair value. The Trust’s policy is intended to result in a calculation of the Portfolio’s NAV that fairly reflects security values as of the time of pricing. However, fair values determined by the Board of Trustees or persons acting at their direction may not accurately reflect the price that the Portfolio could obtain for a security if it were to dispose of that security as of the time of pricing. Because foreign securities can trade on non-business days of the Portfolio, the NAV of the Portfolio may change on days when shareholders will not be able to purchase or redeem Portfolio shares. The prices used by the Portfolio may differ from the value that would be realized if the securities were sold and the differences could be material to the financial statements.
(b) Securities Transactions and Investment Income Securities transactions are recorded as of the trade date for financial reporting purposes. Securities purchased or sold on a when-issued or delayed-delivery basis may be settled a month or more after the trade date. Realized gains and losses from securities sold are recorded on the identified cost basis. Dividend income is recorded on the ex-dividend date, except certain dividends from foreign securities where the ex-dividend date may have passed, which are recorded as soon as the Portfolio is informed of the ex-dividend date. Interest income, adjusted for the accretion of discounts and amortization of premiums, is recorded on the accrual basis. Paydown gains and losses on mortgage-related and other asset-backed securities are recorded as components of interest income on the Statement of Operations.
(c) Delayed-Delivery Transactions The Portfolio may purchase or sell securities on a delayed-delivery basis. These transactions involve a commitment by the Portfolio to purchase or sell securities for a predetermined price or yield, with payment and delivery taking place beyond the customary settlement period. When delayed-delivery purchases are outstanding, the Portfolio will designate liquid assets in an amount sufficient to meet the purchase price. When purchasing a security on a delayed-delivery basis, the Portfolio assumes the rights and risks of ownership of the security, including the risk of price and yield fluctuations, and takes such fluctuations into account when determining its net asset value. The Portfolio may dispose of or renegotiate a delayed-delivery transaction after it is entered into, and may sell when-issued securities before they are delivered, which may result in a capital gain or loss. When the Portfolio has sold a security on a delayed-delivery basis, the Portfolio does not participate in future gains and losses with respect to the security.
(d) When-Issued Transactions The Portfolio may purchase or sell securities on a when-issued basis. These transactions are made conditionally because a security, although authorized, has not yet been issued in the market. A commitment by the Portfolio is made regarding these transactions to purchase or sell securities for a predetermined price or yield, with payment and delivery taking place beyond the customary settlement period. The Portfolio may sell when-issued securities before they are delivered, which may result in a capital gain or loss.
| | | | | | |
| | Semiannual Report | | June 30, 2007 | | 17 |
Notes to Financial Statements (Cont.)
(e) Dividends and Distributions to Shareholders Dividends from net investment income, if any, are declared daily and distributed to shareholders monthly. Net realized capital gains earned by the Portfolio, if any, will be distributed no less frequently than once each year.
Income dividends and capital gain distributions are determined in accordance with income tax regulations which may differ from GAAP. Differences between tax regulations and GAAP may change the fiscal year when income and capital items are recognized for tax and GAAP purposes. Examples of events that give rise to timing differences include wash sales, straddles, net operating losses and capital loss carryforwards. Further, the character of investment income and capital gains may be different for certain transactions under the two methods of accounting. Examples of characterization differences include the treatment of mortgage paydowns, swaps, foreign currency transactions and contingent debt instruments. As a result, income dividends and capital gain distributions declared during a fiscal period may differ significantly from the net investment income and realized capital gain reported on the Portfolio’s annual financial statements presented under GAAP.
Distributions classified as a tax basis return of capital, if any, are reflected on the accompanying Statements of Changes in Net Assets and have been reclassified to paid in capital. In addition, other amounts have been reclassified between undistributed net investment income, accumulated undistributed net realized gains or losses and/or paid in capital to more appropriately conform financial accounting to tax characterizations of dividend distributions.
(f) Multiclass Operations Each class offered by the Portfolio has equal rights as to assets and voting privileges (except that shareholders of a class have exclusive voting rights regarding any matter relating solely to that class of shares). Income and non-class specific expenses of the Portfolio are allocated daily to each class of shares based on the relative value of settled shares. Realized and unrealized capital gains and losses of the Portfolio are allocated daily to each class of shares based on the relative net assets of each class. Class specific expenses, where applicable, currently include administrative, distribution and servicing fees.
(g) Foreign Currency The functional and reporting currency for the Portfolio is the U.S. dollar. The market values of foreign securities, currency holdings and other assets and liabilities are translated into U.S. dollars based on the current exchange rates each business day. Fluctuations in the value of currency holdings and other assets and liabilities resulting from changes in exchange rates are recorded as unrealized foreign currency gains or losses. Realized gains or losses and unrealized appreciation or depreciation on investment securities and income and expenses are translated on the respective dates of such transactions. The effects of changes in foreign currency exchange rates on investments in securities are not segregated on the Statement of Operations from the effects of changes in market prices of those securities, but are included with the net realized and unrealized gain or loss on investment securities.
| | | | | | |
|
| Non-U.S. currency symbols utilized throughout the report are defined as follows: |
AUD BRL CAD CLP CNY DKK EUR GBP HKD INR | | Australian Dollar Brazilian Real Canadian Dollar Chilean Peso Chinese Yuan Renminbi Danish Krone Euro Great British Pound Hong Kong Dollar Indian Rupee | | KRW MXN NOK NZD PLN RUB SEK SGD TWD ZAR | | South Korean Won Mexican Peso Norwegian Krone New Zealand Dollar Polish Zloty Russian Ruble Swedish Krona Singapore Dollar Taiwan Dollar South African Rand |
| JPY | | Japanese Yen | | | | |
(h) Foreign Currency Transactions The Portfolio may enter into foreign currency contracts in connection with settling planned purchases or sales of securities, to hedge the currency exposure associated with some or all of the Portfolio’s securities or as a part of an investment strategy. A foreign currency contract is an agreement between two parties to buy and sell a currency at a set price on a future date. The market value of a foreign currency contract fluctuates with changes in foreign currency exchange rates. Foreign currency contracts are marked to market daily and the change in value is recorded by the Portfolio as an unrealized gain or loss. Realized gains or losses equal to the difference between the value of the contract at the time it was opened and the value at the time it was closed are recorded upon delivery or receipt of the currency. These contracts may involve market risk in excess of the unrealized gain or loss reflected on the Statement of Assets and Liabilities. In addition, the Portfolio could be exposed to risk if the counterparties are unable to meet the terms of the contracts or if the value of the currency changes unfavorably to the U.S. dollar.
(i) Futures Contracts The Portfolio may enter into futures contracts. The Portfolio may use futures contracts to manage its exposure to the securities markets or to movements in interest rates and currency values. The primary risks associated with the use of futures contracts are the imperfect correlation between the change in market value of the securities held by the Portfolio and the prices of futures contracts, the possibility of an illiquid market, and the inability of the counterparty to meet the terms of the contract. Futures contracts are valued based upon their quoted daily settlement prices. Upon entering into a futures contract, the Portfolio is required to deposit with its futures broker, an amount of cash or U.S. Government and Agency Obligations in accordance with the initial margin requirements of the broker or exchange. Futures contracts are marked to market daily and an appropriate payable or receivable for the change in value (“variation margin”) is recorded by the Portfolio. Gains or losses are recognized but not considered realized until the contracts expire or are closed. Futures contracts involve, to varying degrees, risk of loss in excess of the variation margin disclosed on the Statement of Assets and Liabilities.
(j) Inflation-Indexed Bonds The Portfolio may invest in inflation-indexed bonds. Inflation-indexed bonds are fixed-income securities whose principal value is periodically adjusted to the rate of inflation. The interest rate on these bonds is generally fixed at issuance at a rate lower than typical bonds. Over the life of an inflation-indexed bond, however, interest will be paid based on a principal value, which is adjusted for inflation. Any increase in the principal amount of an inflation-indexed bond will be included as interest income on the Statement of Operations, even though investors do not receive their principal until maturity.
(k) Options Contracts The Portfolio may write call and put options on futures, swaps, securities or currencies it owns or in which it may invest. Writing put options tends to increase the Portfolio’s exposure to the underlying instrument. Writing call options tends to decrease the Portfolio’s exposure to the underlying instrument. When the Portfolio writes a call or put option, an amount equal to the premium received is recorded as a liability and subsequently marked to market to reflect the current value of the option written. These liabilities are reflected as written options outstanding on the Statement of Assets and Liabilities. Certain options may be written with premiums to be determined on a future date. The premiums for these options are based upon implied volatility parameters at specified terms. Premiums received from writing options which expire are treated as realized gains. Premiums received from writing options which are exercised or closed are added to the proceeds or offset against amounts paid on the underlying future, swap, security or currency transaction to determine the realized gain or loss. The Portfolio as a writer of an option has no control over whether the underlying future, swap, security or currency may be sold (call) or purchased (put) and as a result bears the market risk of an unfavorable change in the price of the future, swap, security or currency underlying the written option. There is the risk the Portfolio may not be able to enter into a closing transaction because of an illiquid market.
| | | | |
| 18 | | PIMCO Variable Insurance Trust | | |
| | |
| |
| | | June 30, 2007 (Unaudited) |
The Portfolio may also purchase put and call options. Purchasing call options tends to increase the Portfolio’s exposure to the underlying instrument. Purchasing put options tends to decrease the Portfolio’s exposure to the underlying instrument. The Portfolio pays a premium which is included on the Statement of Assets and Liabilities as an investment and subsequently marked to market to reflect the current value of the option. Premiums paid for purchasing options which expire are treated as realized losses. Certain options may be purchased with premiums to be determined on a future date. The premiums for these options are based upon implied volatility parameters at specified terms. The risk associated with purchasing put and call options is limited to the premium paid. Premiums paid for purchasing options which are exercised or closed are added to the amounts paid or offset against the proceeds on the underlying future, swap, security or currency transaction to determine the realized gain or loss.
(l) Repurchase Agreements The Portfolio may engage in repurchase transactions. Under the terms of a typical repurchase agreement, the Portfolio takes possession of an underlying debt obligation (collateral) subject to an obligation of the seller to repurchase, and the Portfolio to resell, the obligation at an agreed-upon price and time. The underlying securities for all repurchase agreements are held in safekeeping at the Portfolio’s custodian or designated subcustodians under tri-party repurchase agreements. The market value of the collateral must be equal to or exceed the total amount of the repurchase obligations, including interest. Securities purchased under repurchase agreements are reflected as an asset on the Statement of Assets and Liabilities. Generally, in the event of counterparty default, the Portfolio has the right to use the collateral to offset losses incurred. If the counterparty should default, the Portfolio will seek to sell the securities which it holds as collateral. This could involve procedural costs or delays in addition to a loss on the securities if their value should fall below their repurchase price.
(m) Inverse Floating Rate Transactions—Residual Interest Municipal Bonds (“RIBs”)/Residual Interest Tax Exempt Bonds (“RITEs”) The Portfolio may invest in RIBs and RITEs (“Inverse Floaters”). Inverse Floaters are created via a master trust agreement between a broker-dealer, acting as trustor and liquidity provider, and an investment bank, acting as trustee and tender agent. The master trust agreement defines the terms for each trust series; with each series being established by the transfer of long-term, fixed-rate municipal bonds (“Fixed Rate Bonds”) to the trustee to be held and provide for the creation, execution and delivery of floater certificates (“Floating Rate Notes”) and Inverse Floaters. Floating Rate Notes are liquid notes that are issued with a short-term variable rate typically linked to the LIBOR, subject to limitations, for some duration. After interest income is paid on the Floating Rate Notes at current rates, the residual income from the Fixed Rate Bonds is paid to the Inverse Floaters. Inverse Floaters are issued with a coupon that fluctuates inversely with the Floating Rate Notes’ referenced rate, subject to certain limitations. Therefore, rising short-term rates result in lower income for the Inverse Floaters and vice versa.
Floating Rate Notes are generally remarketed to municipal money market funds. Inverse Floaters are acquired by either tax-exempt municipal bond funds or trusts, or other parties interested in potentially higher yielding tax-exempt securities. Inverse Floaters may also be acquired for the purpose of increasing leverage. Floating Rate Note holders typically have the option to tender their notes to the liquidity provider for redemption at par at each reset date. The Inverse Floater holders have the option to (i) require the Floating Rate Note holders to tender their notes at par, and (ii) require the liquidity provider to transfer the Fixed Rate Bonds to the Inverse Floater holders. The holders of Inverse Floaters bear substantially all of the downside investment risk associated with the underlying Fixed Rate Bonds, and also benefit from a disproportionate amount of the potential appreciation of the underlying Fixed Rate Bonds’ value. Inverse Floaters may be more volatile and less liquid than other municipal bonds of comparable maturity.
Inverse Floaters may be acquired with or without first transferring to the trustor the Fixed Rate Bonds that were utilized to create the trust series. Inverse Floaters acquired without a transfer of Fixed Rate Bonds are recognized as purchases of securities as outlined in Note 2(b). Statement of Financial Accounting Standards No. 140—Accounting for Transfers and Servicing of Financial Assets and Extinguishments of Liabilities (“FAS No. 140”), governs the standards for accounting for securitizations and other transfers of financial assets. If there is a transfer of Fixed Rate Bonds and it meets sale criteria under FAS No. 140, a Portfolio records a sale of the Fixed Rate Bonds and a purchase of the Inverse Floaters. The cash received from the Inverse Floaters is then recorded as interest income in the Statement of Operations.
If the transfer of Fixed Rate Bonds does not meet sale criteria under FAS No. 140, a Portfolio accounts for the transaction described above as a secured borrowing by including the Fixed Rate Bonds in its Schedule of Investments, and recording the Floating Rate Notes as a liability under the caption “Payable for floating rate notes” in the Portfolio’s Statement of Assets and Liabilities. In a secured borrowing transaction, cash received from the Inverse Floaters is not recorded as interest income. Instead, a Portfolio records interest income related to the Fixed Rate Bonds and interest expense related to the Floating Rate Notes, the net of which is equal to the cash received from the Inverse Floaters acquired by the Portfolio. Thus, while a Portfolio’s reported total income, net expenses, and net expense ratio are generally higher for investments in Inverse Floaters acquired via a secured borrowing, the method of acquiring Inverse Floaters does not result in differences for reported cash flows, net asset value or total return.
(n) Short Sales The Portfolio may enter into short sales transactions. A short sale is a transaction in which the Portfolio sells securities it does not own in anticipation of a decline in the market price of the securities. Securities sold in short sale transactions and interest payable on such securities, if any, are reflected as a liability on the Statement of Assets and Liabilities. The Portfolio is obligated to deliver securities at the market price at the time the short position is closed. Possible losses from short sales may be unlimited, whereas losses from purchases cannot exceed the total amount invested.
(o) Swap Agreements The Portfolio may invest in swap agreements. Swap transactions are privately negotiated agreements between the Portfolio and a counterparty to exchange or swap investment cash flows, assets, or market-linked returns at specified, future intervals. The Portfolio may enter into interest rate, total return, forward spread-lock, credit default, and other forms of swap agreements to manage its exposure to interest rates and credit risk. In connection with these agreements, securities may be identified as collateral in accordance with the terms of the respective swap agreements.
Interest rate swap agreements involve the exchange by the Portfolio with another party of their respective commitments to pay or receive interest, e.g., an exchange of floating rate payments for fixed rate payments with respect to the notional amount of principal. Certain forms of interest rate swap agreements may include: (i) interest rate caps, under which, in return for a premium, one party agrees to make payments to the other to the extent that interest rates exceed a specified rate, or “cap”, (ii) interest rate floors, under which, in return for a premium, one party agrees to make payments to the other to the extent that interest rates fall below a specified rate, or “floor”, or (iii) interest rate collars, under which a party sells a cap and purchases a floor or vice versa in an attempt to protect itself against interest rate movements exceeding given minimum or maximum levels.
Total return swap agreements involve commitments to pay interest in exchange for a market-linked return, both based on notional amounts. To the extent the total return of the security or index underlying the transaction exceeds or falls short of the offsetting interest rate obligation, the Portfolio will receive a payment from or make a payment to the counterparty.
| | | | | | |
| | Semiannual Report | | June 30, 2007 | | 19 |
Notes to Financial Statements (Cont.)
Forward spread-lock swap agreements involve commitments to pay or receive a settlement amount calculated as the difference between the swap spread and a fixed spread, multiplied by the notional amount times the duration of the swap. The swap spread is the difference between the benchmark swap rate (market rate) and the specific Treasury rate.
Credit default swap agreements involve one party making a stream of payments to another party in exchange for the right to receive a specified return in the event of a default by a third party, typically corporate issues or sovereign issues of an emerging country, on its obligation. The Portfolio may use credit default swaps to provide a measure of protection against defaults of the issuers (i.e., to reduce risk where the Portfolio owns or has exposure to the sovereign issuer) or to take an active long or short position with respect to the likelihood of a particular issuer’s default. As a seller of protection, the Portfolio generally receives an upfront payment or a fixed rate of income throughout the term of the swap provided that there is no credit event. If the Portfolio is a seller of protection and a credit event occurs, as defined under the terms of that particular swap agreement, the Portfolio will pay to the buyer of the protection an amount up to the notional value of the swap and in certain instances take delivery of the security. As the seller, the Portfolio would effectively add leverage to its portfolio because, in addition to its total net assets, the Portfolio would be subject to investment exposure on the notional amount of the swap. As a buyer of protection, the Portfolio generally receives an amount up to the notional value of the swap if a credit event occurs. The treatment of credit default swaps and other swap agreements that provide for contingent, non-periodic, bullet-type payments as “notional principal contracts” for U.S. federal income tax purposes is uncertain. Were the U.S. Internal Revenue Service (“IRS”) to take the position that a credit default swap or other bullet-type swap is not a “notional principal contract” for U.S. federal income tax purposes, payments received by the Portfolio from such investments might be subject to U.S. excise or income taxes.
Swaps are marked to market daily based upon quotations from market makers and the change in value, if any, is recorded as unrealized gain or loss on the Statement of Operations. Payments received or made at the beginning of the measurement period are reflected as such on the Statement of Assets and Liabilities. These upfront payments are recorded as realized gain or loss on the Statement of Operations upon termination or maturity of the swap. A liquidation payment received or made at the termination of the swap is recorded as realized gain or loss on the Statement of Operations. Net periodic payments received or paid by the Portfolio are included as part of realized gain or loss on the Statement of Operations. Entering into these agreements involves, to varying degrees, elements of credit, market and documentation risk in excess of the amounts recognized on the Statement of Assets and Liabilities. Such risks involve the possibility that there will be no liquid market for these agreements, that the counterparty to the agreements may default on its obligation to perform or disagree as to the meaning of contractual terms in the agreements and that there may be unfavorable changes in interest rates.
(p) Commodities Index-Linked/Structured Notes The Portfolio invests in structured notes whose value is based on the price movements of a commodity index. The structured notes are often leveraged, increasing the volatility of each note’s value relative to the change in the underlying linked financial element. The value of these notes will rise and fall in response to changes in the underlying commodity index. Structured notes may entail a greater degree of market risk than other types of debt securities because the investor bears the risk of the underlying commodity index. Structured notes may also be more volatile, less liquid, and more difficult to accurately price than less complex securities or more traditional debt securities. Fluctuations in value of the structured notes are recorded as unrealized gains and losses on the accompanying financial statements. Net payments are recorded as net realized gains and losses. These notes are subject to prepayment, credit and interest risks. The Portfolio has the option to request
prepayment from the issuer. At maturity, or when a note is sold, the Portfolio records a realized gain or loss. At June 30, 2007, the value of these securities comprised 0.5% of the Portfolio’s net assets and resulted in unrealized depreciation of $5,668.
(q) Mortgage-Related and Other Asset-Backed Securities The Portfolio may invest in mortgage-related or other asset-backed securities. These securities include mortgage pass-through securities, collateralized mortgage obligations (“CMOs”), commercial mortgage-backed securities, mortgage dollar rolls, CMO residuals, stripped mortgage-backed securities (“SMBSs”) and other securities that directly or indirectly represent a participation in, or are secured by and payable from, mortgage loans on real property. The value of some mortgage-related or asset-backed securities may be particularly sensitive to changes in prevailing interest rates. Early repayment of principal on some mortgage-related securities may expose the Portfolio to a lower rate of return upon reinvestment of principal. The value of these securities may fluctuate in response to the market’s perception of the creditworthiness of the issuers. Additionally, although mortgages and mortgage-related securities are generally supported by some form of government or private guarantee and/or insurance, there is no assurance that private guarantors or insurers will meet their obligations.
(r) U.S. Government Agencies or Government-Sponsored Enterprises Securities issued by U.S. Government agencies or government-sponsored enterprises may not be guaranteed by the U.S. Treasury. The Government National Mortgage Association (“GNMA” or “Ginnie Mae”), a wholly owned U.S. Government corporation, is authorized to guarantee, with the full faith and credit of the U.S. Government, the timely payment of principal and interest on securities issued by institutions approved by GNMA and backed by pools of mortgages insured by the Federal Housing Administration or guaranteed by the Department of Veterans Affairs. Government-related guarantors (i.e., not backed by the full faith and credit of the U.S. Government) include the Federal National Mortgage Association (“FNMA” or “Fannie Mae”) and the Federal Home Loan Mortgage Corporation (“FHLMC” or “Freddie Mac”). Pass-through securities issued by FNMA are guaranteed as to timely payment of principal and interest by FNMA but are not backed by the full faith and credit of the U.S. Government. FHLMC guarantees the timely payment of interest and ultimate collection of principal, but its participation certificates are not backed by the full faith and credit of the U.S. Government.
(s) New Accounting Policies In July 2006, the Financial Accounting Standards Board (“FASB”) issued Interpretation No. 48, “Accounting for Uncertainty in Income Taxes—an Interpretation of FASB Statement No. 109” (the “Interpretation”). The Interpretation became effective for the Portfolio on June 29, 2007. Management has evaluated the application of the Interpretation in relation to the Portfolio and has concluded that no single filing position or combination of filing positions identified as uncertain tax positions required the accrual of a tax liability in the accounting records of the Portfolio for the period ending June 30, 2007. Management will monitor all existing filing positions and future filing positions in light of the Interpretation and evaluate the need for any future tax accruals and financial statement disclosures as warranted.
In September 2006, the FASB issued Statement of Financial Accounting Standards No. 157, “Fair Value Measurements” (the “Statement”). The Statement is effective for fiscal years beginning after November 15, 2007 and will require expanded disclosure about fair value measurements, separately for each major category of assets and liabilities, that enables shareholders to assess the inputs used to develop those measurements, and for recurring fair value measurements using significant unobservable inputs the effect of the measurements on changes in net assets for the reporting period. Management is currently evaluating the application of the Statement to the Portfolio and will provide additional information in relation to the Statement on the Portfolio’s annual financial statements for the period ending December 31, 2007.
| | | | |
| 20 | | PIMCO Variable Insurance Trust | | |
| | |
| |
| | | June 30, 2007 (Unaudited) |
3. FEES AND EXPENSES
(a) Investment Advisory Fee PIMCO is a majority-owned subsidiary of Allianz Global Investors of America L.P. (“AGI”), and serves as investment adviser (the “Adviser”) to the Trust, pursuant to an investment advisory contract. The Adviser receives a monthly fee from the Portfolio, at an annual rate based on average daily net assets. The Advisory Fee for all classes is charged at an annual rate of 0.25%.
(b) Administration Fee PIMCO serves as administrator (the “Administrator”), and provides administrative services to the Trust for which it receives a monthly administrative fee based on each share class’s average daily net assets. As the Administrator, PIMCO bears the costs of various third-party services, including audit, custodial, portfolio accounting, legal, transfer agency and printing costs. The Administration Fee for all classes is charged at the annual rate of 0.50%.
(c) Distribution and Servicing Fees Allianz Global Investors Distributors LLC (“AGID”) is an indirect wholly-owned subsidiary of AGI and serves as the distributor (the “Distributor”) of the Trust’s shares. The Trust is permitted to reimburse AGID on a quarterly basis, out of the Administrative Class assets of the Portfolio in the amount of 0.15% on an annual basis of the average daily net assets of that class, for payments made to financial intermediaries that provide services in connection with the distribution of shares or administration of plans or programs that use Portfolio shares as their funding medium. The effective rate paid to AGID was 0.15% during the current fiscal year.
The Trust has adopted a Distribution Plan, for the Advisor Class shares of the Portfolio (the “Plan”). The Plan has been adopted pursuant to Rule 12b-1 under the Act. The Plan permits payments for expenses in connection with the distribution and marketing of Advisor Class shares and/or the provision of shareholder services to Advisor Class shareholders. The Plan permits the Portfolio to make total payments at an annual rate of 0.25% of its average daily net assets attributable to its Advisor Class shares.
(d) Portfolio Expenses The Trust is responsible for the following expenses: (i) salaries and other compensation of any of the Trust’s executive officers and employees who are not officers, directors, stockholders or employees of PIMCO or its subsidiaries or affiliates; (ii) taxes and governmental fees; (iii) brokerage fees and commissions and other portfolio transaction expenses; (iv) the costs of borrowing money, including interest expenses and bank overdraft charges; (v) fees and expenses of the Trustees who are not “interested persons” of PIMCO or the Trust, and any counsel retained exclusively for their benefit; (vi) extraordinary expenses, including costs of litigation and indemnification expenses; (vii) organization expenses and (viii) any expenses allocated or allocable to a specific class of shares, which include service fees payable with respect to the Administrative Class Shares, and may include certain other expenses as permitted by the Trust’s Multiple Class Plan adopted pursuant to Rule 18f-3 under the Act and subject to review and approval by the Trustees. The ratio of expenses to average net assets per share class, as disclosed in the Financial Highlights, may differ from the annual portfolio operating expenses per share class as disclosed in the Prospectus for the reasons set forth above.
Effective April 1, 2007, each Trustee, other than those affiliated with PIMCO or its affiliates, receives an annual retainer of $15,000, plus $2,375 for each Board of Trustees meeting attended in person, $500 for each committee meeting attended and $750 for each Board of Trustees meeting attended telephonically, plus reimbursement of related expenses. In addition, the audit committee chair receives an additional annual retainer of $2,000 and each other committee chair receives an additional annual retainer of $500. These expenses are allocated on a pro-rata basis to the various portfolios of the Trust according to their respective net assets. The Trust pays no compensation directly to any Trustee or any other officer who is affiliated with the Administrator, all of whom receive remuneration for their services to the Trust from the Administrator or its affiliates. Prior to
April 1, 2007, each Trustee, other than those affiliated with PIMCO or its affiliates, received an annual retainer of $15,000 plus $2,000 for each Board of Trustees meeting attended ($500 for each special meeting attended), plus reimbursement of related expenses. The Audit Committee Chairman received an annual retainer of $1,500 and the Governance Committee Chairman received an annual retainer of $500. In addition, each member of a committee received $500 for each committee meeting attended.
4. RELATED PARTY TRANSACTIONS
The Adviser, Administrator, and Distributor are related parties as defined by FAS 57, Related Party Disclosures. Fees payable to these parties are disclosed in Note 3.
5. GUARANTEES AND INDEMNIFICATIONS
Under the Trust’s organizational documents, each Trustee, officer, employee or other agent of the Trust (including the Trust’s investment manager) is indemnified, to the extent permitted by the Act, against certain liabilities that may arise out of performance of their duties to the Portfolio. Additionally, in the normal course of business, the Portfolio enters into contracts that contain a variety of indemnification clauses. The Portfolio’s maximum exposure under these arrangements is unknown as this would involve future claims that may be made against the Portfolio that have not yet occurred. However, the Portfolio has not had prior claims or losses pursuant to these contracts and believes the risk of loss to be remote.
6. PURCHASES AND SALES OF SECURITIES
The length of time the Portfolio has held a particular security is not generally a consideration in investment decisions. A change in the securities held by the Portfolio is known as “portfolio turnover”. The Portfolio may engage in frequent and active trading of portfolio securities to achieve its investment objective, particularly during periods of volatile market movements. High portfolio turnover (e.g., over 100%) involves correspondingly greater expenses to the Portfolio, including brokerage commissions or dealer mark-ups and other transaction costs on the sale of securities and reinvestments in other securities. Such sales may also result in realization of taxable capital gains, including short-term capital gains (which are generally taxed at ordinary income tax rates). The trading costs and tax effects associated with portfolio turnover may adversely affect the Portfolio’s performance.
Purchases and sales of securities (excluding short-term investments) for the period ended June 30, 2007, were as follows (amounts in thousands):
| | | | | | | | | | | | |
| U.S. Government/Agency | | | | All Other |
| Purchases | | Sales | | | | Purchases | | Sales |
| $ | 725,855 | | $ | 722,821 | | | | $ | 57,615 | | $ | 17,547 |
| | | | | | |
| | Semiannual Report | | June 30, 2007 | | 21 |
Notes to Financial Statements (Cont.)
7. TRANSACTIONS IN WRITTEN CALL AND PUT OPTIONS
Transactions in written call and put options were as follows (amounts in thousands, except for number of contracts):
| | | | | | | | | | | | | | |
| | | | | Notional
Amount
in $ | | | Notional
Amount
in GBP | | | Premium | |
Balance at 12/31/2006 | | | | $ | 79,300 | | | GBP | 2,100 | | | $ | 827 | |
Sales | | | | | 29,600 | | | | 0 | | | | 344 | |
Closing Buys | | | | | (61,800 | ) | | | 0 | | | | (588 | ) |
Expirations | | | | | 0 | | | | (2,100 | ) | | | (36 | ) |
Exercised | | | | | 0 | | | | 0 | | | | 0 | |
Balance at 06/30/2007 | | | | $ | 47,100 | | | GBP | 0 | | | $ | 547 | |
8. SHARES OF BENEFICIAL INTEREST
The Portfolio may issue an unlimited number of shares of beneficial interest with a $0.001 par value. Changes in shares of beneficial interest were as follows (shares and amounts in thousands):
| | | | | | | | | | | | | | | | |
| | | | | Six Months Ended
06/30/2007 | | | Year Ended
12/31/2006 | |
| | | | | Shares | | | Amount | | | Shares | | | Amount | |
| | | | | |
Receipts for shares sold | | | | | | | | | | | | | | | | |
Institutional Class | | | | 13 | | | $ | 149 | | | 4 | | | $ | 49 | |
Administrative Class | | | | 4,198 | | | | 50,329 | | | 8,273 | | | | 99,227 | |
Advisor Class | | | | 0 | | | | 1 | | | 1 | | | | 10 | |
Issued as reinvestment of distributions | | | | | | | | | | | | | | | | |
Institutional Class | | | | 0 | | | | 2 | | | 0 | | | | 0 | |
Administrative Class | | | | 255 | | | | 3,049 | | | 381 | | | | 4,593 | |
Advisor Class | | | | 0 | | | | 0 | | | 0 | | | | 0 | |
Cost of shares redeemed | | | | | | | | | | | | | | | | |
Institutional Class | | | | (1 | ) | | | (8 | ) | | 0 | | | | (1 | ) |
Administrative Class | | | | (1,721 | ) | | | (20,729 | ) | | (2,147 | ) | | | (25,733 | ) |
Advisor Class | | | | 0 | | | | 0 | | | 0 | | | | 0 | |
Net increase resulting from Portfolio share transactions | | | | 2,744 | | | $ | 32,793 | | | 6,512 | | | $ | 78,145 | |
The following schedule shows the number of shareholders each owning 5% or more of the Portfolio and the total percentage of the Portfolio held by such shareholders:
| | | | | | |
| | | | | Number of
Shareholders | | % of Portfolio Held |
Institutional Class | | | | 3 | | 100 |
Administrative Class | | | | 6 | | 96 |
Advisor Class | | | | 1 | | 95 |
9. REGULATORY AND LITIGATION MATTERS
Since February 2004, PIMCO, Allianz Global Investors of America L.P. (PIMCO’s parent company), AGID, and certain of their affiliates, including the PIMCO Funds (another series of funds managed by PIMCO), the Allianz Funds (formerly known as PIMCO Funds: Multi-Manager Series (another series of funds managed by affiliates of PIMCO)), certain Trustees of the Trust (in their capacity as Trustees of the PIMCO Funds or the Allianz Funds) and certain employees of PIMCO, have been named as defendants in fifteen lawsuits filed in various jurisdictions. Eleven of those lawsuits concern “market timing,” and they have been transferred to and
consolidated for pre-trial proceedings in a multi-district litigation proceeding in the U.S. District Court for the District of Maryland; the other four lawsuits concern “revenue sharing” and have been consolidated into a single action in the U.S. District Court for the District of Connecticut. The lawsuits have been commenced as putative class actions on behalf of investors who purchased, held or redeemed shares of the various series of the PIMCO Funds and the Allianz Funds during specified periods, or as derivative actions on behalf of the PIMCO Funds and the Allianz Funds.
The market timing actions in the District of Maryland generally allege that certain hedge funds were allowed to engage in “market timing” in certain funds of the PIMCO Funds and the Allianz Funds and this alleged activity was not disclosed. Pursuant to tolling agreements entered into with the derivative and class action plaintiffs, PIMCO, certain PIMCO Funds Trustees, and certain employees of PIMCO who were previously named as defendants have all been dropped as defendants in the market timing actions; the plaintiffs continue to assert claims on behalf of the shareholders of the PIMCO Funds or on behalf of the PIMCO Funds itself against other defendants. By order dated November 3, 2005, the U.S. District Court for the District of Maryland granted the PIMCO Funds’ motion to dismiss claims asserted against it in a consolidated amended complaint where the PIMCO Funds were named, in the complaint, as a nominal defendant. The revenue sharing action in the District of Connecticut generally alleges that fund assets were inappropriately used to pay brokers to promote funds of the PIMCO Funds and the Allianz Funds, including directing fund brokerage transactions to such brokers, and that such alleged arrangements were not fully disclosed to shareholders. On August 11, 2005, the U.S. District Court for the District of Connecticut conducted a hearing on defendants’ motion to dismiss the consolidated amended complaint in the revenue sharing action but has not yet ruled on the motion to dismiss. The market timing and revenue sharing lawsuits seek, among other things, unspecified compensatory damages plus interest and, in some cases, punitive damages, the rescission of investment advisory contracts, the return of fees paid under those contracts and restitution.
Two nearly identical class action civil complaints have been filed in August 2005, in the Northern District of Illinois Eastern Division, alleging that the plaintiffs each purchased and sold a 10-year Treasury note futures contract and suffered damages from an alleged shortage when PIMCO held both physical and futures positions in 10-year Treasury notes for its client accounts. The two actions have been consolidated into one action, and the two separate complaints have been replaced by a consolidated complaint. PIMCO is a named defendant, and PIMCO Funds has been added as a defendant, to the consolidated action. PIMCO strongly believes the complaint is without merit and intends to vigorously defend itself.
In April 2006, certain portfolios of the Trust and certain other funds managed by PIMCO were served in an adversary proceeding brought by the Official Committee of Asbestos Claimants of G-I Holdings, Inc. in G-I Holdings, Inc.’s bankruptcy in the District of New Jersey. In July 2004, PIMCO was named in this lawsuit and remains a defendant. The plaintiff seeks to recover for the bankruptcy estate assets that were transferred by the predecessor entity of G-I Holdings, Inc. to a wholly-owned subsidiary in 1994. The subsidiary has since issued notes, of which certain portfolios of the Trust and certain other funds managed by PIMCO are alleged to be holders. The complaint alleges that in 2000, more than two hundred noteholders—including certain portfolios of the Trust and certain other funds managed by PIMCO—were granted a second priority lien on the assets of the subsidiary in exchange for their consent to a refinancing transaction and the granting of a first priority lien to the lending banks. The plaintiff is seeking invalidation of the lien in favor of the noteholders and/or the value of the lien. On June 21, 2006, the District of New Jersey overturned the Bankruptcy Court’s decision granting permission to file the adversary proceeding and remanded the matter to the Bankruptcy Court for further proceedings. Following a motion to
| | | | |
| 22 | | PIMCO Variable Insurance Trust | | |
| | |
| |
| | | June 30, 2007 (Unaudited) |
reconsider, the District Court upheld its remand on August 7, 2006, and instructed the Bankruptcy Court to conduct a “cost-benefit” analysis of the Committee’s claims, including the claims against the noteholders. The Bankruptcy Court held a status conference on October 25, 2006 and set a briefing schedule relating to this cost-benefit analysis.
The foregoing speaks only as of the date of this report. It is possible that these matters and/or other developments resulting from these matters could result in increased portfolio redemptions or other adverse consequences to the Portfolio. However, PIMCO and AGID believe that these matters are not likely to have a material adverse effect on the Portfolio or on PIMCO’s or AGID’s ability to perform their respective investment advisory or distribution services relating to the Portfolio.
10. FEDERAL INCOME TAX MATTERS
The Portfolio intends to qualify as a regulated investment company under sub-chapter M of the Internal Revenue Code (the “Code”) and distribute all of its taxable income and net realized gains, if applicable, to shareholders. Accordingly, no provision for Federal income taxes has been made.
As of June 30, 2007, the aggregate cost of investments was the same for federal income tax and financial statement purposes. The net unrealized appreciation (depreciation) of investment securities for federal income tax purposes is as follows (amount in thousands):
| | | | |
Aggregate
Gross
Unrealized
Appreciation | | Aggregate
Gross
Unrealized
(Depreciation) | | Net
Unrealized
(Depreciation) |
$ 2,880 | | $ (3,202) | | $ (322) |
| | | | | | |
| | Semiannual Report | | June 30, 2007 | | 23 |
| | |
| |
Privacy Policy* | | (Unaudited) |
The Funds consider customer privacy to be a fundamental aspect of their relationships with shareholders and are committed to maintaining the confidentiality, integrity and security of their current, prospective and former shareholders’ personal information. To ensure their shareholders’ privacy, the Funds have developed policies that are designed to protect this confidentiality, while allowing shareholder needs to be served.
Obtaining Personal Information
In the course of providing shareholders with products and services, the Funds and certain service providers to the Funds, such as the Funds’ investment advisers (“Advisers”), may obtain non-public personal information about shareholders, which may come from sources such as account applications and other forms, from other written, electronic or verbal correspondence, from shareholder transactions, from a shareholder’s brokerage or financial advisory firm, financial adviser or consultant, and/or from information captured on the Funds’ internet web sites.
Respecting Your Privacy
As a matter of policy, the Funds do not disclose any personal or account information provided by shareholders or gathered by the Funds to non-affiliated third parties, except as required or permitted by law or as necessary for such third parties to perform their agreements with respect to the Funds. As is common in the industry, non-affiliated companies may from time to time be used to provide certain services, such as preparing and mailing prospectuses, reports, account statements and other information, conducting research on shareholder satisfaction and gathering shareholder proxies. A Fund’s Distributor may also retain non-affiliated companies to market the Fund’s shares or products which use the Fund’s shares and enter into joint marketing agreements with other companies. These companies may have access to a shareholder’s personal and account information, but are permitted to use this information solely to provide the specific service or as otherwise permitted by law. In most cases, the shareholders will be clients of a third party, but the Funds may also provide a shareholder’s personal and account information to the shareholder’s respective brokerage or financial advisory firm.
Sharing Information with Third Parties
The Funds reserve the right to disclose or report personal information to non-affiliated third parties, in limited circumstances, where the Funds believe in good faith that disclosure is required under law to cooperate with regulators or law enforcement authorities, to protect their rights or property or upon reasonable request by any Fund in which a shareholder has chosen to invest. In addition, the Funds may disclose information about a shareholder’s accounts to a non-affiliated third party with the consent of the shareholder.
Sharing Information with Affiliates
The Funds may share shareholder information with their affiliates in connection with servicing their shareholders’ accounts or to provide shareholders with information about products and services that the Funds or their Advisers, principal underwriters or their affiliates (“Service Affiliates”) believe may be of interest to such shareholders. The information that the Funds share may include, for example, a shareholder’s participation in one of the Funds or in other investment programs sponsored by a Service Affiliate, a shareholder’s ownership of certain types of accounts (such as IRAs), or other data about a shareholder’s accounts. The Funds’ Service Affiliates, in turn, are not permitted to share shareholder information with non-affiliated entities, except as required or permitted by law.
Procedures to Safeguard Private Information
The Funds take seriously the obligation to safeguard shareholder non-public personal information. In addition to this policy, the Funds have also implemented procedures that are designed to restrict access to a shareholder’s non-public personal information only to internal personnel who need to know that information in order to provide products or services to such shareholders. In order to guard a shareholder’s non-public personal information, physical, electronic and procedural safeguards are in place.
* This Privacy Policy applies to the following entities: PIMCO Funds, PIMCO Variable Insurance Trust, PCM Fund, Inc. and PIMCO Strategic Global Government Fund, Inc. (collectively, the “Funds”).
| | | | |
| 24 | | PIMCO Variable Insurance Trust | | |
Investment Adviser and Administrator
Pacific Investment Management Company LLC
840 Newport Center Drive
Newport Beach, California 92660
Distributor
Allianz Global Investors Distributors LLC
1345 Avenue of the Americas
New York, New York 10105
Custodian
State Street Bank & Trust Company
801 Pennsylvania
Kansas City, Missouri 64105
Transfer Agent
Boston Financial Data Services–Midwest
330 W. 9th Street
Kansas City, Missouri 64105
Legal Counsel
Dechert LLP
1775 I Street, N.W.
Washington, D.C. 20006
Independent Registered Public Accounting Firm
PricewaterhouseCoopers LLP
1055 Broadway
Kansas City, Missouri 64105
P I M C O

Table of Contents
This material is authorized for use only when preceded or accompanied by the current PIMCO Variable Insurance Trust (the “Trust”) prospectus. Investors should consider the investment objectives, risks, charges and expenses of this Trust carefully before investing. Ask your financial professional to explain all charges that may apply. This and other information is contained in the Trust’s prospectus. The variable product prospectus may be obtained by contacting your Investment Consultant. Please read the Trust and variable product prospectus carefully before you invest or send money.
Chairman’s Letter
Dear PIMCO Variable Insurance Trust Shareholder:
It is our pleasure to present to you the semiannual report for the PIMCO Variable Insurance Trust, covering the six-month period ended June 30, 2007. The PIMCO Variable Insurance Trust’s net assets were $8.68 billion at June 30, 2007, as compared to $7.76 billion at December 31, 2006.
Highlights of the financial markets during the reporting period include:
| | n | | Economic data during the first quarter of 2007 pointed to slower growth, which heightened market expectations for a decrease in the Federal Funds Rate. By the second quarter, economic data, such as employment statistics, provided little indication of economic weakness, causing expectations of a decrease in the Federal Funds Rate to unwind and U.S. interest rates to move higher. Interest rates in Europe and the U.K. also rose over the period as central banks raised their key lending rates due to inflation concerns. The benchmark ten-year U.S. Treasury yielded 5.03% as of June 30, 2007, or 0.32% higher than at the beginning of the year. |
| | n | | Most bonds generally returned much of their gains from earlier in the year as worldwide growth and capital flows drove interest rates higher in the second quarter. Increased risk aversion in global financial markets, due in part to subprime mortgage worries in the U.S., also contributed to the rise in interest rates. The Lehman Brothers Aggregate Bond Index, which includes Treasury, investment-grade corporate and mortgage-backed securities, returned 0.98% for the six-month period. |
| | n | | Locally issued emerging market (“EM”) bonds posted positive returns for the reporting period. Yields on these bonds declined and the local currencies in which they are denominated generally gained, amid increasing investor awareness, strong economic growth and surging capital inflows. External EM bonds (debt instruments issued by emerging markets countries and typically denominated in U.S. dollars) lagged behind local EM bonds (debt instruments issued by emerging markets countries and denominated in the currency of the issuer), as external EM bonds tend to trade more in-line with U.S. Treasuries. |
| | n | | Treasury Inflation-Protected Securities (“TIPS”) outpaced nominal bonds (non-inflation linked bonds) for the first part of the year and all but the longest maturity TIPS outperformed in the second quarter as high gasoline prices drove higher inflation accruals. Commodities, as represented by the Dow Jones-AIG Commodity Total Return Index, returned 4.46% for the period. Equities, as measured by the S&P 500 Index and the Russell 2000 Index, returned 6.96% and 6.45%, respectively, for the period. |
On the following pages, please find specific details as to the Portfolio’s total return investment performance and a discussion of those factors that affected performance.
Thank you for the trust you have placed in us. We will continue to work diligently to serve your investment needs.
Sincerely,
Brent R. Harris
Chairman, PIMCO Variable Insurance Trust
July 31, 2007
| | | | | | |
| | Semiannual Report | | June 30, 2007 | | 1 |
Important Information About the Portfolio
PIMCO Variable Insurance Trust (the “Trust”) is an open-end management investment company currently consisting of twenty separate investment portfolios, including the Global Bond Portfolio (Unhedged) (the “Portfolio”). The Portfolio is only available as a funding vehicle under variable life insurance policies or variable annuity contracts issued by insurance companies (“Variable Contracts”). Individuals may not purchase shares of the Portfolio directly. Shares of the Portfolio also may be sold to qualified pension and retirement plans outside of the separate account context.
We believe that bond funds have an important role to play in a well diversified investment portfolio. It is important to note, however, that in an environment where interest rates may trend upward, rising rates would negatively impact the performance of most bond funds, and fixed-income securities held by a fund are likely to decrease in value. The price volatility of fixed-income securities can also increase during periods of rising interest rates resulting in increased losses to a fund. Bond funds and individual bonds with a longer duration (a measure of the expected life of a security) tend to be more sensitive to changes in interest rates, usually making them more volatile than securities or funds with shorter durations.
The Portfolio may be subject to various risks in addition to those described above. Some of these risks may include, but are not limited to, the following: credit risk, high yield risk, market risk, issuer risk, liquidity risk, derivatives risk, mortgage risk, non-U.S. investment risk, emerging markets risk, currency risk, issuer non-diversification risk, leveraging risk and management risk. A complete description of these risks is contained in the Portfolio’s prospectus. The Portfolio may use derivative instruments for hedging purposes or as part of an investment strategy. Use of these instruments may involve certain costs and risks such as liquidity risk, interest rate risk, market risk, credit risk, management risk and the risk that the Portfolio could not close out a position when it would be most advantageous to do so. Because the Portfolio may invest in derivatives, it could lose more than the principal amount invested in these instruments. Investing in non-U.S. securities may entail risk due to non-U.S. economic and political developments; this risk may be increased when investing in emerging markets.
On the performance summary page in this Semiannual Report, the Total Return Investment Performance table measures performance assuming that all dividend and capital gain distributions were reinvested.
An investment in the Portfolio is not a deposit of a bank and is not guaranteed or insured by the Federal Deposit Insurance Corporation or any other government agency. It is possible to lose money on investments in the Portfolio.
PIMCO has adopted written proxy voting policies and procedures (“Proxy Policy”) as required by Rule 206(4)-6 under the Investment Advisers Act of 1940, as amended. The Proxy Policy has been adopted by the Trust as the policies and procedures that PIMCO will use when voting proxies on behalf of the Portfolio. A description of the policies and procedures that PIMCO uses to vote proxies relating to portfolio securities of the Portfolio, and information about how the Portfolio voted proxies relating to portfolio securities held during the most recent twelve-month period ended June 30, are available without charge, upon request, by calling the Trust at 1-866-746-2606 and on the Portfolio’s website at www.pimco.com.
The Portfolio files its complete schedule of portfolio holdings with the SEC for the first and third quarters of each fiscal year on Form N-Q. A copy of the Trust’s Form N-Q is also available on the SEC’s website at http://www.sec.gov and may be reviewed and copied at the SEC’s Public Reference Room in Washington D.C. Information on the operation of the Public Reference Room may be obtained by calling 1-800-SEC-0330, and is available without charge, upon request, by calling the Trust at 1-866-746-2606 and on the Portfolio’s website at www.pimco.com.
PIMCO Variable Insurance Trust is distributed by Allianz Global Investors Distributors LLC, 1345 Avenue of the Americas, New York, NY 10105.
| | | | |
| 2 | | PIMCO Variable Insurance Trust | | |
The following disclosure provides important information regarding the Portfolio’s Expense Example (“Example” or “Expense Example”), which appears in this Semiannual Report. Please refer to this information when reviewing the Expense Example for the Portfolio.
Example
As a shareholder of the Portfolio, you incur two types of costs: (1) transaction costs and (2) ongoing costs, including advisory and administrative fees; distribution and/or service (12b-1) fees (Administrative and Advisor Class only); and other Portfolio expenses. The Example is intended to help you understand your ongoing costs (in dollars) of investing in the Portfolio and to compare these costs with the ongoing costs of investing in other mutual funds. The Expense Example does not reflect any fees or other expenses imposed by the Variable Contracts. If it did, the expenses reflected in the Expense Example would be higher. The Example is based on an investment of $1,000 invested at the beginning of the period and held for the entire period indicated, which is from January 1, 2007 to June 30, 2007.
Actual Expenses
The information in the table under the heading “Actual Performance” provides information about actual account values and actual expenses. You may use the information in these columns, together with the amount you invested, to estimate the expenses that you paid over the period. Simply divide your account value by $1,000 (for example, an $8,600 account value divided by $1,000 = $8.60), then multiply the result by the number in the row titled “Expenses Paid During Period” to estimate the expenses you paid on your account during this period.
Hypothetical Example for Comparison Purposes
The information in the table under the heading “Hypothetical Performance (5% return before expenses)” provides information about hypothetical account values and hypothetical expenses based on the Portfolio’s actual expense ratio and an assumed rate of return of 5% per year before expenses, which is not the Portfolio’s actual return. The hypothetical account values and expenses may not be used to estimate the actual ending account balance or expenses you paid for the period. You may use this information to compare the ongoing costs of investing in the Portfolio and other portfolios. To do so, compare this 5% hypothetical example with the 5% hypothetical examples that appear in the shareholder reports of the other portfolios.
Please note that the expenses shown in the table are meant to highlight your ongoing costs only and do not reflect any transactional costs. Therefore, the information under the heading “Hypothetical Performance (5% return before expenses)” is useful in comparing ongoing costs only, and will not help you determine the relative total costs of owning different portfolios. In addition, if these transactional costs were included, your costs would have been higher.
The expense ratio may vary period to period because of various factors, such as an increase in expenses not covered by the advisory and administrative fees (such as expenses of the trustees and their counsel or litigation expense).
| | | | | | |
| | Semiannual Report | | June 30, 2007 | | 3 |
PIMCO Global Bond Portfolio (Unhedged)
Cumulative Returns Through June 30, 2007
$10,000 invested at the end of the nearest month to the inception date of the Portfolio’s Institutional Class.
Allocation Breakdown‡
| | |
United States | | 55.5% |
Germany | | 12.6% |
United Kingdom | | 10.1% |
Japan | | 9.1% |
Short-Term Instruments | | 6.1% |
Spain | | 2.9% |
Other | | 3.7% |
| | ‡ | % of Total Investments as of 06/30/2007 |
| | | | | | | | |
Average Annual Total Return for the period ended June 30, 2007 |
| | | | | 6 Months* | | 1 Year | | Portfolio
Inception
(01/31/06) |
| | PIMCO Global Bond Portfolio (Unhedged) Institutional Class | | -1.03% | | 1.36% | | 1.91% |
| | JPMorgan Government Bond Indices Global FX New York Index Unhedged in USD± | | -0.43% | | 2.91% | | 2.98% |
All Portfolio returns are net of fees and expenses.
* Cumulative return.
Performance quoted represents past performance. Past performance is no guarantee of future results. Investment return and principal value will fluctuate so the Portfolio shares, when redeemed, may be worth more or less than their original cost. The Portfolio’s performance does not reflect the deduction of additional charges and expenses imposed in connection with investing in Variable Contracts, which will reduce returns. Current performance may be lower or higher than the performance data quoted. Performance data current to the most recent month-end is available by calling (800) 927-4648.
± JPMorgan Government Bond Indices Global FX New York Index Unhedged in USD is an unmanaged index representative of the total return performance in U.S. dollars on an unhedged basis of major world bond markets. It is not possible to invest directly in the index. The index does not reflect deductions for fees and expenses.
| | | | | | |
| Expense Example | | Actual Performance | | Hypothetical Performance |
| | | | | (5% return before expenses) |
Beginning Account Value (01/01/07) | | $ | 1,000.00 | | $ | 1,000.00 |
Ending Account Value (06/30/07) | | $ | 989.72 | | $ | 1,021.08 |
Expenses Paid During Period† | | $ | 3.70 | | $ | 3.76 |
† Expenses are equal to the Portfolio’s Institutional Class annualized expense ratio of 0.75%, multiplied by the average account value over the period, multiplied by 181/365 (to reflect the one-half year period). Overall fees and expenses of investing in the Portfolio will be higher because the example does not reflect Variable Contract fees and expenses.
Please refer to page 3 herein for an explanation of the information presented in the above Expense Example.
Portfolio Insights
| » | | The PIMCO Global Bond Portfolio (Unhedged) seeks to achieve its investment objective by investing under normal circumstances at least 80% of its assets in fixed-income instruments of issuers located in at least three countries (one of which may be the United States), which may be represented by futures contracts (including related options) with respect to such securities, and options on such securities. |
| » | | Global unhedged bonds produced weak returns as bond yields rose across major markets. |
| » | | Exposure to U.S. shorter maturities, principally through interest rate futures contracts, detracted from performance as yields rose. |
| » | | An underweight to U.K. interest rates, notably at the long-end of the yield curve, was positive for returns as U.K. yields rose sharply. |
| » | | An overweight to European interest rates was negative for returns as yields rose due to the region’s growth momentum. |
| » | | An overweight to mortgage-backed securities detracted from returns as mortgage spreads widened. |
| » | | Emerging market currency exposure was positive for returns as these currencies outperformed the U.S. dollar. |
| » | | Global swap spread widening strategies were positive for returns as global swap spreads widened. |
| | | | |
| 4 | | PIMCO Variable Insurance Trust | | |
Financial Highlights Global Bond Portfolio (Unhedged)
| | | | | | | | |
| Selected per Share Data for the Period Ended: | | 06/30/2007+ | | | 01/31/2006-12/31/2006 | |
| | |
Institutional Class | | | | | | | | |
Net asset value beginning of period | | $ | 12.06 | | | $ | 12.00 | |
Net investment income (a) | | | 0.21 | | | | 0.41 | |
Net realized/unrealized gain (loss) on investments (a) | | | (0.33 | ) | | | 0.04 | |
Total income (loss) from investment operations | | | (0.12 | ) | | | 0.45 | |
Dividends from net investment income | | | (0.20 | ) | | | (0.39 | ) |
Total distributions | | | (0.20 | ) | | | (0.39 | ) |
Net asset value end of period | | $ | 11.74 | | | $ | 12.06 | |
Total return | | | (1.03 | )% | | | 3.77 | % |
Net assets end of period (000s) | | $ | 188 | | | $ | 48 | |
Ratio of expenses to average net assets | | | 0.75 | %* | | | 0.75 | %* |
Ratio of expenses to average net assets excluding interest expense | | | 0.75 | %* | | | 0.75 | %* |
Ratio of net investment income to average net assets | | | 3.48 | %* | | | 3.70 | %* |
Portfolio turnover rate | | | 277 | % | | | 224 | % |
+ Unaudited
* Annualized
(a) Per share amounts based on average number of shares outstanding during the period.
| | | | | | |
| See Accompanying Notes | | Semiannual Report | | June 30, 2007 | | 5 |
Statement of Assets and Liabilities Global Bond Portfolio (Unhedged)
| | | | |
| (Amounts in thousands, except per share amounts) | | June 30, 2007
(Unaudited) | |
| |
Assets: | | | | |
Investments, at value | | $ | 296,193 | |
Foreign currency, at value | | | 4,357 | |
Receivable for investments sold | | | 25,626 | |
Receivable for Portfolio shares sold | | | 134 | |
Interest and dividends receivable | | | 2,426 | |
Variation margin receivable | | | 98 | |
Swap premiums paid | | | 5,055 | |
Unrealized appreciation on foreign currency contracts | | | 458 | |
Unrealized appreciation on swap agreements | | | 2,768 | |
| | | | 337,115 | |
| |
Liabilities: | | | | |
Payable for investments purchased | | $ | 101,093 | |
Payable for investments purchased on a delayed-delivery basis | | | 5,295 | |
Payable for Portfolio shares redeemed | | | 580 | |
Payable for short sales | | | 24,418 | |
Written options outstanding | | | 123 | |
Accrued investment advisory fee | | | 42 | |
Accrued administration fee | | | 84 | |
Accrued servicing fee | | | 25 | |
Variation margin payable | | | 109 | |
Swap premiums received | | | 583 | |
Unrealized depreciation on foreign currency contracts | | | 589 | |
Unrealized depreciation on swap agreements | | | 2,628 | |
| | | | 135,569 | |
| |
Net Assets | | $ | 201,546 | |
| |
Net Assets Consist of: | | | | |
Paid in capital | | $ | 206,138 | |
(Overdistributed) net investment income | | | (311 | ) |
Accumulated undistributed net realized (loss) | | | (4,303 | ) |
Net unrealized appreciation | | | 22 | |
| | | $ | 201,546 | |
| |
Net Assets: | | | | |
Institutional Class | | $ | 188 | |
Administrative Class | | | 201,348 | |
Advisor Class | | | 10 | |
| |
Shares Issued and Outstanding: | | | | |
Institutional Class | | | 16 | |
Administrative Class | | | 17,147 | |
Advisor Class | | | 1 | |
| |
Net Asset Value and Redemption Price Per Share (Net Asset Per Share Outstanding) | | | | |
Institutional Class | | $ | 11.74 | |
Administrative Class | | | 11.74 | |
Advisor Class | | | 11.74 | |
| |
Cost of Investments Owned | | $ | 296,515 | |
Cost of Foreign Currency Held | | $ | 4,343 | |
Proceeds Received on Short Sales | | $ | 24,631 | |
Premiums Received on Written Options | | $ | 547 | |
| | | | |
| 6 | | PIMCO Variable Insurance Trust | | See Accompanying Notes |
Statement of Operations Global Bond Portfolio (Unhedged)
| | | | |
| (Amounts in thousands) | | Six Months Ended June 30, 2007 (Unaudited) | |
| |
| Investment Income: | | | | |
Interest, net of foreign taxes* | | $ | 3,989 | |
Dividends | | | 23 | |
Miscellaneous income | | | 4 | |
Total Income | | | 4,016 | |
| |
Expenses: | | | | |
Investment advisory fees | | | 237 | |
Administration fees | | | 475 | |
Servicing fees – Administrative Class | | | 142 | |
Trustees’ fees | | | 2 | |
Interest expense | | | 1 | |
Total Expenses | | | 857 | |
| |
Net Investment Income | | | 3,159 | |
| |
Net Realized and Unrealized Gain (Loss): | | | | |
Net realized (loss) on investments | | | (1,909 | ) |
Net realized (loss) on futures contracts, written options and swaps | | | (946 | ) |
Net realized (loss) on foreign currency transactions | | | (1,938 | ) |
Net change in unrealized (depreciation) on investments | | | (2,177 | ) |
Net change in unrealized appreciation on futures contracts, written options and swaps | | | 1,272 | |
Net change in unrealized appreciation on translation of assets and liabilities denominated in foreign currencies | | | 391 | |
Net (Loss) | | | (5,307 | ) |
| |
Net (Decrease) in Net Assets Resulting from Operations | | $ | (2,148 | ) |
| |
*Foreign tax withholding | | $ | 1 | |
| | | | | | |
| See Accompanying Notes | | Semiannual Report | | June 30, 2007 | | 7 |
Statements of Changes in Net Assets Global Bond Portfolio (Unhedged)
| | | | | | | | |
| (Amounts in thousands) | | Six Months Ended June 30, 2007 (Unaudited) | | | Year Ended December 31, 2006 | |
| | |
| Increase (Decrease) in Net Assets from: | | | | | | | | |
| | |
Operations: | | | | | | | | |
Net investment income | | $ | 3,159 | | | $ | 4,817 | |
Net realized gain (loss) | | | (4,793 | ) | | | 1,490 | |
Net change in unrealized (depreciation) | | | (514 | ) | | | (120 | ) |
Net increase (decrease) resulting from operations | | | (2,148 | ) | | | 6,187 | |
| | |
Distributions to Shareholders: | | | | | | | | |
From net investment income | | | | | | | | |
Institutional Class | | | (3 | ) | | | 0 | |
Administrative Class | | | (3,049 | ) | | | (4,594 | ) |
Advisor Class | | | 0 | | | | 0 | |
| | |
Total Distributions | | | (3,052 | ) | | | (4,594 | ) |
| | |
Portfolio Share Transactions: | | | | | | | | |
Receipts for shares sold | | | | | | | | |
Institutional Class | | | 150 | | | | 49 | |
Administrative Class | | | 50,329 | | | | 99,227 | |
Advisor Class | | | 0 | | | | 10 | |
Issued as reinvestment of distributions | | | | | | | | |
Institutional Class | | | 3 | | | | 0 | |
Administrative Class | | | 3,049 | | | | 4,593 | |
Advisor Class | | | 0 | | | | 0 | |
Cost of shares redeemed | | | | | | | | |
Institutional Class | | | (8 | ) | | | (1 | ) |
Administrative Class | | | (20,729 | ) | | | (25,733 | ) |
Advisor Class | | | 0 | | | | 0 | |
Net increase resulting from Portfolio share transactions | | | 32,794 | | | | 78,145 | |
| | |
Total Increase in Net Assets | | | 27,594 | | | | 79,738 | |
| | |
Net Assets: | | | | | | | | |
Beginning of period | | | 173,952 | | | | 94,214 | |
End of period* | | $ | 201,546 | | | $ | 173,952 | |
| | |
*Including (overdistributed) net investment income of: | | $ | (311 | ) | | $ | (418 | ) |
| | | | |
| 8 | | PIMCO Variable Insurance Trust | | See Accompanying Notes |
| | |
| |
| Schedule of Investments Global Bond Portfolio (Unhedged) | | June 30, 2007 (Unaudited) |
| | | | | | | | |
| | | | | PRINCIPAL
AMOUNT
(000S) | | | | VALUE (000S) |
| BELGIUM 0.4% |
| Belgium Government Bond | | | | |
4.250% due 09/28/2014 | | EUR | | 600 | | $ | | 795 |
| | | | | | | | |
Total Belgium (Cost $761) | | | | 795 |
| | | | | | | | |
|
| BERMUDA 0.2% |
| Intelsat Bermuda Ltd. | | | | | | | | |
5.250% due 11/01/2008 | | $ | | 400 | | | | 396 |
| | | | | | | | |
Total Bermuda (Cost $395) | | | | 396 |
| | | | | | | | |
|
| BRAZIL 0.1% |
| Vale Overseas Ltd. | | | | | | | | |
6.250% due 01/11/2016 | | $ | | 300 | | | | 299 |
| | | | | | | | |
Total Brazil (Cost $300) | | | | 299 |
| | | | | | | | |
|
| CANADA 0.5% |
| DaimlerChrysler Canada Finance, Inc. | | | | |
4.850% due 03/30/2009 | | CAD | | 200 | | | | 187 |
| |
| Province of Ontario Canada | | | | |
6.200% due 06/02/2031 | | | | 500 | | | | 550 |
| |
| Rogers Wireless, Inc. | | | | |
7.250% due 12/15/2012 | | $ | | 200 | | | | 211 |
| | | | | | | | |
Total Canada (Cost $939) | | | | 948 |
| | | | | | | | |
|
| CAYMAN ISLANDS 1.0% |
| Mizuho Finance Cayman Ltd. | | | | |
2.116% due 08/29/2049 | | JPY | | 100,000 | | | | 822 |
8.375% due 12/29/2049 | | $ | | 400 | | | | 418 |
| |
| MUFG Capital Finance 1 Ltd. | | | | |
6.346% due 07/29/2049 | | | | 400 | | | | 394 |
| |
| SMFG Preferred Capital USD 1 Ltd. | | | | |
6.078% due 01/29/2049 | | | | 400 | | | | 387 |
| | | | | | | | |
Total Cayman Islands (Cost $2,083) | | | | 2,021 |
| | | | | | | | |
|
| FRANCE 0.8% |
| France Government Bond | | | | |
3.150% due 07/25/2032 (c) | | EUR | | 110 | | | | 170 |
5.750% due 10/25/2032 | | | | 600 | | | | 930 |
6.500% due 04/25/2011 | | | | 300 | | | | 434 |
| | | | | | | | |
Total France (Cost $1,569) | | | | 1,534 |
| | | | | | | | |
|
| GERMANY 18.5% |
| Republic of Germany | | | | |
3.750% due 01/04/2015 | | EUR | | 3,200 | | | | 4,111 |
4.250% due 01/04/2014 | | | | 1,400 | | | | 1,862 |
4.250% due 07/04/2014 | | | | 5,700 | | | | 7,573 |
4.750% due 07/04/2028 | | | | 300 | | | | 407 |
4.750% due 07/04/2034 | | | | 100 | | | | 136 |
5.000% due 07/04/2012 | | | | 3,500 | | | | 4,833 |
5.250% due 01/04/2011 | | | | 5,400 | | | | 7,475 |
5.500% due 01/04/2031 | | | | 400 | | | | 600 |
5.625% due 01/04/2028 | | | | 3,550 | | | | 5,357 |
6.250% due 01/04/2024 | | | | 600 | | | | 955 |
6.250% due 01/04/2030 | | | | 1,300 | | | | 2,124 |
6.500% due 07/04/2027 | | | | 1,100 | | | | 1,826 |
| | | | | | | | |
Total Germany (Cost $36,778) | | | | 37,259 |
| | | | | | | | |
|
| ICELAND 0.2% |
| Glitnir Banki HF | | | | | | | | |
5.618% due 04/20/2010 | | $ | | 500 | | | | 500 |
| | | | | | | | |
Total Iceland (Cost $500) | | | | 500 |
| | | | | | | | |
| | | | | | | | |
| | | | | PRINCIPAL
AMOUNT
(000S) | | | | VALUE (000S) |
| IRELAND 0.2% |
| Bank of Ireland | | | | | | | | |
5.370% due 12/19/2008 | | $ | | 400 | | $ | | 401 |
| | | | | | | | |
Total Ireland (Cost $400) | | 401 |
| | | | | | | | |
|
| ITALY 0.2% |
| Seashell Securities PLC | | | | | | | | |
4.295% due 07/25/2028 | | EUR | | 39 | | | | 52 |
| |
| Siena Mortgages SpA | | | | | | | | |
4.377% due 12/16/2038 | | | | 237 | | | | 323 |
| | | | | | | | |
Total Italy (Cost $332) | | | | 375 |
| | | | | | | | |
|
| JAPAN 13.4% |
| Bank of Tokyo-Mitsubishi UFJ Ltd. | | | | |
3.500% due 12/16/2015 | | EUR | | 100 | | | | 129 |
| |
| Japan Government Bond | | | | |
1.000% due 09/20/2010 | | JPY | | 100,000 | | | | 806 |
1.500% due 03/20/2011 | | | | 620,000 | | | | 5,075 |
1.500% due 03/20/2014 | | | | 30,000 | | | | 241 |
1.600% due 09/20/2013 | | | | 10,000 | | | | 81 |
1.600% due 06/20/2014 | | | | 120,000 | | | | 971 |
1.600% due 09/20/2014 | | | | 120,000 | | | | 969 |
2.300% due 05/20/2030 | | | | 7,000 | | | | 57 |
2.300% due 06/20/2035 | | | | 130,000 | | | | 1,028 |
2.400% due 03/20/2034 | | | | 130,000 | | | | 1,054 |
2.500% due 09/20/2035 | | | | 360,000 | | | | 2,968 |
2.500% due 06/20/2036 | | | | 280,000 | | | | 2,299 |
| |
| Japanese Government CPI Linked Bond |
0.800% due 12/10/2015 | | | | 119,880 | | | | 944 |
1.100% due 12/10/2016 | | | | 1,053,640 | | | | 8,453 |
1.200% due 06/10/2017 | | | | 120,000 | | | | 968 |
| |
| Resona Bank Ltd. | | | | |
5.850% due 09/29/2049 | | $ | | 100 | | | | 96 |
| |
| Sumitomo Mitsui Banking Corp. | | | | |
1.641% due 12/31/2049 | | JPY | | 100,000 | | | | 819 |
5.625% due 07/29/2049 | | $ | | 100 | | | | 95 |
| | | | | | | | |
Total Japan (Cost $28,833) | | | | 27,053 |
| | | | | | | | |
|
| JERSEY, CHANNEL ISLANDS 0.1% |
| HSBC Capital Funding LP | | | | |
9.547% due 12/31/2049 | | $ | | 100 | | | | 110 |
| | | | | | | | |
Total Jersey, Channel Islands
(Cost $112) | | 111 |
| | | | | | | | |
|
| MEXICO 0.1% |
| Pemex Project Funding Master Trust | | | | |
5.750% due 12/15/2015 | | $ | | 100 | | | | 98 |
| | | | | | | | |
Total Mexico (Cost $97) | | | | 98 |
| | | | | | | | |
|
| NETHERLANDS 0.8% |
| Dutch Mortgage-Backed Securities BV | | | | |
4.202% due 10/02/2079 | | EUR | | 969 | | | | 1,317 |
| |
| Netherlands Government Bond | | | | |
4.250% due 07/15/2013 | | | | 200 | | | | 266 |
| |
| Siemens Financieringsmaatschappij NV | | |
5.410% due 08/14/2009 | | $ | | 100 | | | | 100 |
| | | | | | | | |
Total Netherlands (Cost $1,539) | | | | 1,683 |
| | | | | | | | |
|
| NORWAY 0.2% |
| DnB NORBank ASA | | | | | | | | |
5.425% due 10/13/2009 | | $ | | 300 | | | | 300 |
| | | | | | | | |
Total Norway (Cost $300) | | | | 300 |
| | | | | | | | |
| | | | | | | | |
| | | | | PRINCIPAL
AMOUNT
(000S) | | | | VALUE
(000S) |
| RUSSIA 0.2% | | |
| VTB Capital S.A. for Vneshtorgbank | | | | |
5.955% due 08/01/2008 | | $ | | 500 | | $ | | 501 |
| | | | | | | | |
Total Russia (Cost $500) | | | | 501 |
| | | | | | | | |
|
| SPAIN 4.2% | | |
| Santander U.S. Debt S.A. Unipersonal | | |
5.420% due 11/20/2009 | | $ | | 400 | | | | 400 |
| |
| Spain Government Bond | | | | | | | | |
4.750% due 07/30/2014 | | EUR | | 5,000 | | | | 6,844 |
5.150% due 07/30/2009 | | | | 900 | | | | 1,233 |
| | | | | | | | |
Total Spain (Cost $8,097) | | | | 8,477 |
| | | | | | | | |
|
| UNITED KINGDOM 14.8% | | |
| HBOS PLC | | | | | | | | |
5.920% due 09/29/2049 | | $ | | 1,200 | | | | 1,127 |
| |
| Holmes Financing PLC | | | | | | | | |
4.228% due 07/15/2010 | | EUR | | 100 | | | | 135 |
| |
| HSBC Holdings PLC | | | | | | | | |
6.500% due 05/02/2036 | | $ | | 1,200 | | | | 1,237 |
| |
| Punch Taverns Finance Ltd. | | | | |
6.824% due 10/15/2032 (a) | | GBP | | 100 | | | | 201 |
| |
| Royal Bank of Scotland Group PLC | | | | |
5.750% due 07/06/2012 | | $ | | 100 | | | | 100 |
| |
| Tate & Lyle International Finance PLC |
6.125% due 06/15/2011 | | | | 200 | | | | 202 |
| |
| United Kingdom Gilt | | | | |
4.250% due 03/07/2011 | | GBP | | 2,200 | | | | 4,194 |
4.750% due 06/07/2010 | | | | 7,520 | | | | 14,675 |
4.750% due 09/07/2015 | | | | 1,500 | | | | 2,859 |
5.000% due 03/07/2008 | | | | 100 | | | | 200 |
5.000% due 03/07/2012 | | | | 2,500 | | | | 4,877 |
| |
| XL Capital Europe PLC | | | | |
6.500% due 01/15/2012 | | $ | | 100 | | | | 103 |
| | | | | | | | |
Total United Kingdom (Cost $28,717) | | 29,910 |
| | | | | | | | |
|
| UNITED STATES 81.6% |
|
| ASSET-BACKED SECURITIES 7.5% |
| Accredited Mortgage Loan Trust | | | | |
5.360% due 09/25/2036 | | $ | | 373 | | | | 373 |
5.370% due 02/25/2037 | | | | 689 | | | | 690 |
| |
| ACE Securities Corp. |
5.430% due 10/25/2035 | | | | 17 | | | | 17 |
| |
| Amortizing Residential Collateral Trust |
5.610% due 07/25/2032 | | | | 1 | | | | 1 |
5.670% due 10/25/2031 | | | | 3 | | | | 3 |
| |
| Asset-Backed Funding Certificates |
5.380% due 01/25/2037 | | | | 603 | | | | 603 |
| |
| Asset-Backed Securities Corp. Home Equity |
5.370% due 12/25/2036 | | | | 571 | | | | 571 |
| |
| Carrington Mortgage Loan Trust |
5.370% due 12/25/2036 | | | | 680 | | | | 681 |
| |
| Centex Home Equity |
5.370% due 06/25/2036 | | | | 182 | | | | 182 |
| |
| Countrywide Asset-Backed Certificates |
5.350% due 01/25/2046 | | | | 362 | | | | 362 |
5.370% due 05/25/2037 | | | | 1,328 | | | | 1,328 |
| |
| Credit-Based Asset Servicing & Securitization LLC |
5.380% due 11/25/2036 | | | | 655 | | | | 656 |
| |
| CSAB Mortgage-Backed Trust |
5.420% due 06/25/2036 | | | | 97 | | | | 97 |
| |
| | | | | | |
| See Accompanying Notes | | Semiannual Report | | June 30, 2007 | | 9 |
Schedule of Investments Global Bond Portfolio (Unhedged) (Cont.)
| | | | | | | | |
| | | | | PRINCIPAL
AMOUNT
(000S) | | | | VALUE
(000S) |
| CS First Boston Mortgage Securities Corp. |
5.940% due 01/25/2032 | | $ | | 1 | | $ | | 1 |
| |
| First Franklin Mortgage Loan Asset-Backed Certificates |
5.350% due 05/25/2036 | | | | 277 | | | | 277 |
5.360% due 01/25/2038 | | | | 658 | | | | 658 |
| |
| Fremont Home Loan Trust | | | | |
5.370% due 10/25/2036 | | | | 554 | | | | 554 |
| |
| GSAMP Trust | | | | |
5.420% due 01/25/2047 | | | | 721 | | | | 721 |
5.610% due 03/25/2034 | | | | 41 | | | | 41 |
| |
| HSI Asset Securitization Corp. Trust | | | | |
5.370% due 12/25/2036 | | | | 674 | | | | 675 |
| |
| Indymac Residential Asset-Backed Trust |
5.360% due 08/25/2036 | | | | 272 | | | | 272 |
5.380% due 04/25/2037 | | | | 632 | | | | 632 |
| |
| IXIS Real Estate Capital Trust | | | | |
5.380% due 08/25/2036 | | | | 94 | | | | 94 |
| |
| JPMorgan Mortgage Acquisition Corp. | | |
5.370% due 10/25/2036 | | | | 654 | | | | 653 |
| |
| Lehman XS Trust | | | | |
5.400% due 04/25/2046 | | | | 178 | | | | 179 |
5.400% due 07/25/2046 | | | | 354 | | | | 354 |
| |
| Long Beach Mortgage Loan Trust | | | | |
5.380% due 05/25/2046 | | | | 124 | | | | 124 |
| |
| Merrill Lynch Mortgage Investors, Inc. | | |
5.390% due 08/25/2036 | | | | 520 | | | | 521 |
| |
| Morgan Stanley ABS Capital I | | | | |
5.360% due 07/25/2036 | | | | 340 | | | | 340 |
5.390% due 02/25/2036 | | | | 155 | | | | 155 |
| |
| Morgan Stanley Home Equity Loans | | | | |
5.390% due 02/25/2036 | | | | 227 | | | | 227 |
| |
| Option One Mortgage Loan Trust | | | | |
5.390% due 01/25/2036 | | | | 186 | | | | 187 |
| |
| Residential Asset Mortgage Products, Inc. | | |
5.400% due 01/25/2036 | | | | 96 | | | | 96 |
5.400% due 02/25/2036 | | | | 129 | | | | 129 |
| |
| Residential Asset Securities Corp. | | | | |
5.380% due 04/25/2036 | | | | 81 | | | | 81 |
| |
| SACO I, Inc. | | | | |
5.380% due 05/25/2036 | | | | 92 | | | | 92 |
| |
| Saxon Asset Securities Trust | | | | |
5.590% due 01/25/2032 | | | | 2 | | | | 2 |
| |
| Securitized Asset-Backed Receivables LLC Trust |
5.370% due 12/25/2036 | | | | 675 | | | | 675 |
5.380% due 03/25/2036 | | | | 202 | | | | 202 |
| |
| Soundview Home Equity Loan Trust | | | | |
5.430% due 11/25/2035 | | | | 8 | | | | 8 |
| |
| Structured Asset Securities Corp. | | | | |
4.900% due 04/25/2035 | | | | 54 | | | | 54 |
5.720% due 05/25/2034 | | | | 10 | | | | 10 |
| |
| Truman Capital Mortgage Loan Trust |
5.660% due 01/25/2034 | | | | 13 | | | | 13 |
| |
| Washington Mutual Asset-Backed Certificates |
5.380% due 10/25/2036 | | | | 674 | | | | 675 |
| |
| Wells Fargo Home Equity Trust | | | | |
5.440% due 12/25/2035 | | | | 270 | | | | 270 |
5.550% due 10/25/2035 | | | | 546 | | | | 547 |
| | | | | | | | |
| | | | | | | | 15,083 |
| | | | | | | | |
|
| CORPORATE BONDS & NOTES 11.4% | | |
| American Express Credit Corp. | | | | |
5.380% due 03/02/2009 | | | | 400 | | | | 401 |
| |
| | | | | | | | |
| | | | | PRINCIPAL
AMOUNT
(000S) | | | | VALUE
(000S) |
| American International Group, Inc. | | |
4.875% due 03/15/2067 | | EUR | | 200 | | $ | | 257 |
6.250% due 03/15/2037 | | $ | | 100 | | | | 95 |
| |
| AT&T, Inc. | | | | | | | | |
5.450% due 05/15/2008 | | | | 600 | | | | 601 |
| |
| AutoZone, Inc. | | | | | | | | |
5.875% due 10/15/2012 | | | | 100 | | | | 100 |
| |
| Bank of America Corp. |
5.366% due 11/06/2009 | | | | 400 | | | | 400 |
| |
| BellSouth Corp. |
5.200% due 09/15/2014 | | | | 200 | | | | 192 |
| |
| Boston Scientific Corp. |
6.400% due 06/15/2016 | | | | 200 | | | | 195 |
| |
| CenterPoint Energy, Inc. |
5.875% due 06/01/2008 | | | | 200 | | | | 200 |
| |
| Charter One Bank N.A. |
5.405% due 04/24/2009 | | | | 1,000 | | | | 1,001 |
| |
| CIT Group, Inc. |
5.430% due 02/21/2008 | | | | 300 | | | | 300 |
5.470% due 06/08/2009 | | | | 500 | | | | 498 |
5.570% due 05/23/2008 | | | | 100 | | | | 100 |
| |
| Citigroup, Inc. |
5.400% due 12/26/2008 | | | | 400 | | | | 400 |
| |
| CMS Energy Corp. |
6.310% due 01/15/2013 (a) | | 200 | | | | 201 |
7.500% due 01/15/2009 | | | | 200 | | | | 206 |
| |
| CNA Financial Corp. |
6.000% due 08/15/2011 | | | | 200 | | | | 201 |
| |
| ConocoPhillips Australia Funding Co. |
5.460% due 04/09/2009 | | | | 500 | | | | 500 |
| |
| CSX Corp. |
6.300% due 03/15/2012 | | | | 200 | | | | 204 |
| |
| CVS Caremark Corp. |
5.750% due 08/15/2011 | | | | 200 | | | | 200 |
| |
| DaimlerChrysler N.A. Holding Corp. |
5.710% due 03/13/2009 | | | | 600 | | | | 601 |
5.750% due 05/18/2009 | | | | 200 | | | | 201 |
| |
| Dex Media East LLC |
9.875% due 11/15/2009 | | | | 400 | | | | 416 |
| |
| Dominion Resources, Inc. |
5.660% due 09/28/2007 | | | | 100 | | | | 100 |
| |
| DR Horton, Inc. |
6.000% due 04/15/2011 | | | | 200 | | | | 195 |
| |
| El Paso Performance-Linked Trust |
7.750% due 07/15/2011 | | | | 300 | | | | 311 |
| |
| Equistar Chemicals LP |
8.750% due 02/15/2009 | | | | 400 | | | | 416 |
| |
| Fleet National Bank |
0.801% due 07/07/2008 | | JPY | | 30,000 | | | | 244 |
| |
| Ford Motor Credit Co. |
5.800% due 01/12/2009 | | $ | | 200 | | | | 196 |
6.625% due 06/16/2008 | | | | 600 | | | | 600 |
7.250% due 10/25/2011 | | | | 200 | | | | 193 |
8.105% due 01/13/2012 | | | | 500 | | | | 499 |
| |
| Freeport-McMoRan Copper & Gold, Inc. |
8.564% due 04/01/2015 | | | | 400 | | | | 420 |
| |
| General Electric Capital Corp. |
5.460% due 06/15/2009 | | | | 1,300 | | | | 1,304 |
| |
| General Motors Acceptance Corp. |
6.510% due 09/23/2008 | | | | 500 | | | | 500 |
| |
| GMAC LLC |
6.610% due 05/15/2009 | | | | 500 | | | | 500 |
| |
| | | | | | | | |
| | | | | PRINCIPAL
AMOUNT
(000S) | | | | VALUE
(000S) |
| Harrah’s Operating Co., Inc. |
5.956% due 02/08/2008 | | $ | | 100 | | $ | | 100 |
| |
| HJ Heinz Co. |
6.428% due 12/01/2008 | | | | 300 | | | | 303 |
| |
| HJ Heinz Finance Co. | | | | | | | | |
6.000% due 03/15/2012 | | | | 100 | | | | 100 |
| |
| HSBC Finance Corp. | | | | | | | | |
5.450% due 06/19/2009 | | | | 400 | | | | 401 |
5.490% due 09/15/2008 | | | | 100 | | | | 100 |
| |
| International Lease Finance Corp. |
5.350% due 03/01/2012 | | | | 200 | | | | 198 |
5.400% due 02/15/2012 | | | | 200 | | | | 198 |
| |
| iStar Financial, Inc. |
5.150% due 03/01/2012 | | | | 200 | | | | 193 |
| |
| JC Penney Corp., Inc. |
8.000% due 03/01/2010 | | | | 200 | | | | 211 |
| |
| JPMorgan Chase & Co. |
5.058% due 02/22/2021 | | CAD | | 200 | | | | 182 |
| |
| JPMorgan Chase Capital XXII |
6.450% due 02/02/2037 | | $ | | 100 | | | | 95 |
| |
| JPMorgan Mortgage Acquisition Corp. |
6.550% due 09/15/2066 | | | | 400 | | | | 386 |
| |
| Kraft Foods, Inc. |
6.250% due 06/01/2012 | | | | 200 | | | | 204 |
| |
| Mandalay Resort Group |
6.500% due 07/31/2009 | | | | 400 | | | | 402 |
| |
| Merck & Co., Inc. |
4.750% due 03/01/2015 | | | | 200 | | | | 188 |
| |
| Merrill Lynch & Co., Inc. |
5.395% due 10/23/2008 | | | | 200 | | | | 200 |
5.450% due 08/14/2009 | | | | 200 | | | | 200 |
| |
| Mizuho Preferred Capital Co. LLC |
8.790% due 12/29/2049 | | | | 100 | | | | 103 |
| |
| Morgan Stanley |
5.467% due 02/09/2009 | | | | 500 | | | | 501 |
5.809% due 10/18/2016 | | | | 200 | | | | 200 |
| |
| Newell Rubbermaid, Inc. |
4.000% due 05/01/2010 | | | | 200 | | | | 192 |
| |
| Qwest Capital Funding, Inc. |
6.375% due 07/15/2008 | | | | 100 | | | | 101 |
| |
| Rabobank Capital Funding Trust |
5.254% due 12/29/2049 | | | | 400 | | | | 375 |
| |
| Ryder System, Inc. |
5.850% due 11/01/2016 | | | | 200 | | | | 194 |
| |
| Sara Lee Corp. |
6.250% due 09/15/2011 | | | | 200 | | | | 204 |
| |
| SB Treasury Co. LLC |
9.400% due 12/29/2049 | | | | 100 | | | | 103 |
| |
| State Street Capital Trust IV |
6.355% due 06/15/2037 | | | | 500 | | | | 504 |
| |
| Time Warner, Inc. |
5.500% due 11/15/2011 | | | | 200 | | | | 198 |
5.590% due 11/13/2009 | | | | 400 | | | | 401 |
| |
| Tokai Preferred Capital Co. LLC |
9.980% due 12/29/2049 | | | | 300 | | | | 313 |
| |
| Toyota Motor Credit Corp. |
5.330% due 10/12/2007 | | | | 400 | | | | 400 |
| |
| TXU Corp. |
6.375% due 01/01/2008 | | | | 300 | | | | 302 |
| |
| U.S. Bancorp |
5.350% due 04/28/2009 | | | | 300 | | | | 300 |
| |
| Wachovia Bank N.A. |
5.400% due 03/23/2009 | | | | 500 | | | | 500 |
| |
| | | | |
| 10 | | PIMCO Variable Insurance Trust | | See Accompanying Notes |
| | |
| |
| | | June 30, 2007 (Unaudited) |
| | | | | | | | |
| | | | | PRINCIPAL
AMOUNT
(000S) | | | | VALUE
(000S) |
| Wal-Mart Stores, Inc. |
5.260% due 06/16/2008 | | $ | | 400 | | $ | | 400 |
| |
| Wells Fargo Capital X |
5.950% due 12/15/2036 | | | | 200 | | | | 187 |
| |
| Westpac Banking Corp. | | | | | | | | |
5.280% due 06/06/2008 | | | | 400 | | | | 400 |
| |
| Wyeth | | | | | | | | |
6.950% due 03/15/2011 | | | | 200 | | | | 210 |
| |
| Xerox Corp. | | | | | | | | |
9.750% due 01/15/2009 | | | | 200 | | | | 212 |
| | | | | | | | |
| | | | | | | | 22,909 |
| | | | | | | | |
|
| MORTGAGE-BACKED SECURITIES 5.8% | | |
| Banc of America Mortgage Securities, Inc. |
5.000% due 05/25/2034 | | | | 231 | | | | 226 |
| |
| Bear Stearns Commercial Mortgage Securities |
5.430% due 03/15/2019 | | | | 649 | | | | 649 |
| |
| Bear Stearns Mortgage Funding Trust |
5.390% due 02/25/2037 | | | | 737 | | | | 737 |
| |
| CC Mortgage Funding Corp. |
5.500% due 07/25/2036 | | | | 514 | | | | 514 |
| |
| Countrywide Alternative Loan Trust |
5.530% due 03/20/2046 | | | | 348 | | | | 347 |
5.600% due 02/25/2037 | | | | 388 | | | | 389 |
6.185% due 08/25/2036 | | | | 579 | | | | 579 |
| |
| Countrywide Home Loan Mortgage Pass-Through Trust |
5.550% due 05/25/2035 | | | | 258 | | | | 258 |
5.610% due 04/25/2035 | | | | 23 | | | | 23 |
5.640% due 03/25/2035 | | | | 330 | | | | 331 |
5.650% due 02/25/2035 | | | | 31 | | | | 31 |
5.700% due 09/25/2034 | | | | 41 | | | | 41 |
| |
| CS First Boston Mortgage Securities Corp. |
6.500% due 04/25/2033 | | | | 7 | | | | 7 |
| |
| First Horizon Asset Securities, Inc. |
6.250% due 08/25/2017 | | | | 235 | | | | 234 |
| |
| GE Capital Commercial Mortgage Corp. |
4.229% due 12/10/2037 | | | | 507 | | | | 496 |
| |
| GMAC Commercial Mortgage Securities, Inc. |
6.420% due 05/15/2035 | | | | 87 | | | | 88 |
| |
| GMAC Mortgage Corp. Loan Trust |
5.500% due 09/25/2034 | | | | 110 | | | | 109 |
| |
| Greenpoint Mortgage Funding Trust |
5.590% due 11/25/2045 | | | | 35 | | | | 35 |
| |
| Greenwich Capital Commercial Funding Corp. |
5.444% due 03/10/2039 | | | | 800 | | | | 775 |
| |
| GSR Mortgage Loan Trust |
4.538% due 09/25/2035 | | | | 232 | | | | 229 |
5.354% due 06/25/2034 | | | | 50 | | | | 51 |
| |
| Harborview Mortgage Loan Trust |
5.690% due 02/19/2034 | | | | 13 | | | | 13 |
| |
| Indymac Index Mortgage Loan Trust |
5.400% due 07/25/2046 | | | | 87 | | | | 87 |
| |
| JPMorgan Mortgage Trust |
4.768% due 07/25/2035 | | | | 750 | | | | 741 |
| |
| MASTR Asset Securitization Trust |
4.500% due 03/25/2018 | | | | 173 | | | | 169 |
| |
| Mellon Residential Funding Corp. |
5.760% due 12/15/2030 | | | | 46 | | | | 46 |
| |
| Nomura Asset Acceptance Corp. |
5.050% due 10/25/2035 | | | | 69 | | | | 69 |
| |
| Residential Accredit Loans, Inc. |
5.530% due 04/25/2046 | | | | 465 | | | | 465 |
| |
| | | | | | | | |
| | | | | PRINCIPAL
AMOUNT
(000S) | | | | VALUE
(000S) |
| Structured Asset Mortgage Investments, Inc. |
5.540% due 05/25/2036 | | $ | | 509 | | $ | | 510 |
5.610% due 07/19/2034 | | | | 15 | | | | 15 |
5.670% due 03/19/2034 | | | | 25 | | | | 25 |
| |
| Thornburg Mortgage Securities Trust |
5.430% due 12/25/2036 | | | | 681 | | | | 681 |
| |
| Wachovia Bank Commercial Mortgage Trust |
5.410% due 09/15/2021 | | | | 610 | | | | 610 |
| |
| Washington Mutual, Inc. |
5.094% due 10/25/2032 | | | | 4 | | | | 4 |
5.474% due 02/27/2034 | | | | 18 | | | | 18 |
5.590% due 12/25/2045 | | | | 177 | | | | 177 |
5.610% due 10/25/2045 | | | | 93 | | | | 94 |
5.630% due 01/25/2045 | | | | 33 | | | | 33 |
5.640% due 01/25/2045 | | | | 31 | | | | 31 |
5.724% due 07/25/2046 | | | | 563 | | | | 566 |
5.860% due 12/25/2027 | | | | 113 | | | | 113 |
6.429% due 08/25/2042 | | | | 32 | | | | 32 |
| |
| Wells Fargo Mortgage-Backed Securities Trust |
4.500% due 11/25/2018 | | | | 379 | | | | 368 |
4.750% due 10/25/2018 | | | | 218 | | | | 211 |
4.950% due 03/25/2036 | | | | 425 | | | | 419 |
5.254% due 04/25/2036 | | | | 138 | | | | 138 |
| | | | | | | | |
| | | | | | | | 11,784 |
| | | | | | | | |
|
| MUNICIPAL BONDS & NOTES 0.0% | | |
| New York City, New York Transitional Finance Authority Revenue Bonds, Series 2004 |
5.000% due 02/01/2028 | | | | 25 | | | | 26 |
| | | | | | | | |
|
| | | | | SHARES | | | | |
| PREFERRED STOCKS 0.4% | | |
| DG Funding Trust | | | | | | | | |
7.600% due 12/31/2049 | | | | 58 | | | | 604 |
| |
| Fresenius Medical Care Capital Trust II | | |
7.875% due 02/01/2008 | | | | 200 | | | | 202 |
| | | | | | | | |
| | | | | | | | 806 |
| | | | | | | | |
|
| | | | | PRINCIPAL
AMOUNT
(000S) | | | | |
| COMMODITY INDEX-LINKED NOTES 0.5% |
| Morgan Stanley | | | | | | | | |
0.000% due 07/07/2008 | | $ | | 1,000 | | | | 994 |
| | | | | | | | |
|
| U.S. GOVERNMENT AGENCIES 54.8% | | |
| Fannie Mae | | | | | | | | |
4.187% due 11/01/2034 | | | | 325 | | | | 322 |
4.397% due 10/01/2034 | | | | 38 | | | | 38 |
4.940% due 12/01/2034 | | | | 48 | | | | 48 |
5.000% due 11/01/2018 - 03/01/2036 | | | | 796 | | | | 758 |
5.440% due 03/25/2034 | | | | 33 | | | | 33 |
5.470% due 08/25/2034 | | | | 27 | | | | 27 |
5.500% due 10/01/2016 - 07/01/2037 | | | | 22,233 | | | | 21,483 |
5.570% due 06/25/2044 | | | | 29 | | | | 29 |
6.000% due 07/01/2037 - 07/25/2044 | | | | 72,100 | | | | 71,324 |
6.500% due 07/01/2037 | | | | 7,000 | | | | 7,067 |
| |
| Freddie Mac | | | | | | | | |
4.500% due 02/15/2017 - 02/01/2018 | | | | 1,991 | | | | 1,913 |
5.000% due 03/15/2017 | | | | 331 | | | | 327 |
5.500% due 06/01/2035 - 07/01/2037 | | | | 4,657 | | | | 4,497 |
5.550% due 07/15/2037 | | | | 1,400 | | | | 1,400 |
6.000% due 04/15/2036 | | | | 965 | | | | 907 |
6.227% due 10/25/2044 | | | | 193 | | | | 195 |
7.190% due 02/01/2029 | | | | 27 | | | | 27 |
| |
| |
| | | | | | | | |
| | | | | PRINCIPAL
AMOUNT
(000S) | | | | VALUE
(000S) |
| Ginnie Mae | | | | | | | | |
5.125% due 11/20/2024 | | $ | | 6 | | $ | | 7 |
| | | | | | | | |
| | | | | | | | 110,402 |
| | | | | | | | |
|
| U.S. TREASURY OBLIGATIONS 1.2% | | |
| U.S. Treasury Bonds | | | | | | | | |
8.125% due 08/15/2019 | | | | 100 | | | | 127 |
8.750% due 05/15/2017 | | | | 100 | | | | 128 |
8.875% due 02/15/2019 | | | | 200 | | | | 265 |
| |
| U.S. Treasury Notes | | | | | | | | |
4.250% due 11/15/2014 | | | | 1,000 | | | | 954 |
4.625% due 02/29/2012 | | | | 200 | | | | 198 |
4.875% due 01/31/2009 | | | | 100 | | | | 100 |
| |
| U.S. Treasury Strips | | | | | | | | |
0.000% due 05/15/2017 | | | | 430 | | | | 260 |
0.000% due 08/15/2020 | | | | 300 | | | | 151 |
0.000% due 11/15/2021 | | | | 600 | | | | 283 |
| | | | | | | | |
| | | | | | | | 2,466 |
| | | | | | | | |
Total United States (Cost $164,845) | | | | 164,470 |
| | | | | | | | |
|
| SHORT-TERM INSTRUMENTS 9.0% |
|
| CERTIFICATES OF DEPOSIT 2.8% | | |
| Abbey National Treasury Services PLC |
5.270% due 07/02/2008 | | | | 400 | | | | 400 |
| |
| BNP Paribas |
5.262% due 05/28/2008 | | | | 800 | | | | 800 |
| |
| Countrywide Funding Corp. |
5.360% due 08/16/2007 | | | | 700 | | | | 700 |
| |
| Fortis Bank NY |
5.265% due 04/28/2008 | | | | 300 | | | | 300 |
| |
| Nordea Bank Finland PLC |
5.308% due 05/28/2008 | | | | 500 | | | | 501 |
| |
| Societe Generale NY |
5.271% due 06/30/2008 | | | | 1,300 | | | | 1,301 |
| |
| Unicredito Italiano NY |
5.358% due 12/13/2007 | | | | 400 | | | | 400 |
5.358% due 05/06/2008 | | | | 900 | | | | 900 |
5.360% due 12/03/2007 | | | | 300 | | | | 300 |
| | | | | | | | |
| | | | | | | | 5,602 |
| | | | | | | | |
|
| COMMERCIAL PAPER 5.2% | | |
| TotalFinaElf Capital S.A. | | | | | | | | |
5.340% due 07/02/2007 | | | | 4,600 | | | | 4,600 |
| |
| UBS Finance Delaware LLC | | |
5.205% due 10/23/2007 | | | | 300 | | | | 299 |
5.235% due 10/23/2007 | | | | 5,600 | | | | 5,545 |
| | | | | | | | |
| | | | | | | | 10,444 |
| | | | | | | | |
|
| REPURCHASE AGREEMENTS 0.5% | | |
| State Street Bank and Trust Co. | | |
4.900% due 07/02/2007 | | | | 922 | | | | 922 |
| | | | | | | | |
(Dated 06/29/2007. Collateralized by Fannie Mae
3.250% due 08/15/2008 valued at $945. Repurchase proceeds are $922.) |
|
| U.S. TREASURY BILLS 0.5% | | |
4.657% due 08/30/2007 - 09/13/2007 (b)(e) | | | | 1,110 | | | | 1,099 |
| | | | | | | | |
Total Short-Term Instruments
(Cost $18,068) | | | | 18,067 |
| | | | | | | | |
| | | | | | |
| See Accompanying Notes | | Semiannual Report | | June 30, 2007 | | 11 |
Schedule of Investments Global Bond Portfolio (Unhedged) (Cont.)
| | | | | | | | | |
| | | | | | | | | VALUE
(000S) | |
| PURCHASED OPTIONS (g) 0.5% | |
(Cost $1,350) | | $ | | 995 | |
| |
| | | | | | | | | |
Total Investments (d) 147.0%
(Cost $296,515) | | $ | | 296,193 | |
| |
Written Options (h) (0.1%)
(Premiums $547) | | | | | | | | (123 | ) |
| |
| Other Assets and Liabilities (Net) (46.9%) | | (94,524 | ) |
| | | | | | | | | |
| Net Assets 100.0% | | | | | | $ | | 201,546 | |
| | | | | | | | | |
Notes to Schedule of Investments (amounts in thousands*, except number of contracts):
* A zero balance may reflect actual amounts rounding to less than one thousand.
(a) When-issued security.
(b) Coupon represents a weighted average rate.
(c) Principal amount of security is adjusted for inflation.
(d) As of June 30, 2007, portfolio securities with an aggregate value of $2,394 were valued in good faith and pursuant to the guidelines established by the Board of Trustees.
(e) Securities with an aggregate market value of $1,099 have been segregated with the custodian to cover margin requirements for the following open futures contracts on June 30, 2007:
| | | | | | | | | | |
| Description | | Type | | Expiration
Month | | # of
Contracts | | Unrealized
Appreciation/
(Depreciation) | |
90-Day Eurodollar December Futures | | Long | | 12/2007 | | 36 | | $ | 9 | |
90-Day Eurodollar March Futures | | Long | | 03/2008 | | 8 | | | (9 | ) |
90-Day Euroyen December Futures | | Long | | 12/2007 | | 133 | | | (32 | ) |
Euro-Bobl 5-Year Note September Futures | | Long | | 09/2007 | | 146 | | | (50 | ) |
Euro-Bobl 5-Year Note September Futures Put Options
Strike @ EUR 104.000 | | Long | | 09/2007 | | 93 | | | 1 | |
Euro-Bund 10-Year Note September Futures | | Long | | 09/2007 | | 240 | | | (176 | ) |
Euro-Bund 10-Year Note September Futures Put Options
Strike @ EUR 106.000 | | Long | | 09/2007 | | 207 | | | 3 | |
Japan Government 10-Year Bond September Futures | | Long | | 09/2007 | | 34 | | | (132 | ) |
U.S. Treasury 10-Year Note September Futures | | Long | | 09/2007 | | 125 | | | 62 | |
U.S. Treasury 30-Year Bond September Futures | | Long | | 09/2007 | | 32 | | | 33 | |
United Kingdom 90-Day LIBOR Sterling Interest Rate
September Futures | | Long | | 09/2007 | | 34 | | | (36 | ) |
| | | | | | | | | | |
| | | | | | | | $ | (327 | ) |
| | | | | | | | | | |
(f) Swap agreements outstanding on June 30, 2007:
Credit Default Swaps
| | | | | | | | | | | | | | | | |
| Counterparty | | Reference Entity | | Buy/Sell
Protection (1) | | (Pay)/Receive
Fixed Rate | | | Expiration
Date | | Notional
Amount | | Unrealized
Appreciation/
(Depreciation) | |
Barclays Bank PLC | | Dow Jones iTraxx Europe HV6 Index | | Buy | | (0.850% | ) | | 12/20/2016 | | EUR | 800 | | $ | (1 | ) |
BNP Paribas Bank | | Dow Jones iTraxx Europe HV6 Index | | Buy | | (0.850% | ) | | 12/20/2016 | | | 500 | | | 0 | |
Deutsche Bank AG | | Akzo Nobel NV 4.250% due 06/14/2011 | | Buy | | (0.290% | ) | | 06/20/2012 | | | 200 | | | (1 | ) |
Deutsche Bank AG | | Kelda Group PLC 6.625% DUE 04/17/2031 | | Buy | | (0.210% | ) | | 06/20/2012 | | | 200 | | | 0 | |
Deutsche Bank AG | | United Utilities PLC 6.875% due 08/15/2028 | | Buy | | (0.235% | ) | | 06/20/2012 | | | 200 | | | 1 | |
Deutsche Bank AG | | Dow Jones iTraxx Europe HV6 Index | | Buy | | (0.850% | ) | | 12/20/2016 | | | 1,200 | | | (1 | ) |
Goldman Sachs & Co. | | ICI Wilmington, Inc. 5.625% due 12/01/2013 | | Buy | | (0.340% | ) | | 06/20/2012 | | | 200 | | | 0 | |
Goldman Sachs & Co. | | Koninklijke DSM NV 4.000% due 11/10/2015 | | Buy | | (0.365% | ) | | 06/20/2012 | | | 200 | | | (1 | ) |
Goldman Sachs & Co. | | SCA Finans AB 4.500% due 07/15/2015 | | Buy | | (0.250% | ) | | 06/20/2012 | | | 200 | | | 0 | |
Goldman Sachs & Co. | | Dow Jones iTraxx Europe HV6 Index | | Buy | | (0.850% | ) | | 12/20/2016 | | | 100 | | | 0 | |
HSBC Bank USA | | Dow Jones iTraxx Europe HV6 Index | | Buy | | (0.850% | ) | | 12/20/2016 | | | 100 | | | 0 | |
JPMorgan Chase & Co. | | Dow Jones iTraxx Europe HV6 Index | | Buy | | (0.850% | ) | | 12/20/2016 | | | 700 | | | (2 | ) |
Merrill Lynch & Co., Inc. | | Compass Group PLC 6.375% due 05/29/2012 | | Buy | | (0.390% | ) | | 06/20/2012 | | | 200 | | | 0 | |
Deutsche Bank AG | | SOFTBANK Corp. 1.750% due 03/31/2014 | | Sell | | 2.300% | | | 09/20/2007 | | JPY | 47,000 | | | 2 | |
Bank of America | | Lehman Brothers Holdings, Inc. 6.625% due 01/18/2012 | | Sell | | 0.150% | | | 06/20/2008 | | $ | 600 | | | 0 | |
Bank of America | | Merrill Lynch & Co., Inc. 6.000% due 02/17/2009 | | Sell | | 0.150% | | | 06/20/2008 | | | 200 | | | 0 | |
Bank of America | | DR Horton, Inc. 6.000% due 04/15/2011 | | Buy | | (0.890% | ) | | 06/20/2011 | | | 200 | | | 3 | |
Bank of America | | Time Warner, Inc. 5.500% due 11/15/2011 | | Buy | | (0.310% | ) | | 12/20/2011 | | | 200 | | | (1 | ) |
Bank of America | | Transocean, Inc. 7.375% due 04/15/2018 | | Buy | | (0.539% | ) | | 06/20/2017 | | | 100 | | | 0 | |
Bank of America | | Transocean, Inc. 7.375% due 04/15/2018 | | Buy | | (0.505% | ) | | 06/20/2017 | | | 400 | | | (1 | ) |
Barclays Bank PLC | | International Lease Finance Corp. 5.400% due 02/15/2012 | | Buy | | (0.170% | ) | | 03/20/2012 | | | 200 | | | 0 | |
| | | | |
| 12 | | PIMCO Variable Insurance Trust | | See Accompanying Notes |
| | |
| |
| | | June 30, 2007 (Unaudited) |
| | | | | | | | | | | | | | | | |
| Counterparty | | Reference Entity | | Buy/Sell
Protection (1) | | (Pay)/Receive
Fixed Rate | | | Expiration
Date | | Notional
Amount | | Unrealized
Appreciation/
(Depreciation) | |
Barclays Bank PLC | | XL Capital Europe PLC 6.500% due 01/15/2012 | | Buy | | (0.310% | ) | | 03/20/2012 | | $ | 100 | | $ | 0 | |
Barclays Bank PLC | | American Electric Power Co., Inc. 5.250% due 06/01/2015 | | Buy | | (0.100% | ) | | 06/20/2012 | | | 100 | | | 0 | |
Barclays Bank PLC | | Capital One Bank 5.125% due 02/15/2014 | | Buy | | (0.160% | ) | | 06/20/2012 | | | 400 | | | 1 | |
Barclays Bank PLC | | Noble Corp. 5.875% due 06/01/2013 | | Buy | | (0.530% | ) | | 06/20/2012 | | | 100 | | | 0 | |
Bear Stearns & Co., Inc. | | CNA Financial Corp. 6.000% due 08/15/2011 | | Buy | | (0.440% | ) | | 09/20/2011 | | | 100 | | | 0 | |
Bear Stearns & Co., Inc. | | H.J. Heinz Finance Co. 6.000% due 03/15/2012 | | Buy | | (0.370% | ) | | 03/20/2012 | | | 100 | | | 0 | |
Bear Stearns & Co., Inc. | | Kraft Foods, Inc. 6.250% due 06/01//2012 | | Buy | | (0.170% | ) | | 06/20/2012 | | | 200 | | | 1 | |
Bear Stearns & Co., Inc. | | MeadWestvaco Corp. 6.850% due 04/01/2012 | | Buy | | (0.520% | ) | | 06/20/2012 | | | 1,000 | | | 2 | |
Bear Stearns & Co., Inc. | | Weyerhaeuser Co. 6.750% due 03/15/2012 | | Buy | | (0.480% | ) | | 06/20/2012 | | | 1,000 | | | (1 | ) |
Bear Stearns & Co., Inc. | | Ryder System, Inc. 5.850% due 11/01/2016 | | Buy | | (0.460% | ) | | 12/20/2016 | | | 200 | | | 4 | |
Citibank N.A. | | Newell Rubbermaid, Inc. 4.000% due 05/01/2010 | | Buy | | (0.130% | ) | | 06/20/2010 | | | 200 | | | 0 | |
Citibank N.A. | | Nabors Industries, Inc. 5.375% due 08/15/2012 | | Buy | | (0.470% | ) | | 06/20/2012 | | | 100 | | | (1 | ) |
Citibank N.A. | | AutoZone, Inc. 5.875% due 10/15/2012 | | Buy | | (0.680% | ) | | 12/20/2012 | | | 100 | | | (2 | ) |
Credit Suisse First Boston | | CenterPoint Energy, Inc. 5.875% due 06/01/2008 | | Buy | | (0.170% | ) | | 06/20/2008 | | | 200 | | | 0 | |
Credit Suisse First Boston | | DaimlerChrysler N.A. Holding Corp. 5.750% due 05/18/2009 | | Buy | | (0.380% | ) | | 06/20/2009 | | | 200 | | | (1 | ) |
Credit Suisse First Boston | | iStar Financial, Inc. 5.150% due 03/01/2012 | | Buy | | (0.450% | ) | | 03/20/2012 | | | 200 | | | 1 | |
Credit Suisse First Boston | | Noble Corp. 5.875% due 06/01/2013 | | Buy | | (0.530% | ) | | 06/20/2012 | | | 100 | | | 0 | |
Credit Suisse First Boston | | Noble Corp. 5.875% due 06/01/2013 | | Buy | | (0.519% | ) | | 06/20/2012 | | | 300 | | | (1 | ) |
Deutsche Bank AG | | Bear Stearns Cos., Inc. 5.300% due 10/30/2015 | | Sell | | 0.160% | | | 06/20/2008 | | | 300 | | | 0 | |
Deutsche Bank AG | | Goldman Sachs Group, Inc. 6.600% due 01/15/2012 | | Sell | | 0.120% | | | 06/20/2008 | | | 600 | | | 0 | |
Deutsche Bank AG | | Lehman Brothers Holdings, Inc. 6.625% due 01/18/2012 | | Sell | | 0.160% | | | 06/20/2008 | | | 700 | | | 0 | |
Deutsche Bank AG | | JC Penney Corp., Inc. 8.000% due 03/01/2010 | | Buy | | (0.270% | ) | | 03/20/2010 | | | 200 | | | 0 | |
Goldman Sachs & Co. | | Carnival Corp. 6.650% due 01/15/2028 | | Buy | | (0.210% | ) | | 06/20/2012 | | | 100 | | | 0 | |
Goldman Sachs & Co. | | Dow Jones CDX N.A. IG8 Index | | Sell | | 0.350% | | | 06/20/2012 | | | 6,700 | | | (15 | ) |
Goldman Sachs & Co. | | GlobalSantaFe Corp. 5.000% due 02/15/2013 | | Buy | | (0.445% | ) | | 06/20/2012 | | | 300 | | | (1 | ) |
Goldman Sachs & Co. | | Dow Jones CDX N.A. IG8 Index | | Buy | | (0.600% | ) | | 06/20/2017 | | | 26,200 | | | 150 | |
Goldman Sachs & Co. | | International Paper Co. 5.850% due 10/30/2012 | | Buy | | (0.675% | ) | | 06/20/2017 | | | 100 | | | 0 | |
Goldman Sachs & Co. | | MeadWestvaco Corp. 6.850% due 04/01/2012 | | Buy | | (1.040% | ) | | 06/20/2017 | | | 500 | | | 3 | |
HSBC Bank USA | | Russia Government International Bond 7.500% due 03/31/2030 | | Sell | | 0.240% | | | 02/20/2008 | | | 500 | | | 0 | |
HSBC Bank USA | | Ukraine Government International Bond 7.650% due 06/11/2013 | | Sell | | 0.700% | | | 04/20/2009 | | | 400 | | | 2 | |
HSBC Bank USA | | Ukraine Government International Bond 7.650% due 06/11/2013 | | Sell | | 0.730% | | | 04/20/2009 | | | 400 | | | 2 | |
JPMorgan Chase & Co. | | CNA Financial Corp. 6.000% due 08/15/2011 | | Buy | | (0.440% | ) | | 09/20/2011 | | | 100 | | | 0 | |
Lehman Brothers, Inc. | | Ford Motor Credit Co. 7.875% due 06/15/2010 | | Buy | | (2.310% | ) | | 06/20/2010 | | | 200 | | | 0 | |
Lehman Brothers, Inc. | | Wyeth 6.950% due 03/15/2011 | | Buy | | (0.100% | ) | | 03/20/2011 | | | 200 | | | 0 | |
Lehman Brothers, Inc. | | Tate & Lyle International Finance PLC 6.125% due 06/15/2011 | | Buy | | (0.315% | ) | | 06/20/2011 | | | 200 | | | 0 | |
Lehman Brothers, Inc. | | Brazilian Government International Bond 12.250% due 03/06/2030 | | Sell | | 1.280% | | | 08/20/2011 | | | 3,200 | | | 93 | |
Lehman Brothers, Inc. | | Brazilian Government International Bond 12.250% due 03/06/2030 | | Sell | | 1.350% | | | 08/20/2011 | | | 2,300 | | | 73 | |
Lehman Brothers, Inc. | | CVS Corp. 5.750% due 08/15/2011 | | Buy | | (0.210% | ) | | 09/20/2011 | | | 200 | | | 0 | |
Lehman Brothers, Inc. | | Sealed Air Corp. 6.250% due 09/15/2011 | | Buy | | (0.350% | ) | | 09/20/2011 | | | 200 | | | 0 | |
Lehman Brothers, Inc. | | BellSouth Corp. 5.200% due 09/15/2014 | | Buy | | (0.325% | ) | | 09/20/2014 | | | 200 | | | (1 | ) |
Lehman Brothers, Inc. | | Merck & Co., Inc. 4.750% due 03/01/2015 | | Buy | | (0.135% | ) | | 03/20/2015 | | | 200 | | | 1 | |
Merrill Lynch & Co., Inc. | | CSX Corp. 6.300% due 03/15/2012 | | Buy | | (0.230% | ) | | 03/20/2012 | | | 200 | | | 1 | |
Merrill Lynch & Co., Inc. | | International Lease Finance Corp. 5.350% due 03/01/2012 | | Buy | | (0.130% | ) | | 03/20/2012 | | | 200 | | | 0 | |
Morgan Stanley | | Xerox Corp. 9.750% due 01/15/2009 | | Buy | | (0.290% | ) | | 03/20/2009 | | | 200 | | | 0 | |
Morgan Stanley | | Glitnir Banki HF floating rate based on 3-Month USD-LIBOR plus 0.260% due 04/20/2010 | | Buy | | (0.170% | ) | | 06/20/2010 | | | 500 | | | 0 | |
Morgan Stanley | | Weyerhaeuser Co. 6.750% due 03/15/2012 | | Buy | | (0.480% | ) | | 06/20/2012 | | | 1,000 | | | (1 | ) |
Morgan Stanley | | Rogers Wireless, Inc. 7.250% due 12/15/2012 | | Buy | | (0.540% | ) | | 12/20/2012 | | | 200 | | | 0 | |
Morgan Stanley | | Diamond Offshore Drilling, Inc. 4.875% due 07/01/2015 | | Buy | | (0.495% | ) | | 06/20/2017 | | | 100 | | | 0 | |
Royal Bank of Canada | | DaimlerChrysler Canada Finance, Inc. 4.850% due 03/30/2009 | | Buy | | (0.350% | ) | | 06/20/2009 | | | 200 | | | (1 | ) |
Royal Bank of Canada | | JPMorgan Chase & Co. 6.750% due 02/01/2011 | | Buy | | (0.310% | ) | | 03/20/2016 | | | 200 | | | 0 | |
Royal Bank of Scotland Group PLC | | Indonesia Government International Bond
6.750% due 03/10/2014 | | Sell | | 1.280% | | | 12/20/2011 | | | 100 | | | 1 | |
Royal Bank of Scotland Group PLC | | Morgan Stanley floating rate based on 3-Month USD-LIBOR plus 0.450% due 10/18/2016 | | Buy | | (0.320% | ) | | 12/20/2016 | | | 200 | | | 2 | |
UBS Warburg LLC | | American International Group, Inc.
4.250% due 05/15/2013 | | Sell | | 0.070% | | | 06/20/2008 | | | 800 | | | 0 | |
UBS Warburg LLC | | DR Horton, Inc. 5.375% due 06/15/2012 | | Buy | | (1.540% | ) | | 06/20/2017 | | | 200 | | | 12 | |
UBS Warburg LLC | | Lennar Corp. 5.950% due 03/01/2013 | | Buy | | (1.190% | ) | | 06/20/2017 | | | 500 | | | 14 | |
UBS Warburg LLC | | Weyerhaeuser Co. 6.750% due 03/15/2012 | | Buy | | (0.930% | ) | | 06/20/2017 | | | 400 | | | 2 | |
Wachovia Bank N.A. | | GlobalSantaFe Corp. 5.000% due 02/15/2013 | | Buy | | (0.530% | ) | | 06/20/2012 | | | 100 | | | (1 | ) |
Wachovia Bank N.A. | | GlobalSantaFe Corp. 5.000% due 02/15/2013 | | Buy | | (0.520% | ) | | 06/20/2012 | | | 100 | | | (1 | ) |
| | | | | | | | | | | | | | | | |
| | | | | | | | | | | | | | $ | 336 | |
| | | | | | | | | | | | | | | | |
(1) If the Portfolio is a seller of protection and a credit event occurs, as defined under the terms of that particular swap agreement, the Portfolio will pay to the buyer of the protection an amount up to the notional value of the swap and in certain instances, take delivery of the security. As a buyer of protection, the Portfolio will generally receive from the seller of protection an amount up to the notional amount of the swap if a credit event occurs.
| | | | | | |
| See Accompanying Notes | | Semiannual Report | | June 30, 2007 | | 13 |
Schedule of Investments Global Bond Portfolio (Unhedged) (Cont.)
Interest Rate Swaps
| | | | | | | | | | | | | | | |
| Counterparty | | Floating Rate Index | | Pay/Receive
Floating Rate | | Fixed Rate | | Expiration
Date | | Notional
Amount | | Unrealized
Appreciation/
(Depreciation) | |
Citibank N.A. | | 6-Month Australian Bank Bill | | Pay | | 6.500% | | 01/15/2009 | | AUD | 4,600 | | $ | (12 | ) |
Citibank N.A. | | 6-Month Australian Bank Bill | | Pay | | 6.000% | | 06/15/2010 | | | 700 | | | (19 | ) |
Citibank N.A. | | 6-Month Australian Bank Bill | | Receive | | 6.000% | | 06/15/2015 | | | 400 | | | 21 | |
Deutsche Bank AG | | 6-Month Australian Bank Bill | | Pay | | 6.500% | | 01/15/2009 | | | 15,700 | | | (40 | ) |
Deutsche Bank AG | | 6-Month Australian Bank Bill | | Pay | | 6.500% | | 01/15/2010 | | | 7,000 | | | (52 | ) |
Deutsche Bank AG | | 6-Month Australian Bank Bill | | Pay | | 6.000% | | 06/15/2012 | | | 3,900 | | | (99 | ) |
Deutsche Bank AG | | 6-Month Australian Bank Bill | | Receive | | 6.000% | | 06/15/2017 | | | 2,300 | | | 103 | |
HSBC Bank USA | | 6-Month Australian Bank Bill | | Pay | | 6.000% | | 06/15/2012 | | | 3,100 | | | (80 | ) |
HSBC Bank USA | | 6-Month Australian Bank Bill | | Receive | | 6.000% | | 06/15/2017 | | | 1,800 | | | 82 | |
Morgan Stanley | | 6-Month Australian Bank Bill | | Pay | | 6.500% | | 01/15/2009 | | | 7,000 | | | (18 | ) |
Royal Bank of Canada | | 6-Month Australian Bank Bill | | Pay | | 6.500% | | 01/15/2010 | | | 2,400 | | | (18 | ) |
UBS Warburg LLC | | 6-Month Australian Bank Bill | | Pay | | 6.000% | | 06/15/2010 | | | 1,700 | | | (48 | ) |
UBS Warburg LLC | | 6-Month Australian Bank Bill | | Receive | | 6.000% | | 06/15/2015 | | | 1,100 | | | 63 | |
Citibank N.A. | | 3-Month Canadian Bank Bill | | Receive | | 5.000% | | 06/15/2015 | | CAD | 500 | | | 21 | |
Royal Bank of Canada | | 3-Month Canadian Bank Bill | | Receive | | 5.000% | | 06/15/2015 | | | 1,500 | | | 20 | |
Barclays Bank PLC | | 6-Month EUR-LIBOR | | Receive | | 4.000% | | 06/17/2010 | | EUR | 10 | | | 0 | |
Barclays Bank PLC | | 5-Year French CPI Ex Tobacco Daily Reference Index | | Pay | | 1.948% | | 03/15/2012 | | | 900 | | | (23 | ) |
Deutsche Bank AG | | 6-Month EUR-LIBOR | | Receive | | 4.000% | | 12/15/2011 | | | 700 | | | 23 | |
Deutsche Bank AG | | 6-Month EUR-LIBOR | | Receive | | 4.000% | | 12/15/2014 | | | 12,160 | | | 514 | |
Goldman Sachs & Co. | | 6-Month EUR-LIBOR | | Receive | | 5.000% | | 09/19/2012 | | | 2,600 | | | (12 | ) |
Goldman Sachs & Co. | | 6-Month EUR-LIBOR | | Receive | | 4.000% | | 12/15/2014 | | | 7,000 | | | 421 | |
Goldman Sachs & Co. | | 6-Month EUR-LIBOR | | Receive | | 5.000% | | 03/19/2038 | | | 1,400 | | | (26 | ) |
HSBC Bank USA | | 6-Month EUR-LIBOR | | Receive | | 4.000% | | 12/15/2014 | | | 2,300 | | | 102 | |
JPMorgan Chase & Co. | | 6-Month EUR-LIBOR | | Receive | | 5.000% | | 06/17/2012 | | | 900 | | | 75 | |
Lehman Brothers, Inc. | | 6-Month EUR-LIBOR | | Receive | | 4.000% | | 12/15/2014 | | | 600 | | | 43 | |
Lehman Brothers, Inc. | | 6-Month EUR-LIBOR | | Pay | | 6.000% | | 06/18/2034 | | | 700 | | | (58 | ) |
Merrill Lynch & Co., Inc. | | 6-Month EUR-LIBOR | | Pay | | 6.000% | | 06/18/2034 | | | 1,000 | | | (58 | ) |
Morgan Stanley | | 6-Month EUR-LIBOR | | Receive | | 4.000% | | 12/15/2011 | | | 3,300 | | | 130 | |
Morgan Stanley | | 6-Month EUR-LIBOR | | Receive | | 4.000% | | 06/15/2017 | | | 500 | | | 48 | |
Morgan Stanley | | 6-Month EUR-LIBOR | | Pay | | 6.000% | | 06/18/2034 | | | 2,000 | | | (56 | ) |
Royal Bank of Scotland Group PLC | | 5-Year French CPI Ex Tobacco Daily Reference Index | | Pay | | 1.950% | | 03/30/2012 | | | 600 | | | (6 | ) |
Royal Bank of Scotland Group PLC | | 5-Year French CPI Ex Tobacco Daily Reference Index | | Pay | | 1.940% | | 04/10/2012 | | | 600 | | | (7 | ) |
UBS Warburg LLC | | 6-Month EUR-LIBOR | | Pay | | 4.000% | | 06/17/2010 | | | 200 | | | (15 | ) |
Barclays Bank PLC | | 6-Month GBP-LIBOR | | Pay | | 6.000% | | 03/20/2009 | | GBP | 9,800 | | | (110 | ) |
Barclays Bank PLC | | 6-Month GBP-LIBOR | | Pay | | 5.000% | | 09/15/2010 | | | 3,200 | | | (216 | ) |
Barclays Bank PLC | | 6-Month GBP-LIBOR | | Receive | | 5.000% | | 09/15/2015 | | | 600 | | | 78 | |
Barclays Bank PLC | | 6-Month GBP-LIBOR | | Receive | | 4.500% | | 09/15/2017 | | | 4,500 | | | 45 | |
Barclays Bank PLC | | 6-Month GBP-LIBOR | | Receive | | 4.000% | | 12/15/2035 | | | 1,200 | | | 134 | |
Deutsche Bank AG | | 6-Month GBP-LIBOR | | Pay | | 5.000% | | 06/15/2009 | | | 100 | | | (4 | ) |
Deutsche Bank AG | | 6-Month GBP-LIBOR | | Receive | | 4.250% | | 06/12/2036 | | | 200 | | | 52 | |
Goldman Sachs & Co. | | 6-Month GBP-LIBOR | | Receive | | 4.250% | | 06/12/2036 | | | 300 | | | 80 | |
JPMorgan Chase & Co. | | 6-Month GBP-LIBOR | | Receive | | 4.000% | | 12/15/2035 | | | 400 | | | 28 | |
Merrill Lynch & Co., Inc. | | 6-Month GBP-LIBOR | | Pay | | 5.000% | | 09/15/2010 | | | 2,800 | | | (251 | ) |
Morgan Stanley | | 6-Month GBP-LIBOR | | Pay | | 5.000% | | 09/15/2015 | | | 700 | | | (87 | ) |
Goldman Sachs & Co. | | 3-Month Hong Kong Bank Bill | | Receive | | 4.235% | | 12/17/2008 | | HKD | 5,800 | | | 5 | |
Deutsche Bank AG | | 6-Month JPY-LIBOR | | Pay | | 1.000% | | 09/18/2008 | | JPY | 2,060,000 | | | 6 | |
Deutsche Bank AG | | 6-Month JPY-LIBOR | | Pay | | 3.000% | | 06/20/2027 | | | 120,000 | | | (7 | ) |
Goldman Sachs & Co. | | 6-Month JPY-LIBOR | | Receive | | 2.000% | | 12/20/2016 | | | 1,520,000 | | | (93 | ) |
Morgan Stanley | | 6-Month JPY-LIBOR | | Pay | | 1.000% | | 03/18/2009 | | | 20,000 | | | 0 | |
Morgan Stanley | | 6-Month JPY-LIBOR | | Receive | | 2.000% | | 12/20/2016 | | | 1,460,000 | | | (84 | ) |
UBS Warburg LLC | | 6-Month JPY-LIBOR | | Pay | | 1.000% | | 09/18/2008 | | | 2,660,000 | | | (41 | ) |
UBS Warburg LLC | | 6-Month JPY-LIBOR | | Pay | | 1.000% | | 03/18/2009 | | | 2,090,000 | | | (38 | ) |
UBS Warburg LLC | | 6-Month JPY-LIBOR | | Receive | | 0.800% | | 03/20/2012 | | | 50,000 | | | (3 | ) |
UBS Warburg LLC | | 6-Month JPY-LIBOR | | Receive | | 2.000% | | 06/15/2012 | | | 45,000 | | | 11 | |
UBS Warburg LLC | | 6-Month JPY-LIBOR | | Receive | | 2.000% | | 12/20/2013 | | | 420,000 | | | 41 | |
UBS Warburg LLC | | 6-Month JPY-LIBOR | | Receive | | 2.000% | | 12/20/2016 | | | 1,730,000 | | | (70 | ) |
UBS Warburg LLC | | 6-Month JPY-LIBOR | | Pay | | 3.000% | | 06/20/2027 | | | 130,000 | | | (8 | ) |
UBS Warburg LLC | | 6-Month JPY-LIBOR | | Pay | | 2.500% | | 06/20/2036 | | | 380,000 | | | (88 | ) |
Citibank N.A. | | 28-Day Mexico Interbank TIIE Banxico | | Pay | | 8.170% | | 11/04/2016 | | MXN | 5,000 | | | (4 | ) |
Bank of America | | 3-Month USD-LIBOR | | Pay | | 5.000% | | 06/18/2009 | | $ | 18,100 | | | (90 | ) |
Barclays Bank PLC | | 3-Month USD-LIBOR | | Receive | | 5.000% | | 12/19/2017 | | | 4,500 | | | (28 | ) |
Citibank N.A. | | 3-Month USD-LIBOR | | Receive | | 5.000% | | 06/20/2014 | | | 2,000 | | | 71 | |
Deutsche Bank AG | | 3-Month USD-LIBOR | | Pay | | 5.000% | | 06/18/2009 | | | 81,000 | | | (396 | ) |
Deutsche Bank AG | | 3-Month USD-LIBOR | | Receive | | 5.000% | | 12/19/2009 | | | 700 | | | (1 | ) |
Deutsche Bank AG | | 3-Month USD-LIBOR | | Receive | | 5.000% | | 12/19/2012 | | | 700 | | | (1 | ) |
Deutsche Bank AG | | 3-Month USD-LIBOR | | Receive | | 5.000% | | 06/20/2014 | | | 500 | | | 18 | |
Deutsche Bank AG | | 3-Month USD-LIBOR | | Receive | | 5.000% | | 12/19/2017 | | | 1,400 | | | (9 | ) |
Deutsche Bank AG | | 3-Month USD-LIBOR | | Pay | | 5.000% | | 12/19/2037 | | | 800 | | | 10 | |
Goldman Sachs & Co. | | 3-Month USD-LIBOR | | Pay | | 5.500% | | 12/16/2014 | | | 700 | | | (15 | ) |
Lehman Brothers, Inc. | | 3-Month USD-LIBOR | | Receive | | 5.000% | | 06/20/2014 | | | 4,300 | | | 152 | |
Morgan Stanley | | 3-Month USD-LIBOR | | Receive | | 5.000% | | 12/19/2017 | | | 4,700 | | | (31 | ) |
Royal Bank of Scotland Group PLC | | 3-Month USD-LIBOR | | Pay | | 5.000% | | 12/19/2008 | | | 7,300 | | | (36 | ) |
Royal Bank of Scotland Group PLC | | 3-Month USD-LIBOR | | Receive | | 5.000% | | 12/19/2014 | | | 600 | | | (2 | ) |
Royal Bank of Scotland Group PLC | | 3-Month USD-LIBOR | | Receive | | 5.000% | | 12/19/2017 | | | 39,000 | | | (233 | ) |
| | | | | | | | | | | | | | | |
| | | | | | | | | | | | | $ | (196 | ) |
| | | | | | | | | | | | | | | |
| | | | |
| 14 | | PIMCO Variable Insurance Trust | | See Accompanying Notes |
| | |
| |
| | | June 30, 2007 (Unaudited) |
(g) Purchased options outstanding on June 30, 2007:
Interest Rate Swaptions
| | | | | | | | | | | | | | | | | | | |
| Description | | Counterparty | | Floating Rate
Index | | Pay/Receive
Floating Rate | | Exercise
Rate | | Expiration
Date | | Notional
Amount | | Cost | | Value |
Call - OTC 2-Year Interest Rate Swap | | Bank of America | | 3-Month USD-LIBOR | | Pay | | 4.800% | | 08/08/2007 | | $ | 7,000 | | $ | 29 | | $ | 0 |
Call - OTC 2-Year Interest Rate Swap | | Bank of America | | 3-Month USD-LIBOR | | Pay | | 5.000% | | 02/01/2008 | | | 4,600 | | | 18 | | | 7 |
Call - OTC 2-Year Interest Rate Swap | | Bank of America | | 3-Month USD-LIBOR | | Pay | | 4.750% | | 09/26/2008 | | | 5,400 | | | 27 | | | 11 |
Call - OTC 1-Year Interest Rate Swap | | Barclays Bank PLC | | 3-Month USD-LIBOR | | Pay | | 4.750% | | 02/01/2008 | | | 14,000 | | | 40 | | | 4 |
Call - OTC 2-Year Interest Rate Swap | | Lehman Brothers, Inc. | | 3-Month USD-LIBOR | | Pay | | 5.000% | | 12/20/2007 | | | 12,200 | | | 79 | | | 15 |
Call - OTC 1-Year Interest Rate Swap | | Royal Bank of Scotland Group PLC | | 3-Month USD-LIBOR | | Pay | | 4.850% | | 07/02/2007 | | | 42,700 | | | 111 | | | 0 |
Call - OTC 1-Year Interest Rate Swap | | Royal Bank of Scotland Group PLC | | 3-Month USD-LIBOR | | Pay | | 4.900% | | 08/08/2007 | | | 19,900 | | | 45 | | | 0 |
Call - OTC 2-Year Interest Rate Swap | | Royal Bank of Scotland Group PLC | | 3-Month USD-LIBOR | | Pay | | 5.000% | | 02/01/2008 | | | 5,800 | | | 29 | | | 9 |
Call - OTC 2-Year Interest Rate Swap | | Royal Bank of Scotland Group PLC | | 3-Month USD-LIBOR | | Pay | | 4.750% | | 03/31/2008 | | | 22,800 | | | 138 | | | 28 |
Call - OTC 2-Year Interest Rate Swap | | Royal Bank of Scotland Group PLC | | 3-Month USD-LIBOR | | Pay | | 4.750% | | 09/26/2008 | | | 5,400 | | | 19 | | | 11 |
Call - OTC 2-Year Interest Rate Swap | | Royal Bank of Scotland Group PLC | | 3-Month USD-LIBOR | | Pay | | 4.750% | | 12/15/2008 | | | 12,200 | | | 41 | | | 28 |
| | | | | | | | | | | | | | | | | | | |
| | | | | | | | | | | | | | | $ | 576 | | $ | 113 |
| | | | | | | | | | | | | | | | | | | |
Foreign Currency Options
| | | | | | | | | | | | | | |
| Description | | Exercise
Price | | Expiration
Date | | Notional
Amount | | Cost | | Value |
Call - OTC Euro versus U.S. dollar | | | $1.362 | | 05/21/2008 | | EUR | 1,000 | | $ | 31 | | $ | 30 |
Put - OTC Euro versus U.S. dollar | | | 1.362 | | 05/21/2008 | | | 1,000 | | | 30 | | | 29 |
Call - OTC Euro versus U.S. dollar | | | 1.375 | | 05/21/2010 | | | 1,200 | | | 59 | | | 60 |
Call - OTC Euro versus U.S. dollar | | | 1.375 | | 05/21/2010 | | | 1,100 | | | 52 | | | 55 |
Put - OTC Euro versus U.S. dollar | | | 1.375 | | 05/21/2010 | | | 1,100 | | | 52 | | | 50 |
Put - OTC Euro versus U.S. dollar | | | 1.375 | | 05/21/2010 | | | 1,200 | | | 59 | | | 55 |
Call - OTC U.S. dollar versus Japanese yen | | JPY | 120.000 | | 09/26/2007 | | $ | 800 | | | 6 | | | 18 |
Call - OTC U.S. dollar versus Japanese yen | | | 117.900 | | 11/09/2007 | | | 1,600 | | | 17 | | | 54 |
Call - OTC U.S. dollar versus Japanese yen | | | 117.500 | | 11/19/2007 | | | 800 | | | 9 | | | 29 |
Call - OTC U.S. dollar versus Japanese yen | | | 114.281 | | 12/05/2007 | | | 700 | | | 8 | | | 40 |
Call - OTC U.S. dollar versus Japanese yen | | | 114.650 | | 01/18/2008 | | | 2,000 | | | 67 | | | 105 |
Put - OTC U.S. dollar versus Japanese yen | | | 114.650 | | 01/18/2008 | | | 2,000 | | | 67 | | | 17 |
Call - OTC U.S. dollar versus Japanese yen | | | 117.500 | | 03/13/2008 | | | 1,200 | | | 10 | | | 38 |
Call - OTC U.S. dollar versus Japanese yen | | | 115.950 | | 06/09/2008 | | | 3,000 | | | 80 | | | 111 |
Put - OTC U.S. dollar versus Japanese yen | | | 115.950 | | 06/09/2008 | | | 3,000 | | | 80 | | | 58 |
Call - OTC U.S. dollar versus Japanese yen | | | 118.150 | | 06/23/2008 | | | 2,600 | | | 68 | | | 67 |
Put - OTC U.S. dollar versus Japanese yen | | | 118.150 | | 06/23/2008 | | | 2,600 | | | 68 | | | 71 |
| | | | | | | | | | | | | | |
| | | | | | | | | | $ | 763 | | $ | 887 |
| | | | | | | | | | | | | | |
Options on Securities
| | | | | | | | | | | | | | |
| Description | | Strike
Price | | Expiration
Date | | Notional
Amount | | Cost | | Value |
Put - OTC Fannie Mae 5.500% due 08/01/2037 | | $ | 89.500 | | 08/07/2007 | | $ | 21,000 | | $ | 3 | | $ | 0 |
Put - OTC Fannie Mae 6.000% due 09/01/2037 | | | 92.500 | | 09/06/2007 | | | 72,000 | | | 8 | | | 5 |
| | | | | | | | | | | | | | |
| | | | | | | | | | $ | 11 | | $ | 5 |
| | | | | | | | | | | | | | |
Straddle Options
| | | | | | | | | | | | | | | | |
| Description | | Counterparty | | Exercise
Price (2) | | Expiration
Date | | Notional
Amount | | Cost (2) | | Value | |
Call & Put - OTC U.S. dollar versus Japanese yen Forward Delta Neutral Straddle | | Goldman Sachs & Co. | | $ 0.000 | | 09/20/2007 | | $ | 3,900 | | $ | 0 | | $ | (10 | ) |
| | | | | | | | | | | | | | | | |
(2) Exercise price and final cost determined on a future date, based upon implied volatility parameters.
(h) Written options outstanding on June 30, 2007:
Interest Rate Swaptions
| | | | | | | | | | | | | | | | | | | |
| Description | | Counterparty | | Floating Rate Index | | Pay/Receive
Floating Rate | | Exercise
Rate | | Expiration
Date | | Notional
Amount | | Premium | | Value |
Call - OTC 5-Year Interest Rate Swap | | Bank of America | | 3-Month USD-LIBOR | | Receive | | 4.900% | | 08/08/2007 | | $ | 3,000 | | $ | 26 | | $ | 0 |
Call - OTC 5-Year Interest Rate Swap | | Bank of America | | 3-Month USD-LIBOR | | Receive | | 5.100% | | 02/01/2008 | | | 2,000 | | | 18 | | | 7 |
Call - OTC 5-Year Interest Rate Swap | | Bank of America | | 3-Month USD-LIBOR | | Receive | | 4.950% | | 09/26/2008 | | | 2,300 | | | 27 | | | 12 |
Call - OTC 5-Year Interest Rate Swap | | Barclays Bank PLC | | 3-Month USD-LIBOR | | Receive | | 4.900% | | 02/01/2008 | | | 3,100 | | | 39 | | | 7 |
Call - OTC 5-Year Interest Rate Swap | | Lehman Brothers, Inc. | | 3-Month USD-LIBOR | | Receive | | 5.150% | | 12/20/2007 | | | 5,300 | | | 77 | | | 17 |
Call - OTC 5-Year Interest Rate Swap | | Royal Bank of Scotland Group PLC | | 3-Month USD-LIBOR | | Receive | | 4.950% | | 07/02/2007 | | | 9,200 | | | 99 | | | 0 |
Call - OTC 7-Year Interest Rate Swap | | Royal Bank of Scotland Group PLC | | 3-Month USD-LIBOR | | Receive | | 4.900% | | 08/08/2007 | | | 3,300 | | | 38 | | | 0 |
Call - OTC 5-Year Interest Rate Swap | | Royal Bank of Scotland Group PLC | | 3-Month USD-LIBOR | | Receive | | 5.100% | | 02/01/2008 | | | 2,500 | | | 30 | | | 9 |
Call - OTC 5-Year Interest Rate Swap | | Royal Bank of Scotland Group PLC | | 3-Month USD-LIBOR | | Receive | | 4.900% | | 03/31/2008 | | | 9,900 | | | 132 | | | 30 |
Call - OTC 5-Year Interest Rate Swap | | Royal Bank of Scotland Group PLC | | 3-Month USD-LIBOR | | Receive | | 4.950% | | 09/26/2008 | | | 2,400 | | | 20 | | | 12 |
Call - OTC 7-Year Interest Rate Swap | | Royal Bank of Scotland Group PLC | | 3-Month USD-LIBOR | | Receive | | 5.000% | | 12/15/2008 | | | 4,100 | | | 41 | | | 29 |
| | | | | | | | | | | | | | | | | | | |
| | | | | | | | | | | | | | | $ | 547 | | $ | 123 |
| | | | | | | | | | | | | | | | | | | |
| | | | | | |
| See Accompanying Notes | | Semiannual Report | | June 30, 2007 | | 15 |
| | |
| |
| Schedule of Investments Global Bond Portfolio (Unhedged) (Cont.) | | June 30, 2007 (Unaudited) |
(i) Short sales outstanding on June 30, 2007:
| | | | | | | | | | | | | |
| Description | | Coupon | | Maturity
Date | | Principal
Amount | | Proceeds | | Value |
Fannie Mae | | 5.000% | | 07/01/2037 | | $ | 24,000 | | $ | 22,703 | | $ | 22,489 |
Fannie Mae | | 5.500% | | 07/01/2037 | | | 2,000 | | | 1,928 | | | 1,929 |
| | | | | | | | | | | | | |
| | | | | | | | | $ | 24,631 | | $ | 24,418 |
| | | | | | | | | | | | | |
(j) Foreign currency contracts outstanding on June 30, 2007:
| | | | | | | | | | | | | | | | | |
| Type | | Currency | | Principal
Amount
Covered by
Contract | | Settlement
Month | | Unrealized
Appreciation | | Unrealized
(Depreciation) | | | Net
Unrealized
Appreciation/
(Depreciation) | |
Buy | | AUD | | 5,465 | | 07/2007 | | $ | 42 | | $ | 0 | | | $ | 42 | |
Sell | | | | 1,316 | | 07/2007 | | | 0 | | | (9 | ) | | | (9 | ) |
Buy | | BRL | | 2,865 | | 10/2007 | | | 53 | | | 0 | | | | 53 | |
Buy | | | | 1,209 | | 03/2008 | | | 52 | | | 0 | | | | 52 | |
Buy | | CAD | | 2,958 | | 08/2007 | | | 12 | | | 0 | | | | 12 | |
Buy | | CLP | | 6,033 | | 11/2007 | | | 0 | | | 0 | | | | 0 | |
Buy | | | | 10,300 | | 03/2008 | | | 0 | | | 0 | | | | 0 | |
Buy | | CNY | | 17,463 | | 11/2007 | | | 9 | | | 0 | | | | 9 | |
Buy | | | | 43,578 | | 01/2008 | | | 0 | | | (26 | ) | | | (26 | ) |
Buy | | DKK | | 6,472 | | 09/2007 | | | 4 | | | 0 | | | | 4 | |
Buy | | EUR | | 14,841 | | 07/2007 | | | 186 | | | 0 | | | | 186 | |
Sell | | GBP | | 7,298 | | 08/2007 | | | 0 | | | (77 | ) | | | (77 | ) |
Buy | | INR | | 648 | | 11/2007 | | | 0 | | | 0 | | | | 0 | |
Buy | | JPY | | 3,843,259 | | 07/2007 | | | 0 | | | (451 | ) | | | (451 | ) |
Sell | | | | 42,254 | | 07/2007 | | | 0 | | | (1 | ) | | | (1 | ) |
Buy | | KRW | | 760,822 | | 07/2007 | | | 7 | | | 0 | | | | 7 | |
Buy | | | | 916,130 | | 08/2007 | | | 0 | | | 0 | | | | 0 | |
Buy | | | | 39,973 | | 09/2007 | | | 1 | | | 0 | | | | 1 | |
Buy | | MXN | | 12,663 | | 03/2008 | | | 28 | | | 0 | | | | 28 | |
Buy | | NOK | | 6,216 | | 09/2007 | | | 18 | | | 0 | | | | 18 | |
Sell | | NZD | | 1,995 | | 07/2007 | | | 0 | | | (19 | ) | | | (19 | ) |
Buy | | PLN | | 1,692 | | 09/2007 | | | 6 | | | 0 | | | | 6 | |
Buy | | RUB | | 31,071 | | 09/2007 | | | 7 | | | 0 | | | | 7 | |
Buy | | | | 458 | | 11/2007 | | | 1 | | | 0 | | | | 1 | |
Buy | | | | 20,301 | | 12/2007 | | | 3 | | | 0 | | | | 3 | |
Buy | | SEK | | 15,066 | | 09/2007 | | | 26 | | | 0 | | | | 26 | |
Buy | | SGD | | 439 | | 08/2007 | | | 0 | | | (5 | ) | | | (5 | ) |
Buy | | TWD | | 9,248 | | 07/2007 | | | 3 | | | 0 | | | | 3 | |
Buy | | | | 9,248 | | 08/2007 | | | 0 | | | (1 | ) | | | (1 | ) |
Buy | | ZAR | | 97 | | 09/2007 | | | 0 | | | 0 | | | | 0 | |
| | | | | | | | | | | | | | | | | |
| | | | | | | | $ | 458 | | $ | (589 | ) | | $ | (131 | ) |
| | | | | | | | | | | | | | | | | |
| | | | |
| 16 | | PIMCO Variable Insurance Trust | | See Accompanying Notes |
| | |
| |
| Notes to Financial Statements | | June 30, 2007 (Unaudited) |
1. ORGANIZATION
The Global Bond Portfolio (Unhedged) (the “Portfolio”) is a series of the PIMCO Variable Insurance Trust (the “Trust”). The Trust is registered under the Investment Company Act of 1940 (the “Act”), as amended, as an open-end management investment company organized as a Delaware business trust on October 3, 1997. The Portfolio offers three classes of shares: Institutional, Administrative and Advisor. Information presented on these financial statements pertains to the Institutional Class of the Portfolio. Certain detailed financial information for the Administrative Class and Advisor Class is provided separately and is available upon request. The Trust is designed to be used as an investment vehicle by Separate Accounts of insurance companies that fund variable annuity contracts and variable life insurance policies and by qualified pension and retirement plans.
2. SIGNIFICANT ACCOUNTING POLICIES
The following is a summary of significant accounting policies consistently followed by the Portfolio in the preparation of its financial statements in conformity with accounting principles generally accepted in the United States of America (“GAAP”). The preparation of financial statements in accordance with GAAP requires management to make estimates and assumptions that affect the reported amounts and disclosures on the financial statements. Actual results could differ from those estimates.
(a) Security Valuation Portfolio securities are valued as of the close of regular trading (normally 4:00 p.m., Eastern Time) on each day that the New York Stock Exchange (“NYSE”) is open. Portfolio securities and other assets for which market quotes are readily available are stated at market value. Market value is generally determined on the basis of last reported sales prices, or if no sales are reported, based on quotes obtained from a quotation reporting system, established market makers, or pricing services. Fixed-income securities and non-exchange traded derivatives are normally valued on the basis of quotes obtained from brokers and dealers or pricing services. Prices obtained from independent pricing services use information provided by market makers or estimates of market values obtained from yield data relating to investments or securities with similar characteristics. Certain fixed income securities purchased on a delayed-delivery basis are marked to market daily until settlement at the forward settlement date. Short-term investments having a maturity of 60 days or less are generally valued at amortized cost. Exchange traded options, futures and options on futures are valued at the settlement price determined by the relevant exchange. With respect to any portion of the Portfolio’s assets that are invested in one or more open end management investment companies, the Portfolio’s net asset value (“NAV”) will be calculated based upon the NAVs of such investments.
Investments initially valued in currencies other than the U.S. dollar are converted to the U.S. dollar using exchange rates obtained from pricing services. As a result, the NAV of the Portfolio’s securities may be affected by changes in the value of currencies in relation to the U.S. dollar. The value of securities traded in markets outside the United States or denominated in currencies other than the U.S. dollar may be affected significantly on a day that the NYSE is closed and an investor is not able to purchase, redeem or exchange shares.
Securities and other assets for which market quotes are not readily available are valued at fair value as determined in good faith by the Board of Trustees or persons acting at their direction. The Board of Trustees has adopted methods for valuing securities and other assets in circumstances where market quotes are not readily available, and has delegated to Pacific Investment Management Company LLC (“PIMCO”) the responsibility for applying the valuation methods. In the event that market quotes are not readily available, and the security or asset cannot be valued pursuant to one of the valuation methods, the value of the security or asset will be determined in good faith by the Valuation Committee of the Board of Trustees, generally based upon recommendations provided by PIMCO.
Market quotes are considered not readily available in circumstances where there is an absence of current or reliable market-based data (e.g., trade information, bid/asked information, broker quotes), including where events occur after the close of the relevant market, but prior to the close of regular trading, that materially affect the values of the Portfolio’s securities or assets. In addition, market quotes are considered not readily available when, due to extraordinary circumstances, the exchanges or markets on which the securities trade, do not open for trading for the entire day and no other market prices are available. The Board has delegated to PIMCO the responsibility for monitoring significant events that may materially affect the values of the Portfolio’s securities or assets and for determining whether the value of the applicable securities or assets should be re-evaluated in light of such significant events.
When the Portfolio uses fair value pricing to determine its NAV, securities will not be priced on the basis of quotations from the primary market in which they are traded, but rather may be priced by another method that the Board of Trustees or persons acting at their direction believe accurately reflects fair value. The Trust’s policy is intended to result in a calculation of the Portfolio’s NAV that fairly reflects security values as of the time of pricing. However, fair values determined by the Board of Trustees or persons acting at their direction may not accurately reflect the price that the Portfolio could obtain for a security if it were to dispose of that security as of the time of pricing. Because foreign securities can trade on non-business days of the Portfolio, the NAV of the Portfolio may change on days when shareholders will not be able to purchase or redeem Portfolio shares. The prices used by the Portfolio may differ from the value that would be realized if the securities were sold and the differences could be material to the financial statements.
(b) Securities Transactions and Investment Income Securities transactions are recorded as of the trade date for financial reporting purposes. Securities purchased or sold on a when-issued or delayed-delivery basis may be settled a month or more after the trade date. Realized gains and losses from securities sold are recorded on the identified cost basis. Dividend income is recorded on the ex-dividend date, except certain dividends from foreign securities where the ex-dividend date may have passed, which are recorded as soon as the Portfolio is informed of the ex-dividend date. Interest income, adjusted for the accretion of discounts and amortization of premiums, is recorded on the accrual basis. Paydown gains and losses on mortgage-related and other asset-backed securities are recorded as components of interest income on the Statement of Operations.
(c) Delayed-Delivery Transactions The Portfolio may purchase or sell securities on a delayed-delivery basis. These transactions involve a commitment by the Portfolio to purchase or sell securities for a predetermined price or yield, with payment and delivery taking place beyond the customary settlement period. When delayed-delivery purchases are outstanding, the Portfolio will designate liquid assets in an amount sufficient to meet the purchase price. When purchasing a security on a delayed-delivery basis, the Portfolio assumes the rights and risks of ownership of the security, including the risk of price and yield fluctuations, and takes such fluctuations into account when determining its net asset value. The Portfolio may dispose of or renegotiate a delayed-delivery transaction after it is entered into, and may sell when-issued securities before they are delivered, which may result in a capital gain or loss. When the Portfolio has sold a security on a delayed-delivery basis, the Portfolio does not participate in future gains and losses with respect to the security.
(d) When-Issued Transactions The Portfolio may purchase or sell securities on a when-issued basis. These transactions are made conditionally because a security, although authorized, has not yet been issued in the market. A commitment by the Portfolio is made regarding these transactions to purchase or sell securities for a predetermined price or yield, with payment and delivery taking place beyond the customary settlement period. The Portfolio may sell when-issued securities before they are delivered, which may result in a capital gain or loss.
| | | | | | |
| | Semiannual Report | | June 30, 2007 | | 17 |
Notes to Financial Statements (Cont.)
(e) Dividends and Distributions to Shareholders Dividends from net investment income, if any, are declared daily and distributed to shareholders monthly. Net realized capital gains earned by the Portfolio, if any, will be distributed no less frequently than once each year.
Income dividends and capital gain distributions are determined in accordance with income tax regulations which may differ from GAAP. Differences between tax regulations and GAAP may change the fiscal year when income and capital items are recognized for tax and GAAP purposes. Examples of events that give rise to timing differences include wash sales, straddles, net operating losses and capital loss carryforwards. Further, the character of investment income and capital gains may be different for certain transactions under the two methods of accounting. Examples of characterization differences include the treatment of mortgage paydowns, swaps, foreign currency transactions and contingent debt instruments. As a result, income dividends and capital gain distributions declared during a fiscal period may differ significantly from the net investment income and realized capital gain reported on the Portfolio’s annual financial statements presented under GAAP.
Distributions classified as a tax basis return of capital, if any, are reflected on the accompanying Statements of Changes in Net Assets and have been reclassified to paid in capital. In addition, other amounts have been reclassified between undistributed net investment income, accumulated undistributed net realized gains or losses and/or paid in capital to more appropriately conform financial accounting to tax characterizations of dividend distributions.
(f) Multiclass Operations Each class offered by the Portfolio has equal rights as to assets and voting privileges (except that shareholders of a class have exclusive voting rights regarding any matter relating solely to that class of shares). Income and non-class specific expenses of the Portfolio are allocated daily to each class of shares based on the relative value of settled shares. Realized and unrealized capital gains and losses of the Portfolio are allocated daily to each class of shares based on the relative net assets of each class. Class specific expenses, where applicable, currently include administrative, distribution and servicing fees.
(g) Foreign Currency The functional and reporting currency for the Portfolio is the U.S. dollar. The market values of foreign securities, currency holdings and other assets and liabilities are translated into U.S. dollars based on the current exchange rates each business day. Fluctuations in the value of currency holdings and other assets and liabilities resulting from changes in exchange rates are recorded as unrealized foreign currency gains or losses. Realized gains or losses and unrealized appreciation or depreciation on investment securities and income and expenses are translated on the respective dates of such transactions. The effects of changes in foreign currency exchange rates on investments in securities are not segregated on the Statement of Operations from the effects of changes in market prices of those securities, but are included with the net realized and unrealized gain or loss on investment securities.
| | | | | | |
|
| Non-U.S. currency symbols utilized throughout the report are defined as follows: |
AUD BRL CAD CLP CNY DKK EUR GBP HKD INR | | Australian Dollar Brazilian Real Canadian Dollar Chilean Peso Chinese Yuan Renminbi Danish Krone Euro Great British Pound Hong Kong Dollar Indian Rupee | | KRW MXN NOK NZD PLN RUB SEK SGD TWD ZAR | | South Korean Won Mexican Peso Norwegian Krone New Zealand Dollar Polish Zloty Russian Ruble Swedish Krona Singapore Dollar Taiwan Dollar South African Rand |
| JPY | | Japanese Yen | | | | |
(h) Foreign Currency Transactions The Portfolio may enter into foreign currency contracts in connection with settling planned purchases or sales of securities, to hedge the currency exposure associated with some or all of the Portfolio’s securities or as a part of an investment strategy. A foreign currency contract is an agreement between two parties to buy and sell a currency at a set price on a future date. The market value of a foreign currency contract fluctuates with changes in foreign currency exchange rates. Foreign currency contracts are marked to market daily and the change in value is recorded by the Portfolio as an unrealized gain or loss. Realized gains or losses equal to the difference between the value of the contract at the time it was opened and the value at the time it was closed are recorded upon delivery or receipt of the currency. These contracts may involve market risk in excess of the unrealized gain or loss reflected on the Statement of Assets and Liabilities. In addition, the Portfolio could be exposed to risk if the counterparties are unable to meet the terms of the contracts or if the value of the currency changes unfavorably to the U.S. dollar.
(i) Futures Contracts The Portfolio may enter into futures contracts. The Portfolio may use futures contracts to manage its exposure to the securities markets or to movements in interest rates and currency values. The primary risks associated with the use of futures contracts are the imperfect correlation between the change in market value of the securities held by the Portfolio and the prices of futures contracts, the possibility of an illiquid market, and the inability of the counterparty to meet the terms of the contract. Futures contracts are valued based upon their quoted daily settlement prices. Upon entering into a futures contract, the Portfolio is required to deposit with its futures broker, an amount of cash or U.S. Government and Agency Obligations in accordance with the initial margin requirements of the broker or exchange. Futures contracts are marked to market daily and an appropriate payable or receivable for the change in value (“variation margin”) is recorded by the Portfolio. Gains or losses are recognized but not considered realized until the contracts expire or are closed. Futures contracts involve, to varying degrees, risk of loss in excess of the variation margin disclosed on the Statement of Assets and Liabilities.
(j) Inflation-Indexed Bonds The Portfolio may invest in inflation-indexed bonds. Inflation-indexed bonds are fixed-income securities whose principal value is periodically adjusted to the rate of inflation. The interest rate on these bonds is generally fixed at issuance at a rate lower than typical bonds. Over the life of an inflation-indexed bond, however, interest will be paid based on a principal value, which is adjusted for inflation. Any increase in the principal amount of an inflation-indexed bond will be included as interest income on the Statement of Operations, even though investors do not receive their principal until maturity.
(k) Options Contracts The Portfolio may write call and put options on futures, swaps, securities or currencies it owns or in which it may invest. Writing put options tends to increase the Portfolio’s exposure to the underlying instrument. Writing call options tends to decrease the Portfolio’s exposure to the underlying instrument. When the Portfolio writes a call or put option, an amount equal to the premium received is recorded as a liability and subsequently marked to market to reflect the current value of the option written. These liabilities are reflected as written options outstanding on the Statement of Assets and Liabilities. Certain options may be written with premiums to be determined on a future date. The premiums for these options are based upon implied volatility parameters at specified terms. Premiums received from writing options which expire are treated as realized gains. Premiums received from writing options which are exercised or closed are added to the proceeds or offset against amounts paid on the underlying future, swap, security or currency transaction to determine the realized gain or loss. The Portfolio as a writer of an option has no control over whether the underlying future, swap, security or currency may be sold (call) or purchased (put) and as a result bears the market risk of an unfavorable change in the price of the future, swap, security or currency underlying the written option. There is the risk the Portfolio may not be able to enter into a closing transaction because of an illiquid market.
| | | | |
| 18 | | PIMCO Variable Insurance Trust | | |
| | |
| |
| | | June 30, 2007 (Unaudited) |
The Portfolio may also purchase put and call options. Purchasing call options tends to increase the Portfolio’s exposure to the underlying instrument. Purchasing put options tends to decrease the Portfolio’s exposure to the underlying instrument. The Portfolio pays a premium which is included on the Statement of Assets and Liabilities as an investment and subsequently marked to market to reflect the current value of the option. Premiums paid for purchasing options which expire are treated as realized losses. Certain options may be purchased with premiums to be determined on a future date. The premiums for these options are based upon implied volatility parameters at specified terms. The risk associated with purchasing put and call options is limited to the premium paid. Premiums paid for purchasing options which are exercised or closed are added to the amounts paid or offset against the proceeds on the underlying future, swap, security or currency transaction to determine the realized gain or loss.
(l) Repurchase Agreements The Portfolio may engage in repurchase transactions. Under the terms of a typical repurchase agreement, the Portfolio takes possession of an underlying debt obligation (collateral) subject to an obligation of the seller to repurchase, and the Portfolio to resell, the obligation at an agreed-upon price and time. The underlying securities for all repurchase agreements are held in safekeeping at the Portfolio’s custodian or designated subcustodians under tri-party repurchase agreements. The market value of the collateral must be equal to or exceed the total amount of the repurchase obligations, including interest. Securities purchased under repurchase agreements are reflected as an asset on the Statement of Assets and Liabilities. Generally, in the event of counterparty default, the Portfolio has the right to use the collateral to offset losses incurred. If the counterparty should default, the Portfolio will seek to sell the securities which it holds as collateral. This could involve procedural costs or delays in addition to a loss on the securities if their value should fall below their repurchase price.
(m) Inverse Floating Rate Transactions—Residual Interest Municipal Bonds (“RIBs”)/Residual Interest Tax Exempt Bonds (“RITEs”) The Portfolio may invest in RIBs and RITEs (“Inverse Floaters”). Inverse Floaters are created via a master trust agreement between a broker-dealer, acting as trustor and liquidity provider, and an investment bank, acting as trustee and tender agent. The master trust agreement defines the terms for each trust series; with each series being established by the transfer of long-term, fixed-rate municipal bonds (“Fixed Rate Bonds”) to the trustee to be held and provide for the creation, execution and delivery of floater certificates (“Floating Rate Notes”) and Inverse Floaters. Floating Rate Notes are liquid notes that are issued with a short-term variable rate typically linked to the LIBOR, subject to limitations, for some duration. After interest income is paid on the Floating Rate Notes at current rates, the residual income from the Fixed Rate Bonds is paid to the Inverse Floaters. Inverse Floaters are issued with a coupon that fluctuates inversely with the Floating Rate Notes’ referenced rate, subject to certain limitations. Therefore, rising short-term rates result in lower income for the Inverse Floaters and vice versa.
Floating Rate Notes are generally remarketed to municipal money market funds. Inverse Floaters are acquired by either tax-exempt municipal bond funds or trusts, or other parties interested in potentially higher yielding tax-exempt securities. Inverse Floaters may also be acquired for the purpose of increasing leverage. Floating Rate Note holders typically have the option to tender their notes to the liquidity provider for redemption at par at each reset date. The Inverse Floater holders have the option to (i) require the Floating Rate Note holders to tender their notes at par, and (ii) require the liquidity provider to transfer the Fixed Rate Bonds to the Inverse Floater holders. The holders of Inverse Floaters bear substantially all of the downside investment risk associated with the underlying Fixed Rate Bonds, and also benefit from a disproportionate amount of the potential appreciation of the underlying Fixed Rate Bonds’ value. Inverse Floaters may be more volatile and less liquid than other municipal bonds of comparable maturity.
Inverse Floaters may be acquired with or without first transferring to the trustor the Fixed Rate Bonds that were utilized to create the trust series. Inverse Floaters acquired without a transfer of Fixed Rate Bonds are recognized as purchases of securities as outlined in Note 2(b). Statement of Financial Accounting Standards No. 140—Accounting for Transfers and Servicing of Financial Assets and Extinguishments of Liabilities (“FAS No. 140”), governs the standards for accounting for securitizations and other transfers of financial assets. If there is a transfer of Fixed Rate Bonds and it meets sale criteria under FAS No. 140, a Portfolio records a sale of the Fixed Rate Bonds and a purchase of the Inverse Floaters. The cash received from the Inverse Floaters is then recorded as interest income in the Statement of Operations.
If the transfer of Fixed Rate Bonds does not meet sale criteria under FAS No. 140, a Portfolio accounts for the transaction described above as a secured borrowing by including the Fixed Rate Bonds in its Schedule of Investments, and recording the Floating Rate Notes as a liability under the caption “Payable for floating rate notes” in the Portfolio’s Statement of Assets and Liabilities. In a secured borrowing transaction, cash received from the Inverse Floaters is not recorded as interest income. Instead, a Portfolio records interest income related to the Fixed Rate Bonds and interest expense related to the Floating Rate Notes, the net of which is equal to the cash received from the Inverse Floaters acquired by the Portfolio. Thus, while a Portfolio’s reported total income, net expenses, and net expense ratio are generally higher for investments in Inverse Floaters acquired via a secured borrowing, the method of acquiring Inverse Floaters does not result in differences for reported cash flows, net asset value or total return.
(n) Short Sales The Portfolio may enter into short sales transactions. A short sale is a transaction in which the Portfolio sells securities it does not own in anticipation of a decline in the market price of the securities. Securities sold in short sale transactions and interest payable on such securities, if any, are reflected as a liability on the Statement of Assets and Liabilities. The Portfolio is obligated to deliver securities at the market price at the time the short position is closed. Possible losses from short sales may be unlimited, whereas losses from purchases cannot exceed the total amount invested.
(o) Swap Agreements The Portfolio may invest in swap agreements. Swap transactions are privately negotiated agreements between the Portfolio and a counterparty to exchange or swap investment cash flows, assets, or market-linked returns at specified, future intervals. The Portfolio may enter into interest rate, total return, forward spread-lock, credit default, and other forms of swap agreements to manage its exposure to interest rates and credit risk. In connection with these agreements, securities may be identified as collateral in accordance with the terms of the respective swap agreements.
Interest rate swap agreements involve the exchange by the Portfolio with another party of their respective commitments to pay or receive interest, e.g., an exchange of floating rate payments for fixed rate payments with respect to the notional amount of principal. Certain forms of interest rate swap agreements may include: (i) interest rate caps, under which, in return for a premium, one party agrees to make payments to the other to the extent that interest rates exceed a specified rate, or “cap”, (ii) interest rate floors, under which, in return for a premium, one party agrees to make payments to the other to the extent that interest rates fall below a specified rate, or “floor”, or (iii) interest rate collars, under which a party sells a cap and purchases a floor or vice versa in an attempt to protect itself against interest rate movements exceeding given minimum or maximum levels.
Total return swap agreements involve commitments to pay interest in exchange for a market-linked return, both based on notional amounts. To the extent the total return of the security or index underlying the transaction exceeds or falls short of the offsetting interest rate obligation, the Portfolio will receive a payment from or make a payment to the counterparty.
| | | | | | |
| | Semiannual Report | | June 30, 2007 | | 19 |
Notes to Financial Statements (Cont.)
Forward spread-lock swap agreements involve commitments to pay or receive a settlement amount calculated as the difference between the swap spread and a fixed spread, multiplied by the notional amount times the duration of the swap. The swap spread is the difference between the benchmark swap rate (market rate) and the specific Treasury rate.
Credit default swap agreements involve one party making a stream of payments to another party in exchange for the right to receive a specified return in the event of a default by a third party, typically corporate issues or sovereign issues of an emerging country, on its obligation. The Portfolio may use credit default swaps to provide a measure of protection against defaults of the issuers (i.e., to reduce risk where the Portfolio owns or has exposure to the sovereign issuer) or to take an active long or short position with respect to the likelihood of a particular issuer’s default. As a seller of protection, the Portfolio generally receives an upfront payment or a fixed rate of income throughout the term of the swap provided that there is no credit event. If the Portfolio is a seller of protection and a credit event occurs, as defined under the terms of that particular swap agreement, the Portfolio will pay to the buyer of the protection an amount up to the notional value of the swap and in certain instances take delivery of the security. As the seller, the Portfolio would effectively add leverage to its portfolio because, in addition to its total net assets, the Portfolio would be subject to investment exposure on the notional amount of the swap. As a buyer of protection, the Portfolio generally receives an amount up to the notional value of the swap if a credit event occurs. The treatment of credit default swaps and other swap agreements that provide for contingent, non-periodic, bullet-type payments as “notional principal contracts” for U.S. federal income tax purposes is uncertain. Were the U.S. Internal Revenue Service (“IRS”) to take the position that a credit default swap or other bullet-type swap is not a “notional principal contract” for U.S. federal income tax purposes, payments received by the Portfolio from such investments might be subject to U.S. excise or income taxes.
Swaps are marked to market daily based upon quotations from market makers and the change in value, if any, is recorded as unrealized gain or loss on the Statement of Operations. Payments received or made at the beginning of the measurement period are reflected as such on the Statement of Assets and Liabilities. These upfront payments are recorded as realized gain or loss on the Statement of Operations upon termination or maturity of the swap. A liquidation payment received or made at the termination of the swap is recorded as realized gain or loss on the Statement of Operations. Net periodic payments received or paid by the Portfolio are included as part of realized gain or loss on the Statement of Operations. Entering into these agreements involves, to varying degrees, elements of credit, market and documentation risk in excess of the amounts recognized on the Statement of Assets and Liabilities. Such risks involve the possibility that there will be no liquid market for these agreements, that the counterparty to the agreements may default on its obligation to perform or disagree as to the meaning of contractual terms in the agreements and that there may be unfavorable changes in interest rates.
(p) Commodities Index-Linked/Structured Notes The Portfolio invests in structured notes whose value is based on the price movements of a commodity index. The structured notes are often leveraged, increasing the volatility of each note’s value relative to the change in the underlying linked financial element. The value of these notes will rise and fall in response to changes in the underlying commodity index. Structured notes may entail a greater degree of market risk than other types of debt securities because the investor bears the risk of the underlying commodity index. Structured notes may also be more volatile, less liquid, and more difficult to accurately price than less complex securities or more traditional debt securities. Fluctuations in value of the structured notes are recorded as unrealized gains and losses on the accompanying financial statements. Net payments are recorded as net realized gains and losses. These notes are subject to prepayment, credit and interest risks. The Portfolio has the option to request
prepayment from the issuer. At maturity, or when a note is sold, the Portfolio records a realized gain or loss. At June 30, 2007, the value of these securities comprised 0.5% of the Portfolio’s net assets and resulted in unrealized depreciation of $5,668.
(q) Mortgage-Related and Other Asset-Backed Securities The Portfolio may invest in mortgage-related or other asset-backed securities. These securities include mortgage pass-through securities, collateralized mortgage obligations (“CMOs”), commercial mortgage-backed securities, mortgage dollar rolls, CMO residuals, stripped mortgage-backed securities (“SMBSs”) and other securities that directly or indirectly represent a participation in, or are secured by and payable from, mortgage loans on real property. The value of some mortgage-related or asset-backed securities may be particularly sensitive to changes in prevailing interest rates. Early repayment of principal on some mortgage-related securities may expose the Portfolio to a lower rate of return upon reinvestment of principal. The value of these securities may fluctuate in response to the market’s perception of the creditworthiness of the issuers. Additionally, although mortgages and mortgage-related securities are generally supported by some form of government or private guarantee and/or insurance, there is no assurance that private guarantors or insurers will meet their obligations.
(r) U.S. Government Agencies or Government-Sponsored Enterprises Securities issued by U.S. Government agencies or government-sponsored enterprises may not be guaranteed by the U.S. Treasury. The Government National Mortgage Association (“GNMA” or “Ginnie Mae”), a wholly owned U.S. Government corporation, is authorized to guarantee, with the full faith and credit of the U.S. Government, the timely payment of principal and interest on securities issued by institutions approved by GNMA and backed by pools of mortgages insured by the Federal Housing Administration or guaranteed by the Department of Veterans Affairs. Government-related guarantors (i.e., not backed by the full faith and credit of the U.S. Government) include the Federal National Mortgage Association (“FNMA” or “Fannie Mae”) and the Federal Home Loan Mortgage Corporation (“FHLMC” or “Freddie Mac”). Pass-through securities issued by FNMA are guaranteed as to timely payment of principal and interest by FNMA but are not backed by the full faith and credit of the U.S. Government. FHLMC guarantees the timely payment of interest and ultimate collection of principal, but its participation certificates are not backed by the full faith and credit of the U.S. Government.
(s) New Accounting Policies In July 2006, the Financial Accounting Standards Board (“FASB”) issued Interpretation No. 48, “Accounting for Uncertainty in Income Taxes—an Interpretation of FASB Statement No. 109” (the “Interpretation”). The Interpretation became effective for the Portfolio on June 29, 2007. Management has evaluated the application of the Interpretation in relation to the Portfolio and has concluded that no single filing position or combination of filing positions identified as uncertain tax positions required the accrual of a tax liability in the accounting records of the Portfolio for the period ending June 30, 2007. Management will monitor all existing filing positions and future filing positions in light of the Interpretation and evaluate the need for any future tax accruals and financial statement disclosures as warranted.
In September 2006, the FASB issued Statement of Financial Accounting Standards No. 157, “Fair Value Measurements” (the “Statement”). The Statement is effective for fiscal years beginning after November 15, 2007 and will require expanded disclosure about fair value measurements, separately for each major category of assets and liabilities, that enables shareholders to assess the inputs used to develop those measurements, and for recurring fair value measurements using significant unobservable inputs the effect of the measurements on changes in net assets for the reporting period. Management is currently evaluating the application of the Statement to the Portfolio and will provide additional information in relation to the Statement on the Portfolio’s annual financial statements for the period ending December 31, 2007.
| | | | |
| 20 | | PIMCO Variable Insurance Trust | | |
| | |
| |
| | | June 30, 2007 (Unaudited) |
3. FEES AND EXPENSES
(a) Investment Advisory Fee PIMCO is a majority-owned subsidiary of Allianz Global Investors of America L.P. (“AGI”), and serves as investment adviser (the “Adviser”) to the Trust, pursuant to an investment advisory contract. The Adviser receives a monthly fee from the Portfolio, at an annual rate based on average daily net assets. The Advisory Fee for all classes is charged at an annual rate of 0.25%.
(b) Administration Fee PIMCO serves as administrator (the “Administrator”), and provides administrative services to the Trust for which it receives a monthly administrative fee based on each share class’s average daily net assets. As the Administrator, PIMCO bears the costs of various third-party services, including audit, custodial, portfolio accounting, legal, transfer agency and printing costs. The Administration Fee for all classes is charged at the annual rate of 0.50%.
(c) Distribution and Servicing Fees Allianz Global Investors Distributors LLC (“AGID”) is an indirect wholly-owned subsidiary of AGI and serves as the distributor (the “Distributor”) of the Trust’s shares. The Trust is permitted to reimburse AGID on a quarterly basis, out of the Administrative Class assets of the Portfolio in the amount of 0.15% on an annual basis of the average daily net assets of that class, for payments made to financial intermediaries that provide services in connection with the distribution of shares or administration of plans or programs that use Portfolio shares as their funding medium. The effective rate paid to AGID was 0.15% during the current fiscal year.
The Trust has adopted a Distribution Plan, for the Advisor Class shares of the Portfolio (the “Plan”). The Plan has been adopted pursuant to Rule 12b-1 under the Act. The Plan permits payments for expenses in connection with the distribution and marketing of Advisor Class shares and/or the provision of shareholder services to Advisor Class shareholders. The Plan permits the Portfolio to make total payments at an annual rate of 0.25% of its average daily net assets attributable to its Advisor Class shares.
(d) Portfolio Expenses The Trust is responsible for the following expenses: (i) salaries and other compensation of any of the Trust’s executive officers and employees who are not officers, directors, stockholders or employees of PIMCO or its subsidiaries or affiliates; (ii) taxes and governmental fees; (iii) brokerage fees and commissions and other portfolio transaction expenses; (iv) the costs of borrowing money, including interest expenses and bank overdraft charges; (v) fees and expenses of the Trustees who are not “interested persons” of PIMCO or the Trust, and any counsel retained exclusively for their benefit; (vi) extraordinary expenses, including costs of litigation and indemnification expenses; (vii) organization expenses and (viii) any expenses allocated or allocable to a specific class of shares, which include service fees payable with respect to the Administrative Class Shares, and may include certain other expenses as permitted by the Trust’s Multiple Class Plan adopted pursuant to Rule 18f-3 under the Act and subject to review and approval by the Trustees. The ratio of expenses to average net assets per share class, as disclosed in the Financial Highlights, may differ from the annual portfolio operating expenses per share class as disclosed in the Prospectus for the reasons set forth above.
Effective April 1, 2007, each Trustee, other than those affiliated with PIMCO or its affiliates, receives an annual retainer of $15,000, plus $2,375 for each Board of Trustees meeting attended in person, $500 for each committee meeting attended and $750 for each Board of Trustees meeting attended telephonically, plus reimbursement of related expenses. In addition, the audit committee chair receives an additional annual retainer of $2,000 and each other committee chair receives an additional annual retainer of $500. These expenses are allocated on a pro-rata basis to the various portfolios of the Trust according to their respective net assets. The Trust pays no compensation directly to any Trustee or any other officer who is affiliated with the Administrator, all of whom receive remuneration for their services to the Trust from the Administrator or its affiliates. Prior to
April 1, 2007, each Trustee, other than those affiliated with PIMCO or its affiliates, received an annual retainer of $15,000 plus $2,000 for each Board of Trustees meeting attended ($500 for each special meeting attended), plus reimbursement of related expenses. The Audit Committee Chairman received an annual retainer of $1,500 and the Governance Committee Chairman received an annual retainer of $500. In addition, each member of a committee received $500 for each committee meeting attended.
4. RELATED PARTY TRANSACTIONS
The Adviser, Administrator, and Distributor are related parties as defined by FAS 57, Related Party Disclosures. Fees payable to these parties are disclosed in Note 3.
5. GUARANTEES AND INDEMNIFICATIONS
Under the Trust’s organizational documents, each Trustee, officer, employee or other agent of the Trust (including the Trust’s investment manager) is indemnified, to the extent permitted by the Act, against certain liabilities that may arise out of performance of their duties to the Portfolio. Additionally, in the normal course of business, the Portfolio enters into contracts that contain a variety of indemnification clauses. The Portfolio’s maximum exposure under these arrangements is unknown as this would involve future claims that may be made against the Portfolio that have not yet occurred. However, the Portfolio has not had prior claims or losses pursuant to these contracts and believes the risk of loss to be remote.
6. PURCHASES AND SALES OF SECURITIES
The length of time the Portfolio has held a particular security is not generally a consideration in investment decisions. A change in the securities held by the Portfolio is known as “portfolio turnover”. The Portfolio may engage in frequent and active trading of portfolio securities to achieve its investment objective, particularly during periods of volatile market movements. High portfolio turnover (e.g., over 100%) involves correspondingly greater expenses to the Portfolio, including brokerage commissions or dealer mark-ups and other transaction costs on the sale of securities and reinvestments in other securities. Such sales may also result in realization of taxable capital gains, including short-term capital gains (which are generally taxed at ordinary income tax rates). The trading costs and tax effects associated with portfolio turnover may adversely affect the Portfolio’s performance.
Purchases and sales of securities (excluding short-term investments) for the period ended June 30, 2007, were as follows (amounts in thousands):
| | | | | | | | | | | | |
| U.S. Government/Agency | | | | All Other |
| Purchases | | Sales | | | | Purchases | | Sales |
| $ | 725,855 | | $ | 722,821 | | | | $ | 57,615 | | $ | 17,547 |
| | | | | | |
| | Semiannual Report | | June 30, 2007 | | 21 |
Notes to Financial Statements (Cont.)
7. TRANSACTIONS IN WRITTEN CALL AND PUT OPTIONS
Transactions in written call and put options were as follows (amounts in thousands, except for number of contracts):
| | | | | | | | | | | | | | |
| | | | | Notional
Amount
in $ | | | Notional
Amount
in GBP | | | Premium | |
Balance at 12/31/2006 | | | | $ | 79,300 | | | GBP | 2,100 | | | $ | 827 | |
Sales | | | | | 29,600 | | | | 0 | | | | 344 | |
Closing Buys | | | | | (61,800 | ) | | | 0 | | | | (588 | ) |
Expirations | | | | | 0 | | | | (2,100 | ) | | | (36 | ) |
Exercised | | | | | 0 | | | | 0 | | | | 0 | |
Balance at 06/30/2007 | | | | $ | 47,100 | | | GBP | 0 | | | $ | 547 | |
8. SHARES OF BENEFICIAL INTEREST
The Portfolio may issue an unlimited number of shares of beneficial interest with a $0.001 par value. Changes in shares of beneficial interest were as follows (shares and amounts in thousands):
| | | | | | | | | | | | | | | | |
| | | | | Six Months Ended
06/30/2007 | | | Year Ended
12/31/2006 | |
| | | | | Shares | | | Amount | | | Shares | | | Amount | |
| | | | | |
Receipts for shares sold | | | | | | | | | | | | | | | | |
Institutional Class | | | | 13 | | | $ | 149 | | | 4 | | | $ | 49 | |
Administrative Class | | | | 4,198 | | | | 50,329 | | | 8,273 | | | | 99,227 | |
Advisor Class | | | | 0 | | | | 1 | | | 1 | | | | 10 | |
Issued as reinvestment of distributions | | | | | | | | | | | | | | | | |
Institutional Class | | | | 0 | | | | 2 | | | 0 | | | | 0 | |
Administrative Class | | | | 255 | | | | 3,049 | | | 381 | | | | 4,593 | |
Advisor Class | | | | 0 | | | | 0 | | | 0 | | | | 0 | |
Cost of shares redeemed | | | | | | | | | | | | | | | | |
Institutional Class | | | | (1 | ) | | | (8 | ) | | 0 | | | | (1 | ) |
Administrative Class | | | | (1,721 | ) | | | (20,729 | ) | | (2,147 | ) | | | (25,733 | ) |
Advisor Class | | | | 0 | | | | 0 | | | 0 | | | | 0 | |
Net increase resulting from Portfolio share transactions | | | | 2,744 | | | $ | 32,793 | | | 6,512 | | | $ | 78,145 | |
The following schedule shows the number of shareholders each owning 5% or more of the Portfolio and the total percentage of the Portfolio held by such shareholders:
| | | | | | |
| | | | | Number of
Shareholders | | % of Portfolio Held |
Institutional Class | | | | 3 | | 100 |
Administrative Class | | | | 6 | | 96 |
Advisor Class | | | | 1 | | 95 |
9. REGULATORY AND LITIGATION MATTERS
Since February 2004, PIMCO, Allianz Global Investors of America L.P. (PIMCO’s parent company), AGID, and certain of their affiliates, including the PIMCO Funds (another series of funds managed by PIMCO), the Allianz Funds (formerly known as PIMCO Funds: Multi-Manager Series (another series of funds managed by affiliates of PIMCO)), certain Trustees of the Trust (in their capacity as Trustees of the PIMCO Funds or the Allianz Funds) and certain employees of PIMCO, have been named as defendants in fifteen lawsuits filed in various jurisdictions. Eleven of those lawsuits concern “market timing,” and they have been transferred to and
consolidated for pre-trial proceedings in a multi-district litigation proceeding in the U.S. District Court for the District of Maryland; the other four lawsuits concern “revenue sharing” and have been consolidated into a single action in the U.S. District Court for the District of Connecticut. The lawsuits have been commenced as putative class actions on behalf of investors who purchased, held or redeemed shares of the various series of the PIMCO Funds and the Allianz Funds during specified periods, or as derivative actions on behalf of the PIMCO Funds and the Allianz Funds.
The market timing actions in the District of Maryland generally allege that certain hedge funds were allowed to engage in “market timing” in certain funds of the PIMCO Funds and the Allianz Funds and this alleged activity was not disclosed. Pursuant to tolling agreements entered into with the derivative and class action plaintiffs, PIMCO, certain PIMCO Funds Trustees, and certain employees of PIMCO who were previously named as defendants have all been dropped as defendants in the market timing actions; the plaintiffs continue to assert claims on behalf of the shareholders of the PIMCO Funds or on behalf of the PIMCO Funds itself against other defendants. By order dated November 3, 2005, the U.S. District Court for the District of Maryland granted the PIMCO Funds’ motion to dismiss claims asserted against it in a consolidated amended complaint where the PIMCO Funds were named, in the complaint, as a nominal defendant. The revenue sharing action in the District of Connecticut generally alleges that fund assets were inappropriately used to pay brokers to promote funds of the PIMCO Funds and the Allianz Funds, including directing fund brokerage transactions to such brokers, and that such alleged arrangements were not fully disclosed to shareholders. On August 11, 2005, the U.S. District Court for the District of Connecticut conducted a hearing on defendants’ motion to dismiss the consolidated amended complaint in the revenue sharing action but has not yet ruled on the motion to dismiss. The market timing and revenue sharing lawsuits seek, among other things, unspecified compensatory damages plus interest and, in some cases, punitive damages, the rescission of investment advisory contracts, the return of fees paid under those contracts and restitution.
Two nearly identical class action civil complaints have been filed in August 2005, in the Northern District of Illinois Eastern Division, alleging that the plaintiffs each purchased and sold a 10-year Treasury note futures contract and suffered damages from an alleged shortage when PIMCO held both physical and futures positions in 10-year Treasury notes for its client accounts. The two actions have been consolidated into one action, and the two separate complaints have been replaced by a consolidated complaint. PIMCO is a named defendant, and PIMCO Funds has been added as a defendant, to the consolidated action. PIMCO strongly believes the complaint is without merit and intends to vigorously defend itself.
In April 2006, certain portfolios of the Trust and certain other funds managed by PIMCO were served in an adversary proceeding brought by the Official Committee of Asbestos Claimants of G-I Holdings, Inc. in G-I Holdings, Inc.’s bankruptcy in the District of New Jersey. In July 2004, PIMCO was named in this lawsuit and remains a defendant. The plaintiff seeks to recover for the bankruptcy estate assets that were transferred by the predecessor entity of G-I Holdings, Inc. to a wholly-owned subsidiary in 1994. The subsidiary has since issued notes, of which certain portfolios of the Trust and certain other funds managed by PIMCO are alleged to be holders. The complaint alleges that in 2000, more than two hundred noteholders—including certain portfolios of the Trust and certain other funds managed by PIMCO—were granted a second priority lien on the assets of the subsidiary in exchange for their consent to a refinancing transaction and the granting of a first priority lien to the lending banks. The plaintiff is seeking invalidation of the lien in favor of the noteholders and/or the value of the lien. On June 21, 2006, the District of New Jersey overturned the Bankruptcy Court’s decision granting permission to file the adversary proceeding and remanded the matter to the Bankruptcy Court for further proceedings. Following a motion to
| | | | |
| 22 | | PIMCO Variable Insurance Trust | | |
| | |
| |
| | | June 30, 2007 (Unaudited) |
reconsider, the District Court upheld its remand on August 7, 2006, and instructed the Bankruptcy Court to conduct a “cost-benefit” analysis of the Committee’s claims, including the claims against the noteholders. The Bankruptcy Court held a status conference on October 25, 2006 and set a briefing schedule relating to this cost-benefit analysis.
The foregoing speaks only as of the date of this report. It is possible that these matters and/or other developments resulting from these matters could result in increased portfolio redemptions or other adverse consequences to the Portfolio. However, PIMCO and AGID believe that these matters are not likely to have a material adverse effect on the Portfolio or on PIMCO’s or AGID’s ability to perform their respective investment advisory or distribution services relating to the Portfolio.
10. FEDERAL INCOME TAX MATTERS
The Portfolio intends to qualify as a regulated investment company under sub-chapter M of the Internal Revenue Code (the “Code”) and distribute all of its taxable income and net realized gains, if applicable, to shareholders. Accordingly, no provision for Federal income taxes has been made.
As of June 30, 2007, the aggregate cost of investments was the same for federal income tax and financial statement purposes. The net unrealized appreciation (depreciation) of investment securities for federal income tax purposes is as follows (amount in thousands):
| | | | |
Aggregate
Gross
Unrealized
Appreciation | | Aggregate
Gross
Unrealized
(Depreciation) | | Net
Unrealized
(Depreciation) |
$ 2,880 | | $ (3,202) | | $ (322) |
| | | | | | |
| | Semiannual Report | | June 30, 2007 | | 23 |
| | |
| |
Privacy Policy* | | (Unaudited) |
The Funds consider customer privacy to be a fundamental aspect of their relationships with shareholders and are committed to maintaining the confidentiality, integrity and security of their current, prospective and former shareholders’ personal information. To ensure their shareholders’ privacy, the Funds have developed policies that are designed to protect this confidentiality, while allowing shareholder needs to be served.
Obtaining Personal Information
In the course of providing shareholders with products and services, the Funds and certain service providers to the Funds, such as the Funds’ investment advisers (“Advisers”), may obtain non-public personal information about shareholders, which may come from sources such as account applications and other forms, from other written, electronic or verbal correspondence, from shareholder transactions, from a shareholder’s brokerage or financial advisory firm, financial adviser or consultant, and/or from information captured on the Funds’ internet web sites.
Respecting Your Privacy
As a matter of policy, the Funds do not disclose any personal or account information provided by shareholders or gathered by the Funds to non-affiliated third parties, except as required or permitted by law or as necessary for such third parties to perform their agreements with respect to the Funds. As is common in the industry, non-affiliated companies may from time to time be used to provide certain services, such as preparing and mailing prospectuses, reports, account statements and other information, conducting research on shareholder satisfaction and gathering shareholder proxies. A Fund’s Distributor may also retain non-affiliated companies to market the Fund’s shares or products which use the Fund’s shares and enter into joint marketing agreements with other companies. These companies may have access to a shareholder’s personal and account information, but are permitted to use this information solely to provide the specific service or as otherwise permitted by law. In most cases, the shareholders will be clients of a third party, but the Funds may also provide a shareholder’s personal and account information to the shareholder’s respective brokerage or financial advisory firm.
Sharing Information with Third Parties
The Funds reserve the right to disclose or report personal information to non-affiliated third parties, in limited circumstances, where the Funds believe in good faith that disclosure is required under law to cooperate with regulators or law enforcement authorities, to protect their rights or property or upon reasonable request by any Fund in which a shareholder has chosen to invest. In addition, the Funds may disclose information about a shareholder’s accounts to a non-affiliated third party with the consent of the shareholder.
Sharing Information with Affiliates
The Funds may share shareholder information with their affiliates in connection with servicing their shareholders’ accounts or to provide shareholders with information about products and services that the Funds or their Advisers, principal underwriters or their affiliates (“Service Affiliates”) believe may be of interest to such shareholders. The information that the Funds share may include, for example, a shareholder’s participation in one of the Funds or in other investment programs sponsored by a Service Affiliate, a shareholder’s ownership of certain types of accounts (such as IRAs), or other data about a shareholder’s accounts. The Funds’ Service Affiliates, in turn, are not permitted to share shareholder information with non-affiliated entities, except as required or permitted by law.
Procedures to Safeguard Private Information
The Funds take seriously the obligation to safeguard shareholder non-public personal information. In addition to this policy, the Funds have also implemented procedures that are designed to restrict access to a shareholder’s non-public personal information only to internal personnel who need to know that information in order to provide products or services to such shareholders. In order to guard a shareholder’s non-public personal information, physical, electronic and procedural safeguards are in place.
* This Privacy Policy applies to the following entities: PIMCO Funds, PIMCO Variable Insurance Trust, PCM Fund, Inc. and PIMCO Strategic Global Government Fund, Inc. (collectively, the “Funds”).
| | | | |
| 24 | | PIMCO Variable Insurance Trust | | |
Investment Adviser and Administrator
Pacific Investment Management Company LLC
840 Newport Center Drive
Newport Beach, California 92660
Distributor
Allianz Global Investors Distributors LLC
1345 Avenue of the Americas
New York, New York 10105
Custodian
State Street Bank & Trust Company
801 Pennsylvania
Kansas City, Missouri 64105
Transfer Agent
Boston Financial Data Services–Midwest
330 W. 9th Street
Kansas City, Missouri 64105
Legal Counsel
Dechert LLP
1775 I Street, N.W.
Washington, D.C. 20006
Independent Registered Public Accounting Firm
PricewaterhouseCoopers LLP
1055 Broadway
Kansas City, Missouri 64105
P I M C O

Table of Contents
This material is authorized for use only when preceded or accompanied by the current PIMCO Variable Insurance Trust (the “Trust”) prospectus. Investors should consider the investment objectives, risks, charges and expenses of this Trust carefully before investing. Ask your financial professional to explain all charges that may apply. This and other information is contained in the Trust’s prospectus. The variable product prospectus may be obtained by contacting your Investment Consultant. Please read the Trust and variable product prospectus carefully before you invest or send money.
Chairman’s Letter
Dear PIMCO Variable Insurance Trust Shareholder:
It is our pleasure to present to you the semiannual report for the PIMCO Variable Insurance Trust, covering the six-month period ended June 30, 2007. The PIMCO Variable Insurance Trust’s net assets were $8.68 billion at June 30, 2007, as compared to $7.76 billion at December 31, 2006.
Highlights of the financial markets during the reporting period include:
| | n | | Economic data during the first quarter of 2007 pointed to slower growth, which heightened market expectations for a decrease in the Federal Funds Rate. By the second quarter, economic data, such as employment statistics, provided little indication of economic weakness, causing expectations of a decrease in the Federal Funds Rate to unwind and U.S. interest rates to move higher. Interest rates in Europe and the U.K. also rose over the period as central banks raised their key lending rates due to inflation concerns. The benchmark ten-year U.S. Treasury yielded 5.03% as of June 30, 2007, or 0.32% higher than at the beginning of the year. |
| | n | | Most bonds generally returned much of their gains from earlier in the year as worldwide growth and capital flows drove interest rates higher in the second quarter. Increased risk aversion in global financial markets, due in part to subprime mortgage worries in the U.S., also contributed to the rise in interest rates. The Lehman Brothers Aggregate Bond Index, which includes Treasury, investment-grade corporate and mortgage-backed securities, returned 0.98% for the six-month period. |
| | n | | Locally issued emerging market (“EM”) bonds posted positive returns for the reporting period. Yields on these bonds declined and the local currencies in which they are denominated generally gained, amid increasing investor awareness, strong economic growth and surging capital inflows. External EM bonds (debt instruments issued by emerging markets countries and typically denominated in U.S. dollars) lagged behind local EM bonds (debt instruments issued by emerging markets countries and denominated in the currency of the issuer), as external EM bonds tend to trade more in-line with U.S. Treasuries. |
| | n | | Treasury Inflation-Protected Securities (“TIPS”) outpaced nominal bonds (non-inflation linked bonds) for the first part of the year and all but the longest maturity TIPS outperformed in the second quarter as high gasoline prices drove higher inflation accruals. Commodities, as represented by the Dow Jones-AIG Commodity Total Return Index, returned 4.46% for the period. Equities, as measured by the S&P 500 Index and the Russell 2000 Index, returned 6.96% and 6.45%, respectively, for the period. |
On the following pages, please find specific details as to the Portfolio’s total return investment performance and a discussion of those factors that affected performance.
Thank you for the trust you have placed in us. We will continue to work diligently to serve your investment needs.
Sincerely,
Brent R. Harris
Chairman, PIMCO Variable Insurance Trust
July 31, 2007
| | | | | | |
| | Semiannual Report | | June 30, 2007 | | 1 |
Important Information About the Portfolio
PIMCO Variable Insurance Trust (the “Trust”) is an open-end management investment company currently consisting of twenty separate investment portfolios, including the Emerging Markets Bond Portfolio (the “Portfolio”). The Portfolio is only available as a funding vehicle under variable life insurance policies or variable annuity contracts issued by insurance companies (“Variable Contracts”). Individuals may not purchase shares of the Portfolio directly. Shares of the Portfolio also may be sold to qualified pension and retirement plans outside of the separate account context.
We believe that bond funds have an important role to play in a well diversified investment portfolio. It is important to note, however, that in an environment where interest rates may trend upward, rising rates would negatively impact the performance of most bond funds, and fixed-income securities held by a fund are likely to decrease in value. The price volatility of fixed-income securities can also increase during periods of rising interest rates resulting in increased losses to a fund. Bond funds and individual bonds with a longer duration (a measure of the expected life of a security) tend to be more sensitive to changes in interest rates, usually making them more volatile than securities or funds with shorter durations.
The Portfolio may be subject to various risks in addition to those described above. Some of these risks may include, but are not limited to, the following: credit risk, high yield risk, market risk, issuer risk, liquidity risk, derivatives risk, mortgage risk, non-U.S. investment risk, emerging markets risk, currency risk, issuer non-diversification risk, leveraging risk and management risk. A complete description of these risks is contained in the Portfolio’s prospectus. The Portfolio may use derivative instruments for hedging purposes or as part of an investment strategy. Use of these instruments may involve certain costs and risks such as liquidity risk, interest rate risk, market risk, credit risk, management risk and the risk that the Portfolio could not close out a position when it would be most advantageous to do so. Because the Portfolio may invest in derivatives, it could lose more than the principal amount invested in these instruments. Investing in non-U.S. securities may entail risk due to non-U.S. economic and political developments; this risk may be increased when investing in emerging markets.
On the performance summary page in this Semiannual Report, the Total Return Investment Performance table measures performance assuming that all dividend and capital gain distributions were reinvested.
An investment in the Portfolio is not a deposit of a bank and is not guaranteed or insured by the Federal Deposit Insurance Corporation or any other government agency. It is possible to lose money on investments in the Portfolio.
PIMCO has adopted written proxy voting policies and procedures (“Proxy Policy”) as required by Rule 206(4)-6 under the Investment Advisers Act of 1940, as amended. The Proxy Policy has been adopted by the Trust as the policies and procedures that PIMCO will use when voting proxies on behalf of the Portfolio. A description of the policies and procedures that PIMCO uses to vote proxies relating to portfolio securities of the Portfolio, and information about how the Portfolio voted proxies relating to portfolio securities held during the most recent twelve-month period ended June 30, are available without charge, upon request, by calling the Trust at 1-866-746-2606 and on the Portfolio’s website at www.pimco.com.
The Portfolio files its complete schedule of portfolio holdings with the SEC for the first and third quarters of each fiscal year on Form N-Q. A copy of the Trust’s Form N-Q is also available on the SEC’s website at http://www.sec.gov and may be reviewed and copied at the SEC’s Public Reference Room in Washington D.C. Information on the operation of the Public Reference Room may be obtained by calling 1-800-SEC-0330, and is available without charge, upon request, by calling the Trust at 1-866-746-2606 and on the Portfolio’s website at www.pimco.com.
PIMCO Variable Insurance Trust is distributed by Allianz Global Investors Distributors LLC, 1345 Avenue of the Americas, New York, NY 10105.
| | | | |
| 2 | | PIMCO Variable Insurance Trust | | |
The following disclosure provides important information regarding the Portfolio’s Expense Example (“Example” or “Expense Example”), which appears in this Semiannual Report. Please refer to this information when reviewing the Expense Example for the Portfolio.
Example
As a shareholder of the Portfolio, you incur two types of costs: (1) transaction costs and (2) ongoing costs, including advisory and administrative fees; distribution and/or service (12b-1) fees (Administrative and Advisor Class only); and other Portfolio expenses. The Example is intended to help you understand your ongoing costs (in dollars) of investing in the Portfolio and to compare these costs with the ongoing costs of investing in other mutual funds. The Expense Example does not reflect any fees or other expenses imposed by the Variable Contracts. If it did, the expenses reflected in the Expense Example would be higher. The Example is based on an investment of $1,000 invested at the beginning of the period and held for the entire period indicated, which is from January 1, 2007 to June 30, 2007.
Actual Expenses
The information in the table under the heading “Actual Performance” provides information about actual account values and actual expenses. You may use the information in these columns, together with the amount you invested, to estimate the expenses that you paid over the period. Simply divide your account value by $1,000 (for example, an $8,600 account value divided by $1,000 = $8.60), then multiply the result by the number in the row titled “Expenses Paid During Period” to estimate the expenses you paid on your account during this period.
Hypothetical Example for Comparison Purposes
The information in the table under the heading “Hypothetical Performance (5% return before expenses)” provides information about hypothetical account values and hypothetical expenses based on the Portfolio’s actual expense ratio and an assumed rate of return of 5% per year before expenses, which is not the Portfolio’s actual return. The hypothetical account values and expenses may not be used to estimate the actual ending account balance or expenses you paid for the period. You may use this information to compare the ongoing costs of investing in the Portfolio and other portfolios. To do so, compare this 5% hypothetical example with the 5% hypothetical examples that appear in the shareholder reports of the other portfolios.
Please note that the expenses shown in the table are meant to highlight your ongoing costs only and do not reflect any transactional costs. Therefore, the information under the heading “Hypothetical Performance (5% return before expenses)” is useful in comparing ongoing costs only, and will not help you determine the relative total costs of owning different portfolios. In addition, if these transactional costs were included, your costs would have been higher.
The expense ratio may vary period to period because of various factors, such as an increase in expenses not covered by the advisory and administrative fees (such as expenses of the trustees and their counsel, litigation expense and interest expense).
| | | | | | |
| | Semiannual Report | | June 30, 2007 | | 3 |
PIMCO Global Bond Portfolio (Unhedged)
Cumulative Returns Through June 30, 2007
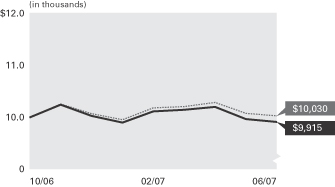
$10,000 invested at the beginning of the first full month following the inception date of the Portfolio’s Advisor Class.
Allocation Breakdown‡
| | |
United States | | 55.5% |
Germany | | 12.6% |
United Kingdom | | 10.1% |
Japan | | 9.1% |
Short-Term Instruments | | 6.1% |
Spain | | 2.9% |
Other | | 3.7% |
| | ‡ | % of Total Investments as of 06/30/2007 |
| | | | | | |
| Cumulative Total Return for the period ended June 30, 2007 |
| | | | | 6 Months* | | Portfolio
Inception
(10/31/06) |
| | PIMCO Global Bond Portfolio (Unhedged) Advisor Class | | -1.15% | | -0.87% |
| | JPMorgan Government Bond Indices Global FX New York Index Unhedged in USD± | | -0.43% | | 0.30% |
All Portfolio returns are net of fees and expenses.
* Cumulative return.
Performance quoted represents past performance. Past performance is no guarantee of future results. Investment return and principal value will fluctuate so the Portfolio shares, when redeemed, may be worth more or less than their original cost. The Portfolio’s performance does not reflect the deduction of additional charges and expenses imposed in connection with investing in Variable Contracts, which will reduce returns. Current performance may be lower or higher than the performance data quoted. Performance data current to the most recent month-end is available by calling (800) 927-4648.
± JPMorgan Government Bond Indices Global FX New York Index Unhedged in USD is an unmanaged index representative of the total return performance in U.S. dollars on an unhedged basis of major world bond markets. It is not possible to invest directly in the index. The index does not reflect deductions for fees and expenses.
| | | | | | |
| Expense Example | | Actual Performance | | Hypothetical Performance |
| | | | | (5% return before expenses) |
Beginning Account Value (01/01/07) | | $ | 1,000.00 | | $ | 1,000.00 |
Ending Account Value (06/30/07) | | $ | 988.48 | | $ | 1,019.84 |
Expenses Paid During Period† | | $ | 4.93 | | $ | 5.01 |
† Expenses are equal to the Portfolio’s Advisor Class annualized expense ratio of 1.00%, multiplied by the average account value over the period, multiplied by 181/365 (to reflect the one-half year period). Overall fees and expenses of investing in the Portfolio will be higher because the example does not reflect Variable Contract fees and expenses.
Please refer to page 3 herein for an explanation of the information presented in the above Expense Example.
Portfolio Insights
| » | | The PIMCO Global Bond Portfolio (Unhedged) seeks to achieve its investment objective by investing under normal circumstances at least 80% of its assets in fixed-income instruments of issuers located in at least three countries (one of which may be the United States), which may be represented by futures contracts (including related options) with respect to such securities, and options on such securities. |
| » | | Global unhedged bonds produced weak returns as bond yields rose across major markets. |
| » | | Exposure to U.S. shorter maturities, principally through interest rate futures contracts, detracted from performance as yields rose. |
| » | | An underweight to U.K. interest rates, notably at the long-end of the yield curve, was positive for returns as U.K. yields rose sharply. |
| » | | An overweight to European interest rates was negative for returns as yields rose due to the region’s growth momentum. |
| » | | An overweight to mortgage-backed securities detracted from returns as mortgage spreads widened. |
| » | | Emerging market currency exposure was positive for returns as these currencies outperformed the U.S. dollar. |
| » | | Global swap spread widening strategies were positive for returns as global swap spreads widened. |
| | | | |
| 4 | | PIMCO Variable Insurance Trust | | |
Financial Highlights Global Bond Portfolio (Unhedged)
| | | | | | | | |
| Selected per Share Data for the Period Ended: | | 06/30/2007+ | | | 10/31/2006-12/31/2006 | |
| | |
Advisor Class | | | | | | | | |
Net asset value beginning of period | | $ | 12.06 | | | $ | 12.09 | |
Net investment income (a) | | | 0.19 | | | | 0.07 | |
Net realized/unrealized (loss) on investments (a) | | | (0.33 | ) | | | (0.04 | ) |
Total income (loss) from investment operations | | | (0.14 | ) | | | 0.03 | |
Dividends from net investment income | | | (0.18 | ) | | | (0.06 | ) |
Total distributions | | | (0.18 | ) | | | (0.06 | ) |
Net asset value end of period | | $ | 11.74 | | | $ | 12.06 | |
Total return | | | (1.15 | )% | | | 0.28 | % |
Net assets end of period (000s) | | $ | 10 | | | $ | 10 | |
Ratio of expenses to average net assets | | | 1.00 | %* | | | 1.00 | %* |
Ratio of expenses to average net assets excluding interest expense | | | 1.00 | %* | | | 1.00 | %* |
Ratio of net investment income to average net assets | | | 3.20 | %* | | | 3.08 | %* |
Portfolio turnover rate | | | 277 | % | | | 224 | % |
+ Unaudited
* Annualized
(a) Per share amounts based on average number of shares outstanding during the period.
| | | | | | |
| See Accompanying Notes | | Semiannual Report | | June 30, 2007 | | 5 |
Statement of Assets and Liabilities Global Bond Portfolio (Unhedged)
| | | | |
| (Amounts in thousands, except per share amounts) | | June 30, 2007
(Unaudited) | |
| |
Assets: | | | | |
Investments, at value | | $ | 296,193 | |
Foreign currency, at value | | | 4,357 | |
Receivable for investments sold | | | 25,626 | |
Receivable for Portfolio shares sold | | | 134 | |
Interest and dividends receivable | | | 2,426 | |
Variation margin receivable | | | 98 | |
Swap premiums paid | | | 5,055 | |
Unrealized appreciation on foreign currency contracts | | | 458 | |
Unrealized appreciation on swap agreements | | | 2,768 | |
| | | | 337,115 | |
| |
Liabilities: | | | | |
Payable for investments purchased | | $ | 101,093 | |
Payable for investments purchased on a delayed-delivery basis | | | 5,295 | |
Payable for Portfolio shares redeemed | | | 580 | |
Payable for short sales | | | 24,418 | |
Written options outstanding | | | 123 | |
Accrued investment advisory fee | | | 42 | |
Accrued administration fee | | | 84 | |
Accrued servicing fee | | | 25 | |
Variation margin payable | | | 109 | |
Swap premiums received | | | 583 | |
Unrealized depreciation on foreign currency contracts | | | 589 | |
Unrealized depreciation on swap agreements | | | 2,628 | |
| | | | 135,569 | |
| |
Net Assets | | $ | 201,546 | |
| |
Net Assets Consist of: | | | | |
Paid in capital | | $ | 206,138 | |
(Overdistributed) net investment income | | | (311 | ) |
Accumulated undistributed net realized (loss) | | | (4,303 | ) |
Net unrealized appreciation | | | 22 | |
| | | $ | 201,546 | |
| |
Net Assets: | | | | |
Institutional Class | | $ | 188 | |
Administrative Class | | | 201,348 | |
Advisor Class | | | 10 | |
| |
Shares Issued and Outstanding: | | | | |
Institutional Class | | | 16 | |
Administrative Class | | | 17,147 | |
Advisor Class | | | 1 | |
| |
Net Asset Value and Redemption Price Per Share (Net Asset Per Share Outstanding) | | | | |
Institutional Class | | $ | 11.74 | |
Administrative Class | | | 11.74 | |
Advisor Class | | | 11.74 | |
| |
Cost of Investments Owned | | $ | 296,515 | |
Cost of Foreign Currency Held | | $ | 4,343 | |
Proceeds Received on Short Sales | | $ | 24,631 | |
Premiums Received on Written Options | | $ | 547 | |
| | | | |
| 6 | | PIMCO Variable Insurance Trust | | See Accompanying Notes |
Statement of Operations Global Bond Portfolio (Unhedged)
| | | | |
| (Amounts in thousands) | | Six Months Ended June 30, 2007 (Unaudited) | |
| |
| Investment Income: | | | | |
Interest, net of foreign taxes* | | $ | 3,989 | |
Dividends | | | 23 | |
Miscellaneous income | | | 4 | |
Total Income | | | 4,016 | |
| |
Expenses: | | | | |
Investment advisory fees | | | 237 | |
Administration fees | | | 475 | |
Servicing fees – Administrative Class | | | 142 | |
Trustees’ fees | | | 2 | |
Interest expense | | | 1 | |
Total Expenses | | | 857 | |
| |
Net Investment Income | | | 3,159 | |
| |
Net Realized and Unrealized Gain (Loss): | | | | |
Net realized (loss) on investments | | | (1,909 | ) |
Net realized (loss) on futures contracts, written options and swaps | | | (946 | ) |
Net realized (loss) on foreign currency transactions | | | (1,938 | ) |
Net change in unrealized (depreciation) on investments | | | (2,177 | ) |
Net change in unrealized appreciation on futures contracts, written options and swaps | | | 1,272 | |
Net change in unrealized appreciation on translation of assets and liabilities denominated in foreign currencies | | | 391 | |
Net (Loss) | | | (5,307 | ) |
| |
Net (Decrease) in Net Assets Resulting from Operations | | $ | (2,148 | ) |
| |
*Foreign tax withholding | | $ | 1 | |
| | | | | | |
| See Accompanying Notes | | Semiannual Report | | June 30, 2007 | | 7 |
Statements of Changes in Net Assets Global Bond Portfolio (Unhedged)
| | | | | | | | |
| (Amounts in thousands) | | Six Months Ended June 30, 2007 (Unaudited) | | | Year Ended December 31, 2006 | |
| | |
| Increase (Decrease) in Net Assets from: | | | | | | | | |
| | |
Operations: | | | | | | | | |
Net investment income | | $ | 3,159 | | | $ | 4,817 | |
Net realized gain (loss) | | | (4,793 | ) | | | 1,490 | |
Net change in unrealized (depreciation) | | | (514 | ) | | | (120 | ) |
Net increase (decrease) resulting from operations | | | (2,148 | ) | | | 6,187 | |
| | |
Distributions to Shareholders: | | | | | | | | |
From net investment income | | | | | | | | |
Institutional Class | | | (3 | ) | | | 0 | |
Administrative Class | | | (3,049 | ) | | | (4,594 | ) |
Advisor Class | | | 0 | | | | 0 | |
| | |
Total Distributions | | | (3,052 | ) | | | (4,594 | ) |
| | |
Portfolio Share Transactions: | | | | | | | | |
Receipts for shares sold | | | | | | | | |
Institutional Class | | | 150 | | | | 49 | |
Administrative Class | | | 50,329 | | | | 99,227 | |
Advisor Class | | | 0 | | | | 10 | |
Issued as reinvestment of distributions | | | | | | | | |
Institutional Class | | | 3 | | | | 0 | |
Administrative Class | | | 3,049 | | | | 4,593 | |
Advisor Class | | | 0 | | | | 0 | |
Cost of shares redeemed | | | | | | | | |
Institutional Class | | | (8 | ) | | | (1 | ) |
Administrative Class | | | (20,729 | ) | | | (25,733 | ) |
Advisor Class | | | 0 | | | | 0 | |
Net increase resulting from Portfolio share transactions | | | 32,794 | | | | 78,145 | |
| | |
Total Increase in Net Assets | | | 27,594 | | | | 79,738 | |
| | |
Net Assets: | | | | | | | | |
Beginning of period | | | 173,952 | | | | 94,214 | |
End of period* | | $ | 201,546 | | | $ | 173,952 | |
| | |
*Including (overdistributed) net investment income of: | | $ | (311 | ) | | $ | (418 | ) |
| | | | |
| 8 | | PIMCO Variable Insurance Trust | | See Accompanying Notes |
| | |
| |
| Schedule of Investments Global Bond Portfolio (Unhedged) | | June 30, 2007 (Unaudited) |
| | | | | | | | |
| | | | | PRINCIPAL
AMOUNT
(000S) | | | | VALUE (000S) |
| BELGIUM 0.4% |
| Belgium Government Bond | | | | |
4.250% due 09/28/2014 | | EUR | | 600 | | $ | | 795 |
| | | | | | | | |
Total Belgium (Cost $761) | | | | 795 |
| | | | | | | | |
|
| BERMUDA 0.2% |
| Intelsat Bermuda Ltd. | | | | | | | | |
5.250% due 11/01/2008 | | $ | | 400 | | | | 396 |
| | | | | | | | |
Total Bermuda (Cost $395) | | | | 396 |
| | | | | | | | |
|
| BRAZIL 0.1% |
| Vale Overseas Ltd. | | | | | | | | |
6.250% due 01/11/2016 | | $ | | 300 | | | | 299 |
| | | | | | | | |
Total Brazil (Cost $300) | | | | 299 |
| | | | | | | | |
|
| CANADA 0.5% |
| DaimlerChrysler Canada Finance, Inc. | | | | |
4.850% due 03/30/2009 | | CAD | | 200 | | | | 187 |
| |
| Province of Ontario Canada | | | | |
6.200% due 06/02/2031 | | | | 500 | | | | 550 |
| |
| Rogers Wireless, Inc. | | | | |
7.250% due 12/15/2012 | | $ | | 200 | | | | 211 |
| | | | | | | | |
Total Canada (Cost $939) | | | | 948 |
| | | | | | | | |
|
| CAYMAN ISLANDS 1.0% |
| Mizuho Finance Cayman Ltd. | | | | |
2.116% due 08/29/2049 | | JPY | | 100,000 | | | | 822 |
8.375% due 12/29/2049 | | $ | | 400 | | | | 418 |
| |
| MUFG Capital Finance 1 Ltd. | | | | |
6.346% due 07/29/2049 | | | | 400 | | | | 394 |
| |
| SMFG Preferred Capital USD 1 Ltd. | | | | |
6.078% due 01/29/2049 | | | | 400 | | | | 387 |
| | | | | | | | |
Total Cayman Islands (Cost $2,083) | | | | 2,021 |
| | | | | | | | |
|
| FRANCE 0.8% |
| France Government Bond | | | | |
3.150% due 07/25/2032 (c) | | EUR | | 110 | | | | 170 |
5.750% due 10/25/2032 | | | | 600 | | | | 930 |
6.500% due 04/25/2011 | | | | 300 | | | | 434 |
| | | | | | | | |
Total France (Cost $1,569) | | | | 1,534 |
| | | | | | | | |
|
| GERMANY 18.5% |
| Republic of Germany | | | | |
3.750% due 01/04/2015 | | EUR | | 3,200 | | | | 4,111 |
4.250% due 01/04/2014 | | | | 1,400 | | | | 1,862 |
4.250% due 07/04/2014 | | | | 5,700 | | | | 7,573 |
4.750% due 07/04/2028 | | | | 300 | | | | 407 |
4.750% due 07/04/2034 | | | | 100 | | | | 136 |
5.000% due 07/04/2012 | | | | 3,500 | | | | 4,833 |
5.250% due 01/04/2011 | | | | 5,400 | | | | 7,475 |
5.500% due 01/04/2031 | | | | 400 | | | | 600 |
5.625% due 01/04/2028 | | | | 3,550 | | | | 5,357 |
6.250% due 01/04/2024 | | | | 600 | | | | 955 |
6.250% due 01/04/2030 | | | | 1,300 | | | | 2,124 |
6.500% due 07/04/2027 | | | | 1,100 | | | | 1,826 |
| | | | | | | | |
Total Germany (Cost $36,778) | | | | 37,259 |
| | | | | | | | |
|
| ICELAND 0.2% |
| Glitnir Banki HF | | | | | | | | |
5.618% due 04/20/2010 | | $ | | 500 | | | | 500 |
| | | | | | | | |
Total Iceland (Cost $500) | | | | 500 |
| | | | | | | | |
| | | | | | | | |
| | | | | PRINCIPAL
AMOUNT
(000S) | | | | VALUE (000S) |
| IRELAND 0.2% |
| Bank of Ireland | | | | | | | | |
5.370% due 12/19/2008 | | $ | | 400 | | $ | | 401 |
| | | | | | | | |
Total Ireland (Cost $400) | | 401 |
| | | | | | | | |
|
| ITALY 0.2% |
| Seashell Securities PLC | | | | | | | | |
4.295% due 07/25/2028 | | EUR | | 39 | | | | 52 |
| |
| Siena Mortgages SpA | | | | | | | | |
4.377% due 12/16/2038 | | | | 237 | | | | 323 |
| | | | | | | | |
Total Italy (Cost $332) | | | | 375 |
| | | | | | | | |
|
| JAPAN 13.4% |
| Bank of Tokyo-Mitsubishi UFJ Ltd. | | | | |
3.500% due 12/16/2015 | | EUR | | 100 | | | | 129 |
| |
| Japan Government Bond | | | | |
1.000% due 09/20/2010 | | JPY | | 100,000 | | | | 806 |
1.500% due 03/20/2011 | | | | 620,000 | | | | 5,075 |
1.500% due 03/20/2014 | | | | 30,000 | | | | 241 |
1.600% due 09/20/2013 | | | | 10,000 | | | | 81 |
1.600% due 06/20/2014 | | | | 120,000 | | | | 971 |
1.600% due 09/20/2014 | | | | 120,000 | | | | 969 |
2.300% due 05/20/2030 | | | | 7,000 | | | | 57 |
2.300% due 06/20/2035 | | | | 130,000 | | | | 1,028 |
2.400% due 03/20/2034 | | | | 130,000 | | | | 1,054 |
2.500% due 09/20/2035 | | | | 360,000 | | | | 2,968 |
2.500% due 06/20/2036 | | | | 280,000 | | | | 2,299 |
| |
| Japanese Government CPI Linked Bond |
0.800% due 12/10/2015 | | | | 119,880 | | | | 944 |
1.100% due 12/10/2016 | | | | 1,053,640 | | | | 8,453 |
1.200% due 06/10/2017 | | | | 120,000 | | | | 968 |
| |
| Resona Bank Ltd. | | | | |
5.850% due 09/29/2049 | | $ | | 100 | | | | 96 |
| |
| Sumitomo Mitsui Banking Corp. | | | | |
1.641% due 12/31/2049 | | JPY | | 100,000 | | | | 819 |
5.625% due 07/29/2049 | | $ | | 100 | | | | 95 |
| | | | | | | | |
Total Japan (Cost $28,833) | | | | 27,053 |
| | | | | | | | |
|
| JERSEY, CHANNEL ISLANDS 0.1% |
| HSBC Capital Funding LP | | | | |
9.547% due 12/31/2049 | | $ | | 100 | | | | 110 |
| | | | | | | | |
Total Jersey, Channel Islands
(Cost $112) | | 111 |
| | | | | | | | |
|
| MEXICO 0.1% |
| Pemex Project Funding Master Trust | | | | |
5.750% due 12/15/2015 | | $ | | 100 | | | | 98 |
| | | | | | | | |
Total Mexico (Cost $97) | | | | 98 |
| | | | | | | | |
|
| NETHERLANDS 0.8% |
| Dutch Mortgage-Backed Securities BV | | | | |
4.202% due 10/02/2079 | | EUR | | 969 | | | | 1,317 |
| |
| Netherlands Government Bond | | | | |
4.250% due 07/15/2013 | | | | 200 | | | | 266 |
| |
| Siemens Financieringsmaatschappij NV | | |
5.410% due 08/14/2009 | | $ | | 100 | | | | 100 |
| | | | | | | | |
Total Netherlands (Cost $1,539) | | | | 1,683 |
| | | | | | | | |
|
| NORWAY 0.2% |
| DnB NORBank ASA | | | | | | | | |
5.425% due 10/13/2009 | | $ | | 300 | | | | 300 |
| | | | | | | | |
Total Norway (Cost $300) | | | | 300 |
| | | | | | | | |
| | | | | | | | |
| | | | | PRINCIPAL
AMOUNT
(000S) | | | | VALUE
(000S) |
| RUSSIA 0.2% | | |
| VTB Capital S.A. for Vneshtorgbank | | | | |
5.955% due 08/01/2008 | | $ | | 500 | | $ | | 501 |
| | | | | | | | |
Total Russia (Cost $500) | | | | 501 |
| | | | | | | | |
|
| SPAIN 4.2% | | |
| Santander U.S. Debt S.A. Unipersonal | | |
5.420% due 11/20/2009 | | $ | | 400 | | | | 400 |
| |
| Spain Government Bond | | | | | | | | |
4.750% due 07/30/2014 | | EUR | | 5,000 | | | | 6,844 |
5.150% due 07/30/2009 | | | | 900 | | | | 1,233 |
| | | | | | | | |
Total Spain (Cost $8,097) | | | | 8,477 |
| | | | | | | | |
|
| UNITED KINGDOM 14.8% | | |
| HBOS PLC | | | | | | | | |
5.920% due 09/29/2049 | | $ | | 1,200 | | | | 1,127 |
| |
| Holmes Financing PLC | | | | | | | | |
4.228% due 07/15/2010 | | EUR | | 100 | | | | 135 |
| |
| HSBC Holdings PLC | | | | | | | | |
6.500% due 05/02/2036 | | $ | | 1,200 | | | | 1,237 |
| |
| Punch Taverns Finance Ltd. | | | | |
6.824% due 10/15/2032 (a) | | GBP | | 100 | | | | 201 |
| |
| Royal Bank of Scotland Group PLC | | | | |
5.750% due 07/06/2012 | | $ | | 100 | | | | 100 |
| |
| Tate & Lyle International Finance PLC |
6.125% due 06/15/2011 | | | | 200 | | | | 202 |
| |
| United Kingdom Gilt | | | | |
4.250% due 03/07/2011 | | GBP | | 2,200 | | | | 4,194 |
4.750% due 06/07/2010 | | | | 7,520 | | | | 14,675 |
4.750% due 09/07/2015 | | | | 1,500 | | | | 2,859 |
5.000% due 03/07/2008 | | | | 100 | | | | 200 |
5.000% due 03/07/2012 | | | | 2,500 | | | | 4,877 |
| |
| XL Capital Europe PLC | | | | |
6.500% due 01/15/2012 | | $ | | 100 | | | | 103 |
| | | | | | | | |
Total United Kingdom (Cost $28,717) | | 29,910 |
| | | | | | | | |
|
| UNITED STATES 81.6% |
|
| ASSET-BACKED SECURITIES 7.5% |
| Accredited Mortgage Loan Trust | | | | |
5.360% due 09/25/2036 | | $ | | 373 | | | | 373 |
5.370% due 02/25/2037 | | | | 689 | | | | 690 |
| |
| ACE Securities Corp. |
5.430% due 10/25/2035 | | | | 17 | | | | 17 |
| |
| Amortizing Residential Collateral Trust |
5.610% due 07/25/2032 | | | | 1 | | | | 1 |
5.670% due 10/25/2031 | | | | 3 | | | | 3 |
| |
| Asset-Backed Funding Certificates |
5.380% due 01/25/2037 | | | | 603 | | | | 603 |
| |
| Asset-Backed Securities Corp. Home Equity |
5.370% due 12/25/2036 | | | | 571 | | | | 571 |
| |
| Carrington Mortgage Loan Trust |
5.370% due 12/25/2036 | | | | 680 | | | | 681 |
| |
| Centex Home Equity |
5.370% due 06/25/2036 | | | | 182 | | | | 182 |
| |
| Countrywide Asset-Backed Certificates |
5.350% due 01/25/2046 | | | | 362 | | | | 362 |
5.370% due 05/25/2037 | | | | 1,328 | | | | 1,328 |
| |
| Credit-Based Asset Servicing & Securitization LLC |
5.380% due 11/25/2036 | | | | 655 | | | | 656 |
| |
| CSAB Mortgage-Backed Trust |
5.420% due 06/25/2036 | | | | 97 | | | | 97 |
| |
| | | | | | |
| See Accompanying Notes | | Semiannual Report | | June 30, 2007 | | 9 |
Schedule of Investments Global Bond Portfolio (Unhedged) (Cont.)
| | | | | | | | |
| | | | | PRINCIPAL
AMOUNT
(000S) | | | | VALUE
(000S) |
| CS First Boston Mortgage Securities Corp. |
5.940% due 01/25/2032 | | $ | | 1 | | $ | | 1 |
| |
| First Franklin Mortgage Loan Asset-Backed Certificates |
5.350% due 05/25/2036 | | | | 277 | | | | 277 |
5.360% due 01/25/2038 | | | | 658 | | | | 658 |
| |
| Fremont Home Loan Trust | | | | |
5.370% due 10/25/2036 | | | | 554 | | | | 554 |
| |
| GSAMP Trust | | | | |
5.420% due 01/25/2047 | | | | 721 | | | | 721 |
5.610% due 03/25/2034 | | | | 41 | | | | 41 |
| |
| HSI Asset Securitization Corp. Trust | | | | |
5.370% due 12/25/2036 | | | | 674 | | | | 675 |
| |
| Indymac Residential Asset-Backed Trust |
5.360% due 08/25/2036 | | | | 272 | | | | 272 |
5.380% due 04/25/2037 | | | | 632 | | | | 632 |
| |
| IXIS Real Estate Capital Trust | | | | |
5.380% due 08/25/2036 | | | | 94 | | | | 94 |
| |
| JPMorgan Mortgage Acquisition Corp. | | |
5.370% due 10/25/2036 | | | | 654 | | | | 653 |
| |
| Lehman XS Trust | | | | |
5.400% due 04/25/2046 | | | | 178 | | | | 179 |
5.400% due 07/25/2046 | | | | 354 | | | | 354 |
| |
| Long Beach Mortgage Loan Trust | | | | |
5.380% due 05/25/2046 | | | | 124 | | | | 124 |
| |
| Merrill Lynch Mortgage Investors, Inc. | | |
5.390% due 08/25/2036 | | | | 520 | | | | 521 |
| |
| Morgan Stanley ABS Capital I | | | | |
5.360% due 07/25/2036 | | | | 340 | | | | 340 |
5.390% due 02/25/2036 | | | | 155 | | | | 155 |
| |
| Morgan Stanley Home Equity Loans | | | | |
5.390% due 02/25/2036 | | | | 227 | | | | 227 |
| |
| Option One Mortgage Loan Trust | | | | |
5.390% due 01/25/2036 | | | | 186 | | | | 187 |
| |
| Residential Asset Mortgage Products, Inc. | | |
5.400% due 01/25/2036 | | | | 96 | | | | 96 |
5.400% due 02/25/2036 | | | | 129 | | | | 129 |
| |
| Residential Asset Securities Corp. | | | | |
5.380% due 04/25/2036 | | | | 81 | | | | 81 |
| |
| SACO I, Inc. | | | | |
5.380% due 05/25/2036 | | | | 92 | | | | 92 |
| |
| Saxon Asset Securities Trust | | | | |
5.590% due 01/25/2032 | | | | 2 | | | | 2 |
| |
| Securitized Asset-Backed Receivables LLC Trust |
5.370% due 12/25/2036 | | | | 675 | | | | 675 |
5.380% due 03/25/2036 | | | | 202 | | | | 202 |
| |
| Soundview Home Equity Loan Trust | | | | |
5.430% due 11/25/2035 | | | | 8 | | | | 8 |
| |
| Structured Asset Securities Corp. | | | | |
4.900% due 04/25/2035 | | | | 54 | | | | 54 |
5.720% due 05/25/2034 | | | | 10 | | | | 10 |
| |
| Truman Capital Mortgage Loan Trust |
5.660% due 01/25/2034 | | | | 13 | | | | 13 |
| |
| Washington Mutual Asset-Backed Certificates |
5.380% due 10/25/2036 | | | | 674 | | | | 675 |
| |
| Wells Fargo Home Equity Trust | | | | |
5.440% due 12/25/2035 | | | | 270 | | | | 270 |
5.550% due 10/25/2035 | | | | 546 | | | | 547 |
| | | | | | | | |
| | | | | | | | 15,083 |
| | | | | | | | |
|
| CORPORATE BONDS & NOTES 11.4% | | |
| American Express Credit Corp. | | | | |
5.380% due 03/02/2009 | | | | 400 | | | | 401 |
| |
| | | | | | | | |
| | | | | PRINCIPAL
AMOUNT
(000S) | | | | VALUE
(000S) |
| American International Group, Inc. | | |
4.875% due 03/15/2067 | | EUR | | 200 | | $ | | 257 |
6.250% due 03/15/2037 | | $ | | 100 | | | | 95 |
| |
| AT&T, Inc. | | | | | | | | |
5.450% due 05/15/2008 | | | | 600 | | | | 601 |
| |
| AutoZone, Inc. | | | | | | | | |
5.875% due 10/15/2012 | | | | 100 | | | | 100 |
| |
| Bank of America Corp. |
5.366% due 11/06/2009 | | | | 400 | | | | 400 |
| |
| BellSouth Corp. |
5.200% due 09/15/2014 | | | | 200 | | | | 192 |
| |
| Boston Scientific Corp. |
6.400% due 06/15/2016 | | | | 200 | | | | 195 |
| |
| CenterPoint Energy, Inc. |
5.875% due 06/01/2008 | | | | 200 | | | | 200 |
| |
| Charter One Bank N.A. |
5.405% due 04/24/2009 | | | | 1,000 | | | | 1,001 |
| |
| CIT Group, Inc. |
5.430% due 02/21/2008 | | | | 300 | | | | 300 |
5.470% due 06/08/2009 | | | | 500 | | | | 498 |
5.570% due 05/23/2008 | | | | 100 | | | | 100 |
| |
| Citigroup, Inc. |
5.400% due 12/26/2008 | | | | 400 | | | | 400 |
| |
| CMS Energy Corp. |
6.310% due 01/15/2013 (a) | | 200 | | | | 201 |
7.500% due 01/15/2009 | | | | 200 | | | | 206 |
| |
| CNA Financial Corp. |
6.000% due 08/15/2011 | | | | 200 | | | | 201 |
| |
| ConocoPhillips Australia Funding Co. |
5.460% due 04/09/2009 | | | | 500 | | | | 500 |
| |
| CSX Corp. |
6.300% due 03/15/2012 | | | | 200 | | | | 204 |
| |
| CVS Caremark Corp. |
5.750% due 08/15/2011 | | | | 200 | | | | 200 |
| |
| DaimlerChrysler N.A. Holding Corp. |
5.710% due 03/13/2009 | | | | 600 | | | | 601 |
5.750% due 05/18/2009 | | | | 200 | | | | 201 |
| |
| Dex Media East LLC |
9.875% due 11/15/2009 | | | | 400 | | | | 416 |
| |
| Dominion Resources, Inc. |
5.660% due 09/28/2007 | | | | 100 | | | | 100 |
| |
| DR Horton, Inc. |
6.000% due 04/15/2011 | | | | 200 | | | | 195 |
| |
| El Paso Performance-Linked Trust |
7.750% due 07/15/2011 | | | | 300 | | | | 311 |
| |
| Equistar Chemicals LP |
8.750% due 02/15/2009 | | | | 400 | | | | 416 |
| |
| Fleet National Bank |
0.801% due 07/07/2008 | | JPY | | 30,000 | | | | 244 |
| |
| Ford Motor Credit Co. |
5.800% due 01/12/2009 | | $ | | 200 | | | | 196 |
6.625% due 06/16/2008 | | | | 600 | | | | 600 |
7.250% due 10/25/2011 | | | | 200 | | | | 193 |
8.105% due 01/13/2012 | | | | 500 | | | | 499 |
| |
| Freeport-McMoRan Copper & Gold, Inc. |
8.564% due 04/01/2015 | | | | 400 | | | | 420 |
| |
| General Electric Capital Corp. |
5.460% due 06/15/2009 | | | | 1,300 | | | | 1,304 |
| |
| General Motors Acceptance Corp. |
6.510% due 09/23/2008 | | | | 500 | | | | 500 |
| |
| GMAC LLC |
6.610% due 05/15/2009 | | | | 500 | | | | 500 |
| |
| | | | | | | | |
| | | | | PRINCIPAL
AMOUNT
(000S) | | | | VALUE
(000S) |
| Harrah’s Operating Co., Inc. |
5.956% due 02/08/2008 | | $ | | 100 | | $ | | 100 |
| |
| HJ Heinz Co. |
6.428% due 12/01/2008 | | | | 300 | | | | 303 |
| |
| HJ Heinz Finance Co. | | | | | | | | |
6.000% due 03/15/2012 | | | | 100 | | | | 100 |
| |
| HSBC Finance Corp. | | | | | | | | |
5.450% due 06/19/2009 | | | | 400 | | | | 401 |
5.490% due 09/15/2008 | | | | 100 | | | | 100 |
| |
| International Lease Finance Corp. |
5.350% due 03/01/2012 | | | | 200 | | | | 198 |
5.400% due 02/15/2012 | | | | 200 | | | | 198 |
| |
| iStar Financial, Inc. |
5.150% due 03/01/2012 | | | | 200 | | | | 193 |
| |
| JC Penney Corp., Inc. |
8.000% due 03/01/2010 | | | | 200 | | | | 211 |
| |
| JPMorgan Chase & Co. |
5.058% due 02/22/2021 | | CAD | | 200 | | | | 182 |
| |
| JPMorgan Chase Capital XXII |
6.450% due 02/02/2037 | | $ | | 100 | | | | 95 |
| |
| JPMorgan Mortgage Acquisition Corp. |
6.550% due 09/15/2066 | | | | 400 | | | | 386 |
| |
| Kraft Foods, Inc. |
6.250% due 06/01/2012 | | | | 200 | | | | 204 |
| |
| Mandalay Resort Group |
6.500% due 07/31/2009 | | | | 400 | | | | 402 |
| |
| Merck & Co., Inc. |
4.750% due 03/01/2015 | | | | 200 | | | | 188 |
| |
| Merrill Lynch & Co., Inc. |
5.395% due 10/23/2008 | | | | 200 | | | | 200 |
5.450% due 08/14/2009 | | | | 200 | | | | 200 |
| |
| Mizuho Preferred Capital Co. LLC |
8.790% due 12/29/2049 | | | | 100 | | | | 103 |
| |
| Morgan Stanley |
5.467% due 02/09/2009 | | | | 500 | | | | 501 |
5.809% due 10/18/2016 | | | | 200 | | | | 200 |
| |
| Newell Rubbermaid, Inc. |
4.000% due 05/01/2010 | | | | 200 | | | | 192 |
| |
| Qwest Capital Funding, Inc. |
6.375% due 07/15/2008 | | | | 100 | | | | 101 |
| |
| Rabobank Capital Funding Trust |
5.254% due 12/29/2049 | | | | 400 | | | | 375 |
| |
| Ryder System, Inc. |
5.850% due 11/01/2016 | | | | 200 | | | | 194 |
| |
| Sara Lee Corp. |
6.250% due 09/15/2011 | | | | 200 | | | | 204 |
| |
| SB Treasury Co. LLC |
9.400% due 12/29/2049 | | | | 100 | | | | 103 |
| |
| State Street Capital Trust IV |
6.355% due 06/15/2037 | | | | 500 | | | | 504 |
| |
| Time Warner, Inc. |
5.500% due 11/15/2011 | | | | 200 | | | | 198 |
5.590% due 11/13/2009 | | | | 400 | | | | 401 |
| |
| Tokai Preferred Capital Co. LLC |
9.980% due 12/29/2049 | | | | 300 | | | | 313 |
| |
| Toyota Motor Credit Corp. |
5.330% due 10/12/2007 | | | | 400 | | | | 400 |
| |
| TXU Corp. |
6.375% due 01/01/2008 | | | | 300 | | | | 302 |
| |
| U.S. Bancorp |
5.350% due 04/28/2009 | | | | 300 | | | | 300 |
| |
| Wachovia Bank N.A. |
5.400% due 03/23/2009 | | | | 500 | | | | 500 |
| |
| | | | |
| 10 | | PIMCO Variable Insurance Trust | | See Accompanying Notes |
| | |
| |
| | | June 30, 2007 (Unaudited) |
| | | | | | | | |
| | | | | PRINCIPAL
AMOUNT
(000S) | | | | VALUE
(000S) |
| Wal-Mart Stores, Inc. |
5.260% due 06/16/2008 | | $ | | 400 | | $ | | 400 |
| |
| Wells Fargo Capital X |
5.950% due 12/15/2036 | | | | 200 | | | | 187 |
| |
| Westpac Banking Corp. | | | | | | | | |
5.280% due 06/06/2008 | | | | 400 | | | | 400 |
| |
| Wyeth | | | | | | | | |
6.950% due 03/15/2011 | | | | 200 | | | | 210 |
| |
| Xerox Corp. | | | | | | | | |
9.750% due 01/15/2009 | | | | 200 | | | | 212 |
| | | | | | | | |
| | | | | | | | 22,909 |
| | | | | | | | |
|
| MORTGAGE-BACKED SECURITIES 5.8% | | |
| Banc of America Mortgage Securities, Inc. |
5.000% due 05/25/2034 | | | | 231 | | | | 226 |
| |
| Bear Stearns Commercial Mortgage Securities |
5.430% due 03/15/2019 | | | | 649 | | | | 649 |
| |
| Bear Stearns Mortgage Funding Trust |
5.390% due 02/25/2037 | | | | 737 | | | | 737 |
| |
| CC Mortgage Funding Corp. |
5.500% due 07/25/2036 | | | | 514 | | | | 514 |
| |
| Countrywide Alternative Loan Trust |
5.530% due 03/20/2046 | | | | 348 | | | | 347 |
5.600% due 02/25/2037 | | | | 388 | | | | 389 |
6.185% due 08/25/2036 | | | | 579 | | | | 579 |
| |
| Countrywide Home Loan Mortgage Pass-Through Trust |
5.550% due 05/25/2035 | | | | 258 | | | | 258 |
5.610% due 04/25/2035 | | | | 23 | | | | 23 |
5.640% due 03/25/2035 | | | | 330 | | | | 331 |
5.650% due 02/25/2035 | | | | 31 | | | | 31 |
5.700% due 09/25/2034 | | | | 41 | | | | 41 |
| |
| CS First Boston Mortgage Securities Corp. |
6.500% due 04/25/2033 | | | | 7 | | | | 7 |
| |
| First Horizon Asset Securities, Inc. |
6.250% due 08/25/2017 | | | | 235 | | | | 234 |
| |
| GE Capital Commercial Mortgage Corp. |
4.229% due 12/10/2037 | | | | 507 | | | | 496 |
| |
| GMAC Commercial Mortgage Securities, Inc. |
6.420% due 05/15/2035 | | | | 87 | | | | 88 |
| |
| GMAC Mortgage Corp. Loan Trust |
5.500% due 09/25/2034 | | | | 110 | | | | 109 |
| |
| Greenpoint Mortgage Funding Trust |
5.590% due 11/25/2045 | | | | 35 | | | | 35 |
| |
| Greenwich Capital Commercial Funding Corp. |
5.444% due 03/10/2039 | | | | 800 | | | | 775 |
| |
| GSR Mortgage Loan Trust |
4.538% due 09/25/2035 | | | | 232 | | | | 229 |
5.354% due 06/25/2034 | | | | 50 | | | | 51 |
| |
| Harborview Mortgage Loan Trust |
5.690% due 02/19/2034 | | | | 13 | | | | 13 |
| |
| Indymac Index Mortgage Loan Trust |
5.400% due 07/25/2046 | | | | 87 | | | | 87 |
| |
| JPMorgan Mortgage Trust |
4.768% due 07/25/2035 | | | | 750 | | | | 741 |
| |
| MASTR Asset Securitization Trust |
4.500% due 03/25/2018 | | | | 173 | | | | 169 |
| |
| Mellon Residential Funding Corp. |
5.760% due 12/15/2030 | | | | 46 | | | | 46 |
| |
| Nomura Asset Acceptance Corp. |
5.050% due 10/25/2035 | | | | 69 | | | | 69 |
| |
| Residential Accredit Loans, Inc. |
5.530% due 04/25/2046 | | | | 465 | | | | 465 |
| |
| | | | | | | | |
| | | | | PRINCIPAL
AMOUNT
(000S) | | | | VALUE
(000S) |
| Structured Asset Mortgage Investments, Inc. |
5.540% due 05/25/2036 | | $ | | 509 | | $ | | 510 |
5.610% due 07/19/2034 | | | | 15 | | | | 15 |
5.670% due 03/19/2034 | | | | 25 | | | | 25 |
| |
| Thornburg Mortgage Securities Trust |
5.430% due 12/25/2036 | | | | 681 | | | | 681 |
| |
| Wachovia Bank Commercial Mortgage Trust |
5.410% due 09/15/2021 | | | | 610 | | | | 610 |
| |
| Washington Mutual, Inc. |
5.094% due 10/25/2032 | | | | 4 | | | | 4 |
5.474% due 02/27/2034 | | | | 18 | | | | 18 |
5.590% due 12/25/2045 | | | | 177 | | | | 177 |
5.610% due 10/25/2045 | | | | 93 | | | | 94 |
5.630% due 01/25/2045 | | | | 33 | | | | 33 |
5.640% due 01/25/2045 | | | | 31 | | | | 31 |
5.724% due 07/25/2046 | | | | 563 | | | | 566 |
5.860% due 12/25/2027 | | | | 113 | | | | 113 |
6.429% due 08/25/2042 | | | | 32 | | | | 32 |
| |
| Wells Fargo Mortgage-Backed Securities Trust |
4.500% due 11/25/2018 | | | | 379 | | | | 368 |
4.750% due 10/25/2018 | | | | 218 | | | | 211 |
4.950% due 03/25/2036 | | | | 425 | | | | 419 |
5.254% due 04/25/2036 | | | | 138 | | | | 138 |
| | | | | | | | |
| | | | | | | | 11,784 |
| | | | | | | | |
|
| MUNICIPAL BONDS & NOTES 0.0% | | |
| New York City, New York Transitional Finance Authority Revenue Bonds, Series 2004 |
5.000% due 02/01/2028 | | | | 25 | | | | 26 |
| | | | | | | | |
|
| | | | | SHARES | | | | |
| PREFERRED STOCKS 0.4% | | |
| DG Funding Trust | | | | | | | | |
7.600% due 12/31/2049 | | | | 58 | | | | 604 |
| |
| Fresenius Medical Care Capital Trust II | | |
7.875% due 02/01/2008 | | | | 200 | | | | 202 |
| | | | | | | | |
| | | | | | | | 806 |
| | | | | | | | |
|
| | | | | PRINCIPAL
AMOUNT
(000S) | | | | |
| COMMODITY INDEX-LINKED NOTES 0.5% |
| Morgan Stanley | | | | | | | | |
0.000% due 07/07/2008 | | $ | | 1,000 | | | | 994 |
| | | | | | | | |
|
| U.S. GOVERNMENT AGENCIES 54.8% | | |
| Fannie Mae | | | | | | | | |
4.187% due 11/01/2034 | | | | 325 | | | | 322 |
4.397% due 10/01/2034 | | | | 38 | | | | 38 |
4.940% due 12/01/2034 | | | | 48 | | | | 48 |
5.000% due 11/01/2018 - 03/01/2036 | | | | 796 | | | | 758 |
5.440% due 03/25/2034 | | | | 33 | | | | 33 |
5.470% due 08/25/2034 | | | | 27 | | | | 27 |
5.500% due 10/01/2016 - 07/01/2037 | | | | 22,233 | | | | 21,483 |
5.570% due 06/25/2044 | | | | 29 | | | | 29 |
6.000% due 07/01/2037 - 07/25/2044 | | | | 72,100 | | | | 71,324 |
6.500% due 07/01/2037 | | | | 7,000 | | | | 7,067 |
| |
| Freddie Mac | | | | | | | | |
4.500% due 02/15/2017 - 02/01/2018 | | | | 1,991 | | | | 1,913 |
5.000% due 03/15/2017 | | | | 331 | | | | 327 |
5.500% due 06/01/2035 - 07/01/2037 | | | | 4,657 | | | | 4,497 |
5.550% due 07/15/2037 | | | | 1,400 | | | | 1,400 |
6.000% due 04/15/2036 | | | | 965 | | | | 907 |
6.227% due 10/25/2044 | | | | 193 | | | | 195 |
7.190% due 02/01/2029 | | | | 27 | | | | 27 |
| |
| |
| | | | | | | | |
| | | | | PRINCIPAL
AMOUNT
(000S) | | | | VALUE
(000S) |
| Ginnie Mae | | | | | | | | |
5.125% due 11/20/2024 | | $ | | 6 | | $ | | 7 |
| | | | | | | | |
| | | | | | | | 110,402 |
| | | | | | | | |
|
| U.S. TREASURY OBLIGATIONS 1.2% | | |
| U.S. Treasury Bonds | | | | | | | | |
8.125% due 08/15/2019 | | | | 100 | | | | 127 |
8.750% due 05/15/2017 | | | | 100 | | | | 128 |
8.875% due 02/15/2019 | | | | 200 | | | | 265 |
| |
| U.S. Treasury Notes | | | | | | | | |
4.250% due 11/15/2014 | | | | 1,000 | | | | 954 |
4.625% due 02/29/2012 | | | | 200 | | | | 198 |
4.875% due 01/31/2009 | | | | 100 | | | | 100 |
| |
| U.S. Treasury Strips | | | | | | | | |
0.000% due 05/15/2017 | | | | 430 | | | | 260 |
0.000% due 08/15/2020 | | | | 300 | | | | 151 |
0.000% due 11/15/2021 | | | | 600 | | | | 283 |
| | | | | | | | |
| | | | | | | | 2,466 |
| | | | | | | | |
Total United States (Cost $164,845) | | | | 164,470 |
| | | | | | | | |
|
| SHORT-TERM INSTRUMENTS 9.0% |
|
| CERTIFICATES OF DEPOSIT 2.8% | | |
| Abbey National Treasury Services PLC |
5.270% due 07/02/2008 | | | | 400 | | | | 400 |
| |
| BNP Paribas |
5.262% due 05/28/2008 | | | | 800 | | | | 800 |
| |
| Countrywide Funding Corp. |
5.360% due 08/16/2007 | | | | 700 | | | | 700 |
| |
| Fortis Bank NY |
5.265% due 04/28/2008 | | | | 300 | | | | 300 |
| |
| Nordea Bank Finland PLC |
5.308% due 05/28/2008 | | | | 500 | | | | 501 |
| |
| Societe Generale NY |
5.271% due 06/30/2008 | | | | 1,300 | | | | 1,301 |
| |
| Unicredito Italiano NY |
5.358% due 12/13/2007 | | | | 400 | | | | 400 |
5.358% due 05/06/2008 | | | | 900 | | | | 900 |
5.360% due 12/03/2007 | | | | 300 | | | | 300 |
| | | | | | | | |
| | | | | | | | 5,602 |
| | | | | | | | |
|
| COMMERCIAL PAPER 5.2% | | |
| TotalFinaElf Capital S.A. | | | | | | | | |
5.340% due 07/02/2007 | | | | 4,600 | | | | 4,600 |
| |
| UBS Finance Delaware LLC | | |
5.205% due 10/23/2007 | | | | 300 | | | | 299 |
5.235% due 10/23/2007 | | | | 5,600 | | | | 5,545 |
| | | | | | | | |
| | | | | | | | 10,444 |
| | | | | | | | |
|
| REPURCHASE AGREEMENTS 0.5% | | |
| State Street Bank and Trust Co. | | |
4.900% due 07/02/2007 | | | | 922 | | | | 922 |
| | | | | | | | |
(Dated 06/29/2007. Collateralized by Fannie Mae
3.250% due 08/15/2008 valued at $945. Repurchase proceeds are $922.) |
|
| U.S. TREASURY BILLS 0.5% | | |
4.657% due 08/30/2007 - 09/13/2007 (b)(e) | | | | 1,110 | | | | 1,099 |
| | | | | | | | |
Total Short-Term Instruments
(Cost $18,068) | | | | 18,067 |
| | | | | | | | |
| | | | | | |
| See Accompanying Notes | | Semiannual Report | | June 30, 2007 | | 11 |
Schedule of Investments Global Bond Portfolio (Unhedged) (Cont.)
| | | | | | | | | |
| | | | | | | | | VALUE
(000S) | |
| PURCHASED OPTIONS (g) 0.5% | |
(Cost $1,350) | | $ | | 995 | |
| |
| | | | | | | | | |
Total Investments (d) 147.0%
(Cost $296,515) | | $ | | 296,193 | |
| |
Written Options (h) (0.1%)
(Premiums $547) | | | | | | | | (123 | ) |
| |
| Other Assets and Liabilities (Net) (46.9%) | | (94,524 | ) |
| | | | | | | | | |
| Net Assets 100.0% | | | | | | $ | | 201,546 | |
| | | | | | | | | |
Notes to Schedule of Investments (amounts in thousands*, except number of contracts):
* A zero balance may reflect actual amounts rounding to less than one thousand.
(a) When-issued security.
(b) Coupon represents a weighted average rate.
(c) Principal amount of security is adjusted for inflation.
(d) As of June 30, 2007, portfolio securities with an aggregate value of $2,394 were valued in good faith and pursuant to the guidelines established by the Board of Trustees.
(e) Securities with an aggregate market value of $1,099 have been segregated with the custodian to cover margin requirements for the following open futures contracts on June 30, 2007:
| | | | | | | | | | |
| Description | | Type | | Expiration
Month | | # of
Contracts | | Unrealized
Appreciation/
(Depreciation) | |
90-Day Eurodollar December Futures | | Long | | 12/2007 | | 36 | | $ | 9 | |
90-Day Eurodollar March Futures | | Long | | 03/2008 | | 8 | | | (9 | ) |
90-Day Euroyen December Futures | | Long | | 12/2007 | | 133 | | | (32 | ) |
Euro-Bobl 5-Year Note September Futures | | Long | | 09/2007 | | 146 | | | (50 | ) |
Euro-Bobl 5-Year Note September Futures Put Options
Strike @ EUR 104.000 | | Long | | 09/2007 | | 93 | | | 1 | |
Euro-Bund 10-Year Note September Futures | | Long | | 09/2007 | | 240 | | | (176 | ) |
Euro-Bund 10-Year Note September Futures Put Options
Strike @ EUR 106.000 | | Long | | 09/2007 | | 207 | | | 3 | |
Japan Government 10-Year Bond September Futures | | Long | | 09/2007 | | 34 | | | (132 | ) |
U.S. Treasury 10-Year Note September Futures | | Long | | 09/2007 | | 125 | | | 62 | |
U.S. Treasury 30-Year Bond September Futures | | Long | | 09/2007 | | 32 | | | 33 | |
United Kingdom 90-Day LIBOR Sterling Interest Rate
September Futures | | Long | | 09/2007 | | 34 | | | (36 | ) |
| | | | | | | | | | |
| | | | | | | | $ | (327 | ) |
| | | | | | | | | | |
(f) Swap agreements outstanding on June 30, 2007:
Credit Default Swaps
| | | | | | | | | | | | | | | | |
| Counterparty | | Reference Entity | | Buy/Sell
Protection (1) | | (Pay)/Receive
Fixed Rate | | | Expiration
Date | | Notional
Amount | | Unrealized
Appreciation/
(Depreciation) | |
Barclays Bank PLC | | Dow Jones iTraxx Europe HV6 Index | | Buy | | (0.850% | ) | | 12/20/2016 | | EUR | 800 | | $ | (1 | ) |
BNP Paribas Bank | | Dow Jones iTraxx Europe HV6 Index | | Buy | | (0.850% | ) | | 12/20/2016 | | | 500 | | | 0 | |
Deutsche Bank AG | | Akzo Nobel NV 4.250% due 06/14/2011 | | Buy | | (0.290% | ) | | 06/20/2012 | | | 200 | | | (1 | ) |
Deutsche Bank AG | | Kelda Group PLC 6.625% DUE 04/17/2031 | | Buy | | (0.210% | ) | | 06/20/2012 | | | 200 | | | 0 | |
Deutsche Bank AG | | United Utilities PLC 6.875% due 08/15/2028 | | Buy | | (0.235% | ) | | 06/20/2012 | | | 200 | | | 1 | |
Deutsche Bank AG | | Dow Jones iTraxx Europe HV6 Index | | Buy | | (0.850% | ) | | 12/20/2016 | | | 1,200 | | | (1 | ) |
Goldman Sachs & Co. | | ICI Wilmington, Inc. 5.625% due 12/01/2013 | | Buy | | (0.340% | ) | | 06/20/2012 | | | 200 | | | 0 | |
Goldman Sachs & Co. | | Koninklijke DSM NV 4.000% due 11/10/2015 | | Buy | | (0.365% | ) | | 06/20/2012 | | | 200 | | | (1 | ) |
Goldman Sachs & Co. | | SCA Finans AB 4.500% due 07/15/2015 | | Buy | | (0.250% | ) | | 06/20/2012 | | | 200 | | | 0 | |
Goldman Sachs & Co. | | Dow Jones iTraxx Europe HV6 Index | | Buy | | (0.850% | ) | | 12/20/2016 | | | 100 | | | 0 | |
HSBC Bank USA | | Dow Jones iTraxx Europe HV6 Index | | Buy | | (0.850% | ) | | 12/20/2016 | | | 100 | | | 0 | |
JPMorgan Chase & Co. | | Dow Jones iTraxx Europe HV6 Index | | Buy | | (0.850% | ) | | 12/20/2016 | | | 700 | | | (2 | ) |
Merrill Lynch & Co., Inc. | | Compass Group PLC 6.375% due 05/29/2012 | | Buy | | (0.390% | ) | | 06/20/2012 | | | 200 | | | 0 | |
Deutsche Bank AG | | SOFTBANK Corp. 1.750% due 03/31/2014 | | Sell | | 2.300% | | | 09/20/2007 | | JPY | 47,000 | | | 2 | |
Bank of America | | Lehman Brothers Holdings, Inc. 6.625% due 01/18/2012 | | Sell | | 0.150% | | | 06/20/2008 | | $ | 600 | | | 0 | |
Bank of America | | Merrill Lynch & Co., Inc. 6.000% due 02/17/2009 | | Sell | | 0.150% | | | 06/20/2008 | | | 200 | | | 0 | |
Bank of America | | DR Horton, Inc. 6.000% due 04/15/2011 | | Buy | | (0.890% | ) | | 06/20/2011 | | | 200 | | | 3 | |
Bank of America | | Time Warner, Inc. 5.500% due 11/15/2011 | | Buy | | (0.310% | ) | | 12/20/2011 | | | 200 | | | (1 | ) |
Bank of America | | Transocean, Inc. 7.375% due 04/15/2018 | | Buy | | (0.539% | ) | | 06/20/2017 | | | 100 | | | 0 | |
Bank of America | | Transocean, Inc. 7.375% due 04/15/2018 | | Buy | | (0.505% | ) | | 06/20/2017 | | | 400 | | | (1 | ) |
Barclays Bank PLC | | International Lease Finance Corp. 5.400% due 02/15/2012 | | Buy | | (0.170% | ) | | 03/20/2012 | | | 200 | | | 0 | |
| | | | |
| 12 | | PIMCO Variable Insurance Trust | | See Accompanying Notes |
| | |
| |
| | | June 30, 2007 (Unaudited) |
| | | | | | | | | | | | | | | | |
| Counterparty | | Reference Entity | | Buy/Sell
Protection (1) | | (Pay)/Receive
Fixed Rate | | | Expiration
Date | | Notional
Amount | | Unrealized
Appreciation/
(Depreciation) | |
Barclays Bank PLC | | XL Capital Europe PLC 6.500% due 01/15/2012 | | Buy | | (0.310% | ) | | 03/20/2012 | | $ | 100 | | $ | 0 | |
Barclays Bank PLC | | American Electric Power Co., Inc. 5.250% due 06/01/2015 | | Buy | | (0.100% | ) | | 06/20/2012 | | | 100 | | | 0 | |
Barclays Bank PLC | | Capital One Bank 5.125% due 02/15/2014 | | Buy | | (0.160% | ) | | 06/20/2012 | | | 400 | | | 1 | |
Barclays Bank PLC | | Noble Corp. 5.875% due 06/01/2013 | | Buy | | (0.530% | ) | | 06/20/2012 | | | 100 | | | 0 | |
Bear Stearns & Co., Inc. | | CNA Financial Corp. 6.000% due 08/15/2011 | | Buy | | (0.440% | ) | | 09/20/2011 | | | 100 | | | 0 | |
Bear Stearns & Co., Inc. | | H.J. Heinz Finance Co. 6.000% due 03/15/2012 | | Buy | | (0.370% | ) | | 03/20/2012 | | | 100 | | | 0 | |
Bear Stearns & Co., Inc. | | Kraft Foods, Inc. 6.250% due 06/01//2012 | | Buy | | (0.170% | ) | | 06/20/2012 | | | 200 | | | 1 | |
Bear Stearns & Co., Inc. | | MeadWestvaco Corp. 6.850% due 04/01/2012 | | Buy | | (0.520% | ) | | 06/20/2012 | | | 1,000 | | | 2 | |
Bear Stearns & Co., Inc. | | Weyerhaeuser Co. 6.750% due 03/15/2012 | | Buy | | (0.480% | ) | | 06/20/2012 | | | 1,000 | | | (1 | ) |
Bear Stearns & Co., Inc. | | Ryder System, Inc. 5.850% due 11/01/2016 | | Buy | | (0.460% | ) | | 12/20/2016 | | | 200 | | | 4 | |
Citibank N.A. | | Newell Rubbermaid, Inc. 4.000% due 05/01/2010 | | Buy | | (0.130% | ) | | 06/20/2010 | | | 200 | | | 0 | |
Citibank N.A. | | Nabors Industries, Inc. 5.375% due 08/15/2012 | | Buy | | (0.470% | ) | | 06/20/2012 | | | 100 | | | (1 | ) |
Citibank N.A. | | AutoZone, Inc. 5.875% due 10/15/2012 | | Buy | | (0.680% | ) | | 12/20/2012 | | | 100 | | | (2 | ) |
Credit Suisse First Boston | | CenterPoint Energy, Inc. 5.875% due 06/01/2008 | | Buy | | (0.170% | ) | | 06/20/2008 | | | 200 | | | 0 | |
Credit Suisse First Boston | | DaimlerChrysler N.A. Holding Corp. 5.750% due 05/18/2009 | | Buy | | (0.380% | ) | | 06/20/2009 | | | 200 | | | (1 | ) |
Credit Suisse First Boston | | iStar Financial, Inc. 5.150% due 03/01/2012 | | Buy | | (0.450% | ) | | 03/20/2012 | | | 200 | | | 1 | |
Credit Suisse First Boston | | Noble Corp. 5.875% due 06/01/2013 | | Buy | | (0.530% | ) | | 06/20/2012 | | | 100 | | | 0 | |
Credit Suisse First Boston | | Noble Corp. 5.875% due 06/01/2013 | | Buy | | (0.519% | ) | | 06/20/2012 | | | 300 | | | (1 | ) |
Deutsche Bank AG | | Bear Stearns Cos., Inc. 5.300% due 10/30/2015 | | Sell | | 0.160% | | | 06/20/2008 | | | 300 | | | 0 | |
Deutsche Bank AG | | Goldman Sachs Group, Inc. 6.600% due 01/15/2012 | | Sell | | 0.120% | | | 06/20/2008 | | | 600 | | | 0 | |
Deutsche Bank AG | | Lehman Brothers Holdings, Inc. 6.625% due 01/18/2012 | | Sell | | 0.160% | | | 06/20/2008 | | | 700 | | | 0 | |
Deutsche Bank AG | | JC Penney Corp., Inc. 8.000% due 03/01/2010 | | Buy | | (0.270% | ) | | 03/20/2010 | | | 200 | | | 0 | |
Goldman Sachs & Co. | | Carnival Corp. 6.650% due 01/15/2028 | | Buy | | (0.210% | ) | | 06/20/2012 | | | 100 | | | 0 | |
Goldman Sachs & Co. | | Dow Jones CDX N.A. IG8 Index | | Sell | | 0.350% | | | 06/20/2012 | | | 6,700 | | | (15 | ) |
Goldman Sachs & Co. | | GlobalSantaFe Corp. 5.000% due 02/15/2013 | | Buy | | (0.445% | ) | | 06/20/2012 | | | 300 | | | (1 | ) |
Goldman Sachs & Co. | | Dow Jones CDX N.A. IG8 Index | | Buy | | (0.600% | ) | | 06/20/2017 | | | 26,200 | | | 150 | |
Goldman Sachs & Co. | | International Paper Co. 5.850% due 10/30/2012 | | Buy | | (0.675% | ) | | 06/20/2017 | | | 100 | | | 0 | |
Goldman Sachs & Co. | | MeadWestvaco Corp. 6.850% due 04/01/2012 | | Buy | | (1.040% | ) | | 06/20/2017 | | | 500 | | | 3 | |
HSBC Bank USA | | Russia Government International Bond
7.500% due 03/31/2030 | | Sell | | 0.240% | | | 02/20/2008 | | | 500 | | | 0 | |
HSBC Bank USA | | Ukraine Government International Bond
7.650% due 06/11/2013 | | Sell | | 0.700% | | | 04/20/2009 | | | 400 | | | 2 | |
HSBC Bank USA | | Ukraine Government International Bond
7.650% due 06/11/2013 | | Sell | | 0.730% | | | 04/20/2009 | | | 400 | | | 2 | |
JPMorgan Chase & Co. | | CNA Financial Corp. 6.000% due 08/15/2011 | | Buy | | (0.440% | ) | | 09/20/2011 | | | 100 | | | 0 | |
Lehman Brothers, Inc. | | Ford Motor Credit Co. 7.875% due 06/15/2010 | | Buy | | (2.310% | ) | | 06/20/2010 | | | 200 | | | 0 | |
Lehman Brothers, Inc. | | Wyeth 6.950% due 03/15/2011 | | Buy | | (0.100% | ) | | 03/20/2011 | | | 200 | | | 0 | |
Lehman Brothers, Inc. | | Tate & Lyle International Finance PLC
6.125% due 06/15/2011 | | Buy | | (0.315% | ) | | 06/20/2011 | | | 200 | | | 0 | |
Lehman Brothers, Inc. | | Brazilian Government International Bond
12.250% due 03/06/2030 | | Sell | | 1.280% | | | 08/20/2011 | | | 3,200 | | | 93 | |
Lehman Brothers, Inc. | | Brazilian Government International Bond
12.250% due 03/06/2030 | | Sell | | 1.350% | | | 08/20/2011 | | | 2,300 | | | 73 | |
Lehman Brothers, Inc. | | CVS Corp. 5.750% due 08/15/2011 | | Buy | | (0.210% | ) | | 09/20/2011 | | | 200 | | | 0 | |
Lehman Brothers, Inc. | | Sealed Air Corp. 6.250% due 09/15/2011 | | Buy | | (0.350% | ) | | 09/20/2011 | | | 200 | | | 0 | |
Lehman Brothers, Inc. | | BellSouth Corp. 5.200% due 09/15/2014 | | Buy | | (0.325% | ) | | 09/20/2014 | | | 200 | | | (1 | ) |
Lehman Brothers, Inc. | | Merck & Co., Inc. 4.750% due 03/01/2015 | | Buy | | (0.135% | ) | | 03/20/2015 | | | 200 | | | 1 | |
Merrill Lynch & Co., Inc. | | CSX Corp. 6.300% due 03/15/2012 | | Buy | | (0.230% | ) | | 03/20/2012 | | | 200 | | | 1 | |
Merrill Lynch & Co., Inc. | | International Lease Finance Corp. 5.350% due 03/01/2012 | | Buy | | (0.130% | ) | | 03/20/2012 | | | 200 | | | 0 | |
Morgan Stanley | | Xerox Corp. 9.750% due 01/15/2009 | | Buy | | (0.290% | ) | | 03/20/2009 | | | 200 | | | 0 | |
Morgan Stanley | | Glitnir Banki HF floating rate based on 3-Month
USD-LIBOR plus 0.260% due 04/20/2010 | | Buy | | (0.170% | ) | | 06/20/2010 | | | 500 | | | 0 | |
Morgan Stanley | | Weyerhaeuser Co. 6.750% due 03/15/2012 | | Buy | | (0.480% | ) | | 06/20/2012 | | | 1,000 | | | (1 | ) |
Morgan Stanley | | Rogers Wireless, Inc. 7.250% due 12/15/2012 | | Buy | | (0.540% | ) | | 12/20/2012 | | | 200 | | | 0 | |
Morgan Stanley | | Diamond Offshore Drilling, Inc. 4.875% due 07/01/2015 | | Buy | | (0.495% | ) | | 06/20/2017 | | | 100 | | | 0 | |
Royal Bank of Canada | | DaimlerChrysler Canada Finance, Inc.
4.850% due 03/30/2009 | | Buy | | (0.350% | ) | | 06/20/2009 | | | 200 | | | (1 | ) |
Royal Bank of Canada | | JPMorgan Chase & Co. 6.750% due 02/01/2011 | | Buy | | (0.310% | ) | | 03/20/2016 | | | 200 | | | 0 | |
Royal Bank of Scotland Group PLC | | Indonesia Government International Bond
6.750% due 03/10/2014 | | Sell | | 1.280% | | | 12/20/2011 | | | 100 | | | 1 | |
Royal Bank of Scotland Group PLC | | Morgan Stanley floating rate based on 3-Month USD-LIBOR plus 0.450% due 10/18/2016 | | Buy | | (0.320% | ) | | 12/20/2016 | | | 200 | | | 2 | |
UBS Warburg LLC | | American International Group, Inc.
4.250% due 05/15/2013 | | Sell | | 0.070% | | | 06/20/2008 | | | 800 | | | 0 | |
UBS Warburg LLC | | DR Horton, Inc. 5.375% due 06/15/2012 | | Buy | | (1.540% | ) | | 06/20/2017 | | | 200 | | | 12 | |
UBS Warburg LLC | | Lennar Corp. 5.950% due 03/01/2013 | | Buy | | (1.190% | ) | | 06/20/2017 | | | 500 | | | 14 | |
UBS Warburg LLC | | Weyerhaeuser Co. 6.750% due 03/15/2012 | | Buy | | (0.930% | ) | | 06/20/2017 | | | 400 | | | 2 | |
Wachovia Bank N.A. | | GlobalSantaFe Corp. 5.000% due 02/15/2013 | | Buy | | (0.530% | ) | | 06/20/2012 | | | 100 | | | (1 | ) |
Wachovia Bank N.A. | | GlobalSantaFe Corp. 5.000% due 02/15/2013 | | Buy | | (0.520% | ) | | 06/20/2012 | | | 100 | | | (1 | ) |
| | | | | | | | | | | | | | | | |
| | | | | | | | | | | | | | $ | 336 | |
| | | | | | | | | | | | | | | | |
(1) If the Portfolio is a seller of protection and a credit event occurs, as defined under the terms of that particular swap agreement, the Portfolio will pay to the buyer of the protection an amount up to the notional value of the swap and in certain instances, take delivery of the security. As a buyer of protection, the Portfolio will generally receive from the seller of protection an amount up to the notional amount of the swap if a credit event occurs.
| | | | | | |
| See Accompanying Notes | | Semiannual Report | | June 30, 2007 | | 13 |
Schedule of Investments Global Bond Portfolio (Unhedged) (Cont.)
Interest Rate Swaps
| | | | | | | | | | | | | | | |
| Counterparty | | Floating Rate Index | | Pay/Receive
Floating Rate | | Fixed Rate | | Expiration
Date | | Notional
Amount | | Unrealized
Appreciation/
(Depreciation) | |
Citibank N.A. | | 6-Month Australian Bank Bill | | Pay | | 6.500% | | 01/15/2009 | | AUD | 4,600 | | $ | (12 | ) |
Citibank N.A. | | 6-Month Australian Bank Bill | | Pay | | 6.000% | | 06/15/2010 | | | 700 | | | (19 | ) |
Citibank N.A. | | 6-Month Australian Bank Bill | | Receive | | 6.000% | | 06/15/2015 | | | 400 | | | 21 | |
Deutsche Bank AG | | 6-Month Australian Bank Bill | | Pay | | 6.500% | | 01/15/2009 | | | 15,700 | | | (40 | ) |
Deutsche Bank AG | | 6-Month Australian Bank Bill | | Pay | | 6.500% | | 01/15/2010 | | | 7,000 | | | (52 | ) |
Deutsche Bank AG | | 6-Month Australian Bank Bill | | Pay | | 6.000% | | 06/15/2012 | | | 3,900 | | | (99 | ) |
Deutsche Bank AG | | 6-Month Australian Bank Bill | | Receive | | 6.000% | | 06/15/2017 | | | 2,300 | | | 103 | |
HSBC Bank USA | | 6-Month Australian Bank Bill | | Pay | | 6.000% | | 06/15/2012 | | | 3,100 | | | (80 | ) |
HSBC Bank USA | | 6-Month Australian Bank Bill | | Receive | | 6.000% | | 06/15/2017 | | | 1,800 | | | 82 | |
Morgan Stanley | | 6-Month Australian Bank Bill | | Pay | | 6.500% | | 01/15/2009 | | | 7,000 | | | (18 | ) |
Royal Bank of Canada | | 6-Month Australian Bank Bill | | Pay | | 6.500% | | 01/15/2010 | | | 2,400 | | | (18 | ) |
UBS Warburg LLC | | 6-Month Australian Bank Bill | | Pay | | 6.000% | | 06/15/2010 | | | 1,700 | | | (48 | ) |
UBS Warburg LLC | | 6-Month Australian Bank Bill | | Receive | | 6.000% | | 06/15/2015 | | | 1,100 | | | 63 | |
Citibank N.A. | | 3-Month Canadian Bank Bill | | Receive | | 5.000% | | 06/15/2015 | | CAD | 500 | | | 21 | |
Royal Bank of Canada | | 3-Month Canadian Bank Bill | | Receive | | 5.000% | | 06/15/2015 | | | 1,500 | | | 20 | |
Barclays Bank PLC | | 6-Month EUR-LIBOR | | Receive | | 4.000% | | 06/17/2010 | | EUR | 10 | | | 0 | |
Barclays Bank PLC | | 5-Year French CPI Ex Tobacco Daily Reference Index | | Pay | | 1.948% | | 03/15/2012 | | | 900 | | | (23 | ) |
Deutsche Bank AG | | 6-Month EUR-LIBOR | | Receive | | 4.000% | | 12/15/2011 | | | 700 | | | 23 | |
Deutsche Bank AG | | 6-Month EUR-LIBOR | | Receive | | 4.000% | | 12/15/2014 | | | 12,160 | | | 514 | |
Goldman Sachs & Co. | | 6-Month EUR-LIBOR | | Receive | | 5.000% | | 09/19/2012 | | | 2,600 | | | (12 | ) |
Goldman Sachs & Co. | | 6-Month EUR-LIBOR | | Receive | | 4.000% | | 12/15/2014 | | | 7,000 | | | 421 | |
Goldman Sachs & Co. | | 6-Month EUR-LIBOR | | Receive | | 5.000% | | 03/19/2038 | | | 1,400 | | | (26 | ) |
HSBC Bank USA | | 6-Month EUR-LIBOR | | Receive | | 4.000% | | 12/15/2014 | | | 2,300 | | | 102 | |
JPMorgan Chase & Co. | | 6-Month EUR-LIBOR | | Receive | | 5.000% | | 06/17/2012 | | | 900 | | | 75 | |
Lehman Brothers, Inc. | | 6-Month EUR-LIBOR | | Receive | | 4.000% | | 12/15/2014 | | | 600 | | | 43 | |
Lehman Brothers, Inc. | | 6-Month EUR-LIBOR | | Pay | | 6.000% | | 06/18/2034 | | | 700 | | | (58 | ) |
Merrill Lynch & Co., Inc. | | 6-Month EUR-LIBOR | | Pay | | 6.000% | | 06/18/2034 | | | 1,000 | | | (58 | ) |
Morgan Stanley | | 6-Month EUR-LIBOR | | Receive | | 4.000% | | 12/15/2011 | | | 3,300 | | | 130 | |
Morgan Stanley | | 6-Month EUR-LIBOR | | Receive | | 4.000% | | 06/15/2017 | | | 500 | | | 48 | |
Morgan Stanley | | 6-Month EUR-LIBOR | | Pay | | 6.000% | | 06/18/2034 | | | 2,000 | | | (56 | ) |
Royal Bank of Scotland Group PLC | | 5-Year French CPI Ex Tobacco Daily Reference Index | | Pay | | 1.950% | | 03/30/2012 | | | 600 | | | (6 | ) |
Royal Bank of Scotland Group PLC | | 5-Year French CPI Ex Tobacco Daily Reference Index | | Pay | | 1.940% | | 04/10/2012 | | | 600 | | | (7 | ) |
UBS Warburg LLC | | 6-Month EUR-LIBOR | | Pay | | 4.000% | | 06/17/2010 | | | 200 | | | (15 | ) |
Barclays Bank PLC | | 6-Month GBP-LIBOR | | Pay | | 6.000% | | 03/20/2009 | | GBP | 9,800 | | | (110 | ) |
Barclays Bank PLC | | 6-Month GBP-LIBOR | | Pay | | 5.000% | | 09/15/2010 | | | 3,200 | | | (216 | ) |
Barclays Bank PLC | | 6-Month GBP-LIBOR | | Receive | | 5.000% | | 09/15/2015 | | | 600 | | | 78 | |
Barclays Bank PLC | | 6-Month GBP-LIBOR | | Receive | | 4.500% | | 09/15/2017 | | | 4,500 | | | 45 | |
Barclays Bank PLC | | 6-Month GBP-LIBOR | | Receive | | 4.000% | | 12/15/2035 | | | 1,200 | | | 134 | |
Deutsche Bank AG | | 6-Month GBP-LIBOR | | Pay | | 5.000% | | 06/15/2009 | | | 100 | | | (4 | ) |
Deutsche Bank AG | | 6-Month GBP-LIBOR | | Receive | | 4.250% | | 06/12/2036 | | | 200 | | | 52 | |
Goldman Sachs & Co. | | 6-Month GBP-LIBOR | | Receive | | 4.250% | | 06/12/2036 | | | 300 | | | 80 | |
JPMorgan Chase & Co. | | 6-Month GBP-LIBOR | | Receive | | 4.000% | | 12/15/2035 | | | 400 | | | 28 | |
Merrill Lynch & Co., Inc. | | 6-Month GBP-LIBOR | | Pay | | 5.000% | | 09/15/2010 | | | 2,800 | | | (251 | ) |
Morgan Stanley | | 6-Month GBP-LIBOR | | Pay | | 5.000% | | 09/15/2015 | | | 700 | | | (87 | ) |
Goldman Sachs & Co. | | 3-Month Hong Kong Bank Bill | | Receive | | 4.235% | | 12/17/2008 | | HKD | 5,800 | | | 5 | |
Deutsche Bank AG | | 6-Month JPY-LIBOR | | Pay | | 1.000% | | 09/18/2008 | | JPY | 2,060,000 | | | 6 | |
Deutsche Bank AG | | 6-Month JPY-LIBOR | | Pay | | 3.000% | | 06/20/2027 | | | 120,000 | | | (7 | ) |
Goldman Sachs & Co. | | 6-Month JPY-LIBOR | | Receive | | 2.000% | | 12/20/2016 | | | 1,520,000 | | | (93 | ) |
Morgan Stanley | | 6-Month JPY-LIBOR | | Pay | | 1.000% | | 03/18/2009 | | | 20,000 | | | 0 | |
Morgan Stanley | | 6-Month JPY-LIBOR | | Receive | | 2.000% | | 12/20/2016 | | | 1,460,000 | | | (84 | ) |
UBS Warburg LLC | | 6-Month JPY-LIBOR | | Pay | | 1.000% | | 09/18/2008 | | | 2,660,000 | | | (41 | ) |
UBS Warburg LLC | | 6-Month JPY-LIBOR | | Pay | | 1.000% | | 03/18/2009 | | | 2,090,000 | | | (38 | ) |
UBS Warburg LLC | | 6-Month JPY-LIBOR | | Receive | | 0.800% | | 03/20/2012 | | | 50,000 | | | (3 | ) |
UBS Warburg LLC | | 6-Month JPY-LIBOR | | Receive | | 2.000% | | 06/15/2012 | | | 45,000 | | | 11 | |
UBS Warburg LLC | | 6-Month JPY-LIBOR | | Receive | | 2.000% | | 12/20/2013 | | | 420,000 | | | 41 | |
UBS Warburg LLC | | 6-Month JPY-LIBOR | | Receive | | 2.000% | | 12/20/2016 | | | 1,730,000 | | | (70 | ) |
UBS Warburg LLC | | 6-Month JPY-LIBOR | | Pay | | 3.000% | | 06/20/2027 | | | 130,000 | | | (8 | ) |
UBS Warburg LLC | | 6-Month JPY-LIBOR | | Pay | | 2.500% | | 06/20/2036 | | | 380,000 | | | (88 | ) |
Citibank N.A. | | 28-Day Mexico Interbank TIIE Banxico | | Pay | | 8.170% | | 11/04/2016 | | MXN | 5,000 | | | (4 | ) |
Bank of America | | 3-Month USD-LIBOR | | Pay | | 5.000% | | 06/18/2009 | | $ | 18,100 | | | (90 | ) |
Barclays Bank PLC | | 3-Month USD-LIBOR | | Receive | | 5.000% | | 12/19/2017 | | | 4,500 | | | (28 | ) |
Citibank N.A. | | 3-Month USD-LIBOR | | Receive | | 5.000% | | 06/20/2014 | | | 2,000 | | | 71 | |
Deutsche Bank AG | | 3-Month USD-LIBOR | | Pay | | 5.000% | | 06/18/2009 | | | 81,000 | | | (396 | ) |
Deutsche Bank AG | | 3-Month USD-LIBOR | | Receive | | 5.000% | | 12/19/2009 | | | 700 | | | (1 | ) |
Deutsche Bank AG | | 3-Month USD-LIBOR | | Receive | | 5.000% | | 12/19/2012 | | | 700 | | | (1 | ) |
Deutsche Bank AG | | 3-Month USD-LIBOR | | Receive | | 5.000% | | 06/20/2014 | | | 500 | | | 18 | |
Deutsche Bank AG | | 3-Month USD-LIBOR | | Receive | | 5.000% | | 12/19/2017 | | | 1,400 | | | (9 | ) |
Deutsche Bank AG | | 3-Month USD-LIBOR | | Pay | | 5.000% | | 12/19/2037 | | | 800 | | | 10 | |
Goldman Sachs & Co. | | 3-Month USD-LIBOR | | Pay | | 5.500% | | 12/16/2014 | | | 700 | | | (15 | ) |
Lehman Brothers, Inc. | | 3-Month USD-LIBOR | | Receive | | 5.000% | | 06/20/2014 | | | 4,300 | | | 152 | |
Morgan Stanley | | 3-Month USD-LIBOR | | Receive | | 5.000% | | 12/19/2017 | | | 4,700 | | | (31 | ) |
Royal Bank of Scotland Group PLC | | 3-Month USD-LIBOR | | Pay | | 5.000% | | 12/19/2008 | | | 7,300 | | | (36 | ) |
Royal Bank of Scotland Group PLC | | 3-Month USD-LIBOR | | Receive | | 5.000% | | 12/19/2014 | | | 600 | | | (2 | ) |
Royal Bank of Scotland Group PLC | | 3-Month USD-LIBOR | | Receive | | 5.000% | | 12/19/2017 | | | 39,000 | | | (233 | ) |
| | | | | | | | | | | | | | | |
| | | | | | | | | | | | | $ | (196 | ) |
| | | | | | | | | | | | | | | |
| | | | |
| 14 | | PIMCO Variable Insurance Trust | | See Accompanying Notes |
| | |
| |
| | | June 30, 2007 (Unaudited) |
(g) Purchased options outstanding on June 30, 2007:
Interest Rate Swaptions
| | | | | | | | | | | | | | | | | | | |
| Description | | Counterparty | | Floating Rate
Index | | Pay/Receive
Floating Rate | | Exercise
Rate | | Expiration
Date | | Notional
Amount | | Cost | | Value |
Call - OTC 2-Year Interest Rate Swap | | Bank of America | | 3-Month USD-LIBOR | | Pay | | 4.800% | | 08/08/2007 | | $ | 7,000 | | $ | 29 | | $ | 0 |
Call - OTC 2-Year Interest Rate Swap | | Bank of America | | 3-Month USD-LIBOR | | Pay | | 5.000% | | 02/01/2008 | | | 4,600 | | | 18 | | | 7 |
Call - OTC 2-Year Interest Rate Swap | | Bank of America | | 3-Month USD-LIBOR | | Pay | | 4.750% | | 09/26/2008 | | | 5,400 | | | 27 | | | 11 |
Call - OTC 1-Year Interest Rate Swap | | Barclays Bank PLC | | 3-Month USD-LIBOR | | Pay | | 4.750% | | 02/01/2008 | | | 14,000 | | | 40 | | | 4 |
Call - OTC 2-Year Interest Rate Swap | | Lehman Brothers, Inc. | | 3-Month USD-LIBOR | | Pay | | 5.000% | | 12/20/2007 | | | 12,200 | | | 79 | | | 15 |
Call - OTC 1-Year Interest Rate Swap | | Royal Bank of Scotland Group PLC | | 3-Month USD-LIBOR | | Pay | | 4.850% | | 07/02/2007 | | | 42,700 | | | 111 | | | 0 |
Call - OTC 1-Year Interest Rate Swap | | Royal Bank of Scotland Group PLC | | 3-Month USD-LIBOR | | Pay | | 4.900% | | 08/08/2007 | | | 19,900 | | | 45 | | | 0 |
Call - OTC 2-Year Interest Rate Swap | | Royal Bank of Scotland Group PLC | | 3-Month USD-LIBOR | | Pay | | 5.000% | | 02/01/2008 | | | 5,800 | | | 29 | | | 9 |
Call - OTC 2-Year Interest Rate Swap | | Royal Bank of Scotland Group PLC | | 3-Month USD-LIBOR | | Pay | | 4.750% | | 03/31/2008 | | | 22,800 | | | 138 | | | 28 |
Call - OTC 2-Year Interest Rate Swap | | Royal Bank of Scotland Group PLC | | 3-Month USD-LIBOR | | Pay | | 4.750% | | 09/26/2008 | | | 5,400 | | | 19 | | | 11 |
Call - OTC 2-Year Interest Rate Swap | | Royal Bank of Scotland Group PLC | | 3-Month USD-LIBOR | | Pay | | 4.750% | | 12/15/2008 | | | 12,200 | | | 41 | | | 28 |
| | | | | | | | | | | | | | | | | | | |
| | | | | | | | | | | | | | | $ | 576 | | $ | 113 |
| | | | | | | | | | | | | | | | | | | |
Foreign Currency Options
| | | | | | | | | | | | | | |
| Description | | Exercise
Price | | Expiration
Date | | Notional
Amount | | Cost | | Value |
Call - OTC Euro versus U.S. dollar | | | $1.362 | | 05/21/2008 | | EUR | 1,000 | | $ | 31 | | $ | 30 |
Put - OTC Euro versus U.S. dollar | | | 1.362 | | 05/21/2008 | | | 1,000 | | | 30 | | | 29 |
Call - OTC Euro versus U.S. dollar | | | 1.375 | | 05/21/2010 | | | 1,200 | | | 59 | | | 60 |
Call - OTC Euro versus U.S. dollar | | | 1.375 | | 05/21/2010 | | | 1,100 | | | 52 | | | 55 |
Put - OTC Euro versus U.S. dollar | | | 1.375 | | 05/21/2010 | | | 1,100 | | | 52 | | | 50 |
Put - OTC Euro versus U.S. dollar | | | 1.375 | | 05/21/2010 | | | 1,200 | | | 59 | | | 55 |
Call - OTC U.S. dollar versus Japanese yen | | JPY | 120.000 | | 09/26/2007 | | $ | 800 | | | 6 | | | 18 |
Call - OTC U.S. dollar versus Japanese yen | | | 117.900 | | 11/09/2007 | | | 1,600 | | | 17 | | | 54 |
Call - OTC U.S. dollar versus Japanese yen | | | 117.500 | | 11/19/2007 | | | 800 | | | 9 | | | 29 |
Call - OTC U.S. dollar versus Japanese yen | | | 114.281 | | 12/05/2007 | | | 700 | | | 8 | | | 40 |
Call - OTC U.S. dollar versus Japanese yen | | | 114.650 | | 01/18/2008 | | | 2,000 | | | 67 | | | 105 |
Put - OTC U.S. dollar versus Japanese yen | | | 114.650 | | 01/18/2008 | | | 2,000 | | | 67 | | | 17 |
Call - OTC U.S. dollar versus Japanese yen | | | 117.500 | | 03/13/2008 | | | 1,200 | | | 10 | | | 38 |
Call - OTC U.S. dollar versus Japanese yen | | | 115.950 | | 06/09/2008 | | | 3,000 | | | 80 | | | 111 |
Put - OTC U.S. dollar versus Japanese yen | | | 115.950 | | 06/09/2008 | | | 3,000 | | | 80 | | | 58 |
Call - OTC U.S. dollar versus Japanese yen | | | 118.150 | | 06/23/2008 | | | 2,600 | | | 68 | | | 67 |
Put - OTC U.S. dollar versus Japanese yen | | | 118.150 | | 06/23/2008 | | | 2,600 | | | 68 | | | 71 |
| | | | | | | | | | | | | | |
| | | | | | | | | | $ | 763 | | $ | 887 |
| | | | | | | | | | | | | | |
Options on Securities
| | | | | | | | | | | | | | |
| Description | | Strike
Price | | Expiration
Date | | Notional
Amount | | Cost | | Value |
Put - OTC Fannie Mae 5.500% due 08/01/2037 | | $ | 89.500 | | 08/07/2007 | | $ | 21,000 | | $ | 3 | | $ | 0 |
Put - OTC Fannie Mae 6.000% due 09/01/2037 | | | 92.500 | | 09/06/2007 | | | 72,000 | | | 8 | | | 5 |
| | | | | | | | | | | | | | |
| | | | | | | | | | $ | 11 | | $ | 5 |
| | | | | | | | | | | | | | |
Straddle Options
| | | | | | | | | | | | | | | | |
| Description | | Counterparty | | Exercise
Price (2) | | Expiration
Date | | Notional
Amount | | Cost (2) | | Value | |
Call & Put - OTC U.S. dollar versus Japanese yen Forward Delta Neutral Straddle | | Goldman Sachs & Co. | | $ 0.000 | | 09/20/2007 | | $ | 3,900 | | $ | 0 | | $ | (10 | ) |
| | | | | | | | | | | | | | | | |
(2) Exercise price and final cost determined on a future date, based upon implied volatility parameters.
(h) Written options outstanding on June 30, 2007:
Interest Rate Swaptions
| | | | | | | | | | | | | | | | | | | |
| Description | | Counterparty | | Floating Rate Index | | Pay/Receive
Floating Rate | | Exercise
Rate | | Expiration
Date | | Notional
Amount | | Premium | | Value |
Call - OTC 5-Year Interest Rate Swap | | Bank of America | | 3-Month USD-LIBOR | | Receive | | 4.900% | | 08/08/2007 | | $ | 3,000 | | $ | 26 | | $ | 0 |
Call - OTC 5-Year Interest Rate Swap | | Bank of America | | 3-Month USD-LIBOR | | Receive | | 5.100% | | 02/01/2008 | | | 2,000 | | | 18 | | | 7 |
Call - OTC 5-Year Interest Rate Swap | | Bank of America | | 3-Month USD-LIBOR | | Receive | | 4.950% | | 09/26/2008 | | | 2,300 | | | 27 | | | 12 |
Call - OTC 5-Year Interest Rate Swap | | Barclays Bank PLC | | 3-Month USD-LIBOR | | Receive | | 4.900% | | 02/01/2008 | | | 3,100 | | | 39 | | | 7 |
Call - OTC 5-Year Interest Rate Swap | | Lehman Brothers, Inc. | | 3-Month USD-LIBOR | | Receive | | 5.150% | | 12/20/2007 | | | 5,300 | | | 77 | | | 17 |
Call - OTC 5-Year Interest Rate Swap | | Royal Bank of Scotland Group PLC | | 3-Month USD-LIBOR | | Receive | | 4.950% | | 07/02/2007 | | | 9,200 | | | 99 | | | 0 |
Call - OTC 7-Year Interest Rate Swap | | Royal Bank of Scotland Group PLC | | 3-Month USD-LIBOR | | Receive | | 4.900% | | 08/08/2007 | | | 3,300 | | | 38 | | | 0 |
Call - OTC 5-Year Interest Rate Swap | | Royal Bank of Scotland Group PLC | | 3-Month USD-LIBOR | | Receive | | 5.100% | | 02/01/2008 | | | 2,500 | | | 30 | | | 9 |
Call - OTC 5-Year Interest Rate Swap | | Royal Bank of Scotland Group PLC | | 3-Month USD-LIBOR | | Receive | | 4.900% | | 03/31/2008 | | | 9,900 | | | 132 | | | 30 |
Call - OTC 5-Year Interest Rate Swap | | Royal Bank of Scotland Group PLC | | 3-Month USD-LIBOR | | Receive | | 4.950% | | 09/26/2008 | | | 2,400 | | | 20 | | | 12 |
Call - OTC 7-Year Interest Rate Swap | | Royal Bank of Scotland Group PLC | | 3-Month USD-LIBOR | | Receive | | 5.000% | | 12/15/2008 | | | 4,100 | | | 41 | | | 29 |
| | | | | | | | | | | | | | | | | | | |
| | | | | | | | | | | | | | | $ | 547 | | $ | 123 |
| | | | | | | | | | | | | | | | | | | |
| | | | | | |
| See Accompanying Notes | | Semiannual Report | | June 30, 2007 | | 15 |
| | |
| |
| Schedule of Investments Global Bond Portfolio (Unhedged) (Cont.) | | June 30, 2007 (Unaudited) |
(i) Short sales outstanding on June 30, 2007:
| | | | | | | | | | | | | |
| Description | | Coupon | | Maturity
Date | | Principal
Amount | | Proceeds | | Value |
Fannie Mae | | 5.000% | | 07/01/2037 | | $ | 24,000 | | $ | 22,703 | | $ | 22,489 |
Fannie Mae | | 5.500% | | 07/01/2037 | | | 2,000 | | | 1,928 | | | 1,929 |
| | | | | | | | | | | | | |
| | | | | | | | | $ | 24,631 | | $ | 24,418 |
| | | | | | | | | | | | | |
(j) Foreign currency contracts outstanding on June 30, 2007:
| | | | | | | | | | | | | | | | | |
| Type | | Currency | | Principal
Amount
Covered by
Contract | | Settlement
Month | | Unrealized
Appreciation | | Unrealized
(Depreciation) | | | Net
Unrealized
Appreciation/
(Depreciation) | |
Buy | | AUD | | 5,465 | | 07/2007 | | $ | 42 | | $ | 0 | | | $ | 42 | |
Sell | | | | 1,316 | | 07/2007 | | | 0 | | | (9 | ) | | | (9 | ) |
Buy | | BRL | | 2,865 | | 10/2007 | | | 53 | | | 0 | | | | 53 | |
Buy | | | | 1,209 | | 03/2008 | | | 52 | | | 0 | | | | 52 | |
Buy | | CAD | | 2,958 | | 08/2007 | | | 12 | | | 0 | | | | 12 | |
Buy | | CLP | | 6,033 | | 11/2007 | | | 0 | | | 0 | | | | 0 | |
Buy | | | | 10,300 | | 03/2008 | | | 0 | | | 0 | | | | 0 | |
Buy | | CNY | | 17,463 | | 11/2007 | | | 9 | | | 0 | | | | 9 | |
Buy | | | | 43,578 | | 01/2008 | | | 0 | | | (26 | ) | | | (26 | ) |
Buy | | DKK | | 6,472 | | 09/2007 | | | 4 | | | 0 | | | | 4 | |
Buy | | EUR | | 14,841 | | 07/2007 | | | 186 | | | 0 | | | | 186 | |
Sell | | GBP | | 7,298 | | 08/2007 | | | 0 | | | (77 | ) | | | (77 | ) |
Buy | | INR | | 648 | | 11/2007 | | | 0 | | | 0 | | | | 0 | |
Buy | | JPY | | 3,843,259 | | 07/2007 | | | 0 | | | (451 | ) | | | (451 | ) |
Sell | | | | 42,254 | | 07/2007 | | | 0 | | | (1 | ) | | | (1 | ) |
Buy | | KRW | | 760,822 | | 07/2007 | | | 7 | | | 0 | | | | 7 | |
Buy | | | | 916,130 | | 08/2007 | | | 0 | | | 0 | | | | 0 | |
Buy | | | | 39,973 | | 09/2007 | | | 1 | | | 0 | | | | 1 | |
Buy | | MXN | | 12,663 | | 03/2008 | | | 28 | | | 0 | | | | 28 | |
Buy | | NOK | | 6,216 | | 09/2007 | | | 18 | | | 0 | | | | 18 | |
Sell | | NZD | | 1,995 | | 07/2007 | | | 0 | | | (19 | ) | | | (19 | ) |
Buy | | PLN | | 1,692 | | 09/2007 | | | 6 | | | 0 | | | | 6 | |
Buy | | RUB | | 31,071 | | 09/2007 | | | 7 | | | 0 | | | | 7 | |
Buy | | | | 458 | | 11/2007 | | | 1 | | | 0 | | | | 1 | |
Buy | | | | 20,301 | | 12/2007 | | | 3 | | | 0 | | | | 3 | |
Buy | | SEK | | 15,066 | | 09/2007 | | | 26 | | | 0 | | | | 26 | |
Buy | | SGD | | 439 | | 08/2007 | | | 0 | | | (5 | ) | | | (5 | ) |
Buy | | TWD | | 9,248 | | 07/2007 | | | 3 | | | 0 | | | | 3 | |
Buy | | | | 9,248 | | 08/2007 | | | 0 | | | (1 | ) | | | (1 | ) |
Buy | | ZAR | | 97 | | 09/2007 | | | 0 | | | 0 | | | | 0 | |
| | | | | | | | | | | | | | | | | |
| | | | | | | | $ | 458 | | $ | (589 | ) | | $ | (131 | ) |
| | | | | | | | | | | | | | | | | |
| | | | |
| 16 | | PIMCO Variable Insurance Trust | | See Accompanying Notes |
| | |
| |
| Notes to Financial Statements | | June 30, 2007 (Unaudited) |
1. ORGANIZATION
The Global Bond Portfolio (Unhedged) (the “Portfolio”) is a series of the PIMCO Variable Insurance Trust (the “Trust”). The Trust is registered under the Investment Company Act of 1940 (the “Act”), as amended, as an open-end management investment company organized as a Delaware business trust on October 3, 1997. The Portfolio offers three classes of shares: Institutional, Administrative and Advisor. Information presented on these financial statements pertains to the Advisor Class of the Portfolio. Certain detailed financial information for the Institutional Class and Administrative Class is provided separately and is available upon request. The Trust is designed to be used as an investment vehicle by Separate Accounts of insurance companies that fund variable annuity contracts and variable life insurance policies and by qualified pension and retirement plans.
2. SIGNIFICANT ACCOUNTING POLICIES
The following is a summary of significant accounting policies consistently followed by the Portfolio in the preparation of its financial statements in conformity with accounting principles generally accepted in the United States of America (“GAAP”). The preparation of financial statements in accordance with GAAP requires management to make estimates and assumptions that affect the reported amounts and disclosures on the financial statements. Actual results could differ from those estimates.
(a) Security Valuation Portfolio securities are valued as of the close of regular trading (normally 4:00 p.m., Eastern Time) on each day that the New York Stock Exchange (“NYSE”) is open. Portfolio securities and other assets for which market quotes are readily available are stated at market value. Market value is generally determined on the basis of last reported sales prices, or if no sales are reported, based on quotes obtained from a quotation reporting system, established market makers, or pricing services. Fixed-income securities and non-exchange traded derivatives are normally valued on the basis of quotes obtained from brokers and dealers or pricing services. Prices obtained from independent pricing services use information provided by market makers or estimates of market values obtained from yield data relating to investments or securities with similar characteristics. Certain fixed income securities purchased on a delayed-delivery basis are marked to market daily until settlement at the forward settlement date. Short-term investments having a maturity of 60 days or less are generally valued at amortized cost. Exchange traded options, futures and options on futures are valued at the settlement price determined by the relevant exchange. With respect to any portion of the Portfolio’s assets that are invested in one or more open end management investment companies, the Portfolio’s net asset value (“NAV”) will be calculated based upon the NAVs of such investments.
Investments initially valued in currencies other than the U.S. dollar are converted to the U.S. dollar using exchange rates obtained from pricing services. As a result, the NAV of the Portfolio’s securities may be affected by changes in the value of currencies in relation to the U.S. dollar. The value of securities traded in markets outside the United States or denominated in currencies other than the U.S. dollar may be affected significantly on a day that the NYSE is closed and an investor is not able to purchase, redeem or exchange shares.
Securities and other assets for which market quotes are not readily available are valued at fair value as determined in good faith by the Board of Trustees or persons acting at their direction. The Board of Trustees has adopted methods for valuing securities and other assets in circumstances where market quotes are not readily available, and has delegated to Pacific Investment Management Company LLC (“PIMCO”) the responsibility for applying the valuation methods. In the event that market quotes are not readily available, and the security or asset cannot be valued pursuant to one of the valuation methods, the value of the security or asset will be determined in good faith by the Valuation Committee of the Board of Trustees, generally based upon recommendations provided by PIMCO.
Market quotes are considered not readily available in circumstances where there is an absence of current or reliable market-based data (e.g., trade information, bid/asked information, broker quotes), including where events occur after the close of the relevant market, but prior to the close of regular trading, that materially affect the values of the Portfolio’s securities or assets. In addition, market quotes are considered not readily available when, due to extraordinary circumstances, the exchanges or markets on which the securities trade, do not open for trading for the entire day and no other market prices are available. The Board has delegated to PIMCO the responsibility for monitoring significant events that may materially affect the values of the Portfolio’s securities or assets and for determining whether the value of the applicable securities or assets should be re-evaluated in light of such significant events.
When the Portfolio uses fair value pricing to determine its NAV, securities will not be priced on the basis of quotations from the primary market in which they are traded, but rather may be priced by another method that the Board of Trustees or persons acting at their direction believe accurately reflects fair value. The Trust’s policy is intended to result in a calculation of the Portfolio’s NAV that fairly reflects security values as of the time of pricing. However, fair values determined by the Board of Trustees or persons acting at their direction may not accurately reflect the price that the Portfolio could obtain for a security if it were to dispose of that security as of the time of pricing. Because foreign securities can trade on non-business days of the Portfolio, the NAV of the Portfolio may change on days when shareholders will not be able to purchase or redeem Portfolio shares. The prices used by the Portfolio may differ from the value that would be realized if the securities were sold and the differences could be material to the financial statements.
(b) Securities Transactions and Investment Income Securities transactions are recorded as of the trade date for financial reporting purposes. Securities purchased or sold on a when-issued or delayed-delivery basis may be settled a month or more after the trade date. Realized gains and losses from securities sold are recorded on the identified cost basis. Dividend income is recorded on the ex-dividend date, except certain dividends from foreign securities where the ex-dividend date may have passed, which are recorded as soon as the Portfolio is informed of the ex-dividend date. Interest income, adjusted for the accretion of discounts and amortization of premiums, is recorded on the accrual basis. Paydown gains and losses on mortgage-related and other asset-backed securities are recorded as components of interest income on the Statement of Operations.
(c) Delayed-Delivery Transactions The Portfolio may purchase or sell securities on a delayed-delivery basis. These transactions involve a commitment by the Portfolio to purchase or sell securities for a predetermined price or yield, with payment and delivery taking place beyond the customary settlement period. When delayed-delivery purchases are outstanding, the Portfolio will designate liquid assets in an amount sufficient to meet the purchase price. When purchasing a security on a delayed-delivery basis, the Portfolio assumes the rights and risks of ownership of the security, including the risk of price and yield fluctuations, and takes such fluctuations into account when determining its net asset value. The Portfolio may dispose of or renegotiate a delayed-delivery transaction after it is entered into, and may sell when-issued securities before they are delivered, which may result in a capital gain or loss. When the Portfolio has sold a security on a delayed-delivery basis, the Portfolio does not participate in future gains and losses with respect to the security.
(d) When-Issued Transactions The Portfolio may purchase or sell securities on a when-issued basis. These transactions are made conditionally because a security, although authorized, has not yet been issued in the market. A commitment by the Portfolio is made regarding these transactions to purchase or sell securities for a predetermined price or yield, with payment and delivery taking place beyond the customary settlement period. The Portfolio may sell when-issued securities before they are delivered, which may result in a capital gain or loss.
| | | | | | |
| | Semiannual Report | | June 30, 2007 | | 17 |
Notes to Financial Statements (Cont.)
(e) Dividends and Distributions to Shareholders Dividends from net investment income, if any, are declared daily and distributed to shareholders monthly. Net realized capital gains earned by the Portfolio, if any, will be distributed no less frequently than once each year.
Income dividends and capital gain distributions are determined in accordance with income tax regulations which may differ from GAAP. Differences between tax regulations and GAAP may change the fiscal year when income and capital items are recognized for tax and GAAP purposes. Examples of events that give rise to timing differences include wash sales, straddles, net operating losses and capital loss carryforwards. Further, the character of investment income and capital gains may be different for certain transactions under the two methods of accounting. Examples of characterization differences include the treatment of mortgage paydowns, swaps, foreign currency transactions and contingent debt instruments. As a result, income dividends and capital gain distributions declared during a fiscal period may differ significantly from the net investment income and realized capital gain reported on the Portfolio’s annual financial statements presented under GAAP.
Distributions classified as a tax basis return of capital, if any, are reflected on the accompanying Statements of Changes in Net Assets and have been reclassified to paid in capital. In addition, other amounts have been reclassified between undistributed net investment income, accumulated undistributed net realized gains or losses and/or paid in capital to more appropriately conform financial accounting to tax characterizations of dividend distributions.
(f) Multiclass Operations Each class offered by the Portfolio has equal rights as to assets and voting privileges (except that shareholders of a class have exclusive voting rights regarding any matter relating solely to that class of shares). Income and non-class specific expenses of the Portfolio are allocated daily to each class of shares based on the relative value of settled shares. Realized and unrealized capital gains and losses of the Portfolio are allocated daily to each class of shares based on the relative net assets of each class. Class specific expenses, where applicable, currently include administrative, distribution and servicing fees.
(g) Foreign Currency The functional and reporting currency for the Portfolio is the U.S. dollar. The market values of foreign securities, currency holdings and other assets and liabilities are translated into U.S. dollars based on the current exchange rates each business day. Fluctuations in the value of currency holdings and other assets and liabilities resulting from changes in exchange rates are recorded as unrealized foreign currency gains or losses. Realized gains or losses and unrealized appreciation or depreciation on investment securities and income and expenses are translated on the respective dates of such transactions. The effects of changes in foreign currency exchange rates on investments in securities are not segregated on the Statement of Operations from the effects of changes in market prices of those securities, but are included with the net realized and unrealized gain or loss on investment securities.
| | | | | | |
|
| Non-U.S. currency symbols utilized throughout the report are defined as follows: |
AUD BRL CAD CLP CNY DKK EUR GBP HKD INR | | Australian Dollar Brazilian Real Canadian Dollar Chilean Peso Chinese Yuan Renminbi Danish Krone Euro Great British Pound Hong Kong Dollar Indian Rupee | | KRW MXN NOK NZD PLN RUB SEK SGD TWD ZAR | | South Korean Won Mexican Peso Norwegian Krone New Zealand Dollar Polish Zloty Russian Ruble Swedish Krona Singapore Dollar Taiwan Dollar South African Rand |
| JPY | | Japanese Yen | | | | |
(h) Foreign Currency Transactions The Portfolio may enter into foreign currency contracts in connection with settling planned purchases or sales of securities, to hedge the currency exposure associated with some or all of the Portfolio’s securities or as a part of an investment strategy. A foreign currency contract is an agreement between two parties to buy and sell a currency at a set price on a future date. The market value of a foreign currency contract fluctuates with changes in foreign currency exchange rates. Foreign currency contracts are marked to market daily and the change in value is recorded by the Portfolio as an unrealized gain or loss. Realized gains or losses equal to the difference between the value of the contract at the time it was opened and the value at the time it was closed are recorded upon delivery or receipt of the currency. These contracts may involve market risk in excess of the unrealized gain or loss reflected on the Statement of Assets and Liabilities. In addition, the Portfolio could be exposed to risk if the counterparties are unable to meet the terms of the contracts or if the value of the currency changes unfavorably to the U.S. dollar.
(i) Futures Contracts The Portfolio may enter into futures contracts. The Portfolio may use futures contracts to manage its exposure to the securities markets or to movements in interest rates and currency values. The primary risks associated with the use of futures contracts are the imperfect correlation between the change in market value of the securities held by the Portfolio and the prices of futures contracts, the possibility of an illiquid market, and the inability of the counterparty to meet the terms of the contract. Futures contracts are valued based upon their quoted daily settlement prices. Upon entering into a futures contract, the Portfolio is required to deposit with its futures broker, an amount of cash or U.S. Government and Agency Obligations in accordance with the initial margin requirements of the broker or exchange. Futures contracts are marked to market daily and an appropriate payable or receivable for the change in value (“variation margin”) is recorded by the Portfolio. Gains or losses are recognized but not considered realized until the contracts expire or are closed. Futures contracts involve, to varying degrees, risk of loss in excess of the variation margin disclosed on the Statement of Assets and Liabilities.
(j) Inflation-Indexed Bonds The Portfolio may invest in inflation-indexed bonds. Inflation-indexed bonds are fixed-income securities whose principal value is periodically adjusted to the rate of inflation. The interest rate on these bonds is generally fixed at issuance at a rate lower than typical bonds. Over the life of an inflation-indexed bond, however, interest will be paid based on a principal value, which is adjusted for inflation. Any increase in the principal amount of an inflation-indexed bond will be included as interest income on the Statement of Operations, even though investors do not receive their principal until maturity.
(k) Options Contracts The Portfolio may write call and put options on futures, swaps, securities or currencies it owns or in which it may invest. Writing put options tends to increase the Portfolio’s exposure to the underlying instrument. Writing call options tends to decrease the Portfolio’s exposure to the underlying instrument. When the Portfolio writes a call or put option, an amount equal to the premium received is recorded as a liability and subsequently marked to market to reflect the current value of the option written. These liabilities are reflected as written options outstanding on the Statement of Assets and Liabilities. Certain options may be written with premiums to be determined on a future date. The premiums for these options are based upon implied volatility parameters at specified terms. Premiums received from writing options which expire are treated as realized gains. Premiums received from writing options which are exercised or closed are added to the proceeds or offset against amounts paid on the underlying future, swap, security or currency transaction to determine the realized gain or loss. The Portfolio as a writer of an option has no control over whether the underlying future, swap, security or currency may be sold (call) or purchased (put) and as a result bears the market risk of an unfavorable change in the price of the future, swap, security or currency underlying the written option. There is the risk the Portfolio may not be able to enter into a closing transaction because of an illiquid market.
| | | | |
| 18 | | PIMCO Variable Insurance Trust | | |
| | |
| |
| | | June 30, 2007 (Unaudited) |
The Portfolio may also purchase put and call options. Purchasing call options tends to increase the Portfolio’s exposure to the underlying instrument. Purchasing put options tends to decrease the Portfolio’s exposure to the underlying instrument. The Portfolio pays a premium which is included on the Statement of Assets and Liabilities as an investment and subsequently marked to market to reflect the current value of the option. Premiums paid for purchasing options which expire are treated as realized losses. Certain options may be purchased with premiums to be determined on a future date. The premiums for these options are based upon implied volatility parameters at specified terms. The risk associated with purchasing put and call options is limited to the premium paid. Premiums paid for purchasing options which are exercised or closed are added to the amounts paid or offset against the proceeds on the underlying future, swap, security or currency transaction to determine the realized gain or loss.
(l) Repurchase Agreements The Portfolio may engage in repurchase transactions. Under the terms of a typical repurchase agreement, the Portfolio takes possession of an underlying debt obligation (collateral) subject to an obligation of the seller to repurchase, and the Portfolio to resell, the obligation at an agreed-upon price and time. The underlying securities for all repurchase agreements are held in safekeeping at the Portfolio’s custodian or designated subcustodians under tri-party repurchase agreements. The market value of the collateral must be equal to or exceed the total amount of the repurchase obligations, including interest. Securities purchased under repurchase agreements are reflected as an asset on the Statement of Assets and Liabilities. Generally, in the event of counterparty default, the Portfolio has the right to use the collateral to offset losses incurred. If the counterparty should default, the Portfolio will seek to sell the securities which it holds as collateral. This could involve procedural costs or delays in addition to a loss on the securities if their value should fall below their repurchase price.
(m) Inverse Floating Rate Transactions—Residual Interest Municipal Bonds (“RIBs”)/Residual Interest Tax Exempt Bonds (“RITEs”) The Portfolio may invest in RIBs and RITEs (“Inverse Floaters”). Inverse Floaters are created via a master trust agreement between a broker-dealer, acting as trustor and liquidity provider, and an investment bank, acting as trustee and tender agent. The master trust agreement defines the terms for each trust series; with each series being established by the transfer of long-term, fixed-rate municipal bonds (“Fixed Rate Bonds”) to the trustee to be held and provide for the creation, execution and delivery of floater certificates (“Floating Rate Notes”) and Inverse Floaters. Floating Rate Notes are liquid notes that are issued with a short-term variable rate typically linked to the LIBOR, subject to limitations, for some duration. After interest income is paid on the Floating Rate Notes at current rates, the residual income from the Fixed Rate Bonds is paid to the Inverse Floaters. Inverse Floaters are issued with a coupon that fluctuates inversely with the Floating Rate Notes’ referenced rate, subject to certain limitations. Therefore, rising short-term rates result in lower income for the Inverse Floaters and vice versa.
Floating Rate Notes are generally remarketed to municipal money market funds. Inverse Floaters are acquired by either tax-exempt municipal bond funds or trusts, or other parties interested in potentially higher yielding tax-exempt securities. Inverse Floaters may also be acquired for the purpose of increasing leverage. Floating Rate Note holders typically have the option to tender their notes to the liquidity provider for redemption at par at each reset date. The Inverse Floater holders have the option to (i) require the Floating Rate Note holders to tender their notes at par, and (ii) require the liquidity provider to transfer the Fixed Rate Bonds to the Inverse Floater holders. The holders of Inverse Floaters bear substantially all of the downside investment risk associated with the underlying Fixed Rate Bonds, and also benefit from a disproportionate amount of the potential appreciation of the underlying Fixed Rate Bonds’ value. Inverse Floaters may be more volatile and less liquid than other municipal bonds of comparable maturity.
Inverse Floaters may be acquired with or without first transferring to the trustor the Fixed Rate Bonds that were utilized to create the trust series. Inverse Floaters acquired without a transfer of Fixed Rate Bonds are recognized as purchases of securities as outlined in Note 2(b). Statement of Financial Accounting Standards No. 140—Accounting for Transfers and Servicing of Financial Assets and Extinguishments of Liabilities (“FAS No. 140”), governs the standards for accounting for securitizations and other transfers of financial assets. If there is a transfer of Fixed Rate Bonds and it meets sale criteria under FAS No. 140, a Portfolio records a sale of the Fixed Rate Bonds and a purchase of the Inverse Floaters. The cash received from the Inverse Floaters is then recorded as interest income in the Statement of Operations.
If the transfer of Fixed Rate Bonds does not meet sale criteria under FAS No. 140, a Portfolio accounts for the transaction described above as a secured borrowing by including the Fixed Rate Bonds in its Schedule of Investments, and recording the Floating Rate Notes as a liability under the caption “Payable for floating rate notes” in the Portfolio’s Statement of Assets and Liabilities. In a secured borrowing transaction, cash received from the Inverse Floaters is not recorded as interest income. Instead, a Portfolio records interest income related to the Fixed Rate Bonds and interest expense related to the Floating Rate Notes, the net of which is equal to the cash received from the Inverse Floaters acquired by the Portfolio. Thus, while a Portfolio’s reported total income, net expenses, and net expense ratio are generally higher for investments in Inverse Floaters acquired via a secured borrowing, the method of acquiring Inverse Floaters does not result in differences for reported cash flows, net asset value or total return.
(n) Short Sales The Portfolio may enter into short sales transactions. A short sale is a transaction in which the Portfolio sells securities it does not own in anticipation of a decline in the market price of the securities. Securities sold in short sale transactions and interest payable on such securities, if any, are reflected as a liability on the Statement of Assets and Liabilities. The Portfolio is obligated to deliver securities at the market price at the time the short position is closed. Possible losses from short sales may be unlimited, whereas losses from purchases cannot exceed the total amount invested.
(o) Swap Agreements The Portfolio may invest in swap agreements. Swap transactions are privately negotiated agreements between the Portfolio and a counterparty to exchange or swap investment cash flows, assets, or market-linked returns at specified, future intervals. The Portfolio may enter into interest rate, total return, forward spread-lock, credit default, and other forms of swap agreements to manage its exposure to interest rates and credit risk. In connection with these agreements, securities may be identified as collateral in accordance with the terms of the respective swap agreements.
Interest rate swap agreements involve the exchange by the Portfolio with another party of their respective commitments to pay or receive interest, e.g., an exchange of floating rate payments for fixed rate payments with respect to the notional amount of principal. Certain forms of interest rate swap agreements may include: (i) interest rate caps, under which, in return for a premium, one party agrees to make payments to the other to the extent that interest rates exceed a specified rate, or “cap”, (ii) interest rate floors, under which, in return for a premium, one party agrees to make payments to the other to the extent that interest rates fall below a specified rate, or “floor”, or (iii) interest rate collars, under which a party sells a cap and purchases a floor or vice versa in an attempt to protect itself against interest rate movements exceeding given minimum or maximum levels.
Total return swap agreements involve commitments to pay interest in exchange for a market-linked return, both based on notional amounts. To the extent the total return of the security or index underlying the transaction exceeds or falls short of the offsetting interest rate obligation, the Portfolio will receive a payment from or make a payment to the counterparty.
| | | | | | |
| | Semiannual Report | | June 30, 2007 | | 19 |
Notes to Financial Statements (Cont.)
Forward spread-lock swap agreements involve commitments to pay or receive a settlement amount calculated as the difference between the swap spread and a fixed spread, multiplied by the notional amount times the duration of the swap. The swap spread is the difference between the benchmark swap rate (market rate) and the specific Treasury rate.
Credit default swap agreements involve one party making a stream of payments to another party in exchange for the right to receive a specified return in the event of a default by a third party, typically corporate issues or sovereign issues of an emerging country, on its obligation. The Portfolio may use credit default swaps to provide a measure of protection against defaults of the issuers (i.e., to reduce risk where the Portfolio owns or has exposure to the sovereign issuer) or to take an active long or short position with respect to the likelihood of a particular issuer’s default. As a seller of protection, the Portfolio generally receives an upfront payment or a fixed rate of income throughout the term of the swap provided that there is no credit event. If the Portfolio is a seller of protection and a credit event occurs, as defined under the terms of that particular swap agreement, the Portfolio will pay to the buyer of the protection an amount up to the notional value of the swap and in certain instances take delivery of the security. As the seller, the Portfolio would effectively add leverage to its portfolio because, in addition to its total net assets, the Portfolio would be subject to investment exposure on the notional amount of the swap. As a buyer of protection, the Portfolio generally receives an amount up to the notional value of the swap if a credit event occurs. The treatment of credit default swaps and other swap agreements that provide for contingent, non-periodic, bullet-type payments as “notional principal contracts” for U.S. federal income tax purposes is uncertain. Were the U.S. Internal Revenue Service (“IRS”) to take the position that a credit default swap or other bullet-type swap is not a “notional principal contract” for U.S. federal income tax purposes, payments received by the Portfolio from such investments might be subject to U.S. excise or income taxes.
Swaps are marked to market daily based upon quotations from market makers and the change in value, if any, is recorded as unrealized gain or loss on the Statement of Operations. Payments received or made at the beginning of the measurement period are reflected as such on the Statement of Assets and Liabilities. These upfront payments are recorded as realized gain or loss on the Statement of Operations upon termination or maturity of the swap. A liquidation payment received or made at the termination of the swap is recorded as realized gain or loss on the Statement of Operations. Net periodic payments received or paid by the Portfolio are included as part of realized gain or loss on the Statement of Operations. Entering into these agreements involves, to varying degrees, elements of credit, market and documentation risk in excess of the amounts recognized on the Statement of Assets and Liabilities. Such risks involve the possibility that there will be no liquid market for these agreements, that the counterparty to the agreements may default on its obligation to perform or disagree as to the meaning of contractual terms in the agreements and that there may be unfavorable changes in interest rates.
(p) Commodities Index-Linked/Structured Notes The Portfolio invests in structured notes whose value is based on the price movements of a commodity index. The structured notes are often leveraged, increasing the volatility of each note’s value relative to the change in the underlying linked financial element. The value of these notes will rise and fall in response to changes in the underlying commodity index. Structured notes may entail a greater degree of market risk than other types of debt securities because the investor bears the risk of the underlying commodity index. Structured notes may also be more volatile, less liquid, and more difficult to accurately price than less complex securities or more traditional debt securities. Fluctuations in value of the structured notes are recorded as unrealized gains and losses on the accompanying financial statements. Net payments are recorded as net realized gains and losses. These notes are subject to prepayment, credit and interest risks. The Portfolio has the option to request
prepayment from the issuer. At maturity, or when a note is sold, the Portfolio records a realized gain or loss. At June 30, 2007, the value of these securities comprised 0.5% of the Portfolio’s net assets and resulted in unrealized depreciation of $5,668.
(q) Mortgage-Related and Other Asset-Backed Securities The Portfolio may invest in mortgage-related or other asset-backed securities. These securities include mortgage pass-through securities, collateralized mortgage obligations (“CMOs”), commercial mortgage-backed securities, mortgage dollar rolls, CMO residuals, stripped mortgage-backed securities (“SMBSs”) and other securities that directly or indirectly represent a participation in, or are secured by and payable from, mortgage loans on real property. The value of some mortgage-related or asset-backed securities may be particularly sensitive to changes in prevailing interest rates. Early repayment of principal on some mortgage-related securities may expose the Portfolio to a lower rate of return upon reinvestment of principal. The value of these securities may fluctuate in response to the market’s perception of the creditworthiness of the issuers. Additionally, although mortgages and mortgage-related securities are generally supported by some form of government or private guarantee and/or insurance, there is no assurance that private guarantors or insurers will meet their obligations.
(r) U.S. Government Agencies or Government-Sponsored Enterprises Securities issued by U.S. Government agencies or government-sponsored enterprises may not be guaranteed by the U.S. Treasury. The Government National Mortgage Association (“GNMA” or “Ginnie Mae”), a wholly owned U.S. Government corporation, is authorized to guarantee, with the full faith and credit of the U.S. Government, the timely payment of principal and interest on securities issued by institutions approved by GNMA and backed by pools of mortgages insured by the Federal Housing Administration or guaranteed by the Department of Veterans Affairs. Government-related guarantors (i.e., not backed by the full faith and credit of the U.S. Government) include the Federal National Mortgage Association (“FNMA” or “Fannie Mae”) and the Federal Home Loan Mortgage Corporation (“FHLMC” or “Freddie Mac”). Pass-through securities issued by FNMA are guaranteed as to timely payment of principal and interest by FNMA but are not backed by the full faith and credit of the U.S. Government. FHLMC guarantees the timely payment of interest and ultimate collection of principal, but its participation certificates are not backed by the full faith and credit of the U.S. Government.
(s) New Accounting Policies In July 2006, the Financial Accounting Standards Board (“FASB”) issued Interpretation No. 48, “Accounting for Uncertainty in Income Taxes—an Interpretation of FASB Statement No. 109” (the “Interpretation”). The Interpretation became effective for the Portfolio on June 29, 2007. Management has evaluated the application of the Interpretation in relation to the Portfolio and has concluded that no single filing position or combination of filing positions identified as uncertain tax positions required the accrual of a tax liability in the accounting records of the Portfolio for the period ending June 30, 2007. Management will monitor all existing filing positions and future filing positions in light of the Interpretation and evaluate the need for any future tax accruals and financial statement disclosures as warranted.
In September 2006, the FASB issued Statement of Financial Accounting Standards No. 157, “Fair Value Measurements” (the “Statement”). The Statement is effective for fiscal years beginning after November 15, 2007 and will require expanded disclosure about fair value measurements, separately for each major category of assets and liabilities, that enables shareholders to assess the inputs used to develop those measurements, and for recurring fair value measurements using significant unobservable inputs the effect of the measurements on changes in net assets for the reporting period. Management is currently evaluating the application of the Statement to the Portfolio and will provide additional information in relation to the Statement on the Portfolio’s annual financial statements for the period ending December 31, 2007.
| | | | |
| 20 | | PIMCO Variable Insurance Trust | | |
| | |
| |
| | | June 30, 2007 (Unaudited) |
3. FEES AND EXPENSES
(a) Investment Advisory Fee PIMCO is a majority-owned subsidiary of Allianz Global Investors of America L.P. (“AGI”), and serves as investment adviser (the “Adviser”) to the Trust, pursuant to an investment advisory contract. The Adviser receives a monthly fee from the Portfolio, at an annual rate based on average daily net assets. The Advisory Fee for all classes is charged at an annual rate of 0.25%.
(b) Administration Fee PIMCO serves as administrator (the “Administrator”), and provides administrative services to the Trust for which it receives a monthly administrative fee based on each share class’s average daily net assets. As the Administrator, PIMCO bears the costs of various third-party services, including audit, custodial, portfolio accounting, legal, transfer agency and printing costs. The Administration Fee for all classes is charged at the annual rate of 0.50%.
(c) Distribution and Servicing Fees Allianz Global Investors Distributors LLC (“AGID”) is an indirect wholly-owned subsidiary of AGI and serves as the distributor (the “Distributor”) of the Trust’s shares. The Trust is permitted to reimburse AGID on a quarterly basis, out of the Administrative Class assets of the Portfolio in the amount of 0.15% on an annual basis of the average daily net assets of that class, for payments made to financial intermediaries that provide services in connection with the distribution of shares or administration of plans or programs that use Portfolio shares as their funding medium. The effective rate paid to AGID was 0.15% during the current fiscal year.
The Trust has adopted a Distribution Plan, for the Advisor Class shares of the Portfolio (the “Plan”). The Plan has been adopted pursuant to Rule 12b-1 under the Act. The Plan permits payments for expenses in connection with the distribution and marketing of Advisor Class shares and/or the provision of shareholder services to Advisor Class shareholders. The Plan permits the Portfolio to make total payments at an annual rate of 0.25% of its average daily net assets attributable to its Advisor Class shares.
(d) Portfolio Expenses The Trust is responsible for the following expenses: (i) salaries and other compensation of any of the Trust’s executive officers and employees who are not officers, directors, stockholders or employees of PIMCO or its subsidiaries or affiliates; (ii) taxes and governmental fees; (iii) brokerage fees and commissions and other portfolio transaction expenses; (iv) the costs of borrowing money, including interest expenses and bank overdraft charges; (v) fees and expenses of the Trustees who are not “interested persons” of PIMCO or the Trust, and any counsel retained exclusively for their benefit; (vi) extraordinary expenses, including costs of litigation and indemnification expenses; (vii) organization expenses and (viii) any expenses allocated or allocable to a specific class of shares, which include service fees payable with respect to the Administrative Class Shares, and may include certain other expenses as permitted by the Trust’s Multiple Class Plan adopted pursuant to Rule 18f-3 under the Act and subject to review and approval by the Trustees. The ratio of expenses to average net assets per share class, as disclosed in the Financial Highlights, may differ from the annual portfolio operating expenses per share class as disclosed in the Prospectus for the reasons set forth above.
Effective April 1, 2007, each Trustee, other than those affiliated with PIMCO or its affiliates, receives an annual retainer of $15,000, plus $2,375 for each Board of Trustees meeting attended in person, $500 for each committee meeting attended and $750 for each Board of Trustees meeting attended telephonically, plus reimbursement of related expenses. In addition, the audit committee chair receives an additional annual retainer of $2,000 and each other committee chair receives an additional annual retainer of $500. These expenses are allocated on a pro-rata basis to the various portfolios of the Trust according to their respective net assets. The Trust pays no compensation directly to any Trustee or any other officer who is affiliated with the Administrator, all of whom receive remuneration for their services to the Trust from the Administrator or its affiliates. Prior to
April 1, 2007, each Trustee, other than those affiliated with PIMCO or its affiliates, received an annual retainer of $15,000 plus $2,000 for each Board of Trustees meeting attended ($500 for each special meeting attended), plus reimbursement of related expenses. The Audit Committee Chairman received an annual retainer of $1,500 and the Governance Committee Chairman received an annual retainer of $500. In addition, each member of a committee received $500 for each committee meeting attended.
4. RELATED PARTY TRANSACTIONS
The Adviser, Administrator, and Distributor are related parties as defined by FAS 57, Related Party Disclosures. Fees payable to these parties are disclosed in Note 3.
5. GUARANTEES AND INDEMNIFICATIONS
Under the Trust’s organizational documents, each Trustee, officer, employee or other agent of the Trust (including the Trust’s investment manager) is indemnified, to the extent permitted by the Act, against certain liabilities that may arise out of performance of their duties to the Portfolio. Additionally, in the normal course of business, the Portfolio enters into contracts that contain a variety of indemnification clauses. The Portfolio’s maximum exposure under these arrangements is unknown as this would involve future claims that may be made against the Portfolio that have not yet occurred. However, the Portfolio has not had prior claims or losses pursuant to these contracts and believes the risk of loss to be remote.
6. PURCHASES AND SALES OF SECURITIES
The length of time the Portfolio has held a particular security is not generally a consideration in investment decisions. A change in the securities held by the Portfolio is known as “portfolio turnover”. The Portfolio may engage in frequent and active trading of portfolio securities to achieve its investment objective, particularly during periods of volatile market movements. High portfolio turnover (e.g., over 100%) involves correspondingly greater expenses to the Portfolio, including brokerage commissions or dealer mark-ups and other transaction costs on the sale of securities and reinvestments in other securities. Such sales may also result in realization of taxable capital gains, including short-term capital gains (which are generally taxed at ordinary income tax rates). The trading costs and tax effects associated with portfolio turnover may adversely affect the Portfolio’s performance.
Purchases and sales of securities (excluding short-term investments) for the period ended June 30, 2007, were as follows (amounts in thousands):
| | | | | | | | | | | | |
| U.S. Government/Agency | | | | All Other |
| Purchases | | Sales | | | | Purchases | | Sales |
| $ | 725,855 | | $ | 722,821 | | | | $ | 57,615 | | $ | 17,547 |
| | | | | | |
| | Semiannual Report | | June 30, 2007 | | 21 |
Notes to Financial Statements (Cont.)
7. TRANSACTIONS IN WRITTEN CALL AND PUT OPTIONS
Transactions in written call and put options were as follows (amounts in thousands, except for number of contracts):
| | | | | | | | | | | | | | |
| | | | | Notional
Amount
in $ | | | Notional
Amount
in GBP | | | Premium | |
Balance at 12/31/2006 | | | | $ | 79,300 | | | GBP | 2,100 | | | $ | 827 | |
Sales | | | | | 29,600 | | | | 0 | | | | 344 | |
Closing Buys | | | | | (61,800 | ) | | | 0 | | | | (588 | ) |
Expirations | | | | | 0 | | | | (2,100 | ) | | | (36 | ) |
Exercised | | | | | 0 | | | | 0 | | | | 0 | |
Balance at 06/30/2007 | | | | $ | 47,100 | | | GBP | 0 | | | $ | 547 | |
8. SHARES OF BENEFICIAL INTEREST
The Portfolio may issue an unlimited number of shares of beneficial interest with a $0.001 par value. Changes in shares of beneficial interest were as follows (shares and amounts in thousands):
| | | | | | | | | | | | | | | | |
| | | | | Six Months Ended
06/30/2007 | | | Year Ended
12/31/2006 | |
| | | | | Shares | | | Amount | | | Shares | | | Amount | |
| | | | | |
Receipts for shares sold | | | | | | | | | | | | | | | | |
Institutional Class | | | | 13 | | | $ | 149 | | | 4 | | | $ | 49 | |
Administrative Class | | | | 4,198 | | | | 50,329 | | | 8,273 | | | | 99,227 | |
Advisor Class | | | | 0 | | | | 1 | | | 1 | | | | 10 | |
Issued as reinvestment of distributions | | | | | | | | | | | | | | | | |
Institutional Class | | | | 0 | | | | 2 | | | 0 | | | | 0 | |
Administrative Class | | | | 255 | | | | 3,049 | | | 381 | | | | 4,593 | |
Advisor Class | | | | 0 | | | | 0 | | | 0 | | | | 0 | |
Cost of shares redeemed | | | | | | | | | | | | | | | | |
Institutional Class | | | | (1 | ) | | | (8 | ) | | 0 | | | | (1 | ) |
Administrative Class | | | | (1,721 | ) | | | (20,729 | ) | | (2,147 | ) | | | (25,733 | ) |
Advisor Class | | | | 0 | | | | 0 | | | 0 | | | | 0 | |
Net increase resulting from Portfolio share transactions | | | | 2,744 | | | $ | 32,793 | | | 6,512 | | | $ | 78,145 | |
The following schedule shows the number of shareholders each owning 5% or more of the Portfolio and the total percentage of the Portfolio held by such shareholders:
| | | | | | |
| | | | | Number of
Shareholders | | % of Portfolio Held |
Institutional Class | | | | 3 | | 100 |
Administrative Class | | | | 6 | | 96 |
Advisor Class | | | | 1 | | 95 |
9. REGULATORY AND LITIGATION MATTERS
Since February 2004, PIMCO, Allianz Global Investors of America L.P. (PIMCO’s parent company), AGID, and certain of their affiliates, including the PIMCO Funds (another series of funds managed by PIMCO), the Allianz Funds (formerly known as PIMCO Funds: Multi-Manager Series (another series of funds managed by affiliates of PIMCO)), certain Trustees of the Trust (in their capacity as Trustees of the PIMCO Funds or the Allianz Funds) and certain employees of PIMCO, have been named as defendants in fifteen lawsuits filed in various jurisdictions. Eleven of those lawsuits concern “market timing,” and they have been transferred to and
consolidated for pre-trial proceedings in a multi-district litigation proceeding in the U.S. District Court for the District of Maryland; the other four lawsuits concern “revenue sharing” and have been consolidated into a single action in the U.S. District Court for the District of Connecticut. The lawsuits have been commenced as putative class actions on behalf of investors who purchased, held or redeemed shares of the various series of the PIMCO Funds and the Allianz Funds during specified periods, or as derivative actions on behalf of the PIMCO Funds and the Allianz Funds.
The market timing actions in the District of Maryland generally allege that certain hedge funds were allowed to engage in “market timing” in certain funds of the PIMCO Funds and the Allianz Funds and this alleged activity was not disclosed. Pursuant to tolling agreements entered into with the derivative and class action plaintiffs, PIMCO, certain PIMCO Funds Trustees, and certain employees of PIMCO who were previously named as defendants have all been dropped as defendants in the market timing actions; the plaintiffs continue to assert claims on behalf of the shareholders of the PIMCO Funds or on behalf of the PIMCO Funds itself against other defendants. By order dated November 3, 2005, the U.S. District Court for the District of Maryland granted the PIMCO Funds’ motion to dismiss claims asserted against it in a consolidated amended complaint where the PIMCO Funds were named, in the complaint, as a nominal defendant. The revenue sharing action in the District of Connecticut generally alleges that fund assets were inappropriately used to pay brokers to promote funds of the PIMCO Funds and the Allianz Funds, including directing fund brokerage transactions to such brokers, and that such alleged arrangements were not fully disclosed to shareholders. On August 11, 2005, the U.S. District Court for the District of Connecticut conducted a hearing on defendants’ motion to dismiss the consolidated amended complaint in the revenue sharing action but has not yet ruled on the motion to dismiss. The market timing and revenue sharing lawsuits seek, among other things, unspecified compensatory damages plus interest and, in some cases, punitive damages, the rescission of investment advisory contracts, the return of fees paid under those contracts and restitution.
Two nearly identical class action civil complaints have been filed in August 2005, in the Northern District of Illinois Eastern Division, alleging that the plaintiffs each purchased and sold a 10-year Treasury note futures contract and suffered damages from an alleged shortage when PIMCO held both physical and futures positions in 10-year Treasury notes for its client accounts. The two actions have been consolidated into one action, and the two separate complaints have been replaced by a consolidated complaint. PIMCO is a named defendant, and PIMCO Funds has been added as a defendant, to the consolidated action. PIMCO strongly believes the complaint is without merit and intends to vigorously defend itself.
In April 2006, certain portfolios of the Trust and certain other funds managed by PIMCO were served in an adversary proceeding brought by the Official Committee of Asbestos Claimants of G-I Holdings, Inc. in G-I Holdings, Inc.’s bankruptcy in the District of New Jersey. In July 2004, PIMCO was named in this lawsuit and remains a defendant. The plaintiff seeks to recover for the bankruptcy estate assets that were transferred by the predecessor entity of G-I Holdings, Inc. to a wholly-owned subsidiary in 1994. The subsidiary has since issued notes, of which certain portfolios of the Trust and certain other funds managed by PIMCO are alleged to be holders. The complaint alleges that in 2000, more than two hundred noteholders—including certain portfolios of the Trust and certain other funds managed by PIMCO—were granted a second priority lien on the assets of the subsidiary in exchange for their consent to a refinancing transaction and the granting of a first priority lien to the lending banks. The plaintiff is seeking invalidation of the lien in favor of the noteholders and/or the value of the lien. On June 21, 2006, the District of New Jersey overturned the Bankruptcy Court’s decision granting permission to file the adversary proceeding and remanded the matter to the Bankruptcy Court for further proceedings. Following a motion to
| | | | |
| 22 | | PIMCO Variable Insurance Trust | | |
| | |
| |
| | | June 30, 2007 (Unaudited) |
reconsider, the District Court upheld its remand on August 7, 2006, and instructed the Bankruptcy Court to conduct a “cost-benefit” analysis of the Committee’s claims, including the claims against the noteholders. The Bankruptcy Court held a status conference on October 25, 2006 and set a briefing schedule relating to this cost-benefit analysis.
The foregoing speaks only as of the date of this report. It is possible that these matters and/or other developments resulting from these matters could result in increased portfolio redemptions or other adverse consequences to the Portfolio. However, PIMCO and AGID believe that these matters are not likely to have a material adverse effect on the Portfolio or on PIMCO’s or AGID’s ability to perform their respective investment advisory or distribution services relating to the Portfolio.
10. FEDERAL INCOME TAX MATTERS
The Portfolio intends to qualify as a regulated investment company under sub-chapter M of the Internal Revenue Code (the “Code”) and distribute all of its taxable income and net realized gains, if applicable, to shareholders. Accordingly, no provision for Federal income taxes has been made.
As of June 30, 2007, the aggregate cost of investments was the same for federal income tax and financial statement purposes. The net unrealized appreciation (depreciation) of investment securities for federal income tax purposes is as follows (amount in thousands):
| | | | |
Aggregate
Gross
Unrealized
Appreciation | | Aggregate
Gross
Unrealized
(Depreciation) | | Net
Unrealized
(Depreciation) |
$ 2,880 | | $ (3,202) | | $ (322) |
| | | | | | |
| | Semiannual Report | | June 30, 2007 | | 23 |
| | |
| |
Privacy Policy* | | (Unaudited) |
The Funds consider customer privacy to be a fundamental aspect of their relationships with shareholders and are committed to maintaining the confidentiality, integrity and security of their current, prospective and former shareholders’ personal information. To ensure their shareholders’ privacy, the Funds have developed policies that are designed to protect this confidentiality, while allowing shareholder needs to be served.
Obtaining Personal Information
In the course of providing shareholders with products and services, the Funds and certain service providers to the Funds, such as the Funds’ investment advisers (“Advisers”), may obtain non-public personal information about shareholders, which may come from sources such as account applications and other forms, from other written, electronic or verbal correspondence, from shareholder transactions, from a shareholder’s brokerage or financial advisory firm, financial adviser or consultant, and/or from information captured on the Funds’ internet web sites.
Respecting Your Privacy
As a matter of policy, the Funds do not disclose any personal or account information provided by shareholders or gathered by the Funds to non-affiliated third parties, except as required or permitted by law or as necessary for such third parties to perform their agreements with respect to the Funds. As is common in the industry, non-affiliated companies may from time to time be used to provide certain services, such as preparing and mailing prospectuses, reports, account statements and other information, conducting research on shareholder satisfaction and gathering shareholder proxies. A Fund’s Distributor may also retain non-affiliated companies to market the Fund’s shares or products which use the Fund’s shares and enter into joint marketing agreements with other companies. These companies may have access to a shareholder’s personal and account information, but are permitted to use this information solely to provide the specific service or as otherwise permitted by law. In most cases, the shareholders will be clients of a third party, but the Funds may also provide a shareholder’s personal and account information to the shareholder’s respective brokerage or financial advisory firm.
Sharing Information with Third Parties
The Funds reserve the right to disclose or report personal information to non-affiliated third parties, in limited circumstances, where the Funds believe in good faith that disclosure is required under law to cooperate with regulators or law enforcement authorities, to protect their rights or property or upon reasonable request by any Fund in which a shareholder has chosen to invest. In addition, the Funds may disclose information about a shareholder’s accounts to a non-affiliated third party with the consent of the shareholder.
Sharing Information with Affiliates
The Funds may share shareholder information with their affiliates in connection with servicing their shareholders’ accounts or to provide shareholders with information about products and services that the Funds or their Advisers, principal underwriters or their affiliates (“Service Affiliates”) believe may be of interest to such shareholders. The information that the Funds share may include, for example, a shareholder’s participation in one of the Funds or in other investment programs sponsored by a Service Affiliate, a shareholder’s ownership of certain types of accounts (such as IRAs), or other data about a shareholder’s accounts. The Funds’ Service Affiliates, in turn, are not permitted to share shareholder information with non-affiliated entities, except as required or permitted by law.
Procedures to Safeguard Private Information
The Funds take seriously the obligation to safeguard shareholder non-public personal information. In addition to this policy, the Funds have also implemented procedures that are designed to restrict access to a shareholder’s non-public personal information only to internal personnel who need to know that information in order to provide products or services to such shareholders. In order to guard a shareholder’s non-public personal information, physical, electronic and procedural safeguards are in place.
* This Privacy Policy applies to the following entities: PIMCO Funds, PIMCO Variable Insurance Trust, PCM Fund, Inc. and PIMCO Strategic Global Government Fund, Inc. (collectively, the “Funds”).
| | | | |
| 24 | | PIMCO Variable Insurance Trust | | |
Investment Adviser and Administrator
Pacific Investment Management Company LLC
840 Newport Center Drive
Newport Beach, California 92660
Distributor
Allianz Global Investors Distributors LLC
1345 Avenue of the Americas
New York, New York 10105
Custodian
State Street Bank & Trust Company
801 Pennsylvania
Kansas City, Missouri 64105
Transfer Agent
Boston Financial Data Services–Midwest
330 W. 9th Street
Kansas City, Missouri 64105
Legal Counsel
Dechert LLP
1775 I Street, N.W.
Washington, D.C. 20006
Independent Registered Public Accounting Firm
PricewaterhouseCoopers LLP
1055 Broadway
Kansas City, Missouri 64105
P I M C O

Table of Contents
This material is authorized for use only when preceded or accompanied by the current PIMCO Variable Insurance Trust (the “Trust”) prospectus. Investors should consider the investment objectives, risks, charges and expenses of this Trust carefully before investing. Ask your financial professional to explain all charges that may apply. This and other information is contained in the Trust’s prospectus. The variable product prospectus may be obtained by contacting your Investment Consultant. Please read the Trust and variable product prospectus carefully before you invest or send money.
Chairman’s Letter
Dear PIMCO Variable Insurance Trust Shareholder:
It is our pleasure to present to you the semiannual report for the PIMCO Variable Insurance Trust, covering the six-month period ended June 30, 2007. The PIMCO Variable Insurance Trust’s net assets were $8.68 billion at June 30, 2007, as compared to $7.76 billion at December 31, 2006.
Highlights of the financial markets during the reporting period include:
| | n | | Economic data during the first quarter of 2007 pointed to slower growth, which heightened market expectations for a decrease in the Federal Funds Rate. By the second quarter, economic data, such as employment statistics, provided little indication of economic weakness, causing expectations of a decrease in the Federal Funds Rate to unwind and U.S. interest rates to move higher. Interest rates in Europe and the U.K. also rose over the period as central banks raised their key lending rates due to inflation concerns. The benchmark ten-year U.S. Treasury yielded 5.03% as of June 30, 2007, or 0.32% higher than at the beginning of the year. |
| | n | | Most bonds generally returned much of their gains from earlier in the year as worldwide growth and capital flows drove interest rates higher in the second quarter. Increased risk aversion in global financial markets, due in part to subprime mortgage worries in the U.S., also contributed to the rise in interest rates. The Lehman Brothers Aggregate Bond Index, which includes Treasury, investment-grade corporate and mortgage-backed securities, returned 0.98% for the six-month period. |
| | n | | Locally issued emerging market (“EM”) bonds posted positive returns for the reporting period. Yields on these bonds declined and the local currencies in which they are denominated generally gained, amid increasing investor awareness, strong economic growth and surging capital inflows. External EM bonds (debt instruments issued by emerging markets countries and typically denominated in U.S. dollars) lagged behind local EM bonds (debt instruments issued by emerging markets countries and denominated in the currency of the issuer), as external EM bonds tend to trade more in-line with U.S. Treasuries. |
| | n | | Treasury Inflation-Protected Securities (“TIPS”) outpaced nominal bonds (non-inflation linked bonds) for the first part of the year and all but the longest maturity TIPS outperformed in the second quarter as high gasoline prices drove higher inflation accruals. Commodities, as represented by the Dow Jones-AIG Commodity Total Return Index, returned 4.46% for the period. Equities, as measured by the S&P 500 Index and the Russell 2000 Index, returned 6.96% and 6.45%, respectively, for the period. |
On the following pages, please find specific details as to the Portfolio’s total return investment performance and a discussion of those factors that affected performance.
Thank you for the trust you have placed in us. We will continue to work diligently to serve your investment needs.
Sincerely,
Brent R. Harris
Chairman, PIMCO Variable Insurance Trust
July 31, 2007
| | | | | | |
| | Semiannual Report | | June 30, 2007 | | 1 |
Important Information About the Portfolio
PIMCO Variable Insurance Trust (the “Trust”) is an open-end management investment company currently consisting of twenty separate investment portfolios, including the High Yield Portfolio (the “Portfolio”). The Portfolio is only available as a funding vehicle under variable life insurance policies or variable annuity contracts issued by insurance companies (“Variable Contracts”). Individuals may not purchase shares of the Portfolio directly. Shares of the Portfolio also may be sold to qualified pension and retirement plans outside of the separate account context.
We believe that bond funds have an important role to play in a well diversified investment portfolio. It is important to note, however, that in an environment where interest rates may trend upward, rising rates would negatively impact the performance of most bond funds, and fixed-income securities held by a fund are likely to decrease in value. The price volatility of fixed-income securities can also increase during periods of rising interest rates resulting in increased losses to a fund. Bond funds and individual bonds with a longer duration (a measure of the expected life of a security) tend to be more sensitive to changes in interest rates, usually making them more volatile than securities or funds with shorter durations.
The Portfolio may be subject to various risks in addition to those described above. Some of these risks may include, but are not limited to, the following: credit risk, high yield risk, market risk, issuer risk, liquidity risk, derivatives risk, mortgage risk, non-U.S. investment risk, emerging markets risk, currency risk, leveraging risk and management risk. A complete description of these risks is contained in the Portfolio’s prospectus. The Portfolio may use derivative instruments for hedging purposes or as part of an investment strategy. Use of these instruments may involve certain costs and risks such as liquidity risk, interest rate risk, market risk, credit risk, management risk and the risk that the Portfolio could not close out a position when it would be most advantageous to do so. Because the Portfolio may invest in derivatives, it could lose more than the principal amount invested in these instruments. Investing in non-U.S. securities may entail risk due to non-U.S. economic and political developments; this risk may be increased when investing in emerging markets.
On the performance summary page in this Semiannual Report, the Total Return Investment Performance table measures performance assuming that all dividend and capital gain distributions were reinvested.
An investment in the Portfolio is not a deposit of a bank and is not guaranteed or insured by the Federal Deposit Insurance Corporation or any other government agency. It is possible to lose money on investments in the Portfolio.
PIMCO has adopted written proxy voting policies and procedures (“Proxy Policy”) as required by Rule 206(4)-6 under the Investment Advisers Act of 1940, as amended. The Proxy Policy has been adopted by the Trust as the policies and procedures that PIMCO will use when voting proxies on behalf of the Portfolio. A description of the policies and procedures that PIMCO uses to vote proxies relating to portfolio securities of the Portfolio, and information about how the Portfolio voted proxies relating to portfolio securities held during the most recent twelve-month period ended June 30, are available without charge, upon request, by calling the Trust at 1-866-746-2606 and on the Portfolio’s website at www.pimco.com.
The Portfolio files its complete schedule of portfolio holdings with the SEC for the first and third quarters of each fiscal year on Form N-Q. A copy of the Trust’s Form N-Q is also available on the SEC’s website at http://www.sec.gov and may be reviewed and copied at the SEC’s Public Reference Room in Washington D.C. Information on the operation of the Public Reference Room may be obtained by calling 1-800-SEC-0330, and is available without charge, upon request, by calling the Trust at 1-866-746-2606 and on the Portfolio’s website at www.pimco.com.
PIMCO Variable Insurance Trust is distributed by Allianz Global Investors Distributors LLC, 1345 Avenue of the Americas, New York, NY 10105.
| | | | |
| 2 | | PIMCO Variable Insurance Trust | | |
The following disclosure provides important information regarding the Portfolio’s Expense Example (“Example” or “Expense Example”), which appears in this Semiannual Report. Please refer to this information when reviewing the Expense Example for the Portfolio.
Example
As a shareholder of the Portfolio, you incur two types of costs: (1) transaction costs and (2) ongoing costs, including advisory and administrative fees; distribution and/or service (12b-1) fees (Administrative and Advisor Class only); and other Portfolio expenses. The Example is intended to help you understand your ongoing costs (in dollars) of investing in the Portfolio and to compare these costs with the ongoing costs of investing in other mutual funds. The Expense Example does not reflect any fees or other expenses imposed by the Variable Contracts. If it did, the expenses reflected in the Expense Example would be higher. The Example is based on an investment of $1,000 invested at the beginning of the period and held for the entire period indicated, which is from January 1, 2007 to June 30, 2007.
Actual Expenses
The information in the table under the heading “Actual Performance” provides information about actual account values and actual expenses. You may use the information in these columns, together with the amount you invested, to estimate the expenses that you paid over the period. Simply divide your account value by $1,000 (for example, an $8,600 account value divided by $1,000 = $8.60), then multiply the result by the number in the row titled “Expenses Paid During Period” to estimate the expenses you paid on your account during this period.
Hypothetical Example for Comparison Purposes
The information in the table under the heading “Hypothetical Performance (5% return before expenses)” provides information about hypothetical account values and hypothetical expenses based on the Portfolio’s actual expense ratio and an assumed rate of return of 5% per year before expenses, which is not the Portfolio’s actual return. The hypothetical account values and expenses may not be used to estimate the actual ending account balance or expenses you paid for the period. You may use this information to compare the ongoing costs of investing in the Portfolio and other portfolios. To do so, compare this 5% hypothetical example with the 5% hypothetical examples that appear in the shareholder reports of the other portfolios.
Please note that the expenses shown in the table are meant to highlight your ongoing costs only and do not reflect any transactional costs. Therefore, the information under the heading “Hypothetical Performance (5% return before expenses)” is useful in comparing ongoing costs only, and will not help you determine the relative total costs of owning different portfolios. In addition, if these transactional costs were included, your costs would have been higher.
The expense ratio may vary period to period because of various factors, such as an increase in expenses not covered by the advisory and administrative fees (such as expenses of the trustees and their counsel, litigation expense and interest expense).
| | | | | | |
| | Semiannual Report | | June 30, 2007 | | 3 |
PIMCO High Yield Portfolio
Cumulative Returns Through June 30, 2007
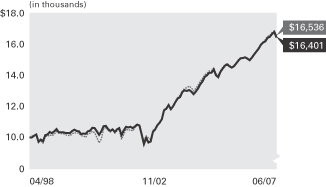
$10,000 invested at the beginning of the first full month following the inception date of the Portfolio’s Administrative Class.
Allocation Breakdown‡
| | |
Corporate Bonds & Notes | | 78.3% |
Bank Loan Obligations | | 8.4% |
Short-Term Instruments | | 5.2% |
U.S. Government Agencies | | 3.1% |
Foreign Currency-Denominated Issues | | 3.0% |
Other | | 2.0% |
| | ‡ | % of Total Investments as of 06/30/2007 |
| | | | | | | | | | |
| Average Annual Total Return for the period ended June 30, 2007 |
| | | | | 6 Months* | | 1 Year | | 5 Years | | Portfolio
Inception
(04/30/98) |
| | PIMCO High Yield Portfolio Administrative Class | | 2.08% | | 9.75% | | 10.00% | | 5.55% |
| | Merrill Lynch U.S. High Yield BB-B Rated Constrained Index± | | 2.59% | | 10.34% | | 10.19% | | 5.64% |
All Portfolio returns are net of fees and expenses.
* Cumulative return.
Performance quoted represents past performance. Past performance is no guarantee of future results. Investment return and principal value will fluctuate so the Portfolio shares, when redeemed, may be worth more or less than their original cost. The Portfolio’s performance does not reflect the deduction of additional charges and expenses imposed in connection with investing in Variable Contracts, which will reduce returns. Current performance may be lower or higher than the performance data quoted. Performance data current to the most recent month-end is available by calling (800) 927-4648.
± Merrill Lynch U.S. High Yield BB-B Rated Constrained Index tracks the performance of BB-B Rated U.S. dollar-denominated corporate bonds publicly issued in the U.S. domestic market. Qualifying bonds are capitalization-weighted provided the total allocation to an individual issuer (defined by Bloomberg tickers) does not exceed 2%. Issuers that exceed the limit are reduced to 2% and the face value of each of their bonds is adjusted on a pro-rata basis. Similarly, the face value of bonds of all other issuers that fall below the 2% cap are increased on a pro-rata basis. It is not possible to invest directly in the index. The index does not reflect deductions for fees and expenses.
| | | | | | |
| Expense Example | | Actual Performance | | Hypothetical Performance |
| | | | | (5% return before expenses) |
Beginning Account Value (01/01/07) | | $ | 1,000.00 | | $ | 1,000.00 |
Ending Account Value (06/30/07) | | $ | 1,020.80 | | $ | 1,021.08 |
Expenses Paid During Period† | | $ | 3.76 | | $ | 3.76 |
† Expenses are equal to the Portfolio’s Administrative Class annualized expense ratio of 0.75%, multiplied by the average account value over the period, multiplied by 181/365 (to reflect the one-half year period). Overall fees and expenses of investing in the Portfolio will be higher because the example does not reflect Variable Contract fees and expenses.
Please refer to page 3 herein for an explanation of the information presented in the above Expense Example.
Portfolio Insights
| » | | The PIMCO High Yield Portfolio seeks to achieve its investment objective by investing under normal circumstances at least 80% of its assets in a diversified portfolio of high-yield securities (“junk bonds”), which may be represented by forwards or derivatives such as options, futures contracts, or swap agreements, rated below investment grade but rated at least Caa by Moody’s, or equivalently rated by S&P or Fitch, or, if unrated, determined by PIMCO to be of comparable quality, subject to a maximum of 5% of total assets in securities rated Caa by Moody’s, or equivalently rated by S&P or Fitch, or if unrated, determined by PIMCO to be of comparable quality. |
| » | | An underweight to the building products sector, led lower by poor performing building and construction credits, added to relative performance. |
| » | | An emphasis on B-rated technology issues, which outperformed their higher-quality BB-rated counterparts, was a strong boost to returns. |
| » | | Security selection in the healthcare sector was a strong positive for returns as middle- and lower-rated quality tiers outperformed considerably. |
| » | | An underweight to consumer non-cyclicals, which outperformed wholesale foods, food/drug retailers, and pharmaceuticals, detracted from relative performance. |
| » | | As the metals and mining sector outperformed over the period, an underweight to the sector weighed on the Portfolio’s returns. |
| » | | Within the telecom sector, an emphasis on integrated service providers, which fell significantly short of wireless and wireline companies, was negative for relative performance. |
| » | | An underweight to BB-rated issues, in general, and some tactical exposure to CCC-rated bonds, added to performance as lower quality outperformed. |
| | | | |
| 4 | | PIMCO Variable Insurance Trust | | |
Financial Highlights High Yield Portfolio
| | | | | | | | | | | | | | | | | | | | | | | | |
| Selected per Share Data for the Year or Period Ended: | | 06/30/2007+ | | | 12/31/2006 | | | 12/31/2005 | | | 12/31/2004 | | | 12/31/2003 | | | 12/31/2002 | |
| | | | | | |
Administrative Class | | | | | | | | | | | | | | | | | | | | | | | | |
Net asset value beginning of year or period | | $ | 8.34 | | | $ | 8.19 | | | $ | 8.40 | | | $ | 8.19 | | | $ | 7.17 | | | $ | 7.88 | |
Net investment income (a) | | | 0.28 | | | | 0.56 | | | | 0.54 | | | | 0.53 | | | | 0.55 | | | | 0.59 | |
Net realized/unrealized gain (loss) on investments (a) | | | (0.10 | ) | | | 0.16 | | | | (0.21 | ) | | | 0.22 | | | | 1.04 | | | | (0.70 | ) |
Total income from investment operations | | | 0.18 | | | | 0.72 | | | | 0.33 | | | | 0.75 | | | | 1.59 | | | | (0.11 | ) |
Dividends from net investment income | | | (0.29 | ) | | | (0.57 | ) | | | (0.54 | ) | | | (0.54 | ) | | | (0.57 | ) | | | (0.60 | ) |
Total distributions | | | (0.29 | ) | | | (0.57 | ) | | | (0.54 | ) | | | (0.54 | ) | | | (0.57 | ) | | | (0.60 | ) |
Net asset value end of year or period | | $ | 8.23 | | | $ | 8.34 | | | $ | 8.19 | | | $ | 8.40 | | | $ | 8.19 | | | $ | 7.17 | |
Total return | | | 2.08 | % | | | 9.08 | % | | | 4.11 | % | | | 9.54 | % | | | 22.85 | % | | | (1.19 | )% |
Net assets end of year or period (000s) | | $ | 500,127 | | | $ | 516,823 | | | $ | 460,926 | | | $ | 414,062 | | | $ | 955,599 | | | $ | 481,473 | |
Ratio of expenses to average net assets | | | 0.75 | %* | | | 0.75 | % | | | 0.75 | % | | | 0.75 | % | | | 0.75 | % | | | 0.75 | %(b) |
Ratio of expenses to average net assets excluding interest expense | | | 0.75 | %* | | | 0.75 | % | | | 0.75 | % | | | 0.75 | % | | | 0.75 | % | | | 0.75 | %(b) |
Ratio of net investment income to average net assets | | | 6.79 | %* | | | 6.90 | % | | | 6.50 | % | | | 6.48 | % | | | 7.14 | % | | | 8.14 | % |
Portfolio turnover rate | | | 38 | % | | | 81 | % | | | 109 | % | | | 97 | % | | | 97 | % | | | 102 | % |
+ Unaudited
* Annualized
(a) Per share amounts based on average number of shares outstanding during the period.
(b) If the investment manager had not reimbursed expenses, the ratio of expenses to average net assets would have been 0.76%.
| | | | | | |
| See Accompanying Notes | | Semiannual Report | | June 30, 2007 | | 5 |
Statement of Assets and Liabilities High Yield Portfolio
| | | | |
| (Amounts in thousands, except per share amounts) | | June 30, 2007 | |
| | | (Unaudited) | |
| |
Assets: | | | | |
Investments, at value | | $ | 489,863 | |
Cash | | | 745 | |
Foreign currency, at value | | | 3,556 | |
Receivable for investments sold | | | 37,299 | |
Receivable for Portfolio shares sold | | | 118 | |
Interest and dividends receivable | | | 8,417 | |
Swap premiums paid | | | 45 | |
Unrealized appreciation on swap agreements | | | 843 | |
| | | | 540,886 | |
| |
Liabilities: | | | | |
Payable for investments purchased | | $ | 34,671 | |
Payable for Portfolio shares redeemed | | | 1,933 | |
Accrued investment advisory fee | | | 111 | |
Accrued administration fee | | | 155 | |
Accrued servicing fee | | | 55 | |
Swap premiums received | | | 5 | |
Unrealized depreciation on foreign currency contracts | | | 168 | |
Unrealized depreciation on swap agreements | | | 990 | |
| | | | 38,088 | |
| |
Net Assets | | $ | 502,798 | |
| |
Net Assets Consist of: | | | | |
Paid in capital | | $ | 503,818 | |
(Overdistributed) net investment income | | | (1,553 | ) |
Accumulated undistributed net realized (loss) | | | (1,193 | ) |
Net unrealized appreciation | | | 1,726 | |
| | | $ | 502,798 | |
| |
Net Assets: | | | | |
Institutional Class | | $ | 2,588 | |
Administrative Class | | | 500,127 | |
Advisor Class | | | 83 | |
| |
Shares Issued and Outstanding: | | | | |
Institutional Class | | | 315 | |
Administrative Class | | | 60,773 | |
Advisor Class | | | 10 | |
| |
Net Asset Value and Redemption Price Per Share (Net Asset Per Share Outstanding) | | | | |
Institutional Class | | $ | 8.23 | |
Administrative Class | | | 8.23 | |
Advisor Class | | | 8.23 | |
| |
Cost of Investments Owned | | $ | 487,844 | |
Cost of Foreign Currency Held | | $ | 3,537 | |
| | | | |
| 6 | | PIMCO Variable Insurance Trust | | See Accompanying Notes |
Statement of Operations High Yield Portfolio
| | | | |
| (Amounts in thousands) | | Six Months Ended
June 30, 2007 | |
| | | (Unaudited) | |
| |
| Investment Income: | | | | |
Interest | | $ | 19,591 | |
Dividends | | | 92 | |
Miscellaneous income | | | 39 | |
Total Income | | | 19,722 | |
| |
Expenses: | | | | |
Investment advisory fees | | | 650 | |
Administration fees | | | 910 | |
Servicing fees – Administrative Class | | | 388 | |
Trustees’ fees | | | 5 | |
Interest expense | | | 6 | |
Total Expenses | | | 1,959 | |
| |
Net Investment Income | | | 17,763 | |
| |
Net Realized and Unrealized Gain (Loss): | | | | |
Net realized gain on investments | | | 4,407 | |
Net realized (loss) on futures contracts, written options and swaps | | | (2,164 | ) |
Net realized (loss) on foreign currency transactions | | | (156 | ) |
Net change in unrealized (depreciation) on investments | | | (9,745 | ) |
Net change in unrealized appreciation on futures contracts, written options and swaps | | | 860 | |
Net change in unrealized (depreciation) on translation of assets and liabilities denominated in foreign currencies | | | (259 | ) |
Net (Loss) | | | (7,057 | ) |
| |
Net Increase in Net Assets Resulting from Operations | | $ | 10,706 | |
| | | | | | |
| See Accompanying Notes | | Semiannual Report | | June 30, 2007 | | 7 |
Statements of Changes in Net Assets High Yield Portfolio
| | | | | | | | |
| (Amounts in thousands) | | Six Months Ended
June 30, 2007 | | | Year Ended
December 31, 2006 | |
| | | (Unaudited) | | | | |
| | |
| Increase (Decrease) in Net Assets from: | | | | | | | | |
| | |
Operations: | | | | | | | | |
Net investment income | | $ | 17,763 | | | $ | 33,041 | |
Net realized gain | | | 2,087 | | | | 2,834 | |
Net change in unrealized appreciation (depreciation) | | | (9,144 | ) | | | 6,670 | |
Net increase resulting from operations | | | 10,706 | | | | 42,545 | |
| | |
Distributions to Shareholders: | | | | | | | | |
From net investment income | | | | | | | | |
Institutional Class | | | (81 | ) | | | (70 | ) |
Administrative Class | | | (17,782 | ) | | | (32,991 | ) |
Advisor Class | | | (3 | ) | | | (1 | ) |
| | |
Total Distributions | | | (17,866 | ) | | | (33,062 | ) |
| | |
Portfolio Share Transactions: | | | | | | | | |
Receipts for shares sold | | | | | | | | |
Institutional Class | | | 717 | | | | 1,213 | |
Administrative Class | | | 57,387 | | | | 140,974 | |
Advisor Class | | | 270 | | | | 64 | |
Issued as reinvestment of distributions | | | | | | | | |
Institutional Class | | | 81 | | | | 70 | |
Administrative Class | | | 17,782 | | | | 33,006 | |
Advisor Class | | | 3 | | | | 1 | |
Cost of shares redeemed | | | | | | | | |
Institutional Class | | | (132 | ) | | | (27 | ) |
Administrative Class | | | (84,751 | ) | | | (127,544 | ) |
Advisor Class | | | (251 | ) | | | (1 | ) |
Net increase (decrease) resulting from Portfolio share transactions | | | (8,894 | ) | | | 47,756 | |
| | |
Total Increase (Decrease) in Net Assets | | | (16,054 | ) | | | 57,239 | |
| | |
Net Assets: | | | | | | | | |
Beginning of period | | | 518,852 | | | | 461,613 | |
End of period* | | $ | 502,798 | | | $ | 518,852 | |
| | |
*Including (overdistributed) net investment income of: | | $ | (1,553 | ) | | $ | (1,450 | ) |
| | | | |
| 8 | | PIMCO Variable Insurance Trust | | See Accompanying Notes |
| | |
| |
| Schedule of Investments High Yield Portfolio | | June 30, 2007 (Unaudited) |
| | | | | | | | |
| | | | | PRINCIPAL
AMOUNT
(000S) | | | | VALUE (000S) |
| BANK LOAN OBLIGATIONS 8.2% |
| AES Corp. | | | | | | | | |
7.180% due 04/30/2010 | | $ | | 2,000 | | $ | | 2,005 |
| |
| Amadeus Global Travel Distribution S.A. |
7.830% due 04/08/2013 | | | | 700 | | | | 705 |
8.580% due 04/08/2014 | | | | 700 | | | | 708 |
| |
| Biomet, Inc. | | | | | | | | |
6.000% due 03/08/2008 | | | | 1,500 | | | | 1,504 |
| |
| Centennial Cellular Operating Co. LLC |
7.350% due 02/09/2011 | | | | 766 | | | | 770 |
7.360% due 01/20/2011 | | | | 59 | | | | 60 |
| |
| Community Health Corp. | | | | | | | | |
4.000% due 07/02/2014 | | | | 62 | | | | 62 |
5.000% due 07/02/2014 | | | | 938 | | | | 940 |
7.000% due 04/10/2008 | | | | 2,000 | | | | 1,995 |
| |
| Ford Motor Co. | | | | | | | | |
8.360% due 11/29/2013 | | | | 1,493 | | | | 1,500 |
| |
| Harrah’s Entertainment, Inc. | | | | |
7.500% due 03/09/2008 | | | | 3,000 | | | | 2,985 |
| |
| HCA, Inc. | | | | | | | | |
7.600% due 11/14/2013 | | | | 1,247 | | | | 1,254 |
| |
| Headwaters, Inc. | | | | | | | | |
7.360% due 04/30/2011 | | | | 852 | | | | 855 |
| |
| HealthSouth Corp. | | | | | | | | |
7.850% due 02/02/2013 | | | | 1,695 | | | | 1,704 |
7.860% due 02/02/2013 | | | | 32 | | | | 32 |
| |
| Ineos Group Holdings PLC | | | | | | | | |
7.571% due 10/07/2012 | | | | 56 | | | | 56 |
7.580% due 10/07/2012 | | | | 937 | | | | 940 |
| |
| JSG Holding PLC | | | | | | | | |
7.725% due 11/29/2013 | | | | 650 | | | | 654 |
8.225% due 11/29/2014 | | | | 650 | | | | 654 |
| |
| Lear Corp. | | | | | | | | |
8.000% due 06/27/2014 | | | | 1,000 | | | | 992 |
| |
| Metro-Goldwyn-Mayer, Inc. | | | | |
8.614% due 04/08/2012 | | | | 1,489 | | | | 1,494 |
| |
| Novelis, Inc. | | | | | | | | |
4.000% due 05/25/2008 | | | | 1,100 | | | | 1,102 |
| |
| Riverdeep Interactive | | | | | | | | |
8.100% due 11/28/2013 | | | | 997 | | | | 1,001 |
| |
| Roundy’s Supermarket, Inc. | | | | |
8.070% due 10/27/2011 | | | | 2 | | | | 2 |
8.110% due 11/01/2011 | | | | 985 | | | | 994 |
| |
| SLM Corp. | | | | | | | | |
6.000% due 06/30/2008 | | | | 2,600 | | | | 2,587 |
| |
| Telesat Canada, Inc. | | | | | | | | |
2.620% due 02/14/2008 | | | | 1,500 | | | | 1,501 |
| |
| Thompson Learning, Inc. | | | | | | | | |
5.000% due 06/27/2014 | | | | 2,100 | | | | 2,076 |
| |
| Tribune Co. | | | | | | | | |
7.875% due 05/30/2009 | | | | 825 | | | | 826 |
8.375% due 05/30/2014 | | | | 1,375 | | | | 1,346 |
| |
| Univision Communications, Inc. |
6.250% due 09/15/2014 | | | | 121 | | | | 119 |
7.605% due 09/15/2014 | | | | 1,879 | | | | 1,856 |
| |
| VNU/Nielson Finance LLC | | | | | | | | |
7.607% due 08/08/2013 | | | | 1,990 | | | | 2,004 |
| |
| VWR International, Inc. | | | | | | | | |
7.000% due 05/30/2008 | | | | 2,500 | | | | 2,503 |
| |
| Wind Acquisition Finance S.A. |
12.609% due 12/21/2011 | | | | 517 | | | | 521 |
| |
| Worldspan LP | | | | | | | | |
8.606% due 12/07/2013 | | | | 500 | | | | 503 |
| | | | | | | | |
| | | | | PRINCIPAL
AMOUNT
(000S) | | | | VALUE (000S) |
8.610% due 12/07/2013 | | $ | | 495 | | $ | | 497 |
10.500% due 12/07/2013 | | | | 2 | | | | 3 |
| | | | | | | | |
Total Bank Loan Obligations
(Cost $41,194) | | 41,310 |
| | | | | | | | |
|
| CORPORATE BONDS��& NOTES 76.3% |
|
| BANKING & FINANCE 9.7% |
| AES Ironwood LLC | | | | | | | | |
8.857% due 11/30/2025 | | | | 2,421 | | | | 2,700 |
| |
| AES Red Oak LLC | | | | | | | | |
8.540% due 11/30/2019 | | | | 1,185 | | | | 1,297 |
| |
| Bluewater Finance Ltd. | | | | | | | | |
10.250% due 02/15/2012 | | | | 2,200 | | | | 2,305 |
| |
| Ferrellgas Escrow LLC | | | | | | | | |
6.750% due 05/01/2014 | | | | 2,100 | | | | 2,000 |
| |
| Ford Motor Credit Co. | | | | | | | | |
7.250% due 10/25/2011 | | | | 1,900 | | | | 1,830 |
7.800% due 06/01/2012 | | | | 8,375 | | | | 8,178 |
8.625% due 11/01/2010 | | | | 1,260 | | | | 1,281 |
| |
| Forest City Enterprises, Inc. |
7.625% due 06/01/2015 | | | | 1,225 | | | | 1,240 |
| |
| General Motors Acceptance Corp. |
6.000% due 04/01/2011 | | | | 1,194 | | | | 1,152 |
7.000% due 02/01/2012 | | | | 3,000 | | | | 2,945 |
7.250% due 03/02/2011 | | | | 500 | | | | 499 |
8.000% due 11/01/2031 | | | | 2,350 | | | | 2,410 |
| |
| GMAC LLC | | | | | | | | |
6.625% due 05/15/2012 | | | | 1,100 | | | | 1,063 |
| |
| Hexion U.S. Finance Corp. | | | | | | | | |
9.750% due 11/15/2014 | | | | 1,300 | | | | 1,352 |
| |
| K&F Acquisition, Inc. | | | | | | | | |
7.750% due 11/15/2014 | | | | 1,000 | | | | 1,065 |
| |
| KRATON Polymers LLC | | | | | | | | |
8.125% due 01/15/2014 | | | | 1,500 | | | | 1,470 |
| |
| NSG Holdings LLC/NSG Holdings, Inc. |
7.750% due 12/15/2025 | | | | 925 | | | | 939 |
| |
| Petroleum Export Ltd. II | | | | | | | | |
6.340% due 06/20/2011 | | | | 1,280 | | | | 1,254 |
| |
| Petroplus Finance Ltd. | | | | | | | | |
6.750% due 05/01/2014 | | | | 375 | | | | 363 |
7.000% due 05/01/2017 | | | | 375 | | | | 363 |
| |
| Rotech Healthcare, Inc. | | | | | | | | |
9.500% due 04/01/2012 | | | | 3,575 | | | | 3,396 |
| |
| Targeted Return Index Securities Trust |
7.548% due 05/01/2016 | | | | 826 | | | | 814 |
| |
| Tenneco, Inc. | | | | | | | | |
8.625% due 11/15/2014 | | | | 975 | | | | 1,009 |
10.250% due 07/15/2013 | | | | 500 | | | | 540 |
| |
| TNK-BP Finance S.A. | | | | | | | | |
6.625% due 03/20/2017 | | | | 500 | | | | 486 |
7.500% due 07/18/2016 | | | | 1,000 | | | | 1,034 |
| |
| Universal City Development Partners |
11.750% due 04/01/2010 | | | | 525 | | | | 558 |
| |
| Universal City Florida Holding Co. I |
8.375% due 05/01/2010 | | | | 1,425 | | | | 1,464 |
10.106% due 05/01/2010 | | | | 175 | | | | 179 |
| |
| Ventas Realty LP | | | | | | | | |
6.750% due 04/01/2017 | | | | 250 | | | | 248 |
7.125% due 06/01/2015 | | | | 500 | | | | 506 |
9.000% due 05/01/2012 | | | | 500 | | | | 549 |
| |
| Wind Acquisition Finance S.A. |
10.750% due 12/01/2015 | | | | 1,000 | | | | 1,152 |
| |
| | | | | | | | |
| | | | | PRINCIPAL
AMOUNT
(000S) | | | | VALUE (000S) |
| Yankee Acquisition Corp. | | | | | | | | |
8.500% due 02/15/2015 | | $ | | 1,100 | | $ | | 1,072 |
| | | | | | | | |
| | | | | | | | 48,713 |
| | | | | | | | |
|
| INDUSTRIALS 54.2% |
| Abitibi-Consolidated Co. of Canada |
7.750% due 06/15/2011 | | | | 125 | | | | 115 |
| |
| Abitibi-Consolidated, Inc. | | | | | | | | |
8.550% due 08/01/2010 | | | | 1,275 | | | | 1,224 |
| |
| Actuant Corp. | | | | | | | | |
6.875% due 06/15/2017 | | | | 1,000 | | | | 995 |
| |
| Albertson’s, Inc. | | | | | | | | |
7.450% due 08/01/2029 | | | | 3,250 | | | | 3,186 |
| |
| Allied Waste North America, Inc. |
7.250% due 03/15/2015 | | | | 5,650 | | | | 5,622 |
| |
| AmeriGas Partners LP | | | | | | | | |
7.125% due 05/20/2016 | | | | 2,650 | | | | 2,617 |
7.250% due 05/20/2015 | | | | 1,850 | | | | 1,841 |
| |
| Aramark Corp. | | | | | | | | |
8.500% due 02/01/2015 | | | | 3,775 | | | | 3,860 |
| |
| Arco Chemical Co. | | | | | | | | |
10.250% due 11/01/2010 | | | | 50 | | | | 54 |
| |
| Armor Holdings, Inc. | | | | | | | | |
8.250% due 08/15/2013 | | | | 800 | | | | 846 |
| |
| ArvinMeritor, Inc. | | | | | | | | |
8.125% due 09/15/2015 | | | | 1,525 | | | | 1,485 |
8.750% due 03/01/2012 | | | | 2,750 | | | | 2,791 |
| |
| Berry Plastics Holding Corp. |
8.875% due 09/15/2014 | | | | 975 | | | | 992 |
| |
| Bon-Ton Stores, Inc. | | | | | | | | |
10.250% due 03/15/2014 | | | | 3,750 | | | | 3,816 |
| |
| Bowater Canada Finance | | | | | | | | |
7.950% due 11/15/2011 | | | | 1,315 | | | | 1,244 |
| |
| Buhrmann U.S., Inc. | | | | | | | | |
7.875% due 03/01/2015 | | | | 1,300 | | | | 1,287 |
8.250% due 07/01/2014 | | | | 1,000 | | | | 1,010 |
| |
| C8 Capital SPV Ltd. | | | | | | | | |
6.640% due 12/31/2049 | | | | 1,500 | | | | 1,478 |
| |
| CanWest Media, Inc. | | | | | | | | |
8.000% due 09/15/2012 | | | | 770 | | | | 768 |
| |
| Cascades, Inc. | | | | | | | | |
7.250% due 02/15/2013 | | | | 1,425 | | | | 1,393 |
| |
| CCO Holdings LLC | | | | | | | | |
8.750% due 11/15/2013 | | | | 7,400 | | | | 7,567 |
| |
| Celestica, Inc. | | | | | | | | |
7.625% due 07/01/2013 | | | | 875 | | | | 823 |
7.875% due 07/01/2011 | | | | 1,900 | | | | 1,853 |
| |
| Chart Industries, Inc. | | | | | | | | |
9.125% due 10/15/2015 | | | | 425 | | | | 448 |
| |
| Chemtura Corp. | | | | | | | | |
6.875% due 06/01/2016 | | | | 1,750 | | | | 1,663 |
| |
| Chesapeake Energy Corp. | | | | | | | | |
6.875% due 01/15/2016 | | | | 1,200 | | | | 1,179 |
7.000% due 08/15/2014 | | | | 1,550 | | | | 1,546 |
7.500% due 06/15/2014 | | | | 75 | | | | 76 |
7.750% due 01/15/2015 | | | | 500 | | | | 511 |
| |
| Choctaw Resort Development Enterprise |
7.250% due 11/15/2019 | | | | 1,357 | | | | 1,343 |
| |
| Citic Resources Finance Ltd. |
6.750% due 05/15/2014 | | | | 450 | | | | 435 |
| |
| Compagnie Générale de Géophysique-Veritas |
7.500% due 05/15/2015 | | | | 450 | | | | 452 |
7.750% due 05/15/2017 | | | | 225 | | | | 229 |
| |
| | | | | | |
| See Accompanying Notes | | Semiannual Report | | June 30, 2007 | | 9 |
Schedule of Investments High Yield Portfolio (Cont.)
| | | | | | | | |
| | | | | PRINCIPAL
AMOUNT
(000S) | | | | VALUE (000S) |
| Continental Airlines, Inc. |
6.920% due 04/02/2013 (f) | | $ | | 712 | | $ | | 725 |
7.373% due 06/15/2017 | | | | 253 | | | | 251 |
| |
| Cooper-Standard Automotive, Inc. |
7.000% due 12/15/2012 | | | | 1,100 | | | | 1,037 |
| |
| Corrections Corp. of America |
7.500% due 05/01/2011 | | | | 1,250 | | | | 1,273 |
| |
| Crown Americas LLC & Crown Americas Capital Corp. |
7.625% due 11/15/2013 | | | | 425 | | | | 431 |
7.750% due 11/15/2015 | | | | 1,500 | | | | 1,515 |
| |
| CSC Holdings, Inc. |
6.750% due 04/15/2012 | | | | 1,000 | | | | 955 |
7.625% due 04/01/2011 | | | | 2,000 | | | | 1,995 |
| |
| DaVita, Inc. |
7.250% due 03/15/2015 | | | | 4,150 | | | | 4,119 |
| |
| Delhaize America, Inc. |
9.000% due 04/15/2031 | | | | 1,917 | | | | 2,326 |
| |
| Dresser-Rand Group, Inc. |
7.375% due 11/01/2014 | | | | 396 | | | | 399 |
| |
| DRS Technologies, Inc. |
7.625% due 02/01/2018 | �� | | | 1,050 | | | | 1,066 |
| |
| Dynegy Holdings, Inc. |
7.125% due 05/15/2018 | | | | 1,750 | | | | 1,566 |
7.500% due 06/01/2015 | | | | 200 | | | | 189 |
7.750% due 06/01/2019 | | | | 3,100 | | | | 2,899 |
8.375% due 05/01/2016 | | | | 1,000 | | | | 983 |
| |
| EchoStar DBS Corp. |
6.625% due 10/01/2014 | | | | 1,000 | | | | 958 |
7.125% due 02/01/2016 | | | | 3,225 | | | | 3,169 |
| |
| El Paso Corp. |
7.000% due 06/15/2017 | | | | 1,750 | | | | 1,740 |
7.750% due 01/15/2032 | | | | 1,200 | | | | 1,215 |
7.800% due 08/01/2031 | | | | 325 | | | | 331 |
8.050% due 10/15/2030 | | | | 1,300 | | | | 1,372 |
| |
| Equistar Chemicals LP |
10.125% due 09/01/2008 | | | | 26 | | | | 27 |
| |
| Ferrellgas Partners LP |
8.750% due 06/15/2012 | | | | 1,525 | | | | 1,578 |
8.870% due 08/01/2009 (f) | | | | 1,200 | | | | 1,272 |
| |
| Fisher Communications, Inc. |
8.625% due 09/15/2014 | | | | 1,000 | | | | 1,070 |
| |
| Ford Motor Co. |
7.450% due 07/16/2031 | | | | 3,600 | | | | 2,894 |
| |
| Forest Oil Corp. |
7.250% due 06/15/2019 | | | | 825 | | | | 804 |
| |
| Freeport-McMoRan Copper & Gold, Inc. |
8.250% due 04/01/2015 | | | | 1,200 | | | | 1,269 |
8.375% due 04/01/2017 | | | | 2,300 | | | | 2,461 |
| |
| Freescale Semiconductor, Inc. |
8.875% due 12/15/2014 | | | | 4,000 | | | | 3,840 |
9.125% due 12/15/2014 (b) | | | | 1,850 | | | | 1,748 |
9.235% due 12/15/2014 | | | | 500 | | | | 485 |
| |
| Fresenius Medical Care Capital Trust |
7.875% due 06/15/2011 | | | | 2,250 | | | | 2,340 |
| |
| Gaylord Entertainment Co. |
8.000% due 11/15/2013 | | | | 800 | | | | 815 |
| |
| General Motors Corp. |
8.100% due 06/15/2024 | | | | 300 | | | | 266 |
8.250% due 07/15/2023 | | | | 4,850 | | | | 4,444 |
8.800% due 03/01/2021 | | | | 700 | | | | 665 |
| |
| Georgia-Pacific Corp. |
7.125% due 01/15/2017 | | | | 2,000 | | | | 1,930 |
7.375% due 12/01/2025 | | | | 5,960 | | | | 5,617 |
7.750% due 11/15/2029 | | | | 100 | | | | 94 |
8.000% due 01/15/2024 | | | | 775 | | | | 756 |
| |
| | | | | | | | |
| | | | | PRINCIPAL
AMOUNT
(000S) | | | | VALUE (000S) |
| Goodyear Tire & Rubber Co. |
9.000% due 07/01/2015 | | $ | | 1,024 | | $ | | 1,108 |
| |
Grupo Transportacion Ferroviaria
Mexicana S.A. de C.V. |
9.375% due 05/01/2012 | | | | 1,200 | | | | 1,290 |
| |
| Hanover Compressor Co. |
9.000% due 06/01/2014 | | | | 500 | | | | 531 |
| |
| Hanover Equipment Trust |
8.750% due 09/01/2011 | | | | 800 | | | | 826 |
| |
| HCA, Inc. |
6.750% due 07/15/2013 | | | | 4,400 | | | | 4,015 |
7.190% due 11/15/2015 | | | | 200 | | | | 181 |
7.500% due 12/15/2023 | | | | 400 | | | | 347 |
7.580% due 09/15/2025 | | | | 550 | | | | 478 |
9.250% due 11/15/2016 | | | | 8,595 | | | | 9,175 |
| |
| Herbst Gaming, Inc. |
7.000% due 11/15/2014 | | | | 2,000 | | | | 1,885 |
| |
| Hertz Corp. |
8.875% due 01/01/2014 | | | | 4,225 | | | | 4,426 |
| |
| Horizon Lines LLC |
9.000% due 11/01/2012 | | | | 1,016 | | | | 1,080 |
| |
| Host Marriott LP |
7.125% due 11/01/2013 | | | | 1,430 | | | | 1,435 |
| |
| Idearc, Inc. |
8.000% due 11/15/2016 | | | | 3,800 | | | | 3,857 |
| |
| Ineos Group Holdings PLC |
8.500% due 02/15/2016 | | | | 3,125 | | | | 3,070 |
| |
| Ingles Markets, Inc. |
8.875% due 12/01/2011 | | | | 1,450 | | | | 1,510 |
| |
| Intelsat Bermuda Ltd. |
9.250% due 06/15/2016 | | | | 1,275 | | | | 1,361 |
| |
| Intelsat Corp. |
9.000% due 06/15/2016 | | | | 400 | | | | 421 |
| |
| Intelsat Subsidiary Holding Co. Ltd. |
8.250% due 01/15/2013 | | | | 400 | | | | 408 |
8.625% due 01/15/2015 | | | | 1,500 | | | | 1,545 |
| |
| Jefferson Smurfit Corp. U.S. |
8.250% due 10/01/2012 | | | | 600 | | | | 599 |
| |
| JET Equipment Trust |
7.630% due 08/15/2012 (a) | | | | 218 | | | | 161 |
10.000% due 06/15/2012 (a) | | | | 526 | | | | 547 |
| |
| L-3 Communications Corp. |
6.375% due 10/15/2015 | | | | 700 | | | | 665 |
7.625% due 06/15/2012 | | | | 2,450 | | | | 2,520 |
| |
| Legrand France |
8.500% due 02/15/2025 | | | | 975 | | | | 1,143 |
| |
| Lyondell Chemical Co. |
8.000% due 09/15/2014 | | | | 1,475 | | | | 1,523 |
8.250% due 09/15/2016 | | | | 925 | | | | 971 |
| |
| MGM Mirage |
6.625% due 07/15/2015 | | | | 850 | | | | 777 |
6.875% due 04/01/2016 | | | | 1,725 | | | | 1,596 |
7.500% due 06/01/2016 | | | | 1,725 | | | | 1,645 |
| |
| Mirage Resorts, Inc. |
7.250% due 08/01/2017 | | | | 2,600 | | | | 2,561 |
| |
| Nalco Co. |
7.750% due 11/15/2011 | | | | 500 | | | | 506 |
| |
| Norampac, Inc. |
6.750% due 06/01/2013 | | | | 875 | | | | 839 |
| |
| Nordic Telephone Co. Holdings ApS |
8.875% due 05/01/2016 | | | | 1,500 | | | | 1,598 |
| |
| Nortel Networks Ltd. |
9.606% due 07/15/2011 | | | | 200 | | | | 214 |
| | | | | | | | |
| | | | | PRINCIPAL
AMOUNT
(000S) | | | | VALUE (000S) |
10.125% due 07/15/2013 | | $ | | 1,500 | | $ | | 1,616 |
10.750% due 07/15/2016 | | | | 475 | | | | 527 |
| |
| Northwest Pipeline Corp. |
7.125% due 12/01/2025 | | | | 500 | | | | 516 |
| |
| Novelis, Inc. |
7.250% due 02/15/2015 | | | | 120 | | | | 124 |
| |
| NPC International, Inc. |
9.500% due 05/01/2014 | | | | 2,050 | | | | 1,999 |
| |
| OPTI Canada, Inc. |
8.250% due 12/15/2014 | | | | 1,900 | | | | 1,938 |
| |
| Owens Brockway Glass Container, Inc. |
6.750% due 12/01/2014 | | | | 1,775 | | | | 1,740 |
8.750% due 11/15/2012 | | | | 525 | | | | 550 |
| |
| Peabody Energy Corp. |
6.875% due 03/15/2013 | | | | 1,291 | | | | 1,291 |
| |
| Pilgrim’s Pride Corp. |
7.625% due 05/01/2015 | | | | 1,695 | | | | 1,699 |
8.375% due 05/01/2017 | | | | 300 | | | | 299 |
| |
| Plains Exploration & Production Co. |
7.000% due 03/15/2017 | | | | 225 | | | | 214 |
7.750% due 06/15/2015 | | | | 650 | | | | 648 |
| |
| Pogo Producing Co. |
7.875% due 05/01/2013 | | | | 175 | | | | 179 |
| |
| PQ Corp. |
7.500% due 02/15/2013 | | | | 2,225 | | | | 2,370 |
| |
| Premier Entertainment Biloxi LLC |
10.750% due 02/01/2012 | | | | 750 | | | | 784 |
| |
| Primedia, Inc. |
8.000% due 05/15/2013 | | | | 400 | | | | 423 |
| |
| Quiksilver, Inc. |
6.875% due 04/15/2015 | | | | 1,350 | | | | 1,276 |
| |
| Qwest Communications International, Inc. |
7.500% due 02/15/2014 | | | | 8,250 | | | | 8,394 |
| |
| Reynolds American, Inc. |
7.250% due 06/15/2037 | | | | 500 | | | | 514 |
7.625% due 06/01/2016 | | | | 925 | | | | 984 |
7.750% due 06/01/2018 | | | | 1,875 | | | | 2,010 |
| |
| RH Donnelley Corp. |
6.875% due 01/15/2013 | | | | 250 | | | | 238 |
8.875% due 01/15/2016 | | | | 5,950 | | | | 6,218 |
| |
| Rockwood Specialties Group, Inc. |
7.500% due 11/15/2014 | | | | 1,700 | | | | 1,717 |
| |
| Rogers Cable, Inc. |
8.750% due 05/01/2032 | | | | 400 | | | | 486 |
| |
| Roseton |
7.270% due 11/08/2010 | | | | 1,200 | | | | 1,214 |
7.670% due 11/08/2016 | | | | 2,325 | | | | 2,408 |
| |
| Royal Caribbean Cruises Ltd. |
7.250% due 03/15/2018 | | | | 1,750 | | | | 1,722 |
| |
| Sanmina-SCI Corp. |
8.125% due 03/01/2016 | | | | 2,325 | | | | 2,174 |
| |
| SemGroup LP |
8.750% due 11/15/2015 | | | | 3,075 | | | | 3,106 |
| |
| Sensata Technologies BV |
8.000% due 05/01/2014 | | | | 1,175 | | | | 1,140 |
| |
| Service Corp. International |
7.375% due 10/01/2014 | | | | 425 | | | | 429 |
7.625% due 10/01/2018 | | | | 1,025 | | | | 1,043 |
| |
| Sinclair Broadcast Group, Inc. |
8.000% due 03/15/2012 | | | | 6 | | | | 7 |
| |
| Smurfit Capital Funding PLC |
7.500% due 11/20/2025 | | | | 500 | | | | 506 |
| |
| | | | |
| 10 | | PIMCO Variable Insurance Trust | | See Accompanying Notes |
| | |
| |
| | | June 30, 2007 (Unaudited) |
| | | | | | | | |
| | | | | PRINCIPAL
AMOUNT
(000S) | | | | VALUE (000S) |
| Smurfit Kappa Funding PLC |
7.750% due 04/01/2015 | | $ | | 125 | | $ | | 126 |
9.625% due 10/01/2012 | | | | 342 | | | | 360 |
| |
| Smurfit-Stone Container Enterprises, Inc. |
8.000% due 03/15/2017 | | | | 925 | | | | 902 |
8.375% due 07/01/2012 | | | | 750 | | | | 755 |
| |
| Sonat, Inc. | | | | | | | | |
7.000% due 02/01/2018 | | | | 500 | | | | 492 |
| |
| Station Casinos, Inc. | | | | | | | | |
6.875% due 03/01/2016 | | | | 1,275 | | | | 1,132 |
7.750% due 08/15/2016 | | | | 2,295 | | | | 2,284 |
| |
| Suburban Propane Partners LP |
6.875% due 12/15/2013 | | | | 2,750 | | | | 2,668 |
| |
| Sungard Data Systems, Inc. |
9.125% due 08/15/2013 | | | | 3,141 | | | | 3,231 |
| |
| Superior Essex Communications LLC |
9.000% due 04/15/2012 | | | | 500 | | | | 513 |
| |
| Supervalu, Inc. | | | | | | | | |
7.500% due 11/15/2014 | | | | 1,475 | | | | 1,519 |
| |
| Tenet Healthcare Corp. | | | | | | | | |
7.375% due 02/01/2013 | | | | 1,766 | | | | 1,605 |
| |
| Tesoro Corp. | | | | | | | | |
6.500% due 06/01/2017 | | | | 1,000 | | | | 982 |
| |
| TransDigm, Inc. | | | | | | | | |
7.750% due 07/15/2014 | | | | 1,330 | | | | 1,350 |
| |
| Triad Hospitals, Inc. | | | | | | | | |
7.000% due 11/15/2013 | | | | 2,640 | | | | 2,781 |
| |
| Trinity Industries, Inc. | | | | | | | | |
6.500% due 03/15/2014 | | | | 780 | | | | 766 |
| |
| TRW Automotive, Inc. | | | | | | | | |
7.000% due 03/15/2014 | | | | 500 | | | | 479 |
7.250% due 03/15/2017 | | | | 550 | | | | 527 |
| |
| U.S. Airways Group, Inc. | | | | | | | | |
9.330% due 01/01/2049 (a) | | | | 84 | | | | 1 |
| |
| United Airlines, Inc. | | | | | | | | |
6.071% due 03/01/2013 | | | | 215 | | | | 216 |
6.201% due 03/01/2010 | | | | 108 | | | | 109 |
6.602% due 03/01/2015 | | | | 243 | | | | 245 |
| |
| Unity Media GmbH | | | | | | | | |
10.375% due 02/15/2015 | | | | 750 | | | | 767 |
| |
| Verso Paper Holdings LLC | | | | | | | | |
9.125% due 08/01/2014 | | | | 3,150 | | | | 3,268 |
| |
| West Corp. | | | | | | | | |
9.500% due 10/15/2014 | | | | 300 | | | | 309 |
11.000% due 10/15/2016 | | | | 300 | | | | 315 |
| |
| Williams Cos., Inc. | | | | | | | | |
7.625% due 07/15/2019 | | | | 3,950 | | | | 4,187 |
7.750% due 06/15/2031 | | | | 775 | | | | 824 |
7.875% due 09/01/2021 | | | | 2,575 | | | | 2,781 |
| |
| Williams Partners LP | | | | | | | | |
7.250% due 02/01/2017 | | | | 425 | | | | 429 |
| |
| Wynn Las Vegas LLC | | | | | | | | |
6.625% due 12/01/2014 | | | | 5,400 | | | | 5,231 |
| |
| Xerox Capital Trust I | | | | | | | | |
8.000% due 02/01/2027 | | | | 2,100 | | | | 2,161 |
| | | | | | | | |
| | | | | | | | 272,270 |
| | | | | | | | |
|
| UTILITIES 12.4% |
| AES Corp. | | | | | | | | |
8.750% due 05/15/2013 | | | | 2,325 | | | | 2,464 |
| |
| Cincinnati Bell, Inc. | | | | | | | | |
7.250% due 07/15/2013 | | | | 2,500 | | | | 2,575 |
8.375% due 01/15/2014 | | | | 1,270 | | | | 1,289 |
| |
| | | | | | | | |
| | | | | PRINCIPAL
AMOUNT
(000S) | | | | VALUE (000S) |
| Citizens Communications Co. |
7.125% due 03/15/2019 | | $ | | 2,300 | | $ | | 2,185 |
7.450% due 07/01/2035 | | | | 250 | | | | 221 |
7.875% due 01/15/2027 | | | | 425 | | | | 415 |
9.000% due 08/15/2031 | | | | 1,425 | | | | 1,475 |
| |
| Complete Production Services, Inc. |
8.000% due 12/15/2016 | | | | 575 | | | | 584 |
| |
| Edison Mission Energy | | | | | | | | |
7.000% due 05/15/2017 | | | | 675 | | | | 639 |
7.200% due 05/15/2019 | | | | 975 | | | | 921 |
7.750% due 06/15/2016 | | | | 1,000 | | | | 1,000 |
| |
| Hawaiian Telcom Communications, Inc. |
9.750% due 05/01/2013 | | | | 1,500 | | | | 1,579 |
10.860% due 05/01/2013 | | | | 1,000 | | | | 1,025 |
| |
| Homer City Funding LLC | | | | | | | | |
8.734% due 10/01/2026 | | | | 974 | | | | 1,076 |
| |
| MetroPCS Wireless, Inc. | | | | | | | | |
9.250% due 11/01/2014 | | | | 1,300 | | | | 1,349 |
| |
| Midwest Generation LLC | | | | | | | | |
8.560% due 01/02/2016 | | | | 4,487 | | | | 4,787 |
| |
| Mobile Telesystems Finance S.A. |
8.000% due 01/28/2012 | | | | 450 | | | | 464 |
8.375% due 10/14/2010 | | | | 500 | | | | 522 |
| |
| Nevada Power Co. | | | | | | | | |
6.750% due 07/01/2037 | | | | 300 | | | | 307 |
| |
| Nextel Communications, Inc. |
7.375% due 08/01/2015 | | | | 1,575 | | | | 1,576 |
| |
| Northwestern Bell Telephone |
7.750% due 05/01/2030 | | | | 1,208 | | | | 1,225 |
| |
| NRG Energy, Inc. | | | | | | | | |
7.250% due 02/01/2014 | | | | 1,000 | | | | 1,005 |
7.375% due 02/01/2016 | | | | 5,665 | | | | 5,693 |
7.375% due 01/15/2017 | | | | 450 | | | | 453 |
| |
| NTL Cable PLC | | | | | | | | |
9.125% due 08/15/2016 | | | | 500 | | | | 526 |
| |
| PSEG Energy Holdings LLC | | | | | | | | |
8.500% due 06/15/2011 | | | | 4,250 | | | | 4,523 |
| |
| Qwest Corp. | | | | | | | | |
7.200% due 11/10/2026 | | | | 1,700 | | | | 1,679 |
8.875% due 03/15/2012 | | | | 2,625 | | | | 2,841 |
| |
| Reliant Energy, Inc. | | | | | | | | |
6.750% due 12/15/2014 | | | | 3,075 | | | | 3,152 |
7.625% due 06/15/2014 | | | | 1,000 | | | | 980 |
7.875% due 06/15/2017 | | | | 1,300 | | | | 1,271 |
9.250% due 07/15/2010 | | | | 0 | | | | 1 |
| |
| Rural Cellular Corp. | | | | | | | | |
9.875% due 02/01/2010 | | | | 1,775 | | | | 1,864 |
| |
| Sierra Pacific Power Co. | | | | | | |
6.750% due 07/01/2037 | | | | 500 | | | | 506 |
| |
| Sierra Pacific Resources | | | | |
6.750% due 08/15/2017 | | | | 775 | | | | 766 |
7.803% due 06/15/2012 | | | | 625 | | | | 660 |
8.625% due 03/15/2014 | | | | 1,250 | | | | 1,348 |
| |
| South Point Energy Center LLC |
8.400% due 05/30/2012 (h) | | | | 1,158 | | | | 1,145 |
| |
| Tenaska Alabama Partners LP |
7.000% due 06/30/2021 | | | | 2,189 | | | | 2,251 |
| |
| Time Warner Telecom Holdings, Inc. |
9.250% due 02/15/2014 | | | | 2,875 | | | | 3,062 |
| |
| | | | | | | | |
| | | | | PRINCIPAL
AMOUNT
(000S) | | | | VALUE (000S) |
| UBS Luxembourg S.A. for OJSC Vimpel Communications |
8.250% due 05/23/2016 | | $ | | 1,000 | | $ | | 1,046 |
| | | | | | | | |
| | | | | | | | 62,450 |
| | | | | | | | |
Total Corporate Bonds & Notes
(Cost $383,250) | | 383,433 |
| | | | | | | | |
|
| CONVERTIBLE BONDS & NOTES 0.9% |
| Advanced Micro Devices, Inc. |
6.000% due 05/01/2015 | | | | 750 | | | | 726 |
| |
| Chesapeake Energy Corp. |
2.750% due 11/15/2035 | | | | 300 | | | | 327 |
| |
| CMS Energy Corp. | | | | | | | | |
2.875% due 12/01/2024 | | | | 1,000 | | | | 1,311 |
| |
| Deutsche Bank AG | | | | | | | | |
0.000% due 07/14/2008 | | | | 300 | | | | 280 |
0.000% due 09/29/2008 | | | | 275 | | | | 258 |
0.000% due 10/24/2008 | | | | 350 | | | | 344 |
| |
| Host Hotels & Resorts, Inc. |
2.625% due 04/15/2027 | | | | 100 | | | | 92 |
| |
| Nortel Networks Corp. | | | | | | | | |
2.125% due 04/15/2014 | | | | 800 | | | | 785 |
| |
| Qwest Communications International, Inc. |
3.500% due 11/15/2025 | | | | 200 | | | | 351 |
| | | | | | | | |
Total Convertible Bonds & Notes
(Cost $4,354) | | 4,474 |
| | | | | | | | |
|
| MUNICIPAL BONDS & NOTES 0.3% |
| Bell, California Public Financing Authority Notes, Series 2006 |
7.400% due 11/01/2007 | | | | 1,500 | | | | 1,502 |
| | | | | | | | |
Total Municipal Bonds & Notes
(Cost $1,500) | �� | 1,502 |
| | | | | | | | |
|
| U.S. GOVERNMENT AGENCIES 3.0% |
| Fannie Mae |
5.500% due 07/01/2037 - 08/01/2037 | | | | 15,600 | | | | 15,042 |
| | | | | | | | |
Total U.S. Government Agencies
(Cost $14,999) | | 15,042 |
| | | | | | | | |
|
| FOREIGN CURRENCY-DENOMINATED ISSUES 2.9% |
| Bombardier, Inc. | | | | | | | | |
7.250% due 11/15/2016 | | EUR | | 1,750 | | | | 2,478 |
| |
| JSG Holding PLC | | | | | | | | |
10.125% due 10/01/2012 | | | | 15 | | | | 22 |
| |
| Lighthouse International Co. S.A. |
8.000% due 04/30/2014 | | | | 1,670 | | | | 2,399 |
| |
| Nordic Telephone Co. Holdings ApS |
5.875% due 11/30/2014 | | | | 446 | | | | 610 |
6.125% due 11/30/2014 | | | | 550 | | | | 755 |
8.250% due 05/01/2016 | | | | 1,000 | | | | 1,455 |
| |
| NTL Cable PLC | | | | | | | | |
8.750% due 04/15/2014 | | | | 1,000 | | | | 1,418 |
| |
| Royal Bank of Scotland Group PLC |
9.370% due 04/06/2011 | | GBP | | 586 | | | | 1,181 |
| |
| SigmaKalon | | | | | | | | |
6.164% due 06/30/2012 | | EUR | | 924 | | | | 1,252 |
| |
| UPC Financing Partnership |
5.942% due 12/31/2014 | | | | 942 | | | | 1,276 |
| |
| UPC Holding BV | | | | | | | | |
7.750% due 01/15/2014 | | | | 600 | | | | 808 |
8.625% due 01/15/2014 | | | | 800 | | | | 1,113 |
| | | | | | | | |
Total Foreign Currency-Denominated Issues (Cost $13,185) | | 14,767 |
| | | | | | | | |
| | | | | | |
| See Accompanying Notes | | Semiannual Report | | June 30, 2007 | | 11 |
Schedule of Investments High Yield Portfolio (Cont.)
| | | | | | | | |
| | | | | SHARES | | | |
VALUE (000S) |
| CONVERTIBLE PREFERRED STOCKS 0.4% |
| Chesapeake Energy Corp. | | | | | | | | |
4.500% due 12/31/2049 | | | | 5,000 | | $ | | 507 |
5.000% due 12/31/2049 | | | | 2,900 | | | | 324 |
| |
| Freeport-McMoRan Copper & Gold, Inc. |
6.750% due 05/01/2010 | | | | 3,300 | | | | 424 |
| |
| Vale Capital Ltd. | | | | | | | | |
5.500% due 06/15/2010 | | | | 14,100 | | | | 697 |
| | | | | | | | |
Total Convertible Preferred Stocks (Cost $1,863) | | | | 1,952 |
| | | | | | | | |
|
| PREFERRED STOCKS 0.4% |
| Fresenius Medical Care Capital Trust II |
7.875% due 02/01/2008 | | | | 2,050 | | | | 2,065 |
| | | | | | | | |
Total Preferred Stocks
(Cost $2,172) | | | | 2,065 |
| | | | | | | | |
| | | | | | | | |
| | | | | PRINCIPAL
AMOUNT
(000S) | | | | VALUE (000S) |
| SHORT-TERM INSTRUMENTS 5.0% |
|
| COMMERCIAL PAPER 4.8% |
| Societe Generale NY | | | | | | | | |
5.245% due 11/26/2007 | | $ | | 21,300 | | $ | | 21,043 |
| |
| TotalFinaElf Capital S.A. | | | | | | | | |
5.340% due 07/02/2007 | | | | 1,900 | | | | 1,900 |
| |
| UBS Finance Delaware LLC | | | | |
5.350% due 10/23/2007 | | | | 1,400 | | | | 1,400 |
| | | | | | | | |
| | | | | | | | 24,343 |
| | | | | | | | |
|
| REPURCHASE AGREEMENTS 0.1% |
| State Street Bank and Trust Co. |
4.900% due 07/02/2007 | | | | 728 | | | | 728 |
| | | | | | | | |
(Dated 06/29/2007. Collateralized by Fannie Mae 3.250% due 08/15/2008 valued at $747. Repurchase proceeds are $728.) |
| | | | | | | | |
| | | | | PRINCIPAL
AMOUNT
(000S) | | | | VALUE (000S) |
| U.S. TREASURY BILLS 0.1% |
4.605% due 09/13/2007 (c) | | $ | | 250 | | $ | | 247 |
| | | | | | | | |
Total Short-Term Instruments
(Cost $25,327) | | | | 25,318 |
| | | | | | | | |
|
|
Total Investments (d) 97.4%
(Cost $487,844) | | $ | | 489,863 |
|
| Other Assets and Liabilities (Net) 2.6% | | 12,935 |
| | | | | | | | |
| Net Assets 100.0% | | | | | | $ | | 502,798 |
| | | | | | | | |
Notes to Schedule of Investments (amounts in thousands*, except number of contracts):
* A zero balance may reflect actual amounts rounding to less than one thousand.
(a) Security is in default.
(b) Payment in-kind bond security.
(c) Securities with an aggregate market value of $247 have been pledged as collateral for swap and swaption contracts on June 30, 2007.
(d) As of June 30, 2007, portfolio securities with an aggregate value of $9,228 were valued in good faith and pursuant to the guidelines established by the Board of Trustees.
(e) Swap agreements outstanding on June 30, 2007:
Credit Default Swaps
| | | | | | | | | | | | | | | | |
| Counterparty | | Reference Entity | | Buy/Sell
Protection (1) | | (Pay)/Receive
Fixed Rate | | | Expiration
Date | | Notional
Amount | | Unrealized
Appreciation/
(Depreciation) | |
Deutsche Bank AG | | SOFTBANK Corp. 1.750% due 03/31/2014 | | Sell | | 2.300% | | | 09/20/2007 | | JPY | 300,000 | | $ | 12 | |
Bank of America | | MGM Mirage 5.875% due 02/27/2014 | | Buy | | (0.810% | ) | | 06/20/2010 | | $ | 1,500 | | | 18 | |
Bank of America | | Dow Jones CDX N.A. HY7 Index | | Buy | | (3.250% | ) | | 12/20/2011 | | | 3,300 | | | (30 | ) |
Bank of America | | Aramark Corp. 8.500 due 02/01/2015 | | Sell | | 2.302% | | | 06/20/2012 | | | 200 | | | (6 | ) |
Bank of America | | MGM Mirage 5.875% due 02/27/2014 | | Sell | | 1.530% | | | 06/20/2012 | | | 1,500 | | | (51 | ) |
Bank of America | | Community Health Systems 8.875% due 07/15/2015 | | Sell | | 2.850% | | | 09/20/2012 | | | 900 | | | 4 | |
Barclays Bank PLC | | Domtar, Inc. 7.875% due 10/15/2011 | | Sell | | 1.500% | | | 09/20/2007 | | | 400 | | | 1 | |
Barclays Bank PLC | | Russia Government International Bond 7.500% due 03/31/2030 | | Sell | | 0.760% | | | 02/20/2009 | | | 1,500 | | | 16 | |
Barclays Bank PLC | | RSHB Capital S.A. for OJSC Russian Agricultural Bank 7.175% due 05/16/2013 | | Sell | | 0.740% | | | 03/20/2009 | | | 1,000 | | | 9 | |
Barclays Bank PLC | | Brazilian Government International Bond 12.250% due 03/06/2030 | | Sell | | 0.900% | | | 02/20/2012 | | | 2,000 | | | 23 | |
Barclays Bank PLC | | Qwest Capital Funding, Inc. 7.250% due 02/15/2011 | | Sell | | 1.470% | | | 03/20/2012 | | | 2,000 | | | (54 | ) |
Barclays Bank PLC | | Allied Waste North America, Inc.
7.375% due 04/15/2014 | | Sell | | 2.030% | | | 06/20/2012 | | | 500 | | | (16 | ) |
Barclays Bank PLC | | Forest Oil Corp. 7.750% due 05/01/2014 | | Sell | | 1.770% | | | 06/20/2012 | | | 200 | | | (3 | ) |
Barclays Bank PLC | | Freescale Semiconductor, Inc. 8.875% due 12/15/2014 | | Sell | | 3.620% | | | 06/20/2012 | | | 200 | | | (4 | ) |
Barclays Bank PLC | | Nortel Networks Corp. 4.250% due 09/01/2008 | | Sell | | 2.360% | | | 06/20/2012 | | | 200 | | | (3 | ) |
Barclays Bank PLC | | Sungard Data Systems, Inc. 9.125% due 08/15/2013 | | Sell | | 2.600% | | | 06/20/2012 | | | 200 | | | (5 | ) |
Bear Stearns & Co., Inc. | | Georgia-Pacific Corp. 8.125% due 05/15/2011 | | Sell | | 1.950% | | | 06/20/2012 | | | 200 | | | (6 | ) |
Citibank N.A. | | Ford Motor Credit Co. 7.000% due 10/01/2013 | | Sell | | 2.000% | | | 09/20/2007 | | | 1,000 | | | 4 | |
Citibank N.A. | | General Motors Acceptance Corp.
6.875% due 08/28/2012 | | Sell | | 1.120% | | | 12/20/2008 | | | 1,000 | | | (3 | ) |
Citibank N.A. | | Georgia-Pacific Corp. 8.125% due 05/15/2011 | | Buy | | (1.070% | ) | | 06/20/2010 | | | 1,500 | | | 28 | |
Citibank N.A. | | Nortel Networks Corp. 4.250% due 09/01/2008 | | Sell | | 2.050% | | | 06/20/2011 | | | 1,500 | | | (12 | ) |
Citibank N.A. | | General Motors Acceptance Corp.
6.875% due 08/28/2012 | | Sell | | 1.050% | | | 03/20/2012 | | | 3,000 | | | (94 | ) |
Citibank N.A. | | General Motors Acceptance Corp.
6.875% due 08/28/2012 | | Sell | | 1.600% | | | 03/20/2012 | | | 1,000 | | | (10 | ) |
Citibank N.A. | | General Motors Acceptance Corp.
6.875% due 08/28/2012 | | Sell | | 1.880% | | | 03/20/2012 | | | 1,000 | | | 0 | |
Citibank N.A. | | Chesapeake Energy Corp. 6.875% due 01/15/2016 | | Sell | | 1.030% | | | 06/20/2012 | | | 100 | | | (1 | ) |
Citibank N.A. | | General Motors Acceptance Corp.
6.875% due 08/28/2012 | | Sell | | 2.000% | | | 06/20/2012 | | | 1,500 | | | 5 | |
Citibank N.A. | | Georgia-Pacific Corp. 8.125% due 05/15/2011 | | Sell | | 1.820% | | | 06/20/2012 | | | 1,000 | | | (38 | ) |
Citibank N.A. | | LCDX N.A. 8 Index | | Sell | | 1.200% | | | 06/20/2012 | | | 1,500 | | | (35 | ) |
Citibank N.A. | | Nortel Networks Corp. 4.250% due 09/01/2008 | | Sell | | 2.300% | | | 06/20/2012 | | | 1,000 | | | (16 | ) |
| | | | |
| 12 | | PIMCO Variable Insurance Trust | | See Accompanying Notes |
| | |
| |
| | | June 30, 2007 (Unaudited) |
| | | | | | | | | | | | | | | | |
| Counterparty | | Reference Entity | | Buy/Sell
Protection (1) | | (Pay)/Receive
Fixed Rate | | | Expiration
Date | | Notional
Amount | | Unrealized
Appreciation/
(Depreciation) | |
Citibank N.A. | | Nortel Networks Corp. 4.250% due 09/01/2008 | | Sell | | 2.400% | | | 06/20/2012 | | $ | 1,000 | | $ | (14 | ) |
Citibank N.A. | | Georgia-Pacific Corp. 7.750% due 11/15/2029 | | Sell | | 2.220% | | | 09/20/2012 | | | 500 | | | (13 | ) |
Citibank N.A. | | Nortel Networks Corp. 4.250% due 09/01/2008 | | Sell | | 2.600% | | | 09/20/2012 | | | 625 | | | (6 | ) |
Citibank N.A. | | Sungard Data Systems, Inc. 9.125% due 08/15/2013 | | Sell | | 2.920% | | | 09/20/2012 | | | 1,000 | | | (17 | ) |
Citibank N.A. | | Anadarko Petroleum Corp. 6.125% due 03/15/2012 | | Buy | | (0.490% | ) | | 03/20/2014 | | | 1,000 | | | (2 | ) |
Citibank N.A. | | Chesapeake Energy Corp. 6.875% due 01/15/2016 | | Sell | | 1.370% | | | 03/20/2014 | | | 1,000 | | | (14 | ) |
Credit Suisse First Boston | | Abitibi-Consolidated Co. of Canada
8.375% due 04/01/2015 | | Sell | | 0.650% | | | 03/20/2008 | | | 1,000 | | | (17 | ) |
Credit Suisse First Boston | | Ford Motor Credit Co. 7.000% due 10/01/2013 | | Sell | | 0.750% | | | 03/20/2008 | | | 2,500 | | | (10 | ) |
Credit Suisse First Boston | | Ford Motor Credit Co. 7.000% due 10/01/2013 | | Sell | | 1.450% | | | 12/20/2008 | | | 2,000 | | | (5 | ) |
Credit Suisse First Boston | | Forest Oil Corp. 7.750% due 05/01/2014 | | Sell | | 1.610% | | | 06/20/2012 | | | 400 | | | (9 | ) |
Credit Suisse First Boston | | Solectron Global Finance Ltd. 8.000% due 03/15/2016 | | Sell | | 3.700% | | | 06/20/2012 | | | 1,000 | | | 93 | |
Credit Suisse First Boston | | Forest Oil Corp. 7.750% due 05/01/2014 | | Sell | | 1.930% | | | 09/20/2012 | | | 1,000 | | | (11 | ) |
Credit Suisse First Boston | | Pride International, Inc. 7.375% due 07/15/2014 | | Sell | | 1.950% | | | 09/20/2012 | | | 300 | | | (3 | ) |
Deutsche Bank AG | | Dow Jones CDX N.A. HY7 Index | | Buy | | (3.250% | ) | | 12/20/2011 | | | 100 | | | (1 | ) |
Deutsche Bank AG | | LCDX N.A. 8 Index | | Sell | | 1.200% | | | 06/20/2012 | | | 500 | | | (10 | ) |
Goldman Sachs & Co. | | Host Marriott LP 7.125% due 11/01/2013 | | Sell | | 1.770% | | | 12/20/2010 | | | 500 | | | 5 | |
Goldman Sachs & Co. | | Dow Jones CDX N.A. HY7 Index | | Sell | | 0.785% | | | 12/20/2011 | | | 800 | | | 0 | |
Goldman Sachs & Co. | | General Motors Acceptance Corp.
6.875% due 08/28/2012 | | Sell | | 1.025% | | | 03/20/2012 | | | 2,000 | | | (64 | ) |
HSBC Bank USA | | NAK Naftogaz Ukrainy 8.125% due 09/30/2009 | | Sell | | 3.000% | | | 04/20/2008 | | | 1,500 | | | (8 | ) |
HSBC Bank USA | | Ukraine Government International Bond 7.650% due 06/11/2013 | | Sell | | 0.700% | | | 04/20/2009 | | | 1,500 | | | 6 | |
JPMorgan Chase & Co. | | Multiple Reference Entities of Gazprom | | Sell | | 0.770% | | | 02/20/2012 | | | 2,000 | | | 23 | |
Lehman Brothers, Inc. | | NRG Energy, Inc. 7.250% due 02/01/2014 | | Sell | | 0.750% | | | 03/20/2008 | | | 1,800 | | | (5 | ) |
Lehman Brothers, Inc. | | Nortel Networks Corp. 4.250% due 09/01/2008 | | Buy | | (1.520% | ) | | 06/20/2010 | | | 1,500 | | | 10 | |
Lehman Brothers, Inc. | | Brazilian Government International Bond 12.250% due 03/06/2030 | | Sell | | 1.370% | | | 08/20/2011 | | | 5,400 | | | 177 | |
Lehman Brothers, Inc. | | Dow Jones CDX N.A. HY7 Index | | Sell | | 0.720% | | | 12/20/2011 | | | 2,000 | | | (6 | ) |
Lehman Brothers, Inc. | | Solectron Global Finance Ltd. 8.000% due 03/15/2016 | | Sell | | 3.100% | | | 03/20/2012 | | | 1,000 | | | 67 | |
Lehman Brothers, Inc. | | Chesapeake Energy Corp. 6.875% due 01/15/2016 | | Sell | | 1.090% | | | 06/20/2012 | | | 500 | | | (4 | ) |
Lehman Brothers, Inc. | | Chesapeake Energy Corp. 6.875% due 01/15/2016 | | Sell | | 1.110% | | | 06/20/2012 | | | 1,000 | | | (7 | ) |
Lehman Brothers, Inc. | | Forest Oil Corp. 7.750% due 05/01/2014 | | Sell | | 1.750% | | | 06/20/2012 | | | 250 | | | (4 | ) |
Lehman Brothers, Inc. | | LCDX N.A. 8 Index | | Sell | | 1.200% | | | 06/20/2012 | | | 600 | | | (14 | ) |
Lehman Brothers, Inc. | | Pride International, Inc. 7.375% due 07/15/2014 | | Sell | | 1.750% | | | 06/20/2012 | | | 325 | | | (4 | ) |
Lehman Brothers, Inc. | | Celestica, Inc. 7.625% due 07/01/2013 | | Sell | | 4.250% | | | 09/20/2012 | | | 1,000 | | | (13 | ) |
Lehman Brothers, Inc. | | CSC Holdings, Inc. 7.625% due 07/15/2018 | | Sell | | 2.520% | | | 09/20/2012 | | | 1,000 | | | (13 | ) |
Merrill Lynch & Co., Inc. | | CSC Holdings, Inc. 7.625% due 07/15/2018 | | Sell | | 2.080% | | | 06/20/2012 | | | 400 | | | (11 | ) |
Merrill Lynch & Co., Inc. | | Georgia-Pacific Corp. 8.125% due 05/15/2011 | | Sell | | 1.800% | | | 06/20/2012 | | | 500 | | | (19 | ) |
Morgan Stanley | | Russia Government International Bond 7.500% due 03/31/2030 | | Sell | | 0.245% | | | 06/20/2008 | | | 200 | | | 0 | |
Morgan Stanley | | Allied Waste North America, Inc.
7.375% due 04/15/2014 | | Buy | | (1.120% | ) | | 06/20/2010 | | | 1,500 | | | 17 | |
Morgan Stanley | | Qwest Capital Funding, Inc. 7.250% due 02/15/2011 | | Sell | | 1.800% | | | 06/20/2010 | | | 2,000 | | | 28 | |
Morgan Stanley | | Multiple Reference Entities of Gazprom | | Sell | | 1.050% | | | 04/20/2011 | | | 3,000 | | | 63 | |
Morgan Stanley | | Brazilian Government International Bond 12.250% due 03/06/2030 | | Sell | | 1.380% | | | 08/20/2011 | | | 5,400 | | | 179 | |
Morgan Stanley | | Allied Waste North America, Inc.
7.375% due 04/15/2014 | | Sell | | 2.020% | | | 06/20/2012 | | | 1,000 | | | (34 | ) |
Morgan Stanley | | Forest Oil Corp. 7.750% due 05/01/2014 | | Sell | | 1.700% | | | 06/20/2012 | | | 500 | | | (9 | ) |
Morgan Stanley | | Forest Oil Corp. 7.750% due 05/01/2014 | | Sell | | 1.730% | | | 06/20/2012 | | | 250 | | | (4 | ) |
Morgan Stanley | | Reliant Energy, Inc. 6.750% due 12/15/2014 | | Sell | | 2.200% | | | 06/20/2012 | | | 425 | | | (12 | ) |
Morgan Stanley | | Aramark Corp. 8.500 due 02/01/2015 | | Sell | | 2.680% | | | 09/20/2012 | | | 500 | | | (9 | ) |
Morgan Stanley | | Nortel Networks Corp. 4.250% due 09/01/2008 | | Sell | | 2.630% | | | 09/20/2012 | | | 625 | | | (5 | ) |
Morgan Stanley | | Pride International, Inc. 7.375% due 07/15/2014 | | Sell | | 1.960% | | | 09/20/2012 | | | 700 | | | (4 | ) |
Royal Bank of Scotland Group PLC | | Indonesia Government International Bond 6.750% due 03/10/2014 | | Sell | | 1.390% | | | 12/20/2011 | | | 3,000 | | | 51 | |
Royal Bank of Scotland Group PLC | | Indonesia Government International Bond 6.750% due 03/10/2014 | | Sell | | 1.100% | | | 03/20/2012 | | | 1,000 | | | 4 | |
| | | | | | | | | | | | | | | | |
| | | | | | | | | | | | | | $ | 75 | |
| | | | | | | | | | | | | | | | |
(1) If the Portfolio is a seller of protection and a credit event occurs, as defined under the terms of that particular swap agreement, the Portfolio will pay to the buyer of the protection an amount up to the notional value of the swap and in certain instances, take delivery of the security. As a buyer of protection, the Portfolio will generally receive from the seller of protection an amount up to the notional amount of the swap if a credit event occurs.
Interest Rate Swaps
| | | | | | | | | | | | | | | |
| Counterparty | | Floating Rate Index | | Pay/Receive
Floating Rate | | Fixed Rate | | Expiration
Date | | Notional
Amount | | Unrealized
(Depreciation) | |
Morgan Stanley | | BRL-CDI-Compounded | | Pay | | 10.115% | | 01/02/2012 | | BRL | 21,000 | | $ | (219 | ) |
Citibank N.A. | | 28-Day Mexico Interbank TIIE Banxico | | Pay | | 7.910% | | 05/14/2009 | | MXN | 25,000 | | | 0 | |
Morgan Stanley | | 28-Day Mexico Interbank TIIE Banxico | | Pay | | 7.910% | | 05/14/2009 | | | 33,000 | | | (1 | ) |
| | | | | | | | | | | | | | | |
| | | | | | | | | | | | | $ | (220 | ) |
| | | | | | | | | | | | | | | |
| | | | | | |
| See Accompanying Notes | | Semiannual Report | | June 30, 2007 | | 13 |
| | |
| |
| Schedule of Investments High Yield Portfolio (Cont.) | | June 30, 2007 (Unaudited) |
Total Return Swaps
| | | | | | | | | | | | | | |
| Counterparty | | Type | | Receive Total Return | | Pay | | Expiration
Date | | # of
Contracts | | Unrealized
(Depreciation) | |
Merrill Lynch & Co., Inc. | | Long | | Motorola, Inc. | | 5.579% | | 07/23/2007 | | 10,100 | | $ | (2 | ) |
| | | | | | | | | | | | | | |
(f) Restricted securities as of June 30, 2007:
| | | | | | | | | | | | | | |
| Issuer Description | | Coupon | | Maturity
Date | | Acquisition
Date | | Cost | | Market
Value | | Market Value
as Percentage
of Net Assets |
Continental Airlines, Inc. | | 6.920% | | 04/02/2013 | | 07/01/2003 | | $ | 657 | | $ | 725 | | 0.15% |
Ferrellgas Partners LP | | 8.870% | | 08/01/2009 | | 06/30/2003 | | | 1,260 | | | 1,272 | | 0.25% |
| | | | | | | | | | | | | | |
| | | | | | | | $ | 1,917 | | $ | 1,997 | | 0.40% |
| | | | | | | | | | | | | | |
(g) Foreign currency contracts outstanding on June 30, 2007:
| | | | | | | | | | | | | | | | | |
| Type | | Currency | | Principal
Amount
Covered by
Contract | | Settlement
Month | | Unrealized
Appreciation | | Unrealized
(Depreciation) | | | Net Unrealized
(Depreciation) | |
Sell | | EUR | | 12,247 | | 07/2007 | | $ | 0 | | $ | (160 | ) | | $ | (160 | ) |
Sell | | GBP | | 704 | | 08/2007 | | | 0 | | | (8 | ) | | | (8 | ) |
| | | | | | | | | | | | | | | | | |
| | | | | | | | $ | 0 | | $ | (168 | ) | | $ | (168 | ) |
| | | | | | | | | | | | | | | | | |
(h) Security is subject to a forbearance agreement entered into by the Portfolio which forbears the Portfolio from taking action to, among other things, accelerate and collect payments on the subject note with respect to specified events of default.
| | | | |
| 14 | | PIMCO Variable Insurance Trust | | See Accompanying Notes |
| | |
| |
| Notes to Financial Statements | | June 30, 2007 (Unaudited) |
1. ORGANIZATION
The High Yield Portfolio (the “Portfolio”) is a series of the PIMCO Variable Insurance Trust (the “Trust”). The Trust is registered under the Investment Company Act of 1940 (the “Act”), as amended, as an open-end management investment company organized as a Delaware business trust on October 3, 1997. The Portfolio offers three classes of shares: Institutional, Administrative and Advisor. Information presented on these financial statements pertains to the Administrative Class of the Portfolio. Certain detailed financial information for the Institutional Class and Advisor Class is provided separately and is available upon request. The Trust is designed to be used as an investment vehicle by Separate Accounts of insurance companies that fund variable annuity contracts and variable life insurance policies and by qualified pension and retirement plans.
2. SIGNIFICANT ACCOUNTING POLICIES
The following is a summary of significant accounting policies consistently followed by the Portfolio in the preparation of its financial statements in conformity with accounting principles generally accepted in the United States of America (“GAAP”). The preparation of financial statements in accordance with GAAP requires management to make estimates and assumptions that affect the reported amounts and disclosures on the financial statements. Actual results could differ from those estimates.
(a) Security Valuation Portfolio securities are valued as of the close of regular trading (normally 4:00 p.m., Eastern Time) on each day that the New York Stock Exchange (“NYSE”) is open. Portfolio securities and other assets for which market quotes are readily available are stated at market value. Market value is generally determined on the basis of last reported sales prices, or if no sales are reported, based on quotes obtained from a quotation reporting system, established market makers, or pricing services. Fixed-income securities and non-exchange traded derivatives are normally valued on the basis of quotes obtained from brokers and dealers or pricing services. Prices obtained from independent pricing services use information provided by market makers or estimates of market values obtained from yield data relating to investments or securities with similar characteristics. Certain fixed income securities purchased on a delayed-delivery basis are marked to market daily until settlement at the forward settlement date. Short-term investments having a maturity of 60 days or less are generally valued at amortized cost. Exchange traded options, futures and options on futures are valued at the settlement price determined by the relevant exchange. With respect to any portion of the Portfolio’s assets that are invested in one or more open end management investment companies, the Portfolio’s net asset value (“NAV”) will be calculated based upon the NAVs of such investments.
Investments initially valued in currencies other than the U.S. dollar are converted to the U.S. dollar using exchange rates obtained from pricing services. As a result, the NAV of the Portfolio’s securities may be affected by changes in the value of currencies in relation to the U.S. dollar. The value of securities traded in markets outside the United States or denominated in currencies other than the U.S. dollar may be affected significantly on a day that the NYSE is closed and an investor is not able to purchase, redeem or exchange shares.
Securities and other assets for which market quotes are not readily available are valued at fair value as determined in good faith by the Board of Trustees or persons acting at their direction. The Board of Trustees has adopted methods for valuing securities and other assets in circumstances where market quotes are not readily available, and has delegated to Pacific Investment Management Company LLC (“PIMCO”) the responsibility for applying the valuation methods. In the event that market quotes are not readily available, and the security or asset cannot be valued pursuant to one of the valuation methods, the value of the security or asset will be determined in good faith by the Valuation Committee of the Board of Trustees, generally based upon recommendations provided by PIMCO.
Market quotes are considered not readily available in circumstances where there is an absence of current or reliable market-based data (e.g., trade information, bid/asked information, broker quotes), including where events occur after the close of the relevant market, but prior to the close of regular trading, that materially affect the values of the Portfolio’s securities or assets. In addition, market quotes are considered not readily available when, due to extraordinary circumstances, the exchanges or markets on which the securities trade, do not open for trading for the entire day and no other market prices are available. The Board has delegated to PIMCO the responsibility for monitoring significant events that may materially affect the values of the Portfolio’s securities or assets and for determining whether the value of the applicable securities or assets should be re-evaluated in light of such significant events.
When the Portfolio uses fair value pricing to determine its NAV, securities will not be priced on the basis of quotations from the primary market in which they are traded, but rather may be priced by another method that the Board of Trustees or persons acting at their direction believe accurately reflects fair value. The Trust’s policy is intended to result in a calculation of the Portfolio’s NAV that fairly reflects security values as of the time of pricing. However, fair values determined by the Board of Trustees or persons acting at their direction may not accurately reflect the price that the Portfolio could obtain for a security if it were to dispose of that security as of the time of pricing. Because foreign securities can trade on non-business days of the Portfolio, the NAV of the Portfolio may change on days when shareholders will not be able to purchase or redeem Portfolio shares. The prices used by the Portfolio may differ from the value that would be realized if the securities were sold and the differences could be material to the financial statements.
(b) Securities Transactions and Investment Income Securities transactions are recorded as of the trade date for financial reporting purposes. Securities purchased or sold on a when-issued or delayed-delivery basis may be settled a month or more after the trade date. Realized gains and losses from securities sold are recorded on the identified cost basis. Dividend income is recorded on the ex-dividend date, except certain dividends from foreign securities where the ex-dividend date may have passed, which are recorded as soon as the Portfolio is informed of the ex-dividend date. Interest income, adjusted for the accretion of discounts and amortization of premiums, is recorded on the accrual basis. Paydown gains and losses on mortgage-related and other asset-backed securities are recorded as components of interest income on the Statement of Operations.
(c) Dividends and Distributions to Shareholders Dividends from net investment income, if any, are declared daily and distributed to shareholders monthly. Net realized capital gains earned by the Portfolio, if any, will be distributed no less frequently than once each year.
Income dividends and capital gain distributions are determined in accordance with income tax regulations which may differ from GAAP. Differences between tax regulations and GAAP may change the fiscal year when income and capital items are recognized for tax and GAAP purposes. Examples of events that give rise to timing differences include wash sales, straddles, net operating losses and capital loss carryforwards. Further, the character of investment income and capital gains may be different for certain transactions under the two methods of accounting. Examples of characterization differences include the treatment of mortgage paydowns, swaps, foreign currency transactions and contingent debt instruments. As a result, income dividends and capital gain distributions declared during a fiscal period may differ significantly from the net investment income and realized capital gain reported on the Portfolio’s annual financial statements presented under GAAP.
Distributions classified as a tax basis return of capital, if any, are reflected on the accompanying Statements of Changes in Net Assets and have been reclassified to paid in capital. In addition, other amounts have been reclassified between
| | | | | | |
| | Semiannual Report | | June 30, 2007 | | 15 |
Notes to Financial Statements (Cont.)
undistributed net investment income, accumulated undistributed net realized gains or losses and/or paid in capital to more appropriately conform financial accounting to tax characterizations of dividend distributions.
(d) Multiclass Operations Each class offered by the Portfolio has equal rights as to assets and voting privileges (except that shareholders of a class have exclusive voting rights regarding any matter relating solely to that class of shares). Income and non-class specific expenses of the Portfolio are allocated daily to each class of shares based on the relative value of settled shares. Realized and unrealized capital gains and losses of the Portfolio are allocated daily to each class of shares based on the relative net assets of each class. Class specific expenses, where applicable, currently include administrative, distribution and servicing fees.
(e) Foreign Currency The functional and reporting currency for the Portfolio is the U.S. dollar. The market values of foreign securities, currency holdings and other assets and liabilities are translated into U.S. dollars based on the current exchange rates each business day. Fluctuations in the value of currency holdings and other assets and liabilities resulting from changes in exchange rates are recorded as unrealized foreign currency gains or losses. Realized gains or losses and unrealized appreciation or depreciation on investment securities and income and expenses are translated on the respective dates of such transactions. The effects of changes in foreign currency exchange rates on investments in securities are not segregated on the Statement of Operations from the effects of changes in market prices of those securities, but are included with the net realized and unrealized gain or loss on investment securities.
| | | | | | |
|
| Non-U.S. currency symbols utilized throughout the report are defined as follows: |
| BRL | | Brazilian Real | | JPY | | Japanese Yen |
| EUR | | Euro | | MXN | | Mexican Peso |
| GBP | | Great British Pound | | | | |
(f) Foreign Currency Transactions The Portfolio may enter into foreign currency contracts in connection with settling planned purchases or sales of securities, to hedge the currency exposure associated with some or all of the Portfolio’s securities or as a part of an investment strategy. A foreign currency contract is an agreement between two parties to buy and sell a currency at a set price on a future date. The market value of a foreign currency contract fluctuates with changes in foreign currency exchange rates. Foreign currency contracts are marked to market daily and the change in value is recorded by the Portfolio as an unrealized gain or loss. Realized gains or losses equal to the difference between the value of the contract at the time it was opened and the value at the time it was closed are recorded upon delivery or receipt of the currency. These contracts may involve market risk in excess of the unrealized gain or loss reflected on the Statement of Assets and Liabilities. In addition, the Portfolio could be exposed to risk if the counterparties are unable to meet the terms of the contracts or if the value of the currency changes unfavorably to the U.S. dollar.
(g) Payment In-Kind Securities The portfolio may invest in payment in-kind securities. Payment in-kind securities (“PIKs”) give the issuer the option at each interest payment date of making interest payments in either cash or additional debt securities. Those additional debt securities usually have the same term, including maturity dates and interest rates, and associated risks as the original bonds. The daily market quotations of the original bonds include the accrued interest (referred to as a dirty price) and require a pro-rata adjustment from interest receivable to the unrealized appreciation or depreciation on investment on the Statement of Assets and Liabilities.
(h) Repurchase Agreements The Portfolio may engage in repurchase transactions. Under the terms of a typical repurchase agreement, the Portfolio takes possession of an underlying debt obligation (collateral) subject to an obligation of the seller to repurchase, and the Portfolio to resell, the obligation at an agreed-upon price and time. The underlying securities for all repurchase agreements are held in safekeeping at the Portfolio’s custodian or designated subcustodians under tri-party repurchase agreements. The market value of the collateral must be equal to or exceed the total amount of the repurchase obligations, including interest. Securities purchased under repurchase agreements are reflected as an asset on the Statement of Assets and Liabilities. Generally, in the event of counterparty default, the Portfolio has the right to use the collateral to offset losses incurred. If the counterparty should default, the Portfolio will seek to sell the securities which it holds as collateral. This could involve procedural costs or delays in addition to a loss on the securities if their value should fall below their repurchase price.
(i) Reverse Repurchase Agreements The Portfolio may enter into reverse repurchase agreements. In a reverse repurchase agreement, the Portfolio sells to a financial institution a security that it holds with an agreement to repurchase the same security at an agreed-upon price and date. Securities sold under reverse repurchase agreements are reflected as a liability on the Statement of Assets and Liabilities. A reverse repurchase agreement involves the risk that the market value of the security sold by the Portfolio may decline below the repurchase price of the security. The Portfolio will segregate assets determined to be liquid by the investment adviser or otherwise cover its obligations under reverse repurchase agreements.
(j) Inverse Floating Rate Transactions—Residual Interest Municipal Bonds (“RIBs”)/Residual Interest Tax Exempt Bonds (“RITEs”) The Portfolio may invest in RIBs and RITEs (“Inverse Floaters”). Inverse Floaters are created via a master trust agreement between a broker-dealer, acting as trustor and liquidity provider, and an investment bank, acting as trustee and tender agent. The master trust agreement defines the terms for each trust series; with each series being established by the transfer of long-term, fixed-rate municipal bonds (“Fixed Rate Bonds”) to the trustee to be held and provide for the creation, execution and delivery of floater certificates (“Floating Rate Notes”) and Inverse Floaters. Floating Rate Notes are liquid notes that are issued with a short-term variable rate typically linked to the LIBOR, subject to limitations, for some duration. After interest income is paid on the Floating Rate Notes at current rates, the residual income from the Fixed Rate Bonds is paid to the Inverse Floaters. Inverse Floaters are issued with a coupon that fluctuates inversely with the Floating Rate Notes’ referenced rate, subject to certain limitations. Therefore, rising short-term rates result in lower income for the Inverse Floaters and vice versa.
Floating Rate Notes are generally remarketed to municipal money market funds. Inverse Floaters are acquired by either tax-exempt municipal bond funds or trusts, or other parties interested in potentially higher yielding tax-exempt securities. Inverse Floaters may also be acquired for the purpose of increasing leverage. Floating Rate Note holders typically have the option to tender their notes to the liquidity provider for redemption at par at each reset date. The Inverse Floater holders have the option to (i) require the Floating Rate Note holders to tender their notes at par, and (ii) require the liquidity provider to transfer the Fixed Rate Bonds to the Inverse Floater holders. The holders of Inverse Floaters bear substantially all of the downside investment risk associated with the underlying Fixed Rate Bonds, and also benefit from a disproportionate amount of the potential appreciation of the underlying Fixed Rate Bonds’ value. Inverse Floaters may be more volatile and less liquid than other municipal bonds of comparable maturity.
Inverse Floaters may be acquired with or without first transferring to the trustor the Fixed Rate Bonds that were utilized to create the trust series. Inverse Floaters
| | | | |
| 16 | | PIMCO Variable Insurance Trust | | |
| | |
| |
| | | June 30, 2007 (Unaudited) |
acquired without a transfer of Fixed Rate Bonds are recognized as purchases of securities as outlined in Note 2(b). Statement of Financial Accounting Standards No. 140—Accounting for Transfers and Servicing of Financial Assets and Extinguishments of Liabilities (“FAS No. 140”), governs the standards for accounting for securitizations and other transfers of financial assets. If there is a transfer of Fixed Rate Bonds and it meets sale criteria under FAS No. 140, a Portfolio records a sale of the Fixed Rate Bonds and a purchase of the Inverse Floaters. The cash received from the Inverse Floaters is then recorded as interest income in the Statement of Operations.
If the transfer of Fixed Rate Bonds does not meet sale criteria under FAS No. 140, a Portfolio accounts for the transaction described above as a secured borrowing by including the Fixed Rate Bonds in its Schedule of Investments, and recording the Floating Rate Notes as a liability under the caption “Payable for floating rate notes” in the Portfolio’s Statement of Assets and Liabilities. In a secured borrowing transaction, cash received from the Inverse Floaters is not recorded as interest income. Instead, a Portfolio records interest income related to the Fixed Rate Bonds and interest expense related to the Floating Rate Notes, the net of which is equal to the cash received from the Inverse Floaters acquired by the Portfolio. Thus, while a Portfolio’s reported total income, net expenses, and net expense ratio are generally higher for investments in Inverse Floaters acquired via a secured borrowing, the method of acquiring Inverse Floaters does not result in differences for reported cash flows, net asset value or total return.
(k) Restricted Securities The Portfolio may invest in securities that are subject to legal or contractual restrictions on resale. These securities generally may be resold in transactions exempt from registration or to the public if the securities are registered. Disposal of these securities may involve time-consuming negotiations and expenses, and prompt sale at an acceptable price may be difficult. Securities acquired under the provisions of Rule 144A can only be traded between qualified institutional investors. The Board of Trustees considers 144A securities to be liquid.
(l) Swap Agreements The Portfolio may invest in swap agreements. Swap transactions are privately negotiated agreements between the Portfolio and a counterparty to exchange or swap investment cash flows, assets, or market-linked returns at specified, future intervals. The Portfolio may enter into interest rate, total return, forward spread-lock, credit default, and other forms of swap agreements to manage its exposure to interest rates and credit risk. In connection with these agreements, securities may be identified as collateral in accordance with the terms of the respective swap agreements.
Interest rate swap agreements involve the exchange by the Portfolio with another party of their respective commitments to pay or receive interest, e.g., an exchange of floating rate payments for fixed rate payments with respect to the notional amount of principal. Certain forms of interest rate swap agreements may include: (i) interest rate caps, under which, in return for a premium, one party agrees to make payments to the other to the extent that interest rates exceed a specified rate, or “cap”, (ii) interest rate floors, under which, in return for a premium, one party agrees to make payments to the other to the extent that interest rates fall below a specified rate, or “floor”, or (iii) interest rate collars, under which a party sells a cap and purchases a floor or vice versa in an attempt to protect itself against interest rate movements exceeding given minimum or maximum levels.
Total return swap agreements involve commitments to pay interest in exchange for a market-linked return, both based on notional amounts. To the extent the total return of the security or index underlying the transaction exceeds or falls short of the offsetting interest rate obligation, the Portfolio will receive a payment from or make a payment to the counterparty.
Forward spread-lock swap agreements involve commitments to pay or receive a settlement amount calculated as the difference between the swap spread and a
fixed spread, multiplied by the notional amount times the duration of the swap. The swap spread is the difference between the benchmark swap rate (market rate) and the specific Treasury rate.
Credit default swap agreements involve one party making a stream of payments to another party in exchange for the right to receive a specified return in the event of a default by a third party, typically corporate issues or sovereign issues of an emerging country, on its obligation. The Portfolio may use credit default swaps to provide a measure of protection against defaults of the issuers (i.e., to reduce risk where the Portfolio owns or has exposure to the sovereign issuer) or to take an active long or short position with respect to the likelihood of a particular issuer’s default. As a seller of protection, the Portfolio generally receives an upfront payment or a fixed rate of income throughout the term of the swap provided that there is no credit event. If the Portfolio is a seller of protection and a credit event occurs, as defined under the terms of that particular swap agreement, the Portfolio will pay to the buyer of the protection an amount up to the notional value of the swap and in certain instances take delivery of the security. As the seller, the Portfolio would effectively add leverage to its portfolio because, in addition to its total net assets, the Portfolio would be subject to investment exposure on the notional amount of the swap. As a buyer of protection, the Portfolio generally receives an amount up to the notional value of the swap if a credit event occurs. The treatment of credit default swaps and other swap agreements that provide for contingent, non-periodic, bullet-type payments as “notional principal contracts” for U.S. federal income tax purposes is uncertain. Were the U.S. Internal Revenue Service (“IRS”) to take the position that a credit default swap or other bullet-type swap is not a “notional principal contract” for U.S. federal income tax purposes, payments received by the Portfolio from such investments might be subject to U.S. excise or income taxes.
Swaps are marked to market daily based upon quotations from market makers and the change in value, if any, is recorded as unrealized gain or loss on the Statement of Operations. Payments received or made at the beginning of the measurement period are reflected as such on the Statement of Assets and Liabilities. These upfront payments are recorded as realized gain or loss on the Statement of Operations upon termination or maturity of the swap. A liquidation payment received or made at the termination of the swap is recorded as realized gain or loss on the Statement of Operations. Net periodic payments received or paid by the Portfolio are included as part of realized gain or loss on the Statement of Operations. Entering into these agreements involves, to varying degrees, elements of credit, market and documentation risk in excess of the amounts recognized on the Statement of Assets and Liabilities. Such risks involve the possibility that there will be no liquid market for these agreements, that the counterparty to the agreements may default on its obligation to perform or disagree as to the meaning of contractual terms in the agreements and that there may be unfavorable changes in interest rates.
(m) Loan Participations and Assignments The Portfolio may invest in direct debt instruments which are interests in amounts owned by corporate, governmental, or other borrowers to lenders or lending syndicates. The Portfolio’s investments in loans may be in the form of participations in loans or assignments of all or a portion of loans from third parties. A loan is often administered by a bank or other financial institution (the “lender”) that acts as agent for all holders. The agent administers the terms of the loan, as specified in the loan agreement. When investing in a loan participation, the Portfolio has the right to receive payments of principal, interest and any fees to which it is entitled only from the lender selling the loan agreement and only upon receipt by the lender of payments from the borrower. The Portfolio generally has no right to enforce compliance with the terms of the loan agreement with the borrower. As a result, the Portfolio may be subject to the credit risk of both the borrower and the lender that is selling the loan agreement. When the Portfolio purchases assignments from lenders it acquires direct rights against the borrower of the loan. At the end of the period June 30, 2007, the Portfolio had no unfunded loan commitments.
| | | | | | |
| | Semiannual Report | | June 30, 2007 | | 17 |
Notes to Financial Statements (Cont.)
(n) Bridge Debt Commitments At the period ended June 30, 2007, the Portfolio had $14,177,071 in commitments outstanding to fund high yield bridge debt. The Portfolio is entitled to a fee upon the expiration of the commitment period. The bridge debt terms approximate market rates at the time the commitment is entered into.
(o) U.S. Government Agencies or Government-Sponsored Enterprises Securities issued by U.S. Government agencies or government-sponsored enterprises may not be guaranteed by the U.S. Treasury. The Government National Mortgage Association (“GNMA” or “Ginnie Mae”), a wholly owned U.S. Government corporation, is authorized to guarantee, with the full faith and credit of the U.S. Government, the timely payment of principal and interest on securities issued by institutions approved by GNMA and backed by pools of mortgages insured by the Federal Housing Administration or guaranteed by the Department of Veterans Affairs. Government-related guarantors (i.e., not backed by the full faith and credit of the U.S. Government) include the Federal National Mortgage Association (“FNMA” or “Fannie Mae”) and the Federal Home Loan Mortgage Corporation (“FHLMC” or “Freddie Mac”). Pass-through securities issued by FNMA are guaranteed as to timely payment of principal and interest by FNMA but are not backed by the full faith and credit of the U.S. Government. FHLMC guarantees the timely payment of interest and ultimate collection of principal, but its participation certificates are not backed by the full faith and credit of the U.S. Government.
(p) New Accounting Policies In July 2006, the Financial Accounting Standards Board (“FASB”) issued Interpretation No. 48, “Accounting for Uncertainty in Income Taxes—an Interpretation of FASB Statement No. 109” (the “Interpretation”). The Interpretation became effective for the Portfolio on June 29, 2007. Management has evaluated the application of the Interpretation in relation to the Portfolio and has concluded that no single filing position or combination of filing positions identified as uncertain tax positions required the accrual of a tax liability in the accounting records of the Portfolio for the period ending June 30, 2007. Management will monitor all existing filing positions and future filing positions in light of the Interpretation and evaluate the need for any future tax accruals and financial statement disclosures as warranted.
In September 2006, the FASB issued Statement of Financial Accounting Standards No. 157, “Fair Value Measurements” (the “Statement”). The Statement is effective for fiscal years beginning after November 15, 2007 and will require expanded disclosure about fair value measurements, separately for each major category of assets and liabilities, that enables shareholders to assess the inputs used to develop those measurements, and for recurring fair value measurements using significant unobservable inputs the effect of the measurements on changes in net assets for the reporting period. Management is currently evaluating the application of the Statement to the Portfolio and will provide additional information in relation to the Statement on the Portfolio’s annual financial statements for the period ending December 31, 2007.
3. FEES AND EXPENSES
(a) Investment Advisory Fee PIMCO is a majority-owned subsidiary of Allianz Global Investors of America L.P. (“AGI”), and serves as investment adviser (the “Adviser”) to the Trust, pursuant to an investment advisory contract. The Adviser receives a monthly fee from the Portfolio, at an annual rate based on average daily net assets. The Advisory Fee for all classes is charged at an annual rate of 0.25%.
(b) Administration Fee PIMCO serves as administrator (the “Administrator”), and provides administrative services to the Trust for which it receives a monthly administrative fee based on each share class’s average daily net assets. As the Administrator, PIMCO bears the costs of various third-party services, including audit, custodial, portfolio accounting, legal, transfer agency and printing costs. The Administration Fee for all classes is charged at the annual rate of 0.35%.
(c) Distribution and Servicing Fees Allianz Global Investors Distributors LLC (“AGID”) is an indirect wholly-owned subsidiary of AGI and serves as the distributor (the “Distributor”) of the Trust’s shares. The Trust is permitted to reimburse AGID on a quarterly basis, out of the Administrative Class assets of the Portfolio in the amount of 0.15% on an annual basis of the average daily net assets of that class, for payments made to financial intermediaries that provide services in connection with the distribution of shares or administration of plans or programs that use Portfolio shares as their funding medium. The effective rate paid to AGID was 0.15% during the current fiscal year.
The Trust has adopted a Distribution Plan, for the Advisor Class shares of the Portfolio (the “Plan”). The Plan has been adopted pursuant to Rule 12b-1 under the Act. The Plan permits payments for expenses in connection with the distribution and marketing of Advisor Class shares and/or the provision of shareholder services to Advisor Class shareholders. The Plan permits the Portfolio to make total payments at an annual rate of 0.25% of its average daily net assets attributable to its Advisor Class shares.
(d) Portfolio Expenses The Trust is responsible for the following expenses: (i) salaries and other compensation of any of the Trust’s executive officers and employees who are not officers, directors, stockholders or employees of PIMCO or its subsidiaries or affiliates; (ii) taxes and governmental fees; (iii) brokerage fees and commissions and other portfolio transaction expenses; (iv) the costs of borrowing money, including interest expenses and bank overdraft charges; (v) fees and expenses of the Trustees who are not “interested persons” of PIMCO or the Trust, and any counsel retained exclusively for their benefit; (vi) extraordinary expenses, including costs of litigation and indemnification expenses; (vii) organization expenses and (viii) any expenses allocated or allocable to a specific class of shares, which include service fees payable with respect to the Administrative Class Shares, and may include certain other expenses as permitted by the Trust’s Multiple Class Plan adopted pursuant to Rule 18f-3 under the Act and subject to review and approval by the Trustees. The ratio of expenses to average net assets per share class, as disclosed in the Financial Highlights, may differ from the annual portfolio operating expenses per share class as disclosed in the Prospectus for the reasons set forth above.
Effective April 1, 2007, each Trustee, other than those affiliated with PIMCO or its affiliates, receives an annual retainer of $15,000, plus $2,375 for each Board of Trustees meeting attended in person, $500 for each committee meeting attended and $750 for each Board of Trustees meeting attended telephonically, plus reimbursement of related expenses. In addition, the audit committee chair receives an additional annual retainer of $2,000 and each other committee chair receives an additional annual retainer of $500. These expenses are allocated on a pro-rata basis to the various portfolios of the Trust according to their respective net assets. The Trust pays no compensation directly to any Trustee or any other officer who is affiliated with the Administrator, all of whom receive remuneration for their services to the Trust from the Administrator or its affiliates. Prior to April 1, 2007, each Trustee, other than those affiliated with PIMCO or its affiliates, received an annual retainer of $15,000 plus $2,000 for each Board of Trustees meeting attended ($500 for each special meeting attended), plus reimbursement of related expenses. The Audit Committee Chairman received an annual retainer of $1,500 and the Governance Committee Chairman received an annual retainer of $500. In addition, each member of a committee received $500 for each committee meeting attended.
4. RELATED PARTY TRANSACTIONS
The Adviser, Administrator, and Distributor are related parties as defined by FAS 57, Related Party Disclosures. Fees payable to these parties are disclosed in Note 3.
| | | | |
| 18 | | PIMCO Variable Insurance Trust | | |
| | |
| |
| | | June 30, 2007 (Unaudited) |
The Portfolio is permitted to purchase or sell securities from or to certain related affiliated portfolios under specified conditions outlined in procedures adopted by the Board of Trustees of the Trust. The procedures have been designed to ensure that any purchase or sale of securities by the Portfolio from or to another portfolio that are, or could be, considered an affiliate by virtue of having a common investment advisor (or affiliated investment advisors), common Trustees and/or common officers complies with Rule 17a-7 of the Act. Further, as defined under the procedures, each transaction is effected at the current market price. During the period ended June 30, 2007, the Portfolio engaged in purchases and sales of securities pursuant to the Rule 17a-7 of the Act (amounts in thousands):
| | |
| Purchases | | Sales |
$ 0 | | $ 1,816 |
5. GUARANTEES AND INDEMNIFICATIONS
Under the Trust’s organizational documents, each Trustee, officer, employee or other agent of the Trust (including the Trust’s investment manager) is indemnified, to the extent permitted by the Act, against certain liabilities that may arise out of performance of their duties to the Portfolio. Additionally, in the normal course of business, the Portfolio enters into contracts that contain a variety of indemnification clauses. The Portfolio’s maximum exposure under these arrangements is unknown as this would involve future claims that may be made against the Portfolio that have not yet occurred. However, the Portfolio has not had prior claims or losses pursuant to these contracts and believes the risk of loss to be remote.
6. PURCHASES AND SALES OF SECURITIES
The length of time the Portfolio has held a particular security is not generally a consideration in investment decisions. A change in the securities held by the Portfolio is known as “portfolio turnover”. The Portfolio may engage in frequent and active trading of portfolio securities to achieve its investment objective, particularly during periods of volatile market movements. High portfolio turnover (e.g., over 100%) involves correspondingly greater expenses to the Portfolio, including brokerage commissions or dealer mark-ups and other transaction costs on the sale of securities and reinvestments in other securities. Such sales may also result in realization of taxable capital gains, including short-term capital gains (which are generally taxed at ordinary income tax rates). The trading costs and tax effects associated with portfolio turnover may adversely affect the Portfolio’s performance.
Purchases and sales of securities (excluding short-term investments) for the period ended June 30, 2007, were as follows (amounts in thousands):
| | | | | | | | | | | | |
| U.S. Government/Agency | | | | All Other |
| Purchases | | Sales | | | | Purchases | | Sales |
| $ | 17,586 | | $ | 0 | | | | $ | 173,842 | | $ | 206,950 |
7. TRANSACTIONS IN WRITTEN CALL AND PUT OPTIONS
Transactions in written call and put options were as follows (amounts in thousands, except for number of contracts):
| | | | | | | | | |
| | | | | # of
Contracts | | | Premium | |
Balance at 12/31/2006 | | | | 290 | | | $ | 99 | |
Sales | | | | 0 | | | | 0 | |
Closing Buys | | | | (290 | ) | | | (99 | ) |
Expirations | | | | 0 | | | | 0 | |
Exercised | | | | 0 | | | | 0 | |
Balance at 06/30/2007 | | | | 0 | | | $ | 0 | |
8. SHARES OF BENEFICIAL INTEREST
The Portfolio may issue an unlimited number of shares of beneficial interest with a $0.001 par value. Changes in shares of beneficial interest were as follows (shares and amounts in thousands):
| | | | | | | | | | | | | | | | |
| | | | | Six Months Ended
06/30/2007 | | | Year Ended
12/31/2006 | |
| | | | | Shares | | | Amount | | | Shares | | | Amount | |
| | | | | |
Receipts for shares sold | | | | | | | | | | | | | | | | |
Institutional Class | | | | 85 | | | $ | 717 | | | 146 | | | $ | 1,213 | |
Administrative Class | | | | 6,841 | | | | 57,387 | | | 17,264 | | | | 140,974 | |
Advisor Class | | | | 32 | | | | 270 | | | 8 | | | | 64 | |
Issued as reinvestment of distributions | | | | | | | | | | | | | | | | |
Institutional Class | | | | 10 | | | | 81 | | | 8 | | | | 70 | |
Administrative Class | | | | 2,123 | | | | 17,782 | | | 4,025 | | | | 33,006 | |
Advisor Class | | | | 0 | | | | 3 | | | 0 | | | | 1 | |
Cost of shares redeemed | | | | | | | | | | | | | | | | |
Institutional Class | | | | (15 | ) | | | (132 | ) | | (3 | ) | | | (27 | ) |
Administrative Class | | | | (10,252 | ) | | | (84,751 | ) | | (15,623 | ) | | | (127,544 | ) |
Advisor Class | | | | (30 | ) | | | (251 | ) | | 0 | | | | (1 | ) |
Net increase (decrease) resulting from Portfolio share transactions | | | | (1,206 | ) | | $ | (8,894 | ) | | 5,825 | | | $ | 47,756 | |
The following schedule shows the number of shareholders each owning 5% or more of the Portfolio and the total percentage of the Portfolio held by such shareholders:
| | | | | | |
| | | | | Number of Shareholders | | % of Portfolio Held |
Institutional Class | | | | 1 | | 96 |
Administrative Class | | | | 3 | | 76 |
Advisor Class | | | | 2 | | 99 |
9. REGULATORY AND LITIGATION MATTERS
Since February 2004, PIMCO, Allianz Global Investors of America L.P. (PIMCO’s parent company), AGID, and certain of their affiliates, including the PIMCO Funds (another series of funds managed by PIMCO), the Allianz Funds (formerly known as PIMCO Funds: Multi-Manager Series (another series of funds managed by affiliates of PIMCO)), certain Trustees of the Trust (in their capacity as Trustees of the PIMCO Funds or the Allianz Funds) and certain employees of PIMCO, have been named as defendants in fifteen lawsuits filed in various jurisdictions. Eleven of those lawsuits concern “market timing,” and they have been transferred to and consolidated for pre-trial proceedings in a multi-district litigation proceeding in the U.S. District Court for the District of Maryland; the other four lawsuits concern “revenue sharing” and have been consolidated into a single action in the U.S. District Court for the District of Connecticut. The lawsuits have been commenced as putative class actions on behalf of investors who purchased, held or redeemed shares of the various series of the PIMCO Funds and the Allianz Funds during specified periods, or as derivative actions on behalf of the PIMCO Funds and the Allianz Funds.
The market timing actions in the District of Maryland generally allege that certain hedge funds were allowed to engage in “market timing” in certain funds of the PIMCO Funds and the Allianz Funds and this alleged activity was not disclosed. Pursuant to tolling agreements entered into with the derivative and class action plaintiffs, PIMCO, certain PIMCO Funds Trustees, and certain employees of PIMCO who were previously named as defendants have all been dropped as defendants in the market timing actions; the plaintiffs continue to assert claims on behalf of the
| | | | | | |
| | Semiannual Report | | June 30, 2007 | | 19 |
Notes to Financial Statements (Cont.)
shareholders of the PIMCO Funds or on behalf of the PIMCO Funds itself against other defendants. By order dated November 3, 2005, the U.S. District Court for the District of Maryland granted the PIMCO Funds’ motion to dismiss claims asserted against it in a consolidated amended complaint where the PIMCO Funds were named, in the complaint, as a nominal defendant. The revenue sharing action in the District of Connecticut generally alleges that fund assets were inappropriately used to pay brokers to promote funds of the PIMCO Funds and the Allianz Funds, including directing fund brokerage transactions to such brokers, and that such alleged arrangements were not fully disclosed to shareholders. On August 11, 2005, the U.S. District Court for the District of Connecticut conducted a hearing on defendants’ motion to dismiss the consolidated amended complaint in the revenue sharing action but has not yet ruled on the motion to dismiss. The market timing and revenue sharing lawsuits seek, among other things, unspecified compensatory damages plus interest and, in some cases, punitive damages, the rescission of investment advisory contracts, the return of fees paid under those contracts and restitution.
Two nearly identical class action civil complaints have been filed in August 2005, in the Northern District of Illinois Eastern Division, alleging that the plaintiffs each purchased and sold a 10-year Treasury note futures contract and suffered damages from an alleged shortage when PIMCO held both physical and futures positions in 10-year Treasury notes for its client accounts. The two actions have been consolidated into one action, and the two separate complaints have been replaced by a consolidated complaint. PIMCO is a named defendant, and PIMCO Funds has been added as a defendant, to the consolidated action. PIMCO strongly believes the complaint is without merit and intends to vigorously defend itself.
In April 2006, certain portfolios of the Trust and certain other funds managed by PIMCO were served in an adversary proceeding brought by the Official Committee of Asbestos Claimants of G-I Holdings, Inc. in G-I Holdings, Inc.’s bankruptcy in the District of New Jersey. In July 2004, PIMCO was named in this lawsuit and remains a defendant. The plaintiff seeks to recover for the bankruptcy estate assets that were transferred by the predecessor entity of G-I Holdings, Inc. to a wholly-owned subsidiary in 1994. The subsidiary has since issued notes, of which certain portfolios of the Trust and certain other funds managed by PIMCO are alleged to be holders. The complaint alleges that in 2000, more than two hundred noteholders—including certain portfolios of the Trust and certain other funds
managed by PIMCO—were granted a second priority lien on the assets of the
subsidiary in exchange for their consent to a refinancing transaction and the granting of a first priority lien to the lending banks. The plaintiff is seeking invalidation of the lien in favor of the noteholders and/or the value of the lien. On June 21, 2006, the District of New Jersey overturned the Bankruptcy Court’s decision granting permission to file the adversary proceeding and remanded the matter to the Bankruptcy Court for further proceedings. Following a motion to reconsider, the District Court upheld its remand on August 7, 2006, and instructed the Bankruptcy Court to conduct a “cost-benefit” analysis of the Committee’s claims, including the claims against the noteholders. The Bankruptcy Court held a status conference on October 25, 2006 and set a briefing schedule relating to this cost-benefit analysis.
The foregoing speaks only as of the date of this report. It is possible that these matters and/or other developments resulting from these matters could result in increased portfolio redemptions or other adverse consequences to the Portfolio. However, PIMCO and AGID believe that these matters are not likely to have a material adverse effect on the Portfolio or on PIMCO’s or AGID’s ability to perform their respective investment advisory or distribution services relating to the Portfolio.
10. FEDERAL INCOME TAX MATTERS
The Portfolio intends to qualify as a regulated investment company under sub-chapter M of the Internal Revenue Code (the “Code”) and distribute all of its taxable income and net realized gains, if applicable, to shareholders. Accordingly, no provision for Federal income taxes has been made.
As of June 30, 2007, the aggregate cost of investments was the same for federal income tax and financial statement purposes. The net unrealized appreciation (depreciation) of investment securities for federal income tax purposes is as follows (amount in thousands):
| | | | |
Aggregate
Gross
Unrealized
Appreciation | | Aggregate
Gross
Unrealized
(Depreciation) | | Net
Unrealized
Appreciation |
$ 7,556 | | $ (5,537) | | $ 2,019 |
| | | | |
| 20 | | PIMCO Variable Insurance Trust | | |
| | |
| |
Privacy Policy* | | (Unaudited) |
The Funds consider customer privacy to be a fundamental aspect of their relationships with shareholders and are committed to maintaining the confidentiality, integrity and security of their current, prospective and former shareholders’ personal information. To ensure their shareholders’ privacy, the Funds have developed policies that are designed to protect this confidentiality, while allowing shareholder needs to be served.
Obtaining Personal Information
In the course of providing shareholders with products and services, the Funds and certain service providers to the Funds, such as the Funds’ investment advisers (“Advisers”), may obtain non-public personal information about shareholders, which may come from sources such as account applications and other forms, from other written, electronic or verbal correspondence, from shareholder transactions, from a shareholder’s brokerage or financial advisory firm, financial adviser or consultant, and/or from information captured on the Funds’ internet web sites.
Respecting Your Privacy
As a matter of policy, the Funds do not disclose any personal or account information provided by shareholders or gathered by the Funds to non-affiliated third parties, except as required or permitted by law or as necessary for such third parties to perform their agreements with respect to the Funds. As is common in the industry, non-affiliated companies may from time to time be used to provide certain services, such as preparing and mailing prospectuses, reports, account statements and other information, conducting research on shareholder satisfaction and gathering shareholder proxies. A Fund’s Distributor may also retain non-affiliated companies to market the Fund’s shares or products which use the Fund’s shares and enter into joint marketing agreements with other companies. These companies may have access to a shareholder’s personal and account information, but are permitted to use this information solely to provide the specific service or as otherwise permitted by law. In most cases, the shareholders will be clients of a third party, but the Funds may also provide a shareholder’s personal and account information to the shareholder’s respective brokerage or financial advisory firm.
Sharing Information with Third Parties
The Funds reserve the right to disclose or report personal information to non-affiliated third parties, in limited circumstances, where the Funds believe in good faith that disclosure is required under law to cooperate with regulators or law enforcement authorities, to protect their rights or property or upon reasonable request by any Fund in which a shareholder has chosen to invest. In addition, the Funds may disclose information about a shareholder’s accounts to a non-affiliated third party with the consent of the shareholder.
Sharing Information with Affiliates
The Funds may share shareholder information with their affiliates in connection with servicing their shareholders’ accounts or to provide shareholders with information about products and services that the Funds or their Advisers, principal underwriters or their affiliates (“Service Affiliates”) believe may be of interest to such shareholders. The information that the Funds share may include, for example, a shareholder’s participation in one of the Funds or in other investment programs sponsored by a Service Affiliate, a shareholder’s ownership of certain types of accounts (such as IRAs), or other data about a shareholder’s accounts. The Funds’ Service Affiliates, in turn, are not permitted to share shareholder information with non-affiliated entities, except as required or permitted by law.
Procedures to Safeguard Private Information
The Funds take seriously the obligation to safeguard shareholder non-public personal information. In addition to this policy, the Funds have also implemented procedures that are designed to restrict access to a shareholder’s non-public personal information only to internal personnel who need to know that information in order to provide products or services to such shareholders. In order to guard a shareholder’s non-public personal information, physical, electronic and procedural safeguards are in place.
* This Privacy Policy applies to the following entities: PIMCO Funds, PIMCO Variable Insurance Trust, PCM Fund, Inc. and PIMCO Strategic Global Government Fund, Inc. (collectively, the “Funds”).
| | | | | | |
| | Semiannual Report | | June 30, 2007 | | 21 |
Investment Adviser and Administrator
Pacific Investment Management Company LLC
840 Newport Center Drive
Newport Beach, California 92660
Distributor
Allianz Global Investors Distributors LLC
1345 Avenue of the Americas
New York, New York 10105
Custodian
State Street Bank & Trust Company
801 Pennsylvania
Kansas City, Missouri 64105
Transfer Agent
Boston Financial Data Services–Midwest
330 W. 9th Street
Kansas City, Missouri 64105
Legal Counsel
Dechert LLP
1775 I Street, N.W.
Washington, D.C. 20006
Independent Registered Public Accounting Firm
PricewaterhouseCoopers LLP
1055 Broadway
Kansas City, Missouri 64105
P I M C O

Table of Contents
This material is authorized for use only when preceded or accompanied by the current PIMCO Variable Insurance Trust (the “Trust”) prospectus. Investors should consider the investment objectives, risks, charges and expenses of this Trust carefully before investing. Ask your financial professional to explain all charges that may apply. This and other information is contained in the Trust’s prospectus. The variable product prospectus may be obtained by contacting your Investment Consultant. Please read the Trust and variable product prospectus carefully before you invest or send money.
Chairman’s Letter
Dear PIMCO Variable Insurance Trust Shareholder:
It is our pleasure to present to you the semiannual report for the PIMCO Variable Insurance Trust, covering the six-month period ended June 30, 2007. The PIMCO Variable Insurance Trust’s net assets were $8.68 billion at June 30, 2007, as compared to $7.76 billion at December 31, 2006.
Highlights of the financial markets during the reporting period include:
| | n | | Economic data during the first quarter of 2007 pointed to slower growth, which heightened market expectations for a decrease in the Federal Funds Rate. By the second quarter, economic data, such as employment statistics, provided little indication of economic weakness, causing expectations of a decrease in the Federal Funds Rate to unwind and U.S. interest rates to move higher. Interest rates in Europe and the U.K. also rose over the period as central banks raised their key lending rates due to inflation concerns. The benchmark ten-year U.S. Treasury yielded 5.03% as of June 30, 2007, or 0.32% higher than at the beginning of the year. |
| | n | | Most bonds generally returned much of their gains from earlier in the year as worldwide growth and capital flows drove interest rates higher in the second quarter. Increased risk aversion in global financial markets, due in part to subprime mortgage worries in the U.S., also contributed to the rise in interest rates. The Lehman Brothers Aggregate Bond Index, which includes Treasury, investment-grade corporate and mortgage-backed securities, returned 0.98% for the six-month period. |
| | n | | Locally issued emerging market (“EM”) bonds posted positive returns for the reporting period. Yields on these bonds declined and the local currencies in which they are denominated generally gained, amid increasing investor awareness, strong economic growth and surging capital inflows. External EM bonds (debt instruments issued by emerging markets countries and typically denominated in U.S. dollars) lagged behind local EM bonds (debt instruments issued by emerging markets countries and denominated in the currency of the issuer), as external EM bonds tend to trade more in-line with U.S. Treasuries. |
| | n | | Treasury Inflation-Protected Securities (“TIPS”) outpaced nominal bonds (non-inflation linked bonds) for the first part of the year and all but the longest maturity TIPS outperformed in the second quarter as high gasoline prices drove higher inflation accruals. Commodities, as represented by the Dow Jones-AIG Commodity Total Return Index, returned 4.46% for the period. Equities, as measured by the S&P 500 Index and the Russell 2000 Index, returned 6.96% and 6.45%, respectively, for the period. |
On the following pages, please find specific details as to the Portfolio’s total return investment performance and a discussion of those factors that affected performance.
Thank you for the trust you have placed in us. We will continue to work diligently to serve your investment needs.
Sincerely,
Brent R. Harris
Chairman, PIMCO Variable Insurance Trust
July 31, 2007
| | | | | | |
| | Semiannual Report | | June 30, 2007 | | 1 |
Important Information About the Portfolio
PIMCO Variable Insurance Trust (the “Trust”) is an open-end management investment company currently consisting of twenty separate investment portfolios, including the High Yield Portfolio (the “Portfolio”). The Portfolio is only available as a funding vehicle under variable life insurance policies or variable annuity contracts issued by insurance companies (“Variable Contracts”). Individuals may not purchase shares of the Portfolio directly. Shares of the Portfolio also may be sold to qualified pension and retirement plans outside of the separate account context.
We believe that bond funds have an important role to play in a well diversified investment portfolio. It is important to note, however, that in an environment where interest rates may trend upward, rising rates would negatively impact the performance of most bond funds, and fixed-income securities held by a fund are likely to decrease in value. The price volatility of fixed-income securities can also increase during periods of rising interest rates resulting in increased losses to a fund. Bond funds and individual bonds with a longer duration (a measure of the expected life of a security) tend to be more sensitive to changes in interest rates, usually making them more volatile than securities or funds with shorter durations.
The Portfolio may be subject to various risks in addition to those described above. Some of these risks may include, but are not limited to, the following: credit risk, high yield risk, market risk, issuer risk, liquidity risk, derivatives risk, mortgage risk, non-U.S. investment risk, emerging markets risk, currency risk, leveraging risk and management risk. A complete description of these risks is contained in the Portfolio’s prospectus. The Portfolio may use derivative instruments for hedging purposes or as part of an investment strategy. Use of these instruments may involve certain costs and risks such as liquidity risk, interest rate risk, market risk, credit risk, management risk and the risk that the Portfolio could not close out a position when it would be most advantageous to do so. Because the Portfolio may invest in derivatives, it could lose more than the principal amount invested in these instruments. Investing in non-U.S. securities may entail risk due to non-U.S. economic and political developments; this risk may be increased when investing in emerging markets.
On the performance summary page in this Semiannual Report, the Total Return Investment Performance table measures performance assuming that all dividend and capital gain distributions were reinvested.
An investment in the Portfolio is not a deposit of a bank and is not guaranteed or insured by the Federal Deposit Insurance Corporation or any other government agency. It is possible to lose money on investments in the Portfolio.
PIMCO has adopted written proxy voting policies and procedures (“Proxy Policy”) as required by Rule 206(4)-6 under the Investment Advisers Act of 1940, as amended. The Proxy Policy has been adopted by the Trust as the policies and procedures that PIMCO will use when voting proxies on behalf of the Portfolio. A description of the policies and procedures that PIMCO uses to vote proxies relating to portfolio securities of the Portfolio, and information about how the Portfolio voted proxies relating to portfolio securities held during the most recent twelve-month period ended June 30, are available without charge, upon request, by calling the Trust at 1-866-746-2606 and on the Portfolio’s website at www.pimco.com.
The Portfolio files its complete schedule of portfolio holdings with the SEC for the first and third quarters of each fiscal year on Form N-Q. A copy of the Trust’s Form N-Q is also available on the SEC’s website at http://www.sec.gov and may be reviewed and copied at the SEC’s Public Reference Room in Washington D.C. Information on the operation of the Public Reference Room may be obtained by calling 1-800-SEC-0330, and is available without charge, upon request, by calling the Trust at 1-866-746-2606 and on the Portfolio’s website at www.pimco.com.
PIMCO Variable Insurance Trust is distributed by Allianz Global Investors Distributors LLC, 1345 Avenue of the Americas, New York, NY 10105.
| | | | |
| 2 | | PIMCO Variable Insurance Trust | | |
The following disclosure provides important information regarding the Portfolio’s Expense Example (“Example” or “Expense Example”), which appears in this Semiannual Report. Please refer to this information when reviewing the Expense Example for the Portfolio.
Example
As a shareholder of the Portfolio, you incur two types of costs: (1) transaction costs and (2) ongoing costs, including advisory and administrative fees; distribution and/or service (12b-1) fees (Administrative and Advisor Class only); and other Portfolio expenses. The Example is intended to help you understand your ongoing costs (in dollars) of investing in the Portfolio and to compare these costs with the ongoing costs of investing in other mutual funds. The Expense Example does not reflect any fees or other expenses imposed by the Variable Contracts. If it did, the expenses reflected in the Expense Example would be higher. The Example is based on an investment of $1,000 invested at the beginning of the period and held for the entire period indicated, which is from January 1, 2007 to June 30, 2007.
Actual Expenses
The information in the table under the heading “Actual Performance” provides information about actual account values and actual expenses. You may use the information in these columns, together with the amount you invested, to estimate the expenses that you paid over the period. Simply divide your account value by $1,000 (for example, an $8,600 account value divided by $1,000 = $8.60), then multiply the result by the number in the row titled “Expenses Paid During Period” to estimate the expenses you paid on your account during this period.
Hypothetical Example for Comparison Purposes
The information in the table under the heading “Hypothetical Performance (5% return before expenses)” provides information about hypothetical account values and hypothetical expenses based on the Portfolio’s actual expense ratio and an assumed rate of return of 5% per year before expenses, which is not the Portfolio’s actual return. The hypothetical account values and expenses may not be used to estimate the actual ending account balance or expenses you paid for the period. You may use this information to compare the ongoing costs of investing in the Portfolio and other portfolios. To do so, compare this 5% hypothetical example with the 5% hypothetical examples that appear in the shareholder reports of the other portfolios.
Please note that the expenses shown in the table are meant to highlight your ongoing costs only and do not reflect any transactional costs. Therefore, the information under the heading “Hypothetical Performance (5% return before expenses)” is useful in comparing ongoing costs only, and will not help you determine the relative total costs of owning different portfolios. In addition, if these transactional costs were included, your costs would have been higher.
The expense ratio may vary period to period because of various factors, such as an increase in expenses not covered by the advisory and administrative fees (such as expenses of the trustees and their counsel, litigation expense and interest expense).
| | | | | | |
| | Semiannual Report | | June 30, 2007 | | 3 |
PIMCO High Yield Portfolio
Cumulative Returns Through June 30, 2007
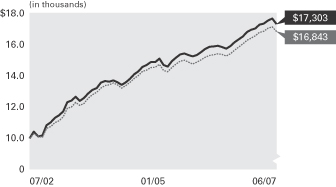
$10,000 invested at the end of the nearest month to the inception date of the Portfolio’s Institutional Class.
Allocation Breakdown‡
| | |
Corporate Bonds & Notes | | 78.3% |
Bank Loan Obligations | | 8.4% |
Short-Term Instruments | | 5.2% |
U.S. Government Agencies | | 3.1% |
Foreign Currency-Denominated Issues | | 3.0% |
Other | | 2.0% |
| | ‡ | % of Total Investments as of 06/30/2007 |
| | | | | | | | |
| Average Annual Total Return for the period ended June 30, 2007 | | |
| | | | | 6 Months* | | 1 Year | | Portfolio
Inception
(07/01/02)** |
| | PIMCO High Yield Portfolio Institutional Class | | 2.16% | | 9.91% | | 10.20% |
| | Merrill Lynch U.S. High Yield BB-B Rated Constrained Index± | | 2.59% | | 10.34% | | 10.19% |
All Portfolio returns are net of fees and expenses.
* Cumulative return.
** The Portfolio began operations on 07/01/02. Index comparisons began on 06/30/02.
Performance quoted represents past performance. Past performance is no guarantee of future results. Investment return and principal value will fluctuate so the Portfolio shares, when redeemed, may be worth more or less than their original cost. The Portfolio’s performance does not reflect the deduction of additional charges and expenses imposed in connection with investing in Variable Contracts, which will reduce returns. Current performance may be lower or higher than the performance data quoted. Performance data current to the most recent month-end is available by calling (800) 927-4648.
± Merrill Lynch U.S. High Yield BB-B Rated Constrained Index tracks the performance of BB-B Rated US Dollar-denominated corporate bonds publicly issued in the U.S. domestic market. Qualifying bonds are capitalization-weighted provided the total allocation to an individual issuer (defined by Bloomberg tickers) does not exceed 2%. Issuers that exceed the limit are reduced to 2% and the face value of each of their bonds is adjusted on a pro-rata basis. Similarly, the face value of bonds of all other issuers that fall below the 2% cap are increased on a pro-rata basis. It is not possible to invest directly in the index. The index does not reflect deductions for fees and expenses.
| | | | | | |
| Expense Example | | Actual Performance | | Hypothetical Performance |
| | | | | (5% return before expenses) |
Beginning Account Value (01/01/07) | | $ | 1,000.00 | | $ | 1,000.00 |
Ending Account Value (06/30/07) | | $ | 1,021.56 | | $ | 1,021.82 |
Expenses Paid During Period† | | $ | 3.01 | | $ | 3.01 |
† Expenses are equal to the Portfolio’s Institutional Class annualized expense ratio of 0.60%, multiplied by the average account value over the period, multiplied by 181/365 (to reflect the one-half year period). Overall fees and expenses of investing in the Portfolio will be higher because the example does not reflect Variable Contract fees and expenses.
Please refer to page 3 herein for an explanation of the information presented in the above Expense Example.
Portfolio Insights
| » | | The PIMCO High Yield Portfolio seeks to achieve its investment objective by investing under normal circumstances at least 80% of its assets in a diversified portfolio of high-yield securities (“junk bonds”), which may be represented by forwards or derivatives such as options, futures contracts, or swap agreements, rated below investment grade but rated at least Caa by Moody’s, or equivalently rated by S&P or Fitch, or, if unrated, determined by PIMCO to be of comparable quality, subject to a maximum of 5% of total assets in securities rated Caa by Moody’s, or equivalently rated by S&P or Fitch, or if unrated, determined by PIMCO to be of comparable quality. |
| » | | An underweight to the building products sector, led lower by poor performing building and construction credits, added to relative performance. |
| » | | An emphasis on B-rated technology issues, which outperformed their higher-quality BB-rated counterparts, was a strong boost to returns. |
| » | | Security selection in the healthcare sector was a strong positive for returns as middle- and lower-rated quality tiers outperformed considerably. |
| » | | An underweight to consumer non-cyclicals, which outperformed wholesale foods, food/drug retailers, and pharmaceuticals, detracted from relative performance. |
| » | | As the metals and mining sector outperformed over the period, an underweight to the sector weighed on the Portfolio’s returns. |
| » | | Within the telecom sector, an emphasis on integrated service providers, which fell significantly short of wireless and wireline companies, was negative for relative performance. |
| » | | An underweight to BB-rated issues, in general, and some tactical exposure to CCC-rated bonds, added to performance as lower quality outperformed. |
| | | | |
| 4 | | PIMCO Variable Insurance Trust | | |
Financial Highlights High Yield Portfolio
| | | | | | | | | | | | | | | | | | | | | | | | |
| Selected per Share Data for the Year or Period Ended: | | 06/30/2007+ | | | 12/31/2006 | | | 12/31/2005 | | | 12/31/2004 | | | 12/31/2003 | | | 07/01/2002-12/31/2002 | |
| | | | | | |
Institutional Class | | | | | | | | | | | | | | | | | | | | | | | | |
Net asset value beginning of year or period | | $ | 8.34 | | | $ | 8.19 | | | $ | 8.40 | | | $ | 8.19 | | | $ | 7.17 | | | $ | 7.25 | |
Net investment income (a) | | | 0.29 | | | | 0.58 | | | | 0.55 | | | | 0.53 | | | | 0.57 | | | | 0.29 | |
Net realized/unrealized gain (loss) on investments (a) | | | (0.10 | ) | | | 0.15 | | | | (0.21 | ) | | | 0.23 | | | | 1.03 | | | | (0.06 | ) |
Total income from investment operations | | | 0.19 | | | | 0.73 | | | | 0.34 | | | | 0.76 | | | | 1.60 | | | | 0.23 | |
Dividends from net investment income | | | (0.30 | ) | | | (0.58 | ) | | | (0.55 | ) | | | (0.55 | ) | | | (0.58 | ) | | | (0.31 | ) |
Total distributions | | | (0.30 | ) | | | (0.58 | ) | | | (0.55 | ) | | | (0.55 | ) | | | (0.58 | ) | | | (0.31 | ) |
Net asset value end of year or period | | $ | 8.23 | | | $ | 8.34 | | | $ | 8.19 | | | $ | 8.40 | | | $ | 8.19 | | | $ | 7.17 | |
Total return | | | 2.16 | % | | | 9.24 | % | | | 4.26 | % | | | 9.71 | % | | | 23.08 | % | | | 3.43 | % |
Net assets end of year or period (000s) | | $ | 2,588 | | | $ | 1,963 | | | $ | 687 | | | $ | 343 | | | $ | 13 | | | $ | 10 | |
Ratio of expenses to average net assets | | | 0.60 | %* | | | 0.60 | % | | | 0.60 | % | | | 0.60 | % | | | 0.60 | % | | | 0.60 | %*(b) |
Ratio of expenses to average net assets excluding interest expense | | | 0.60 | %* | | | 0.60 | % | | | 0.60 | % | | | 0.60 | % | | | 0.60 | % | | | 0.60 | %*(b) |
Ratio of net investment income to average net assets | | | 6.96 | %* | | | 7.05 | % | | | 6.68 | % | | | 6.51 | % | | | 7.36 | % | | | 8.59 | %* |
Portfolio turnover rate | | | 38 | % | | | 81 | % | | | 109 | % | | | 97 | % | | | 97 | % | | | 102 | % |
+ Unaudited
* Annualized
(a) Per share amounts based on average number of shares outstanding during the period.
(b) If the investment manager had not reimbursed expenses, the ratio of expenses to average net assets would have been 0.61%.
| | | | | | |
| See Accompanying Notes | | Semiannual Report | | June 30, 2007 | | 5 |
Statement of Assets and Liabilities High Yield Portfolio
| | | | |
| (Amounts in thousands, except per share amounts) | | June 30, 2007 | |
| | | (Unaudited) | |
| |
Assets: | | | | |
Investments, at value | | $ | 489,863 | |
Cash | | | 745 | |
Foreign currency, at value | | | 3,556 | |
Receivable for investments sold | | | 37,299 | |
Receivable for Portfolio shares sold | | | 118 | |
Interest and dividends receivable | | | 8,417 | |
Swap premiums paid | | | 45 | |
Unrealized appreciation on swap agreements | | | 843 | |
| | | | 540,886 | |
| |
Liabilities: | | | | |
Payable for investments purchased | | $ | 34,671 | |
Payable for Portfolio shares redeemed | | | 1,933 | |
Accrued investment advisory fee | | | 111 | |
Accrued administration fee | | | 155 | |
Accrued servicing fee | | | 55 | |
Swap premiums received | | | 5 | |
Unrealized depreciation on foreign currency contracts | | | 168 | |
Unrealized depreciation on swap agreements | | | 990 | |
| | | | 38,088 | |
| |
Net Assets | | $ | 502,798 | |
| |
Net Assets Consist of: | | | | |
Paid in capital | | $ | 503,818 | |
(Overdistributed) net investment income | | | (1,553 | ) |
Accumulated undistributed net realized (loss) | | | (1,193 | ) |
Net unrealized appreciation | | | 1,726 | |
| | | $ | 502,798 | |
| |
Net Assets: | | | | |
Institutional Class | | $ | 2,588 | |
Administrative Class | | | 500,127 | |
Advisor Class | | | 83 | |
| |
Shares Issued and Outstanding: | | | | |
Institutional Class | | | 315 | |
Administrative Class | | | 60,773 | |
Advisor Class | | | 10 | |
| |
Net Asset Value and Redemption Price Per Share (Net Asset Per Share Outstanding) | | | | |
Institutional Class | | $ | 8.23 | |
Administrative Class | | | 8.23 | |
Advisor Class | | | 8.23 | |
| |
Cost of Investments Owned | | $ | 487,844 | |
Cost of Foreign Currency Held | | $ | 3,537 | |
| | | | |
| 6 | | PIMCO Variable Insurance Trust | | See Accompanying Notes |
Statement of Operations High Yield Portfolio
| | | | |
| (Amounts in thousands) | | Six Months Ended
June 30, 2007 | |
| | | (Unaudited) | |
| |
| Investment Income: | | | | |
Interest | | $ | 19,591 | |
Dividends | | | 92 | |
Miscellaneous income | | | 39 | |
Total Income | | | 19,722 | |
| |
Expenses: | | | | |
Investment advisory fees | | | 650 | |
Administration fees | | | 910 | |
Servicing fees – Administrative Class | | | 388 | |
Trustees’ fees | | | 5 | |
Interest expense | | | 6 | |
Total Expenses | | | 1,959 | |
| |
Net Investment Income | | | 17,763 | |
| |
Net Realized and Unrealized Gain (Loss): | | | | |
Net realized gain on investments | | | 4,407 | |
Net realized (loss) on futures contracts, written options and swaps | | | (2,164 | ) |
Net realized (loss) on foreign currency transactions | | | (156 | ) |
Net change in unrealized (depreciation) on investments | | | (9,745 | ) |
Net change in unrealized appreciation on futures contracts, written options and swaps | | | 860 | |
Net change in unrealized (depreciation) on translation of assets and liabilities denominated in foreign currencies | | | (259 | ) |
Net (Loss) | | | (7,057 | ) |
| |
Net Increase in Net Assets Resulting from Operations | | $ | 10,706 | |
| | | | | | |
| See Accompanying Notes | | Semiannual Report | | June 30, 2007 | | 7 |
Statements of Changes in Net Assets High Yield Portfolio
| | | | | | | | |
| (Amounts in thousands) | | Six Months Ended
June 30, 2007 | | | Year Ended
December 31, 2006 | |
| | | (Unaudited) | | | | |
| | |
| Increase (Decrease) in Net Assets from: | | | | | | | | |
| | |
Operations: | | | | | | | | |
Net investment income | | $ | 17,763 | | | $ | 33,041 | |
Net realized gain | | | 2,087 | | | | 2,834 | |
Net change in unrealized appreciation (depreciation) | | | (9,144 | ) | | | 6,670 | |
Net increase resulting from operations | | | 10,706 | | | | 42,545 | |
| | |
Distributions to Shareholders: | | | | | | | | |
From net investment income | | | | | | | | |
Institutional Class | | | (81 | ) | | | (70 | ) |
Administrative Class | | | (17,782 | ) | | | (32,991 | ) |
Advisor Class | | | (3 | ) | | | (1 | ) |
| | |
Total Distributions | | | (17,866 | ) | | | (33,062 | ) |
| | |
Portfolio Share Transactions: | | | | | | | | |
Receipts for shares sold | | | | | | | | |
Institutional Class | | | 717 | | | | 1,213 | |
Administrative Class | | | 57,387 | | | | 140,974 | |
Advisor Class | | | 270 | | | | 64 | |
Issued as reinvestment of distributions | | | | | | | | |
Institutional Class | | | 81 | | | | 70 | |
Administrative Class | | | 17,782 | | | | 33,006 | |
Advisor Class | | | 3 | | | | 1 | |
Cost of shares redeemed | | | | | | | | |
Institutional Class | | | (132 | ) | | | (27 | ) |
Administrative Class | | | (84,751 | ) | | | (127,544 | ) |
Advisor Class | | | (251 | ) | | | (1 | ) |
Net increase (decrease) resulting from Portfolio share transactions | | | (8,894 | ) | | | 47,756 | |
| | |
Total Increase (Decrease) in Net Assets | | | (16,054 | ) | | | 57,239 | |
| | |
Net Assets: | | | | | | | | |
Beginning of period | | | 518,852 | | | | 461,613 | |
End of period* | | $ | 502,798 | | | $ | 518,852 | |
| | |
*Including (overdistributed) net investment income of: | | $ | (1,553 | ) | | $ | (1,450 | ) |
| | | | |
| 8 | | PIMCO Variable Insurance Trust | | See Accompanying Notes |
| | |
| |
| Schedule of Investments High Yield Portfolio | | June 30, 2007 (Unaudited) |
| | | | | | | | |
| | | | | PRINCIPAL
AMOUNT
(000S) | | | | VALUE (000S) |
| BANK LOAN OBLIGATIONS 8.2% |
| AES Corp. | | | | | | | | |
7.180% due 04/30/2010 | | $ | | 2,000 | | $ | | 2,005 |
| |
| Amadeus Global Travel Distribution S.A. |
7.830% due 04/08/2013 | | | | 700 | | | | 705 |
8.580% due 04/08/2014 | | | | 700 | | | | 708 |
| |
| Biomet, Inc. | | | | | | | | |
6.000% due 03/08/2008 | | | | 1,500 | | | | 1,504 |
| |
| Centennial Cellular Operating Co. LLC |
7.350% due 02/09/2011 | | | | 766 | | | | 770 |
7.360% due 01/20/2011 | | | | 59 | | | | 60 |
| |
| Community Health Corp. | | | | | | | | |
4.000% due 07/02/2014 | | | | 62 | | | | 62 |
5.000% due 07/02/2014 | | | | 938 | | | | 940 |
7.000% due 04/10/2008 | | | | 2,000 | | | | 1,995 |
| |
| Ford Motor Co. | | | | | | | | |
8.360% due 11/29/2013 | | | | 1,493 | | | | 1,500 |
| |
| Harrah’s Entertainment, Inc. | | | | |
7.500% due 03/09/2008 | | | | 3,000 | | | | 2,985 |
| |
| HCA, Inc. | | | | | | | | |
7.600% due 11/14/2013 | | | | 1,247 | | | | 1,254 |
| |
| Headwaters, Inc. | | | | | | | | |
7.360% due 04/30/2011 | | | | 852 | | | | 855 |
| |
| HealthSouth Corp. | | | | | | | | |
7.850% due 02/02/2013 | | | | 1,695 | | | | 1,704 |
7.860% due 02/02/2013 | | | | 32 | | | | 32 |
| |
| Ineos Group Holdings PLC | | | | | | | | |
7.571% due 10/07/2012 | | | | 56 | | | | 56 |
7.580% due 10/07/2012 | | | | 937 | | | | 940 |
| |
| JSG Holding PLC | | | | | | | | |
7.725% due 11/29/2013 | | | | 650 | | | | 654 |
8.225% due 11/29/2014 | | | | 650 | | | | 654 |
| |
| Lear Corp. | | | | | | | | |
8.000% due 06/27/2014 | | | | 1,000 | | | | 992 |
| |
| Metro-Goldwyn-Mayer, Inc. | | | | |
8.614% due 04/08/2012 | | | | 1,489 | | | | 1,494 |
| |
| Novelis, Inc. | | | | | | | | |
4.000% due 05/25/2008 | | | | 1,100 | | | | 1,102 |
| |
| Riverdeep Interactive | | | | | | | | |
8.100% due 11/28/2013 | | | | 997 | | | | 1,001 |
| |
| Roundy’s Supermarket, Inc. | | | | |
8.070% due 10/27/2011 | | | | 2 | | | | 2 |
8.110% due 11/01/2011 | | | | 985 | | | | 994 |
| |
| SLM Corp. | | | | | | | | |
6.000% due 06/30/2008 | | | | 2,600 | | | | 2,587 |
| |
| Telesat Canada, Inc. | | | | | | | | |
2.620% due 02/14/2008 | | | | 1,500 | | | | 1,501 |
| |
| Thompson Learning, Inc. | | | | | | | | |
5.000% due 06/27/2014 | | | | 2,100 | | | | 2,076 |
| |
| Tribune Co. | | | | | | | | |
7.875% due 05/30/2009 | | | | 825 | | | | 826 |
8.375% due 05/30/2014 | | | | 1,375 | | | | 1,346 |
| |
| Univision Communications, Inc. |
6.250% due 09/15/2014 | | | | 121 | | | | 119 |
7.605% due 09/15/2014 | | | | 1,879 | | | | 1,856 |
| |
| VNU/Nielson Finance LLC | | | | | | | | |
7.607% due 08/08/2013 | | | | 1,990 | | | | 2,004 |
| |
| VWR International, Inc. | | | | | | | | |
7.000% due 05/30/2008 | | | | 2,500 | | | | 2,503 |
| |
| Wind Acquisition Finance S.A. |
12.609% due 12/21/2011 | | | | 517 | | | | 521 |
| |
| Worldspan LP | | | | | | | | |
8.606% due 12/07/2013 | | | | 500 | | | | 503 |
| | | | | | | | |
| | | | | PRINCIPAL
AMOUNT
(000S) | | | | VALUE (000S) |
8.610% due 12/07/2013 | | $ | | 495 | | $ | | 497 |
10.500% due 12/07/2013 | | | | 2 | | | | 3 |
| | | | | | | | |
Total Bank Loan Obligations
(Cost $41,194) | | 41,310 |
| | | | | | | | |
|
| CORPORATE BONDS & NOTES 76.3% |
|
| BANKING & FINANCE 9.7% |
| AES Ironwood LLC | | | | | | | | |
8.857% due 11/30/2025 | | | | 2,421 | | | | 2,700 |
| |
| AES Red Oak LLC | | | | | | | | |
8.540% due 11/30/2019 | | | | 1,185 | | | | 1,297 |
| |
| Bluewater Finance Ltd. | | | | | | | | |
10.250% due 02/15/2012 | | | | 2,200 | | | | 2,305 |
| |
| Ferrellgas Escrow LLC | | | | | | | | |
6.750% due 05/01/2014 | | | | 2,100 | | | | 2,000 |
| |
| Ford Motor Credit Co. | | | | | | | | |
7.250% due 10/25/2011 | | | | 1,900 | | | | 1,830 |
7.800% due 06/01/2012 | | | | 8,375 | | | | 8,178 |
8.625% due 11/01/2010 | | | | 1,260 | | | | 1,281 |
| |
| Forest City Enterprises, Inc. |
7.625% due 06/01/2015 | | | | 1,225 | | | | 1,240 |
| |
| General Motors Acceptance Corp. |
6.000% due 04/01/2011 | | | | 1,194 | | | | 1,152 |
7.000% due 02/01/2012 | | | | 3,000 | | | | 2,945 |
7.250% due 03/02/2011 | | | | 500 | | | | 499 |
8.000% due 11/01/2031 | | | | 2,350 | | | | 2,410 |
| |
| GMAC LLC | | | | | | | | |
6.625% due 05/15/2012 | | | | 1,100 | | | | 1,063 |
| |
| Hexion U.S. Finance Corp. | | | | | | | | |
9.750% due 11/15/2014 | | | | 1,300 | | | | 1,352 |
| |
| K&F Acquisition, Inc. | | | | | | | | |
7.750% due 11/15/2014 | | | | 1,000 | | | | 1,065 |
| |
| KRATON Polymers LLC | | | | | | | | |
8.125% due 01/15/2014 | | | | 1,500 | | | | 1,470 |
| |
| NSG Holdings LLC/NSG Holdings, Inc. |
7.750% due 12/15/2025 | | | | 925 | | | | 939 |
| |
| Petroleum Export Ltd. II | | | | | | | | |
6.340% due 06/20/2011 | | | | 1,280 | | | | 1,254 |
| |
| Petroplus Finance Ltd. | | | | | | | | |
6.750% due 05/01/2014 | | | | 375 | | | | 363 |
7.000% due 05/01/2017 | | | | 375 | | | | 363 |
| |
| Rotech Healthcare, Inc. | | | | | | | | |
9.500% due 04/01/2012 | | | | 3,575 | | | | 3,396 |
| |
| Targeted Return Index Securities Trust |
7.548% due 05/01/2016 | | | | 826 | | | | 814 |
| |
| Tenneco, Inc. | | | | | | | | |
8.625% due 11/15/2014 | | | | 975 | | | | 1,009 |
10.250% due 07/15/2013 | | | | 500 | | | | 540 |
| |
| TNK-BP Finance S.A. | | | | | | | | |
6.625% due 03/20/2017 | | | | 500 | | | | 486 |
7.500% due 07/18/2016 | | | | 1,000 | | | | 1,034 |
| |
| Universal City Development Partners |
11.750% due 04/01/2010 | | | | 525 | | | | 558 |
| |
| Universal City Florida Holding Co. I |
8.375% due 05/01/2010 | | | | 1,425 | | | | 1,464 |
10.106% due 05/01/2010 | | | | 175 | | | | 179 |
| |
| Ventas Realty LP | | | | | | | | |
6.750% due 04/01/2017 | | | | 250 | | | | 248 |
7.125% due 06/01/2015 | | | | 500 | | | | 506 |
9.000% due 05/01/2012 | | | | 500 | | | | 549 |
| |
| Wind Acquisition Finance S.A. |
10.750% due 12/01/2015 | | | | 1,000 | | | | 1,152 |
| |
| | | | | | | | |
| | | | | PRINCIPAL
AMOUNT
(000S) | | | | VALUE (000S) |
| Yankee Acquisition Corp. | | | | | | | | |
8.500% due 02/15/2015 | | $ | | 1,100 | | $ | | 1,072 |
| | | | | | | | |
| | | | | | | | 48,713 |
| | | | | | | | |
|
| INDUSTRIALS 54.2% |
| Abitibi-Consolidated Co. of Canada |
7.750% due 06/15/2011 | | | | 125 | | | | 115 |
| |
| Abitibi-Consolidated, Inc. | | | | | | | | |
8.550% due 08/01/2010 | | | | 1,275 | | | | 1,224 |
| |
| Actuant Corp. | | | | | | | | |
6.875% due 06/15/2017 | | | | 1,000 | | | | 995 |
| |
| Albertson’s, Inc. | | | | | | | | |
7.450% due 08/01/2029 | | | | 3,250 | | | | 3,186 |
| |
| Allied Waste North America, Inc. |
7.250% due 03/15/2015 | | | | 5,650 | | | | 5,622 |
| |
| AmeriGas Partners LP | | | | | | | | |
7.125% due 05/20/2016 | | | | 2,650 | | | | 2,617 |
7.250% due 05/20/2015 | | | | 1,850 | | | | 1,841 |
| |
| Aramark Corp. | | | | | | | | |
8.500% due 02/01/2015 | | | | 3,775 | | | | 3,860 |
| |
| Arco Chemical Co. | | | | | | | | |
10.250% due 11/01/2010 | | | | 50 | | | | 54 |
| |
| Armor Holdings, Inc. | | | | | | | | |
8.250% due 08/15/2013 | | | | 800 | | | | 846 |
| |
| ArvinMeritor, Inc. | | | | | | | | |
8.125% due 09/15/2015 | | | | 1,525 | | | | 1,485 |
8.750% due 03/01/2012 | | | | 2,750 | | | | 2,791 |
| |
| Berry Plastics Holding Corp. |
8.875% due 09/15/2014 | | | | 975 | | | | 992 |
| |
| Bon-Ton Stores, Inc. | | | | | | | | |
10.250% due 03/15/2014 | | | | 3,750 | | | | 3,816 |
| |
| Bowater Canada Finance | | | | | | | | |
7.950% due 11/15/2011 | | | | 1,315 | | | | 1,244 |
| |
| Buhrmann U.S., Inc. | | | | | | | | |
7.875% due 03/01/2015 | | | | 1,300 | | | | 1,287 |
8.250% due 07/01/2014 | | | | 1,000 | | | | 1,010 |
| |
| C8 Capital SPV Ltd. | | | | | | | | |
6.640% due 12/31/2049 | | | | 1,500 | | | | 1,478 |
| |
| CanWest Media, Inc. | | | | | | | | |
8.000% due 09/15/2012 | | | | 770 | | | | 768 |
| |
| Cascades, Inc. | | | | | | | | |
7.250% due 02/15/2013 | | | | 1,425 | | | | 1,393 |
| |
| CCO Holdings LLC | | | | | | | | |
8.750% due 11/15/2013 | | | | 7,400 | | | | 7,567 |
| |
| Celestica, Inc. | | | | | | | | |
7.625% due 07/01/2013 | | | | 875 | | | | 823 |
7.875% due 07/01/2011 | | | | 1,900 | | | | 1,853 |
| |
| Chart Industries, Inc. | | | | | | | | |
9.125% due 10/15/2015 | | | | 425 | | | | 448 |
| |
| Chemtura Corp. | | | | | | | | |
6.875% due 06/01/2016 | | | | 1,750 | | | | 1,663 |
| |
| Chesapeake Energy Corp. | | | | | | | | |
6.875% due 01/15/2016 | | | | 1,200 | | | | 1,179 |
7.000% due 08/15/2014 | | | | 1,550 | | | | 1,546 |
7.500% due 06/15/2014 | | | | 75 | | | | 76 |
7.750% due 01/15/2015 | | | | 500 | | | | 511 |
| |
| Choctaw Resort Development Enterprise |
7.250% due 11/15/2019 | | | | 1,357 | | | | 1,343 |
| |
| Citic Resources Finance Ltd. |
6.750% due 05/15/2014 | | | | 450 | | | | 435 |
| |
| Compagnie Générale de Géophysique-Veritas |
7.500% due 05/15/2015 | | | | 450 | | | | 452 |
7.750% due 05/15/2017 | | | | 225 | | | | 229 |
| |
| | | | | | |
| See Accompanying Notes | | Semiannual Report | | June 30, 2007 | | 9 |
Schedule of Investments High Yield Portfolio (Cont.)
| | | | | | | | |
| | | | | PRINCIPAL
AMOUNT
(000S) | | | | VALUE (000S) |
| Continental Airlines, Inc. |
6.920% due 04/02/2013 (f) | | $ | | 712 | | $ | | 725 |
7.373% due 06/15/2017 | | | | 253 | | | | 251 |
| |
| Cooper-Standard Automotive, Inc. |
7.000% due 12/15/2012 | | | | 1,100 | | | | 1,037 |
| |
| Corrections Corp. of America |
7.500% due 05/01/2011 | | | | 1,250 | | | | 1,273 |
| |
| Crown Americas LLC & Crown Americas Capital Corp. |
7.625% due 11/15/2013 | | | | 425 | | | | 431 |
7.750% due 11/15/2015 | | | | 1,500 | | | | 1,515 |
| |
| CSC Holdings, Inc. |
6.750% due 04/15/2012 | | | | 1,000 | | | | 955 |
7.625% due 04/01/2011 | | | | 2,000 | | | | 1,995 |
| |
| DaVita, Inc. |
7.250% due 03/15/2015 | | | | 4,150 | | | | 4,119 |
| |
| Delhaize America, Inc. |
9.000% due 04/15/2031 | | | | 1,917 | | | | 2,326 |
| |
| Dresser-Rand Group, Inc. |
7.375% due 11/01/2014 | | | | 396 | | | | 399 |
| |
| DRS Technologies, Inc. |
7.625% due 02/01/2018 | | | | 1,050 | | | | 1,066 |
| |
| Dynegy Holdings, Inc. |
7.125% due 05/15/2018 | | | | 1,750 | | | | 1,566 |
7.500% due 06/01/2015 | | | | 200 | | | | 189 |
7.750% due 06/01/2019 | | | | 3,100 | | | | 2,899 |
8.375% due 05/01/2016 | | | | 1,000 | | | | 983 |
| |
| EchoStar DBS Corp. |
6.625% due 10/01/2014 | | | | 1,000 | | | | 958 |
7.125% due 02/01/2016 | | | | 3,225 | | | | 3,169 |
| |
| El Paso Corp. |
7.000% due 06/15/2017 | | | | 1,750 | | | | 1,740 |
7.750% due 01/15/2032 | | | | 1,200 | | | | 1,215 |
7.800% due 08/01/2031 | | | | 325 | | | | 331 |
8.050% due 10/15/2030 | | | | 1,300 | | | | 1,372 |
| |
| Equistar Chemicals LP |
10.125% due 09/01/2008 | | | | 26 | | | | 27 |
| |
| Ferrellgas Partners LP |
8.750% due 06/15/2012 | | | | 1,525 | | | | 1,578 |
8.870% due 08/01/2009 (f) | | | | 1,200 | | | | 1,272 |
| |
| Fisher Communications, Inc. |
8.625% due 09/15/2014 | | | | 1,000 | | | | 1,070 |
| |
| Ford Motor Co. |
7.450% due 07/16/2031 | | | | 3,600 | | | | 2,894 |
| |
| Forest Oil Corp. |
7.250% due 06/15/2019 | | | | 825 | | | | 804 |
| |
| Freeport-McMoRan Copper & Gold, Inc. |
8.250% due 04/01/2015 | | | | 1,200 | | | | 1,269 |
8.375% due 04/01/2017 | | | | 2,300 | | | | 2,461 |
| |
| Freescale Semiconductor, Inc. |
8.875% due 12/15/2014 | | | | 4,000 | | | | 3,840 |
9.125% due 12/15/2014 (b) | | | | 1,850 | | | | 1,748 |
9.235% due 12/15/2014 | | | | 500 | | | | 485 |
| |
| Fresenius Medical Care Capital Trust |
7.875% due 06/15/2011 | | | | 2,250 | | | | 2,340 |
| |
| Gaylord Entertainment Co. |
8.000% due 11/15/2013 | | | | 800 | | | | 815 |
| |
| General Motors Corp. |
8.100% due 06/15/2024 | | | | 300 | | | | 266 |
8.250% due 07/15/2023 | | | | 4,850 | | | | 4,444 |
8.800% due 03/01/2021 | | | | 700 | | | | 665 |
| |
| Georgia-Pacific Corp. |
7.125% due 01/15/2017 | | | | 2,000 | | | | 1,930 |
7.375% due 12/01/2025 | | | | 5,960 | | | | 5,617 |
7.750% due 11/15/2029 | | | | 100 | | | | 94 |
8.000% due 01/15/2024 | | | | 775 | | | | 756 |
| |
| | | | | | | | |
| | | | | PRINCIPAL
AMOUNT
(000S) | | | | VALUE (000S) |
| Goodyear Tire & Rubber Co. |
9.000% due 07/01/2015 | | $ | | 1,024 | | $ | | 1,108 |
| |
Grupo Transportacion Ferroviaria
Mexicana S.A. de C.V. |
9.375% due 05/01/2012 | | | | 1,200 | | | | 1,290 |
| |
| Hanover Compressor Co. |
9.000% due 06/01/2014 | | | | 500 | | | | 531 |
| |
| Hanover Equipment Trust |
8.750% due 09/01/2011 | | | | 800 | | | | 826 |
| |
| HCA, Inc. |
6.750% due 07/15/2013 | | | | 4,400 | | | | 4,015 |
7.190% due 11/15/2015 | | | | 200 | | | | 181 |
7.500% due 12/15/2023 | | | | 400 | | | | 347 |
7.580% due 09/15/2025 | | | | 550 | | | | 478 |
9.250% due 11/15/2016 | | | | 8,595 | | | | 9,175 |
| |
| Herbst Gaming, Inc. |
7.000% due 11/15/2014 | | | | 2,000 | | | | 1,885 |
| |
| Hertz Corp. |
8.875% due 01/01/2014 | | | | 4,225 | | | | 4,426 |
| |
| Horizon Lines LLC |
9.000% due 11/01/2012 | | | | 1,016 | | | | 1,080 |
| |
| Host Marriott LP |
7.125% due 11/01/2013 | | | | 1,430 | | | | 1,435 |
| |
| Idearc, Inc. |
8.000% due 11/15/2016 | | | | 3,800 | | | | 3,857 |
| |
| Ineos Group Holdings PLC |
8.500% due 02/15/2016 | | | | 3,125 | | | | 3,070 |
| |
| Ingles Markets, Inc. |
8.875% due 12/01/2011 | | | | 1,450 | | | | 1,510 |
| |
| Intelsat Bermuda Ltd. |
9.250% due 06/15/2016 | | | | 1,275 | | | | 1,361 |
| |
| Intelsat Corp. |
9.000% due 06/15/2016 | | | | 400 | | | | 421 |
| |
| Intelsat Subsidiary Holding Co. Ltd. |
8.250% due 01/15/2013 | | | | 400 | | | | 408 |
8.625% due 01/15/2015 | | | | 1,500 | | | | 1,545 |
| |
| Jefferson Smurfit Corp. U.S. |
8.250% due 10/01/2012 | | | | 600 | | | | 599 |
| |
| JET Equipment Trust |
7.630% due 08/15/2012 (a) | | | | 218 | | | | 161 |
10.000% due 06/15/2012 (a) | | | | 526 | | | | 547 |
| |
| L-3 Communications Corp. |
6.375% due 10/15/2015 | | | | 700 | | | | 665 |
7.625% due 06/15/2012 | | | | 2,450 | | | | 2,520 |
| |
| Legrand France |
8.500% due 02/15/2025 | | | | 975 | | | | 1,143 |
| |
| Lyondell Chemical Co. |
8.000% due 09/15/2014 | | | | 1,475 | | | | 1,523 |
8.250% due 09/15/2016 | | | | 925 | | | | 971 |
| |
| MGM Mirage |
6.625% due 07/15/2015 | | | | 850 | | | | 777 |
6.875% due 04/01/2016 | | | | 1,725 | | | | 1,596 |
7.500% due 06/01/2016 | | | | 1,725 | | | | 1,645 |
| |
| Mirage Resorts, Inc. |
7.250% due 08/01/2017 | | | | 2,600 | | | | 2,561 |
| |
| Nalco Co. |
7.750% due 11/15/2011 | | | | 500 | | | | 506 |
| |
| Norampac, Inc. |
6.750% due 06/01/2013 | | | | 875 | | | | 839 |
| |
| Nordic Telephone Co. Holdings ApS |
8.875% due 05/01/2016 | | | | 1,500 | | | | 1,598 |
| |
| Nortel Networks Ltd. |
9.606% due 07/15/2011 | | | | 200 | | | | 214 |
| | | | | | | | |
| | | | | PRINCIPAL
AMOUNT
(000S) | | | | VALUE (000S) |
10.125% due 07/15/2013 | | $ | | 1,500 | | $ | | 1,616 |
10.750% due 07/15/2016 | | | | 475 | | | | 527 |
| |
| Northwest Pipeline Corp. |
7.125% due 12/01/2025 | | | | 500 | | | | 516 |
| |
| Novelis, Inc. |
7.250% due 02/15/2015 | | | | 120 | | | | 124 |
| |
| NPC International, Inc. |
9.500% due 05/01/2014 | | | | 2,050 | | | | 1,999 |
| |
| OPTI Canada, Inc. |
8.250% due 12/15/2014 | | | | 1,900 | | | | 1,938 |
| |
| Owens Brockway Glass Container, Inc. |
6.750% due 12/01/2014 | | | | 1,775 | | | | 1,740 |
8.750% due 11/15/2012 | | | | 525 | | | | 550 |
| |
| Peabody Energy Corp. |
6.875% due 03/15/2013 | | | | 1,291 | | | | 1,291 |
| |
| Pilgrim’s Pride Corp. |
7.625% due 05/01/2015 | | | | 1,695 | | | | 1,699 |
8.375% due 05/01/2017 | | | | 300 | | | | 299 |
| |
| Plains Exploration & Production Co. |
7.000% due 03/15/2017 | | | | 225 | | | | 214 |
7.750% due 06/15/2015 | | | | 650 | | | | 648 |
| |
| Pogo Producing Co. |
7.875% due 05/01/2013 | | | | 175 | | | | 179 |
| |
| PQ Corp. |
7.500% due 02/15/2013 | | | | 2,225 | | | | 2,370 |
| |
| Premier Entertainment Biloxi LLC |
10.750% due 02/01/2012 | | | | 750 | | | | 784 |
| |
| Primedia, Inc. |
8.000% due 05/15/2013 | | | | 400 | | | | 423 |
| |
| Quiksilver, Inc. |
6.875% due 04/15/2015 | | | | 1,350 | | | | 1,276 |
| |
| Qwest Communications International, Inc. |
7.500% due 02/15/2014 | | | | 8,250 | | | | 8,394 |
| |
| Reynolds American, Inc. |
7.250% due 06/15/2037 | | | | 500 | | | | 514 |
7.625% due 06/01/2016 | | | | 925 | | | | 984 |
7.750% due 06/01/2018 | | | | 1,875 | | | | 2,010 |
| |
| RH Donnelley Corp. |
6.875% due 01/15/2013 | | | | 250 | | | | 238 |
8.875% due 01/15/2016 | | | | 5,950 | | | | 6,218 |
| |
| Rockwood Specialties Group, Inc. |
7.500% due 11/15/2014 | | | | 1,700 | | | | 1,717 |
| |
| Rogers Cable, Inc. |
8.750% due 05/01/2032 | | | | 400 | | | | 486 |
| |
| Roseton |
7.270% due 11/08/2010 | | | | 1,200 | | | | 1,214 |
7.670% due 11/08/2016 | | | | 2,325 | | | | 2,408 |
| |
| Royal Caribbean Cruises Ltd. |
7.250% due 03/15/2018 | | | | 1,750 | | | | 1,722 |
| |
| Sanmina-SCI Corp. |
8.125% due 03/01/2016 | | | | 2,325 | | | | 2,174 |
| |
| SemGroup LP |
8.750% due 11/15/2015 | | | | 3,075 | | | | 3,106 |
| |
| Sensata Technologies BV |
8.000% due 05/01/2014 | | | | 1,175 | | | | 1,140 |
| |
| Service Corp. International |
7.375% due 10/01/2014 | | | | 425 | | | | 429 |
7.625% due 10/01/2018 | | | | 1,025 | | | | 1,043 |
| |
| Sinclair Broadcast Group, Inc. |
8.000% due 03/15/2012 | | | | 6 | | | | 7 |
| |
| Smurfit Capital Funding PLC |
7.500% due 11/20/2025 | | | | 500 | | | | 506 |
| |
| | | | |
| 10 | | PIMCO Variable Insurance Trust | | See Accompanying Notes |
| | |
| |
| | | June 30, 2007 (Unaudited) |
| | | | | | | | |
| | | | | PRINCIPAL
AMOUNT
(000S) | | | | VALUE (000S) |
| Smurfit Kappa Funding PLC |
7.750% due 04/01/2015 | | $ | | 125 | | $ | | 126 |
9.625% due 10/01/2012 | | | | 342 | | | | 360 |
| |
| Smurfit-Stone Container Enterprises, Inc. |
8.000% due 03/15/2017 | | | | 925 | | | | 902 |
8.375% due 07/01/2012 | | | | 750 | | | | 755 |
| |
| Sonat, Inc. | | | | | | | | |
7.000% due 02/01/2018 | | | | 500 | | | | 492 |
| |
| Station Casinos, Inc. | | | | | | | | |
6.875% due 03/01/2016 | | | | 1,275 | | | | 1,132 |
7.750% due 08/15/2016 | | | | 2,295 | | | | 2,284 |
| |
| Suburban Propane Partners LP |
6.875% due 12/15/2013 | | | | 2,750 | | | | 2,668 |
| |
| Sungard Data Systems, Inc. |
9.125% due 08/15/2013 | | | | 3,141 | | | | 3,231 |
| |
| Superior Essex Communications LLC |
9.000% due 04/15/2012 | | | | 500 | | | | 513 |
| |
| Supervalu, Inc. | | | | | | | | |
7.500% due 11/15/2014 | | | | 1,475 | | | | 1,519 |
| |
| Tenet Healthcare Corp. | | | | | | | | |
7.375% due 02/01/2013 | | | | 1,766 | | | | 1,605 |
| |
| Tesoro Corp. | | | | | | | | |
6.500% due 06/01/2017 | | | | 1,000 | | | | 982 |
| |
| TransDigm, Inc. | | | | | | | | |
7.750% due 07/15/2014 | | | | 1,330 | | | | 1,350 |
| |
| Triad Hospitals, Inc. | | | | | | | | |
7.000% due 11/15/2013 | | | | 2,640 | | | | 2,781 |
| |
| Trinity Industries, Inc. | | | | | | | | |
6.500% due 03/15/2014 | | | | 780 | | | | 766 |
| |
| TRW Automotive, Inc. | | | | | | | | |
7.000% due 03/15/2014 | | | | 500 | | | | 479 |
7.250% due 03/15/2017 | | | | 550 | | | | 527 |
| |
| U.S. Airways Group, Inc. | | | | | | | | |
9.330% due 01/01/2049 (a) | | | | 84 | | | | 1 |
| |
| United Airlines, Inc. | | | | | | | | |
6.071% due 03/01/2013 | | | | 215 | | | | 216 |
6.201% due 03/01/2010 | | | | 108 | | | | 109 |
6.602% due 03/01/2015 | | | | 243 | | | | 245 |
| |
| Unity Media GmbH | | | | | | | | |
10.375% due 02/15/2015 | | | | 750 | | | | 767 |
| |
| Verso Paper Holdings LLC | | | | | | | | |
9.125% due 08/01/2014 | | | | 3,150 | | | | 3,268 |
| |
| West Corp. | | | | | | | | |
9.500% due 10/15/2014 | | | | 300 | | | | 309 |
11.000% due 10/15/2016 | | | | 300 | | | | 315 |
| |
| Williams Cos., Inc. | | | | | | | | |
7.625% due 07/15/2019 | | | | 3,950 | | | | 4,187 |
7.750% due 06/15/2031 | | | | 775 | | | | 824 |
7.875% due 09/01/2021 | | | | 2,575 | | | | 2,781 |
| |
| Williams Partners LP | | | | | | | | |
7.250% due 02/01/2017 | | | | 425 | | | | 429 |
| |
| Wynn Las Vegas LLC | | | | | | | | |
6.625% due 12/01/2014 | | | | 5,400 | | | | 5,231 |
| |
| Xerox Capital Trust I | | | | | | | | |
8.000% due 02/01/2027 | | | | 2,100 | | | | 2,161 |
| | | | | | | | |
| | | | | | | | 272,270 |
| | | | | | | | |
|
| UTILITIES 12.4% |
| AES Corp. | | | | | | | | |
8.750% due 05/15/2013 | | | | 2,325 | | | | 2,464 |
| |
| Cincinnati Bell, Inc. | | | | | | | | |
7.250% due 07/15/2013 | | | | 2,500 | | | | 2,575 |
8.375% due 01/15/2014 | | | | 1,270 | | | | 1,289 |
| |
| | | | | | | | |
| | | | | PRINCIPAL
AMOUNT
(000S) | | | | VALUE (000S) |
| Citizens Communications Co. |
7.125% due 03/15/2019 | | $ | | 2,300 | | $ | | 2,185 |
7.450% due 07/01/2035 | | | | 250 | | | | 221 |
7.875% due 01/15/2027 | | | | 425 | | | | 415 |
9.000% due 08/15/2031 | | | | 1,425 | | | | 1,475 |
| |
| Complete Production Services, Inc. |
8.000% due 12/15/2016 | | | | 575 | | | | 584 |
| |
| Edison Mission Energy | | | | | | | | |
7.000% due 05/15/2017 | | | | 675 | | | | 639 |
7.200% due 05/15/2019 | | | | 975 | | | | 921 |
7.750% due 06/15/2016 | | | | 1,000 | | | | 1,000 |
| |
| Hawaiian Telcom Communications, Inc. |
9.750% due 05/01/2013 | | | | 1,500 | | | | 1,579 |
10.860% due 05/01/2013 | | | | 1,000 | | | | 1,025 |
| |
| Homer City Funding LLC | | | | | | | | |
8.734% due 10/01/2026 | | | | 974 | | | | 1,076 |
| |
| MetroPCS Wireless, Inc. | | | | | | | | |
9.250% due 11/01/2014 | | | | 1,300 | | | | 1,349 |
| |
| Midwest Generation LLC | | | | | | | | |
8.560% due 01/02/2016 | | | | 4,487 | | | | 4,787 |
| |
| Mobile Telesystems Finance S.A. |
8.000% due 01/28/2012 | | | | 450 | | | | 464 |
8.375% due 10/14/2010 | | | | 500 | | | | 522 |
| |
| Nevada Power Co. | | | | | | | | |
6.750% due 07/01/2037 | | | | 300 | | | | 307 |
| |
| Nextel Communications, Inc. |
7.375% due 08/01/2015 | | | | 1,575 | | | | 1,576 |
| |
| Northwestern Bell Telephone |
7.750% due 05/01/2030 | | | | 1,208 | | | | 1,225 |
| |
| NRG Energy, Inc. | | | | | | | | |
7.250% due 02/01/2014 | | | | 1,000 | | | | 1,005 |
7.375% due 02/01/2016 | | | | 5,665 | | | | 5,693 |
7.375% due 01/15/2017 | | | | 450 | | | | 453 |
| |
| NTL Cable PLC | | | | | | | | |
9.125% due 08/15/2016 | | | | 500 | | | | 526 |
| |
| PSEG Energy Holdings LLC | | | | | | | | |
8.500% due 06/15/2011 | | | | 4,250 | | | | 4,523 |
| |
| Qwest Corp. | | | | | | | | |
7.200% due 11/10/2026 | | | | 1,700 | | | | 1,679 |
8.875% due 03/15/2012 | | | | 2,625 | | | | 2,841 |
| |
| Reliant Energy, Inc. | | | | | | | | |
6.750% due 12/15/2014 | | | | 3,075 | | | | 3,152 |
7.625% due 06/15/2014 | | | | 1,000 | | | | 980 |
7.875% due 06/15/2017 | | | | 1,300 | | | | 1,271 |
9.250% due 07/15/2010 | | | | 0 | | | | 1 |
| |
| Rural Cellular Corp. | | | | | | | | |
9.875% due 02/01/2010 | | | | 1,775 | | | | 1,864 |
| |
| Sierra Pacific Power Co. | | | | | | |
6.750% due 07/01/2037 | | | | 500 | | | | 506 |
| |
| Sierra Pacific Resources | | | | |
6.750% due 08/15/2017 | | | | 775 | | | | 766 |
7.803% due 06/15/2012 | | | | 625 | | | | 660 |
8.625% due 03/15/2014 | | | | 1,250 | | | | 1,348 |
| |
| South Point Energy Center LLC |
8.400% due 05/30/2012 (h) | | | | 1,158 | | | | 1,145 |
| |
| Tenaska Alabama Partners LP |
7.000% due 06/30/2021 | | | | 2,189 | | | | 2,251 |
| |
| Time Warner Telecom Holdings, Inc. |
9.250% due 02/15/2014 | | | | 2,875 | | | | 3,062 |
| |
| | | | | | | | |
| | | | | PRINCIPAL
AMOUNT
(000S) | | | | VALUE (000S) |
| UBS Luxembourg S.A. for OJSC Vimpel Communications |
8.250% due 05/23/2016 | | $ | | 1,000 | | $ | | 1,046 |
| | | | | | | | |
| | | | | | | | 62,450 |
| | | | | | | | |
Total Corporate Bonds & Notes
(Cost $383,250) | | 383,433 |
| | | | | | | | |
|
| CONVERTIBLE BONDS & NOTES 0.9% |
| Advanced Micro Devices, Inc. |
6.000% due 05/01/2015 | | | | 750 | | | | 726 |
| |
| Chesapeake Energy Corp. |
2.750% due 11/15/2035 | | | | 300 | | | | 327 |
| |
| CMS Energy Corp. | | | | | | | | |
2.875% due 12/01/2024 | | | | 1,000 | | | | 1,311 |
| |
| Deutsche Bank AG | | | | | | | | |
0.000% due 07/14/2008 | | | | 300 | | | | 280 |
0.000% due 09/29/2008 | | | | 275 | | | | 258 |
0.000% due 10/24/2008 | | | | 350 | | | | 344 |
| |
| Host Hotels & Resorts, Inc. |
2.625% due 04/15/2027 | | | | 100 | | | | 92 |
| |
| Nortel Networks Corp. | | | | | | | | |
2.125% due 04/15/2014 | | | | 800 | | | | 785 |
| |
| Qwest Communications International, Inc. |
3.500% due 11/15/2025 | | | | 200 | | | | 351 |
| | | | | | | | |
Total Convertible Bonds & Notes
(Cost $4,354) | | 4,474 |
| | | | | | | | |
|
| MUNICIPAL BONDS & NOTES 0.3% |
| Bell, California Public Financing Authority Notes, Series 2006 |
7.400% due 11/01/2007 | | | | 1,500 | | | | 1,502 |
| | | | | | | | |
Total Municipal Bonds & Notes
(Cost $1,500) | | 1,502 |
| | | | | | | | |
|
| U.S. GOVERNMENT AGENCIES 3.0% |
| Fannie Mae |
5.500% due 07/01/2037 - 08/01/2037 | | | | 15,600 | | | | 15,042 |
| | | | | | | | |
Total U.S. Government Agencies
(Cost $14,999) | | 15,042 |
| | | | | | | | |
|
| FOREIGN CURRENCY-DENOMINATED ISSUES 2.9% |
| Bombardier, Inc. | | | | | | | | |
7.250% due 11/15/2016 | | EUR | | 1,750 | | | | 2,478 |
| |
| JSG Holding PLC | | | | | | | | |
10.125% due 10/01/2012 | | | | 15 | | | | 22 |
| |
| Lighthouse International Co. S.A. |
8.000% due 04/30/2014 | | | | 1,670 | | | | 2,399 |
| |
| Nordic Telephone Co. Holdings ApS |
5.875% due 11/30/2014 | | | | 446 | | | | 610 |
6.125% due 11/30/2014 | | | | 550 | | | | 755 |
8.250% due 05/01/2016 | | | | 1,000 | | | | 1,455 |
| |
| NTL Cable PLC | | | | | | | | |
8.750% due 04/15/2014 | | | | 1,000 | | | | 1,418 |
| |
| Royal Bank of Scotland Group PLC |
9.370% due 04/06/2011 | | GBP | | 586 | | | | 1,181 |
| |
| SigmaKalon | | | | | | | | |
6.164% due 06/30/2012 | | EUR | | 924 | | | | 1,252 |
| |
| UPC Financing Partnership |
5.942% due 12/31/2014 | | | | 942 | | | | 1,276 |
| |
| UPC Holding BV | | | | | | | | |
7.750% due 01/15/2014 | | | | 600 | | | | 808 |
8.625% due 01/15/2014 | | | | 800 | | | | 1,113 |
| | | | | | | | |
Total Foreign Currency-Denominated Issues (Cost $13,185) | | 14,767 |
| | | | | | | | |
| | | | | | |
| See Accompanying Notes | | Semiannual Report | | June 30, 2007 | | 11 |
Schedule of Investments High Yield Portfolio (Cont.)
| | | | | | | | |
| | | | | SHARES | | | |
VALUE (000S) |
| CONVERTIBLE PREFERRED STOCKS 0.4% |
| Chesapeake Energy Corp. | | | | | | | | |
4.500% due 12/31/2049 | | | | 5,000 | | $ | | 507 |
5.000% due 12/31/2049 | | | | 2,900 | | | | 324 |
| |
| Freeport-McMoRan Copper & Gold, Inc. |
6.750% due 05/01/2010 | | | | 3,300 | | | | 424 |
| |
| Vale Capital Ltd. | | | | | | | | |
5.500% due 06/15/2010 | | | | 14,100 | | | | 697 |
| | | | | | | | |
Total Convertible Preferred Stocks (Cost $1,863) | | | | 1,952 |
| | | | | | | | |
|
| PREFERRED STOCKS 0.4% |
| Fresenius Medical Care Capital Trust II |
7.875% due 02/01/2008 | | | | 2,050 | | | | 2,065 |
| | | | | | | | |
Total Preferred Stocks
(Cost $2,172) | | | | 2,065 |
| | | | | | | | |
| | | | | | | | |
| | | | | PRINCIPAL
AMOUNT
(000S) | | | | VALUE (000S) |
| SHORT-TERM INSTRUMENTS 5.0% |
|
| COMMERCIAL PAPER 4.8% |
| Societe Generale NY | | | | | | | | |
5.245% due 11/26/2007 | | $ | | 21,300 | | $ | | 21,043 |
| |
| TotalFinaElf Capital S.A. | | | | | | | | |
5.340% due 07/02/2007 | | | | 1,900 | | | | 1,900 |
| |
| UBS Finance Delaware LLC | | | | |
5.350% due 10/23/2007 | | | | 1,400 | | | | 1,400 |
| | | | | | | | |
| | | | | | | | 24,343 |
| | | | | | | | |
|
| REPURCHASE AGREEMENTS 0.1% |
| State Street Bank and Trust Co. |
4.900% due 07/02/2007 | | | | 728 | | | | 728 |
| | | | | | | | |
(Dated 06/29/2007. Collateralized by Fannie Mae 3.250% due 08/15/2008 valued at $747. Repurchase proceeds are $728.) |
| | | | | | | | |
| | | | | PRINCIPAL
AMOUNT
(000S) | | | | VALUE (000S) |
| U.S. TREASURY BILLS 0.1% |
4.605% due 09/13/2007 (c) | | $ | | 250 | | $ | | 247 |
| | | | | | | | |
Total Short-Term Instruments
(Cost $25,327) | | | | 25,318 |
| | | | | | | | |
|
|
Total Investments (d) 97.4%
(Cost $487,844) | | $ | | 489,863 |
|
| Other Assets and Liabilities (Net) 2.6% | | 12,935 |
| | | | | | | | |
| Net Assets 100.0% | | | | | | $ | | 502,798 |
| | | | | | | | |
Notes to Schedule of Investments (amounts in thousands*, except number of contracts):
* A zero balance may reflect actual amounts rounding to less than one thousand.
(a) Security is in default.
(b) Payment in-kind bond security.
(c) Securities with an aggregate market value of $247 have been pledged as collateral for swap and swaption contracts on June 30, 2007.
(d) As of June 30, 2007, portfolio securities with an aggregate value of $9,228 were valued in good faith and pursuant to the guidelines established by the Board of Trustees.
(e) Swap agreements outstanding on June 30, 2007:
Credit Default Swaps
| | | | | | | | | | | | | | | | |
| Counterparty | | Reference Entity | | Buy/Sell
Protection (1) | | (Pay)/Receive
Fixed Rate | | | Expiration
Date | | Notional
Amount | | Unrealized
Appreciation/
(Depreciation) | |
Deutsche Bank AG | | SOFTBANK Corp. 1.750% due 03/31/2014 | | Sell | | 2.300% | | | 09/20/2007 | | JPY | 300,000 | | $ | 12 | |
Bank of America | | MGM Mirage 5.875% due 02/27/2014 | | Buy | | (0.810% | ) | | 06/20/2010 | | $ | 1,500 | | | 18 | |
Bank of America | | Dow Jones CDX N.A. HY7 Index | | Buy | | (3.250% | ) | | 12/20/2011 | | | 3,300 | | | (30 | ) |
Bank of America | | Aramark Corp. 8.500 due 02/01/2015 | | Sell | | 2.302% | | | 06/20/2012 | | | 200 | | | (6 | ) |
Bank of America | | MGM Mirage 5.875% due 02/27/2014 | | Sell | | 1.530% | | | 06/20/2012 | | | 1,500 | | | (51 | ) |
Bank of America | | Community Health Systems 8.875% due 07/15/2015 | | Sell | | 2.850% | | | 09/20/2012 | | | 900 | | | 4 | |
Barclays Bank PLC | | Domtar, Inc. 7.875% due 10/15/2011 | | Sell | | 1.500% | | | 09/20/2007 | | | 400 | | | 1 | |
Barclays Bank PLC | | Russia Government International Bond 7.500% due 03/31/2030 | | Sell | | 0.760% | | | 02/20/2009 | | | 1,500 | | | 16 | |
Barclays Bank PLC | | RSHB Capital S.A. for OJSC Russian Agricultural Bank 7.175% due 05/16/2013 | | Sell | | 0.740% | | | 03/20/2009 | | | 1,000 | | | 9 | |
Barclays Bank PLC | | Brazilian Government International Bond 12.250% due 03/06/2030 | | Sell | | 0.900% | | | 02/20/2012 | | | 2,000 | | | 23 | |
Barclays Bank PLC | | Qwest Capital Funding, Inc. 7.250% due 02/15/2011 | | Sell | | 1.470% | | | 03/20/2012 | | | 2,000 | | | (54 | ) |
Barclays Bank PLC | | Allied Waste North America, Inc. 7.375% due 04/15/2014 | | Sell | | 2.030% | | | 06/20/2012 | | | 500 | | | (16 | ) |
Barclays Bank PLC | | Forest Oil Corp. 7.750% due 05/01/2014 | | Sell | | 1.770% | | | 06/20/2012 | | | 200 | | | (3 | ) |
Barclays Bank PLC | | Freescale Semiconductor, Inc. 8.875% due 12/15/2014 | | Sell | | 3.620% | | | 06/20/2012 | | | 200 | | | (4 | ) |
Barclays Bank PLC | | Nortel Networks Corp. 4.250% due 09/01/2008 | | Sell | | 2.360% | | | 06/20/2012 | | | 200 | | | (3 | ) |
Barclays Bank PLC | | Sungard Data Systems, Inc. 9.125% due 08/15/2013 | | Sell | | 2.600% | | | 06/20/2012 | | | 200 | | | (5 | ) |
Bear Stearns & Co., Inc. | | Georgia-Pacific Corp. 8.125% due 05/15/2011 | | Sell | | 1.950% | | | 06/20/2012 | | | 200 | | | (6 | ) |
Citibank N.A. | | Ford Motor Credit Co. 7.000% due 10/01/2013 | | Sell | | 2.000% | | | 09/20/2007 | | | 1,000 | | | 4 | |
Citibank N.A. | | General Motors Acceptance Corp.
6.875% due 08/28/2012 | | Sell | | 1.120% | | | 12/20/2008 | | | 1,000 | | | (3 | ) |
Citibank N.A. | | Georgia-Pacific Corp. 8.125% due 05/15/2011 | | Buy | | (1.070% | ) | | 06/20/2010 | | | 1,500 | | | 28 | |
Citibank N.A. | | Nortel Networks Corp. 4.250% due 09/01/2008 | | Sell | | 2.050% | | | 06/20/2011 | | | 1,500 | | | (12 | ) |
Citibank N.A. | | General Motors Acceptance Corp.
6.875% due 08/28/2012 | | Sell | | 1.050% | | | 03/20/2012 | | | 3,000 | | | (94 | ) |
Citibank N.A. | | General Motors Acceptance Corp.
6.875% due 08/28/2012 | | Sell | | 1.600% | | | 03/20/2012 | | | 1,000 | | | (10 | ) |
Citibank N.A. | | General Motors Acceptance Corp.
6.875% due 08/28/2012 | | Sell | | 1.880% | | | 03/20/2012 | | | 1,000 | | | 0 | |
Citibank N.A. | | Chesapeake Energy Corp. 6.875% due 01/15/2016 | | Sell | | 1.030% | | | 06/20/2012 | | | 100 | | | (1 | ) |
Citibank N.A. | | General Motors Acceptance Corp.
6.875% due 08/28/2012 | | Sell | | 2.000% | | | 06/20/2012 | | | 1,500 | | | 5 | |
Citibank N.A. | | Georgia-Pacific Corp. 8.125% due 05/15/2011 | | Sell | | 1.820% | | | 06/20/2012 | | | 1,000 | | | (38 | ) |
Citibank N.A. | | LCDX N.A. 8 Index | | Sell | | 1.200% | | | 06/20/2012 | | | 1,500 | | | (35 | ) |
Citibank N.A. | | Nortel Networks Corp. 4.250% due 09/01/2008 | | Sell | | 2.300% | | | 06/20/2012 | | | 1,000 | | | (16 | ) |
| | | | |
| 12 | | PIMCO Variable Insurance Trust | | See Accompanying Notes |
| | |
| |
| | | June 30, 2007 (Unaudited) |
| | | | | | | | | | | | | | | | |
| Counterparty | | Reference Entity | | Buy/Sell
Protection (1) | | (Pay)/Receive
Fixed Rate | | | Expiration
Date | | Notional
Amount | | Unrealized
Appreciation/
(Depreciation) | |
Citibank N.A. | | Nortel Networks Corp. 4.250% due 09/01/2008 | | Sell | | 2.400% | | | 06/20/2012 | | $ | 1,000 | | $ | (14 | ) |
Citibank N.A. | | Georgia-Pacific Corp. 7.750% due 11/15/2029 | | Sell | | 2.220% | | | 09/20/2012 | | | 500 | | | (13 | ) |
Citibank N.A. | | Nortel Networks Corp. 4.250% due 09/01/2008 | | Sell | | 2.600% | | | 09/20/2012 | | | 625 | | | (6 | ) |
Citibank N.A. | | Sungard Data Systems, Inc. 9.125% due 08/15/2013 | | Sell | | 2.920% | | | 09/20/2012 | | | 1,000 | | | (17 | ) |
Citibank N.A. | | Anadarko Petroleum Corp. 6.125% due 03/15/2012 | | Buy | | (0.490% | ) | | 03/20/2014 | | | 1,000 | | | (2 | ) |
Citibank N.A. | | Chesapeake Energy Corp. 6.875% due 01/15/2016 | | Sell | | 1.370% | | | 03/20/2014 | | | 1,000 | | | (14 | ) |
Credit Suisse First Boston | | Abitibi-Consolidated Co. of Canada
8.375% due 04/01/2015 | | Sell | | 0.650% | | | 03/20/2008 | | | 1,000 | | | (17 | ) |
Credit Suisse First Boston | | Ford Motor Credit Co. 7.000% due 10/01/2013 | | Sell | | 0.750% | | | 03/20/2008 | | | 2,500 | | | (10 | ) |
Credit Suisse First Boston | | Ford Motor Credit Co. 7.000% due 10/01/2013 | | Sell | | 1.450% | | | 12/20/2008 | | | 2,000 | | | (5 | ) |
Credit Suisse First Boston | | Forest Oil Corp. 7.750% due 05/01/2014 | | Sell | | 1.610% | | | 06/20/2012 | | | 400 | | | (9 | ) |
Credit Suisse First Boston | | Solectron Global Finance Ltd. 8.000% due 03/15/2016 | | Sell | | 3.700% | | | 06/20/2012 | | | 1,000 | | | 93 | |
Credit Suisse First Boston | | Forest Oil Corp. 7.750% due 05/01/2014 | | Sell | | 1.930% | | | 09/20/2012 | | | 1,000 | | | (11 | ) |
Credit Suisse First Boston | | Pride International, Inc. 7.375% due 07/15/2014 | | Sell | | 1.950% | | | 09/20/2012 | | | 300 | | | (3 | ) |
Deutsche Bank AG | | Dow Jones CDX N.A. HY7 Index | | Buy | | (3.250% | ) | | 12/20/2011 | | | 100 | | | (1 | ) |
Deutsche Bank AG | | LCDX N.A. 8 Index | | Sell | | 1.200% | | | 06/20/2012 | | | 500 | | | (10 | ) |
Goldman Sachs & Co. | | Host Marriott LP 7.125% due 11/01/2013 | | Sell | | 1.770% | | | 12/20/2010 | | | 500 | | | 5 | |
Goldman Sachs & Co. | | Dow Jones CDX N.A. HY7 Index | | Sell | | 0.785% | | | 12/20/2011 | | | 800 | | | 0 | |
Goldman Sachs & Co. | | General Motors Acceptance Corp.
6.875% due 08/28/2012 | | Sell | | 1.025% | | | 03/20/2012 | | | 2,000 | | | (64 | ) |
HSBC Bank USA | | NAK Naftogaz Ukrainy 8.125% due 09/30/2009 | | Sell | | 3.000% | | | 04/20/2008 | | | 1,500 | | | (8 | ) |
HSBC Bank USA | | Ukraine Government International Bond 7.650% due 06/11/2013 | | Sell | | 0.700% | | | 04/20/2009 | | | 1,500 | | | 6 | |
JPMorgan Chase & Co. | | Multiple Reference Entities of Gazprom | | Sell | | 0.770% | | | 02/20/2012 | | | 2,000 | | | 23 | |
Lehman Brothers, Inc. | | NRG Energy, Inc. 7.250% due 02/01/2014 | | Sell | | 0.750% | | | 03/20/2008 | | | 1,800 | | | (5 | ) |
Lehman Brothers, Inc. | | Nortel Networks Corp. 4.250% due 09/01/2008 | | Buy | | (1.520% | ) | | 06/20/2010 | | | 1,500 | | | 10 | |
Lehman Brothers, Inc. | | Brazilian Government International Bond 12.250% due 03/06/2030 | | Sell | | 1.370% | | | 08/20/2011 | | | 5,400 | | | 177 | |
Lehman Brothers, Inc. | | Dow Jones CDX N.A. HY7 Index | | Sell | | 0.720% | | | 12/20/2011 | | | 2,000 | | | (6 | ) |
Lehman Brothers, Inc. | | Solectron Global Finance Ltd. 8.000% due 03/15/2016 | | Sell | | 3.100% | | | 03/20/2012 | | | 1,000 | | | 67 | |
Lehman Brothers, Inc. | | Chesapeake Energy Corp. 6.875% due 01/15/2016 | | Sell | | 1.090% | | | 06/20/2012 | | | 500 | | | (4 | ) |
Lehman Brothers, Inc. | | Chesapeake Energy Corp. 6.875% due 01/15/2016 | | Sell | | 1.110% | | | 06/20/2012 | | | 1,000 | | | (7 | ) |
Lehman Brothers, Inc. | | Forest Oil Corp. 7.750% due 05/01/2014 | | Sell | | 1.750% | | | 06/20/2012 | | | 250 | | | (4 | ) |
Lehman Brothers, Inc. | | LCDX N.A. 8 Index | | Sell | | 1.200% | | | 06/20/2012 | | | 600 | | | (14 | ) |
Lehman Brothers, Inc. | | Pride International, Inc. 7.375% due 07/15/2014 | | Sell | | 1.750% | | | 06/20/2012 | | | 325 | | | (4 | ) |
Lehman Brothers, Inc. | | Celestica, Inc. 7.625% due 07/01/2013 | | Sell | | 4.250% | | | 09/20/2012 | | | 1,000 | | | (13 | ) |
Lehman Brothers, Inc. | | CSC Holdings, Inc. 7.625% due 07/15/2018 | | Sell | | 2.520% | | | 09/20/2012 | | | 1,000 | | | (13 | ) |
Merrill Lynch & Co., Inc. | | CSC Holdings, Inc. 7.625% due 07/15/2018 | | Sell | | 2.080% | | | 06/20/2012 | | | 400 | | | (11 | ) |
Merrill Lynch & Co., Inc. | | Georgia-Pacific Corp. 8.125% due 05/15/2011 | | Sell | | 1.800% | | | 06/20/2012 | | | 500 | | | (19 | ) |
Morgan Stanley | | Russia Government International Bond 7.500% due 03/31/2030 | | Sell | | 0.245% | | | 06/20/2008 | | | 200 | | | 0 | |
Morgan Stanley | | Allied Waste North America, Inc.
7.375% due 04/15/2014 | | Buy | | (1.120% | ) | | 06/20/2010 | | | 1,500 | | | 17 | |
Morgan Stanley | | Qwest Capital Funding, Inc. 7.250% due 02/15/2011 | | Sell | | 1.800% | | | 06/20/2010 | | | 2,000 | | | 28 | |
Morgan Stanley | | Multiple Reference Entities of Gazprom | | Sell | | 1.050% | | | 04/20/2011 | | | 3,000 | | | 63 | |
Morgan Stanley | | Brazilian Government International Bond 12.250% due 03/06/2030 | | Sell | | 1.380% | | | 08/20/2011 | | | 5,400 | | | 179 | |
Morgan Stanley | | Allied Waste North America, Inc.
7.375% due 04/15/2014 | | Sell | | 2.020% | | | 06/20/2012 | | | 1,000 | | | (34 | ) |
Morgan Stanley | | Forest Oil Corp. 7.750% due 05/01/2014 | | Sell | | 1.700% | | | 06/20/2012 | | | 500 | | | (9 | ) |
Morgan Stanley | | Forest Oil Corp. 7.750% due 05/01/2014 | | Sell | | 1.730% | | | 06/20/2012 | | | 250 | | | (4 | ) |
Morgan Stanley | | Reliant Energy, Inc. 6.750% due 12/15/2014 | | Sell | | 2.200% | | | 06/20/2012 | | | 425 | | | (12 | ) |
Morgan Stanley | | Aramark Corp. 8.500 due 02/01/2015 | | Sell | | 2.680% | | | 09/20/2012 | | | 500 | | | (9 | ) |
Morgan Stanley | | Nortel Networks Corp. 4.250% due 09/01/2008 | | Sell | | 2.630% | | | 09/20/2012 | | | 625 | | | (5 | ) |
Morgan Stanley | | Pride International, Inc. 7.375% due 07/15/2014 | | Sell | | 1.960% | | | 09/20/2012 | | | 700 | | | (4 | ) |
Royal Bank of Scotland Group PLC | | Indonesia Government International Bond 6.750% due 03/10/2014 | | Sell | | 1.390% | | | 12/20/2011 | | | 3,000 | | | 51 | |
Royal Bank of Scotland Group PLC | | Indonesia Government International Bond 6.750% due 03/10/2014 | | Sell | | 1.100% | | | 03/20/2012 | | | 1,000 | | | 4 | |
| | | | | | | | | | | | | | | | |
| | | | | | | | | | | | | | $ | 75 | |
| | | | | | | | | | | | | | | | |
(1) If the Portfolio is a seller of protection and a credit event occurs, as defined under the terms of that particular swap agreement, the Portfolio will pay to the buyer of the protection an amount up to the notional value of the swap and in certain instances, take delivery of the security. As a buyer of protection, the Portfolio will generally receive from the seller of protection an amount up to the notional amount of the swap if a credit event occurs.
Interest Rate Swaps
| | | | | | | | | | | | | | | |
| Counterparty | | Floating Rate Index | | Pay/Receive
Floating Rate | | Fixed Rate | | Expiration
Date | | Notional
Amount | | Unrealized
(Depreciation) | |
Morgan Stanley | | BRL-CDI-Compounded | | Pay | | 10.115% | | 01/02/2012 | | BRL | 21,000 | | $ | (219 | ) |
Citibank N.A. | | 28-Day Mexico Interbank TIIE Banxico | | Pay | | 7.910% | | 05/14/2009 | | MXN | 25,000 | | | 0 | |
Morgan Stanley | | 28-Day Mexico Interbank TIIE Banxico | | Pay | | 7.910% | | 05/14/2009 | | | 33,000 | | | (1 | ) |
| | | | | | | | | | | | | | | |
| | | | | | | | | | | | | $ | (220 | ) |
| | | | | | | | | | | | | | | |
| | | | | | |
| See Accompanying Notes | | Semiannual Report | | June 30, 2007 | | 13 |
| | |
| |
| Schedule of Investments High Yield Portfolio (Cont.) | | June 30, 2007 (Unaudited) |
Total Return Swaps
| | | | | | | | | | | | | | |
| Counterparty | | Type | | Receive Total Return | | Pay | | Expiration
Date | | # of
Contracts | | Unrealized
(Depreciation) | |
Merrill Lynch & Co., Inc. | | Long | | Motorola, Inc. | | 5.579% | | 07/23/2007 | | 10,100 | | $ | (2 | ) |
| | | | | | | | | | | | | | |
(f) Restricted securities as of June 30, 2007:
| | | | | | | | | | | | | | |
| Issuer Description | | Coupon | | Maturity
Date | | Acquisition
Date | | Cost | | Market
Value | | Market Value
as Percentage
of Net Assets |
Continental Airlines, Inc. | | 6.920% | | 04/02/2013 | | 07/01/2003 | | $ | 657 | | $ | 725 | | 0.15% |
Ferrellgas Partners LP | | 8.870% | | 08/01/2009 | | 06/30/2003 | | | 1,260 | | | 1,272 | | 0.25% |
| | | | | | | | | | | | | | |
| | | | | | | | $ | 1,917 | | $ | 1,997 | | 0.40% |
| | | | | | | | | | | | | | |
(g) Foreign currency contracts outstanding on June 30, 2007:
| | | | | | | | | | | | | | | | | |
| Type | | Currency | | Principal
Amount
Covered by
Contract | | Settlement
Month | | Unrealized
Appreciation | | Unrealized
(Depreciation) | | | Net Unrealized
(Depreciation) | |
Sell | | EUR | | 12,247 | | 07/2007 | | $ | 0 | | $ | (160 | ) | | $ | (160 | ) |
Sell | | GBP | | 704 | | 08/2007 | | | 0 | | | (8 | ) | | | (8 | ) |
| | | | | | | | | | | | | | | | | |
| | | | | | | | $ | 0 | | $ | (168 | ) | | $ | (168 | ) |
| | | | | | | | | | | | | | | | | |
(h) Security is subject to a forbearance agreement entered into by the Portfolio which forbears the Portfolio from taking action to, among other things, accelerate and collect payments on the subject note with respect to specified events of default.
| | | | |
| 14 | | PIMCO Variable Insurance Trust | | See Accompanying Notes |
| | |
| |
| Notes to Financial Statements | | June 30, 2007 (Unaudited) |
1. ORGANIZATION
The High Yield Portfolio (the “Portfolio”) is a series of the PIMCO Variable Insurance Trust (the “Trust”). The Trust is registered under the Investment Company Act of 1940 (the “Act”), as amended, as an open-end management investment company organized as a Delaware business trust on October 3, 1997. The Portfolio offers three classes of shares: Institutional, Administrative and Advisor. Information presented on these financial statements pertains to the Institutional Class of the Portfolio. Certain detailed financial information for the Administrative Class and Advisor Class is provided separately and is available upon request. The Trust is designed to be used as an investment vehicle by Separate Accounts of insurance companies that fund variable annuity contracts and variable life insurance policies and by qualified pension and retirement plans.
2. SIGNIFICANT ACCOUNTING POLICIES
The following is a summary of significant accounting policies consistently followed by the Portfolio in the preparation of its financial statements in conformity with accounting principles generally accepted in the United States of America (“GAAP”). The preparation of financial statements in accordance with GAAP requires management to make estimates and assumptions that affect the reported amounts and disclosures on the financial statements. Actual results could differ from those estimates.
(a) Security Valuation Portfolio securities are valued as of the close of regular trading (normally 4:00 p.m., Eastern Time) on each day that the New York Stock Exchange (“NYSE”) is open. Portfolio securities and other assets for which market quotes are readily available are stated at market value. Market value is generally determined on the basis of last reported sales prices, or if no sales are reported, based on quotes obtained from a quotation reporting system, established market makers, or pricing services. Fixed-income securities and non-exchange traded derivatives are normally valued on the basis of quotes obtained from brokers and dealers or pricing services. Prices obtained from independent pricing services use information provided by market makers or estimates of market values obtained from yield data relating to investments or securities with similar characteristics. Certain fixed income securities purchased on a delayed-delivery basis are marked to market daily until settlement at the forward settlement date. Short-term investments having a maturity of 60 days or less are generally valued at amortized cost. Exchange traded options, futures and options on futures are valued at the settlement price determined by the relevant exchange. With respect to any portion of the Portfolio’s assets that are invested in one or more open end management investment companies, the Portfolio’s net asset value (“NAV”) will be calculated based upon the NAVs of such investments.
Investments initially valued in currencies other than the U.S. dollar are converted to the U.S. dollar using exchange rates obtained from pricing services. As a result, the NAV of the Portfolio’s securities may be affected by changes in the value of currencies in relation to the U.S. dollar. The value of securities traded in markets outside the United States or denominated in currencies other than the U.S. dollar may be affected significantly on a day that the NYSE is closed and an investor is not able to purchase, redeem or exchange shares.
Securities and other assets for which market quotes are not readily available are valued at fair value as determined in good faith by the Board of Trustees or persons acting at their direction. The Board of Trustees has adopted methods for valuing securities and other assets in circumstances where market quotes are not readily available, and has delegated to Pacific Investment Management Company LLC (“PIMCO”) the responsibility for applying the valuation methods. In the event that market quotes are not readily available, and the security or asset cannot be valued pursuant to one of the valuation methods, the value of the security or asset will be determined in good faith by the Valuation Committee of the Board of Trustees, generally based upon recommendations provided by PIMCO.
Market quotes are considered not readily available in circumstances where there is an absence of current or reliable market-based data (e.g., trade information, bid/asked information, broker quotes), including where events occur after the close of the relevant market, but prior to the close of regular trading, that materially affect the values of the Portfolio’s securities or assets. In addition, market quotes are considered not readily available when, due to extraordinary circumstances, the exchanges or markets on which the securities trade, do not open for trading for the entire day and no other market prices are available. The Board has delegated to PIMCO the responsibility for monitoring significant events that may materially affect the values of the Portfolio’s securities or assets and for determining whether the value of the applicable securities or assets should be re-evaluated in light of such significant events.
When the Portfolio uses fair value pricing to determine its NAV, securities will not be priced on the basis of quotations from the primary market in which they are traded, but rather may be priced by another method that the Board of Trustees or persons acting at their direction believe accurately reflects fair value. The Trust’s policy is intended to result in a calculation of the Portfolio’s NAV that fairly reflects security values as of the time of pricing. However, fair values determined by the Board of Trustees or persons acting at their direction may not accurately reflect the price that the Portfolio could obtain for a security if it were to dispose of that security as of the time of pricing. Because foreign securities can trade on non-business days of the Portfolio, the NAV of the Portfolio may change on days when shareholders will not be able to purchase or redeem Portfolio shares. The prices used by the Portfolio may differ from the value that would be realized if the securities were sold and the differences could be material to the financial statements.
(b) Securities Transactions and Investment Income Securities transactions are recorded as of the trade date for financial reporting purposes. Securities purchased or sold on a when-issued or delayed-delivery basis may be settled a month or more after the trade date. Realized gains and losses from securities sold are recorded on the identified cost basis. Dividend income is recorded on the ex-dividend date, except certain dividends from foreign securities where the ex-dividend date may have passed, which are recorded as soon as the Portfolio is informed of the ex-dividend date. Interest income, adjusted for the accretion of discounts and amortization of premiums, is recorded on the accrual basis. Paydown gains and losses on mortgage-related and other asset-backed securities are recorded as components of interest income on the Statement of Operations.
(c) Dividends and Distributions to Shareholders Dividends from net investment income, if any, are declared daily and distributed to shareholders monthly. Net realized capital gains earned by the Portfolio, if any, will be distributed no less frequently than once each year.
Income dividends and capital gain distributions are determined in accordance with income tax regulations which may differ from GAAP. Differences between tax regulations and GAAP may change the fiscal year when income and capital items are recognized for tax and GAAP purposes. Examples of events that give rise to timing differences include wash sales, straddles, net operating losses and capital loss carryforwards. Further, the character of investment income and capital gains may be different for certain transactions under the two methods of accounting. Examples of characterization differences include the treatment of mortgage paydowns, swaps, foreign currency transactions and contingent debt instruments. As a result, income dividends and capital gain distributions declared during a fiscal period may differ significantly from the net investment income and realized capital gain reported on the Portfolio’s annual financial statements presented under GAAP.
Distributions classified as a tax basis return of capital, if any, are reflected on the accompanying Statements of Changes in Net Assets and have been reclassified to paid in capital. In addition, other amounts have been reclassified between
| | | | | | |
| | Semiannual Report | | June 30, 2007 | | 15 |
Notes to Financial Statements (Cont.)
undistributed net investment income, accumulated undistributed net realized gains or losses and/or paid in capital to more appropriately conform financial accounting to tax characterizations of dividend distributions.
(d) Multiclass Operations Each class offered by the Portfolio has equal rights as to assets and voting privileges (except that shareholders of a class have exclusive voting rights regarding any matter relating solely to that class of shares). Income and non-class specific expenses of the Portfolio are allocated daily to each class of shares based on the relative value of settled shares. Realized and unrealized capital gains and losses of the Portfolio are allocated daily to each class of shares based on the relative net assets of each class. Class specific expenses, where applicable, currently include administrative, distribution and servicing fees.
(e) Foreign Currency The functional and reporting currency for the Portfolio is the U.S. dollar. The market values of foreign securities, currency holdings and other assets and liabilities are translated into U.S. dollars based on the current exchange rates each business day. Fluctuations in the value of currency holdings and other assets and liabilities resulting from changes in exchange rates are recorded as unrealized foreign currency gains or losses. Realized gains or losses and unrealized appreciation or depreciation on investment securities and income and expenses are translated on the respective dates of such transactions. The effects of changes in foreign currency exchange rates on investments in securities are not segregated on the Statement of Operations from the effects of changes in market prices of those securities, but are included with the net realized and unrealized gain or loss on investment securities.
| | | | | | |
|
| Non-U.S. currency symbols utilized throughout the report are defined as follows: |
| BRL | | Brazilian Real | | JPY | | Japanese Yen |
| EUR | | Euro | | MXN | | Mexican Peso |
| GBP | | Great British Pound | | | | |
(f) Foreign Currency Transactions The Portfolio may enter into foreign currency contracts in connection with settling planned purchases or sales of securities, to hedge the currency exposure associated with some or all of the Portfolio’s securities or as a part of an investment strategy. A foreign currency contract is an agreement between two parties to buy and sell a currency at a set price on a future date. The market value of a foreign currency contract fluctuates with changes in foreign currency exchange rates. Foreign currency contracts are marked to market daily and the change in value is recorded by the Portfolio as an unrealized gain or loss. Realized gains or losses equal to the difference between the value of the contract at the time it was opened and the value at the time it was closed are recorded upon delivery or receipt of the currency. These contracts may involve market risk in excess of the unrealized gain or loss reflected on the Statement of Assets and Liabilities. In addition, the Portfolio could be exposed to risk if the counterparties are unable to meet the terms of the contracts or if the value of the currency changes unfavorably to the U.S. dollar.
(g) Payment In-Kind Securities The portfolio may invest in payment in-kind securities. Payment in-kind securities (“PIKs”) give the issuer the option at each interest payment date of making interest payments in either cash or additional debt securities. Those additional debt securities usually have the same term, including maturity dates and interest rates, and associated risks as the original bonds. The daily market quotations of the original bonds include the accrued interest (referred to as a dirty price) and require a pro-rata adjustment from interest receivable to the unrealized appreciation or depreciation on investment on the Statement of Assets and Liabilities.
(h) Repurchase Agreements The Portfolio may engage in repurchase transactions. Under the terms of a typical repurchase agreement, the Portfolio takes possession of an underlying debt obligation (collateral) subject to an obligation of the seller to repurchase, and the Portfolio to resell, the obligation at an agreed-upon price and time. The underlying securities for all repurchase agreements are held in safekeeping at the Portfolio’s custodian or designated subcustodians under tri-party repurchase agreements. The market value of the collateral must be equal to or exceed the total amount of the repurchase obligations, including interest. Securities purchased under repurchase agreements are reflected as an asset on the Statement of Assets and Liabilities. Generally, in the event of counterparty default, the Portfolio has the right to use the collateral to offset losses incurred. If the counterparty should default, the Portfolio will seek to sell the securities which it holds as collateral. This could involve procedural costs or delays in addition to a loss on the securities if their value should fall below their repurchase price.
(i) Reverse Repurchase Agreements The Portfolio may enter into reverse repurchase agreements. In a reverse repurchase agreement, the Portfolio sells to a financial institution a security that it holds with an agreement to repurchase the same security at an agreed-upon price and date. Securities sold under reverse repurchase agreements are reflected as a liability on the Statement of Assets and Liabilities. A reverse repurchase agreement involves the risk that the market value of the security sold by the Portfolio may decline below the repurchase price of the security. The Portfolio will segregate assets determined to be liquid by the investment adviser or otherwise cover its obligations under reverse repurchase agreements.
(j) Inverse Floating Rate Transactions—Residual Interest Municipal Bonds (“RIBs”)/Residual Interest Tax Exempt Bonds (“RITEs”) The Portfolio may invest in RIBs and RITEs (“Inverse Floaters”). Inverse Floaters are created via a master trust agreement between a broker-dealer, acting as trustor and liquidity provider, and an investment bank, acting as trustee and tender agent. The master trust agreement defines the terms for each trust series; with each series being established by the transfer of long-term, fixed-rate municipal bonds (“Fixed Rate Bonds”) to the trustee to be held and provide for the creation, execution and delivery of floater certificates (“Floating Rate Notes”) and Inverse Floaters. Floating Rate Notes are liquid notes that are issued with a short-term variable rate typically linked to the LIBOR, subject to limitations, for some duration. After interest income is paid on the Floating Rate Notes at current rates, the residual income from the Fixed Rate Bonds is paid to the Inverse Floaters. Inverse Floaters are issued with a coupon that fluctuates inversely with the Floating Rate Notes’ referenced rate, subject to certain limitations. Therefore, rising short-term rates result in lower income for the Inverse Floaters and vice versa.
Floating Rate Notes are generally remarketed to municipal money market funds. Inverse Floaters are acquired by either tax-exempt municipal bond funds or trusts, or other parties interested in potentially higher yielding tax-exempt securities. Inverse Floaters may also be acquired for the purpose of increasing leverage. Floating Rate Note holders typically have the option to tender their notes to the liquidity provider for redemption at par at each reset date. The Inverse Floater holders have the option to (i) require the Floating Rate Note holders to tender their notes at par, and (ii) require the liquidity provider to transfer the Fixed Rate Bonds to the Inverse Floater holders. The holders of Inverse Floaters bear substantially all of the downside investment risk associated with the underlying Fixed Rate Bonds, and also benefit from a disproportionate amount of the potential appreciation of the underlying Fixed Rate Bonds’ value. Inverse Floaters may be more volatile and less liquid than other municipal bonds of comparable maturity.
Inverse Floaters may be acquired with or without first transferring to the trustor the Fixed Rate Bonds that were utilized to create the trust series. Inverse Floaters
| | | | |
| 16 | | PIMCO Variable Insurance Trust | | |
| | |
| |
| | | June 30, 2007 (Unaudited) |
acquired without a transfer of Fixed Rate Bonds are recognized as purchases of securities as outlined in Note 2(b). Statement of Financial Accounting Standards No. 140—Accounting for Transfers and Servicing of Financial Assets and Extinguishments of Liabilities (“FAS No. 140”), governs the standards for accounting for securitizations and other transfers of financial assets. If there is a transfer of Fixed Rate Bonds and it meets sale criteria under FAS No. 140, a Portfolio records a sale of the Fixed Rate Bonds and a purchase of the Inverse Floaters. The cash received from the Inverse Floaters is then recorded as interest income in the Statement of Operations.
If the transfer of Fixed Rate Bonds does not meet sale criteria under FAS No. 140, a Portfolio accounts for the transaction described above as a secured borrowing by including the Fixed Rate Bonds in its Schedule of Investments, and recording the Floating Rate Notes as a liability under the caption “Payable for floating rate notes” in the Portfolio’s Statement of Assets and Liabilities. In a secured borrowing transaction, cash received from the Inverse Floaters is not recorded as interest income. Instead, a Portfolio records interest income related to the Fixed Rate Bonds and interest expense related to the Floating Rate Notes, the net of which is equal to the cash received from the Inverse Floaters acquired by the Portfolio. Thus, while a Portfolio’s reported total income, net expenses, and net expense ratio are generally higher for investments in Inverse Floaters acquired via a secured borrowing, the method of acquiring Inverse Floaters does not result in differences for reported cash flows, net asset value or total return.
(k) Restricted Securities The Portfolio may invest in securities that are subject to legal or contractual restrictions on resale. These securities generally may be resold in transactions exempt from registration or to the public if the securities are registered. Disposal of these securities may involve time-consuming negotiations and expenses, and prompt sale at an acceptable price may be difficult. Securities acquired under the provisions of Rule 144A can only be traded between qualified institutional investors. The Board of Trustees considers 144A securities to be liquid.
(l) Swap Agreements The Portfolio may invest in swap agreements. Swap transactions are privately negotiated agreements between the Portfolio and a counterparty to exchange or swap investment cash flows, assets, or market-linked returns at specified, future intervals. The Portfolio may enter into interest rate, total return, forward spread-lock, credit default, and other forms of swap agreements to manage its exposure to interest rates and credit risk. In connection with these agreements, securities may be identified as collateral in accordance with the terms of the respective swap agreements.
Interest rate swap agreements involve the exchange by the Portfolio with another party of their respective commitments to pay or receive interest, e.g., an exchange of floating rate payments for fixed rate payments with respect to the notional amount of principal. Certain forms of interest rate swap agreements may include: (i) interest rate caps, under which, in return for a premium, one party agrees to make payments to the other to the extent that interest rates exceed a specified rate, or “cap”, (ii) interest rate floors, under which, in return for a premium, one party agrees to make payments to the other to the extent that interest rates fall below a specified rate, or “floor”, or (iii) interest rate collars, under which a party sells a cap and purchases a floor or vice versa in an attempt to protect itself against interest rate movements exceeding given minimum or maximum levels.
Total return swap agreements involve commitments to pay interest in exchange for a market-linked return, both based on notional amounts. To the extent the total return of the security or index underlying the transaction exceeds or falls short of the offsetting interest rate obligation, the Portfolio will receive a payment from or make a payment to the counterparty.
Forward spread-lock swap agreements involve commitments to pay or receive a settlement amount calculated as the difference between the swap spread and a
fixed spread, multiplied by the notional amount times the duration of the swap. The swap spread is the difference between the benchmark swap rate (market rate) and the specific Treasury rate.
Credit default swap agreements involve one party making a stream of payments to another party in exchange for the right to receive a specified return in the event of a default by a third party, typically corporate issues or sovereign issues of an emerging country, on its obligation. The Portfolio may use credit default swaps to provide a measure of protection against defaults of the issuers (i.e., to reduce risk where the Portfolio owns or has exposure to the sovereign issuer) or to take an active long or short position with respect to the likelihood of a particular issuer’s default. As a seller of protection, the Portfolio generally receives an upfront payment or a fixed rate of income throughout the term of the swap provided that there is no credit event. If the Portfolio is a seller of protection and a credit event occurs, as defined under the terms of that particular swap agreement, the Portfolio will pay to the buyer of the protection an amount up to the notional value of the swap and in certain instances take delivery of the security. As the seller, the Portfolio would effectively add leverage to its portfolio because, in addition to its total net assets, the Portfolio would be subject to investment exposure on the notional amount of the swap. As a buyer of protection, the Portfolio generally receives an amount up to the notional value of the swap if a credit event occurs. The treatment of credit default swaps and other swap agreements that provide for contingent, non-periodic, bullet-type payments as “notional principal contracts” for U.S. federal income tax purposes is uncertain. Were the U.S. Internal Revenue Service (“IRS”) to take the position that a credit default swap or other bullet-type swap is not a “notional principal contract” for U.S. federal income tax purposes, payments received by the Portfolio from such investments might be subject to U.S. excise or income taxes.
Swaps are marked to market daily based upon quotations from market makers and the change in value, if any, is recorded as unrealized gain or loss on the Statement of Operations. Payments received or made at the beginning of the measurement period are reflected as such on the Statement of Assets and Liabilities. These upfront payments are recorded as realized gain or loss on the Statement of Operations upon termination or maturity of the swap. A liquidation payment received or made at the termination of the swap is recorded as realized gain or loss on the Statement of Operations. Net periodic payments received or paid by the Portfolio are included as part of realized gain or loss on the Statement of Operations. Entering into these agreements involves, to varying degrees, elements of credit, market and documentation risk in excess of the amounts recognized on the Statement of Assets and Liabilities. Such risks involve the possibility that there will be no liquid market for these agreements, that the counterparty to the agreements may default on its obligation to perform or disagree as to the meaning of contractual terms in the agreements and that there may be unfavorable changes in interest rates.
(m) Loan Participations and Assignments The Portfolio may invest in direct debt instruments which are interests in amounts owned by corporate, governmental, or other borrowers to lenders or lending syndicates. The Portfolio’s investments in loans may be in the form of participations in loans or assignments of all or a portion of loans from third parties. A loan is often administered by a bank or other financial institution (the “lender”) that acts as agent for all holders. The agent administers the terms of the loan, as specified in the loan agreement. When investing in a loan participation, the Portfolio has the right to receive payments of principal, interest and any fees to which it is entitled only from the lender selling the loan agreement and only upon receipt by the lender of payments from the borrower. The Portfolio generally has no right to enforce compliance with the terms of the loan agreement with the borrower. As a result, the Portfolio may be subject to the credit risk of both the borrower and the lender that is selling the loan agreement. When the Portfolio purchases assignments from lenders it acquires direct rights against the borrower of the loan. At the end of the period June 30, 2007, the Portfolio had no unfunded loan commitments.
| | | | | | |
| | Semiannual Report | | June 30, 2007 | | 17 |
Notes to Financial Statements (Cont.)
(n) Bridge Debt Commitments At the period ended June 30, 2007, the Portfolio had $14,177,071 in commitments outstanding to fund high yield bridge debt. The Portfolio is entitled to a fee upon the expiration of the commitment period. The bridge debt terms approximate market rates at the time the commitment is entered into.
(o) U.S. Government Agencies or Government-Sponsored Enterprises Securities issued by U.S. Government agencies or government-sponsored enterprises may not be guaranteed by the U.S. Treasury. The Government National Mortgage Association (“GNMA” or “Ginnie Mae”), a wholly owned U.S. Government corporation, is authorized to guarantee, with the full faith and credit of the U.S. Government, the timely payment of principal and interest on securities issued by institutions approved by GNMA and backed by pools of mortgages insured by the Federal Housing Administration or guaranteed by the Department of Veterans Affairs. Government-related guarantors (i.e., not backed by the full faith and credit of the U.S. Government) include the Federal National Mortgage Association (“FNMA” or “Fannie Mae”) and the Federal Home Loan Mortgage Corporation (“FHLMC” or “Freddie Mac”). Pass-through securities issued by FNMA are guaranteed as to timely payment of principal and interest by FNMA but are not backed by the full faith and credit of the U.S. Government. FHLMC guarantees the timely payment of interest and ultimate collection of principal, but its participation certificates are not backed by the full faith and credit of the U.S. Government.
(p) New Accounting Policies In July 2006, the Financial Accounting Standards Board (“FASB”) issued Interpretation No. 48, “Accounting for Uncertainty in Income Taxes—an Interpretation of FASB Statement No. 109” (the “Interpretation”). The Interpretation became effective for the Portfolio on June 29, 2007. Management has evaluated the application of the Interpretation in relation to the Portfolio and has concluded that no single filing position or combination of filing positions identified as uncertain tax positions required the accrual of a tax liability in the accounting records of the Portfolio for the period ending June 30, 2007. Management will monitor all existing filing positions and future filing positions in light of the Interpretation and evaluate the need for any future tax accruals and financial statement disclosures as warranted.
In September 2006, the FASB issued Statement of Financial Accounting Standards No. 157, “Fair Value Measurements” (the “Statement”). The Statement is effective for fiscal years beginning after November 15, 2007 and will require expanded disclosure about fair value measurements, separately for each major category of assets and liabilities, that enables shareholders to assess the inputs used to develop those measurements, and for recurring fair value measurements using significant unobservable inputs the effect of the measurements on changes in net assets for the reporting period. Management is currently evaluating the application of the Statement to the Portfolio and will provide additional information in relation to the Statement on the Portfolio’s annual financial statements for the period ending December 31, 2007.
3. FEES AND EXPENSES
(a) Investment Advisory Fee PIMCO is a majority-owned subsidiary of Allianz Global Investors of America L.P. (“AGI”), and serves as investment adviser (the “Adviser”) to the Trust, pursuant to an investment advisory contract. The Adviser receives a monthly fee from the Portfolio, at an annual rate based on average daily net assets. The Advisory Fee for all classes is charged at an annual rate of 0.25%.
(b) Administration Fee PIMCO serves as administrator (the “Administrator”), and provides administrative services to the Trust for which it receives a monthly administrative fee based on each share class’s average daily net assets. As the Administrator, PIMCO bears the costs of various third-party services, including audit, custodial, portfolio accounting, legal, transfer agency and printing costs. The Administration Fee for all classes is charged at the annual rate of 0.35%.
(c) Distribution and Servicing Fees Allianz Global Investors Distributors LLC (“AGID”) is an indirect wholly-owned subsidiary of AGI and serves as the distributor (the “Distributor”) of the Trust’s shares. The Trust is permitted to reimburse AGID on a quarterly basis, out of the Administrative Class assets of the Portfolio in the amount of 0.15% on an annual basis of the average daily net assets of that class, for payments made to financial intermediaries that provide services in connection with the distribution of shares or administration of plans or programs that use Portfolio shares as their funding medium. The effective rate paid to AGID was 0.15% during the current fiscal year.
The Trust has adopted a Distribution Plan, for the Advisor Class shares of the Portfolio (the “Plan”). The Plan has been adopted pursuant to Rule 12b-1 under the Act. The Plan permits payments for expenses in connection with the distribution and marketing of Advisor Class shares and/or the provision of shareholder services to Advisor Class shareholders. The Plan permits the Portfolio to make total payments at an annual rate of 0.25% of its average daily net assets attributable to its Advisor Class shares.
(d) Portfolio Expenses The Trust is responsible for the following expenses: (i) salaries and other compensation of any of the Trust’s executive officers and employees who are not officers, directors, stockholders or employees of PIMCO or its subsidiaries or affiliates; (ii) taxes and governmental fees; (iii) brokerage fees and commissions and other portfolio transaction expenses; (iv) the costs of borrowing money, including interest expenses and bank overdraft charges; (v) fees and expenses of the Trustees who are not “interested persons” of PIMCO or the Trust, and any counsel retained exclusively for their benefit; (vi) extraordinary expenses, including costs of litigation and indemnification expenses; (vii) organization expenses and (viii) any expenses allocated or allocable to a specific class of shares, which include service fees payable with respect to the Administrative Class Shares, and may include certain other expenses as permitted by the Trust’s Multiple Class Plan adopted pursuant to Rule 18f-3 under the Act and subject to review and approval by the Trustees. The ratio of expenses to average net assets per share class, as disclosed in the Financial Highlights, may differ from the annual portfolio operating expenses per share class as disclosed in the Prospectus for the reasons set forth above.
Effective April 1, 2007, each Trustee, other than those affiliated with PIMCO or its affiliates, receives an annual retainer of $15,000, plus $2,375 for each Board of Trustees meeting attended in person, $500 for each committee meeting attended and $750 for each Board of Trustees meeting attended telephonically, plus reimbursement of related expenses. In addition, the audit committee chair receives an additional annual retainer of $2,000 and each other committee chair receives an additional annual retainer of $500. These expenses are allocated on a pro-rata basis to the various portfolios of the Trust according to their respective net assets. The Trust pays no compensation directly to any Trustee or any other officer who is affiliated with the Administrator, all of whom receive remuneration for their services to the Trust from the Administrator or its affiliates. Prior to April 1, 2007, each Trustee, other than those affiliated with PIMCO or its affiliates, received an annual retainer of $15,000 plus $2,000 for each Board of Trustees meeting attended ($500 for each special meeting attended), plus reimbursement of related expenses. The Audit Committee Chairman received an annual retainer of $1,500 and the Governance Committee Chairman received an annual retainer of $500. In addition, each member of a committee received $500 for each committee meeting attended.
4. RELATED PARTY TRANSACTIONS
The Adviser, Administrator, and Distributor are related parties as defined by FAS 57, Related Party Disclosures. Fees payable to these parties are disclosed in Note 3.
| | | | |
| 18 | | PIMCO Variable Insurance Trust | | |
| | |
| |
| | | June 30, 2007 (Unaudited) |
The Portfolio is permitted to purchase or sell securities from or to certain related affiliated portfolios under specified conditions outlined in procedures adopted by the Board of Trustees of the Trust. The procedures have been designed to ensure that any purchase or sale of securities by the Portfolio from or to another portfolio that are, or could be, considered an affiliate by virtue of having a common investment advisor (or affiliated investment advisors), common Trustees and/or common officers complies with Rule 17a-7 of the Act. Further, as defined under the procedures, each transaction is effected at the current market price. During the period ended June 30, 2007, the Portfolio engaged in purchases and sales of securities pursuant to the Rule 17a-7 of the Act (amounts in thousands):
| | |
| Purchases | | Sales |
$ 0 | | $ 1,816 |
5. GUARANTEES AND INDEMNIFICATIONS
Under the Trust’s organizational documents, each Trustee, officer, employee or other agent of the Trust (including the Trust’s investment manager) is indemnified, to the extent permitted by the Act, against certain liabilities that may arise out of performance of their duties to the Portfolio. Additionally, in the normal course of business, the Portfolio enters into contracts that contain a variety of indemnification clauses. The Portfolio’s maximum exposure under these arrangements is unknown as this would involve future claims that may be made against the Portfolio that have not yet occurred. However, the Portfolio has not had prior claims or losses pursuant to these contracts and believes the risk of loss to be remote.
6. PURCHASES AND SALES OF SECURITIES
The length of time the Portfolio has held a particular security is not generally a consideration in investment decisions. A change in the securities held by the Portfolio is known as “portfolio turnover”. The Portfolio may engage in frequent and active trading of portfolio securities to achieve its investment objective, particularly during periods of volatile market movements. High portfolio turnover (e.g., over 100%) involves correspondingly greater expenses to the Portfolio, including brokerage commissions or dealer mark-ups and other transaction costs on the sale of securities and reinvestments in other securities. Such sales may also result in realization of taxable capital gains, including short-term capital gains (which are generally taxed at ordinary income tax rates). The trading costs and tax effects associated with portfolio turnover may adversely affect the Portfolio’s performance.
Purchases and sales of securities (excluding short-term investments) for the period ended June 30, 2007, were as follows (amounts in thousands):
| | | | | | | | | | | | |
| U.S. Government/Agency | | | | All Other |
| Purchases | | Sales | | | | Purchases | | Sales |
| $ | 17,586 | | $ | 0 | | | | $ | 173,842 | | $ | 206,950 |
7. TRANSACTIONS IN WRITTEN CALL AND PUT OPTIONS
Transactions in written call and put options were as follows (amounts in thousands, except for number of contracts):
| | | | | | | | | |
| | | | | # of
Contracts | | | Premium | |
Balance at 12/31/2006 | | | | 290 | | | $ | 99 | |
Sales | | | | 0 | | | | 0 | |
Closing Buys | | | | (290 | ) | | | (99 | ) |
Expirations | | | | 0 | | | | 0 | |
Exercised | | | | 0 | | | | 0 | |
Balance at 06/30/2007 | | | | 0 | | | $ | 0 | |
8. SHARES OF BENEFICIAL INTEREST
The Portfolio may issue an unlimited number of shares of beneficial interest with a $0.001 par value. Changes in shares of beneficial interest were as follows (shares and amounts in thousands):
| | | | | | | | | | | | | | | | |
| | | | | Six Months Ended
06/30/2007 | | | Year Ended
12/31/2006 | |
| | | | | Shares | | | Amount | | | Shares | | | Amount | |
| | | | | |
Receipts for shares sold | | | | | | | | | | | | | | | | |
Institutional Class | | | | 85 | | | $ | 717 | | | 146 | | | $ | 1,213 | |
Administrative Class | | | | 6,841 | | | | 57,387 | | | 17,264 | | | | 140,974 | |
Advisor Class | | | | 32 | | | | 270 | | | 8 | | | | 64 | |
Issued as reinvestment of distributions | | | | | | | | | | | | | | | | |
Institutional Class | | | | 10 | | | | 81 | | | 8 | | | | 70 | |
Administrative Class | | | | 2,123 | | | | 17,782 | | | 4,025 | | | | 33,006 | |
Advisor Class | | | | 0 | | | | 3 | | | 0 | | | | 1 | |
Cost of shares redeemed | | | | | | | | | | | | | | | | |
Institutional Class | | | | (15 | ) | | | (132 | ) | | (3 | ) | | | (27 | ) |
Administrative Class | | | | (10,252 | ) | | | (84,751 | ) | | (15,623 | ) | | | (127,544 | ) |
Advisor Class | | | | (30 | ) | | | (251 | ) | | 0 | | | | (1 | ) |
Net increase (decrease) resulting from Portfolio share transactions | | | | (1,206 | ) | | $ | (8,894 | ) | | 5,825 | | | $ | 47,756 | |
The following schedule shows the number of shareholders each owning 5% or more of the Portfolio and the total percentage of the Portfolio held by such shareholders:
| | | | | | |
| | | | | Number of Shareholders | | % of Portfolio Held |
Institutional Class | | | | 1 | | 96 |
Administrative Class | | | | 3 | | 76 |
Advisor Class | | | | 2 | | 99 |
9. REGULATORY AND LITIGATION MATTERS
Since February 2004, PIMCO, Allianz Global Investors of America L.P. (PIMCO’s parent company), AGID, and certain of their affiliates, including the PIMCO Funds (another series of funds managed by PIMCO), the Allianz Funds (formerly known as PIMCO Funds: Multi-Manager Series (another series of funds managed by affiliates of PIMCO)), certain Trustees of the Trust (in their capacity as Trustees of the PIMCO Funds or the Allianz Funds) and certain employees of PIMCO, have been named as defendants in fifteen lawsuits filed in various jurisdictions. Eleven of those lawsuits concern “market timing,” and they have been transferred to and consolidated for pre-trial proceedings in a multi-district litigation proceeding in the U.S. District Court for the District of Maryland; the other four lawsuits concern “revenue sharing” and have been consolidated into a single action in the U.S. District Court for the District of Connecticut. The lawsuits have been commenced as putative class actions on behalf of investors who purchased, held or redeemed shares of the various series of the PIMCO Funds and the Allianz Funds during specified periods, or as derivative actions on behalf of the PIMCO Funds and the Allianz Funds.
The market timing actions in the District of Maryland generally allege that certain hedge funds were allowed to engage in “market timing” in certain funds of the PIMCO Funds and the Allianz Funds and this alleged activity was not disclosed. Pursuant to tolling agreements entered into with the derivative and class action plaintiffs, PIMCO, certain PIMCO Funds Trustees, and certain employees of PIMCO who were previously named as defendants have all been dropped as defendants in the market timing actions; the plaintiffs continue to assert claims on behalf of the
| | | | | | |
| | Semiannual Report | | June 30, 2007 | | 19 |
Notes to Financial Statements (Cont.)
shareholders of the PIMCO Funds or on behalf of the PIMCO Funds itself against other defendants. By order dated November 3, 2005, the U.S. District Court for the District of Maryland granted the PIMCO Funds’ motion to dismiss claims asserted against it in a consolidated amended complaint where the PIMCO Funds were named, in the complaint, as a nominal defendant. The revenue sharing action in the District of Connecticut generally alleges that fund assets were inappropriately used to pay brokers to promote funds of the PIMCO Funds and the Allianz Funds, including directing fund brokerage transactions to such brokers, and that such alleged arrangements were not fully disclosed to shareholders. On August 11, 2005, the U.S. District Court for the District of Connecticut conducted a hearing on defendants’ motion to dismiss the consolidated amended complaint in the revenue sharing action but has not yet ruled on the motion to dismiss. The market timing and revenue sharing lawsuits seek, among other things, unspecified compensatory damages plus interest and, in some cases, punitive damages, the rescission of investment advisory contracts, the return of fees paid under those contracts and restitution.
Two nearly identical class action civil complaints have been filed in August 2005, in the Northern District of Illinois Eastern Division, alleging that the plaintiffs each purchased and sold a 10-year Treasury note futures contract and suffered damages from an alleged shortage when PIMCO held both physical and futures positions in 10-year Treasury notes for its client accounts. The two actions have been consolidated into one action, and the two separate complaints have been replaced by a consolidated complaint. PIMCO is a named defendant, and PIMCO Funds has been added as a defendant, to the consolidated action. PIMCO strongly believes the complaint is without merit and intends to vigorously defend itself.
In April 2006, certain portfolios of the Trust and certain other funds managed by PIMCO were served in an adversary proceeding brought by the Official Committee of Asbestos Claimants of G-I Holdings, Inc. in G-I Holdings, Inc.’s bankruptcy in the District of New Jersey. In July 2004, PIMCO was named in this lawsuit and remains a defendant. The plaintiff seeks to recover for the bankruptcy estate assets that were transferred by the predecessor entity of G-I Holdings, Inc. to a wholly-owned subsidiary in 1994. The subsidiary has since issued notes, of which certain portfolios of the Trust and certain other funds managed by PIMCO are alleged to be holders. The complaint alleges that in 2000, more than two hundred noteholders—including certain portfolios of the Trust and certain other funds
managed by PIMCO—were granted a second priority lien on the assets of the
subsidiary in exchange for their consent to a refinancing transaction and the granting of a first priority lien to the lending banks. The plaintiff is seeking invalidation of the lien in favor of the noteholders and/or the value of the lien. On June 21, 2006, the District of New Jersey overturned the Bankruptcy Court’s decision granting permission to file the adversary proceeding and remanded the matter to the Bankruptcy Court for further proceedings. Following a motion to reconsider, the District Court upheld its remand on August 7, 2006, and instructed the Bankruptcy Court to conduct a “cost-benefit” analysis of the Committee’s claims, including the claims against the noteholders. The Bankruptcy Court held a status conference on October 25, 2006 and set a briefing schedule relating to this cost-benefit analysis.
The foregoing speaks only as of the date of this report. It is possible that these matters and/or other developments resulting from these matters could result in increased portfolio redemptions or other adverse consequences to the Portfolio. However, PIMCO and AGID believe that these matters are not likely to have a material adverse effect on the Portfolio or on PIMCO’s or AGID’s ability to perform their respective investment advisory or distribution services relating to the Portfolio.
10. FEDERAL INCOME TAX MATTERS
The Portfolio intends to qualify as a regulated investment company under sub-chapter M of the Internal Revenue Code (the “Code”) and distribute all of its taxable income and net realized gains, if applicable, to shareholders. Accordingly, no provision for Federal income taxes has been made.
As of June 30, 2007, the aggregate cost of investments was the same for federal income tax and financial statement purposes. The net unrealized appreciation (depreciation) of investment securities for federal income tax purposes is as follows (amount in thousands):
| | | | |
Aggregate
Gross
Unrealized
Appreciation | | Aggregate
Gross
Unrealized
(Depreciation) | | Net
Unrealized
Appreciation |
$ 7,556 | | $ (5,537) | | $ 2,019 |
| | | | |
| 20 | | PIMCO Variable Insurance Trust | | |
| | |
| |
Privacy Policy* | | (Unaudited) |
The Funds consider customer privacy to be a fundamental aspect of their relationships with shareholders and are committed to maintaining the confidentiality, integrity and security of their current, prospective and former shareholders’ personal information. To ensure their shareholders’ privacy, the Funds have developed policies that are designed to protect this confidentiality, while allowing shareholder needs to be served.
Obtaining Personal Information
In the course of providing shareholders with products and services, the Funds and certain service providers to the Funds, such as the Funds’ investment advisers (“Advisers”), may obtain non-public personal information about shareholders, which may come from sources such as account applications and other forms, from other written, electronic or verbal correspondence, from shareholder transactions, from a shareholder’s brokerage or financial advisory firm, financial adviser or consultant, and/or from information captured on the Funds’ internet web sites.
Respecting Your Privacy
As a matter of policy, the Funds do not disclose any personal or account information provided by shareholders or gathered by the Funds to non-affiliated third parties, except as required or permitted by law or as necessary for such third parties to perform their agreements with respect to the Funds. As is common in the industry, non-affiliated companies may from time to time be used to provide certain services, such as preparing and mailing prospectuses, reports, account statements and other information, conducting research on shareholder satisfaction and gathering shareholder proxies. A Fund’s Distributor may also retain non-affiliated companies to market the Fund’s shares or products which use the Fund’s shares and enter into joint marketing agreements with other companies. These companies may have access to a shareholder’s personal and account information, but are permitted to use this information solely to provide the specific service or as otherwise permitted by law. In most cases, the shareholders will be clients of a third party, but the Funds may also provide a shareholder’s personal and account information to the shareholder’s respective brokerage or financial advisory firm.
Sharing Information with Third Parties
The Funds reserve the right to disclose or report personal information to non-affiliated third parties, in limited circumstances, where the Funds believe in good faith that disclosure is required under law to cooperate with regulators or law enforcement authorities, to protect their rights or property or upon reasonable request by any Fund in which a shareholder has chosen to invest. In addition, the Funds may disclose information about a shareholder’s accounts to a non-affiliated third party with the consent of the shareholder.
Sharing Information with Affiliates
The Funds may share shareholder information with their affiliates in connection with servicing their shareholders’ accounts or to provide shareholders with information about products and services that the Funds or their Advisers, principal underwriters or their affiliates (“Service Affiliates”) believe may be of interest to such shareholders. The information that the Funds share may include, for example, a shareholder’s participation in one of the Funds or in other investment programs sponsored by a Service Affiliate, a shareholder’s ownership of certain types of accounts (such as IRAs), or other data about a shareholder’s accounts. The Funds’ Service Affiliates, in turn, are not permitted to share shareholder information with non-affiliated entities, except as required or permitted by law.
Procedures to Safeguard Private Information
The Funds take seriously the obligation to safeguard shareholder non-public personal information. In addition to this policy, the Funds have also implemented procedures that are designed to restrict access to a shareholder’s non-public personal information only to internal personnel who need to know that information in order to provide products or services to such shareholders. In order to guard a shareholder’s non-public personal information, physical, electronic and procedural safeguards are in place.
* This Privacy Policy applies to the following entities: PIMCO Funds, PIMCO Variable Insurance Trust, PCM Fund, Inc. and PIMCO Strategic Global Government Fund, Inc. (collectively, the “Funds”).
| | | | | | |
| | Semiannual Report | | June 30, 2007 | | 21 |
Investment Adviser and Administrator
Pacific Investment Management Company LLC
840 Newport Center Drive
Newport Beach, California 92660
Distributor
Allianz Global Investors Distributors LLC
1345 Avenue of the Americas
New York, New York 10105
Custodian
State Street Bank & Trust Company
801 Pennsylvania
Kansas City, Missouri 64105
Transfer Agent
Boston Financial Data Services–Midwest
330 W. 9th Street
Kansas City, Missouri 64105
Legal Counsel
Dechert LLP
1775 I Street, N.W.
Washington, D.C. 20006
Independent Registered Public Accounting Firm
PricewaterhouseCoopers LLP
1055 Broadway
Kansas City, Missouri 64105
P I M C O

Table of Contents
This material is authorized for use only when preceded or accompanied by the current PIMCO Variable Insurance Trust (the “Trust”) prospectus. Investors should consider the investment objectives, risks, charges and expenses of this Trust carefully before investing. Ask your financial professional to explain all charges that may apply. This and other information is contained in the Trust’s prospectus. The variable product prospectus may be obtained by contacting your Investment Consultant. Please read the Trust and variable product prospectus carefully before you invest or send money.
Chairman’s Letter
Dear PIMCO Variable Insurance Trust Shareholder:
It is our pleasure to present to you the semiannual report for the PIMCO Variable Insurance Trust, covering the six-month period ended June 30, 2007. The PIMCO Variable Insurance Trust’s net assets were $8.68 billion at June 30, 2007, as compared to $7.76 billion at December 31, 2006.
Highlights of the financial markets during the reporting period include:
| | n | | Economic data during the first quarter of 2007 pointed to slower growth, which heightened market expectations for a decrease in the Federal Funds Rate. By the second quarter, economic data, such as employment statistics, provided little indication of economic weakness, causing expectations of a decrease in the Federal Funds Rate to unwind and U.S. interest rates to move higher. Interest rates in Europe and the U.K. also rose over the period as central banks raised their key lending rates due to inflation concerns. The benchmark ten-year U.S. Treasury yielded 5.03% as of June 30, 2007, or 0.32% higher than at the beginning of the year. |
| | n | | Most bonds generally returned much of their gains from earlier in the year as worldwide growth and capital flows drove interest rates higher in the second quarter. Increased risk aversion in global financial markets, due in part to subprime mortgage worries in the U.S., also contributed to the rise in interest rates. The Lehman Brothers Aggregate Bond Index, which includes Treasury, investment-grade corporate and mortgage-backed securities, returned 0.98% for the six-month period. |
| | n | | Locally issued emerging market (“EM”) bonds posted positive returns for the reporting period. Yields on these bonds declined and the local currencies in which they are denominated generally gained, amid increasing investor awareness, strong economic growth and surging capital inflows. External EM bonds (debt instruments issued by emerging markets countries and typically denominated in U.S. dollars) lagged behind local EM bonds (debt instruments issued by emerging markets countries and denominated in the currency of the issuer), as external EM bonds tend to trade more in-line with U.S. Treasuries. |
| | n | | Treasury Inflation-Protected Securities (“TIPS”) outpaced nominal bonds (non-inflation linked bonds) for the first part of the year and all but the longest maturity TIPS outperformed in the second quarter as high gasoline prices drove higher inflation accruals. Commodities, as represented by the Dow Jones-AIG Commodity Total Return Index, returned 4.46% for the period. Equities, as measured by the S&P 500 Index and the Russell 2000 Index, returned 6.96% and 6.45%, respectively, for the period. |
On the following pages, please find specific details as to the Portfolio’s total return investment performance and a discussion of those factors that affected performance.
Thank you for the trust you have placed in us. We will continue to work diligently to serve your investment needs.
Sincerely,
Brent R. Harris
Chairman, PIMCO Variable Insurance Trust
July 31, 2007
| | | | | | |
| | Semiannual Report | | June 30, 2007 | | 1 |
Important Information About the Portfolio
PIMCO Variable Insurance Trust (the “Trust”) is an open-end management investment company currently consisting of twenty separate investment portfolios, including the High Yield Portfolio (the “Portfolio”). The Portfolio is only available as a funding vehicle under variable life insurance policies or variable annuity contracts issued by insurance companies (“Variable Contracts”). Individuals may not purchase shares of the Portfolio directly. Shares of the Portfolio also may be sold to qualified pension and retirement plans outside of the separate account context.
We believe that bond funds have an important role to play in a well diversified investment portfolio. It is important to note, however, that in an environment where interest rates may trend upward, rising rates would negatively impact the performance of most bond funds, and fixed-income securities held by a fund are likely to decrease in value. The price volatility of fixed-income securities can also increase during periods of rising interest rates resulting in increased losses to a fund. Bond funds and individual bonds with a longer duration (a measure of the expected life of a security) tend to be more sensitive to changes in interest rates, usually making them more volatile than securities or funds with shorter durations.
The Portfolio may be subject to various risks in addition to those described above. Some of these risks may include, but are not limited to, the following: credit risk, high yield risk, market risk, issuer risk, liquidity risk, derivatives risk, mortgage risk, non-U.S. investment risk, emerging markets risk, currency risk, leveraging risk and management risk. A complete description of these risks is contained in the Portfolio’s prospectus. The Portfolio may use derivative instruments for hedging purposes or as part of an investment strategy. Use of these instruments may involve certain costs and risks such as liquidity risk, interest rate risk, market risk, credit risk, management risk and the risk that the Portfolio could not close out a position when it would be most advantageous to do so. Because the Portfolio may invest in derivatives, it could lose more than the principal amount invested in these instruments. Investing in non-U.S. securities may entail risk due to non-U.S. economic and political developments; this risk may be increased when investing in emerging markets.
On the performance summary page in this Semiannual Report, the Total Return Investment Performance table measures performance assuming that all dividend and capital gain distributions were reinvested.
An investment in the Portfolio is not a deposit of a bank and is not guaranteed or insured by the Federal Deposit Insurance Corporation or any other government agency. It is possible to lose money on investments in the Portfolio.
PIMCO has adopted written proxy voting policies and procedures (“Proxy Policy”) as required by Rule 206(4)-6 under the Investment Advisers Act of 1940, as amended. The Proxy Policy has been adopted by the Trust as the policies and procedures that PIMCO will use when voting proxies on behalf of the Portfolio. A description of the policies and procedures that PIMCO uses to vote proxies relating to portfolio securities of the Portfolio, and information about how the Portfolio voted proxies relating to portfolio securities held during the most recent twelve-month period ended June 30, are available without charge, upon request, by calling the Trust at 1-866-746-2606 and on the Portfolio’s website at www.pimco.com.
The Portfolio files its complete schedule of portfolio holdings with the SEC for the first and third quarters of each fiscal year on Form N-Q. A copy of the Trust’s Form N-Q is also available on the SEC’s website at http://www.sec.gov and may be reviewed and copied at the SEC’s Public Reference Room in Washington D.C. Information on the operation of the Public Reference Room may be obtained by calling 1-800-SEC-0330, and is available without charge, upon request, by calling the Trust at 1-866-746-2606 and on the Portfolio’s website at www.pimco.com.
PIMCO Variable Insurance Trust is distributed by Allianz Global Investors Distributors LLC, 1345 Avenue of the Americas, New York, NY 10105.
| | | | |
| 2 | | PIMCO Variable Insurance Trust | | |
The following disclosure provides important information regarding the Portfolio’s Expense Example (“Example” or “Expense Example”), which appears in this Semiannual Report. Please refer to this information when reviewing the Expense Example for the Portfolio.
Example
As a shareholder of the Portfolio, you incur two types of costs: (1) transaction costs and (2) ongoing costs, including advisory and administrative fees; distribution and/or service (12b-1) fees (Administrative and Advisor Class only); and other Portfolio expenses. The Example is intended to help you understand your ongoing costs (in dollars) of investing in the Portfolio and to compare these costs with the ongoing costs of investing in other mutual funds. The Expense Example does not reflect any fees or other expenses imposed by the Variable Contracts. If it did, the expenses reflected in the Expense Example would be higher. The Example is based on an investment of $1,000 invested at the beginning of the period and held for the entire period indicated, which is from January 1, 2007 to June 30, 2007.
Actual Expenses
The information in the table under the heading “Actual Performance” provides information about actual account values and actual expenses. You may use the information in these columns, together with the amount you invested, to estimate the expenses that you paid over the period. Simply divide your account value by $1,000 (for example, an $8,600 account value divided by $1,000 = $8.60), then multiply the result by the number in the row titled “Expenses Paid During Period” to estimate the expenses you paid on your account during this period.
Hypothetical Example for Comparison Purposes
The information in the table under the heading “Hypothetical Performance (5% return before expenses)” provides information about hypothetical account values and hypothetical expenses based on the Portfolio’s actual expense ratio and an assumed rate of return of 5% per year before expenses, which is not the Portfolio’s actual return. The hypothetical account values and expenses may not be used to estimate the actual ending account balance or expenses you paid for the period. You may use this information to compare the ongoing costs of investing in the Portfolio and other portfolios. To do so, compare this 5% hypothetical example with the 5% hypothetical examples that appear in the shareholder reports of the other portfolios.
Please note that the expenses shown in the table are meant to highlight your ongoing costs only and do not reflect any transactional costs. Therefore, the information under the heading “Hypothetical Performance (5% return before expenses)” is useful in comparing ongoing costs only, and will not help you determine the relative total costs of owning different portfolios. In addition, if these transactional costs were included, your costs would have been higher.
The expense ratio may vary period to period because of various factors, such as an increase in expenses not covered by the advisory and administrative fees (such as expenses of the trustees and their counsel, litigation expense and interest expense).
| | | | | | |
| | Semiannual Report | | June 30, 2007 | | 3 |
PIMCO High Yield Portfolio
Cumulative Returns Through June 30, 2007
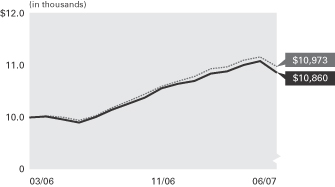
$10,000 invested at the beginning of the first full month following the inception date of the Portfolio’s Advisor Class.
Allocation Breakdown‡
| | |
Corporate Bonds & Notes | | 78.3% |
Bank Loan Obligations | | 8.4% |
Short-Term Instruments | | 5.2% |
U.S. Government Agencies | | 3.1% |
Foreign Currency-Denominated Issues | | 3.0% |
Other | | 2.0% |
| | ‡ | % of Total Investments as of 06/30/2007 |
| | | | | | | | |
| Average Annual Total Return for the period ended June 30, 2007 |
| | | | | 6 Months* | | 1 Year | | Portfolio
Inception
(03/31/06) |
| | PIMCO High Yield Portfolio Advisor Class | | 2.03% | | 9.64% | | 6.80% |
| | Merrill Lynch U.S. High Yield BB-B Rated Constrained Index± | | 2.59% | | 10.34% | | 7.72% |
All Portfolio returns are net of fees and expenses.
* Cumulative return.
Performance quoted represents past performance. Past performance is no guarantee of future results. Investment return and principal value will fluctuate so the Portfolio shares, when redeemed, may be worth more or less than their original cost. The Portfolio’s performance does not reflect the deduction of additional charges and expenses imposed in connection with investing in Variable Contracts, which will reduce returns. Current performance may be lower or higher than the performance data quoted. Performance data current to the most recent month-end is available by calling (800) 927-4648.
± Merrill Lynch U.S. High Yield BB-B Rated Constrained Index tracks the performance of BB-B Rated U.S. dollar-denominated corporate bonds publicly issued in the U.S. domestic market. Qualifying bonds are capitalization-weighted provided the total allocation to an individual issuer (defined by Bloomberg tickers) does not exceed 2%. Issuers that exceed the limit are reduced to 2% and the face value of each of their bonds is adjusted on a pro-rata basis. Similarly, the face value of bonds of all other issuers that fall below the 2% cap are increased on a pro-rata basis. It is not possible to invest directly in the index. The index does not reflect deductions for fees and expenses.
| | | | | | |
| Expense Example | | Actual Performance | | Hypothetical Performance |
| | | | | (5% return before expenses) |
Beginning Account Value (01/01/07) | | $ | 1,000.00 | | $ | 1,000.00 |
Ending Account Value (06/30/07) | | $ | 1,020.29 | | $ | 1,020.58 |
Expenses Paid During Period† | | $ | 4.26 | | $ | 4.26 |
† Expenses are equal to the Portfolio’s Advisor Class annualized expense ratio of 0.85%, multiplied by the average account value over the period, multiplied by 181/365 (to reflect the one-half year period). Overall fees and expenses of investing in the Portfolio will be higher because the example does not reflect Variable Contract fees and expenses.
Please refer to page 3 herein for an explanation of the information presented in the above Expense Example.
Portfolio Insights
| » | | The PIMCO High Yield Portfolio seeks to achieve its investment objective by investing under normal circumstances at least 80% of its assets in a diversified portfolio of high-yield securities (“junk bonds”), which may be represented by forwards or derivatives such as options, futures contracts, or swap agreements, rated below investment grade but rated at least Caa by Moody’s, or equivalently rated by S&P or Fitch, or, if unrated, determined by PIMCO to be of comparable quality, subject to a maximum of 5% of total assets in securities rated Caa by Moody’s, or equivalently rated by S&P or Fitch, or if unrated, determined by PIMCO to be of comparable quality. |
| » | | An underweight to the building products sector, led lower by poor performing building and construction credits, added to relative performance. |
| » | | An emphasis on B-rated technology issues, which outperformed their higher-quality BB-rated counterparts, was a strong boost to returns. |
| » | | Security selection in the healthcare sector was a strong positive for returns as middle- and lower-rated quality tiers outperformed considerably. |
| » | | An underweight to consumer non-cyclicals, which outperformed wholesale foods, food/drug retailers, and pharmaceuticals, detracted from relative performance. |
| » | | As the metals and mining sector outperformed over the period, an underweight to the sector weighed on the Portfolio’s returns. |
| » | | Within the telecom sector, an emphasis on integrated service providers, which fell significantly short of wireless and wireline companies, was negative for relative performance. |
| » | | An underweight to BB-rated issues, in general, and some tactical exposure to CCC-rated bonds, added to performance as lower quality outperformed. |
| | | | |
| 4 | | PIMCO Variable Insurance Trust | | |
Financial Highlights High Yield Portfolio
| | | | | | | | |
| Selected per Share Data for the Period Ended: | | 06/30/2007+ | | | 03/31/2006-12/31/2006 | |
| | |
Advisor Class | | | | | | | | |
Net asset value beginning of period | | $ | 8.34 | | | $ | 8.24 | |
Net investment income (a) | | | 0.28 | | | | 0.42 | |
Net realized/unrealized gain (loss) on investments (a) | | | (0.11 | ) | | | 0.09 | |
Total income from investment operations | | | 0.17 | | | | 0.51 | |
Dividends from net investment income | | | (0.28 | ) | | | (0.41 | ) |
Total distributions | | | (0.28 | ) | | | (0.41 | ) |
Net asset value end of period | | $ | 8.23 | | | $ | 8.34 | |
Total return | | | 2.03 | % | | | 6.41 | % |
Net assets end of period (000s) | | $ | 83 | | | $ | 66 | |
Ratio of expenses to average net assets | | | 0.85 | %* | | | 0.86 | %* |
Ratio of expenses to average net assets excluding interest expense | | | 0.85 | %* | | | 0.85 | %* |
Ratio of net investment income to average net assets | | | 6.72 | %* | | | 6.80 | %* |
Portfolio turnover rate | | | 38 | % | | | 81 | % |
+ Unaudited
* Annualized
(a) Per share amounts based on average number of shares outstanding during the period.
| | | | | | |
| See Accompanying Notes | | Semiannual Report | | June 30, 2007 | | 5 |
Statement of Assets and Liabilities High Yield Portfolio
| | | | |
| (Amounts in thousands, except per share amounts) | | June 30, 2007 | |
| | | (Unaudited) | |
| |
Assets: | | | | |
Investments, at value | | $ | 489,863 | |
Cash | | | 745 | |
Foreign currency, at value | | | 3,556 | |
Receivable for investments sold | | | 37,299 | |
Receivable for Portfolio shares sold | | | 118 | |
Interest and dividends receivable | | | 8,417 | |
Swap premiums paid | | | 45 | |
Unrealized appreciation on swap agreements | | | 843 | |
| | | | 540,886 | |
| |
Liabilities: | | | | |
Payable for investments purchased | | $ | 34,671 | |
Payable for Portfolio shares redeemed | | | 1,933 | |
Accrued investment advisory fee | | | 111 | |
Accrued administration fee | | | 155 | |
Accrued servicing fee | | | 55 | |
Swap premiums received | | | 5 | |
Unrealized depreciation on foreign currency contracts | | | 168 | |
Unrealized depreciation on swap agreements | | | 990 | |
| | | | 38,088 | |
| |
Net Assets | | $ | 502,798 | |
| |
Net Assets Consist of: | | | | |
Paid in capital | | $ | 503,818 | |
(Overdistributed) net investment income | | | (1,553 | ) |
Accumulated undistributed net realized (loss) | | | (1,193 | ) |
Net unrealized appreciation | | | 1,726 | |
| | | $ | 502,798 | |
| |
Net Assets: | | | | |
Institutional Class | | $ | 2,588 | |
Administrative Class | | | 500,127 | |
Advisor Class | | | 83 | |
| |
Shares Issued and Outstanding: | | | | |
Institutional Class | | | 315 | |
Administrative Class | | | 60,773 | |
Advisor Class | | | 10 | |
| |
Net Asset Value and Redemption Price Per Share (Net Asset Per Share Outstanding) | | | | |
Institutional Class | | $ | 8.23 | |
Administrative Class | | | 8.23 | |
Advisor Class | | | 8.23 | |
| |
Cost of Investments Owned | | $ | 487,844 | |
Cost of Foreign Currency Held | | $ | 3,537 | |
| | | | |
| 6 | | PIMCO Variable Insurance Trust | | See Accompanying Notes |
Statement of Operations High Yield Portfolio
| | | | |
| (Amounts in thousands) | | Six Months Ended
June 30, 2007 | |
| | | (Unaudited) | |
| |
| Investment Income: | | | | |
Interest | | $ | 19,591 | |
Dividends | | | 92 | |
Miscellaneous income | | | 39 | |
Total Income | | | 19,722 | |
| |
Expenses: | | | | |
Investment advisory fees | | | 650 | |
Administration fees | | | 910 | |
Servicing fees – Administrative Class | | | 388 | |
Trustees’ fees | | | 5 | |
Interest expense | | | 6 | |
Total Expenses | | | 1,959 | |
| |
Net Investment Income | | | 17,763 | |
| |
Net Realized and Unrealized Gain (Loss): | | | | |
Net realized gain on investments | | | 4,407 | |
Net realized (loss) on futures contracts, written options and swaps | | | (2,164 | ) |
Net realized (loss) on foreign currency transactions | | | (156 | ) |
Net change in unrealized (depreciation) on investments | | | (9,745 | ) |
Net change in unrealized appreciation on futures contracts, written options and swaps | | | 860 | |
Net change in unrealized (depreciation) on translation of assets and liabilities denominated in foreign currencies | | | (259 | ) |
Net (Loss) | | | (7,057 | ) |
| |
Net Increase in Net Assets Resulting from Operations | | $ | 10,706 | |
| | | | | | |
| See Accompanying Notes | | Semiannual Report | | June 30, 2007 | | 7 |
Statements of Changes in Net Assets High Yield Portfolio
| | | | | | | | |
| (Amounts in thousands) | | Six Months Ended
June 30, 2007 | | | Year Ended
December 31, 2006 | |
| | | (Unaudited) | | | | |
| | |
| Increase (Decrease) in Net Assets from: | | | | | | | | |
| | |
Operations: | | | | | | | | |
Net investment income | | $ | 17,763 | | | $ | 33,041 | |
Net realized gain | | | 2,087 | | | | 2,834 | |
Net change in unrealized appreciation (depreciation) | | | (9,144 | ) | | | 6,670 | |
Net increase resulting from operations | | | 10,706 | | | | 42,545 | |
| | |
Distributions to Shareholders: | | | | | | | | |
From net investment income | | | | | | | | |
Institutional Class | | | (81 | ) | | | (70 | ) |
Administrative Class | | | (17,782 | ) | | | (32,991 | ) |
Advisor Class | | | (3 | ) | | | (1 | ) |
| | |
Total Distributions | | | (17,866 | ) | | | (33,062 | ) |
| | |
Portfolio Share Transactions: | | | | | | | | |
Receipts for shares sold | | | | | | | | |
Institutional Class | | | 717 | | | | 1,213 | |
Administrative Class | | | 57,387 | | | | 140,974 | |
Advisor Class | | | 270 | | | | 64 | |
Issued as reinvestment of distributions | | | | | | | | |
Institutional Class | | | 81 | | | | 70 | |
Administrative Class | | | 17,782 | | | | 33,006 | |
Advisor Class | | | 3 | | | | 1 | |
Cost of shares redeemed | | | | | | | | |
Institutional Class | | | (132 | ) | | | (27 | ) |
Administrative Class | | | (84,751 | ) | | | (127,544 | ) |
Advisor Class | | | (251 | ) | | | (1 | ) |
Net increase (decrease) resulting from Portfolio share transactions | | | (8,894 | ) | | | 47,756 | |
| | |
Total Increase (Decrease) in Net Assets | | | (16,054 | ) | | | 57,239 | |
| | |
Net Assets: | | | | | | | | |
Beginning of period | | | 518,852 | | | | 461,613 | |
End of period* | | $ | 502,798 | | | $ | 518,852 | |
| | |
*Including (overdistributed) net investment income of: | | $ | (1,553 | ) | | $ | (1,450 | ) |
| | | | |
| 8 | | PIMCO Variable Insurance Trust | | See Accompanying Notes |
| | |
| |
| Schedule of Investments High Yield Portfolio | | June 30, 2007 (Unaudited) |
| | | | | | | | |
| | | | | PRINCIPAL
AMOUNT
(000S) | | | | VALUE (000S) |
| BANK LOAN OBLIGATIONS 8.2% |
| AES Corp. | | | | | | | | |
7.180% due 04/30/2010 | | $ | | 2,000 | | $ | | 2,005 |
| |
| Amadeus Global Travel Distribution S.A. |
7.830% due 04/08/2013 | | | | 700 | | | | 705 |
8.580% due 04/08/2014 | | | | 700 | | | | 708 |
| |
| Biomet, Inc. | | | | | | | | |
6.000% due 03/08/2008 | | | | 1,500 | | | | 1,504 |
| |
| Centennial Cellular Operating Co. LLC |
7.350% due 02/09/2011 | | | | 766 | | | | 770 |
7.360% due 01/20/2011 | | | | 59 | | | | 60 |
| |
| Community Health Corp. | | | | | | | | |
4.000% due 07/02/2014 | | | | 62 | | | | 62 |
5.000% due 07/02/2014 | | | | 938 | | | | 940 |
7.000% due 04/10/2008 | | | | 2,000 | | | | 1,995 |
| |
| Ford Motor Co. | | | | | | | | |
8.360% due 11/29/2013 | | | | 1,493 | | | | 1,500 |
| |
| Harrah’s Entertainment, Inc. | | | | |
7.500% due 03/09/2008 | | | | 3,000 | | | | 2,985 |
| |
| HCA, Inc. | | | | | | | | |
7.600% due 11/14/2013 | | | | 1,247 | | | | 1,254 |
| |
| Headwaters, Inc. | | | | | | | | |
7.360% due 04/30/2011 | | | | 852 | | | | 855 |
| |
| HealthSouth Corp. | | | | | | | | |
7.850% due 02/02/2013 | | | | 1,695 | | | | 1,704 |
7.860% due 02/02/2013 | | | | 32 | | | | 32 |
| |
| Ineos Group Holdings PLC | | | | | | | | |
7.571% due 10/07/2012 | | | | 56 | | | | 56 |
7.580% due 10/07/2012 | | | | 937 | | | | 940 |
| |
| JSG Holding PLC | | | | | | | | |
7.725% due 11/29/2013 | | | | 650 | | | | 654 |
8.225% due 11/29/2014 | | | | 650 | | | | 654 |
| |
| Lear Corp. | | | | | | | | |
8.000% due 06/27/2014 | | | | 1,000 | | | | 992 |
| |
| Metro-Goldwyn-Mayer, Inc. | | | | |
8.614% due 04/08/2012 | | | | 1,489 | | | | 1,494 |
| |
| Novelis, Inc. | | | | | | | | |
4.000% due 05/25/2008 | | | | 1,100 | | | | 1,102 |
| |
| Riverdeep Interactive | | | | | | | | |
8.100% due 11/28/2013 | | | | 997 | | | | 1,001 |
| |
| Roundy’s Supermarket, Inc. | | | | |
8.070% due 10/27/2011 | | | | 2 | | | | 2 |
8.110% due 11/01/2011 | | | | 985 | | | | 994 |
| |
| SLM Corp. | | | | | | | | |
6.000% due 06/30/2008 | | | | 2,600 | | | | 2,587 |
| |
| Telesat Canada, Inc. | | | | | | | | |
2.620% due 02/14/2008 | | | | 1,500 | | | | 1,501 |
| |
| Thompson Learning, Inc. | | | | | | | | |
5.000% due 06/27/2014 | | | | 2,100 | | | | 2,076 |
| |
| Tribune Co. | | | | | | | | |
7.875% due 05/30/2009 | | | | 825 | | | | 826 |
8.375% due 05/30/2014 | | | | 1,375 | | | | 1,346 |
| |
| Univision Communications, Inc. |
6.250% due 09/15/2014 | | | | 121 | | | | 119 |
7.605% due 09/15/2014 | | | | 1,879 | | | | 1,856 |
| |
| VNU/Nielson Finance LLC | | | | | | | | |
7.607% due 08/08/2013 | | | | 1,990 | | | | 2,004 |
| |
| VWR International, Inc. | | | | | | | | |
7.000% due 05/30/2008 | | | | 2,500 | | | | 2,503 |
| |
| Wind Acquisition Finance S.A. |
12.609% due 12/21/2011 | | | | 517 | | | | 521 |
| |
| Worldspan LP | | | | | | | | |
8.606% due 12/07/2013 | | | | 500 | | | | 503 |
| | | | | | | | |
| | | | | PRINCIPAL
AMOUNT
(000S) | | | | VALUE (000S) |
8.610% due 12/07/2013 | | $ | | 495 | | $ | | 497 |
10.500% due 12/07/2013 | | | | 2 | | | | 3 |
| | | | | | | | |
Total Bank Loan Obligations
(Cost $41,194) | | 41,310 |
| | | | | | | | |
|
| CORPORATE BONDS & NOTES 76.3% |
|
| BANKING & FINANCE 9.7% |
| AES Ironwood LLC | | | | | | | | |
8.857% due 11/30/2025 | | | | 2,421 | | | | 2,700 |
| |
| AES Red Oak LLC | | | | | | | | |
8.540% due 11/30/2019 | | | | 1,185 | | | | 1,297 |
| |
| Bluewater Finance Ltd. | | | | | | | | |
10.250% due 02/15/2012 | | | | 2,200 | | | | 2,305 |
| |
| Ferrellgas Escrow LLC | | | | | | | | |
6.750% due 05/01/2014 | | | | 2,100 | | | | 2,000 |
| |
| Ford Motor Credit Co. | | | | | | | | |
7.250% due 10/25/2011 | | | | 1,900 | | | | 1,830 |
7.800% due 06/01/2012 | | | | 8,375 | | | | 8,178 |
8.625% due 11/01/2010 | | | | 1,260 | | | | 1,281 |
| |
| Forest City Enterprises, Inc. |
7.625% due 06/01/2015 | | | | 1,225 | | | | 1,240 |
| |
| General Motors Acceptance Corp. |
6.000% due 04/01/2011 | | | | 1,194 | | | | 1,152 |
7.000% due 02/01/2012 | | | | 3,000 | | | | 2,945 |
7.250% due 03/02/2011 | | | | 500 | | | | 499 |
8.000% due 11/01/2031 | | | | 2,350 | | | | 2,410 |
| |
| GMAC LLC | | | | | | | | |
6.625% due 05/15/2012 | | | | 1,100 | | | | 1,063 |
| |
| Hexion U.S. Finance Corp. | | | | | | | | |
9.750% due 11/15/2014 | | | | 1,300 | | | | 1,352 |
| |
| K&F Acquisition, Inc. | | | | | | | | |
7.750% due 11/15/2014 | | | | 1,000 | | | | 1,065 |
| |
| KRATON Polymers LLC | | | | | | | | |
8.125% due 01/15/2014 | | | | 1,500 | | | | 1,470 |
| |
| NSG Holdings LLC/NSG Holdings, Inc. |
7.750% due 12/15/2025 | | | | 925 | | | | 939 |
| |
| Petroleum Export Ltd. II | | | | | | | | |
6.340% due 06/20/2011 | | | | 1,280 | | | | 1,254 |
| |
| Petroplus Finance Ltd. | | | | | | | | |
6.750% due 05/01/2014 | | | | 375 | | | | 363 |
7.000% due 05/01/2017 | | | | 375 | | | | 363 |
| |
| Rotech Healthcare, Inc. | | | | | | | | |
9.500% due 04/01/2012 | | | | 3,575 | | | | 3,396 |
| |
| Targeted Return Index Securities Trust |
7.548% due 05/01/2016 | | | | 826 | | | | 814 |
| |
| Tenneco, Inc. | | | | | | | | |
8.625% due 11/15/2014 | | | | 975 | | | | 1,009 |
10.250% due 07/15/2013 | | | | 500 | | | | 540 |
| |
| TNK-BP Finance S.A. | | | | | | | | |
6.625% due 03/20/2017 | | | | 500 | | | | 486 |
7.500% due 07/18/2016 | | | | 1,000 | | | | 1,034 |
| |
| Universal City Development Partners |
11.750% due 04/01/2010 | | | | 525 | | | | 558 |
| |
| Universal City Florida Holding Co. I |
8.375% due 05/01/2010 | | | | 1,425 | | | | 1,464 |
10.106% due 05/01/2010 | | | | 175 | | | | 179 |
| |
| Ventas Realty LP | | | | | | | | |
6.750% due 04/01/2017 | | | | 250 | | | | 248 |
7.125% due 06/01/2015 | | | | 500 | | | | 506 |
9.000% due 05/01/2012 | | | | 500 | | | | 549 |
| |
| Wind Acquisition Finance S.A. |
10.750% due 12/01/2015 | | | | 1,000 | | | | 1,152 |
| |
| | | | | | | | |
| | | | | PRINCIPAL
AMOUNT
(000S) | | | | VALUE (000S) |
| Yankee Acquisition Corp. | | | | | | | | |
8.500% due 02/15/2015 | | $ | | 1,100 | | $ | | 1,072 |
| | | | | | | | |
| | | | | | | | 48,713 |
| | | | | | | | |
|
| INDUSTRIALS 54.2% |
| Abitibi-Consolidated Co. of Canada |
7.750% due 06/15/2011 | | | | 125 | | | | 115 |
| |
| Abitibi-Consolidated, Inc. | | | | | | | | |
8.550% due 08/01/2010 | | | | 1,275 | | | | 1,224 |
| |
| Actuant Corp. | | | | | | | | |
6.875% due 06/15/2017 | | | | 1,000 | | | | 995 |
| |
| Albertson’s, Inc. | | | | | | | | |
7.450% due 08/01/2029 | | | | 3,250 | | | | 3,186 |
| |
| Allied Waste North America, Inc. |
7.250% due 03/15/2015 | | | | 5,650 | | | | 5,622 |
| |
| AmeriGas Partners LP | | | | | | | | |
7.125% due 05/20/2016 | | | | 2,650 | | | | 2,617 |
7.250% due 05/20/2015 | | | | 1,850 | | | | 1,841 |
| |
| Aramark Corp. | | | | | | | | |
8.500% due 02/01/2015 | | | | 3,775 | | | | 3,860 |
| |
| Arco Chemical Co. | | | | | | | | |
10.250% due 11/01/2010 | | | | 50 | | | | 54 |
| |
| Armor Holdings, Inc. | | | | | | | | |
8.250% due 08/15/2013 | | | | 800 | | | | 846 |
| |
| ArvinMeritor, Inc. | | | | | | | | |
8.125% due 09/15/2015 | | | | 1,525 | | | | 1,485 |
8.750% due 03/01/2012 | | | | 2,750 | | | | 2,791 |
| |
| Berry Plastics Holding Corp. |
8.875% due 09/15/2014 | | | | 975 | | | | 992 |
| |
| Bon-Ton Stores, Inc. | | | | | | | | |
10.250% due 03/15/2014 | | | | 3,750 | | | | 3,816 |
| |
| Bowater Canada Finance | | | | | | | | |
7.950% due 11/15/2011 | | | | 1,315 | | | | 1,244 |
| |
| Buhrmann U.S., Inc. | | | | | | | | |
7.875% due 03/01/2015 | | | | 1,300 | | | | 1,287 |
8.250% due 07/01/2014 | | | | 1,000 | | | | 1,010 |
| |
| C8 Capital SPV Ltd. | | | | | | | | |
6.640% due 12/31/2049 | | | | 1,500 | | | | 1,478 |
| |
| CanWest Media, Inc. | | | | | | | | |
8.000% due 09/15/2012 | | | | 770 | | | | 768 |
| |
| Cascades, Inc. | | | | | | | | |
7.250% due 02/15/2013 | | | | 1,425 | | | | 1,393 |
| |
| CCO Holdings LLC | | | | | | | | |
8.750% due 11/15/2013 | | | | 7,400 | | | | 7,567 |
| |
| Celestica, Inc. | | | | | | | | |
7.625% due 07/01/2013 | | | | 875 | | | | 823 |
7.875% due 07/01/2011 | | | | 1,900 | | | | 1,853 |
| |
| Chart Industries, Inc. | | | | | | | | |
9.125% due 10/15/2015 | | | | 425 | | | | 448 |
| |
| Chemtura Corp. | | | | | | | | |
6.875% due 06/01/2016 | | | | 1,750 | | | | 1,663 |
| |
| Chesapeake Energy Corp. | | | | | | | | |
6.875% due 01/15/2016 | | | | 1,200 | | | | 1,179 |
7.000% due 08/15/2014 | | | | 1,550 | | | | 1,546 |
7.500% due 06/15/2014 | | | | 75 | | | | 76 |
7.750% due 01/15/2015 | | | | 500 | | | | 511 |
| |
| Choctaw Resort Development Enterprise |
7.250% due 11/15/2019 | | | | 1,357 | | | | 1,343 |
| |
| Citic Resources Finance Ltd. |
6.750% due 05/15/2014 | | | | 450 | | | | 435 |
| |
| Compagnie Générale de Géophysique-Veritas |
7.500% due 05/15/2015 | | | | 450 | | | | 452 |
7.750% due 05/15/2017 | | | | 225 | | | | 229 |
| |
| | | | | | |
| See Accompanying Notes | | Semiannual Report | | June 30, 2007 | | 9 |
Schedule of Investments High Yield Portfolio (Cont.)
| | | | | | | | |
| | | | | PRINCIPAL
AMOUNT
(000S) | | | | VALUE (000S) |
| Continental Airlines, Inc. |
6.920% due 04/02/2013 (f) | | $ | | 712 | | $ | | 725 |
7.373% due 06/15/2017 | | | | 253 | | | | 251 |
| |
| Cooper-Standard Automotive, Inc. |
7.000% due 12/15/2012 | | | | 1,100 | | | | 1,037 |
| |
| Corrections Corp. of America |
7.500% due 05/01/2011 | | | | 1,250 | | | | 1,273 |
| |
| Crown Americas LLC & Crown Americas Capital Corp. |
7.625% due 11/15/2013 | | | | 425 | | | | 431 |
7.750% due 11/15/2015 | | | | 1,500 | | | | 1,515 |
| |
| CSC Holdings, Inc. |
6.750% due 04/15/2012 | | | | 1,000 | | | | 955 |
7.625% due 04/01/2011 | | | | 2,000 | | | | 1,995 |
| |
| DaVita, Inc. |
7.250% due 03/15/2015 | | | | 4,150 | | | | 4,119 |
| |
| Delhaize America, Inc. |
9.000% due 04/15/2031 | | | | 1,917 | | | | 2,326 |
| |
| Dresser-Rand Group, Inc. |
7.375% due 11/01/2014 | | | | 396 | | | | 399 |
| |
| DRS Technologies, Inc. |
7.625% due 02/01/2018 | | | | 1,050 | | | | 1,066 |
| |
| Dynegy Holdings, Inc. |
7.125% due 05/15/2018 | | | | 1,750 | | | | 1,566 |
7.500% due 06/01/2015 | | | | 200 | | | | 189 |
7.750% due 06/01/2019 | | | | 3,100 | | | | 2,899 |
8.375% due 05/01/2016 | | | | 1,000 | | | | 983 |
| |
| EchoStar DBS Corp. |
6.625% due 10/01/2014 | | | | 1,000 | | | | 958 |
7.125% due 02/01/2016 | | | | 3,225 | | | | 3,169 |
| |
| El Paso Corp. |
7.000% due 06/15/2017 | | | | 1,750 | | | | 1,740 |
7.750% due 01/15/2032 | | | | 1,200 | | | | 1,215 |
7.800% due 08/01/2031 | | | | 325 | | | | 331 |
8.050% due 10/15/2030 | | | | 1,300 | | | | 1,372 |
| |
| Equistar Chemicals LP |
10.125% due 09/01/2008 | | | | 26 | | | | 27 |
| |
| Ferrellgas Partners LP |
8.750% due 06/15/2012 | | | | 1,525 | | | | 1,578 |
8.870% due 08/01/2009 (f) | | | | 1,200 | | | | 1,272 |
| |
| Fisher Communications, Inc. |
8.625% due 09/15/2014 | | | | 1,000 | | | | 1,070 |
| |
| Ford Motor Co. |
7.450% due 07/16/2031 | | | | 3,600 | | | | 2,894 |
| |
| Forest Oil Corp. |
7.250% due 06/15/2019 | | | | 825 | | | | 804 |
| |
| Freeport-McMoRan Copper & Gold, Inc. |
8.250% due 04/01/2015 | | | | 1,200 | | | | 1,269 |
8.375% due 04/01/2017 | | | | 2,300 | | | | 2,461 |
| |
| Freescale Semiconductor, Inc. |
8.875% due 12/15/2014 | | | | 4,000 | | | | 3,840 |
9.125% due 12/15/2014 (b) | | | | 1,850 | | | | 1,748 |
9.235% due 12/15/2014 | | | | 500 | | | | 485 |
| |
| Fresenius Medical Care Capital Trust |
7.875% due 06/15/2011 | | | | 2,250 | | | | 2,340 |
| |
| Gaylord Entertainment Co. |
8.000% due 11/15/2013 | | | | 800 | | | | 815 |
| |
| General Motors Corp. |
8.100% due 06/15/2024 | | | | 300 | | | | 266 |
8.250% due 07/15/2023 | | | | 4,850 | | | | 4,444 |
8.800% due 03/01/2021 | | | | 700 | | | | 665 |
| |
| Georgia-Pacific Corp. |
7.125% due 01/15/2017 | | | | 2,000 | | | | 1,930 |
7.375% due 12/01/2025 | | | | 5,960 | | | | 5,617 |
7.750% due 11/15/2029 | | | | 100 | | | | 94 |
8.000% due 01/15/2024 | | | | 775 | | | | 756 |
| |
| | | | | | | | |
| | | | | PRINCIPAL
AMOUNT
(000S) | | | | VALUE (000S) |
| Goodyear Tire & Rubber Co. |
9.000% due 07/01/2015 | | $ | | 1,024 | | $ | | 1,108 |
| |
Grupo Transportacion Ferroviaria
Mexicana S.A. de C.V. |
9.375% due 05/01/2012 | | | | 1,200 | | | | 1,290 |
| |
| Hanover Compressor Co. |
9.000% due 06/01/2014 | | | | 500 | | | | 531 |
| |
| Hanover Equipment Trust |
8.750% due 09/01/2011 | | | | 800 | | | | 826 |
| |
| HCA, Inc. |
6.750% due 07/15/2013 | | | | 4,400 | | | | 4,015 |
7.190% due 11/15/2015 | | | | 200 | | | | 181 |
7.500% due 12/15/2023 | | | | 400 | | | | 347 |
7.580% due 09/15/2025 | | | | 550 | | | | 478 |
9.250% due 11/15/2016 | | | | 8,595 | | | | 9,175 |
| |
| Herbst Gaming, Inc. |
7.000% due 11/15/2014 | | | | 2,000 | | | | 1,885 |
| |
| Hertz Corp. |
8.875% due 01/01/2014 | | | | 4,225 | | | | 4,426 |
| |
| Horizon Lines LLC |
9.000% due 11/01/2012 | | | | 1,016 | | | | 1,080 |
| |
| Host Marriott LP |
7.125% due 11/01/2013 | | | | 1,430 | | | | 1,435 |
| |
| Idearc, Inc. |
8.000% due 11/15/2016 | | | | 3,800 | | | | 3,857 |
| |
| Ineos Group Holdings PLC |
8.500% due 02/15/2016 | | | | 3,125 | | | | 3,070 |
| |
| Ingles Markets, Inc. |
8.875% due 12/01/2011 | | | | 1,450 | | | | 1,510 |
| |
| Intelsat Bermuda Ltd. |
9.250% due 06/15/2016 | | | | 1,275 | | | | 1,361 |
| |
| Intelsat Corp. |
9.000% due 06/15/2016 | | | | 400 | | | | 421 |
| |
| Intelsat Subsidiary Holding Co. Ltd. |
8.250% due 01/15/2013 | | | | 400 | | | | 408 |
8.625% due 01/15/2015 | | | | 1,500 | | | | 1,545 |
| |
| Jefferson Smurfit Corp. U.S. |
8.250% due 10/01/2012 | | | | 600 | | | | 599 |
| |
| JET Equipment Trust |
7.630% due 08/15/2012 (a) | | | | 218 | | | | 161 |
10.000% due 06/15/2012 (a) | | | | 526 | | | | 547 |
| |
| L-3 Communications Corp. |
6.375% due 10/15/2015 | | | | 700 | | | | 665 |
7.625% due 06/15/2012 | | | | 2,450 | | | | 2,520 |
| |
| Legrand France |
8.500% due 02/15/2025 | | | | 975 | | | | 1,143 |
| |
| Lyondell Chemical Co. |
8.000% due 09/15/2014 | | | | 1,475 | | | | 1,523 |
8.250% due 09/15/2016 | | | | 925 | | | | 971 |
| |
| MGM Mirage |
6.625% due 07/15/2015 | | | | 850 | | | | 777 |
6.875% due 04/01/2016 | | | | 1,725 | | | | 1,596 |
7.500% due 06/01/2016 | | | | 1,725 | | | | 1,645 |
| |
| Mirage Resorts, Inc. |
7.250% due 08/01/2017 | | | | 2,600 | | | | 2,561 |
| |
| Nalco Co. |
7.750% due 11/15/2011 | | | | 500 | | | | 506 |
| |
| Norampac, Inc. |
6.750% due 06/01/2013 | | | | 875 | | | | 839 |
| |
| Nordic Telephone Co. Holdings ApS |
8.875% due 05/01/2016 | | | | 1,500 | | | | 1,598 |
| |
| Nortel Networks Ltd. |
9.606% due 07/15/2011 | | | | 200 | | | | 214 |
| | | | | | | | |
| | | | | PRINCIPAL
AMOUNT
(000S) | | | | VALUE (000S) |
10.125% due 07/15/2013 | | $ | | 1,500 | | $ | | 1,616 |
10.750% due 07/15/2016 | | | | 475 | | | | 527 |
| |
| Northwest Pipeline Corp. |
7.125% due 12/01/2025 | | | | 500 | | | | 516 |
| |
| Novelis, Inc. |
7.250% due 02/15/2015 | | | | 120 | | | | 124 |
| |
| NPC International, Inc. |
9.500% due 05/01/2014 | | | | 2,050 | | | | 1,999 |
| |
| OPTI Canada, Inc. |
8.250% due 12/15/2014 | | | | 1,900 | | | | 1,938 |
| |
| Owens Brockway Glass Container, Inc. |
6.750% due 12/01/2014 | | | | 1,775 | | | | 1,740 |
8.750% due 11/15/2012 | | | | 525 | | | | 550 |
| |
| Peabody Energy Corp. |
6.875% due 03/15/2013 | | | | 1,291 | | | | 1,291 |
| |
| Pilgrim’s Pride Corp. |
7.625% due 05/01/2015 | | | | 1,695 | | | | 1,699 |
8.375% due 05/01/2017 | | | | 300 | | | | 299 |
| |
| Plains Exploration & Production Co. |
7.000% due 03/15/2017 | | | | 225 | | | | 214 |
7.750% due 06/15/2015 | | | | 650 | | | | 648 |
| |
| Pogo Producing Co. |
7.875% due 05/01/2013 | | | | 175 | | | | 179 |
| |
| PQ Corp. |
7.500% due 02/15/2013 | | | | 2,225 | | | | 2,370 |
| |
| Premier Entertainment Biloxi LLC |
10.750% due 02/01/2012 | | | | 750 | | | | 784 |
| |
| Primedia, Inc. |
8.000% due 05/15/2013 | | | | 400 | | | | 423 |
| |
| Quiksilver, Inc. |
6.875% due 04/15/2015 | | | | 1,350 | | | | 1,276 |
| |
| Qwest Communications International, Inc. |
7.500% due 02/15/2014 | | | | 8,250 | | | | 8,394 |
| |
| Reynolds American, Inc. |
7.250% due 06/15/2037 | | | | 500 | | | | 514 |
7.625% due 06/01/2016 | | | | 925 | | | | 984 |
7.750% due 06/01/2018 | | | | 1,875 | | | | 2,010 |
| |
| RH Donnelley Corp. |
6.875% due 01/15/2013 | | | | 250 | | | | 238 |
8.875% due 01/15/2016 | | | | 5,950 | | | | 6,218 |
| |
| Rockwood Specialties Group, Inc. |
7.500% due 11/15/2014 | | | | 1,700 | | | | 1,717 |
| |
| Rogers Cable, Inc. |
8.750% due 05/01/2032 | | | | 400 | | | | 486 |
| |
| Roseton |
7.270% due 11/08/2010 | | | | 1,200 | | | | 1,214 |
7.670% due 11/08/2016 | | | | 2,325 | | | | 2,408 |
| |
| Royal Caribbean Cruises Ltd. |
7.250% due 03/15/2018 | | | | 1,750 | | | | 1,722 |
| |
| Sanmina-SCI Corp. |
8.125% due 03/01/2016 | | | | 2,325 | | | | 2,174 |
| |
| SemGroup LP |
8.750% due 11/15/2015 | | | | 3,075 | | | | 3,106 |
| |
| Sensata Technologies BV |
8.000% due 05/01/2014 | | | | 1,175 | | | | 1,140 |
| |
| Service Corp. International |
7.375% due 10/01/2014 | | | | 425 | | | | 429 |
7.625% due 10/01/2018 | | | | 1,025 | | | | 1,043 |
| |
| Sinclair Broadcast Group, Inc. |
8.000% due 03/15/2012 | | | | 6 | | | | 7 |
| |
| Smurfit Capital Funding PLC |
7.500% due 11/20/2025 | | | | 500 | | | | 506 |
| |
| | | | |
| 10 | | PIMCO Variable Insurance Trust | | See Accompanying Notes |
| | |
| |
| | | June 30, 2007 (Unaudited) |
| | | | | | | | |
| | | | | PRINCIPAL
AMOUNT
(000S) | | | | VALUE (000S) |
| Smurfit Kappa Funding PLC |
7.750% due 04/01/2015 | | $ | | 125 | | $ | | 126 |
9.625% due 10/01/2012 | | | | 342 | | | | 360 |
| |
| Smurfit-Stone Container Enterprises, Inc. |
8.000% due 03/15/2017 | | | | 925 | | | | 902 |
8.375% due 07/01/2012 | | | | 750 | | | | 755 |
| |
| Sonat, Inc. | | | | | | | | |
7.000% due 02/01/2018 | | | | 500 | | | | 492 |
| |
| Station Casinos, Inc. | | | | | | | | |
6.875% due 03/01/2016 | | | | 1,275 | | | | 1,132 |
7.750% due 08/15/2016 | | | | 2,295 | | | | 2,284 |
| |
| Suburban Propane Partners LP |
6.875% due 12/15/2013 | | | | 2,750 | | | | 2,668 |
| |
| Sungard Data Systems, Inc. |
9.125% due 08/15/2013 | | | | 3,141 | | | | 3,231 |
| |
| Superior Essex Communications LLC |
9.000% due 04/15/2012 | | | | 500 | | | | 513 |
| |
| Supervalu, Inc. | | | | | | | | |
7.500% due 11/15/2014 | | | | 1,475 | | | | 1,519 |
| |
| Tenet Healthcare Corp. | | | | | | | | |
7.375% due 02/01/2013 | | | | 1,766 | | | | 1,605 |
| |
| Tesoro Corp. | | | | | | | | |
6.500% due 06/01/2017 | | | | 1,000 | | | | 982 |
| |
| TransDigm, Inc. | | | | | | | | |
7.750% due 07/15/2014 | | | | 1,330 | | | | 1,350 |
| |
| Triad Hospitals, Inc. | | | | | | | | |
7.000% due 11/15/2013 | | | | 2,640 | | | | 2,781 |
| |
| Trinity Industries, Inc. | | | | | | | | |
6.500% due 03/15/2014 | | | | 780 | | | | 766 |
| |
| TRW Automotive, Inc. | | | | | | | | |
7.000% due 03/15/2014 | | | | 500 | | | | 479 |
7.250% due 03/15/2017 | | | | 550 | | | | 527 |
| |
| U.S. Airways Group, Inc. | | | | | | | | |
9.330% due 01/01/2049 (a) | | | | 84 | | | | 1 |
| |
| United Airlines, Inc. | | | | | | | | |
6.071% due 03/01/2013 | | | | 215 | | | | 216 |
6.201% due 03/01/2010 | | | | 108 | | | | 109 |
6.602% due 03/01/2015 | | | | 243 | | | | 245 |
| |
| Unity Media GmbH | | | | | | | | |
10.375% due 02/15/2015 | | | | 750 | | | | 767 |
| |
| Verso Paper Holdings LLC | | | | | | | | |
9.125% due 08/01/2014 | | | | 3,150 | | | | 3,268 |
| |
| West Corp. | | | | | | | | |
9.500% due 10/15/2014 | | | | 300 | | | | 309 |
11.000% due 10/15/2016 | | | | 300 | | | | 315 |
| |
| Williams Cos., Inc. | | | | | | | | |
7.625% due 07/15/2019 | | | | 3,950 | | | | 4,187 |
7.750% due 06/15/2031 | | | | 775 | | | | 824 |
7.875% due 09/01/2021 | | | | 2,575 | | | | 2,781 |
| |
| Williams Partners LP | | | | | | | | |
7.250% due 02/01/2017 | | | | 425 | | | | 429 |
| |
| Wynn Las Vegas LLC | | | | | | | | |
6.625% due 12/01/2014 | | | | 5,400 | | | | 5,231 |
| |
| Xerox Capital Trust I | | | | | | | | |
8.000% due 02/01/2027 | | | | 2,100 | | | | 2,161 |
| | | | | | | | |
| | | | | | | | 272,270 |
| | | | | | | | |
|
| UTILITIES 12.4% |
| AES Corp. | | | | | | | | |
8.750% due 05/15/2013 | | | | 2,325 | | | | 2,464 |
| |
| Cincinnati Bell, Inc. | | | | | | | | |
7.250% due 07/15/2013 | | | | 2,500 | | | | 2,575 |
8.375% due 01/15/2014 | | | | 1,270 | | | | 1,289 |
| |
| | | | | | | | |
| | | | | PRINCIPAL
AMOUNT
(000S) | | | | VALUE (000S) |
| Citizens Communications Co. |
7.125% due 03/15/2019 | | $ | | 2,300 | | $ | | 2,185 |
7.450% due 07/01/2035 | | | | 250 | | | | 221 |
7.875% due 01/15/2027 | | | | 425 | | | | 415 |
9.000% due 08/15/2031 | | | | 1,425 | | | | 1,475 |
| |
| Complete Production Services, Inc. |
8.000% due 12/15/2016 | | | | 575 | | | | 584 |
| |
| Edison Mission Energy | | | | | | | | |
7.000% due 05/15/2017 | | | | 675 | | | | 639 |
7.200% due 05/15/2019 | | | | 975 | | | | 921 |
7.750% due 06/15/2016 | | | | 1,000 | | | | 1,000 |
| |
| Hawaiian Telcom Communications, Inc. |
9.750% due 05/01/2013 | | | | 1,500 | | | | 1,579 |
10.860% due 05/01/2013 | | | | 1,000 | | | | 1,025 |
| |
| Homer City Funding LLC | | | | | | | | |
8.734% due 10/01/2026 | | | | 974 | | | | 1,076 |
| |
| MetroPCS Wireless, Inc. | | | | | | | | |
9.250% due 11/01/2014 | | | | 1,300 | | | | 1,349 |
| |
| Midwest Generation LLC | | | | | | | | |
8.560% due 01/02/2016 | | | | 4,487 | | | | 4,787 |
| |
| Mobile Telesystems Finance S.A. |
8.000% due 01/28/2012 | | | | 450 | | | | 464 |
8.375% due 10/14/2010 | | | | 500 | | | | 522 |
| |
| Nevada Power Co. | | | | | | | | |
6.750% due 07/01/2037 | | | | 300 | | | | 307 |
| |
| Nextel Communications, Inc. |
7.375% due 08/01/2015 | | | | 1,575 | | | | 1,576 |
| |
| Northwestern Bell Telephone |
7.750% due 05/01/2030 | | | | 1,208 | | | | 1,225 |
| |
| NRG Energy, Inc. | | | | | | | | |
7.250% due 02/01/2014 | | | | 1,000 | | | | 1,005 |
7.375% due 02/01/2016 | | | | 5,665 | | | | 5,693 |
7.375% due 01/15/2017 | | | | 450 | | | | 453 |
| |
| NTL Cable PLC | | | | | | | | |
9.125% due 08/15/2016 | | | | 500 | | | | 526 |
| |
| PSEG Energy Holdings LLC | | | | | | | | |
8.500% due 06/15/2011 | | | | 4,250 | | | | 4,523 |
| |
| Qwest Corp. | | | | | | | | |
7.200% due 11/10/2026 | | | | 1,700 | | | | 1,679 |
8.875% due 03/15/2012 | | | | 2,625 | | | | 2,841 |
| |
| Reliant Energy, Inc. | | | | | | | | |
6.750% due 12/15/2014 | | | | 3,075 | | | | 3,152 |
7.625% due 06/15/2014 | | | | 1,000 | | | | 980 |
7.875% due 06/15/2017 | | | | 1,300 | | | | 1,271 |
9.250% due 07/15/2010 | | | | 0 | | | | 1 |
| |
| Rural Cellular Corp. | | | | | | | | |
9.875% due 02/01/2010 | | | | 1,775 | | | | 1,864 |
| |
| Sierra Pacific Power Co. | | | | | | |
6.750% due 07/01/2037 | | | | 500 | | | | 506 |
| |
| Sierra Pacific Resources | | | | |
6.750% due 08/15/2017 | | | | 775 | | | | 766 |
7.803% due 06/15/2012 | | | | 625 | | | | 660 |
8.625% due 03/15/2014 | | | | 1,250 | | | | 1,348 |
| |
| South Point Energy Center LLC |
8.400% due 05/30/2012 (h) | | | | 1,158 | | | | 1,145 |
| |
| Tenaska Alabama Partners LP |
7.000% due 06/30/2021 | | | | 2,189 | | | | 2,251 |
| |
| Time Warner Telecom Holdings, Inc. |
9.250% due 02/15/2014 | | | | 2,875 | | | | 3,062 |
| |
| | | | | | | | |
| | | | | PRINCIPAL
AMOUNT
(000S) | | | | VALUE (000S) |
| UBS Luxembourg S.A. for OJSC Vimpel Communications |
8.250% due 05/23/2016 | | $ | | 1,000 | | $ | | 1,046 |
| | | | | | | | |
| | | | | | | | 62,450 |
| | | | | | | | |
Total Corporate Bonds & Notes
(Cost $383,250) | | 383,433 |
| | | | | | | | |
|
| CONVERTIBLE BONDS & NOTES 0.9% |
| Advanced Micro Devices, Inc. |
6.000% due 05/01/2015 | | | | 750 | | | | 726 |
| |
| Chesapeake Energy Corp. |
2.750% due 11/15/2035 | | | | 300 | | | | 327 |
| |
| CMS Energy Corp. | | | | | | | | |
2.875% due 12/01/2024 | | | | 1,000 | | | | 1,311 |
| |
| Deutsche Bank AG | | | | | | | | |
0.000% due 07/14/2008 | | | | 300 | | | | 280 |
0.000% due 09/29/2008 | | | | 275 | | | | 258 |
0.000% due 10/24/2008 | | | | 350 | | | | 344 |
| |
| Host Hotels & Resorts, Inc. |
2.625% due 04/15/2027 | | | | 100 | | | | 92 |
| |
| Nortel Networks Corp. | | | | | | | | |
2.125% due 04/15/2014 | | | | 800 | | | | 785 |
| |
| Qwest Communications International, Inc. |
3.500% due 11/15/2025 | | | | 200 | | | | 351 |
| | | | | | | | |
Total Convertible Bonds & Notes
(Cost $4,354) | | 4,474 |
| | | | | | | | |
|
| MUNICIPAL BONDS & NOTES 0.3% |
| Bell, California Public Financing Authority Notes, Series 2006 |
7.400% due 11/01/2007 | | | | 1,500 | | | | 1,502 |
| | | | | | | | |
Total Municipal Bonds & Notes
(Cost $1,500) | | 1,502 |
| | | | | | | | |
|
| U.S. GOVERNMENT AGENCIES 3.0% |
| Fannie Mae |
5.500% due 07/01/2037 - 08/01/2037 | | | | 15,600 | | | | 15,042 |
| | | | | | | | |
Total U.S. Government Agencies
(Cost $14,999) | | 15,042 |
| | | | | | | | |
|
| FOREIGN CURRENCY-DENOMINATED ISSUES 2.9% |
| Bombardier, Inc. | | | | | | | | |
7.250% due 11/15/2016 | | EUR | | 1,750 | | | | 2,478 |
| |
| JSG Holding PLC | | | | | | | | |
10.125% due 10/01/2012 | | | | 15 | | | | 22 |
| |
| Lighthouse International Co. S.A. |
8.000% due 04/30/2014 | | | | 1,670 | | | | 2,399 |
| |
| Nordic Telephone Co. Holdings ApS |
5.875% due 11/30/2014 | | | | 446 | | | | 610 |
6.125% due 11/30/2014 | | | | 550 | | | | 755 |
8.250% due 05/01/2016 | | | | 1,000 | | | | 1,455 |
| |
| NTL Cable PLC | | | | | | | | |
8.750% due 04/15/2014 | | | | 1,000 | | | | 1,418 |
| |
| Royal Bank of Scotland Group PLC |
9.370% due 04/06/2011 | | GBP | | 586 | | | | 1,181 |
| |
| SigmaKalon | | | | | | | | |
6.164% due 06/30/2012 | | EUR | | 924 | | | | 1,252 |
| |
| UPC Financing Partnership |
5.942% due 12/31/2014 | | | | 942 | | | | 1,276 |
| |
| UPC Holding BV | | | | | | | | |
7.750% due 01/15/2014 | | | | 600 | | | | 808 |
8.625% due 01/15/2014 | | | | 800 | | | | 1,113 |
| | | | | | | | |
Total Foreign Currency-Denominated Issues (Cost $13,185) | | 14,767 |
| | | | | | | | |
| | | | | | |
| See Accompanying Notes | | Semiannual Report | | June 30, 2007 | | 11 |
Schedule of Investments High Yield Portfolio (Cont.)
| | | | | | | | |
| | | | | SHARES | | | |
VALUE (000S) |
| CONVERTIBLE PREFERRED STOCKS 0.4% |
| Chesapeake Energy Corp. | | | | | | | | |
4.500% due 12/31/2049 | | | | 5,000 | | $ | | 507 |
5.000% due 12/31/2049 | | | | 2,900 | | | | 324 |
| |
| Freeport-McMoRan Copper & Gold, Inc. |
6.750% due 05/01/2010 | | | | 3,300 | | | | 424 |
| |
| Vale Capital Ltd. | | | | | | | | |
5.500% due 06/15/2010 | | | | 14,100 | | | | 697 |
| | | | | | | | |
Total Convertible Preferred Stocks (Cost $1,863) | | | | 1,952 |
| | | | | | | | |
|
| PREFERRED STOCKS 0.4% |
| Fresenius Medical Care Capital Trust II |
7.875% due 02/01/2008 | | | | 2,050 | | | | 2,065 |
| | | | | | | | |
Total Preferred Stocks
(Cost $2,172) | | | | 2,065 |
| | | | | | | | |
| | | | | | | | |
| | | | | PRINCIPAL
AMOUNT
(000S) | | | | VALUE (000S) |
| SHORT-TERM INSTRUMENTS 5.0% |
|
| COMMERCIAL PAPER 4.8% |
| Societe Generale NY | | | | | | | | |
5.245% due 11/26/2007 | | $ | | 21,300 | | $ | | 21,043 |
| |
| TotalFinaElf Capital S.A. | | | | | | | | |
5.340% due 07/02/2007 | | | | 1,900 | | | | 1,900 |
| |
| UBS Finance Delaware LLC | | | | |
5.350% due 10/23/2007 | | | | 1,400 | | | | 1,400 |
| | | | | | | | |
| | | | | | | | 24,343 |
| | | | | | | | |
|
| REPURCHASE AGREEMENTS 0.1% |
| State Street Bank and Trust Co. |
4.900% due 07/02/2007 | | | | 728 | | | | 728 |
| | | | | | | | |
(Dated 06/29/2007. Collateralized by Fannie Mae 3.250% due 08/15/2008 valued at $747. Repurchase proceeds are $728.) |
| | | | | | | | |
| | | | | PRINCIPAL
AMOUNT
(000S) | | | | VALUE (000S) |
| U.S. TREASURY BILLS 0.1% |
4.605% due 09/13/2007 (c) | | $ | | 250 | | $ | | 247 |
| | | | | | | | |
Total Short-Term Instruments
(Cost $25,327) | | | | 25,318 |
| | | | | | | | |
|
|
Total Investments (d) 97.4%
(Cost $487,844) | | $ | | 489,863 |
|
| Other Assets and Liabilities (Net) 2.6% | | 12,935 |
| | | | | | | | |
| Net Assets 100.0% | | | | | | $ | | 502,798 |
| | | | | | | | |
Notes to Schedule of Investments (amounts in thousands*, except number of contracts):
* A zero balance may reflect actual amounts rounding to less than one thousand.
(a) Security is in default.
(b) Payment in-kind bond security.
(c) Securities with an aggregate market value of $247 have been pledged as collateral for swap and swaption contracts on June 30, 2007.
(d) As of June 30, 2007, portfolio securities with an aggregate value of $9,228 were valued in good faith and pursuant to the guidelines established by the Board of Trustees.
(e) Swap agreements outstanding on June 30, 2007:
Credit Default Swaps
| | | | | | | | | | | | | | | | |
| Counterparty | | Reference Entity | | Buy/Sell
Protection (1) | | (Pay)/Receive
Fixed Rate | | | Expiration
Date | | Notional
Amount | | Unrealized
Appreciation/
(Depreciation) | |
Deutsche Bank AG | | SOFTBANK Corp. 1.750% due 03/31/2014 | | Sell | | 2.300% | | | 09/20/2007 | | JPY | 300,000 | | $ | 12 | |
Bank of America | | MGM Mirage 5.875% due 02/27/2014 | | Buy | | (0.810% | ) | | 06/20/2010 | | $ | 1,500 | | | 18 | |
Bank of America | | Dow Jones CDX N.A. HY7 Index | | Buy | | (3.250% | ) | | 12/20/2011 | | | 3,300 | | | (30 | ) |
Bank of America | | Aramark Corp. 8.500 due 02/01/2015 | | Sell | | 2.302% | | | 06/20/2012 | | | 200 | | | (6 | ) |
Bank of America | | MGM Mirage 5.875% due 02/27/2014 | | Sell | | 1.530% | | | 06/20/2012 | | | 1,500 | | | (51 | ) |
Bank of America | | Community Health Systems 8.875% due 07/15/2015 | | Sell | | 2.850% | | | 09/20/2012 | | | 900 | | | 4 | |
Barclays Bank PLC | | Domtar, Inc. 7.875% due 10/15/2011 | | Sell | | 1.500% | | | 09/20/2007 | | | 400 | | | 1 | |
Barclays Bank PLC | | Russia Government International Bond
7.500% due 03/31/2030 | | Sell | | 0.760% | | | 02/20/2009 | | | 1,500 | | | 16 | |
Barclays Bank PLC | | RSHB Capital S.A. for OJSC Russian Agricultural Bank 7.175% due 05/16/2013 | | Sell | | 0.740% | | | 03/20/2009 | | | 1,000 | | | 9 | |
Barclays Bank PLC | | Brazilian Government International Bond
12.250% due 03/06/2030 | | Sell | | 0.900% | | | 02/20/2012 | | | 2,000 | | | 23 | |
Barclays Bank PLC | | Qwest Capital Funding, Inc. 7.250% due 02/15/2011 | | Sell | | 1.470% | | | 03/20/2012 | | | 2,000 | | | (54 | ) |
Barclays Bank PLC | | Allied Waste North America, Inc.
7.375% due 04/15/2014 | | Sell | | 2.030% | | | 06/20/2012 | | | 500 | | | (16 | ) |
Barclays Bank PLC | | Forest Oil Corp. 7.750% due 05/01/2014 | | Sell | | 1.770% | | | 06/20/2012 | | | 200 | | | (3 | ) |
Barclays Bank PLC | | Freescale Semiconductor, Inc. 8.875% due 12/15/2014 | | Sell | | 3.620% | | | 06/20/2012 | | | 200 | | | (4 | ) |
Barclays Bank PLC | | Nortel Networks Corp. 4.250% due 09/01/2008 | | Sell | | 2.360% | | | 06/20/2012 | | | 200 | | | (3 | ) |
Barclays Bank PLC | | Sungard Data Systems, Inc. 9.125% due 08/15/2013 | | Sell | | 2.600% | | | 06/20/2012 | | | 200 | | | (5 | ) |
Bear Stearns & Co., Inc. | | Georgia-Pacific Corp. 8.125% due 05/15/2011 | | Sell | | 1.950% | | | 06/20/2012 | | | 200 | | | (6 | ) |
Citibank N.A. | | Ford Motor Credit Co. 7.000% due 10/01/2013 | | Sell | | 2.000% | | | 09/20/2007 | | | 1,000 | | | 4 | |
Citibank N.A. | | General Motors Acceptance Corp.
6.875% due 08/28/2012 | | Sell | | 1.120% | | | 12/20/2008 | | | 1,000 | | | (3 | ) |
Citibank N.A. | | Georgia-Pacific Corp. 8.125% due 05/15/2011 | | Buy | | (1.070% | ) | | 06/20/2010 | | | 1,500 | | | 28 | |
Citibank N.A. | | Nortel Networks Corp. 4.250% due 09/01/2008 | | Sell | | 2.050% | | | 06/20/2011 | | | 1,500 | | | (12 | ) |
Citibank N.A. | | General Motors Acceptance Corp.
6.875% due 08/28/2012 | | Sell | | 1.050% | | | 03/20/2012 | | | 3,000 | | | (94 | ) |
Citibank N.A. | | General Motors Acceptance Corp.
6.875% due 08/28/2012 | | Sell | | 1.600% | | | 03/20/2012 | | | 1,000 | | | (10 | ) |
Citibank N.A. | | General Motors Acceptance Corp.
6.875% due 08/28/2012 | | Sell | | 1.880% | | | 03/20/2012 | | | 1,000 | | | 0 | |
Citibank N.A. | | Chesapeake Energy Corp. 6.875% due 01/15/2016 | | Sell | | 1.030% | | | 06/20/2012 | | | 100 | | | (1 | ) |
Citibank N.A. | | General Motors Acceptance Corp.
6.875% due 08/28/2012 | | Sell | | 2.000% | | | 06/20/2012 | | | 1,500 | | | 5 | |
Citibank N.A. | | Georgia-Pacific Corp. 8.125% due 05/15/2011 | | Sell | | 1.820% | | | 06/20/2012 | | | 1,000 | | | (38 | ) |
Citibank N.A. | | LCDX N.A. 8 Index | | Sell | | 1.200% | | | 06/20/2012 | | | 1,500 | | | (35 | ) |
Citibank N.A. | | Nortel Networks Corp. 4.250% due 09/01/2008 | | Sell | | 2.300% | | | 06/20/2012 | | | 1,000 | | | (16 | ) |
| | | | |
| 12 | | PIMCO Variable Insurance Trust | | See Accompanying Notes |
| | |
| |
| | | June 30, 2007 (Unaudited) |
| | | | | | | | | | | | | | | | |
| Counterparty | | Reference Entity | | Buy/Sell
Protection (1) | | (Pay)/Receive
Fixed Rate | | | Expiration
Date | | Notional
Amount | | Unrealized
Appreciation/
(Depreciation) | |
Citibank N.A. | | Nortel Networks Corp. 4.250% due 09/01/2008 | | Sell | | 2.400% | | | 06/20/2012 | | $ | 1,000 | | $ | (14 | ) |
Citibank N.A. | | Georgia-Pacific Corp. 7.750% due 11/15/2029 | | Sell | | 2.220% | | | 09/20/2012 | | | 500 | | | (13 | ) |
Citibank N.A. | | Nortel Networks Corp. 4.250% due 09/01/2008 | | Sell | | 2.600% | | | 09/20/2012 | | | 625 | | | (6 | ) |
Citibank N.A. | | Sungard Data Systems, Inc. 9.125% due 08/15/2013 | | Sell | | 2.920% | | | 09/20/2012 | | | 1,000 | | | (17 | ) |
Citibank N.A. | | Anadarko Petroleum Corp. 6.125% due 03/15/2012 | | Buy | | (0.490% | ) | | 03/20/2014 | | | 1,000 | | | (2 | ) |
Citibank N.A. | | Chesapeake Energy Corp. 6.875% due 01/15/2016 | | Sell | | 1.370% | | | 03/20/2014 | | | 1,000 | | | (14 | ) |
Credit Suisse First Boston | | Abitibi-Consolidated Co. of Canada
8.375% due 04/01/2015 | | Sell | | 0.650% | | | 03/20/2008 | | | 1,000 | | | (17 | ) |
Credit Suisse First Boston | | Ford Motor Credit Co. 7.000% due 10/01/2013 | | Sell | | 0.750% | | | 03/20/2008 | | | 2,500 | | | (10 | ) |
Credit Suisse First Boston | | Ford Motor Credit Co. 7.000% due 10/01/2013 | | Sell | | 1.450% | | | 12/20/2008 | | | 2,000 | | | (5 | ) |
Credit Suisse First Boston | | Forest Oil Corp. 7.750% due 05/01/2014 | | Sell | | 1.610% | | | 06/20/2012 | | | 400 | | | (9 | ) |
Credit Suisse First Boston | | Solectron Global Finance Ltd. 8.000% due 03/15/2016 | | Sell | | 3.700% | | | 06/20/2012 | | | 1,000 | | | 93 | |
Credit Suisse First Boston | | Forest Oil Corp. 7.750% due 05/01/2014 | | Sell | | 1.930% | | | 09/20/2012 | | | 1,000 | | | (11 | ) |
Credit Suisse First Boston | | Pride International, Inc. 7.375% due 07/15/2014 | | Sell | | 1.950% | | | 09/20/2012 | | | 300 | | | (3 | ) |
Deutsche Bank AG | | Dow Jones CDX N.A. HY7 Index | | Buy | | (3.250% | ) | | 12/20/2011 | | | 100 | | | (1 | ) |
Deutsche Bank AG | | LCDX N.A. 8 Index | | Sell | | 1.200% | | | 06/20/2012 | | | 500 | | | (10 | ) |
Goldman Sachs & Co. | | Host Marriott LP 7.125% due 11/01/2013 | | Sell | | 1.770% | | | 12/20/2010 | | | 500 | | | 5 | |
Goldman Sachs & Co. | | Dow Jones CDX N.A. HY7 Index | | Sell | | 0.785% | | | 12/20/2011 | | | 800 | | | 0 | |
Goldman Sachs & Co. | | General Motors Acceptance Corp.
6.875% due 08/28/2012 | | Sell | | 1.025% | | | 03/20/2012 | | | 2,000 | | | (64 | ) |
HSBC Bank USA | | NAK Naftogaz Ukrainy 8.125% due 09/30/2009 | | Sell | | 3.000% | | | 04/20/2008 | | | 1,500 | | | (8 | ) |
HSBC Bank USA | | Ukraine Government International Bond 7.650% due 06/11/2013 | | Sell | | 0.700% | | | 04/20/2009 | | | 1,500 | | | 6 | |
JPMorgan Chase & Co. | | Multiple Reference Entities of Gazprom | | Sell | | 0.770% | | | 02/20/2012 | | | 2,000 | | | 23 | |
Lehman Brothers, Inc. | | NRG Energy, Inc. 7.250% due 02/01/2014 | | Sell | | 0.750% | | | 03/20/2008 | | | 1,800 | | | (5 | ) |
Lehman Brothers, Inc. | | Nortel Networks Corp. 4.250% due 09/01/2008 | | Buy | | (1.520% | ) | | 06/20/2010 | | | 1,500 | | | 10 | |
Lehman Brothers, Inc. | | Brazilian Government International Bond 12.250% due 03/06/2030 | | Sell | | 1.370% | | | 08/20/2011 | | | 5,400 | | | 177 | |
Lehman Brothers, Inc. | | Dow Jones CDX N.A. HY7 Index | | Sell | | 0.720% | | | 12/20/2011 | | | 2,000 | | | (6 | ) |
Lehman Brothers, Inc. | | Solectron Global Finance Ltd. 8.000% due 03/15/2016 | | Sell | | 3.100% | | | 03/20/2012 | | | 1,000 | | | 67 | |
Lehman Brothers, Inc. | | Chesapeake Energy Corp. 6.875% due 01/15/2016 | | Sell | | 1.090% | | | 06/20/2012 | | | 500 | | | (4 | ) |
Lehman Brothers, Inc. | | Chesapeake Energy Corp. 6.875% due 01/15/2016 | | Sell | | 1.110% | | | 06/20/2012 | | | 1,000 | | | (7 | ) |
Lehman Brothers, Inc. | | Forest Oil Corp. 7.750% due 05/01/2014 | | Sell | | 1.750% | | | 06/20/2012 | | | 250 | | | (4 | ) |
Lehman Brothers, Inc. | | LCDX N.A. 8 Index | | Sell | | 1.200% | | | 06/20/2012 | | | 600 | | | (14 | ) |
Lehman Brothers, Inc. | | Pride International, Inc. 7.375% due 07/15/2014 | | Sell | | 1.750% | | | 06/20/2012 | | | 325 | | | (4 | ) |
Lehman Brothers, Inc. | | Celestica, Inc. 7.625% due 07/01/2013 | | Sell | | 4.250% | | | 09/20/2012 | | | 1,000 | | | (13 | ) |
Lehman Brothers, Inc. | | CSC Holdings, Inc. 7.625% due 07/15/2018 | | Sell | | 2.520% | | | 09/20/2012 | | | 1,000 | | | (13 | ) |
Merrill Lynch & Co., Inc. | | CSC Holdings, Inc. 7.625% due 07/15/2018 | | Sell | | 2.080% | | | 06/20/2012 | | | 400 | | | (11 | ) |
Merrill Lynch & Co., Inc. | | Georgia-Pacific Corp. 8.125% due 05/15/2011 | | Sell | | 1.800% | | | 06/20/2012 | | | 500 | | | (19 | ) |
Morgan Stanley | | Russia Government International Bond 7.500% due 03/31/2030 | | Sell | | 0.245% | | | 06/20/2008 | | | 200 | | | 0 | |
Morgan Stanley | | Allied Waste North America, Inc.
7.375% due 04/15/2014 | | Buy | | (1.120% | ) | | 06/20/2010 | | | 1,500 | | | 17 | |
Morgan Stanley | | Qwest Capital Funding, Inc. 7.250% due 02/15/2011 | | Sell | | 1.800% | | | 06/20/2010 | | | 2,000 | | | 28 | |
Morgan Stanley | | Multiple Reference Entities of Gazprom | | Sell | | 1.050% | | | 04/20/2011 | | | 3,000 | | | 63 | |
Morgan Stanley | | Brazilian Government International Bond 12.250% due 03/06/2030 | | Sell | | 1.380% | | | 08/20/2011 | | | 5,400 | | | 179 | |
Morgan Stanley | | Allied Waste North America, Inc.
7.375% due 04/15/2014 | | Sell | | 2.020% | | | 06/20/2012 | | | 1,000 | | | (34 | ) |
Morgan Stanley | | Forest Oil Corp. 7.750% due 05/01/2014 | | Sell | | 1.700% | | | 06/20/2012 | | | 500 | | | (9 | ) |
Morgan Stanley | | Forest Oil Corp. 7.750% due 05/01/2014 | | Sell | | 1.730% | | | 06/20/2012 | | | 250 | | | (4 | ) |
Morgan Stanley | | Reliant Energy, Inc. 6.750% due 12/15/2014 | | Sell | | 2.200% | | | 06/20/2012 | | | 425 | | | (12 | ) |
Morgan Stanley | | Aramark Corp. 8.500 due 02/01/2015 | | Sell | | 2.680% | | | 09/20/2012 | | | 500 | | | (9 | ) |
Morgan Stanley | | Nortel Networks Corp. 4.250% due 09/01/2008 | | Sell | | 2.630% | | | 09/20/2012 | | | 625 | | | (5 | ) |
Morgan Stanley | | Pride International, Inc. 7.375% due 07/15/2014 | | Sell | | 1.960% | | | 09/20/2012 | | | 700 | | | (4 | ) |
Royal Bank of Scotland Group PLC | | Indonesia Government International Bond 6.750% due 03/10/2014 | | Sell | | 1.390% | | | 12/20/2011 | | | 3,000 | | | 51 | |
Royal Bank of Scotland Group PLC | | Indonesia Government International Bond 6.750% due 03/10/2014 | | Sell | | 1.100% | | | 03/20/2012 | | | 1,000 | | | 4 | |
| | | | | | | | | | | | | | | | |
| | | | | | | | | | | | | | $ | 75 | |
| | | | | | | | | | | | | | | | |
(1) If the Portfolio is a seller of protection and a credit event occurs, as defined under the terms of that particular swap agreement, the Portfolio will pay to the buyer of the protection an amount up to the notional value of the swap and in certain instances, take delivery of the security. As a buyer of protection, the Portfolio will generally receive from the seller of protection an amount up to the notional amount of the swap if a credit event occurs.
Interest Rate Swaps
| | | | | | | | | | | | | | | |
| Counterparty | | Floating Rate Index | | Pay/Receive
Floating Rate | | Fixed Rate | | Expiration
Date | | Notional
Amount | | Unrealized
(Depreciation) | |
Morgan Stanley | | BRL-CDI-Compounded | | Pay | | 10.115% | | 01/02/2012 | | BRL | 21,000 | | $ | (219 | ) |
Citibank N.A. | | 28-Day Mexico Interbank TIIE Banxico | | Pay | | 7.910% | | 05/14/2009 | | MXN | 25,000 | | | 0 | |
Morgan Stanley | | 28-Day Mexico Interbank TIIE Banxico | | Pay | | 7.910% | | 05/14/2009 | | | 33,000 | | | (1 | ) |
| | | | | | | | | | | | | | | |
| | | | | | | | | | | | | $ | (220 | ) |
| | | | | | | | | | | | | | | |
| | | | | | |
| See Accompanying Notes | | Semiannual Report | | June 30, 2007 | | 13 |
| | |
| |
| Schedule of Investments High Yield Portfolio (Cont.) | | June 30, 2007 (Unaudited) |
Total Return Swaps
| | | | | | | | | | | | | | |
| Counterparty | | Type | | Receive Total Return | | Pay | | Expiration
Date | | # of
Contracts | | Unrealized
(Depreciation) | |
Merrill Lynch & Co., Inc. | | Long | | Motorola, Inc. | | 5.579% | | 07/23/2007 | | 10,100 | | $ | (2 | ) |
| | | | | | | | | | | | | | |
(f) Restricted securities as of June 30, 2007:
| | | | | | | | | | | | | | |
| Issuer Description | | Coupon | | Maturity
Date | | Acquisition
Date | | Cost | | Market
Value | | Market Value
as Percentage
of Net Assets |
Continental Airlines, Inc. | | 6.920% | | 04/02/2013 | | 07/01/2003 | | $ | 657 | | $ | 725 | | 0.15% |
Ferrellgas Partners LP | | 8.870% | | 08/01/2009 | | 06/30/2003 | | | 1,260 | | | 1,272 | | 0.25% |
| | | | | | | | | | | | | | |
| | | | | | | | $ | 1,917 | | $ | 1,997 | | 0.40% |
| | | | | | | | | | | | | | |
(g) Foreign currency contracts outstanding on June 30, 2007:
| | | | | | | | | | | | | | | | | |
| Type | | Currency | | Principal
Amount
Covered by
Contract | | Settlement
Month | | Unrealized
Appreciation | | Unrealized
(Depreciation) | | | Net Unrealized
(Depreciation) | |
Sell | | EUR | | 12,247 | | 07/2007 | | $ | 0 | | $ | (160 | ) | | $ | (160 | ) |
Sell | | GBP | | 704 | | 08/2007 | | | 0 | | | (8 | ) | | | (8 | ) |
| | | | | | | | | | | | | | | | | |
| | | | | | | | $ | 0 | | $ | (168 | ) | | $ | (168 | ) |
| | | | | | | | | | | | | | | | | |
(h) Security is subject to a forbearance agreement entered into by the Portfolio which forbears the Portfolio from taking action to, among other things, accelerate and collect payments on the subject note with respect to specified events of default.
| | | | |
| 14 | | PIMCO Variable Insurance Trust | | See Accompanying Notes |
| | |
| |
| Notes to Financial Statements | | June 30, 2007 (Unaudited) |
1. ORGANIZATION
The High Yield Portfolio (the “Portfolio”) is a series of the PIMCO Variable Insurance Trust (the “Trust”). The Trust is registered under the Investment Company Act of 1940 (the “Act”), as amended, as an open-end management investment company organized as a Delaware business trust on October 3, 1997. The Portfolio offers three classes of shares: Institutional, Administrative and Advisor. Information presented on these financial statements pertains to the Advisor Class of the Portfolio. Certain detailed financial information for the Institutional Class and Administrative Class is provided separately and is available upon request. The Trust is designed to be used as an investment vehicle by Separate Accounts of insurance companies that fund variable annuity contracts and variable life insurance policies and by qualified pension and retirement plans.
2. SIGNIFICANT ACCOUNTING POLICIES
The following is a summary of significant accounting policies consistently followed by the Portfolio in the preparation of its financial statements in conformity with accounting principles generally accepted in the United States of America (“GAAP”). The preparation of financial statements in accordance with GAAP requires management to make estimates and assumptions that affect the reported amounts and disclosures on the financial statements. Actual results could differ from those estimates.
(a) Security Valuation Portfolio securities are valued as of the close of regular trading (normally 4:00 p.m., Eastern Time) on each day that the New York Stock Exchange (“NYSE”) is open. Portfolio securities and other assets for which market quotes are readily available are stated at market value. Market value is generally determined on the basis of last reported sales prices, or if no sales are reported, based on quotes obtained from a quotation reporting system, established market makers, or pricing services. Fixed-income securities and non-exchange traded derivatives are normally valued on the basis of quotes obtained from brokers and dealers or pricing services. Prices obtained from independent pricing services use information provided by market makers or estimates of market values obtained from yield data relating to investments or securities with similar characteristics. Certain fixed income securities purchased on a delayed-delivery basis are marked to market daily until settlement at the forward settlement date. Short-term investments having a maturity of 60 days or less are generally valued at amortized cost. Exchange traded options, futures and options on futures are valued at the settlement price determined by the relevant exchange. With respect to any portion of the Portfolio’s assets that are invested in one or more open end management investment companies, the Portfolio’s net asset value (“NAV”) will be calculated based upon the NAVs of such investments.
Investments initially valued in currencies other than the U.S. dollar are converted to the U.S. dollar using exchange rates obtained from pricing services. As a result, the NAV of the Portfolio’s securities may be affected by changes in the value of currencies in relation to the U.S. dollar. The value of securities traded in markets outside the United States or denominated in currencies other than the U.S. dollar may be affected significantly on a day that the NYSE is closed and an investor is not able to purchase, redeem or exchange shares.
Securities and other assets for which market quotes are not readily available are valued at fair value as determined in good faith by the Board of Trustees or persons acting at their direction. The Board of Trustees has adopted methods for valuing securities and other assets in circumstances where market quotes are not readily available, and has delegated to Pacific Investment Management Company LLC (“PIMCO”) the responsibility for applying the valuation methods. In the event that market quotes are not readily available, and the security or asset cannot be valued pursuant to one of the valuation methods, the value of the security or asset will be determined in good faith by the Valuation Committee of the Board of Trustees, generally based upon recommendations provided by PIMCO.
Market quotes are considered not readily available in circumstances where there is an absence of current or reliable market-based data (e.g., trade information, bid/asked information, broker quotes), including where events occur after the close of the relevant market, but prior to the close of regular trading, that materially affect the values of the Portfolio’s securities or assets. In addition, market quotes are considered not readily available when, due to extraordinary circumstances, the exchanges or markets on which the securities trade, do not open for trading for the entire day and no other market prices are available. The Board has delegated to PIMCO the responsibility for monitoring significant events that may materially affect the values of the Portfolio’s securities or assets and for determining whether the value of the applicable securities or assets should be re-evaluated in light of such significant events.
When the Portfolio uses fair value pricing to determine its NAV, securities will not be priced on the basis of quotations from the primary market in which they are traded, but rather may be priced by another method that the Board of Trustees or persons acting at their direction believe accurately reflects fair value. The Trust’s policy is intended to result in a calculation of the Portfolio’s NAV that fairly reflects security values as of the time of pricing. However, fair values determined by the Board of Trustees or persons acting at their direction may not accurately reflect the price that the Portfolio could obtain for a security if it were to dispose of that security as of the time of pricing. Because foreign securities can trade on non-business days of the Portfolio, the NAV of the Portfolio may change on days when shareholders will not be able to purchase or redeem Portfolio shares. The prices used by the Portfolio may differ from the value that would be realized if the securities were sold and the differences could be material to the financial statements.
(b) Securities Transactions and Investment Income Securities transactions are recorded as of the trade date for financial reporting purposes. Securities purchased or sold on a when-issued or delayed-delivery basis may be settled a month or more after the trade date. Realized gains and losses from securities sold are recorded on the identified cost basis. Dividend income is recorded on the ex-dividend date, except certain dividends from foreign securities where the ex-dividend date may have passed, which are recorded as soon as the Portfolio is informed of the ex-dividend date. Interest income, adjusted for the accretion of discounts and amortization of premiums, is recorded on the accrual basis. Paydown gains and losses on mortgage-related and other asset-backed securities are recorded as components of interest income on the Statement of Operations.
(c) Dividends and Distributions to Shareholders Dividends from net investment income, if any, are declared daily and distributed to shareholders monthly. Net realized capital gains earned by the Portfolio, if any, will be distributed no less frequently than once each year.
Income dividends and capital gain distributions are determined in accordance with income tax regulations which may differ from GAAP. Differences between tax regulations and GAAP may change the fiscal year when income and capital items are recognized for tax and GAAP purposes. Examples of events that give rise to timing differences include wash sales, straddles, net operating losses and capital loss carryforwards. Further, the character of investment income and capital gains may be different for certain transactions under the two methods of accounting. Examples of characterization differences include the treatment of mortgage paydowns, swaps, foreign currency transactions and contingent debt instruments. As a result, income dividends and capital gain distributions declared during a fiscal period may differ significantly from the net investment income and realized capital gain reported on the Portfolio’s annual financial statements presented under GAAP.
Distributions classified as a tax basis return of capital, if any, are reflected on the accompanying Statements of Changes in Net Assets and have been reclassified to paid in capital. In addition, other amounts have been reclassified between
| | | | | | |
| | Semiannual Report | | June 30, 2007 | | 15 |
Notes to Financial Statements (Cont.)
undistributed net investment income, accumulated undistributed net realized gains or losses and/or paid in capital to more appropriately conform financial accounting to tax characterizations of dividend distributions.
(d) Multiclass Operations Each class offered by the Portfolio has equal rights as to assets and voting privileges (except that shareholders of a class have exclusive voting rights regarding any matter relating solely to that class of shares). Income and non-class specific expenses of the Portfolio are allocated daily to each class of shares based on the relative value of settled shares. Realized and unrealized capital gains and losses of the Portfolio are allocated daily to each class of shares based on the relative net assets of each class. Class specific expenses, where applicable, currently include administrative, distribution and servicing fees.
(e) Foreign Currency The functional and reporting currency for the Portfolio is the U.S. dollar. The market values of foreign securities, currency holdings and other assets and liabilities are translated into U.S. dollars based on the current exchange rates each business day. Fluctuations in the value of currency holdings and other assets and liabilities resulting from changes in exchange rates are recorded as unrealized foreign currency gains or losses. Realized gains or losses and unrealized appreciation or depreciation on investment securities and income and expenses are translated on the respective dates of such transactions. The effects of changes in foreign currency exchange rates on investments in securities are not segregated on the Statement of Operations from the effects of changes in market prices of those securities, but are included with the net realized and unrealized gain or loss on investment securities.
| | | | | | |
|
| Non-U.S. currency symbols utilized throughout the report are defined as follows: |
| BRL | | Brazilian Real | | JPY | | Japanese Yen |
| EUR | | Euro | | MXN | | Mexican Peso |
| GBP | | Great British Pound | | | | |
(f) Foreign Currency Transactions The Portfolio may enter into foreign currency contracts in connection with settling planned purchases or sales of securities, to hedge the currency exposure associated with some or all of the Portfolio’s securities or as a part of an investment strategy. A foreign currency contract is an agreement between two parties to buy and sell a currency at a set price on a future date. The market value of a foreign currency contract fluctuates with changes in foreign currency exchange rates. Foreign currency contracts are marked to market daily and the change in value is recorded by the Portfolio as an unrealized gain or loss. Realized gains or losses equal to the difference between the value of the contract at the time it was opened and the value at the time it was closed are recorded upon delivery or receipt of the currency. These contracts may involve market risk in excess of the unrealized gain or loss reflected on the Statement of Assets and Liabilities. In addition, the Portfolio could be exposed to risk if the counterparties are unable to meet the terms of the contracts or if the value of the currency changes unfavorably to the U.S. dollar.
(g) Payment In-Kind Securities The portfolio may invest in payment in-kind securities. Payment in-kind securities (“PIKs”) give the issuer the option at each interest payment date of making interest payments in either cash or additional debt securities. Those additional debt securities usually have the same term, including maturity dates and interest rates, and associated risks as the original bonds. The daily market quotations of the original bonds include the accrued interest (referred to as a dirty price) and require a pro-rata adjustment from interest receivable to the unrealized appreciation or depreciation on investment on the Statement of Assets and Liabilities.
(h) Repurchase Agreements The Portfolio may engage in repurchase transactions. Under the terms of a typical repurchase agreement, the Portfolio takes possession of an underlying debt obligation (collateral) subject to an obligation of the seller to repurchase, and the Portfolio to resell, the obligation at an agreed-upon price and time. The underlying securities for all repurchase agreements are held in safekeeping at the Portfolio’s custodian or designated subcustodians under tri-party repurchase agreements. The market value of the collateral must be equal to or exceed the total amount of the repurchase obligations, including interest. Securities purchased under repurchase agreements are reflected as an asset on the Statement of Assets and Liabilities. Generally, in the event of counterparty default, the Portfolio has the right to use the collateral to offset losses incurred. If the counterparty should default, the Portfolio will seek to sell the securities which it holds as collateral. This could involve procedural costs or delays in addition to a loss on the securities if their value should fall below their repurchase price.
(i) Reverse Repurchase Agreements The Portfolio may enter into reverse repurchase agreements. In a reverse repurchase agreement, the Portfolio sells to a financial institution a security that it holds with an agreement to repurchase the same security at an agreed-upon price and date. Securities sold under reverse repurchase agreements are reflected as a liability on the Statement of Assets and Liabilities. A reverse repurchase agreement involves the risk that the market value of the security sold by the Portfolio may decline below the repurchase price of the security. The Portfolio will segregate assets determined to be liquid by the investment adviser or otherwise cover its obligations under reverse repurchase agreements.
(j) Inverse Floating Rate Transactions—Residual Interest Municipal Bonds (“RIBs”)/Residual Interest Tax Exempt Bonds (“RITEs”) The Portfolio may invest in RIBs and RITEs (“Inverse Floaters”). Inverse Floaters are created via a master trust agreement between a broker-dealer, acting as trustor and liquidity provider, and an investment bank, acting as trustee and tender agent. The master trust agreement defines the terms for each trust series; with each series being established by the transfer of long-term, fixed-rate municipal bonds (“Fixed Rate Bonds”) to the trustee to be held and provide for the creation, execution and delivery of floater certificates (“Floating Rate Notes”) and Inverse Floaters. Floating Rate Notes are liquid notes that are issued with a short-term variable rate typically linked to the LIBOR, subject to limitations, for some duration. After interest income is paid on the Floating Rate Notes at current rates, the residual income from the Fixed Rate Bonds is paid to the Inverse Floaters. Inverse Floaters are issued with a coupon that fluctuates inversely with the Floating Rate Notes’ referenced rate, subject to certain limitations. Therefore, rising short-term rates result in lower income for the Inverse Floaters and vice versa.
Floating Rate Notes are generally remarketed to municipal money market funds. Inverse Floaters are acquired by either tax-exempt municipal bond funds or trusts, or other parties interested in potentially higher yielding tax-exempt securities. Inverse Floaters may also be acquired for the purpose of increasing leverage. Floating Rate Note holders typically have the option to tender their notes to the liquidity provider for redemption at par at each reset date. The Inverse Floater holders have the option to (i) require the Floating Rate Note holders to tender their notes at par, and (ii) require the liquidity provider to transfer the Fixed Rate Bonds to the Inverse Floater holders. The holders of Inverse Floaters bear substantially all of the downside investment risk associated with the underlying Fixed Rate Bonds, and also benefit from a disproportionate amount of the potential appreciation of the underlying Fixed Rate Bonds’ value. Inverse Floaters may be more volatile and less liquid than other municipal bonds of comparable maturity.
Inverse Floaters may be acquired with or without first transferring to the trustor the Fixed Rate Bonds that were utilized to create the trust series. Inverse Floaters
| | | | |
| 16 | | PIMCO Variable Insurance Trust | | |
| | |
| |
| | | June 30, 2007 (Unaudited) |
acquired without a transfer of Fixed Rate Bonds are recognized as purchases of securities as outlined in Note 2(b). Statement of Financial Accounting Standards No. 140—Accounting for Transfers and Servicing of Financial Assets and Extinguishments of Liabilities (“FAS No. 140”), governs the standards for accounting for securitizations and other transfers of financial assets. If there is a transfer of Fixed Rate Bonds and it meets sale criteria under FAS No. 140, a Portfolio records a sale of the Fixed Rate Bonds and a purchase of the Inverse Floaters. The cash received from the Inverse Floaters is then recorded as interest income in the Statement of Operations.
If the transfer of Fixed Rate Bonds does not meet sale criteria under FAS No. 140, a Portfolio accounts for the transaction described above as a secured borrowing by including the Fixed Rate Bonds in its Schedule of Investments, and recording the Floating Rate Notes as a liability under the caption “Payable for floating rate notes” in the Portfolio’s Statement of Assets and Liabilities. In a secured borrowing transaction, cash received from the Inverse Floaters is not recorded as interest income. Instead, a Portfolio records interest income related to the Fixed Rate Bonds and interest expense related to the Floating Rate Notes, the net of which is equal to the cash received from the Inverse Floaters acquired by the Portfolio. Thus, while a Portfolio’s reported total income, net expenses, and net expense ratio are generally higher for investments in Inverse Floaters acquired via a secured borrowing, the method of acquiring Inverse Floaters does not result in differences for reported cash flows, net asset value or total return.
(k) Restricted Securities The Portfolio may invest in securities that are subject to legal or contractual restrictions on resale. These securities generally may be resold in transactions exempt from registration or to the public if the securities are registered. Disposal of these securities may involve time-consuming negotiations and expenses, and prompt sale at an acceptable price may be difficult. Securities acquired under the provisions of Rule 144A can only be traded between qualified institutional investors. The Board of Trustees considers 144A securities to be liquid.
(l) Swap Agreements The Portfolio may invest in swap agreements. Swap transactions are privately negotiated agreements between the Portfolio and a counterparty to exchange or swap investment cash flows, assets, or market-linked returns at specified, future intervals. The Portfolio may enter into interest rate, total return, forward spread-lock, credit default, and other forms of swap agreements to manage its exposure to interest rates and credit risk. In connection with these agreements, securities may be identified as collateral in accordance with the terms of the respective swap agreements.
Interest rate swap agreements involve the exchange by the Portfolio with another party of their respective commitments to pay or receive interest, e.g., an exchange of floating rate payments for fixed rate payments with respect to the notional amount of principal. Certain forms of interest rate swap agreements may include: (i) interest rate caps, under which, in return for a premium, one party agrees to make payments to the other to the extent that interest rates exceed a specified rate, or “cap”, (ii) interest rate floors, under which, in return for a premium, one party agrees to make payments to the other to the extent that interest rates fall below a specified rate, or “floor”, or (iii) interest rate collars, under which a party sells a cap and purchases a floor or vice versa in an attempt to protect itself against interest rate movements exceeding given minimum or maximum levels.
Total return swap agreements involve commitments to pay interest in exchange for a market-linked return, both based on notional amounts. To the extent the total return of the security or index underlying the transaction exceeds or falls short of the offsetting interest rate obligation, the Portfolio will receive a payment from or make a payment to the counterparty.
Forward spread-lock swap agreements involve commitments to pay or receive a settlement amount calculated as the difference between the swap spread and a
fixed spread, multiplied by the notional amount times the duration of the swap. The swap spread is the difference between the benchmark swap rate (market rate) and the specific Treasury rate.
Credit default swap agreements involve one party making a stream of payments to another party in exchange for the right to receive a specified return in the event of a default by a third party, typically corporate issues or sovereign issues of an emerging country, on its obligation. The Portfolio may use credit default swaps to provide a measure of protection against defaults of the issuers (i.e., to reduce risk where the Portfolio owns or has exposure to the sovereign issuer) or to take an active long or short position with respect to the likelihood of a particular issuer’s default. As a seller of protection, the Portfolio generally receives an upfront payment or a fixed rate of income throughout the term of the swap provided that there is no credit event. If the Portfolio is a seller of protection and a credit event occurs, as defined under the terms of that particular swap agreement, the Portfolio will pay to the buyer of the protection an amount up to the notional value of the swap and in certain instances take delivery of the security. As the seller, the Portfolio would effectively add leverage to its portfolio because, in addition to its total net assets, the Portfolio would be subject to investment exposure on the notional amount of the swap. As a buyer of protection, the Portfolio generally receives an amount up to the notional value of the swap if a credit event occurs. The treatment of credit default swaps and other swap agreements that provide for contingent, non-periodic, bullet-type payments as “notional principal contracts” for U.S. federal income tax purposes is uncertain. Were the U.S. Internal Revenue Service (“IRS”) to take the position that a credit default swap or other bullet-type swap is not a “notional principal contract” for U.S. federal income tax purposes, payments received by the Portfolio from such investments might be subject to U.S. excise or income taxes.
Swaps are marked to market daily based upon quotations from market makers and the change in value, if any, is recorded as unrealized gain or loss on the Statement of Operations. Payments received or made at the beginning of the measurement period are reflected as such on the Statement of Assets and Liabilities. These upfront payments are recorded as realized gain or loss on the Statement of Operations upon termination or maturity of the swap. A liquidation payment received or made at the termination of the swap is recorded as realized gain or loss on the Statement of Operations. Net periodic payments received or paid by the Portfolio are included as part of realized gain or loss on the Statement of Operations. Entering into these agreements involves, to varying degrees, elements of credit, market and documentation risk in excess of the amounts recognized on the Statement of Assets and Liabilities. Such risks involve the possibility that there will be no liquid market for these agreements, that the counterparty to the agreements may default on its obligation to perform or disagree as to the meaning of contractual terms in the agreements and that there may be unfavorable changes in interest rates.
(m) Loan Participations and Assignments The Portfolio may invest in direct debt instruments which are interests in amounts owned by corporate, governmental, or other borrowers to lenders or lending syndicates. The Portfolio’s investments in loans may be in the form of participations in loans or assignments of all or a portion of loans from third parties. A loan is often administered by a bank or other financial institution (the “lender”) that acts as agent for all holders. The agent administers the terms of the loan, as specified in the loan agreement. When investing in a loan participation, the Portfolio has the right to receive payments of principal, interest and any fees to which it is entitled only from the lender selling the loan agreement and only upon receipt by the lender of payments from the borrower. The Portfolio generally has no right to enforce compliance with the terms of the loan agreement with the borrower. As a result, the Portfolio may be subject to the credit risk of both the borrower and the lender that is selling the loan agreement. When the Portfolio purchases assignments from lenders it acquires direct rights against the borrower of the loan. At the end of the period June 30, 2007, the Portfolio had no unfunded loan commitments.
| | | | | | |
| | Semiannual Report | | June 30, 2007 | | 17 |
Notes to Financial Statements (Cont.)
(n) Bridge Debt Commitments At the period ended June 30, 2007, the Portfolio had $14,177,071 in commitments outstanding to fund high yield bridge debt. The Portfolio is entitled to a fee upon the expiration of the commitment period. The bridge debt terms approximate market rates at the time the commitment is entered into.
(o) U.S. Government Agencies or Government-Sponsored Enterprises Securities issued by U.S. Government agencies or government-sponsored enterprises may not be guaranteed by the U.S. Treasury. The Government National Mortgage Association (“GNMA” or “Ginnie Mae”), a wholly owned U.S. Government corporation, is authorized to guarantee, with the full faith and credit of the U.S. Government, the timely payment of principal and interest on securities issued by institutions approved by GNMA and backed by pools of mortgages insured by the Federal Housing Administration or guaranteed by the Department of Veterans Affairs. Government-related guarantors (i.e., not backed by the full faith and credit of the U.S. Government) include the Federal National Mortgage Association (“FNMA” or “Fannie Mae”) and the Federal Home Loan Mortgage Corporation (“FHLMC” or “Freddie Mac”). Pass-through securities issued by FNMA are guaranteed as to timely payment of principal and interest by FNMA but are not backed by the full faith and credit of the U.S. Government. FHLMC guarantees the timely payment of interest and ultimate collection of principal, but its participation certificates are not backed by the full faith and credit of the U.S. Government.
(p) New Accounting Policies In July 2006, the Financial Accounting Standards Board (“FASB”) issued Interpretation No. 48, “Accounting for Uncertainty in Income Taxes—an Interpretation of FASB Statement No. 109” (the “Interpretation”). The Interpretation became effective for the Portfolio on June 29, 2007. Management has evaluated the application of the Interpretation in relation to the Portfolio and has concluded that no single filing position or combination of filing positions identified as uncertain tax positions required the accrual of a tax liability in the accounting records of the Portfolio for the period ending June 30, 2007. Management will monitor all existing filing positions and future filing positions in light of the Interpretation and evaluate the need for any future tax accruals and financial statement disclosures as warranted.
In September 2006, the FASB issued Statement of Financial Accounting Standards No. 157, “Fair Value Measurements” (the “Statement”). The Statement is effective for fiscal years beginning after November 15, 2007 and will require expanded disclosure about fair value measurements, separately for each major category of assets and liabilities, that enables shareholders to assess the inputs used to develop those measurements, and for recurring fair value measurements using significant unobservable inputs the effect of the measurements on changes in net assets for the reporting period. Management is currently evaluating the application of the Statement to the Portfolio and will provide additional information in relation to the Statement on the Portfolio’s annual financial statements for the period ending December 31, 2007.
3. FEES AND EXPENSES
(a) Investment Advisory Fee PIMCO is a majority-owned subsidiary of Allianz Global Investors of America L.P. (“AGI”), and serves as investment adviser (the “Adviser”) to the Trust, pursuant to an investment advisory contract. The Adviser receives a monthly fee from the Portfolio, at an annual rate based on average daily net assets. The Advisory Fee for all classes is charged at an annual rate of 0.25%.
(b) Administration Fee PIMCO serves as administrator (the “Administrator”), and provides administrative services to the Trust for which it receives a monthly administrative fee based on each share class’s average daily net assets. As the Administrator, PIMCO bears the costs of various third-party services, including audit, custodial, portfolio accounting, legal, transfer agency and printing costs. The Administration Fee for all classes is charged at the annual rate of 0.35%.
(c) Distribution and Servicing Fees Allianz Global Investors Distributors LLC (“AGID”) is an indirect wholly-owned subsidiary of AGI and serves as the distributor (the “Distributor”) of the Trust’s shares. The Trust is permitted to reimburse AGID on a quarterly basis, out of the Administrative Class assets of the Portfolio in the amount of 0.15% on an annual basis of the average daily net assets of that class, for payments made to financial intermediaries that provide services in connection with the distribution of shares or administration of plans or programs that use Portfolio shares as their funding medium. The effective rate paid to AGID was 0.15% during the current fiscal year.
The Trust has adopted a Distribution Plan, for the Advisor Class shares of the Portfolio (the “Plan”). The Plan has been adopted pursuant to Rule 12b-1 under the Act. The Plan permits payments for expenses in connection with the distribution and marketing of Advisor Class shares and/or the provision of shareholder services to Advisor Class shareholders. The Plan permits the Portfolio to make total payments at an annual rate of 0.25% of its average daily net assets attributable to its Advisor Class shares.
(d) Portfolio Expenses The Trust is responsible for the following expenses: (i) salaries and other compensation of any of the Trust’s executive officers and employees who are not officers, directors, stockholders or employees of PIMCO or its subsidiaries or affiliates; (ii) taxes and governmental fees; (iii) brokerage fees and commissions and other portfolio transaction expenses; (iv) the costs of borrowing money, including interest expenses and bank overdraft charges; (v) fees and expenses of the Trustees who are not “interested persons” of PIMCO or the Trust, and any counsel retained exclusively for their benefit; (vi) extraordinary expenses, including costs of litigation and indemnification expenses; (vii) organization expenses and (viii) any expenses allocated or allocable to a specific class of shares, which include service fees payable with respect to the Administrative Class Shares, and may include certain other expenses as permitted by the Trust’s Multiple Class Plan adopted pursuant to Rule 18f-3 under the Act and subject to review and approval by the Trustees. The ratio of expenses to average net assets per share class, as disclosed in the Financial Highlights, may differ from the annual portfolio operating expenses per share class as disclosed in the Prospectus for the reasons set forth above.
Effective April 1, 2007, each Trustee, other than those affiliated with PIMCO or its affiliates, receives an annual retainer of $15,000, plus $2,375 for each Board of Trustees meeting attended in person, $500 for each committee meeting attended and $750 for each Board of Trustees meeting attended telephonically, plus reimbursement of related expenses. In addition, the audit committee chair receives an additional annual retainer of $2,000 and each other committee chair receives an additional annual retainer of $500. These expenses are allocated on a pro-rata basis to the various portfolios of the Trust according to their respective net assets. The Trust pays no compensation directly to any Trustee or any other officer who is affiliated with the Administrator, all of whom receive remuneration for their services to the Trust from the Administrator or its affiliates. Prior to April 1, 2007, each Trustee, other than those affiliated with PIMCO or its affiliates, received an annual retainer of $15,000 plus $2,000 for each Board of Trustees meeting attended ($500 for each special meeting attended), plus reimbursement of related expenses. The Audit Committee Chairman received an annual retainer of $1,500 and the Governance Committee Chairman received an annual retainer of $500. In addition, each member of a committee received $500 for each committee meeting attended.
4. RELATED PARTY TRANSACTIONS
The Adviser, Administrator, and Distributor are related parties as defined by FAS 57, Related Party Disclosures. Fees payable to these parties are disclosed in Note 3.
| | | | |
| 18 | | PIMCO Variable Insurance Trust | | |
| | |
| |
| | | June 30, 2007 (Unaudited) |
The Portfolio is permitted to purchase or sell securities from or to certain related affiliated portfolios under specified conditions outlined in procedures adopted by the Board of Trustees of the Trust. The procedures have been designed to ensure that any purchase or sale of securities by the Portfolio from or to another portfolio that are, or could be, considered an affiliate by virtue of having a common investment advisor (or affiliated investment advisors), common Trustees and/or common officers complies with Rule 17a-7 of the Act. Further, as defined under the procedures, each transaction is effected at the current market price. During the period ended June 30, 2007, the Portfolio engaged in purchases and sales of securities pursuant to the Rule 17a-7 of the Act (amounts in thousands):
| | |
| Purchases | | Sales |
$ 0 | | $ 1,816 |
5. GUARANTEES AND INDEMNIFICATIONS
Under the Trust’s organizational documents, each Trustee, officer, employee or other agent of the Trust (including the Trust’s investment manager) is indemnified, to the extent permitted by the Act, against certain liabilities that may arise out of performance of their duties to the Portfolio. Additionally, in the normal course of business, the Portfolio enters into contracts that contain a variety of indemnification clauses. The Portfolio’s maximum exposure under these arrangements is unknown as this would involve future claims that may be made against the Portfolio that have not yet occurred. However, the Portfolio has not had prior claims or losses pursuant to these contracts and believes the risk of loss to be remote.
6. PURCHASES AND SALES OF SECURITIES
The length of time the Portfolio has held a particular security is not generally a consideration in investment decisions. A change in the securities held by the Portfolio is known as “portfolio turnover”. The Portfolio may engage in frequent and active trading of portfolio securities to achieve its investment objective, particularly during periods of volatile market movements. High portfolio turnover (e.g., over 100%) involves correspondingly greater expenses to the Portfolio, including brokerage commissions or dealer mark-ups and other transaction costs on the sale of securities and reinvestments in other securities. Such sales may also result in realization of taxable capital gains, including short-term capital gains (which are generally taxed at ordinary income tax rates). The trading costs and tax effects associated with portfolio turnover may adversely affect the Portfolio’s performance.
Purchases and sales of securities (excluding short-term investments) for the period ended June 30, 2007, were as follows (amounts in thousands):
| | | | | | | | | | | | |
| U.S. Government/Agency | | | | All Other |
| Purchases | | Sales | | | | Purchases | | Sales |
| $ | 17,586 | | $ | 0 | | | | $ | 173,842 | | $ | 206,950 |
7. TRANSACTIONS IN WRITTEN CALL AND PUT OPTIONS
Transactions in written call and put options were as follows (amounts in thousands, except for number of contracts):
| | | | | | | | | |
| | | | | # of
Contracts | | | Premium | |
Balance at 12/31/2006 | | | | 290 | | | $ | 99 | |
Sales | | | | 0 | | | | 0 | |
Closing Buys | | | | (290 | ) | | | (99 | ) |
Expirations | | | | 0 | | | | 0 | |
Exercised | | | | 0 | | | | 0 | |
Balance at 06/30/2007 | | | | 0 | | | $ | 0 | |
8. SHARES OF BENEFICIAL INTEREST
The Portfolio may issue an unlimited number of shares of beneficial interest with a $0.001 par value. Changes in shares of beneficial interest were as follows (shares and amounts in thousands):
| | | | | | | | | | | | | | | | |
| | | | | Six Months Ended
06/30/2007 | | | Year Ended
12/31/2006 | |
| | | | | Shares | | | Amount | | | Shares | | | Amount | |
| | | | | |
Receipts for shares sold | | | | | | | | | | | | | | | | |
Institutional Class | | | | 85 | | | $ | 717 | | | 146 | | | $ | 1,213 | |
Administrative Class | | | | 6,841 | | | | 57,387 | | | 17,264 | | | | 140,974 | |
Advisor Class | | | | 32 | | | | 270 | | | 8 | | | | 64 | |
Issued as reinvestment of distributions | | | | | | | | | | | | | | | | |
Institutional Class | | | | 10 | | | | 81 | | | 8 | | | | 70 | |
Administrative Class | | | | 2,123 | | | | 17,782 | | | 4,025 | | | | 33,006 | |
Advisor Class | | | | 0 | | | | 3 | | | 0 | | | | 1 | |
Cost of shares redeemed | | | | | | | | | | | | | | | | |
Institutional Class | | | | (15 | ) | | | (132 | ) | | (3 | ) | | | (27 | ) |
Administrative Class | | | | (10,252 | ) | | | (84,751 | ) | | (15,623 | ) | | | (127,544 | ) |
Advisor Class | | | | (30 | ) | | | (251 | ) | | 0 | | | | (1 | ) |
Net increase (decrease) resulting from Portfolio share transactions | | | | (1,206 | ) | | $ | (8,894 | ) | | 5,825 | | | $ | 47,756 | |
The following schedule shows the number of shareholders each owning 5% or more of the Portfolio and the total percentage of the Portfolio held by such shareholders:
| | | | | | |
| | | | | Number of Shareholders | | % of Portfolio Held |
Institutional Class | | | | 1 | | 96 |
Administrative Class | | | | 3 | | 76 |
Advisor Class | | | | 2 | | 99 |
9. REGULATORY AND LITIGATION MATTERS
Since February 2004, PIMCO, Allianz Global Investors of America L.P. (PIMCO’s parent company), AGID, and certain of their affiliates, including the PIMCO Funds (another series of funds managed by PIMCO), the Allianz Funds (formerly known as PIMCO Funds: Multi-Manager Series (another series of funds managed by affiliates of PIMCO)), certain Trustees of the Trust (in their capacity as Trustees of the PIMCO Funds or the Allianz Funds) and certain employees of PIMCO, have been named as defendants in fifteen lawsuits filed in various jurisdictions. Eleven of those lawsuits concern “market timing,” and they have been transferred to and consolidated for pre-trial proceedings in a multi-district litigation proceeding in the U.S. District Court for the District of Maryland; the other four lawsuits concern “revenue sharing” and have been consolidated into a single action in the U.S. District Court for the District of Connecticut. The lawsuits have been commenced as putative class actions on behalf of investors who purchased, held or redeemed shares of the various series of the PIMCO Funds and the Allianz Funds during specified periods, or as derivative actions on behalf of the PIMCO Funds and the Allianz Funds.
The market timing actions in the District of Maryland generally allege that certain hedge funds were allowed to engage in “market timing” in certain funds of the PIMCO Funds and the Allianz Funds and this alleged activity was not disclosed. Pursuant to tolling agreements entered into with the derivative and class action plaintiffs, PIMCO, certain PIMCO Funds Trustees, and certain employees of PIMCO who were previously named as defendants have all been dropped as defendants in the market timing actions; the plaintiffs continue to assert claims on behalf of the
| | | | | | |
| | Semiannual Report | | June 30, 2007 | | 19 |
Notes to Financial Statements (Cont.)
shareholders of the PIMCO Funds or on behalf of the PIMCO Funds itself against other defendants. By order dated November 3, 2005, the U.S. District Court for the District of Maryland granted the PIMCO Funds’ motion to dismiss claims asserted against it in a consolidated amended complaint where the PIMCO Funds were named, in the complaint, as a nominal defendant. The revenue sharing action in the District of Connecticut generally alleges that fund assets were inappropriately used to pay brokers to promote funds of the PIMCO Funds and the Allianz Funds, including directing fund brokerage transactions to such brokers, and that such alleged arrangements were not fully disclosed to shareholders. On August 11, 2005, the U.S. District Court for the District of Connecticut conducted a hearing on defendants’ motion to dismiss the consolidated amended complaint in the revenue sharing action but has not yet ruled on the motion to dismiss. The market timing and revenue sharing lawsuits seek, among other things, unspecified compensatory damages plus interest and, in some cases, punitive damages, the rescission of investment advisory contracts, the return of fees paid under those contracts and restitution.
Two nearly identical class action civil complaints have been filed in August 2005, in the Northern District of Illinois Eastern Division, alleging that the plaintiffs each purchased and sold a 10-year Treasury note futures contract and suffered damages from an alleged shortage when PIMCO held both physical and futures positions in 10-year Treasury notes for its client accounts. The two actions have been consolidated into one action, and the two separate complaints have been replaced by a consolidated complaint. PIMCO is a named defendant, and PIMCO Funds has been added as a defendant, to the consolidated action. PIMCO strongly believes the complaint is without merit and intends to vigorously defend itself.
In April 2006, certain portfolios of the Trust and certain other funds managed by PIMCO were served in an adversary proceeding brought by the Official Committee of Asbestos Claimants of G-I Holdings, Inc. in G-I Holdings, Inc.’s bankruptcy in the District of New Jersey. In July 2004, PIMCO was named in this lawsuit and remains a defendant. The plaintiff seeks to recover for the bankruptcy estate assets that were transferred by the predecessor entity of G-I Holdings, Inc. to a wholly-owned subsidiary in 1994. The subsidiary has since issued notes, of which certain portfolios of the Trust and certain other funds managed by PIMCO are alleged to be holders. The complaint alleges that in 2000, more than two hundred noteholders—including certain portfolios of the Trust and certain other funds
managed by PIMCO—were granted a second priority lien on the assets of the
subsidiary in exchange for their consent to a refinancing transaction and the granting of a first priority lien to the lending banks. The plaintiff is seeking invalidation of the lien in favor of the noteholders and/or the value of the lien. On June 21, 2006, the District of New Jersey overturned the Bankruptcy Court’s decision granting permission to file the adversary proceeding and remanded the matter to the Bankruptcy Court for further proceedings. Following a motion to reconsider, the District Court upheld its remand on August 7, 2006, and instructed the Bankruptcy Court to conduct a “cost-benefit” analysis of the Committee’s claims, including the claims against the noteholders. The Bankruptcy Court held a status conference on October 25, 2006 and set a briefing schedule relating to this cost-benefit analysis.
The foregoing speaks only as of the date of this report. It is possible that these matters and/or other developments resulting from these matters could result in increased portfolio redemptions or other adverse consequences to the Portfolio. However, PIMCO and AGID believe that these matters are not likely to have a material adverse effect on the Portfolio or on PIMCO’s or AGID’s ability to perform their respective investment advisory or distribution services relating to the Portfolio.
10. FEDERAL INCOME TAX MATTERS
The Portfolio intends to qualify as a regulated investment company under sub-chapter M of the Internal Revenue Code (the “Code”) and distribute all of its taxable income and net realized gains, if applicable, to shareholders. Accordingly, no provision for Federal income taxes has been made.
As of June 30, 2007, the aggregate cost of investments was the same for federal income tax and financial statement purposes. The net unrealized appreciation (depreciation) of investment securities for federal income tax purposes is as follows (amount in thousands):
| | | | |
Aggregate
Gross
Unrealized
Appreciation | | Aggregate
Gross
Unrealized
(Depreciation) | | Net
Unrealized
Appreciation |
$ 7,556 | | $ (5,537) | | $ 2,019 |
| | | | |
| 20 | | PIMCO Variable Insurance Trust | | |
| | |
| |
Privacy Policy* | | (Unaudited) |
The Funds consider customer privacy to be a fundamental aspect of their relationships with shareholders and are committed to maintaining the confidentiality, integrity and security of their current, prospective and former shareholders’ personal information. To ensure their shareholders’ privacy, the Funds have developed policies that are designed to protect this confidentiality, while allowing shareholder needs to be served.
Obtaining Personal Information
In the course of providing shareholders with products and services, the Funds and certain service providers to the Funds, such as the Funds’ investment advisers (“Advisers”), may obtain non-public personal information about shareholders, which may come from sources such as account applications and other forms, from other written, electronic or verbal correspondence, from shareholder transactions, from a shareholder’s brokerage or financial advisory firm, financial adviser or consultant, and/or from information captured on the Funds’ internet web sites.
Respecting Your Privacy
As a matter of policy, the Funds do not disclose any personal or account information provided by shareholders or gathered by the Funds to non-affiliated third parties, except as required or permitted by law or as necessary for such third parties to perform their agreements with respect to the Funds. As is common in the industry, non-affiliated companies may from time to time be used to provide certain services, such as preparing and mailing prospectuses, reports, account statements and other information, conducting research on shareholder satisfaction and gathering shareholder proxies. A Fund’s Distributor may also retain non-affiliated companies to market the Fund’s shares or products which use the Fund’s shares and enter into joint marketing agreements with other companies. These companies may have access to a shareholder’s personal and account information, but are permitted to use this information solely to provide the specific service or as otherwise permitted by law. In most cases, the shareholders will be clients of a third party, but the Funds may also provide a shareholder’s personal and account information to the shareholder’s respective brokerage or financial advisory firm.
Sharing Information with Third Parties
The Funds reserve the right to disclose or report personal information to non-affiliated third parties, in limited circumstances, where the Funds believe in good faith that disclosure is required under law to cooperate with regulators or law enforcement authorities, to protect their rights or property or upon reasonable request by any Fund in which a shareholder has chosen to invest. In addition, the Funds may disclose information about a shareholder’s accounts to a non-affiliated third party with the consent of the shareholder.
Sharing Information with Affiliates
The Funds may share shareholder information with their affiliates in connection with servicing their shareholders’ accounts or to provide shareholders with information about products and services that the Funds or their Advisers, principal underwriters or their affiliates (“Service Affiliates”) believe may be of interest to such shareholders. The information that the Funds share may include, for example, a shareholder’s participation in one of the Funds or in other investment programs sponsored by a Service Affiliate, a shareholder’s ownership of certain types of accounts (such as IRAs), or other data about a shareholder’s accounts. The Funds’ Service Affiliates, in turn, are not permitted to share shareholder information with non-affiliated entities, except as required or permitted by law.
Procedures to Safeguard Private Information
The Funds take seriously the obligation to safeguard shareholder non-public personal information. In addition to this policy, the Funds have also implemented procedures that are designed to restrict access to a shareholder’s non-public personal information only to internal personnel who need to know that information in order to provide products or services to such shareholders. In order to guard a shareholder’s non-public personal information, physical, electronic and procedural safeguards are in place.
* This Privacy Policy applies to the following entities: PIMCO Funds, PIMCO Variable Insurance Trust, PCM Fund, Inc. and PIMCO Strategic Global Government Fund, Inc. (collectively, the “Funds”).
| | | | | | |
| | Semiannual Report | | June 30, 2007 | | 21 |
Investment Adviser and Administrator
Pacific Investment Management Company LLC
840 Newport Center Drive
Newport Beach, California 92660
Distributor
Allianz Global Investors Distributors LLC
1345 Avenue of the Americas
New York, New York 10105
Custodian
State Street Bank & Trust Company
801 Pennsylvania
Kansas City, Missouri 64105
Transfer Agent
Boston Financial Data Services–Midwest
330 W. 9th Street
Kansas City, Missouri 64105
Legal Counsel
Dechert LLP
1775 I Street, N.W.
Washington, D.C. 20006
Independent Registered Public Accounting Firm
PricewaterhouseCoopers LLP
1055 Broadway
Kansas City, Missouri 64105
P I M C O

Table of Contents
This material is authorized for use only when preceded or accompanied by the current PIMCO Variable Insurance Trust (the “Trust”) prospectus. Investors should consider the investment objectives, risks, charges and expenses of this Trust carefully before investing. Ask your financial professional to explain all charges that may apply. This and other information is contained in the Trust’s prospectus. The variable product prospectus may be obtained by contacting your Investment Consultant. Please read the Trust and variable product prospectus carefully before you invest or send money.
Chairman’s Letter
Dear PIMCO Variable Insurance Trust Shareholder:
It is our pleasure to present to you the semiannual report for the PIMCO Variable Insurance Trust, covering the six-month period ended June 30, 2007. The PIMCO Variable Insurance Trust’s net assets were $8.68 billion at June 30, 2007, as compared to $7.76 billion at December 31, 2006.
Highlights of the financial markets during the reporting period include:
| | n | | Economic data during the first quarter of 2007 pointed to slower growth, which heightened market expectations for a decrease in the Federal Funds Rate. By the second quarter, economic data, such as employment statistics, provided little indication of economic weakness, causing expectations of a decrease in the Federal Funds Rate to unwind and U.S. interest rates to move higher. Interest rates in Europe and the U.K. also rose over the period as central banks raised their key lending rates due to inflation concerns. The benchmark ten-year U.S. Treasury yielded 5.03% as of June 30, 2007, or 0.32% higher than at the beginning of the year. |
| | n | | Most bonds generally returned much of their gains from earlier in the year as worldwide growth and capital flows drove interest rates higher in the second quarter. Increased risk aversion in global financial markets, due in part to subprime mortgage worries in the U.S., also contributed to the rise in interest rates. The Lehman Brothers Aggregate Bond Index, which includes Treasury, investment-grade corporate and mortgage-backed securities, returned 0.98% for the six-month period. |
| | n | | Locally issued emerging market (“EM”) bonds posted positive returns for the reporting period. Yields on these bonds declined and the local currencies in which they are denominated generally gained, amid increasing investor awareness, strong economic growth and surging capital inflows. External EM bonds (debt instruments issued by emerging markets countries and typically denominated in U.S. dollars) lagged behind local EM bonds (debt instruments issued by emerging markets countries and denominated in the currency of the issuer), as external EM bonds tend to trade more in-line with U.S. Treasuries. |
| | n | | Treasury Inflation-Protected Securities (“TIPS”) outpaced nominal bonds (non-inflation linked bonds) for the first part of the year and all but the longest maturity TIPS outperformed in the second quarter as high gasoline prices drove higher inflation accruals. Commodities, as represented by the Dow Jones-AIG Commodity Total Return Index, returned 4.46% for the period. Equities, as measured by the S&P 500 Index and the Russell 2000 Index, returned 6.96% and 6.45%, respectively, for the period. |
On the following pages, please find specific details as to the Portfolio’s total return investment performance and a discussion of those factors that affected performance.
Thank you for the trust you have placed in us. We will continue to work diligently to serve your investment needs.
Sincerely,
Brent R. Harris
Chairman, PIMCO Variable Insurance Trust
July 31, 2007
| | | | | | |
| | Semiannual Report | | June 30, 2007 | | 1 |
Important Information About the Portfolio
PIMCO Variable Insurance Trust (the “Trust”) is an open-end management investment company currently consisting of twenty separate investment portfolios, including the Long-Term U.S. Government Portfolio (the “Portfolio”). The Portfolio is only available as a funding vehicle under variable life insurance policies or variable annuity contracts issued by insurance companies (“Variable Contracts”). Individuals may not purchase shares of the Portfolio directly. Shares of the Portfolio also may be sold to qualified pension and retirement plans outside of the separate account context.
We believe that bond funds have an important role to play in a well diversified investment portfolio. It is important to note, however, that in an environment where interest rates may trend upward, rising rates would negatively impact the performance of most bond funds, and fixed-income securities held by a fund are likely to decrease in value. The price volatility of fixed-income securities can also increase during periods of rising interest rates resulting in increased losses to a fund. Bond funds and individual bonds with a longer duration (a measure of the expected life of a security) tend to be more sensitive to changes in interest rates, usually making them more volatile than securities or funds with shorter durations.
The Portfolio may be subject to various risks in addition to those described above. Some of these risks may include, but are not limited to, the following: credit risk, market risk, issuer risk, derivatives risk, mortgage risk, leveraging risk and management risk. A complete description of these risks is contained in the Portfolio’s prospectus. The Portfolio may use derivative instruments for hedging purposes or as part of an investment strategy. Use of these instruments may involve certain costs and risks such as liquidity risk, interest rate risk, market risk, credit risk, management risk and the risk that the Portfolio could not close out a position when it would be most advantageous to do so. Because the Portfolio may invest in derivatives, it could lose more than the principal amount invested in these instruments.
On the performance summary page in this Semiannual Report, the Total Return Investment Performance table measures performance assuming that all dividend and capital gain distributions were reinvested.
An investment in the Portfolio is not a deposit of a bank and is not guaranteed or insured by the Federal Deposit Insurance Corporation or any other government agency. It is possible to lose money on investments in the Portfolio.
PIMCO has adopted written proxy voting policies and procedures (“Proxy Policy”) as required by Rule 206(4)-6 under the Investment Advisers Act of 1940, as amended. The Proxy Policy has been adopted by the Trust as the policies and procedures that PIMCO will use when voting proxies on behalf of the Portfolio. A description of the policies and procedures that PIMCO uses to vote proxies relating to portfolio securities of the Portfolio, and information about how the Portfolio voted proxies relating to portfolio securities held during the most recent twelve-month period ended June 30, are available without charge, upon request, by calling the Trust at 1-866-746-2606 and on the Portfolio’s website at www.pimco.com.
The Portfolio files its complete schedule of portfolio holdings with the SEC for the first and third quarters of each fiscal year on Form N-Q. A copy of the Trust’s Form N-Q is also available on the SEC’s website at http://www.sec.gov and may be reviewed and copied at the SEC’s Public Reference Room in Washington D.C. Information on the operation of the Public Reference Room may be obtained by calling 1-800-SEC-0330, and is available without charge, upon request, by calling the Trust at 1-866-746-2606 and on the Portfolio’s website at www.pimco.com.
PIMCO Variable Insurance Trust is distributed by Allianz Global Investors Distributors LLC, 1345 Avenue of the Americas, New York, NY 10105.
| | | | |
| 2 | | PIMCO Variable Insurance Trust | | |
The following disclosure provides important information regarding the Portfolio’s Expense Example (“Example” or “Expense Example”), which appears in this Semiannual Report. Please refer to this information when reviewing the Expense Example for the Portfolio.
Example
As a shareholder of the Portfolio, you incur two types of costs: (1) transaction costs and (2) ongoing costs, including advisory and administrative fees; distribution and/or service (12b-1) fees (Administrative Class only); and other Portfolio expenses. The Example is intended to help you understand your ongoing costs (in dollars) of investing in the Portfolio and to compare these costs with the ongoing costs of investing in other mutual funds. The Expense Example does not reflect any fees or other expenses imposed by the Variable Contracts. If it did, the expenses reflected in the Expense Example would be higher. The Example is based on an investment of $1,000 invested at the beginning of the period and held for the entire period indicated, which is from January 1, 2007 to June 30, 2007.
Actual Expenses
The information in the table under the heading “Actual Performance” provides information about actual account values and actual expenses. You may use the information in these columns, together with the amount you invested, to estimate the expenses that you paid over the period. Simply divide your account value by $1,000 (for example, an $8,600 account value divided by $1,000 = $8.60), then multiply the result by the number in the row titled “Expenses Paid During Period” to estimate the expenses you paid on your account during this period.
Hypothetical Example for Comparison Purposes
The information in the table under the heading “Hypothetical Performance (5% return before expenses)” provides information about hypothetical account values and hypothetical expenses based on the Portfolio’s actual expense ratio and an assumed rate of return of 5% per year before expenses, which is not the Portfolio’s actual return. The hypothetical account values and expenses may not be used to estimate the actual ending account balance or expenses you paid for the period. You may use this information to compare the ongoing costs of investing in the Portfolio and other portfolios. To do so, compare this 5% hypothetical example with the 5% hypothetical examples that appear in the shareholder reports of the other portfolios.
Please note that the expenses shown in the table are meant to highlight your ongoing costs only and do not reflect any transactional costs. Therefore, the information under the heading “Hypothetical Performance (5% return before expenses)” is useful in comparing ongoing costs only, and will not help you determine the relative total costs of owning different portfolios. In addition, if these transactional costs were included, your costs would have been higher.
The expense ratio may vary period to period because of various factors, such as an increase in expenses not covered by the advisory and administrative fees (such as expenses of the trustees and their counsel, litigation expense and interest expense).
| | | | | | |
| | Semiannual Report | | June 30, 2007 | | 3 |
PIMCO Long-Term U.S. Government Portfolio
Cumulative Returns Through June 30, 2007
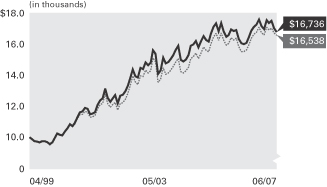
$10,000 invested at the beginning of the first full month following the inception date of the Portfolio’s Administrative Class.
Allocation Breakdown‡
| | |
U.S. Government Agencies | | 39.1% |
Short-Term Instruments | | 29.7% |
U.S. Treasury Obligations | | 10.7% |
Mortgage-Backed Securities | | 9.4% |
Asset-Backed Securities | | 5.6% |
Corporate Bonds & Notes | | 5.5% |
| | ‡ | % of Total Investments as of 06/30/2007 |
| | | | | | | | | | |
Average Annual Total Return for the period ended June 30, 2007 |
| | | | | 6 Months* | | 1 Year | | 5 Years | | Portfolio
Inception
(04/30/99) |
| | PIMCO Long-Term U.S. Government Portfolio Administrative Class | | -2.17% | | 4.30% | | 5.27% | | 6.50% |
| | Lehman Brothers Long-Term Treasury Index± | | -0.90% | | 5.98% | | 5.86% | | 6.35% |
All Portfolio returns are net of fees and expenses.
* Cumulative return.
Performance quoted represents past performance. Past performance is no guarantee of future results. Investment return and principal value will fluctuate so the Portfolio shares, when redeemed, may be worth more or less than their original cost. The Portfolio’s performance does not reflect the deduction of additional charges and expenses imposed in connection with investing in Variable Contracts, which will reduce returns. Current performance may be lower or higher than the performance data quoted. Performance data current to the most recent month-end is available by calling (800) 927-4648.
± Lehman Brothers Long-Term Treasury Index is an unmanaged index of U.S. Treasury issues with maturities greater than 10 years. It is not possible to invest directly in the index. The index does not reflect deductions for fees and expenses.
| | | | | | |
| Expense Example | | Actual Performance | | Hypothetical Performance |
| | | | | (5% return before expenses) |
Beginning Account Value (01/01/07) | | $ | 1,000.00 | | $ | 1,000.00 |
Ending Account Value (06/30/07) | | $ | 978.31 | | $ | 1,021.70 |
Expenses Paid During Period† | | $ | 3.07 | | $ | 3.13 |
† Expenses are equal to the Portfolio’s Administrative Class annualized expense ratio of 0.625%, multiplied by the average account value over the period, multiplied by 181/365 (to reflect the one-half year period). Overall fees and expenses of investing in the Portfolio will be higher because the example does not reflect Variable Contract fees and expenses.
Please refer to page 3 herein for an explanation of the information presented in the above Expense Example.
Portfolio Insights
| » | | The PIMCO Long-Term U.S. Government Portfolio seeks to achieve its investment objective by investing under normal circumstances at least 80% of its assets in a diversified portfolio of fixed-income securities that are issued or guaranteed by the U.S. government, its agencies or government-sponsored enterprises. |
| » | | Over the six-month period, long-term yields rose, which detracted from performance of long-term Treasuries. |
| » | | Duration positioning was slightly negative for performance during the first six months of 2007. During the first quarter, above-benchmark duration added value to performance as interest rates declined across most maturities. The above-index duration position negatively outweighed these gains as interest rates increased in the second quarter, especially during the month of May. |
| » | | The Portfolio’s emphasis on the short-term portion of the yield curve throughout the six- month reporting period positively impacted relative performance as the two- to 30-year yield spread steepened during the period. |
| » | | Interest rate swap exposure detracted from performance as swap spreads widened across all maturities during the period. |
| » | | An allocation to long-term agency debentures detracted from relative performance as they underperformed like-duration Treasuries over the period. |
| » | | Compared to the Lehman Brothers Long-Term Treasury Index, a modest out-of-benchmark allocation to long-term Treasury Inflation-Protected Securities (“TIPS”) slightly detracted from performance for the period. Long-term TIPS outperformed like-duration Treasuries during the first quarter, but their performance declined compared to similar Treasuries during the second quarter. |
| | | | |
| 4 | | PIMCO Variable Insurance Trust | | |
Financial Highlights Long-Term U.S. Government Portfolio
| | | | | | | | | | | | | | | | | | | | | | | | |
| Selected per Share Data for the Year or Period Ended: | | 06/30/2007+ | | | 12/31/2006 | | | 12/31/2005 | | | 12/31/2004 | | | 12/31/2003 | | | 12/31/2002 | |
| | | | | | |
Administrative Class | | | | | | | | | | | | | | | | | | | | | | | | |
Net asset value beginning of year or period | | $ | 10.43 | | | $ | 11.00 | | | $ | 11.19 | | | $ | 11.01 | | | $ | 11.09 | | | $ | 10.27 | |
Net investment income (a) | | | 0.23 | | | | 0.46 | | | | 0.40 | | | | 0.33 | | | | 0.30 | | | | 0.44 | |
Net realized/unrealized gain (loss) on investments (a) | | | (0.45 | ) | | | (0.34 | ) | | | 0.12 | | | | 0.49 | | | | 0.12 | | | | 1.31 | |
Total income (loss) from investment operations | | | (0.22 | ) | | | 0.12 | | | | 0.52 | | | | 0.82 | | | | 0.42 | | | | 1.75 | |
Dividends from net investment income | | | (0.23 | ) | | | (0.46 | ) | | | (0.40 | ) | | | (0.34 | ) | | | (0.33 | ) | | | (0.44 | ) |
Distributions from net realized capital gains | | | 0.00 | | | | (0.23 | ) | | | (0.31 | ) | | | (0.30 | ) | | | (0.17 | ) | | | (0.49 | ) |
Total distributions | | | (0.23 | ) | | | (0.69 | ) | | | (0.71 | ) | | | (0.64 | ) | | | (0.50 | ) | | | (0.93 | ) |
Net asset value end of year or period | | $ | 9.98 | | | $ | 10.43 | | | $ | 11.00 | | | $ | 11.19 | | | $ | 11.01 | | | $ | 11.09 | |
Total return | | | (2.17 | )% | | | 1.15 | % | | | 4.75 | % | | | 7.57 | % | | | 3.90 | % | | | 17.59 | % |
Net assets end of year or period (000s) | | $ | 105,663 | | | $ | 100,762 | | | $ | 89,426 | | | $ | 92,122 | | | $ | 94,003 | | | $ | 92,256 | |
Ratio of expenses to average net assets | | | 0.625 | %* | | | 0.625 | % | | | 0.65 | %(c) | | | 0.66 | % | | | 0.66 | % | | | 0.65 | %(b) |
Ratio of expenses to average net assets excluding interest expense | | | 0.625 | %* | | | 0.625 | % | | | 0.65 | %(c) | | | 0.62 | % | | | 0.62 | % | | | 0.65 | %(b) |
Ratio of net investment income to average net assets | | | 4.49 | %* | | | 4.34 | % | | | 3.52 | % | | | 2.93 | % | | | 2.72 | % | | | 4.05 | % |
Portfolio turnover rate | | | 79 | % | | | 785 | % | | | 533 | % | | | 237 | % | | | 619 | % | | | 586 | % |
+ Unaudited
* Annualized
(a) Per share amounts based on average number of shares outstanding during the period.
(b) If the investment manager had not reimbursed expenses, the ratio of expenses to average net assets would have been 0.66%.
(c) Effective October 31, 2005, the advisory fee was reduced to 0.225%.
| | | | | | |
| See Accompanying Notes | | Semiannual Report | | June 30, 2007 | | 5 |
Statement of Assets and Liabilities Long-Term U.S. Government Portfolio
| | | | |
| (Amounts in thousands, except per share amounts) | | June 30, 2007 | |
| | | (Unaudited) | |
| |
Assets: | | | | |
Investments, at value | | $ | 122,459 | |
Receivable for investments sold | | | 12,561 | |
Receivable for Portfolio shares sold | | | 39 | |
Interest and dividends receivable | | | 512 | |
Variation margin receivable | | | 323 | |
Swap premiums paid | | | 1,021 | |
Unrealized appreciation on swap agreements | | | 732 | |
| | | | 137,647 | |
| |
Liabilities: | | | | |
Payable for investments purchased | | $ | 17,159 | |
Payable for investments purchased on a delayed-delivery basis | | | 800 | |
Payable for Portfolio shares redeemed | | | 1 | |
Payable for short sales | | | 4,877 | |
Overdraft due to custodian | | | 2,749 | |
Written options outstanding | | | 95 | |
Accrued investment advisory fee | | | 20 | |
Accrued administration fee | | | 22 | |
Accrued servicing fee | | | 11 | |
Variation margin payable | | | 97 | |
Swap premiums received | | | 5,372 | |
Unrealized depreciation on swap agreements | | | 132 | |
| | | | 31,335 | |
| |
Net Assets | | $ | 106,312 | |
| |
Net Assets Consist of: | | | | |
Paid in capital | | $ | 114,128 | |
Undistributed net investment income | | | 65 | |
Accumulated undistributed net realized (loss) | | | (6,955 | ) |
Net unrealized (depreciation) | | | (926 | ) |
| | | $ | 106,312 | |
| |
Net Assets: | | | | |
Institutional Class | | $ | 649 | |
Administrative Class | | | 105,663 | |
| |
Shares Issued and Outstanding: | | | | |
Institutional Class | | | 65 | |
Administrative Class | | | 10,587 | |
| |
Net Asset Value and Redemption Price Per Share (Net Asset Per Share Outstanding) | | | | |
Institutional Class | | $ | 9.98 | |
Administrative Class | | | 9.98 | |
| |
Cost of Investments Owned | | $ | 123,574 | |
Proceeds Received on Short Sales | | $ | 4,718 | |
Premiums Received on Written Options | | $ | 199 | |
| | | | |
| 6 | | PIMCO Variable Insurance Trust | | See Accompanying Notes |
Statement of Operations Long-Term U.S. Government Portfolio
| | | | |
| (Amounts in thousands) | | Six Months Ended
June 30, 2007 | |
| | | (Unaudited) | |
| |
| Investment Income: | | | | |
Interest | | $ | 2,646 | |
Total Income | | | 2,646 | |
| |
Expenses: | | | | |
Investment advisory fees | | | 116 | |
Administration fees | | | 129 | |
Servicing fees – Administrative Class | | | 77 | |
Trustees’ fees | | | 1 | |
Total Expenses | | | 323 | |
| |
Net Investment Income | | | 2,323 | |
| |
Net Realized and Unrealized Gain (Loss): | | | | |
Net realized gain on investments | | | 275 | |
Net realized (loss) on futures contracts, written options and swaps | | | (4,471 | ) |
Net change in unrealized (depreciation) on investments | | | (957 | ) |
Net change in unrealized appreciation on futures contracts, written options and swaps | | | 464 | |
Net (Loss) | | | (4,689 | ) |
| |
Net (Decrease) in Net Assets Resulting from Operations | | $ | (2,366 | ) |
| | | | | | |
| See Accompanying Notes | | Semiannual Report | | June 30, 2007 | | 7 |
Statements of Changes in Net Assets Long-Term U.S. Government Portfolio
| | | | | | | | |
| (Amounts in thousands) | | Six Months Ended
June 30, 2007 | | | Year Ended
December 31, 2006 | |
| | | (Unaudited) | | | | |
| | |
| Increase (Decrease) in Net Assets from: | | | | | | | | |
| | |
Operations: | | | | | | | | |
Net investment income | | $ | 2,323 | | | $ | 3,819 | |
Net realized (loss) | | | (4,196 | ) | | | (1,775 | ) |
Net change in unrealized (depreciation) | | | (493 | ) | | | (1,232 | ) |
Net increase (decrease) resulting from operations | | | (2,366 | ) | | | 812 | |
| | |
Distributions to Shareholders: | | | | | | | | |
From net investment income | | | | | | | | |
Institutional Class | | | (13 | ) | | | (23 | ) |
Administrative Class | | | (2,308 | ) | | | (3,800 | ) |
From net realized capital gains | | | | | | | | |
Institutional Class | | | 0 | | | | (7 | ) |
Administrative Class | | | 0 | | | | (2,110 | ) |
| | |
Total Distributions | | | (2,321 | ) | | | (5,940 | ) |
| | |
Portfolio Share Transactions: | | | | | | | | |
Receipts for shares sold | | | | | | | | |
Institutional Class | | | 305 | | | | 495 | |
Administrative Class | | | 18,728 | | | | 23,572 | |
Issued as reinvestment of distributions | | | | | | | | |
Institutional Class | | | 13 | | | | 30 | |
Administrative Class | | | 2,308 | | | | 5,909 | |
Cost of shares redeemed | | | | | | | | |
Institutional Class | | | (82 | ) | | | (467 | ) |
Administrative Class | | | (11,478 | ) | | | (13,023 | ) |
Net increase resulting from Portfolio share transactions | | | 9,794 | | | | 16,516 | |
| | |
Total Increase in Net Assets | | | 5,107 | | | | 11,388 | |
| | |
Net Assets: | | | | | | | | |
Beginning of period | | | 101,205 | | | | 89,817 | |
End of period* | | $ | 106,312 | | | $ | 101,205 | |
| | |
*Including undistributed net investment income of: | | $ | 65 | | | $ | 63 | |
| | | | |
| 8 | | PIMCO Variable Insurance Trust | | See Accompanying Notes |
| | |
| |
| Schedule of Investments Long-Term U.S. Government Portfolio | | June 30, 2007 (Unaudited) |
| | | | | | | | |
| | | | | PRINCIPAL
AMOUNT
(000S) | | | | VALUE
(000S) |
| CORPORATE BONDS & NOTES 6.3% |
|
| BANKING & FINANCE 5.8% |
| Allstate Life Global Funding Trusts |
5.415% due 01/25/2008 | | $ | | 200 | | $ | | 200 |
| |
| Bank of America N.A. | | | | | | | | |
5.360% due 12/18/2008 | | | | 1,300 | | | | 1,301 |
| |
| CIT Group, Inc. | | | | | | | | |
5.480% due 08/17/2009 | | | | 300 | | | | 299 |
| |
| Citigroup, Inc. | | | | | | | | |
5.395% due 01/30/2009 | | | | 600 | | | | 600 |
| |
| Goldman Sachs Group, Inc. | | | | | | | | |
5.536% due 02/06/2012 | | | | 700 | | | | 699 |
| |
| JPMorgan Mortgage Acquisition Corp. |
6.550% due 09/15/2066 | | | | 200 | | | | 193 |
| |
| Lehman Brothers Holdings, Inc. |
5.445% due 01/23/2009 | | | | 1,400 | | | | 1,402 |
| |
| Pricoa Global Funding I | | | | | | | | |
5.435% due 01/25/2008 | | | | 200 | | | | 200 |
| |
| U.S. Trade Funding Corp. | | | | | | | | |
4.260% due 11/15/2014 | | | | 658 | | | | 642 |
| |
| Wachovia Bank N.A. | | | | | | | | |
5.320% due 10/03/2008 | | | | 300 | | | | 300 |
| |
| Wells Fargo & Co. | | | | | | | | |
5.420% due 03/23/2010 | | | | 400 | | | | 401 |
| | | | | | | | |
| | | | | | | | 6,237 |
| | | | | | | | |
|
| INDUSTRIALS 0.5% |
| DaimlerChrysler N.A. Holding Corp. |
5.790% due 03/13/2009 | | | | 400 | | | | 402 |
| |
| Walt Disney Co. | | | | | | | | |
5.460% due 09/10/2009 | | | | 100 | | | | 100 |
| | | | | | | | |
| | | | | | | | 502 |
| | | | | | | | |
Total Corporate Bonds & Notes
(Cost $6,756) | | | | 6,739 |
| | | | | | | | |
|
| U.S. GOVERNMENT AGENCIES 45.1% |
| Fannie Mae | | | | | | | | |
4.425% due 01/01/2033 | | | | 99 | | | | 99 |
4.500% due 06/25/2019 - 09/01/2035 | | | | 660 | | | | 602 |
5.000% due 11/01/2019 - 08/25/2033 | | | | 770 | | | | 703 |
5.250% due 06/15/2008 | | | | 11,100 | | | | 11,097 |
5.375% due 02/25/2022 | | | | 150 | | | | 142 |
5.500% due 09/25/2024 - 08/01/2037 | | | | 11,712 | | | | 11,298 |
5.794% due 08/25/2021 | | | | 20 | | | | 20 |
5.800% due 02/09/2026 | | | | 500 | | | | 490 |
5.944% due 08/25/2022 | | | | 11 | | | | 11 |
6.080% due 09/01/2028 | | | | 64 | | | | 68 |
6.220% due 04/25/2032 | | | | 29 | | | | 30 |
6.244% due 04/25/2021 | | | | 14 | | | | 14 |
6.500% due 07/25/2031 | | | | 590 | | | | 597 |
| |
| Farmer Mac | | | | | | | | |
7.280% due 07/25/2011 | | | | 146 | | | | 145 |
| |
| Federal Farm Credit Bank | | | | | | | | |
5.050% due 03/28/2019 | | | | 400 | | | | 386 |
5.150% due 03/25/2020 | | | | 250 | | | | 241 |
| |
| Federal Home Loan Bank | | | | | | | | |
4.000% due 07/14/2008 | | | | 1,000 | | | | 987 |
5.120% due 01/10/2013 | | | | 5,000 | | | | 4,902 |
6.000% due 02/12/2021 | | | | 50 | | | | 53 |
6.125% due 06/08/2018 | | | | 80 | | | | 84 |
| |
| Federal Housing Administration |
6.896% due 07/01/2020 | | | | 384 | | | | 384 |
| |
| | | | | | | | |
| | | | | PRINCIPAL
AMOUNT
(000S) | | | | VALUE
(000S) |
| Financing Corp. | | | | | | | | |
10.700% due 10/06/2017 | | $ | | 650 | | $ | | 915 |
| |
| Freddie Mac | | | | | | | | |
4.500% due 05/15/2025 | | | | 1,000 | | | | 878 |
5.000% due 03/18/2014 - 09/15/2035 | | | | 2,000 | | | | 1,844 |
5.400% due 03/17/2021 | | | | 1,000 | | | | 979 |
5.500% due 11/15/2023 - 06/15/2034 | | | | 1,302 | | | | 1,251 |
5.550% due 07/15/2037 | | | | 800 | | | | 800 |
5.625% due 11/23/2035 | | | | 900 | | | | 845 |
5.720% due 01/15/2033 | | | | 97 | | | | 98 |
6.000% due 05/15/2036 | | | | 3,201 | | | | 3,006 |
6.075% due 02/15/2027 | | | | 17 | | | | 18 |
6.227% due 10/25/2044 | | | | 155 | | | | 156 |
6.375% due 02/15/2021 | | | | 21 | | | | 21 |
7.000% due 07/15/2023 - 12/01/2031 | | | | 72 | | | | 74 |
8.250% due 06/01/2016 | | | | 350 | | | | 413 |
| |
| Ginnie Mae | | | | | | | | |
4.500% due 08/20/2030 | | | | 18 | | | | 17 |
5.500% due 01/20/2036 | | | | 541 | | | | 489 |
6.000% due 08/20/2033 | | | | 1,258 | | | | 1,207 |
| |
| Overseas Private Investment Corp. |
4.736% due 03/15/2022 | | | | 396 | | | | 375 |
| |
| Private Export Funding Corp. |
5.000% due 12/15/2016 | | | | 500 | | | | 484 |
| |
| Small Business Administration |
5.240% due 08/01/2023 | | | | 773 | | | | 761 |
| |
| Tennessee Valley Authority |
5.375% due 04/01/2056 | | | | 1,000 | | | | 952 |
| | | | | | | | |
Total U.S. Government Agencies
(Cost $48,276) | | | | 47,936 |
| | | | | | | | |
|
| U.S. TREASURY OBLIGATIONS 12.3% |
| Treasury Inflation Protected Securities (b) |
2.000% due 01/15/2026 | | | | 416 | | | | 378 |
2.375% due 01/15/2025 | | | | 329 | | | | 316 |
| |
| U.S. Treasury Bonds | | | | | | | | |
4.750% due 02/15/2037 | | | | 2,800 | | | | 2,641 |
5.375% due 02/15/2031 | | | | 1,000 | | | | 1,027 |
| |
| U.S. Treasury Strips | | | | | | | | |
0.000% due 08/15/2019 | | | | 15,400 | | | | 8,237 |
0.000% due 02/15/2033 | | | | 1,700 | | | | 464 |
| | | | | | | | |
Total U.S. Treasury Obligations
(Cost $13,680) | | | | 13,063 |
| | | | | | | | |
|
| MORTGAGE-BACKED SECURITIES 10.9% |
| American Home Mortgage Investment Trust |
5.000% due 09/25/2035 | | | | 400 | | | | 394 |
| |
| Bear Stearns Adjustable Rate Mortgage Trust |
4.750% due 10/25/2035 | | | | 831 | | | | 818 |
4.773% due 01/25/2034 | | | | 75 | | | | 75 |
5.044% due 04/25/2033 | | | | 507 | | | | 506 |
5.292% due 04/25/2033 | | | | 138 | | | | 138 |
| |
| Countrywide Alternative Loan Trust |
5.500% due 10/25/2033 | | | | 1,228 | | | | 1,078 |
5.530% due 05/25/2035 | | | | 182 | | | | 182 |
| |
Countrywide Home Loan Mortgage
Pass-Through Trust |
5.640% due 03/25/2035 | | | | 335 | | | | 337 |
5.660% due 06/25/2035 | | | | 2,625 | | | | 2,620 |
| |
| CS First Boston Mortgage Securities Corp. |
5.870% due 04/25/2033 | | | | 10 | | | | 10 |
7.339% due 11/25/2032 | | | | 16 | | | | 16 |
| |
| First Republic Mortgage Loan Trust |
5.670% due 11/15/2031 | | | | 234 | | | | 235 |
| |
| | | | | | | | |
| | | | | PRINCIPAL
AMOUNT
(000S) | | | | VALUE
(000S) |
| GS Mortgage Securities Corp. II |
5.410% due 03/06/2020 | | $ | | 500 | | $ | | 501 |
| |
| Harborview Mortgage Loan Trust |
5.450% due 04/19/2038 | | | | 167 | | | | 167 |
5.540% due 05/19/2035 | | | | 143 | | | | 143 |
| |
| Impac CMB Trust | | | | | | | | |
5.249% due 09/25/2034 | | | | 621 | | | | 612 |
| |
| JPMorgan Chase Commercial Mortgage Securities Corp. |
5.747% due 02/12/2049 | | | | 300 | | | | 299 |
| |
| LB-UBS Commercial Mortgage Trust |
2.720% due 03/15/2027 | | | | 356 | | | | 352 |
| |
| MASTR Asset Securitization Trust |
5.500% due 09/25/2033 | | | | 424 | | | | 406 |
| |
| Residential Accredit Loans, Inc. |
5.720% due 01/25/2033 | | | | 43 | | | | 43 |
5.720% due 03/25/2033 | | | | 92 | | | | 93 |
| |
| Residential Funding Mortgage Securities I, Inc. |
6.500% due 03/25/2032 | | | | 77 | | | | 77 |
| |
| Sequoia Mortgage Trust | | | | | | | | |
5.670% due 07/20/2033 | | | | 350 | | | | 352 |
| |
| Structured Adjustable Rate Mortgage Loan Trust |
5.540% due 05/25/2037 | | | | 388 | | | | 389 |
| |
| Structured Asset Mortgage Investments, Inc. |
5.650% due 09/19/2032 | | | | 339 | | | | 339 |
5.740% due 10/19/2033 | | | | 97 | | | | 97 |
| |
Washington Mutual MSC Mortgage
Pass-Through Certificates |
5.407% due 02/25/2033 | | | | 25 | | | | 25 |
6.866% due 02/25/2033 | | | | 12 | | | | 13 |
6.909% due 02/25/2031 | | | | 30 | | | | 30 |
7.301% due 05/25/2033 | | | | 22 | | | | 22 |
| |
| Washington Mutual, Inc. | | | | | | | | |
5.550% due 04/25/2045 | | | | 140 | | | | 140 |
5.724% due 10/25/2046 | | | | 220 | | | | 220 |
6.029% due 08/25/2046 | | | | 845 | | | | 847 |
| | | | | | | | |
Total Mortgage-Backed Securities
(Cost $11,669) | | | | 11,576 |
| | | | | | | | |
|
| ASSET-BACKED SECURITIES 6.4% |
| American Express Credit Account Master Trust |
5.430% due 09/15/2010 | | | | 100 | | | | 100 |
| |
| Argent Securities, Inc. | | | | | | | | |
5.370% due 10/25/2036 | | | | 342 | | | | 342 |
5.390% due 04/25/2036 | | | | 203 | | | | 203 |
| |
| Bear Stearns Asset-Backed Securities, Inc. |
5.820% due 11/25/2042 | | | | 246 | | | | 247 |
| |
| Chase Credit Card Master Trust |
5.490% due 09/15/2011 | | | | 300 | | | | 301 |
| |
Chase Funding Mortgage Loan
Asset-Backed Certificates |
5.820% due 10/25/2031 | | | | 15 | | | | 16 |
| |
| Credit-Based Asset Servicing & Securitization LLC |
5.410% due 12/25/2037 | | | | 228 | | | | 228 |
| |
| First Franklin Mortgage Loan Asset-Backed Certificates |
5.370% due 03/25/2037 | | | | 275 | | | | 275 |
| |
| First USA Credit Card Master Trust |
5.480% due 04/18/2011 | | | | 1,400 | | | | 1,404 |
| |
| Fremont Home Loan Trust |
5.370% due 10/25/2036 | | | | 693 | | | | 693 |
| |
| Indymac Residential Asset-Backed Trust |
5.380% due 04/25/2037 | | | | 237 | | | | 237 |
| |
| LA Arena Funding LLC |
7.656% due 12/15/2026 | | | | 86 | | | | 90 |
| |
| | | | | | |
| See Accompanying Notes | | Semiannual Report | | June 30, 2007 | | 9 |
Schedule of Investments Long-Term U.S. Government Portfolio (Cont.)
| | | | | | | | |
| | | | | PRINCIPAL
AMOUNT
(000S) | | | | VALUE
(000S) |
| MASTR Asset-Backed Securities Trust |
5.380% due 11/25/2036 | | $ | | 407 | | $ | | 407 |
| |
| Merrill Lynch Mortgage Investors, Inc. |
5.390% due 08/25/2036 | | | | 325 | | | | 325 |
| |
| Morgan Stanley ABS Capital I |
5.440% due 02/25/2036 | | | | 300 | | | | 300 |
| |
| Peco Energy Transition Trust |
6.130% due 03/01/2009 | | | | 1 | | | | 1 |
| |
| Renaissance Home Equity Loan Trust |
5.760% due 08/25/2033 | | | | 13 | | | | 13 |
5.820% due 12/25/2033 | | | | 75 | | | | 76 |
| |
| Residential Asset Mortgage Products, Inc. |
5.400% due 02/25/2036 | | | | 215 | | | | 215 |
| |
| Residential Asset Securities Corp. |
6.060% due 01/25/2033 | | | | 60 | | | | 60 |
| |
| SLM Student Loan Trust |
5.345% due 10/27/2014 | | | | 97 | | | | 97 |
5.355% due 04/25/2017 | | | | 500 | | | | 500 |
5.465% due 04/25/2017 | | | | 146 | | | | 146 |
| |
| SMS Student Loan Trust |
5.420% due 10/27/2025 | | | | 51 | | | | 51 |
| |
| Specialty Underwriting & Residential Finance |
5.660% due 01/25/2034 | | | | 12 | | | | 12 |
| |
| | | | | | | | |
| | | | | PRINCIPAL
AMOUNT
(000S) | | | | VALUE
(000S) |
| Structured Asset Securities Corp. |
5.450% due 12/25/2035 | | $ | | 192 | | $ | | 192 |
5.610% due 01/25/2033 | | | | 21 | | | | 22 |
| |
| Wells Fargo Home Equity Trust |
5.370% due 01/25/2037 | | | | 247 | | | | 247 |
| | | | | | | | |
Total Asset-Backed Securities
(Cost $6,804) | | | | 6,800 |
| | | | | | | | |
|
| SHORT-TERM INSTRUMENTS 34.2% |
|
| COMMERCIAL PAPER 24.5% |
| Fannie Mae | | | | | | | | |
5.080% due 07/02/2007 | | | | 17,200 | | | | 17,200 |
| |
| Freddie Mac |
4.800% due 07/02/2007 | | | | 8,800 | | | | 8,800 |
| | | | | | | | |
| | | | | | | | 26,000 |
| | | | | | | | |
|
| REPURCHASE AGREEMENTS 1.2% |
| State Street Bank and Trust Co. |
4.900% due 07/02/2007 | | | | 1,286 | | | | 1,286 |
| | | | | | | | |
(Dated 06/29/2007. Collateralized by Fannie Mae 3.250% due 08/15/2008 valued at $1,317. Repurchase proceeds are $1,287.) |
| | | | | | | | | |
| | | | | PRINCIPAL
AMOUNT
(000S) | | | | VALUE
(000S) | |
| U.S. TREASURY BILLS 8.5% | |
4.557% due 08/30/2007 - 09/13/2007 (a)(c)(e) | | $ | | 9,130 | | $ | | 9,034 | |
| | | | | | | | | |
Total Short-Term Instruments
(Cost $36,335) | | | | 36,320 | |
| | | | | | | | | |
| |
| PURCHASED OPTIONS (g) 0.0% | | | |
(Cost $54) | | | | 25 | |
| |
| |
Total Investments (d) 115.2%
(Cost $123,574) | | $ | | 122,459 | |
| |
| Written Options (h) (0.1%) (Premiums $199) | | | | | | | | (95 | ) |
| |
| Other Assets and Liabilities (Net) (15.1%) | | (16,052 | ) |
| | | | | | | | | |
| Net Assets 100.0% | | | | | | $ | | 106,312 | |
| | | | | | | | | |
Notes to Schedule of Investments (amounts in thousands*, except number of contracts):
* A zero balance may reflect actual amounts rounding to less than one thousand.
(a) Coupon represents a weighted average rate.
(b) Principal amount of security is adjusted for inflation.
(c) Securities with an aggregate market value of $6,928 have been pledged as collateral for swap and swaption contracts on June 30, 2007.
(d) As of June 30, 2007, portfolio securities with an aggregate value of $3,141 were valued in good faith and pursuant to the guidelines established by the Board of Trustees.
(e) Securities with an aggregate market value of $1,365 have been segregated with the custodian to cover margin requirements for the following open futures contracts on June 30, 2007:
| | | | | | | | | | |
| Description | | Type | | Expiration
Month | | # of
Contracts | | Unrealized
Appreciation/
(Depreciation) | |
90-Day Eurodollar December Futures | | Long | | 12/2007 | | 41 | | $ | 0 | |
90-Day Eurodollar March Futures | | Long | | 03/2008 | | 89 | | | 9 | |
90-Day Eurodollar September Futures | | Long | | 09/2008 | | 266 | | | (276 | ) |
U.S. Treasury 5-Year Note September Futures | | Short | | 09/2007 | | 396 | | | (69 | ) |
U.S. Treasury 10-Year Note September Futures | | Long | | 09/2007 | | 3 | | | 4 | |
U.S. Treasury 30-Year Bond September Futures | | Long | | 09/2007 | | 267 | | | (103 | ) |
| | | | | | | | | | |
| | | | | | | | $ | (435 | ) |
| | | | | | | | | | |
(f) Swap agreements outstanding on June 30, 2007:
Interest Rate Swaps
| | | | | | | | | | | | | | | |
| Counterparty | | Floating Rate Index | | Pay/Receive
Floating Rate | | Fixed Rate | | Expiration
Date | | Notional
Amount | | Unrealized
Appreciation/
(Depreciation) | |
Deutsche Bank AG | | 3-Month USD-LIBOR | | Pay | | 5.000% | | 12/19/2012 | | $ | 2,400 | | $ | 8 | |
Deutsche Bank AG | | 3-Month USD-LIBOR | | Pay | | 5.000% | | 12/19/2037 | | | 9,400 | | | 116 | |
Morgan Stanley | | 3-Month USD-LIBOR | | Pay | | 5.000% | | 12/19/2037 | | | 7,800 | | | 128 | |
Royal Bank of Scotland Group PLC | | 3-Month USD-LIBOR | | Pay | | 5.000% | | 12/19/2012 | | | 57,600 | | | 211 | |
Royal Bank of Scotland Group PLC | | 3-Month USD-LIBOR | | Receive | | 5.000% | | 12/19/2017 | | | 17,300 | | | (132 | ) |
Royal Bank of Scotland Group PLC | | 3-Month USD-LIBOR | | Pay | | 5.000% | | 12/19/2022 | | | 17,700 | | | 269 | |
| | | | | | | | | | | | | | | |
| | | | | | | | | | | | | $ | 600 | |
| | | | | | | | | | | | | | | |
| | | | |
| 10 | | PIMCO Variable Insurance Trust | | See Accompanying Notes |
| | |
| |
| | | June 30, 2007 (Unaudited) |
(g) Purchased options outstanding on June 30, 2007:
Options on Exchange-Traded Futures Contracts
| | | | | | | | | | | | | |
| Description | | Exercise
Price | | Expiration
Date | | # of
Contracts | | Cost | | Value |
Call - CBOT U.S. Treasury 5-Year Note September Futures | | $ | 109.000 | | 08/24/2007 | | 89 | | $ | 2 | | $ | 1 |
Call - CBOT U.S. Treasury 5-Year Note September Futures | | | 109.500 | | 08/24/2007 | | 160 | | | 3 | | | 2 |
Call - CME 90-Day Eurodollar December Futures | | | 95.500 | | 12/17/2007 | | 21 | | | 8 | | | 1 |
Call - CME 90-Day Eurodollar December Futures | | | 96.250 | | 12/17/2007 | | 43 | | | 4 | | | 0 |
Put - CME 90-Day Eurodollar December Futures | | | 94.500 | | 12/17/2007 | | 21 | | | 7 | | | 2 |
| | | | | | | | | | | | | |
| | | | | | | | | $ | 24 | | $ | 6 |
| | | | | | | | | | | | | |
Interest Rate Swaptions
| | | | | | | | | | | | | | | | | | | |
| Description | | Counterparty | | Floating Rate Index | | Pay/Receive
Floating Rate | | Exercise
Rate | | Expiration
Date | | Notional
Amount | | Cost | | Value |
Call - OTC 2-Year Interest Rate Swap | | Bank of America | | 3-Month USD-LIBOR | | Pay | | 4.750% | | 09/26/2008 | | $ | 1,600 | | $ | 8 | | $ | 3 |
Call - OTC 2-Year Interest Rate Swap | | Royal Bank of Scotland Group PLC | | 3-Month USD-LIBOR | | Pay | | 4.750% | | 09/26/2008 | | | 1,700 | | | 6 | | | 3 |
Call - OTC 2-Year Interest Rate Swap | | Royal Bank of Scotland Group PLC | | 3-Month USD-LIBOR | | Pay | | 5.000% | | 12/15/2008 | | | 3,800 | | | 16 | | | 13 |
| | | | | | | | | | | | | | | | | | | |
| | | | | | | | | | | | | | | $ | 30 | | $ | 19 |
| | | | | | | | | | | | | | | | | | | |
(h) Written options outstanding on June 30, 2007:
Options on Exchange-Traded Futures Contracts
| | | | | | | | | | | | | |
| Description | | Exercise
Price | | Expiration
Date | | # of
Contracts | | Premium | | Value |
Call - CME 90-Day Eurodollar December Futures | | $ | 95.250 | | 12/17/2007 | | 43 | | $ | 28 | | $ | 2 |
| | | | | | | | | | | | | |
Interest Rate Swaptions
| | | | | | | | | | | | | | | | | | | |
| Description | | Counterparty | | Floating Rate Index | | Pay/Receive
Floating Rate | | Exercise
Rate | | Expiration
Date | | Notional
Amount | | Premium | | Value |
Call - OTC 7-Year Interest Rate Swap | | Bank of America | | 3-Month USD-LIBOR | | Receive | | 4.500% | | 05/02/2008 | | $ | 700 | | $ | 14 | | $ | 0 |
Put - OTC 7-Year Interest Rate Swap | | Bank of America | | 3-Month USD-LIBOR | | Pay | | 5.500% | | 05/02/2008 | | | 700 | | | 17 | | | 14 |
Call - OTC 5-Year Interest Rate Swap | | Bank of America | | 3-Month USD-LIBOR | | Receive | | 4.950% | | 09/26/2008 | | | 700 | | | 8 | | | 4 |
Call - OTC 7-Year Interest Rate Swap | | JPMorgan Chase & Co. | | 3-Month USD-LIBOR | | Receive | | 4.500% | | 05/02/2008 | | | 1,500 | | | 33 | | | 2 |
Put - OTC 7-Year Interest Rate Swap | | JPMorgan Chase & Co. | | 3-Month USD-LIBOR | | Pay | | 5.500% | | 05/02/2008 | | | 1,500 | | | 35 | | | 29 |
Call - OTC 7-Year Interest Rate Swap | | Merrill Lynch & Co., Inc. | | 3-Month USD-LIBOR | | Receive | | 4.500% | | 05/02/2008 | | | 700 | | | 14 | | | 0 |
Put - OTC 7-Year Interest Rate Swap | | Merrill Lynch & Co., Inc. | | 3-Month USD-LIBOR | | Pay | | 5.500% | | 05/02/2008 | | | 700 | | | 17 | | | 14 |
Call - OTC 5-Year Interest Rate Swap | | Royal Bank of Scotland Group PLC | | 3-Month USD-LIBOR | | Receive | | 4.950% | | 09/26/2008 | | | 700 | | | 6 | | | 3 |
Call - OTC 7-Year Interest Rate Swap | | Royal Bank of Scotland Group PLC | | 3-Month USD-LIBOR | | Receive | | 5.200% | | 12/15/2008 | | | 1,300 | | | 15 | | | 13 |
| | | | | | | | | | | | | | | | | | | |
| | | | | | | | | | | | | | | $ | 159 | | $ | 79 |
| | | | | | | | | | | | | | | | | | | |
Options on Securities
| | | | | | | | | | | | | | |
| Description | | Strike
Price | | Expiration
Date | | Notional
Amount | | Premium | | Value |
Call - OTC Fannie Mae 6.000% due 09/01/2037 | | $ | 99.188 | | 08/23/2007 | | $ | 4,000 | | $ | 12 | | $ | 14 |
| | | | | | | | | | | | | | |
(i) Short sales outstanding on June 30, 2007:
| | | | | | | | | | | | | |
| Description | | Coupon | | Maturity
Date | | Principal
Amount | | Proceeds | | Value (1) |
Fannie Mae | | 6.000% | | 07/01/2037 | | $ | 747 | | $ | 743 | | $ | 739 |
U.S. Treasury Bonds | | 4.750% | | 02/15/2037 | | | 4,300 | | | 3,975 | | | 4,138 |
| | | | | | | | | | | | | |
| | | | | | | | | $ | 4,718 | | $ | 4,877 |
| | | | | | | | | | | | | |
(1) Market value includes $82 of interest payable on short sales.
| | | | | | |
| See Accompanying Notes | | Semiannual Report | | June 30, 2007 | | 11 |
Notes to Financial Statements
1. ORGANIZATION
The Long-Term U.S. Government Portfolio (the “Portfolio”) is a series of the PIMCO Variable Insurance Trust (the “Trust”). The Trust is registered under the Investment Company Act of 1940 (the “Act”), as amended, as an open-end management investment company organized as a Delaware business trust on October 3, 1997. The Portfolio offers two classes of shares: Institutional and Administrative. Information presented on these financial statements pertains to the Administrative Class of the Portfolio. Certain detailed financial information for the Institutional Class is provided separately and is available upon request. The Trust is designed to be used as an investment vehicle by Separate Accounts of insurance companies that fund variable annuity contracts and variable life insurance policies and by qualified pension and retirement plans.
2. SIGNIFICANT ACCOUNTING POLICIES
The following is a summary of significant accounting policies consistently followed by the Portfolio in the preparation of its financial statements in conformity with accounting principles generally accepted in the United States of America (“GAAP”). The preparation of financial statements in accordance with GAAP requires management to make estimates and assumptions that affect the reported amounts and disclosures on the financial statements. Actual results could differ from those estimates.
(a) Security Valuation Portfolio securities are valued as of the close of regular trading (normally 4:00 p.m., Eastern Time) on each day that the New York Stock Exchange (“NYSE”) is open. Portfolio securities and other assets for which market quotes are readily available are stated at market value. Market value is generally determined on the basis of last reported sales prices, or if no sales are reported, based on quotes obtained from a quotation reporting system, established market makers, or pricing services. Fixed-income securities and non-exchange traded derivatives are normally valued on the basis of quotes obtained from brokers and dealers or pricing services. Prices obtained from independent pricing services use information provided by market makers or estimates of market values obtained from yield data relating to investments or securities with similar characteristics. Certain fixed income securities purchased on a delayed-delivery basis are marked to market daily until settlement at the forward settlement date. Short-term investments having a maturity of 60 days or less are generally valued at amortized cost. Exchange traded options, futures and options on futures are valued at the settlement price determined by the relevant exchange. With respect to any portion of the Portfolio’s assets that are invested in one or more open end management investment companies, the Portfolio’s net asset value (“NAV”) will be calculated based upon the NAVs of such investments.
Investments initially valued in currencies other than the U.S. dollar are converted to the U.S. dollar using exchange rates obtained from pricing services. As a result, the NAV of the Portfolio’s securities may be affected by changes in the value of currencies in relation to the U.S. dollar. The value of securities traded in markets outside the United States or denominated in currencies other than the U.S. dollar may be affected significantly on a day that the NYSE is closed and an investor is not able to purchase, redeem or exchange shares.
Securities and other assets for which market quotes are not readily available are valued at fair value as determined in good faith by the Board of Trustees or persons acting at their direction. The Board of Trustees has adopted methods for valuing securities and other assets in circumstances where market quotes are not readily available, and has delegated to Pacific Investment Management Company LLC (“PIMCO”) the responsibility for applying the valuation methods. In the event that market quotes are not readily available, and the security or asset cannot be valued pursuant to one of the valuation methods, the value of the security or asset will be determined in good faith by the Valuation Committee of the Board of Trustees, generally based upon recommendations provided by PIMCO.
Market quotes are considered not readily available in circumstances where there is an absence of current or reliable market-based data (e.g., trade information, bid/asked information, broker quotes), including where events occur after the close of the relevant market, but prior to the close of regular trading, that materially affect the values of the Portfolio’s securities or assets. In addition, market quotes are considered not readily available when, due to extraordinary circumstances, the exchanges or markets on which the securities trade, do not open for trading for the entire day and no other market prices are available. The Board has delegated to PIMCO the responsibility for monitoring significant events that may materially affect the values of the Portfolio’s securities or assets and for determining whether the value of the applicable securities or assets should be re-evaluated in light of such significant events.
When the Portfolio uses fair value pricing to determine its NAV, securities will not be priced on the basis of quotations from the primary market in which they are traded, but rather may be priced by another method that the Board of Trustees or persons acting at their direction believe accurately reflects fair value. The Trust’s policy is intended to result in a calculation of the Portfolio’s NAV that fairly reflects security values as of the time of pricing. However, fair values determined by the Board of Trustees or persons acting at their direction may not accurately reflect the price that the Portfolio could obtain for a security if it were to dispose of that security as of the time of pricing. Because foreign securities can trade on non-business days of the Portfolio, the NAV of the Portfolio may change on days when shareholders will not be able to purchase or redeem Portfolio shares. The prices used by the Portfolio may differ from the value that would be realized if the securities were sold and the differences could be material to the financial statements.
(b) Securities Transactions and Investment Income Securities transactions are recorded as of the trade date for financial reporting purposes. Securities purchased or sold on a when-issued or delayed-delivery basis may be settled a month or more after the trade date. Realized gains and losses from securities sold are recorded on the identified cost basis. Dividend income is recorded on the ex-dividend date, except certain dividends from foreign securities where the ex-dividend date may have passed, which are recorded as soon as the Portfolio is informed of the ex-dividend date. Interest income, adjusted for the accretion of discounts and amortization of premiums, is recorded on the accrual basis. Paydown gains and losses on mortgage-related and other asset-backed securities are recorded as components of interest income on the Statement of Operations.
(c) Delayed-Delivery Transactions The Portfolio may purchase or sell securities on a delayed-delivery basis. These transactions involve a commitment by the Portfolio to purchase or sell securities for a predetermined price or yield, with payment and delivery taking place beyond the customary settlement period. When delayed-delivery purchases are outstanding, the Portfolio will designate liquid assets in an amount sufficient to meet the purchase price. When purchasing a security on a delayed-delivery basis, the Portfolio assumes the rights and risks of ownership of the security, including the risk of price and yield fluctuations, and takes such fluctuations into account when determining its net asset value. The Portfolio may dispose of or renegotiate a delayed-delivery transaction after it is entered into, and may sell when-issued securities before they are delivered, which may result in a capital gain or loss. When the Portfolio has sold a security on a delayed-delivery basis, the Portfolio does not participate in future gains and losses with respect to the security.
(d) Dividends and Distributions to Shareholders Dividends from net investment income, if any, are declared daily and distributed to shareholders monthly. Net realized capital gains earned by the Portfolio, if any, will be distributed no less frequently than once each year.
| | | | |
| 12 | | PIMCO Variable Insurance Trust | | |
| | |
| |
| | | June 30, 2007 (Unaudited) |
Income dividends and capital gain distributions are determined in accordance with income tax regulations which may differ from GAAP. Differences between tax regulations and GAAP may change the fiscal year when income and capital items are recognized for tax and GAAP purposes. Examples of events that give rise to timing differences include wash sales, straddles, net operating losses and capital loss carryforwards. Further, the character of investment income and capital gains may be different for certain transactions under the two methods of accounting. Examples of characterization differences include the treatment of mortgage paydowns, swaps, foreign currency transactions and contingent debt instruments. As a result, income dividends and capital gain distributions declared during a fiscal period may differ significantly from the net investment income and realized capital gain reported on the Portfolio’s annual financial statements presented under GAAP.
Distributions classified as a tax basis return of capital, if any, are reflected on the accompanying Statements of Changes in Net Assets and have been reclassified to paid in capital. In addition, other amounts have been reclassified between undistributed net investment income, accumulated undistributed net realized gains or losses and/or paid in capital to more appropriately conform financial accounting to tax characterizations of dividend distributions.
(e) Multiclass Operations Each class offered by the Portfolio has equal rights as to assets and voting privileges (except that shareholders of a class have exclusive voting rights regarding any matter relating solely to that class of shares). Income and non-class specific expenses of the Portfolio are allocated daily to each class of shares based on the relative value of settled shares. Realized and unrealized capital gains and losses of the Portfolio are allocated daily to each class of shares based on the relative net assets of each class. Class specific expenses, where applicable, currently include administrative, distribution and servicing fees.
(f) Futures Contracts The Portfolio may enter into futures contracts. The Portfolio may use futures contracts to manage its exposure to the securities markets or to movements in interest rates and currency values. The primary risks associated with the use of futures contracts are the imperfect correlation between the change in market value of the securities held by the Portfolio and the prices of futures contracts, the possibility of an illiquid market, and the inability of the counterparty to meet the terms of the contract. Futures contracts are valued based upon their quoted daily settlement prices. Upon entering into a futures contract, the Portfolio is required to deposit with its futures broker, an amount of cash or U.S. Government and Agency Obligations in accordance with the initial margin requirements of the broker or exchange. Futures contracts are marked to market daily and an appropriate payable or receivable for the change in value (“variation margin”) is recorded by the Portfolio. Gains or losses are recognized but not considered realized until the contracts expire or are closed. Futures contracts involve, to varying degrees, risk of loss in excess of the variation margin disclosed on the Statement of Assets and Liabilities.
(g) Inflation-Indexed Bonds The Portfolio may invest in inflation-indexed bonds. Inflation-indexed bonds are fixed-income securities whose principal value is periodically adjusted to the rate of inflation. The interest rate on these bonds is generally fixed at issuance at a rate lower than typical bonds. Over the life of an inflation-indexed bond, however, interest will be paid based on a principal value, which is adjusted for inflation. Any increase in the principal amount of an inflation-indexed bond will be included as interest income on the Statement of Operations, even though investors do not receive their principal until maturity.
(h) Options Contracts The Portfolio may write call and put options on futures, swaps, securities or currencies it owns or in which it may invest. Writing put options tends to increase the Portfolio’s exposure to the underlying instrument. Writing call options tends to decrease the Portfolio’s exposure to the underlying
instrument. When the Portfolio writes a call or put option, an amount equal to the premium received is recorded as a liability and subsequently marked to market to reflect the current value of the option written. These liabilities are reflected as written options outstanding on the Statement of Assets and Liabilities. Certain options may be written with premiums to be determined on a future date. The premiums for these options are based upon implied volatility parameters at specified terms. Premiums received from writing options which expire are treated as realized gains. Premiums received from writing options which are exercised or closed are added to the proceeds or offset against amounts paid on the underlying future, swap, security or currency transaction to determine the realized gain or loss. The Portfolio as a writer of an option has no control over whether the underlying future, swap, security or currency may be sold (call) or purchased (put) and as a result bears the market risk of an unfavorable change in the price of the future, swap, security or currency underlying the written option. There is the risk the Portfolio may not be able to enter into a closing transaction because of an illiquid market.
The Portfolio may also purchase put and call options. Purchasing call options tends to increase the Portfolio’s exposure to the underlying instrument. Purchasing put options tends to decrease the Portfolio’s exposure to the underlying instrument. The Portfolio pays a premium which is included on the Statement of Assets and Liabilities as an investment and subsequently marked to market to reflect the current value of the option. Premiums paid for purchasing options which expire are treated as realized losses. Certain options may be purchased with premiums to be determined on a future date. The premiums for these options are based upon implied volatility parameters at specified terms. The risk associated with purchasing put and call options is limited to the premium paid. Premiums paid for purchasing options which are exercised or closed are added to the amounts paid or offset against the proceeds on the underlying future, swap, security or currency transaction to determine the realized gain or loss.
(i) Repurchase Agreements The Portfolio may engage in repurchase transactions. Under the terms of a typical repurchase agreement, the Portfolio takes possession of an underlying debt obligation (collateral) subject to an obligation of the seller to repurchase, and the Portfolio to resell, the obligation at an agreed-upon price and time. The underlying securities for all repurchase agreements are held in safekeeping at the Portfolio’s custodian or designated subcustodians under tri-party repurchase agreements. The market value of the collateral must be equal to or exceed the total amount of the repurchase obligations, including interest. Securities purchased under repurchase agreements are reflected as an asset on the Statement of Assets and Liabilities. Generally, in the event of counterparty default, the Portfolio has the right to use the collateral to offset losses incurred. If the counterparty should default, the Portfolio will seek to sell the securities which it holds as collateral. This could involve procedural costs or delays in addition to a loss on the securities if their value should fall below their repurchase price.
(j) Inverse Floating Rate Transactions—Residual Interest Municipal Bonds (“RIBs”)/Residual Interest Tax Exempt Bonds (“RITEs”) The Portfolio may invest in RIBs and RITEs (“Inverse Floaters”). Inverse Floaters are created via a master trust agreement between a broker-dealer, acting as trustor and liquidity provider, and an investment bank, acting as trustee and tender agent. The master trust agreement defines the terms for each trust series; with each series being established by the transfer of long-term, fixed-rate municipal bonds (“Fixed Rate Bonds”) to the trustee to be held and provide for the creation, execution and delivery of floater certificates (“Floating Rate Notes”) and Inverse Floaters. Floating Rate Notes are liquid notes that are issued with a short-term variable rate typically linked to the LIBOR, subject to limitations, for some duration. After interest income is paid on the Floating Rate Notes at current rates, the residual income from the Fixed Rate Bonds is paid to the Inverse Floaters. Inverse Floaters are issued with a coupon that fluctuates inversely with the
| | | | | | |
| | Semiannual Report | | June 30, 2007 | | 13 |
Notes to Financial Statements (Cont.)
Floating Rate Notes’ referenced rate, subject to certain limitations. Therefore, rising short-term rates result in lower income for the Inverse Floaters and vice versa.
Floating Rate Notes are generally remarketed to municipal money market funds. Inverse Floaters are acquired by either tax-exempt municipal bond funds or trusts, or other parties interested in potentially higher yielding tax-exempt securities. Inverse Floaters may also be acquired for the purpose of increasing leverage. Floating Rate Note holders typically have the option to tender their notes to the liquidity provider for redemption at par at each reset date. The Inverse Floater holders have the option to (i) require the Floating Rate Note holders to tender their notes at par, and (ii) require the liquidity provider to transfer the Fixed Rate Bonds to the Inverse Floater holders. The holders of Inverse Floaters bear substantially all of the downside investment risk associated with the underlying Fixed Rate Bonds, and also benefit from a disproportionate amount of the potential appreciation of the underlying Fixed Rate Bonds’ value. Inverse Floaters may be more volatile and less liquid than other municipal bonds of comparable maturity.
Inverse Floaters may be acquired with or without first transferring to the trustor the Fixed Rate Bonds that were utilized to create the trust series. Inverse Floaters acquired without a transfer of Fixed Rate Bonds are recognized as purchases of securities as outlined in Note 2(b). Statement of Financial Accounting Standards No. 140—Accounting for Transfers and Servicing of Financial Assets and Extinguishments of Liabilities (“FAS No. 140”), governs the standards for accounting for securitizations and other transfers of financial assets. If there is a transfer of Fixed Rate Bonds and it meets sale criteria under FAS No. 140, a Portfolio records a sale of the Fixed Rate Bonds and a purchase of the Inverse Floaters. The cash received from the Inverse Floaters is then recorded as interest income in the Statement of Operations.
If the transfer of Fixed Rate Bonds does not meet sale criteria under FAS No. 140, a Portfolio accounts for the transaction described above as a secured borrowing by including the Fixed Rate Bonds in its Schedule of Investments, and recording the Floating Rate Notes as a liability under the caption “Payable for floating rate notes” in the Portfolio’s Statement of Assets and Liabilities. In a secured borrowing transaction, cash received from the Inverse Floaters is not recorded as interest income. Instead, a Portfolio records interest income related to the Fixed Rate Bonds and interest expense related to the Floating Rate Notes, the net of which is equal to the cash received from the Inverse Floaters acquired by the Portfolio. Thus, while a Portfolio’s reported total income, net expenses, and net expense ratio are generally higher for investments in Inverse Floaters acquired via a secured borrowing, the method of acquiring Inverse Floaters does not result in differences for reported cash flows, net asset value or total return.
(k) Short Sales The Portfolio may enter into short sales transactions. A short sale is a transaction in which the Portfolio sells securities it does not own in anticipation of a decline in the market price of the securities. Securities sold in short sale transactions and interest payable on such securities, if any, are reflected as a liability on the Statement of Assets and Liabilities. The Portfolio is obligated to deliver securities at the market price at the time the short position is closed. Possible losses from short sales may be unlimited, whereas losses from purchases cannot exceed the total amount invested.
(l) Swap Agreements The Portfolio may invest in swap agreements. Swap transactions are privately negotiated agreements between the Portfolio and a counterparty to exchange or swap investment cash flows, assets, or market-linked returns at specified, future intervals. The Portfolio may enter into interest rate, total return, forward spread-lock, credit default, and other forms of swap agreements to manage its exposure to interest rates and credit risk. In connection with these agreements, securities may be identified as collateral in accordance with the terms of the respective swap agreements.
Interest rate swap agreements involve the exchange by the Portfolio with another party of their respective commitments to pay or receive interest, e.g., an exchange of floating rate payments for fixed rate payments with respect to the notional amount of principal. Certain forms of interest rate swap agreements may include: (i) interest rate caps, under which, in return for a premium, one party agrees to make payments to the other to the extent that interest rates exceed a specified rate, or “cap”, (ii) interest rate floors, under which, in return for a premium, one party agrees to make payments to the other to the extent that interest rates fall below a specified rate, or “floor”, or (iii) interest rate collars, under which a party sells a cap and purchases a floor or vice versa in an attempt to protect itself against interest rate movements exceeding given minimum or maximum levels.
Total return swap agreements involve commitments to pay interest in exchange for a market-linked return, both based on notional amounts. To the extent the total return of the security or index underlying the transaction exceeds or falls short of the offsetting interest rate obligation, the Portfolio will receive a payment from or make a payment to the counterparty.
Forward spread-lock swap agreements involve commitments to pay or receive a settlement amount calculated as the difference between the swap spread and a fixed spread, multiplied by the notional amount times the duration of the swap. The swap spread is the difference between the benchmark swap rate (market rate) and the specific Treasury rate.
Credit default swap agreements involve one party making a stream of payments to another party in exchange for the right to receive a specified return in the event of a default by a third party, typically corporate issues or sovereign issues of an emerging country, on its obligation. The Portfolio may use credit default swaps to provide a measure of protection against defaults of the issuers (i.e., to reduce risk where the Portfolio owns or has exposure to the sovereign issuer) or to take an active long or short position with respect to the likelihood of a particular issuer’s default. As a seller of protection, the Portfolio generally receives an upfront payment or a fixed rate of income throughout the term of the swap provided that there is no credit event. If the Portfolio is a seller of protection and a credit event occurs, as defined under the terms of that particular swap agreement, the Portfolio will pay to the buyer of the protection an amount up to the notional value of the swap and in certain instances take delivery of the security. As the seller, the Portfolio would effectively add leverage to its portfolio because, in addition to its total net assets, the Portfolio would be subject to investment exposure on the notional amount of the swap. As a buyer of protection, the Portfolio generally receives an amount up to the notional value of the swap if a credit event occurs. The treatment of credit default swaps and other swap agreements that provide for contingent, non-periodic, bullet-type payments as “notional principal contracts” for U.S. federal income tax purposes is uncertain. Were the U.S. Internal Revenue Service (“IRS”) to take the position that a credit default swap or other bullet-type swap is not a “notional principal contract” for U.S. federal income tax purposes, payments received by the Portfolio from such investments might be subject to U.S. excise or income taxes.
Swaps are marked to market daily based upon quotations from market makers and the change in value, if any, is recorded as unrealized gain or loss on the Statement of Operations. Payments received or made at the beginning of the measurement period are reflected as such on the Statement of Assets and Liabilities. These upfront payments are recorded as realized gain or loss on the Statement of Operations upon termination or maturity of the swap. A liquidation payment received or made at the termination of the swap is recorded as realized gain or loss on the Statement of Operations. Net periodic payments received or paid by the Portfolio are included as part of realized gain or loss on the Statement of Operations. Entering into these agreements involves, to varying degrees, elements of credit, market and documentation risk in excess of the amounts recognized on the Statement of Assets and Liabilities. Such risks involve the possibility that
| | | | |
| 14 | | PIMCO Variable Insurance Trust | | |
| | |
| |
| | | June 30, 2007 (Unaudited) |
there will be no liquid market for these agreements, that the counterparty to the agreements may default on its obligation to perform or disagree as to the meaning of contractual terms in the agreements and that there may be unfavorable changes in interest rates.
(m) Mortgage-Related and Other Asset-Backed Securities The Portfolio may invest in mortgage-related or other asset-backed securities. These securities include mortgage pass-through securities, collateralized mortgage obligations (“CMOs”), commercial mortgage-backed securities, mortgage dollar rolls, CMO residuals, stripped mortgage-backed securities (“SMBSs”) and other securities that directly or indirectly represent a participation in, or are secured by and payable from, mortgage loans on real property. The value of some mortgage-related or asset-backed securities may be particularly sensitive to changes in prevailing interest rates. Early repayment of principal on some mortgage-related securities may expose the Portfolio to a lower rate of return upon reinvestment of principal. The value of these securities may fluctuate in response to the market’s perception of the creditworthiness of the issuers. Additionally, although mortgages and mortgage-related securities are generally supported by some form of government or private guarantee and/or insurance, there is no assurance that private guarantors or insurers will meet their obligations.
(n) U.S. Government Agencies or Government-Sponsored Enterprises Securities issued by U.S. Government agencies or government-sponsored enterprises may not be guaranteed by the U.S. Treasury. The Government National Mortgage Association (“GNMA” or “Ginnie Mae”), a wholly owned U.S. Government corporation, is authorized to guarantee, with the full faith and credit of the U.S. Government, the timely payment of principal and interest on securities issued by institutions approved by GNMA and backed by pools of mortgages insured by the Federal Housing Administration or guaranteed by the Department of Veterans Affairs. Government-related guarantors (i.e., not backed by the full faith and credit of the U.S. Government) include the Federal National Mortgage Association (“FNMA” or “Fannie Mae”) and the Federal Home Loan Mortgage Corporation (“FHLMC” or “Freddie Mac”). Pass-through securities issued by FNMA are guaranteed as to timely payment of principal and interest by FNMA but are not backed by the full faith and credit of the U.S. Government. FHLMC guarantees the timely payment of interest and ultimate collection of principal, but its participation certificates are not backed by the full faith and credit of the U.S. Government.
(o) New Accounting Policies In July 2006, the Financial Accounting Standards Board (“FASB”) issued Interpretation No. 48, “Accounting for Uncertainty in Income Taxes—an Interpretation of FASB Statement No. 109” (the “Interpretation”). The Interpretation became effective for the Portfolio on June 29, 2007. Management has evaluated the application of the Interpretation in relation to the Portfolio and has concluded that no single filing position or combination of filing positions identified as uncertain tax positions required the accrual of a tax liability in the accounting records of the Portfolio for the period ending June 30, 2007. Management will monitor all existing filing positions and future filing positions in light of the Interpretation and evaluate the need for any future tax accruals and financial statement disclosures as warranted.
In September 2006, the FASB issued Statement of Financial Accounting Standards No. 157, “Fair Value Measurements” (the “Statement”). The Statement is effective for fiscal years beginning after November 15, 2007 and will require expanded disclosure about fair value measurements, separately for each major category of assets and liabilities, that enables shareholders to assess the inputs used to develop those measurements, and for recurring fair value measurements using significant unobservable inputs the effect of the measurements on changes in net assets for the reporting period. Management is currently evaluating the application of the Statement to the Portfolio and will provide additional information in relation to the Statement on the Portfolio’s annual financial statements for the period ending December 31, 2007.
3. FEES AND EXPENSES
(a) Investment Advisory Fee PIMCO is a majority-owned subsidiary of Allianz Global Investors of America L.P. (“AGI”), and serves as investment adviser (the “Adviser”) to the Trust, pursuant to an investment advisory contract. The Adviser receives a monthly fee from the Portfolio, at an annual rate based on average daily net assets. The Advisory Fee for all classes is charged at an annual rate of 0.225%.
(b) Administration Fee PIMCO serves as administrator (the “Administrator”), and provides administrative services to the Trust for which it receives a monthly administrative fee based on each share class’s average daily net assets. As the Administrator, PIMCO bears the costs of various third-party services, including audit, custodial, portfolio accounting, legal, transfer agency and printing costs. The Administration Fee for all classes is charged at the annual rate of 0.25%.
(c) Distribution and Servicing Fees Allianz Global Investors Distributors LLC (“AGID”) is an indirect wholly-owned subsidiary of AGI and serves as the distributor (the “Distributor”) of the Trust’s shares. The Trust is permitted to reimburse AGID on a quarterly basis, out of the Administrative Class assets of the Portfolio in the amount of 0.15% on an annual basis of the average daily net assets of that class, for payments made to financial intermediaries that provide services in connection with the distribution of shares or administration of plans or programs that use Portfolio shares as their funding medium. The effective rate paid to AGID was 0.15% during the current fiscal year.
(d) Portfolio Expenses The Trust is responsible for the following expenses: (i) salaries and other compensation of any of the Trust’s executive officers and employees who are not officers, directors, stockholders or employees of PIMCO or its subsidiaries or affiliates; (ii) taxes and governmental fees; (iii) brokerage fees and commissions and other portfolio transaction expenses; (iv) the costs of borrowing money, including interest expenses and bank overdraft charges; (v) fees and expenses of the Trustees who are not “interested persons” of PIMCO or the Trust, and any counsel retained exclusively for their benefit; (vi) extraordinary expenses, including costs of litigation and indemnification expenses; (vii) organization expenses and (viii) any expenses allocated or allocable to a specific class of shares, which include service fees payable with respect to the Administrative Class Shares, and may include certain other expenses as permitted by the Trust’s Multiple Class Plan adopted pursuant to Rule 18f-3 under the Act and subject to review and approval by the Trustees. The ratio of expenses to average net assets per share class, as disclosed in the Financial Highlights, may differ from the annual portfolio operating expenses per share class as disclosed in the Prospectus for the reasons set forth above.
Effective April 1, 2007, each Trustee, other than those affiliated with PIMCO or its affiliates, receives an annual retainer of $15,000, plus $2,375 for each Board of Trustees meeting attended in person, $500 for each committee meeting attended and $750 for each Board of Trustees meeting attended telephonically, plus reimbursement of related expenses. In addition, the audit committee chair receives an additional annual retainer of $2,000 and each other committee chair receives an additional annual retainer of $500. These expenses are allocated on a pro-rata basis to the various portfolios of the Trust according to their respective net assets. The Trust pays no compensation directly to any Trustee or any other officer who is affiliated with the Administrator, all of whom receive remuneration for their services to the Trust from the Administrator or its affiliates. Prior to April 1, 2007, each Trustee, other than those affiliated with PIMCO or its affiliates, received an annual retainer of $15,000 plus $2,000 for each Board of Trustees meeting attended ($500 for each special meeting attended), plus reimbursement of related expenses. The Audit Committee Chairman received an annual retainer of $1,500 and the Governance Committee Chairman received an annual retainer of $500. In addition, each member of a committee received $500 for each committee meeting attended.
| | | | | | |
| | Semiannual Report | | June 30, 2007 | | 15 |
Notes to Financial Statements (Cont.)
4. RELATED PARTY TRANSACTIONS
The Adviser, Administrator, and Distributor are related parties as defined by FAS 57, Related Party Disclosures. Fees payable to these parties are disclosed in Note 3.
5. GUARANTEES AND INDEMNIFICATIONS
Under the Trust’s organizational documents, each Trustee, officer, employee or other agent of the Trust (including the Trust’s investment manager) is indemnified, to the extent permitted by the Act, against certain liabilities that may arise out of performance of their duties to the Portfolio. Additionally, in the normal course of business, the Portfolio enters into contracts that contain a variety of indemnification clauses. The Portfolio’s maximum exposure under these arrangements is unknown as this would involve future claims that may be made against the Portfolio that have not yet occurred. However, the Portfolio has not had prior claims or losses pursuant to these contracts and believes the risk of loss to be remote.
6. PURCHASES AND SALES OF SECURITIES
The length of time the Portfolio has held a particular security is not generally a consideration in investment decisions. A change in the securities held by the Portfolio is known as “portfolio turnover”. The Portfolio may engage in frequent and active trading of portfolio securities to achieve its investment objective, particularly during periods of volatile market movements. High portfolio turnover (e.g., over 100%) involves correspondingly greater expenses to the Portfolio, including brokerage commissions or dealer mark-ups and other transaction costs on the sale of securities and reinvestments in other securities. Such sales may also result in realization of taxable capital gains, including short-term capital gains (which are generally taxed at ordinary income tax rates). The trading costs and tax effects associated with portfolio turnover may adversely affect the Portfolio’s performance.
Purchases and sales of securities (excluding short-term investments) for the period ended June 30, 2007, were as follows (amounts in thousands):
| | | | | | | | | | | | |
| U.S. Government/Agency | | | | All Other |
| Purchases | | Sales | | | | Purchases | | Sales |
| $ | 64,589 | | $ | 89,775 | | | | $ | 6,044 | | $ | 788 |
7. TRANSACTIONS IN WRITTEN CALL AND PUT OPTIONS
Transactions in written call and put options were as follows (amounts in thousands, except for number of contracts):
| | | | | | | | | | | | | |
| | | | | # of
Contracts | | | Notional
Amount
in $ | | | Premium | |
Balance at 12/31/2006 | | | | 129 | | | $ | 8,800 | | | $ | 223 | |
Sales | | | | 194 | | | | 6,700 | | | | 86 | |
Closing Buys | | | | 0 | | | | (3,000 | ) | | | (35 | ) |
Expirations | | | | (259 | ) | | | 0 | | | | (67 | ) |
Exercised | | | | (21 | ) | | | 0 | | | | (8 | ) |
Balance at 06/30/2007 | | | | 43 | | | $ | 12,500 | | | $ | 199 | |
8. SHARES OF BENEFICIAL INTEREST
The Portfolio may issue an unlimited number of shares of beneficial interest with a $0.001 par value. Changes in shares of beneficial interest were as follows (shares and amounts in thousands):
| | | | | | | | | | | | | | | | |
| | | | | Six Months Ended
06/30/2007 | | | Year Ended
12/31/2006 | |
| | | | | Shares | | | Amount | | | Shares | | | Amount | |
| | | | | |
Receipts for shares sold | | | | | | | | | | | | | | | | |
Institutional Class | | | | 29 | | | $ | 304 | | | 47 | | | $ | 495 | |
Administrative Class | | | | 1,793 | | | | 18,728 | | | 2,211 | | | | 23,572 | |
Issued as reinvestment of distributions | | | | | | | | | | | | | | | | |
Institutional Class | | | | 2 | | | | 13 | | | 3 | | | | 30 | |
Administrative Class | | | | 224 | | | | 2,309 | | | 560 | | | | 5,909 | |
Cost of shares redeemed | | | | | | | | | | | | | | | | |
Institutional Class | | | | (8 | ) | | | (82 | ) | | (44 | ) | | | (467 | ) |
Administrative Class | | | | (1,092 | ) | | | (11,478 | ) | | (1,234 | ) | | | (13,023 | ) |
Net increase resulting from Portfolio share transactions | | | | 948 | | | $ | 9,794 | | | 1,543 | | | $ | 16,516 | |
The following schedule shows the number of shareholders each owning 5% or more of the Portfolio and the total percentage of the Portfolio held by such shareholders:
| | | | | | |
| | | | | Number of
Shareholders | | % of Portfolio Held |
Institutional Class | | | | 1 | | 99 |
Administrative Class | | | | 4 | | 95 |
9. REGULATORY AND LITIGATION MATTERS
Since February 2004, PIMCO, Allianz Global Investors of America L.P. (PIMCO’s parent company), AGID, and certain of their affiliates, including the PIMCO Funds (another series of funds managed by PIMCO), the Allianz Funds (formerly known as PIMCO Funds: Multi-Manager Series (another series of funds managed by affiliates of PIMCO)), certain Trustees of the Trust (in their capacity as Trustees of the PIMCO Funds or the Allianz Funds) and certain employees of PIMCO, have been named as defendants in fifteen lawsuits filed in various jurisdictions. Eleven of those lawsuits concern “market timing,” and they have been transferred to and consolidated for pre-trial proceedings in a multi-district litigation proceeding in the U.S. District Court for the District of Maryland; the other four lawsuits concern “revenue sharing” and have been consolidated into a single action in the U.S. District Court for the District of Connecticut. The lawsuits have been commenced as putative class actions on behalf of investors who purchased, held or redeemed shares of the various series of the PIMCO Funds and the Allianz Funds during specified periods, or as derivative actions on behalf of the PIMCO Funds and the Allianz Funds.
The market timing actions in the District of Maryland generally allege that certain hedge funds were allowed to engage in “market timing” in certain funds of the PIMCO Funds and the Allianz Funds and this alleged activity was not disclosed. Pursuant to tolling agreements entered into with the derivative and class action plaintiffs, PIMCO, certain PIMCO Funds Trustees, and certain employees of PIMCO who were previously named as defendants have all been dropped as defendants in the market timing actions; the plaintiffs continue to assert claims on behalf of the shareholders of the PIMCO Funds or on behalf of the PIMCO Funds itself against other defendants. By order dated November 3, 2005, the U.S. District Court for the District of Maryland granted the PIMCO Funds’ motion to dismiss claims asserted against it in a consolidated amended complaint where the PIMCO Funds were named, in the complaint, as a nominal defendant. The revenue sharing action in the District of Connecticut generally alleges that fund assets were inappropriately
| | | | |
| 16 | | PIMCO Variable Insurance Trust | | |
| | |
| |
| | | June 30, 2007 (Unaudited) |
used to pay brokers to promote funds of the PIMCO Funds and the Allianz Funds, including directing fund brokerage transactions to such brokers, and that such alleged arrangements were not fully disclosed to shareholders. On August 11, 2005, the U.S. District Court for the District of Connecticut conducted a hearing on defendants’ motion to dismiss the consolidated amended complaint in the revenue sharing action but has not yet ruled on the motion to dismiss. The market timing and revenue sharing lawsuits seek, among other things, unspecified compensatory damages plus interest and, in some cases, punitive damages, the rescission of investment advisory contracts, the return of fees paid under those contracts and restitution.
Two nearly identical class action civil complaints have been filed in August 2005, in the Northern District of Illinois Eastern Division, alleging that the plaintiffs each purchased and sold a 10-year Treasury note futures contract and suffered damages from an alleged shortage when PIMCO held both physical and futures positions in 10-year Treasury notes for its client accounts. The two actions have been consolidated into one action, and the two separate complaints have been replaced by a consolidated complaint. PIMCO is a named defendant, and PIMCO Funds has been added as a defendant, to the consolidated action. PIMCO strongly believes the complaint is without merit and intends to vigorously defend itself.
In April 2006, certain portfolios of the Trust and certain other funds managed by PIMCO were served in an adversary proceeding brought by the Official Committee of Asbestos Claimants of G-I Holdings, Inc. in G-I Holdings, Inc.’s bankruptcy in the District of New Jersey. In July 2004, PIMCO was named in this lawsuit and remains a defendant. The plaintiff seeks to recover for the bankruptcy estate assets that were transferred by the predecessor entity of G-I Holdings, Inc. to a wholly-owned subsidiary in 1994. The subsidiary has since issued notes, of which certain portfolios of the Trust and certain other funds managed by PIMCO are alleged to be holders. The complaint alleges that in 2000, more than two hundred noteholders—including certain portfolios of the Trust and certain other funds managed by PIMCO—were granted a second priority lien on the assets of the subsidiary in exchange for their consent to a refinancing transaction and the granting of a first priority lien to the lending banks. The plaintiff is seeking
invalidation of the lien in favor of the noteholders and/or the value of the lien. On June 21, 2006, the District of New Jersey overturned the Bankruptcy Court’s decision granting permission to file the adversary proceeding and remanded the matter to the Bankruptcy Court for further proceedings. Following a motion to reconsider, the District Court upheld its remand on August 7, 2006, and instructed the Bankruptcy Court to conduct a “cost-benefit” analysis of the Committee’s claims, including the claims against the noteholders. The Bankruptcy Court held a status conference on October 25, 2006 and set a briefing schedule relating to this cost-benefit analysis.
The foregoing speaks only as of the date of this report. It is possible that these matters and/or other developments resulting from these matters could result in increased portfolio redemptions or other adverse consequences to the Portfolio. However, PIMCO and AGID believe that these matters are not likely to have a material adverse effect on the Portfolio or on PIMCO’s or AGID’s ability to perform their respective investment advisory or distribution services relating to the Portfolio.
10. FEDERAL INCOME TAX MATTERS
The Portfolio intends to qualify as a regulated investment company under sub-chapter M of the Internal Revenue Code (the “Code”) and distribute all of its taxable income and net realized gains, if applicable, to shareholders. Accordingly, no provision for Federal income taxes has been made.
As of June 30, 2007, the aggregate cost of investments was the same for federal income tax and financial statement purposes. The net unrealized appreciation (depreciation) of investment securities for federal income tax purposes is as follows (amount in thousands):
| | | | |
Aggregate
Gross
Unrealized
Appreciation | | Aggregate
Gross
Unrealized
(Depreciation) | | Net
Unrealized
(Depreciation) |
$ 203 | | $ (1,318) | | $ (1,115) |
| | | | | | |
| | Semiannual Report | | June 30, 2007 | | 17 |
| | |
| |
Privacy Policy* | | (Unaudited) |
The Funds consider customer privacy to be a fundamental aspect of their relationships with shareholders and are committed to maintaining the confidentiality, integrity and security of their current, prospective and former shareholders’ personal information. To ensure their shareholders’ privacy, the Funds have developed policies that are designed to protect this confidentiality, while allowing shareholder needs to be served.
Obtaining Personal Information
In the course of providing shareholders with products and services, the Funds and certain service providers to the Funds, such as the Funds’ investment advisers (“Advisers”), may obtain non-public personal information about shareholders, which may come from sources such as account applications and other forms, from other written, electronic or verbal correspondence, from shareholder transactions, from a shareholder’s brokerage or financial advisory firm, financial adviser or consultant, and/or from information captured on the Funds’ internet web sites.
Respecting Your Privacy
As a matter of policy, the Funds do not disclose any personal or account information provided by shareholders or gathered by the Funds to non-affiliated third parties, except as required or permitted by law or as necessary for such third parties to perform their agreements with respect to the Funds. As is common in the industry, non-affiliated companies may from time to time be used to provide certain services, such as preparing and mailing prospectuses, reports, account statements and other information, conducting research on shareholder satisfaction and gathering shareholder proxies. A Fund’s Distributor may also retain non-affiliated companies to market the Fund’s shares or products which use the Fund’s shares and enter into joint marketing agreements with other companies. These companies may have access to a shareholder’s personal and account information, but are permitted to use this information solely to provide the specific service or as otherwise permitted by law. In most cases, the shareholders will be clients of a third party, but the Funds may also provide a shareholder’s personal and account information to the shareholder’s respective brokerage or financial advisory firm.
Sharing Information with Third Parties
The Funds reserve the right to disclose or report personal information to non-affiliated third parties, in limited circumstances, where the Funds believe in good faith that disclosure is required under law to cooperate with regulators or law enforcement authorities, to protect their rights or property or upon reasonable request by any Fund in which a shareholder has chosen to invest. In addition, the Funds may disclose information about a shareholder’s accounts to a non-affiliated third party with the consent of the shareholder.
Sharing Information with Affiliates
The Funds may share shareholder information with their affiliates in connection with servicing their shareholders’ accounts or to provide shareholders with information about products and services that the Funds or their Advisers, principal underwriters or their affiliates (“Service Affiliates”) believe may be of interest to such shareholders. The information that the Funds share may include, for example, a shareholder’s participation in one of the Funds or in other investment programs sponsored by a Service Affiliate, a shareholder’s ownership of certain types of accounts (such as IRAs), or other data about a shareholder’s accounts. The Funds’ Service Affiliates, in turn, are not permitted to share shareholder information with non-affiliated entities, except as required or permitted by law.
Procedures to Safeguard Private Information
The Funds take seriously the obligation to safeguard shareholder non-public personal information. In addition to this policy, the Funds have also implemented procedures that are designed to restrict access to a shareholder’s non-public personal information only to internal personnel who need to know that information in order to provide products or services to such shareholders. In order to guard a shareholder’s non-public personal information, physical, electronic and procedural safeguards are in place.
* This Privacy Policy applies to the following entities: PIMCO Funds, PIMCO Variable Insurance Trust, PCM Fund, Inc. and PIMCO Strategic Global Government Fund, Inc. (collectively, the “Funds”).
| | | | |
| 18 | | PIMCO Variable Insurance Trust | | |
Investment Adviser and Administrator
Pacific Investment Management Company LLC
840 Newport Center Drive
Newport Beach, California 92660
Distributor
Allianz Global Investors Distributors LLC
1345 Avenue of the Americas
New York, New York 10105
Custodian
State Street Bank & Trust Company
801 Pennsylvania
Kansas City, Missouri 64105
Transfer Agent
Boston Financial Data Services–Midwest
330 W. 9th Street
Kansas City, Missouri 64105
Legal Counsel
Dechert LLP
1775 I Street, N.W.
Washington, D.C. 20006
Independent Registered Public Accounting Firm
PricewaterhouseCoopers LLP
1055 Broadway
Kansas City, Missouri 64105
P I M C O

Table of Contents
This material is authorized for use only when preceded or accompanied by the current PIMCO Variable Insurance Trust (the “Trust”) prospectus. Investors should consider the investment objectives, risks, charges and expenses of this Trust carefully before investing. Ask your financial professional to explain all charges that may apply. This and other information is contained in the Trust’s prospectus. The variable product prospectus may be obtained by contacting your Investment Consultant. Please read the Trust and variable product prospectus carefully before you invest or send money.
Chairman’s Letter
Dear PIMCO Variable Insurance Trust Shareholder:
It is our pleasure to present to you the semiannual report for the PIMCO Variable Insurance Trust, covering the six-month period ended June 30, 2007. The PIMCO Variable Insurance Trust’s net assets were $8.68 billion at June 30, 2007, as compared to $7.76 billion at December 31, 2006.
Highlights of the financial markets during the reporting period include:
| | n | | Economic data during the first quarter of 2007 pointed to slower growth, which heightened market expectations for a decrease in the Federal Funds Rate. By the second quarter, economic data, such as employment statistics, provided little indication of economic weakness, causing expectations of a decrease in the Federal Funds Rate to unwind and U.S. interest rates to move higher. Interest rates in Europe and the U.K. also rose over the period as central banks raised their key lending rates due to inflation concerns. The benchmark ten-year U.S. Treasury yielded 5.03% as of June 30, 2007, or 0.32% higher than at the beginning of the year. |
| | n | | Most bonds generally returned much of their gains from earlier in the year as worldwide growth and capital flows drove interest rates higher in the second quarter. Increased risk aversion in global financial markets, due in part to subprime mortgage worries in the U.S., also contributed to the rise in interest rates. The Lehman Brothers Aggregate Bond Index, which includes Treasury, investment-grade corporate and mortgage-backed securities, returned 0.98% for the six-month period. |
| | n | | Locally issued emerging market (“EM”) bonds posted positive returns for the reporting period. Yields on these bonds declined and the local currencies in which they are denominated generally gained, amid increasing investor awareness, strong economic growth and surging capital inflows. External EM bonds (debt instruments issued by emerging markets countries and typically denominated in U.S. dollars) lagged behind local EM bonds (debt instruments issued by emerging markets countries and denominated in the currency of the issuer), as external EM bonds tend to trade more in-line with U.S. Treasuries. |
| | n | | Treasury Inflation-Protected Securities (“TIPS”) outpaced nominal bonds (non-inflation linked bonds) for the first part of the year and all but the longest maturity TIPS outperformed in the second quarter as high gasoline prices drove higher inflation accruals. Commodities, as represented by the Dow Jones-AIG Commodity Total Return Index, returned 4.46% for the period. Equities, as measured by the S&P 500 Index and the Russell 2000 Index, returned 6.96% and 6.45%, respectively, for the period. |
On the following pages, please find specific details as to the Portfolio’s total return investment performance and a discussion of those factors that affected performance.
Thank you for the trust you have placed in us. We will continue to work diligently to serve your investment needs.
Sincerely,
Brent R. Harris
Chairman, PIMCO Variable Insurance Trust
July 31, 2007
| | | | | | |
| | Semiannual Report | | June 30, 2007 | | 1 |
Important Information About the Portfolio
PIMCO Variable Insurance Trust (the “Trust”) is an open-end management investment company currently consisting of twenty separate investment portfolios, including the Long-Term U.S. Government Portfolio (the “Portfolio”). The Portfolio is only available as a funding vehicle under variable life insurance policies or variable annuity contracts issued by insurance companies (“Variable Contracts”). Individuals may not purchase shares of the Portfolio directly. Shares of the Portfolio also may be sold to qualified pension and retirement plans outside of the separate account context.
We believe that bond funds have an important role to play in a well diversified investment portfolio. It is important to note, however, that in an environment where interest rates may trend upward, rising rates would negatively impact the performance of most bond funds, and fixed-income securities held by a fund are likely to decrease in value. The price volatility of fixed-income securities can also increase during periods of rising interest rates resulting in increased losses to a fund. Bond funds and individual bonds with a longer duration (a measure of the expected life of a security) tend to be more sensitive to changes in interest rates, usually making them more volatile than securities or funds with shorter durations.
The Portfolio may be subject to various risks in addition to those described above. Some of these risks may include, but are not limited to, the following: credit risk, market risk, issuer risk, derivatives risk, mortgage risk, leveraging risk and management risk. A complete description of these risks is contained in the Portfolio’s prospectus. The Portfolio may use derivative instruments for hedging purposes or as part of an investment strategy. Use of these instruments may involve certain costs and risks such as liquidity risk, interest rate risk, market risk, credit risk, management risk and the risk that the Portfolio could not close out a position when it would be most advantageous to do so. Because the Portfolio may invest in derivatives, it could lose more than the principal amount invested in these instruments.
On the performance summary page in this Semiannual Report, the Total Return Investment Performance table measures performance assuming that all dividend and capital gain distributions were reinvested.
An investment in the Portfolio is not a deposit of a bank and is not guaranteed or insured by the Federal Deposit Insurance Corporation or any other government agency. It is possible to lose money on investments in the Portfolio.
PIMCO has adopted written proxy voting policies and procedures (“Proxy Policy”) as required by Rule 206(4)-6 under the Investment Advisers Act of 1940, as amended. The Proxy Policy has been adopted by the Trust as the policies and procedures that PIMCO will use when voting proxies on behalf of the Portfolio. A description of the policies and procedures that PIMCO uses to vote proxies relating to portfolio securities of the Portfolio, and information about how the Portfolio voted proxies relating to portfolio securities held during the most recent twelve-month period ended June 30, are available without charge, upon request, by calling the Trust at 1-866-746-2606 and on the Portfolio’s website at www.pimco.com.
The Portfolio files its complete schedule of portfolio holdings with the SEC for the first and third quarters of each fiscal year on Form N-Q. A copy of the Trust’s Form N-Q is also available on the SEC’s website at http://www.sec.gov and may be reviewed and copied at the SEC’s Public Reference Room in Washington D.C. Information on the operation of the Public Reference Room may be obtained by calling 1-800-SEC-0330, and is available without charge, upon request, by calling the Trust at 1-866-746-2606 and on the Portfolio’s website at www.pimco.com.
PIMCO Variable Insurance Trust is distributed by Allianz Global Investors Distributors LLC, 1345 Avenue of the Americas, New York, NY 10105.
| | | | |
| 2 | | PIMCO Variable Insurance Trust | | |
The following disclosure provides important information regarding the Portfolio’s Expense Example (“Example” or “Expense Example”), which appears in this Semiannual Report. Please refer to this information when reviewing the Expense Example for the Portfolio.
Example
As a shareholder of the Portfolio, you incur two types of costs: (1) transaction costs and (2) ongoing costs, including advisory and administrative fees; distribution and/or service (12b-1) fees (Administrative Class only); and other Portfolio expenses. The Example is intended to help you understand your ongoing costs (in dollars) of investing in the Portfolio and to compare these costs with the ongoing costs of investing in other mutual funds. The Expense Example does not reflect any fees or other expenses imposed by the Variable Contracts. If it did, the expenses reflected in the Expense Example would be higher. The Example is based on an investment of $1,000 invested at the beginning of the period and held for the entire period indicated, which is from January 1, 2007 to June 30, 2007.
Actual Expenses
The information in the table under the heading “Actual Performance” provides information about actual account values and actual expenses. You may use the information in these columns, together with the amount you invested, to estimate the expenses that you paid over the period. Simply divide your account value by $1,000 (for example, an $8,600 account value divided by $1,000 = $8.60), then multiply the result by the number in the row titled “Expenses Paid During Period” to estimate the expenses you paid on your account during this period.
Hypothetical Example for Comparison Purposes
The information in the table under the heading “Hypothetical Performance (5% return before expenses)” provides information about hypothetical account values and hypothetical expenses based on the Portfolio’s actual expense ratio and an assumed rate of return of 5% per year before expenses, which is not the Portfolio’s actual return. The hypothetical account values and expenses may not be used to estimate the actual ending account balance or expenses you paid for the period. You may use this information to compare the ongoing costs of investing in the Portfolio and other portfolios. To do so, compare this 5% hypothetical example with the 5% hypothetical examples that appear in the shareholder reports of the other portfolios.
Please note that the expenses shown in the table are meant to highlight your ongoing costs only and do not reflect any transactional costs. Therefore, the information under the heading “Hypothetical Performance (5% return before expenses)” is useful in comparing ongoing costs only, and will not help you determine the relative total costs of owning different portfolios. In addition, if these transactional costs were included, your costs would have been higher.
The expense ratio may vary period to period because of various factors, such as an increase in expenses not covered by the advisory and administrative fees (such as expenses of the trustees and their counsel, litigation expense and interest expense).
| | | | | | |
| | Semiannual Report | | June 30, 2007 | | 3 |
PIMCO Long-Term U.S. Government Portfolio
Cumulative Returns Through June 30, 2007
$10,000 invested at the beginning of the first full month following the inception date of the Portfolio’s Institutional Class.
Allocation Breakdown‡
| | |
U.S. Government Agencies | | 39.1% |
Short-Term Instruments | | 29.7% |
U.S. Treasury Obligations | | 10.7% |
Mortgage-Backed Securities | | 9.4% |
Asset-Backed Securities | | 5.6% |
Corporate Bonds & Notes | | 5.5% |
| | ‡ | % of Total Investments as of 06/30/2007 |
| | | | | | | | | | |
Average Annual Total Return for the period ended June 30, 2007 |
| | | | | 6 Months* | | 1 Year | | 5 Years | | Portfolio
Inception
(04/10/00)** |
| | PIMCO Long-Term U.S. Government Portfolio Institutional Class | | -2.10% | | 4.45% | | 5.42% | | 6.92% |
| | Lehman Brothers Long-Term Treasury Index± | | -0.90% | | 5.98% | | 5.86% | | 6.77% |
All Portfolio returns are net of fees and expenses.
* Cumulative return.
** The Portfolio began operations on 04/10/00. Index comparisons began on 03/31/00.
Performance quoted represents past performance. Past performance is no guarantee of future results. Investment return and principal value will fluctuate so the Portfolio shares, when redeemed, may be worth more or less than their original cost. The Portfolio’s performance does not reflect the deduction of additional charges and expenses imposed in connection with investing in Variable Contracts, which will reduce returns. Current performance may be lower or higher than the performance data quoted. Performance data current to the most recent month-end is available by calling (800) 927-4648.
± Lehman Brothers Long-Term Treasury Index is an unmanaged index of U.S. Treasury issues with maturities greater than 10 years. It is not possible to invest directly in the index. The index does not reflect deductions for fees and expenses.
| | | | | | |
| Expense Example | | Actual Performance | | Hypothetical Performance |
| | | | | (5% return before expenses) |
Beginning Account Value (01/01/07) | | $ | 1,000.00 | | $ | 1,000.00 |
Ending Account Value (06/30/07) | | $ | 979.05 | | $ | 1,022.44 |
Expenses Paid During Period† | | $ | 2.33 | | $ | 2.38 |
† Expenses are equal to the Portfolio’s Institutional Class annualized expense ratio of 0.475%, multiplied by the average account value over the period, multiplied by 181/365 (to reflect the one-half year period). Overall fees and expenses of investing in the Portfolio will be higher because the example does not reflect Variable Contract fees and expenses.
Please refer to page 3 herein for an explanation of the information presented in the above Expense Example.
Portfolio Insights
| » | | The PIMCO Long-Term U.S. Government Portfolio seeks to achieve its investment objective by investing under normal circumstances at least 80% of its assets in a diversified portfolio of fixed-income securities that are issued or guaranteed by the U.S. government, its agencies or government-sponsored enterprises. |
| » | | Over the six-month period, long-term yields rose, which detracted from performance of long-term Treasuries. |
| » | | Duration positioning was slightly negative for performance during the first six months of 2007. During the first quarter, above-benchmark duration added value to performance as interest rates declined across most maturities. The above-index duration position negatively outweighed these gains as interest rates increased in the second quarter, especially during the month of May. |
| » | | The Portfolio’s emphasis on the short-term portion of the yield curve throughout the six-month reporting period positively impacted relative performance as the two- to 30-year yield spread steepened during the period. |
| » | | Interest rate swap exposure detracted from performance as swap spreads widened across all maturities during the period. |
| » | | An allocation to long-term agency debentures detracted from relative performance as they underperformed like-duration Treasuries over the period. |
| » | | Compared to the Lehman Brothers Long-Term Treasury Index, a modest out-of-benchmark allocation to long-term Treasury Inflation-Protected Securities (“TIPS”) slightly detracted from performance for the period. Long-term TIPS outperformed like-duration Treasuries during the first quarter, but their performance declined compared to similar Treasuries during the second quarter. |
| | | | |
| 4 | | PIMCO Variable Insurance Trust | | |
Financial Highlights Long-Term U.S. Government Portfolio
| | | | | | | | | | | | | | | | | | | | | | | | |
| Selected per Share Data for the Year or Period Ended: | | 06/30/2007+ | | | 12/31/2006 | | | 12/31/2005 | | | 12/31/2004 | | | 12/31/2003 | | | 12/31/2002 | |
| | | | | | |
Institutional Class | | | | | | | | | | | | | | | | | | | | | | | | |
Net asset value beginning of year or period | | $ | 10.43 | | | $ | 11.00 | | | $ | 11.19 | | | $ | 11.01 | | | $ | 11.09 | | | $ | 10.27 | |
Net investment income (a) | | | 0.24 | | | | 0.49 | | | | 0.42 | | | | 0.36 | | | | 0.32 | | | | 0.46 | |
Net realized/unrealized gain (loss) on investments (a) | | | (0.45 | ) | | | (0.35 | ) | | | 0.12 | | | | 0.48 | | | | 0.12 | | | | 1.31 | |
Total income (loss) from investment operations | | | (0.21 | ) | | | 0.14 | | | | 0.54 | | | | 0.84 | | | | 0.44 | | | | 1.77 | |
Dividends from net investment income | | | (0.24 | ) | | | (0.48 | ) | | | (0.42 | ) | | | (0.36 | ) | | | (0.35 | ) | | | (0.46 | ) |
Distributions from net realized capital gains | | | 0.00 | | | | (0.23 | ) | | | (0.31 | ) | | | (0.30 | ) | | | (0.17 | ) | | | (0.49 | ) |
Total distributions | | | (0.24 | ) | | | (0.71 | ) | | | (0.73 | ) | | | (0.66 | ) | | | (0.52 | ) | | | (0.95 | ) |
Net asset value end of year or period | | $ | 9.98 | | | $ | 10.43 | | | $ | 11.00 | | | $ | 11.19 | | | $ | 11.01 | | | $ | 11.09 | |
Total return | | | (2.10 | )% | | | 1.30 | % | | | 4.90 | % | | | 7.73 | % | | | 4.05 | % | | | 17.77 | % |
Net assets end of year or period (000s) | | $ | 649 | | | $ | 443 | | | $ | 391 | | | $ | 311 | | | $ | 13 | | | $ | 13 | |
Ratio of expenses to average net assets | | | 0.475 | %* | | | 0.475 | % | | | 0.50 | %(c) | | | 0.50 | % | | | 0.51 | % | | | 0.50 | %(b) |
Ratio of expenses to average net assets excluding interest expense | | | 0.475 | %* | | | 0.475 | % | | | 0.50 | %(c) | | | 0.50 | % | | | 0.50 | % | | | 0.50 | %(b) |
Ratio of net investment income to average net assets | | | 4.68 | %* | | | 4.61 | % | | | 3.75 | % | | | 3.22 | % | | | 2.85 | % | | | 4.22 | % |
Portfolio turnover rate | | | 79 | % | | | 785 | % | | | 533 | % | | | 237 | % | | | 619 | % | | | 586 | % |
+ Unaudited
* Annualized
(a) Per share amounts based on average number of shares outstanding during the period.
(b) If the investment manager had not reimbursed expenses, the ratio of expenses to average net assets would have been 0.51%.
(c) Effective October 31, 2005, the advisory fee was reduced to 0.225%.
| | | | | | |
| See Accompanying Notes | | Semiannual Report | | June 30, 2007 | | 5 |
Statement of Assets and Liabilities Long-Term U.S. Government Portfolio
| | | | |
| (Amounts in thousands, except per share amounts) | | June 30, 2007 | |
| | | (Unaudited) | |
| |
Assets: | | | | |
Investments, at value | | $ | 122,459 | |
Receivable for investments sold | | | 12,561 | |
Receivable for Portfolio shares sold | | | 39 | |
Interest and dividends receivable | | | 512 | |
Variation margin receivable | | | 323 | |
Swap premiums paid | | | 1,021 | |
Unrealized appreciation on swap agreements | | | 732 | |
| | | | 137,647 | |
| |
Liabilities: | | | | |
Payable for investments purchased | | $ | 17,159 | |
Payable for investments purchased on a delayed-delivery basis | | | 800 | |
Payable for Portfolio shares redeemed | | | 1 | |
Payable for short sales | | | 4,877 | |
Overdraft due to custodian | | | 2,749 | |
Written options outstanding | | | 95 | |
Accrued investment advisory fee | | | 20 | |
Accrued administration fee | | | 22 | |
Accrued servicing fee | | | 11 | |
Variation margin payable | | | 97 | |
Swap premiums received | | | 5,372 | |
Unrealized depreciation on swap agreements | | | 132 | |
| | | | 31,335 | |
| |
Net Assets | | $ | 106,312 | |
| |
Net Assets Consist of: | | | | |
Paid in capital | | $ | 114,128 | |
Undistributed net investment income | | | 65 | |
Accumulated undistributed net realized (loss) | | | (6,955 | ) |
Net unrealized (depreciation) | | | (926 | ) |
| | | $ | 106,312 | |
| |
Net Assets: | | | | |
Institutional Class | | $ | 649 | |
Administrative Class | | | 105,663 | |
| |
Shares Issued and Outstanding: | | | | |
Institutional Class | | | 65 | |
Administrative Class | | | 10,587 | |
| |
Net Asset Value and Redemption Price Per Share (Net Asset Per Share Outstanding) | | | | |
Institutional Class | | $ | 9.98 | |
Administrative Class | | | 9.98 | |
| |
Cost of Investments Owned | | $ | 123,574 | |
Proceeds Received on Short Sales | | $ | 4,718 | |
Premiums Received on Written Options | | $ | 199 | |
| | | | |
| 6 | | PIMCO Variable Insurance Trust | | See Accompanying Notes |
Statement of Operations Long-Term U.S. Government Portfolio
| | | | |
| (Amounts in thousands) | | Six Months Ended
June 30, 2007 | |
| | | (Unaudited) | |
| |
| Investment Income: | | | | |
Interest | | $ | 2,646 | |
Total Income | | | 2,646 | |
| |
Expenses: | | | | |
Investment advisory fees | | | 116 | |
Administration fees | | | 129 | |
Servicing fees – Administrative Class | | | 77 | |
Trustees’ fees | | | 1 | |
Total Expenses | | | 323 | |
| |
Net Investment Income | | | 2,323 | |
| |
Net Realized and Unrealized Gain (Loss): | | | | |
Net realized gain on investments | | | 275 | |
Net realized (loss) on futures contracts, written options and swaps | | | (4,471 | ) |
Net change in unrealized (depreciation) on investments | | | (957 | ) |
Net change in unrealized appreciation on futures contracts, written options and swaps | | | 464 | |
Net (Loss) | | | (4,689 | ) |
| |
Net (Decrease) in Net Assets Resulting from Operations | | $ | (2,366 | ) |
| | | | | | |
| See Accompanying Notes | | Semiannual Report | | June 30, 2007 | | 7 |
Statements of Changes in Net Assets Long-Term U.S. Government Portfolio
| | | | | | | | |
| (Amounts in thousands) | | Six Months Ended
June 30, 2007 | | | Year Ended
December 31, 2006 | |
| | | (Unaudited) | | | | |
| | |
| Increase (Decrease) in Net Assets from: | | | | | | | | |
| | |
Operations: | | | | | | | | |
Net investment income | | $ | 2,323 | | | $ | 3,819 | |
Net realized (loss) | | | (4,196 | ) | | | (1,775 | ) |
Net change in unrealized (depreciation) | | | (493 | ) | | | (1,232 | ) |
Net increase (decrease) resulting from operations | | | (2,366 | ) | | | 812 | |
| | |
Distributions to Shareholders: | | | | | | | | |
From net investment income | | | | | | | | |
Institutional Class | | | (13 | ) | | | (23 | ) |
Administrative Class | | | (2,308 | ) | | | (3,800 | ) |
From net realized capital gains | | | | | | | | |
Institutional Class | | | 0 | | | | (7 | ) |
Administrative Class | | | 0 | | | | (2,110 | ) |
| | |
Total Distributions | | | (2,321 | ) | | | (5,940 | ) |
| | |
Portfolio Share Transactions: | | | | | | | | |
Receipts for shares sold | | | | | | | | |
Institutional Class | | | 305 | | | | 495 | |
Administrative Class | | | 18,728 | | | | 23,572 | |
Issued as reinvestment of distributions | | | | | | | | |
Institutional Class | | | 13 | | | | 30 | |
Administrative Class | | | 2,308 | | | | 5,909 | |
Cost of shares redeemed | | | | | | | | |
Institutional Class | | | (82 | ) | | | (467 | ) |
Administrative Class | | | (11,478 | ) | | | (13,023 | ) |
Net increase resulting from Portfolio share transactions | | | 9,794 | | | | 16,516 | |
| | |
Total Increase in Net Assets | | | 5,107 | | | | 11,388 | |
| | |
Net Assets: | | | | | | | | |
Beginning of period | | | 101,205 | | | | 89,817 | |
End of period* | | $ | 106,312 | | | $ | 101,205 | |
| | |
*Including undistributed net investment income of: | | $ | 65 | | | $ | 63 | |
| | | | |
| 8 | | PIMCO Variable Insurance Trust | | See Accompanying Notes |
| | |
| |
| Schedule of Investments Long-Term U.S. Government Portfolio | | June 30, 2007 (Unaudited) |
| | | | | | | | |
| | | | | PRINCIPAL
AMOUNT
(000S) | | | | VALUE
(000S) |
| CORPORATE BONDS & NOTES 6.3% |
|
| BANKING & FINANCE 5.8% |
| Allstate Life Global Funding Trusts |
5.415% due 01/25/2008 | | $ | | 200 | | $ | | 200 |
| |
| Bank of America N.A. | | | | | | | | |
5.360% due 12/18/2008 | | | | 1,300 | | | | 1,301 |
| |
| CIT Group, Inc. | | | | | | | | |
5.480% due 08/17/2009 | | | | 300 | | | | 299 |
| |
| Citigroup, Inc. | | | | | | | | |
5.395% due 01/30/2009 | | | | 600 | | | | 600 |
| |
| Goldman Sachs Group, Inc. | | | | | | | | |
5.536% due 02/06/2012 | | | | 700 | | | | 699 |
| |
| JPMorgan Mortgage Acquisition Corp. |
6.550% due 09/15/2066 | | | | 200 | | | | 193 |
| |
| Lehman Brothers Holdings, Inc. |
5.445% due 01/23/2009 | | | | 1,400 | | | | 1,402 |
| |
| Pricoa Global Funding I | | | | | | | | |
5.435% due 01/25/2008 | | | | 200 | | | | 200 |
| |
| U.S. Trade Funding Corp. | | | | | | | | |
4.260% due 11/15/2014 | | | | 658 | | | | 642 |
| |
| Wachovia Bank N.A. | | | | | | | | |
5.320% due 10/03/2008 | | | | 300 | | | | 300 |
| |
| Wells Fargo & Co. | | | | | | | | |
5.420% due 03/23/2010 | | | | 400 | | | | 401 |
| | | | | | | | |
| | | | | | | | 6,237 |
| | | | | | | | |
|
| INDUSTRIALS 0.5% |
| DaimlerChrysler N.A. Holding Corp. |
5.790% due 03/13/2009 | | | | 400 | | | | 402 |
| |
| Walt Disney Co. | | | | | | | | |
5.460% due 09/10/2009 | | | | 100 | | | | 100 |
| | | | | | | | |
| | | | | | | | 502 |
| | | | | | | | |
Total Corporate Bonds & Notes
(Cost $6,756) | | | | 6,739 |
| | | | | | | | |
|
| U.S. GOVERNMENT AGENCIES 45.1% |
| Fannie Mae | | | | | | | | |
4.425% due 01/01/2033 | | | | 99 | | | | 99 |
4.500% due 06/25/2019 - 09/01/2035 | | | | 660 | | | | 602 |
5.000% due 11/01/2019 - 08/25/2033 | | | | 770 | | | | 703 |
5.250% due 06/15/2008 | | | | 11,100 | | | | 11,097 |
5.375% due 02/25/2022 | | | | 150 | | | | 142 |
5.500% due 09/25/2024 - 08/01/2037 | | | | 11,712 | | | | 11,298 |
5.794% due 08/25/2021 | | | | 20 | | | | 20 |
5.800% due 02/09/2026 | | | | 500 | | | | 490 |
5.944% due 08/25/2022 | | | | 11 | | | | 11 |
6.080% due 09/01/2028 | | | | 64 | | | | 68 |
6.220% due 04/25/2032 | | | | 29 | | | | 30 |
6.244% due 04/25/2021 | | | | 14 | | | | 14 |
6.500% due 07/25/2031 | | | | 590 | | | | 597 |
| |
| Farmer Mac | | | | | | | | |
7.280% due 07/25/2011 | | | | 146 | | | | 145 |
| |
| Federal Farm Credit Bank | | | | | | | | |
5.050% due 03/28/2019 | | | | 400 | | | | 386 |
5.150% due 03/25/2020 | | | | 250 | | | | 241 |
| |
| Federal Home Loan Bank | | | | | | | | |
4.000% due 07/14/2008 | | | | 1,000 | | | | 987 |
5.120% due 01/10/2013 | | | | 5,000 | | | | 4,902 |
6.000% due 02/12/2021 | | | | 50 | | | | 53 |
6.125% due 06/08/2018 | | | | 80 | | | | 84 |
| |
| Federal Housing Administration |
6.896% due 07/01/2020 | | | | 384 | | | | 384 |
| |
| | | | | | | | |
| | | | | PRINCIPAL
AMOUNT
(000S) | | | | VALUE
(000S) |
| Financing Corp. | | | | | | | | |
10.700% due 10/06/2017 | | $ | | 650 | | $ | | 915 |
| |
| Freddie Mac | | | | | | | | |
4.500% due 05/15/2025 | | | | 1,000 | | | | 878 |
5.000% due 03/18/2014 - 09/15/2035 | | | | 2,000 | | | | 1,844 |
5.400% due 03/17/2021 | | | | 1,000 | | | | 979 |
5.500% due 11/15/2023 - 06/15/2034 | | | | 1,302 | | | | 1,251 |
5.550% due 07/15/2037 | | | | 800 | | | | 800 |
5.625% due 11/23/2035 | | | | 900 | | | | 845 |
5.720% due 01/15/2033 | | | | 97 | | | | 98 |
6.000% due 05/15/2036 | | | | 3,201 | | | | 3,006 |
6.075% due 02/15/2027 | | | | 17 | | | | 18 |
6.227% due 10/25/2044 | | | | 155 | | | | 156 |
6.375% due 02/15/2021 | | | | 21 | | | | 21 |
7.000% due 07/15/2023 - 12/01/2031 | | | | 72 | | | | 74 |
8.250% due 06/01/2016 | | | | 350 | | | | 413 |
| |
| Ginnie Mae | | | | | | | | |
4.500% due 08/20/2030 | | | | 18 | | | | 17 |
5.500% due 01/20/2036 | | | | 541 | | | | 489 |
6.000% due 08/20/2033 | | | | 1,258 | | | | 1,207 |
| |
| Overseas Private Investment Corp. |
4.736% due 03/15/2022 | | | | 396 | | | | 375 |
| |
| Private Export Funding Corp. |
5.000% due 12/15/2016 | | | | 500 | | | | 484 |
| |
| Small Business Administration |
5.240% due 08/01/2023 | | | | 773 | | | | 761 |
| |
| Tennessee Valley Authority |
5.375% due 04/01/2056 | | | | 1,000 | | | | 952 |
| | | | | | | | |
Total U.S. Government Agencies
(Cost $48,276) | | | | 47,936 |
| | | | | | | | |
|
| U.S. TREASURY OBLIGATIONS 12.3% |
| Treasury Inflation Protected Securities (b) |
2.000% due 01/15/2026 | | | | 416 | | | | 378 |
2.375% due 01/15/2025 | | | | 329 | | | | 316 |
| |
| U.S. Treasury Bonds | | | | | | | | |
4.750% due 02/15/2037 | | | | 2,800 | | | | 2,641 |
5.375% due 02/15/2031 | | | | 1,000 | | | | 1,027 |
| |
| U.S. Treasury Strips | | | | | | | | |
0.000% due 08/15/2019 | | | | 15,400 | | | | 8,237 |
0.000% due 02/15/2033 | | | | 1,700 | | | | 464 |
| | | | | | | | |
Total U.S. Treasury Obligations
(Cost $13,680) | | | | 13,063 |
| | | | | | | | |
|
| MORTGAGE-BACKED SECURITIES 10.9% |
| American Home Mortgage Investment Trust |
5.000% due 09/25/2035 | | | | 400 | | | | 394 |
| |
| Bear Stearns Adjustable Rate Mortgage Trust |
4.750% due 10/25/2035 | | | | 831 | | | | 818 |
4.773% due 01/25/2034 | | | | 75 | | | | 75 |
5.044% due 04/25/2033 | | | | 507 | | | | 506 |
5.292% due 04/25/2033 | | | | 138 | | | | 138 |
| |
| Countrywide Alternative Loan Trust |
5.500% due 10/25/2033 | | | | 1,228 | | | | 1,078 |
5.530% due 05/25/2035 | | | | 182 | | | | 182 |
| |
Countrywide Home Loan Mortgage
Pass-Through Trust |
5.640% due 03/25/2035 | | | | 335 | | | | 337 |
5.660% due 06/25/2035 | | | | 2,625 | | | | 2,620 |
| |
| CS First Boston Mortgage Securities Corp. |
5.870% due 04/25/2033 | | | | 10 | | | | 10 |
7.339% due 11/25/2032 | | | | 16 | | | | 16 |
| |
| First Republic Mortgage Loan Trust |
5.670% due 11/15/2031 | | | | 234 | | | | 235 |
| |
| | | | | | | | |
| | | | | PRINCIPAL
AMOUNT
(000S) | | | | VALUE
(000S) |
| GS Mortgage Securities Corp. II |
5.410% due 03/06/2020 | | $ | | 500 | | $ | | 501 |
| |
| Harborview Mortgage Loan Trust |
5.450% due 04/19/2038 | | | | 167 | | | | 167 |
5.540% due 05/19/2035 | | | | 143 | | | | 143 |
| |
| Impac CMB Trust | | | | | | | | |
5.249% due 09/25/2034 | | | | 621 | | | | 612 |
| |
| JPMorgan Chase Commercial Mortgage Securities Corp. |
5.747% due 02/12/2049 | | | | 300 | | | | 299 |
| |
| LB-UBS Commercial Mortgage Trust |
2.720% due 03/15/2027 | | | | 356 | | | | 352 |
| |
| MASTR Asset Securitization Trust |
5.500% due 09/25/2033 | | | | 424 | | | | 406 |
| |
| Residential Accredit Loans, Inc. |
5.720% due 01/25/2033 | | | | 43 | | | | 43 |
5.720% due 03/25/2033 | | | | 92 | | | | 93 |
| |
| Residential Funding Mortgage Securities I, Inc. |
6.500% due 03/25/2032 | | | | 77 | | | | 77 |
| |
| Sequoia Mortgage Trust | | | | | | | | |
5.670% due 07/20/2033 | | | | 350 | | | | 352 |
| |
| Structured Adjustable Rate Mortgage Loan Trust |
5.540% due 05/25/2037 | | | | 388 | | | | 389 |
| |
| Structured Asset Mortgage Investments, Inc. |
5.650% due 09/19/2032 | | | | 339 | | | | 339 |
5.740% due 10/19/2033 | | | | 97 | | | | 97 |
| |
Washington Mutual MSC Mortgage
Pass-Through Certificates |
5.407% due 02/25/2033 | | | | 25 | | | | 25 |
6.866% due 02/25/2033 | | | | 12 | | | | 13 |
6.909% due 02/25/2031 | | | | 30 | | | | 30 |
7.301% due 05/25/2033 | | | | 22 | | | | 22 |
| |
| Washington Mutual, Inc. | | | | | | | | |
5.550% due 04/25/2045 | | | | 140 | | | | 140 |
5.724% due 10/25/2046 | | | | 220 | | | | 220 |
6.029% due 08/25/2046 | | | | 845 | | | | 847 |
| | | | | | | | |
Total Mortgage-Backed Securities
(Cost $11,669) | | | | 11,576 |
| | | | | | | | |
|
| ASSET-BACKED SECURITIES 6.4% |
| American Express Credit Account Master Trust |
5.430% due 09/15/2010 | | | | 100 | | | | 100 |
| |
| Argent Securities, Inc. | | | | | | | | |
5.370% due 10/25/2036 | | | | 342 | | | | 342 |
5.390% due 04/25/2036 | | | | 203 | | | | 203 |
| |
| Bear Stearns Asset-Backed Securities, Inc. |
5.820% due 11/25/2042 | | | | 246 | | | | 247 |
| |
| Chase Credit Card Master Trust |
5.490% due 09/15/2011 | | | | 300 | | | | 301 |
| |
Chase Funding Mortgage Loan
Asset-Backed Certificates |
5.820% due 10/25/2031 | | | | 15 | | | | 16 |
| |
| Credit-Based Asset Servicing & Securitization LLC |
5.410% due 12/25/2037 | | | | 228 | | | | 228 |
| |
| First Franklin Mortgage Loan Asset-Backed Certificates |
5.370% due 03/25/2037 | | | | 275 | | | | 275 |
| |
| First USA Credit Card Master Trust |
5.480% due 04/18/2011 | | | | 1,400 | | | | 1,404 |
| |
| Fremont Home Loan Trust |
5.370% due 10/25/2036 | | | | 693 | | | | 693 |
| |
| Indymac Residential Asset-Backed Trust |
5.380% due 04/25/2037 | | | | 237 | | | | 237 |
| |
| LA Arena Funding LLC |
7.656% due 12/15/2026 | | | | 86 | | | | 90 |
| |
| | | | | | |
| See Accompanying Notes | | Semiannual Report | | June 30, 2007 | | 9 |
Schedule of Investments Long-Term U.S. Government Portfolio (Cont.)
| | | | | | | | |
| | | | | PRINCIPAL
AMOUNT
(000S) | | | | VALUE
(000S) |
| MASTR Asset-Backed Securities Trust |
5.380% due 11/25/2036 | | $ | | 407 | | $ | | 407 |
| |
| Merrill Lynch Mortgage Investors, Inc. |
5.390% due 08/25/2036 | | | | 325 | | | | 325 |
| |
| Morgan Stanley ABS Capital I |
5.440% due 02/25/2036 | | | | 300 | | | | 300 |
| |
| Peco Energy Transition Trust |
6.130% due 03/01/2009 | | | | 1 | | | | 1 |
| |
| Renaissance Home Equity Loan Trust |
5.760% due 08/25/2033 | | | | 13 | | | | 13 |
5.820% due 12/25/2033 | | | | 75 | | | | 76 |
| |
| Residential Asset Mortgage Products, Inc. |
5.400% due 02/25/2036 | | | | 215 | | | | 215 |
| |
| Residential Asset Securities Corp. |
6.060% due 01/25/2033 | | | | 60 | | | | 60 |
| |
| SLM Student Loan Trust |
5.345% due 10/27/2014 | | | | 97 | | | | 97 |
5.355% due 04/25/2017 | | | | 500 | | | | 500 |
5.465% due 04/25/2017 | | | | 146 | | | | 146 |
| |
| SMS Student Loan Trust |
5.420% due 10/27/2025 | | | | 51 | | | | 51 |
| |
| Specialty Underwriting & Residential Finance |
5.660% due 01/25/2034 | | | | 12 | | | | 12 |
| |
| | | | | | | | |
| | | | | PRINCIPAL
AMOUNT
(000S) | | | | VALUE
(000S) |
| Structured Asset Securities Corp. |
5.450% due 12/25/2035 | | $ | | 192 | | $ | | 192 |
5.610% due 01/25/2033 | | | | 21 | | | | 22 |
| |
| Wells Fargo Home Equity Trust |
5.370% due 01/25/2037 | | | | 247 | | | | 247 |
| | | | | | | | |
Total Asset-Backed Securities
(Cost $6,804) | | | | 6,800 |
| | | | | | | | |
|
| SHORT-TERM INSTRUMENTS 34.2% |
|
| COMMERCIAL PAPER 24.5% |
| Fannie Mae | | | | | | | | |
5.080% due 07/02/2007 | | | | 17,200 | | | | 17,200 |
| |
| Freddie Mac |
4.800% due 07/02/2007 | | | | 8,800 | | | | 8,800 |
| | | | | | | | |
| | | | | | | | 26,000 |
| | | | | | | | |
|
| REPURCHASE AGREEMENTS 1.2% |
| State Street Bank and Trust Co. |
4.900% due 07/02/2007 | | | | 1,286 | | | | 1,286 |
| | | | | | | | |
(Dated 06/29/2007. Collateralized by Fannie Mae 3.250% due 08/15/2008 valued at $1,317. Repurchase proceeds are $1,287.) |
| | | | | | | | | |
| | | | | PRINCIPAL
AMOUNT
(000S) | | | | VALUE
(000S) | |
| U.S. TREASURY BILLS 8.5% | |
4.557% due 08/30/2007 - 09/13/2007 (a)(c)(e) | | $ | | 9,130 | | $ | | 9,034 | |
| | | | | | | | | |
Total Short-Term Instruments
(Cost $36,335) | | | | 36,320 | |
| | | | | | | | | |
| |
| PURCHASED OPTIONS (g) 0.0% | | | |
(Cost $54) | | | | 25 | |
| |
| |
Total Investments (d) 115.2%
(Cost $123,574) | | $ | | 122,459 | |
| |
| Written Options (h) (0.1%) (Premiums $199) | | | | | | | | (95 | ) |
| |
| Other Assets and Liabilities (Net) (15.1%) | | (16,052 | ) |
| | | | | | | | | |
| Net Assets 100.0% | | | | | | $ | | 106,312 | |
| | | | | | | | | |
Notes to Schedule of Investments (amounts in thousands*, except number of contracts):
* A zero balance may reflect actual amounts rounding to less than one thousand.
(a) Coupon represents a weighted average rate.
(b) Principal amount of security is adjusted for inflation.
(c) Securities with an aggregate market value of $6,928 have been pledged as collateral for swap and swaption contracts on June 30, 2007.
(d) As of June 30, 2007, portfolio securities with an aggregate value of $3,141 were valued in good faith and pursuant to the guidelines established by the Board of Trustees.
(e) Securities with an aggregate market value of $1,365 have been segregated with the custodian to cover margin requirements for the following open futures contracts on June 30, 2007:
| | | | | | | | | | |
| Description | | Type | | Expiration
Month | | # of
Contracts | | Unrealized
Appreciation/
(Depreciation) | |
90-Day Eurodollar December Futures | | Long | | 12/2007 | | 41 | | $ | 0 | |
90-Day Eurodollar March Futures | | Long | | 03/2008 | | 89 | | | 9 | |
90-Day Eurodollar September Futures | | Long | | 09/2008 | | 266 | | | (276 | ) |
U.S. Treasury 5-Year Note September Futures | | Short | | 09/2007 | | 396 | | | (69 | ) |
U.S. Treasury 10-Year Note September Futures | | Long | | 09/2007 | | 3 | | | 4 | |
U.S. Treasury 30-Year Bond September Futures | | Long | | 09/2007 | | 267 | | | (103 | ) |
| | | | | | | | | | |
| | | | | | | | $ | (435 | ) |
| | | | | | | | | | |
(f) Swap agreements outstanding on June 30, 2007:
Interest Rate Swaps
| | | | | | | | | | | | | | | |
| Counterparty | | Floating Rate Index | | Pay/Receive
Floating Rate | | Fixed Rate | | Expiration
Date | | Notional
Amount | | Unrealized
Appreciation/
(Depreciation) | |
Deutsche Bank AG | | 3-Month USD-LIBOR | | Pay | | 5.000% | | 12/19/2012 | | $ | 2,400 | | $ | 8 | |
Deutsche Bank AG | | 3-Month USD-LIBOR | | Pay | | 5.000% | | 12/19/2037 | | | 9,400 | | | 116 | |
Morgan Stanley | | 3-Month USD-LIBOR | | Pay | | 5.000% | | 12/19/2037 | | | 7,800 | | | 128 | |
Royal Bank of Scotland Group PLC | | 3-Month USD-LIBOR | | Pay | | 5.000% | | 12/19/2012 | | | 57,600 | | | 211 | |
Royal Bank of Scotland Group PLC | | 3-Month USD-LIBOR | | Receive | | 5.000% | | 12/19/2017 | | | 17,300 | | | (132 | ) |
Royal Bank of Scotland Group PLC | | 3-Month USD-LIBOR | | Pay | | 5.000% | | 12/19/2022 | | | 17,700 | | | 269 | |
| | | | | | | | | | | | | | | |
| | | | | | | | | | | | | $ | 600 | |
| | | | | | | | | | | | | | | |
| | | | |
| 10 | | PIMCO Variable Insurance Trust | | See Accompanying Notes |
| | |
| |
| | | June 30, 2007 (Unaudited) |
(g) Purchased options outstanding on June 30, 2007:
Options on Exchange-Traded Futures Contracts
| | | | | | | | | | | | | |
| Description | | Exercise
Price | | Expiration
Date | | # of
Contracts | | Cost | | Value |
Call - CBOT U.S. Treasury 5-Year Note September Futures | | $ | 109.000 | | 08/24/2007 | | 89 | | $ | 2 | | $ | 1 |
Call - CBOT U.S. Treasury 5-Year Note September Futures | | | 109.500 | | 08/24/2007 | | 160 | | | 3 | | | 2 |
Call - CME 90-Day Eurodollar December Futures | | | 95.500 | | 12/17/2007 | | 21 | | | 8 | | | 1 |
Call - CME 90-Day Eurodollar December Futures | | | 96.250 | | 12/17/2007 | | 43 | | | 4 | | | 0 |
Put - CME 90-Day Eurodollar December Futures | | | 94.500 | | 12/17/2007 | | 21 | | | 7 | | | 2 |
| | | | | | | | | | | | | |
| | | | | | | | | $ | 24 | | $ | 6 |
| | | | | | | | | | | | | |
Interest Rate Swaptions
| | | | | | | | | | | | | | | | | | | |
| Description | | Counterparty | | Floating Rate Index | | Pay/Receive
Floating Rate | | Exercise
Rate | | Expiration
Date | | Notional
Amount | | Cost | | Value |
Call - OTC 2-Year Interest Rate Swap | | Bank of America | | 3-Month USD-LIBOR | | Pay | | 4.750% | | 09/26/2008 | | $ | 1,600 | | $ | 8 | | $ | 3 |
Call - OTC 2-Year Interest Rate Swap | | Royal Bank of Scotland Group PLC | | 3-Month USD-LIBOR | | Pay | | 4.750% | | 09/26/2008 | | | 1,700 | | | 6 | | | 3 |
Call - OTC 2-Year Interest Rate Swap | | Royal Bank of Scotland Group PLC | | 3-Month USD-LIBOR | | Pay | | 5.000% | | 12/15/2008 | | | 3,800 | | | 16 | | | 13 |
| | | | | | | | | | | | | | | | | | | |
| | | | | | | | | | | | | | | $ | 30 | | $ | 19 |
| | | | | | | | | | | | | | | | | | | |
(h) Written options outstanding on June 30, 2007:
Options on Exchange-Traded Futures Contracts
| | | | | | | | | | | | | |
| Description | | Exercise
Price | | Expiration
Date | | # of
Contracts | | Premium | | Value |
Call - CME 90-Day Eurodollar December Futures | | $ | 95.250 | | 12/17/2007 | | 43 | | $ | 28 | | $ | 2 |
| | | | | | | | | | | | | |
Interest Rate Swaptions
| | | | | | | | | | | | | | | | | | | |
| Description | | Counterparty | | Floating Rate Index | | Pay/Receive
Floating Rate | | Exercise
Rate | | Expiration
Date | | Notional
Amount | | Premium | | Value |
Call - OTC 7-Year Interest Rate Swap | | Bank of America | | 3-Month USD-LIBOR | | Receive | | 4.500% | | 05/02/2008 | | $ | 700 | | $ | 14 | | $ | 0 |
Put - OTC 7-Year Interest Rate Swap | | Bank of America | | 3-Month USD-LIBOR | | Pay | | 5.500% | | 05/02/2008 | | | 700 | | | 17 | | | 14 |
Call - OTC 5-Year Interest Rate Swap | | Bank of America | | 3-Month USD-LIBOR | | Receive | | 4.950% | | 09/26/2008 | | | 700 | | | 8 | | | 4 |
Call - OTC 7-Year Interest Rate Swap | | JPMorgan Chase & Co. | | 3-Month USD-LIBOR | | Receive | | 4.500% | | 05/02/2008 | | | 1,500 | | | 33 | | | 2 |
Put - OTC 7-Year Interest Rate Swap | | JPMorgan Chase & Co. | | 3-Month USD-LIBOR | | Pay | | 5.500% | | 05/02/2008 | | | 1,500 | | | 35 | | | 29 |
Call - OTC 7-Year Interest Rate Swap | | Merrill Lynch & Co., Inc. | | 3-Month USD-LIBOR | | Receive | | 4.500% | | 05/02/2008 | | | 700 | | | 14 | | | 0 |
Put - OTC 7-Year Interest Rate Swap | | Merrill Lynch & Co., Inc. | | 3-Month USD-LIBOR | | Pay | | 5.500% | | 05/02/2008 | | | 700 | | | 17 | | | 14 |
Call - OTC 5-Year Interest Rate Swap | | Royal Bank of Scotland Group PLC | | 3-Month USD-LIBOR | | Receive | | 4.950% | | 09/26/2008 | | | 700 | | | 6 | | | 3 |
Call - OTC 7-Year Interest Rate Swap | | Royal Bank of Scotland Group PLC | | 3-Month USD-LIBOR | | Receive | | 5.200% | | 12/15/2008 | | | 1,300 | | | 15 | | | 13 |
| | | | | | | | | | | | | | | | | | | |
| | | | | | | | | | | | | | | $ | 159 | | $ | 79 |
| | | | | | | | | | | | | | | | | | | |
Options on Securities
| | | | | | | | | | | | | | |
| Description | | Strike
Price | | Expiration
Date | | Notional
Amount | | Premium | | Value |
Call - OTC Fannie Mae 6.000% due 09/01/2037 | | $ | 99.188 | | 08/23/2007 | | $ | 4,000 | | $ | 12 | | $ | 14 |
| | | | | | | | | | | | | | |
(i) Short sales outstanding on June 30, 2007:
| | | | | | | | | | | | | |
| Description | | Coupon | | Maturity
Date | | Principal
Amount | | Proceeds | | Value (1) |
Fannie Mae | | 6.000% | | 07/01/2037 | | $ | 747 | | $ | 743 | | $ | 739 |
U.S. Treasury Bonds | | 4.750% | | 02/15/2037 | | | 4,300 | | | 3,975 | | | 4,138 |
| | | | | | | | | | | | | |
| | | | | | | | | $ | 4,718 | | $ | 4,877 |
| | | | | | | | | | | | | |
(1) Market value includes $82 of interest payable on short sales.
| | | | | | |
| See Accompanying Notes | | Semiannual Report | | June 30, 2007 | | 11 |
Notes to Financial Statements
1. ORGANIZATION
The Long-Term U.S. Government Portfolio (the “Portfolio”) is a series of the PIMCO Variable Insurance Trust (the “Trust”). The Trust is registered under the Investment Company Act of 1940 (the “Act”), as amended, as an open-end management investment company organized as a Delaware business trust on October 3, 1997. The Portfolio offers two classes of shares: Institutional and Administrative. Information presented on these financial statements pertains to the Institutional Class of the Portfolio. Certain detailed financial information for the Administrative Class is provided separately and is available upon request. The Trust is designed to be used as an investment vehicle by Separate Accounts of insurance companies that fund variable annuity contracts and variable life insurance policies and by qualified pension and retirement plans.
2. SIGNIFICANT ACCOUNTING POLICIES
The following is a summary of significant accounting policies consistently followed by the Portfolio in the preparation of its financial statements in conformity with accounting principles generally accepted in the United States of America (“GAAP”). The preparation of financial statements in accordance with GAAP requires management to make estimates and assumptions that affect the reported amounts and disclosures on the financial statements. Actual results could differ from those estimates.
(a) Security Valuation Portfolio securities are valued as of the close of regular trading (normally 4:00 p.m., Eastern Time) on each day that the New York Stock Exchange (“NYSE”) is open. Portfolio securities and other assets for which market quotes are readily available are stated at market value. Market value is generally determined on the basis of last reported sales prices, or if no sales are reported, based on quotes obtained from a quotation reporting system, established market makers, or pricing services. Fixed-income securities and non-exchange traded derivatives are normally valued on the basis of quotes obtained from brokers and dealers or pricing services. Prices obtained from independent pricing services use information provided by market makers or estimates of market values obtained from yield data relating to investments or securities with similar characteristics. Certain fixed income securities purchased on a delayed-delivery basis are marked to market daily until settlement at the forward settlement date. Short-term investments having a maturity of 60 days or less are generally valued at amortized cost. Exchange traded options, futures and options on futures are valued at the settlement price determined by the relevant exchange. With respect to any portion of the Portfolio’s assets that are invested in one or more open end management investment companies, the Portfolio’s net asset value (“NAV”) will be calculated based upon the NAVs of such investments.
Investments initially valued in currencies other than the U.S. dollar are converted to the U.S. dollar using exchange rates obtained from pricing services. As a result, the NAV of the Portfolio’s securities may be affected by changes in the value of currencies in relation to the U.S. dollar. The value of securities traded in markets outside the United States or denominated in currencies other than the U.S. dollar may be affected significantly on a day that the NYSE is closed and an investor is not able to purchase, redeem or exchange shares.
Securities and other assets for which market quotes are not readily available are valued at fair value as determined in good faith by the Board of Trustees or persons acting at their direction. The Board of Trustees has adopted methods for valuing securities and other assets in circumstances where market quotes are not readily available, and has delegated to Pacific Investment Management Company LLC (“PIMCO”) the responsibility for applying the valuation methods. In the event that market quotes are not readily available, and the security or asset cannot be valued pursuant to one of the valuation methods, the value of the security or asset will be determined in good faith by the Valuation Committee of the Board of Trustees, generally based upon recommendations provided by PIMCO.
Market quotes are considered not readily available in circumstances where there is an absence of current or reliable market-based data (e.g., trade information, bid/asked information, broker quotes), including where events occur after the close of the relevant market, but prior to the close of regular trading, that materially affect the values of the Portfolio’s securities or assets. In addition, market quotes are considered not readily available when, due to extraordinary circumstances, the exchanges or markets on which the securities trade, do not open for trading for the entire day and no other market prices are available. The Board has delegated to PIMCO the responsibility for monitoring significant events that may materially affect the values of the Portfolio’s securities or assets and for determining whether the value of the applicable securities or assets should be re-evaluated in light of such significant events.
When the Portfolio uses fair value pricing to determine its NAV, securities will not be priced on the basis of quotations from the primary market in which they are traded, but rather may be priced by another method that the Board of Trustees or persons acting at their direction believe accurately reflects fair value. The Trust’s policy is intended to result in a calculation of the Portfolio’s NAV that fairly reflects security values as of the time of pricing. However, fair values determined by the Board of Trustees or persons acting at their direction may not accurately reflect the price that the Portfolio could obtain for a security if it were to dispose of that security as of the time of pricing. Because foreign securities can trade on non-business days of the Portfolio, the NAV of the Portfolio may change on days when shareholders will not be able to purchase or redeem Portfolio shares. The prices used by the Portfolio may differ from the value that would be realized if the securities were sold and the differences could be material to the financial statements.
(b) Securities Transactions and Investment Income Securities transactions are recorded as of the trade date for financial reporting purposes. Securities purchased or sold on a when-issued or delayed-delivery basis may be settled a month or more after the trade date. Realized gains and losses from securities sold are recorded on the identified cost basis. Dividend income is recorded on the ex-dividend date, except certain dividends from foreign securities where the ex-dividend date may have passed, which are recorded as soon as the Portfolio is informed of the ex-dividend date. Interest income, adjusted for the accretion of discounts and amortization of premiums, is recorded on the accrual basis. Paydown gains and losses on mortgage-related and other asset-backed securities are recorded as components of interest income on the Statement of Operations.
(c) Delayed-Delivery Transactions The Portfolio may purchase or sell securities on a delayed-delivery basis. These transactions involve a commitment by the Portfolio to purchase or sell securities for a predetermined price or yield, with payment and delivery taking place beyond the customary settlement period. When delayed-delivery purchases are outstanding, the Portfolio will designate liquid assets in an amount sufficient to meet the purchase price. When purchasing a security on a delayed-delivery basis, the Portfolio assumes the rights and risks of ownership of the security, including the risk of price and yield fluctuations, and takes such fluctuations into account when determining its net asset value. The Portfolio may dispose of or renegotiate a delayed-delivery transaction after it is entered into, and may sell when-issued securities before they are delivered, which may result in a capital gain or loss. When the Portfolio has sold a security on a delayed-delivery basis, the Portfolio does not participate in future gains and losses with respect to the security.
(d) Dividends and Distributions to Shareholders Dividends from net investment income, if any, are declared daily and distributed to shareholders monthly. Net realized capital gains earned by the Portfolio, if any, will be distributed no less frequently than once each year.
| | | | |
| 12 | | PIMCO Variable Insurance Trust | | |
| | |
| |
| | | June 30, 2007 (Unaudited) |
Income dividends and capital gain distributions are determined in accordance with income tax regulations which may differ from GAAP. Differences between tax regulations and GAAP may change the fiscal year when income and capital items are recognized for tax and GAAP purposes. Examples of events that give rise to timing differences include wash sales, straddles, net operating losses and capital loss carryforwards. Further, the character of investment income and capital gains may be different for certain transactions under the two methods of accounting. Examples of characterization differences include the treatment of mortgage paydowns, swaps, foreign currency transactions and contingent debt instruments. As a result, income dividends and capital gain distributions declared during a fiscal period may differ significantly from the net investment income and realized capital gain reported on the Portfolio’s annual financial statements presented under GAAP.
Distributions classified as a tax basis return of capital, if any, are reflected on the accompanying Statements of Changes in Net Assets and have been reclassified to paid in capital. In addition, other amounts have been reclassified between undistributed net investment income, accumulated undistributed net realized gains or losses and/or paid in capital to more appropriately conform financial accounting to tax characterizations of dividend distributions.
(e) Multiclass Operations Each class offered by the Portfolio has equal rights as to assets and voting privileges (except that shareholders of a class have exclusive voting rights regarding any matter relating solely to that class of shares). Income and non-class specific expenses of the Portfolio are allocated daily to each class of shares based on the relative value of settled shares. Realized and unrealized capital gains and losses of the Portfolio are allocated daily to each class of shares based on the relative net assets of each class. Class specific expenses, where applicable, currently include administrative, distribution and servicing fees.
(f) Futures Contracts The Portfolio may enter into futures contracts. The Portfolio may use futures contracts to manage its exposure to the securities markets or to movements in interest rates and currency values. The primary risks associated with the use of futures contracts are the imperfect correlation between the change in market value of the securities held by the Portfolio and the prices of futures contracts, the possibility of an illiquid market, and the inability of the counterparty to meet the terms of the contract. Futures contracts are valued based upon their quoted daily settlement prices. Upon entering into a futures contract, the Portfolio is required to deposit with its futures broker, an amount of cash or U.S. Government and Agency Obligations in accordance with the initial margin requirements of the broker or exchange. Futures contracts are marked to market daily and an appropriate payable or receivable for the change in value (“variation margin”) is recorded by the Portfolio. Gains or losses are recognized but not considered realized until the contracts expire or are closed. Futures contracts involve, to varying degrees, risk of loss in excess of the variation margin disclosed on the Statement of Assets and Liabilities.
(g) Inflation-Indexed Bonds The Portfolio may invest in inflation-indexed bonds. Inflation-indexed bonds are fixed-income securities whose principal value is periodically adjusted to the rate of inflation. The interest rate on these bonds is generally fixed at issuance at a rate lower than typical bonds. Over the life of an inflation-indexed bond, however, interest will be paid based on a principal value, which is adjusted for inflation. Any increase in the principal amount of an inflation-indexed bond will be included as interest income on the Statement of Operations, even though investors do not receive their principal until maturity.
(h) Options Contracts The Portfolio may write call and put options on futures, swaps, securities or currencies it owns or in which it may invest. Writing put options tends to increase the Portfolio’s exposure to the underlying instrument. Writing call options tends to decrease the Portfolio’s exposure to the underlying
instrument. When the Portfolio writes a call or put option, an amount equal to the premium received is recorded as a liability and subsequently marked to market to reflect the current value of the option written. These liabilities are reflected as written options outstanding on the Statement of Assets and Liabilities. Certain options may be written with premiums to be determined on a future date. The premiums for these options are based upon implied volatility parameters at specified terms. Premiums received from writing options which expire are treated as realized gains. Premiums received from writing options which are exercised or closed are added to the proceeds or offset against amounts paid on the underlying future, swap, security or currency transaction to determine the realized gain or loss. The Portfolio as a writer of an option has no control over whether the underlying future, swap, security or currency may be sold (call) or purchased (put) and as a result bears the market risk of an unfavorable change in the price of the future, swap, security or currency underlying the written option. There is the risk the Portfolio may not be able to enter into a closing transaction because of an illiquid market.
The Portfolio may also purchase put and call options. Purchasing call options tends to increase the Portfolio’s exposure to the underlying instrument. Purchasing put options tends to decrease the Portfolio’s exposure to the underlying instrument. The Portfolio pays a premium which is included on the Statement of Assets and Liabilities as an investment and subsequently marked to market to reflect the current value of the option. Premiums paid for purchasing options which expire are treated as realized losses. Certain options may be purchased with premiums to be determined on a future date. The premiums for these options are based upon implied volatility parameters at specified terms. The risk associated with purchasing put and call options is limited to the premium paid. Premiums paid for purchasing options which are exercised or closed are added to the amounts paid or offset against the proceeds on the underlying future, swap, security or currency transaction to determine the realized gain or loss.
(i) Repurchase Agreements The Portfolio may engage in repurchase transactions. Under the terms of a typical repurchase agreement, the Portfolio takes possession of an underlying debt obligation (collateral) subject to an obligation of the seller to repurchase, and the Portfolio to resell, the obligation at an agreed-upon price and time. The underlying securities for all repurchase agreements are held in safekeeping at the Portfolio’s custodian or designated subcustodians under tri-party repurchase agreements. The market value of the collateral must be equal to or exceed the total amount of the repurchase obligations, including interest. Securities purchased under repurchase agreements are reflected as an asset on the Statement of Assets and Liabilities. Generally, in the event of counterparty default, the Portfolio has the right to use the collateral to offset losses incurred. If the counterparty should default, the Portfolio will seek to sell the securities which it holds as collateral. This could involve procedural costs or delays in addition to a loss on the securities if their value should fall below their repurchase price.
(j) Inverse Floating Rate Transactions—Residual Interest Municipal Bonds (“RIBs”)/Residual Interest Tax Exempt Bonds (“RITEs”) The Portfolio may invest in RIBs and RITEs (“Inverse Floaters”). Inverse Floaters are created via a master trust agreement between a broker-dealer, acting as trustor and liquidity provider, and an investment bank, acting as trustee and tender agent. The master trust agreement defines the terms for each trust series; with each series being established by the transfer of long-term, fixed-rate municipal bonds (“Fixed Rate Bonds”) to the trustee to be held and provide for the creation, execution and delivery of floater certificates (“Floating Rate Notes”) and Inverse Floaters. Floating Rate Notes are liquid notes that are issued with a short-term variable rate typically linked to the LIBOR, subject to limitations, for some duration. After interest income is paid on the Floating Rate Notes at current rates, the residual income from the Fixed Rate Bonds is paid to the Inverse Floaters. Inverse Floaters are issued with a coupon that fluctuates inversely with the
| | | | | | |
| | Semiannual Report | | June 30, 2007 | | 13 |
Notes to Financial Statements (Cont.)
Floating Rate Notes’ referenced rate, subject to certain limitations. Therefore, rising short-term rates result in lower income for the Inverse Floaters and vice versa.
Floating Rate Notes are generally remarketed to municipal money market funds. Inverse Floaters are acquired by either tax-exempt municipal bond funds or trusts, or other parties interested in potentially higher yielding tax-exempt securities. Inverse Floaters may also be acquired for the purpose of increasing leverage. Floating Rate Note holders typically have the option to tender their notes to the liquidity provider for redemption at par at each reset date. The Inverse Floater holders have the option to (i) require the Floating Rate Note holders to tender their notes at par, and (ii) require the liquidity provider to transfer the Fixed Rate Bonds to the Inverse Floater holders. The holders of Inverse Floaters bear substantially all of the downside investment risk associated with the underlying Fixed Rate Bonds, and also benefit from a disproportionate amount of the potential appreciation of the underlying Fixed Rate Bonds’ value. Inverse Floaters may be more volatile and less liquid than other municipal bonds of comparable maturity.
Inverse Floaters may be acquired with or without first transferring to the trustor the Fixed Rate Bonds that were utilized to create the trust series. Inverse Floaters acquired without a transfer of Fixed Rate Bonds are recognized as purchases of securities as outlined in Note 2(b). Statement of Financial Accounting Standards No. 140—Accounting for Transfers and Servicing of Financial Assets and Extinguishments of Liabilities (“FAS No. 140”), governs the standards for accounting for securitizations and other transfers of financial assets. If there is a transfer of Fixed Rate Bonds and it meets sale criteria under FAS No. 140, a Portfolio records a sale of the Fixed Rate Bonds and a purchase of the Inverse Floaters. The cash received from the Inverse Floaters is then recorded as interest income in the Statement of Operations.
If the transfer of Fixed Rate Bonds does not meet sale criteria under FAS No. 140, a Portfolio accounts for the transaction described above as a secured borrowing by including the Fixed Rate Bonds in its Schedule of Investments, and recording the Floating Rate Notes as a liability under the caption “Payable for floating rate notes” in the Portfolio’s Statement of Assets and Liabilities. In a secured borrowing transaction, cash received from the Inverse Floaters is not recorded as interest income. Instead, a Portfolio records interest income related to the Fixed Rate Bonds and interest expense related to the Floating Rate Notes, the net of which is equal to the cash received from the Inverse Floaters acquired by the Portfolio. Thus, while a Portfolio’s reported total income, net expenses, and net expense ratio are generally higher for investments in Inverse Floaters acquired via a secured borrowing, the method of acquiring Inverse Floaters does not result in differences for reported cash flows, net asset value or total return.
(k) Short Sales The Portfolio may enter into short sales transactions. A short sale is a transaction in which the Portfolio sells securities it does not own in anticipation of a decline in the market price of the securities. Securities sold in short sale transactions and interest payable on such securities, if any, are reflected as a liability on the Statement of Assets and Liabilities. The Portfolio is obligated to deliver securities at the market price at the time the short position is closed. Possible losses from short sales may be unlimited, whereas losses from purchases cannot exceed the total amount invested.
(l) Swap Agreements The Portfolio may invest in swap agreements. Swap transactions are privately negotiated agreements between the Portfolio and a counterparty to exchange or swap investment cash flows, assets, or market-linked returns at specified, future intervals. The Portfolio may enter into interest rate, total return, forward spread-lock, credit default, and other forms of swap agreements to manage its exposure to interest rates and credit risk. In connection with these agreements, securities may be identified as collateral in accordance with the terms of the respective swap agreements.
Interest rate swap agreements involve the exchange by the Portfolio with another party of their respective commitments to pay or receive interest, e.g., an exchange of floating rate payments for fixed rate payments with respect to the notional amount of principal. Certain forms of interest rate swap agreements may include: (i) interest rate caps, under which, in return for a premium, one party agrees to make payments to the other to the extent that interest rates exceed a specified rate, or “cap”, (ii) interest rate floors, under which, in return for a premium, one party agrees to make payments to the other to the extent that interest rates fall below a specified rate, or “floor”, or (iii) interest rate collars, under which a party sells a cap and purchases a floor or vice versa in an attempt to protect itself against interest rate movements exceeding given minimum or maximum levels.
Total return swap agreements involve commitments to pay interest in exchange for a market-linked return, both based on notional amounts. To the extent the total return of the security or index underlying the transaction exceeds or falls short of the offsetting interest rate obligation, the Portfolio will receive a payment from or make a payment to the counterparty.
Forward spread-lock swap agreements involve commitments to pay or receive a settlement amount calculated as the difference between the swap spread and a fixed spread, multiplied by the notional amount times the duration of the swap. The swap spread is the difference between the benchmark swap rate (market rate) and the specific Treasury rate.
Credit default swap agreements involve one party making a stream of payments to another party in exchange for the right to receive a specified return in the event of a default by a third party, typically corporate issues or sovereign issues of an emerging country, on its obligation. The Portfolio may use credit default swaps to provide a measure of protection against defaults of the issuers (i.e., to reduce risk where the Portfolio owns or has exposure to the sovereign issuer) or to take an active long or short position with respect to the likelihood of a particular issuer’s default. As a seller of protection, the Portfolio generally receives an upfront payment or a fixed rate of income throughout the term of the swap provided that there is no credit event. If the Portfolio is a seller of protection and a credit event occurs, as defined under the terms of that particular swap agreement, the Portfolio will pay to the buyer of the protection an amount up to the notional value of the swap and in certain instances take delivery of the security. As the seller, the Portfolio would effectively add leverage to its portfolio because, in addition to its total net assets, the Portfolio would be subject to investment exposure on the notional amount of the swap. As a buyer of protection, the Portfolio generally receives an amount up to the notional value of the swap if a credit event occurs. The treatment of credit default swaps and other swap agreements that provide for contingent, non-periodic, bullet-type payments as “notional principal contracts” for U.S. federal income tax purposes is uncertain. Were the U.S. Internal Revenue Service (“IRS”) to take the position that a credit default swap or other bullet-type swap is not a “notional principal contract” for U.S. federal income tax purposes, payments received by the Portfolio from such investments might be subject to U.S. excise or income taxes.
Swaps are marked to market daily based upon quotations from market makers and the change in value, if any, is recorded as unrealized gain or loss on the Statement of Operations. Payments received or made at the beginning of the measurement period are reflected as such on the Statement of Assets and Liabilities. These upfront payments are recorded as realized gain or loss on the Statement of Operations upon termination or maturity of the swap. A liquidation payment received or made at the termination of the swap is recorded as realized gain or loss on the Statement of Operations. Net periodic payments received or paid by the Portfolio are included as part of realized gain or loss on the Statement of Operations. Entering into these agreements involves, to varying degrees, elements of credit, market and documentation risk in excess of the amounts recognized on the Statement of Assets and Liabilities. Such risks involve the possibility that
| | | | |
| 14 | | PIMCO Variable Insurance Trust | | |
| | |
| |
| | | June 30, 2007 (Unaudited) |
there will be no liquid market for these agreements, that the counterparty to the agreements may default on its obligation to perform or disagree as to the meaning of contractual terms in the agreements and that there may be unfavorable changes in interest rates.
(m) Mortgage-Related and Other Asset-Backed Securities The Portfolio may invest in mortgage-related or other asset-backed securities. These securities include mortgage pass-through securities, collateralized mortgage obligations (“CMOs”), commercial mortgage-backed securities, mortgage dollar rolls, CMO residuals, stripped mortgage-backed securities (“SMBSs”) and other securities that directly or indirectly represent a participation in, or are secured by and payable from, mortgage loans on real property. The value of some mortgage-related or asset-backed securities may be particularly sensitive to changes in prevailing interest rates. Early repayment of principal on some mortgage-related securities may expose the Portfolio to a lower rate of return upon reinvestment of principal. The value of these securities may fluctuate in response to the market’s perception of the creditworthiness of the issuers. Additionally, although mortgages and mortgage-related securities are generally supported by some form of government or private guarantee and/or insurance, there is no assurance that private guarantors or insurers will meet their obligations.
(n) U.S. Government Agencies or Government-Sponsored Enterprises Securities issued by U.S. Government agencies or government-sponsored enterprises may not be guaranteed by the U.S. Treasury. The Government National Mortgage Association (“GNMA” or “Ginnie Mae”), a wholly owned U.S. Government corporation, is authorized to guarantee, with the full faith and credit of the U.S. Government, the timely payment of principal and interest on securities issued by institutions approved by GNMA and backed by pools of mortgages insured by the Federal Housing Administration or guaranteed by the Department of Veterans Affairs. Government-related guarantors (i.e., not backed by the full faith and credit of the U.S. Government) include the Federal National Mortgage Association (“FNMA” or “Fannie Mae”) and the Federal Home Loan Mortgage Corporation (“FHLMC” or “Freddie Mac”). Pass-through securities issued by FNMA are guaranteed as to timely payment of principal and interest by FNMA but are not backed by the full faith and credit of the U.S. Government. FHLMC guarantees the timely payment of interest and ultimate collection of principal, but its participation certificates are not backed by the full faith and credit of the U.S. Government.
(o) New Accounting Policies In July 2006, the Financial Accounting Standards Board (“FASB”) issued Interpretation No. 48, “Accounting for Uncertainty in Income Taxes—an Interpretation of FASB Statement No. 109” (the “Interpretation”). The Interpretation became effective for the Portfolio on June 29, 2007. Management has evaluated the application of the Interpretation in relation to the Portfolio and has concluded that no single filing position or combination of filing positions identified as uncertain tax positions required the accrual of a tax liability in the accounting records of the Portfolio for the period ending June 30, 2007. Management will monitor all existing filing positions and future filing positions in light of the Interpretation and evaluate the need for any future tax accruals and financial statement disclosures as warranted.
In September 2006, the FASB issued Statement of Financial Accounting Standards No. 157, “Fair Value Measurements” (the “Statement”). The Statement is effective for fiscal years beginning after November 15, 2007 and will require expanded disclosure about fair value measurements, separately for each major category of assets and liabilities, that enables shareholders to assess the inputs used to develop those measurements, and for recurring fair value measurements using significant unobservable inputs the effect of the measurements on changes in net assets for the reporting period. Management is currently evaluating the application of the Statement to the Portfolio and will provide additional information in relation to the Statement on the Portfolio’s annual financial statements for the period ending December 31, 2007.
3. FEES AND EXPENSES
(a) Investment Advisory Fee PIMCO is a majority-owned subsidiary of Allianz Global Investors of America L.P. (“AGI”), and serves as investment adviser (the “Adviser”) to the Trust, pursuant to an investment advisory contract. The Adviser receives a monthly fee from the Portfolio, at an annual rate based on average daily net assets. The Advisory Fee for all classes is charged at an annual rate of 0.225%.
(b) Administration Fee PIMCO serves as administrator (the “Administrator”), and provides administrative services to the Trust for which it receives a monthly administrative fee based on each share class’s average daily net assets. As the Administrator, PIMCO bears the costs of various third-party services, including audit, custodial, portfolio accounting, legal, transfer agency and printing costs. The Administration Fee for all classes is charged at the annual rate of 0.25%.
(c) Distribution and Servicing Fees Allianz Global Investors Distributors LLC (“AGID”) is an indirect wholly-owned subsidiary of AGI and serves as the distributor (the “Distributor”) of the Trust’s shares. The Trust is permitted to reimburse AGID on a quarterly basis, out of the Administrative Class assets of the Portfolio in the amount of 0.15% on an annual basis of the average daily net assets of that class, for payments made to financial intermediaries that provide services in connection with the distribution of shares or administration of plans or programs that use Portfolio shares as their funding medium. The effective rate paid to AGID was 0.15% during the current fiscal year.
(d) Portfolio Expenses The Trust is responsible for the following expenses: (i) salaries and other compensation of any of the Trust’s executive officers and employees who are not officers, directors, stockholders or employees of PIMCO or its subsidiaries or affiliates; (ii) taxes and governmental fees; (iii) brokerage fees and commissions and other portfolio transaction expenses; (iv) the costs of borrowing money, including interest expenses and bank overdraft charges; (v) fees and expenses of the Trustees who are not “interested persons” of PIMCO or the Trust, and any counsel retained exclusively for their benefit; (vi) extraordinary expenses, including costs of litigation and indemnification expenses; (vii) organization expenses and (viii) any expenses allocated or allocable to a specific class of shares, which include service fees payable with respect to the Administrative Class Shares, and may include certain other expenses as permitted by the Trust’s Multiple Class Plan adopted pursuant to Rule 18f-3 under the Act and subject to review and approval by the Trustees. The ratio of expenses to average net assets per share class, as disclosed in the Financial Highlights, may differ from the annual portfolio operating expenses per share class as disclosed in the Prospectus for the reasons set forth above.
Effective April 1, 2007, each Trustee, other than those affiliated with PIMCO or its affiliates, receives an annual retainer of $15,000, plus $2,375 for each Board of Trustees meeting attended in person, $500 for each committee meeting attended and $750 for each Board of Trustees meeting attended telephonically, plus reimbursement of related expenses. In addition, the audit committee chair receives an additional annual retainer of $2,000 and each other committee chair receives an additional annual retainer of $500. These expenses are allocated on a pro-rata basis to the various portfolios of the Trust according to their respective net assets. The Trust pays no compensation directly to any Trustee or any other officer who is affiliated with the Administrator, all of whom receive remuneration for their services to the Trust from the Administrator or its affiliates. Prior to April 1, 2007, each Trustee, other than those affiliated with PIMCO or its affiliates, received an annual retainer of $15,000 plus $2,000 for each Board of Trustees meeting attended ($500 for each special meeting attended), plus reimbursement of related expenses. The Audit Committee Chairman received an annual retainer of $1,500 and the Governance Committee Chairman received an annual retainer of $500. In addition, each member of a committee received $500 for each committee meeting attended.
| | | | | | |
| | Semiannual Report | | June 30, 2007 | | 15 |
Notes to Financial Statements (Cont.)
4. RELATED PARTY TRANSACTIONS
The Adviser, Administrator, and Distributor are related parties as defined by FAS 57, Related Party Disclosures. Fees payable to these parties are disclosed in Note 3.
5. GUARANTEES AND INDEMNIFICATIONS
Under the Trust’s organizational documents, each Trustee, officer, employee or other agent of the Trust (including the Trust’s investment manager) is indemnified, to the extent permitted by the Act, against certain liabilities that may arise out of performance of their duties to the Portfolio. Additionally, in the normal course of business, the Portfolio enters into contracts that contain a variety of indemnification clauses. The Portfolio’s maximum exposure under these arrangements is unknown as this would involve future claims that may be made against the Portfolio that have not yet occurred. However, the Portfolio has not had prior claims or losses pursuant to these contracts and believes the risk of loss to be remote.
6. PURCHASES AND SALES OF SECURITIES
The length of time the Portfolio has held a particular security is not generally a consideration in investment decisions. A change in the securities held by the Portfolio is known as “portfolio turnover”. The Portfolio may engage in frequent and active trading of portfolio securities to achieve its investment objective, particularly during periods of volatile market movements. High portfolio turnover (e.g., over 100%) involves correspondingly greater expenses to the Portfolio, including brokerage commissions or dealer mark-ups and other transaction costs on the sale of securities and reinvestments in other securities. Such sales may also result in realization of taxable capital gains, including short-term capital gains (which are generally taxed at ordinary income tax rates). The trading costs and tax effects associated with portfolio turnover may adversely affect the Portfolio’s performance.
Purchases and sales of securities (excluding short-term investments) for the period ended June 30, 2007, were as follows (amounts in thousands):
| | | | | | | | | | | | |
| U.S. Government/Agency | | | | All Other |
| Purchases | | Sales | | | | Purchases | | Sales |
| $ | 64,589 | | $ | 89,775 | | | | $ | 6,044 | | $ | 788 |
7. TRANSACTIONS IN WRITTEN CALL AND PUT OPTIONS
Transactions in written call and put options were as follows (amounts in thousands, except for number of contracts):
| | | | | | | | | | | | | |
| | | | | # of
Contracts | | | Notional
Amount
in $ | | | Premium | |
Balance at 12/31/2006 | | | | 129 | | | $ | 8,800 | | | $ | 223 | |
Sales | | | | 194 | | | | 6,700 | | | | 86 | |
Closing Buys | | | | 0 | | | | (3,000 | ) | | | (35 | ) |
Expirations | | | | (259 | ) | | | 0 | | | | (67 | ) |
Exercised | | | | (21 | ) | | | 0 | | | | (8 | ) |
Balance at 06/30/2007 | | | | 43 | | | $ | 12,500 | | | $ | 199 | |
8. SHARES OF BENEFICIAL INTEREST
The Portfolio may issue an unlimited number of shares of beneficial interest with a $0.001 par value. Changes in shares of beneficial interest were as follows (shares and amounts in thousands):
| | | | | | | | | | | | | | | | |
| | | | | Six Months Ended
06/30/2007 | | | Year Ended
12/31/2006 | |
| | | | | Shares | | | Amount | | | Shares | | | Amount | |
| | | | | |
Receipts for shares sold | | | | | | | | | | | | | | | | |
Institutional Class | | | | 29 | | | $ | 304 | | | 47 | | | $ | 495 | |
Administrative Class | | | | 1,793 | | | | 18,728 | | | 2,211 | | | | 23,572 | |
Issued as reinvestment of distributions | | | | | | | | | | | | | | | | |
Institutional Class | | | | 2 | | | | 13 | | | 3 | | | | 30 | |
Administrative Class | | | | 224 | | | | 2,309 | | | 560 | | | | 5,909 | |
Cost of shares redeemed | | | | | | | | | | | | | | | | |
Institutional Class | | | | (8 | ) | | | (82 | ) | | (44 | ) | | | (467 | ) |
Administrative Class | | | | (1,092 | ) | | | (11,478 | ) | | (1,234 | ) | | | (13,023 | ) |
Net increase resulting from Portfolio share transactions | | | | 948 | | | $ | 9,794 | | | 1,543 | | | $ | 16,516 | |
The following schedule shows the number of shareholders each owning 5% or more of the Portfolio and the total percentage of the Portfolio held by such shareholders:
| | | | | | |
| | | | | Number of
Shareholders | | % of Portfolio Held |
Institutional Class | | | | 1 | | 99 |
Administrative Class | | | | 4 | | 95 |
9. REGULATORY AND LITIGATION MATTERS
Since February 2004, PIMCO, Allianz Global Investors of America L.P. (PIMCO’s parent company), AGID, and certain of their affiliates, including the PIMCO Funds (another series of funds managed by PIMCO), the Allianz Funds (formerly known as PIMCO Funds: Multi-Manager Series (another series of funds managed by affiliates of PIMCO)), certain Trustees of the Trust (in their capacity as Trustees of the PIMCO Funds or the Allianz Funds) and certain employees of PIMCO, have been named as defendants in fifteen lawsuits filed in various jurisdictions. Eleven of those lawsuits concern “market timing,” and they have been transferred to and consolidated for pre-trial proceedings in a multi-district litigation proceeding in the U.S. District Court for the District of Maryland; the other four lawsuits concern “revenue sharing” and have been consolidated into a single action in the U.S. District Court for the District of Connecticut. The lawsuits have been commenced as putative class actions on behalf of investors who purchased, held or redeemed shares of the various series of the PIMCO Funds and the Allianz Funds during specified periods, or as derivative actions on behalf of the PIMCO Funds and the Allianz Funds.
The market timing actions in the District of Maryland generally allege that certain hedge funds were allowed to engage in “market timing” in certain funds of the PIMCO Funds and the Allianz Funds and this alleged activity was not disclosed. Pursuant to tolling agreements entered into with the derivative and class action plaintiffs, PIMCO, certain PIMCO Funds Trustees, and certain employees of PIMCO who were previously named as defendants have all been dropped as defendants in the market timing actions; the plaintiffs continue to assert claims on behalf of the shareholders of the PIMCO Funds or on behalf of the PIMCO Funds itself against other defendants. By order dated November 3, 2005, the U.S. District Court for the District of Maryland granted the PIMCO Funds’ motion to dismiss claims asserted against it in a consolidated amended complaint where the PIMCO Funds were named, in the complaint, as a nominal defendant. The revenue sharing action in the District of Connecticut generally alleges that fund assets were inappropriately
| | | | |
| 16 | | PIMCO Variable Insurance Trust | | |
| | |
| |
| | | June 30, 2007 (Unaudited) |
used to pay brokers to promote funds of the PIMCO Funds and the Allianz Funds, including directing fund brokerage transactions to such brokers, and that such alleged arrangements were not fully disclosed to shareholders. On August 11, 2005, the U.S. District Court for the District of Connecticut conducted a hearing on defendants’ motion to dismiss the consolidated amended complaint in the revenue sharing action but has not yet ruled on the motion to dismiss. The market timing and revenue sharing lawsuits seek, among other things, unspecified compensatory damages plus interest and, in some cases, punitive damages, the rescission of investment advisory contracts, the return of fees paid under those contracts and restitution.
Two nearly identical class action civil complaints have been filed in August 2005, in the Northern District of Illinois Eastern Division, alleging that the plaintiffs each purchased and sold a 10-year Treasury note futures contract and suffered damages from an alleged shortage when PIMCO held both physical and futures positions in 10-year Treasury notes for its client accounts. The two actions have been consolidated into one action, and the two separate complaints have been replaced by a consolidated complaint. PIMCO is a named defendant, and PIMCO Funds has been added as a defendant, to the consolidated action. PIMCO strongly believes the complaint is without merit and intends to vigorously defend itself.
In April 2006, certain portfolios of the Trust and certain other funds managed by PIMCO were served in an adversary proceeding brought by the Official Committee of Asbestos Claimants of G-I Holdings, Inc. in G-I Holdings, Inc.’s bankruptcy in the District of New Jersey. In July 2004, PIMCO was named in this lawsuit and remains a defendant. The plaintiff seeks to recover for the bankruptcy estate assets that were transferred by the predecessor entity of G-I Holdings, Inc. to a wholly-owned subsidiary in 1994. The subsidiary has since issued notes, of which certain portfolios of the Trust and certain other funds managed by PIMCO are alleged to be holders. The complaint alleges that in 2000, more than two hundred noteholders—including certain portfolios of the Trust and certain other funds managed by PIMCO—were granted a second priority lien on the assets of the subsidiary in exchange for their consent to a refinancing transaction and the granting of a first priority lien to the lending banks. The plaintiff is seeking
invalidation of the lien in favor of the noteholders and/or the value of the lien. On June 21, 2006, the District of New Jersey overturned the Bankruptcy Court’s decision granting permission to file the adversary proceeding and remanded the matter to the Bankruptcy Court for further proceedings. Following a motion to reconsider, the District Court upheld its remand on August 7, 2006, and instructed the Bankruptcy Court to conduct a “cost-benefit” analysis of the Committee’s claims, including the claims against the noteholders. The Bankruptcy Court held a status conference on October 25, 2006 and set a briefing schedule relating to this cost-benefit analysis.
The foregoing speaks only as of the date of this report. It is possible that these matters and/or other developments resulting from these matters could result in increased portfolio redemptions or other adverse consequences to the Portfolio. However, PIMCO and AGID believe that these matters are not likely to have a material adverse effect on the Portfolio or on PIMCO’s or AGID’s ability to perform their respective investment advisory or distribution services relating to the Portfolio.
10. FEDERAL INCOME TAX MATTERS
The Portfolio intends to qualify as a regulated investment company under sub-chapter M of the Internal Revenue Code (the “Code”) and distribute all of its taxable income and net realized gains, if applicable, to shareholders. Accordingly, no provision for Federal income taxes has been made.
As of June 30, 2007, the aggregate cost of investments was the same for federal income tax and financial statement purposes. The net unrealized appreciation (depreciation) of investment securities for federal income tax purposes is as follows (amount in thousands):
| | | | |
Aggregate
Gross
Unrealized
Appreciation | | Aggregate
Gross
Unrealized
(Depreciation) | | Net
Unrealized
(Depreciation) |
$ 203 | | $ (1,318) | | $ (1,115) |
| | | | | | |
| | Semiannual Report | | June 30, 2007 | | 17 |
| | |
| |
Privacy Policy* | | (Unaudited) |
The Funds consider customer privacy to be a fundamental aspect of their relationships with shareholders and are committed to maintaining the confidentiality, integrity and security of their current, prospective and former shareholders’ personal information. To ensure their shareholders’ privacy, the Funds have developed policies that are designed to protect this confidentiality, while allowing shareholder needs to be served.
Obtaining Personal Information
In the course of providing shareholders with products and services, the Funds and certain service providers to the Funds, such as the Funds’ investment advisers (“Advisers”), may obtain non-public personal information about shareholders, which may come from sources such as account applications and other forms, from other written, electronic or verbal correspondence, from shareholder transactions, from a shareholder’s brokerage or financial advisory firm, financial adviser or consultant, and/or from information captured on the Funds’ internet web sites.
Respecting Your Privacy
As a matter of policy, the Funds do not disclose any personal or account information provided by shareholders or gathered by the Funds to non-affiliated third parties, except as required or permitted by law or as necessary for such third parties to perform their agreements with respect to the Funds. As is common in the industry, non-affiliated companies may from time to time be used to provide certain services, such as preparing and mailing prospectuses, reports, account statements and other information, conducting research on shareholder satisfaction and gathering shareholder proxies. A Fund’s Distributor may also retain non-affiliated companies to market the Fund’s shares or products which use the Fund’s shares and enter into joint marketing agreements with other companies. These companies may have access to a shareholder’s personal and account information, but are permitted to use this information solely to provide the specific service or as otherwise permitted by law. In most cases, the shareholders will be clients of a third party, but the Funds may also provide a shareholder’s personal and account information to the shareholder’s respective brokerage or financial advisory firm.
Sharing Information with Third Parties
The Funds reserve the right to disclose or report personal information to non-affiliated third parties, in limited circumstances, where the Funds believe in good faith that disclosure is required under law to cooperate with regulators or law enforcement authorities, to protect their rights or property or upon reasonable request by any Fund in which a shareholder has chosen to invest. In addition, the Funds may disclose information about a shareholder’s accounts to a non-affiliated third party with the consent of the shareholder.
Sharing Information with Affiliates
The Funds may share shareholder information with their affiliates in connection with servicing their shareholders’ accounts or to provide shareholders with information about products and services that the Funds or their Advisers, principal underwriters or their affiliates (“Service Affiliates”) believe may be of interest to such shareholders. The information that the Funds share may include, for example, a shareholder’s participation in one of the Funds or in other investment programs sponsored by a Service Affiliate, a shareholder’s ownership of certain types of accounts (such as IRAs), or other data about a shareholder’s accounts. The Funds’ Service Affiliates, in turn, are not permitted to share shareholder information with non-affiliated entities, except as required or permitted by law.
Procedures to Safeguard Private Information
The Funds take seriously the obligation to safeguard shareholder non-public personal information. In addition to this policy, the Funds have also implemented procedures that are designed to restrict access to a shareholder’s non-public personal information only to internal personnel who need to know that information in order to provide products or services to such shareholders. In order to guard a shareholder’s non-public personal information, physical, electronic and procedural safeguards are in place.
* This Privacy Policy applies to the following entities: PIMCO Funds, PIMCO Variable Insurance Trust, PCM Fund, Inc. and PIMCO Strategic Global Government Fund, Inc. (collectively, the “Funds”).
| | | | |
| 18 | | PIMCO Variable Insurance Trust | | |
Investment Adviser and Administrator
Pacific Investment Management Company LLC
840 Newport Center Drive
Newport Beach, California 92660
Distributor
Allianz Global Investors Distributors LLC
1345 Avenue of the Americas
New York, New York 10105
Custodian
State Street Bank & Trust Company
801 Pennsylvania
Kansas City, Missouri 64105
Transfer Agent
Boston Financial Data Services–Midwest
330 W. 9th Street
Kansas City, Missouri 64105
Legal Counsel
Dechert LLP
1775 I Street, N.W.
Washington, D.C. 20006
Independent Registered Public Accounting Firm
PricewaterhouseCoopers LLP
1055 Broadway
Kansas City, Missouri 64105
P I M C O

Table of Contents
This material is authorized for use only when preceded or accompanied by the current PIMCO Variable Insurance Trust (the “Trust”) prospectus. Investors should consider the investment objectives, risks, charges and expenses of this Trust carefully before investing. Ask your financial professional to explain all charges that may apply. This and other information is contained in the Trust’s prospectus. The variable product prospectus may be obtained by contacting your Investment Consultant. Please read the Trust and variable product prospectus carefully before you invest or send money.
Chairman’s Letter
Dear PIMCO Variable Insurance Trust Shareholder:
It is our pleasure to present to you the semiannual report for the PIMCO Variable Insurance Trust, covering the six-month period ended June 30, 2007. The PIMCO Variable Insurance Trust’s net assets were $8.68 billion at June 30, 2007, as compared to $7.76 billion at December 31, 2006.
Highlights of the financial markets during the reporting period include:
| | n | | Economic data during the first quarter of 2007 pointed to slower growth, which heightened market expectations for a decrease in the Federal Funds Rate. By the second quarter, economic data, such as employment statistics, provided little indication of economic weakness, causing expectations of a decrease in the Federal Funds Rate to unwind and U.S. interest rates to move higher. Interest rates in Europe and the U.K. also rose over the period as central banks raised their key lending rates due to inflation concerns. The benchmark ten-year U.S. Treasury yielded 5.03% as of June 30, 2007, or 0.32% higher than at the beginning of the year. |
| | n | | Most bonds generally returned much of their gains from earlier in the year as worldwide growth and capital flows drove interest rates higher in the second quarter. Increased risk aversion in global financial markets, due in part to subprime mortgage worries in the U.S., also contributed to the rise in interest rates. The Lehman Brothers Aggregate Bond Index, which includes Treasury, investment-grade corporate and mortgage-backed securities, returned 0.98% for the six-month period. |
| | n | | Locally issued emerging market (“EM”) bonds posted positive returns for the reporting period. Yields on these bonds declined and the local currencies in which they are denominated generally gained, amid increasing investor awareness, strong economic growth and surging capital inflows. External EM bonds (debt instruments issued by emerging markets countries and typically denominated in U.S. dollars) lagged behind local EM bonds (debt instruments issued by emerging markets countries and denominated in the currency of the issuer), as external EM bonds tend to trade more in-line with U.S. Treasuries. |
| | n | | Treasury Inflation-Protected Securities (“TIPS”) outpaced nominal bonds (non-inflation linked bonds) for the first part of the year and all but the longest maturity TIPS outperformed in the second quarter as high gasoline prices drove higher inflation accruals. Commodities, as represented by the Dow Jones-AIG Commodity Total Return Index, returned 4.46% for the period. Equities, as measured by the S&P 500 Index and the Russell 2000 Index, returned 6.96% and 6.45%, respectively, for the period. |
On the following pages, please find specific details as to the Portfolio’s total return investment performance and a discussion of those factors that affected performance.
Thank you for the trust you have placed in us. We will continue to work diligently to serve your investment needs.
Sincerely,
Brent R. Harris
Chairman, PIMCO Variable Insurance Trust
July 31, 2007
| | | | | | |
| | Semiannual Report | | June 30, 2007 | | 1 |
Important Information About the Portfolio
PIMCO Variable Insurance Trust (the “Trust”) is an open-end management investment company currently consisting of twenty separate investment portfolios, including the Low Duration Portfolio (the “Portfolio”). The Portfolio is only available as a funding vehicle under variable life insurance policies or variable annuity contracts issued by insurance companies (“Variable Contracts”). Individuals may not purchase shares of the Portfolio directly. Shares of the Portfolio also may be sold to qualified pension and retirement plans outside of the separate account context.
We believe that bond funds have an important role to play in a well diversified investment portfolio. It is important to note, however, that in an environment where interest rates may trend upward, rising rates would negatively impact the performance of most bond funds, and fixed-income securities held by a fund are likely to decrease in value. The price volatility of fixed-income securities can also increase during periods of rising interest rates resulting in increased losses to a fund. Bond funds and individual bonds with a longer duration (a measure of the expected life of a security) tend to be more sensitive to changes in interest rates, usually making them more volatile than securities or funds with shorter durations.
The Portfolio may be subject to various risks in addition to those described above. Some of these risks may include, but are not limited to, the following: credit risk, high yield risk, market risk, issuer risk, liquidity risk, derivatives risk, mortgage risk, non-U.S. investment risk, emerging markets risk, currency risk, leveraging risk and management risk. A complete description of these risks is contained in the Portfolio’s prospectus. The Portfolio may use derivative instruments for hedging purposes or as part of an investment strategy. Use of these instruments may involve certain costs and risks such as liquidity risk, interest rate risk, market risk, credit risk, management risk and the risk that the Portfolio could not close out a position when it would be most advantageous to do so. Because the Portfolio may invest in derivatives, it could lose more than the principal amount invested in these instruments. Investing in non-U.S. securities may entail risk due to non-U.S. economic and political developments.
On the performance summary page in this Semiannual Report, the Total Return Investment Performance table measures performance assuming that all dividend and capital gain distributions were reinvested.
An investment in the Portfolio is not a deposit of a bank and is not guaranteed or insured by the Federal Deposit Insurance Corporation or any other government agency. It is possible to lose money on investments in the Portfolio.
PIMCO has adopted written proxy voting policies and procedures (“Proxy Policy”) as required by Rule 206(4)-6 under the Investment Advisers Act of 1940, as amended. The Proxy Policy has been adopted by the Trust as the policies and procedures that PIMCO will use when voting proxies on behalf of the Portfolio. A description of the policies and procedures that PIMCO uses to vote proxies relating to portfolio securities of the Portfolio, and information about how the Portfolio voted proxies relating to portfolio securities held during the most recent twelve-month period ended June 30, are available without charge, upon request, by calling the Trust at 1-866-746-2606 and on the Portfolio’s website at www.pimco.com.
The Portfolio files its complete schedule of portfolio holdings with the SEC for the first and third quarters of each fiscal year on Form N-Q. A copy of the Trust’s Form N-Q is also available on the SEC’s website at http://www.sec.gov and may be reviewed and copied at the SEC’s Public Reference Room in Washington D.C. Information on the operation of the Public Reference Room may be obtained by calling 1-800-SEC-0330, and is available without charge, upon request, by calling the Trust at 1-866-746-2606 and on the Portfolio’s website at www.pimco.com.
PIMCO Variable Insurance Trust is distributed by Allianz Global Investors Distributors LLC, 1345 Avenue of the Americas, New York, NY 10105.
| | | | |
| 2 | | PIMCO Variable Insurance Trust | | |
The following disclosure provides important information regarding the Portfolio’s Expense Example (“Example” or “Expense Example”), which appears in this Semiannual Report. Please refer to this information when reviewing the Expense Example for the Portfolio.
Example
As a shareholder of the Portfolio, you incur two types of costs: (1) transaction costs and (2) ongoing costs, including advisory and administrative fees; distribution and/or service (12b-1) fees (Administrative and Advisor Class only); and other Portfolio expenses. The Example is intended to help you understand your ongoing costs (in dollars) of investing in the Portfolio and to compare these costs with the ongoing costs of investing in other mutual funds. The Expense Example does not reflect any fees or other expenses imposed by the Variable Contracts. If it did, the expenses reflected in the Expense Example would be higher. The Example is based on an investment of $1,000 invested at the beginning of the period and held for the entire period indicated, which is from January 1, 2007 to June 30, 2007.
Actual Expenses
The information in the table under the heading “Actual Performance” provides information about actual account values and actual expenses. You may use the information in these columns, together with the amount you invested, to estimate the expenses that you paid over the period. Simply divide your account value by $1,000 (for example, an $8,600 account value divided by $1,000 = $8.60), then multiply the result by the number in the row titled “Expenses Paid During Period” to estimate the expenses you paid on your account during this period.
Hypothetical Example for Comparison Purposes
The information in the table under the heading “Hypothetical Performance (5% return before expenses)” provides information about hypothetical account values and hypothetical expenses based on the Portfolio’s actual expense ratio and an assumed rate of return of 5% per year before expenses, which is not the Portfolio’s actual return. The hypothetical account values and expenses may not be used to estimate the actual ending account balance or expenses you paid for the period. You may use this information to compare the ongoing costs of investing in the Portfolio and other portfolios. To do so, compare this 5% hypothetical example with the 5% hypothetical examples that appear in the shareholder reports of the other portfolios.
Please note that the expenses shown in the table are meant to highlight your ongoing costs only and do not reflect any transactional costs. Therefore, the information under the heading “Hypothetical Performance (5% return before expenses)” is useful in comparing ongoing costs only, and will not help you determine the relative total costs of owning different portfolios. In addition, if these transactional costs were included, your costs would have been higher.
The expense ratio may vary period to period because of various factors, such as an increase in expenses not covered by the advisory and administrative fees (such as expenses of the trustees and their counsel, litigation expense and interest expense).
| | | | | | |
| | Semiannual Report | | June 30, 2007 | | 3 |
PIMCO Low Duration Portfolio
Cumulative Returns Through June 30, 2007
$10,000 invested at the beginning of the first full month following the inception date of the Portfolio’s Administrative Class.
Allocation Breakdown‡
| | |
Corporate Bonds & Notes | | 26.9% |
Short-Term Instruments | | 26.0% |
U.S. Government Agencies | | 20.5% |
Asset-Backed Securities | | 18.0% |
Mortgage-Backed Securities | | 7.0% |
Other | | 1.6% |
| | ‡ | % of Total Investments as of 06/30/2007 |
| | | | | | | | | | |
| Average Annual Total Return for the period ended June 30, 2007 | | |
| | | | | 6 Months* | | 1 Year | | 5 Years | | Portfolio
Inception
(02/16/99)** |
| | PIMCO Low Duration Portfolio Administrative Class | | 1.57% | | 4.90% | | 2.87% | | 4.20% |
| | Merrill Lynch 1-3 Year Treasury Index± | | 2.11% | | 5.07% | | 2.77% | | 4.26% |
All Portfolio returns are net of fees and expenses.
* Cumulative return.
** The Portfolio began operations on 02/16/99. Index comparisons began on 02/28/99.
Performance quoted represents past performance. Past performance is no guarantee of future results. Investment return and principal value will fluctuate so the Portfolio shares, when redeemed, may be worth more or less than their original cost. The Portfolio’s performance does not reflect the deduction of additional charges and expenses imposed in connection with investing in Variable Contracts, which will reduce returns. Current performance may be lower or higher than the performance data quoted. Performance data current to the most recent month-end is available by calling (800) 927-4648.
± Merrill Lynch 1-3 Year Treasury Index is an unmanaged index that tracks the performance of the direct sovereign debt of the U.S. Government having a maturity of at least 1 year and less than 3 years. It is not possible to invest directly in the index. The index does not reflect deductions for fees and expenses.
| | | | | | |
| Expense Example | | Actual Performance | | Hypothetical Performance |
| | | | | (5% return before expenses) |
Beginning Account Value (01/01/07) | | $ | 1,000.00 | | $ | 1,000.00 |
Ending Account Value (06/30/07) | | $ | 1,015.73 | | $ | 1,021.57 |
Expenses Paid During Period† | | $ | 3.25 | | $ | 3.26 |
† Expenses are equal to the Portfolio’s Administrative Class annualized expense ratio of 0.65%, multiplied by the average account value over the period, multiplied by 181/365 (to reflect the one-half year period). Overall fees and expenses of investing in the Portfolio will be higher because the example does not reflect Variable Contract fees and expenses.
Please refer to page 3 herein for an explanation of the information presented in the above Expense Example.
Portfolio Insights
| » | | The PIMCO Low Duration Portfolio seeks to achieve its investment objective by investing, under normal circumstances, at least 65% of its total assets in a diversified portfolio of fixed-income securities of varying maturities, which may be represented by forwards or derivatives, such as options, futures contracts or swap agreements. |
| » | | Above-index duration exposure, or sensitivity to changes in market interest rates, during the period detracted from performance as interest rates rose. |
| » | | The Portfolio’s emphasis at the shorter-end of the yield curve, mostly through Eurodollar contracts, added to returns as rates on short maturities declined during the period. |
| » | | An emphasis on mortgages was slightly negative for returns as the sector slightly underperformed Treasuries on a like-duration basis. |
| » | | Exposure to high-yield and corporate bonds was slightly positive for performance as these sectors outperformed Treasuries. |
| » | | Low exposure to emerging markets was neutral for performance as the sector slightly outperformed Treasuries on a like-duration basis. |
| » | | Tactical exposure to non-U.S. issues, with a focus on shorter-maturity U.K. securities, detracted from returns as these positions underperformed comparable U.S. Treasuries. |
| | | | |
| 4 | | PIMCO Variable Insurance Trust | | |
Financial Highlights Low Duration Portfolio
| | | | | | | | | | | | | | | | | | | | | | | | |
| Selected per Share Data for the Year or Period Ended: | | 06/30/2007+ | | | 12/31/2006 | | | 12/31/2005 | | | 12/31/2004 | | | 12/31/2003 | | | 12/31/2002 | |
| | | | | | |
Administrative Class | | | | | | | | | | | | | | | | | | | | | | | | |
Net asset value beginning of year or period | | $ | 10.06 | | | $ | 10.09 | | | $ | 10.30 | | | $ | 10.27 | | | $ | 10.23 | | | $ | 9.95 | |
Net investment income (a) | | | 0.24 | | | | 0.43 | | | | 0.29 | | | | 0.13 | | | | 0.13 | | | | 0.34 | |
Net realized/unrealized gain (loss) on investments (a) | | | (0.08 | ) | | | (0.04 | ) | | | (0.18 | ) | | | 0.06 | | | | 0.11 | | | | 0.35 | |
Total income from investment operations | | | 0.16 | | | | 0.39 | | | | 0.11 | | | | 0.19 | | | | 0.24 | | | | 0.69 | |
Dividends from net investment income | | | (0.24 | ) | | | (0.42 | ) | | | (0.29 | ) | | | (0.13 | ) | | | (0.19 | ) | | | (0.35 | ) |
Distributions from net realized capital gains | | | 0.00 | | | | 0.00 | | | | (0.03 | ) | | | (0.03 | ) | | | (0.01 | ) | | | (0.06 | ) |
Total distributions | | | (0.24 | ) | | | (0.42 | ) | | | (0.32 | ) | | | (0.16 | ) | | | (0.20 | ) | | | (0.41 | ) |
Net asset value end of year or period | | $ | 9.98 | | | $ | 10.06 | | | $ | 10.09 | | | $ | 10.30 | | | $ | 10.27 | | | $ | 10.23 | |
Total return | | | 1.57 | % | | | 3.97 | % | | | 1.01 | % | | | 1.85 | % | | | 2.34 | % | | | 7.05 | % |
Net assets end of year or period (000s) | | $ | 1,002,451 | | | $ | 764,846 | | | $ | 458,677 | | | $ | 281,711 | | | $ | 115,419 | | | $ | 19,495 | |
Ratio of expenses to average net assets | | | 0.65 | %* | | | 0.65 | % | | | 0.65 | % | | | 0.65 | % | | | 0.65 | % | | | 0.66 | %(b) |
Ratio of expenses to average net assets excluding interest expense | | | 0.65 | %* | | | 0.65 | % | | | 0.65 | % | | | 0.65 | % | | | 0.65 | % | | | 0.65 | %(b) |
Ratio of net investment income to average net assets | | | 4.75 | %* | | | 4.24 | % | | | 2.83 | % | | | 1.24 | % | | | 1.30 | % | | | 3.39 | % |
Portfolio turnover rate | | | 12 | % | | | 200 | % | | | 184 | % | | | 483 | % | | | 284 | % | | | 339 | % |
+ Unaudited
* Annualized
(a) Per share amounts based on average number of shares outstanding during the period.
(b) If the investment manager had not reimbursed expenses, the ratio of expenses to average net assets would have been 0.67%.
| | | | | | |
| See Accompanying Notes | | Semiannual Report | | June 30, 2007 | | 5 |
Statement of Assets and Liabilities Low Duration Portfolio
| | | | |
| (Amounts in thousands, except per share amounts) | | June 30, 2007 | |
| | | (Unaudited) | |
| |
Assets: | | | | |
Investments, at value | | $ | 1,037,081 | |
Cash | | | 259 | |
Foreign currency, at value | | | 6,512 | |
Receivable for investments sold | | | 6,658 | |
Receivable for Portfolio shares sold | | | 3,235 | |
Interest and dividends receivable | | | 3,739 | |
Variation margin receivable | | | 773 | |
Swap premiums paid | | | 2,713 | |
Unrealized appreciation on foreign currency contracts | | | 1,514 | |
Unrealized appreciation on swap agreements | | | 956 | |
| | | | 1,063,440 | |
| |
Liabilities: | | | | |
Payable for investments purchased | | $ | 20,328 | |
Payable for investments purchased on a delayed-delivery basis | | | 12,597 | |
Payable for Portfolio shares redeemed | | | 48 | |
Payable for short sales | | | 6,621 | |
Written options outstanding | | | 492 | |
Dividends payable | | | 12 | |
Accrued investment advisory fee | | | 208 | |
Accrued administration fee | | | 208 | |
Accrued servicing fee | | | 111 | |
Variation margin payable | | | 663 | |
Swap premiums received | | | 444 | |
Unrealized depreciation on foreign currency contracts | | | 109 | |
Unrealized depreciation on swap agreements | | | 715 | |
Other liabilities | | | 11 | |
| | | | 42,567 | |
| |
Net Assets | | $ | 1,020,873 | |
| |
Net Assets Consist of: | | | | |
Paid in capital | | $ | 1,036,658 | |
Undistributed net investment income | | | 1,093 | |
Accumulated undistributed net realized (loss) | | | (9,797 | ) |
Net unrealized (depreciation) | | | (7,081 | ) |
| | | $ | 1,020,873 | |
| |
Net Assets: | | | | |
Institutional Class | | $ | 18,166 | |
Administrative Class | | | 1,002,451 | |
Advisor Class | | | 256 | |
| |
Shares Issued and Outstanding: | | | | |
Institutional Class | | | 1,820 | |
Administrative Class | | | 100,430 | |
Advisor Class | | | 26 | |
| |
Net Asset Value and Redemption Price Per Share (Net Asset Per Share Outstanding) | | | | |
Institutional Class | | $ | 9.98 | |
Administrative Class | | | 9.98 | |
Advisor Class | | | 9.98 | |
| |
Cost of Investments Owned | | $ | 1,040,151 | |
Cost of Foreign Currency Held | | $ | 6,490 | |
Proceeds Received on Short Sales | | $ | 6,608 | |
Premiums Received on Written Options | | $ | 1,363 | |
| | | | |
| 6 | | PIMCO Variable Insurance Trust | | See Accompanying Notes |
Statement of Operations Low Duration Portfolio
| | | | |
| (Amounts in thousands) | | Six Months Ended
June 30, 2007 | |
| | | (Unaudited) | |
| |
| Investment Income: | | | | |
Interest, net of foreign taxes* | | $ | 23,402 | |
Dividends | | | 166 | |
Miscellaneous income | | | 25 | |
Total Income | | | 23,593 | |
| |
Expenses: | | | | |
Investment advisory fees | | | 1,086 | |
Administration fees | | | 1,086 | |
Servicing fees – Administrative Class | | | 633 | |
Trustees’ fees | | | 9 | |
Total Expenses | | | 2,814 | |
| |
Net Investment Income | | | 20,779 | |
| |
Net Realized and Unrealized Gain (Loss): | | | | |
Net realized (loss) on investments | | | (434 | ) |
Net realized (loss) on futures contracts, written options and swaps | | | (2,941 | ) |
Net realized gain on foreign currency transactions | | | 512 | |
Net change in unrealized (depreciation) on investments | | | (2,479 | ) |
Net change in unrealized (depreciation) on futures contracts, written options and swaps | | | (3,146 | ) |
Net change in unrealized appreciation on translation of assets and liabilities denominated in foreign currencies | | | 1,382 | |
Net (Loss) | | | (7,106 | ) |
| |
Net Increase in Net Assets Resulting from Operations | | $ | 13,673 | |
| |
*Foreign tax withholding | | $ | 8 | |
| | | | | | |
| See Accompanying Notes | | Semiannual Report | | June 30, 2007 | | 7 |
Statements of Changes in Net Assets Low Duration Portfolio
| | | | | | | | |
| (Amounts in thousands) | | Six Months Ended
June 30, 2007 | | | Year Ended
December 31, 2006 | |
| | | (Unaudited) | | | | |
| | |
| Increase in Net Assets from: | | | | | | | | |
| | |
Operations: | | | | | | | | |
Net investment income | | $ | 20,779 | | | $ | 26,588 | |
Net realized (loss) | | | (2,863 | ) | | | (382 | ) |
Net change in unrealized (depreciation) | | | (4,243 | ) | | | (846 | ) |
Net increase resulting from operations | | | 13,673 | | | | 25,360 | |
| | |
Distributions to Shareholders: | | | | | | | | |
From net investment income | | | | | | | | |
Institutional Class | | | (600 | ) | | | (1,072 | ) |
Administrative Class | | | (20,271 | ) | | | (25,602 | ) |
Advisor Class | | | (3 | ) | | | (2 | ) |
| | |
Total Distributions | | | (20,874 | ) | | | (26,676 | ) |
| | |
Portfolio Share Transactions: | | | | | | | | |
Receipts for shares sold | | | | | | | | |
Institutional Class | | | 3,048 | | | | 11,541 | |
Administrative Class | | | 291,518 | | | | 369,230 | |
Advisor Class | | | 421 | | | | 390 | |
Issued as reinvestment of distributions | | | | | | | | |
Institutional Class | | | 600 | | | | 1,072 | |
Administrative Class | | | 20,247 | | | | 25,602 | |
Advisor Class | | | 3 | | | | 2 | |
Cost of shares redeemed | | | | | | | | |
Institutional Class | | | (11,174 | ) | | | (4,778 | ) |
Administrative Class | | | (67,154 | ) | | | (87,388 | ) |
Advisor Class | | | (355 | ) | | | (204 | ) |
Net increase resulting from Portfolio share transactions | | | 237,154 | | | | 315,467 | |
| | |
Total Increase in Net Assets | | | 229,953 | | | | 314,151 | |
| | |
Net Assets: | | | | | | | | |
Beginning of period | | | 790,920 | | | | 476,769 | |
End of period* | | $ | 1,020,873 | | | $ | 790,920 | |
| | |
*Including undistributed net investment income of: | | $ | 1,093 | | | $ | 1,188 | |
| | | | |
| 8 | | PIMCO Variable Insurance Trust | | See Accompanying Notes |
| | |
| |
| Schedule of Investments Low Duration Portfolio | | June 30, 2007 (Unaudited) |
| | | | | | | | |
| | | | | PRINCIPAL
AMOUNT
(000S) | | | | VALUE
(000S) |
| BANK LOAN OBLIGATIONS 0.2% |
| SLM Corp. |
6.000% due 06/30/2008 | | $ | | 2,200 | | $ | | 2,189 |
| | | | | | | | |
Total Bank Loan Obligations
(Cost $2,189) | | 2,189 |
| | | | | | | | |
|
| CORPORATE BONDS & NOTES 27.4% |
|
| BANKING & FINANCE 21.0% |
| AIG-Fp Matched Funding Corp. |
5.360% due 06/16/2008 | | | | 1,700 | | | | 1,703 |
| |
| Allstate Life Global Funding Trusts |
5.400% due 03/23/2009 | | | | 800 | | | | 801 |
| |
| American Express Bank FSB |
5.330% due 10/16/2008 | | | | 2,000 | | | | 2,000 |
5.380% due 06/22/2009 | | | | 1,300 | | | | 1,301 |
5.380% due 10/20/2009 | | | | 2,100 | | | | 2,101 |
| |
| American Express Centurion Bank |
5.320% due 05/07/2008 | | | | 1,400 | | | | 1,400 |
5.340% due 06/12/2009 | | | | 1,900 | | | | 1,901 |
| |
| American Express Credit Corp. |
5.380% due 11/09/2009 | | | | 1,100 | | | | 1,101 |
| |
| American International Group, Inc. |
5.360% due 06/23/2008 | | | | 600 | | | | 600 |
5.370% due 06/16/2009 | | | | 5,200 | | | | 5,222 |
| |
| ANZ National International Ltd. |
5.396% due 08/07/2009 | | | | 1,500 | | | | 1,500 |
| |
| Bank of America Corp. |
5.366% due 11/06/2009 | | | | 900 | | | | 900 |
5.370% due 06/19/2009 | | | | 6,100 | | | | 6,109 |
| |
| Bank of America N.A. |
5.360% due 02/27/2009 | | | | 700 | | | | 700 |
| |
| Bank of Ireland |
5.370% due 12/19/2008 | | | | 3,100 | | | | 3,104 |
5.410% due 12/18/2009 | | | | 1,120 | | | | 1,122 |
| |
| Bear Stearns Cos., Inc. |
5.450% due 03/30/2009 | | | | 2,900 | | | | 2,902 |
5.450% due 08/21/2009 | | | | 300 | | | | 300 |
5.480% due 05/18/2010 | | | | 2,400 | | | | 2,399 |
5.505% due 04/29/2008 | | | | 3,400 | | | | 3,405 |
| |
| Calabash Re II Ltd. |
13.760% due 01/08/2010 | | | | 1,900 | | | | 1,917 |
16.260% due 01/08/2010 | | | | 1,900 | | | | 1,978 |
| |
| Caterpillar Financial Services Corp. |
5.420% due 05/18/2009 | | | | 5,480 | | | | 5,488 |
5.430% due 03/10/2009 | | | | 6,400 | | | | 6,407 |
| |
| CIT Group, Inc. |
5.510% due 08/15/2008 | | | | 300 | | | | 300 |
5.510% due 12/19/2008 | | | | 400 | | | | 400 |
5.570% due 05/23/2008 | | | | 4,600 | | | | 4,606 |
| |
| Citigroup Funding, Inc. |
5.360% due 06/26/2009 | | | | 1,400 | | | | 1,399 |
| |
| Citigroup Global Markets Holdings, Inc. |
5.460% due 03/17/2009 | | | | 1,800 | | | | 1,803 |
| |
| Citigroup, Inc. |
4.200% due 12/20/2007 | | | | 4,100 | | | | 4,078 |
5.390% due 12/28/2009 | | | | 4,000 | | | | 4,003 |
5.395% due 01/30/2009 | | | | 1,900 | | | | 1,901 |
5.400% due 12/26/2008 | | | | 200 | | | | 200 |
| |
| Credit Agricole S.A. |
5.360% due 05/28/2009 | | | | 1,500 | | | | 1,501 |
5.410% due 05/28/2010 | | | | 1,700 | | | | 1,701 |
| |
| DnB NORBank ASA |
5.425% due 10/13/2009 | | | | 8,400 | | | | 8,405 |
| |
| | | | | | | | |
| | | | | PRINCIPAL
AMOUNT
(000S) | | | | VALUE
(000S) |
| Export-Import Bank of Korea |
5.450% due 06/01/2009 | | $ | | 2,200 | | $ | | 2,201 |
| |
| General Electric Capital Corp. |
5.390% due 01/05/2009 | | | | 2,500 | | | | 2,502 |
5.410% due 10/06/2010 | | | | 2,100 | | | | 2,102 |
5.428% due 01/20/2010 | | | | 1,400 | | | | 1,403 |
5.430% due 08/15/2011 | | | | 5,500 | | | | 5,498 |
5.560% due 01/08/2016 | | | | 300 | | | | 300 |
| |
| General Motors Acceptance Corp. |
6.510% due 09/23/2008 | | | | 1,100 | | | | 1,100 |
| |
| GMAC LLC |
6.000% due 12/15/2011 | | | | 300 | | | | 285 |
| |
| Goldman Sachs Group, Inc. |
5.400% due 12/23/2008 | | | | 400 | | | | 400 |
5.410% due 03/30/2009 | | | | 2,900 | | | | 2,902 |
5.440% due 11/16/2009 | | | | 600 | | | | 601 |
5.450% due 12/22/2008 | | | | 2,100 | | | | 2,103 |
5.455% due 07/29/2008 | | | | 1,700 | | | | 1,703 |
5.475% due 10/05/2007 | | | | 1,600 | | | | 1,601 |
5.685% due 07/23/2009 | | | | 1,300 | | | | 1,307 |
| |
| HBOS Treasury Services PLC |
5.397% due 07/17/2009 | | | | 2,200 | | | | 2,203 |
| |
| HSBC Bank USA N.A. |
5.500% due 06/10/2009 | | | | 1,400 | | | | 1,404 |
| |
| HSBC Finance Corp. |
5.490% due 09/15/2008 | | | | 500 | | | | 501 |
5.500% due 12/05/2008 | | | | 1,300 | | | | 1,303 |
5.607% due 05/10/2010 | | | | 2,200 | | | | 2,211 |
| |
| ICICI Bank Ltd. |
5.895% due 01/12/2010 | | | | 2,300 | | | | 2,305 |
| |
| John Deere Capital Corp. |
5.406% due 04/15/2008 | | | | 1,200 | | | | 1,201 |
5.406% due 07/15/2008 | | | | 1,400 | | | | 1,401 |
| |
| JPMorgan Chase & Co. |
5.539% due 10/02/2009 | | | | 3,500 | | | | 3,515 |
| |
| Lehman Brothers Holdings, Inc. |
5.370% due 11/24/2008 | | | | 1,000 | | | | 1,000 |
5.410% due 12/23/2008 | | | | 400 | | | | 400 |
5.440% due 04/03/2009 | | | | 1,700 | | | | 1,702 |
5.460% due 08/21/2009 | | | | 1,600 | | | | 1,601 |
5.460% due 11/16/2009 | | | | 5,200 | | | | 5,205 |
5.570% due 12/23/2010 | | | | 900 | | | | 901 |
5.579% due 07/18/2011 | | | | 1,000 | | | | 1,002 |
| |
| Longpoint Re Ltd. |
10.609% due 05/08/2010 | | | | 700 | | | | 700 |
| |
| Merrill Lynch & Co., Inc. |
5.406% due 05/08/2009 | | | | 1,700 | | | | 1,701 |
5.440% due 12/04/2009 | | | | 1,400 | | | | 1,401 |
5.460% due 06/16/2008 | | | | 6,000 | | | | 6,007 |
| |
| Metropolitan Life Global Funding I |
5.400% due 05/17/2010 | | | | 3,200 | | | | 3,202 |
| |
| Morgan Stanley |
5.406% due 05/07/2009 | | | | 2,800 | | | | 2,802 |
5.467% due 02/09/2009 | | | | 1,100 | | | | 1,102 |
5.595% due 01/22/2009 | | | | 3,700 | | | | 3,703 |
5.609% due 01/18/2011 | | | | 1,500 | | | | 1,502 |
| |
| Mystic Re Ltd. |
11.660% due 12/05/2008 | | | | 1,800 | | | | 1,789 |
| |
| National Australia Bank Ltd. |
5.400% due 09/11/2009 | | | | 1,400 | | | | 1,402 |
| |
| Pricoa Global Funding I |
5.405% due 07/27/2009 | | | | 3,700 | | | | 3,706 |
5.440% due 06/03/2008 | | | | 3,000 | | | | 3,005 |
| |
| Residential Capital LLC |
6.460% due 05/22/2009 | | | | 2,000 | | | | 1,992 |
| |
| | | | | | | | |
| | | | | PRINCIPAL
AMOUNT
(000S) | | | | VALUE
(000S) |
| Residential Reinsurance 2007 Ltd. |
15.610% due 06/07/2010 | | $ | | 300 | | $ | | 300 |
| |
| Royal Bank of Scotland Group PLC |
5.360% due 12/21/2007 | | | | 1,200 | | | | 1,201 |
5.750% due 07/06/2012 | | | | 5,900 | | | | 5,900 |
| |
| Santander U.S. Debt S.A. Unipersonal |
5.370% due 09/21/2007 | | | | 3,000 | | | | 3,001 |
5.370% due 11/20/2008 | | | | 700 | | | | 700 |
5.420% due 09/19/2008 | | | | 2,800 | | | | 2,803 |
| |
| SLM Corp. |
5.495% due 07/27/2009 | | | | 900 | | | | 878 |
| |
| Unicredit Luxembourg Finance S.A. |
5.405% due 10/24/2008 | | | | 1,700 | | | | 1,701 |
| |
| VTB Capital S.A. for Vneshtorgbank |
5.955% due 08/01/2008 | | | | 1,300 | | | | 1,303 |
| |
| Wachovia Bank N.A. |
5.420% due 05/25/2010 | | | | 6,000 | | | | 6,016 |
| |
| Wachovia Corp. |
5.486% due 10/15/2011 | | | | 1,100 | | | | 1,102 |
| |
| Wells Fargo & Co. |
5.400% due 03/10/2008 | | | | 4,000 | | | | 4,003 |
5.460% due 09/15/2009 | | | | 2,600 | | | | 2,607 |
| |
| Westpac Banking Corp. |
5.280% due 06/06/2008 | | | | 900 | | | | 900 |
| |
| World Savings Bank FSB |
5.396% due 05/08/2009 | | | | 7,100 | | | | 7,104 |
| | | | | | | | |
| | | | | | | | 214,054 |
| | | | | | | | |
|
| INDUSTRIALS 3.7% |
| Altria Group, Inc. | | | | | | | | |
7.650% due 07/01/2008 | | | | 200 | | | | 204 |
| |
| Amgen, Inc. |
5.440% due 11/28/2008 | | | | 3,600 | | | | 3,602 |
| |
| Anadarko Petroleum Corp. |
5.760% due 09/15/2009 | | | | 2,200 | | | | 2,203 |
| |
| BP AMI Leasing, Inc. |
5.370% due 06/26/2009 | | | | 3,700 | | | | 3,701 |
| |
| Comcast Corp. |
5.656% due 07/14/2009 | | | | 1,600 | | | | 1,601 |
| |
| CSC Holdings, Inc. |
7.250% due 07/15/2008 | | | | 3,500 | | | | 3,535 |
7.875% due 12/15/2007 | | | | 1,500 | | | | 1,513 |
| |
| DaimlerChrysler N.A. Holding Corp. |
5.710% due 03/13/2009 | | | | 1,600 | | | | 1,604 |
5.840% due 09/10/2007 | | | | 4,758 | | | | 4,762 |
| |
| Diageo Capital PLC |
5.457% due 11/10/2008 | | | | 2,600 | | | | 2,603 |
| |
| El Paso Corp. |
6.950% due 12/15/2007 | | | | 1,980 | | | | 2,001 |
| |
| FedEx Corp. |
5.436% due 08/08/2007 | | | | 1,300 | | | | 1,300 |
| |
| General Electric Co. |
5.400% due 12/09/2008 | | | | 2,600 | | | | 2,602 |
| |
| Salomon Brothers AG for OAO Gazprom |
10.500% due 10/21/2009 | | | | 200 | | | | 221 |
| |
| Time Warner, Inc. |
5.590% due 11/13/2009 | | | | 1,800 | | | | 1,803 |
| |
| Transocean, Inc. |
5.560% due 09/05/2008 | | | | 1,300 | | | | 1,301 |
| |
| Wal-Mart Stores, Inc. |
5.260% due 06/16/2008 | | | | 3,300 | | | | 3,300 |
| | | | | | | | |
| | | | | | | | 37,856 |
| | | | | | | | |
| | | | | | |
| See Accompanying Notes | | Semiannual Report | | June 30, 2007 | | 9 |
Schedule of Investments Low Duration Portfolio (Cont.)
| | | | | | | | |
| | | | | PRINCIPAL
AMOUNT
(000S) | | | | VALUE
(000S) |
| UTILITIES 2.7% |
| AT&T, Inc. | | | | | | | | |
5.450% due 05/15/2008 | | $ | | 5,900 | | $ | | 5,906 |
| |
| BellSouth Corp. | | |
5.460% due 08/15/2008 | | | | 5,900 | | | | 5,906 |
| |
| Deutsche Telekom International Finance BV |
5.540% due 03/23/2009 | | | | 2,500 | | | | 2,507 |
| |
| Qwest Capital Funding, Inc. |
6.375% due 07/15/2008 | | | | 5,670 | | | | 5,698 |
| |
| Telecom Italia Capital S.A. |
5.969% due 07/18/2011 | | | | 1,800 | | | | 1,813 |
| |
| Telefonica Emisones SAU |
5.660% due 06/19/2009 | | | | 1,700 | | | | 1,706 |
| |
| Verizon Communications, Inc. |
5.400% due 04/03/2009 | | | | 3,800 | | | | 3,803 |
| | | | | | | | |
| | | | | | | | 27,339 |
| | | | | | | | |
Total Corporate Bonds & Notes
(Cost $278,880) | | 279,249 |
| | | | | | | | |
| | | | |
| COMMODITY INDEX-LINKED NOTES 0.3% |
| Morgan Stanley |
0.000% due 07/07/2008 | | | | 3,000 | | | | 2,983 |
| | | | | | | | |
Total Commodity Index-Linked Notes (Cost $3,000) | | 2,983 |
| | | | | | | | |
| | | | |
| U.S. GOVERNMENT AGENCIES 20.9% |
| Fannie Mae |
3.736% due 07/01/2034 | | | | 248 | | | | 250 |
4.350% due 03/01/2035 | | | | 323 | | | | 326 |
4.417% due 05/01/2035 | | | | 774 | | | | 771 |
4.500% due 06/25/2043 | | | | 2,895 | | | | 2,873 |
4.510% due 05/01/2035 | | | | 717 | | | | 712 |
4.542% due 09/01/2035 | | | | 1,335 | | | | 1,326 |
4.560% due 11/01/2035 | | | | 1,476 | | | | 1,466 |
4.655% due 08/01/2035 | | | | 3,369 | | | | 3,333 |
4.683% due 07/01/2035 | | | | 519 | | | | 512 |
5.000% due 12/25/2016 -
04/25/2033 | | | | 70,546 | | | | 68,501 |
5.380% due 12/25/2036 | | | | 905 | | | | 903 |
5.440% due 03/25/2034 | | | | 133 | | | | 133 |
5.500% due 12/01/2009 -
10/01/2035 | | | | 64,244 | | | | 63,276 |
5.670% due 09/25/2042 -
03/25/2044 | | | | 1,567 | | | | 1,573 |
5.720% due 05/25/2031 -
11/25/2032 | | | | 1,501 | | | | 1,507 |
6.000% due 08/01/2016 -
07/01/2037 | | | | 1,140 | | | | 1,129 |
6.183% due 09/01/2034 | | | | 80 | | | | 81 |
6.214% due 07/01/2042 -
06/01/2043 | | | | 1,647 | | | | 1,672 |
6.264% due 09/01/2041 | | | | 675 | | | | 681 |
6.335% due 12/01/2036 | | | | 83 | | | | 84 |
6.414% due 09/01/2040 | | | | 11 | | | | 11 |
6.500% due 12/25/2042 | | | | 22 | | | | 23 |
6.973% due 11/01/2035 | | | | 385 | | | | 398 |
| |
| Federal Housing Administration |
7.430% due 10/01/2020 | | | | 19 | | | | 19 |
| |
| Freddie Mac |
4.715% due 06/01/2035 | | | | 2,255 | | | | 2,207 |
4.922% due 07/01/2035 | | | | 975 | | | | 965 |
5.000% due 10/01/2018 - 12/15/2026 | | | | 5,284 | | | | 5,251 |
5.470% due 07/15/2019 - 10/15/2020 | | | | 36,000 | | | | 35,969 |
5.500% due 08/15/2030 | | | | 1 | | | | 1 |
5.550% due 07/15/2037 | | | | 12,600 | | | | 12,599 |
5.580% due 08/25/2031 | | | | 436 | | | | 438 |
5.620% due 05/15/2036 | | | | 1,093 | | | | 1,097 |
| | | | | | | | |
| | | | | PRINCIPAL
AMOUNT
(000S) | | | | VALUE
(000S) |
5.670% due 12/15/2030 | | $ | | 533 | | $ | | 535 |
5.720% due 06/15/2018 | | | | 187 | | | | 187 |
6.000% due 09/01/2016 - 07/01/2037 | | | | 1,113 | | | | 1,104 |
6.227% due 02/25/2045 | | | | 961 | | | | 957 |
6.500% due 07/25/2043 | | | | 166 | | | | 168 |
| |
| Ginnie Mae |
4.000% due 07/16/2027 | | | | 56 | | | | 56 |
| | | | | | | | |
Total U.S. Government Agencies
(Cost $215,509) | | 213,094 |
| | | | | | | | |
|
| MORTGAGE-BACKED SECURITIES 7.1% |
| American Home Mortgage Investment Trust |
4.290% due 10/25/2034 | | | | 1,475 | | | | 1,448 |
4.390% due 02/25/2045 | | | | 566 | | | | 554 |
| |
| Arran Residential Mortgages Funding PLC |
5.340% due 04/12/2036 | | | | 1,099 | | | | 1,099 |
| |
| Banc of America Funding Corp. |
4.113% due 05/25/2035 | | | | 7,605 | | | | 7,449 |
| |
| Banc of America Mortgage Securities, Inc. |
6.500% due 10/25/2031 | | | | 89 | | | | 90 |
| |
| Bear Stearns Adjustable Rate Mortgage Trust |
4.750% due 10/25/2035 | | | | 2,780 | | | | 2,749 |
4.773% due 01/25/2034 | | | | 125 | | | | 125 |
5.044% due 04/25/2033 | | | | 29 | | | | 29 |
5.329% due 02/25/2033 | | | | 11 | | | | 11 |
5.448% due 04/25/2033 | | | | 52 | | | | 51 |
| |
| Bear Stearns Alt-A Trust |
5.377% due 05/25/2035 | | | | 913 | | | | 909 |
5.480% due 02/25/2034 | | | | 1,472 | | | | 1,472 |
| |
| Bear Stearns Mortgage Funding Trust |
5.390% due 02/25/2037 | | | | 2,672 | | | | 2,673 |
| |
| Citigroup Mortgage Loan Trust, Inc. |
4.900% due 12/25/2035 | | | | 729 | | | | 728 |
| |
| Countrywide Alternative Loan Trust |
4.500% due 06/25/2035 | | | | 2,381 | | | | 2,349 |
5.500% due 05/25/2047 | | | | 1,196 | | | | 1,199 |
5.600% due 02/25/2037 | | | | 3,646 | | | | 3,656 |
6.000% due 10/25/2033 | | | | 93 | | | | 92 |
6.500% due 06/25/2033 | | | | 9 | | | | 9 |
| |
| Countrywide Home Loan Mortgage Pass-Through Trust |
5.250% due 02/20/2036 | | | | 1,166 | | | | 1,162 |
5.560% due 04/25/2035 | | | | 258 | | | | 259 |
5.590% due 05/25/2034 | | | | 44 | | | | 44 |
| |
| CS First Boston Mortgage Securities Corp. |
4.938% due 12/15/2040 | | | | 622 | | | | 617 |
5.953% due 03/25/2032 | | | | 6 | | | | 6 |
| |
| GMAC Mortgage Corp. Loan Trust |
4.998% due 11/19/2035 | | | | 776 | | | | 776 |
| |
| Greenpoint Mortgage Funding Trust |
5.400% due 10/25/2046 | | | | 1,563 | | | | 1,565 |
5.400% due 01/25/2047 | | | | 1,639 | | | | 1,640 |
| |
| GS Mortgage Securities Corp. II |
5.410% due 03/06/2020 | | | | 6,000 | | | | 6,007 |
5.420% due 06/06/2020 | | | | 763 | | | | 764 |
| |
| GSR Mortgage Loan Trust |
4.538% due 09/25/2035 | | | | 3,249 | | | | 3,203 |
6.000% due 03/25/2032 | | | | 2 | | | | 2 |
| |
| Harborview Mortgage Loan Trust |
5.540% due 05/19/2035 | | | | 321 | | | | 321 |
| |
| Impac CMB Trust |
6.120% due 07/25/2033 | | | | 61 | | | | 61 |
| |
| LB-UBS Commercial Mortgage Trust |
4.990% due 11/15/2030 | | | | 818 | | | | 812 |
| |
| | | | | | | | |
| | | | | PRINCIPAL
AMOUNT
(000S) | | | | VALUE (000S) |
Lehman Brothers Floating Rate Commercial
Mortgage Trust |
5.400% due 09/15/2021 | | $ | | 330 | | $ | | 331 |
| |
| MASTR Asset Securitization Trust |
5.500% due 09/25/2033 | | | | 77 | | | | 74 |
| |
| Mellon Residential Funding Corp. |
5.800% due 06/15/2030 | | | | 532 | | | | 532 |
| |
| MLCC Mortgage Investors, Inc. |
6.974% due 01/25/2029 | | | | 101 | | | | 102 |
| |
| Morgan Stanley Capital I |
5.380% due 10/15/2020 | | | | 4,081 | | | | 4,086 |
| |
| Prime Mortgage Trust |
5.720% due 02/25/2019 | | | | 20 | | | | 20 |
5.720% due 02/25/2034 | | | | 67 | | | | 67 |
| |
| Salomon Brothers Mortgage Securities VII, Inc. |
4.000% due 12/25/2018 | | | | 267 | | | | 254 |
| |
| Structured Adjustable Rate Mortgage Loan Trust |
4.580% due 02/25/2034 | | | | 1,027 | | | | 1,028 |
5.340% due 08/25/2034 | | | | 1,260 | | | | 1,259 |
6.429% due 01/25/2035 | | | | 734 | | | | 738 |
| |
| Structured Asset Mortgage Investments, Inc. |
5.600% due 02/25/2036 | | | | 376 | | | | 376 |
5.650% due 09/19/2032 | | | | 16 | | | | 16 |
| |
| Structured Asset Securities Corp. |
5.329% due 10/25/2035 | | | | 1,695 | | | | 1,693 |
| |
| Thornburg Mortgage Securities Trust |
5.430% due 12/25/2036 | | | | 1,363 | | | | 1,363 |
5.440% due 08/25/2036 | | | | 2,967 | | | | 2,965 |
| |
| Wachovia Bank Commercial Mortgage Trust |
5.400% due 06/15/2020 | | | | 2,900 | | | | 2,901 |
5.410% due 09/15/2021 | | | | 3,811 | | | | 3,813 |
| |
| Washington Mutual, Inc. |
4.816% due 10/25/2032 | | | | 208 | | | | 208 |
5.474% due 02/27/2034 | | | | 72 | | | | 71 |
5.590% due 12/25/2045 | | | | 397 | | | | 399 |
5.610% due 10/25/2045 | | | | 2,287 | | | | 2,292 |
5.759% due 01/25/2047 | | | | 796 | | | | 796 |
6.223% due 05/25/2041 | | | | 189 | | | | 190 |
6.229% due 11/25/2042 | | | | 285 | | | | 285 |
6.429% due 06/25/2042 | | | | 191 | | | | 191 |
6.429% due 08/25/2042 | | | | 79 | | | | 79 |
6.529% due 09/25/2046 | | | | 1,238 | | | | 1,243 |
| |
| Wells Fargo Mortgage-Backed Securities Trust |
4.950% due 03/25/2036 | | | | 1,444 | | | | 1,424 |
| | | | | | | | |
Total Mortgage-Backed Securities
(Cost $72,892) | | 72,727 |
| | | | | | | | |
| | | | |
| ASSET-BACKED SECURITIES 18.2% |
| Accredited Mortgage Loan Trust |
5.360% due 09/25/2036 | | | | 2,983 | | | | 2,985 |
| |
| ACE Securities Corp. |
5.380% due 10/25/2036 | | | | 1,642 | | | | 1,643 |
5.430% due 10/25/2035 | | | | 353 | | | | 353 |
| |
| Amortizing Residential Collateral Trust |
5.610% due 07/25/2032 | | | | 13 | | | | 13 |
| |
| Argent Securities, Inc. |
5.370% due 09/25/2036 | | | | 541 | | | | 541 |
5.380% due 05/25/2036 | | | | 1,948 | | | | 1,949 |
5.400% due 01/25/2036 | | | | 470 | | | | 471 |
| |
| Asset-Backed Funding Certificates |
5.380% due 10/25/2036 | | | | 1,533 | | | | 1,534 |
5.380% due 01/25/2037 | | | | 1,130 | | | | 1,131 |
| |
| Asset-Backed Securities Corp. Home Equity |
5.370% due 12/25/2036 | | | | 1,784 | | | | 1,785 |
5.595% due 09/25/2034 | | | | 495 | | | | 495 |
6.970% due 03/15/2032 | | | | 359 | | | | 359 |
| |
| | | | |
| 10 | | PIMCO Variable Insurance Trust | | See Accompanying Notes |
| | |
| |
| | | June 30, 2007 (Unaudited) |
| | | | | | | | |
| | | | | PRINCIPAL
AMOUNT
(000S) | | | | VALUE
(000S) |
| Bear Stearns Asset-Backed Securities, Inc. |
5.520% due 09/25/2034 | | $ | | 97 | | $ | | 97 |
| |
| Carrington Mortgage Loan Trust |
5.385% due 02/25/2036 | | | | 256 | | | | 256 |
| |
| Chase Credit Card Master Trust |
5.430% due 02/15/2011 | | | | 2,300 | | | | 2,305 |
| |
| CIT Group Home Equity Loan Trust |
5.590% due 06/25/2033 | | | | 4 | | | | 4 |
| |
| Citibank Credit Card Issuance Trust |
2.900% due 05/17/2010 | | | | 2,500 | | | | 2,449 |
5.526% due 02/07/2010 | | | | 9,300 | | | | 9,316 |
| |
| Citigroup Mortgage Loan Trust, Inc. |
5.360% due 08/25/2036 | | | | 949 | | | | 950 |
5.380% due 05/25/2037 | | | | 19,300 | | | | 19,309 |
5.390% due 01/25/2036 | | | | 393 | | | | 393 |
5.420% due 10/25/2036 | | | | 7,100 | | | | 7,099 |
| |
| Countrywide Asset-Backed Certificates |
5.370% due 01/25/2037 | | | | 1,612 | | | | 1,613 |
5.370% due 05/25/2037 | | | | 13,790 | | | | 13,798 |
5.370% due 12/25/2046 | | | | 556 | | | | 556 |
5.370% due 03/25/2047 | | | | 1,212 | | | | 1,213 |
5.390% due 06/25/2037 | | | | 1,387 | | | | 1,388 |
5.400% due 06/25/2037 | | | | 1,149 | | | | 1,149 |
5.430% due 10/25/2046 | | | | 1,306 | | | | 1,307 |
5.500% due 09/25/2036 | | | | 9,500 | | | | 9,507 |
5.800% due 12/25/2031 | | | | 77 | | | | 77 |
| |
| Credit-Based Asset Servicing & Securitization LLC |
5.380% due 03/25/2036 | | | | 369 | | | | 369 |
5.380% due 11/25/2036 | | | | 1,228 | | | | 1,229 |
| |
| CS First Boston Mortgage Securities Corp. |
5.940% due 01/25/2032 | | | | 15 | | | | 16 |
| |
| Equity One Asset-Backed Securities, Inc. |
5.600% due 11/25/2032 | | | | 17 | | | | 17 |
| |
| First Franklin Mortgage Loan Asset-Backed Certificates |
5.370% due 11/25/2036 | | | | 1,965 | | | | 1,966 |
| |
| First USA Credit Card Master Trust |
5.480% due 04/18/2011 | | | | 4,400 | | | | 4,412 |
| |
| Fremont Home Loan Trust |
5.370% due 05/25/2036 | | | | 245 | | | | 245 |
5.380% due 01/25/2037 | | | | 1,076 | | | | 1,076 |
5.390% due 02/25/2037 | | | | 791 | | | | 791 |
| |
| GE-WMC Mortgage Securities LLC |
5.360% due 08/25/2036 | | | | 582 | | | | 582 |
| |
| GS Auto Loan Trust |
5.344% due 07/15/2008 | | | | 2,500 | | | | 2,500 |
| |
| GSAMP Trust |
5.390% due 12/25/2036 | | | | 1,485 | | | | 1,485 |
5.610% due 03/25/2034 | | | | 228 | | | | 228 |
| |
| GSR Mortgage Loan Trust |
5.420% due 11/25/2030 | | | | 157 | | | | 158 |
| |
| HFC Home Equity Loan Asset-Backed Certificates |
5.390% due 03/20/2036 | | | | 1,140 | | | | 1,140 |
5.670% due 09/20/2033 | | | | 188 | | | | 188 |
| |
| HSI Asset Securitization Corp. Trust |
5.370% due 12/25/2036 | | | | 843 | | | | 844 |
| |
| Indymac Residential Asset-Backed Trust |
5.380% due 04/25/2037 | | | | 947 | | | | 948 |
5.420% due 03/25/2036 | | | | 146 | | | | 146 |
| |
| JPMorgan Mortgage Acquisition Corp. |
5.370% due 08/25/2036 | | | | 608 | | | | 608 |
5.380% due 04/01/2037 | | | | 2,121 | | | | 2,120 |
| |
| Lehman XS Trust |
5.390% due 05/25/2046 | | | | 558 | | | | 558 |
5.400% due 11/25/2046 | | | | 1,935 | | | | 1,936 |
5.440% due 11/25/2036 | | | | 2,021 | | | | 2,023 |
| |
| | | | | | | | |
| | | | | PRINCIPAL
AMOUNT
(000S) | | | | VALUE
(000S) |
| Long Beach Mortgage Loan Trust |
5.400% due 02/25/2036 | | $ | | 179 | | $ | | 179 |
5.410% due 01/25/2036 | | | | 346 | | | | 347 |
5.600% due 10/25/2034 | | | | 135 | | | | 135 |
| |
| MASTR Asset-Backed Securities Trust |
5.380% due 11/25/2036 | | | | 1,466 | | | | 1,467 |
| |
| Merrill Lynch Mortgage Investors, Inc. |
5.390% due 08/25/2036 | | | | 5,009 | | | | 5,010 |
5.430% due 07/25/2036 | | | | 975 | | | | 976 |
| |
| Morgan Stanley ABS Capital I |
5.370% due 09/25/2036 | | | | 4,997 | | | | 4,998 |
5.380% due 05/25/2037 | | | | 2,754 | | | | 2,753 |
| |
| Nationstar Home Equity Loan Trust |
5.440% due 04/25/2037 | | | | 8,602 | | | | 8,608 |
| |
| Nelnet Student Loan Trust |
5.340% due 09/25/2012 | | | | 941 | | | | 942 |
| |
| Newcastle Mortgage Securities Trust |
5.390% due 03/25/2036 | | | | 1,040 | | | | 1,040 |
| |
| Nomura Home Equity Loan, Inc. |
5.400% due 02/25/2036 | | | | 323 | | | | 323 |
| |
| Option One Mortgage Loan Trust |
5.370% due 01/25/2037 | | | | 1,560 | | | | 1,561 |
5.420% due 11/25/2035 | | | | 194 | | | | 194 |
| |
| Residential Asset Mortgage Products, Inc. |
5.430% due 09/25/2035 | | | | 193 | | | | 193 |
| |
| Residential Asset Securities Corp. |
5.360% due 08/25/2036 | | | | 625 | | | | 625 |
5.390% due 11/25/2036 | | | | 1,533 | | | | 1,534 |
| |
| Residential Funding Mortgage Securities II, Inc. |
5.440% due 05/25/2037 | | | | 3,267 | | | | 3,269 |
| |
| Saxon Asset Securities Trust |
5.380% due 11/25/2036 | | | | 718 | | | | 718 |
| |
| Securitized Asset-Backed Receivables LLC Trust |
5.440% due 05/25/2037 | | | | 2,500 | | | | 2,500 |
| |
| SLM Student Loan Trust |
5.325% due 10/25/2012 | | | | 2,224 | | | | 2,225 |
5.335% due 04/25/2012 | | | | 1,454 | | | | 1,455 |
5.335% due 04/25/2014 | | | | 6,348 | | | | 6,352 |
5.355% due 01/25/2016 | | | | 880 | | | | 881 |
5.355% due 10/25/2016 | | | | 2,500 | | | | 2,502 |
5.365% due 01/26/2015 | | | | 170 | | | | 170 |
5.365% due 04/27/2015 | | | | 2,270 | | | | 2,271 |
| |
| Soundview Home Equity Loan Trust |
5.370% due 10/25/2036 | | | | 1,010 | | | | 1,010 |
5.380% due 11/25/2036 | | | | 5,465 | | | | 5,465 |
5.400% due 01/25/2037 | | | | 5,629 | | | | 5,633 |
5.420% due 12/25/2035 | | | | 67 | | | | 67 |
5.430% due 11/25/2035 | | | | 79 | | | | 79 |
| |
| Structured Asset Securities Corp. |
5.370% due 10/25/2036 | | | | 1,700 | | | | 1,701 |
5.420% due 09/25/2035 | | | | 581 | | | | 581 |
5.450% due 12/25/2035 | | | | 423 | | | | 423 |
| |
| Truman Capital Mortgage Loan Trust |
5.660% due 01/25/2034 | | | | 67 | | | | 67 |
| |
| USAA Auto Owner Trust |
5.337% due 07/11/2008 | | | | 1,800 | | | | 1,800 |
| |
| Wachovia Auto Owner Trust |
4.820% due 02/20/2009 | | | | 88 | | | | 88 |
5.337% due 06/20/2008 | | | | 2,100 | | | | 2,100 |
| |
| Wells Fargo Home Equity Trust |
5.370% due 01/25/2037 | | | | 988 | | | | 989 |
5.440% due 12/25/2035 | | | | 1,285 | | | | 1,285 |
| | | | | | | | |
Total Asset-Backed Securities
(Cost $186,057) | | 186,146 |
| | | | | | | | |
| | | | | | | | |
| | | | | PRINCIPAL
AMOUNT
(000S) | | | | VALUE
(000S) |
| SOVEREIGN ISSUES 0.6% |
| Korea Development Bank |
5.490% due 04/03/2010 | | $ | | 6,100 | | $ | | 6,105 |
| | | | | | | | |
Total Sovereign Issues (Cost $6,100) | | 6,105 |
| | | | | | | | |
|
| | | | | SHARES | | | | |
| PREFERRED STOCKS 0.4% |
| DG Funding Trust |
7.600% due 12/31/2049 | | | | 420 | | | | 4,376 |
| | | | | | | | |
Total Preferred Stocks (Cost $4,462) | | 4,376 |
| | | | | | | | |
|
| | | | | PRINCIPAL
AMOUNT
(000S) | | | | |
| SHORT-TERM INSTRUMENTS 26.4% |
|
| CERTIFICATES OF DEPOSIT 5.2% |
| BNP Paribas |
5.262% due 05/28/2008 | | $ | | 1,200 | | | | 1,200 |
5.262% due 07/03/2008 | | | | 6,800 | | | | 6,799 |
| |
| BNP Paribas Finance, Inc. |
5.270% due 09/23/2008 | | | | 800 | | | | 799 |
| |
| Calyon Financial, Inc. |
5.340% due 01/16/2009 | | | | 2,400 | | | | 2,400 |
| |
| Dexia Credit Local S.A. |
5.270% due 09/29/2008 | | | | 8,900 | | | | 8,895 |
| |
| Fortis Bank NY |
5.265% due 04/28/2008 | | | | 3,200 | | | | 3,202 |
5.265% due 06/30/2008 | | | | 1,400 | | | | 1,400 |
5.310% due 09/30/2008 | | | | 1,800 | | | | 1,800 |
| |
| HSBC Bank USA N.A. |
5.460% due 07/28/2008 | | | | 3,100 | | | | 3,105 |
| |
| Nordea Bank Finland PLC |
5.308% due 05/28/2008 | | | | 1,200 | | | | 1,201 |
| |
| Royal Bank of Canada |
5.267% due 06/30/2008 | | | | 3,300 | | | | 3,303 |
| |
| Royal Bank of Scotland Group PLC |
5.262% due 07/03/2008 | | | | 900 | | | | 900 |
5.265% due 03/26/2008 | | | | 800 | | | | 800 |
| |
| Societe Generale NY |
5.269% due 06/30/2008 | | | | 5,600 | | | | 5,603 |
5.270% due 03/26/2008 | | | | 3,000 | | | | 3,000 |
5.271% due 06/30/2008 | | | | 900 | | | | 901 |
| |
| Unicredito Italiano NY |
5.360% due 12/03/2007 | | | | 5,400 | | | | 5,402 |
5.360% due 05/29/2008 | | | | 2,200 | | | | 2,201 |
| | | | | | | | |
| | | | | | | | 52,911 |
| | | | | | | | |
|
| COMMERCIAL PAPER 20.2% |
| Bank of America Corp. |
5.195% due 10/04/2007 | | | | 10,700 | | | | 10,668 |
| |
| Calyon N.A. LLC |
5.175% due 06/29/2010 | | | | 23,000 | | | | 22,977 |
| |
| Cox Communications, Inc. |
5.570% due 09/17/2007 | | | | 600 | | | | 600 |
| |
| Danske Corp. |
5.205% due 10/12/2007 | | | | 18,300 | | | | 18,103 |
| |
| Fortis Funding LLC |
5.255% due 09/05/2007 | | | | 23,200 | | | | 23,146 |
5.275% due 09/05/2007 | | | | 900 | | | | 896 |
| |
| Freddie Mac |
4.800% due 07/02/2007 | | | | 35,000 | | | | 35,000 |
| |
| Nordea N.A., Inc. |
5.308% due 04/09/2009 | | | | 3,600 | | | | 3,599 |
| |
| | | | | | |
| See Accompanying Notes | | Semiannual Report | | June 30, 2007 | | 11 |
Schedule of Investments Low Duration Portfolio (Cont.)
| | | | | | | | |
| | | | | PRINCIPAL
AMOUNT
(000S) | | | | VALUE
(000S) |
| Societe Generale NY |
5.210% due 11/26/2007 | | $ | | 900 | | $ | | 891 |
5.225% due 11/26/2007 | | | | 1,200 | | | | 1,182 |
5.240% due 11/26/2007 | | | | 2,200 | | | | 2,174 |
5.250% due 11/26/2007 | | | | 800 | | | | 789 |
| |
| TotalFinaElf Capital S.A. |
5.340% due 07/02/2007 | | | | 27,500 | | | | 27,500 |
| |
| UBS Finance Delaware LLC |
5.145% due 10/23/2007 | | | | 400 | | | | 398 |
5.205% due 10/23/2007 | | | | 1,100 | | | | 1,097 |
5.230% due 10/23/2007 | | | | 21,200 | | | | 20,868 |
5.235% due 10/23/2007 | | | | 2,200 | | | | 2,178 |
5.240% due 10/23/2007 | | | | 5,900 | | | | 5,819 |
| |
| | | | | | | | |
| | | | | PRINCIPAL
AMOUNT
(000S) | | | | VALUE
(000S) |
| Westpac Banking Corp. |
5.240% due 11/05/2007 | | $ | | 28,700 | | $ | | 28,361 |
| | | | | | | | |
| | | | | | | | 206,246 |
| | | | | | | | |
|
| REPURCHASE AGREEMENTS 0.6% |
| State Street Bank and Trust Co. |
4.900% due 07/02/2007 | | | | 5,573 | | | | 5,573 |
| | | | | | | | |
(Dated 06/29/2007. Collateralized by Fannie Mae 3.250% due 08/15/2008 valued at $5,687. Repurchase proceeds are $5,575.) |
|
| | | | | | | | | |
| | | | | PRINCIPAL
AMOUNT
(000S) | | | | VALUE
(000S) | |
| U.S. TREASURY BILLS 0.4% | |
4.635% due 08/30/2007 -
09/13/2007 (a)(c) | | $ | | 4,470 | | $ | | 4,422 | |
| | | | | | | | | |
Total Short-Term Instruments
(Cost $269,167) | | 269,152 | |
| | | | | | | | | |
| | | | | | | | | |
| PURCHASED OPTIONS (e) 0.1% | |
| (Cost $1,895) | | | | 1,060 | |
| |
| |
| Total Investments (b) 101.6% (Cost $1,040,151) | | $ | | 1,037,081 | |
| |
| Written Options (f) (0.1%) (Premiums $1,363) | | | | (492 | ) |
| |
| Other Assets and Liabilities (Net) (1.5%) | | (15,716 | ) |
| | | | | | | | | |
| Net Assets 100.0% | | $ | | 1,020,873 | |
| | | | | | | | | |
Notes to Schedule of Investments (amounts in thousands*, except number of contracts):
* A zero balance may reflect actual amounts rounding to less than one thousand.
(a) Coupon represents a weighted average rate.
(b) As of June 30, 2007, portfolio securities with an aggregate value of $77,693 were valued in good faith and pursuant to the guidelines established by the Board of Trustees.
(c) Securities with an aggregate market value of $4,422 have been segregated with the custodian to cover margin requirements for the following open futures contracts on June 30, 2007:
| | | | | | | | | | |
| Description | | Type | | Expiration
Month | | # of
Contracts | | Unrealized
(Depreciation) | |
90-Day Euribor December Futures | | Long | | 12/2007 | | 140 | | $ | (199 | ) |
90-Day Euribor December Futures | | Long | | 12/2008 | | 46 | | | (103 | ) |
90-Day Euribor June Futures | | Long | | 06/2008 | | 86 | | | (185 | ) |
90-Day Euribor March Futures | | Long | | 03/2008 | | 22 | | | (44 | ) |
90-Day Euribor September Futures | | Long | | 09/2008 | | 46 | | | (106 | ) |
90-Day Eurodollar December Futures | | Long | | 12/2007 | | 784 | | | (748 | ) |
90-Day Eurodollar December Futures | | Long | | 12/2008 | | 259 | | | (115 | ) |
90-Day Eurodollar June Futures | | Long | | 06/2008 | | 1,258 | | | (1,320 | ) |
90-Day Eurodollar March Futures | | Long | | 03/2008 | | 1,978 | | | (2,263 | ) |
90-Day Eurodollar March Futures | | Long | | 03/2009 | | 20 | | | (29 | ) |
90-Day Eurodollar September Futures | | Long | | 09/2008 | | 178 | | | (57 | ) |
90-Day Euroyen December Futures | | Long | | 12/2007 | | 131 | | | (16 | ) |
United Kingdom 90-Day LIBOR Sterling Interest Rate December Futures | | Long | | 12/2007 | | 55 | | | (113 | ) |
United Kingdom 90-Day LIBOR Sterling Interest Rate June Futures | | Long | | 06/2008 | | 371 | | | (541 | ) |
United Kingdom 90-Day LIBOR Sterling Interest Rate March Futures | | Long | | 03/2008 | | 21 | | | (28 | ) |
United Kingdom 90-Day LIBOR Sterling Interest Rate September Futures | | Long | | 09/2007 | | 55 | | | (118 | ) |
United Kingdom 90-Day LIBOR Sterling Interest Rate September Futures | | Long | | 09/2008 | | 324 | | | (500 | ) |
U.S. Treasury 30-Year Bond September Futures | | Short | | 09/2007 | | 445 | | | (97 | ) |
| | | | | | | | | | |
| | | | | | | | $ | (6,582 | ) |
| | | | | | | | | | |
(d) Swap agreements outstanding on June 30, 2007:
Credit Default Swaps
| | | | | | | | | | | | | | | | |
| Counterparty | | Reference Entity | | Buy/Sell
Protection (1) | | (Pay)/Receive
Fixed Rate | | | Expiration
Date | | Notional
Amount | | Unrealized
Appreciation/
(Depreciation) | |
Deutsche Bank AG | | SOFTBANK Corp. 1.750% due 03/31/2014 | | Sell | | 2.300% | | | 09/20/2007 | | JPY | 54,000 | | $ | 2 | |
Bank of America | | Dow Jones CDX N.A. IG7 Index | | Buy | | (0.650% | ) | | 12/20/2016 | | $ | 2,000 | | | 17 | |
Barclays Bank PLC | | Ukraine Government International Bond 7.650% due 06/11/2013 | | Sell | | 0.710% | | | 12/20/2008 | | | 1,000 | | | 3 | |
Barclays Bank PLC | | Brazilian Government International Bond 12.250% due 03/06/2030 | | Sell | | 0.290% | | | 06/20/2009 | | | 4,000 | | | (4 | ) |
Barclays Bank PLC | | Russia Government International Bond 7.500% due 03/31/2030 | | Sell | | 0.275% | | | 06/20/2009 | | | 4,000 | | | (1 | ) |
Credit Suisse First Boston | | Ford Motor Credit Co. 7.000% due 10/01/2013 | | Sell | | 0.950% | | | 12/20/2007 | | | 300 | | | 0 | |
Deutsche Bank AG | | Dow Jones CDX N.A. IG8 Index | | Buy | | (0.600% | ) | | 06/20/2017 | | | 1,400 | | | 6 | |
HSBC Bank USA | | Ukraine Government International Bond 7.650% due 06/11/2013 | | Sell | | 0.730% | | | 04/20/2009 | | | 2,700 | | | 12 | |
HSBC Bank USA | | Ukraine Government International Bond 7.650% due 06/11/2013 | | Sell | | 0.520% | | | 05/20/2009 | | | 1,000 | | | 0 | |
HSBC Bank USA | | Ukraine Government International Bond 7.650% due 06/11/2013 | | Sell | | 0.490% | | | 06/20/2009 | | | 4,000 | | | (5 | ) |
JPMorgan Chase & Co. | | Multiple Reference Entities of Gazprom | | Sell | | 0.415% | | | 11/20/2007 | | | 5,100 | | | 6 | |
| | | | |
| 12 | | PIMCO Variable Insurance Trust | | See Accompanying Notes |
| | |
| |
| | | June 30, 2007 (Unaudited) |
| | | | | | | | | | | | | | |
| Counterparty | | Reference Entity | | Buy/Sell
Protection (1) | | (Pay)/Receive
Fixed Rate | | Expiration
Date | | Notional
Amount | | Unrealized
Appreciation |
Lehman Brothers, Inc. | | Brazilian Government International Bond 12.250% due 03/06/2030 | | Sell | | 0.240% | | 11/20/2007 | | $ | 3,600 | | $ | 2 |
Lehman Brothers, Inc. | | Ford Motor Credit Co. 7.000% due 10/01/2013 | | Sell | | 0.950% | | 12/20/2007 | | | 500 | | | 0 |
Lehman Brothers, Inc. | | Indonesia Government International Bond 6.750% due 03/10/2014 | | Sell | | 0.400% | | 12/20/2008 | | | 500 | | | 0 |
Lehman Brothers, Inc. | | Brazilian Government International Bond 12.250% due 03/06/2030 | | Sell | | 1.120% | | 11/20/2011 | | | 6,000 | | | 114 |
Morgan Stanley | | Russia Government International Bond 7.500% due 03/31/2030 | | Sell | | 0.245% | | 06/20/2008 | | | 200 | | | 0 |
Morgan Stanley | | Multiple Reference Entities of Gazprom | | Sell | | 0.860% | | 11/20/2011 | | | 2,600 | | | 34 |
Royal Bank of Scotland Group PLC | | Indonesia Government International Bond 6.750% due 03/10/2014 | | Sell | | 0.390% | | 12/20/2008 | | | 1,000 | | | 0 |
Royal Bank of Scotland Group PLC | | Indonesia Government International Bond 6.750% due 03/10/2014 | | Sell | | 0.438% | | 06/20/2009 | | | 4,000 | | | 0 |
| | | | | | | | | | | | | | |
| | | | | | | | | | | | | $ | 186 |
| | | | | | | | | | | | | | |
(1) If the Portfolio is a seller of protection and a credit event occurs, as defined under the terms of that particular swap agreement, the Portfolio will pay to the buyer of the protection an amount up to the notional value of the swap and in certain instances, take delivery of the security. As a buyer of protection, the Portfolio will generally receive from the seller of protection an amount up to the notional amount of the swap if a credit event occurs.
Interest Rate Swaps
| | | | | | | | | | | | | | | |
| Counterparty | | Floating Rate Index | | Pay/Receive
Floating Rate | | Fixed Rate | | Expiration
Date | | Notional
Amount | | Unrealized
Appreciation/
(Depreciation) | |
Deutsche Bank AG | | 6-Month Australian Bank Bill | | Pay | | 7.000% | | 12/15/2009 | | AUD | 2,100 | | $ | (1 | ) |
Barclays Bank PLC | | BRL-CDI-Compounded | | Pay | | 11.360% | | 01/04/2010 | | BRL | 4,200 | | | 24 | |
Goldman Sachs & Co. | | BRL-CDI-Compounded | | Pay | | 11.465% | | 01/04/2010 | | | 1,100 | | | 8 | |
Merrill Lynch & Co., Inc. | | BRL-CDI-Compounded | | Pay | | 11.430% | | 01/04/2010 | | | 2,700 | | | 18 | |
Merrill Lynch & Co., Inc. | | BRL-CDI-Compounded | | Pay | | 12.948% | | 01/04/2010 | | | 1,400 | | | 29 | |
Morgan Stanley | | BRL-CDI-Compounded | | Pay | | 12.780% | | 01/04/2010 | | | 1,500 | | | 27 | |
Barclays Bank PLC | | 5-Year French CPI Ex Tobacco Daily Reference Index | | Pay | | 1.960% | | 04/05/2012 | | EUR | 300 | | | (3 | ) |
BNP Paribas Bank | | 5-Year French CPI Ex Tobacco Daily Reference Index | | Pay | | 2.090% | | 10/15/2010 | | | 1,300 | | | 16 | |
Deutsche Bank AG | | 6-Month EUR-LIBOR | | Receive | | 4.000% | | 12/15/2011 | | | 4,600 | | | 94 | |
Goldman Sachs & Co. | | 6-Month EUR-LIBOR | | Pay | | 4.000% | | 03/20/2009 | | | 2,400 | | | (17 | ) |
Goldman Sachs & Co. | | 5-Year French CPI Ex Tobacco Daily Reference Index | | Pay | | 1.960% | | 03/30/2012 | | | 600 | | | (5 | ) |
JPMorgan Chase & Co. | | 5-Year French CPI Ex Tobacco Daily Reference Index | | Pay | | 1.948% | | 03/15/2012 | | | 1,100 | | | (11 | ) |
JPMorgan Chase & Co. | | 5-Year French CPI Ex Tobacco Daily Reference Index | | Pay | | 1.958% | | 04/10/2012 | | | 3,600 | | | (38 | ) |
Royal Bank of Scotland Group PLC | | 5-Year French CPI Ex Tobacco Daily Reference Index | | Pay | | 1.955% | | 03/28/2012 | | | 900 | | | (9 | ) |
Royal Bank of Scotland Group PLC | | 5-Year French CPI Ex Tobacco Daily Reference Index | | Pay | | 1.950% | | 03/30/2012 | | | 1,300 | | | (13 | ) |
Barclays Bank PLC | | 6-Month GBP-LIBOR | | Pay | | 6.000% | | 12/20/2008 | | GBP | 5,900 | | | (58 | ) |
Barclays Bank PLC | | 6-Month GBP-LIBOR | | Pay | | 6.000% | | 03/20/2009 | | | 3,400 | | | (49 | ) |
Credit Suisse First Boston | | 6-Month GBP-LIBOR | | Pay | | 5.000% | | 06/15/2009 | | | 700 | | | (17 | ) |
Deutsche Bank AG | | 6-Month GBP-LIBOR | | Pay | | 6.000% | | 12/20/2008 | | | 3,500 | | | (35 | ) |
Deutsche Bank AG | | 6-Month GBP-LIBOR | | Receive | | 4.000% | | 12/15/2036 | | | 6,000 | | | 525 | |
HSBC Bank USA | | 6-Month GBP-LIBOR | | Pay | | 4.500% | | 12/20/2007 | | | 1,700 | | | (26 | ) |
Lehman Brothers, Inc. | | 6-Month GBP-LIBOR | | Pay | | 4.500% | | 09/20/2009 | | | 200 | | | (13 | ) |
Royal Bank of Scotland Group PLC | | 6-Month GBP-LIBOR | | Pay | | 6.000% | | 03/20/2009 | | | 3,100 | | | (46 | ) |
Barclays Bank PLC | | 6-Month JPY-LIBOR | | Pay | | 1.000% | | 03/18/2009 | | JPY | 310,000 | | | (7 | ) |
Deutsche Bank AG | | 6-Month JPY-LIBOR | | Pay | | 1.000% | | 09/18/2008 | | | 2,290,000 | | | (12 | ) |
Deutsche Bank AG | | 6-Month JPY-LIBOR | | Pay | | 1.000% | | 03/18/2009 | | | 500,000 | | | (7 | ) |
UBS Warburg LLC | | 6-Month JPY-LIBOR | | Pay | | 1.000% | | 09/18/2008 | | | 160,000 | | | (1 | ) |
UBS Warburg LLC | | 6-Month JPY-LIBOR | | Pay | | 1.000% | | 03/18/2009 | | | 2,940,000 | | | (42 | ) |
Goldman Sachs & Co. | | 28-Day Mexico Interbank TIIE Banxico | | Pay | | 7.780% | | 04/03/2012 | | MXN | 12,200 | | | (10 | ) |
Bank of America | | 3-Month USD-LIBOR | | Pay | | 5.000% | | 12/19/2009 | | $ | 13,600 | | | (15 | ) |
Deutsche Bank AG | | 3-Month USD-LIBOR | | Pay | | 5.000% | | 12/19/2009 | | | 41,900 | | | 18 | |
Deutsche Bank AG | | 3-Month USD-LIBOR | | Receive | | 5.000% | | 12/19/2017 | | | 11,100 | | | (84 | ) |
Morgan Stanley | | 3-Month USD-LIBOR | | Pay | | 5.000% | | 06/20/2009 | | | 20,300 | | | (160 | ) |
Morgan Stanley | | 3-Month USD-LIBOR | | Receive | | 5.000% | | 12/19/2017 | | | 3,800 | | | (25 | ) |
| | | | | | | | | | | | | | | |
| | | | | | | | | | | | | $ | 55 | |
| | | | | | | | | | | | | | | |
(e) Purchased options outstanding on June 30, 2007:
Interest Rate Swaptions
| | | | | | | | | | | | | | | | | | | |
| Description | | Counterparty | | Floating Rate Index | | Pay/Receive
Floating Rate | | Exercise
Rate | | Expiration
Date | | Notional
Amount | | Cost | | Value |
Call - OTC 2-Year Interest Rate Swap | | Barclays Bank PLC | | 6-Month EUR-LIBOR | | Pay | | 3.960% | | 07/02/2007 | | EUR | 6,000 | | $ | 28 | | $ | 0 |
Call - OTC 2-Year Interest Rate Swap | | Bank of America | | 3-Month USD-LIBOR | | Pay | | 4.900% | | 08/08/2007 | | $ | 9,000 | | | 40 | | | 0 |
Call - OTC 2-Year Interest Rate Swap | | Bank of America | | 3-Month USD-LIBOR | | Pay | | 4.750% | | 09/26/2008 | | | 44,000 | | | 208 | | | 87 |
Call - OTC 2-Year Interest Rate Swap | | Lehman Brothers, Inc. | | 3-Month USD-LIBOR | | Pay | | 4.750% | | 03/31/2008 | | | 13,800 | | | 77 | | | 17 |
Call - OTC 2-Year Interest Rate Swap | | Lehman Brothers, Inc. | | 3-Month USD-LIBOR | | Pay | | 4.750% | | 09/26/2008 | | | 5,200 | | | 18 | | | 10 |
Call - OTC 2-Year Interest Rate Swap | | Royal Bank of Scotland Group PLC | | 3-Month USD-LIBOR | | Pay | | 4.750% | | 07/02/2007 | | | 10,000 | | | 41 | | | 0 |
Call - OTC 1-Year Interest Rate Swap | | Royal Bank of Scotland Group PLC | | 3-Month USD-LIBOR | | Pay | | 4.850% | | 07/02/2007 | | | 30,000 | | | 78 | | | 0 |
Call - OTC 1-Year Interest Rate Swap | | Royal Bank of Scotland Group PLC | | 3-Month USD-LIBOR | | Pay | | 4.900% | | 08/08/2007 | | | 36,000 | | | 81 | | | 0 |
Call - OTC 2-Year Interest Rate Swap | | Royal Bank of Scotland Group PLC | | 3-Month USD-LIBOR | | Pay | | 5.000% | | 02/01/2008 | | | 45,700 | | | 227 | | | 73 |
Call - OTC 2-Year Interest Rate Swap | | Royal Bank of Scotland Group PLC | | 3-Month USD-LIBOR | | Pay | | 4.750% | | 03/31/2008 | | | 63,600 | | | 371 | | | 79 |
Call - OTC 2-Year Interest Rate Swap | | Royal Bank of Scotland Group PLC | | 3-Month USD-LIBOR | | Pay | | 5.000% | | 12/15/2008 | | | 62,700 | | | 218 | | | 212 |
| | | | | | | | | | | | | | | | | | | |
| | | | | | | | | | | | | | | $ | 1,387 | | $ | 478 |
| | | | | | | | | | | | | | | | | | | |
| | | | | | |
| See Accompanying Notes | | Semiannual Report | | June 30, 2007 | | 13 |
Schedule of Investments Low Duration Portfolio (Cont.)
Foreign Currency Options
| | | | | | | | | | | | | | |
| Description | | Exercise
Price | | Expiration
Date | | Notional
Amount | | Cost | | Value |
Call - OTC U.S. dollar versus Japanese yen | | JPY | 103.800 | | 03/17/2010 | | $ | 1,000 | | $ | 44 | | $ | 77 |
Put - OTC U.S. dollar versus Japanese yen | | | 103.800 | | 03/17/2010 | | | 1,000 | | | 44 | | | 25 |
Call - OTC U.S. dollar versus Japanese yen | | | 104.650 | | 03/31/2010 | | | 1,000 | | | 45 | | | 71 |
Put - OTC U.S. dollar versus Japanese yen | | | 104.650 | | 03/31/2010 | | | 1,000 | | | 39 | | | 27 |
Call - OTC U.S. dollar versus Japanese yen | | | 105.200 | | 03/31/2010 | | | 1,000 | | | 42 | | | 68 |
Put - OTC U.S. dollar versus Japanese yen | | | 105.200 | | 03/31/2010 | | | 1,000 | | | 42 | | | 28 |
Call - OTC U.S. dollar versus Japanese yen | | | 105.400 | | 03/31/2010 | | | 3,000 | | | 126 | | | 201 |
Put - OTC U.S. dollar versus Japanese yen | | | 105.400 | | 03/31/2010 | | | 3,000 | | | 126 | | | 85 |
| | | | | | | | | | | | | | |
| | | | | | | | | | $ | 508 | | $ | 582 |
| | | | | | | | | | | | | | |
(f) Written options outstanding on June 30, 2007:
Interest Rate Swaptions
| | | | | | | | | | | | | | | | | | | |
| Description | | Counterparty | | Floating Rate Index | | Pay/Receive
Floating Rate | | Exercise
Rate | | Expiration
Date | | Notional
Amount | | Premium | | Value |
Call - OTC 5-Year Interest Rate Swap | | Barclays Bank PLC | | 6-Month EUR-LIBOR | | Receive | | 4.100% | | 07/02/2007 | | EUR | 2,000 | | $ | 24 | | $ | 0 |
Call - OTC 5-Year Interest Rate Swap | | Bank of America | | 3-Month USD-LIBOR | | Receive | | 4.950% | | 09/26/2008 | | $ | 19,000 | | | 209 | | | 96 |
Call - OTC 5-Year Interest Rate Swap | | Lehman Brothers, Inc. | | 3-Month USD-LIBOR | | Receive | | 4.900% | | 03/31/2008 | | | 6,000 | | | 73 | | | 18 |
Call - OTC 5-Year Interest Rate Swap | | Lehman Brothers, Inc. | | 3-Month USD-LIBOR | | Receive | | 4.950% | | 09/26/2008 | | | 2,300 | | | 19 | | | 12 |
Call - OTC 5-Year Interest Rate Swap | | Royal Bank of Scotland Group PLC | | 3-Month USD-LIBOR | | Receive | | 4.950% | | 07/02/2007 | | | 7,600 | | | 82 | | | 0 |
Call - OTC 5-Year Interest Rate Swap | | Royal Bank of Scotland Group PLC | | 3-Month USD-LIBOR | | Receive | | 5.000% | | 07/02/2007 | | | 4,500 | | | 47 | | | 0 |
Call - OTC 7-Year Interest Rate Swap | | Royal Bank of Scotland Group PLC | | 3-Month USD-LIBOR | | Receive | | 4.900% | | 08/08/2007 | | | 6,000 | | | 70 | | | 0 |
Call - OTC 7-Year Interest Rate Swap | | Royal Bank of Scotland Group PLC | | 3-Month USD-LIBOR | | Receive | | 5.000% | | 08/08/2007 | | | 3,000 | | | 34 | | | 0 |
Call - OTC 5-Year Interest Rate Swap | | Royal Bank of Scotland Group PLC | | 3-Month USD-LIBOR | | Receive | | 5.100% | | 02/01/2008 | | | 20,000 | | | 240 | | | 72 |
Call - OTC 5-Year Interest Rate Swap | | Royal Bank of Scotland Group PLC | | 3-Month USD-LIBOR | | Receive | | 4.900% | | 03/31/2008 | | | 14,700 | | | 196 | | | 45 |
Call - OTC 5-Year Interest Rate Swap | | Royal Bank of Scotland Group PLC | | 3-Month USD-LIBOR | | Receive | | 4.950% | | 03/31/2008 | | | 13,000 | | | 160 | | | 44 |
Call - OTC 7-Year Interest Rate Swap | | Royal Bank of Scotland Group PLC | | 3-Month USD-LIBOR | | Receive | | 5.200% | | 12/15/2008 | | | 20,900 | | | 209 | | | 205 |
| | | | | | | | | | | | | | | | | | | |
| | | | | | | | | | | | | | | $ | 1,363 | | $ | 492 |
| | | | | | | | | | | | | | | | | | | |
(g) Short sales outstanding on June 30, 2007:
| | | | | | | | | | | | | |
| Description | | Coupon | | Maturity
Date | | Principal
Amount | | Proceeds | | Value (2) |
Fannie Mae | | 5.500% | | 07/01/2037 | | $ | 4,000 | | $ | 3,885 | | $ | 3,858 |
U.S. Treasury Notes | | 4.625% | | 02/15/2017 | | | 2,800 | | | 2,723 | | | 2,763 |
| | | | | | | | | | | | | |
| | | | | | | | | $ | 6,608 | | $ | 6,621 |
| | | | | | | | | | | | | |
(2) Market value includes $50 of interest payable on short sales.
(h) Foreign currency contracts outstanding on June 30, 2007:
| | | | | | | | | | | | | | | | | |
| Type | | Currency | | Principal
Amount
Covered by
Contract | | Settlement
Month | | Unrealized
Appreciation | | Unrealized
(Depreciation) | | | Net Unrealized
Appreciation/
(Depreciation) | |
Buy | | AUD | | 3,792 | | 07/2007 | | $ | 23 | | $ | 0 | | | $ | 23 | |
Sell | | | | 34 | | 07/2007 | | | 0 | | | 0 | | | | 0 | |
Buy | | BRL | | 29,907 | | 10/2007 | | | 572 | | | 0 | | | | 572 | |
Buy | | | | 14,977 | | 03/2008 | | | 478 | | | 0 | | | | 478 | |
Buy | | CAD | | 2,735 | | 08/2007 | | | 11 | | | 0 | | | | 11 | |
Buy | | CLP | | 130,534 | | 03/2008 | | | 0 | | | (1 | ) | | | (1 | ) |
Buy | | CNY | | 768 | | 09/2007 | | | 2 | | | 0 | | | | 2 | |
Sell | | | | 768 | | 09/2007 | | | 0 | | | 0 | | | | 0 | |
Buy | | | | 11,517 | | 11/2007 | | | 12 | | | 0 | | | | 12 | |
Sell | | | | 14,080 | | 11/2007 | | | 1 | | | (4 | ) | | | (3 | ) |
Buy | | | | 4,059 | | 01/2008 | | | 0 | | | (4 | ) | | | (4 | ) |
Sell | | | | 4,059 | | 01/2008 | | | 0 | | | (1 | ) | | | (1 | ) |
Buy | | EUR | | 5,466 | | 07/2007 | | | 72 | | | 0 | | | | 72 | |
Sell | | GBP | | 3,730 | | 08/2007 | | | 0 | | | (39 | ) | | | (39 | ) |
Buy | | INR | | 41,409 | | 10/2007 | | | 4 | | | 0 | | | | 4 | |
Buy | | | | 4,970 | | 11/2007 | | | 0 | | | (1 | ) | | | (1 | ) |
Buy | | | | 260,547 | | 05/2008 | | | 59 | | | 0 | | | | 59 | |
Buy | | KRW | | 2,631,872 | | 07/2007 | | | 17 | | | 0 | | | | 17 | |
Sell | | | | 177,295 | | 07/2007 | | | 0 | | | (1 | ) | | | (1 | ) |
Buy | | | | 1,082,809 | | 08/2007 | | | 0 | | | 0 | | | | 0 | |
Buy | | | | 987,632 | | 09/2007 | | | 7 | | | 0 | | | | 7 | |
Sell | | | | 241,906 | | 09/2007 | | | 0 | | | (5 | ) | | | (5 | ) |
Buy | | MXN | | 14,088 | | 09/2007 | | | 18 | | | 0 | | | | 18 | |
Buy | | | | 34,243 | | 03/2008 | | | 19 | | | (5 | ) | | | 14 | |
| | | | |
| 14 | | PIMCO Variable Insurance Trust | | See Accompanying Notes |
| | |
| |
| | | June 30, 2007 (Unaudited) |
| | | | | | | | | | | | | | | | | |
| Type | | Currency | | Principal
Amount
Covered by
Contract | | Settlement
Month | | Unrealized
Appreciation | | Unrealized
(Depreciation) | | | Net Unrealized
Appreciation/
(Depreciation) | |
Buy | | MYR | | 6,017 | | 05/2008 | | $ | 0 | | $ | (13 | ) | | $ | (13 | ) |
Buy | | NZD | | 408 | | 07/2007 | | | 8 | | | 0 | | | | 8 | |
Buy | | PHP | | 14,604 | | 05/2008 | | | 0 | | | (3 | ) | | | (3 | ) |
Buy | | PLN | | 11,325 | | 09/2007 | | | 76 | | | (1 | ) | | | 75 | |
Buy | | RUB | | 35,543 | | 09/2007 | | | 18 | | | 0 | | | | 18 | |
Buy | | | | 21,548 | | 11/2007 | | | 21 | | | 0 | | | | 21 | |
Buy | | | | 50,111 | | 12/2007 | | | 45 | | | 0 | | | | 45 | |
Buy | | | | 85,054 | | 01/2008 | | | 17 | | | 0 | | | | 17 | |
Buy | | SEK | | 5,098 | | 09/2007 | | | 9 | | | 0 | | | | 9 | |
Buy | | SGD | | 5,064 | | 07/2007 | | | 0 | | | (18 | ) | | | (18 | ) |
Sell | | | | 2,968 | | 07/2007 | | | 0 | | | (11 | ) | | | (11 | ) |
Buy | | | | 2,154 | | 08/2007 | | | 8 | | | (2 | ) | | | 6 | |
Buy | | | | 172 | | 09/2007 | | | 0 | | | 0 | | | | 0 | |
Buy | | | | 4,887 | | 10/2007 | | | 17 | | | 0 | | | | 17 | |
Buy | | ZAR | | 106 | | 09/2007 | | | 0 | | | 0 | | | | 0 | |
Buy | | | | 202 | | 03/2008 | | | 0 | | | 0 | | | | 0 | |
| | | | | | | | | | | | | | | | | |
| | | | | | | | $ | 1,514 | | $ | (109 | ) | | $ | 1,405 | |
| | | | | | | | | | | | | | | | | |
| | | | | | |
| See Accompanying Notes | | Semiannual Report | | June 30, 2007 | | 15 |
Notes to Financial Statements
1. ORGANIZATION
The Low Duration Portfolio (the “Portfolio”) is a series of the PIMCO Variable Insurance Trust (the “Trust”). The Trust is registered under the Investment Company Act of 1940 (the “Act”), as amended, as an open-end management investment company organized as a Delaware business trust on October 3, 1997. The Portfolio offers three classes of shares: Institutional, Administrative and Advisor. Information presented on these financial statements pertains to the Administrative Class of the Portfolio. Certain detailed financial information for the Institutional Class and Advisor Class is provided separately and is available upon request. The Trust is designed to be used as an investment vehicle by Separate Accounts of insurance companies that fund variable annuity contracts and variable life insurance policies and by qualified pension and retirement plans.
2. SIGNIFICANT ACCOUNTING POLICIES
The following is a summary of significant accounting policies consistently followed by the Portfolio in the preparation of its financial statements in conformity with accounting principles generally accepted in the United States of America (“GAAP”). The preparation of financial statements in accordance with GAAP requires management to make estimates and assumptions that affect the reported amounts and disclosures on the financial statements. Actual results could differ from those estimates.
(a) Security Valuation Portfolio securities are valued as of the close of regular trading (normally 4:00 p.m., Eastern Time) on each day that the New York Stock Exchange (“NYSE”) is open. Portfolio securities and other assets for which market quotes are readily available are stated at market value. Market value is generally determined on the basis of last reported sales prices, or if no sales are reported, based on quotes obtained from a quotation reporting system, established market makers, or pricing services. Fixed-income securities and non-exchange traded derivatives are normally valued on the basis of quotes obtained from brokers and dealers or pricing services. Prices obtained from independent pricing services use information provided by market makers or estimates of market values obtained from yield data relating to investments or securities with similar characteristics. Certain fixed income securities purchased on a delayed-delivery basis are marked to market daily until settlement at the forward settlement date. Short-term investments having a maturity of 60 days or less are generally valued at amortized cost. Exchange traded options, futures and options on futures are valued at the settlement price determined by the relevant exchange. With respect to any portion of the Portfolio’s assets that are invested in one or more open end management investment companies, the Portfolio’s net asset value (“NAV”) will be calculated based upon the NAVs of such investments.
Investments initially valued in currencies other than the U.S. dollar are converted to the U.S. dollar using exchange rates obtained from pricing services. As a result, the NAV of the Portfolio’s securities may be affected by changes in the value of currencies in relation to the U.S. dollar. The value of securities traded in markets outside the United States or denominated in currencies other than the U.S. dollar may be affected significantly on a day that the NYSE is closed and an investor is not able to purchase, redeem or exchange shares.
Securities and other assets for which market quotes are not readily available are valued at fair value as determined in good faith by the Board of Trustees or persons acting at their direction. The Board of Trustees has adopted methods for valuing securities and other assets in circumstances where market quotes are not readily available, and has delegated to Pacific Investment Management Company LLC (“PIMCO”) the responsibility for applying the valuation methods. In the event that market quotes are not readily available, and the security or asset cannot be valued pursuant to one of the valuation methods, the value of the security or asset will be determined in good faith by the Valuation Committee of the Board of Trustees, generally based upon recommendations provided by PIMCO.
Market quotes are considered not readily available in circumstances where there is an absence of current or reliable market-based data (e.g., trade information, bid/asked information, broker quotes), including where events occur after the close of the relevant market, but prior to the close of regular trading, that materially affect the values of the Portfolio’s securities or assets. In addition, market quotes are considered not readily available when, due to extraordinary circumstances, the exchanges or markets on which the securities trade, do not open for trading for the entire day and no other market prices are available. The Board has delegated to PIMCO the responsibility for monitoring significant events that may materially affect the values of the Portfolio’s securities or assets and for determining whether the value of the applicable securities or assets should be re-evaluated in light of such significant events.
When the Portfolio uses fair value pricing to determine its NAV, securities will not be priced on the basis of quotations from the primary market in which they are traded, but rather may be priced by another method that the Board of Trustees or persons acting at their direction believe accurately reflects fair value. The Trust’s policy is intended to result in a calculation of the Portfolio’s NAV that fairly reflects security values as of the time of pricing. However, fair values determined by the Board of Trustees or persons acting at their direction may not accurately reflect the price that the Portfolio could obtain for a security if it were to dispose of that security as of the time of pricing. Because foreign securities can trade on non-business days of the Portfolio, the NAV of the Portfolio may change on days when shareholders will not be able to purchase or redeem Portfolio shares. The prices used by the Portfolio may differ from the value that would be realized if the securities were sold and the differences could be material to the financial statements.
(b) Securities Transactions and Investment Income Securities transactions are recorded as of the trade date for financial reporting purposes. Securities purchased or sold on a when-issued or delayed-delivery basis may be settled a month or more after the trade date. Realized gains and losses from securities sold are recorded on the identified cost basis. Dividend income is recorded on the ex-dividend date, except certain dividends from foreign securities where the ex-dividend date may have passed, which are recorded as soon as the Portfolio is informed of the ex-dividend date. Interest income, adjusted for the accretion of discounts and amortization of premiums, is recorded on the accrual basis. Paydown gains and losses on mortgage-related and other asset-backed securities are recorded as components of interest income on the Statement of Operations.
(c) Delayed-Delivery Transactions The Portfolio may purchase or sell securities on a delayed-delivery basis. These transactions involve a commitment by the Portfolio to purchase or sell securities for a predetermined price or yield, with payment and delivery taking place beyond the customary settlement period. When delayed-delivery purchases are outstanding, the Portfolio will designate liquid assets in an amount sufficient to meet the purchase price. When purchasing a security on a delayed-delivery basis, the Portfolio assumes the rights and risks of ownership of the security, including the risk of price and yield fluctuations, and takes such fluctuations into account when determining its net asset value. The Portfolio may dispose of or renegotiate a delayed-delivery transaction after it is entered into, and may sell when-issued securities before they are delivered, which may result in a capital gain or loss. When the Portfolio has sold a security on a delayed-delivery basis, the Portfolio does not participate in future gains and losses with respect to the security.
(d) Dividends and Distributions to Shareholders Dividends from net investment income, if any, are declared daily and distributed to shareholders monthly. Net realized capital gains earned by the Portfolio, if any, will be distributed no less frequently than once each year.
Income dividends and capital gain distributions are determined in accordance with income tax regulations which may differ from GAAP. Differences between tax regulations and GAAP may change the fiscal year when income and capital items
| | | | |
| 16 | | PIMCO Variable Insurance Trust | | |
| | |
| |
| | | June 30, 2007 (Unaudited) |
are recognized for tax and GAAP purposes. Examples of events that give rise to timing differences include wash sales, straddles, net operating losses and capital loss carryforwards. Further, the character of investment income and capital gains may be different for certain transactions under the two methods of accounting. Examples of characterization differences include the treatment of mortgage paydowns, swaps, foreign currency transactions and contingent debt instruments. As a result, income dividends and capital gain distributions declared during a fiscal period may differ significantly from the net investment income and realized capital gain reported on the Portfolio’s annual financial statements presented under GAAP.
Distributions classified as a tax basis return of capital, if any, are reflected on the accompanying Statements of Changes in Net Assets and have been reclassified to paid in capital. In addition, other amounts have been reclassified between undistributed net investment income, accumulated undistributed net realized gains or losses and/or paid in capital to more appropriately conform financial accounting to tax characterizations of dividend distributions.
(e) Multiclass Operations Each class offered by the Portfolio has equal rights as to assets and voting privileges (except that shareholders of a class have exclusive voting rights regarding any matter relating solely to that class of shares). Income and non-class specific expenses of the Portfolio are allocated daily to each class of shares based on the relative value of settled shares. Realized and unrealized capital gains and losses of the Portfolio are allocated daily to each class of shares based on the relative net assets of each class. Class specific expenses, where applicable, currently include administrative, distribution and servicing fees.
(f) Foreign Currency The functional and reporting currency for the Portfolio is the U.S. dollar. The market values of foreign securities, currency holdings and other assets and liabilities are translated into U.S. dollars based on the current exchange rates each business day. Fluctuations in the value of currency holdings and other assets and liabilities resulting from changes in exchange rates are recorded as unrealized foreign currency gains or losses. Realized gains or losses and unrealized appreciation or depreciation on investment securities and income and expenses are translated on the respective dates of such transactions. The effects of changes in foreign currency exchange rates on investments in securities are not segregated on the Statement of Operations from the effects of changes in market prices of those securities, but are included with the net realized and unrealized gain or loss on investment securities.
| | | | | | |
|
Non-U.S. currency symbols utilized throughout the report are defined
as follows: |
| AUD | | Australian Dollar | | MXN | | Mexican Peso |
| BRL | | Brazilian Real | | MYR | | Malaysian Ringgit |
| CAD | | Canadian Dollar | | NZD | | New Zealand Dollar |
| CLP | | Chilean Peso | | PHP | | Philippines Peso |
| CNY | | Chinese Yuan Renminbi | | PLN | | Polish Zloty |
| EUR | | Euro | | RUB | | Russian Ruble |
| GBP | | Great British Pound | | SEK | | Swedish Krona |
| INR | | Indian Rupee | | SGD | | Singapore Dollar |
| JPY | | Japanese Yen | | ZAR | | South African Rand |
| KRW | | South Korean Won | | | | |
| | | | | | |
(g) Foreign Currency Transactions The Portfolio may enter into foreign currency contracts in connection with settling planned purchases or sales of securities, to hedge the currency exposure associated with some or all of the Portfolio’s securities or as a part of an investment strategy. A foreign currency
contract is an agreement between two parties to buy and sell a currency at a set price on a future date. The market value of a foreign currency contract fluctuates with changes in foreign currency exchange rates. Foreign currency contracts are marked to market daily and the change in value is recorded by the Portfolio as an unrealized gain or loss. Realized gains or losses equal to the difference between the value of the contract at the time it was opened and the value at the time it was closed are recorded upon delivery or receipt of the currency. These contracts may involve market risk in excess of the unrealized gain or loss reflected on the Statement of Assets and Liabilities. In addition, the Portfolio could be exposed to risk if the counterparties are unable to meet the terms of the contracts or if the value of the currency changes unfavorably to the U.S. dollar.
(h) Futures Contracts The Portfolio may enter into futures contracts. The Portfolio may use futures contracts to manage its exposure to the securities markets or to movements in interest rates and currency values. The primary risks associated with the use of futures contracts are the imperfect correlation between the change in market value of the securities held by the Portfolio and the prices of futures contracts, the possibility of an illiquid market, and the inability of the counterparty to meet the terms of the contract. Futures contracts are valued based upon their quoted daily settlement prices. Upon entering into a futures contract, the Portfolio is required to deposit with its futures broker, an amount of cash or U.S. Government and Agency Obligations in accordance with the initial margin requirements of the broker or exchange. Futures contracts are marked to market daily and an appropriate payable or receivable for the change in value (“variation margin”) is recorded by the Portfolio. Gains or losses are recognized but not considered realized until the contracts expire or are closed. Futures contracts involve, to varying degrees, risk of loss in excess of the variation margin disclosed on the Statement of Assets and Liabilities.
(i) Options Contracts The Portfolio may write call and put options on futures, swaps, securities or currencies it owns or in which it may invest. Writing put options tends to increase the Portfolio’s exposure to the underlying instrument. Writing call options tends to decrease the Portfolio’s exposure to the underlying instrument. When the Portfolio writes a call or put option, an amount equal to the premium received is recorded as a liability and subsequently marked to market to reflect the current value of the option written. These liabilities are reflected as written options outstanding on the Statement of Assets and Liabilities. Certain options may be written with premiums to be determined on a future date. The premiums for these options are based upon implied volatility parameters at specified terms. Premiums received from writing options which expire are treated as realized gains. Premiums received from writing options which are exercised or closed are added to the proceeds or offset against amounts paid on the underlying future, swap, security or currency transaction to determine the realized gain or loss. The Portfolio as a writer of an option has no control over whether the underlying future, swap, security or currency may be sold (call) or purchased (put) and as a result bears the market risk of an unfavorable change in the price of the future, swap, security or currency underlying the written option. There is the risk the Portfolio may not be able to enter into a closing transaction because of an illiquid market.
The Portfolio may also purchase put and call options. Purchasing call options tends to increase the Portfolio’s exposure to the underlying instrument. Purchasing put options tends to decrease the Portfolio’s exposure to the underlying instrument. The Portfolio pays a premium which is included on the Statement of Assets and Liabilities as an investment and subsequently marked to market to reflect the current value of the option. Premiums paid for purchasing options which expire are treated as realized losses. Certain options may be purchased with premiums to be determined on a future date. The premiums for these options are based upon implied volatility parameters at specified terms. The risk associated with purchasing put and call options is limited to the premium paid. Premiums paid for purchasing options which are exercised or closed are added to the amounts paid or
| | | | | | |
| | Semiannual Report | | June 30, 2007 | | 17 |
Notes to Financial Statements (Cont.)
offset against the proceeds on the underlying future, swap, security or currency transaction to determine the realized gain or loss.
(j) Repurchase Agreements The Portfolio may engage in repurchase transactions. Under the terms of a typical repurchase agreement, the Portfolio takes possession of an underlying debt obligation (collateral) subject to an obligation of the seller to repurchase, and the Portfolio to resell, the obligation at an agreed-upon price and time. The underlying securities for all repurchase agreements are held in safekeeping at the Portfolio’s custodian or designated subcustodians under tri-party repurchase agreements. The market value of the collateral must be equal to or exceed the total amount of the repurchase obligations, including interest. Securities purchased under repurchase agreements are reflected as an asset on the Statement of Assets and Liabilities. Generally, in the event of counterparty default, the Portfolio has the right to use the collateral to offset losses incurred. If the counterparty should default, the Portfolio will seek to sell the securities which it holds as collateral. This could involve procedural costs or delays in addition to a loss on the securities if their value should fall below their repurchase price.
(k) Inverse Floating Rate Transactions—Residual Interest Municipal Bonds (“RIBs”)/Residual Interest Tax Exempt Bonds (“RITEs”) The Portfolio may invest in RIBs and RITEs (“Inverse Floaters”). Inverse Floaters are created via a master trust agreement between a broker-dealer, acting as trustor and liquidity provider, and an investment bank, acting as trustee and tender agent. The master trust agreement defines the terms for each trust series; with each series being established by the transfer of long-term, fixed-rate municipal bonds (“Fixed Rate Bonds”) to the trustee to be held and provide for the creation, execution and delivery of floater certificates (“Floating Rate Notes”) and Inverse Floaters. Floating Rate Notes are liquid notes that are issued with a short-term variable rate typically linked to the LIBOR, subject to limitations, for some duration. After interest income is paid on the Floating Rate Notes at current rates, the residual income from the Fixed Rate Bonds is paid to the Inverse Floaters. Inverse Floaters are issued with a coupon that fluctuates inversely with the Floating Rate Notes’ referenced rate, subject to certain limitations. Therefore, rising short-term rates result in lower income for the Inverse Floaters and vice versa.
Floating Rate Notes are generally remarketed to municipal money market funds. Inverse Floaters are acquired by either tax-exempt municipal bond funds or trusts, or other parties interested in potentially higher yielding tax-exempt securities. Inverse Floaters may also be acquired for the purpose of increasing leverage. Floating Rate Note holders typically have the option to tender their notes to the liquidity provider for redemption at par at each reset date. The Inverse Floater holders have the option to (i) require the Floating Rate Note holders to tender their notes at par, and (ii) require the liquidity provider to transfer the Fixed Rate Bonds to the Inverse Floater holders. The holders of Inverse Floaters bear substantially all of the downside investment risk associated with the underlying Fixed Rate Bonds, and also benefit from a disproportionate amount of the potential appreciation of the underlying Fixed Rate Bonds’ value. Inverse Floaters may be more volatile and less liquid than other municipal bonds of comparable maturity.
Inverse Floaters may be acquired with or without first transferring to the trustor the Fixed Rate Bonds that were utilized to create the trust series. Inverse Floaters acquired without a transfer of Fixed Rate Bonds are recognized as purchases of securities as outlined in Note 2(b). Statement of Financial Accounting Standards No. 140—Accounting for Transfers and Servicing of Financial Assets and Extinguishments of Liabilities (“FAS No. 140”), governs the standards for accounting for securitizations and other transfers of financial assets. If there is a transfer of Fixed Rate Bonds and it meets sale criteria under FAS No. 140, a Portfolio records a sale of the Fixed Rate Bonds and a purchase of the Inverse Floaters. The cash received from the Inverse Floaters is then recorded as interest income in the Statement of Operations.
If the transfer of Fixed Rate Bonds does not meet sale criteria under FAS No. 140, a Portfolio accounts for the transaction described above as a secured borrowing by including the Fixed Rate Bonds in its Schedule of Investments, and recording the Floating Rate Notes as a liability under the caption “Payable for floating rate notes” in the Portfolio’s Statement of Assets and Liabilities. In a secured borrowing transaction, cash received from the Inverse Floaters is not recorded as interest income. Instead, a Portfolio records interest income related to the Fixed Rate Bonds and interest expense related to the Floating Rate Notes, the net of which is equal to the cash received from the Inverse Floaters acquired by the Portfolio. Thus, while a Portfolio’s reported total income, net expenses, and net expense ratio are generally higher for investments in Inverse Floaters acquired via a secured borrowing, the method of acquiring Inverse Floaters does not result in differences for reported cash flows, net asset value or total return.
(l) Short Sales The Portfolio may enter into short sales transactions. A short sale is a transaction in which the Portfolio sells securities it does not own in anticipation of a decline in the market price of the securities. Securities sold in short sale transactions and interest payable on such securities, if any, are reflected as a liability on the Statement of Assets and Liabilities. The Portfolio is obligated to deliver securities at the market price at the time the short position is closed. Possible losses from short sales may be unlimited, whereas losses from purchases cannot exceed the total amount invested.
(m) Swap Agreements The Portfolio may invest in swap agreements. Swap transactions are privately negotiated agreements between the Portfolio and a counterparty to exchange or swap investment cash flows, assets, or market-linked returns at specified, future intervals. The Portfolio may enter into interest rate, total return, forward spread-lock, credit default, and other forms of swap agreements to manage its exposure to interest rates and credit risk. In connection with these agreements, securities may be identified as collateral in accordance with the terms of the respective swap agreements.
Interest rate swap agreements involve the exchange by the Portfolio with another party of their respective commitments to pay or receive interest, e.g., an exchange of floating rate payments for fixed rate payments with respect to the notional amount of principal. Certain forms of interest rate swap agreements may include: (i) interest rate caps, under which, in return for a premium, one party agrees to make payments to the other to the extent that interest rates exceed a specified rate, or “cap”, (ii) interest rate floors, under which, in return for a premium, one party agrees to make payments to the other to the extent that interest rates fall below a specified rate, or “floor”, or (iii) interest rate collars, under which a party sells a cap and purchases a floor or vice versa in an attempt to protect itself against interest rate movements exceeding given minimum or maximum levels.
Total return swap agreements involve commitments to pay interest in exchange for a market-linked return, both based on notional amounts. To the extent the total return of the security or index underlying the transaction exceeds or falls short of the offsetting interest rate obligation, the Portfolio will receive a payment from or make a payment to the counterparty.
Forward spread-lock swap agreements involve commitments to pay or receive a settlement amount calculated as the difference between the swap spread and a fixed spread, multiplied by the notional amount times the duration of the swap. The swap spread is the difference between the benchmark swap rate (market rate) and the specific Treasury rate.
Credit default swap agreements involve one party making a stream of payments to another party in exchange for the right to receive a specified return in the event of a default by a third party, typically corporate issues or sovereign issues of an emerging country, on its obligation. The Portfolio may use credit default swaps to provide a measure of protection against defaults of the issuers (i.e., to reduce risk where the Portfolio owns or has exposure to the sovereign issuer) or to take an
| | | | |
| 18 | | PIMCO Variable Insurance Trust | | |
| | |
| |
| | | June 30, 2007 (Unaudited) |
active long or short position with respect to the likelihood of a particular issuer’s default. As a seller of protection, the Portfolio generally receives an upfront payment or a fixed rate of income throughout the term of the swap provided that there is no credit event. If the Portfolio is a seller of protection and a credit event occurs, as defined under the terms of that particular swap agreement, the Portfolio will pay to the buyer of the protection an amount up to the notional value of the swap and in certain instances take delivery of the security. As the seller, the Portfolio would effectively add leverage to its portfolio because, in addition to its total net assets, the Portfolio would be subject to investment exposure on the notional amount of the swap. As a buyer of protection, the Portfolio generally receives an amount up to the notional value of the swap if a credit event occurs. The treatment of credit default swaps and other swap agreements that provide for contingent, non-periodic, bullet-type payments as “notional principal contracts” for U.S. federal income tax purposes is uncertain. Were the U.S. Internal Revenue Service (“IRS”) to take the position that a credit default swap or other bullet-type swap is not a “notional principal contract” for U.S. federal income tax purposes, payments received by the Portfolio from such investments might be subject to U.S. excise or income taxes.
Swaps are marked to market daily based upon quotations from market makers and the change in value, if any, is recorded as unrealized gain or loss on the Statement of Operations. Payments received or made at the beginning of the measurement period are reflected as such on the Statement of Assets and Liabilities. These upfront payments are recorded as realized gain or loss on the Statement of Operations upon termination or maturity of the swap. A liquidation payment received or made at the termination of the swap is recorded as realized gain or loss on the Statement of Operations. Net periodic payments received or paid by the Portfolio are included as part of realized gain or loss on the Statement of Operations. Entering into these agreements involves, to varying degrees, elements of credit, market and documentation risk in excess of the amounts recognized on the Statement of Assets and Liabilities. Such risks involve the possibility that there will be no liquid market for these agreements, that the counterparty to the agreements may default on its obligation to perform or disagree as to the meaning of contractual terms in the agreements and that there may be unfavorable changes in interest rates.
(n) Loan Participations and Assignments The Portfolio may invest in direct debt instruments which are interests in amounts owned by corporate, governmental, or other borrowers to lenders or lending syndicates. The Portfolio’s investments in loans may be in the form of participations in loans or assignments of all or a portion of loans from third parties. A loan is often administered by a bank or other financial institution (the “lender”) that acts as agent for all holders. The agent administers the terms of the loan, as specified in the loan agreement. When investing in a loan participation, the Portfolio has the right to receive payments of principal, interest and any fees to which it is entitled only from the lender selling the loan agreement and only upon receipt by the lender of payments from the borrower. The Portfolio generally has no right to enforce compliance with the terms of the loan agreement with the borrower. As a result, the Portfolio may be subject to the credit risk of both the borrower and the lender that is selling the loan agreement. When the Portfolio purchases assignments from lenders it acquires direct rights against the borrower of the loan. At the end of the period June 30, 2007, the Portfolio had no unfunded loan commitments.
(o) Bridge Debt Commitments At the period ended June 30, 2007, the Portfolio had $2,189,000 in commitments outstanding to fund high yield bridge debt. The Portfolio is entitled to a fee upon the expiration of the commitment period. The bridge debt terms approximate market rates at the time the commitment is entered into.
(p) Commodities Index-Linked/Structured Notes The Portfolio invests in structured notes whose value is based on the price movements of a commodity
index. The structured notes are often leveraged, increasing the volatility of each note’s value relative to the change in the underlying linked financial element. The value of these notes will rise and fall in response to changes in the underlying commodity index. Structured notes may entail a greater degree of market risk than other types of debt securities because the investor bears the risk of the underlying commodity index. Structured notes may also be more volatile, less liquid, and more difficult to accurately price than less complex securities or more traditional debt securities. Fluctuations in value of the structured notes are recorded as unrealized gains and losses on the accompanying financial statements. Net payments are recorded as net realized gains and losses. These notes are subject to prepayment, credit and interest risks. The Portfolio has the option to request prepayment from the issuer. At maturity, or when a note is sold, the Portfolio records a realized gain or loss. At June 30, 2007, the value of these securities comprised 0.3% of the Portfolio’s net assets and resulted in unrealized depreciation of $17,003.
(q) Mortgage-Related and Other Asset-Backed Securities The Portfolio may invest in mortgage-related or other asset-backed securities. These securities include mortgage pass-through securities, collateralized mortgage obligations (“CMOs”), commercial mortgage-backed securities, mortgage dollar rolls, CMO residuals, stripped mortgage-backed securities (“SMBSs”) and other securities that directly or indirectly represent a participation in, or are secured by and payable from, mortgage loans on real property. The value of some mortgage-related or asset-backed securities may be particularly sensitive to changes in prevailing interest rates. Early repayment of principal on some mortgage-related securities may expose the Portfolio to a lower rate of return upon reinvestment of principal. The value of these securities may fluctuate in response to the market’s perception of the creditworthiness of the issuers. Additionally, although mortgages and mortgage-related securities are generally supported by some form of government or private guarantee and/or insurance, there is no assurance that private guarantors or insurers will meet their obligations.
(r) U.S. Government Agencies or Government-Sponsored Enterprises Securities issued by U.S. Government agencies or government-sponsored enterprises may not be guaranteed by the U.S. Treasury. The Government National Mortgage Association (“GNMA” or “Ginnie Mae”), a wholly owned U.S. Government corporation, is authorized to guarantee, with the full faith and credit of the U.S. Government, the timely payment of principal and interest on securities issued by institutions approved by GNMA and backed by pools of mortgages insured by the Federal Housing Administration or guaranteed by the Department of Veterans Affairs. Government-related guarantors (i.e., not backed by the full faith and credit of the U.S. Government) include the Federal National Mortgage Association (“FNMA” or “Fannie Mae”) and the Federal Home Loan Mortgage Corporation (“FHLMC” or “Freddie Mac”). Pass-through securities issued by FNMA are guaranteed as to timely payment of principal and interest by FNMA but are not backed by the full faith and credit of the U.S. Government. FHLMC guarantees the timely payment of interest and ultimate collection of principal, but its participation certificates are not backed by the full faith and credit of the U.S. Government.
(s) New Accounting Policies In July 2006, the Financial Accounting Standards Board (“FASB”) issued Interpretation No. 48, “Accounting for Uncertainty in Income Taxes—an Interpretation of FASB Statement No. 109” (the “Interpretation”). The Interpretation became effective for the Portfolio on June 29, 2007. Management has evaluated the application of the Interpretation in relation to the Portfolio and has concluded that no single filing position or combination of filing positions identified as uncertain tax positions required the accrual of a tax liability in the accounting records of the Portfolio for the period ending June 30, 2007. Management will monitor all existing filing positions and future filing positions in light of the Interpretation and evaluate the need for any future tax accruals and financial statement disclosures as warranted.
| | | | | | |
| | Semiannual Report | | June 30, 2007 | | 19 |
Notes to Financial Statements (Cont.)
In September 2006, the FASB issued Statement of Financial Accounting Standards No. 157, “Fair Value Measurements” (the “Statement”). The Statement is effective for fiscal years beginning after November 15, 2007 and will require expanded disclosure about fair value measurements, separately for each major category of assets and liabilities, that enables shareholders to assess the inputs used to develop those measurements, and for recurring fair value measurements using significant unobservable inputs the effect of the measurements on changes in net assets for the reporting period. Management is currently evaluating the application of the Statement to the Portfolio and will provide additional information in relation to the Statement on the Portfolio’s annual financial statements for the period ending December 31, 2007.
3. FEES AND EXPENSES
(a) Investment Advisory Fee PIMCO is a majority-owned subsidiary of Allianz Global Investors of America L.P. (“AGI”), and serves as investment adviser (the “Adviser”) to the Trust, pursuant to an investment advisory contract. The Adviser receives a monthly fee from the Portfolio, at an annual rate based on average daily net assets. The Advisory Fee for all classes is charged at an annual rate of 0.25%.
(b) Administration Fee PIMCO serves as administrator (the “Administrator”), and provides administrative services to the Trust for which it receives a monthly administrative fee based on each share class’s average daily net assets. As the Administrator, PIMCO bears the costs of various third-party services, including audit, custodial, portfolio accounting, legal, transfer agency and printing costs. The Administration Fee for all classes is charged at the annual rate of 0.25%.
(c) Distribution and Servicing Fees Allianz Global Investors Distributors LLC (“AGID”) is an indirect wholly-owned subsidiary of AGI and serves as the distributor (the “Distributor”) of the Trust’s shares. The Trust is permitted to reimburse AGID on a quarterly basis, out of the Administrative Class assets of the Portfolio in the amount of 0.15% on an annual basis of the average daily net assets of that class, for payments made to financial intermediaries that provide services in connection with the distribution of shares or administration of plans or programs that use Portfolio shares as their funding medium. The effective rate paid to AGID was 0.15% during the current fiscal year.
The Trust has adopted a Distribution Plan, for the Advisor Class shares of the Portfolio (the “Plan”). The Plan has been adopted pursuant to Rule 12b-1 under the Act. The Plan permits payments for expenses in connection with the distribution and marketing of Advisor Class shares and/or the provision of shareholder services to Advisor Class shareholders. The Plan permits the Portfolio to make total payments at an annual rate of 0.25% of its average daily net assets attributable to its Advisor Class shares.
(d) Portfolio Expenses The Trust is responsible for the following expenses: (i) salaries and other compensation of any of the Trust’s executive officers and employees who are not officers, directors, stockholders or employees of PIMCO or its subsidiaries or affiliates; (ii) taxes and governmental fees; (iii) brokerage fees and commissions and other portfolio transaction expenses; (iv) the costs of borrowing money, including interest expenses and bank overdraft charges; (v) fees and expenses of the Trustees who are not “interested persons” of PIMCO or the Trust, and any counsel retained exclusively for their benefit; (vi) extraordinary expenses, including costs of litigation and indemnification expenses; (vii) organization expenses and (viii) any expenses allocated or allocable to a specific class of shares, which include service fees payable with respect to the Administrative Class Shares, and may include certain other expenses as permitted by the Trust’s Multiple Class Plan adopted pursuant to Rule 18f-3 under the Act and subject to review and approval by the Trustees. The ratio of expenses to average net assets per share class, as disclosed in the Financial Highlights, may
differ from the annual portfolio operating expenses per share class as disclosed in the Prospectus for the reasons set forth above.
Effective April 1, 2007, each Trustee, other than those affiliated with PIMCO or its affiliates, receives an annual retainer of $15,000, plus $2,375 for each Board of Trustees meeting attended in person, $500 for each committee meeting attended and $750 for each Board of Trustees meeting attended telephonically, plus reimbursement of related expenses. In addition, the audit committee chair receives an additional annual retainer of $2,000 and each other committee chair receives an additional annual retainer of $500. These expenses are allocated on a pro-rata basis to the various portfolios of the Trust according to their respective net assets. The Trust pays no compensation directly to any Trustee or any other officer who is affiliated with the Administrator, all of whom receive remuneration for their services to the Trust from the Administrator or its affiliates. Prior to April 1, 2007, each Trustee, other than those affiliated with PIMCO or its affiliates, received an annual retainer of $15,000 plus $2,000 for each Board of Trustees meeting attended ($500 for each special meeting attended), plus reimbursement of related expenses. The Audit Committee Chairman received an annual retainer of $1,500 and the Governance Committee Chairman received an annual retainer of $500. In addition, each member of a committee received $500 for each committee meeting attended.
4. RELATED PARTY TRANSACTIONS
The Adviser, Administrator, and Distributor are related parties as defined by FAS 57, Related Party Disclosures. Fees payable to these parties are disclosed in Note 3.
5. GUARANTEES AND INDEMNIFICATIONS
Under the Trust’s organizational documents, each Trustee, officer, employee or other agent of the Trust (including the Trust’s investment manager) is indemnified, to the extent permitted by the Act, against certain liabilities that may arise out of performance of their duties to the Portfolio. Additionally, in the normal course of business, the Portfolio enters into contracts that contain a variety of indemnification clauses. The Portfolio’s maximum exposure under these arrangements is unknown as this would involve future claims that may be made against the Portfolio that have not yet occurred. However, the Portfolio has not had prior claims or losses pursuant to these contracts and believes the risk of loss to be remote.
6. PURCHASES AND SALES OF SECURITIES
The length of time the Portfolio has held a particular security is not generally a consideration in investment decisions. A change in the securities held by the Portfolio is known as “portfolio turnover”. The Portfolio may engage in frequent and active trading of portfolio securities to achieve its investment objective, particularly during periods of volatile market movements. High portfolio turnover (e.g., over 100%) involves correspondingly greater expenses to the Portfolio, including brokerage commissions or dealer mark-ups and other transaction costs on the sale of securities and reinvestments in other securities. Such sales may also result in realization of taxable capital gains, including short-term capital gains (which are generally taxed at ordinary income tax rates). The trading costs and tax effects associated with portfolio turnover may adversely affect the Portfolio’s performance.
Purchases and sales of securities (excluding short-term investments) for the period ended June 30, 2007, were as follows (amounts in thousands):
| | | | | | | | | | | | |
| U.S. Government/Agency | | | | All Other |
| Purchases | | Sales | | | | Purchases | | Sales |
| $ | 132,589 | | $ | 60,737 | | | | $ | 195,469 | | $ | 25,549 |
| | | | |
| 20 | | PIMCO Variable Insurance Trust | | |
| | |
| |
| | | June 30, 2007 (Unaudited) |
7. TRANSACTIONS IN WRITTEN CALL AND PUT OPTIONS
Transactions in written call and put options were as follows (amounts in thousands, except for number of contracts):
| | | | | | | | | | | | | | | | | | | | |
| | | | | # of
Contracts | | | Notional
Amount
in $ | | | Notional
Amount
in EUR | | Notional
Amount
in GBP | | | Premium | |
Balance at 12/31/2006 | | | | 19 | | | $ | 98,000 | | | EUR | 2,000 | | GBP | 1,300 | | | $ | 1,000 | |
Sales | | | | 309 | | | | 104,900 | | | | 0 | | | 0 | | | | 1,311 | |
Closing Buys | | | | (138 | ) | | | (85,900 | ) | | | 0 | | | 0 | | | | (862 | ) |
Expirations | | | | (165 | ) | | | 0 | | | | 0 | | | (1,300 | ) | | | (76 | ) |
Exercised | | | | (25 | ) | | | 0 | | | | 0 | | | 0 | | | | (10 | ) |
Balance at 06/30/2007 | | | | 0 | | | $ | 117,000 | | | EUR | 2,000 | | GBP | 0 | | | $ | 1,363 | |
8. SHARES OF BENEFICIAL INTEREST
The Portfolio may issue an unlimited number of shares of beneficial interest with a $0.001 par value. Changes in shares of beneficial interest were as follows (shares and amounts in thousands):
| | | | | | | | | | | | | | | | |
| | | | | Six Months Ended
06/30/2007 | | | Year Ended
12/31/2006 | |
| | | | | Shares | | | Amount | | | Shares | | | Amount | |
| | | | | |
Receipts for shares sold | | | | | | | | | | | | | | | | |
Institutional Class | | | | 304 | | | $ | 3,048 | | | 1,150 | | | $ | 11,541 | |
Administrative Class | | | | 29,060 | | | | 291,519 | | | 36,746 | | | | 369,230 | |
Advisor Class | | | | 42 | | | | 421 | | | 39 | | | | 390 | |
Issued as reinvestment of distributions | | | | | | | | | | | | | | | | |
Institutional Class | | | | 60 | | | | 599 | | | 106 | | | | 1,072 | |
Administrative Class | | | | 2,018 | | | | 20,247 | | | 2,547 | | | | 25,602 | |
Advisor Class | | | | 0 | | | | 3 | | | 0 | | | | 2 | |
Cost of shares redeemed | | | | | | | | | | | | | | | | |
Institutional Class | | | | (1,117 | ) | | | (11,174 | ) | | (476 | ) | | | (4,778 | ) |
Administrative Class | | | | (6,686 | ) | | | (67,154 | ) | | (8,707 | ) | | | (87,388 | ) |
Advisor Class | | | | (35 | ) | | | (355 | ) | | (20 | ) | | | (204 | ) |
Net increase resulting from Portfolio share transactions | | | | 23,646 | | | $ | 237,154 | | | 31,385 | | | $ | 315,467 | |
The following schedule shows the number of shareholders each owning 5% or more of the Portfolio and the total percentage of the Portfolio held by such shareholders:
| | | | | | |
| | | | | Number of
Shareholders | | % of Portfolio Held |
Institutional Class | | | | 2 | | 100 |
Administrative Class | | | | 2 | | 71 |
Advisor Class | | | | 1 | | 96 |
9. REGULATORY AND LITIGATION MATTERS
Since February 2004, PIMCO, Allianz Global Investors of America L.P. (PIMCO’s parent company), AGID, and certain of their affiliates, including the PIMCO Funds (another series of funds managed by PIMCO), the Allianz Funds (formerly known as PIMCO Funds: Multi-Manager Series (another series of funds managed by affiliates of PIMCO)), certain Trustees of the Trust (in their capacity as Trustees of the PIMCO Funds or the Allianz Funds) and certain employees of PIMCO, have been named as defendants in fifteen lawsuits filed in various jurisdictions. Eleven
of those lawsuits concern “market timing,” and they have been transferred to and consolidated for pre-trial proceedings in a multi-district litigation proceeding in the U.S. District Court for the District of Maryland; the other four lawsuits concern “revenue sharing” and have been consolidated into a single action in the U.S. District Court for the District of Connecticut. The lawsuits have been commenced as putative class actions on behalf of investors who purchased, held or redeemed shares of the various series of the PIMCO Funds and the Allianz Funds during specified periods, or as derivative actions on behalf of the PIMCO Funds and the Allianz Funds.
The market timing actions in the District of Maryland generally allege that certain hedge funds were allowed to engage in “market timing” in certain funds of the PIMCO Funds and the Allianz Funds and this alleged activity was not disclosed. Pursuant to tolling agreements entered into with the derivative and class action plaintiffs, PIMCO, certain PIMCO Funds Trustees, and certain employees of PIMCO who were previously named as defendants have all been dropped as defendants in the market timing actions; the plaintiffs continue to assert claims on behalf of the shareholders of the PIMCO Funds or on behalf of the PIMCO Funds itself against other defendants. By order dated November 3, 2005, the U.S. District Court for the District of Maryland granted the PIMCO Funds’ motion to dismiss claims asserted against it in a consolidated amended complaint where the PIMCO Funds were named, in the complaint, as a nominal defendant. The revenue sharing action in the District of Connecticut generally alleges that fund assets were inappropriately used to pay brokers to promote funds of the PIMCO Funds and the Allianz Funds, including directing fund brokerage transactions to such brokers, and that such alleged arrangements were not fully disclosed to shareholders. On August 11, 2005, the U.S. District Court for the District of Connecticut conducted a hearing on defendants’ motion to dismiss the consolidated amended complaint in the revenue sharing action but has not yet ruled on the motion to dismiss. The market timing and revenue sharing lawsuits seek, among other things, unspecified compensatory damages plus interest and, in some cases, punitive damages, the rescission of investment advisory contracts, the return of fees paid under those contracts and restitution.
Two nearly identical class action civil complaints have been filed in August 2005, in the Northern District of Illinois Eastern Division, alleging that the plaintiffs each purchased and sold a 10-year Treasury note futures contract and suffered damages from an alleged shortage when PIMCO held both physical and futures positions in 10-year Treasury notes for its client accounts. The two actions have been consolidated into one action, and the two separate complaints have been replaced by a consolidated complaint. PIMCO is a named defendant, and PIMCO Funds has been added as a defendant, to the consolidated action. PIMCO strongly believes the complaint is without merit and intends to vigorously defend itself.
In April 2006, certain portfolios of the Trust and certain other funds managed by PIMCO were served in an adversary proceeding brought by the Official Committee of Asbestos Claimants of G-I Holdings, Inc. in G-I Holdings, Inc.’s bankruptcy in the District of New Jersey. In July 2004, PIMCO was named in this lawsuit and remains a defendant. The plaintiff seeks to recover for the bankruptcy estate assets that were transferred by the predecessor entity of G-I Holdings, Inc. to a wholly-owned subsidiary in 1994. The subsidiary has since issued notes, of which certain portfolios of the Trust and certain other funds managed by PIMCO are alleged to be holders. The complaint alleges that in 2000, more than two hundred noteholders—including certain portfolios of the Trust and certain other funds managed by PIMCO—were granted a second priority lien on the assets of the subsidiary in exchange for their consent to a refinancing transaction and the granting of a first priority lien to the lending banks. The plaintiff is seeking invalidation of the lien in favor of the noteholders and/or the value of the lien. On June 21, 2006, the District of New Jersey overturned the Bankruptcy Court’s decision granting permission to file the adversary proceeding and remanded the matter to the Bankruptcy Court for further proceedings. Following a motion to
| | | | | | |
| | Semiannual Report | | June 30, 2007 | | 21 |
Notes to Financial Statements (Cont.)
reconsider, the District Court upheld its remand on August 7, 2006, and instructed the Bankruptcy Court to conduct a “cost-benefit” analysis of the Committee’s claims, including the claims against the noteholders. The Bankruptcy Court held a status conference on October 25, 2006 and set a briefing schedule relating to this cost-benefit analysis.
The foregoing speaks only as of the date of this report. It is possible that these matters and/or other developments resulting from these matters could result in increased portfolio redemptions or other adverse consequences to the Portfolio. However, PIMCO and AGID believe that these matters are not likely to have a material adverse effect on the Portfolio or on PIMCO’s or AGID’s ability to perform their respective investment advisory or distribution services relating to the Portfolio.
10. FEDERAL INCOME TAX MATTERS
The Portfolio intends to qualify as a regulated investment company under sub-chapter M of the Internal Revenue Code (the “Code”) and distribute all of its taxable income and net realized gains, if applicable, to shareholders. Accordingly, no provision for Federal income taxes has been made.
As of June 30, 2007, the aggregate cost of investments was the same for federal income tax and financial statement purposes. The net unrealized appreciation (depreciation) of investment securities for federal income tax purposes is as follows (amount in thousands):
| | | | |
Aggregate
Gross
Unrealized
Appreciation | | Aggregate
Gross
Unrealized
(Depreciation) | | Net
Unrealized
(Depreciation) |
$ 767 | | $ (3,837) | | $ (3,070) |
| | | | |
| 22 | | PIMCO Variable Insurance Trust | | |
| | |
| |
Privacy Policy* | | (Unaudited) |
The Funds consider customer privacy to be a fundamental aspect of their relationships with shareholders and are committed to maintaining the confidentiality, integrity and security of their current, prospective and former shareholders’ personal information. To ensure their shareholders’ privacy, the Funds have developed policies that are designed to protect this confidentiality, while allowing shareholder needs to be served.
Obtaining Personal Information
In the course of providing shareholders with products and services, the Funds and certain service providers to the Funds, such as the Funds’ investment advisers (“Advisers”), may obtain non-public personal information about shareholders, which may come from sources such as account applications and other forms, from other written, electronic or verbal correspondence, from shareholder transactions, from a shareholder’s brokerage or financial advisory firm, financial adviser or consultant, and/or from information captured on the Funds’ internet web sites.
Respecting Your Privacy
As a matter of policy, the Funds do not disclose any personal or account information provided by shareholders or gathered by the Funds to non-affiliated third parties, except as required or permitted by law or as necessary for such third parties to perform their agreements with respect to the Funds. As is common in the industry, non-affiliated companies may from time to time be used to provide certain services, such as preparing and mailing prospectuses, reports, account statements and other information, conducting research on shareholder satisfaction and gathering shareholder proxies. A Fund’s Distributor may also retain non-affiliated companies to market the Fund’s shares or products which use the Fund’s shares and enter into joint marketing agreements with other companies. These companies may have access to a shareholder’s personal and account information, but are permitted to use this information solely to provide the specific service or as otherwise permitted by law. In most cases, the shareholders will be clients of a third party, but the Funds may also provide a shareholder’s personal and account information to the shareholder’s respective brokerage or financial advisory firm.
Sharing Information with Third Parties
The Funds reserve the right to disclose or report personal information to non-affiliated third parties, in limited circumstances, where the Funds believe in good faith that disclosure is required under law to cooperate with regulators or law enforcement authorities, to protect their rights or property or upon reasonable request by any Fund in which a shareholder has chosen to invest. In addition, the Funds may disclose information about a shareholder’s accounts to a non-affiliated third party with the consent of the shareholder.
Sharing Information with Affiliates
The Funds may share shareholder information with their affiliates in connection with servicing their shareholders’ accounts or to provide shareholders with information about products and services that the Funds or their Advisers, principal underwriters or their affiliates (“Service Affiliates”) believe may be of interest to such shareholders. The information that the Funds share may include, for example, a shareholder’s participation in one of the Funds or in other investment programs sponsored by a Service Affiliate, a shareholder’s ownership of certain types of accounts (such as IRAs), or other data about a shareholder’s accounts. The Funds’ Service Affiliates, in turn, are not permitted to share shareholder information with non-affiliated entities, except as required or permitted by law.
Procedures to Safeguard Private Information
The Funds take seriously the obligation to safeguard shareholder non-public personal information. In addition to this policy, the Funds have also implemented procedures that are designed to restrict access to a shareholder’s non-public personal information only to internal personnel who need to know that information in order to provide products or services to such shareholders. In order to guard a shareholder’s non-public personal information, physical, electronic and procedural safeguards are in place.
* This Privacy Policy applies to the following entities: PIMCO Funds, PIMCO Variable Insurance Trust, PCM Fund, Inc. and PIMCO Strategic Global Government Fund, Inc. (collectively, the “Funds”).
| | | | | | |
| | Semiannual Report | | June 30, 2007 | | 23 |
Investment Adviser and Administrator
Pacific Investment Management Company LLC
840 Newport Center Drive
Newport Beach, California 92660
Distributor
Allianz Global Investors Distributors LLC
1345 Avenue of the Americas
New York, New York 10105
Custodian
State Street Bank & Trust Company
801 Pennsylvania
Kansas City, Missouri 64105
Transfer Agent
Boston Financial Data Services–Midwest
330 W. 9th Street
Kansas City, Missouri 64105
Legal Counsel
Dechert LLP
1775 I Street, N.W.
Washington, D.C. 20006
Independent Registered Public Accounting Firm
PricewaterhouseCoopers LLP
1055 Broadway
Kansas City, Missouri 64105
P I M C O

Table of Contents
This material is authorized for use only when preceded or accompanied by the current PIMCO Variable Insurance Trust (the “Trust”) prospectus. Investors should consider the investment objectives, risks, charges and expenses of this Trust carefully before investing. Ask your financial professional to explain all charges that may apply. This and other information is contained in the Trust’s prospectus. The variable product prospectus may be obtained by contacting your Investment Consultant. Please read the Trust and variable product prospectus carefully before you invest or send money.
Chairman’s Letter
Dear PIMCO Variable Insurance Trust Shareholder:
It is our pleasure to present to you the semiannual report for the PIMCO Variable Insurance Trust, covering the six-month period ended June 30, 2007. The PIMCO Variable Insurance Trust’s net assets were $8.68 billion at June 30, 2007, as compared to $7.76 billion at December 31, 2006.
Highlights of the financial markets during the reporting period include:
| | n | | Economic data during the first quarter of 2007 pointed to slower growth, which heightened market expectations for a decrease in the Federal Funds Rate. By the second quarter, economic data, such as employment statistics, provided little indication of economic weakness, causing expectations of a decrease in the Federal Funds Rate to unwind and U.S. interest rates to move higher. Interest rates in Europe and the U.K. also rose over the period as central banks raised their key lending rates due to inflation concerns. The benchmark ten-year U.S. Treasury yielded 5.03% as of June 30, 2007, or 0.32% higher than at the beginning of the year. |
| | n | | Most bonds generally returned much of their gains from earlier in the year as worldwide growth and capital flows drove interest rates higher in the second quarter. Increased risk aversion in global financial markets, due in part to subprime mortgage worries in the U.S., also contributed to the rise in interest rates. The Lehman Brothers Aggregate Bond Index, which includes Treasury, investment-grade corporate and mortgage-backed securities, returned 0.98% for the six-month period. |
| | n | | Locally issued emerging market (“EM”) bonds posted positive returns for the reporting period. Yields on these bonds declined and the local currencies in which they are denominated generally gained, amid increasing investor awareness, strong economic growth and surging capital inflows. External EM bonds (debt instruments issued by emerging markets countries and typically denominated in U.S. dollars) lagged behind local EM bonds (debt instruments issued by emerging markets countries and denominated in the currency of the issuer), as external EM bonds tend to trade more in-line with U.S. Treasuries. |
| | n | | Treasury Inflation-Protected Securities (“TIPS”) outpaced nominal bonds (non-inflation linked bonds) for the first part of the year and all but the longest maturity TIPS outperformed in the second quarter as high gasoline prices drove higher inflation accruals. Commodities, as represented by the Dow Jones-AIG Commodity Total Return Index, returned 4.46% for the period. Equities, as measured by the S&P 500 Index and the Russell 2000 Index, returned 6.96% and 6.45%, respectively, for the period. |
On the following pages, please find specific details as to the Portfolio’s total return investment performance and a discussion of those factors that affected performance.
Thank you for the trust you have placed in us. We will continue to work diligently to serve your investment needs.
Sincerely,
Brent R. Harris
Chairman, PIMCO Variable Insurance Trust
July 31, 2007
| | | | | | |
| | Semiannual Report | | June 30, 2007 | | 1 |
Important Information About the Portfolio
PIMCO Variable Insurance Trust (the “Trust”) is an open-end management investment company currently consisting of twenty separate investment portfolios, including the Low Duration Portfolio (the “Portfolio”). The Portfolio is only available as a funding vehicle under variable life insurance policies or variable annuity contracts issued by insurance companies (“Variable Contracts”). Individuals may not purchase shares of the Portfolio directly. Shares of the Portfolio also may be sold to qualified pension and retirement plans outside of the separate account context.
We believe that bond funds have an important role to play in a well diversified investment portfolio. It is important to note, however, that in an environment where interest rates may trend upward, rising rates would negatively impact the performance of most bond funds, and fixed-income securities held by a fund are likely to decrease in value. The price volatility of fixed-income securities can also increase during periods of rising interest rates resulting in increased losses to a fund. Bond funds and individual bonds with a longer duration (a measure of the expected life of a security) tend to be more sensitive to changes in interest rates, usually making them more volatile than securities or funds with shorter durations.
The Portfolio may be subject to various risks in addition to those described above. Some of these risks may include, but are not limited to, the following: credit risk, high yield risk, market risk, issuer risk, liquidity risk, derivatives risk, mortgage risk, non-U.S. investment risk, emerging markets risk, currency risk, leveraging risk and management risk. A complete description of these risks is contained in the Portfolio’s prospectus. The Portfolio may use derivative instruments for hedging purposes or as part of an investment strategy. Use of these instruments may involve certain costs and risks such as liquidity risk, interest rate risk, market risk, credit risk, management risk and the risk that the Portfolio could not close out a position when it would be most advantageous to do so. Because the Portfolio may invest in derivatives, it could lose more than the principal amount invested in these instruments. Investing in non-U.S. securities may entail risk due to non-U.S. economic and political developments.
On the performance summary page in this Semiannual Report, the Total Return Investment Performance table measures performance assuming that all dividend and capital gain distributions were reinvested.
An investment in the Portfolio is not a deposit of a bank and is not guaranteed or insured by the Federal Deposit Insurance Corporation or any other government agency. It is possible to lose money on investments in the Portfolio.
PIMCO has adopted written proxy voting policies and procedures (“Proxy Policy”) as required by Rule 206(4)-6 under the Investment Advisers Act of 1940, as amended. The Proxy Policy has been adopted by the Trust as the policies and procedures that PIMCO will use when voting proxies on behalf of the Portfolio. A description of the policies and procedures that PIMCO uses to vote proxies relating to portfolio securities of the Portfolio, and information about how the Portfolio voted proxies relating to portfolio securities held during the most recent twelve-month period ended June 30, are available without charge, upon request, by calling the Trust at 1-866-746-2606 and on the Portfolio’s website at www.pimco.com.
The Portfolio files its complete schedule of portfolio holdings with the SEC for the first and third quarters of each fiscal year on Form N-Q. A copy of the Trust’s Form N-Q is also available on the SEC’s website at http://www.sec.gov and may be reviewed and copied at the SEC’s Public Reference Room in Washington D.C. Information on the operation of the Public Reference Room may be obtained by calling 1-800-SEC-0330, and is available without charge, upon request, by calling the Trust at 1-866-746-2606 and on the Portfolio’s website at www.pimco.com.
PIMCO Variable Insurance Trust is distributed by Allianz Global Investors Distributors LLC, 1345 Avenue of the Americas, New York, NY 10105.
| | | | |
| 2 | | PIMCO Variable Insurance Trust | | |
The following disclosure provides important information regarding the Portfolio’s Expense Example (“Example” or “Expense Example”), which appears in this Semiannual Report. Please refer to this information when reviewing the Expense Example for the Portfolio.
Example
As a shareholder of the Portfolio, you incur two types of costs: (1) transaction costs and (2) ongoing costs, including advisory and administrative fees; distribution and/or service (12b-1) fees (Administrative and Advisor Class only); and other Portfolio expenses. The Example is intended to help you understand your ongoing costs (in dollars) of investing in the Portfolio and to compare these costs with the ongoing costs of investing in other mutual funds. The Expense Example does not reflect any fees or other expenses imposed by the Variable Contracts. If it did, the expenses reflected in the Expense Example would be higher. The Example is based on an investment of $1,000 invested at the beginning of the period and held for the entire period indicated, which is from January 1, 2007 to June 30, 2007.
Actual Expenses
The information in the table under the heading “Actual Performance” provides information about actual account values and actual expenses. You may use the information in these columns, together with the amount you invested, to estimate the expenses that you paid over the period. Simply divide your account value by $1,000 (for example, an $8,600 account value divided by $1,000 = $8.60), then multiply the result by the number in the row titled “Expenses Paid During Period” to estimate the expenses you paid on your account during this period.
Hypothetical Example for Comparison Purposes
The information in the table under the heading “Hypothetical Performance (5% return before expenses)” provides information about hypothetical account values and hypothetical expenses based on the Portfolio’s actual expense ratio and an assumed rate of return of 5% per year before expenses, which is not the Portfolio’s actual return. The hypothetical account values and expenses may not be used to estimate the actual ending account balance or expenses you paid for the period. You may use this information to compare the ongoing costs of investing in the Portfolio and other portfolios. To do so, compare this 5% hypothetical example with the 5% hypothetical examples that appear in the shareholder reports of the other portfolios.
Please note that the expenses shown in the table are meant to highlight your ongoing costs only and do not reflect any transactional costs. Therefore, the information under the heading “Hypothetical Performance (5% return before expenses)” is useful in comparing ongoing costs only, and will not help you determine the relative total costs of owning different portfolios. In addition, if these transactional costs were included, your costs would have been higher.
The expense ratio may vary period to period because of various factors, such as an increase in expenses not covered by the advisory and administrative fees (such as expenses of the trustees and their counsel, litigation expense and interest expense).
| | | | | | |
| | Semiannual Report | | June 30, 2007 | | 3 |
PIMCO Low Duration Portfolio
Cumulative Returns Through June 30, 2007
$10,000 invested at the beginning of the first full month following the inception date of the Portfolio’s Institutional Class.
Allocation Breakdown‡
| | |
Corporate Bonds & Notes | | 26.9% |
Short-Term Instruments | | 26.0% |
U.S. Government Agencies | | 20.5% |
Asset-Backed Securities | | 18.0% |
Mortgage-Backed Securities | | 7.0% |
Other | | 1.6% |
| | ‡ | % of Total Investments as of 06/30/2007 |
| | | | | | | | | | |
| Average Annual Total Return for the period ended June 30, 2007 | | |
| | | | | 6 Months* | | 1 Year | | 5 Years | | Portfolio
Inception (04/10/00)** |
| | PIMCO Low Duration Portfolio Institutional Class | | 1.65% | | 5.06% | | 3.02% | | 4.48% |
| | Merrill Lynch 1-3 Year U.S. Treasury Index± | | 2.11% | | 5.07% | | 2.77% | | 4.29% |
All Portfolio returns are net of fees and expenses.
* Cumulative return.
** The Portfolio began operations on 04/10/00. Index comparisons began on 03/31/00.
Performance quoted represents past performance. Past performance is no guarantee of future results. Investment return and principal value will fluctuate so the Portfolio shares, when redeemed, may be worth more or less than their original cost. The Portfolio’s performance does not reflect the deduction of additional charges and expenses imposed in connection with investing in Variable Contracts, which will reduce returns. Current performance may be lower or higher than the performance data quoted. Performance data current to the most recent month-end is available by calling (800) 927-4648.
± Merrill Lynch 1-3 Year Treasury Index is an unmanaged index that tracks the performance of the direct Sovereign debt of the U.S. Government having a maturity of at least 1 year and less than 3 years. It is not possible to invest directly in the index. The index does not reflect deductions for fees and expenses.
| | | | | | |
| Expense Example | | Actual Performance | | Hypothetical Performance |
| | | | | (5% return before expenses) |
Beginning Account Value (01/01/07) | | $ | 1,000.00 | | $ | 1,000.00 |
Ending Account Value (06/30/07) | | $ | 1,016.48 | | $ | 1,022.32 |
Expenses Paid During Period† | | $ | 2.50 | | $ | 2.51 |
† Expenses are equal to the Portfolio’s Institutional Class annualized expense ratio of 0.50%, multiplied by the average account value over the period, multiplied by 181/365 (to reflect the one-half year period). Overall fees and expenses of investing in the Portfolio will be higher because the example does not reflect Variable Contract fees and expenses.
Please refer to page 3 herein for an explanation of the information presented in the above Expense Example.
Portfolio Insights
| » | | The PIMCO Low Duration Portfolio seeks to achieve its investment objective by investing, under normal circumstances, at least 65% of its total assets in a diversified portfolio of fixed-income securities of varying maturities, which may be represented by forwards or derivatives, such as options, futures contracts or swap agreements. |
| » | | Above-index duration exposure, or sensitivity to changes in market interest rates, during the period detracted from performance as interest rates rose. |
| » | | The Portfolio’s emphasis at the shorter-end of the yield curve, mostly through Eurodollar contracts, added to returns as rates on short maturities declined during the period. |
| » | | An emphasis on mortgages was slightly negative for returns as the sector slightly underperformed Treasuries on a like-duration basis. |
| » | | Exposure to high-yield and corporate bonds was slightly positive for performance as these sectors outperformed Treasuries. |
| » | | Low exposure to emerging markets was neutral for performance as the sector slightly outperformed Treasuries on a like-duration basis. |
| » | | Tactical exposure to non-U.S. issues, with a focus on shorter-maturity U.K. securities, detracted from returns as these positions underperformed comparable U.S. Treasuries. |
| | | | |
| 4 | | PIMCO Variable Insurance Trust | | |
Financial Highlights Low Duration Portfolio
| | | | | | | | | | | | | | | | | | | | | | | | |
| Selected per Share Data for the Year or Period Ended: | | 06/30/2007+ | | | 12/31/2006 | | | 12/31/2005 | | | 12/31/2004 | | | 12/31/2003 | | | 12/31/2002 | |
| | | | | | |
Institutional Class | | | | | | | | | | | | | | | | | | | | | | | | |
Net asset value beginning of year or period | | $ | 10.06 | | | $ | 10.09 | | | $ | 10.30 | | | $ | 10.27 | | | $ | 10.23 | | | $ | 9.95 | |
Net investment income (a) | | | 0.24 | | | | 0.44 | | | | 0.30 | | | | 0.15 | | | | 0.17 | | | | 0.38 | |
Net realized/unrealized gain (loss) on investments (a) | | | (0.07 | ) | | | (0.03 | ) | | | (0.18 | ) | | | 0.05 | | | | 0.08 | | | | 0.33 | |
Total income from investment operations | | | 0.17 | | | | 0.41 | | | | 0.12 | | | | 0.20 | | | | 0.25 | | | | 0.71 | |
Dividends from net investment income | | | (0.25 | ) | | | (0.44 | ) | | | (0.30 | ) | | | (0.14 | ) | | | (0.20 | ) | | | (0.37 | ) |
Distributions from net realized capital gains | | | 0.00 | | | | 0.00 | | | | (0.03 | ) | | | (0.03 | ) | | | (0.01 | ) | | | (0.06 | ) |
Total distributions | | | (0.25 | ) | | | (0.44 | ) | | | (0.33 | ) | | | (0.17 | ) | | | (0.21 | ) | | | (0.43 | ) |
Net asset value end of year or period | | $ | 9.98 | | | $ | 10.06 | | | $ | 10.09 | | | $ | 10.30 | | | $ | 10.27 | | | $ | 10.23 | |
Total return | | | 1.65 | % | | | 4.13 | % | | | 1.16 | % | | | 2.00 | % | | | 2.49 | % | | | 7.22 | % |
Net assets end of year or period (000s) | | $ | 18,166 | | | $ | 25,886 | | | $ | 18,093 | | | $ | 12,252 | | | $ | 11 | | | $ | 11 | |
Ratio of expenses to average net assets | | | 0.50 | %* | | | 0.50 | % | | | 0.50 | % | | | 0.50 | % | | | 0.50 | % | | | 0.51 | % |
Ratio of expenses to average net assets excluding interest expense | | | 0.50 | %* | | | 0.50 | % | | | 0.50 | % | | | 0.50 | % | | | 0.50 | % | | | 0.50 | % |
Ratio of net investment income to average net assets | | | 4.88 | %* | | | 4.37 | % | | | 2.92 | % | | | 1.49 | % | | | 1.68 | % | | | 3.78 | % |
Portfolio turnover rate | | | 12 | % | | | 200 | % | | | 184 | % | | | 483 | % | | | 284 | % | | | 339 | % |
+ Unaudited
* Annualized
(a) Per share amounts based on average number of shares outstanding during the period.
| | | | | | |
| See Accompanying Notes | | Semiannual Report | | June 30, 2007 | | 5 |
Statement of Assets and Liabilities Low Duration Portfolio
| | | | |
| (Amounts in thousands, except per share amounts) | | June 30, 2007 | |
| | | (Unaudited) | |
| |
Assets: | | | | |
Investments, at value | | $ | 1,037,081 | |
Cash | | | 259 | |
Foreign currency, at value | | | 6,512 | |
Receivable for investments sold | | | 6,658 | |
Receivable for Portfolio shares sold | | | 3,235 | |
Interest and dividends receivable | | | 3,739 | |
Variation margin receivable | | | 773 | |
Swap premiums paid | | | 2,713 | |
Unrealized appreciation on foreign currency contracts | | | 1,514 | |
Unrealized appreciation on swap agreements | | | 956 | |
| | | | 1,063,440 | |
| |
Liabilities: | | | | |
Payable for investments purchased | | $ | 20,328 | |
Payable for investments purchased on a delayed-delivery basis | | | 12,597 | |
Payable for Portfolio shares redeemed | | | 48 | |
Payable for short sales | | | 6,621 | |
Written options outstanding | | | 492 | |
Dividends payable | | | 12 | |
Accrued investment advisory fee | | | 208 | |
Accrued administration fee | | | 208 | |
Accrued servicing fee | | | 111 | |
Variation margin payable | | | 663 | |
Swap premiums received | | | 444 | |
Unrealized depreciation on foreign currency contracts | | | 109 | |
Unrealized depreciation on swap agreements | | | 715 | |
Other liabilities | | | 11 | |
| | | | 42,567 | |
| |
Net Assets | | $ | 1,020,873 | |
| |
Net Assets Consist of: | | | | |
Paid in capital | | $ | 1,036,658 | |
Undistributed net investment income | | | 1,093 | |
Accumulated undistributed net realized (loss) | | | (9,797 | ) |
Net unrealized (depreciation) | | | (7,081 | ) |
| | | $ | 1,020,873 | |
| |
Net Assets: | | | | |
Institutional Class | | $ | 18,166 | |
Administrative Class | | | 1,002,451 | |
Advisor Class | | | 256 | |
| |
Shares Issued and Outstanding: | | | | |
Institutional Class | | | 1,820 | |
Administrative Class | | | 100,430 | |
Advisor Class | | | 26 | |
| |
Net Asset Value and Redemption Price Per Share (Net Asset Per Share Outstanding) | | | | |
Institutional Class | | $ | 9.98 | |
Administrative Class | | | 9.98 | |
Advisor Class | | | 9.98 | |
| |
Cost of Investments Owned | | $ | 1,040,151 | |
Cost of Foreign Currency Held | | $ | 6,490 | |
Proceeds Received on Short Sales | | $ | 6,608 | |
Premiums Received on Written Options | | $ | 1,363 | |
| | | | |
| 6 | | PIMCO Variable Insurance Trust | | See Accompanying Notes |
Statement of Operations Low Duration Portfolio
| | | | |
| (Amounts in thousands) | | Six Months Ended
June 30, 2007 | |
| | | (Unaudited) | |
| |
| Investment Income: | | | | |
Interest, net of foreign taxes* | | $ | 23,402 | |
Dividends | | | 166 | |
Miscellaneous income | | | 25 | |
Total Income | | | 23,593 | |
| |
Expenses: | | | | |
Investment advisory fees | | | 1,086 | |
Administration fees | | | 1,086 | |
Servicing fees – Administrative Class | | | 633 | |
Trustees’ fees | | | 9 | |
Total Expenses | | | 2,814 | |
| |
Net Investment Income | | | 20,779 | |
| |
Net Realized and Unrealized Gain (Loss): | | | | |
Net realized (loss) on investments | | | (434 | ) |
Net realized (loss) on futures contracts, written options and swaps | | | (2,941 | ) |
Net realized gain on foreign currency transactions | | | 512 | |
Net change in unrealized (depreciation) on investments | | | (2,479 | ) |
Net change in unrealized (depreciation) on futures contracts, written options and swaps | | | (3,146 | ) |
Net change in unrealized appreciation on translation of assets and liabilities denominated in foreign currencies | | | 1,382 | |
Net (Loss) | | | (7,106 | ) |
| |
Net Increase in Net Assets Resulting from Operations | | $ | 13,673 | |
| |
*Foreign tax withholding | | $ | 8 | |
| | | | | | |
| See Accompanying Notes | | Semiannual Report | | June 30, 2007 | | 7 |
Statements of Changes in Net Assets Low Duration Portfolio
| | | | | | | | |
| (Amounts in thousands) | | Six Months Ended
June 30, 2007 | | | Year Ended
December 31, 2006 | |
| | | (Unaudited) | | | | |
| | |
| Increase in Net Assets from: | | | | | | | | |
| | |
Operations: | | | | | | | | |
Net investment income | | $ | 20,779 | | | $ | 26,588 | |
Net realized (loss) | | | (2,863 | ) | | | (382 | ) |
Net change in unrealized (depreciation) | | | (4,243 | ) | | | (846 | ) |
Net increase resulting from operations | | | 13,673 | | | | 25,360 | |
| | |
Distributions to Shareholders: | | | | | | | | |
From net investment income | | | | | | | | |
Institutional Class | | | (600 | ) | | | (1,072 | ) |
Administrative Class | | | (20,271 | ) | | | (25,602 | ) |
Advisor Class | | | (3 | ) | | | (2 | ) |
| | |
Total Distributions | | | (20,874 | ) | | | (26,676 | ) |
| | |
Portfolio Share Transactions: | | | | | | | | |
Receipts for shares sold | | | | | | | | |
Institutional Class | | | 3,048 | | | | 11,541 | |
Administrative Class | | | 291,518 | | | | 369,230 | |
Advisor Class | | | 421 | | | | 390 | |
Issued as reinvestment of distributions | | | | | | | | |
Institutional Class | | | 600 | | | | 1,072 | |
Administrative Class | | | 20,247 | | | | 25,602 | |
Advisor Class | | | 3 | | | | 2 | |
Cost of shares redeemed | | | | | | | | |
Institutional Class | | | (11,174 | ) | | | (4,778 | ) |
Administrative Class | | | (67,154 | ) | | | (87,388 | ) |
Advisor Class | | | (355 | ) | | | (204 | ) |
Net increase resulting from Portfolio share transactions | | | 237,154 | | | | 315,467 | |
| | |
Total Increase in Net Assets | | | 229,953 | | | | 314,151 | |
| | |
Net Assets: | | | | | | | | |
Beginning of period | | | 790,920 | | | | 476,769 | |
End of period* | | $ | 1,020,873 | | | $ | 790,920 | |
| | |
*Including undistributed net investment income of: | | $ | 1,093 | | | $ | 1,188 | |
| | | | |
| 8 | | PIMCO Variable Insurance Trust | | See Accompanying Notes |
| | |
| |
| Schedule of Investments Low Duration Portfolio | | June 30, 2007 (Unaudited) |
| | | | | | | | |
| | | | | PRINCIPAL
AMOUNT
(000S) | | | | VALUE
(000S) |
| BANK LOAN OBLIGATIONS 0.2% |
| SLM Corp. |
6.000% due 06/30/2008 | | $ | | 2,200 | | $ | | 2,189 |
| | | | | | | | |
Total Bank Loan Obligations
(Cost $2,189) | | 2,189 |
| | | | | | | | |
|
| CORPORATE BONDS & NOTES 27.4% |
|
| BANKING & FINANCE 21.0% |
| AIG-Fp Matched Funding Corp. |
5.360% due 06/16/2008 | | | | 1,700 | | | | 1,703 |
| |
| Allstate Life Global Funding Trusts |
5.400% due 03/23/2009 | | | | 800 | | | | 801 |
| |
| American Express Bank FSB |
5.330% due 10/16/2008 | | | | 2,000 | | | | 2,000 |
5.380% due 06/22/2009 | | | | 1,300 | | | | 1,301 |
5.380% due 10/20/2009 | | | | 2,100 | | | | 2,101 |
| |
| American Express Centurion Bank |
5.320% due 05/07/2008 | | | | 1,400 | | | | 1,400 |
5.340% due 06/12/2009 | | | | 1,900 | | | | 1,901 |
| |
| American Express Credit Corp. |
5.380% due 11/09/2009 | | | | 1,100 | | | | 1,101 |
| |
| American International Group, Inc. |
5.360% due 06/23/2008 | | | | 600 | | | | 600 |
5.370% due 06/16/2009 | | | | 5,200 | | | | 5,222 |
| |
| ANZ National International Ltd. |
5.396% due 08/07/2009 | | | | 1,500 | | | | 1,500 |
| |
| Bank of America Corp. |
5.366% due 11/06/2009 | | | | 900 | | | | 900 |
5.370% due 06/19/2009 | | | | 6,100 | | | | 6,109 |
| |
| Bank of America N.A. |
5.360% due 02/27/2009 | | | | 700 | | | | 700 |
| |
| Bank of Ireland |
5.370% due 12/19/2008 | | | | 3,100 | | | | 3,104 |
5.410% due 12/18/2009 | | | | 1,120 | | | | 1,122 |
| |
| Bear Stearns Cos., Inc. |
5.450% due 03/30/2009 | | | | 2,900 | | | | 2,902 |
5.450% due 08/21/2009 | | | | 300 | | | | 300 |
5.480% due 05/18/2010 | | | | 2,400 | | | | 2,399 |
5.505% due 04/29/2008 | | | | 3,400 | | | | 3,405 |
| |
| Calabash Re II Ltd. |
13.760% due 01/08/2010 | | | | 1,900 | | | | 1,917 |
16.260% due 01/08/2010 | | | | 1,900 | | | | 1,978 |
| |
| Caterpillar Financial Services Corp. |
5.420% due 05/18/2009 | | | | 5,480 | | | | 5,488 |
5.430% due 03/10/2009 | | | | 6,400 | | | | 6,407 |
| |
| CIT Group, Inc. |
5.510% due 08/15/2008 | | | | 300 | | | | 300 |
5.510% due 12/19/2008 | | | | 400 | | | | 400 |
5.570% due 05/23/2008 | | | | 4,600 | | | | 4,606 |
| |
| Citigroup Funding, Inc. |
5.360% due 06/26/2009 | | | | 1,400 | | | | 1,399 |
| |
| Citigroup Global Markets Holdings, Inc. |
5.460% due 03/17/2009 | | | | 1,800 | | | | 1,803 |
| |
| Citigroup, Inc. |
4.200% due 12/20/2007 | | | | 4,100 | | | | 4,078 |
5.390% due 12/28/2009 | | | | 4,000 | | | | 4,003 |
5.395% due 01/30/2009 | | | | 1,900 | | | | 1,901 |
5.400% due 12/26/2008 | | | | 200 | | | | 200 |
| |
| Credit Agricole S.A. |
5.360% due 05/28/2009 | | | | 1,500 | | | | 1,501 |
5.410% due 05/28/2010 | | | | 1,700 | | | | 1,701 |
| |
| DnB NORBank ASA |
5.425% due 10/13/2009 | | | | 8,400 | | | | 8,405 |
| |
| | | | | | | | |
| | | | | PRINCIPAL
AMOUNT
(000S) | | | | VALUE
(000S) |
| Export-Import Bank of Korea |
5.450% due 06/01/2009 | | $ | | 2,200 | | $ | | 2,201 |
| |
| General Electric Capital Corp. |
5.390% due 01/05/2009 | | | | 2,500 | | | | 2,502 |
5.410% due 10/06/2010 | | | | 2,100 | | | | 2,102 |
5.428% due 01/20/2010 | | | | 1,400 | | | | 1,403 |
5.430% due 08/15/2011 | | | | 5,500 | | | | 5,498 |
5.560% due 01/08/2016 | | | | 300 | | | | 300 |
| |
| General Motors Acceptance Corp. |
6.510% due 09/23/2008 | | | | 1,100 | | | | 1,100 |
| |
| GMAC LLC |
6.000% due 12/15/2011 | | | | 300 | | | | 285 |
| |
| Goldman Sachs Group, Inc. |
5.400% due 12/23/2008 | | | | 400 | | | | 400 |
5.410% due 03/30/2009 | | | | 2,900 | | | | 2,902 |
5.440% due 11/16/2009 | | | | 600 | | | | 601 |
5.450% due 12/22/2008 | | | | 2,100 | | | | 2,103 |
5.455% due 07/29/2008 | | | | 1,700 | | | | 1,703 |
5.475% due 10/05/2007 | | | | 1,600 | | | | 1,601 |
5.685% due 07/23/2009 | | | | 1,300 | | | | 1,307 |
| |
| HBOS Treasury Services PLC |
5.397% due 07/17/2009 | | | | 2,200 | | | | 2,203 |
| |
| HSBC Bank USA N.A. |
5.500% due 06/10/2009 | | | | 1,400 | | | | 1,404 |
| |
| HSBC Finance Corp. |
5.490% due 09/15/2008 | | | | 500 | | | | 501 |
5.500% due 12/05/2008 | | | | 1,300 | | | | 1,303 |
5.607% due 05/10/2010 | | | | 2,200 | | | | 2,211 |
| |
| ICICI Bank Ltd. |
5.895% due 01/12/2010 | | | | 2,300 | | | | 2,305 |
| |
| John Deere Capital Corp. |
5.406% due 04/15/2008 | | | | 1,200 | | | | 1,201 |
5.406% due 07/15/2008 | | | | 1,400 | | | | 1,401 |
| |
| JPMorgan Chase & Co. |
5.539% due 10/02/2009 | | | | 3,500 | | | | 3,515 |
| |
| Lehman Brothers Holdings, Inc. |
5.370% due 11/24/2008 | | | | 1,000 | | | | 1,000 |
5.410% due 12/23/2008 | | | | 400 | | | | 400 |
5.440% due 04/03/2009 | | | | 1,700 | | | | 1,702 |
5.460% due 08/21/2009 | | | | 1,600 | | | | 1,601 |
5.460% due 11/16/2009 | | | | 5,200 | | | | 5,205 |
5.570% due 12/23/2010 | | | | 900 | | | | 901 |
5.579% due 07/18/2011 | | | | 1,000 | | | | 1,002 |
| |
| Longpoint Re Ltd. |
10.609% due 05/08/2010 | | | | 700 | | | | 700 |
| |
| Merrill Lynch & Co., Inc. |
5.406% due 05/08/2009 | | | | 1,700 | | | | 1,701 |
5.440% due 12/04/2009 | | | | 1,400 | | | | 1,401 |
5.460% due 06/16/2008 | | | | 6,000 | | | | 6,007 |
| |
| Metropolitan Life Global Funding I |
5.400% due 05/17/2010 | | | | 3,200 | | | | 3,202 |
| |
| Morgan Stanley |
5.406% due 05/07/2009 | | | | 2,800 | | | | 2,802 |
5.467% due 02/09/2009 | | | | 1,100 | | | | 1,102 |
5.595% due 01/22/2009 | | | | 3,700 | | | | 3,703 |
5.609% due 01/18/2011 | | | | 1,500 | | | | 1,502 |
| |
| Mystic Re Ltd. |
11.660% due 12/05/2008 | | | | 1,800 | | | | 1,789 |
| |
| National Australia Bank Ltd. |
5.400% due 09/11/2009 | | | | 1,400 | | | | 1,402 |
| |
| Pricoa Global Funding I |
5.405% due 07/27/2009 | | | | 3,700 | | | | 3,706 |
5.440% due 06/03/2008 | | | | 3,000 | | | | 3,005 |
| |
| Residential Capital LLC |
6.460% due 05/22/2009 | | | | 2,000 | | | | 1,992 |
| |
| | | | | | | | |
| | | | | PRINCIPAL
AMOUNT
(000S) | | | | VALUE
(000S) |
| Residential Reinsurance 2007 Ltd. |
15.610% due 06/07/2010 | | $ | | 300 | | $ | | 300 |
| |
| Royal Bank of Scotland Group PLC |
5.360% due 12/21/2007 | | | | 1,200 | | | | 1,201 |
5.750% due 07/06/2012 | | | | 5,900 | | | | 5,900 |
| |
| Santander U.S. Debt S.A. Unipersonal |
5.370% due 09/21/2007 | | | | 3,000 | | | | 3,001 |
5.370% due 11/20/2008 | | | | 700 | | | | 700 |
5.420% due 09/19/2008 | | | | 2,800 | | | | 2,803 |
| |
| SLM Corp. |
5.495% due 07/27/2009 | | | | 900 | | | | 878 |
| |
| Unicredit Luxembourg Finance S.A. |
5.405% due 10/24/2008 | | | | 1,700 | | | | 1,701 |
| |
| VTB Capital S.A. for Vneshtorgbank |
5.955% due 08/01/2008 | | | | 1,300 | | | | 1,303 |
| |
| Wachovia Bank N.A. |
5.420% due 05/25/2010 | | | | 6,000 | | | | 6,016 |
| |
| Wachovia Corp. |
5.486% due 10/15/2011 | | | | 1,100 | | | | 1,102 |
| |
| Wells Fargo & Co. |
5.400% due 03/10/2008 | | | | 4,000 | | | | 4,003 |
5.460% due 09/15/2009 | | | | 2,600 | | | | 2,607 |
| |
| Westpac Banking Corp. |
5.280% due 06/06/2008 | | | | 900 | | | | 900 |
| |
| World Savings Bank FSB |
5.396% due 05/08/2009 | | | | 7,100 | | | | 7,104 |
| | | | | | | | |
| | | | | | | | 214,054 |
| | | | | | | | |
|
| INDUSTRIALS 3.7% |
| Altria Group, Inc. | | | | | | | | |
7.650% due 07/01/2008 | | | | 200 | | | | 204 |
| |
| Amgen, Inc. |
5.440% due 11/28/2008 | | | | 3,600 | | | | 3,602 |
| |
| Anadarko Petroleum Corp. |
5.760% due 09/15/2009 | | | | 2,200 | | | | 2,203 |
| |
| BP AMI Leasing, Inc. |
5.370% due 06/26/2009 | | | | 3,700 | | | | 3,701 |
| |
| Comcast Corp. |
5.656% due 07/14/2009 | | | | 1,600 | | | | 1,601 |
| |
| CSC Holdings, Inc. |
7.250% due 07/15/2008 | | | | 3,500 | | | | 3,535 |
7.875% due 12/15/2007 | | | | 1,500 | | | | 1,513 |
| |
| DaimlerChrysler N.A. Holding Corp. |
5.710% due 03/13/2009 | | | | 1,600 | | | | 1,604 |
5.840% due 09/10/2007 | | | | 4,758 | | | | 4,762 |
| |
| Diageo Capital PLC |
5.457% due 11/10/2008 | | | | 2,600 | | | | 2,603 |
| |
| El Paso Corp. |
6.950% due 12/15/2007 | | | | 1,980 | | | | 2,001 |
| |
| FedEx Corp. |
5.436% due 08/08/2007 | | | | 1,300 | | | | 1,300 |
| |
| General Electric Co. |
5.400% due 12/09/2008 | | | | 2,600 | | | | 2,602 |
| |
| Salomon Brothers AG for OAO Gazprom |
10.500% due 10/21/2009 | | | | 200 | | | | 221 |
| |
| Time Warner, Inc. |
5.590% due 11/13/2009 | | | | 1,800 | | | | 1,803 |
| |
| Transocean, Inc. |
5.560% due 09/05/2008 | | | | 1,300 | | | | 1,301 |
| |
| Wal-Mart Stores, Inc. |
5.260% due 06/16/2008 | | | | 3,300 | | | | 3,300 |
| | | | | | | | |
| | | | | | | | 37,856 |
| | | | | | | | |
| | | | | | |
| See Accompanying Notes | | Semiannual Report | | June 30, 2007 | | 9 |
Schedule of Investments Low Duration Portfolio (Cont.)
| | | | | | | | |
| | | | | PRINCIPAL
AMOUNT
(000S) | | | | VALUE
(000S) |
| UTILITIES 2.7% |
| AT&T, Inc. | | | | | | | | |
5.450% due 05/15/2008 | | $ | | 5,900 | | $ | | 5,906 |
| |
| BellSouth Corp. | | |
5.460% due 08/15/2008 | | | | 5,900 | | | | 5,906 |
| |
| Deutsche Telekom International Finance BV |
5.540% due 03/23/2009 | | | | 2,500 | | | | 2,507 |
| |
| Qwest Capital Funding, Inc. |
6.375% due 07/15/2008 | | | | 5,670 | | | | 5,698 |
| |
| Telecom Italia Capital S.A. |
5.969% due 07/18/2011 | | | | 1,800 | | | | 1,813 |
| |
| Telefonica Emisones SAU |
5.660% due 06/19/2009 | | | | 1,700 | | | | 1,706 |
| |
| Verizon Communications, Inc. |
5.400% due 04/03/2009 | | | | 3,800 | | | | 3,803 |
| | | | | | | | |
| | | | | | | | 27,339 |
| | | | | | | | |
Total Corporate Bonds & Notes
(Cost $278,880) | | 279,249 |
| | | | | | | | |
| | | | |
| COMMODITY INDEX-LINKED NOTES 0.3% |
| Morgan Stanley |
0.000% due 07/07/2008 | | | | 3,000 | | | | 2,983 |
| | | | | | | | |
Total Commodity Index-Linked Notes (Cost $3,000) | | 2,983 |
| | | | | | | | |
| | | | |
| U.S. GOVERNMENT AGENCIES 20.9% |
| Fannie Mae |
3.736% due 07/01/2034 | | | | 248 | | | | 250 |
4.350% due 03/01/2035 | | | | 323 | | | | 326 |
4.417% due 05/01/2035 | | | | 774 | | | | 771 |
4.500% due 06/25/2043 | | | | 2,895 | | | | 2,873 |
4.510% due 05/01/2035 | | | | 717 | | | | 712 |
4.542% due 09/01/2035 | | | | 1,335 | | | | 1,326 |
4.560% due 11/01/2035 | | | | 1,476 | | | | 1,466 |
4.655% due 08/01/2035 | | | | 3,369 | | | | 3,333 |
4.683% due 07/01/2035 | | | | 519 | | | | 512 |
5.000% due 12/25/2016 -
04/25/2033 | | | | 70,546 | | | | 68,501 |
5.380% due 12/25/2036 | | | | 905 | | | | 903 |
5.440% due 03/25/2034 | | | | 133 | | | | 133 |
5.500% due 12/01/2009 -
10/01/2035 | | | | 64,244 | | | | 63,276 |
5.670% due 09/25/2042 -
03/25/2044 | | | | 1,567 | | | | 1,573 |
5.720% due 05/25/2031 -
11/25/2032 | | | | 1,501 | | | | 1,507 |
6.000% due 08/01/2016 -
07/01/2037 | | | | 1,140 | | | | 1,129 |
6.183% due 09/01/2034 | | | | 80 | | | | 81 |
6.214% due 07/01/2042 -
06/01/2043 | | | | 1,647 | | | | 1,672 |
6.264% due 09/01/2041 | | | | 675 | | | | 681 |
6.335% due 12/01/2036 | | | | 83 | | | | 84 |
6.414% due 09/01/2040 | | | | 11 | | | | 11 |
6.500% due 12/25/2042 | | | | 22 | | | | 23 |
6.973% due 11/01/2035 | | | | 385 | | | | 398 |
| |
| Federal Housing Administration |
7.430% due 10/01/2020 | | | | 19 | | | | 19 |
| |
| Freddie Mac |
4.715% due 06/01/2035 | | | | 2,255 | | | | 2,207 |
4.922% due 07/01/2035 | | | | 975 | | | | 965 |
5.000% due 10/01/2018 - 12/15/2026 | | | | 5,284 | | | | 5,251 |
5.470% due 07/15/2019 - 10/15/2020 | | | | 36,000 | | | | 35,969 |
5.500% due 08/15/2030 | | | | 1 | | | | 1 |
5.550% due 07/15/2037 | | | | 12,600 | | | | 12,599 |
5.580% due 08/25/2031 | | | | 436 | | | | 438 |
5.620% due 05/15/2036 | | | | 1,093 | | | | 1,097 |
| | | | | | | | |
| | | | | PRINCIPAL
AMOUNT
(000S) | | | | VALUE
(000S) |
5.670% due 12/15/2030 | | $ | | 533 | | $ | | 535 |
5.720% due 06/15/2018 | | | | 187 | | | | 187 |
6.000% due 09/01/2016 - 07/01/2037 | | | | 1,113 | | | | 1,104 |
6.227% due 02/25/2045 | | | | 961 | | | | 957 |
6.500% due 07/25/2043 | | | | 166 | | | | 168 |
| |
| Ginnie Mae |
4.000% due 07/16/2027 | | | | 56 | | | | 56 |
| | | | | | | | |
Total U.S. Government Agencies
(Cost $215,509) | | 213,094 |
| | | | | | | | |
|
| MORTGAGE-BACKED SECURITIES 7.1% |
| American Home Mortgage Investment Trust |
4.290% due 10/25/2034 | | | | 1,475 | | | | 1,448 |
4.390% due 02/25/2045 | | | | 566 | | | | 554 |
| |
| Arran Residential Mortgages Funding PLC |
5.340% due 04/12/2036 | | | | 1,099 | | | | 1,099 |
| |
| Banc of America Funding Corp. |
4.113% due 05/25/2035 | | | | 7,605 | | | | 7,449 |
| |
| Banc of America Mortgage Securities, Inc. |
6.500% due 10/25/2031 | | | | 89 | | | | 90 |
| |
| Bear Stearns Adjustable Rate Mortgage Trust |
4.750% due 10/25/2035 | | | | 2,780 | | | | 2,749 |
4.773% due 01/25/2034 | | | | 125 | | | | 125 |
5.044% due 04/25/2033 | | | | 29 | | | | 29 |
5.329% due 02/25/2033 | | | | 11 | | | | 11 |
5.448% due 04/25/2033 | | | | 52 | | | | 51 |
| |
| Bear Stearns Alt-A Trust |
5.377% due 05/25/2035 | | | | 913 | | | | 909 |
5.480% due 02/25/2034 | | | | 1,472 | | | | 1,472 |
| |
| Bear Stearns Mortgage Funding Trust |
5.390% due 02/25/2037 | | | | 2,672 | | | | 2,673 |
| |
| Citigroup Mortgage Loan Trust, Inc. |
4.900% due 12/25/2035 | | | | 729 | | | | 728 |
| |
| Countrywide Alternative Loan Trust |
4.500% due 06/25/2035 | | | | 2,381 | | | | 2,349 |
5.500% due 05/25/2047 | | | | 1,196 | | | | 1,199 |
5.600% due 02/25/2037 | | | | 3,646 | | | | 3,656 |
6.000% due 10/25/2033 | | | | 93 | | | | 92 |
6.500% due 06/25/2033 | | | | 9 | | | | 9 |
| |
| Countrywide Home Loan Mortgage Pass-Through Trust |
5.250% due 02/20/2036 | | | | 1,166 | | | | 1,162 |
5.560% due 04/25/2035 | | | | 258 | | | | 259 |
5.590% due 05/25/2034 | | | | 44 | | | | 44 |
| |
| CS First Boston Mortgage Securities Corp. |
4.938% due 12/15/2040 | | | | 622 | | | | 617 |
5.953% due 03/25/2032 | | | | 6 | | | | 6 |
| |
| GMAC Mortgage Corp. Loan Trust |
4.998% due 11/19/2035 | | | | 776 | | | | 776 |
| |
| Greenpoint Mortgage Funding Trust |
5.400% due 10/25/2046 | | | | 1,563 | | | | 1,565 |
5.400% due 01/25/2047 | | | | 1,639 | | | | 1,640 |
| |
| GS Mortgage Securities Corp. II |
5.410% due 03/06/2020 | | | | 6,000 | | | | 6,007 |
5.420% due 06/06/2020 | | | | 763 | | | | 764 |
| |
| GSR Mortgage Loan Trust |
4.538% due 09/25/2035 | | | | 3,249 | | | | 3,203 |
6.000% due 03/25/2032 | | | | 2 | | | | 2 |
| |
| Harborview Mortgage Loan Trust |
5.540% due 05/19/2035 | | | | 321 | | | | 321 |
| |
| Impac CMB Trust |
6.120% due 07/25/2033 | | | | 61 | | | | 61 |
| |
| LB-UBS Commercial Mortgage Trust |
4.990% due 11/15/2030 | | | | 818 | | | | 812 |
| |
| | | | | | | | |
| | | | | PRINCIPAL
AMOUNT
(000S) | | | | VALUE (000S) |
Lehman Brothers Floating Rate Commercial
Mortgage Trust |
5.400% due 09/15/2021 | | $ | | 330 | | $ | | 331 |
| |
| MASTR Asset Securitization Trust |
5.500% due 09/25/2033 | | | | 77 | | | | 74 |
| |
| Mellon Residential Funding Corp. |
5.800% due 06/15/2030 | | | | 532 | | | | 532 |
| |
| MLCC Mortgage Investors, Inc. |
6.974% due 01/25/2029 | | | | 101 | | | | 102 |
| |
| Morgan Stanley Capital I |
5.380% due 10/15/2020 | | | | 4,081 | | | | 4,086 |
| |
| Prime Mortgage Trust |
5.720% due 02/25/2019 | | | | 20 | | | | 20 |
5.720% due 02/25/2034 | | | | 67 | | | | 67 |
| |
| Salomon Brothers Mortgage Securities VII, Inc. |
4.000% due 12/25/2018 | | | | 267 | | | | 254 |
| |
| Structured Adjustable Rate Mortgage Loan Trust |
4.580% due 02/25/2034 | | | | 1,027 | | | | 1,028 |
5.340% due 08/25/2034 | | | | 1,260 | | | | 1,259 |
6.429% due 01/25/2035 | | | | 734 | | | | 738 |
| |
| Structured Asset Mortgage Investments, Inc. |
5.600% due 02/25/2036 | | | | 376 | | | | 376 |
5.650% due 09/19/2032 | | | | 16 | | | | 16 |
| |
| Structured Asset Securities Corp. |
5.329% due 10/25/2035 | | | | 1,695 | | | | 1,693 |
| |
| Thornburg Mortgage Securities Trust |
5.430% due 12/25/2036 | | | | 1,363 | | | | 1,363 |
5.440% due 08/25/2036 | | | | 2,967 | | | | 2,965 |
| |
| Wachovia Bank Commercial Mortgage Trust |
5.400% due 06/15/2020 | | | | 2,900 | | | | 2,901 |
5.410% due 09/15/2021 | | | | 3,811 | | | | 3,813 |
| |
| Washington Mutual, Inc. |
4.816% due 10/25/2032 | | | | 208 | | | | 208 |
5.474% due 02/27/2034 | | | | 72 | | | | 71 |
5.590% due 12/25/2045 | | | | 397 | | | | 399 |
5.610% due 10/25/2045 | | | | 2,287 | | | | 2,292 |
5.759% due 01/25/2047 | | | | 796 | | | | 796 |
6.223% due 05/25/2041 | | | | 189 | | | | 190 |
6.229% due 11/25/2042 | | | | 285 | | | | 285 |
6.429% due 06/25/2042 | | | | 191 | | | | 191 |
6.429% due 08/25/2042 | | | | 79 | | | | 79 |
6.529% due 09/25/2046 | | | | 1,238 | | | | 1,243 |
| |
| Wells Fargo Mortgage-Backed Securities Trust |
4.950% due 03/25/2036 | | | | 1,444 | | | | 1,424 |
| | | | | | | | |
Total Mortgage-Backed Securities
(Cost $72,892) | | 72,727 |
| | | | | | | | |
| | | | |
| ASSET-BACKED SECURITIES 18.2% |
| Accredited Mortgage Loan Trust |
5.360% due 09/25/2036 | | | | 2,983 | | | | 2,985 |
| |
| ACE Securities Corp. |
5.380% due 10/25/2036 | | | | 1,642 | | | | 1,643 |
5.430% due 10/25/2035 | | | | 353 | | | | 353 |
| |
| Amortizing Residential Collateral Trust |
5.610% due 07/25/2032 | | | | 13 | | | | 13 |
| |
| Argent Securities, Inc. |
5.370% due 09/25/2036 | | | | 541 | | | | 541 |
5.380% due 05/25/2036 | | | | 1,948 | | | | 1,949 |
5.400% due 01/25/2036 | | | | 470 | | | | 471 |
| |
| Asset-Backed Funding Certificates |
5.380% due 10/25/2036 | | | | 1,533 | | | | 1,534 |
5.380% due 01/25/2037 | | | | 1,130 | | | | 1,131 |
| |
| Asset-Backed Securities Corp. Home Equity |
5.370% due 12/25/2036 | | | | 1,784 | | | | 1,785 |
5.595% due 09/25/2034 | | | | 495 | | | | 495 |
6.970% due 03/15/2032 | | | | 359 | | | | 359 |
| |
| | | | |
| 10 | | PIMCO Variable Insurance Trust | | See Accompanying Notes |
| | |
| |
| | | June 30, 2007 (Unaudited) |
| | | | | | | | |
| | | | | PRINCIPAL
AMOUNT
(000S) | | | | VALUE
(000S) |
| Bear Stearns Asset-Backed Securities, Inc. |
5.520% due 09/25/2034 | | $ | | 97 | | $ | | 97 |
| |
| Carrington Mortgage Loan Trust |
5.385% due 02/25/2036 | | | | 256 | | | | 256 |
| |
| Chase Credit Card Master Trust |
5.430% due 02/15/2011 | | | | 2,300 | | | | 2,305 |
| |
| CIT Group Home Equity Loan Trust |
5.590% due 06/25/2033 | | | | 4 | | | | 4 |
| |
| Citibank Credit Card Issuance Trust |
2.900% due 05/17/2010 | | | | 2,500 | | | | 2,449 |
5.526% due 02/07/2010 | | | | 9,300 | | | | 9,316 |
| |
| Citigroup Mortgage Loan Trust, Inc. |
5.360% due 08/25/2036 | | | | 949 | | | | 950 |
5.380% due 05/25/2037 | | | | 19,300 | | | | 19,309 |
5.390% due 01/25/2036 | | | | 393 | | | | 393 |
5.420% due 10/25/2036 | | | | 7,100 | | | | 7,099 |
| |
| Countrywide Asset-Backed Certificates |
5.370% due 01/25/2037 | | | | 1,612 | | | | 1,613 |
5.370% due 05/25/2037 | | | | 13,790 | | | | 13,798 |
5.370% due 12/25/2046 | | | | 556 | | | | 556 |
5.370% due 03/25/2047 | | | | 1,212 | | | | 1,213 |
5.390% due 06/25/2037 | | | | 1,387 | | | | 1,388 |
5.400% due 06/25/2037 | | | | 1,149 | | | | 1,149 |
5.430% due 10/25/2046 | | | | 1,306 | | | | 1,307 |
5.500% due 09/25/2036 | | | | 9,500 | | | | 9,507 |
5.800% due 12/25/2031 | | | | 77 | | | | 77 |
| |
| Credit-Based Asset Servicing & Securitization LLC |
5.380% due 03/25/2036 | | | | 369 | | | | 369 |
5.380% due 11/25/2036 | | | | 1,228 | | | | 1,229 |
| |
| CS First Boston Mortgage Securities Corp. |
5.940% due 01/25/2032 | | | | 15 | | | | 16 |
| |
| Equity One Asset-Backed Securities, Inc. |
5.600% due 11/25/2032 | | | | 17 | | | | 17 |
| |
| First Franklin Mortgage Loan Asset-Backed Certificates |
5.370% due 11/25/2036 | | | | 1,965 | | | | 1,966 |
| |
| First USA Credit Card Master Trust |
5.480% due 04/18/2011 | | | | 4,400 | | | | 4,412 |
| |
| Fremont Home Loan Trust |
5.370% due 05/25/2036 | | | | 245 | | | | 245 |
5.380% due 01/25/2037 | | | | 1,076 | | | | 1,076 |
5.390% due 02/25/2037 | | | | 791 | | | | 791 |
| |
| GE-WMC Mortgage Securities LLC |
5.360% due 08/25/2036 | | | | 582 | | | | 582 |
| |
| GS Auto Loan Trust |
5.344% due 07/15/2008 | | | | 2,500 | | | | 2,500 |
| |
| GSAMP Trust |
5.390% due 12/25/2036 | | | | 1,485 | | | | 1,485 |
5.610% due 03/25/2034 | | | | 228 | | | | 228 |
| |
| GSR Mortgage Loan Trust |
5.420% due 11/25/2030 | | | | 157 | | | | 158 |
| |
| HFC Home Equity Loan Asset-Backed Certificates |
5.390% due 03/20/2036 | | | | 1,140 | | | | 1,140 |
5.670% due 09/20/2033 | | | | 188 | | | | 188 |
| |
| HSI Asset Securitization Corp. Trust |
5.370% due 12/25/2036 | | | | 843 | | | | 844 |
| |
| Indymac Residential Asset-Backed Trust |
5.380% due 04/25/2037 | | | | 947 | | | | 948 |
5.420% due 03/25/2036 | | | | 146 | | | | 146 |
| |
| JPMorgan Mortgage Acquisition Corp. |
5.370% due 08/25/2036 | | | | 608 | | | | 608 |
5.380% due 04/01/2037 | | | | 2,121 | | | | 2,120 |
| |
| Lehman XS Trust |
5.390% due 05/25/2046 | | | | 558 | | | | 558 |
5.400% due 11/25/2046 | | | | 1,935 | | | | 1,936 |
5.440% due 11/25/2036 | | | | 2,021 | | | | 2,023 |
| |
| | | | | | | | |
| | | | | PRINCIPAL
AMOUNT
(000S) | | | | VALUE
(000S) |
| Long Beach Mortgage Loan Trust |
5.400% due 02/25/2036 | | $ | | 179 | | $ | | 179 |
5.410% due 01/25/2036 | | | | 346 | | | | 347 |
5.600% due 10/25/2034 | | | | 135 | | | | 135 |
| |
| MASTR Asset-Backed Securities Trust |
5.380% due 11/25/2036 | | | | 1,466 | | | | 1,467 |
| |
| Merrill Lynch Mortgage Investors, Inc. |
5.390% due 08/25/2036 | | | | 5,009 | | | | 5,010 |
5.430% due 07/25/2036 | | | | 975 | | | | 976 |
| |
| Morgan Stanley ABS Capital I |
5.370% due 09/25/2036 | | | | 4,997 | | | | 4,998 |
5.380% due 05/25/2037 | | | | 2,754 | | | | 2,753 |
| |
| Nationstar Home Equity Loan Trust |
5.440% due 04/25/2037 | | | | 8,602 | | | | 8,608 |
| |
| Nelnet Student Loan Trust |
5.340% due 09/25/2012 | | | | 941 | | | | 942 |
| |
| Newcastle Mortgage Securities Trust |
5.390% due 03/25/2036 | | | | 1,040 | | | | 1,040 |
| |
| Nomura Home Equity Loan, Inc. |
5.400% due 02/25/2036 | | | | 323 | | | | 323 |
| |
| Option One Mortgage Loan Trust |
5.370% due 01/25/2037 | | | | 1,560 | | | | 1,561 |
5.420% due 11/25/2035 | | | | 194 | | | | 194 |
| |
| Residential Asset Mortgage Products, Inc. |
5.430% due 09/25/2035 | | | | 193 | | | | 193 |
| |
| Residential Asset Securities Corp. |
5.360% due 08/25/2036 | | | | 625 | | | | 625 |
5.390% due 11/25/2036 | | | | 1,533 | | | | 1,534 |
| |
| Residential Funding Mortgage Securities II, Inc. |
5.440% due 05/25/2037 | | | | 3,267 | | | | 3,269 |
| |
| Saxon Asset Securities Trust |
5.380% due 11/25/2036 | | | | 718 | | | | 718 |
| |
| Securitized Asset-Backed Receivables LLC Trust |
5.440% due 05/25/2037 | | | | 2,500 | | | | 2,500 |
| |
| SLM Student Loan Trust |
5.325% due 10/25/2012 | | | | 2,224 | | | | 2,225 |
5.335% due 04/25/2012 | | | | 1,454 | | | | 1,455 |
5.335% due 04/25/2014 | | | | 6,348 | | | | 6,352 |
5.355% due 01/25/2016 | | | | 880 | | | | 881 |
5.355% due 10/25/2016 | | | | 2,500 | | | | 2,502 |
5.365% due 01/26/2015 | | | | 170 | | | | 170 |
5.365% due 04/27/2015 | | | | 2,270 | | | | 2,271 |
| |
| Soundview Home Equity Loan Trust |
5.370% due 10/25/2036 | | | | 1,010 | | | | 1,010 |
5.380% due 11/25/2036 | | | | 5,465 | | | | 5,465 |
5.400% due 01/25/2037 | | | | 5,629 | | | | 5,633 |
5.420% due 12/25/2035 | | | | 67 | | | | 67 |
5.430% due 11/25/2035 | | | | 79 | | | | 79 |
| |
| Structured Asset Securities Corp. |
5.370% due 10/25/2036 | | | | 1,700 | | | | 1,701 |
5.420% due 09/25/2035 | | | | 581 | | | | 581 |
5.450% due 12/25/2035 | | | | 423 | | | | 423 |
| |
| Truman Capital Mortgage Loan Trust |
5.660% due 01/25/2034 | | | | 67 | | | | 67 |
| |
| USAA Auto Owner Trust |
5.337% due 07/11/2008 | | | | 1,800 | | | | 1,800 |
| |
| Wachovia Auto Owner Trust |
4.820% due 02/20/2009 | | | | 88 | | | | 88 |
5.337% due 06/20/2008 | | | | 2,100 | | | | 2,100 |
| |
| Wells Fargo Home Equity Trust |
5.370% due 01/25/2037 | | | | 988 | | | | 989 |
5.440% due 12/25/2035 | | | | 1,285 | | | | 1,285 |
| | | | | | | | |
Total Asset-Backed Securities
(Cost $186,057) | | 186,146 |
| | | | | | | | |
| | | | | | | | |
| | | | | PRINCIPAL
AMOUNT
(000S) | | | | VALUE
(000S) |
| SOVEREIGN ISSUES 0.6% |
| Korea Development Bank |
5.490% due 04/03/2010 | | $ | | 6,100 | | $ | | 6,105 |
| | | | | | | | |
Total Sovereign Issues (Cost $6,100) | | 6,105 |
| | | | | | | | |
|
| | | | | SHARES | | | | |
| PREFERRED STOCKS 0.4% |
| DG Funding Trust |
7.600% due 12/31/2049 | | | | 420 | | | | 4,376 |
| | | | | | | | |
Total Preferred Stocks (Cost $4,462) | | 4,376 |
| | | | | | | | |
|
| | | | | PRINCIPAL
AMOUNT
(000S) | | | | |
| SHORT-TERM INSTRUMENTS 26.4% |
|
| CERTIFICATES OF DEPOSIT 5.2% |
| BNP Paribas |
5.262% due 05/28/2008 | | $ | | 1,200 | | | | 1,200 |
5.262% due 07/03/2008 | | | | 6,800 | | | | 6,799 |
| |
| BNP Paribas Finance, Inc. |
5.270% due 09/23/2008 | | | | 800 | | | | 799 |
| |
| Calyon Financial, Inc. |
5.340% due 01/16/2009 | | | | 2,400 | | | | 2,400 |
| |
| Dexia Credit Local S.A. |
5.270% due 09/29/2008 | | | | 8,900 | | | | 8,895 |
| |
| Fortis Bank NY |
5.265% due 04/28/2008 | | | | 3,200 | | | | 3,202 |
5.265% due 06/30/2008 | | | | 1,400 | | | | 1,400 |
5.310% due 09/30/2008 | | | | 1,800 | | | | 1,800 |
| |
| HSBC Bank USA N.A. |
5.460% due 07/28/2008 | | | | 3,100 | | | | 3,105 |
| |
| Nordea Bank Finland PLC |
5.308% due 05/28/2008 | | | | 1,200 | | | | 1,201 |
| |
| Royal Bank of Canada |
5.267% due 06/30/2008 | | | | 3,300 | | | | 3,303 |
| |
| Royal Bank of Scotland Group PLC |
5.262% due 07/03/2008 | | | | 900 | | | | 900 |
5.265% due 03/26/2008 | | | | 800 | | | | 800 |
| |
| Societe Generale NY |
5.269% due 06/30/2008 | | | | 5,600 | | | | 5,603 |
5.270% due 03/26/2008 | | | | 3,000 | | | | 3,000 |
5.271% due 06/30/2008 | | | | 900 | | | | 901 |
| |
| Unicredito Italiano NY |
5.360% due 12/03/2007 | | | | 5,400 | | | | 5,402 |
5.360% due 05/29/2008 | | | | 2,200 | | | | 2,201 |
| | | | | | | | |
| | | | | | | | 52,911 |
| | | | | | | | |
|
| COMMERCIAL PAPER 20.2% |
| Bank of America Corp. |
5.195% due 10/04/2007 | | | | 10,700 | | | | 10,668 |
| |
| Calyon N.A. LLC |
5.175% due 06/29/2010 | | | | 23,000 | | | | 22,977 |
| |
| Cox Communications, Inc. |
5.570% due 09/17/2007 | | | | 600 | | | | 600 |
| |
| Danske Corp. |
5.205% due 10/12/2007 | | | | 18,300 | | | | 18,103 |
| |
| Fortis Funding LLC |
5.255% due 09/05/2007 | | | | 23,200 | | | | 23,146 |
5.275% due 09/05/2007 | | | | 900 | | | | 896 |
| |
| Freddie Mac |
4.800% due 07/02/2007 | | | | 35,000 | | | | 35,000 |
| |
| Nordea N.A., Inc. |
5.308% due 04/09/2009 | | | | 3,600 | | | | 3,599 |
| |
| | | | | | |
| See Accompanying Notes | | Semiannual Report | | June 30, 2007 | | 11 |
Schedule of Investments Low Duration Portfolio (Cont.)
| | | | | | | | |
| | | | | PRINCIPAL
AMOUNT
(000S) | | | | VALUE
(000S) |
| Societe Generale NY |
5.210% due 11/26/2007 | | $ | | 900 | | $ | | 891 |
5.225% due 11/26/2007 | | | | 1,200 | | | | 1,182 |
5.240% due 11/26/2007 | | | | 2,200 | | | | 2,174 |
5.250% due 11/26/2007 | | | | 800 | | | | 789 |
| |
| TotalFinaElf Capital S.A. |
5.340% due 07/02/2007 | | | | 27,500 | | | | 27,500 |
| |
| UBS Finance Delaware LLC |
5.145% due 10/23/2007 | | | | 400 | | | | 398 |
5.205% due 10/23/2007 | | | | 1,100 | | | | 1,097 |
5.230% due 10/23/2007 | | | | 21,200 | | | | 20,868 |
5.235% due 10/23/2007 | | | | 2,200 | | | | 2,178 |
5.240% due 10/23/2007 | | | | 5,900 | | | | 5,819 |
| |
| | | | | | | | |
| | | | | PRINCIPAL
AMOUNT
(000S) | | | | VALUE
(000S) |
| Westpac Banking Corp. |
5.240% due 11/05/2007 | | $ | | 28,700 | | $ | | 28,361 |
| | | | | | | | |
| | | | | | | | 206,246 |
| | | | | | | | |
|
| REPURCHASE AGREEMENTS 0.6% |
| State Street Bank and Trust Co. |
4.900% due 07/02/2007 | | | | 5,573 | | | | 5,573 |
| | | | | | | | |
(Dated 06/29/2007. Collateralized by Fannie Mae 3.250% due 08/15/2008 valued at $5,687. Repurchase proceeds are $5,575.) |
|
| | | | | | | | | |
| | | | | PRINCIPAL
AMOUNT
(000S) | | | | VALUE
(000S) | |
| U.S. TREASURY BILLS 0.4% | |
4.635% due 08/30/2007 -
09/13/2007 (a)(c) | | $ | | 4,470 | | $ | | 4,422 | |
| | | | | | | | | |
Total Short-Term Instruments
(Cost $269,167) | | 269,152 | |
| | | | | | | | | |
| | | | | | | | | |
| PURCHASED OPTIONS (e) 0.1% | |
| (Cost $1,895) | | | | 1,060 | |
| |
| |
Total Investments (b) 101.6%
(Cost $1,040,151) | | $ | | 1,037,081 | |
| |
Written Options (f) (0.1%)
(Premiums $1,363) | | | | (492 | ) |
| |
| Other Assets and Liabilities (Net) (1.5%) | | (15,716 | ) |
| | | | | | | | | |
| Net Assets 100.0% | | $ | | 1,020,873 | |
| | | | | | | | | |
Notes to Schedule of Investments (amounts in thousands*, except number of contracts):
* A zero balance may reflect actual amounts rounding to less than one thousand.
(a) Coupon represents a weighted average rate.
(b) As of June 30, 2007, portfolio securities with an aggregate value of $77,693 were valued in good faith and pursuant to the guidelines established by the Board of Trustees.
(c) Securities with an aggregate market value of $4,422 have been segregated with the custodian to cover margin requirements for the following open futures contracts on June 30, 2007:
| | | | | | | | | | |
| Description | | Type | | Expiration
Month | | # of
Contracts | | Unrealized
(Depreciation) | |
90-Day Euribor December Futures | | Long | | 12/2007 | | 140 | | $ | (199 | ) |
90-Day Euribor December Futures | | Long | | 12/2008 | | 46 | | | (103 | ) |
90-Day Euribor June Futures | | Long | | 06/2008 | | 86 | | | (185 | ) |
90-Day Euribor March Futures | | Long | | 03/2008 | | 22 | | | (44 | ) |
90-Day Euribor September Futures | | Long | | 09/2008 | | 46 | | | (106 | ) |
90-Day Eurodollar December Futures | | Long | | 12/2007 | | 784 | | | (748 | ) |
90-Day Eurodollar December Futures | | Long | | 12/2008 | | 259 | | | (115 | ) |
90-Day Eurodollar June Futures | | Long | | 06/2008 | | 1,258 | | | (1,320 | ) |
90-Day Eurodollar March Futures | | Long | | 03/2008 | | 1,978 | | | (2,263 | ) |
90-Day Eurodollar March Futures | | Long | | 03/2009 | | 20 | | | (29 | ) |
90-Day Eurodollar September Futures | | Long | | 09/2008 | | 178 | | | (57 | ) |
90-Day Euroyen December Futures | | Long | | 12/2007 | | 131 | | | (16 | ) |
United Kingdom 90-Day LIBOR Sterling Interest Rate December Futures | | Long | | 12/2007 | | 55 | | | (113 | ) |
United Kingdom 90-Day LIBOR Sterling Interest Rate June Futures | | Long | | 06/2008 | | 371 | | | (541 | ) |
United Kingdom 90-Day LIBOR Sterling Interest Rate March Futures | | Long | | 03/2008 | | 21 | | | (28 | ) |
United Kingdom 90-Day LIBOR Sterling Interest Rate September Futures | | Long | | 09/2007 | | 55 | | | (118 | ) |
United Kingdom 90-Day LIBOR Sterling Interest Rate September Futures | | Long | | 09/2008 | | 324 | | | (500 | ) |
U.S. Treasury 30-Year Bond September Futures | | Short | | 09/2007 | | 445 | | | (97 | ) |
| | | | | | | | | | |
| | | | | | | | $ | (6,582 | ) |
| | | | | | | | | | |
(d) Swap agreements outstanding on June 30, 2007:
Credit Default Swaps
| | | | | | | | | | | | | | | | |
| Counterparty | | Reference Entity | | Buy/Sell
Protection (1) | | (Pay)/Receive
Fixed Rate | | | Expiration
Date | | Notional
Amount | | Unrealized
Appreciation/
(Depreciation) | |
Deutsche Bank AG | | SOFTBANK Corp. 1.750% due 03/31/2014 | | Sell | | 2.300% | | | 09/20/2007 | | JPY | 54,000 | | $ | 2 | |
Bank of America | | Dow Jones CDX N.A. IG7 Index | | Buy | | (0.650% | ) | | 12/20/2016 | | $ | 2,000 | | | 17 | |
Barclays Bank PLC | | Ukraine Government International Bond 7.650% due 06/11/2013 | | Sell | | 0.710% | | | 12/20/2008 | | | 1,000 | | | 3 | |
Barclays Bank PLC | | Brazilian Government International Bond 12.250% due 03/06/2030 | | Sell | | 0.290% | | | 06/20/2009 | | | 4,000 | | | (4 | ) |
Barclays Bank PLC | | Russia Government International Bond 7.500% due 03/31/2030 | | Sell | | 0.275% | | | 06/20/2009 | | | 4,000 | | | (1 | ) |
Credit Suisse First Boston | | Ford Motor Credit Co. 7.000% due 10/01/2013 | | Sell | | 0.950% | | | 12/20/2007 | | | 300 | | | 0 | |
Deutsche Bank AG | | Dow Jones CDX N.A. IG8 Index | | Buy | | (0.600% | ) | | 06/20/2017 | | | 1,400 | | | 6 | |
HSBC Bank USA | | Ukraine Government International Bond 7.650% due 06/11/2013 | | Sell | | 0.730% | | | 04/20/2009 | | | 2,700 | | | 12 | |
HSBC Bank USA | | Ukraine Government International Bond 7.650% due 06/11/2013 | | Sell | | 0.520% | | | 05/20/2009 | | | 1,000 | | | 0 | |
HSBC Bank USA | | Ukraine Government International Bond 7.650% due 06/11/2013 | | Sell | | 0.490% | | | 06/20/2009 | | | 4,000 | | | (5 | ) |
JPMorgan Chase & Co. | | Multiple Reference Entities of Gazprom | | Sell | | 0.415% | | | 11/20/2007 | | | 5,100 | | | 6 | |
| | | | |
| 12 | | PIMCO Variable Insurance Trust | | See Accompanying Notes |
| | |
| |
| | | June 30, 2007 (Unaudited) |
| | | | | | | | | | | | | | |
| Counterparty | | Reference Entity | | Buy/Sell
Protection (1) | | (Pay)/Receive
Fixed Rate | | Expiration
Date | | Notional
Amount | | Unrealized
Appreciation |
Lehman Brothers, Inc. | | Brazilian Government International Bond 12.250% due 03/06/2030 | | Sell | | 0.240% | | 11/20/2007 | | $ | 3,600 | | $ | 2 |
Lehman Brothers, Inc. | | Ford Motor Credit Co. 7.000% due 10/01/2013 | | Sell | | 0.950% | | 12/20/2007 | | | 500 | | | 0 |
Lehman Brothers, Inc. | | Indonesia Government International Bond 6.750% due 03/10/2014 | | Sell | | 0.400% | | 12/20/2008 | | | 500 | | | 0 |
Lehman Brothers, Inc. | | Brazilian Government International Bond 12.250% due 03/06/2030 | | Sell | | 1.120% | | 11/20/2011 | | | 6,000 | | | 114 |
Morgan Stanley | | Russia Government International Bond 7.500% due 03/31/2030 | | Sell | | 0.245% | | 06/20/2008 | | | 200 | | | 0 |
Morgan Stanley | | Multiple Reference Entities of Gazprom | | Sell | | 0.860% | | 11/20/2011 | | | 2,600 | | | 34 |
Royal Bank of Scotland Group PLC | | Indonesia Government International Bond 6.750% due 03/10/2014 | | Sell | | 0.390% | | 12/20/2008 | | | 1,000 | | | 0 |
Royal Bank of Scotland Group PLC | | Indonesia Government International Bond 6.750% due 03/10/2014 | | Sell | | 0.438% | | 06/20/2009 | | | 4,000 | | | 0 |
| | | | | | | | | | | | | | |
| | | | | | | | | | | | | $ | 186 |
| | | | | | | | | | | | | | |
(1) If the Portfolio is a seller of protection and a credit event occurs, as defined under the terms of that particular swap agreement, the Portfolio will pay to the buyer of the protection an amount up to the notional value of the swap and in certain instances, take delivery of the security. As a buyer of protection, the Portfolio will generally receive from the seller of protection an amount up to the notional amount of the swap if a credit event occurs.
Interest Rate Swaps
| | | | | | | | | | | | | | | |
| Counterparty | | Floating Rate Index | | Pay/Receive
Floating Rate | | Fixed Rate | | Expiration
Date | | Notional
Amount | | Unrealized
Appreciation/
(Depreciation) | |
Deutsche Bank AG | | 6-Month Australian Bank Bill | | Pay | | 7.000% | | 12/15/2009 | | AUD | 2,100 | | $ | (1 | ) |
Barclays Bank PLC | | BRL-CDI-Compounded | | Pay | | 11.360% | | 01/04/2010 | | BRL | 4,200 | | | 24 | |
Goldman Sachs & Co. | | BRL-CDI-Compounded | | Pay | | 11.465% | | 01/04/2010 | | | 1,100 | | | 8 | |
Merrill Lynch & Co., Inc. | | BRL-CDI-Compounded | | Pay | | 11.430% | | 01/04/2010 | | | 2,700 | | | 18 | |
Merrill Lynch & Co., Inc. | | BRL-CDI-Compounded | | Pay | | 12.948% | | 01/04/2010 | | | 1,400 | | | 29 | |
Morgan Stanley | | BRL-CDI-Compounded | | Pay | | 12.780% | | 01/04/2010 | | | 1,500 | | | 27 | |
Barclays Bank PLC | | 5-Year French CPI Ex Tobacco Daily Reference Index | | Pay | | 1.960% | | 04/05/2012 | | EUR | 300 | | | (3 | ) |
BNP Paribas Bank | | 5-Year French CPI Ex Tobacco Daily Reference Index | | Pay | | 2.090% | | 10/15/2010 | | | 1,300 | | | 16 | |
Deutsche Bank AG | | 6-Month EUR-LIBOR | | Receive | | 4.000% | | 12/15/2011 | | | 4,600 | | | 94 | |
Goldman Sachs & Co. | | 6-Month EUR-LIBOR | | Pay | | 4.000% | | 03/20/2009 | | | 2,400 | | | (17 | ) |
Goldman Sachs & Co. | | 5-Year French CPI Ex Tobacco Daily Reference Index | | Pay | | 1.960% | | 03/30/2012 | | | 600 | | | (5 | ) |
JPMorgan Chase & Co. | | 5-Year French CPI Ex Tobacco Daily Reference Index | | Pay | | 1.948% | | 03/15/2012 | | | 1,100 | | | (11 | ) |
JPMorgan Chase & Co. | | 5-Year French CPI Ex Tobacco Daily Reference Index | | Pay | | 1.958% | | 04/10/2012 | | | 3,600 | | | (38 | ) |
Royal Bank of Scotland Group PLC | | 5-Year French CPI Ex Tobacco Daily Reference Index | | Pay | | 1.955% | | 03/28/2012 | | | 900 | | | (9 | ) |
Royal Bank of Scotland Group PLC | | 5-Year French CPI Ex Tobacco Daily Reference Index | | Pay | | 1.950% | | 03/30/2012 | | | 1,300 | | | (13 | ) |
Barclays Bank PLC | | 6-Month GBP-LIBOR | | Pay | | 6.000% | | 12/20/2008 | | GBP | 5,900 | | | (58 | ) |
Barclays Bank PLC | | 6-Month GBP-LIBOR | | Pay | | 6.000% | | 03/20/2009 | | | 3,400 | | | (49 | ) |
Credit Suisse First Boston | | 6-Month GBP-LIBOR | | Pay | | 5.000% | | 06/15/2009 | | | 700 | | | (17 | ) |
Deutsche Bank AG | | 6-Month GBP-LIBOR | | Pay | | 6.000% | | 12/20/2008 | | | 3,500 | | | (35 | ) |
Deutsche Bank AG | | 6-Month GBP-LIBOR | | Receive | | 4.000% | | 12/15/2036 | | | 6,000 | | | 525 | |
HSBC Bank USA | | 6-Month GBP-LIBOR | | Pay | | 4.500% | | 12/20/2007 | | | 1,700 | | | (26 | ) |
Lehman Brothers, Inc. | | 6-Month GBP-LIBOR | | Pay | | 4.500% | | 09/20/2009 | | | 200 | | | (13 | ) |
Royal Bank of Scotland Group PLC | | 6-Month GBP-LIBOR | | Pay | | 6.000% | | 03/20/2009 | | | 3,100 | | | (46 | ) |
Barclays Bank PLC | | 6-Month JPY-LIBOR | | Pay | | 1.000% | | 03/18/2009 | | JPY | 310,000 | | | (7 | ) |
Deutsche Bank AG | | 6-Month JPY-LIBOR | | Pay | | 1.000% | | 09/18/2008 | | | 2,290,000 | | | (12 | ) |
Deutsche Bank AG | | 6-Month JPY-LIBOR | | Pay | | 1.000% | | 03/18/2009 | | | 500,000 | | | (7 | ) |
UBS Warburg LLC | | 6-Month JPY-LIBOR | | Pay | | 1.000% | | 09/18/2008 | | | 160,000 | | | (1 | ) |
UBS Warburg LLC | | 6-Month JPY-LIBOR | | Pay | | 1.000% | | 03/18/2009 | | | 2,940,000 | | | (42 | ) |
Goldman Sachs & Co. | | 28-Day Mexico Interbank TIIE Banxico | | Pay | | 7.780% | | 04/03/2012 | | MXN | 12,200 | | | (10 | ) |
Bank of America | | 3-Month USD-LIBOR | | Pay | | 5.000% | | 12/19/2009 | | $ | 13,600 | | | (15 | ) |
Deutsche Bank AG | | 3-Month USD-LIBOR | | Pay | | 5.000% | | 12/19/2009 | | | 41,900 | | | 18 | |
Deutsche Bank AG | | 3-Month USD-LIBOR | | Receive | | 5.000% | | 12/19/2017 | | | 11,100 | | | (84 | ) |
Morgan Stanley | | 3-Month USD-LIBOR | | Pay | | 5.000% | | 06/20/2009 | | | 20,300 | | | (160 | ) |
Morgan Stanley | | 3-Month USD-LIBOR | | Receive | | 5.000% | | 12/19/2017 | | | 3,800 | | | (25 | ) |
| | | | | | | | | | | | | | | |
| | | | | | | | | | | | | $ | 55 | |
| | | | | | | | | | | | | | | |
(e) Purchased options outstanding on June 30, 2007:
Interest Rate Swaptions
| | | | | | | | | | | | | | | | | | | |
| Description | | Counterparty | | Floating Rate Index | | Pay/Receive
Floating Rate | | Exercise
Rate | | Expiration
Date | | Notional
Amount | | Cost | | Value |
Call - OTC 2-Year Interest Rate Swap | | Barclays Bank PLC | | 6-Month EUR-LIBOR | | Pay | | 3.960% | | 07/02/2007 | | EUR | 6,000 | | $ | 28 | | $ | 0 |
Call - OTC 2-Year Interest Rate Swap | | Bank of America | | 3-Month USD-LIBOR | | Pay | | 4.900% | | 08/08/2007 | | $ | 9,000 | | | 40 | | | 0 |
Call - OTC 2-Year Interest Rate Swap | | Bank of America | | 3-Month USD-LIBOR | | Pay | | 4.750% | | 09/26/2008 | | | 44,000 | | | 208 | | | 87 |
Call - OTC 2-Year Interest Rate Swap | | Lehman Brothers, Inc. | | 3-Month USD-LIBOR | | Pay | | 4.750% | | 03/31/2008 | | | 13,800 | | | 77 | | | 17 |
Call - OTC 2-Year Interest Rate Swap | | Lehman Brothers, Inc. | | 3-Month USD-LIBOR | | Pay | | 4.750% | | 09/26/2008 | | | 5,200 | | | 18 | | | 10 |
Call - OTC 2-Year Interest Rate Swap | | Royal Bank of Scotland Group PLC | | 3-Month USD-LIBOR | | Pay | | 4.750% | | 07/02/2007 | | | 10,000 | | | 41 | | | 0 |
Call - OTC 1-Year Interest Rate Swap | | Royal Bank of Scotland Group PLC | | 3-Month USD-LIBOR | | Pay | | 4.850% | | 07/02/2007 | | | 30,000 | | | 78 | | | 0 |
Call - OTC 1-Year Interest Rate Swap | | Royal Bank of Scotland Group PLC | | 3-Month USD-LIBOR | | Pay | | 4.900% | | 08/08/2007 | | | 36,000 | | | 81 | | | 0 |
Call - OTC 2-Year Interest Rate Swap | | Royal Bank of Scotland Group PLC | | 3-Month USD-LIBOR | | Pay | | 5.000% | | 02/01/2008 | | | 45,700 | | | 227 | | | 73 |
Call - OTC 2-Year Interest Rate Swap | | Royal Bank of Scotland Group PLC | | 3-Month USD-LIBOR | | Pay | | 4.750% | | 03/31/2008 | | | 63,600 | | | 371 | | | 79 |
Call - OTC 2-Year Interest Rate Swap | | Royal Bank of Scotland Group PLC | | 3-Month USD-LIBOR | | Pay | | 5.000% | | 12/15/2008 | | | 62,700 | | | 218 | | | 212 |
| | | | | | | | | | | | | | | | | | | |
| | | | | | | | | | | | | | | $ | 1,387 | | $ | 478 |
| | | | | | | | | | | | | | | | | | | |
| | | | | | |
| See Accompanying Notes | | Semiannual Report | | June 30, 2007 | | 13 |
Schedule of Investments Low Duration Portfolio (Cont.)
Foreign Currency Options
| | | | | | | | | | | | | | |
| Description | | Exercise
Price | | Expiration
Date | | Notional
Amount | | Cost | | Value |
Call - OTC U.S. dollar versus Japanese yen | | JPY | 103.800 | | 03/17/2010 | | $ | 1,000 | | $ | 44 | | $ | 77 |
Put - OTC U.S. dollar versus Japanese yen | | | 103.800 | | 03/17/2010 | | | 1,000 | | | 44 | | | 25 |
Call - OTC U.S. dollar versus Japanese yen | | | 104.650 | | 03/31/2010 | | | 1,000 | | | 45 | | | 71 |
Put - OTC U.S. dollar versus Japanese yen | | | 104.650 | | 03/31/2010 | | | 1,000 | | | 39 | | | 27 |
Call - OTC U.S. dollar versus Japanese yen | | | 105.200 | | 03/31/2010 | | | 1,000 | | | 42 | | | 68 |
Put - OTC U.S. dollar versus Japanese yen | | | 105.200 | | 03/31/2010 | | | 1,000 | | | 42 | | | 28 |
Call - OTC U.S. dollar versus Japanese yen | | | 105.400 | | 03/31/2010 | | | 3,000 | | | 126 | | | 201 |
Put - OTC U.S. dollar versus Japanese yen | | | 105.400 | | 03/31/2010 | | | 3,000 | | | 126 | | | 85 |
| | | | | | | | | | | | | | |
| | | | | | | | | | $ | 508 | | $ | 582 |
| | | | | | | | | | | | | | |
(f) Written options outstanding on June 30, 2007:
Interest Rate Swaptions
| | | | | | | | | | | | | | | | | | | |
| Description | | Counterparty | | Floating Rate Index | | Pay/Receive
Floating Rate | | Exercise
Rate | | Expiration
Date | | Notional
Amount | | Premium | | Value |
Call - OTC 5-Year Interest Rate Swap | | Barclays Bank PLC | | 6-Month EUR-LIBOR | | Receive | | 4.100% | | 07/02/2007 | | EUR | 2,000 | | $ | 24 | | $ | 0 |
Call - OTC 5-Year Interest Rate Swap | | Bank of America | | 3-Month USD-LIBOR | | Receive | | 4.950% | | 09/26/2008 | | $ | 19,000 | | | 209 | | | 96 |
Call - OTC 5-Year Interest Rate Swap | | Lehman Brothers, Inc. | | 3-Month USD-LIBOR | | Receive | | 4.900% | | 03/31/2008 | | | 6,000 | | | 73 | | | 18 |
Call - OTC 5-Year Interest Rate Swap | | Lehman Brothers, Inc. | | 3-Month USD-LIBOR | | Receive | | 4.950% | | 09/26/2008 | | | 2,300 | | | 19 | | | 12 |
Call - OTC 5-Year Interest Rate Swap | | Royal Bank of Scotland Group PLC | | 3-Month USD-LIBOR | | Receive | | 4.950% | | 07/02/2007 | | | 7,600 | | | 82 | | | 0 |
Call - OTC 5-Year Interest Rate Swap | | Royal Bank of Scotland Group PLC | | 3-Month USD-LIBOR | | Receive | | 5.000% | | 07/02/2007 | | | 4,500 | | | 47 | | | 0 |
Call - OTC 7-Year Interest Rate Swap | | Royal Bank of Scotland Group PLC | | 3-Month USD-LIBOR | | Receive | | 4.900% | | 08/08/2007 | | | 6,000 | | | 70 | | | 0 |
Call - OTC 7-Year Interest Rate Swap | | Royal Bank of Scotland Group PLC | | 3-Month USD-LIBOR | | Receive | | 5.000% | | 08/08/2007 | | | 3,000 | | | 34 | | | 0 |
Call - OTC 5-Year Interest Rate Swap | | Royal Bank of Scotland Group PLC | | 3-Month USD-LIBOR | | Receive | | 5.100% | | 02/01/2008 | | | 20,000 | | | 240 | | | 72 |
Call - OTC 5-Year Interest Rate Swap | | Royal Bank of Scotland Group PLC | | 3-Month USD-LIBOR | | Receive | | 4.900% | | 03/31/2008 | | | 14,700 | | | 196 | | | 45 |
Call - OTC 5-Year Interest Rate Swap | | Royal Bank of Scotland Group PLC | | 3-Month USD-LIBOR | | Receive | | 4.950% | | 03/31/2008 | | | 13,000 | | | 160 | | | 44 |
Call - OTC 7-Year Interest Rate Swap | | Royal Bank of Scotland Group PLC | | 3-Month USD-LIBOR | | Receive | | 5.200% | | 12/15/2008 | | | 20,900 | | | 209 | | | 205 |
| | | | | | | | | | | | | | | | | | | |
| | | | | | | | | | | | | | | $ | 1,363 | | $ | 492 |
| | | | | | | | | | | | | | | | | | | |
(g) Short sales outstanding on June 30, 2007:
| | | | | | | | | | | | | |
| Description | | Coupon | | Maturity
Date | | Principal
Amount | | Proceeds | | Value (2) |
Fannie Mae | | 5.500% | | 07/01/2037 | | $ | 4,000 | | $ | 3,885 | | $ | 3,858 |
U.S. Treasury Notes | | 4.625% | | 02/15/2017 | | | 2,800 | | | 2,723 | | | 2,763 |
| | | | | | | | | | | | | |
| | | | | | | | | $ | 6,608 | | $ | 6,621 |
| | | | | | | | | | | | | |
(2) Market value includes $50 of interest payable on short sales.
(h) Foreign currency contracts outstanding on June 30, 2007:
| | | | | | | | | | | | | | | | | |
| Type | | Currency | | Principal
Amount
Covered by
Contract | | Settlement
Month | | Unrealized
Appreciation | | Unrealized
(Depreciation) | | | Net Unrealized
Appreciation/
(Depreciation) | |
Buy | | AUD | | 3,792 | | 07/2007 | | $ | 23 | | $ | 0 | | | $ | 23 | |
Sell | | | | 34 | | 07/2007 | | | 0 | | | 0 | | | | 0 | |
Buy | | BRL | | 29,907 | | 10/2007 | | | 572 | | | 0 | | | | 572 | |
Buy | | | | 14,977 | | 03/2008 | | | 478 | | | 0 | | | | 478 | |
Buy | | CAD | | 2,735 | | 08/2007 | | | 11 | | | 0 | | | | 11 | |
Buy | | CLP | | 130,534 | | 03/2008 | | | 0 | | | (1 | ) | | | (1 | ) |
Buy | | CNY | | 768 | | 09/2007 | | | 2 | | | 0 | | | | 2 | |
Sell | | | | 768 | | 09/2007 | | | 0 | | | 0 | | | | 0 | |
Buy | | | | 11,517 | | 11/2007 | | | 12 | | | 0 | | | | 12 | |
Sell | | | | 14,080 | | 11/2007 | | | 1 | | | (4 | ) | | | (3 | ) |
Buy | | | | 4,059 | | 01/2008 | | | 0 | | | (4 | ) | | | (4 | ) |
Sell | | | | 4,059 | | 01/2008 | | | 0 | | | (1 | ) | | | (1 | ) |
Buy | | EUR | | 5,466 | | 07/2007 | | | 72 | | | 0 | | | | 72 | |
Sell | | GBP | | 3,730 | | 08/2007 | | | 0 | | | (39 | ) | | | (39 | ) |
Buy | | INR | | 41,409 | | 10/2007 | | | 4 | | | 0 | | | | 4 | |
Buy | | | | 4,970 | | 11/2007 | | | 0 | | | (1 | ) | | | (1 | ) |
Buy | | | | 260,547 | | 05/2008 | | | 59 | | | 0 | | | | 59 | |
Buy | | KRW | | 2,631,872 | | 07/2007 | | | 17 | | | 0 | | | | 17 | |
Sell | | | | 177,295 | | 07/2007 | | | 0 | | | (1 | ) | | | (1 | ) |
Buy | | | | 1,082,809 | | 08/2007 | | | 0 | | | 0 | | | | 0 | |
Buy | | | | 987,632 | | 09/2007 | | | 7 | | | 0 | | | | 7 | |
Sell | | | | 241,906 | | 09/2007 | | | 0 | | | (5 | ) | | | (5 | ) |
Buy | | MXN | | 14,088 | | 09/2007 | | | 18 | | | 0 | | | | 18 | |
Buy | | | | 34,243 | | 03/2008 | | | 19 | | | (5 | ) | | | 14 | |
| | | | |
| 14 | | PIMCO Variable Insurance Trust | | See Accompanying Notes |
| | |
| |
| | | June 30, 2007 (Unaudited) |
| | | | | | | | | | | | | | | | | |
| Type | | Currency | | Principal
Amount
Covered by
Contract | | Settlement
Month | | Unrealized
Appreciation | | Unrealized
(Depreciation) | | | Net Unrealized
Appreciation/
(Depreciation) | |
Buy | | MYR | | 6,017 | | 05/2008 | | $ | 0 | | $ | (13 | ) | | $ | (13 | ) |
Buy | | NZD | | 408 | | 07/2007 | | | 8 | | | 0 | | | | 8 | |
Buy | | PHP | | 14,604 | | 05/2008 | | | 0 | | | (3 | ) | | | (3 | ) |
Buy | | PLN | | 11,325 | | 09/2007 | | | 76 | | | (1 | ) | | | 75 | |
Buy | | RUB | | 35,543 | | 09/2007 | | | 18 | | | 0 | | | | 18 | |
Buy | | | | 21,548 | | 11/2007 | | | 21 | | | 0 | | | | 21 | |
Buy | | | | 50,111 | | 12/2007 | | | 45 | | | 0 | | | | 45 | |
Buy | | | | 85,054 | | 01/2008 | | | 17 | | | 0 | | | | 17 | |
Buy | | SEK | | 5,098 | | 09/2007 | | | 9 | | | 0 | | | | 9 | |
Buy | | SGD | | 5,064 | | 07/2007 | | | 0 | | | (18 | ) | | | (18 | ) |
Sell | | | | 2,968 | | 07/2007 | | | 0 | | | (11 | ) | | | (11 | ) |
Buy | | | | 2,154 | | 08/2007 | | | 8 | | | (2 | ) | | | 6 | |
Buy | | | | 172 | | 09/2007 | | | 0 | | | 0 | | | | 0 | |
Buy | | | | 4,887 | | 10/2007 | | | 17 | | | 0 | | | | 17 | |
Buy | | ZAR | | 106 | | 09/2007 | | | 0 | | | 0 | | | | 0 | |
Buy | | | | 202 | | 03/2008 | | | 0 | | | 0 | | | | 0 | |
| | | | | | | | | | | | | | | | | |
| | | | | | | | $ | 1,514 | | $ | (109 | ) | | $ | 1,405 | |
| | | | | | | | | | | | | | | | | |
| | | | | | |
| See Accompanying Notes | | Semiannual Report | | June 30, 2007 | | 15 |
Notes to Financial Statements
1. ORGANIZATION
The Low Duration Portfolio (the “Portfolio”) is a series of the PIMCO Variable Insurance Trust (the “Trust”). The Trust is registered under the Investment Company Act of 1940 (the “Act”), as amended, as an open-end management investment company organized as a Delaware business trust on October 3, 1997. The Portfolio offers three classes of shares: Institutional, Administrative and Advisor. Information presented on these financial statements pertains to the Institutional Class of the Portfolio. Certain detailed financial information for the Administrative Class and Advisor Class is provided separately and is available upon request. The Trust is designed to be used as an investment vehicle by Separate Accounts of insurance companies that fund variable annuity contracts and variable life insurance policies and by qualified pension and retirement plans.
2. SIGNIFICANT ACCOUNTING POLICIES
The following is a summary of significant accounting policies consistently followed by the Portfolio in the preparation of its financial statements in conformity with accounting principles generally accepted in the United States of America (“GAAP”). The preparation of financial statements in accordance with GAAP requires management to make estimates and assumptions that affect the reported amounts and disclosures on the financial statements. Actual results could differ from those estimates.
(a) Security Valuation Portfolio securities are valued as of the close of regular trading (normally 4:00 p.m., Eastern Time) on each day that the New York Stock Exchange (“NYSE”) is open. Portfolio securities and other assets for which market quotes are readily available are stated at market value. Market value is generally determined on the basis of last reported sales prices, or if no sales are reported, based on quotes obtained from a quotation reporting system, established market makers, or pricing services. Fixed-income securities and non-exchange traded derivatives are normally valued on the basis of quotes obtained from brokers and dealers or pricing services. Prices obtained from independent pricing services use information provided by market makers or estimates of market values obtained from yield data relating to investments or securities with similar characteristics. Certain fixed income securities purchased on a delayed-delivery basis are marked to market daily until settlement at the forward settlement date. Short-term investments having a maturity of 60 days or less are generally valued at amortized cost. Exchange traded options, futures and options on futures are valued at the settlement price determined by the relevant exchange. With respect to any portion of the Portfolio’s assets that are invested in one or more open end management investment companies, the Portfolio’s net asset value (“NAV”) will be calculated based upon the NAVs of such investments.
Investments initially valued in currencies other than the U.S. dollar are converted to the U.S. dollar using exchange rates obtained from pricing services. As a result, the NAV of the Portfolio’s securities may be affected by changes in the value of currencies in relation to the U.S. dollar. The value of securities traded in markets outside the United States or denominated in currencies other than the U.S. dollar may be affected significantly on a day that the NYSE is closed and an investor is not able to purchase, redeem or exchange shares.
Securities and other assets for which market quotes are not readily available are valued at fair value as determined in good faith by the Board of Trustees or persons acting at their direction. The Board of Trustees has adopted methods for valuing securities and other assets in circumstances where market quotes are not readily available, and has delegated to Pacific Investment Management Company LLC (“PIMCO”) the responsibility for applying the valuation methods. In the event that market quotes are not readily available, and the security or asset cannot be valued pursuant to one of the valuation methods, the value of the security or asset will be determined in good faith by the Valuation Committee of the Board of Trustees, generally based upon recommendations provided by PIMCO.
Market quotes are considered not readily available in circumstances where there is an absence of current or reliable market-based data (e.g., trade information, bid/asked information, broker quotes), including where events occur after the close of the relevant market, but prior to the close of regular trading, that materially affect the values of the Portfolio’s securities or assets. In addition, market quotes are considered not readily available when, due to extraordinary circumstances, the exchanges or markets on which the securities trade, do not open for trading for the entire day and no other market prices are available. The Board has delegated to PIMCO the responsibility for monitoring significant events that may materially affect the values of the Portfolio’s securities or assets and for determining whether the value of the applicable securities or assets should be re-evaluated in light of such significant events.
When the Portfolio uses fair value pricing to determine its NAV, securities will not be priced on the basis of quotations from the primary market in which they are traded, but rather may be priced by another method that the Board of Trustees or persons acting at their direction believe accurately reflects fair value. The Trust’s policy is intended to result in a calculation of the Portfolio’s NAV that fairly reflects security values as of the time of pricing. However, fair values determined by the Board of Trustees or persons acting at their direction may not accurately reflect the price that the Portfolio could obtain for a security if it were to dispose of that security as of the time of pricing. Because foreign securities can trade on non-business days of the Portfolio, the NAV of the Portfolio may change on days when shareholders will not be able to purchase or redeem Portfolio shares. The prices used by the Portfolio may differ from the value that would be realized if the securities were sold and the differences could be material to the financial statements.
(b) Securities Transactions and Investment Income Securities transactions are recorded as of the trade date for financial reporting purposes. Securities purchased or sold on a when-issued or delayed-delivery basis may be settled a month or more after the trade date. Realized gains and losses from securities sold are recorded on the identified cost basis. Dividend income is recorded on the ex-dividend date, except certain dividends from foreign securities where the ex-dividend date may have passed, which are recorded as soon as the Portfolio is informed of the ex-dividend date. Interest income, adjusted for the accretion of discounts and amortization of premiums, is recorded on the accrual basis. Paydown gains and losses on mortgage-related and other asset-backed securities are recorded as components of interest income on the Statement of Operations.
(c) Delayed-Delivery Transactions The Portfolio may purchase or sell securities on a delayed-delivery basis. These transactions involve a commitment by the Portfolio to purchase or sell securities for a predetermined price or yield, with payment and delivery taking place beyond the customary settlement period. When delayed-delivery purchases are outstanding, the Portfolio will designate liquid assets in an amount sufficient to meet the purchase price. When purchasing a security on a delayed-delivery basis, the Portfolio assumes the rights and risks of ownership of the security, including the risk of price and yield fluctuations, and takes such fluctuations into account when determining its net asset value. The Portfolio may dispose of or renegotiate a delayed-delivery transaction after it is entered into, and may sell when-issued securities before they are delivered, which may result in a capital gain or loss. When the Portfolio has sold a security on a delayed-delivery basis, the Portfolio does not participate in future gains and losses with respect to the security.
(d) Dividends and Distributions to Shareholders Dividends from net investment income, if any, are declared daily and distributed to shareholders monthly. Net realized capital gains earned by the Portfolio, if any, will be distributed no less frequently than once each year.
Income dividends and capital gain distributions are determined in accordance with income tax regulations which may differ from GAAP. Differences between tax regulations and GAAP may change the fiscal year when income and capital items
| | | | |
| 16 | | PIMCO Variable Insurance Trust | | |
| | |
| |
| | | June 30, 2007 (Unaudited) |
are recognized for tax and GAAP purposes. Examples of events that give rise to timing differences include wash sales, straddles, net operating losses and capital loss carryforwards. Further, the character of investment income and capital gains may be different for certain transactions under the two methods of accounting. Examples of characterization differences include the treatment of mortgage paydowns, swaps, foreign currency transactions and contingent debt instruments. As a result, income dividends and capital gain distributions declared during a fiscal period may differ significantly from the net investment income and realized capital gain reported on the Portfolio’s annual financial statements presented under GAAP.
Distributions classified as a tax basis return of capital, if any, are reflected on the accompanying Statements of Changes in Net Assets and have been reclassified to paid in capital. In addition, other amounts have been reclassified between undistributed net investment income, accumulated undistributed net realized gains or losses and/or paid in capital to more appropriately conform financial accounting to tax characterizations of dividend distributions.
(e) Multiclass Operations Each class offered by the Portfolio has equal rights as to assets and voting privileges (except that shareholders of a class have exclusive voting rights regarding any matter relating solely to that class of shares). Income and non-class specific expenses of the Portfolio are allocated daily to each class of shares based on the relative value of settled shares. Realized and unrealized capital gains and losses of the Portfolio are allocated daily to each class of shares based on the relative net assets of each class. Class specific expenses, where applicable, currently include administrative, distribution and servicing fees.
(f) Foreign Currency The functional and reporting currency for the Portfolio is the U.S. dollar. The market values of foreign securities, currency holdings and other assets and liabilities are translated into U.S. dollars based on the current exchange rates each business day. Fluctuations in the value of currency holdings and other assets and liabilities resulting from changes in exchange rates are recorded as unrealized foreign currency gains or losses. Realized gains or losses and unrealized appreciation or depreciation on investment securities and income and expenses are translated on the respective dates of such transactions. The effects of changes in foreign currency exchange rates on investments in securities are not segregated on the Statement of Operations from the effects of changes in market prices of those securities, but are included with the net realized and unrealized gain or loss on investment securities.
| | | | | | |
|
Non-U.S. currency symbols utilized throughout the report are defined
as follows: |
| AUD | | Australian Dollar | | MXN | | Mexican Peso |
| BRL | | Brazilian Real | | MYR | | Malaysian Ringgit |
| CAD | | Canadian Dollar | | NZD | | New Zealand Dollar |
| CLP | | Chilean Peso | | PHP | | Philippines Peso |
| CNY | | Chinese Yuan Renminbi | | PLN | | Polish Zloty |
| EUR | | Euro | | RUB | | Russian Ruble |
| GBP | | Great British Pound | | SEK | | Swedish Krona |
| INR | | Indian Rupee | | SGD | | Singapore Dollar |
| JPY | | Japanese Yen | | ZAR | | South African Rand |
| KRW | | South Korean Won | | | | |
| | | | | | |
(g) Foreign Currency Transactions The Portfolio may enter into foreign currency contracts in connection with settling planned purchases or sales of securities, to hedge the currency exposure associated with some or all of the Portfolio’s securities or as a part of an investment strategy. A foreign currency
contract is an agreement between two parties to buy and sell a currency at a set price on a future date. The market value of a foreign currency contract fluctuates with changes in foreign currency exchange rates. Foreign currency contracts are marked to market daily and the change in value is recorded by the Portfolio as an unrealized gain or loss. Realized gains or losses equal to the difference between the value of the contract at the time it was opened and the value at the time it was closed are recorded upon delivery or receipt of the currency. These contracts may involve market risk in excess of the unrealized gain or loss reflected on the Statement of Assets and Liabilities. In addition, the Portfolio could be exposed to risk if the counterparties are unable to meet the terms of the contracts or if the value of the currency changes unfavorably to the U.S. dollar.
(h) Futures Contracts The Portfolio may enter into futures contracts. The Portfolio may use futures contracts to manage its exposure to the securities markets or to movements in interest rates and currency values. The primary risks associated with the use of futures contracts are the imperfect correlation between the change in market value of the securities held by the Portfolio and the prices of futures contracts, the possibility of an illiquid market, and the inability of the counterparty to meet the terms of the contract. Futures contracts are valued based upon their quoted daily settlement prices. Upon entering into a futures contract, the Portfolio is required to deposit with its futures broker, an amount of cash or U.S. Government and Agency Obligations in accordance with the initial margin requirements of the broker or exchange. Futures contracts are marked to market daily and an appropriate payable or receivable for the change in value (“variation margin”) is recorded by the Portfolio. Gains or losses are recognized but not considered realized until the contracts expire or are closed. Futures contracts involve, to varying degrees, risk of loss in excess of the variation margin disclosed on the Statement of Assets and Liabilities.
(i) Options Contracts The Portfolio may write call and put options on futures, swaps, securities or currencies it owns or in which it may invest. Writing put options tends to increase the Portfolio’s exposure to the underlying instrument. Writing call options tends to decrease the Portfolio’s exposure to the underlying instrument. When the Portfolio writes a call or put option, an amount equal to the premium received is recorded as a liability and subsequently marked to market to reflect the current value of the option written. These liabilities are reflected as written options outstanding on the Statement of Assets and Liabilities. Certain options may be written with premiums to be determined on a future date. The premiums for these options are based upon implied volatility parameters at specified terms. Premiums received from writing options which expire are treated as realized gains. Premiums received from writing options which are exercised or closed are added to the proceeds or offset against amounts paid on the underlying future, swap, security or currency transaction to determine the realized gain or loss. The Portfolio as a writer of an option has no control over whether the underlying future, swap, security or currency may be sold (call) or purchased (put) and as a result bears the market risk of an unfavorable change in the price of the future, swap, security or currency underlying the written option. There is the risk the Portfolio may not be able to enter into a closing transaction because of an illiquid market.
The Portfolio may also purchase put and call options. Purchasing call options tends to increase the Portfolio’s exposure to the underlying instrument. Purchasing put options tends to decrease the Portfolio’s exposure to the underlying instrument. The Portfolio pays a premium which is included on the Statement of Assets and Liabilities as an investment and subsequently marked to market to reflect the current value of the option. Premiums paid for purchasing options which expire are treated as realized losses. Certain options may be purchased with premiums to be determined on a future date. The premiums for these options are based upon implied volatility parameters at specified terms. The risk associated with purchasing put and call options is limited to the premium paid. Premiums paid for purchasing options which are exercised or closed are added to the amounts paid or
| | | | | | |
| | Semiannual Report | | June 30, 2007 | | 17 |
Notes to Financial Statements (Cont.)
offset against the proceeds on the underlying future, swap, security or currency transaction to determine the realized gain or loss.
(j) Repurchase Agreements The Portfolio may engage in repurchase transactions. Under the terms of a typical repurchase agreement, the Portfolio takes possession of an underlying debt obligation (collateral) subject to an obligation of the seller to repurchase, and the Portfolio to resell, the obligation at an agreed-upon price and time. The underlying securities for all repurchase agreements are held in safekeeping at the Portfolio’s custodian or designated subcustodians under tri-party repurchase agreements. The market value of the collateral must be equal to or exceed the total amount of the repurchase obligations, including interest. Securities purchased under repurchase agreements are reflected as an asset on the Statement of Assets and Liabilities. Generally, in the event of counterparty default, the Portfolio has the right to use the collateral to offset losses incurred. If the counterparty should default, the Portfolio will seek to sell the securities which it holds as collateral. This could involve procedural costs or delays in addition to a loss on the securities if their value should fall below their repurchase price.
(k) Inverse Floating Rate Transactions—Residual Interest Municipal Bonds (“RIBs”)/Residual Interest Tax Exempt Bonds (“RITEs”) The Portfolio may invest in RIBs and RITEs (“Inverse Floaters”). Inverse Floaters are created via a master trust agreement between a broker-dealer, acting as trustor and liquidity provider, and an investment bank, acting as trustee and tender agent. The master trust agreement defines the terms for each trust series; with each series being established by the transfer of long-term, fixed-rate municipal bonds (“Fixed Rate Bonds”) to the trustee to be held and provide for the creation, execution and delivery of floater certificates (“Floating Rate Notes”) and Inverse Floaters. Floating Rate Notes are liquid notes that are issued with a short-term variable rate typically linked to the LIBOR, subject to limitations, for some duration. After interest income is paid on the Floating Rate Notes at current rates, the residual income from the Fixed Rate Bonds is paid to the Inverse Floaters. Inverse Floaters are issued with a coupon that fluctuates inversely with the Floating Rate Notes’ referenced rate, subject to certain limitations. Therefore, rising short-term rates result in lower income for the Inverse Floaters and vice versa.
Floating Rate Notes are generally remarketed to municipal money market funds. Inverse Floaters are acquired by either tax-exempt municipal bond funds or trusts, or other parties interested in potentially higher yielding tax-exempt securities. Inverse Floaters may also be acquired for the purpose of increasing leverage. Floating Rate Note holders typically have the option to tender their notes to the liquidity provider for redemption at par at each reset date. The Inverse Floater holders have the option to (i) require the Floating Rate Note holders to tender their notes at par, and (ii) require the liquidity provider to transfer the Fixed Rate Bonds to the Inverse Floater holders. The holders of Inverse Floaters bear substantially all of the downside investment risk associated with the underlying Fixed Rate Bonds, and also benefit from a disproportionate amount of the potential appreciation of the underlying Fixed Rate Bonds’ value. Inverse Floaters may be more volatile and less liquid than other municipal bonds of comparable maturity.
Inverse Floaters may be acquired with or without first transferring to the trustor the Fixed Rate Bonds that were utilized to create the trust series. Inverse Floaters acquired without a transfer of Fixed Rate Bonds are recognized as purchases of securities as outlined in Note 2(b). Statement of Financial Accounting Standards No. 140—Accounting for Transfers and Servicing of Financial Assets and Extinguishments of Liabilities (“FAS No. 140”), governs the standards for accounting for securitizations and other transfers of financial assets. If there is a transfer of Fixed Rate Bonds and it meets sale criteria under FAS No. 140, a Portfolio records a sale of the Fixed Rate Bonds and a purchase of the Inverse Floaters. The cash received from the Inverse Floaters is then recorded as interest income in the Statement of Operations.
If the transfer of Fixed Rate Bonds does not meet sale criteria under FAS No. 140, a Portfolio accounts for the transaction described above as a secured borrowing by including the Fixed Rate Bonds in its Schedule of Investments, and recording the Floating Rate Notes as a liability under the caption “Payable for floating rate notes” in the Portfolio’s Statement of Assets and Liabilities. In a secured borrowing transaction, cash received from the Inverse Floaters is not recorded as interest income. Instead, a Portfolio records interest income related to the Fixed Rate Bonds and interest expense related to the Floating Rate Notes, the net of which is equal to the cash received from the Inverse Floaters acquired by the Portfolio. Thus, while a Portfolio’s reported total income, net expenses, and net expense ratio are generally higher for investments in Inverse Floaters acquired via a secured borrowing, the method of acquiring Inverse Floaters does not result in differences for reported cash flows, net asset value or total return.
(l) Short Sales The Portfolio may enter into short sales transactions. A short sale is a transaction in which the Portfolio sells securities it does not own in anticipation of a decline in the market price of the securities. Securities sold in short sale transactions and interest payable on such securities, if any, are reflected as a liability on the Statement of Assets and Liabilities. The Portfolio is obligated to deliver securities at the market price at the time the short position is closed. Possible losses from short sales may be unlimited, whereas losses from purchases cannot exceed the total amount invested.
(m) Swap Agreements The Portfolio may invest in swap agreements. Swap transactions are privately negotiated agreements between the Portfolio and a counterparty to exchange or swap investment cash flows, assets, or market-linked returns at specified, future intervals. The Portfolio may enter into interest rate, total return, forward spread-lock, credit default, and other forms of swap agreements to manage its exposure to interest rates and credit risk. In connection with these agreements, securities may be identified as collateral in accordance with the terms of the respective swap agreements.
Interest rate swap agreements involve the exchange by the Portfolio with another party of their respective commitments to pay or receive interest, e.g., an exchange of floating rate payments for fixed rate payments with respect to the notional amount of principal. Certain forms of interest rate swap agreements may include: (i) interest rate caps, under which, in return for a premium, one party agrees to make payments to the other to the extent that interest rates exceed a specified rate, or “cap”, (ii) interest rate floors, under which, in return for a premium, one party agrees to make payments to the other to the extent that interest rates fall below a specified rate, or “floor”, or (iii) interest rate collars, under which a party sells a cap and purchases a floor or vice versa in an attempt to protect itself against interest rate movements exceeding given minimum or maximum levels.
Total return swap agreements involve commitments to pay interest in exchange for a market-linked return, both based on notional amounts. To the extent the total return of the security or index underlying the transaction exceeds or falls short of the offsetting interest rate obligation, the Portfolio will receive a payment from or make a payment to the counterparty.
Forward spread-lock swap agreements involve commitments to pay or receive a settlement amount calculated as the difference between the swap spread and a fixed spread, multiplied by the notional amount times the duration of the swap. The swap spread is the difference between the benchmark swap rate (market rate) and the specific Treasury rate.
Credit default swap agreements involve one party making a stream of payments to another party in exchange for the right to receive a specified return in the event of a default by a third party, typically corporate issues or sovereign issues of an emerging country, on its obligation. The Portfolio may use credit default swaps to provide a measure of protection against defaults of the issuers (i.e., to reduce risk where the Portfolio owns or has exposure to the sovereign issuer) or to take an
| | | | |
| 18 | | PIMCO Variable Insurance Trust | | |
| | |
| |
| | | June 30, 2007 (Unaudited) |
active long or short position with respect to the likelihood of a particular issuer’s default. As a seller of protection, the Portfolio generally receives an upfront payment or a fixed rate of income throughout the term of the swap provided that there is no credit event. If the Portfolio is a seller of protection and a credit event occurs, as defined under the terms of that particular swap agreement, the Portfolio will pay to the buyer of the protection an amount up to the notional value of the swap and in certain instances take delivery of the security. As the seller, the Portfolio would effectively add leverage to its portfolio because, in addition to its total net assets, the Portfolio would be subject to investment exposure on the notional amount of the swap. As a buyer of protection, the Portfolio generally receives an amount up to the notional value of the swap if a credit event occurs. The treatment of credit default swaps and other swap agreements that provide for contingent, non-periodic, bullet-type payments as “notional principal contracts” for U.S. federal income tax purposes is uncertain. Were the U.S. Internal Revenue Service (“IRS”) to take the position that a credit default swap or other bullet-type swap is not a “notional principal contract” for U.S. federal income tax purposes, payments received by the Portfolio from such investments might be subject to U.S. excise or income taxes.
Swaps are marked to market daily based upon quotations from market makers and the change in value, if any, is recorded as unrealized gain or loss on the Statement of Operations. Payments received or made at the beginning of the measurement period are reflected as such on the Statement of Assets and Liabilities. These upfront payments are recorded as realized gain or loss on the Statement of Operations upon termination or maturity of the swap. A liquidation payment received or made at the termination of the swap is recorded as realized gain or loss on the Statement of Operations. Net periodic payments received or paid by the Portfolio are included as part of realized gain or loss on the Statement of Operations. Entering into these agreements involves, to varying degrees, elements of credit, market and documentation risk in excess of the amounts recognized on the Statement of Assets and Liabilities. Such risks involve the possibility that there will be no liquid market for these agreements, that the counterparty to the agreements may default on its obligation to perform or disagree as to the meaning of contractual terms in the agreements and that there may be unfavorable changes in interest rates.
(n) Loan Participations and Assignments The Portfolio may invest in direct debt instruments which are interests in amounts owned by corporate, governmental, or other borrowers to lenders or lending syndicates. The Portfolio’s investments in loans may be in the form of participations in loans or assignments of all or a portion of loans from third parties. A loan is often administered by a bank or other financial institution (the “lender”) that acts as agent for all holders. The agent administers the terms of the loan, as specified in the loan agreement. When investing in a loan participation, the Portfolio has the right to receive payments of principal, interest and any fees to which it is entitled only from the lender selling the loan agreement and only upon receipt by the lender of payments from the borrower. The Portfolio generally has no right to enforce compliance with the terms of the loan agreement with the borrower. As a result, the Portfolio may be subject to the credit risk of both the borrower and the lender that is selling the loan agreement. When the Portfolio purchases assignments from lenders it acquires direct rights against the borrower of the loan. At the end of the period June 30, 2007, the Portfolio had no unfunded loan commitments.
(o) Bridge Debt Commitments At the period ended June 30, 2007, the Portfolio had $2,189,000 in commitments outstanding to fund high yield bridge debt. The Portfolio is entitled to a fee upon the expiration of the commitment period. The bridge debt terms approximate market rates at the time the commitment is entered into.
(p) Commodities Index-Linked/Structured Notes The Portfolio invests in structured notes whose value is based on the price movements of a commodity
index. The structured notes are often leveraged, increasing the volatility of each note’s value relative to the change in the underlying linked financial element. The value of these notes will rise and fall in response to changes in the underlying commodity index. Structured notes may entail a greater degree of market risk than other types of debt securities because the investor bears the risk of the underlying commodity index. Structured notes may also be more volatile, less liquid, and more difficult to accurately price than less complex securities or more traditional debt securities. Fluctuations in value of the structured notes are recorded as unrealized gains and losses on the accompanying financial statements. Net payments are recorded as net realized gains and losses. These notes are subject to prepayment, credit and interest risks. The Portfolio has the option to request prepayment from the issuer. At maturity, or when a note is sold, the Portfolio records a realized gain or loss. At June 30, 2007, the value of these securities comprised 0.3% of the Portfolio’s net assets and resulted in unrealized depreciation of $17,003.
(q) Mortgage-Related and Other Asset-Backed Securities The Portfolio may invest in mortgage-related or other asset-backed securities. These securities include mortgage pass-through securities, collateralized mortgage obligations (“CMOs”), commercial mortgage-backed securities, mortgage dollar rolls, CMO residuals, stripped mortgage-backed securities (“SMBSs”) and other securities that directly or indirectly represent a participation in, or are secured by and payable from, mortgage loans on real property. The value of some mortgage-related or asset-backed securities may be particularly sensitive to changes in prevailing interest rates. Early repayment of principal on some mortgage-related securities may expose the Portfolio to a lower rate of return upon reinvestment of principal. The value of these securities may fluctuate in response to the market’s perception of the creditworthiness of the issuers. Additionally, although mortgages and mortgage-related securities are generally supported by some form of government or private guarantee and/or insurance, there is no assurance that private guarantors or insurers will meet their obligations.
(r) U.S. Government Agencies or Government-Sponsored Enterprises Securities issued by U.S. Government agencies or government-sponsored enterprises may not be guaranteed by the U.S. Treasury. The Government National Mortgage Association (“GNMA” or “Ginnie Mae”), a wholly owned U.S. Government corporation, is authorized to guarantee, with the full faith and credit of the U.S. Government, the timely payment of principal and interest on securities issued by institutions approved by GNMA and backed by pools of mortgages insured by the Federal Housing Administration or guaranteed by the Department of Veterans Affairs. Government-related guarantors (i.e., not backed by the full faith and credit of the U.S. Government) include the Federal National Mortgage Association (“FNMA” or “Fannie Mae”) and the Federal Home Loan Mortgage Corporation (“FHLMC” or “Freddie Mac”). Pass-through securities issued by FNMA are guaranteed as to timely payment of principal and interest by FNMA but are not backed by the full faith and credit of the U.S. Government. FHLMC guarantees the timely payment of interest and ultimate collection of principal, but its participation certificates are not backed by the full faith and credit of the U.S. Government.
(s) New Accounting Policies In July 2006, the Financial Accounting Standards Board (“FASB”) issued Interpretation No. 48, “Accounting for Uncertainty in Income Taxes—an Interpretation of FASB Statement No. 109” (the “Interpretation”). The Interpretation became effective for the Portfolio on June 29, 2007. Management has evaluated the application of the Interpretation in relation to the Portfolio and has concluded that no single filing position or combination of filing positions identified as uncertain tax positions required the accrual of a tax liability in the accounting records of the Portfolio for the period ending June 30, 2007. Management will monitor all existing filing positions and future filing positions in light of the Interpretation and evaluate the need for any future tax accruals and financial statement disclosures as warranted.
| | | | | | |
| | Semiannual Report | | June 30, 2007 | | 19 |
Notes to Financial Statements (Cont.)
In September 2006, the FASB issued Statement of Financial Accounting Standards No. 157, “Fair Value Measurements” (the “Statement”). The Statement is effective for fiscal years beginning after November 15, 2007 and will require expanded disclosure about fair value measurements, separately for each major category of assets and liabilities, that enables shareholders to assess the inputs used to develop those measurements, and for recurring fair value measurements using significant unobservable inputs the effect of the measurements on changes in net assets for the reporting period. Management is currently evaluating the application of the Statement to the Portfolio and will provide additional information in relation to the Statement on the Portfolio’s annual financial statements for the period ending December 31, 2007.
3. FEES AND EXPENSES
(a) Investment Advisory Fee PIMCO is a majority-owned subsidiary of Allianz Global Investors of America L.P. (“AGI”), and serves as investment adviser (the “Adviser”) to the Trust, pursuant to an investment advisory contract. The Adviser receives a monthly fee from the Portfolio, at an annual rate based on average daily net assets. The Advisory Fee for all classes is charged at an annual rate of 0.25%.
(b) Administration Fee PIMCO serves as administrator (the “Administrator”), and provides administrative services to the Trust for which it receives a monthly administrative fee based on each share class’s average daily net assets. As the Administrator, PIMCO bears the costs of various third-party services, including audit, custodial, portfolio accounting, legal, transfer agency and printing costs. The Administration Fee for all classes is charged at the annual rate of 0.25%.
(c) Distribution and Servicing Fees Allianz Global Investors Distributors LLC (“AGID”) is an indirect wholly-owned subsidiary of AGI and serves as the distributor (the “Distributor”) of the Trust’s shares. The Trust is permitted to reimburse AGID on a quarterly basis, out of the Administrative Class assets of the Portfolio in the amount of 0.15% on an annual basis of the average daily net assets of that class, for payments made to financial intermediaries that provide services in connection with the distribution of shares or administration of plans or programs that use Portfolio shares as their funding medium. The effective rate paid to AGID was 0.15% during the current fiscal year.
The Trust has adopted a Distribution Plan, for the Advisor Class shares of the Portfolio (the “Plan”). The Plan has been adopted pursuant to Rule 12b-1 under the Act. The Plan permits payments for expenses in connection with the distribution and marketing of Advisor Class shares and/or the provision of shareholder services to Advisor Class shareholders. The Plan permits the Portfolio to make total payments at an annual rate of 0.25% of its average daily net assets attributable to its Advisor Class shares.
(d) Portfolio Expenses The Trust is responsible for the following expenses: (i) salaries and other compensation of any of the Trust’s executive officers and employees who are not officers, directors, stockholders or employees of PIMCO or its subsidiaries or affiliates; (ii) taxes and governmental fees; (iii) brokerage fees and commissions and other portfolio transaction expenses; (iv) the costs of borrowing money, including interest expenses and bank overdraft charges; (v) fees and expenses of the Trustees who are not “interested persons” of PIMCO or the Trust, and any counsel retained exclusively for their benefit; (vi) extraordinary expenses, including costs of litigation and indemnification expenses; (vii) organization expenses and (viii) any expenses allocated or allocable to a specific class of shares, which include service fees payable with respect to the Administrative Class Shares, and may include certain other expenses as permitted by the Trust’s Multiple Class Plan adopted pursuant to Rule 18f-3 under the Act and subject to review and approval by the Trustees. The ratio of expenses to average net assets per share class, as disclosed in the Financial Highlights, may
differ from the annual portfolio operating expenses per share class as disclosed in the Prospectus for the reasons set forth above.
Effective April 1, 2007, each Trustee, other than those affiliated with PIMCO or its affiliates, receives an annual retainer of $15,000, plus $2,375 for each Board of Trustees meeting attended in person, $500 for each committee meeting attended and $750 for each Board of Trustees meeting attended telephonically, plus reimbursement of related expenses. In addition, the audit committee chair receives an additional annual retainer of $2,000 and each other committee chair receives an additional annual retainer of $500. These expenses are allocated on a pro-rata basis to the various portfolios of the Trust according to their respective net assets. The Trust pays no compensation directly to any Trustee or any other officer who is affiliated with the Administrator, all of whom receive remuneration for their services to the Trust from the Administrator or its affiliates. Prior to April 1, 2007, each Trustee, other than those affiliated with PIMCO or its affiliates, received an annual retainer of $15,000 plus $2,000 for each Board of Trustees meeting attended ($500 for each special meeting attended), plus reimbursement of related expenses. The Audit Committee Chairman received an annual retainer of $1,500 and the Governance Committee Chairman received an annual retainer of $500. In addition, each member of a committee received $500 for each committee meeting attended.
4. RELATED PARTY TRANSACTIONS
The Adviser, Administrator, and Distributor are related parties as defined by FAS 57, Related Party Disclosures. Fees payable to these parties are disclosed in Note 3.
5. GUARANTEES AND INDEMNIFICATIONS
Under the Trust’s organizational documents, each Trustee, officer, employee or other agent of the Trust (including the Trust’s investment manager) is indemnified, to the extent permitted by the Act, against certain liabilities that may arise out of performance of their duties to the Portfolio. Additionally, in the normal course of business, the Portfolio enters into contracts that contain a variety of indemnification clauses. The Portfolio’s maximum exposure under these arrangements is unknown as this would involve future claims that may be made against the Portfolio that have not yet occurred. However, the Portfolio has not had prior claims or losses pursuant to these contracts and believes the risk of loss to be remote.
6. PURCHASES AND SALES OF SECURITIES
The length of time the Portfolio has held a particular security is not generally a consideration in investment decisions. A change in the securities held by the Portfolio is known as “portfolio turnover”. The Portfolio may engage in frequent and active trading of portfolio securities to achieve its investment objective, particularly during periods of volatile market movements. High portfolio turnover (e.g., over 100%) involves correspondingly greater expenses to the Portfolio, including brokerage commissions or dealer mark-ups and other transaction costs on the sale of securities and reinvestments in other securities. Such sales may also result in realization of taxable capital gains, including short-term capital gains (which are generally taxed at ordinary income tax rates). The trading costs and tax effects associated with portfolio turnover may adversely affect the Portfolio’s performance.
Purchases and sales of securities (excluding short-term investments) for the period ended June 30, 2007, were as follows (amounts in thousands):
| | | | | | | | | | | | |
| U.S. Government/Agency | | | | All Other |
| Purchases | | Sales | | | | Purchases | | Sales |
| $ | 132,589 | | $ | 60,737 | | | | $ | 195,469 | | $ | 25,549 |
| | | | |
| 20 | | PIMCO Variable Insurance Trust | | |
| | |
| |
| | | June 30, 2007 (Unaudited) |
7. TRANSACTIONS IN WRITTEN CALL AND PUT OPTIONS
Transactions in written call and put options were as follows (amounts in thousands, except for number of contracts):
| | | | | | | | | | | | | | | | | | | | |
| | | | | # of
Contracts | | | Notional
Amount
in $ | | | Notional
Amount
in EUR | | Notional
Amount
in GBP | | | Premium | |
Balance at 12/31/2006 | | | | 19 | | | $ | 98,000 | | | EUR | 2,000 | | GBP | 1,300 | | | $ | 1,000 | |
Sales | | | | 309 | | | | 104,900 | | | | 0 | | | 0 | | | | 1,311 | |
Closing Buys | | | | (138 | ) | | | (85,900 | ) | | | 0 | | | 0 | | | | (862 | ) |
Expirations | | | | (165 | ) | | | 0 | | | | 0 | | | (1,300 | ) | | | (76 | ) |
Exercised | | | | (25 | ) | | | 0 | | | | 0 | | | 0 | | | | (10 | ) |
Balance at 06/30/2007 | | | | 0 | | | $ | 117,000 | | | EUR | 2,000 | | GBP | 0 | | | $ | 1,363 | |
8. SHARES OF BENEFICIAL INTEREST
The Portfolio may issue an unlimited number of shares of beneficial interest with a $0.001 par value. Changes in shares of beneficial interest were as follows (shares and amounts in thousands):
| | | | | | | | | | | | | | | | |
| | | | | Six Months Ended
06/30/2007 | | | Year Ended
12/31/2006 | |
| | | | | Shares | | | Amount | | | Shares | | | Amount | |
| | | | | |
Receipts for shares sold | | | | | | | | | | | | | | | | |
Institutional Class | | | | 304 | | | $ | 3,048 | | | 1,150 | | | $ | 11,541 | |
Administrative Class | | | | 29,060 | | | | 291,519 | | | 36,746 | | | | 369,230 | |
Advisor Class | | | | 42 | | | | 421 | | | 39 | | | | 390 | |
Issued as reinvestment of distributions | | | | | | | | | | | | | | | | |
Institutional Class | | | | 60 | | | | 599 | | | 106 | | | | 1,072 | |
Administrative Class | | | | 2,018 | | | | 20,247 | | | 2,547 | | | | 25,602 | |
Advisor Class | | | | 0 | | | | 3 | | | 0 | | | | 2 | |
Cost of shares redeemed | | | | | | | | | | | | | | | | |
Institutional Class | | | | (1,117 | ) | | | (11,174 | ) | | (476 | ) | | | (4,778 | ) |
Administrative Class | | | | (6,686 | ) | | | (67,154 | ) | | (8,707 | ) | | | (87,388 | ) |
Advisor Class | | | | (35 | ) | | | (355 | ) | | (20 | ) | | | (204 | ) |
Net increase resulting from Portfolio share transactions | | | | 23,646 | | | $ | 237,154 | | | 31,385 | | | $ | 315,467 | |
The following schedule shows the number of shareholders each owning 5% or more of the Portfolio and the total percentage of the Portfolio held by such shareholders:
| | | | | | |
| | | | | Number of
Shareholders | | % of Portfolio Held |
Institutional Class | | | | 2 | | 100 |
Administrative Class | | | | 2 | | 71 |
Advisor Class | | | | 1 | | 96 |
9. REGULATORY AND LITIGATION MATTERS
Since February 2004, PIMCO, Allianz Global Investors of America L.P. (PIMCO’s parent company), AGID, and certain of their affiliates, including the PIMCO Funds (another series of funds managed by PIMCO), the Allianz Funds (formerly known as PIMCO Funds: Multi-Manager Series (another series of funds managed by affiliates of PIMCO)), certain Trustees of the Trust (in their capacity as Trustees of the PIMCO Funds or the Allianz Funds) and certain employees of PIMCO, have been named as defendants in fifteen lawsuits filed in various jurisdictions. Eleven
of those lawsuits concern “market timing,” and they have been transferred to and consolidated for pre-trial proceedings in a multi-district litigation proceeding in the U.S. District Court for the District of Maryland; the other four lawsuits concern “revenue sharing” and have been consolidated into a single action in the U.S. District Court for the District of Connecticut. The lawsuits have been commenced as putative class actions on behalf of investors who purchased, held or redeemed shares of the various series of the PIMCO Funds and the Allianz Funds during specified periods, or as derivative actions on behalf of the PIMCO Funds and the Allianz Funds.
The market timing actions in the District of Maryland generally allege that certain hedge funds were allowed to engage in “market timing” in certain funds of the PIMCO Funds and the Allianz Funds and this alleged activity was not disclosed. Pursuant to tolling agreements entered into with the derivative and class action plaintiffs, PIMCO, certain PIMCO Funds Trustees, and certain employees of PIMCO who were previously named as defendants have all been dropped as defendants in the market timing actions; the plaintiffs continue to assert claims on behalf of the shareholders of the PIMCO Funds or on behalf of the PIMCO Funds itself against other defendants. By order dated November 3, 2005, the U.S. District Court for the District of Maryland granted the PIMCO Funds’ motion to dismiss claims asserted against it in a consolidated amended complaint where the PIMCO Funds were named, in the complaint, as a nominal defendant. The revenue sharing action in the District of Connecticut generally alleges that fund assets were inappropriately used to pay brokers to promote funds of the PIMCO Funds and the Allianz Funds, including directing fund brokerage transactions to such brokers, and that such alleged arrangements were not fully disclosed to shareholders. On August 11, 2005, the U.S. District Court for the District of Connecticut conducted a hearing on defendants’ motion to dismiss the consolidated amended complaint in the revenue sharing action but has not yet ruled on the motion to dismiss. The market timing and revenue sharing lawsuits seek, among other things, unspecified compensatory damages plus interest and, in some cases, punitive damages, the rescission of investment advisory contracts, the return of fees paid under those contracts and restitution.
Two nearly identical class action civil complaints have been filed in August 2005, in the Northern District of Illinois Eastern Division, alleging that the plaintiffs each purchased and sold a 10-year Treasury note futures contract and suffered damages from an alleged shortage when PIMCO held both physical and futures positions in 10-year Treasury notes for its client accounts. The two actions have been consolidated into one action, and the two separate complaints have been replaced by a consolidated complaint. PIMCO is a named defendant, and PIMCO Funds has been added as a defendant, to the consolidated action. PIMCO strongly believes the complaint is without merit and intends to vigorously defend itself.
In April 2006, certain portfolios of the Trust and certain other funds managed by PIMCO were served in an adversary proceeding brought by the Official Committee of Asbestos Claimants of G-I Holdings, Inc. in G-I Holdings, Inc.’s bankruptcy in the District of New Jersey. In July 2004, PIMCO was named in this lawsuit and remains a defendant. The plaintiff seeks to recover for the bankruptcy estate assets that were transferred by the predecessor entity of G-I Holdings, Inc. to a wholly-owned subsidiary in 1994. The subsidiary has since issued notes, of which certain portfolios of the Trust and certain other funds managed by PIMCO are alleged to be holders. The complaint alleges that in 2000, more than two hundred noteholders—including certain portfolios of the Trust and certain other funds managed by PIMCO—were granted a second priority lien on the assets of the subsidiary in exchange for their consent to a refinancing transaction and the granting of a first priority lien to the lending banks. The plaintiff is seeking invalidation of the lien in favor of the noteholders and/or the value of the lien. On June 21, 2006, the District of New Jersey overturned the Bankruptcy Court’s decision granting permission to file the adversary proceeding and remanded the matter to the Bankruptcy Court for further proceedings. Following a motion to
| | | | | | |
| | Semiannual Report | | June 30, 2007 | | 21 |
Notes to Financial Statements (Cont.)
reconsider, the District Court upheld its remand on August 7, 2006, and instructed the Bankruptcy Court to conduct a “cost-benefit” analysis of the Committee’s claims, including the claims against the noteholders. The Bankruptcy Court held a status conference on October 25, 2006 and set a briefing schedule relating to this cost-benefit analysis.
The foregoing speaks only as of the date of this report. It is possible that these matters and/or other developments resulting from these matters could result in increased portfolio redemptions or other adverse consequences to the Portfolio. However, PIMCO and AGID believe that these matters are not likely to have a material adverse effect on the Portfolio or on PIMCO’s or AGID’s ability to perform their respective investment advisory or distribution services relating to the Portfolio.
10. FEDERAL INCOME TAX MATTERS
The Portfolio intends to qualify as a regulated investment company under sub-chapter M of the Internal Revenue Code (the “Code”) and distribute all of its taxable income and net realized gains, if applicable, to shareholders. Accordingly, no provision for Federal income taxes has been made.
As of June 30, 2007, the aggregate cost of investments was the same for federal income tax and financial statement purposes. The net unrealized appreciation (depreciation) of investment securities for federal income tax purposes is as follows (amount in thousands):
| | | | |
Aggregate
Gross
Unrealized
Appreciation | | Aggregate
Gross
Unrealized
(Depreciation) | | Net
Unrealized
(Depreciation) |
$ 767 | | $ (3,837) | | $ (3,070) |
| | | | |
| 22 | | PIMCO Variable Insurance Trust | | |
| | |
| |
Privacy Policy* | | (Unaudited) |
The Funds consider customer privacy to be a fundamental aspect of their relationships with shareholders and are committed to maintaining the confidentiality, integrity and security of their current, prospective and former shareholders’ personal information. To ensure their shareholders’ privacy, the Funds have developed policies that are designed to protect this confidentiality, while allowing shareholder needs to be served.
Obtaining Personal Information
In the course of providing shareholders with products and services, the Funds and certain service providers to the Funds, such as the Funds’ investment advisers (“Advisers”), may obtain non-public personal information about shareholders, which may come from sources such as account applications and other forms, from other written, electronic or verbal correspondence, from shareholder transactions, from a shareholder’s brokerage or financial advisory firm, financial adviser or consultant, and/or from information captured on the Funds’ internet web sites.
Respecting Your Privacy
As a matter of policy, the Funds do not disclose any personal or account information provided by shareholders or gathered by the Funds to non-affiliated third parties, except as required or permitted by law or as necessary for such third parties to perform their agreements with respect to the Funds. As is common in the industry, non-affiliated companies may from time to time be used to provide certain services, such as preparing and mailing prospectuses, reports, account statements and other information, conducting research on shareholder satisfaction and gathering shareholder proxies. A Fund’s Distributor may also retain non-affiliated companies to market the Fund’s shares or products which use the Fund’s shares and enter into joint marketing agreements with other companies. These companies may have access to a shareholder’s personal and account information, but are permitted to use this information solely to provide the specific service or as otherwise permitted by law. In most cases, the shareholders will be clients of a third party, but the Funds may also provide a shareholder’s personal and account information to the shareholder’s respective brokerage or financial advisory firm.
Sharing Information with Third Parties
The Funds reserve the right to disclose or report personal information to non-affiliated third parties, in limited circumstances, where the Funds believe in good faith that disclosure is required under law to cooperate with regulators or law enforcement authorities, to protect their rights or property or upon reasonable request by any Fund in which a shareholder has chosen to invest. In addition, the Funds may disclose information about a shareholder’s accounts to a non-affiliated third party with the consent of the shareholder.
Sharing Information with Affiliates
The Funds may share shareholder information with their affiliates in connection with servicing their shareholders’ accounts or to provide shareholders with information about products and services that the Funds or their Advisers, principal underwriters or their affiliates (“Service Affiliates”) believe may be of interest to such shareholders. The information that the Funds share may include, for example, a shareholder’s participation in one of the Funds or in other investment programs sponsored by a Service Affiliate, a shareholder’s ownership of certain types of accounts (such as IRAs), or other data about a shareholder’s accounts. The Funds’ Service Affiliates, in turn, are not permitted to share shareholder information with non-affiliated entities, except as required or permitted by law.
Procedures to Safeguard Private Information
The Funds take seriously the obligation to safeguard shareholder non-public personal information. In addition to this policy, the Funds have also implemented procedures that are designed to restrict access to a shareholder’s non-public personal information only to internal personnel who need to know that information in order to provide products or services to such shareholders. In order to guard a shareholder’s non-public personal information, physical, electronic and procedural safeguards are in place.
* This Privacy Policy applies to the following entities: PIMCO Funds, PIMCO Variable Insurance Trust, PCM Fund, Inc. and PIMCO Strategic Global Government Fund, Inc. (collectively, the “Funds”).
| | | | | | |
| | Semiannual Report | | June 30, 2007 | | 23 |
Investment Adviser and Administrator
Pacific Investment Management Company LLC
840 Newport Center Drive
Newport Beach, California 92660
Distributor
Allianz Global Investors Distributors LLC
1345 Avenue of the Americas
New York, New York 10105
Custodian
State Street Bank & Trust Company
801 Pennsylvania
Kansas City, Missouri 64105
Transfer Agent
Boston Financial Data Services–Midwest
330 W. 9th Street
Kansas City, Missouri 64105
Legal Counsel
Dechert LLP
1775 I Street, N.W.
Washington, D.C. 20006
Independent Registered Public Accounting Firm
PricewaterhouseCoopers LLP
1055 Broadway
Kansas City, Missouri 64105
P I M C O

Table of Contents
This material is authorized for use only when preceded or accompanied by the current PIMCO Variable Insurance Trust (the “Trust”) prospectus. Investors should consider the investment objectives, risks, charges and expenses of this Trust carefully before investing. Ask your financial professional to explain all charges that may apply. This and other information is contained in the Trust’s prospectus. The variable product prospectus may be obtained by contacting your Investment Consultant. Please read the Trust and variable product prospectus carefully before you invest or send money.
Chairman’s Letter
Dear PIMCO Variable Insurance Trust Shareholder:
It is our pleasure to present to you the semiannual report for the PIMCO Variable Insurance Trust, covering the six-month period ended June 30, 2007. The PIMCO Variable Insurance Trust’s net assets were $8.68 billion at June 30, 2007, as compared to $7.76 billion at December 31, 2006.
Highlights of the financial markets during the reporting period include:
| | n | | Economic data during the first quarter of 2007 pointed to slower growth, which heightened market expectations for a decrease in the Federal Funds Rate. By the second quarter, economic data, such as employment statistics, provided little indication of economic weakness, causing expectations of a decrease in the Federal Funds Rate to unwind and U.S. interest rates to move higher. Interest rates in Europe and the U.K. also rose over the period as central banks raised their key lending rates due to inflation concerns. The benchmark ten-year U.S. Treasury yielded 5.03% as of June 30, 2007, or 0.32% higher than at the beginning of the year. |
| | n | | Most bonds generally returned much of their gains from earlier in the year as worldwide growth and capital flows drove interest rates higher in the second quarter. Increased risk aversion in global financial markets, due in part to subprime mortgage worries in the U.S., also contributed to the rise in interest rates. The Lehman Brothers Aggregate Bond Index, which includes Treasury, investment-grade corporate and mortgage-backed securities, returned 0.98% for the six-month period. |
| | n | | Locally issued emerging market (“EM”) bonds posted positive returns for the reporting period. Yields on these bonds declined and the local currencies in which they are denominated generally gained, amid increasing investor awareness, strong economic growth and surging capital inflows. External EM bonds (debt instruments issued by emerging markets countries and typically denominated in U.S. dollars) lagged behind local EM bonds (debt instruments issued by emerging markets countries and denominated in the currency of the issuer), as external EM bonds tend to trade more in-line with U.S. Treasuries. |
| | n | | Treasury Inflation-Protected Securities (“TIPS”) outpaced nominal bonds (non-inflation linked bonds) for the first part of the year and all but the longest maturity TIPS outperformed in the second quarter as high gasoline prices drove higher inflation accruals. Commodities, as represented by the Dow Jones-AIG Commodity Total Return Index, returned 4.46% for the period. Equities, as measured by the S&P 500 Index and the Russell 2000 Index, returned 6.96% and 6.45%, respectively, for the period. |
On the following pages, please find specific details as to the Portfolio’s total return investment performance and a discussion of those factors that affected performance.
Thank you for the trust you have placed in us. We will continue to work diligently to serve your investment needs.
Sincerely,
Brent R. Harris
Chairman, PIMCO Variable Insurance Trust
July 31, 2007
| | | | | | |
| | Semiannual Report | | June 30, 2007 | | 1 |
Important Information About the Portfolio
PIMCO Variable Insurance Trust (the “Trust”) is an open-end management investment company currently consisting of twenty separate investment portfolios, including the Low Duration Portfolio (the “Portfolio”). The Portfolio is only available as a funding vehicle under variable life insurance policies or variable annuity contracts issued by insurance companies (“Variable Contracts”). Individuals may not purchase shares of the Portfolio directly. Shares of the Portfolio also may be sold to qualified pension and retirement plans outside of the separate account context.
We believe that bond funds have an important role to play in a well diversified investment portfolio. It is important to note, however, that in an environment where interest rates may trend upward, rising rates would negatively impact the performance of most bond funds, and fixed-income securities held by a fund are likely to decrease in value. The price volatility of fixed-income securities can also increase during periods of rising interest rates resulting in increased losses to a fund. Bond funds and individual bonds with a longer duration (a measure of the expected life of a security) tend to be more sensitive to changes in interest rates, usually making them more volatile than securities or funds with shorter durations.
The Portfolio may be subject to various risks in addition to those described above. Some of these risks may include, but are not limited to, the following: credit risk, high yield risk, market risk, issuer risk, liquidity risk, derivatives risk, mortgage risk, non-U.S. investment risk, emerging markets risk, currency risk, leveraging risk and management risk. A complete description of these risks is contained in the Portfolio’s prospectus. The Portfolio may use derivative instruments for hedging purposes or as part of an investment strategy. Use of these instruments may involve certain costs and risks such as liquidity risk, interest rate risk, market risk, credit risk, management risk and the risk that the Portfolio could not close out a position when it would be most advantageous to do so. Because the Portfolio may invest in derivatives, it could lose more than the principal amount invested in these instruments. Investing in non-U.S. securities may entail risk due to non-U.S. economic and political developments.
On the performance summary page in this Semiannual Report, the Total Return Investment Performance table measures performance assuming that all dividend and capital gain distributions were reinvested.
An investment in the Portfolio is not a deposit of a bank and is not guaranteed or insured by the Federal Deposit Insurance Corporation or any other government agency. It is possible to lose money on investments in the Portfolio.
PIMCO has adopted written proxy voting policies and procedures (“Proxy Policy”) as required by Rule 206(4)-6 under the Investment Advisers Act of 1940, as amended. The Proxy Policy has been adopted by the Trust as the policies and procedures that PIMCO will use when voting proxies on behalf of the Portfolio. A description of the policies and procedures that PIMCO uses to vote proxies relating to portfolio securities of the Portfolio, and information about how the Portfolio voted proxies relating to portfolio securities held during the most recent twelve-month period ended June 30, are available without charge, upon request, by calling the Trust at 1-866-746-2606 and on the Portfolio’s website at www.pimco.com.
The Portfolio files its complete schedule of portfolio holdings with the SEC for the first and third quarters of each fiscal year on Form N-Q. A copy of the Trust’s Form N-Q is also available on the SEC’s website at http://www.sec.gov and may be reviewed and copied at the SEC’s Public Reference Room in Washington D.C. Information on the operation of the Public Reference Room may be obtained by calling 1-800-SEC-0330, and is available without charge, upon request, by calling the Trust at 1-866-746-2606 and on the Portfolio’s website at www.pimco.com.
PIMCO Variable Insurance Trust is distributed by Allianz Global Investors Distributors LLC, 1345 Avenue of the Americas, New York, NY 10105.
| | | | |
| 2 | | PIMCO Variable Insurance Trust | | |
The following disclosure provides important information regarding the Portfolio’s Expense Example (“Example” or “Expense Example”), which appears in this Semiannual Report. Please refer to this information when reviewing the Expense Example for the Portfolio.
Example
As a shareholder of the Portfolio, you incur two types of costs: (1) transaction costs and (2) ongoing costs, including advisory and administrative fees; distribution and/or service (12b-1) fees (Administrative and Advisor Class only); and other Portfolio expenses. The Example is intended to help you understand your ongoing costs (in dollars) of investing in the Portfolio and to compare these costs with the ongoing costs of investing in other mutual funds. The Expense Example does not reflect any fees or other expenses imposed by the Variable Contracts. If it did, the expenses reflected in the Expense Example would be higher. The Example is based on an investment of $1,000 invested at the beginning of the period and held for the entire period indicated, which is from January 1, 2007 to June 30, 2007.
Actual Expenses
The information in the table under the heading “Actual Performance” provides information about actual account values and actual expenses. You may use the information in these columns, together with the amount you invested, to estimate the expenses that you paid over the period. Simply divide your account value by $1,000 (for example, an $8,600 account value divided by $1,000 = $8.60), then multiply the result by the number in the row titled “Expenses Paid During Period” to estimate the expenses you paid on your account during this period.
Hypothetical Example for Comparison Purposes
The information in the table under the heading “Hypothetical Performance (5% return before expenses)” provides information about hypothetical account values and hypothetical expenses based on the Portfolio’s actual expense ratio and an assumed rate of return of 5% per year before expenses, which is not the Portfolio’s actual return. The hypothetical account values and expenses may not be used to estimate the actual ending account balance or expenses you paid for the period. You may use this information to compare the ongoing costs of investing in the Portfolio and other portfolios. To do so, compare this 5% hypothetical example with the 5% hypothetical examples that appear in the shareholder reports of the other portfolios.
Please note that the expenses shown in the table are meant to highlight your ongoing costs only and do not reflect any transactional costs. Therefore, the information under the heading “Hypothetical Performance (5% return before expenses)” is useful in comparing ongoing costs only, and will not help you determine the relative total costs of owning different portfolios. In addition, if these transactional costs were included, your costs would have been higher.
The expense ratio may vary period to period because of various factors, such as an increase in expenses not covered by the advisory and administrative fees (such as expenses of the trustees and their counsel, litigation expense and interest expense).
| | | | | | |
| | Semiannual Report | | June 30, 2007 | | 3 |
PIMCO Low Duration Portfolio
Cumulative Returns Through June 30, 2007
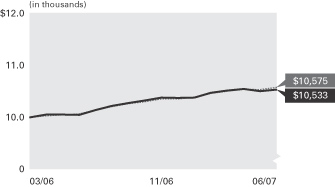
$10,000 invested at the beginning of the first full month following the inception date of the Portfolio’s Advisor Class.
Allocation Breakdown‡
| | |
Corporate Bonds & Notes | | 26.9% |
Short-Term Instruments | | 26.0% |
U.S. Government Agencies | | 20.5% |
Asset-Backed Securities | | 18.0% |
Mortgage-Backed Securities | | 7.0% |
Other | | 1.6% |
| | ‡ | % of Total Investments as of 06/30/2007 |
| | | | | | | | |
| Average Annual Total Return for the period ended June 30, 2007 |
| | | | | 6 Months* | | 1 Year | | Portfolio
Inception
(03/31/06) |
| | PIMCO Low Duration Portfolio Advisor Class | | 1.52% | | 4.80% | | 4.24% |
| | Merrill Lynch 1-3 Year Treasury Index± | | 2.11% | | 5.07% | | 4.58% |
All Portfolio returns are net of fees and expenses.
* Cumulative return.
Performance quoted represents past performance. Past performance is no guarantee of future results. Investment return and principal value will fluctuate so the Portfolio shares, when redeemed, may be worth more or less than their original cost. The Portfolio’s performance does not reflect the deduction of additional charges and expenses imposed in connection with investing in Variable Contracts, which will reduce returns. Current performance may be lower or higher than the performance data quoted. Performance data current to the most recent month-end is available by calling (800) 927-4648.
± Merrill Lynch 1-3 Year Treasury Index is an unmanaged index that tracks the performance of the direct Sovereign debt of the U.S. Government having a maturity of at least 1 year and less than 3 years. It is not possible to invest directly in the index. The index does not reflect deductions for fees and expenses.
| | | | | | |
| Expense Example | | Actual Performance | | Hypothetical Performance |
| | | | | (5% return before expenses) |
Beginning Account Value (01/01/07) | | $ | 1,000.00 | | $ | 1,000.00 |
Ending Account Value (06/30/07) | | $ | 1,015.18 | | $ | 1,021.08 |
Expenses Paid During Period† | | $ | 3.75 | | $ | 3.76 |
† Expenses are equal to the Portfolio’s Advisor Class annualized expense ratio of 0.75%, multiplied by the average account value over the period, multiplied by 181/365 (to reflect the one-half year period). Overall fees and expenses of investing in the Portfolio will be higher because the example does not reflect Variable Contract fees and expenses.
Please refer to page 3 herein for an explanation of the information presented in the above Expense Example.
Portfolio Insights
| » | | The PIMCO Low Duration Portfolio seeks to achieve its investment objective by investing, under normal circumstances, at least 65% of its total assets in a diversified portfolio of fixed-income securities of varying maturities, which may be represented by forwards or derivatives, such as options, futures contracts or swap agreements. |
| » | | Above-index duration exposure, or sensitivity to changes in market interest rates, during the period detracted from performance as interest rates rose. |
| » | | The Portfolio’s emphasis at the shorter-end of the yield curve, mostly through Eurodollar contracts, added to returns as rates on short maturities declined during the period. |
| » | | An emphasis on mortgages was slightly negative for returns as the sector slightly underperformed Treasuries on a like-duration basis. |
| » | | Exposure to high-yield and corporate bonds was slightly positive for performance as these sectors outperformed Treasuries. |
| » | | Low exposure to emerging markets was neutral for performance as the sector slightly outperformed Treasuries on a like-duration basis. |
| » | | Tactical exposure to non-U.S. issues, with a focus on shorter-maturity U.K. securities, detracted from returns as these positions underperformed comparable U.S. Treasuries. |
| | | | |
| 4 | | PIMCO Variable Insurance Trust | | |
Financial Highlights Low Duration Portfolio
| | | | | | | | |
| Selected per Share Data for the Period Ended: | | 06/30/2007+ | | | 03/31/2006–12/31/2006 | |
| | |
Advisor Class | | | | | | | | |
Net asset value beginning of period | | $ | 10.06 | | | $ | 10.01 | |
Net investment income (a) | | | 0.23 | | | | 0.35 | |
Net realized/unrealized gain (loss) on investments (a) | | | (0.08 | ) | | | 0.02 | |
Total income from investment operations | | | 0.15 | | | | 0.37 | |
Dividends from net investment income | | | (0.23 | ) | | | (0.32 | ) |
Total distributions | | | (0.23 | ) | | | (0.32 | ) |
Net asset value end of period | | $ | 9.98 | | | $ | 10.06 | |
Total return | | | 1.52 | % | | | 3.75 | % |
Net assets end of period (000s) | | $ | 256 | | | $ | 188 | |
Ratio of expenses to average net assets | | | 0.75 | %* | | | 0.75 | %* |
Ratio of expenses to average net assets excluding interest expense | | | 0.75 | %* | | | 0.75 | %* |
Ratio of net investment income to average net assets | | | 4.58 | %* | | | 4.59 | %* |
Portfolio turnover rate | | | 12 | % | | | 200 | % |
+ Unaudited
* Annualized
(a) Per share amounts based on average number of shares outstanding during the period.
| | | | | | |
| See Accompanying Notes | | Semiannual Report | | June 30, 2007 | | 5 |
Statement of Assets and Liabilities Low Duration Portfolio
| | | | |
| (Amounts in thousands, except per share amounts) | | June 30, 2007 | |
| | | (Unaudited) | |
| |
Assets: | | | | |
Investments, at value | | $ | 1,037,081 | |
Cash | | | 259 | |
Foreign currency, at value | | | 6,512 | |
Receivable for investments sold | | | 6,658 | |
Receivable for Portfolio shares sold | | | 3,235 | |
Interest and dividends receivable | | | 3,739 | |
Variation margin receivable | | | 773 | |
Swap premiums paid | | | 2,713 | |
Unrealized appreciation on foreign currency contracts | | | 1,514 | |
Unrealized appreciation on swap agreements | | | 956 | |
| | | | 1,063,440 | |
| |
Liabilities: | | | | |
Payable for investments purchased | | $ | 20,328 | |
Payable for investments purchased on a delayed-delivery basis | | | 12,597 | |
Payable for Portfolio shares redeemed | | | 48 | |
Payable for short sales | | | 6,621 | |
Written options outstanding | | | 492 | |
Dividends payable | | | 12 | |
Accrued investment advisory fee | | | 208 | |
Accrued administration fee | | | 208 | |
Accrued servicing fee | | | 111 | |
Variation margin payable | | | 663 | |
Swap premiums received | | | 444 | |
Unrealized depreciation on foreign currency contracts | | | 109 | |
Unrealized depreciation on swap agreements | | | 715 | |
Other liabilities | | | 11 | |
| | | | 42,567 | |
| |
Net Assets | | $ | 1,020,873 | |
| |
Net Assets Consist of: | | | | |
Paid in capital | | $ | 1,036,658 | |
Undistributed net investment income | | | 1,093 | |
Accumulated undistributed net realized (loss) | | | (9,797 | ) |
Net unrealized (depreciation) | | | (7,081 | ) |
| | | $ | 1,020,873 | |
| |
Net Assets: | | | | |
Institutional Class | | $ | 18,166 | |
Administrative Class | | | 1,002,451 | |
Advisor Class | | | 256 | |
| |
Shares Issued and Outstanding: | | | | |
Institutional Class | | | 1,820 | |
Administrative Class | | | 100,430 | |
Advisor Class | | | 26 | |
| |
Net Asset Value and Redemption Price Per Share (Net Asset Per Share Outstanding) | | | | |
Institutional Class | | $ | 9.98 | |
Administrative Class | | | 9.98 | |
Advisor Class | | | 9.98 | |
| |
Cost of Investments Owned | | $ | 1,040,151 | |
Cost of Foreign Currency Held | | $ | 6,490 | |
Proceeds Received on Short Sales | | $ | 6,608 | |
Premiums Received on Written Options | | $ | 1,363 | |
| | | | |
| 6 | | PIMCO Variable Insurance Trust | | See Accompanying Notes |
Statement of Operations Low Duration Portfolio
| | | | |
| (Amounts in thousands) | | Six Months Ended
June 30, 2007 | |
| | | (Unaudited) | |
| |
| Investment Income: | | | | |
Interest, net of foreign taxes* | | $ | 23,402 | |
Dividends | | | 166 | |
Miscellaneous income | | | 25 | |
Total Income | | | 23,593 | |
| |
Expenses: | | | | |
Investment advisory fees | | | 1,086 | |
Administration fees | | | 1,086 | |
Servicing fees – Administrative Class | | | 633 | |
Trustees’ fees | | | 9 | |
Total Expenses | | | 2,814 | |
| |
Net Investment Income | | | 20,779 | |
| |
Net Realized and Unrealized Gain (Loss): | | | | |
Net realized (loss) on investments | | | (434 | ) |
Net realized (loss) on futures contracts, written options and swaps | | | (2,941 | ) |
Net realized gain on foreign currency transactions | | | 512 | |
Net change in unrealized (depreciation) on investments | | | (2,479 | ) |
Net change in unrealized (depreciation) on futures contracts, written options and swaps | | | (3,146 | ) |
Net change in unrealized appreciation on translation of assets and liabilities denominated in foreign currencies | | | 1,382 | |
Net (Loss) | | | (7,106 | ) |
| |
Net Increase in Net Assets Resulting from Operations | | $ | 13,673 | |
| |
*Foreign tax withholding | | $ | 8 | |
| | | | | | |
| See Accompanying Notes | | Semiannual Report | | June 30, 2007 | | 7 |
Statements of Changes in Net Assets Low Duration Portfolio
| | | | | | | | |
| (Amounts in thousands) | | Six Months Ended
June 30, 2007 | | | Year Ended
December 31, 2006 | |
| | | (Unaudited) | | | | |
| | |
| Increase in Net Assets from: | | | | | | | | |
| | |
Operations: | | | | | | | | |
Net investment income | | $ | 20,779 | | | $ | 26,588 | |
Net realized (loss) | | | (2,863 | ) | | | (382 | ) |
Net change in unrealized (depreciation) | | | (4,243 | ) | | | (846 | ) |
Net increase resulting from operations | | | 13,673 | | | | 25,360 | |
| | |
Distributions to Shareholders: | | | | | | | | |
From net investment income | | | | | | | | |
Institutional Class | | | (600 | ) | | | (1,072 | ) |
Administrative Class | | | (20,271 | ) | | | (25,602 | ) |
Advisor Class | | | (3 | ) | | | (2 | ) |
| | |
Total Distributions | | | (20,874 | ) | | | (26,676 | ) |
| | |
Portfolio Share Transactions: | | | | | | | | |
Receipts for shares sold | | | | | | | | |
Institutional Class | | | 3,048 | | | | 11,541 | |
Administrative Class | | | 291,518 | | | | 369,230 | |
Advisor Class | | | 421 | | | | 390 | |
Issued as reinvestment of distributions | | | | | | | | |
Institutional Class | | | 600 | | | | 1,072 | |
Administrative Class | | | 20,247 | | | | 25,602 | |
Advisor Class | | | 3 | | | | 2 | |
Cost of shares redeemed | | | | | | | | |
Institutional Class | | | (11,174 | ) | | | (4,778 | ) |
Administrative Class | | | (67,154 | ) | | | (87,388 | ) |
Advisor Class | | | (355 | ) | | | (204 | ) |
Net increase resulting from Portfolio share transactions | | | 237,154 | | | | 315,467 | |
| | |
Total Increase in Net Assets | | | 229,953 | | | | 314,151 | |
| | |
Net Assets: | | | | | | | | |
Beginning of period | | | 790,920 | | | | 476,769 | |
End of period* | | $ | 1,020,873 | | | $ | 790,920 | |
| | |
*Including undistributed net investment income of: | | $ | 1,093 | | | $ | 1,188 | |
| | | | |
| 8 | | PIMCO Variable Insurance Trust | | See Accompanying Notes |
| | |
| |
| Schedule of Investments Low Duration Portfolio | | June 30, 2007 (Unaudited) |
| | | | | | | | |
| | | | | PRINCIPAL
AMOUNT
(000S) | | | | VALUE
(000S) |
| BANK LOAN OBLIGATIONS 0.2% |
| SLM Corp. |
6.000% due 06/30/2008 | | $ | | 2,200 | | $ | | 2,189 |
| | | | | | | | |
Total Bank Loan Obligations
(Cost $2,189) | | 2,189 |
| | | | | | | | |
|
| CORPORATE BONDS & NOTES 27.4% |
|
| BANKING & FINANCE 21.0% |
| AIG-Fp Matched Funding Corp. |
5.360% due 06/16/2008 | | | | 1,700 | | | | 1,703 |
| |
| Allstate Life Global Funding Trusts |
5.400% due 03/23/2009 | | | | 800 | | | | 801 |
| |
| American Express Bank FSB |
5.330% due 10/16/2008 | | | | 2,000 | | | | 2,000 |
5.380% due 06/22/2009 | | | | 1,300 | | | | 1,301 |
5.380% due 10/20/2009 | | | | 2,100 | | | | 2,101 |
| |
| American Express Centurion Bank |
5.320% due 05/07/2008 | | | | 1,400 | | | | 1,400 |
5.340% due 06/12/2009 | | | | 1,900 | | | | 1,901 |
| |
| American Express Credit Corp. |
5.380% due 11/09/2009 | | | | 1,100 | | | | 1,101 |
| |
| American International Group, Inc. |
5.360% due 06/23/2008 | | | | 600 | | | | 600 |
5.370% due 06/16/2009 | | | | 5,200 | | | | 5,222 |
| |
| ANZ National International Ltd. |
5.396% due 08/07/2009 | | | | 1,500 | | | | 1,500 |
| |
| Bank of America Corp. |
5.366% due 11/06/2009 | | | | 900 | | | | 900 |
5.370% due 06/19/2009 | | | | 6,100 | | | | 6,109 |
| |
| Bank of America N.A. |
5.360% due 02/27/2009 | | | | 700 | | | | 700 |
| |
| Bank of Ireland |
5.370% due 12/19/2008 | | | | 3,100 | | | | 3,104 |
5.410% due 12/18/2009 | | | | 1,120 | | | | 1,122 |
| |
| Bear Stearns Cos., Inc. |
5.450% due 03/30/2009 | | | | 2,900 | | | | 2,902 |
5.450% due 08/21/2009 | | | | 300 | | | | 300 |
5.480% due 05/18/2010 | | | | 2,400 | | | | 2,399 |
5.505% due 04/29/2008 | | | | 3,400 | | | | 3,405 |
| |
| Calabash Re II Ltd. |
13.760% due 01/08/2010 | | | | 1,900 | | | | 1,917 |
16.260% due 01/08/2010 | | | | 1,900 | | | | 1,978 |
| |
| Caterpillar Financial Services Corp. |
5.420% due 05/18/2009 | | | | 5,480 | | | | 5,488 |
5.430% due 03/10/2009 | | | | 6,400 | | | | 6,407 |
| |
| CIT Group, Inc. |
5.510% due 08/15/2008 | | | | 300 | | | | 300 |
5.510% due 12/19/2008 | | | | 400 | | | | 400 |
5.570% due 05/23/2008 | | | | 4,600 | | | | 4,606 |
| |
| Citigroup Funding, Inc. |
5.360% due 06/26/2009 | | | | 1,400 | | | | 1,399 |
| |
| Citigroup Global Markets Holdings, Inc. |
5.460% due 03/17/2009 | | | | 1,800 | | | | 1,803 |
| |
| Citigroup, Inc. |
4.200% due 12/20/2007 | | | | 4,100 | | | | 4,078 |
5.390% due 12/28/2009 | | | | 4,000 | | | | 4,003 |
5.395% due 01/30/2009 | | | | 1,900 | | | | 1,901 |
5.400% due 12/26/2008 | | | | 200 | | | | 200 |
| |
| Credit Agricole S.A. |
5.360% due 05/28/2009 | | | | 1,500 | | | | 1,501 |
5.410% due 05/28/2010 | | | | 1,700 | | | | 1,701 |
| |
| DnB NORBank ASA |
5.425% due 10/13/2009 | | | | 8,400 | | | | 8,405 |
| |
| | | | | | | | |
| | | | | PRINCIPAL
AMOUNT
(000S) | | | | VALUE
(000S) |
| Export-Import Bank of Korea |
5.450% due 06/01/2009 | | $ | | 2,200 | | $ | | 2,201 |
| |
| General Electric Capital Corp. |
5.390% due 01/05/2009 | | | | 2,500 | | | | 2,502 |
5.410% due 10/06/2010 | | | | 2,100 | | | | 2,102 |
5.428% due 01/20/2010 | | | | 1,400 | | | | 1,403 |
5.430% due 08/15/2011 | | | | 5,500 | | | | 5,498 |
5.560% due 01/08/2016 | | | | 300 | | | | 300 |
| |
| General Motors Acceptance Corp. |
6.510% due 09/23/2008 | | | | 1,100 | | | | 1,100 |
| |
| GMAC LLC |
6.000% due 12/15/2011 | | | | 300 | | | | 285 |
| |
| Goldman Sachs Group, Inc. |
5.400% due 12/23/2008 | | | | 400 | | | | 400 |
5.410% due 03/30/2009 | | | | 2,900 | | | | 2,902 |
5.440% due 11/16/2009 | | | | 600 | | | | 601 |
5.450% due 12/22/2008 | | | | 2,100 | | | | 2,103 |
5.455% due 07/29/2008 | | | | 1,700 | | | | 1,703 |
5.475% due 10/05/2007 | | | | 1,600 | | | | 1,601 |
5.685% due 07/23/2009 | | | | 1,300 | | | | 1,307 |
| |
| HBOS Treasury Services PLC |
5.397% due 07/17/2009 | | | | 2,200 | | | | 2,203 |
| |
| HSBC Bank USA N.A. |
5.500% due 06/10/2009 | | | | 1,400 | | | | 1,404 |
| |
| HSBC Finance Corp. |
5.490% due 09/15/2008 | | | | 500 | | | | 501 |
5.500% due 12/05/2008 | | | | 1,300 | | | | 1,303 |
5.607% due 05/10/2010 | | | | 2,200 | | | | 2,211 |
| |
| ICICI Bank Ltd. |
5.895% due 01/12/2010 | | | | 2,300 | | | | 2,305 |
| |
| John Deere Capital Corp. |
5.406% due 04/15/2008 | | | | 1,200 | | | | 1,201 |
5.406% due 07/15/2008 | | | | 1,400 | | | | 1,401 |
| |
| JPMorgan Chase & Co. |
5.539% due 10/02/2009 | | | | 3,500 | | | | 3,515 |
| |
| Lehman Brothers Holdings, Inc. |
5.370% due 11/24/2008 | | | | 1,000 | | | | 1,000 |
5.410% due 12/23/2008 | | | | 400 | | | | 400 |
5.440% due 04/03/2009 | | | | 1,700 | | | | 1,702 |
5.460% due 08/21/2009 | | | | 1,600 | | | | 1,601 |
5.460% due 11/16/2009 | | | | 5,200 | | | | 5,205 |
5.570% due 12/23/2010 | | | | 900 | | | | 901 |
5.579% due 07/18/2011 | | | | 1,000 | | | | 1,002 |
| |
| Longpoint Re Ltd. |
10.609% due 05/08/2010 | | | | 700 | | | | 700 |
| |
| Merrill Lynch & Co., Inc. |
5.406% due 05/08/2009 | | | | 1,700 | | | | 1,701 |
5.440% due 12/04/2009 | | | | 1,400 | | | | 1,401 |
5.460% due 06/16/2008 | | | | 6,000 | | | | 6,007 |
| |
| Metropolitan Life Global Funding I |
5.400% due 05/17/2010 | | | | 3,200 | | | | 3,202 |
| |
| Morgan Stanley |
5.406% due 05/07/2009 | | | | 2,800 | | | | 2,802 |
5.467% due 02/09/2009 | | | | 1,100 | | | | 1,102 |
5.595% due 01/22/2009 | | | | 3,700 | | | | 3,703 |
5.609% due 01/18/2011 | | | | 1,500 | | | | 1,502 |
| |
| Mystic Re Ltd. |
11.660% due 12/05/2008 | | | | 1,800 | | | | 1,789 |
| |
| National Australia Bank Ltd. |
5.400% due 09/11/2009 | | | | 1,400 | | | | 1,402 |
| |
| Pricoa Global Funding I |
5.405% due 07/27/2009 | | | | 3,700 | | | | 3,706 |
5.440% due 06/03/2008 | | | | 3,000 | | | | 3,005 |
| |
| Residential Capital LLC |
6.460% due 05/22/2009 | | | | 2,000 | | | | 1,992 |
| |
| | | | | | | | |
| | | | | PRINCIPAL
AMOUNT
(000S) | | | | VALUE
(000S) |
| Residential Reinsurance 2007 Ltd. |
15.610% due 06/07/2010 | | $ | | 300 | | $ | | 300 |
| |
| Royal Bank of Scotland Group PLC |
5.360% due 12/21/2007 | | | | 1,200 | | | | 1,201 |
5.750% due 07/06/2012 | | | | 5,900 | | | | 5,900 |
| |
| Santander U.S. Debt S.A. Unipersonal |
5.370% due 09/21/2007 | | | | 3,000 | | | | 3,001 |
5.370% due 11/20/2008 | | | | 700 | | | | 700 |
5.420% due 09/19/2008 | | | | 2,800 | | | | 2,803 |
| |
| SLM Corp. |
5.495% due 07/27/2009 | | | | 900 | | | | 878 |
| |
| Unicredit Luxembourg Finance S.A. |
5.405% due 10/24/2008 | | | | 1,700 | | | | 1,701 |
| |
| VTB Capital S.A. for Vneshtorgbank |
5.955% due 08/01/2008 | | | | 1,300 | | | | 1,303 |
| |
| Wachovia Bank N.A. |
5.420% due 05/25/2010 | | | | 6,000 | | | | 6,016 |
| |
| Wachovia Corp. |
5.486% due 10/15/2011 | | | | 1,100 | | | | 1,102 |
| |
| Wells Fargo & Co. |
5.400% due 03/10/2008 | | | | 4,000 | | | | 4,003 |
5.460% due 09/15/2009 | | | | 2,600 | | | | 2,607 |
| |
| Westpac Banking Corp. |
5.280% due 06/06/2008 | | | | 900 | | | | 900 |
| |
| World Savings Bank FSB |
5.396% due 05/08/2009 | | | | 7,100 | | | | 7,104 |
| | | | | | | | |
| | | | | | | | 214,054 |
| | | | | | | | |
|
| INDUSTRIALS 3.7% |
| Altria Group, Inc. | | | | | | | | |
7.650% due 07/01/2008 | | | | 200 | | | | 204 |
| |
| Amgen, Inc. |
5.440% due 11/28/2008 | | | | 3,600 | | | | 3,602 |
| |
| Anadarko Petroleum Corp. |
5.760% due 09/15/2009 | | | | 2,200 | | | | 2,203 |
| |
| BP AMI Leasing, Inc. |
5.370% due 06/26/2009 | | | | 3,700 | | | | 3,701 |
| |
| Comcast Corp. |
5.656% due 07/14/2009 | | | | 1,600 | | | | 1,601 |
| |
| CSC Holdings, Inc. |
7.250% due 07/15/2008 | | | | 3,500 | | | | 3,535 |
7.875% due 12/15/2007 | | | | 1,500 | | | | 1,513 |
| |
| DaimlerChrysler N.A. Holding Corp. |
5.710% due 03/13/2009 | | | | 1,600 | | | | 1,604 |
5.840% due 09/10/2007 | | | | 4,758 | | | | 4,762 |
| |
| Diageo Capital PLC |
5.457% due 11/10/2008 | | | | 2,600 | | | | 2,603 |
| |
| El Paso Corp. |
6.950% due 12/15/2007 | | | | 1,980 | | | | 2,001 |
| |
| FedEx Corp. |
5.436% due 08/08/2007 | | | | 1,300 | | | | 1,300 |
| |
| General Electric Co. |
5.400% due 12/09/2008 | | | | 2,600 | | | | 2,602 |
| |
| Salomon Brothers AG for OAO Gazprom |
10.500% due 10/21/2009 | | | | 200 | | | | 221 |
| |
| Time Warner, Inc. |
5.590% due 11/13/2009 | | | | 1,800 | | | | 1,803 |
| |
| Transocean, Inc. |
5.560% due 09/05/2008 | | | | 1,300 | | | | 1,301 |
| |
| Wal-Mart Stores, Inc. |
5.260% due 06/16/2008 | | | | 3,300 | | | | 3,300 |
| | | | | | | | |
| | | | | | | | 37,856 |
| | | | | | | | |
| | | | | | |
| See Accompanying Notes | | Semiannual Report | | June 30, 2007 | | 9 |
Schedule of Investments Low Duration Portfolio (Cont.)
| | | | | | | | |
| | | | | PRINCIPAL
AMOUNT
(000S) | | | | VALUE
(000S) |
| UTILITIES 2.7% |
| AT&T, Inc. | | | | | | | | |
5.450% due 05/15/2008 | | $ | | 5,900 | | $ | | 5,906 |
| |
| BellSouth Corp. | | |
5.460% due 08/15/2008 | | | | 5,900 | | | | 5,906 |
| |
| Deutsche Telekom International Finance BV |
5.540% due 03/23/2009 | | | | 2,500 | | | | 2,507 |
| |
| Qwest Capital Funding, Inc. |
6.375% due 07/15/2008 | | | | 5,670 | | | | 5,698 |
| |
| Telecom Italia Capital S.A. |
5.969% due 07/18/2011 | | | | 1,800 | | | | 1,813 |
| |
| Telefonica Emisones SAU |
5.660% due 06/19/2009 | | | | 1,700 | | | | 1,706 |
| |
| Verizon Communications, Inc. |
5.400% due 04/03/2009 | | | | 3,800 | | | | 3,803 |
| | | | | | | | |
| | | | | | | | 27,339 |
| | | | | | | | |
Total Corporate Bonds & Notes
(Cost $278,880) | | 279,249 |
| | | | | | | | |
| | | | |
| COMMODITY INDEX-LINKED NOTES 0.3% |
| Morgan Stanley |
0.000% due 07/07/2008 | | | | 3,000 | | | | 2,983 |
| | | | | | | | |
Total Commodity Index-Linked Notes (Cost $3,000) | | 2,983 |
| | | | | | | | |
| | | | |
| U.S. GOVERNMENT AGENCIES 20.9% |
| Fannie Mae |
3.736% due 07/01/2034 | | | | 248 | | | | 250 |
4.350% due 03/01/2035 | | | | 323 | | | | 326 |
4.417% due 05/01/2035 | | | | 774 | | | | 771 |
4.500% due 06/25/2043 | | | | 2,895 | | | | 2,873 |
4.510% due 05/01/2035 | | | | 717 | | | | 712 |
4.542% due 09/01/2035 | | | | 1,335 | | | | 1,326 |
4.560% due 11/01/2035 | | | | 1,476 | | | | 1,466 |
4.655% due 08/01/2035 | | | | 3,369 | | | | 3,333 |
4.683% due 07/01/2035 | | | | 519 | | | | 512 |
5.000% due 12/25/2016 -
04/25/2033 | | | | 70,546 | | | | 68,501 |
5.380% due 12/25/2036 | | | | 905 | | | | 903 |
5.440% due 03/25/2034 | | | | 133 | | | | 133 |
5.500% due 12/01/2009 -
10/01/2035 | | | | 64,244 | | | | 63,276 |
5.670% due 09/25/2042 -
03/25/2044 | | | | 1,567 | | | | 1,573 |
5.720% due 05/25/2031 -
11/25/2032 | | | | 1,501 | | | | 1,507 |
6.000% due 08/01/2016 -
07/01/2037 | | | | 1,140 | | | | 1,129 |
6.183% due 09/01/2034 | | | | 80 | | | | 81 |
6.214% due 07/01/2042 -
06/01/2043 | | | | 1,647 | | | | 1,672 |
6.264% due 09/01/2041 | | | | 675 | | | | 681 |
6.335% due 12/01/2036 | | | | 83 | | | | 84 |
6.414% due 09/01/2040 | | | | 11 | | | | 11 |
6.500% due 12/25/2042 | | | | 22 | | | | 23 |
6.973% due 11/01/2035 | | | | 385 | | | | 398 |
| |
| Federal Housing Administration |
7.430% due 10/01/2020 | | | | 19 | | | | 19 |
| |
| Freddie Mac |
4.715% due 06/01/2035 | | | | 2,255 | | | | 2,207 |
4.922% due 07/01/2035 | | | | 975 | | | | 965 |
5.000% due 10/01/2018 - 12/15/2026 | | | | 5,284 | | | | 5,251 |
5.470% due 07/15/2019 - 10/15/2020 | | | | 36,000 | | | | 35,969 |
5.500% due 08/15/2030 | | | | 1 | | | | 1 |
5.550% due 07/15/2037 | | | | 12,600 | | | | 12,599 |
5.580% due 08/25/2031 | | | | 436 | | | | 438 |
5.620% due 05/15/2036 | | | | 1,093 | | | | 1,097 |
| | | | | | | | |
| | | | | PRINCIPAL
AMOUNT
(000S) | | | | VALUE
(000S) |
5.670% due 12/15/2030 | | $ | | 533 | | $ | | 535 |
5.720% due 06/15/2018 | | | | 187 | | | | 187 |
6.000% due 09/01/2016 - 07/01/2037 | | | | 1,113 | | | | 1,104 |
6.227% due 02/25/2045 | | | | 961 | | | | 957 |
6.500% due 07/25/2043 | | | | 166 | | | | 168 |
| |
| Ginnie Mae |
4.000% due 07/16/2027 | | | | 56 | | | | 56 |
| | | | | | | | |
Total U.S. Government Agencies
(Cost $215,509) | | 213,094 |
| | | | | | | | |
|
| MORTGAGE-BACKED SECURITIES 7.1% |
| American Home Mortgage Investment Trust |
4.290% due 10/25/2034 | | | | 1,475 | | | | 1,448 |
4.390% due 02/25/2045 | | | | 566 | | | | 554 |
| |
| Arran Residential Mortgages Funding PLC |
5.340% due 04/12/2036 | | | | 1,099 | | | | 1,099 |
| |
| Banc of America Funding Corp. |
4.113% due 05/25/2035 | | | | 7,605 | | | | 7,449 |
| |
| Banc of America Mortgage Securities, Inc. |
6.500% due 10/25/2031 | | | | 89 | | | | 90 |
| |
| Bear Stearns Adjustable Rate Mortgage Trust |
4.750% due 10/25/2035 | | | | 2,780 | | | | 2,749 |
4.773% due 01/25/2034 | | | | 125 | | | | 125 |
5.044% due 04/25/2033 | | | | 29 | | | | 29 |
5.329% due 02/25/2033 | | | | 11 | | | | 11 |
5.448% due 04/25/2033 | | | | 52 | | | | 51 |
| |
| Bear Stearns Alt-A Trust |
5.377% due 05/25/2035 | | | | 913 | | | | 909 |
5.480% due 02/25/2034 | | | | 1,472 | | | | 1,472 |
| |
| Bear Stearns Mortgage Funding Trust |
5.390% due 02/25/2037 | | | | 2,672 | | | | 2,673 |
| |
| Citigroup Mortgage Loan Trust, Inc. |
4.900% due 12/25/2035 | | | | 729 | | | | 728 |
| |
| Countrywide Alternative Loan Trust |
4.500% due 06/25/2035 | | | | 2,381 | | | | 2,349 |
5.500% due 05/25/2047 | | | | 1,196 | | | | 1,199 |
5.600% due 02/25/2037 | | | | 3,646 | | | | 3,656 |
6.000% due 10/25/2033 | | | | 93 | | | | 92 |
6.500% due 06/25/2033 | | | | 9 | | | | 9 |
| |
| Countrywide Home Loan Mortgage Pass-Through Trust |
5.250% due 02/20/2036 | | | | 1,166 | | | | 1,162 |
5.560% due 04/25/2035 | | | | 258 | | | | 259 |
5.590% due 05/25/2034 | | | | 44 | | | | 44 |
| |
| CS First Boston Mortgage Securities Corp. |
4.938% due 12/15/2040 | | | | 622 | | | | 617 |
5.953% due 03/25/2032 | | | | 6 | | | | 6 |
| |
| GMAC Mortgage Corp. Loan Trust |
4.998% due 11/19/2035 | | | | 776 | | | | 776 |
| |
| Greenpoint Mortgage Funding Trust |
5.400% due 10/25/2046 | | | | 1,563 | | | | 1,565 |
5.400% due 01/25/2047 | | | | 1,639 | | | | 1,640 |
| |
| GS Mortgage Securities Corp. II |
5.410% due 03/06/2020 | | | | 6,000 | | | | 6,007 |
5.420% due 06/06/2020 | | | | 763 | | | | 764 |
| |
| GSR Mortgage Loan Trust |
4.538% due 09/25/2035 | | | | 3,249 | | | | 3,203 |
6.000% due 03/25/2032 | | | | 2 | | | | 2 |
| |
| Harborview Mortgage Loan Trust |
5.540% due 05/19/2035 | | | | 321 | | | | 321 |
| |
| Impac CMB Trust |
6.120% due 07/25/2033 | | | | 61 | | | | 61 |
| |
| LB-UBS Commercial Mortgage Trust |
4.990% due 11/15/2030 | | | | 818 | | | | 812 |
| |
| | | | | | | | |
| | | | | PRINCIPAL
AMOUNT
(000S) | | | | VALUE (000S) |
Lehman Brothers Floating Rate Commercial
Mortgage Trust |
5.400% due 09/15/2021 | | $ | | 330 | | $ | | 331 |
| |
| MASTR Asset Securitization Trust |
5.500% due 09/25/2033 | | | | 77 | | | | 74 |
| |
| Mellon Residential Funding Corp. |
5.800% due 06/15/2030 | | | | 532 | | | | 532 |
| |
| MLCC Mortgage Investors, Inc. |
6.974% due 01/25/2029 | | | | 101 | | | | 102 |
| |
| Morgan Stanley Capital I |
5.380% due 10/15/2020 | | | | 4,081 | | | | 4,086 |
| |
| Prime Mortgage Trust |
5.720% due 02/25/2019 | | | | 20 | | | | 20 |
5.720% due 02/25/2034 | | | | 67 | | | | 67 |
| |
| Salomon Brothers Mortgage Securities VII, Inc. |
4.000% due 12/25/2018 | | | | 267 | | | | 254 |
| |
| Structured Adjustable Rate Mortgage Loan Trust |
4.580% due 02/25/2034 | | | | 1,027 | | | | 1,028 |
5.340% due 08/25/2034 | | | | 1,260 | | | | 1,259 |
6.429% due 01/25/2035 | | | | 734 | | | | 738 |
| |
| Structured Asset Mortgage Investments, Inc. |
5.600% due 02/25/2036 | | | | 376 | | | | 376 |
5.650% due 09/19/2032 | | | | 16 | | | | 16 |
| |
| Structured Asset Securities Corp. |
5.329% due 10/25/2035 | | | | 1,695 | | | | 1,693 |
| |
| Thornburg Mortgage Securities Trust |
5.430% due 12/25/2036 | | | | 1,363 | | | | 1,363 |
5.440% due 08/25/2036 | | | | 2,967 | | | | 2,965 |
| |
| Wachovia Bank Commercial Mortgage Trust |
5.400% due 06/15/2020 | | | | 2,900 | | | | 2,901 |
5.410% due 09/15/2021 | | | | 3,811 | | | | 3,813 |
| |
| Washington Mutual, Inc. |
4.816% due 10/25/2032 | | | | 208 | | | | 208 |
5.474% due 02/27/2034 | | | | 72 | | | | 71 |
5.590% due 12/25/2045 | | | | 397 | | | | 399 |
5.610% due 10/25/2045 | | | | 2,287 | | | | 2,292 |
5.759% due 01/25/2047 | | | | 796 | | | | 796 |
6.223% due 05/25/2041 | | | | 189 | | | | 190 |
6.229% due 11/25/2042 | | | | 285 | | | | 285 |
6.429% due 06/25/2042 | | | | 191 | | | | 191 |
6.429% due 08/25/2042 | | | | 79 | | | | 79 |
6.529% due 09/25/2046 | | | | 1,238 | | | | 1,243 |
| |
| Wells Fargo Mortgage-Backed Securities Trust |
4.950% due 03/25/2036 | | | | 1,444 | | | | 1,424 |
| | | | | | | | |
Total Mortgage-Backed Securities
(Cost $72,892) | | 72,727 |
| | | | | | | | |
| | | | |
| ASSET-BACKED SECURITIES 18.2% |
| Accredited Mortgage Loan Trust |
5.360% due 09/25/2036 | | | | 2,983 | | | | 2,985 |
| |
| ACE Securities Corp. |
5.380% due 10/25/2036 | | | | 1,642 | | | | 1,643 |
5.430% due 10/25/2035 | | | | 353 | | | | 353 |
| |
| Amortizing Residential Collateral Trust |
5.610% due 07/25/2032 | | | | 13 | | | | 13 |
| |
| Argent Securities, Inc. |
5.370% due 09/25/2036 | | | | 541 | | | | 541 |
5.380% due 05/25/2036 | | | | 1,948 | | | | 1,949 |
5.400% due 01/25/2036 | | | | 470 | | | | 471 |
| |
| Asset-Backed Funding Certificates |
5.380% due 10/25/2036 | | | | 1,533 | | | | 1,534 |
5.380% due 01/25/2037 | | | | 1,130 | | | | 1,131 |
| |
| Asset-Backed Securities Corp. Home Equity |
5.370% due 12/25/2036 | | | | 1,784 | | | | 1,785 |
5.595% due 09/25/2034 | | | | 495 | | | | 495 |
6.970% due 03/15/2032 | | | | 359 | | | | 359 |
| |
| | | | |
| 10 | | PIMCO Variable Insurance Trust | | See Accompanying Notes |
| | |
| |
| | | June 30, 2007 (Unaudited) |
| | | | | | | | |
| | | | | PRINCIPAL
AMOUNT
(000S) | | | | VALUE
(000S) |
| Bear Stearns Asset-Backed Securities, Inc. |
5.520% due 09/25/2034 | | $ | | 97 | | $ | | 97 |
| |
| Carrington Mortgage Loan Trust |
5.385% due 02/25/2036 | | | | 256 | | | | 256 |
| |
| Chase Credit Card Master Trust |
5.430% due 02/15/2011 | | | | 2,300 | | | | 2,305 |
| |
| CIT Group Home Equity Loan Trust |
5.590% due 06/25/2033 | | | | 4 | | | | 4 |
| |
| Citibank Credit Card Issuance Trust |
2.900% due 05/17/2010 | | | | 2,500 | | | | 2,449 |
5.526% due 02/07/2010 | | | | 9,300 | | | | 9,316 |
| |
| Citigroup Mortgage Loan Trust, Inc. |
5.360% due 08/25/2036 | | | | 949 | | | | 950 |
5.380% due 05/25/2037 | | | | 19,300 | | | | 19,309 |
5.390% due 01/25/2036 | | | | 393 | | | | 393 |
5.420% due 10/25/2036 | | | | 7,100 | | | | 7,099 |
| |
| Countrywide Asset-Backed Certificates |
5.370% due 01/25/2037 | | | | 1,612 | | | | 1,613 |
5.370% due 05/25/2037 | | | | 13,790 | | | | 13,798 |
5.370% due 12/25/2046 | | | | 556 | | | | 556 |
5.370% due 03/25/2047 | | | | 1,212 | | | | 1,213 |
5.390% due 06/25/2037 | | | | 1,387 | | | | 1,388 |
5.400% due 06/25/2037 | | | | 1,149 | | | | 1,149 |
5.430% due 10/25/2046 | | | | 1,306 | | | | 1,307 |
5.500% due 09/25/2036 | | | | 9,500 | | | | 9,507 |
5.800% due 12/25/2031 | | | | 77 | | | | 77 |
| |
| Credit-Based Asset Servicing & Securitization LLC |
5.380% due 03/25/2036 | | | | 369 | | | | 369 |
5.380% due 11/25/2036 | | | | 1,228 | | | | 1,229 |
| |
| CS First Boston Mortgage Securities Corp. |
5.940% due 01/25/2032 | | | | 15 | | | | 16 |
| |
| Equity One Asset-Backed Securities, Inc. |
5.600% due 11/25/2032 | | | | 17 | | | | 17 |
| |
| First Franklin Mortgage Loan Asset-Backed Certificates |
5.370% due 11/25/2036 | | | | 1,965 | | | | 1,966 |
| |
| First USA Credit Card Master Trust |
5.480% due 04/18/2011 | | | | 4,400 | | | | 4,412 |
| |
| Fremont Home Loan Trust |
5.370% due 05/25/2036 | | | | 245 | | | | 245 |
5.380% due 01/25/2037 | | | | 1,076 | | | | 1,076 |
5.390% due 02/25/2037 | | | | 791 | | | | 791 |
| |
| GE-WMC Mortgage Securities LLC |
5.360% due 08/25/2036 | | | | 582 | | | | 582 |
| |
| GS Auto Loan Trust |
5.344% due 07/15/2008 | | | | 2,500 | | | | 2,500 |
| |
| GSAMP Trust |
5.390% due 12/25/2036 | | | | 1,485 | | | | 1,485 |
5.610% due 03/25/2034 | | | | 228 | | | | 228 |
| |
| GSR Mortgage Loan Trust |
5.420% due 11/25/2030 | | | | 157 | | | | 158 |
| |
| HFC Home Equity Loan Asset-Backed Certificates |
5.390% due 03/20/2036 | | | | 1,140 | | | | 1,140 |
5.670% due 09/20/2033 | | | | 188 | | | | 188 |
| |
| HSI Asset Securitization Corp. Trust |
5.370% due 12/25/2036 | | | | 843 | | | | 844 |
| |
| Indymac Residential Asset-Backed Trust |
5.380% due 04/25/2037 | | | | 947 | | | | 948 |
5.420% due 03/25/2036 | | | | 146 | | | | 146 |
| |
| JPMorgan Mortgage Acquisition Corp. |
5.370% due 08/25/2036 | | | | 608 | | | | 608 |
5.380% due 04/01/2037 | | | | 2,121 | | | | 2,120 |
| |
| Lehman XS Trust |
5.390% due 05/25/2046 | | | | 558 | | | | 558 |
5.400% due 11/25/2046 | | | | 1,935 | | | | 1,936 |
5.440% due 11/25/2036 | | | | 2,021 | | | | 2,023 |
| |
| | | | | | | | |
| | | | | PRINCIPAL
AMOUNT
(000S) | | | | VALUE
(000S) |
| Long Beach Mortgage Loan Trust |
5.400% due 02/25/2036 | | $ | | 179 | | $ | | 179 |
5.410% due 01/25/2036 | | | | 346 | | | | 347 |
5.600% due 10/25/2034 | | | | 135 | | | | 135 |
| |
| MASTR Asset-Backed Securities Trust |
5.380% due 11/25/2036 | | | | 1,466 | | | | 1,467 |
| |
| Merrill Lynch Mortgage Investors, Inc. |
5.390% due 08/25/2036 | | | | 5,009 | | | | 5,010 |
5.430% due 07/25/2036 | | | | 975 | | | | 976 |
| |
| Morgan Stanley ABS Capital I |
5.370% due 09/25/2036 | | | | 4,997 | | | | 4,998 |
5.380% due 05/25/2037 | | | | 2,754 | | | | 2,753 |
| |
| Nationstar Home Equity Loan Trust |
5.440% due 04/25/2037 | | | | 8,602 | | | | 8,608 |
| |
| Nelnet Student Loan Trust |
5.340% due 09/25/2012 | | | | 941 | | | | 942 |
| |
| Newcastle Mortgage Securities Trust |
5.390% due 03/25/2036 | | | | 1,040 | | | | 1,040 |
| |
| Nomura Home Equity Loan, Inc. |
5.400% due 02/25/2036 | | | | 323 | | | | 323 |
| |
| Option One Mortgage Loan Trust |
5.370% due 01/25/2037 | | | | 1,560 | | | | 1,561 |
5.420% due 11/25/2035 | | | | 194 | | | | 194 |
| |
| Residential Asset Mortgage Products, Inc. |
5.430% due 09/25/2035 | | | | 193 | | | | 193 |
| |
| Residential Asset Securities Corp. |
5.360% due 08/25/2036 | | | | 625 | | | | 625 |
5.390% due 11/25/2036 | | | | 1,533 | | | | 1,534 |
| |
| Residential Funding Mortgage Securities II, Inc. |
5.440% due 05/25/2037 | | | | 3,267 | | | | 3,269 |
| |
| Saxon Asset Securities Trust |
5.380% due 11/25/2036 | | | | 718 | | | | 718 |
| |
| Securitized Asset-Backed Receivables LLC Trust |
5.440% due 05/25/2037 | | | | 2,500 | | | | 2,500 |
| |
| SLM Student Loan Trust |
5.325% due 10/25/2012 | | | | 2,224 | | | | 2,225 |
5.335% due 04/25/2012 | | | | 1,454 | | | | 1,455 |
5.335% due 04/25/2014 | | | | 6,348 | | | | 6,352 |
5.355% due 01/25/2016 | | | | 880 | | | | 881 |
5.355% due 10/25/2016 | | | | 2,500 | | | | 2,502 |
5.365% due 01/26/2015 | | | | 170 | | | | 170 |
5.365% due 04/27/2015 | | | | 2,270 | | | | 2,271 |
| |
| Soundview Home Equity Loan Trust |
5.370% due 10/25/2036 | | | | 1,010 | | | | 1,010 |
5.380% due 11/25/2036 | | | | 5,465 | | | | 5,465 |
5.400% due 01/25/2037 | | | | 5,629 | | | | 5,633 |
5.420% due 12/25/2035 | | | | 67 | | | | 67 |
5.430% due 11/25/2035 | | | | 79 | | | | 79 |
| |
| Structured Asset Securities Corp. |
5.370% due 10/25/2036 | | | | 1,700 | | | | 1,701 |
5.420% due 09/25/2035 | | | | 581 | | | | 581 |
5.450% due 12/25/2035 | | | | 423 | | | | 423 |
| |
| Truman Capital Mortgage Loan Trust |
5.660% due 01/25/2034 | | | | 67 | | | | 67 |
| |
| USAA Auto Owner Trust |
5.337% due 07/11/2008 | | | | 1,800 | | | | 1,800 |
| |
| Wachovia Auto Owner Trust |
4.820% due 02/20/2009 | | | | 88 | | | | 88 |
5.337% due 06/20/2008 | | | | 2,100 | | | | 2,100 |
| |
| Wells Fargo Home Equity Trust |
5.370% due 01/25/2037 | | | | 988 | | | | 989 |
5.440% due 12/25/2035 | | | | 1,285 | | | | 1,285 |
| | | | | | | | |
Total Asset-Backed Securities
(Cost $186,057) | | 186,146 |
| | | | | | | | |
| | | | | | | | |
| | | | | PRINCIPAL
AMOUNT
(000S) | | | | VALUE
(000S) |
| SOVEREIGN ISSUES 0.6% |
| Korea Development Bank |
5.490% due 04/03/2010 | | $ | | 6,100 | | $ | | 6,105 |
| | | | | | | | |
Total Sovereign Issues (Cost $6,100) | | 6,105 |
| | | | | | | | |
|
| | | | | SHARES | | | | |
| PREFERRED STOCKS 0.4% |
| DG Funding Trust |
7.600% due 12/31/2049 | | | | 420 | | | | 4,376 |
| | | | | | | | |
Total Preferred Stocks (Cost $4,462) | | 4,376 |
| | | | | | | | |
|
| | | | | PRINCIPAL
AMOUNT
(000S) | | | | |
| SHORT-TERM INSTRUMENTS 26.4% |
|
| CERTIFICATES OF DEPOSIT 5.2% |
| BNP Paribas |
5.262% due 05/28/2008 | | $ | | 1,200 | | | | 1,200 |
5.262% due 07/03/2008 | | | | 6,800 | | | | 6,799 |
| |
| BNP Paribas Finance, Inc. |
5.270% due 09/23/2008 | | | | 800 | | | | 799 |
| |
| Calyon Financial, Inc. |
5.340% due 01/16/2009 | | | | 2,400 | | | | 2,400 |
| |
| Dexia Credit Local S.A. |
5.270% due 09/29/2008 | | | | 8,900 | | | | 8,895 |
| |
| Fortis Bank NY |
5.265% due 04/28/2008 | | | | 3,200 | | | | 3,202 |
5.265% due 06/30/2008 | | | | 1,400 | | | | 1,400 |
5.310% due 09/30/2008 | | | | 1,800 | | | | 1,800 |
| |
| HSBC Bank USA N.A. |
5.460% due 07/28/2008 | | | | 3,100 | | | | 3,105 |
| |
| Nordea Bank Finland PLC |
5.308% due 05/28/2008 | | | | 1,200 | | | | 1,201 |
| |
| Royal Bank of Canada |
5.267% due 06/30/2008 | | | | 3,300 | | | | 3,303 |
| |
| Royal Bank of Scotland Group PLC |
5.262% due 07/03/2008 | | | | 900 | | | | 900 |
5.265% due 03/26/2008 | | | | 800 | | | | 800 |
| |
| Societe Generale NY |
5.269% due 06/30/2008 | | | | 5,600 | | | | 5,603 |
5.270% due 03/26/2008 | | | | 3,000 | | | | 3,000 |
5.271% due 06/30/2008 | | | | 900 | | | | 901 |
| |
| Unicredito Italiano NY |
5.360% due 12/03/2007 | | | | 5,400 | | | | 5,402 |
5.360% due 05/29/2008 | | | | 2,200 | | | | 2,201 |
| | | | | | | | |
| | | | | | | | 52,911 |
| | | | | | | | |
|
| COMMERCIAL PAPER 20.2% |
| Bank of America Corp. |
5.195% due 10/04/2007 | | | | 10,700 | | | | 10,668 |
| |
| Calyon N.A. LLC |
5.175% due 06/29/2010 | | | | 23,000 | | | | 22,977 |
| |
| Cox Communications, Inc. |
5.570% due 09/17/2007 | | | | 600 | | | | 600 |
| |
| Danske Corp. |
5.205% due 10/12/2007 | | | | 18,300 | | | | 18,103 |
| |
| Fortis Funding LLC |
5.255% due 09/05/2007 | | | | 23,200 | | | | 23,146 |
5.275% due 09/05/2007 | | | | 900 | | | | 896 |
| |
| Freddie Mac |
4.800% due 07/02/2007 | | | | 35,000 | | | | 35,000 |
| |
| Nordea N.A., Inc. |
5.308% due 04/09/2009 | | | | 3,600 | | | | 3,599 |
| |
| | | | | | |
| See Accompanying Notes | | Semiannual Report | | June 30, 2007 | | 11 |
Schedule of Investments Low Duration Portfolio (Cont.)
| | | | | | | | |
| | | | | PRINCIPAL
AMOUNT
(000S) | | | | VALUE
(000S) |
| Societe Generale NY |
5.210% due 11/26/2007 | | $ | | 900 | | $ | | 891 |
5.225% due 11/26/2007 | | | | 1,200 | | | | 1,182 |
5.240% due 11/26/2007 | | | | 2,200 | | | | 2,174 |
5.250% due 11/26/2007 | | | | 800 | | | | 789 |
| |
| TotalFinaElf Capital S.A. |
5.340% due 07/02/2007 | | | | 27,500 | | | | 27,500 |
| |
| UBS Finance Delaware LLC |
5.145% due 10/23/2007 | | | | 400 | | | | 398 |
5.205% due 10/23/2007 | | | | 1,100 | | | | 1,097 |
5.230% due 10/23/2007 | | | | 21,200 | | | | 20,868 |
5.235% due 10/23/2007 | | | | 2,200 | | | | 2,178 |
5.240% due 10/23/2007 | | | | 5,900 | | | | 5,819 |
| |
| | | | | | | | |
| | | | | PRINCIPAL
AMOUNT
(000S) | | | | VALUE
(000S) |
| Westpac Banking Corp. |
5.240% due 11/05/2007 | | $ | | 28,700 | | $ | | 28,361 |
| | | | | | | | |
| | | | | | | | 206,246 |
| | | | | | | | |
|
| REPURCHASE AGREEMENTS 0.6% |
| State Street Bank and Trust Co. |
4.900% due 07/02/2007 | | | | 5,573 | | | | 5,573 |
| | | | | | | | |
(Dated 06/29/2007. Collateralized by Fannie Mae 3.250% due 08/15/2008 valued at $5,687. Repurchase proceeds are $5,575.) |
|
| | | | | | | | | |
| | | | | PRINCIPAL
AMOUNT
(000S) | | | | VALUE
(000S) | |
| U.S. TREASURY BILLS 0.4% | |
4.635% due 08/30/2007 -
09/13/2007 (a)(c) | | $ | | 4,470 | | $ | | 4,422 | |
| | | | | | | | | |
Total Short-Term Instruments
(Cost $269,167) | | 269,152 | |
| | | | | | | | | |
| | | | | | | | | |
| PURCHASED OPTIONS (e) 0.1% | |
| (Cost $1,895) | | | | 1,060 | |
| |
| |
Total Investments (b) 101.6%
(Cost $1,040,151) | | $ | | 1,037,081 | |
| |
Written Options (f) (0.1%)
(Premiums $1,363) | | | | (492 | ) |
| |
| Other Assets and Liabilities (Net) (1.5%) | | (15,716 | ) |
| | | | | | | | | |
| Net Assets 100.0% | | $ | | 1,020,873 | |
| | | | | | | | | |
Notes to Schedule of Investments (amounts in thousands*, except number of contracts):
* A zero balance may reflect actual amounts rounding to less than one thousand.
(a) Coupon represents a weighted average rate.
(b) As of June 30, 2007, portfolio securities with an aggregate value of $77,693 were valued in good faith and pursuant to the guidelines established by the Board of Trustees.
(c) Securities with an aggregate market value of $4,422 have been segregated with the custodian to cover margin requirements for the following open futures contracts on June 30, 2007:
| | | | | | | | | | |
| Description | | Type | | Expiration
Month | | # of
Contracts | | Unrealized
(Depreciation) | |
90-Day Euribor December Futures | | Long | | 12/2007 | | 140 | | $ | (199 | ) |
90-Day Euribor December Futures | | Long | | 12/2008 | | 46 | | | (103 | ) |
90-Day Euribor June Futures | | Long | | 06/2008 | | 86 | | | (185 | ) |
90-Day Euribor March Futures | | Long | | 03/2008 | | 22 | | | (44 | ) |
90-Day Euribor September Futures | | Long | | 09/2008 | | 46 | | | (106 | ) |
90-Day Eurodollar December Futures | | Long | | 12/2007 | | 784 | | | (748 | ) |
90-Day Eurodollar December Futures | | Long | | 12/2008 | | 259 | | | (115 | ) |
90-Day Eurodollar June Futures | | Long | | 06/2008 | | 1,258 | | | (1,320 | ) |
90-Day Eurodollar March Futures | | Long | | 03/2008 | | 1,978 | | | (2,263 | ) |
90-Day Eurodollar March Futures | | Long | | 03/2009 | | 20 | | | (29 | ) |
90-Day Eurodollar September Futures | | Long | | 09/2008 | | 178 | | | (57 | ) |
90-Day Euroyen December Futures | | Long | | 12/2007 | | 131 | | | (16 | ) |
United Kingdom 90-Day LIBOR Sterling Interest Rate December Futures | | Long | | 12/2007 | | 55 | | | (113 | ) |
United Kingdom 90-Day LIBOR Sterling Interest Rate June Futures | | Long | | 06/2008 | | 371 | | | (541 | ) |
United Kingdom 90-Day LIBOR Sterling Interest Rate March Futures | | Long | | 03/2008 | | 21 | | | (28 | ) |
United Kingdom 90-Day LIBOR Sterling Interest Rate September Futures | | Long | | 09/2007 | | 55 | | | (118 | ) |
United Kingdom 90-Day LIBOR Sterling Interest Rate September Futures | | Long | | 09/2008 | | 324 | | | (500 | ) |
U.S. Treasury 30-Year Bond September Futures | | Short | | 09/2007 | | 445 | | | (97 | ) |
| | | | | | | | | | |
| | | | | | | | $ | (6,582 | ) |
| | | | | | | | | | |
(d) Swap agreements outstanding on June 30, 2007:
Credit Default Swaps
| | | | | | | | | | | | | | | | |
| Counterparty | | Reference Entity | | Buy/Sell
Protection (1) | | (Pay)/Receive
Fixed Rate | | | Expiration
Date | | Notional
Amount | | Unrealized
Appreciation/
(Depreciation) | |
Deutsche Bank AG | | SOFTBANK Corp. 1.750% due 03/31/2014 | | Sell | | 2.300% | | | 09/20/2007 | | JPY | 54,000 | | $ | 2 | |
Bank of America | | Dow Jones CDX N.A. IG7 Index | | Buy | | (0.650% | ) | | 12/20/2016 | | $ | 2,000 | | | 17 | |
Barclays Bank PLC | | Ukraine Government International Bond 7.650% due 06/11/2013 | | Sell | | 0.710% | | | 12/20/2008 | | | 1,000 | | | 3 | |
Barclays Bank PLC | | Brazilian Government International Bond 12.250% due 03/06/2030 | | Sell | | 0.290% | | | 06/20/2009 | | | 4,000 | | | (4 | ) |
Barclays Bank PLC | | Russia Government International Bond 7.500% due 03/31/2030 | | Sell | | 0.275% | | | 06/20/2009 | | | 4,000 | | | (1 | ) |
Credit Suisse First Boston | | Ford Motor Credit Co. 7.000% due 10/01/2013 | | Sell | | 0.950% | | | 12/20/2007 | | | 300 | | | 0 | |
Deutsche Bank AG | | Dow Jones CDX N.A. IG8 Index | | Buy | | (0.600% | ) | | 06/20/2017 | | | 1,400 | | | 6 | |
HSBC Bank USA | | Ukraine Government International Bond 7.650% due 06/11/2013 | | Sell | | 0.730% | | | 04/20/2009 | | | 2,700 | | | 12 | |
HSBC Bank USA | | Ukraine Government International Bond 7.650% due 06/11/2013 | | Sell | | 0.520% | | | 05/20/2009 | | | 1,000 | | | 0 | |
HSBC Bank USA | | Ukraine Government International Bond 7.650% due 06/11/2013 | | Sell | | 0.490% | | | 06/20/2009 | | | 4,000 | | | (5 | ) |
JPMorgan Chase & Co. | | Multiple Reference Entities of Gazprom | | Sell | | 0.415% | | | 11/20/2007 | | | 5,100 | | | 6 | |
| | | | |
| 12 | | PIMCO Variable Insurance Trust | | See Accompanying Notes |
| | |
| |
| | | June 30, 2007 (Unaudited) |
| | | | | | | | | | | | | | |
| Counterparty | | Reference Entity | | Buy/Sell
Protection (1) | | (Pay)/Receive
Fixed Rate | | Expiration
Date | | Notional
Amount | | Unrealized
Appreciation |
Lehman Brothers, Inc. | | Brazilian Government International Bond 12.250% due 03/06/2030 | | Sell | | 0.240% | | 11/20/2007 | | $ | 3,600 | | $ | 2 |
Lehman Brothers, Inc. | | Ford Motor Credit Co. 7.000% due 10/01/2013 | | Sell | | 0.950% | | 12/20/2007 | | | 500 | | | 0 |
Lehman Brothers, Inc. | | Indonesia Government International Bond 6.750% due 03/10/2014 | | Sell | | 0.400% | | 12/20/2008 | | | 500 | | | 0 |
Lehman Brothers, Inc. | | Brazilian Government International Bond 12.250% due 03/06/2030 | | Sell | | 1.120% | | 11/20/2011 | | | 6,000 | | | 114 |
Morgan Stanley | | Russia Government International Bond 7.500% due 03/31/2030 | | Sell | | 0.245% | | 06/20/2008 | | | 200 | | | 0 |
Morgan Stanley | | Multiple Reference Entities of Gazprom | | Sell | | 0.860% | | 11/20/2011 | | | 2,600 | | | 34 |
Royal Bank of Scotland Group PLC | | Indonesia Government International Bond 6.750% due 03/10/2014 | | Sell | | 0.390% | | 12/20/2008 | | | 1,000 | | | 0 |
Royal Bank of Scotland Group PLC | | Indonesia Government International Bond 6.750% due 03/10/2014 | | Sell | | 0.438% | | 06/20/2009 | | | 4,000 | | | 0 |
| | | | | | | | | | | | | | |
| | | | | | | | | | | | | $ | 186 |
| | | | | | | | | | | | | | |
(1) If the Portfolio is a seller of protection and a credit event occurs, as defined under the terms of that particular swap agreement, the Portfolio will pay to the buyer of the protection an amount up to the notional value of the swap and in certain instances, take delivery of the security. As a buyer of protection, the Portfolio will generally receive from the seller of protection an amount up to the notional amount of the swap if a credit event occurs.
Interest Rate Swaps
| | | | | | | | | | | | | | | |
| Counterparty | | Floating Rate Index | | Pay/Receive
Floating Rate | | Fixed Rate | | Expiration
Date | | Notional
Amount | | Unrealized
Appreciation/
(Depreciation) | |
Deutsche Bank AG | | 6-Month Australian Bank Bill | | Pay | | 7.000% | | 12/15/2009 | | AUD | 2,100 | | $ | (1 | ) |
Barclays Bank PLC | | BRL-CDI-Compounded | | Pay | | 11.360% | | 01/04/2010 | | BRL | 4,200 | | | 24 | |
Goldman Sachs & Co. | | BRL-CDI-Compounded | | Pay | | 11.465% | | 01/04/2010 | | | 1,100 | | | 8 | |
Merrill Lynch & Co., Inc. | | BRL-CDI-Compounded | | Pay | | 11.430% | | 01/04/2010 | | | 2,700 | | | 18 | |
Merrill Lynch & Co., Inc. | | BRL-CDI-Compounded | | Pay | | 12.948% | | 01/04/2010 | | | 1,400 | | | 29 | |
Morgan Stanley | | BRL-CDI-Compounded | | Pay | | 12.780% | | 01/04/2010 | | | 1,500 | | | 27 | |
Barclays Bank PLC | | 5-Year French CPI Ex Tobacco Daily Reference Index | | Pay | | 1.960% | | 04/05/2012 | | EUR | 300 | | | (3 | ) |
BNP Paribas Bank | | 5-Year French CPI Ex Tobacco Daily Reference Index | | Pay | | 2.090% | | 10/15/2010 | | | 1,300 | | | 16 | |
Deutsche Bank AG | | 6-Month EUR-LIBOR | | Receive | | 4.000% | | 12/15/2011 | | | 4,600 | | | 94 | |
Goldman Sachs & Co. | | 6-Month EUR-LIBOR | | Pay | | 4.000% | | 03/20/2009 | | | 2,400 | | | (17 | ) |
Goldman Sachs & Co. | | 5-Year French CPI Ex Tobacco Daily Reference Index | | Pay | | 1.960% | | 03/30/2012 | | | 600 | | | (5 | ) |
JPMorgan Chase & Co. | | 5-Year French CPI Ex Tobacco Daily Reference Index | | Pay | | 1.948% | | 03/15/2012 | | | 1,100 | | | (11 | ) |
JPMorgan Chase & Co. | | 5-Year French CPI Ex Tobacco Daily Reference Index | | Pay | | 1.958% | | 04/10/2012 | | | 3,600 | | | (38 | ) |
Royal Bank of Scotland Group PLC | | 5-Year French CPI Ex Tobacco Daily Reference Index | | Pay | | 1.955% | | 03/28/2012 | | | 900 | | | (9 | ) |
Royal Bank of Scotland Group PLC | | 5-Year French CPI Ex Tobacco Daily Reference Index | | Pay | | 1.950% | | 03/30/2012 | | | 1,300 | | | (13 | ) |
Barclays Bank PLC | | 6-Month GBP-LIBOR | | Pay | | 6.000% | | 12/20/2008 | | GBP | 5,900 | | | (58 | ) |
Barclays Bank PLC | | 6-Month GBP-LIBOR | | Pay | | 6.000% | | 03/20/2009 | | | 3,400 | | | (49 | ) |
Credit Suisse First Boston | | 6-Month GBP-LIBOR | | Pay | | 5.000% | | 06/15/2009 | | | 700 | | | (17 | ) |
Deutsche Bank AG | | 6-Month GBP-LIBOR | | Pay | | 6.000% | | 12/20/2008 | | | 3,500 | | | (35 | ) |
Deutsche Bank AG | | 6-Month GBP-LIBOR | | Receive | | 4.000% | | 12/15/2036 | | | 6,000 | | | 525 | |
HSBC Bank USA | | 6-Month GBP-LIBOR | | Pay | | 4.500% | | 12/20/2007 | | | 1,700 | | | (26 | ) |
Lehman Brothers, Inc. | | 6-Month GBP-LIBOR | | Pay | | 4.500% | | 09/20/2009 | | | 200 | | | (13 | ) |
Royal Bank of Scotland Group PLC | | 6-Month GBP-LIBOR | | Pay | | 6.000% | | 03/20/2009 | | | 3,100 | | | (46 | ) |
Barclays Bank PLC | | 6-Month JPY-LIBOR | | Pay | | 1.000% | | 03/18/2009 | | JPY | 310,000 | | | (7 | ) |
Deutsche Bank AG | | 6-Month JPY-LIBOR | | Pay | | 1.000% | | 09/18/2008 | | | 2,290,000 | | | (12 | ) |
Deutsche Bank AG | | 6-Month JPY-LIBOR | | Pay | | 1.000% | | 03/18/2009 | | | 500,000 | | | (7 | ) |
UBS Warburg LLC | | 6-Month JPY-LIBOR | | Pay | | 1.000% | | 09/18/2008 | | | 160,000 | | | (1 | ) |
UBS Warburg LLC | | 6-Month JPY-LIBOR | | Pay | | 1.000% | | 03/18/2009 | | | 2,940,000 | | | (42 | ) |
Goldman Sachs & Co. | | 28-Day Mexico Interbank TIIE Banxico | | Pay | | 7.780% | | 04/03/2012 | | MXN | 12,200 | | | (10 | ) |
Bank of America | | 3-Month USD-LIBOR | | Pay | | 5.000% | | 12/19/2009 | | $ | 13,600 | | | (15 | ) |
Deutsche Bank AG | | 3-Month USD-LIBOR | | Pay | | 5.000% | | 12/19/2009 | | | 41,900 | | | 18 | |
Deutsche Bank AG | | 3-Month USD-LIBOR | | Receive | | 5.000% | | 12/19/2017 | | | 11,100 | | | (84 | ) |
Morgan Stanley | | 3-Month USD-LIBOR | | Pay | | 5.000% | | 06/20/2009 | | | 20,300 | | | (160 | ) |
Morgan Stanley | | 3-Month USD-LIBOR | | Receive | | 5.000% | | 12/19/2017 | | | 3,800 | | | (25 | ) |
| | | | | | | | | | | | | | | |
| | | | | | | | | | | | | $ | 55 | |
| | | | | | | | | | | | | | | |
(e) Purchased options outstanding on June 30, 2007:
Interest Rate Swaptions
| | | | | | | | | | | | | | | | | | | |
| Description | | Counterparty | | Floating Rate Index | | Pay/Receive
Floating Rate | | Exercise
Rate | | Expiration
Date | | Notional
Amount | | Cost | | Value |
Call - OTC 2-Year Interest Rate Swap | | Barclays Bank PLC | | 6-Month EUR-LIBOR | | Pay | | 3.960% | | 07/02/2007 | | EUR | 6,000 | | $ | 28 | | $ | 0 |
Call - OTC 2-Year Interest Rate Swap | | Bank of America | | 3-Month USD-LIBOR | | Pay | | 4.900% | | 08/08/2007 | | $ | 9,000 | | | 40 | | | 0 |
Call - OTC 2-Year Interest Rate Swap | | Bank of America | | 3-Month USD-LIBOR | | Pay | | 4.750% | | 09/26/2008 | | | 44,000 | | | 208 | | | 87 |
Call - OTC 2-Year Interest Rate Swap | | Lehman Brothers, Inc. | | 3-Month USD-LIBOR | | Pay | | 4.750% | | 03/31/2008 | | | 13,800 | | | 77 | | | 17 |
Call - OTC 2-Year Interest Rate Swap | | Lehman Brothers, Inc. | | 3-Month USD-LIBOR | | Pay | | 4.750% | | 09/26/2008 | | | 5,200 | | | 18 | | | 10 |
Call - OTC 2-Year Interest Rate Swap | | Royal Bank of Scotland Group PLC | | 3-Month USD-LIBOR | | Pay | | 4.750% | | 07/02/2007 | | | 10,000 | | | 41 | | | 0 |
Call - OTC 1-Year Interest Rate Swap | | Royal Bank of Scotland Group PLC | | 3-Month USD-LIBOR | | Pay | | 4.850% | | 07/02/2007 | | | 30,000 | | | 78 | | | 0 |
Call - OTC 1-Year Interest Rate Swap | | Royal Bank of Scotland Group PLC | | 3-Month USD-LIBOR | | Pay | | 4.900% | | 08/08/2007 | | | 36,000 | | | 81 | | | 0 |
Call - OTC 2-Year Interest Rate Swap | | Royal Bank of Scotland Group PLC | | 3-Month USD-LIBOR | | Pay | | 5.000% | | 02/01/2008 | | | 45,700 | | | 227 | | | 73 |
Call - OTC 2-Year Interest Rate Swap | | Royal Bank of Scotland Group PLC | | 3-Month USD-LIBOR | | Pay | | 4.750% | | 03/31/2008 | | | 63,600 | | | 371 | | | 79 |
Call - OTC 2-Year Interest Rate Swap | | Royal Bank of Scotland Group PLC | | 3-Month USD-LIBOR | | Pay | | 5.000% | | 12/15/2008 | | | 62,700 | | | 218 | | | 212 |
| | | | | | | | | | | | | | | | | | | |
| | | | | | | | | | | | | | | $ | 1,387 | | $ | 478 |
| | | | | | | | | | | | | | | | | | | |
| | | | | | |
| See Accompanying Notes | | Semiannual Report | | June 30, 2007 | | 13 |
Schedule of Investments Low Duration Portfolio (Cont.)
Foreign Currency Options
| | | | | | | | | | | | | | |
| Description | | Exercise
Price | | Expiration
Date | | Notional
Amount | | Cost | | Value |
Call - OTC U.S. dollar versus Japanese yen | | JPY | 103.800 | | 03/17/2010 | | $ | 1,000 | | $ | 44 | | $ | 77 |
Put - OTC U.S. dollar versus Japanese yen | | | 103.800 | | 03/17/2010 | | | 1,000 | | | 44 | | | 25 |
Call - OTC U.S. dollar versus Japanese yen | | | 104.650 | | 03/31/2010 | | | 1,000 | | | 45 | | | 71 |
Put - OTC U.S. dollar versus Japanese yen | | | 104.650 | | 03/31/2010 | | | 1,000 | | | 39 | | | 27 |
Call - OTC U.S. dollar versus Japanese yen | | | 105.200 | | 03/31/2010 | | | 1,000 | | | 42 | | | 68 |
Put - OTC U.S. dollar versus Japanese yen | | | 105.200 | | 03/31/2010 | | | 1,000 | | | 42 | | | 28 |
Call - OTC U.S. dollar versus Japanese yen | | | 105.400 | | 03/31/2010 | | | 3,000 | | | 126 | | | 201 |
Put - OTC U.S. dollar versus Japanese yen | | | 105.400 | | 03/31/2010 | | | 3,000 | | | 126 | | | 85 |
| | | | | | | | | | | | | | |
| | | | | | | | | | $ | 508 | | $ | 582 |
| | | | | | | | | | | | | | |
(f) Written options outstanding on June 30, 2007:
Interest Rate Swaptions
| | | | | | | | | | | | | | | | | | | |
| Description | | Counterparty | | Floating Rate Index | | Pay/Receive
Floating Rate | | Exercise
Rate | | Expiration
Date | | Notional
Amount | | Premium | | Value |
Call - OTC 5-Year Interest Rate Swap | | Barclays Bank PLC | | 6-Month EUR-LIBOR | | Receive | | 4.100% | | 07/02/2007 | | EUR | 2,000 | | $ | 24 | | $ | 0 |
Call - OTC 5-Year Interest Rate Swap | | Bank of America | | 3-Month USD-LIBOR | | Receive | | 4.950% | | 09/26/2008 | | $ | 19,000 | | | 209 | | | 96 |
Call - OTC 5-Year Interest Rate Swap | | Lehman Brothers, Inc. | | 3-Month USD-LIBOR | | Receive | | 4.900% | | 03/31/2008 | | | 6,000 | | | 73 | | | 18 |
Call - OTC 5-Year Interest Rate Swap | | Lehman Brothers, Inc. | | 3-Month USD-LIBOR | | Receive | | 4.950% | | 09/26/2008 | | | 2,300 | | | 19 | | | 12 |
Call - OTC 5-Year Interest Rate Swap | | Royal Bank of Scotland Group PLC | | 3-Month USD-LIBOR | | Receive | | 4.950% | | 07/02/2007 | | | 7,600 | | | 82 | | | 0 |
Call - OTC 5-Year Interest Rate Swap | | Royal Bank of Scotland Group PLC | | 3-Month USD-LIBOR | | Receive | | 5.000% | | 07/02/2007 | | | 4,500 | | | 47 | | | 0 |
Call - OTC 7-Year Interest Rate Swap | | Royal Bank of Scotland Group PLC | | 3-Month USD-LIBOR | | Receive | | 4.900% | | 08/08/2007 | | | 6,000 | | | 70 | | | 0 |
Call - OTC 7-Year Interest Rate Swap | | Royal Bank of Scotland Group PLC | | 3-Month USD-LIBOR | | Receive | | 5.000% | | 08/08/2007 | | | 3,000 | | | 34 | | | 0 |
Call - OTC 5-Year Interest Rate Swap | | Royal Bank of Scotland Group PLC | | 3-Month USD-LIBOR | | Receive | | 5.100% | | 02/01/2008 | | | 20,000 | | | 240 | | | 72 |
Call - OTC 5-Year Interest Rate Swap | | Royal Bank of Scotland Group PLC | | 3-Month USD-LIBOR | | Receive | | 4.900% | | 03/31/2008 | | | 14,700 | | | 196 | | | 45 |
Call - OTC 5-Year Interest Rate Swap | | Royal Bank of Scotland Group PLC | | 3-Month USD-LIBOR | | Receive | | 4.950% | | 03/31/2008 | | | 13,000 | | | 160 | | | 44 |
Call - OTC 7-Year Interest Rate Swap | | Royal Bank of Scotland Group PLC | | 3-Month USD-LIBOR | | Receive | | 5.200% | | 12/15/2008 | | | 20,900 | | | 209 | | | 205 |
| | | | | | | | | | | | | | | | | | | |
| | | | | | | | | | | | | | | $ | 1,363 | | $ | 492 |
| | | | | | | | | | | | | | | | | | | |
(g) Short sales outstanding on June 30, 2007:
| | | | | | | | | | | | | |
| Description | | Coupon | | Maturity
Date | | Principal
Amount | | Proceeds | | Value (2) |
Fannie Mae | | 5.500% | | 07/01/2037 | | $ | 4,000 | | $ | 3,885 | | $ | 3,858 |
U.S. Treasury Notes | | 4.625% | | 02/15/2017 | | | 2,800 | | | 2,723 | | | 2,763 |
| | | | | | | | | | | | | |
| | | | | | | | | $ | 6,608 | | $ | 6,621 |
| | | | | | | | | | | | | |
(2) Market value includes $50 of interest payable on short sales.
(h) Foreign currency contracts outstanding on June 30, 2007:
| | | | | | | | | | | | | | | | | |
| Type | | Currency | | Principal
Amount
Covered by
Contract | | Settlement
Month | | Unrealized
Appreciation | | Unrealized
(Depreciation) | | | Net Unrealized
Appreciation/
(Depreciation) | |
Buy | | AUD | | 3,792 | | 07/2007 | | $ | 23 | | $ | 0 | | | $ | 23 | |
Sell | | | | 34 | | 07/2007 | | | 0 | | | 0 | | | | 0 | |
Buy | | BRL | | 29,907 | | 10/2007 | | | 572 | | | 0 | | | | 572 | |
Buy | | | | 14,977 | | 03/2008 | | | 478 | | | 0 | | | | 478 | |
Buy | | CAD | | 2,735 | | 08/2007 | | | 11 | | | 0 | | | | 11 | |
Buy | | CLP | | 130,534 | | 03/2008 | | | 0 | | | (1 | ) | | | (1 | ) |
Buy | | CNY | | 768 | | 09/2007 | | | 2 | | | 0 | | | | 2 | |
Sell | | | | 768 | | 09/2007 | | | 0 | | | 0 | | | | 0 | |
Buy | | | | 11,517 | | 11/2007 | | | 12 | | | 0 | | | | 12 | |
Sell | | | | 14,080 | | 11/2007 | | | 1 | | | (4 | ) | | | (3 | ) |
Buy | | | | 4,059 | | 01/2008 | | | 0 | | | (4 | ) | | | (4 | ) |
Sell | | | | 4,059 | | 01/2008 | | | 0 | | | (1 | ) | | | (1 | ) |
Buy | | EUR | | 5,466 | | 07/2007 | | | 72 | | | 0 | | | | 72 | |
Sell | | GBP | | 3,730 | | 08/2007 | | | 0 | | | (39 | ) | | | (39 | ) |
Buy | | INR | | 41,409 | | 10/2007 | | | 4 | | | 0 | | | | 4 | |
Buy | | | | 4,970 | | 11/2007 | | | 0 | | | (1 | ) | | | (1 | ) |
Buy | | | | 260,547 | | 05/2008 | | | 59 | | | 0 | | | | 59 | |
Buy | | KRW | | 2,631,872 | | 07/2007 | | | 17 | | | 0 | | | | 17 | |
Sell | | | | 177,295 | | 07/2007 | | | 0 | | | (1 | ) | | | (1 | ) |
Buy | | | | 1,082,809 | | 08/2007 | | | 0 | | | 0 | | | | 0 | |
Buy | | | | 987,632 | | 09/2007 | | | 7 | | | 0 | | | | 7 | |
Sell | | | | 241,906 | | 09/2007 | | | 0 | | | (5 | ) | | | (5 | ) |
Buy | | MXN | | 14,088 | | 09/2007 | | | 18 | | | 0 | | | | 18 | |
Buy | | | | 34,243 | | 03/2008 | | | 19 | | | (5 | ) | | | 14 | |
| | | | |
| 14 | | PIMCO Variable Insurance Trust | | See Accompanying Notes |
| | |
| |
| | | June 30, 2007 (Unaudited) |
| | | | | | | | | | | | | | | | | |
| Type | | Currency | | Principal
Amount
Covered by
Contract | | Settlement
Month | | Unrealized
Appreciation | | Unrealized
(Depreciation) | | | Net Unrealized
Appreciation/
(Depreciation) | |
Buy | | MYR | | 6,017 | | 05/2008 | | $ | 0 | | $ | (13 | ) | | $ | (13 | ) |
Buy | | NZD | | 408 | | 07/2007 | | | 8 | | | 0 | | | | 8 | |
Buy | | PHP | | 14,604 | | 05/2008 | | | 0 | | | (3 | ) | | | (3 | ) |
Buy | | PLN | | 11,325 | | 09/2007 | | | 76 | | | (1 | ) | | | 75 | |
Buy | | RUB | | 35,543 | | 09/2007 | | | 18 | | | 0 | | | | 18 | |
Buy | | | | 21,548 | | 11/2007 | | | 21 | | | 0 | | | | 21 | |
Buy | | | | 50,111 | | 12/2007 | | | 45 | | | 0 | | | | 45 | |
Buy | | | | 85,054 | | 01/2008 | | | 17 | | | 0 | | | | 17 | |
Buy | | SEK | | 5,098 | | 09/2007 | | | 9 | | | 0 | | | | 9 | |
Buy | | SGD | | 5,064 | | 07/2007 | | | 0 | | | (18 | ) | | | (18 | ) |
Sell | | | | 2,968 | | 07/2007 | | | 0 | | | (11 | ) | | | (11 | ) |
Buy | | | | 2,154 | | 08/2007 | | | 8 | | | (2 | ) | | | 6 | |
Buy | | | | 172 | | 09/2007 | | | 0 | | | 0 | | | | 0 | |
Buy | | | | 4,887 | | 10/2007 | | | 17 | | | 0 | | | | 17 | |
Buy | | ZAR | | 106 | | 09/2007 | | | 0 | | | 0 | | | | 0 | |
Buy | | | | 202 | | 03/2008 | | | 0 | | | 0 | | | | 0 | |
| | | | | | | | | | | | | | | | | |
| | | | | | | | $ | 1,514 | | $ | (109 | ) | | $ | 1,405 | |
| | | | | | | | | | | | | | | | | |
| | | | | | |
| See Accompanying Notes | | Semiannual Report | | June 30, 2007 | | 15 |
Notes to Financial Statements
1. ORGANIZATION
The Low Duration Portfolio (the “Portfolio”) is a series of the PIMCO Variable Insurance Trust (the “Trust”). The Trust is registered under the Investment Company Act of 1940 (the “Act”), as amended, as an open-end management investment company organized as a Delaware business trust on October 3, 1997. The Portfolio offers three classes of shares: Institutional, Administrative and Advisor. Information presented on these financial statements pertains to the Advisor Class of the Portfolio. Certain detailed financial information for the Institutional Class and Administrative Class is provided separately and is available upon request. The Trust is designed to be used as an investment vehicle by Separate Accounts of insurance companies that fund variable annuity contracts and variable life insurance policies and by qualified pension and retirement plans.
2. SIGNIFICANT ACCOUNTING POLICIES
The following is a summary of significant accounting policies consistently followed by the Portfolio in the preparation of its financial statements in conformity with accounting principles generally accepted in the United States of America (“GAAP”). The preparation of financial statements in accordance with GAAP requires management to make estimates and assumptions that affect the reported amounts and disclosures on the financial statements. Actual results could differ from those estimates.
(a) Security Valuation Portfolio securities are valued as of the close of regular trading (normally 4:00 p.m., Eastern Time) on each day that the New York Stock Exchange (“NYSE”) is open. Portfolio securities and other assets for which market quotes are readily available are stated at market value. Market value is generally determined on the basis of last reported sales prices, or if no sales are reported, based on quotes obtained from a quotation reporting system, established market makers, or pricing services. Fixed-income securities and non-exchange traded derivatives are normally valued on the basis of quotes obtained from brokers and dealers or pricing services. Prices obtained from independent pricing services use information provided by market makers or estimates of market values obtained from yield data relating to investments or securities with similar characteristics. Certain fixed income securities purchased on a delayed-delivery basis are marked to market daily until settlement at the forward settlement date. Short-term investments having a maturity of 60 days or less are generally valued at amortized cost. Exchange traded options, futures and options on futures are valued at the settlement price determined by the relevant exchange. With respect to any portion of the Portfolio’s assets that are invested in one or more open end management investment companies, the Portfolio’s net asset value (“NAV”) will be calculated based upon the NAVs of such investments.
Investments initially valued in currencies other than the U.S. dollar are converted to the U.S. dollar using exchange rates obtained from pricing services. As a result, the NAV of the Portfolio’s securities may be affected by changes in the value of currencies in relation to the U.S. dollar. The value of securities traded in markets outside the United States or denominated in currencies other than the U.S. dollar may be affected significantly on a day that the NYSE is closed and an investor is not able to purchase, redeem or exchange shares.
Securities and other assets for which market quotes are not readily available are valued at fair value as determined in good faith by the Board of Trustees or persons acting at their direction. The Board of Trustees has adopted methods for valuing securities and other assets in circumstances where market quotes are not readily available, and has delegated to Pacific Investment Management Company LLC (“PIMCO”) the responsibility for applying the valuation methods. In the event that market quotes are not readily available, and the security or asset cannot be valued pursuant to one of the valuation methods, the value of the security or asset will be determined in good faith by the Valuation Committee of the Board of Trustees, generally based upon recommendations provided by PIMCO.
Market quotes are considered not readily available in circumstances where there is an absence of current or reliable market-based data (e.g., trade information, bid/asked information, broker quotes), including where events occur after the close of the relevant market, but prior to the close of regular trading, that materially affect the values of the Portfolio’s securities or assets. In addition, market quotes are considered not readily available when, due to extraordinary circumstances, the exchanges or markets on which the securities trade, do not open for trading for the entire day and no other market prices are available. The Board has delegated to PIMCO the responsibility for monitoring significant events that may materially affect the values of the Portfolio’s securities or assets and for determining whether the value of the applicable securities or assets should be re-evaluated in light of such significant events.
When the Portfolio uses fair value pricing to determine its NAV, securities will not be priced on the basis of quotations from the primary market in which they are traded, but rather may be priced by another method that the Board of Trustees or persons acting at their direction believe accurately reflects fair value. The Trust’s policy is intended to result in a calculation of the Portfolio’s NAV that fairly reflects security values as of the time of pricing. However, fair values determined by the Board of Trustees or persons acting at their direction may not accurately reflect the price that the Portfolio could obtain for a security if it were to dispose of that security as of the time of pricing. Because foreign securities can trade on non-business days of the Portfolio, the NAV of the Portfolio may change on days when shareholders will not be able to purchase or redeem Portfolio shares. The prices used by the Portfolio may differ from the value that would be realized if the securities were sold and the differences could be material to the financial statements.
(b) Securities Transactions and Investment Income Securities transactions are recorded as of the trade date for financial reporting purposes. Securities purchased or sold on a when-issued or delayed-delivery basis may be settled a month or more after the trade date. Realized gains and losses from securities sold are recorded on the identified cost basis. Dividend income is recorded on the ex-dividend date, except certain dividends from foreign securities where the ex-dividend date may have passed, which are recorded as soon as the Portfolio is informed of the ex-dividend date. Interest income, adjusted for the accretion of discounts and amortization of premiums, is recorded on the accrual basis. Paydown gains and losses on mortgage-related and other asset-backed securities are recorded as components of interest income on the Statement of Operations.
(c) Delayed-Delivery Transactions The Portfolio may purchase or sell securities on a delayed-delivery basis. These transactions involve a commitment by the Portfolio to purchase or sell securities for a predetermined price or yield, with payment and delivery taking place beyond the customary settlement period. When delayed-delivery purchases are outstanding, the Portfolio will designate liquid assets in an amount sufficient to meet the purchase price. When purchasing a security on a delayed-delivery basis, the Portfolio assumes the rights and risks of ownership of the security, including the risk of price and yield fluctuations, and takes such fluctuations into account when determining its net asset value. The Portfolio may dispose of or renegotiate a delayed-delivery transaction after it is entered into, and may sell when-issued securities before they are delivered, which may result in a capital gain or loss. When the Portfolio has sold a security on a delayed-delivery basis, the Portfolio does not participate in future gains and losses with respect to the security.
(d) Dividends and Distributions to Shareholders Dividends from net investment income, if any, are declared daily and distributed to shareholders monthly. Net realized capital gains earned by the Portfolio, if any, will be distributed no less frequently than once each year.
Income dividends and capital gain distributions are determined in accordance with income tax regulations which may differ from GAAP. Differences between tax regulations and GAAP may change the fiscal year when income and capital items
| | | | |
| 16 | | PIMCO Variable Insurance Trust | | |
| | |
| |
| | | June 30, 2007 (Unaudited) |
are recognized for tax and GAAP purposes. Examples of events that give rise to timing differences include wash sales, straddles, net operating losses and capital loss carryforwards. Further, the character of investment income and capital gains may be different for certain transactions under the two methods of accounting. Examples of characterization differences include the treatment of mortgage paydowns, swaps, foreign currency transactions and contingent debt instruments. As a result, income dividends and capital gain distributions declared during a fiscal period may differ significantly from the net investment income and realized capital gain reported on the Portfolio’s annual financial statements presented under GAAP.
Distributions classified as a tax basis return of capital, if any, are reflected on the accompanying Statements of Changes in Net Assets and have been reclassified to paid in capital. In addition, other amounts have been reclassified between undistributed net investment income, accumulated undistributed net realized gains or losses and/or paid in capital to more appropriately conform financial accounting to tax characterizations of dividend distributions.
(e) Multiclass Operations Each class offered by the Portfolio has equal rights as to assets and voting privileges (except that shareholders of a class have exclusive voting rights regarding any matter relating solely to that class of shares). Income and non-class specific expenses of the Portfolio are allocated daily to each class of shares based on the relative value of settled shares. Realized and unrealized capital gains and losses of the Portfolio are allocated daily to each class of shares based on the relative net assets of each class. Class specific expenses, where applicable, currently include administrative, distribution and servicing fees.
(f) Foreign Currency The functional and reporting currency for the Portfolio is the U.S. dollar. The market values of foreign securities, currency holdings and other assets and liabilities are translated into U.S. dollars based on the current exchange rates each business day. Fluctuations in the value of currency holdings and other assets and liabilities resulting from changes in exchange rates are recorded as unrealized foreign currency gains or losses. Realized gains or losses and unrealized appreciation or depreciation on investment securities and income and expenses are translated on the respective dates of such transactions. The effects of changes in foreign currency exchange rates on investments in securities are not segregated on the Statement of Operations from the effects of changes in market prices of those securities, but are included with the net realized and unrealized gain or loss on investment securities.
| | | | | | |
|
Non-U.S. currency symbols utilized throughout the report are defined
as follows: |
| AUD | | Australian Dollar | | MXN | | Mexican Peso |
| BRL | | Brazilian Real | | MYR | | Malaysian Ringgit |
| CAD | | Canadian Dollar | | NZD | | New Zealand Dollar |
| CLP | | Chilean Peso | | PHP | | Philippines Peso |
| CNY | | Chinese Yuan Renminbi | | PLN | | Polish Zloty |
| EUR | | Euro | | RUB | | Russian Ruble |
| GBP | | Great British Pound | | SEK | | Swedish Krona |
| INR | | Indian Rupee | | SGD | | Singapore Dollar |
| JPY | | Japanese Yen | | ZAR | | South African Rand |
| KRW | | South Korean Won | | | | |
| | | | | | |
(g) Foreign Currency Transactions The Portfolio may enter into foreign currency contracts in connection with settling planned purchases or sales of securities, to hedge the currency exposure associated with some or all of the Portfolio’s securities or as a part of an investment strategy. A foreign currency
contract is an agreement between two parties to buy and sell a currency at a set price on a future date. The market value of a foreign currency contract fluctuates with changes in foreign currency exchange rates. Foreign currency contracts are marked to market daily and the change in value is recorded by the Portfolio as an unrealized gain or loss. Realized gains or losses equal to the difference between the value of the contract at the time it was opened and the value at the time it was closed are recorded upon delivery or receipt of the currency. These contracts may involve market risk in excess of the unrealized gain or loss reflected on the Statement of Assets and Liabilities. In addition, the Portfolio could be exposed to risk if the counterparties are unable to meet the terms of the contracts or if the value of the currency changes unfavorably to the U.S. dollar.
(h) Futures Contracts The Portfolio may enter into futures contracts. The Portfolio may use futures contracts to manage its exposure to the securities markets or to movements in interest rates and currency values. The primary risks associated with the use of futures contracts are the imperfect correlation between the change in market value of the securities held by the Portfolio and the prices of futures contracts, the possibility of an illiquid market, and the inability of the counterparty to meet the terms of the contract. Futures contracts are valued based upon their quoted daily settlement prices. Upon entering into a futures contract, the Portfolio is required to deposit with its futures broker, an amount of cash or U.S. Government and Agency Obligations in accordance with the initial margin requirements of the broker or exchange. Futures contracts are marked to market daily and an appropriate payable or receivable for the change in value (“variation margin”) is recorded by the Portfolio. Gains or losses are recognized but not considered realized until the contracts expire or are closed. Futures contracts involve, to varying degrees, risk of loss in excess of the variation margin disclosed on the Statement of Assets and Liabilities.
(i) Options Contracts The Portfolio may write call and put options on futures, swaps, securities or currencies it owns or in which it may invest. Writing put options tends to increase the Portfolio’s exposure to the underlying instrument. Writing call options tends to decrease the Portfolio’s exposure to the underlying instrument. When the Portfolio writes a call or put option, an amount equal to the premium received is recorded as a liability and subsequently marked to market to reflect the current value of the option written. These liabilities are reflected as written options outstanding on the Statement of Assets and Liabilities. Certain options may be written with premiums to be determined on a future date. The premiums for these options are based upon implied volatility parameters at specified terms. Premiums received from writing options which expire are treated as realized gains. Premiums received from writing options which are exercised or closed are added to the proceeds or offset against amounts paid on the underlying future, swap, security or currency transaction to determine the realized gain or loss. The Portfolio as a writer of an option has no control over whether the underlying future, swap, security or currency may be sold (call) or purchased (put) and as a result bears the market risk of an unfavorable change in the price of the future, swap, security or currency underlying the written option. There is the risk the Portfolio may not be able to enter into a closing transaction because of an illiquid market.
The Portfolio may also purchase put and call options. Purchasing call options tends to increase the Portfolio’s exposure to the underlying instrument. Purchasing put options tends to decrease the Portfolio’s exposure to the underlying instrument. The Portfolio pays a premium which is included on the Statement of Assets and Liabilities as an investment and subsequently marked to market to reflect the current value of the option. Premiums paid for purchasing options which expire are treated as realized losses. Certain options may be purchased with premiums to be determined on a future date. The premiums for these options are based upon implied volatility parameters at specified terms. The risk associated with purchasing put and call options is limited to the premium paid. Premiums paid for purchasing options which are exercised or closed are added to the amounts paid or
| | | | | | |
| | Semiannual Report | | June 30, 2007 | | 17 |
Notes to Financial Statements (Cont.)
offset against the proceeds on the underlying future, swap, security or currency transaction to determine the realized gain or loss.
(j) Repurchase Agreements The Portfolio may engage in repurchase transactions. Under the terms of a typical repurchase agreement, the Portfolio takes possession of an underlying debt obligation (collateral) subject to an obligation of the seller to repurchase, and the Portfolio to resell, the obligation at an agreed-upon price and time. The underlying securities for all repurchase agreements are held in safekeeping at the Portfolio’s custodian or designated subcustodians under tri-party repurchase agreements. The market value of the collateral must be equal to or exceed the total amount of the repurchase obligations, including interest. Securities purchased under repurchase agreements are reflected as an asset on the Statement of Assets and Liabilities. Generally, in the event of counterparty default, the Portfolio has the right to use the collateral to offset losses incurred. If the counterparty should default, the Portfolio will seek to sell the securities which it holds as collateral. This could involve procedural costs or delays in addition to a loss on the securities if their value should fall below their repurchase price.
(k) Inverse Floating Rate Transactions—Residual Interest Municipal Bonds (“RIBs”)/Residual Interest Tax Exempt Bonds (“RITEs”) The Portfolio may invest in RIBs and RITEs (“Inverse Floaters”). Inverse Floaters are created via a master trust agreement between a broker-dealer, acting as trustor and liquidity provider, and an investment bank, acting as trustee and tender agent. The master trust agreement defines the terms for each trust series; with each series being established by the transfer of long-term, fixed-rate municipal bonds (“Fixed Rate Bonds”) to the trustee to be held and provide for the creation, execution and delivery of floater certificates (“Floating Rate Notes”) and Inverse Floaters. Floating Rate Notes are liquid notes that are issued with a short-term variable rate typically linked to the LIBOR, subject to limitations, for some duration. After interest income is paid on the Floating Rate Notes at current rates, the residual income from the Fixed Rate Bonds is paid to the Inverse Floaters. Inverse Floaters are issued with a coupon that fluctuates inversely with the Floating Rate Notes’ referenced rate, subject to certain limitations. Therefore, rising short-term rates result in lower income for the Inverse Floaters and vice versa.
Floating Rate Notes are generally remarketed to municipal money market funds. Inverse Floaters are acquired by either tax-exempt municipal bond funds or trusts, or other parties interested in potentially higher yielding tax-exempt securities. Inverse Floaters may also be acquired for the purpose of increasing leverage. Floating Rate Note holders typically have the option to tender their notes to the liquidity provider for redemption at par at each reset date. The Inverse Floater holders have the option to (i) require the Floating Rate Note holders to tender their notes at par, and (ii) require the liquidity provider to transfer the Fixed Rate Bonds to the Inverse Floater holders. The holders of Inverse Floaters bear substantially all of the downside investment risk associated with the underlying Fixed Rate Bonds, and also benefit from a disproportionate amount of the potential appreciation of the underlying Fixed Rate Bonds’ value. Inverse Floaters may be more volatile and less liquid than other municipal bonds of comparable maturity.
Inverse Floaters may be acquired with or without first transferring to the trustor the Fixed Rate Bonds that were utilized to create the trust series. Inverse Floaters acquired without a transfer of Fixed Rate Bonds are recognized as purchases of securities as outlined in Note 2(b). Statement of Financial Accounting Standards No. 140—Accounting for Transfers and Servicing of Financial Assets and Extinguishments of Liabilities (“FAS No. 140”), governs the standards for accounting for securitizations and other transfers of financial assets. If there is a transfer of Fixed Rate Bonds and it meets sale criteria under FAS No. 140, a Portfolio records a sale of the Fixed Rate Bonds and a purchase of the Inverse Floaters. The cash received from the Inverse Floaters is then recorded as interest income in the Statement of Operations.
If the transfer of Fixed Rate Bonds does not meet sale criteria under FAS No. 140, a Portfolio accounts for the transaction described above as a secured borrowing by including the Fixed Rate Bonds in its Schedule of Investments, and recording the Floating Rate Notes as a liability under the caption “Payable for floating rate notes” in the Portfolio’s Statement of Assets and Liabilities. In a secured borrowing transaction, cash received from the Inverse Floaters is not recorded as interest income. Instead, a Portfolio records interest income related to the Fixed Rate Bonds and interest expense related to the Floating Rate Notes, the net of which is equal to the cash received from the Inverse Floaters acquired by the Portfolio. Thus, while a Portfolio’s reported total income, net expenses, and net expense ratio are generally higher for investments in Inverse Floaters acquired via a secured borrowing, the method of acquiring Inverse Floaters does not result in differences for reported cash flows, net asset value or total return.
(l) Short Sales The Portfolio may enter into short sales transactions. A short sale is a transaction in which the Portfolio sells securities it does not own in anticipation of a decline in the market price of the securities. Securities sold in short sale transactions and interest payable on such securities, if any, are reflected as a liability on the Statement of Assets and Liabilities. The Portfolio is obligated to deliver securities at the market price at the time the short position is closed. Possible losses from short sales may be unlimited, whereas losses from purchases cannot exceed the total amount invested.
(m) Swap Agreements The Portfolio may invest in swap agreements. Swap transactions are privately negotiated agreements between the Portfolio and a counterparty to exchange or swap investment cash flows, assets, or market-linked returns at specified, future intervals. The Portfolio may enter into interest rate, total return, forward spread-lock, credit default, and other forms of swap agreements to manage its exposure to interest rates and credit risk. In connection with these agreements, securities may be identified as collateral in accordance with the terms of the respective swap agreements.
Interest rate swap agreements involve the exchange by the Portfolio with another party of their respective commitments to pay or receive interest, e.g., an exchange of floating rate payments for fixed rate payments with respect to the notional amount of principal. Certain forms of interest rate swap agreements may include: (i) interest rate caps, under which, in return for a premium, one party agrees to make payments to the other to the extent that interest rates exceed a specified rate, or “cap”, (ii) interest rate floors, under which, in return for a premium, one party agrees to make payments to the other to the extent that interest rates fall below a specified rate, or “floor”, or (iii) interest rate collars, under which a party sells a cap and purchases a floor or vice versa in an attempt to protect itself against interest rate movements exceeding given minimum or maximum levels.
Total return swap agreements involve commitments to pay interest in exchange for a market-linked return, both based on notional amounts. To the extent the total return of the security or index underlying the transaction exceeds or falls short of the offsetting interest rate obligation, the Portfolio will receive a payment from or make a payment to the counterparty.
Forward spread-lock swap agreements involve commitments to pay or receive a settlement amount calculated as the difference between the swap spread and a fixed spread, multiplied by the notional amount times the duration of the swap. The swap spread is the difference between the benchmark swap rate (market rate) and the specific Treasury rate.
Credit default swap agreements involve one party making a stream of payments to another party in exchange for the right to receive a specified return in the event of a default by a third party, typically corporate issues or sovereign issues of an emerging country, on its obligation. The Portfolio may use credit default swaps to provide a measure of protection against defaults of the issuers (i.e., to reduce risk where the Portfolio owns or has exposure to the sovereign issuer) or to take an
| | | | |
| 18 | | PIMCO Variable Insurance Trust | | |
| | |
| |
| | | June 30, 2007 (Unaudited) |
active long or short position with respect to the likelihood of a particular issuer’s default. As a seller of protection, the Portfolio generally receives an upfront payment or a fixed rate of income throughout the term of the swap provided that there is no credit event. If the Portfolio is a seller of protection and a credit event occurs, as defined under the terms of that particular swap agreement, the Portfolio will pay to the buyer of the protection an amount up to the notional value of the swap and in certain instances take delivery of the security. As the seller, the Portfolio would effectively add leverage to its portfolio because, in addition to its total net assets, the Portfolio would be subject to investment exposure on the notional amount of the swap. As a buyer of protection, the Portfolio generally receives an amount up to the notional value of the swap if a credit event occurs. The treatment of credit default swaps and other swap agreements that provide for contingent, non-periodic, bullet-type payments as “notional principal contracts” for U.S. federal income tax purposes is uncertain. Were the U.S. Internal Revenue Service (“IRS”) to take the position that a credit default swap or other bullet-type swap is not a “notional principal contract” for U.S. federal income tax purposes, payments received by the Portfolio from such investments might be subject to U.S. excise or income taxes.
Swaps are marked to market daily based upon quotations from market makers and the change in value, if any, is recorded as unrealized gain or loss on the Statement of Operations. Payments received or made at the beginning of the measurement period are reflected as such on the Statement of Assets and Liabilities. These upfront payments are recorded as realized gain or loss on the Statement of Operations upon termination or maturity of the swap. A liquidation payment received or made at the termination of the swap is recorded as realized gain or loss on the Statement of Operations. Net periodic payments received or paid by the Portfolio are included as part of realized gain or loss on the Statement of Operations. Entering into these agreements involves, to varying degrees, elements of credit, market and documentation risk in excess of the amounts recognized on the Statement of Assets and Liabilities. Such risks involve the possibility that there will be no liquid market for these agreements, that the counterparty to the agreements may default on its obligation to perform or disagree as to the meaning of contractual terms in the agreements and that there may be unfavorable changes in interest rates.
(n) Loan Participations and Assignments The Portfolio may invest in direct debt instruments which are interests in amounts owned by corporate, governmental, or other borrowers to lenders or lending syndicates. The Portfolio’s investments in loans may be in the form of participations in loans or assignments of all or a portion of loans from third parties. A loan is often administered by a bank or other financial institution (the “lender”) that acts as agent for all holders. The agent administers the terms of the loan, as specified in the loan agreement. When investing in a loan participation, the Portfolio has the right to receive payments of principal, interest and any fees to which it is entitled only from the lender selling the loan agreement and only upon receipt by the lender of payments from the borrower. The Portfolio generally has no right to enforce compliance with the terms of the loan agreement with the borrower. As a result, the Portfolio may be subject to the credit risk of both the borrower and the lender that is selling the loan agreement. When the Portfolio purchases assignments from lenders it acquires direct rights against the borrower of the loan. At the end of the period June 30, 2007, the Portfolio had no unfunded loan commitments.
(o) Bridge Debt Commitments At the period ended June 30, 2007, the Portfolio had $2,189,000 in commitments outstanding to fund high yield bridge debt. The Portfolio is entitled to a fee upon the expiration of the commitment period. The bridge debt terms approximate market rates at the time the commitment is entered into.
(p) Commodities Index-Linked/Structured Notes The Portfolio invests in structured notes whose value is based on the price movements of a commodity
index. The structured notes are often leveraged, increasing the volatility of each note’s value relative to the change in the underlying linked financial element. The value of these notes will rise and fall in response to changes in the underlying commodity index. Structured notes may entail a greater degree of market risk than other types of debt securities because the investor bears the risk of the underlying commodity index. Structured notes may also be more volatile, less liquid, and more difficult to accurately price than less complex securities or more traditional debt securities. Fluctuations in value of the structured notes are recorded as unrealized gains and losses on the accompanying financial statements. Net payments are recorded as net realized gains and losses. These notes are subject to prepayment, credit and interest risks. The Portfolio has the option to request prepayment from the issuer. At maturity, or when a note is sold, the Portfolio records a realized gain or loss. At June 30, 2007, the value of these securities comprised 0.3% of the Portfolio’s net assets and resulted in unrealized depreciation of $17,003.
(q) Mortgage-Related and Other Asset-Backed Securities The Portfolio may invest in mortgage-related or other asset-backed securities. These securities include mortgage pass-through securities, collateralized mortgage obligations (“CMOs”), commercial mortgage-backed securities, mortgage dollar rolls, CMO residuals, stripped mortgage-backed securities (“SMBSs”) and other securities that directly or indirectly represent a participation in, or are secured by and payable from, mortgage loans on real property. The value of some mortgage-related or asset-backed securities may be particularly sensitive to changes in prevailing interest rates. Early repayment of principal on some mortgage-related securities may expose the Portfolio to a lower rate of return upon reinvestment of principal. The value of these securities may fluctuate in response to the market’s perception of the creditworthiness of the issuers. Additionally, although mortgages and mortgage-related securities are generally supported by some form of government or private guarantee and/or insurance, there is no assurance that private guarantors or insurers will meet their obligations.
(r) U.S. Government Agencies or Government-Sponsored Enterprises Securities issued by U.S. Government agencies or government-sponsored enterprises may not be guaranteed by the U.S. Treasury. The Government National Mortgage Association (“GNMA” or “Ginnie Mae”), a wholly owned U.S. Government corporation, is authorized to guarantee, with the full faith and credit of the U.S. Government, the timely payment of principal and interest on securities issued by institutions approved by GNMA and backed by pools of mortgages insured by the Federal Housing Administration or guaranteed by the Department of Veterans Affairs. Government-related guarantors (i.e., not backed by the full faith and credit of the U.S. Government) include the Federal National Mortgage Association (“FNMA” or “Fannie Mae”) and the Federal Home Loan Mortgage Corporation (“FHLMC” or “Freddie Mac”). Pass-through securities issued by FNMA are guaranteed as to timely payment of principal and interest by FNMA but are not backed by the full faith and credit of the U.S. Government. FHLMC guarantees the timely payment of interest and ultimate collection of principal, but its participation certificates are not backed by the full faith and credit of the U.S. Government.
(s) New Accounting Policies In July 2006, the Financial Accounting Standards Board (“FASB”) issued Interpretation No. 48, “Accounting for Uncertainty in Income Taxes—an Interpretation of FASB Statement No. 109” (the “Interpretation”). The Interpretation became effective for the Portfolio on June 29, 2007. Management has evaluated the application of the Interpretation in relation to the Portfolio and has concluded that no single filing position or combination of filing positions identified as uncertain tax positions required the accrual of a tax liability in the accounting records of the Portfolio for the period ending June 30, 2007. Management will monitor all existing filing positions and future filing positions in light of the Interpretation and evaluate the need for any future tax accruals and financial statement disclosures as warranted.
| | | | | | |
| | Semiannual Report | | June 30, 2007 | | 19 |
Notes to Financial Statements (Cont.)
In September 2006, the FASB issued Statement of Financial Accounting Standards No. 157, “Fair Value Measurements” (the “Statement”). The Statement is effective for fiscal years beginning after November 15, 2007 and will require expanded disclosure about fair value measurements, separately for each major category of assets and liabilities, that enables shareholders to assess the inputs used to develop those measurements, and for recurring fair value measurements using significant unobservable inputs the effect of the measurements on changes in net assets for the reporting period. Management is currently evaluating the application of the Statement to the Portfolio and will provide additional information in relation to the Statement on the Portfolio’s annual financial statements for the period ending December 31, 2007.
3. FEES AND EXPENSES
(a) Investment Advisory Fee PIMCO is a majority-owned subsidiary of Allianz Global Investors of America L.P. (“AGI”), and serves as investment adviser (the “Adviser”) to the Trust, pursuant to an investment advisory contract. The Adviser receives a monthly fee from the Portfolio, at an annual rate based on average daily net assets. The Advisory Fee for all classes is charged at an annual rate of 0.25%.
(b) Administration Fee PIMCO serves as administrator (the “Administrator”), and provides administrative services to the Trust for which it receives a monthly administrative fee based on each share class’s average daily net assets. As the Administrator, PIMCO bears the costs of various third-party services, including audit, custodial, portfolio accounting, legal, transfer agency and printing costs. The Administration Fee for all classes is charged at the annual rate of 0.25%.
(c) Distribution and Servicing Fees Allianz Global Investors Distributors LLC (“AGID”) is an indirect wholly-owned subsidiary of AGI and serves as the distributor (the “Distributor”) of the Trust’s shares. The Trust is permitted to reimburse AGID on a quarterly basis, out of the Administrative Class assets of the Portfolio in the amount of 0.15% on an annual basis of the average daily net assets of that class, for payments made to financial intermediaries that provide services in connection with the distribution of shares or administration of plans or programs that use Portfolio shares as their funding medium. The effective rate paid to AGID was 0.15% during the current fiscal year.
The Trust has adopted a Distribution Plan, for the Advisor Class shares of the Portfolio (the “Plan”). The Plan has been adopted pursuant to Rule 12b-1 under the Act. The Plan permits payments for expenses in connection with the distribution and marketing of Advisor Class shares and/or the provision of shareholder services to Advisor Class shareholders. The Plan permits the Portfolio to make total payments at an annual rate of 0.25% of its average daily net assets attributable to its Advisor Class shares.
(d) Portfolio Expenses The Trust is responsible for the following expenses: (i) salaries and other compensation of any of the Trust’s executive officers and employees who are not officers, directors, stockholders or employees of PIMCO or its subsidiaries or affiliates; (ii) taxes and governmental fees; (iii) brokerage fees and commissions and other portfolio transaction expenses; (iv) the costs of borrowing money, including interest expenses and bank overdraft charges; (v) fees and expenses of the Trustees who are not “interested persons” of PIMCO or the Trust, and any counsel retained exclusively for their benefit; (vi) extraordinary expenses, including costs of litigation and indemnification expenses; (vii) organization expenses and (viii) any expenses allocated or allocable to a specific class of shares, which include service fees payable with respect to the Administrative Class Shares, and may include certain other expenses as permitted by the Trust’s Multiple Class Plan adopted pursuant to Rule 18f-3 under the Act and subject to review and approval by the Trustees. The ratio of expenses to average net assets per share class, as disclosed in the Financial Highlights, may
differ from the annual portfolio operating expenses per share class as disclosed in the Prospectus for the reasons set forth above.
Effective April 1, 2007, each Trustee, other than those affiliated with PIMCO or its affiliates, receives an annual retainer of $15,000, plus $2,375 for each Board of Trustees meeting attended in person, $500 for each committee meeting attended and $750 for each Board of Trustees meeting attended telephonically, plus reimbursement of related expenses. In addition, the audit committee chair receives an additional annual retainer of $2,000 and each other committee chair receives an additional annual retainer of $500. These expenses are allocated on a pro-rata basis to the various portfolios of the Trust according to their respective net assets. The Trust pays no compensation directly to any Trustee or any other officer who is affiliated with the Administrator, all of whom receive remuneration for their services to the Trust from the Administrator or its affiliates. Prior to April 1, 2007, each Trustee, other than those affiliated with PIMCO or its affiliates, received an annual retainer of $15,000 plus $2,000 for each Board of Trustees meeting attended ($500 for each special meeting attended), plus reimbursement of related expenses. The Audit Committee Chairman received an annual retainer of $1,500 and the Governance Committee Chairman received an annual retainer of $500. In addition, each member of a committee received $500 for each committee meeting attended.
4. RELATED PARTY TRANSACTIONS
The Adviser, Administrator, and Distributor are related parties as defined by FAS 57, Related Party Disclosures. Fees payable to these parties are disclosed in Note 3.
5. GUARANTEES AND INDEMNIFICATIONS
Under the Trust’s organizational documents, each Trustee, officer, employee or other agent of the Trust (including the Trust’s investment manager) is indemnified, to the extent permitted by the Act, against certain liabilities that may arise out of performance of their duties to the Portfolio. Additionally, in the normal course of business, the Portfolio enters into contracts that contain a variety of indemnification clauses. The Portfolio’s maximum exposure under these arrangements is unknown as this would involve future claims that may be made against the Portfolio that have not yet occurred. However, the Portfolio has not had prior claims or losses pursuant to these contracts and believes the risk of loss to be remote.
6. PURCHASES AND SALES OF SECURITIES
The length of time the Portfolio has held a particular security is not generally a consideration in investment decisions. A change in the securities held by the Portfolio is known as “portfolio turnover”. The Portfolio may engage in frequent and active trading of portfolio securities to achieve its investment objective, particularly during periods of volatile market movements. High portfolio turnover (e.g., over 100%) involves correspondingly greater expenses to the Portfolio, including brokerage commissions or dealer mark-ups and other transaction costs on the sale of securities and reinvestments in other securities. Such sales may also result in realization of taxable capital gains, including short-term capital gains (which are generally taxed at ordinary income tax rates). The trading costs and tax effects associated with portfolio turnover may adversely affect the Portfolio’s performance.
Purchases and sales of securities (excluding short-term investments) for the period ended June 30, 2007, were as follows (amounts in thousands):
| | | | | | | | | | | | |
| U.S. Government/Agency | | | | All Other |
| Purchases | | Sales | | | | Purchases | | Sales |
| $ | 132,589 | | $ | 60,737 | | | | $ | 195,469 | | $ | 25,549 |
| | | | |
| 20 | | PIMCO Variable Insurance Trust | | |
| | |
| |
| | | June 30, 2007 (Unaudited) |
7. TRANSACTIONS IN WRITTEN CALL AND PUT OPTIONS
Transactions in written call and put options were as follows (amounts in thousands, except for number of contracts):
| | | | | | | | | | | | | | | | | | | | |
| | | | | # of
Contracts | | | Notional
Amount
in $ | | | Notional
Amount
in EUR | | Notional
Amount
in GBP | | | Premium | |
Balance at 12/31/2006 | | | | 19 | | | $ | 98,000 | | | EUR | 2,000 | | GBP | 1,300 | | | $ | 1,000 | |
Sales | | | | 309 | | | | 104,900 | | | | 0 | | | 0 | | | | 1,311 | |
Closing Buys | | | | (138 | ) | | | (85,900 | ) | | | 0 | | | 0 | | | | (862 | ) |
Expirations | | | | (165 | ) | | | 0 | | | | 0 | | | (1,300 | ) | | | (76 | ) |
Exercised | | | | (25 | ) | | | 0 | | | | 0 | | | 0 | | | | (10 | ) |
Balance at 06/30/2007 | | | | 0 | | | $ | 117,000 | | | EUR | 2,000 | | GBP | 0 | | | $ | 1,363 | |
8. SHARES OF BENEFICIAL INTEREST
The Portfolio may issue an unlimited number of shares of beneficial interest with a $0.001 par value. Changes in shares of beneficial interest were as follows (shares and amounts in thousands):
| | | | | | | | | | | | | | | | |
| | | | | Six Months Ended
06/30/2007 | | | Year Ended
12/31/2006 | |
| | | | | Shares | | | Amount | | | Shares | | | Amount | |
| | | | | |
Receipts for shares sold | | | | | | | | | | | | | | | | |
Institutional Class | | | | 304 | | | $ | 3,048 | | | 1,150 | | | $ | 11,541 | |
Administrative Class | | | | 29,060 | | | | 291,519 | | | 36,746 | | | | 369,230 | |
Advisor Class | | | | 42 | | | | 421 | | | 39 | | | | 390 | |
Issued as reinvestment of distributions | | | | | | | | | | | | | | | | |
Institutional Class | | | | 60 | | | | 599 | | | 106 | | | | 1,072 | |
Administrative Class | | | | 2,018 | | | | 20,247 | | | 2,547 | | | | 25,602 | |
Advisor Class | | | | 0 | | | | 3 | | | 0 | | | | 2 | |
Cost of shares redeemed | | | | | | | | | | | | | | | | |
Institutional Class | | | | (1,117 | ) | | | (11,174 | ) | | (476 | ) | | | (4,778 | ) |
Administrative Class | | | | (6,686 | ) | | | (67,154 | ) | | (8,707 | ) | | | (87,388 | ) |
Advisor Class | | | | (35 | ) | | | (355 | ) | | (20 | ) | | | (204 | ) |
Net increase resulting from Portfolio share transactions | | | | 23,646 | | | $ | 237,154 | | | 31,385 | | | $ | 315,467 | |
The following schedule shows the number of shareholders each owning 5% or more of the Portfolio and the total percentage of the Portfolio held by such shareholders:
| | | | | | |
| | | | | Number of
Shareholders | | % of Portfolio Held |
Institutional Class | | | | 2 | | 100 |
Administrative Class | | | | 2 | | 71 |
Advisor Class | | | | 1 | | 96 |
9. REGULATORY AND LITIGATION MATTERS
Since February 2004, PIMCO, Allianz Global Investors of America L.P. (PIMCO’s parent company), AGID, and certain of their affiliates, including the PIMCO Funds (another series of funds managed by PIMCO), the Allianz Funds (formerly known as PIMCO Funds: Multi-Manager Series (another series of funds managed by affiliates of PIMCO)), certain Trustees of the Trust (in their capacity as Trustees of the PIMCO Funds or the Allianz Funds) and certain employees of PIMCO, have been named as defendants in fifteen lawsuits filed in various jurisdictions. Eleven
of those lawsuits concern “market timing,” and they have been transferred to and consolidated for pre-trial proceedings in a multi-district litigation proceeding in the U.S. District Court for the District of Maryland; the other four lawsuits concern “revenue sharing” and have been consolidated into a single action in the U.S. District Court for the District of Connecticut. The lawsuits have been commenced as putative class actions on behalf of investors who purchased, held or redeemed shares of the various series of the PIMCO Funds and the Allianz Funds during specified periods, or as derivative actions on behalf of the PIMCO Funds and the Allianz Funds.
The market timing actions in the District of Maryland generally allege that certain hedge funds were allowed to engage in “market timing” in certain funds of the PIMCO Funds and the Allianz Funds and this alleged activity was not disclosed. Pursuant to tolling agreements entered into with the derivative and class action plaintiffs, PIMCO, certain PIMCO Funds Trustees, and certain employees of PIMCO who were previously named as defendants have all been dropped as defendants in the market timing actions; the plaintiffs continue to assert claims on behalf of the shareholders of the PIMCO Funds or on behalf of the PIMCO Funds itself against other defendants. By order dated November 3, 2005, the U.S. District Court for the District of Maryland granted the PIMCO Funds’ motion to dismiss claims asserted against it in a consolidated amended complaint where the PIMCO Funds were named, in the complaint, as a nominal defendant. The revenue sharing action in the District of Connecticut generally alleges that fund assets were inappropriately used to pay brokers to promote funds of the PIMCO Funds and the Allianz Funds, including directing fund brokerage transactions to such brokers, and that such alleged arrangements were not fully disclosed to shareholders. On August 11, 2005, the U.S. District Court for the District of Connecticut conducted a hearing on defendants’ motion to dismiss the consolidated amended complaint in the revenue sharing action but has not yet ruled on the motion to dismiss. The market timing and revenue sharing lawsuits seek, among other things, unspecified compensatory damages plus interest and, in some cases, punitive damages, the rescission of investment advisory contracts, the return of fees paid under those contracts and restitution.
Two nearly identical class action civil complaints have been filed in August 2005, in the Northern District of Illinois Eastern Division, alleging that the plaintiffs each purchased and sold a 10-year Treasury note futures contract and suffered damages from an alleged shortage when PIMCO held both physical and futures positions in 10-year Treasury notes for its client accounts. The two actions have been consolidated into one action, and the two separate complaints have been replaced by a consolidated complaint. PIMCO is a named defendant, and PIMCO Funds has been added as a defendant, to the consolidated action. PIMCO strongly believes the complaint is without merit and intends to vigorously defend itself.
In April 2006, certain portfolios of the Trust and certain other funds managed by PIMCO were served in an adversary proceeding brought by the Official Committee of Asbestos Claimants of G-I Holdings, Inc. in G-I Holdings, Inc.’s bankruptcy in the District of New Jersey. In July 2004, PIMCO was named in this lawsuit and remains a defendant. The plaintiff seeks to recover for the bankruptcy estate assets that were transferred by the predecessor entity of G-I Holdings, Inc. to a wholly-owned subsidiary in 1994. The subsidiary has since issued notes, of which certain portfolios of the Trust and certain other funds managed by PIMCO are alleged to be holders. The complaint alleges that in 2000, more than two hundred noteholders—including certain portfolios of the Trust and certain other funds managed by PIMCO—were granted a second priority lien on the assets of the subsidiary in exchange for their consent to a refinancing transaction and the granting of a first priority lien to the lending banks. The plaintiff is seeking invalidation of the lien in favor of the noteholders and/or the value of the lien. On June 21, 2006, the District of New Jersey overturned the Bankruptcy Court’s decision granting permission to file the adversary proceeding and remanded the matter to the Bankruptcy Court for further proceedings. Following a motion to
| | | | | | |
| | Semiannual Report | | June 30, 2007 | | 21 |
Notes to Financial Statements (Cont.)
reconsider, the District Court upheld its remand on August 7, 2006, and instructed the Bankruptcy Court to conduct a “cost-benefit” analysis of the Committee’s claims, including the claims against the noteholders. The Bankruptcy Court held a status conference on October 25, 2006 and set a briefing schedule relating to this cost-benefit analysis.
The foregoing speaks only as of the date of this report. It is possible that these matters and/or other developments resulting from these matters could result in increased portfolio redemptions or other adverse consequences to the Portfolio. However, PIMCO and AGID believe that these matters are not likely to have a material adverse effect on the Portfolio or on PIMCO’s or AGID’s ability to perform their respective investment advisory or distribution services relating to the Portfolio.
10. FEDERAL INCOME TAX MATTERS
The Portfolio intends to qualify as a regulated investment company under sub-chapter M of the Internal Revenue Code (the “Code”) and distribute all of its taxable income and net realized gains, if applicable, to shareholders. Accordingly, no provision for Federal income taxes has been made.
As of June 30, 2007, the aggregate cost of investments was the same for federal income tax and financial statement purposes. The net unrealized appreciation (depreciation) of investment securities for federal income tax purposes is as follows (amount in thousands):
| | | | |
Aggregate
Gross
Unrealized
Appreciation | | Aggregate
Gross
Unrealized
(Depreciation) | | Net
Unrealized
(Depreciation) |
$ 767 | | $ (3,837) | | $ (3,070) |
| | | | |
| 22 | | PIMCO Variable Insurance Trust | | |
| | |
| |
Privacy Policy* | | (Unaudited) |
The Funds consider customer privacy to be a fundamental aspect of their relationships with shareholders and are committed to maintaining the confidentiality, integrity and security of their current, prospective and former shareholders’ personal information. To ensure their shareholders’ privacy, the Funds have developed policies that are designed to protect this confidentiality, while allowing shareholder needs to be served.
Obtaining Personal Information
In the course of providing shareholders with products and services, the Funds and certain service providers to the Funds, such as the Funds’ investment advisers (“Advisers”), may obtain non-public personal information about shareholders, which may come from sources such as account applications and other forms, from other written, electronic or verbal correspondence, from shareholder transactions, from a shareholder’s brokerage or financial advisory firm, financial adviser or consultant, and/or from information captured on the Funds’ internet web sites.
Respecting Your Privacy
As a matter of policy, the Funds do not disclose any personal or account information provided by shareholders or gathered by the Funds to non-affiliated third parties, except as required or permitted by law or as necessary for such third parties to perform their agreements with respect to the Funds. As is common in the industry, non-affiliated companies may from time to time be used to provide certain services, such as preparing and mailing prospectuses, reports, account statements and other information, conducting research on shareholder satisfaction and gathering shareholder proxies. A Fund’s Distributor may also retain non-affiliated companies to market the Fund’s shares or products which use the Fund’s shares and enter into joint marketing agreements with other companies. These companies may have access to a shareholder’s personal and account information, but are permitted to use this information solely to provide the specific service or as otherwise permitted by law. In most cases, the shareholders will be clients of a third party, but the Funds may also provide a shareholder’s personal and account information to the shareholder’s respective brokerage or financial advisory firm.
Sharing Information with Third Parties
The Funds reserve the right to disclose or report personal information to non-affiliated third parties, in limited circumstances, where the Funds believe in good faith that disclosure is required under law to cooperate with regulators or law enforcement authorities, to protect their rights or property or upon reasonable request by any Fund in which a shareholder has chosen to invest. In addition, the Funds may disclose information about a shareholder’s accounts to a non-affiliated third party with the consent of the shareholder.
Sharing Information with Affiliates
The Funds may share shareholder information with their affiliates in connection with servicing their shareholders’ accounts or to provide shareholders with information about products and services that the Funds or their Advisers, principal underwriters or their affiliates (“Service Affiliates”) believe may be of interest to such shareholders. The information that the Funds share may include, for example, a shareholder’s participation in one of the Funds or in other investment programs sponsored by a Service Affiliate, a shareholder’s ownership of certain types of accounts (such as IRAs), or other data about a shareholder’s accounts. The Funds’ Service Affiliates, in turn, are not permitted to share shareholder information with non-affiliated entities, except as required or permitted by law.
Procedures to Safeguard Private Information
The Funds take seriously the obligation to safeguard shareholder non-public personal information. In addition to this policy, the Funds have also implemented procedures that are designed to restrict access to a shareholder’s non-public personal information only to internal personnel who need to know that information in order to provide products or services to such shareholders. In order to guard a shareholder’s non-public personal information, physical, electronic and procedural safeguards are in place.
* This Privacy Policy applies to the following entities: PIMCO Funds, PIMCO Variable Insurance Trust, PCM Fund, Inc. and PIMCO Strategic Global Government Fund, Inc. (collectively, the “Funds”).
| | | | | | |
| | Semiannual Report | | June 30, 2007 | | 23 |
Investment Adviser and Administrator
Pacific Investment Management Company LLC
840 Newport Center Drive
Newport Beach, California 92660
Distributor
Allianz Global Investors Distributors LLC
1345 Avenue of the Americas
New York, New York 10105
Custodian
State Street Bank & Trust Company
801 Pennsylvania
Kansas City, Missouri 64105
Transfer Agent
Boston Financial Data Services–Midwest
330 W. 9th Street
Kansas City, Missouri 64105
Legal Counsel
Dechert LLP
1775 I Street, N.W.
Washington, D.C. 20006
Independent Registered Public Accounting Firm
PricewaterhouseCoopers LLP
1055 Broadway
Kansas City, Missouri 64105
P I M C O

Table of Contents
This material is authorized for use only when preceded or accompanied by the current PIMCO Variable Insurance Trust (the “Trust”) prospectus. Investors should consider the investment objectives, risks, charges and expenses of this Trust carefully before investing. Ask your financial professional to explain all charges that may apply. This and other information is contained in the Trust’s prospectus. The variable product prospectus may be obtained by contacting your Investment Consultant. Please read the Trust and variable product prospectus carefully before you invest or send money.
Chairman’s Letter
Dear PIMCO Variable Insurance Trust Shareholder:
It is our pleasure to present to you the semiannual report for the PIMCO Variable Insurance Trust, covering the six-month period ended June 30, 2007. The PIMCO Variable Insurance Trust’s net assets were $8.68 billion at June 30, 2007, as compared to $7.76 billion at December 31, 2006.
Highlights of the financial markets during the reporting period include:
| | n | | Economic data during the first quarter of 2007 pointed to slower growth, which heightened market expectations for a decrease in the Federal Funds Rate. By the second quarter, economic data, such as employment statistics, provided little indication of economic weakness, causing expectations of a decrease in the Federal Funds Rate to unwind and U.S. interest rates to move higher. Interest rates in Europe and the U.K. also rose over the period as central banks raised their key lending rates due to inflation concerns. The benchmark ten-year U.S. Treasury yielded 5.03% as of June 30, 2007, or 0.32% higher than at the beginning of the year. |
| | n | | Most bonds generally returned much of their gains from earlier in the year as worldwide growth and capital flows drove interest rates higher in the second quarter. Increased risk aversion in global financial markets, due in part to subprime mortgage worries in the U.S., also contributed to the rise in interest rates. The Lehman Brothers Aggregate Bond Index, which includes Treasury, investment-grade corporate and mortgage-backed securities, returned 0.98% for the six-month period. |
| | n | | Locally issued emerging market (“EM”) bonds posted positive returns for the reporting period. Yields on these bonds declined and the local currencies in which they are denominated generally gained, amid increasing investor awareness, strong economic growth and surging capital inflows. External EM bonds (debt instruments issued by emerging markets countries and typically denominated in U.S. dollars) lagged behind local EM bonds (debt instruments issued by emerging markets countries and denominated in the currency of the issuer), as external EM bonds tend to trade more in-line with U.S. Treasuries. |
| | n | | Treasury Inflation-Protected Securities (“TIPS”) outpaced nominal bonds (non-inflation linked bonds) for the first part of the year and all but the longest maturity TIPS outperformed in the second quarter as high gasoline prices drove higher inflation accruals. Commodities, as represented by the Dow Jones-AIG Commodity Total Return Index, returned 4.46% for the period. Equities, as measured by the S&P 500 Index and the Russell 2000 Index, returned 6.96% and 6.45%, respectively, for the period. |
On the following pages, please find specific details as to the Portfolio’s total return investment performance and a discussion of those factors that affected performance.
Thank you for the trust you have placed in us. We will continue to work diligently to serve your investment needs.
Sincerely,
Brent R. Harris
Chairman, PIMCO Variable Insurance Trust
July 31, 2007
| | | | | | |
| | Semiannual Report | | June 30, 2007 | | 1 |
Important Information About the Portfolio
PIMCO Variable Insurance Trust (the “Trust”) is an open-end management investment company currently consisting of twenty separate investment portfolios, including the Money Market Portfolio (the “Portfolio”). The Portfolio is only available as a funding vehicle under variable life insurance policies or variable annuity contracts issued by insurance companies (“Variable Contracts”). Individuals may not purchase shares of the Portfolio directly. Shares of the Portfolio also may be sold to qualified pension and retirement plans outside of the separate account context.
We believe that bond funds have an important role to play in a well diversified investment portfolio. It is important to note, however, that in an environment where interest rates may trend upward, rising rates would negatively impact the performance of most bond funds, and fixed-income securities held by a fund are likely to decrease in value. The price volatility of fixed-income securities can also increase during periods of rising interest rates resulting in increased losses to a fund. Bond funds and individual bonds with a longer duration (a measure of the expected life of a security) tend to be more sensitive to changes in interest rates, usually making them more volatile than securities or funds with shorter durations.
The Portfolio may be subject to various risks in addition to those described above. Some of these risks may include, but are not limited to, the following: credit risk, market risk, issuer risk, non-U.S. investment risk and management risk. A complete description of these risks is contained in the Portfolio’s prospectus. Investing in non-U.S. securities may entail risk due to non-U.S. economic and political developments.
On the performance summary page in this Semiannual Report, the Total Return Investment Performance table measures performance assuming that all dividend and capital gain distributions were reinvested.
An investment in the Portfolio is not a deposit of a bank and is not guaranteed or insured by the Federal Deposit Insurance Corporation or any other government agency. It is possible to lose money on investments in the Portfolio.
PIMCO has adopted written proxy voting policies and procedures (“Proxy Policy”) as required by Rule 206(4)-6 under the Investment Advisers Act of 1940, as amended. The Proxy Policy has been adopted by the Trust as the policies and procedures that PIMCO will use when voting proxies on behalf of the Portfolio. A description of the policies and procedures that PIMCO uses to vote proxies relating to portfolio securities of the Portfolio, and information about how the Portfolio voted proxies relating to portfolio securities held during the most recent twelve-month period ended June 30, are available without charge, upon request, by calling the Trust at 1-866-746-2606 and on the Portfolio’s website at www.pimco.com.
The Portfolio files its complete schedule of portfolio holdings with the SEC for the first and third quarters of each fiscal year on Form N-Q. A copy of the Trust’s Form N-Q is also available on the SEC’s website at http://www.sec.gov and may be reviewed and copied at the SEC’s Public Reference Room in Washington D.C. Information on the operation of the Public Reference Room may be obtained by calling 1-800-SEC-0330, and is available without charge, upon request, by calling the Trust at 1-866-746-2606 and on the Portfolio’s website at www.pimco.com.
PIMCO Variable Insurance Trust is distributed by Allianz Global Investors Distributors LLC, 1345 Avenue of the Americas, New York, NY 10105.
| | | | |
| 2 | | PIMCO Variable Insurance Trust | | |
The following disclosure provides important information regarding the Portfolio’s Expense Example (“Example” or “Expense Example”), which appears in this Semiannual Report. Please refer to this information when reviewing the Expense Example for the Portfolio.
Example
As a shareholder of the Portfolio, you incur two types of costs: (1) transaction costs and (2) ongoing costs, including advisory and administrative fees; distribution and/or service (12b-1) fees (Administrative Class only); and other Portfolio expenses. The Example is intended to help you understand your ongoing costs (in dollars) of investing in the Portfolio and to compare these costs with the ongoing costs of investing in other mutual funds. The Expense Example does not reflect any fees or other expenses imposed by the Variable Contracts. If it did, the expenses reflected in the Expense Example would be higher. The Example is based on an investment of $1,000 invested at the beginning of the period and held for the entire period indicated, which is from January 1, 2007 to June 30, 2007.
Actual Expenses
The information in the table under the heading “Actual Performance” provides information about actual account values and actual expenses. You may use the information in these columns, together with the amount you invested, to estimate the expenses that you paid over the period. Simply divide your account value by $1,000 (for example, an $8,600 account value divided by $1,000 = $8.60), then multiply the result by the number in the row titled “Expenses Paid During Period” to estimate the expenses you paid on your account during this period.
Hypothetical Example for Comparison Purposes
The information in the table under the heading “Hypothetical Performance (5% return before expenses)” provides information about hypothetical account values and hypothetical expenses based on the Portfolio’s actual expense ratio and an assumed rate of return of 5% per year before expenses, which is not the Portfolio’s actual return. The hypothetical account values and expenses may not be used to estimate the actual ending account balance or expenses you paid for the period. You may use this information to compare the ongoing costs of investing in the Portfolio and other portfolios. To do so, compare this 5% hypothetical example with the 5% hypothetical examples that appear in the shareholder reports of the other portfolios.
Please note that the expenses shown in the table are meant to highlight your ongoing costs only and do not reflect any transactional costs. Therefore, the information under the heading “Hypothetical Performance (5% return before expenses)” is useful in comparing ongoing costs only, and will not help you determine the relative total costs of owning different portfolios. In addition, if these transactional costs were included, your costs would have been higher.
The expense ratio may vary period to period because of various factors, such as an increase in expenses not covered by the advisory and administrative fees (such as expenses of the trustees and their counsel, litigation expense and interest expense).
| | | | | | |
| | Semiannual Report | | June 30, 2007 | | 3 |
PIMCO Money Market Portfolio
Cumulative Returns Through June 30, 2007
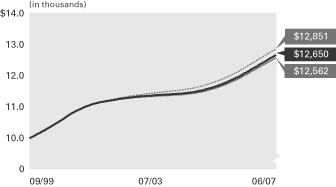
$10,000 invested at the beginning of the first full month following the inception date of the Portfolio’s Administrative Class.
Allocation Breakdown‡
| | |
Commercial Paper | | 93.3% |
Corporate Bonds & Notes | | 4.7% |
Certificates of Deposit | | 1.8% |
Repurchase Agreements | | 0.2% |
| | ‡ | % of Total Investments as of 06/30/2007 |
| | | | | | | | | | | | | | |
Average Annual Total Return for the period ended June 30, 2007 |
| | | | | 7-Day
Yield | | 30-Day
Yield | | 6 Months* | | 1 Year | | 5 Years | | Portfolio
Inception
(09/30/99) |
| | PIMCO Money Market Portfolio Administrative Class | | 4.85% | | 4.83% | | 2.40% | | 4.92% | | 2.40% | | 3.08% |
| | Citigroup 3-Month Treasury Bill Index± | | — | | — | | 2.49% | | 5.06% | | 2.67% | | 3.29% |
| | Lipper Money Market Fund Index±± | | — | | — | | 2.36% | | 4.82% | | 2.29% | | 2.99% |
All Portfolio returns are net of fees and expenses.
* Cumulative return.
Performance quoted represents past performance. Past performance is no guarantee of future results. Investment return and principal value will fluctuate so the Portfolio shares, when redeemed, may be worth more or less than their original cost. The Portfolio’s performance does not reflect the deduction of additional charges and expenses imposed in connection with investing in Variable Contracts, which will reduce returns. Current performance may be lower or higher than the performance data quoted. Performance data current to the most recent month-end is available by calling (800) 927-4648.
An investment in the PIMCO Money Market Portfolio is not insured or guaranteed by the Federal Deposit Insurance Corporation or any other government agency. Although the portfolio seeks to preserve the value of your investment at $1.00 per share, it is possible to lose money by investing in the Portfolio.
± Citigroup 3-Month Treasury Bill Index is an unmanaged index representing monthly return equivalents of yield averages of the last 3-month Treasury Bill issues. It is not possible to invest directly in the index. The index does not reflect deductions for fees and expenses.
±± Lipper Money Market Fund Index is an average of the 30 largest equal weighted Money Market Funds as compiled by Lipper Analytic Inc. It is not possible to invest directly in an unmanaged index. The index does not reflect deductions for fees and expenses.
| | | | | | |
| Expense Example | | Actual Performance | | Hypothetical Performance |
| | | | | (5% return before expenses) |
Beginning Account Value (01/01/07) | | $ | 1,000.00 | | $ | 1,000.00 |
Ending Account Value (06/30/07) | | $ | 1,024.04 | | $ | 1,022.32 |
Expenses Paid During Period† | | $ | 2.51 | | $ | 2.51 |
† Expenses are equal to the Portfolio’s Administrative Class annualized expense ratio of 0.50%, multiplied by the average account value over the period, multiplied by 181/365 (to reflect the one-half year period). Overall fees and expenses of investing in the Portfolio will be higher because the example does not reflect Variable Contract fees and expenses.
Please refer to page 3 herein for an explanation of the information presented in the above Expense Example.
Portfolio Insights
| » | | The PIMCO Money Market Portfolio seeks to achieve its investment objective by investing at least 95% of its total assets in a diversified portfolio of money market securities that are in the highest rating category for short-term obligations. |
| » | | The Portfolio, which has a Aaa money market fund rating by Moody’s Investors Service, emphasizes high-quality commercial paper, shorter-term agency and high-quality corporate debt issues due to their potential for strong liquidity, attractive yields and limited credit risks. |
| » | | The yield curve for high-quality (A1/P1) commercial paper steepened slightly during the period, providing opportunities to capture term premiums. |
| » | | U.S. and non-U.S. issued high-quality (A1/P1) commercial paper was emphasized due to their potential for attractive yields compared to Treasuries, modest interest rate sensitivity, and limited credit risk. |
| » | | Higher-quality (A1/P1) three-month commercial paper yield spreads relative to Treasuries widened by 0.25%, which added to the yield of the Portfolio. |
| | | | |
| 4 | | PIMCO Variable Insurance Trust | | |
Financial Highlights Money Market Portfolio
| | | | | | | | | | | | | | | | | | | | | | | | |
| Selected per Share Data for the Year or Period Ended: | | 06/30/2007+ | | | 12/31/2006 | | | 12/31/2005 | | | 12/31/2004 | | | 12/31/2003 | | | 12/31/2002 | |
| | | | | | |
Administrative Class | | | | | | | | | | | | | | | | | | | | | | | | |
Net asset value beginning of year or period | | $ | 1.00 | | | $ | 1.00 | | | $ | 1.00 | | | $ | 1.00 | | | $ | 1.00 | | | $ | 1.00 | |
Net investment income (a) | | | 0.02 | | | | 0.05 | | | | 0.03 | | | | 0.01 | | | | 0.01 | | | | 0.01 | |
Dividends from net investment income | | | (0.02 | ) | | | (0.05 | ) | | | (0.03 | ) | | | (0.01 | ) | | | (0.01 | ) | | | (0.01 | ) |
Net asset value end of year or period | | $ | 1.00 | | | $ | 1.00 | | | $ | 1.00 | | | $ | 1.00 | | | $ | 1.00 | | | $ | 1.00 | |
Total return | | | 2.40 | % | | | 4.61 | % | | | 2.77 | % | | | 0.89 | % | | | 0.72 | % | | | 1.41 | % |
Net assets end of year or period (000s) | | $ | 155,978 | | | $ | 66,240 | | | $ | 43,434 | | | $ | 32,184 | | | $ | 27,032 | | | $ | 25,850 | |
Ratio of expenses to average net assets | | | 0.50 | %* | | | 0.50 | % | | | 0.50 | % | | | 0.50 | % | | | 0.50 | % | | | 0.50 | % |
Ratio of expenses to average net assets excluding interest expense | | | 0.50 | %* | | | 0.50 | % | | | 0.50 | % | | | 0.50 | % | | | 0.50 | % | | | 0.50 | % |
Ratio of net investment income to average net assets | | | 4.84 | %* | | | 4.61 | % | | | 2.81 | % | | | 0.91 | % | | | 0.70 | % | | | 1.41 | % |
+ Unaudited
* Annualized
(a) Per share amounts based on average number of shares outstanding during the period.
| | | | | | |
| See Accompanying Notes | | Semiannual Report | | June 30, 2007 | | 5 |
Statement of Assets and Liabilities Money Market Portfolio
| | | | |
| (Amounts in thousands, except per share amounts) | | June 30, 2007 | |
| | | (Unaudited) | |
| |
Assets: | | | | |
Investments, at value | | $ | 390,196 | |
Receivable for Portfolio shares sold | | | 4,949 | |
Interest and dividends receivable | | | 118 | |
| | | | 395,263 | |
| |
Liabilities: | | | | |
Payable for Portfolio shares redeemed | | $ | 26 | |
Accrued investment advisory fee | | | 40 | |
Accrued administration fee | | | 53 | |
Accrued servicing fee | | | 17 | |
| | | | 136 | |
| |
Net Assets | | $ | 395,127 | |
| |
Net Assets Consist of: | | | | |
Paid in capital | | $ | 395,128 | |
Undistributed net investment income | | | 35 | |
Accumulated undistributed net realized (loss) | | | (36 | ) |
| | | $ | 395,127 | |
| |
Net Assets: | | | | |
Institutional Class | | $ | 239,149 | |
Administrative Class | | | 155,978 | |
| |
Shares Issued and Outstanding: | | | | |
Institutional Class | | | 239,149 | |
Administrative Class | | | 155,978 | |
| |
Net Asset Value and Redemption Price Per Share (Net Asset Per Share Outstanding) | | | | |
Institutional Class | | $ | 1.00 | |
Administrative Class | | | 1.00 | |
| |
Cost of Investments Owned | | $ | 390,196 | |
| | | | |
| 6 | | PIMCO Variable Insurance Trust | | See Accompanying Notes |
Statement of Operations Money Market Portfolio
| | | | |
| (Amounts in thousands) | | Six Months Ended
June 30, 2007 | |
| | | (Unaudited) | |
| |
| Investment Income: | | | | |
Interest | | $ | 8,209 | |
Total Income | | | 8,209 | |
| |
Expenses: | | | | |
Investment advisory fees | | | 230 | |
Administration fees | | | 306 | |
Servicing fees – Administrative Class | | | 86 | |
Trustees’ fees | | | 3 | |
Total Expenses | | | 625 | |
| |
Net Investment Income | | | 7,584 | |
| |
Net Realized (Loss): | | | | |
Net realized (loss) on investments | | | (14 | ) |
Net (Loss) | | | (14 | ) |
| |
Net Increase in Net Assets Resulting from Operations | | $ | 7,570 | |
| | | | | | |
| See Accompanying Notes | | Semiannual Report | | June 30, 2007 | | 7 |
Statements of Changes in Net Assets Money Market Portfolio
| | | | | | | | |
| (Amounts in thousands) | | Six Months Ended
June 30, 2007 | | | Year Ended
December 31, 2006 | |
| | | (Unaudited) | | | | |
| | |
| Increase in Net Assets from: | | | | | | | | |
| | |
Operations: | | | | | | | | |
Net investment income | | $ | 7,584 | | | $ | 8,555 | |
Net realized (loss) | | | (14 | ) | | | (16 | ) |
Net increase resulting from operations | | | 7,570 | | | | 8,539 | |
| | |
Distributions to Shareholders: | | | | | | | | |
From net investment income | | | | | | | | |
Institutional Class | | | (4,798 | ) | | | (6,063 | ) |
Administrative Class | | | (2,772 | ) | | | (2,476 | ) |
| | |
Total Distributions | | | (7,570 | ) | | | (8,539 | ) |
| | |
Portfolio Share Transactions: | | | | | | | | |
Receipts for shares sold | | | | | | | | |
Institutional Class | | | 140,803 | | | | 159,066 | |
Administrative Class | | | 214,175 | | | | 72,207 | |
Issued as reinvestment of distributions | | | | | | | | |
Institutional Class | | | 4,798 | | | | 6,063 | |
Administrative Class | | | 2,772 | | | | 2,477 | |
Cost of shares redeemed | | | | | | | | |
Institutional Class | | | (113,757 | ) | | | (58,019 | ) |
Administrative Class | | | (127,209 | ) | | | (51,878 | ) |
Net increase resulting from Portfolio share transactions | | | 121,582 | | | | 129,916 | |
| | |
Total Increase in Net Assets | | | 121,582 | | | | 129,916 | |
| | |
Net Assets: | | | | | | | | |
Beginning of period | | | 273,545 | | | | 143,629 | |
End of period* | | $ | 395,127 | | | $ | 273,545 | |
| | |
*Including undistributed net investment income of: | | $ | 35 | | | $ | 21 | |
| | | | |
| 8 | | PIMCO Variable Insurance Trust | | See Accompanying Notes |
| | |
| |
| Schedule of Investments Money Market Portfolio | | June 30, 2007 (Unaudited) |
| | | | | | | | |
| | | PRINCIPAL
AMOUNT
(000S) | | | | VALUE
(000S) |
| CORPORATE BONDS & NOTES 4.7% |
| Allstate Life Global Funding Trusts |
5.380% due 11/14/2007 | | $ | | 2,350 | | $ | | 2,351 |
| |
| American Honda Finance Corp. |
5.465% due 10/22/2007 | | | | 2,600 | | | | 2,601 |
| |
| Bear Stearns Cos., Inc. |
5.420% due 01/15/2008 | | | | 2,600 | | | | 2,602 |
| |
| Lehman Brothers Holdings, Inc. |
5.385% due 07/19/2007 | | | | 2,700 | | | | 2,700 |
| |
| Morgan Stanley |
5.482% due 11/09/2007 | | | | 3,200 | | | | 3,202 |
| |
| Santander U.S. Debt S.A. Unipersonal |
5.370% due 09/21/2007 | | | | 2,300 | | | | 2,300 |
| |
| Wachovia Bank N.A. |
5.310% due 11/30/2007 | | | | 2,600 | | | | 2,600 |
| | | | | | | | |
Total Corporate Bonds & Notes (Cost $18,356) | | | | 18,356 |
| | | | | | | | |
|
| SHORT-TERM INSTRUMENTS 94.1% |
|
| CERTIFICATES OF DEPOSIT 1.8% |
| BNP Paribas |
5.262% due 04/03/2008 | | | | 2,000 | | | | 1,999 |
| |
| Royal Bank of Scotland Group PLC |
5.265% due 03/26/2008 | | | | 3,200 | | | | 3,199 |
| |
| Societe Generale NY |
5.265% due 09/21/2007 | | | | 1,600 | | | | 1,600 |
| |
| Unicredito Italiano SpA |
5.360% due 05/29/2008 | | | | 300 | | | | 300 |
| | | | | | | | |
| | | | | | | | 7,098 |
| | | | | | | | |
|
| COMMERCIAL PAPER 92.2% |
| Abbey National Treasury Services PLC |
5.270% due 07/02/2008 | | | | 700 | | | | 700 |
| |
| ANZ National International Ltd. |
5.165% due 09/19/2007 | | | | 14,000 | | | | 13,869 |
| |
| | | | | | | | |
| | | PRINCIPAL
AMOUNT
(000S) | | | | VALUE
(000S) |
| Bank of America Corp. |
5.245% due 10/04/2007 | | $ | | 12,700 | | $ | | 12,550 |
| |
| Bank of Ireland |
5.230% due 11/08/2007 | | | | 13,700 | | | | 13,684 |
| |
| CBA (de) Finance |
5.255% due 09/28/2007 | | | | 11,800 | | | | 11,716 |
| |
| Danske Corp. |
5.165% due 10/12/2007 | | | | 8,900 | | | | 8,770 |
5.220% due 10/12/2007 | | | | 4,000 | | | | 3,995 |
| |
| Dexia Delaware LLC |
5.225% due 09/21/2007 | | | | 8,400 | | | | 8,361 |
| |
| DnB NORBank ASA |
5.170% due 10/12/2007 | | | | 10,700 | | | | 10,543 |
| |
| Eksportfinans A/S |
5.290% due 07/02/2007 | | | | 12,700 | | | | 12,700 |
| |
| Export Development Corp. |
5.190% due 12/27/2007 | | | | 10,500 | | | | 10,231 |
| |
| Fannie Mae |
5.080% due 07/02/2007 | | | | 23,200 | | | | 23,200 |
5.100% due 07/18/2007 | | | | 12,800 | | | | 12,771 |
| |
| Freddie Mac |
5.050% due 08/20/2007 | | | | 12,200 | | | | 12,116 |
5.052% due 09/24/2007 | | | | 1,195 | | | | 1,181 |
5.065% due 09/10/2007 | | | | 4,284 | | | | 4,242 |
5.065% due 01/11/2008 | | | | 6,700 | | | | 6,518 |
| |
| General Electric Capital Corp. |
5.155% due 02/29/2008 | | | | 11,600 | | | | 11,198 |
| |
| HBOS Treasury Services PLC |
5.155% due 11/13/2007 | | | | 3,300 | | | | 3,237 |
5.240% due 09/21/2007 | | | | 4,000 | | | | 3,981 |
| |
| Intesa Funding LLC |
5.265% due 09/05/2007 | | | | 15,000 | | | | 14,982 |
| |
| National Australia Funding Corp. |
5.270% due 07/16/2007 | | | | 14,600 | | | | 14,577 |
| |
| Natixis S.A. |
5.260% due 09/21/2007 | | | | 13,000 | | | | 12,954 |
| |
| | | | | | | | |
| | | PRINCIPAL
AMOUNT
(000S) | | | | VALUE
(000S) |
| Nordea N.A., Inc. |
5.170% due 07/26/2007 | | $ | | 11,300 | | $ | | 11,285 |
| |
| Rabobank USA Financial Corp. |
5.330% due 07/26/2007 | | | | 15,300 | | | | 15,300 |
| |
| Sanofi Aventis |
5.260% due 07/06/2007 | | | | 12,700 | | | | 12,693 |
| |
| Societe Generale NY |
5.225% due 11/26/2007 | | | | 7,500 | | | | 7,476 |
| |
| Statens Bostadsfin Bank |
5.270% due 09/14/2007 | | | | 15,000 | | | | 14,859 |
| |
| Svenska Handelsbanken, Inc. |
5.225% due 08/06/2007 | | | | 4,800 | | | | 4,779 |
5.260% due 10/09/2007 | | | | 15,000 | | | | 14,783 |
| |
| TotalFinaElf Capital S.A. |
5.340% due 07/02/2007 | | | | 15,300 | | | | 15,300 |
| |
| Toyota Motor Credit Corp. |
5.170% due 09/14/2007 | | | | 11,500 | | | | 11,378 |
5.220% due 09/14/2007 | | | | 4,600 | | | | 4,598 |
| |
| UBS Finance Delaware LLC |
5.270% due 10/23/2007 | | | | 13,000 | | | | 12,985 |
| |
| Unicredito Italiano SpA |
5.125% due 01/22/2008 | | | | 11,000 | | | | 10,681 |
| | | | | | | | |
| | | | | | | | 364,193 |
| | | | | | | | |
|
| REPURCHASE AGREEMENTS 0.1% |
| State Street Bank and Trust Co. |
4.900% due 07/02/2007 | | | | 549 | | | | 549 |
| | | | | | | | |
(Dated 06/29/2007. Collateralized by Fannie Mae 3.250% due 08/15/2008 valued at $564. Repurchase proceeds are $549.) |
Total Short-Term Instruments
(Cost $371,840) | | 371,840 |
| | | | | | | | |
|
|
Total Investments 98.8% (Cost $390,196) | | $ | | 390,196 |
|
| Other Assets and Liabilities (Net) 1.2% | | 4,931 |
| | | | | | | | |
| Net Assets 100.0% | | | | | | $ | | 395,127 |
| | | | | | | | |
| | | | | | |
| See Accompanying Notes | | Semiannual Report | | June 30, 2007 | | 9 |
Notes to Financial Statements
1. ORGANIZATION
The Money Market Portfolio (the “Portfolio”) is a series of the PIMCO Variable Insurance Trust (the “Trust”). The Trust is registered under the Investment Company Act of 1940 (the “Act”), as amended, as an open-end management investment company organized as a Delaware business trust on October 3, 1997. The Portfolio offers two classes of shares: Institutional and Administrative. Information presented on these financial statements pertains to the Administrative Class of the Portfolio. Certain detailed financial information for the Institutional Class is provided separately and is available upon request. The Trust is designed to be used as an investment vehicle by Separate Accounts of insurance companies that fund variable annuity contracts and variable life insurance policies and by qualified pension and retirement plans.
2. SIGNIFICANT ACCOUNTING POLICIES
The following is a summary of significant accounting policies consistently followed by the Portfolio in the preparation of its financial statements in conformity with accounting principles generally accepted in the United States of America (“GAAP”). The preparation of financial statements in accordance with GAAP requires management to make estimates and assumptions that affect the reported amounts and disclosures on the financial statements. Actual results could differ from those estimates.
(a) Security Valuation Portfolio securities held by the Portfolio are valued at amortized cost, which approximates current market value.
(b) Securities Transactions and Investment Income Securities transactions are recorded as of the trade date for financial reporting purposes. Securities purchased or sold on a when-issued or delayed-delivery basis may be settled a month or more after the trade date. Realized gains and losses from securities sold are recorded on the identified cost basis. Dividend income is recorded on the ex-dividend date, except certain dividends from foreign securities where the ex-dividend date may have passed, which are recorded as soon as the Portfolio is informed of the ex-dividend date. Interest income, adjusted for the accretion of discounts and amortization of premiums, is recorded on the accrual basis. Paydown gains and losses on mortgage-related and other asset-backed securities are recorded as components of interest income on the Statement of Operations.
(c) Dividends and Distributions to Shareholders Dividends from net investment income, if any, are declared daily and distributed to shareholders monthly. Net realized capital gains earned by the Portfolio, if any, will be distributed no less frequently than once each year.
Income dividends and capital gain distributions are determined in accordance with income tax regulations which may differ from GAAP. Differences between tax regulations and GAAP may change the fiscal year when income and capital items are recognized for tax and GAAP purposes. Examples of events that give rise to timing differences include wash sales, straddles, net operating losses and capital loss carryforwards. Further, the character of investment income and capital gains may be different for certain transactions under the two methods of accounting. Examples of characterization differences include the treatment of mortgage paydowns, swaps, foreign currency transactions and contingent debt instruments. As a result, income dividends and capital gain distributions declared during a fiscal period may differ significantly from the net investment income and realized capital gain reported on the Portfolio’s annual financial statements presented under GAAP.
Distributions classified as a tax basis return of capital, if any, are reflected on the accompanying Statements of Changes in Net Assets and have been reclassified to paid in capital. In addition, other amounts have been reclassified between undistributed net investment income, accumulated undistributed net realized gains
or losses and/or paid in capital to more appropriately conform financial accounting to tax characterizations of dividend distributions.
(d) Multiclass Operations Each class offered by the Portfolio has equal rights as to assets and voting privileges (except that shareholders of a class have exclusive voting rights regarding any matter relating solely to that class of shares). Income and non-class specific expenses of the Portfolio are allocated daily to each class of shares based on the relative value of settled shares. Realized and unrealized capital gains and losses of the Portfolio are allocated daily to each class of shares based on the relative net assets of each class. Class specific expenses, where applicable, currently include administrative, distribution and servicing fees.
(e) Repurchase Agreements The Portfolio may engage in repurchase transactions. Under the terms of a typical repurchase agreement, the Portfolio takes possession of an underlying debt obligation (collateral) subject to an obligation of the seller to repurchase, and the Portfolio to resell, the obligation at an agreed-upon price and time. The underlying securities for all repurchase agreements are held in safekeeping at the Portfolio’s custodian or designated subcustodians under tri-party repurchase agreements. The market value of the collateral must be equal to or exceed the total amount of the repurchase obligations, including interest. Securities purchased under repurchase agreements are reflected as an asset on the Statement of Assets and Liabilities. Generally, in the event of counterparty default, the Portfolio has the right to use the collateral to offset losses incurred. If the counterparty should default, the Portfolio will seek to sell the securities which it holds as collateral. This could involve procedural costs or delays in addition to a loss on the securities if their value should fall below their repurchase price.
(f) New Accounting Policies In July 2006, the Financial Accounting Standards Board (“FASB”) issued Interpretation No. 48, “Accounting for Uncertainty in Income Taxes—an Interpretation of FASB Statement No. 109” (the “Interpretation”). The Interpretation became effective for the Portfolio on June 29, 2007. Management has evaluated the application of the Interpretation in relation to the Portfolio and has concluded that no single filing position or combination of filing positions identified as uncertain tax positions required the accrual of a tax liability in the accounting records of the Portfolio for the period ending June 30, 2007. Management will monitor all existing filing positions and future filing positions in light of the Interpretation and evaluate the need for any future tax accruals and financial statement disclosures as warranted.
In September 2006, the FASB issued Statement of Financial Accounting Standards No. 157, “Fair Value Measurements” (the “Statement”). The Statement is effective for fiscal years beginning after November 15, 2007 and will require expanded disclosure about fair value measurements, separately for each major category of assets and liabilities, that enables shareholders to assess the inputs used to develop those measurements, and for recurring fair value measurements using significant unobservable inputs the effect of the measurements on changes in net assets for the reporting period. Management is currently evaluating the application of the Statement to the Portfolio and will provide additional information in relation to the Statement on the Portfolio’s annual financial statements for the period ending December 31, 2007.
3. FEES AND EXPENSES
(a) Investment Advisory Fee Pacific Investment Management Company LLC (“PIMCO”) is a majority-owned subsidiary of Allianz Global Investors of America L.P. (“AGI”), and serves as investment adviser (the “Adviser”) to the Trust, pursuant to an investment advisory contract. The Adviser receives a monthly fee from the Portfolio, at an annual rate based on average daily net assets. The Advisory Fee for all classes is charged at an annual rate of 0.15%.
| | | | |
| 10 | | PIMCO Variable Insurance Trust | | |
| | |
| |
| | | June 30, 2007 (Unaudited) |
(b) Administration Fee PIMCO serves as administrator (the “Administrator”), and provides administrative services to the Trust for which it receives a monthly administrative fee based on each share class’s average daily net assets. As the Administrator, PIMCO bears the costs of various third-party services, including audit, custodial, portfolio accounting, legal, transfer agency and printing costs. The Administration Fee for all classes is charged at the annual rate of 0.20%.
(c) Distribution and Servicing Fees Allianz Global Investors Distributors LLC (“AGID”) is an indirect wholly-owned subsidiary of AGI and serves as the distributor (the “Distributor”) of the Trust’s shares. The Trust is permitted to reimburse AGID on a quarterly basis, out of the Administrative Class assets of the Portfolio in the amount of 0.15% on an annual basis of the average daily net assets of that class, for payments made to financial intermediaries that provide services in connection with the distribution of shares or administration of plans or programs that use Portfolio shares as their funding medium. The effective rate paid to AGID was 0.15% during the current fiscal year.
(d) Portfolio Expenses The Trust is responsible for the following expenses: (i) salaries and other compensation of any of the Trust’s executive officers and employees who are not officers, directors, stockholders or employees of PIMCO or its subsidiaries or affiliates; (ii) taxes and governmental fees; (iii) brokerage fees and commissions and other portfolio transaction expenses; (iv) the costs of borrowing money, including interest expenses and bank overdraft charges; (v) fees and expenses of the Trustees who are not “interested persons” of PIMCO or the Trust, and any counsel retained exclusively for their benefit; (vi) extraordinary expenses, including costs of litigation and indemnification expenses; (vii) organization expenses and (viii) any expenses allocated or allocable to a specific class of shares, which include service fees payable with respect to the Administrative Class Shares, and may include certain other expenses as permitted by the Trust’s Multiple Class Plan adopted pursuant to Rule 18f-3 under the Act and subject to review and approval by the Trustees. The ratio of expenses to average net assets per share class, as disclosed in the Financial Highlights, may differ from the annual portfolio operating expenses per share class as disclosed in the Prospectus for the reasons set forth above.
Effective April 1, 2007, each Trustee, other than those affiliated with PIMCO or its affiliates, receives an annual retainer of $15,000, plus $2,375 for each Board of Trustees meeting attended in person, $500 for each committee meeting attended and $750 for each Board of Trustees meeting attended telephonically, plus reimbursement of related expenses. In addition, the audit committee chair receives an additional annual retainer of $2,000 and each other committee chair receives an additional annual retainer of $500. These expenses are allocated on a pro-rata basis to the various portfolios of the Trust according to their respective net assets. The Trust pays no compensation directly to any Trustee or any other officer who is affiliated with the Administrator, all of whom receive remuneration for their services to the Trust from the Administrator or its affiliates. Prior to April 1, 2007, each Trustee, other than those affiliated with PIMCO or its affiliates, received an annual retainer of $15,000 plus $2,000 for each Board of Trustees meeting attended ($500 for each special meeting attended), plus reimbursement of related expenses. The Audit Committee Chairman received an annual retainer of $1,500 and the Governance Committee Chairman received an annual retainer of $500. In addition, each member of a committee received $500 for each committee meeting attended.
4. RELATED PARTY TRANSACTIONS
The Adviser, Administrator, and Distributor are related parties as defined by FAS 57, Related Party Disclosures. Fees payable to these parties are disclosed in Note 3.
5. GUARANTEES AND INDEMNIFICATIONS
Under the Trust’s organizational documents, each Trustee, officer, employee or other agent of the Trust (including the Trust’s investment manager) is indemnified, to the extent permitted by the Act, against certain liabilities that may arise out of performance of their duties to the Portfolio. Additionally, in the normal course of business, the Portfolio enters into contracts that contain a variety of indemnification clauses. The Portfolio’s maximum exposure under these arrangements is unknown as this would involve future claims that may be made against the Portfolio that have not yet occurred. However, the Portfolio has not had prior claims or losses pursuant to these contracts and believes the risk of loss to be remote.
6. SHARES OF BENEFICIAL INTEREST
The Portfolio may issue an unlimited number of shares of beneficial interest with a $0.001 par value. Changes in shares of beneficial interest were as follows (shares and amounts in thousands):
| | | | | | | | | | | | | | | | |
| | | | | Six Months Ended
06/30/2007 | | | Year Ended
12/31/2006 | |
| | | | | Shares | | | Amount | | | Shares | | | Amount | |
| | | | | |
Receipts for shares sold | | | | | | | | | | | | | | | | |
Institutional Class | | | | 140,802 | | | $ | 140,803 | | | 159,066 | | | $ | 159,066 | |
Administrative Class | | | | 214,174 | | | | 214,174 | | | 72,207 | | | | 72,207 | |
Issued as reinvestment of distributions | | | | | | | | | | | | | | | | |
Institutional Class | | | | 4,799 | | | | 4,799 | | | 6,063 | | | | 6,063 | |
Administrative Class | | | | 2,772 | | | | 2,772 | | | 2,477 | | | | 2,477 | |
Cost of shares redeemed | | | | | | | | | | | | | | | | |
Institutional Class | | | | (113,757 | ) | | | (113,757 | ) | | (58,019 | ) | | | (58,019 | ) |
Administrative Class | | | | (127,446 | ) | | | (127,209 | ) | | (51,878 | ) | | | (51,878 | ) |
Net increase resulting from Portfolio share transactions | | | | 121,344 | | | $ | 121,582 | | | 129,916 | | | $ | 129,916 | |
The following schedule shows the number of shareholders each owning 5% or more of the Portfolio and the total percentage of the Portfolio held by such shareholders:
| | | | | | |
| | | | | Number of
Shareholders | | % of Portfolio Held |
Institutional Class | | | | 3 | | 94 |
Administrative Class | | | | 2 | | 98 |
7. REGULATORY AND LITIGATION MATTERS
Since February 2004, PIMCO, Allianz Global Investors of America L.P. (PIMCO’s parent company), AGID, and certain of their affiliates, including the PIMCO Funds (another series of funds managed by PIMCO), the Allianz Funds (formerly known as PIMCO Funds: Multi-Manager Series (another series of funds managed by affiliates of PIMCO)), certain Trustees of the Trust (in their capacity as Trustees of the PIMCO Funds or the Allianz Funds) and certain employees of PIMCO, have been named as defendants in fifteen lawsuits filed in various jurisdictions. Eleven of those lawsuits concern “market timing,” and they have been transferred to and consolidated for pre-trial proceedings in a multi-district litigation proceeding in the U.S. District Court for the District of Maryland; the other four lawsuits concern “revenue sharing” and have been consolidated into a single action in the U.S. District Court for the District of Connecticut. The lawsuits have been commenced as putative class actions on behalf of investors who purchased, held or redeemed
| | | | | | |
| | Semiannual Report | | June 30, 2007 | | 11 |
Notes to Financial Statements (Cont.)
shares of the various series of the PIMCO Funds and the Allianz Funds during specified periods, or as derivative actions on behalf of the PIMCO Funds and the Allianz Funds.
The market timing actions in the District of Maryland generally allege that certain hedge funds were allowed to engage in “market timing” in certain funds of the PIMCO Funds and the Allianz Funds and this alleged activity was not disclosed. Pursuant to tolling agreements entered into with the derivative and class action plaintiffs, PIMCO, certain PIMCO Funds Trustees, and certain employees of PIMCO who were previously named as defendants have all been dropped as defendants in the market timing actions; the plaintiffs continue to assert claims on behalf of the shareholders of the PIMCO Funds or on behalf of the PIMCO Funds itself against other defendants. By order dated November 3, 2005, the U.S. District Court for the District of Maryland granted the PIMCO Funds’ motion to dismiss claims asserted against it in a consolidated amended complaint where the PIMCO Funds were named, in the complaint, as a nominal defendant. The revenue sharing action in the District of Connecticut generally alleges that fund assets were inappropriately used to pay brokers to promote funds of the PIMCO Funds and the Allianz Funds, including directing fund brokerage transactions to such brokers, and that such alleged arrangements were not fully disclosed to shareholders. On August 11, 2005, the U.S. District Court for the District of Connecticut conducted a hearing on defendants’ motion to dismiss the consolidated amended complaint in the revenue sharing action but has not yet ruled on the motion to dismiss. The market timing and revenue sharing lawsuits seek, among other things, unspecified compensatory damages plus interest and, in some cases, punitive damages, the rescission of investment advisory contracts, the return of fees paid under those contracts and restitution.
Two nearly identical class action civil complaints have been filed in August 2005, in the Northern District of Illinois Eastern Division, alleging that the plaintiffs each purchased and sold a 10-year Treasury note futures contract and suffered damages from an alleged shortage when PIMCO held both physical and futures positions in 10-year Treasury notes for its client accounts. The two actions have been consolidated into one action, and the two separate complaints have been replaced by a consolidated complaint. PIMCO is a named defendant, and PIMCO Funds has been added as a defendant, to the consolidated action. PIMCO strongly believes the complaint is without merit and intends to vigorously defend itself.
In April 2006, certain portfolios of the Trust and certain other funds managed by PIMCO were served in an adversary proceeding brought by the Official Committee of Asbestos Claimants of G-I Holdings, Inc. in G-I Holdings, Inc.’s bankruptcy in the District of New Jersey. In July 2004, PIMCO was named in this lawsuit and remains a defendant. The plaintiff seeks to recover for the bankruptcy estate
assets that were transferred by the predecessor entity of G-I Holdings, Inc. to a wholly-owned subsidiary in 1994. The subsidiary has since issued notes, of which certain portfolios of the Trust and certain other funds managed by PIMCO are alleged to be holders. The complaint alleges that in 2000, more than two hundred noteholders—including certain portfolios of the Trust and certain other funds managed by PIMCO—were granted a second priority lien on the assets of the subsidiary in exchange for their consent to a refinancing transaction and the granting of a first priority lien to the lending banks. The plaintiff is seeking invalidation of the lien in favor of the noteholders and/or the value of the lien. On June 21, 2006, the District of New Jersey overturned the Bankruptcy Court’s decision granting permission to file the adversary proceeding and remanded the matter to the Bankruptcy Court for further proceedings. Following a motion to reconsider, the District Court upheld its remand on August 7, 2006, and instructed the Bankruptcy Court to conduct a “cost-benefit” analysis of the Committee’s claims, including the claims against the noteholders. The Bankruptcy Court held a status conference on October 25, 2006 and set a briefing schedule relating to this cost-benefit analysis.
The foregoing speaks only as of the date of this report. It is possible that these matters and/or other developments resulting from these matters could result in increased portfolio redemptions or other adverse consequences to the Portfolio. However, PIMCO and AGID believe that these matters are not likely to have a material adverse effect on the Portfolio or on PIMCO’s or AGID’s ability to perform their respective investment advisory or distribution services relating to the Portfolio.
8. FEDERAL INCOME TAX MATTERS
The Portfolio intends to qualify as a regulated investment company under sub-chapter M of the Internal Revenue Code (the “Code”) and distribute all of its taxable income and net realized gains, if applicable, to shareholders. Accordingly, no provision for Federal income taxes has been made.
As of June 30, 2007, the aggregate cost of investments was the same for federal income tax and financial statement purposes. The net unrealized appreciation (depreciation) of investment securities for federal income tax purposes is as follows (amount in thousands):
| | | | |
Aggregate
Gross
Unrealized
Appreciation | | Aggregate
Gross
Unrealized
(Depreciation) | | Net
Unrealized
Appreciation |
$ 0 | | $ 0 | | $ 0 |
| | | | |
| 12 | | PIMCO Variable Insurance Trust | | |
| | |
| |
Privacy Policy* | | (Unaudited) |
The Funds consider customer privacy to be a fundamental aspect of their relationships with shareholders and are committed to maintaining the confidentiality, integrity and security of their current, prospective and former shareholders’ personal information. To ensure their shareholders’ privacy, the Funds have developed policies that are designed to protect this confidentiality, while allowing shareholder needs to be served.
Obtaining Personal Information
In the course of providing shareholders with products and services, the Funds and certain service providers to the Funds, such as the Funds’ investment advisers (“Advisers”), may obtain non-public personal information about shareholders, which may come from sources such as account applications and other forms, from other written, electronic or verbal correspondence, from shareholder transactions, from a shareholder’s brokerage or financial advisory firm, financial adviser or consultant, and/or from information captured on the Funds’ internet web sites.
Respecting Your Privacy
As a matter of policy, the Funds do not disclose any personal or account information provided by shareholders or gathered by the Funds to non-affiliated third parties, except as required or permitted by law or as necessary for such third parties to perform their agreements with respect to the Funds. As is common in the industry, non-affiliated companies may from time to time be used to provide certain services, such as preparing and mailing prospectuses, reports, account statements and other information, conducting research on shareholder satisfaction and gathering shareholder proxies. A Fund’s Distributor may also retain non-affiliated companies to market the Fund’s shares or products which use the Fund’s shares and enter into joint marketing agreements with other companies. These companies may have access to a shareholder’s personal and account information, but are permitted to use this information solely to provide the specific service or as otherwise permitted by law. In most cases, the shareholders will be clients of a third party, but the Funds may also provide a shareholder’s personal and account information to the shareholder’s respective brokerage or financial advisory firm.
Sharing Information with Third Parties
The Funds reserve the right to disclose or report personal information to non-affiliated third parties, in limited circumstances, where the Funds believe in good faith that disclosure is required under law to cooperate with regulators or law enforcement authorities, to protect their rights or property or upon reasonable request by any Fund in which a shareholder has chosen to invest. In addition, the Funds may disclose information about a shareholder’s accounts to a non-affiliated third party with the consent of the shareholder.
Sharing Information with Affiliates
The Funds may share shareholder information with their affiliates in connection with servicing their shareholders’ accounts or to provide shareholders with information about products and services that the Funds or their Advisers, principal underwriters or their affiliates (“Service Affiliates”) believe may be of interest to such shareholders. The information that the Funds share may include, for example, a shareholder’s participation in one of the Funds or in other investment programs sponsored by a Service Affiliate, a shareholder’s ownership of certain types of accounts (such as IRAs), or other data about a shareholder’s accounts. The Funds’ Service Affiliates, in turn, are not permitted to share shareholder information with non-affiliated entities, except as required or permitted by law.
Procedures to Safeguard Private Information
The Funds take seriously the obligation to safeguard shareholder non-public personal information. In addition to this policy, the Funds have also implemented procedures that are designed to restrict access to a shareholder’s non-public personal information only to internal personnel who need to know that information in order to provide products or services to such shareholders. In order to guard a shareholder’s non-public personal information, physical, electronic and procedural safeguards are in place.
* This Privacy Policy applies to the following entities: PIMCO Funds, PIMCO Variable Insurance Trust, PCM Fund, Inc. and PIMCO Strategic Global Government Fund, Inc. (collectively, the “Funds”).
| | | | | | |
| | Semiannual Report | | June 30, 2007 | | 13 |
Investment Adviser and Administrator
Pacific Investment Management Company LLC
840 Newport Center Drive
Newport Beach, California 92660
Distributor
Allianz Global Investors Distributors LLC
1345 Avenue of the Americas
New York, New York 10105
Custodian
State Street Bank & Trust Company
801 Pennsylvania
Kansas City, Missouri 64105
Transfer Agent
Boston Financial Data Services–Midwest
330 W. 9th Street
Kansas City, Missouri 64105
Legal Counsel
Dechert LLP
1775 I Street, N.W.
Washington, D.C. 20006
Independent Registered Public Accounting Firm
PricewaterhouseCoopers LLP
1055 Broadway
Kansas City, Missouri 64105
P I M C O

Table of Contents
This material is authorized for use only when preceded or accompanied by the current PIMCO Variable Insurance Trust (the “Trust”) prospectus. Investors should consider the investment objectives, risks, charges and expenses of this Trust carefully before investing. Ask your financial professional to explain all charges that may apply. This and other information is contained in the Trust’s prospectus. The variable product prospectus may be obtained by contacting your Investment Consultant. Please read the Trust and variable product prospectus carefully before you invest or send money.
Chairman’s Letter
Dear PIMCO Variable Insurance Trust Shareholder:
It is our pleasure to present to you the semiannual report for the PIMCO Variable Insurance Trust, covering the six-month period ended June 30, 2007. The PIMCO Variable Insurance Trust’s net assets were $8.68 billion at June 30, 2007, as compared to $7.76 billion at December 31, 2006.
Highlights of the financial markets during the reporting period include:
| | n | | Economic data during the first quarter of 2007 pointed to slower growth, which heightened market expectations for a decrease in the Federal Funds Rate. By the second quarter, economic data, such as employment statistics, provided little indication of economic weakness, causing expectations of a decrease in the Federal Funds Rate to unwind and U.S. interest rates to move higher. Interest rates in Europe and the U.K. also rose over the period as central banks raised their key lending rates due to inflation concerns. The benchmark ten-year U.S. Treasury yielded 5.03% as of June 30, 2007, or 0.32% higher than at the beginning of the year. |
| | n | | Most bonds generally returned much of their gains from earlier in the year as worldwide growth and capital flows drove interest rates higher in the second quarter. Increased risk aversion in global financial markets, due in part to subprime mortgage worries in the U.S., also contributed to the rise in interest rates. The Lehman Brothers Aggregate Bond Index, which includes Treasury, investment-grade corporate and mortgage-backed securities, returned 0.98% for the six-month period. |
| | n | | Locally issued emerging market (“EM”) bonds posted positive returns for the reporting period. Yields on these bonds declined and the local currencies in which they are denominated generally gained, amid increasing investor awareness, strong economic growth and surging capital inflows. External EM bonds (debt instruments issued by emerging markets countries and typically denominated in U.S. dollars) lagged behind local EM bonds (debt instruments issued by emerging markets countries and denominated in the currency of the issuer), as external EM bonds tend to trade more in-line with U.S. Treasuries. |
| | n | | Treasury Inflation-Protected Securities (“TIPS”) outpaced nominal bonds (non-inflation linked bonds) for the first part of the year and all but the longest maturity TIPS outperformed in the second quarter as high gasoline prices drove higher inflation accruals. Commodities, as represented by the Dow Jones-AIG Commodity Total Return Index, returned 4.46% for the period. Equities, as measured by the S&P 500 Index and the Russell 2000 Index, returned 6.96% and 6.45%, respectively, for the period. |
On the following pages, please find specific details as to the Portfolio’s total return investment performance and a discussion of those factors that affected performance.
Thank you for the trust you have placed in us. We will continue to work diligently to serve your investment needs.
Sincerely,
Brent R. Harris
Chairman, PIMCO Variable Insurance Trust
July 31, 2007
| | | | | | |
| | Semiannual Report | | June 30, 2007 | | 1 |
Important Information About the Portfolio
PIMCO Variable Insurance Trust (the “Trust”) is an open-end management investment company currently consisting of twenty separate investment portfolios, including the Money Market Portfolio (the “Portfolio”). The Portfolio is only available as a funding vehicle under variable life insurance policies or variable annuity contracts issued by insurance companies (“Variable Contracts”). Individuals may not purchase shares of the Portfolio directly. Shares of the Portfolio also may be sold to qualified pension and retirement plans outside of the separate account context.
We believe that bond funds have an important role to play in a well diversified investment portfolio. It is important to note, however, that in an environment where interest rates may trend upward, rising rates would negatively impact the performance of most bond funds, and fixed-income securities held by a fund are likely to decrease in value. The price volatility of fixed-income securities can also increase during periods of rising interest rates resulting in increased losses to a fund. Bond funds and individual bonds with a longer duration (a measure of the expected life of a security) tend to be more sensitive to changes in interest rates, usually making them more volatile than securities or funds with shorter durations.
The Portfolio may be subject to various risks in addition to those described above. Some of these risks may include, but are not limited to, the following: credit risk, market risk, issuer risk, non-U.S. investment risk and management risk. A complete description of these risks is contained in the Portfolio’s prospectus. Investing in non-U.S. securities may entail risk due to non-U.S. economic and political developments.
On the performance summary page in this Semiannual Report, the Total Return Investment Performance table measures performance assuming that all dividend and capital gain distributions were reinvested.
An investment in the Portfolio is not a deposit of a bank and is not guaranteed or insured by the Federal Deposit Insurance Corporation or any other government agency. It is possible to lose money on investments in the Portfolio.
PIMCO has adopted written proxy voting policies and procedures (“Proxy Policy”) as required by Rule 206(4)-6 under the Investment Advisers Act of 1940, as amended. The Proxy Policy has been adopted by the Trust as the policies and procedures that PIMCO will use when voting proxies on behalf of the Portfolio. A description of the policies and procedures that PIMCO uses to vote proxies relating to portfolio securities of the Portfolio, and information about how the Portfolio voted proxies relating to portfolio securities held during the most recent twelve-month period ended June 30, are available without charge, upon request, by calling the Trust at 1-866-746-2606 and on the Portfolio’s website at www.pimco.com.
The Portfolio files its complete schedule of portfolio holdings with the SEC for the first and third quarters of each fiscal year on Form N-Q. A copy of the Trust’s Form N-Q is also available on the SEC’s website at http://www.sec.gov and may be reviewed and copied at the SEC’s Public Reference Room in Washington D.C. Information on the operation of the Public Reference Room may be obtained by calling 1-800-SEC-0330, and is available without charge, upon request, by calling the Trust at 1-866-746-2606 and on the Portfolio’s website at www.pimco.com.
PIMCO Variable Insurance Trust is distributed by Allianz Global Investors Distributors LLC, 1345 Avenue of the Americas, New York, NY 10105.
| | | | |
| 2 | | PIMCO Variable Insurance Trust | | |
The following disclosure provides important information regarding the Portfolio’s Expense Example (“Example” or “Expense Example”), which appears in this Semiannual Report. Please refer to this information when reviewing the Expense Example for the Portfolio.
Example
As a shareholder of the Portfolio, you incur two types of costs: (1) transaction costs and (2) ongoing costs, including advisory and administrative fees; distribution and/or service (12b-1) fees (Administrative Class only); and other Portfolio expenses. The Example is intended to help you understand your ongoing costs (in dollars) of investing in the Portfolio and to compare these costs with the ongoing costs of investing in other mutual funds. The Expense Example does not reflect any fees or other expenses imposed by the Variable Contracts. If it did, the expenses reflected in the Expense Example would be higher. The Example is based on an investment of $1,000 invested at the beginning of the period and held for the entire period indicated, which is from January 1, 2007 to June 30, 2007.
Actual Expenses
The information in the table under the heading “Actual Performance” provides information about actual account values and actual expenses. You may use the information in these columns, together with the amount you invested, to estimate the expenses that you paid over the period. Simply divide your account value by $1,000 (for example, an $8,600 account value divided by $1,000 = $8.60), then multiply the result by the number in the row titled “Expenses Paid During Period” to estimate the expenses you paid on your account during this period.
Hypothetical Example for Comparison Purposes
The information in the table under the heading “Hypothetical Performance (5% return before expenses)” provides information about hypothetical account values and hypothetical expenses based on the Portfolio’s actual expense ratio and an assumed rate of return of 5% per year before expenses, which is not the Portfolio’s actual return. The hypothetical account values and expenses may not be used to estimate the actual ending account balance or expenses you paid for the period. You may use this information to compare the ongoing costs of investing in the Portfolio and other portfolios. To do so, compare this 5% hypothetical example with the 5% hypothetical examples that appear in the shareholder reports of the other portfolios.
Please note that the expenses shown in the table are meant to highlight your ongoing costs only and do not reflect any transactional costs. Therefore, the information under the heading “Hypothetical Performance (5% return before expenses)” is useful in comparing ongoing costs only, and will not help you determine the relative total costs of owning different portfolios. In addition, if these transactional costs were included, your costs would have been higher.
The expense ratio may vary period to period because of various factors, such as an increase in expenses not covered by the advisory and administrative fees (such as expenses of the trustees and their counsel, litigation expense and interest expense).
| | | | | | |
| | Semiannual Report | | June 30, 2007 | | 3 |
PIMCO Money Market Portfolio
Cumulative Returns Through June 30, 2007
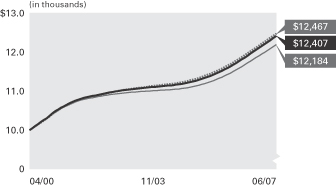
$10,000 invested at the beginning of the first full month following the inception date of the Portfolio’s Institutional Class.
Allocation Breakdown‡
| | |
Commercial Paper | | 93.3% |
Corporate Bonds & Notes | | 4.7% |
Certificates of Deposit | | 1.8% |
Repurchase Agreements | | 0.2% |
| | ‡ | % of Total Investments as of 06/30/2007 |
| | | | | | | | | | | | | | |
| Average Annual Total Return for the period ended June 30, 2007 |
| | | | | 7-Day
Yield | | 30-Day
Yield | | 6 Months* | | 1 Year | | 5 Years | | Portfolio
Inception
(04/10/00)** |
| | PIMCO Money Market Portfolio Institutional Class | | 5.00% | | 4.98% | | 2.48% | | 5.09% | | 2.56% | | 3.08% |
| | Citigroup 3-Month Treasury Bill Index± | | — | | — | | 2.49% | | 5.06% | | 2.67% | | 3.16% |
| | Lipper Money Market Fund Index±± | | — | | — | | 2.36% | | 4.82% | | 2.29% | | 2.83% |
All Portfolio returns are net of fees and expenses.
* Cumulative return.
** The Portfolio began operations on 04/10/00. Index comparisons began on 03/31/00.
Performance quoted represents past performance. Past performance is no guarantee of future results. Investment return and principal value will fluctuate so the Portfolio shares, when redeemed, may be worth more or less than their original cost. The Portfolio’s performance does not reflect the deduction of additional charges and expenses imposed in connection with investing in Variable Contracts, which will reduce returns. Current performance may be lower or higher than the performance data quoted. Performance data current to the most recent month-end is available by calling (800) 927-4648.
An investment in the PIMCO Money Market Portfolio is not insured or guaranteed by the Federal Deposit Insurance Corporation or any other government agency. Although the portfolio seeks to preserve the value of your investment at $1.00 per share, it is possible to lose money by investing in the Portfolio.
± Citigroup 3-Month Treasury Bill Index is an unmanaged index representing monthly return equivalents of yield averages of the last 3-month Treasury Bill issues. It is not possible to invest directly in the index. The index does not reflect deductions for fees and expenses.
±± Lipper Money Market Fund Index is an average of the 30 largest equal weighted Money Market Funds as compiled by Lipper Analytic Inc. It is not possible to invest directly in an unmanaged index. The index does not reflect deductions for fees and expenses.
| | | | | | |
| Expense Example | | Actual Performance | | Hypothetical Performance |
| | | | | (5% return before expenses) |
Beginning Account Value (01/01/07) | | $ | 1,000.00 | | $ | 1,000.00 |
Ending Account Value (06/30/07) | | $ | 1,024.79 | | $ | 1,023.06 |
Expenses Paid During Period† | | $ | 1.76 | | $ | 1.76 |
† Expenses are equal to the Portfolio’s Institutional Class annualized expense ratio of 0.35%, multiplied by the average account value over the period, multiplied by 181/365 (to reflect the one-half year period). Overall fees and expenses of investing in the Portfolio will be higher because the example does not reflect Variable Contract fees and expenses.
Please refer to page 3 herein for an explanation of the information presented in the above Expense Example.
Portfolio Insights
| » | | The PIMCO Money Market Portfolio seeks to achieve its investment objective by investing at least 95% of its total assets in a diversified portfolio of money market securities that are in the highest rating category for short-term obligations. |
| » | | The Portfolio, which has a Aaa money market fund rating by Moody’s Investors Service, emphasizes high-quality commercial paper, shorter-term agency and high-quality corporate debt issues due to their potential for strong liquidity, attractive yields and limited credit risks. |
| » | | The yield curve for high-quality (A1/P1) commercial paper steepened slightly during the period, providing opportunities to capture term premiums. |
| » | | U.S. and non-U.S. issued high-quality (A1/P1) commercial paper was emphasized due to their potential for attractive yields compared to Treasuries, modest interest rate sensitivity, and limited credit risk. |
| » | | Higher-quality (A1/P1) three-month commercial paper yield spreads relative to Treasuries widened by 0.25%, which added to the yield of the Portfolio. |
| | | | |
| 4 | | PIMCO Variable Insurance Trust | | |
Financial Highlights Money Market Portfolio
| | | | | | | | | | | | | | | | | | | | | | | | |
| Selected per Share Data for the Year or Period Ended: | | 06/30/2007+ | | | 12/31/2006 | | | 12/31/2005 | | | 12/31/2004 | | | 12/31/2003 | | | 12/31/2002 | |
| | | | | | |
Institutional Class | | | | | | | | | | | | | | | | | | | | | | | | |
Net asset value beginning of year or period | | $ | 1.00 | | | $ | 1.00 | | | $ | 1.00 | | | $ | 1.00 | | | $ | 1.00 | | | $ | 1.00 | |
Net investment income (a) | | | 0.03 | | | | 0.05 | | | | 0.03 | | | | 0.01 | | | | 0.01 | | | | 0.02 | |
Dividends from net investment income | | | (0.03 | ) | | | (0.05 | ) | | | (0.03 | ) | | | (0.01 | ) | | | (0.01 | ) | | | (0.02 | ) |
Net asset value end of year or period | | $ | 1.00 | | | $ | 1.00 | | | $ | 1.00 | | | $ | 1.00 | | | $ | 1.00 | | | $ | 1.00 | |
Total return | | | 2.48 | % | | | 4.78 | % | | | 2.93 | % | | | 1.06 | % | | | 0.88 | % | | | 1.56 | % |
Net assets end of year or period (000s) | | $ | 239,149 | | | $ | 207,305 | | | $ | 100,195 | | | $ | 12 | | | $ | 11 | | | $ | 11 | |
Ratio of expenses to average net assets | | | 0.35 | %* | | | 0.35 | % | | | 0.35 | % | | | 0.35 | % | | | 0.35 | % | | | 0.35 | % |
Ratio of expenses to average net assets excluding interest expense | | | 0.35 | %* | | | 0.35 | % | | | 0.35 | % | | | 0.35 | % | | | 0.35 | % | | | 0.35 | % |
Ratio of net investment income to average net assets | | | 4.96 | %* | | | 4.77 | % | | | 3.23 | % | | | 1.04 | % | | | 0.85 | % | | | 1.58 | % |
+ Unaudited
* Annualized
(a) Per share amounts based on average number of shares outstanding during the period.
| | | | | | |
| See Accompanying Notes | | Semiannual Report | | June 30, 2007 | | 5 |
Statement of Assets and Liabilities Money Market Portfolio
| | | | |
| (Amounts in thousands, except per share amounts) | | June 30, 2007 | |
| | | (Unaudited) | |
| |
Assets: | | | | |
Investments, at value | | $ | 390,196 | |
Receivable for Portfolio shares sold | | | 4,949 | |
Interest and dividends receivable | | | 118 | |
| | | | 395,263 | |
| |
Liabilities: | | | | |
Payable for Portfolio shares redeemed | | $ | 26 | |
Accrued investment advisory fee | | | 40 | |
Accrued administration fee | | | 53 | |
Accrued servicing fee | | | 17 | |
| | | | 136 | |
| |
Net Assets | | $ | 395,127 | |
| |
Net Assets Consist of: | | | | |
Paid in capital | | $ | 395,128 | |
Undistributed net investment income | | | 35 | |
Accumulated undistributed net realized (loss) | | | (36 | ) |
| | | $ | 395,127 | |
| |
Net Assets: | | | | |
Institutional Class | | $ | 239,149 | |
Administrative Class | | | 155,978 | |
| |
Shares Issued and Outstanding: | | | | |
Institutional Class | | | 239,149 | |
Administrative Class | | | 155,978 | |
| |
Net Asset Value and Redemption Price Per Share (Net Asset Per Share Outstanding) | | | | |
Institutional Class | | $ | 1.00 | |
Administrative Class | | | 1.00 | |
| |
Cost of Investments Owned | | $ | 390,196 | |
| | | | |
| 6 | | PIMCO Variable Insurance Trust | | See Accompanying Notes |
Statement of Operations Money Market Portfolio
| | | | |
| (Amounts in thousands) | | Six Months Ended
June 30, 2007 | |
| | | (Unaudited) | |
| |
| Investment Income: | | | | |
Interest | | $ | 8,209 | |
Total Income | | | 8,209 | |
| |
Expenses: | | | | |
Investment advisory fees | | | 230 | |
Administration fees | | | 306 | |
Servicing fees – Administrative Class | | | 86 | |
Trustees’ fees | | | 3 | |
Total Expenses | | | 625 | |
| |
Net Investment Income | | | 7,584 | |
| |
Net Realized (Loss): | | | | |
Net realized (loss) on investments | | | (14 | ) |
Net (Loss) | | | (14 | ) |
| |
Net Increase in Net Assets Resulting from Operations | | $ | 7,570 | |
| | | | | | |
| See Accompanying Notes | | Semiannual Report | | June 30, 2007 | | 7 |
Statements of Changes in Net Assets Money Market Portfolio
| | | | | | | | |
| (Amounts in thousands) | | Six Months Ended
June 30, 2007 | | | Year Ended
December 31, 2006 | |
| | | (Unaudited) | | | | |
| | |
| Increase in Net Assets from: | | | | | | | | |
| | |
Operations: | | | | | | | | |
Net investment income | | $ | 7,584 | | | $ | 8,555 | |
Net realized (loss) | | | (14 | ) | | | (16 | ) |
Net increase resulting from operations | | | 7,570 | | | | 8,539 | |
| | |
Distributions to Shareholders: | | | | | | | | |
From net investment income | | | | | | | | |
Institutional Class | | | (4,798 | ) | | | (6,063 | ) |
Administrative Class | | | (2,772 | ) | | | (2,476 | ) |
| | |
Total Distributions | | | (7,570 | ) | | | (8,539 | ) |
| | |
Portfolio Share Transactions: | | | | | | | | |
Receipts for shares sold | | | | | | | | |
Institutional Class | | | 140,803 | | | | 159,066 | |
Administrative Class | | | 214,175 | | | | 72,207 | |
Issued as reinvestment of distributions | | | | | | | | |
Institutional Class | | | 4,798 | | | | 6,063 | |
Administrative Class | | | 2,772 | | | | 2,477 | |
Cost of shares redeemed | | | | | | | | |
Institutional Class | | | (113,757 | ) | | | (58,019 | ) |
Administrative Class | | | (127,209 | ) | | | (51,878 | ) |
Net increase resulting from Portfolio share transactions | | | 121,582 | | | | 129,916 | |
| | |
Total Increase in Net Assets | | | 121,582 | | | | 129,916 | |
| | |
Net Assets: | | | | | | | | |
Beginning of period | | | 273,545 | | | | 143,629 | |
End of period* | | $ | 395,127 | | | $ | 273,545 | |
| | |
*Including undistributed net investment income of: | | $ | 35 | | | $ | 21 | |
| | | | |
| 8 | | PIMCO Variable Insurance Trust | | See Accompanying Notes |
| | |
| |
| Schedule of Investments Money Market Portfolio | | June 30, 2007 (Unaudited) |
| | | | | | | | |
| | | PRINCIPAL
AMOUNT
(000S) | | | | VALUE
(000S) |
| CORPORATE BONDS & NOTES 4.7% |
| Allstate Life Global Funding Trusts |
5.380% due 11/14/2007 | | $ | | 2,350 | | $ | | 2,351 |
| |
| American Honda Finance Corp. |
5.465% due 10/22/2007 | | | | 2,600 | | | | 2,601 |
| |
| Bear Stearns Cos., Inc. |
5.420% due 01/15/2008 | | | | 2,600 | | | | 2,602 |
| |
| Lehman Brothers Holdings, Inc. |
5.385% due 07/19/2007 | | | | 2,700 | | | | 2,700 |
| |
| Morgan Stanley |
5.482% due 11/09/2007 | | | | 3,200 | | | | 3,202 |
| |
| Santander U.S. Debt S.A. Unipersonal |
5.370% due 09/21/2007 | | | | 2,300 | | | | 2,300 |
| |
| Wachovia Bank N.A. |
5.310% due 11/30/2007 | | | | 2,600 | | | | 2,600 |
| | | | | | | | |
Total Corporate Bonds & Notes (Cost $18,356) | | | | 18,356 |
| | | | | | | | |
|
| SHORT-TERM INSTRUMENTS 94.1% |
|
| CERTIFICATES OF DEPOSIT 1.8% |
| BNP Paribas |
5.262% due 04/03/2008 | | | | 2,000 | | | | 1,999 |
| |
| Royal Bank of Scotland Group PLC |
5.265% due 03/26/2008 | | | | 3,200 | | | | 3,199 |
| |
| Societe Generale NY |
5.265% due 09/21/2007 | | | | 1,600 | | | | 1,600 |
| |
| Unicredito Italiano SpA |
5.360% due 05/29/2008 | | | | 300 | | | | 300 |
| | | | | | | | |
| | | | | | | | 7,098 |
| | | | | | | | |
|
| COMMERCIAL PAPER 92.2% |
| Abbey National Treasury Services PLC |
5.270% due 07/02/2008 | | | | 700 | | | | 700 |
| |
| ANZ National International Ltd. |
5.165% due 09/19/2007 | | | | 14,000 | | | | 13,869 |
| |
| | | | | | | | |
| | | PRINCIPAL
AMOUNT
(000S) | | | | VALUE
(000S) |
| Bank of America Corp. |
5.245% due 10/04/2007 | | $ | | 12,700 | | $ | | 12,550 |
| |
| Bank of Ireland |
5.230% due 11/08/2007 | | | | 13,700 | | | | 13,684 |
| |
| CBA (de) Finance |
5.255% due 09/28/2007 | | | | 11,800 | | | | 11,716 |
| |
| Danske Corp. |
5.165% due 10/12/2007 | | | | 8,900 | | | | 8,770 |
5.220% due 10/12/2007 | | | | 4,000 | | | | 3,995 |
| |
| Dexia Delaware LLC |
5.225% due 09/21/2007 | | | | 8,400 | | | | 8,361 |
| |
| DnB NORBank ASA |
5.170% due 10/12/2007 | | | | 10,700 | | | | 10,543 |
| |
| Eksportfinans A/S |
5.290% due 07/02/2007 | | | | 12,700 | | | | 12,700 |
| |
| Export Development Corp. |
5.190% due 12/27/2007 | | | | 10,500 | | | | 10,231 |
| |
| Fannie Mae |
5.080% due 07/02/2007 | | | | 23,200 | | | | 23,200 |
5.100% due 07/18/2007 | | | | 12,800 | | | | 12,771 |
| |
| Freddie Mac |
5.050% due 08/20/2007 | | | | 12,200 | | | | 12,116 |
5.052% due 09/24/2007 | | | | 1,195 | | | | 1,181 |
5.065% due 09/10/2007 | | | | 4,284 | | | | 4,242 |
5.065% due 01/11/2008 | | | | 6,700 | | | | 6,518 |
| |
| General Electric Capital Corp. |
5.155% due 02/29/2008 | | | | 11,600 | | | | 11,198 |
| |
| HBOS Treasury Services PLC |
5.155% due 11/13/2007 | | | | 3,300 | | | | 3,237 |
5.240% due 09/21/2007 | | | | 4,000 | | | | 3,981 |
| |
| Intesa Funding LLC |
5.265% due 09/05/2007 | | | | 15,000 | | | | 14,982 |
| |
| National Australia Funding Corp. |
5.270% due 07/16/2007 | | | | 14,600 | | | | 14,577 |
| |
| Natixis S.A. |
5.260% due 09/21/2007 | | | | 13,000 | | | | 12,954 |
| |
| | | | | | | | |
| | | PRINCIPAL
AMOUNT
(000S) | | | | VALUE
(000S) |
| Nordea N.A., Inc. |
5.170% due 07/26/2007 | | $ | | 11,300 | | $ | | 11,285 |
| |
| Rabobank USA Financial Corp. |
5.330% due 07/26/2007 | | | | 15,300 | | | | 15,300 |
| |
| Sanofi Aventis |
5.260% due 07/06/2007 | | | | 12,700 | | | | 12,693 |
| |
| Societe Generale NY |
5.225% due 11/26/2007 | | | | 7,500 | | | | 7,476 |
| |
| Statens Bostadsfin Bank |
5.270% due 09/14/2007 | | | | 15,000 | | | | 14,859 |
| |
| Svenska Handelsbanken, Inc. |
5.225% due 08/06/2007 | | | | 4,800 | | | | 4,779 |
5.260% due 10/09/2007 | | | | 15,000 | | | | 14,783 |
| |
| TotalFinaElf Capital S.A. |
5.340% due 07/02/2007 | | | | 15,300 | | | | 15,300 |
| |
| Toyota Motor Credit Corp. |
5.170% due 09/14/2007 | | | | 11,500 | | | | 11,378 |
5.220% due 09/14/2007 | | | | 4,600 | | | | 4,598 |
| |
| UBS Finance Delaware LLC |
5.270% due 10/23/2007 | | | | 13,000 | | | | 12,985 |
| |
| Unicredito Italiano SpA |
5.125% due 01/22/2008 | | | | 11,000 | | | | 10,681 |
| | | | | | | | |
| | | | | | | | 364,193 |
| | | | | | | | |
|
| REPURCHASE AGREEMENTS 0.1% |
| State Street Bank and Trust Co. |
4.900% due 07/02/2007 | | | | 549 | | | | 549 |
| | | | | | | | |
(Dated 06/29/2007. Collateralized by Fannie Mae 3.250% due 08/15/2008 valued at $564. Repurchase proceeds are $549.) |
Total Short-Term Instruments
(Cost $371,840) | | 371,840 |
| | | | | | | | |
|
|
Total Investments 98.8% (Cost $390,196) | | $ | | 390,196 |
|
| Other Assets and Liabilities (Net) 1.2% | | 4,931 |
| | | | | | | | |
| Net Assets 100.0% | | | | | | $ | | 395,127 |
| | | | | | | | |
| | | | | | |
| See Accompanying Notes | | Semiannual Report | | June 30, 2007 | | 9 |
Notes to Financial Statements
1. ORGANIZATION
The Money Market Portfolio (the “Portfolio”) is a series of the PIMCO Variable Insurance Trust (the “Trust”). The Trust is registered under the Investment Company Act of 1940 (the “Act”), as amended, as an open-end management investment company organized as a Delaware business trust on October 3, 1997. The Portfolio offers two classes of shares: Institutional and Administrative. Information presented on these financial statements pertains to the Institutional Class of the Portfolio. Certain detailed financial information for the Administrative Class is provided separately and is available upon request. The Trust is designed to be used as an investment vehicle by Separate Accounts of insurance companies that fund variable annuity contracts and variable life insurance policies and by qualified pension and retirement plans.
2. SIGNIFICANT ACCOUNTING POLICIES
The following is a summary of significant accounting policies consistently followed by the Portfolio in the preparation of its financial statements in conformity with accounting principles generally accepted in the United States of America (“GAAP”). The preparation of financial statements in accordance with GAAP requires management to make estimates and assumptions that affect the reported amounts and disclosures on the financial statements. Actual results could differ from those estimates.
(a) Security Valuation Portfolio securities held by the Portfolio are valued at amortized cost, which approximates current market value.
(b) Securities Transactions and Investment Income Securities transactions are recorded as of the trade date for financial reporting purposes. Securities purchased or sold on a when-issued or delayed-delivery basis may be settled a month or more after the trade date. Realized gains and losses from securities sold are recorded on the identified cost basis. Dividend income is recorded on the ex-dividend date, except certain dividends from foreign securities where the ex-dividend date may have passed, which are recorded as soon as the Portfolio is informed of the ex-dividend date. Interest income, adjusted for the accretion of discounts and amortization of premiums, is recorded on the accrual basis. Paydown gains and losses on mortgage-related and other asset-backed securities are recorded as components of interest income on the Statement of Operations.
(c) Dividends and Distributions to Shareholders Dividends from net investment income, if any, are declared daily and distributed to shareholders monthly. Net realized capital gains earned by the Portfolio, if any, will be distributed no less frequently than once each year.
Income dividends and capital gain distributions are determined in accordance with income tax regulations which may differ from GAAP. Differences between tax regulations and GAAP may change the fiscal year when income and capital items are recognized for tax and GAAP purposes. Examples of events that give rise to timing differences include wash sales, straddles, net operating losses and capital loss carryforwards. Further, the character of investment income and capital gains may be different for certain transactions under the two methods of accounting. Examples of characterization differences include the treatment of mortgage paydowns, swaps, foreign currency transactions and contingent debt instruments. As a result, income dividends and capital gain distributions declared during a fiscal period may differ significantly from the net investment income and realized capital gain reported on the Portfolio’s annual financial statements presented under GAAP.
Distributions classified as a tax basis return of capital, if any, are reflected on the accompanying Statements of Changes in Net Assets and have been reclassified to paid in capital. In addition, other amounts have been reclassified between undistributed net investment income, accumulated undistributed net realized gains
or losses and/or paid in capital to more appropriately conform financial accounting to tax characterizations of dividend distributions.
(d) Multiclass Operations Each class offered by the Portfolio has equal rights as to assets and voting privileges (except that shareholders of a class have exclusive voting rights regarding any matter relating solely to that class of shares). Income and non-class specific expenses of the Portfolio are allocated daily to each class of shares based on the relative value of settled shares. Realized and unrealized capital gains and losses of the Portfolio are allocated daily to each class of shares based on the relative net assets of each class. Class specific expenses, where applicable, currently include administrative, distribution and servicing fees.
(e) Repurchase Agreements The Portfolio may engage in repurchase transactions. Under the terms of a typical repurchase agreement, the Portfolio takes possession of an underlying debt obligation (collateral) subject to an obligation of the seller to repurchase, and the Portfolio to resell, the obligation at an agreed-upon price and time. The underlying securities for all repurchase agreements are held in safekeeping at the Portfolio’s custodian or designated subcustodians under tri-party repurchase agreements. The market value of the collateral must be equal to or exceed the total amount of the repurchase obligations, including interest. Securities purchased under repurchase agreements are reflected as an asset on the Statement of Assets and Liabilities. Generally, in the event of counterparty default, the Portfolio has the right to use the collateral to offset losses incurred. If the counterparty should default, the Portfolio will seek to sell the securities which it holds as collateral. This could involve procedural costs or delays in addition to a loss on the securities if their value should fall below their repurchase price.
(f) New Accounting Policies In July 2006, the Financial Accounting Standards Board (“FASB”) issued Interpretation No. 48, “Accounting for Uncertainty in Income Taxes—an Interpretation of FASB Statement No. 109” (the “Interpretation”). The Interpretation became effective for the Portfolio on June 29, 2007. Management has evaluated the application of the Interpretation in relation to the Portfolio and has concluded that no single filing position or combination of filing positions identified as uncertain tax positions required the accrual of a tax liability in the accounting records of the Portfolio for the period ending June 30, 2007. Management will monitor all existing filing positions and future filing positions in light of the Interpretation and evaluate the need for any future tax accruals and financial statement disclosures as warranted.
In September 2006, the FASB issued Statement of Financial Accounting Standards No. 157, “Fair Value Measurements” (the “Statement”). The Statement is effective for fiscal years beginning after November 15, 2007 and will require expanded disclosure about fair value measurements, separately for each major category of assets and liabilities, that enables shareholders to assess the inputs used to develop those measurements, and for recurring fair value measurements using significant unobservable inputs the effect of the measurements on changes in net assets for the reporting period. Management is currently evaluating the application of the Statement to the Portfolio and will provide additional information in relation to the Statement on the Portfolio’s annual financial statements for the period ending December 31, 2007.
3. FEES AND EXPENSES
(a) Investment Advisory Fee Pacific Investment Management Company LLC (“PIMCO”) is a majority-owned subsidiary of Allianz Global Investors of America L.P. (“AGI”), and serves as investment adviser (the “Adviser”) to the Trust, pursuant to an investment advisory contract. The Adviser receives a monthly fee from the Portfolio, at an annual rate based on average daily net assets. The Advisory Fee for all classes is charged at an annual rate of 0.15%.
| | | | |
| 10 | | PIMCO Variable Insurance Trust | | |
| | |
| |
| | | June 30, 2007 (Unaudited) |
(b) Administration Fee PIMCO serves as administrator (the “Administrator”), and provides administrative services to the Trust for which it receives a monthly administrative fee based on each share class’s average daily net assets. As the Administrator, PIMCO bears the costs of various third-party services, including audit, custodial, portfolio accounting, legal, transfer agency and printing costs. The Administration Fee for all classes is charged at the annual rate of 0.20%.
(c) Distribution and Servicing Fees Allianz Global Investors Distributors LLC (“AGID”) is an indirect wholly-owned subsidiary of AGI and serves as the distributor (the “Distributor”) of the Trust’s shares. The Trust is permitted to reimburse AGID on a quarterly basis, out of the Administrative Class assets of the Portfolio in the amount of 0.15% on an annual basis of the average daily net assets of that class, for payments made to financial intermediaries that provide services in connection with the distribution of shares or administration of plans or programs that use Portfolio shares as their funding medium. The effective rate paid to AGID was 0.15% during the current fiscal year.
(d) Portfolio Expenses The Trust is responsible for the following expenses: (i) salaries and other compensation of any of the Trust’s executive officers and employees who are not officers, directors, stockholders or employees of PIMCO or its subsidiaries or affiliates; (ii) taxes and governmental fees; (iii) brokerage fees and commissions and other portfolio transaction expenses; (iv) the costs of borrowing money, including interest expenses and bank overdraft charges; (v) fees and expenses of the Trustees who are not “interested persons” of PIMCO or the Trust, and any counsel retained exclusively for their benefit; (vi) extraordinary expenses, including costs of litigation and indemnification expenses; (vii) organization expenses and (viii) any expenses allocated or allocable to a specific class of shares, which include service fees payable with respect to the Administrative Class Shares, and may include certain other expenses as permitted by the Trust’s Multiple Class Plan adopted pursuant to Rule 18f-3 under the Act and subject to review and approval by the Trustees. The ratio of expenses to average net assets per share class, as disclosed in the Financial Highlights, may differ from the annual portfolio operating expenses per share class as disclosed in the Prospectus for the reasons set forth above.
Effective April 1, 2007, each Trustee, other than those affiliated with PIMCO or its affiliates, receives an annual retainer of $15,000, plus $2,375 for each Board of Trustees meeting attended in person, $500 for each committee meeting attended and $750 for each Board of Trustees meeting attended telephonically, plus reimbursement of related expenses. In addition, the audit committee chair receives an additional annual retainer of $2,000 and each other committee chair receives an additional annual retainer of $500. These expenses are allocated on a pro-rata basis to the various portfolios of the Trust according to their respective net assets. The Trust pays no compensation directly to any Trustee or any other officer who is affiliated with the Administrator, all of whom receive remuneration for their services to the Trust from the Administrator or its affiliates. Prior to April 1, 2007, each Trustee, other than those affiliated with PIMCO or its affiliates, received an annual retainer of $15,000 plus $2,000 for each Board of Trustees meeting attended ($500 for each special meeting attended), plus reimbursement of related expenses. The Audit Committee Chairman received an annual retainer of $1,500 and the Governance Committee Chairman received an annual retainer of $500. In addition, each member of a committee received $500 for each committee meeting attended.
4. RELATED PARTY TRANSACTIONS
The Adviser, Administrator, and Distributor are related parties as defined by FAS 57, Related Party Disclosures. Fees payable to these parties are disclosed in Note 3.
5. GUARANTEES AND INDEMNIFICATIONS
Under the Trust’s organizational documents, each Trustee, officer, employee or other agent of the Trust (including the Trust’s investment manager) is indemnified, to the extent permitted by the Act, against certain liabilities that may arise out of performance of their duties to the Portfolio. Additionally, in the normal course of business, the Portfolio enters into contracts that contain a variety of indemnification clauses. The Portfolio’s maximum exposure under these arrangements is unknown as this would involve future claims that may be made against the Portfolio that have not yet occurred. However, the Portfolio has not had prior claims or losses pursuant to these contracts and believes the risk of loss to be remote.
6. SHARES OF BENEFICIAL INTEREST
The Portfolio may issue an unlimited number of shares of beneficial interest with a $0.001 par value. Changes in shares of beneficial interest were as follows (shares and amounts in thousands):
| | | | | | | | | | | | | | | | |
| | | | | Six Months Ended
06/30/2007 | | | Year Ended
12/31/2006 | |
| | | | | Shares | | | Amount | | | Shares | | | Amount | |
| | | | | |
Receipts for shares sold | | | | | | | | | | | | | | | | |
Institutional Class | | | | 140,802 | | | $ | 140,803 | | | 159,066 | | | $ | 159,066 | |
Administrative Class | | | | 214,174 | | | | 214,174 | | | 72,207 | | | | 72,207 | |
Issued as reinvestment of distributions | | | | | | | | | | | | | | | | |
Institutional Class | | | | 4,799 | | | | 4,799 | | | 6,063 | | | | 6,063 | |
Administrative Class | | | | 2,772 | | | | 2,772 | | | 2,477 | | | | 2,477 | |
Cost of shares redeemed | | | | | | | | | | | | | | | | |
Institutional Class | | | | (113,757 | ) | | | (113,757 | ) | | (58,019 | ) | | | (58,019 | ) |
Administrative Class | | | | (127,446 | ) | | | (127,209 | ) | | (51,878 | ) | | | (51,878 | ) |
Net increase resulting from Portfolio share transactions | | | | 121,344 | | | $ | 121,582 | | | 129,916 | | | $ | 129,916 | |
The following schedule shows the number of shareholders each owning 5% or more of the Portfolio and the total percentage of the Portfolio held by such shareholders:
| | | | | | |
| | | | | Number of
Shareholders | | % of Portfolio Held |
Institutional Class | | | | 3 | | 94 |
Administrative Class | | | | 2 | | 98 |
7. REGULATORY AND LITIGATION MATTERS
Since February 2004, PIMCO, Allianz Global Investors of America L.P. (PIMCO’s parent company), AGID, and certain of their affiliates, including the PIMCO Funds (another series of funds managed by PIMCO), the Allianz Funds (formerly known as PIMCO Funds: Multi-Manager Series (another series of funds managed by affiliates of PIMCO)), certain Trustees of the Trust (in their capacity as Trustees of the PIMCO Funds or the Allianz Funds) and certain employees of PIMCO, have been named as defendants in fifteen lawsuits filed in various jurisdictions. Eleven of those lawsuits concern “market timing,” and they have been transferred to and consolidated for pre-trial proceedings in a multi-district litigation proceeding in the U.S. District Court for the District of Maryland; the other four lawsuits concern “revenue sharing” and have been consolidated into a single action in the U.S. District Court for the District of Connecticut. The lawsuits have been commenced as putative class actions on behalf of investors who purchased, held or redeemed
| | | | | | |
| | Semiannual Report | | June 30, 2007 | | 11 |
Notes to Financial Statements (Cont.)
shares of the various series of the PIMCO Funds and the Allianz Funds during specified periods, or as derivative actions on behalf of the PIMCO Funds and the Allianz Funds.
The market timing actions in the District of Maryland generally allege that certain hedge funds were allowed to engage in “market timing” in certain funds of the PIMCO Funds and the Allianz Funds and this alleged activity was not disclosed. Pursuant to tolling agreements entered into with the derivative and class action plaintiffs, PIMCO, certain PIMCO Funds Trustees, and certain employees of PIMCO who were previously named as defendants have all been dropped as defendants in the market timing actions; the plaintiffs continue to assert claims on behalf of the shareholders of the PIMCO Funds or on behalf of the PIMCO Funds itself against other defendants. By order dated November 3, 2005, the U.S. District Court for the District of Maryland granted the PIMCO Funds’ motion to dismiss claims asserted against it in a consolidated amended complaint where the PIMCO Funds were named, in the complaint, as a nominal defendant. The revenue sharing action in the District of Connecticut generally alleges that fund assets were inappropriately used to pay brokers to promote funds of the PIMCO Funds and the Allianz Funds, including directing fund brokerage transactions to such brokers, and that such alleged arrangements were not fully disclosed to shareholders. On August 11, 2005, the U.S. District Court for the District of Connecticut conducted a hearing on defendants’ motion to dismiss the consolidated amended complaint in the revenue sharing action but has not yet ruled on the motion to dismiss. The market timing and revenue sharing lawsuits seek, among other things, unspecified compensatory damages plus interest and, in some cases, punitive damages, the rescission of investment advisory contracts, the return of fees paid under those contracts and restitution.
Two nearly identical class action civil complaints have been filed in August 2005, in the Northern District of Illinois Eastern Division, alleging that the plaintiffs each purchased and sold a 10-year Treasury note futures contract and suffered damages from an alleged shortage when PIMCO held both physical and futures positions in 10-year Treasury notes for its client accounts. The two actions have been consolidated into one action, and the two separate complaints have been replaced by a consolidated complaint. PIMCO is a named defendant, and PIMCO Funds has been added as a defendant, to the consolidated action. PIMCO strongly believes the complaint is without merit and intends to vigorously defend itself.
In April 2006, certain portfolios of the Trust and certain other funds managed by PIMCO were served in an adversary proceeding brought by the Official Committee of Asbestos Claimants of G-I Holdings, Inc. in G-I Holdings, Inc.’s bankruptcy in the District of New Jersey. In July 2004, PIMCO was named in this lawsuit and remains a defendant. The plaintiff seeks to recover for the bankruptcy estate
assets that were transferred by the predecessor entity of G-I Holdings, Inc. to a wholly-owned subsidiary in 1994. The subsidiary has since issued notes, of which certain portfolios of the Trust and certain other funds managed by PIMCO are alleged to be holders. The complaint alleges that in 2000, more than two hundred noteholders—including certain portfolios of the Trust and certain other funds managed by PIMCO—were granted a second priority lien on the assets of the subsidiary in exchange for their consent to a refinancing transaction and the granting of a first priority lien to the lending banks. The plaintiff is seeking invalidation of the lien in favor of the noteholders and/or the value of the lien. On June 21, 2006, the District of New Jersey overturned the Bankruptcy Court’s decision granting permission to file the adversary proceeding and remanded the matter to the Bankruptcy Court for further proceedings. Following a motion to reconsider, the District Court upheld its remand on August 7, 2006, and instructed the Bankruptcy Court to conduct a “cost-benefit” analysis of the Committee’s claims, including the claims against the noteholders. The Bankruptcy Court held a status conference on October 25, 2006 and set a briefing schedule relating to this cost-benefit analysis.
The foregoing speaks only as of the date of this report. It is possible that these matters and/or other developments resulting from these matters could result in increased portfolio redemptions or other adverse consequences to the Portfolio. However, PIMCO and AGID believe that these matters are not likely to have a material adverse effect on the Portfolio or on PIMCO’s or AGID’s ability to perform their respective investment advisory or distribution services relating to the Portfolio.
8. FEDERAL INCOME TAX MATTERS
The Portfolio intends to qualify as a regulated investment company under sub-chapter M of the Internal Revenue Code (the “Code”) and distribute all of its taxable income and net realized gains, if applicable, to shareholders. Accordingly, no provision for Federal income taxes has been made.
As of June 30, 2007, the aggregate cost of investments was the same for federal income tax and financial statement purposes. The net unrealized appreciation (depreciation) of investment securities for federal income tax purposes is as follows (amount in thousands):
| | | | |
Aggregate
Gross
Unrealized
Appreciation | | Aggregate
Gross
Unrealized
(Depreciation) | | Net
Unrealized
Appreciation |
$ 0 | | $ 0 | | $ 0 |
| | | | |
| 12 | | PIMCO Variable Insurance Trust | | |
| | |
| |
Privacy Policy* | | (Unaudited) |
The Funds consider customer privacy to be a fundamental aspect of their relationships with shareholders and are committed to maintaining the confidentiality, integrity and security of their current, prospective and former shareholders’ personal information. To ensure their shareholders’ privacy, the Funds have developed policies that are designed to protect this confidentiality, while allowing shareholder needs to be served.
Obtaining Personal Information
In the course of providing shareholders with products and services, the Funds and certain service providers to the Funds, such as the Funds’ investment advisers (“Advisers”), may obtain non-public personal information about shareholders, which may come from sources such as account applications and other forms, from other written, electronic or verbal correspondence, from shareholder transactions, from a shareholder’s brokerage or financial advisory firm, financial adviser or consultant, and/or from information captured on the Funds’ internet web sites.
Respecting Your Privacy
As a matter of policy, the Funds do not disclose any personal or account information provided by shareholders or gathered by the Funds to non-affiliated third parties, except as required or permitted by law or as necessary for such third parties to perform their agreements with respect to the Funds. As is common in the industry, non-affiliated companies may from time to time be used to provide certain services, such as preparing and mailing prospectuses, reports, account statements and other information, conducting research on shareholder satisfaction and gathering shareholder proxies. A Fund’s Distributor may also retain non-affiliated companies to market the Fund’s shares or products which use the Fund’s shares and enter into joint marketing agreements with other companies. These companies may have access to a shareholder’s personal and account information, but are permitted to use this information solely to provide the specific service or as otherwise permitted by law. In most cases, the shareholders will be clients of a third party, but the Funds may also provide a shareholder’s personal and account information to the shareholder’s respective brokerage or financial advisory firm.
Sharing Information with Third Parties
The Funds reserve the right to disclose or report personal information to non-affiliated third parties, in limited circumstances, where the Funds believe in good faith that disclosure is required under law to cooperate with regulators or law enforcement authorities, to protect their rights or property or upon reasonable request by any Fund in which a shareholder has chosen to invest. In addition, the Funds may disclose information about a shareholder’s accounts to a non-affiliated third party with the consent of the shareholder.
Sharing Information with Affiliates
The Funds may share shareholder information with their affiliates in connection with servicing their shareholders’ accounts or to provide shareholders with information about products and services that the Funds or their Advisers, principal underwriters or their affiliates (“Service Affiliates”) believe may be of interest to such shareholders. The information that the Funds share may include, for example, a shareholder’s participation in one of the Funds or in other investment programs sponsored by a Service Affiliate, a shareholder’s ownership of certain types of accounts (such as IRAs), or other data about a shareholder’s accounts. The Funds’ Service Affiliates, in turn, are not permitted to share shareholder information with non-affiliated entities, except as required or permitted by law.
Procedures to Safeguard Private Information
The Funds take seriously the obligation to safeguard shareholder non-public personal information. In addition to this policy, the Funds have also implemented procedures that are designed to restrict access to a shareholder’s non-public personal information only to internal personnel who need to know that information in order to provide products or services to such shareholders. In order to guard a shareholder’s non-public personal information, physical, electronic and procedural safeguards are in place.
* This Privacy Policy applies to the following entities: PIMCO Funds, PIMCO Variable Insurance Trust, PCM Fund, Inc. and PIMCO Strategic Global Government Fund, Inc. (collectively, the “Funds”).
| | | | | | |
| | Semiannual Report | | June 30, 2007 | | 13 |
Investment Adviser and Administrator
Pacific Investment Management Company LLC
840 Newport Center Drive
Newport Beach, California 92660
Distributor
Allianz Global Investors Distributors LLC
1345 Avenue of the Americas
New York, New York 10105
Custodian
State Street Bank & Trust Company
801 Pennsylvania
Kansas City, Missouri 64105
Transfer Agent
Boston Financial Data Services–Midwest
330 W. 9th Street
Kansas City, Missouri 64105
Legal Counsel
Dechert LLP
1775 I Street, N.W.
Washington, D.C. 20006
Independent Registered Public Accounting Firm
PricewaterhouseCoopers LLP
1055 Broadway
Kansas City, Missouri 64105
P I M C O

Table of Contents
This material is authorized for use only when preceded or accompanied by the current PIMCO Variable Insurance Trust (the “Trust”) prospectus. Investors should consider the investment objectives, risks, charges and expenses of this Trust carefully before investing. Ask your financial professional to explain all charges that may apply. This and other information is contained in the Trust’s prospectus. The variable product prospectus may be obtained by contacting your Investment Consultant. Please read the Trust and variable product prospectus carefully before you invest or send money.
Chairman’s Letter
Dear PIMCO Variable Insurance Trust Shareholder:
It is our pleasure to present to you the semiannual report for the PIMCO Variable Insurance Trust, covering the six-month period ended June 30, 2007. The PIMCO Variable Insurance Trust’s net assets were $8.68 billion at June 30, 2007, as compared to $7.76 billion at December 31, 2006.
Highlights of the financial markets during the reporting period include:
| | n | | Economic data during the first quarter of 2007 pointed to slower growth, which heightened market expectations for a decrease in the Federal Funds Rate. By the second quarter, economic data, such as employment statistics, provided little indication of economic weakness, causing expectations of a decrease in the Federal Funds Rate to unwind and U.S. interest rates to move higher. Interest rates in Europe and the U.K. also rose over the period as central banks raised their key lending rates due to inflation concerns. The benchmark ten-year U.S. Treasury yielded 5.03% as of June 30, 2007, or 0.32% higher than at the beginning of the year. |
| | n | | Most bonds generally returned much of their gains from earlier in the year as worldwide growth and capital flows drove interest rates higher in the second quarter. Increased risk aversion in global financial markets, due in part to subprime mortgage worries in the U.S., also contributed to the rise in interest rates. The Lehman Brothers Aggregate Bond Index, which includes Treasury, investment-grade corporate and mortgage-backed securities, returned 0.98% for the six-month period. |
| | n | | Locally issued emerging market (“EM”) bonds posted positive returns for the reporting period. Yields on these bonds declined and the local currencies in which they are denominated generally gained, amid increasing investor awareness, strong economic growth and surging capital inflows. External EM bonds (debt instruments issued by emerging markets countries and typically denominated in U.S. dollars) lagged behind local EM bonds (debt instruments issued by emerging markets countries and denominated in the currency of the issuer), as external EM bonds tend to trade more in-line with U.S. Treasuries. |
| | n | | Treasury Inflation-Protected Securities (“TIPS”) outpaced nominal bonds (non-inflation linked bonds) for the first part of the year and all but the longest maturity TIPS outperformed in the second quarter as high gasoline prices drove higher inflation accruals. Commodities, as represented by the Dow Jones-AIG Commodity Total Return Index, returned 4.46% for the period. Equities, as measured by the S&P 500 Index and the Russell 2000 Index, returned 6.96% and 6.45%, respectively, for the period. |
On the following pages, please find specific details as to the Portfolio’s total return investment performance and a discussion of those factors that affected performance.
Thank you for the trust you have placed in us. We will continue to work diligently to serve your investment needs.
Sincerely,
Brent R. Harris
Chairman, PIMCO Variable Insurance Trust
July 31, 2007
| | | | | | |
| | Semiannual Report | | June 30, 2007 | | 1 |
Important Information About the Portfolio
PIMCO Variable Insurance Trust (the “Trust”) is an open-end management investment company currently consisting of twenty separate investment portfolios, including the Real Return Portfolio (the “Portfolio”). The Portfolio is only available as a funding vehicle under variable life insurance policies or variable annuity contracts issued by insurance companies (“Variable Contracts”). Individuals may not purchase shares of the Portfolio directly. Shares of the Portfolio also may be sold to qualified pension and retirement plans outside of the separate account context.
We believe that bond funds have an important role to play in a well diversified investment portfolio. It is important to note, however, that in an environment where interest rates may trend upward, rising rates would negatively impact the performance of most bond funds, and fixed-income securities held by a fund are likely to decrease in value. The price volatility of fixed-income securities can also increase during periods of rising interest rates resulting in increased losses to a fund. Bond funds and individual bonds with a longer duration (a measure of the expected life of a security) tend to be more sensitive to changes in interest rates, usually making them more volatile than securities or funds with shorter durations.
The Portfolio may be subject to various risks in addition to those described above. Some of these risks may include, but are not limited to, the following: credit risk, high yield risk, market risk, issuer risk, liquidity risk, derivatives risk, mortgage risk, non-U.S. investment risk, emerging markets risk, currency risk, issuer non-diversification risk, leveraging risk and management risk. A complete description of these risks is contained in the Portfolio’s prospectus. The Portfolio may use derivative instruments for hedging purposes or as part of an investment strategy. Use of these instruments may involve certain costs and risks such as liquidity risk, interest rate risk, market risk, credit risk, management risk and the risk that the Portfolio could not close out a position when it would be most advantageous to do so. Because the Portfolio may invest in derivatives, it could lose more than the principal amount invested in these instruments. Investing in non-U.S. securities may entail risk due to non-U.S. economic and political developments; this risk may be increased when investing in emerging markets.
On the performance summary page in this Semiannual Report, the Total Return Investment Performance table measures performance assuming that all dividend and capital gain distributions were reinvested.
An investment in the Portfolio is not a deposit of a bank and is not guaranteed or insured by the Federal Deposit Insurance Corporation or any other government agency. It is possible to lose money on investments in the Portfolio.
PIMCO has adopted written proxy voting policies and procedures (“Proxy Policy”) as required by Rule 206(4)-6 under the Investment Advisers Act of 1940, as amended. The Proxy Policy has been adopted by the Trust as the policies and procedures that PIMCO will use when voting proxies on behalf of the Portfolio. A description of the policies and procedures that PIMCO uses to vote proxies relating to portfolio securities of the Portfolio, and information about how the Portfolio voted proxies relating to portfolio securities held during the most recent twelve-month period ended June 30, are available without charge, upon request, by calling the Trust at 1-866-746-2606 and on the Portfolio’s website at www.pimco.com.
The Portfolio files its complete schedule of portfolio holdings with the SEC for the first and third quarters of each fiscal year on Form N-Q. A copy of the Trust’s Form N-Q is also available on the SEC’s website at http://www.sec.gov and may be reviewed and copied at the SEC’s Public Reference Room in Washington D.C. Information on the operation of the Public Reference Room may be obtained by calling 1-800-SEC-0330, and is available without charge, upon request, by calling the Trust at 1-866-746-2606 and on the Portfolio’s website at www.pimco.com.
PIMCO Variable Insurance Trust is distributed by Allianz Global Investors Distributors LLC, 1345 Avenue of the Americas, New York, NY 10105.
| | | | |
| 2 | | PIMCO Variable Insurance Trust | | |
The following disclosure provides important information regarding the Portfolio’s Expense Example (“Example” or “Expense Example”), which appears in this Semiannual Report. Please refer to this information when reviewing the Expense Example for the Portfolio.
Example
As a shareholder of the Portfolio, you incur two types of costs: (1) transaction costs and (2) ongoing costs, including advisory and administrative fees; distribution and/or service (12b-1) fees (Administrative and Advisor Class only); and other Portfolio expenses. The Example is intended to help you understand your ongoing costs (in dollars) of investing in the Portfolio and to compare these costs with the ongoing costs of investing in other mutual funds. The Expense Example does not reflect any fees or other expenses imposed by the Variable Contracts. If it did, the expenses reflected in the Expense Example would be higher. The Example is based on an investment of $1,000 invested at the beginning of the period and held for the entire period indicated, which is from January 1, 2007 to June 30, 2007.
Actual Expenses
The information in the table under the heading “Actual Performance” provides information about actual account values and actual expenses. You may use the information in these columns, together with the amount you invested, to estimate the expenses that you paid over the period. Simply divide your account value by $1,000 (for example, an $8,600 account value divided by $1,000 = $8.60), then multiply the result by the number in the row titled “Expenses Paid During Period” to estimate the expenses you paid on your account during this period.
Hypothetical Example for Comparison Purposes
The information in the table under the heading “Hypothetical Performance (5% return before expenses)” provides information about hypothetical account values and hypothetical expenses based on the Portfolio’s actual expense ratio and an assumed rate of return of 5% per year before expenses, which is not the Portfolio’s actual return. The hypothetical account values and expenses may not be used to estimate the actual ending account balance or expenses you paid for the period. You may use this information to compare the ongoing costs of investing in the Portfolio and other portfolios. To do so, compare this 5% hypothetical example with the 5% hypothetical examples that appear in the shareholder reports of the other portfolios.
Please note that the expenses shown in the table are meant to highlight your ongoing costs only and do not reflect any transactional costs. Therefore, the information under the heading “Hypothetical Performance (5% return before expenses)” is useful in comparing ongoing costs only, and will not help you determine the relative total costs of owning different portfolios. In addition, if these transactional costs were included, your costs would have been higher.
The expense ratio may vary period to period because of various factors, such as an increase in expenses not covered by the advisory and administrative fees (such as expenses of the trustees and their counsel, litigation expense and interest expense).
| | | | | | |
| | Semiannual Report | | June 30, 2007 | | 3 |
PIMCO Real Return Portfolio
Cumulative Returns Through June 30, 2007
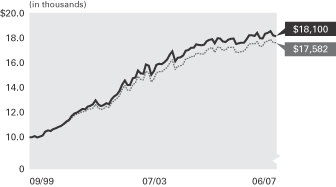
$10,000 invested at the beginning of the first full month following the inception date of the Portfolio’s Administrative Class.
Allocation Breakdown‡
| | |
U.S. Treasury Obligations | | 47.8% |
Short-Term Instruments | | 26.5% |
U.S. Government Agencies | | 10.2% |
Corporate Bonds & Notes | | 6.3% |
Asset-Backed Securities | | 5.1% |
Other | | 4.1% |
| | ‡ | % of Total Investments as of 06/30/2007 |
| | | | | | | | | | |
| Average Annual Total Return for the period ended June 30, 2007 |
| | | | | 6 Months* | | 1 Year | | 5 Years | | Portfolio
Inception
(09/30/99) |
| | PIMCO Real Return Portfolio Administrative Class | | 0.83% | | 2.90% | | 6.14% | | 7.95% |
| | Lehman Brothers U.S. TIPS Index± | | 1.73% | | 3.99% | | 6.03% | | 7.55% |
All Portfolio returns are net of fees and expenses.
* Cumulative return.
Performance quoted represents past performance. Past performance is no guarantee of future results. Investment return and principal value will fluctuate so the Portfolio shares, when redeemed, may be worth more or less than their original cost. The Portfolio’s performance does not reflect the deduction of additional charges and expenses imposed in connection with investing in Variable Contracts, which will reduce returns. Current performance may be lower or higher than the performance data quoted. Performance data current to the most recent month-end is available by calling (800) 927-4648.
± Lehman Brothers U.S. TIPS Index is an unmanaged market index comprised of all U.S. Treasury Inflation-Protected Securities rated investment grade (Baa3 or better), having at least 1 year to final maturity, and at least $250 million par amount outstanding. It is not possible to invest directly in the index. The index does not reflect deduction for fees or expenses.
| | | | | | |
| Expense Example | | Actual Performance | | Hypothetical Performance |
| | | | | (5% return before expenses) |
Beginning Account Value (01/01/07) | | $ | 1,000.00 | | $ | 1,000.00 |
Ending Account Value (06/30/07) | | $ | 1,008.34 | | $ | 1,021.57 |
Expenses Paid During Period† | | $ | 3.24 | | $ | 3.26 |
† Expenses are equal to the Portfolio’s Administrative Class annualized expense ratio of 0.65%, multiplied by the average account value over the period, multiplied by 181/365 (to reflect the one-half year period). Overall fees and expenses of investing in the Portfolio will be higher because the example does not reflect Variable Contract fees and expenses.
Please refer to page 3 herein for an explanation of the information presented in the above Expense Example.
Portfolio Insights
| » | | The PIMCO Real Return Portfolio seeks to achieve its investment objective by investing under normal circumstances at least 80% of its net assets in inflation-indexed bonds of varying maturities issued by the U.S. and non-U.S. governments, their agencies, or instrumentalities or corporations, which may be represented by forwards or derivatives such as options, futures contracts, or swap agreements. |
| » | | Positioning for a steeper U.S. nominal yield curve added to performance as the U.S. nominal yield curve steepened. |
| » | | An emphasis on nominal bonds in the Eurozone benefited performance as nominal bonds outperformed inflation-linked bonds in the region. |
| » | | Above-index U.S. real duration was negative for performance as real yields increased. |
| » | | Modest exposure to U.K. nominal bonds was negative for performance due to rising interest rates and a tightening bias from the Bank of England. |
| » | | Holdings of mortgage-backed securities detracted from performance as mortgage spreads widened. |
| | | | |
| 4 | | PIMCO Variable Insurance Trust | | |
Financial Highlights Real Return Portfolio
| | | | | | | | | | | | | | | | | | | | | | | | |
| Selected per Share Data for the Year or Period Ended: | | 06/30/2007+ | | | 12/31/2006 | | | 12/31/2005 | | | 12/31/2004 | | | 12/31/2003 | | | 12/31/2002 | |
| | | | | | |
Administrative Class | | | | | | | | | | | | | | | | | | | | | | | | |
Net asset value beginning of year or period | | $ | 11.93 | | | $ | 12.69 | | | $ | 12.92 | | | $ | 12.36 | | | $ | 11.90 | | | $ | 10.56 | |
Net investment income (a) | | | 0.28 | | | | 0.53 | | | | 0.36 | | | | 0.13 | | | | 0.27 | | | | 0.48 | |
Net realized/unrealized gain (loss) on investments (a) | | | (0.17 | ) | | | (0.43 | ) | | | (0.09 | ) | | | 0.97 | | | | 0.77 | | | | 1.36 | |
Total income from investment operations | | | 0.11 | | | | 0.10 | | | | 0.27 | | | | 1.10 | | | | 1.04 | | | | 1.84 | |
Dividends from net investment income | | | (0.29 | ) | | | (0.53 | ) | | | (0.36 | ) | | | (0.13 | ) | | | (0.32 | ) | | | (0.48 | ) |
Distributions from net realized capital gains | | | 0.00 | | | | (0.33 | ) | | | (0.14 | ) | | | (0.41 | ) | | | (0.26 | ) | | | (0.02 | ) |
Total distributions | | | (0.29 | ) | | | (0.86 | ) | | | (0.50 | ) | | | (0.54 | ) | | | (0.58 | ) | | | (0.50 | ) |
Net asset value end of year or period | | $ | 11.75 | | | $ | 11.93 | | | $ | 12.69 | | | $ | 12.92 | | | $ | 12.36 | | | $ | 11.90 | |
Total return | | | 0.83 | % | | | 0.71 | % | | | 2.09 | % | | | 8.92 | % | | | 8.84 | % | | | 17.77 | % |
Net assets end of year or period (000s) | | $ | 942,932 | | | $ | 1,033,666 | | | $ | 1,012,042 | | | $ | 636,565 | | | $ | 275,029 | | | $ | 90,724 | |
Ratio of expenses to average net assets | | | 0.65 | %* | | | 0.65 | % | | | 0.66 | % | | | 0.65 | % | | | 0.66 | % | | | 0.66 | % |
Ratio of expenses to average net assets excluding interest expense | | | 0.65 | %* | | | 0.65 | % | | | 0.65 | % | | | 0.65 | % | | | 0.65 | % | | | 0.65 | % |
Ratio of net investment income to average net assets | | | 4.73 | %* | | | 4.22 | % | | | 2.79 | % | | | 1.03 | % | | | 2.21 | % | | | 4.19 | % |
Portfolio turnover rate | | | 484 | % | | | 963 | % | | | 1,102 | % | | | 1,064 | % | | | 738 | % | | | 87 | % |
+ Unaudited
* Annualized
(a) Per share amounts based on average number of shares outstanding during the period.
| | | | | | |
| See Accompanying Notes | | Semiannual Report | | June 30, 2007 | | 5 |
Statement of Assets and Liabilities Real Return Portfolio
| | | | |
| (Amounts in thousands, except per share amounts) | | June 30, 2007 | |
| | | (Unaudited) | |
| |
Assets: | | | | |
Investments, at value | | $ | 2,091,451 | |
Cash | | | 72 | |
Foreign currency, at value | | | 8,246 | |
Receivable for investments sold | | | 96,104 | |
Receivable for investments sold on a delayed-delivery basis | | | 10,275 | |
Receivable for Portfolio shares sold | | | 7,639 | |
Interest and dividends receivable | | | 4,575 | |
Variation margin receivable | | | 12 | |
Swap premiums paid | | | 5,874 | |
Unrealized appreciation on foreign currency contracts | | | 179 | |
Unrealized appreciation on swap agreements | | | 3,526 | |
| | | | 2,227,953 | |
| |
Liabilities: | | | | |
Payable for investments purchased | | $ | 149,673 | |
Payable for investments purchased on a delayed-delivery basis | | | 1,007,734 | |
Payable for Portfolio shares redeemed | | | 1,310 | |
Payable for short sales | | | 57,627 | |
Written options outstanding | | | 238 | |
Dividends payable | | | 18 | |
Accrued investment advisory fee | | | 207 | |
Accrued administration fee | | | 207 | |
Accrued distribution fee | | | 2 | |
Accrued servicing fee | | | 106 | |
Variation margin payable | | | 933 | |
Swap premiums received | | | 5,324 | |
Unrealized depreciation on foreign currency contracts | | | 239 | |
Unrealized depreciation on swap agreements | | | 3,124 | |
Other liabilities | | | 2,531 | |
| | | | 1,229,273 | |
| |
Net Assets | | $ | 998,680 | |
| |
Net Assets Consist of: | | | | |
Paid in capital | | $ | 1,073,947 | |
Undistributed net investment income | | | 9,102 | |
Accumulated undistributed net realized (loss) | | | (87,924 | ) |
Net unrealized appreciation | | | 3,555 | |
| | | $ | 998,680 | |
| |
Net Assets: | | | | |
Institutional Class | | $ | 46,629 | |
Administrative Class | | | 942,932 | |
Advisor Class | | | 9,119 | |
| |
Shares Issued and Outstanding: | | | | |
Institutional Class | | | 3,967 | |
Administrative Class | | | 80,217 | |
Advisor Class | | | 776 | |
| |
Net Asset Value and Redemption Price Per Share (Net Asset Per Share Outstanding) | | | | |
Institutional Class | | $ | 11.75 | |
Administrative Class | | | 11.75 | |
Advisor Class | | | 11.75 | |
| |
Cost of Investments Owned | | $ | 2,084,650 | |
Cost of Foreign Currency Held | | $ | 8,225 | |
Proceeds Received on Short Sales | | $ | 56,863 | |
Premiums Received on Written Options | | $ | 387 | |
| | | | |
| 6 | | PIMCO Variable Insurance Trust | | See Accompanying Notes |
Statement of Operations Real Return Portfolio
| | | | |
| (Amounts in thousands) | | Six Months Ended
June 30, 2007 | |
| | | (Unaudited) | |
| |
| Investment Income: | | | | |
Interest | | $ | 28,500 | |
Miscellaneous income | | | 32 | |
Total Income | | | 28,532 | |
| |
Expenses: | | | | |
Investment advisory fees | | | 1,318 | |
Administration fees | | | 1,318 | |
Servicing fees – Administrative Class | | | 753 | |
Distribution and/or servicing fees – Advisor Class | | | 7 | |
Trustees’ fees | | | 10 | |
Total Expenses | | | 3,406 | |
| |
Net Investment Income | | | 25,126 | |
| |
Net Realized and Unrealized Gain (Loss): | | | | |
Net realized (loss) on investments | | | (40,473 | ) |
Net realized gain on futures contracts, written options and swaps | | | 84 | |
Net realized (loss) on foreign currency transactions | | | (743 | ) |
Net change in unrealized appreciation on investments | | | 30,216 | |
Net change in unrealized (depreciation) on futures contracts, written options and swaps | | | (2,279 | ) |
Net change in unrealized appreciation on translation of assets and liabilities denominated in foreign currencies | | | 321 | |
Net (Loss) | | | (12,874 | ) |
| |
Net Increase in Net Assets Resulting from Operations | | $ | 12,252 | |
| | | | | | |
| See Accompanying Notes | | Semiannual Report | | June 30, 2007 | | 7 |
Statements of Changes in Net Assets Real Return Portfolio
| | | | | | | | |
| (Amounts in thousands) | | Six Months Ended
June 30, 2007 | | | Year Ended
December 31, 2006 | |
| | | (Unaudited) | | | | |
| | |
| Increase (Decrease) in Net Assets from: | | | | | | | | |
| | |
Operations: | | | | | | | | |
Net investment income | | $ | 25,126 | | | $ | 47,440 | |
Net realized (loss) | | | (41,132 | ) | | | (12,066 | ) |
Net change in unrealized appreciation (depreciation) | | | 28,258 | | | | (27,331 | ) |
Net increase resulting from operations | | | 12,252 | | | | 8,043 | |
| | |
Distributions to Shareholders: | | | | | | | | |
From net investment income | | | | | | | | |
Institutional Class | | | (1,137 | ) | | | (1,932 | ) |
Administrative Class | | | (24,024 | ) | | | (45,759 | ) |
Advisor Class | | | (119 | ) | | | (41 | ) |
From net realized capital gains | | | | | | | | |
Institutional Class | | | 0 | | | | (1,205 | ) |
Administrative Class | | | 0 | | | | (28,225 | ) |
Advisor Class | | | 0 | | | | (68 | ) |
| | |
Total Distributions | | | (25,280 | ) | | | (77,230 | ) |
| | |
Portfolio Share Transactions: | | | | | | | | |
Receipts for shares sold | | | | | | | | |
Institutional Class | | | 3,580 | | | | 7,837 | |
Administrative Class | | | 166,885 | | | | 367,822 | |
Advisor Class | | | 6,796 | | | | 3,086 | |
Issued as reinvestment of distributions | | | | | | | | |
Institutional Class | | | 1,137 | | | | 3,137 | |
Administrative Class | | | 23,367 | | | | 73,676 | |
Advisor Class | | | 119 | | | | 109 | |
Cost of shares redeemed | | | | | | | | |
Institutional Class | | | (3,266 | ) | | | (6,951 | ) |
Administrative Class | | | (268,783 | ) | | | (353,626 | ) |
Advisor Class | | | (329 | ) | | | (402 | ) |
Net increase (decrease) resulting from Portfolio share transactions | | | (70,494 | ) | | | 94,688 | |
| | |
Total Increase (Decrease) in Net Assets | | | (83,522 | ) | | | 25,501 | |
| | |
Net Assets: | | | | | | | | |
Beginning of period | | | 1,082,202 | | | | 1,056,701 | |
End of period* | | $ | 998,680 | | | $ | 1,082,202 | |
| | |
*Including undistributed net investment income of: | | $ | 9,102 | | | $ | 9,256 | |
| | | | |
| 8 | | PIMCO Variable Insurance Trust | | See Accompanying Notes |
| | |
| |
| Schedule of Investments Real Return Portfolio | | June 30, 2007 (Unaudited) |
| | | | | | | | |
| | | | | PRINCIPAL
AMOUNT
(000S) | | | | VALUE
(000S) |
| BANK LOAN OBLIGATIONS 0.3% |
| Georgia-Pacific Corp. | | | | | | | | |
7.110% due 12/20/2012 | | $ | | 988 | | $ | | 991 |
| |
| OAO Rosneft Oil Co. |
6.000% due 09/16/2007 | | | | 1,600 | | | | 1,602 |
| | | | | | | | |
Total Bank Loan Obligations
(Cost $2,586) | | 2,593 |
| | | | | | | | |
|
| CORPORATE BONDS & NOTES 13.2% |
|
| BANKING & FINANCE 11.0% |
| American Express Centurion Bank |
5.320% due 05/07/2008 | | | | 500 | | | | 500 |
| |
| American International Group, Inc. |
5.360% due 06/23/2008 | | | | 1,200 | | | | 1,200 |
| |
| Atlantic & Western Re Ltd. |
11.599% due 01/09/2009 | | | | 900 | | | | 908 |
| |
| Bank of America Corp. |
5.366% due 11/06/2009 | | | | 900 | | | | 900 |
5.510% due 02/17/2009 | | | | 5,400 | | | | 5,414 |
| |
| Bank of America N.A. |
5.360% due 12/18/2008 | | | | 5,400 | | | | 5,403 |
| |
| Bank of Ireland |
5.370% due 12/19/2008 | | | | 1,500 | | | | 1,502 |
5.410% due 12/18/2009 | | | | 1,000 | | | | 1,002 |
| |
| C10 Capital SPV Ltd. |
6.722% due 12/31/2049 | | | | 500 | | | | 488 |
| |
| Calabash Re II Ltd. |
16.260% due 01/08/2010 | | | | 250 | | | | 260 |
| |
| Charter One Bank N.A. |
5.405% due 04/24/2009 | | | | 8,400 | | | | 8,411 |
| |
| CIT Group, Inc. |
5.505% due 01/30/2009 | | | | 4,600 | | | | 4,594 |
| |
| Citigroup Funding, Inc. |
5.320% due 04/23/2009 | | | | 5,700 | | | | 5,703 |
| |
| Citigroup, Inc. |
5.390% due 12/28/2009 | | | | 3,900 | | | | 3,903 |
5.395% due 01/30/2009 | | | | 1,000 | | | | 1,001 |
5.400% due 12/26/2008 | | | | 4,900 | | | | 4,904 |
5.405% due 05/02/2008 | | | | 1,000 | | | | 1,001 |
| |
| Commonwealth Bank of Australia |
5.360% due 06/08/2009 | | | | 400 | | | | 400 |
| |
| Credit Agricole S.A. |
5.360% due 05/28/2009 | | | | 1,900 | | | | 1,901 |
| |
| DnB NORBank ASA |
5.425% due 10/13/2009 | | | | 1,100 | | | | 1,101 |
| |
| East Lane Re Ltd. |
12.355% due 05/06/2011 | | | | 300 | | | | 301 |
| |
| Export-Import Bank of Korea |
5.570% due 10/04/2011 | | | | 1,600 | | | | 1,602 |
| |
| Ford Motor Credit Co. |
7.250% due 10/25/2011 | | | | 1,200 | | | | 1,156 |
7.800% due 06/01/2012 | | | | 100 | | | | 98 |
| |
| Foundation Re II Ltd. |
12.110% due 11/26/2010 | | | | 800 | | | | 803 |
| |
| General Electric Capital Corp. |
5.355% due 10/24/2008 | | | | 800 | | | | 801 |
5.385% due 10/26/2009 | | | | 1,000 | | | | 1,001 |
5.400% due 03/04/2008 | | | | 2,800 | | | | 2,803 |
5.400% due 12/12/2008 | | | | 900 | | | | 901 |
| |
| General Motors Acceptance Corp. |
6.750% due 12/01/2014 | | | | 1,600 | | | | 1,534 |
| |
| Goldman Sachs Group, Inc. |
5.660% due 06/28/2010 | | | | 4,700 | | | | 4,730 |
| |
| | | | | | | | |
| | | | | PRINCIPAL
AMOUNT
(000S) | | | | VALUE
(000S) |
| HBOS Treasury Services PLC |
5.320% due 07/17/2008 | | $ | | 1,100 | | $ | | 1,101 |
| |
| HSBC Finance Corp. |
5.360% due 05/21/2008 | | | | 1,200 | | | | 1,201 |
5.415% due 10/21/2009 | | | | 1,900 | | | | 1,901 |
| |
| JPMorgan Chase & Co. |
5.370% due 06/26/2009 | | | | 700 | | | | 701 |
5.410% due 06/26/2009 | | | | 5,500 | | | | 5,508 |
| |
| Lehman Brothers Holdings, Inc. |
5.370% due 11/24/2008 | | | | 300 | | | | 300 |
| |
| Longpoint Re Ltd. |
10.609% due 05/08/2010 | | | | 1,100 | | | | 1,100 |
| |
| Merrill Lynch & Co., Inc. |
5.395% due 10/23/2008 | | | | 2,500 | | | | 2,504 |
| |
| Morgan Stanley |
5.360% due 11/21/2008 | | | | 1,000 | | | | 1,000 |
| |
| Mystic Re Ltd. |
14.360% due 12/05/2008 | | | | 600 | | | | 594 |
| |
| Phoenix Quake Ltd. |
7.800% due 07/03/2008 | | | | 500 | | | | 503 |
| |
| Phoenix Quake Wind I Ltd. |
7.800% due 07/03/2008 | | | | 2,000 | | | | 2,007 |
| |
| Rabobank Nederland |
5.376% due 01/15/2009 | | | | 800 | | | | 801 |
| |
| Redwood Capital IX Ltd. |
11.610% due 01/09/2008 | | | | 500 | | | | 504 |
12.110% due 01/09/2008 | | | | 500 | | | | 504 |
| |
| Royal Bank of Scotland Group PLC |
5.405% due 07/21/2008 | | | | 400 | | | | 400 |
| |
| Santander U.S. Debt S.A. Unipersonal |
5.370% due 09/21/2007 | | | | 400 | | | | 400 |
5.420% due 09/19/2008 | | | | 500 | | | | 501 |
5.420% due 11/20/2009 | | | | 2,700 | | | | 2,702 |
| |
| Shackleton Re Ltd. |
13.355% due 02/07/2008 | | | | 1,000 | | | | 1,015 |
| |
| Travelers Property Casualty Corp. |
3.750% due 03/15/2008 | | | | 100 | | | | 99 |
| |
| Unicredit Luxembourg Finance S.A. |
5.405% due 10/24/2008 | | | | 1,700 | | | | 1,701 |
| |
| Vita Capital II Ltd. |
6.249% due 01/01/2010 | | | | 300 | | | | 300 |
| |
| Vita Capital III Ltd. |
6.469% due 01/01/2012 | | | | 700 | | | | 701 |
| |
| VTB Capital S.A. for Vneshtorgbank |
5.955% due 08/01/2008 | | | | 1,700 | | | | 1,704 |
| |
| Wachovia Bank N.A. |
5.360% due 02/23/2009 | | | | 5,400 | | | | 5,403 |
5.430% due 12/02/2010 | | | | 2,400 | | | | 2,402 |
| |
| Westpac Banking Corp. |
5.280% due 06/06/2008 | | | | 5,400 | | | | 5,401 |
| |
| World Savings Bank FSB |
5.396% due 05/08/2009 | | | | 300 | | | | 300 |
5.410% due 06/20/2008 | | | | 300 | | | | 300 |
5.485% due 03/02/2009 | | | | 300 | | | | 301 |
| | | | | | | | |
| | | | | | | | 110,085 |
| | | | | | | | |
|
| INDUSTRIALS 1.1% |
| C8 Capital SPV Ltd. |
6.640% due 12/31/2049 | | | | 500 | | | | 493 |
| |
| CSC Holdings, Inc. |
7.875% due 12/15/2007 | | | | 600 | | | | 605 |
| |
| EchoStar DBS Corp. |
5.750% due 10/01/2008 | | | | 500 | | | | 500 |
7.000% due 10/01/2013 | | | | 5,000 | | | | 4,950 |
| |
| | | | | | | | |
| | | | | PRINCIPAL
AMOUNT
(000S) | | | | VALUE
(000S) |
| Pemex Project Funding Master Trust |
7.375% due 12/15/2014 | | $ | | 500 | | $ | | 546 |
8.625% due 02/01/2022 | | | | 200 | | | | 247 |
| |
| Royal Caribbean Cruises Ltd. |
7.000% due 10/15/2007 | | | | 200 | | | | 202 |
| |
| Wal-Mart Stores, Inc. |
5.260% due 06/16/2008 | | | | 3,200 | | | | 3,199 |
| | | | | | | | |
| | | | | | | | 10,742 |
| | | | | | | | |
|
| UTILITIES 1.1% |
| America Movil SAB de C.V. |
5.460% due 06/27/2008 | | | | 5,500 | | | | 5,501 |
| |
| AT&T, Inc. |
5.456% due 02/05/2010 | | | | 2,800 | | | | 2,805 |
| |
| Cleveland Electric Illuminating Co. |
6.860% due 10/01/2008 | | | | 100 | | | | 102 |
| |
| CMS Energy Corp. |
9.875% due 10/15/2007 | | | | 1,600 | | | | 1,623 |
| |
| Dominion Resources, Inc. |
5.540% due 11/14/2008 | | | | 300 | | | | 300 |
| |
| Embarq Corp. |
7.082% due 06/01/2016 | | | | 300 | | | | 302 |
| |
| NiSource Finance Corp. |
5.930% due 11/23/2009 | | | | 800 | | | | 802 |
| | | | | | | | |
| | | | | | | | 11,435 |
| | | | | | | | |
Total Corporate Bonds & Notes
(Cost $132,018) | | 132,262 |
| | | | | | | | |
|
| CONVERTIBLE BONDS & NOTES 0.4% |
| Chesapeake Energy Corp. |
2.500% due 05/15/2037 | | | | 3,750 | | | | 3,844 |
| | | | | | | | |
Total Convertible Bonds & Notes
(Cost $3,808) | | 3,844 |
| | | | | | | | |
|
| MUNICIPAL BONDS & NOTES 0.1% |
| Badger, Wisconsin Tobacco Asset Securitization Corporations Revenue Bonds, Series 2002 |
6.000% due 06/01/2017 | | | | 475 | | | | 509 |
| |
| New York City, New York Municipal Water Finance Authority Revenue Notes, Series 2006 |
6.265% due 12/15/2013 | | | | 130 | | | | 128 |
| |
| Rhode Island State Tobacco Settlement Financing Corporations Revenue Bonds, Series 2002 |
6.000% due 06/01/2023 | | | | 500 | | | | 529 |
| | | | | | | | |
Total Municipal Bonds & Notes
(Cost $1,016) | | 1,166 |
| | | | | | | | |
|
| U.S. GOVERNMENT AGENCIES 21.3% |
| Fannie Mae |
4.187% due 11/01/2034 | | | | 6,176 | | | | 6,125 |
4.541% due 07/01/2035 | | | | 740 | | | | 736 |
4.673% due 05/25/2035 | | | | 2,900 | | | | 2,863 |
4.682% due 01/01/2035 | | | | 680 | | | | 670 |
5.380% due 12/25/2036 | | | | 490 | | | | 489 |
5.470% due 08/25/2034 | | | | 450 | | | | 450 |
5.500% due 03/01/2034 - 08/01/2037 | | | | 117,293 | | | | 113,134 |
5.670% due 05/25/2042 | | | | 298 | | | | 299 |
5.950% due 02/25/2044 | | | | 1,053 | | | | 1,051 |
6.000% due 09/01/2035 - 07/01/2037 | | | | 14,538 | | | | 14,387 |
6.227% due 06/01/2043 - 09/01/2044 | | | | 10,458 | | | | 10,592 |
7.320% due 11/01/2024 | | | | 17 | | | | 17 |
| |
| | | | | | |
| See Accompanying Notes | | Semiannual Report | | June 30, 2007 | | 9 |
Schedule of Investments Real Return Portfolio (Cont.)
| | | | | | | | |
| | | | | PRINCIPAL
AMOUNT
(000S) | | | | VALUE
(000S) |
| Freddie Mac | | | | | | | | |
4.000% due 03/15/2023 - 10/15/2023 | | $ | | 957 | | $ | | 945 |
4.550% due 01/01/2034 | | | | 667 | | | | 659 |
5.000% due 02/15/2020 - 08/15/2020 | | | | 9,907 | | | | 9,748 |
5.470% due 07/15/2019 - 10/15/2020 | | | | 19,200 | | | | 19,183 |
5.500% due 05/15/2016 | | | | 7,567 | | | | 7,567 |
5.550% due 07/15/2037 | | | | 1,400 | | | | 1,400 |
5.580% due 08/25/2031 | | | | 182 | | | | 182 |
5.670% due 12/15/2030 | | | | 485 | | | | 486 |
6.227% due 10/25/2044 - 02/25/2045 | | | | 16,300 | | | | 16,404 |
| |
| Small Business Administration | | | | |
4.504% due 02/10/2014 | | | | 1,567 | | | | 1,497 |
4.880% due 11/01/2024 | | | | 3,464 | | | | 3,314 |
| | | | | | | | |
Total U.S. Government Agencies
(Cost $212,767) | | 212,198 |
| | | | | | | | |
|
| U.S. TREASURY OBLIGATIONS 100.1% |
| Treasury Inflation Protected Securities (b) | | |
0.875% due 04/15/2010 | | | | 46,039 | | | | 43,737 |
1.625% due 01/15/2015 | | | | 3,372 | | | | 3,135 |
1.875% due 07/15/2015 | | | | 105,075 | | | | 99,329 |
2.000% due 04/15/2012 | | | | 22,109 | | | | 21,465 |
2.000% due 01/15/2014 | | | | 82,621 | | | | 79,426 |
2.000% due 07/15/2014 | | | | 99,281 | | | | 95,333 |
2.000% due 01/15/2016 | | | | 4,500 | | | | 4,274 |
2.000% due 01/15/2026 | | | | 81,940 | | | | 74,245 |
2.375% due 04/15/2011 | | | | 28,981 | | | | 28,673 |
2.375% due 01/15/2025 | | | | 74,048 | | | | 71,225 |
2.375% due 01/15/2027 | | | | 24,616 | | | | 23,647 |
2.500% due 07/15/2016 | | | | 20,261 | | | | 20,041 |
3.000% due 07/15/2012 | | | | 107,896 | | | | 110,020 |
3.375% due 01/15/2012 | | | | 4,679 | | | | 4,831 |
3.375% due 04/15/2032 | | | | 1,872 | | | | 2,155 |
3.500% due 01/15/2011 | | | | 28,874 | | | | 29,716 |
3.625% due 01/15/2008 | | | | 1,285 | | | | 1,287 |
3.625% due 04/15/2028 | | | | 63,131 | | | | 73,158 |
3.875% due 01/15/2009 | | | | 71,163 | | | | 72,319 |
3.875% due 04/15/2029 | | | | 66,711 | | | | 80,564 |
4.250% due 01/15/2010 | | | | 48,693 | | | | 50,553 |
| |
| U.S. Treasury Bonds | | | | |
6.000% due 02/15/2026 | | | | 1,400 | | | | 1,529 |
6.625% due 02/15/2027 | | | | 1,300 | | | | 1,523 |
8.875% due 08/15/2017 | | | | 1,000 | | | | 1,296 |
| |
| U.S. Treasury Notes | | | | |
4.500% due 02/28/2011 | | | | 1,700 | | | | 1,677 |
4.875% due 04/30/2011 | | | | 4,600 | | | | 4,595 |
| | | | | | | | |
Total U.S. Treasury Obligations
(Cost $993,078) | | 999,753 |
| | | | | | | | |
|
| MORTGAGE-BACKED SECURITIES 6.5% |
| American Home Mortgage Investment Trust |
5.470% due 09/25/2035 | | | | 111 | | | | 111 |
| |
| Arkle Master Issuer PLC | | | | |
5.300% due 11/19/2007 | | | | 1,300 | | | | 1,300 |
| |
| Arran Residential Mortgages Funding PLC |
5.340% due 04/12/2036 | | | | 2,119 | | | | 2,119 |
| |
| Banc of America Funding Corp. | | | | |
4.614% due 02/20/2036 | | | | 3,244 | | | | 3,193 |
| |
| Banc of America Mortgage Securities, Inc. |
6.500% due 09/25/2033 | | | | 186 | | | | 186 |
| |
| Bear Stearns Commercial Mortgage Securities |
6.440% due 06/16/2030 | | | | 600 | | | | 603 |
| |
| Citigroup Commercial Mortgage Trust |
5.390% due 08/15/2021 | | | | 95 | | | | 95 |
| |
| | | | | | | | |
| | | | | PRINCIPAL
AMOUNT
(000S) | | | | VALUE
(000S) |
| Citigroup Mortgage Loan Trust, Inc. |
4.700% due 12/25/2035 | | $ | | 4,161 | | $ | | 4,087 |
4.900% due 12/25/2035 | | | | 219 | | | | 218 |
| |
| Countrywide Alternative Loan Trust |
5.390% due 07/25/2046 | | | | 326 | | | | 326 |
5.400% due 09/20/2046 | | | | 667 | | | | 668 |
5.500% due 02/20/2047 | | | | 1,349 | | | | 1,347 |
5.500% due 05/25/2047 | | | | 460 | | | | 461 |
5.600% due 12/25/2035 | | | | 105 | | | | 105 |
| |
| Countrywide Home Loan Mortgage Pass-Through Trust |
3.786% due 11/19/2033 | | | | 250 | | | | 241 |
5.660% due 06/25/2035 | | | | 687 | | | | 686 |
| |
| CS First Boston Mortgage Securities Corp. |
4.938% due 12/15/2040 | | | | 1,011 | | | | 1,003 |
| |
| Deutsche ALT-A Securities, Inc. Mortgage Loan Trust |
5.420% due 10/25/2036 | | | | 1,018 | | | | 1,019 |
| |
| First Horizon Alternative Mortgage Securities |
4.732% due 06/25/2034 | | | | 885 | | | | 874 |
| |
| GE Capital Commercial Mortgage Corp. |
4.229% due 12/10/2037 | | | | 7,248 | | | | 7,087 |
| |
| Greenpoint Mortgage Funding Trust |
5.400% due 10/25/2046 | | | | 695 | | | | 695 |
5.400% due 01/25/2047 | | | | 5,206 | | | | 5,209 |
5.540% due 06/25/2045 | | | | 1,099 | | | | 1,100 |
5.590% due 11/25/2045 | | | | 635 | | | | 636 |
| |
| GSR Mortgage Loan Trust |
4.538% due 09/25/2035 | | | | 2,321 | | | | 2,288 |
| |
| Harborview Mortgage Loan Trust |
5.540% due 05/19/2035 | | | | 285 | | | | 286 |
| |
| Impac Secured Assets CMN Owner Trust |
5.400% due 01/25/2037 | | | | 354 | | | | 354 |
| |
| Indymac Index Mortgage Loan Trust |
5.410% due 11/25/2046 | | | | 932 | | | | 933 |
5.420% due 01/25/2037 | | | | 672 | | | | 672 |
| |
| JPMorgan Mortgage Trust |
5.008% due 07/25/2035 | | | | 1,416 | | | | 1,398 |
| |
| MASTR Adjustable Rate Mortgages Trust |
3.786% due 11/21/2034 | | | | 700 | | | | 686 |
| |
| Mellon Residential Funding Corp. |
5.670% due 11/15/2031 | | | | 1,131 | | | | 1,133 |
5.760% due 12/15/2030 | | | | 940 | | | | 944 |
| |
| Merrill Lynch Floating Trust |
5.390% due 06/15/2022 | | | | 267 | | | | 267 |
| |
| Residential Accredit Loans, Inc. |
5.620% due 08/25/2035 | | | | 368 | | | | 369 |
| |
| Securitized Asset Sales, Inc. |
7.542% due 11/26/2023 | | | | 12 | | | | 12 |
| |
| Sequoia Mortgage Trust |
5.670% due 10/19/2026 | | | | 350 | | | | 350 |
| |
| Structured Adjustable Rate Mortgage Loan Trust |
4.580% due 02/25/2034 | | | | 693 | | | | 694 |
6.429% due 01/25/2035 | | | | 389 | | | | 391 |
| |
| Structured Asset Mortgage Investments, Inc. |
5.390% due 08/25/2036 | | | | 784 | | | | 785 |
5.510% due 06/25/2036 | | | | 343 | | | | 343 |
| |
| Structured Asset Securities Corp. |
5.329% due 10/25/2035 | | | | 693 | | | | 692 |
5.370% due 05/25/2036 | | | | 56 | | | | 56 |
| |
| TBW Mortgage-Backed Pass-Through Certificates |
5.420% due 09/25/2036 | | | | 138 | | | | 139 |
5.430% due 01/25/2037 | | | | 991 | | | | 992 |
| |
| Thornburg Mortgage Securities Trust |
5.430% due 04/25/2036 | | | | 90 | | | | 90 |
| | | | | | | | |
| | | | | PRINCIPAL
AMOUNT
(000S) | | | | VALUE
(000S) |
5.430% due 12/25/2036 | | $ | | 4,514 | | $ | | 4,514 |
5.440% due 08/25/2036 | | | | 2,225 | | | | 2,224 |
| |
| Wachovia Bank Commercial Mortgage Trust |
5.681% due 04/15/2034 | | | | 595 | | | | 596 |
| |
| Washington Mutual, Inc. |
5.580% due 11/25/2045 | | | | 551 | | | | 553 |
5.610% due 08/25/2045 | | | | 89 | | | | 89 |
5.610% due 10/25/2045 | | | | 3,593 | | | | 3,602 |
5.724% due 07/25/2046 | | | | 1,931 | | | | 1,939 |
5.759% due 01/25/2047 | | | | 1,946 | | | | 1,946 |
5.839% due 12/25/2046 | | | | 252 | | | | 253 |
6.029% due 02/25/2046 | | | | 469 | | | | 470 |
6.229% due 11/25/2042 | | | | 119 | | | | 120 |
6.529% due 11/25/2046 | | | | 285 | | | | 286 |
| |
| Wells Fargo Mortgage-Backed Securities Trust |
3.539% due 09/25/2034 | | | | 531 | | | | 517 |
4.110% due 06/25/2035 | | | | 788 | | | | 785 |
| | | | | | | | |
Total Mortgage-Backed Securities
(Cost $65,143) | | 65,137 |
| | | | | | | | |
|
| ASSET-BACKED SECURITIES 10.7% |
| Aames Mortgage Investment Trust | | |
5.380% due 04/25/2036 | | | | 71 | | | | 71 |
| |
| Accredited Mortgage Loan Trust |
5.480% due 09/25/2035 | | | | 216 | | | | 216 |
| |
| ACE Securities Corp. |
5.370% due 07/25/2036 | | | | 406 | | | | 406 |
5.370% due 12/25/2036 | | | | 301 | | | | 301 |
5.430% due 10/25/2035 | | | | 431 | | | | 431 |
| |
| Argent Securities, Inc. |
5.370% due 10/25/2036 | | | | 1,026 | | | | 1,026 |
5.390% due 04/25/2036 | | | | 365 | | | | 365 |
5.400% due 03/25/2036 | | | | 411 | | | | 412 |
| |
| Asset-Backed Funding Certificates |
5.380% due 11/25/2036 | | | | 142 | | | | 142 |
5.380% due 01/25/2037 | | | | 4,070 | | | | 4,072 |
5.670% due 06/25/2034 | | | | 1,169 | | | | 1,172 |
| |
| Asset-Backed Securities Corp. Home Equity |
5.370% due 11/25/2036 | | | | 114 | | | | 114 |
| |
| Bank One Issuance Trust |
5.430% due 12/15/2010 | | | | 600 | | | | 601 |
| |
| Bear Stearns Asset-Backed Securities, Inc. |
5.370% due 11/25/2036 | | | | 154 | | | | 154 |
5.400% due 12/25/2035 | | | | 130 | | | | 130 |
5.410% due 04/25/2036 | | | | 234 | | | | 234 |
5.520% due 09/25/2034 | | | | 422 | | | | 422 |
5.650% due 10/25/2032 | | | | 58 | | | | 58 |
5.650% due 01/25/2036 | | | | 141 | | | | 141 |
5.770% due 03/25/2043 | | | | 191 | | | | 191 |
| |
| Carrington Mortgage Loan Trust |
5.370% due 01/25/2037 | | | | 978 | | | | 979 |
| |
| Centex Home Equity |
5.370% due 06/25/2036 | | | | 1,123 | | | | 1,124 |
| |
| Chase Credit Card Master Trust |
5.430% due 10/15/2010 | | | | 500 | | | | 501 |
5.430% due 02/15/2011 | | | | 1,000 | | | | 1,002 |
5.440% due 02/15/2010 | | | | 300 | | | | 300 |
| |
| Chase Issuance Trust |
5.330% due 12/15/2010 | | | | 400 | | | | 400 |
| |
| Citibank Credit Card Issuance Trust |
5.456% due 01/15/2010 | | | | 1,505 | | | | 1,507 |
| |
| Citigroup Mortgage Loan Trust, Inc. |
5.370% due 11/25/2036 | | | | 373 | | | | 374 |
5.400% due 12/25/2035 | | | | 586 | | | | 586 |
| |
| Countrywide Asset-Backed Certificates |
5.350% due 01/25/2046 | | | | 1,188 | | | | 1,189 |
5.370% due 01/25/2037 | | | | 733 | | | | 733 |
| | | | |
| 10 | | PIMCO Variable Insurance Trust | | See Accompanying Notes |
| | |
| |
| | | June 30, 2007 (Unaudited) |
| | | | | | | | |
| | | | | PRINCIPAL
AMOUNT
(000S) | | | | VALUE
(000S) |
5.370% due 05/25/2037 | | $ | | 4,697 | | $ | | 4,699 |
5.380% due 09/25/2046 | | | | 425 | | | | 425 |
5.390% due 07/25/2036 | | | | 285 | | | | 285 |
5.390% due 09/25/2036 | | | | 316 | | | | 316 |
5.390% due 06/25/2037 | | | | 7,110 | | | | 7,114 |
5.430% due 10/25/2046 | | | | 1,031 | | | | 1,032 |
5.450% due 07/25/2036 | | | | 235 | | | | 236 |
| |
| Credit-Based Asset Servicing & Securitization LLC |
5.380% due 11/25/2036 | | | | 2,538 | | | | 2,540 |
| |
| Equity One Asset-Backed Securities, Inc. |
5.620% due 04/25/2034 | | | | 96 | | | | 96 |
| |
| First Franklin Mortgage Loan Asset-Backed Certificates |
5.350% due 07/25/2036 | | | | 2,846 | | | | 2,848 |
5.370% due 11/25/2036 | | | | 2,047 | | | | 2,048 |
5.370% due 12/25/2036 | | | | 214 | | | | 214 |
5.410% due 01/25/2036 | | | | 979 | | | | 980 |
| |
| Fremont Home Loan Trust |
5.370% due 10/25/2036 | | | | 139 | | | | 139 |
5.380% due 01/25/2037 | | | | 497 | | | | 497 |
5.490% due 01/25/2036 | | | | 194 | | | | 194 |
| |
| GSAMP Trust |
5.360% due 10/25/2046 | | | | 217 | | | | 217 |
5.390% due 10/25/2036 | | | | 110 | | | | 110 |
5.390% due 12/25/2036 | | | | 990 | | | | 990 |
5.430% due 11/25/2035 | | | | 190 | | | | 190 |
5.610% due 03/25/2034 | | | | 207 | | | | 207 |
| |
| GSR Mortgage Loan Trust |
5.420% due 11/25/2030 | | | | 315 | | | | 315 |
| |
| HFC Home Equity Loan Asset-Backed Certificates |
5.390% due 03/20/2036 | | | | 317 | | | | 317 |
| |
| Home Equity Asset Trust |
5.400% due 05/25/2036 | | | | 454 | | | | 454 |
5.430% due 02/25/2036 | | | | 173 | | | | 173 |
| |
| Honda Auto Receivables Owner Trust |
5.342% due 11/15/2007 | | | | 189 | | | | 190 |
| |
| HSI Asset Securitization Corp. Trust |
5.370% due 10/25/2036 | | | | 238 | | | | 238 |
5.370% due 12/25/2036 | | | | 5,130 | | | | 5,133 |
5.400% due 12/25/2035 | | | | 525 | | | | 526 |
| |
| Hyundai Auto Receivables Trust |
5.348% due 11/15/2007 | | | | 32 | | | | 32 |
| |
| Indymac Residential Asset-Backed Trust |
5.370% due 11/25/2036 | | | | 379 | | | | 379 |
5.380% due 04/25/2037 | | | | 2,842 | | | | 2,843 |
5.420% due 03/25/2036 | | | | 249 | | | | 249 |
| |
| JPMorgan Mortgage Acquisition Corp. |
5.360% due 08/25/2036 | | | | 177 | | | | 177 |
5.370% due 07/25/2036 | | | | 363 | | | | 363 |
5.370% due 08/25/2036 | | | | 912 | | | | 912 |
5.370% due 10/25/2036 | | | | 2,698 | | | | 2,695 |
5.390% due 11/25/2036 | | | | 195 | | | | 195 |
5.530% due 06/25/2035 | | | | 23 | | | | 23 |
| |
| Lehman XS Trust |
5.390% due 05/25/2046 | | | | 418 | | | | 419 |
5.400% due 04/25/2046 | | | | 1,107 | | | | 1,107 |
5.400% due 07/25/2046 | | | | 759 | | | | 760 |
5.400% due 11/25/2046 | | | | 1,161 | | | | 1,162 |
| |
| Long Beach Mortgage Loan Trust |
5.350% due 06/25/2036 | | | | 68 | | | | 68 |
5.360% due 11/25/2036 | | | | 154 | | | | 154 |
5.380% due 05/25/2046 | | | | 99 | | | | 99 |
5.390% due 03/25/2036 | | | | 84 | | | | 84 |
5.400% due 02/25/2036 | | | | 164 | | | | 164 |
5.410% due 01/25/2036 | | | | 231 | | | | 231 |
5.500% due 08/25/2035 | | | | 180 | | | | 180 |
| |
| MASTR Asset-Backed Securities Trust |
5.380% due 10/25/2036 | | | | 34 | | | | 35 |
| | | | | | | | |
| | | | | PRINCIPAL
AMOUNT
(000S) | | | | VALUE
(000S) |
5.380% due 11/25/2036 | | $ | | 2,442 | | $ | | 2,444 |
5.400% due 01/25/2036 | | | | 487 | | | | 488 |
| |
| MBNA Credit Card Master Note Trust |
5.420% due 12/15/2011 | | | | 100 | | | | 100 |
5.501% due 09/15/2010 | | | | 200 | | | | 200 |
| |
| Merrill Lynch Mortgage Investors, Inc. |
5.350% due 06/25/2037 | | | | 321 | | | | 321 |
5.370% due 05/25/2037 | | | | 670 | | | | 670 |
5.390% due 08/25/2036 | | | | 2,928 | | | | 2,928 |
5.390% due 07/25/2037 | | | | 704 | | | | 705 |
5.400% due 01/25/2037 | | | | 102 | | | | 102 |
| |
| Morgan Stanley ABS Capital I |
5.350% due 06/25/2036 | | | | 39 | | | | 39 |
5.360% due 06/25/2036 | | | | 86 | | | | 86 |
5.360% due 07/25/2036 | | | | 2,608 | | | | 2,610 |
5.360% due 10/25/2036 | | | | 589 | | | | 590 |
5.370% due 09/25/2036 | | | | 563 | | | | 563 |
5.370% due 10/25/2036 | | | | 373 | | | | 373 |
5.400% due 12/25/2035 | | | | 16 | | | | 16 |
| |
| Morgan Stanley IXIS Real Estate Capital Trust |
5.370% due 11/25/2036 | | | | 145 | | | | 145 |
| |
| Nelnet Student Loan Trust |
5.325% due 10/27/2014 | | | | 81 | | | | 81 |
5.340% due 09/25/2012 | | | | 3,764 | | | | 3,766 |
5.445% due 07/25/2016 | | | | 386 | | | | 387 |
5.445% due 10/25/2016 | | | | 346 | | | | 346 |
| |
| Newcastle Mortgage Securities Trust |
5.390% due 03/25/2036 | | | | 260 | | | | 260 |
| |
| Nissan Auto Lease Trust |
5.347% due 12/14/2007 | | | | 9 | | | | 9 |
| |
| Nomura Asset Acceptance Corp. |
5.460% due 01/25/2036 | | | | 289 | | | | 290 |
| |
| Nomura Home Equity Loan, Inc. |
5.400% due 02/25/2036 | | | | 86 | | | | 86 |
| |
| Option One Mortgage Loan Trust |
5.360% due 02/25/2037 | | | | 71 | | | | 71 |
5.370% due 07/25/2036 | | | | 84 | | | | 84 |
5.420% due 11/25/2035 | | | | 147 | | | | 147 |
| |
| Park Place Securities, Inc. |
5.580% due 09/25/2035 | | | | 51 | | | | 52 |
| |
| Renaissance Home Equity Loan Trust |
5.700% due 12/25/2032 | | | | 81 | | | | 81 |
| |
| Residential Asset Mortgage Products, Inc. |
5.390% due 11/25/2036 | | | | 232 | | | | 232 |
5.400% due 01/25/2036 | | | | 60 | | | | 60 |
| |
| Residential Asset Securities Corp. |
5.360% due 06/25/2036 | | | | 2,188 | | | | 2,190 |
5.390% due 04/25/2036 | | | | 79 | | | | 79 |
5.390% due 11/25/2036 | | | | 1,914 | | | | 1,915 |
| |
| Residential Funding Mortgage Securities II, Inc. |
5.460% due 09/25/2035 | | | | 531 | | | | 532 |
| |
| Securitized Asset-Backed Receivables LLC Trust |
5.370% due 09/25/2036 | | | | 206 | | | | 206 |
5.380% due 12/25/2036 | | | | 9,622 | | | | 9,626 |
5.390% due 10/25/2035 | | | | 99 | | | | 99 |
| |
| SLM Student Loan Trust | | | | | | | | |
5.325% due 10/25/2012 | | | | 489 | | | | 489 |
5.325% due 07/25/2013 | | | | 550 | | | | 550 |
5.335% due 04/25/2012 | | | | 260 | | | | 260 |
| |
| Soundview Home Equity Loan Trust |
5.350% due 07/25/2036 | | | | 538 | | | | 538 |
5.370% due 10/25/2036 | | | | 831 | | | | 832 |
5.380% due 11/25/2036 | | | | 462 | | | | 462 |
5.390% due 03/25/2036 | | | | 47 | | | | 47 |
5.420% due 10/25/2036 | | | | 212 | | | | 212 |
5.550% due 06/25/2035 | | | | 72 | | | | 72 |
| |
| | | | | | | | | |
| | | | | PRINCIPAL
AMOUNT
(000S) | | | | VALUE
(000S) |
| Specialty Underwriting & Residential Finance |
5.350% due 06/25/2037 | | $ | | | 114 | | $ | | 114 |
5.365% due 11/25/2037 | | | | | 70 | | | | 70 |
| |
| Structured Asset Investment Loan Trust |
5.370% due 07/25/2036 | | | | | 113 | | | | 113 |
| |
| Structured Asset Securities Corp. |
4.900% due 04/25/2035 | | | | | 1,410 | | | | 1,406 |
5.370% due 10/25/2036 | | | | | 1,035 | | | | 1,035 |
5.400% due 11/25/2035 | | | | | 195 | | | | 196 |
5.450% due 12/25/2035 | | | | | 692 | | | | 692 |
| |
| Truman Capital Mortgage Loan Trust |
5.660% due 01/25/2034 | | | | | 33 | | | | 33 |
| |
| USAA Auto Owner Trust |
5.030% due 11/17/2008 | | | | | 72 | | | | 73 |
| |
| Wachovia Auto Owner Trust |
4.820% due 02/20/2009 | | | | | 662 | | | | 663 |
| |
| Washington Mutual Asset-Backed Certificates |
5.370% due 01/25/2037 | | | | | 874 | | | | 875 |
| |
| Wells Fargo Home Equity Trust |
5.370% due 01/25/2037 | | | | | 1,070 | | | | 1,071 |
| | | | | | | | | |
Total Asset-Backed Securities
(Cost $107,130) | | 107,190 |
| | | | | | | | | |
|
| SOVEREIGN ISSUES 0.0% |
| Colombia Government International Bond |
10.000% due 01/23/2012 | | | | | 350 | | | | 405 |
| | | | | | | | | |
Total Sovereign Issues (Cost $352) | | 405 |
| | | | | | | | | |
|
| FOREIGN CURRENCY-DENOMINATED ISSUES 1.2% |
| Canadian Government Bond |
3.000% due 12/01/2036 (b) | | CAD | | | 542 | | | | 610 |
| |
| France Government Bond |
3.000% due 07/25/2012 (b) | | EUR | | | 1,678 | | | | 2,335 |
| |
| Italy Buoni Poliennali Del Tesoro |
2.150% due 09/15/2014 (b) | | | | | 543 | | | | 717 |
| |
| Pylon Ltd. |
5.648% due 12/18/2008 | | | | | 700 | | | | 956 |
8.048% due 12/18/2008 | | | | | 1,100 | | | | 1,520 |
| |
| United Kingdom Gilt Inflation Linked Bond |
2.500% due 05/20/2009 | | GBP | | | 1,100 | | | | 5,679 |
| | | | | | | | | |
Total Foreign Currency-Denominated Issues (Cost $11,335) | | 11,817 |
| | | | | | | | | |
|
| SHORT-TERM INSTRUMENTS 55.4% |
| CERTIFICATES OF DEPOSIT 7.0% |
| Abbey National Treasury Services PLC |
5.270% due 07/02/2008 | | $ | | | 7,200 | | | | 7,203 |
| |
| BNP Paribas |
5.262% due 05/28/2008 | | | | | 5,400 | | | | 5,402 |
5.262% due 07/03/2008 | | | | | 8,200 | | | | 8,198 |
| |
| Calyon Financial, Inc. |
5.340% due 01/16/2009 | | | | | 1,800 | | | | 1,800 |
| |
| Fortis Bank NY |
5.265% due 06/30/2008 | | | | | 5,200 | | | | 5,202 |
| |
| HSBC Bank USA N.A. |
5.426% due 07/28/2008 | | | | | 1,100 | | | | 1,102 |
| |
| Nordea Bank Finland PLC |
5.267% due 03/31/2008 | | | | | 300 | | | | 300 |
5.308% due 05/28/2008 | | | | | 700 | | | | 701 |
| |
| Royal Bank of Canada |
5.267% due 06/30/2008 | | | | | 7,900 | | | | 7,907 |
| |
| | | | | | |
| See Accompanying Notes | | Semiannual Report | | June 30, 2007 | | 11 |
Schedule of Investments Real Return Portfolio (Cont.)
| | | | | | | | |
| | | | | PRINCIPAL
AMOUNT
(000S) | | | | VALUE
(000S) |
| Royal Bank of Scotland Group PLC |
5.265% due 03/26/2008 | | $ | | 5,700 | | $ | | 5,700 |
| |
| Skandinav Enskilda BK |
5.272% due 08/21/2008 | | | | 100 | | | | 100 |
5.340% due 08/21/2008 | | | | 5,600 | | | | 5,602 |
5.350% due 02/13/2009 | | | | 5,400 | | | | 5,404 |
| |
| Societe Generale NY |
5.270% due 03/26/2008 | | | | 5,700 | | | | 5,700 |
5.271% due 06/30/2008 | | | | 5,600 | | | | 5,602 |
| |
| Unicredito Italiano NY |
5.360% due 05/29/2008 | | | | 4,200 | | | | 4,202 |
| | | | | | | | |
| | | | | | | | 70,125 |
| | | | | | | | |
|
| COMMERCIAL PAPER 45.3% |
| Australia and New Zealand Banking Group Ltd. |
5.245% due 09/19/2007 | | | | 26,800 | | | | 26,480 |
| |
| Bank of Ireland |
5.230% due 11/08/2007 | | | | 1,300 | | | | 1,298 |
| |
| Barclays U.S. Funding Corp. |
5.235% due 09/26/2007 | | | | 27,800 | | | | 27,598 |
5.245% due 09/26/2007 | | | | 100 | | | | 99 |
5.250% due 09/26/2007 | | | | 2,000 | | | | 1,974 |
| |
| BNP Paribas Finance, Inc. |
5.330% due 10/23/2007 | | | | 10,600 | | | | 10,600 |
| |
| Calyon N.A. LLC |
5.175% due 06/29/2010 | | | | 31,200 | | | | 31,169 |
| |
| CBA (de) Finance |
5.225% due 09/28/2007 | | | | 4,100 | | | | 4,087 |
| |
| Cox Communications, Inc. |
5.570% due 09/17/2007 | | | | 1,100 | | | | 1,100 |
| |
| Danske Corp. |
5.205% due 10/12/2007 | | | | 300 | | | | 298 |
5.220% due 10/12/2007 | | | | 30,500 | | | | 30,465 |
| |
| | | | | | | | |
| | | | | PRINCIPAL
AMOUNT
(000S) | | | | VALUE
(000S) |
| Dexia Delaware LLC |
5.240% due 09/21/2007 | | $ | | 29,000 | | $ | | 28,662 |
| |
| DnB NORBank ASA |
5.225% due 10/12/2007 | | | | 3,900 | | | | 3,900 |
| |
| Fortis Funding LLC |
5.255% due 09/05/2007 | | | | 23,900 | | | | 23,844 |
5.275% due 09/05/2007 | | | | 600 | | | | 598 |
| |
| General Electric Capital Corp. |
5.200% due 11/06/2007 | | | | 2,500 | | | | 2,490 |
| |
| HBOS Treasury Services PLC |
5.225% due 11/13/2007 | | | | 500 | | | | 500 |
5.250% due 09/21/2007 | | | | 27,700 | | | | 27,365 |
| |
| Intesa Funding LLC |
5.320% due 09/05/2007 | | | | 20,000 | | | | 19,988 |
| |
| Natixis S.A. |
5.250% due 09/21/2007 | | | | 2,400 | | | | 2,371 |
5.380% due 09/21/2007 | | | | 27,200 | | | | 27,200 |
| |
| Nordea N.A., Inc. |
5.308% due 04/09/2009 | | | | 2,300 | | | | 2,300 |
| |
| Rabobank USA Financial Corp. |
5.330% due 07/26/2007 | | | | 27,200 | | | | 27,200 |
| |
| Santander Hispano Finance Delaware |
5.250% due 09/26/2007 | | | | 18,800 | | | | 18,556 |
| |
| Societe Generale NY |
5.240% due 11/26/2007 | | | | 1,000 | | | | 988 |
5.245% due 11/26/2007 | | | | 17,300 | | | | 17,093 |
5.250% due 11/26/2007 | | | | 200 | | | | 197 |
| |
| Svenska Handelsbanken, Inc. |
5.185% due 10/09/2007 | | | | 22,500 | | | | 22,477 |
| |
| TotalFinaElf Capital S.A. |
5.340% due 07/02/2007 | | | | 27,200 | | | | 27,200 |
| |
| | | | | | | | | |
| | | | | PRINCIPAL
AMOUNT
(000S) | | | | VALUE
(000S) | |
| UBS Finance Delaware LLC | |
5.145% due 10/23/2007 | | $ | | 800 | | $ | | 797 | |
5.200% due 10/23/2007 | | | | 20,800 | | | | 20,463 | |
5.230% due 10/23/2007 | | | | 2,200 | | | | 2,165 | |
5.235% due 10/23/2007 | | | | 5,800 | | | | 5,742 | |
5.240% due 10/23/2007 | | | | 700 | | | | 690 | |
| | |
| Unicredito Italiano SpA | |
5.200% due 01/22/2008 | | | | 10,500 | | | | 10,319 | |
| | |
| Westpac Banking Corp. | |
5.195% due 11/05/2007 | | | | 22,400 | | | | 22,300 | |
5.230% due 11/05/2007 | | | | 600 | | | | 598 | |
5.240% due 11/05/2007 | | | | 1,100 | | | | 1,087 | |
| | | | | | | | | |
| | | | | | | | 452,258 | |
| | | | | | | | | |
| |
| TRI-PARTY REPURCHASE AGREEMENTS 0.3% | |
| State Street Bank and Trust Co. | |
4.900% due 07/02/2007 | | | | 3,467 | | | | 3,467 | |
| | | | | | | | | |
(Dated 06/29/2007. Collateralized by Freddie Mac 5.000% due 06/11/2009 valued at $3,539. Repurchase proceeds are $3,468.) | |
| |
| U.S. TREASURY BILLS 2.8% | |
4.575% due 08/30/2007 - 09/13/2007 (a)(c)(d)(f) | | | | 27,920 | | | | 27,666 | |
| | | | | | | | | |
Total Short-Term Instruments
(Cost $553,565) | | 553,516 | |
| | | | | | | | | |
| |
| PURCHASED OPTIONS (h) 0.2% | | 1,570 | |
(Cost $1,852) | | | | 1,570 | |
| |
| |
| Total Investments (e) 209.4% (Cost $2,084,650) | | $ | | 2,091,451 | |
| | | | | |
| Written Options (i) (0.0%) | | | | (238 | ) |
| (Premiums $387) | | | | | | | | | |
| |
| Other Assets and Liabilities (Net) (109.4%) | | (1,092,533 | ) |
| | | | | | | | | |
| Net Assets 100.0% | | | | | | $ | | 998,680 | |
| | | | | | | | | |
| |
Notes to Schedule of Investments (amounts in thousands*, except number of contracts):
* A zero balance may reflect actual amounts rounding to less than one thousand.
(a) Coupon represents a weighted average rate.
(b) Principal amount of security is adjusted for inflation.
(c) Securities with an aggregate market value of $2,476 have been pledged as collateral for swap and swaption contracts on June 30, 2007.
(d) Securities with an aggregate market value of $2,661 have been pledged as collateral for delayed-delivery securities on June 30, 2007.
(e) As of June 30, 2007, portfolio securities with an aggregate value of $30,875 were valued in good faith and pursuant to the guidelines established by the Board of Trustees.
(f) Securities with an aggregate market value of $2,406 have been segregated with the custodian to cover margin requirements for the following open futures contracts on June 30, 2007:
| | | | | | | | | | |
| Description | | Type | | Expiration
Month | | # of
Contracts | | Unrealized
Appreciation/
(Depreciation) | |
90-Day Euribor December Futures | | Long | | 12/2008 | | 21 | | $ | (8 | ) |
90-Day Euribor June Futures | | Long | | 06/2009 | | 21 | | | (5 | ) |
90-Day Euribor March Futures | | Long | | 03/2009 | | 21 | | | (7 | ) |
90-Day Euribor September Futures | | Long | | 09/2008 | | 21 | | | (8 | ) |
90-Day Eurodollar December Futures | | Short | | 12/2007 | | 28 | | | 38 | |
90-Day Eurodollar December Futures | | Long | | 12/2008 | | 12 | | | (6 | ) |
90-Day Eurodollar June Futures | | Short | | 06/2008 | | 35 | | | 38 | |
90-Day Eurodollar June Futures | | Long | | 06/2009 | | 35 | | | (17 | ) |
90-Day Eurodollar March Futures | | Short | | 03/2008 | | 28 | | | 34 | |
90-Day Eurodollar March Futures | | Long | | 03/2009 | | 12 | | | (6 | ) |
90-Day Eurodollar September Futures | | Short | | 09/2008 | | 49 | | | 49 | |
Japan Government 10-Year Bond September Futures | | Long | | 09/2007 | | 16 | | | 7 | |
U.S. Treasury 30-Year Bond September Futures | | Short | | 09/2007 | | 665 | | | 932 | |
U.S. Treasury 5-Year Note September Futures | | Short | | 09/2007 | | 214 | | | (105 | ) |
United Kingdom 90-Day LIBOR Sterling Interest Rate June Futures | | Long | | 06/2008 | | 550 | | | (944 | ) |
United Kingdom 90-Day LIBOR Sterling Interest Rate March Futures | | Long | | 03/2008 | | 448 | | | (845 | ) |
| | | | | | | | | | |
| | | | | | | | $ | (853 | ) |
| | | | | | | | | | |
| | | | |
| 12 | | PIMCO Variable Insurance Trust | | See Accompanying Notes |
| | |
| |
| | | June 30, 2007 (Unaudited) |
(g) Swap agreements outstanding on June 30, 2007:
Credit Default Swaps
| | | | | | | | | | | | | | | | |
| Counterparty | | Reference Entity | | Buy/Sell
Protection (1) | | (Pay)/Receive
Fixed Rate | | | Expiration
Date | | Notional
Amount | | Unrealized
Appreciation/
(Depreciation) | |
Barclays Bank PLC | | Panama Government International Bond 8.875% due 09/30/2027 | | Sell | | 0.300% | | | 12/20/2008 | | $ | 2,900 | | $ | 1 | |
Barclays Bank PLC | | Peru Government International Bond 8.750% due 11/21/2033 | | Sell | | 0.350% | | | 12/20/2008 | | | 1,500 | | | 1 | |
Barclays Bank PLC | | Russia Government International Bond 7.500% due 03/31/2030 | | Sell | | 0.330% | | | 12/20/2008 | | | 1,500 | | | 1 | |
Barclays Bank PLC | | Ukraine Government International Bond 7.650% due 06/11/2013 | | Sell | | 0.780% | | | 12/20/2008 | | | 1,500 | | | 6 | |
Citibank N.A. | | Glitnir Banki HF 6.330% due 07/28/2011 | | Buy | | (0.290% | ) | | 06/20/2012 | | | 1,100 | | | (1 | ) |
Credit Suisse First Boston | | Chesapeake Energy Corp. 6.875% due 01/15/2016 | | Sell | | 0.970% | | | 06/20/2012 | | | 300 | | | (3 | ) |
Credit Suisse First Boston | | Chesapeake Energy Corp. 6.875% due 01/15/2016 | | Sell | | 1.010% | | | 06/20/2012 | | | 300 | | | (3 | ) |
Credit Suisse First Boston | | Chesapeake Energy Corp. 6.875% due 01/15/2016 | | Sell | | 1.010% | | | 06/20/2012 | | | 1,100 | | | (11 | ) |
Credit Suisse First Boston | | Chesapeake Energy Corp. 6.875% due 01/15/2016 | | Sell | | 1.040% | | | 06/20/2012 | | | 200 | | | (2 | ) |
Deutsche Bank AG | | Indonesia Government International Bond 6.750% due 03/10/2014 | | Sell | | 0.510% | | | 12/20/2008 | | | 3,000 | | | 6 | |
Deutsche Bank AG | | Russia Government International Bond 7.500% due 03/31/2030 | | Sell | | 0.325% | | | 12/20/2008 | | | 1,400 | | | 1 | |
Deutsche Bank AG | | Ukraine Government International Bond 7.650% due 06/11/2013 | | Sell | | 0.790% | | | 12/20/2008 | | | 1,400 | | | 6 | |
Goldman Sachs & Co. | | General Motors Acceptance Corp. 6.875% due 08/28/2012 | | Sell | | 3.400% | | | 06/20/2011 | | | 700 | | | 37 | |
HSBC Bank USA | | Russia Government International Bond 7.500% due 03/31/2030 | | Sell | | 0.280% | | | 11/20/2007 | | | 1,000 | | | 0 | |
HSBC Bank USA | | Russia Government International Bond 7.500% due 03/31/2030 | | Sell | | 0.240% | | | 02/20/2008 | | | 2,000 | | | 2 | |
Lehman Brothers, Inc. | | Peru Government International Bond 9.125% due 02/21/2012 | | Sell | | 0.370% | | | 12/20/2008 | | | 1,400 | | | 2 | |
UBS Warburg LLC | | Ford Motor Credit Co. 7.000% due 10/01/2013 | | Sell | | 5.250% | | | 09/20/2007 | | | 1,300 | | | 16 | |
| | | | | | | | | | | | | | | | |
| | | | | | | | | | | | | | $ | 59 | |
| | | | | | | | | | | | | | | | |
(1) If the Portfolio is a seller of protection and a credit event occurs, as defined under the terms of that particular swap agreement, the Portfolio will pay to the buyer of the protection an amount up to the notional value of the swap and in certain instances, take delivery of the security. As a buyer of protection, the Portfolio will generally receive from the seller of protection an amount up to the notional amount of the swap if a credit event occurs.
Interest Rate Swaps
| | | | | | | | | | | | | | | |
| Counterparty | | Floating Rate Index | | Pay/Receive
Floating Rate | | Fixed
Rate | | Expiration
Date | | Notional Amount | | Unrealized
Appreciation/
(Depreciation) | |
Citibank N.A. | | 6-Month Australian Bank Bill | | Pay | | 6.500% | | 01/15/2010 | | AUD | 4,700 | | $ | (33 | ) |
Deutsche Bank AG | | 6-Month Australian Bank Bill | | Pay | | 6.500% | | 01/15/2010 | | | 18,700 | | | (126 | ) |
Deutsche Bank AG | | 6-Month Australian Bank Bill | | Pay | | 7.000% | | 06/15/2010 | | | 46,200 | | | (50 | ) |
JPMorgan Chase & Co. | | 6-Month Australian Bank Bill | | Pay | | 6.500% | | 01/15/2010 | | | 3,100 | | | (22 | ) |
Royal Bank of Canada | | 6-Month Australian Bank Bill | | Pay | | 6.500% | | 01/15/2010 | | | 1,900 | | | (12 | ) |
Royal Bank of Canada | | 3-Month Canadian Bank Bill | | Receive | | 5.500% | | 06/20/2017 | | CAD | 18,500 | | | 3 | |
Barclays Bank PLC | | 5-Year French CPI Ex Tobacco Daily Reference Index | | Pay | | 2.103% | | 10/15/2010 | | EUR | 2,500 | | | 41 | |
Barclays Bank PLC | | 5-Year French CPI Ex Tobacco Daily Reference Index | | Pay | | 1.948% | | 03/15/2012 | | | 600 | | | (15 | ) |
Barclays Bank PLC | | 5-Year French CPI Ex Tobacco Daily Reference Index | | Pay | | 1.960% | | 04/05/2012 | | | 300 | | | (3 | ) |
Barclays Bank PLC | | 5-Year French CPI Ex Tobacco Daily Reference Index | | Pay | | 1.980% | | 04/30/2012 | | | 900 | | | (10 | ) |
BNP Paribas Bank | | 5-Year French CPI Ex Tobacco Daily Reference Index | | Pay | | 2.090% | | 10/15/2010 | | | 2,500 | | | 30 | |
BNP Paribas Bank | | 5-Year French CPI Ex Tobacco Daily Reference Index | | Pay | | 1.983% | | 03/15/2012 | | | 1,900 | | | (16 | ) |
BNP Paribas Bank | | 5-Year French CPI Ex Tobacco Daily Reference Index | | Pay | | 2.150% | | 01/19/2016 | | | 15,000 | | | 120 | |
Goldman Sachs & Co. | | 5-Year French CPI Ex Tobacco Daily Reference Index | | Pay | | 1.976% | | 12/15/2011 | | | 5,100 | | | (15 | ) |
Goldman Sachs & Co. | | 5-Year French CPI Ex Tobacco Daily Reference Index | | Pay | | 1.995% | | 03/15/2012 | | | 9,200 | | | (51 | ) |
Goldman Sachs & Co. | | 5-Year French CPI Ex Tobacco Daily Reference Index | | Pay | | 1.960% | | 03/30/2012 | | | 700 | | | (6 | ) |
JPMorgan Chase & Co. | | 5-Year French CPI Ex Tobacco Daily Reference Index | | Pay | | 1.948% | | 03/15/2012 | | | 600 | | | (6 | ) |
JPMorgan Chase & Co. | | 5-Year French CPI Ex Tobacco Daily Reference Index | | Pay | | 1.958% | | 04/10/2012 | | | 3,800 | | | (40 | ) |
JPMorgan Chase & Co. | | 5-Year French CPI Ex Tobacco Daily Reference Index | | Pay | | 2.353% | | 10/15/2016 | | | 2,500 | | | 14 | |
Morgan Stanley | | 6-Month EUR-LIBOR | | Receive | | 4.000% | | 06/15/2017 | | | 6,800 | | | 657 | |
Royal Bank of Scotland Group PLC | | 5-Year French CPI Ex Tobacco Daily Reference Index | | Pay | | 1.955% | | 03/28/2012 | | | 2,100 | | | (20 | ) |
UBS Warburg LLC | | 5-Year French CPI Ex Tobacco Daily Reference Index | | Pay | | 2.146% | | 10/15/2010 | | | 3,700 | | | 56 | |
UBS Warburg LLC | | Eurostat Eurozone HICP Ex Tobacco Unrevised Series NSA Index | | Receive | | 2.275% | | 10/15/2016 | | | 2,700 | | | 9 | |
UBS Warburg LLC | | 5-Year French CPI Ex Tobacco Daily Reference Index | | Pay | | 2.350% | | 10/15/2016 | | | 2,700 | | | 10 | |
Barclays Bank PLC | | 6-Month GBP-LIBOR | | Pay | | 5.000% | | 06/15/2009 | | GBP | 19,700 | | | (731 | ) |
Barclays Bank PLC | | 6-Month GBP-LIBOR | | Receive | | 4.000% | | 12/15/2035 | | | 5,700 | | | 442 | |
Credit Suisse First Boston | | 6-Month GBP-LIBOR | | Pay | | 5.000% | | 09/15/2010 | | | 4,600 | | | (203 | ) |
Credit Suisse First Boston | | 6-Month GBP-LIBOR | | Receive | | 4.000% | | 12/15/2035 | | | 1,800 | | | 134 | |
Goldman Sachs & Co. | | 6-Month GBP-LIBOR | | Receive | | 5.000% | | 09/15/2015 | | | 4,300 | | | 413 | |
HSBC Bank USA | | 6-Month GBP-LIBOR | | Receive | | 4.250% | | 06/12/2036 | | | 2,500 | | | 635 | |
JPMorgan Chase & Co. | | 6-Month GBP-LIBOR | | Pay | | 5.000% | | 06/15/2008 | | | 5,000 | | | (85 | ) |
Royal Bank of Scotland Group PLC | | 6-Month GBP-LIBOR | | Pay | | 5.000% | | 09/15/2010 | | | 6,700 | | | (306 | ) |
UBS Warburg LLC | | United Kingdom RPI Index | | Pay | | 2.548% | | 11/14/2016 | | | 5,000 | | | (118 | ) |
Morgan Stanley | | 6-Month JPY-LIBOR | | Pay | | 1.000% | | 03/18/2009 | | JPY | 2,900,000 | | | (4 | ) |
Barclays Bank PLC | | 28-Day Mexico Interbank TIIE Banxico | | Pay | | 8.720% | | 09/05/2016 | | MXN | 17,000 | | | 66 | |
Barclays Bank PLC | | 28-Day Mexico Interbank TIIE Banxico | | Pay | | 8.330% | | 02/14/2017 | | | 11,100 | | | 18 | |
Citibank N.A. | | 28-Day Mexico Interbank TIIE Banxico | | Pay | | 8.170% | | 11/04/2016 | | | 136,400 | | | 44 | |
Goldman Sachs & Co. | | 28-Day Mexico Interbank TIIE Banxico | | Pay | | 8.170% | | 11/04/2016 | | | 15,300 | | | 11 | |
Merrill Lynch & Co., Inc. | | 28-Day Mexico Interbank TIIE Banxico | | Pay | | 8.170% | | 11/04/2016 | | | 52,900 | | | 28 | |
Morgan Stanley | | 28-Day Mexico Interbank TIIE Banxico | | Pay | | 8.170% | | 11/04/2016 | | | 20,900 | | | 5 | |
| | | | | | |
| See Accompanying Notes | | Semiannual Report | | June 30, 2007 | | 13 |
Schedule of Investments Real Return Portfolio (Cont.)
| | | | | | | | | | | | | | | |
| Counterparty | | Floating Rate Index | | Pay/Receive
Floating Rate | | Fixed
Rate | | Expiration
Date | | Notional
Amount | | Unrealized
Appreciation/
(Depreciation) | |
Bank of America | | 3-Month USD-LIBOR | | Pay | | 5.000% | | 06/20/2027 | | $ | 5,000 | | $ | (333 | ) |
Barclays Bank PLC | | 3-Month USD-LIBOR | | Pay | | 5.000% | | 12/19/2009 | | | 5,900 | | | (7 | ) |
Barclays Bank PLC | | 3-Month USD-LIBOR | | Pay | | 5.000% | | 12/19/2012 | | | 10,600 | | | 34 | |
Barclays Bank PLC | | 3-Month USD-LIBOR | | Receive | | 5.000% | | 12/19/2017 | | | 23,000 | | | (145 | ) |
Deutsche Bank AG | | 3-Month USD-LIBOR | | Pay | | 5.000% | | 12/19/2009 | | | 9,000 | | | 19 | |
Deutsche Bank AG | | 3-Month USD-LIBOR | | Pay | | 5.000% | | 12/19/2012 | | | 17,100 | | | 27 | |
Deutsche Bank AG | | 3-Month USD-LIBOR | | Receive | | 5.000% | | 12/20/2021 | | | 5,400 | | | 27 | |
Deutsche Bank AG | | 3-Month USD-LIBOR | | Receive | | 5.000% | | 12/20/2026 | | | 5,700 | | | 8 | |
Deutsche Bank AG | | 3-Month USD-LIBOR | | Pay | | 5.000% | | 12/19/2037 | | | 1,700 | | | 21 | |
Goldman Sachs & Co. | | 3-Month USD-LIBOR | | Pay | | 5.000% | | 12/19/2009 | | | 23,500 | | | (26 | ) |
Goldman Sachs & Co. | | 3-Month USD-LIBOR | | Receive | | 5.000% | | 06/20/2014 | | | 6,500 | | | 230 | |
JPMorgan Chase & Co. | | 3-Month USD-LIBOR | | Receive | | 5.000% | | 12/19/2017 | | | 2,900 | | | (7 | ) |
Lehman Brothers, Inc. | | 3-Month USD-LIBOR | | Pay | | 5.000% | | 12/19/2012 | | | 1,400 | | | 2 | |
Morgan Stanley | | 3-Month USD-LIBOR | | Pay | | 5.000% | | 06/20/2009 | | | 30,000 | | | (281 | ) |
Morgan Stanley | | 3-Month USD-LIBOR | | Receive | | 5.000% | | 12/19/2017 | | | 100 | | | (1 | ) |
Morgan Stanley | | 3-Month USD-LIBOR | | Pay | | 5.000% | | 12/19/2037 | | | 13,500 | | | 221 | |
Royal Bank of Scotland Group PLC | | 3-Month USD-LIBOR | | Pay | | 5.000% | | 12/19/2012 | | | 13,000 | | | 48 | |
Royal Bank of Scotland Group PLC | | 3-Month USD-LIBOR | | Receive | | 5.000% | | 12/19/2017 | | | 47,100 | | | (348 | ) |
Royal Bank of Scotland Group PLC | | 3-Month USD-LIBOR | | Pay | | 5.000% | | 12/19/2037 | | | 4,600 | | | 74 | |
UBS Warburg LLC | | 3-Month USD-LIBOR | | Pay | | 5.000% | | 06/18/2009 | | | 184,000 | | | (50 | ) |
UBS Warburg LLC | | 3-Month USD-LIBOR | | Receive | | 5.000% | | 12/19/2017 | | | 2,700 | | | (34 | ) |
| | | | | | | | | | | | | | | |
| | | | | | | | | | | | | $ | 343 | |
| | | | | | | | | | | | | | | |
(h) Purchased options outstanding on June 30, 2007:
Options on Exchange-Traded Futures Contracts
| | | | | | | | | | | | | |
| Description | | Exercise
Price | | Expiration
Date | | # of
Contracts | | Cost | | Value |
Call - CBOT U.S. Treasury 30-Year Bond September Futures | | $ | 118.000 | | 08/24/2007 | | 665 | | $ | 13 | | $ | 11 |
Put - CBOT U.S. Treasury 10-Year Note September Futures | | | 102.000 | | 08/24/2007 | | 294 | | | 5 | | | 18 |
| | | | | | | | | | | | | |
| | | | | | | | | $ | 18 | | $ | 29 |
| | | | | | | | | | | | | |
Interest Rate Swaptions
| | | | | | | | | | | | | | | | | | | |
| Description | | Counterparty | | Floating Rate Index | | Pay/Receive
Floating Rate | | Exercise
Rate | | Expiration
Date | | Notional
Amount | | Cost | | Value |
Call - OTC 2-Year Interest Rate Swap | | Royal Bank of Scotland Group PLC | | 3-Month USD-LIBOR | | Pay | | 4.750% | | 03/31/2008 | | $ | 43,000 | | $ | 241 | | $ | 53 |
Call - OTC 2-Year Interest Rate Swap | | Royal Bank of Scotland Group PLC | | 3-Month USD-LIBOR | | Pay | | 4.750% | | 09/26/2008 | | | 9,000 | | | 45 | | | 18 |
| | | | | | | | | | | | | | | | | | | |
| | | | | | | | | | | | | | | $ | 286 | | $ | 71 |
| | | | | | | | | | | | | | | | | | | |
Foreign Currency Options
| | | | | | | | | | | | | | |
| Description | | Exercise
Price | | Expiration
Date | | Notional
Amount | | Cost | | Value |
Call - OTC Euro versus U.S. dollar | | $ | 1.353 | | 06/26/2008 | | EUR | 4,600 | | $ | 145 | | $ | 169 |
Put - OTC Euro versus U.S. dollar | | | 1.353 | | 06/26/2008 | | | 4,600 | | | 145 | | | 118 |
Call - OTC U.S. dollar versus Japanese yen | | JPY | 118.150 | | 06/23/2008 | | $ | 21,800 | | | 574 | | | 564 |
Put - OTC U.S. dollar versus Japanese yen | | | 118.150 | | 06/23/2008 | | | 21,800 | | | 574 | | | 594 |
| | | | | | | | | | | | | | |
| | | | | | | | | | $ | 1,438 | | $ | 1,445 |
| | | | | | | | | | | | | | |
Options on Securities
| | | | | | | | | | | | | | |
| Description | | Strike
Price | | Expiration
Date | | Notional
Amount | | Cost | | Value |
Put - OTC Fannie Mae 5.500% due 07/01/2037 | | $ | 89.000 | | 07/05/2007 | | $ | 81,300 | | $ | 10 | | $ | 0 |
Put - OTC Treasury Inflation Protected Securities 1.875% due 07/15/2015 | | | 66.531 | | 09/19/2007 | | | 92,100 | | | 22 | | | 0 |
Put - OTC Treasury Inflation Protected Securities 3.875% due 01/15/2009 | | | 90.000 | | 09/19/2007 | | | 70,700 | | | 17 | | | 0 |
Put - OTC Treasury Inflation Protected Securities 2.375% due 01/15/2025 | | | 65.000 | | 07/23/2007 | | | 100,000 | | | 23 | | | 0 |
Put - OTC Treasury Inflation Protected Securities 3.000% due 07/15/2012 | | | 88.000 | | 07/23/2007 | | | 100,000 | | | 23 | | | 0 |
Put - OTC Treasury Inflation Protected Securities 3.625% due 04/15/2028 | | | 77.000 | | 08/27/2007 | | | 53,000 | | | 12 | | | 0 |
Put - OTC Treasury Inflation Protected Securities 3.875% due 04/15/2029 | | | 79.000 | | 08/27/2007 | | | 13,000 | | | 3 | | | 0 |
| | | | | | | | | | | | | | |
| | | | | | | | | | $ | 110 | | $ | 0 |
| | | | | | | | | | | | | | |
Straddle Options
| | | | | | | | | | | | | | | | |
| Description | | Counterparty | | Exercise
Price (2) | | Expiration
Date | | Notional
Amount | | Cost (2) | | Value |
Call & Put - OTC U.S. dollar versus Swiss franc Forward Delta Neutral Straddle | | JPMorgan Chase & Co. | | CHF | 0.000 | | 09/26/2007 | | $ | 5,800 | | $ | 0 | | $ | 10 |
Call & Put - OTC U.S. dollar versus Swiss franc Forward Delta Neutral Straddle | | Royal Bank of Scotland
Group PLC | | | 0.000 | | 09/26/2007 | | | 5,700 | | | 0 | | | 15 |
| | | | | | | | | | | | | | | | |
| | | | | | | | | | | | $ | 0 | | $ | 25 |
| | | | | | | | | | | | | | | | |
(2) Exercise price and final cost determined on a future date, based upon implied volatility parameters.
| | | | |
| 14 | | PIMCO Variable Insurance Trust | | See Accompanying Notes |
| | |
| |
| | | June 30, 2007 (Unaudited) |
(i) Written options outstanding on June 30, 2007:
Options on Exchange-Traded Futures Contracts
| | | | | | | | | | | | | |
| Description | | Exercise
Price | | Expiration
Date | | # of
Contracts | | Premium | | Value |
Call - CBOT U.S. Treasury 10-Year Note September Futures | | $ | 106.000 | | 08/24/2007 | | 112 | | $ | 29 | | $ | 68 |
Call - CBOT U.S. Treasury 10-Year Note September Futures | | | 109.000 | | 08/24/2007 | | 110 | | | 13 | | | 5 |
Call - CBOT U.S. Treasury 30-Year Bond September Futures | | | 109.000 | | 08/24/2007 | | 103 | | | 35 | | | 68 |
Put - CBOT U.S. Treasury 10-Year Note September Futures | | | 103.000 | | 08/24/2007 | | 112 | | | 31 | | | 12 |
| | | | | | | | | | | | | |
| | | | | | | | | $ | 108 | | $ | 153 |
| | | | | | | | | | | | | |
Interest Rate Swaptions
| | | | | | | | | | | | | | | | | | | |
| Description | | Counterparty | | Floating Rate Index | | Pay/Receive
Floating Rate | | Exercise
Rate | | Expiration
Date | | Notional
Amount | | Premium | | Value |
Call - OTC 5-Year Interest Rate Swap | | Royal Bank of Scotland Group PLC | | 3-Month USD-LIBOR | | Receive | | 4.950% | | 03/31/2008 | | $ | 19,000 | | $ | 234 | | $ | 65 |
Call - OTC 5-Year Interest Rate Swap | | Royal Bank of Scotland Group PLC | | 3-Month USD-LIBOR | | Receive | | 4.950% | | 09/26/2008 | | | 4,000 | | | 45 | | | 20 |
| | | | | | | | | | | | | | | | | | | |
| | | | | | | | | | | | | | | $ | 279 | | $ | 85 |
| | | | | | | | | | | | | | | | | | | |
(j) Short sales outstanding on June 30, 2007:
| | | | | | | | | | | | | |
| Description | | Coupon | | Maturity
Date | | Principal
Amount | | Proceeds | | Value (3) |
Treasury Inflation Protected Securities | | 1.875% | | 07/15/2013 | | $ | 11,966 | | $ | 11,427 | | $ | 11,483 |
Treasury Inflation Protected Securities | | 2.375% | | 01/15/2017 | | | 26,526 | | | 25,775 | | | 25,909 |
U.S. Treasury Notes | | 3.625% | | 05/15/2013 | | | 300 | | | 281 | | | 282 |
U.S. Treasury Notes | | 4.875% | | 08/15/2016 | | | 19,800 | | | 19,380 | | | 19,953 |
| | | | | | | | | | | | | |
| | | | | | | | | $ | 56,863 | | $ | 57,627 |
| | | | | | | | | | | | | |
(3) Market value includes $395 of interest payable on short sales.
(k) Foreign currency contracts outstanding on June 30, 2007:
| | | | | | | | | | | | | | | | | |
| Type | | Currency | | Principal
Amount
Covered by
Contract | | Settlement
Month | | Unrealized
Appreciation | | Unrealized
(Depreciation) | | | Net Unrealized
Appreciation/
(Depreciation) | |
Buy | | BRL | | 3,604 | | 10/2007 | | $ | 4 | | $ | (15 | ) | | $ | (11 | ) |
Sell | | CAD | | 1,247 | | 08/2007 | | | 0 | | | (5 | ) | | | (5 | ) |
Sell | | CHF | | 910 | | 09/2007 | | | 0 | | | 0 | | | | 0 | |
Buy | | CNY | | 92,519 | | 01/2008 | | | 62 | | | 0 | | | | 62 | |
Buy | | | | 92,514 | | 03/2008 | | | 0 | | | (66 | ) | | | (66 | ) |
Sell | | EUR | | 5,798 | | 07/2007 | | | 0 | | | (76 | ) | | | (76 | ) |
Sell | | GBP | | 6,409 | | 08/2007 | | | 0 | | | (68 | ) | | | (68 | ) |
Sell | | JPY | | 214,501 | | 07/2007 | | | 25 | | | 0 | | | | 25 | |
Buy | | KRW | | 148,200 | | 07/2007 | | | 1 | | | 0 | | | | 1 | |
Buy | | | | 1,571,959 | | 09/2007 | | | 8 | | | 0 | | | | 8 | |
Buy | | MXN | | 15,220 | | 09/2007 | | | 1 | | | (3 | ) | | | (2 | ) |
Buy | | | | 5,042 | | 03/2008 | | | 5 | | | 0 | | | | 5 | |
Buy | | PLN | | 5,528 | | 09/2007 | | | 38 | | | 0 | | | | 38 | |
Buy | | RUB | | 2,255 | | 12/2007 | | | 2 | | | 0 | | | | 2 | |
Buy | | | | 48,032 | | 01/2008 | | | 16 | | | 0 | | | | 16 | |
Buy | | SGD | | 2,610 | | 07/2007 | | | 7 | | | 0 | | | | 7 | |
Sell | | | | 1,578 | | 07/2007 | | | 0 | | | (6 | ) | | | (6 | ) |
Buy | | | | 245 | | 08/2007 | | | 1 | | | 0 | | | | 1 | |
Buy | | | | 2,599 | | 10/2007 | | | 9 | | | 0 | | | | 9 | |
| | | | | | | | | | | | | | | | | |
| | | | | | | | $ | 179 | | $ | (239 | ) | | $ | (60 | ) |
| | | | | | | | | | | | | | | | | |
| | | | | | |
| See Accompanying Notes | | Semiannual Report | | June 30, 2007 | | 15 |
Notes to Financial Statements
1. ORGANIZATION
The Real Return Portfolio (the “Portfolio”) is a series of the PIMCO Variable Insurance Trust (the “Trust”). The Trust is registered under the Investment Company Act of 1940 (the “Act”), as amended, as an open-end management investment company organized as a Delaware business trust on October 3, 1997. The Portfolio offers three classes of shares: Institutional, Administrative and Advisor. Information presented on these financial statements pertains to the Administrative Class of the Portfolio. Certain detailed financial information for the Institutional Class and Advisor Class is provided separately and is available upon request. The Trust is designed to be used as an investment vehicle by Separate Accounts of insurance companies that fund variable annuity contracts and variable life insurance policies and by qualified pension and retirement plans.
2. SIGNIFICANT ACCOUNTING POLICIES
The following is a summary of significant accounting policies consistently followed by the Portfolio in the preparation of its financial statements in conformity with accounting principles generally accepted in the United States of America (“GAAP”). The preparation of financial statements in accordance with GAAP requires management to make estimates and assumptions that affect the reported amounts and disclosures on the financial statements. Actual results could differ from those estimates.
(a) Security Valuation Portfolio securities are valued as of the close of regular trading (normally 4:00 p.m., Eastern Time) on each day that the New York Stock Exchange (“NYSE”) is open. Portfolio securities and other assets for which market quotes are readily available are stated at market value. Market value is generally determined on the basis of last reported sales prices, or if no sales are reported, based on quotes obtained from a quotation reporting system, established market makers, or pricing services. Fixed-income securities and non-exchange traded derivatives are normally valued on the basis of quotes obtained from brokers and dealers or pricing services. Prices obtained from independent pricing services use information provided by market makers or estimates of market values obtained from yield data relating to investments or securities with similar characteristics. Certain fixed income securities purchased on a delayed-delivery basis are marked to market daily until settlement at the forward settlement date. Short-term investments having a maturity of 60 days or less are generally valued at amortized cost. Exchange traded options, futures and options on futures are valued at the settlement price determined by the relevant exchange. With respect to any portion of the Portfolio’s assets that are invested in one or more open end management investment companies, the Portfolio’s net asset value (“NAV”) will be calculated based upon the NAVs of such investments.
Investments initially valued in currencies other than the U.S. dollar are converted to the U.S. dollar using exchange rates obtained from pricing services. As a result, the NAV of the Portfolio’s securities may be affected by changes in the value of currencies in relation to the U.S. dollar. The value of securities traded in markets outside the United States or denominated in currencies other than the U.S. dollar may be affected significantly on a day that the NYSE is closed and an investor is not able to purchase, redeem or exchange shares.
Securities and other assets for which market quotes are not readily available are valued at fair value as determined in good faith by the Board of Trustees or persons acting at their direction. The Board of Trustees has adopted methods for valuing securities and other assets in circumstances where market quotes are not readily available, and has delegated to Pacific Investment Management Company LLC (“PIMCO”) the responsibility for applying the valuation methods. In the event that market quotes are not readily available, and the security or asset cannot be valued pursuant to one of the valuation methods, the value of the security or asset will be determined in good faith by the Valuation Committee of the Board of Trustees, generally based upon recommendations provided by PIMCO.
Market quotes are considered not readily available in circumstances where there is an absence of current or reliable market-based data (e.g., trade information, bid/asked information, broker quotes), including where events occur after the close of the relevant market, but prior to the close of regular trading, that materially affect the values of the Portfolio’s securities or assets. In addition, market quotes are considered not readily available when, due to extraordinary circumstances, the exchanges or markets on which the securities trade, do not open for trading for the entire day and no other market prices are available. The Board has delegated to PIMCO the responsibility for monitoring significant events that may materially affect the values of the Portfolio’s securities or assets and for determining whether the value of the applicable securities or assets should be re-evaluated in light of such significant events.
When the Portfolio uses fair value pricing to determine its NAV, securities will not be priced on the basis of quotations from the primary market in which they are traded, but rather may be priced by another method that the Board of Trustees or persons acting at their direction believe accurately reflects fair value. The Trust’s policy is intended to result in a calculation of the Portfolio’s NAV that fairly reflects security values as of the time of pricing. However, fair values determined by the Board of Trustees or persons acting at their direction may not accurately reflect the price that the Portfolio could obtain for a security if it were to dispose of that security as of the time of pricing. Because foreign securities can trade on non-business days of the Portfolio, the NAV of the Portfolio may change on days when shareholders will not be able to purchase or redeem Portfolio shares. The prices used by the Portfolio may differ from the value that would be realized if the securities were sold and the differences could be material to the financial statements.
(b) Securities Transactions and Investment Income Securities transactions are recorded as of the trade date for financial reporting purposes. Securities purchased or sold on a when-issued or delayed-delivery basis may be settled a month or more after the trade date. Realized gains and losses from securities sold are recorded on the identified cost basis. Dividend income is recorded on the ex-dividend date, except certain dividends from foreign securities where the ex-dividend date may have passed, which are recorded as soon as the Portfolio is informed of the ex-dividend date. Interest income, adjusted for the accretion of discounts and amortization of premiums, is recorded on the accrual basis. Paydown gains and losses on mortgage-related and other asset-backed securities are recorded as components of interest income on the Statement of Operations.
(c) Delayed-Delivery Transactions The Portfolio may purchase or sell securities on a delayed-delivery basis. These transactions involve a commitment by the Portfolio to purchase or sell securities for a predetermined price or yield, with payment and delivery taking place beyond the customary settlement period. When delayed-delivery purchases are outstanding, the Portfolio will designate liquid assets in an amount sufficient to meet the purchase price. When purchasing a security on a delayed-delivery basis, the Portfolio assumes the rights and risks of ownership of the security, including the risk of price and yield fluctuations, and takes such fluctuations into account when determining its net asset value. The Portfolio may dispose of or renegotiate a delayed-delivery transaction after it is entered into, and may sell when-issued securities before they are delivered, which may result in a capital gain or loss. When the Portfolio has sold a security on a delayed-delivery basis, the Portfolio does not participate in future gains and losses with respect to the security.
(d) Dividends and Distributions to Shareholders Dividends from net investment income, if any, are declared daily and distributed to shareholders monthly. Net realized capital gains earned by the Portfolio, if any, will be distributed no less frequently than once each year.
Income dividends and capital gain distributions are determined in accordance with income tax regulations which may differ from GAAP. Differences between tax regulations and GAAP may change the fiscal year when income and capital items
| | | | |
| 16 | | PIMCO Variable Insurance Trust | | |
| | |
| |
| | | June 30, 2007 (Unaudited) |
are recognized for tax and GAAP purposes. Examples of events that give rise to timing differences include wash sales, straddles, net operating losses and capital loss carryforwards. Further, the character of investment income and capital gains may be different for certain transactions under the two methods of accounting. Examples of characterization differences include the treatment of mortgage paydowns, swaps, foreign currency transactions and contingent debt instruments. As a result, income dividends and capital gain distributions declared during a fiscal period may differ significantly from the net investment income and realized capital gain reported on the Portfolio’s annual financial statements presented under GAAP.
Distributions classified as a tax basis return of capital, if any, are reflected on the accompanying Statements of Changes in Net Assets and have been reclassified to paid in capital. In addition, other amounts have been reclassified between undistributed net investment income, accumulated undistributed net realized gains or losses and/or paid in capital to more appropriately conform financial accounting to tax characterizations of dividend distributions.
(e) Multiclass Operations Each class offered by the Portfolio has equal rights as to assets and voting privileges (except that shareholders of a class have exclusive voting rights regarding any matter relating solely to that class of shares). Income and non-class specific expenses of the Portfolio are allocated daily to each class of shares based on the relative value of settled shares. Realized and unrealized capital gains and losses of the Portfolio are allocated daily to each class of shares based on the relative net assets of each class. Class specific expenses, where applicable, currently include administrative, distribution and servicing fees.
(f) Foreign Currency The functional and reporting currency for the Portfolio is the U.S. dollar. The market values of foreign securities, currency holdings and other assets and liabilities are translated into U.S. dollars based on the current exchange rates each business day. Fluctuations in the value of currency holdings and other assets and liabilities resulting from changes in exchange rates are recorded as unrealized foreign currency gains or losses. Realized gains or losses and unrealized appreciation or depreciation on investment securities and income and expenses are translated on the respective dates of such transactions. The effects of changes in foreign currency exchange rates on investments in securities are not segregated on the Statement of Operations from the effects of changes in market prices of those securities, but are included with the net realized and unrealized gain or loss on investment securities.
| | | | | | |
|
| Non-U.S. currency symbols utilized throughout the report are defined as follows: |
| AUD | | Australian Dollar | | JPY | | Japanese Yen |
| BRL | | Brazilian Real | | KRW | | South Korean Won |
| CAD | | Canadian Dollar | | MXN | | Mexican Peso |
| CHF | | Swiss Franc | | PLN | | Polish Zloty |
| CNY | | Chinese Yuan Renminbi | | RUB | | Russian Ruble |
| EUR | | Euro | | SGD | | Singapore Dollar |
| GBP | | Great British Pound | | | | |
(g) Foreign Currency Transactions The Portfolio may enter into foreign currency contracts in connection with settling planned purchases or sales of securities, to hedge the currency exposure associated with some or all of the Portfolio’s securities or as a part of an investment strategy. A foreign currency contract is an agreement between two parties to buy and sell a currency at a set price on a future date. The market value of a foreign currency contract fluctuates with changes in foreign currency exchange rates. Foreign currency contracts are marked to market daily and the change in value is recorded by the Portfolio as an
unrealized gain or loss. Realized gains or losses equal to the difference between the value of the contract at the time it was opened and the value at the time it was closed are recorded upon delivery or receipt of the currency. These contracts may involve market risk in excess of the unrealized gain or loss reflected on the Statement of Assets and Liabilities. In addition, the Portfolio could be exposed to risk if the counterparties are unable to meet the terms of the contracts or if the value of the currency changes unfavorably to the U.S. dollar.
(h) Futures Contracts The Portfolio may enter into futures contracts. The Portfolio may use futures contracts to manage its exposure to the securities markets or to movements in interest rates and currency values. The primary risks associated with the use of futures contracts are the imperfect correlation between the change in market value of the securities held by the Portfolio and the prices of futures contracts, the possibility of an illiquid market, and the inability of the counterparty to meet the terms of the contract. Futures contracts are valued based upon their quoted daily settlement prices. Upon entering into a futures contract, the Portfolio is required to deposit with its futures broker, an amount of cash or U.S. Government and Agency Obligations in accordance with the initial margin requirements of the broker or exchange. Futures contracts are marked to market daily and an appropriate payable or receivable for the change in value (“variation margin”) is recorded by the Portfolio. Gains or losses are recognized but not considered realized until the contracts expire or are closed. Futures contracts involve, to varying degrees, risk of loss in excess of the variation margin disclosed on the Statement of Assets and Liabilities.
(i) Inflation-Indexed Bonds The Portfolio may invest in inflation-indexed bonds. Inflation-indexed bonds are fixed-income securities whose principal value is periodically adjusted to the rate of inflation. The interest rate on these bonds is generally fixed at issuance at a rate lower than typical bonds. Over the life of an inflation-indexed bond, however, interest will be paid based on a principal value, which is adjusted for inflation. Any increase in the principal amount of an inflation-indexed bond will be included as interest income on the Statement of Operations, even though investors do not receive their principal until maturity.
(j) Options Contracts The Portfolio may write call and put options on futures, swaps, securities or currencies it owns or in which it may invest. Writing put options tends to increase the Portfolio’s exposure to the underlying instrument. Writing call options tends to decrease the Portfolio’s exposure to the underlying instrument. When the Portfolio writes a call or put option, an amount equal to the premium received is recorded as a liability and subsequently marked to market to reflect the current value of the option written. These liabilities are reflected as written options outstanding on the Statement of Assets and Liabilities. Certain options may be written with premiums to be determined on a future date. The premiums for these options are based upon implied volatility parameters at specified terms. Premiums received from writing options which expire are treated as realized gains. Premiums received from writing options which are exercised or closed are added to the proceeds or offset against amounts paid on the underlying future, swap, security or currency transaction to determine the realized gain or loss. The Portfolio as a writer of an option has no control over whether the underlying future, swap, security or currency may be sold (call) or purchased (put) and as a result bears the market risk of an unfavorable change in the price of the future, swap, security or currency underlying the written option. There is the risk the Portfolio may not be able to enter into a closing transaction because of an illiquid market.
The Portfolio may also purchase put and call options. Purchasing call options tends to increase the Portfolio’s exposure to the underlying instrument. Purchasing put options tends to decrease the Portfolio’s exposure to the underlying instrument. The Portfolio pays a premium which is included on the Statement of Assets and Liabilities as an investment and subsequently marked to market to reflect the current value of the option. Premiums paid for purchasing options which expire are
| | | | | | |
| | Semiannual Report | | June 30, 2007 | | 17 |
Notes to Financial Statements (Cont.)
treated as realized losses. Certain options may be purchased with premiums to be determined on a future date. The premiums for these options are based upon implied volatility parameters at specified terms. The risk associated with purchasing put and call options is limited to the premium paid. Premiums paid for purchasing options which are exercised or closed are added to the amounts paid or offset against the proceeds on the underlying future, swap, security or currency transaction to determine the realized gain or loss.
(k) Repurchase Agreements The Portfolio may engage in repurchase transactions. Under the terms of a typical repurchase agreement, the Portfolio takes possession of an underlying debt obligation (collateral) subject to an obligation of the seller to repurchase, and the Portfolio to resell, the obligation at an agreed-upon price and time. The underlying securities for all repurchase agreements are held in safekeeping at the Portfolio’s custodian or designated subcustodians under tri-party repurchase agreements. The market value of the collateral must be equal to or exceed the total amount of the repurchase obligations, including interest. Securities purchased under repurchase agreements are reflected as an asset on the Statement of Assets and Liabilities. Generally, in the event of counterparty default, the Portfolio has the right to use the collateral to offset losses incurred. If the counterparty should default, the Portfolio will seek to sell the securities which it holds as collateral. This could involve procedural costs or delays in addition to a loss on the securities if their value should fall below their repurchase price.
(l) Inverse Floating Rate Transactions—Residual Interest Municipal Bonds (“RIBs”)/Residual Interest Tax Exempt Bonds (“RITEs”) The Portfolio may invest in RIBs and RITEs (“Inverse Floaters”). Inverse Floaters are created via a master trust agreement between a broker-dealer, acting as trustor and liquidity provider, and an investment bank, acting as trustee and tender agent. The master trust agreement defines the terms for each trust series; with each series being established by the transfer of long-term, fixed-rate municipal bonds (“Fixed Rate Bonds”) to the trustee to be held and provide for the creation, execution and delivery of floater certificates (“Floating Rate Notes”) and Inverse Floaters. Floating Rate Notes are liquid notes that are issued with a short-term variable rate typically linked to the LIBOR, subject to limitations, for some duration. After interest income is paid on the Floating Rate Notes at current rates, the residual income from the Fixed Rate Bonds is paid to the Inverse Floaters. Inverse Floaters are issued with a coupon that fluctuates inversely with the Floating Rate Notes’ referenced rate, subject to certain limitations. Therefore, rising short-term rates result in lower income for the Inverse Floaters and vice versa.
Floating Rate Notes are generally remarketed to municipal money market funds. Inverse Floaters are acquired by either tax-exempt municipal bond funds or trusts, or other parties interested in potentially higher yielding tax-exempt securities. Inverse Floaters may also be acquired for the purpose of increasing leverage. Floating Rate Note holders typically have the option to tender their notes to the liquidity provider for redemption at par at each reset date. The Inverse Floater holders have the option to (i) require the Floating Rate Note holders to tender their notes at par, and (ii) require the liquidity provider to transfer the Fixed Rate Bonds to the Inverse Floater holders. The holders of Inverse Floaters bear substantially all of the downside investment risk associated with the underlying Fixed Rate Bonds, and also benefit from a disproportionate amount of the potential appreciation of the underlying Fixed Rate Bonds’ value. Inverse Floaters may be more volatile and less liquid than other municipal bonds of comparable maturity.
Inverse Floaters may be acquired with or without first transferring to the trustor the Fixed Rate Bonds that were utilized to create the trust series. Inverse Floaters acquired without a transfer of Fixed Rate Bonds are recognized as purchases of securities as outlined in Note 2(b). Statement of Financial Accounting Standards No. 140—Accounting for Transfers and Servicing of Financial Assets and Extinguishments of Liabilities (“FAS No. 140”), governs the standards for
accounting for securitizations and other transfers of financial assets. If there is a transfer of Fixed Rate Bonds and it meets sale criteria under FAS No. 140, a Portfolio records a sale of the Fixed Rate Bonds and a purchase of the Inverse Floaters. The cash received from the Inverse Floaters is then recorded as interest income in the Statement of Operations.
If the transfer of Fixed Rate Bonds does not meet sale criteria under FAS No. 140, a Portfolio accounts for the transaction described above as a secured borrowing by including the Fixed Rate Bonds in its Schedule of Investments, and recording the Floating Rate Notes as a liability under the caption “Payable for floating rate notes” in the Portfolio’s Statement of Assets and Liabilities. In a secured borrowing transaction, cash received from the Inverse Floaters is not recorded as interest income. Instead, a Portfolio records interest income related to the Fixed Rate Bonds and interest expense related to the Floating Rate Notes, the net of which is equal to the cash received from the Inverse Floaters acquired by the Portfolio. Thus, while a Portfolio’s reported total income, net expenses, and net expense ratio are generally higher for investments in Inverse Floaters acquired via a secured borrowing, the method of acquiring Inverse Floaters does not result in differences for reported cash flows, net asset value or total return.
(m) Short Sales The Portfolio may enter into short sales transactions. A short sale is a transaction in which the Portfolio sells securities it does not own in anticipation of a decline in the market price of the securities. Securities sold in short sale transactions and interest payable on such securities, if any, are reflected as a liability on the Statement of Assets and Liabilities. The Portfolio is obligated to deliver securities at the market price at the time the short position is closed. Possible losses from short sales may be unlimited, whereas losses from purchases cannot exceed the total amount invested.
(n) Swap Agreements The Portfolio may invest in swap agreements. Swap transactions are privately negotiated agreements between the Portfolio and a counterparty to exchange or swap investment cash flows, assets, or market-linked returns at specified, future intervals. The Portfolio may enter into interest rate, total return, forward spread-lock, credit default, and other forms of swap agreements to manage its exposure to interest rates and credit risk. In connection with these agreements, securities may be identified as collateral in accordance with the terms of the respective swap agreements.
Interest rate swap agreements involve the exchange by the Portfolio with another party of their respective commitments to pay or receive interest, e.g., an exchange of floating rate payments for fixed rate payments with respect to the notional amount of principal. Certain forms of interest rate swap agreements may include: (i) interest rate caps, under which, in return for a premium, one party agrees to make payments to the other to the extent that interest rates exceed a specified rate, or “cap”, (ii) interest rate floors, under which, in return for a premium, one party agrees to make payments to the other to the extent that interest rates fall below a specified rate, or “floor”, or (iii) interest rate collars, under which a party sells a cap and purchases a floor or vice versa in an attempt to protect itself against interest rate movements exceeding given minimum or maximum levels.
Total return swap agreements involve commitments to pay interest in exchange for a market-linked return, both based on notional amounts. To the extent the total return of the security or index underlying the transaction exceeds or falls short of the offsetting interest rate obligation, the Portfolio will receive a payment from or make a payment to the counterparty.
Forward spread-lock swap agreements involve commitments to pay or receive a settlement amount calculated as the difference between the swap spread and a fixed spread, multiplied by the notional amount times the duration of the swap. The swap spread is the difference between the benchmark swap rate (market rate) and the specific Treasury rate.
| | | | |
| 18 | | PIMCO Variable Insurance Trust | | |
| | |
| |
| | | June 30, 2007 (Unaudited) |
Credit default swap agreements involve one party making a stream of payments to another party in exchange for the right to receive a specified return in the event of a default by a third party, typically corporate issues or sovereign issues of an emerging country, on its obligation. The Portfolio may use credit default swaps to provide a measure of protection against defaults of the issuers (i.e., to reduce risk where the Portfolio owns or has exposure to the sovereign issuer) or to take an active long or short position with respect to the likelihood of a particular issuer’s default. As a seller of protection, the Portfolio generally receives an upfront payment or a fixed rate of income throughout the term of the swap provided that there is no credit event. If the Portfolio is a seller of protection and a credit event occurs, as defined under the terms of that particular swap agreement, the Portfolio will pay to the buyer of the protection an amount up to the notional value of the swap and in certain instances take delivery of the security. As the seller, the Portfolio would effectively add leverage to its portfolio because, in addition to its total net assets, the Portfolio would be subject to investment exposure on the notional amount of the swap. As a buyer of protection, the Portfolio generally receives an amount up to the notional value of the swap if a credit event occurs. The treatment of credit default swaps and other swap agreements that provide for contingent, non-periodic, bullet-type payments as “notional principal contracts” for U.S. federal income tax purposes is uncertain. Were the U.S. Internal Revenue Service (“IRS”) to take the position that a credit default swap or other bullet-type swap is not a “notional principal contract” for U.S. federal income tax purposes, payments received by the Portfolio from such investments might be subject to U.S. excise or income taxes.
Swaps are marked to market daily based upon quotations from market makers and the change in value, if any, is recorded as unrealized gain or loss on the Statement of Operations. Payments received or made at the beginning of the measurement period are reflected as such on the Statement of Assets and Liabilities. These upfront payments are recorded as realized gain or loss on the Statement of Operations upon termination or maturity of the swap. A liquidation payment received or made at the termination of the swap is recorded as realized gain or loss on the Statement of Operations. Net periodic payments received or paid by the Portfolio are included as part of realized gain or loss on the Statement of Operations. Entering into these agreements involves, to varying degrees, elements of credit, market and documentation risk in excess of the amounts recognized on the Statement of Assets and Liabilities. Such risks involve the possibility that there will be no liquid market for these agreements, that the counterparty to the agreements may default on its obligation to perform or disagree as to the meaning of contractual terms in the agreements and that there may be unfavorable changes in interest rates.
(o) Loan Participations and Assignments The Portfolio may invest in direct debt instruments which are interests in amounts owned by corporate, governmental, or other borrowers to lenders or lending syndicates. The Portfolio’s investments in loans may be in the form of participations in loans or assignments of all or a portion of loans from third parties. A loan is often administered by a bank or other financial institution (the “lender”) that acts as agent for all holders. The agent administers the terms of the loan, as specified in the loan agreement. When investing in a loan participation, the Portfolio has the right to receive payments of principal, interest and any fees to which it is entitled only from the lender selling the loan agreement and only upon receipt by the lender of payments from the borrower. The Portfolio generally has no right to enforce compliance with the terms of the loan agreement with the borrower. As a result, the Portfolio may be subject to the credit risk of both the borrower and the lender that is selling the loan agreement. When the Portfolio purchases assignments from lenders it acquires direct rights against the borrower of the loan. At the end of the period June 30, 2007, the Portfolio had no unfunded loan commitments.
(p) Bridge Debt Commitments At the period ended June 30, 2007, the Portfolio had $1,602,246 in commitments outstanding to fund high yield bridge debt. The
Portfolio is entitled to a fee upon the expiration of the commitment period. The bridge debt terms approximate market rates at the time the commitment is entered into.
(q) Mortgage-Related and Other Asset-Backed Securities The Portfolio may invest in mortgage-related or other asset-backed securities. These securities include mortgage pass-through securities, collateralized mortgage obligations (“CMOs”), commercial mortgage-backed securities, mortgage dollar rolls, CMO residuals, stripped mortgage-backed securities (“SMBSs”) and other securities that directly or indirectly represent a participation in, or are secured by and payable from, mortgage loans on real property. The value of some mortgage-related or asset-backed securities may be particularly sensitive to changes in prevailing interest rates. Early repayment of principal on some mortgage-related securities may expose the Portfolio to a lower rate of return upon reinvestment of principal. The value of these securities may fluctuate in response to the market’s perception of the creditworthiness of the issuers. Additionally, although mortgages and mortgage-related securities are generally supported by some form of government or private guarantee and/or insurance, there is no assurance that private guarantors or insurers will meet their obligations.
(r) U.S. Government Agencies or Government-Sponsored Enterprises Securities issued by U.S. Government agencies or government-sponsored enterprises may not be guaranteed by the U.S. Treasury. The Government National Mortgage Association (“GNMA” or “Ginnie Mae”), a wholly owned U.S. Government corporation, is authorized to guarantee, with the full faith and credit of the U.S. Government, the timely payment of principal and interest on securities issued by institutions approved by GNMA and backed by pools of mortgages insured by the Federal Housing Administration or guaranteed by the Department of Veterans Affairs. Government-related guarantors (i.e., not backed by the full faith and credit of the U.S. Government) include the Federal National Mortgage Association (“FNMA” or “Fannie Mae”) and the Federal Home Loan Mortgage Corporation (“FHLMC” or “Freddie Mac”). Pass-through securities issued by FNMA are guaranteed as to timely payment of principal and interest by FNMA but are not backed by the full faith and credit of the U.S. Government. FHLMC guarantees the timely payment of interest and ultimate collection of principal, but its participation certificates are not backed by the full faith and credit of the U.S. Government.
(s) New Accounting Policies In July 2006, the Financial Accounting Standards Board (“FASB”) issued Interpretation No. 48, “Accounting for Uncertainty in Income Taxes—an Interpretation of FASB Statement No. 109” (the “Interpretation”). The Interpretation became effective for the Portfolio on June 29, 2007. Management has evaluated the application of the Interpretation in relation to the Portfolio and has concluded that no single filing position or combination of filing positions identified as uncertain tax positions required the accrual of a tax liability in the accounting records of the Portfolio for the period ending June 30, 2007. Management will monitor all existing filing positions and future filing positions in light of the Interpretation and evaluate the need for any future tax accruals and financial statement disclosures as warranted.
In September 2006, the FASB issued Statement of Financial Accounting Standards No. 157, “Fair Value Measurements” (the “Statement”). The Statement is effective for fiscal years beginning after November 15, 2007 and will require expanded disclosure about fair value measurements, separately for each major category of assets and liabilities, that enables shareholders to assess the inputs used to develop those measurements, and for recurring fair value measurements using significant unobservable inputs the effect of the measurements on changes in net assets for the reporting period. Management is currently evaluating the application of the Statement to the Portfolio and will provide additional information in relation to the Statement on the Portfolio’s annual financial statements for the period ending December 31, 2007.
| | | | | | |
| | Semiannual Report | | June 30, 2007 | | 19 |
Notes to Financial Statements (Cont.)
3. FEES AND EXPENSES
(a) Investment Advisory Fee PIMCO is a majority-owned subsidiary of Allianz Global Investors of America L.P. (“AGI”), and serves as investment adviser (the “Adviser”) to the Trust, pursuant to an investment advisory contract. The Adviser receives a monthly fee from the Portfolio, at an annual rate based on average daily net assets. The Advisory Fee for all classes is charged at an annual rate of 0.25%.
(b) Administration Fee PIMCO serves as administrator (the “Administrator”), and provides administrative services to the Trust for which it receives a monthly administrative fee based on each share class’s average daily net assets. As the Administrator, PIMCO bears the costs of various third-party services, including audit, custodial, portfolio accounting, legal, transfer agency and printing costs. The Administration Fee for all classes is charged at the annual rate of 0.25%.
(c) Distribution and Servicing Fees Allianz Global Investors Distributors LLC (“AGID”) is an indirect wholly-owned subsidiary of AGI and serves as the distributor (the “Distributor”) of the Trust’s shares. The Trust is permitted to reimburse AGID on a quarterly basis, out of the Administrative Class assets of the Portfolio in the amount of 0.15% on an annual basis of the average daily net assets of that class, for payments made to financial intermediaries that provide services in connection with the distribution of shares or administration of plans or programs that use Portfolio shares as their funding medium. The effective rate paid to AGID was 0.15% during the current fiscal year.
The Trust has adopted a Distribution Plan, for the Advisor Class shares of the Portfolio (the “Plan”). The Plan has been adopted pursuant to Rule 12b-1 under the Act. The Plan permits payments for expenses in connection with the distribution and marketing of Advisor Class shares and/or the provision of shareholder services to Advisor Class shareholders. The Plan permits the Portfolio to make total payments at an annual rate of 0.25% of its average daily net assets attributable to its Advisor Class shares.
(d) Portfolio Expenses The Trust is responsible for the following expenses: (i) salaries and other compensation of any of the Trust’s executive officers and employees who are not officers, directors, stockholders or employees of PIMCO or its subsidiaries or affiliates; (ii) taxes and governmental fees; (iii) brokerage fees and commissions and other portfolio transaction expenses; (iv) the costs of borrowing money, including interest expenses and bank overdraft charges; (v) fees and expenses of the Trustees who are not “interested persons” of PIMCO or the Trust, and any counsel retained exclusively for their benefit; (vi) extraordinary expenses, including costs of litigation and indemnification expenses; (vii) organization expenses and (viii) any expenses allocated or allocable to a specific class of shares, which include service fees payable with respect to the Administrative Class Shares, and may include certain other expenses as permitted by the Trust’s Multiple Class Plan adopted pursuant to Rule 18f-3 under the Act and subject to review and approval by the Trustees. The ratio of expenses to average net assets per share class, as disclosed in the Financial Highlights, may differ from the annual portfolio operating expenses per share class as disclosed in the Prospectus for the reasons set forth above.
Effective April 1, 2007, each Trustee, other than those affiliated with PIMCO or its affiliates, receives an annual retainer of $15,000, plus $2,375 for each Board of Trustees meeting attended in person, $500 for each committee meeting attended and $750 for each Board of Trustees meeting attended telephonically, plus reimbursement of related expenses. In addition, the audit committee chair receives an additional annual retainer of $2,000 and each other committee chair receives an additional annual retainer of $500. These expenses are allocated on a pro-rata basis to the various portfolios of the Trust according to their respective net assets. The Trust pays no compensation directly to any Trustee or any other officer who is affiliated with the Administrator, all of whom receive remuneration for their services to the Trust from the Administrator or its affiliates. Prior to
April 1, 2007, each Trustee, other than those affiliated with PIMCO or its affiliates, received an annual retainer of $15,000 plus $2,000 for each Board of Trustees meeting attended ($500 for each special meeting attended), plus reimbursement of related expenses. The Audit Committee Chairman received an annual retainer of $1,500 and the Governance Committee Chairman received an annual retainer of $500. In addition, each member of a committee received $500 for each committee meeting attended.
4. RELATED PARTY TRANSACTIONS
The Adviser, Administrator, and Distributor are related parties as defined by FAS 57, Related Party Disclosures. Fees payable to these parties are disclosed in Note 3.
5. GUARANTEES AND INDEMNIFICATIONS
Under the Trust’s organizational documents, each Trustee, officer, employee or other agent of the Trust (including the Trust’s investment manager) is indemnified, to the extent permitted by the Act, against certain liabilities that may arise out of performance of their duties to the Portfolio. Additionally, in the normal course of business, the Portfolio enters into contracts that contain a variety of indemnification clauses. The Portfolio’s maximum exposure under these arrangements is unknown as this would involve future claims that may be made against the Portfolio that have not yet occurred. However, the Portfolio has not had prior claims or losses pursuant to these contracts and believes the risk of loss to be remote.
6. PURCHASES AND SALES OF SECURITIES
The length of time the Portfolio has held a particular security is not generally a consideration in investment decisions. A change in the securities held by the Portfolio is known as “portfolio turnover”. The Portfolio may engage in frequent and active trading of portfolio securities to achieve its investment objective, particularly during periods of volatile market movements. High portfolio turnover (e.g., over 100%) involves correspondingly greater expenses to the Portfolio, including brokerage commissions or dealer mark-ups and other transaction costs on the sale of securities and reinvestments in other securities. Such sales may also result in realization of taxable capital gains, including short-term capital gains (which are generally taxed at ordinary income tax rates). The trading costs and tax effects associated with portfolio turnover may adversely affect the Portfolio’s performance.
Purchases and sales of securities (excluding short-term investments) for the period ended June 30, 2007, were as follows (amounts in thousands):
| | | | | | | | | | | | |
| U.S. Government/Agency | | | | All Other |
| Purchases | | Sales | | | | Purchases | | Sales |
| $ | 8,513,157 | | $ | 8,707,451 | | | | $ | 137,558 | | $ | 29,607 |
7. TRANSACTIONS IN WRITTEN CALL AND PUT OPTIONS
Transactions in written call and put options were as follows (amounts in thousands, except for number of contracts):
| | | | | | | | | | | | | |
| | | | | # of
Contracts | | | Notional
Amount in $ | | | Premium | |
Balance at 12/31/2006 | | | | 146 | | | $ | 97,800 | | | $ | 643 | |
Sales | | | | 1,025 | | | | 23,000 | | | | 592 | |
Closing Buys | | | | (73 | ) | | | (46,000 | ) | | | (362 | ) |
Expirations | | | | (661 | ) | | | (51,800 | ) | | | (486 | ) |
Exercised | | | | 0 | | | | 0 | | | | 0 | |
Balance at 06/30/2007 | | | | 437 | | | $ | 23,000 | | | $ | 387 | |
| | | | |
| 20 | | PIMCO Variable Insurance Trust | | |
| | |
| |
| | | June 30, 2007 (Unaudited) |
8. SHARES OF BENEFICIAL INTEREST
The Portfolio may issue an unlimited number of shares of beneficial interest with a $0.001 par value. Changes in shares of beneficial interest were as follows (shares and amounts in thousands):
| | | | | | | | | | | | | | | | |
| | | | | Six Months Ended
06/30/2007 | | | Year Ended
12/31/2006 | |
| | | | | Shares | | | Amount | | | Shares | | | Amount | |
| | | | | |
Receipts for shares sold | | | | | | | | | | | | | | | | |
Institutional Class | | | | 301 | | | $ | 3,580 | | | 629 | | | $ | 7,837 | |
Administrative Class | | | | 13,980 | | | | 166,885 | | | 29,533 | | | | 367,822 | |
Advisor Class | | | | 568 | | | | 6,796 | | | 248 | | | | 3,086 | |
Issued as reinvestment of distributions | | | | | | | | | | | | | | | | |
Institutional Class | | | | 95 | | | | 1,137 | | | 255 | | | | 3,137 | |
Administrative Class | | | | 1,955 | | | | 23,367 | | | 5,979 | | | | 73,676 | |
Advisor Class | | | | 10 | | | | 119 | | | 9 | | | | 109 | |
Cost of shares redeemed | | | | | | | | | | | | | | | | |
Institutional Class | | | | (274 | ) | | | (3,266 | ) | | (557 | ) | | | (6,951 | ) |
Administrative Class | | | | (22,385 | ) | | | (268,783 | ) | | (28,578 | ) | | | (353,626 | ) |
Advisor Class | | | | (27 | ) | | | (329 | ) | | (32 | ) | | | (402 | ) |
Net increase (decrease) resulting from Portfolio share transactions | | | | (5,777 | ) | | $ | (70,494 | ) | | 7,486 | | | $ | 94,688 | |
The following schedule shows the number of shareholders each owning 5% or more of the Portfolio and the total percentage of the Portfolio held by such shareholders:
| | | | | | |
| | | | | Number of Shareholders | | % of Portfolio Held |
Institutional Class | | | | 2 | | 95 |
Administrative Class | | | | 3 | | 54 |
Advisor Class | | | | 2 | | 94 |
9. REGULATORY AND LITIGATION MATTERS
Since February 2004, PIMCO, Allianz Global Investors of America L.P. (PIMCO’s parent company), AGID, and certain of their affiliates, including the PIMCO Funds (another series of funds managed by PIMCO), the Allianz Funds (formerly known as PIMCO Funds: Multi-Manager Series (another series of funds managed by affiliates of PIMCO)), certain Trustees of the Trust (in their capacity as Trustees of the PIMCO Funds or the Allianz Funds) and certain employees of PIMCO, have been named as defendants in fifteen lawsuits filed in various jurisdictions. Eleven of those lawsuits concern “market timing,” and they have been transferred to and consolidated for pre-trial proceedings in a multi-district litigation proceeding in the U.S. District Court for the District of Maryland; the other four lawsuits concern “revenue sharing” and have been consolidated into a single action in the U.S. District Court for the District of Connecticut. The lawsuits have been commenced as putative class actions on behalf of investors who purchased, held or redeemed shares of the various series of the PIMCO Funds and the Allianz Funds during specified periods, or as derivative actions on behalf of the PIMCO Funds and the Allianz Funds.
The market timing actions in the District of Maryland generally allege that certain hedge funds were allowed to engage in “market timing” in certain funds of the PIMCO Funds and the Allianz Funds and this alleged activity was not disclosed. Pursuant to tolling agreements entered into with the derivative and class action plaintiffs, PIMCO, certain PIMCO Funds Trustees, and certain employees of PIMCO who were previously named as defendants have all been dropped as defendants in the market timing actions; the plaintiffs continue to assert claims on behalf of the shareholders of the PIMCO Funds or on behalf of the PIMCO Funds itself against
other defendants. By order dated November 3, 2005, the U.S. District Court for the District of Maryland granted the PIMCO Funds’ motion to dismiss claims asserted against it in a consolidated amended complaint where the PIMCO Funds were named, in the complaint, as a nominal defendant. The revenue sharing action in the District of Connecticut generally alleges that fund assets were inappropriately used to pay brokers to promote funds of the PIMCO Funds and the Allianz Funds, including directing fund brokerage transactions to such brokers, and that such alleged arrangements were not fully disclosed to shareholders. On August 11, 2005, the U.S. District Court for the District of Connecticut conducted a hearing on defendants’ motion to dismiss the consolidated amended complaint in the revenue sharing action but has not yet ruled on the motion to dismiss. The market timing and revenue sharing lawsuits seek, among other things, unspecified compensatory damages plus interest and, in some cases, punitive damages, the rescission of investment advisory contracts, the return of fees paid under those contracts and restitution.
Two nearly identical class action civil complaints have been filed in August 2005, in the Northern District of Illinois Eastern Division, alleging that the plaintiffs each purchased and sold a 10-year Treasury note futures contract and suffered damages from an alleged shortage when PIMCO held both physical and futures positions in 10-year Treasury notes for its client accounts. The two actions have been consolidated into one action, and the two separate complaints have been replaced by a consolidated complaint. PIMCO is a named defendant, and PIMCO Funds has been added as a defendant, to the consolidated action. PIMCO strongly believes the complaint is without merit and intends to vigorously defend itself.
In April 2006, certain portfolios of the Trust and certain other funds managed by PIMCO were served in an adversary proceeding brought by the Official Committee of Asbestos Claimants of G-I Holdings, Inc. in G-I Holdings, Inc.’s bankruptcy in the District of New Jersey. In July 2004, PIMCO was named in this lawsuit and remains a defendant. The plaintiff seeks to recover for the bankruptcy estate assets that were transferred by the predecessor entity of G-I Holdings, Inc. to a wholly-owned subsidiary in 1994. The subsidiary has since issued notes, of which certain portfolios of the Trust and certain other funds managed by PIMCO are alleged to be holders. The complaint alleges that in 2000, more than two hundred noteholders—including certain portfolios of the Trust and certain other funds managed by PIMCO—were granted a second priority lien on the assets of the subsidiary in exchange for their consent to a refinancing transaction and the granting of a first priority lien to the lending banks. The plaintiff is seeking invalidation of the lien in favor of the noteholders and/or the value of the lien. On June 21, 2006, the District of New Jersey overturned the Bankruptcy Court’s decision granting permission to file the adversary proceeding and remanded the matter to the Bankruptcy Court for further proceedings. Following a motion to reconsider, the District Court upheld its remand on August 7, 2006, and instructed the Bankruptcy Court to conduct a “cost-benefit” analysis of the Committee’s claims, including the claims against the noteholders. The Bankruptcy Court held a status conference on October 25, 2006 and set a briefing schedule relating to this cost-benefit analysis.
The foregoing speaks only as of the date of this report. It is possible that these matters and/or other developments resulting from these matters could result in increased portfolio redemptions or other adverse consequences to the Portfolio. However, PIMCO and AGID believe that these matters are not likely to have a material adverse effect on the Portfolio or on PIMCO’s or AGID’s ability to perform their respective investment advisory or distribution services relating to the Portfolio.
10. FEDERAL INCOME TAX MATTERS
The Portfolio intends to qualify as a regulated investment company under sub-chapter M of the Internal Revenue Code (the “Code”) and distribute all of its taxable income and net realized gains, if applicable, to shareholders. Accordingly, no provision for Federal income taxes has been made.
| | | | | | |
| | Semiannual Report | | June 30, 2007 | | 21 |
Notes to Financial Statements (Cont.)
As of June 30, 2007, the aggregate cost of investments was the same for federal income tax and financial statement purposes. The net unrealized appreciation (depreciation) of investment securities for federal income tax purposes is as follows (amount in thousands):
| | | | |
Aggregate
Gross
Unrealized
Appreciation | | Aggregate
Gross
Unrealized
(Depreciation) | | Net
Unrealized
Appreciation |
$ 8,525 | | $ (1,724) | | $ 6,801 |
| | | | |
| 22 | | PIMCO Variable Insurance Trust | | |
| | |
| |
Privacy Policy* | | (Unaudited) |
The Funds consider customer privacy to be a fundamental aspect of their relationships with shareholders and are committed to maintaining the confidentiality, integrity and security of their current, prospective and former shareholders’ personal information. To ensure their shareholders’ privacy, the Funds have developed policies that are designed to protect this confidentiality, while allowing shareholder needs to be served.
Obtaining Personal Information
In the course of providing shareholders with products and services, the Funds and certain service providers to the Funds, such as the Funds’ investment advisers (“Advisers”), may obtain non-public personal information about shareholders, which may come from sources such as account applications and other forms, from other written, electronic or verbal correspondence, from shareholder transactions, from a shareholder’s brokerage or financial advisory firm, financial adviser or consultant, and/or from information captured on the Funds’ internet web sites.
Respecting Your Privacy
As a matter of policy, the Funds do not disclose any personal or account information provided by shareholders or gathered by the Funds to non-affiliated third parties, except as required or permitted by law or as necessary for such third parties to perform their agreements with respect to the Funds. As is common in the industry, non-affiliated companies may from time to time be used to provide certain services, such as preparing and mailing prospectuses, reports, account statements and other information, conducting research on shareholder satisfaction and gathering shareholder proxies. A Fund’s Distributor may also retain non-affiliated companies to market the Fund’s shares or products which use the Fund’s shares and enter into joint marketing agreements with other companies. These companies may have access to a shareholder’s personal and account information, but are permitted to use this information solely to provide the specific service or as otherwise permitted by law. In most cases, the shareholders will be clients of a third party, but the Funds may also provide a shareholder’s personal and account information to the shareholder’s respective brokerage or financial advisory firm.
Sharing Information with Third Parties
The Funds reserve the right to disclose or report personal information to non-affiliated third parties, in limited circumstances, where the Funds believe in good faith that disclosure is required under law to cooperate with regulators or law enforcement authorities, to protect their rights or property or upon reasonable request by any Fund in which a shareholder has chosen to invest. In addition, the Funds may disclose information about a shareholder’s accounts to a non-affiliated third party with the consent of the shareholder.
Sharing Information with Affiliates
The Funds may share shareholder information with their affiliates in connection with servicing their shareholders’ accounts or to provide shareholders with information about products and services that the Funds or their Advisers, principal underwriters or their affiliates (“Service Affiliates”) believe may be of interest to such shareholders. The information that the Funds share may include, for example, a shareholder’s participation in one of the Funds or in other investment programs sponsored by a Service Affiliate, a shareholder’s ownership of certain types of accounts (such as IRAs), or other data about a shareholder’s accounts. The Funds’ Service Affiliates, in turn, are not permitted to share shareholder information with non-affiliated entities, except as required or permitted by law.
Procedures to Safeguard Private Information
The Funds take seriously the obligation to safeguard shareholder non-public personal information. In addition to this policy, the Funds have also implemented procedures that are designed to restrict access to a shareholder’s non-public personal information only to internal personnel who need to know that information in order to provide products or services to such shareholders. In order to guard a shareholder’s non-public personal information, physical, electronic and procedural safeguards are in place.
* This Privacy Policy applies to the following entities: PIMCO Funds, PIMCO Variable Insurance Trust, PCM Fund, Inc. and PIMCO Strategic Global Government Fund, Inc. (collectively, the “Funds”).
| | | | | | |
| | Semiannual Report | | June 30, 2007 | | 23 |
Investment Adviser and Administrator
Pacific Investment Management Company LLC
840 Newport Center Drive
Newport Beach, California 92660
Distributor
Allianz Global Investors Distributors LLC
1345 Avenue of the Americas
New York, New York 10105
Custodian
State Street Bank & Trust Company
801 Pennsylvania
Kansas City, Missouri 64105
Transfer Agent
Boston Financial Data Services–Midwest
330 W. 9th Street
Kansas City, Missouri 64105
Legal Counsel
Dechert LLP
1775 I Street, N.W.
Washington, D.C. 20006
Independent Registered Public Accounting Firm
PricewaterhouseCoopers LLP
1055 Broadway
Kansas City, Missouri 64105
P I M C O

Table of Contents
This material is authorized for use only when preceded or accompanied by the current PIMCO Variable Insurance Trust (the “Trust”) prospectus. Investors should consider the investment objectives, risks, charges and expenses of this Trust carefully before investing. Ask your financial professional to explain all charges that may apply. This and other information is contained in the Trust’s prospectus. The variable product prospectus may be obtained by contacting your Investment Consultant. Please read the Trust and variable product prospectus carefully before you invest or send money.
Chairman’s Letter
Dear PIMCO Variable Insurance Trust Shareholder:
It is our pleasure to present to you the semiannual report for the PIMCO Variable Insurance Trust, covering the six-month period ended June 30, 2007. The PIMCO Variable Insurance Trust’s net assets were $8.68 billion at June 30, 2007, as compared to $7.76 billion at December 31, 2006.
Highlights of the financial markets during the reporting period include:
| | n | | Economic data during the first quarter of 2007 pointed to slower growth, which heightened market expectations for a decrease in the Federal Funds Rate. By the second quarter, economic data, such as employment statistics, provided little indication of economic weakness, causing expectations of a decrease in the Federal Funds Rate to unwind and U.S. interest rates to move higher. Interest rates in Europe and the U.K. also rose over the period as central banks raised their key lending rates due to inflation concerns. The benchmark ten-year U.S. Treasury yielded 5.03% as of June 30, 2007, or 0.32% higher than at the beginning of the year. |
| | n | | Most bonds generally returned much of their gains from earlier in the year as worldwide growth and capital flows drove interest rates higher in the second quarter. Increased risk aversion in global financial markets, due in part to subprime mortgage worries in the U.S., also contributed to the rise in interest rates. The Lehman Brothers Aggregate Bond Index, which includes Treasury, investment-grade corporate and mortgage-backed securities, returned 0.98% for the six-month period. |
| | n | | Locally issued emerging market (“EM”) bonds posted positive returns for the reporting period. Yields on these bonds declined and the local currencies in which they are denominated generally gained, amid increasing investor awareness, strong economic growth and surging capital inflows. External EM bonds (debt instruments issued by emerging markets countries and typically denominated in U.S. dollars) lagged behind local EM bonds (debt instruments issued by emerging markets countries and denominated in the currency of the issuer), as external EM bonds tend to trade more in-line with U.S. Treasuries. |
| | n | | Treasury Inflation-Protected Securities (“TIPS”) outpaced nominal bonds (non-inflation linked bonds) for the first part of the year and all but the longest maturity TIPS outperformed in the second quarter as high gasoline prices drove higher inflation accruals. Commodities, as represented by the Dow Jones-AIG Commodity Total Return Index, returned 4.46% for the period. Equities, as measured by the S&P 500 Index and the Russell 2000 Index, returned 6.96% and 6.45%, respectively, for the period. |
On the following pages, please find specific details as to the Portfolio’s total return investment performance and a discussion of those factors that affected performance.
Thank you for the trust you have placed in us. We will continue to work diligently to serve your investment needs.
Sincerely,
Brent R. Harris
Chairman, PIMCO Variable Insurance Trust
July 31, 2007
| | | | | | |
| | Semiannual Report | | June 30, 2007 | | 1 |
Important Information About the Portfolio
PIMCO Variable Insurance Trust (the “Trust”) is an open-end management investment company currently consisting of twenty separate investment portfolios, including the Real Return Portfolio (the “Portfolio”). The Portfolio is only available as a funding vehicle under variable life insurance policies or variable annuity contracts issued by insurance companies (“Variable Contracts”). Individuals may not purchase shares of the Portfolio directly. Shares of the Portfolio also may be sold to qualified pension and retirement plans outside of the separate account context.
We believe that bond funds have an important role to play in a well diversified investment portfolio. It is important to note, however, that in an environment where interest rates may trend upward, rising rates would negatively impact the performance of most bond funds, and fixed-income securities held by a fund are likely to decrease in value. The price volatility of fixed-income securities can also increase during periods of rising interest rates resulting in increased losses to a fund. Bond funds and individual bonds with a longer duration (a measure of the expected life of a security) tend to be more sensitive to changes in interest rates, usually making them more volatile than securities or funds with shorter durations.
The Portfolio may be subject to various risks in addition to those described above. Some of these risks may include, but are not limited to, the following: credit risk, high yield risk, market risk, issuer risk, liquidity risk, derivatives risk, mortgage risk, non-U.S. investment risk, emerging markets risk, currency risk, issuer non-diversification risk, leveraging risk and management risk. A complete description of these risks is contained in the Portfolio’s prospectus. The Portfolio may use derivative instruments for hedging purposes or as part of an investment strategy. Use of these instruments may involve certain costs and risks such as liquidity risk, interest rate risk, market risk, credit risk, management risk and the risk that the Portfolio could not close out a position when it would be most advantageous to do so. Because the Portfolio may invest in derivatives, it could lose more than the principal amount invested in these instruments. Investing in non-U.S. securities may entail risk due to non-U.S. economic and political developments; this risk may be increased when investing in emerging markets.
On the performance summary page in this Semiannual Report, the Total Return Investment Performance table measures performance assuming that all dividend and capital gain distributions were reinvested.
An investment in the Portfolio is not a deposit of a bank and is not guaranteed or insured by the Federal Deposit Insurance Corporation or any other government agency. It is possible to lose money on investments in the Portfolio.
PIMCO has adopted written proxy voting policies and procedures (“Proxy Policy”) as required by Rule 206(4)-6 under the Investment Advisers Act of 1940, as amended. The Proxy Policy has been adopted by the Trust as the policies and procedures that PIMCO will use when voting proxies on behalf of the Portfolio. A description of the policies and procedures that PIMCO uses to vote proxies relating to portfolio securities of the Portfolio, and information about how the Portfolio voted proxies relating to portfolio securities held during the most recent twelve-month period ended June 30, are available without charge, upon request, by calling the Trust at 1-866-746-2606 and on the Portfolio’s website at www.pimco.com.
The Portfolio files its complete schedule of portfolio holdings with the SEC for the first and third quarters of each fiscal year on Form N-Q. A copy of the Trust’s Form N-Q is also available on the SEC’s website at http://www.sec.gov and may be reviewed and copied at the SEC’s Public Reference Room in Washington D.C. Information on the operation of the Public Reference Room may be obtained by calling 1-800-SEC-0330, and is available without charge, upon request, by calling the Trust at 1-866-746-2606 and on the Portfolio’s website at www.pimco.com.
PIMCO Variable Insurance Trust is distributed by Allianz Global Investors Distributors LLC, 1345 Avenue of the Americas, New York, NY 10105.
| | | | |
| 2 | | PIMCO Variable Insurance Trust | | |
The following disclosure provides important information regarding the Portfolio’s Expense Example (“Example” or “Expense Example”), which appears in this Semiannual Report. Please refer to this information when reviewing the Expense Example for the Portfolio.
Example
As a shareholder of the Portfolio, you incur two types of costs: (1) transaction costs and (2) ongoing costs, including advisory and administrative fees; distribution and/or service (12b-1) fees (Administrative and Advisor Class only); and other Portfolio expenses. The Example is intended to help you understand your ongoing costs (in dollars) of investing in the Portfolio and to compare these costs with the ongoing costs of investing in other mutual funds. The Expense Example does not reflect any fees or other expenses imposed by the Variable Contracts. If it did, the expenses reflected in the Expense Example would be higher. The Example is based on an investment of $1,000 invested at the beginning of the period and held for the entire period indicated, which is from January 1, 2007 to June 30, 2007.
Actual Expenses
The information in the table under the heading “Actual Performance” provides information about actual account values and actual expenses. You may use the information in these columns, together with the amount you invested, to estimate the expenses that you paid over the period. Simply divide your account value by $1,000 (for example, an $8,600 account value divided by $1,000 = $8.60), then multiply the result by the number in the row titled “Expenses Paid During Period” to estimate the expenses you paid on your account during this period.
Hypothetical Example for Comparison Purposes
The information in the table under the heading “Hypothetical Performance (5% return before expenses)” provides information about hypothetical account values and hypothetical expenses based on the Portfolio’s actual expense ratio and an assumed rate of return of 5% per year before expenses, which is not the Portfolio’s actual return. The hypothetical account values and expenses may not be used to estimate the actual ending account balance or expenses you paid for the period. You may use this information to compare the ongoing costs of investing in the Portfolio and other portfolios. To do so, compare this 5% hypothetical example with the 5% hypothetical examples that appear in the shareholder reports of the other portfolios.
Please note that the expenses shown in the table are meant to highlight your ongoing costs only and do not reflect any transactional costs. Therefore, the information under the heading “Hypothetical Performance (5% return before expenses)” is useful in comparing ongoing costs only, and will not help you determine the relative total costs of owning different portfolios. In addition, if these transactional costs were included, your costs would have been higher.
The expense ratio may vary period to period because of various factors, such as an increase in expenses not covered by the advisory and administrative fees (such as expenses of the trustees and their counsel, litigation expense and interest expense).
| | | | | | |
| | Semiannual Report | | June 30, 2007 | | 3 |
PIMCO Real Return Portfolio
Cumulative Returns Through June 30, 2007
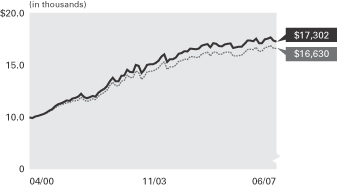
$10,000 invested at the beginning of the first full month following the inception date of the Portfolio’s Institutional Class.
Allocation Breakdown‡
| | |
U.S. Treasury Obligations | | 47.8% |
Short-Term Instruments | | 26.5% |
U.S. Government Agencies | | 10.2% |
Corporate Bonds & Notes | | 6.3% |
Asset-Backed Securities | | 5.1% |
Other | | 4.1% |
| | ‡ | % of Total Investments as of 06/30/2007 |
| | | | | | | | | | |
| Average Annual Total Return for the period ended June 30, 2007 |
| | | | | 6 Months* | | 1 Year | | 5 Years | | Portfolio
Inception
(04/10/00)** |
| | PIMCO Real Return Portfolio Institutional Class | | 0.91% | | 3.05% | | 6.30% | | 7.99% |
| | Lehman Brothers U.S. TIPS Index± | | 1.73% | | 3.99% | | 6.03% | | 7.47% |
All Portfolio returns are net of fees and expenses.
* Cumulative return.
** The Portfolio began operations on 04/10/00. Index comparisons began on 03/31/00.
Performance quoted represents past performance. Past performance is no guarantee of future results. Investment return and principal value will fluctuate so the Portfolio shares, when redeemed, may be worth more or less than their original cost. The Portfolio’s performance does not reflect the deduction of additional charges and expenses imposed in connection with investing in Variable Contracts, which will reduce returns. Current performance may be lower or higher than the performance data quoted. Performance data current to the most recent month-end is available by calling (800) 927-4648.
± Lehman Brothers U.S. TIPS Index is an unmanaged market index comprised of all U.S. Treasury Inflation-Protected Securities rated investment grade (Baa3 or better), having at least 1 year to final maturity, and at least $250 million par amount outstanding. It is not possible to invest directly in the index. The index does not reflect deductions for fees or expenses.
| | | | | | |
| Expense Example | | Actual Performance | | Hypothetical Performance |
| | | | | (5% return before expenses) |
Beginning Account Value (01/01/07) | | $ | 1,000.00 | | $ | 1,000.00 |
Ending Account Value (06/30/07) | | $ | 1,009.09 | | $ | 1,022.32 |
Expenses Paid During Period† | | $ | 2.49 | | $ | 2.51 |
† Expenses are equal to the Portfolio’s Institutional Class annualized expense ratio of 0.50%, multiplied by the average account value over the period, multiplied by 181/365 (to reflect the one-half year period). Overall fees and expenses of investing in the Portfolio will be higher because the example does not reflect Variable Contract fees and expenses.
Please refer to page 3 herein for an explanation of the information presented in the above Expense Example.
Portfolio Insights
| » | | The PIMCO Real Return Portfolio seeks to achieve its investment objective by investing under normal circumstances at least 80% of its net assets in inflation-indexed bonds of varying maturities issued by the U.S. and non-U.S. governments, their agencies, or instrumentalities or corporations, which may be represented by forwards or derivatives such as options, futures contracts, or swap agreements. |
| » | | Positioning for a steeper U.S. nominal yield curve added to performance as the U.S. nominal yield curve steepened. |
| » | | An emphasis on nominal bonds in the Eurozone benefited performance as nominal bonds outperformed inflation-linked bonds in the region. |
| » | | Above-index U.S. real duration was negative for performance as real yields increased. |
| » | | Modest exposure to U.K. nominal bonds was negative for performance due to rising interest rates and a tightening bias from the Bank of England. |
| » | | Holdings of mortgage-backed securities detracted from performance as mortgage spreads widened. |
| | | | |
| 4 | | PIMCO Variable Insurance Trust | | |
Financial Highlights Real Return Portfolio
| | | | | | | | | | | | | | | | | | | | | | | | |
| Selected per Share Data for the Year or Period Ended: | | 06/30/2007+ | | | 12/31/2006 | | | 12/31/2005 | | | 12/31/2004 | | | 12/31/2003 | | | 12/31/2002 | |
| | | | | | |
Institutional Class | | | | | | | | | | | | | | | | | | | | | | | | |
Net asset value beginning of year or period | | $ | 11.93 | | | $ | 12.69 | | | $ | 12.92 | | | $ | 12.36 | | | $ | 11.90 | | | $ | 10.56 | |
Net investment income (a) | | | 0.29 | | | | 0.54 | | | | 0.37 | | | | 0.15 | | | | 0.25 | | | | 0.49 | |
Net realized/unrealized gain (loss) on investments (a) | | | (0.17 | ) | | | (0.42 | ) | | | (0.08 | ) | | | 0.96 | | | | 0.81 | | | | 1.36 | |
Total income from investment operations | | | 0.12 | | | | 0.12 | | | | 0.29 | | | | 1.11 | | | | 1.06 | | | | 1.85 | |
Dividends from net investment income | | | (0.30 | ) | | | (0.55 | ) | | | (0.38 | ) | | | (0.14 | ) | | | (0.34 | ) | | | (0.49 | ) |
Distributions from net realized capital gains | | | 0.00 | | | | (0.33 | ) | | | (0.14 | ) | | | (0.41 | ) | | | (0.26 | ) | | | (0.02 | ) |
Total distributions | | | (0.30 | ) | | | (0.88 | ) | | | (0.52 | ) | | | (0.55 | ) | | | (0.60 | ) | | | (0.51 | ) |
Net asset value end of year or period | | $ | 11.75 | | | $ | 11.93 | | | $ | 12.69 | | | $ | 12.92 | | | $ | 12.36 | | | $ | 11.90 | |
Total return | | | 0.91 | % | | | 0.86 | % | | | 2.24 | % | | | 9.08 | % | | | 9.00 | % | | | 17.93 | % |
Net assets end of year or period (000s) | | $ | 46,629 | | | $ | 45,852 | | | $ | 44,659 | | | $ | 36,691 | | | $ | 26,540 | | | $ | 16 | |
Ratio of expenses to average net assets | | | 0.50 | %* | | | 0.50 | % | | | 0.51 | % | | | 0.50 | % | | | 0.51 | % | | | 0.51 | % |
Ratio of expenses to average net assets excluding interest expense | | | 0.50 | %* | | | 0.50 | % | | | 0.50 | % | | | 0.50 | % | | | 0.50 | % | | | 0.50 | % |
Ratio of net investment income to average net assets | | | 4.88 | %* | | | 4.38 | % | | | 2.88 | % | | | 1.14 | % | | | 2.06 | % | | | 4.40 | % |
Portfolio turnover rate | | | 484 | % | | | 963 | % | | | 1,102 | % | | | 1,064 | % | | | 738 | % | | | 87 | % |
+ Unaudited
* Annualized
(a) Per share amounts based on average number of shares outstanding during the period.
| | | | | | |
| See Accompanying Notes | | Semiannual Report | | June 30, 2007 | | 5 |
Statement of Assets and Liabilities Real Return Portfolio
| | | | |
| (Amounts in thousands, except per share amounts) | | June 30, 2007 | |
| | | (Unaudited) | |
| |
Assets: | | | | |
Investments, at value | | $ | 2,091,451 | |
Cash | | | 72 | |
Foreign currency, at value | | | 8,246 | |
Receivable for investments sold | | | 96,104 | |
Receivable for investments sold on a delayed-delivery basis | | | 10,275 | |
Receivable for Portfolio shares sold | | | 7,639 | |
Interest and dividends receivable | | | 4,575 | |
Variation margin receivable | | | 12 | |
Swap premiums paid | | | 5,874 | |
Unrealized appreciation on foreign currency contracts | | | 179 | |
Unrealized appreciation on swap agreements | | | 3,526 | |
| | | | 2,227,953 | |
| |
Liabilities: | | | | |
Payable for investments purchased | | $ | 149,673 | |
Payable for investments purchased on a delayed-delivery basis | | | 1,007,734 | |
Payable for Portfolio shares redeemed | | | 1,310 | |
Payable for short sales | | | 57,627 | |
Written options outstanding | | | 238 | |
Dividends payable | | | 18 | |
Accrued investment advisory fee | | | 207 | |
Accrued administration fee | | | 207 | |
Accrued distribution fee | | | 2 | |
Accrued servicing fee | | | 106 | |
Variation margin payable | | | 933 | |
Swap premiums received | | | 5,324 | |
Unrealized depreciation on foreign currency contracts | | | 239 | |
Unrealized depreciation on swap agreements | | | 3,124 | |
Other liabilities | | | 2,531 | |
| | | | 1,229,273 | |
| |
Net Assets | | $ | 998,680 | |
| |
Net Assets Consist of: | | | | |
Paid in capital | | $ | 1,073,947 | |
Undistributed net investment income | | | 9,102 | |
Accumulated undistributed net realized (loss) | | | (87,924 | ) |
Net unrealized appreciation | | | 3,555 | |
| | | $ | 998,680 | |
| |
Net Assets: | | | | |
Institutional Class | | $ | 46,629 | |
Administrative Class | | | 942,932 | |
Advisor Class | | | 9,119 | |
| |
Shares Issued and Outstanding: | | | | |
Institutional Class | | | 3,967 | |
Administrative Class | | | 80,217 | |
Advisor Class | | | 776 | |
| |
Net Asset Value and Redemption Price Per Share (Net Asset Per Share Outstanding) | | | | |
Institutional Class | | $ | 11.75 | |
Administrative Class | | | 11.75 | |
Advisor Class | | | 11.75 | |
| |
Cost of Investments Owned | | $ | 2,084,650 | |
Cost of Foreign Currency Held | | $ | 8,225 | |
Proceeds Received on Short Sales | | $ | 56,863 | |
Premiums Received on Written Options | | $ | 387 | |
| | | | |
| 6 | | PIMCO Variable Insurance Trust | | See Accompanying Notes |
Statement of Operations Real Return Portfolio
| | | | |
| (Amounts in thousands) | | Six Months Ended
June 30, 2007 | |
| | | (Unaudited) | |
| |
| Investment Income: | | | | |
Interest | | $ | 28,500 | |
Miscellaneous income | | | 32 | |
Total Income | | | 28,532 | |
| |
Expenses: | | | | |
Investment advisory fees | | | 1,318 | |
Administration fees | | | 1,318 | |
Servicing fees – Administrative Class | | | 753 | |
Distribution and/or servicing fees – Advisor Class | | | 7 | |
Trustees’ fees | | | 10 | |
Total Expenses | | | 3,406 | |
| |
Net Investment Income | | | 25,126 | |
| |
Net Realized and Unrealized Gain (Loss): | | | | |
Net realized (loss) on investments | | | (40,473 | ) |
Net realized gain on futures contracts, written options and swaps | | | 84 | |
Net realized (loss) on foreign currency transactions | | | (743 | ) |
Net change in unrealized appreciation on investments | | | 30,216 | |
Net change in unrealized (depreciation) on futures contracts, written options and swaps | | | (2,279 | ) |
Net change in unrealized appreciation on translation of assets and liabilities denominated in foreign currencies | | | 321 | |
Net (Loss) | | | (12,874 | ) |
| |
Net Increase in Net Assets Resulting from Operations | | $ | 12,252 | |
| | | | | | |
| See Accompanying Notes | | Semiannual Report | | June 30, 2007 | | 7 |
Statements of Changes in Net Assets Real Return Portfolio
| | | | | | | | |
| (Amounts in thousands) | | Six Months Ended
June 30, 2007 | | | Year Ended
December 31, 2006 | |
| | | (Unaudited) | | | | |
| | |
| Increase (Decrease) in Net Assets from: | | | | | | | | |
| | |
Operations: | | | | | | | | |
Net investment income | | $ | 25,126 | | | $ | 47,440 | |
Net realized (loss) | | | (41,132 | ) | | | (12,066 | ) |
Net change in unrealized appreciation (depreciation) | | | 28,258 | | | | (27,331 | ) |
Net increase resulting from operations | | | 12,252 | | | | 8,043 | |
| | |
Distributions to Shareholders: | | | | | | | | |
From net investment income | | | | | | | | |
Institutional Class | | | (1,137 | ) | | | (1,932 | ) |
Administrative Class | | | (24,024 | ) | | | (45,759 | ) |
Advisor Class | | | (119 | ) | | | (41 | ) |
From net realized capital gains | | | | | | | | |
Institutional Class | | | 0 | | | | (1,205 | ) |
Administrative Class | | | 0 | | | | (28,225 | ) |
Advisor Class | | | 0 | | | | (68 | ) |
| | |
Total Distributions | | | (25,280 | ) | | | (77,230 | ) |
| | |
Portfolio Share Transactions: | | | | | | | | |
Receipts for shares sold | | | | | | | | |
Institutional Class | | | 3,580 | | | | 7,837 | |
Administrative Class | | | 166,885 | | | | 367,822 | |
Advisor Class | | | 6,796 | | | | 3,086 | |
Issued as reinvestment of distributions | | | | | | | | |
Institutional Class | | | 1,137 | | | | 3,137 | |
Administrative Class | | | 23,367 | | | | 73,676 | |
Advisor Class | | | 119 | | | | 109 | |
Cost of shares redeemed | | | | | | | | |
Institutional Class | | | (3,266 | ) | | | (6,951 | ) |
Administrative Class | | | (268,783 | ) | | | (353,626 | ) |
Advisor Class | | | (329 | ) | | | (402 | ) |
Net increase (decrease) resulting from Portfolio share transactions | | | (70,494 | ) | | | 94,688 | |
| | |
Total Increase (Decrease) in Net Assets | | | (83,522 | ) | | | 25,501 | |
| | |
Net Assets: | | | | | | | | |
Beginning of period | | | 1,082,202 | | | | 1,056,701 | |
End of period* | | $ | 998,680 | | | $ | 1,082,202 | |
| | |
*Including undistributed net investment income of: | | $ | 9,102 | | | $ | 9,256 | |
| | | | |
| 8 | | PIMCO Variable Insurance Trust | | See Accompanying Notes |
| | |
| |
| Schedule of Investments Real Return Portfolio | | June 30, 2007 (Unaudited) |
| | | | | | | | |
| | | | | PRINCIPAL
AMOUNT
(000S) | | | | VALUE
(000S) |
| BANK LOAN OBLIGATIONS 0.3% |
| Georgia-Pacific Corp. | | | | | | | | |
7.110% due 12/20/2012 | | $ | | 988 | | $ | | 991 |
| |
| OAO Rosneft Oil Co. |
6.000% due 09/16/2007 | | | | 1,600 | | | | 1,602 |
| | | | | | | | |
Total Bank Loan Obligations
(Cost $2,586) | | 2,593 |
| | | | | | | | |
|
| CORPORATE BONDS & NOTES 13.2% |
|
| BANKING & FINANCE 11.0% |
| American Express Centurion Bank |
5.320% due 05/07/2008 | | | | 500 | | | | 500 |
| |
| American International Group, Inc. |
5.360% due 06/23/2008 | | | | 1,200 | | | | 1,200 |
| |
| Atlantic & Western Re Ltd. |
11.599% due 01/09/2009 | | | | 900 | | | | 908 |
| |
| Bank of America Corp. |
5.366% due 11/06/2009 | | | | 900 | | | | 900 |
5.510% due 02/17/2009 | | | | 5,400 | | | | 5,414 |
| |
| Bank of America N.A. |
5.360% due 12/18/2008 | | | | 5,400 | | | | 5,403 |
| |
| Bank of Ireland |
5.370% due 12/19/2008 | | | | 1,500 | | | | 1,502 |
5.410% due 12/18/2009 | | | | 1,000 | | | | 1,002 |
| |
| C10 Capital SPV Ltd. |
6.722% due 12/31/2049 | | | | 500 | | | | 488 |
| |
| Calabash Re II Ltd. |
16.260% due 01/08/2010 | | | | 250 | | | | 260 |
| |
| Charter One Bank N.A. |
5.405% due 04/24/2009 | | | | 8,400 | | | | 8,411 |
| |
| CIT Group, Inc. |
5.505% due 01/30/2009 | | | | 4,600 | | | | 4,594 |
| |
| Citigroup Funding, Inc. |
5.320% due 04/23/2009 | | | | 5,700 | | | | 5,703 |
| |
| Citigroup, Inc. |
5.390% due 12/28/2009 | | | | 3,900 | | | | 3,903 |
5.395% due 01/30/2009 | | | | 1,000 | | | | 1,001 |
5.400% due 12/26/2008 | | | | 4,900 | | | | 4,904 |
5.405% due 05/02/2008 | | | | 1,000 | | | | 1,001 |
| |
| Commonwealth Bank of Australia |
5.360% due 06/08/2009 | | | | 400 | | | | 400 |
| |
| Credit Agricole S.A. |
5.360% due 05/28/2009 | | | | 1,900 | | | | 1,901 |
| |
| DnB NORBank ASA |
5.425% due 10/13/2009 | | | | 1,100 | | | | 1,101 |
| |
| East Lane Re Ltd. |
12.355% due 05/06/2011 | | | | 300 | | | | 301 |
| |
| Export-Import Bank of Korea |
5.570% due 10/04/2011 | | | | 1,600 | | | | 1,602 |
| |
| Ford Motor Credit Co. |
7.250% due 10/25/2011 | | | | 1,200 | | | | 1,156 |
7.800% due 06/01/2012 | | | | 100 | | | | 98 |
| |
| Foundation Re II Ltd. |
12.110% due 11/26/2010 | | | | 800 | | | | 803 |
| |
| General Electric Capital Corp. |
5.355% due 10/24/2008 | | | | 800 | | | | 801 |
5.385% due 10/26/2009 | | | | 1,000 | | | | 1,001 |
5.400% due 03/04/2008 | | | | 2,800 | | | | 2,803 |
5.400% due 12/12/2008 | | | | 900 | | | | 901 |
| |
| General Motors Acceptance Corp. |
6.750% due 12/01/2014 | | | | 1,600 | | | | 1,534 |
| |
| Goldman Sachs Group, Inc. |
5.660% due 06/28/2010 | | | | 4,700 | | | | 4,730 |
| |
| | | | | | | | |
| | | | | PRINCIPAL
AMOUNT
(000S) | | | | VALUE
(000S) |
| HBOS Treasury Services PLC |
5.320% due 07/17/2008 | | $ | | 1,100 | | $ | | 1,101 |
| |
| HSBC Finance Corp. |
5.360% due 05/21/2008 | | | | 1,200 | | | | 1,201 |
5.415% due 10/21/2009 | | | | 1,900 | | | | 1,901 |
| |
| JPMorgan Chase & Co. |
5.370% due 06/26/2009 | | | | 700 | | | | 701 |
5.410% due 06/26/2009 | | | | 5,500 | | | | 5,508 |
| |
| Lehman Brothers Holdings, Inc. |
5.370% due 11/24/2008 | | | | 300 | | | | 300 |
| |
| Longpoint Re Ltd. |
10.609% due 05/08/2010 | | | | 1,100 | | | | 1,100 |
| |
| Merrill Lynch & Co., Inc. |
5.395% due 10/23/2008 | | | | 2,500 | | | | 2,504 |
| |
| Morgan Stanley |
5.360% due 11/21/2008 | | | | 1,000 | | | | 1,000 |
| |
| Mystic Re Ltd. |
14.360% due 12/05/2008 | | | | 600 | | | | 594 |
| |
| Phoenix Quake Ltd. |
7.800% due 07/03/2008 | | | | 500 | | | | 503 |
| |
| Phoenix Quake Wind I Ltd. |
7.800% due 07/03/2008 | | | | 2,000 | | | | 2,007 |
| |
| Rabobank Nederland |
5.376% due 01/15/2009 | | | | 800 | | | | 801 |
| |
| Redwood Capital IX Ltd. |
11.610% due 01/09/2008 | | | | 500 | | | | 504 |
12.110% due 01/09/2008 | | | | 500 | | | | 504 |
| |
| Royal Bank of Scotland Group PLC |
5.405% due 07/21/2008 | | | | 400 | | | | 400 |
| |
| Santander U.S. Debt S.A. Unipersonal |
5.370% due 09/21/2007 | | | | 400 | | | | 400 |
5.420% due 09/19/2008 | | | | 500 | | | | 501 |
5.420% due 11/20/2009 | | | | 2,700 | | | | 2,702 |
| |
| Shackleton Re Ltd. |
13.355% due 02/07/2008 | | | | 1,000 | | | | 1,015 |
| |
| Travelers Property Casualty Corp. |
3.750% due 03/15/2008 | | | | 100 | | | | 99 |
| |
| Unicredit Luxembourg Finance S.A. |
5.405% due 10/24/2008 | | | | 1,700 | | | | 1,701 |
| |
| Vita Capital II Ltd. |
6.249% due 01/01/2010 | | | | 300 | | | | 300 |
| |
| Vita Capital III Ltd. |
6.469% due 01/01/2012 | | | | 700 | | | | 701 |
| |
| VTB Capital S.A. for Vneshtorgbank |
5.955% due 08/01/2008 | | | | 1,700 | | | | 1,704 |
| |
| Wachovia Bank N.A. |
5.360% due 02/23/2009 | | | | 5,400 | | | | 5,403 |
5.430% due 12/02/2010 | | | | 2,400 | | | | 2,402 |
| |
| Westpac Banking Corp. |
5.280% due 06/06/2008 | | | | 5,400 | | | | 5,401 |
| |
| World Savings Bank FSB |
5.396% due 05/08/2009 | | | | 300 | | | | 300 |
5.410% due 06/20/2008 | | | | 300 | | | | 300 |
5.485% due 03/02/2009 | | | | 300 | | | | 301 |
| | | | | | | | |
| | | | | | | | 110,085 |
| | | | | | | | |
|
| INDUSTRIALS 1.1% |
| C8 Capital SPV Ltd. |
6.640% due 12/31/2049 | | | | 500 | | | | 493 |
| |
| CSC Holdings, Inc. |
7.875% due 12/15/2007 | | | | 600 | | | | 605 |
| |
| EchoStar DBS Corp. |
5.750% due 10/01/2008 | | | | 500 | | | | 500 |
7.000% due 10/01/2013 | | | | 5,000 | | | | 4,950 |
| |
| | | | | | | | |
| | | | | PRINCIPAL
AMOUNT
(000S) | | | | VALUE
(000S) |
| Pemex Project Funding Master Trust |
7.375% due 12/15/2014 | | $ | | 500 | | $ | | 546 |
8.625% due 02/01/2022 | | | | 200 | | | | 247 |
| |
| Royal Caribbean Cruises Ltd. |
7.000% due 10/15/2007 | | | | 200 | | | | 202 |
| |
| Wal-Mart Stores, Inc. |
5.260% due 06/16/2008 | | | | 3,200 | | | | 3,199 |
| | | | | | | | |
| | | | | | | | 10,742 |
| | | | | | | | |
|
| UTILITIES 1.1% |
| America Movil SAB de C.V. |
5.460% due 06/27/2008 | | | | 5,500 | | | | 5,501 |
| |
| AT&T, Inc. |
5.456% due 02/05/2010 | | | | 2,800 | | | | 2,805 |
| |
| Cleveland Electric Illuminating Co. |
6.860% due 10/01/2008 | | | | 100 | | | | 102 |
| |
| CMS Energy Corp. |
9.875% due 10/15/2007 | | | | 1,600 | | | | 1,623 |
| |
| Dominion Resources, Inc. |
5.540% due 11/14/2008 | | | | 300 | | | | 300 |
| |
| Embarq Corp. |
7.082% due 06/01/2016 | | | | 300 | | | | 302 |
| |
| NiSource Finance Corp. |
5.930% due 11/23/2009 | | | | 800 | | | | 802 |
| | | | | | | | |
| | | | | | | | 11,435 |
| | | | | | | | |
Total Corporate Bonds & Notes
(Cost $132,018) | | 132,262 |
| | | | | | | | |
|
| CONVERTIBLE BONDS & NOTES 0.4% |
| Chesapeake Energy Corp. |
2.500% due 05/15/2037 | | | | 3,750 | | | | 3,844 |
| | | | | | | | |
Total Convertible Bonds & Notes
(Cost $3,808) | | 3,844 |
| | | | | | | | |
|
| MUNICIPAL BONDS & NOTES 0.1% |
| Badger, Wisconsin Tobacco Asset Securitization Corporations Revenue Bonds, Series 2002 |
6.000% due 06/01/2017 | | | | 475 | | | | 509 |
| |
| New York City, New York Municipal Water Finance Authority Revenue Notes, Series 2006 |
6.265% due 12/15/2013 | | | | 130 | | | | 128 |
| |
| Rhode Island State Tobacco Settlement Financing Corporations Revenue Bonds, Series 2002 |
6.000% due 06/01/2023 | | | | 500 | | | | 529 |
| | | | | | | | |
Total Municipal Bonds & Notes
(Cost $1,016) | | 1,166 |
| | | | | | | | |
|
| U.S. GOVERNMENT AGENCIES 21.3% |
| Fannie Mae |
4.187% due 11/01/2034 | | | | 6,176 | | | | 6,125 |
4.541% due 07/01/2035 | | | | 740 | | | | 736 |
4.673% due 05/25/2035 | | | | 2,900 | | | | 2,863 |
4.682% due 01/01/2035 | | | | 680 | | | | 670 |
5.380% due 12/25/2036 | | | | 490 | | | | 489 |
5.470% due 08/25/2034 | | | | 450 | | | | 450 |
5.500% due 03/01/2034 - 08/01/2037 | | | | 117,293 | | | | 113,134 |
5.670% due 05/25/2042 | | | | 298 | | | | 299 |
5.950% due 02/25/2044 | | | | 1,053 | | | | 1,051 |
6.000% due 09/01/2035 - 07/01/2037 | | | | 14,538 | | | | 14,387 |
6.227% due 06/01/2043 - 09/01/2044 | | | | 10,458 | | | | 10,592 |
7.320% due 11/01/2024 | | | | 17 | | | | 17 |
| |
| | | | | | |
| See Accompanying Notes | | Semiannual Report | | June 30, 2007 | | 9 |
Schedule of Investments Real Return Portfolio (Cont.)
| | | | | | | | |
| | | | | PRINCIPAL
AMOUNT
(000S) | | | | VALUE
(000S) |
| Freddie Mac | | | | | | | | |
4.000% due 03/15/2023 - 10/15/2023 | | $ | | 957 | | $ | | 945 |
4.550% due 01/01/2034 | | | | 667 | | | | 659 |
5.000% due 02/15/2020 - 08/15/2020 | | | | 9,907 | | | | 9,748 |
5.470% due 07/15/2019 - 10/15/2020 | | | | 19,200 | | | | 19,183 |
5.500% due 05/15/2016 | | | | 7,567 | | | | 7,567 |
5.550% due 07/15/2037 | | | | 1,400 | | | | 1,400 |
5.580% due 08/25/2031 | | | | 182 | | | | 182 |
5.670% due 12/15/2030 | | | | 485 | | | | 486 |
6.227% due 10/25/2044 - 02/25/2045 | | | | 16,300 | | | | 16,404 |
| |
| Small Business Administration | | | | |
4.504% due 02/10/2014 | | | | 1,567 | | | | 1,497 |
4.880% due 11/01/2024 | | | | 3,464 | | | | 3,314 |
| | | | | | | | |
Total U.S. Government Agencies
(Cost $212,767) | | 212,198 |
| | | | | | | | |
|
| U.S. TREASURY OBLIGATIONS 100.1% |
| Treasury Inflation Protected Securities (b) | | |
0.875% due 04/15/2010 | | | | 46,039 | | | | 43,737 |
1.625% due 01/15/2015 | | | | 3,372 | | | | 3,135 |
1.875% due 07/15/2015 | | | | 105,075 | | | | 99,329 |
2.000% due 04/15/2012 | | | | 22,109 | | | | 21,465 |
2.000% due 01/15/2014 | | | | 82,621 | | | | 79,426 |
2.000% due 07/15/2014 | | | | 99,281 | | | | 95,333 |
2.000% due 01/15/2016 | | | | 4,500 | | | | 4,274 |
2.000% due 01/15/2026 | | | | 81,940 | | | | 74,245 |
2.375% due 04/15/2011 | | | | 28,981 | | | | 28,673 |
2.375% due 01/15/2025 | | | | 74,048 | | | | 71,225 |
2.375% due 01/15/2027 | | | | 24,616 | | | | 23,647 |
2.500% due 07/15/2016 | | | | 20,261 | | | | 20,041 |
3.000% due 07/15/2012 | | | | 107,896 | | | | 110,020 |
3.375% due 01/15/2012 | | | | 4,679 | | | | 4,831 |
3.375% due 04/15/2032 | | | | 1,872 | | | | 2,155 |
3.500% due 01/15/2011 | | | | 28,874 | | | | 29,716 |
3.625% due 01/15/2008 | | | | 1,285 | | | | 1,287 |
3.625% due 04/15/2028 | | | | 63,131 | | | | 73,158 |
3.875% due 01/15/2009 | | | | 71,163 | | | | 72,319 |
3.875% due 04/15/2029 | | | | 66,711 | | | | 80,564 |
4.250% due 01/15/2010 | | | | 48,693 | | | | 50,553 |
| |
| U.S. Treasury Bonds | | | | |
6.000% due 02/15/2026 | | | | 1,400 | | | | 1,529 |
6.625% due 02/15/2027 | | | | 1,300 | | | | 1,523 |
8.875% due 08/15/2017 | | | | 1,000 | | | | 1,296 |
| |
| U.S. Treasury Notes | | | | |
4.500% due 02/28/2011 | | | | 1,700 | | | | 1,677 |
4.875% due 04/30/2011 | | | | 4,600 | | | | 4,595 |
| | | | | | | | |
Total U.S. Treasury Obligations
(Cost $993,078) | | 999,753 |
| | | | | | | | |
|
| MORTGAGE-BACKED SECURITIES 6.5% |
| American Home Mortgage Investment Trust |
5.470% due 09/25/2035 | | | | 111 | | | | 111 |
| |
| Arkle Master Issuer PLC | | | | |
5.300% due 11/19/2007 | | | | 1,300 | | | | 1,300 |
| |
| Arran Residential Mortgages Funding PLC |
5.340% due 04/12/2036 | | | | 2,119 | | | | 2,119 |
| |
| Banc of America Funding Corp. | | | | |
4.614% due 02/20/2036 | | | | 3,244 | | | | 3,193 |
| |
| Banc of America Mortgage Securities, Inc. |
6.500% due 09/25/2033 | | | | 186 | | | | 186 |
| |
| Bear Stearns Commercial Mortgage Securities |
6.440% due 06/16/2030 | | | | 600 | | | | 603 |
| |
| Citigroup Commercial Mortgage Trust |
5.390% due 08/15/2021 | | | | 95 | | | | 95 |
| |
| | | | | | | | |
| | | | | PRINCIPAL
AMOUNT
(000S) | | | | VALUE
(000S) |
| Citigroup Mortgage Loan Trust, Inc. |
4.700% due 12/25/2035 | | $ | | 4,161 | | $ | | 4,087 |
4.900% due 12/25/2035 | | | | 219 | | | | 218 |
| |
| Countrywide Alternative Loan Trust |
5.390% due 07/25/2046 | | | | 326 | | | | 326 |
5.400% due 09/20/2046 | | | | 667 | | | | 668 |
5.500% due 02/20/2047 | | | | 1,349 | | | | 1,347 |
5.500% due 05/25/2047 | | | | 460 | | | | 461 |
5.600% due 12/25/2035 | | | | 105 | | | | 105 |
| |
| Countrywide Home Loan Mortgage Pass-Through Trust |
3.786% due 11/19/2033 | | | | 250 | | | | 241 |
5.660% due 06/25/2035 | | | | 687 | | | | 686 |
| |
| CS First Boston Mortgage Securities Corp. |
4.938% due 12/15/2040 | | | | 1,011 | | | | 1,003 |
| |
| Deutsche ALT-A Securities, Inc. Mortgage Loan Trust |
5.420% due 10/25/2036 | | | | 1,018 | | | | 1,019 |
| |
| First Horizon Alternative Mortgage Securities |
4.732% due 06/25/2034 | | | | 885 | | | | 874 |
| |
| GE Capital Commercial Mortgage Corp. |
4.229% due 12/10/2037 | | | | 7,248 | | | | 7,087 |
| |
| Greenpoint Mortgage Funding Trust |
5.400% due 10/25/2046 | | | | 695 | | | | 695 |
5.400% due 01/25/2047 | | | | 5,206 | | | | 5,209 |
5.540% due 06/25/2045 | | | | 1,099 | | | | 1,100 |
5.590% due 11/25/2045 | | | | 635 | | | | 636 |
| |
| GSR Mortgage Loan Trust |
4.538% due 09/25/2035 | | | | 2,321 | | | | 2,288 |
| |
| Harborview Mortgage Loan Trust |
5.540% due 05/19/2035 | | | | 285 | | | | 286 |
| |
| Impac Secured Assets CMN Owner Trust |
5.400% due 01/25/2037 | | | | 354 | | | | 354 |
| |
| Indymac Index Mortgage Loan Trust |
5.410% due 11/25/2046 | | | | 932 | | | | 933 |
5.420% due 01/25/2037 | | | | 672 | | | | 672 |
| |
| JPMorgan Mortgage Trust |
5.008% due 07/25/2035 | | | | 1,416 | | | | 1,398 |
| |
| MASTR Adjustable Rate Mortgages Trust |
3.786% due 11/21/2034 | | | | 700 | | | | 686 |
| |
| Mellon Residential Funding Corp. |
5.670% due 11/15/2031 | | | | 1,131 | | | | 1,133 |
5.760% due 12/15/2030 | | | | 940 | | | | 944 |
| |
| Merrill Lynch Floating Trust |
5.390% due 06/15/2022 | | | | 267 | | | | 267 |
| |
| Residential Accredit Loans, Inc. |
5.620% due 08/25/2035 | | | | 368 | | | | 369 |
| |
| Securitized Asset Sales, Inc. |
7.542% due 11/26/2023 | | | | 12 | | | | 12 |
| |
| Sequoia Mortgage Trust |
5.670% due 10/19/2026 | | | | 350 | | | | 350 |
| |
| Structured Adjustable Rate Mortgage Loan Trust |
4.580% due 02/25/2034 | | | | 693 | | | | 694 |
6.429% due 01/25/2035 | | | | 389 | | | | 391 |
| |
| Structured Asset Mortgage Investments, Inc. |
5.390% due 08/25/2036 | | | | 784 | | | | 785 |
5.510% due 06/25/2036 | | | | 343 | | | | 343 |
| |
| Structured Asset Securities Corp. |
5.329% due 10/25/2035 | | | | 693 | | | | 692 |
5.370% due 05/25/2036 | | | | 56 | | | | 56 |
| |
| TBW Mortgage-Backed Pass-Through Certificates |
5.420% due 09/25/2036 | | | | 138 | | | | 139 |
5.430% due 01/25/2037 | | | | 991 | | | | 992 |
| |
| Thornburg Mortgage Securities Trust |
5.430% due 04/25/2036 | | | | 90 | | | | 90 |
| | | | | | | | |
| | | | | PRINCIPAL
AMOUNT
(000S) | | | | VALUE
(000S) |
5.430% due 12/25/2036 | | $ | | 4,514 | | $ | | 4,514 |
5.440% due 08/25/2036 | | | | 2,225 | | | | 2,224 |
| |
| Wachovia Bank Commercial Mortgage Trust |
5.681% due 04/15/2034 | | | | 595 | | | | 596 |
| |
| Washington Mutual, Inc. |
5.580% due 11/25/2045 | | | | 551 | | | | 553 |
5.610% due 08/25/2045 | | | | 89 | | | | 89 |
5.610% due 10/25/2045 | | | | 3,593 | | | | 3,602 |
5.724% due 07/25/2046 | | | | 1,931 | | | | 1,939 |
5.759% due 01/25/2047 | | | | 1,946 | | | | 1,946 |
5.839% due 12/25/2046 | | | | 252 | | | | 253 |
6.029% due 02/25/2046 | | | | 469 | | | | 470 |
6.229% due 11/25/2042 | | | | 119 | | | | 120 |
6.529% due 11/25/2046 | | | | 285 | | | | 286 |
| |
| Wells Fargo Mortgage-Backed Securities Trust |
3.539% due 09/25/2034 | | | | 531 | | | | 517 |
4.110% due 06/25/2035 | | | | 788 | | | | 785 |
| | | | | | | | |
Total Mortgage-Backed Securities
(Cost $65,143) | | 65,137 |
| | | | | | | | |
|
| ASSET-BACKED SECURITIES 10.7% |
| Aames Mortgage Investment Trust | | |
5.380% due 04/25/2036 | | | | 71 | | | | 71 |
| |
| Accredited Mortgage Loan Trust |
5.480% due 09/25/2035 | | | | 216 | | | | 216 |
| |
| ACE Securities Corp. |
5.370% due 07/25/2036 | | | | 406 | | | | 406 |
5.370% due 12/25/2036 | | | | 301 | | | | 301 |
5.430% due 10/25/2035 | | | | 431 | | | | 431 |
| |
| Argent Securities, Inc. |
5.370% due 10/25/2036 | | | | 1,026 | | | | 1,026 |
5.390% due 04/25/2036 | | | | 365 | | | | 365 |
5.400% due 03/25/2036 | | | | 411 | | | | 412 |
| |
| Asset-Backed Funding Certificates |
5.380% due 11/25/2036 | | | | 142 | | | | 142 |
5.380% due 01/25/2037 | | | | 4,070 | | | | 4,072 |
5.670% due 06/25/2034 | | | | 1,169 | | | | 1,172 |
| |
| Asset-Backed Securities Corp. Home Equity |
5.370% due 11/25/2036 | | | | 114 | | | | 114 |
| |
| Bank One Issuance Trust |
5.430% due 12/15/2010 | | | | 600 | | | | 601 |
| |
| Bear Stearns Asset-Backed Securities, Inc. |
5.370% due 11/25/2036 | | | | 154 | | | | 154 |
5.400% due 12/25/2035 | | | | 130 | | | | 130 |
5.410% due 04/25/2036 | | | | 234 | | | | 234 |
5.520% due 09/25/2034 | | | | 422 | | | | 422 |
5.650% due 10/25/2032 | | | | 58 | | | | 58 |
5.650% due 01/25/2036 | | | | 141 | | | | 141 |
5.770% due 03/25/2043 | | | | 191 | | | | 191 |
| |
| Carrington Mortgage Loan Trust |
5.370% due 01/25/2037 | | | | 978 | | | | 979 |
| |
| Centex Home Equity |
5.370% due 06/25/2036 | | | | 1,123 | | | | 1,124 |
| |
| Chase Credit Card Master Trust |
5.430% due 10/15/2010 | | | | 500 | | | | 501 |
5.430% due 02/15/2011 | | | | 1,000 | | | | 1,002 |
5.440% due 02/15/2010 | | | | 300 | | | | 300 |
| |
| Chase Issuance Trust |
5.330% due 12/15/2010 | | | | 400 | | | | 400 |
| |
| Citibank Credit Card Issuance Trust |
5.456% due 01/15/2010 | | | | 1,505 | | | | 1,507 |
| |
| Citigroup Mortgage Loan Trust, Inc. |
5.370% due 11/25/2036 | | | | 373 | | | | 374 |
5.400% due 12/25/2035 | | | | 586 | | | | 586 |
| |
| Countrywide Asset-Backed Certificates |
5.350% due 01/25/2046 | | | | 1,188 | | | | 1,189 |
5.370% due 01/25/2037 | | | | 733 | | | | 733 |
| | | | |
| 10 | | PIMCO Variable Insurance Trust | | See Accompanying Notes |
| | |
| |
| | | June 30, 2007 (Unaudited) |
| | | | | | | | |
| | | | | PRINCIPAL
AMOUNT
(000S) | | | | VALUE
(000S) |
5.370% due 05/25/2037 | | $ | | 4,697 | | $ | | 4,699 |
5.380% due 09/25/2046 | | | | 425 | | | | 425 |
5.390% due 07/25/2036 | | | | 285 | | | | 285 |
5.390% due 09/25/2036 | | | | 316 | | | | 316 |
5.390% due 06/25/2037 | | | | 7,110 | | | | 7,114 |
5.430% due 10/25/2046 | | | | 1,031 | | | | 1,032 |
5.450% due 07/25/2036 | | | | 235 | | | | 236 |
| |
| Credit-Based Asset Servicing & Securitization LLC |
5.380% due 11/25/2036 | | | | 2,538 | | | | 2,540 |
| |
| Equity One Asset-Backed Securities, Inc. |
5.620% due 04/25/2034 | | | | 96 | | | | 96 |
| |
| First Franklin Mortgage Loan Asset-Backed Certificates |
5.350% due 07/25/2036 | | | | 2,846 | | | | 2,848 |
5.370% due 11/25/2036 | | | | 2,047 | | | | 2,048 |
5.370% due 12/25/2036 | | | | 214 | | | | 214 |
5.410% due 01/25/2036 | | | | 979 | | | | 980 |
| |
| Fremont Home Loan Trust |
5.370% due 10/25/2036 | | | | 139 | | | | 139 |
5.380% due 01/25/2037 | | | | 497 | | | | 497 |
5.490% due 01/25/2036 | | | | 194 | | | | 194 |
| |
| GSAMP Trust |
5.360% due 10/25/2046 | | | | 217 | | | | 217 |
5.390% due 10/25/2036 | | | | 110 | | | | 110 |
5.390% due 12/25/2036 | | | | 990 | | | | 990 |
5.430% due 11/25/2035 | | | | 190 | | | | 190 |
5.610% due 03/25/2034 | | | | 207 | | | | 207 |
| |
| GSR Mortgage Loan Trust |
5.420% due 11/25/2030 | | | | 315 | | | | 315 |
| |
| HFC Home Equity Loan Asset-Backed Certificates |
5.390% due 03/20/2036 | | | | 317 | | | | 317 |
| |
| Home Equity Asset Trust |
5.400% due 05/25/2036 | | | | 454 | | | | 454 |
5.430% due 02/25/2036 | | | | 173 | | | | 173 |
| |
| Honda Auto Receivables Owner Trust |
5.342% due 11/15/2007 | | | | 189 | | | | 190 |
| |
| HSI Asset Securitization Corp. Trust |
5.370% due 10/25/2036 | | | | 238 | | | | 238 |
5.370% due 12/25/2036 | | | | 5,130 | | | | 5,133 |
5.400% due 12/25/2035 | | | | 525 | | | | 526 |
| |
| Hyundai Auto Receivables Trust |
5.348% due 11/15/2007 | | | | 32 | | | | 32 |
| |
| Indymac Residential Asset-Backed Trust |
5.370% due 11/25/2036 | | | | 379 | | | | 379 |
5.380% due 04/25/2037 | | | | 2,842 | | | | 2,843 |
5.420% due 03/25/2036 | | | | 249 | | | | 249 |
| |
| JPMorgan Mortgage Acquisition Corp. |
5.360% due 08/25/2036 | | | | 177 | | | | 177 |
5.370% due 07/25/2036 | | | | 363 | | | | 363 |
5.370% due 08/25/2036 | | | | 912 | | | | 912 |
5.370% due 10/25/2036 | | | | 2,698 | | | | 2,695 |
5.390% due 11/25/2036 | | | | 195 | | | | 195 |
5.530% due 06/25/2035 | | | | 23 | | | | 23 |
| |
| Lehman XS Trust |
5.390% due 05/25/2046 | | | | 418 | | | | 419 |
5.400% due 04/25/2046 | | | | 1,107 | | | | 1,107 |
5.400% due 07/25/2046 | | | | 759 | | | | 760 |
5.400% due 11/25/2046 | | | | 1,161 | | | | 1,162 |
| |
| Long Beach Mortgage Loan Trust |
5.350% due 06/25/2036 | | | | 68 | | | | 68 |
5.360% due 11/25/2036 | | | | 154 | | | | 154 |
5.380% due 05/25/2046 | | | | 99 | | | | 99 |
5.390% due 03/25/2036 | | | | 84 | | | | 84 |
5.400% due 02/25/2036 | | | | 164 | | | | 164 |
5.410% due 01/25/2036 | | | | 231 | | | | 231 |
5.500% due 08/25/2035 | | | | 180 | | | | 180 |
| |
| MASTR Asset-Backed Securities Trust |
5.380% due 10/25/2036 | | | | 34 | | | | 35 |
| | | | | | | | |
| | | | | PRINCIPAL
AMOUNT
(000S) | | | | VALUE
(000S) |
5.380% due 11/25/2036 | | $ | | 2,442 | | $ | | 2,444 |
5.400% due 01/25/2036 | | | | 487 | | | | 488 |
| |
| MBNA Credit Card Master Note Trust |
5.420% due 12/15/2011 | | | | 100 | | | | 100 |
5.501% due 09/15/2010 | | | | 200 | | | | 200 |
| |
| Merrill Lynch Mortgage Investors, Inc. |
5.350% due 06/25/2037 | | | | 321 | | | | 321 |
5.370% due 05/25/2037 | | | | 670 | | | | 670 |
5.390% due 08/25/2036 | | | | 2,928 | | | | 2,928 |
5.390% due 07/25/2037 | | | | 704 | | | | 705 |
5.400% due 01/25/2037 | | | | 102 | | | | 102 |
| |
| Morgan Stanley ABS Capital I |
5.350% due 06/25/2036 | | | | 39 | | | | 39 |
5.360% due 06/25/2036 | | | | 86 | | | | 86 |
5.360% due 07/25/2036 | | | | 2,608 | | | | 2,610 |
5.360% due 10/25/2036 | | | | 589 | | | | 590 |
5.370% due 09/25/2036 | | | | 563 | | | | 563 |
5.370% due 10/25/2036 | | | | 373 | | | | 373 |
5.400% due 12/25/2035 | | | | 16 | | | | 16 |
| |
| Morgan Stanley IXIS Real Estate Capital Trust |
5.370% due 11/25/2036 | | | | 145 | | | | 145 |
| |
| Nelnet Student Loan Trust |
5.325% due 10/27/2014 | | | | 81 | | | | 81 |
5.340% due 09/25/2012 | | | | 3,764 | | | | 3,766 |
5.445% due 07/25/2016 | | | | 386 | | | | 387 |
5.445% due 10/25/2016 | | | | 346 | | | | 346 |
| |
| Newcastle Mortgage Securities Trust |
5.390% due 03/25/2036 | | | | 260 | | | | 260 |
| |
| Nissan Auto Lease Trust |
5.347% due 12/14/2007 | | | | 9 | | | | 9 |
| |
| Nomura Asset Acceptance Corp. |
5.460% due 01/25/2036 | | | | 289 | | | | 290 |
| |
| Nomura Home Equity Loan, Inc. |
5.400% due 02/25/2036 | | | | 86 | | | | 86 |
| |
| Option One Mortgage Loan Trust |
5.360% due 02/25/2037 | | | | 71 | | | | 71 |
5.370% due 07/25/2036 | | | | 84 | | | | 84 |
5.420% due 11/25/2035 | | | | 147 | | | | 147 |
| |
| Park Place Securities, Inc. |
5.580% due 09/25/2035 | | | | 51 | | | | 52 |
| |
| Renaissance Home Equity Loan Trust |
5.700% due 12/25/2032 | | | | 81 | | | | 81 |
| |
| Residential Asset Mortgage Products, Inc. |
5.390% due 11/25/2036 | | | | 232 | | | | 232 |
5.400% due 01/25/2036 | | | | 60 | | | | 60 |
| |
| Residential Asset Securities Corp. |
5.360% due 06/25/2036 | | | | 2,188 | | | | 2,190 |
5.390% due 04/25/2036 | | | | 79 | | | | 79 |
5.390% due 11/25/2036 | | | | 1,914 | | | | 1,915 |
| |
| Residential Funding Mortgage Securities II, Inc. |
5.460% due 09/25/2035 | | | | 531 | | | | 532 |
| |
| Securitized Asset-Backed Receivables LLC Trust |
5.370% due 09/25/2036 | | | | 206 | | | | 206 |
5.380% due 12/25/2036 | | | | 9,622 | | | | 9,626 |
5.390% due 10/25/2035 | | | | 99 | | | | 99 |
| |
| SLM Student Loan Trust | | | | | | | | |
5.325% due 10/25/2012 | | | | 489 | | | | 489 |
5.325% due 07/25/2013 | | | | 550 | | | | 550 |
5.335% due 04/25/2012 | | | | 260 | | | | 260 |
| |
| Soundview Home Equity Loan Trust |
5.350% due 07/25/2036 | | | | 538 | | | | 538 |
5.370% due 10/25/2036 | | | | 831 | | | | 832 |
5.380% due 11/25/2036 | | | | 462 | | | | 462 |
5.390% due 03/25/2036 | | | | 47 | | | | 47 |
5.420% due 10/25/2036 | | | | 212 | | | | 212 |
5.550% due 06/25/2035 | | | | 72 | | | | 72 |
| |
| | | | | | | | | |
| | | | | PRINCIPAL
AMOUNT
(000S) | | | | VALUE
(000S) |
| Specialty Underwriting & Residential Finance |
5.350% due 06/25/2037 | | $ | | | 114 | | $ | | 114 |
5.365% due 11/25/2037 | | | | | 70 | | | | 70 |
| |
| Structured Asset Investment Loan Trust |
5.370% due 07/25/2036 | | | | | 113 | | | | 113 |
| |
| Structured Asset Securities Corp. |
4.900% due 04/25/2035 | | | | | 1,410 | | | | 1,406 |
5.370% due 10/25/2036 | | | | | 1,035 | | | | 1,035 |
5.400% due 11/25/2035 | | | | | 195 | | | | 196 |
5.450% due 12/25/2035 | | | | | 692 | | | | 692 |
| |
| Truman Capital Mortgage Loan Trust |
5.660% due 01/25/2034 | | | | | 33 | | | | 33 |
| |
| USAA Auto Owner Trust |
5.030% due 11/17/2008 | | | | | 72 | | | | 73 |
| |
| Wachovia Auto Owner Trust |
4.820% due 02/20/2009 | | | | | 662 | | | | 663 |
| |
| Washington Mutual Asset-Backed Certificates |
5.370% due 01/25/2037 | | | | | 874 | | | | 875 |
| |
| Wells Fargo Home Equity Trust |
5.370% due 01/25/2037 | | | | | 1,070 | | | | 1,071 |
| | | | | | | | | |
Total Asset-Backed Securities
(Cost $107,130) | | 107,190 |
| | | | | | | | | |
|
| SOVEREIGN ISSUES 0.0% |
| Colombia Government International Bond |
10.000% due 01/23/2012 | | | | | 350 | | | | 405 |
| | | | | | | | | |
Total Sovereign Issues (Cost $352) | | 405 |
| | | | | | | | | |
|
| FOREIGN CURRENCY-DENOMINATED ISSUES 1.2% |
| Canadian Government Bond |
3.000% due 12/01/2036 (b) | | CAD | | | 542 | | | | 610 |
| |
| France Government Bond |
3.000% due 07/25/2012 (b) | | EUR | | | 1,678 | | | | 2,335 |
| |
| Italy Buoni Poliennali Del Tesoro |
2.150% due 09/15/2014 (b) | | | | | 543 | | | | 717 |
| |
| Pylon Ltd. |
5.648% due 12/18/2008 | | | | | 700 | | | | 956 |
8.048% due 12/18/2008 | | | | | 1,100 | | | | 1,520 |
| |
| United Kingdom Gilt Inflation Linked Bond |
2.500% due 05/20/2009 | | GBP | | | 1,100 | | | | 5,679 |
| | | | | | | | | |
Total Foreign Currency-Denominated Issues (Cost $11,335) | | 11,817 |
| | | | | | | | | |
|
| SHORT-TERM INSTRUMENTS 55.4% |
| CERTIFICATES OF DEPOSIT 7.0% |
| Abbey National Treasury Services PLC |
5.270% due 07/02/2008 | | $ | | | 7,200 | | | | 7,203 |
| |
| BNP Paribas |
5.262% due 05/28/2008 | | | | | 5,400 | | | | 5,402 |
5.262% due 07/03/2008 | | | | | 8,200 | | | | 8,198 |
| |
| Calyon Financial, Inc. |
5.340% due 01/16/2009 | | | | | 1,800 | | | | 1,800 |
| |
| Fortis Bank NY |
5.265% due 06/30/2008 | | | | | 5,200 | | | | 5,202 |
| |
| HSBC Bank USA N.A. |
5.426% due 07/28/2008 | | | | | 1,100 | | | | 1,102 |
| |
| Nordea Bank Finland PLC |
5.267% due 03/31/2008 | | | | | 300 | | | | 300 |
5.308% due 05/28/2008 | | | | | 700 | | | | 701 |
| |
| Royal Bank of Canada |
5.267% due 06/30/2008 | | | | | 7,900 | | | | 7,907 |
| |
| | | | | | |
| See Accompanying Notes | | Semiannual Report | | June 30, 2007 | | 11 |
Schedule of Investments Real Return Portfolio (Cont.)
| | | | | | | | |
| | | | | PRINCIPAL
AMOUNT
(000S) | | | | VALUE
(000S) |
| Royal Bank of Scotland Group PLC |
5.265% due 03/26/2008 | | $ | | 5,700 | | $ | | 5,700 |
| |
| Skandinav Enskilda BK |
5.272% due 08/21/2008 | | | | 100 | | | | 100 |
5.340% due 08/21/2008 | | | | 5,600 | | | | 5,602 |
5.350% due 02/13/2009 | | | | 5,400 | | | | 5,404 |
| |
| Societe Generale NY |
5.270% due 03/26/2008 | | | | 5,700 | | | | 5,700 |
5.271% due 06/30/2008 | | | | 5,600 | | | | 5,602 |
| |
| Unicredito Italiano NY |
5.360% due 05/29/2008 | | | | 4,200 | | | | 4,202 |
| | | | | | | | |
| | | | | | | | 70,125 |
| | | | | | | | |
|
| COMMERCIAL PAPER 45.3% |
| Australia and New Zealand Banking Group Ltd. |
5.245% due 09/19/2007 | | | | 26,800 | | | | 26,480 |
| |
| Bank of Ireland |
5.230% due 11/08/2007 | | | | 1,300 | | | | 1,298 |
| |
| Barclays U.S. Funding Corp. |
5.235% due 09/26/2007 | | | | 27,800 | | | | 27,598 |
5.245% due 09/26/2007 | | | | 100 | | | | 99 |
5.250% due 09/26/2007 | | | | 2,000 | | | | 1,974 |
| |
| BNP Paribas Finance, Inc. |
5.330% due 10/23/2007 | | | | 10,600 | | | | 10,600 |
| |
| Calyon N.A. LLC |
5.175% due 06/29/2010 | | | | 31,200 | | | | 31,169 |
| |
| CBA (de) Finance |
5.225% due 09/28/2007 | | | | 4,100 | | | | 4,087 |
| |
| Cox Communications, Inc. |
5.570% due 09/17/2007 | | | | 1,100 | | | | 1,100 |
| |
| Danske Corp. |
5.205% due 10/12/2007 | | | | 300 | | | | 298 |
5.220% due 10/12/2007 | | | | 30,500 | | | | 30,465 |
| |
| | | | | | | | |
| | | | | PRINCIPAL
AMOUNT
(000S) | | | | VALUE
(000S) |
| Dexia Delaware LLC |
5.240% due 09/21/2007 | | $ | | 29,000 | | $ | | 28,662 |
| |
| DnB NORBank ASA |
5.225% due 10/12/2007 | | | | 3,900 | | | | 3,900 |
| |
| Fortis Funding LLC |
5.255% due 09/05/2007 | | | | 23,900 | | | | 23,844 |
5.275% due 09/05/2007 | | | | 600 | | | | 598 |
| |
| General Electric Capital Corp. |
5.200% due 11/06/2007 | | | | 2,500 | | | | 2,490 |
| |
| HBOS Treasury Services PLC |
5.225% due 11/13/2007 | | | | 500 | | | | 500 |
5.250% due 09/21/2007 | | | | 27,700 | | | | 27,365 |
| |
| Intesa Funding LLC |
5.320% due 09/05/2007 | | | | 20,000 | | | | 19,988 |
| |
| Natixis S.A. |
5.250% due 09/21/2007 | | | | 2,400 | | | | 2,371 |
5.380% due 09/21/2007 | | | | 27,200 | | | | 27,200 |
| |
| Nordea N.A., Inc. |
5.308% due 04/09/2009 | | | | 2,300 | | | | 2,300 |
| |
| Rabobank USA Financial Corp. |
5.330% due 07/26/2007 | | | | 27,200 | | | | 27,200 |
| |
| Santander Hispano Finance Delaware |
5.250% due 09/26/2007 | | | | 18,800 | | | | 18,556 |
| |
| Societe Generale NY |
5.240% due 11/26/2007 | | | | 1,000 | | | | 988 |
5.245% due 11/26/2007 | | | | 17,300 | | | | 17,093 |
5.250% due 11/26/2007 | | | | 200 | | | | 197 |
| |
| Svenska Handelsbanken, Inc. |
5.185% due 10/09/2007 | | | | 22,500 | | | | 22,477 |
| |
| TotalFinaElf Capital S.A. |
5.340% due 07/02/2007 | | | | 27,200 | | | | 27,200 |
| |
| | | | | | | | | |
| | | | | PRINCIPAL
AMOUNT
(000S) | | | | VALUE
(000S) | |
| UBS Finance Delaware LLC | |
5.145% due 10/23/2007 | | $ | | 800 | | $ | | 797 | |
5.200% due 10/23/2007 | | | | 20,800 | | | | 20,463 | |
5.230% due 10/23/2007 | | | | 2,200 | | | | 2,165 | |
5.235% due 10/23/2007 | | | | 5,800 | | | | 5,742 | |
5.240% due 10/23/2007 | | | | 700 | | | | 690 | |
| | |
| Unicredito Italiano SpA | |
5.200% due 01/22/2008 | | | | 10,500 | | | | 10,319 | |
| | |
| Westpac Banking Corp. | |
5.195% due 11/05/2007 | | | | 22,400 | | | | 22,300 | |
5.230% due 11/05/2007 | | | | 600 | | | | 598 | |
5.240% due 11/05/2007 | | | | 1,100 | | | | 1,087 | |
| | | | | | | | | |
| | | | | | | | 452,258 | |
| | | | | | | | | |
| |
| TRI-PARTY REPURCHASE AGREEMENTS 0.3% | |
| State Street Bank and Trust Co. | |
4.900% due 07/02/2007 | | | | 3,467 | | | | 3,467 | |
| | | | | | | | | |
(Dated 06/29/2007. Collateralized by Freddie Mac 5.000% due 06/11/2009 valued at $3,539. Repurchase proceeds are $3,468.) | |
| |
| U.S. TREASURY BILLS 2.8% | |
4.575% due 08/30/2007 - 09/13/2007 (a)(c)(d)(f) | | | | 27,920 | | | | 27,666 | |
| | | | | | | | | |
Total Short-Term Instruments
(Cost $553,565) | | 553,516 | |
| | | | | | | | | |
| |
| PURCHASED OPTIONS (h) 0.2% | | 1,570 | |
(Cost $1,852) | | | | 1,570 | |
| |
| |
Total Investments (e) 209.4%
(Cost $2,084,650) | | $ | | 2,091,451 | |
| |
| Written Options (i) (0.0%) | | | | (238 | ) |
| (Premiums $387) | | | | | | | | | |
| |
| Other Assets and Liabilities (Net) (109.4%) | | (1,092,533 | ) |
| | | | | | | | | |
| Net Assets 100.0% | | | | | | $ | | 998,680 | |
| | | | | | | | | |
| |
Notes to Schedule of Investments (amounts in thousands*, except number of contracts):
* A zero balance may reflect actual amounts rounding to less than one thousand.
(a) Coupon represents a weighted average rate.
(b) Principal amount of security is adjusted for inflation.
(c) Securities with an aggregate market value of $2,476 have been pledged as collateral for swap and swaption contracts on June 30, 2007.
(d) Securities with an aggregate market value of $2,661 have been pledged as collateral for delayed-delivery securities on June 30, 2007.
(e) As of June 30, 2007, portfolio securities with an aggregate value of $30,875 were valued in good faith and pursuant to the guidelines established by the Board of Trustees.
(f) Securities with an aggregate market value of $2,406 have been segregated with the custodian to cover margin requirements for the following open futures contracts on June 30, 2007:
| | | | | | | | | | |
| Description | | Type | | Expiration
Month | | # of
Contracts | | Unrealized
Appreciation/
(Depreciation) | |
90-Day Euribor December Futures | | Long | | 12/2008 | | 21 | | $ | (8 | ) |
90-Day Euribor June Futures | | Long | | 06/2009 | | 21 | | | (5 | ) |
90-Day Euribor March Futures | | Long | | 03/2009 | | 21 | | | (7 | ) |
90-Day Euribor September Futures | | Long | | 09/2008 | | 21 | | | (8 | ) |
90-Day Eurodollar December Futures | | Short | | 12/2007 | | 28 | | | 38 | |
90-Day Eurodollar December Futures | | Long | | 12/2008 | | 12 | | | (6 | ) |
90-Day Eurodollar June Futures | | Short | | 06/2008 | | 35 | | | 38 | |
90-Day Eurodollar June Futures | | Long | | 06/2009 | | 35 | | | (17 | ) |
90-Day Eurodollar March Futures | | Short | | 03/2008 | | 28 | | | 34 | |
90-Day Eurodollar March Futures | | Long | | 03/2009 | | 12 | | | (6 | ) |
90-Day Eurodollar September Futures | | Short | | 09/2008 | | 49 | | | 49 | |
Japan Government 10-Year Bond September Futures | | Long | | 09/2007 | | 16 | | | 7 | |
U.S. Treasury 30-Year Bond September Futures | | Short | | 09/2007 | | 665 | | | 932 | |
U.S. Treasury 5-Year Note September Futures | | Short | | 09/2007 | | 214 | | | (105 | ) |
United Kingdom 90-Day LIBOR Sterling Interest Rate June Futures | | Long | | 06/2008 | | 550 | | | (944 | ) |
United Kingdom 90-Day LIBOR Sterling Interest Rate March Futures | | Long | | 03/2008 | | 448 | | | (845 | ) |
| | | | | | | | | | |
| | | | | | | | $ | (853 | ) |
| | | | | | | | | | |
| | | | |
| 12 | | PIMCO Variable Insurance Trust | | See Accompanying Notes |
| | |
| |
| | | June 30, 2007 (Unaudited) |
(g) Swap agreements outstanding on June 30, 2007:
Credit Default Swaps
| | | | | | | | | | | | | | | | |
| Counterparty | | Reference Entity | | Buy/Sell
Protection (1) | | (Pay)/Receive
Fixed Rate | | | Expiration
Date | | Notional
Amount | | Unrealized
Appreciation/
(Depreciation) | |
Barclays Bank PLC | | Panama Government International Bond 8.875% due 09/30/2027 | | Sell | | 0.300% | | | 12/20/2008 | | $ | 2,900 | | $ | 1 | |
Barclays Bank PLC | | Peru Government International Bond 8.750% due 11/21/2033 | | Sell | | 0.350% | | | 12/20/2008 | | | 1,500 | | | 1 | |
Barclays Bank PLC | | Russia Government International Bond 7.500% due 03/31/2030 | | Sell | | 0.330% | | | 12/20/2008 | | | 1,500 | | | 1 | |
Barclays Bank PLC | | Ukraine Government International Bond 7.650% due 06/11/2013 | | Sell | | 0.780% | | | 12/20/2008 | | | 1,500 | | | 6 | |
Citibank N.A. | | Glitnir Banki HF 6.330% due 07/28/2011 | | Buy | | (0.290% | ) | | 06/20/2012 | | | 1,100 | | | (1 | ) |
Credit Suisse First Boston | | Chesapeake Energy Corp. 6.875% due 01/15/2016 | | Sell | | 0.970% | | | 06/20/2012 | | | 300 | | | (3 | ) |
Credit Suisse First Boston | | Chesapeake Energy Corp. 6.875% due 01/15/2016 | | Sell | | 1.010% | | | 06/20/2012 | | | 300 | | | (3 | ) |
Credit Suisse First Boston | | Chesapeake Energy Corp. 6.875% due 01/15/2016 | | Sell | | 1.010% | | | 06/20/2012 | | | 1,100 | | | (11 | ) |
Credit Suisse First Boston | | Chesapeake Energy Corp. 6.875% due 01/15/2016 | | Sell | | 1.040% | | | 06/20/2012 | | | 200 | | | (2 | ) |
Deutsche Bank AG | | Indonesia Government International Bond 6.750% due 03/10/2014 | | Sell | | 0.510% | | | 12/20/2008 | | | 3,000 | | | 6 | |
Deutsche Bank AG | | Russia Government International Bond 7.500% due 03/31/2030 | | Sell | | 0.325% | | | 12/20/2008 | | | 1,400 | | | 1 | |
Deutsche Bank AG | | Ukraine Government International Bond 7.650% due 06/11/2013 | | Sell | | 0.790% | | | 12/20/2008 | | | 1,400 | | | 6 | |
Goldman Sachs & Co. | | General Motors Acceptance Corp. 6.875% due 08/28/2012 | | Sell | | 3.400% | | | 06/20/2011 | | | 700 | | | 37 | |
HSBC Bank USA | | Russia Government International Bond 7.500% due 03/31/2030 | | Sell | | 0.280% | | | 11/20/2007 | | | 1,000 | | | 0 | |
HSBC Bank USA | | Russia Government International Bond 7.500% due 03/31/2030 | | Sell | | 0.240% | | | 02/20/2008 | | | 2,000 | | | 2 | |
Lehman Brothers, Inc. | | Peru Government International Bond 9.125% due 02/21/2012 | | Sell | | 0.370% | | | 12/20/2008 | | | 1,400 | | | 2 | |
UBS Warburg LLC | | Ford Motor Credit Co. 7.000% due 10/01/2013 | | Sell | | 5.250% | | | 09/20/2007 | | | 1,300 | | | 16 | |
| | | | | | | | | | | | | | | | |
| | | | | | | | | | | | | | $ | 59 | |
| | | | | | | | | | | | | | | | |
(1) If the Portfolio is a seller of protection and a credit event occurs, as defined under the terms of that particular swap agreement, the Portfolio will pay to the buyer of the protection an amount up to the notional value of the swap and in certain instances, take delivery of the security. As a buyer of protection, the Portfolio will generally receive from the seller of protection an amount up to the notional amount of the swap if a credit event occurs.
Interest Rate Swaps
| | | | | | | | | | | | | | | |
| Counterparty | | Floating Rate Index | | Pay/Receive
Floating Rate | | Fixed
Rate | | Expiration
Date | | Notional Amount | | Unrealized
Appreciation/
(Depreciation) | |
Citibank N.A. | | 6-Month Australian Bank Bill | | Pay | | 6.500% | | 01/15/2010 | | AUD | 4,700 | | $ | (33 | ) |
Deutsche Bank AG | | 6-Month Australian Bank Bill | | Pay | | 6.500% | | 01/15/2010 | | | 18,700 | | | (126 | ) |
Deutsche Bank AG | | 6-Month Australian Bank Bill | | Pay | | 7.000% | | 06/15/2010 | | | 46,200 | | | (50 | ) |
JPMorgan Chase & Co. | | 6-Month Australian Bank Bill | | Pay | | 6.500% | | 01/15/2010 | | | 3,100 | | | (22 | ) |
Royal Bank of Canada | | 6-Month Australian Bank Bill | | Pay | | 6.500% | | 01/15/2010 | | | 1,900 | | | (12 | ) |
Royal Bank of Canada | | 3-Month Canadian Bank Bill | | Receive | | 5.500% | | 06/20/2017 | | CAD | 18,500 | | | 3 | |
Barclays Bank PLC | | 5-Year French CPI Ex Tobacco Daily Reference Index | | Pay | | 2.103% | | 10/15/2010 | | EUR | 2,500 | | | 41 | |
Barclays Bank PLC | | 5-Year French CPI Ex Tobacco Daily Reference Index | | Pay | | 1.948% | | 03/15/2012 | | | 600 | | | (15 | ) |
Barclays Bank PLC | | 5-Year French CPI Ex Tobacco Daily Reference Index | | Pay | | 1.960% | | 04/05/2012 | | | 300 | | | (3 | ) |
Barclays Bank PLC | | 5-Year French CPI Ex Tobacco Daily Reference Index | | Pay | | 1.980% | | 04/30/2012 | | | 900 | | | (10 | ) |
BNP Paribas Bank | | 5-Year French CPI Ex Tobacco Daily Reference Index | | Pay | | 2.090% | | 10/15/2010 | | | 2,500 | | | 30 | |
BNP Paribas Bank | | 5-Year French CPI Ex Tobacco Daily Reference Index | | Pay | | 1.983% | | 03/15/2012 | | | 1,900 | | | (16 | ) |
BNP Paribas Bank | | 5-Year French CPI Ex Tobacco Daily Reference Index | | Pay | | 2.150% | | 01/19/2016 | | | 15,000 | | | 120 | |
Goldman Sachs & Co. | | 5-Year French CPI Ex Tobacco Daily Reference Index | | Pay | | 1.976% | | 12/15/2011 | | | 5,100 | | | (15 | ) |
Goldman Sachs & Co. | | 5-Year French CPI Ex Tobacco Daily Reference Index | | Pay | | 1.995% | | 03/15/2012 | | | 9,200 | | | (51 | ) |
Goldman Sachs & Co. | | 5-Year French CPI Ex Tobacco Daily Reference Index | | Pay | | 1.960% | | 03/30/2012 | | | 700 | | | (6 | ) |
JPMorgan Chase & Co. | | 5-Year French CPI Ex Tobacco Daily Reference Index | | Pay | | 1.948% | | 03/15/2012 | | | 600 | | | (6 | ) |
JPMorgan Chase & Co. | | 5-Year French CPI Ex Tobacco Daily Reference Index | | Pay | | 1.958% | | 04/10/2012 | | | 3,800 | | | (40 | ) |
JPMorgan Chase & Co. | | 5-Year French CPI Ex Tobacco Daily Reference Index | | Pay | | 2.353% | | 10/15/2016 | | | 2,500 | | | 14 | |
Morgan Stanley | | 6-Month EUR-LIBOR | | Receive | | 4.000% | | 06/15/2017 | | | 6,800 | | | 657 | |
Royal Bank of Scotland Group PLC | | 5-Year French CPI Ex Tobacco Daily Reference Index | | Pay | | 1.955% | | 03/28/2012 | | | 2,100 | | | (20 | ) |
UBS Warburg LLC | | 5-Year French CPI Ex Tobacco Daily Reference Index | | Pay | | 2.146% | | 10/15/2010 | | | 3,700 | | | 56 | |
UBS Warburg LLC | | Eurostat Eurozone HICP Ex Tobacco Unrevised Series NSA Index | | Receive | | 2.275% | | 10/15/2016 | | | 2,700 | | | 9 | |
UBS Warburg LLC | | 5-Year French CPI Ex Tobacco Daily Reference Index | | Pay | | 2.350% | | 10/15/2016 | | | 2,700 | | | 10 | |
Barclays Bank PLC | | 6-Month GBP-LIBOR | | Pay | | 5.000% | | 06/15/2009 | | GBP | 19,700 | | | (731 | ) |
Barclays Bank PLC | | 6-Month GBP-LIBOR | | Receive | | 4.000% | | 12/15/2035 | | | 5,700 | | | 442 | |
Credit Suisse First Boston | | 6-Month GBP-LIBOR | | Pay | | 5.000% | | 09/15/2010 | | | 4,600 | | | (203 | ) |
Credit Suisse First Boston | | 6-Month GBP-LIBOR | | Receive | | 4.000% | | 12/15/2035 | | | 1,800 | | | 134 | |
Goldman Sachs & Co. | | 6-Month GBP-LIBOR | | Receive | | 5.000% | | 09/15/2015 | | | 4,300 | | | 413 | |
HSBC Bank USA | | 6-Month GBP-LIBOR | | Receive | | 4.250% | | 06/12/2036 | | | 2,500 | | | 635 | |
JPMorgan Chase & Co. | | 6-Month GBP-LIBOR | | Pay | | 5.000% | | 06/15/2008 | | | 5,000 | | | (85 | ) |
Royal Bank of Scotland Group PLC | | 6-Month GBP-LIBOR | | Pay | | 5.000% | | 09/15/2010 | | | 6,700 | | | (306 | ) |
UBS Warburg LLC | | United Kingdom RPI Index | | Pay | | 2.548% | | 11/14/2016 | | | 5,000 | | | (118 | ) |
Morgan Stanley | | 6-Month JPY-LIBOR | | Pay | | 1.000% | | 03/18/2009 | | JPY | 2,900,000 | | | (4 | ) |
Barclays Bank PLC | | 28-Day Mexico Interbank TIIE Banxico | | Pay | | 8.720% | | 09/05/2016 | | MXN | 17,000 | | | 66 | |
Barclays Bank PLC | | 28-Day Mexico Interbank TIIE Banxico | | Pay | | 8.330% | | 02/14/2017 | | | 11,100 | | | 18 | |
Citibank N.A. | | 28-Day Mexico Interbank TIIE Banxico | | Pay | | 8.170% | | 11/04/2016 | | | 136,400 | | | 44 | |
Goldman Sachs & Co. | | 28-Day Mexico Interbank TIIE Banxico | | Pay | | 8.170% | | 11/04/2016 | | | 15,300 | | | 11 | |
Merrill Lynch & Co., Inc. | | 28-Day Mexico Interbank TIIE Banxico | | Pay | | 8.170% | | 11/04/2016 | | | 52,900 | | | 28 | |
Morgan Stanley | | 28-Day Mexico Interbank TIIE Banxico | | Pay | | 8.170% | | 11/04/2016 | | | 20,900 | | | 5 | |
| | | | | | |
| See Accompanying Notes | | Semiannual Report | | June 30, 2007 | | 13 |
Schedule of Investments Real Return Portfolio (Cont.)
| | | | | | | | | | | | | | | |
| Counterparty | | Floating Rate Index | | Pay/Receive
Floating Rate | | Fixed
Rate | | Expiration
Date | | Notional
Amount | | Unrealized
Appreciation/
(Depreciation) | |
Bank of America | | 3-Month USD-LIBOR | | Pay | | 5.000% | | 06/20/2027 | | $ | 5,000 | | $ | (333 | ) |
Barclays Bank PLC | | 3-Month USD-LIBOR | | Pay | | 5.000% | | 12/19/2009 | | | 5,900 | | | (7 | ) |
Barclays Bank PLC | | 3-Month USD-LIBOR | | Pay | | 5.000% | | 12/19/2012 | | | 10,600 | | | 34 | |
Barclays Bank PLC | | 3-Month USD-LIBOR | | Receive | | 5.000% | | 12/19/2017 | | | 23,000 | | | (145 | ) |
Deutsche Bank AG | | 3-Month USD-LIBOR | | Pay | | 5.000% | | 12/19/2009 | | | 9,000 | | | 19 | |
Deutsche Bank AG | | 3-Month USD-LIBOR | | Pay | | 5.000% | | 12/19/2012 | | | 17,100 | | | 27 | |
Deutsche Bank AG | | 3-Month USD-LIBOR | | Receive | | 5.000% | | 12/20/2021 | | | 5,400 | | | 27 | |
Deutsche Bank AG | | 3-Month USD-LIBOR | | Receive | | 5.000% | | 12/20/2026 | | | 5,700 | | | 8 | |
Deutsche Bank AG | | 3-Month USD-LIBOR | | Pay | | 5.000% | | 12/19/2037 | | | 1,700 | | | 21 | |
Goldman Sachs & Co. | | 3-Month USD-LIBOR | | Pay | | 5.000% | | 12/19/2009 | | | 23,500 | | | (26 | ) |
Goldman Sachs & Co. | | 3-Month USD-LIBOR | | Receive | | 5.000% | | 06/20/2014 | | | 6,500 | | | 230 | |
JPMorgan Chase & Co. | | 3-Month USD-LIBOR | | Receive | | 5.000% | | 12/19/2017 | | | 2,900 | | | (7 | ) |
Lehman Brothers, Inc. | | 3-Month USD-LIBOR | | Pay | | 5.000% | | 12/19/2012 | | | 1,400 | | | 2 | |
Morgan Stanley | | 3-Month USD-LIBOR | | Pay | | 5.000% | | 06/20/2009 | | | 30,000 | | | (281 | ) |
Morgan Stanley | | 3-Month USD-LIBOR | | Receive | | 5.000% | | 12/19/2017 | | | 100 | | | (1 | ) |
Morgan Stanley | | 3-Month USD-LIBOR | | Pay | | 5.000% | | 12/19/2037 | | | 13,500 | | | 221 | |
Royal Bank of Scotland Group PLC | | 3-Month USD-LIBOR | | Pay | | 5.000% | | 12/19/2012 | | | 13,000 | | | 48 | |
Royal Bank of Scotland Group PLC | | 3-Month USD-LIBOR | | Receive | | 5.000% | | 12/19/2017 | | | 47,100 | | | (348 | ) |
Royal Bank of Scotland Group PLC | | 3-Month USD-LIBOR | | Pay | | 5.000% | | 12/19/2037 | | | 4,600 | | | 74 | |
UBS Warburg LLC | | 3-Month USD-LIBOR | | Pay | | 5.000% | | 06/18/2009 | | | 184,000 | | | (50 | ) |
UBS Warburg LLC | | 3-Month USD-LIBOR | | Receive | | 5.000% | | 12/19/2017 | | | 2,700 | | | (34 | ) |
| | | | | | | | | | | | | | | |
| | | | | | | | | | | | | $ | 343 | |
| | | | | | | | | | | | | | | |
(h) Purchased options outstanding on June 30, 2007:
Options on Exchange-Traded Futures Contracts
| | | | | | | | | | | | | |
| Description | | Exercise
Price | | Expiration
Date | | # of
Contracts | | Cost | | Value |
Call - CBOT U.S. Treasury 30-Year Bond September Futures | | $ | 118.000 | | 08/24/2007 | | 665 | | $ | 13 | | $ | 11 |
Put - CBOT U.S. Treasury 10-Year Note September Futures | | | 102.000 | | 08/24/2007 | | 294 | | | 5 | | | 18 |
| | | | | | | | | | | | | |
| | | | | | | | | $ | 18 | | $ | 29 |
| | | | | | | | | | | | | |
Interest Rate Swaptions
| | | | | | | | | | | | | | | | | | | |
| Description | | Counterparty | | Floating Rate Index | | Pay/Receive
Floating Rate | | Exercise
Rate | | Expiration
Date | | Notional
Amount | | Cost | | Value |
Call - OTC 2-Year Interest Rate Swap | | Royal Bank of Scotland Group PLC | | 3-Month USD-LIBOR | | Pay | | 4.750% | | 03/31/2008 | | $ | 43,000 | | $ | 241 | | $ | 53 |
Call - OTC 2-Year Interest Rate Swap | | Royal Bank of Scotland Group PLC | | 3-Month USD-LIBOR | | Pay | | 4.750% | | 09/26/2008 | | | 9,000 | | | 45 | | | 18 |
| | | | | | | | | | | | | | | | | | | |
| | | | | | | | | | | | | | | $ | 286 | | $ | 71 |
| | | | | | | | | | | | | | | | | | | |
Foreign Currency Options
| | | | | | | | | | | | | | |
| Description | | Exercise
Price | | Expiration
Date | | Notional
Amount | | Cost | | Value |
Call - OTC Euro versus U.S. dollar | | $ | 1.353 | | 06/26/2008 | | EUR | 4,600 | | $ | 145 | | $ | 169 |
Put - OTC Euro versus U.S. dollar | | | 1.353 | | 06/26/2008 | | | 4,600 | | | 145 | | | 118 |
Call - OTC U.S. dollar versus Japanese yen | | JPY | 118.150 | | 06/23/2008 | | $ | 21,800 | | | 574 | | | 564 |
Put - OTC U.S. dollar versus Japanese yen | | | 118.150 | | 06/23/2008 | | | 21,800 | | | 574 | | | 594 |
| | | | | | | | | | | | | | |
| | | | | | | | | | $ | 1,438 | | $ | 1,445 |
| | | | | | | | | | | | | | |
Options on Securities
| | | | | | | | | | | | | | |
| Description | | Strike
Price | | Expiration
Date | | Notional
Amount | | Cost | | Value |
Put - OTC Fannie Mae 5.500% due 07/01/2037 | | $ | 89.000 | | 07/05/2007 | | $ | 81,300 | | $ | 10 | | $ | 0 |
Put - OTC Treasury Inflation Protected Securities 1.875% due 07/15/2015 | | | 66.531 | | 09/19/2007 | | | 92,100 | | | 22 | | | 0 |
Put - OTC Treasury Inflation Protected Securities 3.875% due 01/15/2009 | | | 90.000 | | 09/19/2007 | | | 70,700 | | | 17 | | | 0 |
Put - OTC Treasury Inflation Protected Securities 2.375% due 01/15/2025 | | | 65.000 | | 07/23/2007 | | | 100,000 | | | 23 | | | 0 |
Put - OTC Treasury Inflation Protected Securities 3.000% due 07/15/2012 | | | 88.000 | | 07/23/2007 | | | 100,000 | | | 23 | | | 0 |
Put - OTC Treasury Inflation Protected Securities 3.625% due 04/15/2028 | | | 77.000 | | 08/27/2007 | | | 53,000 | | | 12 | | | 0 |
Put - OTC Treasury Inflation Protected Securities 3.875% due 04/15/2029 | | | 79.000 | | 08/27/2007 | | | 13,000 | | | 3 | | | 0 |
| | | | | | | | | | | | | | |
| | | | | | | | | | $ | 110 | | $ | 0 |
| | | | | | | | | | | | | | |
Straddle Options
| | | | | | | | | | | | | | | | |
| Description | | Counterparty | | Exercise
Price (2) | | Expiration
Date | | Notional
Amount | | Cost (2) | | Value |
Call & Put - OTC U.S. dollar versus Swiss franc Forward Delta Neutral Straddle | | JPMorgan Chase & Co. | | CHF | 0.000 | | 09/26/2007 | | $ | 5,800 | | $ | 0 | | $ | 10 |
Call & Put - OTC U.S. dollar versus Swiss franc Forward Delta Neutral Straddle | | Royal Bank of Scotland
Group PLC | | | 0.000 | | 09/26/2007 | | | 5,700 | | | 0 | | | 15 |
| | | | | | | | | | | | | | | | |
| | | | | | | | | | | | $ | 0 | | $ | 25 |
| | | | | | | | | | | | | | | | |
(2) Exercise price and final cost determined on a future date, based upon implied volatility parameters.
| | | | |
| 14 | | PIMCO Variable Insurance Trust | | See Accompanying Notes |
| | |
| |
| | | June 30, 2007 (Unaudited) |
(i) Written options outstanding on June 30, 2007:
Options on Exchange-Traded Futures Contracts
| | | | | | | | | | | | | |
| Description | | Exercise
Price | | Expiration
Date | | # of
Contracts | | Premium | | Value |
Call - CBOT U.S. Treasury 10-Year Note September Futures | | $ | 106.000 | | 08/24/2007 | | 112 | | $ | 29 | | $ | 68 |
Call - CBOT U.S. Treasury 10-Year Note September Futures | | | 109.000 | | 08/24/2007 | | 110 | | | 13 | | | 5 |
Call - CBOT U.S. Treasury 30-Year Bond September Futures | | | 109.000 | | 08/24/2007 | | 103 | | | 35 | | | 68 |
Put - CBOT U.S. Treasury 10-Year Note September Futures | | | 103.000 | | 08/24/2007 | | 112 | | | 31 | | | 12 |
| | | | | | | | | | | | | |
| | | | | | | | | $ | 108 | | $ | 153 |
| | | | | | | | | | | | | |
Interest Rate Swaptions
| | | | | | | | | | | | | | | | | | | |
| Description | | Counterparty | | Floating Rate Index | | Pay/Receive
Floating Rate | | Exercise
Rate | | Expiration
Date | | Notional
Amount | | Premium | | Value |
Call - OTC 5-Year Interest Rate Swap | | Royal Bank of Scotland Group PLC | | 3-Month USD-LIBOR | | Receive | | 4.950% | | 03/31/2008 | | $ | 19,000 | | $ | 234 | | $ | 65 |
Call - OTC 5-Year Interest Rate Swap | | Royal Bank of Scotland Group PLC | | 3-Month USD-LIBOR | | Receive | | 4.950% | | 09/26/2008 | | | 4,000 | | | 45 | | | 20 |
| | | | | | | | | | | | | | | | | | | |
| | | | | | | | | | | | | | | $ | 279 | | $ | 85 |
| | | | | | | | | | | | | | | | | | | |
(j) Short sales outstanding on June 30, 2007:
| | | | | | | | | | | | | |
| Description | | Coupon | | Maturity
Date | | Principal
Amount | | Proceeds | | Value (3) |
Treasury Inflation Protected Securities | | 1.875% | | 07/15/2013 | | $ | 11,966 | | $ | 11,427 | | $ | 11,483 |
Treasury Inflation Protected Securities | | 2.375% | | 01/15/2017 | | | 26,526 | | | 25,775 | | | 25,909 |
U.S. Treasury Notes | | 3.625% | | 05/15/2013 | | | 300 | | | 281 | | | 282 |
U.S. Treasury Notes | | 4.875% | | 08/15/2016 | | | 19,800 | | | 19,380 | | | 19,953 |
| | | | | | | | | | | | | |
| | | | | | | | | $ | 56,863 | | $ | 57,627 |
| | | | | | | | | | | | | |
(3) Market value includes $395 of interest payable on short sales.
(k) Foreign currency contracts outstanding on June 30, 2007:
| | | | | | | | | | | | | | | | | |
| Type | | Currency | | Principal
Amount
Covered by
Contract | | Settlement
Month | | Unrealized
Appreciation | | Unrealized
(Depreciation) | | | Net Unrealized
Appreciation/
(Depreciation) | |
Buy | | BRL | | 3,604 | | 10/2007 | | $ | 4 | | $ | (15 | ) | | $ | (11 | ) |
Sell | | CAD | | 1,247 | | 08/2007 | | | 0 | | | (5 | ) | | | (5 | ) |
Sell | | CHF | | 910 | | 09/2007 | | | 0 | | | 0 | | | | 0 | |
Buy | | CNY | | 92,519 | | 01/2008 | | | 62 | | | 0 | | | | 62 | |
Buy | | | | 92,514 | | 03/2008 | | | 0 | | | (66 | ) | | | (66 | ) |
Sell | | EUR | | 5,798 | | 07/2007 | | | 0 | | | (76 | ) | | | (76 | ) |
Sell | | GBP | | 6,409 | | 08/2007 | | | 0 | | | (68 | ) | | | (68 | ) |
Sell | | JPY | | 214,501 | | 07/2007 | | | 25 | | | 0 | | | | 25 | |
Buy | | KRW | | 148,200 | | 07/2007 | | | 1 | | | 0 | | | | 1 | |
Buy | | | | 1,571,959 | | 09/2007 | | | 8 | | | 0 | | | | 8 | |
Buy | | MXN | | 15,220 | | 09/2007 | | | 1 | | | (3 | ) | | | (2 | ) |
Buy | | | | 5,042 | | 03/2008 | | | 5 | | | 0 | | | | 5 | |
Buy | | PLN | | 5,528 | | 09/2007 | | | 38 | | | 0 | | | | 38 | |
Buy | | RUB | | 2,255 | | 12/2007 | | | 2 | | | 0 | | | | 2 | |
Buy | | | | 48,032 | | 01/2008 | | | 16 | | | 0 | | | | 16 | |
Buy | | SGD | | 2,610 | | 07/2007 | | | 7 | | | 0 | | | | 7 | |
Sell | | | | 1,578 | | 07/2007 | | | 0 | | | (6 | ) | | | (6 | ) |
Buy | | | | 245 | | 08/2007 | | | 1 | | | 0 | | | | 1 | |
Buy | | | | 2,599 | | 10/2007 | | | 9 | | | 0 | | | | 9 | |
| | | | | | | | | | | | | | | | | |
| | | | | | | | $ | 179 | | $ | (239 | ) | | $ | (60 | ) |
| | | | | | | | | | | | | | | | | |
| | | | | | |
| See Accompanying Notes | | Semiannual Report | | June 30, 2007 | | 15 |
Notes to Financial Statements
1. ORGANIZATION
The Real Return Portfolio (the “Portfolio”) is a series of the PIMCO Variable Insurance Trust (the “Trust”). The Trust is registered under the Investment Company Act of 1940 (the “Act”), as amended, as an open-end management investment company organized as a Delaware business trust on October 3, 1997. The Portfolio offers three classes of shares: Institutional, Administrative and Advisor. Information presented on these financial statements pertains to the Institutional Class of the Portfolio. Certain detailed financial information for the Administrative Class and Advisor Class is provided separately and is available upon request. The Trust is designed to be used as an investment vehicle by Separate Accounts of insurance companies that fund variable annuity contracts and variable life insurance policies and by qualified pension and retirement plans.
2. SIGNIFICANT ACCOUNTING POLICIES
The following is a summary of significant accounting policies consistently followed by the Portfolio in the preparation of its financial statements in conformity with accounting principles generally accepted in the United States of America (“GAAP”). The preparation of financial statements in accordance with GAAP requires management to make estimates and assumptions that affect the reported amounts and disclosures on the financial statements. Actual results could differ from those estimates.
(a) Security Valuation Portfolio securities are valued as of the close of regular trading (normally 4:00 p.m., Eastern Time) on each day that the New York Stock Exchange (“NYSE”) is open. Portfolio securities and other assets for which market quotes are readily available are stated at market value. Market value is generally determined on the basis of last reported sales prices, or if no sales are reported, based on quotes obtained from a quotation reporting system, established market makers, or pricing services. Fixed-income securities and non-exchange traded derivatives are normally valued on the basis of quotes obtained from brokers and dealers or pricing services. Prices obtained from independent pricing services use information provided by market makers or estimates of market values obtained from yield data relating to investments or securities with similar characteristics. Certain fixed income securities purchased on a delayed-delivery basis are marked to market daily until settlement at the forward settlement date. Short-term investments having a maturity of 60 days or less are generally valued at amortized cost. Exchange traded options, futures and options on futures are valued at the settlement price determined by the relevant exchange. With respect to any portion of the Portfolio’s assets that are invested in one or more open end management investment companies, the Portfolio’s net asset value (“NAV”) will be calculated based upon the NAVs of such investments.
Investments initially valued in currencies other than the U.S. dollar are converted to the U.S. dollar using exchange rates obtained from pricing services. As a result, the NAV of the Portfolio’s securities may be affected by changes in the value of currencies in relation to the U.S. dollar. The value of securities traded in markets outside the United States or denominated in currencies other than the U.S. dollar may be affected significantly on a day that the NYSE is closed and an investor is not able to purchase, redeem or exchange shares.
Securities and other assets for which market quotes are not readily available are valued at fair value as determined in good faith by the Board of Trustees or persons acting at their direction. The Board of Trustees has adopted methods for valuing securities and other assets in circumstances where market quotes are not readily available, and has delegated to Pacific Investment Management Company LLC (“PIMCO”) the responsibility for applying the valuation methods. In the event that market quotes are not readily available, and the security or asset cannot be valued pursuant to one of the valuation methods, the value of the security or asset will be determined in good faith by the Valuation Committee of the Board of Trustees, generally based upon recommendations provided by PIMCO.
Market quotes are considered not readily available in circumstances where there is an absence of current or reliable market-based data (e.g., trade information, bid/asked information, broker quotes), including where events occur after the close of the relevant market, but prior to the close of regular trading, that materially affect the values of the Portfolio’s securities or assets. In addition, market quotes are considered not readily available when, due to extraordinary circumstances, the exchanges or markets on which the securities trade, do not open for trading for the entire day and no other market prices are available. The Board has delegated to PIMCO the responsibility for monitoring significant events that may materially affect the values of the Portfolio’s securities or assets and for determining whether the value of the applicable securities or assets should be re-evaluated in light of such significant events.
When the Portfolio uses fair value pricing to determine its NAV, securities will not be priced on the basis of quotations from the primary market in which they are traded, but rather may be priced by another method that the Board of Trustees or persons acting at their direction believe accurately reflects fair value. The Trust’s policy is intended to result in a calculation of the Portfolio’s NAV that fairly reflects security values as of the time of pricing. However, fair values determined by the Board of Trustees or persons acting at their direction may not accurately reflect the price that the Portfolio could obtain for a security if it were to dispose of that security as of the time of pricing. Because foreign securities can trade on non-business days of the Portfolio, the NAV of the Portfolio may change on days when shareholders will not be able to purchase or redeem Portfolio shares. The prices used by the Portfolio may differ from the value that would be realized if the securities were sold and the differences could be material to the financial statements.
(b) Securities Transactions and Investment Income Securities transactions are recorded as of the trade date for financial reporting purposes. Securities purchased or sold on a when-issued or delayed-delivery basis may be settled a month or more after the trade date. Realized gains and losses from securities sold are recorded on the identified cost basis. Dividend income is recorded on the ex-dividend date, except certain dividends from foreign securities where the ex-dividend date may have passed, which are recorded as soon as the Portfolio is informed of the ex-dividend date. Interest income, adjusted for the accretion of discounts and amortization of premiums, is recorded on the accrual basis. Paydown gains and losses on mortgage-related and other asset-backed securities are recorded as components of interest income on the Statement of Operations.
(c) Delayed-Delivery Transactions The Portfolio may purchase or sell securities on a delayed-delivery basis. These transactions involve a commitment by the Portfolio to purchase or sell securities for a predetermined price or yield, with payment and delivery taking place beyond the customary settlement period. When delayed-delivery purchases are outstanding, the Portfolio will designate liquid assets in an amount sufficient to meet the purchase price. When purchasing a security on a delayed-delivery basis, the Portfolio assumes the rights and risks of ownership of the security, including the risk of price and yield fluctuations, and takes such fluctuations into account when determining its net asset value. The Portfolio may dispose of or renegotiate a delayed-delivery transaction after it is entered into, and may sell when-issued securities before they are delivered, which may result in a capital gain or loss. When the Portfolio has sold a security on a delayed-delivery basis, the Portfolio does not participate in future gains and losses with respect to the security.
(d) Dividends and Distributions to Shareholders Dividends from net investment income, if any, are declared daily and distributed to shareholders monthly. Net realized capital gains earned by the Portfolio, if any, will be distributed no less frequently than once each year.
Income dividends and capital gain distributions are determined in accordance with income tax regulations which may differ from GAAP. Differences between tax regulations and GAAP may change the fiscal year when income and capital items
| | | | |
| 16 | | PIMCO Variable Insurance Trust | | |
| | |
| |
| | | June 30, 2007 (Unaudited) |
are recognized for tax and GAAP purposes. Examples of events that give rise to timing differences include wash sales, straddles, net operating losses and capital loss carryforwards. Further, the character of investment income and capital gains may be different for certain transactions under the two methods of accounting. Examples of characterization differences include the treatment of mortgage paydowns, swaps, foreign currency transactions and contingent debt instruments. As a result, income dividends and capital gain distributions declared during a fiscal period may differ significantly from the net investment income and realized capital gain reported on the Portfolio’s annual financial statements presented under GAAP.
Distributions classified as a tax basis return of capital, if any, are reflected on the accompanying Statements of Changes in Net Assets and have been reclassified to paid in capital. In addition, other amounts have been reclassified between undistributed net investment income, accumulated undistributed net realized gains or losses and/or paid in capital to more appropriately conform financial accounting to tax characterizations of dividend distributions.
(e) Multiclass Operations Each class offered by the Portfolio has equal rights as to assets and voting privileges (except that shareholders of a class have exclusive voting rights regarding any matter relating solely to that class of shares). Income and non-class specific expenses of the Portfolio are allocated daily to each class of shares based on the relative value of settled shares. Realized and unrealized capital gains and losses of the Portfolio are allocated daily to each class of shares based on the relative net assets of each class. Class specific expenses, where applicable, currently include administrative, distribution and servicing fees.
(f) Foreign Currency The functional and reporting currency for the Portfolio is the U.S. dollar. The market values of foreign securities, currency holdings and other assets and liabilities are translated into U.S. dollars based on the current exchange rates each business day. Fluctuations in the value of currency holdings and other assets and liabilities resulting from changes in exchange rates are recorded as unrealized foreign currency gains or losses. Realized gains or losses and unrealized appreciation or depreciation on investment securities and income and expenses are translated on the respective dates of such transactions. The effects of changes in foreign currency exchange rates on investments in securities are not segregated on the Statement of Operations from the effects of changes in market prices of those securities, but are included with the net realized and unrealized gain or loss on investment securities.
| | | | | | |
|
| Non-U.S. currency symbols utilized throughout the report are defined as follows: |
| AUD | | Australian Dollar | | JPY | | Japanese Yen |
| BRL | | Brazilian Real | | KRW | | South Korean Won |
| CAD | | Canadian Dollar | | MXN | | Mexican Peso |
| CHF | | Swiss Franc | | PLN | | Polish Zloty |
| CNY | | Chinese Yuan Renminbi | | RUB | | Russian Ruble |
| EUR | | Euro | | SGD | | Singapore Dollar |
| GBP | | Great British Pound | | | | |
(g) Foreign Currency Transactions The Portfolio may enter into foreign currency contracts in connection with settling planned purchases or sales of securities, to hedge the currency exposure associated with some or all of the Portfolio’s securities or as a part of an investment strategy. A foreign currency contract is an agreement between two parties to buy and sell a currency at a set price on a future date. The market value of a foreign currency contract fluctuates with changes in foreign currency exchange rates. Foreign currency contracts are marked to market daily and the change in value is recorded by the Portfolio as an
unrealized gain or loss. Realized gains or losses equal to the difference between the value of the contract at the time it was opened and the value at the time it was closed are recorded upon delivery or receipt of the currency. These contracts may involve market risk in excess of the unrealized gain or loss reflected on the Statement of Assets and Liabilities. In addition, the Portfolio could be exposed to risk if the counterparties are unable to meet the terms of the contracts or if the value of the currency changes unfavorably to the U.S. dollar.
(h) Futures Contracts The Portfolio may enter into futures contracts. The Portfolio may use futures contracts to manage its exposure to the securities markets or to movements in interest rates and currency values. The primary risks associated with the use of futures contracts are the imperfect correlation between the change in market value of the securities held by the Portfolio and the prices of futures contracts, the possibility of an illiquid market, and the inability of the counterparty to meet the terms of the contract. Futures contracts are valued based upon their quoted daily settlement prices. Upon entering into a futures contract, the Portfolio is required to deposit with its futures broker, an amount of cash or U.S. Government and Agency Obligations in accordance with the initial margin requirements of the broker or exchange. Futures contracts are marked to market daily and an appropriate payable or receivable for the change in value (“variation margin”) is recorded by the Portfolio. Gains or losses are recognized but not considered realized until the contracts expire or are closed. Futures contracts involve, to varying degrees, risk of loss in excess of the variation margin disclosed on the Statement of Assets and Liabilities.
(i) Inflation-Indexed Bonds The Portfolio may invest in inflation-indexed bonds. Inflation-indexed bonds are fixed-income securities whose principal value is periodically adjusted to the rate of inflation. The interest rate on these bonds is generally fixed at issuance at a rate lower than typical bonds. Over the life of an inflation-indexed bond, however, interest will be paid based on a principal value, which is adjusted for inflation. Any increase in the principal amount of an inflation-indexed bond will be included as interest income on the Statement of Operations, even though investors do not receive their principal until maturity.
(j) Options Contracts The Portfolio may write call and put options on futures, swaps, securities or currencies it owns or in which it may invest. Writing put options tends to increase the Portfolio’s exposure to the underlying instrument. Writing call options tends to decrease the Portfolio’s exposure to the underlying instrument. When the Portfolio writes a call or put option, an amount equal to the premium received is recorded as a liability and subsequently marked to market to reflect the current value of the option written. These liabilities are reflected as written options outstanding on the Statement of Assets and Liabilities. Certain options may be written with premiums to be determined on a future date. The premiums for these options are based upon implied volatility parameters at specified terms. Premiums received from writing options which expire are treated as realized gains. Premiums received from writing options which are exercised or closed are added to the proceeds or offset against amounts paid on the underlying future, swap, security or currency transaction to determine the realized gain or loss. The Portfolio as a writer of an option has no control over whether the underlying future, swap, security or currency may be sold (call) or purchased (put) and as a result bears the market risk of an unfavorable change in the price of the future, swap, security or currency underlying the written option. There is the risk the Portfolio may not be able to enter into a closing transaction because of an illiquid market.
The Portfolio may also purchase put and call options. Purchasing call options tends to increase the Portfolio’s exposure to the underlying instrument. Purchasing put options tends to decrease the Portfolio’s exposure to the underlying instrument. The Portfolio pays a premium which is included on the Statement of Assets and Liabilities as an investment and subsequently marked to market to reflect the current value of the option. Premiums paid for purchasing options which expire are
| | | | | | |
| | Semiannual Report | | June 30, 2007 | | 17 |
Notes to Financial Statements (Cont.)
treated as realized losses. Certain options may be purchased with premiums to be determined on a future date. The premiums for these options are based upon implied volatility parameters at specified terms. The risk associated with purchasing put and call options is limited to the premium paid. Premiums paid for purchasing options which are exercised or closed are added to the amounts paid or offset against the proceeds on the underlying future, swap, security or currency transaction to determine the realized gain or loss.
(k) Repurchase Agreements The Portfolio may engage in repurchase transactions. Under the terms of a typical repurchase agreement, the Portfolio takes possession of an underlying debt obligation (collateral) subject to an obligation of the seller to repurchase, and the Portfolio to resell, the obligation at an agreed-upon price and time. The underlying securities for all repurchase agreements are held in safekeeping at the Portfolio’s custodian or designated subcustodians under tri-party repurchase agreements. The market value of the collateral must be equal to or exceed the total amount of the repurchase obligations, including interest. Securities purchased under repurchase agreements are reflected as an asset on the Statement of Assets and Liabilities. Generally, in the event of counterparty default, the Portfolio has the right to use the collateral to offset losses incurred. If the counterparty should default, the Portfolio will seek to sell the securities which it holds as collateral. This could involve procedural costs or delays in addition to a loss on the securities if their value should fall below their repurchase price.
(l) Inverse Floating Rate Transactions—Residual Interest Municipal Bonds (“RIBs”)/Residual Interest Tax Exempt Bonds (“RITEs”) The Portfolio may invest in RIBs and RITEs (“Inverse Floaters”). Inverse Floaters are created via a master trust agreement between a broker-dealer, acting as trustor and liquidity provider, and an investment bank, acting as trustee and tender agent. The master trust agreement defines the terms for each trust series; with each series being established by the transfer of long-term, fixed-rate municipal bonds (“Fixed Rate Bonds”) to the trustee to be held and provide for the creation, execution and delivery of floater certificates (“Floating Rate Notes”) and Inverse Floaters. Floating Rate Notes are liquid notes that are issued with a short-term variable rate typically linked to the LIBOR, subject to limitations, for some duration. After interest income is paid on the Floating Rate Notes at current rates, the residual income from the Fixed Rate Bonds is paid to the Inverse Floaters. Inverse Floaters are issued with a coupon that fluctuates inversely with the Floating Rate Notes’ referenced rate, subject to certain limitations. Therefore, rising short-term rates result in lower income for the Inverse Floaters and vice versa.
Floating Rate Notes are generally remarketed to municipal money market funds. Inverse Floaters are acquired by either tax-exempt municipal bond funds or trusts, or other parties interested in potentially higher yielding tax-exempt securities. Inverse Floaters may also be acquired for the purpose of increasing leverage. Floating Rate Note holders typically have the option to tender their notes to the liquidity provider for redemption at par at each reset date. The Inverse Floater holders have the option to (i) require the Floating Rate Note holders to tender their notes at par, and (ii) require the liquidity provider to transfer the Fixed Rate Bonds to the Inverse Floater holders. The holders of Inverse Floaters bear substantially all of the downside investment risk associated with the underlying Fixed Rate Bonds, and also benefit from a disproportionate amount of the potential appreciation of the underlying Fixed Rate Bonds’ value. Inverse Floaters may be more volatile and less liquid than other municipal bonds of comparable maturity.
Inverse Floaters may be acquired with or without first transferring to the trustor the Fixed Rate Bonds that were utilized to create the trust series. Inverse Floaters acquired without a transfer of Fixed Rate Bonds are recognized as purchases of securities as outlined in Note 2(b). Statement of Financial Accounting Standards No. 140—Accounting for Transfers and Servicing of Financial Assets and Extinguishments of Liabilities (“FAS No. 140”), governs the standards for
accounting for securitizations and other transfers of financial assets. If there is a transfer of Fixed Rate Bonds and it meets sale criteria under FAS No. 140, a Portfolio records a sale of the Fixed Rate Bonds and a purchase of the Inverse Floaters. The cash received from the Inverse Floaters is then recorded as interest income in the Statement of Operations.
If the transfer of Fixed Rate Bonds does not meet sale criteria under FAS No. 140, a Portfolio accounts for the transaction described above as a secured borrowing by including the Fixed Rate Bonds in its Schedule of Investments, and recording the Floating Rate Notes as a liability under the caption “Payable for floating rate notes” in the Portfolio’s Statement of Assets and Liabilities. In a secured borrowing transaction, cash received from the Inverse Floaters is not recorded as interest income. Instead, a Portfolio records interest income related to the Fixed Rate Bonds and interest expense related to the Floating Rate Notes, the net of which is equal to the cash received from the Inverse Floaters acquired by the Portfolio. Thus, while a Portfolio’s reported total income, net expenses, and net expense ratio are generally higher for investments in Inverse Floaters acquired via a secured borrowing, the method of acquiring Inverse Floaters does not result in differences for reported cash flows, net asset value or total return.
(m) Short Sales The Portfolio may enter into short sales transactions. A short sale is a transaction in which the Portfolio sells securities it does not own in anticipation of a decline in the market price of the securities. Securities sold in short sale transactions and interest payable on such securities, if any, are reflected as a liability on the Statement of Assets and Liabilities. The Portfolio is obligated to deliver securities at the market price at the time the short position is closed. Possible losses from short sales may be unlimited, whereas losses from purchases cannot exceed the total amount invested.
(n) Swap Agreements The Portfolio may invest in swap agreements. Swap transactions are privately negotiated agreements between the Portfolio and a counterparty to exchange or swap investment cash flows, assets, or market-linked returns at specified, future intervals. The Portfolio may enter into interest rate, total return, forward spread-lock, credit default, and other forms of swap agreements to manage its exposure to interest rates and credit risk. In connection with these agreements, securities may be identified as collateral in accordance with the terms of the respective swap agreements.
Interest rate swap agreements involve the exchange by the Portfolio with another party of their respective commitments to pay or receive interest, e.g., an exchange of floating rate payments for fixed rate payments with respect to the notional amount of principal. Certain forms of interest rate swap agreements may include: (i) interest rate caps, under which, in return for a premium, one party agrees to make payments to the other to the extent that interest rates exceed a specified rate, or “cap”, (ii) interest rate floors, under which, in return for a premium, one party agrees to make payments to the other to the extent that interest rates fall below a specified rate, or “floor”, or (iii) interest rate collars, under which a party sells a cap and purchases a floor or vice versa in an attempt to protect itself against interest rate movements exceeding given minimum or maximum levels.
Total return swap agreements involve commitments to pay interest in exchange for a market-linked return, both based on notional amounts. To the extent the total return of the security or index underlying the transaction exceeds or falls short of the offsetting interest rate obligation, the Portfolio will receive a payment from or make a payment to the counterparty.
Forward spread-lock swap agreements involve commitments to pay or receive a settlement amount calculated as the difference between the swap spread and a fixed spread, multiplied by the notional amount times the duration of the swap. The swap spread is the difference between the benchmark swap rate (market rate) and the specific Treasury rate.
| | | | |
| 18 | | PIMCO Variable Insurance Trust | | |
| | |
| |
| | | June 30, 2007 (Unaudited) |
Credit default swap agreements involve one party making a stream of payments to another party in exchange for the right to receive a specified return in the event of a default by a third party, typically corporate issues or sovereign issues of an emerging country, on its obligation. The Portfolio may use credit default swaps to provide a measure of protection against defaults of the issuers (i.e., to reduce risk where the Portfolio owns or has exposure to the sovereign issuer) or to take an active long or short position with respect to the likelihood of a particular issuer’s default. As a seller of protection, the Portfolio generally receives an upfront payment or a fixed rate of income throughout the term of the swap provided that there is no credit event. If the Portfolio is a seller of protection and a credit event occurs, as defined under the terms of that particular swap agreement, the Portfolio will pay to the buyer of the protection an amount up to the notional value of the swap and in certain instances take delivery of the security. As the seller, the Portfolio would effectively add leverage to its portfolio because, in addition to its total net assets, the Portfolio would be subject to investment exposure on the notional amount of the swap. As a buyer of protection, the Portfolio generally receives an amount up to the notional value of the swap if a credit event occurs. The treatment of credit default swaps and other swap agreements that provide for contingent, non-periodic, bullet-type payments as “notional principal contracts” for U.S. federal income tax purposes is uncertain. Were the U.S. Internal Revenue Service (“IRS”) to take the position that a credit default swap or other bullet-type swap is not a “notional principal contract” for U.S. federal income tax purposes, payments received by the Portfolio from such investments might be subject to U.S. excise or income taxes.
Swaps are marked to market daily based upon quotations from market makers and the change in value, if any, is recorded as unrealized gain or loss on the Statement of Operations. Payments received or made at the beginning of the measurement period are reflected as such on the Statement of Assets and Liabilities. These upfront payments are recorded as realized gain or loss on the Statement of Operations upon termination or maturity of the swap. A liquidation payment received or made at the termination of the swap is recorded as realized gain or loss on the Statement of Operations. Net periodic payments received or paid by the Portfolio are included as part of realized gain or loss on the Statement of Operations. Entering into these agreements involves, to varying degrees, elements of credit, market and documentation risk in excess of the amounts recognized on the Statement of Assets and Liabilities. Such risks involve the possibility that there will be no liquid market for these agreements, that the counterparty to the agreements may default on its obligation to perform or disagree as to the meaning of contractual terms in the agreements and that there may be unfavorable changes in interest rates.
(o) Loan Participations and Assignments The Portfolio may invest in direct debt instruments which are interests in amounts owned by corporate, governmental, or other borrowers to lenders or lending syndicates. The Portfolio’s investments in loans may be in the form of participations in loans or assignments of all or a portion of loans from third parties. A loan is often administered by a bank or other financial institution (the “lender”) that acts as agent for all holders. The agent administers the terms of the loan, as specified in the loan agreement. When investing in a loan participation, the Portfolio has the right to receive payments of principal, interest and any fees to which it is entitled only from the lender selling the loan agreement and only upon receipt by the lender of payments from the borrower. The Portfolio generally has no right to enforce compliance with the terms of the loan agreement with the borrower. As a result, the Portfolio may be subject to the credit risk of both the borrower and the lender that is selling the loan agreement. When the Portfolio purchases assignments from lenders it acquires direct rights against the borrower of the loan. At the end of the period June 30, 2007, the Portfolio had no unfunded loan commitments.
(p) Bridge Debt Commitments At the period ended June 30, 2007, the Portfolio had $1,602,246 in commitments outstanding to fund high yield bridge debt. The
Portfolio is entitled to a fee upon the expiration of the commitment period. The bridge debt terms approximate market rates at the time the commitment is entered into.
(q) Mortgage-Related and Other Asset-Backed Securities The Portfolio may invest in mortgage-related or other asset-backed securities. These securities include mortgage pass-through securities, collateralized mortgage obligations (“CMOs”), commercial mortgage-backed securities, mortgage dollar rolls, CMO residuals, stripped mortgage-backed securities (“SMBSs”) and other securities that directly or indirectly represent a participation in, or are secured by and payable from, mortgage loans on real property. The value of some mortgage-related or asset-backed securities may be particularly sensitive to changes in prevailing interest rates. Early repayment of principal on some mortgage-related securities may expose the Portfolio to a lower rate of return upon reinvestment of principal. The value of these securities may fluctuate in response to the market’s perception of the creditworthiness of the issuers. Additionally, although mortgages and mortgage-related securities are generally supported by some form of government or private guarantee and/or insurance, there is no assurance that private guarantors or insurers will meet their obligations.
(r) U.S. Government Agencies or Government-Sponsored Enterprises Securities issued by U.S. Government agencies or government-sponsored enterprises may not be guaranteed by the U.S. Treasury. The Government National Mortgage Association (“GNMA” or “Ginnie Mae”), a wholly owned U.S. Government corporation, is authorized to guarantee, with the full faith and credit of the U.S. Government, the timely payment of principal and interest on securities issued by institutions approved by GNMA and backed by pools of mortgages insured by the Federal Housing Administration or guaranteed by the Department of Veterans Affairs. Government-related guarantors (i.e., not backed by the full faith and credit of the U.S. Government) include the Federal National Mortgage Association (“FNMA” or “Fannie Mae”) and the Federal Home Loan Mortgage Corporation (“FHLMC” or “Freddie Mac”). Pass-through securities issued by FNMA are guaranteed as to timely payment of principal and interest by FNMA but are not backed by the full faith and credit of the U.S. Government. FHLMC guarantees the timely payment of interest and ultimate collection of principal, but its participation certificates are not backed by the full faith and credit of the U.S. Government.
(s) New Accounting Policies In July 2006, the Financial Accounting Standards Board (“FASB”) issued Interpretation No. 48, “Accounting for Uncertainty in Income Taxes—an Interpretation of FASB Statement No. 109” (the “Interpretation”). The Interpretation became effective for the Portfolio on June 29, 2007. Management has evaluated the application of the Interpretation in relation to the Portfolio and has concluded that no single filing position or combination of filing positions identified as uncertain tax positions required the accrual of a tax liability in the accounting records of the Portfolio for the period ending June 30, 2007. Management will monitor all existing filing positions and future filing positions in light of the Interpretation and evaluate the need for any future tax accruals and financial statement disclosures as warranted.
In September 2006, the FASB issued Statement of Financial Accounting Standards No. 157, “Fair Value Measurements” (the “Statement”). The Statement is effective for fiscal years beginning after November 15, 2007 and will require expanded disclosure about fair value measurements, separately for each major category of assets and liabilities, that enables shareholders to assess the inputs used to develop those measurements, and for recurring fair value measurements using significant unobservable inputs the effect of the measurements on changes in net assets for the reporting period. Management is currently evaluating the application of the Statement to the Portfolio and will provide additional information in relation to the Statement on the Portfolio’s annual financial statements for the period ending December 31, 2007.
| | | | | | |
| | Semiannual Report | | June 30, 2007 | | 19 |
Notes to Financial Statements (Cont.)
3. FEES AND EXPENSES
(a) Investment Advisory Fee PIMCO is a majority-owned subsidiary of Allianz Global Investors of America L.P. (“AGI”), and serves as investment adviser (the “Adviser”) to the Trust, pursuant to an investment advisory contract. The Adviser receives a monthly fee from the Portfolio, at an annual rate based on average daily net assets. The Advisory Fee for all classes is charged at an annual rate of 0.25%.
(b) Administration Fee PIMCO serves as administrator (the “Administrator”), and provides administrative services to the Trust for which it receives a monthly administrative fee based on each share class’s average daily net assets. As the Administrator, PIMCO bears the costs of various third-party services, including audit, custodial, portfolio accounting, legal, transfer agency and printing costs. The Administration Fee for all classes is charged at the annual rate of 0.25%.
(c) Distribution and Servicing Fees Allianz Global Investors Distributors LLC (“AGID”) is an indirect wholly-owned subsidiary of AGI and serves as the distributor (the “Distributor”) of the Trust’s shares. The Trust is permitted to reimburse AGID on a quarterly basis, out of the Administrative Class assets of the Portfolio in the amount of 0.15% on an annual basis of the average daily net assets of that class, for payments made to financial intermediaries that provide services in connection with the distribution of shares or administration of plans or programs that use Portfolio shares as their funding medium. The effective rate paid to AGID was 0.15% during the current fiscal year.
The Trust has adopted a Distribution Plan, for the Advisor Class shares of the Portfolio (the “Plan”). The Plan has been adopted pursuant to Rule 12b-1 under the Act. The Plan permits payments for expenses in connection with the distribution and marketing of Advisor Class shares and/or the provision of shareholder services to Advisor Class shareholders. The Plan permits the Portfolio to make total payments at an annual rate of 0.25% of its average daily net assets attributable to its Advisor Class shares.
(d) Portfolio Expenses The Trust is responsible for the following expenses: (i) salaries and other compensation of any of the Trust’s executive officers and employees who are not officers, directors, stockholders or employees of PIMCO or its subsidiaries or affiliates; (ii) taxes and governmental fees; (iii) brokerage fees and commissions and other portfolio transaction expenses; (iv) the costs of borrowing money, including interest expenses and bank overdraft charges; (v) fees and expenses of the Trustees who are not “interested persons” of PIMCO or the Trust, and any counsel retained exclusively for their benefit; (vi) extraordinary expenses, including costs of litigation and indemnification expenses; (vii) organization expenses and (viii) any expenses allocated or allocable to a specific class of shares, which include service fees payable with respect to the Administrative Class Shares, and may include certain other expenses as permitted by the Trust’s Multiple Class Plan adopted pursuant to Rule 18f-3 under the Act and subject to review and approval by the Trustees. The ratio of expenses to average net assets per share class, as disclosed in the Financial Highlights, may differ from the annual portfolio operating expenses per share class as disclosed in the Prospectus for the reasons set forth above.
Effective April 1, 2007, each Trustee, other than those affiliated with PIMCO or its affiliates, receives an annual retainer of $15,000, plus $2,375 for each Board of Trustees meeting attended in person, $500 for each committee meeting attended and $750 for each Board of Trustees meeting attended telephonically, plus reimbursement of related expenses. In addition, the audit committee chair receives an additional annual retainer of $2,000 and each other committee chair receives an additional annual retainer of $500. These expenses are allocated on a pro-rata basis to the various portfolios of the Trust according to their respective net assets. The Trust pays no compensation directly to any Trustee or any other officer who is affiliated with the Administrator, all of whom receive remuneration for their services to the Trust from the Administrator or its affiliates. Prior to
April 1, 2007, each Trustee, other than those affiliated with PIMCO or its affiliates, received an annual retainer of $15,000 plus $2,000 for each Board of Trustees meeting attended ($500 for each special meeting attended), plus reimbursement of related expenses. The Audit Committee Chairman received an annual retainer of $1,500 and the Governance Committee Chairman received an annual retainer of $500. In addition, each member of a committee received $500 for each committee meeting attended.
4. RELATED PARTY TRANSACTIONS
The Adviser, Administrator, and Distributor are related parties as defined by FAS 57, Related Party Disclosures. Fees payable to these parties are disclosed in Note 3.
5. GUARANTEES AND INDEMNIFICATIONS
Under the Trust’s organizational documents, each Trustee, officer, employee or other agent of the Trust (including the Trust’s investment manager) is indemnified, to the extent permitted by the Act, against certain liabilities that may arise out of performance of their duties to the Portfolio. Additionally, in the normal course of business, the Portfolio enters into contracts that contain a variety of indemnification clauses. The Portfolio’s maximum exposure under these arrangements is unknown as this would involve future claims that may be made against the Portfolio that have not yet occurred. However, the Portfolio has not had prior claims or losses pursuant to these contracts and believes the risk of loss to be remote.
6. PURCHASES AND SALES OF SECURITIES
The length of time the Portfolio has held a particular security is not generally a consideration in investment decisions. A change in the securities held by the Portfolio is known as “portfolio turnover”. The Portfolio may engage in frequent and active trading of portfolio securities to achieve its investment objective, particularly during periods of volatile market movements. High portfolio turnover (e.g., over 100%) involves correspondingly greater expenses to the Portfolio, including brokerage commissions or dealer mark-ups and other transaction costs on the sale of securities and reinvestments in other securities. Such sales may also result in realization of taxable capital gains, including short-term capital gains (which are generally taxed at ordinary income tax rates). The trading costs and tax effects associated with portfolio turnover may adversely affect the Portfolio’s performance.
Purchases and sales of securities (excluding short-term investments) for the period ended June 30, 2007, were as follows (amounts in thousands):
| | | | | | | | | | | | |
| U.S. Government/Agency | | | | All Other |
| Purchases | | Sales | | | | Purchases | | Sales |
| $ | 8,513,157 | | $ | 8,707,451 | | | | $ | 137,558 | | $ | 29,607 |
7. TRANSACTIONS IN WRITTEN CALL AND PUT OPTIONS
Transactions in written call and put options were as follows (amounts in thousands, except for number of contracts):
| | | | | | | | | | | | | |
| | | | | # of
Contracts | | | Notional
Amount in $ | | | Premium | |
Balance at 12/31/2006 | | | | 146 | | | $ | 97,800 | | | $ | 643 | |
Sales | | | | 1,025 | | | | 23,000 | | | | 592 | |
Closing Buys | | | | (73 | ) | | | (46,000 | ) | | | (362 | ) |
Expirations | | | | (661 | ) | | | (51,800 | ) | | | (486 | ) |
Exercised | | | | 0 | | | | 0 | | | | 0 | |
Balance at 06/30/2007 | | | | 437 | | | $ | 23,000 | | | $ | 387 | |
| | | | |
| 20 | | PIMCO Variable Insurance Trust | | |
| | |
| |
| | | June 30, 2007 (Unaudited) |
8. SHARES OF BENEFICIAL INTEREST
The Portfolio may issue an unlimited number of shares of beneficial interest with a $0.001 par value. Changes in shares of beneficial interest were as follows (shares and amounts in thousands):
| | | | | | | | | | | | | | | | |
| | | | | Six Months Ended
06/30/2007 | | | Year Ended
12/31/2006 | |
| | | | | Shares | | | Amount | | | Shares | | | Amount | |
| | | | | |
Receipts for shares sold | | | | | | | | | | | | | | | | |
Institutional Class | | | | 301 | | | $ | 3,580 | | | 629 | | | $ | 7,837 | |
Administrative Class | | | | 13,980 | | | | 166,885 | | | 29,533 | | | | 367,822 | |
Advisor Class | | | | 568 | | | | 6,796 | | | 248 | | | | 3,086 | |
Issued as reinvestment of distributions | | | | | | | | | | | | | | | | |
Institutional Class | | | | 95 | | | | 1,137 | | | 255 | | | | 3,137 | |
Administrative Class | | | | 1,955 | | | | 23,367 | | | 5,979 | | | | 73,676 | |
Advisor Class | | | | 10 | | | | 119 | | | 9 | | | | 109 | |
Cost of shares redeemed | | | | | | | | | | | | | | | | |
Institutional Class | | | | (274 | ) | | | (3,266 | ) | | (557 | ) | | | (6,951 | ) |
Administrative Class | | | | (22,385 | ) | | | (268,783 | ) | | (28,578 | ) | | | (353,626 | ) |
Advisor Class | | | | (27 | ) | | | (329 | ) | | (32 | ) | | | (402 | ) |
Net increase (decrease) resulting from Portfolio share transactions | | | | (5,777 | ) | | $ | (70,494 | ) | | 7,486 | | | $ | 94,688 | |
The following schedule shows the number of shareholders each owning 5% or more of the Portfolio and the total percentage of the Portfolio held by such shareholders:
| | | | | | |
| | | | | Number of Shareholders | | % of Portfolio Held |
Institutional Class | | | | 2 | | 95 |
Administrative Class | | | | 3 | | 54 |
Advisor Class | | | | 2 | | 94 |
9. REGULATORY AND LITIGATION MATTERS
Since February 2004, PIMCO, Allianz Global Investors of America L.P. (PIMCO’s parent company), AGID, and certain of their affiliates, including the PIMCO Funds (another series of funds managed by PIMCO), the Allianz Funds (formerly known as PIMCO Funds: Multi-Manager Series (another series of funds managed by affiliates of PIMCO)), certain Trustees of the Trust (in their capacity as Trustees of the PIMCO Funds or the Allianz Funds) and certain employees of PIMCO, have been named as defendants in fifteen lawsuits filed in various jurisdictions. Eleven of those lawsuits concern “market timing,” and they have been transferred to and consolidated for pre-trial proceedings in a multi-district litigation proceeding in the U.S. District Court for the District of Maryland; the other four lawsuits concern “revenue sharing” and have been consolidated into a single action in the U.S. District Court for the District of Connecticut. The lawsuits have been commenced as putative class actions on behalf of investors who purchased, held or redeemed shares of the various series of the PIMCO Funds and the Allianz Funds during specified periods, or as derivative actions on behalf of the PIMCO Funds and the Allianz Funds.
The market timing actions in the District of Maryland generally allege that certain hedge funds were allowed to engage in “market timing” in certain funds of the PIMCO Funds and the Allianz Funds and this alleged activity was not disclosed. Pursuant to tolling agreements entered into with the derivative and class action plaintiffs, PIMCO, certain PIMCO Funds Trustees, and certain employees of PIMCO who were previously named as defendants have all been dropped as defendants in the market timing actions; the plaintiffs continue to assert claims on behalf of the shareholders of the PIMCO Funds or on behalf of the PIMCO Funds itself against
other defendants. By order dated November 3, 2005, the U.S. District Court for the District of Maryland granted the PIMCO Funds’ motion to dismiss claims asserted against it in a consolidated amended complaint where the PIMCO Funds were named, in the complaint, as a nominal defendant. The revenue sharing action in the District of Connecticut generally alleges that fund assets were inappropriately used to pay brokers to promote funds of the PIMCO Funds and the Allianz Funds, including directing fund brokerage transactions to such brokers, and that such alleged arrangements were not fully disclosed to shareholders. On August 11, 2005, the U.S. District Court for the District of Connecticut conducted a hearing on defendants’ motion to dismiss the consolidated amended complaint in the revenue sharing action but has not yet ruled on the motion to dismiss. The market timing and revenue sharing lawsuits seek, among other things, unspecified compensatory damages plus interest and, in some cases, punitive damages, the rescission of investment advisory contracts, the return of fees paid under those contracts and restitution.
Two nearly identical class action civil complaints have been filed in August 2005, in the Northern District of Illinois Eastern Division, alleging that the plaintiffs each purchased and sold a 10-year Treasury note futures contract and suffered damages from an alleged shortage when PIMCO held both physical and futures positions in 10-year Treasury notes for its client accounts. The two actions have been consolidated into one action, and the two separate complaints have been replaced by a consolidated complaint. PIMCO is a named defendant, and PIMCO Funds has been added as a defendant, to the consolidated action. PIMCO strongly believes the complaint is without merit and intends to vigorously defend itself.
In April 2006, certain portfolios of the Trust and certain other funds managed by PIMCO were served in an adversary proceeding brought by the Official Committee of Asbestos Claimants of G-I Holdings, Inc. in G-I Holdings, Inc.’s bankruptcy in the District of New Jersey. In July 2004, PIMCO was named in this lawsuit and remains a defendant. The plaintiff seeks to recover for the bankruptcy estate assets that were transferred by the predecessor entity of G-I Holdings, Inc. to a wholly-owned subsidiary in 1994. The subsidiary has since issued notes, of which certain portfolios of the Trust and certain other funds managed by PIMCO are alleged to be holders. The complaint alleges that in 2000, more than two hundred noteholders—including certain portfolios of the Trust and certain other funds managed by PIMCO—were granted a second priority lien on the assets of the subsidiary in exchange for their consent to a refinancing transaction and the granting of a first priority lien to the lending banks. The plaintiff is seeking invalidation of the lien in favor of the noteholders and/or the value of the lien. On June 21, 2006, the District of New Jersey overturned the Bankruptcy Court’s decision granting permission to file the adversary proceeding and remanded the matter to the Bankruptcy Court for further proceedings. Following a motion to reconsider, the District Court upheld its remand on August 7, 2006, and instructed the Bankruptcy Court to conduct a “cost-benefit” analysis of the Committee’s claims, including the claims against the noteholders. The Bankruptcy Court held a status conference on October 25, 2006 and set a briefing schedule relating to this cost-benefit analysis.
The foregoing speaks only as of the date of this report. It is possible that these matters and/or other developments resulting from these matters could result in increased portfolio redemptions or other adverse consequences to the Portfolio. However, PIMCO and AGID believe that these matters are not likely to have a material adverse effect on the Portfolio or on PIMCO’s or AGID’s ability to perform their respective investment advisory or distribution services relating to the Portfolio.
10. FEDERAL INCOME TAX MATTERS
The Portfolio intends to qualify as a regulated investment company under sub-chapter M of the Internal Revenue Code (the “Code”) and distribute all of its taxable income and net realized gains, if applicable, to shareholders. Accordingly, no provision for Federal income taxes has been made.
| | | | | | |
| | Semiannual Report | | June 30, 2007 | | 21 |
Notes to Financial Statements (Cont.)
As of June 30, 2007, the aggregate cost of investments was the same for federal income tax and financial statement purposes. The net unrealized appreciation (depreciation) of investment securities for federal income tax purposes is as follows (amount in thousands):
| | | | |
Aggregate
Gross
Unrealized
Appreciation | | Aggregate
Gross
Unrealized
(Depreciation) | | Net
Unrealized
Appreciation |
$ 8,525 | | $ (1,724) | | $ 6,801 |
| | | | |
| 22 | | PIMCO Variable Insurance Trust | | |
| | |
| |
Privacy Policy* | | (Unaudited) |
The Funds consider customer privacy to be a fundamental aspect of their relationships with shareholders and are committed to maintaining the confidentiality, integrity and security of their current, prospective and former shareholders’ personal information. To ensure their shareholders’ privacy, the Funds have developed policies that are designed to protect this confidentiality, while allowing shareholder needs to be served.
Obtaining Personal Information
In the course of providing shareholders with products and services, the Funds and certain service providers to the Funds, such as the Funds’ investment advisers (“Advisers”), may obtain non-public personal information about shareholders, which may come from sources such as account applications and other forms, from other written, electronic or verbal correspondence, from shareholder transactions, from a shareholder’s brokerage or financial advisory firm, financial adviser or consultant, and/or from information captured on the Funds’ internet web sites.
Respecting Your Privacy
As a matter of policy, the Funds do not disclose any personal or account information provided by shareholders or gathered by the Funds to non-affiliated third parties, except as required or permitted by law or as necessary for such third parties to perform their agreements with respect to the Funds. As is common in the industry, non-affiliated companies may from time to time be used to provide certain services, such as preparing and mailing prospectuses, reports, account statements and other information, conducting research on shareholder satisfaction and gathering shareholder proxies. A Fund’s Distributor may also retain non-affiliated companies to market the Fund’s shares or products which use the Fund’s shares and enter into joint marketing agreements with other companies. These companies may have access to a shareholder’s personal and account information, but are permitted to use this information solely to provide the specific service or as otherwise permitted by law. In most cases, the shareholders will be clients of a third party, but the Funds may also provide a shareholder’s personal and account information to the shareholder’s respective brokerage or financial advisory firm.
Sharing Information with Third Parties
The Funds reserve the right to disclose or report personal information to non-affiliated third parties, in limited circumstances, where the Funds believe in good faith that disclosure is required under law to cooperate with regulators or law enforcement authorities, to protect their rights or property or upon reasonable request by any Fund in which a shareholder has chosen to invest. In addition, the Funds may disclose information about a shareholder’s accounts to a non-affiliated third party with the consent of the shareholder.
Sharing Information with Affiliates
The Funds may share shareholder information with their affiliates in connection with servicing their shareholders’ accounts or to provide shareholders with information about products and services that the Funds or their Advisers, principal underwriters or their affiliates (“Service Affiliates”) believe may be of interest to such shareholders. The information that the Funds share may include, for example, a shareholder’s participation in one of the Funds or in other investment programs sponsored by a Service Affiliate, a shareholder’s ownership of certain types of accounts (such as IRAs), or other data about a shareholder’s accounts. The Funds’ Service Affiliates, in turn, are not permitted to share shareholder information with non-affiliated entities, except as required or permitted by law.
Procedures to Safeguard Private Information
The Funds take seriously the obligation to safeguard shareholder non-public personal information. In addition to this policy, the Funds have also implemented procedures that are designed to restrict access to a shareholder’s non-public personal information only to internal personnel who need to know that information in order to provide products or services to such shareholders. In order to guard a shareholder’s non-public personal information, physical, electronic and procedural safeguards are in place.
* This Privacy Policy applies to the following entities: PIMCO Funds, PIMCO Variable Insurance Trust, PCM Fund, Inc. and PIMCO Strategic Global Government Fund, Inc. (collectively, the “Funds”).
| | | | | | |
| | Semiannual Report | | June 30, 2007 | | 23 |
Investment Adviser and Administrator
Pacific Investment Management Company LLC
840 Newport Center Drive
Newport Beach, California 92660
Distributor
Allianz Global Investors Distributors LLC
1345 Avenue of the Americas
New York, New York 10105
Custodian
State Street Bank & Trust Company
801 Pennsylvania
Kansas City, Missouri 64105
Transfer Agent
Boston Financial Data Services–Midwest
330 W. 9th Street
Kansas City, Missouri 64105
Legal Counsel
Dechert LLP
1775 I Street, N.W.
Washington, D.C. 20006
Independent Registered Public Accounting Firm
PricewaterhouseCoopers LLP
1055 Broadway
Kansas City, Missouri 64105
P I M C O

Table of Contents
This material is authorized for use only when preceded or accompanied by the current PIMCO Variable Insurance Trust (the “Trust”) prospectus. Investors should consider the investment objectives, risks, charges and expenses of this Trust carefully before investing. Ask your financial professional to explain all charges that may apply. This and other information is contained in the Trust’s prospectus. The variable product prospectus may be obtained by contacting your Investment Consultant. Please read the Trust and variable product prospectus carefully before you invest or send money.
Chairman’s Letter
Dear PIMCO Variable Insurance Trust Shareholder:
It is our pleasure to present to you the semiannual report for the PIMCO Variable Insurance Trust, covering the six-month period ended June 30, 2007. The PIMCO Variable Insurance Trust’s net assets were $8.68 billion at June 30, 2007, as compared to $7.76 billion at December 31, 2006.
Highlights of the financial markets during the reporting period include:
| | n | | Economic data during the first quarter of 2007 pointed to slower growth, which heightened market expectations for a decrease in the Federal Funds Rate. By the second quarter, economic data, such as employment statistics, provided little indication of economic weakness, causing expectations of a decrease in the Federal Funds Rate to unwind and U.S. interest rates to move higher. Interest rates in Europe and the U.K. also rose over the period as central banks raised their key lending rates due to inflation concerns. The benchmark ten-year U.S. Treasury yielded 5.03% as of June 30, 2007, or 0.32% higher than at the beginning of the year. |
| | n | | Most bonds generally returned much of their gains from earlier in the year as worldwide growth and capital flows drove interest rates higher in the second quarter. Increased risk aversion in global financial markets, due in part to subprime mortgage worries in the U.S., also contributed to the rise in interest rates. The Lehman Brothers Aggregate Bond Index, which includes Treasury, investment-grade corporate and mortgage-backed securities, returned 0.98% for the six-month period. |
| | n | | Locally issued emerging market (“EM”) bonds posted positive returns for the reporting period. Yields on these bonds declined and the local currencies in which they are denominated generally gained, amid increasing investor awareness, strong economic growth and surging capital inflows. External EM bonds (debt instruments issued by emerging markets countries and typically denominated in U.S. dollars) lagged behind local EM bonds (debt instruments issued by emerging markets countries and denominated in the currency of the issuer), as external EM bonds tend to trade more in-line with U.S. Treasuries. |
| | n | | Treasury Inflation-Protected Securities (“TIPS”) outpaced nominal bonds (non-inflation linked bonds) for the first part of the year and all but the longest maturity TIPS outperformed in the second quarter as high gasoline prices drove higher inflation accruals. Commodities, as represented by the Dow Jones-AIG Commodity Total Return Index, returned 4.46% for the period. Equities, as measured by the S&P 500 Index and the Russell 2000 Index, returned 6.96% and 6.45%, respectively, for the period. |
On the following pages, please find specific details as to the Portfolio’s total return investment performance and a discussion of those factors that affected performance.
Thank you for the trust you have placed in us. We will continue to work diligently to serve your investment needs.
Sincerely,
Brent R. Harris
Chairman, PIMCO Variable Insurance Trust
July 31, 2007
| | | | | | |
| | Semiannual Report | | June 30, 2007 | | 1 |
Important Information About the Portfolio
PIMCO Variable Insurance Trust (the “Trust”) is an open-end management investment company currently consisting of twenty separate investment portfolios, including the Real Return Portfolio (the “Portfolio”). The Portfolio is only available as a funding vehicle under variable life insurance policies or variable annuity contracts issued by insurance companies (“Variable Contracts”). Individuals may not purchase shares of the Portfolio directly. Shares of the Portfolio also may be sold to qualified pension and retirement plans outside of the separate account context.
We believe that bond funds have an important role to play in a well diversified investment portfolio. It is important to note, however, that in an environment where interest rates may trend upward, rising rates would negatively impact the performance of most bond funds, and fixed-income securities held by a fund are likely to decrease in value. The price volatility of fixed-income securities can also increase during periods of rising interest rates resulting in increased losses to a fund. Bond funds and individual bonds with a longer duration (a measure of the expected life of a security) tend to be more sensitive to changes in interest rates, usually making them more volatile than securities or funds with shorter durations.
The Portfolio may be subject to various risks in addition to those described above. Some of these risks may include, but are not limited to, the following: credit risk, high yield risk, market risk, issuer risk, liquidity risk, derivatives risk, mortgage risk, non-U.S. investment risk, emerging markets risk, currency risk, issuer non-diversification risk, leveraging risk and management risk. A complete description of these risks is contained in the Portfolio’s prospectus. The Portfolio may use derivative instruments for hedging purposes or as part of an investment strategy. Use of these instruments may involve certain costs and risks such as liquidity risk, interest rate risk, market risk, credit risk, management risk and the risk that the Portfolio could not close out a position when it would be most advantageous to do so. Because the Portfolio may invest in derivatives, it could lose more than the principal amount invested in these instruments. Investing in non-U.S. securities may entail risk due to non-U.S. economic and political developments; this risk may be increased when investing in emerging markets.
On the performance summary page in this Semiannual Report, the Total Return Investment Performance table measures performance assuming that all dividend and capital gain distributions were reinvested.
An investment in the Portfolio is not a deposit of a bank and is not guaranteed or insured by the Federal Deposit Insurance Corporation or any other government agency. It is possible to lose money on investments in the Portfolio.
PIMCO has adopted written proxy voting policies and procedures (“Proxy Policy”) as required by Rule 206(4)-6 under the Investment Advisers Act of 1940, as amended. The Proxy Policy has been adopted by the Trust as the policies and procedures that PIMCO will use when voting proxies on behalf of the Portfolio. A description of the policies and procedures that PIMCO uses to vote proxies relating to portfolio securities of the Portfolio, and information about how the Portfolio voted proxies relating to portfolio securities held during the most recent twelve-month period ended June 30, are available without charge, upon request, by calling the Trust at 1-866-746-2606 and on the Portfolio’s website at www.pimco.com.
The Portfolio files its complete schedule of portfolio holdings with the SEC for the first and third quarters of each fiscal year on Form N-Q. A copy of the Trust’s Form N-Q is also available on the SEC’s website at http://www.sec.gov and may be reviewed and copied at the SEC’s Public Reference Room in Washington D.C. Information on the operation of the Public Reference Room may be obtained by calling 1-800-SEC-0330, and is available without charge, upon request, by calling the Trust at 1-866-746-2606 and on the Portfolio’s website at www.pimco.com.
PIMCO Variable Insurance Trust is distributed by Allianz Global Investors Distributors LLC, 1345 Avenue of the Americas, New York, NY 10105.
| | | | |
| 2 | | PIMCO Variable Insurance Trust | | |
The following disclosure provides important information regarding the Portfolio’s Expense Example (“Example” or “Expense Example”), which appears in this Semiannual Report. Please refer to this information when reviewing the Expense Example for the Portfolio.
Example
As a shareholder of the Portfolio, you incur two types of costs: (1) transaction costs and (2) ongoing costs, including advisory and administrative fees; distribution and/or service (12b-1) fees (Administrative and Advisor Class only); and other Portfolio expenses. The Example is intended to help you understand your ongoing costs (in dollars) of investing in the Portfolio and to compare these costs with the ongoing costs of investing in other mutual funds. The Expense Example does not reflect any fees or other expenses imposed by the Variable Contracts. If it did, the expenses reflected in the Expense Example would be higher. The Example is based on an investment of $1,000 invested at the beginning of the period and held for the entire period indicated, which is from January 1, 2007 to June 30, 2007.
Actual Expenses
The information in the table under the heading “Actual Performance” provides information about actual account values and actual expenses. You may use the information in these columns, together with the amount you invested, to estimate the expenses that you paid over the period. Simply divide your account value by $1,000 (for example, an $8,600 account value divided by $1,000 = $8.60), then multiply the result by the number in the row titled “Expenses Paid During Period” to estimate the expenses you paid on your account during this period.
Hypothetical Example for Comparison Purposes
The information in the table under the heading “Hypothetical Performance (5% return before expenses)” provides information about hypothetical account values and hypothetical expenses based on the Portfolio’s actual expense ratio and an assumed rate of return of 5% per year before expenses, which is not the Portfolio’s actual return. The hypothetical account values and expenses may not be used to estimate the actual ending account balance or expenses you paid for the period. You may use this information to compare the ongoing costs of investing in the Portfolio and other portfolios. To do so, compare this 5% hypothetical example with the 5% hypothetical examples that appear in the shareholder reports of the other portfolios.
Please note that the expenses shown in the table are meant to highlight your ongoing costs only and do not reflect any transactional costs. Therefore, the information under the heading “Hypothetical Performance (5% return before expenses)” is useful in comparing ongoing costs only, and will not help you determine the relative total costs of owning different portfolios. In addition, if these transactional costs were included, your costs would have been higher.
The expense ratio may vary period to period because of various factors, such as an increase in expenses not covered by the advisory and administrative fees (such as expenses of the trustees and their counsel, litigation expense and interest expense).
| | | | | | |
| | Semiannual Report | | June 30, 2007 | | 3 |
PIMCO Real Return Portfolio
Cumulative Returns Through June 30, 2007
$10,000 invested at the beginning of the first full month following the inception date of the Portfolio’s Advisor Class.
Allocation Breakdown‡
| | |
U.S. Treasury Obligations | | 47.8% |
Short-Term Instruments | | 26.5% |
U.S. Government Agencies | | 10.2% |
Corporate Bonds & Notes | | 6.3% |
Asset-Backed Securities | | 5.1% |
Other | | 4.1% |
| | ‡ | % of Total Investments as of 06/30/2007 |
| | | | | | | | |
| Average Annual Total Return for the period ended June 30, 2007 |
| | | | | 6 Months* | | 1 Year | | Portfolio
Inception
(02/28/06) |
| | PIMCO Real Return Portfolio Advisor Class | | 0.79% | | 2.79% | | 0.62% |
| | Lehman Brothers U.S. TIPS Index± | | 1.73% | | 3.99% | | 1.65% |
All Portfolio returns are net of fees and expenses.
* Cumulative return.
Performance quoted represents past performance. Past performance is no guarantee of future results. Investment return and principal value will fluctuate so the Portfolio shares, when redeemed, may be worth more or less than their original cost. The Portfolio’s performance does not reflect the deduction of additional charges and expenses imposed in connection with investing in Variable Contracts, which will reduce returns. Current performance may be lower or higher than the performance data quoted. Performance data current to the most recent month-end is available by calling (800) 927-4648.
± Lehman Brothers U.S. TIPS Index is an unmanaged market index comprised of all U.S. Treasury Inflation-Protected Securities rated investment grade (Baa3 or better), having at least 1 year to final maturity, and at least $250 million par amount outstanding. It is not possible to invest directly in the index. The index does not reflect deductions for fees or expenses.
| | | | | | |
| Expense Example | | Actual Performance | | Hypothetical Performance |
| | | | | (5% return before expenses) |
Beginning Account Value (01/01/07) | | $ | 1,000.00 | | $ | 1,000.00 |
Ending Account Value (06/30/07) | | $ | 1,007.87 | | $ | 1,021.08 |
Expenses Paid During Period† | | $ | 3.73 | | $ | 3.76 |
† Expenses are equal to the Portfolio’s Advisor Class annualized expense ratio of 0.75%, multiplied by the average account value over the period, multiplied by 181/365 (to reflect the one-half year period). Overall fees and expenses of investing in the Portfolio will be higher because the example does not reflect Variable Contract fees and expenses.
Please refer to page 3 herein for an explanation of the information presented in the above Expense Example.
Portfolio Insights
| » | | The PIMCO Real Return Portfolio seeks to achieve its investment objective by investing under normal circumstances at least 80% of its net assets in inflation-indexed bonds of varying maturities issued by the U.S. and non-U.S. governments, their agencies, or instrumentalities or corporations, which may be represented by forwards or derivatives such as options, futures contracts, or swap agreements. |
| » | | Positioning for a steeper U.S. nominal yield curve added to performance as the U.S. nominal yield curve steepened. |
| » | | An emphasis on nominal bonds in the Eurozone benefited performance as nominal bonds outperformed inflation-linked bonds in the region. |
| » | | Above-index U.S. real duration was negative for performance as real yields increased. |
| » | | Modest exposure to U.K. nominal bonds was negative for performance due to rising interest rates and a tightening bias from the Bank of England. |
| » | | Holdings of mortgage-backed securities detracted from performance as mortgage spreads widened. |
| | | | |
| 4 | | PIMCO Variable Insurance Trust | | |
Financial Highlights Real Return Portfolio
| | | | | | | | |
| Selected per Share Data for the Period Ended: | | 06/30/2007+ | | | 02/28/2006-12/31/2006 | |
| | |
Advisor Class | | | | | | | | |
Net asset value beginning of period | | $ | 11.93 | | | $ | 12.69 | |
Net investment income (a) | | | 0.28 | | | | 0.47 | |
Net realized/unrealized (loss) on investments (a) | | | (0.18 | ) | | | (0.46 | ) |
Total income from investment operations | | | 0.10 | | | | 0.01 | |
Dividends from net investment income | | | (0.28 | ) | | | (0.44 | ) |
Distributions from net realized capital gains | | | 0.00 | | | | (0.33 | ) |
Total distributions | | | (0.28 | ) | | | (0.77 | ) |
Net asset value end of period | | $ | 11.75 | | | $ | 11.93 | |
Total return | | | 0.79 | % | | | 0.04 | % |
Net assets end of period (000s) | | $ | 9,119 | | | $ | 2,684 | |
Ratio of expenses to average net assets | | | 0.75 | %* | | | 0.75 | %* |
Ratio of expenses to average net assets excluding interest expense | | | 0.75 | %* | | | 0.75 | %* |
Ratio of net investment income to average net assets | | | 4.67 | %* | | | 4.49 | %* |
Portfolio turnover rate | | | 484 | % | | | 963 | % |
+ Unaudited
* Annualized
(a) Per share amounts based on average number of shares outstanding during the period.
| | | | | | |
| See Accompanying Notes | | Semiannual Report | | June 30, 2007 | | 5 |
Statement of Assets and Liabilities Real Return Portfolio
| | | | |
| (Amounts in thousands, except per share amounts) | | June 30, 2007 | |
| | | (Unaudited) | |
| |
Assets: | | | | |
Investments, at value | | $ | 2,091,451 | |
Cash | | | 72 | |
Foreign currency, at value | | | 8,246 | |
Receivable for investments sold | | | 96,104 | |
Receivable for investments sold on a delayed-delivery basis | | | 10,275 | |
Receivable for Portfolio shares sold | | | 7,639 | |
Interest and dividends receivable | | | 4,575 | |
Variation margin receivable | | | 12 | |
Swap premiums paid | | | 5,874 | |
Unrealized appreciation on foreign currency contracts | | | 179 | |
Unrealized appreciation on swap agreements | | | 3,526 | |
| | | | 2,227,953 | |
| |
Liabilities: | | | | |
Payable for investments purchased | | $ | 149,673 | |
Payable for investments purchased on a delayed-delivery basis | | | 1,007,734 | |
Payable for Portfolio shares redeemed | | | 1,310 | |
Payable for short sales | | | 57,627 | |
Written options outstanding | | | 238 | |
Dividends payable | | | 18 | |
Accrued investment advisory fee | | | 207 | |
Accrued administration fee | | | 207 | |
Accrued distribution fee | | | 2 | |
Accrued servicing fee | | | 106 | |
Variation margin payable | | | 933 | |
Swap premiums received | | | 5,324 | |
Unrealized depreciation on foreign currency contracts | | | 239 | |
Unrealized depreciation on swap agreements | | | 3,124 | |
Other liabilities | | | 2,531 | |
| | | | 1,229,273 | |
| |
Net Assets | | $ | 998,680 | |
| |
Net Assets Consist of: | | | | |
Paid in capital | | $ | 1,073,947 | |
Undistributed net investment income | | | 9,102 | |
Accumulated undistributed net realized (loss) | | | (87,924 | ) |
Net unrealized appreciation | | | 3,555 | |
| | | $ | 998,680 | |
| |
Net Assets: | | | | |
Institutional Class | | $ | 46,629 | |
Administrative Class | | | 942,932 | |
Advisor Class | | | 9,119 | |
| |
Shares Issued and Outstanding: | | | | |
Institutional Class | | | 3,967 | |
Administrative Class | | | 80,217 | |
Advisor Class | | | 776 | |
| |
Net Asset Value and Redemption Price Per Share (Net Asset Per Share Outstanding) | | | | |
Institutional Class | | $ | 11.75 | |
Administrative Class | | | 11.75 | |
Advisor Class | | | 11.75 | |
| |
Cost of Investments Owned | | $ | 2,084,650 | |
Cost of Foreign Currency Held | | $ | 8,225 | |
Proceeds Received on Short Sales | | $ | 56,863 | |
Premiums Received on Written Options | | $ | 387 | |
| | | | |
| 6 | | PIMCO Variable Insurance Trust | | See Accompanying Notes |
Statement of Operations Real Return Portfolio
| | | | |
| (Amounts in thousands) | | Six Months Ended
June 30, 2007 | |
| | | (Unaudited) | |
| |
| Investment Income: | | | | |
Interest | | $ | 28,500 | |
Miscellaneous income | | | 32 | |
Total Income | | | 28,532 | |
| |
Expenses: | | | | |
Investment advisory fees | | | 1,318 | |
Administration fees | | | 1,318 | |
Servicing fees – Administrative Class | | | 753 | |
Distribution and/or servicing fees – Advisor Class | | | 7 | |
Trustees’ fees | | | 10 | |
Total Expenses | | | 3,406 | |
| |
Net Investment Income | | | 25,126 | |
| |
Net Realized and Unrealized Gain (Loss): | | | | |
Net realized (loss) on investments | | | (40,473 | ) |
Net realized gain on futures contracts, written options and swaps | | | 84 | |
Net realized (loss) on foreign currency transactions | | | (743 | ) |
Net change in unrealized appreciation on investments | | | 30,216 | |
Net change in unrealized (depreciation) on futures contracts, written options and swaps | | | (2,279 | ) |
Net change in unrealized appreciation on translation of assets and liabilities denominated in foreign currencies | | | 321 | |
Net (Loss) | | | (12,874 | ) |
| |
Net Increase in Net Assets Resulting from Operations | | $ | 12,252 | |
| | | | | | |
| See Accompanying Notes | | Semiannual Report | | June 30, 2007 | | 7 |
Statements of Changes in Net Assets Real Return Portfolio
| | | | | | | | |
| (Amounts in thousands) | | Six Months Ended
June 30, 2007 | | | Year Ended
December 31, 2006 | |
| | | (Unaudited) | | | | |
| | |
| Increase (Decrease) in Net Assets from: | | | | | | | | |
| | |
Operations: | | | | | | | | |
Net investment income | | $ | 25,126 | | | $ | 47,440 | |
Net realized (loss) | | | (41,132 | ) | | | (12,066 | ) |
Net change in unrealized appreciation (depreciation) | | | 28,258 | | | | (27,331 | ) |
Net increase resulting from operations | | | 12,252 | | | | 8,043 | |
| | |
Distributions to Shareholders: | | | | | | | | |
From net investment income | | | | | | | | |
Institutional Class | | | (1,137 | ) | | | (1,932 | ) |
Administrative Class | | | (24,024 | ) | | | (45,759 | ) |
Advisor Class | | | (119 | ) | | | (41 | ) |
From net realized capital gains | | | | | | | | |
Institutional Class | | | 0 | | | | (1,205 | ) |
Administrative Class | | | 0 | | | | (28,225 | ) |
Advisor Class | | | 0 | | | | (68 | ) |
| | |
Total Distributions | | | (25,280 | ) | | | (77,230 | ) |
| | |
Portfolio Share Transactions: | | | | | | | | |
Receipts for shares sold | | | | | | | | |
Institutional Class | | | 3,580 | | | | 7,837 | |
Administrative Class | | | 166,885 | | | | 367,822 | |
Advisor Class | | | 6,796 | | | | 3,086 | |
Issued as reinvestment of distributions | | | | | | | | |
Institutional Class | | | 1,137 | | | | 3,137 | |
Administrative Class | | | 23,367 | | | | 73,676 | |
Advisor Class | | | 119 | | | | 109 | |
Cost of shares redeemed | | | | | | | | |
Institutional Class | | | (3,266 | ) | | | (6,951 | ) |
Administrative Class | | | (268,783 | ) | | | (353,626 | ) |
Advisor Class | | | (329 | ) | | | (402 | ) |
Net increase (decrease) resulting from Portfolio share transactions | | | (70,494 | ) | | | 94,688 | |
| | |
Total Increase (Decrease) in Net Assets | | | (83,522 | ) | | | 25,501 | |
| | |
Net Assets: | | | | | | | | |
Beginning of period | | | 1,082,202 | | | | 1,056,701 | |
End of period* | | $ | 998,680 | | | $ | 1,082,202 | |
| | |
*Including undistributed net investment income of: | | $ | 9,102 | | | $ | 9,256 | |
| | | | |
| 8 | | PIMCO Variable Insurance Trust | | See Accompanying Notes |
| | |
| |
| Schedule of Investments Real Return Portfolio | | June 30, 2007 (Unaudited) |
| | | | | | | | |
| | | | | PRINCIPAL
AMOUNT
(000S) | | | | VALUE
(000S) |
| BANK LOAN OBLIGATIONS 0.3% |
| Georgia-Pacific Corp. | | | | | | | | |
7.110% due 12/20/2012 | | $ | | 988 | | $ | | 991 |
| |
| OAO Rosneft Oil Co. |
6.000% due 09/16/2007 | | | | 1,600 | | | | 1,602 |
| | | | | | | | |
Total Bank Loan Obligations
(Cost $2,586) | | 2,593 |
| | | | | | | | |
|
| CORPORATE BONDS & NOTES 13.2% |
|
| BANKING & FINANCE 11.0% |
| American Express Centurion Bank |
5.320% due 05/07/2008 | | | | 500 | | | | 500 |
| |
| American International Group, Inc. |
5.360% due 06/23/2008 | | | | 1,200 | | | | 1,200 |
| |
| Atlantic & Western Re Ltd. |
11.599% due 01/09/2009 | | | | 900 | | | | 908 |
| |
| Bank of America Corp. |
5.366% due 11/06/2009 | | | | 900 | | | | 900 |
5.510% due 02/17/2009 | | | | 5,400 | | | | 5,414 |
| |
| Bank of America N.A. |
5.360% due 12/18/2008 | | | | 5,400 | | | | 5,403 |
| |
| Bank of Ireland |
5.370% due 12/19/2008 | | | | 1,500 | | | | 1,502 |
5.410% due 12/18/2009 | | | | 1,000 | | | | 1,002 |
| |
| C10 Capital SPV Ltd. |
6.722% due 12/31/2049 | | | | 500 | | | | 488 |
| |
| Calabash Re II Ltd. |
16.260% due 01/08/2010 | | | | 250 | | | | 260 |
| |
| Charter One Bank N.A. |
5.405% due 04/24/2009 | | | | 8,400 | | | | 8,411 |
| |
| CIT Group, Inc. |
5.505% due 01/30/2009 | | | | 4,600 | | | | 4,594 |
| |
| Citigroup Funding, Inc. |
5.320% due 04/23/2009 | | | | 5,700 | | | | 5,703 |
| |
| Citigroup, Inc. |
5.390% due 12/28/2009 | | | | 3,900 | | | | 3,903 |
5.395% due 01/30/2009 | | | | 1,000 | | | | 1,001 |
5.400% due 12/26/2008 | | | | 4,900 | | | | 4,904 |
5.405% due 05/02/2008 | | | | 1,000 | | | | 1,001 |
| |
| Commonwealth Bank of Australia |
5.360% due 06/08/2009 | | | | 400 | | | | 400 |
| |
| Credit Agricole S.A. |
5.360% due 05/28/2009 | | | | 1,900 | | | | 1,901 |
| |
| DnB NORBank ASA |
5.425% due 10/13/2009 | | | | 1,100 | | | | 1,101 |
| |
| East Lane Re Ltd. |
12.355% due 05/06/2011 | | | | 300 | | | | 301 |
| |
| Export-Import Bank of Korea |
5.570% due 10/04/2011 | | | | 1,600 | | | | 1,602 |
| |
| Ford Motor Credit Co. |
7.250% due 10/25/2011 | | | | 1,200 | | | | 1,156 |
7.800% due 06/01/2012 | | | | 100 | | | | 98 |
| |
| Foundation Re II Ltd. |
12.110% due 11/26/2010 | | | | 800 | | | | 803 |
| |
| General Electric Capital Corp. |
5.355% due 10/24/2008 | | | | 800 | | | | 801 |
5.385% due 10/26/2009 | | | | 1,000 | | | | 1,001 |
5.400% due 03/04/2008 | | | | 2,800 | | | | 2,803 |
5.400% due 12/12/2008 | | | | 900 | | | | 901 |
| |
| General Motors Acceptance Corp. |
6.750% due 12/01/2014 | | | | 1,600 | | | | 1,534 |
| |
| Goldman Sachs Group, Inc. |
5.660% due 06/28/2010 | | | | 4,700 | | | | 4,730 |
| |
| | | | | | | | |
| | | | | PRINCIPAL
AMOUNT
(000S) | | | | VALUE
(000S) |
| HBOS Treasury Services PLC |
5.320% due 07/17/2008 | | $ | | 1,100 | | $ | | 1,101 |
| |
| HSBC Finance Corp. |
5.360% due 05/21/2008 | | | | 1,200 | | | | 1,201 |
5.415% due 10/21/2009 | | | | 1,900 | | | | 1,901 |
| |
| JPMorgan Chase & Co. |
5.370% due 06/26/2009 | | | | 700 | | | | 701 |
5.410% due 06/26/2009 | | | | 5,500 | | | | 5,508 |
| |
| Lehman Brothers Holdings, Inc. |
5.370% due 11/24/2008 | | | | 300 | | | | 300 |
| |
| Longpoint Re Ltd. |
10.609% due 05/08/2010 | | | | 1,100 | | | | 1,100 |
| |
| Merrill Lynch & Co., Inc. |
5.395% due 10/23/2008 | | | | 2,500 | | | | 2,504 |
| |
| Morgan Stanley |
5.360% due 11/21/2008 | | | | 1,000 | | | | 1,000 |
| |
| Mystic Re Ltd. |
14.360% due 12/05/2008 | | | | 600 | | | | 594 |
| |
| Phoenix Quake Ltd. |
7.800% due 07/03/2008 | | | | 500 | | | | 503 |
| |
| Phoenix Quake Wind I Ltd. |
7.800% due 07/03/2008 | | | | 2,000 | | | | 2,007 |
| |
| Rabobank Nederland |
5.376% due 01/15/2009 | | | | 800 | | | | 801 |
| |
| Redwood Capital IX Ltd. |
11.610% due 01/09/2008 | | | | 500 | | | | 504 |
12.110% due 01/09/2008 | | | | 500 | | | | 504 |
| |
| Royal Bank of Scotland Group PLC |
5.405% due 07/21/2008 | | | | 400 | | | | 400 |
| |
| Santander U.S. Debt S.A. Unipersonal |
5.370% due 09/21/2007 | | | | 400 | | | | 400 |
5.420% due 09/19/2008 | | | | 500 | | | | 501 |
5.420% due 11/20/2009 | | | | 2,700 | | | | 2,702 |
| |
| Shackleton Re Ltd. |
13.355% due 02/07/2008 | | | | 1,000 | | | | 1,015 |
| |
| Travelers Property Casualty Corp. |
3.750% due 03/15/2008 | | | | 100 | | | | 99 |
| |
| Unicredit Luxembourg Finance S.A. |
5.405% due 10/24/2008 | | | | 1,700 | | | | 1,701 |
| |
| Vita Capital II Ltd. |
6.249% due 01/01/2010 | | | | 300 | | | | 300 |
| |
| Vita Capital III Ltd. |
6.469% due 01/01/2012 | | | | 700 | | | | 701 |
| |
| VTB Capital S.A. for Vneshtorgbank |
5.955% due 08/01/2008 | | | | 1,700 | | | | 1,704 |
| |
| Wachovia Bank N.A. |
5.360% due 02/23/2009 | | | | 5,400 | | | | 5,403 |
5.430% due 12/02/2010 | | | | 2,400 | | | | 2,402 |
| |
| Westpac Banking Corp. |
5.280% due 06/06/2008 | | | | 5,400 | | | | 5,401 |
| |
| World Savings Bank FSB |
5.396% due 05/08/2009 | | | | 300 | | | | 300 |
5.410% due 06/20/2008 | | | | 300 | | | | 300 |
5.485% due 03/02/2009 | | | | 300 | | | | 301 |
| | | | | | | | |
| | | | | | | | 110,085 |
| | | | | | | | |
|
| INDUSTRIALS 1.1% |
| C8 Capital SPV Ltd. |
6.640% due 12/31/2049 | | | | 500 | | | | 493 |
| |
| CSC Holdings, Inc. |
7.875% due 12/15/2007 | | | | 600 | | | | 605 |
| |
| EchoStar DBS Corp. |
5.750% due 10/01/2008 | | | | 500 | | | | 500 |
7.000% due 10/01/2013 | | | | 5,000 | | | | 4,950 |
| |
| | | | | | | | |
| | | | | PRINCIPAL
AMOUNT
(000S) | | | | VALUE
(000S) |
| Pemex Project Funding Master Trust |
7.375% due 12/15/2014 | | $ | | 500 | | $ | | 546 |
8.625% due 02/01/2022 | | | | 200 | | | | 247 |
| |
| Royal Caribbean Cruises Ltd. |
7.000% due 10/15/2007 | | | | 200 | | | | 202 |
| |
| Wal-Mart Stores, Inc. |
5.260% due 06/16/2008 | | | | 3,200 | | | | 3,199 |
| | | | | | | | |
| | | | | | | | 10,742 |
| | | | | | | | |
|
| UTILITIES 1.1% |
| America Movil SAB de C.V. |
5.460% due 06/27/2008 | | | | 5,500 | | | | 5,501 |
| |
| AT&T, Inc. |
5.456% due 02/05/2010 | | | | 2,800 | | | | 2,805 |
| |
| Cleveland Electric Illuminating Co. |
6.860% due 10/01/2008 | | | | 100 | | | | 102 |
| |
| CMS Energy Corp. |
9.875% due 10/15/2007 | | | | 1,600 | | | | 1,623 |
| |
| Dominion Resources, Inc. |
5.540% due 11/14/2008 | | | | 300 | | | | 300 |
| |
| Embarq Corp. |
7.082% due 06/01/2016 | | | | 300 | | | | 302 |
| |
| NiSource Finance Corp. |
5.930% due 11/23/2009 | | | | 800 | | | | 802 |
| | | | | | | | |
| | | | | | | | 11,435 |
| | | | | | | | |
Total Corporate Bonds & Notes
(Cost $132,018) | | 132,262 |
| | | | | | | | |
|
| CONVERTIBLE BONDS & NOTES 0.4% |
| Chesapeake Energy Corp. |
2.500% due 05/15/2037 | | | | 3,750 | | | | 3,844 |
| | | | | | | | |
Total Convertible Bonds & Notes
(Cost $3,808) | | 3,844 |
| | | | | | | | |
|
| MUNICIPAL BONDS & NOTES 0.1% |
| Badger, Wisconsin Tobacco Asset Securitization Corporations Revenue Bonds, Series 2002 |
6.000% due 06/01/2017 | | | | 475 | | | | 509 |
| |
| New York City, New York Municipal Water Finance Authority Revenue Notes, Series 2006 |
6.265% due 12/15/2013 | | | | 130 | | | | 128 |
| |
| Rhode Island State Tobacco Settlement Financing Corporations Revenue Bonds, Series 2002 |
6.000% due 06/01/2023 | | | | 500 | | | | 529 |
| | | | | | | | |
Total Municipal Bonds & Notes
(Cost $1,016) | | 1,166 |
| | | | | | | | |
|
| U.S. GOVERNMENT AGENCIES 21.3% |
| Fannie Mae |
4.187% due 11/01/2034 | | | | 6,176 | | | | 6,125 |
4.541% due 07/01/2035 | | | | 740 | | | | 736 |
4.673% due 05/25/2035 | | | | 2,900 | | | | 2,863 |
4.682% due 01/01/2035 | | | | 680 | | | | 670 |
5.380% due 12/25/2036 | | | | 490 | | | | 489 |
5.470% due 08/25/2034 | | | | 450 | | | | 450 |
5.500% due 03/01/2034 - 08/01/2037 | | | | 117,293 | | | | 113,134 |
5.670% due 05/25/2042 | | | | 298 | | | | 299 |
5.950% due 02/25/2044 | | | | 1,053 | | | | 1,051 |
6.000% due 09/01/2035 - 07/01/2037 | | | | 14,538 | | | | 14,387 |
6.227% due 06/01/2043 - 09/01/2044 | | | | 10,458 | | | | 10,592 |
7.320% due 11/01/2024 | | | | 17 | | | | 17 |
| |
| | | | | | |
| See Accompanying Notes | | Semiannual Report | | June 30, 2007 | | 9 |
Schedule of Investments Real Return Portfolio (Cont.)
| | | | | | | | |
| | | | | PRINCIPAL
AMOUNT
(000S) | | | | VALUE
(000S) |
| Freddie Mac | | | | | | | | |
4.000% due 03/15/2023 - 10/15/2023 | | $ | | 957 | | $ | | 945 |
4.550% due 01/01/2034 | | | | 667 | | | | 659 |
5.000% due 02/15/2020 - 08/15/2020 | | | | 9,907 | | | | 9,748 |
5.470% due 07/15/2019 - 10/15/2020 | | | | 19,200 | | | | 19,183 |
5.500% due 05/15/2016 | | | | 7,567 | | | | 7,567 |
5.550% due 07/15/2037 | | | | 1,400 | | | | 1,400 |
5.580% due 08/25/2031 | | | | 182 | | | | 182 |
5.670% due 12/15/2030 | | | | 485 | | | | 486 |
6.227% due 10/25/2044 - 02/25/2045 | | | | 16,300 | | | | 16,404 |
| |
| Small Business Administration | | | | |
4.504% due 02/10/2014 | | | | 1,567 | | | | 1,497 |
4.880% due 11/01/2024 | | | | 3,464 | | | | 3,314 |
| | | | | | | | |
Total U.S. Government Agencies
(Cost $212,767) | | 212,198 |
| | | | | | | | |
|
| U.S. TREASURY OBLIGATIONS 100.1% |
| Treasury Inflation Protected Securities (b) | | |
0.875% due 04/15/2010 | | | | 46,039 | | | | 43,737 |
1.625% due 01/15/2015 | | | | 3,372 | | | | 3,135 |
1.875% due 07/15/2015 | | | | 105,075 | | | | 99,329 |
2.000% due 04/15/2012 | | | | 22,109 | | | | 21,465 |
2.000% due 01/15/2014 | | | | 82,621 | | | | 79,426 |
2.000% due 07/15/2014 | | | | 99,281 | | | | 95,333 |
2.000% due 01/15/2016 | | | | 4,500 | | | | 4,274 |
2.000% due 01/15/2026 | | | | 81,940 | | | | 74,245 |
2.375% due 04/15/2011 | | | | 28,981 | | | | 28,673 |
2.375% due 01/15/2025 | | | | 74,048 | | | | 71,225 |
2.375% due 01/15/2027 | | | | 24,616 | | | | 23,647 |
2.500% due 07/15/2016 | | | | 20,261 | | | | 20,041 |
3.000% due 07/15/2012 | | | | 107,896 | | | | 110,020 |
3.375% due 01/15/2012 | | | | 4,679 | | | | 4,831 |
3.375% due 04/15/2032 | | | | 1,872 | | | | 2,155 |
3.500% due 01/15/2011 | | | | 28,874 | | | | 29,716 |
3.625% due 01/15/2008 | | | | 1,285 | | | | 1,287 |
3.625% due 04/15/2028 | | | | 63,131 | | | | 73,158 |
3.875% due 01/15/2009 | | | | 71,163 | | | | 72,319 |
3.875% due 04/15/2029 | | | | 66,711 | | | | 80,564 |
4.250% due 01/15/2010 | | | | 48,693 | | | | 50,553 |
| |
| U.S. Treasury Bonds | | | | |
6.000% due 02/15/2026 | | | | 1,400 | | | | 1,529 |
6.625% due 02/15/2027 | | | | 1,300 | | | | 1,523 |
8.875% due 08/15/2017 | | | | 1,000 | | | | 1,296 |
| |
| U.S. Treasury Notes | | | | |
4.500% due 02/28/2011 | | | | 1,700 | | | | 1,677 |
4.875% due 04/30/2011 | | | | 4,600 | | | | 4,595 |
| | | | | | | | |
Total U.S. Treasury Obligations
(Cost $993,078) | | 999,753 |
| | | | | | | | |
|
| MORTGAGE-BACKED SECURITIES 6.5% |
| American Home Mortgage Investment Trust |
5.470% due 09/25/2035 | | | | 111 | | | | 111 |
| |
| Arkle Master Issuer PLC | | | | |
5.300% due 11/19/2007 | | | | 1,300 | | | | 1,300 |
| |
| Arran Residential Mortgages Funding PLC |
5.340% due 04/12/2036 | | | | 2,119 | | | | 2,119 |
| |
| Banc of America Funding Corp. | | | | |
4.614% due 02/20/2036 | | | | 3,244 | | | | 3,193 |
| |
| Banc of America Mortgage Securities, Inc. |
6.500% due 09/25/2033 | | | | 186 | | | | 186 |
| |
| Bear Stearns Commercial Mortgage Securities |
6.440% due 06/16/2030 | | | | 600 | | | | 603 |
| |
| Citigroup Commercial Mortgage Trust |
5.390% due 08/15/2021 | | | | 95 | | | | 95 |
| |
| | | | | | | | |
| | | | | PRINCIPAL
AMOUNT
(000S) | | | | VALUE
(000S) |
| Citigroup Mortgage Loan Trust, Inc. |
4.700% due 12/25/2035 | | $ | | 4,161 | | $ | | 4,087 |
4.900% due 12/25/2035 | | | | 219 | | | | 218 |
| |
| Countrywide Alternative Loan Trust |
5.390% due 07/25/2046 | | | | 326 | | | | 326 |
5.400% due 09/20/2046 | | | | 667 | | | | 668 |
5.500% due 02/20/2047 | | | | 1,349 | | | | 1,347 |
5.500% due 05/25/2047 | | | | 460 | | | | 461 |
5.600% due 12/25/2035 | | | | 105 | | | | 105 |
| |
| Countrywide Home Loan Mortgage Pass-Through Trust |
3.786% due 11/19/2033 | | | | 250 | | | | 241 |
5.660% due 06/25/2035 | | | | 687 | | | | 686 |
| |
| CS First Boston Mortgage Securities Corp. |
4.938% due 12/15/2040 | | | | 1,011 | | | | 1,003 |
| |
| Deutsche ALT-A Securities, Inc. Mortgage Loan Trust |
5.420% due 10/25/2036 | | | | 1,018 | | | | 1,019 |
| |
| First Horizon Alternative Mortgage Securities |
4.732% due 06/25/2034 | | | | 885 | | | | 874 |
| |
| GE Capital Commercial Mortgage Corp. |
4.229% due 12/10/2037 | | | | 7,248 | | | | 7,087 |
| |
| Greenpoint Mortgage Funding Trust |
5.400% due 10/25/2046 | | | | 695 | | | | 695 |
5.400% due 01/25/2047 | | | | 5,206 | | | | 5,209 |
5.540% due 06/25/2045 | | | | 1,099 | | | | 1,100 |
5.590% due 11/25/2045 | | | | 635 | | | | 636 |
| |
| GSR Mortgage Loan Trust |
4.538% due 09/25/2035 | | | | 2,321 | | | | 2,288 |
| |
| Harborview Mortgage Loan Trust |
5.540% due 05/19/2035 | | | | 285 | | | | 286 |
| |
| Impac Secured Assets CMN Owner Trust |
5.400% due 01/25/2037 | | | | 354 | | | | 354 |
| |
| Indymac Index Mortgage Loan Trust |
5.410% due 11/25/2046 | | | | 932 | | | | 933 |
5.420% due 01/25/2037 | | | | 672 | | | | 672 |
| |
| JPMorgan Mortgage Trust |
5.008% due 07/25/2035 | | | | 1,416 | | | | 1,398 |
| |
| MASTR Adjustable Rate Mortgages Trust |
3.786% due 11/21/2034 | | | | 700 | | | | 686 |
| |
| Mellon Residential Funding Corp. |
5.670% due 11/15/2031 | | | | 1,131 | | | | 1,133 |
5.760% due 12/15/2030 | | | | 940 | | | | 944 |
| |
| Merrill Lynch Floating Trust |
5.390% due 06/15/2022 | | | | 267 | | | | 267 |
| |
| Residential Accredit Loans, Inc. |
5.620% due 08/25/2035 | | | | 368 | | | | 369 |
| |
| Securitized Asset Sales, Inc. |
7.542% due 11/26/2023 | | | | 12 | | | | 12 |
| |
| Sequoia Mortgage Trust |
5.670% due 10/19/2026 | | | | 350 | | | | 350 |
| |
| Structured Adjustable Rate Mortgage Loan Trust |
4.580% due 02/25/2034 | | | | 693 | | | | 694 |
6.429% due 01/25/2035 | | | | 389 | | | | 391 |
| |
| Structured Asset Mortgage Investments, Inc. |
5.390% due 08/25/2036 | | | | 784 | | | | 785 |
5.510% due 06/25/2036 | | | | 343 | | | | 343 |
| |
| Structured Asset Securities Corp. |
5.329% due 10/25/2035 | | | | 693 | | | | 692 |
5.370% due 05/25/2036 | | | | 56 | | | | 56 |
| |
| TBW Mortgage-Backed Pass-Through Certificates |
5.420% due 09/25/2036 | | | | 138 | | | | 139 |
5.430% due 01/25/2037 | | | | 991 | | | | 992 |
| |
| Thornburg Mortgage Securities Trust |
5.430% due 04/25/2036 | | | | 90 | | | | 90 |
| | | | | | | | |
| | | | | PRINCIPAL
AMOUNT
(000S) | | | | VALUE
(000S) |
5.430% due 12/25/2036 | | $ | | 4,514 | | $ | | 4,514 |
5.440% due 08/25/2036 | | | | 2,225 | | | | 2,224 |
| |
| Wachovia Bank Commercial Mortgage Trust |
5.681% due 04/15/2034 | | | | 595 | | | | 596 |
| |
| Washington Mutual, Inc. |
5.580% due 11/25/2045 | | | | 551 | | | | 553 |
5.610% due 08/25/2045 | | | | 89 | | | | 89 |
5.610% due 10/25/2045 | | | | 3,593 | | | | 3,602 |
5.724% due 07/25/2046 | | | | 1,931 | | | | 1,939 |
5.759% due 01/25/2047 | | | | 1,946 | | | | 1,946 |
5.839% due 12/25/2046 | | | | 252 | | | | 253 |
6.029% due 02/25/2046 | | | | 469 | | | | 470 |
6.229% due 11/25/2042 | | | | 119 | | | | 120 |
6.529% due 11/25/2046 | | | | 285 | | | | 286 |
| |
| Wells Fargo Mortgage-Backed Securities Trust |
3.539% due 09/25/2034 | | | | 531 | | | | 517 |
4.110% due 06/25/2035 | | | | 788 | | | | 785 |
| | | | | | | | |
Total Mortgage-Backed Securities
(Cost $65,143) | | 65,137 |
| | | | | | | | |
|
| ASSET-BACKED SECURITIES 10.7% |
| Aames Mortgage Investment Trust | | |
5.380% due 04/25/2036 | | | | 71 | | | | 71 |
| |
| Accredited Mortgage Loan Trust |
5.480% due 09/25/2035 | | | | 216 | | | | 216 |
| |
| ACE Securities Corp. |
5.370% due 07/25/2036 | | | | 406 | | | | 406 |
5.370% due 12/25/2036 | | | | 301 | | | | 301 |
5.430% due 10/25/2035 | | | | 431 | | | | 431 |
| |
| Argent Securities, Inc. |
5.370% due 10/25/2036 | | | | 1,026 | | | | 1,026 |
5.390% due 04/25/2036 | | | | 365 | | | | 365 |
5.400% due 03/25/2036 | | | | 411 | | | | 412 |
| |
| Asset-Backed Funding Certificates |
5.380% due 11/25/2036 | | | | 142 | | | | 142 |
5.380% due 01/25/2037 | | | | 4,070 | | | | 4,072 |
5.670% due 06/25/2034 | | | | 1,169 | | | | 1,172 |
| |
| Asset-Backed Securities Corp. Home Equity |
5.370% due 11/25/2036 | | | | 114 | | | | 114 |
| |
| Bank One Issuance Trust |
5.430% due 12/15/2010 | | | | 600 | | | | 601 |
| |
| Bear Stearns Asset-Backed Securities, Inc. |
5.370% due 11/25/2036 | | | | 154 | | | | 154 |
5.400% due 12/25/2035 | | | | 130 | | | | 130 |
5.410% due 04/25/2036 | | | | 234 | | | | 234 |
5.520% due 09/25/2034 | | | | 422 | | | | 422 |
5.650% due 10/25/2032 | | | | 58 | | | | 58 |
5.650% due 01/25/2036 | | | | 141 | | | | 141 |
5.770% due 03/25/2043 | | | | 191 | | | | 191 |
| |
| Carrington Mortgage Loan Trust |
5.370% due 01/25/2037 | | | | 978 | | | | 979 |
| |
| Centex Home Equity |
5.370% due 06/25/2036 | | | | 1,123 | | | | 1,124 |
| |
| Chase Credit Card Master Trust |
5.430% due 10/15/2010 | | | | 500 | | | | 501 |
5.430% due 02/15/2011 | | | | 1,000 | | | | 1,002 |
5.440% due 02/15/2010 | | | | 300 | | | | 300 |
| |
| Chase Issuance Trust |
5.330% due 12/15/2010 | | | | 400 | | | | 400 |
| |
| Citibank Credit Card Issuance Trust |
5.456% due 01/15/2010 | | | | 1,505 | | | | 1,507 |
| |
| Citigroup Mortgage Loan Trust, Inc. |
5.370% due 11/25/2036 | | | | 373 | | | | 374 |
5.400% due 12/25/2035 | | | | 586 | | | | 586 |
| |
| Countrywide Asset-Backed Certificates |
5.350% due 01/25/2046 | | | | 1,188 | | | | 1,189 |
5.370% due 01/25/2037 | | | | 733 | | | | 733 |
| | | | |
| 10 | | PIMCO Variable Insurance Trust | | See Accompanying Notes |
| | |
| |
| | | June 30, 2007 (Unaudited) |
| | | | | | | | |
| | | | | PRINCIPAL
AMOUNT
(000S) | | | | VALUE
(000S) |
5.370% due 05/25/2037 | | $ | | 4,697 | | $ | | 4,699 |
5.380% due 09/25/2046 | | | | 425 | | | | 425 |
5.390% due 07/25/2036 | | | | 285 | | | | 285 |
5.390% due 09/25/2036 | | | | 316 | | | | 316 |
5.390% due 06/25/2037 | | | | 7,110 | | | | 7,114 |
5.430% due 10/25/2046 | | | | 1,031 | | | | 1,032 |
5.450% due 07/25/2036 | | | | 235 | | | | 236 |
| |
| Credit-Based Asset Servicing & Securitization LLC |
5.380% due 11/25/2036 | | | | 2,538 | | | | 2,540 |
| |
| Equity One Asset-Backed Securities, Inc. |
5.620% due 04/25/2034 | | | | 96 | | | | 96 |
| |
| First Franklin Mortgage Loan Asset-Backed Certificates |
5.350% due 07/25/2036 | | | | 2,846 | | | | 2,848 |
5.370% due 11/25/2036 | | | | 2,047 | | | | 2,048 |
5.370% due 12/25/2036 | | | | 214 | | | | 214 |
5.410% due 01/25/2036 | | | | 979 | | | | 980 |
| |
| Fremont Home Loan Trust |
5.370% due 10/25/2036 | | | | 139 | | | | 139 |
5.380% due 01/25/2037 | | | | 497 | | | | 497 |
5.490% due 01/25/2036 | | | | 194 | | | | 194 |
| |
| GSAMP Trust |
5.360% due 10/25/2046 | | | | 217 | | | | 217 |
5.390% due 10/25/2036 | | | | 110 | | | | 110 |
5.390% due 12/25/2036 | | | | 990 | | | | 990 |
5.430% due 11/25/2035 | | | | 190 | | | | 190 |
5.610% due 03/25/2034 | | | | 207 | | | | 207 |
| |
| GSR Mortgage Loan Trust |
5.420% due 11/25/2030 | | | | 315 | | | | 315 |
| |
| HFC Home Equity Loan Asset-Backed Certificates |
5.390% due 03/20/2036 | | | | 317 | | | | 317 |
| |
| Home Equity Asset Trust |
5.400% due 05/25/2036 | | | | 454 | | | | 454 |
5.430% due 02/25/2036 | | | | 173 | | | | 173 |
| |
| Honda Auto Receivables Owner Trust |
5.342% due 11/15/2007 | | | | 189 | | | | 190 |
| |
| HSI Asset Securitization Corp. Trust |
5.370% due 10/25/2036 | | | | 238 | | | | 238 |
5.370% due 12/25/2036 | | | | 5,130 | | | | 5,133 |
5.400% due 12/25/2035 | | | | 525 | | | | 526 |
| |
| Hyundai Auto Receivables Trust |
5.348% due 11/15/2007 | | | | 32 | | | | 32 |
| |
| Indymac Residential Asset-Backed Trust |
5.370% due 11/25/2036 | | | | 379 | | | | 379 |
5.380% due 04/25/2037 | | | | 2,842 | | | | 2,843 |
5.420% due 03/25/2036 | | | | 249 | | | | 249 |
| |
| JPMorgan Mortgage Acquisition Corp. |
5.360% due 08/25/2036 | | | | 177 | | | | 177 |
5.370% due 07/25/2036 | | | | 363 | | | | 363 |
5.370% due 08/25/2036 | | | | 912 | | | | 912 |
5.370% due 10/25/2036 | | | | 2,698 | | | | 2,695 |
5.390% due 11/25/2036 | | | | 195 | | | | 195 |
5.530% due 06/25/2035 | | | | 23 | | | | 23 |
| |
| Lehman XS Trust |
5.390% due 05/25/2046 | | | | 418 | | | | 419 |
5.400% due 04/25/2046 | | | | 1,107 | | | | 1,107 |
5.400% due 07/25/2046 | | | | 759 | | | | 760 |
5.400% due 11/25/2046 | | | | 1,161 | | | | 1,162 |
| |
| Long Beach Mortgage Loan Trust |
5.350% due 06/25/2036 | | | | 68 | | | | 68 |
5.360% due 11/25/2036 | | | | 154 | | | | 154 |
5.380% due 05/25/2046 | | | | 99 | | | | 99 |
5.390% due 03/25/2036 | | | | 84 | | | | 84 |
5.400% due 02/25/2036 | | | | 164 | | | | 164 |
5.410% due 01/25/2036 | | | | 231 | | | | 231 |
5.500% due 08/25/2035 | | | | 180 | | | | 180 |
| |
| MASTR Asset-Backed Securities Trust |
5.380% due 10/25/2036 | | | | 34 | | | | 35 |
| | | | | | | | |
| | | | | PRINCIPAL
AMOUNT
(000S) | | | | VALUE
(000S) |
5.380% due 11/25/2036 | | $ | | 2,442 | | $ | | 2,444 |
5.400% due 01/25/2036 | | | | 487 | | | | 488 |
| |
| MBNA Credit Card Master Note Trust |
5.420% due 12/15/2011 | | | | 100 | | | | 100 |
5.501% due 09/15/2010 | | | | 200 | | | | 200 |
| |
| Merrill Lynch Mortgage Investors, Inc. |
5.350% due 06/25/2037 | | | | 321 | | | | 321 |
5.370% due 05/25/2037 | | | | 670 | | | | 670 |
5.390% due 08/25/2036 | | | | 2,928 | | | | 2,928 |
5.390% due 07/25/2037 | | | | 704 | | | | 705 |
5.400% due 01/25/2037 | | | | 102 | | | | 102 |
| |
| Morgan Stanley ABS Capital I |
5.350% due 06/25/2036 | | | | 39 | | | | 39 |
5.360% due 06/25/2036 | | | | 86 | | | | 86 |
5.360% due 07/25/2036 | | | | 2,608 | | | | 2,610 |
5.360% due 10/25/2036 | | | | 589 | | | | 590 |
5.370% due 09/25/2036 | | | | 563 | | | | 563 |
5.370% due 10/25/2036 | | | | 373 | | | | 373 |
5.400% due 12/25/2035 | | | | 16 | | | | 16 |
| |
| Morgan Stanley IXIS Real Estate Capital Trust |
5.370% due 11/25/2036 | | | | 145 | | | | 145 |
| |
| Nelnet Student Loan Trust |
5.325% due 10/27/2014 | | | | 81 | | | | 81 |
5.340% due 09/25/2012 | | | | 3,764 | | | | 3,766 |
5.445% due 07/25/2016 | | | | 386 | | | | 387 |
5.445% due 10/25/2016 | | | | 346 | | | | 346 |
| |
| Newcastle Mortgage Securities Trust |
5.390% due 03/25/2036 | | | | 260 | | | | 260 |
| |
| Nissan Auto Lease Trust |
5.347% due 12/14/2007 | | | | 9 | | | | 9 |
| |
| Nomura Asset Acceptance Corp. |
5.460% due 01/25/2036 | | | | 289 | | | | 290 |
| |
| Nomura Home Equity Loan, Inc. |
5.400% due 02/25/2036 | | | | 86 | | | | 86 |
| |
| Option One Mortgage Loan Trust |
5.360% due 02/25/2037 | | | | 71 | | | | 71 |
5.370% due 07/25/2036 | | | | 84 | | | | 84 |
5.420% due 11/25/2035 | | | | 147 | | | | 147 |
| |
| Park Place Securities, Inc. |
5.580% due 09/25/2035 | | | | 51 | | | | 52 |
| |
| Renaissance Home Equity Loan Trust |
5.700% due 12/25/2032 | | | | 81 | | | | 81 |
| |
| Residential Asset Mortgage Products, Inc. |
5.390% due 11/25/2036 | | | | 232 | | | | 232 |
5.400% due 01/25/2036 | | | | 60 | | | | 60 |
| |
| Residential Asset Securities Corp. |
5.360% due 06/25/2036 | | | | 2,188 | | | | 2,190 |
5.390% due 04/25/2036 | | | | 79 | | | | 79 |
5.390% due 11/25/2036 | | | | 1,914 | | | | 1,915 |
| |
| Residential Funding Mortgage Securities II, Inc. |
5.460% due 09/25/2035 | | | | 531 | | | | 532 |
| |
| Securitized Asset-Backed Receivables LLC Trust |
5.370% due 09/25/2036 | | | | 206 | | | | 206 |
5.380% due 12/25/2036 | | | | 9,622 | | | | 9,626 |
5.390% due 10/25/2035 | | | | 99 | | | | 99 |
| |
| SLM Student Loan Trust | | | | | | | | |
5.325% due 10/25/2012 | | | | 489 | | | | 489 |
5.325% due 07/25/2013 | | | | 550 | | | | 550 |
5.335% due 04/25/2012 | | | | 260 | | | | 260 |
| |
| Soundview Home Equity Loan Trust |
5.350% due 07/25/2036 | | | | 538 | | | | 538 |
5.370% due 10/25/2036 | | | | 831 | | | | 832 |
5.380% due 11/25/2036 | | | | 462 | | | | 462 |
5.390% due 03/25/2036 | | | | 47 | | | | 47 |
5.420% due 10/25/2036 | | | | 212 | | | | 212 |
5.550% due 06/25/2035 | | | | 72 | | | | 72 |
| |
| | | | | | | | | |
| | | | | PRINCIPAL
AMOUNT
(000S) | | | | VALUE
(000S) |
| Specialty Underwriting & Residential Finance |
5.350% due 06/25/2037 | | $ | | | 114 | | $ | | 114 |
5.365% due 11/25/2037 | | | | | 70 | | | | 70 |
| |
| Structured Asset Investment Loan Trust |
5.370% due 07/25/2036 | | | | | 113 | | | | 113 |
| |
| Structured Asset Securities Corp. |
4.900% due 04/25/2035 | | | | | 1,410 | | | | 1,406 |
5.370% due 10/25/2036 | | | | | 1,035 | | | | 1,035 |
5.400% due 11/25/2035 | | | | | 195 | | | | 196 |
5.450% due 12/25/2035 | | | | | 692 | | | | 692 |
| |
| Truman Capital Mortgage Loan Trust |
5.660% due 01/25/2034 | | | | | 33 | | | | 33 |
| |
| USAA Auto Owner Trust |
5.030% due 11/17/2008 | | | | | 72 | | | | 73 |
| |
| Wachovia Auto Owner Trust |
4.820% due 02/20/2009 | | | | | 662 | | | | 663 |
| |
| Washington Mutual Asset-Backed Certificates |
5.370% due 01/25/2037 | | | | | 874 | | | | 875 |
| |
| Wells Fargo Home Equity Trust |
5.370% due 01/25/2037 | | | | | 1,070 | | | | 1,071 |
| | | | | | | | | |
Total Asset-Backed Securities
(Cost $107,130) | | 107,190 |
| | | | | | | | | |
|
| SOVEREIGN ISSUES 0.0% |
| Colombia Government International Bond |
10.000% due 01/23/2012 | | | | | 350 | | | | 405 |
| | | | | | | | | |
Total Sovereign Issues (Cost $352) | | 405 |
| | | | | | | | | |
|
| FOREIGN CURRENCY-DENOMINATED ISSUES 1.2% |
| Canadian Government Bond |
3.000% due 12/01/2036 (b) | | CAD | | | 542 | | | | 610 |
| |
| France Government Bond |
3.000% due 07/25/2012 (b) | | EUR | | | 1,678 | | | | 2,335 |
| |
| Italy Buoni Poliennali Del Tesoro |
2.150% due 09/15/2014 (b) | | | | | 543 | | | | 717 |
| |
| Pylon Ltd. |
5.648% due 12/18/2008 | | | | | 700 | | | | 956 |
8.048% due 12/18/2008 | | | | | 1,100 | | | | 1,520 |
| |
| United Kingdom Gilt Inflation Linked Bond |
2.500% due 05/20/2009 | | GBP | | | 1,100 | | | | 5,679 |
| | | | | | | | | |
Total Foreign Currency-Denominated Issues (Cost $11,335) | | 11,817 |
| | | | | | | | | |
|
| SHORT-TERM INSTRUMENTS 55.4% |
| CERTIFICATES OF DEPOSIT 7.0% |
| Abbey National Treasury Services PLC |
5.270% due 07/02/2008 | | $ | | | 7,200 | | | | 7,203 |
| |
| BNP Paribas |
5.262% due 05/28/2008 | | | | | 5,400 | | | | 5,402 |
5.262% due 07/03/2008 | | | | | 8,200 | | | | 8,198 |
| |
| Calyon Financial, Inc. |
5.340% due 01/16/2009 | | | | | 1,800 | | | | 1,800 |
| |
| Fortis Bank NY |
5.265% due 06/30/2008 | | | | | 5,200 | | | | 5,202 |
| |
| HSBC Bank USA N.A. |
5.426% due 07/28/2008 | | | | | 1,100 | | | | 1,102 |
| |
| Nordea Bank Finland PLC |
5.267% due 03/31/2008 | | | | | 300 | | | | 300 |
5.308% due 05/28/2008 | | | | | 700 | | | | 701 |
| |
| Royal Bank of Canada |
5.267% due 06/30/2008 | | | | | 7,900 | | | | 7,907 |
| |
| | | | | | |
| See Accompanying Notes | | Semiannual Report | | June 30, 2007 | | 11 |
Schedule of Investments Real Return Portfolio (Cont.)
| | | | | | | | |
| | | | | PRINCIPAL
AMOUNT
(000S) | | | | VALUE
(000S) |
| Royal Bank of Scotland Group PLC |
5.265% due 03/26/2008 | | $ | | 5,700 | | $ | | 5,700 |
| |
| Skandinav Enskilda BK |
5.272% due 08/21/2008 | | | | 100 | | | | 100 |
5.340% due 08/21/2008 | | | | 5,600 | | | | 5,602 |
5.350% due 02/13/2009 | | | | 5,400 | | | | 5,404 |
| |
| Societe Generale NY |
5.270% due 03/26/2008 | | | | 5,700 | | | | 5,700 |
5.271% due 06/30/2008 | | | | 5,600 | | | | 5,602 |
| |
| Unicredito Italiano NY |
5.360% due 05/29/2008 | | | | 4,200 | | | | 4,202 |
| | | | | | | | |
| | | | | | | | 70,125 |
| | | | | | | | |
|
| COMMERCIAL PAPER 45.3% |
| Australia and New Zealand Banking Group Ltd. |
5.245% due 09/19/2007 | | | | 26,800 | | | | 26,480 |
| |
| Bank of Ireland |
5.230% due 11/08/2007 | | | | 1,300 | | | | 1,298 |
| |
| Barclays U.S. Funding Corp. |
5.235% due 09/26/2007 | | | | 27,800 | | | | 27,598 |
5.245% due 09/26/2007 | | | | 100 | | | | 99 |
5.250% due 09/26/2007 | | | | 2,000 | | | | 1,974 |
| |
| BNP Paribas Finance, Inc. |
5.330% due 10/23/2007 | | | | 10,600 | | | | 10,600 |
| |
| Calyon N.A. LLC |
5.175% due 06/29/2010 | | | | 31,200 | | | | 31,169 |
| |
| CBA (de) Finance |
5.225% due 09/28/2007 | | | | 4,100 | | | | 4,087 |
| |
| Cox Communications, Inc. |
5.570% due 09/17/2007 | | | | 1,100 | | | | 1,100 |
| |
| Danske Corp. |
5.205% due 10/12/2007 | | | | 300 | | | | 298 |
5.220% due 10/12/2007 | | | | 30,500 | | | | 30,465 |
| |
| | | | | | | | |
| | | | | PRINCIPAL
AMOUNT
(000S) | | | | VALUE
(000S) |
| Dexia Delaware LLC |
5.240% due 09/21/2007 | | $ | | 29,000 | | $ | | 28,662 |
| |
| DnB NORBank ASA |
5.225% due 10/12/2007 | | | | 3,900 | | | | 3,900 |
| |
| Fortis Funding LLC |
5.255% due 09/05/2007 | | | | 23,900 | | | | 23,844 |
5.275% due 09/05/2007 | | | | 600 | | | | 598 |
| |
| General Electric Capital Corp. |
5.200% due 11/06/2007 | | | | 2,500 | | | | 2,490 |
| |
| HBOS Treasury Services PLC |
5.225% due 11/13/2007 | | | | 500 | | | | 500 |
5.250% due 09/21/2007 | | | | 27,700 | | | | 27,365 |
| |
| Intesa Funding LLC |
5.320% due 09/05/2007 | | | | 20,000 | | | | 19,988 |
| |
| Natixis S.A. |
5.250% due 09/21/2007 | | | | 2,400 | | | | 2,371 |
5.380% due 09/21/2007 | | | | 27,200 | | | | 27,200 |
| |
| Nordea N.A., Inc. |
5.308% due 04/09/2009 | | | | 2,300 | | | | 2,300 |
| |
| Rabobank USA Financial Corp. |
5.330% due 07/26/2007 | | | | 27,200 | | | | 27,200 |
| |
| Santander Hispano Finance Delaware |
5.250% due 09/26/2007 | | | | 18,800 | | | | 18,556 |
| |
| Societe Generale NY |
5.240% due 11/26/2007 | | | | 1,000 | | | | 988 |
5.245% due 11/26/2007 | | | | 17,300 | | | | 17,093 |
5.250% due 11/26/2007 | | | | 200 | | | | 197 |
| |
| Svenska Handelsbanken, Inc. |
5.185% due 10/09/2007 | | | | 22,500 | | | | 22,477 |
| |
| TotalFinaElf Capital S.A. |
5.340% due 07/02/2007 | | | | 27,200 | | | | 27,200 |
| |
| | | | | | | | | |
| | | | | PRINCIPAL
AMOUNT
(000S) | | | | VALUE
(000S) | |
| UBS Finance Delaware LLC | |
5.145% due 10/23/2007 | | $ | | 800 | | $ | | 797 | |
5.200% due 10/23/2007 | | | | 20,800 | | | | 20,463 | |
5.230% due 10/23/2007 | | | | 2,200 | | | | 2,165 | |
5.235% due 10/23/2007 | | | | 5,800 | | | | 5,742 | |
5.240% due 10/23/2007 | | | | 700 | | | | 690 | |
| | |
| Unicredito Italiano SpA | |
5.200% due 01/22/2008 | | | | 10,500 | | | | 10,319 | |
| | |
| Westpac Banking Corp. | |
5.195% due 11/05/2007 | | | | 22,400 | | | | 22,300 | |
5.230% due 11/05/2007 | | | | 600 | | | | 598 | |
5.240% due 11/05/2007 | | | | 1,100 | | | | 1,087 | |
| | | | | | | | | |
| | | | | | | | 452,258 | |
| | | | | | | | | |
| |
| TRI-PARTY REPURCHASE AGREEMENTS 0.3% | |
| State Street Bank and Trust Co. | |
4.900% due 07/02/2007 | | | | 3,467 | | | | 3,467 | |
| | | | | | | | | |
(Dated 06/29/2007. Collateralized by Freddie Mac 5.000% due 06/11/2009 valued at $3,539. Repurchase proceeds are $3,468.) | |
| |
| U.S. TREASURY BILLS 2.8% | |
4.575% due 08/30/2007 - 09/13/2007 (a)(c)(d)(f) | | | | 27,920 | | | | 27,666 | |
| | | | | | | | | |
Total Short-Term Instruments
(Cost $553,565) | | 553,516 | |
| | | | | | | | | |
| |
| PURCHASED OPTIONS (h) 0.2% | | 1,570 | |
(Cost $1,852) | | | | 1,570 | |
| |
| |
| Total Investments (e) 209.4% (Cost $2,084,650) | | | | $ | | 2,091,451 | |
| |
| Written Options (i) (0.0%) | | | | | | | | (238 | ) |
| (Premiums $387) | | | | | | | | | |
| |
| Other Assets and Liabilities (Net) (109.4%) | | (1,092,533 | ) |
| | | | | | | | | |
| Net Assets 100.0% | | | | | | $ | | 998,680 | |
| | | | | | | | | |
| |
Notes to Schedule of Investments (amounts in thousands*, except number of contracts):
* A zero balance may reflect actual amounts rounding to less than one thousand.
(a) Coupon represents a weighted average rate.
(b) Principal amount of security is adjusted for inflation.
(c) Securities with an aggregate market value of $2,476 have been pledged as collateral for swap and swaption contracts on June 30, 2007.
(d) Securities with an aggregate market value of $2,661 have been pledged as collateral for delayed-delivery securities on June 30, 2007.
(e) As of June 30, 2007, portfolio securities with an aggregate value of $30,875 were valued in good faith and pursuant to the guidelines established by the Board of Trustees.
(f) Securities with an aggregate market value of $2,406 have been segregated with the custodian to cover margin requirements for the following open futures contracts on June 30, 2007:
| | | | | | | | | | |
| Description | | Type | | Expiration
Month | | # of
Contracts | | Unrealized
Appreciation/
(Depreciation) | |
90-Day Euribor December Futures | | Long | | 12/2008 | | 21 | | $ | (8 | ) |
90-Day Euribor June Futures | | Long | | 06/2009 | | 21 | | | (5 | ) |
90-Day Euribor March Futures | | Long | | 03/2009 | | 21 | | | (7 | ) |
90-Day Euribor September Futures | | Long | | 09/2008 | | 21 | | | (8 | ) |
90-Day Eurodollar December Futures | | Short | | 12/2007 | | 28 | | | 38 | |
90-Day Eurodollar December Futures | | Long | | 12/2008 | | 12 | | | (6 | ) |
90-Day Eurodollar June Futures | | Short | | 06/2008 | | 35 | | | 38 | |
90-Day Eurodollar June Futures | | Long | | 06/2009 | | 35 | | | (17 | ) |
90-Day Eurodollar March Futures | | Short | | 03/2008 | | 28 | | | 34 | |
90-Day Eurodollar March Futures | | Long | | 03/2009 | | 12 | | | (6 | ) |
90-Day Eurodollar September Futures | | Short | | 09/2008 | | 49 | | | 49 | |
Japan Government 10-Year Bond September Futures | | Long | | 09/2007 | | 16 | | | 7 | |
U.S. Treasury 30-Year Bond September Futures | | Short | | 09/2007 | | 665 | | | 932 | |
U.S. Treasury 5-Year Note September Futures | | Short | | 09/2007 | | 214 | | | (105 | ) |
United Kingdom 90-Day LIBOR Sterling Interest Rate June Futures | | Long | | 06/2008 | | 550 | | | (944 | ) |
United Kingdom 90-Day LIBOR Sterling Interest Rate March Futures | | Long | | 03/2008 | | 448 | | | (845 | ) |
| | | | | | | | | | |
| | | | | | | | $ | (853 | ) |
| | | | | | | | | | |
| | | | |
| 12 | | PIMCO Variable Insurance Trust | | See Accompanying Notes |
| | |
| |
| | | June 30, 2007 (Unaudited) |
(g) Swap agreements outstanding on June 30, 2007:
Credit Default Swaps
| | | | | | | | | | | | | | | | |
| Counterparty | | Reference Entity | | Buy/Sell
Protection (1) | | (Pay)/Receive
Fixed Rate | | | Expiration
Date | | Notional
Amount | | Unrealized
Appreciation/
(Depreciation) | |
Barclays Bank PLC | | Panama Government International Bond 8.875% due 09/30/2027 | | Sell | | 0.300% | | | 12/20/2008 | | $ | 2,900 | | $ | 1 | |
Barclays Bank PLC | | Peru Government International Bond 8.750% due 11/21/2033 | | Sell | | 0.350% | | | 12/20/2008 | | | 1,500 | | | 1 | |
Barclays Bank PLC | | Russia Government International Bond 7.500% due 03/31/2030 | | Sell | | 0.330% | | | 12/20/2008 | | | 1,500 | | | 1 | |
Barclays Bank PLC | | Ukraine Government International Bond 7.650% due 06/11/2013 | | Sell | | 0.780% | | | 12/20/2008 | | | 1,500 | | | 6 | |
Citibank N.A. | | Glitnir Banki HF 6.330% due 07/28/2011 | | Buy | | (0.290% | ) | | 06/20/2012 | | | 1,100 | | | (1 | ) |
Credit Suisse First Boston | | Chesapeake Energy Corp. 6.875% due 01/15/2016 | | Sell | | 0.970% | | | 06/20/2012 | | | 300 | | | (3 | ) |
Credit Suisse First Boston | | Chesapeake Energy Corp. 6.875% due 01/15/2016 | | Sell | | 1.010% | | | 06/20/2012 | | | 300 | | | (3 | ) |
Credit Suisse First Boston | | Chesapeake Energy Corp. 6.875% due 01/15/2016 | | Sell | | 1.010% | | | 06/20/2012 | | | 1,100 | | | (11 | ) |
Credit Suisse First Boston | | Chesapeake Energy Corp. 6.875% due 01/15/2016 | | Sell | | 1.040% | | | 06/20/2012 | | | 200 | | | (2 | ) |
Deutsche Bank AG | | Indonesia Government International Bond 6.750% due 03/10/2014 | | Sell | | 0.510% | | | 12/20/2008 | | | 3,000 | | | 6 | |
Deutsche Bank AG | | Russia Government International Bond 7.500% due 03/31/2030 | | Sell | | 0.325% | | | 12/20/2008 | | | 1,400 | | | 1 | |
Deutsche Bank AG | | Ukraine Government International Bond 7.650% due 06/11/2013 | | Sell | | 0.790% | | | 12/20/2008 | | | 1,400 | | | 6 | |
Goldman Sachs & Co. | | General Motors Acceptance Corp. 6.875% due 08/28/2012 | | Sell | | 3.400% | | | 06/20/2011 | | | 700 | | | 37 | |
HSBC Bank USA | | Russia Government International Bond 7.500% due 03/31/2030 | | Sell | | 0.280% | | | 11/20/2007 | | | 1,000 | | | 0 | |
HSBC Bank USA | | Russia Government International Bond 7.500% due 03/31/2030 | | Sell | | 0.240% | | | 02/20/2008 | | | 2,000 | | | 2 | |
Lehman Brothers, Inc. | | Peru Government International Bond 9.125% due 02/21/2012 | | Sell | | 0.370% | | | 12/20/2008 | | | 1,400 | | | 2 | |
UBS Warburg LLC | | Ford Motor Credit Co. 7.000% due 10/01/2013 | | Sell | | 5.250% | | | 09/20/2007 | | | 1,300 | | | 16 | |
| | | | | | | | | | | | | | | | |
| | | | | | | | | | | | | | $ | 59 | |
| | | | | | | | | | | | | | | | |
(1) If the Portfolio is a seller of protection and a credit event occurs, as defined under the terms of that particular swap agreement, the Portfolio will pay to the buyer of the protection an amount up to the notional value of the swap and in certain instances, take delivery of the security. As a buyer of protection, the Portfolio will generally receive from the seller of protection an amount up to the notional amount of the swap if a credit event occurs.
Interest Rate Swaps
| | | | | | | | | | | | | | | |
| Counterparty | | Floating Rate Index | | Pay/Receive
Floating Rate | | Fixed
Rate | | Expiration
Date | | Notional Amount | | Unrealized
Appreciation/
(Depreciation) | |
Citibank N.A. | | 6-Month Australian Bank Bill | | Pay | | 6.500% | | 01/15/2010 | | AUD | 4,700 | | $ | (33 | ) |
Deutsche Bank AG | | 6-Month Australian Bank Bill | | Pay | | 6.500% | | 01/15/2010 | | | 18,700 | | | (126 | ) |
Deutsche Bank AG | | 6-Month Australian Bank Bill | | Pay | | 7.000% | | 06/15/2010 | | | 46,200 | | | (50 | ) |
JPMorgan Chase & Co. | | 6-Month Australian Bank Bill | | Pay | | 6.500% | | 01/15/2010 | | | 3,100 | | | (22 | ) |
Royal Bank of Canada | | 6-Month Australian Bank Bill | | Pay | | 6.500% | | 01/15/2010 | | | 1,900 | | | (12 | ) |
Royal Bank of Canada | | 3-Month Canadian Bank Bill | | Receive | | 5.500% | | 06/20/2017 | | CAD | 18,500 | | | 3 | |
Barclays Bank PLC | | 5-Year French CPI Ex Tobacco Daily Reference Index | | Pay | | 2.103% | | 10/15/2010 | | EUR | 2,500 | | | 41 | |
Barclays Bank PLC | | 5-Year French CPI Ex Tobacco Daily Reference Index | | Pay | | 1.948% | | 03/15/2012 | | | 600 | | | (15 | ) |
Barclays Bank PLC | | 5-Year French CPI Ex Tobacco Daily Reference Index | | Pay | | 1.960% | | 04/05/2012 | | | 300 | | | (3 | ) |
Barclays Bank PLC | | 5-Year French CPI Ex Tobacco Daily Reference Index | | Pay | | 1.980% | | 04/30/2012 | | | 900 | | | (10 | ) |
BNP Paribas Bank | | 5-Year French CPI Ex Tobacco Daily Reference Index | | Pay | | 2.090% | | 10/15/2010 | | | 2,500 | | | 30 | |
BNP Paribas Bank | | 5-Year French CPI Ex Tobacco Daily Reference Index | | Pay | | 1.983% | | 03/15/2012 | | | 1,900 | | | (16 | ) |
BNP Paribas Bank | | 5-Year French CPI Ex Tobacco Daily Reference Index | | Pay | | 2.150% | | 01/19/2016 | | | 15,000 | | | 120 | |
Goldman Sachs & Co. | | 5-Year French CPI Ex Tobacco Daily Reference Index | | Pay | | 1.976% | | 12/15/2011 | | | 5,100 | | | (15 | ) |
Goldman Sachs & Co. | | 5-Year French CPI Ex Tobacco Daily Reference Index | | Pay | | 1.995% | | 03/15/2012 | | | 9,200 | | | (51 | ) |
Goldman Sachs & Co. | | 5-Year French CPI Ex Tobacco Daily Reference Index | | Pay | | 1.960% | | 03/30/2012 | | | 700 | | | (6 | ) |
JPMorgan Chase & Co. | | 5-Year French CPI Ex Tobacco Daily Reference Index | | Pay | | 1.948% | | 03/15/2012 | | | 600 | | | (6 | ) |
JPMorgan Chase & Co. | | 5-Year French CPI Ex Tobacco Daily Reference Index | | Pay | | 1.958% | | 04/10/2012 | | | 3,800 | | | (40 | ) |
JPMorgan Chase & Co. | | 5-Year French CPI Ex Tobacco Daily Reference Index | | Pay | | 2.353% | | 10/15/2016 | | | 2,500 | | | 14 | |
Morgan Stanley | | 6-Month EUR-LIBOR | | Receive | | 4.000% | | 06/15/2017 | | | 6,800 | | | 657 | |
Royal Bank of Scotland Group PLC | | 5-Year French CPI Ex Tobacco Daily Reference Index | | Pay | | 1.955% | | 03/28/2012 | | | 2,100 | | | (20 | ) |
UBS Warburg LLC | | 5-Year French CPI Ex Tobacco Daily Reference Index | | Pay | | 2.146% | | 10/15/2010 | | | 3,700 | | | 56 | |
UBS Warburg LLC | | Eurostat Eurozone HICP Ex Tobacco Unrevised Series NSA Index | | Receive | | 2.275% | | 10/15/2016 | | | 2,700 | | | 9 | |
UBS Warburg LLC | | 5-Year French CPI Ex Tobacco Daily Reference Index | | Pay | | 2.350% | | 10/15/2016 | | | 2,700 | | | 10 | |
Barclays Bank PLC | | 6-Month GBP-LIBOR | | Pay | | 5.000% | | 06/15/2009 | | GBP | 19,700 | | | (731 | ) |
Barclays Bank PLC | | 6-Month GBP-LIBOR | | Receive | | 4.000% | | 12/15/2035 | | | 5,700 | | | 442 | |
Credit Suisse First Boston | | 6-Month GBP-LIBOR | | Pay | | 5.000% | | 09/15/2010 | | | 4,600 | | | (203 | ) |
Credit Suisse First Boston | | 6-Month GBP-LIBOR | | Receive | | 4.000% | | 12/15/2035 | | | 1,800 | | | 134 | |
Goldman Sachs & Co. | | 6-Month GBP-LIBOR | | Receive | | 5.000% | | 09/15/2015 | | | 4,300 | | | 413 | |
HSBC Bank USA | | 6-Month GBP-LIBOR | | Receive | | 4.250% | | 06/12/2036 | | | 2,500 | | | 635 | |
JPMorgan Chase & Co. | | 6-Month GBP-LIBOR | | Pay | | 5.000% | | 06/15/2008 | | | 5,000 | | | (85 | ) |
Royal Bank of Scotland Group PLC | | 6-Month GBP-LIBOR | | Pay | | 5.000% | | 09/15/2010 | | | 6,700 | | | (306 | ) |
UBS Warburg LLC | | United Kingdom RPI Index | | Pay | | 2.548% | | 11/14/2016 | | | 5,000 | | | (118 | ) |
Morgan Stanley | | 6-Month JPY-LIBOR | | Pay | | 1.000% | | 03/18/2009 | | JPY | 2,900,000 | | | (4 | ) |
Barclays Bank PLC | | 28-Day Mexico Interbank TIIE Banxico | | Pay | | 8.720% | | 09/05/2016 | | MXN | 17,000 | | | 66 | |
Barclays Bank PLC | | 28-Day Mexico Interbank TIIE Banxico | | Pay | | 8.330% | | 02/14/2017 | | | 11,100 | | | 18 | |
Citibank N.A. | | 28-Day Mexico Interbank TIIE Banxico | | Pay | | 8.170% | | 11/04/2016 | | | 136,400 | | | 44 | |
Goldman Sachs & Co. | | 28-Day Mexico Interbank TIIE Banxico | | Pay | | 8.170% | | 11/04/2016 | | | 15,300 | | | 11 | |
Merrill Lynch & Co., Inc. | | 28-Day Mexico Interbank TIIE Banxico | | Pay | | 8.170% | | 11/04/2016 | | | 52,900 | | | 28 | |
Morgan Stanley | | 28-Day Mexico Interbank TIIE Banxico | | Pay | | 8.170% | | 11/04/2016 | | | 20,900 | | | 5 | |
| | | | | | |
| See Accompanying Notes | | Semiannual Report | | June 30, 2007 | | 13 |
Schedule of Investments Real Return Portfolio (Cont.)
| | | | | | | | | | | | | | | |
| Counterparty | | Floating Rate Index | | Pay/Receive
Floating Rate | | Fixed
Rate | | Expiration
Date | | Notional
Amount | | Unrealized
Appreciation/
(Depreciation) | |
Bank of America | | 3-Month USD-LIBOR | | Pay | | 5.000% | | 06/20/2027 | | $ | 5,000 | | $ | (333 | ) |
Barclays Bank PLC | | 3-Month USD-LIBOR | | Pay | | 5.000% | | 12/19/2009 | | | 5,900 | | | (7 | ) |
Barclays Bank PLC | | 3-Month USD-LIBOR | | Pay | | 5.000% | | 12/19/2012 | | | 10,600 | | | 34 | |
Barclays Bank PLC | | 3-Month USD-LIBOR | | Receive | | 5.000% | | 12/19/2017 | | | 23,000 | | | (145 | ) |
Deutsche Bank AG | | 3-Month USD-LIBOR | | Pay | | 5.000% | | 12/19/2009 | | | 9,000 | | | 19 | |
Deutsche Bank AG | | 3-Month USD-LIBOR | | Pay | | 5.000% | | 12/19/2012 | | | 17,100 | | | 27 | |
Deutsche Bank AG | | 3-Month USD-LIBOR | | Receive | | 5.000% | | 12/20/2021 | | | 5,400 | | | 27 | |
Deutsche Bank AG | | 3-Month USD-LIBOR | | Receive | | 5.000% | | 12/20/2026 | | | 5,700 | | | 8 | |
Deutsche Bank AG | | 3-Month USD-LIBOR | | Pay | | 5.000% | | 12/19/2037 | | | 1,700 | | | 21 | |
Goldman Sachs & Co. | | 3-Month USD-LIBOR | | Pay | | 5.000% | | 12/19/2009 | | | 23,500 | | | (26 | ) |
Goldman Sachs & Co. | | 3-Month USD-LIBOR | | Receive | | 5.000% | | 06/20/2014 | | | 6,500 | | | 230 | |
JPMorgan Chase & Co. | | 3-Month USD-LIBOR | | Receive | | 5.000% | | 12/19/2017 | | | 2,900 | | | (7 | ) |
Lehman Brothers, Inc. | | 3-Month USD-LIBOR | | Pay | | 5.000% | | 12/19/2012 | | | 1,400 | | | 2 | |
Morgan Stanley | | 3-Month USD-LIBOR | | Pay | | 5.000% | | 06/20/2009 | | | 30,000 | | | (281 | ) |
Morgan Stanley | | 3-Month USD-LIBOR | | Receive | | 5.000% | | 12/19/2017 | | | 100 | | | (1 | ) |
Morgan Stanley | | 3-Month USD-LIBOR | | Pay | | 5.000% | | 12/19/2037 | | | 13,500 | | | 221 | |
Royal Bank of Scotland Group PLC | | 3-Month USD-LIBOR | | Pay | | 5.000% | | 12/19/2012 | | | 13,000 | | | 48 | |
Royal Bank of Scotland Group PLC | | 3-Month USD-LIBOR | | Receive | | 5.000% | | 12/19/2017 | | | 47,100 | | | (348 | ) |
Royal Bank of Scotland Group PLC | | 3-Month USD-LIBOR | | Pay | | 5.000% | | 12/19/2037 | | | 4,600 | | | 74 | |
UBS Warburg LLC | | 3-Month USD-LIBOR | | Pay | | 5.000% | | 06/18/2009 | | | 184,000 | | | (50 | ) |
UBS Warburg LLC | | 3-Month USD-LIBOR | | Receive | | 5.000% | | 12/19/2017 | | | 2,700 | | | (34 | ) |
| | | | | | | | | | | | | | | |
| | | | | | | | | | | | | $ | 343 | |
| | | | | | | | | | | | | | | |
(h) Purchased options outstanding on June 30, 2007:
Options on Exchange-Traded Futures Contracts
| | | | | | | | | | | | | |
| Description | | Exercise
Price | | Expiration
Date | | # of
Contracts | | Cost | | Value |
Call - CBOT U.S. Treasury 30-Year Bond September Futures | | $ | 118.000 | | 08/24/2007 | | 665 | | $ | 13 | | $ | 11 |
Put - CBOT U.S. Treasury 10-Year Note September Futures | | | 102.000 | | 08/24/2007 | | 294 | | | 5 | | | 18 |
| | | | | | | | | | | | | |
| | | | | | | | | $ | 18 | | $ | 29 |
| | | | | | | | | | | | | |
Interest Rate Swaptions
| | | | | | | | | | | | | | | | | | | |
| Description | | Counterparty | | Floating Rate Index | | Pay/Receive
Floating Rate | | Exercise
Rate | | Expiration
Date | | Notional
Amount | | Cost | | Value |
Call - OTC 2-Year Interest Rate Swap | | Royal Bank of Scotland Group PLC | | 3-Month USD-LIBOR | | Pay | | 4.750% | | 03/31/2008 | | $ | 43,000 | | $ | 241 | | $ | 53 |
Call - OTC 2-Year Interest Rate Swap | | Royal Bank of Scotland Group PLC | | 3-Month USD-LIBOR | | Pay | | 4.750% | | 09/26/2008 | | | 9,000 | | | 45 | | | 18 |
| | | | | | | | | | | | | | | | | | | |
| | | | | | | | | | | | | | | $ | 286 | | $ | 71 |
| | | | | | | | | | | | | | | | | | | |
Foreign Currency Options
| | | | | | | | | | | | | | |
| Description | | Exercise
Price | | Expiration
Date | | Notional
Amount | | Cost | | Value |
Call - OTC Euro versus U.S. dollar | | $ | 1.353 | | 06/26/2008 | | EUR | 4,600 | | $ | 145 | | $ | 169 |
Put - OTC Euro versus U.S. dollar | | | 1.353 | | 06/26/2008 | | | 4,600 | | | 145 | | | 118 |
Call - OTC U.S. dollar versus Japanese yen | | JPY | 118.150 | | 06/23/2008 | | $ | 21,800 | | | 574 | | | 564 |
Put - OTC U.S. dollar versus Japanese yen | | | 118.150 | | 06/23/2008 | | | 21,800 | | | 574 | | | 594 |
| | | | | | | | | | | | | | |
| | | | | | | | | | $ | 1,438 | | $ | 1,445 |
| | | | | | | | | | | | | | |
Options on Securities
| | | | | | | | | | | | | | |
| Description | | Strike
Price | | Expiration
Date | | Notional
Amount | | Cost | | Value |
Put - OTC Fannie Mae 5.500% due 07/01/2037 | | $ | 89.000 | | 07/05/2007 | | $ | 81,300 | | $ | 10 | | $ | 0 |
Put - OTC Treasury Inflation Protected Securities 1.875% due 07/15/2015 | | | 66.531 | | 09/19/2007 | | | 92,100 | | | 22 | | | 0 |
Put - OTC Treasury Inflation Protected Securities 3.875% due 01/15/2009 | | | 90.000 | | 09/19/2007 | | | 70,700 | | | 17 | | | 0 |
Put - OTC Treasury Inflation Protected Securities 2.375% due 01/15/2025 | | | 65.000 | | 07/23/2007 | | | 100,000 | | | 23 | | | 0 |
Put - OTC Treasury Inflation Protected Securities 3.000% due 07/15/2012 | | | 88.000 | | 07/23/2007 | | | 100,000 | | | 23 | | | 0 |
Put - OTC Treasury Inflation Protected Securities 3.625% due 04/15/2028 | | | 77.000 | | 08/27/2007 | | | 53,000 | | | 12 | | | 0 |
Put - OTC Treasury Inflation Protected Securities 3.875% due 04/15/2029 | | | 79.000 | | 08/27/2007 | | | 13,000 | | | 3 | | | 0 |
| | | | | | | | | | | | | | |
| | | | | | | | | | $ | 110 | | $ | 0 |
| | | | | | | | | | | | | | |
Straddle Options
| | | | | | | | | | | | | | | | |
| Description | | Counterparty | | Exercise
Price (2) | | Expiration
Date | | Notional
Amount | | Cost (2) | | Value |
Call & Put - OTC U.S. dollar versus Swiss franc Forward Delta Neutral Straddle | | JPMorgan Chase & Co. | | CHF | 0.000 | | 09/26/2007 | | $ | 5,800 | | $ | 0 | | $ | 10 |
Call & Put - OTC U.S. dollar versus Swiss franc Forward Delta Neutral Straddle | | Royal Bank of Scotland
Group PLC | | | 0.000 | | 09/26/2007 | | | 5,700 | | | 0 | | | 15 |
| | | | | | | | | | | | | | | | |
| | | | | | | | | | | | $ | 0 | | $ | 25 |
| | | | | | | | | | | | | | | | |
(2) Exercise price and final cost determined on a future date, based upon implied volatility parameters.
| | | | |
| 14 | | PIMCO Variable Insurance Trust | | See Accompanying Notes |
| | |
| |
| | | June 30, 2007 (Unaudited) |
(i) Written options outstanding on June 30, 2007:
Options on Exchange-Traded Futures Contracts
| | | | | | | | | | | | | |
| Description | | Exercise
Price | | Expiration
Date | | # of
Contracts | | Premium | | Value |
Call - CBOT U.S. Treasury 10-Year Note September Futures | | $ | 106.000 | | 08/24/2007 | | 112 | | $ | 29 | | $ | 68 |
Call - CBOT U.S. Treasury 10-Year Note September Futures | | | 109.000 | | 08/24/2007 | | 110 | | | 13 | | | 5 |
Call - CBOT U.S. Treasury 30-Year Bond September Futures | | | 109.000 | | 08/24/2007 | | 103 | | | 35 | | | 68 |
Put - CBOT U.S. Treasury 10-Year Note September Futures | | | 103.000 | | 08/24/2007 | | 112 | | | 31 | | | 12 |
| | | | | | | | | | | | | |
| | | | | | | | | $ | 108 | | $ | 153 |
| | | | | | | | | | | | | |
Interest Rate Swaptions
| | | | | | | | | | | | | | | | | | | |
| Description | | Counterparty | | Floating Rate Index | | Pay/Receive
Floating Rate | | Exercise
Rate | | Expiration
Date | | Notional
Amount | | Premium | | Value |
Call - OTC 5-Year Interest Rate Swap | | Royal Bank of Scotland Group PLC | | 3-Month USD-LIBOR | | Receive | | 4.950% | | 03/31/2008 | | $ | 19,000 | | $ | 234 | | $ | 65 |
Call - OTC 5-Year Interest Rate Swap | | Royal Bank of Scotland Group PLC | | 3-Month USD-LIBOR | | Receive | | 4.950% | | 09/26/2008 | | | 4,000 | | | 45 | | | 20 |
| | | | | | | | | | | | | | | | | | | |
| | | | | | | | | | | | | | | $ | 279 | | $ | 85 |
| | | | | | | | | | | | | | | | | | | |
(j) Short sales outstanding on June 30, 2007:
| | | | | | | | | | | | | |
| Description | | Coupon | | Maturity
Date | | Principal
Amount | | Proceeds | | Value (3) |
Treasury Inflation Protected Securities | | 1.875% | | 07/15/2013 | | $ | 11,966 | | $ | 11,427 | | $ | 11,483 |
Treasury Inflation Protected Securities | | 2.375% | | 01/15/2017 | | | 26,526 | | | 25,775 | | | 25,909 |
U.S. Treasury Notes | | 3.625% | | 05/15/2013 | | | 300 | | | 281 | | | 282 |
U.S. Treasury Notes | | 4.875% | | 08/15/2016 | | | 19,800 | | | 19,380 | | | 19,953 |
| | | | | | | | | | | | | |
| | | | | | | | | $ | 56,863 | | $ | 57,627 |
| | | | | | | | | | | | | |
(3) Market value includes $395 of interest payable on short sales.
(k) Foreign currency contracts outstanding on June 30, 2007:
| | | | | | | | | | | | | | | | | |
| Type | | Currency | | Principal
Amount
Covered by
Contract | | Settlement
Month | | Unrealized
Appreciation | | Unrealized
(Depreciation) | | | Net Unrealized
Appreciation/
(Depreciation) | |
Buy | | BRL | | 3,604 | | 10/2007 | | $ | 4 | | $ | (15 | ) | | $ | (11 | ) |
Sell | | CAD | | 1,247 | | 08/2007 | | | 0 | | | (5 | ) | | | (5 | ) |
Sell | | CHF | | 910 | | 09/2007 | | | 0 | | | 0 | | | | 0 | |
Buy | | CNY | | 92,519 | | 01/2008 | | | 62 | | | 0 | | | | 62 | |
Buy | | | | 92,514 | | 03/2008 | | | 0 | | | (66 | ) | | | (66 | ) |
Sell | | EUR | | 5,798 | | 07/2007 | | | 0 | | | (76 | ) | | | (76 | ) |
Sell | | GBP | | 6,409 | | 08/2007 | | | 0 | | | (68 | ) | | | (68 | ) |
Sell | | JPY | | 214,501 | | 07/2007 | | | 25 | | | 0 | | | | 25 | |
Buy | | KRW | | 148,200 | | 07/2007 | | | 1 | | | 0 | | | | 1 | |
Buy | | | | 1,571,959 | | 09/2007 | | | 8 | | | 0 | | | | 8 | |
Buy | | MXN | | 15,220 | | 09/2007 | | | 1 | | | (3 | ) | | | (2 | ) |
Buy | | | | 5,042 | | 03/2008 | | | 5 | | | 0 | | | | 5 | |
Buy | | PLN | | 5,528 | | 09/2007 | | | 38 | | | 0 | | | | 38 | |
Buy | | RUB | | 2,255 | | 12/2007 | | | 2 | | | 0 | | | | 2 | |
Buy | | | | 48,032 | | 01/2008 | | | 16 | | | 0 | | | | 16 | |
Buy | | SGD | | 2,610 | | 07/2007 | | | 7 | | | 0 | | | | 7 | |
Sell | | | | 1,578 | | 07/2007 | | | 0 | | | (6 | ) | | | (6 | ) |
Buy | | | | 245 | | 08/2007 | | | 1 | | | 0 | | | | 1 | |
Buy | | | | 2,599 | | 10/2007 | | | 9 | | | 0 | | | | 9 | |
| | | | | | | | | | | | | | | | | |
| | | | | | | | $ | 179 | | $ | (239 | ) | | $ | (60 | ) |
| | | | | | | | | | | | | | | | | |
| | | | | | |
| See Accompanying Notes | | Semiannual Report | | June 30, 2007 | | 15 |
Notes to Financial Statements
1. ORGANIZATION
The Real Return Portfolio (the “Portfolio”) is a series of the PIMCO Variable Insurance Trust (the “Trust”). The Trust is registered under the Investment Company Act of 1940 (the “Act”), as amended, as an open-end management investment company organized as a Delaware business trust on October 3, 1997. The Portfolio offers three classes of shares: Institutional, Administrative and Advisor. Information presented on these financial statements pertains to the Advisor Class of the Portfolio. Certain detailed financial information for the Institutional Class and Administrative Class is provided separately and is available upon request. The Trust is designed to be used as an investment vehicle by Separate Accounts of insurance companies that fund variable annuity contracts and variable life insurance policies and by qualified pension and retirement plans.
2. SIGNIFICANT ACCOUNTING POLICIES
The following is a summary of significant accounting policies consistently followed by the Portfolio in the preparation of its financial statements in conformity with accounting principles generally accepted in the United States of America (“GAAP”). The preparation of financial statements in accordance with GAAP requires management to make estimates and assumptions that affect the reported amounts and disclosures on the financial statements. Actual results could differ from those estimates.
(a) Security Valuation Portfolio securities are valued as of the close of regular trading (normally 4:00 p.m., Eastern Time) on each day that the New York Stock Exchange (“NYSE”) is open. Portfolio securities and other assets for which market quotes are readily available are stated at market value. Market value is generally determined on the basis of last reported sales prices, or if no sales are reported, based on quotes obtained from a quotation reporting system, established market makers, or pricing services. Fixed-income securities and non-exchange traded derivatives are normally valued on the basis of quotes obtained from brokers and dealers or pricing services. Prices obtained from independent pricing services use information provided by market makers or estimates of market values obtained from yield data relating to investments or securities with similar characteristics. Certain fixed income securities purchased on a delayed-delivery basis are marked to market daily until settlement at the forward settlement date. Short-term investments having a maturity of 60 days or less are generally valued at amortized cost. Exchange traded options, futures and options on futures are valued at the settlement price determined by the relevant exchange. With respect to any portion of the Portfolio’s assets that are invested in one or more open end management investment companies, the Portfolio’s net asset value (“NAV”) will be calculated based upon the NAVs of such investments.
Investments initially valued in currencies other than the U.S. dollar are converted to the U.S. dollar using exchange rates obtained from pricing services. As a result, the NAV of the Portfolio’s securities may be affected by changes in the value of currencies in relation to the U.S. dollar. The value of securities traded in markets outside the United States or denominated in currencies other than the U.S. dollar may be affected significantly on a day that the NYSE is closed and an investor is not able to purchase, redeem or exchange shares.
Securities and other assets for which market quotes are not readily available are valued at fair value as determined in good faith by the Board of Trustees or persons acting at their direction. The Board of Trustees has adopted methods for valuing securities and other assets in circumstances where market quotes are not readily available, and has delegated to Pacific Investment Management Company LLC (“PIMCO”) the responsibility for applying the valuation methods. In the event that market quotes are not readily available, and the security or asset cannot be valued pursuant to one of the valuation methods, the value of the security or asset will be determined in good faith by the Valuation Committee of the Board of Trustees, generally based upon recommendations provided by PIMCO.
Market quotes are considered not readily available in circumstances where there is an absence of current or reliable market-based data (e.g., trade information, bid/asked information, broker quotes), including where events occur after the close of the relevant market, but prior to the close of regular trading, that materially affect the values of the Portfolio’s securities or assets. In addition, market quotes are considered not readily available when, due to extraordinary circumstances, the exchanges or markets on which the securities trade, do not open for trading for the entire day and no other market prices are available. The Board has delegated to PIMCO the responsibility for monitoring significant events that may materially affect the values of the Portfolio’s securities or assets and for determining whether the value of the applicable securities or assets should be re-evaluated in light of such significant events.
When the Portfolio uses fair value pricing to determine its NAV, securities will not be priced on the basis of quotations from the primary market in which they are traded, but rather may be priced by another method that the Board of Trustees or persons acting at their direction believe accurately reflects fair value. The Trust’s policy is intended to result in a calculation of the Portfolio’s NAV that fairly reflects security values as of the time of pricing. However, fair values determined by the Board of Trustees or persons acting at their direction may not accurately reflect the price that the Portfolio could obtain for a security if it were to dispose of that security as of the time of pricing. Because foreign securities can trade on non-business days of the Portfolio, the NAV of the Portfolio may change on days when shareholders will not be able to purchase or redeem Portfolio shares. The prices used by the Portfolio may differ from the value that would be realized if the securities were sold and the differences could be material to the financial statements.
(b) Securities Transactions and Investment Income Securities transactions are recorded as of the trade date for financial reporting purposes. Securities purchased or sold on a when-issued or delayed-delivery basis may be settled a month or more after the trade date. Realized gains and losses from securities sold are recorded on the identified cost basis. Dividend income is recorded on the ex-dividend date, except certain dividends from foreign securities where the ex-dividend date may have passed, which are recorded as soon as the Portfolio is informed of the ex-dividend date. Interest income, adjusted for the accretion of discounts and amortization of premiums, is recorded on the accrual basis. Paydown gains and losses on mortgage-related and other asset-backed securities are recorded as components of interest income on the Statement of Operations.
(c) Delayed-Delivery Transactions The Portfolio may purchase or sell securities on a delayed-delivery basis. These transactions involve a commitment by the Portfolio to purchase or sell securities for a predetermined price or yield, with payment and delivery taking place beyond the customary settlement period. When delayed-delivery purchases are outstanding, the Portfolio will designate liquid assets in an amount sufficient to meet the purchase price. When purchasing a security on a delayed-delivery basis, the Portfolio assumes the rights and risks of ownership of the security, including the risk of price and yield fluctuations, and takes such fluctuations into account when determining its net asset value. The Portfolio may dispose of or renegotiate a delayed-delivery transaction after it is entered into, and may sell when-issued securities before they are delivered, which may result in a capital gain or loss. When the Portfolio has sold a security on a delayed-delivery basis, the Portfolio does not participate in future gains and losses with respect to the security.
(d) Dividends and Distributions to Shareholders Dividends from net investment income, if any, are declared daily and distributed to shareholders monthly. Net realized capital gains earned by the Portfolio, if any, will be distributed no less frequently than once each year.
Income dividends and capital gain distributions are determined in accordance with income tax regulations which may differ from GAAP. Differences between tax regulations and GAAP may change the fiscal year when income and capital items
| | | | |
| 16 | | PIMCO Variable Insurance Trust | | |
| | |
| |
| | | June 30, 2007 (Unaudited) |
are recognized for tax and GAAP purposes. Examples of events that give rise to timing differences include wash sales, straddles, net operating losses and capital loss carryforwards. Further, the character of investment income and capital gains may be different for certain transactions under the two methods of accounting. Examples of characterization differences include the treatment of mortgage paydowns, swaps, foreign currency transactions and contingent debt instruments. As a result, income dividends and capital gain distributions declared during a fiscal period may differ significantly from the net investment income and realized capital gain reported on the Portfolio’s annual financial statements presented under GAAP.
Distributions classified as a tax basis return of capital, if any, are reflected on the accompanying Statements of Changes in Net Assets and have been reclassified to paid in capital. In addition, other amounts have been reclassified between undistributed net investment income, accumulated undistributed net realized gains or losses and/or paid in capital to more appropriately conform financial accounting to tax characterizations of dividend distributions.
(e) Multiclass Operations Each class offered by the Portfolio has equal rights as to assets and voting privileges (except that shareholders of a class have exclusive voting rights regarding any matter relating solely to that class of shares). Income and non-class specific expenses of the Portfolio are allocated daily to each class of shares based on the relative value of settled shares. Realized and unrealized capital gains and losses of the Portfolio are allocated daily to each class of shares based on the relative net assets of each class. Class specific expenses, where applicable, currently include administrative, distribution and servicing fees.
(f) Foreign Currency The functional and reporting currency for the Portfolio is the U.S. dollar. The market values of foreign securities, currency holdings and other assets and liabilities are translated into U.S. dollars based on the current exchange rates each business day. Fluctuations in the value of currency holdings and other assets and liabilities resulting from changes in exchange rates are recorded as unrealized foreign currency gains or losses. Realized gains or losses and unrealized appreciation or depreciation on investment securities and income and expenses are translated on the respective dates of such transactions. The effects of changes in foreign currency exchange rates on investments in securities are not segregated on the Statement of Operations from the effects of changes in market prices of those securities, but are included with the net realized and unrealized gain or loss on investment securities.
| | | | | | |
|
| Non-U.S. currency symbols utilized throughout the report are defined as follows: |
| AUD | | Australian Dollar | | JPY | | Japanese Yen |
| BRL | | Brazilian Real | | KRW | | South Korean Won |
| CAD | | Canadian Dollar | | MXN | | Mexican Peso |
| CHF | | Swiss Franc | | PLN | | Polish Zloty |
| CNY | | Chinese Yuan Renminbi | | RUB | | Russian Ruble |
| EUR | | Euro | | SGD | | Singapore Dollar |
| GBP | | Great British Pound | | | | |
(g) Foreign Currency Transactions The Portfolio may enter into foreign currency contracts in connection with settling planned purchases or sales of securities, to hedge the currency exposure associated with some or all of the Portfolio’s securities or as a part of an investment strategy. A foreign currency contract is an agreement between two parties to buy and sell a currency at a set price on a future date. The market value of a foreign currency contract fluctuates with changes in foreign currency exchange rates. Foreign currency contracts are marked to market daily and the change in value is recorded by the Portfolio as an
unrealized gain or loss. Realized gains or losses equal to the difference between the value of the contract at the time it was opened and the value at the time it was closed are recorded upon delivery or receipt of the currency. These contracts may involve market risk in excess of the unrealized gain or loss reflected on the Statement of Assets and Liabilities. In addition, the Portfolio could be exposed to risk if the counterparties are unable to meet the terms of the contracts or if the value of the currency changes unfavorably to the U.S. dollar.
(h) Futures Contracts The Portfolio may enter into futures contracts. The Portfolio may use futures contracts to manage its exposure to the securities markets or to movements in interest rates and currency values. The primary risks associated with the use of futures contracts are the imperfect correlation between the change in market value of the securities held by the Portfolio and the prices of futures contracts, the possibility of an illiquid market, and the inability of the counterparty to meet the terms of the contract. Futures contracts are valued based upon their quoted daily settlement prices. Upon entering into a futures contract, the Portfolio is required to deposit with its futures broker, an amount of cash or U.S. Government and Agency Obligations in accordance with the initial margin requirements of the broker or exchange. Futures contracts are marked to market daily and an appropriate payable or receivable for the change in value (“variation margin”) is recorded by the Portfolio. Gains or losses are recognized but not considered realized until the contracts expire or are closed. Futures contracts involve, to varying degrees, risk of loss in excess of the variation margin disclosed on the Statement of Assets and Liabilities.
(i) Inflation-Indexed Bonds The Portfolio may invest in inflation-indexed bonds. Inflation-indexed bonds are fixed-income securities whose principal value is periodically adjusted to the rate of inflation. The interest rate on these bonds is generally fixed at issuance at a rate lower than typical bonds. Over the life of an inflation-indexed bond, however, interest will be paid based on a principal value, which is adjusted for inflation. Any increase in the principal amount of an inflation-indexed bond will be included as interest income on the Statement of Operations, even though investors do not receive their principal until maturity.
(j) Options Contracts The Portfolio may write call and put options on futures, swaps, securities or currencies it owns or in which it may invest. Writing put options tends to increase the Portfolio’s exposure to the underlying instrument. Writing call options tends to decrease the Portfolio’s exposure to the underlying instrument. When the Portfolio writes a call or put option, an amount equal to the premium received is recorded as a liability and subsequently marked to market to reflect the current value of the option written. These liabilities are reflected as written options outstanding on the Statement of Assets and Liabilities. Certain options may be written with premiums to be determined on a future date. The premiums for these options are based upon implied volatility parameters at specified terms. Premiums received from writing options which expire are treated as realized gains. Premiums received from writing options which are exercised or closed are added to the proceeds or offset against amounts paid on the underlying future, swap, security or currency transaction to determine the realized gain or loss. The Portfolio as a writer of an option has no control over whether the underlying future, swap, security or currency may be sold (call) or purchased (put) and as a result bears the market risk of an unfavorable change in the price of the future, swap, security or currency underlying the written option. There is the risk the Portfolio may not be able to enter into a closing transaction because of an illiquid market.
The Portfolio may also purchase put and call options. Purchasing call options tends to increase the Portfolio’s exposure to the underlying instrument. Purchasing put options tends to decrease the Portfolio’s exposure to the underlying instrument. The Portfolio pays a premium which is included on the Statement of Assets and Liabilities as an investment and subsequently marked to market to reflect the current value of the option. Premiums paid for purchasing options which expire are
| | | | | | |
| | Semiannual Report | | June 30, 2007 | | 17 |
Notes to Financial Statements (Cont.)
treated as realized losses. Certain options may be purchased with premiums to be determined on a future date. The premiums for these options are based upon implied volatility parameters at specified terms. The risk associated with purchasing put and call options is limited to the premium paid. Premiums paid for purchasing options which are exercised or closed are added to the amounts paid or offset against the proceeds on the underlying future, swap, security or currency transaction to determine the realized gain or loss.
(k) Repurchase Agreements The Portfolio may engage in repurchase transactions. Under the terms of a typical repurchase agreement, the Portfolio takes possession of an underlying debt obligation (collateral) subject to an obligation of the seller to repurchase, and the Portfolio to resell, the obligation at an agreed-upon price and time. The underlying securities for all repurchase agreements are held in safekeeping at the Portfolio’s custodian or designated subcustodians under tri-party repurchase agreements. The market value of the collateral must be equal to or exceed the total amount of the repurchase obligations, including interest. Securities purchased under repurchase agreements are reflected as an asset on the Statement of Assets and Liabilities. Generally, in the event of counterparty default, the Portfolio has the right to use the collateral to offset losses incurred. If the counterparty should default, the Portfolio will seek to sell the securities which it holds as collateral. This could involve procedural costs or delays in addition to a loss on the securities if their value should fall below their repurchase price.
(l) Inverse Floating Rate Transactions—Residual Interest Municipal Bonds (“RIBs”)/Residual Interest Tax Exempt Bonds (“RITEs”) The Portfolio may invest in RIBs and RITEs (“Inverse Floaters”). Inverse Floaters are created via a master trust agreement between a broker-dealer, acting as trustor and liquidity provider, and an investment bank, acting as trustee and tender agent. The master trust agreement defines the terms for each trust series; with each series being established by the transfer of long-term, fixed-rate municipal bonds (“Fixed Rate Bonds”) to the trustee to be held and provide for the creation, execution and delivery of floater certificates (“Floating Rate Notes”) and Inverse Floaters. Floating Rate Notes are liquid notes that are issued with a short-term variable rate typically linked to the LIBOR, subject to limitations, for some duration. After interest income is paid on the Floating Rate Notes at current rates, the residual income from the Fixed Rate Bonds is paid to the Inverse Floaters. Inverse Floaters are issued with a coupon that fluctuates inversely with the Floating Rate Notes’ referenced rate, subject to certain limitations. Therefore, rising short-term rates result in lower income for the Inverse Floaters and vice versa.
Floating Rate Notes are generally remarketed to municipal money market funds. Inverse Floaters are acquired by either tax-exempt municipal bond funds or trusts, or other parties interested in potentially higher yielding tax-exempt securities. Inverse Floaters may also be acquired for the purpose of increasing leverage. Floating Rate Note holders typically have the option to tender their notes to the liquidity provider for redemption at par at each reset date. The Inverse Floater holders have the option to (i) require the Floating Rate Note holders to tender their notes at par, and (ii) require the liquidity provider to transfer the Fixed Rate Bonds to the Inverse Floater holders. The holders of Inverse Floaters bear substantially all of the downside investment risk associated with the underlying Fixed Rate Bonds, and also benefit from a disproportionate amount of the potential appreciation of the underlying Fixed Rate Bonds’ value. Inverse Floaters may be more volatile and less liquid than other municipal bonds of comparable maturity.
Inverse Floaters may be acquired with or without first transferring to the trustor the Fixed Rate Bonds that were utilized to create the trust series. Inverse Floaters acquired without a transfer of Fixed Rate Bonds are recognized as purchases of securities as outlined in Note 2(b). Statement of Financial Accounting Standards No. 140—Accounting for Transfers and Servicing of Financial Assets and Extinguishments of Liabilities (“FAS No. 140”), governs the standards for
accounting for securitizations and other transfers of financial assets. If there is a transfer of Fixed Rate Bonds and it meets sale criteria under FAS No. 140, a Portfolio records a sale of the Fixed Rate Bonds and a purchase of the Inverse Floaters. The cash received from the Inverse Floaters is then recorded as interest income in the Statement of Operations.
If the transfer of Fixed Rate Bonds does not meet sale criteria under FAS No. 140, a Portfolio accounts for the transaction described above as a secured borrowing by including the Fixed Rate Bonds in its Schedule of Investments, and recording the Floating Rate Notes as a liability under the caption “Payable for floating rate notes” in the Portfolio’s Statement of Assets and Liabilities. In a secured borrowing transaction, cash received from the Inverse Floaters is not recorded as interest income. Instead, a Portfolio records interest income related to the Fixed Rate Bonds and interest expense related to the Floating Rate Notes, the net of which is equal to the cash received from the Inverse Floaters acquired by the Portfolio. Thus, while a Portfolio’s reported total income, net expenses, and net expense ratio are generally higher for investments in Inverse Floaters acquired via a secured borrowing, the method of acquiring Inverse Floaters does not result in differences for reported cash flows, net asset value or total return.
(m) Short Sales The Portfolio may enter into short sales transactions. A short sale is a transaction in which the Portfolio sells securities it does not own in anticipation of a decline in the market price of the securities. Securities sold in short sale transactions and interest payable on such securities, if any, are reflected as a liability on the Statement of Assets and Liabilities. The Portfolio is obligated to deliver securities at the market price at the time the short position is closed. Possible losses from short sales may be unlimited, whereas losses from purchases cannot exceed the total amount invested.
(n) Swap Agreements The Portfolio may invest in swap agreements. Swap transactions are privately negotiated agreements between the Portfolio and a counterparty to exchange or swap investment cash flows, assets, or market-linked returns at specified, future intervals. The Portfolio may enter into interest rate, total return, forward spread-lock, credit default, and other forms of swap agreements to manage its exposure to interest rates and credit risk. In connection with these agreements, securities may be identified as collateral in accordance with the terms of the respective swap agreements.
Interest rate swap agreements involve the exchange by the Portfolio with another party of their respective commitments to pay or receive interest, e.g., an exchange of floating rate payments for fixed rate payments with respect to the notional amount of principal. Certain forms of interest rate swap agreements may include: (i) interest rate caps, under which, in return for a premium, one party agrees to make payments to the other to the extent that interest rates exceed a specified rate, or “cap”, (ii) interest rate floors, under which, in return for a premium, one party agrees to make payments to the other to the extent that interest rates fall below a specified rate, or “floor”, or (iii) interest rate collars, under which a party sells a cap and purchases a floor or vice versa in an attempt to protect itself against interest rate movements exceeding given minimum or maximum levels.
Total return swap agreements involve commitments to pay interest in exchange for a market-linked return, both based on notional amounts. To the extent the total return of the security or index underlying the transaction exceeds or falls short of the offsetting interest rate obligation, the Portfolio will receive a payment from or make a payment to the counterparty.
Forward spread-lock swap agreements involve commitments to pay or receive a settlement amount calculated as the difference between the swap spread and a fixed spread, multiplied by the notional amount times the duration of the swap. The swap spread is the difference between the benchmark swap rate (market rate) and the specific Treasury rate.
| | | | |
| 18 | | PIMCO Variable Insurance Trust | | |
| | |
| |
| | | June 30, 2007 (Unaudited) |
Credit default swap agreements involve one party making a stream of payments to another party in exchange for the right to receive a specified return in the event of a default by a third party, typically corporate issues or sovereign issues of an emerging country, on its obligation. The Portfolio may use credit default swaps to provide a measure of protection against defaults of the issuers (i.e., to reduce risk where the Portfolio owns or has exposure to the sovereign issuer) or to take an active long or short position with respect to the likelihood of a particular issuer’s default. As a seller of protection, the Portfolio generally receives an upfront payment or a fixed rate of income throughout the term of the swap provided that there is no credit event. If the Portfolio is a seller of protection and a credit event occurs, as defined under the terms of that particular swap agreement, the Portfolio will pay to the buyer of the protection an amount up to the notional value of the swap and in certain instances take delivery of the security. As the seller, the Portfolio would effectively add leverage to its portfolio because, in addition to its total net assets, the Portfolio would be subject to investment exposure on the notional amount of the swap. As a buyer of protection, the Portfolio generally receives an amount up to the notional value of the swap if a credit event occurs. The treatment of credit default swaps and other swap agreements that provide for contingent, non-periodic, bullet-type payments as “notional principal contracts” for U.S. federal income tax purposes is uncertain. Were the U.S. Internal Revenue Service (“IRS”) to take the position that a credit default swap or other bullet-type swap is not a “notional principal contract” for U.S. federal income tax purposes, payments received by the Portfolio from such investments might be subject to U.S. excise or income taxes.
Swaps are marked to market daily based upon quotations from market makers and the change in value, if any, is recorded as unrealized gain or loss on the Statement of Operations. Payments received or made at the beginning of the measurement period are reflected as such on the Statement of Assets and Liabilities. These upfront payments are recorded as realized gain or loss on the Statement of Operations upon termination or maturity of the swap. A liquidation payment received or made at the termination of the swap is recorded as realized gain or loss on the Statement of Operations. Net periodic payments received or paid by the Portfolio are included as part of realized gain or loss on the Statement of Operations. Entering into these agreements involves, to varying degrees, elements of credit, market and documentation risk in excess of the amounts recognized on the Statement of Assets and Liabilities. Such risks involve the possibility that there will be no liquid market for these agreements, that the counterparty to the agreements may default on its obligation to perform or disagree as to the meaning of contractual terms in the agreements and that there may be unfavorable changes in interest rates.
(o) Loan Participations and Assignments The Portfolio may invest in direct debt instruments which are interests in amounts owned by corporate, governmental, or other borrowers to lenders or lending syndicates. The Portfolio’s investments in loans may be in the form of participations in loans or assignments of all or a portion of loans from third parties. A loan is often administered by a bank or other financial institution (the “lender”) that acts as agent for all holders. The agent administers the terms of the loan, as specified in the loan agreement. When investing in a loan participation, the Portfolio has the right to receive payments of principal, interest and any fees to which it is entitled only from the lender selling the loan agreement and only upon receipt by the lender of payments from the borrower. The Portfolio generally has no right to enforce compliance with the terms of the loan agreement with the borrower. As a result, the Portfolio may be subject to the credit risk of both the borrower and the lender that is selling the loan agreement. When the Portfolio purchases assignments from lenders it acquires direct rights against the borrower of the loan. At the end of the period June 30, 2007, the Portfolio had no unfunded loan commitments.
(p) Bridge Debt Commitments At the period ended June 30, 2007, the Portfolio had $1,602,246 in commitments outstanding to fund high yield bridge debt. The
Portfolio is entitled to a fee upon the expiration of the commitment period. The bridge debt terms approximate market rates at the time the commitment is entered into.
(q) Mortgage-Related and Other Asset-Backed Securities The Portfolio may invest in mortgage-related or other asset-backed securities. These securities include mortgage pass-through securities, collateralized mortgage obligations (“CMOs”), commercial mortgage-backed securities, mortgage dollar rolls, CMO residuals, stripped mortgage-backed securities (“SMBSs”) and other securities that directly or indirectly represent a participation in, or are secured by and payable from, mortgage loans on real property. The value of some mortgage-related or asset-backed securities may be particularly sensitive to changes in prevailing interest rates. Early repayment of principal on some mortgage-related securities may expose the Portfolio to a lower rate of return upon reinvestment of principal. The value of these securities may fluctuate in response to the market’s perception of the creditworthiness of the issuers. Additionally, although mortgages and mortgage-related securities are generally supported by some form of government or private guarantee and/or insurance, there is no assurance that private guarantors or insurers will meet their obligations.
(r) U.S. Government Agencies or Government-Sponsored Enterprises Securities issued by U.S. Government agencies or government-sponsored enterprises may not be guaranteed by the U.S. Treasury. The Government National Mortgage Association (“GNMA” or “Ginnie Mae”), a wholly owned U.S. Government corporation, is authorized to guarantee, with the full faith and credit of the U.S. Government, the timely payment of principal and interest on securities issued by institutions approved by GNMA and backed by pools of mortgages insured by the Federal Housing Administration or guaranteed by the Department of Veterans Affairs. Government-related guarantors (i.e., not backed by the full faith and credit of the U.S. Government) include the Federal National Mortgage Association (“FNMA” or “Fannie Mae”) and the Federal Home Loan Mortgage Corporation (“FHLMC” or “Freddie Mac”). Pass-through securities issued by FNMA are guaranteed as to timely payment of principal and interest by FNMA but are not backed by the full faith and credit of the U.S. Government. FHLMC guarantees the timely payment of interest and ultimate collection of principal, but its participation certificates are not backed by the full faith and credit of the U.S. Government.
(s) New Accounting Policies In July 2006, the Financial Accounting Standards Board (“FASB”) issued Interpretation No. 48, “Accounting for Uncertainty in Income Taxes—an Interpretation of FASB Statement No. 109” (the “Interpretation”). The Interpretation became effective for the Portfolio on June 29, 2007. Management has evaluated the application of the Interpretation in relation to the Portfolio and has concluded that no single filing position or combination of filing positions identified as uncertain tax positions required the accrual of a tax liability in the accounting records of the Portfolio for the period ending June 30, 2007. Management will monitor all existing filing positions and future filing positions in light of the Interpretation and evaluate the need for any future tax accruals and financial statement disclosures as warranted.
In September 2006, the FASB issued Statement of Financial Accounting Standards No. 157, “Fair Value Measurements” (the “Statement”). The Statement is effective for fiscal years beginning after November 15, 2007 and will require expanded disclosure about fair value measurements, separately for each major category of assets and liabilities, that enables shareholders to assess the inputs used to develop those measurements, and for recurring fair value measurements using significant unobservable inputs the effect of the measurements on changes in net assets for the reporting period. Management is currently evaluating the application of the Statement to the Portfolio and will provide additional information in relation to the Statement on the Portfolio’s annual financial statements for the period ending December 31, 2007.
| | | | | | |
| | Semiannual Report | | June 30, 2007 | | 19 |
Notes to Financial Statements (Cont.)
3. FEES AND EXPENSES
(a) Investment Advisory Fee PIMCO is a majority-owned subsidiary of Allianz Global Investors of America L.P. (“AGI”), and serves as investment adviser (the “Adviser”) to the Trust, pursuant to an investment advisory contract. The Adviser receives a monthly fee from the Portfolio, at an annual rate based on average daily net assets. The Advisory Fee for all classes is charged at an annual rate of 0.25%.
(b) Administration Fee PIMCO serves as administrator (the “Administrator”), and provides administrative services to the Trust for which it receives a monthly administrative fee based on each share class’s average daily net assets. As the Administrator, PIMCO bears the costs of various third-party services, including audit, custodial, portfolio accounting, legal, transfer agency and printing costs. The Administration Fee for all classes is charged at the annual rate of 0.25%.
(c) Distribution and Servicing Fees Allianz Global Investors Distributors LLC (“AGID”) is an indirect wholly-owned subsidiary of AGI and serves as the distributor (the “Distributor”) of the Trust’s shares. The Trust is permitted to reimburse AGID on a quarterly basis, out of the Administrative Class assets of the Portfolio in the amount of 0.15% on an annual basis of the average daily net assets of that class, for payments made to financial intermediaries that provide services in connection with the distribution of shares or administration of plans or programs that use Portfolio shares as their funding medium. The effective rate paid to AGID was 0.15% during the current fiscal year.
The Trust has adopted a Distribution Plan, for the Advisor Class shares of the Portfolio (the “Plan”). The Plan has been adopted pursuant to Rule 12b-1 under the Act. The Plan permits payments for expenses in connection with the distribution and marketing of Advisor Class shares and/or the provision of shareholder services to Advisor Class shareholders. The Plan permits the Portfolio to make total payments at an annual rate of 0.25% of its average daily net assets attributable to its Advisor Class shares.
(d) Portfolio Expenses The Trust is responsible for the following expenses: (i) salaries and other compensation of any of the Trust’s executive officers and employees who are not officers, directors, stockholders or employees of PIMCO or its subsidiaries or affiliates; (ii) taxes and governmental fees; (iii) brokerage fees and commissions and other portfolio transaction expenses; (iv) the costs of borrowing money, including interest expenses and bank overdraft charges; (v) fees and expenses of the Trustees who are not “interested persons” of PIMCO or the Trust, and any counsel retained exclusively for their benefit; (vi) extraordinary expenses, including costs of litigation and indemnification expenses; (vii) organization expenses and (viii) any expenses allocated or allocable to a specific class of shares, which include service fees payable with respect to the Administrative Class Shares, and may include certain other expenses as permitted by the Trust’s Multiple Class Plan adopted pursuant to Rule 18f-3 under the Act and subject to review and approval by the Trustees. The ratio of expenses to average net assets per share class, as disclosed in the Financial Highlights, may differ from the annual portfolio operating expenses per share class as disclosed in the Prospectus for the reasons set forth above.
Effective April 1, 2007, each Trustee, other than those affiliated with PIMCO or its affiliates, receives an annual retainer of $15,000, plus $2,375 for each Board of Trustees meeting attended in person, $500 for each committee meeting attended and $750 for each Board of Trustees meeting attended telephonically, plus reimbursement of related expenses. In addition, the audit committee chair receives an additional annual retainer of $2,000 and each other committee chair receives an additional annual retainer of $500. These expenses are allocated on a pro-rata basis to the various portfolios of the Trust according to their respective net assets. The Trust pays no compensation directly to any Trustee or any other officer who is affiliated with the Administrator, all of whom receive remuneration for their services to the Trust from the Administrator or its affiliates. Prior to
April 1, 2007, each Trustee, other than those affiliated with PIMCO or its affiliates, received an annual retainer of $15,000 plus $2,000 for each Board of Trustees meeting attended ($500 for each special meeting attended), plus reimbursement of related expenses. The Audit Committee Chairman received an annual retainer of $1,500 and the Governance Committee Chairman received an annual retainer of $500. In addition, each member of a committee received $500 for each committee meeting attended.
4. RELATED PARTY TRANSACTIONS
The Adviser, Administrator, and Distributor are related parties as defined by FAS 57, Related Party Disclosures. Fees payable to these parties are disclosed in Note 3.
5. GUARANTEES AND INDEMNIFICATIONS
Under the Trust’s organizational documents, each Trustee, officer, employee or other agent of the Trust (including the Trust’s investment manager) is indemnified, to the extent permitted by the Act, against certain liabilities that may arise out of performance of their duties to the Portfolio. Additionally, in the normal course of business, the Portfolio enters into contracts that contain a variety of indemnification clauses. The Portfolio’s maximum exposure under these arrangements is unknown as this would involve future claims that may be made against the Portfolio that have not yet occurred. However, the Portfolio has not had prior claims or losses pursuant to these contracts and believes the risk of loss to be remote.
6. PURCHASES AND SALES OF SECURITIES
The length of time the Portfolio has held a particular security is not generally a consideration in investment decisions. A change in the securities held by the Portfolio is known as “portfolio turnover”. The Portfolio may engage in frequent and active trading of portfolio securities to achieve its investment objective, particularly during periods of volatile market movements. High portfolio turnover (e.g., over 100%) involves correspondingly greater expenses to the Portfolio, including brokerage commissions or dealer mark-ups and other transaction costs on the sale of securities and reinvestments in other securities. Such sales may also result in realization of taxable capital gains, including short-term capital gains (which are generally taxed at ordinary income tax rates). The trading costs and tax effects associated with portfolio turnover may adversely affect the Portfolio’s performance.
Purchases and sales of securities (excluding short-term investments) for the period ended June 30, 2007, were as follows (amounts in thousands):
| | | | | | | | | | | | |
| U.S. Government/Agency | | | | All Other |
| Purchases | | Sales | | | | Purchases | | Sales |
| $ | 8,513,157 | | $ | 8,707,451 | | | | $ | 137,558 | | $ | 29,607 |
7. TRANSACTIONS IN WRITTEN CALL AND PUT OPTIONS
Transactions in written call and put options were as follows (amounts in thousands, except for number of contracts):
| | | | | | | | | | | | | |
| | | | | # of
Contracts | | | Notional
Amount in $ | | | Premium | |
Balance at 12/31/2006 | | | | 146 | | | $ | 97,800 | | | $ | 643 | |
Sales | | | | 1,025 | | | | 23,000 | | | | 592 | |
Closing Buys | | | | (73 | ) | | | (46,000 | ) | | | (362 | ) |
Expirations | | | | (661 | ) | | | (51,800 | ) | | | (486 | ) |
Exercised | | | | 0 | | | | 0 | | | | 0 | |
Balance at 06/30/2007 | | | | 437 | | | $ | 23,000 | | | $ | 387 | |
| | | | |
| 20 | | PIMCO Variable Insurance Trust | | |
| | |
| |
| | | June 30, 2007 (Unaudited) |
8. SHARES OF BENEFICIAL INTEREST
The Portfolio may issue an unlimited number of shares of beneficial interest with a $0.001 par value. Changes in shares of beneficial interest were as follows (shares and amounts in thousands):
| | | | | | | | | | | | | | | | |
| | | | | Six Months Ended
06/30/2007 | | | Year Ended
12/31/2006 | |
| | | | | Shares | | | Amount | | | Shares | | | Amount | |
| | | | | |
Receipts for shares sold | | | | | | | | | | | | | | | | |
Institutional Class | | | | 301 | | | $ | 3,580 | | | 629 | | | $ | 7,837 | |
Administrative Class | | | | 13,980 | | | | 166,885 | | | 29,533 | | | | 367,822 | |
Advisor Class | | | | 568 | | | | 6,796 | | | 248 | | | | 3,086 | |
Issued as reinvestment of distributions | | | | | | | | | | | | | | | | |
Institutional Class | | | | 95 | | | | 1,137 | | | 255 | | | | 3,137 | |
Administrative Class | | | | 1,955 | | | | 23,367 | | | 5,979 | | | | 73,676 | |
Advisor Class | | | | 10 | | | | 119 | | | 9 | | | | 109 | |
Cost of shares redeemed | | | | | | | | | | | | | | | | |
Institutional Class | | | | (274 | ) | | | (3,266 | ) | | (557 | ) | | | (6,951 | ) |
Administrative Class | | | | (22,385 | ) | | | (268,783 | ) | | (28,578 | ) | | | (353,626 | ) |
Advisor Class | | | | (27 | ) | | | (329 | ) | | (32 | ) | | | (402 | ) |
Net increase (decrease) resulting from Portfolio share transactions | | | | (5,777 | ) | | $ | (70,494 | ) | | 7,486 | | | $ | 94,688 | |
The following schedule shows the number of shareholders each owning 5% or more of the Portfolio and the total percentage of the Portfolio held by such shareholders:
| | | | | | |
| | | | | Number of Shareholders | | % of Portfolio Held |
Institutional Class | | | | 2 | | 95 |
Administrative Class | | | | 3 | | 54 |
Advisor Class | | | | 2 | | 94 |
9. REGULATORY AND LITIGATION MATTERS
Since February 2004, PIMCO, Allianz Global Investors of America L.P. (PIMCO’s parent company), AGID, and certain of their affiliates, including the PIMCO Funds (another series of funds managed by PIMCO), the Allianz Funds (formerly known as PIMCO Funds: Multi-Manager Series (another series of funds managed by affiliates of PIMCO)), certain Trustees of the Trust (in their capacity as Trustees of the PIMCO Funds or the Allianz Funds) and certain employees of PIMCO, have been named as defendants in fifteen lawsuits filed in various jurisdictions. Eleven of those lawsuits concern “market timing,” and they have been transferred to and consolidated for pre-trial proceedings in a multi-district litigation proceeding in the U.S. District Court for the District of Maryland; the other four lawsuits concern “revenue sharing” and have been consolidated into a single action in the U.S. District Court for the District of Connecticut. The lawsuits have been commenced as putative class actions on behalf of investors who purchased, held or redeemed shares of the various series of the PIMCO Funds and the Allianz Funds during specified periods, or as derivative actions on behalf of the PIMCO Funds and the Allianz Funds.
The market timing actions in the District of Maryland generally allege that certain hedge funds were allowed to engage in “market timing” in certain funds of the PIMCO Funds and the Allianz Funds and this alleged activity was not disclosed. Pursuant to tolling agreements entered into with the derivative and class action plaintiffs, PIMCO, certain PIMCO Funds Trustees, and certain employees of PIMCO who were previously named as defendants have all been dropped as defendants in the market timing actions; the plaintiffs continue to assert claims on behalf of the shareholders of the PIMCO Funds or on behalf of the PIMCO Funds itself against
other defendants. By order dated November 3, 2005, the U.S. District Court for the District of Maryland granted the PIMCO Funds’ motion to dismiss claims asserted against it in a consolidated amended complaint where the PIMCO Funds were named, in the complaint, as a nominal defendant. The revenue sharing action in the District of Connecticut generally alleges that fund assets were inappropriately used to pay brokers to promote funds of the PIMCO Funds and the Allianz Funds, including directing fund brokerage transactions to such brokers, and that such alleged arrangements were not fully disclosed to shareholders. On August 11, 2005, the U.S. District Court for the District of Connecticut conducted a hearing on defendants’ motion to dismiss the consolidated amended complaint in the revenue sharing action but has not yet ruled on the motion to dismiss. The market timing and revenue sharing lawsuits seek, among other things, unspecified compensatory damages plus interest and, in some cases, punitive damages, the rescission of investment advisory contracts, the return of fees paid under those contracts and restitution.
Two nearly identical class action civil complaints have been filed in August 2005, in the Northern District of Illinois Eastern Division, alleging that the plaintiffs each purchased and sold a 10-year Treasury note futures contract and suffered damages from an alleged shortage when PIMCO held both physical and futures positions in 10-year Treasury notes for its client accounts. The two actions have been consolidated into one action, and the two separate complaints have been replaced by a consolidated complaint. PIMCO is a named defendant, and PIMCO Funds has been added as a defendant, to the consolidated action. PIMCO strongly believes the complaint is without merit and intends to vigorously defend itself.
In April 2006, certain portfolios of the Trust and certain other funds managed by PIMCO were served in an adversary proceeding brought by the Official Committee of Asbestos Claimants of G-I Holdings, Inc. in G-I Holdings, Inc.’s bankruptcy in the District of New Jersey. In July 2004, PIMCO was named in this lawsuit and remains a defendant. The plaintiff seeks to recover for the bankruptcy estate assets that were transferred by the predecessor entity of G-I Holdings, Inc. to a wholly-owned subsidiary in 1994. The subsidiary has since issued notes, of which certain portfolios of the Trust and certain other funds managed by PIMCO are alleged to be holders. The complaint alleges that in 2000, more than two hundred noteholders—including certain portfolios of the Trust and certain other funds managed by PIMCO—were granted a second priority lien on the assets of the subsidiary in exchange for their consent to a refinancing transaction and the granting of a first priority lien to the lending banks. The plaintiff is seeking invalidation of the lien in favor of the noteholders and/or the value of the lien. On June 21, 2006, the District of New Jersey overturned the Bankruptcy Court’s decision granting permission to file the adversary proceeding and remanded the matter to the Bankruptcy Court for further proceedings. Following a motion to reconsider, the District Court upheld its remand on August 7, 2006, and instructed the Bankruptcy Court to conduct a “cost-benefit” analysis of the Committee’s claims, including the claims against the noteholders. The Bankruptcy Court held a status conference on October 25, 2006 and set a briefing schedule relating to this cost-benefit analysis.
The foregoing speaks only as of the date of this report. It is possible that these matters and/or other developments resulting from these matters could result in increased portfolio redemptions or other adverse consequences to the Portfolio. However, PIMCO and AGID believe that these matters are not likely to have a material adverse effect on the Portfolio or on PIMCO’s or AGID’s ability to perform their respective investment advisory or distribution services relating to the Portfolio.
10. FEDERAL INCOME TAX MATTERS
The Portfolio intends to qualify as a regulated investment company under sub-chapter M of the Internal Revenue Code (the “Code”) and distribute all of its taxable income and net realized gains, if applicable, to shareholders. Accordingly, no provision for Federal income taxes has been made.
| | | | | | |
| | Semiannual Report | | June 30, 2007 | | 21 |
Notes to Financial Statements (Cont.)
As of June 30, 2007, the aggregate cost of investments was the same for federal income tax and financial statement purposes. The net unrealized appreciation (depreciation) of investment securities for federal income tax purposes is as follows (amount in thousands):
| | | | |
Aggregate
Gross
Unrealized
Appreciation | | Aggregate
Gross
Unrealized
(Depreciation) | | Net
Unrealized
Appreciation |
$ 8,525 | | $ (1,724) | | $ 6,801 |
| | | | |
| 22 | | PIMCO Variable Insurance Trust | | |
| | |
| |
Privacy Policy* | | (Unaudited) |
The Funds consider customer privacy to be a fundamental aspect of their relationships with shareholders and are committed to maintaining the confidentiality, integrity and security of their current, prospective and former shareholders’ personal information. To ensure their shareholders’ privacy, the Funds have developed policies that are designed to protect this confidentiality, while allowing shareholder needs to be served.
Obtaining Personal Information
In the course of providing shareholders with products and services, the Funds and certain service providers to the Funds, such as the Funds’ investment advisers (“Advisers”), may obtain non-public personal information about shareholders, which may come from sources such as account applications and other forms, from other written, electronic or verbal correspondence, from shareholder transactions, from a shareholder’s brokerage or financial advisory firm, financial adviser or consultant, and/or from information captured on the Funds’ internet web sites.
Respecting Your Privacy
As a matter of policy, the Funds do not disclose any personal or account information provided by shareholders or gathered by the Funds to non-affiliated third parties, except as required or permitted by law or as necessary for such third parties to perform their agreements with respect to the Funds. As is common in the industry, non-affiliated companies may from time to time be used to provide certain services, such as preparing and mailing prospectuses, reports, account statements and other information, conducting research on shareholder satisfaction and gathering shareholder proxies. A Fund’s Distributor may also retain non-affiliated companies to market the Fund’s shares or products which use the Fund’s shares and enter into joint marketing agreements with other companies. These companies may have access to a shareholder’s personal and account information, but are permitted to use this information solely to provide the specific service or as otherwise permitted by law. In most cases, the shareholders will be clients of a third party, but the Funds may also provide a shareholder’s personal and account information to the shareholder’s respective brokerage or financial advisory firm.
Sharing Information with Third Parties
The Funds reserve the right to disclose or report personal information to non-affiliated third parties, in limited circumstances, where the Funds believe in good faith that disclosure is required under law to cooperate with regulators or law enforcement authorities, to protect their rights or property or upon reasonable request by any Fund in which a shareholder has chosen to invest. In addition, the Funds may disclose information about a shareholder’s accounts to a non-affiliated third party with the consent of the shareholder.
Sharing Information with Affiliates
The Funds may share shareholder information with their affiliates in connection with servicing their shareholders’ accounts or to provide shareholders with information about products and services that the Funds or their Advisers, principal underwriters or their affiliates (“Service Affiliates”) believe may be of interest to such shareholders. The information that the Funds share may include, for example, a shareholder’s participation in one of the Funds or in other investment programs sponsored by a Service Affiliate, a shareholder’s ownership of certain types of accounts (such as IRAs), or other data about a shareholder’s accounts. The Funds’ Service Affiliates, in turn, are not permitted to share shareholder information with non-affiliated entities, except as required or permitted by law.
Procedures to Safeguard Private Information
The Funds take seriously the obligation to safeguard shareholder non-public personal information. In addition to this policy, the Funds have also implemented procedures that are designed to restrict access to a shareholder’s non-public personal information only to internal personnel who need to know that information in order to provide products or services to such shareholders. In order to guard a shareholder’s non-public personal information, physical, electronic and procedural safeguards are in place.
* This Privacy Policy applies to the following entities: PIMCO Funds, PIMCO Variable Insurance Trust, PCM Fund, Inc. and PIMCO Strategic Global Government Fund, Inc. (collectively, the “Funds”).
| | | | | | |
| | Semiannual Report | | June 30, 2007 | | 23 |
Investment Adviser and Administrator
Pacific Investment Management Company LLC
840 Newport Center Drive
Newport Beach, California 92660
Distributor
Allianz Global Investors Distributors LLC
1345 Avenue of the Americas
New York, New York 10105
Custodian
State Street Bank & Trust Company
801 Pennsylvania
Kansas City, Missouri 64105
Transfer Agent
Boston Financial Data Services–Midwest
330 W. 9th Street
Kansas City, Missouri 64105
Legal Counsel
Dechert LLP
1775 I Street, N.W.
Washington, D.C. 20006
Independent Registered Public Accounting Firm
PricewaterhouseCoopers LLP
1055 Broadway
Kansas City, Missouri 64105
P I M C O

Table of Contents
This material is authorized for use only when preceded or accompanied by the current PIMCO Variable Insurance Trust (the “Trust”) prospectus. Investors should consider the investment objectives, risks, charges and expenses of this Trust carefully before investing. Ask your financial professional to explain all charges that may apply. This and other information is contained in the Trust’s prospectus. The variable product prospectus may be obtained by contacting your Investment Consultant. Please read the Trust and variable product prospectus carefully before you invest or send money.
Chairman’s Letter
Dear PIMCO Variable Insurance Trust Shareholder:
It is our pleasure to present to you the semiannual report for the PIMCO Variable Insurance Trust, covering the six-month period ended June 30, 2007. The PIMCO Variable Insurance Trust’s net assets were $8.68 billion at June 30, 2007, as compared to $7.76 billion at December 31, 2006.
Highlights of the financial markets during the reporting period include:
| | n | | Economic data during the first quarter of 2007 pointed to slower growth, which heightened market expectations for a decrease in the Federal Funds Rate. By the second quarter, economic data, such as employment statistics, provided little indication of economic weakness, causing expectations of a decrease in the Federal Funds Rate to unwind and U.S. interest rates to move higher. Interest rates in Europe and the U.K. also rose over the period as central banks raised their key lending rates due to inflation concerns. The benchmark ten-year U.S. Treasury yielded 5.03% as of June 30, 2007, or 0.32% higher than at the beginning of the year. |
| | n | | Most bonds generally returned much of their gains from earlier in the year as worldwide growth and capital flows drove interest rates higher in the second quarter. Increased risk aversion in global financial markets, due in part to subprime mortgage worries in the U.S., also contributed to the rise in interest rates. The Lehman Brothers Aggregate Bond Index, which includes Treasury, investment-grade corporate and mortgage-backed securities, returned 0.98% for the six-month period. |
| | n | | Locally issued emerging market (“EM”) bonds posted positive returns for the reporting period. Yields on these bonds declined and the local currencies in which they are denominated generally gained, amid increasing investor awareness, strong economic growth and surging capital inflows. External EM bonds (debt instruments issued by emerging markets countries and typically denominated in U.S. dollars) lagged behind local EM bonds (debt instruments issued by emerging markets countries and denominated in the currency of the issuer), as external EM bonds tend to trade more in-line with U.S. Treasuries. |
| | n | | Treasury Inflation-Protected Securities (“TIPS”) outpaced nominal bonds (non-inflation linked bonds) for the first part of the year and all but the longest maturity TIPS outperformed in the second quarter as high gasoline prices drove higher inflation accruals. Commodities, as represented by the Dow Jones-AIG Commodity Total Return Index, returned 4.46% for the period. Equities, as measured by the S&P 500 Index and the Russell 2000 Index, returned 6.96% and 6.45%, respectively, for the period. |
On the following pages, please find specific details as to the Portfolio’s total return investment performance and a discussion of those factors that affected performance.
Thank you for the trust you have placed in us. We will continue to work diligently to serve your investment needs.
Sincerely,
Brent R. Harris
Chairman, PIMCO Variable Insurance Trust
July 31, 2007
| | | | | | |
| | Semiannual Report | | June 30, 2007 | | 1 |
Important Information About the Portfolio
PIMCO Variable Insurance Trust (the “Trust”) is an open-end management investment company currently consisting of twenty separate investment portfolios, including the RealEstateRealReturn Strategy Portfolio (the “Portfolio”). The Portfolio is only available as a funding vehicle under variable life insurance policies or variable annuity contracts issued by insurance companies (“Variable Contracts”). Individuals may not purchase shares of the Portfolio directly. Shares of the Portfolio also may be sold to qualified pension and retirement plans outside of the separate account context.
We believe that bond funds have an important role to play in a well diversified investment portfolio. It is important to note, however, that in an environment where interest rates may trend upward, rising rates would negatively impact the performance of most bond funds, and fixed-income securities held by a fund are likely to decrease in value. The price volatility of fixed-income securities can also increase during periods of rising interest rates resulting in increased losses to a fund. Bond funds and individual bonds with a longer duration (a measure of the expected life of a security) tend to be more sensitive to changes in interest rates, usually making them more volatile than securities or funds with shorter durations.
The Portfolio may be subject to various risks in addition to those described above. Some of these risks may include, but are not limited to, the following: credit risk, high yield risk, market risk, issuer risk, liquidity risk, derivatives risk, mortgage risk, non-U.S. investment risk, real estate risk, emerging markets risk, currency risk, issuer non-diversification risk, leveraging risk and management risk. A complete description of these risks is contained in the Portfolio’s prospectus. The Portfolio may use derivative instruments as part of an investment strategy, as described under “Portfolio Insights”, or for hedging purposes. Use of these instruments may involve certain costs and risks such as liquidity risk, interest rate risk, market risk, credit risk, management risk and the risk that the Portfolio could not close out a position when it would be most advantageous to do so. Because the Portfolio may invest in derivatives, it could lose more than the principal amount invested in these instruments. Investing in non-U.S. securities may entail risk due to non-U.S. economic and political developments; this risk may be increased when investing in emerging markets.
On the performance summary page in this Semiannual Report, the Total Return Investment Performance table measures performance assuming that all dividend and capital gain distributions were reinvested.
An investment in the Portfolio is not a deposit of a bank and is not guaranteed or insured by the Federal Deposit Insurance Corporation or any other government agency. It is possible to lose money on investments in the Portfolio.
PIMCO has adopted written proxy voting policies and procedures (“Proxy Policy”) as required by Rule 206(4)-6 under the Investment Advisers Act of 1940, as amended. The Proxy Policy has been adopted by the Trust as the policies and procedures that PIMCO will use when voting proxies on behalf of the Portfolio. A description of the policies and procedures that PIMCO uses to vote proxies relating to portfolio securities of the Portfolio, and information about how the Portfolio voted proxies relating to portfolio securities held during the most recent twelve-month period ended June 30, are available without charge, upon request, by calling the Trust at 1-866-746-2606 and on the Portfolio’s website at www.pimco.com.
The Portfolio files its complete schedule of portfolio holdings with the SEC for the first and third quarters of each fiscal year on Form N-Q. A copy of the Trust’s Form N-Q is also available on the SEC’s website at http://www.sec.gov and may be reviewed and copied at the SEC’s Public Reference Room in Washington D.C. Information on the operation of the Public Reference Room may be obtained by calling 1-800-SEC-0330, and is available without charge, upon request, by calling the Trust at 1-866-746-2606 and on the Portfolio’s website at www.pimco.com.
PIMCO Variable Insurance Trust is distributed by Allianz Global Investors Distributors LLC, 1345 Avenue of the Americas, New York, NY 10105.
| | | | |
| 2 | | PIMCO Variable Insurance Trust | | |
The following disclosure provides important information regarding the Portfolio’s Expense Example (“Example” or “Expense Example”), which appears in this Semiannual Report. Please refer to this information when reviewing the Expense Example for the Portfolio.
Example
As a shareholder of the Portfolio, you incur two types of costs: (1) transaction costs and (2) ongoing costs, including advisory and administrative fees; distribution and/or service (12b-1) fees; and other Portfolio expenses. The Example is intended to help you understand your ongoing costs (in dollars) of investing in the Portfolio and to compare these costs with the ongoing costs of investing in other mutual funds. The Expense Example does not reflect any fees or other expenses imposed by the Variable Contracts. If it did, the expenses reflected in the Expense Example would be higher. The Example is based on an investment of $1,000 invested at the beginning of the period and held for the entire period indicated, which is from January 1, 2007 to June 30, 2007.
Actual Expenses
The information in the table under the heading “Actual Performance” provides information about actual account values and actual expenses. You may use the information in these columns, together with the amount you invested, to estimate the expenses that you paid over the period. Simply divide your account value by $1,000 (for example, an $8,600 account value divided by $1,000 = $8.60), then multiply the result by the number in the row titled “Expenses Paid During Period” to estimate the expenses you paid on your account during this period.
Hypothetical Example for Comparison Purposes
The information in the table under the heading “Hypothetical Performance (5% return before expenses)” provides information about hypothetical account values and hypothetical expenses based on the Portfolio’s actual expense ratio and an assumed rate of return of 5% per year before expenses, which is not the Portfolio’s actual return. The hypothetical account values and expenses may not be used to estimate the actual ending account balance or expenses you paid for the period. You may use this information to compare the ongoing costs of investing in the Portfolio and other portfolios. To do so, compare this 5% hypothetical example with the 5% hypothetical examples that appear in the shareholder reports of the other portfolios.
Please note that the expenses shown in the table are meant to highlight your ongoing costs only and do not reflect any transactional costs. Therefore, the information under the heading “Hypothetical Performance (5% return before expenses)” is useful in comparing ongoing costs only, and will not help you determine the relative total costs of owning different portfolios. In addition, if these transactional costs were included, your costs would have been higher.
The expense ratio may vary period to period because of various factors, such as an increase in expenses not covered by the advisory and administrative fees (such as expenses of the trustees and their counsel, litigation expense and interest expense).
| | | | | | |
| | Semiannual Report | | June 30, 2007 | | 3 |
PIMCO RealEstateRealReturn Strategy Portfolio
Cumulative Returns Through June 30, 2007
$10,000 invested at the beginning of the first full month following the inception date of the Portfolio’s Administrative Class.
Allocation Breakdown‡
| | |
U.S. Treasury Obligations | | 47.5% |
Short-Term Instruments | | 46.0% |
U.S. Government Agencies | | 6.5% |
| | ‡ | % of Total Investments as of 06/30/2007 |
| | | | | | | | |
| Average Annual Total Return for the period ended June 30, 2007 |
| | | | | 6 Months* | | 1 Year | | Portfolio
Inception
(09/30/05) |
| | PIMCO RealEstateRealReturn Strategy Portfolio Administrative Class | | -8.39% | | 8.00% | | 10.54% |
| | Dow Jones Wilshire Real Estate Investment Trust Index± | | -6.33% | | 11.47% | | 16.57% |
All Portfolio returns are net of fees and expenses.
* Cumulative return.
Performance quoted represents past performance. Past performance is no guarantee of future results. Investment return and principal value will fluctuate so the Portfolio shares, when redeemed, may be worth more or less than their original cost. The Portfolio’s performance does not reflect the deduction of additional charges and expenses imposed in connection with investing in Variable Contracts, which will reduce returns. Current performance may be lower or higher than the performance data quoted. Performance data current to the most recent month-end is available by calling (800) 927-4648.
± Dow Jones Wilshire Real Estate Investment Trust Index, a subset of the Wilshire Real Estate Securities Index (WRESI), is an unmanaged index comprised of U.S. publicly traded Real Estate Investment Trusts, weighted by full market capitalization. Effective March 1, 2007, the Portfolio began tracking its performance against a float-adjusted version of the Index as real-time calculation of the Index ceased to be disseminated on February 28, 2007. It is not possible to invest directly in the index. The index does not reflect deductions for fees, expenses or taxes.
| | | | | | |
| Expense Example | | Actual Performance | | Hypothetical Performance |
| | | | | (5% return before expenses) |
Beginning Account Value (01/01/07) | | $ | 1,000.00 | | $ | 1,000.00 |
Ending Account Value (06/30/07) | | $ | 916.06 | | $ | 1,020.33 |
Expenses Paid During Period† | | $ | 4.28 | | $ | 4.51 |
† Expenses are equal to the Portfolio’s Administrative Class annualized expense ratio of 0.90%, multiplied by the average account value over the period, multiplied by 181/365 (to reflect the one-half year period). Overall fees and expenses of investing in the Portfolio will be higher because the example does not reflect Variable Contract fees and expenses.
Please refer to page 3 herein for an explanation of the information presented in the following Expense Example.
Portfolio Insights
| » | | The PIMCO RealEstateRealReturn Strategy Portfolio seeks to achieve its investment objective by investing under normal circumstances in real estate-linked derivative instruments backed by a portfolio of inflation-indexed securities and other fixed-income instruments. |
| » | | Returns for Real Estate Investment Trusts (“REITs”) generally declined for the period, which detracted from total return performance. |
| » | | The Portfolio’s use of Treasury Inflation-Protected Securities (“TIPS”) as collateral was negative for performance in the first half of the year as TIPS underperformed the assumed one-month LIBOR financing cost of gaining REIT index exposure. |
| » | | Positioning for a steeper U.S. nominal yield curve added to performance as the U.S. nominal yield curve steepened. |
| » | | An emphasis on nominal bonds in the Eurozone benefited performance as nominal bonds outperformed inflation-linked bonds in the region. |
| » | | Holdings of mortgage-backed securities detracted from performance as mortgage spreads widened. |
| | | | |
| 4 | | PIMCO Variable Insurance Trust | | |
Financial Highlights RealEstateRealReturn Strategy Portfolio
| | | | | | | | | | | | |
| Selected per Share Data for the Year or Period Ended: | | 06/30/2007+ | | | 12/31/2006 | | | 09/30/2005-12/31/2005 | |
| | | |
Administrative Class | | | | | | | | | | | | |
Net asset value beginning of year or period | | $ | 12.22 | | | $ | 10.21 | | | $ | 10.00 | |
Net investment income (a) | | | 0.27 | | | | 0.44 | | | | 0.19 | |
Net realized/unrealized gain (loss) on investments (a) | | | (1.22 | ) | | | 2.31 | | | | 0.02 | |
Total income (loss) from investment operations | | | (0.95 | ) | | | 2.75 | | | | 0.21 | |
Dividends from net investment income | | | (0.93 | ) | | | (0.74 | ) | | | 0.00 | |
Total distributions | | | (0.93 | ) | | | (0.74 | ) | | | 0.00 | |
Net asset value end of year or period | | $ | 10.34 | | | $ | 12.22 | | | $ | 10.21 | |
Total return | | | (8.39 | )% | | | 27.38 | % | | | 2.10 | % |
Net assets end of year or period (000s) | | $ | 4,598 | | | $ | 4,434 | | | $ | 3,062 | |
Ratio of expenses to average net assets | | | 0.90 | %* | | | 0.90 | % | | | 0.89 | %*(b) |
Ratio of expenses to average net assets excluding interest expense | | | 0.89 | %* | | | 0.89 | % | | | 0.89 | %*(b) |
Ratio of net investment income to average net assets | | | 4.40 | %* | | | 3.88 | % | | | 7.78 | %* |
Portfolio turnover rate | | | 656 | % | | | 1213 | % | | | 163 | % |
+ Unaudited
* Annualized
(a) Per share amounts based on average number of shares outstanding during the period.
(b) If the investment manager had not reimbursed expenses, the ratio of expenses to average net assets would have been 3.83%.
| | | | | | |
| See Accompanying Notes | | Semiannual Report | | June 30, 2007 | | 5 |
Statement of Assets and Liabilities RealEstateRealReturn Strategy Portfolio
| | | | |
| (Amounts in thousands, except per share amounts) | | June 30, 2007 | |
| | | (Unaudited) | |
| |
Assets: | | | | |
Investments, at value | | $ | 9,336 | |
Repurchase agreements, at value | | | 1,090 | |
Foreign currency, at value | | | 45 | |
Receivable for investments sold | | | 541 | |
Receivable for investments sold on a delayed-delivery basis | | | 749 | |
Interest and dividends receivable | | | 7 | |
Swap premiums paid | | | 2 | |
Unrealized appreciation on foreign currency contracts | | | 1 | |
Unrealized appreciation on swap agreements | | | 24 | |
| | | | 11,795 | |
| |
Liabilities: | | | | |
Payable for investments purchased | | $ | 965 | |
Payable for investments purchased on a delayed-delivery basis | | | 5,561 | |
Payable for short sales | | | 104 | |
Written options outstanding | | | 1 | |
Accrued investment advisory fee | | | 2 | |
Accrued administration fee | | | 1 | |
Accrued servicing fee | | | 1 | |
Variation margin payable | | | 7 | |
Swap premiums received | | | 36 | |
Unrealized depreciation on foreign currency contracts | | | 1 | |
Unrealized depreciation on swap agreements | | | 505 | |
Other liabilities | | | 13 | |
| | | | 7,197 | |
| |
Net Assets | | $ | 4,598 | |
| |
Net Assets Consist of: | | | | |
Paid in capital | | $ | 4,709 | |
Undistributed net investment income | | | 767 | |
Accumulated undistributed net realized (loss) | | | (392 | ) |
Net unrealized (depreciation) | | | (486 | ) |
| | | $ | 4,598 | |
| |
Net Assets: | | | | |
Administrative Class | | $ | 4,598 | |
| |
Shares Issued and Outstanding: | | | | |
Administrative Class | | | 445 | |
| |
Net Asset Value and Redemption Price Per Share (Net Asset Per Share Outstanding) | | | | |
Administrative Class | | $ | 10.34 | |
| |
Cost of Investments Owned | | $ | 9,306 | |
Cost of Repurchase Agreements Owned | | $ | 1,090 | |
Cost of Foreign Currency Held | | $ | 45 | |
Proceeds Received on Short Sales | | $ | 103 | |
Premiums Received on Written Options | | $ | 1 | |
| | | | |
| 6 | | PIMCO Variable Insurance Trust | | See Accompanying Notes |
Statement of Operations RealEstateRealReturn Strategy Portfolio
| | | | |
| (Amounts in thousands) | | Six Months Ended
June 30, 2007 | |
| | | (Unaudited) | |
| |
| Investment Income: | | | | |
Interest | | $ | 127 | |
Total Income | | | 127 | |
| |
Expenses: | | | | |
Investment advisory fees | | | 12 | |
Administration fees | | | 6 | |
Servicing fees – Administrative Class | | | 4 | |
Total Expenses | | | 22 | |
| |
Net Investment Income | | | 105 | |
| |
Net Realized and Unrealized Gain (Loss): | | | | |
Net realized (loss) on investments | | | (224 | ) |
Net realized (loss) on futures contracts, written options and swaps | | | (69 | ) |
Net realized (loss) on foreign currency transactions | | | (2 | ) |
Net change in unrealized appreciation on investments | | | 149 | |
Net change in unrealized (depreciation) on futures contracts, written options and swaps | | | (388 | ) |
Net change in unrealized appreciation on translation of assets and liabilities denominated in foreign currencies | | | 2 | |
Net (Loss) | | | (532 | ) |
| |
Net (Decrease) in Net Assets Resulting from Operations | | $ | (427 | ) |
| | | | | | |
| See Accompanying Notes | | Semiannual Report | | June 30, 2007 | | 7 |
Statements of Changes in Net Assets RealEstateRealReturn Strategy Portfolio
| | | | | | | | |
| (Amounts in thousands) | | Six Months Ended
June 30, 2007 | | | Year Ended
December 31, 2006 | |
| | | (Unaudited) | | | | |
| | |
| Increase (Decrease) in Net Assets from: | | | | | | | | |
| | |
Operations: | | | | | | | | |
Net investment income | | $ | 105 | | | $ | 142 | |
Net realized gain (loss) | | | (295 | ) | | | 999 | |
Net change in unrealized (depreciation) | | | (237 | ) | | | (267 | ) |
Net increase (decrease) resulting from operations | | | (427 | ) | | | 874 | |
| | |
Distributions to Shareholders: | | | | | | | | |
From net investment income | | | | | | | | |
Administrative Class | | | (372 | ) | | | (247 | ) |
| | |
Total Distributions | | | (372 | ) | | | (247 | ) |
| | |
Portfolio Share Transactions: | | | | | | | | |
Receipts for shares sold | | | | | | | | |
Administrative Class | | | 1,116 | | | | 816 | |
Issued as reinvestment of distributions | | | | | | | | |
Administrative Class | | | 372 | | | | 246 | |
Cost of shares redeemed | | | | | | | | |
Administrative Class | | | (525 | ) | | | (317 | ) |
Net increase resulting from Portfolio share transactions | | | 963 | | | | 745 | |
| | |
Total Increase in Net Assets | | | 164 | | | | 1,372 | |
| | |
Net Assets: | | | | | | | | |
Beginning of period | | | 4,434 | | | | 3,062 | |
End of period* | | $ | 4,598 | | | $ | 4,434 | |
| | |
*Including undistributed net investment income of: | | $ | 767 | | | $ | 1,034 | |
| | | | |
| 8 | | PIMCO Variable Insurance Trust | | See Accompanying Notes |
| | |
| |
| Schedule of Investments RealEstateRealReturn Strategy Portfolio | | June 30, 2007 (Unaudited) |
| | | | | | | | |
| | | | | PRINCIPAL
AMOUNT
(000S) | | | | VALUE
(000S) |
| U.S. GOVERNMENT AGENCIES 14.7% |
| Fannie Mae | | | | | | | | |
5.500% due 07/01/2037 | | $ | | 200 | | $ | | 193 |
6.000% due 09/01/2036 - 07/01/2037 | | | | 486 | | | | 481 |
| | | | | | | | |
Total U.S. Government Agencies
(Cost $678) | | | | 674 |
| | | | | | | | |
|
| U.S. TREASURY OBLIGATIONS 107.6% |
| Treasury Inflation Protected Securities (b) |
1.875% due 07/15/2015 | | | | 1,249 | | | | 1,181 |
2.000% due 04/15/2012 | | | | 409 | | | | 397 |
2.000% due 01/15/2014 | | | | 337 | | | | 324 |
2.000% due 01/15/2026 | | | | 471 | | | | 427 |
2.375% due 01/15/2017 | | | | 309 | | | | 302 |
2.375% due 01/15/2025 | | | | 1,322 | | | | 1,272 |
2.375% due 01/15/2027 | | | | 31 | | | | 30 |
2.500% due 07/15/2016 | | | | 1,029 | | | | 1,017 |
| | | | | | | | |
Total U.S. Treasury Obligations
(Cost $4,915) | | | | 4,950 |
| | | | | | | | |
|
| SHORT-TERM INSTRUMENTS 104.4% |
|
| COMMERCIAL PAPER 79.1% |
| Abbey National N.A. LLC | | | | | | | | |
5.270% due 09/14/2007 | | | | 100 | | | | 99 |
| |
| Bank of America Corp. | | | | | | | | |
5.230% due 10/04/2007 | | | | 200 | | | | 199 |
| |
| Barclays U.S. Funding Corp. | | | | | | |
5.235% due 09/26/2007 | | | | 200 | | | | 200 |
| |
| BNP Paribas Finance, Inc. | | | | | | | | |
5.200% due 10/23/2007 | | | | 250 | | | | 250 |
| |
| CBA (de) Finance | | | | | | | | |
5.260% due 09/28/2007 | | | | 100 | | | | 99 |
| |
| | | | | | | | |
| | | | | PRINCIPAL
AMOUNT
(000S) | | | | VALUE
(000S) |
| Dexia Delaware LLC | | | | | | | | |
5.225% due 09/21/2007 | | $ | | 200 | | $ | | 199 |
| |
| DnB NORBank ASA | | | | | | | | |
5.350% due 10/12/2007 | | | | 100 | | | | 100 |
| |
| Fannie Mae | | | | | | | | |
5.080% due 07/02/2007 | | | | 100 | | | | 100 |
| |
| Freddie Mac | | | | | | | | |
5.150% due 07/20/2007 | | | | 700 | | | | 698 |
5.165% due 07/25/2007 | | | | 700 | | | | 698 |
| |
| HBOS Treasury Services PLC |
5.245% due 11/13/2007 | | | | 100 | | | | 99 |
| |
| Oesterreichische | | | | | | | | |
5.240% due 07/20/2007 | | | | 400 | | | | 399 |
| |
| Rabobank USA Financial Corp. | | |
5.330% due 07/26/2007 | | | | 100 | | | | 100 |
| |
| Societe Generale NY | | | | | | | | |
5.280% due 11/26/2007 | | | | 200 | | | | 199 |
| |
| Swedbank AB | | | | | | | | |
5.225% due 09/06/2007 | | | | 100 | | | | 100 |
| |
| UBS Finance Delaware LLC |
5.230% due 10/23/2007 | | | | 100 | | | | 99 |
| | | | | | | | |
| | | | | | | | 3,638 |
| | | | | | | | |
|
| REPURCHASE AGREEMENTS 23.7% |
| Lehman Brothers, Inc. | | | | | | | | |
4.000% due 07/02/2007 | | | | 900 | | | | 900 |
| | | | | | | | |
(Dated 06/29/2007. Collateralized by U.S. Treasury Inflation Protected Securities 2.000% due 01/15/2014 valued at $923. Repurchase proceeds are $900.) |
| | | | | | | | | |
| | | | | PRINCIPAL
AMOUNT
(000S) | | | | VALUE
(000S) | |
| State Street Bank and Trust Co. | |
4.900% due 07/02/2007 | | $ | | 190 | | $ | | 190 | |
| | | | | | | | | |
(Dated 06/29/2007. Collateralized by Federal Home Loan Bank 3.750% due 08/15/2008 valued at $194. Repurchase proceeds are $190.) | |
| | | | | | | | | |
| | | | | | | | 1,090 | |
| | | | | | | | | |
| |
| U.S. TREASURY BILLS 1.6% | |
4.615% due 08/30/2007 - 09/13/2007 (a)(c) | | | | 75 | | | | 74 | |
| | | | | | | | | |
Total Short-Term Instruments
(Cost $4,802) | | | | 4,802 | |
| | | | | | | | | |
| |
| PURCHASED OPTIONS (e) 0.0% | |
(Cost $1) | | | | 0 | |
| | | | | | | | | |
| |
Total Investments 226.7%
(Cost $10,396) | | $ | | 10,426 | |
| |
Written Options (f) (0.0%)
(Premiums $1) | | | | (1 | ) |
| |
| Other Assets and Liabilities (Net) (126.7%) | | (5,827 | ) |
| | | | | | | | | |
| Net Assets 100.0% | | | | | | $ | | 4,598 | |
| | | | | | | | | |
Notes to Schedule of Investments (amounts in thousands*, except number of contracts):
* A zero balance may reflect actual amounts rounding to less than one thousand.
(a) Coupon represents a weighted average rate.
(b) Principal amount of security is adjusted for inflation.
(c) Securities with an aggregate market value of $74 have been segregated with the custodian to cover margin requirements for the following open futures contracts on June 30, 2007:
| | | | | | | | | | |
| Description | | Type | | Expiration
Month | | # of
Contracts | | Unrealized
Appreciation/
(Depreciation) | |
90-Day Eurodollar December Futures | | Long | | 12/2007 | | 2 | | $ | (2 | ) |
90-Day Eurodollar June Futures | | Long | | 06/2008 | | 3 | | | (4 | ) |
90-Day Eurodollar June Futures | | Long | | 06/2009 | | 2 | | | 1 | |
90-Day Eurodollar March Futures | | Short | | 03/2008 | | 1 | | | 1 | |
90-Day Eurodollar March Futures | | Long | | 03/2009 | | 1 | | | 0 | |
Euro-Bund 10-Year Note September Futures Put Options Strike @ EUR 106.000 | | Long | | 09/2007 | | 2 | | | 0 | |
U.S. Treasury 5-Year Note September Futures | | Short | | 09/2007 | | 6 | | | (2 | ) |
U.S. Treasury 10-Year Note September Futures | | Short | | 09/2007 | | 4 | | | 4 | |
U.S. Treasury 30-Year Bond September Futures | | Short | | 09/2007 | | 3 | | | (3 | ) |
United Kingdom 90-Day LIBOR Sterling Interest Rate June Futures | | Long | | 06/2008 | | 4 | | | (8 | ) |
United Kingdom 90-Day LIBOR Sterling Interest Rate March Futures | | Long | | 03/2008 | | 4 | | | (8 | ) |
| | | | | | | | | | |
| | | | | | | | $ | (21 | ) |
| | | | | | | | | | |
| | | | | | |
| See Accompanying Notes | | Semiannual Report | | June 30, 2007 | | 9 |
Schedule of Investments RealEstateRealReturn Strategy Portfolio (Cont.)
(d) Swap agreements outstanding on June 30, 2007:
Interest Rate Swaps
| | | | | | | | | | | | | | | |
| Counterparty | | Floating Rate Index | | Pay/Receive
Floating Rate | | Fixed Rate | | Expiration Date | | Notional
Amount | | Unrealized
Appreciation/
(Depreciation) | |
Deutsche Bank AG | | 6-Month Australian Bank Bill | | Pay | | 6.500% | | 01/15/2010 | | AUD | 100 | | $ | (1 | ) |
Deutsche Bank AG | | 6-Month Australian Bank Bill | | Pay | | 7.000% | | 06/15/2010 | | | 300 | | | 0 | |
BNP Paribas Bank | | 5-Year French CPI Ex Tobacco Daily Reference Index | | Pay | | 1.988% | | 12/15/2011 | | EUR | 100 | | | 0 | |
Goldman Sachs & Co. | | 5-Year French CPI Ex Tobacco Daily Reference Index | | Pay | | 1.976% | | 12/15/2011 | | | 600 | | | (2 | ) |
JPMorgan Chase & Co. | | 5-Year French CPI Ex Tobacco Daily Reference Index | | Pay | | 2.261% | | 07/14/2011 | | | 100 | | | 2 | |
Barclays Bank PLC | | 6-Month GBP-LIBOR | | Pay | | 5.000% | | 06/15/2009 | | GBP | 100 | | | (4 | ) |
Barclays Bank PLC | | 6-Month GBP-LIBOR | | Receive | | 4.000% | | 12/15/2035 | | | 100 | | | 8 | |
Morgan Stanley | | 6-Month JPY-LIBOR | | Pay | | 1.500% | | 06/20/2012 | | JPY | 30,000 | | | (2 | ) |
Deutsche Bank AG | | 3-Month USD-LIBOR | | Pay | | 5.000% | | 12/19/2012 | | $ | 100 | | | 0 | |
Deutsche Bank AG | | 3-Month USD-LIBOR | | Pay | | 5.000% | | 12/19/2017 | | | 100 | | | 1 | |
Deutsche Bank AG | | 3-Month USD-LIBOR | | Pay | | 5.000% | | 12/19/2037 | | | 200 | | | 2 | |
| | | | | | | | | | | | | | | |
| | | | | | | | | | | | | $ | 4 | |
| | | | | | | | | | | | | | | |
Total Return Swaps
| | | | | | | | | | | | | | |
| Counterparty | | Type | | Receive Total Return | | Pay | | Expiration
Date | | # of
Contracts | | Unrealized
Appreciation/
(Depreciation) | |
Credit Suisse First Boston | | Long | | Dow Jones - Wilshire REIT Total Return | | 1-Month USD-LIBOR plus 0.350% | | 02/29/2008 | | 809 | | $ | (496 | ) |
Credit Suisse First Boston | | Short | | Dow Jones - Wilshire REIT Total Return | | 1-Month USD-LIBOR plus 0.350% | | 02/29/2008 | | 18 | | | 11 | |
| | | | | | | | | | | | | | |
| | | | | | | | | | | | $ | (485 | ) |
| | | | | | | | | | | | | | |
(e) Purchased options outstanding on June 30, 2007:
Options on Exchange-Traded Futures Contracts
| | | | | | | | | | | | | |
| Description | | Exercise
Price | | Expiration
Date | | # of
Contracts | | Cost | | Value |
Call - CBOT U.S. Treasury 5-Year Note September Futures | | $ | 106.000 | | 08/24/2007 | | 5 | | $ | 0 | | $ | 0 |
Call - CBOT U.S. Treasury 10-Year Note September Futures | | | 110.000 | | 08/24/2007 | | 5 | | | 0 | | | 0 |
Put - CME 90-Day Eurodollar September Futures | | | 90.500 | | 09/17/2007 | | 8 | | | 0 | | | 0 |
| | | | | | | | | | | | | |
| | | | | | | | | $ | 0 | | $ | 0 |
| | | | | | | | | | | | | |
Options on Securities
| | | | | | | | | | | | | | |
| Description | | Strike
Price | | Expiration
Date | | Notional
Amount | | Cost | | Value |
Put - OTC Fannie Mae 5.500% due 09/01/2037 | | $ | 86.500 | | 09/06/2007 | | $ | 200 | | $ | 0 | | $ | 0 |
Put - OTC Fannie Mae 6.000% due 09/01/2037 | | | 88.000 | | 09/06/2007 | | | 240 | | | 0 | | | 0 |
Put - OTC Treasury Inflation Protected Securities 0.875% due 04/15/2010 | | | 88.000 | | 09/28/2007 | | | 400 | | | 0 | | | 0 |
Put - OTC Treasury Inflation Protected Securities 1.875% due 07/15/2015 | | | 75.000 | | 07/23/2007 | | | 500 | | | 0 | | | 0 |
Put - OTC Treasury Inflation Protected Securities 1.875% due 07/15/2015 | | | 75.000 | | 08/22/2007 | | | 800 | | | 1 | | | 0 |
Put - OTC Treasury Inflation Protected Securities 2.000% due 01/15/2026 | | | 61.000 | | 09/20/2007 | | | 300 | | | 0 | | | 0 |
Put - OTC Treasury Inflation Protected Securities 2.000% due 04/15/2012 | | | 86.000 | | 09/28/2007 | | | 200 | | | 0 | | | 0 |
Put - OTC Treasury Inflation Protected Securities 2.375% due 01/15/2025 | | | 62.700 | | 09/07/2007 | | | 700 | | | 0 | | | 0 |
Put - OTC Treasury Inflation Protected Securities 2.375% due 01/15/2025 | | | 66.000 | | 09/20/2007 | | | 600 | | | 0 | | | 0 |
Put - OTC Treasury Inflation Protected Securities 2.500% due 07/15/2016 | | | 70.531 | | 09/19/2007 | | | 600 | | | 0 | | | 0 |
| | | | | | | | | | | | | | |
| | | | | | | | | | $ | 1 | | $ | 0 |
| | | | | | | | | | | | | | |
(f) Written options outstanding on June 30, 2007:
Options on Exchange-Traded Futures Contracts
| | | | | | | | | | | | | |
| Description | | Exercise
Price | | Expiration
Date | | # of
Contracts | | Premium | | Value |
Call - CBOT U.S. Treasury 10-Year Note September Futures | | $ | 107.000 | | 08/24/2007 | | 2 | | $ | 1 | | $ | 1 |
Call - CBOT U.S. Treasury 10-Year Note September Futures | | | 109.000 | | 08/24/2007 | | 1 | | | 0 | | | 0 |
Put - CBOT U.S. Treasury 10-Year Note September Futures | | | 103.000 | | 08/24/2007 | | 2 | | | 0 | | | 0 |
| | | | | | | | | | | | | |
| | | | | | | | | $ | 1 | | $ | 1 |
| | | | | | | | | | | | | |
(g) Short sales outstanding on June 30, 2007:
| | | | | | | | | | | | | |
| Description | | Coupon | | Maturity
Date | | Principal
Amount | | Proceeds | | Value (1) |
Treasury Inflation Protected Securities | | 2.375% | | 0/15/2011 | | $ | 105 | | $ | 103 | | $ | 104 |
| | | | | | | | | | | | | |
(1) Market value includes $1 of interest payable on short sales.
| | | | |
| 10 | | PIMCO Variable Insurance Trust | | See Accompanying Notes |
| | |
| |
| | | June 30, 2007 (Unaudited) |
(h) Foreign currency contracts outstanding on June 30, 2007:
| | | | | | | | | | | | | | | | | |
| Type | | Currency | | Principal
Amount
Covered by
Contract | | Settlement
Month | | Unrealized
Appreciation | | Unrealized
(Depreciation) | | | Net Unrealized
Appreciation/
(Depreciation) | |
Buy | | BRL | | 17 | | 10/2007 | | $ | 0 | | $ | 0 | | | $ | 0 | |
Sell | | CHF | | 5 | | 09/2007 | | | 0 | | | 0 | | | | 0 | |
Buy | | CNY | | 381 | | 01/2008 | | | 1 | | | 0 | | | | 1 | |
Buy | | | | 440 | | 03/2008 | | | 0 | | | (1 | ) | | | (1 | ) |
Sell | | EUR | | 25 | | 07/2007 | | | 0 | | | 0 | | | | 0 | |
Sell | | GBP | | 18 | | 08/2007 | | | 0 | | | 0 | | | | 0 | |
Sell | | JPY | | 238 | | 07/2007 | | | 0 | | | 0 | | | | 0 | |
Buy | | KRW | | 926 | | 07/2007 | | | 0 | | | 0 | | | | 0 | |
Buy | | | | 7,407 | | 09/2007 | | | 0 | | | 0 | | | | 0 | |
Buy | | MXN | | 76 | | 09/2007 | | | 0 | | | 0 | | | | 0 | |
Buy | | | | 22 | | 03/2008 | | | 0 | | | 0 | | | | 0 | |
Buy | | PLN | | 25 | | 09/2007 | | | 0 | | | 0 | | | | 0 | |
Buy | | RUB | | 233 | | 01/2008 | | | 0 | | | 0 | | | | 0 | |
Buy | | SGD | | 12 | | 07/2007 | | | 0 | | | 0 | | | | 0 | |
Sell | | | | 8 | | 07/2007 | | | 0 | | | 0 | | | | 0 | |
Buy | | | | 2 | | 08/2007 | | | 0 | | | 0 | | | | 0 | |
Buy | | | | 12 | | 10/2007 | | | 0 | | | 0 | | | | 0 | |
| | | | | | | | | | | | | | | | | |
| | | | | | | | $ | 1 | | $ | (1 | ) | | $ | 0 | |
| | | | | | | | | | | | | | | | | |
| | | | | | |
| See Accompanying Notes | | Semiannual Report | | June 30, 2007 | | 11 |
Notes to Financial Statements
1. ORGANIZATION
The RealEstateRealReturn Strategy Portfolio (the “Portfolio”) is a series of the PIMCO Variable Insurance Trust (the “Trust”). The Trust is registered under the Investment Company Act of 1940 (the “Act”), as amended, as an open-end management investment company organized as a Delaware business trust on October 3, 1997. The Portfolio offers one class of shares: Administrative. Information presented on these financial statements pertains to the Administrative Class of the Portfolio. The Trust is designed to be used as an investment vehicle by Separate Accounts of insurance companies that fund variable annuity contracts and variable life insurance policies and by qualified pension and retirement plans.
2. SIGNIFICANT ACCOUNTING POLICIES
The following is a summary of significant accounting policies consistently followed by the Portfolio in the preparation of its financial statements in conformity with accounting principles generally accepted in the United States of America (“GAAP”). The preparation of financial statements in accordance with GAAP requires management to make estimates and assumptions that affect the reported amounts and disclosures on the financial statements. Actual results could differ from those estimates.
(a) Security Valuation Portfolio securities are valued as of the close of regular trading (normally 4:00 p.m., Eastern Time) on each day that the New York Stock Exchange (“NYSE”) is open. Portfolio securities and other assets for which market quotes are readily available are stated at market value. Market value is generally determined on the basis of last reported sales prices, or if no sales are reported, based on quotes obtained from a quotation reporting system, established market makers, or pricing services. Fixed-income securities and non-exchange traded derivatives are normally valued on the basis of quotes obtained from brokers and dealers or pricing services. Prices obtained from independent pricing services use information provided by market makers or estimates of market values obtained from yield data relating to investments or securities with similar characteristics. Certain fixed income securities purchased on a delayed-delivery basis are marked to market daily until settlement at the forward settlement date. Short-term investments having a maturity of 60 days or less are generally valued at amortized cost. Exchange traded options, futures and options on futures are valued at the settlement price determined by the relevant exchange. With respect to any portion of the Portfolio’s assets that are invested in one or more open end management investment companies, the Portfolio’s net asset value (“NAV”) will be calculated based upon the NAVs of such investments.
Investments initially valued in currencies other than the U.S. dollar are converted to the U.S. dollar using exchange rates obtained from pricing services. As a result, the NAV of the Portfolio’s securities may be affected by changes in the value of currencies in relation to the U.S. dollar. The value of securities traded in markets outside the United States or denominated in currencies other than the U.S. dollar may be affected significantly on a day that the NYSE is closed and an investor is not able to purchase, redeem or exchange shares.
Securities and other assets for which market quotes are not readily available are valued at fair value as determined in good faith by the Board of Trustees or persons acting at their direction. The Board of Trustees has adopted methods for valuing securities and other assets in circumstances where market quotes are not readily available, and has delegated to Pacific Investment Management Company LLC (“PIMCO”) the responsibility for applying the valuation methods. In the event that market quotes are not readily available, and the security or asset cannot be valued pursuant to one of the valuation methods, the value of the security or asset will be determined in good faith by the Valuation Committee of the Board of Trustees, generally based upon recommendations provided by PIMCO.
Market quotes are considered not readily available in circumstances where there is an absence of current or reliable market-based data (e.g., trade information, bid/asked information, broker quotes), including where events occur after the close of the relevant market, but prior to the close of regular trading, that materially affect the values of the Portfolio’s securities or assets. In addition, market quotes are considered not readily available when, due to extraordinary circumstances, the exchanges or markets on which the securities trade, do not open for trading for the entire day and no other market prices are available. The Board has delegated to PIMCO the responsibility for monitoring significant events that may materially affect the values of the Portfolio’s securities or assets and for determining whether the value of the applicable securities or assets should be re-evaluated in light of such significant events.
When the Portfolio uses fair value pricing to determine its NAV, securities will not be priced on the basis of quotations from the primary market in which they are traded, but rather may be priced by another method that the Board of Trustees or persons acting at their direction believe accurately reflects fair value. The Trust’s policy is intended to result in a calculation of the Portfolio’s NAV that fairly reflects security values as of the time of pricing. However, fair values determined by the Board of Trustees or persons acting at their direction may not accurately reflect the price that the Portfolio could obtain for a security if it were to dispose of that security as of the time of pricing. Because foreign securities can trade on non-business days of the Portfolio, the NAV of the Portfolio may change on days when shareholders will not be able to purchase or redeem Portfolio shares. The prices used by the Portfolio may differ from the value that would be realized if the securities were sold and the differences could be material to the financial statements.
(b) Securities Transactions and Investment Income Securities transactions are recorded as of the trade date for financial reporting purposes. Securities purchased or sold on a when-issued or delayed-delivery basis may be settled a month or more after the trade date. Realized gains and losses from securities sold are recorded on the identified cost basis. Dividend income is recorded on the ex-dividend date, except certain dividends from foreign securities where the ex-dividend date may have passed, which are recorded as soon as the Portfolio is informed of the ex-dividend date. Interest income, adjusted for the accretion of discounts and amortization of premiums, is recorded on the accrual basis. Paydown gains and losses on mortgage-related and other asset-backed securities are recorded as components of interest income on the Statement of Operations.
(c) Delayed-Delivery Transactions The Portfolio may purchase or sell securities on a delayed-delivery basis. These transactions involve a commitment by the Portfolio to purchase or sell securities for a predetermined price or yield, with payment and delivery taking place beyond the customary settlement period. When delayed-delivery purchases are outstanding, the Portfolio will designate liquid assets in an amount sufficient to meet the purchase price. When purchasing a security on a delayed-delivery basis, the Portfolio assumes the rights and risks of ownership of the security, including the risk of price and yield fluctuations, and takes such fluctuations into account when determining its net asset value. The Portfolio may dispose of or renegotiate a delayed-delivery transaction after it is entered into, and may sell when-issued securities before they are delivered, which may result in a capital gain or loss. When the Portfolio has sold a security on a delayed-delivery basis, the Portfolio does not participate in future gains and losses with respect to the security.
(d) Dividends and Distributions to Shareholders Dividends from net investment income, if any, are declared and distributed to shareholders quarterly. Net realized capital gains earned by the Portfolio, if any, will be distributed no less frequently than once each year.
| | | | |
| 12 | | PIMCO Variable Insurance Trust | | |
| | |
| |
| | | June 30, 2007 (Unaudited) |
Income dividends and capital gain distributions are determined in accordance with income tax regulations which may differ from GAAP. Differences between tax regulations and GAAP may change the fiscal year when income and capital items are recognized for tax and GAAP purposes. Examples of events that give rise to timing differences include wash sales, straddles, net operating losses and capital loss carryforwards. Further, the character of investment income and capital gains may be different for certain transactions under the two methods of accounting. Examples of characterization differences include the treatment of mortgage paydowns, swaps, foreign currency transactions and contingent debt instruments. As a result, income dividends and capital gain distributions declared during a fiscal period may differ significantly from the net investment income and realized capital gain reported on the Portfolio’s annual financial statements presented under GAAP.
Distributions classified as a tax basis return of capital, if any, are reflected on the accompanying Statements of Changes in Net Assets and have been reclassified to paid in capital. In addition, other amounts have been reclassified between undistributed net investment income, accumulated undistributed net realized gains or losses and/or paid in capital to more appropriately conform financial accounting to tax characterizations of dividend distributions.
(e) Foreign Currency The functional and reporting currency for the Portfolio is the U.S. dollar. The market values of foreign securities, currency holdings and other assets and liabilities are translated into U.S. dollars based on the current exchange rates each business day. Fluctuations in the value of currency holdings and other assets and liabilities resulting from changes in exchange rates are recorded as unrealized foreign currency gains or losses. Realized gains or losses and unrealized appreciation or depreciation on investment securities and income and expenses are translated on the respective dates of such transactions. The effects of changes in foreign currency exchange rates on investments in securities are not segregated on the Statement of Operations from the effects of changes in market prices of those securities, but are included with the net realized and unrealized gain or loss on investment securities.
| | | | | | |
|
| Non-U.S. currency symbols utilized throughout the report are defined as follows: |
AUD BRL CHF CNY EUR | | Australian Dollar Brazilian Real Swiss Franc Chinese Yuan Renminbi Euro | | JPY KRW MXN PLN RUB | | Japanese Yen South Korean Won Mexican Peso Polish Zloty Russian Ruble |
| GBP | | Great British Pound | | SGD | | Singapore Dollar |
(f) Foreign Currency Transactions The Portfolio may enter into foreign currency contracts in connection with settling planned purchases or sales of securities, to hedge the currency exposure associated with some or all of the Portfolio’s securities or as a part of an investment strategy. A foreign currency contract is an agreement between two parties to buy and sell a currency at a set price on a future date. The market value of a foreign currency contract fluctuates with changes in foreign currency exchange rates. Foreign currency contracts are marked to market daily and the change in value is recorded by the Portfolio as an unrealized gain or loss. Realized gains or losses equal to the difference between the value of the contract at the time it was opened and the value at the time it was closed are recorded upon delivery or receipt of the currency. These contracts may involve market risk in excess of the unrealized gain or loss reflected on the Statement of Assets and Liabilities. In addition, the Portfolio could be exposed to risk if the counterparties are unable to meet the terms of the contracts or if the value of the currency changes unfavorably to the U.S. dollar.
(g) Futures Contracts The Portfolio may enter into futures contracts. The Portfolio may use futures contracts to manage its exposure to the securities markets or to movements in interest rates and currency values. The primary risks associated with the use of futures contracts are the imperfect correlation between the change in market value of the securities held by the Portfolio and the prices of futures contracts, the possibility of an illiquid market, and the inability of the counterparty to meet the terms of the contract. Futures contracts are valued based upon their quoted daily settlement prices. Upon entering into a futures contract, the Portfolio is required to deposit with its futures broker, an amount of cash or U.S. Government and Agency Obligations in accordance with the initial margin requirements of the broker or exchange. Futures contracts are marked to market daily and an appropriate payable or receivable for the change in value (“variation margin”) is recorded by the Portfolio. Gains or losses are recognized but not considered realized until the contracts expire or are closed. Futures contracts involve, to varying degrees, risk of loss in excess of the variation margin disclosed on the Statement of Assets and Liabilities.
(h) Inflation-Indexed Bonds The Portfolio may invest in inflation-indexed bonds. Inflation-indexed bonds are fixed-income securities whose principal value is periodically adjusted to the rate of inflation. The interest rate on these bonds is generally fixed at issuance at a rate lower than typical bonds. Over the life of an inflation-indexed bond, however, interest will be paid based on a principal value, which is adjusted for inflation. Any increase in the principal amount of an inflation-indexed bond will be included as interest income on the Statement of Operations, even though investors do not receive their principal until maturity.
(i) Options Contracts The Portfolio may write call and put options on futures, swaps, securities or currencies it owns or in which it may invest. Writing put options tends to increase the Portfolio’s exposure to the underlying instrument. Writing call options tends to decrease the Portfolio’s exposure to the underlying instrument. When the Portfolio writes a call or put option, an amount equal to the premium received is recorded as a liability and subsequently marked to market to reflect the current value of the option written. These liabilities are reflected as written options outstanding on the Statement of Assets and Liabilities. Certain options may be written with premiums to be determined on a future date. The premiums for these options are based upon implied volatility parameters at specified terms. Premiums received from writing options which expire are treated as realized gains. Premiums received from writing options which are exercised or closed are added to the proceeds or offset against amounts paid on the underlying future, swap, security or currency transaction to determine the realized gain or loss. The Portfolio as a writer of an option has no control over whether the underlying future, swap, security or currency may be sold (call) or purchased (put) and as a result bears the market risk of an unfavorable change in the price of the future, swap, security or currency underlying the written option. There is the risk the Portfolio may not be able to enter into a closing transaction because of an illiquid market.
The Portfolio may also purchase put and call options. Purchasing call options tends to increase the Portfolio’s exposure to the underlying instrument. Purchasing put options tends to decrease the Portfolio’s exposure to the underlying instrument. The Portfolio pays a premium which is included on the Statement of Assets and Liabilities as an investment and subsequently marked to market to reflect the current value of the option. Premiums paid for purchasing options which expire are treated as realized losses. Certain options may be purchased with premiums to be determined on a future date. The premiums for these options are based upon implied volatility parameters at specified terms. The risk associated with purchasing put and call options is limited to the premium paid. Premiums paid for purchasing options which are exercised or closed are added to the amounts paid or offset against the proceeds on the underlying future, swap, security or currency transaction to determine the realized gain or loss.
| | | | | | |
| | Semiannual Report | | June 30, 2007 | | 13 |
Notes to Financial Statements (Cont.)
(j) Repurchase Agreements The Portfolio may engage in repurchase transactions. Under the terms of a typical repurchase agreement, the Portfolio takes possession of an underlying debt obligation (collateral) subject to an obligation of the seller to repurchase, and the Portfolio to resell, the obligation at an agreed-upon price and time. The underlying securities for all repurchase agreements are held in safekeeping at the Portfolio’s custodian or designated subcustodians under tri-party repurchase agreements. The market value of the collateral must be equal to or exceed the total amount of the repurchase obligations, including interest. Securities purchased under repurchase agreements are reflected as an asset on the Statement of Assets and Liabilities. Generally, in the event of counterparty default, the Portfolio has the right to use the collateral to offset losses incurred. If the counterparty should default, the Portfolio will seek to sell the securities which it holds as collateral. This could involve procedural costs or delays in addition to a loss on the securities if their value should fall below their repurchase price.
(k) Inverse Floating Rate Transactions—Residual Interest Municipal Bonds (“RIBs”)/Residual Interest Tax Exempt Bonds (“RITEs”) The Portfolio may invest in RIBs and RITEs (“Inverse Floaters”). Inverse Floaters are created via a master trust agreement between a broker-dealer, acting as trustor and liquidity provider, and an investment bank, acting as trustee and tender agent. The master trust agreement defines the terms for each trust series; with each series being established by the transfer of long-term, fixed-rate municipal bonds (“Fixed Rate Bonds”) to the trustee to be held and provide for the creation, execution and delivery of floater certificates (“Floating Rate Notes”) and Inverse Floaters. Floating Rate Notes are liquid notes that are issued with a short-term variable rate typically linked to the LIBOR, subject to limitations, for some duration. After interest income is paid on the Floating Rate Notes at current rates, the residual income from the Fixed Rate Bonds is paid to the Inverse Floaters. Inverse Floaters are issued with a coupon that fluctuates inversely with the Floating Rate Notes’ referenced rate, subject to certain limitations. Therefore, rising short-term rates result in lower income for the Inverse Floaters and vice versa.
Floating Rate Notes are generally remarketed to municipal money market funds. Inverse Floaters are acquired by either tax-exempt municipal bond funds or trusts, or other parties interested in potentially higher yielding tax-exempt securities. Inverse Floaters may also be acquired for the purpose of increasing leverage. Floating Rate Note holders typically have the option to tender their notes to the liquidity provider for redemption at par at each reset date. The Inverse Floater holders have the option to (i) require the Floating Rate Note holders to tender their notes at par, and (ii) require the liquidity provider to transfer the Fixed Rate Bonds to the Inverse Floater holders. The holders of Inverse Floaters bear substantially all of the downside investment risk associated with the underlying Fixed Rate Bonds, and also benefit from a disproportionate amount of the potential appreciation of the underlying Fixed Rate Bonds’ value. Inverse Floaters may be more volatile and less liquid than other municipal bonds of comparable maturity.
Inverse Floaters may be acquired with or without first transferring to the trustor the Fixed Rate Bonds that were utilized to create the trust series. Inverse Floaters acquired without a transfer of Fixed Rate Bonds are recognized as purchases of securities as outlined in Note 2(b). Statement of Financial Accounting Standards No. 140—Accounting for Transfers and Servicing of Financial Assets and Extinguishments of Liabilities (“FAS No. 140”), governs the standards for accounting for securitizations and other transfers of financial assets. If there is a transfer of Fixed Rate Bonds and it meets sale criteria under FAS No. 140, a Portfolio records a sale of the Fixed Rate Bonds and a purchase of the Inverse Floaters. The cash received from the Inverse Floaters is then recorded as interest income in the Statement of Operations.
If the transfer of Fixed Rate Bonds does not meet sale criteria under FAS No. 140, a Portfolio accounts for the transaction described above as a secured borrowing by
including the Fixed Rate Bonds in its Schedule of Investments, and recording the Floating Rate Notes as a liability under the caption “Payable for floating rate notes” in the Portfolio’s Statement of Assets and Liabilities. In a secured borrowing transaction, cash received from the Inverse Floaters is not recorded as interest income. Instead, a Portfolio records interest income related to the Fixed Rate Bonds and interest expense related to the Floating Rate Notes, the net of which is equal to the cash received from the Inverse Floaters acquired by the Portfolio. Thus, while a Portfolio’s reported total income, net expenses, and net expense ratio are generally higher for investments in Inverse Floaters acquired via a secured borrowing, the method of acquiring Inverse Floaters does not result in differences for reported cash flows, net asset value or total return.
(l) Short Sales The Portfolio may enter into short sales transactions. A short sale is a transaction in which the Portfolio sells securities it does not own in anticipation of a decline in the market price of the securities. Securities sold in short sale transactions and interest payable on such securities, if any, are reflected as a liability on the Statement of Assets and Liabilities. The Portfolio is obligated to deliver securities at the market price at the time the short position is closed. Possible losses from short sales may be unlimited, whereas losses from purchases cannot exceed the total amount invested.
(m) Swap Agreements The Portfolio may invest in swap agreements. Swap transactions are privately negotiated agreements between the Portfolio and a counterparty to exchange or swap investment cash flows, assets, or market-linked returns at specified, future intervals. The Portfolio may enter into interest rate, total return, forward spread-lock, credit default, and other forms of swap agreements to manage its exposure to interest rates and credit risk. In connection with these agreements, securities may be identified as collateral in accordance with the terms of the respective swap agreements.
Interest rate swap agreements involve the exchange by the Portfolio with another party of their respective commitments to pay or receive interest, e.g., an exchange of floating rate payments for fixed rate payments with respect to the notional amount of principal. Certain forms of interest rate swap agreements may include: (i) interest rate caps, under which, in return for a premium, one party agrees to make payments to the other to the extent that interest rates exceed a specified rate, or “cap”, (ii) interest rate floors, under which, in return for a premium, one party agrees to make payments to the other to the extent that interest rates fall below a specified rate, or “floor”, or (iii) interest rate collars, under which a party sells a cap and purchases a floor or vice versa in an attempt to protect itself against interest rate movements exceeding given minimum or maximum levels.
Total return swap agreements involve commitments to pay interest in exchange for a market-linked return, both based on notional amounts. To the extent the total return of the security or index underlying the transaction exceeds or falls short of the offsetting interest rate obligation, the Portfolio will receive a payment from or make a payment to the counterparty.
Forward spread-lock swap agreements involve commitments to pay or receive a settlement amount calculated as the difference between the swap spread and a fixed spread, multiplied by the notional amount times the duration of the swap. The swap spread is the difference between the benchmark swap rate (market rate) and the specific Treasury rate.
Credit default swap agreements involve one party making a stream of payments to another party in exchange for the right to receive a specified return in the event of a default by a third party, typically corporate issues or sovereign issues of an emerging country, on its obligation. The Portfolio may use credit default swaps to provide a measure of protection against defaults of the issuers (i.e., to reduce risk where the Portfolio owns or has exposure to the sovereign issuer) or to take an active long or short position with respect to the likelihood of a particular issuer’s
| | | | |
| 14 | | PIMCO Variable Insurance Trust | | |
| | |
| |
| | | June 30, 2007 (Unaudited) |
default. As a seller of protection, the Portfolio generally receives an upfront payment or a fixed rate of income throughout the term of the swap provided that there is no credit event. If the Portfolio is a seller of protection and a credit event occurs, as defined under the terms of that particular swap agreement, the Portfolio will pay to the buyer of the protection an amount up to the notional value of the swap and in certain instances take delivery of the security. As the seller, the Portfolio would effectively add leverage to its portfolio because, in addition to its total net assets, the Portfolio would be subject to investment exposure on the notional amount of the swap. As a buyer of protection, the Portfolio generally receives an amount up to the notional value of the swap if a credit event occurs. The treatment of credit default swaps and other swap agreements that provide for contingent, non-periodic, bullet-type payments as “notional principal contracts” for U.S. federal income tax purposes is uncertain. Were the U.S. Internal Revenue Service (“IRS”) to take the position that a credit default swap or other bullet-type swap is not a “notional principal contract” for U.S. federal income tax purposes, payments received by the Portfolio from such investments might be subject to U.S. excise or income taxes.
Swaps are marked to market daily based upon quotations from market makers and the change in value, if any, is recorded as unrealized gain or loss on the Statement of Operations. Payments received or made at the beginning of the measurement period are reflected as such on the Statement of Assets and Liabilities. These upfront payments are recorded as realized gain or loss on the Statement of Operations upon termination or maturity of the swap. A liquidation payment received or made at the termination of the swap is recorded as realized gain or loss on the Statement of Operations. Net periodic payments received or paid by the Portfolio are included as part of realized gain or loss on the Statement of Operations. Entering into these agreements involves, to varying degrees, elements of credit, market and documentation risk in excess of the amounts recognized on the Statement of Assets and Liabilities. Such risks involve the possibility that there will be no liquid market for these agreements, that the counterparty to the agreements may default on its obligation to perform or disagree as to the meaning of contractual terms in the agreements and that there may be unfavorable changes in interest rates.
(n) U.S. Government Agencies or Government-Sponsored Enterprises Securities issued by U.S. Government agencies or government-sponsored enterprises may not be guaranteed by the U.S. Treasury. The Government National Mortgage Association (“GNMA” or “Ginnie Mae”), a wholly owned U.S. Government corporation, is authorized to guarantee, with the full faith and credit of the U.S. Government, the timely payment of principal and interest on securities issued by institutions approved by GNMA and backed by pools of mortgages insured by the Federal Housing Administration or guaranteed by the Department of Veterans Affairs. Government-related guarantors (i.e., not backed by the full faith and credit of the U.S. Government) include the Federal National Mortgage Association (“FNMA” or “Fannie Mae”) and the Federal Home Loan Mortgage Corporation (“FHLMC” or “Freddie Mac”). Pass-through securities issued by FNMA are guaranteed as to timely payment of principal and interest by FNMA but are not backed by the full faith and credit of the U.S. Government. FHLMC guarantees the timely payment of interest and ultimate collection of principal, but its participation certificates are not backed by the full faith and credit of the U.S. Government.
(o) New Accounting Policies In July 2006, the Financial Accounting Standards Board (“FASB”) issued Interpretation No. 48, “Accounting for Uncertainty in Income Taxes—an Interpretation of FASB Statement No. 109” (the “Interpretation”). The Interpretation became effective for the Portfolio on June 29, 2007. Management has evaluated the application of the Interpretation in relation to the Portfolio and has concluded that no single filing position or combination of filing positions identified as uncertain tax positions required the accrual of a tax liability in the accounting records of the Portfolio for the period ending June 30,
2007. Management will monitor all existing filing positions and future filing positions in light of the Interpretation and evaluate the need for any future tax accruals and financial statement disclosures as warranted.
In September 2006, the FASB issued Statement of Financial Accounting Standards No. 157, “Fair Value Measurements” (the “Statement”). The Statement is effective for fiscal years beginning after November 15, 2007 and will require expanded disclosure about fair value measurements, separately for each major category of assets and liabilities, that enables shareholders to assess the inputs used to develop those measurements, and for recurring fair value measurements using significant unobservable inputs the effect of the measurements on changes in net assets for the reporting period. Management is currently evaluating the application of the Statement to the Portfolio and will provide additional information in relation to the Statement on the Portfolio’s annual financial statements for the period ending December 31, 2007.
3. FEES AND EXPENSES
(a) Investment Advisory Fee PIMCO is a majority-owned subsidiary of Allianz Global Investors of America L.P. (“AGI”), and serves as investment adviser (the “Adviser”) to the Trust, pursuant to an investment advisory contract. The Adviser receives a monthly fee from the Portfolio, at an annual rate based on average daily net assets. The Advisory Fee for all classes is charged at an annual rate of 0.49%.
(b) Administration Fee PIMCO serves as administrator (the “Administrator”), and provides administrative services to the Trust for which it receives a monthly administrative fee based on each share class’s average daily net assets. As the Administrator, PIMCO bears the costs of various third-party services, including audit, custodial, portfolio accounting, legal, transfer agency and printing costs. The Administration Fee for all classes is charged at the annual rate of 0.25%.
(c) Distribution and Servicing Fees Allianz Global Investors Distributors LLC (“AGID”) is an indirect wholly-owned subsidiary of AGI and serves as the distributor (the “Distributor”) of the Trust’s shares. The Trust is permitted to reimburse AGID on a quarterly basis, out of the Administrative Class assets of the Portfolio in the amount of 0.15% on an annual basis of the average daily net assets of that class, for payments made to financial intermediaries that provide services in connection with the distribution of shares or administration of plans or programs that use Portfolio shares as their funding medium. The effective rate paid to AGID was 0.15% during the current fiscal year.
(d) Portfolio Expenses The Trust is responsible for the following expenses: (i) salaries and other compensation of any of the Trust’s executive officers and employees who are not officers, directors, stockholders or employees of PIMCO or its subsidiaries or affiliates; (ii) taxes and governmental fees; (iii) brokerage fees and commissions and other portfolio transaction expenses; (iv) the costs of borrowing money, including interest expenses and bank overdraft charges; (v) fees and expenses of the Trustees who are not “interested persons” of PIMCO or the Trust, and any counsel retained exclusively for their benefit; (vi) extraordinary expenses, including costs of litigation and indemnification expenses; (vii) organization expenses and (viii) any expenses allocated or allocable to a specific class of shares, which include service fees payable with respect to the Administrative Class Shares, and may include certain other expenses as permitted by the Trust’s Multiple Class Plan adopted pursuant to Rule 18f-3 under the Act and subject to review and approval by the Trustees. The ratio of expenses to average net assets per share class, as disclosed in the Financial Highlights, may differ from the annual portfolio operating expenses per share class as disclosed in the Prospectus for the reasons set forth above.
Effective April 1, 2007, each Trustee, other than those affiliated with PIMCO or its affiliates, receives an annual retainer of $15,000, plus $2,375 for each Board of
| | | | | | |
| | Semiannual Report | | June 30, 2007 | | 15 |
Notes to Financial Statements (Cont.)
Trustees meeting attended in person, $500 for each committee meeting attended and $750 for each Board of Trustees meeting attended telephonically, plus reimbursement of related expenses. In addition, the audit committee chair receives an additional annual retainer of $2,000 and each other committee chair receives an additional annual retainer of $500. These expenses are allocated on a pro-rata basis to the various portfolios of the Trust according to their respective net assets. The Trust pays no compensation directly to any Trustee or any other officer who is affiliated with the Administrator, all of whom receive remuneration for their services to the Trust from the Administrator or its affiliates. Prior to April 1, 2007, each Trustee, other than those affiliated with PIMCO or its affiliates, received an annual retainer of $15,000 plus $2,000 for each Board of Trustees meeting attended ($500 for each special meeting attended), plus reimbursement of related expenses. The Audit Committee Chairman received an annual retainer of $1,500 and the Governance Committee Chairman received an annual retainer of $500. In addition, each member of a committee received $500 for each committee meeting attended.
(e) Expense Limitation PIMCO has contractually agreed to reduce total annual portfolio operating expenses for the Portfolio by waiving a portion of its administrative fee or reimbursing the Portfolio, to the extent that they would exceed, due to the payment of organizational expenses and pro rata Trustees’ fees, the sum of such Portfolio’s advisory fee, service fees, distribution fees (with respect to Advisor Class only), administrative fees and other expenses borne by the Portfolio not covered by the administrative fee as described above (other than organizational expenses and pro rata Trustees’ fees), plus 0.49 basis points. PIMCO may recoup these waivers and reimbursements for a period not exceeding three years, provided that total expenses, including such recoupment, do not exceed the annual expense limit. As of June 30, 2007, the recoverable amount to the Administrator was $20,992.
4. RELATED PARTY TRANSACTIONS
The Adviser, Administrator, and Distributor are related parties as defined by FAS 57, Related Party Disclosures. Fees payable to these parties are disclosed in Note 3.
5. GUARANTEES AND INDEMNIFICATIONS
Under the Trust’s organizational documents, each Trustee, officer, employee or other agent of the Trust (including the Trust’s investment manager) is indemnified, to the extent permitted by the Act, against certain liabilities that may arise out of performance of their duties to the Portfolio. Additionally, in the normal course of business, the Portfolio enters into contracts that contain a variety of indemnification clauses. The Portfolio’s maximum exposure under these arrangements is unknown as this would involve future claims that may be made against the Portfolio that have not yet occurred. However, the Portfolio has not had prior claims or losses pursuant to these contracts and believes the risk of loss to be remote.
6. PURCHASES AND SALES OF SECURITIES
The length of time the Portfolio has held a particular security is not generally a consideration in investment decisions. A change in the securities held by the Portfolio is known as “portfolio turnover”. The Portfolio may engage in frequent and active trading of portfolio securities to achieve its investment objective, particularly during periods of volatile market movements. High portfolio turnover (e.g., over 100%) involves correspondingly greater expenses to the Portfolio, including brokerage commissions or dealer mark-ups and other transaction costs on the sale of securities and reinvestments in other securities. Such sales may also result in realization of taxable capital gains, including short-term capital gains (which are generally taxed at ordinary income tax rates). The trading costs and tax
effects associated with portfolio turnover may adversely affect the Portfolio’s performance.
Purchases and sales of securities (excluding short-term investments) for the period ended June 30, 2007, were as follows (amounts in thousands):
| | | | | | | | | | | | |
| U.S. Government/Agency | | | | All Other |
| Purchases | | Sales | | | | Purchases | | Sales |
| $ | 37,196 | | $ | 37,015 | | | | $ | 0 | | $ | 0 |
7. TRANSACTIONS IN WRITTEN CALL AND PUT OPTIONS
Transactions in written call and put options were as follows (amounts in thousands, except for number of contracts):
| | | | | | | | | |
| | | | | # of
Contracts | | | Premium | |
Balance at 12/31/2006 | | | | 0 | | | $ | 0 | |
Sales | | | | 13 | | | | 3 | |
Closing Buys | | | | (6 | ) | | | (2 | ) |
Expirations | | | | (2 | ) | | | 0 | |
Exercised | | | | 0 | | | | 0 | |
Balance at 06/30/2007 | | | | 5 | | | $ | 1 | |
8. SHARES OF BENEFICIAL INTEREST
The Portfolio may issue an unlimited number of shares of beneficial interest with a $0.001 par value. Changes in shares of beneficial interest were as follows (shares and amounts in thousands):
| | | | | | | | | | | | | | | | |
| | | | | Six Months Ended
06/30/2007 | | | Year Ended
12/31/2006 | |
| | | | | Shares | | | Amount | | | Shares | | | Amount | |
| | | | | |
Receipts for shares sold | | | | | | | | | | | | | | | | |
Administrative Class | | | | 92 | | | $ | 1,116 | | | 68 | | | $ | 816 | |
Issued as reinvestment of distributions | | | | | | | | | | | | | | | | |
Administrative Class | | | | 33 | | | | 372 | | | 21 | | | | 246 | |
Cost of shares redeemed | | | | | | | | | | | | | | | | |
Administrative Class | | | | (43 | ) | | | (525 | ) | | (26 | ) | | | (317 | ) |
Net increase resulting from Portfolio share transactions | | | | 82 | | | $ | 963 | | | 63 | | | $ | 745 | |
The following schedule shows the number of shareholders each owning 5% or more of the Portfolio and the total percentage of the Portfolio held by such shareholders:
| | | | | | |
| | | | | Number of Shareholders | | % of Portfolio
Held |
Administrative Class | | | | 2 | | 100 |
9. REGULATORY AND LITIGATION MATTERS
Since February 2004, PIMCO, Allianz Global Investors of America L.P. (PIMCO’s parent company), AGID, and certain of their affiliates, including the PIMCO Funds (another series of funds managed by PIMCO), the Allianz Funds (formerly known as PIMCO Funds: Multi-Manager Series (another series of funds managed by affiliates of PIMCO)), certain Trustees of the Trust (in their capacity as Trustees of the PIMCO Funds or the Allianz Funds) and certain employees of PIMCO, have been named as defendants in fifteen lawsuits filed in various jurisdictions. Eleven of those lawsuits concern “market timing,” and they have been transferred to and
| | | | |
| 16 | | PIMCO Variable Insurance Trust | | |
| | |
| |
| | | June 30, 2007 (Unaudited) |
consolidated for pre-trial proceedings in a multi-district litigation proceeding in the U.S. District Court for the District of Maryland; the other four lawsuits concern “revenue sharing” and have been consolidated into a single action in the U.S. District Court for the District of Connecticut. The lawsuits have been commenced as putative class actions on behalf of investors who purchased, held or redeemed shares of the various series of the PIMCO Funds and the Allianz Funds during specified periods, or as derivative actions on behalf of the PIMCO Funds and the Allianz Funds.
The market timing actions in the District of Maryland generally allege that certain hedge funds were allowed to engage in “market timing” in certain funds of the PIMCO Funds and the Allianz Funds and this alleged activity was not disclosed. Pursuant to tolling agreements entered into with the derivative and class action plaintiffs, PIMCO, certain PIMCO Funds Trustees, and certain employees of PIMCO who were previously named as defendants have all been dropped as defendants in the market timing actions; the plaintiffs continue to assert claims on behalf of the shareholders of the PIMCO Funds or on behalf of the PIMCO Funds itself against other defendants. By order dated November 3, 2005, the U.S. District Court for the District of Maryland granted the PIMCO Funds’ motion to dismiss claims asserted against it in a consolidated amended complaint where the PIMCO Funds were named, in the complaint, as a nominal defendant. The revenue sharing action in the District of Connecticut generally alleges that fund assets were inappropriately used to pay brokers to promote funds of the PIMCO Funds and the Allianz Funds, including directing fund brokerage transactions to such brokers, and that such alleged arrangements were not fully disclosed to shareholders. On August 11, 2005, the U.S. District Court for the District of Connecticut conducted a hearing on defendants’ motion to dismiss the consolidated amended complaint in the revenue sharing action but has not yet ruled on the motion to dismiss. The market timing and revenue sharing lawsuits seek, among other things, unspecified compensatory damages plus interest and, in some cases, punitive damages, the rescission of investment advisory contracts, the return of fees paid under those contracts and restitution.
Two nearly identical class action civil complaints have been filed in August 2005, in the Northern District of Illinois Eastern Division, alleging that the plaintiffs each purchased and sold a 10-year Treasury note futures contract and suffered damages from an alleged shortage when PIMCO held both physical and futures positions in 10-year Treasury notes for its client accounts. The two actions have been consolidated into one action, and the two separate complaints have been replaced by a consolidated complaint. PIMCO is a named defendant, and PIMCO Funds has been added as a defendant, to the consolidated action. PIMCO strongly believes the complaint is without merit and intends to vigorously defend itself.
In April 2006, certain portfolios of the Trust and certain other funds managed by PIMCO were served in an adversary proceeding brought by the Official Committee
of Asbestos Claimants of G-I Holdings, Inc. in G-I Holdings, Inc.’s bankruptcy in the District of New Jersey. In July 2004, PIMCO was named in this lawsuit and remains a defendant. The plaintiff seeks to recover for the bankruptcy estate assets that were transferred by the predecessor entity of G-I Holdings, Inc. to a wholly-owned subsidiary in 1994. The subsidiary has since issued notes, of which certain portfolios of the Trust and certain other funds managed by PIMCO are alleged to be holders. The complaint alleges that in 2000, more than two hundred noteholders—including certain portfolios of the Trust and certain other funds managed by PIMCO—were granted a second priority lien on the assets of the subsidiary in exchange for their consent to a refinancing transaction and the granting of a first priority lien to the lending banks. The plaintiff is seeking invalidation of the lien in favor of the noteholders and/or the value of the lien. On June 21, 2006, the District of New Jersey overturned the Bankruptcy Court’s decision granting permission to file the adversary proceeding and remanded the matter to the Bankruptcy Court for further proceedings. Following a motion to reconsider, the District Court upheld its remand on August 7, 2006, and instructed the Bankruptcy Court to conduct a “cost-benefit” analysis of the Committee’s claims, including the claims against the noteholders. The Bankruptcy Court held a status conference on October 25, 2006 and set a briefing schedule relating to this cost-benefit analysis.
The foregoing speaks only as of the date of this report. It is possible that these matters and/or other developments resulting from these matters could result in increased portfolio redemptions or other adverse consequences to the Portfolio. However, PIMCO and AGID believe that these matters are not likely to have a material adverse effect on the Portfolio or on PIMCO’s or AGID’s ability to perform their respective investment advisory or distribution services relating to the Portfolio.
10. FEDERAL INCOME TAX MATTERS
The Portfolio intends to qualify as a regulated investment company under sub-chapter M of the Internal Revenue Code (the “Code”) and distribute all of its taxable income and net realized gains, if applicable, to shareholders. Accordingly, no provision for Federal income taxes has been made.
As of June 30, 2007, the aggregate cost of investments was the same for federal income tax and financial statement purposes. The net unrealized appreciation (depreciation) of investment securities for federal income tax purposes is as follows (amount in thousands):
| | | | |
Aggregate
Gross
Unrealized
Appreciation | | Aggregate
Gross
Unrealized
(Depreciation) | | Net
Unrealized
Appreciation |
$ 35 | | $ (5) | | $ 30 |
| | | | | | |
| | Semiannual Report | | June 30, 2007 | | 17 |
| | |
| |
Privacy Policy* | | (Unaudited) |
The Funds consider customer privacy to be a fundamental aspect of their relationships with shareholders and are committed to maintaining the confidentiality, integrity and security of their current, prospective and former shareholders’ personal information. To ensure their shareholders’ privacy, the Funds have developed policies that are designed to protect this confidentiality, while allowing shareholder needs to be served.
Obtaining Personal Information
In the course of providing shareholders with products and services, the Funds and certain service providers to the Funds, such as the Funds’ investment advisers (“Advisers”), may obtain non-public personal information about shareholders, which may come from sources such as account applications and other forms, from other written, electronic or verbal correspondence, from shareholder transactions, from a shareholder’s brokerage or financial advisory firm, financial adviser or consultant, and/or from information captured on the Funds’ internet web sites.
Respecting Your Privacy
As a matter of policy, the Funds do not disclose any personal or account information provided by shareholders or gathered by the Funds to non-affiliated third parties, except as required or permitted by law or as necessary for such third parties to perform their agreements with respect to the Funds. As is common in the industry, non-affiliated companies may from time to time be used to provide certain services, such as preparing and mailing prospectuses, reports, account statements and other information, conducting research on shareholder satisfaction and gathering shareholder proxies. A Fund’s Distributor may also retain non-affiliated companies to market the Fund’s shares or products which use the Fund’s shares and enter into joint marketing agreements with other companies. These companies may have access to a shareholder’s personal and account information, but are permitted to use this information solely to provide the specific service or as otherwise permitted by law. In most cases, the shareholders will be clients of a third party, but the Funds may also provide a shareholder’s personal and account information to the shareholder’s respective brokerage or financial advisory firm.
Sharing Information with Third Parties
The Funds reserve the right to disclose or report personal information to non-affiliated third parties, in limited circumstances, where the Funds believe in good faith that disclosure is required under law to cooperate with regulators or law enforcement authorities, to protect their rights or property or upon reasonable request by any Fund in which a shareholder has chosen to invest. In addition, the Funds may disclose information about a shareholder’s accounts to a non-affiliated third party with the consent of the shareholder.
Sharing Information with Affiliates
The Funds may share shareholder information with their affiliates in connection with servicing their shareholders’ accounts or to provide shareholders with information about products and services that the Funds or their Advisers, principal underwriters or their affiliates (“Service Affiliates”) believe may be of interest to such shareholders. The information that the Funds share may include, for example, a shareholder’s participation in one of the Funds or in other investment programs sponsored by a Service Affiliate, a shareholder’s ownership of certain types of accounts (such as IRAs), or other data about a shareholder’s accounts. The Funds’ Service Affiliates, in turn, are not permitted to share shareholder information with non-affiliated entities, except as required or permitted by law.
Procedures to Safeguard Private Information
The Funds take seriously the obligation to safeguard shareholder non-public personal information. In addition to this policy, the Funds have also implemented procedures that are designed to restrict access to a shareholder’s non-public personal information only to internal personnel who need to know that information in order to provide products or services to such shareholders. In order to guard a shareholder’s non-public personal information, physical, electronic and procedural safeguards are in place.
* This Privacy Policy applies to the following entities: PIMCO Funds, PIMCO Variable Insurance Trust, PCM Fund, Inc. and PIMCO Strategic Global Government Fund, Inc. (collectively, the “Funds”).
| | | | |
| 18 | | PIMCO Variable Insurance Trust | | |
Investment Adviser and Administrator
Pacific Investment Management Company LLC
840 Newport Center Drive
Newport Beach, California 92660
Distributor
Allianz Global Investors Distributors LLC
1345 Avenue of the Americas
New York, New York 10105
Custodian
State Street Bank & Trust Company
801 Pennsylvania
Kansas City, Missouri 64105
Transfer Agent
Boston Financial Data Services–Midwest
330 W. 9th Street
Kansas City, Missouri 64105
Legal Counsel
Dechert LLP
1775 I Street, N.W.
Washington, D.C. 20006
Independent Registered Public Accounting Firm
PricewaterhouseCoopers LLP
1055 Broadway
Kansas City, Missouri 64105
P I M C O

Table of Contents
This material is authorized for use only when preceded or accompanied by the current PIMCO Variable Insurance Trust (the “Trust”) prospectus. Investors should consider the investment objectives, risks, charges and expenses of this Trust carefully before investing. Ask your financial professional to explain all charges that may apply. This and other information is contained in the Trust’s prospectus. The variable product prospectus may be obtained by contacting your Investment Consultant. Please read the Trust and variable product prospectus carefully before you invest or send money.
Chairman’s Letter
Dear PIMCO Variable Insurance Trust Shareholder:
It is our pleasure to present to you the semiannual report for the PIMCO Variable Insurance Trust, covering the six-month period ended June 30, 2007. The PIMCO Variable Insurance Trust’s net assets were $8.68 billion at June 30, 2007, as compared to $7.76 billion at December 31, 2006.
Highlights of the financial markets during the reporting period include:
| | n | | Economic data during the first quarter of 2007 pointed to slower growth, which heightened market expectations for a decrease in the Federal Funds Rate. By the second quarter, economic data, such as employment statistics, provided little indication of economic weakness, causing expectations of a decrease in the Federal Funds Rate to unwind and U.S. interest rates to move higher. Interest rates in Europe and the U.K. also rose over the period as central banks raised their key lending rates due to inflation concerns. The benchmark ten-year U.S. Treasury yielded 5.03% as of June 30, 2007, or 0.32% higher than at the beginning of the year. |
| | n | | Most bonds generally returned much of their gains from earlier in the year as worldwide growth and capital flows drove interest rates higher in the second quarter. Increased risk aversion in global financial markets, due in part to subprime mortgage worries in the U.S., also contributed to the rise in interest rates. The Lehman Brothers Aggregate Bond Index, which includes Treasury, investment-grade corporate and mortgage-backed securities, returned 0.98% for the six-month period. |
| | n | | Locally issued emerging market (“EM”) bonds posted positive returns for the reporting period. Yields on these bonds declined and the local currencies in which they are denominated generally gained, amid increasing investor awareness, strong economic growth and surging capital inflows. External EM bonds (debt instruments issued by emerging markets countries and typically denominated in U.S. dollars) lagged behind local EM bonds (debt instruments issued by emerging markets countries and denominated in the currency of the issuer), as external EM bonds tend to trade more in-line with U.S. Treasuries. |
| | n | | Treasury Inflation-Protected Securities (“TIPS”) outpaced nominal bonds (non-inflation linked bonds) for the first part of the year and all but the longest maturity TIPS outperformed in the second quarter as high gasoline prices drove higher inflation accruals. Commodities, as represented by the Dow Jones-AIG Commodity Total Return Index, returned 4.46% for the period. Equities, as measured by the S&P 500 Index and the Russell 2000 Index, returned 6.96% and 6.45%, respectively, for the period. |
On the following pages, please find specific details as to the Portfolio’s total return investment performance and a discussion of those factors that affected performance.
Thank you for the trust you have placed in us. We will continue to work diligently to serve your investment needs.
Sincerely,
Brent R. Harris
Chairman, PIMCO Variable Insurance Trust
July 31, 2007
| | | | | | |
| | Semiannual Report | | June 30, 2007 | | 1 |
Important Information About the Portfolio
PIMCO Variable Insurance Trust (the “Trust”) is an open-end management investment company currently consisting of twenty separate investment portfolios, including the Short-Term Portfolio (the “Portfolio”). The Portfolio is only available as a funding vehicle under variable life insurance policies or variable annuity contracts issued by insurance companies (“Variable Contracts”). Individuals may not purchase shares of the Portfolio directly. Shares of the Portfolio also may be sold to qualified pension and retirement plans outside of the separate account context.
We believe that bond funds have an important role to play in a well diversified investment portfolio. It is important to note, however, that in an environment where interest rates may trend upward, rising rates would negatively impact the performance of most bond funds, and fixed-income securities held by a fund are likely to decrease in value. The price volatility of fixed-income securities can also increase during periods of rising interest rates resulting in increased losses to a fund. Bond funds and individual bonds with a longer duration (a measure of the expected life of a security) tend to be more sensitive to changes in interest rates, usually making them more volatile than securities or funds with shorter durations.
The Portfolio may be subject to various risks in addition to those described above. Some of these risks may include, but are not limited to, the following: credit risk, high yield risk, market risk, issuer risk, derivatives risk, mortgage risk, non-U.S. investment risk, currency risk, leveraging risk and management risk. A complete description of these risks is contained in the Portfolio’s prospectus. The Portfolio may use derivative instruments for hedging purposes or as part of an investment strategy. Use of these instruments may involve certain costs and risks such as liquidity risk, interest rate risk, market risk, credit risk, management risk and the risk that the Portfolio could not close out a position when it would be most advantageous to do so. Because the Portfolio may invest in derivatives, it could lose more than the principal amount invested in these instruments. Investing in non-U.S. securities may entail risk due to non-U.S. economic and political developments.
On the performance summary page in this Semiannual Report, the Total Return Investment Performance table measures performance assuming that all dividend and capital gain distributions were reinvested.
An investment in the Portfolio is not a deposit of a bank and is not guaranteed or insured by the Federal Deposit Insurance Corporation or any other government agency. It is possible to lose money on investments in the Portfolio.
PIMCO has adopted written proxy voting policies and procedures (“Proxy Policy”) as required by Rule 206(4)-6 under the Investment Advisers Act of 1940, as amended. The Proxy Policy has been adopted by the Trust as the policies and procedures that PIMCO will use when voting proxies on behalf of the Portfolio. A description of the policies and procedures that PIMCO uses to vote proxies relating to portfolio securities of the Portfolio, and information about how the Portfolio voted proxies relating to portfolio securities held during the most recent twelve-month period ended June 30, are available without charge, upon request, by calling the Trust at 1-866-746-2606 and on the Portfolio’s website at www.pimco.com.
The Portfolio files its complete schedule of portfolio holdings with the SEC for the first and third quarters of each fiscal year on Form N-Q. A copy of the Trust’s Form N-Q is also available on the SEC’s website at http://www.sec.gov and may be reviewed and copied at the SEC’s Public Reference Room in Washington D.C. Information on the operation of the Public Reference Room may be obtained by calling 1-800-SEC-0330, and is available without charge, upon request, by calling the Trust at 1-866-746-2606 and on the Portfolio’s website at www.pimco.com.
PIMCO Variable Insurance Trust is distributed by Allianz Global Investors Distributors LLC, 1345 Avenue of the Americas, New York, NY 10105.
| | | | |
| 2 | | PIMCO Variable Insurance Trust | | |
The following disclosure provides important information regarding the Portfolio’s Expense Example (“Example” or “Expense Example”), which appears in this Semiannual Report. Please refer to this information when reviewing the Expense Example for the Portfolio.
Example
As a shareholder of the Portfolio, you incur two types of costs: (1) transaction costs and (2) ongoing costs, including advisory and administrative fees; distribution and/or service (12b-1) fees (Administrative Class only); and other Portfolio expenses. The Example is intended to help you understand your ongoing costs (in dollars) of investing in the Portfolio and to compare these costs with the ongoing costs of investing in other mutual funds. The Expense Example does not reflect any fees or other expenses imposed by the Variable Contracts. If it did, the expenses reflected in the Expense Example would be higher. The Example is based on an investment of $1,000 invested at the beginning of the period and held for the entire period indicated, which is from January 1, 2007 to June 30, 2007.
Actual Expenses
The information in the table under the heading “Actual Performance” provides information about actual account values and actual expenses. You may use the information in these columns, together with the amount you invested, to estimate the expenses that you paid over the period. Simply divide your account value by $1,000 (for example, an $8,600 account value divided by $1,000 = $8.60), then multiply the result by the number in the row titled “Expenses Paid During Period” to estimate the expenses you paid on your account during this period.
Hypothetical Example for Comparison Purposes
The information in the table under the heading “Hypothetical Performance (5% return before expenses)” provides information about hypothetical account values and hypothetical expenses based on the Portfolio’s actual expense ratio and an assumed rate of return of 5% per year before expenses, which is not the Portfolio’s actual return. The hypothetical account values and expenses may not be used to estimate the actual ending account balance or expenses you paid for the period. You may use this information to compare the ongoing costs of investing in the Portfolio and other portfolios. To do so, compare this 5% hypothetical example with the 5% hypothetical examples that appear in the shareholder reports of the other portfolios.
Please note that the expenses shown in the table are meant to highlight your ongoing costs only and do not reflect any transactional costs. Therefore, the information under the heading “Hypothetical Performance (5% return before expenses)” is useful in comparing ongoing costs only, and will not help you determine the relative total costs of owning different portfolios. In addition, if these transactional costs were included, your costs would have been higher.
The expense ratio may vary period to period because of various factors, such as an increase in expenses not covered by the advisory and administrative fees (such as expenses of the trustees and their counsel, litigation expense and interest expense).
| | | | | | |
| | Semiannual Report | | June 30, 2007 | | 3 |
PIMCO Short-Term Portfolio
Cumulative Returns Through June 30, 2007
$10,000 invested at the beginning of the first full month following the inception date of the Portfolio’s Administrative Class.
Allocation Breakdown‡
| | |
Short-Term Instruments | | 39.7% |
U.S. Government Agencies | | 21.4% |
Corporate Bonds & Notes | | 17.1% |
Asset-Backed Securities | | 12.9% |
Mortgage-Backed Securities | | 8.4% |
Other | | 0.5% |
| | ‡ | % of Total Investments as of 06/30/2007 |
| | | | | | | | | | |
| Average Annual Total Return for the period ended June 30, 2007 |
| | | | | 6 Months* | | 1 Year | | 5 Years | | Portfolio
Inception
(09/30/99) |
| | PIMCO Short-Term Portfolio Administrative Class | | 1.96% | | 4.52% | | 2.79% | | 3.77% |
| | Citigroup 3-Month Treasury Bill Index± | | 2.49% | | 5.06% | | 2.67% | | 3.29% |
All Portfolio returns are net of fees and expenses.
* Cumulative return.
Performance quoted represents past performance. Past performance is no guarantee of future results. Investment return and principal value will fluctuate so the Portfolio shares, when redeemed, may be worth more or less than their original cost. The Portfolio’s performance does not reflect the deduction of additional charges and expenses imposed in connection with investing in Variable Contracts, which will reduce returns. Current performance may be lower or higher than the performance data quoted. Performance data current to the most recent month-end is available by calling (800) 927-4648.
± Citigroup 3-Month Treasury Bill Index is an unmanaged index representing monthly return equivalents of yield averages of the last 3 month Treasury Bill issues. It is not possible to invest directly in the index. The index does not reflect deductions for fees and expenses.
| | | | | | |
| Expense Example | | Actual Performance | | Hypothetical Performance |
| | | | | (5% return before expenses) |
Beginning Account Value (01/01/07) | | $ | 1,000.00 | | $ | 1,000.00 |
Ending Account Value (06/30/07) | | $ | 1,019.60 | | $ | 1,021.82 |
Expenses Paid During Period† | | $ | 3.00 | | $ | 3.01 |
† Expenses are equal to the Portfolio’s Administrative Class annualized expense ratio of 0.60%, multiplied by the average account value over the period, multiplied by 181/365 (to reflect the one-half year period). Overall fees and expenses of investing in the Portfolio will be higher because the example does not reflect Variable Contract fees and expenses.
Please refer to page 3 herein for an explanation of the information presented in the above Expense Example.
Portfolio Insights
| » | | The PIMCO Short-Term Portfolio seeks to achieve its investment objective by investing under normal circumstances at least 65% of its total assets in a diversified portfolio of fixed-income instruments of varying maturities, which may be represented by forwards or derivatives, such as options, futures contracts or swap agreements. |
| » | | U.S. duration exposure, with emphasis at the front end of the yield curve, was the primary detractor from performance as U.S. interest rates trended higher during the first half of 2007. |
| » | | Curve steepening strategies enhanced performance as the U.S. Treasury yield curve steepened during the period. |
| » | | Positions at the front end of the U.K. and the European yield curves detracted from returns as central banks raised interest rates during the period. |
| » | | Exposure to credit sensitive assets, such as mortgages, emerging markets and positive swap spread exposure, detracted from performance as spreads widened. |
| | | | |
| 4 | | PIMCO Variable Insurance Trust | | |
Financial Highlights Short-Term Portfolio
| | | | | | | | | | | | | | | | | | | | | | | | |
| Selected per Share Data for the Year or Period Ended: | | 06/30/2007+ | | | 12/31/2006 | | | 12/31/2005 | | | 12/31/2004 | | | 12/31/2003 | | | 12/31/2002 | |
| | | | | | |
Administrative Class | | | | | | | | | | | | | | | | | | | | | | | | |
Net asset value beginning of year or period | | $ | 10.04 | | | $ | 10.05 | | | $ | 10.08 | | | $ | 10.10 | | | $ | 10.08 | | | $ | 10.08 | |
Net investment income (a) | | | 0.24 | | | | 0.44 | | | | 0.28 | | | | 0.12 | | | | 0.13 | | | | 0.28 | |
Net realized/unrealized gain (loss) on investments (a) | | | (0.04 | ) | | | (0.02 | ) | | | (0.03 | ) | | | 0.01 | | | | 0.07 | | | | 0.02 | |
Total income from investment operations | | | 0.20 | | | | 0.42 | | | | 0.25 | | | | 0.13 | | | | 0.20 | | | | 0.30 | |
Dividends from net investment income | | | (0.24 | ) | | | (0.43 | ) | | | (0.28 | ) | | | (0.13 | ) | | | (0.17 | ) | | | (0.29 | ) |
Distributions from net realized capital gains | | | 0.00 | | | | 0.00 | | | | 0.00 | | | | (0.02 | ) | | | (0.01 | ) | | | (0.01 | ) |
Total distributions | | | (0.24 | ) | | | (0.43 | ) | | | (0.28 | ) | | | (0.15 | ) | | | (0.18 | ) | | | (0.30 | ) |
Net asset value end of year or period | | $ | 10.00 | | | $ | 10.04 | | | $ | 10.05 | | | $ | 10.08 | | | $ | 10.10 | | | $ | 10.08 | |
Total return | | | 1.96 | % | | | 4.27 | % | | | 2.52 | % | | | 1.30 | % | | | 2.05 | % | | | 3.02 | % |
Net assets end of year or period (000s) | | $ | 10,539 | | | $ | 9,211 | | | $ | 8,186 | | | $ | 8,274 | | | $ | 5,948 | | | $ | 4,340 | |
Ratio of expenses to average net assets | | | 0.60 | %* | | | 0.60 | % | | | 0.60 | % | | | 0.60 | % | | | 0.60 | % | | | 0.60 | %(b) |
Ratio of expenses to average net assets excluding interest expense | | | 0.60 | %* | | | 0.60 | % | | | 0.60 | % | | | 0.60 | % | | | 0.60 | % | | | 0.60 | %(b) |
Ratio of net investment income to average net assets | | | 4.80 | %* | | | 4.40 | % | | | 2.77 | % | | | 1.18 | % | | | 1.33 | % | | | 2.81 | % |
Portfolio turnover rate | | | 88 | % | | | 111 | % | | | 154 | % | | | 251 | % | | | 199 | % | | | 60 | % |
+ Unaudited
* Annualized
(a) Per share amounts based on average number of shares outstanding during the period.
(b) If the investment manager had not reimbursed expenses, the ratio of average net assets would have been 0.61%.
| | | | | | |
| See Accompanying Notes | | Semiannual Report | | June 30, 2007 | | 5 |
Statement of Assets and Liabilities Short-Term Portfolio
| | | | |
| (Amounts in thousands, except per share amounts) | | June 30, 2007 | |
| | | (Unaudited) | |
| |
Assets: | | | | |
Investments, at value | | $ | 22,881 | |
Cash | | | 3 | |
Foreign currency, at value | | | 65 | |
Receivable for investments sold | | | 489 | |
Receivable for Portfolio shares sold | | | 75 | |
Interest and dividends receivable | | | 80 | |
Swap premiums paid | | | 49 | |
Unrealized appreciation on foreign currency contracts | | | 18 | |
| | | | 23,660 | |
| |
Liabilities: | | | | |
Payable for investments purchased | | $ | 994 | |
Payable for investments purchased on a delayed-delivery basis | | | 400 | |
Payable for Portfolio shares redeemed | | | 7 | |
Payable for short sales | | | 494 | |
Written options outstanding | | | 5 | |
Accrued investment advisory fee | | | 4 | |
Accrued administration fee | | | 4 | |
Accrued servicing fee | | | 1 | |
Variation margin payable | | | 7 | |
Unrealized depreciation on foreign currency contracts | | | 7 | |
Unrealized depreciation on swap agreements | | | 32 | |
| | | | 1,955 | |
| |
Net Assets | | $ | 21,705 | |
| |
Net Assets Consist of: | | | | |
Paid in capital | | $ | 21,926 | |
Undistributed net investment income | | | 47 | |
Accumulated undistributed net realized (loss) | | | (124 | ) |
Net unrealized (depreciation) | | | (144 | ) |
| | | $ | 21,705 | |
| |
Net Assets: | | | | |
Institutional Class | | $ | 11,166 | |
Administrative Class | | | 10,539 | |
| |
Shares Issued and Outstanding: | | | | |
Institutional Class | | | 1,117 | |
Administrative Class | | | 1,054 | |
| |
Net Asset Value and Redemption Price Per Share (Net Asset Per Share Outstanding) | | | | |
Institutional Class | | $ | 10.00 | |
Administrative Class | | | 10.00 | |
| |
Cost of Investments Owned | | $ | 22,946 | |
Cost of Foreign Currency Held | | $ | 65 | |
Proceeds Received on Short Sales | | $ | 483 | |
Premiums Received on Written Options | | $ | 12 | |
| | | | |
| 6 | | PIMCO Variable Insurance Trust | | See Accompanying Notes |
Statement of Operations Short-Term Portfolio
| | | | |
| (Amounts in thousands) | | Six Months Ended
June 30, 2007 | |
| | | (Unaudited) | |
| |
| Investment Income: | | | | |
Interest | | $ | 610 | |
Dividends | | | 2 | |
Total Income | | | 612 | |
| |
Expenses: | | | | |
Investment advisory fees | | | 28 | |
Administration fees | | | 23 | |
Servicing fees – Administrative Class | | | 7 | |
Total Expenses | | | 58 | |
| |
Net Investment Income | | | 554 | |
| |
Net Realized and Unrealized Gain (Loss): | | | | |
Net realized (loss) on investments | | | (24 | ) |
Net realized gain on futures contracts, written options and swaps | | | 93 | |
Net realized (loss) on foreign currency transactions | | | (16 | ) |
Net change in unrealized (depreciation) on investments | | | (60 | ) |
Net change in unrealized (depreciation) on futures contracts, written options and swaps | | | (97 | ) |
Net change in unrealized appreciation on translation of assets and liabilities denominated in foreign currencies | | | 18 | |
Net (Loss) | | | (86 | ) |
| |
Net Increase in Net Assets Resulting from Operations | | $ | 468 | |
| | | | | | |
| See Accompanying Notes | | Semiannual Report | | June 30, 2007 | | 7 |
Statements of Changes in Net Assets Short-Term Portfolio
| | | | | | | | |
| (Amounts in thousands) | | Six Months Ended
June 30, 2007 | | | Year Ended
December 31, 2006 | |
| | | (Unaudited) | | | | |
| | |
| Increase (Decrease) in Net Assets from: | | | | | | | | |
| | |
Operations: | | | | | | | | |
Net investment income | | $ | 554 | | | $ | 1,308 | |
Net realized gain (loss) | | | 53 | | | | (155 | ) |
Net change in unrealized appreciation (depreciation) | | | (139 | ) | | | 87 | |
Net increase resulting from operations | | | 468 | | | | 1,240 | |
| | |
Distributions to Shareholders: | | | | | | | | |
From net investment income | | | | | | | | |
Institutional Class | | | (314 | ) | | | (884 | ) |
Administrative Class | | | (231 | ) | | | (399 | ) |
| | |
Total Distributions | | | (545 | ) | | | (1,283 | ) |
| | |
Portfolio Share Transactions: | | | | | | | | |
Receipts for shares sold | | | | | | | | |
Institutional Class | | | 1,304 | | | | 17,254 | |
Administrative Class | | | 5,388 | | | | 5,591 | |
Issued as reinvestment of distributions | | | | | | | | |
Institutional Class | | | 314 | | | | 885 | |
Administrative Class | | | 231 | | | | 399 | |
Cost of shares redeemed | | | | | | | | |
Institutional Class | | | (7,783 | ) | | | (33,154 | ) |
Administrative Class | | | (4,255 | ) | | | (4,954 | ) |
Net (decrease) resulting from Portfolio share transactions | | | (4,801 | ) | | | (13,979 | ) |
| | |
Total (Decrease) in Net Assets | | | (4,878 | ) | | | (14,022 | ) |
| | |
Net Assets: | | | | | | | | |
Beginning of period | | | 26,583 | | | | 40,605 | |
End of period* | | $ | 21,705 | | | $ | 26,583 | |
| | |
*Including undistributed net investment income of: | | $ | 47 | | | $ | 38 | |
| | | | |
| 8 | | PIMCO Variable Insurance Trust | | See Accompanying Notes |
| | |
| |
| Schedule of Investments Short-Term Portfolio | | June 30, 2007 (Unaudited) |
| | | | | | | | |
| | | | | PRINCIPAL
AMOUNT
(000S) | | | | VALUE (000S) |
| CORPORATE BONDS & NOTES 18.0% |
|
| BANKING & FINANCE 11.3% |
| American Express Bank FSB |
5.380% due 06/22/2009 | | $ | | 10 | | $ | | 10 |
| |
| American International Group, Inc. |
5.395% due 01/29/2010 | | | | 200 | | | | 200 |
| |
| Bear Stearns Cos., Inc. | | | | | | | | |
5.450% due 02/23/2010 | | | | 100 | | | | 100 |
| |
| Citigroup, Inc. | | | | | | | | |
5.405% due 05/02/2008 | | | | 250 | | | | 251 |
| |
| Ford Motor Credit Co. | | | | | | | | |
5.625% due 10/01/2008 | | | | 100 | | | | 99 |
| |
| General Electric Capital Corp. |
5.410% due 10/06/2010 | | | | 100 | | | | 100 |
5.417% due 05/10/2010 | | | | 100 | | | | 100 |
| |
| Goldman Sachs Group, Inc. | | | | | | | | |
5.450% due 06/23/2009 | | | | 200 | | | | 201 |
5.475% due 10/05/2007 | | | | 100 | | | | 100 |
| |
| HSBC Finance Corp. | | | | | | | | |
5.490% due 09/15/2008 | | | | 100 | | | | 100 |
| |
| Lehman Brothers Holdings, Inc. |
5.570% due 12/23/2010 | | | | 100 | | | | 100 |
| |
| MBNA Europe Funding PLC |
5.460% due 09/07/2007 | | | | 300 | | | | 300 |
| |
| Metropolitan Life Global Funding I |
5.400% due 05/17/2010 | | | | 100 | | | | 100 |
| |
| Mirage Resorts, Inc. | | | | | | | | |
6.750% due 08/01/2007 | | | | 100 | | | | 100 |
| |
| Morgan Stanley | | | | | | | | |
5.467% due 02/09/2009 | | | | 100 | | | | 100 |
| |
| National Australia Bank Ltd. |
5.400% due 09/11/2009 | | | | 100 | | | | 100 |
| |
| Rabobank Nederland | | | | | | | | |
5.376% due 01/15/2009 | | | | 200 | | | | 200 |
| |
| Royal Bank of Scotland Group PLC |
5.360% due 04/11/2008 | | | | 100 | | | | 100 |
| |
| VTB Capital S.A. for Vneshtorgbank |
6.110% due 09/21/2007 | | | | 100 | | | | 100 |
| | | | | | | | |
| | | | | | | | 2,461 |
| | | | | | | | |
|
| INDUSTRIALS 5.2% |
| Albertson’s, Inc. | | | | | | | | |
6.950% due 08/01/2009 | | | | 100 | | | | 103 |
| |
| CSC Holdings, Inc. | | | | | | | | |
7.250% due 07/15/2008 | | | | 100 | | | | 101 |
| |
| Enterprise Products Operating LP |
4.000% due 10/15/2007 | | | | 30 | | | | 30 |
| |
| Historic TW, Inc. | | | | | | | | |
8.180% due 08/15/2007 | | | | 100 | | | | 100 |
| |
| HJ Heinz Co. | | | | | | | | |
6.428% due 12/01/2008 | | | | 100 | | | | 101 |
| |
| Home Depot, Inc. | | | | | | | | |
5.485% due 12/16/2009 | | | | 100 | | | | 100 |
| |
| Service Corp. International |
6.500% due 03/15/2008 | | | | 100 | | | | 100 |
| |
| Siemens Financieringsmaatschappij NV |
5.410% due 08/14/2009 | | | | 100 | | | | 100 |
| |
| Sungard Data Systems, Inc. |
3.750% due 01/15/2009 | | | | 100 | | | | 97 |
| |
| Transocean, Inc. | | | | | | | | |
5.560% due 09/05/2008 | | | | 100 | | | | 100 |
| |
| | | | | | | | |
| | | | | PRINCIPAL
AMOUNT
(000S) | | | | VALUE (000S) |
| Walt Disney Co. | | | | | | | | |
5.460% due 09/10/2009 | | $ | | 100 | | $ | | 100 |
| |
| Xerox Corp. | | | | | | | | |
9.750% due 01/15/2009 | | | | 100 | | | | 106 |
| | | | | | | | |
| | | | | | | | 1,138 |
| | | | | | | | |
|
| UTILITIES 1.5% |
| Entergy Gulf States, Inc. | | | | | | | | |
3.600% due 06/01/2008 | | | | 100 | | | | 98 |
| |
| Midwest Generation LLC | | | | | | | | |
8.300% due 07/02/2009 | | | | 84 | | | | 86 |
| |
| Ohio Edison Co. | | | | | | | | |
4.000% due 05/01/2008 | | | | 30 | | | | 30 |
| |
| SEMCO Energy, Inc. | | | | | | | | |
7.125% due 05/15/2008 | | | | 100 | | | | 101 |
| | | | | | | | |
| | | | | | | | 315 |
| | | | | | | | |
Total Corporate Bonds & Notes
(Cost $3,915) | | 3,914 |
| | | | | | | | |
|
| U.S. GOVERNMENT AGENCIES 22.6% |
| Fannie Mae | | | | | | | | |
5.000% due 07/25/2020 - 02/01/2037 | | | | 590 | | | | 558 |
5.380% due 12/25/2036 | | | | 82 | | | | 81 |
5.440% due 03/25/2034 | | | | 37 | | | | 37 |
5.470% due 08/25/2034 | | | | 14 | | | | 14 |
5.500% due 11/01/2016 | | | | 98 | | | | 97 |
5.670% due 05/25/2042 | | | | 25 | | | | 25 |
6.000% due 06/01/2017 - 07/01/2037 | | | | 2,423 | | | | 2,399 |
6.227% due 03/01/2044 - 07/01/2044 | | | | 149 | | | | 151 |
7.252% due 10/01/2031 | | | | 11 | | | | 11 |
| |
| Freddie Mac | | | | | | | | |
3.500% due 03/15/2022 | | | | 81 | | | | 80 |
5.000% due 01/15/2018 | | | | 55 | | | | 54 |
5.500% due 08/15/2030 | | | | 2 | | | | 2 |
5.550% due 07/15/2037 | | | | 400 | | | | 400 |
5.670% due 06/15/2031 | | | | 65 | | | | 65 |
6.227% due 10/25/2044 - 02/25/2045 | | | | 696 | | | | 698 |
6.427% due 07/25/2044 | | | | 138 | | | | 139 |
9.500% due 12/01/2019 | | | | 18 | | | | 19 |
| |
| Ginnie Mae | | | | | | | | |
6.000% due 02/20/2032 - 03/20/2032 | | | | 67 | | | | 67 |
| | | | | | | | |
Total U.S. Government Agencies (Cost $4,947) | | | | | | | | 4,897 |
| | | | | | | | |
|
| MORTGAGE-BACKED SECURITIES 8.9% |
| Arran Residential Mortgages Funding PLC |
5.340% due 04/12/2036 | | | | 39 | | | | 39 |
| |
| Banc of America Mortgage Securities, Inc. |
7.429% due 07/20/2032 | | | | 2 | | | | 2 |
| |
| Bear Stearns Adjustable Rate Mortgage Trust |
4.622% due 01/25/2034 | | | | 14 | | | | 14 |
4.750% due 10/25/2035 | | | | 199 | | | | 196 |
| |
| Bear Stearns Commercial Mortgage Securities |
6.440% due 06/16/2030 | | | | 100 | | | | 101 |
| |
| Countrywide Alternative Loan Trust |
5.470% due 05/20/2046 | | | | 47 | | | | 47 |
5.600% due 02/25/2037 | | | | 155 | | | | 156 |
| |
| Countrywide Home Loan Mortgage Pass-Through Trust |
5.660% due 06/25/2035 | | | | 62 | | | | 62 |
| |
| | | | | | | | |
| | | | | PRINCIPAL
AMOUNT
(000S) | | | | VALUE (000S) |
| CS First Boston Mortgage Securities Corp. |
5.631% due 05/25/2032 | | $ | | 3 | | $ | | 3 |
5.953% due 03/25/2032 | | | | 18 | | | | 18 |
| |
| First Republic Mortgage Loan Trust |
5.620% due 08/15/2032 | | | | 47 | | | | 48 |
| |
| Greenpoint Mortgage Funding Trust |
5.540% due 06/25/2045 | | | | 94 | | | | 94 |
| |
| GSR Mortgage Loan Trust | | | | | | | | |
4.538% due 09/25/2035 | | | | 77 | | | | 76 |
| |
| Harborview Mortgage Loan Trust |
5.540% due 05/19/2035 | | | | 107 | | | | 107 |
| |
| Impac Secured Assets CMN Owner Trust |
5.400% due 01/25/2037 | | | | 71 | | | | 71 |
| |
| Indymac Index Mortgage Loan Trust |
5.420% due 01/25/2037 | | | | 67 | | | | 67 |
| |
| Mellon Residential Funding Corp. |
5.760% due 12/15/2030 | | | | 23 | | | | 23 |
| |
| Merrill Lynch Floating Trust |
5.390% due 06/15/2022 | | | | 89 | | | | 89 |
| |
| Sequoia Mortgage Funding Co. |
0.800% due 10/21/2008 (a) | | | | 115 | | | | 0 |
| |
| Structured Asset Mortgage Investments, Inc. |
5.540% due 05/25/2036 | | | | 85 | | | | 85 |
5.550% due 05/25/2045 | | | | 123 | | | | 123 |
5.650% due 09/19/2032 | | | | 14 | | | | 14 |
| |
| Structured Asset Securities Corp. |
5.370% due 05/25/2036 | | | | 56 | | | | 56 |
| |
| Thornburg Mortgage Securities Trust |
5.430% due 12/25/2036 | | | | 85 | | | | 85 |
5.440% due 04/25/2036 | | | | 100 | | | | 100 |
| |
| Washington Mutual, Inc. |
5.094% due 10/25/2032 | | | | 3 | | | | 3 |
5.860% due 12/25/2027 | | | | 38 | | | | 38 |
6.029% due 02/25/2046 | | | | 59 | | | | 59 |
6.029% due 08/25/2046 | | | | 84 | | | | 85 |
6.229% due 11/25/2042 | | | | 55 | | | | 55 |
6.429% due 06/25/2042 | | | | 13 | | | | 13 |
| | | | | | | | |
Total Mortgage-Backed Securities
(Cost $1,932) | | 1,929 |
| | | | | | | | |
|
| ASSET-BACKED SECURITIES 13.6% |
| ACE Securities Corp. | | | | | | | | |
5.370% due 12/25/2036 | | | | 75 | | | | 75 |
5.400% due 02/25/2036 | | | | 55 | | | | 55 |
| |
| Argent Securities, Inc. | | | | | | | | |
5.390% due 04/25/2036 | | | | 20 | | | | 20 |
| |
| Asset-Backed Securities Corp. Home Equity |
5.370% due 11/25/2036 | | | | 57 | | | | 57 |
| |
| Bank One Issuance Trust | | | | | | | | |
5.430% due 12/15/2010 | | | | 200 | | | | 200 |
| |
| Bear Stearns Asset-Backed Securities, Inc. |
5.370% due 11/25/2036 | | | | 77 | | | | 77 |
5.400% due 10/25/2036 | | | | 82 | | | | 82 |
5.410% due 04/25/2036 | | | | 33 | | | | 33 |
5.650% due 10/25/2032 | | | | 4 | | | | 4 |
| |
| Chase Credit Card Master Trust |
5.430% due 02/15/2011 | | | | 100 | | | | 100 |
| |
| Citibank Credit Card Issuance Trust |
5.456% due 01/15/2010 | | | | 100 | | | | 100 |
| |
| Countrywide Asset-Backed Certificates |
5.370% due 05/25/2037 | | | | 167 | | | | 167 |
5.390% due 06/25/2036 | | | | 62 | | | | 62 |
5.390% due 07/25/2036 | | | | 26 | | | | 26 |
5.390% due 08/25/2036 | | | | 29 | | | | 29 |
| | | | | | |
| See Accompanying Notes | | Semiannual Report | | June 30, 2007 | | 9 |
Schedule of Investments Short-Term Portfolio (Cont.)
| | | | | | | | |
| | | | | PRINCIPAL
AMOUNT
(000S) | | | | VALUE (000S) |
5.480% due 02/25/2036 | | $ | | 57 | | $ | | 57 |
5.800% due 12/25/2031 | | | | 4 | | | | 4 |
6.060% due 05/25/2032 | | | | 1 | | | | 1 |
| |
| CS First Boston Mortgage Securities Corp. |
6.060% due 08/25/2032 | | | | 3 | | | | 3 |
| |
| First Franklin Mortgage Loan Asset-Backed Certificates |
5.370% due 12/25/2036 | | | | 71 | | | | 72 |
5.390% due 01/25/2036 | | | | 21 | | | | 21 |
5.410% due 01/25/2036 | | | | 36 | | | | 36 |
| |
| First NLC Trust |
5.440% due 02/25/2036 | | | | 9 | | | | 9 |
| |
| Fremont Home Loan Trust |
5.380% due 01/25/2037 | | | | 83 | | | | 83 |
| |
| GSAMP Trust |
5.430% due 11/25/2035 | | | | 18 | | | | 18 |
5.440% due 12/25/2035 | | | | 27 | | | | 27 |
| |
| Home Equity Asset Trust |
5.400% due 05/25/2036 | | | | 41 | | | | 41 |
| |
| HSI Asset Securitization Corp. Trust |
5.370% due 12/25/2036 | | | | 84 | | | | 84 |
| |
| Irwin Home Equity Corp. |
5.860% due 07/25/2032 | | | | 4 | | | | 4 |
| |
| JPMorgan Mortgage Acquisition Corp. |
5.370% due 10/25/2036 | | | | 82 | | | | 82 |
| |
| Lehman XS Trust |
5.390% due 05/25/2046 | | | | 47 | | | | 47 |
| |
| Long Beach Mortgage Loan Trust |
5.360% due 11/25/2036 | | | | 77 | | | | 77 |
5.390% due 03/25/2036 | | | | 17 | | | | 17 |
5.410% due 01/25/2036 | | | | 58 | | | | 58 |
5.500% due 08/25/2035 | | | | 30 | | | | 30 |
| |
| MASTR Asset-Backed Securities Trust |
5.370% due 11/25/2036 | | | | 82 | | | | 82 |
5.400% due 01/25/2036 | | | | 38 | | | | 38 |
| |
| Merrill Lynch Mortgage Investors, Inc. |
5.350% due 06/25/2037 | | | | 53 | | | | 54 |
5.390% due 02/25/2037 | | | | 32 | | | | 32 |
| |
| Morgan Stanley ABS Capital I |
5.390% due 02/25/2036 | | | | 26 | | | | 26 |
| |
| Nelnet Student Loan Trust |
5.445% due 07/25/2016 | | | | 55 | | | | 55 |
| |
| New Century Home Equity Loan Trust |
5.580% due 06/25/2035 | | | | 43 | | | | 42 |
| |
| Nissan Auto Lease Trust |
5.347% due 12/14/2007 | | | | 3 | | | | 3 |
| |
| Option One Mortgage Loan Trust |
5.360% due 02/25/2037 | | | | 71 | | | | 71 |
| |
| Quest Trust |
5.880% due 06/25/2034 | | | | 2 | | | | 2 |
| |
| Renaissance Home Equity Loan Trust |
5.680% due 11/25/2034 | | | | 20 | | | | 20 |
5.760% due 08/25/2033 | | | | 16 | | | | 16 |
5.820% due 12/25/2033 | | | | 75 | | | | 76 |
| |
| Residential Asset Mortgage Products, Inc. |
5.400% due 01/25/2036 | | | | 16 | | | | 16 |
5.400% due 02/25/2036 | | | | 16 | | | | 16 |
| |
| Residential Asset Securities Corp. |
5.400% due 01/25/2036 | | | | 22 | | | | 22 |
| |
| Residential Funding Mortgage Securities II, Inc. |
5.460% due 09/25/2035 | | | | 71 | | | | 71 |
| |
| SACO I, Inc. |
5.400% due 04/25/2036 | | | | 1 | | | | 1 |
| |
| | | | | | | | |
| | | | | PRINCIPAL
AMOUNT
(000S) | | | | VALUE (000S) |
| Saxon Asset Securities Trust |
5.590% due 01/25/2032 | | $ | | 1 | | $ | | 1 |
| |
| SLC Student Loan Trust |
5.313% due 02/15/2015 | | | | 100 | | | | 100 |
| |
| SLM Student Loan Trust |
5.325% due 07/25/2013 | | | | 79 | | | | 79 |
| |
| Soundview Home Equity Loan Trust |
5.390% due 03/25/2036 | | | | 5 | | | | 5 |
5.390% due 05/25/2036 | | | | 5 | | | | 5 |
| |
| Specialty Underwriting & Residential Finance |
5.365% due 11/25/2037 | | | | 70 | | | | 70 |
| |
| Structured Asset Investment Loan Trust |
5.370% due 07/25/2036 | | | | 56 | | | | 56 |
| |
| Structured Asset Securities Corp. |
5.610% due 01/25/2033 | | | | 4 | | | | 4 |
| |
| Wachovia Auto Owner Trust |
4.820% due 02/20/2009 | | | | 27 | | | | 27 |
| |
| Wells Fargo Home Equity Trust |
5.560% due 10/25/2035 | | | | 100 | | | | 100 |
| | | | | | | | |
Total Asset-Backed Securities
(Cost $2,947) | | | | 2,948 |
| | | | | | | | |
|
| | | | | SHARES | | | | |
| PREFERRED STOCKS 0.4% |
| Fresenius Medical Care Capital Trust II |
7.875% due 02/01/2008 | | | | 100 | | | | 101 |
| | | | | | | | |
Total Preferred Stocks (Cost $103) | | | | 101 |
| | | | | | | | |
|
| | | | | PRINCIPAL
AMOUNT
(000S) | | | | |
| SHORT-TERM INSTRUMENTS 41.9% |
|
| CERTIFICATES OF DEPOSIT 6.9% |
| Bank of Ireland | | | | | | | | |
5.400% due 01/15/2010 | | $ | | 100 | | | | 100 |
| |
| BNP Paribas |
5.262% due 07/03/2008 | | | | 200 | | | | 200 |
| |
| Calyon Financial, Inc. |
5.340% due 01/16/2009 | | | | 100 | | | | 100 |
| |
| Fortis Bank NY |
5.300% due 09/30/2008 | | | | 100 | | | | 100 |
| |
| Nordea Bank Finland PLC |
5.282% due 12/01/2008 | | | | 100 | | | | 100 |
5.308% due 05/28/2008 | | | | 100 | | | | 100 |
| |
| Royal Bank of Canada |
5.267% due 06/30/2008 | | | | 200 | | | | 200 |
| |
| Royal Bank of Scotland Group PLC |
5.262% due 07/03/2008 | | | | 100 | | | | 100 |
5.265% due 03/26/2008 | | | | 100 | | | | 100 |
| |
| Skandinav Enskilda BK |
5.340% due 08/21/2008 | | | | 100 | | | | 100 |
| |
| Societe Generale NY |
5.265% due 09/21/2007 | | | | 200 | | | | 200 |
5.270% due 03/26/2008 | | | | 100 | | | | 100 |
| | | | | | | | |
| | | | | | | | 1,500 |
| | | | | | | | |
|
| COMMERCIAL PAPER 33.9% |
| Danske Corp. | | | | | | | | |
5.235% due 10/12/2007 | | | | 800 | | | | 792 |
| |
| Dexia Delaware LLC |
5.240% due 09/21/2007 | | | | 600 | | | | 593 |
| |
| Fortis Funding LLC |
5.255% due 09/05/2007 | | | | 500 | | | | 499 |
| |
| | | | | | | | | |
| | | | | PRINCIPAL
AMOUNT
(000S) | | | | VALUE (000S) | |
| Freddie Mac | |
4.800% due 07/02/2007 | | $ | | 400 | | $ | | 400 | |
| | |
| General Electric Capital Corp. | |
5.200% due 11/06/2007 | | | | 300 | | | | 299 | |
| | |
| HBOS Treasury Services PLC | |
5.250% due 09/21/2007 | | | | 1,000 | | | | 988 | |
| | |
| Rabobank USA Financial Corp. | |
5.330% due 07/26/2007 | | | | 400 | | | | 400 | |
| | |
| Societe Generale NY | |
5.240% due 11/26/2007 | | | | 300 | | | | 296 | |
| | |
| Statens Bostadsfin Bank | |
5.255% due 09/14/2007 | | | | 500 | | | | 494 | |
| | |
| Swedbank AB | |
5.225% due 09/06/2007 | | | | 500 | | | | 498 | |
| | |
| TotalFinaElf Capital S.A. | |
5.340% due 07/02/2007 | | | | 500 | | | | 500 | |
| | |
| UBS Finance Delaware LLC | |
5.230% due 10/23/2007 | | | | 300 | | | | 298 | |
5.245% due 10/23/2007 | | | | 300 | | | | 297 | |
| | |
| Westpac Trust Securities NZ Ltd. | |
5.240% due 10/19/2007 | | | | 1,000 | | | | 993 | |
| | | | | | | | | |
| | | | | | | | 7,347 | |
| | | | | | | | | |
| |
| REPURCHASE AGREEMENTS 0.6% | |
| State Street Bank and Trust Co. | |
4.900% due 07/02/2007 | | | | 134 | | | | 134 | |
| | | | | | | | | |
(Dated 06/29/2007. Collateralized by Federal Home Loan Bank 4.375% due 09/17/2010 valued at $138. Repurchase proceeds are $134.) | |
| |
| U.S. TREASURY BILLS 0.5% | |
4.701% due 08/30/2007 - 09/13/2007 (b)(d) | | | | 105 | | | | 104 | |
| | | | | | | | | |
Total Short-Term Instruments
(Cost $9,086) | | | | 9,085 | |
| | | | | | | | | |
| |
| PURCHASED OPTIONS (f) 0.0% | |
| (Cost $16) | | | | | | | | 7 | |
| |
| |
| |
Total Investments (c) 105.4%
(Cost $22,946) | | $ | | 22,881 | |
| |
| Written Options (g) (0.0%) (Premiums $12) | | | | | | | | (5 | ) |
| |
| Other Assets and Liabilities (Net) (5.4%) | | (1,171 | ) |
| | | | | | | | | |
| Net Assets 100.0% | | | | | | $ | | 21,705 | |
| | | | | | | | | |
| | | | |
| 10 | | PIMCO Variable Insurance Trust | | See Accompanying Notes |
| | |
| |
| | | June 30, 2007 (Unaudited) |
Notes to Schedule of Investments (amounts in thousands*, except number of contracts):
* A zero balance may reflect actual amounts rounding to less than one thousand.
(a) Interest only security.
(b) Coupon represents a weighted average rate.
(c) As of June 30, 2007, portfolio securities with an aggregate value of $485 were valued in good faith and pursuant to the guidelines established by the Board of Trustees.
(d) Securities with an aggregate market value of $104 have been segregated with the custodian to cover margin requirements for the following open futures contracts on June 30, 2007:
| | | | | | | | | | |
| Description | | Type | | Expiration
Month | | # of
Contracts | | Unrealized
Appreciation/
(Depreciation) | |
90-Day Eurodollar June Futures | | Long | | 06/2008 | | 12 | | $ | (12 | ) |
90-Day Eurodollar March Futures | | Long | | 03/2008 | | 59 | | | (46 | ) |
United Kingdom 90-Day LIBOR Sterling Interest Rate
December Futures | | Long | | 12/2007 | | 13 | | | (31 | ) |
U.S. Treasury 10-Year Note September Futures | | Short | | 09/2007 | | 37 | | | 30 | |
| | | | | | | | | | |
| | | | | | | | $ | (59 | ) |
| | | | | | | | | | |
(e) Swap agreements outstanding on June 30, 2007:
Credit Default Swaps
| | | | | | | | | | | | | | |
| Counterparty | | Reference Entity | | Buy/Sell
Protection (1) | | (Pay)/Receive
Fixed Rate | | Expiration
Date | | Notional
Amount | | Unrealized
Appreciation |
JPMorgan Chase & Co. | | Morgan Stanley 6.600% due 04/01/2012 | | Sell | | 0.070% | | 12/20/2007 | | $ | 100 | | $ | 0 |
| | | | | | | | | | | | | | |
(1) If the Portfolio is a seller of protection and a credit event occurs, as defined under the terms of that particular swap agreement, the Portfolio will pay to the buyer of the protection an amount up to the notional value of the swap and in certain instances, take delivery of the security.
Interest Rate Swaps
| | | | | | | | | | | | | | | |
| Counterparty | | Floating Rate Index | | Pay/Receive
Floating Rate | | Fixed Rate | | Expiration
Date | | Notional
Amount | | Unrealized
(Depreciation) | |
Goldman Sachs & Co. | | 5-Year French CPI Ex Tobacco Daily Reference Index | | Pay | | 1.995% | | 03/15/2012 | | EUR | 100 | | $ | (1 | ) |
Deutsche Bank AG | | 3-Month USD-LIBOR | | Pay | | 5.000% | | 06/18/2009 | | $ | 5,600 | | | (24 | ) |
Deutsche Bank AG | | 3-Month USD-LIBOR | | Receive | | 5.000% | | 12/19/2017 | | | 300 | | | (2 | ) |
Royal Bank of Scotland Group PLC | | 3-Month USD-LIBOR | | Receive | | 5.000% | | 12/19/2017 | | | 400 | | | (3 | ) |
UBS Warburg LLC | | 3-Month USD-LIBOR | | Pay | | 5.000% | | 06/21/2008 | | | 800 | | | (2 | ) |
| | | | | | | | | | | | | | | |
| | | | | | | | | | | | | $ | (32 | ) |
| | | | | | | | | | | | | | | |
(f) Purchased options outstanding on June 30, 2007:
Interest Rate Swaptions
| | | | | | | | | | | | | | | | | | | |
| Description | | Counterparty | | Floating Rate Index | | Pay/Receive
Floating Rate | | Exercise
Rate | | Expiration Date | | Notional
Amount | | Cost | | Value |
Call - OTC 1-Year Interest Rate Swap | | Barclays Bank PLC | | 3-Month USD-LIBOR | | Pay | | 4.750% | | 02/01/2008 | | $ | 1,000 | | $ | 3 | | $ | 0 |
Call - OTC 2-Year Interest Rate Swap | | Lehman Brothers, Inc. | | 3-Month USD-LIBOR | | Pay | | 4.750% | | 03/31/2008 | | | 500 | | | 3 | | | 1 |
Call - OTC 2-Year Interest Rate Swap | | Royal Bank of Scotland Group PLC | | 3-Month USD-LIBOR | | Pay | | 5.000% | | 02/01/2008 | | | 700 | | | 3 | | | 1 |
Call - OTC 2-Year Interest Rate Swap | | Royal Bank of Scotland Group PLC | | 3-Month USD-LIBOR | | Pay | | 4.750% | | 09/26/2008 | | | 1,000 | | | 4 | | | 2 |
Call - OTC 2-Year Interest Rate Swap | | Royal Bank of Scotland Group PLC | | 3-Month USD-LIBOR | | Pay | | 5.000% | | 12/15/2008 | | | 800 | | | 3 | | | 3 |
| | | | | | | | | | | | | | | | | | | |
| | | | | | | | | | | | | | | $ | 16 | | $ | 7 |
| | | | | | | | | | | | | | | | | | | |
(g) Written options outstanding on June 30, 2007:
Interest Rate Swaptions
| | | | | | | | | | | | | | | | | | | |
| Description | | Counterparty | | Floating Rate Index | | Pay/Receive
Floating Rate | | Exercise
Rate | | Expiration
Date | | Notional
Amount | | Premium | | Value |
Call - OTC 5-Year Interest Rate Swap | | Barclays Bank PLC | | 3-Month USD-LIBOR | | Receive | | 4.900% | | 02/01/2008 | | $ | 200 | | $ | 2 | | $ | 0 |
Call - OTC 5-Year Interest Rate Swap | | Lehman Brothers, Inc. | | 3-Month USD-LIBOR | | Receive | | 4.900% | | 03/31/2008 | | | 200 | | | 2 | | | 1 |
Call - OTC 5-Year Interest Rate Swap | | Royal Bank of Scotland Group PLC | | 3-Month USD-LIBOR | | Receive | | 5.100% | | 02/01/2008 | | | 300 | | | 4 | | | 1 |
Call - OTC 7-Year Interest Rate Swap | | Royal Bank of Scotland Group PLC | | 3-Month USD-LIBOR | | Receive | | 5.200% | | 12/15/2008 | | | 300 | | | 4 | | | 3 |
| | | | | | | | | | | | | | | | | | | |
| | | | | | | | | | | | | | | $ | 12 | | $ | 5 |
| | | | | | | | | | | | | | | | | | | |
| | | | | | |
| See Accompanying Notes | | Semiannual Report | | June 30, 2007 | | 11 |
| | |
| |
| Schedule of Investments Short-Term Portfolio (Cont.) | | June 30, 2007 (Unaudited) |
(h) Short sales outstanding on June 30, 2007:
| | | | | | | | | | | | | |
| Description | | Coupon | | Maturity
Date | | Principal
Amount | | Proceeds | | Value (2) |
U.S. Treasury Notes | | 4.250% | | 11/15/2014 | | $ | 300 | | $ | 283 | | $ | 291 |
U.S. Treasury Notes | | 5.000% | | 02/15/2011 | | | 200 | | | 200 | | | 203 |
| | | | | | | | | | | | | |
| | | | | | | | | $ | 483 | | $ | 494 |
| | | | | | | | | | | | | |
(2) Market value includes $6 of interest payable on short sales.
(i) Foreign currency contracts outstanding on June 30, 2007:
| | | | | | | | | | | | | | | | | |
| Type | | Currency | | Principal
Amount
Covered by
Contract | | Settlement
Month | | Unrealized
Appreciation | | Unrealized
(Depreciation) | | | Net Unrealized
Appreciation/
(Depreciation) | |
Buy | | BRL | | 176 | | 03/2008 | | $ | 8 | | $ | 0 | | | $ | 8 | |
Buy | | CLP | | 10,534 | | 11/2007 | | | 0 | | | 0 | | | | 0 | |
Buy | | CNY | | 1,791 | | 01/2008 | | | 0 | | | (2 | ) | | | (2 | ) |
Buy | | | | 2,916 | | 03/2008 | | | 0 | | | (3 | ) | | | (3 | ) |
Sell | | | | 1,102 | | 03/2008 | | | 1 | | | 0 | | | | 1 | |
Buy | | EUR | | 14 | | 07/2007 | | | 0 | | | 0 | | | | 0 | |
Sell | | GBP | | 76 | | 08/2007 | | | 0 | | | (1 | ) | | | (1 | ) |
Buy | | KRW | | 73,885 | | 11/2007 | | | 0 | | | 0 | | | | 0 | |
Buy | | MXN | | 866 | | 03/2008 | | | 2 | | | 0 | | | | 2 | |
Buy | | NOK | | 347 | | 09/2007 | | | 1 | | | 0 | | | | 1 | |
Buy | | PLN | | 230 | | 09/2007 | | | 3 | | | 0 | | | | 3 | |
Buy | | RUB | | 7,775 | | 12/2007 | | | 3 | | | 0 | | | | 3 | |
Buy | | SGD | | 92 | | 07/2007 | | | 0 | | | (1 | ) | | | (1 | ) |
Buy | | ZAR | | 213 | | 03/2008 | | | 0 | | | 0 | | | | 0 | |
| | | | | | | | | | | | | | | | | |
| | | | | | | | $ | 18 | | $ | (7 | ) | | $ | 11 | |
| | | | | | | | | | | | | | | | | |
| | | | |
| 12 | | PIMCO Variable Insurance Trust | | See Accompanying Notes |
| | |
| |
| Notes to Financial Statements | | June 30, 2007 (Unaudited) |
1. ORGANIZATION
The Short-Term Portfolio (the “Portfolio”) is a series of the PIMCO Variable Insurance Trust (the “Trust”). The Trust is registered under the Investment Company Act of 1940 (the “Act”), as amended, as an open-end management investment company organized as a Delaware business trust on October 3, 1997. The Portfolio offers two classes of shares: Institutional and Administrative. Information presented on these financial statements pertains to the Administrative Class of the Portfolio. Certain detailed financial information for the Institutional Class is provided separately and is available upon request. The Trust is designed to be used as an investment vehicle by Separate Accounts of insurance companies that fund variable annuity contracts and variable life insurance policies and by qualified pension and retirement plans.
2. SIGNIFICANT ACCOUNTING POLICIES
The following is a summary of significant accounting policies consistently followed by the Portfolio in the preparation of its financial statements in conformity with accounting principles generally accepted in the United States of America (“GAAP”). The preparation of financial statements in accordance with GAAP requires management to make estimates and assumptions that affect the reported amounts and disclosures on the financial statements. Actual results could differ from those estimates.
(a) Security Valuation Portfolio securities are valued as of the close of regular trading (normally 4:00 p.m., Eastern Time) on each day that the New York Stock Exchange (“NYSE”) is open. Portfolio securities and other assets for which market quotes are readily available are stated at market value. Market value is generally determined on the basis of last reported sales prices, or if no sales are reported, based on quotes obtained from a quotation reporting system, established market makers, or pricing services. Fixed-income securities and non-exchange traded derivatives are normally valued on the basis of quotes obtained from brokers and dealers or pricing services. Prices obtained from independent pricing services use information provided by market makers or estimates of market values obtained from yield data relating to investments or securities with similar characteristics. Certain fixed income securities purchased on a delayed-delivery basis are marked to market daily until settlement at the forward settlement date. Short-term investments having a maturity of 60 days or less are generally valued at amortized cost. Exchange traded options, futures and options on futures are valued at the settlement price determined by the relevant exchange. With respect to any portion of the Portfolio’s assets that are invested in one or more open end management investment companies, the Portfolio’s net asset value (“NAV”) will be calculated based upon the NAVs of such investments.
Investments initially valued in currencies other than the U.S. dollar are converted to the U.S. dollar using exchange rates obtained from pricing services. As a result, the NAV of the Portfolio’s securities may be affected by changes in the value of currencies in relation to the U.S. dollar. The value of securities traded in markets outside the United States or denominated in currencies other than the U.S. dollar may be affected significantly on a day that the NYSE is closed and an investor is not able to purchase, redeem or exchange shares.
Securities and other assets for which market quotes are not readily available are valued at fair value as determined in good faith by the Board of Trustees or persons acting at their direction. The Board of Trustees has adopted methods for valuing securities and other assets in circumstances where market quotes are not readily available, and has delegated to Pacific Investment Management Company LLC (“PIMCO”) the responsibility for applying the valuation methods. In the event that market quotes are not readily available, and the security or asset cannot be valued pursuant to one of the valuation methods, the value of the security or asset will be determined in good faith by the Valuation Committee of the Board of Trustees, generally based upon recommendations provided by PIMCO.
Market quotes are considered not readily available in circumstances where there is an absence of current or reliable market-based data (e.g., trade information, bid/asked information, broker quotes), including where events occur after the close of the relevant market, but prior to the close of regular trading, that materially affect the values of the Portfolio’s securities or assets. In addition, market quotes are considered not readily available when, due to extraordinary circumstances, the exchanges or markets on which the securities trade, do not open for trading for the entire day and no other market prices are available. The Board has delegated to PIMCO the responsibility for monitoring significant events that may materially affect the values of the Portfolio’s securities or assets and for determining whether the value of the applicable securities or assets should be re-evaluated in light of such significant events.
When the Portfolio uses fair value pricing to determine its NAV, securities will not be priced on the basis of quotations from the primary market in which they are traded, but rather may be priced by another method that the Board of Trustees or persons acting at their direction believe accurately reflects fair value. The Trust’s policy is intended to result in a calculation of the Portfolio’s NAV that fairly reflects security values as of the time of pricing. However, fair values determined by the Board of Trustees or persons acting at their direction may not accurately reflect the price that the Portfolio could obtain for a security if it were to dispose of that security as of the time of pricing. Because foreign securities can trade on non-business days of the Portfolio, the NAV of the Portfolio may change on days when shareholders will not be able to purchase or redeem Portfolio shares. The prices used by the Portfolio may differ from the value that would be realized if the securities were sold and the differences could be material to the financial statements.
(b) Securities Transactions and Investment Income Securities transactions are recorded as of the trade date for financial reporting purposes. Securities purchased or sold on a when-issued or delayed-delivery basis may be settled a month or more after the trade date. Realized gains and losses from securities sold are recorded on the identified cost basis. Dividend income is recorded on the ex-dividend date, except certain dividends from foreign securities where the ex-dividend date may have passed, which are recorded as soon as the Portfolio is informed of the ex-dividend date. Interest income, adjusted for the accretion of discounts and amortization of premiums, is recorded on the accrual basis. Paydown gains and losses on mortgage-related and other asset-backed securities are recorded as components of interest income on the Statement of Operations.
(c) Delayed-Delivery Transactions The Portfolio may purchase or sell securities on a delayed-delivery basis. These transactions involve a commitment by the Portfolio to purchase or sell securities for a predetermined price or yield, with payment and delivery taking place beyond the customary settlement period. When delayed-delivery purchases are outstanding, the Portfolio will designate liquid assets in an amount sufficient to meet the purchase price. When purchasing a security on a delayed-delivery basis, the Portfolio assumes the rights and risks of ownership of the security, including the risk of price and yield fluctuations, and takes such fluctuations into account when determining its net asset value. The Portfolio may dispose of or renegotiate a delayed-delivery transaction after it is entered into, and may sell when-issued securities before they are delivered, which may result in a capital gain or loss. When the Portfolio has sold a security on a delayed-delivery basis, the Portfolio does not participate in future gains and losses with respect to the security.
(d) Dividends and Distributions to Shareholders Dividends from net investment income, if any, are declared daily and distributed to shareholders monthly. Net realized capital gains earned by the Portfolio, if any, will be distributed no less frequently than once each year.
Income dividends and capital gain distributions are determined in accordance with income tax regulations which may differ from GAAP. Differences between tax
| | | | | | |
| | Semiannual Report | | June 30, 2007 | | 13 |
Notes to Financial Statements (Cont.)
regulations and GAAP may change the fiscal year when income and capital items are recognized for tax and GAAP purposes. Examples of events that give rise to timing differences include wash sales, straddles, net operating losses and capital loss carryforwards. Further, the character of investment income and capital gains may be different for certain transactions under the two methods of accounting. Examples of characterization differences include the treatment of mortgage paydowns, swaps, foreign currency transactions and contingent debt instruments. As a result, income dividends and capital gain distributions declared during a fiscal period may differ significantly from the net investment income and realized capital gain reported on the Portfolio’s annual financial statements presented under GAAP.
Distributions classified as a tax basis return of capital, if any, are reflected on the accompanying Statements of Changes in Net Assets and have been reclassified to paid in capital. In addition, other amounts have been reclassified between undistributed net investment income, accumulated undistributed net realized gains or losses and/or paid in capital to more appropriately conform financial accounting to tax characterizations of dividend distributions.
(e) Multiclass Operations Each class offered by the Portfolio has equal rights as to assets and voting privileges (except that shareholders of a class have exclusive voting rights regarding any matter relating solely to that class of shares). Income and non-class specific expenses of the Portfolio are allocated daily to each class of shares based on the relative value of settled shares. Realized and unrealized capital gains and losses of the Portfolio are allocated daily to each class of shares based on the relative net assets of each class. Class specific expenses, where applicable, currently include administrative, distribution and servicing fees.
(f) Foreign Currency The functional and reporting currency for the Portfolio is the U.S. dollar. The market values of foreign securities, currency holdings and other assets and liabilities are translated into U.S. dollars based on the current exchange rates each business day. Fluctuations in the value of currency holdings and other assets and liabilities resulting from changes in exchange rates are recorded as unrealized foreign currency gains or losses. Realized gains or losses and unrealized appreciation or depreciation on investment securities and income and expenses are translated on the respective dates of such transactions. The effects of changes in foreign currency exchange rates on investments in securities are not segregated on the Statement of Operations from the effects of changes in market prices of those securities, but are included with the net realized and unrealized gain or loss on investment securities.
| | | | | | |
|
Non-U.S. currency symbols utilized throughout the report are defined
as follows: |
| BRL | | Brazilian Real | | MXN | | Mexican Peso |
| CLP | | Chilean Peso | | NOK | | Norwegian Krone |
| CNY | | Chinese Yuan Renminbi | | PLN | | Polish Zloty |
| EUR | | Euro | | RUB | | Russian Ruble |
| GBP | | Great British Pound | | SGD | | Singapore Dollar |
| KRW | | South Korean Won | | ZAR | | South African Rand |
(g) Foreign Currency Transactions The Portfolio may enter into foreign currency contracts in connection with settling planned purchases or sales of securities, to hedge the currency exposure associated with some or all of the Portfolio’s securities or as a part of an investment strategy. A foreign currency contract is an agreement between two parties to buy and sell a currency at a set price on a future date. The market value of a foreign currency contract fluctuates with changes in foreign currency exchange rates. Foreign currency contracts are
marked to market daily and the change in value is recorded by the Portfolio as an unrealized gain or loss. Realized gains or losses equal to the difference between the value of the contract at the time it was opened and the value at the time it was closed are recorded upon delivery or receipt of the currency. These contracts may involve market risk in excess of the unrealized gain or loss reflected on the Statement of Assets and Liabilities. In addition, the Portfolio could be exposed to risk if the counterparties are unable to meet the terms of the contracts or if the value of the currency changes unfavorably to the U.S. dollar.
(h) Futures Contracts The Portfolio may enter into futures contracts. The Portfolio may use futures contracts to manage its exposure to the securities markets or to movements in interest rates and currency values. The primary risks associated with the use of futures contracts are the imperfect correlation between the change in market value of the securities held by the Portfolio and the prices of futures contracts, the possibility of an illiquid market, and the inability of the counterparty to meet the terms of the contract. Futures contracts are valued based upon their quoted daily settlement prices. Upon entering into a futures contract, the Portfolio is required to deposit with its futures broker, an amount of cash or U.S. Government and Agency Obligations in accordance with the initial margin requirements of the broker or exchange. Futures contracts are marked to market daily and an appropriate payable or receivable for the change in value (“variation margin”) is recorded by the Portfolio. Gains or losses are recognized but not considered realized until the contracts expire or are closed. Futures contracts involve, to varying degrees, risk of loss in excess of the variation margin disclosed on the Statement of Assets and Liabilities.
(i) Options Contracts The Portfolio may write call and put options on futures, swaps, securities or currencies it owns or in which it may invest. Writing put options tends to increase the Portfolio’s exposure to the underlying instrument. Writing call options tends to decrease the Portfolio’s exposure to the underlying instrument. When the Portfolio writes a call or put option, an amount equal to the premium received is recorded as a liability and subsequently marked to market to reflect the current value of the option written. These liabilities are reflected as written options outstanding on the Statement of Assets and Liabilities. Certain options may be written with premiums to be determined on a future date. The premiums for these options are based upon implied volatility parameters at specified terms. Premiums received from writing options which expire are treated as realized gains. Premiums received from writing options which are exercised or closed are added to the proceeds or offset against amounts paid on the underlying future, swap, security or currency transaction to determine the realized gain or loss. The Portfolio as a writer of an option has no control over whether the underlying future, swap, security or currency may be sold (call) or purchased (put) and as a result bears the market risk of an unfavorable change in the price of the future, swap, security or currency underlying the written option. There is the risk the Portfolio may not be able to enter into a closing transaction because of an illiquid market.
The Portfolio may also purchase put and call options. Purchasing call options tends to increase the Portfolio’s exposure to the underlying instrument. Purchasing put options tends to decrease the Portfolio’s exposure to the underlying instrument. The Portfolio pays a premium which is included on the Statement of Assets and Liabilities as an investment and subsequently marked to market to reflect the current value of the option. Premiums paid for purchasing options which expire are treated as realized losses. Certain options may be purchased with premiums to be determined on a future date. The premiums for these options are based upon implied volatility parameters at specified terms. The risk associated with purchasing put and call options is limited to the premium paid. Premiums paid for purchasing options which are exercised or closed are added to the amounts paid or offset against the proceeds on the underlying future, swap, security or currency transaction to determine the realized gain or loss.
| | | | |
| 14 | | PIMCO Variable Insurance Trust | | |
| | |
| |
| | | June 30, 2007 (Unaudited) |
(j) Repurchase Agreements The Portfolio may engage in repurchase transactions. Under the terms of a typical repurchase agreement, the Portfolio takes possession of an underlying debt obligation (collateral) subject to an obligation of the seller to repurchase, and the Portfolio to resell, the obligation at an agreed-upon price and time. The underlying securities for all repurchase agreements are held in safekeeping at the Portfolio’s custodian or designated subcustodians under tri-party repurchase agreements. The market value of the collateral must be equal to or exceed the total amount of the repurchase obligations, including interest. Securities purchased under repurchase agreements are reflected as an asset on the Statement of Assets and Liabilities. Generally, in the event of counterparty default, the Portfolio has the right to use the collateral to offset losses incurred. If the counterparty should default, the Portfolio will seek to sell the securities which it holds as collateral. This could involve procedural costs or delays in addition to a loss on the securities if their value should fall below their repurchase price.
(k) Inverse Floating Rate Transactions—Residual Interest Municipal Bonds (“RIBs”)/Residual Interest Tax Exempt Bonds (“RITEs”) The Portfolio may invest in RIBs and RITEs (“Inverse Floaters”). Inverse Floaters are created via a master trust agreement between a broker-dealer, acting as trustor and liquidity provider, and an investment bank, acting as trustee and tender agent. The master trust agreement defines the terms for each trust series; with each series being established by the transfer of long-term, fixed-rate municipal bonds (“Fixed Rate Bonds”) to the trustee to be held and provide for the creation, execution and delivery of floater certificates (“Floating Rate Notes”) and Inverse Floaters. Floating Rate Notes are liquid notes that are issued with a short-term variable rate typically linked to the LIBOR, subject to limitations, for some duration. After interest income is paid on the Floating Rate Notes at current rates, the residual income from the Fixed Rate Bonds is paid to the Inverse Floaters. Inverse Floaters are issued with a coupon that fluctuates inversely with the Floating Rate Notes’ referenced rate, subject to certain limitations. Therefore, rising short-term rates result in lower income for the Inverse Floaters and vice versa.
Floating Rate Notes are generally remarketed to municipal money market funds. Inverse Floaters are acquired by either tax-exempt municipal bond funds or trusts, or other parties interested in potentially higher yielding tax-exempt securities. Inverse Floaters may also be acquired for the purpose of increasing leverage. Floating Rate Note holders typically have the option to tender their notes to the liquidity provider for redemption at par at each reset date. The Inverse Floater holders have the option to (i) require the Floating Rate Note holders to tender their notes at par, and (ii) require the liquidity provider to transfer the Fixed Rate Bonds to the Inverse Floater holders. The holders of Inverse Floaters bear substantially all of the downside investment risk associated with the underlying Fixed Rate Bonds, and also benefit from a disproportionate amount of the potential appreciation of the underlying Fixed Rate Bonds’ value. Inverse Floaters may be more volatile and less liquid than other municipal bonds of comparable maturity.
Inverse Floaters may be acquired with or without first transferring to the trustor the Fixed Rate Bonds that were utilized to create the trust series. Inverse Floaters acquired without a transfer of Fixed Rate Bonds are recognized as purchases of securities as outlined in Note 2(b). Statement of Financial Accounting Standards No. 140—Accounting for Transfers and Servicing of Financial Assets and Extinguishments of Liabilities (“FAS No. 140”), governs the standards for accounting for securitizations and other transfers of financial assets. If there is a transfer of Fixed Rate Bonds and it meets sale criteria under FAS No. 140, a Portfolio records a sale of the Fixed Rate Bonds and a purchase of the Inverse Floaters. The cash received from the Inverse Floaters is then recorded as interest income in the Statement of Operations.
If the transfer of Fixed Rate Bonds does not meet sale criteria under FAS No. 140, a Portfolio accounts for the transaction described above as a secured borrowing by
including the Fixed Rate Bonds in its Schedule of Investments, and recording the Floating Rate Notes as a liability under the caption “Payable for floating rate notes” in the Portfolio’s Statement of Assets and Liabilities. In a secured borrowing transaction, cash received from the Inverse Floaters is not recorded as interest income. Instead, a Portfolio records interest income related to the Fixed Rate Bonds and interest expense related to the Floating Rate Notes, the net of which is equal to the cash received from the Inverse Floaters acquired by the Portfolio. Thus, while a Portfolio’s reported total income, net expenses, and net expense ratio are generally higher for investments in Inverse Floaters acquired via a secured borrowing, the method of acquiring Inverse Floaters does not result in differences for reported cash flows, net asset value or total return.
(l) Short Sales The Portfolio may enter into short sales transactions. A short sale is a transaction in which the Portfolio sells securities it does not own in anticipation of a decline in the market price of the securities. Securities sold in short sale transactions and interest payable on such securities, if any, are reflected as a liability on the Statement of Assets and Liabilities. The Portfolio is obligated to deliver securities at the market price at the time the short position is closed. Possible losses from short sales may be unlimited, whereas losses from purchases cannot exceed the total amount invested.
(m) Swap Agreements The Portfolio may invest in swap agreements. Swap transactions are privately negotiated agreements between the Portfolio and a counterparty to exchange or swap investment cash flows, assets, or market-linked returns at specified, future intervals. The Portfolio may enter into interest rate, total return, forward spread-lock, credit default, and other forms of swap agreements to manage its exposure to interest rates and credit risk. In connection with these agreements, securities may be identified as collateral in accordance with the terms of the respective swap agreements.
Interest rate swap agreements involve the exchange by the Portfolio with another party of their respective commitments to pay or receive interest, e.g., an exchange of floating rate payments for fixed rate payments with respect to the notional amount of principal. Certain forms of interest rate swap agreements may include: (i) interest rate caps, under which, in return for a premium, one party agrees to make payments to the other to the extent that interest rates exceed a specified rate, or “cap”, (ii) interest rate floors, under which, in return for a premium, one party agrees to make payments to the other to the extent that interest rates fall below a specified rate, or “floor”, or (iii) interest rate collars, under which a party sells a cap and purchases a floor or vice versa in an attempt to protect itself against interest rate movements exceeding given minimum or maximum levels.
Total return swap agreements involve commitments to pay interest in exchange for a market-linked return, both based on notional amounts. To the extent the total return of the security or index underlying the transaction exceeds or falls short of the offsetting interest rate obligation, the Portfolio will receive a payment from or make a payment to the counterparty.
Forward spread-lock swap agreements involve commitments to pay or receive a settlement amount calculated as the difference between the swap spread and a fixed spread, multiplied by the notional amount times the duration of the swap. The swap spread is the difference between the benchmark swap rate (market rate) and the specific Treasury rate.
Credit default swap agreements involve one party making a stream of payments to another party in exchange for the right to receive a specified return in the event of a default by a third party, typically corporate issues or sovereign issues of an emerging country, on its obligation. The Portfolio may use credit default swaps to provide a measure of protection against defaults of the issuers (i.e., to reduce risk where the Portfolio owns or has exposure to the sovereign issuer) or to take an active long or short position with respect to the likelihood of a particular issuer’s
| | | | | | |
| | Semiannual Report | | June 30, 2007 | | 15 |
Notes to Financial Statements (Cont.)
default. As a seller of protection, the Portfolio generally receives an upfront payment or a fixed rate of income throughout the term of the swap provided that there is no credit event. If the Portfolio is a seller of protection and a credit event occurs, as defined under the terms of that particular swap agreement, the Portfolio will pay to the buyer of the protection an amount up to the notional value of the swap and in certain instances take delivery of the security. As the seller, the Portfolio would effectively add leverage to its portfolio because, in addition to its total net assets, the Portfolio would be subject to investment exposure on the notional amount of the swap. As a buyer of protection, the Portfolio generally receives an amount up to the notional value of the swap if a credit event occurs. The treatment of credit default swaps and other swap agreements that provide for contingent, non-periodic, bullet-type payments as “notional principal contracts” for U.S. federal income tax purposes is uncertain. Were the U.S. Internal Revenue Service (“IRS”) to take the position that a credit default swap or other bullet-type swap is not a “notional principal contract” for U.S. federal income tax purposes, payments received by the Portfolio from such investments might be subject to U.S. excise or income taxes.
Swaps are marked to market daily based upon quotations from market makers and the change in value, if any, is recorded as unrealized gain or loss on the Statement of Operations. Payments received or made at the beginning of the measurement period are reflected as such on the Statement of Assets and Liabilities. These upfront payments are recorded as realized gain or loss on the Statement of Operations upon termination or maturity of the swap. A liquidation payment received or made at the termination of the swap is recorded as realized gain or loss on the Statement of Operations. Net periodic payments received or paid by the Portfolio are included as part of realized gain or loss on the Statement of Operations. Entering into these agreements involves, to varying degrees, elements of credit, market and documentation risk in excess of the amounts recognized on the Statement of Assets and Liabilities. Such risks involve the possibility that there will be no liquid market for these agreements, that the counterparty to the agreements may default on its obligation to perform or disagree as to the meaning of contractual terms in the agreements and that there may be unfavorable changes in interest rates.
(n) Mortgage-Related and Other Asset-Backed Securities The Portfolio may invest in mortgage-related or other asset-backed securities. These securities include mortgage pass-through securities, collateralized mortgage obligations (“CMOs”), commercial mortgage-backed securities, mortgage dollar rolls, CMO residuals, stripped mortgage-backed securities (“SMBSs”) and other securities that directly or indirectly represent a participation in, or are secured by and payable from, mortgage loans on real property. The value of some mortgage-related or asset-backed securities may be particularly sensitive to changes in prevailing interest rates. Early repayment of principal on some mortgage-related securities may expose the Portfolio to a lower rate of return upon reinvestment of principal. The value of these securities may fluctuate in response to the market’s perception of the creditworthiness of the issuers. Additionally, although mortgages and mortgage-related securities are generally supported by some form of government or private guarantee and/or insurance, there is no assurance that private guarantors or insurers will meet their obligations.
One type of SMBS has one class receiving all or a portion of the interest from the mortgage assets (the interest-only, or “IO” and/or the high coupon rate with relatively low principal amount, or “IOette” class), while the other class will receive all of the principal (the principal-only, or “PO” class). Payments received for IOs and IOettes are included in interest income on the Statements of Operations. Because little to no principal will be received at the maturity of an IO or IOettes, adjustments are made to the book value of the security on a daily basis until maturity. These adjustments are included in interest income on the Statements of Operations. Payments received for POs are treated as reductions to the cost and par value of the securities.
(o) U.S. Government Agencies or Government-Sponsored Enterprises Securities issued by U.S. Government agencies or government-sponsored enterprises may not be guaranteed by the U.S. Treasury. The Government National Mortgage Association (“GNMA” or “Ginnie Mae”), a wholly owned U.S. Government corporation, is authorized to guarantee, with the full faith and credit of the U.S. Government, the timely payment of principal and interest on securities issued by institutions approved by GNMA and backed by pools of mortgages insured by the Federal Housing Administration or guaranteed by the Department of Veterans Affairs. Government-related guarantors (i.e., not backed by the full faith and credit of the U.S. Government) include the Federal National Mortgage Association (“FNMA” or “Fannie Mae”) and the Federal Home Loan Mortgage Corporation (“FHLMC” or “Freddie Mac”). Pass-through securities issued by FNMA are guaranteed as to timely payment of principal and interest by FNMA but are not backed by the full faith and credit of the U.S. Government. FHLMC guarantees the timely payment of interest and ultimate collection of principal, but its participation certificates are not backed by the full faith and credit of the U.S. Government.
(p) New Accounting Policies In July 2006, the Financial Accounting Standards Board (“FASB”) issued Interpretation No. 48, “Accounting for Uncertainty in Income Taxes—an Interpretation of FASB Statement No. 109” (the “Interpretation”). The Interpretation became effective for the Portfolio on June 29, 2007. Management has evaluated the application of the Interpretation in relation to the Portfolio and has concluded that no single filing position or combination of filing positions identified as uncertain tax positions required the accrual of a tax liability in the accounting records of the Portfolio for the period ending June 30, 2007. Management will monitor all existing filing positions and future filing positions in light of the Interpretation and evaluate the need for any future tax accruals and financial statement disclosures as warranted.
In September 2006, the FASB issued Statement of Financial Accounting Standards No. 157, “Fair Value Measurements” (the “Statement”). The Statement is effective for fiscal years beginning after November 15, 2007 and will require expanded disclosure about fair value measurements, separately for each major category of assets and liabilities, that enables shareholders to assess the inputs used to develop those measurements, and for recurring fair value measurements using significant unobservable inputs the effect of the measurements on changes in net assets for the reporting period. Management is currently evaluating the application of the Statement to the Portfolio and will provide additional information in relation to the Statement on the Portfolio’s annual financial statements for the period ending December 31, 2007.
3. FEES AND EXPENSES
(a) Investment Advisory Fee PIMCO is a majority-owned subsidiary of Allianz Global Investors of America L.P. (“AGI”), and serves as investment adviser (the “Adviser”) to the Trust, pursuant to an investment advisory contract. The Adviser receives a monthly fee from the Portfolio, at an annual rate based on average daily net assets. The Advisory Fee for all classes is charged at an annual rate of 0.25%.
(b) Administration Fee PIMCO serves as administrator (the “Administrator”), and provides administrative services to the Trust for which it receives a monthly administrative fee based on each share class’s average daily net assets. As the Administrator, PIMCO bears the costs of various third-party services, including audit, custodial, portfolio accounting, legal, transfer agency and printing costs. The Administration Fee for all classes is charged at the annual rate of 0.20%.
(c) Distribution and Servicing Fees Allianz Global Investors Distributors LLC (“AGID”) is an indirect wholly-owned subsidiary of AGI and serves as the distributor (the “Distributor”) of the Trust’s shares. The Trust is permitted to reimburse AGID on a quarterly basis, out of the Administrative Class assets of the
| | | | |
| 16 | | PIMCO Variable Insurance Trust | | |
| | |
| |
| | | June 30, 2007 (Unaudited) |
Portfolio in the amount of 0.15% on an annual basis of the average daily net assets of that class, for payments made to financial intermediaries that provide services in connection with the distribution of shares or administration of plans or programs that use Portfolio shares as their funding medium. The effective rate paid to AGID was 0.15% during the current fiscal year.
(d) Portfolio Expenses The Trust is responsible for the following expenses: (i) salaries and other compensation of any of the Trust’s executive officers and employees who are not officers, directors, stockholders or employees of PIMCO or its subsidiaries or affiliates; (ii) taxes and governmental fees; (iii) brokerage fees and commissions and other portfolio transaction expenses; (iv) the costs of borrowing money, including interest expenses and bank overdraft charges; (v) fees and expenses of the Trustees who are not “interested persons” of PIMCO or the Trust, and any counsel retained exclusively for their benefit; (vi) extraordinary expenses, including costs of litigation and indemnification expenses; (vii) organization expenses and (viii) any expenses allocated or allocable to a specific class of shares, which include service fees payable with respect to the Administrative Class Shares, and may include certain other expenses as permitted by the Trust’s Multiple Class Plan adopted pursuant to Rule 18f-3 under the Act and subject to review and approval by the Trustees. The ratio of expenses to average net assets per share class, as disclosed in the Financial Highlights, may differ from the annual portfolio operating expenses per share class as disclosed in the Prospectus for the reasons set forth above.
Effective April 1, 2007, each Trustee, other than those affiliated with PIMCO or its affiliates, receives an annual retainer of $15,000, plus $2,375 for each Board of Trustees meeting attended in person, $500 for each committee meeting attended and $750 for each Board of Trustees meeting attended telephonically, plus reimbursement of related expenses. In addition, the audit committee chair receives an additional annual retainer of $2,000 and each other committee chair receives an additional annual retainer of $500. These expenses are allocated on a pro-rata basis to the various portfolios of the Trust according to their respective net assets. The Trust pays no compensation directly to any Trustee or any other officer who is affiliated with the Administrator, all of whom receive remuneration for their services to the Trust from the Administrator or its affiliates. Prior to April 1, 2007, each Trustee, other than those affiliated with PIMCO or its affiliates, received an annual retainer of $15,000 plus $2,000 for each Board of Trustees meeting attended ($500 for each special meeting attended), plus reimbursement of related expenses. The Audit Committee Chairman received an annual retainer of $1,500 and the Governance Committee Chairman received an annual retainer of $500. In addition, each member of a committee received $500 for each committee meeting attended.
4. RELATED PARTY TRANSACTIONS
The Adviser, Administrator, and Distributor are related parties as defined by FAS 57, Related Party Disclosures. Fees payable to these parties are disclosed in Note 3.
5. GUARANTEES AND INDEMNIFICATIONS
Under the Trust’s organizational documents, each Trustee, officer, employee or other agent of the Trust (including the Trust’s investment manager) is indemnified, to the extent permitted by the Act, against certain liabilities that may arise out of performance of their duties to the Portfolio. Additionally, in the normal course of business, the Portfolio enters into contracts that contain a variety of indemnification clauses. The Portfolio’s maximum exposure under these arrangements is unknown as this would involve future claims that may be made against the Portfolio that have not yet occurred. However, the Portfolio has not had prior claims or losses pursuant to these contracts and believes the risk of loss to be remote.
6. PURCHASES AND SALES OF SECURITIES
The length of time the Portfolio has held a particular security is not generally a consideration in investment decisions. A change in the securities held by the Portfolio is known as “portfolio turnover”. The Portfolio may engage in frequent and active trading of portfolio securities to achieve its investment objective, particularly during periods of volatile market movements. High portfolio turnover (e.g., over 100%) involves correspondingly greater expenses to the Portfolio, including brokerage commissions or dealer mark-ups and other transaction costs on the sale of securities and reinvestments in other securities. Such sales may also result in realization of taxable capital gains, including short-term capital gains (which are generally taxed at ordinary income tax rates). The trading costs and tax effects associated with portfolio turnover may adversely affect the Portfolio’s performance.
Purchases and sales of securities (excluding short-term investments) for the period ended June 30, 2007, were as follows (amounts in thousands):
| | | | | | | | | | | | |
| U.S. Government/Agency | | | | All Other |
| Purchases | | Sales | | | | Purchases | | Sales |
| $ | 12,754 | | $ | 12,785 | | | | $ | 2,560 | | $ | 1,429 |
7. TRANSACTIONS IN WRITTEN CALL AND PUT OPTIONS
Transactions in written call and put options were as follows (amounts in thousands, except for number of contracts):
| | | | | | | | | | |
| | | | | Notional
Amount
in $ | | | Premium | |
Balance at 12/31/2006 | | | | $ | 800 | | | $ | 9 | |
Sales | | | | | 1,000 | | | | 12 | |
Closing Buys | | | | | (800 | ) | | | (9 | ) |
Expirations | | | | | 0 | | | | 0 | |
Exercised | | | | | 0 | | | | 0 | |
Balance at 06/30/2007 | | | | $ | 1,000 | | | $ | 12 | |
8. SHARES OF BENEFICIAL INTEREST
The Portfolio may issue an unlimited number of shares of beneficial interest with a $0.001 par value. Changes in shares of beneficial interest were as follows (shares and amounts in thousands):
| | | | | | | | | | | | | | | | |
| | | | | Six Months Ended
06/30/2007 | | | Year Ended
12/31/2006 | |
| | | | | Shares | | | Amount | | | Shares | | | Amount | |
| | | | | |
Receipts for shares sold | | | | | | | | | | | | | | | | |
Institutional Class | | | | 130 | | | $ | 1,304 | | | 1,718 | | | $ | 17,254 | |
Administrative Class | | | | 537 | | | | 5,388 | | | 557 | | | | 5,591 | |
Issued as reinvestment of distributions | | | | | | | | | | | | | | | | |
Institutional Class | | | | 32 | | | | 314 | | | 88 | | | | 885 | |
Administrative Class | | | | 23 | | | | 231 | | | 40 | | | | 399 | |
Cost of shares redeemed | | | | | | | | | | | | | | | | |
Institutional Class | | | | (775 | ) | | | (7,783 | ) | | (3,302 | ) | | | (33,154 | ) |
Administrative Class | | | | (424 | ) | | | (4,255 | ) | | (494 | ) | | | (4,954 | ) |
Net (decrease) resulting from Portfolio share transactions | | | | (477 | ) | | $ | (4,801 | ) | | (1,393 | ) | | $ | (13,979 | ) |
| | | | | | |
| | Semiannual Report | | June 30, 2007 | | 17 |
Notes to Financial Statements (Cont.)
The following schedule shows the number of shareholders each owning 5% or more of the Portfolio and the total percentage of the Portfolio held by such shareholders:
| | | | | | |
| | | | | Number of
Shareholders | | % of Portfolio Held |
Institutional Class | | | | 2 | | 95 |
Administrative Class | | | | 3 | | 78 |
9. REGULATORY AND LITIGATION MATTERS
Since February 2004, PIMCO, Allianz Global Investors of America L.P. (PIMCO’s parent company), AGID, and certain of their affiliates, including the PIMCO Funds (another series of funds managed by PIMCO), the Allianz Funds (formerly known as PIMCO Funds: Multi-Manager Series (another series of funds managed by affiliates of PIMCO)), certain Trustees of the Trust (in their capacity as Trustees of the PIMCO Funds or the Allianz Funds) and certain employees of PIMCO, have been named as defendants in fifteen lawsuits filed in various jurisdictions. Eleven of those lawsuits concern “market timing,” and they have been transferred to and consolidated for pre-trial proceedings in a multi-district litigation proceeding in the U.S. District Court for the District of Maryland; the other four lawsuits concern “revenue sharing” and have been consolidated into a single action in the U.S. District Court for the District of Connecticut. The lawsuits have been commenced as putative class actions on behalf of investors who purchased, held or redeemed shares of the various series of the PIMCO Funds and the Allianz Funds during specified periods, or as derivative actions on behalf of the PIMCO Funds and the Allianz Funds.
The market timing actions in the District of Maryland generally allege that certain hedge funds were allowed to engage in “market timing” in certain funds of the PIMCO Funds and the Allianz Funds and this alleged activity was not disclosed. Pursuant to tolling agreements entered into with the derivative and class action plaintiffs, PIMCO, certain PIMCO Funds Trustees, and certain employees of PIMCO who were previously named as defendants have all been dropped as defendants in the market timing actions; the plaintiffs continue to assert claims on behalf of the shareholders of the PIMCO Funds or on behalf of the PIMCO Funds itself against other defendants. By order dated November 3, 2005, the U.S. District Court for the District of Maryland granted the PIMCO Funds’ motion to dismiss claims asserted against it in a consolidated amended complaint where the PIMCO Funds were named, in the complaint, as a nominal defendant. The revenue sharing action in the District of Connecticut generally alleges that fund assets were inappropriately used to pay brokers to promote funds of the PIMCO Funds and the Allianz Funds, including directing fund brokerage transactions to such brokers, and that such alleged arrangements were not fully disclosed to shareholders. On August 11, 2005, the U.S. District Court for the District of Connecticut conducted a hearing on defendants’ motion to dismiss the consolidated amended complaint in the revenue sharing action but has not yet ruled on the motion to dismiss. The market timing and revenue sharing lawsuits seek, among other things, unspecified compensatory damages plus interest and, in some cases, punitive damages, the rescission of investment advisory contracts, the return of fees paid under those contracts and restitution.
Two nearly identical class action civil complaints have been filed in August 2005, in the Northern District of Illinois Eastern Division, alleging that the plaintiffs each purchased and sold a 10-year Treasury note futures contract and suffered damages
from an alleged shortage when PIMCO held both physical and futures positions in 10-year Treasury notes for its client accounts. The two actions have been consolidated into one action, and the two separate complaints have been replaced by a consolidated complaint. PIMCO is a named defendant, and PIMCO Funds has been added as a defendant, to the consolidated action. PIMCO strongly believes the complaint is without merit and intends to vigorously defend itself.
In April 2006, certain portfolios of the Trust and certain other funds managed by PIMCO were served in an adversary proceeding brought by the Official Committee of Asbestos Claimants of G-I Holdings, Inc. in G-I Holdings, Inc.’s bankruptcy in the District of New Jersey. In July 2004, PIMCO was named in this lawsuit and remains a defendant. The plaintiff seeks to recover for the bankruptcy estate assets that were transferred by the predecessor entity of G-I Holdings, Inc. to a wholly-owned subsidiary in 1994. The subsidiary has since issued notes, of which certain portfolios of the Trust and certain other funds managed by PIMCO are alleged to be holders. The complaint alleges that in 2000, more than two hundred noteholders—including certain portfolios of the Trust and certain other funds managed by PIMCO—were granted a second priority lien on the assets of the subsidiary in exchange for their consent to a refinancing transaction and the granting of a first priority lien to the lending banks. The plaintiff is seeking invalidation of the lien in favor of the noteholders and/or the value of the lien. On June 21, 2006, the District of New Jersey overturned the Bankruptcy Court’s decision granting permission to file the adversary proceeding and remanded the matter to the Bankruptcy Court for further proceedings. Following a motion to reconsider, the District Court upheld its remand on August 7, 2006, and instructed the Bankruptcy Court to conduct a “cost-benefit” analysis of the Committee’s claims, including the claims against the noteholders. The Bankruptcy Court held a status conference on October 25, 2006 and set a briefing schedule relating to this cost-benefit analysis.
The foregoing speaks only as of the date of this report. It is possible that these matters and/or other developments resulting from these matters could result in increased portfolio redemptions or other adverse consequences to the Portfolio. However, PIMCO and AGID believe that these matters are not likely to have a material adverse effect on the Portfolio or on PIMCO’s or AGID’s ability to perform their respective investment advisory or distribution services relating to the Portfolio.
10. FEDERAL INCOME TAX MATTERS
The Portfolio intends to qualify as a regulated investment company under sub-chapter M of the Internal Revenue Code (the “Code”) and distribute all of its taxable income and net realized gains, if applicable, to shareholders. Accordingly, no provision for Federal income taxes has been made.
As of June 30, 2007, the aggregate cost of investments was the same for federal income tax and financial statement purposes. The net unrealized appreciation (depreciation) of investment securities for federal income tax purposes is as follows (amount in thousands):
| | | | |
Aggregate
Gross
Unrealized
Appreciation | | Aggregate
Gross
Unrealized
(Depreciation) | | Net
Unrealized
(Depreciation) |
$ 14 | | $ (79) | | $ (65) |
| | | | |
| 18 | | PIMCO Variable Insurance Trust | | |
| | |
| |
Privacy Policy* | | (Unaudited) |
The Funds consider customer privacy to be a fundamental aspect of their relationships with shareholders and are committed to maintaining the confidentiality, integrity and security of their current, prospective and former shareholders’ personal information. To ensure their shareholders’ privacy, the Funds have developed policies that are designed to protect this confidentiality, while allowing shareholder needs to be served.
Obtaining Personal Information
In the course of providing shareholders with products and services, the Funds and certain service providers to the Funds, such as the Funds’ investment advisers (“Advisers”), may obtain non-public personal information about shareholders, which may come from sources such as account applications and other forms, from other written, electronic or verbal correspondence, from shareholder transactions, from a shareholder’s brokerage or financial advisory firm, financial adviser or consultant, and/or from information captured on the Funds’ internet web sites.
Respecting Your Privacy
As a matter of policy, the Funds do not disclose any personal or account information provided by shareholders or gathered by the Funds to non-affiliated third parties, except as required or permitted by law or as necessary for such third parties to perform their agreements with respect to the Funds. As is common in the industry, non-affiliated companies may from time to time be used to provide certain services, such as preparing and mailing prospectuses, reports, account statements and other information, conducting research on shareholder satisfaction and gathering shareholder proxies. A Fund’s Distributor may also retain non-affiliated companies to market the Fund’s shares or products which use the Fund’s shares and enter into joint marketing agreements with other companies. These companies may have access to a shareholder’s personal and account information, but are permitted to use this information solely to provide the specific service or as otherwise permitted by law. In most cases, the shareholders will be clients of a third party, but the Funds may also provide a shareholder’s personal and account information to the shareholder’s respective brokerage or financial advisory firm.
Sharing Information with Third Parties
The Funds reserve the right to disclose or report personal information to non-affiliated third parties, in limited circumstances, where the Funds believe in good faith that disclosure is required under law to cooperate with regulators or law enforcement authorities, to protect their rights or property or upon reasonable request by any Fund in which a shareholder has chosen to invest. In addition, the Funds may disclose information about a shareholder’s accounts to a non-affiliated third party with the consent of the shareholder.
Sharing Information with Affiliates
The Funds may share shareholder information with their affiliates in connection with servicing their shareholders’ accounts or to provide shareholders with information about products and services that the Funds or their Advisers, principal underwriters or their affiliates (“Service Affiliates”) believe may be of interest to such shareholders. The information that the Funds share may include, for example, a shareholder’s participation in one of the Funds or in other investment programs sponsored by a Service Affiliate, a shareholder’s ownership of certain types of accounts (such as IRAs), or other data about a shareholder’s accounts. The Funds’ Service Affiliates, in turn, are not permitted to share shareholder information with non-affiliated entities, except as required or permitted by law.
Procedures to Safeguard Private Information
The Funds take seriously the obligation to safeguard shareholder non-public personal information. In addition to this policy, the Funds have also implemented procedures that are designed to restrict access to a shareholder’s non-public personal information only to internal personnel who need to know that information in order to provide products or services to such shareholders. In order to guard a shareholder’s non-public personal information, physical, electronic and procedural safeguards are in place.
* This Privacy Policy applies to the following entities: PIMCO Funds, PIMCO Variable Insurance Trust, PCM Fund, Inc. and PIMCO Strategic Global Government Fund, Inc. (collectively, the “Funds”).
| | | | | | |
| | Semiannual Report | | June 30, 2007 | | 19 |
Investment Adviser and Administrator
Pacific Investment Management Company LLC
840 Newport Center Drive
Newport Beach, California 92660
Distributor
Allianz Global Investors Distributors LLC
1345 Avenue of the Americas
New York, New York 10105
Custodian
State Street Bank & Trust Company
801 Pennsylvania
Kansas City, Missouri 64105
Transfer Agent
Boston Financial Data Services–Midwest
330 W. 9th Street
Kansas City, Missouri 64105
Legal Counsel
Dechert LLP
1775 I Street, N.W.
Washington, D.C. 20006
Independent Registered Public Accounting Firm
PricewaterhouseCoopers LLP
1055 Broadway
Kansas City, Missouri 64105
P I M C O

Table of Contents
This material is authorized for use only when preceded or accompanied by the current PIMCO Variable Insurance Trust (the “Trust”) prospectus. Investors should consider the investment objectives, risks, charges and expenses of this Trust carefully before investing. Ask your financial professional to explain all charges that may apply. This and other information is contained in the Trust’s prospectus. The variable product prospectus may be obtained by contacting your Investment Consultant. Please read the Trust and variable product prospectus carefully before you invest or send money.
Chairman’s Letter
Dear PIMCO Variable Insurance Trust Shareholder:
It is our pleasure to present to you the semiannual report for the PIMCO Variable Insurance Trust, covering the six-month period ended June 30, 2007. The PIMCO Variable Insurance Trust’s net assets were $8.68 billion at June 30, 2007, as compared to $7.76 billion at December 31, 2006.
Highlights of the financial markets during the reporting period include:
| | n | | Economic data during the first quarter of 2007 pointed to slower growth, which heightened market expectations for a decrease in the Federal Funds Rate. By the second quarter, economic data, such as employment statistics, provided little indication of economic weakness, causing expectations of a decrease in the Federal Funds Rate to unwind and U.S. interest rates to move higher. Interest rates in Europe and the U.K. also rose over the period as central banks raised their key lending rates due to inflation concerns. The benchmark ten-year U.S. Treasury yielded 5.03% as of June 30, 2007, or 0.32% higher than at the beginning of the year. |
| | n | | Most bonds generally returned much of their gains from earlier in the year as worldwide growth and capital flows drove interest rates higher in the second quarter. Increased risk aversion in global financial markets, due in part to subprime mortgage worries in the U.S., also contributed to the rise in interest rates. The Lehman Brothers Aggregate Bond Index, which includes Treasury, investment-grade corporate and mortgage-backed securities, returned 0.98% for the six-month period. |
| | n | | Locally issued emerging market (“EM”) bonds posted positive returns for the reporting period. Yields on these bonds declined and the local currencies in which they are denominated generally gained, amid increasing investor awareness, strong economic growth and surging capital inflows. External EM bonds (debt instruments issued by emerging markets countries and typically denominated in U.S. dollars) lagged behind local EM bonds (debt instruments issued by emerging markets countries and denominated in the currency of the issuer), as external EM bonds tend to trade more in-line with U.S. Treasuries. |
| | n | | Treasury Inflation-Protected Securities (“TIPS”) outpaced nominal bonds (non-inflation linked bonds) for the first part of the year and all but the longest maturity TIPS outperformed in the second quarter as high gasoline prices drove higher inflation accruals. Commodities, as represented by the Dow Jones-AIG Commodity Total Return Index, returned 4.46% for the period. Equities, as measured by the S&P 500 Index and the Russell 2000 Index, returned 6.96% and 6.45%, respectively, for the period. |
On the following pages, please find specific details as to the Portfolio’s total return investment performance and a discussion of those factors that affected performance.
Thank you for the trust you have placed in us. We will continue to work diligently to serve your investment needs.
Sincerely,
Brent R. Harris
Chairman, PIMCO Variable Insurance Trust
July 31, 2007
| | | | | | |
| | Semiannual Report | | June 30, 2007 | | 1 |
Important Information About the Portfolio
PIMCO Variable Insurance Trust (the “Trust”) is an open-end management investment company currently consisting of twenty separate investment portfolios, including the Short-Term Portfolio (the “Portfolio”). The Portfolio is only available as a funding vehicle under variable life insurance policies or variable annuity contracts issued by insurance companies (“Variable Contracts”). Individuals may not purchase shares of the Portfolio directly. Shares of the Portfolio also may be sold to qualified pension and retirement plans outside of the separate account context.
We believe that bond funds have an important role to play in a well diversified investment portfolio. It is important to note, however, that in an environment where interest rates may trend upward, rising rates would negatively impact the performance of most bond funds, and fixed-income securities held by a fund are likely to decrease in value. The price volatility of fixed-income securities can also increase during periods of rising interest rates resulting in increased losses to a fund. Bond funds and individual bonds with a longer duration (a measure of the expected life of a security) tend to be more sensitive to changes in interest rates, usually making them more volatile than securities or funds with shorter durations.
The Portfolio may be subject to various risks in addition to those described above. Some of these risks may include, but are not limited to, the following: credit risk, high yield risk, market risk, issuer risk, derivatives risk, mortgage risk, non-U.S. investment risk, currency risk, leveraging risk and management risk. A complete description of these risks is contained in the Portfolio’s prospectus. The Portfolio may use derivative instruments for hedging purposes or as part of an investment strategy. Use of these instruments may involve certain costs and risks such as liquidity risk, interest rate risk, market risk, credit risk, management risk and the risk that the Portfolio could not close out a position when it would be most advantageous to do so. Because the Portfolio may invest in derivatives, it could lose more than the principal amount invested in these instruments. Investing in non-U.S. securities may entail risk due to non-U.S. economic and political developments.
On the performance summary page in this Semiannual Report, the Total Return Investment Performance table measures performance assuming that all dividend and capital gain distributions were reinvested.
An investment in the Portfolio is not a deposit of a bank and is not guaranteed or insured by the Federal Deposit Insurance Corporation or any other government agency. It is possible to lose money on investments in the Portfolio.
PIMCO has adopted written proxy voting policies and procedures (“Proxy Policy”) as required by Rule 206(4)-6 under the Investment Advisers Act of 1940, as amended. The Proxy Policy has been adopted by the Trust as the policies and procedures that PIMCO will use when voting proxies on behalf of the Portfolio. A description of the policies and procedures that PIMCO uses to vote proxies relating to portfolio securities of the Portfolio, and information about how the Portfolio voted proxies relating to portfolio securities held during the most recent twelve-month period ended June 30, are available without charge, upon request, by calling the Trust at 1-866-746-2606 and on the Portfolio’s website at www.pimco.com.
The Portfolio files its complete schedule of portfolio holdings with the SEC for the first and third quarters of each fiscal year on Form N-Q. A copy of the Trust’s Form N-Q is also available on the SEC’s website at http://www.sec.gov and may be reviewed and copied at the SEC’s Public Reference Room in Washington D.C. Information on the operation of the Public Reference Room may be obtained by calling 1-800-SEC-0330, and is available without charge, upon request, by calling the Trust at 1-866-746-2606 and on the Portfolio’s website at www.pimco.com.
PIMCO Variable Insurance Trust is distributed by Allianz Global Investors Distributors LLC, 1345 Avenue of the Americas, New York, NY 10105.
| | | | |
| 2 | | PIMCO Variable Insurance Trust | | |
The following disclosure provides important information regarding the Portfolio’s Expense Example (“Example” or “Expense Example”), which appears in this Semiannual Report. Please refer to this information when reviewing the Expense Example for the Portfolio.
Example
As a shareholder of the Portfolio, you incur two types of costs: (1) transaction costs and (2) ongoing costs, including advisory and administrative fees; distribution and/or service (12b-1) fees (Administrative Class only); and other Portfolio expenses. The Example is intended to help you understand your ongoing costs (in dollars) of investing in the Portfolio and to compare these costs with the ongoing costs of investing in other mutual funds. The Expense Example does not reflect any fees or other expenses imposed by the Variable Contracts. If it did, the expenses reflected in the Expense Example would be higher. The Example is based on an investment of $1,000 invested at the beginning of the period and held for the entire period indicated, which is from January 1, 2007 to June 30, 2007.
Actual Expenses
The information in the table under the heading “Actual Performance” provides information about actual account values and actual expenses. You may use the information in these columns, together with the amount you invested, to estimate the expenses that you paid over the period. Simply divide your account value by $1,000 (for example, an $8,600 account value divided by $1,000 = $8.60), then multiply the result by the number in the row titled “Expenses Paid During Period” to estimate the expenses you paid on your account during this period.
Hypothetical Example for Comparison Purposes
The information in the table under the heading “Hypothetical Performance (5% return before expenses)” provides information about hypothetical account values and hypothetical expenses based on the Portfolio’s actual expense ratio and an assumed rate of return of 5% per year before expenses, which is not the Portfolio’s actual return. The hypothetical account values and expenses may not be used to estimate the actual ending account balance or expenses you paid for the period. You may use this information to compare the ongoing costs of investing in the Portfolio and other portfolios. To do so, compare this 5% hypothetical example with the 5% hypothetical examples that appear in the shareholder reports of the other portfolios.
Please note that the expenses shown in the table are meant to highlight your ongoing costs only and do not reflect any transactional costs. Therefore, the information under the heading “Hypothetical Performance (5% return before expenses)” is useful in comparing ongoing costs only, and will not help you determine the relative total costs of owning different portfolios. In addition, if these transactional costs were included, your costs would have been higher.
The expense ratio may vary period to period because of various factors, such as an increase in expenses not covered by the advisory and administrative fees (such as expenses of the trustees and their counsel, litigation expense and interest expense).
| | | | | | |
| | Semiannual Report | | June 30, 2007 | | 3 |
PIMCO Short-Term Portfolio
Cumulative Returns Through June 30, 2007
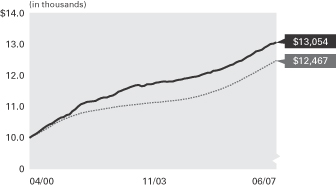
$10,000 invested at the beginning of the first full month following the inception date of the Portfolio’s Institutional Class.
Allocation Breakdown‡
| | |
Short-Term Instruments | | 39.7% |
U.S. Government Agencies | | 21.4% |
Corporate Bonds & Notes | | 17.1% |
Asset-Backed Securities | | 12.9% |
Mortgage-Backed Securities | | 8.4% |
Other | | 0.5% |
| | ‡ | % of Total Investments as of 06/30/2007 |
| | | | | | | | | | |
| Average Annual Total Return for the period ended June 30, 2007 |
| | | | | 6 Months* | | 1 Year | | 5 Years | | Portfolio
Inception
(04/28/00)** |
| | PIMCO Short-Term Portfolio Institutional Class | | 2.04% | | 4.67% | | 2.94% | | 3.78% |
| | Citigroup 3-Month Treasury Bill Index± | | 2.49% | | 5.06% | | 2.67% | | 3.12% |
All Portfolio returns are net of fees and expenses.
* Cumulative return.
** The Portfolio began operations on 04/28/00. Index comparisons began on 04/30/00.
Performance quoted represents past performance. Past performance is no guarantee of future results. Investment return and principal value will fluctuate so the Portfolio shares, when redeemed, may be worth more or less than their original cost. The Portfolio’s performance does not reflect the deduction of additional charges and expenses imposed in connection with investing in Variable Contracts, which will reduce returns. Current performance may be lower or higher than the performance data quoted. Performance data current to the most recent month-end is available by calling (800) 927-4648.
± Citigroup 3-Month Treasury Bill Index is an unmanaged index representing monthly return equivalents of yield averages of the last 3 month Treasury Bill issues. It is not possible to invest directly in the index. The index does not reflect deductions for fees and expenses.
| | | | | | |
| Expense Example | | Actual Performance | | Hypothetical Performance |
| | | | | (5% return before expenses) |
Beginning Account Value (01/01/07) | | $ | 1,000.00 | | $ | 1,000.00 |
Ending Account Value (06/30/07) | | $ | 1,020.38 | | $ | 1,022.56 |
Expenses Paid During Period† | | $ | 2.25 | | $ | 2.26 |
† Expenses are equal to the Portfolio’s Institutional Class annualized expense ratio of 0.45%, multiplied by the average account value over the period, multiplied by 181/365 (to reflect the one-half year period). Overall fees and expenses of investing in the Portfolio will be higher because the example does not reflect Variable Contract fees and expenses.
Please refer to page 3 herein for an explanation of the information presented in the above Expense Example.
Portfolio Insights
| » | | The PIMCO Short-Term Portfolio seeks to achieve its investment objective by investing under normal circumstances at least 65% of its total assets in a diversified portfolio of fixed-income instruments of varying maturities, which may be represented by forwards or derivatives, such as options, futures contracts or swap agreements. |
| » | | U.S. duration exposure, with emphasis at the front end of the yield curve, was the primary detractor from performance as U.S. interest rates trended higher during the first half of 2007. |
| » | | Curve steepening strategies enhanced performance as the U.S. Treasury yield curve steepened during the period. |
| » | | Positions at the front end of the U.K. and the European yield curves detracted from returns as central banks raised interest rates during the period. |
| » | | Exposure to credit sensitive assets, such as mortgages, emerging markets and positive swap spread exposure, detracted from performance as spreads widened. |
| | | | |
| 4 | | PIMCO Variable Insurance Trust | | |
Financial Highlights Short-Term Portfolio
| | | | | | | | | | | | | | | | | | | | | | | | |
| Selected per Share Data for the Year or Period Ended: | | 06/30/2007+ | | | 12/31/2006 | | | 12/31/2005 | | | 12/31/2004 | | | 12/31/2003 | | | 12/31/2002 | |
| | | | | | |
Institutional Class | | | | | | | | | | | | | | | | | | | | | | | | |
Net asset value beginning of year or period | | $ | 10.04 | | | $ | 10.05 | | | $ | 10.08 | | | $ | 10.10 | | | $ | 10.08 | | | $ | 10.08 | |
Net investment income (a) | | | 0.24 | | | | 0.45 | | | | 0.30 | | | | 0.14 | | | | 0.14 | | | | 0.30 | |
Net realized/unrealized gain (loss) on investments (a) | | | (0.03 | ) | | | (0.01 | ) | | | (0.03 | ) | | | 0.00 | | | | 0.08 | | | | 0.01 | |
Total income from investment operations | | | 0.21 | | | | 0.44 | | | | 0.27 | | | | 0.14 | | | | 0.22 | | | | 0.31 | |
Dividends from net investment income | | | (0.25 | ) | | | (0.45 | ) | | | (0.30 | ) | | | (0.14 | ) | | | (0.19 | ) | | | (0.30 | ) |
Distributions from net realized capital gains | | | 0.00 | | | | 0.00 | | | | 0.00 | | | | (0.02 | ) | | | (0.01 | ) | | | (0.01 | ) |
Total distributions | | | (0.25 | ) | | | (0.45 | ) | | | (0.30 | ) | | | (0.16 | ) | | | (0.20 | ) | | | (0.31 | ) |
Net asset value end of year or period | | $ | 10.00 | | | $ | 10.04 | | | $ | 10.05 | | | $ | 10.08 | | | $ | 10.10 | | | $ | 10.08 | |
Total return | | | 2.04 | % | | | 4.43 | % | | | 2.67 | % | | | 1.45 | % | | | 2.20 | % | | | 3.18 | % |
Net assets end of year or period (000s) | | $ | 11,166 | | | $ | 17,372 | | | $ | 32,419 | | | $ | 25,320 | | | $ | 14,932 | | | $ | 4,893 | |
Ratio of expenses to average net assets | | | 0.45 | %* | | | 0.45 | % | | | 0.45 | % | | | 0.45 | % | | | 0.45 | % | | | 0.45 | % |
Ratio of expenses to average net assets excluding interest expense | | | 0.45 | %* | | | 0.45 | % | | | 0.45 | % | | | 0.45 | % | | | 0.45 | % | | | 0.45 | % |
Ratio of net investment income to average net assets | | | 4.93 | %* | | | 4.44 | % | | | 2.95 | % | | | 1.34 | % | | | 1.36 | % | | | 2.99 | % |
Portfolio turnover rate | | | 88 | % | | | 111 | % | | | 154 | % | | | 251 | % | | | 199 | % | | | 60 | % |
+ Unaudited
* Annualized
(a) Per share amounts based on average number of shares outstanding during the period.
| | | | | | |
| See Accompanying Notes | | Semiannual Report | | June 30, 2007 | | 5 |
Statement of Assets and Liabilities Short-Term Portfolio
| | | | |
| (Amounts in thousands, except per share amounts) | | June 30, 2007 | |
| | | (Unaudited) | |
| |
Assets: | | | | |
Investments, at value | | $ | 22,881 | |
Cash | | | 3 | |
Foreign currency, at value | | | 65 | |
Receivable for investments sold | | | 489 | |
Receivable for Portfolio shares sold | | | 75 | |
Interest and dividends receivable | | | 80 | |
Swap premiums paid | | | 49 | |
Unrealized appreciation on foreign currency contracts | | | 18 | |
| | | | 23,660 | |
| |
Liabilities: | | | | |
Payable for investments purchased | | $ | 994 | |
Payable for investments purchased on a delayed-delivery basis | | | 400 | |
Payable for Portfolio shares redeemed | | | 7 | |
Payable for short sales | | | 494 | |
Written options outstanding | | | 5 | |
Accrued investment advisory fee | | | 4 | |
Accrued administration fee | | | 4 | |
Accrued servicing fee | | | 1 | |
Variation margin payable | | | 7 | |
Unrealized depreciation on foreign currency contracts | | | 7 | |
Unrealized depreciation on swap agreements | | | 32 | |
| | | | 1,955 | |
| |
Net Assets | | $ | 21,705 | |
| |
Net Assets Consist of: | | | | |
Paid in capital | | $ | 21,926 | |
Undistributed net investment income | | | 47 | |
Accumulated undistributed net realized (loss) | | | (124 | ) |
Net unrealized (depreciation) | | | (144 | ) |
| | | $ | 21,705 | |
| |
Net Assets: | | | | |
Institutional Class | | $ | 11,166 | |
Administrative Class | | | 10,539 | |
| |
Shares Issued and Outstanding: | | | | |
Institutional Class | | | 1,117 | |
Administrative Class | | | 1,054 | |
| |
Net Asset Value and Redemption Price Per Share (Net Asset Per Share Outstanding) | | | | |
Institutional Class | | $ | 10.00 | |
Administrative Class | | | 10.00 | |
| |
Cost of Investments Owned | | $ | 22,946 | |
Cost of Foreign Currency Held | | $ | 65 | |
Proceeds Received on Short Sales | | $ | 483 | |
Premiums Received on Written Options | | $ | 12 | |
| | | | |
| 6 | | PIMCO Variable Insurance Trust | | See Accompanying Notes |
Statement of Operations Short-Term Portfolio
| | | | |
| (Amounts in thousands) | | Six Months Ended
June 30, 2007 | |
| | | (Unaudited) | |
| |
| Investment Income: | | | | |
Interest | | $ | 610 | |
Dividends | | | 2 | |
Total Income | | | 612 | |
| |
Expenses: | | | | |
Investment advisory fees | | | 28 | |
Administration fees | | | 23 | |
Servicing fees – Administrative Class | | | 7 | |
Total Expenses | | | 58 | |
| |
Net Investment Income | | | 554 | |
| |
Net Realized and Unrealized Gain (Loss): | | | | |
Net realized (loss) on investments | | | (24 | ) |
Net realized gain on futures contracts, written options and swaps | | | 93 | |
Net realized (loss) on foreign currency transactions | | | (16 | ) |
Net change in unrealized (depreciation) on investments | | | (60 | ) |
Net change in unrealized (depreciation) on futures contracts, written options and swaps | | | (97 | ) |
Net change in unrealized appreciation on translation of assets and liabilities denominated in foreign currencies | | | 18 | |
Net (Loss) | | | (86 | ) |
| |
Net Increase in Net Assets Resulting from Operations | | $ | 468 | |
| | | | | | |
| See Accompanying Notes | | Semiannual Report | | June 30, 2007 | | 7 |
Statements of Changes in Net Assets Short-Term Portfolio
| | | | | | | | |
| (Amounts in thousands) | | Six Months Ended
June 30, 2007 | | | Year Ended
December 31, 2006 | |
| | | (Unaudited) | | | | |
| | |
| Increase (Decrease) in Net Assets from: | | | | | | | | |
| | |
Operations: | | | | | | | | |
Net investment income | | $ | 554 | | | $ | 1,308 | |
Net realized gain (loss) | | | 53 | | | | (155 | ) |
Net change in unrealized appreciation (depreciation) | | | (139 | ) | | | 87 | |
Net increase resulting from operations | | | 468 | | | | 1,240 | |
| | |
Distributions to Shareholders: | | | | | | | | |
From net investment income | | | | | | | | |
Institutional Class | | | (314 | ) | | | (884 | ) |
Administrative Class | | | (231 | ) | | | (399 | ) |
| | |
Total Distributions | | | (545 | ) | | | (1,283 | ) |
| | |
Portfolio Share Transactions: | | | | | | | | |
Receipts for shares sold | | | | | | | | |
Institutional Class | | | 1,304 | | | | 17,254 | |
Administrative Class | | | 5,388 | | | | 5,591 | |
Issued as reinvestment of distributions | | | | | | | | |
Institutional Class | | | 314 | | | | 885 | |
Administrative Class | | | 231 | | | | 399 | |
Cost of shares redeemed | | | | | | | | |
Institutional Class | | | (7,783 | ) | | | (33,154 | ) |
Administrative Class | | | (4,255 | ) | | | (4,954 | ) |
Net (decrease) resulting from Portfolio share transactions | | | (4,801 | ) | | | (13,979 | ) |
| | |
Total (Decrease) in Net Assets | | | (4,878 | ) | | | (14,022 | ) |
| | |
Net Assets: | | | | | | | | |
Beginning of period | | | 26,583 | | | | 40,605 | |
End of period* | | $ | 21,705 | | | $ | 26,583 | |
| | |
*Including undistributed net investment income of: | | $ | 47 | | | $ | 38 | |
| | | | |
| 8 | | PIMCO Variable Insurance Trust | | See Accompanying Notes |
| | |
| |
| Schedule of Investments Short-Term Portfolio | | June 30, 2007 (Unaudited) |
| | | | | | | | |
| | | | | PRINCIPAL
AMOUNT
(000S) | | | | VALUE (000S) |
| CORPORATE BONDS & NOTES 18.0% |
|
| BANKING & FINANCE 11.3% |
| American Express Bank FSB |
5.380% due 06/22/2009 | | $ | | 10 | | $ | | 10 |
| |
| American International Group, Inc. |
5.395% due 01/29/2010 | | | | 200 | | | | 200 |
| |
| Bear Stearns Cos., Inc. | | | | | | | | |
5.450% due 02/23/2010 | | | | 100 | | | | 100 |
| |
| Citigroup, Inc. | | | | | | | | |
5.405% due 05/02/2008 | | | | 250 | | | | 251 |
| |
| Ford Motor Credit Co. | | | | | | | | |
5.625% due 10/01/2008 | | | | 100 | | | | 99 |
| |
| General Electric Capital Corp. |
5.410% due 10/06/2010 | | | | 100 | | | | 100 |
5.417% due 05/10/2010 | | | | 100 | | | | 100 |
| |
| Goldman Sachs Group, Inc. | | | | | | | | |
5.450% due 06/23/2009 | | | | 200 | | | | 201 |
5.475% due 10/05/2007 | | | | 100 | | | | 100 |
| |
| HSBC Finance Corp. | | | | | | | | |
5.490% due 09/15/2008 | | | | 100 | | | | 100 |
| |
| Lehman Brothers Holdings, Inc. |
5.570% due 12/23/2010 | | | | 100 | | | | 100 |
| |
| MBNA Europe Funding PLC |
5.460% due 09/07/2007 | | | | 300 | | | | 300 |
| |
| Metropolitan Life Global Funding I |
5.400% due 05/17/2010 | | | | 100 | | | | 100 |
| |
| Mirage Resorts, Inc. | | | | | | | | |
6.750% due 08/01/2007 | | | | 100 | | | | 100 |
| |
| Morgan Stanley | | | | | | | | |
5.467% due 02/09/2009 | | | | 100 | | | | 100 |
| |
| National Australia Bank Ltd. |
5.400% due 09/11/2009 | | | | 100 | | | | 100 |
| |
| Rabobank Nederland | | | | | | | | |
5.376% due 01/15/2009 | | | | 200 | | | | 200 |
| |
| Royal Bank of Scotland Group PLC |
5.360% due 04/11/2008 | | | | 100 | | | | 100 |
| |
| VTB Capital S.A. for Vneshtorgbank |
6.110% due 09/21/2007 | | | | 100 | | | | 100 |
| | | | | | | | |
| | | | | | | | 2,461 |
| | | | | | | | |
|
| INDUSTRIALS 5.2% |
| Albertson’s, Inc. | | | | | | | | |
6.950% due 08/01/2009 | | | | 100 | | | | 103 |
| |
| CSC Holdings, Inc. | | | | | | | | |
7.250% due 07/15/2008 | | | | 100 | | | | 101 |
| |
| Enterprise Products Operating LP |
4.000% due 10/15/2007 | | | | 30 | | | | 30 |
| |
| Historic TW, Inc. | | | | | | | | |
8.180% due 08/15/2007 | | | | 100 | | | | 100 |
| |
| HJ Heinz Co. | | | | | | | | |
6.428% due 12/01/2008 | | | | 100 | | | | 101 |
| |
| Home Depot, Inc. | | | | | | | | |
5.485% due 12/16/2009 | | | | 100 | | | | 100 |
| |
| Service Corp. International |
6.500% due 03/15/2008 | | | | 100 | | | | 100 |
| |
| Siemens Financieringsmaatschappij NV |
5.410% due 08/14/2009 | | | | 100 | | | | 100 |
| |
| Sungard Data Systems, Inc. |
3.750% due 01/15/2009 | | | | 100 | | | | 97 |
| |
| Transocean, Inc. | | | | | | | | |
5.560% due 09/05/2008 | | | | 100 | | | | 100 |
| |
| | | | | | | | |
| | | | | PRINCIPAL
AMOUNT
(000S) | | | | VALUE (000S) |
| Walt Disney Co. | | | | | | | | |
5.460% due 09/10/2009 | | $ | | 100 | | $ | | 100 |
| |
| Xerox Corp. | | | | | | | | |
9.750% due 01/15/2009 | | | | 100 | | | | 106 |
| | | | | | | | |
| | | | | | | | 1,138 |
| | | | | | | | |
|
| UTILITIES 1.5% |
| Entergy Gulf States, Inc. | | | | | | | | |
3.600% due 06/01/2008 | | | | 100 | | | | 98 |
| |
| Midwest Generation LLC | | | | | | | | |
8.300% due 07/02/2009 | | | | 84 | | | | 86 |
| |
| Ohio Edison Co. | | | | | | | | |
4.000% due 05/01/2008 | | | | 30 | | | | 30 |
| |
| SEMCO Energy, Inc. | | | | | | | | |
7.125% due 05/15/2008 | | | | 100 | | | | 101 |
| | | | | | | | |
| | | | | | | | 315 |
| | | | | | | | |
Total Corporate Bonds & Notes
(Cost $3,915) | | 3,914 |
| | | | | | | | |
|
| U.S. GOVERNMENT AGENCIES 22.6% |
| Fannie Mae | | | | | | | | |
5.000% due 07/25/2020 - 02/01/2037 | | | | 590 | | | | 558 |
5.380% due 12/25/2036 | | | | 82 | | | | 81 |
5.440% due 03/25/2034 | | | | 37 | | | | 37 |
5.470% due 08/25/2034 | | | | 14 | | | | 14 |
5.500% due 11/01/2016 | | | | 98 | | | | 97 |
5.670% due 05/25/2042 | | | | 25 | | | | 25 |
6.000% due 06/01/2017 - 07/01/2037 | | | | 2,423 | | | | 2,399 |
6.227% due 03/01/2044 - 07/01/2044 | | | | 149 | | | | 151 |
7.252% due 10/01/2031 | | | | 11 | | | | 11 |
| |
| Freddie Mac | | | | | | | | |
3.500% due 03/15/2022 | | | | 81 | | | | 80 |
5.000% due 01/15/2018 | | | | 55 | | | | 54 |
5.500% due 08/15/2030 | | | | 2 | | | | 2 |
5.550% due 07/15/2037 | | | | 400 | | | | 400 |
5.670% due 06/15/2031 | | | | 65 | | | | 65 |
6.227% due 10/25/2044 - 02/25/2045 | | | | 696 | | | | 698 |
6.427% due 07/25/2044 | | | | 138 | | | | 139 |
9.500% due 12/01/2019 | | | | 18 | | | | 19 |
| |
| Ginnie Mae | | | | | | | | |
6.000% due 02/20/2032 - 03/20/2032 | | | | 67 | | | | 67 |
| | | | | | | | |
Total U.S. Government Agencies (Cost $4,947) | | | | | | | | 4,897 |
| | | | | | | | |
|
| MORTGAGE-BACKED SECURITIES 8.9% |
| Arran Residential Mortgages Funding PLC |
5.340% due 04/12/2036 | | | | 39 | | | | 39 |
| |
| Banc of America Mortgage Securities, Inc. |
7.429% due 07/20/2032 | | | | 2 | | | | 2 |
| |
| Bear Stearns Adjustable Rate Mortgage Trust |
4.622% due 01/25/2034 | | | | 14 | | | | 14 |
4.750% due 10/25/2035 | | | | 199 | | | | 196 |
| |
| Bear Stearns Commercial Mortgage Securities |
6.440% due 06/16/2030 | | | | 100 | | | | 101 |
| |
| Countrywide Alternative Loan Trust |
5.470% due 05/20/2046 | | | | 47 | | | | 47 |
5.600% due 02/25/2037 | | | | 155 | | | | 156 |
| |
| Countrywide Home Loan Mortgage Pass-Through Trust |
5.660% due 06/25/2035 | | | | 62 | | | | 62 |
| |
| | | | | | | | |
| | | | | PRINCIPAL
AMOUNT
(000S) | | | | VALUE (000S) |
| CS First Boston Mortgage Securities Corp. |
5.631% due 05/25/2032 | | $ | | 3 | | $ | | 3 |
5.953% due 03/25/2032 | | | | 18 | | | | 18 |
| |
| First Republic Mortgage Loan Trust |
5.620% due 08/15/2032 | | | | 47 | | | | 48 |
| |
| Greenpoint Mortgage Funding Trust |
5.540% due 06/25/2045 | | | | 94 | | | | 94 |
| |
| GSR Mortgage Loan Trust | | | | | | | | |
4.538% due 09/25/2035 | | | | 77 | | | | 76 |
| |
| Harborview Mortgage Loan Trust |
5.540% due 05/19/2035 | | | | 107 | | | | 107 |
| |
| Impac Secured Assets CMN Owner Trust |
5.400% due 01/25/2037 | | | | 71 | | | | 71 |
| |
| Indymac Index Mortgage Loan Trust |
5.420% due 01/25/2037 | | | | 67 | | | | 67 |
| |
| Mellon Residential Funding Corp. |
5.760% due 12/15/2030 | | | | 23 | | | | 23 |
| |
| Merrill Lynch Floating Trust |
5.390% due 06/15/2022 | | | | 89 | | | | 89 |
| |
| Sequoia Mortgage Funding Co. |
0.800% due 10/21/2008 (a) | | | | 115 | | | | 0 |
| |
| Structured Asset Mortgage Investments, Inc. |
5.540% due 05/25/2036 | | | | 85 | | | | 85 |
5.550% due 05/25/2045 | | | | 123 | | | | 123 |
5.650% due 09/19/2032 | | | | 14 | | | | 14 |
| |
| Structured Asset Securities Corp. |
5.370% due 05/25/2036 | | | | 56 | | | | 56 |
| |
| Thornburg Mortgage Securities Trust |
5.430% due 12/25/2036 | | | | 85 | | | | 85 |
5.440% due 04/25/2036 | | | | 100 | | | | 100 |
| |
| Washington Mutual, Inc. |
5.094% due 10/25/2032 | | | | 3 | | | | 3 |
5.860% due 12/25/2027 | | | | 38 | | | | 38 |
6.029% due 02/25/2046 | | | | 59 | | | | 59 |
6.029% due 08/25/2046 | | | | 84 | | | | 85 |
6.229% due 11/25/2042 | | | | 55 | | | | 55 |
6.429% due 06/25/2042 | | | | 13 | | | | 13 |
| | | | | | | | |
Total Mortgage-Backed Securities
(Cost $1,932) | | 1,929 |
| | | | | | | | |
|
| ASSET-BACKED SECURITIES 13.6% |
| ACE Securities Corp. | | | | | | | | |
5.370% due 12/25/2036 | | | | 75 | | | | 75 |
5.400% due 02/25/2036 | | | | 55 | | | | 55 |
| |
| Argent Securities, Inc. | | | | | | | | |
5.390% due 04/25/2036 | | | | 20 | | | | 20 |
| |
| Asset-Backed Securities Corp. Home Equity |
5.370% due 11/25/2036 | | | | 57 | | | | 57 |
| |
| Bank One Issuance Trust | | | | | | | | |
5.430% due 12/15/2010 | | | | 200 | | | | 200 |
| |
| Bear Stearns Asset-Backed Securities, Inc. |
5.370% due 11/25/2036 | | | | 77 | | | | 77 |
5.400% due 10/25/2036 | | | | 82 | | | | 82 |
5.410% due 04/25/2036 | | | | 33 | | | | 33 |
5.650% due 10/25/2032 | | | | 4 | | | | 4 |
| |
| Chase Credit Card Master Trust |
5.430% due 02/15/2011 | | | | 100 | | | | 100 |
| |
| Citibank Credit Card Issuance Trust |
5.456% due 01/15/2010 | | | | 100 | | | | 100 |
| |
| Countrywide Asset-Backed Certificates |
5.370% due 05/25/2037 | | | | 167 | | | | 167 |
5.390% due 06/25/2036 | | | | 62 | | | | 62 |
5.390% due 07/25/2036 | | | | 26 | | | | 26 |
5.390% due 08/25/2036 | | | | 29 | | | | 29 |
| | | | | | |
| See Accompanying Notes | | Semiannual Report | | June 30, 2007 | | 9 |
Schedule of Investments Short-Term Portfolio (Cont.)
| | | | | | | | |
| | | | | PRINCIPAL
AMOUNT
(000S) | | | | VALUE (000S) |
5.480% due 02/25/2036 | | $ | | 57 | | $ | | 57 |
5.800% due 12/25/2031 | | | | 4 | | | | 4 |
6.060% due 05/25/2032 | | | | 1 | | | | 1 |
| |
| CS First Boston Mortgage Securities Corp. |
6.060% due 08/25/2032 | | | | 3 | | | | 3 |
| |
| First Franklin Mortgage Loan Asset-Backed Certificates |
5.370% due 12/25/2036 | | | | 71 | | | | 72 |
5.390% due 01/25/2036 | | | | 21 | | | | 21 |
5.410% due 01/25/2036 | | | | 36 | | | | 36 |
| |
| First NLC Trust |
5.440% due 02/25/2036 | | | | 9 | | | | 9 |
| |
| Fremont Home Loan Trust |
5.380% due 01/25/2037 | | | | 83 | | | | 83 |
| |
| GSAMP Trust |
5.430% due 11/25/2035 | | | | 18 | | | | 18 |
5.440% due 12/25/2035 | | | | 27 | | | | 27 |
| |
| Home Equity Asset Trust |
5.400% due 05/25/2036 | | | | 41 | | | | 41 |
| |
| HSI Asset Securitization Corp. Trust |
5.370% due 12/25/2036 | | | | 84 | | | | 84 |
| |
| Irwin Home Equity Corp. |
5.860% due 07/25/2032 | | | | 4 | | | | 4 |
| |
| JPMorgan Mortgage Acquisition Corp. |
5.370% due 10/25/2036 | | | | 82 | | | | 82 |
| |
| Lehman XS Trust |
5.390% due 05/25/2046 | | | | 47 | | | | 47 |
| |
| Long Beach Mortgage Loan Trust |
5.360% due 11/25/2036 | | | | 77 | | | | 77 |
5.390% due 03/25/2036 | | | | 17 | | | | 17 |
5.410% due 01/25/2036 | | | | 58 | | | | 58 |
5.500% due 08/25/2035 | | | | 30 | | | | 30 |
| |
| MASTR Asset-Backed Securities Trust |
5.370% due 11/25/2036 | | | | 82 | | | | 82 |
5.400% due 01/25/2036 | | | | 38 | | | | 38 |
| |
| Merrill Lynch Mortgage Investors, Inc. |
5.350% due 06/25/2037 | | | | 53 | | | | 54 |
5.390% due 02/25/2037 | | | | 32 | | | | 32 |
| |
| Morgan Stanley ABS Capital I |
5.390% due 02/25/2036 | | | | 26 | | | | 26 |
| |
| Nelnet Student Loan Trust |
5.445% due 07/25/2016 | | | | 55 | | | | 55 |
| |
| New Century Home Equity Loan Trust |
5.580% due 06/25/2035 | | | | 43 | | | | 42 |
| |
| Nissan Auto Lease Trust |
5.347% due 12/14/2007 | | | | 3 | | | | 3 |
| |
| Option One Mortgage Loan Trust |
5.360% due 02/25/2037 | | | | 71 | | | | 71 |
| |
| Quest Trust |
5.880% due 06/25/2034 | | | | 2 | | | | 2 |
| |
| Renaissance Home Equity Loan Trust |
5.680% due 11/25/2034 | | | | 20 | | | | 20 |
5.760% due 08/25/2033 | | | | 16 | | | | 16 |
5.820% due 12/25/2033 | | | | 75 | | | | 76 |
| |
| Residential Asset Mortgage Products, Inc. |
5.400% due 01/25/2036 | | | | 16 | | | | 16 |
5.400% due 02/25/2036 | | | | 16 | | | | 16 |
| |
| Residential Asset Securities Corp. |
5.400% due 01/25/2036 | | | | 22 | | | | 22 |
| |
| Residential Funding Mortgage Securities II, Inc. |
5.460% due 09/25/2035 | | | | 71 | | | | 71 |
| |
| SACO I, Inc. |
5.400% due 04/25/2036 | | | | 1 | | | | 1 |
| |
| | | | | | | | |
| | | | | PRINCIPAL
AMOUNT
(000S) | | | | VALUE (000S) |
| Saxon Asset Securities Trust |
5.590% due 01/25/2032 | | $ | | 1 | | $ | | 1 |
| |
| SLC Student Loan Trust |
5.313% due 02/15/2015 | | | | 100 | | | | 100 |
| |
| SLM Student Loan Trust |
5.325% due 07/25/2013 | | | | 79 | | | | 79 |
| |
| Soundview Home Equity Loan Trust |
5.390% due 03/25/2036 | | | | 5 | | | | 5 |
5.390% due 05/25/2036 | | | | 5 | | | | 5 |
| |
| Specialty Underwriting & Residential Finance |
5.365% due 11/25/2037 | | | | 70 | | | | 70 |
| |
| Structured Asset Investment Loan Trust |
5.370% due 07/25/2036 | | | | 56 | | | | 56 |
| |
| Structured Asset Securities Corp. |
5.610% due 01/25/2033 | | | | 4 | | | | 4 |
| |
| Wachovia Auto Owner Trust |
4.820% due 02/20/2009 | | | | 27 | | | | 27 |
| |
| Wells Fargo Home Equity Trust |
5.560% due 10/25/2035 | | | | 100 | | | | 100 |
| | | | | | | | |
Total Asset-Backed Securities
(Cost $2,947) | | | | 2,948 |
| | | | | | | | |
|
| | | | | SHARES | | | | |
| PREFERRED STOCKS 0.4% |
| Fresenius Medical Care Capital Trust II |
7.875% due 02/01/2008 | | | | 100 | | | | 101 |
| | | | | | | | |
Total Preferred Stocks (Cost $103) | | | | 101 |
| | | | | | | | |
|
| | | | | PRINCIPAL
AMOUNT
(000S) | | | | |
| SHORT-TERM INSTRUMENTS 41.9% |
|
| CERTIFICATES OF DEPOSIT 6.9% |
| Bank of Ireland | | | | | | | | |
5.400% due 01/15/2010 | | $ | | 100 | | | | 100 |
| |
| BNP Paribas |
5.262% due 07/03/2008 | | | | 200 | | | | 200 |
| |
| Calyon Financial, Inc. |
5.340% due 01/16/2009 | | | | 100 | | | | 100 |
| |
| Fortis Bank NY |
5.300% due 09/30/2008 | | | | 100 | | | | 100 |
| |
| Nordea Bank Finland PLC |
5.282% due 12/01/2008 | | | | 100 | | | | 100 |
5.308% due 05/28/2008 | | | | 100 | | | | 100 |
| |
| Royal Bank of Canada |
5.267% due 06/30/2008 | | | | 200 | | | | 200 |
| |
| Royal Bank of Scotland Group PLC |
5.262% due 07/03/2008 | | | | 100 | | | | 100 |
5.265% due 03/26/2008 | | | | 100 | | | | 100 |
| |
| Skandinav Enskilda BK |
5.340% due 08/21/2008 | | | | 100 | | | | 100 |
| |
| Societe Generale NY |
5.265% due 09/21/2007 | | | | 200 | | | | 200 |
5.270% due 03/26/2008 | | | | 100 | | | | 100 |
| | | | | | | | |
| | | | | | | | 1,500 |
| | | | | | | | |
|
| COMMERCIAL PAPER 33.9% |
| Danske Corp. | | | | | | | | |
5.235% due 10/12/2007 | | | | 800 | | | | 792 |
| |
| Dexia Delaware LLC |
5.240% due 09/21/2007 | | | | 600 | | | | 593 |
| |
| Fortis Funding LLC |
5.255% due 09/05/2007 | | | | 500 | | | | 499 |
| |
| | | | | | | | | |
| | | | | PRINCIPAL
AMOUNT
(000S) | | | | VALUE (000S) | |
| Freddie Mac | |
4.800% due 07/02/2007 | | $ | | 400 | | $ | | 400 | |
| | |
| General Electric Capital Corp. | |
5.200% due 11/06/2007 | | | | 300 | | | | 299 | |
| | |
| HBOS Treasury Services PLC | |
5.250% due 09/21/2007 | | | | 1,000 | | | | 988 | |
| | |
| Rabobank USA Financial Corp. | |
5.330% due 07/26/2007 | | | | 400 | | | | 400 | |
| | |
| Societe Generale NY | |
5.240% due 11/26/2007 | | | | 300 | | | | 296 | |
| | |
| Statens Bostadsfin Bank | |
5.255% due 09/14/2007 | | | | 500 | | | | 494 | |
| | |
| Swedbank AB | |
5.225% due 09/06/2007 | | | | 500 | | | | 498 | |
| | |
| TotalFinaElf Capital S.A. | |
5.340% due 07/02/2007 | | | | 500 | | | | 500 | |
| | |
| UBS Finance Delaware LLC | |
5.230% due 10/23/2007 | | | | 300 | | | | 298 | |
5.245% due 10/23/2007 | | | | 300 | | | | 297 | |
| | |
| Westpac Trust Securities NZ Ltd. | |
5.240% due 10/19/2007 | | | | 1,000 | | | | 993 | |
| | | | | | | | | |
| | | | | | | | 7,347 | |
| | | | | | | | | |
| |
| REPURCHASE AGREEMENTS 0.6% | |
| State Street Bank and Trust Co. | |
4.900% due 07/02/2007 | | | | 134 | | | | 134 | |
| | | | | | | | | |
(Dated 06/29/2007. Collateralized by Federal Home Loan Bank 4.375% due 09/17/2010 valued at $138. Repurchase proceeds are $134.) | |
| |
| U.S. TREASURY BILLS 0.5% | |
4.701% due 08/30/2007 - 09/13/2007 (b)(d) | | | | 105 | | | | 104 | |
| | | | | | | | | |
Total Short-Term Instruments
(Cost $9,086) | | | | 9,085 | |
| | | | | | | | | |
| |
| PURCHASED OPTIONS (f) 0.0% | |
| (Cost $16) | | | | | | | | 7 | |
| |
| |
| |
Total Investments (c) 105.4%
(Cost $22,946) | | $ | | 22,881 | |
| |
Written Options (g) (0.0%)
(Premiums $12) | | | | (5 | ) |
| |
| Other Assets and Liabilities (Net) (5.4%) | | (1,171 | ) |
| | | | | | | | | |
| Net Assets 100.0% | | | | | | $ | | 21,705 | |
| | | | | | | | | |
| | | | |
| 10 | | PIMCO Variable Insurance Trust | | See Accompanying Notes |
| | |
| |
| | | June 30, 2007 (Unaudited) |
Notes to Schedule of Investments (amounts in thousands*, except number of contracts):
* A zero balance may reflect actual amounts rounding to less than one thousand.
(a) Interest only security.
(b) Coupon represents a weighted average rate.
(c) As of June 30, 2007, portfolio securities with an aggregate value of $485 were valued in good faith and pursuant to the guidelines established by the Board of Trustees.
(d) Securities with an aggregate market value of $104 have been segregated with the custodian to cover margin requirements for the following open futures contracts on June 30, 2007:
| | | | | | | | | | |
| Description | | Type | | Expiration
Month | | # of
Contracts | | Unrealized
Appreciation/
(Depreciation) | |
90-Day Eurodollar June Futures | | Long | | 06/2008 | | 12 | | $ | (12 | ) |
90-Day Eurodollar March Futures | | Long | | 03/2008 | | 59 | | | (46 | ) |
United Kingdom 90-Day LIBOR Sterling Interest Rate
December Futures | | Long | | 12/2007 | | 13 | | | (31 | ) |
U.S. Treasury 10-Year Note September Futures | | Short | | 09/2007 | | 37 | | | 30 | |
| | | | | | | | | | |
| | | | | | | | $ | (59 | ) |
| | | | | | | | | | |
(e) Swap agreements outstanding on June 30, 2007:
Credit Default Swaps
| | | | | | | | | | | | | | |
| Counterparty | | Reference Entity | | Buy/Sell
Protection (1) | | (Pay)/Receive
Fixed Rate | | Expiration
Date | | Notional
Amount | | Unrealized
Appreciation |
JPMorgan Chase & Co. | | Morgan Stanley 6.600% due 04/01/2012 | | Sell | | 0.070% | | 12/20/2007 | | $ | 100 | | $ | 0 |
| | | | | | | | | | | | | | |
(1) If the Portfolio is a seller of protection and a credit event occurs, as defined under the terms of that particular swap agreement, the Portfolio will pay to the buyer of the protection an amount up to the notional value of the swap and in certain instances, take delivery of the security.
Interest Rate Swaps
| | | | | | | | | | | | | | | |
| Counterparty | | Floating Rate Index | | Pay/Receive
Floating Rate | | Fixed Rate | | Expiration
Date | | Notional
Amount | | Unrealized
(Depreciation) | |
Goldman Sachs & Co. | | 5-Year French CPI Ex Tobacco Daily Reference Index | | Pay | | 1.995% | | 03/15/2012 | | EUR | 100 | | $ | (1 | ) |
Deutsche Bank AG | | 3-Month USD-LIBOR | | Pay | | 5.000% | | 06/18/2009 | | $ | 5,600 | | | (24 | ) |
Deutsche Bank AG | | 3-Month USD-LIBOR | | Receive | | 5.000% | | 12/19/2017 | | | 300 | | | (2 | ) |
Royal Bank of Scotland Group PLC | | 3-Month USD-LIBOR | | Receive | | 5.000% | | 12/19/2017 | | | 400 | | | (3 | ) |
UBS Warburg LLC | | 3-Month USD-LIBOR | | Pay | | 5.000% | | 06/21/2008 | | | 800 | | | (2 | ) |
| | | | | | | | | | | | | | | |
| | | | | | | | | | | | | $ | (32 | ) |
| | | | | | | | | | | | | | | |
(f) Purchased options outstanding on June 30, 2007:
Interest Rate Swaptions
| | | | | | | | | | | | | | | | | | | |
| Description | | Counterparty | | Floating Rate Index | | Pay/Receive
Floating Rate | | Exercise
Rate | | Expiration Date | | Notional
Amount | | Cost | | Value |
Call - OTC 1-Year Interest Rate Swap | | Barclays Bank PLC | | 3-Month USD-LIBOR | | Pay | | 4.750% | | 02/01/2008 | | $ | 1,000 | | $ | 3 | | $ | 0 |
Call - OTC 2-Year Interest Rate Swap | | Lehman Brothers, Inc. | | 3-Month USD-LIBOR | | Pay | | 4.750% | | 03/31/2008 | | | 500 | | | 3 | | | 1 |
Call - OTC 2-Year Interest Rate Swap | | Royal Bank of Scotland Group PLC | | 3-Month USD-LIBOR | | Pay | | 5.000% | | 02/01/2008 | | | 700 | | | 3 | | | 1 |
Call - OTC 2-Year Interest Rate Swap | | Royal Bank of Scotland Group PLC | | 3-Month USD-LIBOR | | Pay | | 4.750% | | 09/26/2008 | | | 1,000 | | | 4 | | | 2 |
Call - OTC 2-Year Interest Rate Swap | | Royal Bank of Scotland Group PLC | | 3-Month USD-LIBOR | | Pay | | 5.000% | | 12/15/2008 | | | 800 | | | 3 | | | 3 |
| | | | | | | | | | | | | | | | | | | |
| | | | | | | | | | | | | | | $ | 16 | | $ | 7 |
| | | | | | | | | | | | | | | | | | | |
(g) Written options outstanding on June 30, 2007:
Interest Rate Swaptions
| | | | | | | | | | | | | | | | | | | |
| Description | | Counterparty | | Floating Rate Index | | Pay/Receive
Floating Rate | | Exercise
Rate | | Expiration
Date | | Notional
Amount | | Premium | | Value |
Call - OTC 5-Year Interest Rate Swap | | Barclays Bank PLC | | 3-Month USD-LIBOR | | Receive | | 4.900% | | 02/01/2008 | | $ | 200 | | $ | 2 | | $ | 0 |
Call - OTC 5-Year Interest Rate Swap | | Lehman Brothers, Inc. | | 3-Month USD-LIBOR | | Receive | | 4.900% | | 03/31/2008 | | | 200 | | | 2 | | | 1 |
Call - OTC 5-Year Interest Rate Swap | | Royal Bank of Scotland Group PLC | | 3-Month USD-LIBOR | | Receive | | 5.100% | | 02/01/2008 | | | 300 | | | 4 | | | 1 |
Call - OTC 7-Year Interest Rate Swap | | Royal Bank of Scotland Group PLC | | 3-Month USD-LIBOR | | Receive | | 5.200% | | 12/15/2008 | | | 300 | | | 4 | | | 3 |
| | | | | | | | | | | | | | | | | | | |
| | | | | | | | | | | | | | | $ | 12 | | $ | 5 |
| | | | | | | | | | | | | | | | | | | |
| | | | | | |
| See Accompanying Notes | | Semiannual Report | | June 30, 2007 | | 11 |
| | |
| |
| Schedule of Investments Short-Term Portfolio (Cont.) | | June 30, 2007 (Unaudited) |
(h) Short sales outstanding on June 30, 2007:
| | | | | | | | | | | | | |
| Description | | Coupon | | Maturity
Date | | Principal
Amount | | Proceeds | | Value (2) |
U.S. Treasury Notes | | 4.250% | | 11/15/2014 | | $ | 300 | | $ | 283 | | $ | 291 |
U.S. Treasury Notes | | 5.000% | | 02/15/2011 | | | 200 | | | 200 | | | 203 |
| | | | | | | | | | | | | |
| | | | | | | | | $ | 483 | | $ | 494 |
| | | | | | | | | | | | | |
(2) Market value includes $6 of interest payable on short sales.
(i) Foreign currency contracts outstanding on June 30, 2007:
| | | | | | | | | | | | | | | | | |
| Type | | Currency | | Principal
Amount
Covered by
Contract | | Settlement
Month | | Unrealized
Appreciation | | Unrealized
(Depreciation) | | | Net Unrealized
Appreciation/
(Depreciation) | |
Buy | | BRL | | 176 | | 03/2008 | | $ | 8 | | $ | 0 | | | $ | 8 | |
Buy | | CLP | | 10,534 | | 11/2007 | | | 0 | | | 0 | | | | 0 | |
Buy | | CNY | | 1,791 | | 01/2008 | | | 0 | | | (2 | ) | | | (2 | ) |
Buy | | | | 2,916 | | 03/2008 | | | 0 | | | (3 | ) | | | (3 | ) |
Sell | | | | 1,102 | | 03/2008 | | | 1 | | | 0 | | | | 1 | |
Buy | | EUR | | 14 | | 07/2007 | | | 0 | | | 0 | | | | 0 | |
Sell | | GBP | | 76 | | 08/2007 | | | 0 | | | (1 | ) | | | (1 | ) |
Buy | | KRW | | 73,885 | | 11/2007 | | | 0 | | | 0 | | | | 0 | |
Buy | | MXN | | 866 | | 03/2008 | | | 2 | | | 0 | | | | 2 | |
Buy | | NOK | | 347 | | 09/2007 | | | 1 | | | 0 | | | | 1 | |
Buy | | PLN | | 230 | | 09/2007 | | | 3 | | | 0 | | | | 3 | |
Buy | | RUB | | 7,775 | | 12/2007 | | | 3 | | | 0 | | | | 3 | |
Buy | | SGD | | 92 | | 07/2007 | | | 0 | | | (1 | ) | | | (1 | ) |
Buy | | ZAR | | 213 | | 03/2008 | | | 0 | | | 0 | | | | 0 | |
| | | | | | | | | | | | | | | | | |
| | | | | | | | $ | 18 | | $ | (7 | ) | | $ | 11 | |
| | | | | | | | | | | | | | | | | |
| | | | |
| 12 | | PIMCO Variable Insurance Trust | | See Accompanying Notes |
| | |
| |
| Notes to Financial Statements | | June 30, 2007 (Unaudited) |
1. ORGANIZATION
The Short-Term Portfolio (the “Portfolio”) is a series of the PIMCO Variable Insurance Trust (the “Trust”). The Trust is registered under the Investment Company Act of 1940 (the “Act”), as amended, as an open-end management investment company organized as a Delaware business trust on October 3, 1997. The Portfolio offers two classes of shares: Institutional and Administrative. Information presented on these financial statements pertains to the Institutional Class of the Portfolio. Certain detailed financial information for the Administrative Class is provided separately and is available upon request. The Trust is designed to be used as an investment vehicle by Separate Accounts of insurance companies that fund variable annuity contracts and variable life insurance policies and by qualified pension and retirement plans.
2. SIGNIFICANT ACCOUNTING POLICIES
The following is a summary of significant accounting policies consistently followed by the Portfolio in the preparation of its financial statements in conformity with accounting principles generally accepted in the United States of America (“GAAP”). The preparation of financial statements in accordance with GAAP requires management to make estimates and assumptions that affect the reported amounts and disclosures on the financial statements. Actual results could differ from those estimates.
(a) Security Valuation Portfolio securities are valued as of the close of regular trading (normally 4:00 p.m., Eastern Time) on each day that the New York Stock Exchange (“NYSE”) is open. Portfolio securities and other assets for which market quotes are readily available are stated at market value. Market value is generally determined on the basis of last reported sales prices, or if no sales are reported, based on quotes obtained from a quotation reporting system, established market makers, or pricing services. Fixed-income securities and non-exchange traded derivatives are normally valued on the basis of quotes obtained from brokers and dealers or pricing services. Prices obtained from independent pricing services use information provided by market makers or estimates of market values obtained from yield data relating to investments or securities with similar characteristics. Certain fixed income securities purchased on a delayed-delivery basis are marked to market daily until settlement at the forward settlement date. Short-term investments having a maturity of 60 days or less are generally valued at amortized cost. Exchange traded options, futures and options on futures are valued at the settlement price determined by the relevant exchange. With respect to any portion of the Portfolio’s assets that are invested in one or more open end management investment companies, the Portfolio’s net asset value (“NAV”) will be calculated based upon the NAVs of such investments.
Investments initially valued in currencies other than the U.S. dollar are converted to the U.S. dollar using exchange rates obtained from pricing services. As a result, the NAV of the Portfolio’s securities may be affected by changes in the value of currencies in relation to the U.S. dollar. The value of securities traded in markets outside the United States or denominated in currencies other than the U.S. dollar may be affected significantly on a day that the NYSE is closed and an investor is not able to purchase, redeem or exchange shares.
Securities and other assets for which market quotes are not readily available are valued at fair value as determined in good faith by the Board of Trustees or persons acting at their direction. The Board of Trustees has adopted methods for valuing securities and other assets in circumstances where market quotes are not readily available, and has delegated to Pacific Investment Management Company LLC (“PIMCO”) the responsibility for applying the valuation methods. In the event that market quotes are not readily available, and the security or asset cannot be valued pursuant to one of the valuation methods, the value of the security or asset will be determined in good faith by the Valuation Committee of the Board of Trustees, generally based upon recommendations provided by PIMCO.
Market quotes are considered not readily available in circumstances where there is an absence of current or reliable market-based data (e.g., trade information, bid/asked information, broker quotes), including where events occur after the close of the relevant market, but prior to the close of regular trading, that materially affect the values of the Portfolio’s securities or assets. In addition, market quotes are considered not readily available when, due to extraordinary circumstances, the exchanges or markets on which the securities trade, do not open for trading for the entire day and no other market prices are available. The Board has delegated to PIMCO the responsibility for monitoring significant events that may materially affect the values of the Portfolio’s securities or assets and for determining whether the value of the applicable securities or assets should be re-evaluated in light of such significant events.
When the Portfolio uses fair value pricing to determine its NAV, securities will not be priced on the basis of quotations from the primary market in which they are traded, but rather may be priced by another method that the Board of Trustees or persons acting at their direction believe accurately reflects fair value. The Trust’s policy is intended to result in a calculation of the Portfolio’s NAV that fairly reflects security values as of the time of pricing. However, fair values determined by the Board of Trustees or persons acting at their direction may not accurately reflect the price that the Portfolio could obtain for a security if it were to dispose of that security as of the time of pricing. Because foreign securities can trade on non-business days of the Portfolio, the NAV of the Portfolio may change on days when shareholders will not be able to purchase or redeem Portfolio shares. The prices used by the Portfolio may differ from the value that would be realized if the securities were sold and the differences could be material to the financial statements.
(b) Securities Transactions and Investment Income Securities transactions are recorded as of the trade date for financial reporting purposes. Securities purchased or sold on a when-issued or delayed-delivery basis may be settled a month or more after the trade date. Realized gains and losses from securities sold are recorded on the identified cost basis. Dividend income is recorded on the ex-dividend date, except certain dividends from foreign securities where the ex-dividend date may have passed, which are recorded as soon as the Portfolio is informed of the ex-dividend date. Interest income, adjusted for the accretion of discounts and amortization of premiums, is recorded on the accrual basis. Paydown gains and losses on mortgage-related and other asset-backed securities are recorded as components of interest income on the Statement of Operations.
(c) Delayed-Delivery Transactions The Portfolio may purchase or sell securities on a delayed-delivery basis. These transactions involve a commitment by the Portfolio to purchase or sell securities for a predetermined price or yield, with payment and delivery taking place beyond the customary settlement period. When delayed-delivery purchases are outstanding, the Portfolio will designate liquid assets in an amount sufficient to meet the purchase price. When purchasing a security on a delayed-delivery basis, the Portfolio assumes the rights and risks of ownership of the security, including the risk of price and yield fluctuations, and takes such fluctuations into account when determining its net asset value. The Portfolio may dispose of or renegotiate a delayed-delivery transaction after it is entered into, and may sell when-issued securities before they are delivered, which may result in a capital gain or loss. When the Portfolio has sold a security on a delayed-delivery basis, the Portfolio does not participate in future gains and losses with respect to the security.
(d) Dividends and Distributions to Shareholders Dividends from net investment income, if any, are declared daily and distributed to shareholders monthly. Net realized capital gains earned by the Portfolio, if any, will be distributed no less frequently than once each year.
Income dividends and capital gain distributions are determined in accordance with income tax regulations which may differ from GAAP. Differences between tax
| | | | | | |
| | Semiannual Report | | June 30, 2007 | | 13 |
Notes to Financial Statements (Cont.)
regulations and GAAP may change the fiscal year when income and capital items are recognized for tax and GAAP purposes. Examples of events that give rise to timing differences include wash sales, straddles, net operating losses and capital loss carryforwards. Further, the character of investment income and capital gains may be different for certain transactions under the two methods of accounting. Examples of characterization differences include the treatment of mortgage paydowns, swaps, foreign currency transactions and contingent debt instruments. As a result, income dividends and capital gain distributions declared during a fiscal period may differ significantly from the net investment income and realized capital gain reported on the Portfolio’s annual financial statements presented under GAAP.
Distributions classified as a tax basis return of capital, if any, are reflected on the accompanying Statements of Changes in Net Assets and have been reclassified to paid in capital. In addition, other amounts have been reclassified between undistributed net investment income, accumulated undistributed net realized gains or losses and/or paid in capital to more appropriately conform financial accounting to tax characterizations of dividend distributions.
(e) Multiclass Operations Each class offered by the Portfolio has equal rights as to assets and voting privileges (except that shareholders of a class have exclusive voting rights regarding any matter relating solely to that class of shares). Income and non-class specific expenses of the Portfolio are allocated daily to each class of shares based on the relative value of settled shares. Realized and unrealized capital gains and losses of the Portfolio are allocated daily to each class of shares based on the relative net assets of each class. Class specific expenses, where applicable, currently include administrative, distribution and servicing fees.
(f) Foreign Currency The functional and reporting currency for the Portfolio is the U.S. dollar. The market values of foreign securities, currency holdings and other assets and liabilities are translated into U.S. dollars based on the current exchange rates each business day. Fluctuations in the value of currency holdings and other assets and liabilities resulting from changes in exchange rates are recorded as unrealized foreign currency gains or losses. Realized gains or losses and unrealized appreciation or depreciation on investment securities and income and expenses are translated on the respective dates of such transactions. The effects of changes in foreign currency exchange rates on investments in securities are not segregated on the Statement of Operations from the effects of changes in market prices of those securities, but are included with the net realized and unrealized gain or loss on investment securities.
| | | | | | |
|
Non-U.S. currency symbols utilized throughout the report are defined
as follows: |
| BRL | | Brazilian Real | | MXN | | Mexican Peso |
| CLP | | Chilean Peso | | NOK | | Norwegian Krone |
| CNY | | Chinese Yuan Renminbi | | PLN | | Polish Zloty |
| EUR | | Euro | | RUB | | Russian Ruble |
| GBP | | Great British Pound | | SGD | | Singapore Dollar |
| KRW | | South Korean Won | | ZAR | | South African Rand |
(g) Foreign Currency Transactions The Portfolio may enter into foreign currency contracts in connection with settling planned purchases or sales of securities, to hedge the currency exposure associated with some or all of the Portfolio’s securities or as a part of an investment strategy. A foreign currency contract is an agreement between two parties to buy and sell a currency at a set price on a future date. The market value of a foreign currency contract fluctuates with changes in foreign currency exchange rates. Foreign currency contracts are
marked to market daily and the change in value is recorded by the Portfolio as an unrealized gain or loss. Realized gains or losses equal to the difference between the value of the contract at the time it was opened and the value at the time it was closed are recorded upon delivery or receipt of the currency. These contracts may involve market risk in excess of the unrealized gain or loss reflected on the Statement of Assets and Liabilities. In addition, the Portfolio could be exposed to risk if the counterparties are unable to meet the terms of the contracts or if the value of the currency changes unfavorably to the U.S. dollar.
(h) Futures Contracts The Portfolio may enter into futures contracts. The Portfolio may use futures contracts to manage its exposure to the securities markets or to movements in interest rates and currency values. The primary risks associated with the use of futures contracts are the imperfect correlation between the change in market value of the securities held by the Portfolio and the prices of futures contracts, the possibility of an illiquid market, and the inability of the counterparty to meet the terms of the contract. Futures contracts are valued based upon their quoted daily settlement prices. Upon entering into a futures contract, the Portfolio is required to deposit with its futures broker, an amount of cash or U.S. Government and Agency Obligations in accordance with the initial margin requirements of the broker or exchange. Futures contracts are marked to market daily and an appropriate payable or receivable for the change in value (“variation margin”) is recorded by the Portfolio. Gains or losses are recognized but not considered realized until the contracts expire or are closed. Futures contracts involve, to varying degrees, risk of loss in excess of the variation margin disclosed on the Statement of Assets and Liabilities.
(i) Options Contracts The Portfolio may write call and put options on futures, swaps, securities or currencies it owns or in which it may invest. Writing put options tends to increase the Portfolio’s exposure to the underlying instrument. Writing call options tends to decrease the Portfolio’s exposure to the underlying instrument. When the Portfolio writes a call or put option, an amount equal to the premium received is recorded as a liability and subsequently marked to market to reflect the current value of the option written. These liabilities are reflected as written options outstanding on the Statement of Assets and Liabilities. Certain options may be written with premiums to be determined on a future date. The premiums for these options are based upon implied volatility parameters at specified terms. Premiums received from writing options which expire are treated as realized gains. Premiums received from writing options which are exercised or closed are added to the proceeds or offset against amounts paid on the underlying future, swap, security or currency transaction to determine the realized gain or loss. The Portfolio as a writer of an option has no control over whether the underlying future, swap, security or currency may be sold (call) or purchased (put) and as a result bears the market risk of an unfavorable change in the price of the future, swap, security or currency underlying the written option. There is the risk the Portfolio may not be able to enter into a closing transaction because of an illiquid market.
The Portfolio may also purchase put and call options. Purchasing call options tends to increase the Portfolio’s exposure to the underlying instrument. Purchasing put options tends to decrease the Portfolio’s exposure to the underlying instrument. The Portfolio pays a premium which is included on the Statement of Assets and Liabilities as an investment and subsequently marked to market to reflect the current value of the option. Premiums paid for purchasing options which expire are treated as realized losses. Certain options may be purchased with premiums to be determined on a future date. The premiums for these options are based upon implied volatility parameters at specified terms. The risk associated with purchasing put and call options is limited to the premium paid. Premiums paid for purchasing options which are exercised or closed are added to the amounts paid or offset against the proceeds on the underlying future, swap, security or currency transaction to determine the realized gain or loss.
| | | | |
| 14 | | PIMCO Variable Insurance Trust | | |
| | |
| |
| | | June 30, 2007 (Unaudited) |
(j) Repurchase Agreements The Portfolio may engage in repurchase transactions. Under the terms of a typical repurchase agreement, the Portfolio takes possession of an underlying debt obligation (collateral) subject to an obligation of the seller to repurchase, and the Portfolio to resell, the obligation at an agreed-upon price and time. The underlying securities for all repurchase agreements are held in safekeeping at the Portfolio’s custodian or designated subcustodians under tri-party repurchase agreements. The market value of the collateral must be equal to or exceed the total amount of the repurchase obligations, including interest. Securities purchased under repurchase agreements are reflected as an asset on the Statement of Assets and Liabilities. Generally, in the event of counterparty default, the Portfolio has the right to use the collateral to offset losses incurred. If the counterparty should default, the Portfolio will seek to sell the securities which it holds as collateral. This could involve procedural costs or delays in addition to a loss on the securities if their value should fall below their repurchase price.
(k) Inverse Floating Rate Transactions—Residual Interest Municipal Bonds (“RIBs”)/Residual Interest Tax Exempt Bonds (“RITEs”) The Portfolio may invest in RIBs and RITEs (“Inverse Floaters”). Inverse Floaters are created via a master trust agreement between a broker-dealer, acting as trustor and liquidity provider, and an investment bank, acting as trustee and tender agent. The master trust agreement defines the terms for each trust series; with each series being established by the transfer of long-term, fixed-rate municipal bonds (“Fixed Rate Bonds”) to the trustee to be held and provide for the creation, execution and delivery of floater certificates (“Floating Rate Notes”) and Inverse Floaters. Floating Rate Notes are liquid notes that are issued with a short-term variable rate typically linked to the LIBOR, subject to limitations, for some duration. After interest income is paid on the Floating Rate Notes at current rates, the residual income from the Fixed Rate Bonds is paid to the Inverse Floaters. Inverse Floaters are issued with a coupon that fluctuates inversely with the Floating Rate Notes’ referenced rate, subject to certain limitations. Therefore, rising short-term rates result in lower income for the Inverse Floaters and vice versa.
Floating Rate Notes are generally remarketed to municipal money market funds. Inverse Floaters are acquired by either tax-exempt municipal bond funds or trusts, or other parties interested in potentially higher yielding tax-exempt securities. Inverse Floaters may also be acquired for the purpose of increasing leverage. Floating Rate Note holders typically have the option to tender their notes to the liquidity provider for redemption at par at each reset date. The Inverse Floater holders have the option to (i) require the Floating Rate Note holders to tender their notes at par, and (ii) require the liquidity provider to transfer the Fixed Rate Bonds to the Inverse Floater holders. The holders of Inverse Floaters bear substantially all of the downside investment risk associated with the underlying Fixed Rate Bonds, and also benefit from a disproportionate amount of the potential appreciation of the underlying Fixed Rate Bonds’ value. Inverse Floaters may be more volatile and less liquid than other municipal bonds of comparable maturity.
Inverse Floaters may be acquired with or without first transferring to the trustor the Fixed Rate Bonds that were utilized to create the trust series. Inverse Floaters acquired without a transfer of Fixed Rate Bonds are recognized as purchases of securities as outlined in Note 2(b). Statement of Financial Accounting Standards No. 140—Accounting for Transfers and Servicing of Financial Assets and Extinguishments of Liabilities (“FAS No. 140”), governs the standards for accounting for securitizations and other transfers of financial assets. If there is a transfer of Fixed Rate Bonds and it meets sale criteria under FAS No. 140, a Portfolio records a sale of the Fixed Rate Bonds and a purchase of the Inverse Floaters. The cash received from the Inverse Floaters is then recorded as interest income in the Statement of Operations.
If the transfer of Fixed Rate Bonds does not meet sale criteria under FAS No. 140, a Portfolio accounts for the transaction described above as a secured borrowing by
including the Fixed Rate Bonds in its Schedule of Investments, and recording the Floating Rate Notes as a liability under the caption “Payable for floating rate notes” in the Portfolio’s Statement of Assets and Liabilities. In a secured borrowing transaction, cash received from the Inverse Floaters is not recorded as interest income. Instead, a Portfolio records interest income related to the Fixed Rate Bonds and interest expense related to the Floating Rate Notes, the net of which is equal to the cash received from the Inverse Floaters acquired by the Portfolio. Thus, while a Portfolio’s reported total income, net expenses, and net expense ratio are generally higher for investments in Inverse Floaters acquired via a secured borrowing, the method of acquiring Inverse Floaters does not result in differences for reported cash flows, net asset value or total return.
(l) Short Sales The Portfolio may enter into short sales transactions. A short sale is a transaction in which the Portfolio sells securities it does not own in anticipation of a decline in the market price of the securities. Securities sold in short sale transactions and interest payable on such securities, if any, are reflected as a liability on the Statement of Assets and Liabilities. The Portfolio is obligated to deliver securities at the market price at the time the short position is closed. Possible losses from short sales may be unlimited, whereas losses from purchases cannot exceed the total amount invested.
(m) Swap Agreements The Portfolio may invest in swap agreements. Swap transactions are privately negotiated agreements between the Portfolio and a counterparty to exchange or swap investment cash flows, assets, or market-linked returns at specified, future intervals. The Portfolio may enter into interest rate, total return, forward spread-lock, credit default, and other forms of swap agreements to manage its exposure to interest rates and credit risk. In connection with these agreements, securities may be identified as collateral in accordance with the terms of the respective swap agreements.
Interest rate swap agreements involve the exchange by the Portfolio with another party of their respective commitments to pay or receive interest, e.g., an exchange of floating rate payments for fixed rate payments with respect to the notional amount of principal. Certain forms of interest rate swap agreements may include: (i) interest rate caps, under which, in return for a premium, one party agrees to make payments to the other to the extent that interest rates exceed a specified rate, or “cap”, (ii) interest rate floors, under which, in return for a premium, one party agrees to make payments to the other to the extent that interest rates fall below a specified rate, or “floor”, or (iii) interest rate collars, under which a party sells a cap and purchases a floor or vice versa in an attempt to protect itself against interest rate movements exceeding given minimum or maximum levels.
Total return swap agreements involve commitments to pay interest in exchange for a market-linked return, both based on notional amounts. To the extent the total return of the security or index underlying the transaction exceeds or falls short of the offsetting interest rate obligation, the Portfolio will receive a payment from or make a payment to the counterparty.
Forward spread-lock swap agreements involve commitments to pay or receive a settlement amount calculated as the difference between the swap spread and a fixed spread, multiplied by the notional amount times the duration of the swap. The swap spread is the difference between the benchmark swap rate (market rate) and the specific Treasury rate.
Credit default swap agreements involve one party making a stream of payments to another party in exchange for the right to receive a specified return in the event of a default by a third party, typically corporate issues or sovereign issues of an emerging country, on its obligation. The Portfolio may use credit default swaps to provide a measure of protection against defaults of the issuers (i.e., to reduce risk where the Portfolio owns or has exposure to the sovereign issuer) or to take an active long or short position with respect to the likelihood of a particular issuer’s
| | | | | | |
| | Semiannual Report | | June 30, 2007 | | 15 |
Notes to Financial Statements (Cont.)
default. As a seller of protection, the Portfolio generally receives an upfront payment or a fixed rate of income throughout the term of the swap provided that there is no credit event. If the Portfolio is a seller of protection and a credit event occurs, as defined under the terms of that particular swap agreement, the Portfolio will pay to the buyer of the protection an amount up to the notional value of the swap and in certain instances take delivery of the security. As the seller, the Portfolio would effectively add leverage to its portfolio because, in addition to its total net assets, the Portfolio would be subject to investment exposure on the notional amount of the swap. As a buyer of protection, the Portfolio generally receives an amount up to the notional value of the swap if a credit event occurs. The treatment of credit default swaps and other swap agreements that provide for contingent, non-periodic, bullet-type payments as “notional principal contracts” for U.S. federal income tax purposes is uncertain. Were the U.S. Internal Revenue Service (“IRS”) to take the position that a credit default swap or other bullet-type swap is not a “notional principal contract” for U.S. federal income tax purposes, payments received by the Portfolio from such investments might be subject to U.S. excise or income taxes.
Swaps are marked to market daily based upon quotations from market makers and the change in value, if any, is recorded as unrealized gain or loss on the Statement of Operations. Payments received or made at the beginning of the measurement period are reflected as such on the Statement of Assets and Liabilities. These upfront payments are recorded as realized gain or loss on the Statement of Operations upon termination or maturity of the swap. A liquidation payment received or made at the termination of the swap is recorded as realized gain or loss on the Statement of Operations. Net periodic payments received or paid by the Portfolio are included as part of realized gain or loss on the Statement of Operations. Entering into these agreements involves, to varying degrees, elements of credit, market and documentation risk in excess of the amounts recognized on the Statement of Assets and Liabilities. Such risks involve the possibility that there will be no liquid market for these agreements, that the counterparty to the agreements may default on its obligation to perform or disagree as to the meaning of contractual terms in the agreements and that there may be unfavorable changes in interest rates.
(n) Mortgage-Related and Other Asset-Backed Securities The Portfolio may invest in mortgage-related or other asset-backed securities. These securities include mortgage pass-through securities, collateralized mortgage obligations (“CMOs”), commercial mortgage-backed securities, mortgage dollar rolls, CMO residuals, stripped mortgage-backed securities (“SMBSs”) and other securities that directly or indirectly represent a participation in, or are secured by and payable from, mortgage loans on real property. The value of some mortgage-related or asset-backed securities may be particularly sensitive to changes in prevailing interest rates. Early repayment of principal on some mortgage-related securities may expose the Portfolio to a lower rate of return upon reinvestment of principal. The value of these securities may fluctuate in response to the market’s perception of the creditworthiness of the issuers. Additionally, although mortgages and mortgage-related securities are generally supported by some form of government or private guarantee and/or insurance, there is no assurance that private guarantors or insurers will meet their obligations.
One type of SMBS has one class receiving all or a portion of the interest from the mortgage assets (the interest-only, or “IO” and/or the high coupon rate with relatively low principal amount, or “IOette” class), while the other class will receive all of the principal (the principal-only, or “PO” class). Payments received for IOs and IOettes are included in interest income on the Statements of Operations. Because little to no principal will be received at the maturity of an IO or IOettes, adjustments are made to the book value of the security on a daily basis until maturity. These adjustments are included in interest income on the Statements of Operations. Payments received for POs are treated as reductions to the cost and par value of the securities.
(o) U.S. Government Agencies or Government-Sponsored Enterprises Securities issued by U.S. Government agencies or government-sponsored enterprises may not be guaranteed by the U.S. Treasury. The Government National Mortgage Association (“GNMA” or “Ginnie Mae”), a wholly owned U.S. Government corporation, is authorized to guarantee, with the full faith and credit of the U.S. Government, the timely payment of principal and interest on securities issued by institutions approved by GNMA and backed by pools of mortgages insured by the Federal Housing Administration or guaranteed by the Department of Veterans Affairs. Government-related guarantors (i.e., not backed by the full faith and credit of the U.S. Government) include the Federal National Mortgage Association (“FNMA” or “Fannie Mae”) and the Federal Home Loan Mortgage Corporation (“FHLMC” or “Freddie Mac”). Pass-through securities issued by FNMA are guaranteed as to timely payment of principal and interest by FNMA but are not backed by the full faith and credit of the U.S. Government. FHLMC guarantees the timely payment of interest and ultimate collection of principal, but its participation certificates are not backed by the full faith and credit of the U.S. Government.
(p) New Accounting Policies In July 2006, the Financial Accounting Standards Board (“FASB”) issued Interpretation No. 48, “Accounting for Uncertainty in Income Taxes—an Interpretation of FASB Statement No. 109” (the “Interpretation”). The Interpretation became effective for the Portfolio on June 29, 2007. Management has evaluated the application of the Interpretation in relation to the Portfolio and has concluded that no single filing position or combination of filing positions identified as uncertain tax positions required the accrual of a tax liability in the accounting records of the Portfolio for the period ending June 30, 2007. Management will monitor all existing filing positions and future filing positions in light of the Interpretation and evaluate the need for any future tax accruals and financial statement disclosures as warranted.
In September 2006, the FASB issued Statement of Financial Accounting Standards No. 157, “Fair Value Measurements” (the “Statement”). The Statement is effective for fiscal years beginning after November 15, 2007 and will require expanded disclosure about fair value measurements, separately for each major category of assets and liabilities, that enables shareholders to assess the inputs used to develop those measurements, and for recurring fair value measurements using significant unobservable inputs the effect of the measurements on changes in net assets for the reporting period. Management is currently evaluating the application of the Statement to the Portfolio and will provide additional information in relation to the Statement on the Portfolio’s annual financial statements for the period ending December 31, 2007.
3. FEES AND EXPENSES
(a) Investment Advisory Fee PIMCO is a majority-owned subsidiary of Allianz Global Investors of America L.P. (“AGI”), and serves as investment adviser (the “Adviser”) to the Trust, pursuant to an investment advisory contract. The Adviser receives a monthly fee from the Portfolio, at an annual rate based on average daily net assets. The Advisory Fee for all classes is charged at an annual rate of 0.25%.
(b) Administration Fee PIMCO serves as administrator (the “Administrator”), and provides administrative services to the Trust for which it receives a monthly administrative fee based on each share class’s average daily net assets. As the Administrator, PIMCO bears the costs of various third-party services, including audit, custodial, portfolio accounting, legal, transfer agency and printing costs. The Administration Fee for all classes is charged at the annual rate of 0.20%.
(c) Distribution and Servicing Fees Allianz Global Investors Distributors LLC (“AGID”) is an indirect wholly-owned subsidiary of AGI and serves as the distributor (the “Distributor”) of the Trust’s shares. The Trust is permitted to reimburse AGID on a quarterly basis, out of the Administrative Class assets of the
| | | | |
| 16 | | PIMCO Variable Insurance Trust | | |
| | |
| |
| | | June 30, 2007 (Unaudited) |
Portfolio in the amount of 0.15% on an annual basis of the average daily net assets of that class, for payments made to financial intermediaries that provide services in connection with the distribution of shares or administration of plans or programs that use Portfolio shares as their funding medium. The effective rate paid to AGID was 0.15% during the current fiscal year.
(d) Portfolio Expenses The Trust is responsible for the following expenses: (i) salaries and other compensation of any of the Trust’s executive officers and employees who are not officers, directors, stockholders or employees of PIMCO or its subsidiaries or affiliates; (ii) taxes and governmental fees; (iii) brokerage fees and commissions and other portfolio transaction expenses; (iv) the costs of borrowing money, including interest expenses and bank overdraft charges; (v) fees and expenses of the Trustees who are not “interested persons” of PIMCO or the Trust, and any counsel retained exclusively for their benefit; (vi) extraordinary expenses, including costs of litigation and indemnification expenses; (vii) organization expenses and (viii) any expenses allocated or allocable to a specific class of shares, which include service fees payable with respect to the Administrative Class Shares, and may include certain other expenses as permitted by the Trust’s Multiple Class Plan adopted pursuant to Rule 18f-3 under the Act and subject to review and approval by the Trustees. The ratio of expenses to average net assets per share class, as disclosed in the Financial Highlights, may differ from the annual portfolio operating expenses per share class as disclosed in the Prospectus for the reasons set forth above.
Effective April 1, 2007, each Trustee, other than those affiliated with PIMCO or its affiliates, receives an annual retainer of $15,000, plus $2,375 for each Board of Trustees meeting attended in person, $500 for each committee meeting attended and $750 for each Board of Trustees meeting attended telephonically, plus reimbursement of related expenses. In addition, the audit committee chair receives an additional annual retainer of $2,000 and each other committee chair receives an additional annual retainer of $500. These expenses are allocated on a pro-rata basis to the various portfolios of the Trust according to their respective net assets. The Trust pays no compensation directly to any Trustee or any other officer who is affiliated with the Administrator, all of whom receive remuneration for their services to the Trust from the Administrator or its affiliates. Prior to April 1, 2007, each Trustee, other than those affiliated with PIMCO or its affiliates, received an annual retainer of $15,000 plus $2,000 for each Board of Trustees meeting attended ($500 for each special meeting attended), plus reimbursement of related expenses. The Audit Committee Chairman received an annual retainer of $1,500 and the Governance Committee Chairman received an annual retainer of $500. In addition, each member of a committee received $500 for each committee meeting attended.
4. RELATED PARTY TRANSACTIONS
The Adviser, Administrator, and Distributor are related parties as defined by FAS 57, Related Party Disclosures. Fees payable to these parties are disclosed in Note 3.
5. GUARANTEES AND INDEMNIFICATIONS
Under the Trust’s organizational documents, each Trustee, officer, employee or other agent of the Trust (including the Trust’s investment manager) is indemnified, to the extent permitted by the Act, against certain liabilities that may arise out of performance of their duties to the Portfolio. Additionally, in the normal course of business, the Portfolio enters into contracts that contain a variety of indemnification clauses. The Portfolio’s maximum exposure under these arrangements is unknown as this would involve future claims that may be made against the Portfolio that have not yet occurred. However, the Portfolio has not had prior claims or losses pursuant to these contracts and believes the risk of loss to be remote.
6. PURCHASES AND SALES OF SECURITIES
The length of time the Portfolio has held a particular security is not generally a consideration in investment decisions. A change in the securities held by the Portfolio is known as “portfolio turnover”. The Portfolio may engage in frequent and active trading of portfolio securities to achieve its investment objective, particularly during periods of volatile market movements. High portfolio turnover (e.g., over 100%) involves correspondingly greater expenses to the Portfolio, including brokerage commissions or dealer mark-ups and other transaction costs on the sale of securities and reinvestments in other securities. Such sales may also result in realization of taxable capital gains, including short-term capital gains (which are generally taxed at ordinary income tax rates). The trading costs and tax effects associated with portfolio turnover may adversely affect the Portfolio’s performance.
Purchases and sales of securities (excluding short-term investments) for the period ended June 30, 2007, were as follows (amounts in thousands):
| | | | | | | | | | | | |
| U.S. Government/Agency | | | | All Other |
| Purchases | | Sales | | | | Purchases | | Sales |
| $ | 12,754 | | $ | 12,785 | | | | $ | 2,560 | | $ | 1,429 |
7. TRANSACTIONS IN WRITTEN CALL AND PUT OPTIONS
Transactions in written call and put options were as follows (amounts in thousands, except for number of contracts):
| | | | | | | | | | |
| | | | | Notional
Amount
in $ | | | Premium | |
Balance at 12/31/2006 | | | | $ | 800 | | | $ | 9 | |
Sales | | | | | 1,000 | | | | 12 | |
Closing Buys | | | | | (800 | ) | | | (9 | ) |
Expirations | | | | | 0 | | | | 0 | |
Exercised | | | | | 0 | | | | 0 | |
Balance at 06/30/2007 | | | | $ | 1,000 | | | $ | 12 | |
8. SHARES OF BENEFICIAL INTEREST
The Portfolio may issue an unlimited number of shares of beneficial interest with a $0.001 par value. Changes in shares of beneficial interest were as follows (shares and amounts in thousands):
| | | | | | | | | | | | | | | | |
| | | | | Six Months Ended
06/30/2007 | | | Year Ended
12/31/2006 | |
| | | | | Shares | | | Amount | | | Shares | | | Amount | |
| | | | | |
Receipts for shares sold | | | | | | | | | | | | | | | | |
Institutional Class | | | | 130 | | | $ | 1,304 | | | 1,718 | | | $ | 17,254 | |
Administrative Class | | | | 537 | | | | 5,388 | | | 557 | | | | 5,591 | |
Issued as reinvestment of distributions | | | | | | | | | | | | | | | | |
Institutional Class | | | | 32 | | | | 314 | | | 88 | | | | 885 | |
Administrative Class | | | | 23 | | | | 231 | | | 40 | | | | 399 | |
Cost of shares redeemed | | | | | | | | | | | | | | | | |
Institutional Class | | | | (775 | ) | | | (7,783 | ) | | (3,302 | ) | | | (33,154 | ) |
Administrative Class | | | | (424 | ) | | | (4,255 | ) | | (494 | ) | | | (4,954 | ) |
Net (decrease) resulting from Portfolio share transactions | | | | (477 | ) | | $ | (4,801 | ) | | (1,393 | ) | | $ | (13,979 | ) |
| | | | | | |
| | Semiannual Report | | June 30, 2007 | | 17 |
Notes to Financial Statements (Cont.)
The following schedule shows the number of shareholders each owning 5% or more of the Portfolio and the total percentage of the Portfolio held by such shareholders:
| | | | | | |
| | | | | Number of
Shareholders | | % of Portfolio Held |
Institutional Class | | | | 2 | | 95 |
Administrative Class | | | | 3 | | 78 |
9. REGULATORY AND LITIGATION MATTERS
Since February 2004, PIMCO, Allianz Global Investors of America L.P. (PIMCO’s parent company), AGID, and certain of their affiliates, including the PIMCO Funds (another series of funds managed by PIMCO), the Allianz Funds (formerly known as PIMCO Funds: Multi-Manager Series (another series of funds managed by affiliates of PIMCO)), certain Trustees of the Trust (in their capacity as Trustees of the PIMCO Funds or the Allianz Funds) and certain employees of PIMCO, have been named as defendants in fifteen lawsuits filed in various jurisdictions. Eleven of those lawsuits concern “market timing,” and they have been transferred to and consolidated for pre-trial proceedings in a multi-district litigation proceeding in the U.S. District Court for the District of Maryland; the other four lawsuits concern “revenue sharing” and have been consolidated into a single action in the U.S. District Court for the District of Connecticut. The lawsuits have been commenced as putative class actions on behalf of investors who purchased, held or redeemed shares of the various series of the PIMCO Funds and the Allianz Funds during specified periods, or as derivative actions on behalf of the PIMCO Funds and the Allianz Funds.
The market timing actions in the District of Maryland generally allege that certain hedge funds were allowed to engage in “market timing” in certain funds of the PIMCO Funds and the Allianz Funds and this alleged activity was not disclosed. Pursuant to tolling agreements entered into with the derivative and class action plaintiffs, PIMCO, certain PIMCO Funds Trustees, and certain employees of PIMCO who were previously named as defendants have all been dropped as defendants in the market timing actions; the plaintiffs continue to assert claims on behalf of the shareholders of the PIMCO Funds or on behalf of the PIMCO Funds itself against other defendants. By order dated November 3, 2005, the U.S. District Court for the District of Maryland granted the PIMCO Funds’ motion to dismiss claims asserted against it in a consolidated amended complaint where the PIMCO Funds were named, in the complaint, as a nominal defendant. The revenue sharing action in the District of Connecticut generally alleges that fund assets were inappropriately used to pay brokers to promote funds of the PIMCO Funds and the Allianz Funds, including directing fund brokerage transactions to such brokers, and that such alleged arrangements were not fully disclosed to shareholders. On August 11, 2005, the U.S. District Court for the District of Connecticut conducted a hearing on defendants’ motion to dismiss the consolidated amended complaint in the revenue sharing action but has not yet ruled on the motion to dismiss. The market timing and revenue sharing lawsuits seek, among other things, unspecified compensatory damages plus interest and, in some cases, punitive damages, the rescission of investment advisory contracts, the return of fees paid under those contracts and restitution.
Two nearly identical class action civil complaints have been filed in August 2005, in the Northern District of Illinois Eastern Division, alleging that the plaintiffs each purchased and sold a 10-year Treasury note futures contract and suffered damages
from an alleged shortage when PIMCO held both physical and futures positions in 10-year Treasury notes for its client accounts. The two actions have been consolidated into one action, and the two separate complaints have been replaced by a consolidated complaint. PIMCO is a named defendant, and PIMCO Funds has been added as a defendant, to the consolidated action. PIMCO strongly believes the complaint is without merit and intends to vigorously defend itself.
In April 2006, certain portfolios of the Trust and certain other funds managed by PIMCO were served in an adversary proceeding brought by the Official Committee of Asbestos Claimants of G-I Holdings, Inc. in G-I Holdings, Inc.’s bankruptcy in the District of New Jersey. In July 2004, PIMCO was named in this lawsuit and remains a defendant. The plaintiff seeks to recover for the bankruptcy estate assets that were transferred by the predecessor entity of G-I Holdings, Inc. to a wholly-owned subsidiary in 1994. The subsidiary has since issued notes, of which certain portfolios of the Trust and certain other funds managed by PIMCO are alleged to be holders. The complaint alleges that in 2000, more than two hundred noteholders—including certain portfolios of the Trust and certain other funds managed by PIMCO—were granted a second priority lien on the assets of the subsidiary in exchange for their consent to a refinancing transaction and the granting of a first priority lien to the lending banks. The plaintiff is seeking invalidation of the lien in favor of the noteholders and/or the value of the lien. On June 21, 2006, the District of New Jersey overturned the Bankruptcy Court’s decision granting permission to file the adversary proceeding and remanded the matter to the Bankruptcy Court for further proceedings. Following a motion to reconsider, the District Court upheld its remand on August 7, 2006, and instructed the Bankruptcy Court to conduct a “cost-benefit” analysis of the Committee’s claims, including the claims against the noteholders. The Bankruptcy Court held a status conference on October 25, 2006 and set a briefing schedule relating to this cost-benefit analysis.
The foregoing speaks only as of the date of this report. It is possible that these matters and/or other developments resulting from these matters could result in increased portfolio redemptions or other adverse consequences to the Portfolio. However, PIMCO and AGID believe that these matters are not likely to have a material adverse effect on the Portfolio or on PIMCO’s or AGID’s ability to perform their respective investment advisory or distribution services relating to the Portfolio.
10. FEDERAL INCOME TAX MATTERS
The Portfolio intends to qualify as a regulated investment company under sub-chapter M of the Internal Revenue Code (the “Code”) and distribute all of its taxable income and net realized gains, if applicable, to shareholders. Accordingly, no provision for Federal income taxes has been made.
As of June 30, 2007, the aggregate cost of investments was the same for federal income tax and financial statement purposes. The net unrealized appreciation (depreciation) of investment securities for federal income tax purposes is as follows (amount in thousands):
| | | | |
Aggregate
Gross
Unrealized
Appreciation | | Aggregate
Gross
Unrealized
(Depreciation) | | Net
Unrealized
(Depreciation) |
$ 14 | | $ (79) | | $ (65) |
| | | | |
| 18 | | PIMCO Variable Insurance Trust | | |
| | |
| |
Privacy Policy* | | (Unaudited) |
The Funds consider customer privacy to be a fundamental aspect of their relationships with shareholders and are committed to maintaining the confidentiality, integrity and security of their current, prospective and former shareholders’ personal information. To ensure their shareholders’ privacy, the Funds have developed policies that are designed to protect this confidentiality, while allowing shareholder needs to be served.
Obtaining Personal Information
In the course of providing shareholders with products and services, the Funds and certain service providers to the Funds, such as the Funds’ investment advisers (“Advisers”), may obtain non-public personal information about shareholders, which may come from sources such as account applications and other forms, from other written, electronic or verbal correspondence, from shareholder transactions, from a shareholder’s brokerage or financial advisory firm, financial adviser or consultant, and/or from information captured on the Funds’ internet web sites.
Respecting Your Privacy
As a matter of policy, the Funds do not disclose any personal or account information provided by shareholders or gathered by the Funds to non-affiliated third parties, except as required or permitted by law or as necessary for such third parties to perform their agreements with respect to the Funds. As is common in the industry, non-affiliated companies may from time to time be used to provide certain services, such as preparing and mailing prospectuses, reports, account statements and other information, conducting research on shareholder satisfaction and gathering shareholder proxies. A Fund’s Distributor may also retain non-affiliated companies to market the Fund’s shares or products which use the Fund’s shares and enter into joint marketing agreements with other companies. These companies may have access to a shareholder’s personal and account information, but are permitted to use this information solely to provide the specific service or as otherwise permitted by law. In most cases, the shareholders will be clients of a third party, but the Funds may also provide a shareholder’s personal and account information to the shareholder’s respective brokerage or financial advisory firm.
Sharing Information with Third Parties
The Funds reserve the right to disclose or report personal information to non-affiliated third parties, in limited circumstances, where the Funds believe in good faith that disclosure is required under law to cooperate with regulators or law enforcement authorities, to protect their rights or property or upon reasonable request by any Fund in which a shareholder has chosen to invest. In addition, the Funds may disclose information about a shareholder’s accounts to a non-affiliated third party with the consent of the shareholder.
Sharing Information with Affiliates
The Funds may share shareholder information with their affiliates in connection with servicing their shareholders’ accounts or to provide shareholders with information about products and services that the Funds or their Advisers, principal underwriters or their affiliates (“Service Affiliates”) believe may be of interest to such shareholders. The information that the Funds share may include, for example, a shareholder’s participation in one of the Funds or in other investment programs sponsored by a Service Affiliate, a shareholder’s ownership of certain types of accounts (such as IRAs), or other data about a shareholder’s accounts. The Funds’ Service Affiliates, in turn, are not permitted to share shareholder information with non-affiliated entities, except as required or permitted by law.
Procedures to Safeguard Private Information
The Funds take seriously the obligation to safeguard shareholder non-public personal information. In addition to this policy, the Funds have also implemented procedures that are designed to restrict access to a shareholder’s non-public personal information only to internal personnel who need to know that information in order to provide products or services to such shareholders. In order to guard a shareholder’s non-public personal information, physical, electronic and procedural safeguards are in place.
* This Privacy Policy applies to the following entities: PIMCO Funds, PIMCO Variable Insurance Trust, PCM Fund, Inc. and PIMCO Strategic Global Government Fund, Inc. (collectively, the “Funds”).
| | | | | | |
| | Semiannual Report | | June 30, 2007 | | 19 |
Investment Adviser and Administrator
Pacific Investment Management Company LLC
840 Newport Center Drive
Newport Beach, California 92660
Distributor
Allianz Global Investors Distributors LLC
1345 Avenue of the Americas
New York, New York 10105
Custodian
State Street Bank & Trust Company
801 Pennsylvania
Kansas City, Missouri 64105
Transfer Agent
Boston Financial Data Services–Midwest
330 W. 9th Street
Kansas City, Missouri 64105
Legal Counsel
Dechert LLP
1775 I Street, N.W.
Washington, D.C. 20006
Independent Registered Public Accounting Firm
PricewaterhouseCoopers LLP
1055 Broadway
Kansas City, Missouri 64105
P I M C O

Table of Contents
This material is authorized for use only when preceded or accompanied by the current PIMCO Variable Insurance Trust (the “Trust”) prospectus. Investors should consider the investment objectives, risks, charges and expenses of this Trust carefully before investing. Ask your financial professional to explain all charges that may apply. This and other information is contained in the Trust’s prospectus. The variable product prospectus may be obtained by contacting your Investment Consultant. Please read the Trust and variable product prospectus carefully before you invest or send money.
Chairman’s Letter
Dear PIMCO Variable Insurance Trust Shareholder:
It is our pleasure to present to you the semiannual report for the PIMCO Variable Insurance Trust, covering the six-month period ended June 30, 2007. The PIMCO Variable Insurance Trust’s net assets were $8.68 billion at June 30, 2007, as compared to $7.76 billion at December 31, 2006.
Highlights of the financial markets during the reporting period include:
| | n | | Economic data during the first quarter of 2007 pointed to slower growth, which heightened market expectations for a decrease in the Federal Funds Rate. By the second quarter, economic data, such as employment statistics, provided little indication of economic weakness, causing expectations of a decrease in the Federal Funds Rate to unwind and U.S. interest rates to move higher. Interest rates in Europe and the U.K. also rose over the period as central banks raised their key lending rates due to inflation concerns. The benchmark ten-year U.S. Treasury yielded 5.03% as of June 30, 2007, or 0.32% higher than at the beginning of the year. |
| | n | | Most bonds generally returned much of their gains from earlier in the year as worldwide growth and capital flows drove interest rates higher in the second quarter. Increased risk aversion in global financial markets, due in part to subprime mortgage worries in the U.S., also contributed to the rise in interest rates. The Lehman Brothers Aggregate Bond Index, which includes Treasury, investment-grade corporate and mortgage-backed securities, returned 0.98% for the six-month period. |
| | n | | Locally issued emerging market (“EM”) bonds posted positive returns for the reporting period. Yields on these bonds declined and the local currencies in which they are denominated generally gained, amid increasing investor awareness, strong economic growth and surging capital inflows. External EM bonds (debt instruments issued by emerging markets countries and typically denominated in U.S. dollars) lagged behind local EM bonds (debt instruments issued by emerging markets countries and denominated in the currency of the issuer), as external EM bonds tend to trade more in-line with U.S. Treasuries. |
| | n | | Treasury Inflation-Protected Securities (“TIPS”) outpaced nominal bonds (non-inflation linked bonds) for the first part of the year and all but the longest maturity TIPS outperformed in the second quarter as high gasoline prices drove higher inflation accruals. Commodities, as represented by the Dow Jones-AIG Commodity Total Return Index, returned 4.46% for the period. Equities, as measured by the S&P 500 Index and the Russell 2000 Index, returned 6.96% and 6.45%, respectively, for the period. |
On the following pages, please find specific details as to the Portfolio’s total return investment performance and a discussion of those factors that affected performance.
Thank you for the trust you have placed in us. We will continue to work diligently to serve your investment needs.
Sincerely,
Brent R. Harris
Chairman, PIMCO Variable Insurance Trust
July 31, 2007
| | | | | | |
| | Semiannual Report | | June 30, 2007 | | 1 |
Important Information About the Portfolio
PIMCO Variable Insurance Trust (the “Trust”) is an open-end management investment company currently consisting of twenty separate investment portfolios, including the Small Cap StocksPLUS® TR Portfolio (the “Portfolio”). The Portfolio is only available as a funding vehicle under variable life insurance policies or variable annuity contracts issued by insurance companies (“Variable Contracts”). Individuals may not purchase shares of the Portfolio directly. Shares of the Portfolio also may be sold to qualified pension and retirement plans outside of the separate account context.
We believe that bond funds have an important role to play in a well diversified investment portfolio. It is important to note, however, that in an environment where interest rates may trend upward, rising rates would negatively impact the performance of most bond funds, and fixed-income securities held by a fund are likely to decrease in value. The price volatility of fixed-income securities can also increase during periods of rising interest rates resulting in increased losses to a fund. Bond funds and individual bonds with a longer duration (a measure of the expected life of a security) tend to be more sensitive to changes in interest rates, usually making them more volatile than securities or funds with shorter durations.
The Portfolio may be subject to various risks in addition to those described above. Some of these risks may include, but are not limited to, the following: credit risk, high yield risk, market risk, issuer risk, liquidity risk, derivatives risk, equity risk, mortgage risk, non-U.S. investment risk, emerging markets risk, currency risk, leveraging risk and management risk. A complete description of these risks is contained in the Portfolio’s prospectus. The Portfolio may use derivative instruments as part of an investment strategy, as described under “Portfolio Insights”, or for hedging purposes. Use of these instruments may involve certain costs and risks such as liquidity risk, interest rate risk, market risk, credit risk, management risk and the risk that the Portfolio could not close out a position when it would be most advantageous to do so. Because the Portfolio may invest in derivatives, it could lose more than the principal amount invested in these instruments. Investing in non-U.S. securities may entail risk due to non-U.S. economic and political developments; this risk may be increased when investing in emerging markets.
On the performance summary page in this Semiannual Report, the Total Return Investment Performance table measures performance assuming that all dividend and capital gain distributions were reinvested.
An investment in the Portfolio is not a deposit of a bank and is not guaranteed or insured by the Federal Deposit Insurance Corporation or any other government agency. It is possible to lose money on investments in the Portfolio.
PIMCO has adopted written proxy voting policies and procedures (“Proxy Policy”) as required by Rule 206(4)-6 under the Investment Advisers Act of 1940, as amended. The Proxy Policy has been adopted by the Trust as the policies and procedures that PIMCO will use when voting proxies on behalf of the Portfolio. A description of the policies and procedures that PIMCO uses to vote proxies relating to portfolio securities of the Portfolio, and information about how the Portfolio voted proxies relating to portfolio securities held during the most recent twelve-month period ended June 30, are available without charge, upon request, by calling the Trust at 1-866-746-2606 and on the Portfolio’s website at www.pimco.com.
The Portfolio files its complete schedule of portfolio holdings with the SEC for the first and third quarters of each fiscal year on Form N-Q. A copy of the Trust’s Form N-Q is also available on the SEC’s website at http://www.sec.gov and may be reviewed and copied at the SEC’s Public Reference Room in Washington D.C. Information on the operation of the Public Reference Room may be obtained by calling 1-800-SEC-0330, and is available without charge, upon request, by calling the Trust at 1-866-746-2606 and on the Portfolio’s website at www.pimco.com.
PIMCO Variable Insurance Trust is distributed by Allianz Global Investors Distributors LLC, 1345 Avenue of the Americas, New York, NY 10105.
| | | | |
| 2 | | PIMCO Variable Insurance Trust | | |
The following disclosure provides important information regarding the Portfolio’s Expense Example (“Example” or “Expense Example”), which appears in this Semiannual Report. Please refer to this information when reviewing the Expense Example for the Portfolio.
Example
As a shareholder of the Portfolio, you incur two types of costs: (1) transaction costs and (2) ongoing costs, including advisory and administrative fees; distribution and/or service (12b-1) fees (Administrative Class only); and other Portfolio expenses. The Example is intended to help you understand your ongoing costs (in dollars) of investing in the Portfolio and to compare these costs with the ongoing costs of investing in other mutual funds. The Expense Example does not reflect any fees or other expenses imposed by the Variable Contracts. If it did, the expenses reflected in the Expense Example would be higher. The Example is based on an investment of $1,000 invested at the beginning of the period and held for the entire period indicated, which is from January 31, 2007 to June 30, 2007.
Actual Expenses
The information in the table under the heading “Actual Performance” provides information about actual account values and actual expenses. You may use the information in these columns, together with the amount you invested, to estimate the expenses that you paid over the period. Simply divide your account value by $1,000 (for example, an $8,600 account value divided by $1,000 = $8.60), then multiply the result by the number in the row titled “Expenses Paid During Period” to estimate the expenses you paid on your account during this period.
Hypothetical Example for Comparison Purposes
The information in the table under the heading “Hypothetical Performance (5% return before expenses)” provides information about hypothetical account values and hypothetical expenses based on the Portfolio’s actual expense ratio and an assumed rate of return of 5% per year before expenses, which is not the Portfolio’s actual return. The hypothetical account values and expenses may not be used to estimate the actual ending account balance or expenses you paid for the period. You may use this information to compare the ongoing costs of investing in the Portfolio and other portfolios. To do so, compare this 5% hypothetical example with the 5% hypothetical examples that appear in the shareholder reports of the other portfolios.
Please note that the expenses shown in the table are meant to highlight your ongoing costs only and do not reflect any transactional costs. Therefore, the information under the heading “Hypothetical Performance (5% return before expenses)” is useful in comparing ongoing costs only, and will not help you determine the relative total costs of owning different portfolios. In addition, if these transactional costs were included, your costs would have been higher.
The expense ratio may vary period to period because of various factors, such as an increase in expenses not covered by the advisory and administrative fees (such as expenses of the trustees and their counsel, litigation expense and interest expense).
| | | | | | |
| | Semiannual Report | | June 30, 2007 | | 3 |
PIMCO Small Cap StocksPLUS® TR Portfolio
Allocation Breakdown‡
| | |
U.S. Government Agencies | | 29.9% |
Corporate Bonds & Notes | | 25.9% |
Asset-Backed Securities | | 21.8% |
Short-Term Instruments | | 20.2% |
Mortgage-Backed Securities | | 2.2% |
| | ‡ | % of Total Investments as of 06/30/2007 |
A line graph is not included since the Portfolio has less than six months of unaudited financial statements.
| | | | |
Cumulative Total Return for the period ended June 30, 2007 |
| | | | | Portfolio
Inception
(01/31/07) |
| | PIMCO Small Cap StocksPLUS® TR Portfolio Administrative Class | | 3.63% |
| | Russell 2000® Index± | | 4.70% |
All Portfolio returns are net of fees and expenses.
Performance quoted represents past performance. Past performance is no guarantee of future results. Investment return and principal value will fluctuate so the Portfolio shares, when redeemed, may be worth more or less than their original cost. The Portfolio’s performance does not reflect the deduction of additional charges and expenses imposed in connection with investing in Variable Contracts, which will reduce returns. Current performance may be lower or higher than the performance data quoted. Performance data current to the most recent month-end is available by calling (800) 927-4648.
± Russell 2000® Index is composed of 2,000 of the smallest companies in the Russell 3000 Index and is considered to be representative of the small cap market in general. It is not possible to invest directly in an unmanaged index. The index does not reflect deductions for fees, expenses or taxes.
| | | | | | |
| Expense Example | | Actual Performance | | Hypothetical Performance |
| | | | | (5% return before expenses) |
Beginning Account Value (01/31/07) | | $ | 1,000.00 | | $ | 1,000.00 |
Ending Account Value (06/30/07) | | $ | 1,036.35 | | $ | 1,020.18 |
Expenses Paid During Period† | | $ | 3.89 | | $ | 4.66 |
† Expenses are equal to the Portfolio’s Administrative annualized expense ratio of 0.93%, multiplied by the average account value over the period, multiplied by 151/365 (to reflect the one-half year period). Overall fees and expenses of investing in the Portfolio will be higher because the example does not reflect Variable Contract fees and expenses.
Please refer to page 3 herein for an explanation of the information presented in the above Expense Example.
Portfolio Insights
» | | The PIMCO Small Cap StocksPLUS® TR Portfolio seeks to exceed the total return of the Russell 2000® Index by investing under normal circumstances substantially all of its assets in Russell 2000® Index derivatives, backed by a diversified portfolio of fixed-income instruments actively managed by PIMCO. |
» | | The Portfolio’s fixed-income portfolio underperformed the financing cost embedded in equity index futures holdings, thus leading the Portfolio to underperform the Russell 2000. |
| » | | U.S. duration exposure was negative for performance as interest rates moved higher in instruments where the Portfolio’s duration exposure was concentrated. In particular, Eurodollar futures yields moved higher. Exposure to three-year and longer maturities also detracted from performance as rates moved higher among these maturities. |
| » | | Holdings of mortgage-backed securities detracted from performance as they underperformed like-duration Treasuries. |
| » | | Credit sensitive holdings, including corporate bonds and emerging market bonds, added value as they outperformed like-duration Treasuries. |
| » | | Currency strategies, including long exposure to the euro and a basket of emerging market currencies, helped performance as these currencies appreciated relative to the U.S. dollar. |
| | | | |
| 4 | | PIMCO Variable Insurance Trust | | |
Financial Highlights Small Cap StocksPLUS® TR Portfolio
| | | | |
| Selected per Share Data for the Period Ended: | | 01/31/2007-06/30/2007+ | |
| |
Administrative Class | | | | |
Net asset value beginning of period | | $ | 10.00 | |
Net investment income (a) | | | 0.19 | |
Net realized/unrealized gain on investments (a) | | | 0.17 | |
Total income from investment operations | | | 0.36 | |
Dividends from net investment income | | | (0.02 | ) |
Total distributions | | | (0.02 | ) |
Net asset value end of period | | $ | 10.34 | |
Total return | | | 3.63 | % |
Net assets end of period (000s) | | $ | 3,091 | |
Ratio of expenses to average net assets | | | 0.93 | %* |
Ratio of expenses to average net assets excluding interest expense | | | 0.89 | %* |
Ratio of net investment income to average net assets | | | 4.41 | %* |
Portfolio turnover rate | | | 250 | % |
+ Unaudited
* Annualized
(a) Per share amounts based on average number of shares outstanding during the period.
| | | | | | |
| See Accompanying Notes | | Semiannual Report | | June 30, 2007 | | 5 |
Statement of Assets and Liabilities Small Cap StocksPLUS® TR Portfolio
| | | | |
| (Amounts in thousands, except per share amounts) | | June 30, 2007 | |
| | | (Unaudited) | |
| |
Assets: | | | | |
Investments, at value | | $ | 4,094 | |
Cash | | | 2 | |
Receivable for investments sold | | | 29 | |
Interest and dividends receivable | | | 10 | |
Variation margin receivable | | | 8 | |
Unrealized appreciation on foreign currency contracts | | | 4 | |
| | | | 4,147 | |
| |
Liabilities: | | | | |
Payable for investments purchased | | $ | 994 | |
Payable for investments purchased on a delayed-delivery basis | | | 30 | |
Accrued investment advisory fee | | | 1 | |
Accrued administration fee | | | 1 | |
Variation margin payable | | | 12 | |
Swap premiums received | | | 1 | |
Unrealized depreciation on swap agreements | | | 1 | |
| | | | 1,040 | |
| |
Net Assets | | $ | 3,107 | |
| |
Net Assets Consist of: | | | | |
Paid in capital | | $ | 3,003 | |
Undistributed net investment income | | | 49 | |
Accumulated undistributed net realized gain | | | 140 | |
Net unrealized (depreciation) | | | (85 | ) |
| | | $ | 3,107 | |
| |
Net Assets: | | | | |
Administrative Class | | $ | 3,091 | |
Advisor Class | | | 16 | |
| |
Shares Issued and Outstanding: | | | | |
Administrative Class | | | 299 | |
Advisor Class | | | 1 | |
| |
Net Asset Value and Redemption Price Per Share (Net Asset Per Share Outstanding) | | | | |
Administrative Class | | $ | 10.34 | |
Advisor Class | | | 10.35 | |
| |
Cost of Investments Owned | | $ | 4,101 | |
| | | | |
| 6 | | PIMCO Variable Insurance Trust | | See Accompanying Notes |
Statement of Operations Small Cap StocksPLUS® TR Portfolio
| | | | |
| (Amounts in thousands) | | Period from
January 31, 2007
to June 30, 2007 | |
| | | (Unaudited) | |
| |
| Investment Income: | | | | |
Interest | | $ | 68 | |
Total Income | | | 68 | |
| |
Expenses: | | | | |
Investment advisory fees | | | 6 | |
Administration fees | | | 3 | |
Servicing fees – Administrative Class | | | 2 | |
Interest expense | | | 1 | |
Total Expenses | | | 12 | |
| |
Net Investment Income | | | 56 | |
| |
Net Realized and Unrealized Gain (Loss): | | | | |
Net realized (loss) on investments | | | (9 | ) |
Net realized gain on futures contracts, written options and swaps | | | 150 | |
Net realized (loss) on foreign currency transactions | | | (1 | ) |
Net change in unrealized (depreciation) on investments | | | (7 | ) |
Net change in unrealized (depreciation) on futures contracts, written options and swaps | | | (82 | ) |
Net change in unrealized appreciation on translation of assets and liabilities denominated in foreign currencies | | | 4 | |
Net Gain | | | 55 | |
| |
Net Increase in Net Assets Resulting from Operations | | $ | 111 | |
| | | | | | |
| See Accompanying Notes | | Semiannual Report | | June 30, 2007 | | 7 |
Statements of Changes in Net Assets Small Cap StocksPLUS® TR Portfolio
| | | | |
| (Amounts in thousands) | | Period from
January 31, 2007
to June 30, 2007 | |
| | | (Unaudited) | |
| |
| Increase in Net Assets from: | | | | |
| |
Operations: | | | | |
Net investment income | | $ | 56 | |
Net realized gain | | | 140 | |
Net change in unrealized (depreciation) | | | (85 | ) |
Net increase resulting from operations | | | 111 | |
| |
Distributions to Shareholders: | | | | |
From net investment income | | | | |
Administrative Class | | | (7 | ) |
| |
Total Distributions | | | (7 | ) |
| |
Portfolio Share Transactions: | | | | |
Receipts for shares sold | | | | |
Administrative Class | | | 3,000 | |
Advisor Class | | | 16 | |
Issued as reinvestment of distributions | | | | |
Administrative Class | | | 7 | |
Cost of shares redeemed | | | | |
Administrative Class | | | (20 | ) |
Net increase resulting from Portfolio share transactions | | | 3,003 | |
| |
Total Increase in Net Assets | | | 3,107 | |
| |
Net Assets: | | | | |
Beginning of period | | | 0 | |
End of period* | | $ | 3,107 | |
| |
*Including undistributed net investment income of: | | $ | 49 | |
| | | | |
| 8 | | PIMCO Variable Insurance Trust | | See Accompanying Notes |
| | |
| |
| Schedule of Investments Small Cap StocksPLUS® TR Portfolio | | June 30, 2007 (Unaudited) |
| | | | | | | | |
| | | | | PRINCIPAL
AMOUNT
(000S) | | | | VALUE
(000S) |
| CORPORATE BONDS & NOTES 34.1% |
|
| BANKING & FINANCE 21.5% |
| American Express Bank FSB |
5.380% due 06/22/2009 | | $ | | 30 | | $ | | 30 |
| |
| American Honda Finance Corp. |
5.407% due 02/09/2010 | | | | 30 | | | | 30 |
| |
| Bear Stearns Cos., Inc. |
5.480% due 05/18/2010 | | | | 30 | | | | 30 |
| |
| Caterpillar Financial Services Corp. |
5.420% due 05/18/2009 | | | | 30 | | | | 30 |
| |
| Citigroup Funding, Inc. |
5.320% due 04/23/2009 | | | | 50 | | | | 50 |
| |
| Credit Suisse First Boston |
5.560% due 08/15/2010 | | | | 30 | | | | 30 |
| |
| Ford Motor Credit Co. |
6.625% due 06/16/2008 | | | | 100 | | | | 100 |
7.250% due 10/25/2011 | | | | 30 | | | | 29 |
| |
| General Electric Capital Corp. |
5.430% due 08/15/2011 | | | | 50 | | | | 50 |
| |
| Goldman Sachs Group, Inc. |
5.685% due 07/23/2009 | | | | 30 | | | | 30 |
| |
| HSBC Finance Corp. |
5.607% due 05/10/2010 | | | | 30 | | | | 30 |
5.640% due 11/16/2009 | | | | 20 | | | | 20 |
| |
| JPMorgan Chase & Co. |
5.396% due 05/07/2010 | | | | 30 | | | | 30 |
| |
| Lehman Brothers Holdings, Inc. |
5.460% due 11/16/2009 | | | | 30 | | | | 30 |
| |
| Merrill Lynch & Co., Inc. |
5.406% due 05/08/2009 | | | | 30 | | | | 30 |
| |
| Morgan Stanley |
5.360% due 11/21/2008 | | | | 30 | | | | 30 |
| |
| SLM Corp. |
5.495% due 07/27/2009 | | | | 30 | | | | 30 |
| |
| Wachovia Corp. |
5.410% due 12/01/2009 | | | | 30 | | | | 30 |
| |
| Wells Fargo & Co. |
5.460% due 09/15/2009 | | | | 30 | | | | 30 |
| | | | | | | | |
| | | | | | | | 669 |
| | | | | | | | |
|
| INDUSTRIALS 7.1% |
| Amgen, Inc. | | | | | | | | |
5.440% due 11/28/2008 | | | | 30 | | | | 30 |
| |
| DaimlerChrysler N.A. Holding Corp. |
5.886% due 10/31/2008 | | | | 38 | | | | 39 |
| |
| Salomon Brothers AG for OAO Gazprom |
10.500% due 10/21/2009 | | | | 30 | | | | 33 |
| |
| Time Warner, Inc. |
5.590% due 11/13/2009 | | | | 100 | | | | 100 |
| |
| Walt Disney Co. |
5.460% due 09/10/2009 | | | | 20 | | | | 20 |
| | | | | | | | |
| | | | | | | | 222 |
| | | | | | | | |
|
| UTILITIES 5.5% |
| AT&T, Inc. | | | | | | | | |
5.456% due 02/05/2010 | | | | 100 | | | | 100 |
| |
| Ohio Power Co. |
5.530% due 04/05/2010 | | | | 30 | | | | 30 |
| |
| TXU Electric Delivery Co. |
5.735% due 09/16/2008 | | | | 30 | | | | 30 |
| |
| | | | | | | | |
| | | | | PRINCIPAL
AMOUNT
(000S) | | | | VALUE
(000S) |
| Verizon Communications, Inc. |
5.400% due 04/03/2009 | | $ | | 10 | | $ | | 10 |
| | | | | | | | |
| | | | | | | | 170 |
| | | | | | | | |
Total Corporate Bonds & Notes
(Cost $1,062) | | | | 1,061 |
| | | | | | | | |
|
| U.S. GOVERNMENT AGENCIES 39.4% |
| Fannie Mae | | | | | | | | |
4.500% due 06/25/2043 | | | | 10 | | | | 9 |
5.000% due 12/25/2016 - 02/25/2017 | | | | 36 | | | | 36 |
6.000% due 07/01/2037 | | | | 1,000 | | | | 989 |
| |
| Freddie Mac |
4.250% due 09/15/2024 | | | | 19 | | | | 19 |
5.470% due 08/15/2019 - 10/15/2020 | | | | 140 | | | | 140 |
5.550% due 07/15/2037 | | | | 30 | | | | 30 |
| | | | | | | | |
Total U.S. Government Agencies
(Cost $1,229) | | 1,223 |
| | | | | | | | |
|
| MORTGAGE-BACKED SECURITIES 2.9% |
| Countrywide Alternative Loan Trust |
5.520% due 06/25/2037 | | | | 29 | | | | 29 |
| |
| Deutsche ALT-A Securities, Inc. Mortgage Loan Trust |
5.400% due 03/25/2037 | | | | 24 | | | | 24 |
| |
| GS Mortgage Securities Corp. II |
5.410% due 03/06/2020 | | | | 30 | | | | 30 |
| |
| Lehman Brothers Floating Rate Commercial Mortgage Trust |
5.400% due 09/15/2021 | | | | 7 | | | | 7 |
| | | | | | | | |
Total Mortgage-Backed Securities (Cost $90) | | | | 90 |
| | | | | | | | |
|
| ASSET-BACKED SECURITIES 28.7% |
| American Express Credit Account Master Trust |
5.320% due 01/18/2011 | | | | 30 | | | | 30 |
5.430% due 09/15/2010 | | | | 30 | | | | 30 |
| |
| Bank One Issuance Trust |
5.440% due 06/15/2010 | | | | 30 | | | | 30 |
| |
| Bear Stearns Asset-Backed Securities, Inc. |
5.410% due 06/25/2047 | | | | 29 | | | | 29 |
| |
| BNC Mortgage Loan Trust |
5.420% due 05/25/2037 | | | | 28 | | | | 28 |
| |
| Chase Credit Card Master Trust |
5.430% due 07/15/2010 | | | | 30 | | | | 30 |
| |
| Citibank Credit Card Issuance Trust |
5.526% due 02/07/2010 | | | | 30 | | | | 30 |
| |
| Citigroup Mortgage Loan Trust, Inc. |
5.360% due 12/25/2036 | | | | 27 | | | | 27 |
5.390% due 01/25/2037 | | | | 26 | | | | 26 |
5.400% due 12/25/2035 | | | | 18 | | | | 18 |
5.430% due 03/25/2037 | | | | 29 | | | | 29 |
| |
| Countrywide Asset-Backed Certificates |
5.400% due 10/25/2037 | | | | 29 | | | | 29 |
5.500% due 09/25/2036 | | | | 30 | | | | 30 |
| |
| First Franklin Mortgage Loan Asset-Backed Certificates |
5.370% due 10/25/2036 | | | | 23 | | | | 23 |
5.370% due 11/25/2036 | | | | 24 | | | | 25 |
| |
| First USA Credit Card Master Trust |
5.480% due 04/18/2011 | | | | 30 | | | | 30 |
| |
| Fremont Home Loan Trust |
5.420% due 05/25/2036 | | | | 30 | | | | 30 |
| |
| | | | | | | | |
| | | | | PRINCIPAL
AMOUNT
(000S) | | | | VALUE
(000S) |
| GE-WMC Mortgage Securities LLC |
5.440% due 10/25/2035 | | $ | | 6 | | $ | | 6 |
| |
| Honda Auto Receivables Owner Trust |
5.322% due 03/18/2008 | | | | 16 | | | | 16 |
| |
| Long Beach Mortgage Loan Trust |
5.400% due 02/25/2036 | | | | 12 | | | | 12 |
| |
| MASTR Asset-Backed Securities Trust |
5.360% due 08/25/2036 | | | | 19 | | | | 19 |
5.370% due 01/25/2037 | | | | 28 | | | | 28 |
5.400% due 05/25/2037 | | | | 29 | | | | 29 |
| |
| MBNA Credit Card Master Note Trust |
4.200% due 09/15/2010 | | | | 30 | | | | 30 |
5.440% due 08/16/2010 | | | | 30 | | | | 30 |
5.446% due 12/15/2009 | | | | 30 | | | | 30 |
| |
| Morgan Stanley ABS Capital I |
5.360% due 01/25/2037 | | | | 27 | | | | 27 |
5.370% due 10/25/2036 | | | | 22 | | | | 22 |
| |
| Nationstar Home Equity Loan Trust |
5.440% due 04/25/2037 | | | | 29 | | | | 29 |
| |
| Securitized Asset-Backed Receivables LLC Trust |
5.360% due 01/25/2037 | | | | 26 | | | | 26 |
| |
| Soundview Home Equity Loan Trust |
5.400% due 06/25/2037 | | | | 29 | | | | 29 |
| |
| Structured Asset Securities Corp. |
5.420% due 01/25/2037 | | | | 26 | | | | 26 |
| |
| USAA Auto Owner Trust | | | | | | | | |
5.337% due 07/11/2008 | | | | 30 | | | | 30 |
| |
| Wells Fargo Home Equity Trust |
5.420% due 03/25/2037 | | | | 29 | | | | 29 |
| | | | | | | | |
Total Asset-Backed Securities (Cost $891) | | | | 892 |
| | | | | | | | |
|
| SHORT-TERM INSTRUMENTS 26.6% |
|
| CERTIFICATES OF DEPOSIT 3.5% |
| Dexia S.A. | | | | | | | | |
5.270% due 09/29/2008 | | | | 30 | | | | 30 |
| |
| Fortis Bank NY | | | | | | | | |
5.300% due 09/30/2008 | | | | 30 | | | | 30 |
| |
| Skandinav Enskilda BK | | | | | | | | |
5.350% due 02/13/2009 | | | | 10 | | | | 10 |
| |
| Societe Generale NY | | | | | | | | |
5.270% due 03/26/2008 | | | | 40 | | | | 40 |
| | | | | | | | |
| | | | | | | | 110 |
| | | | | | | | |
|
| COMMERCIAL PAPER 12.8% |
| Dexia Delaware LLC | | | | | | | | |
5.225% due 09/21/2007 | | | | 100 | | | | 100 |
| |
| Freddie Mac | | | | | | | | |
4.800% due 07/02/2007 | | | | 200 | | | | 200 |
| |
| UBS Finance Delaware LLC |
5.200% due 10/23/2007 | | | | 100 | | | | 98 |
| | | | | | | | |
| | | | | | | | 398 |
| | | | | | | | |
|
| REPURCHASE AGREEMENTS 4.7% |
| State Street Bank and Trust Co. |
4.900% due 07/02/2007 | | | | 147 | | | | 147 |
| | | | | | | | |
(Dated 06/29/2007. Collateralized by Fannie Mae 3.250% due 08/15/2008 valued at $153. Repurchase proceeds are $147.) | | | | | | | | |
|
| | | | | | |
| See Accompanying Notes | | Semiannual Report | | June 30, 2007 | | 9 |
Schedule of Investments Small Cap StocksPLUS® TR Portfolio (Cont.)
| | | | | | | | | |
| | | | | PRINCIPAL
AMOUNT
(000S) | | | | VALUE
(000S) | |
| U.S. TREASURY BILLS 5.6% | |
4.659% due 08/30/2007 - 09/13/2007 (a)(c) | | $ | | 175 | | $ | | 173 | |
| | | | | | | | | |
Total Short-Term Instruments
(Cost $828) | | 828 | |
| | | | | | | | | |
| |
| PURCHASED OPTIONS (e) 0.0% | | | |
(Cost $1) | | | | 0 | |
| |
Total Investments (b) 131.7%
(Cost $4,101) | | $ | | 4,094 | |
| |
| Other Assets and Liabilities (Net) (31.7%) | | (987 | ) |
| | | | | | | | | |
| Net Assets 100.0% | | | | | | $ | | 3,107 | |
| | | | | | | | | |
Notes to Schedule of Investments (amounts in thousands*, except number of contracts):
* A zero balance may reflect actual amounts rounding to less than one thousand.
(a) Coupon represents a weighted average rate.
(b) As of June 30, 2007 portfolio securities with an aggregate value of $160 were valued in good faith and pursuant to the guidelines established by the Board of Trustees.
(c) Securities with an aggregate market value of $173 have been segregated with the custodian to cover margin requirements for the following open futures contracts on June 30, 2007:
| | | | | | | | | | |
| Description | | Type | | Expiration
Month | | # of
Contracts | | Unrealized
(Depreciation) | |
90-Day Eurodollar December Futures | | Long | | 12/2008 | | 8 | | $ | (4 | ) |
90-Day Eurodollar June Futures | | Long | | 06/2008 | | 7 | | | (2 | ) |
90-Day Eurodollar March Futures | | Long | | 03/2008 | | 9 | | | (5 | ) |
90-Day Eurodollar September Futures | | Long | | 09/2008 | | 8 | | | (3 | ) |
E-mini Russell 2000 Index September Futures | | Long | | 09/2007 | | 37 | | | (67 | ) |
U.S. Treasury 30-Year Bond September Futures | | Long | | 09/2007 | | 1 | | | (1 | ) |
| | | | | | | | | | |
| | | | | | | | $ | (82 | ) |
| | | | | | | | | | |
(d) Swap agreements outstanding on June 30, 2007:
Credit Default Swaps
| | | | | | | | | | | | | | |
| Counterparty | | Reference Entity | | Buy/Sell
Protection (1) | | (Pay)/Receive
Fixed Rate | | Expiration
Date | | Notional
Amount | | Unrealized
Appreciation |
Barclays Bank PLC | | General Motors Acceptance Corp. 6.875% due 08/28/2012 | | Sell | | 0.620% | | 09/20/2007 | | $ | 100 | | $ | 0 |
Credit Suisse First Boston | | Panama Government International Bond 8.875% due 09/30/2027 | | Sell | | 0.300% | | 02/20/2009 | | | 30 | | | 0 |
HSBC Bank USA | | Russia Government International Bond 7.500% due 03/31/2030 | | Sell | | 0.240% | | 02/20/2008 | | | 30 | | | 0 |
Morgan Stanley | | General Motors Acceptance Corp. 6.875% due 08/28/2012 | | Sell | | 1.050% | | 09/20/2008 | | | 10 | | | 0 |
Morgan Stanley | | Ukraine Government International Bond 7.650% due 06/11/2013 | | Sell | | 0.610% | | 02/20/2009 | | | 30 | | | 0 |
Royal Bank of Scotland Group PLC | | Indonesia Government International Bond 6.750% due 03/10/2014 | | Sell | | 1.085% | | 03/20/2012 | | | 30 | | | 0 |
| | | | | | | | | | | | | | |
| | | | | | | | | | | | | $ | 0 |
| | | | | | | | | | | | | | |
(1) If the Portfolio is a seller of protection and a credit event occurs, as defined under the terms of that particular swap agreement, the Portfolio will pay to the buyer of the protection an amount up to the notional value of the swap and in certain instances, take delivery of the security.
Interest Rate Swaps
| | | | | | | | | | | | | | | |
| Counterparty | | Floating Rate Index | | Pay/Receive
Floating Rate | | Fixed Rate | | Expiration
Date | | Notional
Amount | | Unrealized
(Depreciation) | |
Royal Bank of Scotland Group PLC | | 5-Year French CPI Ex Tobacco Daily Reference Index | | Pay | | 1.955% | | 03/28/2012 | | EUR | 30 | | $ | 0 | |
Goldman Sachs & Co. | | 6-Month GBP-LIBOR | | Pay | | 6.000% | | 06/19/2009 | | GBP | 100 | | | (1 | ) |
UBS Warburg LLC | | 6-Month JPY-LIBOR | | Pay | | 1.000% | | 03/18/2009 | | JPY | 20,000 | | | 0 | |
Bank of America | | 3-Month USD-LIBOR | | Pay | | 5.000% | | 12/19/2009 | | $ | 100 | | | 0 | |
| | | | | | | | | | | | | | | |
| | | | | | | | | | | | | $ | (1 | ) |
| | | | | | | | | | | | | | | |
| | | | |
| 10 | | PIMCO Variable Insurance Trust | | See Accompanying Notes |
| | |
| |
| | | June 30, 2007 (Unaudited) |
(e) Purchased options outstanding on June 30, 2007:
Options on Exchange-Traded Futures Contracts
| | | | | | | | | | | | | |
| Description | | Exercise
Price | | Expiration
Date | | # of
Contracts | | Cost | | Value |
Put - CME E-mini Russell 2000 Index September Futures | | $ | 570.000 | | 09/21/2007 | | 16 | | $ | 1 | | $ | 0 |
| | | | | | | | | | | | | |
Options on Securities
| | | | | | | | | | | | | | |
| Description | | Strike
Price | | Expiration
Date | | Notional
Amount | | Cost | | Value |
Put - OTC Fannie Mae 6.000% due 07/01/2037 | | $ | 93.750 | | 07/05/2007 | | $ | 1,000 | | $ | 0 | | $ | 0 |
| | | | | | | | | | | | | | |
(f) Foreign currency contracts outstanding on June 30, 2007:
| | | | | | | | | | | | | | | |
| Type | | Currency | | Principal
Amount
Covered by
Contract | | Settlement
Month | | Unrealized
Appreciation | | Unrealized
(Depreciation) | | Net Unrealized
Appreciation |
Buy | | AUD | | 8 | | 07/2007 | | $ | 0 | | $ | 0 | | $ | 0 |
Buy | | BRL | | 117 | | 10/2007 | | | 3 | | | 0 | | | 3 |
Buy | | | | 8 | | 03/2008 | | | 0 | | | 0 | | | 0 |
Buy | | CAD | | 8 | | 08/2007 | | | 0 | | | 0 | | | 0 |
Buy | | EUR | | 62 | | 07/2007 | | | 1 | | | 0 | | | 1 |
Sell | | GBP | | 3 | | 08/2007 | | | 0 | | | 0 | | | 0 |
Buy | | INR | | 136 | | 10/2007 | | | 0 | | | 0 | | | 0 |
Buy | | | | 113 | | 05/2008 | | | 0 | | | 0 | | | 0 |
Buy | | KRW | | 4,085 | | 07/2007 | | | 0 | | | 0 | | | 0 |
Buy | | | | 4,912 | | 09/2007 | | | 0 | | | 0 | | | 0 |
Buy | | MXN | | 22 | | 09/2007 | | | 0 | | | 0 | | | 0 |
Buy | | | | 81 | | 03/2008 | | | 0 | | | 0 | | | 0 |
Buy | | MYR | | 17 | | 05/2008 | | | 0 | | | 0 | | | 0 |
Buy | | PHP | | 367 | | 05/2008 | | | 0 | | | 0 | | | 0 |
Buy | | PLN | | 21 | | 09/2007 | | | 0 | | | 0 | | | 0 |
Buy | | | | 6 | | 03/2008 | | | 0 | | | 0 | | | 0 |
Buy | | RUB | | 52 | | 09/2007 | | | 0 | | | 0 | | | 0 |
Buy | | | | 343 | | 01/2008 | | | 0 | | | 0 | | | 0 |
Buy | | SGD | | 8 | | 07/2007 | | | 0 | | | 0 | | | 0 |
Buy | | | | 3 | | 08/2007 | | | 0 | | | 0 | | | 0 |
Buy | | | | 11 | | 10/2007 | | | 0 | | | 0 | | | 0 |
| | | | | | | | | | | | | | | |
| | | | | | | | $ | 4 | | $ | 0 | | $ | 4 |
| | | | | | | | | | | | | | | |
| | | | | | |
| See Accompanying Notes | | Semiannual Report | | June 30, 2007 | | 11 |
Notes to Financial Statements
1. ORGANIZATION
The Small Cap StocksPLUS® TR Portfolio (the “Portfolio”) is a series of the PIMCO Variable Insurance Trust (the “Trust”). The Trust is registered under the Investment Company Act of 1940 (the “Act”), as amended, as an open-end management investment company organized as a Delaware business trust on October 3, 1997. The Portfolio offers two classes of shares: Administrative and Advisor. Information presented on these financial statements pertains to the Administrative Class of the Portfolio. Certain detailed financial information for the Advisor Class is provided separately and is available upon request. The Trust is designed to be used as an investment vehicle by Separate Accounts of insurance companies that fund variable annuity contracts and variable life insurance policies and by qualified pension and retirement plans.
2. SIGNIFICANT ACCOUNTING POLICIES
The following is a summary of significant accounting policies consistently followed by the Portfolio in the preparation of its financial statements in conformity with accounting principles generally accepted in the United States of America (“GAAP”). The preparation of financial statements in accordance with GAAP requires management to make estimates and assumptions that affect the reported amounts and disclosures on the financial statements. Actual results could differ from those estimates.
(a) Security Valuation Portfolio securities are valued as of the close of regular trading (normally 4:00 p.m., Eastern Time) on each day that the New York Stock Exchange (“NYSE”) is open. Portfolio securities and other assets for which market quotes are readily available are stated at market value. Market value is generally determined on the basis of last reported sales prices, or if no sales are reported, based on quotes obtained from a quotation reporting system, established market makers, or pricing services. Fixed-income securities and non-exchange traded derivatives are normally valued on the basis of quotes obtained from brokers and dealers or pricing services. Prices obtained from independent pricing services use information provided by market makers or estimates of market values obtained from yield data relating to investments or securities with similar characteristics. Certain fixed income securities purchased on a delayed-delivery basis are marked to market daily until settlement at the forward settlement date. Short-term investments having a maturity of 60 days or less are generally valued at amortized cost. Exchange traded options, futures and options on futures are valued at the settlement price determined by the relevant exchange. With respect to any portion of the Portfolio’s assets that are invested in one or more open end management investment companies, the Portfolio’s net asset value (“NAV”) will be calculated based upon the NAVs of such investments.
Investments initially valued in currencies other than the U.S. dollar are converted to the U.S. dollar using exchange rates obtained from pricing services. As a result, the NAV of the Portfolio’s securities may be affected by changes in the value of currencies in relation to the U.S. dollar. The value of securities traded in markets outside the United States or denominated in currencies other than the U.S. dollar may be affected significantly on a day that the NYSE is closed and an investor is not able to purchase, redeem or exchange shares.
Securities and other assets for which market quotes are not readily available are valued at fair value as determined in good faith by the Board of Trustees or persons acting at their direction. The Board of Trustees has adopted methods for valuing securities and other assets in circumstances where market quotes are not readily available, and has delegated to Pacific Investment Management Company LLC (“PIMCO”) the responsibility for applying the valuation methods. In the event that market quotes are not readily available, and the security or asset cannot be valued pursuant to one of the valuation methods, the value of the security or asset will be determined in good faith by the Valuation Committee of the Board of Trustees, generally based upon recommendations provided by PIMCO.
Market quotes are considered not readily available in circumstances where there is an absence of current or reliable market-based data (e.g., trade information, bid/asked information, broker quotes), including where events occur after the close of the relevant market, but prior to the close of regular trading, that materially affect the values of the Portfolio’s securities or assets. In addition, market quotes are considered not readily available when, due to extraordinary circumstances, the exchanges or markets on which the securities trade, do not open for trading for the entire day and no other market prices are available. The Board has delegated to PIMCO the responsibility for monitoring significant events that may materially affect the values of the Portfolio’s securities or assets and for determining whether the value of the applicable securities or assets should be re-evaluated in light of such significant events.
When the Portfolio uses fair value pricing to determine its NAV, securities will not be priced on the basis of quotations from the primary market in which they are traded, but rather may be priced by another method that the Board of Trustees or persons acting at their direction believe accurately reflects fair value. The Trust’s policy is intended to result in a calculation of the Portfolio’s NAV that fairly reflects security values as of the time of pricing. However, fair values determined by the Board of Trustees or persons acting at their direction may not accurately reflect the price that the Portfolio could obtain for a security if it were to dispose of that security as of the time of pricing. Because foreign securities can trade on non-business days of the Portfolio, the NAV of the Portfolio may change on days when shareholders will not be able to purchase or redeem Portfolio shares. The prices used by the Portfolio may differ from the value that would be realized if the securities were sold and the differences could be material to the financial statements.
(b) Securities Transactions and Investment Income Securities transactions are recorded as of the trade date for financial reporting purposes. Securities purchased or sold on a when-issued or delayed-delivery basis may be settled a month or more after the trade date. Realized gains and losses from securities sold are recorded on the identified cost basis. Dividend income is recorded on the ex-dividend date, except certain dividends from foreign securities where the ex-dividend date may have passed, which are recorded as soon as the Portfolio is informed of the ex-dividend date. Interest income, adjusted for the accretion of discounts and amortization of premiums, is recorded on the accrual basis. Paydown gains and losses on mortgage-related and other asset-backed securities are recorded as components of interest income on the Statement of Operations.
(c) Delayed-Delivery Transactions The Portfolio may purchase or sell securities on a delayed-delivery basis. These transactions involve a commitment by the Portfolio to purchase or sell securities for a predetermined price or yield, with payment and delivery taking place beyond the customary settlement period. When delayed-delivery purchases are outstanding, the Portfolio will designate liquid assets in an amount sufficient to meet the purchase price. When purchasing a security on a delayed-delivery basis, the Portfolio assumes the rights and risks of ownership of the security, including the risk of price and yield fluctuations, and takes such fluctuations into account when determining its net asset value. The Portfolio may dispose of or renegotiate a delayed-delivery transaction after it is entered into, and may sell when-issued securities before they are delivered, which may result in a capital gain or loss. When the Portfolio has sold a security on a delayed-delivery basis, the Portfolio does not participate in future gains and losses with respect to the security.
(d) Dividends and Distributions to Shareholders Dividends from net investment income, if any, are declared and distributed to shareholders quarterly. Net realized capital gains earned by the Portfolio, if any, will be distributed no less frequently than once each year.
Income dividends and capital gain distributions are determined in accordance with income tax regulations which may differ from GAAP. Differences between tax
| | | | |
| 12 | | PIMCO Variable Insurance Trust | | |
| | |
| |
| | | June 30, 2007 (Unaudited) |
regulations and GAAP may change the fiscal year when income and capital items are recognized for tax and GAAP purposes. Examples of events that give rise to timing differences include wash sales, straddles, net operating losses and capital loss carryforwards. Further, the character of investment income and capital gains may be different for certain transactions under the two methods of accounting. Examples of characterization differences include the treatment of mortgage paydowns, swaps, foreign currency transactions and contingent debt instruments. As a result, income dividends and capital gain distributions declared during a fiscal period may differ significantly from the net investment income and realized capital gain reported on the Portfolio’s annual financial statements presented under GAAP.
Distributions classified as a tax basis return of capital, if any, are reflected on the accompanying Statements of Changes in Net Assets and have been reclassified to paid in capital. In addition, other amounts have been reclassified between undistributed net investment income, accumulated undistributed net realized gains or losses and/or paid in capital to more appropriately conform financial accounting to tax characterizations of dividend distributions.
(e) Multiclass Operations Each class offered by the Portfolio has equal rights as to assets and voting privileges (except that shareholders of a class have exclusive voting rights regarding any matter relating solely to that class of shares). Income and non-class specific expenses of the Portfolio are allocated daily to each class of shares based on the relative value of settled shares. Realized and unrealized capital gains and losses of the Portfolio are allocated daily to each class of shares based on the relative net assets of each class. Class specific expenses, where applicable, currently include administrative, distribution and servicing fees.
(f) Foreign Currency The functional and reporting currency for the Portfolio is the U.S. dollar. The market values of foreign securities, currency holdings and other assets and liabilities are translated into U.S. dollars based on the current exchange rates each business day. Fluctuations in the value of currency holdings and other assets and liabilities resulting from changes in exchange rates are recorded as unrealized foreign currency gains or losses. Realized gains or losses and unrealized appreciation or depreciation on investment securities and income and expenses are translated on the respective dates of such transactions. The effects of changes in foreign currency exchange rates on investments in securities are not segregated on the Statement of Operations from the effects of changes in market prices of those securities, but are included with the net realized and unrealized gain or loss on investment securities.
| | | | | | |
|
| Non-U.S. currency symbols utilized throughout the report are defined as follows: |
| AUD | | Australian Dollar | | KRW | | South Korean Won |
| BRL | | Brazilian Real | | MXN | | Mexican Peso |
| CAD | | Canadian Dollar | | MYR | | Malaysian Ringgit |
| EUR | | Euro | | PHP | | Philippines Peso |
| GBP | | Great British Pound | | PLN | | Polish Zloty |
| INR | | Indian Rupee | | RUB | | Russian Ruble |
| JPY | | Japanese Yen | | SGD | | Singapore Dollar |
(g) Foreign Currency Transactions The Portfolio may enter into foreign currency contracts in connection with settling planned purchases or sales of securities, to hedge the currency exposure associated with some or all of the Portfolio’s securities or as a part of an investment strategy. A foreign currency contract is an agreement between two parties to buy and sell a currency at a set price on a future date. The market value of a foreign currency contract fluctuates with changes in foreign currency exchange rates. Foreign currency contracts are marked to market daily and the change in value is recorded by the Portfolio as an
unrealized gain or loss. Realized gains or losses equal to the difference between the value of the contract at the time it was opened and the value at the time it was closed are recorded upon delivery or receipt of the currency. These contracts may involve market risk in excess of the unrealized gain or loss reflected on the Statement of Assets and Liabilities. In addition, the Portfolio could be exposed to risk if the counterparties are unable to meet the terms of the contracts or if the value of the currency changes unfavorably to the U.S. dollar.
(h) Futures Contracts The Portfolio may enter into futures contracts. The Portfolio may use futures contracts to manage its exposure to the securities markets or to movements in interest rates and currency values. The primary risks associated with the use of futures contracts are the imperfect correlation between the change in market value of the securities held by the Portfolio and the prices of futures contracts, the possibility of an illiquid market, and the inability of the counterparty to meet the terms of the contract. Futures contracts are valued based upon their quoted daily settlement prices. Upon entering into a futures contract, the Portfolio is required to deposit with its futures broker, an amount of cash or U.S. Government and Agency Obligations in accordance with the initial margin requirements of the broker or exchange. Futures contracts are marked to market daily and an appropriate payable or receivable for the change in value (“variation margin”) is recorded by the Portfolio. Gains or losses are recognized but not considered realized until the contracts expire or are closed. Futures contracts involve, to varying degrees, risk of loss in excess of the variation margin disclosed on the Statement of Assets and Liabilities.
(i) Options Contracts The Portfolio may write call and put options on futures, swaps, securities or currencies it owns or in which it may invest. Writing put options tends to increase the Portfolio’s exposure to the underlying instrument. Writing call options tends to decrease the Portfolio’s exposure to the underlying instrument. When the Portfolio writes a call or put option, an amount equal to the premium received is recorded as a liability and subsequently marked to market to reflect the current value of the option written. These liabilities are reflected as written options outstanding on the Statement of Assets and Liabilities. Certain options may be written with premiums to be determined on a future date. The premiums for these options are based upon implied volatility parameters at specified terms. Premiums received from writing options which expire are treated as realized gains. Premiums received from writing options which are exercised or closed are added to the proceeds or offset against amounts paid on the underlying future, swap, security or currency transaction to determine the realized gain or loss. The Portfolio as a writer of an option has no control over whether the underlying future, swap, security or currency may be sold (call) or purchased (put) and as a result bears the market risk of an unfavorable change in the price of the future, swap, security or currency underlying the written option. There is the risk the Portfolio may not be able to enter into a closing transaction because of an illiquid market.
The Portfolio may also purchase put and call options. Purchasing call options tends to increase the Portfolio’s exposure to the underlying instrument. Purchasing put options tends to decrease the Portfolio’s exposure to the underlying instrument. The Portfolio pays a premium which is included on the Statement of Assets and Liabilities as an investment and subsequently marked to market to reflect the current value of the option. Premiums paid for purchasing options which expire are treated as realized losses. Certain options may be purchased with premiums to be determined on a future date. The premiums for these options are based upon implied volatility parameters at specified terms. The risk associated with purchasing put and call options is limited to the premium paid. Premiums paid for purchasing options which are exercised or closed are added to the amounts paid or offset against the proceeds on the underlying future, swap, security or currency transaction to determine the realized gain or loss.
(j) Repurchase Agreements The Portfolio may engage in repurchase transactions. Under the terms of a typical repurchase agreement, the Portfolio
| | | | | | |
| | Semiannual Report | | June 30, 2007 | | 13 |
Notes to Financial Statements (Cont.)
takes possession of an underlying debt obligation (collateral) subject to an obligation of the seller to repurchase, and the Portfolio to resell, the obligation at an agreed-upon price and time. The underlying securities for all repurchase agreements are held in safekeeping at the Portfolio’s custodian or designated subcustodians under tri-party repurchase agreements. The market value of the collateral must be equal to or exceed the total amount of the repurchase obligations, including interest. Securities purchased under repurchase agreements are reflected as an asset on the Statement of Assets and Liabilities. Generally, in the event of counterparty default, the Portfolio has the right to use the collateral to offset losses incurred. If the counterparty should default, the Portfolio will seek to sell the securities which it holds as collateral. This could involve procedural costs or delays in addition to a loss on the securities if their value should fall below their repurchase price.
(k) Inverse Floating Rate Transactions—Residual Interest Municipal Bonds (“RIBs”)/Residual Interest Tax Exempt Bonds (“RITEs”) The Portfolio may invest in RIBs and RITEs (“Inverse Floaters”). Inverse Floaters are created via a master trust agreement between a broker-dealer, acting as trustor and liquidity provider, and an investment bank, acting as trustee and tender agent. The master trust agreement defines the terms for each trust series; with each series being established by the transfer of long-term, fixed-rate municipal bonds (“Fixed Rate Bonds”) to the trustee to be held and provide for the creation, execution and delivery of floater certificates (“Floating Rate Notes”) and Inverse Floaters. Floating Rate Notes are liquid notes that are issued with a short-term variable rate typically linked to the LIBOR, subject to limitations, for some duration. After interest income is paid on the Floating Rate Notes at current rates, the residual income from the Fixed Rate Bonds is paid to the Inverse Floaters. Inverse Floaters are issued with a coupon that fluctuates inversely with the Floating Rate Notes’ referenced rate, subject to certain limitations. Therefore, rising short-term rates result in lower income for the Inverse Floaters and vice versa.
Floating Rate Notes are generally remarketed to municipal money market funds. Inverse Floaters are acquired by either tax-exempt municipal bond funds or trusts, or other parties interested in potentially higher yielding tax-exempt securities. Inverse Floaters may also be acquired for the purpose of increasing leverage. Floating Rate Note holders typically have the option to tender their notes to the liquidity provider for redemption at par at each reset date. The Inverse Floater holders have the option to (i) require the Floating Rate Note holders to tender their notes at par, and (ii) require the liquidity provider to transfer the Fixed Rate Bonds to the Inverse Floater holders. The holders of Inverse Floaters bear substantially all of the downside investment risk associated with the underlying Fixed Rate Bonds, and also benefit from a disproportionate amount of the potential appreciation of the underlying Fixed Rate Bonds’ value. Inverse Floaters may be more volatile and less liquid than other municipal bonds of comparable maturity.
Inverse Floaters may be acquired with or without first transferring to the trustor the Fixed Rate Bonds that were utilized to create the trust series. Inverse Floaters acquired without a transfer of Fixed Rate Bonds are recognized as purchases of securities as outlined in Note 2(b). Statement of Financial Accounting Standards No. 140 – Accounting for Transfers and Servicing of Financial Assets and Extinguishments of Liabilities (“FAS No. 140”), governs the standards for accounting for securitizations and other transfers of financial assets. If there is a transfer of Fixed Rate Bonds and it meets sale criteria under FAS No. 140, a Portfolio records a sale of the Fixed Rate Bonds and a purchase of the Inverse Floaters. The cash received from the Inverse Floaters is then recorded as interest income in the Statement of Operations.
If the transfer of Fixed Rate Bonds does not meet sale criteria under FAS No. 140, a Portfolio accounts for the transaction described above as a secured borrowing by including the Fixed Rate Bonds in its Schedule of Investments, and recording the
Floating Rate Notes as a liability under the caption “Payable for floating rate notes” in the Portfolio’s Statement of Assets and Liabilities. In a secured borrowing transaction, cash received from the Inverse Floaters is not recorded as interest income. Instead, a Portfolio records interest income related to the Fixed Rate Bonds and interest expense related to the Floating Rate Notes, the net of which is equal to the cash received from the Inverse Floaters acquired by the Portfolio. Thus, while a Portfolio’s reported total income, net expenses, and net expense ratio are generally higher for investments in Inverse Floaters acquired via a secured borrowing, the method of acquiring Inverse Floaters does not result in differences for reported cash flows, net asset value or total return.
(l) Swap Agreements The Portfolio may invest in swap agreements. Swap transactions are privately negotiated agreements between the Portfolio and a counterparty to exchange or swap investment cash flows, assets, or market-linked returns at specified, future intervals. The Portfolio may enter into interest rate, total return, forward spread-lock, credit default, and other forms of swap agreements to manage its exposure to interest rates and credit risk. In connection with these agreements, securities may be identified as collateral in accordance with the terms of the respective swap agreements.
Interest rate swap agreements involve the exchange by the Portfolio with another party of their respective commitments to pay or receive interest, e.g., an exchange of floating rate payments for fixed rate payments with respect to the notional amount of principal. Certain forms of interest rate swap agreements may include: (i) interest rate caps, under which, in return for a premium, one party agrees to make payments to the other to the extent that interest rates exceed a specified rate, or “cap”, (ii) interest rate floors, under which, in return for a premium, one party agrees to make payments to the other to the extent that interest rates fall below a specified rate, or “floor”, or (iii) interest rate collars, under which a party sells a cap and purchases a floor or vice versa in an attempt to protect itself against interest rate movements exceeding given minimum or maximum levels.
Total return swap agreements involve commitments to pay interest in exchange for a market-linked return, both based on notional amounts. To the extent the total return of the security or index underlying the transaction exceeds or falls short of the offsetting interest rate obligation, the Portfolio will receive a payment from or make a payment to the counterparty.
Forward spread-lock swap agreements involve commitments to pay or receive a settlement amount calculated as the difference between the swap spread and a fixed spread, multiplied by the notional amount times the duration of the swap. The swap spread is the difference between the benchmark swap rate (market rate) and the specific Treasury rate.
Credit default swap agreements involve one party making a stream of payments to another party in exchange for the right to receive a specified return in the event of a default by a third party, typically corporate issues or sovereign issues of an emerging country, on its obligation. The Portfolio may use credit default swaps to provide a measure of protection against defaults of the issuers (i.e., to reduce risk where the Portfolio owns or has exposure to the sovereign issuer) or to take an active long or short position with respect to the likelihood of a particular issuer’s default. As a seller of protection, the Portfolio generally receives an upfront payment or a fixed rate of income throughout the term of the swap provided that there is no credit event. If the Portfolio is a seller of protection and a credit event occurs, as defined under the terms of that particular swap agreement, the Portfolio will pay to the buyer of the protection an amount up to the notional value of the swap and in certain instances take delivery of the security. As the seller, the Portfolio would effectively add leverage to its portfolio because, in addition to its total net assets, the Portfolio would be subject to investment exposure on the notional amount of the swap. As a buyer of protection, the Portfolio generally receives an amount up to the notional value of the swap if a credit event occurs. The treatment of credit default swaps and other swap agreements that provide for
| | | | |
| 14 | | PIMCO Variable Insurance Trust | | |
| | |
| |
| | | June 30, 2007 (Unaudited) |
contingent, non-periodic, bullet-type payments as “notional principal contracts” for U.S. federal income tax purposes is uncertain. Were the U.S. Internal Revenue Service (“IRS”) to take the position that a credit default swap or other bullet-type swap is not a “notional principal contract” for U.S. federal income tax purposes, payments received by the Portfolio from such investments might be subject to U.S. excise or income taxes.
Swaps are marked to market daily based upon quotations from market makers and the change in value, if any, is recorded as unrealized gain or loss on the Statement of Operations. Payments received or made at the beginning of the measurement period are reflected as such on the Statement of Assets and Liabilities. These upfront payments are recorded as realized gain or loss on the Statement of Operations upon termination or maturity of the swap. A liquidation payment received or made at the termination of the swap is recorded as realized gain or loss on the Statement of Operations. Net periodic payments received or paid by the Portfolio are included as part of realized gain or loss on the Statement of Operations. Entering into these agreements involves, to varying degrees, elements of credit, market and documentation risk in excess of the amounts recognized on the Statement of Assets and Liabilities. Such risks involve the possibility that there will be no liquid market for these agreements, that the counterparty to the agreements may default on its obligation to perform or disagree as to the meaning of contractual terms in the agreements and that there may be unfavorable changes in interest rates.
(m) Mortgage-Related and Other Asset-Backed Securities The Portfolio may invest in mortgage-related or other asset-backed securities. These securities include mortgage pass-through securities, collateralized mortgage obligations (“CMOs”), commercial mortgage-backed securities, mortgage dollar rolls, CMO residuals, stripped mortgage-backed securities (“SMBSs”) and other securities that directly or indirectly represent a participation in, or are secured by and payable from, mortgage loans on real property. The value of some mortgage-related or asset-backed securities may be particularly sensitive to changes in prevailing interest rates. Early repayment of principal on some mortgage-related securities may expose the Portfolio to a lower rate of return upon reinvestment of principal. The value of these securities may fluctuate in response to the market’s perception of the creditworthiness of the issuers. Additionally, although mortgages and mortgage-related securities are generally supported by some form of government or private guarantee and/or insurance, there is no assurance that private guarantors or insurers will meet their obligations.
(n) U.S. Government Agencies or Government-Sponsored Enterprises Securities issued by U.S. Government agencies or government-sponsored enterprises may not be guaranteed by the U.S. Treasury. The Government National Mortgage Association (“GNMA” or “Ginnie Mae”), a wholly owned U.S. Government corporation, is authorized to guarantee, with the full faith and credit of the U.S. Government, the timely payment of principal and interest on securities issued by institutions approved by GNMA and backed by pools of mortgages insured by the Federal Housing Administration or guaranteed by the Department of Veterans Affairs. Government-related guarantors (i.e., not backed by the full faith and credit of the U.S. Government) include the Federal National Mortgage Association (“FNMA” or “Fannie Mae”) and the Federal Home Loan Mortgage Corporation (“FHLMC” or “Freddie Mac”). Pass-through securities issued by FNMA are guaranteed as to timely payment of principal and interest by FNMA but are not backed by the full faith and credit of the U.S. Government. FHLMC guarantees the timely payment of interest and ultimate collection of principal, but its participation certificates are not backed by the full faith and credit of the U.S. Government.
(o) New Accounting Policies In July 2006, the Financial Accounting Standards Board (“FASB”) issued Interpretation No. 48, “Accounting for Uncertainty in Income Taxes—an Interpretation of FASB Statement No. 109” (the “Interpretation”). The Interpretation became effective for the Portfolio on June 29, 2007. Management has
evaluated the application of the Interpretation in relation to the Portfolio and has concluded that no single filing position or combination of filing positions identified as uncertain tax positions required the accrual of a tax liability in the accounting records of the Portfolio for the period ending June 30, 2007. Management will monitor all existing filing positions and future filing positions in light of the Interpretation and evaluate the need for any future tax accruals and financial statement disclosures as warranted.
In September 2006, the FASB issued Statement of Financial Accounting Standards No. 157, “Fair Value Measurements” (the “Statement”). The Statement is effective for fiscal years beginning after November 15, 2007 and will require expanded disclosure about fair value measurements, separately for each major category of assets and liabilities, that enables shareholders to assess the inputs used to develop those measurements, and for recurring fair value measurements using significant unobservable inputs the effect of the measurements on changes in net assets for the reporting period. Management is currently evaluating the application of the Statement to the Portfolio and will provide additional information in relation to the Statement on the Portfolio’s annual financial statements for the period ending December 31, 2007.
3. FEES AND EXPENSES
(a) Investment Advisory Fee PIMCO is a majority-owned subsidiary of Allianz Global Investors of America L.P. (“AGI”), and serves as investment adviser (the “Adviser”) to the Trust, pursuant to an investment advisory contract. The Adviser receives a monthly fee from the Portfolio, at an annual rate based on average daily net assets. The Advisory Fee for all classes is charged at an annual rate of 0.49%.
(b) Administration Fee PIMCO serves as administrator (the “Administrator”), and provides administrative services to the Trust for which it receives a monthly administrative fee based on each share class’s average daily net assets. As the Administrator, PIMCO bears the costs of various third-party services, including audit, custodial, portfolio accounting, legal, transfer agency and printing costs. The Administration Fee for all classes is charged at the annual rate of 0.25%.
(c) Distribution and Servicing Fees Allianz Global Investors Distributors LLC (“AGID”) is an indirect wholly-owned subsidiary of AGI and serves as the distributor (the “Distributor”) of the Trust’s shares. The Trust is permitted to reimburse AGID on a quarterly basis, out of the Administrative Class assets of the Portfolio in the amount of 0.15% on an annual basis of the average daily net assets of that class, for payments made to financial intermediaries that provide services in connection with the distribution of shares or administration of plans or programs that use Portfolio shares as their funding medium. The effective rate paid to AGID was 0.15% during the current fiscal year.
The Trust has adopted a Distribution Plan, for the Advisor Class shares of the Portfolio (the “Plan”). The Plan has been adopted pursuant to Rule 12b-1 under the Act. The Plan permits payments for expenses in connection with the distribution and marketing of Advisor Class shares and/or the provision of shareholder services to Advisor Class shareholders. The Plan permits the Portfolio to make total payments at an annual rate of 0.25% of its average daily net assets attributable to its Advisor Class shares.
(d) Portfolio Expenses The Trust is responsible for the following expenses: (i) salaries and other compensation of any of the Trust’s executive officers and employees who are not officers, directors, stockholders or employees of PIMCO or its subsidiaries or affiliates; (ii) taxes and governmental fees; (iii) brokerage fees and commissions and other portfolio transaction expenses; (iv) the costs of borrowing money, including interest expenses and bank overdraft charges; (v) fees and expenses of the Trustees who are not “interested persons” of PIMCO or the Trust, and any counsel retained exclusively for their benefit; (vi) extraordinary expenses, including costs of litigation and indemnification expenses;
| | | | | | |
| | Semiannual Report | | June 30, 2007 | | 15 |
Notes to Financial Statements (Cont.)
(vii) organization expenses and (viii) any expenses allocated or allocable to a specific class of shares, which include service fees payable with respect to the Administrative Class Shares, and may include certain other expenses as permitted by the Trust’s Multiple Class Plan adopted pursuant to Rule 18f-3 under the Act and subject to review and approval by the Trustees. The ratio of expenses to average net assets per share class, as disclosed in the Financial Highlights, may differ from the annual portfolio operating expenses per share class as disclosed in the Prospectus for the reasons set forth above.
Effective April 1, 2007, each Trustee, other than those affiliated with PIMCO or its affiliates, receives an annual retainer of $15,000, plus $2,375 for each Board of Trustees meeting attended in person, $500 for each committee meeting attended and $750 for each Board of Trustees meeting attended telephonically, plus reimbursement of related expenses. In addition, the audit committee chair receives an additional annual retainer of $2,000 and each other committee chair receives an additional annual retainer of $500. These expenses are allocated on a pro-rata basis to the various portfolios of the Trust according to their respective net assets. The Trust pays no compensation directly to any Trustee or any other officer who is affiliated with the Administrator, all of whom receive remuneration for their services to the Trust from the Administrator or its affiliates. Prior to April 1, 2007, each Trustee, other than those affiliated with PIMCO or its affiliates, received an annual retainer of $15,000 plus $2,000 for each Board of Trustees meeting attended ($500 for each special meeting attended), plus reimbursement of related expenses. The Audit Committee Chairman received an annual retainer of $1,500 and the Governance Committee Chairman received an annual retainer of $500. In addition, each member of a committee received $500 for each committee meeting attended.
(e) Expense Limitation PIMCO has contractually agreed to reduce total annual portfolio operating expenses for the Portfolio by waiving a portion of its administrative fee or reimbursing the Portfolio, to the extent that they would exceed, due to the payment of organizational expenses and pro rata Trustees’ fees, the sum of such Portfolio’s advisory fee, service fees, distribution fees (with respect to Advisor Class only), administrative fees and other expenses borne by the Portfolio not covered by the administrative fee as described above (other than organizational expenses and pro rata Trustees’ fees), plus 0.49 basis points. PIMCO may recoup these waivers and reimbursements for a period not exceeding three years, provided that total expenses, including such recoupment, do not exceed the annual expense limit. As of June 30, 2007, there was no recoverable amount.
4. RELATED PARTY TRANSACTIONS
The Adviser, Administrator, and Distributor are related parties as defined by FAS 57, Related Party Disclosures. Fees payable to these parties are disclosed in Note 3.
5. GUARANTEES AND INDEMNIFICATIONS
Under the Trust’s organizational documents, each Trustee, officer, employee or other agent of the Trust (including the Trust’s investment manager) is indemnified, to the extent permitted by the Act, against certain liabilities that may arise out of performance of their duties to the Portfolio. Additionally, in the normal course of business, the Portfolio enters into contracts that contain a variety of indemnification clauses. The Portfolio’s maximum exposure under these arrangements is unknown as this would involve future claims that may be made against the Portfolio that have not yet occurred. However, the Portfolio has not had prior claims or losses pursuant to these contracts and believes the risk of loss to be remote.
6. PURCHASES AND SALES OF SECURITIES
The length of time the Portfolio has held a particular security is not generally a consideration in investment decisions. A change in the securities held by the Portfolio is known as “portfolio turnover”. The Portfolio may engage in frequent and active trading of portfolio securities to achieve its investment objective, particularly during periods of volatile market movements. High portfolio turnover (e.g., over 100%) involves correspondingly greater expenses to the Portfolio, including brokerage commissions or dealer mark-ups and other transaction costs on the sale of securities and reinvestments in other securities. Such sales may also result in realization of taxable capital gains, including short-term capital gains (which are generally taxed at ordinary income tax rates). The trading costs and tax effects associated with portfolio turnover may adversely affect the Portfolio’s performance.
Purchases and sales of securities (excluding short-term investments) for the period ended June 30, 2007, were as follows (amounts in thousands):
| | | | | | | | | | | | |
| U.S. Government/Agency | | | | All Other |
| Purchases | | Sales | | | | Purchases | | Sales |
| $ | 7,455 | | $ | 6,184 | | | | $ | 2,284 | | $ | 90 |
7. SHARES OF BENEFICIAL INTEREST
The Portfolio may issue an unlimited number of shares of beneficial interest with a $0.001 par value. Changes in shares of beneficial interest were as follows (shares and amounts in thousands):
| | | | | | | | | |
| | | | | Period from
01/31/2007 to 06/30/2007 | |
| | | | | Shares | | | Amount | |
| | | |
Receipts for shares sold | | | | | | | | | |
Administrative Class | | | | 300 | | | $ | 3,000 | |
Advisor Class | | | | 2 | | | | 16 | |
Issued as reinvestment of distributions | | | | | | | | | |
Administrative Class | | | | 1 | | | | 7 | |
Advisor Class | | | | 0 | | | | 0 | |
Cost of shares redeemed | | | | | | | | | |
Administrative Class | | | | (2 | ) | | | (20 | ) |
Advisor Class | | | | 0 | | | | 0 | |
Net increase resulting from Portfolio share transactions | | | | 301 | | | $ | 3,003 | |
The following schedule shows the number of shareholders each owning 5% or more of the Portfolio and the total percentage of the Portfolio held by such shareholders:
| | | | | | |
| | | | | Number of
Shareholders | | % of Portfolio
Held |
Administrative Class | | | | 1 | | 100 |
Advisor Class | | | | 2 | | 100 |
8. REGULATORY AND LITIGATION MATTERS
Since February 2004, PIMCO, Allianz Global Investors of America L.P. (PIMCO’s parent company), AGID, and certain of their affiliates, including the PIMCO Funds (another series of funds managed by PIMCO), the Allianz Funds (formerly known as PIMCO Funds: Multi-Manager Series (another series of funds managed by affiliates of PIMCO)), certain Trustees of the Trust (in their capacity as Trustees of the PIMCO Funds or the Allianz Funds) and certain employees of PIMCO, have been named as defendants in fifteen lawsuits filed in various jurisdictions. Eleven of those lawsuits concern “market timing,” and they have been transferred to and
| | | | |
| 16 | | PIMCO Variable Insurance Trust | | |
| | |
| |
| | | June 30, 2007 (Unaudited) |
consolidated for pre-trial proceedings in a multi-district litigation proceeding in the U.S. District Court for the District of Maryland; the other four lawsuits concern “revenue sharing” and have been consolidated into a single action in the U.S. District Court for the District of Connecticut. The lawsuits have been commenced as putative class actions on behalf of investors who purchased, held or redeemed shares of the various series of the PIMCO Funds and the Allianz Funds during specified periods, or as derivative actions on behalf of the PIMCO Funds and the Allianz Funds.
The market timing actions in the District of Maryland generally allege that certain hedge funds were allowed to engage in “market timing” in certain funds of the PIMCO Funds and the Allianz Funds and this alleged activity was not disclosed. Pursuant to tolling agreements entered into with the derivative and class action plaintiffs, PIMCO, certain PIMCO Funds Trustees, and certain employees of PIMCO who were previously named as defendants have all been dropped as defendants in the market timing actions; the plaintiffs continue to assert claims on behalf of the shareholders of the PIMCO Funds or on behalf of the PIMCO Funds itself against other defendants. By order dated November 3, 2005, the U.S. District Court for the District of Maryland granted the PIMCO Funds’ motion to dismiss claims asserted against it in a consolidated amended complaint where the PIMCO Funds were named, in the complaint, as a nominal defendant. The revenue sharing action in the District of Connecticut generally alleges that fund assets were inappropriately used to pay brokers to promote funds of the PIMCO Funds and the Allianz Funds, including directing fund brokerage transactions to such brokers, and that such alleged arrangements were not fully disclosed to shareholders. On August 11, 2005, the U.S. District Court for the District of Connecticut conducted a hearing on defendants’ motion to dismiss the consolidated amended complaint in the revenue sharing action but has not yet ruled on the motion to dismiss. The market timing and revenue sharing lawsuits seek, among other things, unspecified compensatory damages plus interest and, in some cases, punitive damages, the rescission of investment advisory contracts, the return of fees paid under those contracts and restitution.
Two nearly identical class action civil complaints have been filed in August 2005, in the Northern District of Illinois Eastern Division, alleging that the plaintiffs each purchased and sold a 10-year Treasury note futures contract and suffered damages from an alleged shortage when PIMCO held both physical and futures positions in 10-year Treasury notes for its client accounts. The two actions have been consolidated into one action, and the two separate complaints have been replaced by a consolidated complaint. PIMCO is a named defendant, and PIMCO Funds has been added as a defendant, to the consolidated action. PIMCO strongly believes the complaint is without merit and intends to vigorously defend itself.
In April 2006, certain portfolios of the Trust and certain other funds managed by PIMCO were served in an adversary proceeding brought by the Official Committee
of Asbestos Claimants of G-I Holdings, Inc. in G-I Holdings, Inc.’s bankruptcy in the District of New Jersey. In July 2004, PIMCO was named in this lawsuit and remains a defendant. The plaintiff seeks to recover for the bankruptcy estate assets that were transferred by the predecessor entity of G-I Holdings, Inc. to a wholly-owned subsidiary in 1994. The subsidiary has since issued notes, of which certain portfolios of the Trust and certain other funds managed by PIMCO are alleged to be holders. The complaint alleges that in 2000, more than two hundred noteholders—including certain portfolios of the Trust and certain other funds managed by PIMCO—were granted a second priority lien on the assets of the subsidiary in exchange for their consent to a refinancing transaction and the granting of a first priority lien to the lending banks. The plaintiff is seeking invalidation of the lien in favor of the noteholders and/or the value of the lien. On June 21, 2006, the District of New Jersey overturned the Bankruptcy Court’s decision granting permission to file the adversary proceeding and remanded the matter to the Bankruptcy Court for further proceedings. Following a motion to reconsider, the District Court upheld its remand on August 7, 2006, and instructed the Bankruptcy Court to conduct a “cost-benefit” analysis of the Committee’s claims, including the claims against the noteholders. The Bankruptcy Court held a status conference on October 25, 2006 and set a briefing schedule relating to this cost-benefit analysis.
The foregoing speaks only as of the date of this report. It is possible that these matters and/or other developments resulting from these matters could result in increased portfolio redemptions or other adverse consequences to the Portfolio. However, PIMCO and AGID believe that these matters are not likely to have a material adverse effect on the Portfolio or on PIMCO’s or AGID’s ability to perform their respective investment advisory or distribution services relating to the Portfolio.
9. FEDERAL INCOME TAX MATTERS
The Portfolio intends to qualify as a regulated investment company under sub-chapter M of the Internal Revenue Code (the “Code”) and distribute all of its taxable income and net realized gains, if applicable, to shareholders. Accordingly, no provision for Federal income taxes has been made.
As of June 30, 2007, the aggregate cost of investments was the same for federal income tax and financial statement purposes. The net unrealized appreciation (depreciation) of investment securities for federal income tax purposes is as follows (amount in thousands):
| | | | |
Aggregate
Gross
Unrealized
Appreciation | | Aggregate
Gross
Unrealized
(Depreciation) | | Net
Unrealized
(Depreciation) |
$ 1 | | $ (8) | | $ (7) |
| | | | | | |
| | Semiannual Report | | June 30, 2007 | | 17 |
| | |
| |
Privacy Policy* | | (Unaudited) |
The Funds consider customer privacy to be a fundamental aspect of their relationships with shareholders and are committed to maintaining the confidentiality, integrity and security of their current, prospective and former shareholders’ personal information. To ensure their shareholders’ privacy, the Funds have developed policies that are designed to protect this confidentiality, while allowing shareholder needs to be served.
Obtaining Personal Information
In the course of providing shareholders with products and services, the Funds and certain service providers to the Funds, such as the Funds’ investment advisers (“Advisers”), may obtain non-public personal information about shareholders, which may come from sources such as account applications and other forms, from other written, electronic or verbal correspondence, from shareholder transactions, from a shareholder’s brokerage or financial advisory firm, financial adviser or consultant, and/or from information captured on the Funds’ internet web sites.
Respecting Your Privacy
As a matter of policy, the Funds do not disclose any personal or account information provided by shareholders or gathered by the Funds to non-affiliated third parties, except as required or permitted by law or as necessary for such third parties to perform their agreements with respect to the Funds. As is common in the industry, non-affiliated companies may from time to time be used to provide certain services, such as preparing and mailing prospectuses, reports, account statements and other information, conducting research on shareholder satisfaction and gathering shareholder proxies. A Fund’s Distributor may also retain non-affiliated companies to market the Fund’s shares or products which use the Fund’s shares and enter into joint marketing agreements with other companies. These companies may have access to a shareholder’s personal and account information, but are permitted to use this information solely to provide the specific service or as otherwise permitted by law. In most cases, the shareholders will be clients of a third party, but the Funds may also provide a shareholder’s personal and account information to the shareholder’s respective brokerage or financial advisory firm.
Sharing Information with Third Parties
The Funds reserve the right to disclose or report personal information to non-affiliated third parties, in limited circumstances, where the Funds believe in good faith that disclosure is required under law to cooperate with regulators or law enforcement authorities, to protect their rights or property or upon reasonable request by any Fund in which a shareholder has chosen to invest. In addition, the Funds may disclose information about a shareholder’s accounts to a non-affiliated third party with the consent of the shareholder.
Sharing Information with Affiliates
The Funds may share shareholder information with their affiliates in connection with servicing their shareholders’ accounts or to provide shareholders with information about products and services that the Funds or their Advisers, principal underwriters or their affiliates (“Service Affiliates”) believe may be of interest to such shareholders. The information that the Funds share may include, for example, a shareholder’s participation in one of the Funds or in other investment programs sponsored by a Service Affiliate, a shareholder’s ownership of certain types of accounts (such as IRAs), or other data about a shareholder’s accounts. The Funds’ Service Affiliates, in turn, are not permitted to share shareholder information with non-affiliated entities, except as required or permitted by law.
Procedures to Safeguard Private Information
The Funds take seriously the obligation to safeguard shareholder non-public personal information. In addition to this policy, the Funds have also implemented procedures that are designed to restrict access to a shareholder’s non-public personal information only to internal personnel who need to know that information in order to provide products or services to such shareholders. In order to guard a shareholder’s non-public personal information, physical, electronic and procedural safeguards are in place.
* This Privacy Policy applies to the following entities: PIMCO Funds, PIMCO Variable Insurance Trust, PCM Fund, Inc. and PIMCO Strategic Global Government Fund, Inc. (collectively, the “Funds”).
| | | | |
| 18 | | PIMCO Variable Insurance Trust | | |
Investment Adviser and Administrator
Pacific Investment Management Company LLC
840 Newport Center Drive
Newport Beach, California 92660
Distributor
Allianz Global Investors Distributors LLC
1345 Avenue of the Americas
New York, New York 10105
Custodian
State Street Bank & Trust Company
801 Pennsylvania
Kansas City, Missouri 64105
Transfer Agent
Boston Financial Data Services–Midwest
330 W. 9th Street
Kansas City, Missouri 64105
Legal Counsel
Dechert LLP
1775 I Street, N.W.
Washington, D.C. 20006
Independent Registered Public Accounting Firm
PricewaterhouseCoopers LLP
1055 Broadway
Kansas City, Missouri 64105
P I M C O

Table of Contents
This material is authorized for use only when preceded or accompanied by the current PIMCO Variable Insurance Trust (the “Trust”) prospectus. Investors should consider the investment objectives, risks, charges and expenses of this Trust carefully before investing. Ask your financial professional to explain all charges that may apply. This and other information is contained in the Trust’s prospectus. The variable product prospectus may be obtained by contacting your Investment Consultant. Please read the Trust and variable product prospectus carefully before you invest or send money.
Chairman’s Letter
Dear PIMCO Variable Insurance Trust Shareholder:
It is our pleasure to present to you the semiannual report for the PIMCO Variable Insurance Trust, covering the six-month period ended June 30, 2007. The PIMCO Variable Insurance Trust’s net assets were $8.68 billion at June 30, 2007, as compared to $7.76 billion at December 31, 2006.
Highlights of the financial markets during the reporting period include:
| | n | | Economic data during the first quarter of 2007 pointed to slower growth, which heightened market expectations for a decrease in the Federal Funds Rate. By the second quarter, economic data, such as employment statistics, provided little indication of economic weakness, causing expectations of a decrease in the Federal Funds Rate to unwind and U.S. interest rates to move higher. Interest rates in Europe and the U.K. also rose over the period as central banks raised their key lending rates due to inflation concerns. The benchmark ten-year U.S. Treasury yielded 5.03% as of June 30, 2007, or 0.32% higher than at the beginning of the year. |
| | n | | Most bonds generally returned much of their gains from earlier in the year as worldwide growth and capital flows drove interest rates higher in the second quarter. Increased risk aversion in global financial markets, due in part to subprime mortgage worries in the U.S., also contributed to the rise in interest rates. The Lehman Brothers Aggregate Bond Index, which includes Treasury, investment-grade corporate and mortgage-backed securities, returned 0.98% for the six-month period. |
| | n | | Locally issued emerging market (“EM”) bonds posted positive returns for the reporting period. Yields on these bonds declined and the local currencies in which they are denominated generally gained, amid increasing investor awareness, strong economic growth and surging capital inflows. External EM bonds (debt instruments issued by emerging markets countries and typically denominated in U.S. dollars) lagged behind local EM bonds (debt instruments issued by emerging markets countries and denominated in the currency of the issuer), as external EM bonds tend to trade more in-line with U.S. Treasuries. |
| | n | | Treasury Inflation-Protected Securities (“TIPS”) outpaced nominal bonds (non-inflation linked bonds) for the first part of the year and all but the longest maturity TIPS outperformed in the second quarter as high gasoline prices drove higher inflation accruals. Commodities, as represented by the Dow Jones-AIG Commodity Total Return Index, returned 4.46% for the period. Equities, as measured by the S&P 500 Index and the Russell 2000 Index, returned 6.96% and 6.45%, respectively, for the period. |
On the following pages, please find specific details as to the Portfolio’s total return investment performance and a discussion of those factors that affected performance.
Thank you for the trust you have placed in us. We will continue to work diligently to serve your investment needs.
Sincerely,
Brent R. Harris
Chairman, PIMCO Variable Insurance Trust
July 31, 2007
| | | | | | |
| | Semiannual Report | | June 30, 2007 | | 1 |
Important Information About the Portfolio
PIMCO Variable Insurance Trust (the “Trust”) is an open-end management investment company currently consisting of twenty separate investment portfolios, including the Small Cap StocksPLUS® TR Portfolio (the “Portfolio”). The Portfolio is only available as a funding vehicle under variable life insurance policies or variable annuity contracts issued by insurance companies (“Variable Contracts”). Individuals may not purchase shares of the Portfolio directly. Shares of the Portfolio also may be sold to qualified pension and retirement plans outside of the separate account context.
We believe that bond funds have an important role to play in a well diversified investment portfolio. It is important to note, however, that in an environment where interest rates may trend upward, rising rates would negatively impact the performance of most bond funds, and fixed-income securities held by a fund are likely to decrease in value. The price volatility of fixed-income securities can also increase during periods of rising interest rates resulting in increased losses to a fund. Bond funds and individual bonds with a longer duration (a measure of the expected life of a security) tend to be more sensitive to changes in interest rates, usually making them more volatile than securities or funds with shorter durations.
The Portfolio may be subject to various risks in addition to those described above. Some of these risks may include, but are not limited to, the following: credit risk, high yield risk, market risk, issuer risk, liquidity risk, derivatives risk, equity risk, mortgage risk, non-U.S. investment risk, emerging markets risk, currency risk, leveraging risk and management risk. A complete description of these risks is contained in the Portfolio’s prospectus. The Portfolio may use derivative instruments as part of an investment strategy, as described under “Portfolio Insights”, or for hedging purposes. Use of these instruments may involve certain costs and risks such as liquidity risk, interest rate risk, market risk, credit risk, management risk and the risk that the Portfolio could not close out a position when it would be most advantageous to do so. Because the Portfolio may invest in derivatives, it could lose more than the principal amount invested in these instruments. Investing in non-U.S. securities may entail risk due to non-U.S. economic and political developments; this risk may be increased when investing in emerging markets.
On the performance summary page in this Semiannual Report, the Total Return Investment Performance table measures performance assuming that all dividend and capital gain distributions were reinvested.
An investment in the Portfolio is not a deposit of a bank and is not guaranteed or insured by the Federal Deposit Insurance Corporation or any other government agency. It is possible to lose money on investments in the Portfolio.
PIMCO has adopted written proxy voting policies and procedures (“Proxy Policy”) as required by Rule 206(4)-6 under the Investment Advisers Act of 1940, as amended. The Proxy Policy has been adopted by the Trust as the policies and procedures that PIMCO will use when voting proxies on behalf of the Portfolio. A description of the policies and procedures that PIMCO uses to vote proxies relating to portfolio securities of the Portfolio, and information about how the Portfolio voted proxies relating to portfolio securities held during the most recent twelve-month period ended June 30, are available without charge, upon request, by calling the Trust at 1-866-746-2606 and on the Portfolio’s website at www.pimco.com.
The Portfolio files its complete schedule of portfolio holdings with the SEC for the first and third quarters of each fiscal year on Form N-Q. A copy of the Trust’s Form N-Q is also available on the SEC’s website at http://www.sec.gov and may be reviewed and copied at the SEC’s Public Reference Room in Washington D.C. Information on the operation of the Public Reference Room may be obtained by calling 1-800-SEC-0330, and is available without charge, upon request, by calling the Trust at 1-866-746-2606 and on the Portfolio’s website at www.pimco.com.
PIMCO Variable Insurance Trust is distributed by Allianz Global Investors Distributors LLC, 1345 Avenue of the Americas, New York, NY 10105.
| | | | |
| 2 | | PIMCO Variable Insurance Trust | | |
The following disclosure provides important information regarding the Portfolio’s Expense Example (“Example” or “Expense Example”), which appears in this Semiannual Report. Please refer to this information when reviewing the Expense Example for the Portfolio.
Example
As a shareholder of the Portfolio, you incur two types of costs: (1) transaction costs and (2) ongoing costs, including advisory and administrative fees; distribution and/or service (12b-1) fees (Administrative Class only); and other Portfolio expenses. The Example is intended to help you understand your ongoing costs (in dollars) of investing in the Portfolio and to compare these costs with the ongoing costs of investing in other mutual funds. The Expense Example does not reflect any fees or other expenses imposed by the Variable Contracts. If it did, the expenses reflected in the Expense Example would be higher. The Example is based on an investment of $1,000 invested at the beginning of the period and held for the entire period indicated, which is from January 31, 2007 to June 30, 2007.
Actual Expenses
The information in the table under the heading “Actual Performance” provides information about actual account values and actual expenses. You may use the information in these columns, together with the amount you invested, to estimate the expenses that you paid over the period. Simply divide your account value by $1,000 (for example, an $8,600 account value divided by $1,000 = $8.60), then multiply the result by the number in the row titled “Expenses Paid During Period” to estimate the expenses you paid on your account during this period.
Hypothetical Example for Comparison Purposes
The information in the table under the heading “Hypothetical Performance (5% return before expenses)” provides information about hypothetical account values and hypothetical expenses based on the Portfolio’s actual expense ratio and an assumed rate of return of 5% per year before expenses, which is not the Portfolio’s actual return. The hypothetical account values and expenses may not be used to estimate the actual ending account balance or expenses you paid for the period. You may use this information to compare the ongoing costs of investing in the Portfolio and other portfolios. To do so, compare this 5% hypothetical example with the 5% hypothetical examples that appear in the shareholder reports of the other portfolios.
Please note that the expenses shown in the table are meant to highlight your ongoing costs only and do not reflect any transactional costs. Therefore, the information under the heading “Hypothetical Performance (5% return before expenses)” is useful in comparing ongoing costs only, and will not help you determine the relative total costs of owning different portfolios. In addition, if these transactional costs were included, your costs would have been higher.
The expense ratio may vary period to period because of various factors, such as an increase in expenses not covered by the advisory and administrative fees (such as expenses of the trustees and their counsel, litigation expense and interest expense).
| | | | | | |
| | Semiannual Report | | June 30, 2007 | | 3 |
PIMCO Small Cap StocksPLUS® TR Portfolio
Allocation Breakdown‡
| | |
U.S. Government Agencies | | 29.9% |
Corporate Bonds & Notes | | 25.9% |
Asset-Backed Securities | | 21.8% |
Short-Term Instruments | | 20.2% |
Mortgage-Backed Securities | | 2.2% |
| | ‡ | % of Total Investments as of 06/30/2007 |
A line graph is not included since the Portfolio has less than six months of unaudited financials statements.
| | | | |
| Cumulative Total Return for the period ended June 30, 2007 |
| | | | | Portfolio
Inception
(01/31/07) |
| | PIMCO Small Cap StocksPLUS® TR Portfolio Advisor Class | | 3.70% |
| | Russell 2000® Index± | | 4.70% |
All Portfolio returns are net of fees and expenses.
Performance quoted represents past performance. Past performance is no guarantee of future results. Investment return and principal value will fluctuate so the Portfolio shares, when redeemed, may be worth more or less than their original cost. The Portfolio’s performance does not reflect the deduction of additional charges and expenses imposed in connection with investing in Variable Contracts, which will reduce returns. Current performance may be lower or higher than the performance data quoted. Performance data current to the most recent month-end is available by calling (800) 927-4648.
± Russell 2000® Index is composed of 2,000 of the smallest companies in the Russell 3000 Index and is considered to be representative of the small cap market in general. It is not possible to invest directly in an unmanaged index. The index does not reflect deductions for fees and expenses.
| | | | | | |
| Expense Example | | Actual Performance | | Hypothetical Performance |
| | | | | (5% return before expenses) |
Beginning Account Value (01/31/07) | | $ | 1,000.00 | | $ | 1,000.00 |
Ending Account Value (06/30/07) | | $ | 1,037.03 | | $ | 1,019.59 |
Expenses Paid During Period† | | $ | 4.39 | | $ | 5.26 |
† Expenses are equal to the Portfolio’s Advisor Class annualized expense ratio of 1.05%, multiplied by the average account value over the period, multiplied by 151/365 (to reflect the one-half year period). Overall fees and expenses of investing in the Portfolio will be higher because the example does not reflect Variable Contract fees and expenses.
Please refer to page 3 herein for an explanation of the information presented in the above Expense Example.
Portfolio Insights
» | | The PIMCO Small Cap StocksPLUS® TR Portfolio seeks to exceed the total return of the Russell 2000® Index by investing under normal circumstances substantially all of its assets in Russell 2000® Index derivatives, backed by a diversified portfolio of fixed-income instruments actively managed by PIMCO. |
| » | | The Portfolio’s fixed-income portfolio underperformed the financing cost embedded in equity index futures holdings, thus leading the Portfolio to underperform the Russell 2000. |
| » | | U.S. duration exposure was negative for performance as interest rates moved higher in instruments where the Portfolio’s duration exposure was concentrated. In particular, Eurodollar futures yields moved higher. Exposure to three-year and longer maturities also detracted from performance as rates moved higher among these maturities. |
| » | | Holdings of mortgage-backed securities detracted from performance as they underperformed like-duration Treasuries. |
| » | | Credit sensitive holdings, including corporate bonds and emerging market bonds, added value as they outperformed like-duration Treasuries. |
| » | | Currency strategies, including long exposure to the euro and a basket of emerging market currencies, helped performance as these currencies appreciated relative to the U.S. dollar. |
| | | | |
| 4 | | PIMCO Variable Insurance Trust | | |
Financial Highlights Small Cap StocksPLUS® TR Portfolio
| | | | |
| Selected per Share Data for the Period Ended: | | 01/31/2007-06/30/2007+ | |
| |
Advisor Class | | | | |
Net asset value beginning of period | | $ | 10.00 | |
Net investment income (a) | | | 0.18 | |
Net realized/unrealized gain on investments (a) | | | 0.19 | |
Total income from investment operations | | | 0.37 | |
Dividends from net investment income | | | (0.02 | ) |
Total distributions | | | (0.02 | ) |
Net asset value end of period | | $ | 10.35 | |
Total return | | | 3.70 | % |
Net assets end of period (000s) | | $ | 16 | |
Ratio of expenses to average net assets | | | 1.05 | %* |
Ratio of expenses to average net assets excluding interest expense | | | 0.99 | %* |
Ratio of net investment income to average net assets | | | 4.31 | %* |
Portfolio turnover rate | | | 250 | % |
+ Unaudited
* Annualized
(a) Per share amounts based on average number of shares outstanding during the period.
| | | | | | |
| See Accompanying Notes | | Semiannual Report | | June 30, 2007 | | 5 |
Statement of Assets and Liabilities Small Cap StocksPLUS® TR Portfolio
| | | | |
| (Amounts in thousands, except per share amounts) | | June 30, 2007 | |
| | | (Unaudited) | |
| |
Assets: | | | | |
Investments, at value | | $ | 4,094 | |
Cash | | | 2 | |
Receivable for investments sold | | | 29 | |
Interest and dividends receivable | | | 10 | |
Variation margin receivable | | | 8 | |
Unrealized appreciation on foreign currency contracts | | | 4 | |
| | | | 4,147 | |
| |
Liabilities: | | | | |
Payable for investments purchased | | $ | 994 | |
Payable for investments purchased on a delayed-delivery basis | | | 30 | |
Accrued investment advisory fee | | | 1 | |
Accrued administration fee | | | 1 | |
Variation margin payable | | | 12 | |
Swap premiums received | | | 1 | |
Unrealized depreciation on swap agreements | | | 1 | |
| | | | 1,040 | |
| |
Net Assets | | $ | 3,107 | |
| |
Net Assets Consist of: | | | | |
Paid in capital | | $ | 3,003 | |
Undistributed net investment income | | | 49 | |
Accumulated undistributed net realized gain | | | 140 | |
Net unrealized (depreciation) | | | (85 | ) |
| | | $ | 3,107 | |
| |
Net Assets: | | | | |
Administrative Class | | $ | 3,091 | |
Advisor Class | | | 16 | |
| |
Shares Issued and Outstanding: | | | | |
Administrative Class | | | 299 | |
Advisor Class | | | 1 | |
| |
Net Asset Value and Redemption Price Per Share (Net Asset Per Share Outstanding) | | | | |
Administrative Class | | $ | 10.34 | |
Advisor Class | | | 10.35 | |
| |
Cost of Investments Owned | | $ | 4,101 | |
| | | | |
| 6 | | PIMCO Variable Insurance Trust | | See Accompanying Notes |
Statement of Operations Small Cap StocksPLUS® TR Portfolio
| | | | |
| (Amounts in thousands) | | Period from
January 31, 2007
to June 30, 2007 | |
| | | (Unaudited) | |
| |
| Investment Income: | | | | |
Interest | | $ | 68 | |
Total Income | | | 68 | |
| |
Expenses: | | | | |
Investment advisory fees | | | 6 | |
Administration fees | | | 3 | |
Servicing fees – Administrative Class | | | 2 | |
Interest expense | | | 1 | |
Total Expenses | | | 12 | |
| |
Net Investment Income | | | 56 | |
| |
Net Realized and Unrealized Gain (Loss): | | | | |
Net realized (loss) on investments | | | (9 | ) |
Net realized gain on futures contracts, written options and swaps | | | 150 | |
Net realized (loss) on foreign currency transactions | | | (1 | ) |
Net change in unrealized (depreciation) on investments | | | (7 | ) |
Net change in unrealized (depreciation) on futures contracts, written options and swaps | | | (82 | ) |
Net change in unrealized appreciation on translation of assets and liabilities denominated in foreign currencies | | | 4 | |
Net Gain | | | 55 | |
| |
Net Increase in Net Assets Resulting from Operations | | $ | 111 | |
| | | | | | |
| See Accompanying Notes | | Semiannual Report | | June 30, 2007 | | 7 |
Statements of Changes in Net Assets Small Cap StocksPLUS® TR Portfolio
| | | | |
| (Amounts in thousands) | | Period from
January 31, 2007
to June 30, 2007 | |
| | | (Unaudited) | |
| |
| Increase in Net Assets from: | | | | |
| |
Operations: | | | | |
Net investment income | | $ | 56 | |
Net realized gain | | | 140 | |
Net change in unrealized (depreciation) | | | (85 | ) |
Net increase resulting from operations | | | 111 | |
| |
Distributions to Shareholders: | | | | |
From net investment income | | | | |
Administrative Class | | | (7 | ) |
| |
Total Distributions | | | (7 | ) |
| |
Portfolio Share Transactions: | | | | |
Receipts for shares sold | | | | |
Administrative Class | | | 3,000 | |
Advisor Class | | | 16 | |
Issued as reinvestment of distributions | | | | |
Administrative Class | | | 7 | |
Cost of shares redeemed | | | | |
Administrative Class | | | (20 | ) |
Net increase resulting from Portfolio share transactions | | | 3,003 | |
| |
Total Increase in Net Assets | | | 3,107 | |
| |
Net Assets: | | | | |
Beginning of period | | | 0 | |
End of period* | | $ | 3,107 | |
| |
*Including undistributed net investment income of: | | $ | 49 | |
| | | | |
| 8 | | PIMCO Variable Insurance Trust | | See Accompanying Notes |
| | |
| |
| Schedule of Investments Small Cap StocksPLUS® TR Portfolio | | June 30, 2007 (Unaudited) |
| | | | | | | | |
| | | | | PRINCIPAL
AMOUNT
(000S) | | | | VALUE
(000S) |
| CORPORATE BONDS & NOTES 34.1% |
|
| BANKING & FINANCE 21.5% |
| American Express Bank FSB |
5.380% due 06/22/2009 | | $ | | 30 | | $ | | 30 |
| |
| American Honda Finance Corp. |
5.407% due 02/09/2010 | | | | 30 | | | | 30 |
| |
| Bear Stearns Cos., Inc. |
5.480% due 05/18/2010 | | | | 30 | | | | 30 |
| |
| Caterpillar Financial Services Corp. |
5.420% due 05/18/2009 | | | | 30 | | | | 30 |
| |
| Citigroup Funding, Inc. |
5.320% due 04/23/2009 | | | | 50 | | | | 50 |
| |
| Credit Suisse First Boston |
5.560% due 08/15/2010 | | | | 30 | | | | 30 |
| |
| Ford Motor Credit Co. |
6.625% due 06/16/2008 | | | | 100 | | | | 100 |
7.250% due 10/25/2011 | | | | 30 | | | | 29 |
| |
| General Electric Capital Corp. |
5.430% due 08/15/2011 | | | | 50 | | | | 50 |
| |
| Goldman Sachs Group, Inc. |
5.685% due 07/23/2009 | | | | 30 | | | | 30 |
| |
| HSBC Finance Corp. |
5.607% due 05/10/2010 | | | | 30 | | | | 30 |
5.640% due 11/16/2009 | | | | 20 | | | | 20 |
| |
| JPMorgan Chase & Co. |
5.396% due 05/07/2010 | | | | 30 | | | | 30 |
| |
| Lehman Brothers Holdings, Inc. |
5.460% due 11/16/2009 | | | | 30 | | | | 30 |
| |
| Merrill Lynch & Co., Inc. |
5.406% due 05/08/2009 | | | | 30 | | | | 30 |
| |
| Morgan Stanley |
5.360% due 11/21/2008 | | | | 30 | | | | 30 |
| |
| SLM Corp. |
5.495% due 07/27/2009 | | | | 30 | | | | 30 |
| |
| Wachovia Corp. |
5.410% due 12/01/2009 | | | | 30 | | | | 30 |
| |
| Wells Fargo & Co. |
5.460% due 09/15/2009 | | | | 30 | | | | 30 |
| | | | | | | | |
| | | | | | | | 669 |
| | | | | | | | |
|
| INDUSTRIALS 7.1% |
| Amgen, Inc. | | | | | | | | |
5.440% due 11/28/2008 | | | | 30 | | | | 30 |
| |
| DaimlerChrysler N.A. Holding Corp. |
5.886% due 10/31/2008 | | | | 38 | | | | 39 |
| |
| Salomon Brothers AG for OAO Gazprom |
10.500% due 10/21/2009 | | | | 30 | | | | 33 |
| |
| Time Warner, Inc. |
5.590% due 11/13/2009 | | | | 100 | | | | 100 |
| |
| Walt Disney Co. |
5.460% due 09/10/2009 | | | | 20 | | | | 20 |
| | | | | | | | |
| | | | | | | | 222 |
| | | | | | | | |
|
| UTILITIES 5.5% |
| AT&T, Inc. | | | | | | | | |
5.456% due 02/05/2010 | | | | 100 | | | | 100 |
| |
| Ohio Power Co. |
5.530% due 04/05/2010 | | | | 30 | | | | 30 |
| |
| TXU Electric Delivery Co. |
5.735% due 09/16/2008 | | | | 30 | | | | 30 |
| |
| | | | | | | | |
| | | | | PRINCIPAL
AMOUNT
(000S) | | | | VALUE
(000S) |
| Verizon Communications, Inc. |
5.400% due 04/03/2009 | | $ | | 10 | | $ | | 10 |
| | | | | | | | |
| | | | | | | | 170 |
| | | | | | | | |
Total Corporate Bonds & Notes
(Cost $1,062) | | | | 1,061 |
| | | | | | | | |
|
| U.S. GOVERNMENT AGENCIES 39.4% |
| Fannie Mae | | | | | | | | |
4.500% due 06/25/2043 | | | | 10 | | | | 9 |
5.000% due 12/25/2016 - 02/25/2017 | | | | 36 | | | | 36 |
6.000% due 07/01/2037 | | | | 1,000 | | | | 989 |
| |
| Freddie Mac |
4.250% due 09/15/2024 | | | | 19 | | | | 19 |
5.470% due 08/15/2019 - 10/15/2020 | | | | 140 | | | | 140 |
5.550% due 07/15/2037 | | | | 30 | | | | 30 |
| | | | | | | | |
Total U.S. Government Agencies
(Cost $1,229) | | 1,223 |
| | | | | | | | |
|
| MORTGAGE-BACKED SECURITIES 2.9% |
| Countrywide Alternative Loan Trust |
5.520% due 06/25/2037 | | | | 29 | | | | 29 |
| |
| Deutsche ALT-A Securities, Inc. Mortgage Loan Trust |
5.400% due 03/25/2037 | | | | 24 | | | | 24 |
| |
| GS Mortgage Securities Corp. II |
5.410% due 03/06/2020 | | | | 30 | | | | 30 |
| |
| Lehman Brothers Floating Rate Commercial Mortgage Trust |
5.400% due 09/15/2021 | | | | 7 | | | | 7 |
| | | | | | | | |
Total Mortgage-Backed Securities (Cost $90) | | | | 90 |
| | | | | | | | |
|
| ASSET-BACKED SECURITIES 28.7% |
| American Express Credit Account Master Trust |
5.320% due 01/18/2011 | | | | 30 | | | | 30 |
5.430% due 09/15/2010 | | | | 30 | | | | 30 |
| |
| Bank One Issuance Trust |
5.440% due 06/15/2010 | | | | 30 | | | | 30 |
| |
| Bear Stearns Asset-Backed Securities, Inc. |
5.410% due 06/25/2047 | | | | 29 | | | | 29 |
| |
| BNC Mortgage Loan Trust |
5.420% due 05/25/2037 | | | | 28 | | | | 28 |
| |
| Chase Credit Card Master Trust |
5.430% due 07/15/2010 | | | | 30 | | | | 30 |
| |
| Citibank Credit Card Issuance Trust |
5.526% due 02/07/2010 | | | | 30 | | | | 30 |
| |
| Citigroup Mortgage Loan Trust, Inc. |
5.360% due 12/25/2036 | | | | 27 | | | | 27 |
5.390% due 01/25/2037 | | | | 26 | | | | 26 |
5.400% due 12/25/2035 | | | | 18 | | | | 18 |
5.430% due 03/25/2037 | | | | 29 | | | | 29 |
| |
| Countrywide Asset-Backed Certificates |
5.400% due 10/25/2037 | | | | 29 | | | | 29 |
5.500% due 09/25/2036 | | | | 30 | | | | 30 |
| |
| First Franklin Mortgage Loan Asset-Backed Certificates |
5.370% due 10/25/2036 | | | | 23 | | | | 23 |
5.370% due 11/25/2036 | | | | 24 | | | | 25 |
| |
| First USA Credit Card Master Trust |
5.480% due 04/18/2011 | | | | 30 | | | | 30 |
| |
| Fremont Home Loan Trust |
5.420% due 05/25/2036 | | | | 30 | | | | 30 |
| |
| | | | | | | | |
| | | | | PRINCIPAL
AMOUNT
(000S) | | | | VALUE
(000S) |
| GE-WMC Mortgage Securities LLC |
5.440% due 10/25/2035 | | $ | | 6 | | $ | | 6 |
| |
| Honda Auto Receivables Owner Trust |
5.322% due 03/18/2008 | | | | 16 | | | | 16 |
| |
| Long Beach Mortgage Loan Trust |
5.400% due 02/25/2036 | | | | 12 | | | | 12 |
| |
| MASTR Asset-Backed Securities Trust |
5.360% due 08/25/2036 | | | | 19 | | | | 19 |
5.370% due 01/25/2037 | | | | 28 | | | | 28 |
5.400% due 05/25/2037 | | | | 29 | | | | 29 |
| |
| MBNA Credit Card Master Note Trust |
4.200% due 09/15/2010 | | | | 30 | | | | 30 |
5.440% due 08/16/2010 | | | | 30 | | | | 30 |
5.446% due 12/15/2009 | | | | 30 | | | | 30 |
| |
| Morgan Stanley ABS Capital I |
5.360% due 01/25/2037 | | | | 27 | | | | 27 |
5.370% due 10/25/2036 | | | | 22 | | | | 22 |
| |
| Nationstar Home Equity Loan Trust |
5.440% due 04/25/2037 | | | | 29 | | | | 29 |
| |
| Securitized Asset-Backed Receivables LLC Trust |
5.360% due 01/25/2037 | | | | 26 | | | | 26 |
| |
| Soundview Home Equity Loan Trust |
5.400% due 06/25/2037 | | | | 29 | | | | 29 |
| |
| Structured Asset Securities Corp. |
5.420% due 01/25/2037 | | | | 26 | | | | 26 |
| |
| USAA Auto Owner Trust | | | | | | | | |
5.337% due 07/11/2008 | | | | 30 | | | | 30 |
| |
| Wells Fargo Home Equity Trust |
5.420% due 03/25/2037 | | | | 29 | | | | 29 |
| | | | | | | | |
Total Asset-Backed Securities (Cost $891) | | | | 892 |
| | | | | | | | |
|
| SHORT-TERM INSTRUMENTS 26.6% |
|
| CERTIFICATES OF DEPOSIT 3.5% |
| Dexia S.A. | | | | | | | | |
5.270% due 09/29/2008 | | | | 30 | | | | 30 |
| |
| Fortis Bank NY | | | | | | | | |
5.300% due 09/30/2008 | | | | 30 | | | | 30 |
| |
| Skandinav Enskilda BK | | | | | | | | |
5.350% due 02/13/2009 | | | | 10 | | | | 10 |
| |
| Societe Generale NY | | | | | | | | |
5.270% due 03/26/2008 | | | | 40 | | | | 40 |
| | | | | | | | |
| | | | | | | | 110 |
| | | | | | | | |
|
| COMMERCIAL PAPER 12.8% |
| Dexia Delaware LLC | | | | | | | | |
5.225% due 09/21/2007 | | | | 100 | | | | 100 |
| |
| Freddie Mac | | | | | | | | |
4.800% due 07/02/2007 | | | | 200 | | | | 200 |
| |
| UBS Finance Delaware LLC |
5.200% due 10/23/2007 | | | | 100 | | | | 98 |
| | | | | | | | |
| | | | | | | | 398 |
| | | | | | | | |
|
| REPURCHASE AGREEMENTS 4.7% |
| State Street Bank and Trust Co. |
4.900% due 07/02/2007 | | | | 147 | | | | 147 |
| | | | | | | | |
(Dated 06/29/2007. Collateralized by Fannie Mae 3.250% due 08/15/2008 valued at $153. Repurchase proceeds are $147.) | | | | | | | | |
|
| | | | | | |
| See Accompanying Notes | | Semiannual Report | | June 30, 2007 | | 9 |
Schedule of Investments Small Cap StocksPLUS® TR Portfolio (Cont.)
| | | | | | | | | |
| | | | | PRINCIPAL
AMOUNT
(000S) | | | | VALUE
(000S) | |
| U.S. TREASURY BILLS 5.6% | |
4.659% due 08/30/2007 - 09/13/2007 (a)(c) | | $ | | 175 | | $ | | 173 | |
| | | | | | | | | |
Total Short-Term Instruments
(Cost $828) | | 828 | |
| | | | | | | | | |
| |
| PURCHASED OPTIONS (e) 0.0% | | | |
(Cost $1) | | | | 0 | |
| |
Total Investments (b) 131.7%
(Cost $4,101) | | | | $ | | 4,094 | |
| |
| Other Assets and Liabilities (Net) (31.7%) | | (987 | ) |
| | | | | | | | | |
| Net Assets 100.0% | | | | | | $ | | 3,107 | |
| | | | | | | | | |
Notes to Schedule of Investments (amounts in thousands*, except number of contracts):
* A zero balance may reflect actual amounts rounding to less than one thousand.
(a) Coupon represents a weighted average rate.
(b) As of June 30, 2007 portfolio securities with an aggregate value of $160 were valued in good faith and pursuant to the guidelines established by the Board of Trustees.
(c) Securities with an aggregate market value of $173 have been segregated with the custodian to cover margin requirements for the following open futures contracts on June 30, 2007:
| | | | | | | | | | |
| Description | | Type | | Expiration
Month | | # of
Contracts | | Unrealized
(Depreciation) | |
90-Day Eurodollar December Futures | | Long | | 12/2008 | | 8 | | $ | (4 | ) |
90-Day Eurodollar June Futures | | Long | | 06/2008 | | 7 | | | (2 | ) |
90-Day Eurodollar March Futures | | Long | | 03/2008 | | 9 | | | (5 | ) |
90-Day Eurodollar September Futures | | Long | | 09/2008 | | 8 | | | (3 | ) |
E-mini Russell 2000 Index September Futures | | Long | | 09/2007 | | 37 | | | (67 | ) |
U.S. Treasury 30-Year Bond September Futures | | Long | | 09/2007 | | 1 | | | (1 | ) |
| | | | | | | | | | |
| | | | | | | | $ | (82 | ) |
| | | | | | | | | | |
(d) Swap agreements outstanding on June 30, 2007:
Credit Default Swaps
| | | | | | | | | | | | | | |
| Counterparty | | Reference Entity | | Buy/Sell
Protection (1) | | (Pay)/Receive
Fixed Rate | | Expiration
Date | | Notional
Amount | | Unrealized
Appreciation |
Barclays Bank PLC | | General Motors Acceptance Corp. 6.875% due 08/28/2012 | | Sell | | 0.620% | | 09/20/2007 | | $ | 100 | | $ | 0 |
Credit Suisse First Boston | | Panama Government International Bond 8.875% due 09/30/2027 | | Sell | | 0.300% | | 02/20/2009 | | | 30 | | | 0 |
HSBC Bank USA | | Russia Government International Bond 7.500% due 03/31/2030 | | Sell | | 0.240% | | 02/20/2008 | | | 30 | | | 0 |
Morgan Stanley | | General Motors Acceptance Corp. 6.875% due 08/28/2012 | | Sell | | 1.050% | | 09/20/2008 | | | 10 | | | 0 |
Morgan Stanley | | Ukraine Government International Bond 7.650% due 06/11/2013 | | Sell | | 0.610% | | 02/20/2009 | | | 30 | | | 0 |
Royal Bank of Scotland Group PLC | | Indonesia Government International Bond 6.750% due 03/10/2014 | | Sell | | 1.085% | | 03/20/2012 | | | 30 | | | 0 |
| | | | | | | | | | | | | | |
| | | | | | | | | | | | | $ | 0 |
| | | | | | | | | | | | | | |
(1) If the Portfolio is a seller of protection and a credit event occurs, as defined under the terms of that particular swap agreement, the Portfolio will pay to the buyer of the protection an amount up to the notional value of the swap and in certain instances, take delivery of the security.
Interest Rate Swaps
| | | | | | | | | | | | | | | |
| Counterparty | | Floating Rate Index | | Pay/Receive
Floating Rate | | Fixed Rate | | Expiration
Date | | Notional
Amount | | Unrealized
(Depreciation) | |
Royal Bank of Scotland Group PLC | | 5-Year French CPI Ex Tobacco Daily Reference Index | | Pay | | 1.955% | | 03/28/2012 | | EUR | 30 | | $ | 0 | |
Goldman Sachs & Co. | | 6-Month GBP-LIBOR | | Pay | | 6.000% | | 06/19/2009 | | GBP | 100 | | | (1 | ) |
UBS Warburg LLC | | 6-Month JPY-LIBOR | | Pay | | 1.000% | | 03/18/2009 | | JPY | 20,000 | | | 0 | |
Bank of America | | 3-Month USD-LIBOR | | Pay | | 5.000% | | 12/19/2009 | | $ | 100 | | | 0 | |
| | | | | | | | | | | | | | | |
| | | | | | | | | | | | | $ | (1 | ) |
| | | | | | | | | | | | | | | |
| | | | |
| 10 | | PIMCO Variable Insurance Trust | | See Accompanying Notes |
| | |
| |
| | | June 30, 2007 (Unaudited) |
(e) Purchased options outstanding on June 30, 2007:
Options on Exchange-Traded Futures Contracts
| | | | | | | | | | | | | |
| Description | | Exercise
Price | | Expiration
Date | | # of
Contracts | | Cost | | Value |
Put - CME E-mini Russell 2000 Index September Futures | | $ | 570.000 | | 09/21/2007 | | 16 | | $ | 1 | | $ | 0 |
| | | | | | | | | | | | | |
Options on Securities
| | | | | | | | | | | | | | |
| Description | | Strike
Price | | Expiration
Date | | Notional
Amount | | Cost | | Value |
Put - OTC Fannie Mae 6.000% due 07/01/2037 | | $ | 93.750 | | 07/05/2007 | | $ | 1,000 | | $ | 0 | | $ | 0 |
| | | | | | | | | | | | | | |
(f) Foreign currency contracts outstanding on June 30, 2007:
| | | | | | | | | | | | | | | |
| Type | | Currency | | Principal
Amount
Covered by
Contract | | Settlement
Month | | Unrealized
Appreciation | | Unrealized
(Depreciation) | | Net Unrealized
Appreciation |
Buy | | AUD | | 8 | | 07/2007 | | $ | 0 | | $ | 0 | | $ | 0 |
Buy | | BRL | | 117 | | 10/2007 | | | 3 | | | 0 | | | 3 |
Buy | | | | 8 | | 03/2008 | | | 0 | | | 0 | | | 0 |
Buy | | CAD | | 8 | | 08/2007 | | | 0 | | | 0 | | | 0 |
Buy | | EUR | | 62 | | 07/2007 | | | 1 | | | 0 | | | 1 |
Sell | | GBP | | 3 | | 08/2007 | | | 0 | | | 0 | | | 0 |
Buy | | INR | | 136 | | 10/2007 | | | 0 | | | 0 | | | 0 |
Buy | | | | 113 | | 05/2008 | | | 0 | | | 0 | | | 0 |
Buy | | KRW | | 4,085 | | 07/2007 | | | 0 | | | 0 | | | 0 |
Buy | | | | 4,912 | | 09/2007 | | | 0 | | | 0 | | | 0 |
Buy | | MXN | | 22 | | 09/2007 | | | 0 | | | 0 | | | 0 |
Buy | | | | 81 | | 03/2008 | | | 0 | | | 0 | | | 0 |
Buy | | MYR | | 17 | | 05/2008 | | | 0 | | | 0 | | | 0 |
Buy | | PHP | | 367 | | 05/2008 | | | 0 | | | 0 | | | 0 |
Buy | | PLN | | 21 | | 09/2007 | | | 0 | | | 0 | | | 0 |
Buy | | | | 6 | | 03/2008 | | | 0 | | | 0 | | | 0 |
Buy | | RUB | | 52 | | 09/2007 | | | 0 | | | 0 | | | 0 |
Buy | | | | 343 | | 01/2008 | | | 0 | | | 0 | | | 0 |
Buy | | SGD | | 8 | | 07/2007 | | | 0 | | | 0 | | | 0 |
Buy | | | | 3 | | 08/2007 | | | 0 | | | 0 | | | 0 |
Buy | | | | 11 | | 10/2007 | | | 0 | | | 0 | | | 0 |
| | | | | | | | | | | | | | | |
| | | | | | | | $ | 4 | | $ | 0 | | $ | 4 |
| | | | | | | | | | | | | | | |
| | | | | | |
| See Accompanying Notes | | Semiannual Report | | June 30, 2007 | | 11 |
Notes to Financial Statements
1. ORGANIZATION
The Small Cap StocksPLUS® TR Portfolio (the “Portfolio”) is a series of the PIMCO Variable Insurance Trust (the “Trust”). The Trust is registered under the Investment Company Act of 1940 (the “Act”), as amended, as an open-end management investment company organized as a Delaware business trust on October 3, 1997. The Portfolio offers two classes of shares: Administrative and Advisor. Information presented on these financial statements pertains to the Advisor Class of the Portfolio. Certain detailed financial information for the Administrative Class is provided separately and is available upon request. The Trust is designed to be used as an investment vehicle by Separate Accounts of insurance companies that fund variable annuity contracts and variable life insurance policies and by qualified pension and retirement plans.
2. SIGNIFICANT ACCOUNTING POLICIES
The following is a summary of significant accounting policies consistently followed by the Portfolio in the preparation of its financial statements in conformity with accounting principles generally accepted in the United States of America (“GAAP”). The preparation of financial statements in accordance with GAAP requires management to make estimates and assumptions that affect the reported amounts and disclosures on the financial statements. Actual results could differ from those estimates.
(a) Security Valuation Portfolio securities are valued as of the close of regular trading (normally 4:00 p.m., Eastern Time) on each day that the New York Stock Exchange (“NYSE”) is open. Portfolio securities and other assets for which market quotes are readily available are stated at market value. Market value is generally determined on the basis of last reported sales prices, or if no sales are reported, based on quotes obtained from a quotation reporting system, established market makers, or pricing services. Fixed-income securities and non-exchange traded derivatives are normally valued on the basis of quotes obtained from brokers and dealers or pricing services. Prices obtained from independent pricing services use information provided by market makers or estimates of market values obtained from yield data relating to investments or securities with similar characteristics. Certain fixed income securities purchased on a delayed-delivery basis are marked to market daily until settlement at the forward settlement date. Short-term investments having a maturity of 60 days or less are generally valued at amortized cost. Exchange traded options, futures and options on futures are valued at the settlement price determined by the relevant exchange. With respect to any portion of the Portfolio’s assets that are invested in one or more open end management investment companies, the Portfolio’s net asset value (“NAV”) will be calculated based upon the NAVs of such investments.
Investments initially valued in currencies other than the U.S. dollar are converted to the U.S. dollar using exchange rates obtained from pricing services. As a result, the NAV of the Portfolio’s securities may be affected by changes in the value of currencies in relation to the U.S. dollar. The value of securities traded in markets outside the United States or denominated in currencies other than the U.S. dollar may be affected significantly on a day that the NYSE is closed and an investor is not able to purchase, redeem or exchange shares.
Securities and other assets for which market quotes are not readily available are valued at fair value as determined in good faith by the Board of Trustees or persons acting at their direction. The Board of Trustees has adopted methods for valuing securities and other assets in circumstances where market quotes are not readily available, and has delegated to Pacific Investment Management Company LLC (“PIMCO”) the responsibility for applying the valuation methods. In the event that market quotes are not readily available, and the security or asset cannot be valued pursuant to one of the valuation methods, the value of the security or asset will be determined in good faith by the Valuation Committee of the Board of Trustees, generally based upon recommendations provided by PIMCO.
Market quotes are considered not readily available in circumstances where there is an absence of current or reliable market-based data (e.g., trade information, bid/asked information, broker quotes), including where events occur after the close of the relevant market, but prior to the close of regular trading, that materially affect the values of the Portfolio’s securities or assets. In addition, market quotes are considered not readily available when, due to extraordinary circumstances, the exchanges or markets on which the securities trade, do not open for trading for the entire day and no other market prices are available. The Board has delegated to PIMCO the responsibility for monitoring significant events that may materially affect the values of the Portfolio’s securities or assets and for determining whether the value of the applicable securities or assets should be re-evaluated in light of such significant events.
When the Portfolio uses fair value pricing to determine its NAV, securities will not be priced on the basis of quotations from the primary market in which they are traded, but rather may be priced by another method that the Board of Trustees or persons acting at their direction believe accurately reflects fair value. The Trust’s policy is intended to result in a calculation of the Portfolio’s NAV that fairly reflects security values as of the time of pricing. However, fair values determined by the Board of Trustees or persons acting at their direction may not accurately reflect the price that the Portfolio could obtain for a security if it were to dispose of that security as of the time of pricing. Because foreign securities can trade on non-business days of the Portfolio, the NAV of the Portfolio may change on days when shareholders will not be able to purchase or redeem Portfolio shares. The prices used by the Portfolio may differ from the value that would be realized if the securities were sold and the differences could be material to the financial statements.
(b) Securities Transactions and Investment Income Securities transactions are recorded as of the trade date for financial reporting purposes. Securities purchased or sold on a when-issued or delayed-delivery basis may be settled a month or more after the trade date. Realized gains and losses from securities sold are recorded on the identified cost basis. Dividend income is recorded on the ex-dividend date, except certain dividends from foreign securities where the ex-dividend date may have passed, which are recorded as soon as the Portfolio is informed of the ex-dividend date. Interest income, adjusted for the accretion of discounts and amortization of premiums, is recorded on the accrual basis. Paydown gains and losses on mortgage-related and other asset-backed securities are recorded as components of interest income on the Statement of Operations.
(c) Delayed-Delivery Transactions The Portfolio may purchase or sell securities on a delayed-delivery basis. These transactions involve a commitment by the Portfolio to purchase or sell securities for a predetermined price or yield, with payment and delivery taking place beyond the customary settlement period. When delayed-delivery purchases are outstanding, the Portfolio will designate liquid assets in an amount sufficient to meet the purchase price. When purchasing a security on a delayed-delivery basis, the Portfolio assumes the rights and risks of ownership of the security, including the risk of price and yield fluctuations, and takes such fluctuations into account when determining its net asset value. The Portfolio may dispose of or renegotiate a delayed-delivery transaction after it is entered into, and may sell when-issued securities before they are delivered, which may result in a capital gain or loss. When the Portfolio has sold a security on a delayed-delivery basis, the Portfolio does not participate in future gains and losses with respect to the security.
(d) Dividends and Distributions to Shareholders Dividends from net investment income, if any, are declared and distributed to shareholders quarterly. Net realized capital gains earned by the Portfolio, if any, will be distributed no less frequently than once each year.
Income dividends and capital gain distributions are determined in accordance with income tax regulations which may differ from GAAP. Differences between tax
| | | | |
| 12 | | PIMCO Variable Insurance Trust | | |
| | |
| |
| | | June 30, 2007 (Unaudited) |
regulations and GAAP may change the fiscal year when income and capital items are recognized for tax and GAAP purposes. Examples of events that give rise to timing differences include wash sales, straddles, net operating losses and capital loss carryforwards. Further, the character of investment income and capital gains may be different for certain transactions under the two methods of accounting. Examples of characterization differences include the treatment of mortgage paydowns, swaps, foreign currency transactions and contingent debt instruments. As a result, income dividends and capital gain distributions declared during a fiscal period may differ significantly from the net investment income and realized capital gain reported on the Portfolio’s annual financial statements presented under GAAP.
Distributions classified as a tax basis return of capital, if any, are reflected on the accompanying Statements of Changes in Net Assets and have been reclassified to paid in capital. In addition, other amounts have been reclassified between undistributed net investment income, accumulated undistributed net realized gains or losses and/or paid in capital to more appropriately conform financial accounting to tax characterizations of dividend distributions.
(e) Multiclass Operations Each class offered by the Portfolio has equal rights as to assets and voting privileges (except that shareholders of a class have exclusive voting rights regarding any matter relating solely to that class of shares). Income and non-class specific expenses of the Portfolio are allocated daily to each class of shares based on the relative value of settled shares. Realized and unrealized capital gains and losses of the Portfolio are allocated daily to each class of shares based on the relative net assets of each class. Class specific expenses, where applicable, currently include administrative, distribution and servicing fees.
(f) Foreign Currency The functional and reporting currency for the Portfolio is the U.S. dollar. The market values of foreign securities, currency holdings and other assets and liabilities are translated into U.S. dollars based on the current exchange rates each business day. Fluctuations in the value of currency holdings and other assets and liabilities resulting from changes in exchange rates are recorded as unrealized foreign currency gains or losses. Realized gains or losses and unrealized appreciation or depreciation on investment securities and income and expenses are translated on the respective dates of such transactions. The effects of changes in foreign currency exchange rates on investments in securities are not segregated on the Statement of Operations from the effects of changes in market prices of those securities, but are included with the net realized and unrealized gain or loss on investment securities.
| | | | | | |
|
| Non-U.S. currency symbols utilized throughout the report are defined as follows: |
| AUD | | Australian Dollar | | KRW | | South Korean Won |
| BRL | | Brazilian Real | | MXN | | Mexican Peso |
| CAD | | Canadian Dollar | | MYR | | Malaysian Ringgit |
| EUR | | Euro | | PHP | | Philippines Peso |
| GBP | | Great British Pound | | PLN | | Polish Zloty |
| INR | | Indian Rupee | | RUB | | Russian Ruble |
| JPY | | Japanese Yen | | SGD | | Singapore Dollar |
(g) Foreign Currency Transactions The Portfolio may enter into foreign currency contracts in connection with settling planned purchases or sales of securities, to hedge the currency exposure associated with some or all of the Portfolio’s securities or as a part of an investment strategy. A foreign currency contract is an agreement between two parties to buy and sell a currency at a set price on a future date. The market value of a foreign currency contract fluctuates with changes in foreign currency exchange rates. Foreign currency contracts are marked to market daily and the change in value is recorded by the Portfolio as an
unrealized gain or loss. Realized gains or losses equal to the difference between the value of the contract at the time it was opened and the value at the time it was closed are recorded upon delivery or receipt of the currency. These contracts may involve market risk in excess of the unrealized gain or loss reflected on the Statement of Assets and Liabilities. In addition, the Portfolio could be exposed to risk if the counterparties are unable to meet the terms of the contracts or if the value of the currency changes unfavorably to the U.S. dollar.
(h) Futures Contracts The Portfolio may enter into futures contracts. The Portfolio may use futures contracts to manage its exposure to the securities markets or to movements in interest rates and currency values. The primary risks associated with the use of futures contracts are the imperfect correlation between the change in market value of the securities held by the Portfolio and the prices of futures contracts, the possibility of an illiquid market, and the inability of the counterparty to meet the terms of the contract. Futures contracts are valued based upon their quoted daily settlement prices. Upon entering into a futures contract, the Portfolio is required to deposit with its futures broker, an amount of cash or U.S. Government and Agency Obligations in accordance with the initial margin requirements of the broker or exchange. Futures contracts are marked to market daily and an appropriate payable or receivable for the change in value (“variation margin”) is recorded by the Portfolio. Gains or losses are recognized but not considered realized until the contracts expire or are closed. Futures contracts involve, to varying degrees, risk of loss in excess of the variation margin disclosed on the Statement of Assets and Liabilities.
(i) Options Contracts The Portfolio may write call and put options on futures, swaps, securities or currencies it owns or in which it may invest. Writing put options tends to increase the Portfolio’s exposure to the underlying instrument. Writing call options tends to decrease the Portfolio’s exposure to the underlying instrument. When the Portfolio writes a call or put option, an amount equal to the premium received is recorded as a liability and subsequently marked to market to reflect the current value of the option written. These liabilities are reflected as written options outstanding on the Statement of Assets and Liabilities. Certain options may be written with premiums to be determined on a future date. The premiums for these options are based upon implied volatility parameters at specified terms. Premiums received from writing options which expire are treated as realized gains. Premiums received from writing options which are exercised or closed are added to the proceeds or offset against amounts paid on the underlying future, swap, security or currency transaction to determine the realized gain or loss. The Portfolio as a writer of an option has no control over whether the underlying future, swap, security or currency may be sold (call) or purchased (put) and as a result bears the market risk of an unfavorable change in the price of the future, swap, security or currency underlying the written option. There is the risk the Portfolio may not be able to enter into a closing transaction because of an illiquid market.
The Portfolio may also purchase put and call options. Purchasing call options tends to increase the Portfolio’s exposure to the underlying instrument. Purchasing put options tends to decrease the Portfolio’s exposure to the underlying instrument. The Portfolio pays a premium which is included on the Statement of Assets and Liabilities as an investment and subsequently marked to market to reflect the current value of the option. Premiums paid for purchasing options which expire are treated as realized losses. Certain options may be purchased with premiums to be determined on a future date. The premiums for these options are based upon implied volatility parameters at specified terms. The risk associated with purchasing put and call options is limited to the premium paid. Premiums paid for purchasing options which are exercised or closed are added to the amounts paid or offset against the proceeds on the underlying future, swap, security or currency transaction to determine the realized gain or loss.
(j) Repurchase Agreements The Portfolio may engage in repurchase transactions. Under the terms of a typical repurchase agreement, the Portfolio
| | | | | | |
| | Semiannual Report | | June 30, 2007 | | 13 |
Notes to Financial Statements (Cont.)
takes possession of an underlying debt obligation (collateral) subject to an obligation of the seller to repurchase, and the Portfolio to resell, the obligation at an agreed-upon price and time. The underlying securities for all repurchase agreements are held in safekeeping at the Portfolio’s custodian or designated subcustodians under tri-party repurchase agreements. The market value of the collateral must be equal to or exceed the total amount of the repurchase obligations, including interest. Securities purchased under repurchase agreements are reflected as an asset on the Statement of Assets and Liabilities. Generally, in the event of counterparty default, the Portfolio has the right to use the collateral to offset losses incurred. If the counterparty should default, the Portfolio will seek to sell the securities which it holds as collateral. This could involve procedural costs or delays in addition to a loss on the securities if their value should fall below their repurchase price.
(k) Inverse Floating Rate Transactions—Residual Interest Municipal Bonds (“RIBs”)/Residual Interest Tax Exempt Bonds (“RITEs”) The Portfolio may invest in RIBs and RITEs (“Inverse Floaters”). Inverse Floaters are created via a master trust agreement between a broker-dealer, acting as trustor and liquidity provider, and an investment bank, acting as trustee and tender agent. The master trust agreement defines the terms for each trust series; with each series being established by the transfer of long-term, fixed-rate municipal bonds (“Fixed Rate Bonds”) to the trustee to be held and provide for the creation, execution and delivery of floater certificates (“Floating Rate Notes”) and Inverse Floaters. Floating Rate Notes are liquid notes that are issued with a short-term variable rate typically linked to the LIBOR, subject to limitations, for some duration. After interest income is paid on the Floating Rate Notes at current rates, the residual income from the Fixed Rate Bonds is paid to the Inverse Floaters. Inverse Floaters are issued with a coupon that fluctuates inversely with the Floating Rate Notes’ referenced rate, subject to certain limitations. Therefore, rising short-term rates result in lower income for the Inverse Floaters and vice versa.
Floating Rate Notes are generally remarketed to municipal money market funds. Inverse Floaters are acquired by either tax-exempt municipal bond funds or trusts, or other parties interested in potentially higher yielding tax-exempt securities. Inverse Floaters may also be acquired for the purpose of increasing leverage. Floating Rate Note holders typically have the option to tender their notes to the liquidity provider for redemption at par at each reset date. The Inverse Floater holders have the option to (i) require the Floating Rate Note holders to tender their notes at par, and (ii) require the liquidity provider to transfer the Fixed Rate Bonds to the Inverse Floater holders. The holders of Inverse Floaters bear substantially all of the downside investment risk associated with the underlying Fixed Rate Bonds, and also benefit from a disproportionate amount of the potential appreciation of the underlying Fixed Rate Bonds’ value. Inverse Floaters may be more volatile and less liquid than other municipal bonds of comparable maturity.
Inverse Floaters may be acquired with or without first transferring to the trustor the Fixed Rate Bonds that were utilized to create the trust series. Inverse Floaters acquired without a transfer of Fixed Rate Bonds are recognized as purchases of securities as outlined in Note 2(b). Statement of Financial Accounting Standards No. 140 – Accounting for Transfers and Servicing of Financial Assets and Extinguishments of Liabilities (“FAS No. 140”), governs the standards for accounting for securitizations and other transfers of financial assets. If there is a transfer of Fixed Rate Bonds and it meets sale criteria under FAS No. 140, a Portfolio records a sale of the Fixed Rate Bonds and a purchase of the Inverse Floaters. The cash received from the Inverse Floaters is then recorded as interest income in the Statement of Operations.
If the transfer of Fixed Rate Bonds does not meet sale criteria under FAS No. 140, a Portfolio accounts for the transaction described above as a secured borrowing by including the Fixed Rate Bonds in its Schedule of Investments, and recording the
Floating Rate Notes as a liability under the caption “Payable for floating rate notes” in the Portfolio’s Statement of Assets and Liabilities. In a secured borrowing transaction, cash received from the Inverse Floaters is not recorded as interest income. Instead, a Portfolio records interest income related to the Fixed Rate Bonds and interest expense related to the Floating Rate Notes, the net of which is equal to the cash received from the Inverse Floaters acquired by the Portfolio. Thus, while a Portfolio’s reported total income, net expenses, and net expense ratio are generally higher for investments in Inverse Floaters acquired via a secured borrowing, the method of acquiring Inverse Floaters does not result in differences for reported cash flows, net asset value or total return.
(l) Swap Agreements The Portfolio may invest in swap agreements. Swap transactions are privately negotiated agreements between the Portfolio and a counterparty to exchange or swap investment cash flows, assets, or market-linked returns at specified, future intervals. The Portfolio may enter into interest rate, total return, forward spread-lock, credit default, and other forms of swap agreements to manage its exposure to interest rates and credit risk. In connection with these agreements, securities may be identified as collateral in accordance with the terms of the respective swap agreements.
Interest rate swap agreements involve the exchange by the Portfolio with another party of their respective commitments to pay or receive interest, e.g., an exchange of floating rate payments for fixed rate payments with respect to the notional amount of principal. Certain forms of interest rate swap agreements may include: (i) interest rate caps, under which, in return for a premium, one party agrees to make payments to the other to the extent that interest rates exceed a specified rate, or “cap”, (ii) interest rate floors, under which, in return for a premium, one party agrees to make payments to the other to the extent that interest rates fall below a specified rate, or “floor”, or (iii) interest rate collars, under which a party sells a cap and purchases a floor or vice versa in an attempt to protect itself against interest rate movements exceeding given minimum or maximum levels.
Total return swap agreements involve commitments to pay interest in exchange for a market-linked return, both based on notional amounts. To the extent the total return of the security or index underlying the transaction exceeds or falls short of the offsetting interest rate obligation, the Portfolio will receive a payment from or make a payment to the counterparty.
Forward spread-lock swap agreements involve commitments to pay or receive a settlement amount calculated as the difference between the swap spread and a fixed spread, multiplied by the notional amount times the duration of the swap. The swap spread is the difference between the benchmark swap rate (market rate) and the specific Treasury rate.
Credit default swap agreements involve one party making a stream of payments to another party in exchange for the right to receive a specified return in the event of a default by a third party, typically corporate issues or sovereign issues of an emerging country, on its obligation. The Portfolio may use credit default swaps to provide a measure of protection against defaults of the issuers (i.e., to reduce risk where the Portfolio owns or has exposure to the sovereign issuer) or to take an active long or short position with respect to the likelihood of a particular issuer’s default. As a seller of protection, the Portfolio generally receives an upfront payment or a fixed rate of income throughout the term of the swap provided that there is no credit event. If the Portfolio is a seller of protection and a credit event occurs, as defined under the terms of that particular swap agreement, the Portfolio will pay to the buyer of the protection an amount up to the notional value of the swap and in certain instances take delivery of the security. As the seller, the Portfolio would effectively add leverage to its portfolio because, in addition to its total net assets, the Portfolio would be subject to investment exposure on the notional amount of the swap. As a buyer of protection, the Portfolio generally receives an amount up to the notional value of the swap if a credit event occurs. The treatment of credit default swaps and other swap agreements that provide for
| | | | |
| 14 | | PIMCO Variable Insurance Trust | | |
| | |
| |
| | | June 30, 2007 (Unaudited) |
contingent, non-periodic, bullet-type payments as “notional principal contracts” for U.S. federal income tax purposes is uncertain. Were the U.S. Internal Revenue Service (“IRS”) to take the position that a credit default swap or other bullet-type swap is not a “notional principal contract” for U.S. federal income tax purposes, payments received by the Portfolio from such investments might be subject to U.S. excise or income taxes.
Swaps are marked to market daily based upon quotations from market makers and the change in value, if any, is recorded as unrealized gain or loss on the Statement of Operations. Payments received or made at the beginning of the measurement period are reflected as such on the Statement of Assets and Liabilities. These upfront payments are recorded as realized gain or loss on the Statement of Operations upon termination or maturity of the swap. A liquidation payment received or made at the termination of the swap is recorded as realized gain or loss on the Statement of Operations. Net periodic payments received or paid by the Portfolio are included as part of realized gain or loss on the Statement of Operations. Entering into these agreements involves, to varying degrees, elements of credit, market and documentation risk in excess of the amounts recognized on the Statement of Assets and Liabilities. Such risks involve the possibility that there will be no liquid market for these agreements, that the counterparty to the agreements may default on its obligation to perform or disagree as to the meaning of contractual terms in the agreements and that there may be unfavorable changes in interest rates.
(m) Mortgage-Related and Other Asset-Backed Securities The Portfolio may invest in mortgage-related or other asset-backed securities. These securities include mortgage pass-through securities, collateralized mortgage obligations (“CMOs”), commercial mortgage-backed securities, mortgage dollar rolls, CMO residuals, stripped mortgage-backed securities (“SMBSs”) and other securities that directly or indirectly represent a participation in, or are secured by and payable from, mortgage loans on real property. The value of some mortgage-related or asset-backed securities may be particularly sensitive to changes in prevailing interest rates. Early repayment of principal on some mortgage-related securities may expose the Portfolio to a lower rate of return upon reinvestment of principal. The value of these securities may fluctuate in response to the market’s perception of the creditworthiness of the issuers. Additionally, although mortgages and mortgage-related securities are generally supported by some form of government or private guarantee and/or insurance, there is no assurance that private guarantors or insurers will meet their obligations.
(n) U.S. Government Agencies or Government-Sponsored Enterprises Securities issued by U.S. Government agencies or government-sponsored enterprises may not be guaranteed by the U.S. Treasury. The Government National Mortgage Association (“GNMA” or “Ginnie Mae”), a wholly owned U.S. Government corporation, is authorized to guarantee, with the full faith and credit of the U.S. Government, the timely payment of principal and interest on securities issued by institutions approved by GNMA and backed by pools of mortgages insured by the Federal Housing Administration or guaranteed by the Department of Veterans Affairs. Government-related guarantors (i.e., not backed by the full faith and credit of the U.S. Government) include the Federal National Mortgage Association (“FNMA” or “Fannie Mae”) and the Federal Home Loan Mortgage Corporation (“FHLMC” or “Freddie Mac”). Pass-through securities issued by FNMA are guaranteed as to timely payment of principal and interest by FNMA but are not backed by the full faith and credit of the U.S. Government. FHLMC guarantees the timely payment of interest and ultimate collection of principal, but its participation certificates are not backed by the full faith and credit of the U.S. Government.
(o) New Accounting Policies In July 2006, the Financial Accounting Standards Board (“FASB”) issued Interpretation No. 48, “Accounting for Uncertainty in Income Taxes—an Interpretation of FASB Statement No. 109” (the “Interpretation”). The Interpretation became effective for the Portfolio on June 29, 2007. Management has
evaluated the application of the Interpretation in relation to the Portfolio and has concluded that no single filing position or combination of filing positions identified as uncertain tax positions required the accrual of a tax liability in the accounting records of the Portfolio for the period ending June 30, 2007. Management will monitor all existing filing positions and future filing positions in light of the Interpretation and evaluate the need for any future tax accruals and financial statement disclosures as warranted.
In September 2006, the FASB issued Statement of Financial Accounting Standards No. 157, “Fair Value Measurements” (the “Statement”). The Statement is effective for fiscal years beginning after November 15, 2007 and will require expanded disclosure about fair value measurements, separately for each major category of assets and liabilities, that enables shareholders to assess the inputs used to develop those measurements, and for recurring fair value measurements using significant unobservable inputs the effect of the measurements on changes in net assets for the reporting period. Management is currently evaluating the application of the Statement to the Portfolio and will provide additional information in relation to the Statement on the Portfolio’s annual financial statements for the period ending December 31, 2007.
3. FEES AND EXPENSES
(a) Investment Advisory Fee PIMCO is a majority-owned subsidiary of Allianz Global Investors of America L.P. (“AGI”), and serves as investment adviser (the “Adviser”) to the Trust, pursuant to an investment advisory contract. The Adviser receives a monthly fee from the Portfolio, at an annual rate based on average daily net assets. The Advisory Fee for all classes is charged at an annual rate of 0.49%.
(b) Administration Fee PIMCO serves as administrator (the “Administrator”), and provides administrative services to the Trust for which it receives a monthly administrative fee based on each share class’s average daily net assets. As the Administrator, PIMCO bears the costs of various third-party services, including audit, custodial, portfolio accounting, legal, transfer agency and printing costs. The Administration Fee for all classes is charged at the annual rate of 0.25%.
(c) Distribution and Servicing Fees Allianz Global Investors Distributors LLC (“AGID”) is an indirect wholly-owned subsidiary of AGI and serves as the distributor (the “Distributor”) of the Trust’s shares. The Trust is permitted to reimburse AGID on a quarterly basis, out of the Administrative Class assets of the Portfolio in the amount of 0.15% on an annual basis of the average daily net assets of that class, for payments made to financial intermediaries that provide services in connection with the distribution of shares or administration of plans or programs that use Portfolio shares as their funding medium. The effective rate paid to AGID was 0.15% during the current fiscal year.
The Trust has adopted a Distribution Plan, for the Advisor Class shares of the Portfolio (the “Plan”). The Plan has been adopted pursuant to Rule 12b-1 under the Act. The Plan permits payments for expenses in connection with the distribution and marketing of Advisor Class shares and/or the provision of shareholder services to Advisor Class shareholders. The Plan permits the Portfolio to make total payments at an annual rate of 0.25% of its average daily net assets attributable to its Advisor Class shares.
(d) Portfolio Expenses The Trust is responsible for the following expenses: (i) salaries and other compensation of any of the Trust’s executive officers and employees who are not officers, directors, stockholders or employees of PIMCO or its subsidiaries or affiliates; (ii) taxes and governmental fees; (iii) brokerage fees and commissions and other portfolio transaction expenses; (iv) the costs of borrowing money, including interest expenses and bank overdraft charges; (v) fees and expenses of the Trustees who are not “interested persons” of PIMCO or the Trust, and any counsel retained exclusively for their benefit; (vi) extraordinary expenses, including costs of litigation and indemnification expenses;
| | | | | | |
| | Semiannual Report | | June 30, 2007 | | 15 |
Notes to Financial Statements (Cont.)
(vii) organization expenses and (viii) any expenses allocated or allocable to a specific class of shares, which include service fees payable with respect to the Administrative Class Shares, and may include certain other expenses as permitted by the Trust’s Multiple Class Plan adopted pursuant to Rule 18f-3 under the Act and subject to review and approval by the Trustees. The ratio of expenses to average net assets per share class, as disclosed in the Financial Highlights, may differ from the annual portfolio operating expenses per share class as disclosed in the Prospectus for the reasons set forth above.
Effective April 1, 2007, each Trustee, other than those affiliated with PIMCO or its affiliates, receives an annual retainer of $15,000, plus $2,375 for each Board of Trustees meeting attended in person, $500 for each committee meeting attended and $750 for each Board of Trustees meeting attended telephonically, plus reimbursement of related expenses. In addition, the audit committee chair receives an additional annual retainer of $2,000 and each other committee chair receives an additional annual retainer of $500. These expenses are allocated on a pro-rata basis to the various portfolios of the Trust according to their respective net assets. The Trust pays no compensation directly to any Trustee or any other officer who is affiliated with the Administrator, all of whom receive remuneration for their services to the Trust from the Administrator or its affiliates. Prior to April 1, 2007, each Trustee, other than those affiliated with PIMCO or its affiliates, received an annual retainer of $15,000 plus $2,000 for each Board of Trustees meeting attended ($500 for each special meeting attended), plus reimbursement of related expenses. The Audit Committee Chairman received an annual retainer of $1,500 and the Governance Committee Chairman received an annual retainer of $500. In addition, each member of a committee received $500 for each committee meeting attended.
(e) Expense Limitation PIMCO has contractually agreed to reduce total annual portfolio operating expenses for the Portfolio by waiving a portion of its administrative fee or reimbursing the Portfolio, to the extent that they would exceed, due to the payment of organizational expenses and pro rata Trustees’ fees, the sum of such Portfolio’s advisory fee, service fees, distribution fees (with respect to Advisor Class only), administrative fees and other expenses borne by the Portfolio not covered by the administrative fee as described above (other than organizational expenses and pro rata Trustees’ fees), plus 0.49 basis points. PIMCO may recoup these waivers and reimbursements for a period not exceeding three years, provided that total expenses, including such recoupment, do not exceed the annual expense limit. As of June 30, 2007, there was no recoverable amount.
4. RELATED PARTY TRANSACTIONS
The Adviser, Administrator, and Distributor are related parties as defined by FAS 57, Related Party Disclosures. Fees payable to these parties are disclosed in Note 3.
5. GUARANTEES AND INDEMNIFICATIONS
Under the Trust’s organizational documents, each Trustee, officer, employee or other agent of the Trust (including the Trust’s investment manager) is indemnified, to the extent permitted by the Act, against certain liabilities that may arise out of performance of their duties to the Portfolio. Additionally, in the normal course of business, the Portfolio enters into contracts that contain a variety of indemnification clauses. The Portfolio’s maximum exposure under these arrangements is unknown as this would involve future claims that may be made against the Portfolio that have not yet occurred. However, the Portfolio has not had prior claims or losses pursuant to these contracts and believes the risk of loss to be remote.
6. PURCHASES AND SALES OF SECURITIES
The length of time the Portfolio has held a particular security is not generally a consideration in investment decisions. A change in the securities held by the Portfolio is known as “portfolio turnover”. The Portfolio may engage in frequent and active trading of portfolio securities to achieve its investment objective, particularly during periods of volatile market movements. High portfolio turnover (e.g., over 100%) involves correspondingly greater expenses to the Portfolio, including brokerage commissions or dealer mark-ups and other transaction costs on the sale of securities and reinvestments in other securities. Such sales may also result in realization of taxable capital gains, including short-term capital gains (which are generally taxed at ordinary income tax rates). The trading costs and tax effects associated with portfolio turnover may adversely affect the Portfolio’s performance.
Purchases and sales of securities (excluding short-term investments) for the period ended June 30, 2007, were as follows (amounts in thousands):
| | | | | | | | | | | | |
| U.S. Government/Agency | | | | All Other |
| Purchases | | Sales | | | | Purchases | | Sales |
| $ | 7,455 | | $ | 6,184 | | | | $ | 2,284 | | $ | 90 |
7. SHARES OF BENEFICIAL INTEREST
The Portfolio may issue an unlimited number of shares of beneficial interest with a $0.001 par value. Changes in shares of beneficial interest were as follows (shares and amounts in thousands):
| | | | | | | | | |
| | | | | Period from
01/31/2007 to 06/30/2007 | |
| | | | | Shares | | | Amount | |
| | | |
Receipts for shares sold | | | | | | | | | |
Administrative Class | | | | 300 | | | $ | 3,000 | |
Advisor Class | | | | 2 | | | | 16 | |
Issued as reinvestment of distributions | | | | | | | | | |
Administrative Class | | | | 1 | | | | 7 | |
Advisor Class | | | | 0 | | | | 0 | |
Cost of shares redeemed | | | | | | | | | |
Administrative Class | | | | (2 | ) | | | (20 | ) |
Advisor Class | | | | 0 | | | | 0 | |
Net increase resulting from Portfolio share transactions | | | | 301 | | | $ | 3,003 | |
The following schedule shows the number of shareholders each owning 5% or more of the Portfolio and the total percentage of the Portfolio held by such shareholders:
| | | | | | |
| | | | | Number of
Shareholders | | % of Portfolio
Held |
Administrative Class | | | | 1 | | 100 |
Advisor Class | | | | 2 | | 100 |
8. REGULATORY AND LITIGATION MATTERS
Since February 2004, PIMCO, Allianz Global Investors of America L.P. (PIMCO’s parent company), AGID, and certain of their affiliates, including the PIMCO Funds (another series of funds managed by PIMCO), the Allianz Funds (formerly known as PIMCO Funds: Multi-Manager Series (another series of funds managed by affiliates of PIMCO)), certain Trustees of the Trust (in their capacity as Trustees of the PIMCO Funds or the Allianz Funds) and certain employees of PIMCO, have been named as defendants in fifteen lawsuits filed in various jurisdictions. Eleven of those lawsuits concern “market timing,” and they have been transferred to and
| | | | |
| 16 | | PIMCO Variable Insurance Trust | | |
| | |
| |
| | | June 30, 2007 (Unaudited) |
consolidated for pre-trial proceedings in a multi-district litigation proceeding in the U.S. District Court for the District of Maryland; the other four lawsuits concern “revenue sharing” and have been consolidated into a single action in the U.S. District Court for the District of Connecticut. The lawsuits have been commenced as putative class actions on behalf of investors who purchased, held or redeemed shares of the various series of the PIMCO Funds and the Allianz Funds during specified periods, or as derivative actions on behalf of the PIMCO Funds and the Allianz Funds.
The market timing actions in the District of Maryland generally allege that certain hedge funds were allowed to engage in “market timing” in certain funds of the PIMCO Funds and the Allianz Funds and this alleged activity was not disclosed. Pursuant to tolling agreements entered into with the derivative and class action plaintiffs, PIMCO, certain PIMCO Funds Trustees, and certain employees of PIMCO who were previously named as defendants have all been dropped as defendants in the market timing actions; the plaintiffs continue to assert claims on behalf of the shareholders of the PIMCO Funds or on behalf of the PIMCO Funds itself against other defendants. By order dated November 3, 2005, the U.S. District Court for the District of Maryland granted the PIMCO Funds’ motion to dismiss claims asserted against it in a consolidated amended complaint where the PIMCO Funds were named, in the complaint, as a nominal defendant. The revenue sharing action in the District of Connecticut generally alleges that fund assets were inappropriately used to pay brokers to promote funds of the PIMCO Funds and the Allianz Funds, including directing fund brokerage transactions to such brokers, and that such alleged arrangements were not fully disclosed to shareholders. On August 11, 2005, the U.S. District Court for the District of Connecticut conducted a hearing on defendants’ motion to dismiss the consolidated amended complaint in the revenue sharing action but has not yet ruled on the motion to dismiss. The market timing and revenue sharing lawsuits seek, among other things, unspecified compensatory damages plus interest and, in some cases, punitive damages, the rescission of investment advisory contracts, the return of fees paid under those contracts and restitution.
Two nearly identical class action civil complaints have been filed in August 2005, in the Northern District of Illinois Eastern Division, alleging that the plaintiffs each purchased and sold a 10-year Treasury note futures contract and suffered damages from an alleged shortage when PIMCO held both physical and futures positions in 10-year Treasury notes for its client accounts. The two actions have been consolidated into one action, and the two separate complaints have been replaced by a consolidated complaint. PIMCO is a named defendant, and PIMCO Funds has been added as a defendant, to the consolidated action. PIMCO strongly believes the complaint is without merit and intends to vigorously defend itself.
In April 2006, certain portfolios of the Trust and certain other funds managed by PIMCO were served in an adversary proceeding brought by the Official Committee
of Asbestos Claimants of G-I Holdings, Inc. in G-I Holdings, Inc.’s bankruptcy in the District of New Jersey. In July 2004, PIMCO was named in this lawsuit and remains a defendant. The plaintiff seeks to recover for the bankruptcy estate assets that were transferred by the predecessor entity of G-I Holdings, Inc. to a wholly-owned subsidiary in 1994. The subsidiary has since issued notes, of which certain portfolios of the Trust and certain other funds managed by PIMCO are alleged to be holders. The complaint alleges that in 2000, more than two hundred noteholders—including certain portfolios of the Trust and certain other funds managed by PIMCO—were granted a second priority lien on the assets of the subsidiary in exchange for their consent to a refinancing transaction and the granting of a first priority lien to the lending banks. The plaintiff is seeking invalidation of the lien in favor of the noteholders and/or the value of the lien. On June 21, 2006, the District of New Jersey overturned the Bankruptcy Court’s decision granting permission to file the adversary proceeding and remanded the matter to the Bankruptcy Court for further proceedings. Following a motion to reconsider, the District Court upheld its remand on August 7, 2006, and instructed the Bankruptcy Court to conduct a “cost-benefit” analysis of the Committee’s claims, including the claims against the noteholders. The Bankruptcy Court held a status conference on October 25, 2006 and set a briefing schedule relating to this cost-benefit analysis.
The foregoing speaks only as of the date of this report. It is possible that these matters and/or other developments resulting from these matters could result in increased portfolio redemptions or other adverse consequences to the Portfolio. However, PIMCO and AGID believe that these matters are not likely to have a material adverse effect on the Portfolio or on PIMCO’s or AGID’s ability to perform their respective investment advisory or distribution services relating to the Portfolio.
9. FEDERAL INCOME TAX MATTERS
The Portfolio intends to qualify as a regulated investment company under sub-chapter M of the Internal Revenue Code (the “Code”) and distribute all of its taxable income and net realized gains, if applicable, to shareholders. Accordingly, no provision for Federal income taxes has been made.
As of June 30, 2007, the aggregate cost of investments was the same for federal income tax and financial statement purposes. The net unrealized appreciation (depreciation) of investment securities for federal income tax purposes is as follows (amount in thousands):
| | | | |
Aggregate
Gross
Unrealized
Appreciation | | Aggregate
Gross
Unrealized
(Depreciation) | | Net
Unrealized
(Depreciation) |
$ 1 | | $ (8) | | $ (7) |
| | | | | | |
| | Semiannual Report | | June 30, 2007 | | 17 |
| | |
| |
Privacy Policy* | | (Unaudited) |
The Funds consider customer privacy to be a fundamental aspect of their relationships with shareholders and are committed to maintaining the confidentiality, integrity and security of their current, prospective and former shareholders’ personal information. To ensure their shareholders’ privacy, the Funds have developed policies that are designed to protect this confidentiality, while allowing shareholder needs to be served.
Obtaining Personal Information
In the course of providing shareholders with products and services, the Funds and certain service providers to the Funds, such as the Funds’ investment advisers (“Advisers”), may obtain non-public personal information about shareholders, which may come from sources such as account applications and other forms, from other written, electronic or verbal correspondence, from shareholder transactions, from a shareholder’s brokerage or financial advisory firm, financial adviser or consultant, and/or from information captured on the Funds’ internet web sites.
Respecting Your Privacy
As a matter of policy, the Funds do not disclose any personal or account information provided by shareholders or gathered by the Funds to non-affiliated third parties, except as required or permitted by law or as necessary for such third parties to perform their agreements with respect to the Funds. As is common in the industry, non-affiliated companies may from time to time be used to provide certain services, such as preparing and mailing prospectuses, reports, account statements and other information, conducting research on shareholder satisfaction and gathering shareholder proxies. A Fund’s Distributor may also retain non-affiliated companies to market the Fund’s shares or products which use the Fund’s shares and enter into joint marketing agreements with other companies. These companies may have access to a shareholder’s personal and account information, but are permitted to use this information solely to provide the specific service or as otherwise permitted by law. In most cases, the shareholders will be clients of a third party, but the Funds may also provide a shareholder’s personal and account information to the shareholder’s respective brokerage or financial advisory firm.
Sharing Information with Third Parties
The Funds reserve the right to disclose or report personal information to non-affiliated third parties, in limited circumstances, where the Funds believe in good faith that disclosure is required under law to cooperate with regulators or law enforcement authorities, to protect their rights or property or upon reasonable request by any Fund in which a shareholder has chosen to invest. In addition, the Funds may disclose information about a shareholder’s accounts to a non-affiliated third party with the consent of the shareholder.
Sharing Information with Affiliates
The Funds may share shareholder information with their affiliates in connection with servicing their shareholders’ accounts or to provide shareholders with information about products and services that the Funds or their Advisers, principal underwriters or their affiliates (“Service Affiliates”) believe may be of interest to such shareholders. The information that the Funds share may include, for example, a shareholder’s participation in one of the Funds or in other investment programs sponsored by a Service Affiliate, a shareholder’s ownership of certain types of accounts (such as IRAs), or other data about a shareholder’s accounts. The Funds’ Service Affiliates, in turn, are not permitted to share shareholder information with non-affiliated entities, except as required or permitted by law.
Procedures to Safeguard Private Information
The Funds take seriously the obligation to safeguard shareholder non-public personal information. In addition to this policy, the Funds have also implemented procedures that are designed to restrict access to a shareholder’s non-public personal information only to internal personnel who need to know that information in order to provide products or services to such shareholders. In order to guard a shareholder’s non-public personal information, physical, electronic and procedural safeguards are in place.
* This Privacy Policy applies to the following entities: PIMCO Funds, PIMCO Variable Insurance Trust, PCM Fund, Inc. and PIMCO Strategic Global Government Fund, Inc. (collectively, the “Funds”).
| | | | |
| 18 | | PIMCO Variable Insurance Trust | | |
Investment Adviser and Administrator
Pacific Investment Management Company LLC
840 Newport Center Drive
Newport Beach, California 92660
Distributor
Allianz Global Investors Distributors LLC
1345 Avenue of the Americas
New York, New York 10105
Custodian
State Street Bank & Trust Company
801 Pennsylvania
Kansas City, Missouri 64105
Transfer Agent
Boston Financial Data Services–Midwest
330 W. 9th Street
Kansas City, Missouri 64105
Legal Counsel
Dechert LLP
1775 I Street, N.W.
Washington, D.C. 20006
Independent Registered Public Accounting Firm
PricewaterhouseCoopers LLP
1055 Broadway
Kansas City, Missouri 64105
P I M C O

Table of Contents
This material is authorized for use only when preceded or accompanied by the current PIMCO Variable Insurance Trust (the “Trust”) prospectus. Investors should consider the investment objectives, risks, charges and expenses of this Trust carefully before investing. Ask your financial professional to explain all charges that may apply. This and other information is contained in the Trust’s prospectus. The variable product prospectus may be obtained by contacting your Investment Consultant. Please read the Trust and variable product prospectus carefully before you invest or send money.
Chairman’s Letter
Dear PIMCO Variable Insurance Trust Shareholder:
It is our pleasure to present to you the semiannual report for the PIMCO Variable Insurance Trust, covering the six-month period ended June 30, 2007. The PIMCO Variable Insurance Trust’s net assets were $8.68 billion at June 30, 2007, as compared to $7.76 billion at December 31, 2006.
Highlights of the financial markets during the reporting period include:
| | n | | Economic data during the first quarter of 2007 pointed to slower growth, which heightened market expectations for a decrease in the Federal Funds Rate. By the second quarter, economic data, such as employment statistics, provided little indication of economic weakness, causing expectations of a decrease in the Federal Funds Rate to unwind and U.S. interest rates to move higher. Interest rates in Europe and the U.K. also rose over the period as central banks raised their key lending rates due to inflation concerns. The benchmark ten-year U.S. Treasury yielded 5.03% as of June 30, 2007, or 0.32% higher than at the beginning of the year. |
| | n | | Most bonds generally returned much of their gains from earlier in the year as worldwide growth and capital flows drove interest rates higher in the second quarter. Increased risk aversion in global financial markets, due in part to subprime mortgage worries in the U.S., also contributed to the rise in interest rates. The Lehman Brothers Aggregate Bond Index, which includes Treasury, investment-grade corporate and mortgage-backed securities, returned 0.98% for the six-month period. |
| | n | | Locally issued emerging market (“EM”) bonds posted positive returns for the reporting period. Yields on these bonds declined and the local currencies in which they are denominated generally gained, amid increasing investor awareness, strong economic growth and surging capital inflows. External EM bonds (debt instruments issued by emerging markets countries and typically denominated in U.S. dollars) lagged behind local EM bonds (debt instruments issued by emerging markets countries and denominated in the currency of the issuer), as external EM bonds tend to trade more in-line with U.S. Treasuries. |
| | n | | Treasury Inflation-Protected Securities (“TIPS”) outpaced nominal bonds (non-inflation linked bonds) for the first part of the year and all but the longest maturity TIPS outperformed in the second quarter as high gasoline prices drove higher inflation accruals. Commodities, as represented by the Dow Jones-AIG Commodity Total Return Index, returned 4.46% for the period. Equities, as measured by the S&P 500 Index and the Russell 2000 Index, returned 6.96% and 6.45%, respectively, for the period. |
On the following pages, please find specific details as to the Portfolio’s total return investment performance and a discussion of those factors that affected performance.
Thank you for the trust you have placed in us. We will continue to work diligently to serve your investment needs.
Sincerely,
Brent R. Harris
Chairman, PIMCO Variable Insurance Trust
July 31, 2007
| | | | | | |
| | Semiannual Report | | June 30, 2007 | | 1 |
Important Information About the Portfolio
PIMCO Variable Insurance Trust (the “Trust”) is an open-end management investment company currently consisting of twenty separate investment portfolios, including the StocksPLUS® Growth and Income Portfolio (the “Portfolio”). The Portfolio is only available as a funding vehicle under variable life insurance policies or variable annuity contracts issued by insurance companies (“Variable Contracts”). Individuals may not purchase shares of the Portfolio directly. Shares of the Portfolio also may be sold to qualified pension and retirement plans outside of the separate account context.
We believe that bond funds have an important role to play in a well diversified investment portfolio. It is important to note, however, that in an environment where interest rates may trend upward, rising rates would negatively impact the performance of most bond funds, and fixed-income securities held by a fund are likely to decrease in value. The price volatility of fixed-income securities can also increase during periods of rising interest rates resulting in increased losses to a fund. Bond funds and individual bonds with a longer duration (a measure of the expected life of a security) tend to be more sensitive to changes in interest rates, usually making them more volatile than securities or funds with shorter durations.
The Portfolio may be subject to various risks in addition to those described above. Some of these risks may include, but are not limited to, the following: credit risk, high yield risk, market risk, issuer risk, liquidity risk, derivatives risk, equity risk, mortgage risk, non-U.S. investment risk, emerging markets risk, currency risk, leveraging risk and management risk. A complete description of these risks is contained in the Portfolio’s prospectus. The Portfolio may use derivative instruments as part of an investment strategy, as described under “Portfolio Insights”, or for hedging purposes. Use of these instruments may involve certain costs and risks such as liquidity risk, interest rate risk, market risk, credit risk, management risk and the risk that the Portfolio could not close out a position when it would be most advantageous to do so. Because the Portfolio may invest in derivatives, it could lose more than the principal amount invested in these instruments. Investing in non-U.S. securities may entail risk due to non-U.S. economic and political developments; this risk may be increased when investing in emerging markets.
On the performance summary page in this Semiannual Report, the Total Return Investment Performance table measures performance assuming that all dividend and capital gain distributions were reinvested.
An investment in the Portfolio is not a deposit of a bank and is not guaranteed or insured by the Federal Deposit Insurance Corporation or any other government agency. It is possible to lose money on investments in the Portfolio.
PIMCO has adopted written proxy voting policies and procedures (“Proxy Policy”) as required by Rule 206(4)-6 under the Investment Advisers Act of 1940, as amended. The Proxy Policy has been adopted by the Trust as the policies and procedures that PIMCO will use when voting proxies on behalf of the Portfolio. A description of the policies and procedures that PIMCO uses to vote proxies relating to portfolio securities of the Portfolio, and information about how the Portfolio voted proxies relating to portfolio securities held during the most recent twelve-month period ended June 30, are available without charge, upon request, by calling the Trust at 1-866-746-2606 and on the Portfolio’s website at www.pimco.com.
The Portfolio files its complete schedule of portfolio holdings with the SEC for the first and third quarters of each fiscal year on Form N-Q. A copy of the Trust’s Form N-Q is also available on the SEC’s website at http://www.sec.gov and may be reviewed and copied at the SEC’s Public Reference Room in Washington D.C. Information on the operation of the Public Reference Room may be obtained by calling 1-800-SEC-0330, and is available without charge, upon request, by calling the Trust at 1-866-746-2606 and on the Portfolio’s website at www.pimco.com.
PIMCO Variable Insurance Trust is distributed by Allianz Global Investors Distributors LLC, 1345 Avenue of the Americas, New York, NY 10105.
| | | | |
| 2 | | PIMCO Variable Insurance Trust | | |
The following disclosure provides important information regarding the Portfolio’s Expense Example (“Example” or “Expense Example”), which appears in this Semiannual Report. Please refer to this information when reviewing the Expense Example for the Portfolio.
Example
As a shareholder of the Portfolio, you incur two types of costs: (1) transaction costs and (2) ongoing costs, including advisory and administrative fees; distribution and/or service (12b-1) fees (Administrative Class only); and other Portfolio expenses. The Example is intended to help you understand your ongoing costs (in dollars) of investing in the Portfolio and to compare these costs with the ongoing costs of investing in other mutual funds. The Expense Example does not reflect any fees or other expenses imposed by the Variable Contracts. If it did, the expenses reflected in the Expense Example would be higher. The Example is based on an investment of $1,000 invested at the beginning of the period and held for the entire period indicated, which is from January 1, 2007 to June 30, 2007.
Actual Expenses
The information in the table under the heading “Actual Performance” provides information about actual account values and actual expenses. You may use the information in these columns, together with the amount you invested, to estimate the expenses that you paid over the period. Simply divide your account value by $1,000 (for example, an $8,600 account value divided by $1,000 = $8.60), then multiply the result by the number in the row titled “Expenses Paid During Period” to estimate the expenses you paid on your account during this period.
Hypothetical Example for Comparison Purposes
The information in the table under the heading “Hypothetical Performance (5% return before expenses)” provides information about hypothetical account values and hypothetical expenses based on the Portfolio’s actual expense ratio and an assumed rate of return of 5% per year before expenses, which is not the Portfolio’s actual return. The hypothetical account values and expenses may not be used to estimate the actual ending account balance or expenses you paid for the period. You may use this information to compare the ongoing costs of investing in the Portfolio and other portfolios. To do so, compare this 5% hypothetical example with the 5% hypothetical examples that appear in the shareholder reports of the other portfolios.
Please note that the expenses shown in the table are meant to highlight your ongoing costs only and do not reflect any transactional costs. Therefore, the information under the heading “Hypothetical Performance (5% return before expenses)” is useful in comparing ongoing costs only, and will not help you determine the relative total costs of owning different portfolios. In addition, if these transactional costs were included, your costs would have been higher.
The expense ratio may vary period to period because of various factors, such as an increase in expenses not covered by the advisory and administrative fees (such as expenses of the trustees and their counsel, litigation expense and interest expense).
| | | | | | |
| | Semiannual Report | | June 30, 2007 | | 3 |
PIMCO StocksPLUS® Growth and Income Portfolio
Cumulative Returns Through June 30, 2007
$10,000 invested at the beginning of the first full month following the inception date of the Portfolio’s Administrative Class.
Allocation Breakdown‡
| | |
Corporate Bonds & Notes | | 37.8% |
Short-Term Instruments | | 22.7% |
U.S. Treasury Obligations | | 12.5% |
U.S. Government Agencies | | 9.4% |
Asset-Backed Securities | | 7.8% |
Mortgage-Backed Securities | | 6.7% |
Other | | 3.1% |
| | ‡ | % of Total Investments as of 06/30/2007 |
| | | | | | | | | | |
| Average Annual Total Return for the period ended June 30, 2007 |
| | | | | 6 Months* | | 1 Year | | 5 Years | | Portfolio
Inception
(12/31/97) |
| | PIMCO StocksPLUS® Growth and Income Portfolio
Administrative Class | | 6.64% | | 20.29% | | 10.78% | | 6.55% |
| | S&P 500 Index± | | 6.96% | | 20.59% | | 10.71% | | 6.39% |
All Portfolio returns are net of fees and expenses.
* Cumulative return.
Performance quoted represents past performance. Past performance is no guarantee of future results. Investment return and principal value will fluctuate so the Portfolio shares, when redeemed, may be worth more or less than their original cost. The Portfolio’s performance does not reflect the deduction of additional charges and expenses imposed in connection with investing in Variable Contracts, which will reduce returns. Current performance may be lower or higher than the performance data quoted. Performance data current to the most recent month-end is available by calling (800) 927-4648.
± S&P 500 Index is an unmanaged market index generally considered representative of the stock market as a whole. The index focuses on the large-cap segment of the U.S. equities market. It is not possible to invest directly in the index. The index does not reflect deductions for fees and expenses.
| | | | | | |
| Expense Example | | Actual Performance | | Hypothetical Performance |
| | | | | (5% return before expenses) |
Beginning Account Value (01/01/07) | | $ | 1,000.00 | | $ | 1,000.00 |
Ending Account Value (06/30/07) | | $ | 1,066.40 | | $ | 1,022.07 |
Expenses Paid During Period† | | $ | 2.82 | | $ | 2.76 |
† Expenses are equal to the Portfolio’s Administrative Class annualized expense ratio of 0.55%, multiplied by the average account value over the period, multiplied by 181/365 (to reflect the one-half year period). Overall fees and expenses of investing in the Portfolio will be higher because the example does not reflect Variable Contract fees and expenses.
Please refer to page 3 herein for an explanation of the information presented in the above Expense Example.
Portfolio Insights
» | | The PIMCO StocksPLUS® Growth and Income Portfolio seeks to exceed the total return of the S&P 500 by investing under normal circumstances substantially all of its assets in S&P 500 derivatives, backed by a portfolio of fixed-income instruments. |
» | | The Portfolio’s fixed-income portfolio underperformed the financing cost embedded in equity index futures holdings, thus leading the Portfolio to underperform the S&P 500. |
| » | | U.S. duration exposure was negative for performance as interest rates moved higher in instruments where the Portfolio’s duration exposure was concentrated. In particular, Eurodollar futures yields moved higher. |
| » | | A U.S. yield curve strategy involving short positions in longer duration (7+ year duration) instruments partially offset the negative duration impact as these rates moved higher, generating a positive price return. |
| » | | Short maturity (less than one year) exposures in Europe, the U.K. and Japan were also negative for performance as upward rate movements were pronounced in these markets. |
| » | | Holdings of mortgage-backed securities detracted from performance as they underperformed like-duration Treasuries. |
| » | | Credit sensitive holdings, including corporate bonds and emerging market bonds, added value as they outperformed like-duration Treasuries. |
| » | | Currency strategies, including long exposure to the euro and a basket of emerging market currencies, helped performance as these currencies appreciated relative to the U.S. dollar. |
| | | | |
| 4 | | PIMCO Variable Insurance Trust | | |
Financial Highlights StocksPLUS® Growth and Income Portfolio
| | | | | | | | | | | | | | | | | | | | | | | | |
| Selected per Share Data for the Year or Period Ended: | | 06/30/2007+ | | | 12/31/2006 | | | 12/31/2005 | | | 12/31/2004 | | | 12/31/2003 | | | 12/31/2002 | |
| | | | | | |
Administrative Class | | | | | | | | | | | | | | | | | | | | | | | | |
Net asset value beginning of year or period | | $ | 11.15 | | | $ | 10.20 | | | $ | 10.09 | | | $ | 9.26 | | | $ | 7.25 | | | $ | 9.35 | |
Net investment income (a) | | | 0.27 | | | | 0.42 | | | | 0.29 | | | | 0.13 | | | | 0.13 | | | | 0.26 | |
Net realized/unrealized gain (loss) on investments (a) | | | 0.46 | | | | 1.06 | | | | 0.06 | | | | 0.86 | | | | 2.06 | | | | (2.14 | ) |
Total income (loss) from investment operations | | | 0.73 | | | | 1.48 | | | | 0.35 | | | | 0.99 | | | | 2.19 | | | | (1.88 | ) |
Dividends from net investment income | | | (0.35 | ) | | | (0.53 | ) | | | (0.24 | ) | | | (0.16 | ) | | | (0.18 | ) | | | (0.22 | ) |
Total distributions | | | (0.35 | ) | | | (0.53 | ) | | | (0.24 | ) | | | (0.16 | ) | | | (0.18 | ) | | | (0.22 | ) |
Net asset value end of year or period | | $ | 11.53 | | | $ | 11.15 | | | $ | 10.20 | | | $ | 10.09 | | | $ | 9.26 | | | $ | 7.25 | |
Total return | | | 6.64 | % | | | 14.90 | % | | | 3.49 | % | | | 10.81 | % | | | 30.38 | % | | | (20.22 | )% |
Net assets end of year or period (000s) | | $ | 85,942 | | | $ | 85,425 | | | $ | 229,193 | | | $ | 266,851 | | | $ | 267,880 | | | $ | 218,993 | |
Ratio of expenses to average net assets | | | 0.55 | %* | | | 0.59 | %(c) | | | 0.65 | % | | | 0.65 | % | | | 0.65 | % | | | 0.65 | %(b) |
Ratio of expenses to average net assets excluding interest expense | | | 0.55 | %* | | | 0.59 | %(c) | | | 0.65 | % | | | 0.65 | % | | | 0.65 | % | | | 0.65 | %(b) |
Ratio of net investment income to average net assets | | | 4.82 | %* | | | 3.95 | % | | | 2.87 | % | | | 1.39 | % | | | 1.54 | % | | | 3.13 | % |
Portfolio turnover rate | | | 26 | % | | | 135 | % | | | 264 | % | | | 249 | % | | | 134 | % | | | 192 | % |
+ Unaudited
* Annualized
(a) Per share amounts based on average number of shares outstanding during the period.
(b) If the investment manager had not reimbursed expenses, the ratio of expenses to average net assets would have been 0.66%.
(c) Effective October 31, 2006, the advisory fee was reduced to 0.30%.
| | | | | | |
| See Accompanying Notes | | Semiannual Report | | June 30, 2007 | | 5 |
Statement of Assets and Liabilities StocksPLUS® Growth and Income Portfolio
| | | | |
| (Amounts in thousands, except per share amounts) | | June 30, 2007 | |
| | | (Unaudited) | |
| |
Assets: | | | | |
Investments, at value | | $ | 91,752 | |
Cash | | | 12 | |
Foreign currency, at value | | | 526 | |
Receivable for investments sold | | | 197 | |
Receivable for Portfolio shares sold | | | 6 | |
Interest and dividends receivable | | | 552 | |
Variation margin receivable | | | 831 | |
Swap premiums paid | | | 258 | |
Unrealized appreciation on foreign currency contracts | | | 196 | |
Unrealized appreciation on swap agreements | | | 135 | |
| | | | 94,465 | |
| |
Liabilities: | | | | |
Payable for investments purchased | | $ | 1,300 | |
Payable for investments purchased on a delayed-delivery basis | | | 1,100 | |
Payable for Portfolio shares redeemed | | | 8 | |
Written options outstanding | | | 38 | |
Accrued investment advisory fee | | | 23 | |
Accrued administration fee | | | 8 | |
Accrued servicing fee | | | 13 | |
Variation margin payable | | | 972 | |
Swap premiums received | | | 73 | |
Unrealized depreciation on foreign currency contracts | | | 24 | |
Unrealized depreciation on swap agreements | | | 302 | |
| | | | 3,861 | |
| |
Net Assets | | $ | 90,604 | |
| |
Net Assets Consist of: | | | | |
Paid in capital | | $ | 135,415 | |
Undistributed net investment income | | | 5,005 | |
Accumulated undistributed net realized (loss) | | | (48,369 | ) |
Net unrealized (depreciation) | | | (1,447 | ) |
| | | $ | 90,604 | |
| |
Net Assets: | | | | |
Institutional Class | | $ | 4,662 | |
Administrative Class | | | 85,942 | |
| |
Shares Issued and Outstanding: | | | | |
Institutional Class | | | 400 | |
Administrative Class | | | 7,453 | |
| |
Net Asset Value and Redemption Price Per Share (Net Asset Per Share Outstanding) | | | | |
Institutional Class | | $ | 11.65 | |
Administrative Class | | | 11.53 | |
| |
Cost of Investments Owned | | $ | 92,307 | |
Cost of Foreign Currency Held | | $ | 526 | |
Premiums Received on Written Options | | $ | 129 | |
| | | | |
| 6 | | PIMCO Variable Insurance Trust | | See Accompanying Notes |
Statement of Operations StocksPLUS® Growth and Income Portfolio
| | | | |
| (Amounts in thousands) | | Six Months Ended
June 30, 2007 | |
| | | (Unaudited) | |
| |
| Investment Income: | | | | |
Interest | | $ | 2,340 | |
Dividends | | | 68 | |
Miscellaneous income | | | 2 | |
Total Income | | | 2,410 | |
| |
Expenses: | | | | |
Investment advisory fees | | | 134 | |
Administration fees | | | 45 | |
Servicing fees – Administrative Class | | | 63 | |
Trustees’ fees | | | 1 | |
Interest expense | | | 2 | |
Total Expenses | | | 245 | |
| |
Net Investment Income | | | 2,165 | |
| |
Net Realized and Unrealized Gain (Loss): | | | | |
Net realized (loss) on investments | | | (78 | ) |
Net realized gain on futures contracts, written options and swaps | | | 5,514 | |
Net realized gain on foreign currency transactions | | | 66 | |
Net change in unrealized (depreciation) on investments | | | (6 | ) |
Net change in unrealized (depreciation) on futures contracts, written options and swaps | | | (1,941 | ) |
Net change in unrealized appreciation on translation of assets and liabilities denominated in foreign currencies | | | 145 | |
Net Gain | | | 3,700 | |
| |
Net Increase in Net Assets Resulting from Operations | | $ | 5,865 | |
| | | | | | |
| See Accompanying Notes | | Semiannual Report | | June 30, 2007 | | 7 |
Statements of Changes in Net Assets StocksPLUS® Growth and Income Portfolio
| | | | | | | | |
| (Amounts in thousands) | | Six Months Ended
June 30, 2007 | | | Year Ended
December 31, 2006 | |
| | | (Unaudited) | | | | |
| | |
| Increase (Decrease) in Net Assets from: | | | | | | | | |
| | |
Operations: | | | | | | | | |
Net investment income | | $ | 2,165 | | | $ | 5,394 | |
Net realized gain | | | 5,502 | | | | 10,420 | |
Net change in unrealized appreciation (depreciation) | | | (1,802 | ) | | | 3,907 | |
Net increase resulting from operations | | | 5,865 | | | | 19,721 | |
| | |
Distributions to Shareholders: | | | | | | | | |
From net investment income | | | | | | | | |
Institutional Class | | | (143 | ) | | | (289 | ) |
Administrative Class | | | (2,609 | ) | | | (4,645 | ) |
| | |
Total Distributions | | | (2,752 | ) | | | (4,934 | ) |
| | |
Portfolio Share Transactions: | | | | | | | | |
Receipts for shares sold | | | | | | | | |
Institutional Class | | | 1,312 | | | | 2,084 | |
Administrative Class | | | 2,953 | | | | 3,872 | |
Issued as reinvestment of distributions | | | | | | | | |
Institutional Class | | | 143 | | | | 289 | |
Administrative Class | | | 2,609 | | | | 4,644 | |
Cost of shares redeemed | | | | | | | | |
Institutional Class | | | (2,888 | ) | | | (2,654 | ) |
Administrative Class | | | (7,973 | ) | | | (166,615 | ) |
Net (decrease) resulting from Portfolio share transactions | | | (3,844 | ) | | | (158,380 | ) |
| | |
Total (Decrease) in Net Assets | | | (731 | ) | | | (143,593 | ) |
| | |
Net Assets: | | | | | | | | |
Beginning of period | | | 91,335 | | | | 234,928 | |
End of period* | | $ | 90,604 | | | $ | 91,335 | |
| | |
*Including undistributed net investment income of: | | $ | 5,005 | | | $ | 5,592 | |
| | | | |
| 8 | | PIMCO Variable Insurance Trust | | See Accompanying Notes |
| | |
| |
| Schedule of Investments StocksPLUS® Growth and Income Portfolio | | June 30, 2007 (Unaudited) |
| | | | | | | | |
| | | | | PRINCIPAL
AMOUNT
(000S) | | | | VALUE
(000S) |
| BANK LOAN OBLIGATIONS 0.4% |
| Metro-Goldwyn-Mayer, Inc. | | | | |
8.614% due 04/08/2012 | | $ | | 100 | | $ | | 100 |
| |
| OAO Rosneft Oil Co. | | | | | | | | |
6.000% due 09/16/2007 | | | | 300 | | | | 301 |
| | | | | | | | |
Total Bank Loan Obligations
(Cost $400) | | | | 401 |
| | | | | | | | |
|
| CORPORATE BONDS & NOTES 38.3% |
|
| BANKING & FINANCE 26.4% |
| American Express Bank FSB | | | | |
5.380% due 10/20/2009 | | | | 200 | | | | 200 |
| |
| American Express Credit Corp. | | | | |
5.380% due 11/09/2009 | | | | 200 | | | | 200 |
| |
| American Honda Finance Corp. | | | | |
5.407% due 02/09/2010 | | | | 900 | | | | 901 |
| |
| American International Group, Inc. | | | | |
5.370% due 06/16/2009 | | | | 800 | | | | 803 |
| |
| Bank of America Corp. | | | | |
5.370% due 06/19/2009 | | | | 800 | | | | 801 |
| |
| Bank of Ireland | | | | |
5.370% due 12/19/2008 | | | | 900 | | | | 901 |
| |
| CIT Group, Inc. | | | | |
5.000% due 11/24/2008 | | | | 300 | | | | 298 |
| |
| Citigroup Funding, Inc. | | | | |
5.360% due 06/26/2009 | | | | 100 | | | | 100 |
| |
| Citigroup, Inc. | | | | |
4.200% due 12/20/2007 | | | | 2,500 | | | | 2,487 |
| |
| Enron Credit Linked Notes Trust | | | | |
8.000% due 08/15/2005 (a) | | | | 1,700 | | | | 1,454 |
| |
| Export-Import Bank of Korea | | | | |
5.600% due 11/16/2010 | | | | 1,900 | | | | 1,905 |
| |
| Ford Motor Credit Co. | | | | |
4.950% due 01/15/2008 | | | | 100 | | | | 99 |
6.190% due 09/28/2007 | | | | 600 | | | | 600 |
6.625% due 06/16/2008 | | | | 3,100 | | | | 3,099 |
| |
| General Electric Capital Corp. | | | | |
5.385% due 10/26/2009 | | | | 400 | | | | 400 |
5.390% due 01/05/2009 | | | | 200 | | | | 200 |
5.430% due 08/15/2011 | | | | 800 | | | | 800 |
| |
| Goldman Sachs Group, Inc. | | | | |
5.410% due 03/30/2009 | | | | 200 | | | | 200 |
5.440% due 11/16/2009 | | | | 900 | | | | 901 |
| |
| HSBC Finance Corp. | | | | |
6.538% due 11/13/2007 | | | | 100 | | | | 100 |
| |
| ICICI Bank Ltd. | | | | |
5.895% due 01/12/2010 | | | | 300 | | | | 301 |
| |
| Lehman Brothers Holdings, Inc. | | | | |
5.445% due 01/23/2009 | | | | 300 | | | | 300 |
5.460% due 11/16/2009 | | | | 500 | | | | 501 |
5.579% due 07/18/2011 | | | | 100 | | | | 100 |
| |
| Merrill Lynch & Co., Inc. | | | | |
5.390% due 12/22/2008 | | | | 500 | | | | 500 |
5.395% due 10/23/2008 | | | | 200 | | | | 200 |
5.440% due 12/04/2009 | | | | 200 | | | | 200 |
| |
| Morgan Stanley | | | | |
5.446% due 01/15/2010 | | | | 500 | | | | 500 |
| |
| Osiris Capital PLC | | | | |
8.206% due 01/15/2010 | | | | 500 | | | | 503 |
| |
| Royal Bank of Scotland Group PLC | | | | |
5.360% due 12/21/2007 | | | | 600 | | | | 600 |
5.750% due 07/06/2012 | | | | 300 | | | | 300 |
| |
| | | | | | | | |
| | | | | PRINCIPAL
AMOUNT
(000S) | | | | VALUE
(000S) |
| Spinnaker Capital Ltd. | | | | |
16.860% due 06/15/2008 | | $ | | 300 | | $ | | 300 |
| |
| Unicredit Luxembourg Finance S.A. | | | | |
5.405% due 10/24/2008 | | | | 900 | | | | 901 |
| |
| VTB Capital S.A. for Vneshtorgbank | | | | |
5.955% due 08/01/2008 | | | | 200 | | | | 200 |
| |
| Wachovia Corp. | | | | |
5.486% due 10/15/2011 | | | | 900 | | | | 902 |
| |
| Wells Fargo & Co. | | | | |
5.400% due 03/10/2008 | | | | 200 | | | | 200 |
| |
| Westpac Banking Corp. | | | | |
5.280% due 06/06/2008 | | | | 100 | | | | 100 |
| |
| World Savings Bank FSB | | | | |
5.396% due 05/08/2009 | | | | 850 | | | | 851 |
| | | | | | | | |
| | | | | | | | 23,908 |
| | | | | | | | |
|
| INDUSTRIALS 7.9% |
| Albertson’s, Inc. | | | | | | | | |
6.950% due 08/01/2009 | | | | 300 | | | | 308 |
| |
| Anadarko Petroleum Corp. | | | | |
5.760% due 09/15/2009 | | | | 200 | | | | 200 |
| |
| DaimlerChrysler N.A. Holding Corp. | | | | |
5.710% due 03/13/2009 | | | | 100 | | | | 100 |
| |
| El Paso Corp. | | | | |
7.625% due 08/16/2007 | | | | 500 | | | | 504 |
| |
| General Electric Co. | | | | |
5.400% due 12/09/2008 | | | | 200 | | | | 200 |
| |
| General Mills, Inc. | | | | |
5.485% due 01/22/2010 | | | | 100 | | | | 100 |
| |
| Harrah’s Operating Co., Inc. | | | | |
7.500% due 01/15/2009 | | | | 200 | | | | 203 |
| |
| Hospira, Inc. | | | | |
5.840% due 03/30/2010 | | | | 200 | | | | 201 |
| |
| JC Penney Corp., Inc. | | | | |
7.375% due 08/15/2008 | | | | 100 | | | | 102 |
| |
| Northwest Pipeline Corp. | | | | |
6.625% due 12/01/2007 | | | | 1,372 | | | | 1,382 |
| |
| Pemex Project Funding Master Trust | | | | |
5.960% due 12/03/2012 | | | | 700 | | | | 710 |
| |
| Salomon Brothers AG for OAO Gazprom | | |
10.500% due 10/21/2009 | | | | 100 | | | | 110 |
| |
| Southern Natural Gas Co. | | | | |
6.700% due 10/01/2007 | | | | 500 | | | | 504 |
| |
| Time Warner, Inc. | | | | |
5.590% due 11/13/2009 | | | | 900 | | | | 901 |
| |
| Transcontinental Gas Pipe Line Corp. | | | | |
6.636% due 04/15/2008 | | | | 1,100 | | | | 1,093 |
| |
| Transocean, Inc. | | | | |
5.560% due 09/05/2008 | | | | 200 | | | | 200 |
| |
| Xerox Corp. | | | | |
9.750% due 01/15/2009 | | | | 300 | | | | 318 |
| | | | | | | | |
| | | | | | | | 7,136 |
| | | | | | | | |
|
| UTILITIES 4.0% |
| America Movil SAB de C.V. | | | | |
5.460% due 06/27/2008 | | | | 200 | | | | 200 |
| |
| AT&T, Inc. | | | | |
5.456% due 02/05/2010 | | | | 100 | | | | 100 |
5.570% due 11/14/2008 | | | | 100 | | | | 100 |
| |
| CMS Energy Corp. | | | | |
9.875% due 10/15/2007 | | | | 1,300 | | | | 1,319 |
| |
| | | | | | | | |
| | | | | PRINCIPAL
AMOUNT
(000S) | | | | VALUE
(000S) |
| Dominion Resources, Inc. | | | | |
5.660% due 09/28/2007 | | $ | | 900 | | $ | | 900 |
| |
| Qwest Capital Funding, Inc. | | | | |
6.375% due 07/15/2008 | | | | 200 | | | | 201 |
| |
| Qwest Corp. | | | | |
8.610% due 06/15/2013 | | | | 700 | | | | 763 |
| |
| Telecom Italia Capital S.A. | | | | |
5.836% due 02/01/2011 | | | | 100 | | | | 101 |
| | | | | | | | |
| | | | | | | | 3,684 |
| | | | | | | | |
Total Corporate Bonds & Notes
(Cost $34,894) | | | | 34,728 |
| | | | | | | | |
|
| MUNICIPAL BONDS & NOTES 0.1% |
| Golden State, California Tobacco Securitization Corporations Revenue Bonds, Series 2003 |
5.000% due 06/01/2021 | | | | 75 | | | | 76 |
| | | | | | | | |
Total Municipal Bonds & Notes (Cost $75) | | | | 76 |
| | | | | | | | |
|
| U.S. GOVERNMENT AGENCIES 9.5% |
| Fannie Mae | | | | | | | | |
5.000% due 12/01/2017 - 09/01/2018 | | 851 | | | | 826 |
6.000% due 04/01/2016 - 11/01/2033 | | 198 | | | | 199 |
8.000% due 05/01/2030 - 09/01/2031 | | 34 | | | | 36 |
| |
| Federal Home Loan Bank | | | | |
0.000% due 02/27/2012 | | | | 500 | | | | 461 |
| |
| Freddie Mac | | | | |
5.470% due 07/15/2019 - 10/15/2020 | | 3,300 | | | | 3,297 |
5.500% due 08/15/2030 | | | | 4 | | | | 4 |
5.550% due 07/15/2037 | | | | 1,100 | | | | 1,100 |
6.000% due 07/01/2016 - 07/01/2037 | | 1,863 | | | | 1,852 |
6.500% due 10/25/2043 | | | | 468 | | | | 475 |
| |
| Ginnie Mae | | | | |
4.000% due 07/16/2027 | | | | 28 | | | | 28 |
5.125% due 11/20/2029 | | | | 117 | | | | 118 |
6.375% due 02/20/2027 | | | | 135 | | | | 136 |
8.000% due 04/15/2027 - 12/15/2029 | | 56 | | | | 59 |
8.500% due 04/20/2030 | | | | 3 | | | | 3 |
| | | | | | | | |
Total U.S. Government Agencies
(Cost $8,719) | | | | 8,594 |
| | | | | | | | |
|
| U.S. TREASURY OBLIGATIONS 12.7% |
| Treasury Inflation Protected Securities (c) |
3.625% due 01/15/2008 (e) | | 11,512 | | | | 11,523 |
| | | | | | | | |
Total U.S. Treasury Obligations
(Cost $11,652) | | | | 11,523 |
| | | | | | | | |
|
| MORTGAGE-BACKED SECURITIES 6.8% |
| Arran Residential Mortgages Funding PLC |
5.340% due 04/12/2036 | | | | 118 | | | | 118 |
| |
| Banc of America Funding Corp. | | | | |
4.113% due 05/25/2035 | | | | 447 | | | | 438 |
| |
| Banc of America Mortgage Securities, Inc. |
6.500% due 10/25/2031 | | | | 178 | | | | 180 |
| |
| Bear Stearns Adjustable Rate Mortgage Trust |
5.329% due 02/25/2033 | | | | 128 | | | | 130 |
| |
| Bear Stearns Mortgage Funding Trust | | | | |
5.390% due 02/25/2037 | | | | 276 | | | | 277 |
| |
| Citigroup Commercial Mortgage Trust | | | | |
5.390% due 08/15/2021 | | | | 127 | | | | 127 |
| |
| | | | | | |
| See Accompanying Notes | | Semiannual Report | | June 30, 2007 | | 9 |
Schedule of Investments StocksPLUS® Growth and Income Portfolio (Cont.)
| | | | | | | | |
| | | | | PRINCIPAL
AMOUNT
(000S) | | | | VALUE
(000S) |
| Countrywide Alternative Loan Trust | | | | |
5.500% due 05/25/2047 | | $ | | 184 | | $ | | 184 |
6.000% due 10/25/2033 | | | | 279 | | | | 277 |
6.029% due 02/25/2036 | | | | 361 | | | | 364 |
| |
| CS First Boston Mortgage Securities Corp. |
5.631% due 05/25/2032 | | | | 100 | | | | 99 |
| |
Deutsche ALT-A Securities, Inc.
Mortgage Loan Trust |
5.390% due 01/25/2047 | | | | 243 | | | | 243 |
| |
| Greenpoint Mortgage Funding Trust | | | | |
5.400% due 10/25/2046 | | | | 174 | | | | 174 |
| |
| Harborview Mortgage Loan Trust | | | | |
5.410% due 01/19/2038 | | | | 272 | | | | 272 |
5.510% due 01/19/2038 | | | | 353 | | | | 353 |
| |
| Impac CMB Trust | | | | |
6.080% due 10/25/2033 | | | | 20 | | | | 20 |
| |
| Indymac Index Mortgage Loan Trust | | | | |
5.410% due 11/25/2046 | | | | 155 | | | | 155 |
| |
| Merrill Lynch Floating Trust | | | | |
5.390% due 06/15/2022 | | | | 800 | | | | 801 |
| |
| Morgan Stanley Capital I | | | | |
5.380% due 10/15/2020 | | | | 82 | | | | 82 |
| |
| Residential Funding Mortgage Securities I, Inc. |
6.500% due 03/25/2032 | | | | 186 | | | | 186 |
| |
| Structured Asset Mortgage Investments, Inc. |
5.450% due 03/25/2037 | | | | 351 | | | | 351 |
5.600% due 02/25/2036 | | | | 150 | | | | 150 |
| |
| Thornburg Mortgage Securities Trust | | |
5.430% due 12/25/2036 | | | | 170 | | | | 170 |
| |
| Wachovia Bank Commercial Mortgage Trust |
5.410% due 09/15/2021 | | | | 152 | | | | 153 |
| |
| Washington Mutual, Inc. | | | | |
5.724% due 12/25/2046 | | | | 863 | | | | 866 |
| | | | | | | | |
Total Mortgage-Backed Securities
(Cost $6,192) | | | | 6,170 |
| | | | | | | | |
|
| ASSET-BACKED SECURITIES 7.9% |
| Argent Securities, Inc. | | | | | | | | |
5.380% due 05/25/2036 | | | | 247 | | | | 247 |
| |
| Bear Stearns Asset-Backed Securities, Inc. |
5.380% due 01/25/2037 | | | | 352 | | | | 352 |
| |
| Citigroup Mortgage Loan Trust, Inc. | | | | |
5.380% due 01/25/2037 | | | | 380 | | | | 380 |
5.390% due 01/25/2036 | | | | 208 | | | | 208 |
5.430% due 08/25/2036 | | | | 600 | | | | 600 |
| |
| Countrywide Asset-Backed Certificates |
5.370% due 07/25/2037 | | | | 832 | | | | 833 |
| |
| Credit-Based Asset Servicing & Securitization LLC |
5.410% due 12/25/2037 | | | | 684 | | | | 683 |
| |
| First Franklin Mortgage Loan Asset-Backed Certificates |
5.360% due 01/25/2038 | | | | 329 | | | | 329 |
5.370% due 11/25/2036 | | | | 246 | | | | 246 |
| |
| | | | | | | | | |
| | | | | PRINCIPAL
AMOUNT
(000S) | | | | VALUE
(000S) |
| HSBC Asset Loan Obligation | | | | |
5.380% due 12/25/2036 | | $ | | | 815 | | $ | | 816 |
| |
| HSI Asset Securitization Corp. Trust | | | | |
5.370% due 12/25/2036 | | | | | 84 | | | | 84 |
| |
| Long Beach Mortgage Loan Trust | | | | |
5.360% due 11/25/2036 | | | | | 540 | | | | 541 |
5.400% due 02/25/2036 | | | | | 357 | | | | 357 |
5.600% due 10/25/2034 | | | | | 18 | | | | 18 |
| |
| Morgan Stanley ABS Capital I | | | | |
5.360% due 10/25/2036 | | | | | 74 | | | | 74 |
| |
| Option One Mortgage Loan Trust | | | | |
5.370% due 01/25/2037 | | | | | 164 | | | | 164 |
| |
| Residential Asset Securities Corp. | | | | |
5.390% due 11/25/2036 | | | | | 230 | | | | 230 |
| |
| Securitized Asset-Backed Receivables LLC Trust |
5.380% due 12/25/2036 | | | | | 267 | | | | 267 |
| |
| Soundview Home Equity Loan Trust | | | | |
5.400% due 01/25/2037 | | | | | 289 | | | | 289 |
| |
| Structured Asset Securities Corp. | | | | |
5.370% due 10/25/2036 | | | | | 222 | | | | 222 |
5.420% due 07/25/2035 | | | | | 23 | | | | 23 |
| |
| Wells Fargo Home Equity Trust | | | | |
5.440% due 12/25/2035 | | | | | 161 | | | | 161 |
| | | | | | | | | |
Total Asset-Backed Securities
(Cost $7,120) | | | | 7,124 |
| | | | | | | | | |
|
| SOVEREIGN ISSUES 0.6% |
| Korea Development Bank | | | | | | | | | |
5.640% due 11/22/2012 | | | | | 500 | | | | 502 |
| | | | | | | | | |
Total Sovereign Issues (Cost $500) | | | | | | | | | 502 |
| | | | | | | | | |
|
| | | | | SHARES | | | | |
| PREFERRED STOCKS 2.0% |
| DG Funding Trust | | | | |
7.600% due 12/31/2049 | | | | | 173 | | | | 1,802 |
| | | | | | | | | |
Total Preferred Stocks (Cost $1,823) | | | | | | | | | 1,802 |
| | | | | | | | | |
|
| | | | | PRINCIPAL
AMOUNT
(000S) | | | | |
| SHORT-TERM INSTRUMENTS 23.0% |
|
| CERTIFICATES OF DEPOSIT 4.4% |
| BNP Paribas | | | | | | | | | |
5.262% due 05/28/2008 | | | | $ | 100 | | | | 100 |
5.262% due 07/03/2008 | | | | | 800 | | | | 800 |
| |
| Calyon Financial, Inc. | | | | |
5.340% due 01/16/2009 | | | | | 300 | | | | 300 |
5.395% due 06/29/2010 | | | | | 30 | | | | 30 |
| |
| | | | | | | | | |
| | | | | PRINCIPAL
AMOUNT
(000S) | | | | VALUE
(000S) | |
| Fortis Bank NY | | | | | |
5.265% due 04/28/2008 | | $ | | 400 | | $ | | 400 | |
| | |
| Nordea Bank Finland PLC | | | | | |
5.308% due 05/28/2008 | | | | 100 | | | | 100 | |
| | |
| Royal Bank of Canada | | | | | |
5.267% due 06/30/2008 | | | | 401 | | | | 400 | |
| | |
| Skandinav Enskilda BK | | | | | |
5.300% due 02/04/2008 | | | | 600 | | | | 601 | |
5.350% due 02/13/2009 | | | | 100 | | | | 100 | |
| | |
| Societe Generale NY | | | | | |
5.269% due 06/30/2008 | | | | 700 | | | | 701 | |
5.270% due 03/26/2008 | | | | 400 | | | | 400 | |
| | | | | | | | | |
| | | | | | | | 3,932 | |
| | | | | | | | | |
| |
| COMMERCIAL PAPER 13.3% | |
| Bank of America Corp. | | | | | | | | | |
5.240% due 10/04/2007 | | | | 1,900 | | | | 1,884 | |
| | |
| Cox Communications, Inc. | | | | | |
5.570% due 09/17/2007 | | | | 300 | | | | 300 | |
| | |
| Danske Corp. | | | | | |
5.205% due 10/12/2007 | | | | 4,300 | | | | 4,269 | |
| | |
| Societe Generale NY | | | | | |
5.225% due 11/26/2007 | | | | 1,600 | | | | 1,592 | |
| | |
| UBS Finance Delaware LLC | | | | | |
5.235% due 10/23/2007 | | | | 4,000 | | | | 3,961 | |
| | | | | | | | | |
| | | | | | | | 12,006 | |
| | | | | | | | | |
| |
| REPURCHASE AGREEMENTS 3.4% | |
| State Street Bank and Trust Co. | | | | | |
4.900% due 07/02/2007 | | | | 3,107 | | | | 3,107 | |
| | | | | | | | | |
(Dated 06/29/2007. Collateralized by Fannie Mae 3.250% due 08/15/2008 valued at $3,173. Repurchase proceeds are $3,108.) | | | |
| |
| U.S. TREASURY BILLS 1.9% | | | | | |
4.708% due 08/30/2007 - 09/13/2007 (b)(e) | | | | 1,765 | | | | 1,749 | |
| | | | | | | | | |
Total Short-Term Instruments
(Cost $20,794) | | | | 20,794 | |
| | | | | | | | | |
| |
| PURCHASED OPTIONS (g) 0.0% | |
| (Cost $138) | | | | 38 | |
| |
Total Investments (d) 101.3%
(Cost $92,307) | | $ | | 91,752 | |
| |
| Written Options (h) (0.1%) (Premiums $129) | | | | | | | | (38 | ) |
| |
| Other Assets and Liabilities (Net) (1.2%) | | (1,110 | ) |
| | | | | | | | | |
| Net Assets 100.0% | | | | | | $ | | 90,604 | |
| | | | | | | | | �� |
Notes to Schedule of Investments (amounts in thousands*, except number of contracts):
* A zero balance may reflect actual amounts rounding to less than one thousand.
(a) Security is in default.
(b) Coupon represents a weighted average rate.
(c) Principal amount of security is adjusted for inflation.
(d) As of June 30, 2007, portfolio securities with an aggregate value of $5,549 were valued in good faith and pursuant to the guidelines established by the Board of Trustees.
| | | | |
| 10 | | PIMCO Variable Insurance Trust | | See Accompanying Notes |
| | |
| |
| | | June 30, 2007 (Unaudited) |
(e) Securities with an aggregate market value of $13,272 have been segregated with the custodian to cover margin requirements for the following open futures contracts on June 30, 2007:
| | | | | | | | | | |
| Description | | Type | | Expiration
Month | | # of
Contracts | | Unrealized
Appreciation/
(Depreciation) | |
90-Day Euribor June Futures | | Long | | 06/2008 | | 1 | | $ | (2 | ) |
90-Day Eurodollar December Futures | | Long | | 12/2008 | | 40 | | | (27 | ) |
90-Day Eurodollar June Futures | | Long | | 06/2008 | | 238 | | | (272 | ) |
90-Day Eurodollar March Futures | | Long | | 03/2008 | | 284 | | | (336 | ) |
90-Day Eurodollar March Futures | | Long | | 03/2009 | | 2 | | | (3 | ) |
90-Day Eurodollar September Futures | | Long | | 09/2008 | | 40 | | | (22 | ) |
90-Day Euroyen December Futures | | Long | | 12/2007 | | 17 | | | (1 | ) |
S&P 500 Index September Futures | | Long | | 09/2007 | | 217 | | | (335 | ) |
U.S. Treasury 30-Year Bond September Futures | | Short | | 09/2007 | | 156 | | | 122 | |
United Kingdom 90-Day LIBOR Sterling Interest Rate December Futures | | Long | | 12/2007 | | 7 | | | (15 | ) |
United Kingdom 90-Day LIBOR Sterling Interest Rate June Futures | | Long | | 06/2008 | | 29 | | | (42 | ) |
United Kingdom 90-Day LIBOR Sterling Interest Rate March Futures | | Long | | 03/2008 | | 2 | | | (3 | ) |
United Kingdom 90-Day LIBOR Sterling Interest Rate September Futures | | Long | | 09/2007 | | 7 | | | (15 | ) |
United Kingdom 90-Day LIBOR Sterling Interest Rate September Futures | | Long | | 09/2008 | | 22 | | | (34 | ) |
| | | | | | | | | | |
| | | | | | | | $ | (985 | ) |
| | | | | | | | | | |
(f) Swap agreements outstanding on June 30, 2007:
Credit Default Swaps
| | | | | | | | | | | | | | | | |
| Counterparty | | Reference Entity | | Buy/Sell
Protection (1) | | (Pay)/Receive
Fixed Rate | | | Expiration
Date | | Notional
Amount | | Unrealized
Appreciation/
(Depreciation) | |
Bank of America | | DaimlerChrysler N.A. Holding Corp. 6.500% due 11/15/2013 | | Sell | | 0.210% | | | 03/20/2008 | | $ | 200 | | $ | 0 | |
Bank of America | | General Motors Acceptance Corp. 6.875% due 08/28/2012 | | Sell | | 1.000% | | | 09/20/2008 | | | 1,000 | | | (3 | ) |
Barclays Bank PLC | | Mexico Government International Bond 7.500% due 04/08/2033 | | Sell | | 0.390% | | | 01/20/2012 | | | 1,000 | | | 4 | |
Barclays Bank PLC | | Multiple Reference Entities of Gazprom | | Sell | | 0.740% | | | 01/20/2012 | | | 200 | | | 2 | |
Bear Stearns & Co., Inc. | | DaimlerChrysler N.A. Holding Corp. 6.500% due 11/15/2013 | | Sell | | 0.200% | | | 03/20/2008 | | | 100 | | | 0 | |
Bear Stearns & Co., Inc. | | DaimlerChrysler N.A. Holding Corp. 6.500% due 11/15/2013 | | Sell | | 0.225% | | | 03/20/2008 | | | 400 | | | 1 | |
Deutsche Bank AG | | Goldman Sachs Group, Inc. 6.600% due 01/15/2012 | | Sell | | 0.063% | | | 12/20/2007 | | | 200 | | | 0 | |
Deutsche Bank AG | | Lehman Brothers Holdings, Inc. 6.625% due 01/18/2012 | | Sell | | 0.063% | | | 12/20/2007 | | | 500 | | | 0 | |
Deutsche Bank AG | | Goldman Sachs Group, Inc. 6.600% due 01/15/2012 | | Sell | | 0.100% | | | 06/20/2008 | | | 1,000 | | | (1 | ) |
Deutsche Bank AG | | Merrill Lynch & Co., Inc. 6.000% due 02/17/2009 | | Sell | | 0.120% | | | 06/20/2008 | | | 100 | | | 0 | |
Deutsche Bank AG | | Multiple Reference Entities of Gazprom | | Sell | | 1.000% | | | 10/20/2011 | | | 300 | | | 6 | |
Deutsche Bank AG | | Brazilian Government International Bond 12.250% due 03/06/2030 | | Sell | | 0.980% | | | 01/20/2012 | | | 700 | | | 12 | |
Deutsche Bank AG | | Dow Jones CDX N.A. IG8 Index | | Buy | | (0.600% | ) | | 06/20/2017 | | | 100 | | | 1 | |
Goldman Sachs & Co. | | Petroleos Mexicanos 9.500% due 09/15/2027 | | Sell | | 0.200% | | | 11/20/2007 | | | 300 | | | 0 | |
Goldman Sachs & Co. | | American International Group, Inc. 5.600% due 10/18/2016 | | Sell | | 0.065% | | | 06/20/2008 | | | 600 | | | 0 | |
JPMorgan Chase & Co. | | Morgan Stanley 6.600% due 04/01/2012 | | Sell | | 0.100% | | | 12/20/2007 | | | 500 | | | 0 | |
Lehman Brothers, Inc. | | Pemex Project Funding Master Trust 9.500% due 09/15/2027 | | Sell | | 0.290% | | | 12/20/2008 | | | 100 | | | 0 | |
Lehman Brothers, Inc. | | Russia Government International Bond 5.000% until 03/31/2007 and 7.500% thereafter, due 03/31/2030 | | Sell | | 0.310% | | | 12/20/2008 | | | 100 | | | 0 | |
Lehman Brothers, Inc. | | Pemex Project Funding Master Trust 9.500% due 09/15/2027 | | Sell | | 0.320% | | | 03/20/2009 | | | 200 | | | 0 | |
Lehman Brothers, Inc. | | Dow Jones CDX N.A. EM6 Index | | Sell | | 1.400% | | | 12/20/2011 | | | 500 | | | 4 | |
Morgan Stanley | | Multiple Reference Entities of Gazprom | | Sell | | 0.420% | | | 11/20/2007 | | | 300 | | | 0 | |
UBS Warburg LLC | | Morgan Stanley 6.600% due 04/01/2012 | | Sell | | 0.065% | | | 12/20/2007 | | | 300 | | | 0 | |
| | | | | | | | | | | | | | | | |
| | | | | | | | | | | | | | $ | 26 | |
| | | | | | | | | | | | | | | | |
(1) If the Portfolio is a seller of protection and a credit event occurs, as defined under the terms of that particular swap agreement, the Portfolio will pay to the buyer of the protection an amount up to the notional value of the swap and in certain instances, take delivery of the security. As a buyer of protection, the Portfolio will generally receive from the seller of protection an amount up to the notional amount of the swap if a credit event occurs.
| | | | | | |
| See Accompanying Notes | | Semiannual Report | | June 30, 2007 | | 11 |
Schedule of Investments StocksPLUS® Growth and Income Portfolio (Cont.)
Interest Rate Swaps
| | | | | | | | | | | | | | | |
| Counterparty | | Floating Rate Index | | Pay/Receive
Floating Rate | | Fixed Rate | | Expiration
Date | | Notional
Amount | | Unrealized
Appreciation/
(Depreciation) | |
Deutsche Bank AG | | 6-Month Australian Bank Bill | | Pay | | 7.000% | | 12/15/2009 | | AUD | 300 | | $ | 0 | |
Barclays Bank PLC | | BRL-CDI-Compounded | | Pay | | 11.360% | | 01/04/2010 | | BRL | 400 | | | 2 | |
Goldman Sachs & Co. | | BRL-CDI-Compounded | | Pay | | 11.465% | | 01/04/2010 | | | 100 | | | 1 | |
Merrill Lynch & Co., Inc. | | BRL-CDI-Compounded | | Pay | | 11.430% | | 01/04/2010 | | | 300 | | | 2 | |
Merrill Lynch & Co., Inc. | | BRL-CDI-Compounded | | Pay | | 12.948% | | 01/04/2010 | | | 200 | | | 4 | |
Morgan Stanley | | BRL-CDI-Compounded | | Pay | | 12.780% | | 01/04/2010 | | | 200 | | | 4 | |
BNP Paribas Bank | | 5-Year French CPI Ex Tobacco Daily Reference Index | | Pay | | 2.090% | | 10/15/2010 | | EUR | 1,000 | | | 12 | |
Deutsche Bank AG | | 6-Month EUR-LIBOR | | Receive | | 4.000% | | 12/15/2011 | | | 400 | | | 8 | |
Goldman Sachs & Co. | | 5-Year French CPI Ex Tobacco Daily Reference Index | | Pay | | 1.995% | | 03/15/2012 | | | 2,600 | | | (15 | ) |
Goldman Sachs & Co. | | 5-Year French CPI Ex Tobacco Daily Reference Index | | Pay | | 1.960% | | 03/30/2012 | | | 100 | | | (1 | ) |
JPMorgan Chase & Co. | | 5-Year French CPI Ex Tobacco Daily Reference Index | | Pay | | 1.948% | | 03/15/2012 | | | 100 | | | (1 | ) |
Credit Suisse First Boston | | 6-Month GBP-LIBOR | | Pay | | 5.000% | | 06/15/2009 | | GBP | 1,800 | | | (51 | ) |
Credit Suisse First Boston | | 6-Month GBP-LIBOR | | Receive | | 4.000% | | 12/15/2036 | | | 200 | | | 36 | |
Deutsche Bank AG | | 6-Month GBP-LIBOR | | Receive | | 4.000% | | 12/15/2036 | | | 400 | | | 34 | |
HSBC Bank USA | | 6-Month GBP-LIBOR | | Pay | | 4.500% | | 12/20/2007 | | | 1,000 | | | (15 | ) |
Royal Bank of Scotland Group PLC | | 6-Month GBP-LIBOR | | Pay | | 6.000% | | 03/20/2009 | | | 300 | | | (4 | ) |
Barclays Bank PLC | | 6-Month JPY-LIBOR | | Pay | | 1.000% | | 03/18/2009 | | JPY | 30,000 | | | (1 | ) |
Deutsche Bank AG | | 6-Month JPY-LIBOR | | Pay | | 1.000% | | 09/18/2008 | | | 260,000 | | | (1 | ) |
Deutsche Bank AG | | 6-Month JPY-LIBOR | | Pay | | 1.000% | | 03/18/2009 | | | 60,000 | | | (1 | ) |
UBS Warburg LLC | | 6-Month JPY-LIBOR | | Pay | | 1.000% | | 09/18/2008 | | | 20,000 | | | 0 | |
UBS Warburg LLC | | 6-Month JPY-LIBOR | | Pay | | 1.000% | | 03/18/2009 | | | 320,000 | | | (5 | ) |
Barclays Bank PLC | | 3-Month USD-LIBOR | | Pay | | 5.000% | | 12/19/2009 | | $ | 400 | | | 0 | |
Deutsche Bank AG | | 3-Month USD-LIBOR | | Pay | | 5.000% | | 12/19/2009 | | | 4,500 | | | 2 | |
Deutsche Bank AG | | 3-Month USD-LIBOR | | Receive | | 5.000% | | 12/19/2017 | | | 1,200 | | | (9 | ) |
Morgan Stanley | | 3-Month USD-LIBOR | | Pay | | 5.000% | | 06/20/2009 | | | 2,000 | | | (16 | ) |
Morgan Stanley | | 3-Month USD-LIBOR | | Receive | | 5.000% | | 12/19/2017 | | | 400 | | | (3 | ) |
| | | | | | | | | | | | | | | |
| | | | | | | | | | | | | $ | (18 | ) |
| | | | | | | | | | | | | | | |
Total Return Swaps
| | | | | | | | | | | | | | |
| Counterparty | | Type | | Receive Total Return | | Pay | | Expiration
Date | | # of
Contracts | | Unrealized
(Depreciation) | |
Merrill Lynch & Co., Inc. | | Long | | S&P 500 Index | | 1-Month USD-LIBOR minus 0.030% | | 05/15/2008 | | 5,567 | | $ | (175 | ) |
| | | | | | | | | | | | | | |
(g) Purchased options outstanding on June 30, 2007:
Options on Exchange-Traded Futures Contracts
| | | | | | | | | | | | | |
| Description | | Exercise
Price | | Expiration
Date | | # of
Contracts | | Cost | | Value |
Call - CBOT U.S. Treasury 30-Year Bond September Futures | | $ | 119.000 | | 08/24/2007 | | 78 | | $ | 1 | | $ | 1 |
Put - CME S&P 500 Index September Futures | | | 925.000 | | 09/20/2007 | | 75 | | | 2 | | | 0 |
Put - CME S&P 500 Index September Futures | | | 950.000 | | 09/20/2007 | | 95 | | | 3 | | | 0 |
| | | | | | | | | | | | | |
| | | | | | | | | $ | 6 | | $ | 1 |
| | | | | | | | | | | | | |
Interest Rate Swaptions
| | | | | | | | | | | | | | | | | | | |
| Description | | Counterparty | | Floating Rate Index | | Pay/Receive
Floating Rate | | Exercise
Rate | | Expiration
Date | | Notional
Amount | | Cost | | Value |
Call - OTC 1-Year Interest Rate Swap | | Barclays Bank PLC | | 3-Month USD-LIBOR | | Pay | | 4.750% | | 02/01/2008 | | $ | 5,000 | | $ | 14 | | $ | 2 |
Call - OTC 2-Year Interest Rate Swap | | Lehman Brothers, Inc. | | 3-Month USD-LIBOR | | Pay | | 4.750% | | 03/31/2008 | | | 9,200 | | | 51 | | | 11 |
Call - OTC 1-Year Interest Rate Swap | | Royal Bank of Scotland Group PLC | | 3-Month USD-LIBOR | | Pay | | 4.900% | | 08/08/2007 | | | 6,000 | | | 14 | | | 0 |
Call - OTC 2-Year Interest Rate Swap | | Royal Bank of Scotland Group PLC | | 3-Month USD-LIBOR | | Pay | | 5.000% | | 02/01/2008 | | | 8,900 | | | 44 | | | 14 |
Call - OTC 2-Year Interest Rate Swap | | Royal Bank of Scotland Group PLC | | 3-Month USD-LIBOR | | Pay | | 5.000% | | 12/15/2008 | | | 3,000 | | | 9 | | | 10 |
| | | | | | | | | | | | | | | | | | | |
| | | | | | | | | | | | | | | $ | 132 | | $ | 37 |
| | | | | | | | | | | | | | | | | | | |
(h) Written options outstanding on June 30, 2007:
Interest Rate Swaptions
| | | | | | | | | | | | | | | | | | | |
| Description | | Counterparty | | Floating Rate Index | | Pay/Receive
Floating Rate | | Exercise
Rate | | Expiration
Date | | Notional
Amount | | Premium | | Value |
Call - OTC 5-Year Interest Rate Swap | | Barclays Bank PLC | | 3-Month USD-LIBOR | | Receive | | 4.900% | | 02/01/2008 | | $ | 1,000 | | $ | 12 | | $ | 2 |
Call - OTC 5-Year Interest Rate Swap | | Lehman Brothers, Inc. | | 3-Month USD-LIBOR | | Receive | | 4.900% | | 03/31/2008 | | | 4,000 | | | 49 | | | 12 |
Call - OTC 7-Year Interest Rate Swap | | Royal Bank of Scotland Group PLC | | 3-Month USD-LIBOR | | Receive | | 4.900% | | 08/08/2007 | | | 1,000 | | | 12 | | | 0 |
Call - OTC 5-Year Interest Rate Swap | | Royal Bank of Scotland Group PLC | | 3-Month USD-LIBOR | | Receive | | 5.100% | | 02/01/2008 | | | 4,000 | | | 48 | | | 14 |
Call - OTC 7-Year Interest Rate Swap | | Royal Bank of Scotland Group PLC | | 3-Month USD-LIBOR | | Receive | | 5.200% | | 12/15/2008 | | | 1,000 | | | 8 | | | 10 |
| | | | | | | | | | | | | | | | | | | |
| | | | | | | | | | | | | | | $ | 129 | | $ | 38 |
| | | | | | | | | | | | | | | | | | | |
| | | | |
| 12 | | PIMCO Variable Insurance Trust | | See Accompanying Notes |
| | |
| |
| | | June 30, 2007 (Unaudited) |
(i) Foreign currency contracts outstanding on June 30, 2007:
| | | | | | | | | | | | | | | | | |
| Type | | Currency | | Principal
Amount
Covered by
Contract | | Settlement
Month | | Unrealized
Appreciation | | Unrealized
(Depreciation) | | | Net Unrealized
Appreciation/
(Depreciation) | |
Buy | | AUD | | 298 | | 07/2007 | | $ | 2 | | $ | 0 | | | $ | 2 | |
Buy | | BRL | | 3,631 | | 10/2007 | | | 96 | | | 0 | | | | 96 | |
Buy | | | | 1,502 | | 03/2008 | | | 57 | | | 0 | | | | 57 | |
Buy | | CAD | | 109 | | 08/2007 | | | 0 | | | 0 | | | | 0 | |
Buy | | CNY | | 192 | | 09/2007 | | | 1 | | | 0 | | | | 1 | |
Sell | | | | 192 | | 09/2007 | | | 0 | | | 0 | | | | 0 | |
Buy | | | | 3,242 | | 10/2007 | | | 8 | | | 0 | | | | 8 | |
Sell | | | | 3,242 | | 10/2007 | | | 0 | | | 0 | | | | 0 | |
Buy | | | | 914 | | 11/2007 | | | 1 | | | 0 | | | | 1 | |
Sell | | | | 914 | | 11/2007 | | | 0 | | | 0 | | | | 0 | |
Buy | | | | 1,818 | | 01/2008 | | | 0 | | | (2 | ) | | | (2 | ) |
Sell | | | | 1,818 | | 01/2008 | | | 0 | | | 0 | | | | 0 | |
Buy | | EUR | | 410 | | 07/2007 | | | 5 | | | 0 | | | | 5 | |
Sell | | GBP | | 284 | | 08/2007 | | | 0 | | | (3 | ) | | | (3 | ) |
Buy | | IDR | | 617,400 | | 05/2008 | | | 0 | | | (3 | ) | | | (3 | ) |
Buy | | INR | | 2,491 | | 10/2007 | | | 0 | | | 0 | | | | 0 | |
Buy | | | | 4,126 | | 05/2008 | | | 2 | | | 0 | | | | 2 | |
Sell | | JPY | | 28,813 | | 07/2007 | | | 3 | | | 0 | | | | 3 | |
Buy | | KRW | | 386,486 | | 07/2007 | | | 2 | | | 0 | | | | 2 | |
Buy | | | | 146,360 | | 08/2007 | | | 0 | | | 0 | | | | 0 | |
Buy | | | | 207,179 | | 09/2007 | | | 0 | | | 0 | | | | 0 | |
Buy | | MXN | | 3,316 | | 03/2008 | | | 3 | | | 0 | | | | 3 | |
Buy | | MYR | | 700 | | 05/2008 | | | 0 | | | (3 | ) | | | (3 | ) |
Buy | | NZD | | 46 | | 07/2007 | | | 1 | | | 0 | | | | 1 | |
Buy | | PHP | | 9,129 | | 05/2008 | | | 0 | | | (3 | ) | | | (3 | ) |
Buy | | PLN | | 659 | | 09/2007 | | | 3 | | | 0 | | | | 3 | |
Buy | | RUB | | 1,156 | | 11/2007 | | | 1 | | | 0 | | | | 1 | |
Buy | | | | 7,505 | | 12/2007 | | | 7 | | | 0 | | | | 7 | |
Buy | | | | 8,717 | | 01/2008 | | | 2 | | | 0 | | | | 2 | |
Buy | | SGD | | 617 | | 07/2007 | | | 0 | | | (2 | ) | | | (2 | ) |
Buy | | | | 662 | | 08/2007 | | | 0 | | | (8 | ) | | | (8 | ) |
Buy | | | | 597 | | 10/2007 | | | 2 | | | 0 | | | | 2 | |
| | | | | | | | | | | | | | | | | |
| | | | | | | | $ | 196 | | $ | (24 | ) | | $ | 172 | |
| | | | | | | | | | | | | | | | | |
| | | | | | |
| See Accompanying Notes | | Semiannual Report | | June 30, 2007 | | 13 |
Notes to Financial Statements
1. ORGANIZATION
The StocksPLUS® Growth and Income Portfolio (the “Portfolio”) is a series of the PIMCO Variable Insurance Trust (the “Trust”). The Trust is registered under the Investment Company Act of 1940 (the “Act”), as amended, as an open-end management investment company organized as a Delaware business trust on October 3, 1997. The Portfolio offers two classes of shares: Institutional and Administrative. Information presented on these financial statements pertains to the Administrative Class of the Portfolio. Certain detailed financial information for the Institutional Class is provided separately and is available upon request. The Trust is designed to be used as an investment vehicle by Separate Accounts of insurance companies that fund variable annuity contracts and variable life insurance policies and by qualified pension and retirement plans.
2. SIGNIFICANT ACCOUNTING POLICIES
The following is a summary of significant accounting policies consistently followed by the Portfolio in the preparation of its financial statements in conformity with accounting principles generally accepted in the United States of America (“GAAP”). The preparation of financial statements in accordance with GAAP requires management to make estimates and assumptions that affect the reported amounts and disclosures on the financial statements. Actual results could differ from those estimates.
(a) Security Valuation Portfolio securities are valued as of the close of regular trading (normally 4:00 p.m., Eastern Time) on each day that the New York Stock Exchange (“NYSE”) is open. Portfolio securities and other assets for which market quotes are readily available are stated at market value. Market value is generally determined on the basis of last reported sales prices, or if no sales are reported, based on quotes obtained from a quotation reporting system, established market makers, or pricing services. Fixed-income securities and non-exchange traded derivatives are normally valued on the basis of quotes obtained from brokers and dealers or pricing services. Prices obtained from independent pricing services use information provided by market makers or estimates of market values obtained from yield data relating to investments or securities with similar characteristics. Certain fixed income securities purchased on a delayed-delivery basis are marked to market daily until settlement at the forward settlement date. Short-term investments having a maturity of 60 days or less are generally valued at amortized cost. Exchange traded options, futures and options on futures are valued at the settlement price determined by the relevant exchange. With respect to any portion of the Portfolio’s assets that are invested in one or more open end management investment companies, the Portfolio’s net asset value (“NAV”) will be calculated based upon the NAVs of such investments.
Investments initially valued in currencies other than the U.S. dollar are converted to the U.S. dollar using exchange rates obtained from pricing services. As a result, the NAV of the Portfolio’s securities may be affected by changes in the value of currencies in relation to the U.S. dollar. The value of securities traded in markets outside the United States or denominated in currencies other than the U.S. dollar may be affected significantly on a day that the NYSE is closed and an investor is not able to purchase, redeem or exchange shares.
Securities and other assets for which market quotes are not readily available are valued at fair value as determined in good faith by the Board of Trustees or persons acting at their direction. The Board of Trustees has adopted methods for valuing securities and other assets in circumstances where market quotes are not readily available, and has delegated to Pacific Investment Management Company LLC (“PIMCO”) the responsibility for applying the valuation methods. In the event that market quotes are not readily available, and the security or asset cannot be valued pursuant to one of the valuation methods, the value of the security or asset will be determined in good faith by the Valuation Committee of the Board of Trustees, generally based upon recommendations provided by PIMCO.
Market quotes are considered not readily available in circumstances where there is an absence of current or reliable market-based data (e.g., trade information, bid/asked information, broker quotes), including where events occur after the close of the relevant market, but prior to the close of regular trading, that materially affect the values of the Portfolio’s securities or assets. In addition, market quotes are considered not readily available when, due to extraordinary circumstances, the exchanges or markets on which the securities trade, do not open for trading for the entire day and no other market prices are available. The Board has delegated to PIMCO the responsibility for monitoring significant events that may materially affect the values of the Portfolio’s securities or assets and for determining whether the value of the applicable securities or assets should be re-evaluated in light of such significant events.
When the Portfolio uses fair value pricing to determine its NAV, securities will not be priced on the basis of quotations from the primary market in which they are traded, but rather may be priced by another method that the Board of Trustees or persons acting at their direction believe accurately reflects fair value. The Trust’s policy is intended to result in a calculation of the Portfolio’s NAV that fairly reflects security values as of the time of pricing. However, fair values determined by the Board of Trustees or persons acting at their direction may not accurately reflect the price that the Portfolio could obtain for a security if it were to dispose of that security as of the time of pricing. Because foreign securities can trade on non-business days of the Portfolio, the NAV of the Portfolio may change on days when shareholders will not be able to purchase or redeem Portfolio shares. The prices used by the Portfolio may differ from the value that would be realized if the securities were sold and the differences could be material to the financial statements.
(b) Securities Transactions and Investment Income Securities transactions are recorded as of the trade date for financial reporting purposes. Securities purchased or sold on a when-issued or delayed-delivery basis may be settled a month or more after the trade date. Realized gains and losses from securities sold are recorded on the identified cost basis. Dividend income is recorded on the ex-dividend date, except certain dividends from foreign securities where the ex-dividend date may have passed, which are recorded as soon as the Portfolio is informed of the ex-dividend date. Interest income, adjusted for the accretion of discounts and amortization of premiums, is recorded on the accrual basis. Paydown gains and losses on mortgage-related and other asset-backed securities are recorded as components of interest income on the Statement of Operations.
(c) Delayed-Delivery Transactions The Portfolio may purchase or sell securities on a delayed-delivery basis. These transactions involve a commitment by the Portfolio to purchase or sell securities for a predetermined price or yield, with payment and delivery taking place beyond the customary settlement period. When delayed-delivery purchases are outstanding, the Portfolio will designate liquid assets in an amount sufficient to meet the purchase price. When purchasing a security on a delayed-delivery basis, the Portfolio assumes the rights and risks of ownership of the security, including the risk of price and yield fluctuations, and takes such fluctuations into account when determining its net asset value. The Portfolio may dispose of or renegotiate a delayed-delivery transaction after it is entered into, and may sell when-issued securities before they are delivered, which may result in a capital gain or loss. When the Portfolio has sold a security on a delayed-delivery basis, the Portfolio does not participate in future gains and losses with respect to the security.
(d) Dividends and Distributions to Shareholders Dividends from net investment income, if any, are declared and distributed to shareholders quarterly. Net realized capital gains earned by the Portfolio, if any, will be distributed no less frequently than once each year.
Income dividends and capital gain distributions are determined in accordance with income tax regulations which may differ from GAAP. Differences between tax
| | | | |
| 14 | | PIMCO Variable Insurance Trust | | |
| | |
| |
| | | June 30, 2007 (Unaudited) |
regulations and GAAP may change the fiscal year when income and capital items are recognized for tax and GAAP purposes. Examples of events that give rise to timing differences include wash sales, straddles, net operating losses and capital loss carryforwards. Further, the character of investment income and capital gains may be different for certain transactions under the two methods of accounting. Examples of characterization differences include the treatment of mortgage paydowns, swaps, foreign currency transactions and contingent debt instruments. As a result, income dividends and capital gain distributions declared during a fiscal period may differ significantly from the net investment income and realized capital gain reported on the Portfolio’s annual financial statements presented under GAAP.
Distributions classified as a tax basis return of capital, if any, are reflected on the accompanying Statements of Changes in Net Assets and have been reclassified to paid in capital. In addition, other amounts have been reclassified between undistributed net investment income, accumulated undistributed net realized gains or losses and/or paid in capital to more appropriately conform financial accounting to tax characterizations of dividend distributions.
(e) Multiclass Operations Each class offered by the Portfolio has equal rights as to assets and voting privileges (except that shareholders of a class have exclusive voting rights regarding any matter relating solely to that class of shares). Income and non-class specific expenses of the Portfolio are allocated daily to each class of shares based on the relative value of settled shares. Realized and unrealized capital gains and losses of the Portfolio are allocated daily to each class of shares based on the relative net assets of each class. Class specific expenses, where applicable, currently include administrative, distribution and servicing fees.
(f) Foreign Currency The functional and reporting currency for the Portfolio is the U.S. dollar. The market values of foreign securities, currency holdings and other assets and liabilities are translated into U.S. dollars based on the current exchange rates each business day. Fluctuations in the value of currency holdings and other assets and liabilities resulting from changes in exchange rates are recorded as unrealized foreign currency gains or losses. Realized gains or losses and unrealized appreciation or depreciation on investment securities and income and expenses are translated on the respective dates of such transactions. The effects of changes in foreign currency exchange rates on investments in securities are not segregated on the Statement of Operations from the effects of changes in market prices of those securities, but are included with the net realized and unrealized gain or loss on investment securities.
| | | | | | |
|
| Non-U.S. currency symbols utilized throughout the report are defined as follows: |
| AUD | | Australian Dollar | | KRW | | South Korean Won |
| BRL | | Brazilian Real | | MXN | | Mexican Peso |
| CAD | | Canadian Dollar | | MYR | | Malaysian Ringgit |
| CNY | | Chinese Yuan Renminbi | | NZD | | New Zealand Dollar |
| EUR | | Euro | | PHP | | Philippines Peso |
| GBP | | Great British Pound | | PLN | | Polish Zloty |
| IDR | | Indonesian Rupiah | | RUB | | Russian Ruble |
| INR | | Indian Rupee | | SGD | | Singapore Dollar |
| JPY | | Japanese Yen | | | | |
(g) Foreign Currency Transactions The Portfolio may enter into foreign currency contracts in connection with settling planned purchases or sales of securities, to hedge the currency exposure associated with some or all of the Portfolio’s securities or as a part of an investment strategy. A foreign currency
contract is an agreement between two parties to buy and sell a currency at a set price on a future date. The market value of a foreign currency contract fluctuates with changes in foreign currency exchange rates. Foreign currency contracts are marked to market daily and the change in value is recorded by the Portfolio as an unrealized gain or loss. Realized gains or losses equal to the difference between the value of the contract at the time it was opened and the value at the time it was closed are recorded upon delivery or receipt of the currency. These contracts may involve market risk in excess of the unrealized gain or loss reflected on the Statement of Assets and Liabilities. In addition, the Portfolio could be exposed to risk if the counterparties are unable to meet the terms of the contracts or if the value of the currency changes unfavorably to the U.S. dollar.
(h) Futures Contracts The Portfolio may enter into futures contracts. The Portfolio may use futures contracts to manage its exposure to the securities markets or to movements in interest rates and currency values. The primary risks associated with the use of futures contracts are the imperfect correlation between the change in market value of the securities held by the Portfolio and the prices of futures contracts, the possibility of an illiquid market, and the inability of the counterparty to meet the terms of the contract. Futures contracts are valued based upon their quoted daily settlement prices. Upon entering into a futures contract, the Portfolio is required to deposit with its futures broker, an amount of cash or U.S. Government and Agency Obligations in accordance with the initial margin requirements of the broker or exchange. Futures contracts are marked to market daily and an appropriate payable or receivable for the change in value (“variation margin”) is recorded by the Portfolio. Gains or losses are recognized but not considered realized until the contracts expire or are closed. Futures contracts involve, to varying degrees, risk of loss in excess of the variation margin disclosed on the Statement of Assets and Liabilities.
(i) Inflation-Indexed Bonds The Portfolio may invest in inflation-indexed bonds. Inflation-indexed bonds are fixed-income securities whose principal value is periodically adjusted to the rate of inflation. The interest rate on these bonds is generally fixed at issuance at a rate lower than typical bonds. Over the life of an inflation-indexed bond, however, interest will be paid based on a principal value, which is adjusted for inflation. Any increase in the principal amount of an inflation-indexed bond will be included as interest income on the Statement of Operations, even though investors do not receive their principal until maturity.
(j) Options Contracts The Portfolio may write call and put options on futures, swaps, securities or currencies it owns or in which it may invest. Writing put options tends to increase the Portfolio’s exposure to the underlying instrument. Writing call options tends to decrease the Portfolio’s exposure to the underlying instrument. When the Portfolio writes a call or put option, an amount equal to the premium received is recorded as a liability and subsequently marked to market to reflect the current value of the option written. These liabilities are reflected as written options outstanding on the Statement of Assets and Liabilities. Certain options may be written with premiums to be determined on a future date. The premiums for these options are based upon implied volatility parameters at specified terms. Premiums received from writing options which expire are treated as realized gains. Premiums received from writing options which are exercised or closed are added to the proceeds or offset against amounts paid on the underlying future, swap, security or currency transaction to determine the realized gain or loss. The Portfolio as a writer of an option has no control over whether the underlying future, swap, security or currency may be sold (call) or purchased (put) and as a result bears the market risk of an unfavorable change in the price of the future, swap, security or currency underlying the written option. There is the risk the Portfolio may not be able to enter into a closing transaction because of an illiquid market.
The Portfolio may also purchase put and call options. Purchasing call options tends to increase the Portfolio’s exposure to the underlying instrument. Purchasing put
| | | | | | |
| | Semiannual Report | | June 30, 2007 | | 15 |
Notes to Financial Statements (Cont.)
options tends to decrease the Portfolio’s exposure to the underlying instrument. The Portfolio pays a premium which is included on the Statement of Assets and Liabilities as an investment and subsequently marked to market to reflect the current value of the option. Premiums paid for purchasing options which expire are treated as realized losses. Certain options may be purchased with premiums to be determined on a future date. The premiums for these options are based upon implied volatility parameters at specified terms. The risk associated with purchasing put and call options is limited to the premium paid. Premiums paid for purchasing options which are exercised or closed are added to the amounts paid or offset against the proceeds on the underlying future, swap, security or currency transaction to determine the realized gain or loss.
(k) Repurchase Agreements The Portfolio may engage in repurchase transactions. Under the terms of a typical repurchase agreement, the Portfolio takes possession of an underlying debt obligation (collateral) subject to an obligation of the seller to repurchase, and the Portfolio to resell, the obligation at an agreed-upon price and time. The underlying securities for all repurchase agreements are held in safekeeping at the Portfolio’s custodian or designated subcustodians under tri-party repurchase agreements. The market value of the collateral must be equal to or exceed the total amount of the repurchase obligations, including interest. Securities purchased under repurchase agreements are reflected as an asset on the Statement of Assets and Liabilities. Generally, in the event of counterparty default, the Portfolio has the right to use the collateral to offset losses incurred. If the counterparty should default, the Portfolio will seek to sell the securities which it holds as collateral. This could involve procedural costs or delays in addition to a loss on the securities if their value should fall below their repurchase price.
(l) Inverse Floating Rate Transactions—Residual Interest Municipal Bonds (“RIBs”)/Residual Interest Tax Exempt Bonds (“RITEs”) The Portfolio may invest in RIBs and RITEs (“Inverse Floaters”). Inverse Floaters are created via a master trust agreement between a broker-dealer, acting as trustor and liquidity provider, and an investment bank, acting as trustee and tender agent. The master trust agreement defines the terms for each trust series; with each series being established by the transfer of long-term, fixed-rate municipal bonds (“Fixed Rate Bonds”) to the trustee to be held and provide for the creation, execution and delivery of floater certificates (“Floating Rate Notes”) and Inverse Floaters. Floating Rate Notes are liquid notes that are issued with a short-term variable rate typically linked to the LIBOR, subject to limitations, for some duration. After interest income is paid on the Floating Rate Notes at current rates, the residual income from the Fixed Rate Bonds is paid to the Inverse Floaters. Inverse Floaters are issued with a coupon that fluctuates inversely with the Floating Rate Notes’ referenced rate, subject to certain limitations. Therefore, rising short-term rates result in lower income for the Inverse Floaters and vice versa.
Floating Rate Notes are generally remarketed to municipal money market funds. Inverse Floaters are acquired by either tax-exempt municipal bond funds or trusts, or other parties interested in potentially higher yielding tax-exempt securities. Inverse Floaters may also be acquired for the purpose of increasing leverage. Floating Rate Note holders typically have the option to tender their notes to the liquidity provider for redemption at par at each reset date. The Inverse Floater holders have the option to (i) require the Floating Rate Note holders to tender their notes at par, and (ii) require the liquidity provider to transfer the Fixed Rate Bonds to the Inverse Floater holders. The holders of Inverse Floaters bear substantially all of the downside investment risk associated with the underlying Fixed Rate Bonds, and also benefit from a disproportionate amount of the potential appreciation of the underlying Fixed Rate Bonds’ value. Inverse Floaters may be more volatile and less liquid than other municipal bonds of comparable maturity.
Inverse Floaters may be acquired with or without first transferring to the trustor the Fixed Rate Bonds that were utilized to create the trust series. Inverse Floaters acquired without a transfer of Fixed Rate Bonds are recognized as purchases of securities as outlined in Note 2(b). Statement of Financial Accounting Standards No. 140—Accounting for Transfers and Servicing of Financial Assets and Extinguishments of Liabilities (“FAS No. 140”), governs the standards for accounting for securitizations and other transfers of financial assets. If there is a transfer of Fixed Rate Bonds and it meets sale criteria under FAS No. 140, a Portfolio records a sale of the Fixed Rate Bonds and a purchase of the Inverse Floaters. The cash received from the Inverse Floaters is then recorded as interest income in the Statement of Operations.
If the transfer of Fixed Rate Bonds does not meet sale criteria under FAS No. 140, a Portfolio accounts for the transaction described above as a secured borrowing by including the Fixed Rate Bonds in its Schedule of Investments, and recording the Floating Rate Notes as a liability under the caption “Payable for floating rate notes” in the Portfolio’s Statement of Assets and Liabilities. In a secured borrowing transaction, cash received from the Inverse Floaters is not recorded as interest income. Instead, a Portfolio records interest income related to the Fixed Rate Bonds and interest expense related to the Floating Rate Notes, the net of which is equal to the cash received from the Inverse Floaters acquired by the Portfolio. Thus, while a Portfolio’s reported total income, net expenses, and net expense ratio are generally higher for investments in Inverse Floaters acquired via a secured borrowing, the method of acquiring Inverse Floaters does not result in differences for reported cash flows, net asset value or total return.
(m) Swap Agreements The Portfolio may invest in swap agreements. Swap transactions are privately negotiated agreements between the Portfolio and a counterparty to exchange or swap investment cash flows, assets, or market-linked returns at specified, future intervals. The Portfolio may enter into interest rate, total return, forward spread-lock, credit default, and other forms of swap agreements to manage its exposure to interest rates and credit risk. In connection with these agreements, securities may be identified as collateral in accordance with the terms of the respective swap agreements.
Interest rate swap agreements involve the exchange by the Portfolio with another party of their respective commitments to pay or receive interest, e.g., an exchange of floating rate payments for fixed rate payments with respect to the notional amount of principal. Certain forms of interest rate swap agreements may include: (i) interest rate caps, under which, in return for a premium, one party agrees to make payments to the other to the extent that interest rates exceed a specified rate, or “cap”, (ii) interest rate floors, under which, in return for a premium, one party agrees to make payments to the other to the extent that interest rates fall below a specified rate, or “floor”, or (iii) interest rate collars, under which a party sells a cap and purchases a floor or vice versa in an attempt to protect itself against interest rate movements exceeding given minimum or maximum levels.
Total return swap agreements involve commitments to pay interest in exchange for a market-linked return, both based on notional amounts. To the extent the total return of the security or index underlying the transaction exceeds or falls short of the offsetting interest rate obligation, the Portfolio will receive a payment from or make a payment to the counterparty.
Forward spread-lock swap agreements involve commitments to pay or receive a settlement amount calculated as the difference between the swap spread and a fixed spread, multiplied by the notional amount times the duration of the swap. The swap spread is the difference between the benchmark swap rate (market rate) and the specific Treasury rate.
Credit default swap agreements involve one party making a stream of payments to another party in exchange for the right to receive a specified return in the event of
| | | | |
| 16 | | PIMCO Variable Insurance Trust | | |
| | |
| |
| | | June 30, 2007 (Unaudited) |
a default by a third party, typically corporate issues or sovereign issues of an emerging country, on its obligation. The Portfolio may use credit default swaps to provide a measure of protection against defaults of the issuers (i.e., to reduce risk where the Portfolio owns or has exposure to the sovereign issuer) or to take an active long or short position with respect to the likelihood of a particular issuer’s default. As a seller of protection, the Portfolio generally receives an upfront payment or a fixed rate of income throughout the term of the swap provided that there is no credit event. If the Portfolio is a seller of protection and a credit event occurs, as defined under the terms of that particular swap agreement, the Portfolio will pay to the buyer of the protection an amount up to the notional value of the swap and in certain instances take delivery of the security. As the seller, the Portfolio would effectively add leverage to its portfolio because, in addition to its total net assets, the Portfolio would be subject to investment exposure on the notional amount of the swap. As a buyer of protection, the Portfolio generally receives an amount up to the notional value of the swap if a credit event occurs. The treatment of credit default swaps and other swap agreements that provide for contingent, non-periodic, bullet-type payments as “notional principal contracts” for U.S. federal income tax purposes is uncertain. Were the U.S. Internal Revenue Service (“IRS”) to take the position that a credit default swap or other bullet-type swap is not a “notional principal contract” for U.S. federal income tax purposes, payments received by the Portfolio from such investments might be subject to U.S. excise or income taxes.
Swaps are marked to market daily based upon quotations from market makers and the change in value, if any, is recorded as unrealized gain or loss on the Statement of Operations. Payments received or made at the beginning of the measurement period are reflected as such on the Statement of Assets and Liabilities. These upfront payments are recorded as realized gain or loss on the Statement of Operations upon termination or maturity of the swap. A liquidation payment received or made at the termination of the swap is recorded as realized gain or loss on the Statement of Operations. Net periodic payments received or paid by the Portfolio are included as part of realized gain or loss on the Statement of Operations. Entering into these agreements involves, to varying degrees, elements of credit, market and documentation risk in excess of the amounts recognized on the Statement of Assets and Liabilities. Such risks involve the possibility that there will be no liquid market for these agreements, that the counterparty to the agreements may default on its obligation to perform or disagree as to the meaning of contractual terms in the agreements and that there may be unfavorable changes in interest rates.
(n) Loan Participations and Assignments The Portfolio may invest in direct debt instruments which are interests in amounts owned by corporate, governmental, or other borrowers to lenders or lending syndicates. The Portfolio’s investments in loans may be in the form of participations in loans or assignments of all or a portion of loans from third parties. A loan is often administered by a bank or other financial institution (the “lender”) that acts as agent for all holders. The agent administers the terms of the loan, as specified in the loan agreement. When investing in a loan participation, the Portfolio has the right to receive payments of principal, interest and any fees to which it is entitled only from the lender selling the loan agreement and only upon receipt by the lender of payments from the borrower. The Portfolio generally has no right to enforce compliance with the terms of the loan agreement with the borrower. As a result, the Portfolio may be subject to the credit risk of both the borrower and the lender that is selling the loan agreement. When the Portfolio purchases assignments from lenders it acquires direct rights against the borrower of the loan. At the end of the period June 30, 2007, the Portfolio had no unfunded loan commitments.
(o) Bridge Debt Commitments At the period ended June 30, 2007, the Portfolio had $300,421 in commitments outstanding to fund high yield bridge debt. The Portfolio is entitled to a fee upon the expiration of the commitment period. The bridge debt terms approximate market rates at the time the commitment is entered into.
(p) Mortgage-Related and Other Asset-Backed Securities The Portfolio may invest in mortgage-related or other asset-backed securities. These securities include mortgage pass-through securities, collateralized mortgage obligations (“CMOs”), commercial mortgage-backed securities, mortgage dollar rolls, CMO residuals, stripped mortgage-backed securities (“SMBSs”) and other securities that directly or indirectly represent a participation in, or are secured by and payable from, mortgage loans on real property. The value of some mortgage-related or asset-backed securities may be particularly sensitive to changes in prevailing interest rates. Early repayment of principal on some mortgage-related securities may expose the Portfolio to a lower rate of return upon reinvestment of principal. The value of these securities may fluctuate in response to the market’s perception of the creditworthiness of the issuers. Additionally, although mortgages and mortgage-related securities are generally supported by some form of government or private guarantee and/or insurance, there is no assurance that private guarantors or insurers will meet their obligations.
(q) U.S. Government Agencies or Government-Sponsored Enterprises Securities issued by U.S. Government agencies or government-sponsored enterprises may not be guaranteed by the U.S. Treasury. The Government National Mortgage Association (“GNMA” or “Ginnie Mae”), a wholly owned U.S. Government corporation, is authorized to guarantee, with the full faith and credit of the U.S. Government, the timely payment of principal and interest on securities issued by institutions approved by GNMA and backed by pools of mortgages insured by the Federal Housing Administration or guaranteed by the Department of Veterans Affairs. Government-related guarantors (i.e., not backed by the full faith and credit of the U.S. Government) include the Federal National Mortgage Association (“FNMA” or “Fannie Mae”) and the Federal Home Loan Mortgage Corporation (“FHLMC” or “Freddie Mac”). Pass-through securities issued by FNMA are guaranteed as to timely payment of principal and interest by FNMA but are not backed by the full faith and credit of the U.S. Government. FHLMC guarantees the timely payment of interest and ultimate collection of principal, but its participation certificates are not backed by the full faith and credit of the U.S. Government.
(r) New Accounting Policies In July 2006, the Financial Accounting Standards Board (“FASB”) issued Interpretation No. 48, “Accounting for Uncertainty in Income Taxes—an Interpretation of FASB Statement No. 109” (the “Interpretation”). The Interpretation became effective for the Portfolio on June 29, 2007. Management has evaluated the application of the Interpretation in relation to the Portfolio and has concluded that no single filing position or combination of filing positions identified as uncertain tax positions required the accrual of a tax liability in the accounting records of the Portfolio for the period ending June 30, 2007. Management will monitor all existing filing positions and future filing positions in light of the Interpretation and evaluate the need for any future tax accruals and financial statement disclosures as warranted.
In September 2006, the FASB issued Statement of Financial Accounting Standards No. 157, “Fair Value Measurements” (the “Statement”). The Statement is effective for fiscal years beginning after November 15, 2007 and will require expanded disclosure about fair value measurements, separately for each major category of assets and liabilities, that enables shareholders to assess the inputs used to develop those measurements, and for recurring fair value measurements using significant unobservable inputs the effect of the measurements on changes in net assets for the reporting period. Management is currently evaluating the application of the Statement to the Portfolio and will provide additional information in relation to the Statement on the Portfolio’s annual financial statements for the period ending December 31, 2007.
| | | | | | |
| | Semiannual Report | | June 30, 2007 | | 17 |
Notes to Financial Statements (Cont.)
3. FEES AND EXPENSES
(a) Investment Advisory Fee PIMCO is a majority-owned subsidiary of Allianz Global Investors of America L.P. (“AGI”), and serves as investment adviser (the “Adviser”) to the Trust, pursuant to an investment advisory contract. The Adviser receives a monthly fee from the Portfolio, at an annual rate based on average daily net assets. The Advisory Fee for all classes is charged at an annual rate of 0.30%.
(b) Administration Fee PIMCO serves as administrator (the “Administrator”), and provides administrative services to the Trust for which it receives a monthly administrative fee based on each share class’s average daily net assets. As the Administrator, PIMCO bears the costs of various third-party services, including audit, custodial, portfolio accounting, legal, transfer agency and printing costs. The Administration Fee for all classes is charged at the annual rate of 0.10%.
(c) Distribution and Servicing Fees Allianz Global Investors Distributors LLC (“AGID”) is an indirect wholly-owned subsidiary of AGI and serves as the distributor (the “Distributor”) of the Trust’s shares. The Trust is permitted to reimburse AGID on a quarterly basis, out of the Administrative Class assets of the Portfolio in the amount of 0.15% on an annual basis of the average daily net assets of that class, for payments made to financial intermediaries that provide services in connection with the distribution of shares or administration of plans or programs that use Portfolio shares as their funding medium. The effective rate paid to AGID was 0.15% during the current fiscal year.
(d) Portfolio Expenses The Trust is responsible for the following expenses: (i) salaries and other compensation of any of the Trust’s executive officers and employees who are not officers, directors, stockholders or employees of PIMCO or its subsidiaries or affiliates; (ii) taxes and governmental fees; (iii) brokerage fees and commissions and other portfolio transaction expenses; (iv) the costs of borrowing money, including interest expenses and bank overdraft charges; (v) fees and expenses of the Trustees who are not “interested persons” of PIMCO or the Trust, and any counsel retained exclusively for their benefit; (vi) extraordinary expenses, including costs of litigation and indemnification expenses; (vii) organization expenses and (viii) any expenses allocated or allocable to a specific class of shares, which include service fees payable with respect to the Administrative Class Shares, and may include certain other expenses as permitted by the Trust’s Multiple Class Plan adopted pursuant to Rule 18f-3 under the Act and subject to review and approval by the Trustees. The ratio of expenses to average net assets per share class, as disclosed in the Financial Highlights, may differ from the annual portfolio operating expenses per share class as disclosed in the Prospectus for the reasons set forth above.
Effective April 1, 2007, each Trustee, other than those affiliated with PIMCO or its affiliates, receives an annual retainer of $15,000, plus $2,375 for each Board of Trustees meeting attended in person, $500 for each committee meeting attended and $750 for each Board of Trustees meeting attended telephonically, plus reimbursement of related expenses. In addition, the audit committee chair receives an additional annual retainer of $2,000 and each other committee chair receives an additional annual retainer of $500. These expenses are allocated on a pro-rata basis to the various portfolios of the Trust according to their respective net assets. The Trust pays no compensation directly to any Trustee or any other officer who is affiliated with the Administrator, all of whom receive remuneration for their services to the Trust from the Administrator or its affiliates. Prior to April 1, 2007, each Trustee, other than those affiliated with PIMCO or its affiliates, received an annual retainer of $15,000 plus $2,000 for each Board of Trustees meeting attended ($500 for each special meeting attended), plus reimbursement of related expenses. The Audit Committee Chairman received an annual retainer of $1,500 and the Governance Committee Chairman received an annual retainer of
$500. In addition, each member of a committee received $500 for each committee meeting attended.
4. RELATED PARTY TRANSACTIONS
The Adviser, Administrator, and Distributor are related parties as defined by FAS 57, Related Party Disclosures. Fees payable to these parties are disclosed in Note 3.
5. GUARANTEES AND INDEMNIFICATIONS
Under the Trust’s organizational documents, each Trustee, officer, employee or other agent of the Trust (including the Trust’s investment manager) is indemnified, to the extent permitted by the Act, against certain liabilities that may arise out of performance of their duties to the Portfolio. Additionally, in the normal course of business, the Portfolio enters into contracts that contain a variety of indemnification clauses. The Portfolio’s maximum exposure under these arrangements is unknown as this would involve future claims that may be made against the Portfolio that have not yet occurred. However, the Portfolio has not had prior claims or losses pursuant to these contracts and believes the risk of loss to be remote.
6. PURCHASES AND SALES OF SECURITIES
The length of time the Portfolio has held a particular security is not generally a consideration in investment decisions. A change in the securities held by the Portfolio is known as “portfolio turnover”. The Portfolio may engage in frequent and active trading of portfolio securities to achieve its investment objective, particularly during periods of volatile market movements. High portfolio turnover (e.g., over 100%) involves correspondingly greater expenses to the Portfolio, including brokerage commissions or dealer mark-ups and other transaction costs on the sale of securities and reinvestments in other securities. Such sales may also result in realization of taxable capital gains, including short-term capital gains (which are generally taxed at ordinary income tax rates). The trading costs and tax effects associated with portfolio turnover may adversely affect the Portfolio’s performance.
Purchases and sales of securities (excluding short-term investments) for the period ended June 30, 2007, were as follows (amounts in thousands):
| | | | | | | | | | | | |
| U.S. Government/Agency | | | | All Other |
| Purchases | | Sales | | | | Purchases | | Sales |
| $ | 14,406 | | $ | 13,974 | | | | $ | 24,307 | | $ | 4,293 |
7. TRANSACTIONS IN WRITTEN CALL AND PUT OPTIONS
Transactions in written call and put options were as follows (amounts in thousands, except for number of contracts):
| | | | | | | | | | | | | | | | | |
| | | | | # of
Contracts | | | Notional
Amount
in $ | | | Notional
Amount
in GBP | | | Premium | |
Balance at 12/31/2006 | | | | 60 | | | $ | 8,000 | | | GBP | 200 | | | $ | 90 | |
Sales | | | | 94 | | | | 11,000 | | | | 0 | | | | 243 | |
Closing Buys | | | | (11 | ) | | | (8,000 | ) | | | 0 | | | | (127 | ) |
Expirations | | | | (143 | ) | | | 0 | | | | (200 | ) | | | (77 | ) |
Exercised | | | | 0 | | | | 0 | | | | 0 | | | | 0 | |
Balance at 06/30/2007 | | | | 0 | | | $ | 11,000 | | | GBP | 0 | | | $ | 129 | |
| | | | |
| 18 | | PIMCO Variable Insurance Trust | | |
| | |
| |
| | | June 30, 2007 (Unaudited) |
8. SHARES OF BENEFICIAL INTEREST
The Portfolio may issue an unlimited number of shares of beneficial interest with a $0.001 par value. Changes in shares of beneficial interest were as follows (shares and amounts in thousands):
| | | | | | | | | | | | | | | | |
| | | | | Six Months Ended
06/30/2007 | | | Year Ended
12/31/2006 | |
| | | | | Shares | | | Amount | | | Shares | | | Amount | |
| | | | | |
Receipts for shares sold | | | | | | | | | | | | | | | | |
Institutional Class | | | | 113 | | | $ | 1,312 | | | 198 | | | $ | 2,084 | |
Administrative Class | | | | 260 | | | | 2,953 | | | 363 | | | | 3,872 | |
Issued as reinvestment of distributions | | | | | | | | | | | | | | | | |
Institutional Class | | | | 13 | | | | 143 | | | 27 | | | | 289 | |
Administrative Class | | | | 228 | | | | 2,609 | | | 438 | | | | 4,644 | |
Cost of shares redeemed | | | | | | | | | | | | | | | | |
Institutional Class | | | | (251 | ) | | | (2,888 | ) | | (258 | ) | | | (2,654 | ) |
Administrative Class | | | | (698 | ) | | | (7,973 | ) | | (15,605 | ) | | | (166,615 | ) |
Net (decrease) resulting from Portfolio share transactions | | | | (335 | ) | | $ | (3,844 | ) | | (14,837 | ) | | $ | (158,380 | ) |
The following schedule shows the number of shareholders each owning 5% or more of the Portfolio and the total percentage of the Portfolio held by such shareholders:
| | | | | | |
| | | | | Number of Shareholders | | % of Portfolio Held |
Institutional Class | | | | 2 | | 99 |
Administrative Class | | | | 5 | | 89 |
9. REGULATORY AND LITIGATION MATTERS
Since February 2004, PIMCO, Allianz Global Investors of America L.P. (PIMCO’s parent company), AGID, and certain of their affiliates, including the PIMCO Funds (another series of funds managed by PIMCO), the Allianz Funds (formerly known as PIMCO Funds: Multi-Manager Series (another series of funds managed by affiliates of PIMCO)), certain Trustees of the Trust (in their capacity as Trustees of the PIMCO Funds or the Allianz Funds) and certain employees of PIMCO, have been named as defendants in fifteen lawsuits filed in various jurisdictions. Eleven of those lawsuits concern “market timing,” and they have been transferred to and consolidated for pre-trial proceedings in a multi-district litigation proceeding in the U.S. District Court for the District of Maryland; the other four lawsuits concern “revenue sharing” and have been consolidated into a single action in the U.S. District Court for the District of Connecticut. The lawsuits have been commenced as putative class actions on behalf of investors who purchased, held or redeemed shares of the various series of the PIMCO Funds and the Allianz Funds during specified periods, or as derivative actions on behalf of the PIMCO Funds and the Allianz Funds.
The market timing actions in the District of Maryland generally allege that certain hedge funds were allowed to engage in “market timing” in certain funds of the PIMCO Funds and the Allianz Funds and this alleged activity was not disclosed. Pursuant to tolling agreements entered into with the derivative and class action plaintiffs, PIMCO, certain PIMCO Funds Trustees, and certain employees of PIMCO who were previously named as defendants have all been dropped as defendants in the market timing actions; the plaintiffs continue to assert claims on behalf of the shareholders of the PIMCO Funds or on behalf of the PIMCO Funds itself against other defendants. By order dated November 3, 2005, the U.S. District Court for the District of Maryland granted the PIMCO Funds’ motion to dismiss claims asserted against it in a consolidated amended complaint where the PIMCO Funds were named, in the complaint, as a nominal defendant. The revenue sharing action in the District of Connecticut generally alleges that fund assets were inappropriately used to pay brokers to promote funds of the PIMCO Funds and the Allianz Funds, including directing fund brokerage transactions to such brokers, and that such alleged arrangements were not fully disclosed to shareholders. On August 11, 2005,
the U.S. District Court for the District of Connecticut conducted a hearing on defendants’ motion to dismiss the consolidated amended complaint in the revenue sharing action but has not yet ruled on the motion to dismiss. The market timing and revenue sharing lawsuits seek, among other things, unspecified compensatory damages plus interest and, in some cases, punitive damages, the rescission of investment advisory contracts, the return of fees paid under those contracts and restitution.
Two nearly identical class action civil complaints have been filed in August 2005, in the Northern District of Illinois Eastern Division, alleging that the plaintiffs each purchased and sold a 10-year Treasury note futures contract and suffered damages from an alleged shortage when PIMCO held both physical and futures positions in 10-year Treasury notes for its client accounts. The two actions have been consolidated into one action, and the two separate complaints have been replaced by a consolidated complaint. PIMCO is a named defendant, and PIMCO Funds has been added as a defendant, to the consolidated action. PIMCO strongly believes the complaint is without merit and intends to vigorously defend itself.
In April 2006, certain portfolios of the Trust and certain other funds managed by PIMCO were served in an adversary proceeding brought by the Official Committee of Asbestos Claimants of G-I Holdings, Inc. in G-I Holdings, Inc.’s bankruptcy in the District of New Jersey. In July 2004, PIMCO was named in this lawsuit and remains a defendant. The plaintiff seeks to recover for the bankruptcy estate assets that were transferred by the predecessor entity of G-I Holdings, Inc. to a wholly-owned subsidiary in 1994. The subsidiary has since issued notes, of which certain portfolios of the Trust and certain other funds managed by PIMCO are alleged to be holders. The complaint alleges that in 2000, more than two hundred noteholders—including certain portfolios of the Trust and certain other funds managed by PIMCO—were granted a second priority lien on the assets of the subsidiary in exchange for their consent to a refinancing transaction and the granting of a first priority lien to the lending banks. The plaintiff is seeking invalidation of the lien in favor of the noteholders and/or the value of the lien. On June 21, 2006, the District of New Jersey overturned the Bankruptcy Court’s decision granting permission to file the adversary proceeding and remanded the matter to the Bankruptcy Court for further proceedings. Following a motion to reconsider, the District Court upheld its remand on August 7, 2006, and instructed the Bankruptcy Court to conduct a “cost-benefit” analysis of the Committee’s claims, including the claims against the noteholders. The Bankruptcy Court held a status conference on October 25, 2006 and set a briefing schedule relating to this cost-benefit analysis.
The foregoing speaks only as of the date of this report. It is possible that these matters and/or other developments resulting from these matters could result in increased portfolio redemptions or other adverse consequences to the Portfolio. However, PIMCO and AGID believe that these matters are not likely to have a material adverse effect on the Portfolio or on PIMCO’s or AGID’s ability to perform their respective investment advisory or distribution services relating to the Portfolio.
10. FEDERAL INCOME TAX MATTERS
The Portfolio intends to qualify as a regulated investment company under sub-chapter M of the Internal Revenue Code (the “Code”) and distribute all of its taxable income and net realized gains, if applicable, to shareholders. Accordingly, no provision for Federal income taxes has been made.
As of June 30, 2007, the aggregate cost of investments was the same for federal income tax and financial statement purposes. The net unrealized appreciation (depreciation) of investment securities for federal income tax purposes is as follows (amount in thousands):
| | | | |
Aggregate
Gross
Unrealized
Appreciation | | Aggregate
Gross
Unrealized
(Depreciation) | | Net
Unrealized
(Depreciation) |
$ 131 | | $ (686) | | $ (555) |
| | | | | | |
| | Semiannual Report | | June 30, 2007 | | 19 |
| | |
| |
Privacy Policy* | | (Unaudited) |
The Funds consider customer privacy to be a fundamental aspect of their relationships with shareholders and are committed to maintaining the confidentiality, integrity and security of their current, prospective and former shareholders’ personal information. To ensure their shareholders’ privacy, the Funds have developed policies that are designed to protect this confidentiality, while allowing shareholder needs to be served.
Obtaining Personal Information
In the course of providing shareholders with products and services, the Funds and certain service providers to the Funds, such as the Funds’ investment advisers (“Advisers”), may obtain non-public personal information about shareholders, which may come from sources such as account applications and other forms, from other written, electronic or verbal correspondence, from shareholder transactions, from a shareholder’s brokerage or financial advisory firm, financial adviser or consultant, and/or from information captured on the Funds’ internet web sites.
Respecting Your Privacy
As a matter of policy, the Funds do not disclose any personal or account information provided by shareholders or gathered by the Funds to non-affiliated third parties, except as required or permitted by law or as necessary for such third parties to perform their agreements with respect to the Funds. As is common in the industry, non-affiliated companies may from time to time be used to provide certain services, such as preparing and mailing prospectuses, reports, account statements and other information, conducting research on shareholder satisfaction and gathering shareholder proxies. A Fund’s Distributor may also retain non-affiliated companies to market the Fund’s shares or products which use the Fund’s shares and enter into joint marketing agreements with other companies. These companies may have access to a shareholder’s personal and account information, but are permitted to use this information solely to provide the specific service or as otherwise permitted by law. In most cases, the shareholders will be clients of a third party, but the Funds may also provide a shareholder’s personal and account information to the shareholder’s respective brokerage or financial advisory firm.
Sharing Information with Third Parties
The Funds reserve the right to disclose or report personal information to non-affiliated third parties, in limited circumstances, where the Funds believe in good faith that disclosure is required under law to cooperate with regulators or law enforcement authorities, to protect their rights or property or upon reasonable request by any Fund in which a shareholder has chosen to invest. In addition, the Funds may disclose information about a shareholder’s accounts to a non-affiliated third party with the consent of the shareholder.
Sharing Information with Affiliates
The Funds may share shareholder information with their affiliates in connection with servicing their shareholders’ accounts or to provide shareholders with information about products and services that the Funds or their Advisers, principal underwriters or their affiliates (“Service Affiliates”) believe may be of interest to such shareholders. The information that the Funds share may include, for example, a shareholder’s participation in one of the Funds or in other investment programs sponsored by a Service Affiliate, a shareholder’s ownership of certain types of accounts (such as IRAs), or other data about a shareholder’s accounts. The Funds’ Service Affiliates, in turn, are not permitted to share shareholder information with non-affiliated entities, except as required or permitted by law.
Procedures to Safeguard Private Information
The Funds take seriously the obligation to safeguard shareholder non-public personal information. In addition to this policy, the Funds have also implemented procedures that are designed to restrict access to a shareholder’s non-public personal information only to internal personnel who need to know that information in order to provide products or services to such shareholders. In order to guard a shareholder’s non-public personal information, physical, electronic and procedural safeguards are in place.
* This Privacy Policy applies to the following entities: PIMCO Funds, PIMCO Variable Insurance Trust, PCM Fund, Inc. and PIMCO Strategic Global Government Fund, Inc. (collectively, the “Funds”).
| | | | |
| 20 | | PIMCO Variable Insurance Trust | | |
Investment Adviser and Administrator
Pacific Investment Management Company LLC
840 Newport Center Drive
Newport Beach, California 92660
Distributor
Allianz Global Investors Distributors LLC
1345 Avenue of the Americas
New York, New York 10105
Custodian
State Street Bank & Trust Company
801 Pennsylvania
Kansas City, Missouri 64105
Transfer Agent
Boston Financial Data Services–Midwest
330 W. 9th Street
Kansas City, Missouri 64105
Legal Counsel
Dechert LLP
1775 I Street, N.W.
Washington, D.C. 20006
Independent Registered Public Accounting Firm
PricewaterhouseCoopers LLP
1055 Broadway
Kansas City, Missouri 64105
P I M C O

Table of Contents
This material is authorized for use only when preceded or accompanied by the current PIMCO Variable Insurance Trust (the “Trust”) prospectus. Investors should consider the investment objectives, risks, charges and expenses of this Trust carefully before investing. Ask your financial professional to explain all charges that may apply. This and other information is contained in the Trust’s prospectus. The variable product prospectus may be obtained by contacting your Investment Consultant. Please read the Trust and variable product prospectus carefully before you invest or send money.
Chairman’s Letter
Dear PIMCO Variable Insurance Trust Shareholder:
It is our pleasure to present to you the semiannual report for the PIMCO Variable Insurance Trust, covering the six-month period ended June 30, 2007. The PIMCO Variable Insurance Trust’s net assets were $8.68 billion at June 30, 2007, as compared to $7.76 billion at December 31, 2006.
Highlights of the financial markets during the reporting period include:
| | n | | Economic data during the first quarter of 2007 pointed to slower growth, which heightened market expectations for a decrease in the Federal Funds Rate. By the second quarter, economic data, such as employment statistics, provided little indication of economic weakness, causing expectations of a decrease in the Federal Funds Rate to unwind and U.S. interest rates to move higher. Interest rates in Europe and the U.K. also rose over the period as central banks raised their key lending rates due to inflation concerns. The benchmark ten-year U.S. Treasury yielded 5.03% as of June 30, 2007, or 0.32% higher than at the beginning of the year. |
| | n | | Most bonds generally returned much of their gains from earlier in the year as worldwide growth and capital flows drove interest rates higher in the second quarter. Increased risk aversion in global financial markets, due in part to subprime mortgage worries in the U.S., also contributed to the rise in interest rates. The Lehman Brothers Aggregate Bond Index, which includes Treasury, investment-grade corporate and mortgage-backed securities, returned 0.98% for the six-month period. |
| | n | | Locally issued emerging market (“EM”) bonds posted positive returns for the reporting period. Yields on these bonds declined and the local currencies in which they are denominated generally gained, amid increasing investor awareness, strong economic growth and surging capital inflows. External EM bonds (debt instruments issued by emerging markets countries and typically denominated in U.S. dollars) lagged behind local EM bonds (debt instruments issued by emerging markets countries and denominated in the currency of the issuer), as external EM bonds tend to trade more in-line with U.S. Treasuries. |
| | n | | Treasury Inflation-Protected Securities (“TIPS”) outpaced nominal bonds (non-inflation linked bonds) for the first part of the year and all but the longest maturity TIPS outperformed in the second quarter as high gasoline prices drove higher inflation accruals. Commodities, as represented by the Dow Jones-AIG Commodity Total Return Index, returned 4.46% for the period. Equities, as measured by the S&P 500 Index and the Russell 2000 Index, returned 6.96% and 6.45%, respectively, for the period. |
On the following pages, please find specific details as to the Portfolio’s total return investment performance and a discussion of those factors that affected performance.
Thank you for the trust you have placed in us. We will continue to work diligently to serve your investment needs.
Sincerely,
Brent R. Harris
Chairman, PIMCO Variable Insurance Trust
July 31, 2007
| | | | | | |
| | Semiannual Report | | June 30, 2007 | | 1 |
Important Information About the Portfolio
PIMCO Variable Insurance Trust (the “Trust”) is an open-end management investment company currently consisting of twenty separate investment portfolios, including the StocksPLUS® Growth and Income Portfolio (the “Portfolio”). The Portfolio is only available as a funding vehicle under variable life insurance policies or variable annuity contracts issued by insurance companies (“Variable Contracts”). Individuals may not purchase shares of the Portfolio directly. Shares of the Portfolio also may be sold to qualified pension and retirement plans outside of the separate account context.
We believe that bond funds have an important role to play in a well diversified investment portfolio. It is important to note, however, that in an environment where interest rates may trend upward, rising rates would negatively impact the performance of most bond funds, and fixed-income securities held by a fund are likely to decrease in value. The price volatility of fixed-income securities can also increase during periods of rising interest rates resulting in increased losses to a fund. Bond funds and individual bonds with a longer duration (a measure of the expected life of a security) tend to be more sensitive to changes in interest rates, usually making them more volatile than securities or funds with shorter durations.
The Portfolio may be subject to various risks in addition to those described above. Some of these risks may include, but are not limited to, the following: credit risk, high yield risk, market risk, issuer risk, liquidity risk, derivatives risk, equity risk, mortgage risk, non-U.S. investment risk, emerging markets risk, currency risk, leveraging risk and management risk. A complete description of these risks is contained in the Portfolio’s prospectus. The Portfolio may use derivative instruments as part of an investment strategy, as described under “Portfolio Insights”, or for hedging purposes. Use of these instruments may involve certain costs and risks such as liquidity risk, interest rate risk, market risk, credit risk, management risk and the risk that the Portfolio could not close out a position when it would be most advantageous to do so. Because the Portfolio may invest in derivatives, it could lose more than the principal amount invested in these instruments. Investing in non-U.S. securities may entail risk due to non-U.S. economic and political developments; this risk may be increased when investing in emerging markets.
On the performance summary page in this Semiannual Report, the Total Return Investment Performance table measures performance assuming that all dividend and capital gain distributions were reinvested.
An investment in the Portfolio is not a deposit of a bank and is not guaranteed or insured by the Federal Deposit Insurance Corporation or any other government agency. It is possible to lose money on investments in the Portfolio.
PIMCO has adopted written proxy voting policies and procedures (“Proxy Policy”) as required by Rule 206(4)-6 under the Investment Advisers Act of 1940, as amended. The Proxy Policy has been adopted by the Trust as the policies and procedures that PIMCO will use when voting proxies on behalf of the Portfolio. A description of the policies and procedures that PIMCO uses to vote proxies relating to portfolio securities of the Portfolio, and information about how the Portfolio voted proxies relating to portfolio securities held during the most recent twelve-month period ended June 30, are available without charge, upon request, by calling the Trust at 1-866-746-2606 and on the Portfolio’s website at www.pimco.com.
The Portfolio files its complete schedule of portfolio holdings with the SEC for the first and third quarters of each fiscal year on Form N-Q. A copy of the Trust’s Form N-Q is also available on the SEC’s website at http://www.sec.gov and may be reviewed and copied at the SEC’s Public Reference Room in Washington D.C. Information on the operation of the Public Reference Room may be obtained by calling 1-800-SEC-0330, and is available without charge, upon request, by calling the Trust at 1-866-746-2606 and on the Portfolio’s website at www.pimco.com.
PIMCO Variable Insurance Trust is distributed by Allianz Global Investors Distributors LLC, 1345 Avenue of the Americas, New York, NY 10105.
| | | | |
| 2 | | PIMCO Variable Insurance Trust | | |
The following disclosure provides important information regarding the Portfolio’s Expense Example (“Example” or “Expense Example”), which appears in this Semiannual Report. Please refer to this information when reviewing the Expense Example for the Portfolio.
Example
As a shareholder of the Portfolio, you incur two types of costs: (1) transaction costs and (2) ongoing costs, including advisory and administrative fees; distribution and/or service (12b-1) fees (Administrative Class only); and other Portfolio expenses. The Example is intended to help you understand your ongoing costs (in dollars) of investing in the Portfolio and to compare these costs with the ongoing costs of investing in other mutual funds. The Expense Example does not reflect any fees or other expenses imposed by the Variable Contracts. If it did, the expenses reflected in the Expense Example would be higher. The Example is based on an investment of $1,000 invested at the beginning of the period and held for the entire period indicated, which is from January 1, 2007 to June 30, 2007.
Actual Expenses
The information in the table under the heading “Actual Performance” provides information about actual account values and actual expenses. You may use the information in these columns, together with the amount you invested, to estimate the expenses that you paid over the period. Simply divide your account value by $1,000 (for example, an $8,600 account value divided by $1,000 = $8.60), then multiply the result by the number in the row titled “Expenses Paid During Period” to estimate the expenses you paid on your account during this period.
Hypothetical Example for Comparison Purposes
The information in the table under the heading “Hypothetical Performance (5% return before expenses)” provides information about hypothetical account values and hypothetical expenses based on the Portfolio’s actual expense ratio and an assumed rate of return of 5% per year before expenses, which is not the Portfolio’s actual return. The hypothetical account values and expenses may not be used to estimate the actual ending account balance or expenses you paid for the period. You may use this information to compare the ongoing costs of investing in the Portfolio and other portfolios. To do so, compare this 5% hypothetical example with the 5% hypothetical examples that appear in the shareholder reports of the other portfolios.
Please note that the expenses shown in the table are meant to highlight your ongoing costs only and do not reflect any transactional costs. Therefore, the information under the heading “Hypothetical Performance (5% return before expenses)” is useful in comparing ongoing costs only, and will not help you determine the relative total costs of owning different portfolios. In addition, if these transactional costs were included, your costs would have been higher.
The expense ratio may vary period to period because of various factors, such as an increase in expenses not covered by the advisory and administrative fees (such as expenses of the trustees and their counsel, litigation expense and interest expense).
| | | | | | |
| | Semiannual Report | | June 30, 2007 | | 3 |
PIMCO StocksPLUS® Growth and Income Portfolio
Cumulative Returns Through June 30, 2007
$10,000 invested at the beginning of the first full month following the inception date of the Portfolio’s Institutional Class.
Allocation Breakdown‡
| | |
Corporate Bonds & Notes | | 37.8% |
Short-Term Instruments | | 22.7% |
U.S. Treasury Obligations | | 12.5% |
U.S. Government Agencies | | 9.4% |
Asset-Backed Securities | | 7.8% |
Mortgage-Backed Securities | | 6.7% |
Other | | 3.1% |
| | ‡ | % of Total Investments as of 06/30/2007 |
| | | | | | | | | | |
| Average Annual Total Return for the period ended June 30, 2007 |
| | | | | 6 Months* | | 1 Year | | 5 Years | | Portfolio
Inception
(04/28/00)** |
| | PIMCO StocksPLUS® Growth and Income Portfolio Institutional Class | | 6.76% | | 20.52% | | 10.97% | | 2.63% |
| | S&P 500 Index± | | 6.96% | | 20.59% | | 10.71% | | 2.17% |
All Portfolio returns are net of fees and expenses.
* Cumulative return.
** The Portfolio began operations on 04/28/00. Index comparisons began on 04/30/00.
Performance quoted represents past performance. Past performance is no guarantee of future results. Investment return and principal value will fluctuate so the Portfolio shares, when redeemed, may be worth more or less than their original cost. The Portfolio’s performance does not reflect the deduction of additional charges and expenses imposed in connection with investing in Variable Contracts, which will reduce returns. Current performance may be lower or higher than the performance data quoted. Performance data current to the most recent month-end is available by calling (800) 927-4648.
± S&P 500 Index is an unmanaged market index generally considered representative of the stock market as a whole. The index focuses on the large-cap segment of the U.S. equities market. It is not possible to invest directly in the index. The index does not reflect deductions for fees and expenses.
| | | | | | |
| Expense Example | | Actual Performance | | Hypothetical Performance |
| | | | | (5% return before expenses) |
Beginning Account Value (01/01/07) | | $ | 1,000.00 | | $ | 1,000.00 |
Ending Account Value (06/30/07) | | $ | 1,067.56 | | $ | 1,022.81 |
Expenses Paid During Period† | | $ | 2.05 | | $ | 2.01 |
† Expenses are equal to the Portfolio’s Institutional Class annualized expense ratio of 0.40%, multiplied by the average account value over the period, multiplied by 181/365 (to reflect the one-half year period). Overall fees and expenses of investing in the Portfolio will be higher because the example does not reflect Variable Contract fees and expenses.
Please refer to page 3 herein for an explanation of the information presented in the above Expense Example.
Portfolio Insights
» | | The PIMCO StocksPLUS® Growth and Income Portfolio seeks to exceed the total return of the S&P 500 by investing under normal circumstances substantially all of its assets in S&P 500 derivatives, backed by a portfolio of fixed-income instruments. |
| » | | The Portfolio’s fixed-income portfolio underperformed the financing cost embedded in equity index futures holdings, thus leading the Portfolio to underperform the S&P 500. |
| » | | U.S. duration exposure was negative for performance as interest rates moved higher in instruments where the Portfolio’s duration exposure was concentrated. In particular, Eurodollar futures yields moved higher. |
| » | | A U.S. yield curve strategy involving short positions in longer duration (7+ year duration) instruments partially offset the negative duration impact as these rates moved higher, generating a positive price return. |
| » | | Short maturity (less than one year) exposures in Europe, the U.K. and Japan were also negative for performance as upward rate movements were pronounced in these markets. |
| » | | Holdings of mortgage-backed securities detracted from performance as they underperformed like-duration Treasuries. |
| » | | Credit sensitive holdings, including corporate bonds and emerging market bonds, added value as they outperformed like-duration Treasuries. |
| » | | Currency strategies, including long exposure to the euro and a basket of emerging market currencies, helped performance as these currencies appreciated relative to the U.S. dollar. |
| | | | |
| 4 | | PIMCO Variable Insurance Trust | | |
Financial Highlights StocksPLUS® Growth and Income Portfolio
| | | | | | | | | | | | | | | | | | | | | | | | |
| Selected per Share Data for the Year or Period Ended: | | 06/30/2007+ | | | 12/31/2006 | | | 12/31/2005 | | | 12/31/2004 | | | 12/31/2003 | | | 12/31/2002 | |
| | | | | | |
Institutional Class | | | | | | | | | | | | | | | | | | | | | | | | |
Net asset value beginning of year or period | | $ | 11.25 | | | $ | 10.27 | | | $ | 10.14 | | | $ | 9.29 | | | $ | 7.27 | | | $ | 9.36 | |
Net investment income (a) | | | 0.28 | | | | 0.45 | | | | 0.31 | | | | 0.15 | | | | 0.14 | | | | 0.26 | |
Net realized/unrealized gain (loss) on investments (a) | | | 0.47 | | | | 1.06 | | | | 0.06 | | | | 0.86 | | | | 2.06 | | | | (2.13 | ) |
Total income (loss) from investment operations | | | 0.75 | | | | 1.51 | | | | 0.37 | | | | 1.01 | | | | 2.20 | | | | (1.87 | ) |
Dividends from net investment income | | | (0.35 | ) | | | (0.53 | ) | | | (0.24 | ) | | | (0.16 | ) | | | (0.18 | ) | | | (0.22 | ) |
Total distributions | | | (0.35 | ) | | | (0.53 | ) | | | (0.24 | ) | | | (0.16 | ) | | | (0.18 | ) | | | (0.22 | ) |
Net asset value end of year or period | | $ | 11.65 | | | $ | 11.25 | | | $ | 10.27 | | | $ | 10.14 | | | $ | 9.29 | | | $ | 7.27 | |
Total return | | | 6.76 | % | | | 15.11 | % | | | 3.68 | % | | | 10.99 | % | | | 30.44 | % | | | (20.08 | )% |
Net assets end of year or period (000s) | | $ | 4,662 | | | $ | 5,910 | | | $ | 5,735 | | | $ | 3,560 | | | $ | 2,203 | | | $ | 786 | |
Ratio of expenses to average net assets | | | 0.40 | %* | | | 0.44 | %(c) | | | 0.50 | % | | | 0.50 | % | | | 0.50 | % | | | 0.50 | %(b) |
Ratio of expenses to average net assets excluding interest expense | | | 0.40 | %* | | | 0.44 | %(c) | | | 0.50 | % | | | 0.50 | % | | | 0.50 | % | | | 0.50 | %(b) |
Ratio of net investment income to average net assets | | | 4.93 | %* | | | 4.23 | % | | | 3.12 | % | | | 1.55 | % | | | 1.65 | % | | | 3.28 | % |
Portfolio turnover rate | | | 26 | % | | | 135 | % | | | 264 | % | | | 249 | % | | | 134 | % | | | 192 | % |
+ Unaudited
* Annualized
(a) Per share amounts based on average number of shares outstanding during the period.
(b) If the investment manager had not reimbursed expenses, the ratio of expenses to average net assets would have been 0.51%.
(c) Effective October 31, 2006, the advisory fee was reduced to 0.30%.
| | | | | | |
| See Accompanying Notes | | Semiannual Report | | June 30, 2007 | | 5 |
Statement of Assets and Liabilities StocksPLUS® Growth and Income Portfolio
| | | | |
| (Amounts in thousands, except per share amounts) | | June 30, 2007 | |
| | | (Unaudited) | |
| |
Assets: | | | | |
Investments, at value | | $ | 91,752 | |
Cash | | | 12 | |
Foreign currency, at value | | | 526 | |
Receivable for investments sold | | | 197 | |
Receivable for Portfolio shares sold | | | 6 | |
Interest and dividends receivable | | | 552 | |
Variation margin receivable | | | 831 | |
Swap premiums paid | | | 258 | |
Unrealized appreciation on foreign currency contracts | | | 196 | |
Unrealized appreciation on swap agreements | | | 135 | |
| | | | 94,465 | |
| |
Liabilities: | | | | |
Payable for investments purchased | | $ | 1,300 | |
Payable for investments purchased on a delayed-delivery basis | | | 1,100 | |
Payable for Portfolio shares redeemed | | | 8 | |
Written options outstanding | | | 38 | |
Accrued investment advisory fee | | | 23 | |
Accrued administration fee | | | 8 | |
Accrued servicing fee | | | 13 | |
Variation margin payable | | | 972 | |
Swap premiums received | | | 73 | |
Unrealized depreciation on foreign currency contracts | | | 24 | |
Unrealized depreciation on swap agreements | | | 302 | |
| | | | 3,861 | |
| |
Net Assets | | $ | 90,604 | |
| |
Net Assets Consist of: | | | | |
Paid in capital | | $ | 135,415 | |
Undistributed net investment income | | | 5,005 | |
Accumulated undistributed net realized (loss) | | | (48,369 | ) |
Net unrealized (depreciation) | | | (1,447 | ) |
| | | $ | 90,604 | |
| |
Net Assets: | | | | |
Institutional Class | | $ | 4,662 | |
Administrative Class | | | 85,942 | |
| |
Shares Issued and Outstanding: | | | | |
Institutional Class | | | 400 | |
Administrative Class | | | 7,453 | |
| |
Net Asset Value and Redemption Price Per Share (Net Asset Per Share Outstanding) | | | | |
Institutional Class | | $ | 11.65 | |
Administrative Class | | | 11.53 | |
| |
Cost of Investments Owned | | $ | 92,307 | |
Cost of Foreign Currency Held | | $ | 526 | |
Premiums Received on Written Options | | $ | 129 | |
| | | | |
| 6 | | PIMCO Variable Insurance Trust | | See Accompanying Notes |
Statement of Operations StocksPLUS® Growth and Income Portfolio
| | | | |
| (Amounts in thousands) | | Six Months Ended
June 30, 2007 | |
| | | (Unaudited) | |
| |
| Investment Income: | | | | |
Interest | | $ | 2,340 | |
Dividends | | | 68 | |
Miscellaneous income | | | 2 | |
Total Income | | | 2,410 | |
| |
Expenses: | | | | |
Investment advisory fees | | | 134 | |
Administration fees | | | 45 | |
Servicing fees – Administrative Class | | | 63 | |
Trustees’ fees | | | 1 | |
Interest expense | | | 2 | |
Total Expenses | | | 245 | |
| |
Net Investment Income | | | 2,165 | |
| |
Net Realized and Unrealized Gain (Loss): | | | | |
Net realized (loss) on investments | | | (78 | ) |
Net realized gain on futures contracts, written options and swaps | | | 5,514 | |
Net realized gain on foreign currency transactions | | | 66 | |
Net change in unrealized (depreciation) on investments | | | (6 | ) |
Net change in unrealized (depreciation) on futures contracts, written options and swaps | | | (1,941 | ) |
Net change in unrealized appreciation on translation of assets and liabilities denominated in foreign currencies | | | 145 | |
Net Gain | | | 3,700 | |
| |
Net Increase in Net Assets Resulting from Operations | | $ | 5,865 | |
| | | | | | |
| See Accompanying Notes | | Semiannual Report | | June 30, 2007 | | 7 |
Statements of Changes in Net Assets StocksPLUS® Growth and Income Portfolio
| | | | | | | | |
| (Amounts in thousands) | | Six Months Ended
June 30, 2007 | | | Year Ended
December 31, 2006 | |
| | | (Unaudited) | | | | |
| | |
| Increase (Decrease) in Net Assets from: | | | | | | | | |
| | |
Operations: | | | | | | | | |
Net investment income | | $ | 2,165 | | | $ | 5,394 | |
Net realized gain | | | 5,502 | | | | 10,420 | |
Net change in unrealized appreciation (depreciation) | | | (1,802 | ) | | | 3,907 | |
Net increase resulting from operations | | | 5,865 | | | | 19,721 | |
| | |
Distributions to Shareholders: | | | | | | | | |
From net investment income | | | | | | | | |
Institutional Class | | | (143 | ) | | | (289 | ) |
Administrative Class | | | (2,609 | ) | | | (4,645 | ) |
| | |
Total Distributions | | | (2,752 | ) | | | (4,934 | ) |
| | |
Portfolio Share Transactions: | | | | | | | | |
Receipts for shares sold | | | | | | | | |
Institutional Class | | | 1,312 | | | | 2,084 | |
Administrative Class | | | 2,953 | | | | 3,872 | |
Issued as reinvestment of distributions | | | | | | | | |
Institutional Class | | | 143 | | | | 289 | |
Administrative Class | | | 2,609 | | | | 4,644 | |
Cost of shares redeemed | | | | | | | | |
Institutional Class | | | (2,888 | ) | | | (2,654 | ) |
Administrative Class | | | (7,973 | ) | | | (166,615 | ) |
Net (decrease) resulting from Portfolio share transactions | | | (3,844 | ) | | | (158,380 | ) |
| | |
Total (Decrease) in Net Assets | | | (731 | ) | | | (143,593 | ) |
| | |
Net Assets: | | | | | | | | |
Beginning of period | | | 91,335 | | | | 234,928 | |
End of period* | | $ | 90,604 | | | $ | 91,335 | |
| | |
*Including undistributed net investment income of: | | $ | 5,005 | | | $ | 5,592 | |
| | | | |
| 8 | | PIMCO Variable Insurance Trust | | See Accompanying Notes |
| | |
| |
| Schedule of Investments StocksPLUS® Growth and Income Portfolio | | June 30, 2007 (Unaudited) |
| | | | | | | | |
| | | | | PRINCIPAL
AMOUNT
(000S) | | | | VALUE
(000S) |
| BANK LOAN OBLIGATIONS 0.4% |
| Metro-Goldwyn-Mayer, Inc. | | | | |
8.614% due 04/08/2012 | | $ | | 100 | | $ | | 100 |
| |
| OAO Rosneft Oil Co. | | | | | | | | |
6.000% due 09/16/2007 | | | | 300 | | | | 301 |
| | | | | | | | |
Total Bank Loan Obligations
(Cost $400) | | | | 401 |
| | | | | | | | |
|
| CORPORATE BONDS & NOTES 38.3% |
|
| BANKING & FINANCE 26.4% |
| American Express Bank FSB | | | | |
5.380% due 10/20/2009 | | | | 200 | | | | 200 |
| |
| American Express Credit Corp. | | | | |
5.380% due 11/09/2009 | | | | 200 | | | | 200 |
| |
| American Honda Finance Corp. | | | | |
5.407% due 02/09/2010 | | | | 900 | | | | 901 |
| |
| American International Group, Inc. | | | | |
5.370% due 06/16/2009 | | | | 800 | | | | 803 |
| |
| Bank of America Corp. | | | | |
5.370% due 06/19/2009 | | | | 800 | | | | 801 |
| |
| Bank of Ireland | | | | |
5.370% due 12/19/2008 | | | | 900 | | | | 901 |
| |
| CIT Group, Inc. | | | | |
5.000% due 11/24/2008 | | | | 300 | | | | 298 |
| |
| Citigroup Funding, Inc. | | | | |
5.360% due 06/26/2009 | | | | 100 | | | | 100 |
| |
| Citigroup, Inc. | | | | |
4.200% due 12/20/2007 | | | | 2,500 | | | | 2,487 |
| |
| Enron Credit Linked Notes Trust | | | | |
8.000% due 08/15/2005 (a) | | | | 1,700 | | | | 1,454 |
| |
| Export-Import Bank of Korea | | | | |
5.600% due 11/16/2010 | | | | 1,900 | | | | 1,905 |
| |
| Ford Motor Credit Co. | | | | |
4.950% due 01/15/2008 | | | | 100 | | | | 99 |
6.190% due 09/28/2007 | | | | 600 | | | | 600 |
6.625% due 06/16/2008 | | | | 3,100 | | | | 3,099 |
| |
| General Electric Capital Corp. | | | | |
5.385% due 10/26/2009 | | | | 400 | | | | 400 |
5.390% due 01/05/2009 | | | | 200 | | | | 200 |
5.430% due 08/15/2011 | | | | 800 | | | | 800 |
| |
| Goldman Sachs Group, Inc. | | | | |
5.410% due 03/30/2009 | | | | 200 | | | | 200 |
5.440% due 11/16/2009 | | | | 900 | | | | 901 |
| |
| HSBC Finance Corp. | | | | |
6.538% due 11/13/2007 | | | | 100 | | | | 100 |
| |
| ICICI Bank Ltd. | | | | |
5.895% due 01/12/2010 | | | | 300 | | | | 301 |
| |
| Lehman Brothers Holdings, Inc. | | | | |
5.445% due 01/23/2009 | | | | 300 | | | | 300 |
5.460% due 11/16/2009 | | | | 500 | | | | 501 |
5.579% due 07/18/2011 | | | | 100 | | | | 100 |
| |
| Merrill Lynch & Co., Inc. | | | | |
5.390% due 12/22/2008 | | | | 500 | | | | 500 |
5.395% due 10/23/2008 | | | | 200 | | | | 200 |
5.440% due 12/04/2009 | | | | 200 | | | | 200 |
| |
| Morgan Stanley | | | | |
5.446% due 01/15/2010 | | | | 500 | | | | 500 |
| |
| Osiris Capital PLC | | | | |
8.206% due 01/15/2010 | | | | 500 | | | | 503 |
| |
| Royal Bank of Scotland Group PLC | | | | |
5.360% due 12/21/2007 | | | | 600 | | | | 600 |
5.750% due 07/06/2012 | | | | 300 | | | | 300 |
| |
| | | | | | | | |
| | | | | PRINCIPAL
AMOUNT
(000S) | | | | VALUE
(000S) |
| Spinnaker Capital Ltd. | | | | |
16.860% due 06/15/2008 | | $ | | 300 | | $ | | 300 |
| |
| Unicredit Luxembourg Finance S.A. | | | | |
5.405% due 10/24/2008 | | | | 900 | | | | 901 |
| |
| VTB Capital S.A. for Vneshtorgbank | | | | |
5.955% due 08/01/2008 | | | | 200 | | | | 200 |
| |
| Wachovia Corp. | | | | |
5.486% due 10/15/2011 | | | | 900 | | | | 902 |
| |
| Wells Fargo & Co. | | | | |
5.400% due 03/10/2008 | | | | 200 | | | | 200 |
| |
| Westpac Banking Corp. | | | | |
5.280% due 06/06/2008 | | | | 100 | | | | 100 |
| |
| World Savings Bank FSB | | | | |
5.396% due 05/08/2009 | | | | 850 | | | | 851 |
| | | | | | | | |
| | | | | | | | 23,908 |
| | | | | | | | |
|
| INDUSTRIALS 7.9% |
| Albertson’s, Inc. | | | | | | | | |
6.950% due 08/01/2009 | | | | 300 | | | | 308 |
| |
| Anadarko Petroleum Corp. | | | | |
5.760% due 09/15/2009 | | | | 200 | | | | 200 |
| |
| DaimlerChrysler N.A. Holding Corp. | | | | |
5.710% due 03/13/2009 | | | | 100 | | | | 100 |
| |
| El Paso Corp. | | | | |
7.625% due 08/16/2007 | | | | 500 | | | | 504 |
| |
| General Electric Co. | | | | |
5.400% due 12/09/2008 | | | | 200 | | | | 200 |
| |
| General Mills, Inc. | | | | |
5.485% due 01/22/2010 | | | | 100 | | | | 100 |
| |
| Harrah’s Operating Co., Inc. | | | | |
7.500% due 01/15/2009 | | | | 200 | | | | 203 |
| |
| Hospira, Inc. | | | | |
5.840% due 03/30/2010 | | | | 200 | | | | 201 |
| |
| JC Penney Corp., Inc. | | | | |
7.375% due 08/15/2008 | | | | 100 | | | | 102 |
| |
| Northwest Pipeline Corp. | | | | |
6.625% due 12/01/2007 | | | | 1,372 | | | | 1,382 |
| |
| Pemex Project Funding Master Trust | | | | |
5.960% due 12/03/2012 | | | | 700 | | | | 710 |
| |
| Salomon Brothers AG for OAO Gazprom | | |
10.500% due 10/21/2009 | | | | 100 | | | | 110 |
| |
| Southern Natural Gas Co. | | | | |
6.700% due 10/01/2007 | | | | 500 | | | | 504 |
| |
| Time Warner, Inc. | | | | |
5.590% due 11/13/2009 | | | | 900 | | | | 901 |
| |
| Transcontinental Gas Pipe Line Corp. | | | | |
6.636% due 04/15/2008 | | | | 1,100 | | | | 1,093 |
| |
| Transocean, Inc. | | | | |
5.560% due 09/05/2008 | | | | 200 | | | | 200 |
| |
| Xerox Corp. | | | | |
9.750% due 01/15/2009 | | | | 300 | | | | 318 |
| | | | | | | | |
| | | | | | | | 7,136 |
| | | | | | | | |
|
| UTILITIES 4.0% |
| America Movil SAB de C.V. | | | | |
5.460% due 06/27/2008 | | | | 200 | | | | 200 |
| |
| AT&T, Inc. | | | | |
5.456% due 02/05/2010 | | | | 100 | | | | 100 |
5.570% due 11/14/2008 | | | | 100 | | | | 100 |
| |
| CMS Energy Corp. | | | | |
9.875% due 10/15/2007 | | | | 1,300 | | | | 1,319 |
| |
| | | | | | | | |
| | | | | PRINCIPAL
AMOUNT
(000S) | | | | VALUE
(000S) |
| Dominion Resources, Inc. | | | | |
5.660% due 09/28/2007 | | $ | | 900 | | $ | | 900 |
| |
| Qwest Capital Funding, Inc. | | | | |
6.375% due 07/15/2008 | | | | 200 | | | | 201 |
| |
| Qwest Corp. | | | | |
8.610% due 06/15/2013 | | | | 700 | | | | 763 |
| |
| Telecom Italia Capital S.A. | | | | |
5.836% due 02/01/2011 | | | | 100 | | | | 101 |
| | | | | | | | |
| | | | | | | | 3,684 |
| | | | | | | | |
Total Corporate Bonds & Notes
(Cost $34,894) | | | | 34,728 |
| | | | | | | | |
|
| MUNICIPAL BONDS & NOTES 0.1% |
| Golden State, California Tobacco Securitization Corporations Revenue Bonds, Series 2003 |
5.000% due 06/01/2021 | | | | 75 | | | | 76 |
| | | | | | | | |
Total Municipal Bonds & Notes (Cost $75) | | | | 76 |
| | | | | | | | |
|
| U.S. GOVERNMENT AGENCIES 9.5% |
| Fannie Mae | | | | | | | | |
5.000% due 12/01/2017 - 09/01/2018 | | 851 | | | | 826 |
6.000% due 04/01/2016 - 11/01/2033 | | 198 | | | | 199 |
8.000% due 05/01/2030 - 09/01/2031 | | 34 | | | | 36 |
| |
| Federal Home Loan Bank | | | | |
0.000% due 02/27/2012 | | | | 500 | | | | 461 |
| |
| Freddie Mac | | | | |
5.470% due 07/15/2019 - 10/15/2020 | | 3,300 | | | | 3,297 |
5.500% due 08/15/2030 | | | | 4 | | | | 4 |
5.550% due 07/15/2037 | | | | 1,100 | | | | 1,100 |
6.000% due 07/01/2016 - 07/01/2037 | | 1,863 | | | | 1,852 |
6.500% due 10/25/2043 | | | | 468 | | | | 475 |
| |
| Ginnie Mae | | | | |
4.000% due 07/16/2027 | | | | 28 | | | | 28 |
5.125% due 11/20/2029 | | | | 117 | | | | 118 |
6.375% due 02/20/2027 | | | | 135 | | | | 136 |
8.000% due 04/15/2027 - 12/15/2029 | | 56 | | | | 59 |
8.500% due 04/20/2030 | | | | 3 | | | | 3 |
| | | | | | | | |
Total U.S. Government Agencies
(Cost $8,719) | | | | 8,594 |
| | | | | | | | |
|
| U.S. TREASURY OBLIGATIONS 12.7% |
| Treasury Inflation Protected Securities (c) |
3.625% due 01/15/2008 (e) | | 11,512 | | | | 11,523 |
| | | | | | | | |
Total U.S. Treasury Obligations
(Cost $11,652) | | | | 11,523 |
| | | | | | | | |
|
| MORTGAGE-BACKED SECURITIES 6.8% |
| Arran Residential Mortgages Funding PLC |
5.340% due 04/12/2036 | | | | 118 | | | | 118 |
| |
| Banc of America Funding Corp. | | | | |
4.113% due 05/25/2035 | | | | 447 | | | | 438 |
| |
| Banc of America Mortgage Securities, Inc. |
6.500% due 10/25/2031 | | | | 178 | | | | 180 |
| |
| Bear Stearns Adjustable Rate Mortgage Trust |
5.329% due 02/25/2033 | | | | 128 | | | | 130 |
| |
| Bear Stearns Mortgage Funding Trust | | | | |
5.390% due 02/25/2037 | | | | 276 | | | | 277 |
| |
| Citigroup Commercial Mortgage Trust | | | | |
5.390% due 08/15/2021 | | | | 127 | | | | 127 |
| |
| | | | | | |
| See Accompanying Notes | | Semiannual Report | | June 30, 2007 | | 9 |
Schedule of Investments StocksPLUS® Growth and Income Portfolio (Cont.)
| | | | | | | | |
| | | | | PRINCIPAL
AMOUNT
(000S) | | | | VALUE
(000S) |
| Countrywide Alternative Loan Trust | | | | |
5.500% due 05/25/2047 | | $ | | 184 | | $ | | 184 |
6.000% due 10/25/2033 | | | | 279 | | | | 277 |
6.029% due 02/25/2036 | | | | 361 | | | | 364 |
| |
| CS First Boston Mortgage Securities Corp. |
5.631% due 05/25/2032 | | | | 100 | | | | 99 |
| |
Deutsche ALT-A Securities, Inc.
Mortgage Loan Trust |
5.390% due 01/25/2047 | | | | 243 | | | | 243 |
| |
| Greenpoint Mortgage Funding Trust | | | | |
5.400% due 10/25/2046 | | | | 174 | | | | 174 |
| |
| Harborview Mortgage Loan Trust | | | | |
5.410% due 01/19/2038 | | | | 272 | | | | 272 |
5.510% due 01/19/2038 | | | | 353 | | | | 353 |
| |
| Impac CMB Trust | | | | |
6.080% due 10/25/2033 | | | | 20 | | | | 20 |
| |
| Indymac Index Mortgage Loan Trust | | | | |
5.410% due 11/25/2046 | | | | 155 | | | | 155 |
| |
| Merrill Lynch Floating Trust | | | | |
5.390% due 06/15/2022 | | | | 800 | | | | 801 |
| |
| Morgan Stanley Capital I | | | | |
5.380% due 10/15/2020 | | | | 82 | | | | 82 |
| |
| Residential Funding Mortgage Securities I, Inc. |
6.500% due 03/25/2032 | | | | 186 | | | | 186 |
| |
| Structured Asset Mortgage Investments, Inc. |
5.450% due 03/25/2037 | | | | 351 | | | | 351 |
5.600% due 02/25/2036 | | | | 150 | | | | 150 |
| |
| Thornburg Mortgage Securities Trust | | |
5.430% due 12/25/2036 | | | | 170 | | | | 170 |
| |
| Wachovia Bank Commercial Mortgage Trust |
5.410% due 09/15/2021 | | | | 152 | | | | 153 |
| |
| Washington Mutual, Inc. | | | | |
5.724% due 12/25/2046 | | | | 863 | | | | 866 |
| | | | | | | | |
Total Mortgage-Backed Securities
(Cost $6,192) | | | | 6,170 |
| | | | | | | | |
|
| ASSET-BACKED SECURITIES 7.9% |
| Argent Securities, Inc. | | | | | | | | |
5.380% due 05/25/2036 | | | | 247 | | | | 247 |
| |
| Bear Stearns Asset-Backed Securities, Inc. |
5.380% due 01/25/2037 | | | | 352 | | | | 352 |
| |
| Citigroup Mortgage Loan Trust, Inc. | | | | |
5.380% due 01/25/2037 | | | | 380 | | | | 380 |
5.390% due 01/25/2036 | | | | 208 | | | | 208 |
5.430% due 08/25/2036 | | | | 600 | | | | 600 |
| |
| Countrywide Asset-Backed Certificates |
5.370% due 07/25/2037 | | | | 832 | | | | 833 |
| |
| Credit-Based Asset Servicing & Securitization LLC |
5.410% due 12/25/2037 | | | | 684 | | | | 683 |
| |
| First Franklin Mortgage Loan Asset-Backed Certificates |
5.360% due 01/25/2038 | | | | 329 | | | | 329 |
5.370% due 11/25/2036 | | | | 246 | | | | 246 |
| |
| | | | | | | | | |
| | | | | PRINCIPAL
AMOUNT
(000S) | | | | VALUE
(000S) |
| HSBC Asset Loan Obligation | | | | |
5.380% due 12/25/2036 | | $ | | | 815 | | $ | | 816 |
| |
| HSI Asset Securitization Corp. Trust | | | | |
5.370% due 12/25/2036 | | | | | 84 | | | | 84 |
| |
| Long Beach Mortgage Loan Trust | | | | |
5.360% due 11/25/2036 | | | | | 540 | | | | 541 |
5.400% due 02/25/2036 | | | | | 357 | | | | 357 |
5.600% due 10/25/2034 | | | | | 18 | | | | 18 |
| |
| Morgan Stanley ABS Capital I | | | | |
5.360% due 10/25/2036 | | | | | 74 | | | | 74 |
| |
| Option One Mortgage Loan Trust | | | | |
5.370% due 01/25/2037 | | | | | 164 | | | | 164 |
| |
| Residential Asset Securities Corp. | | | | |
5.390% due 11/25/2036 | | | | | 230 | | | | 230 |
| |
| Securitized Asset-Backed Receivables LLC Trust |
5.380% due 12/25/2036 | | | | | 267 | | | | 267 |
| |
| Soundview Home Equity Loan Trust | | | | |
5.400% due 01/25/2037 | | | | | 289 | | | | 289 |
| |
| Structured Asset Securities Corp. | | | | |
5.370% due 10/25/2036 | | | | | 222 | | | | 222 |
5.420% due 07/25/2035 | | | | | 23 | | | | 23 |
| |
| Wells Fargo Home Equity Trust | | | | |
5.440% due 12/25/2035 | | | | | 161 | | | | 161 |
| | | | | | | | | |
Total Asset-Backed Securities
(Cost $7,120) | | | | 7,124 |
| | | | | | | | | |
|
| SOVEREIGN ISSUES 0.6% |
| Korea Development Bank | | | | | | | | | |
5.640% due 11/22/2012 | | | | | 500 | | | | 502 |
| | | | | | | | | |
Total Sovereign Issues (Cost $500) | | | | | | | | | 502 |
| | | | | | | | | |
|
| | | | | SHARES | | | | |
| PREFERRED STOCKS 2.0% |
| DG Funding Trust | | | | |
7.600% due 12/31/2049 | | | | | 173 | | | | 1,802 |
| | | | | | | | | |
Total Preferred Stocks (Cost $1,823) | | | | | | | | | 1,802 |
| | | | | | | | | |
|
| | | | | PRINCIPAL
AMOUNT
(000S) | | | | |
| SHORT-TERM INSTRUMENTS 23.0% |
|
| CERTIFICATES OF DEPOSIT 4.4% |
| BNP Paribas | | | | | | | | | |
5.262% due 05/28/2008 | | | | $ | 100 | | | | 100 |
5.262% due 07/03/2008 | | | | | 800 | | | | 800 |
| |
| Calyon Financial, Inc. | | | | |
5.340% due 01/16/2009 | | | | | 300 | | | | 300 |
5.395% due 06/29/2010 | | | | | 30 | | | | 30 |
| |
| | | | | | | | | |
| | | | | PRINCIPAL
AMOUNT
(000S) | | | | VALUE
(000S) | |
| Fortis Bank NY | | | | | |
5.265% due 04/28/2008 | | $ | | 400 | | $ | | 400 | |
| | |
| Nordea Bank Finland PLC | | | | | |
5.308% due 05/28/2008 | | | | 100 | | | | 100 | |
| | |
| Royal Bank of Canada | | | | | |
5.267% due 06/30/2008 | | | | 401 | | | | 400 | |
| | |
| Skandinav Enskilda BK | | | | | |
5.300% due 02/04/2008 | | | | 600 | | | | 601 | |
5.350% due 02/13/2009 | | | | 100 | | | | 100 | |
| | |
| Societe Generale NY | | | | | |
5.269% due 06/30/2008 | | | | 700 | | | | 701 | |
5.270% due 03/26/2008 | | | | 400 | | | | 400 | |
| | | | | | | | | |
| | | | | | | | 3,932 | |
| | | | | | | | | |
| |
| COMMERCIAL PAPER 13.3% | |
| Bank of America Corp. | | | | | | | | | |
5.240% due 10/04/2007 | | | | 1,900 | | | | 1,884 | |
| | |
| Cox Communications, Inc. | | | | | |
5.570% due 09/17/2007 | | | | 300 | | | | 300 | |
| | |
| Danske Corp. | | | | | |
5.205% due 10/12/2007 | | | | 4,300 | | | | 4,269 | |
| | |
| Societe Generale NY | | | | | |
5.225% due 11/26/2007 | | | | 1,600 | | | | 1,592 | |
| | |
| UBS Finance Delaware LLC | | | | | |
5.235% due 10/23/2007 | | | | 4,000 | | | | 3,961 | |
| | | | | | | | | |
| | | | | | | | 12,006 | |
| | | | | | | | | |
| |
| REPURCHASE AGREEMENTS 3.4% | |
| State Street Bank and Trust Co. | | | | | |
4.900% due 07/02/2007 | | | | 3,107 | | | | 3,107 | |
| | | | | | | | | |
(Dated 06/29/2007. Collateralized by Fannie Mae
3.250% due 08/15/2008 valued at $3,173.
Repurchase proceeds are $3,108.) | |
| |
| U.S. TREASURY BILLS 1.9% | | | | | |
4.708% due 08/30/2007 - 09/13/2007 (b)(e) | | | | 1,765 | | | | 1,749 | |
| | | | | | | | | |
Total Short-Term Instruments
(Cost $20,794) | | | | 20,794 | |
| | | | | | | | | |
| |
| PURCHASED OPTIONS (g) 0.0% | |
| (Cost $138) | | | | 38 | |
| |
Total Investments (d) 101.3%
(Cost $92,307) | | $ | | 91,752 | |
| |
Written Options (h) (0.1%)
(Premiums $129) | | | | (38 | ) |
| |
| Other Assets and Liabilities (Net) (1.2%) | | (1,110 | ) |
| | | | | | | | | |
| Net Assets 100.0% | | | | | | $ | | 90,604 | |
| | | | | | | | | |
Notes to Schedule of Investments (amounts in thousands*, except number of contracts):
* A zero balance may reflect actual amounts rounding to less than one thousand.
(a) Security is in default.
(b) Coupon represents a weighted average rate.
(c) Principal amount of security is adjusted for inflation.
(d) As of June 30, 2007, portfolio securities with an aggregate value of $5,549 were valued in good faith and pursuant to the guidelines established by the Board of Trustees.
| | | | |
| 10 | | PIMCO Variable Insurance Trust | | See Accompanying Notes |
| | |
| |
| | | June 30, 2007 (Unaudited) |
(e) Securities with an aggregate market value of $13,272 have been segregated with the custodian to cover margin requirements for the following open futures contracts on June 30, 2007:
| | | | | | | | | | |
| Description | | Type | | Expiration
Month | | # of
Contracts | | Unrealized
Appreciation/
(Depreciation) | |
90-Day Euribor June Futures | | Long | | 06/2008 | | 1 | | $ | (2 | ) |
90-Day Eurodollar December Futures | | Long | | 12/2008 | | 40 | | | (27 | ) |
90-Day Eurodollar June Futures | | Long | | 06/2008 | | 238 | | | (272 | ) |
90-Day Eurodollar March Futures | | Long | | 03/2008 | | 284 | | | (336 | ) |
90-Day Eurodollar March Futures | | Long | | 03/2009 | | 2 | | | (3 | ) |
90-Day Eurodollar September Futures | | Long | | 09/2008 | | 40 | | | (22 | ) |
90-Day Euroyen December Futures | | Long | | 12/2007 | | 17 | | | (1 | ) |
S&P 500 Index September Futures | | Long | | 09/2007 | | 217 | | | (335 | ) |
U.S. Treasury 30-Year Bond September Futures | | Short | | 09/2007 | | 156 | | | 122 | |
United Kingdom 90-Day LIBOR Sterling Interest Rate December Futures | | Long | | 12/2007 | | 7 | | | (15 | ) |
United Kingdom 90-Day LIBOR Sterling Interest Rate June Futures | | Long | | 06/2008 | | 29 | | | (42 | ) |
United Kingdom 90-Day LIBOR Sterling Interest Rate March Futures | | Long | | 03/2008 | | 2 | | | (3 | ) |
United Kingdom 90-Day LIBOR Sterling Interest Rate September Futures | | Long | | 09/2007 | | 7 | | | (15 | ) |
United Kingdom 90-Day LIBOR Sterling Interest Rate September Futures | | Long | | 09/2008 | | 22 | | | (34 | ) |
| | | | | | | | | | |
| | | | | | | | $ | (985 | ) |
| | | | | | | | | | |
(f) Swap agreements outstanding on June 30, 2007:
Credit Default Swaps
| | | | | | | | | | | | | | | | |
| Counterparty | | Reference Entity | | Buy/Sell
Protection (1) | | (Pay)/Receive
Fixed Rate | | | Expiration
Date | | Notional
Amount | | Unrealized
Appreciation/
(Depreciation) | |
Bank of America | | DaimlerChrysler N.A. Holding Corp. 6.500% due 11/15/2013 | | Sell | | 0.210% | | | 03/20/2008 | | $ | 200 | | $ | 0 | |
Bank of America | | General Motors Acceptance Corp. 6.875% due 08/28/2012 | | Sell | | 1.000% | | | 09/20/2008 | | | 1,000 | | | (3 | ) |
Barclays Bank PLC | | Mexico Government International Bond 7.500% due 04/08/2033 | | Sell | | 0.390% | | | 01/20/2012 | | | 1,000 | | | 4 | |
Barclays Bank PLC | | Multiple Reference Entities of Gazprom | | Sell | | 0.740% | | | 01/20/2012 | | | 200 | | | 2 | |
Bear Stearns & Co., Inc. | | DaimlerChrysler N.A. Holding Corp. 6.500% due 11/15/2013 | | Sell | | 0.200% | | | 03/20/2008 | | | 100 | | | 0 | |
Bear Stearns & Co., Inc. | | DaimlerChrysler N.A. Holding Corp. 6.500% due 11/15/2013 | | Sell | | 0.225% | | | 03/20/2008 | | | 400 | | | 1 | |
Deutsche Bank AG | | Goldman Sachs Group, Inc. 6.600% due 01/15/2012 | | Sell | | 0.063% | | | 12/20/2007 | | | 200 | | | 0 | |
Deutsche Bank AG | | Lehman Brothers Holdings, Inc. 6.625% due 01/18/2012 | | Sell | | 0.063% | | | 12/20/2007 | | | 500 | | | 0 | |
Deutsche Bank AG | | Goldman Sachs Group, Inc. 6.600% due 01/15/2012 | | Sell | | 0.100% | | | 06/20/2008 | | | 1,000 | | | (1 | ) |
Deutsche Bank AG | | Merrill Lynch & Co., Inc. 6.000% due 02/17/2009 | | Sell | | 0.120% | | | 06/20/2008 | | | 100 | | | 0 | |
Deutsche Bank AG | | Multiple Reference Entities of Gazprom | | Sell | | 1.000% | | | 10/20/2011 | | | 300 | | | 6 | |
Deutsche Bank AG | | Brazilian Government International Bond 12.250% due 03/06/2030 | | Sell | | 0.980% | | | 01/20/2012 | | | 700 | | | 12 | |
Deutsche Bank AG | | Dow Jones CDX N.A. IG8 Index | | Buy | | (0.600% | ) | | 06/20/2017 | | | 100 | | | 1 | |
Goldman Sachs & Co. | | Petroleos Mexicanos 9.500% due 09/15/2027 | | Sell | | 0.200% | | | 11/20/2007 | | | 300 | | | 0 | |
Goldman Sachs & Co. | | American International Group, Inc. 5.600% due 10/18/2016 | | Sell | | 0.065% | | | 06/20/2008 | | | 600 | | | 0 | |
JPMorgan Chase & Co. | | Morgan Stanley 6.600% due 04/01/2012 | | Sell | | 0.100% | | | 12/20/2007 | | | 500 | | | 0 | |
Lehman Brothers, Inc. | | Pemex Project Funding Master Trust 9.500% due 09/15/2027 | | Sell | | 0.290% | | | 12/20/2008 | | | 100 | | | 0 | |
Lehman Brothers, Inc. | | Russia Government International Bond 5.000% until 03/31/2007 and 7.500% thereafter, due 03/31/2030 | | Sell | | 0.310% | | | 12/20/2008 | | | 100 | | | 0 | |
Lehman Brothers, Inc. | | Pemex Project Funding Master Trust 9.500% due 09/15/2027 | | Sell | | 0.320% | | | 03/20/2009 | | | 200 | | | 0 | |
Lehman Brothers, Inc. | | Dow Jones CDX N.A. EM6 Index | | Sell | | 1.400% | | | 12/20/2011 | | | 500 | | | 4 | |
Morgan Stanley | | Multiple Reference Entities of Gazprom | | Sell | | 0.420% | | | 11/20/2007 | | | 300 | | | 0 | |
UBS Warburg LLC | | Morgan Stanley 6.600% due 04/01/2012 | | Sell | | 0.065% | | | 12/20/2007 | | | 300 | | | 0 | |
| | | | | | | | | | | | | | | | |
| | | | | | | | | | | | | | $ | 26 | |
| | | | | | | | | | | | | | | | |
(1) If the Portfolio is a seller of protection and a credit event occurs, as defined under the terms of that particular swap agreement, the Portfolio will pay to the buyer of the protection an amount up to the notional value of the swap and in certain instances, take delivery of the security. As a buyer of protection, the Portfolio will generally receive from the seller of protection an amount up to the notional amount of the swap if a credit event occurs.
| | | | | | |
| See Accompanying Notes | | Semiannual Report | | June 30, 2007 | | 11 |
Schedule of Investments StocksPLUS® Growth and Income Portfolio (Cont.)
Interest Rate Swaps
| | | | | | | | | | | | | | | |
| Counterparty | | Floating Rate Index | | Pay/Receive
Floating Rate | | Fixed Rate | | Expiration
Date | | Notional
Amount | | Unrealized
Appreciation/
(Depreciation) | |
Deutsche Bank AG | | 6-Month Australian Bank Bill | | Pay | | 7.000% | | 12/15/2009 | | AUD | 300 | | $ | 0 | |
Barclays Bank PLC | | BRL-CDI-Compounded | | Pay | | 11.360% | | 01/04/2010 | | BRL | 400 | | | 2 | |
Goldman Sachs & Co. | | BRL-CDI-Compounded | | Pay | | 11.465% | | 01/04/2010 | | | 100 | | | 1 | |
Merrill Lynch & Co., Inc. | | BRL-CDI-Compounded | | Pay | | 11.430% | | 01/04/2010 | | | 300 | | | 2 | |
Merrill Lynch & Co., Inc. | | BRL-CDI-Compounded | | Pay | | 12.948% | | 01/04/2010 | | | 200 | | | 4 | |
Morgan Stanley | | BRL-CDI-Compounded | | Pay | | 12.780% | | 01/04/2010 | | | 200 | | | 4 | |
BNP Paribas Bank | | 5-Year French CPI Ex Tobacco Daily Reference Index | | Pay | | 2.090% | | 10/15/2010 | | EUR | 1,000 | | | 12 | |
Deutsche Bank AG | | 6-Month EUR-LIBOR | | Receive | | 4.000% | | 12/15/2011 | | | 400 | | | 8 | |
Goldman Sachs & Co. | | 5-Year French CPI Ex Tobacco Daily Reference Index | | Pay | | 1.995% | | 03/15/2012 | | | 2,600 | | | (15 | ) |
Goldman Sachs & Co. | | 5-Year French CPI Ex Tobacco Daily Reference Index | | Pay | | 1.960% | | 03/30/2012 | | | 100 | | | (1 | ) |
JPMorgan Chase & Co. | | 5-Year French CPI Ex Tobacco Daily Reference Index | | Pay | | 1.948% | | 03/15/2012 | | | 100 | | | (1 | ) |
Credit Suisse First Boston | | 6-Month GBP-LIBOR | | Pay | | 5.000% | | 06/15/2009 | | GBP | 1,800 | | | (51 | ) |
Credit Suisse First Boston | | 6-Month GBP-LIBOR | | Receive | | 4.000% | | 12/15/2036 | | | 200 | | | 36 | |
Deutsche Bank AG | | 6-Month GBP-LIBOR | | Receive | | 4.000% | | 12/15/2036 | | | 400 | | | 34 | |
HSBC Bank USA | | 6-Month GBP-LIBOR | | Pay | | 4.500% | | 12/20/2007 | | | 1,000 | | | (15 | ) |
Royal Bank of Scotland Group PLC | | 6-Month GBP-LIBOR | | Pay | | 6.000% | | 03/20/2009 | | | 300 | | | (4 | ) |
Barclays Bank PLC | | 6-Month JPY-LIBOR | | Pay | | 1.000% | | 03/18/2009 | | JPY | 30,000 | | | (1 | ) |
Deutsche Bank AG | | 6-Month JPY-LIBOR | | Pay | | 1.000% | | 09/18/2008 | | | 260,000 | | | (1 | ) |
Deutsche Bank AG | | 6-Month JPY-LIBOR | | Pay | | 1.000% | | 03/18/2009 | | | 60,000 | | | (1 | ) |
UBS Warburg LLC | | 6-Month JPY-LIBOR | | Pay | | 1.000% | | 09/18/2008 | | | 20,000 | | | 0 | |
UBS Warburg LLC | | 6-Month JPY-LIBOR | | Pay | | 1.000% | | 03/18/2009 | | | 320,000 | | | (5 | ) |
Barclays Bank PLC | | 3-Month USD-LIBOR | | Pay | | 5.000% | | 12/19/2009 | | $ | 400 | | | 0 | |
Deutsche Bank AG | | 3-Month USD-LIBOR | | Pay | | 5.000% | | 12/19/2009 | | | 4,500 | | | 2 | |
Deutsche Bank AG | | 3-Month USD-LIBOR | | Receive | | 5.000% | | 12/19/2017 | | | 1,200 | | | (9 | ) |
Morgan Stanley | | 3-Month USD-LIBOR | | Pay | | 5.000% | | 06/20/2009 | | | 2,000 | | | (16 | ) |
Morgan Stanley | | 3-Month USD-LIBOR | | Receive | | 5.000% | | 12/19/2017 | | | 400 | | | (3 | ) |
| | | | | | | | | | | | | | | |
| | | | | | | | | | | | | $ | (18 | ) |
| | | | | | | | | | | | | | | |
Total Return Swaps
| | | | | | | | | | | | | | |
| Counterparty | | Type | | Receive Total Return | | Pay | | Expiration
Date | | # of
Contracts | | Unrealized
(Depreciation) | |
Merrill Lynch & Co., Inc. | | Long | | S&P 500 Index | | 1-Month USD-LIBOR minus 0.030% | | 05/15/2008 | | 5,567 | | $ | (175 | ) |
| | | | | | | | | | | | | | |
(g) Purchased options outstanding on June 30, 2007:
Options on Exchange-Traded Futures Contracts
| | | | | | | | | | | | | |
| Description | | Exercise
Price | | Expiration
Date | | # of
Contracts | | Cost | | Value |
Call - CBOT U.S. Treasury 30-Year Bond September Futures | | $ | 119.000 | | 08/24/2007 | | 78 | | $ | 1 | | $ | 1 |
Put - CME S&P 500 Index September Futures | | | 925.000 | | 09/20/2007 | | 75 | | | 2 | | | 0 |
Put - CME S&P 500 Index September Futures | | | 950.000 | | 09/20/2007 | | 95 | | | 3 | | | 0 |
| | | | | | | | | | | | | |
| | | | | | | | | $ | 6 | | $ | 1 |
| | | | | | | | | | | | | |
Interest Rate Swaptions
| | | | | | | | | | | | | | | | | | | |
| Description | | Counterparty | | Floating Rate Index | | Pay/Receive
Floating Rate | | Exercise
Rate | | Expiration
Date | | Notional
Amount | | Cost | | Value |
Call - OTC 1-Year Interest Rate Swap | | Barclays Bank PLC | | 3-Month USD-LIBOR | | Pay | | 4.750% | | 02/01/2008 | | $ | 5,000 | | $ | 14 | | $ | 2 |
Call - OTC 2-Year Interest Rate Swap | | Lehman Brothers, Inc. | | 3-Month USD-LIBOR | | Pay | | 4.750% | | 03/31/2008 | | | 9,200 | | | 51 | | | 11 |
Call - OTC 1-Year Interest Rate Swap | | Royal Bank of Scotland Group PLC | | 3-Month USD-LIBOR | | Pay | | 4.900% | | 08/08/2007 | | | 6,000 | | | 14 | | | 0 |
Call - OTC 2-Year Interest Rate Swap | | Royal Bank of Scotland Group PLC | | 3-Month USD-LIBOR | | Pay | | 5.000% | | 02/01/2008 | | | 8,900 | | | 44 | | | 14 |
Call - OTC 2-Year Interest Rate Swap | | Royal Bank of Scotland Group PLC | | 3-Month USD-LIBOR | | Pay | | 5.000% | | 12/15/2008 | | | 3,000 | | | 9 | | | 10 |
| | | | | | | | | | | | | | | | | | | |
| | | | | | | | | | | | | | | $ | 132 | | $ | 37 |
| | | | | | | | | | | | | | | | | | | |
(h) Written options outstanding on June 30, 2007:
Interest Rate Swaptions
| | | | | | | | | | | | | | | | | | | |
| Description | | Counterparty | | Floating Rate Index | | Pay/Receive
Floating Rate | | Exercise
Rate | | Expiration
Date | | Notional
Amount | | Premium | | Value |
Call - OTC 5-Year Interest Rate Swap | | Barclays Bank PLC | | 3-Month USD-LIBOR | | Receive | | 4.900% | | 02/01/2008 | | $ | 1,000 | | $ | 12 | | $ | 2 |
Call - OTC 5-Year Interest Rate Swap | | Lehman Brothers, Inc. | | 3-Month USD-LIBOR | | Receive | | 4.900% | | 03/31/2008 | | | 4,000 | | | 49 | | | 12 |
Call - OTC 7-Year Interest Rate Swap | | Royal Bank of Scotland Group PLC | | 3-Month USD-LIBOR | | Receive | | 4.900% | | 08/08/2007 | | | 1,000 | | | 12 | | | 0 |
Call - OTC 5-Year Interest Rate Swap | | Royal Bank of Scotland Group PLC | | 3-Month USD-LIBOR | | Receive | | 5.100% | | 02/01/2008 | | | 4,000 | | | 48 | | | 14 |
Call - OTC 7-Year Interest Rate Swap | | Royal Bank of Scotland Group PLC | | 3-Month USD-LIBOR | | Receive | | 5.200% | | 12/15/2008 | | | 1,000 | | | 8 | | | 10 |
| | | | | | | | | | | | | | | | | | | |
| | | | | | | | | | | | | | | $ | 129 | | $ | 38 |
| | | | | | | | | | | | | | | | | | | |
| | | | |
| 12 | | PIMCO Variable Insurance Trust | | See Accompanying Notes |
| | |
| |
| | | June 30, 2007 (Unaudited) |
(i) Foreign currency contracts outstanding on June 30, 2007:
| | | | | | | | | | | | | | | | | |
| Type | | Currency | | Principal
Amount
Covered by
Contract | | Settlement
Month | | Unrealized
Appreciation | | Unrealized
(Depreciation) | | | Net Unrealized
Appreciation/
(Depreciation) | |
Buy | | AUD | | 298 | | 07/2007 | | $ | 2 | | $ | 0 | | | $ | 2 | |
Buy | | BRL | | 3,631 | | 10/2007 | | | 96 | | | 0 | | | | 96 | |
Buy | | | | 1,502 | | 03/2008 | | | 57 | | | 0 | | | | 57 | |
Buy | | CAD | | 109 | | 08/2007 | | | 0 | | | 0 | | | | 0 | |
Buy | | CNY | | 192 | | 09/2007 | | | 1 | | | 0 | | | | 1 | |
Sell | | | | 192 | | 09/2007 | | | 0 | | | 0 | | | | 0 | |
Buy | | | | 3,242 | | 10/2007 | | | 8 | | | 0 | | | | 8 | |
Sell | | | | 3,242 | | 10/2007 | | | 0 | | | 0 | | | | 0 | |
Buy | | | | 914 | | 11/2007 | | | 1 | | | 0 | | | | 1 | |
Sell | | | | 914 | | 11/2007 | | | 0 | | | 0 | | | | 0 | |
Buy | | | | 1,818 | | 01/2008 | | | 0 | | | (2 | ) | | | (2 | ) |
Sell | | | | 1,818 | | 01/2008 | | | 0 | | | 0 | | | | 0 | |
Buy | | EUR | | 410 | | 07/2007 | | | 5 | | | 0 | | | | 5 | |
Sell | | GBP | | 284 | | 08/2007 | | | 0 | | | (3 | ) | | | (3 | ) |
Buy | | IDR | | 617,400 | | 05/2008 | | | 0 | | | (3 | ) | | | (3 | ) |
Buy | | INR | | 2,491 | | 10/2007 | | | 0 | | | 0 | | | | 0 | |
Buy | | | | 4,126 | | 05/2008 | | | 2 | | | 0 | | | | 2 | |
Sell | | JPY | | 28,813 | | 07/2007 | | | 3 | | | 0 | | | | 3 | |
Buy | | KRW | | 386,486 | | 07/2007 | | | 2 | | | 0 | | | | 2 | |
Buy | | | | 146,360 | | 08/2007 | | | 0 | | | 0 | | | | 0 | |
Buy | | | | 207,179 | | 09/2007 | | | 0 | | | 0 | | | | 0 | |
Buy | | MXN | | 3,316 | | 03/2008 | | | 3 | | | 0 | | | | 3 | |
Buy | | MYR | | 700 | | 05/2008 | | | 0 | | | (3 | ) | | | (3 | ) |
Buy | | NZD | | 46 | | 07/2007 | | | 1 | | | 0 | | | | 1 | |
Buy | | PHP | | 9,129 | | 05/2008 | | | 0 | | | (3 | ) | | | (3 | ) |
Buy | | PLN | | 659 | | 09/2007 | | | 3 | | | 0 | | | | 3 | |
Buy | | RUB | | 1,156 | | 11/2007 | | | 1 | | | 0 | | | | 1 | |
Buy | | | | 7,505 | | 12/2007 | | | 7 | | | 0 | | | | 7 | |
Buy | | | | 8,717 | | 01/2008 | | | 2 | | | 0 | | | | 2 | |
Buy | | SGD | | 617 | | 07/2007 | | | 0 | | | (2 | ) | | | (2 | ) |
Buy | | | | 662 | | 08/2007 | | | 0 | | | (8 | ) | | | (8 | ) |
Buy | | | | 597 | | 10/2007 | | | 2 | | | 0 | | | | 2 | |
| | | | | | | | | | | | | | | | | |
| | | | | | | | $ | 196 | | $ | (24 | ) | | $ | 172 | |
| | | | | | | | | | | | | | | | | |
| | | | | | |
| See Accompanying Notes | | Semiannual Report | | June 30, 2007 | | 13 |
Notes to Financial Statements
1. ORGANIZATION
The StocksPLUS® Growth and Income Portfolio (the “Portfolio”) is a series of the PIMCO Variable Insurance Trust (the “Trust”). The Trust is registered under the Investment Company Act of 1940 (the “Act”), as amended, as an open-end management investment company organized as a Delaware business trust on October 3, 1997. The Portfolio offers two classes of shares: Institutional and Administrative. Information presented on these financial statements pertains to the Institutional Class of the Portfolio. Certain detailed financial information for the Administrative Class is provided separately and is available upon request. The Trust is designed to be used as an investment vehicle by Separate Accounts of insurance companies that fund variable annuity contracts and variable life insurance policies and by qualified pension and retirement plans.
2. SIGNIFICANT ACCOUNTING POLICIES
The following is a summary of significant accounting policies consistently followed by the Portfolio in the preparation of its financial statements in conformity with accounting principles generally accepted in the United States of America (“GAAP”). The preparation of financial statements in accordance with GAAP requires management to make estimates and assumptions that affect the reported amounts and disclosures on the financial statements. Actual results could differ from those estimates.
(a) Security Valuation Portfolio securities are valued as of the close of regular trading (normally 4:00 p.m., Eastern Time) on each day that the New York Stock Exchange (“NYSE”) is open. Portfolio securities and other assets for which market quotes are readily available are stated at market value. Market value is generally determined on the basis of last reported sales prices, or if no sales are reported, based on quotes obtained from a quotation reporting system, established market makers, or pricing services. Fixed-income securities and non-exchange traded derivatives are normally valued on the basis of quotes obtained from brokers and dealers or pricing services. Prices obtained from independent pricing services use information provided by market makers or estimates of market values obtained from yield data relating to investments or securities with similar characteristics. Certain fixed income securities purchased on a delayed-delivery basis are marked to market daily until settlement at the forward settlement date. Short-term investments having a maturity of 60 days or less are generally valued at amortized cost. Exchange traded options, futures and options on futures are valued at the settlement price determined by the relevant exchange. With respect to any portion of the Portfolio’s assets that are invested in one or more open end management investment companies, the Portfolio’s net asset value (“NAV”) will be calculated based upon the NAVs of such investments.
Investments initially valued in currencies other than the U.S. dollar are converted to the U.S. dollar using exchange rates obtained from pricing services. As a result, the NAV of the Portfolio’s securities may be affected by changes in the value of currencies in relation to the U.S. dollar. The value of securities traded in markets outside the United States or denominated in currencies other than the U.S. dollar may be affected significantly on a day that the NYSE is closed and an investor is not able to purchase, redeem or exchange shares.
Securities and other assets for which market quotes are not readily available are valued at fair value as determined in good faith by the Board of Trustees or persons acting at their direction. The Board of Trustees has adopted methods for valuing securities and other assets in circumstances where market quotes are not readily available, and has delegated to Pacific Investment Management Company LLC (“PIMCO”) the responsibility for applying the valuation methods. In the event that market quotes are not readily available, and the security or asset cannot be valued pursuant to one of the valuation methods, the value of the security or asset will be determined in good faith by the Valuation Committee of the Board of Trustees, generally based upon recommendations provided by PIMCO.
Market quotes are considered not readily available in circumstances where there is an absence of current or reliable market-based data (e.g., trade information, bid/asked information, broker quotes), including where events occur after the close of the relevant market, but prior to the close of regular trading, that materially affect the values of the Portfolio’s securities or assets. In addition, market quotes are considered not readily available when, due to extraordinary circumstances, the exchanges or markets on which the securities trade, do not open for trading for the entire day and no other market prices are available. The Board has delegated to PIMCO the responsibility for monitoring significant events that may materially affect the values of the Portfolio’s securities or assets and for determining whether the value of the applicable securities or assets should be re-evaluated in light of such significant events.
When the Portfolio uses fair value pricing to determine its NAV, securities will not be priced on the basis of quotations from the primary market in which they are traded, but rather may be priced by another method that the Board of Trustees or persons acting at their direction believe accurately reflects fair value. The Trust’s policy is intended to result in a calculation of the Portfolio’s NAV that fairly reflects security values as of the time of pricing. However, fair values determined by the Board of Trustees or persons acting at their direction may not accurately reflect the price that the Portfolio could obtain for a security if it were to dispose of that security as of the time of pricing. Because foreign securities can trade on non-business days of the Portfolio, the NAV of the Portfolio may change on days when shareholders will not be able to purchase or redeem Portfolio shares. The prices used by the Portfolio may differ from the value that would be realized if the securities were sold and the differences could be material to the financial statements.
(b) Securities Transactions and Investment Income Securities transactions are recorded as of the trade date for financial reporting purposes. Securities purchased or sold on a when-issued or delayed-delivery basis may be settled a month or more after the trade date. Realized gains and losses from securities sold are recorded on the identified cost basis. Dividend income is recorded on the ex-dividend date, except certain dividends from foreign securities where the ex-dividend date may have passed, which are recorded as soon as the Portfolio is informed of the ex-dividend date. Interest income, adjusted for the accretion of discounts and amortization of premiums, is recorded on the accrual basis. Paydown gains and losses on mortgage-related and other asset-backed securities are recorded as components of interest income on the Statement of Operations.
(c) Delayed-Delivery Transactions The Portfolio may purchase or sell securities on a delayed-delivery basis. These transactions involve a commitment by the Portfolio to purchase or sell securities for a predetermined price or yield, with payment and delivery taking place beyond the customary settlement period. When delayed-delivery purchases are outstanding, the Portfolio will designate liquid assets in an amount sufficient to meet the purchase price. When purchasing a security on a delayed-delivery basis, the Portfolio assumes the rights and risks of ownership of the security, including the risk of price and yield fluctuations, and takes such fluctuations into account when determining its net asset value. The Portfolio may dispose of or renegotiate a delayed-delivery transaction after it is entered into, and may sell when-issued securities before they are delivered, which may result in a capital gain or loss. When the Portfolio has sold a security on a delayed-delivery basis, the Portfolio does not participate in future gains and losses with respect to the security.
(d) Dividends and Distributions to Shareholders Dividends from net investment income, if any, are declared and distributed to shareholders quarterly. Net realized capital gains earned by the Portfolio, if any, will be distributed no less frequently than once each year.
Income dividends and capital gain distributions are determined in accordance with income tax regulations which may differ from GAAP. Differences between tax
| | | | |
| 14 | | PIMCO Variable Insurance Trust | | |
| | |
| |
| | | June 30, 2007 (Unaudited) |
regulations and GAAP may change the fiscal year when income and capital items are recognized for tax and GAAP purposes. Examples of events that give rise to timing differences include wash sales, straddles, net operating losses and capital loss carryforwards. Further, the character of investment income and capital gains may be different for certain transactions under the two methods of accounting. Examples of characterization differences include the treatment of mortgage paydowns, swaps, foreign currency transactions and contingent debt instruments. As a result, income dividends and capital gain distributions declared during a fiscal period may differ significantly from the net investment income and realized capital gain reported on the Portfolio’s annual financial statements presented under GAAP.
Distributions classified as a tax basis return of capital, if any, are reflected on the accompanying Statements of Changes in Net Assets and have been reclassified to paid in capital. In addition, other amounts have been reclassified between undistributed net investment income, accumulated undistributed net realized gains or losses and/or paid in capital to more appropriately conform financial accounting to tax characterizations of dividend distributions.
(e) Multiclass Operations Each class offered by the Portfolio has equal rights as to assets and voting privileges (except that shareholders of a class have exclusive voting rights regarding any matter relating solely to that class of shares). Income and non-class specific expenses of the Portfolio are allocated daily to each class of shares based on the relative value of settled shares. Realized and unrealized capital gains and losses of the Portfolio are allocated daily to each class of shares based on the relative net assets of each class. Class specific expenses, where applicable, currently include administrative, distribution and servicing fees.
(f) Foreign Currency The functional and reporting currency for the Portfolio is the U.S. dollar. The market values of foreign securities, currency holdings and other assets and liabilities are translated into U.S. dollars based on the current exchange rates each business day. Fluctuations in the value of currency holdings and other assets and liabilities resulting from changes in exchange rates are recorded as unrealized foreign currency gains or losses. Realized gains or losses and unrealized appreciation or depreciation on investment securities and income and expenses are translated on the respective dates of such transactions. The effects of changes in foreign currency exchange rates on investments in securities are not segregated on the Statement of Operations from the effects of changes in market prices of those securities, but are included with the net realized and unrealized gain or loss on investment securities.
| | | | | | |
|
| Non-U.S. currency symbols utilized throughout the report are defined as follows: |
| AUD | | Australian Dollar | | KRW | | South Korean Won |
| BRL | | Brazilian Real | | MXN | | Mexican Peso |
| CAD | | Canadian Dollar | | MYR | | Malaysian Ringgit |
| CNY | | Chinese Yuan Renminbi | | NZD | | New Zealand Dollar |
| EUR | | Euro | | PHP | | Philippines Peso |
| GBP | | Great British Pound | | PLN | | Polish Zloty |
| IDR | | Indonesian Rupiah | | RUB | | Russian Ruble |
| INR | | Indian Rupee | | SGD | | Singapore Dollar |
| JPY | | Japanese Yen | | | | |
(g) Foreign Currency Transactions The Portfolio may enter into foreign currency contracts in connection with settling planned purchases or sales of securities, to hedge the currency exposure associated with some or all of the Portfolio’s securities or as a part of an investment strategy. A foreign currency
contract is an agreement between two parties to buy and sell a currency at a set price on a future date. The market value of a foreign currency contract fluctuates with changes in foreign currency exchange rates. Foreign currency contracts are marked to market daily and the change in value is recorded by the Portfolio as an unrealized gain or loss. Realized gains or losses equal to the difference between the value of the contract at the time it was opened and the value at the time it was closed are recorded upon delivery or receipt of the currency. These contracts may involve market risk in excess of the unrealized gain or loss reflected on the Statement of Assets and Liabilities. In addition, the Portfolio could be exposed to risk if the counterparties are unable to meet the terms of the contracts or if the value of the currency changes unfavorably to the U.S. dollar.
(h) Futures Contracts The Portfolio may enter into futures contracts. The Portfolio may use futures contracts to manage its exposure to the securities markets or to movements in interest rates and currency values. The primary risks associated with the use of futures contracts are the imperfect correlation between the change in market value of the securities held by the Portfolio and the prices of futures contracts, the possibility of an illiquid market, and the inability of the counterparty to meet the terms of the contract. Futures contracts are valued based upon their quoted daily settlement prices. Upon entering into a futures contract, the Portfolio is required to deposit with its futures broker, an amount of cash or U.S. Government and Agency Obligations in accordance with the initial margin requirements of the broker or exchange. Futures contracts are marked to market daily and an appropriate payable or receivable for the change in value (“variation margin”) is recorded by the Portfolio. Gains or losses are recognized but not considered realized until the contracts expire or are closed. Futures contracts involve, to varying degrees, risk of loss in excess of the variation margin disclosed on the Statement of Assets and Liabilities.
(i) Inflation-Indexed Bonds The Portfolio may invest in inflation-indexed bonds. Inflation-indexed bonds are fixed-income securities whose principal value is periodically adjusted to the rate of inflation. The interest rate on these bonds is generally fixed at issuance at a rate lower than typical bonds. Over the life of an inflation-indexed bond, however, interest will be paid based on a principal value, which is adjusted for inflation. Any increase in the principal amount of an inflation-indexed bond will be included as interest income on the Statement of Operations, even though investors do not receive their principal until maturity.
(j) Options Contracts The Portfolio may write call and put options on futures, swaps, securities or currencies it owns or in which it may invest. Writing put options tends to increase the Portfolio’s exposure to the underlying instrument. Writing call options tends to decrease the Portfolio’s exposure to the underlying instrument. When the Portfolio writes a call or put option, an amount equal to the premium received is recorded as a liability and subsequently marked to market to reflect the current value of the option written. These liabilities are reflected as written options outstanding on the Statement of Assets and Liabilities. Certain options may be written with premiums to be determined on a future date. The premiums for these options are based upon implied volatility parameters at specified terms. Premiums received from writing options which expire are treated as realized gains. Premiums received from writing options which are exercised or closed are added to the proceeds or offset against amounts paid on the underlying future, swap, security or currency transaction to determine the realized gain or loss. The Portfolio as a writer of an option has no control over whether the underlying future, swap, security or currency may be sold (call) or purchased (put) and as a result bears the market risk of an unfavorable change in the price of the future, swap, security or currency underlying the written option. There is the risk the Portfolio may not be able to enter into a closing transaction because of an illiquid market.
The Portfolio may also purchase put and call options. Purchasing call options tends to increase the Portfolio’s exposure to the underlying instrument. Purchasing put
| | | | | | |
| | Semiannual Report | | June 30, 2007 | | 15 |
Notes to Financial Statements (Cont.)
options tends to decrease the Portfolio’s exposure to the underlying instrument. The Portfolio pays a premium which is included on the Statement of Assets and Liabilities as an investment and subsequently marked to market to reflect the current value of the option. Premiums paid for purchasing options which expire are treated as realized losses. Certain options may be purchased with premiums to be determined on a future date. The premiums for these options are based upon implied volatility parameters at specified terms. The risk associated with purchasing put and call options is limited to the premium paid. Premiums paid for purchasing options which are exercised or closed are added to the amounts paid or offset against the proceeds on the underlying future, swap, security or currency transaction to determine the realized gain or loss.
(k) Repurchase Agreements The Portfolio may engage in repurchase transactions. Under the terms of a typical repurchase agreement, the Portfolio takes possession of an underlying debt obligation (collateral) subject to an obligation of the seller to repurchase, and the Portfolio to resell, the obligation at an agreed-upon price and time. The underlying securities for all repurchase agreements are held in safekeeping at the Portfolio’s custodian or designated subcustodians under tri-party repurchase agreements. The market value of the collateral must be equal to or exceed the total amount of the repurchase obligations, including interest. Securities purchased under repurchase agreements are reflected as an asset on the Statement of Assets and Liabilities. Generally, in the event of counterparty default, the Portfolio has the right to use the collateral to offset losses incurred. If the counterparty should default, the Portfolio will seek to sell the securities which it holds as collateral. This could involve procedural costs or delays in addition to a loss on the securities if their value should fall below their repurchase price.
(l) Inverse Floating Rate Transactions—Residual Interest Municipal Bonds (“RIBs”)/Residual Interest Tax Exempt Bonds (“RITEs”) The Portfolio may invest in RIBs and RITEs (“Inverse Floaters”). Inverse Floaters are created via a master trust agreement between a broker-dealer, acting as trustor and liquidity provider, and an investment bank, acting as trustee and tender agent. The master trust agreement defines the terms for each trust series; with each series being established by the transfer of long-term, fixed-rate municipal bonds (“Fixed Rate Bonds”) to the trustee to be held and provide for the creation, execution and delivery of floater certificates (“Floating Rate Notes”) and Inverse Floaters. Floating Rate Notes are liquid notes that are issued with a short-term variable rate typically linked to the LIBOR, subject to limitations, for some duration. After interest income is paid on the Floating Rate Notes at current rates, the residual income from the Fixed Rate Bonds is paid to the Inverse Floaters. Inverse Floaters are issued with a coupon that fluctuates inversely with the Floating Rate Notes’ referenced rate, subject to certain limitations. Therefore, rising short-term rates result in lower income for the Inverse Floaters and vice versa.
Floating Rate Notes are generally remarketed to municipal money market funds. Inverse Floaters are acquired by either tax-exempt municipal bond funds or trusts, or other parties interested in potentially higher yielding tax-exempt securities. Inverse Floaters may also be acquired for the purpose of increasing leverage. Floating Rate Note holders typically have the option to tender their notes to the liquidity provider for redemption at par at each reset date. The Inverse Floater holders have the option to (i) require the Floating Rate Note holders to tender their notes at par, and (ii) require the liquidity provider to transfer the Fixed Rate Bonds to the Inverse Floater holders. The holders of Inverse Floaters bear substantially all of the downside investment risk associated with the underlying Fixed Rate Bonds, and also benefit from a disproportionate amount of the potential appreciation of the underlying Fixed Rate Bonds’ value. Inverse Floaters may be more volatile and less liquid than other municipal bonds of comparable maturity.
Inverse Floaters may be acquired with or without first transferring to the trustor the Fixed Rate Bonds that were utilized to create the trust series. Inverse Floaters acquired without a transfer of Fixed Rate Bonds are recognized as purchases of securities as outlined in Note 2(b). Statement of Financial Accounting Standards No. 140—Accounting for Transfers and Servicing of Financial Assets and Extinguishments of Liabilities (“FAS No. 140”), governs the standards for accounting for securitizations and other transfers of financial assets. If there is a transfer of Fixed Rate Bonds and it meets sale criteria under FAS No. 140, a Portfolio records a sale of the Fixed Rate Bonds and a purchase of the Inverse Floaters. The cash received from the Inverse Floaters is then recorded as interest income in the Statement of Operations.
If the transfer of Fixed Rate Bonds does not meet sale criteria under FAS No. 140, a Portfolio accounts for the transaction described above as a secured borrowing by including the Fixed Rate Bonds in its Schedule of Investments, and recording the Floating Rate Notes as a liability under the caption “Payable for floating rate notes” in the Portfolio’s Statement of Assets and Liabilities. In a secured borrowing transaction, cash received from the Inverse Floaters is not recorded as interest income. Instead, a Portfolio records interest income related to the Fixed Rate Bonds and interest expense related to the Floating Rate Notes, the net of which is equal to the cash received from the Inverse Floaters acquired by the Portfolio. Thus, while a Portfolio’s reported total income, net expenses, and net expense ratio are generally higher for investments in Inverse Floaters acquired via a secured borrowing, the method of acquiring Inverse Floaters does not result in differences for reported cash flows, net asset value or total return.
(m) Swap Agreements The Portfolio may invest in swap agreements. Swap transactions are privately negotiated agreements between the Portfolio and a counterparty to exchange or swap investment cash flows, assets, or market-linked returns at specified, future intervals. The Portfolio may enter into interest rate, total return, forward spread-lock, credit default, and other forms of swap agreements to manage its exposure to interest rates and credit risk. In connection with these agreements, securities may be identified as collateral in accordance with the terms of the respective swap agreements.
Interest rate swap agreements involve the exchange by the Portfolio with another party of their respective commitments to pay or receive interest, e.g., an exchange of floating rate payments for fixed rate payments with respect to the notional amount of principal. Certain forms of interest rate swap agreements may include: (i) interest rate caps, under which, in return for a premium, one party agrees to make payments to the other to the extent that interest rates exceed a specified rate, or “cap”, (ii) interest rate floors, under which, in return for a premium, one party agrees to make payments to the other to the extent that interest rates fall below a specified rate, or “floor”, or (iii) interest rate collars, under which a party sells a cap and purchases a floor or vice versa in an attempt to protect itself against interest rate movements exceeding given minimum or maximum levels.
Total return swap agreements involve commitments to pay interest in exchange for a market-linked return, both based on notional amounts. To the extent the total return of the security or index underlying the transaction exceeds or falls short of the offsetting interest rate obligation, the Portfolio will receive a payment from or make a payment to the counterparty.
Forward spread-lock swap agreements involve commitments to pay or receive a settlement amount calculated as the difference between the swap spread and a fixed spread, multiplied by the notional amount times the duration of the swap. The swap spread is the difference between the benchmark swap rate (market rate) and the specific Treasury rate.
Credit default swap agreements involve one party making a stream of payments to another party in exchange for the right to receive a specified return in the event of
| | | | |
| 16 | | PIMCO Variable Insurance Trust | | |
| | |
| |
| | | June 30, 2007 (Unaudited) |
a default by a third party, typically corporate issues or sovereign issues of an emerging country, on its obligation. The Portfolio may use credit default swaps to provide a measure of protection against defaults of the issuers (i.e., to reduce risk where the Portfolio owns or has exposure to the sovereign issuer) or to take an active long or short position with respect to the likelihood of a particular issuer’s default. As a seller of protection, the Portfolio generally receives an upfront payment or a fixed rate of income throughout the term of the swap provided that there is no credit event. If the Portfolio is a seller of protection and a credit event occurs, as defined under the terms of that particular swap agreement, the Portfolio will pay to the buyer of the protection an amount up to the notional value of the swap and in certain instances take delivery of the security. As the seller, the Portfolio would effectively add leverage to its portfolio because, in addition to its total net assets, the Portfolio would be subject to investment exposure on the notional amount of the swap. As a buyer of protection, the Portfolio generally receives an amount up to the notional value of the swap if a credit event occurs. The treatment of credit default swaps and other swap agreements that provide for contingent, non-periodic, bullet-type payments as “notional principal contracts” for U.S. federal income tax purposes is uncertain. Were the U.S. Internal Revenue Service (“IRS”) to take the position that a credit default swap or other bullet-type swap is not a “notional principal contract” for U.S. federal income tax purposes, payments received by the Portfolio from such investments might be subject to U.S. excise or income taxes.
Swaps are marked to market daily based upon quotations from market makers and the change in value, if any, is recorded as unrealized gain or loss on the Statement of Operations. Payments received or made at the beginning of the measurement period are reflected as such on the Statement of Assets and Liabilities. These upfront payments are recorded as realized gain or loss on the Statement of Operations upon termination or maturity of the swap. A liquidation payment received or made at the termination of the swap is recorded as realized gain or loss on the Statement of Operations. Net periodic payments received or paid by the Portfolio are included as part of realized gain or loss on the Statement of Operations. Entering into these agreements involves, to varying degrees, elements of credit, market and documentation risk in excess of the amounts recognized on the Statement of Assets and Liabilities. Such risks involve the possibility that there will be no liquid market for these agreements, that the counterparty to the agreements may default on its obligation to perform or disagree as to the meaning of contractual terms in the agreements and that there may be unfavorable changes in interest rates.
(n) Loan Participations and Assignments The Portfolio may invest in direct debt instruments which are interests in amounts owned by corporate, governmental, or other borrowers to lenders or lending syndicates. The Portfolio’s investments in loans may be in the form of participations in loans or assignments of all or a portion of loans from third parties. A loan is often administered by a bank or other financial institution (the “lender”) that acts as agent for all holders. The agent administers the terms of the loan, as specified in the loan agreement. When investing in a loan participation, the Portfolio has the right to receive payments of principal, interest and any fees to which it is entitled only from the lender selling the loan agreement and only upon receipt by the lender of payments from the borrower. The Portfolio generally has no right to enforce compliance with the terms of the loan agreement with the borrower. As a result, the Portfolio may be subject to the credit risk of both the borrower and the lender that is selling the loan agreement. When the Portfolio purchases assignments from lenders it acquires direct rights against the borrower of the loan. At the end of the period June 30, 2007, the Portfolio had no unfunded loan commitments.
(o) Bridge Debt Commitments At the period ended June 30, 2007, the Portfolio had $300,421 in commitments outstanding to fund high yield bridge debt. The Portfolio is entitled to a fee upon the expiration of the commitment period. The bridge debt terms approximate market rates at the time the commitment is entered into.
(p) Mortgage-Related and Other Asset-Backed Securities The Portfolio may invest in mortgage-related or other asset-backed securities. These securities include mortgage pass-through securities, collateralized mortgage obligations (“CMOs”), commercial mortgage-backed securities, mortgage dollar rolls, CMO residuals, stripped mortgage-backed securities (“SMBSs”) and other securities that directly or indirectly represent a participation in, or are secured by and payable from, mortgage loans on real property. The value of some mortgage-related or asset-backed securities may be particularly sensitive to changes in prevailing interest rates. Early repayment of principal on some mortgage-related securities may expose the Portfolio to a lower rate of return upon reinvestment of principal. The value of these securities may fluctuate in response to the market’s perception of the creditworthiness of the issuers. Additionally, although mortgages and mortgage-related securities are generally supported by some form of government or private guarantee and/or insurance, there is no assurance that private guarantors or insurers will meet their obligations.
(q) U.S. Government Agencies or Government-Sponsored Enterprises Securities issued by U.S. Government agencies or government-sponsored enterprises may not be guaranteed by the U.S. Treasury. The Government National Mortgage Association (“GNMA” or “Ginnie Mae”), a wholly owned U.S. Government corporation, is authorized to guarantee, with the full faith and credit of the U.S. Government, the timely payment of principal and interest on securities issued by institutions approved by GNMA and backed by pools of mortgages insured by the Federal Housing Administration or guaranteed by the Department of Veterans Affairs. Government-related guarantors (i.e., not backed by the full faith and credit of the U.S. Government) include the Federal National Mortgage Association (“FNMA” or “Fannie Mae”) and the Federal Home Loan Mortgage Corporation (“FHLMC” or “Freddie Mac”). Pass-through securities issued by FNMA are guaranteed as to timely payment of principal and interest by FNMA but are not backed by the full faith and credit of the U.S. Government. FHLMC guarantees the timely payment of interest and ultimate collection of principal, but its participation certificates are not backed by the full faith and credit of the U.S. Government.
(r) New Accounting Policies In July 2006, the Financial Accounting Standards Board (“FASB”) issued Interpretation No. 48, “Accounting for Uncertainty in Income Taxes—an Interpretation of FASB Statement No. 109” (the “Interpretation”). The Interpretation became effective for the Portfolio on June 29, 2007. Management has evaluated the application of the Interpretation in relation to the Portfolio and has concluded that no single filing position or combination of filing positions identified as uncertain tax positions required the accrual of a tax liability in the accounting records of the Portfolio for the period ending June 30, 2007. Management will monitor all existing filing positions and future filing positions in light of the Interpretation and evaluate the need for any future tax accruals and financial statement disclosures as warranted.
In September 2006, the FASB issued Statement of Financial Accounting Standards No. 157, “Fair Value Measurements” (the “Statement”). The Statement is effective for fiscal years beginning after November 15, 2007 and will require expanded disclosure about fair value measurements, separately for each major category of assets and liabilities, that enables shareholders to assess the inputs used to develop those measurements, and for recurring fair value measurements using significant unobservable inputs the effect of the measurements on changes in net assets for the reporting period. Management is currently evaluating the application of the Statement to the Portfolio and will provide additional information in relation to the Statement on the Portfolio’s annual financial statements for the period ending December 31, 2007.
| | | | | | |
| | Semiannual Report | | June 30, 2007 | | 17 |
Notes to Financial Statements (Cont.)
3. FEES AND EXPENSES
(a) Investment Advisory Fee PIMCO is a majority-owned subsidiary of Allianz Global Investors of America L.P. (“AGI”), and serves as investment adviser (the “Adviser”) to the Trust, pursuant to an investment advisory contract. The Adviser receives a monthly fee from the Portfolio, at an annual rate based on average daily net assets. The Advisory Fee for all classes is charged at an annual rate of 0.30%.
(b) Administration Fee PIMCO serves as administrator (the “Administrator”), and provides administrative services to the Trust for which it receives a monthly administrative fee based on each share class’s average daily net assets. As the Administrator, PIMCO bears the costs of various third-party services, including audit, custodial, portfolio accounting, legal, transfer agency and printing costs. The Administration Fee for all classes is charged at the annual rate of 0.10%.
(c) Distribution and Servicing Fees Allianz Global Investors Distributors LLC (“AGID”) is an indirect wholly-owned subsidiary of AGI and serves as the distributor (the “Distributor”) of the Trust’s shares. The Trust is permitted to reimburse AGID on a quarterly basis, out of the Administrative Class assets of the Portfolio in the amount of 0.15% on an annual basis of the average daily net assets of that class, for payments made to financial intermediaries that provide services in connection with the distribution of shares or administration of plans or programs that use Portfolio shares as their funding medium. The effective rate paid to AGID was 0.15% during the current fiscal year.
(d) Portfolio Expenses The Trust is responsible for the following expenses: (i) salaries and other compensation of any of the Trust’s executive officers and employees who are not officers, directors, stockholders or employees of PIMCO or its subsidiaries or affiliates; (ii) taxes and governmental fees; (iii) brokerage fees and commissions and other portfolio transaction expenses; (iv) the costs of borrowing money, including interest expenses and bank overdraft charges; (v) fees and expenses of the Trustees who are not “interested persons” of PIMCO or the Trust, and any counsel retained exclusively for their benefit; (vi) extraordinary expenses, including costs of litigation and indemnification expenses; (vii) organization expenses and (viii) any expenses allocated or allocable to a specific class of shares, which include service fees payable with respect to the Administrative Class Shares, and may include certain other expenses as permitted by the Trust’s Multiple Class Plan adopted pursuant to Rule 18f-3 under the Act and subject to review and approval by the Trustees. The ratio of expenses to average net assets per share class, as disclosed in the Financial Highlights, may differ from the annual portfolio operating expenses per share class as disclosed in the Prospectus for the reasons set forth above.
Effective April 1, 2007, each Trustee, other than those affiliated with PIMCO or its affiliates, receives an annual retainer of $15,000, plus $2,375 for each Board of Trustees meeting attended in person, $500 for each committee meeting attended and $750 for each Board of Trustees meeting attended telephonically, plus reimbursement of related expenses. In addition, the audit committee chair receives an additional annual retainer of $2,000 and each other committee chair receives an additional annual retainer of $500. These expenses are allocated on a pro-rata basis to the various portfolios of the Trust according to their respective net assets. The Trust pays no compensation directly to any Trustee or any other officer who is affiliated with the Administrator, all of whom receive remuneration for their services to the Trust from the Administrator or its affiliates. Prior to April 1, 2007, each Trustee, other than those affiliated with PIMCO or its affiliates, received an annual retainer of $15,000 plus $2,000 for each Board of Trustees meeting attended ($500 for each special meeting attended), plus reimbursement of related expenses. The Audit Committee Chairman received an annual retainer of $1,500 and the Governance Committee Chairman received an annual retainer of
$500. In addition, each member of a committee received $500 for each committee meeting attended.
4. RELATED PARTY TRANSACTIONS
The Adviser, Administrator, and Distributor are related parties as defined by FAS 57, Related Party Disclosures. Fees payable to these parties are disclosed in Note 3.
5. GUARANTEES AND INDEMNIFICATIONS
Under the Trust’s organizational documents, each Trustee, officer, employee or other agent of the Trust (including the Trust’s investment manager) is indemnified, to the extent permitted by the Act, against certain liabilities that may arise out of performance of their duties to the Portfolio. Additionally, in the normal course of business, the Portfolio enters into contracts that contain a variety of indemnification clauses. The Portfolio’s maximum exposure under these arrangements is unknown as this would involve future claims that may be made against the Portfolio that have not yet occurred. However, the Portfolio has not had prior claims or losses pursuant to these contracts and believes the risk of loss to be remote.
6. PURCHASES AND SALES OF SECURITIES
The length of time the Portfolio has held a particular security is not generally a consideration in investment decisions. A change in the securities held by the Portfolio is known as “portfolio turnover”. The Portfolio may engage in frequent and active trading of portfolio securities to achieve its investment objective, particularly during periods of volatile market movements. High portfolio turnover (e.g., over 100%) involves correspondingly greater expenses to the Portfolio, including brokerage commissions or dealer mark-ups and other transaction costs on the sale of securities and reinvestments in other securities. Such sales may also result in realization of taxable capital gains, including short-term capital gains (which are generally taxed at ordinary income tax rates). The trading costs and tax effects associated with portfolio turnover may adversely affect the Portfolio’s performance.
Purchases and sales of securities (excluding short-term investments) for the period ended June 30, 2007, were as follows (amounts in thousands):
| | | | | | | | | | | | |
| U.S. Government/Agency | | | | All Other |
| Purchases | | Sales | | | | Purchases | | Sales |
| $ | 14,406 | | $ | 13,974 | | | | $ | 24,307 | | $ | 4,293 |
7. TRANSACTIONS IN WRITTEN CALL AND PUT OPTIONS
Transactions in written call and put options were as follows (amounts in thousands, except for number of contracts):
| | | | | | | | | | | | | | | | | |
| | | | | # of
Contracts | | | Notional
Amount
in $ | | | Notional
Amount
in GBP | | | Premium | |
Balance at 12/31/2006 | | | | 60 | | | $ | 8,000 | | | GBP | 200 | | | $ | 90 | |
Sales | | | | 94 | | | | 11,000 | | | | 0 | | | | 243 | |
Closing Buys | | | | (11 | ) | | | (8,000 | ) | | | 0 | | | | (127 | ) |
Expirations | | | | (143 | ) | | | 0 | | | | (200 | ) | | | (77 | ) |
Exercised | | | | 0 | | | | 0 | | | | 0 | | | | 0 | |
Balance at 06/30/2007 | | | | 0 | | | $ | 11,000 | | | GBP | 0 | | | $ | 129 | |
| | | | |
| 18 | | PIMCO Variable Insurance Trust | | |
| | |
| |
| | | June 30, 2007 (Unaudited) |
8. SHARES OF BENEFICIAL INTEREST
The Portfolio may issue an unlimited number of shares of beneficial interest with a $0.001 par value. Changes in shares of beneficial interest were as follows (shares and amounts in thousands):
| | | | | | | | | | | | | | | | |
| | | | | Six Months Ended
06/30/2007 | | | Year Ended
12/31/2006 | |
| | | | | Shares | | | Amount | | | Shares | | | Amount | |
| | | | | |
Receipts for shares sold | | | | | | | | | | | | | | | | |
Institutional Class | | | | 113 | | | $ | 1,312 | | | 198 | | | $ | 2,084 | |
Administrative Class | | | | 260 | | | | 2,953 | | | 363 | | | | 3,872 | |
Issued as reinvestment of distributions | | | | | | | | | | | | | | | | |
Institutional Class | | | | 13 | | | | 143 | | | 27 | | | | 289 | |
Administrative Class | | | | 228 | | | | 2,609 | | | 438 | | | | 4,644 | |
Cost of shares redeemed | | | | | | | | | | | | | | | | |
Institutional Class | | | | (251 | ) | | | (2,888 | ) | | (258 | ) | | | (2,654 | ) |
Administrative Class | | | | (698 | ) | | | (7,973 | ) | | (15,605 | ) | | | (166,615 | ) |
Net (decrease) resulting from Portfolio share transactions | | | | (335 | ) | | $ | (3,844 | ) | | (14,837 | ) | | $ | (158,380 | ) |
The following schedule shows the number of shareholders each owning 5% or more of the Portfolio and the total percentage of the Portfolio held by such shareholders:
| | | | | | |
| | | | | Number of Shareholders | | % of Portfolio Held |
Institutional Class | | | | 2 | | 99 |
Administrative Class | | | | 5 | | 89 |
9. REGULATORY AND LITIGATION MATTERS
Since February 2004, PIMCO, Allianz Global Investors of America L.P. (PIMCO’s parent company), AGID, and certain of their affiliates, including the PIMCO Funds (another series of funds managed by PIMCO), the Allianz Funds (formerly known as PIMCO Funds: Multi-Manager Series (another series of funds managed by affiliates of PIMCO)), certain Trustees of the Trust (in their capacity as Trustees of the PIMCO Funds or the Allianz Funds) and certain employees of PIMCO, have been named as defendants in fifteen lawsuits filed in various jurisdictions. Eleven of those lawsuits concern “market timing,” and they have been transferred to and consolidated for pre-trial proceedings in a multi-district litigation proceeding in the U.S. District Court for the District of Maryland; the other four lawsuits concern “revenue sharing” and have been consolidated into a single action in the U.S. District Court for the District of Connecticut. The lawsuits have been commenced as putative class actions on behalf of investors who purchased, held or redeemed shares of the various series of the PIMCO Funds and the Allianz Funds during specified periods, or as derivative actions on behalf of the PIMCO Funds and the Allianz Funds.
The market timing actions in the District of Maryland generally allege that certain hedge funds were allowed to engage in “market timing” in certain funds of the PIMCO Funds and the Allianz Funds and this alleged activity was not disclosed. Pursuant to tolling agreements entered into with the derivative and class action plaintiffs, PIMCO, certain PIMCO Funds Trustees, and certain employees of PIMCO who were previously named as defendants have all been dropped as defendants in the market timing actions; the plaintiffs continue to assert claims on behalf of the shareholders of the PIMCO Funds or on behalf of the PIMCO Funds itself against other defendants. By order dated November 3, 2005, the U.S. District Court for the District of Maryland granted the PIMCO Funds’ motion to dismiss claims asserted against it in a consolidated amended complaint where the PIMCO Funds were named, in the complaint, as a nominal defendant. The revenue sharing action in the District of Connecticut generally alleges that fund assets were inappropriately used to pay brokers to promote funds of the PIMCO Funds and the Allianz Funds, including directing fund brokerage transactions to such brokers, and that such alleged arrangements were not fully disclosed to shareholders. On August 11, 2005,
the U.S. District Court for the District of Connecticut conducted a hearing on defendants’ motion to dismiss the consolidated amended complaint in the revenue sharing action but has not yet ruled on the motion to dismiss. The market timing and revenue sharing lawsuits seek, among other things, unspecified compensatory damages plus interest and, in some cases, punitive damages, the rescission of investment advisory contracts, the return of fees paid under those contracts and restitution.
Two nearly identical class action civil complaints have been filed in August 2005, in the Northern District of Illinois Eastern Division, alleging that the plaintiffs each purchased and sold a 10-year Treasury note futures contract and suffered damages from an alleged shortage when PIMCO held both physical and futures positions in 10-year Treasury notes for its client accounts. The two actions have been consolidated into one action, and the two separate complaints have been replaced by a consolidated complaint. PIMCO is a named defendant, and PIMCO Funds has been added as a defendant, to the consolidated action. PIMCO strongly believes the complaint is without merit and intends to vigorously defend itself.
In April 2006, certain portfolios of the Trust and certain other funds managed by PIMCO were served in an adversary proceeding brought by the Official Committee of Asbestos Claimants of G-I Holdings, Inc. in G-I Holdings, Inc.’s bankruptcy in the District of New Jersey. In July 2004, PIMCO was named in this lawsuit and remains a defendant. The plaintiff seeks to recover for the bankruptcy estate assets that were transferred by the predecessor entity of G-I Holdings, Inc. to a wholly-owned subsidiary in 1994. The subsidiary has since issued notes, of which certain portfolios of the Trust and certain other funds managed by PIMCO are alleged to be holders. The complaint alleges that in 2000, more than two hundred noteholders—including certain portfolios of the Trust and certain other funds managed by PIMCO—were granted a second priority lien on the assets of the subsidiary in exchange for their consent to a refinancing transaction and the granting of a first priority lien to the lending banks. The plaintiff is seeking invalidation of the lien in favor of the noteholders and/or the value of the lien. On June 21, 2006, the District of New Jersey overturned the Bankruptcy Court’s decision granting permission to file the adversary proceeding and remanded the matter to the Bankruptcy Court for further proceedings. Following a motion to reconsider, the District Court upheld its remand on August 7, 2006, and instructed the Bankruptcy Court to conduct a “cost-benefit” analysis of the Committee’s claims, including the claims against the noteholders. The Bankruptcy Court held a status conference on October 25, 2006 and set a briefing schedule relating to this cost-benefit analysis.
The foregoing speaks only as of the date of this report. It is possible that these matters and/or other developments resulting from these matters could result in increased portfolio redemptions or other adverse consequences to the Portfolio. However, PIMCO and AGID believe that these matters are not likely to have a material adverse effect on the Portfolio or on PIMCO’s or AGID’s ability to perform their respective investment advisory or distribution services relating to the Portfolio.
10. FEDERAL INCOME TAX MATTERS
The Portfolio intends to qualify as a regulated investment company under sub-chapter M of the Internal Revenue Code (the “Code”) and distribute all of its taxable income and net realized gains, if applicable, to shareholders. Accordingly, no provision for Federal income taxes has been made.
As of June 30, 2007, the aggregate cost of investments was the same for federal income tax and financial statement purposes. The net unrealized appreciation (depreciation) of investment securities for federal income tax purposes is as follows (amount in thousands):
| | | | |
Aggregate
Gross
Unrealized
Appreciation | | Aggregate
Gross
Unrealized
(Depreciation) | | Net
Unrealized
(Depreciation) |
$ 131 | | $ (686) | | $ (555) |
| | | | | | |
| | Semiannual Report | | June 30, 2007 | | 19 |
| | |
| |
Privacy Policy* | | (Unaudited) |
The Funds consider customer privacy to be a fundamental aspect of their relationships with shareholders and are committed to maintaining the confidentiality, integrity and security of their current, prospective and former shareholders’ personal information. To ensure their shareholders’ privacy, the Funds have developed policies that are designed to protect this confidentiality, while allowing shareholder needs to be served.
Obtaining Personal Information
In the course of providing shareholders with products and services, the Funds and certain service providers to the Funds, such as the Funds’ investment advisers (“Advisers”), may obtain non-public personal information about shareholders, which may come from sources such as account applications and other forms, from other written, electronic or verbal correspondence, from shareholder transactions, from a shareholder’s brokerage or financial advisory firm, financial adviser or consultant, and/or from information captured on the Funds’ internet web sites.
Respecting Your Privacy
As a matter of policy, the Funds do not disclose any personal or account information provided by shareholders or gathered by the Funds to non-affiliated third parties, except as required or permitted by law or as necessary for such third parties to perform their agreements with respect to the Funds. As is common in the industry, non-affiliated companies may from time to time be used to provide certain services, such as preparing and mailing prospectuses, reports, account statements and other information, conducting research on shareholder satisfaction and gathering shareholder proxies. A Fund’s Distributor may also retain non-affiliated companies to market the Fund’s shares or products which use the Fund’s shares and enter into joint marketing agreements with other companies. These companies may have access to a shareholder’s personal and account information, but are permitted to use this information solely to provide the specific service or as otherwise permitted by law. In most cases, the shareholders will be clients of a third party, but the Funds may also provide a shareholder’s personal and account information to the shareholder’s respective brokerage or financial advisory firm.
Sharing Information with Third Parties
The Funds reserve the right to disclose or report personal information to non-affiliated third parties, in limited circumstances, where the Funds believe in good faith that disclosure is required under law to cooperate with regulators or law enforcement authorities, to protect their rights or property or upon reasonable request by any Fund in which a shareholder has chosen to invest. In addition, the Funds may disclose information about a shareholder’s accounts to a non-affiliated third party with the consent of the shareholder.
Sharing Information with Affiliates
The Funds may share shareholder information with their affiliates in connection with servicing their shareholders’ accounts or to provide shareholders with information about products and services that the Funds or their Advisers, principal underwriters or their affiliates (“Service Affiliates”) believe may be of interest to such shareholders. The information that the Funds share may include, for example, a shareholder’s participation in one of the Funds or in other investment programs sponsored by a Service Affiliate, a shareholder’s ownership of certain types of accounts (such as IRAs), or other data about a shareholder’s accounts. The Funds’ Service Affiliates, in turn, are not permitted to share shareholder information with non-affiliated entities, except as required or permitted by law.
Procedures to Safeguard Private Information
The Funds take seriously the obligation to safeguard shareholder non-public personal information. In addition to this policy, the Funds have also implemented procedures that are designed to restrict access to a shareholder’s non-public personal information only to internal personnel who need to know that information in order to provide products or services to such shareholders. In order to guard a shareholder’s non-public personal information, physical, electronic and procedural safeguards are in place.
* This Privacy Policy applies to the following entities: PIMCO Funds, PIMCO Variable Insurance Trust, PCM Fund, Inc. and PIMCO Strategic Global Government Fund, Inc. (collectively, the “Funds”).
| | | | |
| 20 | | PIMCO Variable Insurance Trust | | |
Investment Adviser and Administrator
Pacific Investment Management Company LLC
840 Newport Center Drive
Newport Beach, California 92660
Distributor
Allianz Global Investors Distributors LLC
1345 Avenue of the Americas
New York, New York 10105
Custodian
State Street Bank & Trust Company
801 Pennsylvania
Kansas City, Missouri 64105
Transfer Agent
Boston Financial Data Services–Midwest
330 W. 9th Street
Kansas City, Missouri 64105
Legal Counsel
Dechert LLP
1775 I Street, N.W.
Washington, D.C. 20006
Independent Registered Public Accounting Firm
PricewaterhouseCoopers LLP
1055 Broadway
Kansas City, Missouri 64105
P I M C O

Table of Contents
This material is authorized for use only when preceded or accompanied by the current PIMCO Variable Insurance Trust (the “Trust”) prospectus. Investors should consider the investment objectives, risks, charges and expenses of this Trust carefully before investing. Ask your financial professional to explain all charges that may apply. This and other information is contained in the Trust’s prospectus. The variable product prospectus may be obtained by contacting your Investment Consultant. Please read the Trust and variable product prospectus carefully before you invest or send money.
Chairman’s Letter
Dear PIMCO Variable Insurance Trust Shareholder:
It is our pleasure to present to you the semiannual report for the PIMCO Variable Insurance Trust, covering the six-month period ended June 30, 2007. The PIMCO Variable Insurance Trust’s net assets were $8.68 billion at June 30, 2007, as compared to $7.76 billion at December 31, 2006.
Highlights of the financial markets during the reporting period include:
| | n | | Economic data during the first quarter of 2007 pointed to slower growth, which heightened market expectations for a decrease in the Federal Funds Rate. By the second quarter, economic data, such as employment statistics, provided little indication of economic weakness, causing expectations of a decrease in the Federal Funds Rate to unwind and U.S. interest rates to move higher. Interest rates in Europe and the U.K. also rose over the period as central banks raised their key lending rates due to inflation concerns. The benchmark ten-year U.S. Treasury yielded 5.03% as of June 30, 2007, or 0.32% higher than at the beginning of the year. |
| | n | | Most bonds generally returned much of their gains from earlier in the year as worldwide growth and capital flows drove interest rates higher in the second quarter. Increased risk aversion in global financial markets, due in part to subprime mortgage worries in the U.S., also contributed to the rise in interest rates. The Lehman Brothers Aggregate Bond Index, which includes Treasury, investment-grade corporate and mortgage-backed securities, returned 0.98% for the six-month period. |
| | n | | Locally issued emerging market (“EM”) bonds posted positive returns for the reporting period. Yields on these bonds declined and the local currencies in which they are denominated generally gained, amid increasing investor awareness, strong economic growth and surging capital inflows. External EM bonds (debt instruments issued by emerging markets countries and typically denominated in U.S. dollars) lagged behind local EM bonds (debt instruments issued by emerging markets countries and denominated in the currency of the issuer), as external EM bonds tend to trade more in-line with U.S. Treasuries. |
| | n | | Treasury Inflation-Protected Securities (“TIPS”) outpaced nominal bonds (non-inflation linked bonds) for the first part of the year and all but the longest maturity TIPS outperformed in the second quarter as high gasoline prices drove higher inflation accruals. Commodities, as represented by the Dow Jones-AIG Commodity Total Return Index, returned 4.46% for the period. Equities, as measured by the S&P 500 Index and the Russell 2000 Index, returned 6.96% and 6.45%, respectively, for the period. |
On the following pages, please find specific details as to the Portfolio’s total return investment performance and a discussion of those factors that affected performance.
Thank you for the trust you have placed in us. We will continue to work diligently to serve your investment needs.
Sincerely,
Brent R. Harris
Chairman, PIMCO Variable Insurance Trust
July 31, 2007
| | | | | | |
| | Semiannual Report | | June 30, 2007 | | 1 |
Important Information About the Portfolio
PIMCO Variable Insurance Trust (the “Trust”) is an open-end management investment company currently consisting of twenty separate investment portfolios, including the StocksPLUS® Total Return Portfolio (the “Portfolio”). The Portfolio is only available as a funding vehicle under variable life insurance policies or variable annuity contracts issued by insurance companies (“Variable Contracts”). Individuals may not purchase shares of the Portfolio directly. Shares of the Portfolio also may be sold to qualified pension and retirement plans outside of the separate account context.
We believe that bond funds have an important role to play in a well diversified investment portfolio. It is important to note, however, that in an environment where interest rates may trend upward, rising rates would negatively impact the performance of most bond funds, and fixed-income securities held by a fund are likely to decrease in value. The price volatility of fixed-income securities can also increase during periods of rising interest rates resulting in increased losses to a fund. Bond funds and individual bonds with a longer duration (a measure of the expected life of a security) tend to be more sensitive to changes in interest rates, usually making them more volatile than securities or funds with shorter durations.
The Portfolio may be subject to various risks in addition to those described above. Some of these risks may include, but are not limited to, the following: credit risk, high yield risk, market risk, issuer risk, liquidity risk, derivatives risk, equity risk, mortgage risk, non-U.S. investment risk, emerging markets risk, currency risk, leveraging risk and management risk. A complete description of these risks is contained in the Portfolio’s prospectus. The Portfolio may use derivative instruments as part of an investment strategy, as described under “Portfolio Insights”, or for hedging purposes. Use of these instruments may involve certain costs and risks such as liquidity risk, interest rate risk, market risk, credit risk, management risk and the risk that the Portfolio could not close out a position when it would be most advantageous to do so. Because the Portfolio may invest in derivatives, it could lose more than the principal amount invested in these instruments. Investing in non-U.S. securities may entail risk due to non-U.S. economic and political developments; this risk may be increased when investing in emerging markets.
On the performance summary page in this Semiannual Report, the Total Return Investment Performance table measures performance assuming that all dividend and capital gain distributions were reinvested.
An investment in the Portfolio is not a deposit of a bank and is not guaranteed or insured by the Federal Deposit Insurance Corporation or any other government agency. It is possible to lose money on investments in the Portfolio.
PIMCO has adopted written proxy voting policies and procedures (“Proxy Policy”) as required by Rule 206(4)-6 under the Investment Advisers Act of 1940, as amended. The Proxy Policy has been adopted by the Trust as the policies and procedures that PIMCO will use when voting proxies on behalf of the Portfolio. A description of the policies and procedures that PIMCO uses to vote proxies relating to portfolio securities of the Portfolio, and information about how the Portfolio voted proxies relating to portfolio securities held during the most recent twelve-month period ended June 30, are available without charge, upon request, by calling the Trust at 1-866-746-2606 and on the Portfolio’s website at www.pimco.com.
The Portfolio files its complete schedule of portfolio holdings with the SEC for the first and third quarters of each fiscal year on Form N-Q. A copy of the Trust’s Form N-Q is also available on the SEC’s website at http://www.sec.gov and may be reviewed and copied at the SEC’s Public Reference Room in Washington D.C. Information on the operation of the Public Reference Room may be obtained by calling 1-800-SEC-0330, and is available without charge, upon request, by calling the Trust at 1-866-746-2606 and on the Portfolio’s website at www.pimco.com.
PIMCO Variable Insurance Trust is distributed by Allianz Global Investors Distributors LLC, 1345 Avenue of the Americas, New York, NY 10105.
| | | | |
| 2 | | PIMCO Variable Insurance Trust | | |
The following disclosure provides important information regarding the Portfolio’s Expense Example (“Example” or “Expense Example”), which appears in this Semiannual Report. Please refer to this information when reviewing the Expense Example for the Portfolio.
Example
As a shareholder of the Portfolio, you incur two types of costs: (1) transaction costs and (2) ongoing costs, including advisory and administrative fees; distribution and/or service (12b-1) fees (Administrative and Advisor Class only); and other Portfolio expenses. The Example is intended to help you understand your ongoing costs (in dollars) of investing in the Portfolio and to compare these costs with the ongoing costs of investing in other mutual funds. The Expense Example does not reflect any fees or other expenses imposed by the Variable Contracts. If it did, the expenses reflected in the Expense Example would be higher. The Example is based on an investment of $1,000 invested at the beginning of the period and held for the entire period indicated, which is from January 1, 2007 to June 30, 2007.
Actual Expenses
The information in the table under the heading “Actual Performance” provides information about actual account values and actual expenses. You may use the information in these columns, together with the amount you invested, to estimate the expenses that you paid over the period. Simply divide your account value by $1,000 (for example, an $8,600 account value divided by $1,000 = $8.60), then multiply the result by the number in the row titled “Expenses Paid During Period” to estimate the expenses you paid on your account during this period.
Hypothetical Example for Comparison Purposes
The information in the table under the heading “Hypothetical Performance (5% return before expenses)” provides information about hypothetical account values and hypothetical expenses based on the Portfolio’s actual expense ratio and an assumed rate of return of 5% per year before expenses, which is not the Portfolio’s actual return. The hypothetical account values and expenses may not be used to estimate the actual ending account balance or expenses you paid for the period. You may use this information to compare the ongoing costs of investing in the Portfolio and other portfolios. To do so, compare this 5% hypothetical example with the 5% hypothetical examples that appear in the shareholder reports of the other portfolios.
Please note that the expenses shown in the table are meant to highlight your ongoing costs only and do not reflect any transactional costs. Therefore, the information under the heading “Hypothetical Performance (5% return before expenses)” is useful in comparing ongoing costs only, and will not help you determine the relative total costs of owning different portfolios. In addition, if these transactional costs were included, your costs would have been higher.
The expense ratio may vary period to period because of various factors, such as an increase in expenses not covered by the advisory and administrative fees (such as expenses of the trustees and their counsel, litigation expense and interest expense).
| | | | | | |
| | Semiannual Report | | June 30, 2007 | | 3 |
PIMCO StocksPLUS® Total Return Portfolio
Cumulative Returns Through June 30, 2007
$10,000 invested at the beginning of the first full month following the inception date of the Portfolio’s Administrative Class.
Allocation Breakdown‡
| | |
Short-Term Instruments | | 31.0% |
U.S. Government Agencies | | 28.0% |
Corporate Bonds & Notes | | 27.3% |
Asset-Backed Securities | | 8.5% |
Mortgage-Backed Securities | | 5.2% |
| | ‡ | % of Total Investments as of 06/30/2007 |
| | | | | | | | |
| Average Annual Total Return for the period ended June 30, 2007 |
| | | | | 6 Months* | | 1 Year | | Portfolio
Inception
(09/30/05) |
| | PIMCO StocksPLUS® Total Return Portfolio Administrative Class | | 4.91% | | 20.54% | | 12.09% |
| | S&P 500 Index± | | 6.96% | | 20.59% | | 14.37% |
All Portfolio returns are net of fees and expenses.
* Cumulative return.
Performance quoted represents past performance. Past performance is no guarantee of future results. Investment return and principal value will fluctuate so the Portfolio shares, when redeemed, may be worth more or less than their original cost. The Portfolio’s performance does not reflect the deduction of additional charges and expenses imposed in connection with investing in Variable Contracts, which will reduce returns. Current performance may be lower or higher than the performance data quoted. Performance data current to the most recent month-end is available by calling (800) 927-4648.
± S&P 500 Index is an unmanaged market index generally considered representative of the stock market as a whole. The index focuses on the large-cap segment of the U.S. equities market. It is not possible to invest directly in the index. The index does not reflect deductions for fees and expenses.
| | | | | | |
| Expense Example | | Actual Performance | | Hypothetical Performance |
| | | | | (5% return before expenses) |
Beginning Account Value (01/01/07) | | $ | 1,000.00 | | $ | 1,000.00 |
Ending Account Value (06/30/07) | | $ | 1,049.12 | | $ | 1,020.63 |
Expenses Paid During Period† | | $ | 4.27 | | $ | 4.21 |
† Expenses are equal to the Portfolio’s Administrative Class annualized expense ratio of 0.84%, multiplied by the average account value over the period, multiplied by 181/365 (to reflect the one-half year period). Overall fees and expenses of investing in the Portfolio will be higher because the example does not reflect Variable Contract fees and expenses.
Please refer to page 3 herein for an explanation of the information presented in the above Expense Example.
Portfolio Insights
» | | The PIMCO StocksPLUS® Total Return Portfolio seeks to exceed the total return of the S&P 500 by investing under normal circumstances substantially all of its assets in S&P 500 derivatives, backed by a portfolio of fixed-income instruments. |
» | | The Portfolio’s fixed-income portfolio underperformed the financing cost embedded in equity index futures holdings, thus leading the Portfolio to underperform the S&P 500. |
| » | | U.S. duration exposure was negative for performance as interest rates moved higher in instruments where the Portfolio’s duration exposure was concentrated. In particular, Eurodollar futures yields moved higher. Exposure to three-year and longer maturities also detracted from performance as rates moved higher among these maturities. |
| » | | Holdings of mortgage-backed securities detracted from performance as they underperformed like-duration Treasuries. |
| » | | Credit sensitive holdings, including corporate bonds and emerging market bonds, added value as they outperformed like-duration Treasuries. |
| » | | Currency strategies, including long exposure to the euro and a basket of emerging market currencies, helped performance as these currencies appreciated relative to the U.S. dollar. |
| | | | |
| 4 | | PIMCO Variable Insurance Trust | | |
Financial Highlights StocksPLUS® Total Return Portfolio
| | | | | | | | | | | | |
| Selected per Share Data for the Year or Period Ended: | | 06/30/2007+ | | | 12/31/2006 | | | 09/30/2005-12/31/2005 | |
| | | |
Administrative Class | | | | | | | | | | | | |
Net asset value beginning of year or period | | $ | 11.38 | | | $ | 10.19 | | | $ | 10.00 | |
Net investment income (a) | | | 0.26 | | | | 0.42 | | | | 0.09 | |
Net realized/unrealized gain on investments (a) | | | 0.30 | | | | 1.02 | | | | 0.10 | |
Total income from investment operations | | | 0.56 | | | | 1.44 | | | | 0.19 | |
Dividends from net investment income | | | (0.22 | ) | | | (0.16 | ) | | | 0.00 | |
Distributions from net realized capital gains | | | 0.00 | | | | (0.09 | ) | | | 0.00 | |
Total distributions | | | (0.22 | ) | | | (0.25 | ) | | | 0.00 | |
Net asset value end of year or period | | $ | 11.72 | | | $ | 11.38 | | | $ | 10.19 | |
Total return | | | 4.91 | % | | | 14.19 | % | | | 1.90 | % |
Net assets end of year or period (000s) | | $ | 4,316 | | | $ | 3,749 | | | $ | 3,056 | |
Ratio of expenses to average net assets | | | 0.84 | %* | | | 0.88 | %(c) | | | 0.90 | %*(b) |
Ratio of expenses to average net assets excluding interest expense | | | 0.84 | %* | | | 0.88 | %(c) | | | 0.89 | %*(b) |
Ratio of net investment income to average net assets | | | 4.49 | %* | | | 3.95 | % | | | 3.77 | %* |
Portfolio turnover rate | | | 149 | % | | | 415 | % | | | 43 | % |
+ Unaudited
* Annualized
(a) Per share amounts based on average number of shares outstanding during the period.
(b) If the investment manager had not reimbursed expenses, the ratio of expenses to average net assets would have been 2.10%.
(c) Effective October 31, 2006, the advisory fee was reduced to 0.44%.
| | | | | | |
| See Accompanying Notes | | Semiannual Report | | June 30, 2007 | | 5 |
Statement of Assets and Liabilities StocksPLUS® Total Return Portfolio
| | | | |
| (Amounts in thousands, except per share amounts) | | June 30, 2007 | |
| | | (Unaudited) | |
| |
Assets: | | | | |
Investments, at value | | $ | 3,981 | |
Repurchase agreements, at value | | | 442 | |
Cash | | | 1 | |
Foreign currency, at value | | | 2 | |
Receivable for investments sold | | | 1 | |
Interest and dividends receivable | | | 15 | |
Variation margin receivable | | | 8 | |
Unrealized appreciation on foreign currency contracts | | | 7 | |
Unrealized appreciation on swap agreements | | | 1 | |
| | | | 4,458 | |
| |
Liabilities: | | | | |
Payable for investments purchased | | $ | 20 | |
Payable for investments purchased on a delayed-delivery basis | | | 100 | |
Accrued investment advisory fee | | | 2 | |
Accrued administration fee | | | 1 | |
Accrued servicing fee | | | 1 | |
Variation margin payable | | | 5 | |
Swap premiums received | | | 10 | |
Unrealized depreciation on swap agreements | | | 3 | |
| | | | 142 | |
| |
Net Assets | | $ | 4,316 | |
| |
Net Assets Consist of: | | | | |
Paid in capital | | $ | 3,773 | |
Undistributed net investment income | | | 123 | |
Accumulated undistributed net realized gain | | | 520 | |
Net unrealized (depreciation) | | | (100 | ) |
| | | $ | 4,316 | |
| |
Net Assets: | | | | |
Administrative Class | | $ | 4,316 | |
| |
Shares Issued and Outstanding: | | | | |
Administrative Class | | | 368 | |
| |
Net Asset Value and Redemption Price Per Share (Net Asset Per Share Outstanding) | | | | |
Administrative Class | | $ | 11.72 | |
| |
Cost of Investments Owned | | $ | 4,009 | |
Cost of Repurchase Agreements Owned | | $ | 442 | |
Cost of Foreign Currency Held | | $ | 2 | |
| | | | |
| 6 | | PIMCO Variable Insurance Trust | | See Accompanying Notes |
Statement of Operations StocksPLUS® Total Return Portfolio
| | | | |
| (Amounts in thousands) | | Six Months Ended
June 30, 2007 | |
| | | (Unaudited) | |
| |
| Investment Income: | | | | |
Interest | | $ | 107 | |
Total Income | | | 107 | |
| |
Expenses: | | | | |
Investment advisory fees | | | 9 | |
Administration fees | | | 5 | |
Distribution and/or servicing fees – Administrative Class | | | 3 | |
Total Expenses | | | 17 | |
| |
Net Investment Income | | | 90 | |
| |
Net Realized and Unrealized Gain (Loss): | | | | |
Net realized (loss) on investments | | | (9 | ) |
Net realized gain on futures contracts, written options and swaps | | | 241 | |
Net realized gain on foreign currency transactions | | | 3 | |
Net change in unrealized (depreciation) on investments | | | (19 | ) |
Net change in unrealized (depreciation) on futures contracts, written options and swaps | | | (124 | ) |
Net change in unrealized appreciation on translation of assets and liabilities denominated in foreign currencies | | | 5 | |
Net Gain | | | 97 | |
| |
Net Increase in Net Assets Resulting from Operations | | $ | 187 | |
| | | | | | |
| See Accompanying Notes | | Semiannual Report | | June 30, 2007 | | 7 |
Statements of Changes in Net Assets StocksPLUS® Total Return Portfolio
| | | | | | | | |
| (Amounts in thousands) | | Six Months Ended
June 30, 2007 | | | Year Ended
December 31, 2006 | |
| | | (Unaudited) | | | | |
| | |
| Increase in Net Assets from: | | | | | | | | |
| | |
Operations: | | | | | | | | |
Net investment income | | $ | 90 | | | $ | 132 | |
Net realized gain | | | 235 | | | | 325 | |
Net change in unrealized appreciation (depreciation) | | | (138 | ) | | | 1 | |
Net increase resulting from operations | | | 187 | | | | 458 | |
| | |
Distributions to Shareholders: | | | | | | | | |
From net investment income | | | | | | | | |
Administrative Class | | | (77 | ) | | | (53 | ) |
From net realized capital gains | | | | | | | | |
Administrative Class | | | 0 | | | | (28 | ) |
| | |
Total Distributions | | | (77 | ) | | | (81 | ) |
| | |
Portfolio Share Transactions: | | | | | | | | |
Receipts for shares sold | | | | | | | | |
Administrative Class | | | 474 | | | | 415 | |
Issued as reinvestment of distributions | | | | | | | | |
Administrative Class | | | 77 | | | | 80 | |
Cost of shares redeemed | | | | | | | | |
Administrative Class | | | (94 | ) | | | (179 | ) |
Net increase resulting from Portfolio share transactions | | | 457 | | | | 316 | |
| | |
Total Increase in Net Assets | | | 567 | | | | 693 | |
| | |
Net Assets: | | | | | | | | |
Beginning of period | | | 3,749 | | | | 3,056 | |
End of period* | | $ | 4,316 | | | $ | 3,749 | |
| | |
*Including undistributed net investment income of: | | $ | 123 | | | $ | 110 | |
| | | | |
| 8 | | PIMCO Variable Insurance Trust | | See Accompanying Notes |
| | |
| |
| Schedule of Investments StocksPLUS® Total Return Portfolio | | June 30, 2007 (Unaudited) |
| | | | | | | | |
| | | | | PRINCIPAL
AMOUNT
(000S) | | | | VALUE
(000S) |
| CORPORATE BONDS & NOTES 28.0% |
|
| BANKING & FINANCE 20.5% |
| American Express Centurion Bank |
5.320% due 05/07/2008 | | $ | | 30 | | $ | | 30 |
| |
| Bank of America Corp. |
5.370% due 06/19/2009 | | | | 30 | | | | 30 |
| |
| Bank of America N.A. |
5.360% due 06/12/2009 | | | | 40 | | | | 40 |
| |
| Bank of Ireland |
5.410% due 12/18/2009 | | | | 20 | | | | 20 |
| |
| BNP Paribas |
5.186% due 06/29/2049 | | | | 30 | | | | 28 |
| |
| Caterpillar Financial Services Corp. |
5.420% due 05/18/2009 | | | | 40 | | | | 40 |
| |
| Citigroup, Inc. |
5.400% due 12/26/2008 | | | | 100 | | | | 100 |
| |
| Ford Motor Credit Co. |
6.625% due 06/16/2008 | | | | 100 | | | | 100 |
7.250% due 10/25/2011 | | | | 40 | | | | 39 |
| |
| General Electric Capital Corp. |
5.410% due 10/06/2010 | | | | 20 | | | | 20 |
5.430% due 08/15/2011 | | | | 50 | | | | 50 |
5.455% due 10/21/2010 | | | | 20 | | | | 20 |
| |
| Goldman Sachs Group, Inc. |
5.440% due 11/16/2009 | | | | 10 | | | | 10 |
5.450% due 06/23/2009 | | | | 30 | | | | 30 |
5.625% due 01/15/2017 | | | | 20 | | | | 19 |
| |
| HSBC Finance Corp. |
5.607% due 05/10/2010 | | | | 40 | | | | 40 |
| |
| JPMorgan Chase & Co. |
5.370% due 06/26/2009 | | | | 40 | | | | 40 |
| |
| Lehman Brothers Holdings, Inc. |
5.440% due 04/03/2009 | | | | 10 | | | | 10 |
5.445% due 10/22/2008 | | | | 30 | | | | 30 |
| |
| Merrill Lynch & Co., Inc. |
5.450% due 08/22/2008 | | | | 30 | | | | 30 |
| |
| Morgan Stanley |
5.360% due 11/21/2008 | | | | 40 | | | | 40 |
| |
| RBS Capital Trust III |
5.512% due 09/29/2049 | | | | 60 | | | | 58 |
| |
| Wachovia Corp. |
5.405% due 10/28/2008 | | | | 30 | | | | 30 |
| |
| Wells Fargo & Co. |
5.420% due 03/23/2010 | | | | 30 | | | | 30 |
| | | | | | | | |
| | | | | | | | 884 |
| | | | | | | | |
|
| INDUSTRIALS 5.6% |
| Amgen, Inc. |
5.440% due 11/28/2008 | | | | 40 | | | | 40 |
| |
| Anadarko Petroleum Corp. |
5.760% due 09/15/2009 | | | | 30 | | | | 30 |
| |
| DaimlerChrysler N.A. Holding Corp. |
5.840% due 09/10/2007 | | | | 30 | | | | 30 |
| |
| EchoStar DBS Corp. |
5.750% due 10/01/2008 | | | | 20 | | | | 20 |
| |
| FedEx Corp. |
5.436% due 08/08/2007 | | | | 30 | | | | 30 |
| |
| Home Depot, Inc. |
5.485% due 12/16/2009 | | | | 10 | | | | 10 |
| |
| Morgan Stanley Bank AG for OAO Gazprom |
9.625% due 03/01/2013 | | | | 20 | | | | 23 |
| |
| | | | | | | | |
| | | | | PRINCIPAL
AMOUNT
(000S) | | | | VALUE
(000S) |
| Salomon Brothers AG for OAO Gazprom |
10.500% due 10/21/2009 | | $ | | 10 | | $ | | 11 |
| |
| Time Warner, Inc. |
5.875% due 11/15/2016 | | | | 10 | | | | 10 |
| |
| Transocean, Inc. |
5.560% due 09/05/2008 | | | | 10 | | | | 10 |
| |
| Westfield Group |
5.700% due 10/01/2016 | | | | 30 | | | | 29 |
| | | | | | | | |
| | | | | | | | 243 |
| | | | | | | | |
|
| UTILITIES 1.9% |
| BellSouth Corp. |
5.460% due 08/15/2008 | | | | 30 | | | | 30 |
| |
| MidAmerican Energy Holdings Co. |
6.125% due 04/01/2036 | | | | 10 | | | | 10 |
| |
| TXU Electric Delivery Co. |
5.735% due 09/16/2008 | | | | 40 | | | | 40 |
| | | | | | | | |
| | | | | | | | 80 |
| | | | | | | | |
Total Corporate Bonds & Notes (Cost $1,211) | | | | 1,207 |
| | | | | | | | |
|
| U.S. GOVERNMENT AGENCIES 28.7% |
| Fannie Mae |
4.439% due 06/01/2035 | | | | 20 | | | | 20 |
4.462% due 09/01/2035 | | | | 18 | | | | 18 |
4.604% due 09/01/2035 | | | | 16 | | | | 16 |
4.641% due 10/01/2035 | | | | 9 | | | | 9 |
4.661% due 12/01/2033 | | | | 9 | | | | 9 |
4.695% due 12/01/2033 | | | | 5 | | | | 5 |
4.834% due 06/01/2035 | | | | 17 | | | | 16 |
4.990% due 06/01/2035 | | | | 15 | | | | 15 |
5.500% due 08/01/2035 - 03/01/2036 | | | | 843 | | | | 815 |
| |
| Freddie Mac |
4.364% due 09/01/2035 | | | | 4 | | | | 4 |
4.590% due 09/01/2035 | | | | 14 | | | | 14 |
4.712% due 08/01/2035 | | | | 17 | | | | 17 |
4.913% due 11/01/2034 | | | | 14 | | | | 14 |
5.000% due 12/15/2020 | | | | 4 | | | | 4 |
5.470% due 08/15/2019 - 10/15/2020 | | | | 160 | | | | 160 |
5.550% due 07/15/2037 | | | | 100 | | | | 100 |
6.227% due 02/25/2045 | | | | 4 | | | | 4 |
| | | | | | | | |
Total U.S. Government Agencies (Cost $1,263) | | | | 1,240 |
| | | | | | | | |
|
| MORTGAGE-BACKED SECURITIES 5.3% |
| American Home Mortgage Investment Trust |
4.390% due 02/25/2045 | | | | 12 | | | | 12 |
| |
| Countrywide Alternative Loan Trust |
5.500% due 05/25/2047 | | | | 28 | | | | 28 |
| |
| Impac Secured Assets CMN Owner Trust |
5.400% due 01/25/2037 | | | | 22 | | | | 22 |
| |
| Indymac Index Mortgage Loan Trust |
5.167% due 01/25/2036 | | | | 7 | | | | 7 |
| |
| LB-UBS Commercial Mortgage Trust |
4.990% due 11/15/2030 | | | | 74 | | | | 74 |
| |
| TBW Mortgage-Backed Pass-Through Certificates |
5.430% due 01/25/2037 | | | | 28 | | | | 28 |
| |
| Thornburg Mortgage Securities Trust |
5.430% due 12/25/2036 | | | | 26 | | | | 26 |
| |
| Washington Mutual, Inc. |
6.029% due 02/25/2046 | | | | 23 | | | | 23 |
| |
| | | | | | | | |
| | | | | PRINCIPAL
AMOUNT
(000S) | | | | VALUE
(000S) |
| Wells Fargo Mortgage-Backed Securities Trust |
4.950% due 03/25/2036 | | $ | | 8 | | $ | | 8 |
| | | | | | | | |
Total Mortgage-Backed Securities
(Cost $228) | | | | 228 |
| | | | | | | | |
|
| ASSET-BACKED SECURITIES 8.7% |
| ACE Securities Corp. |
5.370% due 12/25/2036 | | | | 26 | | | | 26 |
| |
| Bear Stearns Asset-Backed Securities, Inc. |
5.400% due 10/25/2036 | | | | 25 | | | | 25 |
| |
| Chase Credit Card Master Trust |
5.430% due 02/15/2011 | | | | 10 | | | | 10 |
| |
| Citigroup Mortgage Loan Trust, Inc. |
5.380% due 05/25/2037 | | | | 30 | | | | 30 |
5.400% due 12/25/2035 | | | | 20 | | | | 20 |
| |
| Countrywide Asset-Backed Certificates |
5.390% due 06/25/2037 | | | | 35 | | | | 35 |
| |
| First NLC Trust |
5.390% due 08/25/2037 | | | | 20 | | | | 20 |
| |
| First USA Credit Card Master Trust |
5.480% due 04/18/2011 | | | | 40 | | | | 40 |
| |
| Lehman XS Trust |
5.390% due 05/25/2046 | | | | 14 | | | | 14 |
| |
| Long Beach Mortgage Loan Trust |
5.400% due 02/25/2036 | | | | 15 | | | | 15 |
5.600% due 10/25/2034 | | | | 2 | | | | 2 |
| |
| Morgan Stanley ABS Capital I |
5.370% due 10/25/2036 | | | | 22 | | | | 22 |
| |
| Nissan Auto Lease Trust |
5.347% due 12/14/2007 | | | | 1 | | | | 1 |
| |
| Residential Asset Securities Corp. |
5.390% due 11/25/2036 | | | | 23 | | | | 23 |
| |
| SLM Student Loan Trust |
5.325% due 07/25/2013 | | | | 31 | | | | 31 |
| |
| Specialty Underwriting & Residential Finance |
5.365% due 11/25/2037 | | | | 23 | | | | 23 |
| |
| USAA Auto Owner Trust |
5.337% due 07/11/2008 | | | | 40 | | | | 40 |
| | | | | | | | |
Total Asset-Backed Securities (Cost $377) | | | | 377 |
| | | | | | | | |
|
| SHORT-TERM INSTRUMENTS 31.8% |
|
| CERTIFICATES OF DEPOSIT 3.7% |
| Barclays Bank PLC |
5.281% due 03/17/2008 | | | | 40 | | | | 40 |
| |
| BNP Paribas |
5.262% due 05/28/2008 | | | | 30 | | | | 30 |
| |
| Fortis Bank NY |
5.265% due 06/30/2008 | | | | 10 | | | | 10 |
| |
| Nordea Bank Finland PLC |
5.308% due 05/28/2008 | | | | 30 | | | | 30 |
| |
| Royal Bank of Canada |
5.267% due 06/30/2008 | | | | 20 | | | | 20 |
| |
| Skandinav Enskilda BK |
5.350% due 02/13/2009 | | | | 10 | | | | 10 |
| |
| Societe Generale NY |
5.269% due 06/30/2008 | | | | 10 | | | | 10 |
5.270% due 03/26/2008 | | | | 10 | | | | 10 |
| | | | | | | | |
| | | | | | | | 160 |
| | | | | | | | |
|
| COMMERCIAL PAPER 11.5% |
| Dexia Delaware LLC |
5.225% due 09/21/2007 | | | | 100 | | | | 99 |
| |
| | | | | | |
| See Accompanying Notes | | Semiannual Report | | June 30, 2007 | | 9 |
Schedule of Investments StocksPLUS® Total Return Portfolio (Cont.)
| | | | | | | | |
| | | | | PRINCIPAL
AMOUNT
(000S) | | | | VALUE
(000S) |
| Rabobank USA Financial Corp. |
5.330% due 07/26/2007 | | $ | | 100 | | $ | | 100 |
| |
| Societe Generale NY |
5.250% due 11/26/2007 | | | | 100 | | | | 99 |
| |
| Swedbank AB |
5.225% due 09/06/2007 | | | | 100 | | | | 100 |
| |
| UBS Finance Delaware LLC |
5.230% due 10/23/2007 | | | | 100 | | | | 99 |
| | | | | | | | |
| | | | | | | | 497 |
| | | | | | | | |
|
| | | | | | | | |
| | | | | PRINCIPAL
AMOUNT
(000S) | | | | VALUE
(000S) |
| REPURCHASE AGREEMENTS 10.3% |
| State Street Bank and Trust Co. |
4.900% due 07/02/2007 | | $ | | 442 | | $ | | 442 |
| | | | | | | | |
(Dated 06/29/2007. Collateralized by Fannie Mae 3.250% due 08/15/2008 valued at $455. Repurchase proceeds are $442.) |
|
| | | | | | | | | |
| | | | | PRINCIPAL
AMOUNT
(000S) | | | | VALUE
(000S) | |
| U.S. TREASURY BILLS 6.3% | |
4.650% due 09/13/2007 (a)(c) | | $ | | 275 | | $ | | 272 | |
| | | | | | | | | |
Total Short-Term Instruments
(Cost $1,372) | | | | 1,371 | |
| | | | | | | | | |
| |
| PURCHASED OPTIONS (e) 0.0% | |
| (Cost $0) | | | | | | | | 0 | |
| |
Total Investments (b) 102.5%
(Cost $4,451) | | $ | | 4,423 | |
| |
| Other Assets and Liabilities (Net) (2.5%) | | (107 | ) |
| | | | | | | | | |
| Net Assets 100.0% | | | | | | $ | | 4,316 | |
| | | | | | | | | |
Notes to Schedule of Investments (amounts in thousands*, except number of contracts):
* A zero balance may reflect actual amounts rounding to less than one thousand.
(a) Coupon represents a weighted average rate.
(b) As of June 30, 2007, portfolio securities with an aggregate value of $220 were valued in good faith and pursuant to the guidelines established by the Board of Trustees.
(c) Securities with an aggregate market value of $272 have been segregated with the custodian to cover margin requirements for the following open futures contracts on June 30, 2007:
| | | | | | | | | | |
| Description | | Type | | Expiration
Month | | # of
Contracts | | Unrealized
(Depreciation) | |
90-Day Eurodollar December Futures | | Long | | 12/2008 | | 4 | | $ | (2 | ) |
90-Day Eurodollar December Futures | | Long | | 12/2009 | | 1 | | | 0 | |
90-Day Eurodollar June Futures | | Long | | 06/2008 | | 16 | | | (15 | ) |
90-Day Eurodollar June Futures | | Long | | 06/2009 | | 1 | | | 0 | |
90-Day Eurodollar March Futures | | Long | | 03/2008 | | 8 | | | (6 | ) |
90-Day Eurodollar March Futures | | Long | | 03/2010 | | 1 | | | 0 | |
90-Day Eurodollar September Futures | | Long | | 09/2008 | | 4 | | | (2 | ) |
90-Day Eurodollar September Futures | | Long | | 09/2009 | | 1 | | | 0 | |
E-mini S&P 500 Index September Futures | | Long | | 09/2007 | | 12 | | | (21 | ) |
S&P 500 Index September Futures | | Long | | 09/2007 | | 9 | | | (30 | ) |
U.S. Treasury 30-Year Bond September Futures | | Long | | 09/2007 | | 1 | | | 0 | |
| | | | | | | | | | |
| | | | | | | | $ | (76 | ) |
| | | | | | | | | | |
(d) Swap agreements outstanding on June 30, 2007:
Credit Default Swaps
| | | | | | | | | | | | | | | |
| Counterparty | | Reference Entity | | Buy/Sell
Protection (1) | | (Pay)/Receive
Fixed Rate | | | Expiration
Date | | Notional
Amount | | Unrealized
Appreciation |
Barclays Bank PLC | | Indonesia Government International Bond 6.750% due 03/10/2014 | | Sell | | 0.370% | | | 03/20/2009 | | $ | 40 | | $ | 0 |
Credit Suisse First Boston | | Panama Government International Bond 8.875% due 09/30/2027 | | Sell | | 0.300% | | | 02/20/2009 | | | 40 | | | 0 |
Deutsche Bank AG | | Dow Jones CDX N.A. IG8 Index | | Buy | | (0.600% | ) | | 06/20/2017 | | | 10 | | | 0 |
HSBC Bank USA | | Russia Government International Bond 7.500% due 03/31/2030 | | Sell | | 0.240% | | | 02/20/2008 | | | 40 | | | 0 |
Morgan Stanley | | General Motors Acceptance Corp. 6.875% due 08/28/2012 | | Sell | | 1.050% | | | 09/20/2008 | | | 10 | | | 0 |
Morgan Stanley | | Ukraine Government International Bond 7.650% due 06/11/2013 | | Sell | | 0.610% | | | 02/20/2009 | | | 40 | | | 0 |
| | | | | | | | | | | | | | | |
| | | | | | | | | | | | | | $ | 0 |
| | | | | | | | | | | | | | | |
(1) If the Portfolio is a seller of protection and a credit event occurs, as defined under the terms of that particular swap agreement, the Portfolio will pay to the buyer of the protection an amount up to the notional value of the swap and in certain instances, take delivery of the security. As a buyer of protection, the Portfolio will generally receive from the seller of protection an amount up to the notional amount of the swap if a credit event occurs.
Interest Rate Swaps
| | | | | | | | | | | | | | | |
| Counterparty | | Floating Rate Index | | Pay/Receive
Floating Rate | | Fixed Rate | | Expiration
Date | | Notional
Amount | | Unrealized
(Depreciation) | |
Royal Bank of Scotland Group PLC | | 5-Year French CPI Ex Tobacco Daily Reference Index | | Pay | | 1.955% | | 03/28/2012 | | EUR | 40 | | $ | 0 | |
Goldman Sachs | | 6-Month GBP-LIBOR | | Pay | | 6.000% | | 06/19/2009 | | GBP | 100 | | | 0 | |
Deutsche Bank AG | | 6-Month JPY-LIBOR | | Pay | | 1.000% | | 09/18/2008 | | JPY | 20,000 | | | 0 | |
UBS Warburg LLC | | 6-Month JPY-LIBOR | | Pay | | 1.000% | | 03/18/2009 | | | 40,000 | | | 0 | |
Goldman Sachs | | 28-Day Mexico Interbank TIIE Banxico | | Pay | | 7.780% | | 04/03/2012 | | MXN | 100 | | | 0 | |
Bank of America | | 3-Month USD-LIBOR | | Pay | | 5.000% | | 12/19/2009 | | $ | 100 | | | 0 | |
Deutsche Bank AG | | 3-Month USD-LIBOR | | Pay | | 5.000% | | 12/19/2008 | | | 300 | | | (1 | ) |
Deutsche Bank AG | | 3-Month USD-LIBOR | | Pay | | 5.000% | | 12/19/2009 | | | 1,100 | | | 0 | |
Royal Bank of Scotland Group PLC | | 3-Month USD-LIBOR | | Pay | | 5.000% | | 12/19/2008 | | | 300 | | | (1 | ) |
| | | | | | | | | | | | | | | |
| | | | | | | | | | | | | $ | (2 | ) |
| | | | | | | | | | | | | | | |
| | | | |
| 10 | | PIMCO Variable Insurance Trust | | See Accompanying Notes |
| | |
| |
| | | June 30, 2007 (Unaudited) |
(e) Purchased options outstanding on June 30, 2007:
Options on Exchange-Traded Futures Contracts
| | | | | | | | | | | | | |
| Description | | Exercise
Price | | Expiration
Date | | # of
Contracts | | Cost | | Value |
Put - CME S&P 500 Index September Futures | | $ | 925.000 | | 09/20/2007 | | 6 | | $ | 0 | | $ | 0 |
| | | | | | | | | | | | | |
(f) Foreign currency contracts outstanding on June 30, 2007:
| | | | | | | | | | | | | | | |
| Type | | Currency | | Principal
Amount
Covered by
Contract | | Settlement
Month | | Unrealized
Appreciation | | Unrealized
(Depreciation) | | Net Unrealized
Appreciation |
Buy | | AUD | | 17 | | 07/2007 | | $ | 0 | | $ | 0 | | $ | 0 |
Buy | | BRL | | 125 | | 10/2007 | | | 3 | | | 0 | | | 3 |
Buy | | | | 82 | | 03/2008 | | | 3 | | | 0 | | | 3 |
Buy | | CAD | | 12 | | 08/2007 | | | 0 | | | 0 | | | 0 |
Buy | | CNY | | 34 | | 11/2007 | | | 0 | | | 0 | | | 0 |
Sell | | | | 34 | | 11/2007 | | | 0 | | | 0 | | | 0 |
Buy | | EUR | | 32 | | 07/2007 | | | 0 | | | 0 | | | 0 |
Sell | | GBP | | 4 | | 08/2007 | | | 0 | | | 0 | | | 0 |
Buy | | INR | | 183 | | 10/2007 | | | 0 | | | 0 | | | 0 |
Buy | | | | 1,195 | | 05/2008 | | | 1 | | | 0 | | | 1 |
Buy | | KRW | | 5,942 | | 07/2007 | | | 0 | | | 0 | | | 0 |
Sell | | | | 563 | | 07/2007 | | | 0 | | | 0 | | | 0 |
Buy | | | | 779 | | 08/2007 | | | 0 | | | 0 | | | 0 |
Buy | | | | 7,227 | | 09/2007 | | | 0 | | | 0 | | | 0 |
Buy | | MXN | | 33 | | 09/2007 | | | 0 | | | 0 | | | 0 |
Buy | | | | 147 | | 03/2008 | | | 0 | | | 0 | | | 0 |
Buy | | MYR | | 24 | | 05/2008 | | | 0 | | | 0 | | | 0 |
Buy | | NZD | | 2 | | 07/2007 | | | 0 | | | 0 | | | 0 |
Buy | | PHP | | 459 | | 05/2008 | | | 0 | | | 0 | | | 0 |
Buy | | PLN | | 31 | | 09/2007 | | | 0 | | | 0 | | | 0 |
Buy | | | | 8 | | 03/2008 | | | 0 | | | 0 | | | 0 |
Buy | | RUB | | 104 | | 09/2007 | | | 0 | | | 0 | | | 0 |
Buy | | | | 222 | | 12/2007 | | | 0 | | | 0 | | | 0 |
Buy | | | | 453 | | 01/2008 | | | 0 | | | 0 | | | 0 |
Buy | | SEK | | 20 | | 09/2007 | | | 0 | | | 0 | | | 0 |
Buy | | SGD | | 25 | | 07/2007 | | | 0 | | | 0 | | | 0 |
Sell | | | | 14 | | 07/2007 | | | 0 | | | 0 | | | 0 |
Buy | | | | 5 | | 08/2007 | | | 0 | | | 0 | | | 0 |
Buy | | | | 28 | | 10/2007 | | | 0 | | | 0 | | | 0 |
| | | | | | | | | | | | | | | |
| | | | | | | | $ | 7 | | $ | 0 | | $ | 7 |
| | | | | | | | | | | | | | | |
| | | | | | |
| See Accompanying Notes | | Semiannual Report | | June 30, 2007 | | 11 |
Notes to Financial Statements
1. ORGANIZATION
The StocksPLUS® Total Return Portfolio (the “Portfolio”) is a series of the PIMCO Variable Insurance Trust (the “Trust”). The Trust is registered under the Investment Company Act of 1940 (the “Act”), as amended, as an open-end management investment company organized as a Delaware business trust on October 3, 1997. The Portfolio offers one class of shares: Administrative. Information presented on these financial statements pertains to the Administrative Class of the Portfolio. The Trust is designed to be used as an investment vehicle by Separate Accounts of insurance companies that fund variable annuity contracts and variable life insurance policies and by qualified pension and retirement plans.
2. SIGNIFICANT ACCOUNTING POLICIES
The following is a summary of significant accounting policies consistently followed by the Portfolio in the preparation of its financial statements in conformity with accounting principles generally accepted in the United States of America (“GAAP”). The preparation of financial statements in accordance with GAAP requires management to make estimates and assumptions that affect the reported amounts and disclosures on the financial statements. Actual results could differ from those estimates.
(a) Security Valuation Portfolio securities are valued as of the close of regular trading (normally 4:00 p.m., Eastern Time) on each day that the New York Stock Exchange (“NYSE”) is open. Portfolio securities and other assets for which market quotes are readily available are stated at market value. Market value is generally determined on the basis of last reported sales prices, or if no sales are reported, based on quotes obtained from a quotation reporting system, established market makers, or pricing services. Fixed-income securities and non-exchange traded derivatives are normally valued on the basis of quotes obtained from brokers and dealers or pricing services. Prices obtained from independent pricing services use information provided by market makers or estimates of market values obtained from yield data relating to investments or securities with similar characteristics. Certain fixed income securities purchased on a delayed-delivery basis are marked to market daily until settlement at the forward settlement date. Short-term investments having a maturity of 60 days or less are generally valued at amortized cost. Exchange traded options, futures and options on futures are valued at the settlement price determined by the relevant exchange. With respect to any portion of the Portfolio’s assets that are invested in one or more open end management investment companies, the Portfolio’s net asset value (“NAV”) will be calculated based upon the NAVs of such investments.
Investments initially valued in currencies other than the U.S. dollar are converted to the U.S. dollar using exchange rates obtained from pricing services. As a result, the NAV of the Portfolio’s securities may be affected by changes in the value of currencies in relation to the U.S. dollar. The value of securities traded in markets outside the United States or denominated in currencies other than the U.S. dollar may be affected significantly on a day that the NYSE is closed and an investor is not able to purchase, redeem or exchange shares.
Securities and other assets for which market quotes are not readily available are valued at fair value as determined in good faith by the Board of Trustees or persons acting at their direction. The Board of Trustees has adopted methods for valuing securities and other assets in circumstances where market quotes are not readily available, and has delegated to Pacific Investment Management Company LLC (“PIMCO”) the responsibility for applying the valuation methods. In the event that market quotes are not readily available, and the security or asset cannot be valued pursuant to one of the valuation methods, the value of the security or asset will be determined in good faith by the Valuation Committee of the Board of Trustees, generally based upon recommendations provided by PIMCO.
Market quotes are considered not readily available in circumstances where there is an absence of current or reliable market-based data (e.g., trade information,
bid/asked information, broker quotes), including where events occur after the close of the relevant market, but prior to the close of regular trading, that materially affect the values of the Portfolio’s securities or assets. In addition, market quotes are considered not readily available when, due to extraordinary circumstances, the exchanges or markets on which the securities trade, do not open for trading for the entire day and no other market prices are available. The Board has delegated to PIMCO the responsibility for monitoring significant events that may materially affect the values of the Portfolio’s securities or assets and for determining whether the value of the applicable securities or assets should be re-evaluated in light of such significant events.
When the Portfolio uses fair value pricing to determine its NAV, securities will not be priced on the basis of quotations from the primary market in which they are traded, but rather may be priced by another method that the Board of Trustees or persons acting at their direction believe accurately reflects fair value. The Trust’s policy is intended to result in a calculation of the Portfolio’s NAV that fairly reflects security values as of the time of pricing. However, fair values determined by the Board of Trustees or persons acting at their direction may not accurately reflect the price that the Portfolio could obtain for a security if it were to dispose of that security as of the time of pricing. Because foreign securities can trade on non-business days of the Portfolio, the NAV of the Portfolio may change on days when shareholders will not be able to purchase or redeem Portfolio shares. The prices used by the Portfolio may differ from the value that would be realized if the securities were sold and the differences could be material to the financial statements.
(b) Securities Transactions and Investment Income Securities transactions are recorded as of the trade date for financial reporting purposes. Securities purchased or sold on a when-issued or delayed-delivery basis may be settled a month or more after the trade date. Realized gains and losses from securities sold are recorded on the identified cost basis. Dividend income is recorded on the ex-dividend date, except certain dividends from foreign securities where the ex-dividend date may have passed, which are recorded as soon as the Portfolio is informed of the ex-dividend date. Interest income, adjusted for the accretion of discounts and amortization of premiums, is recorded on the accrual basis. Paydown gains and losses on mortgage-related and other asset-backed securities are recorded as components of interest income on the Statement of Operations.
(c) Delayed-Delivery Transactions The Portfolio may purchase or sell securities on a delayed-delivery basis. These transactions involve a commitment by the Portfolio to purchase or sell securities for a predetermined price or yield, with payment and delivery taking place beyond the customary settlement period. When delayed-delivery purchases are outstanding, the Portfolio will designate liquid assets in an amount sufficient to meet the purchase price. When purchasing a security on a delayed-delivery basis, the Portfolio assumes the rights and risks of ownership of the security, including the risk of price and yield fluctuations, and takes such fluctuations into account when determining its net asset value. The Portfolio may dispose of or renegotiate a delayed-delivery transaction after it is entered into, and may sell when-issued securities before they are delivered, which may result in a capital gain or loss. When the Portfolio has sold a security on a delayed-delivery basis, the Portfolio does not participate in future gains and losses with respect to the security.
(d) Dividends and Distributions to Shareholders Dividends from net investment income, if any, are declared and distributed to shareholders quarterly. Net realized capital gains earned by the Portfolio, if any, will be distributed no less frequently than once each year.
Income dividends and capital gain distributions are determined in accordance with income tax regulations which may differ from GAAP. Differences between tax regulations and GAAP may change the fiscal year when income and capital items are recognized for tax and GAAP purposes. Examples of events that give rise to
| | | | |
| 12 | | PIMCO Variable Insurance Trust | | |
| | |
| |
| | | June 30, 2007 (Unaudited) |
timing differences include wash sales, straddles, net operating losses and capital loss carryforwards. Further, the character of investment income and capital gains may be different for certain transactions under the two methods of accounting. Examples of characterization differences include the treatment of mortgage paydowns, swaps, foreign currency transactions and contingent debt instruments. As a result, income dividends and capital gain distributions declared during a fiscal period may differ significantly from the net investment income and realized capital gain reported on the Portfolio’s annual financial statements presented under GAAP.
Distributions classified as a tax basis return of capital, if any, are reflected on the accompanying Statements of Changes in Net Assets and have been reclassified to paid in capital. In addition, other amounts have been reclassified between undistributed net investment income, accumulated undistributed net realized gains or losses and/or paid in capital to more appropriately conform financial accounting to tax characterizations of dividend distributions.
(e) Foreign Currency The functional and reporting currency for the Portfolio is the U.S. dollar. The market values of foreign securities, currency holdings and other assets and liabilities are translated into U.S. dollars based on the current exchange rates each business day. Fluctuations in the value of currency holdings and other assets and liabilities resulting from changes in exchange rates are recorded as unrealized foreign currency gains or losses. Realized gains or losses and unrealized appreciation or depreciation on investment securities and income and expenses are translated on the respective dates of such transactions. The effects of changes in foreign currency exchange rates on investments in securities are not segregated on the Statement of Operations from the effects of changes in market prices of those securities, but are included with the net realized and unrealized gain or loss on investment securities.
| | | | | | |
|
| Non-U.S. currency symbols utilized throughout the report are defined as follows: |
| AUD | | Australian Dollar | | MXN | | Mexican Peso |
| BRL | | Brazilian Real | | MYR | | Malaysian Ringgit |
| CAD | | Canadian Dollar | | NZD | | New Zealand Dollar |
| CNY | | Chinese Yuan Renminbi | | PHP | | Philippines Peso |
| EUR | | Euro | | PLN | | Polish Zloty |
| GBP | | Great British Pound | | RUB | | Russian Ruble |
| INR | | Indian Rupee | | SEK | | Swedish Krona |
| JPY | | Japanese Yen | | SGD | | Singapore Dollar |
| KRW | | South Korean Won | | | | |
(f) Foreign Currency Transactions The Portfolio may enter into foreign currency contracts in connection with settling planned purchases or sales of securities, to hedge the currency exposure associated with some or all of the Portfolio’s securities or as a part of an investment strategy. A foreign currency contract is an agreement between two parties to buy and sell a currency at a set price on a future date. The market value of a foreign currency contract fluctuates with changes in foreign currency exchange rates. Foreign currency contracts are marked to market daily and the change in value is recorded by the Portfolio as an unrealized gain or loss. Realized gains or losses equal to the difference between the value of the contract at the time it was opened and the value at the time it was closed are recorded upon delivery or receipt of the currency. These contracts may involve market risk in excess of the unrealized gain or loss reflected on the Statement of Assets and Liabilities. In addition, the Portfolio could be exposed to risk if the counterparties are unable to meet the terms of the contracts or if the value of the currency changes unfavorably to the U.S. dollar.
(g) Futures Contracts The Portfolio may enter into futures contracts. The Portfolio may use futures contracts to manage its exposure to the securities markets or to movements in interest rates and currency values. The primary risks associated with the use of futures contracts are the imperfect correlation between the change in market value of the securities held by the Portfolio and the prices of futures contracts, the possibility of an illiquid market, and the inability of the counterparty to meet the terms of the contract. Futures contracts are valued based upon their quoted daily settlement prices. Upon entering into a futures contract, the Portfolio is required to deposit with its futures broker, an amount of cash or U.S. Government and Agency Obligations in accordance with the initial margin requirements of the broker or exchange. Futures contracts are marked to market daily and an appropriate payable or receivable for the change in value (“variation margin”) is recorded by the Portfolio. Gains or losses are recognized but not considered realized until the contracts expire or are closed. Futures contracts involve, to varying degrees, risk of loss in excess of the variation margin disclosed on the Statement of Assets and Liabilities.
(h) Options Contracts The Portfolio may write call and put options on futures, swaps, securities or currencies it owns or in which it may invest. Writing put options tends to increase the Portfolio’s exposure to the underlying instrument. Writing call options tends to decrease the Portfolio’s exposure to the underlying instrument. When the Portfolio writes a call or put option, an amount equal to the premium received is recorded as a liability and subsequently marked to market to reflect the current value of the option written. These liabilities are reflected as written options outstanding on the Statement of Assets and Liabilities. Certain options may be written with premiums to be determined on a future date. The premiums for these options are based upon implied volatility parameters at specified terms. Premiums received from writing options which expire are treated as realized gains. Premiums received from writing options which are exercised or closed are added to the proceeds or offset against amounts paid on the underlying future, swap, security or currency transaction to determine the realized gain or loss. The Portfolio as a writer of an option has no control over whether the underlying future, swap, security or currency may be sold (call) or purchased (put) and as a result bears the market risk of an unfavorable change in the price of the future, swap, security or currency underlying the written option. There is the risk the Portfolio may not be able to enter into a closing transaction because of an illiquid market.
The Portfolio may also purchase put and call options. Purchasing call options tends to increase the Portfolio’s exposure to the underlying instrument. Purchasing put options tends to decrease the Portfolio’s exposure to the underlying instrument. The Portfolio pays a premium which is included on the Statement of Assets and Liabilities as an investment and subsequently marked to market to reflect the current value of the option. Premiums paid for purchasing options which expire are treated as realized losses. Certain options may be purchased with premiums to be determined on a future date. The premiums for these options are based upon implied volatility parameters at specified terms. The risk associated with purchasing put and call options is limited to the premium paid. Premiums paid for purchasing options which are exercised or closed are added to the amounts paid or offset against the proceeds on the underlying future, swap, security or currency transaction to determine the realized gain or loss.
(i) Repurchase Agreements The Portfolio may engage in repurchase transactions. Under the terms of a typical repurchase agreement, the Portfolio takes possession of an underlying debt obligation (collateral) subject to an obligation of the seller to repurchase, and the Portfolio to resell, the obligation at an agreed-upon price and time. The underlying securities for all repurchase agreements are held in safekeeping at the Portfolio’s custodian or designated subcustodians under tri-party repurchase agreements. The market value of the collateral must be equal to or exceed the total amount of the repurchase obligations, including interest. Securities purchased under repurchase agreements are reflected as an asset on the Statement of Assets and Liabilities. Generally, in
| | | | | | |
| | Semiannual Report | | June 30, 2007 | | 13 |
Notes to Financial Statements (Cont.)
the event of counterparty default, the Portfolio has the right to use the collateral to offset losses incurred. If the counterparty should default, the Portfolio will seek to sell the securities which it holds as collateral. This could involve procedural costs or delays in addition to a loss on the securities if their value should fall below their repurchase price.
(j) Inverse Floating Rate Transactions—Residual Interest Municipal Bonds (“RIBs”)/Residual Interest Tax Exempt Bonds (“RITEs”) The Portfolio may invest in RIBs and RITEs (“Inverse Floaters”). Inverse Floaters are created via a master trust agreement between a broker-dealer, acting as trustor and liquidity provider, and an investment bank, acting as trustee and tender agent. The master trust agreement defines the terms for each trust series; with each series being established by the transfer of long-term, fixed-rate municipal bonds (“Fixed Rate Bonds”) to the trustee to be held and provide for the creation, execution and delivery of floater certificates (“Floating Rate Notes”) and Inverse Floaters. Floating Rate Notes are liquid notes that are issued with a short-term variable rate typically linked to the LIBOR, subject to limitations, for some duration. After interest income is paid on the Floating Rate Notes at current rates, the residual income from the Fixed Rate Bonds is paid to the Inverse Floaters. Inverse Floaters are issued with a coupon that fluctuates inversely with the Floating Rate Notes’ referenced rate, subject to certain limitations. Therefore, rising short-term rates result in lower income for the Inverse Floaters and vice versa.
Floating Rate Notes are generally remarketed to municipal money market funds. Inverse Floaters are acquired by either tax-exempt municipal bond funds or trusts, or other parties interested in potentially higher yielding tax-exempt securities. Inverse Floaters may also be acquired for the purpose of increasing leverage. Floating Rate Note holders typically have the option to tender their notes to the liquidity provider for redemption at par at each reset date. The Inverse Floater holders have the option to (i) require the Floating Rate Note holders to tender their notes at par, and (ii) require the liquidity provider to transfer the Fixed Rate Bonds to the Inverse Floater holders. The holders of Inverse Floaters bear substantially all of the downside investment risk associated with the underlying Fixed Rate Bonds, and also benefit from a disproportionate amount of the potential appreciation of the underlying Fixed Rate Bonds’ value. Inverse Floaters may be more volatile and less liquid than other municipal bonds of comparable maturity.
Inverse Floaters may be acquired with or without first transferring to the trustor the Fixed Rate Bonds that were utilized to create the trust series. Inverse Floaters acquired without a transfer of Fixed Rate Bonds are recognized as purchases of securities as outlined in Note 2(b). Statement of Financial Accounting Standards No. 140—Accounting for Transfers and Servicing of Financial Assets and Extinguishments of Liabilities (“FAS No. 140”), governs the standards for accounting for securitizations and other transfers of financial assets. If there is a transfer of Fixed Rate Bonds and it meets sale criteria under FAS No. 140, a Portfolio records a sale of the Fixed Rate Bonds and a purchase of the Inverse Floaters. The cash received from the Inverse Floaters is then recorded as interest income in the Statement of Operations.
If the transfer of Fixed Rate Bonds does not meet sale criteria under FAS No. 140, a Portfolio accounts for the transaction described above as a secured borrowing by including the Fixed Rate Bonds in its Schedule of Investments, and recording the Floating Rate Notes as a liability under the caption “Payable for floating rate notes” in the Portfolio’s Statement of Assets and Liabilities. In a secured borrowing transaction, cash received from the Inverse Floaters is not recorded as interest income. Instead, a Portfolio records interest income related to the Fixed Rate Bonds and interest expense related to the Floating Rate Notes, the net of which is equal to the cash received from the Inverse Floaters acquired by the Portfolio. Thus, while a Portfolio’s reported total income, net expenses, and net expense ratio are generally higher for investments in Inverse Floaters acquired via a secured borrowing, the method of acquiring Inverse Floaters does not result in differences for reported cash flows, net asset value or total return.
(k) Swap Agreements The Portfolio may invest in swap agreements. Swap transactions are privately negotiated agreements between the Portfolio and a counterparty to exchange or swap investment cash flows, assets, or market-linked returns at specified, future intervals. The Portfolio may enter into interest rate, total return, forward spread-lock, credit default, and other forms of swap agreements to manage its exposure to interest rates and credit risk. In connection with these agreements, securities may be identified as collateral in accordance with the terms of the respective swap agreements.
Interest rate swap agreements involve the exchange by the Portfolio with another party of their respective commitments to pay or receive interest, e.g., an exchange of floating rate payments for fixed rate payments with respect to the notional amount of principal. Certain forms of interest rate swap agreements may include: (i) interest rate caps, under which, in return for a premium, one party agrees to make payments to the other to the extent that interest rates exceed a specified rate, or “cap”, (ii) interest rate floors, under which, in return for a premium, one party agrees to make payments to the other to the extent that interest rates fall below a specified rate, or “floor”, or (iii) interest rate collars, under which a party sells a cap and purchases a floor or vice versa in an attempt to protect itself against interest rate movements exceeding given minimum or maximum levels.
Total return swap agreements involve commitments to pay interest in exchange for a market-linked return, both based on notional amounts. To the extent the total return of the security or index underlying the transaction exceeds or falls short of the offsetting interest rate obligation, the Portfolio will receive a payment from or make a payment to the counterparty.
Forward spread-lock swap agreements involve commitments to pay or receive a settlement amount calculated as the difference between the swap spread and a fixed spread, multiplied by the notional amount times the duration of the swap. The swap spread is the difference between the benchmark swap rate (market rate) and the specific Treasury rate.
Credit default swap agreements involve one party making a stream of payments to another party in exchange for the right to receive a specified return in the event of a default by a third party, typically corporate issues or sovereign issues of an emerging country, on its obligation. The Portfolio may use credit default swaps to provide a measure of protection against defaults of the issuers (i.e., to reduce risk where the Portfolio owns or has exposure to the sovereign issuer) or to take an active long or short position with respect to the likelihood of a particular issuer’s default. As a seller of protection, the Portfolio generally receives an upfront payment or a fixed rate of income throughout the term of the swap provided that there is no credit event. If the Portfolio is a seller of protection and a credit event occurs, as defined under the terms of that particular swap agreement, the Portfolio will pay to the buyer of the protection an amount up to the notional value of the swap and in certain instances take delivery of the security. As the seller, the Portfolio would effectively add leverage to its portfolio because, in addition to its total net assets, the Portfolio would be subject to investment exposure on the notional amount of the swap. As a buyer of protection, the Portfolio generally receives an amount up to the notional value of the swap if a credit event occurs. The treatment of credit default swaps and other swap agreements that provide for contingent, non-periodic, bullet-type payments as “notional principal contracts” for U.S. federal income tax purposes is uncertain. Were the U.S. Internal Revenue Service (“IRS”) to take the position that a credit default swap or other bullet-type swap is not a “notional principal contract” for U.S. federal income tax purposes, payments received by the Portfolio from such investments might be subject to U.S. excise or income taxes.
Swaps are marked to market daily based upon quotations from market makers and the change in value, if any, is recorded as unrealized gain or loss on the Statement of Operations. Payments received or made at the beginning of the measurement
| | | | |
| 14 | | PIMCO Variable Insurance Trust | | |
| | |
| |
| | | June 30, 2007 (Unaudited) |
period are reflected as such on the Statement of Assets and Liabilities. These upfront payments are recorded as realized gain or loss on the Statement of Operations upon termination or maturity of the swap. A liquidation payment received or made at the termination of the swap is recorded as realized gain or loss on the Statement of Operations. Net periodic payments received or paid by the Portfolio are included as part of realized gain or loss on the Statement of Operations. Entering into these agreements involves, to varying degrees, elements of credit, market and documentation risk in excess of the amounts recognized on the Statement of Assets and Liabilities. Such risks involve the possibility that there will be no liquid market for these agreements, that the counterparty to the agreements may default on its obligation to perform or disagree as to the meaning of contractual terms in the agreements and that there may be unfavorable changes in interest rates.
(l) Mortgage-Related and Other Asset-Backed Securities The Portfolio may invest in mortgage-related or other asset-backed securities. These securities include mortgage pass-through securities, collateralized mortgage obligations (“CMOs”), commercial mortgage-backed securities, mortgage dollar rolls, CMO residuals, stripped mortgage-backed securities (“SMBSs”) and other securities that directly or indirectly represent a participation in, or are secured by and payable from, mortgage loans on real property. The value of some mortgage-related or asset-backed securities may be particularly sensitive to changes in prevailing interest rates. Early repayment of principal on some mortgage-related securities may expose the Portfolio to a lower rate of return upon reinvestment of principal. The value of these securities may fluctuate in response to the market’s perception of the creditworthiness of the issuers. Additionally, although mortgages and mortgage-related securities are generally supported by some form of government or private guarantee and/or insurance, there is no assurance that private guarantors or insurers will meet their obligations.
(m) U.S. Government Agencies or Government-Sponsored Enterprises Securities issued by U.S. Government agencies or government-sponsored enterprises may not be guaranteed by the U.S. Treasury. The Government National Mortgage Association (“GNMA” or “Ginnie Mae”), a wholly owned U.S. Government corporation, is authorized to guarantee, with the full faith and credit of the U.S. Government, the timely payment of principal and interest on securities issued by institutions approved by GNMA and backed by pools of mortgages insured by the Federal Housing Administration or guaranteed by the Department of Veterans Affairs. Government-related guarantors (i.e., not backed by the full faith and credit of the U.S. Government) include the Federal National Mortgage Association (“FNMA” or “Fannie Mae”) and the Federal Home Loan Mortgage Corporation (“FHLMC” or “Freddie Mac”). Pass-through securities issued by FNMA are guaranteed as to timely payment of principal and interest by FNMA but are not backed by the full faith and credit of the U.S. Government. FHLMC guarantees the timely payment of interest and ultimate collection of principal, but its participation certificates are not backed by the full faith and credit of the U.S. Government.
(n) New Accounting Policies In July 2006, the Financial Accounting Standards Board (“FASB”) issued Interpretation No. 48, “Accounting for Uncertainty in Income Taxes—an Interpretation of FASB Statement No. 109” (the “Interpretation”). The Interpretation became effective for the Portfolio on June 29, 2007. Management has evaluated the application of the Interpretation in relation to the Portfolio and has concluded that no single filing position or combination of filing positions identified as uncertain tax positions required the accrual of a tax liability in the accounting records of the Portfolio for the period ending June 30, 2007. Management will monitor all existing filing positions and future filing positions in light of the Interpretation and evaluate the need for any future tax accruals and financial statement disclosures as warranted.
In September 2006, the FASB issued Statement of Financial Accounting Standards No. 157, “Fair Value Measurements” (the “Statement”). The Statement is effective
for fiscal years beginning after November 15, 2007 and will require expanded disclosure about fair value measurements, separately for each major category of assets and liabilities, that enables shareholders to assess the inputs used to develop those measurements, and for recurring fair value measurements using significant unobservable inputs the effect of the measurements on changes in net assets for the reporting period. Management is currently evaluating the application of the Statement to the Portfolio and will provide additional information in relation to the Statement on the Portfolio’s annual financial statements for the period ending December 31, 2007.
3. FEES AND EXPENSES
(a) Investment Advisory Fee PIMCO is a majority-owned subsidiary of Allianz Global Investors of America L.P. (“AGI”), and serves as investment adviser (the “Adviser”) to the Trust, pursuant to an investment advisory contract. The Adviser receives a monthly fee from the Portfolio, at an annual rate based on average daily net assets. The Advisory Fee for all classes is charged at an annual rate of 0.44%.
(b) Administration Fee PIMCO serves as administrator (the “Administrator”), and provides administrative services to the Trust for which it receives a monthly administrative fee based on each share class’s average daily net assets. As the Administrator, PIMCO bears the costs of various third-party services, including audit, custodial, portfolio accounting, legal, transfer agency and printing costs. The Administration Fee for all classes is charged at the annual rate of 0.25%.
(c) Distribution and Servicing Fees Allianz Global Investors Distributors LLC (“AGID”) is an indirect wholly-owned subsidiary of AGI and serves as the distributor (the “Distributor”) of the Trust’s shares. The Trust is permitted to reimburse AGID on a quarterly basis, out of the Administrative Class assets of the Portfolio in the amount of 0.15% on an annual basis of the average daily net assets of that class, for payments made to financial intermediaries that provide services in connection with the distribution of shares or administration of plans or programs that use Portfolio shares as their funding medium. The effective rate paid to AGID was 0.15% during the current fiscal year.
(d) Portfolio Expenses The Trust is responsible for the following expenses: (i) salaries and other compensation of any of the Trust’s executive officers and employees who are not officers, directors, stockholders or employees of PIMCO or its subsidiaries or affiliates; (ii) taxes and governmental fees; (iii) brokerage fees and commissions and other portfolio transaction expenses; (iv) the costs of borrowing money, including interest expenses and bank overdraft charges; (v) fees and expenses of the Trustees who are not “interested persons” of PIMCO or the Trust, and any counsel retained exclusively for their benefit; (vi) extraordinary expenses, including costs of litigation and indemnification expenses; (vii) organization expenses and (viii) any expenses allocated or allocable to a specific class of shares, which include service fees payable with respect to the Administrative Class Shares, and may include certain other expenses as permitted by the Trust’s Multiple Class Plan adopted pursuant to Rule 18f-3 under the Act and subject to review and approval by the Trustees. The ratio of expenses to average net assets per share class, as disclosed in the Financial Highlights, may differ from the annual portfolio operating expenses per share class as disclosed in the Prospectus for the reasons set forth above.
Effective April 1, 2007, each Trustee, other than those affiliated with PIMCO or its affiliates, receives an annual retainer of $15,000, plus $2,375 for each Board of Trustees meeting attended in person, $500 for each committee meeting attended and $750 for each Board of Trustees meeting attended telephonically, plus reimbursement of related expenses. In addition, the audit committee chair receives an additional annual retainer of $2,000 and each other committee chair receives an additional annual retainer of $500. These expenses are allocated on a pro-rata basis to the various portfolios of the Trust according to their respective
| | | | | | |
| | Semiannual Report | | June 30, 2007 | | 15 |
Notes to Financial Statements (Cont.)
net assets. The Trust pays no compensation directly to any Trustee or any other officer who is affiliated with the Administrator, all of whom receive remuneration for their services to the Trust from the Administrator or its affiliates. Prior to April 1, 2007, each Trustee, other than those affiliated with PIMCO or its affiliates, received an annual retainer of $15,000 plus $2,000 for each Board of Trustees meeting attended ($500 for each special meeting attended), plus reimbursement of related expenses. The Audit Committee Chairman received an annual retainer of $1,500 and the Governance Committee Chairman received an annual retainer of $500. In addition, each member of a committee received $500 for each committee meeting attended.
(e) Expense Limitation PIMCO has contractually agreed to reduce total annual portfolio operating expenses for the Portfolio by waiving a portion of its administrative fee or reimbursing the Portfolio, to the extent that they would exceed, due to the payment of organizational expenses and pro rata Trustees’ fees, the sum of such Portfolio’s advisory fee, service fees, distribution fees (with respect to Advisor Class only), administrative fees and other expenses borne by the Portfolio not covered by the administrative fee as described above (other than organizational expenses and pro rata Trustees’ fees), plus 0.49 basis points. PIMCO may recoup these waivers and reimbursements for a period not exceeding three years, provided that total expenses, including such recoupment, do not exceed the annual expense limit. As of June 30, 2007, the recoverable amount to the Administrator was $8,547.
4. RELATED PARTY TRANSACTIONS
The Adviser, Administrator, and Distributor are related parties as defined by FAS 57, Related Party Disclosures. Fees payable to these parties are disclosed in Note 3.
5. GUARANTEES AND INDEMNIFICATIONS
Under the Trust’s organizational documents, each Trustee, officer, employee or other agent of the Trust (including the Trust’s investment manager) is indemnified, to the extent permitted by the Act, against certain liabilities that may arise out of performance of their duties to the Portfolio. Additionally, in the normal course of business, the Portfolio enters into contracts that contain a variety of indemnification clauses. The Portfolio’s maximum exposure under these arrangements is unknown as this would involve future claims that may be made against the Portfolio that have not yet occurred. However, the Portfolio has not had prior claims or losses pursuant to these contracts and believes the risk of loss to be remote.
6. PURCHASES AND SALES OF SECURITIES
The length of time the Portfolio has held a particular security is not generally a consideration in investment decisions. A change in the securities held by the Portfolio is known as “portfolio turnover”. The Portfolio may engage in frequent and active trading of portfolio securities to achieve its investment objective, particularly during periods of volatile market movements. High portfolio turnover (e.g., over 100%) involves correspondingly greater expenses to the Portfolio, including brokerage commissions or dealer mark-ups and other transaction costs on the sale of securities and reinvestments in other securities. Such sales may also result in realization of taxable capital gains, including short-term capital gains (which are generally taxed at ordinary income tax rates). The trading costs and tax effects associated with portfolio turnover may adversely affect the Portfolio’s performance.
Purchases and sales of securities (excluding short-term investments) for the period ended June 30, 2007, were as follows (amounts in thousands):
| | | | | | | | | | | | |
| U.S. Government/Agency | | | | All Other |
| Purchases | | Sales | | | | Purchases | | Sales |
| $ | 4,272 | | $ | 5,788 | | | | $ | 782 | | $ | 94 |
7. SHARES OF BENEFICIAL INTEREST
The Portfolio may issue an unlimited number of shares of beneficial interest with a $0.001 par value. Changes in shares of beneficial interest were as follows (shares and amounts in thousands):
| | | | | | | | | | | | | | | | |
| | | | | Six Months Ended
06/30/2007 | | | Year Ended
12/31/2006 | |
| | | | | Shares | | | Amount | | | Shares | | | Amount | |
| | | | | |
Receipts for shares sold | | | | | | | | | | | | | | | | |
Administrative Class | | | | 40 | | | $ | 473 | | | 39 | | | $ | 415 | |
Issued as reinvestment of distributions | | | | | | | | | | | | | | | | |
Administrative Class | | | | 7 | | | | 77 | | | 7 | | | | 80 | |
Cost of shares redeemed | | | | | | | | | | | | | | | | |
Administrative Class | | | | (8 | ) | | | (94 | ) | | (17 | ) | | | (179 | ) |
Net increase resulting from Portfolio share transactions | | | | 39 | | | $ | 456 | | | 29 | | | $ | 316 | |
The following schedule shows the number of shareholders each owning 5% or more of the Portfolio and the total percentage of the Portfolio held by such shareholders:
| | | | | | |
| | | | | Number of Shareholders | | % of Portfolio Held |
Administrative Class | | | | 2 | | 100 |
8. REGULATORY AND LITIGATION MATTERS
Since February 2004, PIMCO, Allianz Global Investors of America L.P. (PIMCO’s parent company), AGID, and certain of their affiliates, including the PIMCO Funds (another series of funds managed by PIMCO), the Allianz Funds (formerly known as PIMCO Funds: Multi-Manager Series (another series of funds managed by affiliates of PIMCO)), certain Trustees of the Trust (in their capacity as Trustees of the PIMCO Funds or the Allianz Funds) and certain employees of PIMCO, have been named as defendants in fifteen lawsuits filed in various jurisdictions. Eleven of those lawsuits concern “market timing,” and they have been transferred to and consolidated for pre-trial proceedings in a multi-district litigation proceeding in the U.S. District Court for the District of Maryland; the other four lawsuits concern “revenue sharing” and have been consolidated into a single action in the U.S. District Court for the District of Connecticut. The lawsuits have been commenced as putative class actions on behalf of investors who purchased, held or redeemed shares of the various series of the PIMCO Funds and the Allianz Funds during specified periods, or as derivative actions on behalf of the PIMCO Funds and the Allianz Funds.
The market timing actions in the District of Maryland generally allege that certain hedge funds were allowed to engage in “market timing” in certain funds of the PIMCO Funds and the Allianz Funds and this alleged activity was not disclosed. Pursuant to tolling agreements entered into with the derivative and class action plaintiffs, PIMCO, certain PIMCO Funds Trustees, and certain employees of PIMCO who were previously named as defendants have all been dropped as defendants in the market timing actions; the plaintiffs continue to assert claims on behalf of the shareholders of the PIMCO Funds or on behalf of the PIMCO Funds itself against other defendants. By order dated November 3, 2005, the U.S. District Court for the
| | | | |
| 16 | | PIMCO Variable Insurance Trust | | |
| | |
| |
| | | June 30, 2007 (Unaudited) |
District of Maryland granted the PIMCO Funds’ motion to dismiss claims asserted against it in a consolidated amended complaint where the PIMCO Funds were named, in the complaint, as a nominal defendant. The revenue sharing action
in the District of Connecticut generally alleges that fund assets were inappropriately used to pay brokers to promote funds of the PIMCO Funds and the Allianz Funds, including directing fund brokerage transactions to such brokers, and that such alleged arrangements were not fully disclosed to shareholders. On August 11, 2005, the U.S. District Court for the District of Connecticut conducted a hearing on defendants’ motion to dismiss the consolidated amended complaint in the revenue sharing action but has not yet ruled on the motion to dismiss. The market timing and revenue sharing lawsuits seek, among other things, unspecified compensatory damages plus interest and, in some cases, punitive damages, the rescission of investment advisory contracts, the return of fees paid under those contracts and restitution.
Two nearly identical class action civil complaints have been filed in August 2005, in the Northern District of Illinois Eastern Division, alleging that the plaintiffs each purchased and sold a 10-year Treasury note futures contract and suffered damages from an alleged shortage when PIMCO held both physical and futures positions in 10-year Treasury notes for its client accounts. The two actions have been consolidated into one action, and the two separate complaints have been replaced by a consolidated complaint. PIMCO is a named defendant, and PIMCO Funds has been added as a defendant, to the consolidated action. PIMCO strongly believes the complaint is without merit and intends to vigorously defend itself.
In April 2006, certain portfolios of the Trust and certain other funds managed by PIMCO were served in an adversary proceeding brought by the Official Committee of Asbestos Claimants of G-I Holdings, Inc. in G-I Holdings, Inc.’s bankruptcy in the District of New Jersey. In July 2004, PIMCO was named in this lawsuit and remains a defendant. The plaintiff seeks to recover for the bankruptcy estate assets that were transferred by the predecessor entity of G-I Holdings, Inc. to a wholly-owned subsidiary in 1994. The subsidiary has since issued notes, of which certain portfolios of the Trust and certain other funds managed by PIMCO are alleged to be holders. The complaint alleges that in 2000, more than two hundred noteholders—including certain portfolios of the Trust and certain other funds managed by PIMCO—were granted a second priority lien on the assets of the
subsidiary in exchange for their consent to a refinancing transaction and the granting of a first priority lien to the lending banks. The plaintiff is seeking invalidation of the lien in favor of the noteholders and/or the value of the lien. On June 21, 2006, the District of New Jersey overturned the Bankruptcy Court’s decision granting permission to file the adversary proceeding and remanded the matter to the Bankruptcy Court for further proceedings. Following a motion to reconsider, the District Court upheld its remand on August 7, 2006, and instructed the Bankruptcy Court to conduct a “cost-benefit” analysis of the Committee’s claims, including the claims against the noteholders. The Bankruptcy Court held a status conference on October 25, 2006 and set a briefing schedule relating to this cost-benefit analysis.
The foregoing speaks only as of the date of this report. It is possible that these matters and/or other developments resulting from these matters could result in increased portfolio redemptions or other adverse consequences to the Portfolio. However, PIMCO and AGID believe that these matters are not likely to have a material adverse effect on the Portfolio or on PIMCO’s or AGID’s ability to perform their respective investment advisory or distribution services relating to the Portfolio.
9. FEDERAL INCOME TAX MATTERS
The Portfolio intends to qualify as a regulated investment company under sub-chapter M of the Internal Revenue Code (the “Code”) and distribute all of its taxable income and net realized gains, if applicable, to shareholders. Accordingly, no provision for Federal income taxes has been made.
As of June 30, 2007, the aggregate cost of investments was the same for federal income tax and financial statement purposes. The net unrealized appreciation (depreciation) of investment securities for federal income tax purposes is as follows (amount in thousands):
| | | | |
Aggregate
Gross
Unrealized
Appreciation | | Aggregate
Gross
Unrealized
(Depreciation) | | Net
Unrealized
(Depreciation) |
$ 1 | | $ (29) | | $ (28) |
| | | | | | |
| | Semiannual Report | | June 30, 2007 | | 17 |
| | |
| |
Privacy Policy* | | (Unaudited) |
The Funds consider customer privacy to be a fundamental aspect of their relationships with shareholders and are committed to maintaining the confidentiality, integrity and security of their current, prospective and former shareholders’ personal information. To ensure their shareholders’ privacy, the Funds have developed policies that are designed to protect this confidentiality, while allowing shareholder needs to be served.
Obtaining Personal Information
In the course of providing shareholders with products and services, the Funds and certain service providers to the Funds, such as the Funds’ investment advisers (“Advisers”), may obtain non-public personal information about shareholders, which may come from sources such as account applications and other forms, from other written, electronic or verbal correspondence, from shareholder transactions, from a shareholder’s brokerage or financial advisory firm, financial adviser or consultant, and/or from information captured on the Funds’ internet web sites.
Respecting Your Privacy
As a matter of policy, the Funds do not disclose any personal or account information provided by shareholders or gathered by the Funds to non-affiliated third parties, except as required or permitted by law or as necessary for such third parties to perform their agreements with respect to the Funds. As is common in the industry, non-affiliated companies may from time to time be used to provide certain services, such as preparing and mailing prospectuses, reports, account statements and other information, conducting research on shareholder satisfaction and gathering shareholder proxies. A Fund’s Distributor may also retain non-affiliated companies to market the Fund’s shares or products which use the Fund’s shares and enter into joint marketing agreements with other companies. These companies may have access to a shareholder’s personal and account information, but are permitted to use this information solely to provide the specific service or as otherwise permitted by law. In most cases, the shareholders will be clients of a third party, but the Funds may also provide a shareholder’s personal and account information to the shareholder’s respective brokerage or financial advisory firm.
Sharing Information with Third Parties
The Funds reserve the right to disclose or report personal information to non-affiliated third parties, in limited circumstances, where the Funds believe in good faith that disclosure is required under law to cooperate with regulators or law enforcement authorities, to protect their rights or property or upon reasonable request by any Fund in which a shareholder has chosen to invest. In addition, the Funds may disclose information about a shareholder’s accounts to a non-affiliated third party with the consent of the shareholder.
Sharing Information with Affiliates
The Funds may share shareholder information with their affiliates in connection with servicing their shareholders’ accounts or to provide shareholders with information about products and services that the Funds or their Advisers, principal underwriters or their affiliates (“Service Affiliates”) believe may be of interest to such shareholders. The information that the Funds share may include, for example, a shareholder’s participation in one of the Funds or in other investment programs sponsored by a Service Affiliate, a shareholder’s ownership of certain types of accounts (such as IRAs), or other data about a shareholder’s accounts. The Funds’ Service Affiliates, in turn, are not permitted to share shareholder information with non-affiliated entities, except as required or permitted by law.
Procedures to Safeguard Private Information
The Funds take seriously the obligation to safeguard shareholder non-public personal information. In addition to this policy, the Funds have also implemented procedures that are designed to restrict access to a shareholder’s non-public personal information only to internal personnel who need to know that information in order to provide products or services to such shareholders. In order to guard a shareholder’s non-public personal information, physical, electronic and procedural safeguards are in place.
* This Privacy Policy applies to the following entities: PIMCO Funds, PIMCO Variable Insurance Trust, PCM Fund, Inc. and PIMCO Strategic Global Government Fund, Inc. (collectively, the “Funds”).
| | | | |
| 18 | | PIMCO Variable Insurance Trust | | |
Investment Adviser and Administrator
Pacific Investment Management Company LLC
840 Newport Center Drive
Newport Beach, California 92660
Distributor
Allianz Global Investors Distributors LLC
1345 Avenue of the Americas
New York, New York 10105
Custodian
State Street Bank & Trust Company
801 Pennsylvania
Kansas City, Missouri 64105
Transfer Agent
Boston Financial Data Services–Midwest
330 W. 9th Street
Kansas City, Missouri 64105
Legal Counsel
Dechert LLP
1775 I Street, N.W.
Washington, D.C. 20006
Independent Registered Public Accounting Firm
PricewaterhouseCoopers LLP
1055 Broadway
Kansas City, Missouri 64105
P I M C O

Table of Contents
This material is authorized for use only when preceded or accompanied by the current PIMCO Variable Insurance Trust (the “Trust”) prospectus. Investors should consider the investment objectives, risks, charges and expenses of this Trust carefully before investing. Ask your financial professional to explain all charges that may apply. This and other information is contained in the Trust’s prospectus. The variable product prospectus may be obtained by contacting your Investment Consultant. Please read the Trust and variable product prospectus carefully before you invest or send money.
Chairman’s Letter
Dear PIMCO Variable Insurance Trust Shareholder:
It is our pleasure to present to you the semiannual report for the PIMCO Variable Insurance Trust, covering the six-month period ended June 30, 2007. The PIMCO Variable Insurance Trust’s net assets were $8.68 billion at June 30, 2007, as compared to $7.76 billion at December 31, 2006.
Highlights of the financial markets during the reporting period include:
| | n | | Economic data during the first quarter of 2007 pointed to slower growth, which heightened market expectations for a decrease in the Federal Funds Rate. By the second quarter, economic data, such as employment statistics, provided little indication of economic weakness, causing expectations of a decrease in the Federal Funds Rate to unwind and U.S. interest rates to move higher. Interest rates in Europe and the U.K. also rose over the period as central banks raised their key lending rates due to inflation concerns. The benchmark ten-year U.S. Treasury yielded 5.03% as of June 30, 2007, or 0.32% higher than at the beginning of the year. |
| | n | | Most bonds generally returned much of their gains from earlier in the year as worldwide growth and capital flows drove interest rates higher in the second quarter. Increased risk aversion in global financial markets, due in part to subprime mortgage worries in the U.S., also contributed to the rise in interest rates. The Lehman Brothers Aggregate Bond Index, which includes Treasury, investment-grade corporate and mortgage-backed securities, returned 0.98% for the six-month period. |
| | n | | Locally issued emerging market (“EM”) bonds posted positive returns for the reporting period. Yields on these bonds declined and the local currencies in which they are denominated generally gained, amid increasing investor awareness, strong economic growth and surging capital inflows. External EM bonds (debt instruments issued by emerging markets countries and typically denominated in U.S. dollars) lagged behind local EM bonds (debt instruments issued by emerging markets countries and denominated in the currency of the issuer), as external EM bonds tend to trade more in-line with U.S. Treasuries. |
| | n | | Treasury Inflation-Protected Securities (“TIPS”) outpaced nominal bonds (non-inflation linked bonds) for the first part of the year and all but the longest maturity TIPS outperformed in the second quarter as high gasoline prices drove higher inflation accruals. Commodities, as represented by the Dow Jones-AIG Commodity Total Return Index, returned 4.46% for the period. Equities, as measured by the S&P 500 Index and the Russell 2000 Index, returned 6.96% and 6.45%, respectively, for the period. |
On the following pages, please find specific details as to the Portfolio’s total return investment performance and a discussion of those factors that affected performance.
Thank you for the trust you have placed in us. We will continue to work diligently to serve your investment needs.
Sincerely,
Brent R. Harris
Chairman, PIMCO Variable Insurance Trust
July 31, 2007
| | | | | | |
| | Semiannual Report | | June 30, 2007 | | 1 |
Important Information About the Portfolio
PIMCO Variable Insurance Trust (the “Trust”) is an open-end management investment company currently consisting of twenty separate investment portfolios, including the Total Return Portfolio (the “Portfolio”). The Portfolio is only available as a funding vehicle under variable life insurance policies or variable annuity contracts issued by insurance companies (“Variable Contracts”). Individuals may not purchase shares of the Portfolio directly. Shares of the Portfolio also may be sold to qualified pension and retirement plans outside of the separate account context.
We believe that bond funds have an important role to play in a well diversified investment portfolio. It is important to note, however, that in an environment where interest rates may trend upward, rising rates would negatively impact the performance of most bond funds, and fixed-income securities held by a fund are likely to decrease in value. The price volatility of fixed-income securities can also increase during periods of rising interest rates resulting in increased losses to a fund. Bond funds and individual bonds with a longer duration (a measure of the expected life of a security) tend to be more sensitive to changes in interest rates, usually making them more volatile than securities or funds with shorter durations.
The Portfolio may be subject to various risks in addition to those described above. Some of these risks may include, but are not limited to, the following: credit risk, high yield risk, market risk, issuer risk, liquidity risk, derivatives risk, mortgage risk, non-U.S. investment risk, emerging markets risk, currency risk, leveraging risk and management risk. A complete description of these risks is contained in the Portfolio’s prospectus. The Portfolio may use derivative instruments for hedging purposes or as part of an investment strategy. Use of these instruments may involve certain costs and risks such as liquidity risk, interest rate risk, market risk, credit risk, management risk and the risk that the Portfolio could not close out a position when it would be most advantageous to do so. Because the Portfolio may invest in derivatives, it could lose more than the principal amount invested in these instruments. Investing in non-U.S. securities may entail risk due to non-U.S. economic and political developments; this risk may be increased when investing in emerging markets.
On the performance summary page in this Semiannual Report, the Total Return Investment Performance table measures performance assuming that all dividend and capital gain distributions were reinvested.
An investment in the Portfolio is not a deposit of a bank and is not guaranteed or insured by the Federal Deposit Insurance Corporation or any other government agency. It is possible to lose money on investments in the Portfolio.
PIMCO has adopted written proxy voting policies and procedures (“Proxy Policy”) as required by Rule 206(4)-6 under the Investment Advisers Act of 1940, as amended. The Proxy Policy has been adopted by the Trust as the policies and procedures that PIMCO will use when voting proxies on behalf of the Portfolio. A description of the policies and procedures that PIMCO uses to vote proxies relating to portfolio securities of the Portfolio, and information about how the Portfolio voted proxies relating to portfolio securities held during the most recent twelve-month period ended June 30, are available without charge, upon request, by calling the Trust at 1-866-746-2606 and on the Portfolio’s website at www.pimco.com.
The Portfolio files its complete schedule of portfolio holdings with the SEC for the first and third quarters of each fiscal year on Form N-Q. A copy of the Trust’s Form N-Q is also available on the SEC’s website at http://www.sec.gov and may be reviewed and copied at the SEC’s Public Reference Room in Washington D.C. Information on the operation of the Public Reference Room may be obtained by calling 1-800-SEC-0330, and is available without charge, upon request, by calling the Trust at 1-866-746-2606 and on the Portfolio’s website at www.pimco.com.
PIMCO Variable Insurance Trust is distributed by Allianz Global Investors Distributors LLC, 1345 Avenue of the Americas, New York, NY 10105.
| | | | |
| 2 | | PIMCO Variable Insurance Trust | | |
The following disclosure provides important information regarding the Portfolio’s Expense Example (“Example” or “Expense Example”), which appears in this Semiannual Report. Please refer to this information when reviewing the Expense Example for the Portfolio.
Example
As a shareholder of the Portfolio, you incur two types of costs: (1) transaction costs and (2) ongoing costs, including advisory and administrative fees; distribution and/or service (12b-1) fees (Administrative and Advisor Class only); and other Portfolio expenses. The Example is intended to help you understand your ongoing costs (in dollars) of investing in the Portfolio and to compare these costs with the ongoing costs of investing in other mutual funds. The Expense Example does not reflect any fees or other expenses imposed by the Variable Contracts. If it did, the expenses reflected in the Expense Example would be higher. The Example is based on an investment of $1,000 invested at the beginning of the period and held for the entire period indicated, which is from January 1, 2007 to June 30, 2007.
Actual Expenses
The information in the table under the heading “Actual Performance” provides information about actual account values and actual expenses. You may use the information in these columns, together with the amount you invested, to estimate the expenses that you paid over the period. Simply divide your account value by $1,000 (for example, an $8,600 account value divided by $1,000 = $8.60), then multiply the result by the number in the row titled “Expenses Paid During Period” to estimate the expenses you paid on your account during this period.
Hypothetical Example for Comparison Purposes
The information in the table under the heading “Hypothetical Performance (5% return before expenses)” provides information about hypothetical account values and hypothetical expenses based on the Portfolio’s actual expense ratio and an assumed rate of return of 5% per year before expenses, which is not the Portfolio’s actual return. The hypothetical account values and expenses may not be used to estimate the actual ending account balance or expenses you paid for the period. You may use this information to compare the ongoing costs of investing in the Portfolio and other portfolios. To do so, compare this 5% hypothetical example with the 5% hypothetical examples that appear in the shareholder reports of the other portfolios.
Please note that the expenses shown in the table are meant to highlight your ongoing costs only and do not reflect any transactional costs. Therefore, the information under the heading “Hypothetical Performance (5% return before expenses)” is useful in comparing ongoing costs only, and will not help you determine the relative total costs of owning different portfolios. In addition, if these transactional costs were included, your costs would have been higher.
The expense ratio may vary period to period because of various factors, such as an increase in expenses not covered by the advisory and administrative fees (such as expenses of the trustees and their counsel, litigation expense and interest expense).
| | | | | | |
| | Semiannual Report | | June 30, 2007 | | 3 |
PIMCO Total Return Portfolio
Cumulative Returns Through June 30, 2007
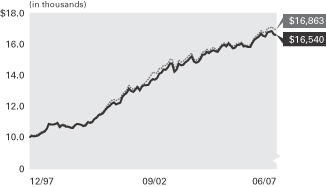
$10,000 invested at the beginning of the first full month following the inception date of the Portfolio’s Administrative Class.
Allocation Breakdown‡
| | |
U.S. Government Agencies | | 42.6% |
Short-Term Instruments | | 23.2% |
Corporate Bonds & Notes | | 20.3% |
Asset-Backed Securities | | 6.5% |
Mortgage-Backed Securities | | 4.9% |
Other | | 2.5% |
| | ‡ | % of Total Investments as of 06/30/2007 |
| | | | | | | | | | |
| Average Annual Total Return for the period ended June 30, 2007 |
| | | | | 6 Months* | | 1 Year | | 5 Years | | Portfolio
Inception
(12/31/97) |
| | PIMCO Total Return Portfolio Administrative Class | | 0.37% | | 5.00% | | 4.43% | | 5.44% |
| | Lehman Brothers Aggregate Bond Index± | | 0.98% | | 6.12% | | 4.48% | | 5.66% |
All Portfolio returns are net of fees and expenses.
* Cumulative return.
Performance quoted represents past performance. Past performance is no guarantee of future results. Investment return and principal value will fluctuate so the Portfolio shares, when redeemed, may be worth more or less than their original cost. The Portfolio’s performance does not reflect the deduction of additional charges and expenses imposed in connection with investing in Variable Contracts, which will reduce returns. Current performance may be lower or higher than the performance data quoted. Performance data current to the most recent month-end is available by calling (800) 927-4648.
± Lehman Brothers Aggregate Bond Index represents securities that are taxable and U.S. dollar denominated. The index covers the U.S. investment grade fixed rate bond market, with index components for government and corporate securities, mortgage pass-through securities, and asset-backed securities. These major sectors are subdivided into more specific indices that are calculated and reported on a regular basis. It is not possible to invest directly in the index. The index does not reflect deductions for fees and expenses.
| | | | | | |
| Expense Example | | Actual Performance | | Hypothetical Performance |
| | | | | (5% return before expenses) |
Beginning Account Value (01/01/07) | | $ | 1,000.00 | | $ | 1,000.00 |
Ending Account Value (06/30/07) | | $ | 1,003.71 | | $ | 1,021.57 |
Expenses Paid During Period† | | $ | 3.23 | | $ | 3.26 |
† Expenses are equal to the Portfolio’s Administrative Class annualized expense ratio of 0.65%, multiplied by the average account value over the period, multiplied by 181/365 (to reflect the one-half year period). Overall fees and expenses of investing in the Portfolio will be higher because the example does not reflect Variable Contract fees and expenses.
Please refer to page 3 herein for an explanation of the information presented in the above Expense Example.
Portfolio Insights
| » | | The PIMCO Total Return Portfolio seeks to achieve its investment objective by investing under normal circumstances at least 65% of its total assets in a diversified portfolio of fixed-income instruments of varying maturities, which may be represented by forwards or derivatives such as options, futures contracts, or swap agreements. |
| » | | The Portfolio’s above-benchmark duration detracted from returns as yields rose in the first half of the year. |
| » | | An emphasis on the front-end of the U.S. yield curve contributed to returns as the curve steepened as measured by the difference between two- and 30-year yields. |
| » | | A slight overweight to mortgage-backed securities for the majority of the period detracted from returns as this sector underperformed like-duration Treasuries. |
| » | | An underweight to corporate securities detracted from returns as the sector outperformed like-duration Treasuries. |
| » | | An allocation to major non-U.S. markets moderately detracted from returns as developed countries underperformed Treasuries. |
| » | | Emerging market and high-yield bonds added to performance as strong demand for their attractive yields allowed these sectors to outperform like-duration Treasuries. |
| » | | Moderate exposure to a broad basket of currencies boosted returns as most emerging and developed market currencies appreciated relative to the U.S. dollar. |
| | | | |
| 4 | | PIMCO Variable Insurance Trust | | |
Financial Highlights Total Return Portfolio
| | | | | | | | | | | | | | | | | | | | | | | | |
| Selected per Share Data for the Year or Period Ended: | | 06/30/2007+ | | | 12/31/2006 | | | 12/31/2005 | | | 12/31/2004 | | | 12/31/2003 | | | 12/31/2002 | |
| | | | | | |
Administrative Class | | | | | | | | | | | | | | | | | | | | | | | | |
Net asset value beginning of year or period | | $ | 10.12 | | | $ | 10.24 | | | $ | 10.51 | | | $ | 10.36 | | | $ | 10.23 | | | $ | 9.89 | |
Net investment income (a) | | | 0.24 | | | | 0.44 | | | | 0.35 | | | | 0.19 | | | | 0.25 | | | | 0.41 | |
Net realized/unrealized gain (loss) on investments (a) | | | (0.20 | ) | | | (0.06 | ) | | | (0.09 | ) | | | 0.31 | | | | 0.26 | | | | 0.47 | |
Total income from investment operations | | | 0.04 | | | | 0.38 | | | | 0.26 | | | | 0.50 | | | | 0.51 | | | | 0.88 | |
Dividends from net investment income | | | (0.24 | ) | | | (0.45 | ) | | | (0.36 | ) | | | (0.20 | ) | | | (0.30 | ) | | | (0.41 | ) |
Distributions from net realized capital gains | | | 0.00 | | | | (0.05 | ) | | | (0.17 | ) | | | (0.15 | ) | | | (0.08 | ) | | | (0.13 | ) |
Total distributions | | | (0.24 | ) | | | (0.50 | ) | | | (0.53 | ) | | | (0.35 | ) | | | (0.38 | ) | | | (0.54 | ) |
Net asset value end of year or period | | $ | 9.92 | | | $ | 10.12 | | | $ | 10.24 | | | $ | 10.51 | | | $ | 10.36 | | | $ | 10.23 | |
Total return | | | 0.37 | % | | | 3.84 | % | | | 2.45 | % | | | 4.89 | % | | | 5.04 | % | | | 9.07 | % |
Net assets end of year or period (000s) | | $ | 3,462,489 | | | $ | 3,114,697 | | | $ | 2,704,383 | | | $ | 2,352,679 | | | $ | 1,908,336 | | | $ | 1,161,299 | |
Ratio of expenses to average net assets | | | 0.65 | %* | | | 0.67 | % | | | 0.65 | % | | | 0.65 | % | | | 0.65 | % | | | 0.65 | %(b) |
Ratio of expenses to average net assets excluding interest expense | | | 0.65 | %* | | | 0.65 | % | | | 0.65 | % | | | 0.65 | % | | | 0.65 | % | | | 0.65 | %(b) |
Ratio of net investment income to average net assets | | | 4.74 | %* | | | 4.36 | % | | | 3.38 | % | | | 1.79 | % | | | 2.45 | % | | | 4.07 | % |
Portfolio turnover rate | | | 160 | % | | | 303 | % | | | 344 | % | | | 373 | % | | | 193 | % | | | 222 | % |
+ Unaudited
* Annualized
(a) Per share amounts based on average number of shares outstanding during the period.
(b) If the investment manager had not reimbursed expenses, the ratio of expenses to average net assets would have been 0.66%.
| | | | | | |
| See Accompanying Notes | | Semiannual Report | | June 30, 2007 | | 5 |
Statement of Assets and Liabilities Total Return Portfolio
| | | | |
| (Amounts in thousands, except per share amounts) | | June 30, 2007 | |
| | | (Unaudited) | |
| |
Assets: | | | | |
Investments, at value | | $ | 4,398,751 | |
Cash | | | 2,364 | |
Foreign currency, at value | | | 31,870 | |
Receivable for investments sold | | | 140,931 | |
Receivable for investments sold on a delayed-delivery basis | | | 14,207 | |
Receivable for Portfolio shares sold | | | 12,294 | |
Interest and dividends receivable | | | 14,571 | |
Variation margin receivable | | | 4,999 | |
Swap premiums paid | | | 9,683 | |
Unrealized appreciation on foreign currency contracts | | | 6,473 | |
Unrealized appreciation on swap agreements | | | 8,189 | |
| | | | 4,644,332 | |
| |
Liabilities: | | | | |
Payable for investments purchased | | $ | 726,520 | |
Payable for investments purchased on a delayed-delivery basis | | | 46,689 | |
Payable for Portfolio shares redeemed | | | 74,637 | |
Payable for short sales | | | 88,060 | |
Written options outstanding | | | 5,904 | |
Dividends payable | | | 1,806 | |
Accrued investment advisory fee | | | 783 | |
Accrued administration fee | | | 783 | |
Accrued distribution fee | | | 12 | |
Accrued servicing fee | | | 395 | |
Variation margin payable | | | 638 | |
Swap premiums received | | | 14,553 | |
Unrealized depreciation on foreign currency contracts | | | 580 | |
Unrealized depreciation on swap agreements | | | 7,150 | |
Other liabilities | | | 45 | |
| | | | 968,555 | |
| |
Net Assets | | $ | 3,675,777 | |
| |
Net Assets Consist of: | | | | |
Paid in capital | | $ | 3,791,949 | |
Undistributed net investment income | | | 1,072 | |
Accumulated undistributed net realized (loss) | | | (49,476 | ) |
Net unrealized (depreciation) | | | (67,768 | ) |
| | | $ | 3,675,777 | |
| |
Net Assets: | | | | |
Institutional Class | | $ | 185,047 | |
Administrative Class | | | 3,462,489 | |
Advisor Class | | | 28,241 | |
| |
Shares Issued and Outstanding: | | | | |
Institutional Class | | | 18,653 | |
Administrative Class | | | 349,007 | |
Advisor Class | | | 2,847 | |
| |
Net Asset Value and Redemption Price Per Share (Net Asset Per Share Outstanding) | | | | |
Institutional Class | | $ | 9.92 | |
Administrative Class | | | 9.92 | |
Advisor Class | | | 9.92 | |
| |
Cost of Investments Owned | | $ | 4,451,256 | |
Cost of Foreign Currency Held | | $ | 31,778 | |
Proceeds Received on Short Sales | | $ | 87,236 | |
Premiums Received on Written Options | | $ | 16,146 | |
| | | | |
| 6 | | PIMCO Variable Insurance Trust | | See Accompanying Notes |
Statement of Operations Total Return Portfolio
| | | | |
| (Amounts in thousands) | | Six Months Ended
June 30, 2007 | |
| | | (Unaudited) | |
| |
| Investment Income: | | | | |
Interest, net of foreign taxes* | | $ | 92,861 | |
Dividends | | | 484 | |
Miscellaneous income | | | 64 | |
Total Income | | | 93,409 | |
| |
Expenses: | | | | |
Investment advisory fees | | | 4,312 | |
Administration fees | | | 4,312 | |
Servicing fees – Administrative Class | | | 2,447 | |
Distribution and/or servicing fees – Advisor Class | | | 28 | |
Trustees’ fees | | | 34 | |
Legal fees | | | 1 | |
Total Expenses | | | 11,134 | |
| |
Net Investment Income | | | 82,275 | |
| |
Net Realized and Unrealized Gain (Loss): | | | | |
Net realized (loss) on investments | | | (6,410 | ) |
Net realized (loss) on futures contracts, written options and swaps | | | (29,590 | ) |
Net realized gain on foreign currency transactions | | | 3,042 | |
Net change in unrealized (depreciation) on investments | | | (40,500 | ) |
Net change in unrealized (depreciation) on futures contracts, written options and swaps | | | (4,370 | ) |
Net change in unrealized appreciation on translation of assets and liabilities denominated in foreign currencies | | | 5,410 | |
Net (Loss) | | | (72,418 | ) |
| |
Net Increase in Net Assets Resulting from Operations | | $ | 9,857 | |
| |
*Foreign tax withholding | | $ | 45 | |
| | | | | | |
| See Accompanying Notes | | Semiannual Report | | June 30, 2007 | | 7 |
Statements of Changes in Net Assets Total Return Portfolio
| | | | | | | | |
| (Amounts in thousands) | | Six Months Ended
June 30, 2007 | | | Year Ended
December 31, 2006 | |
| | | (Unaudited) | | | | |
| | |
| Increase in Net Assets from: | | | | | | | | |
| | |
Operations: | | | | | | | | |
Net investment income | | $ | 82,275 | | | $ | 132,299 | |
Net realized gain (loss) | | | (32,958 | ) | | | 5,631 | |
Net change in unrealized (depreciation) | | | (39,460 | ) | | | (21,541 | ) |
Net increase resulting from operations | | | 9,857 | | | | 116,389 | |
| | |
Distributions to Shareholders: | | | | | | | | |
From net investment income | | | | | | | | |
Institutional Class | | | (4,078 | ) | | | (7,166 | ) |
Administrative Class | | | (78,465 | ) | | | (127,175 | ) |
Advisor Class | | | (522 | ) | | | (267 | ) |
From net realized capital gains | | | | | | | | |
Institutional Class | | | 0 | | | | (917 | ) |
Administrative Class | | | 0 | | | | (16,487 | ) |
Advisor Class | | | 0 | | | | (95 | ) |
| | |
Total Distributions | | | (83,065 | ) | | | (152,107 | ) |
| | |
Portfolio Share Transactions: | | | | | | | | |
Receipts for shares sold | | | | | | | | |
Institutional Class | | | 45,520 | | | | 81,954 | |
Administrative Class | | | 674,962 | | | | 843,490 | |
Advisor Class | | | 11,807 | | | | 18,782 | |
Issued as reinvestment of distributions | | | | | | | | |
Institutional Class | | | 4,078 | | | | 8,017 | |
Administrative Class | | | 68,742 | | | | 123,518 | |
Advisor Class | | | 522 | | | | 362 | |
Cost of shares redeemed | | | | | | | | |
Institutional Class | | | (19,907 | ) | | | (73,276 | ) |
Administrative Class | | | (326,621 | ) | | | (522,647 | ) |
Advisor Class | | | (2,374 | ) | | | (329 | ) |
Net increase resulting from Portfolio share transactions | | | 456,729 | | | | 479,871 | |
| | |
Total Increase in Net Assets | | | 383,521 | | | | 444,153 | |
| | |
Net Assets: | | | | | | | | |
Beginning of period | | | 3,292,256 | | | | 2,848,103 | |
End of period* | | $ | 3,675,777 | | | $ | 3,292,256 | |
| | |
*Including undistributed net investment income of: | | $ | 1,072 | | | $ | 1,862 | |
| | | | |
| 8 | | PIMCO Variable Insurance Trust | | See Accompanying Notes |
| | |
| |
| Schedule of Investments Total Return Portfolio | | June 30, 2007 (Unaudited) |
| | | | | | | | |
| | | | | PRINCIPAL
AMOUNT
(000S) | | | | VALUE (000S) |
| BANK LOAN OBLIGATIONS 0.8% |
| CSC Holdings, Inc. |
7.070% due 02/24/2013 | | $ | | 2,574 | | $ | | 2,576 |
| |
| Freeport-McMoRan Copper & Gold, Inc. |
9.000% due 03/19/2014 | | | | 518 | | | | 519 |
| |
| Fresenius Medical Care Capital Trust |
6.725% due 03/22/2013 | | | | 4,410 | | | | 4,413 |
6.735% due 03/22/2013 | | | | 577 | | | | 578 |
| |
| HCA, Inc. |
7.100% due 11/17/2012 | | | | 5,000 | | | | 5,014 |
| |
| Kinder Morgan, Inc. |
7.000% due 11/24/2013 | | | | 10,000 | | | | 9,981 |
| |
| SLM Corp. |
6.000% due 06/30/2008 | | | | 8,100 | | | | 8,060 |
| | | | | | | | |
Total Bank Loan Obligations
(Cost $31,232) | | 31,141 |
| | | | | | | | |
| | | | |
| CORPORATE BONDS & NOTES 24.3% |
|
| BANKING & FINANCE 19.0% |
| AIG-Fp Matched Funding Corp. |
5.360% due 06/16/2008 | | | | 6,200 | | | | 6,210 |
| |
| American Express Bank FSB |
5.330% due 10/16/2008 | | | | 8,100 | | | | 8,100 |
5.380% due 10/20/2009 | | | | 6,800 | | | | 6,805 |
| |
| American Express Centurion Bank |
5.320% due 05/07/2008 | | | | 6,200 | | | | 6,201 |
5.340% due 06/12/2009 | | | | 9,100 | | | | 9,104 |
| |
| American Express Credit Corp. |
5.380% due 11/09/2009 | | | | 6,700 | | | | 6,706 |
| |
| American International Group, Inc. |
5.050% due 10/01/2015 | | | | 1,300 | | | | 1,240 |
5.370% due 06/16/2009 | | | | 5,400 | | | | 5,422 |
6.250% due 03/15/2037 | | | | 2,100 | | | | 1,992 |
| |
| Bank of America Corp. |
5.366% due 11/06/2009 | | | | 4,000 | | | | 4,000 |
5.450% due 09/18/2009 | | | | 6,100 | | | | 6,105 |
| |
| Bank of America N.A. |
5.355% due 07/25/2008 | | | | 11,200 | | | | 11,207 |
5.360% due 12/18/2008 | | | | 5,400 | | | | 5,403 |
5.360% due 02/27/2009 | | | | 5,200 | | | | 5,204 |
6.000% due 10/15/2036 | | | | 2,100 | | | | 2,034 |
| |
| Bear Stearns Cos., Inc. |
5.450% due 03/30/2009 | | | | 7,100 | | | | 7,105 |
5.450% due 08/21/2009 | | | | 9,100 | | | | 9,093 |
5.480% due 05/18/2010 | | | | 12,200 | | | | 12,193 |
5.655% due 01/30/2009 | | | | 7,180 | | | | 7,200 |
| |
| BNP Paribas |
5.186% due 06/29/2049 | | | | 15,600 | | | | 14,569 |
| |
| C10 Capital SPV Ltd. |
6.722% due 12/31/2049 | | | | 4,300 | | | | 4,198 |
| |
| CIT Group, Inc. |
5.480% due 08/17/2009 | | | | 7,100 | | | | 7,076 |
5.505% due 01/30/2009 | | | | 13,700 | | | | 13,683 |
5.510% due 12/19/2008 | | | | 2,400 | | | | 2,399 |
| |
| Citigroup Funding, Inc. |
5.320% due 04/23/2009 | | | | 4,000 | | | | 4,002 |
5.350% due 12/08/2008 | | | | 2,000 | | | | 2,001 |
5.360% due 06/26/2009 | | | | 5,300 | | | | 5,298 |
| |
| Citigroup, Inc. |
5.390% due 12/28/2009 | | | | 5,300 | | | | 5,304 |
5.400% due 12/26/2008 | | | | 26,880 | | | | 26,903 |
6.125% due 08/25/2036 | | | | 15,000 | | | | 14,778 |
| |
| Credit Agricole S.A. |
5.360% due 05/28/2009 | | | | 5,900 | | | | 5,903 |
5.410% due 05/28/2010 | | | | 6,800 | | | | 6,804 |
| |
| | | | | | | | |
| | | | | PRINCIPAL
AMOUNT
(000S) | | | | VALUE (000S) |
| DBS Bank Ltd. |
5.580% due 05/16/2017 | | $ | | 1,000 | | $ | | 1,002 |
| |
| DnB NORBank ASA |
5.425% due 10/13/2009 | | | | 5,700 | | | | 5,703 |
| |
| Export-Import Bank of China |
4.875% due 07/21/2015 | | | | 900 | | | | 854 |
| |
| Export-Import Bank of Korea |
4.125% due 02/10/2009 | | | | 140 | | | | 137 |
5.450% due 06/01/2009 | | | | 8,500 | | | | 8,504 |
| |
| General Electric Capital Corp. |
5.385% due 10/26/2009 | | | | 12,500 | | | | 12,509 |
5.390% due 01/05/2009 | | | | 11,000 | | | | 11,009 |
5.410% due 10/06/2010 | | | | 4,600 | | | | 4,604 |
5.428% due 01/20/2010 | | | | 5,400 | | | | 5,411 |
5.430% due 08/15/2011 | | | | 14,200 | | | | 14,196 |
5.455% due 10/21/2010 | | | | 14,360 | | | | 14,388 |
| |
| General Motors Acceptance Corp. |
6.510% due 09/23/2008 | | | | 3,900 | | | | 3,901 |
| |
| GMAC LLC |
6.000% due 12/15/2011 | | | | 1,100 | | | | 1,047 |
| |
| Goldman Sachs Group, Inc. |
5.400% due 12/23/2008 | | | | 1,600 | | | | 1,601 |
5.410% due 03/30/2009 | | | | 8,700 | | | | 8,706 |
5.447% due 11/10/2008 | | | | 7,100 | | | | 7,111 |
5.450% due 12/22/2008 | | | | 4,800 | | | | 4,806 |
5.450% due 06/23/2009 | | | | 13,070 | | | | 13,086 |
5.455% due 07/29/2008 | | | | 6,000 | | | | 6,009 |
| |
| HBOS PLC |
5.920% due 09/29/2049 | | | | 1,100 | | | | 1,033 |
| |
| HBOS Treasury Services PLC |
5.397% due 07/17/2009 | | | | 10,400 | | | | 10,412 |
| |
| HSBC Bank USA N.A. |
5.430% due 09/21/2007 | | | | 14,500 | | | | 14,504 |
5.500% due 06/10/2009 | | | | 7,700 | | | | 7,724 |
| |
| HSBC Finance Corp. |
5.415% due 10/21/2009 | | | | 4,500 | | | | 4,503 |
5.490% due 09/15/2008 | | | | 3,600 | | | | 3,608 |
5.500% due 12/05/2008 | | | | 5,900 | | | | 5,915 |
| |
| HSBC Holdings PLC |
6.500% due 05/02/2036 | | | | 2,300 | | | | 2,371 |
| |
| John Deere Capital Corp. |
5.406% due 07/15/2008 | | | | 6,400 | | | | 6,406 |
| |
| JPMorgan Chase & Co. |
5.370% due 06/26/2009 | | | | 4,900 | | | | 4,906 |
5.396% due 05/07/2010 | | | | 9,700 | | | | 9,707 |
| |
| JPMorgan Mortgage Acquisition Corp. |
6.550% due 09/15/2066 | | | | 1,200 | | | | 1,159 |
| |
| Lehman Brothers Holdings, Inc. |
5.410% due 12/23/2008 | | | | 800 | | | | 801 |
5.440% due 04/03/2009 | | | | 5,300 | | | | 5,307 |
5.460% due 08/21/2009 | | | | 11,900 | | | | 11,907 |
5.460% due 11/16/2009 | | | | 15,260 | | | | 15,275 |
5.500% due 05/25/2010 | | | | 5,200 | | | | 5,200 |
5.579% due 07/18/2011 | | | | 4,800 | | | | 4,811 |
5.607% due 11/10/2009 | | | | 4,500 | | | | 4,514 |
| |
| Longpoint Re Ltd. |
10.609% due 05/08/2010 | | | | 2,900 | | | | 2,900 |
| |
| Merrill Lynch & Co., Inc. |
5.390% due 12/22/2008 | | | | 3,500 | | | | 3,501 |
5.395% due 10/23/2008 | | | | 7,500 | | | | 7,511 |
5.406% due 05/08/2009 | | | | 3,500 | | | | 3,502 |
5.440% due 12/04/2009 | | | | 7,300 | | | | 7,304 |
5.450% due 08/14/2009 | | | | 6,200 | | | | 6,207 |
5.555% due 07/25/2011 | | | | 8,500 | | | | 8,501 |
| |
| MetLife, Inc. |
6.400% due 12/15/2036 | | | | 1,700 | | | | 1,580 |
| |
| | | | | | | | |
| | | | | PRINCIPAL
AMOUNT
(000S) | | | | VALUE (000S) |
| Metropolitan Life Global Funding I |
5.125% due 11/09/2011 | | $ | | 8,200 | | $ | | 8,074 |
5.400% due 05/17/2010 | | | | 15,200 | | | | 15,211 |
| |
| Morgan Stanley |
5.360% due 11/21/2008 | | | | 4,900 | | | | 4,900 |
5.406% due 05/07/2009 | | | | 8,700 | | | | 8,705 |
5.446% due 01/15/2010 | | | | 8,200 | | | | 8,205 |
5.467% due 02/09/2009 | | | | 14,600 | | | | 14,624 |
| |
| MUFG Capital Finance 1 Ltd. |
6.346% due 07/29/2049 | | | | 700 | | | | 689 |
| |
| Mystic Re Ltd. |
15.360% due 06/07/2011 | | | | 3,000 | | | | 3,007 |
| |
| National Australia Bank Ltd. |
5.400% due 09/11/2009 | | | | 5,300 | | | | 5,308 |
| |
| Osiris Capital PLC |
10.356% due 01/15/2010 | | | | 3,100 | | | | 3,130 |
| |
| Petroleum Export Ltd. |
5.265% due 06/15/2011 | | | | 829 | | | | 809 |
| |
| Phoenix Quake Ltd. |
7.800% due 07/03/2008 | | | | 800 | | | | 805 |
| |
| Phoenix Quake Wind I Ltd. |
7.800% due 07/03/2008 | | | | 800 | | | | 803 |
| |
| Phoenix Quake Wind II Ltd. |
8.850% due 07/03/2008 | | | | 400 | | | | 380 |
| |
| Premium Asset Trust |
5.735% due 09/08/2007 | | | | 100 | | | | 100 |
| |
| Residential Capital LLC |
6.460% due 05/22/2009 | | | | 7,900 | | | | 7,867 |
| |
| Residential Reinsurance 2007 Ltd. |
15.610% due 06/07/2010 | | | | 1,500 | | | | 1,501 |
| |
| Resona Bank Ltd. |
5.850% due 09/29/2049 | | | | 1,200 | | | | 1,149 |
| |
| Royal Bank of Scotland Group PLC |
5.405% due 07/21/2008 | | | | 11,400 | | | | 11,410 |
| |
| Santander U.S. Debt S.A. Unipersonal |
5.420% due 09/19/2008 | | | | 6,900 | | | | 6,907 |
5.420% due 11/20/2009 | | | | 10,900 | | | | 10,908 |
| |
| SMFG Preferred Capital USD 1 Ltd. |
6.078% due 01/29/2049 | | | | 4,100 | | | | 3,965 |
| |
| State Street Capital Trust IV |
6.355% due 06/15/2037 | | | | 1,000 | | | | 1,007 |
| |
| TNK-BP Finance S.A. |
6.125% due 03/20/2012 | | | | 1,200 | | | | 1,175 |
| |
| UFJ Finance Aruba AEC |
6.750% due 07/15/2013 | | | | 300 | | | | 317 |
| |
| USB Capital IX |
6.189% due 04/15/2049 | | | | 900 | | | | 907 |
| |
| VTB Capital S.A. for Vneshtorgbank |
5.955% due 08/01/2008 | | | | 6,000 | | | | 6,014 |
| |
| Wachovia Bank N.A. |
5.320% due 10/03/2008 | | | | 8,800 | | | | 8,803 |
5.350% due 06/27/2008 | | | | 6,300 | | | | 6,302 |
5.400% due 03/23/2009 | | | | 7,100 | | | | 7,104 |
| |
| Wachovia Corp. |
5.410% due 12/01/2009 | | | | 4,400 | | | | 4,405 |
| |
| Wells Fargo & Co. |
5.460% due 09/15/2009 | | | | 6,715 | | | | 6,733 |
| |
| Westpac Banking Corp. |
5.280% due 06/06/2008 | | | | 4,000 | | | | 4,001 |
| |
| World Savings Bank FSB |
5.485% due 03/02/2009 | | | | 7,900 | | | | 7,924 |
| |
| | | | | | |
| See Accompanying Notes | | Semiannual Report | | June 30, 2007 | | 9 |
| | |
| |
| Schedule of Investments Total Return Portfolio (Cont.) | | |
| | | | | | | | |
| | | | | PRINCIPAL
AMOUNT
(000S) | | | | VALUE (000S) |
| ZFS Finance USA Trust I |
5.875% due 05/09/2032 | | $ | | 4,400 | | $ | | 4,350 |
| | | | | | | | |
| | | | | | | | 697,394 |
| | | | | | | | |
|
| INDUSTRIALS 3.5% |
| Amgen, Inc. |
5.440% due 11/28/2008 | | | | 14,000 | | | | 14,008 |
| |
| Anadarko Petroleum Corp. |
5.760% due 09/15/2009 | | | | 10,000 | | | | 10,014 |
| |
| BP AMI Leasing, Inc. |
5.370% due 06/26/2009 | | | | 13,600 | | | | 13,605 |
| |
| CODELCO, Inc. |
6.150% due 10/24/2036 | | | | 700 | | | | 696 |
| |
| Comcast Corp. |
5.656% due 07/14/2009 | | | | 7,700 | | | | 7,704 |
5.875% due 02/15/2018 | | | | 1,700 | | | | 1,650 |
6.450% due 03/15/2037 | | | | 1,700 | | | | 1,644 |
| |
| DaimlerChrysler N.A. Holding Corp. |
5.710% due 03/13/2009 | | | | 2,900 | | | | 2,907 |
5.805% due 08/03/2009 | | | | 6,300 | | | | 6,336 |
| |
| El Paso Corp. |
6.750% due 05/15/2009 | | | | 6,000 | | | | 6,082 |
7.800% due 08/01/2031 | | | | 1,300 | | | | 1,323 |
7.875% due 06/15/2012 | | | | 5,800 | | | | 6,092 |
9.625% due 05/15/2012 | | | | 800 | | | | 895 |
| |
| Gaz Capital for Gazprom |
6.212% due 11/22/2016 | | | | 1,200 | | | | 1,172 |
| |
| HJ Heinz Co. |
6.428% due 12/01/2008 | | | | 1,100 | | | | 1,111 |
| |
| Morgan Stanley Bank AG for OAO Gazprom |
9.625% due 03/01/2013 | | | | 100 | | | | 116 |
| |
| Peabody Energy Corp. |
7.875% due 11/01/2026 | | | | 2,700 | | | | 2,808 |
| |
| Pemex Project Funding Master Trust |
5.750% due 12/15/2015 | | | | 2,300 | | | | 2,259 |
8.000% due 11/15/2011 | | | | 100 | | | | 109 |
8.625% due 02/01/2022 | | | | 1,200 | | | | 1,482 |
9.500% due 09/15/2027 | | | | 55 | | | | 74 |
| |
| Salomon Brothers AG for OAO Gazprom |
10.500% due 10/21/2009 | | | | 6,000 | | | | 6,622 |
| |
| Time Warner, Inc. |
5.590% due 11/13/2009 | | | | 6,600 | | | | 6,610 |
| |
| Transocean, Inc. |
5.560% due 09/05/2008 | | | | 6,200 | | | | 6,206 |
| |
| United Airlines, Inc. |
6.071% due 03/01/2013 | | | | 3,313 | | | | 3,332 |
8.030% due 01/01/2013 (a) | | | | 465 | | | | 519 |
| |
| Vale Overseas Ltd. |
6.250% due 01/23/2017 | | | | 1,300 | | | | 1,296 |
6.875% due 11/21/2036 | | | | 1,300 | | | | 1,310 |
| |
| Wal-Mart Stores, Inc. |
5.260% due 06/16/2008 | | | | 14,200 | | | | 14,198 |
| |
| Williams Cos., Inc. |
6.375% due 10/01/2010 | | | | 7,000 | | | | 7,052 |
| | | | | | | | |
| | | | | | | | 129,232 |
| | | | | | | | |
|
| UTILITIES 1.8% |
| AT&T, Inc. |
5.456% due 02/05/2010 | | | | 3,600 | | | | 3,606 |
5.570% due 11/14/2008 | | | | 4,200 | | | | 4,214 |
| |
| BellSouth Corp. |
4.240% due 04/26/2008 | | | | 5,500 | | | | 5,452 |
5.460% due 08/15/2008 | | | | 10,200 | | | | 10,211 |
| |
| | | | | | | | |
| | | | | PRINCIPAL
AMOUNT
(000S) | | | | VALUE (000S) |
| Entergy Gulf States, Inc. |
5.700% due 06/01/2015 | | $ | | 8,300 | | $ | | 7,966 |
6.000% due 12/01/2012 | | | | 6,500 | | | | 6,454 |
| |
| Korea Electric Power Corp. |
5.125% due 04/23/2034 | | | | 90 | | | | 87 |
| |
| Qwest Capital Funding, Inc. |
7.250% due 02/15/2011 | | | | 657 | | | | 657 |
| |
| Ras Laffan Liquefied Natural Gas Co. Ltd. III |
5.838% due 09/30/2027 | | | | 2,600 | | | | 2,419 |
| |
| TPSA Finance BV |
7.750% due 12/10/2008 | | | | 120 | | | | 124 |
| |
| TXU Energy Co. LLC |
5.860% due 09/16/2008 | | | | 12,200 | | | | 12,208 |
| |
| Verizon Communications, Inc. |
5.400% due 04/03/2009 | | | | 14,500 | | | | 14,510 |
| | | | | | | | |
| | | | | | | | 67,908 |
| | | | | | | | |
Total Corporate Bonds & Notes
(Cost $894,530) | | 894,534 |
| | | | | | | | |
|
| MUNICIPAL BONDS & NOTES 0.1% |
| Badger, Wisconsin Tobacco Asset Securitization Corporations Revenue Bonds, Series 2002 |
6.000% due 06/01/2017 | | | | 3,700 | | | | 3,967 |
| |
| Iowa State Tobacco Settlement Authority Revenue Bonds, Series 2005 |
6.500% due 06/01/2023 | | | | 1,150 | | | | 1,136 |
| | | | | | | | |
Total Municipal Bonds & Notes
(Cost $4,816) | | 5,103 |
| | | | | | | | |
|
| COMMODITY INDEX-LINKED NOTES 0.3% |
| Morgan Stanley |
0.000% due 07/07/2008 | | | | 10,000 | | | | 9,943 |
| | | | | | | | |
Total Commodity Index-Linked Notes
(Cost $10,000) | | 9,943 |
| | | | | | | | |
|
| U.S. GOVERNMENT AGENCIES 51.0% |
| Fannie Mae |
4.000% due 10/01/2018 | | | | 414 | | | | 385 |
4.500% due 02/01/2035 - 06/25/2043 | | | | 12,566 | | | | 12,373 |
4.673% due 05/25/2035 | | | | 1,300 | | | | 1,283 |
4.709% due 04/01/2035 | | | | 2,817 | | | | 2,800 |
4.759% due 04/01/2035 | | | | 4,039 | | | | 4,015 |
5.000% due 02/25/2017 - 07/01/2037 | | | | 316,751 | | | | 299,211 |
5.380% due 12/25/2036 | | | | 3,799 | | | | 3,794 |
5.500% due 04/01/2014 - 08/01/2037 | | | | 906,903 | | | | 877,528 |
5.647% due 10/01/2032 | | | | 1,588 | | | | 1,601 |
5.648% due 11/01/2035 | | | | 307 | | | | 309 |
5.670% due 03/25/2044 | | | | 6,205 | | | | 6,211 |
6.000% due 04/01/2016 - 07/01/2037 | | | | 343,211 | | | | 339,644 |
6.129% due 09/01/2034 | | | | 2,519 | | | | 2,553 |
6.227% due 06/01/2043 - 07/01/2044 | | | | 7,760 | | | | 7,867 |
6.272% due 12/01/2036 | | | | 2,514 | | | | 2,539 |
6.414% due 09/01/2040 | | | | 61 | | | | 62 |
6.500% due 06/01/2029 - 04/01/2032 | | | | 362 | | | | 369 |
7.000% due 04/25/2023 - 06/01/2032 | | | | 3,464 | | | | 3,546 |
7.130% due 09/01/2039 | | | | 106 | | | | 107 |
7.269% due 11/01/2025 | | | | 2 | | | | 2 |
| |
| Federal Housing Administration |
7.430% due 01/25/2023 | | | | 52 | | | | 53 |
| |
| | | | | | | | |
| | | | | PRINCIPAL
AMOUNT
(000S) | | | | VALUE (000S) |
| Freddie Mac |
4.500% due 04/01/2018 - 10/01/2018 | | $ | | 2,330 | | $ | | 2,221 |
5.000% due 04/01/2018 - 09/01/2035 | | | | 17,324 | | | | 16,925 |
5.470% due 07/15/2019 - 10/15/2020 | | | | 134,500 | | | | 134,383 |
5.500% due 04/01/2033 - 07/01/2037 | | | | 66,903 | | | | 64,536 |
5.550% due 07/15/2037 | | | | 46,700 | | | | 46,696 |
5.620% due 05/15/2036 | | | | 5,068 | | | | 5,086 |
5.770% due 11/15/2030 | | | | 31 | | | | 31 |
5.820% due 09/15/2030 | | | | 29 | | | | 30 |
6.000% due 07/01/2016 - 07/01/2037 | | | | 20,131 | | | | 19,992 |
6.227% due 02/25/2045 | | | | 875 | | | | 872 |
6.500% due 03/01/2013 - 03/01/2034 | | | | 947 | | | | 965 |
7.000% due 06/15/2023 | | | | 1,869 | | | | 1,922 |
7.188% due 07/01/2030 | | | | 2 | | | | 2 |
7.290% due 07/01/2027 | | | | 2 | | | | 2 |
7.412% due 01/01/2028 | | | | 2 | | | | 2 |
7.500% due 07/15/2030 - 03/01/2032 | | | | 268 | | | | 278 |
8.500% due 08/01/2024 | | | | 15 | | | | 16 |
| |
| Ginnie Mae |
4.500% due 07/20/2030 | | | | 13 | | | | 14 |
4.750% due 02/20/2032 | | | | 805 | | | | 807 |
5.125% due 10/20/2029 - 11/20/2029 | | | | 272 | | | | 276 |
5.375% due 04/20/2026 - 05/20/2030 | | | | 116 | | | | 117 |
5.500% due 04/15/2033 - 09/15/2033 | | | | 555 | | | | 540 |
5.720% due 06/20/2030 | | | | 1 | | | | 1 |
5.820% due 09/20/2030 | | | | 25 | | | | 25 |
6.000% due 07/01/2037 | | | | 4,000 | | | | 3,979 |
6.500% due 03/15/2031 - 04/15/2032 | | | | 255 | | | | 260 |
| |
| Small Business Administration |
5.130% due 09/01/2023 | | | | 77 | | | | 76 |
6.030% due 02/10/2012 | | | | 5,089 | | | | 5,129 |
6.290% due 01/01/2021 | | | | 199 | | | | 204 |
6.344% due 08/01/2011 | | | | 650 | | | | 658 |
7.449% due 08/01/2010 | | | | 8 | | | | 8 |
7.500% due 04/01/2017 | | | | 1,025 | | | | 1,059 |
8.017% due 02/10/2010 | | | | 75 | | | | 77 |
| | | | | | | | |
Total U.S. Government Agencies
(Cost $1,913,856) | | 1,873,441 |
| | | | | | | | |
|
| U.S. TREASURY OBLIGATIONS 0.4% |
| Treasury Inflation Protected Securities (c) |
2.000% due 01/15/2026 | | | | 7,163 | | | | 6,490 |
2.375% due 01/15/2025 | | | | 7,236 | | | | 6,959 |
3.625% due 04/15/2028 | | | | 1,533 | | | | 1,777 |
| | | | | | | | |
Total U.S. Treasury Obligations
(Cost $16,092) | | 15,226 |
| | | | | | | | |
|
| MORTGAGE-BACKED SECURITIES 5.9% |
| American Home Mortgage Investment Trust |
4.390% due 02/25/2045 | | | | 3,537 | | | | 3,464 |
| |
| Banc of America Commercial Mortgage, Inc. |
4.128% due 07/10/2042 | | | | 395 | | | | 385 |
4.875% due 06/10/2039 | | | | 590 | | | | 582 |
| |
| Banc of America Funding Corp. |
4.113% due 05/25/2035 | | | | 4,996 | | | | 4,893 |
| |
| Banc of America Mortgage Securities, Inc. |
6.500% due 10/25/2031 | | | | 1,316 | | | | 1,331 |
6.500% due 09/25/2033 | | | | 507 | | | | 508 |
| |
| | | | |
| 10 | | PIMCO Variable Insurance Trust | | See Accompanying Notes |
| | |
| |
| | | June 30, 2007 (Unaudited) |
| | | | | | | | |
| | | | | PRINCIPAL
AMOUNT
(000S) | | | | VALUE (000S) |
| Bear Stearns Adjustable Rate Mortgage Trust |
4.750% due 10/25/2035 | | $ | | 18,398 | | $ | | 18,195 |
4.773% due 01/25/2034 | | | | 2,930 | | | | 2,916 |
5.044% due 04/25/2033 | | | | 1,332 | | | | 1,331 |
5.329% due 02/25/2033 | | | | 350 | | | | 355 |
5.626% due 02/25/2033 | | | | 292 | | | | 290 |
6.337% due 11/25/2030 | | | | 9 | | | | 9 |
| |
| Bear Stearns Alt-A Trust |
5.377% due 05/25/2035 | | | | 6,929 | | | | 6,900 |
| |
| Citigroup Commercial Mortgage Trust |
5.390% due 08/15/2021 | | | | 3,703 | | | | 3,708 |
| |
| Citigroup Mortgage Loan Trust, Inc. |
4.700% due 12/25/2035 | | | | 1,783 | | | | 1,752 |
| |
| Commercial Mortgage Pass-Through Certificates |
6.455% due 05/15/2032 | | | | 6,562 | | | | 6,608 |
| |
| Countrywide Alternative Loan Trust |
4.673% due 08/25/2034 | | | | 142 | | | | 141 |
5.500% due 05/25/2047 | | | | 5,426 | | | | 5,441 |
| |
| Countrywide Home Loan Mortgage Pass-Through Trust |
5.250% due 02/20/2036 | | | | 2,050 | | | | 2,037 |
5.590% due 05/25/2034 | | | | 415 | | | | 415 |
| |
| CS First Boston Mortgage Securities Corp. |
6.890% due 06/25/2032 | | | | 44 | | | | 44 |
| |
| First Nationwide Trust |
6.750% due 08/21/2031 | | | | 38 | | | | 38 |
| |
| Greenpoint Mortgage Funding Trust |
5.400% due 10/25/2046 | | | | 6,949 | | | | 6,955 |
5.400% due 01/25/2047 | | | | 6,845 | | | | 6,849 |
| |
| Greenwich Capital Commercial Funding Corp. |
5.317% due 06/10/2036 | | | | 915 | | | | 895 |
| |
| GS Mortgage Securities Corp. II |
5.396% due 08/10/2038 | | | | 905 | | | | 886 |
5.410% due 03/06/2020 | | | | 23,300 | | | | 23,326 |
| |
| GSR Mortgage Loan Trust |
4.538% due 09/25/2035 | | | | 21,739 | | | | 21,427 |
| |
| Harborview Mortgage Loan Trust |
5.410% due 01/19/2038 | | | | 10,742 | | | | 10,757 |
5.510% due 01/19/2038 | | | | 13,936 | | | | 13,960 |
5.540% due 05/19/2035 | | | | 1,497 | | | | 1,499 |
| |
| Impac Secured Assets CMN Owner Trust |
5.400% due 01/25/2037 | | | | 4,597 | | | | 4,601 |
| |
| Indymac ARM Trust |
6.633% due 01/25/2032 | | | | 7 | | | | 7 |
| |
| Indymac Index Mortgage Loan Trust |
5.410% due 11/25/2046 | | | | 4,816 | | | | 4,819 |
| |
| Lehman Brothers Floating Rate Commercial Mortgage Trust |
5.400% due 09/15/2021 | | | | 1,564 | | | | 1,565 |
| |
| Merrill Lynch Mortgage Trust |
4.353% due 02/12/2042 | | | | 515 | | | | 505 |
| |
| Morgan Stanley Capital I |
4.050% due 01/13/2041 | | | | 530 | | | | 515 |
5.380% due 10/15/2020 | | | | 3,999 | | | | 4,005 |
| |
| Prime Mortgage Trust |
5.720% due 02/25/2019 | | | | 242 | | | | 243 |
5.720% due 02/25/2034 | | | | 1,113 | | | | 1,116 |
| |
| Residential Funding Mortgage Securities I, Inc. |
6.500% due 03/25/2032 | | | | 1,215 | | | | 1,215 |
| |
| Structured Asset Mortgage Investments, Inc. |
5.650% due 09/19/2032 | | | | 190 | | | | 190 |
| |
| Structured Asset Securities Corp. |
6.063% due 02/25/2032 | | | | 24 | | | | 24 |
6.150% due 07/25/2032 | | | | 30 | | | | 30 |
| |
| | | | | | | | |
| | | | | PRINCIPAL
AMOUNT
(000S) | | | | VALUE (000S) |
| Thornburg Mortgage Securities Trust |
5.430% due 12/25/2036 | | $ | | 5,791 | | $ | | 5,791 |
| |
| Wachovia Bank Commercial Mortgage Trust |
5.400% due 06/15/2020 | | | | 10,800 | | | | 10,803 |
5.410% due 09/15/2021 | | | | 19,057 | | | | 19,067 |
| |
| Washington Mutual, Inc. |
5.094% due 10/25/2032 | | | | 283 | | | | 282 |
5.610% due 10/25/2045 | | | | 1,633 | | | | 1,637 |
6.229% due 11/25/2042 | | | | 1,259 | | | | 1,260 |
6.429% due 08/25/2042 | | | | 3,106 | | | | 3,117 |
| |
| Wells Fargo Mortgage-Backed Securities Trust |
4.950% due 03/25/2036 | | | | 8,237 | | | | 8,127 |
| | | | | | | | |
Total Mortgage-Backed Securities
(Cost $217,544) | | 216,816 |
| | | | | | | | |
|
| ASSET-BACKED SECURITIES 7.8% |
| ACE Securities Corp. |
5.370% due 12/25/2036 | | | | 2,407 | | | | 2,409 |
| |
| American Express Credit Account Master Trust |
5.430% due 09/15/2010 | | | | 35,400 | | | | 35,451 |
| |
| Amortizing Residential Collateral Trust |
5.590% due 06/25/2032 | | | | 353 | | | | 353 |
| |
| Argent Securities, Inc. |
5.370% due 09/25/2036 | | | | 2,645 | | | | 2,646 |
| |
| Asset-Backed Funding Certificates |
5.380% due 11/25/2036 | | | | 6,333 | | | | 6,337 |
5.380% due 01/25/2037 | | | | 4,974 | | | | 4,977 |
| |
| Bear Stearns Asset-Backed Securities, Inc. |
5.400% due 10/25/2036 | | | | 2,881 | | | | 2,883 |
5.410% due 06/25/2047 | | | | 4,699 | | | | 4,702 |
| |
| Carrington Mortgage Loan Trust |
5.470% due 09/25/2035 | | | | 631 | | | | 632 |
| |
| Chase Credit Card Master Trust |
5.430% due 02/15/2011 | | | | 9,900 | | | | 9,921 |
| |
| CitiFinancial Mortgage Securities, Inc. |
3.221% due 10/25/2033 | | | | 4 | | | | 4 |
| |
| Countrywide Asset-Backed Certificates |
5.370% due 01/25/2037 | | | | 7,522 | | | | 7,525 |
5.370% due 05/25/2037 | | | | 8,717 | | | | 8,726 |
5.370% due 12/25/2046 | | | | 2,594 | | | | 2,595 |
| |
| Credit-Based Asset Servicing & Securitization LLC |
5.380% due 11/25/2036 | | | | 4,728 | | | | 4,731 |
| |
| DaimlerChrysler Auto Trust |
5.250% due 05/08/2009 | | | | 7,360 | | | | 7,363 |
| |
| EMC Mortgage Loan Trust |
5.690% due 05/25/2040 | | | | 686 | | | | 688 |
| |
| First Franklin Mortgage Loan Asset-Backed Certificates |
5.370% due 11/25/2036 | | | | 8,596 | | | | 8,601 |
| |
| First USA Credit Card Master Trust |
5.480% due 04/18/2011 | | | | 16,500 | | | | 16,544 |
| |
| Fremont Home Loan Trust |
5.380% due 01/25/2037 | | | | 4,635 | | | | 4,634 |
5.390% due 02/25/2037 | | | | 3,480 | | | | 3,482 |
| |
| Honda Auto Receivables Owner Trust |
5.322% due 03/18/2008 | | | | 8,877 | | | | 8,886 |
| |
| HSI Asset Securitization Corp. Trust |
5.370% due 12/25/2036 | | | | 3,457 | | | | 3,459 |
| |
| Indymac Residential Asset-Backed Trust |
5.380% due 04/25/2037 | | | | 4,263 | | | | 4,264 |
| |
| JPMorgan Mortgage Acquisition Corp. |
5.370% due 08/25/2036 | | | | 2,735 | | | | 2,737 |
5.380% due 04/01/2037 | | | | 8,099 | | | | 8,095 |
| |
| | | | | | | | |
| | | | | PRINCIPAL
AMOUNT
(000S) | | | | VALUE (000S) |
| Lehman XS Trust |
5.390% due 05/25/2046 | | $ | | 2,418 | | $ | | 2,419 |
| |
| Long Beach Mortgage Loan Trust |
5.600% due 10/25/2034 | | | | 619 | | | | 620 |
| |
| MASTR Asset-Backed Securities Trust |
5.380% due 11/25/2036 | | | | 6,269 | | | | 6,273 |
| |
| Merrill Lynch Mortgage Investors, Inc. |
5.390% due 08/25/2036 | | | | 9,238 | | | | 9,239 |
| |
| Morgan Stanley ABS Capital I |
5.360% due 10/25/2036 | | | | 2,947 | | | | 2,948 |
5.370% due 10/25/2036 | | | | 2,685 | | | | 2,686 |
| |
| Nelnet Student Loan Trust |
5.340% due 09/25/2012 | | | | 4,156 | | | | 4,159 |
5.420% due 12/22/2016 | | | | 8,200 | | | | 8,206 |
| |
| Newcastle Mortgage Securities Trust |
5.390% due 03/25/2036 | | | | 4,873 | | | | 4,875 |
| |
| Nissan Auto Lease Trust |
5.347% due 12/14/2007 | | | | 105 | | | | 105 |
| |
| Park Place Securities, Inc. |
5.632% due 10/25/2034 | | | | 4,699 | | | | 4,711 |
| |
| Residential Asset Mortgage Products, Inc. |
4.230% due 05/25/2029 | | | | 14 | | | | 14 |
4.450% due 07/25/2028 | | | | 331 | | | | 329 |
| |
| Residential Asset Securities Corp. |
5.360% due 08/25/2036 | | | | 3,066 | | | | 3,068 |
5.390% due 11/25/2036 | | | | 6,745 | | | | 6,750 |
| |
| Saxon Asset Securities Trust |
5.380% due 11/25/2036 | | | | 3,198 | | | | 3,199 |
| |
| SBI HELOC Trust |
5.490% due 08/25/2036 | | | | 4,255 | | | | 4,259 |
| |
| Securitized Asset-Backed Receivables LLC Trust |
5.440% due 05/25/2037 | | | | 9,300 | | | | 9,300 |
| |
| SLM Student Loan Trust |
5.355% due 10/25/2016 | | | | 9,300 | | | | 9,306 |
| |
| Soundview Home Equity Loan Trust |
5.420% due 10/25/2036 | | | | 8,430 | | | | 8,436 |
| |
| Structured Asset Securities Corp. |
4.370% due 10/25/2034 | | | | 250 | | | | 249 |
5.370% due 10/25/2036 | | | | 7,391 | | | | 7,394 |
5.420% due 07/25/2035 | | | | 802 | | | | 803 |
5.610% due 01/25/2033 | | | | 73 | | | | 73 |
| |
| USAA Auto Owner Trust |
5.337% due 07/11/2008 | | | | 6,700 | | | | 6,701 |
| |
| Wachovia Auto Owner Trust |
5.337% due 06/20/2008 | | | | 7,600 | | | | 7,601 |
| |
| Wells Fargo Home Equity Trust |
5.370% due 01/25/2037 | | | | 4,446 | | | | 4,449 |
5.440% due 12/25/2035 | | | | 5,901 | | | | 5,904 |
| | | | | | | | |
Total Asset-Backed Securities
(Cost $286,598) | | 286,721 |
| | | | | | | | |
|
| SOVEREIGN ISSUES 0.7% |
| China Development Bank |
5.000% due 10/15/2015 | | | | 900 | | | | 861 |
| |
| Korea Development Bank |
5.490% due 04/03/2010 | | | | 25,000 | | | | 25,022 |
| |
| South Africa Government International Bond |
5.875% due 05/30/2022 | | | | 500 | | | | 490 |
| | | | | | | | |
Total Sovereign Issues (Cost $26,392) | | 26,373 |
| | | | | | | | |
|
| | | | | | |
| See Accompanying Notes | | Semiannual Report | | June 30, 2007 | | 11 |
| | |
| |
| Schedule of Investments Total Return Portfolio (Cont.) | | |
| | | | | | | | |
| | | | | PRINCIPAL
AMOUNT
(000S) | | | | VALUE (000S) |
| FOREIGN CURRENCY-DENOMINATED ISSUES 0.1% |
| Brazilian Government International Bond |
10.250% due 01/10/2028 | | BRL | | 4,400 | | $ | | 2,543 |
| | | | | | | | |
Total Foreign Currency-Denominated Issues (Cost $2,505) | | 2,543 |
| | | | | | | | |
|
| | | | | SHARES | | | | |
| PREFERRED STOCKS 0.4% |
| DG Funding Trust |
7.600% due 12/31/2049 | | | | 1,239 | | | | 12,909 |
| | | | | | | | |
Total Preferred Stocks (Cost $13,056) | | 12,909 |
| | | | | | | | |
|
| | | | | PRINCIPAL
AMOUNT
(000S) | | | | |
| SHORT-TERM INSTRUMENTS 27.7% |
|
| CERTIFICATES OF DEPOSIT 6.1% |
| Abbey National Treasury Services PLC |
5.270% due 07/02/2008 | | $ | | 13,600 | | | | 13,606 |
| |
| Barclays Bank PLC |
5.281% due 03/17/2008 | | | | 28,400 | | | | 28,404 |
| |
| BNP Paribas |
5.262% due 07/03/2008 | | | | 13,100 | | | | 13,097 |
5.262% due 05/28/2008 | | | | 5,200 | | | | 5,202 |
| |
| Calyon Financial, Inc. |
5.340% due 01/16/2009 | | | | 9,900 | | | | 9,902 |
| |
| Dexia S.A. |
5.270% due 09/29/2008 | | | | 34,500 | | | | 34,510 |
| |
| Fortis Bank NY |
5.265% due 04/28/2008 | | | | 14,100 | | | | 14,107 |
5.265% due 06/30/2008 | | | | 5,100 | | | | 5,102 |
| |
| Nordea Bank Finland PLC |
5.267% due 03/31/2008 | | | | 4,800 | | | | 4,801 |
5.308% due 05/28/2008 | | | | 5,000 | | | | 5,003 |
5.308% due 04/09/2009 | | | | 14,300 | | | | 14,308 |
| |
| Royal Bank of Canada |
5.267% due 06/30/2008 | | | | 17,100 | | | | 17,115 |
| |
| Royal Bank of Scotland Group PLC |
5.262% due 07/03/2008 | | | | 12,600 | | | | 12,600 |
5.265% due 03/26/2008 | | | | 10,300 | | | | 10,299 |
| |
| | | | | | | | |
| | | | | PRINCIPAL
AMOUNT
(000S) | | | | VALUE
(000S) |
| Skandinav Enskilda BK |
5.340% due 08/21/2008 | | $ | | 14,500 | | $ | | 14,506 |
5.350% due 02/13/2009 | | | | 8,300 | | | | 8,306 |
| |
| Societe Generale NY |
5.268% due 03/28/2008 | | | | 4,200 | | | | 4,203 |
5.269% due 06/30/2008 | | | | 1,100 | | | | 1,101 |
5.270% due 03/26/2008 | | | | 8,100 | | | | 8,100 |
| | | | | | | | |
| | | | | | | | 224,272 |
| | | | | | | | |
|
| COMMERCIAL PAPER 20.6% |
| Bank of America Corp. |
5.215% due 10/04/2007 | | | | 37,900 | | | | 37,414 |
5.220% due 10/04/2007 | | | | 38,600 | | | | 38,583 |
5.250% due 10/04/2007 | | | | 2,400 | | | | 2,367 |
| |
| Bank of Ireland |
5.225% due 11/08/2007 | | | | 3,600 | | | | 3,583 |
| |
| Cox Communications, Inc. |
5.619% due 09/17/2007 | | | | 3,500 | | | | 3,500 |
| |
| Danske Corp. |
5.205% due 10/12/2007 | | | | 11,800 | | | | 11,673 |
| |
| Freddie Mac |
4.800% due 07/02/2007 | | | | 113,200 | | | | 113,200 |
| |
| HBOS Treasury Services PLC |
5.230% due 11/13/2007 | | | | 6,500 | | | | 6,471 |
| |
| Natixis S.A. |
5.240% due 09/21/2007 | | | | 1,300 | | | | 1,295 |
| |
| Rabobank USA Financial Corp. |
5.330% due 07/26/2007 | | | | 102,500 | | | | 102,500 |
| |
| San Paolo IMI U.S. Financial Co. |
5.230% due 08/08/2007 | | | | 16,400 | | | | 16,326 |
| |
| Societe Generale NY |
5.180% due 11/26/2007 | | | | 700 | | | | 685 |
5.210% due 11/26/2007 | | | | 1,800 | | | | 1,781 |
5.226% due 11/26/2007 | | | | 67,700 | | | | 67,356 |
5.245% due 11/26/2007 | | | | 24,500 | | | | 24,204 |
5.246% due 11/26/2007 | | | | 4,700 | | | | 4,644 |
5.250% due 11/26/2007 | | | | 500 | | | | 493 |
| |
| Svenska Handelsbanken, Inc. |
5.203% due 10/09/2007 | | | | 29,300 | | | | 29,088 |
| |
| UBS Finance Delaware LLC |
5.145% due 10/23/2007 | | | | 1,700 | | | | 1,693 |
5.200% due 10/23/2007 | | | | 94,000 | | | | 93,579 |
| | | | | | | | | |
| | | | | PRINCIPAL
AMOUNT
(000S) | | | | VALUE
(000S) | |
5.205% due 10/23/2007 | | $ | | 3,900 | | $ | | 3,890 | |
5.215% due 10/23/2007 | | | | 900 | | | | 890 | |
5.230% due 10/23/2007 | | | | 7,600 | | | | 7,559 | |
5.235% due 10/23/2007 | | | | 4,400 | | | | 4,356 | |
5.245% due 10/23/2007 | | | | 700 | | | | 692 | |
| | |
| Unicredito Italiano SpA | |
5.185% due 01/22/2008 | | | | 73,600 | | | | 71,993 | |
| | |
| Westpac Banking Corp. | |
5.165% due 11/05/2007 | | | | 44,300 | | | | 43,472 | |
5.230% due 11/05/2007 | | | | 2,800 | | | | 2,788 | |
5.240% due 11/05/2007 | | | | 1,200 | | | | 1,186 | |
| | |
| Westpac Trust Securities NZ Ltd. | |
5.240% due 10/19/2007 | | | | 60,400 | | | | 59,960 | |
| | | | | | | | | |
| | | | | | | | 757,221 | |
| | | | | | | | | |
| |
| TRI-PARTY REPURCHASE AGREEMENTS 0.2% | |
| State Street Bank and Trust Co. | |
4.900% due 07/02/2007 | | | | 7,112 | | | | 7,112 | |
| | | | | | | | | |
(Dated 06/29/2007. Collateralized by Freddie Mac 5.400% due 06/15/2010 valued at $7,259. Repurchase proceeds are $7,115.) | | | |
| |
| U.S. TREASURY BILLS 0.8% | |
4.621% due 08/30/2007 - 09/13/2007 (b)(d)(f) | | | | 29,860 | | | | 29,543 | |
| | | | | | | | | |
Total Short-Term Instruments
(Cost $1,018,160) | | 1,018,148 | |
| | | | | | | | | |
| |
PURCHASED OPTIONS (h) 0.2% | | | |
| (Cost $16,475) | | | | | | | | 5,853 | |
| |
Total Investments (e) 119.7%
(Cost $4,451,256) | | $ | | 4,398,751 | |
| |
Written Options (i) (0.2%)
(Premiums $16,146) | | (5,904 | ) |
| |
| Other Assets and Liabilities (Net) (19.5%) | | (717,070 | ) |
| | | | | | | | | |
| Net Assets 100.0% | | | | | | $ | | 3,675,777 | |
| | | | | | | | | |
Notes to Schedule of Investments (amounts in thousands*, except number of contracts):
* A zero balance may reflect actual amounts rounding to less than one thousand.
(a) Security is in default.
(b) Coupon represents a weighted average rate.
(c) Principal amount of security is adjusted for inflation.
(d) Securities with an aggregate market value of $7,178 have been pledged as collateral for swap and swaption contracts on June 30, 2007.
(e) As of June 30, 2007, portfolio securities with an aggregate value of $205,868 were valued in good faith and pursuant to the guidelines established by the Board of Trustees.
| | | | |
| 12 | | PIMCO Variable Insurance Trust | | See Accompanying Notes |
| | |
| |
| | | June 30, 2007 (Unaudited) |
(f) Securities with an aggregate market value of $20,629 have been segregated with the custodian to cover margin requirements for the following open futures contracts on June 30, 2007:
| | | | | | | | | | |
| Description | | Type | | Expiration
Month | | # of
Contracts | | Unrealized
(Depreciation) | |
90-Day Euribor December Futures | | Long | | 12/2007 | | 444 | | $ | (632 | ) |
90-Day Euribor December Futures | | Long | | 12/2008 | | 174 | | | (390 | ) |
90-Day Euribor June Futures | | Long | | 06/2008 | | 459 | | | (981 | ) |
90-Day Euribor March Futures | | Long | | 03/2008 | | 209 | | | (414 | ) |
90-Day Euribor September Futures | | Long | | 09/2008 | | 451 | | | (407 | ) |
90-Day Eurodollar December Futures | | Long | | 12/2007 | | 4,365 | | | (4,972 | ) |
90-Day Eurodollar December Futures | | Long | | 12/2008 | | 2,346 | | | (1,336 | ) |
90-Day Eurodollar June Futures | | Long | | 06/2008 | | 8,706 | | | (9,100 | ) |
90-Day Eurodollar March Futures | | Long | | 03/2008 | | 9,007 | | | (9,295 | ) |
90-Day Eurodollar March Futures | | Long | | 03/2009 | | 214 | | | (313 | ) |
90-Day Eurodollar September Futures | | Long | | 09/2008 | | 1,885 | | | (925 | ) |
90-Day Euroyen December Futures | | Long | | 12/2007 | | 604 | | | (68 | ) |
Euro-Bund 10-Year Note September Futures | | Short | | 09/2007 | | 75 | | | (53 | ) |
U.S. Treasury 10-Year Note September Futures | | Short | | 09/2007 | | 13 | | | (11 | ) |
U.S. Treasury 30-Year Bond September Futures | | Long | | 09/2007 | | 221 | | | (250 | ) |
United Kingdom 90-Day LIBOR Sterling Interest Rate December Futures | | Long | | 12/2007 | | 430 | | | (967 | ) |
United Kingdom 90-Day LIBOR Sterling Interest Rate December Futures | | Long | | 12/2008 | | 36 | | | (61 | ) |
United Kingdom 90-Day LIBOR Sterling Interest Rate June Futures | | Long | | 06/2008 | | 362 | | | (640 | ) |
United Kingdom 90-Day LIBOR Sterling Interest Rate March Futures | | Long | | 03/2008 | | 422 | | | (772 | ) |
United Kingdom 90-Day LIBOR Sterling Interest Rate September Futures | | Long | | 09/2007 | | 243 | | | (520 | ) |
United Kingdom 90-Day LIBOR Sterling Interest Rate September Futures | | Long | | 09/2008 | | 115 | | | (301 | ) |
| | | | | | | | | | |
| | | | | | | | $ | (32,408 | ) |
| | | | | | | | | | |
(g) Swap agreements outstanding on June 30, 2007:
Credit Default Swaps
| | | | | | | | | | | | | | | | |
| Counterparty | | Reference Entity | | Buy/Sell
Protection (1) | | (Pay)/Receive
Fixed Rate | | | Expiration
Date | | Notional
Amount | | Unrealized
Appreciation/
(Depreciation) | |
Bank of America | | Dow Jones CDX N.A. IG7 Index | | Buy | | (0.650% | ) | | 12/20/2016 | | $ | 10,000 | | $ | 87 | |
Bear Stearns & Co., Inc. | | Ford Motor Credit Co. 7.000% due 10/01/2013 | | Sell | | 2.320% | | | 09/20/2007 | | | 2,100 | | | 10 | |
Credit Suisse First Boston | | Ford Motor Credit Co. 7.000% due 10/01/2013 | | Sell | | 0.950% | | | 12/20/2007 | | | 2,300 | | | (2 | ) |
Credit Suisse First Boston | | Panama Government International Bond 8.875% due 09/30/2027 | | Sell | | 1.200% | | | 02/20/2017 | | | 400 | | | 7 | |
Deutsche Bank AG | | Dow Jones CDX N.A. IG8 Index | | Buy | | (0.600% | ) | | 06/20/2017 | | | 5,300 | | | 24 | |
Goldman Sachs & Co. | | Ford Motor Credit Co. 7.000% due 10/01/2013 | | Sell | | 2.400% | | | 09/20/2007 | | | 4,200 | | | 20 | |
Goldman Sachs & Co. | | Anadarko Petroleum Corp. 6.125% due 03/15/2012 | | Sell | | 0.150% | | | 03/20/2008 | | | 2,500 | | | 0 | |
Goldman Sachs & Co. | | Dow Jones CDX N.A. IG7 Index | | Buy | | (0.650% | ) | | 12/20/2016 | | | 44,000 | | | 336 | |
Goldman Sachs & Co. | | Dow Jones CDX N.A. IG8 Index | | Buy | | (0.600% | ) | | 06/20/2017 | | | 25,600 | | | 151 | |
HSBC Bank USA | | Ukraine Government International Bond 7.650% due 06/11/2013 | | Sell | | 0.700% | | | 04/20/2009 | | | 1,600 | | | 6 | |
HSBC Bank USA | | Ukraine Government International Bond 7.650% due 06/11/2013 | | Sell | | 0.520% | | | 05/20/2009 | | | 4,000 | | | (1 | ) |
JPMorgan Chase & Co. | | American International Group, Inc. 0.000% convertible until 11/09/2031 | | Sell | | 0.050% | | | 12/20/2007 | | | 17,200 | | | 1 | |
JPMorgan Chase & Co. | | Panama Government International Bond 8.875% due 09/30/2027 | | Sell | | 0.730% | | | 01/20/2012 | | | 1,000 | | | 6 | |
JPMorgan Chase & Co. | | Mexico Government International Bond 7.500% due 04/08/2033 | | Sell | | 0.920% | | | 03/20/2016 | | | 1,200 | | | 41 | |
JPMorgan Chase & Co. | | Panama Government International Bond 8.875% due 09/30/2027 | | Sell | | 1.250% | | | 01/20/2017 | | | 1,200 | | | 27 | |
Lehman Brothers, Inc. | | Ford Motor Credit Co. 7.000% due 10/01/2013 | | Sell | | 0.950% | | | 12/20/2007 | | | 4,200 | | | (3 | ) |
Lehman Brothers, Inc. | | Indonesia Government International Bond 6.750% due 03/10/2014 | | Sell | | 0.400% | | | 12/20/2008 | | | 2,200 | | | 1 | |
Lehman Brothers, Inc. | | Ukraine Government International Bond 7.650% due 06/11/2013 | | Sell | | 0.700% | | | 12/20/2008 | | | 5,000 | | | 14 | |
Lehman Brothers, Inc. | | Multiple Reference Entities of Gazprom | | Sell | | 1.430% | | | 07/20/2011 | | | 600 | | | 24 | |
Lehman Brothers, Inc. | | Mexico Government International Bond 7.500% due 04/08/2033 | | Sell | | 0.920% | | | 03/20/2016 | | | 3,100 | | | 105 | |
Lehman Brothers, Inc. | | Panama Government International Bond 8.875% due 09/30/2027 | | Sell | | 1.170% | | | 04/20/2017 | | | 3,000 | | | 40 | |
Morgan Stanley | | Russia Government International Bond 7.500% due 03/31/2030 | | Sell | | 0.245% | | | 06/20/2008 | | | 1,300 | | | 0 | |
Royal Bank of Scotland Group PLC | | Indonesia Government International Bond 6.750% due 03/10/2014 | | Sell | | 0.390% | | | 12/20/2008 | | | 3,000 | | | 1 | |
Royal Bank of Scotland Group PLC | | Indonesia Government International Bond 6.750% due 03/10/2014 | | Sell | | 0.400% | | | 12/20/2008 | | | 11,000 | | | 3 | |
| | | | | | | | | | | | | | | | |
| | | | | | | | | | | | | | $ | 898 | |
| | | | | | | | | | | | | | | | |
(1) If the Portfolio is a seller of protection and a credit event occurs, as defined under the terms of that particular swap agreement, the Portfolio will pay to the buyer of the protection an amount up to the notional value of the swap and in certain instances, take delivery of the security. As a buyer of protection, the Portfolio will generally receive from the seller of protection an amount up to the notional amount of the swap if a credit event occurs.
| | | | | | |
| See Accompanying Notes | | Semiannual Report | | June 30, 2007 | | 13 |
Schedule of Investments Total Return Portfolio (Cont.)
Interest Rate Swaps
| | | | | | | | | | | | | | | |
| Counterparty | | Floating Rate Index | | Pay/Receive
Floating Rate | | Fixed Rate | | Expiration
Date | | Notional
Amount | | Unrealized
Appreciation/
(Depreciation) | |
Deutsche Bank AG | | 6-Month Australian Bank Bill | | Pay | | 7.000% | | 12/15/2009 | | AUD | 9,300 | | $ | (5 | ) |
Barclays Bank PLC | | BRL-CDI-Compounded | | Pay | | 11.360% | | 01/04/2010 | | BRL | 16,700 | | | 97 | |
Goldman Sachs & Co. | | BRL-CDI-Compounded | | Pay | | 11.465% | | 01/04/2010 | | | 4,300 | | | 30 | |
Merrill Lynch & Co., Inc. | | BRL-CDI-Compounded | | Pay | | 11.430% | | 01/04/2010 | | | 11,000 | | | 73 | |
Merrill Lynch & Co., Inc. | | BRL-CDI-Compounded | | Pay | | 12.948% | | 01/04/2010 | | | 5,900 | | | 120 | |
Morgan Stanley | | BRL-CDI-Compounded | | Pay | | 12.780% | | 01/04/2010 | | | 14,200 | | | 263 | |
Barclays Bank PLC | | 5-Year French CPI Ex Tobacco Daily Reference Index | | Pay | | 2.103% | | 10/15/2010 | | EUR | 1,400 | | | 19 | |
Barclays Bank PLC | | 5-Year French CPI Ex Tobacco Daily Reference Index | | Pay | | 1.960% | | 04/05/2012 | | | 1,200 | | | (13 | ) |
BNP Paribas Bank | | 5-Year French CPI Ex Tobacco Daily Reference Index | | Pay | | 2.090% | | 10/15/2010 | | | 10,200 | | | 128 | |
Deutsche Bank AG | | 6-Month EUR-LIBOR | | Pay | | 5.000% | | 12/19/2009 | | | 26,700 | | | (9 | ) |
Deutsche Bank AG | | 6-Month EUR-LIBOR | | Receive | | 4.000% | | 12/15/2011 | | | 18,700 | | | 377 | |
Deutsche Bank AG | | 6-Month EUR-LIBOR | | Receive | | 5.000% | | 12/19/2017 | | | 6,300 | | | (33 | ) |
Goldman Sachs & Co. | | 6-Month EUR-LIBOR | | Pay | | 4.000% | | 03/20/2009 | | | 9,600 | | | (69 | ) |
Goldman Sachs & Co. | | 5-Year French CPI Ex Tobacco Daily Reference Index | | Pay | | 1.960% | | 03/30/2012 | | | 2,400 | | | (21 | ) |
JPMorgan Chase & Co. | | 5-Year French CPI Ex Tobacco Daily Reference Index | | Pay | | 1.948% | | 03/15/2012 | | | 8,400 | | | (77 | ) |
JPMorgan Chase & Co. | | 5-Year French CPI Ex Tobacco Daily Reference Index | | Pay | | 1.958% | | 04/10/2012 | | | 9,300 | | | (98 | ) |
Royal Bank of Scotland Group PLC | | 5-Year French CPI Ex Tobacco Daily Reference Index | | Pay | | 1.955% | | 03/28/2012 | | | 1,800 | | | (17 | ) |
Royal Bank of Scotland Group PLC | | 5-Year French CPI Ex Tobacco Daily Reference Index | | Pay | | 1.950% | | 03/30/2012 | | | 1,500 | | | (15 | ) |
UBS Warburg LLC | | 5-Year French CPI Ex Tobacco Daily Reference Index | | Pay | | 2.146% | | 10/15/2010 | | | 1,900 | | | 31 | |
Barclays Bank PLC | | 6-Month GBP-LIBOR | | Pay | | 6.000% | | 12/20/2008 | | GBP | 24,100 | | | (236 | ) |
Barclays Bank PLC | | 6-Month GBP-LIBOR | | Pay | | 6.000% | | 03/20/2009 | | | 13,600 | | | (196 | ) |
Barclays Bank PLC | | 6-Month GBP-LIBOR | | Pay | | 5.000% | | 06/15/2009 | | | 14,400 | | | (259 | ) |
Barclays Bank PLC | | 6-Month GBP-LIBOR | | Receive | | 4.000% | | 12/15/2035 | | | 2,900 | | | 268 | |
Barclays Bank PLC | | 6-Month GBP-LIBOR | | Receive | | 4.000% | | 12/15/2036 | | | 3,200 | | | 774 | |
Credit Suisse First Boston | | 6-Month GBP-LIBOR | | Pay | | 5.000% | | 06/15/2009 | | | 2,800 | | | (66 | ) |
Deutsche Bank AG | | 6-Month GBP-LIBOR | | Pay | | 6.000% | | 12/20/2008 | | | 14,400 | | | (146 | ) |
Goldman Sachs & Co. | | 6-Month GBP-LIBOR | | Pay | | 5.000% | | 06/15/2009 | | | 28,500 | | | (697 | ) |
Goldman Sachs & Co. | | 6-Month GBP-LIBOR | | Pay | | 6.000% | | 06/19/2009 | | | 74,700 | | | (235 | ) |
Goldman Sachs & Co. | | 6-Month GBP-LIBOR | | Receive | | 5.500% | | 12/15/2036 | | | 5,000 | | | 287 | |
HSBC Bank USA | | 6-Month GBP-LIBOR | | Pay | | 4.500% | | 12/20/2007 | | | 53,900 | | | (531 | ) |
HSBC Bank USA | | 6-Month GBP-LIBOR | | Receive | | 4.000% | | 12/15/2036 | | | 5,500 | | | 1,145 | |
Lehman Brothers, Inc. | | 6-Month GBP-LIBOR | | Pay | | 4.500% | | 09/20/2009 | | | 17,500 | | | (1,164 | ) |
Merrill Lynch & Co., Inc. | | 6-Month GBP-LIBOR | | Receive | | 4.000% | | 12/15/2035 | | | 2,200 | | | 208 | |
Royal Bank of Scotland Group PLC | | 6-Month GBP-LIBOR | | Pay | | 6.000% | | 03/20/2009 | | | 12,700 | | | (187 | ) |
Royal Bank of Scotland Group PLC | | 6-Month GBP-LIBOR | | Pay | | 6.000% | | 06/19/2009 | | | 21,200 | | | (80 | ) |
Royal Bank of Scotland Group PLC | | 6-Month GBP-LIBOR | | Receive | | 4.000% | | 12/15/2036 | | | 10,000 | | | 2,182 | |
Royal Bank of Scotland Group PLC | | 6-Month GBP-LIBOR | | Receive | | 5.500% | | 12/15/2036 | | | 1,400 | | | 69 | |
Barclays Bank PLC | | 6-Month JPY-LIBOR | | Pay | | 1.000% | | 03/18/2009 | | JPY | 1,270,000 | | | (28 | ) |
Deutsche Bank AG | | 6-Month JPY-LIBOR | | Pay | | 1.000% | | 09/18/2008 | | | 9,500,000 | | | (49 | ) |
Deutsche Bank AG | | 6-Month JPY-LIBOR | | Pay | | 1.000% | | 03/18/2009 | | | 2,050,000 | | | (30 | ) |
UBS Warburg LLC | | 6-Month JPY-LIBOR | | Pay | | 1.000% | | 03/19/2008 | | | 22,300,000 | | | (64 | ) |
UBS Warburg LLC | | 6-Month JPY-LIBOR | | Pay | | 1.000% | | 09/18/2008 | | | 700,000 | | | (3 | ) |
UBS Warburg LLC | | 6-Month JPY-LIBOR | | Pay | | 1.000% | | 03/18/2009 | | | 18,200,000 | | | (298 | ) |
Citibank N.A. | | 28-Day Mexico Interbank TIIE Banxico | | Pay | | 8.170% | | 11/04/2016 | | MXN | 12,100 | | | 7 | |
Goldman Sachs & Co. | | 28-Day Mexico Interbank TIIE Banxico | | Pay | | 7.780% | | 04/03/2012 | | | 46,500 | | | (38 | ) |
Bank of America | | 3-Month USD-LIBOR | | Pay | | 5.000% | | 12/19/2009 | | $ | 66,300 | | | 6 | |
Bank of America | | 3-Month USD-LIBOR | | Pay | | 5.000% | | 12/19/2009 | | | 118,400 | | | (129 | ) |
Bank of America | | 3-Month USD-LIBOR | | Receive | | 5.000% | | 12/19/2017 | | | 17,200 | | | 160 | |
Barclays Bank PLC | | 3-Month USD-LIBOR | | Pay | | 5.000% | | 12/19/2009 | | | 64,200 | | | (71 | ) |
Deutsche Bank AG | | 3-Month USD-LIBOR | | Pay | | 5.000% | | 12/19/2008 | | | 230,400 | | | (498 | ) |
Deutsche Bank AG | | 3-Month USD-LIBOR | | Pay | | 5.000% | | 12/19/2009 | | | 730,900 | | | 551 | |
Deutsche Bank AG | | 3-Month USD-LIBOR | | Receive | | 5.000% | | 12/19/2017 | | | 77,400 | | | (378 | ) |
Goldman Sachs & Co. | | 3-Month USD-LIBOR | | Pay | | 5.000% | | 12/19/2009 | | | 200 | | | 0 | |
Morgan Stanley | | 3-Month USD-LIBOR | | Pay | | 5.000% | | 06/20/2009 | | | 81,500 | | | (641 | ) |
Morgan Stanley | | 3-Month USD-LIBOR | | Receive | | 5.000% | | 12/19/2017 | | | 15,400 | | | (100 | ) |
Morgan Stanley | | 3-Month USD-LIBOR | | Pay | | 5.000% | | 12/19/2037 | | | 2,500 | | | 41 | |
Royal Bank of Scotland Group PLC | | 3-Month USD-LIBOR | | Pay | | 5.000% | | 12/19/2008 | | | 230,400 | | | (529 | ) |
Royal Bank of Scotland Group PLC | | 3-Month USD-LIBOR | | Pay | | 5.000% | | 06/20/2009 | | | 68,700 | | | (134 | ) |
Royal Bank of Scotland Group PLC | | 3-Month USD-LIBOR | | Pay | | 5.000% | | 12/19/2037 | | | 27,900 | | | 449 | |
| | | | | | | | | | | | | | | |
| | | | | | | | | | | | | $ | 141 | |
| | | | | | | | | | | | | | | |
(h) Purchased options outstanding on June 30, 2007:
Options on Exchange-Traded Futures Contracts
| | | | | | | | | | | | | |
| Description | | Exercise
Price | | Expiration
Date | | # of
Contracts | | Cost | | Value |
Put - CME 90-Day Eurodollar September Futures | | $ | 90.750 | | 09/17/2007 | | 400 | | $ | 4 | | $ | 0 |
Put - CME 90-Day Eurodollar September Futures | | | 91.000 | | 09/17/2007 | | 1,774 | | | 17 | | | 0 |
| | | | | | | | | | | | | |
| | | | | | | | | $ | 21 | | $ | 0 |
| | | | | | | | | | | | | |
| | | | |
| 14 | | PIMCO Variable Insurance Trust | | See Accompanying Notes |
| | |
| |
| | | June 30, 2007 (Unaudited) |
Interest Rate Swaptions
| | | | | | | | | | | | | | | | | | | |
| Description | | Counterparty | | Floating Rate Index | | Pay/Receive
Floating Rate | | Exercise
Rate | | Expiration
Date | | Notional
Amount | | Cost | | Value |
Call - OTC 2-Year Interest Rate Swap | | Barclays Bank PLC | | 6-Month EUR-LIBOR | | Pay | | 3.960% | | 07/02/2007 | | EUR | 26,000 | | $ | 120 | | $ | 0 |
Call - OTC 2-Year Interest Rate Swap | | Deutsche Bank AG | | 6-Month EUR-LIBOR | | Pay | | 3.960% | | 07/02/2007 | | | 84,000 | | | 480 | | | 0 |
Call - OTC 2-Year Interest Rate Swap | | Deutsche Bank AG | | 6-Month EUR-LIBOR | | Pay | | 4.100% | | 07/02/2007 | | | 58,000 | | | 323 | | | 0 |
Call - OTC 2-Year Interest Rate Swap | | Royal Bank of Scotland Group PLC | | 6-Month EUR-LIBOR | | Pay | | 3.960% | | 07/02/2007 | | | 56,000 | | | 271 | | | 0 |
Call - OTC 2-Year Interest Rate Swap | | Bank of America | | 3-Month USD-LIBOR | | Pay | | 4.800% | | 08/08/2007 | | $ | 76,000 | | | 309 | | | 1 |
Call - OTC 2-Year Interest Rate Swap | | Bank of America | | 3-Month USD-LIBOR | | Pay | | 4.900% | | 08/08/2007 | | | 39,000 | | | 172 | | | 1 |
Call - OTC 2-Year Interest Rate Swap | | Bank of America | | 3-Month USD-LIBOR | | Pay | | 4.750% | | 09/26/2008 | | | 261,000 | | | 1,258 | | | 513 |
Call - OTC 2-Year Interest Rate Swap | | Barclays Bank PLC | | 3-Month USD-LIBOR | | Pay | | 5.250% | | 08/08/2007 | | | 72,000 | | | 67 | | | 60 |
Call - OTC 1-Year Interest Rate Swap | | Barclays Bank PLC | | 3-Month USD-LIBOR | | Pay | | 4.750% | | 02/01/2008 | | | 100,000 | | | 287 | | | 30 |
Call - OTC 1-Year Interest Rate Swap | | Goldman Sachs & Co. | | 3-Month USD-LIBOR | | Pay | | 4.700% | | 08/08/2007 | | | 89,000 | | | 199 | | | 0 |
Call - OTC 2-Year Interest Rate Swap | | Lehman Brothers, Inc. | | 3-Month USD-LIBOR | | Pay | | 4.750% | | 03/31/2008 | | | 236,900 | | | 1,254 | | | 293 |
Call - OTC 2-Year Interest Rate Swap | | Lehman Brothers, Inc. | | 3-Month USD-LIBOR | | Pay | | 4.750% | | 09/26/2008 | | | 349,600 | | | 1,237 | | | 688 |
Call - OTC 2-Year Interest Rate Swap | | Royal Bank of Scotland Group PLC | | 3-Month USD-LIBOR | | Pay | | 4.750% | | 07/02/2007 | | | 66,000 | | | 273 | | | 0 |
Call - OTC 1-Year Interest Rate Swap | | Royal Bank of Scotland Group PLC | | 3-Month USD-LIBOR | | Pay | | 4.850% | | 07/02/2007 | | | 150,000 | | | 390 | | | 0 |
Call - OTC 2-Year Interest Rate Swap | | Royal Bank of Scotland Group PLC | | 3-Month USD-LIBOR | | Pay | | 5.250% | | 07/02/2007 | | | 316,400 | | | 1,671 | | | 0 |
Call - OTC 1-Year Interest Rate Swap | | Royal Bank of Scotland Group PLC | | 3-Month USD-LIBOR | | Pay | | 4.900% | | 08/08/2007 | | | 144,000 | | | 326 | | | 0 |
Call - OTC 1-Year Interest Rate Swap | | Royal Bank of Scotland Group PLC | | 3-Month USD-LIBOR | | Pay | | 5.000% | | 08/08/2007 | | | 240,000 | | | 306 | | | 0 |
Call - OTC 2-Year Interest Rate Swap | | Royal Bank of Scotland Group PLC | | 3-Month USD-LIBOR | | Pay | | 4.900% | | 10/25/2007 | | | 109,000 | | | 439 | | | 53 |
Call - OTC 2-Year Interest Rate Swap | | Royal Bank of Scotland Group PLC | | 3-Month USD-LIBOR | | Pay | | 5.000% | | 02/01/2008 | | | 222,600 | | | 1,104 | | | 357 |
Call - OTC 2-Year Interest Rate Swap | | Royal Bank of Scotland Group PLC | | 3-Month USD-LIBOR | | Pay | | 4.750% | | 03/31/2008 | | | 386,900 | | | 2,276 | | | 478 |
Call - OTC 2-Year Interest Rate Swap | | Royal Bank of Scotland Group PLC | | 3-Month USD-LIBOR | | Pay | | 4.750% | | 09/26/2008 | | | 94,900 | | | 377 | | | 187 |
Call - OTC 2-Year Interest Rate Swap | | Royal Bank of Scotland Group PLC | | 3-Month USD-LIBOR | | Pay | | 4.750% | | 12/15/2008 | | | 380,900 | | | 1,304 | | | 864 |
Call - OTC 2-Year Interest Rate Swap | | Royal Bank of Scotland Group PLC | | 3-Month USD-LIBOR | | Pay | | 5.000% | | 12/15/2008 | | | 201,000 | | | 573 | | | 680 |
| | | | | | | | | | | | | | | | | | | |
| | | | | | | | | | | | | | | $ | 15,016 | | $ | 4,205 |
| | | | | | | | | | | | | | | | | | | |
Foreign Currency Options
| | | | | | | | | | | | | | |
| Description | | Exercise
Price | | Expiration
Date | | Notional
Amount | | Cost | | Value |
Call - OTC U.S. dollar versus Japanese yen | | JPY | 103.800 | | 03/17/2010 | | $ | 3,000 | | $ | 131 | | $ | 231 |
Put - OTC U.S. dollar versus Japanese yen | | | 103.800 | | 03/17/2010 | | | 3,000 | | | 131 | | | 74 |
Call - OTC U.S. dollar versus Japanese yen | | | 104.650 | | 03/31/2010 | | | 2,000 | | | 91 | | | 143 |
Put - OTC U.S. dollar versus Japanese yen | | | 104.650 | | 03/31/2010 | | | 2,000 | | | 78 | | | 54 |
Call - OTC U.S. dollar versus Japanese yen | | | 105.200 | | 03/31/2010 | | | 3,000 | | | 126 | | | 204 |
Put - OTC U.S. dollar versus Japanese yen | | | 105.200 | | 03/31/2010 | | | 3,000 | | | 126 | | | 84 |
Call - OTC U.S. dollar versus Japanese yen | | | 105.400 | | 03/31/2010 | | | 9,000 | | | 378 | | | 602 |
Put - OTC U.S. dollar versus Japanese yen | | | 105.400 | | 03/31/2010 | | | 9,000 | | | 377 | | | 256 |
| | | | | | | | | | | | | | |
| | | | | | | | | | $ | 1,438 | | $ | 1,648 |
| | | | | | | | | | | | | | |
(i) Written options outstanding on June 30, 2007:
Options on Exchange-Traded Futures Contracts
| | | | | | | | | | | | | |
| Description | | Exercise
Price | | Expiration
Date | | # of
Contracts | | Premium | | Value |
Call - CBOT U.S. Treasury 10-Year Note September Futures | | $ | 106.000 | | 08/24/2007 | | 1,025 | | $ | 330 | | $ | 625 |
Call - CBOT U.S. Treasury 10-Year Note September Futures | | | 107.000 | | 08/24/2007 | | 553 | | | 173 | | | 147 |
Call - CBOT U.S. Treasury 10-Year Note September Futures | | | 108.000 | | 08/24/2007 | | 133 | | | 27 | | | 14 |
Call - CBOT U.S. Treasury 10-Year Note September Futures | | | 109.000 | | 08/24/2007 | | 187 | | | 22 | | | 9 |
Put - CBOT U.S. Treasury 10-Year Note September Futures | | | 103.000 | | 08/24/2007 | | 248 | | | 134 | | | 27 |
Put - CBOT U.S. Treasury 10-Year Note September Futures | | | 104.000 | | 08/24/2007 | | 777 | | | 301 | | | 170 |
Put - CBOT U.S. Treasury 10-Year Note September Futures | | | 105.000 | | 08/24/2007 | | 876 | | | 305 | | | 411 |
| | | | | | | | | | | | | |
| | | | | | | | | $ | 1,292 | | $ | 1,403 |
| | | | | | | | | | | | | |
Interest Rate Swaptions
| | | | | | | | | | | | | | | | | | | |
| Description | | Counterparty | | Floating Rate Index | | Pay/Receive
Floating Rate | | Exercise
Rate | | Expiration
Date | | Notional
Amount | | Premium | | Value |
Call - OTC 5-Year Interest Rate Swap | | Barclays Bank PLC | | 6-Month EUR-LIBOR | | Receive | | 4.100% | | 07/02/2007 | | EUR | 10,000 | | $ | 120 | | $ | 0 |
Call - OTC 5-Year Interest Rate Swap | | Deutsche Bank AG | | 6-Month EUR-LIBOR | | Receive | | 4.100% | | 07/02/2007 | | | 36,000 | | | 493 | | | 0 |
Call - OTC 5-Year Interest Rate Swap | | Deutsche Bank AG | | 6-Month EUR-LIBOR | | Receive | | 4.230% | | 07/02/2007 | | | 25,000 | | | 322 | | | 0 |
Call - OTC 5-Year Interest Rate Swap | | Royal Bank of Scotland Group PLC | | 6-Month EUR-LIBOR | | Receive | | 4.100% | | 07/02/2007 | | | 24,000 | | | 271 | | | 0 |
Call - OTC 5-Year Interest Rate Swap | | Bank of America | | 3-Month USD-LIBOR | | Receive | | 4.900% | | 08/08/2007 | | $ | 33,000 | | | 290 | | | 2 |
Call - OTC 5-Year Interest Rate Swap | | Bank of America | | 3-Month USD-LIBOR | | Receive | | 4.950% | | 09/26/2008 | | | 112,900 | | | 1,265 | | | 569 |
Call - OTC 10-Year Interest Rate Swap | | Barclays Bank PLC | | 3-Month USD-LIBOR | | Receive | | 5.570% | | 08/08/2007 | | | 18,000 | | | 70 | | | 80 |
Call - OTC 5-Year Interest Rate Swap | | Barclays Bank PLC | | 3-Month USD-LIBOR | | Receive | | 4.900% | | 02/01/2008 | | | 22,000 | | | 274 | | | 46 |
Call - OTC 7-Year Interest Rate Swap | | Goldman Sachs & Co. | | 3-Month USD-LIBOR | | Receive | | 4.850% | | 08/08/2007 | | | 15,000 | | | 204 | | | 0 |
Call - OTC 5-Year Interest Rate Swap | | Lehman Brothers, Inc. | | 3-Month USD-LIBOR | | Receive | | 4.900% | | 03/31/2008 | | | 102,000 | | | 1,202 | | | 312 |
Call - OTC 5-Year Interest Rate Swap | | Lehman Brothers, Inc. | | 3-Month USD-LIBOR | | Receive | | 4.950% | | 09/26/2008 | | | 152,000 | | | 1,259 | | | 765 |
Call - OTC 5-Year Interest Rate Swap | | Royal Bank of Scotland Group PLC | | 3-Month USD-LIBOR | | Receive | | 4.950% | | 07/02/2007 | | | 34,000 | | | 367 | | | 0 |
Call - OTC 5-Year Interest Rate Swap | | Royal Bank of Scotland Group PLC | | 3-Month USD-LIBOR | | Receive | | 5.000% | | 07/02/2007 | | | 28,400 | | | 297 | | | 0 |
Call - OTC 5-Year Interest Rate Swap | | Royal Bank of Scotland Group PLC | | 3-Month USD-LIBOR | | Receive | | 5.370% | | 07/02/2007 | | | 138,000 | | | 1,680 | | | 0 |
| | | | | | |
| See Accompanying Notes | | Semiannual Report | | June 30, 2007 | | 15 |
| | |
| |
| Schedule of Investments Total Return Portfolio (Cont.) | | June 30, 2007 (Unaudited) |
| | | | | | | | | | | | | | | | | | | |
| Description | | Counterparty | | Floating Rate Index | | Pay/Receive
Floating Rate | | Exercise
Rate | | Expiration
Date | | Notional
Amount | | Premium | | Value |
Call - OTC 7-Year Interest Rate Swap | | Royal Bank of Scotland Group PLC | | 3-Month USD-LIBOR | | Receive | | 4.900% | | 08/08/2007 | | $ | 24,000 | | $ | 278 | | $ | 1 |
Call - OTC 5-Year Interest Rate Swap | | Royal Bank of Scotland Group PLC | | 3-Month USD-LIBOR | | Receive | | 4.900% | | 08/08/2007 | | | 46,000 | | | 307 | | | 3 |
Call - OTC 7-Year Interest Rate Swap | | Royal Bank of Scotland Group PLC | | 3-Month USD-LIBOR | | Receive | | 5.000% | | 08/08/2007 | | | 13,000 | | | 148 | | | 1 |
Call - OTC 5-Year Interest Rate Swap | | Royal Bank of Scotland Group PLC | | 3-Month USD-LIBOR | | Receive | | 5.010% | | 10/25/2007 | | | 47,000 | | | 433 | | | 63 |
Call - OTC 5-Year Interest Rate Swap | | Royal Bank of Scotland Group PLC | | 3-Month USD-LIBOR | | Receive | | 5.100% | | 02/01/2008 | | | 97,000 | | | 1,164 | | | 347 |
Call - OTC 5-Year Interest Rate Swap | | Royal Bank of Scotland Group PLC | | 3-Month USD-LIBOR | | Receive | | 4.900% | | 03/31/2008 | | | 106,500 | | | 1,417 | | | 325 |
Call - OTC 5-Year Interest Rate Swap | | Royal Bank of Scotland Group PLC | | 3-Month USD-LIBOR | | Receive | | 4.950% | | 03/31/2008 | | | 62,000 | | | 763 | | | 212 |
Call - OTC 5-Year Interest Rate Swap | | Royal Bank of Scotland Group PLC | | 3-Month USD-LIBOR | | Receive | | 4.950% | | 09/26/2008 | | | 41,100 | | | 371 | | | 207 |
Call - OTC 7-Year Interest Rate Swap | | Royal Bank of Scotland Group PLC | | 3-Month USD-LIBOR | | Receive | | 5.000% | | 12/15/2008 | | | 128,100 | | | 1,298 | | | 910 |
Call - OTC 7-Year Interest Rate Swap | | Royal Bank of Scotland Group PLC | | 3-Month USD-LIBOR | | Receive | | 5.200% | | 12/15/2008 | | | 67,000 | | | 561 | | | 658 |
| | | | | | | | | | | | | | | | | | | |
| | | | | | | | | | | | | | | $ | 14,854 | | $ | 4,501 |
| | | | | | | | | | | | | | | | | | | |
(j) Short sales outstanding on June 30, 2007:
| | | | | | | | | | | | | |
| Description | | Coupon | | Maturity
Date | | Principal
Amount | | Proceeds | | Value (2) |
U.S. Treasury Notes | | 4.500% | | 05/15/2017 | | $ | 79,600 | | $ | 76,247 | | $ | 76,909 |
U.S. Treasury Notes | | 4.625% | | 02/15/2017 | | | 11,300 | | | 10,989 | | | 11,151 |
| | | | | | | | | | | | | |
| | | | | | | | | $ | 87,236 | | $ | 88,060 |
| | | | | | | | | | | | | |
(2) Market value includes $771 of interest payable on short sales.
(k) Foreign currency contracts outstanding on June 30, 2007:
| | | | | | | | | | | | | | | | | |
| Type | | Currency | | Principal
Amount
Covered by
Contract | | Settlement
Month | | Unrealized
Appreciation | | Unrealized
(Depreciation) | | | Net Unrealized
Appreciation/
(Depreciation) | |
Buy | | AUD | | 13,512 | | 07/2007 | | $ | 82 | | $ | 0 | | | $ | 82 | |
Sell | | | | 152 | | 07/2007 | | | 0 | | | (2 | ) | | | (2 | ) |
Buy | | BRL | | 134,709 | | 10/2007 | | | 2,711 | | | 0 | | | | 2,711 | |
Buy | | | | 72,223 | | 03/2008 | | | 2,203 | | | 0 | | | | 2,203 | |
Buy | | CAD | | 8,794 | | 08/2007 | | | 37 | | | 0 | | | | 37 | |
Buy | | CLP | | 709,183 | | 03/2008 | | | 0 | | | (4 | ) | | | (4 | ) |
Buy | | CNY | | 3,842 | | 09/2007 | | | 10 | | | 0 | | | | 10 | |
Sell | | | | 3,842 | | 09/2007 | | | 0 | | | (1 | ) | | | (1 | ) |
Buy | | | | 49,610 | | 11/2007 | | | 51 | | | 0 | | | | 51 | |
Sell | | | | 49,610 | | 11/2007 | | | 5 | | | (12 | ) | | | (7 | ) |
Buy | | | | 23,778 | | 01/2008 | | | 0 | | | (21 | ) | | | (21 | ) |
Sell | | | | 23,778 | | 01/2008 | | | 1 | | | (3 | ) | | | (2 | ) |
Buy | | EUR | | 8,967 | | 07/2007 | | | 117 | | | 0 | | | | 117 | |
Sell | | GBP | | 6,996 | | 08/2007 | | | 0 | | | (74 | ) | | | (74 | ) |
Buy | | IDR | | 24,255,000 | | 05/2008 | | | 0 | | | (114 | ) | | | (114 | ) |
Buy | | INR | | 187,331 | | 10/2007 | | | 20 | | | (1 | ) | | | 19 | |
Buy | | | | 1,010 | | 11/2007 | | | 0 | | | 0 | | | | 0 | |
Buy | | | | 122,664 | | 05/2008 | | | 50 | | | 0 | | | | 50 | |
Sell | | JPY | | 1,031,294 | | 07/2007 | | | 121 | | | 0 | | | | 121 | |
Buy | | KRW | | 6,070,349 | | 07/2007 | | | 44 | | | 0 | | | | 44 | |
Sell | | | | 668,852 | | 07/2007 | | | 0 | | | (3 | ) | | | (3 | ) |
Buy | | | | 1,157,326 | | 08/2007 | | | 0 | | | (1 | ) | | | (1 | ) |
Buy | | | | 6,709,511 | | 09/2007 | | | 18 | | | 0 | | | | 18 | |
Buy | | MXN | | 41,747 | | 09/2007 | | | 54 | | | 0 | | | | 54 | |
Buy | | | | 153,994 | | 03/2008 | | | 126 | | | (2 | ) | | | 124 | |
Buy | | MYR | | 28,483 | | 05/2008 | | | 0 | | | (123 | ) | | | (123 | ) |
Buy | | NZD | | 1,690 | | 07/2007 | | | 32 | | | 0 | | | | 32 | |
Buy | | PHP | | 391,443 | | 05/2008 | | | 0 | | | (108 | ) | | | (108 | ) |
Buy | | PLN | | 34,725 | | 09/2007 | | | 221 | | | (2 | ) | | | 219 | |
Buy | | | | 6,468 | | 03/2008 | | | 29 | | | 0 | | | | 29 | |
Buy | | RUB | | 100,792 | | 09/2007 | | | 51 | | | 0 | | | | 51 | |
Buy | | | | 90,414 | | 11/2007 | | | 90 | | | 0 | | | | 90 | |
Buy | | | | 235,816 | | 12/2007 | | | 209 | | | 0 | | | | 209 | |
Buy | | | | 381,762 | | 01/2008 | | | 66 | | | 0 | | | | 66 | |
Buy | | SEK | | 15,753 | | 09/2007 | | | 28 | | | 0 | | | | 28 | |
Buy | | SGD | | 21,054 | | 07/2007 | | | 0 | | | (88 | ) | | | (88 | ) |
Buy | | | | 6,884 | | 08/2007 | | | 25 | | | (13 | ) | | | 12 | |
Buy | | | | 860 | | 09/2007 | | | 0 | | | (2 | ) | | | (2 | ) |
Buy | | | | 23,617 | | 10/2007 | | | 69 | | | (6 | ) | | | 63 | |
Buy | | ZAR | | 964 | | 09/2007 | | | 3 | | | 0 | | | | 3 | |
Buy | | | | 148 | | 03/2008 | | | 0 | | | 0 | | | | 0 | |
| | | | | | | | | | | | | | | | | |
| | | | | | | | $ | 6,473 | | $ | (580 | ) | | $ | 5,893 | |
| | | | | | | | | | | | | | | | | |
| | | | |
| 16 | | PIMCO Variable Insurance Trust | | See Accompanying Notes |
| | |
| |
| Notes to Financial Statements | | June 30, 2007 (Unaudited) |
1. ORGANIZATION
The Total Return Portfolio (the “Portfolio”) is a series of the PIMCO Variable Insurance Trust (the “Trust”). The Trust is registered under the Investment Company Act of 1940 (the “Act”), as amended, as an open-end management investment company organized as a Delaware business trust on October 3, 1997. The Portfolio offers three classes of shares: Institutional, Administrative and Advisor. Information presented on these financial statements pertains to the Administrative Class of the Portfolio. Certain detailed financial information for the Institutional Class and Advisor Class is provided separately and is available upon request. The Trust is designed to be used as an investment vehicle by Separate Accounts of insurance companies that fund variable annuity contracts and variable life insurance policies and by qualified pension and retirement plans.
2. SIGNIFICANT ACCOUNTING POLICIES
The following is a summary of significant accounting policies consistently followed by the Portfolio in the preparation of its financial statements in conformity with accounting principles generally accepted in the United States of America (“GAAP”). The preparation of financial statements in accordance with GAAP requires management to make estimates and assumptions that affect the reported amounts and disclosures on the financial statements. Actual results could differ from those estimates.
(a) Security Valuation Portfolio securities are valued as of the close of regular trading (normally 4:00 p.m., Eastern Time) on each day that the New York Stock Exchange (“NYSE”) is open. Portfolio securities and other assets for which market quotes are readily available are stated at market value. Market value is generally determined on the basis of last reported sales prices, or if no sales are reported, based on quotes obtained from a quotation reporting system, established market makers, or pricing services. Fixed-income securities and non-exchange traded derivatives are normally valued on the basis of quotes obtained from brokers and dealers or pricing services. Prices obtained from independent pricing services use information provided by market makers or estimates of market values obtained from yield data relating to investments or securities with similar characteristics. Certain fixed income securities purchased on a delayed-delivery basis are marked to market daily until settlement at the forward settlement date. Short-term investments having a maturity of 60 days or less are generally valued at amortized cost. Exchange traded options, futures and options on futures are valued at the settlement price determined by the relevant exchange. With respect to any portion of the Portfolio’s assets that are invested in one or more open end management investment companies, the Portfolio’s net asset value (“NAV”) will be calculated based upon the NAVs of such investments.
Investments initially valued in currencies other than the U.S. dollar are converted to the U.S. dollar using exchange rates obtained from pricing services. As a result, the NAV of the Portfolio’s securities may be affected by changes in the value of currencies in relation to the U.S. dollar. The value of securities traded in markets outside the United States or denominated in currencies other than the U.S. dollar may be affected significantly on a day that the NYSE is closed and an investor is not able to purchase, redeem or exchange shares.
Securities and other assets for which market quotes are not readily available are valued at fair value as determined in good faith by the Board of Trustees or persons acting at their direction. The Board of Trustees has adopted methods for valuing securities and other assets in circumstances where market quotes are not readily available, and has delegated to Pacific Investment Management Company LLC (“PIMCO”) the responsibility for applying the valuation methods. In the event that market quotes are not readily available, and the security or asset cannot be valued pursuant to one of the valuation methods, the value of the security or asset will be determined in good faith by the Valuation Committee of the Board of Trustees, generally based upon recommendations provided by PIMCO.
Market quotes are considered not readily available in circumstances where there is an absence of current or reliable market-based data (e.g., trade information, bid/asked information, broker quotes), including where events occur after the close of the relevant market, but prior to the close of regular trading, that materially affect the values of the Portfolio’s securities or assets. In addition, market quotes are considered not readily available when, due to extraordinary circumstances, the exchanges or markets on which the securities trade, do not open for trading for the entire day and no other market prices are available. The Board has delegated to PIMCO the responsibility for monitoring significant events that may materially affect the values of the Portfolio’s securities or assets and for determining whether the value of the applicable securities or assets should be re-evaluated in light of such significant events.
When the Portfolio uses fair value pricing to determine its NAV, securities will not be priced on the basis of quotations from the primary market in which they are traded, but rather may be priced by another method that the Board of Trustees or persons acting at their direction believe accurately reflects fair value. The Trust’s policy is intended to result in a calculation of the Portfolio’s NAV that fairly reflects security values as of the time of pricing. However, fair values determined by the Board of Trustees or persons acting at their direction may not accurately reflect the price that the Portfolio could obtain for a security if it were to dispose of that security as of the time of pricing. Because foreign securities can trade on non-business days of the Portfolio, the NAV of the Portfolio may change on days when shareholders will not be able to purchase or redeem Portfolio shares. The prices used by the Portfolio may differ from the value that would be realized if the securities were sold and the differences could be material to the financial statements.
(b) Securities Transactions and Investment Income Securities transactions are recorded as of the trade date for financial reporting purposes. Securities purchased or sold on a when-issued or delayed-delivery basis may be settled a month or more after the trade date. Realized gains and losses from securities sold are recorded on the identified cost basis. Dividend income is recorded on the ex-dividend date, except certain dividends from foreign securities where the ex-dividend date may have passed, which are recorded as soon as the Portfolio is informed of the ex-dividend date. Interest income, adjusted for the accretion of discounts and amortization of premiums, is recorded on the accrual basis. Paydown gains and losses on mortgage-related and other asset-backed securities are recorded as components of interest income on the Statement of Operations.
(c) Delayed-Delivery Transactions The Portfolio may purchase or sell securities on a delayed-delivery basis. These transactions involve a commitment by the Portfolio to purchase or sell securities for a predetermined price or yield, with payment and delivery taking place beyond the customary settlement period. When delayed-delivery purchases are outstanding, the Portfolio will designate liquid assets in an amount sufficient to meet the purchase price. When purchasing a security on a delayed-delivery basis, the Portfolio assumes the rights and risks of ownership of the security, including the risk of price and yield fluctuations, and takes such fluctuations into account when determining its net asset value. The Portfolio may dispose of or renegotiate a delayed-delivery transaction after it is entered into, and may sell when-issued securities before they are delivered, which may result in a capital gain or loss. When the Portfolio has sold a security on a delayed-delivery basis, the Portfolio does not participate in future gains and losses with respect to the security.
(d) Dividends and Distributions to Shareholders Dividends from net investment income, if any, are declared daily and distributed to shareholders monthly. Net realized capital gains earned by the Portfolio, if any, will be distributed no less frequently than once each year.
Income dividends and capital gain distributions are determined in accordance with income tax regulations which may differ from GAAP. Differences between tax
| | | | | | |
| | Semiannual Report | | June 30, 2007 | | 17 |
Notes to Financial Statements (Cont.)
regulations and GAAP may change the fiscal year when income and capital items are recognized for tax and GAAP purposes. Examples of events that give rise to timing differences include wash sales, straddles, net operating losses and capital loss carryforwards. Further, the character of investment income and capital gains may be different for certain transactions under the two methods of accounting. Examples of characterization differences include the treatment of mortgage paydowns, swaps, foreign currency transactions and contingent debt instruments. As a result, income dividends and capital gain distributions declared during a fiscal period may differ significantly from the net investment income and realized capital gain reported on the Portfolio’s annual financial statements presented under GAAP.
Distributions classified as a tax basis return of capital, if any, are reflected on the accompanying Statements of Changes in Net Assets and have been reclassified to paid in capital. In addition, other amounts have been reclassified between undistributed net investment income, accumulated undistributed net realized gains or losses and/or paid in capital to more appropriately conform financial accounting to tax characterizations of dividend distributions.
(e) Multiclass Operations Each class offered by the Portfolio has equal rights as to assets and voting privileges (except that shareholders of a class have exclusive voting rights regarding any matter relating solely to that class of shares). Income and non-class specific expenses of the Portfolio are allocated daily to each class of shares based on the relative value of settled shares. Realized and unrealized capital gains and losses of the Portfolio are allocated daily to each class of shares based on the relative net assets of each class. Class specific expenses, where applicable, currently include administrative, distribution and servicing fees.
(f) Foreign Currency The functional and reporting currency for the Portfolio is the U.S. dollar. The market values of foreign securities, currency holdings and other assets and liabilities are translated into U.S. dollars based on the current exchange rates each business day. Fluctuations in the value of currency holdings and other assets and liabilities resulting from changes in exchange rates are recorded as unrealized foreign currency gains or losses. Realized gains or losses and unrealized appreciation or depreciation on investment securities and income and expenses are translated on the respective dates of such transactions. The effects of changes in foreign currency exchange rates on investments in securities are not segregated on the Statement of Operations from the effects of changes in market prices of those securities, but are included with the net realized and unrealized gain or loss on investment securities.
| | | | | | |
|
| Non-U.S. currency symbols utilized throughout the report are defined as follows: |
| AUD | | Australian Dollar | | KRW | | South Korean Won |
| BRL | | Brazilian Real | | MXN | | Mexican Peso |
| CAD | | Canadian Dollar | | MYR | | Malaysian Ringgit |
| CLP | | Chilean Peso | | NZD | | New Zealand Dollar |
| CNY | | Chinese Yuan Renminbi | | PHP | | Philippines Peso |
| EUR | | Euro | | PLN | | Polish Zloty |
| GBP | | Great British Pound | | RUB | | Russian Ruble |
| IDR | | Indonesian Rupiah | | SEK | | Swedish Krona |
| INR | | Indian Rupee | | SGD | | Singapore Dollar |
| JPY | | Japanese Yen | | ZAR | | South African Rand |
(g) Foreign Currency Transactions The Portfolio may enter into foreign currency contracts in connection with settling planned purchases or sales of securities, to hedge the currency exposure associated with some or all of the Portfolio’s securities or as a part of an investment strategy. A foreign currency
contract is an agreement between two parties to buy and sell a currency at a set price on a future date. The market value of a foreign currency contract fluctuates with changes in foreign currency exchange rates. Foreign currency contracts are marked to market daily and the change in value is recorded by the Portfolio as an unrealized gain or loss. Realized gains or losses equal to the difference between the value of the contract at the time it was opened and the value at the time it was closed are recorded upon delivery or receipt of the currency. These contracts may involve market risk in excess of the unrealized gain or loss reflected on the Statement of Assets and Liabilities. In addition, the Portfolio could be exposed to risk if the counterparties are unable to meet the terms of the contracts or if the value of the currency changes unfavorably to the U.S. dollar.
(h) Futures Contracts The Portfolio may enter into futures contracts. The Portfolio may use futures contracts to manage its exposure to the securities markets or to movements in interest rates and currency values. The primary risks associated with the use of futures contracts are the imperfect correlation between the change in market value of the securities held by the Portfolio and the prices of futures contracts, the possibility of an illiquid market, and the inability of the counterparty to meet the terms of the contract. Futures contracts are valued based upon their quoted daily settlement prices. Upon entering into a futures contract, the Portfolio is required to deposit with its futures broker, an amount of cash or U.S. Government and Agency Obligations in accordance with the initial margin requirements of the broker or exchange. Futures contracts are marked to market daily and an appropriate payable or receivable for the change in value (“variation margin”) is recorded by the Portfolio. Gains or losses are recognized but not considered realized until the contracts expire or are closed. Futures contracts involve, to varying degrees, risk of loss in excess of the variation margin disclosed on the Statement of Assets and Liabilities.
(i) Inflation-Indexed Bonds The Portfolio may invest in inflation-indexed bonds. Inflation-indexed bonds are fixed-income securities whose principal value is periodically adjusted to the rate of inflation. The interest rate on these bonds is generally fixed at issuance at a rate lower than typical bonds. Over the life of an inflation-indexed bond, however, interest will be paid based on a principal value, which is adjusted for inflation. Any increase in the principal amount of an inflation-indexed bond will be included as interest income on the Statement of Operations, even though investors do not receive their principal until maturity.
(j) Options Contracts The Portfolio may write call and put options on futures, swaps, securities or currencies it owns or in which it may invest. Writing put options tends to increase the Portfolio’s exposure to the underlying instrument. Writing call options tends to decrease the Portfolio’s exposure to the underlying instrument. When the Portfolio writes a call or put option, an amount equal to the premium received is recorded as a liability and subsequently marked to market to reflect the current value of the option written. These liabilities are reflected as written options outstanding on the Statement of Assets and Liabilities. Certain options may be written with premiums to be determined on a future date. The premiums for these options are based upon implied volatility parameters at specified terms. Premiums received from writing options which expire are treated as realized gains. Premiums received from writing options which are exercised or closed are added to the proceeds or offset against amounts paid on the underlying future, swap, security or currency transaction to determine the realized gain or loss. The Portfolio as a writer of an option has no control over whether the underlying future, swap, security or currency may be sold (call) or purchased (put) and as a result bears the market risk of an unfavorable change in the price of the future, swap, security or currency underlying the written option. There is the risk the Portfolio may not be able to enter into a closing transaction because of an illiquid market.
The Portfolio may also purchase put and call options. Purchasing call options tends to increase the Portfolio’s exposure to the underlying instrument. Purchasing put options tends to decrease the Portfolio’s exposure to the underlying instrument.
| | | | |
| 18 | | PIMCO Variable Insurance Trust | | |
| | |
| |
| | | June 30, 2007 (Unaudited) |
The Portfolio pays a premium which is included on the Statement of Assets and Liabilities as an investment and subsequently marked to market to reflect the current value of the option. Premiums paid for purchasing options which expire are treated as realized losses. Certain options may be purchased with premiums to be determined on a future date. The premiums for these options are based upon implied volatility parameters at specified terms. The risk associated with purchasing put and call options is limited to the premium paid. Premiums paid for purchasing options which are exercised or closed are added to the amounts paid or offset against the proceeds on the underlying future, swap, security or currency transaction to determine the realized gain or loss.
(k) Repurchase Agreements The Portfolio may engage in repurchase transactions. Under the terms of a typical repurchase agreement, the Portfolio takes possession of an underlying debt obligation (collateral) subject to an obligation of the seller to repurchase, and the Portfolio to resell, the obligation at an agreed-upon price and time. The underlying securities for all repurchase agreements are held in safekeeping at the Portfolio’s custodian or designated subcustodians under tri-party repurchase agreements. The market value of the collateral must be equal to or exceed the total amount of the repurchase obligations, including interest. Securities purchased under repurchase agreements are reflected as an asset on the Statement of Assets and Liabilities. Generally, in the event of counterparty default, the Portfolio has the right to use the collateral to offset losses incurred. If the counterparty should default, the Portfolio will seek to sell the securities which it holds as collateral. This could involve procedural costs or delays in addition to a loss on the securities if their value should fall below their repurchase price.
(l) Inverse Floating Rate Transactions—Residual Interest Municipal Bonds (“RIBs”)/Residual Interest Tax Exempt Bonds (“RITEs”) The Portfolio may invest in RIBs and RITEs (“Inverse Floaters”). Inverse Floaters are created via a master trust agreement between a broker-dealer, acting as trustor and liquidity provider, and an investment bank, acting as trustee and tender agent. The master trust agreement defines the terms for each trust series; with each series being established by the transfer of long-term, fixed-rate municipal bonds (“Fixed Rate Bonds”) to the trustee to be held and provide for the creation, execution and delivery of floater certificates (“Floating Rate Notes”) and Inverse Floaters. Floating Rate Notes are liquid notes that are issued with a short-term variable rate typically linked to the LIBOR, subject to limitations, for some duration. After interest income is paid on the Floating Rate Notes at current rates, the residual income from the Fixed Rate Bonds is paid to the Inverse Floaters. Inverse Floaters are issued with a coupon that fluctuates inversely with the Floating Rate Notes’ referenced rate, subject to certain limitations. Therefore, rising short-term rates result in lower income for the Inverse Floaters and vice versa.
Floating Rate Notes are generally remarketed to municipal money market funds. Inverse Floaters are acquired by either tax-exempt municipal bond funds or trusts, or other parties interested in potentially higher yielding tax-exempt securities. Inverse Floaters may also be acquired for the purpose of increasing leverage. Floating Rate Note holders typically have the option to tender their notes to the liquidity provider for redemption at par at each reset date. The Inverse Floater holders have the option to (i) require the Floating Rate Note holders to tender their notes at par, and (ii) require the liquidity provider to transfer the Fixed Rate Bonds to the Inverse Floater holders. The holders of Inverse Floaters bear substantially all of the downside investment risk associated with the underlying Fixed Rate Bonds, and also benefit from a disproportionate amount of the potential appreciation of the underlying Fixed Rate Bonds’ value. Inverse Floaters may be more volatile and less liquid than other municipal bonds of comparable maturity.
Inverse Floaters may be acquired with or without first transferring to the trustor the Fixed Rate Bonds that were utilized to create the trust series. Inverse Floaters
acquired without a transfer of Fixed Rate Bonds are recognized as purchases of securities as outlined in Note 2(b). Statement of Financial Accounting Standards No. 140—Accounting for Transfers and Servicing of Financial Assets and Extinguishments of Liabilities (“FAS No. 140”), governs the standards for accounting for securitizations and other transfers of financial assets. If there is a transfer of Fixed Rate Bonds and it meets sale criteria under FAS No. 140, a Portfolio records a sale of the Fixed Rate Bonds and a purchase of the Inverse Floaters. The cash received from the Inverse Floaters is then recorded as interest income in the Statement of Operations.
If the transfer of Fixed Rate Bonds does not meet sale criteria under FAS No. 140, a Portfolio accounts for the transaction described above as a secured borrowing by including the Fixed Rate Bonds in its Schedule of Investments, and recording the Floating Rate Notes as a liability under the caption “Payable for floating rate notes” in the Portfolio’s Statement of Assets and Liabilities. In a secured borrowing transaction, cash received from the Inverse Floaters is not recorded as interest income. Instead, a Portfolio records interest income related to the Fixed Rate Bonds and interest expense related to the Floating Rate Notes, the net of which is equal to the cash received from the Inverse Floaters acquired by the Portfolio. Thus, while a Portfolio’s reported total income, net expenses, and net expense ratio are generally higher for investments in Inverse Floaters acquired via a secured borrowing, the method of acquiring Inverse Floaters does not result in differences for reported cash flows, net asset value or total return.
(m) Short Sales The Portfolio may enter into short sales transactions. A short sale is a transaction in which the Portfolio sells securities it does not own in anticipation of a decline in the market price of the securities. Securities sold in short sale transactions and interest payable on such securities, if any, are reflected as a liability on the Statement of Assets and Liabilities. The Portfolio is obligated to deliver securities at the market price at the time the short position is closed. Possible losses from short sales may be unlimited, whereas losses from purchases cannot exceed the total amount invested.
(n) Swap Agreements The Portfolio may invest in swap agreements. Swap transactions are privately negotiated agreements between the Portfolio and a counterparty to exchange or swap investment cash flows, assets, or market-linked returns at specified, future intervals. The Portfolio may enter into interest rate, total return, forward spread-lock, credit default, and other forms of swap agreements to manage its exposure to interest rates and credit risk. In connection with these agreements, securities may be identified as collateral in accordance with the terms of the respective swap agreements.
Interest rate swap agreements involve the exchange by the Portfolio with another party of their respective commitments to pay or receive interest, e.g., an exchange of floating rate payments for fixed rate payments with respect to the notional amount of principal. Certain forms of interest rate swap agreements may include: (i) interest rate caps, under which, in return for a premium, one party agrees to make payments to the other to the extent that interest rates exceed a specified rate, or “cap”, (ii) interest rate floors, under which, in return for a premium, one party agrees to make payments to the other to the extent that interest rates fall below a specified rate, or “floor”, or (iii) interest rate collars, under which a party sells a cap and purchases a floor or vice versa in an attempt to protect itself against interest rate movements exceeding given minimum or maximum levels.
Total return swap agreements involve commitments to pay interest in exchange for a market-linked return, both based on notional amounts. To the extent the total return of the security or index underlying the transaction exceeds or falls short of the offsetting interest rate obligation, the Portfolio will receive a payment from or make a payment to the counterparty.
Forward spread-lock swap agreements involve commitments to pay or receive a settlement amount calculated as the difference between the swap spread and a
| | | | | | |
| | Semiannual Report | | June 30, 2007 | | 19 |
Notes to Financial Statements (Cont.)
fixed spread, multiplied by the notional amount times the duration of the swap. The swap spread is the difference between the benchmark swap rate (market rate) and the specific Treasury rate.
Credit default swap agreements involve one party making a stream of payments to another party in exchange for the right to receive a specified return in the event of a default by a third party, typically corporate issues or sovereign issues of an emerging country, on its obligation. The Portfolio may use credit default swaps to provide a measure of protection against defaults of the issuers (i.e., to reduce risk where the Portfolio owns or has exposure to the sovereign issuer) or to take an active long or short position with respect to the likelihood of a particular issuer’s default. As a seller of protection, the Portfolio generally receives an upfront payment or a fixed rate of income throughout the term of the swap provided that there is no credit event. If the Portfolio is a seller of protection and a credit event occurs, as defined under the terms of that particular swap agreement, the Portfolio will pay to the buyer of the protection an amount up to the notional value of the swap and in certain instances take delivery of the security. As the seller, the Portfolio would effectively add leverage to its portfolio because, in addition to its total net assets, the Portfolio would be subject to investment exposure on the notional amount of the swap. As a buyer of protection, the Portfolio generally receives an amount up to the notional value of the swap if a credit event occurs. The treatment of credit default swaps and other swap agreements that provide for contingent, non-periodic, bullet-type payments as “notional principal contracts” for U.S. federal income tax purposes is uncertain. Were the U.S. Internal Revenue Service (“IRS”) to take the position that a credit default swap or other bullet-type swap is not a “notional principal contract” for U.S. federal income tax purposes, payments received by the Portfolio from such investments might be subject to U.S. excise or income taxes.
Swaps are marked to market daily based upon quotations from market makers and the change in value, if any, is recorded as unrealized gain or loss on the Statement of Operations. Payments received or made at the beginning of the measurement period are reflected as such on the Statement of Assets and Liabilities. These upfront payments are recorded as realized gain or loss on the Statement of Operations upon termination or maturity of the swap. A liquidation payment received or made at the termination of the swap is recorded as realized gain or loss on the Statement of Operations. Net periodic payments received or paid by the Portfolio are included as part of realized gain or loss on the Statement of Operations. Entering into these agreements involves, to varying degrees, elements of credit, market and documentation risk in excess of the amounts recognized on the Statement of Assets and Liabilities. Such risks involve the possibility that there will be no liquid market for these agreements, that the counterparty to the agreements may default on its obligation to perform or disagree as to the meaning of contractual terms in the agreements and that there may be unfavorable changes in interest rates.
(o) Loan Participations and Assignments The Portfolio may invest in direct debt instruments which are interests in amounts owned by corporate, governmental, or other borrowers to lenders or lending syndicates. The Portfolio’s investments in loans may be in the form of participations in loans or assignments of all or a portion of loans from third parties. A loan is often administered by a bank or other financial institution (the “lender”) that acts as agent for all holders. The agent administers the terms of the loan, as specified in the loan agreement. When investing in a loan participation, the Portfolio has the right to receive payments of principal, interest and any fees to which it is entitled only from the lender selling the loan agreement and only upon receipt by the lender of payments from the borrower. The Portfolio generally has no right to enforce compliance with the terms of the loan agreement with the borrower. As a result, the Portfolio may be subject to the credit risk of both the borrower and the lender that is selling the loan agreement. When the Portfolio purchases assignments from lenders it
acquires direct rights against the borrower of the loan. At the end of the period June 30, 2007, the Portfolio had no unfunded loan commitments.
(p) Bridge Debt Commitments At the period ended June 30, 2007, the Portfolio had $8,059,500 in commitments outstanding to fund high yield bridge debt. The Portfolio is entitled to a fee upon the expiration of the commitment period. The bridge debt terms approximate market rates at the time the commitment is entered into.
(q) Commodities Index-Linked/Structured Notes The Portfolio invests in structured notes whose value is based on the price movements of a commodity index. The structured notes are often leveraged, increasing the volatility of each note’s value relative to the change in the underlying linked financial element. The value of these notes will rise and fall in response to changes in the underlying commodity index. Structured notes may entail a greater degree of market risk than other types of debt securities because the investor bears the risk of the underlying commodity index. Structured notes may also be more volatile, less liquid, and more difficult to accurately price than less complex securities or more traditional debt securities. Fluctuations in value of the structured notes are recorded as unrealized gains and losses on the accompanying financial statements. Net payments are recorded as net realized gains and losses. These notes are subject to prepayment, credit and interest risks. The Portfolio has the option to request prepayment from the issuer. At maturity, or when a note is sold, the Portfolio records a realized gain or loss. At June 30, 2007, the value of these securities comprised 0.3% of the Portfolio’s net assets and resulted in unrealized depreciation of $56,678.
(r) Mortgage-Related and Other Asset-Backed Securities The Portfolio may invest in mortgage-related or other asset-backed securities. These securities include mortgage pass-through securities, collateralized mortgage obligations (“CMOs”), commercial mortgage-backed securities, mortgage dollar rolls, CMO residuals, stripped mortgage-backed securities (“SMBSs”) and other securities that directly or indirectly represent a participation in, or are secured by and payable from, mortgage loans on real property. The value of some mortgage-related or asset-backed securities may be particularly sensitive to changes in prevailing interest rates. Early repayment of principal on some mortgage-related securities may expose the Portfolio to a lower rate of return upon reinvestment of principal. The value of these securities may fluctuate in response to the market’s perception of the creditworthiness of the issuers. Additionally, although mortgages and mortgage-related securities are generally supported by some form of government or private guarantee and/or insurance, there is no assurance that private guarantors or insurers will meet their obligations.
(s) U.S. Government Agencies or Government-Sponsored Enterprises Securities issued by U.S. Government agencies or government-sponsored enterprises may not be guaranteed by the U.S. Treasury. The Government National Mortgage Association (“GNMA” or “Ginnie Mae”), a wholly owned U.S. Government corporation, is authorized to guarantee, with the full faith and credit of the U.S. Government, the timely payment of principal and interest on securities issued by institutions approved by GNMA and backed by pools of mortgages insured by the Federal Housing Administration or guaranteed by the Department of Veterans Affairs. Government-related guarantors (i.e., not backed by the full faith and credit of the U.S. Government) include the Federal National Mortgage Association (“FNMA” or “Fannie Mae”) and the Federal Home Loan Mortgage Corporation (“FHLMC” or “Freddie Mac”). Pass-through securities issued by FNMA are guaranteed as to timely payment of principal and interest by FNMA but are not backed by the full faith and credit of the U.S. Government. FHLMC guarantees the timely payment of interest and ultimate collection of principal, but its participation certificates are not backed by the full faith and credit of the U.S. Government.
| | | | |
| 20 | | PIMCO Variable Insurance Trust | | |
| | |
| |
| | | June 30, 2007 (Unaudited) |
(t) New Accounting Policies In July 2006, the Financial Accounting Standards Board (“FASB”) issued Interpretation No. 48, “Accounting for Uncertainty in Income Taxes—an Interpretation of FASB Statement No. 109” (the “Interpretation”). The Interpretation became effective for the Portfolio on June 29, 2007. Management has evaluated the application of the Interpretation in relation to the Portfolio and has concluded that no single filing position or combination of filing positions identified as uncertain tax positions required the accrual of a tax liability in the accounting records of the Portfolio for the period ending June 30, 2007. Management will monitor all existing filing positions and future filing positions in light of the Interpretation and evaluate the need for any future tax accruals and financial statement disclosures as warranted.
In September 2006, the FASB issued Statement of Financial Accounting Standards No. 157, “Fair Value Measurements” (the “Statement”). The Statement is effective for fiscal years beginning after November 15, 2007 and will require expanded disclosure about fair value measurements, separately for each major category of assets and liabilities, that enables shareholders to assess the inputs used to develop those measurements, and for recurring fair value measurements using significant unobservable inputs the effect of the measurements on changes in net assets for the reporting period. Management is currently evaluating the application of the Statement to the Portfolio and will provide additional information in relation to the Statement on the Portfolio’s annual financial statements for the period ending December 31, 2007.
3. FEES AND EXPENSES
(a) Investment Advisory Fee PIMCO is a majority-owned subsidiary of Allianz Global Investors of America L.P. (“AGI”), and serves as investment adviser (the “Adviser”) to the Trust, pursuant to an investment advisory contract. The Adviser receives a monthly fee from the Portfolio, at an annual rate based on average daily net assets. The Advisory Fee for all classes is charged at an annual rate of 0.25%.
(b) Administration Fee PIMCO serves as administrator (the “Administrator”), and provides administrative services to the Trust for which it receives a monthly administrative fee based on each share class’s average daily net assets. As the Administrator, PIMCO bears the costs of various third-party services, including audit, custodial, portfolio accounting, legal, transfer agency and printing costs. The Administration Fee for all classes is charged at the annual rate of 0.25%.
(c) Distribution and Servicing Fees Allianz Global Investors Distributors LLC (“AGID”) is an indirect wholly-owned subsidiary of AGI and serves as the distributor (the “Distributor”) of the Trust’s shares. The Trust is permitted to reimburse AGID on a quarterly basis, out of the Administrative Class assets of the Portfolio in the amount of 0.15% on an annual basis of the average daily net assets of that class, for payments made to financial intermediaries that provide services in connection with the distribution of shares or administration of plans or programs that use Portfolio shares as their funding medium. The effective rate paid to AGID was 0.15% during the current fiscal year.
The Trust has adopted a Distribution Plan, for the Advisor Class shares of the Portfolio (the “Plan”). The Plan has been adopted pursuant to Rule 12b-1 under the Act. The Plan permits payments for expenses in connection with the distribution and marketing of Advisor Class shares and/or the provision of shareholder services to Advisor Class shareholders. The Plan permits the Portfolio to make total payments at an annual rate of 0.25% of its average daily net assets attributable to its Advisor Class shares.
(d) Portfolio Expenses The Trust is responsible for the following expenses: (i) salaries and other compensation of any of the Trust’s executive officers and employees who are not officers, directors, stockholders or employees of PIMCO or its subsidiaries or affiliates; (ii) taxes and governmental fees; (iii) brokerage fees
and commissions and other portfolio transaction expenses; (iv) the costs of borrowing money, including interest expenses and bank overdraft charges; (v) fees and expenses of the Trustees who are not “interested persons” of PIMCO or the Trust, and any counsel retained exclusively for their benefit; (vi) extraordinary expenses, including costs of litigation and indemnification expenses; (vii) organization expenses and (viii) any expenses allocated or allocable to a specific class of shares, which include service fees payable with respect to the Administrative Class Shares, and may include certain other expenses as permitted by the Trust’s Multiple Class Plan adopted pursuant to Rule 18f-3 under the Act and subject to review and approval by the Trustees. The ratio of expenses to average net assets per share class, as disclosed in the Financial Highlights, may differ from the annual portfolio operating expenses per share class as disclosed in the Prospectus for the reasons set forth above.
Effective April 1, 2007, each Trustee, other than those affiliated with PIMCO or its affiliates, receives an annual retainer of $15,000, plus $2,375 for each Board of Trustees meeting attended in person, $500 for each committee meeting attended and $750 for each Board of Trustees meeting attended telephonically, plus reimbursement of related expenses. In addition, the audit committee chair receives an additional annual retainer of $2,000 and each other committee chair receives an additional annual retainer of $500. These expenses are allocated on a pro-rata basis to the various portfolios of the Trust according to their respective net assets. The Trust pays no compensation directly to any Trustee or any other officer who is affiliated with the Administrator, all of whom receive remuneration for their services to the Trust from the Administrator or its affiliates. Prior to April 1, 2007, each Trustee, other than those affiliated with PIMCO or its affiliates, received an annual retainer of $15,000 plus $2,000 for each Board of Trustees meeting attended ($500 for each special meeting attended), plus reimbursement of related expenses. The Audit Committee Chairman received an annual retainer of $1,500 and the Governance Committee Chairman received an annual retainer of $500. In addition, each member of a committee received $500 for each committee meeting attended.
4. RELATED PARTY TRANSACTIONS
The Adviser, Administrator, and Distributor are related parties as defined by FAS 57, Related Party Disclosures. Fees payable to these parties are disclosed in Note 3.
5. GUARANTEES AND INDEMNIFICATIONS
Under the Trust’s organizational documents, each Trustee, officer, employee or other agent of the Trust (including the Trust’s investment manager) is indemnified, to the extent permitted by the Act, against certain liabilities that may arise out of performance of their duties to the Portfolio. Additionally, in the normal course of business, the Portfolio enters into contracts that contain a variety of indemnification clauses. The Portfolio’s maximum exposure under these arrangements is unknown as this would involve future claims that may be made against the Portfolio that have not yet occurred. However, the Portfolio has not had prior claims or losses pursuant to these contracts and believes the risk of loss to be remote.
6. PURCHASES AND SALES OF SECURITIES
The length of time the Portfolio has held a particular security is not generally a consideration in investment decisions. A change in the securities held by the Portfolio is known as “portfolio turnover”. The Portfolio may engage in frequent and active trading of portfolio securities to achieve its investment objective, particularly during periods of volatile market movements. High portfolio turnover (e.g., over 100%) involves correspondingly greater expenses to the Portfolio, including brokerage commissions or dealer mark-ups and other transaction costs on the sale
| | | | | | |
| | Semiannual Report | | June 30, 2007 | | 21 |
Notes to Financial Statements (Cont.)
of securities and reinvestments in other securities. Such sales may also result in realization of taxable capital gains, including short-term capital gains (which are generally taxed at ordinary income tax rates). The trading costs and tax effects associated with portfolio turnover may adversely affect the Portfolio’s performance.
Purchases and sales of securities (excluding short-term investments) for the period ended June 30, 2007, were as follows (amounts in thousands):
| | | | | | | | | | | | |
| U.S. Government/Agency | | | | All Other |
| Purchases | | Sales | | | | Purchases | | Sales |
| $ | 5,028,312 | | $ | 4,878,535 | | | | $ | 652,891 | | $ | 120,358 |
7. TRANSACTIONS IN WRITTEN CALL AND PUT OPTIONS
Transactions in written call and put options were as follows (amounts in thousands, except for number of contracts):
| | | | | | | | | | | | | | | | | | | |
| | | | | # of
Contracts | | | Notional
Amount
in $ | | | Notional
Amount
in EUR | | Notional
Amount
in GBP | | | Premium | |
| Balance at 12/31/2006 | | | | 2,036 | | | $ | 942,800 | | | EUR 95,000 | | GBP | 11,000 | | | $ | 11,691 | |
| Sales | | | | 7,169 | | | | 991,600 | | | 0 | | | 0 | | | | 12,533 | |
| Closing Buys | | | | (960 | ) | | | (647,400 | ) | | 0 | | | (11,000 | ) | | | (6,704 | ) |
| Expirations | | | | (4,112 | ) | | | 0 | | | 0 | | | 0 | | | | (1,194 | ) |
| Exercised | | | | (334 | ) | | | 0 | | | 0 | | | 0 | | | | (180 | ) |
| Balance at 06/30/2007 | | | | 3,799 | | | $ | 1,287,000 | | | EUR 95,000 | | GBP | 0 | | | $ | 16,146 | |
8. SHARES OF BENEFICIAL INTEREST
The Portfolio may issue an unlimited number of shares of beneficial interest with a $0.001 par value. Changes in shares of beneficial interest were as follows (shares and amounts in thousands):
| | | | | | | | | | | | | | | | |
| | | | | Six Months Ended
06/30/2007 | | | Year Ended
12/31/2006 | |
| | | | | Shares | | | Amount | | | Shares | | | Amount | |
| | | | | |
Receipts for shares sold | | | | | | | | | | | | | | | | |
Institutional Class | | | | 4,531 | | | $ | 45,520 | | | 8,090 | | | $ | 81,954 | |
Administrative Class | | | | 66,886 | | | | 674,962 | | | 83,252 | | | | 843,490 | |
Advisor Class | | | | 1,171 | | | | 11,807 | | | 1,856 | | | | 18,782 | |
Issued as reinvestment of distributions | | | | | | | | | | | | | | | | |
Institutional Class | | | | 405 | | | | 4,078 | | | 790 | | | | 8,017 | |
Administrative Class | | | | 6,829 | | | | 68,742 | | | 12,178 | | | | 123,518 | |
Advisor Class | | | | 52 | | | | 522 | | | 35 | | | | 362 | |
Cost of shares redeemed | | | | | | | | | | | | | | | | |
Institutional Class | | | | (1,973 | ) | | | (19,907 | ) | | (7,223 | ) | | | (73,276 | ) |
Administrative Class | | | | (32,550 | ) | | | (326,621 | ) | | (51,636 | ) | | | (522,647 | ) |
Advisor Class | | | | (235 | ) | | | (2,374 | ) | | (32 | ) | | | (329 | ) |
Net increase resulting from Portfolio share transactions | | | | 45,116 | | | $ | 456,729 | | | 47,310 | | | $ | 479,871 | |
The following schedule shows the number of shareholders each owning 5% or more of the Portfolio and the total percentage of the Portfolio held by such shareholders:
| | | | | | |
| | | | | Number of
Shareholders | | % of Portfolio Held |
Institutional Class | | | | 3 | | 98 |
Administrative Class | | | | 6 | | 62 |
Advisor Class | | | | 3 | | 98 |
9. REGULATORY AND LITIGATION MATTERS
Since February 2004, PIMCO, Allianz Global Investors of America L.P. (PIMCO’s parent company), AGID, and certain of their affiliates, including the PIMCO Funds (another series of funds managed by PIMCO), the Allianz Funds (formerly known as PIMCO Funds: Multi-Manager Series (another series of funds managed by affiliates of PIMCO)), certain Trustees of the Trust (in their capacity as Trustees of the PIMCO Funds or the Allianz Funds) and certain employees of PIMCO, have been named as defendants in fifteen lawsuits filed in various jurisdictions. Eleven of those lawsuits concern “market timing,” and they have been transferred to and consolidated for pre-trial proceedings in a multi-district litigation proceeding in the U.S. District Court for the District of Maryland; the other four lawsuits concern “revenue sharing” and have been consolidated into a single action in the U.S. District Court for the District of Connecticut. The lawsuits have been commenced as putative class actions on behalf of investors who purchased, held or redeemed shares of the various series of the PIMCO Funds and the Allianz Funds during specified periods, or as derivative actions on behalf of the PIMCO Funds and the Allianz Funds.
The market timing actions in the District of Maryland generally allege that certain hedge funds were allowed to engage in “market timing” in certain funds of the PIMCO Funds and the Allianz Funds and this alleged activity was not disclosed. Pursuant to tolling agreements entered into with the derivative and class action plaintiffs, PIMCO, certain PIMCO Funds Trustees, and certain employees of PIMCO who were previously named as defendants have all been dropped as defendants in the market timing actions; the plaintiffs continue to assert claims on behalf of the shareholders of the PIMCO Funds or on behalf of the PIMCO Funds itself against other defendants. By order dated November 3, 2005, the U.S. District Court for the District of Maryland granted the PIMCO Funds’ motion to dismiss claims asserted against it in a consolidated amended complaint where the PIMCO Funds were named, in the complaint, as a nominal defendant. The revenue sharing action in the District of Connecticut generally alleges that fund assets were inappropriately used to pay brokers to promote funds of the PIMCO Funds and the Allianz Funds, including directing fund brokerage transactions to such brokers, and that such alleged arrangements were not fully disclosed to shareholders. On August 11, 2005, the U.S. District Court for the District of Connecticut conducted a hearing on defendants’ motion to dismiss the consolidated amended complaint in the revenue sharing action but has not yet ruled on the motion to dismiss. The market timing and revenue sharing lawsuits seek, among other things, unspecified compensatory damages plus interest and, in some cases, punitive damages, the rescission of investment advisory contracts, the return of fees paid under those contracts and restitution.
Two nearly identical class action civil complaints have been filed in August 2005, in the Northern District of Illinois Eastern Division, alleging that the plaintiffs each purchased and sold a 10-year Treasury note futures contract and suffered damages from an alleged shortage when PIMCO held both physical and futures positions in 10-year Treasury notes for its client accounts. The two actions have been consolidated into one action, and the two separate complaints have been replaced by a consolidated complaint. PIMCO is a named defendant, and PIMCO Funds has been added as a defendant, to the consolidated action. PIMCO strongly believes the complaint is without merit and intends to vigorously defend itself.
In April 2006, certain portfolios of the Trust and certain other funds managed by PIMCO were served in an adversary proceeding brought by the Official Committee of Asbestos Claimants of G-I Holdings, Inc. in G-I Holdings, Inc.’s bankruptcy in the District of New Jersey. In July 2004, PIMCO was named in this lawsuit and remains a defendant. The plaintiff seeks to recover for the bankruptcy estate assets that were transferred by the predecessor entity of G-I Holdings, Inc. to a wholly-owned subsidiary in 1994. The subsidiary has since issued notes, of which certain portfolios of the Trust and certain other funds managed by PIMCO are alleged to be holders. The complaint alleges that in 2000, more than two hundred
| | | | |
| 22 | | PIMCO Variable Insurance Trust | | |
| | |
| |
| | | June 30, 2007 (Unaudited) |
noteholders—including certain portfolios of the Trust and certain other funds managed by PIMCO—were granted a second priority lien on the assets of the subsidiary in exchange for their consent to a refinancing transaction and the granting of a first priority lien to the lending banks. The plaintiff is seeking invalidation of the lien in favor of the noteholders and/or the value of the lien. On June 21, 2006, the District of New Jersey overturned the Bankruptcy Court’s decision granting permission to file the adversary proceeding and remanded the matter to the Bankruptcy Court for further proceedings. Following a motion to reconsider, the District Court upheld its remand on August 7, 2006, and instructed the Bankruptcy Court to conduct a “cost-benefit” analysis of the Committee’s claims, including the claims against the noteholders. The Bankruptcy Court held a status conference on October 25, 2006 and set a briefing schedule relating to this cost-benefit analysis.
The foregoing speaks only as of the date of this report. It is possible that these matters and/or other developments resulting from these matters could result in increased portfolio redemptions or other adverse consequences to the Portfolio. However, PIMCO and AGID believe that these matters are not likely to have a material adverse effect on the Portfolio or on PIMCO’s or AGID’s ability to perform their respective investment advisory or distribution services relating to the Portfolio.
10. FEDERAL INCOME TAX MATTERS
The Portfolio intends to qualify as a regulated investment company under sub-chapter M of the Internal Revenue Code (the “Code”) and distribute all of its taxable income and net realized gains, if applicable, to shareholders. Accordingly, no provision for Federal income taxes has been made.
As of June 30, 2007, the aggregate cost of investments was the same for federal income tax and financial statement purposes. The net unrealized appreciation (depreciation) of investment securities for federal income tax purposes is as follows (amount in thousands):
| | | | |
Aggregate
Gross
Unrealized
Appreciation | | Aggregate
Gross
Unrealized
(Depreciation) | | Net
Unrealized
(Depreciation) |
$ 4,959 | | $ (57,464) | | $ (52,505) |
| | | | | | |
| | Semiannual Report | | June 30, 2007 | | 23 |
| | |
| |
Privacy Policy* | | (Unaudited) |
The Funds consider customer privacy to be a fundamental aspect of their relationships with shareholders and are committed to maintaining the confidentiality, integrity and security of their current, prospective and former shareholders’ personal information. To ensure their shareholders’ privacy, the Funds have developed policies that are designed to protect this confidentiality, while allowing shareholder needs to be served.
Obtaining Personal Information
In the course of providing shareholders with products and services, the Funds and certain service providers to the Funds, such as the Funds’ investment advisers (“Advisers”), may obtain non-public personal information about shareholders, which may come from sources such as account applications and other forms, from other written, electronic or verbal correspondence, from shareholder transactions, from a shareholder’s brokerage or financial advisory firm, financial adviser or consultant, and/or from information captured on the Funds’ internet web sites.
Respecting Your Privacy
As a matter of policy, the Funds do not disclose any personal or account information provided by shareholders or gathered by the Funds to non-affiliated third parties, except as required or permitted by law or as necessary for such third parties to perform their agreements with respect to the Funds. As is common in the industry, non-affiliated companies may from time to time be used to provide certain services, such as preparing and mailing prospectuses, reports, account statements and other information, conducting research on shareholder satisfaction and gathering shareholder proxies. A Fund’s Distributor may also retain non-affiliated companies to market the Fund’s shares or products which use the Fund’s shares and enter into joint marketing agreements with other companies. These companies may have access to a shareholder’s personal and account information, but are permitted to use this information solely to provide the specific service or as otherwise permitted by law. In most cases, the shareholders will be clients of a third party, but the Funds may also provide a shareholder’s personal and account information to the shareholder’s respective brokerage or financial advisory firm.
Sharing Information with Third Parties
The Funds reserve the right to disclose or report personal information to non-affiliated third parties, in limited circumstances, where the Funds believe in good faith that disclosure is required under law to cooperate with regulators or law enforcement authorities, to protect their rights or property or upon reasonable request by any Fund in which a shareholder has chosen to invest. In addition, the Funds may disclose information about a shareholder’s accounts to a non-affiliated third party with the consent of the shareholder.
Sharing Information with Affiliates
The Funds may share shareholder information with their affiliates in connection with servicing their shareholders’ accounts or to provide shareholders with information about products and services that the Funds or their Advisers, principal underwriters or their affiliates (“Service Affiliates”) believe may be of interest to such shareholders. The information that the Funds share may include, for example, a shareholder’s participation in one of the Funds or in other investment programs sponsored by a Service Affiliate, a shareholder’s ownership of certain types of accounts (such as IRAs), or other data about a shareholder’s accounts. The Funds’ Service Affiliates, in turn, are not permitted to share shareholder information with non-affiliated entities, except as required or permitted by law.
Procedures to Safeguard Private Information
The Funds take seriously the obligation to safeguard shareholder non-public personal information. In addition to this policy, the Funds have also implemented procedures that are designed to restrict access to a shareholder’s non-public personal information only to internal personnel who need to know that information in order to provide products or services to such shareholders. In order to guard a shareholder’s non-public personal information, physical, electronic and procedural safeguards are in place.
* This Privacy Policy applies to the following entities: PIMCO Funds, PIMCO Variable Insurance Trust, PCM Fund, Inc. and PIMCO Strategic Global Government Fund, Inc. (collectively, the “Funds”).
| | | | |
| 24 | | PIMCO Variable Insurance Trust | | |
Investment Adviser and Administrator
Pacific Investment Management Company LLC
840 Newport Center Drive
Newport Beach, California 92660
Distributor
Allianz Global Investors Distributors LLC
1345 Avenue of the Americas
New York, New York 10105
Custodian
State Street Bank & Trust Company
801 Pennsylvania
Kansas City, Missouri 64105
Transfer Agent
Boston Financial Data Services–Midwest
330 W. 9th Street
Kansas City, Missouri 64105
Legal Counsel
Dechert LLP
1775 I Street, N.W.
Washington, D.C. 20006
Independent Registered Public Accounting Firm
PricewaterhouseCoopers LLP
1055 Broadway
Kansas City, Missouri 64105
P I M C O

Table of Contents
This material is authorized for use only when preceded or accompanied by the current PIMCO Variable Insurance Trust (the “Trust”) prospectus. Investors should consider the investment objectives, risks, charges and expenses of this Trust carefully before investing. Ask your financial professional to explain all charges that may apply. This and other information is contained in the Trust’s prospectus. The variable product prospectus may be obtained by contacting your Investment Consultant. Please read the Trust and variable product prospectus carefully before you invest or send money.
Chairman’s Letter
Dear PIMCO Variable Insurance Trust Shareholder:
It is our pleasure to present to you the semiannual report for the PIMCO Variable Insurance Trust, covering the six-month period ended June 30, 2007. The PIMCO Variable Insurance Trust’s net assets were $8.68 billion at June 30, 2007, as compared to $7.76 billion at December 31, 2006.
Highlights of the financial markets during the reporting period include:
| | n | | Economic data during the first quarter of 2007 pointed to slower growth, which heightened market expectations for a decrease in the Federal Funds Rate. By the second quarter, economic data, such as employment statistics, provided little indication of economic weakness, causing expectations of a decrease in the Federal Funds Rate to unwind and U.S. interest rates to move higher. Interest rates in Europe and the U.K. also rose over the period as central banks raised their key lending rates due to inflation concerns. The benchmark ten-year U.S. Treasury yielded 5.03% as of June 30, 2007, or 0.32% higher than at the beginning of the year. |
| | n | | Most bonds generally returned much of their gains from earlier in the year as worldwide growth and capital flows drove interest rates higher in the second quarter. Increased risk aversion in global financial markets, due in part to subprime mortgage worries in the U.S., also contributed to the rise in interest rates. The Lehman Brothers Aggregate Bond Index, which includes Treasury, investment-grade corporate and mortgage-backed securities, returned 0.98% for the six-month period. |
| | n | | Locally issued emerging market (“EM”) bonds posted positive returns for the reporting period. Yields on these bonds declined and the local currencies in which they are denominated generally gained, amid increasing investor awareness, strong economic growth and surging capital inflows. External EM bonds (debt instruments issued by emerging markets countries and typically denominated in U.S. dollars) lagged behind local EM bonds (debt instruments issued by emerging markets countries and denominated in the currency of the issuer), as external EM bonds tend to trade more in-line with U.S. Treasuries. |
| | n | | Treasury Inflation-Protected Securities (“TIPS”) outpaced nominal bonds (non-inflation linked bonds) for the first part of the year and all but the longest maturity TIPS outperformed in the second quarter as high gasoline prices drove higher inflation accruals. Commodities, as represented by the Dow Jones-AIG Commodity Total Return Index, returned 4.46% for the period. Equities, as measured by the S&P 500 Index and the Russell 2000 Index, returned 6.96% and 6.45%, respectively, for the period. |
On the following pages, please find specific details as to the Portfolio’s total return investment performance and a discussion of those factors that affected performance.
Thank you for the trust you have placed in us. We will continue to work diligently to serve your investment needs.
Sincerely,
Brent R. Harris
Chairman, PIMCO Variable Insurance Trust
July 31, 2007
| | | | | | |
| | Semiannual Report | | June 30, 2007 | | 1 |
Important Information About the Portfolio
PIMCO Variable Insurance Trust (the “Trust”) is an open-end management investment company currently consisting of twenty separate investment portfolios, including the Total Return Portfolio (the “Portfolio”). The Portfolio is only available as a funding vehicle under variable life insurance policies or variable annuity contracts issued by insurance companies (“Variable Contracts”). Individuals may not purchase shares of the Portfolio directly. Shares of the Portfolio also may be sold to qualified pension and retirement plans outside of the separate account context.
We believe that bond funds have an important role to play in a well diversified investment portfolio. It is important to note, however, that in an environment where interest rates may trend upward, rising rates would negatively impact the performance of most bond funds, and fixed-income securities held by a fund are likely to decrease in value. The price volatility of fixed-income securities can also increase during periods of rising interest rates resulting in increased losses to a fund. Bond funds and individual bonds with a longer duration (a measure of the expected life of a security) tend to be more sensitive to changes in interest rates, usually making them more volatile than securities or funds with shorter durations.
The Portfolio may be subject to various risks in addition to those described above. Some of these risks may include, but are not limited to, the following: credit risk, high yield risk, market risk, issuer risk, liquidity risk, derivatives risk, mortgage risk, non-U.S. investment risk, emerging markets risk, currency risk, leveraging risk and management risk. A complete description of these risks is contained in the Portfolio’s prospectus. The Portfolio may use derivative instruments for hedging purposes or as part of an investment strategy. Use of these instruments may involve certain costs and risks such as liquidity risk, interest rate risk, market risk, credit risk, management risk and the risk that the Portfolio could not close out a position when it would be most advantageous to do so. Because the Portfolio may invest in derivatives, it could lose more than the principal amount invested in these instruments. Investing in non-U.S. securities may entail risk due to non-U.S. economic and political developments; this risk may be increased when investing in emerging markets.
On the performance summary page in this Semiannual Report, the Total Return Investment Performance table measures performance assuming that all dividend and capital gain distributions were reinvested.
An investment in the Portfolio is not a deposit of a bank and is not guaranteed or insured by the Federal Deposit Insurance Corporation or any other government agency. It is possible to lose money on investments in the Portfolio.
PIMCO has adopted written proxy voting policies and procedures (“Proxy Policy”) as required by Rule 206(4)-6 under the Investment Advisers Act of 1940, as amended. The Proxy Policy has been adopted by the Trust as the policies and procedures that PIMCO will use when voting proxies on behalf of the Portfolio. A description of the policies and procedures that PIMCO uses to vote proxies relating to portfolio securities of the Portfolio, and information about how the Portfolio voted proxies relating to portfolio securities held during the most recent twelve-month period ended June 30, are available without charge, upon request, by calling the Trust at 1-866-746-2606 and on the Portfolio’s website at www.pimco.com.
The Portfolio files its complete schedule of portfolio holdings with the SEC for the first and third quarters of each fiscal year on Form N-Q. A copy of the Trust’s Form N-Q is also available on the SEC’s website at http://www.sec.gov and may be reviewed and copied at the SEC’s Public Reference Room in Washington D.C. Information on the operation of the Public Reference Room may be obtained by calling 1-800-SEC-0330, and is available without charge, upon request, by calling the Trust at 1-866-746-2606 and on the Portfolio’s website at www.pimco.com.
PIMCO Variable Insurance Trust is distributed by Allianz Global Investors Distributors LLC, 1345 Avenue of the Americas, New York, NY 10105.
| | | | |
| 2 | | PIMCO Variable Insurance Trust | | |
The following disclosure provides important information regarding the Portfolio’s Expense Example (“Example” or “Expense Example”), which appears in this Semiannual Report. Please refer to this information when reviewing the Expense Example for the Portfolio.
Example
As a shareholder of the Portfolio, you incur two types of costs: (1) transaction costs and (2) ongoing costs, including advisory and administrative fees; distribution and/or service (12b-1) fees (Administrative and Advisor Class only); and other Portfolio expenses. The Example is intended to help you understand your ongoing costs (in dollars) of investing in the Portfolio and to compare these costs with the ongoing costs of investing in other mutual funds. The Expense Example does not reflect any fees or other expenses imposed by the Variable Contracts. If it did, the expenses reflected in the Expense Example would be higher. The Example is based on an investment of $1,000 invested at the beginning of the period and held for the entire period indicated, which is from January 1, 2007 to June 30, 2007.
Actual Expenses
The information in the table under the heading “Actual Performance” provides information about actual account values and actual expenses. You may use the information in these columns, together with the amount you invested, to estimate the expenses that you paid over the period. Simply divide your account value by $1,000 (for example, an $8,600 account value divided by $1,000 = $8.60), then multiply the result by the number in the row titled “Expenses Paid During Period” to estimate the expenses you paid on your account during this period.
Hypothetical Example for Comparison Purposes
The information in the table under the heading “Hypothetical Performance (5% return before expenses)” provides information about hypothetical account values and hypothetical expenses based on the Portfolio’s actual expense ratio and an assumed rate of return of 5% per year before expenses, which is not the Portfolio’s actual return. The hypothetical account values and expenses may not be used to estimate the actual ending account balance or expenses you paid for the period. You may use this information to compare the ongoing costs of investing in the Portfolio and other portfolios. To do so, compare this 5% hypothetical example with the 5% hypothetical examples that appear in the shareholder reports of the other portfolios.
Please note that the expenses shown in the table are meant to highlight your ongoing costs only and do not reflect any transactional costs. Therefore, the information under the heading “Hypothetical Performance (5% return before expenses)” is useful in comparing ongoing costs only, and will not help you determine the relative total costs of owning different portfolios. In addition, if these transactional costs were included, your costs would have been higher.
The expense ratio may vary period to period because of various factors, such as an increase in expenses not covered by the advisory and administrative fees (such as expenses of the trustees and their counsel, litigation expense and interest expense).
| | | | | | |
| | Semiannual Report | | June 30, 2007 | | 3 |
PIMCO Total Return Portfolio
Cumulative Returns Through June 30, 2007
$10,000 invested at the beginning of the first full month following the inception date of the Portfolio’s Institutional Class.
Allocation Breakdown‡
| | |
U.S. Government Agencies | | 42.6% |
Short-Term Instruments | | 23.2% |
Corporate Bonds & Notes | | 20.3% |
Asset-Backed Securities | | 6.5% |
Mortgage-Backed Securities | | 4.9% |
Other | | 2.5% |
| | ‡ | % of Total Investments as of 06/30/2007 |
| | | | | | | | | | |
| Average Annual Total Return for the period ended June 30, 2007 |
| | | | | 6 Months* | | 1 Year | | 5 Years | | Portfolio
Inception
(04/10/00)** |
| | PIMCO Total Return Portfolio Institutional Class | | 0.45% | | 5.16% | | 4.58% | | 5.91% |
| | Lehman Brothers Aggregate Bond Index± | | 0.98% | | 6.12% | | 4.48% | | 6.05% |
All Portfolio returns are net of fees and expenses.
* Cumulative return.
** The Portfolio began operations on 04/10/00. Index comparisons began on 03/31/00.
Performance quoted represents past performance. Past performance is no guarantee of future results. Investment return and principal value will fluctuate so the Portfolio shares, when redeemed, may be worth more or less than their original cost. The Portfolio’s performance does not reflect the deduction of additional charges and expenses imposed in connection with investing in Variable Contracts, which will reduce returns. Current performance may be lower or higher than the performance data quoted. Performance data current to the most recent month-end is available by calling (800) 927-4648.
± Lehman Brothers Aggregate Bond Index represents securities that are taxable and U.S. dollar denominated. The index covers the U.S. investment grade fixed rate bond market, with index components for government and corporate securities, mortgage pass-through securities, and asset-backed securities. These major sectors are subdivided into more specific indices that are calculated and reported on a regular basis. It is not possible to invest directly in the index. The index does not reflect deductions for fees and expenses.
| | | | | | |
| Expense Example | | Actual Performance | | Hypothetical Performance |
| | | | | (5% return before expenses) |
Beginning Account Value (01/01/07) | | $ | 1,000.00 | | $ | 1,000.00 |
Ending Account Value (06/30/07) | | $ | 1,004.47 | | $ | 1,022.32 |
Expenses Paid During Period† | | $ | 2.48 | | $ | 2.51 |
† Expenses are equal to the Portfolio’s Institutional Class annualized expense ratio of 0.50%, multiplied by the average account value over the period, multiplied by 181/365 (to reflect the one-half year period). Overall fees and expenses of investing in the Portfolio will be higher because the example does not reflect Variable Contract fees and expenses.
Please refer to page 3 herein for an explanation of the information presented in the above Expense Example.
Portfolio Insights
| » | | The PIMCO Total Return Portfolio seeks to achieve its investment objective by investing under normal circumstances at least 65% of its total assets in a diversified portfolio of fixed-income instruments of varying maturities, which may be represented by forwards or derivatives such as options, futures contracts, or swap agreements. |
| » | | The Portfolio’s above-benchmark duration detracted from returns as yields rose in the first half of the year. |
| » | | An emphasis on the front-end of the U.S. yield curve contributed to returns as the curve steepened as measured by the difference between two- and 30-year yields. |
| » | | A slight overweight to mortgage-backed securities for the majority of the period detracted from returns as this sector underperformed like-duration Treasuries. |
| » | | An underweight to corporate securities detracted from returns as the sector outperformed like-duration Treasuries. |
| » | | An allocation to major non-U.S. markets moderately detracted from returns as developed countries underperformed Treasuries. |
| » | | Emerging market and high-yield bonds added to performance as strong demand for their attractive yields allowed these sectors to outperform like-duration Treasuries. |
| » | | Moderate exposure to a broad basket of currencies boosted returns as most emerging and developed market currencies appreciated relative to the U.S. dollar. |
| | | | |
| 4 | | PIMCO Variable Insurance Trust | | |
Financial Highlights Total Return Portfolio
| | | | | | | | | | | | | | | | | | | | | | | | |
| Selected per Share Data for the Year or Period Ended: | | 06/30/2007+ | | | 12/31/2006 | | | 12/31/2005 | | | 12/31/2004 | | | 12/31/2003 | | | 12/31/2002 | |
| | | | | | |
Institutional Class | | | | | | | | | | | | | | | | | | | | | | | | |
Net asset value beginning of year or period | | $ | 10.12 | | | $ | 10.24 | | | $ | 10.51 | | | $ | 10.36 | | | $ | 10.23 | | | $ | 9.89 | |
Net investment income (a) | | | 0.24 | | | | 0.46 | | | | 0.39 | | | | 0.20 | | | | 0.27 | | | | 0.43 | |
Net realized/unrealized gain (loss) on investments (a) | | | (0.19 | ) | | | (0.07 | ) | | | (0.12 | ) | | | 0.31 | | | | 0.25 | | | | 0.47 | |
Total income from investment operations | | | 0.05 | | | | 0.39 | | | | 0.27 | | | | 0.51 | | | | 0.52 | | | | 0.90 | |
Dividends from net investment income | | | (0.25 | ) | | | (0.46 | ) | | | (0.37 | ) | | | (0.21 | ) | | | (0.31 | ) | | | (0.43 | ) |
Distributions from net realized capital gains | | | 0.00 | | | | (0.05 | ) | | | (0.17 | ) | | | (0.15 | ) | | | (0.08 | ) | | | (0.13 | ) |
Total distributions | | | (0.25 | ) | | | (0.51 | ) | | | (0.54 | ) | | | (0.36 | ) | | | (0.39 | ) | | | (0.56 | ) |
Net asset value end of year or period | | $ | 9.92 | | | $ | 10.12 | | | $ | 10.24 | | | $ | 10.51 | | | $ | 10.36 | | | $ | 10.23 | |
Total return | | | 0.45 | % | | | 4.00 | % | | | 2.60 | % | | | 5.05 | % | | | 5.20 | % | | | 9.23 | % |
Net assets end of year or period (000s) | | $ | 185,047 | | | $ | 158,748 | | | $ | 143,720 | | | $ | 63,646 | | | $ | 75,540 | | | $ | 46,548 | |
Ratio of expenses to average net assets | | | 0.50 | %* | | | 0.52 | % | | | 0.50 | % | | | 0.50 | % | | | 0.50 | % | | | 0.50 | % |
Ratio of expenses to average net assets excluding interest expense | | | 0.50 | %* | | | 0.50 | % | | | 0.50 | % | | | 0.50 | % | | | 0.50 | % | | | 0.50 | % |
Ratio of net investment income to average net assets | | | 4.89 | %* | | | 4.51 | % | | | 3.69 | % | | | 1.92 | % | | | 2.60 | % | | | 4.23 | % |
Portfolio turnover rate | | | 160 | % | | | 303 | % | | | 344 | % | | | 373 | % | | | 193 | % | | | 222 | % |
+ Unaudited
* Annualized
(a) Per share amounts based on average number of shares outstanding during the period.
| | | | | | |
| See Accompanying Notes | | Semiannual Report | | June 30, 2007 | | 5 |
Statement of Assets and Liabilities Total Return Portfolio
| | | | |
| (Amounts in thousands, except per share amounts) | | June 30, 2007 | |
| | | (Unaudited) | |
| |
Assets: | | | | |
Investments, at value | | $ | 4,398,751 | |
Cash | | | 2,364 | |
Foreign currency, at value | | | 31,870 | |
Receivable for investments sold | | | 140,931 | |
Receivable for investments sold on a delayed-delivery basis | | | 14,207 | |
Receivable for Portfolio shares sold | | | 12,294 | |
Interest and dividends receivable | | | 14,571 | |
Variation margin receivable | | | 4,999 | |
Swap premiums paid | | | 9,683 | |
Unrealized appreciation on foreign currency contracts | | | 6,473 | |
Unrealized appreciation on swap agreements | | | 8,189 | |
| | | | 4,644,332 | |
| |
Liabilities: | | | | |
Payable for investments purchased | | $ | 726,520 | |
Payable for investments purchased on a delayed-delivery basis | | | 46,689 | |
Payable for Portfolio shares redeemed | | | 74,637 | |
Payable for short sales | | | 88,060 | |
Written options outstanding | | | 5,904 | |
Dividends payable | | | 1,806 | |
Accrued investment advisory fee | | | 783 | |
Accrued administration fee | | | 783 | |
Accrued distribution fee | | | 12 | |
Accrued servicing fee | | | 395 | |
Variation margin payable | | | 638 | |
Swap premiums received | | | 14,553 | |
Unrealized depreciation on foreign currency contracts | | | 580 | |
Unrealized depreciation on swap agreements | | | 7,150 | |
Other liabilities | | | 45 | |
| | | | 968,555 | |
| |
Net Assets | | $ | 3,675,777 | |
| |
Net Assets Consist of: | | | | |
Paid in capital | | $ | 3,791,949 | |
Undistributed net investment income | | | 1,072 | |
Accumulated undistributed net realized (loss) | | | (49,476 | ) |
Net unrealized (depreciation) | | | (67,768 | ) |
| | | $ | 3,675,777 | |
| |
Net Assets: | | | | |
Institutional Class | | $ | 185,047 | |
Administrative Class | | | 3,462,489 | |
Advisor Class | | | 28,241 | |
| |
Shares Issued and Outstanding: | | | | |
Institutional Class | | | 18,653 | |
Administrative Class | | | 349,007 | |
Advisor Class | | | 2,847 | |
| |
Net Asset Value and Redemption Price Per Share (Net Asset Per Share Outstanding) | | | | |
Institutional Class | | $ | 9.92 | |
Administrative Class | | | 9.92 | |
Advisor Class | | | 9.92 | |
| |
Cost of Investments Owned | | $ | 4,451,256 | |
Cost of Foreign Currency Held | | $ | 31,778 | |
Proceeds Received on Short Sales | | $ | 87,236 | |
Premiums Received on Written Options | | $ | 16,146 | |
| | | | |
| 6 | | PIMCO Variable Insurance Trust | | See Accompanying Notes |
Statement of Operations Total Return Portfolio
| | | | |
| (Amounts in thousands) | | Six Months Ended
June 30, 2007 | |
| | | (Unaudited) | |
| |
| Investment Income: | | | | |
Interest, net of foreign taxes* | | $ | 92,861 | |
Dividends | | | 484 | |
Miscellaneous income | | | 64 | |
Total Income | | | 93,409 | |
| |
Expenses: | | | | |
Investment advisory fees | | | 4,312 | |
Administration fees | | | 4,312 | |
Servicing fees – Administrative Class | | | 2,447 | |
Distribution and/or servicing fees – Advisor Class | | | 28 | |
Trustees’ fees | | | 34 | |
Legal fees | | | 1 | |
Total Expenses | | | 11,134 | |
| |
Net Investment Income | | | 82,275 | |
| |
Net Realized and Unrealized Gain (Loss): | | | | |
Net realized (loss) on investments | | | (6,410 | ) |
Net realized (loss) on futures contracts, written options and swaps | | | (29,590 | ) |
Net realized gain on foreign currency transactions | | | 3,042 | |
Net change in unrealized (depreciation) on investments | | | (40,500 | ) |
Net change in unrealized (depreciation) on futures contracts, written options and swaps | | | (4,370 | ) |
Net change in unrealized appreciation on translation of assets and liabilities denominated in foreign currencies | | | 5,410 | |
Net (Loss) | | | (72,418 | ) |
| |
Net Increase in Net Assets Resulting from Operations | | $ | 9,857 | |
| |
*Foreign tax withholding | | $ | 45 | |
| | | | | | |
| See Accompanying Notes | | Semiannual Report | | June 30, 2007 | | 7 |
Statements of Changes in Net Assets Total Return Portfolio
| | | | | | | | |
| (Amounts in thousands) | | Six Months Ended
June 30, 2007 | | | Year Ended
December 31, 2006 | |
| | | (Unaudited) | | | | |
| | |
| Increase in Net Assets from: | | | | | | | | |
| | |
Operations: | | | | | | | | |
Net investment income | | $ | 82,275 | | | $ | 132,299 | |
Net realized gain (loss) | | | (32,958 | ) | | | 5,631 | |
Net change in unrealized (depreciation) | | | (39,460 | ) | | | (21,541 | ) |
Net increase resulting from operations | | | 9,857 | | | | 116,389 | |
| | |
Distributions to Shareholders: | | | | | | | | |
From net investment income | | | | | | | | |
Institutional Class | | | (4,078 | ) | | | (7,166 | ) |
Administrative Class | | | (78,465 | ) | | | (127,175 | ) |
Advisor Class | | | (522 | ) | | | (267 | ) |
From net realized capital gains | | | | | | | | |
Institutional Class | | | 0 | | | | (917 | ) |
Administrative Class | | | 0 | | | | (16,487 | ) |
Advisor Class | | | 0 | | | | (95 | ) |
| | |
Total Distributions | | | (83,065 | ) | | | (152,107 | ) |
| | |
Portfolio Share Transactions: | | | | | | | | |
Receipts for shares sold | | | | | | | | |
Institutional Class | | | 45,520 | | | | 81,954 | |
Administrative Class | | | 674,962 | | | | 843,490 | |
Advisor Class | | | 11,807 | | | | 18,782 | |
Issued as reinvestment of distributions | | | | | | | | |
Institutional Class | | | 4,078 | | | | 8,017 | |
Administrative Class | | | 68,742 | | | | 123,518 | |
Advisor Class | | | 522 | | | | 362 | |
Cost of shares redeemed | | | | | | | | |
Institutional Class | | | (19,907 | ) | | | (73,276 | ) |
Administrative Class | | | (326,621 | ) | | | (522,647 | ) |
Advisor Class | | | (2,374 | ) | | | (329 | ) |
Net increase resulting from Portfolio share transactions | | | 456,729 | | | | 479,871 | |
| | |
Total Increase in Net Assets | | | 383,521 | | | | 444,153 | |
| | |
Net Assets: | | | | | | | | |
Beginning of period | | | 3,292,256 | | | | 2,848,103 | |
End of period* | | $ | 3,675,777 | | | $ | 3,292,256 | |
| | |
*Including undistributed net investment income of: | | $ | 1,072 | | | $ | 1,862 | |
| | | | |
| 8 | | PIMCO Variable Insurance Trust | | See Accompanying Notes |
| | |
| |
| Schedule of Investments Total Return Portfolio | | June 30, 2007 (Unaudited) |
| | | | | | | | |
| | | | | PRINCIPAL
AMOUNT
(000S) | | | | VALUE (000S) |
| BANK LOAN OBLIGATIONS 0.8% |
| CSC Holdings, Inc. |
7.070% due 02/24/2013 | | $ | | 2,574 | | $ | | 2,576 |
| |
| Freeport-McMoRan Copper & Gold, Inc. |
9.000% due 03/19/2014 | | | | 518 | | | | 519 |
| |
| Fresenius Medical Care Capital Trust |
6.725% due 03/22/2013 | | | | 4,410 | | | | 4,413 |
6.735% due 03/22/2013 | | | | 577 | | | | 578 |
| |
| HCA, Inc. |
7.100% due 11/17/2012 | | | | 5,000 | | | | 5,014 |
| |
| Kinder Morgan, Inc. |
7.000% due 11/24/2013 | | | | 10,000 | | | | 9,981 |
| |
| SLM Corp. |
6.000% due 06/30/2008 | | | | 8,100 | | | | 8,060 |
| | | | | | | | |
Total Bank Loan Obligations
(Cost $31,232) | | 31,141 |
| | | | | | | | |
| | | | |
| CORPORATE BONDS & NOTES 24.3% |
|
| BANKING & FINANCE 19.0% |
| AIG-Fp Matched Funding Corp. |
5.360% due 06/16/2008 | | | | 6,200 | | | | 6,210 |
| |
| American Express Bank FSB |
5.330% due 10/16/2008 | | | | 8,100 | | | | 8,100 |
5.380% due 10/20/2009 | | | | 6,800 | | | | 6,805 |
| |
| American Express Centurion Bank |
5.320% due 05/07/2008 | | | | 6,200 | | | | 6,201 |
5.340% due 06/12/2009 | | | | 9,100 | | | | 9,104 |
| |
| American Express Credit Corp. |
5.380% due 11/09/2009 | | | | 6,700 | | | | 6,706 |
| |
| American International Group, Inc. |
5.050% due 10/01/2015 | | | | 1,300 | | | | 1,240 |
5.370% due 06/16/2009 | | | | 5,400 | | | | 5,422 |
6.250% due 03/15/2037 | | | | 2,100 | | | | 1,992 |
| |
| Bank of America Corp. |
5.366% due 11/06/2009 | | | | 4,000 | | | | 4,000 |
5.450% due 09/18/2009 | | | | 6,100 | | | | 6,105 |
| |
| Bank of America N.A. |
5.355% due 07/25/2008 | | | | 11,200 | | | | 11,207 |
5.360% due 12/18/2008 | | | | 5,400 | | | | 5,403 |
5.360% due 02/27/2009 | | | | 5,200 | | | | 5,204 |
6.000% due 10/15/2036 | | | | 2,100 | | | | 2,034 |
| |
| Bear Stearns Cos., Inc. |
5.450% due 03/30/2009 | | | | 7,100 | | | | 7,105 |
5.450% due 08/21/2009 | | | | 9,100 | | | | 9,093 |
5.480% due 05/18/2010 | | | | 12,200 | | | | 12,193 |
5.655% due 01/30/2009 | | | | 7,180 | | | | 7,200 |
| |
| BNP Paribas |
5.186% due 06/29/2049 | | | | 15,600 | | | | 14,569 |
| |
| C10 Capital SPV Ltd. |
6.722% due 12/31/2049 | | | | 4,300 | | | | 4,198 |
| |
| CIT Group, Inc. |
5.480% due 08/17/2009 | | | | 7,100 | | | | 7,076 |
5.505% due 01/30/2009 | | | | 13,700 | | | | 13,683 |
5.510% due 12/19/2008 | | | | 2,400 | | | | 2,399 |
| |
| Citigroup Funding, Inc. |
5.320% due 04/23/2009 | | | | 4,000 | | | | 4,002 |
5.350% due 12/08/2008 | | | | 2,000 | | | | 2,001 |
5.360% due 06/26/2009 | | | | 5,300 | | | | 5,298 |
| |
| Citigroup, Inc. |
5.390% due 12/28/2009 | | | | 5,300 | | | | 5,304 |
5.400% due 12/26/2008 | | | | 26,880 | | | | 26,903 |
6.125% due 08/25/2036 | | | | 15,000 | | | | 14,778 |
| |
| Credit Agricole S.A. |
5.360% due 05/28/2009 | | | | 5,900 | | | | 5,903 |
5.410% due 05/28/2010 | | | | 6,800 | | | | 6,804 |
| |
| | | | | | | | |
| | | | | PRINCIPAL
AMOUNT
(000S) | | | | VALUE (000S) |
| DBS Bank Ltd. |
5.580% due 05/16/2017 | | $ | | 1,000 | | $ | | 1,002 |
| |
| DnB NORBank ASA |
5.425% due 10/13/2009 | | | | 5,700 | | | | 5,703 |
| |
| Export-Import Bank of China |
4.875% due 07/21/2015 | | | | 900 | | | | 854 |
| |
| Export-Import Bank of Korea |
4.125% due 02/10/2009 | | | | 140 | | | | 137 |
5.450% due 06/01/2009 | | | | 8,500 | | | | 8,504 |
| |
| General Electric Capital Corp. |
5.385% due 10/26/2009 | | | | 12,500 | | | | 12,509 |
5.390% due 01/05/2009 | | | | 11,000 | | | | 11,009 |
5.410% due 10/06/2010 | | | | 4,600 | | | | 4,604 |
5.428% due 01/20/2010 | | | | 5,400 | | | | 5,411 |
5.430% due 08/15/2011 | | | | 14,200 | | | | 14,196 |
5.455% due 10/21/2010 | | | | 14,360 | | | | 14,388 |
| |
| General Motors Acceptance Corp. |
6.510% due 09/23/2008 | | | | 3,900 | | | | 3,901 |
| |
| GMAC LLC |
6.000% due 12/15/2011 | | | | 1,100 | | | | 1,047 |
| |
| Goldman Sachs Group, Inc. |
5.400% due 12/23/2008 | | | | 1,600 | | | | 1,601 |
5.410% due 03/30/2009 | | | | 8,700 | | | | 8,706 |
5.447% due 11/10/2008 | | | | 7,100 | | | | 7,111 |
5.450% due 12/22/2008 | | | | 4,800 | | | | 4,806 |
5.450% due 06/23/2009 | | | | 13,070 | | | | 13,086 |
5.455% due 07/29/2008 | | | | 6,000 | | | | 6,009 |
| |
| HBOS PLC |
5.920% due 09/29/2049 | | | | 1,100 | | | | 1,033 |
| |
| HBOS Treasury Services PLC |
5.397% due 07/17/2009 | | | | 10,400 | | | | 10,412 |
| |
| HSBC Bank USA N.A. |
5.430% due 09/21/2007 | | | | 14,500 | | | | 14,504 |
5.500% due 06/10/2009 | | | | 7,700 | | | | 7,724 |
| |
| HSBC Finance Corp. |
5.415% due 10/21/2009 | | | | 4,500 | | | | 4,503 |
5.490% due 09/15/2008 | | | | 3,600 | | | | 3,608 |
5.500% due 12/05/2008 | | | | 5,900 | | | | 5,915 |
| |
| HSBC Holdings PLC |
6.500% due 05/02/2036 | | | | 2,300 | | | | 2,371 |
| |
| John Deere Capital Corp. |
5.406% due 07/15/2008 | | | | 6,400 | | | | 6,406 |
| |
| JPMorgan Chase & Co. |
5.370% due 06/26/2009 | | | | 4,900 | | | | 4,906 |
5.396% due 05/07/2010 | | | | 9,700 | | | | 9,707 |
| |
| JPMorgan Mortgage Acquisition Corp. |
6.550% due 09/15/2066 | | | | 1,200 | | | | 1,159 |
| |
| Lehman Brothers Holdings, Inc. |
5.410% due 12/23/2008 | | | | 800 | | | | 801 |
5.440% due 04/03/2009 | | | | 5,300 | | | | 5,307 |
5.460% due 08/21/2009 | | | | 11,900 | | | | 11,907 |
5.460% due 11/16/2009 | | | | 15,260 | | | | 15,275 |
5.500% due 05/25/2010 | | | | 5,200 | | | | 5,200 |
5.579% due 07/18/2011 | | | | 4,800 | | | | 4,811 |
5.607% due 11/10/2009 | | | | 4,500 | | | | 4,514 |
| |
| Longpoint Re Ltd. |
10.609% due 05/08/2010 | | | | 2,900 | | | | 2,900 |
| |
| Merrill Lynch & Co., Inc. |
5.390% due 12/22/2008 | | | | 3,500 | | | | 3,501 |
5.395% due 10/23/2008 | | | | 7,500 | | | | 7,511 |
5.406% due 05/08/2009 | | | | 3,500 | | | | 3,502 |
5.440% due 12/04/2009 | | | | 7,300 | | | | 7,304 |
5.450% due 08/14/2009 | | | | 6,200 | | | | 6,207 |
5.555% due 07/25/2011 | | | | 8,500 | | | | 8,501 |
| |
| MetLife, Inc. |
6.400% due 12/15/2036 | | | | 1,700 | | | | 1,580 |
| |
| | | | | | | | |
| | | | | PRINCIPAL
AMOUNT
(000S) | | | | VALUE (000S) |
| Metropolitan Life Global Funding I |
5.125% due 11/09/2011 | | $ | | 8,200 | | $ | | 8,074 |
5.400% due 05/17/2010 | | | | 15,200 | | | | 15,211 |
| |
| Morgan Stanley |
5.360% due 11/21/2008 | | | | 4,900 | | | | 4,900 |
5.406% due 05/07/2009 | | | | 8,700 | | | | 8,705 |
5.446% due 01/15/2010 | | | | 8,200 | | | | 8,205 |
5.467% due 02/09/2009 | | | | 14,600 | | | | 14,624 |
| |
| MUFG Capital Finance 1 Ltd. |
6.346% due 07/29/2049 | | | | 700 | | | | 689 |
| |
| Mystic Re Ltd. |
15.360% due 06/07/2011 | | | | 3,000 | | | | 3,007 |
| |
| National Australia Bank Ltd. |
5.400% due 09/11/2009 | | | | 5,300 | | | | 5,308 |
| |
| Osiris Capital PLC |
10.356% due 01/15/2010 | | | | 3,100 | | | | 3,130 |
| |
| Petroleum Export Ltd. |
5.265% due 06/15/2011 | | | | 829 | | | | 809 |
| |
| Phoenix Quake Ltd. |
7.800% due 07/03/2008 | | | | 800 | | | | 805 |
| |
| Phoenix Quake Wind I Ltd. |
7.800% due 07/03/2008 | | | | 800 | | | | 803 |
| |
| Phoenix Quake Wind II Ltd. |
8.850% due 07/03/2008 | | | | 400 | | | | 380 |
| |
| Premium Asset Trust |
5.735% due 09/08/2007 | | | | 100 | | | | 100 |
| |
| Residential Capital LLC |
6.460% due 05/22/2009 | | | | 7,900 | | | | 7,867 |
| |
| Residential Reinsurance 2007 Ltd. |
15.610% due 06/07/2010 | | | | 1,500 | | | | 1,501 |
| |
| Resona Bank Ltd. |
5.850% due 09/29/2049 | | | | 1,200 | | | | 1,149 |
| |
| Royal Bank of Scotland Group PLC |
5.405% due 07/21/2008 | | | | 11,400 | | | | 11,410 |
| |
| Santander U.S. Debt S.A. Unipersonal |
5.420% due 09/19/2008 | | | | 6,900 | | | | 6,907 |
5.420% due 11/20/2009 | | | | 10,900 | | | | 10,908 |
| |
| SMFG Preferred Capital USD 1 Ltd. |
6.078% due 01/29/2049 | | | | 4,100 | | | | 3,965 |
| |
| State Street Capital Trust IV |
6.355% due 06/15/2037 | | | | 1,000 | | | | 1,007 |
| |
| TNK-BP Finance S.A. |
6.125% due 03/20/2012 | | | | 1,200 | | | | 1,175 |
| |
| UFJ Finance Aruba AEC |
6.750% due 07/15/2013 | | | | 300 | | | | 317 |
| |
| USB Capital IX |
6.189% due 04/15/2049 | | | | 900 | | | | 907 |
| |
| VTB Capital S.A. for Vneshtorgbank |
5.955% due 08/01/2008 | | | | 6,000 | | | | 6,014 |
| |
| Wachovia Bank N.A. |
5.320% due 10/03/2008 | | | | 8,800 | | | | 8,803 |
5.350% due 06/27/2008 | | | | 6,300 | | | | 6,302 |
5.400% due 03/23/2009 | | | | 7,100 | | | | 7,104 |
| |
| Wachovia Corp. |
5.410% due 12/01/2009 | | | | 4,400 | | | | 4,405 |
| |
| Wells Fargo & Co. |
5.460% due 09/15/2009 | | | | 6,715 | | | | 6,733 |
| |
| Westpac Banking Corp. |
5.280% due 06/06/2008 | | | | 4,000 | | | | 4,001 |
| |
| World Savings Bank FSB |
5.485% due 03/02/2009 | | | | 7,900 | | | | 7,924 |
| |
| | | | | | |
| See Accompanying Notes | | Semiannual Report | | June 30, 2007 | | 9 |
| | |
| |
| Schedule of Investments Total Return Portfolio (Cont.) | | |
| | | | | | | | |
| | | | | PRINCIPAL
AMOUNT
(000S) | | | | VALUE (000S) |
| ZFS Finance USA Trust I |
5.875% due 05/09/2032 | | $ | | 4,400 | | $ | | 4,350 |
| | | | | | | | |
| | | | | | | | 697,394 |
| | | | | | | | |
|
| INDUSTRIALS 3.5% |
| Amgen, Inc. |
5.440% due 11/28/2008 | | | | 14,000 | | | | 14,008 |
| |
| Anadarko Petroleum Corp. |
5.760% due 09/15/2009 | | | | 10,000 | | | | 10,014 |
| |
| BP AMI Leasing, Inc. |
5.370% due 06/26/2009 | | | | 13,600 | | | | 13,605 |
| |
| CODELCO, Inc. |
6.150% due 10/24/2036 | | | | 700 | | | | 696 |
| |
| Comcast Corp. |
5.656% due 07/14/2009 | | | | 7,700 | | | | 7,704 |
5.875% due 02/15/2018 | | | | 1,700 | | | | 1,650 |
6.450% due 03/15/2037 | | | | 1,700 | | | | 1,644 |
| |
| DaimlerChrysler N.A. Holding Corp. |
5.710% due 03/13/2009 | | | | 2,900 | | | | 2,907 |
5.805% due 08/03/2009 | | | | 6,300 | | | | 6,336 |
| |
| El Paso Corp. |
6.750% due 05/15/2009 | | | | 6,000 | | | | 6,082 |
7.800% due 08/01/2031 | | | | 1,300 | | | | 1,323 |
7.875% due 06/15/2012 | | | | 5,800 | | | | 6,092 |
9.625% due 05/15/2012 | | | | 800 | | | | 895 |
| |
| Gaz Capital for Gazprom |
6.212% due 11/22/2016 | | | | 1,200 | | | | 1,172 |
| |
| HJ Heinz Co. |
6.428% due 12/01/2008 | | | | 1,100 | | | | 1,111 |
| |
| Morgan Stanley Bank AG for OAO Gazprom |
9.625% due 03/01/2013 | | | | 100 | | | | 116 |
| |
| Peabody Energy Corp. |
7.875% due 11/01/2026 | | | | 2,700 | | | | 2,808 |
| |
| Pemex Project Funding Master Trust |
5.750% due 12/15/2015 | | | | 2,300 | | | | 2,259 |
8.000% due 11/15/2011 | | | | 100 | | | | 109 |
8.625% due 02/01/2022 | | | | 1,200 | | | | 1,482 |
9.500% due 09/15/2027 | | | | 55 | | | | 74 |
| |
| Salomon Brothers AG for OAO Gazprom |
10.500% due 10/21/2009 | | | | 6,000 | | | | 6,622 |
| |
| Time Warner, Inc. |
5.590% due 11/13/2009 | | | | 6,600 | | | | 6,610 |
| |
| Transocean, Inc. |
5.560% due 09/05/2008 | | | | 6,200 | | | | 6,206 |
| |
| United Airlines, Inc. |
6.071% due 03/01/2013 | | | | 3,313 | | | | 3,332 |
8.030% due 01/01/2013 (a) | | | | 465 | | | | 519 |
| |
| Vale Overseas Ltd. |
6.250% due 01/23/2017 | | | | 1,300 | | | | 1,296 |
6.875% due 11/21/2036 | | | | 1,300 | | | | 1,310 |
| |
| Wal-Mart Stores, Inc. |
5.260% due 06/16/2008 | | | | 14,200 | | | | 14,198 |
| |
| Williams Cos., Inc. |
6.375% due 10/01/2010 | | | | 7,000 | | | | 7,052 |
| | | | | | | | |
| | | | | | | | 129,232 |
| | | | | | | | |
|
| UTILITIES 1.8% |
| AT&T, Inc. |
5.456% due 02/05/2010 | | | | 3,600 | | | | 3,606 |
5.570% due 11/14/2008 | | | | 4,200 | | | | 4,214 |
| |
| BellSouth Corp. |
4.240% due 04/26/2008 | | | | 5,500 | | | | 5,452 |
5.460% due 08/15/2008 | | | | 10,200 | | | | 10,211 |
| |
| | | | | | | | |
| | | | | PRINCIPAL
AMOUNT
(000S) | | | | VALUE (000S) |
| Entergy Gulf States, Inc. |
5.700% due 06/01/2015 | | $ | | 8,300 | | $ | | 7,966 |
6.000% due 12/01/2012 | | | | 6,500 | | | | 6,454 |
| |
| Korea Electric Power Corp. |
5.125% due 04/23/2034 | | | | 90 | | | | 87 |
| |
| Qwest Capital Funding, Inc. |
7.250% due 02/15/2011 | | | | 657 | | | | 657 |
| |
| Ras Laffan Liquefied Natural Gas Co. Ltd. III |
5.838% due 09/30/2027 | | | | 2,600 | | | | 2,419 |
| |
| TPSA Finance BV |
7.750% due 12/10/2008 | | | | 120 | | | | 124 |
| |
| TXU Energy Co. LLC |
5.860% due 09/16/2008 | | | | 12,200 | | | | 12,208 |
| |
| Verizon Communications, Inc. |
5.400% due 04/03/2009 | | | | 14,500 | | | | 14,510 |
| | | | | | | | |
| | | | | | | | 67,908 |
| | | | | | | | |
Total Corporate Bonds & Notes
(Cost $894,530) | | 894,534 |
| | | | | | | | |
|
| MUNICIPAL BONDS & NOTES 0.1% |
| Badger, Wisconsin Tobacco Asset Securitization Corporations Revenue Bonds, Series 2002 |
6.000% due 06/01/2017 | | | | 3,700 | | | | 3,967 |
| |
| Iowa State Tobacco Settlement Authority Revenue Bonds, Series 2005 |
6.500% due 06/01/2023 | | | | 1,150 | | | | 1,136 |
| | | | | | | | |
Total Municipal Bonds & Notes
(Cost $4,816) | | 5,103 |
| | | | | | | | |
|
| COMMODITY INDEX-LINKED NOTES 0.3% |
| Morgan Stanley |
0.000% due 07/07/2008 | | | | 10,000 | | | | 9,943 |
| | | | | | | | |
Total Commodity Index-Linked Notes
(Cost $10,000) | | 9,943 |
| | | | | | | | |
|
| U.S. GOVERNMENT AGENCIES 51.0% |
| Fannie Mae |
4.000% due 10/01/2018 | | | | 414 | | | | 385 |
4.500% due 02/01/2035 - 06/25/2043 | | | | 12,566 | | | | 12,373 |
4.673% due 05/25/2035 | | | | 1,300 | | | | 1,283 |
4.709% due 04/01/2035 | | | | 2,817 | | | | 2,800 |
4.759% due 04/01/2035 | | | | 4,039 | | | | 4,015 |
5.000% due 02/25/2017 - 07/01/2037 | | | | 316,751 | | | | 299,211 |
5.380% due 12/25/2036 | | | | 3,799 | | | | 3,794 |
5.500% due 04/01/2014 - 08/01/2037 | | | | 906,903 | | | | 877,528 |
5.647% due 10/01/2032 | | | | 1,588 | | | | 1,601 |
5.648% due 11/01/2035 | | | | 307 | | | | 309 |
5.670% due 03/25/2044 | | | | 6,205 | | | | 6,211 |
6.000% due 04/01/2016 - 07/01/2037 | | | | 343,211 | | | | 339,644 |
6.129% due 09/01/2034 | | | | 2,519 | | | | 2,553 |
6.227% due 06/01/2043 - 07/01/2044 | | | | 7,760 | | | | 7,867 |
6.272% due 12/01/2036 | | | | 2,514 | | | | 2,539 |
6.414% due 09/01/2040 | | | | 61 | | | | 62 |
6.500% due 06/01/2029 - 04/01/2032 | | | | 362 | | | | 369 |
7.000% due 04/25/2023 - 06/01/2032 | | | | 3,464 | | | | 3,546 |
7.130% due 09/01/2039 | | | | 106 | | | | 107 |
7.269% due 11/01/2025 | | | | 2 | | | | 2 |
| |
| Federal Housing Administration |
7.430% due 01/25/2023 | | | | 52 | | | | 53 |
| |
| | | | | | | | |
| | | | | PRINCIPAL
AMOUNT
(000S) | | | | VALUE (000S) |
| Freddie Mac |
4.500% due 04/01/2018 - 10/01/2018 | | $ | | 2,330 | | $ | | 2,221 |
5.000% due 04/01/2018 - 09/01/2035 | | | | 17,324 | | | | 16,925 |
5.470% due 07/15/2019 - 10/15/2020 | | | | 134,500 | | | | 134,383 |
5.500% due 04/01/2033 - 07/01/2037 | | | | 66,903 | | | | 64,536 |
5.550% due 07/15/2037 | | | | 46,700 | | | | 46,696 |
5.620% due 05/15/2036 | | | | 5,068 | | | | 5,086 |
5.770% due 11/15/2030 | | | | 31 | | | | 31 |
5.820% due 09/15/2030 | | | | 29 | | | | 30 |
6.000% due 07/01/2016 - 07/01/2037 | | | | 20,131 | | | | 19,992 |
6.227% due 02/25/2045 | | | | 875 | | | | 872 |
6.500% due 03/01/2013 - 03/01/2034 | | | | 947 | | | | 965 |
7.000% due 06/15/2023 | | | | 1,869 | | | | 1,922 |
7.188% due 07/01/2030 | | | | 2 | | | | 2 |
7.290% due 07/01/2027 | | | | 2 | | | | 2 |
7.412% due 01/01/2028 | | | | 2 | | | | 2 |
7.500% due 07/15/2030 - 03/01/2032 | | | | 268 | | | | 278 |
8.500% due 08/01/2024 | | | | 15 | | | | 16 |
| |
| Ginnie Mae |
4.500% due 07/20/2030 | | | | 13 | | | | 14 |
4.750% due 02/20/2032 | | | | 805 | | | | 807 |
5.125% due 10/20/2029 - 11/20/2029 | | | | 272 | | | | 276 |
5.375% due 04/20/2026 - 05/20/2030 | | | | 116 | | | | 117 |
5.500% due 04/15/2033 - 09/15/2033 | | | | 555 | | | | 540 |
5.720% due 06/20/2030 | | | | 1 | | | | 1 |
5.820% due 09/20/2030 | | | | 25 | | | | 25 |
6.000% due 07/01/2037 | | | | 4,000 | | | | 3,979 |
6.500% due 03/15/2031 - 04/15/2032 | | | | 255 | | | | 260 |
| |
| Small Business Administration |
5.130% due 09/01/2023 | | | | 77 | | | | 76 |
6.030% due 02/10/2012 | | | | 5,089 | | | | 5,129 |
6.290% due 01/01/2021 | | | | 199 | | | | 204 |
6.344% due 08/01/2011 | | | | 650 | | | | 658 |
7.449% due 08/01/2010 | | | | 8 | | | | 8 |
7.500% due 04/01/2017 | | | | 1,025 | | | | 1,059 |
8.017% due 02/10/2010 | | | | 75 | | | | 77 |
| | | | | | | | |
Total U.S. Government Agencies
(Cost $1,913,856) | | 1,873,441 |
| | | | | | | | |
|
| U.S. TREASURY OBLIGATIONS 0.4% |
| Treasury Inflation Protected Securities (c) |
2.000% due 01/15/2026 | | | | 7,163 | | | | 6,490 |
2.375% due 01/15/2025 | | | | 7,236 | | | | 6,959 |
3.625% due 04/15/2028 | | | | 1,533 | | | | 1,777 |
| | | | | | | | |
Total U.S. Treasury Obligations
(Cost $16,092) | | 15,226 |
| | | | | | | | |
|
| MORTGAGE-BACKED SECURITIES 5.9% |
| American Home Mortgage Investment Trust |
4.390% due 02/25/2045 | | | | 3,537 | | | | 3,464 |
| |
| Banc of America Commercial Mortgage, Inc. |
4.128% due 07/10/2042 | | | | 395 | | | | 385 |
4.875% due 06/10/2039 | | | | 590 | | | | 582 |
| |
| Banc of America Funding Corp. |
4.113% due 05/25/2035 | | | | 4,996 | | | | 4,893 |
| |
| Banc of America Mortgage Securities, Inc. |
6.500% due 10/25/2031 | | | | 1,316 | | | | 1,331 |
6.500% due 09/25/2033 | | | | 507 | | | | 508 |
| |
| | | | |
| 10 | | PIMCO Variable Insurance Trust | | See Accompanying Notes |
| | |
| |
| | | June 30, 2007 (Unaudited) |
| | | | | | | | |
| | | | | PRINCIPAL
AMOUNT
(000S) | | | | VALUE (000S) |
| Bear Stearns Adjustable Rate Mortgage Trust |
4.750% due 10/25/2035 | | $ | | 18,398 | | $ | | 18,195 |
4.773% due 01/25/2034 | | | | 2,930 | | | | 2,916 |
5.044% due 04/25/2033 | | | | 1,332 | | | | 1,331 |
5.329% due 02/25/2033 | | | | 350 | | | | 355 |
5.626% due 02/25/2033 | | | | 292 | | | | 290 |
6.337% due 11/25/2030 | | | | 9 | | | | 9 |
| |
| Bear Stearns Alt-A Trust |
5.377% due 05/25/2035 | | | | 6,929 | | | | 6,900 |
| |
| Citigroup Commercial Mortgage Trust |
5.390% due 08/15/2021 | | | | 3,703 | | | | 3,708 |
| |
| Citigroup Mortgage Loan Trust, Inc. |
4.700% due 12/25/2035 | | | | 1,783 | | | | 1,752 |
| |
| Commercial Mortgage Pass-Through Certificates |
6.455% due 05/15/2032 | | | | 6,562 | | | | 6,608 |
| |
| Countrywide Alternative Loan Trust |
4.673% due 08/25/2034 | | | | 142 | | | | 141 |
5.500% due 05/25/2047 | | | | 5,426 | | | | 5,441 |
| |
| Countrywide Home Loan Mortgage Pass-Through Trust |
5.250% due 02/20/2036 | | | | 2,050 | | | | 2,037 |
5.590% due 05/25/2034 | | | | 415 | | | | 415 |
| |
| CS First Boston Mortgage Securities Corp. |
6.890% due 06/25/2032 | | | | 44 | | | | 44 |
| |
| First Nationwide Trust |
6.750% due 08/21/2031 | | | | 38 | | | | 38 |
| |
| Greenpoint Mortgage Funding Trust |
5.400% due 10/25/2046 | | | | 6,949 | | | | 6,955 |
5.400% due 01/25/2047 | | | | 6,845 | | | | 6,849 |
| |
| Greenwich Capital Commercial Funding Corp. |
5.317% due 06/10/2036 | | | | 915 | | | | 895 |
| |
| GS Mortgage Securities Corp. II |
5.396% due 08/10/2038 | | | | 905 | | | | 886 |
5.410% due 03/06/2020 | | | | 23,300 | | | | 23,326 |
| |
| GSR Mortgage Loan Trust |
4.538% due 09/25/2035 | | | | 21,739 | | | | 21,427 |
| |
| Harborview Mortgage Loan Trust |
5.410% due 01/19/2038 | | | | 10,742 | | | | 10,757 |
5.510% due 01/19/2038 | | | | 13,936 | | | | 13,960 |
5.540% due 05/19/2035 | | | | 1,497 | | | | 1,499 |
| |
| Impac Secured Assets CMN Owner Trust |
5.400% due 01/25/2037 | | | | 4,597 | | | | 4,601 |
| |
| Indymac ARM Trust |
6.633% due 01/25/2032 | | | | 7 | | | | 7 |
| |
| Indymac Index Mortgage Loan Trust |
5.410% due 11/25/2046 | | | | 4,816 | | | | 4,819 |
| |
| Lehman Brothers Floating Rate Commercial Mortgage Trust |
5.400% due 09/15/2021 | | | | 1,564 | | | | 1,565 |
| |
| Merrill Lynch Mortgage Trust |
4.353% due 02/12/2042 | | | | 515 | | | | 505 |
| |
| Morgan Stanley Capital I |
4.050% due 01/13/2041 | | | | 530 | | | | 515 |
5.380% due 10/15/2020 | | | | 3,999 | | | | 4,005 |
| |
| Prime Mortgage Trust |
5.720% due 02/25/2019 | | | | 242 | | | | 243 |
5.720% due 02/25/2034 | | | | 1,113 | | | | 1,116 |
| |
| Residential Funding Mortgage Securities I, Inc. |
6.500% due 03/25/2032 | | | | 1,215 | | | | 1,215 |
| |
| Structured Asset Mortgage Investments, Inc. |
5.650% due 09/19/2032 | | | | 190 | | | | 190 |
| |
| Structured Asset Securities Corp. |
6.063% due 02/25/2032 | | | | 24 | | | | 24 |
6.150% due 07/25/2032 | | | | 30 | | | | 30 |
| |
| | | | | | | | |
| | | | | PRINCIPAL
AMOUNT
(000S) | | | | VALUE (000S) |
| Thornburg Mortgage Securities Trust |
5.430% due 12/25/2036 | | $ | | 5,791 | | $ | | 5,791 |
| |
| Wachovia Bank Commercial Mortgage Trust |
5.400% due 06/15/2020 | | | | 10,800 | | | | 10,803 |
5.410% due 09/15/2021 | | | | 19,057 | | | | 19,067 |
| |
| Washington Mutual, Inc. |
5.094% due 10/25/2032 | | | | 283 | | | | 282 |
5.610% due 10/25/2045 | | | | 1,633 | | | | 1,637 |
6.229% due 11/25/2042 | | | | 1,259 | | | | 1,260 |
6.429% due 08/25/2042 | | | | 3,106 | | | | 3,117 |
| |
| Wells Fargo Mortgage-Backed Securities Trust |
4.950% due 03/25/2036 | | | | 8,237 | | | | 8,127 |
| | | | | | | | |
Total Mortgage-Backed Securities
(Cost $217,544) | | 216,816 |
| | | | | | | | |
|
| ASSET-BACKED SECURITIES 7.8% |
| ACE Securities Corp. |
5.370% due 12/25/2036 | | | | 2,407 | | | | 2,409 |
| |
| American Express Credit Account Master Trust |
5.430% due 09/15/2010 | | | | 35,400 | | | | 35,451 |
| |
| Amortizing Residential Collateral Trust |
5.590% due 06/25/2032 | | | | 353 | | | | 353 |
| |
| Argent Securities, Inc. |
5.370% due 09/25/2036 | | | | 2,645 | | | | 2,646 |
| |
| Asset-Backed Funding Certificates |
5.380% due 11/25/2036 | | | | 6,333 | | | | 6,337 |
5.380% due 01/25/2037 | | | | 4,974 | | | | 4,977 |
| |
| Bear Stearns Asset-Backed Securities, Inc. |
5.400% due 10/25/2036 | | | | 2,881 | | | | 2,883 |
5.410% due 06/25/2047 | | | | 4,699 | | | | 4,702 |
| |
| Carrington Mortgage Loan Trust |
5.470% due 09/25/2035 | | | | 631 | | | | 632 |
| |
| Chase Credit Card Master Trust |
5.430% due 02/15/2011 | | | | 9,900 | | | | 9,921 |
| |
| CitiFinancial Mortgage Securities, Inc. |
3.221% due 10/25/2033 | | | | 4 | | | | 4 |
| |
| Countrywide Asset-Backed Certificates |
5.370% due 01/25/2037 | | | | 7,522 | | | | 7,525 |
5.370% due 05/25/2037 | | | | 8,717 | | | | 8,726 |
5.370% due 12/25/2046 | | | | 2,594 | | | | 2,595 |
| |
| Credit-Based Asset Servicing & Securitization LLC |
5.380% due 11/25/2036 | | | | 4,728 | | | | 4,731 |
| |
| DaimlerChrysler Auto Trust |
5.250% due 05/08/2009 | | | | 7,360 | | | | 7,363 |
| |
| EMC Mortgage Loan Trust |
5.690% due 05/25/2040 | | | | 686 | | | | 688 |
| |
| First Franklin Mortgage Loan Asset-Backed Certificates |
5.370% due 11/25/2036 | | | | 8,596 | | | | 8,601 |
| |
| First USA Credit Card Master Trust |
5.480% due 04/18/2011 | | | | 16,500 | | | | 16,544 |
| |
| Fremont Home Loan Trust |
5.380% due 01/25/2037 | | | | 4,635 | | | | 4,634 |
5.390% due 02/25/2037 | | | | 3,480 | | | | 3,482 |
| |
| Honda Auto Receivables Owner Trust |
5.322% due 03/18/2008 | | | | 8,877 | | | | 8,886 |
| |
| HSI Asset Securitization Corp. Trust |
5.370% due 12/25/2036 | | | | 3,457 | | | | 3,459 |
| |
| Indymac Residential Asset-Backed Trust |
5.380% due 04/25/2037 | | | | 4,263 | | | | 4,264 |
| |
| JPMorgan Mortgage Acquisition Corp. |
5.370% due 08/25/2036 | | | | 2,735 | | | | 2,737 |
5.380% due 04/01/2037 | | | | 8,099 | | | | 8,095 |
| |
| | | | | | | | |
| | | | | PRINCIPAL
AMOUNT
(000S) | | | | VALUE (000S) |
| Lehman XS Trust |
5.390% due 05/25/2046 | | $ | | 2,418 | | $ | | 2,419 |
| |
| Long Beach Mortgage Loan Trust |
5.600% due 10/25/2034 | | | | 619 | | | | 620 |
| |
| MASTR Asset-Backed Securities Trust |
5.380% due 11/25/2036 | | | | 6,269 | | | | 6,273 |
| |
| Merrill Lynch Mortgage Investors, Inc. |
5.390% due 08/25/2036 | | | | 9,238 | | | | 9,239 |
| |
| Morgan Stanley ABS Capital I |
5.360% due 10/25/2036 | | | | 2,947 | | | | 2,948 |
5.370% due 10/25/2036 | | | | 2,685 | | | | 2,686 |
| |
| Nelnet Student Loan Trust |
5.340% due 09/25/2012 | | | | 4,156 | | | | 4,159 |
5.420% due 12/22/2016 | | | | 8,200 | | | | 8,206 |
| |
| Newcastle Mortgage Securities Trust |
5.390% due 03/25/2036 | | | | 4,873 | | | | 4,875 |
| |
| Nissan Auto Lease Trust |
5.347% due 12/14/2007 | | | | 105 | | | | 105 |
| |
| Park Place Securities, Inc. |
5.632% due 10/25/2034 | | | | 4,699 | | | | 4,711 |
| |
| Residential Asset Mortgage Products, Inc. |
4.230% due 05/25/2029 | | | | 14 | | | | 14 |
4.450% due 07/25/2028 | | | | 331 | | | | 329 |
| |
| Residential Asset Securities Corp. |
5.360% due 08/25/2036 | | | | 3,066 | | | | 3,068 |
5.390% due 11/25/2036 | | | | 6,745 | | | | 6,750 |
| |
| Saxon Asset Securities Trust |
5.380% due 11/25/2036 | | | | 3,198 | | | | 3,199 |
| |
| SBI HELOC Trust |
5.490% due 08/25/2036 | | | | 4,255 | | | | 4,259 |
| |
| Securitized Asset-Backed Receivables LLC Trust |
5.440% due 05/25/2037 | | | | 9,300 | | | | 9,300 |
| |
| SLM Student Loan Trust |
5.355% due 10/25/2016 | | | | 9,300 | | | | 9,306 |
| |
| Soundview Home Equity Loan Trust |
5.420% due 10/25/2036 | | | | 8,430 | | | | 8,436 |
| |
| Structured Asset Securities Corp. |
4.370% due 10/25/2034 | | | | 250 | | | | 249 |
5.370% due 10/25/2036 | | | | 7,391 | | | | 7,394 |
5.420% due 07/25/2035 | | | | 802 | | | | 803 |
5.610% due 01/25/2033 | | | | 73 | | | | 73 |
| |
| USAA Auto Owner Trust |
5.337% due 07/11/2008 | | | | 6,700 | | | | 6,701 |
| |
| Wachovia Auto Owner Trust |
5.337% due 06/20/2008 | | | | 7,600 | | | | 7,601 |
| |
| Wells Fargo Home Equity Trust |
5.370% due 01/25/2037 | | | | 4,446 | | | | 4,449 |
5.440% due 12/25/2035 | | | | 5,901 | | | | 5,904 |
| | | | | | | | |
Total Asset-Backed Securities
(Cost $286,598) | | 286,721 |
| | | | | | | | |
|
| SOVEREIGN ISSUES 0.7% |
| China Development Bank |
5.000% due 10/15/2015 | | | | 900 | | | | 861 |
| |
| Korea Development Bank |
5.490% due 04/03/2010 | | | | 25,000 | | | | 25,022 |
| |
| South Africa Government International Bond |
5.875% due 05/30/2022 | | | | 500 | | | | 490 |
| | | | | | | | |
Total Sovereign Issues (Cost $26,392) | | 26,373 |
| | | | | | | | |
|
| | | | | | |
| See Accompanying Notes | | Semiannual Report | | June 30, 2007 | | 11 |
| | |
| |
| Schedule of Investments Total Return Portfolio (Cont.) | | |
| | | | | | | | |
| | | | | PRINCIPAL
AMOUNT
(000S) | | | | VALUE (000S) |
| FOREIGN CURRENCY-DENOMINATED ISSUES 0.1% |
| Brazilian Government International Bond |
10.250% due 01/10/2028 | | BRL | | 4,400 | | $ | | 2,543 |
| | | | | | | | |
Total Foreign Currency-Denominated Issues (Cost $2,505) | | 2,543 |
| | | | | | | | |
|
| | | | | SHARES | | | | |
| PREFERRED STOCKS 0.4% |
| DG Funding Trust |
7.600% due 12/31/2049 | | | | 1,239 | | | | 12,909 |
| | | | | | | | |
Total Preferred Stocks (Cost $13,056) | | 12,909 |
| | | | | | | | |
|
| | | | | PRINCIPAL
AMOUNT
(000S) | | | | |
| SHORT-TERM INSTRUMENTS 27.7% |
|
| CERTIFICATES OF DEPOSIT 6.1% |
| Abbey National Treasury Services PLC |
5.270% due 07/02/2008 | | $ | | 13,600 | | | | 13,606 |
| |
| Barclays Bank PLC |
5.281% due 03/17/2008 | | | | 28,400 | | | | 28,404 |
| |
| BNP Paribas |
5.262% due 07/03/2008 | | | | 13,100 | | | | 13,097 |
5.262% due 05/28/2008 | | | | 5,200 | | | | 5,202 |
| |
| Calyon Financial, Inc. |
5.340% due 01/16/2009 | | | | 9,900 | | | | 9,902 |
| |
| Dexia S.A. |
5.270% due 09/29/2008 | | | | 34,500 | | | | 34,510 |
| |
| Fortis Bank NY |
5.265% due 04/28/2008 | | | | 14,100 | | | | 14,107 |
5.265% due 06/30/2008 | | | | 5,100 | | | | 5,102 |
| |
| Nordea Bank Finland PLC |
5.267% due 03/31/2008 | | | | 4,800 | | | | 4,801 |
5.308% due 05/28/2008 | | | | 5,000 | | | | 5,003 |
5.308% due 04/09/2009 | | | | 14,300 | | | | 14,308 |
| |
| Royal Bank of Canada |
5.267% due 06/30/2008 | | | | 17,100 | | | | 17,115 |
| |
| Royal Bank of Scotland Group PLC |
5.262% due 07/03/2008 | | | | 12,600 | | | | 12,600 |
5.265% due 03/26/2008 | | | | 10,300 | | | | 10,299 |
| |
| | | | | | | | |
| | | | | PRINCIPAL
AMOUNT
(000S) | | | | VALUE
(000S) |
| Skandinav Enskilda BK |
5.340% due 08/21/2008 | | $ | | 14,500 | | $ | | 14,506 |
5.350% due 02/13/2009 | | | | 8,300 | | | | 8,306 |
| |
| Societe Generale NY |
5.268% due 03/28/2008 | | | | 4,200 | | | | 4,203 |
5.269% due 06/30/2008 | | | | 1,100 | | | | 1,101 |
5.270% due 03/26/2008 | | | | 8,100 | | | | 8,100 |
| | | | | | | | |
| | | | | | | | 224,272 |
| | | | | | | | |
|
| COMMERCIAL PAPER 20.6% |
| Bank of America Corp. |
5.215% due 10/04/2007 | | | | 37,900 | | | | 37,414 |
5.220% due 10/04/2007 | | | | 38,600 | | | | 38,583 |
5.250% due 10/04/2007 | | | | 2,400 | | | | 2,367 |
| |
| Bank of Ireland |
5.225% due 11/08/2007 | | | | 3,600 | | | | 3,583 |
| |
| Cox Communications, Inc. |
5.619% due 09/17/2007 | | | | 3,500 | | | | 3,500 |
| |
| Danske Corp. |
5.205% due 10/12/2007 | | | | 11,800 | | | | 11,673 |
| |
| Freddie Mac |
4.800% due 07/02/2007 | | | | 113,200 | | | | 113,200 |
| |
| HBOS Treasury Services PLC |
5.230% due 11/13/2007 | | | | 6,500 | | | | 6,471 |
| |
| Natixis S.A. |
5.240% due 09/21/2007 | | | | 1,300 | | | | 1,295 |
| |
| Rabobank USA Financial Corp. |
5.330% due 07/26/2007 | | | | 102,500 | | | | 102,500 |
| |
| San Paolo IMI U.S. Financial Co. |
5.230% due 08/08/2007 | | | | 16,400 | | | | 16,326 |
| |
| Societe Generale NY |
5.180% due 11/26/2007 | | | | 700 | | | | 685 |
5.210% due 11/26/2007 | | | | 1,800 | | | | 1,781 |
5.226% due 11/26/2007 | | | | 67,700 | | | | 67,356 |
5.245% due 11/26/2007 | | | | 24,500 | | | | 24,204 |
5.246% due 11/26/2007 | | | | 4,700 | | | | 4,644 |
5.250% due 11/26/2007 | | | | 500 | | | | 493 |
| |
| Svenska Handelsbanken, Inc. |
5.203% due 10/09/2007 | | | | 29,300 | | | | 29,088 |
| |
| UBS Finance Delaware LLC |
5.145% due 10/23/2007 | | | | 1,700 | | | | 1,693 |
5.200% due 10/23/2007 | | | | 94,000 | | | | 93,579 |
| | | | | | | | | |
| | | | | PRINCIPAL
AMOUNT
(000S) | | | | VALUE
(000S) | |
5.205% due 10/23/2007 | | $ | | 3,900 | | $ | | 3,890 | |
5.215% due 10/23/2007 | | | | 900 | | | | 890 | |
5.230% due 10/23/2007 | | | | 7,600 | | | | 7,559 | |
5.235% due 10/23/2007 | | | | 4,400 | | | | 4,356 | |
5.245% due 10/23/2007 | | | | 700 | | | | 692 | |
| | |
| Unicredito Italiano SpA | |
5.185% due 01/22/2008 | | | | 73,600 | | | | 71,993 | |
| | |
| Westpac Banking Corp. | |
5.165% due 11/05/2007 | | | | 44,300 | | | | 43,472 | |
5.230% due 11/05/2007 | | | | 2,800 | | | | 2,788 | |
5.240% due 11/05/2007 | | | | 1,200 | | | | 1,186 | |
| | |
| Westpac Trust Securities NZ Ltd. | |
5.240% due 10/19/2007 | | | | 60,400 | | | | 59,960 | |
| | | | | | | | | |
| | | | | | | | 757,221 | |
| | | | | | | | | |
| |
| TRI-PARTY REPURCHASE AGREEMENTS 0.2% | |
| State Street Bank and Trust Co. | |
4.900% due 07/02/2007 | | | | 7,112 | | | | 7,112 | |
| | | | | | | | | |
(Dated 06/29/2007. Collateralized by Freddie Mac 5.400% due 06/15/2010 valued at $7,259. Repurchase proceeds are $7,115.) | | | |
| |
| U.S. TREASURY BILLS 0.8% | |
4.621% due 08/30/2007 - 09/13/2007 (b)(d)(f) | | | | 29,860 | | | | 29,543 | |
| | | | | | | | | |
Total Short-Term Instruments
(Cost $1,018,160) | | 1,018,148 | |
| | | | | | | | | |
| |
PURCHASED OPTIONS (h) 0.2% | | | |
| (Cost $16,475) | | | | | | | | 5,853 | |
| |
Total Investments (e) 119.7%
(Cost $4,451,256) | | $ | | 4,398,751 | |
| |
Written Options (i) (0.2%)
(Premiums $16,146) | | (5,904 | ) |
| |
| Other Assets and Liabilities (Net) (19.5%) | | (717,070 | ) |
| | | | | | | | | |
| Net Assets 100.0% | | | | | | $ | | 3,675,777 | |
| | | | | | | | | |
Notes to Schedule of Investments (amounts in thousands*, except number of contracts):
* A zero balance may reflect actual amounts rounding to less than one thousand.
(a) Security is in default.
(b) Coupon represents a weighted average rate.
(c) Principal amount of security is adjusted for inflation.
(d) Securities with an aggregate market value of $7,178 have been pledged as collateral for swap and swaption contracts on June 30, 2007.
(e) As of June 30, 2007, portfolio securities with an aggregate value of $205,868 were valued in good faith and pursuant to the guidelines established by the Board of Trustees.
| | | | |
| 12 | | PIMCO Variable Insurance Trust | | See Accompanying Notes |
| | |
| |
| | | June 30, 2007 (Unaudited) |
(f) Securities with an aggregate market value of $20,629 have been segregated with the custodian to cover margin requirements for the following open futures contracts on June 30, 2007:
| | | | | | | | | | |
| Description | | Type | | Expiration
Month | | # of
Contracts | | Unrealized
(Depreciation) | |
90-Day Euribor December Futures | | Long | | 12/2007 | | 444 | | $ | (632 | ) |
90-Day Euribor December Futures | | Long | | 12/2008 | | 174 | | | (390 | ) |
90-Day Euribor June Futures | | Long | | 06/2008 | | 459 | | | (981 | ) |
90-Day Euribor March Futures | | Long | | 03/2008 | | 209 | | | (414 | ) |
90-Day Euribor September Futures | | Long | | 09/2008 | | 451 | | | (407 | ) |
90-Day Eurodollar December Futures | | Long | | 12/2007 | | 4,365 | | | (4,972 | ) |
90-Day Eurodollar December Futures | | Long | | 12/2008 | | 2,346 | | | (1,336 | ) |
90-Day Eurodollar June Futures | | Long | | 06/2008 | | 8,706 | | | (9,100 | ) |
90-Day Eurodollar March Futures | | Long | | 03/2008 | | 9,007 | | | (9,295 | ) |
90-Day Eurodollar March Futures | | Long | | 03/2009 | | 214 | | | (313 | ) |
90-Day Eurodollar September Futures | | Long | | 09/2008 | | 1,885 | | | (925 | ) |
90-Day Euroyen December Futures | | Long | | 12/2007 | | 604 | | | (68 | ) |
Euro-Bund 10-Year Note September Futures | | Short | | 09/2007 | | 75 | | | (53 | ) |
U.S. Treasury 10-Year Note September Futures | | Short | | 09/2007 | | 13 | | | (11 | ) |
U.S. Treasury 30-Year Bond September Futures | | Long | | 09/2007 | | 221 | | | (250 | ) |
United Kingdom 90-Day LIBOR Sterling Interest Rate December Futures | | Long | | 12/2007 | | 430 | | | (967 | ) |
United Kingdom 90-Day LIBOR Sterling Interest Rate December Futures | | Long | | 12/2008 | | 36 | | | (61 | ) |
United Kingdom 90-Day LIBOR Sterling Interest Rate June Futures | | Long | | 06/2008 | | 362 | | | (640 | ) |
United Kingdom 90-Day LIBOR Sterling Interest Rate March Futures | | Long | | 03/2008 | | 422 | | | (772 | ) |
United Kingdom 90-Day LIBOR Sterling Interest Rate September Futures | | Long | | 09/2007 | | 243 | | | (520 | ) |
United Kingdom 90-Day LIBOR Sterling Interest Rate September Futures | | Long | | 09/2008 | | 115 | | | (301 | ) |
| | | | | | | | | | |
| | | | | | | | $ | (32,408 | ) |
| | | | | | | | | | |
(g) Swap agreements outstanding on June 30, 2007:
Credit Default Swaps
| | | | | | | | | | | | | | | | |
| Counterparty | | Reference Entity | | Buy/Sell
Protection (1) | | (Pay)/Receive
Fixed Rate | | | Expiration
Date | | Notional
Amount | | Unrealized
Appreciation/
(Depreciation) | |
Bank of America | | Dow Jones CDX N.A. IG7 Index | | Buy | | (0.650% | ) | | 12/20/2016 | | $ | 10,000 | | $ | 87 | |
Bear Stearns & Co., Inc. | | Ford Motor Credit Co. 7.000% due 10/01/2013 | | Sell | | 2.320% | | | 09/20/2007 | | | 2,100 | | | 10 | |
Credit Suisse First Boston | | Ford Motor Credit Co. 7.000% due 10/01/2013 | | Sell | | 0.950% | | | 12/20/2007 | | | 2,300 | | | (2 | ) |
Credit Suisse First Boston | | Panama Government International Bond 8.875% due 09/30/2027 | | Sell | | 1.200% | | | 02/20/2017 | | | 400 | | | 7 | |
Deutsche Bank AG | | Dow Jones CDX N.A. IG8 Index | | Buy | | (0.600% | ) | | 06/20/2017 | | | 5,300 | | | 24 | |
Goldman Sachs & Co. | | Ford Motor Credit Co. 7.000% due 10/01/2013 | | Sell | | 2.400% | | | 09/20/2007 | | | 4,200 | | | 20 | |
Goldman Sachs & Co. | | Anadarko Petroleum Corp. 6.125% due 03/15/2012 | | Sell | | 0.150% | | | 03/20/2008 | | | 2,500 | | | 0 | |
Goldman Sachs & Co. | | Dow Jones CDX N.A. IG7 Index | | Buy | | (0.650% | ) | | 12/20/2016 | | | 44,000 | | | 336 | |
Goldman Sachs & Co. | | Dow Jones CDX N.A. IG8 Index | | Buy | | (0.600% | ) | | 06/20/2017 | | | 25,600 | | | 151 | |
HSBC Bank USA | | Ukraine Government International Bond 7.650% due 06/11/2013 | | Sell | | 0.700% | | | 04/20/2009 | | | 1,600 | | | 6 | |
HSBC Bank USA | | Ukraine Government International Bond 7.650% due 06/11/2013 | | Sell | | 0.520% | | | 05/20/2009 | | | 4,000 | | | (1 | ) |
JPMorgan Chase & Co. | | American International Group, Inc. 0.000% convertible until 11/09/2031 | | Sell | | 0.050% | | | 12/20/2007 | | | 17,200 | | | 1 | |
JPMorgan Chase & Co. | | Panama Government International Bond 8.875% due 09/30/2027 | | Sell | | 0.730% | | | 01/20/2012 | | | 1,000 | | | 6 | |
JPMorgan Chase & Co. | | Mexico Government International Bond 7.500% due 04/08/2033 | | Sell | | 0.920% | | | 03/20/2016 | | | 1,200 | | | 41 | |
JPMorgan Chase & Co. | | Panama Government International Bond 8.875% due 09/30/2027 | | Sell | | 1.250% | | | 01/20/2017 | | | 1,200 | | | 27 | |
Lehman Brothers, Inc. | | Ford Motor Credit Co. 7.000% due 10/01/2013 | | Sell | | 0.950% | | | 12/20/2007 | | | 4,200 | | | (3 | ) |
Lehman Brothers, Inc. | | Indonesia Government International Bond 6.750% due 03/10/2014 | | Sell | | 0.400% | | | 12/20/2008 | | | 2,200 | | | 1 | |
Lehman Brothers, Inc. | | Ukraine Government International Bond 7.650% due 06/11/2013 | | Sell | | 0.700% | | | 12/20/2008 | | | 5,000 | | | 14 | |
Lehman Brothers, Inc. | | Multiple Reference Entities of Gazprom | | Sell | | 1.430% | | | 07/20/2011 | | | 600 | | | 24 | |
Lehman Brothers, Inc. | | Mexico Government International Bond 7.500% due 04/08/2033 | | Sell | | 0.920% | | | 03/20/2016 | | | 3,100 | | | 105 | |
Lehman Brothers, Inc. | | Panama Government International Bond 8.875% due 09/30/2027 | | Sell | | 1.170% | | | 04/20/2017 | | | 3,000 | | | 40 | |
Morgan Stanley | | Russia Government International Bond 7.500% due 03/31/2030 | | Sell | | 0.245% | | | 06/20/2008 | | | 1,300 | | | 0 | |
Royal Bank of Scotland Group PLC | | Indonesia Government International Bond 6.750% due 03/10/2014 | | Sell | | 0.390% | | | 12/20/2008 | | | 3,000 | | | 1 | |
Royal Bank of Scotland Group PLC | | Indonesia Government International Bond 6.750% due 03/10/2014 | | Sell | | 0.400% | | | 12/20/2008 | | | 11,000 | | | 3 | |
| | | | | | | | | | | | | | | | |
| | | | | | | | | | | | | | $ | 898 | |
| | | | | | | | | | | | | | | | |
(1) If the Portfolio is a seller of protection and a credit event occurs, as defined under the terms of that particular swap agreement, the Portfolio will pay to the buyer of the protection an amount up to the notional value of the swap and in certain instances, take delivery of the security. As a buyer of protection, the Portfolio will generally receive from the seller of protection an amount up to the notional amount of the swap if a credit event occurs.
| | | | | | |
| See Accompanying Notes | | Semiannual Report | | June 30, 2007 | | 13 |
Schedule of Investments Total Return Portfolio (Cont.)
Interest Rate Swaps
| | | | | | | | | | | | | | | |
| Counterparty | | Floating Rate Index | | Pay/Receive
Floating Rate | | Fixed Rate | | Expiration
Date | | Notional
Amount | | Unrealized
Appreciation/
(Depreciation) | |
Deutsche Bank AG | | 6-Month Australian Bank Bill | | Pay | | 7.000% | | 12/15/2009 | | AUD | 9,300 | | $ | (5 | ) |
Barclays Bank PLC | | BRL-CDI-Compounded | | Pay | | 11.360% | | 01/04/2010 | | BRL | 16,700 | | | 97 | |
Goldman Sachs & Co. | | BRL-CDI-Compounded | | Pay | | 11.465% | | 01/04/2010 | | | 4,300 | | | 30 | |
Merrill Lynch & Co., Inc. | | BRL-CDI-Compounded | | Pay | | 11.430% | | 01/04/2010 | | | 11,000 | | | 73 | |
Merrill Lynch & Co., Inc. | | BRL-CDI-Compounded | | Pay | | 12.948% | | 01/04/2010 | | | 5,900 | | | 120 | |
Morgan Stanley | | BRL-CDI-Compounded | | Pay | | 12.780% | | 01/04/2010 | | | 14,200 | | | 263 | |
Barclays Bank PLC | | 5-Year French CPI Ex Tobacco Daily Reference Index | | Pay | | 2.103% | | 10/15/2010 | | EUR | 1,400 | | | 19 | |
Barclays Bank PLC | | 5-Year French CPI Ex Tobacco Daily Reference Index | | Pay | | 1.960% | | 04/05/2012 | | | 1,200 | | | (13 | ) |
BNP Paribas Bank | | 5-Year French CPI Ex Tobacco Daily Reference Index | | Pay | | 2.090% | | 10/15/2010 | | | 10,200 | | | 128 | |
Deutsche Bank AG | | 6-Month EUR-LIBOR | | Pay | | 5.000% | | 12/19/2009 | | | 26,700 | | | (9 | ) |
Deutsche Bank AG | | 6-Month EUR-LIBOR | | Receive | | 4.000% | | 12/15/2011 | | | 18,700 | | | 377 | |
Deutsche Bank AG | | 6-Month EUR-LIBOR | | Receive | | 5.000% | | 12/19/2017 | | | 6,300 | | | (33 | ) |
Goldman Sachs & Co. | | 6-Month EUR-LIBOR | | Pay | | 4.000% | | 03/20/2009 | | | 9,600 | | | (69 | ) |
Goldman Sachs & Co. | | 5-Year French CPI Ex Tobacco Daily Reference Index | | Pay | | 1.960% | | 03/30/2012 | | | 2,400 | | | (21 | ) |
JPMorgan Chase & Co. | | 5-Year French CPI Ex Tobacco Daily Reference Index | | Pay | | 1.948% | | 03/15/2012 | | | 8,400 | | | (77 | ) |
JPMorgan Chase & Co. | | 5-Year French CPI Ex Tobacco Daily Reference Index | | Pay | | 1.958% | | 04/10/2012 | | | 9,300 | | | (98 | ) |
Royal Bank of Scotland Group PLC | | 5-Year French CPI Ex Tobacco Daily Reference Index | | Pay | | 1.955% | | 03/28/2012 | | | 1,800 | | | (17 | ) |
Royal Bank of Scotland Group PLC | | 5-Year French CPI Ex Tobacco Daily Reference Index | | Pay | | 1.950% | | 03/30/2012 | | | 1,500 | | | (15 | ) |
UBS Warburg LLC | | 5-Year French CPI Ex Tobacco Daily Reference Index | | Pay | | 2.146% | | 10/15/2010 | | | 1,900 | | | 31 | |
Barclays Bank PLC | | 6-Month GBP-LIBOR | | Pay | | 6.000% | | 12/20/2008 | | GBP | 24,100 | | | (236 | ) |
Barclays Bank PLC | | 6-Month GBP-LIBOR | | Pay | | 6.000% | | 03/20/2009 | | | 13,600 | | | (196 | ) |
Barclays Bank PLC | | 6-Month GBP-LIBOR | | Pay | | 5.000% | | 06/15/2009 | | | 14,400 | | | (259 | ) |
Barclays Bank PLC | | 6-Month GBP-LIBOR | | Receive | | 4.000% | | 12/15/2035 | | | 2,900 | | | 268 | |
Barclays Bank PLC | | 6-Month GBP-LIBOR | | Receive | | 4.000% | | 12/15/2036 | | | 3,200 | | | 774 | |
Credit Suisse First Boston | | 6-Month GBP-LIBOR | | Pay | | 5.000% | | 06/15/2009 | | | 2,800 | | | (66 | ) |
Deutsche Bank AG | | 6-Month GBP-LIBOR | | Pay | | 6.000% | | 12/20/2008 | | | 14,400 | | | (146 | ) |
Goldman Sachs & Co. | | 6-Month GBP-LIBOR | | Pay | | 5.000% | | 06/15/2009 | | | 28,500 | | | (697 | ) |
Goldman Sachs & Co. | | 6-Month GBP-LIBOR | | Pay | | 6.000% | | 06/19/2009 | | | 74,700 | | | (235 | ) |
Goldman Sachs & Co. | | 6-Month GBP-LIBOR | | Receive | | 5.500% | | 12/15/2036 | | | 5,000 | | | 287 | |
HSBC Bank USA | | 6-Month GBP-LIBOR | | Pay | | 4.500% | | 12/20/2007 | | | 53,900 | | | (531 | ) |
HSBC Bank USA | | 6-Month GBP-LIBOR | | Receive | | 4.000% | | 12/15/2036 | | | 5,500 | | | 1,145 | |
Lehman Brothers, Inc. | | 6-Month GBP-LIBOR | | Pay | | 4.500% | | 09/20/2009 | | | 17,500 | | | (1,164 | ) |
Merrill Lynch & Co., Inc. | | 6-Month GBP-LIBOR | | Receive | | 4.000% | | 12/15/2035 | | | 2,200 | | | 208 | |
Royal Bank of Scotland Group PLC | | 6-Month GBP-LIBOR | | Pay | | 6.000% | | 03/20/2009 | | | 12,700 | | | (187 | ) |
Royal Bank of Scotland Group PLC | | 6-Month GBP-LIBOR | | Pay | | 6.000% | | 06/19/2009 | | | 21,200 | | | (80 | ) |
Royal Bank of Scotland Group PLC | | 6-Month GBP-LIBOR | | Receive | | 4.000% | | 12/15/2036 | | | 10,000 | | | 2,182 | |
Royal Bank of Scotland Group PLC | | 6-Month GBP-LIBOR | | Receive | | 5.500% | | 12/15/2036 | | | 1,400 | | | 69 | |
Barclays Bank PLC | | 6-Month JPY-LIBOR | | Pay | | 1.000% | | 03/18/2009 | | JPY | 1,270,000 | | | (28 | ) |
Deutsche Bank AG | | 6-Month JPY-LIBOR | | Pay | | 1.000% | | 09/18/2008 | | | 9,500,000 | | | (49 | ) |
Deutsche Bank AG | | 6-Month JPY-LIBOR | | Pay | | 1.000% | | 03/18/2009 | | | 2,050,000 | | | (30 | ) |
UBS Warburg LLC | | 6-Month JPY-LIBOR | | Pay | | 1.000% | | 03/19/2008 | | | 22,300,000 | | | (64 | ) |
UBS Warburg LLC | | 6-Month JPY-LIBOR | | Pay | | 1.000% | | 09/18/2008 | | | 700,000 | | | (3 | ) |
UBS Warburg LLC | | 6-Month JPY-LIBOR | | Pay | | 1.000% | | 03/18/2009 | | | 18,200,000 | | | (298 | ) |
Citibank N.A. | | 28-Day Mexico Interbank TIIE Banxico | | Pay | | 8.170% | | 11/04/2016 | | MXN | 12,100 | | | 7 | |
Goldman Sachs & Co. | | 28-Day Mexico Interbank TIIE Banxico | | Pay | | 7.780% | | 04/03/2012 | | | 46,500 | | | (38 | ) |
Bank of America | | 3-Month USD-LIBOR | | Pay | | 5.000% | | 12/19/2009 | | $ | 66,300 | | | 6 | |
Bank of America | | 3-Month USD-LIBOR | | Pay | | 5.000% | | 12/19/2009 | | | 118,400 | | | (129 | ) |
Bank of America | | 3-Month USD-LIBOR | | Receive | | 5.000% | | 12/19/2017 | | | 17,200 | | | 160 | |
Barclays Bank PLC | | 3-Month USD-LIBOR | | Pay | | 5.000% | | 12/19/2009 | | | 64,200 | | | (71 | ) |
Deutsche Bank AG | | 3-Month USD-LIBOR | | Pay | | 5.000% | | 12/19/2008 | | | 230,400 | | | (498 | ) |
Deutsche Bank AG | | 3-Month USD-LIBOR | | Pay | | 5.000% | | 12/19/2009 | | | 730,900 | | | 551 | |
Deutsche Bank AG | | 3-Month USD-LIBOR | | Receive | | 5.000% | | 12/19/2017 | | | 77,400 | | | (378 | ) |
Goldman Sachs & Co. | | 3-Month USD-LIBOR | | Pay | | 5.000% | | 12/19/2009 | | | 200 | | | 0 | |
Morgan Stanley | | 3-Month USD-LIBOR | | Pay | | 5.000% | | 06/20/2009 | | | 81,500 | | | (641 | ) |
Morgan Stanley | | 3-Month USD-LIBOR | | Receive | | 5.000% | | 12/19/2017 | | | 15,400 | | | (100 | ) |
Morgan Stanley | | 3-Month USD-LIBOR | | Pay | | 5.000% | | 12/19/2037 | | | 2,500 | | | 41 | |
Royal Bank of Scotland Group PLC | | 3-Month USD-LIBOR | | Pay | | 5.000% | | 12/19/2008 | | | 230,400 | | | (529 | ) |
Royal Bank of Scotland Group PLC | | 3-Month USD-LIBOR | | Pay | | 5.000% | | 06/20/2009 | | | 68,700 | | | (134 | ) |
Royal Bank of Scotland Group PLC | | 3-Month USD-LIBOR | | Pay | | 5.000% | | 12/19/2037 | | | 27,900 | | | 449 | |
| | | | | | | | | | | | | | | |
| | | | | | | | | | | | | $ | 141 | |
| | | | | | | | | | | | | | | |
(h) Purchased options outstanding on June 30, 2007:
Options on Exchange-Traded Futures Contracts
| | | | | | | | | | | | | |
| Description | | Exercise
Price | | Expiration
Date | | # of
Contracts | | Cost | | Value |
Put - CME 90-Day Eurodollar September Futures | | $ | 90.750 | | 09/17/2007 | | 400 | | $ | 4 | | $ | 0 |
Put - CME 90-Day Eurodollar September Futures | | | 91.000 | | 09/17/2007 | | 1,774 | | | 17 | | | 0 |
| | | | | | | | | | | | | |
| | | | | | | | | $ | 21 | | $ | 0 |
| | | | | | | | | | | | | |
| | | | |
| 14 | | PIMCO Variable Insurance Trust | | See Accompanying Notes |
| | |
| |
| | | June 30, 2007 (Unaudited) |
Interest Rate Swaptions
| | | | | | | | | | | | | | | | | | | |
| Description | | Counterparty | | Floating Rate Index | | Pay/Receive
Floating Rate | | Exercise
Rate | | Expiration
Date | | Notional
Amount | | Cost | | Value |
Call - OTC 2-Year Interest Rate Swap | | Barclays Bank PLC | | 6-Month EUR-LIBOR | | Pay | | 3.960% | | 07/02/2007 | | EUR | 26,000 | | $ | 120 | | $ | 0 |
Call - OTC 2-Year Interest Rate Swap | | Deutsche Bank AG | | 6-Month EUR-LIBOR | | Pay | | 3.960% | | 07/02/2007 | | | 84,000 | | | 480 | | | 0 |
Call - OTC 2-Year Interest Rate Swap | | Deutsche Bank AG | | 6-Month EUR-LIBOR | | Pay | | 4.100% | | 07/02/2007 | | | 58,000 | | | 323 | | | 0 |
Call - OTC 2-Year Interest Rate Swap | | Royal Bank of Scotland Group PLC | | 6-Month EUR-LIBOR | | Pay | | 3.960% | | 07/02/2007 | | | 56,000 | | | 271 | | | 0 |
Call - OTC 2-Year Interest Rate Swap | | Bank of America | | 3-Month USD-LIBOR | | Pay | | 4.800% | | 08/08/2007 | | $ | 76,000 | | | 309 | | | 1 |
Call - OTC 2-Year Interest Rate Swap | | Bank of America | | 3-Month USD-LIBOR | | Pay | | 4.900% | | 08/08/2007 | | | 39,000 | | | 172 | | | 1 |
Call - OTC 2-Year Interest Rate Swap | | Bank of America | | 3-Month USD-LIBOR | | Pay | | 4.750% | | 09/26/2008 | | | 261,000 | | | 1,258 | | | 513 |
Call - OTC 2-Year Interest Rate Swap | | Barclays Bank PLC | | 3-Month USD-LIBOR | | Pay | | 5.250% | | 08/08/2007 | | | 72,000 | | | 67 | | | 60 |
Call - OTC 1-Year Interest Rate Swap | | Barclays Bank PLC | | 3-Month USD-LIBOR | | Pay | | 4.750% | | 02/01/2008 | | | 100,000 | | | 287 | | | 30 |
Call - OTC 1-Year Interest Rate Swap | | Goldman Sachs & Co. | | 3-Month USD-LIBOR | | Pay | | 4.700% | | 08/08/2007 | | | 89,000 | | | 199 | | | 0 |
Call - OTC 2-Year Interest Rate Swap | | Lehman Brothers, Inc. | | 3-Month USD-LIBOR | | Pay | | 4.750% | | 03/31/2008 | | | 236,900 | | | 1,254 | | | 293 |
Call - OTC 2-Year Interest Rate Swap | | Lehman Brothers, Inc. | | 3-Month USD-LIBOR | | Pay | | 4.750% | | 09/26/2008 | | | 349,600 | | | 1,237 | | | 688 |
Call - OTC 2-Year Interest Rate Swap | | Royal Bank of Scotland Group PLC | | 3-Month USD-LIBOR | | Pay | | 4.750% | | 07/02/2007 | | | 66,000 | | | 273 | | | 0 |
Call - OTC 1-Year Interest Rate Swap | | Royal Bank of Scotland Group PLC | | 3-Month USD-LIBOR | | Pay | | 4.850% | | 07/02/2007 | | | 150,000 | | | 390 | | | 0 |
Call - OTC 2-Year Interest Rate Swap | | Royal Bank of Scotland Group PLC | | 3-Month USD-LIBOR | | Pay | | 5.250% | | 07/02/2007 | | | 316,400 | | | 1,671 | | | 0 |
Call - OTC 1-Year Interest Rate Swap | | Royal Bank of Scotland Group PLC | | 3-Month USD-LIBOR | | Pay | | 4.900% | | 08/08/2007 | | | 144,000 | | | 326 | | | 0 |
Call - OTC 1-Year Interest Rate Swap | | Royal Bank of Scotland Group PLC | | 3-Month USD-LIBOR | | Pay | | 5.000% | | 08/08/2007 | | | 240,000 | | | 306 | | | 0 |
Call - OTC 2-Year Interest Rate Swap | | Royal Bank of Scotland Group PLC | | 3-Month USD-LIBOR | | Pay | | 4.900% | | 10/25/2007 | | | 109,000 | | | 439 | | | 53 |
Call - OTC 2-Year Interest Rate Swap | | Royal Bank of Scotland Group PLC | | 3-Month USD-LIBOR | | Pay | | 5.000% | | 02/01/2008 | | | 222,600 | | | 1,104 | | | 357 |
Call - OTC 2-Year Interest Rate Swap | | Royal Bank of Scotland Group PLC | | 3-Month USD-LIBOR | | Pay | | 4.750% | | 03/31/2008 | | | 386,900 | | | 2,276 | | | 478 |
Call - OTC 2-Year Interest Rate Swap | | Royal Bank of Scotland Group PLC | | 3-Month USD-LIBOR | | Pay | | 4.750% | | 09/26/2008 | | | 94,900 | | | 377 | | | 187 |
Call - OTC 2-Year Interest Rate Swap | | Royal Bank of Scotland Group PLC | | 3-Month USD-LIBOR | | Pay | | 4.750% | | 12/15/2008 | | | 380,900 | | | 1,304 | | | 864 |
Call - OTC 2-Year Interest Rate Swap | | Royal Bank of Scotland Group PLC | | 3-Month USD-LIBOR | | Pay | | 5.000% | | 12/15/2008 | | | 201,000 | | | 573 | | | 680 |
| | | | | | | | | | | | | | | | | | | |
| | | | | | | | | | | | | | | $ | 15,016 | | $ | 4,205 |
| | | | | | | | | | | | | | | | | | | |
Foreign Currency Options
| | | | | | | | | | | | | | |
| Description | | Exercise
Price | | Expiration
Date | | Notional
Amount | | Cost | | Value |
Call - OTC U.S. dollar versus Japanese yen | | JPY | 103.800 | | 03/17/2010 | | $ | 3,000 | | $ | 131 | | $ | 231 |
Put - OTC U.S. dollar versus Japanese yen | | | 103.800 | | 03/17/2010 | | | 3,000 | | | 131 | | | 74 |
Call - OTC U.S. dollar versus Japanese yen | | | 104.650 | | 03/31/2010 | | | 2,000 | | | 91 | | | 143 |
Put - OTC U.S. dollar versus Japanese yen | | | 104.650 | | 03/31/2010 | | | 2,000 | | | 78 | | | 54 |
Call - OTC U.S. dollar versus Japanese yen | | | 105.200 | | 03/31/2010 | | | 3,000 | | | 126 | | | 204 |
Put - OTC U.S. dollar versus Japanese yen | | | 105.200 | | 03/31/2010 | | | 3,000 | | | 126 | | | 84 |
Call - OTC U.S. dollar versus Japanese yen | | | 105.400 | | 03/31/2010 | | | 9,000 | | | 378 | | | 602 |
Put - OTC U.S. dollar versus Japanese yen | | | 105.400 | | 03/31/2010 | | | 9,000 | | | 377 | | | 256 |
| | | | | | | | | | | | | | |
| | | | | | | | | | $ | 1,438 | | $ | 1,648 |
| | | | | | | | | | | | | | |
(i) Written options outstanding on June 30, 2007:
Options on Exchange-Traded Futures Contracts
| | | | | | | | | | | | | |
| Description | | Exercise
Price | | Expiration
Date | | # of
Contracts | | Premium | | Value |
Call - CBOT U.S. Treasury 10-Year Note September Futures | | $ | 106.000 | | 08/24/2007 | | 1,025 | | $ | 330 | | $ | 625 |
Call - CBOT U.S. Treasury 10-Year Note September Futures | | | 107.000 | | 08/24/2007 | | 553 | | | 173 | | | 147 |
Call - CBOT U.S. Treasury 10-Year Note September Futures | | | 108.000 | | 08/24/2007 | | 133 | | | 27 | | | 14 |
Call - CBOT U.S. Treasury 10-Year Note September Futures | | | 109.000 | | 08/24/2007 | | 187 | | | 22 | | | 9 |
Put - CBOT U.S. Treasury 10-Year Note September Futures | | | 103.000 | | 08/24/2007 | | 248 | | | 134 | | | 27 |
Put - CBOT U.S. Treasury 10-Year Note September Futures | | | 104.000 | | 08/24/2007 | | 777 | | | 301 | | | 170 |
Put - CBOT U.S. Treasury 10-Year Note September Futures | | | 105.000 | | 08/24/2007 | | 876 | | | 305 | | | 411 |
| | | | | | | | | | | | | |
| | | | | | | | | $ | 1,292 | | $ | 1,403 |
| | | | | | | | | | | | | |
Interest Rate Swaptions
| | | | | | | | | | | | | | | | | | | |
| Description | | Counterparty | | Floating Rate Index | | Pay/Receive
Floating Rate | | Exercise
Rate | | Expiration
Date | | Notional
Amount | | Premium | | Value |
Call - OTC 5-Year Interest Rate Swap | | Barclays Bank PLC | | 6-Month EUR-LIBOR | | Receive | | 4.100% | | 07/02/2007 | | EUR | 10,000 | | $ | 120 | | $ | 0 |
Call - OTC 5-Year Interest Rate Swap | | Deutsche Bank AG | | 6-Month EUR-LIBOR | | Receive | | 4.100% | | 07/02/2007 | | | 36,000 | | | 493 | | | 0 |
Call - OTC 5-Year Interest Rate Swap | | Deutsche Bank AG | | 6-Month EUR-LIBOR | | Receive | | 4.230% | | 07/02/2007 | | | 25,000 | | | 322 | | | 0 |
Call - OTC 5-Year Interest Rate Swap | | Royal Bank of Scotland Group PLC | | 6-Month EUR-LIBOR | | Receive | | 4.100% | | 07/02/2007 | | | 24,000 | | | 271 | | | 0 |
Call - OTC 5-Year Interest Rate Swap | | Bank of America | | 3-Month USD-LIBOR | | Receive | | 4.900% | | 08/08/2007 | | $ | 33,000 | | | 290 | | | 2 |
Call - OTC 5-Year Interest Rate Swap | | Bank of America | | 3-Month USD-LIBOR | | Receive | | 4.950% | | 09/26/2008 | | | 112,900 | | | 1,265 | | | 569 |
Call - OTC 10-Year Interest Rate Swap | | Barclays Bank PLC | | 3-Month USD-LIBOR | | Receive | | 5.570% | | 08/08/2007 | | | 18,000 | | | 70 | | | 80 |
Call - OTC 5-Year Interest Rate Swap | | Barclays Bank PLC | | 3-Month USD-LIBOR | | Receive | | 4.900% | | 02/01/2008 | | | 22,000 | | | 274 | | | 46 |
Call - OTC 7-Year Interest Rate Swap | | Goldman Sachs & Co. | | 3-Month USD-LIBOR | | Receive | | 4.850% | | 08/08/2007 | | | 15,000 | | | 204 | | | 0 |
Call - OTC 5-Year Interest Rate Swap | | Lehman Brothers, Inc. | | 3-Month USD-LIBOR | | Receive | | 4.900% | | 03/31/2008 | | | 102,000 | | | 1,202 | | | 312 |
Call - OTC 5-Year Interest Rate Swap | | Lehman Brothers, Inc. | | 3-Month USD-LIBOR | | Receive | | 4.950% | | 09/26/2008 | | | 152,000 | | | 1,259 | | | 765 |
Call - OTC 5-Year Interest Rate Swap | | Royal Bank of Scotland Group PLC | | 3-Month USD-LIBOR | | Receive | | 4.950% | | 07/02/2007 | | | 34,000 | | | 367 | | | 0 |
Call - OTC 5-Year Interest Rate Swap | | Royal Bank of Scotland Group PLC | | 3-Month USD-LIBOR | | Receive | | 5.000% | | 07/02/2007 | | | 28,400 | | | 297 | | | 0 |
Call - OTC 5-Year Interest Rate Swap | | Royal Bank of Scotland Group PLC | | 3-Month USD-LIBOR | | Receive | | 5.370% | | 07/02/2007 | | | 138,000 | | | 1,680 | | | 0 |
| | | | | | |
| See Accompanying Notes | | Semiannual Report | | June 30, 2007 | | 15 |
| | |
| |
| Schedule of Investments Total Return Portfolio (Cont.) | | June 30, 2007 (Unaudited) |
| | | | | | | | | | | | | | | | | | | |
| Description | | Counterparty | | Floating Rate Index | | Pay/Receive
Floating Rate | | Exercise
Rate | | Expiration
Date | | Notional
Amount | | Premium | | Value |
Call - OTC 7-Year Interest Rate Swap | | Royal Bank of Scotland Group PLC | | 3-Month USD-LIBOR | | Receive | | 4.900% | | 08/08/2007 | | $ | 24,000 | | $ | 278 | | $ | 1 |
Call - OTC 5-Year Interest Rate Swap | | Royal Bank of Scotland Group PLC | | 3-Month USD-LIBOR | | Receive | | 4.900% | | 08/08/2007 | | | 46,000 | | | 307 | | | 3 |
Call - OTC 7-Year Interest Rate Swap | | Royal Bank of Scotland Group PLC | | 3-Month USD-LIBOR | | Receive | | 5.000% | | 08/08/2007 | | | 13,000 | | | 148 | | | 1 |
Call - OTC 5-Year Interest Rate Swap | | Royal Bank of Scotland Group PLC | | 3-Month USD-LIBOR | | Receive | | 5.010% | | 10/25/2007 | | | 47,000 | | | 433 | | | 63 |
Call - OTC 5-Year Interest Rate Swap | | Royal Bank of Scotland Group PLC | | 3-Month USD-LIBOR | | Receive | | 5.100% | | 02/01/2008 | | | 97,000 | | | 1,164 | | | 347 |
Call - OTC 5-Year Interest Rate Swap | | Royal Bank of Scotland Group PLC | | 3-Month USD-LIBOR | | Receive | | 4.900% | | 03/31/2008 | | | 106,500 | | | 1,417 | | | 325 |
Call - OTC 5-Year Interest Rate Swap | | Royal Bank of Scotland Group PLC | | 3-Month USD-LIBOR | | Receive | | 4.950% | | 03/31/2008 | | | 62,000 | | | 763 | | | 212 |
Call - OTC 5-Year Interest Rate Swap | | Royal Bank of Scotland Group PLC | | 3-Month USD-LIBOR | | Receive | | 4.950% | | 09/26/2008 | | | 41,100 | | | 371 | | | 207 |
Call - OTC 7-Year Interest Rate Swap | | Royal Bank of Scotland Group PLC | | 3-Month USD-LIBOR | | Receive | | 5.000% | | 12/15/2008 | | | 128,100 | | | 1,298 | | | 910 |
Call - OTC 7-Year Interest Rate Swap | | Royal Bank of Scotland Group PLC | | 3-Month USD-LIBOR | | Receive | | 5.200% | | 12/15/2008 | | | 67,000 | | | 561 | | | 658 |
| | | | | | | | | | | | | | | | | | | |
| | | | | | | | | | | | | | | $ | 14,854 | | $ | 4,501 |
| | | | | | | | | | | | | | | | | | | |
(j) Short sales outstanding on June 30, 2007:
| | | | | | | | | | | | | |
| Description | | Coupon | | Maturity
Date | | Principal
Amount | | Proceeds | | Value (2) |
U.S. Treasury Notes | | 4.500% | | 05/15/2017 | | $ | 79,600 | | $ | 76,247 | | $ | 76,909 |
U.S. Treasury Notes | | 4.625% | | 02/15/2017 | | | 11,300 | | | 10,989 | | | 11,151 |
| | | | | | | | | | | | | |
| | | | | | | | | $ | 87,236 | | $ | 88,060 |
| | | | | | | | | | | | | |
(2) Market value includes $771 of interest payable on short sales.
(k) Foreign currency contracts outstanding on June 30, 2007:
| | | | | | | | | | | | | | | | | |
| Type | | Currency | | Principal
Amount
Covered by
Contract | | Settlement
Month | | Unrealized
Appreciation | | Unrealized
(Depreciation) | | | Net Unrealized
Appreciation/
(Depreciation) | |
Buy | | AUD | | 13,512 | | 07/2007 | | $ | 82 | | $ | 0 | | | $ | 82 | |
Sell | | | | 152 | | 07/2007 | | | 0 | | | (2 | ) | | | (2 | ) |
Buy | | BRL | | 134,709 | | 10/2007 | | | 2,711 | | | 0 | | | | 2,711 | |
Buy | | | | 72,223 | | 03/2008 | | | 2,203 | | | 0 | | | | 2,203 | |
Buy | | CAD | | 8,794 | | 08/2007 | | | 37 | | | 0 | | | | 37 | |
Buy | | CLP | | 709,183 | | 03/2008 | | | 0 | | | (4 | ) | | | (4 | ) |
Buy | | CNY | | 3,842 | | 09/2007 | | | 10 | | | 0 | | | | 10 | |
Sell | | | | 3,842 | | 09/2007 | | | 0 | | | (1 | ) | | | (1 | ) |
Buy | | | | 49,610 | | 11/2007 | | | 51 | | | 0 | | | | 51 | |
Sell | | | | 49,610 | | 11/2007 | | | 5 | | | (12 | ) | | | (7 | ) |
Buy | | | | 23,778 | | 01/2008 | | | 0 | | | (21 | ) | | | (21 | ) |
Sell | | | | 23,778 | | 01/2008 | | | 1 | | | (3 | ) | | | (2 | ) |
Buy | | EUR | | 8,967 | | 07/2007 | | | 117 | | | 0 | | | | 117 | |
Sell | | GBP | | 6,996 | | 08/2007 | | | 0 | | | (74 | ) | | | (74 | ) |
Buy | | IDR | | 24,255,000 | | 05/2008 | | | 0 | | | (114 | ) | | | (114 | ) |
Buy | | INR | | 187,331 | | 10/2007 | | | 20 | | | (1 | ) | | | 19 | |
Buy | | | | 1,010 | | 11/2007 | | | 0 | | | 0 | | | | 0 | |
Buy | | | | 122,664 | | 05/2008 | | | 50 | | | 0 | | | | 50 | |
Sell | | JPY | | 1,031,294 | | 07/2007 | | | 121 | | | 0 | | | | 121 | |
Buy | | KRW | | 6,070,349 | | 07/2007 | | | 44 | | | 0 | | | | 44 | |
Sell | | | | 668,852 | | 07/2007 | | | 0 | | | (3 | ) | | | (3 | ) |
Buy | | | | 1,157,326 | | 08/2007 | | | 0 | | | (1 | ) | | | (1 | ) |
Buy | | | | 6,709,511 | | 09/2007 | | | 18 | | | 0 | | | | 18 | |
Buy | | MXN | | 41,747 | | 09/2007 | | | 54 | | | 0 | | | | 54 | |
Buy | | | | 153,994 | | 03/2008 | | | 126 | | | (2 | ) | | | 124 | |
Buy | | MYR | | 28,483 | | 05/2008 | | | 0 | | | (123 | ) | | | (123 | ) |
Buy | | NZD | | 1,690 | | 07/2007 | | | 32 | | | 0 | | | | 32 | |
Buy | | PHP | | 391,443 | | 05/2008 | | | 0 | | | (108 | ) | | | (108 | ) |
Buy | | PLN | | 34,725 | | 09/2007 | | | 221 | | | (2 | ) | | | 219 | |
Buy | | | | 6,468 | | 03/2008 | | | 29 | | | 0 | | | | 29 | |
Buy | | RUB | | 100,792 | | 09/2007 | | | 51 | | | 0 | | | | 51 | |
Buy | | | | 90,414 | | 11/2007 | | | 90 | | | 0 | | | | 90 | |
Buy | | | | 235,816 | | 12/2007 | | | 209 | | | 0 | | | | 209 | |
Buy | | | | 381,762 | | 01/2008 | | | 66 | | | 0 | | | | 66 | |
Buy | | SEK | | 15,753 | | 09/2007 | | | 28 | | | 0 | | | | 28 | |
Buy | | SGD | | 21,054 | | 07/2007 | | | 0 | | | (88 | ) | | | (88 | ) |
Buy | | | | 6,884 | | 08/2007 | | | 25 | | | (13 | ) | | | 12 | |
Buy | | | | 860 | | 09/2007 | | | 0 | | | (2 | ) | | | (2 | ) |
Buy | | | | 23,617 | | 10/2007 | | | 69 | | | (6 | ) | | | 63 | |
Buy | | ZAR | | 964 | | 09/2007 | | | 3 | | | 0 | | | | 3 | |
Buy | | | | 148 | | 03/2008 | | | 0 | | | 0 | | | | 0 | |
| | | | | | | | | | | | | | | | | |
| | | | | | | | $ | 6,473 | | $ | (580 | ) | | $ | 5,893 | |
| | | | | | | | | | | | | | | | | |
| | | | |
| 16 | | PIMCO Variable Insurance Trust | | See Accompanying Notes |
| | |
| |
| Notes to Financial Statements | | June 30, 2007 (Unaudited) |
1. ORGANIZATION
The Total Return Portfolio (the “Portfolio”) is a series of the PIMCO Variable Insurance Trust (the “Trust”). The Trust is registered under the Investment Company Act of 1940 (the “Act”), as amended, as an open-end management investment company organized as a Delaware business trust on October 3, 1997. The Portfolio offers three classes of shares: Institutional, Administrative and Advisor. Information presented on these financial statements pertains to the Institutional Class of the Portfolio. Certain detailed financial information for the Administrative Class and Advisor Class is provided separately and is available upon request. The Trust is designed to be used as an investment vehicle by Separate Accounts of insurance companies that fund variable annuity contracts and variable life insurance policies and by qualified pension and retirement plans.
2. SIGNIFICANT ACCOUNTING POLICIES
The following is a summary of significant accounting policies consistently followed by the Portfolio in the preparation of its financial statements in conformity with accounting principles generally accepted in the United States of America (“GAAP”). The preparation of financial statements in accordance with GAAP requires management to make estimates and assumptions that affect the reported amounts and disclosures on the financial statements. Actual results could differ from those estimates.
(a) Security Valuation Portfolio securities are valued as of the close of regular trading (normally 4:00 p.m., Eastern Time) on each day that the New York Stock Exchange (“NYSE”) is open. Portfolio securities and other assets for which market quotes are readily available are stated at market value. Market value is generally determined on the basis of last reported sales prices, or if no sales are reported, based on quotes obtained from a quotation reporting system, established market makers, or pricing services. Fixed-income securities and non-exchange traded derivatives are normally valued on the basis of quotes obtained from brokers and dealers or pricing services. Prices obtained from independent pricing services use information provided by market makers or estimates of market values obtained from yield data relating to investments or securities with similar characteristics. Certain fixed income securities purchased on a delayed-delivery basis are marked to market daily until settlement at the forward settlement date. Short-term investments having a maturity of 60 days or less are generally valued at amortized cost. Exchange traded options, futures and options on futures are valued at the settlement price determined by the relevant exchange. With respect to any portion of the Portfolio’s assets that are invested in one or more open end management investment companies, the Portfolio’s net asset value (“NAV”) will be calculated based upon the NAVs of such investments.
Investments initially valued in currencies other than the U.S. dollar are converted to the U.S. dollar using exchange rates obtained from pricing services. As a result, the NAV of the Portfolio’s securities may be affected by changes in the value of currencies in relation to the U.S. dollar. The value of securities traded in markets outside the United States or denominated in currencies other than the U.S. dollar may be affected significantly on a day that the NYSE is closed and an investor is not able to purchase, redeem or exchange shares.
Securities and other assets for which market quotes are not readily available are valued at fair value as determined in good faith by the Board of Trustees or persons acting at their direction. The Board of Trustees has adopted methods for valuing securities and other assets in circumstances where market quotes are not readily available, and has delegated to Pacific Investment Management Company LLC (“PIMCO”) the responsibility for applying the valuation methods. In the event that market quotes are not readily available, and the security or asset cannot be valued pursuant to one of the valuation methods, the value of the security or asset will be determined in good faith by the Valuation Committee of the Board of Trustees, generally based upon recommendations provided by PIMCO.
Market quotes are considered not readily available in circumstances where there is an absence of current or reliable market-based data (e.g., trade information, bid/asked information, broker quotes), including where events occur after the close of the relevant market, but prior to the close of regular trading, that materially affect the values of the Portfolio’s securities or assets. In addition, market quotes are considered not readily available when, due to extraordinary circumstances, the exchanges or markets on which the securities trade, do not open for trading for the entire day and no other market prices are available. The Board has delegated to PIMCO the responsibility for monitoring significant events that may materially affect the values of the Portfolio’s securities or assets and for determining whether the value of the applicable securities or assets should be re-evaluated in light of such significant events.
When the Portfolio uses fair value pricing to determine its NAV, securities will not be priced on the basis of quotations from the primary market in which they are traded, but rather may be priced by another method that the Board of Trustees or persons acting at their direction believe accurately reflects fair value. The Trust’s policy is intended to result in a calculation of the Portfolio’s NAV that fairly reflects security values as of the time of pricing. However, fair values determined by the Board of Trustees or persons acting at their direction may not accurately reflect the price that the Portfolio could obtain for a security if it were to dispose of that security as of the time of pricing. Because foreign securities can trade on non-business days of the Portfolio, the NAV of the Portfolio may change on days when shareholders will not be able to purchase or redeem Portfolio shares. The prices used by the Portfolio may differ from the value that would be realized if the securities were sold and the differences could be material to the financial statements.
(b) Securities Transactions and Investment Income Securities transactions are recorded as of the trade date for financial reporting purposes. Securities purchased or sold on a when-issued or delayed-delivery basis may be settled a month or more after the trade date. Realized gains and losses from securities sold are recorded on the identified cost basis. Dividend income is recorded on the ex-dividend date, except certain dividends from foreign securities where the ex-dividend date may have passed, which are recorded as soon as the Portfolio is informed of the ex-dividend date. Interest income, adjusted for the accretion of discounts and amortization of premiums, is recorded on the accrual basis. Paydown gains and losses on mortgage-related and other asset-backed securities are recorded as components of interest income on the Statement of Operations.
(c) Delayed-Delivery Transactions The Portfolio may purchase or sell securities on a delayed-delivery basis. These transactions involve a commitment by the Portfolio to purchase or sell securities for a predetermined price or yield, with payment and delivery taking place beyond the customary settlement period. When delayed-delivery purchases are outstanding, the Portfolio will designate liquid assets in an amount sufficient to meet the purchase price. When purchasing a security on a delayed-delivery basis, the Portfolio assumes the rights and risks of ownership of the security, including the risk of price and yield fluctuations, and takes such fluctuations into account when determining its net asset value. The Portfolio may dispose of or renegotiate a delayed-delivery transaction after it is entered into, and may sell when-issued securities before they are delivered, which may result in a capital gain or loss. When the Portfolio has sold a security on a delayed-delivery basis, the Portfolio does not participate in future gains and losses with respect to the security.
(d) Dividends and Distributions to Shareholders Dividends from net investment income, if any, are declared daily and distributed to shareholders monthly. Net realized capital gains earned by the Portfolio, if any, will be distributed no less frequently than once each year.
Income dividends and capital gain distributions are determined in accordance with income tax regulations which may differ from GAAP. Differences between tax
| | | | | | |
| | Semiannual Report | | June 30, 2007 | | 17 |
Notes to Financial Statements (Cont.)
regulations and GAAP may change the fiscal year when income and capital items are recognized for tax and GAAP purposes. Examples of events that give rise to timing differences include wash sales, straddles, net operating losses and capital loss carryforwards. Further, the character of investment income and capital gains may be different for certain transactions under the two methods of accounting. Examples of characterization differences include the treatment of mortgage paydowns, swaps, foreign currency transactions and contingent debt instruments. As a result, income dividends and capital gain distributions declared during a fiscal period may differ significantly from the net investment income and realized capital gain reported on the Portfolio’s annual financial statements presented under GAAP.
Distributions classified as a tax basis return of capital, if any, are reflected on the accompanying Statements of Changes in Net Assets and have been reclassified to paid in capital. In addition, other amounts have been reclassified between undistributed net investment income, accumulated undistributed net realized gains or losses and/or paid in capital to more appropriately conform financial accounting to tax characterizations of dividend distributions.
(e) Multiclass Operations Each class offered by the Portfolio has equal rights as to assets and voting privileges (except that shareholders of a class have exclusive voting rights regarding any matter relating solely to that class of shares). Income and non-class specific expenses of the Portfolio are allocated daily to each class of shares based on the relative value of settled shares. Realized and unrealized capital gains and losses of the Portfolio are allocated daily to each class of shares based on the relative net assets of each class. Class specific expenses, where applicable, currently include administrative, distribution and servicing fees.
(f) Foreign Currency The functional and reporting currency for the Portfolio is the U.S. dollar. The market values of foreign securities, currency holdings and other assets and liabilities are translated into U.S. dollars based on the current exchange rates each business day. Fluctuations in the value of currency holdings and other assets and liabilities resulting from changes in exchange rates are recorded as unrealized foreign currency gains or losses. Realized gains or losses and unrealized appreciation or depreciation on investment securities and income and expenses are translated on the respective dates of such transactions. The effects of changes in foreign currency exchange rates on investments in securities are not segregated on the Statement of Operations from the effects of changes in market prices of those securities, but are included with the net realized and unrealized gain or loss on investment securities.
| | | | | | |
|
| Non-U.S. currency symbols utilized throughout the report are defined as follows: |
| AUD | | Australian Dollar | | KRW | | South Korean Won |
| BRL | | Brazilian Real | | MXN | | Mexican Peso |
| CAD | | Canadian Dollar | | MYR | | Malaysian Ringgit |
| CLP | | Chilean Peso | | NZD | | New Zealand Dollar |
| CNY | | Chinese Yuan Renminbi | | PHP | | Philippines Peso |
| EUR | | Euro | | PLN | | Polish Zloty |
| GBP | | Great British Pound | | RUB | | Russian Ruble |
| IDR | | Indonesian Rupiah | | SEK | | Swedish Krona |
| INR | | Indian Rupee | | SGD | | Singapore Dollar |
| JPY | | Japanese Yen | | ZAR | | South African Rand |
(g) Foreign Currency Transactions The Portfolio may enter into foreign currency contracts in connection with settling planned purchases or sales of securities, to hedge the currency exposure associated with some or all of the Portfolio’s securities or as a part of an investment strategy. A foreign currency
contract is an agreement between two parties to buy and sell a currency at a set price on a future date. The market value of a foreign currency contract fluctuates with changes in foreign currency exchange rates. Foreign currency contracts are marked to market daily and the change in value is recorded by the Portfolio as an unrealized gain or loss. Realized gains or losses equal to the difference between the value of the contract at the time it was opened and the value at the time it was closed are recorded upon delivery or receipt of the currency. These contracts may involve market risk in excess of the unrealized gain or loss reflected on the Statement of Assets and Liabilities. In addition, the Portfolio could be exposed to risk if the counterparties are unable to meet the terms of the contracts or if the value of the currency changes unfavorably to the U.S. dollar.
(h) Futures Contracts The Portfolio may enter into futures contracts. The Portfolio may use futures contracts to manage its exposure to the securities markets or to movements in interest rates and currency values. The primary risks associated with the use of futures contracts are the imperfect correlation between the change in market value of the securities held by the Portfolio and the prices of futures contracts, the possibility of an illiquid market, and the inability of the counterparty to meet the terms of the contract. Futures contracts are valued based upon their quoted daily settlement prices. Upon entering into a futures contract, the Portfolio is required to deposit with its futures broker, an amount of cash or U.S. Government and Agency Obligations in accordance with the initial margin requirements of the broker or exchange. Futures contracts are marked to market daily and an appropriate payable or receivable for the change in value (“variation margin”) is recorded by the Portfolio. Gains or losses are recognized but not considered realized until the contracts expire or are closed. Futures contracts involve, to varying degrees, risk of loss in excess of the variation margin disclosed on the Statement of Assets and Liabilities.
(i) Inflation-Indexed Bonds The Portfolio may invest in inflation-indexed bonds. Inflation-indexed bonds are fixed-income securities whose principal value is periodically adjusted to the rate of inflation. The interest rate on these bonds is generally fixed at issuance at a rate lower than typical bonds. Over the life of an inflation-indexed bond, however, interest will be paid based on a principal value, which is adjusted for inflation. Any increase in the principal amount of an inflation-indexed bond will be included as interest income on the Statement of Operations, even though investors do not receive their principal until maturity.
(j) Options Contracts The Portfolio may write call and put options on futures, swaps, securities or currencies it owns or in which it may invest. Writing put options tends to increase the Portfolio’s exposure to the underlying instrument. Writing call options tends to decrease the Portfolio’s exposure to the underlying instrument. When the Portfolio writes a call or put option, an amount equal to the premium received is recorded as a liability and subsequently marked to market to reflect the current value of the option written. These liabilities are reflected as written options outstanding on the Statement of Assets and Liabilities. Certain options may be written with premiums to be determined on a future date. The premiums for these options are based upon implied volatility parameters at specified terms. Premiums received from writing options which expire are treated as realized gains. Premiums received from writing options which are exercised or closed are added to the proceeds or offset against amounts paid on the underlying future, swap, security or currency transaction to determine the realized gain or loss. The Portfolio as a writer of an option has no control over whether the underlying future, swap, security or currency may be sold (call) or purchased (put) and as a result bears the market risk of an unfavorable change in the price of the future, swap, security or currency underlying the written option. There is the risk the Portfolio may not be able to enter into a closing transaction because of an illiquid market.
The Portfolio may also purchase put and call options. Purchasing call options tends to increase the Portfolio’s exposure to the underlying instrument. Purchasing put options tends to decrease the Portfolio’s exposure to the underlying instrument.
| | | | |
| 18 | | PIMCO��Variable Insurance Trust | | |
| | |
| |
| | | June 30, 2007 (Unaudited) |
The Portfolio pays a premium which is included on the Statement of Assets and Liabilities as an investment and subsequently marked to market to reflect the current value of the option. Premiums paid for purchasing options which expire are treated as realized losses. Certain options may be purchased with premiums to be determined on a future date. The premiums for these options are based upon implied volatility parameters at specified terms. The risk associated with purchasing put and call options is limited to the premium paid. Premiums paid for purchasing options which are exercised or closed are added to the amounts paid or offset against the proceeds on the underlying future, swap, security or currency transaction to determine the realized gain or loss.
(k) Repurchase Agreements The Portfolio may engage in repurchase transactions. Under the terms of a typical repurchase agreement, the Portfolio takes possession of an underlying debt obligation (collateral) subject to an obligation of the seller to repurchase, and the Portfolio to resell, the obligation at an agreed-upon price and time. The underlying securities for all repurchase agreements are held in safekeeping at the Portfolio’s custodian or designated subcustodians under tri-party repurchase agreements. The market value of the collateral must be equal to or exceed the total amount of the repurchase obligations, including interest. Securities purchased under repurchase agreements are reflected as an asset on the Statement of Assets and Liabilities. Generally, in the event of counterparty default, the Portfolio has the right to use the collateral to offset losses incurred. If the counterparty should default, the Portfolio will seek to sell the securities which it holds as collateral. This could involve procedural costs or delays in addition to a loss on the securities if their value should fall below their repurchase price.
(l) Inverse Floating Rate Transactions—Residual Interest Municipal Bonds (“RIBs”)/Residual Interest Tax Exempt Bonds (“RITEs”) The Portfolio may invest in RIBs and RITEs (“Inverse Floaters”). Inverse Floaters are created via a master trust agreement between a broker-dealer, acting as trustor and liquidity provider, and an investment bank, acting as trustee and tender agent. The master trust agreement defines the terms for each trust series; with each series being established by the transfer of long-term, fixed-rate municipal bonds (“Fixed Rate Bonds”) to the trustee to be held and provide for the creation, execution and delivery of floater certificates (“Floating Rate Notes”) and Inverse Floaters. Floating Rate Notes are liquid notes that are issued with a short-term variable rate typically linked to the LIBOR, subject to limitations, for some duration. After interest income is paid on the Floating Rate Notes at current rates, the residual income from the Fixed Rate Bonds is paid to the Inverse Floaters. Inverse Floaters are issued with a coupon that fluctuates inversely with the Floating Rate Notes’ referenced rate, subject to certain limitations. Therefore, rising short-term rates result in lower income for the Inverse Floaters and vice versa.
Floating Rate Notes are generally remarketed to municipal money market funds. Inverse Floaters are acquired by either tax-exempt municipal bond funds or trusts, or other parties interested in potentially higher yielding tax-exempt securities. Inverse Floaters may also be acquired for the purpose of increasing leverage. Floating Rate Note holders typically have the option to tender their notes to the liquidity provider for redemption at par at each reset date. The Inverse Floater holders have the option to (i) require the Floating Rate Note holders to tender their notes at par, and (ii) require the liquidity provider to transfer the Fixed Rate Bonds to the Inverse Floater holders. The holders of Inverse Floaters bear substantially all of the downside investment risk associated with the underlying Fixed Rate Bonds, and also benefit from a disproportionate amount of the potential appreciation of the underlying Fixed Rate Bonds’ value. Inverse Floaters may be more volatile and less liquid than other municipal bonds of comparable maturity.
Inverse Floaters may be acquired with or without first transferring to the trustor the Fixed Rate Bonds that were utilized to create the trust series. Inverse Floaters
acquired without a transfer of Fixed Rate Bonds are recognized as purchases of securities as outlined in Note 2(b). Statement of Financial Accounting Standards No. 140—Accounting for Transfers and Servicing of Financial Assets and Extinguishments of Liabilities (“FAS No. 140”), governs the standards for accounting for securitizations and other transfers of financial assets. If there is a transfer of Fixed Rate Bonds and it meets sale criteria under FAS No. 140, a Portfolio records a sale of the Fixed Rate Bonds and a purchase of the Inverse Floaters. The cash received from the Inverse Floaters is then recorded as interest income in the Statement of Operations.
If the transfer of Fixed Rate Bonds does not meet sale criteria under FAS No. 140, a Portfolio accounts for the transaction described above as a secured borrowing by including the Fixed Rate Bonds in its Schedule of Investments, and recording the Floating Rate Notes as a liability under the caption “Payable for floating rate notes” in the Portfolio’s Statement of Assets and Liabilities. In a secured borrowing transaction, cash received from the Inverse Floaters is not recorded as interest income. Instead, a Portfolio records interest income related to the Fixed Rate Bonds and interest expense related to the Floating Rate Notes, the net of which is equal to the cash received from the Inverse Floaters acquired by the Portfolio. Thus, while a Portfolio’s reported total income, net expenses, and net expense ratio are generally higher for investments in Inverse Floaters acquired via a secured borrowing, the method of acquiring Inverse Floaters does not result in differences for reported cash flows, net asset value or total return.
(m) Short Sales The Portfolio may enter into short sales transactions. A short sale is a transaction in which the Portfolio sells securities it does not own in anticipation of a decline in the market price of the securities. Securities sold in short sale transactions and interest payable on such securities, if any, are reflected as a liability on the Statement of Assets and Liabilities. The Portfolio is obligated to deliver securities at the market price at the time the short position is closed. Possible losses from short sales may be unlimited, whereas losses from purchases cannot exceed the total amount invested.
(n) Swap Agreements The Portfolio may invest in swap agreements. Swap transactions are privately negotiated agreements between the Portfolio and a counterparty to exchange or swap investment cash flows, assets, or market-linked returns at specified, future intervals. The Portfolio may enter into interest rate, total return, forward spread-lock, credit default, and other forms of swap agreements to manage its exposure to interest rates and credit risk. In connection with these agreements, securities may be identified as collateral in accordance with the terms of the respective swap agreements.
Interest rate swap agreements involve the exchange by the Portfolio with another party of their respective commitments to pay or receive interest, e.g., an exchange of floating rate payments for fixed rate payments with respect to the notional amount of principal. Certain forms of interest rate swap agreements may include: (i) interest rate caps, under which, in return for a premium, one party agrees to make payments to the other to the extent that interest rates exceed a specified rate, or “cap”, (ii) interest rate floors, under which, in return for a premium, one party agrees to make payments to the other to the extent that interest rates fall below a specified rate, or “floor”, or (iii) interest rate collars, under which a party sells a cap and purchases a floor or vice versa in an attempt to protect itself against interest rate movements exceeding given minimum or maximum levels.
Total return swap agreements involve commitments to pay interest in exchange for a market-linked return, both based on notional amounts. To the extent the total return of the security or index underlying the transaction exceeds or falls short of the offsetting interest rate obligation, the Portfolio will receive a payment from or make a payment to the counterparty.
Forward spread-lock swap agreements involve commitments to pay or receive a settlement amount calculated as the difference between the swap spread and a
| | | | | | |
| | Semiannual Report | | June 30, 2007 | | 19 |
Notes to Financial Statements (Cont.)
fixed spread, multiplied by the notional amount times the duration of the swap. The swap spread is the difference between the benchmark swap rate (market rate) and the specific Treasury rate.
Credit default swap agreements involve one party making a stream of payments to another party in exchange for the right to receive a specified return in the event of a default by a third party, typically corporate issues or sovereign issues of an emerging country, on its obligation. The Portfolio may use credit default swaps to provide a measure of protection against defaults of the issuers (i.e., to reduce risk where the Portfolio owns or has exposure to the sovereign issuer) or to take an active long or short position with respect to the likelihood of a particular issuer’s default. As a seller of protection, the Portfolio generally receives an upfront payment or a fixed rate of income throughout the term of the swap provided that there is no credit event. If the Portfolio is a seller of protection and a credit event occurs, as defined under the terms of that particular swap agreement, the Portfolio will pay to the buyer of the protection an amount up to the notional value of the swap and in certain instances take delivery of the security. As the seller, the Portfolio would effectively add leverage to its portfolio because, in addition to its total net assets, the Portfolio would be subject to investment exposure on the notional amount of the swap. As a buyer of protection, the Portfolio generally receives an amount up to the notional value of the swap if a credit event occurs. The treatment of credit default swaps and other swap agreements that provide for contingent, non-periodic, bullet-type payments as “notional principal contracts” for U.S. federal income tax purposes is uncertain. Were the U.S. Internal Revenue Service (“IRS”) to take the position that a credit default swap or other bullet-type swap is not a “notional principal contract” for U.S. federal income tax purposes, payments received by the Portfolio from such investments might be subject to U.S. excise or income taxes.
Swaps are marked to market daily based upon quotations from market makers and the change in value, if any, is recorded as unrealized gain or loss on the Statement of Operations. Payments received or made at the beginning of the measurement period are reflected as such on the Statement of Assets and Liabilities. These upfront payments are recorded as realized gain or loss on the Statement of Operations upon termination or maturity of the swap. A liquidation payment received or made at the termination of the swap is recorded as realized gain or loss on the Statement of Operations. Net periodic payments received or paid by the Portfolio are included as part of realized gain or loss on the Statement of Operations. Entering into these agreements involves, to varying degrees, elements of credit, market and documentation risk in excess of the amounts recognized on the Statement of Assets and Liabilities. Such risks involve the possibility that there will be no liquid market for these agreements, that the counterparty to the agreements may default on its obligation to perform or disagree as to the meaning of contractual terms in the agreements and that there may be unfavorable changes in interest rates.
(o) Loan Participations and Assignments The Portfolio may invest in direct debt instruments which are interests in amounts owned by corporate, governmental, or other borrowers to lenders or lending syndicates. The Portfolio’s investments in loans may be in the form of participations in loans or assignments of all or a portion of loans from third parties. A loan is often administered by a bank or other financial institution (the “lender”) that acts as agent for all holders. The agent administers the terms of the loan, as specified in the loan agreement. When investing in a loan participation, the Portfolio has the right to receive payments of principal, interest and any fees to which it is entitled only from the lender selling the loan agreement and only upon receipt by the lender of payments from the borrower. The Portfolio generally has no right to enforce compliance with the terms of the loan agreement with the borrower. As a result, the Portfolio may be subject to the credit risk of both the borrower and the lender that is selling the loan agreement. When the Portfolio purchases assignments from lenders it
acquires direct rights against the borrower of the loan. At the end of the period June 30, 2007, the Portfolio had no unfunded loan commitments.
(p) Bridge Debt Commitments At the period ended June 30, 2007, the Portfolio had $8,059,500 in commitments outstanding to fund high yield bridge debt. The Portfolio is entitled to a fee upon the expiration of the commitment period. The bridge debt terms approximate market rates at the time the commitment is entered into.
(q) Commodities Index-Linked/Structured Notes The Portfolio invests in structured notes whose value is based on the price movements of a commodity index. The structured notes are often leveraged, increasing the volatility of each note’s value relative to the change in the underlying linked financial element. The value of these notes will rise and fall in response to changes in the underlying commodity index. Structured notes may entail a greater degree of market risk than other types of debt securities because the investor bears the risk of the underlying commodity index. Structured notes may also be more volatile, less liquid, and more difficult to accurately price than less complex securities or more traditional debt securities. Fluctuations in value of the structured notes are recorded as unrealized gains and losses on the accompanying financial statements. Net payments are recorded as net realized gains and losses. These notes are subject to prepayment, credit and interest risks. The Portfolio has the option to request prepayment from the issuer. At maturity, or when a note is sold, the Portfolio records a realized gain or loss. At June 30, 2007, the value of these securities comprised 0.3% of the Portfolio’s net assets and resulted in unrealized depreciation of $56,678.
(r) Mortgage-Related and Other Asset-Backed Securities The Portfolio may invest in mortgage-related or other asset-backed securities. These securities include mortgage pass-through securities, collateralized mortgage obligations (“CMOs”), commercial mortgage-backed securities, mortgage dollar rolls, CMO residuals, stripped mortgage-backed securities (“SMBSs”) and other securities that directly or indirectly represent a participation in, or are secured by and payable from, mortgage loans on real property. The value of some mortgage-related or asset-backed securities may be particularly sensitive to changes in prevailing interest rates. Early repayment of principal on some mortgage-related securities may expose the Portfolio to a lower rate of return upon reinvestment of principal. The value of these securities may fluctuate in response to the market’s perception of the creditworthiness of the issuers. Additionally, although mortgages and mortgage-related securities are generally supported by some form of government or private guarantee and/or insurance, there is no assurance that private guarantors or insurers will meet their obligations.
(s) U.S. Government Agencies or Government-Sponsored Enterprises Securities issued by U.S. Government agencies or government-sponsored enterprises may not be guaranteed by the U.S. Treasury. The Government National Mortgage Association (“GNMA” or “Ginnie Mae”), a wholly owned U.S. Government corporation, is authorized to guarantee, with the full faith and credit of the U.S. Government, the timely payment of principal and interest on securities issued by institutions approved by GNMA and backed by pools of mortgages insured by the Federal Housing Administration or guaranteed by the Department of Veterans Affairs. Government-related guarantors (i.e., not backed by the full faith and credit of the U.S. Government) include the Federal National Mortgage Association (“FNMA” or “Fannie Mae”) and the Federal Home Loan Mortgage Corporation (“FHLMC” or “Freddie Mac”). Pass-through securities issued by FNMA are guaranteed as to timely payment of principal and interest by FNMA but are not backed by the full faith and credit of the U.S. Government. FHLMC guarantees the timely payment of interest and ultimate collection of principal, but its participation certificates are not backed by the full faith and credit of the U.S. Government.
| | | | |
| 20 | | PIMCO Variable Insurance Trust | | |
| | |
| |
| | | June 30, 2007 (Unaudited) |
(t) New Accounting Policies In July 2006, the Financial Accounting Standards Board (“FASB”) issued Interpretation No. 48, “Accounting for Uncertainty in Income Taxes—an Interpretation of FASB Statement No. 109” (the “Interpretation”). The Interpretation became effective for the Portfolio on June 29, 2007. Management has evaluated the application of the Interpretation in relation to the Portfolio and has concluded that no single filing position or combination of filing positions identified as uncertain tax positions required the accrual of a tax liability in the accounting records of the Portfolio for the period ending June 30, 2007. Management will monitor all existing filing positions and future filing positions in light of the Interpretation and evaluate the need for any future tax accruals and financial statement disclosures as warranted.
In September 2006, the FASB issued Statement of Financial Accounting Standards No. 157, “Fair Value Measurements” (the “Statement”). The Statement is effective for fiscal years beginning after November 15, 2007 and will require expanded disclosure about fair value measurements, separately for each major category of assets and liabilities, that enables shareholders to assess the inputs used to develop those measurements, and for recurring fair value measurements using significant unobservable inputs the effect of the measurements on changes in net assets for the reporting period. Management is currently evaluating the application of the Statement to the Portfolio and will provide additional information in relation to the Statement on the Portfolio’s annual financial statements for the period ending December 31, 2007.
3. FEES AND EXPENSES
(a) Investment Advisory Fee PIMCO is a majority-owned subsidiary of Allianz Global Investors of America L.P. (“AGI”), and serves as investment adviser (the “Adviser”) to the Trust, pursuant to an investment advisory contract. The Adviser receives a monthly fee from the Portfolio, at an annual rate based on average daily net assets. The Advisory Fee for all classes is charged at an annual rate of 0.25%.
(b) Administration Fee PIMCO serves as administrator (the “Administrator”), and provides administrative services to the Trust for which it receives a monthly administrative fee based on each share class’s average daily net assets. As the Administrator, PIMCO bears the costs of various third-party services, including audit, custodial, portfolio accounting, legal, transfer agency and printing costs. The Administration Fee for all classes is charged at the annual rate of 0.25%.
(c) Distribution and Servicing Fees Allianz Global Investors Distributors LLC (“AGID”) is an indirect wholly-owned subsidiary of AGI and serves as the distributor (the “Distributor”) of the Trust’s shares. The Trust is permitted to reimburse AGID on a quarterly basis, out of the Administrative Class assets of the Portfolio in the amount of 0.15% on an annual basis of the average daily net assets of that class, for payments made to financial intermediaries that provide services in connection with the distribution of shares or administration of plans or programs that use Portfolio shares as their funding medium. The effective rate paid to AGID was 0.15% during the current fiscal year.
The Trust has adopted a Distribution Plan, for the Advisor Class shares of the Portfolio (the “Plan”). The Plan has been adopted pursuant to Rule 12b-1 under the Act. The Plan permits payments for expenses in connection with the distribution and marketing of Advisor Class shares and/or the provision of shareholder services to Advisor Class shareholders. The Plan permits the Portfolio to make total payments at an annual rate of 0.25% of its average daily net assets attributable to its Advisor Class shares.
(d) Portfolio Expenses The Trust is responsible for the following expenses: (i) salaries and other compensation of any of the Trust’s executive officers and employees who are not officers, directors, stockholders or employees of PIMCO or its subsidiaries or affiliates; (ii) taxes and governmental fees; (iii) brokerage fees
and commissions and other portfolio transaction expenses; (iv) the costs of borrowing money, including interest expenses and bank overdraft charges; (v) fees and expenses of the Trustees who are not “interested persons” of PIMCO or the Trust, and any counsel retained exclusively for their benefit; (vi) extraordinary expenses, including costs of litigation and indemnification expenses; (vii) organization expenses and (viii) any expenses allocated or allocable to a specific class of shares, which include service fees payable with respect to the Administrative Class Shares, and may include certain other expenses as permitted by the Trust’s Multiple Class Plan adopted pursuant to Rule 18f-3 under the Act and subject to review and approval by the Trustees. The ratio of expenses to average net assets per share class, as disclosed in the Financial Highlights, may differ from the annual portfolio operating expenses per share class as disclosed in the Prospectus for the reasons set forth above.
Effective April 1, 2007, each Trustee, other than those affiliated with PIMCO or its affiliates, receives an annual retainer of $15,000, plus $2,375 for each Board of Trustees meeting attended in person, $500 for each committee meeting attended and $750 for each Board of Trustees meeting attended telephonically, plus reimbursement of related expenses. In addition, the audit committee chair receives an additional annual retainer of $2,000 and each other committee chair receives an additional annual retainer of $500. These expenses are allocated on a pro-rata basis to the various portfolios of the Trust according to their respective net assets. The Trust pays no compensation directly to any Trustee or any other officer who is affiliated with the Administrator, all of whom receive remuneration for their services to the Trust from the Administrator or its affiliates. Prior to April 1, 2007, each Trustee, other than those affiliated with PIMCO or its affiliates, received an annual retainer of $15,000 plus $2,000 for each Board of Trustees meeting attended ($500 for each special meeting attended), plus reimbursement of related expenses. The Audit Committee Chairman received an annual retainer of $1,500 and the Governance Committee Chairman received an annual retainer of $500. In addition, each member of a committee received $500 for each committee meeting attended.
4. RELATED PARTY TRANSACTIONS
The Adviser, Administrator, and Distributor are related parties as defined by FAS 57, Related Party Disclosures. Fees payable to these parties are disclosed in Note 3.
5. GUARANTEES AND INDEMNIFICATIONS
Under the Trust’s organizational documents, each Trustee, officer, employee or other agent of the Trust (including the Trust’s investment manager) is indemnified, to the extent permitted by the Act, against certain liabilities that may arise out of performance of their duties to the Portfolio. Additionally, in the normal course of business, the Portfolio enters into contracts that contain a variety of indemnification clauses. The Portfolio’s maximum exposure under these arrangements is unknown as this would involve future claims that may be made against the Portfolio that have not yet occurred. However, the Portfolio has not had prior claims or losses pursuant to these contracts and believes the risk of loss to be remote.
6. PURCHASES AND SALES OF SECURITIES
The length of time the Portfolio has held a particular security is not generally a consideration in investment decisions. A change in the securities held by the Portfolio is known as “portfolio turnover”. The Portfolio may engage in frequent and active trading of portfolio securities to achieve its investment objective, particularly during periods of volatile market movements. High portfolio turnover (e.g., over 100%) involves correspondingly greater expenses to the Portfolio, including brokerage commissions or dealer mark-ups and other transaction costs on the sale
| | | | | | |
| | Semiannual Report | | June 30, 2007 | | 21 |
Notes to Financial Statements (Cont.)
of securities and reinvestments in other securities. Such sales may also result in realization of taxable capital gains, including short-term capital gains (which are generally taxed at ordinary income tax rates). The trading costs and tax effects associated with portfolio turnover may adversely affect the Portfolio’s performance.
Purchases and sales of securities (excluding short-term investments) for the period ended June 30, 2007, were as follows (amounts in thousands):
| | | | | | | | | | | | |
| U.S. Government/Agency | | | | All Other |
| Purchases | | Sales | | | | Purchases | | Sales |
| $ | 5,028,312 | | $ | 4,878,535 | | | | $ | 652,891 | | $ | 120,358 |
7. TRANSACTIONS IN WRITTEN CALL AND PUT OPTIONS
Transactions in written call and put options were as follows (amounts in thousands, except for number of contracts):
| | | | | | | | | | | | | | | | | | | |
| | | | | # of
Contracts | | | Notional
Amount
in $ | | | Notional
Amount
in EUR | | Notional
Amount
in GBP | | | Premium | |
| Balance at 12/31/2006 | | | | 2,036 | | | $ | 942,800 | | | EUR 95,000 | | GBP | 11,000 | | | $ | 11,691 | |
| Sales | | | | 7,169 | | | | 991,600 | | | 0 | | | 0 | | | | 12,533 | |
| Closing Buys | | | | (960 | ) | | | (647,400 | ) | | 0 | | | (11,000 | ) | | | (6,704 | ) |
| Expirations | | | | (4,112 | ) | | | 0 | | | 0 | | | 0 | | | | (1,194 | ) |
| Exercised | | | | (334 | ) | | | 0 | | | 0 | | | 0 | | | | (180 | ) |
| Balance at 06/30/2007 | | | | 3,799 | | | $ | 1,287,000 | | | EUR 95,000 | | GBP | 0 | | | $ | 16,146 | |
8. SHARES OF BENEFICIAL INTEREST
The Portfolio may issue an unlimited number of shares of beneficial interest with a $0.001 par value. Changes in shares of beneficial interest were as follows (shares and amounts in thousands):
| | | | | | | | | | | | | | | | |
| | | | | Six Months Ended
06/30/2007 | | | Year Ended
12/31/2006 | |
| | | | | Shares | | | Amount | | | Shares | | | Amount | |
| | | | | |
Receipts for shares sold | | | | | | | | | | | | | | | | |
Institutional Class | | | | 4,531 | | | $ | 45,520 | | | 8,090 | | | $ | 81,954 | |
Administrative Class | | | | 66,886 | | | | 674,962 | | | 83,252 | | | | 843,490 | |
Advisor Class | | | | 1,171 | | | | 11,807 | | | 1,856 | | | | 18,782 | |
Issued as reinvestment of distributions | | | | | | | | | | | | | | | | |
Institutional Class | | | | 405 | | | | 4,078 | | | 790 | | | | 8,017 | |
Administrative Class | | | | 6,829 | | | | 68,742 | | | 12,178 | | | | 123,518 | |
Advisor Class | | | | 52 | | | | 522 | | | 35 | | | | 362 | |
Cost of shares redeemed | | | | | | | | | | | | | | | | |
Institutional Class | | | | (1,973 | ) | | | (19,907 | ) | | (7,223 | ) | | | (73,276 | ) |
Administrative Class | | | | (32,550 | ) | | | (326,621 | ) | | (51,636 | ) | | | (522,647 | ) |
Advisor Class | | | | (235 | ) | | | (2,374 | ) | | (32 | ) | | | (329 | ) |
Net increase resulting from Portfolio share transactions | | | | 45,116 | | | $ | 456,729 | | | 47,310 | | | $ | 479,871 | |
The following schedule shows the number of shareholders each owning 5% or more of the Portfolio and the total percentage of the Portfolio held by such shareholders:
| | | | | | |
| | | | | Number of
Shareholders | | % of Portfolio Held |
Institutional Class | | | | 3 | | 98 |
Administrative Class | | | | 6 | | 62 |
Advisor Class | | | | 3 | | 98 |
9. REGULATORY AND LITIGATION MATTERS
Since February 2004, PIMCO, Allianz Global Investors of America L.P. (PIMCO’s parent company), AGID, and certain of their affiliates, including the PIMCO Funds (another series of funds managed by PIMCO), the Allianz Funds (formerly known as PIMCO Funds: Multi-Manager Series (another series of funds managed by affiliates of PIMCO)), certain Trustees of the Trust (in their capacity as Trustees of the PIMCO Funds or the Allianz Funds) and certain employees of PIMCO, have been named as defendants in fifteen lawsuits filed in various jurisdictions. Eleven of those lawsuits concern “market timing,” and they have been transferred to and consolidated for pre-trial proceedings in a multi-district litigation proceeding in the U.S. District Court for the District of Maryland; the other four lawsuits concern “revenue sharing” and have been consolidated into a single action in the U.S. District Court for the District of Connecticut. The lawsuits have been commenced as putative class actions on behalf of investors who purchased, held or redeemed shares of the various series of the PIMCO Funds and the Allianz Funds during specified periods, or as derivative actions on behalf of the PIMCO Funds and the Allianz Funds.
The market timing actions in the District of Maryland generally allege that certain hedge funds were allowed to engage in “market timing” in certain funds of the PIMCO Funds and the Allianz Funds and this alleged activity was not disclosed. Pursuant to tolling agreements entered into with the derivative and class action plaintiffs, PIMCO, certain PIMCO Funds Trustees, and certain employees of PIMCO who were previously named as defendants have all been dropped as defendants in the market timing actions; the plaintiffs continue to assert claims on behalf of the shareholders of the PIMCO Funds or on behalf of the PIMCO Funds itself against other defendants. By order dated November 3, 2005, the U.S. District Court for the District of Maryland granted the PIMCO Funds’ motion to dismiss claims asserted against it in a consolidated amended complaint where the PIMCO Funds were named, in the complaint, as a nominal defendant. The revenue sharing action in the District of Connecticut generally alleges that fund assets were inappropriately used to pay brokers to promote funds of the PIMCO Funds and the Allianz Funds, including directing fund brokerage transactions to such brokers, and that such alleged arrangements were not fully disclosed to shareholders. On August 11, 2005, the U.S. District Court for the District of Connecticut conducted a hearing on defendants’ motion to dismiss the consolidated amended complaint in the revenue sharing action but has not yet ruled on the motion to dismiss. The market timing and revenue sharing lawsuits seek, among other things, unspecified compensatory damages plus interest and, in some cases, punitive damages, the rescission of investment advisory contracts, the return of fees paid under those contracts and restitution.
Two nearly identical class action civil complaints have been filed in August 2005, in the Northern District of Illinois Eastern Division, alleging that the plaintiffs each purchased and sold a 10-year Treasury note futures contract and suffered damages from an alleged shortage when PIMCO held both physical and futures positions in 10-year Treasury notes for its client accounts. The two actions have been consolidated into one action, and the two separate complaints have been replaced by a consolidated complaint. PIMCO is a named defendant, and PIMCO Funds has been added as a defendant, to the consolidated action. PIMCO strongly believes the complaint is without merit and intends to vigorously defend itself.
In April 2006, certain portfolios of the Trust and certain other funds managed by PIMCO were served in an adversary proceeding brought by the Official Committee of Asbestos Claimants of G-I Holdings, Inc. in G-I Holdings, Inc.’s bankruptcy in the District of New Jersey. In July 2004, PIMCO was named in this lawsuit and remains a defendant. The plaintiff seeks to recover for the bankruptcy estate assets that were transferred by the predecessor entity of G-I Holdings, Inc. to a wholly-owned subsidiary in 1994. The subsidiary has since issued notes, of which certain portfolios of the Trust and certain other funds managed by PIMCO are alleged to be holders. The complaint alleges that in 2000, more than two hundred
| | | | |
| 22 | | PIMCO Variable Insurance Trust | | |
| | |
| |
| | | June 30, 2007 (Unaudited) |
noteholders—including certain portfolios of the Trust and certain other funds managed by PIMCO—were granted a second priority lien on the assets of the subsidiary in exchange for their consent to a refinancing transaction and the granting of a first priority lien to the lending banks. The plaintiff is seeking invalidation of the lien in favor of the noteholders and/or the value of the lien. On June 21, 2006, the District of New Jersey overturned the Bankruptcy Court’s decision granting permission to file the adversary proceeding and remanded the matter to the Bankruptcy Court for further proceedings. Following a motion to reconsider, the District Court upheld its remand on August 7, 2006, and instructed the Bankruptcy Court to conduct a “cost-benefit” analysis of the Committee’s claims, including the claims against the noteholders. The Bankruptcy Court held a status conference on October 25, 2006 and set a briefing schedule relating to this cost-benefit analysis.
The foregoing speaks only as of the date of this report. It is possible that these matters and/or other developments resulting from these matters could result in increased portfolio redemptions or other adverse consequences to the Portfolio. However, PIMCO and AGID believe that these matters are not likely to have a material adverse effect on the Portfolio or on PIMCO’s or AGID’s ability to perform their respective investment advisory or distribution services relating to the Portfolio.
10. FEDERAL INCOME TAX MATTERS
The Portfolio intends to qualify as a regulated investment company under sub-chapter M of the Internal Revenue Code (the “Code”) and distribute all of its taxable income and net realized gains, if applicable, to shareholders. Accordingly, no provision for Federal income taxes has been made.
As of June 30, 2007, the aggregate cost of investments was the same for federal income tax and financial statement purposes. The net unrealized appreciation (depreciation) of investment securities for federal income tax purposes is as follows (amount in thousands):
| | | | |
Aggregate
Gross
Unrealized
Appreciation | | Aggregate
Gross
Unrealized
(Depreciation) | | Net
Unrealized
(Depreciation) |
$ 4,959 | | $ (57,464) | | $ (52,505) |
| | | | | | |
| | Semiannual Report | | June 30, 2007 | | 23 |
| | |
| |
Privacy Policy* | | (Unaudited) |
The Funds consider customer privacy to be a fundamental aspect of their relationships with shareholders and are committed to maintaining the confidentiality, integrity and security of their current, prospective and former shareholders’ personal information. To ensure their shareholders’ privacy, the Funds have developed policies that are designed to protect this confidentiality, while allowing shareholder needs to be served.
Obtaining Personal Information
In the course of providing shareholders with products and services, the Funds and certain service providers to the Funds, such as the Funds’ investment advisers (“Advisers”), may obtain non-public personal information about shareholders, which may come from sources such as account applications and other forms, from other written, electronic or verbal correspondence, from shareholder transactions, from a shareholder’s brokerage or financial advisory firm, financial adviser or consultant, and/or from information captured on the Funds’ internet web sites.
Respecting Your Privacy
As a matter of policy, the Funds do not disclose any personal or account information provided by shareholders or gathered by the Funds to non-affiliated third parties, except as required or permitted by law or as necessary for such third parties to perform their agreements with respect to the Funds. As is common in the industry, non-affiliated companies may from time to time be used to provide certain services, such as preparing and mailing prospectuses, reports, account statements and other information, conducting research on shareholder satisfaction and gathering shareholder proxies. A Fund’s Distributor may also retain non-affiliated companies to market the Fund’s shares or products which use the Fund’s shares and enter into joint marketing agreements with other companies. These companies may have access to a shareholder’s personal and account information, but are permitted to use this information solely to provide the specific service or as otherwise permitted by law. In most cases, the shareholders will be clients of a third party, but the Funds may also provide a shareholder’s personal and account information to the shareholder’s respective brokerage or financial advisory firm.
Sharing Information with Third Parties
The Funds reserve the right to disclose or report personal information to non-affiliated third parties, in limited circumstances, where the Funds believe in good faith that disclosure is required under law to cooperate with regulators or law enforcement authorities, to protect their rights or property or upon reasonable request by any Fund in which a shareholder has chosen to invest. In addition, the Funds may disclose information about a shareholder’s accounts to a non-affiliated third party with the consent of the shareholder.
Sharing Information with Affiliates
The Funds may share shareholder information with their affiliates in connection with servicing their shareholders’ accounts or to provide shareholders with information about products and services that the Funds or their Advisers, principal underwriters or their affiliates (“Service Affiliates”) believe may be of interest to such shareholders. The information that the Funds share may include, for example, a shareholder’s participation in one of the Funds or in other investment programs sponsored by a Service Affiliate, a shareholder’s ownership of certain types of accounts (such as IRAs), or other data about a shareholder’s accounts. The Funds’ Service Affiliates, in turn, are not permitted to share shareholder information with non-affiliated entities, except as required or permitted by law.
Procedures to Safeguard Private Information
The Funds take seriously the obligation to safeguard shareholder non-public personal information. In addition to this policy, the Funds have also implemented procedures that are designed to restrict access to a shareholder’s non-public personal information only to internal personnel who need to know that information in order to provide products or services to such shareholders. In order to guard a shareholder’s non-public personal information, physical, electronic and procedural safeguards are in place.
* This Privacy Policy applies to the following entities: PIMCO Funds, PIMCO Variable Insurance Trust, PCM Fund, Inc. and PIMCO Strategic Global Government Fund, Inc. (collectively, the “Funds”).
| | | | |
| 24 | | PIMCO Variable Insurance Trust | | |
Investment Adviser and Administrator
Pacific Investment Management Company LLC
840 Newport Center Drive
Newport Beach, California 92660
Distributor
Allianz Global Investors Distributors LLC
1345 Avenue of the Americas
New York, New York 10105
Custodian
State Street Bank & Trust Company
801 Pennsylvania
Kansas City, Missouri 64105
Transfer Agent
Boston Financial Data Services–Midwest
330 W. 9th Street
Kansas City, Missouri 64105
Legal Counsel
Dechert LLP
1775 I Street, N.W.
Washington, D.C. 20006
Independent Registered Public Accounting Firm
PricewaterhouseCoopers LLP
1055 Broadway
Kansas City, Missouri 64105
P I M C O

Table of Contents
This material is authorized for use only when preceded or accompanied by the current PIMCO Variable Insurance Trust (the “Trust”) prospectus. Investors should consider the investment objectives, risks, charges and expenses of this Trust carefully before investing. Ask your financial professional to explain all charges that may apply. This and other information is contained in the Trust’s prospectus. The variable product prospectus may be obtained by contacting your Investment Consultant. Please read the Trust and variable product prospectus carefully before you invest or send money.
Chairman’s Letter
Dear PIMCO Variable Insurance Trust Shareholder:
It is our pleasure to present to you the semiannual report for the PIMCO Variable Insurance Trust, covering the six-month period ended June 30, 2007. The PIMCO Variable Insurance Trust’s net assets were $8.68 billion at June 30, 2007, as compared to $7.76 billion at December 31, 2006.
Highlights of the financial markets during the reporting period include:
| | n | | Economic data during the first quarter of 2007 pointed to slower growth, which heightened market expectations for a decrease in the Federal Funds Rate. By the second quarter, economic data, such as employment statistics, provided little indication of economic weakness, causing expectations of a decrease in the Federal Funds Rate to unwind and U.S. interest rates to move higher. Interest rates in Europe and the U.K. also rose over the period as central banks raised their key lending rates due to inflation concerns. The benchmark ten-year U.S. Treasury yielded 5.03% as of June 30, 2007, or 0.32% higher than at the beginning of the year. |
| | n | | Most bonds generally returned much of their gains from earlier in the year as worldwide growth and capital flows drove interest rates higher in the second quarter. Increased risk aversion in global financial markets, due in part to subprime mortgage worries in the U.S., also contributed to the rise in interest rates. The Lehman Brothers Aggregate Bond Index, which includes Treasury, investment-grade corporate and mortgage-backed securities, returned 0.98% for the six-month period. |
| | n | | Locally issued emerging market (“EM”) bonds posted positive returns for the reporting period. Yields on these bonds declined and the local currencies in which they are denominated generally gained, amid increasing investor awareness, strong economic growth and surging capital inflows. External EM bonds (debt instruments issued by emerging markets countries and typically denominated in U.S. dollars) lagged behind local EM bonds (debt instruments issued by emerging markets countries and denominated in the currency of the issuer), as external EM bonds tend to trade more in-line with U.S. Treasuries. |
| | n | | Treasury Inflation-Protected Securities (“TIPS”) outpaced nominal bonds (non-inflation linked bonds) for the first part of the year and all but the longest maturity TIPS outperformed in the second quarter as high gasoline prices drove higher inflation accruals. Commodities, as represented by the Dow Jones-AIG Commodity Total Return Index, returned 4.46% for the period. Equities, as measured by the S&P 500 Index and the Russell 2000 Index, returned 6.96% and 6.45%, respectively, for the period. |
On the following pages, please find specific details as to the Portfolio’s total return investment performance and a discussion of those factors that affected performance.
Thank you for the trust you have placed in us. We will continue to work diligently to serve your investment needs.
Sincerely,
Brent R. Harris
Chairman, PIMCO Variable Insurance Trust
July 31, 2007
| | | | | | |
| | Semiannual Report | | June 30, 2007 | | 1 |
Important Information About the Portfolio
PIMCO Variable Insurance Trust (the “Trust”) is an open-end management investment company currently consisting of twenty separate investment portfolios, including the Total Return Portfolio (the “Portfolio”). The Portfolio is only available as a funding vehicle under variable life insurance policies or variable annuity contracts issued by insurance companies (“Variable Contracts”). Individuals may not purchase shares of the Portfolio directly. Shares of the Portfolio also may be sold to qualified pension and retirement plans outside of the separate account context.
We believe that bond funds have an important role to play in a well diversified investment portfolio. It is important to note, however, that in an environment where interest rates may trend upward, rising rates would negatively impact the performance of most bond funds, and fixed-income securities held by a fund are likely to decrease in value. The price volatility of fixed-income securities can also increase during periods of rising interest rates resulting in increased losses to a fund. Bond funds and individual bonds with a longer duration (a measure of the expected life of a security) tend to be more sensitive to changes in interest rates, usually making them more volatile than securities or funds with shorter durations.
The Portfolio may be subject to various risks in addition to those described above. Some of these risks may include, but are not limited to, the following: credit risk, high yield risk, market risk, issuer risk, liquidity risk, derivatives risk, mortgage risk, non-U.S. investment risk, emerging markets risk, currency risk, leveraging risk and management risk. A complete description of these risks is contained in the Portfolio’s prospectus. The Portfolio may use derivative instruments for hedging purposes or as part of an investment strategy. Use of these instruments may involve certain costs and risks such as liquidity risk, interest rate risk, market risk, credit risk, management risk and the risk that the Portfolio could not close out a position when it would be most advantageous to do so. Because the Portfolio may invest in derivatives, it could lose more than the principal amount invested in these instruments. Investing in non-U.S. securities may entail risk due to non-U.S. economic and political developments; this risk may be increased when investing in emerging markets.
On the performance summary page in this Semiannual Report, the Total Return Investment Performance table measures performance assuming that all dividend and capital gain distributions were reinvested.
An investment in the Portfolio is not a deposit of a bank and is not guaranteed or insured by the Federal Deposit Insurance Corporation or any other government agency. It is possible to lose money on investments in the Portfolio.
PIMCO has adopted written proxy voting policies and procedures (“Proxy Policy”) as required by Rule 206(4)-6 under the Investment Advisers Act of 1940, as amended. The Proxy Policy has been adopted by the Trust as the policies and procedures that PIMCO will use when voting proxies on behalf of the Portfolio. A description of the policies and procedures that PIMCO uses to vote proxies relating to portfolio securities of the Portfolio, and information about how the Portfolio voted proxies relating to portfolio securities held during the most recent twelve-month period ended June 30, are available without charge, upon request, by calling the Trust at 1-866-746-2606 and on the Portfolio’s website at www.pimco.com.
The Portfolio files its complete schedule of portfolio holdings with the SEC for the first and third quarters of each fiscal year on Form N-Q. A copy of the Trust’s Form N-Q is also available on the SEC’s website at http://www.sec.gov and may be reviewed and copied at the SEC’s Public Reference Room in Washington D.C. Information on the operation of the Public Reference Room may be obtained by calling 1-800-SEC-0330, and is available without charge, upon request, by calling the Trust at 1-866-746-2606 and on the Portfolio’s website at www.pimco.com.
PIMCO Variable Insurance Trust is distributed by Allianz Global Investors Distributors LLC, 1345 Avenue of the Americas, New York, NY 10105.
| | | | |
| 2 | | PIMCO Variable Insurance Trust | | |
The following disclosure provides important information regarding the Portfolio’s Expense Example (“Example” or “Expense Example”), which appears in this Semiannual Report. Please refer to this information when reviewing the Expense Example for the Portfolio.
Example
As a shareholder of the Portfolio, you incur two types of costs: (1) transaction costs and (2) ongoing costs, including advisory and administrative fees; distribution and/or service (12b-1) fees (Administrative and Advisor Class only); and other Portfolio expenses. The Example is intended to help you understand your ongoing costs (in dollars) of investing in the Portfolio and to compare these costs with the ongoing costs of investing in other mutual funds. The Expense Example does not reflect any fees or other expenses imposed by the Variable Contracts. If it did, the expenses reflected in the Expense Example would be higher. The Example is based on an investment of $1,000 invested at the beginning of the period and held for the entire period indicated, which is from January 1, 2007 to June 30, 2007.
Actual Expenses
The information in the table under the heading “Actual Performance” provides information about actual account values and actual expenses. You may use the information in these columns, together with the amount you invested, to estimate the expenses that you paid over the period. Simply divide your account value by $1,000 (for example, an $8,600 account value divided by $1,000 = $8.60), then multiply the result by the number in the row titled “Expenses Paid During Period” to estimate the expenses you paid on your account during this period.
Hypothetical Example for Comparison Purposes
The information in the table under the heading “Hypothetical Performance (5% return before expenses)” provides information about hypothetical account values and hypothetical expenses based on the Portfolio’s actual expense ratio and an assumed rate of return of 5% per year before expenses, which is not the Portfolio’s actual return. The hypothetical account values and expenses may not be used to estimate the actual ending account balance or expenses you paid for the period. You may use this information to compare the ongoing costs of investing in the Portfolio and other portfolios. To do so, compare this 5% hypothetical example with the 5% hypothetical examples that appear in the shareholder reports of the other portfolios.
Please note that the expenses shown in the table are meant to highlight your ongoing costs only and do not reflect any transactional costs. Therefore, the information under the heading “Hypothetical Performance (5% return before expenses)” is useful in comparing ongoing costs only, and will not help you determine the relative total costs of owning different portfolios. In addition, if these transactional costs were included, your costs would have been higher.
The expense ratio may vary period to period because of various factors, such as an increase in expenses not covered by the advisory and administrative fees (such as expenses of the trustees and their counsel, litigation expense and interest expense).
| | | | | | |
| | Semiannual Report | | June 30, 2007 | | 3 |
PIMCO Total Return Portfolio
Cumulative Returns Through June 30, 2007
$10,000 invested at the beginning of the first full month following the inception date of the Portfolio’s Advisor Class.
Allocation Breakdown‡
| | |
U.S. Government Agencies | | 42.6% |
Short-Term Instruments | | 23.2% |
Corporate Bonds & Notes | | 20.3% |
Asset-Backed Securities | | 6.5% |
Mortgage-Backed Securities | | 4.9% |
Other | | 2.5% |
| | ‡ | % of Total Investments as of 06/30/2007 |
| | | | | | | | |
| Average Annual Total Return for the period ended June 30, 2007 |
| | | | | 6 Months* | | 1 Year | | Portfolio
Inception
(02/28/06) |
| | PIMCO Total Return Portfolio Advisor Class | | 0.32% | | 4.90% | | 2.55% |
| | Lehman Brothers Aggregate Bond Index± | | 0.98% | | 6.12% | | 3.73% |
All Portfolio returns are net of fees and expenses.
* Cumulative return.
Performance quoted represents past performance. Past performance is no guarantee of future results. Investment return and principal value will fluctuate so the Portfolio shares, when redeemed, may be worth more or less than their original cost. The Portfolio’s performance does not reflect the deduction of additional charges and expenses imposed in connection with investing in Variable Contracts, which will reduce returns. Current performance may be lower or higher than the performance data quoted. Performance data current to the most recent month-end is available by calling (800) 927-4648.
± Lehman Brothers Aggregate Bond Index represents securities that are taxable and U.S. dollar denominated. The index covers the U.S. investment grade fixed rate bond market, with index components for government and corporate securities, mortgage pass-through securities, and asset-backed securities. These major sectors are subdivided into more specific indices that are calculated and reported on a regular basis. It is not possible to invest directly in the index. The index does not reflect deductions for fees and expenses.
| | | | | | |
| Expense Example | | Actual Performance | | Hypothetical Performance |
| | | | | (5% return before expenses) |
Beginning Account Value (01/01/07) | | $ | 1,000.00 | | $ | 1,000.00 |
Ending Account Value (06/30/07) | | $ | 1,003.23 | | $ | 1,021.08 |
Expenses Paid During Period† | | $ | 3.73 | | $ | 3.76 |
† Expenses are equal to the Portfolio’s Advisor Class annualized expense ratio of 0.75%, multiplied by the average account value over the period, multiplied by 181/365 (to reflect the one-half year period). Overall fees and expenses of investing in the Portfolio will be higher because the example does not reflect Variable Contract fees and expenses.
Please refer to page 3 herein for an explanation of the information presented in the above Expense Example.
Portfolio Insights
| » | | The PIMCO Total Return Portfolio seeks to achieve its investment objective by investing under normal circumstances at least 65% of its total assets in a diversified portfolio of fixed-income instruments of varying maturities, which may be represented by forwards or derivatives such as options, futures contracts, or swap agreements. |
| » | | The Portfolio’s above-benchmark duration detracted from returns as yields rose in the first half of the year. |
| » | | An emphasis on the front-end of the U.S. yield curve contributed to returns as the curve steepened as measured by the difference between two- and 30-year yields. |
| » | | A slight overweight to mortgage-backed securities for the majority of the period detracted from returns as this sector underperformed like-duration Treasuries. |
| » | | An underweight to corporate securities detracted from returns as the sector outperformed like-duration Treasuries. |
| » | | An allocation to major non-U.S. markets moderately detracted from returns as developed countries underperformed Treasuries. |
| » | | Emerging market and high-yield bonds added to performance as strong demand for their attractive yields allowed these sectors to outperform like-duration Treasuries. |
| » | | Moderate exposure to a broad basket of currencies boosted returns as most emerging and developed market currencies appreciated relative to the U.S. dollar. |
| | | | |
| 4 | | PIMCO Variable Insurance Trust | | |
Financial Highlights Total Return Portfolio
| | | | | | | | |
| Selected per Share Data for the Period Ended: | | 06/30/2007+ | | | 02/28/2006–12/31/2006 | |
| | |
Advisor Class | | | | | | | | |
Net asset value beginning of period | | $ | 10.12 | | | $ | 10.24 | |
Net investment income (a) | | | 0.23 | | | | 0.38 | |
Net realized/unrealized (loss) on investments (a) | | | (0.20 | ) | | | (0.08 | ) |
Total income from investment operations | | | 0.03 | | | | 0.30 | |
Dividends from net investment income | | | (0.23 | ) | | | (0.37 | ) |
Distributions from net realized capital gains | | | 0.00 | | | | (0.05 | ) |
Total distributions | | | (0.23 | ) | | | (0.42 | ) |
Net asset value end of period | | $ | 9.92 | | | $ | 10.12 | |
Total return | | | 0.32 | % | | | 3.09 | % |
Net assets end period (000s) | | $ | 28,241 | | | $ | 18,811 | |
Ratio of expenses to average net assets | | | 0.75 | %* | | | 0.77 | %* |
Ratio of expenses to average net assets excluding interest expense | | | 0.75 | %* | | | 0.75 | %* |
Ratio of net investment income to average net assets | | | 4.65 | %* | | | 4.49 | %* |
Portfolio turnover rate | | | 160 | % | | | 303 | % |
+ Unaudited
* Annualized
(a) Per share amounts based on average number of shares outstanding during the period.
| | | | | | |
| See Accompanying Notes | | Semiannual Report | | June 30, 2007 | | 5 |
Statement of Assets and Liabilities Total Return Portfolio
| | | | |
| (Amounts in thousands, except per share amounts) | | June 30, 2007 | |
| | | (Unaudited) | |
| |
Assets: | | | | |
Investments, at value | | $ | 4,398,751 | |
Cash | | | 2,364 | |
Foreign currency, at value | | | 31,870 | |
Receivable for investments sold | | | 140,931 | |
Receivable for investments sold on a delayed-delivery basis | | | 14,207 | |
Receivable for Portfolio shares sold | | | 12,294 | |
Interest and dividends receivable | | | 14,571 | |
Variation margin receivable | | | 4,999 | |
Swap premiums paid | | | 9,683 | |
Unrealized appreciation on foreign currency contracts | | | 6,473 | |
Unrealized appreciation on swap agreements | | | 8,189 | |
| | | | 4,644,332 | |
| |
Liabilities: | | | | |
Payable for investments purchased | | $ | 726,520 | |
Payable for investments purchased on a delayed-delivery basis | | | 46,689 | |
Payable for Portfolio shares redeemed | | | 74,637 | |
Payable for short sales | | | 88,060 | |
Written options outstanding | | | 5,904 | |
Dividends payable | | | 1,806 | |
Accrued investment advisory fee | | | 783 | |
Accrued administration fee | | | 783 | |
Accrued distribution fee | | | 12 | |
Accrued servicing fee | | | 395 | |
Variation margin payable | | | 638 | |
Swap premiums received | | | 14,553 | |
Unrealized depreciation on foreign currency contracts | | | 580 | |
Unrealized depreciation on swap agreements | | | 7,150 | |
Other liabilities | | | 45 | |
| | | | 968,555 | |
| |
Net Assets | | $ | 3,675,777 | |
| |
Net Assets Consist of: | | | | |
Paid in capital | | $ | 3,791,949 | |
Undistributed net investment income | | | 1,072 | |
Accumulated undistributed net realized (loss) | | | (49,476 | ) |
Net unrealized (depreciation) | | | (67,768 | ) |
| | | $ | 3,675,777 | |
| |
Net Assets: | | | | |
Institutional Class | | $ | 185,047 | |
Administrative Class | | | 3,462,489 | |
Advisor Class | | | 28,241 | |
| |
Shares Issued and Outstanding: | | | | |
Institutional Class | | | 18,653 | |
Administrative Class | | | 349,007 | |
Advisor Class | | | 2,847 | |
| |
Net Asset Value and Redemption Price Per Share (Net Asset Per Share Outstanding) | | | | |
Institutional Class | | $ | 9.92 | |
Administrative Class | | | 9.92 | |
Advisor Class | | | 9.92 | |
| |
Cost of Investments Owned | | $ | 4,451,256 | |
Cost of Foreign Currency Held | | $ | 31,778 | |
Proceeds Received on Short Sales | | $ | 87,236 | |
Premiums Received on Written Options | | $ | 16,146 | |
| | | | |
| 6 | | PIMCO Variable Insurance Trust | | See Accompanying Notes |
Statement of Operations Total Return Portfolio
| | | | |
| (Amounts in thousands) | | Six Months Ended
June 30, 2007 | |
| | | (Unaudited) | |
| |
| Investment Income: | | | | |
Interest, net of foreign taxes* | | $ | 92,861 | |
Dividends | | | 484 | |
Miscellaneous income | | | 64 | |
Total Income | | | 93,409 | |
| |
Expenses: | | | | |
Investment advisory fees | | | 4,312 | |
Administration fees | | | 4,312 | |
Servicing fees – Administrative Class | | | 2,447 | |
Distribution and/or servicing fees – Advisor Class | | | 28 | |
Trustees’ fees | | | 34 | |
Legal fees | | | 1 | |
Total Expenses | | | 11,134 | |
| |
Net Investment Income | | | 82,275 | |
| |
Net Realized and Unrealized Gain (Loss): | | | | |
Net realized (loss) on investments | | | (6,410 | ) |
Net realized (loss) on futures contracts, written options and swaps | | | (29,590 | ) |
Net realized gain on foreign currency transactions | | | 3,042 | |
Net change in unrealized (depreciation) on investments | | | (40,500 | ) |
Net change in unrealized (depreciation) on futures contracts, written options and swaps | | | (4,370 | ) |
Net change in unrealized appreciation on translation of assets and liabilities denominated in foreign currencies | | | 5,410 | |
Net (Loss) | | | (72,418 | ) |
| |
Net Increase in Net Assets Resulting from Operations | | $ | 9,857 | |
| |
*Foreign tax withholding | | $ | 45 | |
| | | | | | |
| See Accompanying Notes | | Semiannual Report | | June 30, 2007 | | 7 |
Statements of Changes in Net Assets Total Return Portfolio
| | | | | | | | |
| (Amounts in thousands) | | Six Months Ended
June 30, 2007 | | | Year Ended
December 31, 2006 | |
| | | (Unaudited) | | | | |
| | |
| Increase in Net Assets from: | | | | | | | | |
| | |
Operations: | | | | | | | | |
Net investment income | | $ | 82,275 | | | $ | 132,299 | |
Net realized gain (loss) | | | (32,958 | ) | | | 5,631 | |
Net change in unrealized (depreciation) | | | (39,460 | ) | | | (21,541 | ) |
Net increase resulting from operations | | | 9,857 | | | | 116,389 | |
| | |
Distributions to Shareholders: | | | | | | | | |
From net investment income | | | | | | | | |
Institutional Class | | | (4,078 | ) | | | (7,166 | ) |
Administrative Class | | | (78,465 | ) | | | (127,175 | ) |
Advisor Class | | | (522 | ) | | | (267 | ) |
From net realized capital gains | | | | | | | | |
Institutional Class | | | 0 | | | | (917 | ) |
Administrative Class | | | 0 | | | | (16,487 | ) |
Advisor Class | | | 0 | | | | (95 | ) |
| | |
Total Distributions | | | (83,065 | ) | | | (152,107 | ) |
| | |
Portfolio Share Transactions: | | | | | | | | |
Receipts for shares sold | | | | | | | | |
Institutional Class | | | 45,520 | | | | 81,954 | |
Administrative Class | | | 674,962 | | | | 843,490 | |
Advisor Class | | | 11,807 | | | | 18,782 | |
Issued as reinvestment of distributions | | | | | | | | |
Institutional Class | | | 4,078 | | | | 8,017 | |
Administrative Class | | | 68,742 | | | | 123,518 | |
Advisor Class | | | 522 | | | | 362 | |
Cost of shares redeemed | | | | | | | | |
Institutional Class | | | (19,907 | ) | | | (73,276 | ) |
Administrative Class | | | (326,621 | ) | | | (522,647 | ) |
Advisor Class | | | (2,374 | ) | | | (329 | ) |
Net increase resulting from Portfolio share transactions | | | 456,729 | | | | 479,871 | |
| | |
Total Increase in Net Assets | | | 383,521 | | | | 444,153 | |
| | |
Net Assets: | | | | | | | | |
Beginning of period | | | 3,292,256 | | | | 2,848,103 | |
End of period* | | $ | 3,675,777 | | | $ | 3,292,256 | |
| | |
*Including undistributed net investment income of: | | $ | 1,072 | | | $ | 1,862 | |
| | | | |
| 8 | | PIMCO Variable Insurance Trust | | See Accompanying Notes |
| | |
| |
| Schedule of Investments Total Return Portfolio | | June 30, 2007 (Unaudited) |
| | | | | | | | |
| | | | | PRINCIPAL
AMOUNT
(000S) | | | | VALUE (000S) |
| BANK LOAN OBLIGATIONS 0.8% |
| CSC Holdings, Inc. |
7.070% due 02/24/2013 | | $ | | 2,574 | | $ | | 2,576 |
| |
| Freeport-McMoRan Copper & Gold, Inc. |
9.000% due 03/19/2014 | | | | 518 | | | | 519 |
| |
| Fresenius Medical Care Capital Trust |
6.725% due 03/22/2013 | | | | 4,410 | | | | 4,413 |
6.735% due 03/22/2013 | | | | 577 | | | | 578 |
| |
| HCA, Inc. |
7.100% due 11/17/2012 | | | | 5,000 | | | | 5,014 |
| |
| Kinder Morgan, Inc. |
7.000% due 11/24/2013 | | | | 10,000 | | | | 9,981 |
| |
| SLM Corp. |
6.000% due 06/30/2008 | | | | 8,100 | | | | 8,060 |
| | | | | | | | |
Total Bank Loan Obligations
(Cost $31,232) | | 31,141 |
| | | | | | | | |
| | | | |
| CORPORATE BONDS & NOTES 24.3% |
|
| BANKING & FINANCE 19.0% |
| AIG-Fp Matched Funding Corp. |
5.360% due 06/16/2008 | | | | 6,200 | | | | 6,210 |
| |
| American Express Bank FSB |
5.330% due 10/16/2008 | | | | 8,100 | | | | 8,100 |
5.380% due 10/20/2009 | | | | 6,800 | | | | 6,805 |
| |
| American Express Centurion Bank |
5.320% due 05/07/2008 | | | | 6,200 | | | | 6,201 |
5.340% due 06/12/2009 | | | | 9,100 | | | | 9,104 |
| |
| American Express Credit Corp. |
5.380% due 11/09/2009 | | | | 6,700 | | | | 6,706 |
| |
| American International Group, Inc. |
5.050% due 10/01/2015 | | | | 1,300 | | | | 1,240 |
5.370% due 06/16/2009 | | | | 5,400 | | | | 5,422 |
6.250% due 03/15/2037 | | | | 2,100 | | | | 1,992 |
| |
| Bank of America Corp. |
5.366% due 11/06/2009 | | | | 4,000 | | | | 4,000 |
5.450% due 09/18/2009 | | | | 6,100 | | | | 6,105 |
| |
| Bank of America N.A. |
5.355% due 07/25/2008 | | | | 11,200 | | | | 11,207 |
5.360% due 12/18/2008 | | | | 5,400 | | | | 5,403 |
5.360% due 02/27/2009 | | | | 5,200 | | | | 5,204 |
6.000% due 10/15/2036 | | | | 2,100 | | | | 2,034 |
| |
| Bear Stearns Cos., Inc. |
5.450% due 03/30/2009 | | | | 7,100 | | | | 7,105 |
5.450% due 08/21/2009 | | | | 9,100 | | | | 9,093 |
5.480% due 05/18/2010 | | | | 12,200 | | | | 12,193 |
5.655% due 01/30/2009 | | | | 7,180 | | | | 7,200 |
| |
| BNP Paribas |
5.186% due 06/29/2049 | | | | 15,600 | | | | 14,569 |
| |
| C10 Capital SPV Ltd. |
6.722% due 12/31/2049 | | | | 4,300 | | | | 4,198 |
| |
| CIT Group, Inc. |
5.480% due 08/17/2009 | | | | 7,100 | | | | 7,076 |
5.505% due 01/30/2009 | | | | 13,700 | | | | 13,683 |
5.510% due 12/19/2008 | | | | 2,400 | | | | 2,399 |
| |
| Citigroup Funding, Inc. |
5.320% due 04/23/2009 | | | | 4,000 | | | | 4,002 |
5.350% due 12/08/2008 | | | | 2,000 | | | | 2,001 |
5.360% due 06/26/2009 | | | | 5,300 | | | | 5,298 |
| |
| Citigroup, Inc. |
5.390% due 12/28/2009 | | | | 5,300 | | | | 5,304 |
5.400% due 12/26/2008 | | | | 26,880 | | | | 26,903 |
6.125% due 08/25/2036 | | | | 15,000 | | | | 14,778 |
| |
| Credit Agricole S.A. |
5.360% due 05/28/2009 | | | | 5,900 | | | | 5,903 |
5.410% due 05/28/2010 | | | | 6,800 | | | | 6,804 |
| |
| | | | | | | | |
| | | | | PRINCIPAL
AMOUNT
(000S) | | | | VALUE (000S) |
| DBS Bank Ltd. |
5.580% due 05/16/2017 | | $ | | 1,000 | | $ | | 1,002 |
| |
| DnB NORBank ASA |
5.425% due 10/13/2009 | | | | 5,700 | | | | 5,703 |
| |
| Export-Import Bank of China |
4.875% due 07/21/2015 | | | | 900 | | | | 854 |
| |
| Export-Import Bank of Korea |
4.125% due 02/10/2009 | | | | 140 | | | | 137 |
5.450% due 06/01/2009 | | | | 8,500 | | | | 8,504 |
| |
| General Electric Capital Corp. |
5.385% due 10/26/2009 | | | | 12,500 | | | | 12,509 |
5.390% due 01/05/2009 | | | | 11,000 | | | | 11,009 |
5.410% due 10/06/2010 | | | | 4,600 | | | | 4,604 |
5.428% due 01/20/2010 | | | | 5,400 | | | | 5,411 |
5.430% due 08/15/2011 | | | | 14,200 | | | | 14,196 |
5.455% due 10/21/2010 | | | | 14,360 | | | | 14,388 |
| |
| General Motors Acceptance Corp. |
6.510% due 09/23/2008 | | | | 3,900 | | | | 3,901 |
| |
| GMAC LLC |
6.000% due 12/15/2011 | | | | 1,100 | | | | 1,047 |
| |
| Goldman Sachs Group, Inc. |
5.400% due 12/23/2008 | | | | 1,600 | | | | 1,601 |
5.410% due 03/30/2009 | | | | 8,700 | | | | 8,706 |
5.447% due 11/10/2008 | | | | 7,100 | | | | 7,111 |
5.450% due 12/22/2008 | | | | 4,800 | | | | 4,806 |
5.450% due 06/23/2009 | | | | 13,070 | | | | 13,086 |
5.455% due 07/29/2008 | | | | 6,000 | | | | 6,009 |
| |
| HBOS PLC |
5.920% due 09/29/2049 | | | | 1,100 | | | | 1,033 |
| |
| HBOS Treasury Services PLC |
5.397% due 07/17/2009 | | | | 10,400 | | | | 10,412 |
| |
| HSBC Bank USA N.A. |
5.430% due 09/21/2007 | | | | 14,500 | | | | 14,504 |
5.500% due 06/10/2009 | | | | 7,700 | | | | 7,724 |
| |
| HSBC Finance Corp. |
5.415% due 10/21/2009 | | | | 4,500 | | | | 4,503 |
5.490% due 09/15/2008 | | | | 3,600 | | | | 3,608 |
5.500% due 12/05/2008 | | | | 5,900 | | | | 5,915 |
| |
| HSBC Holdings PLC |
6.500% due 05/02/2036 | | | | 2,300 | | | | 2,371 |
| |
| John Deere Capital Corp. |
5.406% due 07/15/2008 | | | | 6,400 | | | | 6,406 |
| |
| JPMorgan Chase & Co. |
5.370% due 06/26/2009 | | | | 4,900 | | | | 4,906 |
5.396% due 05/07/2010 | | | | 9,700 | | | | 9,707 |
| |
| JPMorgan Mortgage Acquisition Corp. |
6.550% due 09/15/2066 | | | | 1,200 | | | | 1,159 |
| |
| Lehman Brothers Holdings, Inc. |
5.410% due 12/23/2008 | | | | 800 | | | | 801 |
5.440% due 04/03/2009 | | | | 5,300 | | | | 5,307 |
5.460% due 08/21/2009 | | | | 11,900 | | | | 11,907 |
5.460% due 11/16/2009 | | | | 15,260 | | | | 15,275 |
5.500% due 05/25/2010 | | | | 5,200 | | | | 5,200 |
5.579% due 07/18/2011 | | | | 4,800 | | | | 4,811 |
5.607% due 11/10/2009 | | | | 4,500 | | | | 4,514 |
| |
| Longpoint Re Ltd. |
10.609% due 05/08/2010 | | | | 2,900 | | | | 2,900 |
| |
| Merrill Lynch & Co., Inc. |
5.390% due 12/22/2008 | | | | 3,500 | | | | 3,501 |
5.395% due 10/23/2008 | | | | 7,500 | | | | 7,511 |
5.406% due 05/08/2009 | | | | 3,500 | | | | 3,502 |
5.440% due 12/04/2009 | | | | 7,300 | | | | 7,304 |
5.450% due 08/14/2009 | | | | 6,200 | | | | 6,207 |
5.555% due 07/25/2011 | | | | 8,500 | | | | 8,501 |
| |
| MetLife, Inc. |
6.400% due 12/15/2036 | | | | 1,700 | | | | 1,580 |
| |
| | | | | | | | |
| | | | | PRINCIPAL
AMOUNT
(000S) | | | | VALUE (000S) |
| Metropolitan Life Global Funding I |
5.125% due 11/09/2011 | | $ | | 8,200 | | $ | | 8,074 |
5.400% due 05/17/2010 | | | | 15,200 | | | | 15,211 |
| |
| Morgan Stanley |
5.360% due 11/21/2008 | | | | 4,900 | | | | 4,900 |
5.406% due 05/07/2009 | | | | 8,700 | | | | 8,705 |
5.446% due 01/15/2010 | | | | 8,200 | | | | 8,205 |
5.467% due 02/09/2009 | | | | 14,600 | | | | 14,624 |
| |
| MUFG Capital Finance 1 Ltd. |
6.346% due 07/29/2049 | | | | 700 | | | | 689 |
| |
| Mystic Re Ltd. |
15.360% due 06/07/2011 | | | | 3,000 | | | | 3,007 |
| |
| National Australia Bank Ltd. |
5.400% due 09/11/2009 | | | | 5,300 | | | | 5,308 |
| |
| Osiris Capital PLC |
10.356% due 01/15/2010 | | | | 3,100 | | | | 3,130 |
| |
| Petroleum Export Ltd. |
5.265% due 06/15/2011 | | | | 829 | | | | 809 |
| |
| Phoenix Quake Ltd. |
7.800% due 07/03/2008 | | | | 800 | | | | 805 |
| |
| Phoenix Quake Wind I Ltd. |
7.800% due 07/03/2008 | | | | 800 | | | | 803 |
| |
| Phoenix Quake Wind II Ltd. |
8.850% due 07/03/2008 | | | | 400 | | | | 380 |
| |
| Premium Asset Trust |
5.735% due 09/08/2007 | | | | 100 | | | | 100 |
| |
| Residential Capital LLC |
6.460% due 05/22/2009 | | | | 7,900 | | | | 7,867 |
| |
| Residential Reinsurance 2007 Ltd. |
15.610% due 06/07/2010 | | | | 1,500 | | | | 1,501 |
| |
| Resona Bank Ltd. |
5.850% due 09/29/2049 | | | | 1,200 | | | | 1,149 |
| |
| Royal Bank of Scotland Group PLC |
5.405% due 07/21/2008 | | | | 11,400 | | | | 11,410 |
| |
| Santander U.S. Debt S.A. Unipersonal |
5.420% due 09/19/2008 | | | | 6,900 | | | | 6,907 |
5.420% due 11/20/2009 | | | | 10,900 | | | | 10,908 |
| |
| SMFG Preferred Capital USD 1 Ltd. |
6.078% due 01/29/2049 | | | | 4,100 | | | | 3,965 |
| |
| State Street Capital Trust IV |
6.355% due 06/15/2037 | | | | 1,000 | | | | 1,007 |
| |
| TNK-BP Finance S.A. |
6.125% due 03/20/2012 | | | | 1,200 | | | | 1,175 |
| |
| UFJ Finance Aruba AEC |
6.750% due 07/15/2013 | | | | 300 | | | | 317 |
| |
| USB Capital IX |
6.189% due 04/15/2049 | | | | 900 | | | | 907 |
| |
| VTB Capital S.A. for Vneshtorgbank |
5.955% due 08/01/2008 | | | | 6,000 | | | | 6,014 |
| |
| Wachovia Bank N.A. |
5.320% due 10/03/2008 | | | | 8,800 | | | | 8,803 |
5.350% due 06/27/2008 | | | | 6,300 | | | | 6,302 |
5.400% due 03/23/2009 | | | | 7,100 | | | | 7,104 |
| |
| Wachovia Corp. |
5.410% due 12/01/2009 | | | | 4,400 | | | | 4,405 |
| |
| Wells Fargo & Co. |
5.460% due 09/15/2009 | | | | 6,715 | | | | 6,733 |
| |
| Westpac Banking Corp. |
5.280% due 06/06/2008 | | | | 4,000 | | | | 4,001 |
| |
| World Savings Bank FSB |
5.485% due 03/02/2009 | | | | 7,900 | | | | 7,924 |
| |
| | | | | | |
| See Accompanying Notes | | Semiannual Report | | June 30, 2007 | | 9 |
| | |
| |
| Schedule of Investments Total Return Portfolio (Cont.) | | |
| | | | | | | | |
| | | | | PRINCIPAL
AMOUNT
(000S) | | | | VALUE (000S) |
| ZFS Finance USA Trust I |
5.875% due 05/09/2032 | | $ | | 4,400 | | $ | | 4,350 |
| | | | | | | | |
| | | | | | | | 697,394 |
| | | | | | | | |
|
| INDUSTRIALS 3.5% |
| Amgen, Inc. |
5.440% due 11/28/2008 | | | | 14,000 | | | | 14,008 |
| |
| Anadarko Petroleum Corp. |
5.760% due 09/15/2009 | | | | 10,000 | | | | 10,014 |
| |
| BP AMI Leasing, Inc. |
5.370% due 06/26/2009 | | | | 13,600 | | | | 13,605 |
| |
| CODELCO, Inc. |
6.150% due 10/24/2036 | | | | 700 | | | | 696 |
| |
| Comcast Corp. |
5.656% due 07/14/2009 | | | | 7,700 | | | | 7,704 |
5.875% due 02/15/2018 | | | | 1,700 | | | | 1,650 |
6.450% due 03/15/2037 | | | | 1,700 | | | | 1,644 |
| |
| DaimlerChrysler N.A. Holding Corp. |
5.710% due 03/13/2009 | | | | 2,900 | | | | 2,907 |
5.805% due 08/03/2009 | | | | 6,300 | | | | 6,336 |
| |
| El Paso Corp. |
6.750% due 05/15/2009 | | | | 6,000 | | | | 6,082 |
7.800% due 08/01/2031 | | | | 1,300 | | | | 1,323 |
7.875% due 06/15/2012 | | | | 5,800 | | | | 6,092 |
9.625% due 05/15/2012 | | | | 800 | | | | 895 |
| |
| Gaz Capital for Gazprom |
6.212% due 11/22/2016 | | | | 1,200 | | | | 1,172 |
| |
| HJ Heinz Co. |
6.428% due 12/01/2008 | | | | 1,100 | | | | 1,111 |
| |
| Morgan Stanley Bank AG for OAO Gazprom |
9.625% due 03/01/2013 | | | | 100 | | | | 116 |
| |
| Peabody Energy Corp. |
7.875% due 11/01/2026 | | | | 2,700 | | | | 2,808 |
| |
| Pemex Project Funding Master Trust |
5.750% due 12/15/2015 | | | | 2,300 | | | | 2,259 |
8.000% due 11/15/2011 | | | | 100 | | | | 109 |
8.625% due 02/01/2022 | | | | 1,200 | | | | 1,482 |
9.500% due 09/15/2027 | | | | 55 | | | | 74 |
| |
| Salomon Brothers AG for OAO Gazprom |
10.500% due 10/21/2009 | | | | 6,000 | | | | 6,622 |
| |
| Time Warner, Inc. |
5.590% due 11/13/2009 | | | | 6,600 | | | | 6,610 |
| |
| Transocean, Inc. |
5.560% due 09/05/2008 | | | | 6,200 | | | | 6,206 |
| |
| United Airlines, Inc. |
6.071% due 03/01/2013 | | | | 3,313 | | | | 3,332 |
8.030% due 01/01/2013 (a) | | | | 465 | | | | 519 |
| |
| Vale Overseas Ltd. |
6.250% due 01/23/2017 | | | | 1,300 | | | | 1,296 |
6.875% due 11/21/2036 | | | | 1,300 | | | | 1,310 |
| |
| Wal-Mart Stores, Inc. |
5.260% due 06/16/2008 | | | | 14,200 | | | | 14,198 |
| |
| Williams Cos., Inc. |
6.375% due 10/01/2010 | | | | 7,000 | | | | 7,052 |
| | | | | | | | |
| | | | | | | | 129,232 |
| | | | | | | | |
|
| UTILITIES 1.8% |
| AT&T, Inc. |
5.456% due 02/05/2010 | | | | 3,600 | | | | 3,606 |
5.570% due 11/14/2008 | | | | 4,200 | | | | 4,214 |
| |
| BellSouth Corp. |
4.240% due 04/26/2008 | | | | 5,500 | | | | 5,452 |
5.460% due 08/15/2008 | | | | 10,200 | | | | 10,211 |
| |
| | | | | | | | |
| | | | | PRINCIPAL
AMOUNT
(000S) | | | | VALUE (000S) |
| Entergy Gulf States, Inc. |
5.700% due 06/01/2015 | | $ | | 8,300 | | $ | | 7,966 |
6.000% due 12/01/2012 | | | | 6,500 | | | | 6,454 |
| |
| Korea Electric Power Corp. |
5.125% due 04/23/2034 | | | | 90 | | | | 87 |
| |
| Qwest Capital Funding, Inc. |
7.250% due 02/15/2011 | | | | 657 | | | | 657 |
| |
| Ras Laffan Liquefied Natural Gas Co. Ltd. III |
5.838% due 09/30/2027 | | | | 2,600 | | | | 2,419 |
| |
| TPSA Finance BV |
7.750% due 12/10/2008 | | | | 120 | | | | 124 |
| |
| TXU Energy Co. LLC |
5.860% due 09/16/2008 | | | | 12,200 | | | | 12,208 |
| |
| Verizon Communications, Inc. |
5.400% due 04/03/2009 | | | | 14,500 | | | | 14,510 |
| | | | | | | | |
| | | | | | | | 67,908 |
| | | | | | | | |
Total Corporate Bonds & Notes
(Cost $894,530) | | 894,534 |
| | | | | | | | |
|
| MUNICIPAL BONDS & NOTES 0.1% |
| Badger, Wisconsin Tobacco Asset Securitization Corporations Revenue Bonds, Series 2002 |
6.000% due 06/01/2017 | | | | 3,700 | | | | 3,967 |
| |
| Iowa State Tobacco Settlement Authority Revenue Bonds, Series 2005 |
6.500% due 06/01/2023 | | | | 1,150 | | | | 1,136 |
| | | | | | | | |
Total Municipal Bonds & Notes
(Cost $4,816) | | 5,103 |
| | | | | | | | |
|
| COMMODITY INDEX-LINKED NOTES 0.3% |
| Morgan Stanley |
0.000% due 07/07/2008 | | | | 10,000 | | | | 9,943 |
| | | | | | | | |
Total Commodity Index-Linked Notes
(Cost $10,000) | | 9,943 |
| | | | | | | | |
|
| U.S. GOVERNMENT AGENCIES 51.0% |
| Fannie Mae |
4.000% due 10/01/2018 | | | | 414 | | | | 385 |
4.500% due 02/01/2035 - 06/25/2043 | | | | 12,566 | | | | 12,373 |
4.673% due 05/25/2035 | | | | 1,300 | | | | 1,283 |
4.709% due 04/01/2035 | | | | 2,817 | | | | 2,800 |
4.759% due 04/01/2035 | | | | 4,039 | | | | 4,015 |
5.000% due 02/25/2017 - 07/01/2037 | | | | 316,751 | | | | 299,211 |
5.380% due 12/25/2036 | | | | 3,799 | | | | 3,794 |
5.500% due 04/01/2014 - 08/01/2037 | | | | 906,903 | | | | 877,528 |
5.647% due 10/01/2032 | | | | 1,588 | | | | 1,601 |
5.648% due 11/01/2035 | | | | 307 | | | | 309 |
5.670% due 03/25/2044 | | | | 6,205 | | | | 6,211 |
6.000% due 04/01/2016 - 07/01/2037 | | | | 343,211 | | | | 339,644 |
6.129% due 09/01/2034 | | | | 2,519 | | | | 2,553 |
6.227% due 06/01/2043 - 07/01/2044 | | | | 7,760 | | | | 7,867 |
6.272% due 12/01/2036 | | | | 2,514 | | | | 2,539 |
6.414% due 09/01/2040 | | | | 61 | | | | 62 |
6.500% due 06/01/2029 - 04/01/2032 | | | | 362 | | | | 369 |
7.000% due 04/25/2023 - 06/01/2032 | | | | 3,464 | | | | 3,546 |
7.130% due 09/01/2039 | | | | 106 | | | | 107 |
7.269% due 11/01/2025 | | | | 2 | | | | 2 |
| |
| Federal Housing Administration |
7.430% due 01/25/2023 | | | | 52 | | | | 53 |
| |
| | | | | | | | |
| | | | | PRINCIPAL
AMOUNT
(000S) | | | | VALUE (000S) |
| Freddie Mac |
4.500% due 04/01/2018 - 10/01/2018 | | $ | | 2,330 | | $ | | 2,221 |
5.000% due 04/01/2018 - 09/01/2035 | | | | 17,324 | | | | 16,925 |
5.470% due 07/15/2019 - 10/15/2020 | | | | 134,500 | | | | 134,383 |
5.500% due 04/01/2033 - 07/01/2037 | | | | 66,903 | | | | 64,536 |
5.550% due 07/15/2037 | | | | 46,700 | | | | 46,696 |
5.620% due 05/15/2036 | | | | 5,068 | | | | 5,086 |
5.770% due 11/15/2030 | | | | 31 | | | | 31 |
5.820% due 09/15/2030 | | | | 29 | | | | 30 |
6.000% due 07/01/2016 - 07/01/2037 | | | | 20,131 | | | | 19,992 |
6.227% due 02/25/2045 | | | | 875 | | | | 872 |
6.500% due 03/01/2013 - 03/01/2034 | | | | 947 | | | | 965 |
7.000% due 06/15/2023 | | | | 1,869 | | | | 1,922 |
7.188% due 07/01/2030 | | | | 2 | | | | 2 |
7.290% due 07/01/2027 | | | | 2 | | | | 2 |
7.412% due 01/01/2028 | | | | 2 | | | | 2 |
7.500% due 07/15/2030 - 03/01/2032 | | | | 268 | | | | 278 |
8.500% due 08/01/2024 | | | | 15 | | | | 16 |
| |
| Ginnie Mae |
4.500% due 07/20/2030 | | | | 13 | | | | 14 |
4.750% due 02/20/2032 | | | | 805 | | | | 807 |
5.125% due 10/20/2029 - 11/20/2029 | | | | 272 | | | | 276 |
5.375% due 04/20/2026 - 05/20/2030 | | | | 116 | | | | 117 |
5.500% due 04/15/2033 - 09/15/2033 | | | | 555 | | | | 540 |
5.720% due 06/20/2030 | | | | 1 | | | | 1 |
5.820% due 09/20/2030 | | | | 25 | | | | 25 |
6.000% due 07/01/2037 | | | | 4,000 | | | | 3,979 |
6.500% due 03/15/2031 - 04/15/2032 | | | | 255 | | | | 260 |
| |
| Small Business Administration |
5.130% due 09/01/2023 | | | | 77 | | | | 76 |
6.030% due 02/10/2012 | | | | 5,089 | | | | 5,129 |
6.290% due 01/01/2021 | | | | 199 | | | | 204 |
6.344% due 08/01/2011 | | | | 650 | | | | 658 |
7.449% due 08/01/2010 | | | | 8 | | | | 8 |
7.500% due 04/01/2017 | | | | 1,025 | | | | 1,059 |
8.017% due 02/10/2010 | | | | 75 | | | | 77 |
| | | | | | | | |
Total U.S. Government Agencies
(Cost $1,913,856) | | 1,873,441 |
| | | | | | | | |
|
| U.S. TREASURY OBLIGATIONS 0.4% |
| Treasury Inflation Protected Securities (c) |
2.000% due 01/15/2026 | | | | 7,163 | | | | 6,490 |
2.375% due 01/15/2025 | | | | 7,236 | | | | 6,959 |
3.625% due 04/15/2028 | | | | 1,533 | | | | 1,777 |
| | | | | | | | |
Total U.S. Treasury Obligations
(Cost $16,092) | | 15,226 |
| | | | | | | | |
|
| MORTGAGE-BACKED SECURITIES 5.9% |
| American Home Mortgage Investment Trust |
4.390% due 02/25/2045 | | | | 3,537 | | | | 3,464 |
| |
| Banc of America Commercial Mortgage, Inc. |
4.128% due 07/10/2042 | | | | 395 | | | | 385 |
4.875% due 06/10/2039 | | | | 590 | | | | 582 |
| |
| Banc of America Funding Corp. |
4.113% due 05/25/2035 | | | | 4,996 | | | | 4,893 |
| |
| Banc of America Mortgage Securities, Inc. |
6.500% due 10/25/2031 | | | | 1,316 | | | | 1,331 |
6.500% due 09/25/2033 | | | | 507 | | | | 508 |
| |
| | | | |
| 10 | | PIMCO Variable Insurance Trust | | See Accompanying Notes |
| | |
| |
| | | June 30, 2007 (Unaudited) |
| | | | | | | | |
| | | | | PRINCIPAL
AMOUNT
(000S) | | | | VALUE (000S) |
| Bear Stearns Adjustable Rate Mortgage Trust |
4.750% due 10/25/2035 | | $ | | 18,398 | | $ | | 18,195 |
4.773% due 01/25/2034 | | | | 2,930 | | | | 2,916 |
5.044% due 04/25/2033 | | | | 1,332 | | | | 1,331 |
5.329% due 02/25/2033 | | | | 350 | | | | 355 |
5.626% due 02/25/2033 | | | | 292 | | | | 290 |
6.337% due 11/25/2030 | | | | 9 | | | | 9 |
| |
| Bear Stearns Alt-A Trust |
5.377% due 05/25/2035 | | | | 6,929 | | | | 6,900 |
| |
| Citigroup Commercial Mortgage Trust |
5.390% due 08/15/2021 | | | | 3,703 | | | | 3,708 |
| |
| Citigroup Mortgage Loan Trust, Inc. |
4.700% due 12/25/2035 | | | | 1,783 | | | | 1,752 |
| |
| Commercial Mortgage Pass-Through Certificates |
6.455% due 05/15/2032 | | | | 6,562 | | | | 6,608 |
| |
| Countrywide Alternative Loan Trust |
4.673% due 08/25/2034 | | | | 142 | | | | 141 |
5.500% due 05/25/2047 | | | | 5,426 | | | | 5,441 |
| |
| Countrywide Home Loan Mortgage Pass-Through Trust |
5.250% due 02/20/2036 | | | | 2,050 | | | | 2,037 |
5.590% due 05/25/2034 | | | | 415 | | | | 415 |
| |
| CS First Boston Mortgage Securities Corp. |
6.890% due 06/25/2032 | | | | 44 | | | | 44 |
| |
| First Nationwide Trust |
6.750% due 08/21/2031 | | | | 38 | | | | 38 |
| |
| Greenpoint Mortgage Funding Trust |
5.400% due 10/25/2046 | | | | 6,949 | | | | 6,955 |
5.400% due 01/25/2047 | | | | 6,845 | | | | 6,849 |
| |
| Greenwich Capital Commercial Funding Corp. |
5.317% due 06/10/2036 | | | | 915 | | | | 895 |
| |
| GS Mortgage Securities Corp. II |
5.396% due 08/10/2038 | | | | 905 | | | | 886 |
5.410% due 03/06/2020 | | | | 23,300 | | | | 23,326 |
| |
| GSR Mortgage Loan Trust |
4.538% due 09/25/2035 | | | | 21,739 | | | | 21,427 |
| |
| Harborview Mortgage Loan Trust |
5.410% due 01/19/2038 | | | | 10,742 | | | | 10,757 |
5.510% due 01/19/2038 | | | | 13,936 | | | | 13,960 |
5.540% due 05/19/2035 | | | | 1,497 | | | | 1,499 |
| |
| Impac Secured Assets CMN Owner Trust |
5.400% due 01/25/2037 | | | | 4,597 | | | | 4,601 |
| |
| Indymac ARM Trust |
6.633% due 01/25/2032 | | | | 7 | | | | 7 |
| |
| Indymac Index Mortgage Loan Trust |
5.410% due 11/25/2046 | | | | 4,816 | | | | 4,819 |
| |
| Lehman Brothers Floating Rate Commercial Mortgage Trust |
5.400% due 09/15/2021 | | | | 1,564 | | | | 1,565 |
| |
| Merrill Lynch Mortgage Trust |
4.353% due 02/12/2042 | | | | 515 | | | | 505 |
| |
| Morgan Stanley Capital I |
4.050% due 01/13/2041 | | | | 530 | | | | 515 |
5.380% due 10/15/2020 | | | | 3,999 | | | | 4,005 |
| |
| Prime Mortgage Trust |
5.720% due 02/25/2019 | | | | 242 | | | | 243 |
5.720% due 02/25/2034 | | | | 1,113 | | | | 1,116 |
| |
| Residential Funding Mortgage Securities I, Inc. |
6.500% due 03/25/2032 | | | | 1,215 | | | | 1,215 |
| |
| Structured Asset Mortgage Investments, Inc. |
5.650% due 09/19/2032 | | | | 190 | | | | 190 |
| |
| Structured Asset Securities Corp. |
6.063% due 02/25/2032 | | | | 24 | | | | 24 |
6.150% due 07/25/2032 | | | | 30 | | | | 30 |
| |
| | | | | | | | |
| | | | | PRINCIPAL
AMOUNT
(000S) | | | | VALUE (000S) |
| Thornburg Mortgage Securities Trust |
5.430% due 12/25/2036 | | $ | | 5,791 | | $ | | 5,791 |
| |
| Wachovia Bank Commercial Mortgage Trust |
5.400% due 06/15/2020 | | | | 10,800 | | | | 10,803 |
5.410% due 09/15/2021 | | | | 19,057 | | | | 19,067 |
| |
| Washington Mutual, Inc. |
5.094% due 10/25/2032 | | | | 283 | | | | 282 |
5.610% due 10/25/2045 | | | | 1,633 | | | | 1,637 |
6.229% due 11/25/2042 | | | | 1,259 | | | | 1,260 |
6.429% due 08/25/2042 | | | | 3,106 | | | | 3,117 |
| |
| Wells Fargo Mortgage-Backed Securities Trust |
4.950% due 03/25/2036 | | | | 8,237 | | | | 8,127 |
| | | | | | | | |
Total Mortgage-Backed Securities
(Cost $217,544) | | 216,816 |
| | | | | | | | |
|
| ASSET-BACKED SECURITIES 7.8% |
| ACE Securities Corp. |
5.370% due 12/25/2036 | | | | 2,407 | | | | 2,409 |
| |
| American Express Credit Account Master Trust |
5.430% due 09/15/2010 | | | | 35,400 | | | | 35,451 |
| |
| Amortizing Residential Collateral Trust |
5.590% due 06/25/2032 | | | | 353 | | | | 353 |
| |
| Argent Securities, Inc. |
5.370% due 09/25/2036 | | | | 2,645 | | | | 2,646 |
| |
| Asset-Backed Funding Certificates |
5.380% due 11/25/2036 | | | | 6,333 | | | | 6,337 |
5.380% due 01/25/2037 | | | | 4,974 | | | | 4,977 |
| |
| Bear Stearns Asset-Backed Securities, Inc. |
5.400% due 10/25/2036 | | | | 2,881 | | | | 2,883 |
5.410% due 06/25/2047 | | | | 4,699 | | | | 4,702 |
| |
| Carrington Mortgage Loan Trust |
5.470% due 09/25/2035 | | | | 631 | | | | 632 |
| |
| Chase Credit Card Master Trust |
5.430% due 02/15/2011 | | | | 9,900 | | | | 9,921 |
| |
| CitiFinancial Mortgage Securities, Inc. |
3.221% due 10/25/2033 | | | | 4 | | | | 4 |
| |
| Countrywide Asset-Backed Certificates |
5.370% due 01/25/2037 | | | | 7,522 | | | | 7,525 |
5.370% due 05/25/2037 | | | | 8,717 | | | | 8,726 |
5.370% due 12/25/2046 | | | | 2,594 | | | | 2,595 |
| |
| Credit-Based Asset Servicing & Securitization LLC |
5.380% due 11/25/2036 | | | | 4,728 | | | | 4,731 |
| |
| DaimlerChrysler Auto Trust |
5.250% due 05/08/2009 | | | | 7,360 | | | | 7,363 |
| |
| EMC Mortgage Loan Trust |
5.690% due 05/25/2040 | | | | 686 | | | | 688 |
| |
| First Franklin Mortgage Loan Asset-Backed Certificates |
5.370% due 11/25/2036 | | | | 8,596 | | | | 8,601 |
| |
| First USA Credit Card Master Trust |
5.480% due 04/18/2011 | | | | 16,500 | | | | 16,544 |
| |
| Fremont Home Loan Trust |
5.380% due 01/25/2037 | | | | 4,635 | | | | 4,634 |
5.390% due 02/25/2037 | | | | 3,480 | | | | 3,482 |
| |
| Honda Auto Receivables Owner Trust |
5.322% due 03/18/2008 | | | | 8,877 | | | | 8,886 |
| |
| HSI Asset Securitization Corp. Trust |
5.370% due 12/25/2036 | | | | 3,457 | | | | 3,459 |
| |
| Indymac Residential Asset-Backed Trust |
5.380% due 04/25/2037 | | | | 4,263 | | | | 4,264 |
| |
| JPMorgan Mortgage Acquisition Corp. |
5.370% due 08/25/2036 | | | | 2,735 | | | | 2,737 |
5.380% due 04/01/2037 | | | | 8,099 | | | | 8,095 |
| |
| | | | | | | | |
| | | | | PRINCIPAL
AMOUNT
(000S) | | | | VALUE (000S) |
| Lehman XS Trust |
5.390% due 05/25/2046 | | $ | | 2,418 | | $ | | 2,419 |
| |
| Long Beach Mortgage Loan Trust |
5.600% due 10/25/2034 | | | | 619 | | | | 620 |
| |
| MASTR Asset-Backed Securities Trust |
5.380% due 11/25/2036 | | | | 6,269 | | | | 6,273 |
| |
| Merrill Lynch Mortgage Investors, Inc. |
5.390% due 08/25/2036 | | | | 9,238 | | | | 9,239 |
| |
| Morgan Stanley ABS Capital I |
5.360% due 10/25/2036 | | | | 2,947 | | | | 2,948 |
5.370% due 10/25/2036 | | | | 2,685 | | | | 2,686 |
| |
| Nelnet Student Loan Trust |
5.340% due 09/25/2012 | | | | 4,156 | | | | 4,159 |
5.420% due 12/22/2016 | | | | 8,200 | | | | 8,206 |
| |
| Newcastle Mortgage Securities Trust |
5.390% due 03/25/2036 | | | | 4,873 | | | | 4,875 |
| |
| Nissan Auto Lease Trust |
5.347% due 12/14/2007 | | | | 105 | | | | 105 |
| |
| Park Place Securities, Inc. |
5.632% due 10/25/2034 | | | | 4,699 | | | | 4,711 |
| |
| Residential Asset Mortgage Products, Inc. |
4.230% due 05/25/2029 | | | | 14 | | | | 14 |
4.450% due 07/25/2028 | | | | 331 | | | | 329 |
| |
| Residential Asset Securities Corp. |
5.360% due 08/25/2036 | | | | 3,066 | | | | 3,068 |
5.390% due 11/25/2036 | | | | 6,745 | | | | 6,750 |
| |
| Saxon Asset Securities Trust |
5.380% due 11/25/2036 | | | | 3,198 | | | | 3,199 |
| |
| SBI HELOC Trust |
5.490% due 08/25/2036 | | | | 4,255 | | | | 4,259 |
| |
| Securitized Asset-Backed Receivables LLC Trust |
5.440% due 05/25/2037 | | | | 9,300 | | | | 9,300 |
| |
| SLM Student Loan Trust |
5.355% due 10/25/2016 | | | | 9,300 | | | | 9,306 |
| |
| Soundview Home Equity Loan Trust |
5.420% due 10/25/2036 | | | | 8,430 | | | | 8,436 |
| |
| Structured Asset Securities Corp. |
4.370% due 10/25/2034 | | | | 250 | | | | 249 |
5.370% due 10/25/2036 | | | | 7,391 | | | | 7,394 |
5.420% due 07/25/2035 | | | | 802 | | | | 803 |
5.610% due 01/25/2033 | | | | 73 | | | | 73 |
| |
| USAA Auto Owner Trust |
5.337% due 07/11/2008 | | | | 6,700 | | | | 6,701 |
| |
| Wachovia Auto Owner Trust |
5.337% due 06/20/2008 | | | | 7,600 | | | | 7,601 |
| |
| Wells Fargo Home Equity Trust |
5.370% due 01/25/2037 | | | | 4,446 | | | | 4,449 |
5.440% due 12/25/2035 | | | | 5,901 | | | | 5,904 |
| | | | | | | | |
Total Asset-Backed Securities
(Cost $286,598) | | 286,721 |
| | | | | | | | |
|
| SOVEREIGN ISSUES 0.7% |
| China Development Bank |
5.000% due 10/15/2015 | | | | 900 | | | | 861 |
| |
| Korea Development Bank |
5.490% due 04/03/2010 | | | | 25,000 | | | | 25,022 |
| |
| South Africa Government International Bond |
5.875% due 05/30/2022 | | | | 500 | | | | 490 |
| | | | | | | | |
Total Sovereign Issues (Cost $26,392) | | 26,373 |
| | | | | | | | |
|
| | | | | | |
| See Accompanying Notes | | Semiannual Report | | June 30, 2007 | | 11 |
| | |
| |
| Schedule of Investments Total Return Portfolio (Cont.) | | |
| | | | | | | | |
| | | | | PRINCIPAL
AMOUNT
(000S) | | | | VALUE (000S) |
| FOREIGN CURRENCY-DENOMINATED ISSUES 0.1% |
| Brazilian Government International Bond |
10.250% due 01/10/2028 | | BRL | | 4,400 | | $ | | 2,543 |
| | | | | | | | |
Total Foreign Currency-Denominated Issues (Cost $2,505) | | 2,543 |
| | | | | | | | |
|
| | | | | SHARES | | | | |
| PREFERRED STOCKS 0.4% |
| DG Funding Trust |
7.600% due 12/31/2049 | | | | 1,239 | | | | 12,909 |
| | | | | | | | |
Total Preferred Stocks (Cost $13,056) | | 12,909 |
| | | | | | | | |
|
| | | | | PRINCIPAL
AMOUNT
(000S) | | | | |
| SHORT-TERM INSTRUMENTS 27.7% |
|
| CERTIFICATES OF DEPOSIT 6.1% |
| Abbey National Treasury Services PLC |
5.270% due 07/02/2008 | | $ | | 13,600 | | | | 13,606 |
| |
| Barclays Bank PLC |
5.281% due 03/17/2008 | | | | 28,400 | | | | 28,404 |
| |
| BNP Paribas |
5.262% due 07/03/2008 | | | | 13,100 | | | | 13,097 |
5.262% due 05/28/2008 | | | | 5,200 | | | | 5,202 |
| |
| Calyon Financial, Inc. |
5.340% due 01/16/2009 | | | | 9,900 | | | | 9,902 |
| |
| Dexia S.A. |
5.270% due 09/29/2008 | | | | 34,500 | | | | 34,510 |
| |
| Fortis Bank NY |
5.265% due 04/28/2008 | | | | 14,100 | | | | 14,107 |
5.265% due 06/30/2008 | | | | 5,100 | | | | 5,102 |
| |
| Nordea Bank Finland PLC |
5.267% due 03/31/2008 | | | | 4,800 | | | | 4,801 |
5.308% due 05/28/2008 | | | | 5,000 | | | | 5,003 |
5.308% due 04/09/2009 | | | | 14,300 | | | | 14,308 |
| |
| Royal Bank of Canada |
5.267% due 06/30/2008 | | | | 17,100 | | | | 17,115 |
| |
| Royal Bank of Scotland Group PLC |
5.262% due 07/03/2008 | | | | 12,600 | | | | 12,600 |
5.265% due 03/26/2008 | | | | 10,300 | | | | 10,299 |
| |
| | | | | | | | |
| | | | | PRINCIPAL
AMOUNT
(000S) | | | | VALUE
(000S) |
| Skandinav Enskilda BK |
5.340% due 08/21/2008 | | $ | | 14,500 | | $ | | 14,506 |
5.350% due 02/13/2009 | | | | 8,300 | | | | 8,306 |
| |
| Societe Generale NY |
5.268% due 03/28/2008 | | | | 4,200 | | | | 4,203 |
5.269% due 06/30/2008 | | | | 1,100 | | | | 1,101 |
5.270% due 03/26/2008 | | | | 8,100 | | | | 8,100 |
| | | | | | | | |
| | | | | | | | 224,272 |
| | | | | | | | |
|
| COMMERCIAL PAPER 20.6% |
| Bank of America Corp. |
5.215% due 10/04/2007 | | | | 37,900 | | | | 37,414 |
5.220% due 10/04/2007 | | | | 38,600 | | | | 38,583 |
5.250% due 10/04/2007 | | | | 2,400 | | | | 2,367 |
| |
| Bank of Ireland |
5.225% due 11/08/2007 | | | | 3,600 | | | | 3,583 |
| |
| Cox Communications, Inc. |
5.619% due 09/17/2007 | | | | 3,500 | | | | 3,500 |
| |
| Danske Corp. |
5.205% due 10/12/2007 | | | | 11,800 | | | | 11,673 |
| |
| Freddie Mac |
4.800% due 07/02/2007 | | | | 113,200 | | | | 113,200 |
| |
| HBOS Treasury Services PLC |
5.230% due 11/13/2007 | | | | 6,500 | | | | 6,471 |
| |
| Natixis S.A. |
5.240% due 09/21/2007 | | | | 1,300 | | | | 1,295 |
| |
| Rabobank USA Financial Corp. |
5.330% due 07/26/2007 | | | | 102,500 | | | | 102,500 |
| |
| San Paolo IMI U.S. Financial Co. |
5.230% due 08/08/2007 | | | | 16,400 | | | | 16,326 |
| |
| Societe Generale NY |
5.180% due 11/26/2007 | | | | 700 | | | | 685 |
5.210% due 11/26/2007 | | | | 1,800 | | | | 1,781 |
5.226% due 11/26/2007 | | | | 67,700 | | | | 67,356 |
5.245% due 11/26/2007 | | | | 24,500 | | | | 24,204 |
5.246% due 11/26/2007 | | | | 4,700 | | | | 4,644 |
5.250% due 11/26/2007 | | | | 500 | | | | 493 |
| |
| Svenska Handelsbanken, Inc. |
5.203% due 10/09/2007 | | | | 29,300 | | | | 29,088 |
| |
| UBS Finance Delaware LLC |
5.145% due 10/23/2007 | | | | 1,700 | | | | 1,693 |
5.200% due 10/23/2007 | | | | 94,000 | | | | 93,579 |
| | | | | | | | | |
| | | | | PRINCIPAL
AMOUNT
(000S) | | | | VALUE
(000S) | |
5.205% due 10/23/2007 | | $ | | 3,900 | | $ | | 3,890 | |
5.215% due 10/23/2007 | | | | 900 | | | | 890 | |
5.230% due 10/23/2007 | | | | 7,600 | | | | 7,559 | |
5.235% due 10/23/2007 | | | | 4,400 | | | | 4,356 | |
5.245% due 10/23/2007 | | | | 700 | | | | 692 | |
| | |
| Unicredito Italiano SpA | |
5.185% due 01/22/2008 | | | | 73,600 | | | | 71,993 | |
| | |
| Westpac Banking Corp. | |
5.165% due 11/05/2007 | | | | 44,300 | | | | 43,472 | |
5.230% due 11/05/2007 | | | | 2,800 | | | | 2,788 | |
5.240% due 11/05/2007 | | | | 1,200 | | | | 1,186 | |
| | |
| Westpac Trust Securities NZ Ltd. | |
5.240% due 10/19/2007 | | | | 60,400 | | | | 59,960 | |
| | | | | | | | | |
| | | | | | | | 757,221 | |
| | | | | | | | | |
| |
| TRI-PARTY REPURCHASE AGREEMENTS 0.2% | |
| State Street Bank and Trust Co. | |
4.900% due 07/02/2007 | | | | 7,112 | | | | 7,112 | |
| | | | | | | | | |
(Dated 06/29/2007. Collateralized by Freddie Mac 5.400% due 06/15/2010 valued at $7,259. Repurchase proceeds are $7,115.) | | | |
| |
| U.S. TREASURY BILLS 0.8% | |
4.621% due 08/30/2007 - 09/13/2007 (b)(d)(f) | | | | 29,860 | | | | 29,543 | |
| | | | | | | | | |
Total Short-Term Instruments
(Cost $1,018,160) | | 1,018,148 | |
| | | | | | | | | |
| |
| PURCHASED OPTIONS (h) 0.2% | | | |
| (Cost $16,475) | | | | | | | | 5,853 | |
| |
Total Investments (e) 119.7%
(Cost $4,451,256) | | $ | | 4,398,751 | |
| |
Written Options (i) (0.2%)
(Premiums $16,146) | | (5,904 | ) |
| |
| Other Assets and Liabilities (Net) (19.5%) | | (717,070 | ) |
| | | | | | | | | |
| Net Assets 100.0% | | | | | | $ | | 3,675,777 | |
| | | | | | | | | |
Notes to Schedule of Investments (amounts in thousands*, except number of contracts):
* A zero balance may reflect actual amounts rounding to less than one thousand.
(a) Security is in default.
(b) Coupon represents a weighted average rate.
(c) Principal amount of security is adjusted for inflation.
(d) Securities with an aggregate market value of $7,178 have been pledged as collateral for swap and swaption contracts on June 30, 2007.
(e) As of June 30, 2007, portfolio securities with an aggregate value of $205,868 were valued in good faith and pursuant to the guidelines established by the Board of Trustees.
| | | | |
| 12 | | PIMCO Variable Insurance Trust | | See Accompanying Notes |
| | |
| |
| | | June 30, 2007 (Unaudited) |
(f) Securities with an aggregate market value of $20,629 have been segregated with the custodian to cover margin requirements for the following open futures contracts on June 30, 2007:
| | | | | | | | | | |
| Description | | Type | | Expiration
Month | | # of
Contracts | | Unrealized
(Depreciation) | |
90-Day Euribor December Futures | | Long | | 12/2007 | | 444 | | $ | (632 | ) |
90-Day Euribor December Futures | | Long | | 12/2008 | | 174 | | | (390 | ) |
90-Day Euribor June Futures | | Long | | 06/2008 | | 459 | | | (981 | ) |
90-Day Euribor March Futures | | Long | | 03/2008 | | 209 | | | (414 | ) |
90-Day Euribor September Futures | | Long | | 09/2008 | | 451 | | | (407 | ) |
90-Day Eurodollar December Futures | | Long | | 12/2007 | | 4,365 | | | (4,972 | ) |
90-Day Eurodollar December Futures | | Long | | 12/2008 | | 2,346 | | | (1,336 | ) |
90-Day Eurodollar June Futures | | Long | | 06/2008 | | 8,706 | | | (9,100 | ) |
90-Day Eurodollar March Futures | | Long | | 03/2008 | | 9,007 | | | (9,295 | ) |
90-Day Eurodollar March Futures | | Long | | 03/2009 | | 214 | | | (313 | ) |
90-Day Eurodollar September Futures | | Long | | 09/2008 | | 1,885 | | | (925 | ) |
90-Day Euroyen December Futures | | Long | | 12/2007 | | 604 | | | (68 | ) |
Euro-Bund 10-Year Note September Futures | | Short | | 09/2007 | | 75 | | | (53 | ) |
U.S. Treasury 10-Year Note September Futures | | Short | | 09/2007 | | 13 | | | (11 | ) |
U.S. Treasury 30-Year Bond September Futures | | Long | | 09/2007 | | 221 | | | (250 | ) |
United Kingdom 90-Day LIBOR Sterling Interest Rate December Futures | | Long | | 12/2007 | | 430 | | | (967 | ) |
United Kingdom 90-Day LIBOR Sterling Interest Rate December Futures | | Long | | 12/2008 | | 36 | | | (61 | ) |
United Kingdom 90-Day LIBOR Sterling Interest Rate June Futures | | Long | | 06/2008 | | 362 | | | (640 | ) |
United Kingdom 90-Day LIBOR Sterling Interest Rate March Futures | | Long | | 03/2008 | | 422 | | | (772 | ) |
United Kingdom 90-Day LIBOR Sterling Interest Rate September Futures | | Long | | 09/2007 | | 243 | | | (520 | ) |
United Kingdom 90-Day LIBOR Sterling Interest Rate September Futures | | Long | | 09/2008 | | 115 | | | (301 | ) |
| | | | | | | | | | |
| | | | | | | | $ | (32,408 | ) |
| | | | | | | | | | |
(g) Swap agreements outstanding on June 30, 2007:
Credit Default Swaps
| | | | | | | | | | | | | | | | |
| Counterparty | | Reference Entity | | Buy/Sell
Protection (1) | | (Pay)/Receive
Fixed Rate | | | Expiration
Date | | Notional
Amount | | Unrealized
Appreciation/
(Depreciation) | |
Bank of America | | Dow Jones CDX N.A. IG7 Index | | Buy | | (0.650% | ) | | 12/20/2016 | | $ | 10,000 | | $ | 87 | |
Bear Stearns & Co., Inc. | | Ford Motor Credit Co. 7.000% due 10/01/2013 | | Sell | | 2.320% | | | 09/20/2007 | | | 2,100 | | | 10 | |
Credit Suisse First Boston | | Ford Motor Credit Co. 7.000% due 10/01/2013 | | Sell | | 0.950% | | | 12/20/2007 | | | 2,300 | | | (2 | ) |
Credit Suisse First Boston | | Panama Government International Bond 8.875% due 09/30/2027 | | Sell | | 1.200% | | | 02/20/2017 | | | 400 | | | 7 | |
Deutsche Bank AG | | Dow Jones CDX N.A. IG8 Index | | Buy | | (0.600% | ) | | 06/20/2017 | | | 5,300 | | | 24 | |
Goldman Sachs & Co. | | Ford Motor Credit Co. 7.000% due 10/01/2013 | | Sell | | 2.400% | | | 09/20/2007 | | | 4,200 | | | 20 | |
Goldman Sachs & Co. | | Anadarko Petroleum Corp. 6.125% due 03/15/2012 | | Sell | | 0.150% | | | 03/20/2008 | | | 2,500 | | | 0 | |
Goldman Sachs & Co. | | Dow Jones CDX N.A. IG7 Index | | Buy | | (0.650% | ) | | 12/20/2016 | | | 44,000 | | | 336 | |
Goldman Sachs & Co. | | Dow Jones CDX N.A. IG8 Index | | Buy | | (0.600% | ) | | 06/20/2017 | | | 25,600 | | | 151 | |
HSBC Bank USA | | Ukraine Government International Bond 7.650% due 06/11/2013 | | Sell | | 0.700% | | | 04/20/2009 | | | 1,600 | | | 6 | |
HSBC Bank USA | | Ukraine Government International Bond 7.650% due 06/11/2013 | | Sell | | 0.520% | | | 05/20/2009 | | | 4,000 | | | (1 | ) |
JPMorgan Chase & Co. | | American International Group, Inc. 0.000% convertible until 11/09/2031 | | Sell | | 0.050% | | | 12/20/2007 | | | 17,200 | | | 1 | |
JPMorgan Chase & Co. | | Panama Government International Bond 8.875% due 09/30/2027 | | Sell | | 0.730% | | | 01/20/2012 | | | 1,000 | | | 6 | |
JPMorgan Chase & Co. | | Mexico Government International Bond 7.500% due 04/08/2033 | | Sell | | 0.920% | | | 03/20/2016 | | | 1,200 | | | 41 | |
JPMorgan Chase & Co. | | Panama Government International Bond 8.875% due 09/30/2027 | | Sell | | 1.250% | | | 01/20/2017 | | | 1,200 | | | 27 | |
Lehman Brothers, Inc. | | Ford Motor Credit Co. 7.000% due 10/01/2013 | | Sell | | 0.950% | | | 12/20/2007 | | | 4,200 | | | (3 | ) |
Lehman Brothers, Inc. | | Indonesia Government International Bond 6.750% due 03/10/2014 | | Sell | | 0.400% | | | 12/20/2008 | | | 2,200 | | | 1 | |
Lehman Brothers, Inc. | | Ukraine Government International Bond 7.650% due 06/11/2013 | | Sell | | 0.700% | | | 12/20/2008 | | | 5,000 | | | 14 | |
Lehman Brothers, Inc. | | Multiple Reference Entities of Gazprom | | Sell | | 1.430% | | | 07/20/2011 | | | 600 | | | 24 | |
Lehman Brothers, Inc. | | Mexico Government International Bond 7.500% due 04/08/2033 | | Sell | | 0.920% | | | 03/20/2016 | | | 3,100 | | | 105 | |
Lehman Brothers, Inc. | | Panama Government International Bond 8.875% due 09/30/2027 | | Sell | | 1.170% | | | 04/20/2017 | | | 3,000 | | | 40 | |
Morgan Stanley | | Russia Government International Bond 7.500% due 03/31/2030 | | Sell | | 0.245% | | | 06/20/2008 | | | 1,300 | | | 0 | |
Royal Bank of Scotland Group PLC | | Indonesia Government International Bond 6.750% due 03/10/2014 | | Sell | | 0.390% | | | 12/20/2008 | | | 3,000 | | | 1 | |
Royal Bank of Scotland Group PLC | | Indonesia Government International Bond 6.750% due 03/10/2014 | | Sell | | 0.400% | | | 12/20/2008 | | | 11,000 | | | 3 | |
| | | | | | | | | | | | | | | | |
| | | | | | | | | | | | | | $ | 898 | |
| | | | | | | | | | | | | | | | |
(1) If the Portfolio is a seller of protection and a credit event occurs, as defined under the terms of that particular swap agreement, the Portfolio will pay to the buyer of the protection an amount up to the notional value of the swap and in certain instances, take delivery of the security. As a buyer of protection, the Portfolio will generally receive from the seller of protection an amount up to the notional amount of the swap if a credit event occurs.
| | | | | | |
| See Accompanying Notes | | Semiannual Report | | June 30, 2007 | | 13 |
Schedule of Investments Total Return Portfolio (Cont.)
Interest Rate Swaps
| | | | | | | | | | | | | | | |
| Counterparty | | Floating Rate Index | | Pay/Receive
Floating Rate | | Fixed Rate | | Expiration
Date | | Notional
Amount | | Unrealized
Appreciation/
(Depreciation) | |
Deutsche Bank AG | | 6-Month Australian Bank Bill | | Pay | | 7.000% | | 12/15/2009 | | AUD | 9,300 | | $ | (5 | ) |
Barclays Bank PLC | | BRL-CDI-Compounded | | Pay | | 11.360% | | 01/04/2010 | | BRL | 16,700 | | | 97 | |
Goldman Sachs & Co. | | BRL-CDI-Compounded | | Pay | | 11.465% | | 01/04/2010 | | | 4,300 | | | 30 | |
Merrill Lynch & Co., Inc. | | BRL-CDI-Compounded | | Pay | | 11.430% | | 01/04/2010 | | | 11,000 | | | 73 | |
Merrill Lynch & Co., Inc. | | BRL-CDI-Compounded | | Pay | | 12.948% | | 01/04/2010 | | | 5,900 | | | 120 | |
Morgan Stanley | | BRL-CDI-Compounded | | Pay | | 12.780% | | 01/04/2010 | | | 14,200 | | | 263 | |
Barclays Bank PLC | | 5-Year French CPI Ex Tobacco Daily Reference Index | | Pay | | 2.103% | | 10/15/2010 | | EUR | 1,400 | | | 19 | |
Barclays Bank PLC | | 5-Year French CPI Ex Tobacco Daily Reference Index | | Pay | | 1.960% | | 04/05/2012 | | | 1,200 | | | (13 | ) |
BNP Paribas Bank | | 5-Year French CPI Ex Tobacco Daily Reference Index | | Pay | | 2.090% | | 10/15/2010 | | | 10,200 | | | 128 | |
Deutsche Bank AG | | 6-Month EUR-LIBOR | | Pay | | 5.000% | | 12/19/2009 | | | 26,700 | | | (9 | ) |
Deutsche Bank AG | | 6-Month EUR-LIBOR | | Receive | | 4.000% | | 12/15/2011 | | | 18,700 | | | 377 | |
Deutsche Bank AG | | 6-Month EUR-LIBOR | | Receive | | 5.000% | | 12/19/2017 | | | 6,300 | | | (33 | ) |
Goldman Sachs & Co. | | 6-Month EUR-LIBOR | | Pay | | 4.000% | | 03/20/2009 | | | 9,600 | | | (69 | ) |
Goldman Sachs & Co. | | 5-Year French CPI Ex Tobacco Daily Reference Index | | Pay | | 1.960% | | 03/30/2012 | | | 2,400 | | | (21 | ) |
JPMorgan Chase & Co. | | 5-Year French CPI Ex Tobacco Daily Reference Index | | Pay | | 1.948% | | 03/15/2012 | | | 8,400 | | | (77 | ) |
JPMorgan Chase & Co. | | 5-Year French CPI Ex Tobacco Daily Reference Index | | Pay | | 1.958% | | 04/10/2012 | | | 9,300 | | | (98 | ) |
Royal Bank of Scotland Group PLC | | 5-Year French CPI Ex Tobacco Daily Reference Index | | Pay | | 1.955% | | 03/28/2012 | | | 1,800 | | | (17 | ) |
Royal Bank of Scotland Group PLC | | 5-Year French CPI Ex Tobacco Daily Reference Index | | Pay | | 1.950% | | 03/30/2012 | | | 1,500 | | | (15 | ) |
UBS Warburg LLC | | 5-Year French CPI Ex Tobacco Daily Reference Index | | Pay | | 2.146% | | 10/15/2010 | | | 1,900 | | | 31 | |
Barclays Bank PLC | | 6-Month GBP-LIBOR | | Pay | | 6.000% | | 12/20/2008 | | GBP | 24,100 | | | (236 | ) |
Barclays Bank PLC | | 6-Month GBP-LIBOR | | Pay | | 6.000% | | 03/20/2009 | | | 13,600 | | | (196 | ) |
Barclays Bank PLC | | 6-Month GBP-LIBOR | | Pay | | 5.000% | | 06/15/2009 | | | 14,400 | | | (259 | ) |
Barclays Bank PLC | | 6-Month GBP-LIBOR | | Receive | | 4.000% | | 12/15/2035 | | | 2,900 | | | 268 | |
Barclays Bank PLC | | 6-Month GBP-LIBOR | | Receive | | 4.000% | | 12/15/2036 | | | 3,200 | | | 774 | |
Credit Suisse First Boston | | 6-Month GBP-LIBOR | | Pay | | 5.000% | | 06/15/2009 | | | 2,800 | | | (66 | ) |
Deutsche Bank AG | | 6-Month GBP-LIBOR | | Pay | | 6.000% | | 12/20/2008 | | | 14,400 | | | (146 | ) |
Goldman Sachs & Co. | | 6-Month GBP-LIBOR | | Pay | | 5.000% | | 06/15/2009 | | | 28,500 | | | (697 | ) |
Goldman Sachs & Co. | | 6-Month GBP-LIBOR | | Pay | | 6.000% | | 06/19/2009 | | | 74,700 | | | (235 | ) |
Goldman Sachs & Co. | | 6-Month GBP-LIBOR | | Receive | | 5.500% | | 12/15/2036 | | | 5,000 | | | 287 | |
HSBC Bank USA | | 6-Month GBP-LIBOR | | Pay | | 4.500% | | 12/20/2007 | | | 53,900 | | | (531 | ) |
HSBC Bank USA | | 6-Month GBP-LIBOR | | Receive | | 4.000% | | 12/15/2036 | | | 5,500 | | | 1,145 | |
Lehman Brothers, Inc. | | 6-Month GBP-LIBOR | | Pay | | 4.500% | | 09/20/2009 | | | 17,500 | | | (1,164 | ) |
Merrill Lynch & Co., Inc. | | 6-Month GBP-LIBOR | | Receive | | 4.000% | | 12/15/2035 | | | 2,200 | | | 208 | |
Royal Bank of Scotland Group PLC | | 6-Month GBP-LIBOR | | Pay | | 6.000% | | 03/20/2009 | | | 12,700 | | | (187 | ) |
Royal Bank of Scotland Group PLC | | 6-Month GBP-LIBOR | | Pay | | 6.000% | | 06/19/2009 | | | 21,200 | | | (80 | ) |
Royal Bank of Scotland Group PLC | | 6-Month GBP-LIBOR | | Receive | | 4.000% | | 12/15/2036 | | | 10,000 | | | 2,182 | |
Royal Bank of Scotland Group PLC | | 6-Month GBP-LIBOR | | Receive | | 5.500% | | 12/15/2036 | | | 1,400 | | | 69 | |
Barclays Bank PLC | | 6-Month JPY-LIBOR | | Pay | | 1.000% | | 03/18/2009 | | JPY | 1,270,000 | | | (28 | ) |
Deutsche Bank AG | | 6-Month JPY-LIBOR | | Pay | | 1.000% | | 09/18/2008 | | | 9,500,000 | | | (49 | ) |
Deutsche Bank AG | | 6-Month JPY-LIBOR | | Pay | | 1.000% | | 03/18/2009 | | | 2,050,000 | | | (30 | ) |
UBS Warburg LLC | | 6-Month JPY-LIBOR | | Pay | | 1.000% | | 03/19/2008 | | | 22,300,000 | | | (64 | ) |
UBS Warburg LLC | | 6-Month JPY-LIBOR | | Pay | | 1.000% | | 09/18/2008 | | | 700,000 | | | (3 | ) |
UBS Warburg LLC | | 6-Month JPY-LIBOR | | Pay | | 1.000% | | 03/18/2009 | | | 18,200,000 | | | (298 | ) |
Citibank N.A. | | 28-Day Mexico Interbank TIIE Banxico | | Pay | | 8.170% | | 11/04/2016 | | MXN | 12,100 | | | 7 | |
Goldman Sachs & Co. | | 28-Day Mexico Interbank TIIE Banxico | | Pay | | 7.780% | | 04/03/2012 | | | 46,500 | | | (38 | ) |
Bank of America | | 3-Month USD-LIBOR | | Pay | | 5.000% | | 12/19/2009 | | $ | 66,300 | | | 6 | |
Bank of America | | 3-Month USD-LIBOR | | Pay | | 5.000% | | 12/19/2009 | | | 118,400 | | | (129 | ) |
Bank of America | | 3-Month USD-LIBOR | | Receive | | 5.000% | | 12/19/2017 | | | 17,200 | | | 160 | |
Barclays Bank PLC | | 3-Month USD-LIBOR | | Pay | | 5.000% | | 12/19/2009 | | | 64,200 | | | (71 | ) |
Deutsche Bank AG | | 3-Month USD-LIBOR | | Pay | | 5.000% | | 12/19/2008 | | | 230,400 | | | (498 | ) |
Deutsche Bank AG | | 3-Month USD-LIBOR | | Pay | | 5.000% | | 12/19/2009 | | | 730,900 | | | 551 | |
Deutsche Bank AG | | 3-Month USD-LIBOR | | Receive | | 5.000% | | 12/19/2017 | | | 77,400 | | | (378 | ) |
Goldman Sachs & Co. | | 3-Month USD-LIBOR | | Pay | | 5.000% | | 12/19/2009 | | | 200 | | | 0 | |
Morgan Stanley | | 3-Month USD-LIBOR | | Pay | | 5.000% | | 06/20/2009 | | | 81,500 | | | (641 | ) |
Morgan Stanley | | 3-Month USD-LIBOR | | Receive | | 5.000% | | 12/19/2017 | | | 15,400 | | | (100 | ) |
Morgan Stanley | | 3-Month USD-LIBOR | | Pay | | 5.000% | | 12/19/2037 | | | 2,500 | | | 41 | |
Royal Bank of Scotland Group PLC | | 3-Month USD-LIBOR | | Pay | | 5.000% | | 12/19/2008 | | | 230,400 | | | (529 | ) |
Royal Bank of Scotland Group PLC | | 3-Month USD-LIBOR | | Pay | | 5.000% | | 06/20/2009 | | | 68,700 | | | (134 | ) |
Royal Bank of Scotland Group PLC | | 3-Month USD-LIBOR | | Pay | | 5.000% | | 12/19/2037 | | | 27,900 | | | 449 | |
| | | | | | | | | | | | | | | |
| | | | | | | | | | | | | $ | 141 | |
| | | | | | | | | | | | | | | |
(h) Purchased options outstanding on June 30, 2007:
Options on Exchange-Traded Futures Contracts
| | | | | | | | | | | | | |
| Description | | Exercise
Price | | Expiration
Date | | # of
Contracts | | Cost | | Value |
Put - CME 90-Day Eurodollar September Futures | | $ | 90.750 | | 09/17/2007 | | 400 | | $ | 4 | | $ | 0 |
Put - CME 90-Day Eurodollar September Futures | | | 91.000 | | 09/17/2007 | | 1,774 | | | 17 | | | 0 |
| | | | | | | | | | | | | |
| | | | | | | | | $ | 21 | | $ | 0 |
| | | | | | | | | | | | | |
| | | | |
| 14 | | PIMCO Variable Insurance Trust | | See Accompanying Notes |
| | |
| |
| | | June 30, 2007 (Unaudited) |
Interest Rate Swaptions
| | | | | | | | | | | | | | | | | | | |
| Description | | Counterparty | | Floating Rate Index | | Pay/Receive
Floating Rate | | Exercise
Rate | | Expiration
Date | | Notional
Amount | | Cost | | Value |
Call - OTC 2-Year Interest Rate Swap | | Barclays Bank PLC | | 6-Month EUR-LIBOR | | Pay | | 3.960% | | 07/02/2007 | | EUR | 26,000 | | $ | 120 | | $ | 0 |
Call - OTC 2-Year Interest Rate Swap | | Deutsche Bank AG | | 6-Month EUR-LIBOR | | Pay | | 3.960% | | 07/02/2007 | | | 84,000 | | | 480 | | | 0 |
Call - OTC 2-Year Interest Rate Swap | | Deutsche Bank AG | | 6-Month EUR-LIBOR | | Pay | | 4.100% | | 07/02/2007 | | | 58,000 | | | 323 | | | 0 |
Call - OTC 2-Year Interest Rate Swap | | Royal Bank of Scotland Group PLC | | 6-Month EUR-LIBOR | | Pay | | 3.960% | | 07/02/2007 | | | 56,000 | | | 271 | | | 0 |
Call - OTC 2-Year Interest Rate Swap | | Bank of America | | 3-Month USD-LIBOR | | Pay | | 4.800% | | 08/08/2007 | | $ | 76,000 | | | 309 | | | 1 |
Call - OTC 2-Year Interest Rate Swap | | Bank of America | | 3-Month USD-LIBOR | | Pay | | 4.900% | | 08/08/2007 | | | 39,000 | | | 172 | | | 1 |
Call - OTC 2-Year Interest Rate Swap | | Bank of America | | 3-Month USD-LIBOR | | Pay | | 4.750% | | 09/26/2008 | | | 261,000 | | | 1,258 | | | 513 |
Call - OTC 2-Year Interest Rate Swap | | Barclays Bank PLC | | 3-Month USD-LIBOR | | Pay | | 5.250% | | 08/08/2007 | | | 72,000 | | | 67 | | | 60 |
Call - OTC 1-Year Interest Rate Swap | | Barclays Bank PLC | | 3-Month USD-LIBOR | | Pay | | 4.750% | | 02/01/2008 | | | 100,000 | | | 287 | | | 30 |
Call - OTC 1-Year Interest Rate Swap | | Goldman Sachs & Co. | | 3-Month USD-LIBOR | | Pay | | 4.700% | | 08/08/2007 | | | 89,000 | | | 199 | | | 0 |
Call - OTC 2-Year Interest Rate Swap | | Lehman Brothers, Inc. | | 3-Month USD-LIBOR | | Pay | | 4.750% | | 03/31/2008 | | | 236,900 | | | 1,254 | | | 293 |
Call - OTC 2-Year Interest Rate Swap | | Lehman Brothers, Inc. | | 3-Month USD-LIBOR | | Pay | | 4.750% | | 09/26/2008 | | | 349,600 | | | 1,237 | | | 688 |
Call - OTC 2-Year Interest Rate Swap | | Royal Bank of Scotland Group PLC | | 3-Month USD-LIBOR | | Pay | | 4.750% | | 07/02/2007 | | | 66,000 | | | 273 | | | 0 |
Call - OTC 1-Year Interest Rate Swap | | Royal Bank of Scotland Group PLC | | 3-Month USD-LIBOR | | Pay | | 4.850% | | 07/02/2007 | | | 150,000 | | | 390 | | | 0 |
Call - OTC 2-Year Interest Rate Swap | | Royal Bank of Scotland Group PLC | | 3-Month USD-LIBOR | | Pay | | 5.250% | | 07/02/2007 | | | 316,400 | | | 1,671 | | | 0 |
Call - OTC 1-Year Interest Rate Swap | | Royal Bank of Scotland Group PLC | | 3-Month USD-LIBOR | | Pay | | 4.900% | | 08/08/2007 | | | 144,000 | | | 326 | | | 0 |
Call - OTC 1-Year Interest Rate Swap | | Royal Bank of Scotland Group PLC | | 3-Month USD-LIBOR | | Pay | | 5.000% | | 08/08/2007 | | | 240,000 | | | 306 | | | 0 |
Call - OTC 2-Year Interest Rate Swap | | Royal Bank of Scotland Group PLC | | 3-Month USD-LIBOR | | Pay | | 4.900% | | 10/25/2007 | | | 109,000 | | | 439 | | | 53 |
Call - OTC 2-Year Interest Rate Swap | | Royal Bank of Scotland Group PLC | | 3-Month USD-LIBOR | | Pay | | 5.000% | | 02/01/2008 | | | 222,600 | | | 1,104 | | | 357 |
Call - OTC 2-Year Interest Rate Swap | | Royal Bank of Scotland Group PLC | | 3-Month USD-LIBOR | | Pay | | 4.750% | | 03/31/2008 | | | 386,900 | | | 2,276 | | | 478 |
Call - OTC 2-Year Interest Rate Swap | | Royal Bank of Scotland Group PLC | | 3-Month USD-LIBOR | | Pay | | 4.750% | | 09/26/2008 | | | 94,900 | | | 377 | | | 187 |
Call - OTC 2-Year Interest Rate Swap | | Royal Bank of Scotland Group PLC | | 3-Month USD-LIBOR | | Pay | | 4.750% | | 12/15/2008 | | | 380,900 | | | 1,304 | | | 864 |
Call - OTC 2-Year Interest Rate Swap | | Royal Bank of Scotland Group PLC | | 3-Month USD-LIBOR | | Pay | | 5.000% | | 12/15/2008 | | | 201,000 | | | 573 | | | 680 |
| | | | | | | | | | | | | | | | | | | |
| | | | | | | | | | | | | | | $ | �� 15,016 | | $ | 4,205 |
| | | | | | | | | | | | | | | | | | | |
Foreign Currency Options
| | | | | | | | | | | | | | |
| Description | | Exercise
Price | | Expiration
Date | | Notional
Amount | | Cost | | Value |
Call - OTC U.S. dollar versus Japanese yen | | JPY | 103.800 | | 03/17/2010 | | $ | 3,000 | | $ | 131 | | $ | 231 |
Put - OTC U.S. dollar versus Japanese yen | | | 103.800 | | 03/17/2010 | | | 3,000 | | | 131 | | | 74 |
Call - OTC U.S. dollar versus Japanese yen | | | 104.650 | | 03/31/2010 | | | 2,000 | | | 91 | | | 143 |
Put - OTC U.S. dollar versus Japanese yen | | | 104.650 | | 03/31/2010 | | | 2,000 | | | 78 | | | 54 |
Call - OTC U.S. dollar versus Japanese yen | | | 105.200 | | 03/31/2010 | | | 3,000 | | | 126 | | | 204 |
Put - OTC U.S. dollar versus Japanese yen | | | 105.200 | | 03/31/2010 | | | 3,000 | | | 126 | | | 84 |
Call - OTC U.S. dollar versus Japanese yen | | | 105.400 | | 03/31/2010 | | | 9,000 | | | 378 | | | 602 |
Put - OTC U.S. dollar versus Japanese yen | | | 105.400 | | 03/31/2010 | | | 9,000 | | | 377 | | | 256 |
| | | | | | | | | | | | | | |
| | | | | | | | | | $ | 1,438 | | $ | 1,648 |
| | | | | | | | | | | | | | |
(i) Written options outstanding on June 30, 2007:
Options on Exchange-Traded Futures Contracts
| | | | | | | | | | | | | |
| Description | | Exercise
Price | | Expiration
Date | | # of
Contracts | | Premium | | Value |
Call - CBOT U.S. Treasury 10-Year Note September Futures | | $ | 106.000 | | 08/24/2007 | | 1,025 | | $ | 330 | | $ | 625 |
Call - CBOT U.S. Treasury 10-Year Note September Futures | | | 107.000 | | 08/24/2007 | | 553 | | | 173 | | | 147 |
Call - CBOT U.S. Treasury 10-Year Note September Futures | | | 108.000 | | 08/24/2007 | | 133 | | | 27 | | | 14 |
Call - CBOT U.S. Treasury 10-Year Note September Futures | | | 109.000 | | 08/24/2007 | | 187 | | | 22 | | | 9 |
Put - CBOT U.S. Treasury 10-Year Note September Futures | | | 103.000 | | 08/24/2007 | | 248 | | | 134 | | | 27 |
Put - CBOT U.S. Treasury 10-Year Note September Futures | | | 104.000 | | 08/24/2007 | | 777 | | | 301 | | | 170 |
Put - CBOT U.S. Treasury 10-Year Note September Futures | | | 105.000 | | 08/24/2007 | | 876 | | | 305 | | | 411 |
| | | | | | | | | | | | | |
| | | | | | | | | $ | 1,292 | | $ | 1,403 |
| | | | | | | | | | | | | |
Interest Rate Swaptions
| | | | | | | | | | | | | | | | | | | |
| Description | | Counterparty | | Floating Rate Index | | Pay/Receive
Floating Rate | | Exercise
Rate | | Expiration
Date | | Notional
Amount | | Premium | | Value |
Call - OTC 5-Year Interest Rate Swap | | Barclays Bank PLC | | 6-Month EUR-LIBOR | | Receive | | 4.100% | | 07/02/2007 | | EUR | 10,000 | | $ | 120 | | $ | 0 |
Call - OTC 5-Year Interest Rate Swap | | Deutsche Bank AG | | 6-Month EUR-LIBOR | | Receive | | 4.100% | | 07/02/2007 | | | 36,000 | | | 493 | | | 0 |
Call - OTC 5-Year Interest Rate Swap | | Deutsche Bank AG | | 6-Month EUR-LIBOR | | Receive | | 4.230% | | 07/02/2007 | | | 25,000 | | | 322 | | | 0 |
Call - OTC 5-Year Interest Rate Swap | | Royal Bank of Scotland Group PLC | | 6-Month EUR-LIBOR | | Receive | | 4.100% | | 07/02/2007 | | | 24,000 | | | 271 | | | 0 |
Call - OTC 5-Year Interest Rate Swap | | Bank of America | | 3-Month USD-LIBOR | | Receive | | 4.900% | | 08/08/2007 | | $ | 33,000 | | | 290 | | | 2 |
Call - OTC 5-Year Interest Rate Swap | | Bank of America | | 3-Month USD-LIBOR | | Receive | | 4.950% | | 09/26/2008 | | | 112,900 | | | 1,265 | | | 569 |
Call - OTC 10-Year Interest Rate Swap | | Barclays Bank PLC | | 3-Month USD-LIBOR | | Receive | | 5.570% | | 08/08/2007 | | | 18,000 | | | 70 | | | 80 |
Call - OTC 5-Year Interest Rate Swap | | Barclays Bank PLC | | 3-Month USD-LIBOR | | Receive | | 4.900% | | 02/01/2008 | | | 22,000 | | | 274 | | | 46 |
Call - OTC 7-Year Interest Rate Swap | | Goldman Sachs & Co. | | 3-Month USD-LIBOR | | Receive | | 4.850% | | 08/08/2007 | | | 15,000 | | | 204 | | | 0 |
Call - OTC 5-Year Interest Rate Swap | | Lehman Brothers, Inc. | | 3-Month USD-LIBOR | | Receive | | 4.900% | | 03/31/2008 | | | 102,000 | | | 1,202 | | | 312 |
Call - OTC 5-Year Interest Rate Swap | | Lehman Brothers, Inc. | | 3-Month USD-LIBOR | | Receive | | 4.950% | | 09/26/2008 | | | 152,000 | | | 1,259 | | | 765 |
Call - OTC 5-Year Interest Rate Swap | | Royal Bank of Scotland Group PLC | | 3-Month USD-LIBOR | | Receive | | 4.950% | | 07/02/2007 | | | 34,000 | | | 367 | | | 0 |
Call - OTC 5-Year Interest Rate Swap | | Royal Bank of Scotland Group PLC | | 3-Month USD-LIBOR | | Receive | | 5.000% | | 07/02/2007 | | | 28,400 | | | 297 | | | 0 |
Call - OTC 5-Year Interest Rate Swap | | Royal Bank of Scotland Group PLC | | 3-Month USD-LIBOR | | Receive | | 5.370% | | 07/02/2007 | | | 138,000 | | | 1,680 | | | 0 |
| | | | | | |
| See Accompanying Notes | | Semiannual Report | | June 30, 2007 | | 15 |
| | |
| |
| Schedule of Investments Total Return Portfolio (Cont.) | | June 30, 2007 (Unaudited) |
| | | | | | | | | | | | | | | | | | | |
| Description | | Counterparty | | Floating Rate Index | | Pay/Receive
Floating Rate | | Exercise
Rate | | Expiration
Date | | Notional
Amount | | Premium | | Value |
Call - OTC 7-Year Interest Rate Swap | | Royal Bank of Scotland Group PLC | | 3-Month USD-LIBOR | | Receive | | 4.900% | | 08/08/2007 | | $ | 24,000 | | $ | 278 | | $ | 1 |
Call - OTC 5-Year Interest Rate Swap | | Royal Bank of Scotland Group PLC | | 3-Month USD-LIBOR | | Receive | | 4.900% | | 08/08/2007 | | | 46,000 | | | 307 | | | 3 |
Call - OTC 7-Year Interest Rate Swap | | Royal Bank of Scotland Group PLC | | 3-Month USD-LIBOR | | Receive | | 5.000% | | 08/08/2007 | | | 13,000 | | | 148 | | | 1 |
Call - OTC 5-Year Interest Rate Swap | | Royal Bank of Scotland Group PLC | | 3-Month USD-LIBOR | | Receive | | 5.010% | | 10/25/2007 | | | 47,000 | | | 433 | | | 63 |
Call - OTC 5-Year Interest Rate Swap | | Royal Bank of Scotland Group PLC | | 3-Month USD-LIBOR | | Receive | | 5.100% | | 02/01/2008 | | | 97,000 | | | 1,164 | | | 347 |
Call - OTC 5-Year Interest Rate Swap | | Royal Bank of Scotland Group PLC | | 3-Month USD-LIBOR | | Receive | | 4.900% | | 03/31/2008 | | | 106,500 | | | 1,417 | | | 325 |
Call - OTC 5-Year Interest Rate Swap | | Royal Bank of Scotland Group PLC | | 3-Month USD-LIBOR | | Receive | | 4.950% | | 03/31/2008 | | | 62,000 | | | 763 | | | 212 |
Call - OTC 5-Year Interest Rate Swap | | Royal Bank of Scotland Group PLC | | 3-Month USD-LIBOR | | Receive | | 4.950% | | 09/26/2008 | | | 41,100 | | | 371 | | | 207 |
Call - OTC 7-Year Interest Rate Swap | | Royal Bank of Scotland Group PLC | | 3-Month USD-LIBOR | | Receive | | 5.000% | | 12/15/2008 | | | 128,100 | | | 1,298 | | | 910 |
Call - OTC 7-Year Interest Rate Swap | | Royal Bank of Scotland Group PLC | | 3-Month USD-LIBOR | | Receive | | 5.200% | | 12/15/2008 | | | 67,000 | | | 561 | | | 658 |
| | | | | | | | | | | | | | | | | | | |
| | | | | | | | | | | | | | | $ | 14,854 | | $ | 4,501 |
| | | | | | | | | | | | | | | | | | | |
(j) Short sales outstanding on June 30, 2007:
| | | | | | | | | | | | | |
| Description | | Coupon | | Maturity
Date | | Principal
Amount | | Proceeds | | Value (2) |
U.S. Treasury Notes | | 4.500% | | 05/15/2017 | | $ | 79,600 | | $ | 76,247 | | $ | 76,909 |
U.S. Treasury Notes | | 4.625% | | 02/15/2017 | | | 11,300 | | | 10,989 | | | 11,151 |
| | | | | | | | | | | | | |
| | | | | | | | | $ | 87,236 | | $ | 88,060 |
| | | | | | | | | | | | | |
(2) Market value includes $771 of interest payable on short sales.
(k) Foreign currency contracts outstanding on June 30, 2007:
| | | | | | | | | | | | | | | | | |
| Type | | Currency | | Principal
Amount
Covered by
Contract | | Settlement
Month | | Unrealized
Appreciation | | Unrealized
(Depreciation) | | | Net Unrealized
Appreciation/
(Depreciation) | |
Buy | | AUD | | 13,512 | | 07/2007 | | $ | 82 | | $ | 0 | | | $ | 82 | |
Sell | | | | 152 | | 07/2007 | | | 0 | | | (2 | ) | | | (2 | ) |
Buy | | BRL | | 134,709 | | 10/2007 | | | 2,711 | | | 0 | | | | 2,711 | |
Buy | | | | 72,223 | | 03/2008 | | | 2,203 | | | 0 | | | | 2,203 | |
Buy | | CAD | | 8,794 | | 08/2007 | | | 37 | | | 0 | | | | 37 | |
Buy | | CLP | | 709,183 | | 03/2008 | | | 0 | | | (4 | ) | | | (4 | ) |
Buy | | CNY | | 3,842 | | 09/2007 | | | 10 | | | 0 | | | | 10 | |
Sell | | | | 3,842 | | 09/2007 | | | 0 | | | (1 | ) | | | (1 | ) |
Buy | | | | 49,610 | | 11/2007 | | | 51 | | | 0 | | | | 51 | |
Sell | | | | 49,610 | | 11/2007 | | | 5 | | | (12 | ) | | | (7 | ) |
Buy | | | | 23,778 | | 01/2008 | | | 0 | | | (21 | ) | | | (21 | ) |
Sell | | | | 23,778 | | 01/2008 | | | 1 | | | (3 | ) | | | (2 | ) |
Buy | | EUR | | 8,967 | | 07/2007 | | | 117 | | | 0 | | | | 117 | |
Sell | | GBP | | 6,996 | | 08/2007 | | | 0 | | | (74 | ) | | | (74 | ) |
Buy | | IDR | | 24,255,000 | | 05/2008 | | | 0 | | | (114 | ) | | | (114 | ) |
Buy | | INR | | 187,331 | | 10/2007 | | | 20 | | | (1 | ) | | | 19 | |
Buy | | | | 1,010 | | 11/2007 | | | 0 | | | 0 | | | | 0 | |
Buy | | | | 122,664 | | 05/2008 | | | 50 | | | 0 | | | | 50 | |
Sell | | JPY | | 1,031,294 | | 07/2007 | | | 121 | | | 0 | | | | 121 | |
Buy | | KRW | | 6,070,349 | | 07/2007 | | | 44 | | | 0 | | | | 44 | |
Sell | | | | 668,852 | | 07/2007 | | | 0 | | | (3 | ) | | | (3 | ) |
Buy | | | | 1,157,326 | | 08/2007 | | | 0 | | | (1 | ) | | | (1 | ) |
Buy | | | | 6,709,511 | | 09/2007 | | | 18 | | | 0 | | | | 18 | |
Buy | | MXN | | 41,747 | | 09/2007 | | | 54 | | | 0 | | | | 54 | |
Buy | | | | 153,994 | | 03/2008 | | | 126 | | | (2 | ) | | | 124 | |
Buy | | MYR | | 28,483 | | 05/2008 | | | 0 | | | (123 | ) | | | (123 | ) |
Buy | | NZD | | 1,690 | | 07/2007 | | | 32 | | | 0 | | | | 32 | |
Buy | | PHP | | 391,443 | | 05/2008 | | | 0 | | | (108 | ) | | | (108 | ) |
Buy | | PLN | | 34,725 | | 09/2007 | | | 221 | | | (2 | ) | | | 219 | |
Buy | | | | 6,468 | | 03/2008 | | | 29 | | | 0 | | | | 29 | |
Buy | | RUB | | 100,792 | | 09/2007 | | | 51 | | | 0 | | | | 51 | |
Buy | | | | 90,414 | | 11/2007 | | | 90 | | | 0 | | | | 90 | |
Buy | | | | 235,816 | | 12/2007 | | | 209 | | | 0 | | | | 209 | |
Buy | | | | 381,762 | | 01/2008 | | | 66 | | | 0 | | | | 66 | |
Buy | | SEK | | 15,753 | | 09/2007 | | | 28 | | | 0 | | | | 28 | |
Buy | | SGD | | 21,054 | | 07/2007 | | | 0 | | | (88 | ) | | | (88 | ) |
Buy | | | | 6,884 | | 08/2007 | | | 25 | | | (13 | ) | | | 12 | |
Buy | | | | 860 | | 09/2007 | | | 0 | | | (2 | ) | | | (2 | ) |
Buy | | | | 23,617 | | 10/2007 | | | 69 | | | (6 | ) | | | 63 | |
Buy | | ZAR | | 964 | | 09/2007 | | | 3 | | | 0 | | | | 3 | |
Buy | | | | 148 | | 03/2008 | | | 0 | | | 0 | | | | 0 | |
| | | | | | | | | | | | | | | | | |
| | | | | | | | $ | 6,473 | | $ | (580 | ) | | $ | 5,893 | |
| | | | | | | | | | | | | | | | | |
| | | | |
| 16 | | PIMCO Variable Insurance Trust | | See Accompanying Notes |
| | |
| |
| Notes to Financial Statements | | June 30, 2007 (Unaudited) |
1. ORGANIZATION
The Total Return Portfolio (the “Portfolio”) is a series of the PIMCO Variable Insurance Trust (the “Trust”). The Trust is registered under the Investment Company Act of 1940 (the “Act”), as amended, as an open-end management investment company organized as a Delaware business trust on October 3, 1997. The Portfolio offers three classes of shares: Institutional, Administrative and Advisor. Information presented on these financial statements pertains to the Advisor Class of the Portfolio. Certain detailed financial information for the Institutional Class and Administrative Class is provided separately and is available upon request. The Trust is designed to be used as an investment vehicle by Separate Accounts of insurance companies that fund variable annuity contracts and variable life insurance policies and by qualified pension and retirement plans.
2. SIGNIFICANT ACCOUNTING POLICIES
The following is a summary of significant accounting policies consistently followed by the Portfolio in the preparation of its financial statements in conformity with accounting principles generally accepted in the United States of America (“GAAP”). The preparation of financial statements in accordance with GAAP requires management to make estimates and assumptions that affect the reported amounts and disclosures on the financial statements. Actual results could differ from those estimates.
(a) Security Valuation Portfolio securities are valued as of the close of regular trading (normally 4:00 p.m., Eastern Time) on each day that the New York Stock Exchange (“NYSE”) is open. Portfolio securities and other assets for which market quotes are readily available are stated at market value. Market value is generally determined on the basis of last reported sales prices, or if no sales are reported, based on quotes obtained from a quotation reporting system, established market makers, or pricing services. Fixed-income securities and non-exchange traded derivatives are normally valued on the basis of quotes obtained from brokers and dealers or pricing services. Prices obtained from independent pricing services use information provided by market makers or estimates of market values obtained from yield data relating to investments or securities with similar characteristics. Certain fixed income securities purchased on a delayed-delivery basis are marked to market daily until settlement at the forward settlement date. Short-term investments having a maturity of 60 days or less are generally valued at amortized cost. Exchange traded options, futures and options on futures are valued at the settlement price determined by the relevant exchange. With respect to any portion of the Portfolio’s assets that are invested in one or more open end management investment companies, the Portfolio’s net asset value (“NAV”) will be calculated based upon the NAVs of such investments.
Investments initially valued in currencies other than the U.S. dollar are converted to the U.S. dollar using exchange rates obtained from pricing services. As a result, the NAV of the Portfolio’s securities may be affected by changes in the value of currencies in relation to the U.S. dollar. The value of securities traded in markets outside the United States or denominated in currencies other than the U.S. dollar may be affected significantly on a day that the NYSE is closed and an investor is not able to purchase, redeem or exchange shares.
Securities and other assets for which market quotes are not readily available are valued at fair value as determined in good faith by the Board of Trustees or persons acting at their direction. The Board of Trustees has adopted methods for valuing securities and other assets in circumstances where market quotes are not readily available, and has delegated to Pacific Investment Management Company LLC (“PIMCO”) the responsibility for applying the valuation methods. In the event that market quotes are not readily available, and the security or asset cannot be valued pursuant to one of the valuation methods, the value of the security or asset will be determined in good faith by the Valuation Committee of the Board of Trustees, generally based upon recommendations provided by PIMCO.
Market quotes are considered not readily available in circumstances where there is an absence of current or reliable market-based data (e.g., trade information, bid/asked information, broker quotes), including where events occur after the close of the relevant market, but prior to the close of regular trading, that materially affect the values of the Portfolio’s securities or assets. In addition, market quotes are considered not readily available when, due to extraordinary circumstances, the exchanges or markets on which the securities trade, do not open for trading for the entire day and no other market prices are available. The Board has delegated to PIMCO the responsibility for monitoring significant events that may materially affect the values of the Portfolio’s securities or assets and for determining whether the value of the applicable securities or assets should be re-evaluated in light of such significant events.
When the Portfolio uses fair value pricing to determine its NAV, securities will not be priced on the basis of quotations from the primary market in which they are traded, but rather may be priced by another method that the Board of Trustees or persons acting at their direction believe accurately reflects fair value. The Trust’s policy is intended to result in a calculation of the Portfolio’s NAV that fairly reflects security values as of the time of pricing. However, fair values determined by the Board of Trustees or persons acting at their direction may not accurately reflect the price that the Portfolio could obtain for a security if it were to dispose of that security as of the time of pricing. Because foreign securities can trade on non-business days of the Portfolio, the NAV of the Portfolio may change on days when shareholders will not be able to purchase or redeem Portfolio shares. The prices used by the Portfolio may differ from the value that would be realized if the securities were sold and the differences could be material to the financial statements.
(b) Securities Transactions and Investment Income Securities transactions are recorded as of the trade date for financial reporting purposes. Securities purchased or sold on a when-issued or delayed-delivery basis may be settled a month or more after the trade date. Realized gains and losses from securities sold are recorded on the identified cost basis. Dividend income is recorded on the ex-dividend date, except certain dividends from foreign securities where the ex-dividend date may have passed, which are recorded as soon as the Portfolio is informed of the ex-dividend date. Interest income, adjusted for the accretion of discounts and amortization of premiums, is recorded on the accrual basis. Paydown gains and losses on mortgage-related and other asset-backed securities are recorded as components of interest income on the Statement of Operations.
(c) Delayed-Delivery Transactions The Portfolio may purchase or sell securities on a delayed-delivery basis. These transactions involve a commitment by the Portfolio to purchase or sell securities for a predetermined price or yield, with payment and delivery taking place beyond the customary settlement period. When delayed-delivery purchases are outstanding, the Portfolio will designate liquid assets in an amount sufficient to meet the purchase price. When purchasing a security on a delayed-delivery basis, the Portfolio assumes the rights and risks of ownership of the security, including the risk of price and yield fluctuations, and takes such fluctuations into account when determining its net asset value. The Portfolio may dispose of or renegotiate a delayed-delivery transaction after it is entered into, and may sell when-issued securities before they are delivered, which may result in a capital gain or loss. When the Portfolio has sold a security on a delayed-delivery basis, the Portfolio does not participate in future gains and losses with respect to the security.
(d) Dividends and Distributions to Shareholders Dividends from net investment income, if any, are declared daily and distributed to shareholders monthly. Net realized capital gains earned by the Portfolio, if any, will be distributed no less frequently than once each year.
Income dividends and capital gain distributions are determined in accordance with income tax regulations which may differ from GAAP. Differences between tax
| | | | | | |
| | Semiannual Report | | June 30, 2007 | | 17 |
Notes to Financial Statements (Cont.)
regulations and GAAP may change the fiscal year when income and capital items are recognized for tax and GAAP purposes. Examples of events that give rise to timing differences include wash sales, straddles, net operating losses and capital loss carryforwards. Further, the character of investment income and capital gains may be different for certain transactions under the two methods of accounting. Examples of characterization differences include the treatment of mortgage paydowns, swaps, foreign currency transactions and contingent debt instruments. As a result, income dividends and capital gain distributions declared during a fiscal period may differ significantly from the net investment income and realized capital gain reported on the Portfolio’s annual financial statements presented under GAAP.
Distributions classified as a tax basis return of capital, if any, are reflected on the accompanying Statements of Changes in Net Assets and have been reclassified to paid in capital. In addition, other amounts have been reclassified between undistributed net investment income, accumulated undistributed net realized gains or losses and/or paid in capital to more appropriately conform financial accounting to tax characterizations of dividend distributions.
(e) Multiclass Operations Each class offered by the Portfolio has equal rights as to assets and voting privileges (except that shareholders of a class have exclusive voting rights regarding any matter relating solely to that class of shares). Income and non-class specific expenses of the Portfolio are allocated daily to each class of shares based on the relative value of settled shares. Realized and unrealized capital gains and losses of the Portfolio are allocated daily to each class of shares based on the relative net assets of each class. Class specific expenses, where applicable, currently include administrative, distribution and servicing fees.
(f) Foreign Currency The functional and reporting currency for the Portfolio is the U.S. dollar. The market values of foreign securities, currency holdings and other assets and liabilities are translated into U.S. dollars based on the current exchange rates each business day. Fluctuations in the value of currency holdings and other assets and liabilities resulting from changes in exchange rates are recorded as unrealized foreign currency gains or losses. Realized gains or losses and unrealized appreciation or depreciation on investment securities and income and expenses are translated on the respective dates of such transactions. The effects of changes in foreign currency exchange rates on investments in securities are not segregated on the Statement of Operations from the effects of changes in market prices of those securities, but are included with the net realized and unrealized gain or loss on investment securities.
| | | | | | |
|
| Non-U.S. currency symbols utilized throughout the report are defined as follows: |
| AUD | | Australian Dollar | | KRW | | South Korean Won |
| BRL | | Brazilian Real | | MXN | | Mexican Peso |
| CAD | | Canadian Dollar | | MYR | | Malaysian Ringgit |
| CLP | | Chilean Peso | | NZD | | New Zealand Dollar |
| CNY | | Chinese Yuan Renminbi | | PHP | | Philippines Peso |
| EUR | | Euro | | PLN | | Polish Zloty |
| GBP | | Great British Pound | | RUB | | Russian Ruble |
| IDR | | Indonesian Rupiah | | SEK | | Swedish Krona |
| INR | | Indian Rupee | | SGD | | Singapore Dollar |
| JPY | | Japanese Yen | | ZAR | | South African Rand |
(g) Foreign Currency Transactions The Portfolio may enter into foreign currency contracts in connection with settling planned purchases or sales of securities, to hedge the currency exposure associated with some or all of the Portfolio’s securities or as a part of an investment strategy. A foreign currency
contract is an agreement between two parties to buy and sell a currency at a set price on a future date. The market value of a foreign currency contract fluctuates with changes in foreign currency exchange rates. Foreign currency contracts are marked to market daily and the change in value is recorded by the Portfolio as an unrealized gain or loss. Realized gains or losses equal to the difference between the value of the contract at the time it was opened and the value at the time it was closed are recorded upon delivery or receipt of the currency. These contracts may involve market risk in excess of the unrealized gain or loss reflected on the Statement of Assets and Liabilities. In addition, the Portfolio could be exposed to risk if the counterparties are unable to meet the terms of the contracts or if the value of the currency changes unfavorably to the U.S. dollar.
(h) Futures Contracts The Portfolio may enter into futures contracts. The Portfolio may use futures contracts to manage its exposure to the securities markets or to movements in interest rates and currency values. The primary risks associated with the use of futures contracts are the imperfect correlation between the change in market value of the securities held by the Portfolio and the prices of futures contracts, the possibility of an illiquid market, and the inability of the counterparty to meet the terms of the contract. Futures contracts are valued based upon their quoted daily settlement prices. Upon entering into a futures contract, the Portfolio is required to deposit with its futures broker, an amount of cash or U.S. Government and Agency Obligations in accordance with the initial margin requirements of the broker or exchange. Futures contracts are marked to market daily and an appropriate payable or receivable for the change in value (“variation margin”) is recorded by the Portfolio. Gains or losses are recognized but not considered realized until the contracts expire or are closed. Futures contracts involve, to varying degrees, risk of loss in excess of the variation margin disclosed on the Statement of Assets and Liabilities.
(i) Inflation-Indexed Bonds The Portfolio may invest in inflation-indexed bonds. Inflation-indexed bonds are fixed-income securities whose principal value is periodically adjusted to the rate of inflation. The interest rate on these bonds is generally fixed at issuance at a rate lower than typical bonds. Over the life of an inflation-indexed bond, however, interest will be paid based on a principal value, which is adjusted for inflation. Any increase in the principal amount of an inflation-indexed bond will be included as interest income on the Statement of Operations, even though investors do not receive their principal until maturity.
(j) Options Contracts The Portfolio may write call and put options on futures, swaps, securities or currencies it owns or in which it may invest. Writing put options tends to increase the Portfolio’s exposure to the underlying instrument. Writing call options tends to decrease the Portfolio’s exposure to the underlying instrument. When the Portfolio writes a call or put option, an amount equal to the premium received is recorded as a liability and subsequently marked to market to reflect the current value of the option written. These liabilities are reflected as written options outstanding on the Statement of Assets and Liabilities. Certain options may be written with premiums to be determined on a future date. The premiums for these options are based upon implied volatility parameters at specified terms. Premiums received from writing options which expire are treated as realized gains. Premiums received from writing options which are exercised or closed are added to the proceeds or offset against amounts paid on the underlying future, swap, security or currency transaction to determine the realized gain or loss. The Portfolio as a writer of an option has no control over whether the underlying future, swap, security or currency may be sold (call) or purchased (put) and as a result bears the market risk of an unfavorable change in the price of the future, swap, security or currency underlying the written option. There is the risk the Portfolio may not be able to enter into a closing transaction because of an illiquid market.
The Portfolio may also purchase put and call options. Purchasing call options tends to increase the Portfolio’s exposure to the underlying instrument. Purchasing put options tends to decrease the Portfolio’s exposure to the underlying instrument.
| | | | |
| 18 | | PIMCO Variable Insurance Trust | | |
| | |
| |
| | | June 30, 2007 (Unaudited) |
The Portfolio pays a premium which is included on the Statement of Assets and Liabilities as an investment and subsequently marked to market to reflect the current value of the option. Premiums paid for purchasing options which expire are treated as realized losses. Certain options may be purchased with premiums to be determined on a future date. The premiums for these options are based upon implied volatility parameters at specified terms. The risk associated with purchasing put and call options is limited to the premium paid. Premiums paid for purchasing options which are exercised or closed are added to the amounts paid or offset against the proceeds on the underlying future, swap, security or currency transaction to determine the realized gain or loss.
(k) Repurchase Agreements The Portfolio may engage in repurchase transactions. Under the terms of a typical repurchase agreement, the Portfolio takes possession of an underlying debt obligation (collateral) subject to an obligation of the seller to repurchase, and the Portfolio to resell, the obligation at an agreed-upon price and time. The underlying securities for all repurchase agreements are held in safekeeping at the Portfolio’s custodian or designated subcustodians under tri-party repurchase agreements. The market value of the collateral must be equal to or exceed the total amount of the repurchase obligations, including interest. Securities purchased under repurchase agreements are reflected as an asset on the Statement of Assets and Liabilities. Generally, in the event of counterparty default, the Portfolio has the right to use the collateral to offset losses incurred. If the counterparty should default, the Portfolio will seek to sell the securities which it holds as collateral. This could involve procedural costs or delays in addition to a loss on the securities if their value should fall below their repurchase price.
(l) Inverse Floating Rate Transactions—Residual Interest Municipal Bonds (“RIBs”)/Residual Interest Tax Exempt Bonds (“RITEs”) The Portfolio may invest in RIBs and RITEs (“Inverse Floaters”). Inverse Floaters are created via a master trust agreement between a broker-dealer, acting as trustor and liquidity provider, and an investment bank, acting as trustee and tender agent. The master trust agreement defines the terms for each trust series; with each series being established by the transfer of long-term, fixed-rate municipal bonds (“Fixed Rate Bonds”) to the trustee to be held and provide for the creation, execution and delivery of floater certificates (“Floating Rate Notes”) and Inverse Floaters. Floating Rate Notes are liquid notes that are issued with a short-term variable rate typically linked to the LIBOR, subject to limitations, for some duration. After interest income is paid on the Floating Rate Notes at current rates, the residual income from the Fixed Rate Bonds is paid to the Inverse Floaters. Inverse Floaters are issued with a coupon that fluctuates inversely with the Floating Rate Notes’ referenced rate, subject to certain limitations. Therefore, rising short-term rates result in lower income for the Inverse Floaters and vice versa.
Floating Rate Notes are generally remarketed to municipal money market funds. Inverse Floaters are acquired by either tax-exempt municipal bond funds or trusts, or other parties interested in potentially higher yielding tax-exempt securities. Inverse Floaters may also be acquired for the purpose of increasing leverage. Floating Rate Note holders typically have the option to tender their notes to the liquidity provider for redemption at par at each reset date. The Inverse Floater holders have the option to (i) require the Floating Rate Note holders to tender their notes at par, and (ii) require the liquidity provider to transfer the Fixed Rate Bonds to the Inverse Floater holders. The holders of Inverse Floaters bear substantially all of the downside investment risk associated with the underlying Fixed Rate Bonds, and also benefit from a disproportionate amount of the potential appreciation of the underlying Fixed Rate Bonds’ value. Inverse Floaters may be more volatile and less liquid than other municipal bonds of comparable maturity.
Inverse Floaters may be acquired with or without first transferring to the trustor the Fixed Rate Bonds that were utilized to create the trust series. Inverse Floaters
acquired without a transfer of Fixed Rate Bonds are recognized as purchases of securities as outlined in Note 2(b). Statement of Financial Accounting Standards No. 140—Accounting for Transfers and Servicing of Financial Assets and Extinguishments of Liabilities (“FAS No. 140”), governs the standards for accounting for securitizations and other transfers of financial assets. If there is a transfer of Fixed Rate Bonds and it meets sale criteria under FAS No. 140, a Portfolio records a sale of the Fixed Rate Bonds and a purchase of the Inverse Floaters. The cash received from the Inverse Floaters is then recorded as interest income in the Statement of Operations.
If the transfer of Fixed Rate Bonds does not meet sale criteria under FAS No. 140, a Portfolio accounts for the transaction described above as a secured borrowing by including the Fixed Rate Bonds in its Schedule of Investments, and recording the Floating Rate Notes as a liability under the caption “Payable for floating rate notes” in the Portfolio’s Statement of Assets and Liabilities. In a secured borrowing transaction, cash received from the Inverse Floaters is not recorded as interest income. Instead, a Portfolio records interest income related to the Fixed Rate Bonds and interest expense related to the Floating Rate Notes, the net of which is equal to the cash received from the Inverse Floaters acquired by the Portfolio. Thus, while a Portfolio’s reported total income, net expenses, and net expense ratio are generally higher for investments in Inverse Floaters acquired via a secured borrowing, the method of acquiring Inverse Floaters does not result in differences for reported cash flows, net asset value or total return.
(m) Short Sales The Portfolio may enter into short sales transactions. A short sale is a transaction in which the Portfolio sells securities it does not own in anticipation of a decline in the market price of the securities. Securities sold in short sale transactions and interest payable on such securities, if any, are reflected as a liability on the Statement of Assets and Liabilities. The Portfolio is obligated to deliver securities at the market price at the time the short position is closed. Possible losses from short sales may be unlimited, whereas losses from purchases cannot exceed the total amount invested.
(n) Swap Agreements The Portfolio may invest in swap agreements. Swap transactions are privately negotiated agreements between the Portfolio and a counterparty to exchange or swap investment cash flows, assets, or market-linked returns at specified, future intervals. The Portfolio may enter into interest rate, total return, forward spread-lock, credit default, and other forms of swap agreements to manage its exposure to interest rates and credit risk. In connection with these agreements, securities may be identified as collateral in accordance with the terms of the respective swap agreements.
Interest rate swap agreements involve the exchange by the Portfolio with another party of their respective commitments to pay or receive interest, e.g., an exchange of floating rate payments for fixed rate payments with respect to the notional amount of principal. Certain forms of interest rate swap agreements may include: (i) interest rate caps, under which, in return for a premium, one party agrees to make payments to the other to the extent that interest rates exceed a specified rate, or “cap”, (ii) interest rate floors, under which, in return for a premium, one party agrees to make payments to the other to the extent that interest rates fall below a specified rate, or “floor”, or (iii) interest rate collars, under which a party sells a cap and purchases a floor or vice versa in an attempt to protect itself against interest rate movements exceeding given minimum or maximum levels.
Total return swap agreements involve commitments to pay interest in exchange for a market-linked return, both based on notional amounts. To the extent the total return of the security or index underlying the transaction exceeds or falls short of the offsetting interest rate obligation, the Portfolio will receive a payment from or make a payment to the counterparty.
Forward spread-lock swap agreements involve commitments to pay or receive a settlement amount calculated as the difference between the swap spread and a
| | | | | | |
| | Semiannual Report | | June 30, 2007 | | 19 |
Notes to Financial Statements (Cont.)
fixed spread, multiplied by the notional amount times the duration of the swap. The swap spread is the difference between the benchmark swap rate (market rate) and the specific Treasury rate.
Credit default swap agreements involve one party making a stream of payments to another party in exchange for the right to receive a specified return in the event of a default by a third party, typically corporate issues or sovereign issues of an emerging country, on its obligation. The Portfolio may use credit default swaps to provide a measure of protection against defaults of the issuers (i.e., to reduce risk where the Portfolio owns or has exposure to the sovereign issuer) or to take an active long or short position with respect to the likelihood of a particular issuer’s default. As a seller of protection, the Portfolio generally receives an upfront payment or a fixed rate of income throughout the term of the swap provided that there is no credit event. If the Portfolio is a seller of protection and a credit event occurs, as defined under the terms of that particular swap agreement, the Portfolio will pay to the buyer of the protection an amount up to the notional value of the swap and in certain instances take delivery of the security. As the seller, the Portfolio would effectively add leverage to its portfolio because, in addition to its total net assets, the Portfolio would be subject to investment exposure on the notional amount of the swap. As a buyer of protection, the Portfolio generally receives an amount up to the notional value of the swap if a credit event occurs. The treatment of credit default swaps and other swap agreements that provide for contingent, non-periodic, bullet-type payments as “notional principal contracts” for U.S. federal income tax purposes is uncertain. Were the U.S. Internal Revenue Service (“IRS”) to take the position that a credit default swap or other bullet-type swap is not a “notional principal contract” for U.S. federal income tax purposes, payments received by the Portfolio from such investments might be subject to U.S. excise or income taxes.
Swaps are marked to market daily based upon quotations from market makers and the change in value, if any, is recorded as unrealized gain or loss on the Statement of Operations. Payments received or made at the beginning of the measurement period are reflected as such on the Statement of Assets and Liabilities. These upfront payments are recorded as realized gain or loss on the Statement of Operations upon termination or maturity of the swap. A liquidation payment received or made at the termination of the swap is recorded as realized gain or loss on the Statement of Operations. Net periodic payments received or paid by the Portfolio are included as part of realized gain or loss on the Statement of Operations. Entering into these agreements involves, to varying degrees, elements of credit, market and documentation risk in excess of the amounts recognized on the Statement of Assets and Liabilities. Such risks involve the possibility that there will be no liquid market for these agreements, that the counterparty to the agreements may default on its obligation to perform or disagree as to the meaning of contractual terms in the agreements and that there may be unfavorable changes in interest rates.
(o) Loan Participations and Assignments The Portfolio may invest in direct debt instruments which are interests in amounts owned by corporate, governmental, or other borrowers to lenders or lending syndicates. The Portfolio’s investments in loans may be in the form of participations in loans or assignments of all or a portion of loans from third parties. A loan is often administered by a bank or other financial institution (the “lender”) that acts as agent for all holders. The agent administers the terms of the loan, as specified in the loan agreement. When investing in a loan participation, the Portfolio has the right to receive payments of principal, interest and any fees to which it is entitled only from the lender selling the loan agreement and only upon receipt by the lender of payments from the borrower. The Portfolio generally has no right to enforce compliance with the terms of the loan agreement with the borrower. As a result, the Portfolio may be subject to the credit risk of both the borrower and the lender that is selling the loan agreement. When the Portfolio purchases assignments from lenders it
acquires direct rights against the borrower of the loan. At the end of the period June 30, 2007, the Portfolio had no unfunded loan commitments.
(p) Bridge Debt Commitments At the period ended June 30, 2007, the Portfolio had $8,059,500 in commitments outstanding to fund high yield bridge debt. The Portfolio is entitled to a fee upon the expiration of the commitment period. The bridge debt terms approximate market rates at the time the commitment is entered into.
(q) Commodities Index-Linked/Structured Notes The Portfolio invests in structured notes whose value is based on the price movements of a commodity index. The structured notes are often leveraged, increasing the volatility of each note’s value relative to the change in the underlying linked financial element. The value of these notes will rise and fall in response to changes in the underlying commodity index. Structured notes may entail a greater degree of market risk than other types of debt securities because the investor bears the risk of the underlying commodity index. Structured notes may also be more volatile, less liquid, and more difficult to accurately price than less complex securities or more traditional debt securities. Fluctuations in value of the structured notes are recorded as unrealized gains and losses on the accompanying financial statements. Net payments are recorded as net realized gains and losses. These notes are subject to prepayment, credit and interest risks. The Portfolio has the option to request prepayment from the issuer. At maturity, or when a note is sold, the Portfolio records a realized gain or loss. At June 30, 2007, the value of these securities comprised 0.3% of the Portfolio’s net assets and resulted in unrealized depreciation of $56,678.
(r) Mortgage-Related and Other Asset-Backed Securities The Portfolio may invest in mortgage-related or other asset-backed securities. These securities include mortgage pass-through securities, collateralized mortgage obligations (“CMOs”), commercial mortgage-backed securities, mortgage dollar rolls, CMO residuals, stripped mortgage-backed securities (“SMBSs”) and other securities that directly or indirectly represent a participation in, or are secured by and payable from, mortgage loans on real property. The value of some mortgage-related or asset-backed securities may be particularly sensitive to changes in prevailing interest rates. Early repayment of principal on some mortgage-related securities may expose the Portfolio to a lower rate of return upon reinvestment of principal. The value of these securities may fluctuate in response to the market’s perception of the creditworthiness of the issuers. Additionally, although mortgages and mortgage-related securities are generally supported by some form of government or private guarantee and/or insurance, there is no assurance that private guarantors or insurers will meet their obligations.
(s) U.S. Government Agencies or Government-Sponsored Enterprises Securities issued by U.S. Government agencies or government-sponsored enterprises may not be guaranteed by the U.S. Treasury. The Government National Mortgage Association (“GNMA” or “Ginnie Mae”), a wholly owned U.S. Government corporation, is authorized to guarantee, with the full faith and credit of the U.S. Government, the timely payment of principal and interest on securities issued by institutions approved by GNMA and backed by pools of mortgages insured by the Federal Housing Administration or guaranteed by the Department of Veterans Affairs. Government-related guarantors (i.e., not backed by the full faith and credit of the U.S. Government) include the Federal National Mortgage Association (“FNMA” or “Fannie Mae”) and the Federal Home Loan Mortgage Corporation (“FHLMC” or “Freddie Mac”). Pass-through securities issued by FNMA are guaranteed as to timely payment of principal and interest by FNMA but are not backed by the full faith and credit of the U.S. Government. FHLMC guarantees the timely payment of interest and ultimate collection of principal, but its participation certificates are not backed by the full faith and credit of the U.S. Government.
| | | | |
| 20 | | PIMCO Variable Insurance Trust | | |
| | |
| |
| | | June 30, 2007 (Unaudited) |
(t) New Accounting Policies In July 2006, the Financial Accounting Standards Board (“FASB”) issued Interpretation No. 48, “Accounting for Uncertainty in Income Taxes—an Interpretation of FASB Statement No. 109” (the “Interpretation”). The Interpretation became effective for the Portfolio on June 29, 2007. Management has evaluated the application of the Interpretation in relation to the Portfolio and has concluded that no single filing position or combination of filing positions identified as uncertain tax positions required the accrual of a tax liability in the accounting records of the Portfolio for the period ending June 30, 2007. Management will monitor all existing filing positions and future filing positions in light of the Interpretation and evaluate the need for any future tax accruals and financial statement disclosures as warranted.
In September 2006, the FASB issued Statement of Financial Accounting Standards No. 157, “Fair Value Measurements” (the “Statement”). The Statement is effective for fiscal years beginning after November 15, 2007 and will require expanded disclosure about fair value measurements, separately for each major category of assets and liabilities, that enables shareholders to assess the inputs used to develop those measurements, and for recurring fair value measurements using significant unobservable inputs the effect of the measurements on changes in net assets for the reporting period. Management is currently evaluating the application of the Statement to the Portfolio and will provide additional information in relation to the Statement on the Portfolio’s annual financial statements for the period ending December 31, 2007.
3. FEES AND EXPENSES
(a) Investment Advisory Fee PIMCO is a majority-owned subsidiary of Allianz Global Investors of America L.P. (“AGI”), and serves as investment adviser (the “Adviser”) to the Trust, pursuant to an investment advisory contract. The Adviser receives a monthly fee from the Portfolio, at an annual rate based on average daily net assets. The Advisory Fee for all classes is charged at an annual rate of 0.25%.
(b) Administration Fee PIMCO serves as administrator (the “Administrator”), and provides administrative services to the Trust for which it receives a monthly administrative fee based on each share class’s average daily net assets. As the Administrator, PIMCO bears the costs of various third-party services, including audit, custodial, portfolio accounting, legal, transfer agency and printing costs. The Administration Fee for all classes is charged at the annual rate of 0.25%.
(c) Distribution and Servicing Fees Allianz Global Investors Distributors LLC (“AGID”) is an indirect wholly-owned subsidiary of AGI and serves as the distributor (the “Distributor”) of the Trust’s shares. The Trust is permitted to reimburse AGID on a quarterly basis, out of the Administrative Class assets of the Portfolio in the amount of 0.15% on an annual basis of the average daily net assets of that class, for payments made to financial intermediaries that provide services in connection with the distribution of shares or administration of plans or programs that use Portfolio shares as their funding medium. The effective rate paid to AGID was 0.15% during the current fiscal year.
The Trust has adopted a Distribution Plan, for the Advisor Class shares of the Portfolio (the “Plan”). The Plan has been adopted pursuant to Rule 12b-1 under the Act. The Plan permits payments for expenses in connection with the distribution and marketing of Advisor Class shares and/or the provision of shareholder services to Advisor Class shareholders. The Plan permits the Portfolio to make total payments at an annual rate of 0.25% of its average daily net assets attributable to its Advisor Class shares.
(d) Portfolio Expenses The Trust is responsible for the following expenses: (i) salaries and other compensation of any of the Trust’s executive officers and employees who are not officers, directors, stockholders or employees of PIMCO or its subsidiaries or affiliates; (ii) taxes and governmental fees; (iii) brokerage fees
and commissions and other portfolio transaction expenses; (iv) the costs of borrowing money, including interest expenses and bank overdraft charges; (v) fees and expenses of the Trustees who are not “interested persons” of PIMCO or the Trust, and any counsel retained exclusively for their benefit; (vi) extraordinary expenses, including costs of litigation and indemnification expenses; (vii) organization expenses and (viii) any expenses allocated or allocable to a specific class of shares, which include service fees payable with respect to the Administrative Class Shares, and may include certain other expenses as permitted by the Trust’s Multiple Class Plan adopted pursuant to Rule 18f-3 under the Act and subject to review and approval by the Trustees. The ratio of expenses to average net assets per share class, as disclosed in the Financial Highlights, may differ from the annual portfolio operating expenses per share class as disclosed in the Prospectus for the reasons set forth above.
Effective April 1, 2007, each Trustee, other than those affiliated with PIMCO or its affiliates, receives an annual retainer of $15,000, plus $2,375 for each Board of Trustees meeting attended in person, $500 for each committee meeting attended and $750 for each Board of Trustees meeting attended telephonically, plus reimbursement of related expenses. In addition, the audit committee chair receives an additional annual retainer of $2,000 and each other committee chair receives an additional annual retainer of $500. These expenses are allocated on a pro-rata basis to the various portfolios of the Trust according to their respective net assets. The Trust pays no compensation directly to any Trustee or any other officer who is affiliated with the Administrator, all of whom receive remuneration for their services to the Trust from the Administrator or its affiliates. Prior to April 1, 2007, each Trustee, other than those affiliated with PIMCO or its affiliates, received an annual retainer of $15,000 plus $2,000 for each Board of Trustees meeting attended ($500 for each special meeting attended), plus reimbursement of related expenses. The Audit Committee Chairman received an annual retainer of $1,500 and the Governance Committee Chairman received an annual retainer of $500. In addition, each member of a committee received $500 for each committee meeting attended.
4. RELATED PARTY TRANSACTIONS
The Adviser, Administrator, and Distributor are related parties as defined by FAS 57, Related Party Disclosures. Fees payable to these parties are disclosed in Note 3.
5. GUARANTEES AND INDEMNIFICATIONS
Under the Trust’s organizational documents, each Trustee, officer, employee or other agent of the Trust (including the Trust’s investment manager) is indemnified, to the extent permitted by the Act, against certain liabilities that may arise out of performance of their duties to the Portfolio. Additionally, in the normal course of business, the Portfolio enters into contracts that contain a variety of indemnification clauses. The Portfolio’s maximum exposure under these arrangements is unknown as this would involve future claims that may be made against the Portfolio that have not yet occurred. However, the Portfolio has not had prior claims or losses pursuant to these contracts and believes the risk of loss to be remote.
6. PURCHASES AND SALES OF SECURITIES
The length of time the Portfolio has held a particular security is not generally a consideration in investment decisions. A change in the securities held by the Portfolio is known as “portfolio turnover”. The Portfolio may engage in frequent and active trading of portfolio securities to achieve its investment objective, particularly during periods of volatile market movements. High portfolio turnover (e.g., over 100%) involves correspondingly greater expenses to the Portfolio, including brokerage commissions or dealer mark-ups and other transaction costs on the sale
| | | | | | |
| | Semiannual Report | | June 30, 2007 | | 21 |
Notes to Financial Statements (Cont.)
of securities and reinvestments in other securities. Such sales may also result in realization of taxable capital gains, including short-term capital gains (which are generally taxed at ordinary income tax rates). The trading costs and tax effects associated with portfolio turnover may adversely affect the Portfolio’s performance.
Purchases and sales of securities (excluding short-term investments) for the period ended June 30, 2007, were as follows (amounts in thousands):
| | | | | | | | | | | | |
| U.S. Government/Agency | | | | All Other |
| Purchases | | Sales | | | | Purchases | | Sales |
| $ | 5,028,312 | | $ | 4,878,535 | | | | $ | 652,891 | | $ | 120,358 |
7. TRANSACTIONS IN WRITTEN CALL AND PUT OPTIONS
Transactions in written call and put options were as follows (amounts in thousands, except for number of contracts):
| | | | | | | | | | | | | | | | | | | |
| | | | | # of
Contracts | | | Notional
Amount
in $ | | | Notional
Amount
in EUR | | Notional
Amount
in GBP | | | Premium | |
| Balance at 12/31/2006 | | | | 2,036 | | | $ | 942,800 | | | EUR 95,000 | | GBP | 11,000 | | | $ | 11,691 | |
| Sales | | | | 7,169 | | | | 991,600 | | | 0 | | | 0 | | | | 12,533 | |
| Closing Buys | | | | (960 | ) | | | (647,400 | ) | | 0 | | | (11,000 | ) | | | (6,704 | ) |
| Expirations | | | | (4,112 | ) | | | 0 | | | 0 | | | 0 | | | | (1,194 | ) |
| Exercised | | | | (334 | ) | | | 0 | | | 0 | | | 0 | | | | (180 | ) |
| Balance at 06/30/2007 | | | | 3,799 | | | $ | 1,287,000 | | | EUR 95,000 | | GBP | 0 | | | $ | 16,146 | |
8. SHARES OF BENEFICIAL INTEREST
The Portfolio may issue an unlimited number of shares of beneficial interest with a $0.001 par value. Changes in shares of beneficial interest were as follows (shares and amounts in thousands):
| | | | | | | | | | | | | | | | |
| | | | | Six Months Ended
06/30/2007 | | | Year Ended
12/31/2006 | |
| | | | | Shares | | | Amount | | | Shares | | | Amount | |
| | | | | |
Receipts for shares sold | | | | | | | | | | | | | | | | |
Institutional Class | | | | 4,531 | | | $ | 45,520 | | | 8,090 | | | $ | 81,954 | |
Administrative Class | | | | 66,886 | | | | 674,962 | | | 83,252 | | | | 843,490 | |
Advisor Class | | | | 1,171 | | | | 11,807 | | | 1,856 | | | | 18,782 | |
Issued as reinvestment of distributions | | | | | | | | | | | | | | | | |
Institutional Class | | | | 405 | | | | 4,078 | | | 790 | | | | 8,017 | |
Administrative Class | | | | 6,829 | | | | 68,742 | | | 12,178 | | | | 123,518 | |
Advisor Class | | | | 52 | | | | 522 | | | 35 | | | | 362 | |
Cost of shares redeemed | | | | | | | | | | | | | | | | |
Institutional Class | | | | (1,973 | ) | | | (19,907 | ) | | (7,223 | ) | | | (73,276 | ) |
Administrative Class | | | | (32,550 | ) | | | (326,621 | ) | | (51,636 | ) | | | (522,647 | ) |
Advisor Class | | | | (235 | ) | | | (2,374 | ) | | (32 | ) | | | (329 | ) |
Net increase resulting from Portfolio share transactions | | | | 45,116 | | | $ | 456,729 | | | 47,310 | | | $ | 479,871 | |
The following schedule shows the number of shareholders each owning 5% or more of the Portfolio and the total percentage of the Portfolio held by such shareholders:
| | | | | | |
| | | | | Number of
Shareholders | | % of Portfolio Held |
Institutional Class | | | | 3 | | 98 |
Administrative Class | | | | 6 | | 62 |
Advisor Class | | | | 3 | | 98 |
9. REGULATORY AND LITIGATION MATTERS
Since February 2004, PIMCO, Allianz Global Investors of America L.P. (PIMCO’s parent company), AGID, and certain of their affiliates, including the PIMCO Funds (another series of funds managed by PIMCO), the Allianz Funds (formerly known as PIMCO Funds: Multi-Manager Series (another series of funds managed by affiliates of PIMCO)), certain Trustees of the Trust (in their capacity as Trustees of the PIMCO Funds or the Allianz Funds) and certain employees of PIMCO, have been named as defendants in fifteen lawsuits filed in various jurisdictions. Eleven of those lawsuits concern “market timing,” and they have been transferred to and consolidated for pre-trial proceedings in a multi-district litigation proceeding in the U.S. District Court for the District of Maryland; the other four lawsuits concern “revenue sharing” and have been consolidated into a single action in the U.S. District Court for the District of Connecticut. The lawsuits have been commenced as putative class actions on behalf of investors who purchased, held or redeemed shares of the various series of the PIMCO Funds and the Allianz Funds during specified periods, or as derivative actions on behalf of the PIMCO Funds and the Allianz Funds.
The market timing actions in the District of Maryland generally allege that certain hedge funds were allowed to engage in “market timing” in certain funds of the PIMCO Funds and the Allianz Funds and this alleged activity was not disclosed. Pursuant to tolling agreements entered into with the derivative and class action plaintiffs, PIMCO, certain PIMCO Funds Trustees, and certain employees of PIMCO who were previously named as defendants have all been dropped as defendants in the market timing actions; the plaintiffs continue to assert claims on behalf of the shareholders of the PIMCO Funds or on behalf of the PIMCO Funds itself against other defendants. By order dated November 3, 2005, the U.S. District Court for the District of Maryland granted the PIMCO Funds’ motion to dismiss claims asserted against it in a consolidated amended complaint where the PIMCO Funds were named, in the complaint, as a nominal defendant. The revenue sharing action in the District of Connecticut generally alleges that fund assets were inappropriately used to pay brokers to promote funds of the PIMCO Funds and the Allianz Funds, including directing fund brokerage transactions to such brokers, and that such alleged arrangements were not fully disclosed to shareholders. On August 11, 2005, the U.S. District Court for the District of Connecticut conducted a hearing on defendants’ motion to dismiss the consolidated amended complaint in the revenue sharing action but has not yet ruled on the motion to dismiss. The market timing and revenue sharing lawsuits seek, among other things, unspecified compensatory damages plus interest and, in some cases, punitive damages, the rescission of investment advisory contracts, the return of fees paid under those contracts and restitution.
Two nearly identical class action civil complaints have been filed in August 2005, in the Northern District of Illinois Eastern Division, alleging that the plaintiffs each purchased and sold a 10-year Treasury note futures contract and suffered damages from an alleged shortage when PIMCO held both physical and futures positions in 10-year Treasury notes for its client accounts. The two actions have been consolidated into one action, and the two separate complaints have been replaced by a consolidated complaint. PIMCO is a named defendant, and PIMCO Funds has been added as a defendant, to the consolidated action. PIMCO strongly believes the complaint is without merit and intends to vigorously defend itself.
In April 2006, certain portfolios of the Trust and certain other funds managed by PIMCO were served in an adversary proceeding brought by the Official Committee of Asbestos Claimants of G-I Holdings, Inc. in G-I Holdings, Inc.’s bankruptcy in the District of New Jersey. In July 2004, PIMCO was named in this lawsuit and remains a defendant. The plaintiff seeks to recover for the bankruptcy estate assets that were transferred by the predecessor entity of G-I Holdings, Inc. to a wholly-owned subsidiary in 1994. The subsidiary has since issued notes, of which certain portfolios of the Trust and certain other funds managed by PIMCO are alleged to be holders. The complaint alleges that in 2000, more than two hundred
| | | | |
| 22 | | PIMCO Variable Insurance Trust | | |
| | |
| |
| | | June 30, 2007 (Unaudited) |
noteholders—including certain portfolios of the Trust and certain other funds managed by PIMCO—were granted a second priority lien on the assets of the subsidiary in exchange for their consent to a refinancing transaction and the granting of a first priority lien to the lending banks. The plaintiff is seeking invalidation of the lien in favor of the noteholders and/or the value of the lien. On June 21, 2006, the District of New Jersey overturned the Bankruptcy Court’s decision granting permission to file the adversary proceeding and remanded the matter to the Bankruptcy Court for further proceedings. Following a motion to reconsider, the District Court upheld its remand on August 7, 2006, and instructed the Bankruptcy Court to conduct a “cost-benefit” analysis of the Committee’s claims, including the claims against the noteholders. The Bankruptcy Court held a status conference on October 25, 2006 and set a briefing schedule relating to this cost-benefit analysis.
The foregoing speaks only as of the date of this report. It is possible that these matters and/or other developments resulting from these matters could result in increased portfolio redemptions or other adverse consequences to the Portfolio. However, PIMCO and AGID believe that these matters are not likely to have a material adverse effect on the Portfolio or on PIMCO’s or AGID’s ability to perform their respective investment advisory or distribution services relating to the Portfolio.
10. FEDERAL INCOME TAX MATTERS
The Portfolio intends to qualify as a regulated investment company under sub-chapter M of the Internal Revenue Code (the “Code”) and distribute all of its taxable income and net realized gains, if applicable, to shareholders. Accordingly, no provision for Federal income taxes has been made.
As of June 30, 2007, the aggregate cost of investments was the same for federal income tax and financial statement purposes. The net unrealized appreciation (depreciation) of investment securities for federal income tax purposes is as follows (amount in thousands):
| | | | |
Aggregate
Gross
Unrealized
Appreciation | | Aggregate
Gross
Unrealized
(Depreciation) | | Net
Unrealized
(Depreciation) |
$ 4,959 | | $ (57,464) | | $ (52,505) |
| | | | | | |
| | Semiannual Report | | June 30, 2007 | | 23 |
| | |
| |
Privacy Policy* | | (Unaudited) |
The Funds consider customer privacy to be a fundamental aspect of their relationships with shareholders and are committed to maintaining the confidentiality, integrity and security of their current, prospective and former shareholders’ personal information. To ensure their shareholders’ privacy, the Funds have developed policies that are designed to protect this confidentiality, while allowing shareholder needs to be served.
Obtaining Personal Information
In the course of providing shareholders with products and services, the Funds and certain service providers to the Funds, such as the Funds’ investment advisers (“Advisers”), may obtain non-public personal information about shareholders, which may come from sources such as account applications and other forms, from other written, electronic or verbal correspondence, from shareholder transactions, from a shareholder’s brokerage or financial advisory firm, financial adviser or consultant, and/or from information captured on the Funds’ internet web sites.
Respecting Your Privacy
As a matter of policy, the Funds do not disclose any personal or account information provided by shareholders or gathered by the Funds to non-affiliated third parties, except as required or permitted by law or as necessary for such third parties to perform their agreements with respect to the Funds. As is common in the industry, non-affiliated companies may from time to time be used to provide certain services, such as preparing and mailing prospectuses, reports, account statements and other information, conducting research on shareholder satisfaction and gathering shareholder proxies. A Fund’s Distributor may also retain non-affiliated companies to market the Fund’s shares or products which use the Fund’s shares and enter into joint marketing agreements with other companies. These companies may have access to a shareholder’s personal and account information, but are permitted to use this information solely to provide the specific service or as otherwise permitted by law. In most cases, the shareholders will be clients of a third party, but the Funds may also provide a shareholder’s personal and account information to the shareholder’s respective brokerage or financial advisory firm.
Sharing Information with Third Parties
The Funds reserve the right to disclose or report personal information to non-affiliated third parties, in limited circumstances, where the Funds believe in good faith that disclosure is required under law to cooperate with regulators or law enforcement authorities, to protect their rights or property or upon reasonable request by any Fund in which a shareholder has chosen to invest. In addition, the Funds may disclose information about a shareholder’s accounts to a non-affiliated third party with the consent of the shareholder.
Sharing Information with Affiliates
The Funds may share shareholder information with their affiliates in connection with servicing their shareholders’ accounts or to provide shareholders with information about products and services that the Funds or their Advisers, principal underwriters or their affiliates (“Service Affiliates”) believe may be of interest to such shareholders. The information that the Funds share may include, for example, a shareholder’s participation in one of the Funds or in other investment programs sponsored by a Service Affiliate, a shareholder’s ownership of certain types of accounts (such as IRAs), or other data about a shareholder’s accounts. The Funds’ Service Affiliates, in turn, are not permitted to share shareholder information with non-affiliated entities, except as required or permitted by law.
Procedures to Safeguard Private Information
The Funds take seriously the obligation to safeguard shareholder non-public personal information. In addition to this policy, the Funds have also implemented procedures that are designed to restrict access to a shareholder’s non-public personal information only to internal personnel who need to know that information in order to provide products or services to such shareholders. In order to guard a shareholder’s non-public personal information, physical, electronic and procedural safeguards are in place.
* This Privacy Policy applies to the following entities: PIMCO Funds, PIMCO Variable Insurance Trust, PCM Fund, Inc. and PIMCO Strategic Global Government Fund, Inc. (collectively, the “Funds”).
| | | | |
| 24 | | PIMCO Variable Insurance Trust | | |
Investment Adviser and Administrator
Pacific Investment Management Company LLC
840 Newport Center Drive
Newport Beach, California 92660
Distributor
Allianz Global Investors Distributors LLC
1345 Avenue of the Americas
New York, New York 10105
Custodian
State Street Bank & Trust Company
801 Pennsylvania
Kansas City, Missouri 64105
Transfer Agent
Boston Financial Data Services–Midwest
330 W. 9th Street
Kansas City, Missouri 64105
Legal Counsel
Dechert LLP
1775 I Street, N.W.
Washington, D.C. 20006
Independent Registered Public Accounting Firm
PricewaterhouseCoopers LLP
1055 Broadway
Kansas City, Missouri 64105
P I M C O

Table of Contents
This material is authorized for use only when preceded or accompanied by the current PIMCO Variable Insurance Trust (the “Trust”) prospectus. Investors should consider the investment objectives, risks, charges and expenses of this Trust carefully before investing. Ask your financial professional to explain all charges that may apply. This and other information is contained in the Trust’s prospectus. The variable product prospectus may be obtained by contacting your Investment Consultant. Please read the Trust and variable product prospectus carefully before you invest or send money.
Chairman’s Letter
Dear PIMCO Variable Insurance Trust Shareholder:
It is our pleasure to present to you the semiannual report for the PIMCO Variable Insurance Trust, covering the six-month period ended June 30, 2007. The PIMCO Variable Insurance Trust’s net assets were $8.68 billion at June 30, 2007, as compared to $7.76 billion at December 31, 2006.
Highlights of the financial markets during the reporting period include:
| | n | | Economic data during the first quarter of 2007 pointed to slower growth, which heightened market expectations for a decrease in the Federal Funds Rate. By the second quarter, economic data, such as employment statistics, provided little indication of economic weakness, causing expectations of a decrease in the Federal Funds Rate to unwind and U.S. interest rates to move higher. Interest rates in Europe and the U.K. also rose over the period as central banks raised their key lending rates due to inflation concerns. The benchmark ten-year U.S. Treasury yielded 5.03% as of June 30, 2007, or 0.32% higher than at the beginning of the year. |
| | n | | Most bonds generally returned much of their gains from earlier in the year as worldwide growth and capital flows drove interest rates higher in the second quarter. Increased risk aversion in global financial markets, due in part to subprime mortgage worries in the U.S., also contributed to the rise in interest rates. The Lehman Brothers Aggregate Bond Index, which includes Treasury, investment-grade corporate and mortgage-backed securities, returned 0.98% for the six-month period. |
| | n | | Locally issued emerging market (“EM”) bonds posted positive returns for the reporting period. Yields on these bonds declined and the local currencies in which they are denominated generally gained, amid increasing investor awareness, strong economic growth and surging capital inflows. External EM bonds (debt instruments issued by emerging markets countries and typically denominated in U.S. dollars) lagged behind local EM bonds (debt instruments issued by emerging markets countries and denominated in the currency of the issuer), as external EM bonds tend to trade more in-line with U.S. Treasuries. |
| | n | | Treasury Inflation-Protected Securities (“TIPS”) outpaced nominal bonds (non-inflation linked bonds) for the first part of the year and all but the longest maturity TIPS outperformed in the second quarter as high gasoline prices drove higher inflation accruals. Commodities, as represented by the Dow Jones-AIG Commodity Total Return Index, returned 4.46% for the period. Equities, as measured by the S&P 500 Index and the Russell 2000 Index, returned 6.96% and 6.45%, respectively, for the period. |
On the following pages, please find specific details as to the Portfolio’s total return investment performance and a discussion of those factors that affected performance.
Thank you for the trust you have placed in us. We will continue to work diligently to serve your investment needs.
Sincerely,
Brent R. Harris
Chairman, PIMCO Variable Insurance Trust
July 31, 2007
| | | | | | |
| | Semiannual Report | | June 30, 2007 | | 1 |
Important Information About the Portfolio
PIMCO Variable Insurance Trust (the “Trust”) is an open-end management investment company currently consisting of twenty separate investment portfolios, including the Total Return Portfolio II (the “Portfolio”). The Portfolio is only available as a funding vehicle under variable life insurance policies or variable annuity contracts issued by insurance companies (“Variable Contracts”). Individuals may not purchase shares of the Portfolio directly. Shares of the Portfolio also may be sold to qualified pension and retirement plans outside of the separate account context.
We believe that bond funds have an important role to play in a well diversified investment portfolio. It is important to note, however, that in an environment where interest rates may trend upward, rising rates would negatively impact the performance of most bond funds, and fixed-income securities held by a fund are likely to decrease in value. The price volatility of fixed-income securities can also increase during periods of rising interest rates resulting in increased losses to a fund. Bond funds and individual bonds with a longer duration (a measure of the expected life of a security) tend to be more sensitive to changes in interest rates, usually making them more volatile than securities or funds with shorter durations.
The Portfolio may be subject to various risks in addition to those described above. Some of these risks may include, but are not limited to, the following: credit risk, market risk, issuer risk, liquidity risk, derivatives risk, mortgage risk, leveraging risk and management risk. A complete description of these risks is contained in the Portfolio’s prospectus. The Portfolio may use derivative instruments for hedging purposes or as part of an investment strategy. Use of these instruments may involve certain costs and risks such as liquidity risk, interest rate risk, market risk, credit risk, management risk and the risk that the Portfolio could not close out a position when it would be most advantageous to do so. Because the Portfolio may invest in derivatives, it could lose more than the principal amount invested in these instruments.
On the performance summary page in this Semiannual Report, the Total Return Investment Performance table measures performance assuming that all dividend and capital gain distributions were reinvested.
An investment in the Portfolio is not a deposit of a bank and is not guaranteed or insured by the Federal Deposit Insurance Corporation or any other government agency. It is possible to lose money on investments in the Portfolio.
PIMCO has adopted written proxy voting policies and procedures (“Proxy Policy”) as required by Rule 206(4)-6 under the Investment Advisers Act of 1940, as amended. The Proxy Policy has been adopted by the Trust as the policies and procedures that PIMCO will use when voting proxies on behalf of the Portfolio. A description of the policies and procedures that PIMCO uses to vote proxies relating to portfolio securities of the Portfolio, and information about how the Portfolio voted proxies relating to portfolio securities held during the most recent twelve-month period ended June 30, are available without charge, upon request, by calling the Trust at 1-866-746-2606 and on the Portfolio’s website at www.pimco.com.
The Portfolio files its complete schedule of portfolio holdings with the SEC for the first and third quarters of each fiscal year on Form N-Q. A copy of the Trust’s Form N-Q is also available on the SEC’s website at http://www.sec.gov and may be reviewed and copied at the SEC’s Public Reference Room in Washington D.C. Information on the operation of the Public Reference Room may be obtained by calling 1-800-SEC-0330, and is available without charge, upon request, by calling the Trust at 1-866-746-2606 and on the Portfolio’s website at www.pimco.com.
PIMCO Variable Insurance Trust is distributed by Allianz Global Investors Distributors LLC, 1345 Avenue of the Americas, New York, NY 10105.
| | | | |
| 2 | | PIMCO Variable Insurance Trust | | |
The following disclosure provides important information regarding the Portfolio’s Expense Example (“Example” or “Expense Example”), which appears in this Semiannual Report. Please refer to this information when reviewing the Expense Example for the Portfolio.
Example
As a shareholder of the Portfolio, you incur two types of costs: (1) transaction costs and (2) ongoing costs, including advisory and administrative fees; distribution and/or service (12b-1) fees (Administrative Class only); and other Portfolio expenses. The Example is intended to help you understand your ongoing costs (in dollars) of investing in the Portfolio and to compare these costs with the ongoing costs of investing in other mutual funds. The Expense Example does not reflect any fees or other expenses imposed by the Variable Contracts. If it did, the expenses reflected in the Expense Example would be higher. The Example is based on an investment of $1,000 invested at the beginning of the period and held for the entire period indicated, which is from January 1, 2007 to June 30, 2007.
Actual Expenses
The information in the table under the heading “Actual Performance” provides information about actual account values and actual expenses. You may use the information in these columns, together with the amount you invested, to estimate the expenses that you paid over the period. Simply divide your account value by $1,000 (for example, an $8,600 account value divided by $1,000 = $8.60), then multiply the result by the number in the row titled “Expenses Paid During Period” to estimate the expenses you paid on your account during this period.
Hypothetical Example for Comparison Purposes
The information in the table under the heading “Hypothetical Performance (5% return before expenses)” provides information about hypothetical account values and hypothetical expenses based on the Portfolio’s actual expense ratio and an assumed rate of return of 5% per year before expenses, which is not the Portfolio’s actual return. The hypothetical account values and expenses may not be used to estimate the actual ending account balance or expenses you paid for the period. You may use this information to compare the ongoing costs of investing in the Portfolio and other portfolios. To do so, compare this 5% hypothetical example with the 5% hypothetical examples that appear in the shareholder reports of the other portfolios.
Please note that the expenses shown in the table are meant to highlight your ongoing costs only and do not reflect any transactional costs. Therefore, the information under the heading “Hypothetical Performance (5% return before expenses)” is useful in comparing ongoing costs only, and will not help you determine the relative total costs of owning different portfolios. In addition, if these transactional costs were included, your costs would have been higher.
The expense ratio may vary period to period because of various factors, such as an increase in expenses not covered by the advisory and administrative fees (such as expenses of the trustees and their counsel, litigation expense and interest expense).
| | | | | | |
| | Semiannual Report | | June 30, 2007 | | 3 |
PIMCO Total Return Portfolio II
Cumulative Returns Through June 30, 2007
$10,000 invested at the beginning of the first full month following the inception date of the Portfolio’s Administrative Class.
Allocation Breakdown‡
| | |
U.S. Government Agencies | | 47.9% |
Short-Term Instruments | | 14.7% |
Mortgage-Backed Securities | | 14.7% |
Corporate Bonds & Notes | | 11.5% |
Preferred Stocks | | 6.5% |
Other | | 4.7% |
| | ‡ | % of Total Investments as of 06/30/2007 |
| | | | | | | | | | |
| Average Annual Total Return for the period ended June 30, 2007 |
| | | | | 6 Months* | | 1 Year | | 5 Years | | Portfolio
Inception
(05/28/99)** |
| | PIMCO Total Return Portfolio II Administrative Class | | -0.32% | | 3.44% | | 3.69% | | 5.32% |
| | Lehman Brothers Aggregate Bond Index± | | 0.98% | | 6.12% | | 4.48% | | 5.72% |
All Portfolio returns are net of fees and expenses.
* Cumulative return.
** The Portfolio began operations on 05/28/99. Index comparisons began on 05/31/99.
Performance quoted represents past performance. Past performance is no guarantee of future results. Investment return and principal value will fluctuate so the Portfolio shares, when redeemed, may be worth more or less than their original cost. The Portfolio’s performance does not reflect the deduction of additional charges and expenses imposed in connection with investing in Variable Contracts, which will reduce returns. Current performance may be lower or higher than the performance data quoted. Performance data current to the most recent month-end is available by calling (800) 927-4648.
± Lehman Brothers Aggregate Bond Index represents securities that are taxable and U.S. dollar denominated. The index covers the U.S. investment grade fixed rate bond market, with index components for government and corporate securities, mortgage pass-through securities, and asset-backed securities. These major sectors are subdivided into more specific indices that are calculated and reported on a regular basis. It is not possible to invest directly in the index. The index does not reflect deductions for fees and expenses.
| | | | | | |
| Expense Example | | Actual Performance | | Hypothetical Performance |
| | | | | (5% return before expenses) |
Beginning Account Value (01/01/07) | | $ | 1,000.00 | | $ | 1,000.00 |
Ending Account Value (06/30/07) | | $ | 996.77 | | $ | 1,021.57 |
Expenses Paid During Period† | | $ | 3.22 | | $ | 3.26 |
† Expenses are equal to the Portfolio’s Administrative Class annualized expense ratio of 0.65%, multiplied by the average account value over the period, multiplied by 181/365 (to reflect the one-half year period). Overall fees and expenses of investing in the Portfolio will be higher because the example does not reflect Variable Contract fees and expenses.
Please refer to page 3 herein for an explanation of the information presented in the above Expense Example.
Portfolio Insights
| » | | The PIMCO Total Return Portfolio II seeks to achieve its investment objective by investing under normal circumstances at least 65% of its total assets in a diversified portfolio of fixed-income instruments of varying maturities, which may be represented by forwards or derivatives such as options, futures contracts, or swap agreements. The Portfolio may invest only in investment grade U.S. dollar-denominated securities of U.S. issuers that are rated at least Baa by Moody’s, or equivalently rated by S&P or Fitch, or, if unrated, determined by PIMCO to be of comparable quality. |
| » | | The Portfolio’s above-benchmark duration detracted from returns as yields rose in the first half of the year. |
| » | | An emphasis on the front-end of the U.S. yield curve contributed to returns as the curve steepened as measured by the difference between two- and 30-year yields. |
| » | | A slight underweight to mortgage-backed securities for the majority of the period helped returns as this sector underperformed like-duration Treasuries. |
| » | | An underweight to corporate securities detracted from returns as the sector outperformed like-duration Treasuries. |
| » | | A small allocation to municipal bonds was negative for returns as municipal bond yields increased more than U.S. Treasury yields during the period. |
| | | | |
| 4 | | PIMCO Variable Insurance Trust | | |
Financial Highlights Total Return Portfolio II
| | | | | | | | | | | | | | | | | | | | | | | | |
| Selected per Share Data for the Year or Period Ended: | | 06/30/2007+ | | | 12/31/2006 | | | 12/31/2005 | | | 12/31/2004 | | | 12/31/2003 | | | 12/31/2002 | |
| | | | | | |
Administrative Class | | | | | | | | | | | | | | | | | | | | | | | | |
Net asset value beginning of year or period | | $ | 9.85 | | | $ | 10.04 | | | $ | 10.31 | | | $ | 10.31 | | | $ | 10.09 | | | $ | 10.12 | |
Net investment income (a) | | | 0.23 | | | | 0.44 | | | | 0.34 | | | | 0.17 | | | | 0.17 | | | | 0.38 | |
Net realized/unrealized gain (loss) on investments (a) | | | (0.26 | ) | | | (0.16 | ) | | | (0.18 | ) | | | 0.24 | | | | 0.33 | | | | 0.41 | |
Total income (loss) from investment operations | | | (0.03 | ) | | | 0.28 | | | | 0.16 | | | | 0.41 | | | | 0.50 | | | | 0.79 | |
Dividends from net investment income | | | (0.24 | ) | | | (0.47 | ) | | | (0.35 | ) | | | (0.17 | ) | | | (0.19 | ) | | | (0.40 | ) |
Distributions from net realized capital gains | | | 0.00 | | | | 0.00 | | | | (0.08 | ) | | | (0.24 | ) | | | (0.09 | ) | | | (0.42 | ) |
Total distributions | | | (0.24 | ) | | | (0.47 | ) | | | (0.43 | ) | | | (0.41 | ) | | | (0.28 | ) | | | (0.82 | ) |
Net asset value end of year or period | | $ | 9.58 | | | $ | 9.85 | | | $ | 10.04 | | | $ | 10.31 | | | $ | 10.31 | | | $ | 10.09 | |
Total return | | | (0.32 | )% | | | 2.87 | % | | | 1.58 | % | | | 4.01 | % | | | 5.01 | % | | | 7.97 | % |
Net assets end of year or period (000s) | | $ | 3,511 | | | $ | 3,797 | | | $ | 24,922 | | | $ | 24,843 | | | $ | 17,474 | | | $ | 16,882 | |
Ratio of expenses to average net assets | | | 0.65 | %* | | | 0.66 | % | | | 0.65 | % | | | 0.65 | % | | | 0.65 | % | | | 0.66 | % |
Ratio of expenses to average net assets excluding interest expense | | | 0.65 | %* | | | 0.65 | % | | | 0.65 | % | | | 0.65 | % | | | 0.65 | % | | | 0.65 | % |
Ratio of net investment income to average net assets | | | 4.79 | %* | | | 4.49 | % | | | 3.31 | % | | | 1.58 | % | | | 1.62 | % | | | 3.71 | % |
Portfolio turnover rate | | | 217 | % | | | 321 | % | | | 508 | % | | | 305 | % | | | 863 | % | | | 418 | % |
+ Unaudited
* Annualized
(a) Per share amounts based on average number of shares outstanding during the period.
| | | | | | |
| See Accompanying Notes | | Semiannual Report | | June 30, 2007 | | 5 |
Statement of Assets and Liabilities Total Return Portfolio II
| | | | |
| (Amounts in thousands, except per share amounts) | | June 30, 2007 | |
| | | (Unaudited) | |
| |
| Assets: | | | | |
Investments, at value | | $ | 3,988 | |
Cash | | | 1 | |
Receivable for investments sold | | | 522 | |
Interest and dividends receivable | | | 24 | |
Variation margin receivable | | | 7 | |
Unrealized appreciation on swap agreements | | | 1 | |
| | | | 4,543 | |
| |
Liabilities: | | | | |
Payable for investments purchased | | $ | 967 | |
Written options outstanding | | | 21 | |
Accrued investment advisory fee | | | 1 | |
Accrued administration fee | | | 1 | |
Accrued servicing fee | | | 1 | |
Variation margin payable | | | 2 | |
Swap premiums received | | | 18 | |
Unrealized depreciation on swap agreements | | | 2 | |
| | | | 1,013 | |
| |
Net Assets | | $ | 3,530 | |
| |
Net Assets Consist of: | | | | |
Paid in capital | | $ | 3,906 | |
Undistributed net investment income | | | 151 | |
Accumulated undistributed net realized (loss) | | | (475 | ) |
Net unrealized (depreciation) | | | (52 | ) |
| | | $ | 3,530 | |
| |
Net Assets: | | | | |
Institutional Class | | $ | 19 | |
Administrative Class | | | 3,511 | |
| |
Shares Issued and Outstanding: | | | | |
Institutional Class | | | 2 | |
Administrative Class | | | 366 | |
| |
Net Asset Value and Redemption Price Per Share (Net Asset Per Share Outstanding) | | | | |
Institutional Class | | $ | 9.58 | |
Administrative Class | | | 9.58 | |
| |
Cost of Investments Owned | | $ | 4,061 | |
Premiums Received on Written Options | | $ | 56 | |
| | | | |
| 6 | | PIMCO Variable Insurance Trust | | See Accompanying Notes |
Statement of Operations Total Return Portfolio II
| | | | |
| (Amounts in thousands) | | Six Months Ended
June 30, 2007 | |
| | | (Unaudited) | |
| |
| Investment Income: | | | | |
Interest | | $ | 96 | |
Dividends | | | 10 | |
Miscellaneous income | | | 1 | |
Total Income | | | 107 | |
| |
Expenses: | | | | |
Investment advisory fees | | | 5 | |
Administration fees | | | 5 | |
Servicing fees – Administrative Class | | | 3 | |
Total Expenses | | | 13 | |
| |
Net Investment Income | | | 94 | |
| |
Net Realized and Unrealized Gain (Loss): | | | | |
Net realized (loss) on investments | | | (46 | ) |
Net realized (loss) on futures contracts, written options and swaps | | | (90 | ) |
Net change in unrealized (depreciation) on investments | | | (55 | ) |
Net change in unrealized appreciation on futures contracts, written options and swaps | | | 85 | |
Net (Loss) | | | (106 | ) |
| |
Net (Decrease) in Net Assets Resulting from Operations | | $ | (12 | ) |
| | | | | | |
| See Accompanying Notes | | Semiannual Report | | June 30, 2007 | | 7 |
Statements of Changes in Net Assets Total Return Portfolio II
| | | | | | | | |
| (Amounts in thousands) | | Six Months Ended
June 30, 2007 | | | Year Ended
December 31, 2006 | |
| | | (Unaudited) | | | | |
| | |
| Increase (Decrease) in Net Assets from: | | | | | | | | |
| | |
Operations: | | | | | | | | |
Net investment income | | $ | 94 | | | $ | 1,120 | |
Net realized (loss) | | | (136 | ) | | | (21 | ) |
Net change in unrealized appreciation | | | 30 | | | | 134 | |
Net increase (decrease) resulting from operations | | | (12 | ) | | | 1,233 | |
| | |
Distributions to Shareholders: | | | | | | | | |
From net investment income | | | | | | | | |
Institutional Class | | | (4 | ) | | | (12 | ) |
Administrative Class | | | (92 | ) | | | (1,139 | ) |
| | |
Total Distributions | | | (96 | ) | | | (1,151 | ) |
| | |
Portfolio Share Transactions: | | | | | | | | |
Receipts for shares sold | | | | | | | | |
Institutional Class | | | 0 | | | | 3,025 | |
Administrative Class | | | 0 | | | | 2,262 | |
Issued as reinvestment of distributions | | | | | | | | |
Institutional Class | | | 4 | | | | 12 | |
Administrative Class | | | 92 | | | | 1,236 | |
Cost of shares redeemed | | | | | | | | |
Institutional Class | | | (183 | ) | | | (2,857 | ) |
Administrative Class | | | (273 | ) | | | (24,701 | ) |
Net (decrease) resulting from Portfolio share transactions | | | (360 | ) | | | (21,023 | ) |
| | |
Total (Decrease) in Net Assets | | | (468 | ) | | | (20,941 | ) |
| | |
Net Assets: | | | | | | | | |
Beginning of period | | | 3,998 | | | | 24,939 | |
End of period* | | $ | 3,530 | | | $ | 3,998 | |
| | |
*Including undistributed net investment income of: | | $ | 151 | | | $ | 153 | |
| | | | |
| 8 | | PIMCO Variable Insurance Trust | | See Accompanying Notes |
| | |
| |
| Schedule of Investments Total Return Portfolio II | | June 30, 2007 (Unaudited) |
| | | | | | | | |
| | | | | PRINCIPAL
AMOUNT
(000S) | | | | VALUE
(000S) |
| CORPORATE BONDS & NOTES 13.0% |
|
| BANKING & FINANCE 8.2% |
| American Honda Finance Corp. | | | | |
5.346% due 08/05/2008 | | $ | | 30 | | $ | | 30 |
| |
| Caterpillar Financial Services Corp. | | |
5.420% due 05/18/2009 | | | | 40 | | | | 40 |
| |
| Credit Suisse First Boston | | | | |
5.560% due 08/15/2010 | | | | 40 | | | | 40 |
| |
| Goldman Sachs Group, Inc. | | | | |
5.450% due 12/22/2008 | | | | 40 | | | | 40 |
5.625% due 01/15/2017 | | | | 20 | | | | 20 |
| |
| HSBC Finance Corp. | | | | |
5.607% due 05/10/2010 | | | | 10 | | | | 10 |
5.640% due 11/16/2009 | | | | 30 | | | | 30 |
| |
| Merrill Lynch & Co., Inc. | | | | |
5.406% due 05/08/2009 | | | | 40 | | | | 40 |
| |
| Wells Fargo & Co. | | | | | | | | |
5.400% due 03/10/2008 | | | | 40 | | | | 40 |
| | | | | | | | |
| | | | | | | | 290 |
| | | | | | | | |
|
| INDUSTRIALS 2.3% |
| Amgen, Inc. | | | | |
5.440% due 11/28/2008 | | | | 40 | | | | 40 |
| |
| DaimlerChrysler N.A. Holding Corp. | | |
5.840% due 09/10/2007 | | | | 40 | | | | 40 |
| | | | | | | | |
| | | | | | | | 80 |
| | | | | | | | |
| | | | | | | | |
| UTILITIES 2.5% |
| AT&T, Inc. | | | | |
5.456% due 02/05/2010 | | | | 30 | | | | 30 |
| |
| Ohio Power Co. | | | | |
5.530% due 04/05/2010 | | | | 40 | | | | 40 |
| |
| Verizon Communications, Inc. | | | | |
5.400% due 04/03/2009 | | | | 20 | | | | 20 |
| | | | | | | | |
| | | | | | | | 90 |
| | | | | | | | |
Total Corporate Bonds & Notes
(Cost $460) | | 460 |
| | | | | | | | |
| | | | | | | | |
| U.S. GOVERNMENT AGENCIES 54.1% |
| Fannie Mae | | | | |
5.000% due 04/25/2033 | | | | 62 | | | | 59 |
5.500% due 03/01/2037 - 08/01/2037 | | | | 1,477 | | | | 1,425 |
6.000% due 07/01/2016 - 03/01/2017 | | | | 68 | | | | 68 |
6.170% due 09/01/2034 | | | | 27 | | | | 27 |
6.320% due 12/01/2036 | | | | 28 | | | | 28 |
| |
| Freddie Mac | | | | |
4.250% due 09/15/2024 | | | | 26 | | | | 25 |
6.000% due 09/01/2016 | | | | 8 | | | | 8 |
7.100% due 07/01/2027 | | | | 2 | | | | 2 |
7.411% due 01/01/2028 | | | | 2 | | | | 2 |
| |
| Ginnie Mae | | | | |
5.820% due 09/20/2030 | | | | 3 | | | | 3 |
| |
| Small Business Administration | | | | |
4.750% due 07/01/2025 | | | | 276 | | | | 263 |
| | | | | | | | |
Total U.S. Government Agencies
(Cost $1,939) | | 1,910 |
| | | | | | | | |
| | | | | | | | |
| | | | | PRINCIPAL
AMOUNT
(000S) | | | | VALUE
(000S) |
| MORTGAGE-BACKED SECURITIES 16.6% |
| American Home Mortgage Investment Trust |
4.390% due 02/25/2045 | | $ | | 47 | | $ | | 46 |
| |
| Banc of America Funding Corp. | | | | |
4.113% due 05/25/2035 | | | | 75 | | | | 73 |
| |
| Banc of America Mortgage Securities, Inc. |
6.500% due 10/25/2031 | | | | 18 | | | | 18 |
6.500% due 09/25/2033 | | | | 4 | | | | 4 |
| |
| Bear Stearns Adjustable Rate Mortgage Trust |
4.622% due 01/25/2034 | | | | 29 | | | | 29 |
5.044% due 04/25/2033 | | | | 14 | | | | 14 |
| |
| Bear Stearns Alt-A Trust | | | | |
5.377% due 05/25/2035 | | | | 54 | | | | 54 |
| |
| Countrywide Alternative Loan Trust | | | | |
6.029% due 02/25/2036 | | | | 24 | | | | 24 |
| |
Countrywide Home Loan Mortgage
Pass-Through Trust |
5.610% due 04/25/2035 | | | | 37 | | | | 38 |
| |
| CS First Boston Mortgage Securities Corp. |
7.519% due 06/25/2032 | | | | 2 | | | | 2 |
| |
| Deutsche ALT-A Securities, Inc. Mortgage Loan Trust |
5.400% due 03/25/2037 | | | | 32 | | | | 32 |
| |
| GSR Mortgage Loan Trust | | | | |
6.000% due 03/25/2032 | | | | 2 | | | | 2 |
| |
| Impac CMB Trust | | | | |
6.120% due 07/25/2033 | | | | 28 | | | | 28 |
| |
| Indymac Index Mortgage Loan Trust | | |
5.420% due 01/25/2037 | | | | 67 | | | | 67 |
| |
| MLCC Mortgage Investors, Inc. | | | | |
6.974% due 01/25/2029 | | | | 17 | | | | 17 |
| |
| Morgan Stanley Capital I | | | | |
5.380% due 10/15/2020 | | | | 24 | | | | 25 |
| |
| Prime Mortgage Trust | | | | |
5.720% due 02/25/2034 | | | | 22 | | | | 22 |
| |
| Structured Asset Mortgage Investments, Inc. |
5.450% due 03/25/2037 | | | | 16 | | | | 16 |
5.650% due 09/19/2032 | | | | 1 | | | | 1 |
| |
| Washington Mutual, Inc. | | | | |
5.474% due 02/27/2034 | | | | 18 | | | | 18 |
6.029% due 02/25/2046 | | | | 23 | | | | 23 |
6.429% due 08/25/2042 | | | | 32 | | | | 32 |
| | | | | | | | |
Total Mortgage-Backed Securities (Cost $587) | | | | | | 585 |
| | | | | | | | |
| | |
| ASSET-BACKED SECURITIES 4.8% |
| American Express Credit Account Master Trust |
5.320% due 01/18/2011 | | | | 40 | | | | 40 |
| |
| Chase Credit Card Master Trust | | |
5.430% due 07/15/2010 | | | | 40 | | | | 40 |
| |
| First USA Credit Card Master Trust |
5.480% due 04/18/2011 | | | | 30 | | | | 30 |
| |
| Honda Auto Receivables Owner Trust |
5.322% due 03/18/2008 | | | | 21 | | | | 21 |
| |
| MBNA Credit Card Master Note Trust | | |
4.200% due 09/15/2010 | | | | 40 | | | | 40 |
| | | | | | | | |
Total Asset-Backed Securities
(Cost $171) | | 171 |
| | | | | | | | |
| | | | | | | | | |
| | | | | SHARES | | | |
VALUE
(000S) | |
| PREFERRED STOCKS 7.4% | |
| DG Funding Trust | | | | | | | | | |
7.600% due 12/31/2049 | | | | 25 | | $ | | 260 | |
| | | | | | | | | |
Total Preferred Stocks (Cost $265) | | | | | | | | 260 | |
| | | | | | | | | |
| | | | | | | | | |
| | | | | PRINCIPAL
AMOUNT
(000S) | | | | | |
| SHORT-TERM INSTRUMENTS 16.6% | |
| |
| COMMERCIAL PAPER 5.6% | |
| Bank of America Corp. | | | | | | | | | |
5.245% due 10/04/2007 | | $ | | 100 | | | | 99 | |
| | |
| Freddie Mac | | | | | | | | | |
4.800% due 07/02/2007 | | | | 100 | | | | 100 | |
| | | | | | | | | |
| | | | | | | | 199 | |
| | | | | | | | | |
| | | | | | | | | |
| REPURCHASE AGREEMENTS 9.6% | |
| Lehman Brothers, Inc. | | | | | | | | | |
4.000% due 07/02/2007 | | | | 200 | | | | 200 | |
(Dated 06/29/2007. Collateralized by U.S. Treasury Inflation Protected Securities 3.625% due 01/15/2008 valued at $208. Repurchase proceeds are $200.) | |
| | |
| State Street Bank and Trust Co. | | | | | |
4.900% due 07/02/2007 | | | | 138 | | | | 138 | |
(Dated 06/29/2007. Collateralized by Fannie Mae 3.250% due 02/15/2009 valued at $142. Repurchase proceeds are $138.) | |
| | | | | | | | | |
| | | | | | | | 338 | |
| | | | | | | | | |
| | | | | | | | | |
| U.S. TREASURY BILLS 1.4% | |
4.639% due 09/13/2007 (a)(c) | | 50 | | | | 49 | |
| | | | | | | | | |
Total Short-Term Instruments
(Cost $586) | | | | 586 | |
| | | | | | | | | |
| |
| PURCHASED OPTIONS (e) 0.5% | | | |
| (Cost $53) | | | | | | | | 16 | |
| |
Total Investments (b) 113.0%
(Cost $4,061) | | $ | | 3,988 | |
| | | | | | | | | |
| Written Options (f) (0.6%) (Premiums $56) | | | | | | | | (21 | ) |
| | | | | | | | | |
| Other Assets and Liabilities (Net) (12.4%) | | (437 | ) |
| | | | | | | | | |
| Net Assets 100.0% | | | | | | $ | | 3,530 | |
| | | | | | | | | |
| | | | | | |
| See Accompanying Notes | | Semiannual Report | | June 30, 2007 | | 9 |
| | |
| |
| Schedule of Investments Total Return Portfolio II (Cont.) | | June 30, 2007 (Unaudited) |
Notes to Schedule of Investments (amounts in thousands*, except number of contracts):
* A zero balance may reflect actual amounts rounding to less than one thousand.
(a) Coupon represents a weighted average rate.
(b) As of June 30, 2007, portfolio securities with an aggregate value of $49 were valued in good faith and pursuant to the guidelines established by the Board of Trustees.
(c) Securities with an aggregate market value of $49 have been segregated with the custodian to cover margin requirements for the following open futures contracts on June 30, 2007:
| | | | | | | | | | |
| Description | | Type | | Expiration
Month | | # of
Contracts | | Unrealized
(Depreciation) | |
90-Day Eurodollar June Futures | | Long | | 06/2008 | | 7 | | $ | (4 | ) |
90-Day Eurodollar March Futures | | Long | | 03/2008 | | 8 | | | (4 | ) |
90-Day Eurodollar September Futures | | Long | | 09/2008 | | 8 | | | (5 | ) |
| | | | | | | | | | |
| | | | | | | | $ | (13 | ) |
| | | | | | | | | | |
(d) Swap agreements outstanding on June 30, 2007:
Credit Default Swaps
| | | | | | | | | | | | | | | |
| Counterparty | | Reference Entity | | Buy/Sell
Protection (1) | | (Pay)/Receive
Fixed Rate | | | Expiration
Date | | Notional
Amount | | Unrealized
Appreciation |
Deutsche Bank AG | | Dow Jones CDX N.A. IG8 Index | | Buy | | (0.600% | ) | | 06/20/2017 | | $ | 10 | | $ | 0 |
| | | | | | | | | | | | | | | |
(1) If the Portfolio is a buyer of protection and a credit event occurs, as defined under the terms of that particular swap agreement, the Portfolio will generally receive from the seller of protection an amount up to the notional amount of the swap.
Interest Rate Swaps
| | | | | | | | | | | | | | | |
| Counterparty | | Floating Rate Index | | Pay/Receive
Floating Rate | | Fixed Rate | | Expiration
Date | | Notional
Amount | | Unrealized
Appreciation/
(Depreciation) | |
Bank of America | | 3-Month USD-LIBOR | | Pay | | 5.000% | | 12/19/2009 | | $ | 100 | | $ | 0 | |
Barclays Bank PLC | | 3-Month USD-LIBOR | | Pay | | 5.000% | | 12/19/2009 | | | 800 | | | (1 | ) |
Deutsche Bank AG | | 3-Month USD-LIBOR | | Pay | | 5.000% | | 12/19/2008 | | | 300 | | | 0 | |
Deutsche Bank AG | | 3-Month USD-LIBOR | | Pay | | 5.000% | | 12/19/2037 | | | 100 | | | 1 | |
Royal Bank of Scotland Group PLC | | 3-Month USD-LIBOR | | Pay | | 5.000% | | 12/19/2008 | | | 300 | | | (1 | ) |
| | | | | | | | | | | | | | | |
| | | | | | | | | | | | | $ | (1 | ) |
| | | | | | | | | | | | | | | |
(e) Purchased options outstanding on June 30, 2007:
Interest Rate Swaptions
| | | | | | | | | | | | | | | | | | | |
| Description | | Counterparty | | Floating Rate Index | | Pay/Receive
Floating Rate | | Exercise
Rate | | Expiration
Date | | Notional
Amount | | Cost | | Value |
Call - OTC 2-Year Interest Rate Swap | | Bank of America | | 3-Month USD-LIBOR | | Pay | | 4.750% | | 09/26/2008 | | $ | 2,000 | | $ | 10 | | $ | 4 |
Call - OTC 2-Year Interest Rate Swap | | Lehman Brothers, Inc. | | 3-Month USD-LIBOR | | Pay | | 4.750% | | 03/31/2008 | | | 3,300 | | | 18 | | | 4 |
Call - OTC 2-Year Interest Rate Swap | | Royal Bank of Scotland Group PLC | | 3-Month USD-LIBOR | | Pay | | 5.250% | | 07/02/2007 | | | 1,000 | | | 5 | | | 0 |
Call - OTC 2-Year Interest Rate Swap | | Royal Bank of Scotland Group PLC | | 3-Month USD-LIBOR | | Pay | | 4.750% | | 03/31/2008 | | | 2,000 | | | 11 | | | 2 |
Call - OTC 2-Year Interest Rate Swap | | Royal Bank of Scotland Group PLC | | 3-Month USD-LIBOR | | Pay | | 4.750% | | 12/15/2008 | | | 2,600 | | | 9 | | | 6 |
| | | | | | | | | | | | | | | | | | | |
| | | | | | | | | | | | | | | $ | 53 | | $ | 16 |
| | | | | | | | | | | | | | | | | | | |
(f) Written options outstanding on June 30, 2007:
Interest Rate Swaptions
| | | | | | | | | | | | | | | | | | | |
| Description | | Counterparty | | Floating Rate Index | | Pay/Receive
Floating Rate | | Exercise
Rate | | Expiration
Date | | Notional
Amount | | Premium | | Value |
Call - OTC 5-Year Interest Rate Swap | | Bank of America | | 3-Month USD-LIBOR | | Receive | | 4.950% | | 09/26/2008 | | $ | 1,000 | | $ | 11 | | $ | 5 |
Call - OTC 5-Year Interest Rate Swap | | Lehman Brothers, Inc. | | 3-Month USD-LIBOR | | Receive | | 4.900% | | 03/31/2008 | | | 2,000 | | | 24 | | | 6 |
Call - OTC 5-Year Interest Rate Swap | | Royal Bank of Scotland Group PLC | | 3-Month USD-LIBOR | | Receive | | 4.950% | | 03/31/2008 | | | 1,000 | | | 12 | | | 4 |
Call - OTC 7-Year Interest Rate Swap | | Royal Bank of Scotland Group PLC | | 3-Month USD-LIBOR | | Receive | | 5.000% | | 12/15/2008 | | | 900 | | | 9 | | | 6 |
| | | | | | | | | | | | | | | | | | | |
| | | | | | | | | | | | | | | $ | 56 | | $ | 21 |
| | | | | | | | | | | | | | | | | | | |
| | | | |
| 10 | | PIMCO Variable Insurance Trust | | See Accompanying Notes |
| | |
| |
| Notes to Financial Statements | | June 30, 2007 (Unaudited) |
1. ORGANIZATION
The Total Return Portfolio II (the “Portfolio”) is a series of the PIMCO Variable Insurance Trust (the “Trust”). The Trust is registered under the Investment Company Act of 1940 (the “Act”), as amended, as an open-end management investment company organized as a Delaware business trust on October 3, 1997. The Portfolio offers two classes of shares: Institutional and Administrative. Information presented on these financial statements pertains to the Administrative Class of the Portfolio. Certain detailed financial information for the Institutional Class is provided separately and is available upon request. The Trust is designed to be used as an investment vehicle by Separate Accounts of insurance companies that fund variable annuity contracts and variable life insurance policies and by qualified pension and retirement plans.
2. SIGNIFICANT ACCOUNTING POLICIES
The following is a summary of significant accounting policies consistently followed by the Portfolio in the preparation of its financial statements in conformity with accounting principles generally accepted in the United States of America (“GAAP”). The preparation of financial statements in accordance with GAAP requires management to make estimates and assumptions that affect the reported amounts and disclosures on the financial statements. Actual results could differ from those estimates.
(a) Security Valuation Portfolio securities are valued as of the close of regular trading (normally 4:00 p.m., Eastern Time) on each day that the New York Stock Exchange (“NYSE”) is open. Portfolio securities and other assets for which market quotes are readily available are stated at market value. Market value is generally determined on the basis of last reported sales prices, or if no sales are reported, based on quotes obtained from a quotation reporting system, established market makers, or pricing services. Fixed-income securities and non-exchange traded derivatives are normally valued on the basis of quotes obtained from brokers and dealers or pricing services. Prices obtained from independent pricing services use information provided by market makers or estimates of market values obtained from yield data relating to investments or securities with similar characteristics. Certain fixed income securities purchased on a delayed-delivery basis are marked to market daily until settlement at the forward settlement date. Short-term investments having a maturity of 60 days or less are generally valued at amortized cost. Exchange traded options, futures and options on futures are valued at the settlement price determined by the relevant exchange. With respect to any portion of the Portfolio’s assets that are invested in one or more open end management investment companies, the Portfolio’s net asset value (“NAV”) will be calculated based upon the NAVs of such investments.
Investments initially valued in currencies other than the U.S. dollar are converted to the U.S. dollar using exchange rates obtained from pricing services. As a result, the NAV of the Portfolio’s securities may be affected by changes in the value of currencies in relation to the U.S. dollar. The value of securities traded in markets outside the United States or denominated in currencies other than the U.S. dollar may be affected significantly on a day that the NYSE is closed and an investor is not able to purchase, redeem or exchange shares.
Securities and other assets for which market quotes are not readily available are valued at fair value as determined in good faith by the Board of Trustees or persons acting at their direction. The Board of Trustees has adopted methods for valuing securities and other assets in circumstances where market quotes are not readily available, and has delegated to Pacific Investment Management Company LLC (“PIMCO”) the responsibility for applying the valuation methods. In the event that market quotes are not readily available, and the security or asset cannot be valued pursuant to one of the valuation methods, the value of the security or asset will be determined in good faith by the Valuation Committee of the Board of Trustees, generally based upon recommendations provided by PIMCO.
Market quotes are considered not readily available in circumstances where there is an absence of current or reliable market-based data (e.g., trade information, bid/asked information, broker quotes), including where events occur after the close of the relevant market, but prior to the close of regular trading, that materially affect the values of the Portfolio’s securities or assets. In addition, market quotes are considered not readily available when, due to extraordinary circumstances, the exchanges or markets on which the securities trade, do not open for trading for the entire day and no other market prices are available. The Board has delegated to PIMCO the responsibility for monitoring significant events that may materially affect the values of the Portfolio’s securities or assets and for determining whether the value of the applicable securities or assets should be re-evaluated in light of such significant events.
When the Portfolio uses fair value pricing to determine its NAV, securities will not be priced on the basis of quotations from the primary market in which they are traded, but rather may be priced by another method that the Board of Trustees or persons acting at their direction believe accurately reflects fair value. The Trust’s policy is intended to result in a calculation of the Portfolio’s NAV that fairly reflects security values as of the time of pricing. However, fair values determined by the Board of Trustees or persons acting at their direction may not accurately reflect the price that the Portfolio could obtain for a security if it were to dispose of that security as of the time of pricing. Because foreign securities can trade on non-business days of the Portfolio, the NAV of the Portfolio may change on days when shareholders will not be able to purchase or redeem Portfolio shares. The prices used by the Portfolio may differ from the value that would be realized if the securities were sold and the differences could be material to the financial statements.
(b) Securities Transactions and Investment Income Securities transactions are recorded as of the trade date for financial reporting purposes. Securities purchased or sold on a when-issued or delayed-delivery basis may be settled a month or more after the trade date. Realized gains and losses from securities sold are recorded on the identified cost basis. Dividend income is recorded on the ex-dividend date, except certain dividends from foreign securities where the ex-dividend date may have passed, which are recorded as soon as the Portfolio is informed of the ex-dividend date. Interest income, adjusted for the accretion of discounts and amortization of premiums, is recorded on the accrual basis. Paydown gains and losses on mortgage-related and other asset-backed securities are recorded as components of interest income on the Statement of Operations.
(c) Dividends and Distributions to Shareholders Dividends from net investment income, if any, are declared daily and distributed to shareholders monthly. Net realized capital gains earned by the Portfolio, if any, will be distributed no less frequently than once each year.
Income dividends and capital gain distributions are determined in accordance with income tax regulations which may differ from GAAP. Differences between tax regulations and GAAP may change the fiscal year when income and capital items are recognized for tax and GAAP purposes. Examples of events that give rise to timing differences include wash sales, straddles, net operating losses and capital loss carryforwards. Further, the character of investment income and capital gains may be different for certain transactions under the two methods of accounting. Examples of characterization differences include the treatment of mortgage paydowns, swaps, foreign currency transactions and contingent debt instruments. As a result, income dividends and capital gain distributions declared during a fiscal period may differ significantly from the net investment income and realized capital gain reported on the Portfolio’s annual financial statements presented under GAAP.
Distributions classified as a tax basis return of capital, if any, are reflected on the accompanying Statements of Changes in Net Assets and have been reclassified to paid in capital. In addition, other amounts have been reclassified between
| | | | | | |
| | Semiannual Report | | June 30, 2007 | | 11 |
Notes to Financial Statements (Cont.)
undistributed net investment income, accumulated undistributed net realized gains or losses and/or paid in capital to more appropriately conform financial accounting to tax characterizations of dividend distributions.
(d) Multiclass Operations Each class offered by the Portfolio has equal rights as to assets and voting privileges (except that shareholders of a class have exclusive voting rights regarding any matter relating solely to that class of shares). Income and non-class specific expenses of the Portfolio are allocated daily to each class of shares based on the relative value of settled shares. Realized and unrealized capital gains and losses of the Portfolio are allocated daily to each class of shares based on the relative net assets of each class. Class specific expenses, where applicable, currently include administrative, distribution and servicing fees.
(e) Futures Contracts The Portfolio may enter into futures contracts. The Portfolio may use futures contracts to manage its exposure to the securities markets or to movements in interest rates and currency values. The primary risks associated with the use of futures contracts are the imperfect correlation between the change in market value of the securities held by the Portfolio and the prices of futures contracts, the possibility of an illiquid market, and the inability of the counterparty to meet the terms of the contract. Futures contracts are valued based upon their quoted daily settlement prices. Upon entering into a futures contract, the Portfolio is required to deposit with its futures broker, an amount of cash or U.S. Government and Agency Obligations in accordance with the initial margin requirements of the broker or exchange. Futures contracts are marked to market daily and an appropriate payable or receivable for the change in value (“variation margin”) is recorded by the Portfolio. Gains or losses are recognized but not considered realized until the contracts expire or are closed. Futures contracts involve, to varying degrees, risk of loss in excess of the variation margin disclosed on the Statement of Assets and Liabilities.
(f) Options Contracts The Portfolio may write call and put options on futures, swaps, securities or currencies it owns or in which it may invest. Writing put options tends to increase the Portfolio’s exposure to the underlying instrument. Writing call options tends to decrease the Portfolio’s exposure to the underlying instrument. When the Portfolio writes a call or put option, an amount equal to the premium received is recorded as a liability and subsequently marked to market to reflect the current value of the option written. These liabilities are reflected as written options outstanding on the Statement of Assets and Liabilities. Certain options may be written with premiums to be determined on a future date. The premiums for these options are based upon implied volatility parameters at specified terms. Premiums received from writing options which expire are treated as realized gains. Premiums received from writing options which are exercised or closed are added to the proceeds or offset against amounts paid on the underlying future, swap, security or currency transaction to determine the realized gain or loss. The Portfolio as a writer of an option has no control over whether the underlying future, swap, security or currency may be sold (call) or purchased (put) and as a result bears the market risk of an unfavorable change in the price of the future, swap, security or currency underlying the written option. There is the risk the Portfolio may not be able to enter into a closing transaction because of an illiquid market.
The Portfolio may also purchase put and call options. Purchasing call options tends to increase the Portfolio’s exposure to the underlying instrument. Purchasing put options tends to decrease the Portfolio’s exposure to the underlying instrument. The Portfolio pays a premium which is included on the Statement of Assets and Liabilities as an investment and subsequently marked to market to reflect the current value of the option. Premiums paid for purchasing options which expire are treated as realized losses. Certain options may be purchased with premiums to be determined on a future date. The premiums for these options are based upon implied volatility parameters at specified terms. The risk associated with
purchasing put and call options is limited to the premium paid. Premiums paid for purchasing options which are exercised or closed are added to the amounts paid or offset against the proceeds on the underlying future, swap, security or currency transaction to determine the realized gain or loss.
(g) Repurchase Agreements The Portfolio may engage in repurchase transactions. Under the terms of a typical repurchase agreement, the Portfolio takes possession of an underlying debt obligation (collateral) subject to an obligation of the seller to repurchase, and the Portfolio to resell, the obligation at an agreed-upon price and time. The underlying securities for all repurchase agreements are held in safekeeping at the Portfolio’s custodian or designated subcustodians under tri-party repurchase agreements. The market value of the collateral must be equal to or exceed the total amount of the repurchase obligations, including interest. Securities purchased under repurchase agreements are reflected as an asset on the Statement of Assets and Liabilities. Generally, in the event of counterparty default, the Portfolio has the right to use the collateral to offset losses incurred. If the counterparty should default, the Portfolio will seek to sell the securities which it holds as collateral. This could involve procedural costs or delays in addition to a loss on the securities if their value should fall below their repurchase price.
(h) Inverse Floating Rate Transactions—Residual Interest Municipal Bonds (“RIBs”)/Residual Interest Tax Exempt Bonds (“RITEs”) The Portfolio may invest in RIBs and RITEs (“Inverse Floaters”). Inverse Floaters are created via a master trust agreement between a broker-dealer, acting as trustor and liquidity provider, and an investment bank, acting as trustee and tender agent. The master trust agreement defines the terms for each trust series; with each series being established by the transfer of long-term, fixed-rate municipal bonds (“Fixed Rate Bonds”) to the trustee to be held and provide for the creation, execution and delivery of floater certificates (“Floating Rate Notes”) and Inverse Floaters. Floating Rate Notes are liquid notes that are issued with a short-term variable rate typically linked to the LIBOR, subject to limitations, for some duration. After interest income is paid on the Floating Rate Notes at current rates, the residual income from the Fixed Rate Bonds is paid to the Inverse Floaters. Inverse Floaters are issued with a coupon that fluctuates inversely with the Floating Rate Notes’ referenced rate, subject to certain limitations. Therefore, rising short-term rates result in lower income for the Inverse Floaters and vice versa.
Floating Rate Notes are generally remarketed to municipal money market funds. Inverse Floaters are acquired by either tax-exempt municipal bond funds or trusts, or other parties interested in potentially higher yielding tax-exempt securities. Inverse Floaters may also be acquired for the purpose of increasing leverage. Floating Rate Note holders typically have the option to tender their notes to the liquidity provider for redemption at par at each reset date. The Inverse Floater holders have the option to (i) require the Floating Rate Note holders to tender their notes at par, and (ii) require the liquidity provider to transfer the Fixed Rate Bonds to the Inverse Floater holders. The holders of Inverse Floaters bear substantially all of the downside investment risk associated with the underlying Fixed Rate Bonds, and also benefit from a disproportionate amount of the potential appreciation of the underlying Fixed Rate Bonds’ value. Inverse Floaters may be more volatile and less liquid than other municipal bonds of comparable maturity.
Inverse Floaters may be acquired with or without first transferring to the trustor the Fixed Rate Bonds that were utilized to create the trust series. Inverse Floaters acquired without a transfer of Fixed Rate Bonds are recognized as purchases of securities as outlined in Note 2(b). Statement of Financial Accounting Standards No. 140—Accounting for Transfers and Servicing of Financial Assets and Extinguishments of Liabilities (“FAS No. 140”), governs the standards for accounting for securitizations and other transfers of financial assets. If there is a transfer of Fixed Rate Bonds and it meets sale criteria under FAS No. 140, a Portfolio records a sale of the Fixed Rate Bonds and a purchase of the Inverse
| | | | |
| 12 | | PIMCO Variable Insurance Trust | | |
| | |
| |
| | | June 30, 2007 (Unaudited) |
Floaters. The cash received from the Inverse Floaters is then recorded as interest income in the Statement of Operations.
If the transfer of Fixed Rate Bonds does not meet sale criteria under FAS No. 140, a Portfolio accounts for the transaction described above as a secured borrowing by including the Fixed Rate Bonds in its Schedule of Investments, and recording the Floating Rate Notes as a liability under the caption “Payable for floating rate notes” in the Portfolio’s Statement of Assets and Liabilities. In a secured borrowing transaction, cash received from the Inverse Floaters is not recorded as interest income. Instead, a Portfolio records interest income related to the Fixed Rate Bonds and interest expense related to the Floating Rate Notes, the net of which is equal to the cash received from the Inverse Floaters acquired by the Portfolio. Thus, while a Portfolio’s reported total income, net expenses, and net expense ratio are generally higher for investments in Inverse Floaters acquired via a secured borrowing, the method of acquiring Inverse Floaters does not result in differences for reported cash flows, net asset value or total return.
(i) Swap Agreements The Portfolio may invest in swap agreements. Swap transactions are privately negotiated agreements between the Portfolio and a counterparty to exchange or swap investment cash flows, assets, or market-linked returns at specified, future intervals. The Portfolio may enter into interest rate, total return, forward spread-lock, credit default, and other forms of swap agreements to manage its exposure to interest rates and credit risk. In connection with these agreements, securities may be identified as collateral in accordance with the terms of the respective swap agreements.
Interest rate swap agreements involve the exchange by the Portfolio with another party of their respective commitments to pay or receive interest, e.g., an exchange of floating rate payments for fixed rate payments with respect to the notional amount of principal. Certain forms of interest rate swap agreements may include: (i) interest rate caps, under which, in return for a premium, one party agrees to make payments to the other to the extent that interest rates exceed a specified rate, or “cap”, (ii) interest rate floors, under which, in return for a premium, one party agrees to make payments to the other to the extent that interest rates fall below a specified rate, or “floor”, or (iii) interest rate collars, under which a party sells a cap and purchases a floor or vice versa in an attempt to protect itself against interest rate movements exceeding given minimum or maximum levels.
Total return swap agreements involve commitments to pay interest in exchange for a market-linked return, both based on notional amounts. To the extent the total return of the security or index underlying the transaction exceeds or falls short of the offsetting interest rate obligation, the Portfolio will receive a payment from or make a payment to the counterparty.
Forward spread-lock swap agreements involve commitments to pay or receive a settlement amount calculated as the difference between the swap spread and a fixed spread, multiplied by the notional amount times the duration of the swap. The swap spread is the difference between the benchmark swap rate (market rate) and the specific Treasury rate.
Credit default swap agreements involve one party making a stream of payments to another party in exchange for the right to receive a specified return in the event of a default by a third party, typically corporate issues or sovereign issues of an emerging country, on its obligation. The Portfolio may use credit default swaps to provide a measure of protection against defaults of the issuers (i.e., to reduce risk where the Portfolio owns or has exposure to the sovereign issuer) or to take an active long or short position with respect to the likelihood of a particular issuer’s default. As a seller of protection, the Portfolio generally receives an upfront payment or a fixed rate of income throughout the term of the swap provided that there is no credit event. If the Portfolio is a seller of protection and a credit event occurs, as defined under the terms of that particular swap agreement, the Portfolio
will pay to the buyer of the protection an amount up to the notional value of the swap and in certain instances take delivery of the security. As the seller, the Portfolio would effectively add leverage to its portfolio because, in addition to its total net assets, the Portfolio would be subject to investment exposure on the notional amount of the swap. As a buyer of protection, the Portfolio generally receives an amount up to the notional value of the swap if a credit event occurs. The treatment of credit default swaps and other swap agreements that provide for contingent, non-periodic, bullet-type payments as “notional principal contracts” for U.S. federal income tax purposes is uncertain. Were the U.S. Internal Revenue Service (“IRS”) to take the position that a credit default swap or other bullet-type swap is not a “notional principal contract” for U.S. federal income tax purposes, payments received by the Portfolio from such investments might be subject to U.S. excise or income taxes.
Swaps are marked to market daily based upon quotations from market makers and the change in value, if any, is recorded as unrealized gain or loss on the Statement of Operations. Payments received or made at the beginning of the measurement period are reflected as such on the Statement of Assets and Liabilities. These upfront payments are recorded as realized gain or loss on the Statement of Operations upon termination or maturity of the swap. A liquidation payment received or made at the termination of the swap is recorded as realized gain or loss on the Statement of Operations. Net periodic payments received or paid by the Portfolio are included as part of realized gain or loss on the Statement of Operations. Entering into these agreements involves, to varying degrees, elements of credit, market and documentation risk in excess of the amounts recognized on the Statement of Assets and Liabilities. Such risks involve the possibility that there will be no liquid market for these agreements, that the counterparty to the agreements may default on its obligation to perform or disagree as to the meaning of contractual terms in the agreements and that there may be unfavorable changes in interest rates.
(j) Mortgage-Related and Other Asset-Backed Securities The Portfolio may invest in mortgage-related or other asset-backed securities. These securities include mortgage pass-through securities, collateralized mortgage obligations (“CMOs”), commercial mortgage-backed securities, mortgage dollar rolls, CMO residuals, stripped mortgage-backed securities (“SMBSs”) and other securities that directly or indirectly represent a participation in, or are secured by and payable from, mortgage loans on real property. The value of some mortgage-related or asset-backed securities may be particularly sensitive to changes in prevailing interest rates. Early repayment of principal on some mortgage-related securities may expose the Portfolio to a lower rate of return upon reinvestment of principal. The value of these securities may fluctuate in response to the market’s perception of the creditworthiness of the issuers. Additionally, although mortgages and mortgage-related securities are generally supported by some form of government or private guarantee and/or insurance, there is no assurance that private guarantors or insurers will meet their obligations.
(k) U.S. Government Agencies or Government-Sponsored Enterprises Securities issued by U.S. Government agencies or government-sponsored enterprises may not be guaranteed by the U.S. Treasury. The Government National Mortgage Association (“GNMA” or “Ginnie Mae”), a wholly owned U.S. Government corporation, is authorized to guarantee, with the full faith and credit of the U.S. Government, the timely payment of principal and interest on securities issued by institutions approved by GNMA and backed by pools of mortgages insured by the Federal Housing Administration or guaranteed by the Department of Veterans Affairs. Government-related guarantors (i.e., not backed by the full faith and credit of the U.S. Government) include the Federal National Mortgage Association (“FNMA” or “Fannie Mae”) and the Federal Home Loan Mortgage Corporation (“FHLMC” or “Freddie Mac”). Pass-through securities issued by FNMA are guaranteed as to timely payment of principal and interest by FNMA but are not backed by the full faith and credit of the U.S. Government. FHLMC guarantees the
| | | | | | |
| | Semiannual Report | | June 30, 2007 | | 13 |
Notes to Financial Statements (Cont.)
timely payment of interest and ultimate collection of principal, but its participation certificates are not backed by the full faith and credit of the U.S. Government.
(l) New Accounting Policies In July 2006, the Financial Accounting Standards Board (“FASB”) issued Interpretation No. 48, “Accounting for Uncertainty in Income Taxes—an Interpretation of FASB Statement No. 109” (the “Interpretation”). The Interpretation became effective for the Portfolio on June 29, 2007. Management has evaluated the application of the Interpretation in relation to the Portfolio and has concluded that no single filing position or combination of filing positions identified as uncertain tax positions required the accrual of a tax liability in the accounting records of the Portfolio for the period ending June 30, 2007. Management will monitor all existing filing positions and future filing positions in light of the Interpretation and evaluate the need for any future tax accruals and financial statement disclosures as warranted.
In September 2006, the FASB issued Statement of Financial Accounting Standards No. 157, “Fair Value Measurements” (the “Statement”). The Statement is effective for fiscal years beginning after November 15, 2007 and will require expanded disclosure about fair value measurements, separately for each major category of assets and liabilities, that enables shareholders to assess the inputs used to develop those measurements, and for recurring fair value measurements using significant unobservable inputs the effect of the measurements on changes in net assets for the reporting period. Management is currently evaluating the application of the Statement to the Portfolio and will provide additional information in relation to the Statement on the Portfolio’s annual financial statements for the period ending December 31, 2007.
3. FEES AND EXPENSES
(a) Investment Advisory Fee PIMCO is a majority-owned subsidiary of Allianz Global Investors of America L.P. (“AGI”), and serves as investment adviser (the “Adviser”) to the Trust, pursuant to an investment advisory contract. The Adviser receives a monthly fee from the Portfolio, at an annual rate based on average daily net assets. The Advisory Fee for all classes is charged at an annual rate of 0.25%.
(b) Administration Fee PIMCO serves as administrator (the “Administrator”), and provides administrative services to the Trust for which it receives a monthly administrative fee based on each share class’s average daily net assets. As the Administrator, PIMCO bears the costs of various third-party services, including audit, custodial, portfolio accounting, legal, transfer agency and printing costs. The Administration Fee for all classes is charged at the annual rate of 0.25%.
(c) Distribution and Servicing Fees Allianz Global Investors Distributors LLC (“AGID”) is an indirect wholly-owned subsidiary of AGI and serves as the distributor (the “Distributor”) of the Trust’s shares. The Trust is permitted to reimburse AGID on a quarterly basis, out of the Administrative Class assets of the Portfolio in the amount of 0.15% on an annual basis of the average daily net assets of that class, for payments made to financial intermediaries that provide services in connection with the distribution of shares or administration of plans or programs that use Portfolio shares as their funding medium. The effective rate paid to AGID was 0.15% during the current fiscal year.
(d) Portfolio Expenses The Trust is responsible for the following expenses: (i) salaries and other compensation of any of the Trust’s executive officers and employees who are not officers, directors, stockholders or employees of PIMCO or its subsidiaries or affiliates; (ii) taxes and governmental fees; (iii) brokerage fees and commissions and other portfolio transaction expenses; (iv) the costs of borrowing money, including interest expenses and bank overdraft charges; (v) fees and expenses of the Trustees who are not “interested persons” of PIMCO or the Trust, and any counsel retained exclusively for their benefit; (vi) extraordinary expenses, including costs of litigation and indemnification expenses;
(vii) organization expenses and (viii) any expenses allocated or allocable to a specific class of shares, which include service fees payable with respect to the Administrative Class Shares, and may include certain other expenses as permitted by the Trust’s Multiple Class Plan adopted pursuant to Rule 18f-3 under the Act and subject to review and approval by the Trustees. The ratio of expenses to average net assets per share class, as disclosed in the Financial Highlights, may differ from the annual portfolio operating expenses per share class as disclosed in the Prospectus for the reasons set forth above.
Effective April 1, 2007, each Trustee, other than those affiliated with PIMCO or its affiliates, receives an annual retainer of $15,000, plus $2,375 for each Board of Trustees meeting attended in person, $500 for each committee meeting attended and $750 for each Board of Trustees meeting attended telephonically, plus reimbursement of related expenses. In addition, the audit committee chair receives an additional annual retainer of $2,000 and each other committee chair receives an additional annual retainer of $500. These expenses are allocated on a pro-rata basis to the various portfolios of the Trust according to their respective net assets. The Trust pays no compensation directly to any Trustee or any other officer who is affiliated with the Administrator, all of whom receive remuneration for their services to the Trust from the Administrator or its affiliates. Prior to April 1, 2007, each Trustee, other than those affiliated with PIMCO or its affiliates, received an annual retainer of $15,000 plus $2,000 for each Board of Trustees meeting attended ($500 for each special meeting attended), plus reimbursement of related expenses. The Audit Committee Chairman received an annual retainer of $1,500 and the Governance Committee Chairman received an annual retainer of $500. In addition, each member of a committee received $500 for each committee meeting attended.
4. RELATED PARTY TRANSACTIONS
The Adviser, Administrator, and Distributor are related parties as defined by FAS 57, Related Party Disclosures. Fees payable to these parties are disclosed in Note 3.
5. GUARANTEES AND INDEMNIFICATIONS
Under the Trust’s organizational documents, each Trustee, officer, employee or other agent of the Trust (including the Trust’s investment manager) is indemnified, to the extent permitted by the Act, against certain liabilities that may arise out of performance of their duties to the Portfolio. Additionally, in the normal course of business, the Portfolio enters into contracts that contain a variety of indemnification clauses. The Portfolio’s maximum exposure under these arrangements is unknown as this would involve future claims that may be made against the Portfolio that have not yet occurred. However, the Portfolio has not had prior claims or losses pursuant to these contracts and believes the risk of loss to be remote.
6. PURCHASES AND SALES OF SECURITIES
The length of time the Portfolio has held a particular security is not generally a consideration in investment decisions. A change in the securities held by the Portfolio is known as “portfolio turnover”. The Portfolio may engage in frequent and active trading of portfolio securities to achieve its investment objective, particularly during periods of volatile market movements. High portfolio turnover (e.g., over 100%) involves correspondingly greater expenses to the Portfolio, including brokerage commissions or dealer mark-ups and other transaction costs on the sale of securities and reinvestments in other securities. Such sales may also result in realization of taxable capital gains, including short-term capital gains (which are generally taxed at ordinary income tax rates). The trading costs and tax effects associated with portfolio turnover may adversely affect the Portfolio’s performance.
| | | | |
| 14 | | PIMCO Variable Insurance Trust | | |
| | |
| |
| | | June 30, 2007 (Unaudited) |
Purchases and sales of securities (excluding short-term investments) for the period ended June 30, 2007, were as follows (amounts in thousands):
| | | | | | | | | | | | |
| U.S. Government/Agency | | | | All Other |
| Purchases | | Sales | | | | Purchases | | Sales |
| $ | 5,691 | | $ | 6,039 | | | | $ | 1,751 | | $ | 1,019 |
7. TRANSACTIONS IN WRITTEN CALL AND PUT OPTIONS
Transactions in written call and put options were as follows (amounts in thousands, except for number of contracts):
| | | | | | | | | | | | | |
| | | | | # of
Contracts | | | Notional
Amount in $ | | | Premium | |
Balance at 12/31/2006 | | | | 4 | | | $ | 4,900 | | | $ | 48 | |
Sales | | | | 0 | | | | 4,900 | | | | 56 | |
Closing Buys | | | | (4 | ) | | | (4,900 | ) | | | (48 | ) |
Expirations | | | | 0 | | | | 0 | | | | 0 | |
Exercised | | | | 0 | | | | 0 | | | | 0 | |
Balance at 06/30/2007 | | | | 0 | | | $ | 4,900 | | | $ | 56 | |
8. SHARES OF BENEFICIAL INTEREST
The Portfolio may issue an unlimited number of shares of beneficial interest with a $0.001 par value. Changes in shares of beneficial interest were as follows (shares and amounts in thousands):
| | | | | | | | | | | | | | | | |
| | | | | Six Months Ended
06/30/2007 | | | Year Ended 12/31/2006 | |
| | | | | Shares | | | Amount | | | Shares | | | Amount | |
| | | | | |
Receipts for shares sold | | | | | | | | | | | | | | | | |
Institutional Class | | | | 0 | | | $ | 0 | | | 302 | | | $ | 3,025 | |
Administrative Class | | | | 0 | | | | 0 | | | 225 | | | | 2,262 | |
Issued as reinvestment of distributions | | | | | | | | | | | | | | | | |
Institutional Class | | | | 1 | | | | 4 | | | 1 | | | | 12 | |
Administrative Class | | | | 9 | | | | 92 | | | 125 | | | | 1,236 | |
Cost of shares redeemed | | | | | | | | | | | | | | | | |
Institutional Class | | | | (19 | ) | | | (183 | ) | | (285 | ) | | | (2,857 | ) |
Administrative Class | | | | (29 | ) | | | (273 | ) | | (2,446 | ) | | | (24,701 | ) |
Net (decrease) resulting from Portfolio share transactions | | | | (38 | ) | | $ | (360 | ) | | (2,078 | ) | | $ | (21,023 | ) |
The following schedule shows the number of shareholders each owning 5% or more of the Portfolio and the total percentage of the Portfolio held by such shareholders:
| | | | | | |
| | | | | Number of
Shareholders | | % of Portfolio
Held |
Institutional Class | | | | 2 | | 100 |
Administrative Class | | | | 1 | | 100 |
9. REGULATORY AND LITIGATION MATTERS
Since February 2004, PIMCO, Allianz Global Investors of America L.P. (PIMCO’s parent company), AGID, and certain of their affiliates, including the PIMCO Funds (another series of funds managed by PIMCO), the Allianz Funds (formerly known as PIMCO Funds: Multi-Manager Series (another series of funds managed by
affiliates of PIMCO)), certain Trustees of the Trust (in their capacity as Trustees of the PIMCO Funds or the Allianz Funds) and certain employees of PIMCO, have been named as defendants in fifteen lawsuits filed in various jurisdictions. Eleven of those lawsuits concern “market timing,” and they have been transferred to and consolidated for pre-trial proceedings in a multi-district litigation proceeding in the U.S. District Court for the District of Maryland; the other four lawsuits concern “revenue sharing” and have been consolidated into a single action in the U.S. District Court for the District of Connecticut. The lawsuits have been commenced as putative class actions on behalf of investors who purchased, held or redeemed shares of the various series of the PIMCO Funds and the Allianz Funds during specified periods, or as derivative actions on behalf of the PIMCO Funds and the Allianz Funds.
The market timing actions in the District of Maryland generally allege that certain hedge funds were allowed to engage in “market timing” in certain funds of the PIMCO Funds and the Allianz Funds and this alleged activity was not disclosed. Pursuant to tolling agreements entered into with the derivative and class action plaintiffs, PIMCO, certain PIMCO Funds Trustees, and certain employees of PIMCO who were previously named as defendants have all been dropped as defendants in the market timing actions; the plaintiffs continue to assert claims on behalf of the shareholders of the PIMCO Funds or on behalf of the PIMCO Funds itself against other defendants. By order dated November 3, 2005, the U.S. District Court for the District of Maryland granted the PIMCO Funds’ motion to dismiss claims asserted against it in a consolidated amended complaint where the PIMCO Funds were named, in the complaint, as a nominal defendant. The revenue sharing action in the District of Connecticut generally alleges that fund assets were inappropriately used to pay brokers to promote funds of the PIMCO Funds and the Allianz Funds, including directing fund brokerage transactions to such brokers, and that such alleged arrangements were not fully disclosed to shareholders. On August 11, 2005, the U.S. District Court for the District of Connecticut conducted a hearing on defendants’ motion to dismiss the consolidated amended complaint in the revenue sharing action but has not yet ruled on the motion to dismiss. The market timing and revenue sharing lawsuits seek, among other things, unspecified compensatory damages plus interest and, in some cases, punitive damages, the rescission of investment advisory contracts, the return of fees paid under those contracts and restitution.
Two nearly identical class action civil complaints have been filed in August 2005, in the Northern District of Illinois Eastern Division, alleging that the plaintiffs each purchased and sold a 10-year Treasury note futures contract and suffered damages from an alleged shortage when PIMCO held both physical and futures positions in 10-year Treasury notes for its client accounts. The two actions have been consolidated into one action, and the two separate complaints have been replaced by a consolidated complaint. PIMCO is a named defendant, and PIMCO Funds has been added as a defendant, to the consolidated action. PIMCO strongly believes the complaint is without merit and intends to vigorously defend itself.
In April 2006, certain portfolios of the Trust and certain other funds managed by PIMCO were served in an adversary proceeding brought by the Official Committee of Asbestos Claimants of G-I Holdings, Inc. in G-I Holdings, Inc.’s bankruptcy in the District of New Jersey. In July 2004, PIMCO was named in this lawsuit and remains a defendant. The plaintiff seeks to recover for the bankruptcy estate assets that were transferred by the predecessor entity of G-I Holdings, Inc. to a wholly-owned subsidiary in 1994. The subsidiary has since issued notes, of which certain portfolios of the Trust and certain other funds managed by PIMCO are alleged to be holders. The complaint alleges that in 2000, more than two hundred noteholders—including certain portfolios of the Trust and certain other funds managed by PIMCO—were granted a second priority lien on the assets of the subsidiary in exchange for their consent to a refinancing transaction and the
| | | | | | |
| | Semiannual Report | | June 30, 2007 | | 15 |
Notes to Financial Statements (Cont.)
granting of a first priority lien to the lending banks. The plaintiff is seeking invalidation of the lien in favor of the noteholders and/or the value of the lien. On June 21, 2006, the District of New Jersey overturned the Bankruptcy Court’s decision granting permission to file the adversary proceeding and remanded the matter to the Bankruptcy Court for further proceedings. Following a motion to reconsider, the District Court upheld its remand on August 7, 2006, and instructed the Bankruptcy Court to conduct a “cost-benefit” analysis of the Committee’s claims, including the claims against the noteholders. The Bankruptcy Court held a status conference on October 25, 2006 and set a briefing schedule relating to this cost-benefit analysis.
The foregoing speaks only as of the date of this report. It is possible that these matters and/or other developments resulting from these matters could result in increased portfolio redemptions or other adverse consequences to the Portfolio. However, PIMCO and AGID believe that these matters are not likely to have a material adverse effect on the Portfolio or on PIMCO’s or AGID’s ability to perform their respective investment advisory or distribution services relating to the Portfolio.
10. FEDERAL INCOME TAX MATTERS
The Portfolio intends to qualify as a regulated investment company under sub-chapter M of the Internal Revenue Code (the “Code”) and distribute all of its taxable income and net realized gains, if applicable, to shareholders. Accordingly, no provision for Federal income taxes has been made.
As of June 30, 2007, the aggregate cost of investments was the same for federal income tax and financial statement purposes. The net unrealized appreciation (depreciation) of investment securities for federal income tax purposes is as follows (amount in thousands):
| | | | |
Aggregate
Gross
Unrealized
Appreciation | | Aggregate
Gross
Unrealized
(Depreciation) | | Net
Unrealized
(Depreciation) |
$ 1 | | $ (74) | | $ (73) |
| | | | |
| 16 | | PIMCO Variable Insurance Trust | | |
| | |
| |
Privacy Policy* | | (Unaudited) |
The Funds consider customer privacy to be a fundamental aspect of their relationships with shareholders and are committed to maintaining the confidentiality, integrity and security of their current, prospective and former shareholders’ personal information. To ensure their shareholders’ privacy, the Funds have developed policies that are designed to protect this confidentiality, while allowing shareholder needs to be served.
Obtaining Personal Information
In the course of providing shareholders with products and services, the Funds and certain service providers to the Funds, such as the Funds’ investment advisers (“Advisers”), may obtain non-public personal information about shareholders, which may come from sources such as account applications and other forms, from other written, electronic or verbal correspondence, from shareholder transactions, from a shareholder’s brokerage or financial advisory firm, financial adviser or consultant, and/or from information captured on the Funds’ internet web sites.
Respecting Your Privacy
As a matter of policy, the Funds do not disclose any personal or account information provided by shareholders or gathered by the Funds to non-affiliated third parties, except as required or permitted by law or as necessary for such third parties to perform their agreements with respect to the Funds. As is common in the industry, non-affiliated companies may from time to time be used to provide certain services, such as preparing and mailing prospectuses, reports, account statements and other information, conducting research on shareholder satisfaction and gathering shareholder proxies. A Fund’s Distributor may also retain non-affiliated companies to market the Fund’s shares or products which use the Fund’s shares and enter into joint marketing agreements with other companies. These companies may have access to a shareholder’s personal and account information, but are permitted to use this information solely to provide the specific service or as otherwise permitted by law. In most cases, the shareholders will be clients of a third party, but the Funds may also provide a shareholder’s personal and account information to the shareholder’s respective brokerage or financial advisory firm.
Sharing Information with Third Parties
The Funds reserve the right to disclose or report personal information to non-affiliated third parties, in limited circumstances, where the Funds believe in good faith that disclosure is required under law to cooperate with regulators or law enforcement authorities, to protect their rights or property or upon reasonable request by any Fund in which a shareholder has chosen to invest. In addition, the Funds may disclose information about a shareholder’s accounts to a non-affiliated third party with the consent of the shareholder.
Sharing Information with Affiliates
The Funds may share shareholder information with their affiliates in connection with servicing their shareholders’ accounts or to provide shareholders with information about products and services that the Funds or their Advisers, principal underwriters or their affiliates (“Service Affiliates”) believe may be of interest to such shareholders. The information that the Funds share may include, for example, a shareholder’s participation in one of the Funds or in other investment programs sponsored by a Service Affiliate, a shareholder’s ownership of certain types of accounts (such as IRAs), or other data about a shareholder’s accounts. The Funds’ Service Affiliates, in turn, are not permitted to share shareholder information with non-affiliated entities, except as required or permitted by law.
Procedures to Safeguard Private Information
The Funds take seriously the obligation to safeguard shareholder non-public personal information. In addition to this policy, the Funds have also implemented procedures that are designed to restrict access to a shareholder’s non-public personal information only to internal personnel who need to know that information in order to provide products or services to such shareholders. In order to guard a shareholder’s non-public personal information, physical, electronic and procedural safeguards are in place.
* This Privacy Policy applies to the following entities: PIMCO Funds, PIMCO Variable Insurance Trust, PCM Fund, Inc. and PIMCO Strategic Global Government Fund, Inc. (collectively, the “Funds”).
| | | | | | |
| | Semiannual Report | | June 30, 2007 | | 17 |
Investment Adviser and Administrator
Pacific Investment Management Company LLC
840 Newport Center Drive
Newport Beach, California 92660
Distributor
Allianz Global Investors Distributors LLC
1345 Avenue of the Americas
New York, New York 10105
Custodian
State Street Bank & Trust Company
801 Pennsylvania
Kansas City, Missouri 64105
Transfer Agent
Boston Financial Data Services–Midwest
330 W. 9th Street
Kansas City, Missouri 64105
Legal Counsel
Dechert LLP
1775 I Street, N.W.
Washington, D.C. 20006
Independent Registered Public Accounting Firm
PricewaterhouseCoopers LLP
1055 Broadway
Kansas City, Missouri 64105
P I M C O

Table of Contents
This material is authorized for use only when preceded or accompanied by the current PIMCO Variable Insurance Trust (the “Trust”) prospectus. Investors should consider the investment objectives, risks, charges and expenses of this Trust carefully before investing. Ask your financial professional to explain all charges that may apply. This and other information is contained in the Trust’s prospectus. The variable product prospectus may be obtained by contacting your Investment Consultant. Please read the Trust and variable product prospectus carefully before you invest or send money.
Chairman’s Letter
Dear PIMCO Variable Insurance Trust Shareholder:
It is our pleasure to present to you the semiannual report for the PIMCO Variable Insurance Trust, covering the six-month period ended June 30, 2007. The PIMCO Variable Insurance Trust’s net assets were $8.68 billion at June 30, 2007, as compared to $7.76 billion at December 31, 2006.
Highlights of the financial markets during the reporting period include:
| | n | | Economic data during the first quarter of 2007 pointed to slower growth, which heightened market expectations for a decrease in the Federal Funds Rate. By the second quarter, economic data, such as employment statistics, provided little indication of economic weakness, causing expectations of a decrease in the Federal Funds Rate to unwind and U.S. interest rates to move higher. Interest rates in Europe and the U.K. also rose over the period as central banks raised their key lending rates due to inflation concerns. The benchmark ten-year U.S. Treasury yielded 5.03% as of June 30, 2007, or 0.32% higher than at the beginning of the year. |
| | n | | Most bonds generally returned much of their gains from earlier in the year as worldwide growth and capital flows drove interest rates higher in the second quarter. Increased risk aversion in global financial markets, due in part to subprime mortgage worries in the U.S., also contributed to the rise in interest rates. The Lehman Brothers Aggregate Bond Index, which includes Treasury, investment-grade corporate and mortgage-backed securities, returned 0.98% for the six-month period. |
| | n | | Locally issued emerging market (“EM”) bonds posted positive returns for the reporting period. Yields on these bonds declined and the local currencies in which they are denominated generally gained, amid increasing investor awareness, strong economic growth and surging capital inflows. External EM bonds (debt instruments issued by emerging markets countries and typically denominated in U.S. dollars) lagged behind local EM bonds (debt instruments issued by emerging markets countries and denominated in the currency of the issuer), as external EM bonds tend to trade more in-line with U.S. Treasuries. |
| | n | | Treasury Inflation-Protected Securities (“TIPS”) outpaced nominal bonds (non-inflation linked bonds) for the first part of the year and all but the longest maturity TIPS outperformed in the second quarter as high gasoline prices drove higher inflation accruals. Commodities, as represented by the Dow Jones-AIG Commodity Total Return Index, returned 4.46% for the period. Equities, as measured by the S&P 500 Index and the Russell 2000 Index, returned 6.96% and 6.45%, respectively, for the period. |
On the following pages, please find specific details as to the Portfolio’s total return investment performance and a discussion of those factors that affected performance.
Thank you for the trust you have placed in us. We will continue to work diligently to serve your investment needs.
Sincerely,
Brent R. Harris
Chairman, PIMCO Variable Insurance Trust
July 31, 2007
| | | | | | |
| | Semiannual Report | | June 30, 2007 | | 1 |
Important Information About the Portfolio
PIMCO Variable Insurance Trust (the “Trust”) is an open-end management investment company currently consisting of twenty separate investment portfolios, including the Total Return Portfolio II (the “Portfolio”). The Portfolio is only available as a funding vehicle under variable life insurance policies or variable annuity contracts issued by insurance companies (“Variable Contracts”). Individuals may not purchase shares of the Portfolio directly. Shares of the Portfolio also may be sold to qualified pension and retirement plans outside of the separate account context.
We believe that bond funds have an important role to play in a well diversified investment portfolio. It is important to note, however, that in an environment where interest rates may trend upward, rising rates would negatively impact the performance of most bond funds, and fixed-income securities held by a fund are likely to decrease in value. The price volatility of fixed-income securities can also increase during periods of rising interest rates resulting in increased losses to a fund. Bond funds and individual bonds with a longer duration (a measure of the expected life of a security) tend to be more sensitive to changes in interest rates, usually making them more volatile than securities or funds with shorter durations.
The Portfolio may be subject to various risks in addition to those described above. Some of these risks may include, but are not limited to, the following: credit risk, market risk, issuer risk, liquidity risk, derivatives risk, mortgage risk, leveraging risk and management risk. A complete description of these risks is contained in the Portfolio’s prospectus. The Portfolio may use derivative instruments for hedging purposes or as part of an investment strategy. Use of these instruments may involve certain costs and risks such as liquidity risk, interest rate risk, market risk, credit risk, management risk and the risk that the Portfolio could not close out a position when it would be most advantageous to do so. Because the Portfolio may invest in derivatives, it could lose more than the principal amount invested in these instruments.
On the performance summary page in this Semiannual Report, the Total Return Investment Performance table measures performance assuming that all dividend and capital gain distributions were reinvested.
An investment in the Portfolio is not a deposit of a bank and is not guaranteed or insured by the Federal Deposit Insurance Corporation or any other government agency. It is possible to lose money on investments in the Portfolio.
PIMCO has adopted written proxy voting policies and procedures (“Proxy Policy”) as required by Rule 206(4)-6 under the Investment Advisers Act of 1940, as amended. The Proxy Policy has been adopted by the Trust as the policies and procedures that PIMCO will use when voting proxies on behalf of the Portfolio. A description of the policies and procedures that PIMCO uses to vote proxies relating to portfolio securities of the Portfolio, and information about how the Portfolio voted proxies relating to portfolio securities held during the most recent twelve-month period ended June 30, are available without charge, upon request, by calling the Trust at 1-866-746-2606 and on the Portfolio’s website at www.pimco.com.
The Portfolio files its complete schedule of portfolio holdings with the SEC for the first and third quarters of each fiscal year on Form N-Q. A copy of the Trust’s Form N-Q is also available on the SEC’s website at http://www.sec.gov and may be reviewed and copied at the SEC’s Public Reference Room in Washington D.C. Information on the operation of the Public Reference Room may be obtained by calling 1-800-SEC-0330, and is available without charge, upon request, by calling the Trust at 1-866-746-2606 and on the Portfolio’s website at www.pimco.com.
PIMCO Variable Insurance Trust is distributed by Allianz Global Investors Distributors LLC, 1345 Avenue of the Americas, New York, NY 10105.
| | | | |
| 2 | | PIMCO Variable Insurance Trust | | |
The following disclosure provides important information regarding the Portfolio’s Expense Example (“Example” or “Expense Example”), which appears in this Semiannual Report. Please refer to this information when reviewing the Expense Example for the Portfolio.
Example
As a shareholder of the Portfolio, you incur two types of costs: (1) transaction costs and (2) ongoing costs, including advisory and administrative fees; distribution and/or service (12b-1) fees (Administrative Class only); and other Portfolio expenses. The Example is intended to help you understand your ongoing costs (in dollars) of investing in the Portfolio and to compare these costs with the ongoing costs of investing in other mutual funds. The Expense Example does not reflect any fees or other expenses imposed by the Variable Contracts. If it did, the expenses reflected in the Expense Example would be higher. The Example is based on an investment of $1,000 invested at the beginning of the period and held for the entire period indicated, which is from January 1, 2007 to June 30, 2007.
Actual Expenses
The information in the table under the heading “Actual Performance” provides information about actual account values and actual expenses. You may use the information in these columns, together with the amount you invested, to estimate the expenses that you paid over the period. Simply divide your account value by $1,000 (for example, an $8,600 account value divided by $1,000 = $8.60), then multiply the result by the number in the row titled “Expenses Paid During Period” to estimate the expenses you paid on your account during this period.
Hypothetical Example for Comparison Purposes
The information in the table under the heading “Hypothetical Performance (5% return before expenses)” provides information about hypothetical account values and hypothetical expenses based on the Portfolio’s actual expense ratio and an assumed rate of return of 5% per year before expenses, which is not the Portfolio’s actual return. The hypothetical account values and expenses may not be used to estimate the actual ending account balance or expenses you paid for the period. You may use this information to compare the ongoing costs of investing in the Portfolio and other portfolios. To do so, compare this 5% hypothetical example with the 5% hypothetical examples that appear in the shareholder reports of the other portfolios.
Please note that the expenses shown in the table are meant to highlight your ongoing costs only and do not reflect any transactional costs. Therefore, the information under the heading “Hypothetical Performance (5% return before expenses)” is useful in comparing ongoing costs only, and will not help you determine the relative total costs of owning different portfolios. In addition, if these transactional costs were included, your costs would have been higher.
The expense ratio may vary period to period because of various factors, such as an increase in expenses not covered by the advisory and administrative fees (such as expenses of the trustees and their counsel, litigation expense and interest expense).
| | | | | | |
| | Semiannual Report | | June 30, 2007 | | 3 |
PIMCO Total Return Portfolio II
Cumulative Returns Through June 30, 2007
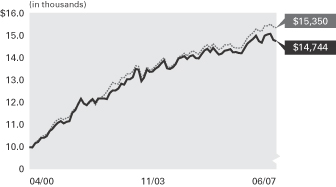
$10,000 invested at the beginning of the first full month following the inception date of the Portfolio’s Institutional Class.
Allocation Breakdown‡
| | |
U.S. Government Agencies | | 47.9% |
Short-Term Instruments | | 14.7% |
Mortgage-Backed Securities | | 14.7% |
Corporate Bonds & Notes | | 11.5% |
Preferred Stocks | | 6.5% |
Other | | 4.7% |
| | ‡ | % of Total Investments as of 06/30/2007 |
| | | | | | | | | | | | |
| Average Annual Total Return for the period ended June 30, 2007 |
| | | | | 6 Months* | | 1 Year | | 5 Years | | Portfolio
Inception
(04/10/00)** |
| | PIMCO Total Return Portfolio II Institutional Class | | -0.05% | | 3.81% | | 3.90% | | 5.43% |
| | Lehman Brothers Aggregate Bond Index± | | 0.98% | | 6.12% | | 4.48% | | 6.05% |
All Portfolio returns are net of fees and expenses.
* Cumulative return.
** The Portfolio began operations on 04/10/00. Index comparisons began on 03/31/00.
Performance quoted represents past performance. Past performance is no guarantee of future results. Investment return and principal value will fluctuate so the Portfolio shares, when redeemed, may be worth more or less than their original cost. The Portfolio’s performance does not reflect the deduction of additional charges and expenses imposed in connection with investing in Variable Contracts, which will reduce returns. Current performance may be lower or higher than the performance data quoted. Performance data current to the most recent month-end is available by calling (800) 927-4648.
± Lehman Brothers Aggregate Bond Index represents securities that are taxable and U.S. dollar denominated. The index covers the U.S. investment grade fixed rate bond market, with index components for government and corporate securities, mortgage pass-through securities, and asset-backed securities. These major sectors are subdivided into more specific indices that are calculated and reported on a regular basis. It is not possible to invest directly in the index. The index does not reflect deductions for fees and expenses.
| | | | | | |
| Expense Example | | Actual Performance | | Hypothetical Performance |
| | | | | (5% return before expenses) |
Beginning Account Value (01/01/07) | | $ | 1,000.00 | | $ | 1,000.00 |
Ending Account Value (06/30/07) | | $ | 999.53 | | $ | 1,022.32 |
Expenses Paid During Period† | | $ | 2.48 | | $ | 2.51 |
† Expenses are equal to the Portfolio’s Institutional Class annualized expense ratio of 0.50%, multiplied by the average account value over the period, multiplied by 181/365 (to reflect the one-half year period). Overall fees and expenses of investing in the Portfolio will be higher because the example does not reflect Variable Contract fees and expenses.
Please refer to page 3 herein for an explanation of the information presented in the above Expense Example.
Portfolio Insights
| » | | The PIMCO Total Return Portfolio II seeks to achieve its investment objective by investing under normal circumstances at least 65% of its total assets in a diversified portfolio of fixed-income instruments of varying maturities, which may be represented by forwards or derivatives such as options, futures contracts, or swap agreements. The Portfolio may invest only in investment grade U.S. dollar-denominated securities of U.S. issuers that are rated at least Baa by Moody’s, or equivalently rated by S&P or Fitch, or, if unrated, determined by PIMCO to be of comparable quality. |
| » | | The Portfolio’s above-benchmark duration detracted from returns as yields rose in the first half of the year. |
| » | | An emphasis on the front-end of the U.S. yield curve contributed to returns as the curve steepened as measured by the difference between two- and 30-year yields. |
| » | | A slight underweight to mortgage-backed securities for the majority of the period helped returns as this sector underperformed like-duration Treasuries. |
| » | | An underweight to corporate securities detracted from returns as the sector outperformed like-duration Treasuries. |
| » | | A small allocation to municipal bonds was negative for returns as municipal bond yields increased more than U.S. Treasury yields during the period. |
| | | | |
| 4 | | PIMCO Variable Insurance Trust | | |
Financial Highlights Total Return Portfolio II
| | | | | | | | | | | | | | | | | | | | | | | | |
| Selected per Share Data for the Year or Period Ended: | | 06/30/2007+ | | | 12/31/2006 | | | 12/31/2005 | | | 12/31/2004 | | | 12/31/2003 | | | 12/31/2002 | |
| | | | | | |
Institutional Class | | | | | | | | | | | | | | | | | | | | | | | | |
Net asset value beginning of year or period | | $ | 9.85 | | | $ | 10.04 | | | $ | 10.31 | | | $ | 10.31 | | | $ | 10.09 | | | $ | 10.12 | |
Net investment income (a) | | | 0.22 | | | | 0.59 | | | | 0.35 | | | | 0.18 | | | | 0.16 | | | | 0.41 | |
Net realized/unrealized gain (loss) on investments (a) | | | (0.22 | ) | | | (0.29 | ) | | | (0.18 | ) | | | 0.25 | | | | 0.36 | | | | 0.39 | |
Total income from investment operations | | | 0.00 | | | | 0.30 | | | | 0.17 | | | | 0.43 | | | | 0.52 | | | | 0.80 | |
Dividends from net investment income | | | (0.27 | ) | | | (0.49 | ) | | | (0.36 | ) | | | (0.19 | ) | | | (0.21 | ) | | | (0.41 | ) |
Distributions from net realized capital gains | | | 0.00 | | | | 0.00 | | | | (0.08 | ) | | | (0.24 | ) | | | (0.09 | ) | | | (0.42 | ) |
Total distributions | | | (0.27 | ) | | | (0.49 | ) | | | (0.44 | ) | | | (0.43 | ) | | | (0.30 | ) | | | (0.83 | ) |
Net asset value end of year or period | | $ | 9.58 | | | $ | 9.85 | | | $ | 10.04 | | | $ | 10.31 | | | $ | 10.31 | | | $ | 10.09 | |
Total return | | | (0.05 | )% | | | 3.03 | % | | | 1.72 | % | | | 4.16 | % | | | 5.24 | % | | | 8.13 | % |
Net assets end of year or period (000s) | | $ | 19 | | | $ | 201 | | | $ | 17 | | | $ | 17 | | | $ | 16 | | | $ | 1,217 | |
Ratio of expenses to average net assets | | | 0.50 | %* | | | 0.51 | % | | | 0.50 | % | | | 0.50 | % | | | 0.50 | % | | | 0.51 | % |
Ratio of expenses to average net assets excluding interest expense | | | 0.50 | %* | | | 0.50 | % | | | 0.50 | % | | | 0.50 | % | | | 0.50 | % | | | 0.50 | % |
Ratio of net investment income to average net assets | | | 4.58 | %* | | | 5.99 | % | | | 3.46 | % | | | 1.70 | % | | | 1.56 | % | | | 3.97 | % |
Portfolio turnover rate | | | 217 | % | | | 321 | % | | | 508 | % | | | 305 | % | | | 863 | % | | | 418 | % |
+ Unaudited
* Annualized
(a) Per share amounts based on average number of shares outstanding during the period.
| | | | | | |
| See Accompanying Notes | | Semiannual Report | | June 30, 2007 | | 5 |
Statement of Assets and Liabilities Total Return Portfolio II
| | | | |
| (Amounts in thousands, except per share amounts) | | June 30, 2007 | |
| | | (Unaudited) | |
| |
| Assets: | | | | |
Investments, at value | | $ | 3,988 | |
Cash | | | 1 | |
Receivable for investments sold | | | 522 | |
Interest and dividends receivable | | | 24 | |
Variation margin receivable | | | 7 | |
Unrealized appreciation on swap agreements | | | 1 | |
| | | | 4,543 | |
| |
Liabilities: | | | | |
Payable for investments purchased | | $ | 967 | |
Written options outstanding | | | 21 | |
Accrued investment advisory fee | | | 1 | |
Accrued administration fee | | | 1 | |
Accrued servicing fee | | | 1 | |
Variation margin payable | | | 2 | |
Swap premiums received | | | 18 | |
Unrealized depreciation on swap agreements | | | 2 | |
| | | | 1,013 | |
| |
Net Assets | | $ | 3,530 | |
| |
Net Assets Consist of: | | | | |
Paid in capital | | $ | 3,906 | |
Undistributed net investment income | | | 151 | |
Accumulated undistributed net realized (loss) | | | (475 | ) |
Net unrealized (depreciation) | | | (52 | ) |
| | | $ | 3,530 | |
| |
Net Assets: | | | | |
Institutional Class | | $ | 19 | |
Administrative Class | | | 3,511 | |
| |
Shares Issued and Outstanding: | | | | |
Institutional Class | | | 2 | |
Administrative Class | | | 366 | |
| |
Net Asset Value and Redemption Price Per Share (Net Asset Per Share Outstanding) | | | | |
Institutional Class | | $ | 9.58 | |
Administrative Class | | | 9.58 | |
| |
Cost of Investments Owned | | $ | 4,061 | |
Premiums Received on Written Options | | $ | 56 | |
| | | | |
| 6 | | PIMCO Variable Insurance Trust | | See Accompanying Notes |
Statement of Operations Total Return Portfolio II
| | | | |
| (Amounts in thousands) | | Six Months Ended
June 30, 2007 | |
| | | (Unaudited) | |
| |
| Investment Income: | | | | |
Interest | | $ | 96 | |
Dividends | | | 10 | |
Miscellaneous income | | | 1 | |
Total Income | | | 107 | |
| |
Expenses: | | | | |
Investment advisory fees | | | 5 | |
Administration fees | | | 5 | |
Servicing fees – Administrative Class | | | 3 | |
Total Expenses | | | 13 | |
| |
Net Investment Income | | | 94 | |
| |
Net Realized and Unrealized Gain (Loss): | | | | |
Net realized (loss) on investments | | | (46 | ) |
Net realized (loss) on futures contracts, written options and swaps | | | (90 | ) |
Net change in unrealized (depreciation) on investments | | | (55 | ) |
Net change in unrealized appreciation on futures contracts, written options and swaps | | | 85 | |
Net (Loss) | | | (106 | ) |
| |
Net (Decrease) in Net Assets Resulting from Operations | | $ | (12 | ) |
| | | | | | |
| See Accompanying Notes | | Semiannual Report | | June 30, 2007 | | 7 |
Statements of Changes in Net Assets Total Return Portfolio II
| | | | | | | | |
| (Amounts in thousands) | | Six Months Ended
June 30, 2007 | | | Year Ended
December 31, 2006 | |
| | | (Unaudited) | | | | |
| | |
| Increase (Decrease) in Net Assets from: | | | | | | | | |
| | |
Operations: | | | | | | | | |
Net investment income | | $ | 94 | | | $ | 1,120 | |
Net realized (loss) | | | (136 | ) | | | (21 | ) |
Net change in unrealized appreciation | | | 30 | | | | 134 | |
Net increase (decrease) resulting from operations | | | (12 | ) | | | 1,233 | |
| | |
Distributions to Shareholders: | | | | | | | | |
From net investment income | | | | | | | | |
Institutional Class | | | (4 | ) | | | (12 | ) |
Administrative Class | | | (92 | ) | | | (1,139 | ) |
| | |
Total Distributions | | | (96 | ) | | | (1,151 | ) |
| | |
Portfolio Share Transactions: | | | | | | | | |
Receipts for shares sold | | | | | | | | |
Institutional Class | | | 0 | | | | 3,025 | |
Administrative Class | | | 0 | | | | 2,262 | |
Issued as reinvestment of distributions | | | | | | | | |
Institutional Class | | | 4 | | | | 12 | |
Administrative Class | | | 92 | | | | 1,236 | |
Cost of shares redeemed | | | | | | | | |
Institutional Class | | | (183 | ) | | | (2,857 | ) |
Administrative Class | | | (273 | ) | | | (24,701 | ) |
Net (decrease) resulting from Portfolio share transactions | | | (360 | ) | | | (21,023 | ) |
| | |
Total (Decrease) in Net Assets | | | (468 | ) | | | (20,941 | ) |
| | |
Net Assets: | | | | | | | | |
Beginning of period | | | 3,998 | | | | 24,939 | |
End of period* | | $ | 3,530 | | | $ | 3,998 | |
| | |
*Including undistributed net investment income of: | | $ | 151 | | | $ | 153 | |
| | | | |
| 8 | | PIMCO Variable Insurance Trust | | See Accompanying Notes |
| | |
| |
| Schedule of Investments Total Return Portfolio II | | June 30, 2007 (Unaudited) |
| | | | | | | | |
| | | | | PRINCIPAL
AMOUNT
(000S) | | | | VALUE
(000S) |
| CORPORATE BONDS & NOTES 13.0% |
|
| BANKING & FINANCE 8.2% |
| American Honda Finance Corp. | | | | |
5.346% due 08/05/2008 | | $ | | 30 | | $ | | 30 |
| |
| Caterpillar Financial Services Corp. | | |
5.420% due 05/18/2009 | | | | 40 | | | | 40 |
| |
| Credit Suisse First Boston | | | | |
5.560% due 08/15/2010 | | | | 40 | | | | 40 |
| |
| Goldman Sachs Group, Inc. | | | | |
5.450% due 12/22/2008 | | | | 40 | | | | 40 |
5.625% due 01/15/2017 | | | | 20 | | | | 20 |
| |
| HSBC Finance Corp. | | | | |
5.607% due 05/10/2010 | | | | 10 | | | | 10 |
5.640% due 11/16/2009 | | | | 30 | | | | 30 |
| |
| Merrill Lynch & Co., Inc. | | | | |
5.406% due 05/08/2009 | | | | 40 | | | | 40 |
| |
| Wells Fargo & Co. | | | | | | | | |
5.400% due 03/10/2008 | | | | 40 | | | | 40 |
| | | | | | | | |
| | | | | | | | 290 |
| | | | | | | | |
|
| INDUSTRIALS 2.3% |
| Amgen, Inc. | | | | |
5.440% due 11/28/2008 | | | | 40 | | | | 40 |
| |
| DaimlerChrysler N.A. Holding Corp. | | |
5.840% due 09/10/2007 | | | | 40 | | | | 40 |
| | | | | | | | |
| | | | | | | | 80 |
| | | | | | | | |
| | | | | | | | |
| UTILITIES 2.5% |
| AT&T, Inc. | | | | |
5.456% due 02/05/2010 | | | | 30 | | | | 30 |
| |
| Ohio Power Co. | | | | |
5.530% due 04/05/2010 | | | | 40 | | | | 40 |
| |
| Verizon Communications, Inc. | | | | |
5.400% due 04/03/2009 | | | | 20 | | | | 20 |
| | | | | | | | |
| | | | | | | | 90 |
| | | | | | | | |
Total Corporate Bonds & Notes
(Cost $460) | | 460 |
| | | | | | | | |
| | | | | | | | |
| U.S. GOVERNMENT AGENCIES 54.1% |
| Fannie Mae | | | | |
5.000% due 04/25/2033 | | | | 62 | | | | 59 |
5.500% due 03/01/2037 - 08/01/2037 | | | | 1,477 | | | | 1,425 |
6.000% due 07/01/2016 - 03/01/2017 | | | | 68 | | | | 68 |
6.170% due 09/01/2034 | | | | 27 | | | | 27 |
6.320% due 12/01/2036 | | | | 28 | | | | 28 |
| |
| Freddie Mac | | | | |
4.250% due 09/15/2024 | | | | 26 | | | | 25 |
6.000% due 09/01/2016 | | | | 8 | | | | 8 |
7.100% due 07/01/2027 | | | | 2 | | | | 2 |
7.411% due 01/01/2028 | | | | 2 | | | | 2 |
| |
| Ginnie Mae | | | | |
5.820% due 09/20/2030 | | | | 3 | | | | 3 |
| |
| Small Business Administration | | | | |
4.750% due 07/01/2025 | | | | 276 | | | | 263 |
| | | | | | | | |
Total U.S. Government Agencies
(Cost $1,939) | | 1,910 |
| | | | | | | | |
| | | | | | | | |
| | | | | PRINCIPAL
AMOUNT
(000S) | | | | VALUE
(000S) |
| MORTGAGE-BACKED SECURITIES 16.6% |
| American Home Mortgage Investment Trust |
4.390% due 02/25/2045 | | $ | | 47 | | $ | | 46 |
| |
| Banc of America Funding Corp. | | | | |
4.113% due 05/25/2035 | | | | 75 | | | | 73 |
| |
| Banc of America Mortgage Securities, Inc. |
6.500% due 10/25/2031 | | | | 18 | | | | 18 |
6.500% due 09/25/2033 | | | | 4 | | | | 4 |
| |
| Bear Stearns Adjustable Rate Mortgage Trust |
4.622% due 01/25/2034 | | | | 29 | | | | 29 |
5.044% due 04/25/2033 | | | | 14 | | | | 14 |
| |
| Bear Stearns Alt-A Trust | | | | |
5.377% due 05/25/2035 | | | | 54 | | | | 54 |
| |
| Countrywide Alternative Loan Trust | | | | |
6.029% due 02/25/2036 | | | | 24 | | | | 24 |
| |
Countrywide Home Loan Mortgage
Pass-Through Trust |
5.610% due 04/25/2035 | | | | 37 | | | | 38 |
| |
| CS First Boston Mortgage Securities Corp. |
7.519% due 06/25/2032 | | | | 2 | | | | 2 |
| |
| Deutsche ALT-A Securities, Inc. Mortgage Loan Trust |
5.400% due 03/25/2037 | | | | 32 | | | | 32 |
| |
| GSR Mortgage Loan Trust | | | | |
6.000% due 03/25/2032 | | | | 2 | | | | 2 |
| |
| Impac CMB Trust | | | | |
6.120% due 07/25/2033 | | | | 28 | | | | 28 |
| |
| Indymac Index Mortgage Loan Trust | | |
5.420% due 01/25/2037 | | | | 67 | | | | 67 |
| |
| MLCC Mortgage Investors, Inc. | | | | |
6.974% due 01/25/2029 | | | | 17 | | | | 17 |
| |
| Morgan Stanley Capital I | | | | |
5.380% due 10/15/2020 | | | | 24 | | | | 25 |
| |
| Prime Mortgage Trust | | | | |
5.720% due 02/25/2034 | | | | 22 | | | | 22 |
| |
| Structured Asset Mortgage Investments, Inc. |
5.450% due 03/25/2037 | | | | 16 | | | | 16 |
5.650% due 09/19/2032 | | | | 1 | | | | 1 |
| |
| Washington Mutual, Inc. | | | | |
5.474% due 02/27/2034 | | | | 18 | | | | 18 |
6.029% due 02/25/2046 | | | | 23 | | | | 23 |
6.429% due 08/25/2042 | | | | 32 | | | | 32 |
| | | | | | | | |
Total Mortgage-Backed Securities (Cost $587) | | | | | | 585 |
| | | | | | | | |
| | |
| ASSET-BACKED SECURITIES 4.8% |
| American Express Credit Account Master Trust |
5.320% due 01/18/2011 | | | | 40 | | | | 40 |
| |
| Chase Credit Card Master Trust | | |
5.430% due 07/15/2010 | | | | 40 | | | | 40 |
| |
| First USA Credit Card Master Trust |
5.480% due 04/18/2011 | | | | 30 | | | | 30 |
| |
| Honda Auto Receivables Owner Trust |
5.322% due 03/18/2008 | | | | 21 | | | | 21 |
| |
| MBNA Credit Card Master Note Trust | | |
4.200% due 09/15/2010 | | | | 40 | | | | 40 |
| | | | | | | | |
Total Asset-Backed Securities
(Cost $171) | | 171 |
| | | | | | | | |
| | | | | | | | | |
| | | | | SHARES | | | |
VALUE
(000S) | |
| PREFERRED STOCKS 7.4% | |
| DG Funding Trust | | | | | | | | | |
7.600% due 12/31/2049 | | | | 25 | | $ | | 260 | |
| | | | | | | | | |
Total Preferred Stocks (Cost $265) | | | | | | | | 260 | |
| | | | | | | | | |
| | | | | | | | | |
| | | | | PRINCIPAL
AMOUNT
(000S) | | | | | |
| SHORT-TERM INSTRUMENTS 16.6% | |
| |
| COMMERCIAL PAPER 5.6% | |
| Bank of America Corp. | | | | | | | | | |
5.245% due 10/04/2007 | | $ | | 100 | | | | 99 | |
| | |
| Freddie Mac | | | | | | | | | |
4.800% due 07/02/2007 | | | | 100 | | | | 100 | |
| | | | | | | | | |
| | | | | | | | 199 | |
| | | | | | | | | |
| | | | | | | | | |
| REPURCHASE AGREEMENTS 9.6% | |
| Lehman Brothers, Inc. | | | | | | | | | |
4.000% due 07/02/2007 | | | | 200 | | | | 200 | |
(Dated 06/29/2007. Collateralized by U.S. Treasury Inflation Protected Securities 3.625% due 01/15/2008 valued at $208. Repurchase proceeds are $200.) | |
| | |
| State Street Bank and Trust Co. | | | | | |
4.900% due 07/02/2007 | | | | 138 | | | | 138 | |
(Dated 06/29/2007. Collateralized by Fannie Mae 3.250% due 02/15/2009 valued at $142. Repurchase proceeds are $138.) | |
| | | | | | | | | |
| | | | | | | | 338 | |
| | | | | | | | | |
| | | | | | | | | |
| U.S. TREASURY BILLS 1.4% | |
4.639% due 09/13/2007 (a)(c) | | 50 | | | | 49 | |
| | | | | | | | | |
Total Short-Term Instruments
(Cost $586) | | | | 586 | |
| | | | | | | | | |
| |
| PURCHASED OPTIONS (e) 0.5% | | | |
| (Cost $53) | | | | | | | | 16 | |
| |
Total Investments (b) 113.0%
(Cost $4,061) | | $ | | 3,988 | |
| | | | | | | | | |
Written Options (f) (0.6%)
(Premiums $56) | | | | (21 | ) |
| | | | | | | | | |
| Other Assets and Liabilities (Net) (12.4%) | | (437 | ) |
| | | | | | | | | |
| Net Assets 100.0% | | | | | | $ | | 3,530 | |
| | | | | | | | | |
| | | | | | |
| See Accompanying Notes | | Semiannual Report | | June 30, 2007 | | 9 |
| | |
| |
| Schedule of Investments Total Return Portfolio II (Cont.) | | June 30, 2007 (Unaudited) |
Notes to Schedule of Investments (amounts in thousands*, except number of contracts):
* A zero balance may reflect actual amounts rounding to less than one thousand.
(a) Coupon represents a weighted average rate.
(b) As of June 30, 2007, portfolio securities with an aggregate value of $49 were valued in good faith and pursuant to the guidelines established by the Board of Trustees.
(c) Securities with an aggregate market value of $49 have been segregated with the custodian to cover margin requirements for the following open futures contracts on June 30, 2007:
| | | | | | | | | | |
| Description | | Type | | Expiration
Month | | # of
Contracts | | Unrealized
(Depreciation) | |
90-Day Eurodollar June Futures | | Long | | 06/2008 | | 7 | | $ | (4 | ) |
90-Day Eurodollar March Futures | | Long | | 03/2008 | | 8 | | | (4 | ) |
90-Day Eurodollar September Futures | | Long | | 09/2008 | | 8 | | | (5 | ) |
| | | | | | | | | | |
| | | | | | | | $ | (13 | ) |
| | | | | | | | | | |
(d) Swap agreements outstanding on June 30, 2007:
Credit Default Swaps
| | | | | | | | | | | | | | | |
| Counterparty | | Reference Entity | | Buy/Sell
Protection (1) | | (Pay)/Receive
Fixed Rate | | | Expiration
Date | | Notional
Amount | | Unrealized
Appreciation |
Deutsche Bank AG | | Dow Jones CDX N.A. IG8 Index | | Buy | | (0.600% | ) | | 06/20/2017 | | $ | 10 | | $ | 0 |
| | | | | | | | | | | | | | | |
(1) If the Portfolio is a buyer of protection and a credit event occurs, as defined under the terms of that particular swap agreement, the Portfolio will generally receive from the seller of protection an amount up to the notional amount of the swap.
Interest Rate Swaps
| | | | | | | | | | | | | | | |
| Counterparty | | Floating Rate Index | | Pay/Receive
Floating Rate | | Fixed Rate | | Expiration
Date | | Notional
Amount | | Unrealized
Appreciation/
(Depreciation) | |
Bank of America | | 3-Month USD-LIBOR | | Pay | | 5.000% | | 12/19/2009 | | $ | 100 | | $ | 0 | |
Barclays Bank PLC | | 3-Month USD-LIBOR | | Pay | | 5.000% | | 12/19/2009 | | | 800 | | | (1 | ) |
Deutsche Bank AG | | 3-Month USD-LIBOR | | Pay | | 5.000% | | 12/19/2008 | | | 300 | | | 0 | |
Deutsche Bank AG | | 3-Month USD-LIBOR | | Pay | | 5.000% | | 12/19/2037 | | | 100 | | | 1 | |
Royal Bank of Scotland Group PLC | | 3-Month USD-LIBOR | | Pay | | 5.000% | | 12/19/2008 | | | 300 | | | (1 | ) |
| | | | | | | | | | | | | | | |
| | | | | | | | | | | | | $ | (1 | ) |
| | | | | | | | | | | | | | | |
(e) Purchased options outstanding on June 30, 2007:
Interest Rate Swaptions
| | | | | | | | | | | | | | | | | | | |
| Description | | Counterparty | | Floating Rate Index | | Pay/Receive
Floating Rate | | Exercise
Rate | | Expiration
Date | | Notional
Amount | | Cost | | Value |
Call - OTC 2-Year Interest Rate Swap | | Bank of America | | 3-Month USD-LIBOR | | Pay | | 4.750% | | 09/26/2008 | | $ | 2,000 | | $ | 10 | | $ | 4 |
Call - OTC 2-Year Interest Rate Swap | | Lehman Brothers, Inc. | | 3-Month USD-LIBOR | | Pay | | 4.750% | | 03/31/2008 | | | 3,300 | | | 18 | | | 4 |
Call - OTC 2-Year Interest Rate Swap | | Royal Bank of Scotland Group PLC | | 3-Month USD-LIBOR | | Pay | | 5.250% | | 07/02/2007 | | | 1,000 | | | 5 | | | 0 |
Call - OTC 2-Year Interest Rate Swap | | Royal Bank of Scotland Group PLC | | 3-Month USD-LIBOR | | Pay | | 4.750% | | 03/31/2008 | | | 2,000 | | | 11 | | | 2 |
Call - OTC 2-Year Interest Rate Swap | | Royal Bank of Scotland Group PLC | | 3-Month USD-LIBOR | | Pay | | 4.750% | | 12/15/2008 | | | 2,600 | | | 9 | | | 6 |
| | | | | | | | | | | | | | | | | | | |
| | | | | | | | | | | | | | | $ | 53 | | $ | 16 |
| | | | | | | | | | | | | | | | | | | |
(f) Written options outstanding on June 30, 2007:
Interest Rate Swaptions
| | | | | | | | | | | | | | | | | | | |
| Description | | Counterparty | | Floating Rate Index | | Pay/Receive
Floating Rate | | Exercise
Rate | | Expiration
Date | | Notional
Amount | | Premium | | Value |
Call - OTC 5-Year Interest Rate Swap | | Bank of America | | 3-Month USD-LIBOR | | Receive | | 4.950% | | 09/26/2008 | | $ | 1,000 | | $ | 11 | | $ | 5 |
Call - OTC 5-Year Interest Rate Swap | | Lehman Brothers, Inc. | | 3-Month USD-LIBOR | | Receive | | 4.900% | | 03/31/2008 | | | 2,000 | | | 24 | | | 6 |
Call - OTC 5-Year Interest Rate Swap | | Royal Bank of Scotland Group PLC | | 3-Month USD-LIBOR | | Receive | | 4.950% | | 03/31/2008 | | | 1,000 | | | 12 | | | 4 |
Call - OTC 7-Year Interest Rate Swap | | Royal Bank of Scotland Group PLC | | 3-Month USD-LIBOR | | Receive | | 5.000% | | 12/15/2008 | | | 900 | | | 9 | | | 6 |
| | | | | | | | | | | | | | | | | | | |
| | | | | | | | | | | | | | | $ | 56 | | $ | 21 |
| | | | | | | | | | | | | | | | | | | |
| | | | |
| 10 | | PIMCO Variable Insurance Trust | | See Accompanying Notes |
| | |
| |
| Notes to Financial Statements | | June 30, 2007 (Unaudited) |
1. ORGANIZATION
The Total Return Portfolio II (the “Portfolio”) is a series of the PIMCO Variable Insurance Trust (the “Trust”). The Trust is registered under the Investment Company Act of 1940 (the “Act”), as amended, as an open-end management investment company organized as a Delaware business trust on October 3, 1997. The Portfolio offers two classes of shares: Institutional and Administrative. Information presented on these financial statements pertains to the Institutional Class of the Portfolio. Certain detailed financial information for the Administrative Class is provided separately and is available upon request. The Trust is designed to be used as an investment vehicle by Separate Accounts of insurance companies that fund variable annuity contracts and variable life insurance policies and by qualified pension and retirement plans.
2. SIGNIFICANT ACCOUNTING POLICIES
The following is a summary of significant accounting policies consistently followed by the Portfolio in the preparation of its financial statements in conformity with accounting principles generally accepted in the United States of America (“GAAP”). The preparation of financial statements in accordance with GAAP requires management to make estimates and assumptions that affect the reported amounts and disclosures on the financial statements. Actual results could differ from those estimates.
(a) Security Valuation Portfolio securities are valued as of the close of regular trading (normally 4:00 p.m., Eastern Time) on each day that the New York Stock Exchange (“NYSE”) is open. Portfolio securities and other assets for which market quotes are readily available are stated at market value. Market value is generally determined on the basis of last reported sales prices, or if no sales are reported, based on quotes obtained from a quotation reporting system, established market makers, or pricing services. Fixed-income securities and non-exchange traded derivatives are normally valued on the basis of quotes obtained from brokers and dealers or pricing services. Prices obtained from independent pricing services use information provided by market makers or estimates of market values obtained from yield data relating to investments or securities with similar characteristics. Certain fixed income securities purchased on a delayed-delivery basis are marked to market daily until settlement at the forward settlement date. Short-term investments having a maturity of 60 days or less are generally valued at amortized cost. Exchange traded options, futures and options on futures are valued at the settlement price determined by the relevant exchange. With respect to any portion of the Portfolio’s assets that are invested in one or more open end management investment companies, the Portfolio’s net asset value (“NAV”) will be calculated based upon the NAVs of such investments.
Investments initially valued in currencies other than the U.S. dollar are converted to the U.S. dollar using exchange rates obtained from pricing services. As a result, the NAV of the Portfolio’s securities may be affected by changes in the value of currencies in relation to the U.S. dollar. The value of securities traded in markets outside the United States or denominated in currencies other than the U.S. dollar may be affected significantly on a day that the NYSE is closed and an investor is not able to purchase, redeem or exchange shares.
Securities and other assets for which market quotes are not readily available are valued at fair value as determined in good faith by the Board of Trustees or persons acting at their direction. The Board of Trustees has adopted methods for valuing securities and other assets in circumstances where market quotes are not readily available, and has delegated to Pacific Investment Management Company LLC (“PIMCO”) the responsibility for applying the valuation methods. In the event that market quotes are not readily available, and the security or asset cannot be valued pursuant to one of the valuation methods, the value of the security or asset will be determined in good faith by the Valuation Committee of the Board of Trustees, generally based upon recommendations provided by PIMCO.
Market quotes are considered not readily available in circumstances where there is an absence of current or reliable market-based data (e.g., trade information, bid/asked information, broker quotes), including where events occur after the close of the relevant market, but prior to the close of regular trading, that materially affect the values of the Portfolio’s securities or assets. In addition, market quotes are considered not readily available when, due to extraordinary circumstances, the exchanges or markets on which the securities trade, do not open for trading for the entire day and no other market prices are available. The Board has delegated to PIMCO the responsibility for monitoring significant events that may materially affect the values of the Portfolio’s securities or assets and for determining whether the value of the applicable securities or assets should be re-evaluated in light of such significant events.
When the Portfolio uses fair value pricing to determine its NAV, securities will not be priced on the basis of quotations from the primary market in which they are traded, but rather may be priced by another method that the Board of Trustees or persons acting at their direction believe accurately reflects fair value. The Trust’s policy is intended to result in a calculation of the Portfolio’s NAV that fairly reflects security values as of the time of pricing. However, fair values determined by the Board of Trustees or persons acting at their direction may not accurately reflect the price that the Portfolio could obtain for a security if it were to dispose of that security as of the time of pricing. Because foreign securities can trade on non-business days of the Portfolio, the NAV of the Portfolio may change on days when shareholders will not be able to purchase or redeem Portfolio shares. The prices used by the Portfolio may differ from the value that would be realized if the securities were sold and the differences could be material to the financial statements.
(b) Securities Transactions and Investment Income Securities transactions are recorded as of the trade date for financial reporting purposes. Securities purchased or sold on a when-issued or delayed-delivery basis may be settled a month or more after the trade date. Realized gains and losses from securities sold are recorded on the identified cost basis. Dividend income is recorded on the ex-dividend date, except certain dividends from foreign securities where the ex-dividend date may have passed, which are recorded as soon as the Portfolio is informed of the ex-dividend date. Interest income, adjusted for the accretion of discounts and amortization of premiums, is recorded on the accrual basis. Paydown gains and losses on mortgage-related and other asset-backed securities are recorded as components of interest income on the Statement of Operations.
(c) Dividends and Distributions to Shareholders Dividends from net investment income, if any, are declared daily and distributed to shareholders monthly. Net realized capital gains earned by the Portfolio, if any, will be distributed no less frequently than once each year.
Income dividends and capital gain distributions are determined in accordance with income tax regulations which may differ from GAAP. Differences between tax regulations and GAAP may change the fiscal year when income and capital items are recognized for tax and GAAP purposes. Examples of events that give rise to timing differences include wash sales, straddles, net operating losses and capital loss carryforwards. Further, the character of investment income and capital gains may be different for certain transactions under the two methods of accounting. Examples of characterization differences include the treatment of mortgage paydowns, swaps, foreign currency transactions and contingent debt instruments. As a result, income dividends and capital gain distributions declared during a fiscal period may differ significantly from the net investment income and realized capital gain reported on the Portfolio’s annual financial statements presented under GAAP.
Distributions classified as a tax basis return of capital, if any, are reflected on the accompanying Statements of Changes in Net Assets and have been reclassified to paid in capital. In addition, other amounts have been reclassified between
| | | | | | |
| | Semiannual Report | | June 30, 2007 | | 11 |
Notes to Financial Statements (Cont.)
undistributed net investment income, accumulated undistributed net realized gains or losses and/or paid in capital to more appropriately conform financial accounting to tax characterizations of dividend distributions.
(d) Multiclass Operations Each class offered by the Portfolio has equal rights as to assets and voting privileges (except that shareholders of a class have exclusive voting rights regarding any matter relating solely to that class of shares). Income and non-class specific expenses of the Portfolio are allocated daily to each class of shares based on the relative value of settled shares. Realized and unrealized capital gains and losses of the Portfolio are allocated daily to each class of shares based on the relative net assets of each class. Class specific expenses, where applicable, currently include administrative, distribution and servicing fees.
(e) Futures Contracts The Portfolio may enter into futures contracts. The Portfolio may use futures contracts to manage its exposure to the securities markets or to movements in interest rates and currency values. The primary risks associated with the use of futures contracts are the imperfect correlation between the change in market value of the securities held by the Portfolio and the prices of futures contracts, the possibility of an illiquid market, and the inability of the counterparty to meet the terms of the contract. Futures contracts are valued based upon their quoted daily settlement prices. Upon entering into a futures contract, the Portfolio is required to deposit with its futures broker, an amount of cash or U.S. Government and Agency Obligations in accordance with the initial margin requirements of the broker or exchange. Futures contracts are marked to market daily and an appropriate payable or receivable for the change in value (“variation margin”) is recorded by the Portfolio. Gains or losses are recognized but not considered realized until the contracts expire or are closed. Futures contracts involve, to varying degrees, risk of loss in excess of the variation margin disclosed on the Statement of Assets and Liabilities.
(f) Options Contracts The Portfolio may write call and put options on futures, swaps, securities or currencies it owns or in which it may invest. Writing put options tends to increase the Portfolio’s exposure to the underlying instrument. Writing call options tends to decrease the Portfolio’s exposure to the underlying instrument. When the Portfolio writes a call or put option, an amount equal to the premium received is recorded as a liability and subsequently marked to market to reflect the current value of the option written. These liabilities are reflected as written options outstanding on the Statement of Assets and Liabilities. Certain options may be written with premiums to be determined on a future date. The premiums for these options are based upon implied volatility parameters at specified terms. Premiums received from writing options which expire are treated as realized gains. Premiums received from writing options which are exercised or closed are added to the proceeds or offset against amounts paid on the underlying future, swap, security or currency transaction to determine the realized gain or loss. The Portfolio as a writer of an option has no control over whether the underlying future, swap, security or currency may be sold (call) or purchased (put) and as a result bears the market risk of an unfavorable change in the price of the future, swap, security or currency underlying the written option. There is the risk the Portfolio may not be able to enter into a closing transaction because of an illiquid market.
The Portfolio may also purchase put and call options. Purchasing call options tends to increase the Portfolio’s exposure to the underlying instrument. Purchasing put options tends to decrease the Portfolio’s exposure to the underlying instrument. The Portfolio pays a premium which is included on the Statement of Assets and Liabilities as an investment and subsequently marked to market to reflect the current value of the option. Premiums paid for purchasing options which expire are treated as realized losses. Certain options may be purchased with premiums to be determined on a future date. The premiums for these options are based upon implied volatility parameters at specified terms. The risk associated with
purchasing put and call options is limited to the premium paid. Premiums paid for purchasing options which are exercised or closed are added to the amounts paid or offset against the proceeds on the underlying future, swap, security or currency transaction to determine the realized gain or loss.
(g) Repurchase Agreements The Portfolio may engage in repurchase transactions. Under the terms of a typical repurchase agreement, the Portfolio takes possession of an underlying debt obligation (collateral) subject to an obligation of the seller to repurchase, and the Portfolio to resell, the obligation at an agreed-upon price and time. The underlying securities for all repurchase agreements are held in safekeeping at the Portfolio’s custodian or designated subcustodians under tri-party repurchase agreements. The market value of the collateral must be equal to or exceed the total amount of the repurchase obligations, including interest. Securities purchased under repurchase agreements are reflected as an asset on the Statement of Assets and Liabilities. Generally, in the event of counterparty default, the Portfolio has the right to use the collateral to offset losses incurred. If the counterparty should default, the Portfolio will seek to sell the securities which it holds as collateral. This could involve procedural costs or delays in addition to a loss on the securities if their value should fall below their repurchase price.
(h) Inverse Floating Rate Transactions—Residual Interest Municipal Bonds (“RIBs”)/Residual Interest Tax Exempt Bonds (“RITEs”) The Portfolio may invest in RIBs and RITEs (“Inverse Floaters”). Inverse Floaters are created via a master trust agreement between a broker-dealer, acting as trustor and liquidity provider, and an investment bank, acting as trustee and tender agent. The master trust agreement defines the terms for each trust series; with each series being established by the transfer of long-term, fixed-rate municipal bonds (“Fixed Rate Bonds”) to the trustee to be held and provide for the creation, execution and delivery of floater certificates (“Floating Rate Notes”) and Inverse Floaters. Floating Rate Notes are liquid notes that are issued with a short-term variable rate typically linked to the LIBOR, subject to limitations, for some duration. After interest income is paid on the Floating Rate Notes at current rates, the residual income from the Fixed Rate Bonds is paid to the Inverse Floaters. Inverse Floaters are issued with a coupon that fluctuates inversely with the Floating Rate Notes’ referenced rate, subject to certain limitations. Therefore, rising short-term rates result in lower income for the Inverse Floaters and vice versa.
Floating Rate Notes are generally remarketed to municipal money market funds. Inverse Floaters are acquired by either tax-exempt municipal bond funds or trusts, or other parties interested in potentially higher yielding tax-exempt securities. Inverse Floaters may also be acquired for the purpose of increasing leverage. Floating Rate Note holders typically have the option to tender their notes to the liquidity provider for redemption at par at each reset date. The Inverse Floater holders have the option to (i) require the Floating Rate Note holders to tender their notes at par, and (ii) require the liquidity provider to transfer the Fixed Rate Bonds to the Inverse Floater holders. The holders of Inverse Floaters bear substantially all of the downside investment risk associated with the underlying Fixed Rate Bonds, and also benefit from a disproportionate amount of the potential appreciation of the underlying Fixed Rate Bonds’ value. Inverse Floaters may be more volatile and less liquid than other municipal bonds of comparable maturity.
Inverse Floaters may be acquired with or without first transferring to the trustor the Fixed Rate Bonds that were utilized to create the trust series. Inverse Floaters acquired without a transfer of Fixed Rate Bonds are recognized as purchases of securities as outlined in Note 2(b). Statement of Financial Accounting Standards No. 140—Accounting for Transfers and Servicing of Financial Assets and Extinguishments of Liabilities (“FAS No. 140”), governs the standards for accounting for securitizations and other transfers of financial assets. If there is a transfer of Fixed Rate Bonds and it meets sale criteria under FAS No. 140, a Portfolio records a sale of the Fixed Rate Bonds and a purchase of the Inverse
| | | | |
| 12 | | PIMCO Variable Insurance Trust | | |
| | |
| |
| | | June 30, 2007 (Unaudited) |
Floaters. The cash received from the Inverse Floaters is then recorded as interest income in the Statement of Operations.
If the transfer of Fixed Rate Bonds does not meet sale criteria under FAS No. 140, a Portfolio accounts for the transaction described above as a secured borrowing by including the Fixed Rate Bonds in its Schedule of Investments, and recording the Floating Rate Notes as a liability under the caption “Payable for floating rate notes” in the Portfolio’s Statement of Assets and Liabilities. In a secured borrowing transaction, cash received from the Inverse Floaters is not recorded as interest income. Instead, a Portfolio records interest income related to the Fixed Rate Bonds and interest expense related to the Floating Rate Notes, the net of which is equal to the cash received from the Inverse Floaters acquired by the Portfolio. Thus, while a Portfolio’s reported total income, net expenses, and net expense ratio are generally higher for investments in Inverse Floaters acquired via a secured borrowing, the method of acquiring Inverse Floaters does not result in differences for reported cash flows, net asset value or total return.
(i) Swap Agreements The Portfolio may invest in swap agreements. Swap transactions are privately negotiated agreements between the Portfolio and a counterparty to exchange or swap investment cash flows, assets, or market-linked returns at specified, future intervals. The Portfolio may enter into interest rate, total return, forward spread-lock, credit default, and other forms of swap agreements to manage its exposure to interest rates and credit risk. In connection with these agreements, securities may be identified as collateral in accordance with the terms of the respective swap agreements.
Interest rate swap agreements involve the exchange by the Portfolio with another party of their respective commitments to pay or receive interest, e.g., an exchange of floating rate payments for fixed rate payments with respect to the notional amount of principal. Certain forms of interest rate swap agreements may include: (i) interest rate caps, under which, in return for a premium, one party agrees to make payments to the other to the extent that interest rates exceed a specified rate, or “cap”, (ii) interest rate floors, under which, in return for a premium, one party agrees to make payments to the other to the extent that interest rates fall below a specified rate, or “floor”, or (iii) interest rate collars, under which a party sells a cap and purchases a floor or vice versa in an attempt to protect itself against interest rate movements exceeding given minimum or maximum levels.
Total return swap agreements involve commitments to pay interest in exchange for a market-linked return, both based on notional amounts. To the extent the total return of the security or index underlying the transaction exceeds or falls short of the offsetting interest rate obligation, the Portfolio will receive a payment from or make a payment to the counterparty.
Forward spread-lock swap agreements involve commitments to pay or receive a settlement amount calculated as the difference between the swap spread and a fixed spread, multiplied by the notional amount times the duration of the swap. The swap spread is the difference between the benchmark swap rate (market rate) and the specific Treasury rate.
Credit default swap agreements involve one party making a stream of payments to another party in exchange for the right to receive a specified return in the event of a default by a third party, typically corporate issues or sovereign issues of an emerging country, on its obligation. The Portfolio may use credit default swaps to provide a measure of protection against defaults of the issuers (i.e., to reduce risk where the Portfolio owns or has exposure to the sovereign issuer) or to take an active long or short position with respect to the likelihood of a particular issuer’s default. As a seller of protection, the Portfolio generally receives an upfront payment or a fixed rate of income throughout the term of the swap provided that there is no credit event. If the Portfolio is a seller of protection and a credit event occurs, as defined under the terms of that particular swap agreement, the Portfolio
will pay to the buyer of the protection an amount up to the notional value of the swap and in certain instances take delivery of the security. As the seller, the Portfolio would effectively add leverage to its portfolio because, in addition to its total net assets, the Portfolio would be subject to investment exposure on the notional amount of the swap. As a buyer of protection, the Portfolio generally receives an amount up to the notional value of the swap if a credit event occurs. The treatment of credit default swaps and other swap agreements that provide for contingent, non-periodic, bullet-type payments as “notional principal contracts” for U.S. federal income tax purposes is uncertain. Were the U.S. Internal Revenue Service (“IRS”) to take the position that a credit default swap or other bullet-type swap is not a “notional principal contract” for U.S. federal income tax purposes, payments received by the Portfolio from such investments might be subject to U.S. excise or income taxes.
Swaps are marked to market daily based upon quotations from market makers and the change in value, if any, is recorded as unrealized gain or loss on the Statement of Operations. Payments received or made at the beginning of the measurement period are reflected as such on the Statement of Assets and Liabilities. These upfront payments are recorded as realized gain or loss on the Statement of Operations upon termination or maturity of the swap. A liquidation payment received or made at the termination of the swap is recorded as realized gain or loss on the Statement of Operations. Net periodic payments received or paid by the Portfolio are included as part of realized gain or loss on the Statement of Operations. Entering into these agreements involves, to varying degrees, elements of credit, market and documentation risk in excess of the amounts recognized on the Statement of Assets and Liabilities. Such risks involve the possibility that there will be no liquid market for these agreements, that the counterparty to the agreements may default on its obligation to perform or disagree as to the meaning of contractual terms in the agreements and that there may be unfavorable changes in interest rates.
(j) Mortgage-Related and Other Asset-Backed Securities The Portfolio may invest in mortgage-related or other asset-backed securities. These securities include mortgage pass-through securities, collateralized mortgage obligations (“CMOs”), commercial mortgage-backed securities, mortgage dollar rolls, CMO residuals, stripped mortgage-backed securities (“SMBSs”) and other securities that directly or indirectly represent a participation in, or are secured by and payable from, mortgage loans on real property. The value of some mortgage-related or asset-backed securities may be particularly sensitive to changes in prevailing interest rates. Early repayment of principal on some mortgage-related securities may expose the Portfolio to a lower rate of return upon reinvestment of principal. The value of these securities may fluctuate in response to the market’s perception of the creditworthiness of the issuers. Additionally, although mortgages and mortgage-related securities are generally supported by some form of government or private guarantee and/or insurance, there is no assurance that private guarantors or insurers will meet their obligations.
(k) U.S. Government Agencies or Government-Sponsored Enterprises Securities issued by U.S. Government agencies or government-sponsored enterprises may not be guaranteed by the U.S. Treasury. The Government National Mortgage Association (“GNMA” or “Ginnie Mae”), a wholly owned U.S. Government corporation, is authorized to guarantee, with the full faith and credit of the U.S. Government, the timely payment of principal and interest on securities issued by institutions approved by GNMA and backed by pools of mortgages insured by the Federal Housing Administration or guaranteed by the Department of Veterans Affairs. Government-related guarantors (i.e., not backed by the full faith and credit of the U.S. Government) include the Federal National Mortgage Association (“FNMA” or “Fannie Mae”) and the Federal Home Loan Mortgage Corporation (“FHLMC” or “Freddie Mac”). Pass-through securities issued by FNMA are guaranteed as to timely payment of principal and interest by FNMA but are not backed by the full faith and credit of the U.S. Government. FHLMC guarantees the
| | | | | | |
| | Semiannual Report | | June 30, 2007 | | 13 |
Notes to Financial Statements (Cont.)
timely payment of interest and ultimate collection of principal, but its participation certificates are not backed by the full faith and credit of the U.S. Government.
(l) New Accounting Policies In July 2006, the Financial Accounting Standards Board (“FASB”) issued Interpretation No. 48, “Accounting for Uncertainty in Income Taxes—an Interpretation of FASB Statement No. 109” (the “Interpretation”). The Interpretation became effective for the Portfolio on June 29, 2007. Management has evaluated the application of the Interpretation in relation to the Portfolio and has concluded that no single filing position or combination of filing positions identified as uncertain tax positions required the accrual of a tax liability in the accounting records of the Portfolio for the period ending June 30, 2007. Management will monitor all existing filing positions and future filing positions in light of the Interpretation and evaluate the need for any future tax accruals and financial statement disclosures as warranted.
In September 2006, the FASB issued Statement of Financial Accounting Standards No. 157, “Fair Value Measurements” (the “Statement”). The Statement is effective for fiscal years beginning after November 15, 2007 and will require expanded disclosure about fair value measurements, separately for each major category of assets and liabilities, that enables shareholders to assess the inputs used to develop those measurements, and for recurring fair value measurements using significant unobservable inputs the effect of the measurements on changes in net assets for the reporting period. Management is currently evaluating the application of the Statement to the Portfolio and will provide additional information in relation to the Statement on the Portfolio’s annual financial statements for the period ending December 31, 2007.
3. FEES AND EXPENSES
(a) Investment Advisory Fee PIMCO is a majority-owned subsidiary of Allianz Global Investors of America L.P. (“AGI”), and serves as investment adviser (the “Adviser”) to the Trust, pursuant to an investment advisory contract. The Adviser receives a monthly fee from the Portfolio, at an annual rate based on average daily net assets. The Advisory Fee for all classes is charged at an annual rate of 0.25%.
(b) Administration Fee PIMCO serves as administrator (the “Administrator”), and provides administrative services to the Trust for which it receives a monthly administrative fee based on each share class’s average daily net assets. As the Administrator, PIMCO bears the costs of various third-party services, including audit, custodial, portfolio accounting, legal, transfer agency and printing costs. The Administration Fee for all classes is charged at the annual rate of 0.25%.
(c) Distribution and Servicing Fees Allianz Global Investors Distributors LLC (“AGID”) is an indirect wholly-owned subsidiary of AGI and serves as the distributor (the “Distributor”) of the Trust’s shares. The Trust is permitted to reimburse AGID on a quarterly basis, out of the Administrative Class assets of the Portfolio in the amount of 0.15% on an annual basis of the average daily net assets of that class, for payments made to financial intermediaries that provide services in connection with the distribution of shares or administration of plans or programs that use Portfolio shares as their funding medium. The effective rate paid to AGID was 0.15% during the current fiscal year.
(d) Portfolio Expenses The Trust is responsible for the following expenses: (i) salaries and other compensation of any of the Trust’s executive officers and employees who are not officers, directors, stockholders or employees of PIMCO or its subsidiaries or affiliates; (ii) taxes and governmental fees; (iii) brokerage fees and commissions and other portfolio transaction expenses; (iv) the costs of borrowing money, including interest expenses and bank overdraft charges; (v) fees and expenses of the Trustees who are not “interested persons” of PIMCO or the Trust, and any counsel retained exclusively for their benefit; (vi) extraordinary expenses, including costs of litigation and indemnification expenses;
(vii) organization expenses and (viii) any expenses allocated or allocable to a specific class of shares, which include service fees payable with respect to the Administrative Class Shares, and may include certain other expenses as permitted by the Trust’s Multiple Class Plan adopted pursuant to Rule 18f-3 under the Act and subject to review and approval by the Trustees. The ratio of expenses to average net assets per share class, as disclosed in the Financial Highlights, may differ from the annual portfolio operating expenses per share class as disclosed in the Prospectus for the reasons set forth above.
Effective April 1, 2007, each Trustee, other than those affiliated with PIMCO or its affiliates, receives an annual retainer of $15,000, plus $2,375 for each Board of Trustees meeting attended in person, $500 for each committee meeting attended and $750 for each Board of Trustees meeting attended telephonically, plus reimbursement of related expenses. In addition, the audit committee chair receives an additional annual retainer of $2,000 and each other committee chair receives an additional annual retainer of $500. These expenses are allocated on a pro-rata basis to the various portfolios of the Trust according to their respective net assets. The Trust pays no compensation directly to any Trustee or any other officer who is affiliated with the Administrator, all of whom receive remuneration for their services to the Trust from the Administrator or its affiliates. Prior to April 1, 2007, each Trustee, other than those affiliated with PIMCO or its affiliates, received an annual retainer of $15,000 plus $2,000 for each Board of Trustees meeting attended ($500 for each special meeting attended), plus reimbursement of related expenses. The Audit Committee Chairman received an annual retainer of $1,500 and the Governance Committee Chairman received an annual retainer of $500. In addition, each member of a committee received $500 for each committee meeting attended.
4. RELATED PARTY TRANSACTIONS
The Adviser, Administrator, and Distributor are related parties as defined by FAS 57, Related Party Disclosures. Fees payable to these parties are disclosed in Note 3.
5. GUARANTEES AND INDEMNIFICATIONS
Under the Trust’s organizational documents, each Trustee, officer, employee or other agent of the Trust (including the Trust’s investment manager) is indemnified, to the extent permitted by the Act, against certain liabilities that may arise out of performance of their duties to the Portfolio. Additionally, in the normal course of business, the Portfolio enters into contracts that contain a variety of indemnification clauses. The Portfolio’s maximum exposure under these arrangements is unknown as this would involve future claims that may be made against the Portfolio that have not yet occurred. However, the Portfolio has not had prior claims or losses pursuant to these contracts and believes the risk of loss to be remote.
6. PURCHASES AND SALES OF SECURITIES
The length of time the Portfolio has held a particular security is not generally a consideration in investment decisions. A change in the securities held by the Portfolio is known as “portfolio turnover”. The Portfolio may engage in frequent and active trading of portfolio securities to achieve its investment objective, particularly during periods of volatile market movements. High portfolio turnover (e.g., over 100%) involves correspondingly greater expenses to the Portfolio, including brokerage commissions or dealer mark-ups and other transaction costs on the sale of securities and reinvestments in other securities. Such sales may also result in realization of taxable capital gains, including short-term capital gains (which are generally taxed at ordinary income tax rates). The trading costs and tax effects associated with portfolio turnover may adversely affect the Portfolio’s performance.
| | | | |
| 14 | | PIMCO Variable Insurance Trust | | |
| | |
| |
| | | June 30, 2007 (Unaudited) |
Purchases and sales of securities (excluding short-term investments) for the period ended June 30, 2007, were as follows (amounts in thousands):
| | | | | | | | | | | | |
| U.S. Government/Agency | | | | All Other |
| Purchases | | Sales | | | | Purchases | | Sales |
| $ | 5,691 | | $ | 6,039 | | | | $ | 1,751 | | $ | 1,019 |
7. TRANSACTIONS IN WRITTEN CALL AND PUT OPTIONS
Transactions in written call and put options were as follows (amounts in thousands, except for number of contracts):
| | | | | | | | | | | | | |
| | | | | # of
Contracts | | | Notional
Amount in $ | | | Premium | |
Balance at 12/31/2006 | | | | 4 | | | $ | 4,900 | | | $ | 48 | |
Sales | | | | 0 | | | | 4,900 | | | | 56 | |
Closing Buys | | | | (4 | ) | | | (4,900 | ) | | | (48 | ) |
Expirations | | | | 0 | | | | 0 | | | | 0 | |
Exercised | | | | 0 | | | | 0 | | | | 0 | |
Balance at 06/30/2007 | | | | 0 | | | $ | 4,900 | | | $ | 56 | |
8. SHARES OF BENEFICIAL INTEREST
The Portfolio may issue an unlimited number of shares of beneficial interest with a $0.001 par value. Changes in shares of beneficial interest were as follows (shares and amounts in thousands):
| | | | | | | | | | | | | | | | |
| | | | | Six Months Ended
06/30/2007 | | | Year Ended 12/31/2006 | |
| | | | | Shares | | | Amount | | | Shares | | | Amount | |
| | | | | |
Receipts for shares sold | | | | | | | | | | | | | | | | |
Institutional Class | | | | 0 | | | $ | 0 | | | 302 | | | $ | 3,025 | |
Administrative Class | | | | 0 | | | | 0 | | | 225 | | | | 2,262 | |
Issued as reinvestment of distributions | | | | | | | | | | | | | | | | |
Institutional Class | | | | 1 | | | | 4 | | | 1 | | | | 12 | |
Administrative Class | | | | 9 | | | | 92 | | | 125 | | | | 1,236 | |
Cost of shares redeemed | | | | | | | | | | | | | | | | |
Institutional Class | | | | (19 | ) | | | (183 | ) | | (285 | ) | | | (2,857 | ) |
Administrative Class | | | | (29 | ) | | | (273 | ) | | (2,446 | ) | | | (24,701 | ) |
Net (decrease) resulting from Portfolio share transactions | | | | (38 | ) | | $ | (360 | ) | | (2,078 | ) | | $ | (21,023 | ) |
The following schedule shows the number of shareholders each owning 5% or more of the Portfolio and the total percentage of the Portfolio held by such shareholders:
| | | | | | |
| | | | | Number of
Shareholders | | % of Portfolio
Held |
Institutional Class | | | | 2 | | 100 |
Administrative Class | | | | 1 | | 100 |
9. REGULATORY AND LITIGATION MATTERS
Since February 2004, PIMCO, Allianz Global Investors of America L.P. (PIMCO’s parent company), AGID, and certain of their affiliates, including the PIMCO Funds (another series of funds managed by PIMCO), the Allianz Funds (formerly known as PIMCO Funds: Multi-Manager Series (another series of funds managed by
affiliates of PIMCO)), certain Trustees of the Trust (in their capacity as Trustees of the PIMCO Funds or the Allianz Funds) and certain employees of PIMCO, have been named as defendants in fifteen lawsuits filed in various jurisdictions. Eleven of those lawsuits concern “market timing,” and they have been transferred to and consolidated for pre-trial proceedings in a multi-district litigation proceeding in the U.S. District Court for the District of Maryland; the other four lawsuits concern “revenue sharing” and have been consolidated into a single action in the U.S. District Court for the District of Connecticut. The lawsuits have been commenced as putative class actions on behalf of investors who purchased, held or redeemed shares of the various series of the PIMCO Funds and the Allianz Funds during specified periods, or as derivative actions on behalf of the PIMCO Funds and the Allianz Funds.
The market timing actions in the District of Maryland generally allege that certain hedge funds were allowed to engage in “market timing” in certain funds of the PIMCO Funds and the Allianz Funds and this alleged activity was not disclosed. Pursuant to tolling agreements entered into with the derivative and class action plaintiffs, PIMCO, certain PIMCO Funds Trustees, and certain employees of PIMCO who were previously named as defendants have all been dropped as defendants in the market timing actions; the plaintiffs continue to assert claims on behalf of the shareholders of the PIMCO Funds or on behalf of the PIMCO Funds itself against other defendants. By order dated November 3, 2005, the U.S. District Court for the District of Maryland granted the PIMCO Funds’ motion to dismiss claims asserted against it in a consolidated amended complaint where the PIMCO Funds were named, in the complaint, as a nominal defendant. The revenue sharing action in the District of Connecticut generally alleges that fund assets were inappropriately used to pay brokers to promote funds of the PIMCO Funds and the Allianz Funds, including directing fund brokerage transactions to such brokers, and that such alleged arrangements were not fully disclosed to shareholders. On August 11, 2005, the U.S. District Court for the District of Connecticut conducted a hearing on defendants’ motion to dismiss the consolidated amended complaint in the revenue sharing action but has not yet ruled on the motion to dismiss. The market timing and revenue sharing lawsuits seek, among other things, unspecified compensatory damages plus interest and, in some cases, punitive damages, the rescission of investment advisory contracts, the return of fees paid under those contracts and restitution.
Two nearly identical class action civil complaints have been filed in August 2005, in the Northern District of Illinois Eastern Division, alleging that the plaintiffs each purchased and sold a 10-year Treasury note futures contract and suffered damages from an alleged shortage when PIMCO held both physical and futures positions in 10-year Treasury notes for its client accounts. The two actions have been consolidated into one action, and the two separate complaints have been replaced by a consolidated complaint. PIMCO is a named defendant, and PIMCO Funds has been added as a defendant, to the consolidated action. PIMCO strongly believes the complaint is without merit and intends to vigorously defend itself.
In April 2006, certain portfolios of the Trust and certain other funds managed by PIMCO were served in an adversary proceeding brought by the Official Committee of Asbestos Claimants of G-I Holdings, Inc. in G-I Holdings, Inc.’s bankruptcy in the District of New Jersey. In July 2004, PIMCO was named in this lawsuit and remains a defendant. The plaintiff seeks to recover for the bankruptcy estate assets that were transferred by the predecessor entity of G-I Holdings, Inc. to a wholly-owned subsidiary in 1994. The subsidiary has since issued notes, of which certain portfolios of the Trust and certain other funds managed by PIMCO are alleged to be holders. The complaint alleges that in 2000, more than two hundred noteholders—including certain portfolios of the Trust and certain other funds managed by PIMCO—were granted a second priority lien on the assets of the subsidiary in exchange for their consent to a refinancing transaction and the
| | | | | | |
| | Semiannual Report | | June 30, 2007 | | 15 |
Notes to Financial Statements (Cont.)
granting of a first priority lien to the lending banks. The plaintiff is seeking invalidation of the lien in favor of the noteholders and/or the value of the lien. On June 21, 2006, the District of New Jersey overturned the Bankruptcy Court’s decision granting permission to file the adversary proceeding and remanded the matter to the Bankruptcy Court for further proceedings. Following a motion to reconsider, the District Court upheld its remand on August 7, 2006, and instructed the Bankruptcy Court to conduct a “cost-benefit” analysis of the Committee’s claims, including the claims against the noteholders. The Bankruptcy Court held a status conference on October 25, 2006 and set a briefing schedule relating to this cost-benefit analysis.
The foregoing speaks only as of the date of this report. It is possible that these matters and/or other developments resulting from these matters could result in increased portfolio redemptions or other adverse consequences to the Portfolio. However, PIMCO and AGID believe that these matters are not likely to have a material adverse effect on the Portfolio or on PIMCO’s or AGID’s ability to perform their respective investment advisory or distribution services relating to the Portfolio.
10. FEDERAL INCOME TAX MATTERS
The Portfolio intends to qualify as a regulated investment company under sub-chapter M of the Internal Revenue Code (the “Code”) and distribute all of its taxable income and net realized gains, if applicable, to shareholders. Accordingly, no provision for Federal income taxes has been made.
As of June 30, 2007, the aggregate cost of investments was the same for federal income tax and financial statement purposes. The net unrealized appreciation (depreciation) of investment securities for federal income tax purposes is as follows (amount in thousands):
| | | | |
Aggregate
Gross
Unrealized
Appreciation | | Aggregate
Gross
Unrealized
(Depreciation) | | Net
Unrealized
(Depreciation) |
$ 1 | | $ (74) | | $ (73) |
| | | | |
| 16 | | PIMCO Variable Insurance Trust | | |
| | |
| |
Privacy Policy* | | (Unaudited) |
The Funds consider customer privacy to be a fundamental aspect of their relationships with shareholders and are committed to maintaining the confidentiality, integrity and security of their current, prospective and former shareholders’ personal information. To ensure their shareholders’ privacy, the Funds have developed policies that are designed to protect this confidentiality, while allowing shareholder needs to be served.
Obtaining Personal Information
In the course of providing shareholders with products and services, the Funds and certain service providers to the Funds, such as the Funds’ investment advisers (“Advisers”), may obtain non-public personal information about shareholders, which may come from sources such as account applications and other forms, from other written, electronic or verbal correspondence, from shareholder transactions, from a shareholder’s brokerage or financial advisory firm, financial adviser or consultant, and/or from information captured on the Funds’ internet web sites.
Respecting Your Privacy
As a matter of policy, the Funds do not disclose any personal or account information provided by shareholders or gathered by the Funds to non-affiliated third parties, except as required or permitted by law or as necessary for such third parties to perform their agreements with respect to the Funds. As is common in the industry, non-affiliated companies may from time to time be used to provide certain services, such as preparing and mailing prospectuses, reports, account statements and other information, conducting research on shareholder satisfaction and gathering shareholder proxies. A Fund’s Distributor may also retain non-affiliated companies to market the Fund’s shares or products which use the Fund’s shares and enter into joint marketing agreements with other companies. These companies may have access to a shareholder’s personal and account information, but are permitted to use this information solely to provide the specific service or as otherwise permitted by law. In most cases, the shareholders will be clients of a third party, but the Funds may also provide a shareholder’s personal and account information to the shareholder’s respective brokerage or financial advisory firm.
Sharing Information with Third Parties
The Funds reserve the right to disclose or report personal information to non-affiliated third parties, in limited circumstances, where the Funds believe in good faith that disclosure is required under law to cooperate with regulators or law enforcement authorities, to protect their rights or property or upon reasonable request by any Fund in which a shareholder has chosen to invest. In addition, the Funds may disclose information about a shareholder’s accounts to a non-affiliated third party with the consent of the shareholder.
Sharing Information with Affiliates
The Funds may share shareholder information with their affiliates in connection with servicing their shareholders’ accounts or to provide shareholders with information about products and services that the Funds or their Advisers, principal underwriters or their affiliates (“Service Affiliates”) believe may be of interest to such shareholders. The information that the Funds share may include, for example, a shareholder’s participation in one of the Funds or in other investment programs sponsored by a Service Affiliate, a shareholder’s ownership of certain types of accounts (such as IRAs), or other data about a shareholder’s accounts. The Funds’ Service Affiliates, in turn, are not permitted to share shareholder information with non-affiliated entities, except as required or permitted by law.
Procedures to Safeguard Private Information
The Funds take seriously the obligation to safeguard shareholder non-public personal information. In addition to this policy, the Funds have also implemented procedures that are designed to restrict access to a shareholder’s non-public personal information only to internal personnel who need to know that information in order to provide products or services to such shareholders. In order to guard a shareholder’s non-public personal information, physical, electronic and procedural safeguards are in place.
* This Privacy Policy applies to the following entities: PIMCO Funds, PIMCO Variable Insurance Trust, PCM Fund, Inc. and PIMCO Strategic Global Government Fund, Inc. (collectively, the “Funds”).
| | | | | | |
| | Semiannual Report | | June 30, 2007 | | 17 |
Investment Adviser and Administrator
Pacific Investment Management Company LLC
840 Newport Center Drive
Newport Beach, California 92660
Distributor
Allianz Global Investors Distributors LLC
1345 Avenue of the Americas
New York, New York 10105
Custodian
State Street Bank & Trust Company
801 Pennsylvania
Kansas City, Missouri 64105
Transfer Agent
Boston Financial Data Services–Midwest
330 W. 9th Street
Kansas City, Missouri 64105
Legal Counsel
Dechert LLP
1775 I Street, N.W.
Washington, D.C. 20006
Independent Registered Public Accounting Firm
PricewaterhouseCoopers LLP
1055 Broadway
Kansas City, Missouri 64105
P I M C O
| | | | | | |
| |
Item 2. | | Code of Ethics |
| |
| | | The information required by this Item 2 is only required in an annual report on this Form N-CSR. |
| |
Item 3. | | Audit Committee Financial Expert |
| |
| | | The information required by this Item 3 is only required in an annual report on this Form N-CSR. |
| |
Item 4. | | Principal Accountant Fees and Services |
| |
| | | The information required by this Item 4 is only required in an annual report on this Form N-CSR. |
| |
Item 5. | | Audit Committee of Listed Registrants. Not applicable. |
| |
Item 6. | | Schedule of Investments. The Schedule of Investments is included as part of the reports to shareholders under Item 1. |
| |
Item 7. | | Disclosure of Proxy Voting Policies and Procedures for Closed-End Management Investment Companies. Not applicable. |
| |
Item 8. | | Portfolio Managers of Closed-End Management Investment Companies. Not applicable. |
| |
Item 9. | | Purchases of Equity Securities by Closed-End Management Investment Company and Affiliated Purchases. Not applicable. |
| |
Item 10. | | Submission of Matters to a Vote of Security Holders. Not applicable. |
| |
Item 11. | | Controls and Procedures |
| | |
| | | (a) | | The principal executive officer and principal financial officer of PIMCO Variable Insurance Trust (“Trust”) have concluded that the Trust’s disclosure controls and procedures (as defined in Rule 30a-3(c) under the Investment Company Act of 1940, as amended (“1940 Act”)) provide reasonable assurances that material information relating to the Trust is made known to them by the appropriate persons, based on their evaluation of these controls and procedures as of a date within 90 days of the filing of this report. |
| | |
| | | (b) | | There were no changes in the Trust’s internal control over financial reporting (as defined in Rule 30a-3(d) under the 1940 Act) that occurred during the second fiscal quarter of the period covered by this report that have materially affected, or are reasonably likely to materially affect, the Trust’s internal control over financial reporting. |
| | |
Item 12. | | Exhibits | | |
| | |
| | | (a)(1) | | Code of Ethics. Not applicable for semiannual reports. |
| | |
| | | (a)(2) | | Exhibit 99.CERT—Certifications pursuant to Section 302 of the Sarbanes-Oxley Act of 2002. |
| | |
| | | (b) | | Exhibit 99.906CERT—Certifications pursuant to Section 906 of the Sarbanes-Oxley Act of 2002. |
Signatures
Pursuant to the requirements of the Securities Exchange Act of 1934 and the Investment Company Act of 1940, the registrant has duly caused this report to be signed on its behalf by the undersigned, thereunto duly authorized.
| | |
| PIMCO Variable Insurance Trust |
| |
By: | | /s/ ERNEST L. SCHMIDER
|
| | | Ernest L. Schmider |
| | | President, Principal Executive Officer |
| |
Date: | | September 4, 2007 |
Pursuant to the requirements of the Securities Exchange Act of 1934 and the Investment Company Act of 1940, this report has been signed below by the following persons on behalf of the registrant and in the capacities and on the dates indicated.
| | |
| |
By: | | /s/ ERNEST L. SCHMIDER
|
| | | Ernest L. Schmider |
| | | President, Principal Executive Officer |
| |
Date: | | September 4, 2007 |
| |
By: | | /s/ JOHN P. HARDAWAY
|
| | | John P. Hardaway |
| | | Treasurer, Principal Financial Officer |
| |
Date: | | September 4, 2007 |