UNITED STATES
SECURITIES AND EXCHANGE COMMISSION
Washington, D.C. 20549
FORM N-CSR
CERTIFIED SHAREHOLDER REPORT OF REGISTERED MANAGEMENT
INVESTMENT COMPANIES
Investment Company Act file number: 811-8399
PIMCO Variable Insurance Trust
(Exact name of registrant as specified in charter)
840 Newport Center Drive, Newport Beach, CA 92660
(Address of principal executive offices)
John P. Hardaway
Treasurer
PIMCO Funds
840 Newport Center Drive
Newport Beach, CA 92660
(Name and address of agent for service)
Copies to:
Brendan Fox
Dechert LLP
1775 I Street, N.W.
Washington, D.C. 20006
Registrant’s telephone number, including area code: (949) 720-4761
Date of fiscal year end: December 31
Date of reporting period: January 1, 2004 – June 30, 2004
Form N-CSR is to be used by management investment companies to file reports with the Commission not later than 10 days after the transmission to stockholders of any report that is required to be transmitted to stockholders under Rule 30e-1 under the Investment Company Act of 1940 (17 CFR 270.30e-1). The Commission may use the information provided on Form N-CSR in its regulatory, disclosure review, inspection, and policymaking roles.
A registrant is required to disclose the information specified by Form N-CSR, and the Commission will make this information public. A registrant is not required to respond to the collection of information contained in Form N-CSR unless the Form displays a currently valid Office of Management and Budget (“OMB”) control number. Please direct comments concerning the accuracy of the information collection burden estimate and any suggestions for reducing the burden to Secretary, Securities and Exchange Commission, 450 Fifth Street, NW, Washington, DC 20549-0609. The OMB has reviewed this collection of information under the clearance requirements of 44 U.S.C. § 3507.
Item 1. Reports to Stockholders.
The following is a copy of the report transmitted to stockholders pursuant to Rule 30e-1 under the Act (17 CFR 270.30e-1).

PIMCO VARIABLE INSURANCE TRUST
HIGH YIELD PORTFOLIO
ADMINISTRATIVE CLASS
SEMI-ANNUAL REPORT
June 30, 2004
|
| This material is authorized for use only when preceded or accompanied by the current PIMCO Variable Insurance Trust prospectus. Investors should consider the investment objectives, risks, charges and expenses of Portfolio carefully before investing. This and other information is contained in the Portfolio’s prospectus. Please read the prospectus carefully before you invest or send money. |
Chairman’s Letter
Dear PIMCO Variable Insurance Trust Shareholder:
Bond prices were more volatile during the six-month period ended June 30, 2004. Interest rates rose sharply during the second quarter 2004, causing bonds to give back modest gains from earlier in the year. The Lehman Brothers Aggregate Bond Index, a widely used index for the high-grade bond market, was nearly flat during the first six months of 2004, returning 0.15% after losing 2.44% during the second quarter. The yield on the benchmark ten-year Treasury closed June 30, 2004 at 4.58%, up 0.75% from April 1, 2004, but up only 0.34% from where it began the six-month period on January 1, 2004.
Continued growth in employment convinced the markets that the Federal Reserve would soon begin a long anticipated tightening cycle. On June 30, 2004, the Fed met market expectations by increasing the federal funds rate 0.25%, which was the first rate increase since June 25, 2003. The central bank had held this rate at 1% for more than a year, which generated negative real short-term rates. And on August 10, 2004, the Fed increased the federal funds rate another 0.25% to 1.50%.
Investors that had profited handsomely from borrowing at low short-term rates and investing in higher-yielding longer maturity bonds surrendered some of those profits towards the latter part of the six-month period. Concern that borrowing rates would rise led investors to liquidate long positions and unwind these trades, which caused bond prices to decrease. However, substantial leverage remained among banks, hedge funds, and other investors, making bond markets somewhat vulnerable to additional Fed rate increases. There were also signs of rising inflation, which fueled anxiety that central banks might continue to raise interest rates.
On the following pages you will find a more complete review of the Portfolio in light of financial market activities as well as specific details about the total return investment performance for the six-month period.
We appreciate the trust you have placed in us, and we will continue to focus our efforts to meet your investment needs.
Sincerely,

Brent R. Harris
Chairman
August 11, 2004
| | | | |
| June 30, 2004 | | Semi-Annual Report | | 1 |
Important Information About the Portfolio
We believe that bond funds have an important role to play in a well diversified investment portfolio. It is important to note, however, that in an environment where interest rates may trend upward, rising rates will negatively impact the performance of most bond funds, and fixed income securities held by a fund are likely to decrease in value. The price volatility of fixed income securities can also increase during periods of rising interest rates resulting in increased losses to a fund. Bond funds and individual bonds with a longer duration (a measure of the expected life of a security) tend to be more sensitive to changes in interest rates, usually making them more volatile than securities or funds with shorter durations. The longer-term performance of most bond funds has benefited from capital gains in part resulting from an extended period of declining interest rates. In the event interest rates increase, these capital gains should not be expected to recur.
The Portfolio may be subject to various risks in addition to those described above. Some of these risks may include, but are not limited to, the following: real rate risk, derivative risk, small company risk, foreign security risk, high yield security risk and specific sector investment risks. The Portfolio may use derivative instruments for hedging purposes or as part of an investment strategy. Use of these instruments may involve certain costs and risks such as liquidity risk, interest rate risk, market risk, credit risk, management risk and the risk that a fund could not close out a position when it would be most advantageous to do so. A Portfolio investing in derivatives could lose more than the principal amount invested in these instruments. Investing in non-U.S. securities may entail risk due to non-U.S. economic and political developments; this risk may be enhanced when investing in emerging markets. High-yield bonds typically have a lower credit rating than other bonds. Lower rated bonds generally involve a greater risk to principal than higher rated bonds. Smaller companies may be more volatile than larger companies and may entail more risk. Concentrating investments in individual sectors may add additional risk and volatility compared to a diversified portfolio.
On the performance summary page in this semi-annual report, the Total Return Investment Performance table measures performance assuming that all dividend and capital gain distributions were reinvested. Returns do not reflect the deduction of taxes that a shareholder would pay (i) on Portfolio distributions or (ii) the redemption of Portfolio shares.
An investment in a Portfolio is not a bank deposit and is not guaranteed or insured by the Federal Deposit Insurance Corporation or any other government agency. It is possible to lose money on investments in the Funds.
The following disclosure provides important information regarding the Portfolio’s Expense Example, which appears on the Portfolio’s individual page in this semi-annual report. Please refer to this information when reviewing the Expense Example for the Portfolio.
Example
As a shareholder of the Portfolio, you incur two types of costs: (1) transaction costs, including redemption and exchange fees; and (2) ongoing costs, including advisory and administrative fees; distribution and/or service (12b-1) fees (Administrative Class only); and other Portfolio expenses. The Example is intended to help you understand your ongoing costs (in dollars) of investing in the Portfolio and to compare these costs with the ongoing costs of investing in other mutual funds.
The Example is based on an investment of $1,000 invested at the beginning of the period and held for the entire period indicated, which is from 1/1/04 to 6/30/04.
Actual Expenses
The information in the table under the heading “Actual Performance” provides information about actual account values and actual expenses. You may use the information in these columns, together with the amount you invested, to estimate the expenses that you paid over the period. Simply divide your account value by $1,000.00 (for example, an $8,600.00 account value divided by $1,000 = 8.60), then multiply the result by the number in the appropriate column for your share class, in the row entitled “Expenses Paid During Period” to estimate the expenses you paid on your account during this period.
Hypothetical Example for Comparison Purposes
The information in the table under the heading “Hypothetical Performance (5% return before expenses)” provides information about hypothetical account values and hypothetical expenses based on the Portfolio’s actual expense ratio and an assumed rate of return of 5% per year before expenses, which is not the Portfolio’s actual return. The hypothetical account values and expenses may not be used to estimate the actual ending account balance or expenses you paid for the period. You may use this information to compare the ongoing costs of investing in the Portfolio and other portfolios. To do so, compare this 5% hypothetical example with the 5% hypothetical examples that appear in the shareholder reports of the other portfolios.
Please note that the expenses shown in the table are meant to highlight your ongoing costs only and do not reflect any transactional costs. Therefore, the information under the heading “Hypothetical Performance (5% return before expenses)” is useful in comparing ongoing costs only, and will not help you determine the relative total costs of owning different portfolios. In addition, if these transactional costs were included, your costs would have been higher.
PIMCO Variable Insurance Trust is distributed by PA Distributors LLC, 2187 Atlantic Street, Stamford, CT 06902.
| | | | |
| 2 | | Semi-Annual Report | | June 30, 2004 |
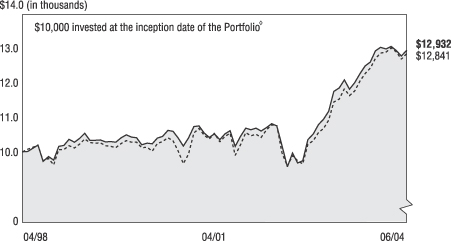
High Yield Portfolio
CUMULATIVE RETURNS THROUGH JUNE 30, 2004
[CHART]
Merrill Lynch
High Yield U.S. High Yield
Portfolio Admin. Class BB-B Rated Index
---------------------- ----------------
04/30/1998 $10,000 $10,000
05/31/1998 $10,004 $10,069
06/30/1998 $10,101 $10,126
07/31/1998 $10,195 $10,189
08/31/1998 $9,722 $9,739
09/30/1998 $9,858 $9,806
10/31/1998 $9,760 $9,617
11/30/1998 $10,152 $10,066
12/31/1998 $10,180 $10,062
01/31/1999 $10,357 $10,173
02/28/1999 $10,279 $10,106
03/31/1999 $10,383 $10,219
04/30/1999 $10,539 $10,370
05/31/1999 $10,335 $10,263
06/30/1999 $10,331 $10,244
07/31/1999 $10,338 $10,260
08/31/1999 $10,288 $10,175
09/30/1999 $10,292 $10,159
10/31/1999 $10,277 $10,121
11/30/1999 $10,403 $10,243
12/31/1999 $10,486 $10,321
01/31/2000 $10,419 $10,272
02/29/2000 $10,401 $10,276
03/31/2000 $10,205 $10,117
04/30/2000 $10,253 $10,127
05/31/2000 $10,226 $10,020
06/30/2000 $10,393 $10,240
07/31/2000 $10,443 $10,290
08/31/2000 $10,619 $10,409
09/30/2000 $10,589 $10,317
10/31/2000 $10,397 $10,014
11/30/2000 $10,162 $9,661
12/31/2000 $10,396 $9,922
01/31/2001 $10,726 $10,542
02/28/2001 $10,742 $10,672
03/31/2001 $10,540 $10,478
04/30/2001 $10,417 $10,372
05/31/2001 $10,516 $10,530
06/30/2001 $10,354 $10,286
07/31/2001 $10,514 $10,439
08/31/2001 $10,607 $10,530
09/30/2001 $10,155 $9,894
10/31/2001 $10,450 $10,216
11/30/2001 $10,678 $10,551
12/31/2001 $10,640 $10,457
01/31/2002 $10,682 $10,509
02/28/2002 $10,603 $10,412
03/31/2002 $10,701 $10,636
04/30/2002 $10,814 $10,776
05/31/2002 $10,751 $10,755
06/30/2002 $10,185 $9,974
07/31/2002 $9,566 $9,586
08/31/2002 $9,966 $9,889
09/30/2002 $9,673 $9,738
10/31/2002 $9,744 $9,649
11/30/2002 $10,351 $10,210
12/31/2002 $10,513 $10,322
01/31/2003 $10,788 $10,553
02/28/2003 $10,945 $10,675
03/31/2003 $11,176 $10,917
04/30/2003 $11,740 $11,444
05/31/2003 $11,846 $11,520
06/30/2003 $12,076 $11,816
07/31/2003 $11,811 $11,620
08/31/2003 $11,994 $11,754
09/30/2003 $12,263 $12,045
10/31/2003 $12,478 $12,265
11/30/2003 $12,589 $12,422
12/31/2003 $12,916 $12,690
01/31/2004 $13,016 $12,854
02/29/2004 $12,970 $12,882
03/31/2004 $13,046 $12,996
04/30/2004 $12,928 $12,887
05/31/2004 $12,767 $12,680
06/30/2004 $12,932 $12,841
SECTOR BREAKDOWN‡
| | | |
Industrials | | 56.6 | % |
Utilities | | 12.7 | % |
Banking & Finance | | 10.8 | % |
Short-Term Instruments | | 6.5 | % |
Sovereign Issues | | 5.8 | % |
Other | | 7.6 | % |
‡ % of Total Investments as of June 30, 2004
à$10,000 invested at the beginning of the first full month following the inception of the Administrative Class.
TOTAL RETURN INVESTMENT PERFORMANCE For the period ended June 30, 2004
| | | | | | | | | | | | | | | | |
| | | | | | | 6 Months | | | 1 Year | | | 5 Years* | | | Since Inception* | |
| | |
| | High Yield Portfolio Administrative Class (Inception 04/30/98) | | 0.13 | % | | 7.09 | % | | 4.59 | % | | 4.27 | % |
| | | - - - - - - - | | Merrill Lynch U.S. High Yield BB-B Rated Index | | 1.18 | % | | 8.67 | % | | 4.62 | % | | — | |
| | | | | * Annualized. All Portfolio returns are net of fees and expenses. | | | | | | | | | | | | |
Past performance is no guarantee of future results. The performance quoted represents past performance. Investment return and principal value will fluctuate so the Portfolio shares, when redeemed, may be worth more or less than their original cost. Current performance may be lower or higher than the performance data quoted. Performance data current to the most recent month-end is available by calling (800) 927-4648.
Please refer to page 2 herein for an explanation of the information presented in the following Expense Example.
| | | | | | | | | | |
| EXPENSE EXAMPLE | | | | Actual Performance | | | | Hypothetical Performance
(5% return before expenses) |
Beginning Account Value (01/01/04) | | | | $ | 1,000.00 | | | | $ | 1,000.00 |
Ending Account Value (06/30/04) | | | | $ | 1,001.30 | | | | $ | 1,025.00 |
Expenses Paid During Period† | | | | $ | 3.73 | | | | $ | 3.78 |
†Expenses are equal to the Portfolio’s Administrative Class annualized expense ratio of 0.75%, multiplied by the average account value over the period, multiplied by 182/366 (to reflect the one-half year period).
PORTFOLIO INSIGHTS
| • | The High Yield Portfolio seeks to achieve its investment objective by investing under normal circumstances at least 80% of its assets in a diversified portfolio of high yield securities rated below investment grade but rated at least Caa (subject to a maximum of 5% of total assets in securities rated Caa) by Moody’s or S&P, or, if unrated, determined by PIMCO to be of comparable quality. |
| • | The Portfolio’s Administrative Class shares returned 0.13% for the six-month period ended June 30, 2004, compared to 1.18% for the Merrill Lynch U.S. High Yield BB-B Rated Index. |
| • | During the semi-annual period, chemical issues outperformed the high yield market by more than 3%, thus the Portfolio’s underweight to the sector hurt performance. |
| • | An overweight to telecom, with an emphasis on large-cap issues, was a detriment to relative performance as this sector was one of the worst performers during the period. |
| • | Although an overweight to the cable/pay TV sector was a slight detractor to performance, security selection was a strong positive and more than offset the negative impact. |
| • | As the airline sector fell lower, due in part to high fuel prices and the threat of terrorism, an emphasis on higher quality secured issues boosted returns. |
| • | Modest exposure to emerging market sovereign debt detracted from performance, as this asset class declined approximately 2.25% over the 6-month period. |
| | | | |
| June 30, 2004 | | Semi-Annual Report | | 3 |
Financial Highlights
High Yield Portfolio (Administrative Class)
| | | | | | | | | | | | | | | | | | | | | | | | | | | | | | | | | | | | |
Selected Per Share Data for the
Year or Period Ended: | | | | 06/30/2004+ | | | | | 12/31/2003 | | | | | 12/31/2002 | | | | | 12/31/2001 | | | | | 12/31/2000 | | | | | 12/31/1999 | |
| | | | | | | | | | | | |
Net asset value beginning of period | | | | $ | 8.19 | | | | | $ | 7.17 | | | | | $ | 7.88 | | | | | $ | 8.33 | | | | | $ | 9.18 | | | | | $ | 9.67 | |
Net investment income (a) | | | | | 0.26 | (c) | | | | | 0.55 | (c) | | | | | 0.59 | (c) | | | | | 0.64 | | | | | | 0.77 | | | | | | 0.77 | |
Net realized/unrealized gain (loss) on investments (a) | | | | | (0.25 | )(c) | | | | | 1.04 | (c) | | | | | (0.70 | )(c) | | | | | (0.45 | ) | | | | | (0.85 | ) | | | | | (0.49 | ) |
Total income (loss) from investment operations | | | | | 0.01 | | | | | | 1.59 | | | | | | (0.11 | ) | | | | | 0.19 | | | | | | (0.08 | ) | | | | | 0.28 | |
Dividends from net investment income | | | | | (0.27 | ) | | | | | (0.57 | ) | | | | | (0.60 | ) | | | | | (0.64 | ) | | | | | (0.77 | ) | | | | | (0.77 | ) |
Distributions from net realized capital gains | | | | | 0.00 | | | | | | 0.00 | | | | | | 0.00 | | | | | | 0.00 | | | | | | 0.00 | | | | | | 0.00 | |
Total distributions | | | | | (0.27 | ) | | | | | (0.57 | ) | | | | | (0.60 | ) | | | | | (0.64 | ) | | | | | (0.77 | ) | | | | | (0.77 | ) |
Net asset value end of period | | | | $ | 7.93 | | | | | $ | 8.19 | | | | | $ | 7.17 | | | | | $ | 7.88 | | | | | $ | 8.33 | | | | | $ | 9.18 | |
Total return | | | | | 0.13 | % | | | | | 22.85 | % | | | | | (1.19 | )% | | | | | 2.35 | % | | | | | (0.86 | )% | | | | | 3.01 | % |
Net assets end of period (000s) | | | | $ | 338,692 | | | | | $ | 955,599 | | | | | $ | 481,473 | | | | | $ | 264,718 | | | | | $ | 169,557 | | | | | $ | 151,020 | |
Ratio of net expenses to average net assets | | | | | 0.75 | %* | | | | | 0.75 | % | | | | | 0.75 | %(b) | | | | | 0.75 | %(b) | | | | | 0.75 | % | | | | | 0.75 | %(b) |
Ratio of net investment income to average net assets | | | | | 6.55 | %*(c) | | | | | 7.14 | %(c) | | | | | 8.14 | %(c) | | | | | 7.88 | % | | | | | 8.81 | % | | | | | 8.25 | % |
Portfolio turnover rate | | | | | 49 | % | | | | | 97 | % | | | | | 102 | % | | | | | 129 | % | | | | | 59 | % | | | | | 13 | % |
| (a) | Per share amounts based on average number of shares outstanding during the period. |
| (b) | If the investment manager had not reimbursed expenses, the ratio of expenses to average net assets would have been 0.76%. |
| (c) | Indicates a period in which, as a result of a change in generally accepted accounting principles, the portfolio has reclassified periodic payments made or received under certain derivative instruments, which were previously included within miscellaneous income, to a component of realized gain (loss) in the Statement of Operations. The effect of this reclassification was to (reduce) the net investment income ratio for the period ending June 30, 2004 by (0.05)% and the net investment income per share by $0.00. For consistency, similar reclassifications have been made to prior year amounts, resulting in (reductions) to the net investment income ratio of (0.07)% and (0.13)% and to the net investment income per share of $(0.01) and $(0.01) in the fiscal years ending December 31, 2003 and 2002, respectively. This change had no impact on the reported net asset value per share for any period. |
| | | | | | |
| 4 | | Semi-Annual Report | | June 30, 2004 | | See accompanying notes |
Statement of Assets and Liabilities
High Yield Portfolio
June 30, 2004 (Unaudited)
| | | | | | |
| Amounts in thousands, except per share amounts | | | | | |
| | |
Assets: | | | | | | |
| | |
Investments, at value | | | | $ | 330,645 | |
Cash | | | | | 14 | |
Foreign currency, at value | | | | | 2,543 | |
Receivable for investments sold | | | | | 2,465 | |
Unrealized appreciation on forward foreign currency contracts | | | | | 101 | |
Receivable for Portfolio shares sold | | | | | 173 | |
Interest and dividends receivable | | | | | 6,596 | |
Variation margin receivable | | | | | 100 | |
Unrealized appreciation on swap agreements | | | | | 21 | |
| | | | | | 342,658 | |
| | |
Liabilities: | | | | | | |
| | |
Payable for investments purchased | | | | $ | 2,859 | |
Unrealized depreciation on forward foreign currency contracts | | | | | 9 | |
Written options outstanding | | | | | 398 | |
Payable for Portfolio shares redeemed | | | | | 12 | |
Dividends payable | | | | | 4 | |
Accrued investment advisory fee | | | | | 67 | |
Accrued administration fee | | | | | 94 | |
Accrued servicing fee | | | | | 32 | |
Recoupment payable to Manager | | | | | 2 | |
Unrealized depreciation on swap agreements | | | | | 171 | |
| | | | | | 3,648 | |
| | |
Net Assets | | | | $ | 339,010 | |
| | |
Net Assets Consist of: | | | | | | |
| | |
Paid in capital | | | | $ | 330,728 | |
(Overdistributed) net investment income | | | | | (2,710 | ) |
Accumulated undistributed net realized gain | | | | | 11,543 | |
Net unrealized (depreciation) | | | | | (551 | ) |
| | | | | $ | 339,010 | |
| | |
Net Assets: | | | | | | |
| | |
Institutional Class | | | | $ | 319 | |
Administrative Class | | | | | 338,692 | |
| | |
Shares Issued and Outstanding: | | | | | | |
| | |
Institutional Class | | | | | 40 | |
Administrative Class | | | | | 42,722 | |
| | |
Net Asset Value and Redemption Price Per Share
(Net Assets Per Share Outstanding) | | | | | | |
| | |
Institutional Class | | | | $ | 7.93 | |
Administrative Class | | | | | 7.93 | |
| | |
Cost of Investments Owned | | | | $ | 332,203 | |
Cost of Foreign Currency Held | | | | $ | 2,530 | |
| | | | | | |
| See accompanying notes | | June 30, 2004 | | Semi-Annual Report | | 5 |
Statement of Operations
High Yield Portfolio
| | | | | | |
| Amounts in thousands | | | | | |
| | | | | Six Months Ended
June 30, 2004
(Unaudited) | |
Investment Income: | | | | | | |
| | |
Interest | | | | $ | 26,945 | |
Dividends | | | | | 384 | |
Miscellaneous income | | | | | 105 | |
Total Income | | | | | 27,434 | |
| | |
Expenses: | | | | | | |
| | |
Investment advisory fees | | | | | 937 | |
Administration fees | | | | | 1,312 | |
Distribution and/or servicing fees - Administrative Class | | | | | 562 | |
Trustees’ fees | | | | | 8 | |
Interest expense | | | | | 5 | |
Miscellaneous expense | | | | | 2 | |
Total Expenses | | | | | 2,826 | |
| | |
Net Investment Income | | | | | 24,608 | |
| | |
Net Realized and Unrealized Gain (Loss): | | | | | | |
| | |
Net realized gain on investments | | | | | 32,492 | |
Net realized gain on futures contracts, options, and swaps | | | | | 2,120 | |
Net realized gain on foreign currency transactions | | | | | 754 | |
Net change in unrealized (depreciation) on investments | | | | | (60,044 | ) |
Net change in unrealized (depreciation) on futures contracts,
options, and swaps | | | | | (331 | ) |
Net change in unrealized appreciation on translation of
assets and liabilities denominated in foreign currencies | | | | | 738 | |
Net (Loss) | | | | | (24,271 | ) |
| | |
Net Increase in Assets Resulting from Operations | | | | $ | 337 | |
| | | | | | |
| 6 | | Semi-Annual Report | | June 30, 2004 | | See accompanying notes |
Statements of Changes in Net Assets
High Yield Portfolio
| | | | | | | | | | | | |
| Amounts in thousands | | | | | | | | | | |
| | | | | Six Months Ended
June 30, 2004
(Unaudited) | | | | | Year Ended
December 31, 2003 | |
Increase (Decrease) in Net Assets from: | | | | | | | | | | | | |
| | | | |
Operations: | | | | | | | | | | | | |
| | | | |
Net investment income | | | | $ | 24,608 | | | | | $ | 51,650 | |
Net realized gain | | | | | 35,366 | | | | | | 15,242 | |
Net change in unrealized appreciation (depreciation) | | | | | (59,637 | ) | | | | | 74,319 | |
Net increase resulting from operations | | | | | 337 | | | | | | 141,211 | |
| | | | |
Distributions to Shareholders: | | | | | | | | | | | | |
| | | | |
From net investment income | | | | | | | | | | | | |
Institutional Class | | | | | (3 | ) | | | | | (1 | ) |
Administrative Class | | | | | (24,831 | ) | | | | | (52,189 | ) |
Total Distributions | | | | | (24,834 | ) | | | | | (52,190 | ) |
| | | | |
Portfolio Share Transactions: | | | | | | | | | | | | |
| | | | |
Receipts for shares sold | | | | | | | | | | | | |
Institutional Class | | | | | 298 | | | | | | 0 | |
Administrative Class | | | | | 155,987 | | | | | | 820,631 | |
| | | | |
Issued as reinvestment of distributions | | | | | | | | | | | | |
Institutional Class | | | | | 3 | | | | | | 1 | |
Administrative Class | | | | | 21,323 | | | | | | 52,190 | |
| | | | |
Cost of shares redeemed | | | | | | | | | | | | |
Institutional Class | | | | | (1 | ) | | | | | 0 | |
Administrative Class | | | | | (769,715 | ) | | | | | (487,714 | ) |
Net increase (decrease) resulting from Portfolio share transactions | | | | | (592,105 | ) | | | | | 385,108 | |
| | | | |
Total Increase (Decrease) in Net Assets | | | | | (616,602 | ) | | | | | 474,129 | |
| | | | |
Net Assets: | | | | | | | | | | | | |
| | | | |
Beginning of period | | | | | 955,612 | | | | | | 481,483 | |
End of period* | | | | $ | 339,010 | | | | | $ | 955,612 | |
| | | | |
*Including (overdistributed) net investment income of: | | | | $ | (2,710 | ) | | | | $ | (2,484 | ) |
| | | | | | |
| See accompanying notes | | June 30, 2004 | | Semi-Annual Report | | 7 |
Schedule of Investments
High Yield Portfolio
June 30, 2004 (Unaudited)
| | | | |
| | | Principal | | |
| | | Amount | | Value |
| | | (000s) | | (000s) |
| | | | | | |
CORPORATE BONDS & NOTES 78.2% |
Banking & Finance 10.6% | | | | | | |
AES Ironwood LLC | | | | | | |
8.857% due 11/30/2025 | | $ | 1,645 | | $ | 1,752 |
BCP Caylux Holdings Luxembourg S.A. | | | |
9.625% due 06/15/2014 | | | 1,425 | | | 1,484 |
Bluewater Finance Ltd. | | | | | | |
10.250% due 02/15/2012 | | | 1,675 | | | 1,775 |
Bombardier Capital, Inc. | | | | | | |
7.090% due 03/30/2007 (i) | | | 1,000 | | | 1,008 |
Cedar Brakes II LLC | | | | | | |
9.875% due 09/01/2013 | | | 572 | | | 573 |
Choctaw Resort Development Enterprise |
9.250% due 04/01/2009 | | | 1,050 | | | 1,134 |
Dow Jones TRAC-X N.A. High Yield Index |
7.375% due 03/25/2009 | | | 3,520 | | | 3,445 |
8.000% due 03/25/2009 | | | 3,500 | | | 3,402 |
Eircom Funding | | | | | | |
8.250% due 08/15/2013 | | | 800 | | | 836 |
FINOVA Group, Inc. | | | | | | |
7.500% due 11/15/2009 | | | 1,380 | | | 762 |
Ford Motor Credit Co. | | | | | | |
7.000% due 10/01/2013 | | | 1,650 | | | 1,668 |
Forest City Enterprises, Inc. | | | | | | |
7.625% due 06/01/2015 | | | 425 | | | 429 |
General Motors Acceptance Corp. |
7.000% due 02/01/2012 | | | 400 | | | 412 |
6.875% due 08/28/2012 | | | 825 | | | 841 |
8.000% due 11/01/2031 | | | 425 | | | 437 |
JET Equipment Trust | | | | | | |
10.000% due 06/15/2012 (b) | | | 800 | | | 540 |
7.630% due 08/15/2012 (b) | | | 403 | | | 259 |
JSG Funding PLC | | | | | | |
9.625% due 10/01/2012 | | | 1,840 | | | 2,024 |
Mizuho Preferred Capital Co. | | | | | | |
9.870% due 06/30/2008 (c) | | | 1,575 | | | 1,783 |
8.790% due 12/29/2049 (c) | | | 700 | | | 770 |
Qwest Capital Funding, Inc. | | | | | | |
7.250% due 02/15/2011 | | | 2,600 | | | 2,236 |
7.750% due 02/15/2031 | | | 140 | | | 111 |
Riggs Capital Trust | | | | | | |
8.625% due 12/31/2026 | | | 150 | | | 151 |
8.875% due 03/15/2027 | | | 550 | | | 554 |
Rotech Healthcare, Inc. | | | | | | |
9.500% due 04/01/2012 | | | 2,000 | | | 2,145 |
Targeted Return Index Securities Trust |
4.149% due 08/01/2015 (b) | | | 3,225 | | | 3,352 |
UGS Corp. | | | | | | |
10.000% due 06/01/2012 | | | 375 | | | 401 |
Universal City Development Partners |
11.750% due 04/01/2010 | | | 550 | | | 639 |
Ventas Capital Corp. | | | | | | |
8.750% due 05/01/2009 | | | 825 | | | 895 |
| | | | | |
|
|
| | | | | | | 35,818 |
| | | | | |
|
|
Industrials 55.2% | | | | | | |
Abitibi-Consolidated, Inc. | | | | | | |
6.950% due 12/15/2006 | | | 700 | | | 721 |
6.950% due 04/01/2008 | | | 250 | | | 254 |
5.250% due 06/20/2008 | | | 375 | | | 358 |
8.550% due 08/01/2010 | | | 350 | | | 371 |
6.000% due 06/20/2013 | | | 400 | | | 356 |
8.850% due 08/01/2030 | | | 1,053 | | | 1,031 |
Ahold Finance USA, Inc. |
8.250% due 07/15/2010 | | | 150 | | | 159 |
Alderwoods Group, Inc. | | | | | | |
12.250% due 01/02/2009 | | | 1,000 | | | 1,110 |
Allied Waste North America, Inc. |
8.875% due 04/01/2008 | | | 600 | | | 660 |
8.500% due 12/01/2008 | | | 350 | | | 385 |
10.000% due 08/01/2009 | | | 1 | | | 1 |
6.375% due 04/15/2011 | | | 700 | | | 689 |
9.250% due 09/01/2012 | | | 2,500 | | | 2,812 |
7.875% due 04/15/2013 | | | 300 | | | 315 |
7.375% due 04/15/2014 | | | 400 | | | 391 |
| | | | | | |
|
American Media Operations, Inc. |
10.250% due 05/01/2009 | | $ | 1,900 | | $ | 1,981 |
American Tower Escrow Corp. | | | | | | |
0.000% due 08/01/2008 | | | 3,150 | | | 2,315 |
AmeriGas Partners LP | | | | | | |
10.000% due 04/15/2006 | | | 120 | | | 130 |
8.830% due 04/19/2010 | | | 488 | | | 523 |
8.875% due 05/20/2011 | | | 200 | | | 214 |
Arco Chemical Co. | | | | | | |
10.250% due 11/01/2010 | | | 50 | | | 51 |
ArvinMeritor, Inc. | | | | | | |
6.625% due 06/15/2007 | | | 250 | | | 257 |
8.750% due 03/01/2012 | | | 1,050 | | | 1,144 |
Aviall, Inc. | | | | | | |
7.625% due 07/01/2011 | | | 650 | | | 679 |
Boise Cascade Corp. | | | | | | |
7.000% due 11/01/2013 | | | 500 | | | 514 |
Boyd Gaming Corp. | | | | | | |
7.750% due 12/15/2012 | | | 900 | | | 913 |
Cablevision Systems Corp. | | | | | | |
8.000% due 04/15/2012 | | | 1,000 | | | 990 |
Canwest Media, Inc. | | | | | | |
10.625% due 05/15/2011 | | | 1,645 | | | 1,853 |
CCO Holdings LLC | | | | | | |
8.750% due 11/15/2013 | | | 3,000 | | | 2,887 |
Chesapeake Energy Corp. | | | | | | |
8.375% due 11/01/2008 | | | 650 | | | 705 |
7.500% due 06/15/2014 | | | 1,000 | | | 1,035 |
Circus & Eldorado Joint Venture Silver Legacy Capital Corp. | | | | | | |
10.125% due 03/01/2012 | | | 575 | | | 581 |
Colorado Interstate Gas Co. | | | | | | |
6.850% due 06/15/2037 | | | 200 | | | 206 |
Commonwealth Brands, Inc. | | | | | | |
9.750% due 04/15/2008 | | | 650 | | | 699 |
10.625% due 09/01/2008 | | | 850 | | | 914 |
Continental Airlines, Inc. | | | | | | |
7.461% due 04/01/2015 | | | 81 | | | 76 |
7.373% due 12/15/2015 | | | 342 | | | 273 |
6.545% due 02/02/2019 | | | 169 | | | 158 |
Crown Castle International Corp. |
9.375% due 08/01/2011 | | | 380 | | | 420 |
10.750% due 08/01/2011 | | | 1,000 | | | 1,125 |
Crown European Holdings S.A. | | | | | | |
9.500% due 03/01/2011 | | | 2,025 | | | 2,217 |
10.875% due 03/01/2013 | | | 450 | | | 515 |
CSC Holdings, Inc. | | | | | | |
8.125% due 07/15/2009 | | | 250 | | | 261 |
8.125% due 08/15/2009 | | | 2,305 | | | 2,409 |
7.625% due 04/01/2011 | | | 1,000 | | | 1,007 |
6.750% due 04/15/2012 | | | 1,250 | | | 1,206 |
Delhaize America, Inc. | | | | | | |
8.125% due 04/15/2011 | | | 1,725 | | | 1,892 |
Dex Media West LLC | | | | | | |
8.500% due 08/15/2010 | | | 1,150 | | | 1,259 |
9.875% due 08/15/2013 | | | 1,650 | | | 1,819 |
Dimon, Inc. | | | | | | |
7.750% due 06/01/2013 | | | 150 | | | 140 |
DirecTV Holdings LLC | | | | | | |
8.375% due 03/15/2013 | | | 1,375 | | | 1,528 |
Dobson Communications Corp. | | | | | | |
8.875% due 10/01/2013 | | | 650 | | | 497 |
Dresser, Inc. |
9.375% due 04/15/2011 | | | 1,650 | | | 1,774 |
Dunlop Standard Aerospace Holdings PLC | | | |
11.875% due 05/15/2009 | | | 1,048 | | | 1,119 |
Dura Operating Corp. | | | | | | |
8.625% due 04/15/2012 | | | 1,875 | | | 1,922 |
Dynegy Danskammer & Roseton LLC | | | |
7.270% due 11/08/2010 | | | 1,100 | | | 1,050 |
7.670% due 11/08/2016 | | | 1,400 | | | 1,218 |
Dynegy Holdings, Inc. | | | | | | |
9.875% due 07/15/2010 | | | 600 | | | 648 |
10.125% due 07/15/2013 | | | 1,150 | | | 1,251 |
| | | | | | |
| | |
EchoStar DBS Corp. | | | | | | |
10.375% due 10/01/2007 | | $ | 550 | | $ | 591 |
El Paso CGP Co. | | | | | | |
7.500% due 08/15/2006 | | | 1,200 | | | 1,191 |
6.500% due 06/01/2008 | | | 250 | | | 226 |
7.625% due 09/01/2008 | | | 750 | | | 697 |
7.750% due 06/15/2010 | | | 250 | | | 227 |
9.625% due 05/15/2012 | | | 200 | | | 191 |
7.750% due 10/15/2035 | | | 400 | | | 316 |
El Paso Corp. | | | | | | |
7.000% due 05/15/2011 | | | 100 | | | 88 |
7.875% due 06/15/2012 | | | 2,155 | | | 1,945 |
7.375% due 12/15/2012 | | | 300 | | | 262 |
7.800% due 08/01/2031 | | | 700 | | | 565 |
El Paso Production Holding Co. | | | | | | |
7.750% due 06/01/2013 | | | 1,650 | | | 1,522 |
Encore Acquisition Co. | | | | | | |
6.250% due 04/15/2014 | | | 550 | | | 520 |
Equistar Chemicals LP | | | | | | |
10.125% due 09/01/2008 | | | 430 | | | 473 |
8.750% due 02/15/2009 | | | 1,435 | | | 1,503 |
10.625% due 05/01/2011 | | | 400 | | | 446 |
Evergreen Resources, Inc. | | | | | | |
5.875% due 03/15/2012 | | | 700 | | | 710 |
EXCO Resources, Inc. | | | | | | |
7.250% due 01/15/2011 | | | 500 | | | 510 |
Extendicare Health Services | | | | | | |
9.500% due 07/01/2010 | | | 800 | | | 892 |
Ferrellgas Partners LP | | | | | | |
6.990% due 08/01/2005 (i) | | | 1,000 | | | 1,013 |
8.870% due 08/01/2009 (i)(l) | | | 1,200 | | | 1,273 |
6.750% due 05/01/2014 | | | 400 | | | 388 |
Fimep S.A. | | | | | | |
10.500% due 02/15/2013 | | | 385 | | | 441 |
Fisher Scientific International | | | | | | |
8.000% due 09/01/2013 | | | 650 | | | 699 |
Fresenius Medical Care | | | | | | |
7.875% due 06/15/2011 | | | 2,250 | | | 2,396 |
General Motors Corp. | | | | | | |
8.250% due 07/15/2023 | | | 450 | | | 472 |
Georgia-Pacific Corp. | | | | | | |
8.125% due 06/15/2023 | | | 600 | | | 619 |
8.000% due 01/15/2024 | | | 2,750 | | | 2,764 |
8.875% due 05/15/2031 | | | 650 | | | 697 |
Grief Brothers Corp. | | | | | | |
8.875% due 08/01/2012 | | | 400 | | | 432 |
GulfTerra Energy Partners LP | | | | | | |
8.500% due 06/01/2010 | | | 649 | | | 709 |
Hanover Compressor Co. | | | | | | |
9.000% due 06/01/2014 | | | 500 | | | 521 |
Hanover Equipment Trust | | | | | | |
8.500% due 09/01/2008 | | | 2,300 | | | 2,444 |
HCA, Inc. | | | | | | |
7.875% due 02/01/2011 | | | 950 | | | 1,043 |
6.250% due 02/15/2013 | | | 1,350 | | | 1,344 |
6.750% due 07/15/2013 | | | 625 | | | 641 |
HealthSouth Corp. | | | | | | |
8.500% due 02/01/2008 (b) | | | 110 | | | 109 |
8.375% due 10/01/2011 (b) | | | 1,000 | | | 972 |
Hilton Hotels Corp. | | | | | | |
7.625% due 12/01/2012 | | | 1,500 | | | 1,620 |
HMH Properties, Inc. | | | | | | |
7.875% due 08/01/2008 | | | 550 | | | 566 |
Hollinger International Publishing |
9.000% due 12/15/2010 | | | 2,550 | | | 2,958 |
Hollinger Participation Trust | | | | | | |
12.125% due 11/15/2010 (d) | | | 389 | | | 398 |
Horizon Lines LLC | | | | | | |
9.000% due 11/01/2012 | | | 275 | | | 277 |
Host Marriott LP | | | | | | |
9.500% due 01/15/2007 | | | 250 | | | 274 |
9.250% due 10/01/2007 | | | 1,200 | | | 1,329 |
7.125% due 11/01/2013 | | | 185 | | | 182 |
Ingles Markets, Inc. | | | | | | |
8.875% due 12/01/2011 | | | 1,000 | | | 1,032 |
| | | | | | |
| 8 | | Semi-Annual Report | | June 30, 2004 | | See accompanying notes |
| | | | |
| | | Principal | | |
| | | Amount | | Value |
| | | (000s) | | (000s) |
| | | | | | |
| | |
Insight Midwest LP | | | | | | |
9.750% due 10/01/2009 | | $ | 445 | | $ | 472 |
9.750% due 10/01/2009 | | | 900 | | | 954 |
10.500% due 11/01/2010 | | | 765 | | | 838 |
10.500% due 11/01/2010 | | | 150 | | | 164 |
Invensys PLC | | | | | | |
9.875% due 03/15/2011 | | | 650 | | | 650 |
ISP Chemco, Inc. | | | | | | |
10.250% due 07/01/2011 | | | 1,465 | | | 1,637 |
Johnsondiversey, Inc. | | | | | | |
9.625% due 05/15/2012 | | | 390 | | | 427 |
K&F Industries, Inc. | | | | | | |
9.625% due 12/15/2010 | | | 350 | | | 385 |
K2, Inc. | | | | | | |
7.375% due 07/01/2014 | | | 150 | | | 153 |
Legrand S.A. | | | | | | |
8.500% due 02/15/2025 | | | 550 | | | 569 |
Mail Well I Corp. | | | | | | |
9.625% due 03/15/2012 | | | 1,000 | | | 1,080 |
Mandalay Resort Group | | | | | | |
6.500% due 07/31/2009 | | | 750 | | | 766 |
9.375% due 02/15/2010 | | | 1,900 | | | 2,080 |
7.625% due 07/15/2013 | | | 200 | | | 200 |
MCI, Inc. | | | | | | |
5.908% due 05/01/2007 | | | 300 | | | 292 |
6.688% due 05/01/2009 | | | 1,590 | | | 1,475 |
7.735% due 05/01/2014 | | | 257 | | | 231 |
Mediacom Broadband LLC | | | | | | |
11.000% due 07/15/2013 | | | 1,515 | | | 1,621 |
Merisant Co. | | | | | | |
9.500% due 07/15/2013 | | | 700 | | | 749 |
Meritor Automotive, Inc. | | | | | | |
6.800% due 02/15/2009 | | | 250 | | | 256 |
MGM Mirage, Inc. | | | | | | |
6.000% due 10/01/2009 | | | 350 | | | 345 |
8.375% due 02/01/2011 | | | 2,050 | | | 2,153 |
Midwest Generation LLC | | | | | | |
8.300% due 07/02/2009 | | | 300 | | | 306 |
8.560% due 01/02/2016 | | | 3,575 | | | 3,593 |
8.750% due 05/01/2034 | | | 1,250 | | | 1,269 |
Nalco Co. | | | | | | |
7.750% due 11/15/2011 | | | 2,750 | | | 2,894 |
Newpark Resources, Inc. | | | | | | |
8.625% due 12/15/2007 | | | 890 | | | 908 |
Norampac, Inc. | | | | | | |
6.750% due 06/01/2013 | | | 650 | | | 640 |
Owens-Brockway Glass Container, Inc. | | | |
8.875% due 02/15/2009 | | | 400 | | | 434 |
7.750% due 05/15/2011 | | | 150 | | | 157 |
8.750% due 11/15/2012 | | | 1,550 | | | 1,690 |
8.250% due 05/15/2013 | | | 850 | | | 882 |
PacifiCare Health Systems, Inc. | | | | | | |
10.750% due 06/01/2009 | | | 417 | | | 477 |
PanAmSat Corp. | | | | | | |
8.500% due 02/01/2012 | | | 625 | | | 713 |
Park Place Entertainment Corp. | | | | | | |
9.375% due 02/15/2007 | | | 1,475 | | | 1,606 |
7.875% due 03/15/2010 | | | 600 | | | 636 |
7.000% due 04/15/2013 | | | 1,400 | | | 1,418 |
Peabody Energy Corp. | | | | | | |
6.875% due 03/15/2013 | | | 1,800 | | | 1,832 |
Plains Exploration & Production Co | | | |
7.125% due 06/15/2014 | | | 1,625 | | | 1,662 |
Premcor Refining Group, Inc. | | | | | | |
6.750% due 02/01/2011 | | | 1,000 | | | 1,033 |
6.750% due 05/01/2014 | | | 300 | | | 299 |
Pride International, Inc. | | | | | | |
9.375% due 05/01/2007 | | | 1,330 | | | 1,360 |
Primedia, Inc. | | | | | | |
7.625% due 04/01/2008 | | | 350 | | | 348 |
6.565% due 05/15/2010 | | | 150 | | | 153 |
8.000% due 05/15/2013 | | | 1,250 | | | 1,181 |
Quebecor Media, Inc. | | | | | | |
11.125% due 07/15/2011 | | | 1,400 | | | 1,605 |
Qwest Communications International, Inc. | | | |
7.250% due 02/15/2011 | | | 2,400 | | | 2,250 |
7.500% due 02/15/2014 | | | 1,800 | | | 1,634 |
| | | | | | |
| | |
Qwest Corp. | | | | | | |
7.200% due 11/01/2004 | | $ | 470 | | $ | 476 |
8.875% due 03/15/2012 | | | 1,650 | | | 1,790 |
Rayovac Corp. | | | | | | |
8.500% due 10/01/2013 | | | 850 | | | 897 |
Rogers Cablesystems, Inc. | | | | | | |
10.000% due 03/15/2005 | | | 235 | | | 245 |
Roundy’s, Inc. | | | | | | |
8.875% due 06/15/2012 | | | 1,900 | | | 2,024 |
Safety-Kleen Corp. | | | | | | |
9.250% due 06/01/2008 (b) | | | 1,450 | | | 4 |
9.250% due 05/15/2009 (b) | | | 250 | | | 13 |
Saks, Inc. | | | | | | |
8.250% due 11/15/2008 | | | 1 | | | 1 |
Sinclair Broadcast Group, Inc. | | | | | | |
8.750% due 12/15/2011 | | | 800 | | | 860 |
Six Flags, Inc. | | | | | | |
9.750% due 04/15/2013 | | | 1,600 | | | 1,616 |
Sonat, Inc. | | | | | | |
7.625% due 07/15/2011 | | | 2,650 | | | 2,378 |
SPX Corp. | | | | | | |
6.250% due 06/15/2011 | | | 650 | | | 635 |
7.500% due 01/01/2013 | | | 1,875 | | | 1,931 |
Starwood Hotels & Resorts Worldwide, Inc. | | | |
7.375% due 05/01/2007 | | | 550 | | | 582 |
7.875% due 05/01/2012 | | | 900 | | | 968 |
Station Casinos, Inc. | | | | | | |
6.000% due 04/01/2012 | | | 825 | | | 802 |
6.500% due 02/01/2014 | | | 225 | | | 218 |
Stone Container Corp. | | | | | | |
11.500% due 08/15/2006 | | | 450 | | | 454 |
9.750% due 02/01/2011 | | | 525 | | | 580 |
8.375% due 07/01/2012 | | | 650 | | | 683 |
Suburban Propane Partners LP | | | | | | |
6.875% due 12/15/2013 | | | 500 | | | 486 |
Tenet Healthcare Corp. | | | | | | |
6.375% due 12/01/2011 | | | 975 | | | 858 |
7.375% due 02/01/2013 | | | 2,975 | | | 2,707 |
9.875% due 07/01/2014 | | | 450 | | | 460 |
Tenneco Automotive, Inc. | | | | | | |
10.250% due 07/15/2013 | | | 525 | | | 596 |
10.250% due 07/15/2013 | | | 1,075 | | | 1,220 |
Time Warner Telecom, Inc. | | | | | | |
9.750% due 07/15/2008 | | | 950 | | | 893 |
10.125% due 02/01/2011 | | | 500 | | | 458 |
Toys “R” Us, Inc. | | | | | | |
7.625% due 08/01/2011 | | | 750 | | | 757 |
7.875% due 04/15/2013 | | | 550 | | | 555 |
Triad Hospitals, Inc. | | | | | | |
7.000% due 05/15/2012 | | | 500 | | | 506 |
7.000% due 11/15/2013 | | | 550 | | | 525 |
Trinity Industries, Inc. | | | | | | |
6.500% due 03/15/2014 | | | 900 | | | 828 |
TRW Automotive, Inc. | | | | | | |
9.375% due 02/15/2013 | | | 1,220 | | | 1,382 |
Tyco International Group S.A. | | | | | | |
6.750% due 02/15/2011 | | | 668 | | | 727 |
U.S. Airways, Inc. | | | | | | |
9.625% due 09/01/2003 (b) | | | 1,016 | | | 295 |
9.330% due 01/01/2006 (b) | | | 84 | | | 22 |
United Airlines, Inc. | | | | | | |
6.201% due 09/01/2008 | | | 225 | | | 185 |
7.730% due 07/01/2010 | | | 800 | | | 654 |
7.186% due 04/01/2011 (b) | | | 196 | | | 163 |
6.602% due 09/01/2013 | | | 500 | | | 417 |
Valero Energy Corp. | | | | | | |
7.800% due 06/14/2010 | | | 400 | | | 387 |
Vintage Petroleum, Inc. | | | | | | |
7.875% due 05/15/2011 | | | 1,125 | | | 1,159 |
8.250% due 05/01/2012 | | | 790 | | | 841 |
Westlake Chemical Corp. | | | | | | |
8.750% due 07/15/2011 | | | 400 | | | 436 |
Williams Cos., Inc. | | | | | | |
8.625% due 06/01/2010 | | | 2,450 | | | 2,707 |
8.125% due 03/15/2012 | | | 450 | | | 483 |
7.625% due 07/15/2019 | | | 3,200 | | | 3,096 |
7.875% due 09/01/2021 | | | 700 | | | 677 |
8.750% due 03/15/2032 | | | 1,000 | | | 1,005 |
| | | | | | |
| | |
Young Broadcasting, Inc. | | | | | | |
8.500% due 12/15/2008 | | $ | 574 | | $ | 607 |
8.500% due 12/15/2008 | | | 350 | | | 370 |
10.000% due 03/01/2011 | | | 580 | | | 593 |
| | | | | |
|
|
| | | | | | | 187,165 |
| | | | | |
|
|
Utilities 12.4% | | | | | | |
ACC Escrow Corp. | | | | | | |
10.000% due 08/01/2011 | | | 1,600 | | | 1,388 |
AES Corp. | | | | | | |
9.375% due 09/15/2010 | | | 300 | | | 321 |
8.875% due 02/15/2011 | | | 825 | | | 860 |
8.750% due 05/15/2013 | | | 2,850 | | | 3,067 |
8.540% due 11/30/2019 | | | 335 | | | 347 |
Calpine Corp. | | | | | | |
8.500% due 07/15/2010 | | | 1,175 | | | 978 |
Centerpoint Energy, Inc. | | | | | | |
7.250% due 09/01/2010 | | | 1,200 | | | 1,278 |
Cincinnati Bell, Inc. | | | | | | |
7.250% due 07/15/2013 | | | 1,475 | | | 1,387 |
8.375% due 01/15/2014 | | | 900 | | | 806 |
CMS Energy Corp. | | | | | | |
7.000% due 01/15/2005 | | | 1,950 | | | 1,970 |
8.900% due 07/15/2008 | | | 100 | | | 105 |
7.500% due 01/15/2009 | | | 2,200 | | | 2,200 |
7.750% due 08/01/2010 | | | 1,200 | | | 1,200 |
DPL, Inc. | | | | | | |
6.875% due 09/01/2011 | | | 1,100 | | | 1,114 |
Edison International, Inc. | | | | | | |
6.875% due 09/15/2004 | | | 1,000 | | | 1,009 |
El Paso Energy Partners | | | | | | |
8.500% due 06/01/2011 | | | 321 | | | 349 |
IPALCO Enterprises, Inc. | | | | | | |
8.375% due 11/14/2008 | | | 1,050 | | | 1,145 |
8.625% due 11/14/2011 | | | 490 | | | 534 |
MSW Energy Holdings LLC | | | | | | |
7.375% due 09/01/2010 | | | 650 | | | 650 |
Nextel Communications, Inc. | | | | | | |
9.500% due 02/01/2011 | | | 1 | | | 1 |
6.875% due 10/31/2013 | | | 2,300 | | | 2,291 |
7.375% due 08/01/2015 | | | 1,875 | | | 1,903 |
Northwestern Bell Telephone | | | | | | |
7.750% due 05/01/2030 | | | 713 | | | 631 |
Northwestern Corp. | | | | | | |
7.250% due 03/03/2008 | | | 650 | | | 621 |
NRG Energy, Inc. | | | | | | |
8.000% due 12/15/2013 | | | 2,150 | | | 2,182 |
PSEG Energy Holdings, Inc. | | | | | | |
7.750% due 04/16/2007 | | | 700 | | | 737 |
8.625% due 02/15/2008 | | | 350 | | | 378 |
10.000% due 10/01/2009 | | | 690 | | | 783 |
8.500% due 06/15/2011 | | | 2,050 | | | 2,204 |
Qwest Capital Funding, Inc. | | | | | | |
7.900% due 08/15/2010 | | | 700 | | | 623 |
Reliant Resources, Inc. | | | | | | |
9.250% due 07/15/2010 | | | 1,975 | | | 2,118 |
9.500% due 07/15/2013 | | | 350 | | | 379 |
Rogers Wireless Communications, Inc. |
6.375% due 03/01/2014 | | | 350 | | | 324 |
Rural Cellular Corp. | | | | | | |
8.250% due 03/15/2012 | | | 950 | | | 976 |
SESI LLC | | | | | | |
8.875% due 05/15/2011 | | | 615 | | | 666 |
South Point Energy Corp. | | | | | | |
8.400% due 05/30/2012 | | | 1,659 | | | 1,444 |
TECO Energy, Inc. | | | | | | |
7.500% due 06/15/2010 | | | 1,950 | | | 1,979 |
Time Warner Telecom Holdings, Inc. | | | |
9.250% due 02/15/2014 | | | 500 | | | 483 |
Triton PCS, Inc. | | | | | | |
8.500% due 06/01/2013 | | | 575 | | | 546 |
| | | | | |
|
|
| | | | | | | 41,977 |
| | | | | |
|
|
Total Corporate Bonds & Notes (Cost $266,069) | | | 264,960 |
| |
|
|
| | | | | | |
| See accompanying notes | | June 30, 2004 | | Semi-Annual Report | | 9 |
Schedule of Investments (Cont.)
High Yield Portfolio
June 30, 2004 (Unaudited)
| | | | |
| | | Principal | | |
| | | Amount | | Value |
| | | (000s) | | (000s) |
| | | | | | |
MUNICIPAL BONDS & NOTES 0.2% |
New Jersey Tobacco Settlement Funding Corp. Revenue Bonds, Series 2003 |
6.375% due 06/01/2032 | | $ | 650 | | $ | 583 |
| | | | | |
|
|
Total Municipal Bonds & Notes (Cost $623) | | | | | | 583 |
| | | | |
|
|
| | | | | | | |
MORTGAGE-BACKED SECURITIES 0.2% |
Continental Airlines, Inc. | | | | | | |
6.920% due 04/02/2013 (i)(l) | | | 840 | | | 829 |
| | | | | |
|
|
Total Mortgage-Backed Securities (Cost $752) | | | | | | 829 |
| | | | |
|
|
| | | | | | | |
ASSET-BACKED SECURITIES 3.9% |
| | |
Allegheny Energy, Inc. | | | | | | |
5.350% due 06/08/2011 (c) | | | 36 | | | 37 |
5.430% due 06/08/2011 (c) | | | 180 | | | 183 |
5.640% due 06/08/2011 (c) | | | 1,584 | | | 1,615 |
Aquila, Inc. | | | | | | |
8.000% due 04/15/2006 (c) | | | 465 | | | 480 |
Brenntag | | | | | | |
3.880% due 02/28/2012 (c) | | | 1,250 | | | 1,268 |
Centennial Communications | | | | | | |
3.875% due 01/20/2011 (c) | | | 38 | | | 38 |
3.910% due 01/20/2011 (c) | | | 754 | | | 759 |
3.910% due 01/20/2011 (c) | | | 71 | | | 71 |
4.050% due 01/20/2011 (c) | | | 35 | | | 36 |
DirecTV Holdings LLC | | | | | | |
3.350% due 03/06/2010 (c) | | | 330 | | | 335 |
3.950% due 04/06/2010 (c) | | | 322 | | | 327 |
Inmarsat Ventures PLC | | | | | | |
4.111% due 10/10/2010 (c) | | | 600 | | | 607 |
4.611% due 10/10/2011 (c) | | | 600 | | | 607 |
Invensys PLC | | | | | | |
4.611% due 08/05/2009 (c) | | | 87 | | | 89 |
4.611% due 09/30/2009 (c) | | | 313 | | | 317 |
5.861% due 12/30/2009 (c) | | | 900 | | | 925 |
Midwest Generation LLC | | | | | | |
4.380% due 04/27/2011 (c) | | | 1,000 | | | 1,013 |
4.570% due 04/27/2011 (c) | | | 1,000 | | | 1,013 |
NRG Energy, Inc. | | | | | | |
5.500% due 05/08/2010 (c) | | | 378 | | | 390 |
5.070% due 12/23/2010 (c) | | | 213 | | | 220 |
Qwest Corp. | | | | | | |
6.500% due 06/30/2007 (c) | | | 1,850 | | | 1,925 |
Tucson Electric Power Co. | | | | | | |
5.000% due 03/30/2009 (c) | | | 1,000 | | | 1,011 |
| | | | | |
|
|
Total Asset-Backed Securities (Cost $13,090) | | | 13,266 |
| |
|
|
| | | | | | | |
SOVEREIGN ISSUES 5.7% |
| | |
Republic of Brazil | | | | | | |
2.062% due 04/15/2006 (c) | | | 1,056 | | | 1,042 |
11.000% due 01/11/2012 | | | 800 | | | 809 |
8.000% due 04/15/2014 (c) | | | 3,987 | | | 3,662 |
8.250% due 01/20/2034 | | | 1,100 | | | 835 |
10.250% due 06/17/2013 | | | 200 | | | 194 |
11.000% due 08/17/2040 | | | 2,750 | | | 2,595 |
Republic of Guatemala | | | | | | |
9.250% due 08/01/2013 | | | 225 | | | 245 |
Republic of Panama | | | | | | |
9.625% due 02/08/2011 | | | 850 | | | 946 |
9.375% due 07/23/2012 | | | 375 | | | 412 |
8.875% due 09/30/2027 | | | 1,050 | | | 1,024 |
| | | | | | |
| | |
Republic of Peru | | | | | | |
9.125% due 01/15/2008 | | $ | 600 | | $ | 654 |
9.125% due 02/21/2012 | | | 1,550 | | | 1,596 |
9.875% due 02/06/2015 | | | 350 | | | 367 |
4.500% due 03/07/2017 (c) | | | 600 | | | 487 |
5.000% due 03/07/2017 (c) | | | 228 | | | 199 |
Republic of Ukraine | | | | | | |
11.000% due 03/15/2007 | | | 342 | | | 369 |
6.875% due 03/04/2011 | | | 500 | | | 472 |
7.650% due 06/11/2013 | | | 300 | | | 286 |
Russian Federation | | | | | | |
5.000% due 03/31/2030 (c) | | | 3,435 | | | 3,145 |
| | | | | |
|
|
Total Sovereign Issues (Cost $20,262) | | | | | | 19,339 |
| | | | |
|
|
| | | | | | | |
FOREIGN CURRENCY-DENOMINATED
ISSUES (j)(k) 1.2% |
| | |
El Paso Corp. | | | | | | |
5.750% due 03/14/2006 | | EC | 700 | | | 818 |
Johnsondiversey, Inc. | | | | | | |
9.625% due 05/15/2012 | | | 350 | | | 462 |
JSG Funding PLC | | | | | | |
10.125% due 10/01/2012 | | | 650 | | | 862 |
Kronos International, Inc. | | | | | | |
8.875% due 06/30/2009 | | | 300 | | | 390 |
Lighthouse International Co. S.A. | | | |
8.000% due 04/30/2014 | | | 1,420 | | | 1,676 |
| | | | | |
|
|
Total Foreign Currency-Denominated Issues (Cost $3,708) | | | 4,208 |
| |
|
|
| | | | | | | |
CONVERTIBLE BONDS & NOTES 0.9% |
Banking & Finance 0.5% | | | | | | |
Fiat Finance Luxembourg S.A. | | | | | | |
3.250% due 01/09/2007 | | $ | 1,600 | | | 1,612 |
| | | | | |
|
|
Industrials 0.2% | | | | | | |
Dimon, Inc. | | | | | | |
6.250% due 03/31/2007 | | | 850 | | | 769 |
| | | | | |
|
|
Utilities 0.2% | | | | | | |
Rogers Communication, Inc. | | | | | | |
2.000% due 11/26/2005 | | | 665 | | | 631 |
| | | | | |
|
|
Total Convertible Bonds & Notes (Cost $2,880) | | | 3,012 |
| |
|
|
| | | | | | | |
COMMON STOCKS 0.3% |
| | | Shares | | |
Communications 0.2% | | | | | | |
MCI, Inc. | | | 38,968 | | | 562 |
| | | | | |
|
|
Industrials 0.1% | | | | | | |
Dobson Communications Corp. | | | 85,601 | | | 279 |
| | | | | |
|
|
Total Common Stocks (Cost $1,253) | | | | | | 841 |
| | | | |
|
|
| | | | | | | |
CONVERTIBLE PREFERRED STOCK 0.0% |
| | |
Dobson Communications Corp. | | | | | | |
6.000% due 08/19/2016 | | | 650 | | | 71 |
| | | | | |
|
|
Total Convertible Preferred Stock (Cost $109) | | | 71 |
| |
|
|
| | | | | | | |
PREFERRED SECURITY 0.3% |
| | |
Riggs Capital Trust II | | | | | | |
8.875% due 03/15/2027 | | | 950,000 | | | 957 |
| | | | | |
|
|
Total Preferred Security (Cost $900) | | | 957 |
| |
|
|
| | | | | | |
PREFERRED STOCK 0.3% |
| | |
Fresenius Medical Care | | | | | | |
7.875% due 02/01/2008 | | | 1,050 | | $ | 1,110 |
| | | | | |
|
|
Total Preferred Stock (Cost $1,082) | | | 1,110 |
| |
|
|
| | | | | | | |
PURCHASED PUT OPTIONS 0.0% |
| | | # of Contracts | | |
Eurodollar September Futures (CME) | | | |
Strike @ 96.500
Exp. 09/13/2004 | | | 400 | | | 2 |
| | | | | |
|
|
Total Purchased Put Options (Cost $4) | | | 2 |
| |
|
|
| | | | | | | |
SHORT-TERM INSTRUMENTS 6.3% |
| | | Principal Amount (000s) | | |
Commercial Paper 5.0% | | | | | | |
Barclays U.S. Funding Corp. | | | | | | |
1.280% due 09/27/2004 | | $ | 1,600 | | | 1,594 |
CDC Commercial Corp. | | | | | | |
1.260% due 09/22/2004 | | | 4,000 | | | 3,986 |
Freddie Mac | | | | | | |
1.200% due 08/09/2004 | | | 900 | | | 899 |
1.410% due 09/14/2004 | | | 200 | | | 200 |
1.560% due 10/20/2004 | | | 3,400 | | | 3,383 |
General Electric Capital Corp. | | | | | | |
1.460% due 09/14/2004 | | | 1,600 | | | 1,595 |
1.480% due 09/15/2004 | | | 900 | | | 897 |
HBOS Treasury Services PLC | | | | | | |
1.290% due 09/24/2004 | | | 600 | | | 598 |
TotalFinaElf Capital S.A. | | | | | | |
1.420% due 07/01/2004 | | | 3,000 | | | 3,000 |
UBS Finance, Inc. | | | | | | |
1.245% due 07/21/2004 | | | 900 | | | 900 |
| | | | | |
|
|
| | | | | | | 17,052 |
| | | | | |
|
|
| | |
Repurchase Agreement 0.9% | | | | | | |
State Street Bank | | | | | | |
0.800% due 07/01/2004 | | | 3,019 | | | 3,019 |
| | | | | |
|
|
(Dated 06/30/2004. Collateralized by Freddie Mac
5.500% due 07/15/2006 valued at $3,080.
Repurchase proceeds are $3,019.) |
U.S. Treasury Bills 0.4% | | | | | | |
1.205% due 09/02/2004-09/16/2004 (a)(e)(f) | | | 1,400 | | | 1,396 |
| | | | | |
|
|
Total Short-Term Instruments (Cost $21,471) | | | 21,467 |
| |
|
|
| | | | | | |
| | |
Total Investments 97.5% | | | | $ | 330,645 | |
(Cost $332,203) | | | | | | |
| | |
Written Options (h) (0.1%) | | | | | (398 | ) |
(Premiums $2,085) | | | | | | |
| |
Other Assets and Liabilities (Net) 2.6% | | | 8,763 | |
| | |
|
|
|
| |
Net Assets 100.0% | | $ | 339,010 | |
| | | | |
|
|
|
| | | | | | |
| 10 | | Semi-Annual Report | | June 30, 2004 | | See accompanying notes |
Notes to Schedule of Investments
(amounts in thousands, except number of contracts):
(a) Securities are grouped by coupon or range of coupons and represent a range of maturities.
(b) Security is in default.
(c) Variable rate security.
(d) Payment in-kind bond security.
(e) Securities with an aggregate market value of $649 have been segregated with the custodian to cover margin requirements for the following open futures contracts at June 30, 2004:
| | | | | | | | |
| Type | | Expiration
Month | | # of
Contracts | | Unrealized (Depreciation) | |
Eurodollar March Long Futures | | 03/2005 | | 20 | | $ | (44 | ) |
Eurodollar March Long Futures | | 03/2006 | | 34 | | | (106 | ) |
Eurodollar June Long Futures | | 06/2005 | | 34 | | | (109 | ) |
Eurodollar September Long Futures | | 09/2005 | | 34 | | | (109 | ) |
Eurodollar December Long Futures | | 12/2005 | | 34 | | | (109 | ) |
Euribor June Long Futures | | 06/2005 | | 118 | | | (47 | ) |
Euribor Purchased Put Options Strike @ 89.000 | | 03/2005 | | 310 | | | (4 | ) |
Euribor September Long Futures | | 09/2005 | | 71 | | | (112 | ) |
| | | | | | |
|
|
|
| | | | | | | | $ (640 | ) |
| | | | | | |
|
|
|
(f) Securities with an aggregate market value of $748 have been pledged as collateral for swap and swaption contracts at June 30, 2004.
(g) Swap agreements outstanding at June 30, 2004:
| | | | | | | |
| Type | | Notional
Amount | | Appreciation/
(Depreciation) | |
|
Receive a fixed rate equal to 1.350% and the
Portfolio will pay to the counterparty at par
in the event of default of Republic of Peru 9.125% due 02/21/2012. | |
Counterparty: UBS Warburg LLC | | | | |
Exp. 09/20/2004 | | $ | 5,000 | | $ | 7 | |
|
Receive a fixed rate equal to 1.400% and the
Portfolio will pay to the counterparty at par
in the event of default of Tyco International Group S.A. 2.750% due 01/15/2018. | |
Counterparty: Morgan Stanley Dean Witter & Co. | |
Exp. 09/20/2004 | | | 4,000 | | | 12 | |
|
Receive a fixed rate equal to 2.600% and the
Portfolio will pay to the counterparty at par
in the event of default of Bombardier, Inc.
6.750% due 05/01/2012. | |
Counterparty: Goldman Sachs & Co. | |
Exp. 09/20/2004 | | | 1,286 | | | (11 | ) |
| | | | | | | |
|
Receive a fixed rate equal to 2.600% and the
Portfolio will pay to the counterparty at par in the
event of default of Clear Channel Communications, Inc.
7.650% due 09/15/2010. | |
Counterparty: Goldman Sachs & Co. | |
Exp. 09/20/2004 | | $ | 1,286 | | $ | (11 | ) |
|
Receive a fixed rate equal to 2.600% and the
Portfolio will pay to the counterparty at par in the
event of default of Comcast Cable Communications, Inc.
6.750% due 01/30/2011. | |
Counterparty: Goldman Sachs & Co. | |
Exp. 09/20/2004 | | | 1,286 | | | (11 | ) |
|
Receive a fixed rate equal to 2.600% and the Portfolio will pay to the counterparty at par in the
event of default of Cox Communications, Inc.
7.750% due 11/01/2010. | |
Counterparty: Goldman Sachs & Co. | |
Exp. 09/20/2004 | | | 1,286 | | | (11 | ) |
|
Receive a fixed rate equal to 2.600% and the
Portfolio will pay to the counterparty at par
in the event of default of Harrah’s Operating Co.
8.000% due 02/01/2011. | |
Counterparty: Goldman Sachs & Co. | |
Exp. 09/20/2004 | | | 1,286 | | | (11 | ) |
|
Receive a fixed rate equal to 2.600% and the
Portfolio will pay to the counterparty at par
in the event of default of Sprint Capital Corp.
6.875% due 11/15/2028. | |
Counterparty: Goldman Sachs & Co. | |
Exp. 09/20/2004 | | | 1,286 | | | (11 | ) |
|
Receive a fixed rate equal to 2.600% and the
Portfolio will pay to the counterparty at par in the event of default of Time Warner, Inc.
6.875% due 05/01/2012. | |
Counterparty: Goldman Sachs & Co. | |
Exp. 09/20/2004 | | | 1,286 | | | (11 | ) |
|
Receive a fixed rate equal to 1.000% and the
Portfolio will pay to the counterparty at par
in the event of default of Russian Federation
5.000% due 03/31/2030. | |
Counterparty: Morgan Stanley Dean Witter & Co. | |
Exp. 09/30/2004 | | | 5,000 | | | 2 | |
|
Receive a fixed rate equal to 0.720% and the
Portfolio will pay to the counterparty at par
in the event of default of Russian Federation,
5.000% until 03/31/2007 and 7.500% thereafter,
due 03/31/2030. | |
Counterparty: Goldman Sachs & Co. | |
Exp. 10/21/2004 | | | 4,000 | | | (2 | ) |
|
Receive a fixed rate equal to 4.100% and the
Portfolio will pay to the counterparty at par
in the event of default of Dow Jones TRAC-X NA High Yield Series. | |
Counterparty: J.P. Morgan Chase & Co. | |
Exp. 03/20/2009 | | | 5,000 | | | (92 | ) |
| | | | | |
|
|
|
| | | | | | $ | (150 | ) |
| | | | | |
|
|
|
| | | | | | |
| See accompanying notes | | June 30, 2004 | | Semi-Annual Report | | 11 |
Schedule of Investments (Cont.)
High Yield Portfolio
June 30, 2004 (Unaudited)
(h) Premiums received on written options:
| | | | | | | | | | | | | | | | | | | |
| Name of Issuer | | Exercise
Price | | | Expiration
Date | | # of
Contracts | | Premium | | | Value | |
Call - CBOT U.S. Treasury Note September Futures | | $ | 115.000 | | | 08/27/2004 | | | 76 | | $ | 36 | | | $ | 2 | |
| | | | | | |
Name of Issuer | | Counterparty | | Exercise
Rate | | | Expiration
Date | | Notional
Amount | | Premium | | | Value | |
Put - OTC 7-Year Interest Rate Swap | | Greenwich Capital Markets, Inc. | | | 5.250 | %* | | 07/19/2004 | | $ | 21,400 | | $ | 128 | | | $ | 3 | |
Call - OTC 7-Year Interest Rate Swap | | J.P. Morgan Chase & Co. | | | 4.500 | %** | | 08/02/2004 | | | 5,600 | | | 19 | | | | 12 | |
Call - OTC 10-Year Interest Rate Swap | | Bear Stearns & Co., Inc. | | | 4.000 | %** | | 10/07/2004 | | | 27,000 | | | 416 | | | | 1 | |
Put - OTC 10-Year Interest Rate Swap | | Bear Stearns & Co., Inc. | | | 6.500 | %* | | 10/07/2004 | | | 27,000 | | | 797 | | | | 9 | |
Call - OTC 7-Year Interest Rate Swap | | Wachovia Bank N.A. | | | 5.500 | %** | | 01/07/2005 | | | 5,900 | | | 285 | | | | 210 | |
Call - OTC 7-Year Interest Rate Swap | | Goldman Sachs & Co. | | | 5.000 | %** | | 01/07/2005 | | | 9,100 | | | 215 | | | | 157 | |
Put - OTC 7-Year Interest Rate Swap | | Goldman Sachs & Co. | | | 7.000 | %* | | 01/07/2005 | | | 9,100 | | | 190 | | | | 4 | |
| | | | | | | | | | | | | | $ | 2,050 | | | $ | 396 | |
| * The Portfolio will pay a floating rate based on 3-month LIBOR. | |
| **The Portfolio will receive a floating rate based on 3-month LIBOR. | |
| (i) Restricted security or securities as of June 30, 2004: | |
| Issuer Description | | | | | | | Acquisition
Date | | Cost as of June 30, 2004 | | Market
Value as of
June 30, 2004 | | | Market Value
as Percentage
of Net Assets | |
Bombardier Capital, Inc. | | | | | | | | 08/11/2003 | | $ | 1,008 | | $ | 1,008 | | | | 0.30 | % |
Continental Airlines, Inc. | | | | | | | | 07/01/2003 | | | 752 | | | 829 | | | | 0.24 | |
Ferrellgas Partners LP | | | | | | | | 06/30/2003 | | | 990 | | | 1,013 | | | | 0.30 | |
Ferrellgas Partners LP | | | | | | | | 06/30/2003 | | | 1,334 | | | 1,273 | | | | 0.38 | |
| | | | | | | | | | | $ | 4,084 | | $ | 4,123 | | | | 1.22 | % |
| | | |
(j) Forward foreign currency contracts outstanding at June 30, 2004: | | | | | | | | | | | |
| | | | | | |
| Type | | Currency | | Principal
Amount
Covered by
Contract | | | Settlement
Month | | Unrealized
Appreciation | | Unrealized
(Depreciation) | | | Net
Unrealized
Appreciation | |
Buy | | EC | | | 1,152 | | | 07/2004 | | $ | 6 | | $ | (5 | ) | | $ | 1 | |
Sell | | | | | 6,621 | | | 07/2004 | | | 86 | | | (4 | ) | | | 82 | |
Buy | | JY | | | 167,529 | | | 07/2004 | | | 9 | | | 0 | | | | 9 | |
| | | | | | | | | | | $ | 101 | | $ | (9 | ) | | $ | 92 | |
(k) Principal amount denoted in indicated currency:
EC - Euro
JY - Japanese Yen
(l) Indicates a fair-valued security which has not been valued utilizing an independent quote but has been valued in good faith pursuant to guidelines established by the Board of Trustees. The aggregate value of fair-valued securities is $2,102, which represents 0.62% of net assets.
| | | | | | |
| 12 | | Semi-Annual Report | | June 30, 2004 | | See accompanying notes |
Notes to Financial Statements
June 30, 2004 (Unaudited)
1. Organization
The High Yield Portfolio (the “Portfolio”) is a series of the PIMCO Variable Insurance Trust (the “Trust”). The Trust is registered under the Investment Company Act of 1940 (the “Act”), as amended, as an open-end investment company organized as a Delaware business trust on October 3, 1997. The Portfolio offers two classes of shares: Institutional and Administrative. Each share class has identical voting rights (except that shareholders of a class have exclusive voting rights regarding any matter relating solely to that class of shares). Information presented in these financial statements pertains to the Administrative Class of the Portfolio. Certain detailed financial information for the Institutional Class is provided separately and is available upon request. The Trust is designed to be used as an investment vehicle by Separate Accounts of insurance companies that fund variable annuity contracts and variable life insurance policies and by qualified pension and retirement plans. The Portfolio commenced operations on April 30, 1998.
2. Significant Accounting Policies
The following is a summary of significant accounting policies consistently followed by the Trust in the preparation of its financial statements in conformity with accounting principles generally accepted in the United States of America. The preparation of financial statements in accordance with accounting principles generally accepted in the United States of America requires management to make estimates and assumptions that affect the reported amounts and disclosures in the financial statements. Actual results could differ from those estimates.
Security Valuation. Portfolio securities and other financial instruments for which market quotations are readily available are stated at market value. Portfolio securities and other financial instruments for which market quotes are not readily available are valued at fair value, as determined in good faith and pursuant to guidelines established by the Board of Trustees, including certain fixed income securities which may be valued with reference to securities whose prices are more readily obtainable. Market value is determined at the close of regular trading (normally, 4:00 p.m., Eastern Time) on the New York Stock Exchange on each day the New York Stock Exchange is open, or if no sales are reported, as is the case for most securities traded over-the-counter, the mean between representative bid and asked quotations obtained from a quotation reporting system or from established market makers. The prices of certain portfolio securities or other financial instruments may be determined at a time prior to the close of regular trading on the New York Stock Exchange. Fair valuation may be used if significant events occur after the close of the relevant markets and prior to the close of regular trading on the New York Stock Exchange that materially affect the values of such securities or financial instruments. Fixed income securities are normally valued on the basis of quotes obtained from brokers and dealers or pricing services. Certain fixed income securities purchased on a delayed delivery basis are marked to market daily until settlement at the forward settlement value. Short-term investments, which mature in 60 days or less are valued at amortized cost, which approximates market value. Exchange traded options, futures and options on futures are valued at the settlement price determined by the relevant exchange. Prices may be obtained from independent pricing services which use information provided by market makers or estimates of market values obtained from yield data relating to investments or securities with similar characteristics. The prices used by the Portfolio may differ from the value that would be realized if the securities were sold and the differences could be material to the financial statements.
Securities Transactions and Investment Income. Securities transactions are recorded as of the trade date. Securities purchased or sold on a when-issued or delayed delivery basis may be settled a month or more after the trade date. Realized gains and losses from securities sold are recorded on the identified cost basis. Dividend income is recorded on the ex-dividend date, except certain dividends from foreign securities where the ex-dividend date may have passed, are recorded as soon as the Portfolio is informed of the ex-dividend date. Interest income, adjusted for the accretion of discounts and amortization of premiums, is recorded on the accrual basis. Paydowns gains and losses on mortgage- and asset-backed securities are recorded as adjustments to interest income in the Statement of Operations.
Dividends and Distributions to Shareholders. Dividends from net investment income, if any, are declared on each day the Trust is open for business and are distributed to shareholders monthly. All dividends are reinvested in additional shares of the Portfolio. Net realized capital gains earned by the Portfolio, if any, will be distributed no less frequently than once each year.
Income dividends and capital gain distributions are determined in accordance with income tax regulations which may differ from accounting principles generally accepted in the United States of America. These differences are primarily due to differing treatments for such items as wash sales, foreign currency transactions, net operating losses, notional principal contracts, certain asset-backed securities, certain futures and forward contracts, tax straddles, and capital loss carryforwards.
Distributions classified as a tax basis return of capital, if any, are reflected in the accompanying Statements of Changes in Net Assets and have been reclassified to paid in capital. In addition, other amounts have been reclassified between undistributed net investment income, accumulated undistributed net realized gains or losses and/or paid in capital to more appropriately conform financial accounting to tax characterizations of dividend distributions.
Multiclass Operations. Each class offered by the Trust has equal rights as to assets. Income, non-class specific expenses, and realized and unrealized capital gains and losses are allocated to each class of shares based on the relative net assets of each class.
Federal Income Taxes. The Portfolio intends to qualify as a regulated investment company and distribute all of its taxable
| | | | |
| June 30, 2004 | | Semi-Annual Report | | 13 |
Notes to Financial Statements (Cont.)
June 30, 2004 (Unaudited)
income and net realized gains, if applicable, to shareholders. Accordingly, no provision for Federal income taxes has been made.
Foreign Currency. The accounting records of the Portfolio are maintained in U.S. dollars. The market values of foreign securities, currency holdings and other assets and liabilities are translated into U.S. dollars based on the current exchange rates each business day. Fluctuations in the value of these assets and liabilities resulting from changes in exchange rates are recorded as unrealized foreign currency gains or losses. Realized gains or losses and unrealized appreciation or depreciation on investment securities and income and expenses are translated on the respective dates of such transactions. The effect of changes in foreign currency exchange rates on investments in securities are not segregated in the Statement of Operations from the effects of changes in market prices of those securities, but are included with the net realized and unrealized gain or loss on investment securities.
Forward Currency Transactions. The Portfolio may enter into forward currency contracts and forward cross-currency contracts in connection with settling planned purchases or sales of securities, to hedge the currency exposure associated with some or all of the Portfolio’s securities or as a part of an investment strategy. A forward currency contract is an agreement between two parties to buy and sell a currency at a set price on a future date. The market value of a forward currency contract fluctuates with changes in forward currency exchange rates. Forward currency contracts are marked to market daily and the change in value is recorded by the Portfolio as an unrealized gain or loss. Realized gains or losses equal to the difference between the value of the contract at the time it was opened and the value at the time it was closed are recorded upon delivery or receipt of the currency or, if a forward currency contract is offset by entering into another forward currency contract with the same broker, upon settlement of the net gain or loss. These contracts may involve market risk in excess of the unrealized gain or loss reflected in the Portfolio’s Statement of Assets and Liabilities. In addition, the Portfolio could be exposed to risk if the counterparties are unable to meet the terms of the contracts or if the value of the currency changes unfavorably to the U.S. dollar.
Futures Contracts. The Portfolio is authorized to enter into futures contracts. The Portfolio may use futures contracts to manage its exposure to the securities markets or to movements in interest rates and currency values. The primary risks associated with the use of futures contracts are the imperfect correlation between the change in market value of the securities held by the Portfolio and the prices of futures contracts, the possibility of an illiquid market, and the inability of the counterparty to meet the terms of the contract. Futures contracts are valued based upon their quoted daily settlement prices. Upon entering into a futures contract, the Portfolio may be required to deposit with its custodian, in a segregated account in the name of the futures broker, an amount of cash or U.S. Government and Agency Obligations in accordance with the initial margin requirements of the broker or exchange. Futures contracts are marked to market daily and an appropriate payable or receivable for the change in value (“variation margin”) is recorded by the Portfolio. Gains or losses are recognized but not considered realized until the contracts expire or are closed. Futures contracts involve, to varying degrees, risk of loss in excess of the variation margin disclosed in the Statement of Assets and Liabilities.
Loan Agreements. The Portfolio may invest in direct debt instruments which are interests in amounts owed by a corporate, governmental, or other borrower to lenders or lending syndicates. The Portfolio’s investments in loans may be in the form of participations in loans or assignments of all or a portion of loans from third parties. A loan is often administered by a bank or other financial institution (the “lender”) that acts as agent for all holders. The agent administers the terms of the loan, as specified in the loan agreement. When investing in a loan participation, the Portfolio has the right to receive payments of principal, interest and any fees to which it is entitled only from the lender selling the loan agreement and only upon receipt by the lender of payments from the borrower. The Portfolio generally has no right to enforce compliance with the terms of the loan agreement with the borrower. As a result, the Portfolio may be subject to the credit risk of both the borrower and the lender that is selling the loan agreement. When the Portfolio purchases assignments from lenders it acquires direct rights against the borrower on the loan.
Options Contracts. The Portfolio may write call and put options on futures, swaps, securities or currencies it owns or in which it may invest. Writing put options tends to increase the Portfolio’s exposure to the underlying instrument. Writing call options tends to decrease the Portfolio’s exposure to the underlying instrument. When the Portfolio writes a call or put option, an amount equal to the premium received is recorded as a liability and subsequently marked to market to reflect the current value of the option written. These liabilities are reflected as written options outstanding in the Statement of Assets and Liabilities. Payments received or made, if any, from writing options with premiums to be determined on a future date are reflected as such on the Statement of Assets and Liabilities. Premiums received from writing options which expire are treated as realized gains. Premiums received from writing options which are exercised or closed are added to the proceeds or offset against amounts paid on the underlying future, swap, security or currency transaction to determine the realized gain or loss. The Portfolio as a writer of an option has no control over whether the underlying future, swap, security or currency may be sold (call) or purchased (put) and as a result bears the market risk of an unfavorable change in the price of the future, swap, security or currency underlying the written option. There is the risk the Portfolio may not be able to enter into a closing transaction because of an illiquid market.
The Portfolio may also purchase put and call options. Purchasing call options tends to increase the Portfolio’s exposure to the underlying instrument. Purchasing put options tends to decrease the Portfolio’s exposure to the underlying instrument. The Portfolio pays a premium which is included in the Portfolio’s Statement of Assets and Liabilities as an investment and subsequently marked to market to reflect the current value of the option. Premiums paid for
| | | | |
| 14 | | Semi-Annual Report | | June 30, 2004 |
purchasing options which expire are treated as realized losses. The risk associated with purchasing put and call options is limited to the premium paid. Premiums paid for purchasing options which are exercised or closed are added to the amounts paid or offset against the proceeds on the underlying future, swap, security or currency transaction to determine the realized gain or loss.
Payment In-Kind Securities. The Portfolio may invest in payment in-kind securities. Payment-in-kind securities (PIKs) give the issuer the option at each interest payment date of making interest payments in either cash or additional debt securities. Those additional debt securities usually have the same terms, including maturity dates and interest rates, and associated risks as the original bonds. The daily market quotations of the original bonds include the accrued interest (referred to as a dirty price) and require an adjustment in an amount equal to the accrued interest to the unrealized appreciation or depreciation on investment in the Statements of Assets and Liabilities.
Repurchase Agreements. The Portfolio may engage in repurchase transactions. Under the terms of a typical repurchase agreement, the Portfolio takes possession of an underlying debt obligation subject to an obligation of the seller to repurchase, and the Portfolio to resell, the obligation at an agreed-upon price and time. The market value of the collateral must be equal at all times to the total amount of the repurchase obligations, including interest. Generally, in the event of counterparty default, the Portfolio has the right to use the collateral to offset losses incurred.
Restricted Securities. The Portfolio is permitted to invest in securities that are subject to legal or contractual restrictions on resale. These securities generally may be resold in transactions exempt from registration or to the public if the securities are registered. Disposal of these securities may involve time-consuming negotiations and expenses, and prompt sale at an acceptable price may be difficult.
Swap Agreements. The Portfolio may invest in swap agreements. A swap is an agreement to exchange the return generated by one instrument for the return generated by another instrument. The Portfolio may enter into interest rate, total return, forward spread lock, and credit default swap agreements to manage its exposure to interest rates and credit risk.
Interest rate swap agreements involve the exchange by the Portfolio with another party of their respective commitments to pay or receive interest, e.g., an exchange of floating rate payments for fixed rate payments with respect to the notional amount of principal.
Total return swap agreements involve commitments to pay interest in exchange for a market-linked return, both based on notional amounts. To the extent the total return of the security or index underlying the transaction exceeds or falls short of the offsetting interest rate obligation, the Portfolio will receive a payment from or make a payment to the counterparty.
Forward spread lock swap agreements involve commitments to pay or receive a settlement amount calculated as the difference between the swap spread and a fixed spread, multiplied by the notional amount times the duration of the swap. The swap spread is the difference between the benchmark swap rate (market rate) and the specific Treasury rate.
In a credit default swap, one party makes a stream of payments to another party in exchange for the right to receive a specified return in the event of a default by a third party, typically corporate issues or sovereign issues of an emerging country, on its obligation. The Portfolio may use credit default swaps to provide a measure of protection against defaults of sovereign issuers (i.e., to reduce risk where the Portfolio owns or has exposure to the sovereign issuer) or to take an active long or short position with respect to the likelihood of a particular issuer’s default.
Swaps are marked to market daily based upon quotations from market makers and the change in value, if any, is recorded as unrealized gain or loss in the Statement of Operations. Payments received or made at the beginning of the measurement period are reflected as such on the Statement of Assets and Liabilities. A liquidation payment received or made at the termination of the swap is recorded as realized gain or loss in the Statement of Operations. Net periodic payments received by the Portfolio are included as part of realized gain (loss) on the Statement of Operations. Entering into these agreements involves, to varying degrees, elements of credit, market and documentation risk in excess of the amounts recognized on the Statement of Assets and Liabilities. Such risks involve the possibility that there will be no liquid market for these agreements, that the counterparty to the agreements may default on its obligation to perform or disagree as to the meaning of contractual terms in the agreements, and that there may be unfavorable changes in interest rates.
As a result of a FASB Emerging Issues Task Force (“EITF”) consensus, No. 03-11, and related SEC staff guidance, the Portfolio has reclassified periodic payments made or received under swap agreements, which were previously included within miscellaneous income, to a component of realized gain (loss) in the Statement of Operations. For consistency, similar reclassifications have been made to amounts appearing in the previous year’s Statement of Changes in Net Assets and the per share amounts in the prior year financial highlights. Prior year net investment income ratios in the financial highlights have also been modified accordingly. This reclassification increased (decreased) net investment income by $(360,176), and $(526,777), and net realized gain by $377,876 and $505,063 and net change in unrealized appreciation (depreciation) by $(17,699) and $21,714 for the six months ended June 30, 2004 and year ended December 31, 2003, respectively. There is no effect on the Portfolio’s net asset value, either in total or per share, or its total increase (decrease) in net assets from operations during any period.
3. Fees, Expenses, and Related Party Transactions
Investment Advisory Fee. Pacific Investment Management Company LLC (“PIMCO”) is a majority owned subsidiary partnership of Allianz Dresdner Asset Management of America L.P. and serves as investment adviser (the “Adviser”) to the Trust, pursuant to an investment advisory contract. The Adviser receives a monthly fee at
| | | | |
| June 30, 2004 | | Semi-Annual Report | | 15 |
Notes to Financial Statements (Cont.)
June 30, 2004 (Unaudited)
an annual rate based on average daily net assets of the Portfolio. The Advisory Fee is charged at an annual rate of 0.25%.
Administration Fee. PIMCO serves as administrator (the “Administrator”), and provides administrative services to the Trust for which it receives a monthly administrative fee based on average daily net assets of the Portfolio. The Administration Fee is charged at the annual rate of 0.35%.
Servicing Fee. PA Distributors LLC (“PAD”), formerly known as PIMCO Advisors Distributors LLC, is an indirect wholly-owned subsidiary of Allianz Dresdner Asset Management of America L.P. and serves as the distributor of the Trust’s shares. The Trust is permitted to reimburse PAD on a quarterly basis, out of the Administrative Class assets of the Portfolio in the amount of 0.15% on an annual basis of the average daily net assets of that class, for payments made to financial intermediaries that provide services in connection with the distribution of shares or administration of plans or programs that use Portfolio shares as their funding medium. The effective rate paid to PAD was 0.15% during current fiscal year.
Expenses. The Trust is responsible for the following expenses: (i) salaries and other compensation of any of the Trust’s executive officers and employees who are not officers, directors, stockholders or employees of PIMCO or its subsidiaries or affiliates; (ii) taxes and governmental fees; (iii) brokerage fees and commissions and other portfolio transaction expenses; (iv) the cost of borrowing money, including interest expense and bank overdraft charges; (v) fees and expenses of the Trustees who are not “interested persons” of PIMCO or the Trust, and any counsel retained exclusively for their benefit; (vi) extraordinary expenses, including costs of litigation and indemnification expenses; (vii) organization expenses and (viii) any expenses allocated or allocable to a specific class of shares, which include service fees payable with respect to the Administrative Class shares and may include certain other expenses as permitted by the Trust’s Multiple Class Plan adopted pursuant to Rule 18f-3 under the Act and subject to review and approval by the Trustees. The ratio of expenses to average net assets per share class, as disclosed in Financial Highlights, may differ from the annual portfolio operating expenses per share class as disclosed in the Prospectus for the reasons set forth above.
PIMCO has agreed to waive a portion of its administrative fees to the extent that the payment of the Portfolio’s pro rata share of organization expenses and Trustee fees cause the actual expense ratio to rise above the rates disclosed in the then-current prospectus plus 0.49 basis points as set forth below (calculated as a percentage of the Portfolio’s average daily net assets attributable to each class):
| | | |
Institutional Class | | 0.60 | % |
Administrative Class | | 0.75 | % |
PIMCO may be reimbursed for these waived amounts in future periods, not to exceed thirty-six months.
Each unaffiliated Trustee receives an annual retainer of $4,000, plus $1,500 for each Board of Trustees meeting attended in person and $250 for each meeting attended telephonically, plus reimbursement of related expenses. In addition, each committee chair receives an additional annual retainer of $500. These expenses are allocated on a pro-rata basis to each Portfolio of the Trust according to its respective net assets.
4. Purchases and Sales of Securities
The length of time a Portfolio has held a particular security is not generally a consideration in investment decisions. A change in the securities held by a Portfolio is known as “portfolio turnover.” The Portfolio may engage in frequent and active trading of portfolio securities to achieve its investment objective, particularly during periods of volatile market movements. High portfolio turnover (e.g., over 100%) involves correspondingly greater expenses to the Portfolio, including brokerage commissions or dealer mark-ups and other transaction costs on the sale of securities and reinvestments in other securities. Such sales may also result in realization of taxable capital gains, including short-term capital gains (which are generally taxed at ordinary income tax rates). The trading costs and tax effects associated with portfolio turnover may adversely affect the Portfolio’s performance.
Purchases and sales of securities (excluding short-term investments) for the period ended June 30, 2004 were as follows (amounts in thousands):
| | | | | | |
| U.S. Government/Agency | | All Other |
| Purchases | | Sales | | Purchases | | Sales |
| $ 249 | | $ 0 | | $ 322,435 | | $ 849,926 |
5. Transactions in Written Call and Put Options
Transactions in written call and put options were as follows (amounts in thousands):
| | | |
| | | Premium | |
Balance at 12/31/2003 | | $1,902 | |
Sales | | 961 | |
Closing Buys | | (418 | ) |
Expirations | | (360 | ) |
| Exercised | | 0 | |
| Balance at 06/30/2004 | | $2,085 | |
6. In-Kind Transactions
For the six months ended June 30, 2004, the following Funds realized gain or losses from in-kind redemptions of approximately (amounts in thousands):
| | |
| Realized Gains | | Realized Losses |
| $ 29,020 | | $ (5,409) |
| | | | |
| 16 | | Semi-Annual Report | | June 30, 2004 |
7. Federal Income Tax Matters
At June 30, 2004, the aggregate cost of investments was the same for federal income tax and financial statement purposes. The net unrealized appreciation (depreciation) of investment securities for federal income tax purposes is as follows (amounts in thousands):
| | | | |
Aggregate Gross
Unrealized Appreciation | | Aggregate Gross
Unrealized
(Depreciation) | | Net Unrealized
Depreciation |
| $ 6,756 | | $ (8,314) | | $ (1,558) |
8. Shares of Beneficial Interest
The Trust may issue an unlimited number of shares of beneficial interest with a $.001 par value. Changes in shares of beneficial interest were as follows (shares and amounts in thousands):
| | | | | | | | | | | | | | |
| | | Six Months Ended
06/30/2004 | | | Year Ended
12/31/2003 | |
| | | Shares | | | Amount | | | Shares | | | Amount | |
Receipts for shares sold | | | | | | | | | | | | | | |
| | | | |
Institutional Class | | 38 | | | $ | 298 | | | 0 | | | $ | 0 | |
Administrative Class | | 19,173 | | | | 155,987 | | | 106,916 | | | | 820,631 | |
| | | | |
Issued as reinvestment of distributions | | | | | | | | | | | | | | |
| | | | |
Institutional Class | | 0 | | | | 3 | | | 1 | | | | 1 | |
Administrative Class | | 2,632 | | | | 21,323 | | | 6,690 | | | | 52,190 | |
| | | | |
Cost of shares redeemed | | | | | | | | | | | | | | |
| | | | |
Institutional Class | | 0 | | | | (1 | ) | | 0 | | | | 0 | |
Administrative Class | | (95,728 | ) | | | (769,715 | ) | | (64,075 | ) | | | (487,714 | ) |
| | | | |
Net increase (decrease) resulting from Portfolio share transactions | | (73,885 | ) | | $ | (592,105 | ) | | 49,532 | | | $ | 385,108 | |
The following schedule shows the number of shareholders each owning 5% or more of the Portfolio and the total percentage of the Portfolio held by such shareholders:
| | | | |
| | | Number | | % of Portfolio Held |
Institutional Class | | 1 | | 96 |
Administrative Class | | 3 | | 89 |
9. Regulatory and Litigation Matters
On February 17, 2004, the Attorney General of the State of New Jersey (“New Jersey AG”) filed a complaint against Allianz Dresdner Asset Management of America L.P. (“ADAM”), PA Distributors LLC (formerly known as PIMCO Advisors Distributors LLC) (“PAD”), PEA Capital LLC (formerly known as PIMCO Equity Advisors LLC) (“PEA”), and Pacific Investment Management Company LLC (“PIMCO”) in connection with its investigation into market timing and late trading. The complaint contends that inappropriate trading by shareholders engaged in market timing activity took place in funds in the PIMCO Funds: Multi-Manager Series (“MMS Funds”) and the PIMCO Funds: Pacific Investment Management Series (“PIMS Funds”). On June 1, 2004, the New Jersey AG dismissed PIMCO from the lawsuit.
On the same day as the dismissal of PIMCO from the lawsuit, the New Jersey AG announced that it had reached a settlement agreement with the remaining defendants (“New Jersey Settlement”). In the New Jersey Settlement, ADAM, PAD and PEA agreed, while neither admitting nor denying the allegations or conclusions of law, to: (i) pay New Jersey a civil fine of $15 million and $3 million for investigative costs and further enforcement initiatives; and (ii) implement certain changes in corporate governance.
On May 6, 2004, the Securities and Exchange Commission filed a complaint in the U.S. District Court in the Southern District of New York alleging that PA Fund Management LLC (formerly known as PIMCO Advisors Fund Management LLC) (“PAFM”), PEA, PAD, Stephen J. Treadway (at the time, the chief executive officer of PAFM and PAD as well as chairman of the Board of Trustees of the MMS Funds) and Kenneth W. Corba (the former chief executive officer of PEA and former portfolio manager of the PEA Growth and PEA Growth & Income Funds) had, among other things, violated and/or aided and abetted violations of, various antifraud provisions of the federal securities laws in connection with alleged
| | | | |
| June 30, 2004 | | Semi-Annual Report | | 17 |
Notes to Financial Statements (Cont.)
June 30, 2004 (Unaudited)
“market timing” arrangements that improperly allowed certain hedge funds to engage in “market timing” in the PEA Growth Fund, the PEA Opportunity Fund, the PEA Innovation Fund, and the PEA Target Fund. The complaint seeks injunctive relief, disgorgement plus pre-judgment interest, monetary penalties, and an order permanently enjoining the defendants from serving as investment advisers, principal underwriters, officers, directors, or members of any advisory boards to any registered investment companies.
On February 20, 2004, a putative class action lawsuit was filed in the U.S. District Court for the District of New Jersey on behalf of certain shareholders of the PIMCO Funds against ADAM, PAD, PIMCO, PEA, the PIMS Funds, the MMS Funds, the Trust, PIMCO Commercial Mortgage Securities Trust, Inc. and certain other defendants, alleging that inappropriate market timing activity by certain shareholders caused financial injury to the shareholders of those Funds.
The following additional putative class action lawsuits have been filed against the PIMS Funds, the MMS Funds and/or their affiliates, each related to alleged market-timing activity in funds advised by PIMCO or its affiliates: (1) a lawsuit filed in the U.S. District Court for the District of Connecticut on February 27, 2004 (naming as defendants ADAM, PAD, PEA, the PIMS Funds, the MMS Funds, the Trust, PCM and certain other parties); (2) a lawsuit filed in the U.S. District Court for the Central District of California on March 4, 2004 (naming as defendants PIMCO, ADAM, PEA and PAD); (3) a lawsuit filed in the U.S. District Court for the Southern District of New York on March 8, 2004 (naming PIMCO, PAD and certain of their affiliates as defendants); (4) a lawsuit filed in the U.S. District Court for the Southern District of New York, on March 15, 2004 (naming PIMCO as the defendant); (5) two separate lawsuits filed in the U.S. District Court for the Central District of California on March 22, 2004, brought derivatively on behalf of the PIMCO High Yield Fund and the PIMCO Money Market Fund, respectively (each naming ADAM, PAFM and certain other parties as defendants, and the PIMCO Funds as the nominal defendant); (6) a lawsuit filed in the U.S. District Court for the Central District of California, also on March 22, 2004, brought derivatively on behalf of the PIMS Funds and the MMS Funds (naming ADAM, PIMCO, PAD and certain other parties as defendants, and the PIMS Funds and the MMS Funds as nominal defendants); (7) a lawsuit filed in the U.S. District Court for the District of New Jersey on April 20, 2004 (naming ADAM, PAD, the PIMS Funds and certain other parties as defendants); and (8) a lawsuit filed in the U.S. District Court for the Northern District of California on April 28, 2004 (naming ADAM, PIMCO, PAD, PEA and certain other parties as defendants, and the “PIMCO Funds” as nominal defendants). Each complaint for the foregoing putative class actions alleges, among other things, that inappropriate trading by shareholders engaged in market timing activities took place in certain of the funds advised by PIMCO, and each complaint seeks unspecified compensatory damages.
On February 17, 2004, a putative class action lawsuit was filed in the U.S. District Court for the District of Connecticut on behalf of certain shareholders of the PIMCO Funds against ADAM, PEA, PIMCO, PIMS Funds, MMS Funds and certain other defendants, alleging excessive investment advisory fees and the use of brokerage commissions to pay for distribution of fund shares. Three similar putative class action lawsuits were subsequently filed, each in the U.S. District Court for the District of Connecticut on March 1, 2004, April 23, 2004 and May 20, 2004, respectively.
Under Section 9(a) of the 1940 Act, if any of the various lawsuits were to result in a court injunction against PAFM, PEA, PAD, PIMCO, ADAM and/or Mr. Treadway, they and their affiliates would, in the absence of exemptive relief granted by the SEC, be barred from serving as an investment adviser/sub-adviser or principal underwriter for any registered investment company, including the Trust. ADAM and certain of its subsidiaries have responded to inquiries from the SEC concerning the status of the New Jersey Settlement under Section 9(a). If any of PAFM, PEA, PAD, PIMCO or ADAM were subject to an injunction, each of these entities and their affiliates could in turn seek exemptive relief from the SEC, as contemplated by the 1940 Act. There is no assurance, however, that such exemptive relief would be granted. The SEC also has the power by order to prohibit PAFM, PEA, PAD and PIMCO from serving as investment advisers and underwriters, if the SEC finds that such entities willfully violated the federal securities laws in connection with the allegations discussed above or aided or abetted such violations.
PIMCO, PAD and the Trust believe that these developments will not have a material adverse effect on the Portfolios or on PIMCO’s, or PAD’s ability to perform their respective investment advisory or distribution services on behalf of the Portfolios.
| | | | |
| 18 | | Semi-Annual Report | | June 30, 2004 |
Trustees and Officers
Brent R. Harris, Chairman and Trustee
R. Wesley Burns, President and Trustee
E. Philip Cannon, Trustee
Vern O. Curtis, Trustee
J. Michael Hagan, Trustee
William J. Popejoy, Trustee
Garlin G. Flynn, Secretary
John P. Hardaway, Treasurer
Investment Adviser and Administrator
Pacific Investment Management Company LLC
840 Newport Center Drive
Newport Beach, California 92660
Distributor
PA Distributors LLC
2187 Atlantic Street
Stamford, Connecticut 06902
Custodian
State Street Bank & Trust Company
801 Pennsylvania
Kansas City, Missouri 64105
Transfer Agent
Boston Financial Data Services–Midwest
330 W. 9th Street
Kansas City, Missouri 64105
Legal Counsel
Dechert LLP
1775 I Street, N.W.
Washington, D.C. 20006
Independent Registered Public Accounting Firm
PricewaterhouseCoopers LLP
1055 Broadway
Kansas City, Missouri 64105
Information about how the Fund voted proxies relating to portfolio securities held during the year July 1, 2003 through June 30, 2004 will be available no later than August 31, 2004 without charge, upon request, by calling the Trust at 1-800-927-4648 and on the SEC’s website at http://www.sec.gov.
Copies of the written Proxy Policy and the factors that PIMCO may consider in determining how to vote proxies for the Funds are available by calling the Trust at 1-800-927-4648 and on the SEC’s website at http://www.sec.gov.
PIMCO VARIABLE INSURANCE TRUST
840 NEWPORT CENTER DRIVE
NEWPORT BEACH, CA 92660

PIMCO VARIABLE INSURANCE TRUST
TOTAL RETURN PORTFOLIO
ADMINISTRATIVE CLASS
SEMI-ANNUAL REPORT
June 30, 2004
|
| This material is authorized for use only when preceded or accompanied by the current PIMCO Variable Insurance Trust prospectus. Investors should consider the investment objectives, risks, charges and expenses of Portfolio carefully before investing. This and other information is contained in the Portfolio’s prospectus. Please read the prospectus carefully before you invest or send money. |
Chairman’s Letter
Dear PIMCO Variable Insurance Trust Shareholder:
Bond prices were more volatile during the six-month period ended June 30, 2004. Interest rates rose sharply during the second quarter 2004, causing bonds to give back modest gains from earlier in the year. The Lehman Brothers Aggregate Bond Index, a widely used index for the high-grade bond market, was nearly flat during the first six months of 2004, returning 0.15% after losing 2.44% during the second quarter. The yield on the benchmark ten-year Treasury closed June 30, 2004 at 4.58%, up 0.75% from April 1, 2004, but up only 0.34% from where it began the six-month period on January 1, 2004.
Continued growth in employment convinced the markets that the Federal Reserve would soon begin a long anticipated tightening cycle. On June 30, 2004, the Fed met market expectations by increasing the federal funds rate 0.25%, which was the first rate increase since June 25, 2003. The central bank had held this rate at 1% for more than a year, which generated negative real short-term rates. And on August 10, 2004, the Fed increased the federal funds rate another 0.25% to 1.50%.
Investors that had profited handsomely from borrowing at low short-term rates and investing in higher-yielding longer maturity bonds surrendered some of those profits towards the latter part of the six-month period. Concern that borrowing rates would rise led investors to liquidate long positions and unwind these trades, which caused bond prices to decrease. However, substantial leverage remained among banks, hedge funds, and other investors, making bond markets somewhat vulnerable to additional Fed rate increases. There were also signs of rising inflation, which fueled anxiety that central banks might continue to raise interest rates.
On the following pages you will find a more complete review of the Portfolio in light of financial market activities as well as specific details about the total return investment performance for the six-month period.
We appreciate the trust you have placed in us, and we will continue to focus our efforts to meet your investment needs.
Sincerely,

Brent R. Harris
Chairman
August 11, 2004
| | | | |
| June 30, 2004 | | Semi-Annual Report | | 1 |
Important Information About the Portfolio
We believe that bond funds have an important role to play in a well diversified investment portfolio. It is important to note, however, that in an environment where interest rates may trend upward, rising rates will negatively impact the performance of most bond funds, and fixed income securities held by a fund are likely to decrease in value. The price volatility of fixed income securities can also increase during periods of rising interest rates resulting in increased losses to a fund. Bond funds and individual bonds with a longer duration (a measure of the expected life of a security) tend to be more sensitive to changes in interest rates, usually making them more volatile than securities or funds with shorter durations. The longer-term performance of most bond funds has benefited from capital gains in part resulting from an extended period of declining interest rates. In the event interest rates increase, these capital gains should not be expected to recur.
The Portfolio may be subject to various risks in addition to those described above. Some of these risks may include, but are not limited to, the following: real rate risk, derivative risk, small company risk, foreign security risk, high yield security risk and specific sector investment risks. The Portfolio may use derivative instruments for hedging purposes or as part of an investment strategy. Use of these instruments may involve certain costs and risks such as liquidity risk, interest rate risk, market risk, credit risk, management risk and the risk that a fund could not close out a position when it would be most advantageous to do so. A Portfolio investing in derivatives could lose more than the principal amount invested in these instruments. Investing in non-U.S. securities may entail risk due to non-U.S. economic and political developments; this risk may be enhanced when investing in emerging markets. High-yield bonds typically have a lower credit rating than other bonds. Lower rated bonds generally involve a greater risk to principal than higher rated bonds. Smaller companies may be more volatile than larger companies and may entail more risk. Concentrating investments in individual sectors may add additional risk and volatility compared to a diversified portfolio.
On the performance summary page in this semi-annual report, the Total Return Investment Performance table measures performance assuming that all dividend and capital gain distributions were reinvested. Returns do not reflect the deduction of taxes that a shareholder would pay (i) on Portfolio distributions or (ii) the redemption of Portfolio shares.
An investment in a Portfolio is not a bank deposit and is not guaranteed or insured by the Federal Deposit Insurance Corporation or any other government agency. It is possible to lose money on investments in the Funds.
The following disclosure provides important information regarding the Portfolio’s Expense Example, which appears on the Portfolio’s individual page in this semi-annual report. Please refer to this information when reviewing the Expense Example for the Portfolio.
Example
As a shareholder of the Portfolio, you incur two types of costs: (1) transaction costs, including redemption and exchange fees; and (2) ongoing costs, including advisory and administrative fees; distribution and/or service (12b-1) fees (Administrative Class only); and other Portfolio expenses. The Example is intended to help you understand your ongoing costs (in dollars) of investing in the Portfolio and to compare these costs with the ongoing costs of investing in other mutual funds.
The Example is based on an investment of $1,000 invested at the beginning of the period and held for the entire period indicated, which is from 1/1/04 to 6/30/04.
Actual Expenses
The information in the table under the heading “Actual Performance” provides information about actual account values and actual expenses. You may use the information in these columns, together with the amount you invested, to estimate the expenses that you paid over the period. Simply divide your account value by $1,000.00 (for example, an $8,600.00 account value divided by $1,000 = 8.60), then multiply the result by the number in the appropriate column for your share class, in the row entitled “Expenses Paid During Period” to estimate the expenses you paid on your account during this period.
Hypothetical Example for Comparison Purposes
The information in the table under the heading “Hypothetical Performance (5% return before expenses)” provides information about hypothetical account values and hypothetical expenses based on the Portfolio’s actual expense ratio and an assumed rate of return of 5% per year before expenses, which is not the Portfolio’s actual return. The hypothetical account values and expenses may not be used to estimate the actual ending account balance or expenses you paid for the period. You may use this information to compare the ongoing costs of investing in the Portfolio and other portfolios. To do so, compare this 5% hypothetical example with the 5% hypothetical examples that appear in the shareholder reports of the other portfolios.
Please note that the expenses shown in the table are meant to highlight your ongoing costs only and do not reflect any transactional costs. Therefore, the information under the heading “Hypothetical Performance (5% return before expenses)” is useful in comparing ongoing costs only, and will not help you determine the relative total costs of owning different portfolios. In addition, if these transactional costs were included, your costs would have been higher.
PIMCO Variable Insurance Trust is distributed by PA Distributors LLC, 2187 Atlantic Street, Stamford, CT 06902.
| | | | |
| 2 | | Semi-Annual Report | | June 30, 2004 |
Total Return Portfolio
CUMULATIVE RETURNS THROUGH JUNE 30, 2004
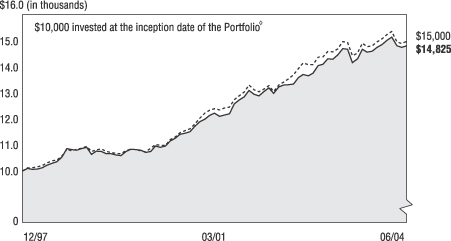
[CHART]
Total Return Portfolio Lehman Brothers Aggregate
Admin. Class Bond Index
---------------------- -------------------------
12/31/1997 $10,000 $10,000
01/31/1998 $10,102 $10,128
02/28/1998 $10,059 $10,120
03/31/1998 $10,081 $10,156
04/30/1998 $10,124 $10,209
05/31/1998 $10,222 $10,305
06/30/1998 $10,302 $10,393
07/31/1998 $10,355 $10,415
08/31/1998 $10,546 $10,584
09/30/1998 $10,861 $10,832
10/31/1998 $10,820 $10,775
11/30/1998 $10,806 $10,836
12/31/1998 $10,861 $10,869
01/31/1999 $10,907 $10,946
02/28/1999 $10,641 $10,755
03/31/1999 $10,769 $10,815
04/30/1999 $10,754 $10,849
05/31/1999 $10,660 $10,754
06/30/1999 $10,668 $10,720
07/31/1999 $10,611 $10,674
08/31/1999 $10,596 $10,669
09/30/1999 $10,755 $10,793
10/31/1999 $10,843 $10,832
11/30/1999 $10,829 $10,832
12/31/1999 $10,798 $10,779
01/31/2000 $10,713 $10,744
02/29/2000 $10,756 $10,874
03/31/2000 $10,959 $11,017
04/30/2000 $10,909 $10,986
05/31/2000 $10,959 $10,981
06/30/2000 $11,161 $11,209
07/31/2000 $11,250 $11,311
08/31/2000 $11,419 $11,475
09/30/2000 $11,451 $11,547
10/31/2000 $11,520 $11,623
11/30/2000 $11,727 $11,813
12/31/2000 $11,895 $12,033
01/31/2001 $11,999 $12,229
02/28/2001 $12,139 $12,336
03/31/2001 $12,224 $12,398
04/30/2001 $12,104 $12,346
05/31/2001 $12,160 $12,421
06/30/2001 $12,200 $12,468
07/31/2001 $12,589 $12,746
08/31/2001 $12,733 $12,892
09/30/2001 $12,861 $13,043
10/31/2001 $13,108 $13,316
11/30/2001 $12,950 $13,132
12/31/2001 $12,891 $13,049
01/31/2002 $13,052 $13,154
02/28/2002 $13,197 $13,282
03/31/2002 $12,995 $13,061
04/30/2002 $13,234 $13,314
05/31/2002 $13,317 $13,427
06/30/2002 $13,319 $13,543
07/31/2002 $13,350 $13,707
08/31/2002 $13,596 $13,938
09/30/2002 $13,715 $14,164
10/31/2002 $13,666 $14,099
11/30/2002 $13,767 $14,096
12/31/2002 $14,059 $14,387
01/31/2003 $14,117 $14,399
02/28/2003 $14,317 $14,598
03/31/2003 $14,314 $14,587
04/30/2003 $14,468 $14,707
05/31/2003 $14,716 $14,982
06/30/2003 $14,691 $14,952
07/31/2003 $14,176 $14,449
08/31/2003 $14,320 $14,545
09/30/2003 $14,688 $14,930
10/31/2003 $14,582 $14,791
11/30/2003 $14,611 $14,826
12/31/2003 $14,768 $14,977
01/31/2004 $14,876 $15,098
02/29/2004 $15,038 $15,261
03/31/2004 $15,161 $15,375
04/30/2004 $14,826 $14,975
05/31/2004 $14,761 $14,915
06/30/2004 $14,825 $15,000
SECTOR BREAKDOWN‡
| | | |
Short-Term Instruments | | 62.2 | % |
U.S. Government Agencies | | 17.5 | % |
U.S. Treasury Obligations | | 4.2 | % |
Municipal Bonds & Notes | | 4.1 | % |
Mortgage-Backed Securities | | 3.5 | % |
Corporate Bonds & Notes | | 3.1 | % |
Other | | 5.4 | % |
‡ % of Total Investments as of June 30, 2004
à$10,000 invested at the beginning of the first full month following the inception of the Administrative Class.
TOTAL RETURN INVESTMENT PERFORMANCE For the period ended June 30, 2004
| | | | | | | | | | | | | | | | |
| | | | | | | 6 Months | | | 1 Year | | | 5 Years* | | | Since Inception* | |
| | |
| | Total Return Portfolio Administrative Class (Inception 12/31/97) | | 0.39 | % | | 0.92 | % | | 6.80 | % | | 6.26 | % |
| | | - - - - - - - | | Lehman Brothers Aggregate Bond Index | | 0.15 | % | | 0.32 | % | | 6.95 | % | | — | |
| | | | | * Annualized. All Portfolio returns are net of fees and expenses. | | | | | | | | | | | | |
Past performance is no guarantee of future results. The performance quoted represents past performance. Investment return and principal value will fluctuate so the Portfolio shares, when redeemed, may be worth more or less than their original cost. Current performance may be lower or higher than the performance data quoted. Performance data current to the most recent month-end is available by calling (800) 927-4648.
Please refer to page 2 herein for an explanation of the information presented in the following Expense Example.
| | | | | | | | | | |
| EXPENSE EXAMPLE | | | | Actual Performance | | | | Hypothetical Performance
(5% return before expenses) |
Beginning Account Value (01/01/04) | | | | $ | 1,000.00 | | | | $ | 1,000.00 |
Ending Account Value (06/30/04) | | | | $ | 1,003.90 | | | | $ | 1,025.00 |
Expenses Paid During Period† | | | | $ | 3.24 | | | | $ | 3.27 |
†Expenses are equal to the Portfolio’s Administrative Class annualized expense ratio of 0.65%, multiplied by the average account value over the period, multiplied by 182/366 (to reflect the one-half year period).
PORTFOLIO INSIGHTS
| • | The Total Return Portfolio seeks to achieve its investment objective by investing under normal circumstances at least 65% of its total assets in a diversified portfolio of Fixed Income Instruments of varying maturities. |
| • | The Portfolio’s Administrative Class shares outperformed the Lehman Brothers Aggregate Bond Index for the six-month period ended June 30, 2004, returning 0.39% versus 0.15% for the Index. |
| • | The Portfolio’s below-Index duration helped returns, as yields rose over the period. |
| • | An emphasis on short/intermediate maturities was negative, as the yield curve flattened in anticipation of Fed tightening. However, this strategy enhanced security returns via “roll down,” or price appreciation, as bonds are revalued at lower yields over time, given the steepness of the yield curve. |
| • | Substituting Real Return Bonds (TIPS-Treasury Inflation Protected Securities) for nominal Treasuries was positive as TIPS benefited from strong demand for the inflation protection they provide. |
| • | A mortgage underweight was slightly negative, as mortgages outpaced comparable Treasuries; mortgage security selection was positive, however, and more than offset this impact. |
| • | The Portfolio’s underweight to corporate securities was slightly positive, as this sector lagged Treasuries modestly on like-duration basis. |
| • | Emerging market bonds (“EM”) detracted from performance, as leveraged tactical investors sold EM bonds as rates rose. |
| • | Non-U.S. positions were slightly positive, as Eurozone issues outperformed amid expectations for slower growth and lower inflation in Europe. |
| | | | |
| June 30, 2004 | | Semi-Annual Report | | 3 |
Financial Highlights
Total Return Portfolio (Administrative Class)
| | | | | | | | | | | | | | | | | | | | | | | | | | | | | | | | | | | | |
Selected Per Share Data for the
Year or Period Ended: | | | | 06/30/2004+ | | | | | 12/31/2003 | | | | | 12/31/2002 | | | | | 12/31/2001 | | | | | 12/31/2000 | | | | | 12/31/1999 | |
| | | | | | | | | | | | |
Net asset value beginning of period | | | | $ | 10.36 | | | | | $ | 10.23 | | | | | $ | 9.89 | | | | | $ | 9.77 | | | | | $ | 9.45 | | | | | $ | 10.09 | |
Net investment income (a) | | | | | 0.08 | (d) | | | | | 0.25 | (d) | | | | | 0.41 | (d) | | | | | 0.45 | (d) | | | | | 0.62 | (d) | | | | | 0.58 | |
Net realized/unrealized gain (loss) on investments (a) | | | | | (0.04 | )(d) | | | | | 0.26 | (d) | | | | | 0.47 | (d) | | | | | 0.35 | (d) | | | | | 0.30 | (d) | | | | | (0.64 | ) |
Total income (loss) from investment operations | | | | | 0.04 | | | | | | 0.51 | | | | | | 0.88 | | | | | | 0.80 | | | | | | 0.92 | | | | | | (0.06 | ) |
Dividends from net investment income | | | | | (0.09 | ) | | | | | (0.30 | ) | | | | | (0.41 | ) | | | | | (0.49 | ) | | | | | (0.60 | ) | | | | | (0.58 | ) |
Distributions from net realized capital gains | | | | | 0.00 | | | | | | (0.08 | ) | | | | | (0.13 | ) | | | | | (0.19 | ) | | | | | 0.00 | | | | | | 0.00 | |
Total distributions | | | | | (0.09 | ) | | | | | (0.38 | ) | | | | | (0.54 | ) | | | | | (0.68 | ) | | | | | (0.60 | ) | | | | | (0.58 | ) |
Net asset value end of period | | | | $ | 10.31 | | | | | $ | 10.36 | | | | | $ | 10.23 | | | | | $ | 9.89 | | | | | $ | 9.77 | | | | | $ | 9.45 | |
Total return | | | | | 0.39 | % | | | | | 5.04 | % | | | | | 9.07 | % | | | | | 8.37 | % | | | | | 10.15 | % | | | | | (0.58 | )% |
Net assets end of period (000s) | | | | $ | 2,141,006 | | | | | $ | 1,908,336 | | | | | $ | 1,161,299 | | | | | $ | 332,823 | | | | | $ | 55,533 | | | | | $ | 3,877 | |
Ratio of net expenses to average net assets | | | | | 0.65 | %* | | | | | 0.65 | % | | | | | 0.65 | %(c) | | | | | 0.65 | %(c) | | | | | 0.65 | %(c) | | | | | 0.65 | %(b) |
Ratio of net investment income to average net assets | | | | | 1.63 | %*(d) | | | | | 2.45 | %(d) | | | | | 4.07 | %(d) | | | | | 4.55 | %(d) | | | | | 6.46 | %(d) | | | | | 5.96 | % |
Portfolio turnover rate | | | | | 143 | % | | | | | 193 | % | | | | | 222 | % | | | | | 217 | % | | | | | 415 | % | | | | | 102 | % |
| (a) | Per share amounts based on average number of shares outstanding during the period. |
| (b) | If the investment manager had not reimbursed expenses, the ratio of expenses to average net assets would have been 0.69%. |
| (c) | If the investment manager had not reimbursed expenses, the ratio of expenses to average net assets would have been 0.66%. |
| (d) | Indicates a period in which, as a result of a change in generally accepted accounting principles, the portfolio has reclassified periodic payments made or received under certain derivative instruments, which were previously included within miscellaneous income, to a component of realized gain (loss) in the Statement of Operations. The effect of this reclassification was to increase the net investment income ratio for the period ending June 30, 2004 by 0.01% and the net investment income per share by $0.00. For consistency, similar reclassifications have been made to prior period amounts, resulting in (reductions) to the net investment income ratio of 0.00%, (0.01)%, 0.00%, and 0.00% and to the net investment income per share of $0.00, $0.00, $0.00, and $0.00 in the fiscal years ending December 31, 2003, 2002, 2001, and 2000, respectively. This change had no impact on the reported net asset value per share for any period. |
| | | | | | |
| 4 | | Semi-Annual Report | | June 30, 2004 | | See accompanying notes |
Statement of Assets and Liabilities
Total Return Portfolio
June 30, 2004 (Unaudited)
| | | | | |
| Amounts in thousands, except per share amounts | | | | |
| | |
Assets: | | | | | |
| | |
Investments, at value | | | | $ | 2,390,263 |
Cash | | | | | 171 |
Foreign currency, at value | | | | | 10,470 |
Receivable for investments sold | | | | | 210 |
Receivable for investments sold on delayed delivery basis | | | | | 67,810 |
Unrealized appreciation on forward foreign currency contracts | | | | | 464 |
Receivable for Portfolio shares sold | | | | | 10,067 |
Interest and dividends receivable | | | | | 6,289 |
Variation margin receivable | | | | | 5,328 |
Swap premiums paid | | | | | 2,233 |
Unrealized appreciation on swap agreements | | | | | 1,702 |
| | | | | | 2,495,007 |
| | |
Liabilities: | | | | | |
| | |
Payable for investments purchased | | | | $ | 183,796 |
Payable for investments purchased on delayed delivery basis | | | | | 36,097 |
Unrealized depreciation on forward foreign currency contracts | | | | | 42 |
Payable for short sale | | | | | 69,211 |
Written options outstanding | | | | | 1,167 |
Payable for Portfolio shares redeemed | | | | | 343 |
Dividends payable | | | | | 585 |
Interest payable | | | | | 10 |
Accrued investment advisory fee | | | | | 442 |
Accrued administration fee | | | | | 441 |
Accrued servicing fee | | | | | 232 |
Swap premiums received | | | | | 6,057 |
Unrealized depreciation on swap agreements | | | | | 1,573 |
Other liabilities | | | | | 2 |
| | | | | | 299,998 |
| | |
Net Assets | | | | $ | 2,195,009 |
| | |
Net Assets Consist of: | | | | | |
| | |
Paid in capital | | | | $ | 2,170,033 |
Undistributed net investment income | | | | | 6,353 |
Accumulated undistributed net realized gain | | | | | 11,635 |
Net unrealized appreciation | | | | | 6,988 |
| | | | | $ | 2,195,009 |
| | |
Net Assets: | | | | | |
| | |
Institutional Class | | | | $ | 54,003 |
Administrative Class | | | | | 2,141,006 |
| | |
Shares Issued and Outstanding: | | | | | |
| | |
Institutional Class | | | | | 5,236 |
Administrative Class | | | | | 207,606 |
| | |
Net Asset Value and Redemption Price Per Share
(Net Assets Per Share Outstanding) | | | | | |
| | |
Institutional Class | | | | $ | 10.31 |
Administrative Class | | | | | 10.31 |
| | |
Cost of Investments Owned | | | | $ | 2,389,014 |
Cost of Foreign Currency Held | | | | $ | 10,415 |
| | | | | | |
| See accompanying notes | | June 30, 2004 | | Semi-Annual Report | | 5 |
Statement of Operations
Total Return Portfolio
| | | | | | |
| Amounts in thousands | | | | | |
| | | | | Six Months Ended June 30, 2004 (Unaudited) | |
Investment Income: | | | | | | |
| | |
Interest | | | | $ | 23,680 | |
Dividends | | | | | 283 | |
Miscellaneous income | | | | | 4 | |
Total Income | | | | | 23,967 | |
| | |
Expenses: | | | | | | |
| | |
Investment advisory fees | | | | | 2,611 | |
Administration fees | | | | | 2,611 | |
Distribution and/or servicing fees - Administrative Class | | | | | 1,517 | |
Trustees’ fees | | | | | 18 | |
Total Expenses | | | | | 6,757 | |
| | |
Net Investment Income | | | | | 17,210 | |
| | |
Net Realized and Unrealized Gain (Loss): | | | | | | |
| | |
Net realized gain on investments | | | | | 13,704 | |
Net realized gain on futures contracts, options, and swaps | | | | | 4,101 | |
Net realized (loss) on foreign currency transactions | | | | | (2,077 | ) |
Net change in unrealized (depreciation) on investments | | | | | (22,840 | ) |
Net change in unrealized (depreciation) on futures contracts,
options, and swaps | | | | | (5,474 | ) |
Net change in unrealized appreciation on translation of
assets and liabilities denominated in foreign currencies | | | | | 319 | |
Net (Loss) | | | | | (12,267 | ) |
| | |
Net Increase in Assets Resulting from Operations | | | | $ | 4,943 | |
| | | | | | |
| 6 | | Semi-Annual Report | | June 30, 2004 | | See accompanying notes |
Statements of Changes in Net Assets
Total Return Portfolio
| | | | | | | | | | | | |
| Amounts in thousands | | | | | | | | | | |
| | | | | Six Months Ended June 30, 2004
(Unaudited) | | | | | Year Ended December 31, 2003 | |
Increase in Net Assets from: | | | | | | | | | | | | |
| | | | |
Operations: | | | | | | | | | | | | |
| | | | |
Net investment income | | | | $ | 17,210 | | | | | $ | 40,936 | |
Net realized gain | | | | | 15,728 | | | | | | 19,113 | |
Net change in unrealized appreciation (depreciation) | | | | | (27,995 | ) | | | | | 16,279 | |
Net increase resulting from operations | | | | | 4,943 | | | | | | 76,328 | |
| | | | |
Distributions to Shareholders: | | | | | | | | | | | | |
| | | | |
From net investment income | | | | | | | | | | | | |
Institutional Class | | | | | (631 | ) | | | | | (2,155 | ) |
Administrative Class | | | | | (17,872 | ) | | | | | (44,938 | ) |
| | | | |
From net realized capital gains | | | | | | | | | | | | |
Institutional Class | | | | | 0 | | | | | | (652 | ) |
Administrative Class | | | | | 0 | | | | | | (14,348 | ) |
Total Distributions | | | | | (18,503 | ) | | | | | (62,093 | ) |
| | | | |
Portfolio Share Transactions: | | | | | | | | | | | | |
| | | | |
Receipts for shares sold | | | | | | | | | | | | |
Institutional Class | | | | | 7,078 | | | | | | 76,213 | |
Administrative Class | | | | | 355,600 | | | | | | 979,977 | |
| | | | |
Issued as reinvestment of distributions | | | | | | | | | | | | |
Institutional Class | | | | | 631 | | | | | | 2,807 | |
Administrative Class | | | | | 14,564 | | | | | | 48,536 | |
| | | | |
Cost of shares redeemed | | | | | | | | | | | | |
Institutional Class | | | | | (29,016 | ) | | | | | (50,575 | ) |
Administrative Class | | | | | (124,164 | ) | | | | | (295,164 | ) |
Net increase resulting from Portfolio share transactions | | | | | 224,693 | | | | | | 761,794 | |
| | | | |
Total Increase in Net Assets | | | | | 211,133 | | | | | | 776,029 | |
| | | | |
Net Assets: | | | | | | | | | | | | |
| | | | |
Beginning of period | | | | | 1,983,876 | | | | | | 1,207,847 | |
End of period * | | | | $ | 2,195,009 | | | | | $ | 1,983,876 | |
| | | | |
*Including undistributed net investment income of: | | | | $ | 6,353 | | | | | $ | 7,646 | |
| | | | | | |
| See accompanying notes | | June 30, 2004 | | Semi-Annual Report | | 7 |
Schedule of Investments
Total Return Portfolio
June 30, 2004 (Unaudited)
| | | | |
| | | Principal | | |
| | | Amount | | Value |
| | | (000s) | | (000s) |
| | | | | | |
CORPORATE BONDS & NOTES 3.4% |
Banking & Finance 1.0% | | | | | | |
Atlas Reinsurance II PLC | | | | | | |
3.515% due 01/07/2005 (a) | | $ | 1,250 | | $ | 1,258 |
CIT Group, Inc. | | | | | | |
2.489% due 07/30/2004 (a) | | | 2,220 | | | 2,221 |
Gemstone Investors Ltd. | | | | | | |
7.710% due 10/31/2004 | | | 700 | | | 709 |
General Motors Acceptance Corp. | | | |
1.580% due 07/20/2004 (a) | | | 500 | | | 500 |
1.499% due 07/21/2004 (a) | | | 200 | | | 200 |
1.510% due 07/30/2004 (a) | | | 600 | | | 600 |
2.400% due 10/20/2005 (a) | | | 900 | | | 908 |
Pemex Project Funding Master Trust | | | |
8.000% due 11/15/2011 | | | 100 | | | 108 |
8.625% due 02/01/2022 | | | 1,800 | | | 1,881 |
Phoenix Quake Wind Ltd. | | | | | | |
3.560% due 07/03/2008 (a) | | | 800 | | | 822 |
3.560% due 07/03/2008 (a) | | | 800 | | | 822 |
4.610% due 07/03/2008 (a) | | | 400 | | | 412 |
Premium Asset Trust | | | | | | |
1.465% due 11/27/2004 (a) | | | 100 | | | 100 |
1.521% due 09/08/2007 (a) | | | 100 | | | 96 |
Qwest Capital Funding, Inc. | | | | | | |
7.250% due 02/15/2011 | | | 657 | | | 565 |
Residential Reinsurance Ltd. | | | | | | |
6.260% due 06/08/2006 (a) | | | 8,100 | | | 8,222 |
UFJ Finance Aruba AEC | | | | | | |
6.750% due 07/15/2013 | | | 2,300 | | | 2,382 |
Vita Capital Ltd. | | | | | | |
2.460% due 01/01/2007 (a) | | | 500 | | | 504 |
| | | | | |
|
|
| | | | | | | 22,310 |
| | | | | |
|
|
Industrials 1.2% | | | | | | |
El Paso Corp. | | | | | | |
6.750% due 05/15/2009 | | | 6,000 | | | 5,460 |
7.875% due 06/15/2012 | | | 8,600 | | | 7,762 |
7.800% due 08/01/2031 | | | 1,500 | | | 1,211 |
ITT Corp. | | | | | | |
6.750% due 11/15/2005 | | | 250 | | | 259 |
United Airlines, Inc. | | | | | | |
8.030% due 07/01/2011 | | | 465 | | | 96 |
6.071% due 03/01/2013 | | | 6,920 | | | 5,745 |
1.340% due 03/02/2049 (a) | | | 1,664 | | | 1,369 |
Williams Cos., Inc. | | | | | | |
7.875% due 09/01/2021 | | | 3,500 | | | 3,386 |
| | | | | |
|
|
| | | | | | | 25,288 |
| | | | | |
|
|
Utilities 1.2% | | | | | | |
AEP Texas Central Co. | | | | | | |
2.500% due 02/15/2005 (a) | | | 900 | | | 901 |
Entergy Gulf States, Inc. | | | | | | |
6.000% due 12/01/2012 | | | 6,500 | | | 6,451 |
Pacific Gas & Electric Co. | | | | | | |
1.810% due 04/03/2006 (a) | | | 18,500 | | | 18,513 |
| | | | | |
|
|
| | | | | | | 25,865 |
| | | | | |
|
|
Total Corporate Bonds & Notes (Cost $72,944) | | | | | | 73,463 |
| | | | |
|
|
| | | | | | | |
MUNICIPAL BONDS & NOTES 4.4% |
| |
Badger Asset Securitization Corporate Revenue Bonds, Series 2002 | | | |
6.000% due 06/01/2017 | | | 3,700 | | | 3,351 |
| |
California State Polytechnic University Revenue Bonds, Series 1972 | | | |
5.000% due 07/01/2012 | | | 4,700 | | | 5,112 |
| |
Durham County, North Carolina General Obligation Revenue Bonds, Series 2002 | | | |
8.640% due 04/01/2021 (a) | | | 2,733 | | | 2,921 |
| |
Energy Northwest Washington Electric Revenue Bonds, Series 2003 | | | |
5.500% due 07/01/2013 | | | 1,700 | | | 1,880 |
5.500% due 07/01/2014 | | | 1,300 | | | 1,436 |
| | | | | | |
| |
Illinois State General Obligation Bonds, Series 2003 | | | |
5.100% due 06/01/2033 | | $ | 20,000 | | $ | 17,745 |
| |
Lewisville, Texas Independent School District General Obligation Bonds,
(PSF-GTD Insured), Series 2004 | | | |
5.000% due 08/15/2027 | | | 3,775 | | | 3,709 |
| |
Los Angeles, California Unified School District General Obligation Bonds,
(MBIA Insured), Series 2003 | | | |
5.000% due 01/01/2028 | | | 7,300 | | | 7,220 |
| |
Massachusetts Bay Transportation Authority Sales Tax Revenue Bonds, Series 2004 | | | |
5.000% due 07/01/2011 | | | 2,800 | | | 3,024 |
| |
Massachusetts State Water Reserve Authority Revenue Bonds, (FSA Insured), Series 2002 | | | |
5.000% due 08/01/2032 | | | 1,000 | | | 979 |
| |
Nassau County, New York Interim Finance Authority Revenue Bonds, (AMBAC Insured), Series 2004 | | | |
5.000% due 11/15/2011 | | | 4,005 | | | 4,346 |
| |
New Jersery State Tobacco Settlement Financing Corp. Revenue Bonds, Series 2003 | | | |
4.375% due 06/01/2019 | | | 4,870 | | | 4,730 |
| |
New Jersey State Tobacco Settlement Financing Corp., Series 2003 | | | |
6.750% due 06/01/2039 | | | 5,450 | | | 4,891 |
| |
New Jersey Tobacco Settlement Financing Corp. Revenue Bonds, Series 2002 | | | |
6.000% due 06/01/2037 | | | 1,530 | | | 1,245 |
| |
New York City, New York Municipal Water Finance Authority Revenue Bonds,
(FGIC Insured), Series 2003-E | | | |
5.000% due 06/15/2034 | | | 1,400 | | | 1,360 |
| |
New York City, New York Municipal Water Finance Authority Revenue Bonds,
(FSA-CR Insured), Series 2002 | | | |
5.125% due 06/15/2034 | | | 10,460 | | | 10,463 |
| |
New York City, New York Transitional Finance Authority Revenue Bonds, Series 2004 | | | |
5.000% due 11/01/2013 | | | 700 | | | 752 |
| |
New York State Environmental Facilities Corporate Revenue Bonds, Series 2002 | | | |
8.860% due 06/15/2023 (a) | | | 850 | | | 898 |
| |
Orange County, California Sanitation District Certificates of Participation Bonds,
(FGIC Insured), Series 2003 | | | |
5.000% due 02/01/2033 | | | 1,000 | | | 975 |
| |
South Carolina State Public Service Authority Revenue Bonds, (FSA Insured), Series 2004 | | | |
5.000% due 01/01/2009 | | | 700 | | | 755 |
| |
South San Antonio, Texas Independent School District General Obligation Bonds, (PSF-GTD Insured), Series 2004 | | | |
5.000% due 08/15/2029 | | | 3,150 | | | 3,132 |
|
State of California Tobacco Securitization Corp.
Revenue Bonds, Series 2003-A1 |
6.250% due 06/01/2033 | | | 2,900 | | | 2,615 |
|
State of Illinois General Obligation Bonds,
Series 2004 |
5.000% due 03/01/2034 | | | 1,000 | | | 964 |
| | | | | | |
|
State of Wisconsin General Obligation Bonds,
(MBIA Insured), Series 2004 |
5.000% due 05/01/2011 | | $ | 2,300 | | $ | 2,493 |
|
University of Texas Revenue Bonds, Series 2003 |
5.000% due 08/15/2033 | | | 1,200 | | | 1,171 |
|
Washington State General Obligation Bonds,
Series 2004 |
5.000% due 01/01/2028 | | | 9,200 | | | 9,013 |
| | | | | |
|
|
Total Municipal Bonds & Notes (Cost $101,805) | | | 97,180 |
| | | | | |
|
|
| | | | | | | |
U.S. GOVERNMENT AGENCIES 19.1% |
| | |
Fannie Mae | | | | | | |
7.000% due 04/25/2023 | | | 6,322 | | | 6,629 |
3.342% due 11/01/2025 (a) | | | 5 | | | 5 |
4.165% due 10/01/2032 (a) | | | 2,887 | | | 2,974 |
5.090% due 09/01/2034 (a) | | | 5,540 | | | 5,642 |
4.294% due 11/01/2035 (a) | | | 561 | | | 580 |
4.797% due 12/01/2036 (a) | | | 5,109 | | | 5,279 |
6.340% due 09/01/2039 (a) | | | 281 | | | 294 |
2.625% due 09/01/2040 (a) | | | 200 | | | 203 |
1.650% due 03/25/2044 (a) | | | 17,169 | | | 16,955 |
6.000% due 04/01/2013-05/01/2033 (b) | | | 18,450 | | | 19,249 |
5.500% due 04/01/2014-07/15/2034 (b) | | | 137,693 | | | 139,660 |
5.000% due 01/01/2018-07/15/2034 (b) | | | 172,900 | | | 168,192 |
6.500% due 06/01/2029-07/01/2032 (b) | | | 682 | | | 711 |
Federal Home Loan Bank | | | | | | |
5.500% due 03/15/2015 | | | 127 | | | 127 |
Federal Housing Administration | | | | | | |
7.430% due 01/25/2023 | | | 282 | | | 277 |
Freddie Mac | | | | | | |
6.250% due 08/25/2022 | | | 1,391 | | | 1,405 |
7.000% due 06/15/2023 | | | 4,385 | | | 4,592 |
8.500% due 08/01/2024 | | | 40 | | | 44 |
3.579% due 07/01/2027 (a) | | | 7 | | | 7 |
5.532% due 01/01/2028 (a) | | | 7 | | | 7 |
7.813% due 07/01/2030 (a) | | | 6 | | | 6 |
7.500% due 07/15/2030 | | | 125 | | | 131 |
1.738% due 09/15/2030 (a) | | | 92 | | | 92 |
1.688% due 11/15/2030 (a) | | | 132 | | | 132 |
6.000% due 07/01/2016-04/01/2033 (b) | | | 10,203 | | | 10,479 |
5.000% due 09/15/2016-11/01/2018 (b) | | | 7,072 | | | 7,112 |
6.500% due 04/15/2029-08/01/2032 (b) | | | 2,759 | | | 2,874 |
Government National Mortgage Association |
4.375% due 04/20/2026 (a) | | | 276 | | | 276 |
3.375% due 02/20/2027 (a) | | | 14 | | | 14 |
7.500% due 11/20/2029 | | | 563 | | | 611 |
3.500% due 05/20/2030 (a) | | | 40 | | | 40 |
1.680% due 06/20/2030 (a) | | | 10 | | | 10 |
1.780% due 09/20/2030 (a) | | | 94 | | | 94 |
2.750% due 02/20/2032 (a) | | | 3,257 | | | 3,158 |
4.000% due 10/20/2029-07/20/2030 (b) | | | 1,009 | | | 1,014 |
3.000% due 04/20/2034-06/20/2034 (b) | | | 2,200 | | | 2,144 |
Small Business Administration | | | | | | |
8.017% due 02/10/2010 | | | 360 | | | 398 |
7.449% due 08/01/2010 | | | 52 | | | 57 |
6.344% due 08/01/2011 | | | 2,032 | | | 2,136 |
6.030% due 02/10/2012 | | | 12,822 | | | 13,321 |
7.500% due 04/01/2017 | | | 2,246 | | | 2,447 |
6.290% due 01/01/2021 | | | 316 | | | 335 |
5.130% due 09/01/2023 | | | 98 | | | 98 |
| | | | | |
|
|
Total U.S. Government Agencies (Cost $418,153) | | | 419,811 |
| | | | | |
|
|
| | | | | | |
| 8 | | Semi-Annual Report | | June 30, 2004 | | See accompanying notes |
| | | | |
| | | Principal | | |
| | | Amount | | Value |
| | | (000s) | | (000s) |
| | | | | | |
U.S. TREASURY OBLIGATIONS 4.6% |
|
Treasury Inflation Protected Securities (f) |
3.375% due 01/15/2007 (c) | | $ | 3,559 | | $ | 3,814 |
3.625% due 01/15/2008 | | | 15,126 | | | 16,536 |
3.875% due 01/15/2009 | | | 25,102 | | | 27,993 |
4.250% due 01/15/2010 | | | 5,363 | | | 6,140 |
3.500% due 01/15/2011 | | | 10,585 | | | 11,755 |
3.375% due 01/15/2012 | | | 1,376 | | | 1,525 |
3.000% due 07/15/2012 | | | 15,264 | | | 16,507 |
3.875% due 04/15/2029 | | | 13,493 | | | 17,210 |
| | | | | |
|
|
Total U.S. Treasury Obligations (Cost $99,059) | | | | | | 101,480 |
| | | | | |
|
|
| | | | | | | |
MORTGAGE-BACKED SECURITIES 3.8% |
|
Amortizing Residential Collateral Trust |
1.620% due 07/25/2032 (a) | | | 3,299 | | | 3,305 |
Aurora Loan Services | | | | | | |
2.000% due 05/25/2030 (a) | | | 47 | | | 47 |
Bank of America Mortgage Securities, Inc. |
6.500% due 10/25/2019 | | | 4,756 | | | 4,757 |
5.667% due 10/20/2032 (a) | | | 758 | | | 771 |
6.500% due 02/25/2033 | | | 1,815 | | | 1,854 |
Bear Stearns Adjustable Rate Mortgage Trust |
3.875% due 11/25/2030 (a) | | | 23 | | | 23 |
6.057% due 08/25/2032 (a) | | | 111 | | | 111 |
5.288% due 10/25/2032 (a) | | | 224 | | | 225 |
5.380% due 01/25/2033 (a) | | | 1,823 | | | 1,836 |
5.635% due 01/25/2033 (a) | | | 607 | | | 610 |
5.134% due 03/25/2033 (a) | | | 3,327 | | | 3,356 |
4.924% due 01/25/2034 (a) | | | 8,983 | | | 9,027 |
Countrywide Home Loans, Inc. | | | | | | |
1.570% due 04/25/2034 (a) | | | 6,831 | | | 6,787 |
Credit-Based Asset Servicing &
Securitization LLC |
1.710% due 09/25/2029 (a) | | | 51 | | | 51 |
CS First Boston Mortgage Securities Corp. |
6.201% due 04/25/2032 (a) | | | 131 | | | 136 |
6.222% due 06/25/2032 (a) | | | 1,644 | | | 1,668 |
5.720% due 10/25/2032 (a) | | | 930 | | | 943 |
First Nationwide Trust |
6.750% due 08/21/2031 | | | 213 | | | 218 |
Impac CMB Trust |
1.550% due 01/25/2034 (a) | | | 7,093 | | | 7,101 |
Indymac Adjustable Rate Mortgage Trust |
6.586% due 01/25/2032 (a) | | | 56 | | | 57 |
Prime Mortgage Trust |
1.500% due 02/25/2034 (a) | | | 837 | | | 839 |
1.700% due 02/25/2034 (a) | | | 3,530 | | | 3,530 |
Residential Asset Securitization Trust |
7.130% due 07/25/2031 | | | 1,057 | | | 1,056 |
Residential Funding Mortgage Securities I, Inc. |
6.500% due 12/25/2023 | | | 1,769 | | | 1,765 |
6.500% due 03/25/2032 | | | 3,623 | | | 3,682 |
5.603% due 09/25/2032 (a) | | | 302 | | | 303 |
Structured Asset Mortgage Investments, Inc. |
1.610% due 09/19/2032 (a) | | | 1,121 | | | 1,117 |
Structured Asset Securities Corp. |
7.000% due 02/25/2016 | | | 13 | | | 13 |
1.750% due 06/25/2017 (a) | | | 1,365 | | | 1,367 |
6.111% due 02/25/2032 (a) | | | 97 | | | 98 |
6.150% due 07/25/2032 (a) | | | 292 | | | 297 |
1.590% due 01/25/2033 (a) | | | 427 | | | 427 |
1.460% due 08/25/2033 (a) | | | 4,050 | | | 4,053 |
Superannuation Members Home
Loans Global Fund |
1.775% due 06/15/2026 (a) | | | 195 | | | 195 |
Torrens Trust |
1.498% due 07/15/2031 (a) | | | 834 | | | 836 |
Washington Mutual Mortgage Securities Corp. |
5.159% due 10/25/2032 (a) | | | 1,182 | | | 1,193 |
3.565% due 01/25/2041 (a) | | | 27 | | | 27 |
2.628% due 08/25/2042 (a) | | | 19,690 | | | 19,893 |
Wells Fargo Mortgage-Backed Securities Trust |
4.959% due 09/25/2032 (a) | | | 269 | | | 272 |
| | | | | |
|
|
Total Mortgage-Backed Securities (Cost $83,988) | | | 83,846 |
| | | | | |
|
|
| | | | | | |
ASSET-BACKED SECURITIES 1.7% | | | |
| | |
ACE Securities Corp. | | | | | | |
1.640% due 06/25/2032 (a) | | $ | 287 | | $ | 288 |
Amortizing Residential Collateral Trust |
1.570% due 06/25/2032 (a) | | | 2,000 | | | 2,001 |
CDC Mortgage Capital Trust | | | | | | |
1.590% due 01/25/2033 (a) | | | 1,761 | | | 1,764 |
Conseco Finance Securitizations Corp. | | | |
1.608% due 10/15/2031 (a) | | | 247 | | | 247 |
Credit-Based Asset Servicing and
Securitization |
1.550% due 09/25/2033 (a) | | | 5,218 | | | 5,218 |
EMC Mortgage Loan Trust | | | | | | |
1.670% due 05/25/2040 (a) | | | 1,862 | | | 1,868 |
GRMT II Mortgage Loan Trust | | | | | | |
1.530% due 06/20/2032 (a) | | | 53 | | | 53 |
GSAMP Trust | | | | | | |
1.490% due 10/25/2033 (a) | | | 12,812 | | | 12,810 |
HFC Home Equity Loan Asset-Backed
Certificates |
1.630% due 10/20/2032 (a) | | | 8,159 | | | 8,173 |
Household Mortgage Loan Trust | | | |
1.580% due 05/20/2032 (a) | | | 474 | | | 475 |
Irwin Home Equity Loan Trust | | | | | | |
1.590% due 06/25/2029 (a) | | | 333 | | | 334 |
Irwin Low Balance Home Equity Loan Trust | | | |
1.675% due 06/25/2021 (a) | | | 10 | | | 10 |
Morgan Stanley Dean Witter Capital I, Inc. | | | |
1.630% due 07/25/2032 (a) | | | 645 | | | 647 |
Structured Asset Investment Loan Trust | | | |
1.420% due 06/25/2033 (a) | | | 3,006 | | | 3,008 |
Vanderbilt Acquisition Loan Trust | | | |
3.280% due 01/07/2013 | | | 764 | | | 766 |
| | | | | |
|
|
Total Asset-Backed Securities (Cost $37,648) | | | 37,662 |
| | | | | |
|
|
| | | | | | | |
SOVEREIGN ISSUES 1.9% | | | | | | |
| | |
Republic of Brazil | | | | | | |
2.062% due 04/15/2006 (a) | | | 1,824 | | | 1,800 |
11.500% due 03/12/2008 | | | 2,300 | | | 2,469 |
2.125% due 04/15/2009 (a) | | | 747 | | | 679 |
11.000% due 01/11/2012 | | | 2,840 | | | 2,871 |
11.000% due 08/17/2040 | | | 2,400 | | | 2,265 |
Republic of Panama | | | | | | |
9.625% due 02/08/2011 | | | 800 | | | 890 |
9.375% due 01/16/2023 | | | 330 | | | 338 |
8.875% due 09/30/2027 | | | 5,200 | | | 5,070 |
Republic of Peru | | | | | | |
9.125% due 02/21/2012 | | | 1,400 | | | 1,442 |
9.875% due 02/06/2015 | | | 5,100 | | | 5,355 |
Republic of South Africa | | | | | | |
9.125% due 05/19/2009 | | | 500 | | | 583 |
United Mexican States | | | | | | |
9.875% due 02/01/2010 | | | 100 | | | 120 |
8.375% due 01/14/2011 | | | 300 | | | 340 |
6.375% due 01/16/2013 | | | 930 | | | 930 |
11.375% due 09/15/2016 | | | 900 | | | 1,260 |
8.125% due 12/30/2019 | | | 4,200 | | | 4,505 |
8.300% due 08/15/2031 | | | 10,300 | | | 10,815 |
| | | | | |
|
|
Total Sovereign Issues (Cost $40,884) | | | 41,732 |
| | | | | |
|
|
| | | | | | | |
FOREIGN CURRENCY-DENOMINATED
ISSUES (i)(j) 1.7% |
| | |
Republic of Germany | | | | | | |
5.250% due 07/04/2010 | | EC | 22,200 | | | 29,051 |
5.250% due 01/04/2011 | | | 5,400 | | | 7,072 |
| | | | | |
|
|
Total Foreign Currency-Denominated Issues (Cost $35,583) | | | 36,123 |
| | | | | |
|
|
| | | | | | | |
| | | | | | |
PURCHASED PUT OPTIONS 0.0% |
| | |
Eurodollar December Futures (CME) Strike @ 95.500 Exp. 09/13/2004 | | | 100 | | $ | 1 |
| | | | | |
|
|
Total Purchased Put Options (Cost $1) | | | 1 |
| | | | | |
|
|
| | | | | | | |
PREFERRED SECURITY 0.6% |
| | | Shares | | |
DG Funding Trust | | | | | | |
3.360% due 12/29/2049 (a) | | | 1,239 | | | 13,319 |
| | | | | |
|
|
Total Preferred Security (Cost $13,055) | | | 13,319 |
| | | | | |
|
|
| | | | | | | |
SHORT-TERM INSTRUMENTS 67.7% |
| | | Principal
Amount
(000s) | | |
Certificates of Deposit 3.8% | | | | | | |
Citibank New York N.A. | | | | | | |
1.090% due 07/30/2004 | | $ | 1,300 | | | 1,300 |
1.190% due 08/20/2004 | | | 40,000 | | | 40,000 |
Wells Fargo Bank N.A. | | | | | | |
1.090% due 07/07/2004 | | | 100 | | | 100 |
1.240% due 07/19/2004 | | | 43,200 | | | 43,200 |
| | | | | |
|
|
| | | | | | | 84,600 |
| | | | | |
|
|
Commercial Paper 60.5% | | | | | | |
Altria Group, Inc. | | | | | | |
1.800% due 10/29/2004 | | | 2,800 | | | 2,800 |
Danske Corp. | | | | | | |
1.195% due 08/20/2004 | | | 4,900 | | | 4,892 |
Fannie Mae | | | | | | |
1.000% due 07/01/2004 | | | 4,600 | | | 4,600 |
1.010% due 07/01/2004 | | | 42,700 | | | 42,700 |
1.025% due 07/07/2004 | | | 23,700 | | | 23,696 |
1.015% due 07/14/2004 | | | 15,700 | | | 15,694 |
1.040% due 07/14/2004 | | | 21,800 | | | 21,792 |
1.060% due 07/21/2004 | | | 21,700 | | | 21,687 |
1.055% due 07/28/2004 | | | 21,800 | | | 21,783 |
1.056% due 07/28/2004 | | | 43,500 | | | 43,466 |
1.055% due 08/04/2004 | | | 21,800 | | | 21,778 |
1.063% due 08/04/2004 | | | 21,700 | | | 21,678 |
1.125% due 08/11/2004 | | | 59,200 | | | 59,124 |
1.150% due 08/18/2004 | | | 12,800 | | | 12,780 |
1.180% due 08/25/2004 | | | 46,600 | | | 46,516 |
1.215% due 09/01/2004 | | | 37,600 | | | 37,508 |
1.220% due 09/01/2004 | | | 21,600 | | | 21,547 |
1.240% due 09/01/2004 | | | 21,500 | | | 21,447 |
1.250% due 09/01/2004 | | | 21,600 | | | 21,547 |
1.120% due 09/08/2004 | | | 21,700 | | | 21,640 |
1.430% due 09/08/2004 | | | 2,800 | | | 2,792 |
1.410% due 09/15/2004 | | | 30,800 | | | 30,704 |
1.435% due 09/22/2004 | | | 17,000 | | | 16,941 |
1.010% due 10/01/2004 | | | 13,300 | | | 13,248 |
1.526% due 10/20/2004 | | | 16,400 | | | 16,320 |
1.530% due 10/20/2004 | | | 21,700 | | | 21,593 |
Federal Home Loan Bank | | | | | | |
1.250% due 07/01/2004 | | | 20,000 | | | 20,000 |
1.250% due 09/01/2004 | | | 21,600 | | | 21,547 |
Ford Motor Credit Co. | | | | | | |
2.076% due 09/03/2004 | | | 14,800 | | | 14,762 |
Freddie Mac | | | | | | |
1.010% due 07/15/2004 | | | 14,000 | | | 13,995 |
1.055% due 08/03/2004 | | | 21,800 | | | 21,779 |
1.060% due 08/03/2004 | | | 21,800 | | | 21,779 |
1.120% due 08/10/2004 | | | 21,500 | | | 21,473 |
1.125% due 08/10/2004 | | | 21,500 | | | 21,473 |
1.079% due 08/23/2004 | | | 21,700 | | | 21,659 |
1.210% due 08/31/2004 | | | 21,600 | | | 21,548 |
1.215% due 08/31/2004 | | | 21,600 | | | 21,548 |
| | | | | | |
| See accompanying notes | | June 30, 2004 | | Semi-Annual Report | | 9 |
Schedule of Investments (Cont.)
Total Return Portfolio
June 30, 2004 (Unaudited)
| | | | |
| | | Principal | | |
| | | Amount | | Value |
| | | (000s) | | (000s) |
| | | | | | | |
| | |
1.275% due 09/07/2004 | | $ | 59,100 | | $ | 58,939 | |
1.320% due 09/07/2004 | | | 21,500 | | | 21,441 | |
1.200% due 09/08/2004 | | | 21,500 | | | 21,440 | |
1.200% due 09/14/2004 | | | 500 | | | 499 | |
1.440% due 09/14/2004 | | | 21,500 | | | 21,434 | |
1.450% due 09/14/2004 | | | 21,500 | | | 21,434 | |
1.260% due 09/20/2004 | | | 16,000 | | | 15,946 | |
1.435% due 09/21/2004 | | | 21,600 | | | 21,526 | |
1.280% due 09/22/2004 | | | 21,500 | | | 21,425 | |
1.465% due 09/28/2004 | | | 9,900 | | | 9,863 | |
1.298% due 09/30/2004 | | | 21,700 | | | 21,616 | |
1.300% due 09/30/2004 | | | 21,500 | | | 21,417 | |
1.436% due 09/30/2004 | | | 21,700 | | | 21,616 | |
1.520% due 10/13/2004 | | | 10,800 | | | 10,751 | |
1.560% due 10/20/2004 | | | 21,800 | | | 21,693 | |
HBOS Treasury Services PLC | | | | | | | |
1.080% due 07/23/2004 | | | 15,400 | | | 15,390 | |
1.120% due 08/24/2004 | | | 40,200 | | | 40,132 | |
Rabobank USA Financial Corp. | | | | | | | |
1.110% due 08/23/2004 | | | 5,400 | | | 5,391 | |
1.210% due 09/07/2004 | | | 21,700 | | | 21,641 | |
Stadshypotek, Inc. | | | | | | | |
1.100% due 08/06/2004 | | | 59,800 | | | 59,734 | |
TotalFinaElf Capital S.A. | | | | | | | |
1.420% due 07/01/2004 | | | 23,400 | | | 23,400 | |
UBS Finance, Inc. | | | | | | | |
1.070% due 07/15/2004 | | | 39,200 | | | 39,184 | |
| | | | | |
|
|
|
| | | | | | | 1,327,748 | |
| | | | | |
|
|
|
Repurchase Agreement 0.2% | | | | | | | |
State Street Bank | | | | | | | |
0.800% due 07/01/2004 | | | 4,012 | | | 4,012 | |
| | | | | |
|
|
|
(Dated 06/30/2004. Collateralized by Freddie Mac 5.500% due 07/15/2006 valued at $4,092. Repurchase proceeds are $4,012.) | |
U.S. Treasury Bills 3.2% | | | | | | | |
1.249% due 09/02/2004-09/16/2004 (b)(c)(d) | | | 69,485 | | | 69,286 | |
| | | | | |
|
|
|
Total Short-Term Instruments (Cost $1,485,894) | | | | | | 1,485,646 | |
| | | | |
|
|
|
| | | | | | | | |
Total Investments 108.9% | | $ | 2,390,263 | |
(Cost $2,389,014) | | | | | | | |
| |
Written Options (g) (0.1%) | | | (1,167 | ) |
(Premiums $2,007) | | | | | | | |
| |
Other Assets and Liabilities (Net) (8.8%) | | | (194,087 | ) |
| | | | | |
|
|
|
Net Assets 100.0% | | $ | 2,195,009 | |
| | | | | |
|
|
|
Notes to Schedule of Investments (amounts in thousands, except number of contracts):
(a) Variable rate security.
(b) Securities are grouped by coupon or range of coupons and represent a range of maturities.
(c) Securities with an aggregate market value of $19,197 have been segregated with the custodian to cover margin
requirements for the following open futures contracts at June 30, 2004:
| | | | | | | | | | |
| Type | | Expiration Month | | # of Contracts | | | | Unrealized
Appreciation/
(Depreciation) | |
Eurodollar March Long Futures | | 03/2005 | | 779 | | | | $ | 204 | |
Eurodollar March Long Futures | | 03/2006 | | 61 | | | | | (68 | ) |
| | | | | | | | | | |
| | | | |
Eurodollar June
Long Futures | | 06/2005 | | 840 | | | | $ | (23 | ) |
Eurodollar September
Long Futures | | 09/2005 | | 64 | | | | | (87 | ) |
Eurodollar December
Long Futures | | 12/2004 | | 296 | | | | | (83 | ) |
Eurodollar December
Long Futures | | 12/2005 | | 64 | | | | | (80 | ) |
Euribor December
Long Futures | | 12/2005 | | 674 | | | | | (605 | ) |
Euribor June
Long Futures | | 06/2005 | | 503 | | | | | 15 | |
Euribor September
Long Futures | | 09/2005 | | 429 | | | | | (148 | ) |
Euribor Written
Put Options
Strike @ 97.000 | | 12/2004 | | 75 | | | | | 75 | |
Euribor Written
Put Options
Strike @ 97.500 | | 09/2004 | | 76 | | | | | 25 | |
Euro-Bobl 5-Year
Note Long Futures | | 09/2004 | | 241 | | | | | 14 | |
U.S. Treasury 10-Year
Note Long Futures | | 09/2004 | | 5,227 | | | | | 6,120 | |
U.S. Treasury 5-Year
Note Long Futures | | 09/2004 | | 838 | | | | | 565 | |
| | | | | | | | | $ | 5,924 | |
(d) Securities with an aggregate market value of $6,984 have been pledged as collateral for swap and swaption
contracts at June 30, 2004.
(e) Swap agreements outstanding at June 30, 2004:
| | | | | | |
Type | | Notional
Amount | |
| Unrealized
Appreciation/
(Depreciation |
) |
| |
| Receive a fixed rate equal to 5.000% and pay floating rate based on 6-month BP-LIBOR. | | | | |
Counterparty: Barclays Bank PLC | | | | |
Exp. 06/16/2011 | | BP 1,800 | | $ | (73 | ) |
|
Receive floating rate based on 6-month BP-LIBOR
and pay a fixed rate equal to 5.000%. | |
Counterparty: UBS Warburg LLC | | | | |
Exp. 03/15/2017 | | 700 | | | 1 | |
|
Receive floating rate based on 6-month BP-LIBOR
and pay a fixed rate equal to 5.000%. | |
Counterparty: J.P. Morgan Chase & Co. | |
Exp. 03/15/2017 | | 300 | | | 1 | |
|
Receive floating rate based on 6-month BP-LIBOR
and pay a fixed rate equal to 5.000%. | |
Counterparty: Goldman Sachs & Co. | | | | |
Exp. 03/15/2017 | | 1,700 | | | 12 | |
|
Receive floating rate based on 6-month BP-LIBOR
and pay a fixed rate equal to 5.000%. | |
Counterparty: J.P. Morgan Chase & Co. | |
Exp. 03/15/2032 | | 900 | | | 5 | |
|
Receive floating rate based on 6-month BP-LIBOR
and pay a fixed rate equal to 5.000%. | |
Counterparty: UBS Warburg LLC | | | | |
Exp. 03/15/2032 | | 1,100 | | | (4 | ) |
| | | | | | | |
| |
| Receive a fixed rate equal to 4.000% and pay floating rate based on 6-month EC-LIBOR. | | | | |
Counterparty: Merrill Lynch & Co., Inc. | |
Exp. 03/15/2007 | | | EC 19,900 | | $ | 150 | |
| |
| Receive a fixed rate equal to 4.000% and pay floating rate based on 6-month EC-LIBOR. | | | | |
Counterparty: J.P. Morgan Chase & Co. | |
Exp. 12/21/2007 | | | 108,700 | | | (776 | ) |
| |
| Receive a fixed rate equal to 4.000% and pay floating rate based on 6-month EC-LIBOR. | | | | |
Counterparty: Citibank N.A. | | | | |
Exp. 06/17/2008 | | | 46,800 | | | (654 | ) |
| |
| Receive a fixed rate equal to 4.000% and pay floating rate based on 6-month EC-LIBOR. | | | | |
Counterparty: Citibank N.A. | | | | |
Exp. 06/17/2010 | | | 5,400 | | | (66 | ) |
| |
| Receive a fixed rate equal to 6.000% and pay floating rate based on 6-month EC-LIBOR. | | | | |
Counterparty: J.P. Morgan Chase & Co. | | | | |
Exp. 03/15/2017 | | | 500 | | | 10 | |
| |
| Receive a fixed rate equal to 6.000% and pay floating rate based on 6-month EC-LIBOR. | | | | |
Counterparty: Goldman Sachs & Co. | | | | |
Exp. 03/15/2017 | | | 4,000 | | | 77 | |
|
Receive a fixed rate equal to 6.000% and
pay floating rate based on 6-month EC-LIBOR. | |
Counterparty: J.P. Morgan Chase & Co. | | | | |
Exp. 03/15/2032 | | | 1,500 | | | 27 | |
|
Receive a fixed rate equal to 6.000% and
pay floating rate based on 6-month EC-LIBOR. | |
Counterparty: UBS Warburg LLC | | | | |
Exp. 03/15/2032 | | | 1,800 | | | 22 | |
|
Receive total return on Lehman Commercial
Mortgage-Backed Securities Index and pay
a floating rate based on 1-month LIBOR less 0.650%. | |
Counterparty: Bear Stearns & Co., Inc. | | | | |
Exp. 07/01/2004 | | $ | 1,600 | | | 0 | |
|
Receive total return on Lehman Commercial
Mortgage-Backed Securities Index and pay
a floating rate based on 1-month LIBOR less 0.650%. | |
Counterparty: Morgan Stanley Dean Witter & Co. | |
Exp. 09/30/2004 | | | 4,300 | | | 0 | |
| |
| Receive a fixed rate equal to 0.625% and the Portfolio will pay to the counterparty at par in the event of default of the United Mexican States 11.500% due 05/15/2026. | | | | |
Counterparty: Morgan Stanley Dean Witter & Co. | |
Exp. 05/20/2005 | | | 900 | | | 3 | |
| |
| Receive a fixed rate equal to 0.650% and the Portfolio will pay to the counterparty at par in the event of default of the United Mexican States 7.500% due 04/08/2033. | | | | |
Counterparty: Barclays Bank PLC | | | | |
Exp. 05/20/2005 | | | 300 | | | 1 | |
| |
| Receive a fixed rate equal to 1.100% and the Portfolio will pay to the counterparty at par in the event of default of Republic of Panama 9.375% due 04/01/2029. | | | | |
Counterparty: Morgan Stanley Dean Witter & Co. | |
Exp. 06/20/2005 | | | 800 | | | 3 | |
| | | | | | |
| 10 | | Semi-Annual Report | | June 30, 2004 | | See accompanying notes |
| | | | | |
| |
| Receive a fixed rate equal to 1.800% and the Portfolio will pay to the counterparty at par in the event of default of Republic of Panama 9.375% due 04/01/2029. | | | |
Counterparty: Morgan Stanley Dean Witter & Co. |
Exp. 06/20/2005 | | 300 | | $ | 3 |
| |
| Receive a fixed rate equal to 4.000% and pay floating rate based on 3-month LIBOR. | | | |
Counterparty: UBS Warburg LLC | | | |
Exp. 12/15/2006 | | 11,800 | | | 17 |
| |
| Receive a fixed rate equal to 4.000% and pay floating rate based on 3-month LIBOR. | | | |
Counterparty: Barclays Bank PLC | | | |
Exp. 12/15/2006 | | 25,200 | | | 19 |
| |
| Receive a fixed rate equal to 4.000% and pay floating rate based on 3-month LIBOR. | | | |
Counterparty: UBS Warburg LLC | | | |
Exp. 12/15/2009 | | 52,100 | | | 431 |
| |
| Receive a fixed rate equal to 4.000% and pay floating rate based on 3-month LIBOR. | | | |
Counterparty: Bank of America | | | |
Exp. 12/15/2009 | | 99,700 | |
| 920
|
| | | | | $
| 129
|
(f) Principal amount of security is adjusted for inflation.
(g) Premiums received on written options:
| | | | | | | | | | | | | | | | | | | | | | | | | | | |
| Name of Issuer | | | | | | Exercise
Price | | | | | Expiration Date | | | | # of
Contracts | | | | Premium | | | | Value |
Call - CBOT U.S. Treasury Note September Futures | | | | $ | 111.500 | | | | | 08/27/2004 | | | | | 62 | | | | $ | 27 | | | | $ | 4 |
Call - CBOT U.S. Treasury Note September Futures | | | | | 115.000 | | | | | 08/27/2004 | | | | | 405 | | | | | 268 | | | | | 12 |
Call - CBOT U.S. Treasury Note September Futures | | | | | 111.000 | | | | | 08/27/2004 | | | | | 106 | | | | | 53 | | | | | 53 |
Call - CBOT U.S. Treasury Note September Futures | | | | | 114.000 | | | | | 08/27/2004 | | | | | 58 | | | | | 38 | | | | | 4 |
Call - CBOT U.S. Treasury Note September Futures | | | | | 110.000 | | | | | 08/27/2004 | | | | | 261 | | | | | 237 | | | | | 224 |
Put - CBOT U.S. Treasury Note September Futures | | | | | 107.500 | | | | | 08/27/2004 | | | | | 92 | | | | | 72 | | | | | 34 |
Put - CBOT U.S. Treasury Note September Futures | | | | | 108.000 | | | | | 08/27/2004 | | | | | 184 | | | | | 229 | | | | | 124 |
Put - CBOT U.S. Treasury Note September Futures | | | | | 105.000 | | | | | 08/27/2004 | | | | | 261 | | | | | 160 | | | | | 37 |
| | | | | | | | | | | | | | | | | | | | | | $ | 1,084 | | | | $ | 492 |
| | | | | | | | | | | |
| Name of Issuer | | Counterparty | | | | Exercise
Rate | | | | | Expiration Date | | | | Notional
Amount | | | | Premium | | | | Value |
Call - OTC 7-Year Interest Rate Swap | | Goldman Sachs & Co. | | | | | 5.970 | %** | | | | 10/04/2004 | | | | $ | 6,400 | | | | $ | 257 | | | | $ | 416 |
Put - OTC 7-Year Interest Rate Swap | | Goldman Sachs & Co. | | | | | 5.970 | %* | | | | 10/04/2004 | | | | | 6,400 | | | | | 257 | | | | | 4 |
Call - OTC 7-Year Interest Rate Swap | | UBS Warburg LLC | | | | | 3.800 | %** | | | | 10/07/2004 | | | | | 9,200 | | | | | 44 | | | | | 1 |
Call - OTC 7-Year Interest Rate Swap | | Bank of America | | | | | 6.000 | %** | | | | 10/19/2004 | | | | | 1,700 | | | | | 69 | | | | | 111 |
Put - OTC 7-Year Interest Rate Swap | | Bank of America | | | | | 6.000 | %* | | | | 10/19/2004 | | | | | 1,700 | | | | | 69 | | | | | 2 |
Call - OTC 7-Year Interest Rate Swap | | Goldman Sachs & Co. | | | | | 5.500 | %** | | | | 01/07/2005 | | | | | 3,900 | | | | | 95 | | | | | 139 |
Put - OTC 7-Year Interest Rate Swap | | Goldman Sachs & Co. | | | | | 7.000 | %* | | | | 01/07/2005 | | | | | 3,900 | | | | | 132 | | | | | 2 |
| | | | | | | | | | | | | | | | | | | | | | $ | 923 | | | | $ | 675 |
| * | The Portfolio will pay a floating rate based on 3-month LIBOR. |
| ** | The Portfolio will receive a floating rate based on 3-month LIBOR. |
(h) Short sales open at June 30, 2004 were as follows:
| | | | | | | | | | | | | | | |
| Type | | Coupon
(%) | | Maturity | | Par | | | | Value | | Proceeds |
U.S. Treasury Bond | | 6.250 | | 05/15/2030 | | $ | 18,600 | | | | $ | 20,831 | | $ | 20,287 |
U.S. Treasury Bond | | 5.375 | | 02/15/2031 | | | 15,300 | | | | | 15,436 | | | 15,064 |
U.S. Treasury Note | | 3.875 | | 02/15/2013 | | | 4,900 | | | | | 4,686 | | | 4,591 |
U.S. Treasury Note | | 4.750 | | 05/15/2014 | | | 11,300 | | | | | 11,421 | | | 11,337 |
U.S. Treasury Note | | 6.250 | | 08/15/2023 | | | 15,200 | | | | | 16,837 | | | 16,531 |
| | | | | | | | | | | | $ | 69,211 | | $ | 67,810 |
(i) Forward foreign currency contracts outstanding at June 30, 2004:
| | | | | | | | | | | | | | | | | | | |
| Type | | Currency | | Principal
Amount
Covered by
Contract | | Settlement
Month | | | | Unrealized
Appreciation | | Unrealized
(Depreciation) | | | Net Unrealized
Appreciation/
(Depreciation) | |
Buy | | BR | | 636 | | 07/2004 | | | | $ | 0 | | $ | (5 | ) | | $ | (5 | ) |
Buy | | | | 1,328 | | 08/2004 | | | | | 17 | | | 0 | | | | 17 | |
Buy | | | | 1,500 | | 09/2004 | | | | | 8 | | | 0 | | | | 8 | |
Buy | | CP | | 371,861 | | 08/2004 | | | | | 1 | | | (3 | ) | | | (2 | ) |
Buy | | | | 303,010 | | 09/2004 | | | | | 8 | | | 0 | | | | 8 | |
Sell | | EC | | 12,099 | | 07/2004 | | | | | 173 | | | 0 | | | | 173 | |
Buy | | H$ | | 3,427 | | 07/2004 | | | | | 0 | | | (1 | ) | | | (1 | ) |
Buy | | | | 3,473 | | 08/2004 | | | | | 0 | | | (1 | ) | | | (1 | ) |
Buy | | | | 3,887 | | 09/2004 | | | | | 0 | | | 0 | | | | 0 | |
Buy | | JY | | 2,917,263 | | 07/2004 | | | | | 152 | | | 0 | | | | 152 | |
Buy | | KW | | 510,840 | | 07/2004 | | | | | 4 | | | 0 | | | | 4 | |
Buy | | | | 520,066 | | 08/2004 | | | | | 12 | | | 0 | | | | 12 | |
Buy | | | | 590,000 | | 09/2004 | | | | | 4 | | | 0 | | | | 4 | |
Buy | | MP | | 4,737 | | 08/2004 | | | | | 0 | | | 0 | | | | 0 | |
Buy | | | | 5,606 | | 09/2004 | | | | | 0 | | | (7 | ) | | | (7 | ) |
Buy | | PN | | 1,526 | | 08/2004 | | | | | 3 | | | 0 | | | | 3 | |
Buy | | | | 1,740 | | 09/2004 | | | | | 2 | | | 0 | | | | 2 | |
Buy | | RP | | 33,915 | | 09/2004 | | | | | 0 | | | (13 | ) | | | (13 | ) |
Buy | | RR | | 12,522 | | 07/2004 | | | | | 2 | | | 0 | | | | 2 | |
Buy | | | | 12,733 | | 08/2004 | | | | | 3 | | | 0 | | | | 3 | |
Buy | | | | 14,270 | | 09/2004 | | | | | 1 | | | 0 | | | | 1 | |
Buy | | S$ | | 743 | | 07/2004 | | | | | 0 | | | (7 | ) | | | (7 | ) |
Buy | | | | 755 | | 08/2004 | | | | | 0 | | | (2 | ) | | | (2 | ) |
Buy | | | | 852 | | 09/2004 | | | | | 0 | | | 0 | | | | 0 | |
Buy | | SR | | 2,955 | | 08/2004 | | | | | 40 | | | 0 | | | | 40 | |
Sell | | | | 1,778 | | 08/2004 | | | | | 0 | | | (1 | ) | | | (1 | ) |
Buy | | | | 3,429 | | 09/2004 | | | | | 19 | | | 0 | | | | 19 | |
Sell | | | | 2,003 | | 09/2004 | | | | | 0 | | | (1 | ) | | | (1 | ) |
Buy | | SV | | 14,486 | | 08/2004 | | | | | 10 | | | 0 | | | | 10 | |
Buy | | | | 16,715 | | 09/2004 | | | | | 5 | | | 0 | | | | 5 | |
Buy | | T$ | | 14,791 | | 08/2004 | | | | | 0 | | | (1 | ) | | | (1 | ) |
Buy | | | | 16,605 | | 09/2004 | | | | | 0 | | | 0 | | | | 0 | |
| | | | | | | | | | |
|
| |
|
|
| |
|
|
|
| | | | | | | | | | | $ | 464 | | $ | (42 | ) | | $ | 422 | |
| | | | | | | | | | |
|
| |
|
|
| |
|
|
|
| (j) | Principal amount denoted in indicated currency: |
| | | | |
BP | | - | | British Pound |
BR | | - | | Brazilian Real |
CP | | - | | Chilean Peso |
EC | | - | | Euro |
H$ | | - | | Hong Kong Dollar |
JY | | - | | Japanese Yen |
KW | | - | | South Korean Won |
MP | | - | | Mexican Peso |
PN | | - | | Peruvian New Sol |
RP | | - | | Indian Rupee |
RR | | - | | Russian Ruble |
S$ | | - | | Singapore Dollar |
SR | | - | | South African Rand |
SV | | - | | Slovakian Koruna |
T$ | | - | | Taiwan Dollar |
| | | | | | |
| See accompanying notes | | June 30, 2004 | | Semi-Annual Report | | 11 |
Notes to Financial Statements
June 30, 2004 (Unaudited)
1. Organization
The Total Return Portfolio (the “Portfolio”) is a series of the PIMCO Variable Insurance Trust (the “Trust”). The Trust is registered under the Investment Company Act of 1940 (the “Act”), as amended, as an open-end investment company organized as a Delaware business trust on October 3, 1997. The Portfolio offers two classes of shares: Institutional and Administrative. Each share class has identical voting rights (except that shareholders of a class have exclusive voting rights regarding any matter relating solely to that class of shares). Information presented in these financial statements pertains to the Administrative Class of the Portfolio. Certain detailed financial information for the Institutional Class is provided separately and is available upon request. The Trust is designed to be used as an investment vehicle by Separate Accounts of insurance companies that fund variable annuity contracts and variable life insurance policies and by qualified pension and retirement plans. The Portfolio commenced operations on December 31, 1997.
2. Significant Accounting Policies
The following is a summary of significant accounting policies consistently followed by the Trust in the preparation of its financial statements in conformity with accounting principles generally accepted in the United States of America. The preparation of financial statements in accordance with accounting principles generally accepted in the United States of America requires management to make estimates and assumptions that affect the reported amounts and disclosures in the financial statements. Actual results could differ from those estimates.
Security Valuation. Portfolio securities and other financial instruments for which market quotations are readily available are stated at market value. Portfolio securities and other financial instruments for which market quotes are not readily available are valued at fair value, as determined in good faith and pursuant to guidelines established by the Board of Trustees, including certain fixed income securities which may be valued with reference to securities whose prices are more readily obtainable. Market value is determined at the close of regular trading (normally, 4:00 p.m., Eastern Time) on the New York Stock Exchange on each day the New York Stock Exchange is open, or if no sales are reported, as is the case for most securities traded over-the-counter, the mean between representative bid and asked quotations obtained from a quotation reporting system or from established market makers. The prices of certain portfolio securities or other financial instruments may be determined at a time prior to the close of regular trading on the New York Stock Exchange. Fair valuation may be used if significant events occur after the close of the relevant markets and prior to the close of regular trading on the New York Stock Exchange that materially affect the values of such securities or financial instruments. Fixed income securities are normally valued on the basis of quotes obtained from brokers and dealers or pricing services. Certain fixed income securities purchased on a delayed delivery basis are marked to market daily until settlement at the forward settlement value. Short-term investments, which mature in 60 days or less are valued at amortized cost, which approximates market value. Exchange traded options, futures and options on futures are valued at the settlement price determined by the relevant exchange. Prices may be obtained from independent pricing services which use information provided by market makers or estimates of market values obtained from yield data relating to investments or securities with similar characteristics. The prices used by the Portfolio may differ from the value that would be realized if the securities were sold and the differences could be material to the financial statements.
Securities Transactions and Investment Income. Securities transactions are recorded as of the trade date. Securities purchased or sold on a when-issued or delayed delivery basis may be settled a month or more after the trade date. Realized gains and losses from securities sold are recorded on the identified cost basis. Dividend income is recorded on the ex-dividend date, except certain dividends from foreign securities where the ex-dividend date may have passed, are recorded as soon as the Portfolio is informed of the ex-dividend date. Interest income, adjusted for the accretion of discounts and amortization of premiums, is recorded on the accrual basis. Paydowns gains and losses on mortgage- and asset-backed securities are recorded as adjustments to interest income in the Statement of Operations.
Dividends and Distributions to Shareholders. Dividends from net investment income, if any, are declared on each day the Trust is open for business and are distributed to shareholders monthly. All dividends are reinvested in additional shares of the Portfolio. Net realized capital gains earned by the Portfolio, if any, will be distributed no less frequently than once each year.
Income dividends and capital gain distributions are determined in accordance with income tax regulations which may differ from accounting principles generally accepted in the United States of America. These differences are primarily due to differing treatments for such items as wash sales, foreign currency transactions, net operating losses, notional principal contracts, certain asset-backed securities, certain futures and forward contracts, tax straddles, and capital loss carryforwards.
Distributions classified as a tax basis return of capital, if any, are reflected in the accompanying Statements of Changes in Net Assets and have been reclassified to paid in capital. In addition, other amounts have been reclassified between undistributed net investment income, accumulated undistributed net realized gains or losses and/or paid in capital to more appropriately conform financial accounting to tax characterizations of dividend distributions.
Multiclass Operations. Each class offered by the Trust has equal rights as to assets. Income, non-class specific expenses, and realized and unrealized capital gains and losses are allocated to each class of shares based on the relative net assets of each class.
Delayed Delivery Transactions. The Portfolio may purchase or sell securities on a when-issued or delayed delivery basis. These transactions involve a commitment by the Portfolio to purchase or
| | | | |
| 12 | | Semi-Annual Report | | June 30, 2004 |
sell securities for a predetermined price or yield, with payment and delivery taking place beyond the customary settlement period. When delayed delivery purchases are outstanding, the Portfolio will designate liquid assets in an amount sufficient to meet the purchase price. When purchasing a security on a delayed delivery basis, the Portfolio assumes the rights and risks of ownership of the security, including the risk of price and yield fluctuations, and takes such fluctuations into account when determining its net asset value. The Portfolio may dispose of or renegotiate a delayed delivery transaction after it is entered into, and may sell when-issued securities before they are delivered, which may result in a capital gain or loss. When the Portfolio has sold a security on a delayed delivery basis, the Portfolio does not participate in future gains and losses with respect to the security.
Federal Income Taxes. The Portfolio intends to qualify as a regulated investment company and distribute all of its taxable income and net realized gains, if applicable, to shareholders. Accordingly, no provision for Federal income taxes has been made.
Foreign Currency. The accounting records of the Portfolio are maintained in U.S. dollars. The market values of foreign securities, currency holdings and other assets and liabilities are translated into U.S. dollars based on the current exchange rates each business day. Fluctuations in the value of these assets and liabilities resulting from changes in exchange rates are recorded as unrealized foreign currency gains or losses. Realized gains or losses and unrealized appreciation or depreciation on investment securities and income and expenses are translated on the respective dates of such transactions. The effect of changes in foreign currency exchange rates on investments in securities are not segregated in the Statement of Operations from the effects of changes in market prices of those securities, but are included with the net realized and unrealized gain or loss on investment securities.
Forward Currency Transactions. The Portfolio may enter into forward currency contracts and forward cross-currency contracts in connection with settling planned purchases or sales of securities, to hedge the currency exposure associated with some or all of the Portfolio’s securities or as a part of an investment strategy. A forward currency contract is an agreement between two parties to buy and sell a currency at a set price on a future date. The market value of a forward currency contract fluctuates with changes in forward currency exchange rates. Forward currency contracts are marked to market daily and the change in value is recorded by the Portfolio as an unrealized gain or loss. Realized gains or losses equal to the difference between the value of the contract at the time it was opened and the value at the time it was closed are recorded upon delivery or receipt of the currency or, if a forward currency contract is offset by entering into another forward currency contract with the same broker, upon settlement of the net gain or loss. These contracts may involve market risk in excess of the unrealized gain or loss reflected in the Portfolio’s Statement of Assets and Liabilities. In addition, the Portfolio could be exposed to risk if the counterparties are unable to meet the terms of the contracts or if the value of the currency changes unfavorably to the U.S. dollar.
Futures Contracts. The Portfolio is authorized to enter into futures contracts. The Portfolio may use futures contracts to manage its exposure to the securities markets or to movements in interest rates and currency values. The primary risks associated with the use of futures contracts are the imperfect correlation between the change in market value of the securities held by the Portfolio and the prices of futures contracts, the possibility of an illiquid market, and the inability of the counterparty to meet the terms of the contract. Futures contracts are valued based upon their quoted daily settlement prices. Upon entering into a futures contract, the Portfolio may be required to deposit with its custodian, in a segregated account in the name of the futures broker, an amount of cash or U.S. Government and Agency Obligations in accordance with the initial margin requirements of the broker or exchange. Futures contracts are marked to market daily and an appropriate payable or receivable for the change in value (“variation margin”) is recorded by the Portfolio. Gains or losses are recognized but not considered realized until the contracts expire or are closed. Futures contracts involve, to varying degrees, risk of loss in excess of the variation margin disclosed in the Statement of Assets and Liabilities.
Inflation-Indexed Bonds. The Portfolio may invest in inflation-indexed bonds. Inflation-indexed bonds are fixed income securities whose principal value is periodically adjusted to the rate of inflation. The interest rate on these bonds is generally fixed at issuance at a rate lower than typical bonds. Over the life of an inflation-indexed bond, however, interest will be paid based on a principal value, which is adjusted for inflation. Any increase in the principal amount of an inflation-indexed bond will be included as interest income in the Statement of Operations, even though investors do not receive their principal until maturity.
Options Contracts. The Portfolio may write call and put options on futures, swaps, securities or currencies it owns or in which it may invest. Writing put options tends to increase the Portfolio’s exposure to the underlying instrument. Writing call options tends to decrease the Portfolio’s exposure to the underlying instrument. When the Portfolio writes a call or put option, an amount equal to the premium received is recorded as a liability and subsequently marked to market to reflect the current value of the option written. These liabilities are reflected as written options outstanding in the Statement of Assets and Liabilities. Payments received or made, if any, from writing options with premiums to be determined on a future date are reflected as such on the Statement of Assets and Liabilities. Premiums received from writing options which expire are treated as realized gains. Premiums received from writing options which are exercised or closed are added to the proceeds or offset against amounts paid on the underlying future, swap, security or currency transaction to determine the realized gain or loss. The Portfolio as a writer of an option has no control over whether the underlying future, swap, security or currency may be sold (call) or purchased (put) and as a result bears the market risk of an unfavorable change in the price of the future, swap, security or currency underlying the written option. There is the risk the Portfolio may not be able to enter into a closing transaction because of an illiquid market.
| | | | |
| June 30, 2004 | | Semi-Annual Report | | 13 |
Notes to Financial Statements (Cont.)
June 30, 2004 (Unaudited)
The Portfolio may also purchase put and call options. Purchasing call options tends to increase the Portfolio’s exposure to the underlying instrument. Purchasing put options tends to decrease the Portfolio’s exposure to the underlying instrument. The Portfolio pays a premium which is included in the Portfolio’s Statement of Assets and Liabilities as an investment and subsequently marked to market to reflect the current value of the option. Premiums paid for purchasing options which expire are treated as realized losses. The risk associated with purchasing put and call options is limited to the premium paid. Premiums paid for purchasing options which are exercised or closed are added to the amounts paid or offset against the proceeds on the underlying future, swap, security or currency transaction to determine the realized gain or loss.
Repurchase Agreements. The Portfolio may engage in repurchase transactions. Under the terms of a typical repurchase agreement, the Portfolio takes possession of an underlying debt obligation subject to an obligation of the seller to repurchase, and the Portfolio to resell, the obligation at an agreed-upon price and time. The market value of the collateral must be equal at all times to the total amount of the repurchase obligations, including interest. Generally, in the event of counterparty default, the Portfolio has the right to use the collateral to offset losses incurred.
Short Sales. The Portfolio may enter into short sales transactions. A short sale is a transaction in which the Portfolio sells securities it does not own in anticipation of a decline in the market price of the securities. The Portfolio is obligated to deliver securities at the market price at the time the short position is closed. Possible losses from short sales may be unlimited, whereas losses from purchases cannot exceed the total amount invested.
Swap Agreements. The Portfolio may invest in swap agreements. A swap is an agreement to exchange the return generated by one instrument for the return generated by another instrument. The Portfolio may enter into interest rate, total return, forward spread lock, and credit default swap agreements to manage its exposure to interest rates and credit risk.
Interest rate swap agreements involve the exchange by the Portfolio with another party of their respective commitments to pay or receive interest, e.g., an exchange of floating rate payments for fixed rate payments with respect to the notional amount of principal.
Total return swap agreements involve commitments to pay interest in exchange for a market-linked return, both based on notional amounts. To the extent the total return of the security or index underlying the transaction exceeds or falls short of the offsetting interest rate obligation, the Portfolio will receive a payment from or make a payment to the counterparty.
Forward spread lock swap agreements involve commitments to pay or receive a settlement amount calculated as the difference between the swap spread and a fixed spread, multiplied by the notional amount times the duration of the swap. The swap spread is the difference between the benchmark swap rate (market rate) and the specific Treasury rate.
In a credit default swap, one party makes a stream of payments to another party in exchange for the right to receive a specified return in the event of a default by a third party, typically corporate issues or sovereign issues of an emerging country, on its obligation. The Portfolio may use credit default swaps to provide a measure of protection against defaults of sovereign issuers (i.e., to reduce risk where the Portfolio owns or has exposure to the sovereign issuer) or to take an active long or short position with respect to the likelihood of a particular issuer’s default.
Swaps are marked to market daily based upon quotations from market makers and the change in value, if any, is recorded as unrealized gain or loss in the Statement of Operations. Payments received or made at the beginning of the measurement period are reflected as such on the Statement of Assets and Liabilities. A liquidation payment received or made at the termination of the swap is recorded as realized gain or loss in the Statement of Operations. Net periodic payments received by the Portfolio are included as part of realized gain (loss) on the Statement of Operations. Entering into these agreements involves, to varying degrees, elements of credit, market and documentation risk in excess of the amounts recognized on the Statement of Assets and Liabilities. Such risks involve the possibility that there will be no liquid market for these agreements, that the counterparty to the agreements may default on its obligation to perform or disagree as to the meaning of contractual terms in the agreements, and that there may be unfavorable changes in interest rates.
As a result of a FASB Emerging Issues Task Force (“EITF”) consensus, No. 03-11, and related SEC staff guidance, the Portfolio has reclassified periodic payments made or received under swap agreements, which were previously included within miscellaneous income, to a component of realized gain (loss) in the Statement of Operations. For consistency, similar reclassifications have been made to amounts appearing in the previous year’s Statement of Changes in Net Assets and the per share amounts in the prior year financial highlights. Prior year net investment income ratios in the financial highlights have also been modified accordingly. This reclassification increased (decreased) net investment income by $157,342 and $(31,206), and net realized gain (loss) by $(137,550) and $11,058 and net change in unrealized appreciation (depreciation) by $(19,792) and $20,148 for the six months ended June 30, 2004 and year ended December 31, 2003, respectively. There is no effect on the Portfolio’s net asset value, either in total or per share, or its total increase (decrease) in net assets from operations during any period.
3. Fees, Expenses, and Related Party Transactions
Investment Advisory Fee. Pacific Investment Management Company LLC (“PIMCO”) is a majority owned subsidiary partnership of Allianz Dresdner Asset Management of America L.P. and serves as investment adviser (the “Adviser”) to the Trust, pursuant to an investment advisory contract. The Adviser receives a monthly fee at an annual rate based on average daily net assets of the Portfolio. The Advisory Fee is charged at an annual rate of 0.25%.
Administration Fee. PIMCO serves as administrator (the “Administrator”), and provides administrative services to the Trust for which it receives a monthly administrative fee based on average
| | | | |
| 14 | | Semi-Annual Report | | June 30, 2004 |
daily net assets of the Portfolio. The Administration Fee is charged at the annual rate of 0.25%.
Servicing Fee. PA Distributors LLC (“PAD”), formerly known as PIMCO Advisors Distributors LLC, is an indirect wholly-owned subsidiary of Allianz Dresdner Asset Management of America L.P. and serves as the distributor of the Trust’s shares. The Trust is permitted to reimburse PAD on a quarterly basis, out of the Administrative Class assets of the Portfolio in the amount of 0.15% on an annual basis of the average daily net assets of that class, for payments made to financial intermediaries that provide services in connection with the distribution of shares or administration of plans or programs that use Portfolio shares as their funding medium. The effective rate paid to PAD was 0.15% during current fiscal year.
Expenses. The Trust is responsible for the following expenses: (i) salaries and other compensation of any of the Trust’s executive officers and employees who are not officers, directors, stockholders or employees of PIMCO or its subsidiaries or affiliates; (ii) taxes and governmental fees; (iii) brokerage fees and commissions and other portfolio transaction expenses; (iv) the cost of borrowing money, including interest expense and back overdraft charges; (v) fees and expenses of the Trustees who are not “interested persons” of PIMCO or the Trust, and any counsel retained exclusively for their benefit; (vi) extraordinary expenses, including costs of litigation and indemnification expenses; (vii) organization expenses and (viii) any expenses allocated or allocable to a specific class of shares, which include service fees payable with respect to the Administrative Class shares and may include certain other expenses as permitted by the Trust’s Multiple Class Plan adopted pursuant to Rule 18f-3 under the Act and subject to review and approval by the Trustees. The ratio of expenses to average net assets per share class, as disclosed in Financial Highlights, may differ from the annual portfolio operating expenses per share class as disclosed in the Prospectus for the reasons set forth above.
PIMCO has agreed to waive a portion of its administrative fees to the extent that the payment of the Portfolio’s pro rata share of organization expenses and Trustee fees cause the actual expense ratio to rise above the rates disclosed in the then-current prospectus plus 0.49 basis points as set forth below (calculated as a percentage of the Portfolio’s average daily net assets attributable to each class):
| | | |
Institutional Class | | 0.50 | % |
Administrative Class | | 0.65 | % |
PIMCO may be reimbursed for these waived amounts in future periods, not to exceed thirty-six months.
Each unaffiliated Trustee receives an annual retainer of $4,000, plus $1,500 for each Board of Trustees meeting attended in person and $250 for each meeting attended telephonically, plus reimbursement of related expenses. In addition, each committee chair receives an additional annual retainer of $500. These expenses are allocated on a pro-rata basis to each Portfolio of the Trust according to its respective net assets.
4. Purchases and Sales of Securities
The length of time a Portfolio has held a particular security is not generally a consideration in investment decisions. A change in the securities held by a Portfolio is known as “portfolio turnover.” The Portfolio may engage in frequent and active trading of portfolio securities to achieve its investment objective, particularly during periods of volatile market movements. High portfolio turnover (e.g., over 100%) involves correspondingly greater expenses to the Portfolio, including brokerage commissions or dealer mark-ups and other transaction costs on the sale of securities and reinvestments in other securities. Such sales may also result in realization of taxable capital gains, including short-term capital gains (which are generally taxed at ordinary income tax rates). The trading costs and tax effects associated with portfolio turnover may adversely affect the Portfolio’s performance.
Purchases and sales of securities (excluding short-term investments) for the period ended June 30, 2004 were as follows (amounts in thousands):
| | | | | | |
| U.S Government/Agency | | All Other |
| Purchases | | Sales | | Purchases | | Sales |
| $1,049,636 | | $906,376 | | $305,244 | | $332,178 |
5. Transactions in Written Call and Put Options
Transactions in written call and put options were as follows (amounts in thousands):
| | | | |
| | | | Premium | |
Balance at 12/31/2003 | | $ | 2,357 | |
Sales | | | 2,374 | |
Closing Buys | | | (638 | ) |
Expirations | | | (2,086 | ) |
Exercised | | | 0 | |
| Balance at 06/30/2004 | | | $2,007 | |
6. Federal Income Tax Matters
At June 30, 2004, the aggregate cost of investments was the same for federal income tax and financial statement purposes. The net unrealized appreciation (depreciation) of investment securities for federal income tax purposes is as follows (amounts in thousands):
| | | | | |
Aggregate Gross
Unrealized
Appreciation | | Aggregate Gross
Unrealized
(Depreciation) | | Net Unrealized
Appreciation |
| $ 11,478 | | $ (10,229) | | $ | 1,249 |
| | | | |
| June 30, 2004 | | Semi-Annual Report | | 15 |
Notes to Financial Statements (Cont.)
June 30, 2004 (Unaudited)
7. Shares of Beneficial Interest
The Trust may issue an unlimited number of shares of beneficial interest with a $.001 par value. Changes in shares of beneficial interest were as follows (shares and amounts in thousands):
| | | | | | | | | | | | | | |
| | | Six Months Ended
06/30/2004 | | | Year Ended
12/31/2003 | |
| | | Shares | | | Amount | | | Shares | | | Amount | |
Receipts for shares sold | | | | | | | | | | | | | | |
| | | | |
Institutional Class | | 679 | | | $ | 7,078 | | | 7,349 | | | $ | 76,213 | |
Administrative Class | | 34,019 | | | | 355,600 | | | 94,450 | | | | 979,977 | |
| | | | |
Issued as reinvestment of distributions | | | | | | | | | | | | | | |
| | | | |
Institutional Class | | 60 | | | | 631 | | | 271 | | | | 2,807 | |
Administrative Class | | 1,399 | | | | 14,564 | | | 4,687 | | | | 48,536 | |
| | | | |
Cost of shares redeemed | | | | | | | | | | | | | | |
| | | | |
Institutional Class | | (2,792 | ) | | | (29,016 | ) | | (4,880 | ) | | | (50,575 | ) |
Administrative Class | | (11,949 | ) | | | (124,164 | ) | | (28,502 | ) | | | (295,164 | ) |
| | | | |
Net increase resulting from Portfolio share transactions | | 21,416 | | | $ | 224,693 | | | 73,375 | | | $ | 761,794 | |
The following schedule shows the number of shareholders each owning 5% or more of the Portfolio and the total percentage of the Portfolio held by such shareholders:
| | | | |
| | | Number | | % of Portfolio Held |
Institutional Class | | 2 | | 100 |
Administrative Class | | 6 | | 79 |
8. Regulatory and Litigation Matters
On February 17, 2004, the Attorney General of the State of New Jersey (“New Jersey AG”) filed a complaint against Allianz Dresdner Asset Management of America L.P. (“ADAM”), PA Distributors LLC (formerly known as PIMCO Advisors Distributors LLC) (“PAD”), PEA Capital LLC (formerly known as PIMCO Equity Advisors LLC) (“PEA”), and Pacific Investment Management Company LLC (“PIMCO”) in connection with its investigation into market timing and late trading. The complaint contends that inappropriate trading by shareholders engaged in market timing activity took place in funds in the PIMCO Funds: Multi-Manager Series (“MMS Funds”) and the PIMCO Funds: Pacific Investment Management Series (“PIMS Funds”). On June 1, 2004, the New Jersey AG dismissed PIMCO from the lawsuit.
On the same day as the dismissal of PIMCO from the lawsuit, the New Jersey AG announced that it had reached a settlement agreement with the remaining defendants (“New Jersey Settlement”). In the New Jersey Settlement, ADAM, PAD and PEA agreed, while neither admitting nor denying the allegations or conclusions of law, to: (i) pay New Jersey a civil fine of $15 million and $3 million for investigative costs and further enforcement initiatives; and (ii) implement certain changes in corporate governance.
On May 6, 2004, the Securities and Exchange Commission filed a complaint in the U.S. District Court in the Southern District of New York alleging that PA Fund Management LLC (formerly known as PIMCO Advisors Fund Management LLC) (“PAFM”), PEA, PAD, Stephen J. Treadway (at the time, the chief executive officer of PAFM and PAD as well as chairman of the Board of Trustees of the MMS Funds) and Kenneth W. Corba (the former chief executive officer of PEA and former portfolio manager of the PEA Growth and PEA Growth & Income Funds) had, among other things, violated and/or aided and abetted violations of, various antifraud provisions of the federal securities laws in connection with alleged “market timing” arrangements that improperly allowed certain hedge funds to engage in “market timing” in the PEA Growth Fund, the PEA Opportunity Fund, the PEA Innovation Fund, and the PEA Target Fund. The complaint seeks injunctive relief, disgorgement plus pre-judgment interest, monetary penalties, and an order permanently enjoining the defendants from serving as investment advisers, principal underwriters, officers, directors, or members of any advisory boards to any registered investment companies.
On February 20, 2004, a putative class action lawsuit was filed in the U.S. District Court for the District of New Jersey on behalf of certain shareholders of the PIMCO Funds against ADAM, PAD, PIMCO, PEA, the PIMS Funds, the MMS Funds, the Trust, PIMCO Commercial Mortgage Securities Trust, Inc. and certain other defendants, alleging that inappropriate market timing activity by certain shareholders caused financial injury to the shareholders of those Funds.
| | | | |
| 16 | | Semi-Annual Report | | June 30, 2004 |
The following additional putative class action lawsuits have been filed against the PIMS Funds, the MMS Funds and/or their affiliates, each related to alleged market-timing activity in funds advised by PIMCO or its affiliates: (1) a lawsuit filed in the U.S. District Court for the District of Connecticut on February 27, 2004 (naming as defendants ADAM, PAD, PEA, the PIMS Funds, the MMS Funds, the Trust, PCM and certain other parties); (2) a lawsuit filed in the U.S. District Court for the Central District of California on March 4, 2004 (naming as defendants PIMCO, ADAM, PEA and PAD); (3) a lawsuit filed in the U.S. District Court for the Southern District of New York on March 8, 2004 (naming PIMCO, PAD and certain of their affiliates as defendants); (4) a lawsuit filed in the U.S. District Court for the Southern District of New York, on March 15, 2004 (naming PIMCO as the defendant); (5) two separate lawsuits filed in the U.S. District Court for the Central District of California on March 22, 2004, brought derivatively on behalf of the PIMCO High Yield Fund and the PIMCO Money Market Fund, respectively (each naming ADAM, PAFM and certain other parties as defendants, and the PIMCO Funds as the nominal defendant); (6) a lawsuit filed in the U.S. District Court for the Central District of California, also on March 22, 2004, brought derivatively on behalf of the PIMS Funds and the MMS Funds (naming ADAM, PIMCO, PAD and certain other parties as defendants, and the PIMS Funds and the MMS Funds as nominal defendants); (7) a lawsuit filed in the U.S. District Court for the District of New Jersey on April 20, 2004 (naming ADAM, PAD, the PIMS Funds and certain other parties as defendants); and (8) a lawsuit filed in the U.S. District Court for the Northern District of California on April 28, 2004 (naming ADAM, PIMCO, PAD, PEA and certain other parties as defendants, and the “PIMCO Funds” as nominal defendants). Each complaint for the foregoing putative class actions alleges, among other things, that inappropriate trading by shareholders engaged in market timing activities took place in certain of the funds advised by PIMCO, and each complaint seeks unspecified compensatory damages.
On February 17, 2004, a putative class action lawsuit was filed in the U.S. District Court for the District of Connecticut on behalf of certain shareholders of the PIMCO Funds against ADAM, PEA, PIMCO, PIMS Funds, MMS Funds and certain other defendants, alleging excessive investment advisory fees and the use of brokerage commissions to pay for distribution of fund shares. Three similar putative class action lawsuits were subsequently filed, each in the U.S. District Court for the District of Connecticut on March 1, 2004, April 23, 2004 and May 20, 2004, respectively.
Under Section 9(a) of the 1940 Act, if any of the various lawsuits were to result in a court injunction against PAFM, PEA, PAD, PIMCO, ADAM and/or Mr. Treadway, they and their affiliates would, in the absence of exemptive relief granted by the SEC, be barred from serving as an investment adviser/sub-adviser or principal underwriter for any registered investment company, including the Trust. ADAM and certain of its subsidiaries have responded to inquiries from the SEC concerning the status of the New Jersey Settlement under Section 9(a). If any of PAFM, PEA, PAD, PIMCO or ADAM were subject to an injunction, each of these entities and their affiliates could in turn seek exemptive relief from the SEC, as contemplated by the 1940 Act. There is no assurance, however, that such exemptive relief would be granted. The SEC also has the power by order to prohibit PAFM, PEA, PAD and PIMCO from serving as investment advisers and underwriters, if the SEC finds that such entities willfully violated the federal securities laws in connection with the allegations discussed above or aided or abetted such violations.
PIMCO, PAD and the Trust believe that these developments will not have a material adverse effect on the Portfolios or on PIMCO’s, or PAD’s ability to perform their respective investment advisory or distribution services on behalf of the Portfolios.
| | | | |
| June 30, 2004 | | Semi-Annual Report | | 17 |
Trustees and Officers
Brent R. Harris, Chairman and Trustee
R. Wesley Burns, President and Trustee
E. Philip Cannon, Trustee
Vern O. Curtis, Trustee
J. Michael Hagan, Trustee
William J. Popejoy, Trustee
Garlin G. Flynn, Secretary
John P. Hardaway, Treasurer
Investment Adviser and Administrator
Pacific Investment Management Company LLC
840 Newport Center Drive
Newport Beach, California 92660
Distributor
PA Distributors LLC
2187 Atlantic Street
Stamford, Connecticut 06902
Custodian
State Street Bank & Trust Company
801 Pennsylvania
Kansas City, Missouri 64105
Transfer Agent
Boston Financial Data Services–Midwest
330 W. 9th Street
Kansas City, Missouri 64105
Legal Counsel
Dechert LLP
1775 I Street, N.W.
Washington, D.C. 20006
Independent Registered Public Accounting Firm
PricewaterhouseCoopers LLP
1055 Broadway
Kansas City, Missouri 64105
Information about how the Fund voted proxies relating to portfolio securities held during the year July 1, 2003 through June 30, 2004 will be available no later than August 31, 2004 without charge, upon request, by calling the Trust at 1-800-927-4648 and on the SEC’s website at http://www.sec.gov.
Copies of the written Proxy Policy and the factors that PIMCO may consider in determining how to vote proxies for the Funds are available by calling the Trust at 1-800-927-4648 and on the SEC’s website at http://www.sec.gov.
PIMCO VARIABLE INSURANCE TRUST
840 NEWPORT CENTER DRIVE
NEWPORT BEACH, CA 92660

PIMCO VARIABLE INSURANCE TRUST
EMERGING MARKETS BOND PORTFOLIO
ADMINISTRATIVE CLASS
SEMI-ANNUAL REPORT
June 30, 2004
|
| This material is authorized for use only when preceded or accompanied by the current PIMCO Variable Insurance Trust prospectus. Investors should consider the investment objectives, risks, charges and expenses of Portfolio carefully before investing. This and other information is contained in the Portfolio’s prospectus. Please read the prospectus carefully before you invest or send money. |
Chairman’s Letter
Dear PIMCO Variable Insurance Trust Shareholder:
Bond prices were more volatile during the six-month period ended June 30, 2004. Interest rates rose sharply during the second quarter 2004, causing bonds to give back modest gains from earlier in the year. The Lehman Brothers Aggregate Bond Index, a widely used index for the high-grade bond market, was nearly flat during the first six months of 2004, returning 0.15% after losing 2.44% during the second quarter. The yield on the benchmark ten-year Treasury closed June 30, 2004 at 4.58%, up 0.75% from April 1, 2004, but up only 0.34% from where it began the six-month period on January 1, 2004.
Continued growth in employment convinced the markets that the Federal Reserve would soon begin a long anticipated tightening cycle. On June 30, 2004, the Fed met market expectations by increasing the federal funds rate 0.25%, which was the first rate increase since June 25, 2003. The central bank had held this rate at 1% for more than a year, which generated negative real short-term rates. And on August 10, 2004, the Fed increased the federal funds rate another 0.25% to 1.50%.
Investors that had profited handsomely from borrowing at low short-term rates and investing in higher-yielding longer maturity bonds surrendered some of those profits towards the latter part of the six-month period. Concern that borrowing rates would rise led investors to liquidate long positions and unwind these trades, which caused bond prices to decrease. However, substantial leverage remained among banks, hedge funds, and other investors, making bond markets somewhat vulnerable to additional Fed rate increases. There were also signs of rising inflation, which fueled anxiety that central banks might continue to raise interest rates.
On the following pages you will find a more complete review of the Portfolio in light of financial market activities as well as specific details about the total return investment performance for the six-month period.
We appreciate the trust you have placed in us, and we will continue to focus our efforts to meet your investment needs.
Sincerely,

Brent R. Harris
Chairman
August 11, 2004
| | | | |
| June 30, 2004 | | Semi-Annual Report | | 1 |
Important Information About the Portfolio
We believe that bond funds have an important role to play in a well diversified investment portfolio. It is important to note, however, that in an environment where interest rates may trend upward, rising rates will negatively impact the performance of most bond funds, and fixed income securities held by a fund are likely to decrease in value. The price volatility of fixed income securities can also increase during periods of rising interest rates resulting in increased losses to a fund. Bond funds and individual bonds with a longer duration (a measure of the expected life of a security) tend to be more sensitive to changes in interest rates, usually making them more volatile than securities or funds with shorter durations. The longer-term performance of most bond funds has benefited from capital gains in part resulting from an extended period of declining interest rates. In the event interest rates increase, these capital gains should not be expected to recur.
The Portfolio may be subject to various risks in addition to those described above. Some of these risks may include, but are not limited to, the following: real rate risk, derivative risk, small company risk, foreign security risk, high yield security risk and specific sector investment risks. The Portfolio may use derivative instruments for hedging purposes or as part of an investment strategy. Use of these instruments may involve certain costs and risks such as liquidity risk, interest rate risk, market risk, credit risk, management risk and the risk that a fund could not close out a position when it would be most advantageous to do so. A Portfolio investing in derivatives could lose more than the principal amount invested in these instruments. Investing in non-U.S. securities may entail risk due to non-U.S. economic and political developments; this risk may be enhanced when investing in emerging markets. High-yield bonds typically have a lower credit rating than other bonds. Lower rated bonds generally involve a greater risk to principal than higher rated bonds. Smaller companies may be more volatile than larger companies and may entail more risk. Concentrating investments in individual sectors may add additional risk and volatility compared to a diversified portfolio.
On the performance summary page in this semi-annual report, the Total Return Investment Performance table measures performance assuming that all dividend and capital gain distributions were reinvested. Returns do not reflect the deduction of taxes that a shareholder would pay (i) on Portfolio distributions or (ii) the redemption of Portfolio shares.
An investment in a Portfolio is not a bank deposit and is not guaranteed or insured by the Federal Deposit Insurance Corporation or any other government agency. It is possible to lose money on investments in the Funds.
The following disclosure provides important information regarding the Portfolio’s Expense Example, which appears on the Portfolio’s individual page in this semi-annual report. Please refer to this information when reviewing the Expense Example for the Portfolio.
Example
As a shareholder of the Portfolio, you incur two types of costs: (1) transaction costs, including redemption and exchange fees; and (2) ongoing costs, including advisory and administrative fees; distribution and/or service (12b-1) fees (Administrative Class only); and other Portfolio expenses. The Example is intended to help you understand your ongoing costs (in dollars) of investing in the Portfolio and to compare these costs with the ongoing costs of investing in other mutual funds.
The Example is based on an investment of $1,000 invested at the beginning of the period and held for the entire period indicated, which is from 1/1/04 to 6/30/04.
Actual Expenses
The information in the table under the heading “Actual Performance” provides information about actual account values and actual expenses. You may use the information in these columns, together with the amount you invested, to estimate the expenses that you paid over the period. Simply divide your account value by $1,000.00 (for example, an $8,600.00 account value divided by $1,000 = 8.60), then multiply the result by the number in the appropriate column for your share class, in the row entitled “Expenses Paid During Period” to estimate the expenses you paid on your account during this period.
Hypothetical Example for Comparison Purposes
The information in the table under the heading “Hypothetical Performance (5% return before expenses)” provides information about hypothetical account values and hypothetical expenses based on the Portfolio’s actual expense ratio and an assumed rate of return of 5% per year before expenses, which is not the Portfolio’s actual return. The hypothetical account values and expenses may not be used to estimate the actual ending account balance or expenses you paid for the period. You may use this information to compare the ongoing costs of investing in the Portfolio and other portfolios. To do so, compare this 5% hypothetical example with the 5% hypothetical examples that appear in the shareholder reports of the other portfolios.
Please note that the expenses shown in the table are meant to highlight your ongoing costs only and do not reflect any transactional costs. Therefore, the information under the heading “Hypothetical Performance (5% return before expenses)” is useful in comparing ongoing costs only, and will not help you determine the relative total costs of owning different portfolios. In addition, if these transactional costs were included, your costs would have been higher.
PIMCO Variable Insurance Trust is distributed by PA Distributors LLC, 2187 Atlantic Street, Stamford, CT 06902.
| | | | |
| 2 | | Semi-Annual Report | | June 30, 2004 |
Emerging Markets Bond Portfolio
CUMULATIVE RETURNS THROUGH JUNE 30, 2004
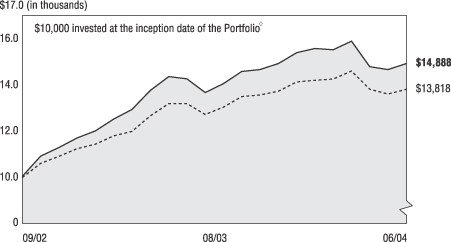
[CHART]
Emerging Markets Bond J.P. Morgan Emerging
Portfolio Admin. Class Markets Bond Index Global
---------------------- -------------------------
09/30/2002 $10,000 $10,000
10/31/2002 $10,879 $10,616
11/30/2002 $11,248 $10,917
12/31/2002 $11,665 $11,253
01/31/2003 $11,972 $11,438
02/28/2003 $12,475 $11,804
03/31/2003 $12,902 $11,995
04/30/2003 $13,728 $12,678
05/31/2003 $14,328 $13,203
06/30/2003 $14,225 $13,203
07/31/2003 $13,624 $12,735
08/31/2003 $14,020 $13,045
09/30/2003 $14,540 $13,503
10/31/2003 $14,623 $13,569
11/30/2003 $14,886 $13,735
12/31/2003 $15,356 $14,139
01/31/2004 $15,541 $14,211
02/29/2004 $15,485 $14,261
03/31/2004 $15,853 $14,617
04/30/2004 $14,754 $13,823
05/31/2004 $14,621 $13,618
06/30/2004 $14,888 $13,818
COUNTRY ALLOCATION‡
| | |
Short-Term Instruments | | 29.5% |
Brazil | | 23.6% |
Russia | | 12.4% |
Mexico | | 11.8% |
Ecuador | | 3.4% |
Peru | | 2.7% |
Ukraine | | 2.6% |
Other | | 14.0% |
‡ % of Total Investments as of June 30, 2004
à$10,000 invested at the beginning of the first full month following the inception of the Administrative Class.
TOTAL RETURN INVESTMENT PERFORMANCE For the period ended June 30, 2004
| | | | | | | | | | | | | |
| | | | | | | 6 Months | | | 1 Year | | | Since Inception* | |
| | |
| | Emerging Markets Bond Portfolio Administrative Class (Inception 09/30/02) | | –3.05 | % | | 4.66 | % | | 25.60 | % |
| | | - - - - - - - | | J.P. Morgan Emerging Markets Bond Index Global | | –2.27 | % | | 4.66 | % | | — | |
| | | | | * Annualized. All Portfolio returns are net of fees and expenses. | | | | | | | | | |
Past performance is no guarantee of future results. The performance quoted represents past performance. Investment return and principal value will fluctuate so the Portfolio shares, when redeemed, may be worth more or less than their original cost. Current performance may be lower or higher than the performance data quoted. Performance data current to the most recent month-end is available by calling (800) 927-4648.
Please refer to page 2 herein for an explanation of the information presented in the following Expense Example.
| | | | | | | | | | |
| EXPENSE EXAMPLE | | | | Actual Performance | | | | Hypothetical Performance
(5% return before expenses) |
Beginning Account Value (01/01/04) | | | | $ | 1,000.00 | | | | $ | 1,000.00 |
Ending Account Value (06/30/04) | | | | $ | 969.50 | | | | $ | 1,025.00 |
Expenses Paid During Period† | | | | $ | 4.95 | | | | $ | 5.09 |
†Expenses are equal to the Portfolio’s Administrative Class annualized expense ratio of 1.01%, multiplied by the average account value over the period, multiplied by 182/366 (to reflect the one-half year period).
PORTFOLIO INSIGHTS
| • | The Emerging Markets Bond Portfolio seeks to achieve its investment objective by investing under normal circumstances at least 80% of its assets in Fixed Income Securities of issuers that economically are tied to countries with emerging securities markets. |
| • | The Portfolio’s Administrative Class shares returned –3.05% for the 6-month period ended June 30, 2004, underperforming the J.P. Morgan Emerging Markets Bond Index Global return of –2.27% for the same period. |
| • | A significant underweight to Turkey was positive for performance; the country’s bonds fell amid concerns over its growing current account deficit and sizable funding needs. |
| • | An overweight to Brazil was negative for performance. Brazilian bonds underperformed early in the year amidst political noise and the exiting of leveraged tactical investors in the asset class. |
| • | An overweight to Ecuador bonds hurt returns; the country lagged due in part to slow progress on the structural reform agenda. |
| • | An underweight to Venezuela bonds detracted from performance as strong oil prices continued to support the country’s bonds. |
| • | Modest emerging market currency exposure was positive for performance due in part to strong appreciation of the South African Rand. |
| • | The use of “structural alpha” strategies such as selling short-maturity credit default protection added to returns. |
| | | | |
| June 30, 2004 | | Semi-Annual Report | | 3 |
Financial Highlights
Emerging Markets Bond Portfolio (Administrative Class)
| | | | | | | | | | | | | | | | | | |
| Selected Per Share Data for the Year or Period Ended: | | | | 06/30/2004+ | | | | | 12/31/2003 | | | | | 09/30/2002-
12/31/2002 | |
| | | | | | |
Net asset value beginning of period | | | | $ | 12.97 | | | | | $ | 11.48 | | | | | $ | 10.00 | |
Net investment income (a) | | | | | 0.20 | (d) | | | | | 0.62 | (d) | | | | | 0.18 | |
Net realized/unrealized gain (loss) on investments (a) | | | | | (0.59 | )(d) | | | | | 2.90 | (d) | | | | | 1.48 | |
Total income (loss) from investment operations | | | | | (0.39 | ) | | | | | 3.52 | | | | | | 1.66 | |
Dividends from net investment income | | | | | (0.23 | ) | | | | | (0.65 | ) | | | | | (0.18 | ) |
Distributions from net realized capital gains | | | | | 0.00 | | | | | | (1.38 | ) | | | | | 0.00 | |
Total distributions | | | | | (0.23 | ) | | | | | (2.03 | ) | | | | | (0.18 | ) |
Net asset value end of period | | | | $ | 12.35 | | | | | $ | 12.97 | | | | | $ | 11.48 | |
Total return | | | | | (3.05 | )% | | | | | 31.64 | % | | | | | 16.65 | % |
Net assets end of period (000s) | | | | $ | 57,110 | | | | | $ | 50,954 | | | | | $ | 32,767 | |
Ratio of net expenses to average net assets | | | | | 1.01 | %*(b) | | | | | 1.04 | %(b) | | | | | 1.02 | %*(b)(c) |
Ratio of net investment income to average net assets | | | | | 3.42 | %*(d) | | | | | 4.78 | %(d) | | | | | 6.58 | %* |
Portfolio turnover rate | | | | | 292 | % | | | | | 451 | % | | | | | 91 | % |
| (a) | Per share amounts based on average number of shares outstanding during the period. |
| (b) | Ratio of expenses to average net assets excluding interest expense is 1.00%. |
| (c) | If the investment manager had not reimbursed expenses, the ratio of expenses to average net assets would have been 1.11%. |
| (d) | Indicates a period in which, as a result of a change in generally accepted accounting principles, the portfolio has reclassified periodic payments made or received under certain derivative instruments, which were previously included within miscellaneous income, to a component of realized gain(loss) in the Statement of Operations. The effect of this reclassification was to (reduce) the net investment income ratio for the period ending June 30, 2004 by (0.09)% and the net investment income per share by $(0.01). For consistency, similar reclassifications have been made to prior period amounts, resulting in (reductions) to the net investment income ratio of (0.13)% and to the net investment income per share of $(0.02) in the fiscal year ending December 31, 2003. This change had no impact on the reported net asset value per share for any period. |
| | | | | | |
| 4 | | Semi-Annual Report | | June 30, 2004 | | See accompanying notes |
Statement of Assets and Liabilities
Emerging Markets Bond Portfolio
June 30, 2004 (Unaudited)
| | | | | |
| Amounts in thousands, except per share amounts | | | | |
| | |
Assets: | | | | | |
| | |
Investments, at value | | | | $ | 72,453 |
Cash | | | | | 2 |
Foreign currency, at value | | | | | 26 |
Receivable for investments sold | | | | | 17,706 |
Unrealized appreciation on forward foreign currency contracts | | | | | 64 |
Receivable for Portfolio shares sold | | | | | 4 |
Interest and dividends receivable | | | | | 1,254 |
Unrealized appreciation on swap agreements | | | | | 108 |
| | | | | | 91,617 |
| | |
Liabilities: | | | | | |
| | |
Payable for investments purchased | | | | $ | 217 |
Payable for investments purchased on a delayed delivery basis | | | | | 34,112 |
Unrealized depreciation on forward foreign currency contracts | | | | | 6 |
Written options outstanding | | | | | 38 |
Accrued investment advisory fee | | | | | 20 |
Accrued administration fee | | | | | 18 |
Accrued servicing fee | | | | | 6 |
Recoupment payable to Manager | | | | | 1 |
Unrealized depreciation on swap agreements | | | | | 36 |
Other liabilities | | | | | 53 |
| | | | | | 34,507 |
| | |
Net Assets | | | | $ | 57,110 |
| | |
Net Assets Consist of: | | | | | |
| | |
Paid in capital | | | | $ | 52,446 |
Undistributed net investment income | | | | | 4,226 |
Accumulated undistributed net realized gain | | | | | 135 |
Net unrealized appreciation | | | | | 303 |
| | | | | $ | 57,110 |
| | |
Net Assets: | | | | | |
| | |
Administrative Class | | | | $ | 57,110 |
| | |
Shares Issued and Outstanding: | | | | | |
| | |
Administrative Class | | | | | 4,625 |
| | |
Net Asset Value and Redemption Price Per Share
(Net Assets Per Share Outstanding) | | | | | |
| | |
Administrative Class | | | | $ | 12.35 |
| | |
Cost of Investments Owned | | | | $ | 72,279 |
Cost of Foreign Currency Held | | | | $ | 25 |
| | | | | | |
| See accompanying notes | | June 30, 2004 | | Semi-Annual Report | | 5 |
Statement of Operations
Emerging Markets Bond Portfolio
| | | | | | |
| Amounts in thousands | | | | | |
| | | | | Six Months Ended
June 30, 2004
(Unaudited) | |
Investment Income: | | | | | | |
| | |
Interest | | | | $ | 1,207 | |
Total Income | | | | | 1,207 | |
| | |
Expenses: | | | | | | |
| | |
Investment advisory fees | | | | | 122 | |
Administration fees | | | | | 109 | |
Distribution and/or servicing fees - Administrative Class | | | | | 40 | |
Interest expense | | | | | 2 | |
Miscellaneous expense | | | | | 1 | |
Total Expenses | | | | | 274 | |
| | |
Net Investment Income | | | | | 933 | |
| | |
Net Realized and Unrealized Gain (Loss): | | | | | | |
| | |
Net realized gain on investments | | | | | 281 | |
Net realized gain on options, and swaps | | | | | 40 | |
Net realized gain on foreign currency transactions | | | | | 12 | |
Net change in unrealized (depreciation) on investments | | | | | (3,062 | ) |
Net change in unrealized (depreciation) on options, and swaps | | | | | (51 | ) |
Net change in unrealized appreciation on translation of
assets and liabilities denominated in foreign currencies | | | | | 47 | |
Net (Loss) | | | | | (2,733 | ) |
| | |
Net Decrease in Assets Resulting from Operations | | | | $ | (1,800 | ) |
| | | | | | |
| 6 | | Semi-Annual Report | | June 30, 2004 | | See accompanying notes |
Statements of Changes in Net Assets
Emerging Markets Bond Portfolio
| | | | | | | | | | | | |
| Amounts in thousands | | | | | | | | | | |
| | | | | Six Months Ended
June 30, 2004
(Unaudited) | | | | | Year Ended
December 31, 2003 | |
Increase in Net Assets from: | | | | | | | | | | | | |
| | | | |
Operations: | | | | | | | | | | | | |
| | | | |
Net investment income | | | | $ | 933 | | | | | $ | 2,022 | |
Net realized gain | | | | | 333 | | | | | | 7,988 | |
Net change in unrealized appreciation (depreciation) | | | | | (3,066 | ) | | | | | 1,092 | |
Net increase (decrease) resulting from operations | | | | | (1,800 | ) | | | | | 11,102 | |
| | | | |
Distributions to Shareholders: | | | | | | | | | | | | |
| | | | |
From net investment income | | | | | | | | | | | | |
Administrative Class | | | | | (988 | ) | | | | | (2,081 | ) |
| | | | |
From net realized capital gains | | | | | | | | | | | | |
Administrative Class | | | | | 0 | | | | | | (4,750 | ) |
Total Distributions | | | | | (988 | ) | | | | | (6,831 | ) |
| | | | |
Portfolio Share Transactions: | | | | | | | | | | | | |
| | | | |
Receipts for shares sold | | | | | | | | | | | | |
Administrative Class | | | | | 9,527 | | | | | | 24,324 | |
| | | | |
Issued as reinvestment of distributions | | | | | | | | | | | | |
Administrative Class | | | | | 993 | | | | | | 6,826 | |
| | | | |
Cost of shares redeemed | | | | | | | | | | | | |
Administrative Class | | | | | (1,576 | ) | | | | | (17,234 | ) |
Net increase resulting from Portfolio share transactions | | | | | 8,944 | | | | | | 13,916 | |
| | | | |
Total Increase in Net Assets | | | | | 6,156 | | | | | | 18,187 | |
| | | | |
Net Assets: | | | | | | | | | | | | |
| | | | |
Beginning of period | | | | | 50,954 | | | | | | 32,767 | |
End of period * | | | | $ | 57,110 | | | | | $ | 50,954 | |
| | | | |
*Including undistributed net investment income of: | | | | $ | 4,226 | | | | | $ | 4,281 | |
| | | | | | |
| See accompanying notes | | June 30, 2004 | | Semi-Annual Report | | 7 |
Schedule of Investments
Emerging Markets Bond Portfolio
June 30, 2004 (Unaudited)
| | | | |
| | | Principal | | |
| | | Amount | | Value |
| | | (000s) | | (000s) |
| | | | | | |
BRAZIL 29.9% | | | | | | |
| | |
Republic of Brazil | | | | | | |
2.060% due 04/15/2006 (a) | | $ | 80 | | $ | 79 |
2.062% due 04/15/2006 (a) | | | 1,258 | | | 1,241 |
11.500% due 03/12/2008 | | | 400 | | | 429 |
2.130% due 04/15/2009 (a) | | | 918 | | | 834 |
14.500% due 10/15/2009 | | | 540 | | | 632 |
12.000% due 04/15/2010 | | | 460 | | | 492 |
10.000% due 08/07/2011 | | | 1,250 | | | 1,219 |
11.000% due 01/11/2012 | | | 1,160 | | | 1,173 |
2.130% due 04/15/2012 (a) | | | 1,925 | | | 1,621 |
2.130% due 04/15/2012 (a) | | | 358 | | | 301 |
8.000% due 04/15/2014 (a) | | | 815 | | | 749 |
2.060% due 04/15/2024 (a) | | | 100 | | | 79 |
6.000% due 04/15/2024 (a) | | | 120 | | | 94 |
8.875% due 04/15/2024 | | | 1,150 | | | 943 |
10.125% due 05/15/2027 | | | 1,540 | | | 1,378 |
12.250% due 03/06/2030 | | | 220 | | | 230 |
8.250% due 01/20/2034 | | | 540 | | | 410 |
11.000% due 08/17/2040 | | | 5,496 | | | 5,187 |
| | | | | |
|
|
Total Brazil
(Cost $17,056) | | | | | | 17,091 |
| | | | | |
|
|
| | | | | | | |
BULGARIA 0.7% | | | | | | |
| | |
Republic of Bulgaria | | | | | | |
2.000% due 07/28/2011 (a) | | $ | 338 | | | 338 |
2.000% due 07/28/2012 (a) | | | 81 | | | 81 |
| | | | | |
|
|
Total Bulgaria (Cost $398) | | | | | | 419 |
| | | | | |
|
|
| | | | | | | |
CHILE 1.7% | | | | | | |
| | |
Republic of Chile | | | | | | |
5.625% due 07/23/2007 | | $ | 915 | | | 959 |
| | | | | |
|
|
Total Chile (Cost $966) | | | | | | 959 |
| | | | | |
|
|
| | | | | | | |
COLOMBIA 1.0% | | | | | | |
| | |
Republic of Colombia | | | | | | |
9.750% due 04/23/2009 | | $ | 220 | | | 235 |
9.750% due 04/09/2011 | | | 87 | | | 97 |
10.750% due 01/15/2013 | | | 220 | | | 235 |
| | | | | |
|
|
Total Colombia (Cost $577) | | | | | | 567 |
| | | | | |
|
|
| | | | | | | |
DOMINICAN REPUBLIC 0.4% | | | |
| | |
Dominican Republic | | | | | | |
9.500% due 09/27/2006 | | $ | 320 | | | 229 |
9.040% due 01/23/2013 | | | 20 | | | 12 |
| | | | | |
|
|
Total Dominican Republic (Cost $318) | | | | | | 241 |
| | | | |
|
|
| | | | | | | |
ECUADOR 4.2% | | | | | | |
| | |
Republic of Ecuador | | | | | | |
7.000% due 08/15/2030 (a) | | $ | 3,444 | | | 2,428 |
| | | | | |
|
|
Total Ecuador (Cost $1,972) | | | | | | 2,428 |
| | | | | |
|
|
| | | | | | | |
GUATEMALA 1.1% | | | | | | |
| | |
Republic of Guatemala | | | | | | |
9.250% due 08/01/2013 | | $ | 570 | | | 617 |
| | | | | |
|
|
Total Guatemala (Cost $570) | | | | | | 617 |
| | | | | |
|
|
| | | | | | | |
| | | | | | |
MALAYSIA 1.5% | | | | | | |
| | |
Petronas Capital Ltd. | | | | | | |
7.000% due 05/22/2012 | | $ | 325 | | $ | 355 |
Republic of Malaysia | | | | | | |
8.750% due 06/01/2009 | | | 120 | | | 141 |
7.500% due 07/15/2011 | | | 325 | | | 368 |
| | | | | |
|
|
Total Malaysia (Cost $887) | | | | | | 864 |
| | | | |
|
|
| | | | | | | |
MEXICO 15.0% | | | | | | |
| | |
Banco Mercantil del Norte S.A. | | | | | | |
5.875% due 02/17/2014 (a) | | $ | 145 | | | 141 |
Pemex Project Funding Master Trust | | | |
8.000% due 11/15/2011 | | | 250 | | | 271 |
7.375% due 12/15/2014 | | | 445 | | | 456 |
Petroleos Mexicanos | | | | | | |
9.250% due 03/30/2018 | | | 217 | | | 242 |
United Mexican States | | | | | | |
10.375% due 02/17/2009 | | | 375 | | | 454 |
8.375% due 01/14/2011 | | | 1,710 | | | 1,937 |
7.500% due 01/14/2012 | | | 485 | | | 524 |
6.375% due 01/16/2013 | | | 2,670 | | | 2,671 |
11.375% due 09/15/2016 | | | 25 | | | 35 |
8.125% due 12/30/2019 | | | 574 | | | 616 |
8.300% due 08/15/2031 | | | 1,165 | | | 1,223 |
| | | | | |
|
|
Total Mexico (Cost $8,659) | | | | | | 8,570 |
| | | | |
|
|
| | | | | | | |
MOROCCO 0.4% | | | | | | |
| | |
Kingdom of Morocco | | | | | | |
2.000% due 01/05/2009 | | $ | 250 | | | 247 |
| | | | | |
|
|
Total Morocco (Cost $229) | | | | | | 247 |
| | | | |
|
|
| | | | | | | |
PANAMA 1.6% | | | | | | |
| | |
Republic of Panama | | | | | | |
8.250% due 04/22/2008 | | $ | 15 | | | 16 |
9.625% due 02/08/2011 | | | 210 | | | 234 |
9.375% due 07/23/2012 | | | 310 | | | 340 |
8.875% due 09/30/2027 | | | 80 | | | 78 |
9.375% due 04/01/2029 | | | 200 | | | 222 |
| | | | | |
|
|
Total Panama (Cost $887) | | | | | | 890 |
| | | | |
|
|
| | | | | | | |
PERU 3.4% | | | | | | |
| | |
Republic of Peru | | | | | | |
9.125% due 01/15/2008 | | $ | 750 | | | 817 |
9.125% due 02/21/2012 | | | 920 | | | 948 |
4.500% due 03/07/2017 (a) | | | 240 | | | 195 |
| | | | | |
|
|
Total Peru (Cost $2,069) | | | | | | 1,960 |
| | | | |
|
|
| | | | | | | |
POLAND 0.6% | | | | | | |
| | |
Republic of Poland | | | | | | |
4.000% due 10/27/2024 (a) | | $ | 130 | | | 109 |
4.750% due 10/27/2024 (a) | | | 250 | | | 224 |
| | | | | |
|
|
Total Poland (Cost $354) | | | | | | 333 |
| | | | |
|
|
| | | | | | | |
RUSSIA 15.8% | | | | | | |
| | |
Gazprom | | | | | | |
9.625% due 03/01/2013 | | $ | 150 | | | 155 |
Russian Federation | | | | | | |
8.750% due 07/24/2005 | | | 550 | | | 581 |
5.000% due 03/31/2030 (a) | | | 9,030 | | | 8,268 |
| | | | | |
|
|
Total Russia (Cost $8,920) | | | | | | 9,004 |
| | | | |
|
|
| | | | | | | |
| | | | | | |
SOUTH AFRICA (d)(e) 2.8% | | | | | | |
| | |
Republic of South Africa | | | | | | |
7.375% due 04/25/2012 | | $ | 310 | | $ | 338 |
5.250% due 05/16/2013 | | EC | 400 | | | 475 |
6.500% due 06/02/2014 | | | 750 | | | 759 |
| | | | | |
|
|
Total South Africa (Cost $1,549) | | | | | | 1,572 |
| | | | | |
|
|
| | | | | | | |
SOUTH KOREA 1.7% | | | | | | |
| |
Hyundai Motor Manufacturing Alabama LLC | | | |
5.300% due 12/19/2008 | | $ | 500 | | | 493 |
Industrial Bank of Korea | | | | | | |
4.000% due 05/19/2014 (a) | | | 110 | | | 103 |
Korea Development Bank | | | | | | |
5.750% due 09/10/2013 | | | 15 | | | 15 |
Republic of Korea | | | | | | |
8.875% due 04/15/2008 | | | 285 | | | 331 |
| | | | | |
|
|
Total South Korea (Cost $963) | | | | | | 942 |
| | | | | |
|
|
| | | | | | | |
TUNISIA (d)(e) 2.8% | | | | | | |
| | |
Banque Centrale De Tunisie | | | | | | |
4.750% due 04/07/2011 | | EC | 500 | | | 599 |
7.375% due 04/25/2012 | | | 900 | | | 986 |
| | | | | |
|
|
Total Tunisia (Cost $1,602) | | | | | | 1,585 |
| | | | | |
|
|
| | | | | | | |
UKRAINE 3.3% | | | | | | |
| | |
Republic of Ukraine | | | | | | |
11.000% due 03/15/2007 | | $ | 400 | | | 433 |
6.875% due 03/04/2011 | | | 1,050 | | | 992 |
7.650% due 06/11/2013 | | | 500 | | | 479 |
| | | | | |
|
|
Total Ukraine (Cost $1,978) | | | | | | 1,904 |
| | | | | |
|
|
| | | | | | | |
VENEZUELA 1.6% | | | | | | |
| | |
Republic of Venezuela | | | | | | |
5.375% due 08/07/2010 | | $ | 600 | | | 479 |
9.375% due 01/13/2034 | | | 500 | | | 424 |
| | | | | |
|
|
Total Venezuela (Cost $966) | | | | | | 903 |
| | | | | |
|
|
| | | | | | | |
SHORT-TERM INSTRUMENTS 37.4% | | | |
Commercial Paper 36.9% | | | | | | |
ABN AMRO North America Finance | | | |
1.040% due 07/06/2004 | | $ | 900 | | | 900 |
Anz (Delaware), Inc. | | | | | | |
1.030% due 07/08/2004 | | | 900 | | | 900 |
CDC Commercial Corp. | | | | | | |
1.100% due 08/04/2004 | | | 1,500 | | | 1,498 |
Den norske Bank | | | | | | |
1.260% due 09/20/2004 | | | 800 | | | 797 |
1.280% due 09/20/2004 | | | 500 | | | 498 |
European Investment Bank | | | | | | |
1.050% due 07/16/2004 | | | 500 | | | 500 |
Fannie Mae | | | | | | |
1.125% due 08/11/2004 | | | 300 | | | 300 |
1.225% due 09/01/2004 | | | 300 | | | 299 |
Freddie Mac | | | | | | |
1.560% due 10/20/2004 | | | 600 | | | 597 |
HBOS Treasury Services PLC | | | | | | |
1.055% due 07/19/2004 | | | 500 | | | 500 |
ING U.S. Funding LLC | | | | | | |
1.345% due 09/09/2004 | | | 200 | | | 199 |
KFW International Finance, Inc. | | | | | | |
1.095% due 08/10/2004 | | | 400 | | | 399 |
Lloyds TSB Bank PLC | | | | | | |
1.185% due 07/21/2004 | | | 1,500 | | | 1,499 |
| | | | | | |
| 8 | | Semi-Annual Report | | June 30, 2004 | | See accompanying notes |
| | | | |
| | | Principal | | |
| | | Amount | | Value |
| | | (000s) | | (000s) |
| | | | | | | |
| | |
National Australia Funding, Inc. | | | | | | | |
1.210% due 07/19/2004 | | $ | 1,400 | | $ | 1,399 | |
Nordea North America, Inc. | | | | | | | |
1.470% due 09/07/2004 | | | 100 | | | 100 | |
Royal Bank of Scotland PLC | | | | | | | |
1.235% due 09/01/2004 | | | 400 | | | 399 | |
Shell Finance (UK) PLC | | | | | | | |
1.230% due 08/11/2004 | | | 900 | | | 899 | |
Svenska Handlesbanken | | | | | | | |
1.295% due 08/03/2004 | | | 1,400 | | | 1,398 | |
1.145% due 09/01/2004 | | | 900 | | | 898 | |
Swedish National Housing Finance Corp. | | | | |
1.060% due 07/16/2004 | | | 1,200 | | | 1,199 | |
1.090% due 07/29/2004 | | | 400 | | | 400 | |
Toyota Motor Credit Corp. | | | | | | | |
1.390% due 09/15/2004 | | | 1,400 | | | 1,396 | |
UBS Finance, Inc. | | | | | | | |
1.060% due 07/01/2004 | | | 500 | | | 500 | |
1.420% due 07/01/2004 | | | 100 | | | 100 | |
1.195% due 07/21/2004 | | | 100 | | | 100 | |
1.135% due 09/01/2004 | | | 400 | | | 399 | |
UniCredit Delaware | | | | | | | |
1.470% due 09/14/2004 | | | 1,400 | | | 1,396 | |
Westpac Capital Corp. | | | | | | | |
1.030% due 07/09/2004 | | | 400 | | | 400 | |
Westpac Trust Securities NZ Ltd. | | | | |
1.120% due 08/16/2004 | | | 1,200 | | | 1,198 | |
| | | | | |
|
|
|
| | | | | | | 21,067 | |
| | | | | |
|
|
|
| | |
Repurchase Agreement 0.3% | | | | | | | |
State Street Bank | | | | | | | |
0.800% due 07/01/2004 | | | 165 | | | 165 | |
| | | | | |
|
|
|
(Dated 06/30/2004. Collateralized by Fannie Mae 1.875% due 09/15/2005 valued at $170.
Repurchase proceeds are $165.) | |
| | |
U.S. Treasury Bills 0.2% | | | | | | | |
1.315% due 09/16/2004 | | | 125 | | | 125 | |
| | | | | |
|
|
|
| | |
Total Short-Term Instruments (Cost $21,359) | | | | | | 21,357 | |
| | | | | |
|
|
|
| | |
Total Investments 126.9% | | | | | $ | 72,453 | |
(Cost $72,279) | | | | | | | |
| | |
Written Options (c) (0.1%) | | | | | | (38 | ) |
(Premiums $49) | | | | | | | |
| |
Other Assets and Liabilities (Net) (26.8%) | | | (15,305 | ) |
| | | | | |
|
|
|
| | |
Net Assets 100.0% | | | | | $ | 57,110 | |
| | | | | |
|
|
|
Notes to Schedule of Investments (amounts in thousands, except number of contracts):
| (a) | Variable rate security |
| (b) | Swap agreements outstanding at June 30, 2004: |
| | | | | | |
| Type | | Notional
Amount | | Unrealized
Appreciation/
(Depreciation) |
| Receive a fixed rate equal to 0.950% and the Portfolio will pay to the counterparty at par in the event of default of Russian Federation 5.000% due 03/31/2030. | | | |
| Counterparty: Morgan Stanley Dean Witter & Co. |
| Exp. 12/09/2004 | | $ | 1,000 | | $ | 0 |
| |
| Receive a fixed rate equal to 1.250% and the Portfolio will pay to the counterparty at par in the event of default of the United Mexican States 11.375% due 09/15/2016. | | | |
| Counterparty: Merrill Lynch & Co., Inc. | | | |
| Exp. 01/22/2005 | | | 100 | | | 0 |
| | | | | | | |
| |
| Receive a fixed rate equal to 1.310% and the Portfolio will pay to the counterparty at par in the event of default of the United Mexican States 11.500% due 05/15/2026. | | | | |
| Counterparty: Goldman Sachs & Co. | | | | |
| Exp. 01/29/2005 | | $ | 300 | | $ | 2 | |
| |
| Receive a fixed rate equal to 1.060% and the Portfolio will pay to the counterparty at par in the event of default of Russian Federation, 5.000% until 03/31/2007 and 7.500% thereafter, due 03/31/2030. | | | | |
| Counterparty: Goldman Sachs & Co. | | | | |
| Exp. 03/06/2005 | | | 300 | | | 0 | |
| |
| Receive a fixed rate equal to 0.700% and the Portfolio will pay to the counterparty at par in the event of default of Republic of Kazakhstan 11.125% due 05/11/2007. | | | | |
| Counterparty: Merrill Lynch & Co., Inc. | | | | |
| Exp. 03/11/2005 | | | 100 | | | 0 | |
| |
| Receive a fixed rate equal to 1.280% and the Portfolio will pay to the counterparty at par in the event of default of Russian Federation, 5.000% until 03/31/2007 and 7.500% thereafter, due 03/31/2030. | | | | |
| Counterparty: Merrill Lynch & Co., Inc. | | | | |
| Exp. 05/01/2005 | | | 1,000 | | | 2 | |
| |
| Receive a fixed rate equal to 0.625% and the Portfolio will pay to the counterparty at par in the event of default of the United Mexican States 11.500% due 05/15/2026. | | | | |
| Counterparty: Morgan Stanley Dean Witter & Co. | | | | |
| Exp. 05/20/2005 | | | 100 | | | 0 | |
| |
| Receive a fixed rate equal to 0.650% and the Portfolio will pay to the counterparty at par in the event of default of the United Mexican States 7.500% due 04/08/2033. | | | | |
| Counterparty: Barclays Bank PLC | | | | |
| Exp. 05/20/2005 | | | 33 | | | 0 | |
| |
| Receive a fixed rate equal to 2.840% and the Portfolio will pay to the counterparty at par in the event of default of the United Mexican States 9.750% due 04/06/2005. | | | | |
| Counterparty: J.P. Morgan Chase & Co. | | | | |
| Exp. 01/04/2013 | | | 1,600 | | | 99 | |
| |
| Receive a fixed rate equal to 3.160% and the Portfolio will pay to the counterparty at par in the event of default of Russian Federation, 5.000% until 03/31/2007 and 7.500% thereafter, due 03/31/2030. | | | | |
| Counterparty: Merrill Lynch & Co., Inc. | | | | |
| Exp. 10/02/2013 | | | 450 | | | 5 | |
| |
| Receive a fixed rate equal to 2.310% and the Portfolio will pay to the counterparty at par in the event of default of Russian Federation, 5.000% until 03/31/2007 and 7.500% thereafter, due 03/31/2030. | | | | |
| Counterparty: Merrill Lynch & Co., Inc. | | | | |
| Exp. 01/21/2014 | | | 525 | | | (25 | ) |
| |
| Receive a fixed rate equal to 2.550% and the Portfolio will pay to the counterparty at par in the event of default of Russian Federation, 5.000% until 03/31/2007 and 7.500% thereafter, due 03/31/2030. | | | | |
| Counterparty: Lehman Brothers, Inc. | | | | |
| Exp. 03/20/2014 | | | 350 | | | (11 | ) |
| | | | | | $ | 72 | |
| | | | | | |
| See accompanying notes | | June 30, 2004 | | Semi-Annual Report | | 9 |
Schedule of Investments (Cont.)
Emerging Markets Bond Portfolio
June 30, 2004 (Unaudited)
(c) Premiums received on written options:
| | | | | | | | | | | | | | | | | |
| Name of Issuer | | Exercise
Price | | Expiration
Date | | # of
Contracts | | | | Premium | | | | Value |
Call - CBOT U.S. Treasury Note September Futures | | $ | 115.000 | | 08/27/2004 | | 3 | | | | $ | 2 | | | | $ | 0 |
Put - CBOT U.S. Treasury Note September Futures | | | 109.000 | | 08/27/2004 | | 40 | | | | | 47 | | | | | 38 |
| | | | | | | | | | | | $ | 49 | | | | $ | 38 |
(d) Forward foreign currency contracts outstanding at June 30, 2004:
| | | | | | | | | | | | | | | | | | | | | | | |
| Type | | Currency | | Principal Amount
Covered by
Contract | | Settlement Month | | | | Unrealized
Appreciation | | | | Unrealized
(Depreciation) | | | | | Net Unrealized
Appreciation/
(Depreciation) | |
Buy | | BR | | 163 | | 07/2004 | | | | $ | 0 | | | | $ | (1 | ) | | | | $ | (1 | ) |
Buy | | | | 149 | | 08/2004 | | | | | 2 | | | | | 0 | | | | | | 2 | |
Buy | | | | 90 | | 09/2004 | | | | | 0 | | | | | 0 | | | | | | 0 | |
Buy | | CP | | 27,622 | | 08/2004 | | | | | 0 | | | | | 0 | | | | | | 0 | |
Buy | | | | 18,181 | | 09/2004 | | | | | 0 | | | | | 0 | | | | | | 0 | |
Sell | | CY | | 891 | | 09/2004 | | | | | 0 | | | | | (3 | ) | | | | | (3 | ) |
Buy | | EC | | 896 | | 07/2004 | | | | | 13 | | | | | 0 | | | | | | 13 | |
Buy | | H$ | | 350 | | 07/2004 | | | | | 0 | | | | | 0 | | | | | | 0 | |
Buy | | | | 389 | | 08/2004 | | | | | 0 | | | | | 0 | | | | | | 0 | |
Buy | | | | 233 | | 09/2004 | | | | | 0 | | | | | 0 | | | | | | 0 | |
Buy | | KW | | 52,245 | | 07/2004 | | | | | 1 | | | | | 0 | | | | | | 1 | |
Buy | | | | 58,225 | | 08/2004 | | | | | 1 | | | | | 0 | | | | | | 1 | |
Buy | | | | 35,400 | | 09/2004 | | | | | 0 | | | | | 0 | | | | | | 0 | |
Buy | | | | 456,522 | | 11/2004 | | | | | 6 | | | | | 0 | | | | | | 6 | |
Buy | | MP | | 5,952 | | 08/2004 | | | | | 3 | | | | | 0 | | | | | | 3 | |
Buy | | | | 336 | | 09/2004 | | | | | 0 | | | | | 0 | | | | | | 0 | |
Buy | | PN | | 174 | | 08/2004 | | | | | 0 | | | | | 0 | | | | | | 0 | |
Buy | | | | 104 | | 09/2004 | | | | | 0 | | | | | 0 | | | | | | 0 | |
Buy | | RP | | 2,035 | | 09/2004 | | | | | 0 | | | | | (1 | ) | | | | | (1 | ) |
Buy | | RR | | 1,281 | | 07/2004 | | | | | 0 | | | | | 0 | | | | | | 0 | |
Buy | | | | 1,426 | | 08/2004 | | | | | 0 | | | | | 0 | | | | | | 0 | |
Buy | | | | 856 | | 09/2004 | | | | | 0 | | | | | 0 | | | | | | 0 | |
Buy | | S$ | | 76 | | 07/2004 | | | | | 0 | | | | | (1 | ) | | | | | (1 | ) |
Buy | | | | 85 | | 08/2004 | | | | | 0 | | | | | 0 | | | | | | 0 | |
Buy | | | | 51 | | 09/2004 | | | | | 0 | | | | | 0 | | | | | | 0 | |
Buy | | SR | | 1,583 | | 08/2004 | | | | | 28 | | | | | 0 | | | | | | 28 | |
Sell | | | | 202 | | 08/2004 | | | | | 0 | | | | | 0 | | | | | | 0 | |
Buy | | | | 206 | | 09/2004 | | | | | 1 | | | | | 0 | | | | | | 1 | |
Sell | | | | 120 | | 09/2004 | | | | | 0 | | | | | 0 | | | | | | 0 | |
Buy | | SV | | 9,346 | | 08/2004 | | | | | 9 | | | | | 0 | | | | | | 9 | |
Buy | | | | 1,003 | | 09/2004 | | | | | 0 | | | | | 0 | | | | | | 0 | |
Buy | | T$ | | 1,656 | | 08/2004 | | | | | 0 | | | | | 0 | | | | | | 0 | |
Buy | | | | 996 | | 09/2004 | | | | | 0 | | | | | 0 | | | | | | 0 | |
| | | | | | | | | | | $ | 64 | | | | $ | (6 | ) | | | | $ | 58 | |
(e) Principal amount denoted in indicated currency:
| | | | |
BR | | - | | Brazilian Real |
CP | | - | | Chilean Peso |
CY | | - | | Chinese Yuan Renminbi |
EC | | - | | Euro |
H$ | | - | | Hong Kong Dollar |
KW | | - | | South Korean Won |
MP | | - | | Mexican Peso |
PN | | - | | Peruvian New Sol |
RP | | - | | Indian Rupee |
RR | | - | | Russian Ruble |
S$ | | - | | Singapore Dollar |
SR | | - | | South African Rand |
SV | | - | | Slovakian Koruna |
T$ | | - | | Taiwan Dollar |
| | | | | | |
| 10 | | Semi-Annual Report | | June 30, 2004 | | See accompanying notes |
Notes to Financial Statements
June 30, 2004 (Unaudited)
1. Organization
The Emerging Markets Bond Portfolio (the “Portfolio”) is a series of the PIMCO Variable Insurance Trust (the “Trust”). The Trust is registered under the Investment Company Act of 1940 (the “Act”), as amended, as an open-end investment company organized as a Delaware business trust on October 3, 1997. The Portfolio offers one class of shares: Administrative. Information presented in these financial statements pertains to the Administrative Class of the Portfolio. The Trust is designed to be used as an investment vehicle by Separate Accounts of insurance companies that fund variable annuity contracts and variable life insurance policies and by qualified pension and retirement plans. The Portfolio commenced operations on September 30, 2002.
2. Significant Accounting Policies
The following is a summary of significant accounting policies consistently followed by the Trust in the preparation of its financial statements in conformity with accounting principles generally accepted in the United States of America. The preparation of financial statements in accordance with accounting principles generally accepted in the United States of America requires management to make estimates and assumptions that affect the reported amounts and disclosures in the financial statements. Actual results could differ from those estimates.
Security Valuation. Portfolio securities and other financial instruments for which market quotations are readily available are stated at market value. Portfolio securities and other financial instruments for which market quotes are not readily available are valued at fair value, as determined in good faith and pursuant to guidelines established by the Board of Trustees, including certain fixed income securities which may be valued with reference to securities whose prices are more readily obtainable. Market value is determined at the close of regular trading (normally, 4:00 p.m., Eastern Time) on the New York Stock Exchange on each day the New York Stock Exchange is open, or if no sales are reported, as is the case for most securities traded over-the-counter, the mean between representative bid and asked quotations obtained from a quotation reporting system or from established market makers. The prices of certain portfolio securities or other financial instruments may be determined at a time prior to the close of regular trading on the New York Stock Exchange. Fair valuation may be used if significant events occur after the close of the relevant markets and prior to the close of regular trading on the New York Stock Exchange that materially affect the values of such securities or financial instruments. Fixed income securities are normally valued on the basis of quotes obtained from brokers and dealers or pricing services. Certain fixed income securities purchased on a delayed delivery basis are marked to market daily until settlement at the forward settlement value. Short-term investments, which mature in 60 days or less are valued at amortized cost, which approximates market value. Exchange traded options, futures and options on futures are valued at the settlement price determined by the relevant exchange. Prices may be obtained from independent pricing services which use information provided by market makers or estimates of market values obtained from yield data relating to investments or securities with similar characteristics. The prices used by the Portfolio may differ from the value that would be realized if the securities were sold and the differences could be material to the financial statements.
Securities Transactions and Investment Income. Securities transactions are recorded as of the trade date. Securities purchased or sold on a when-issued or delayed delivery basis may be settled a month or more after the trade date. Realized gains and losses from securities sold are recorded on the identified cost basis. Dividend income is recorded on the ex-dividend date, except certain dividends from foreign securities where the ex-dividend date may have passed, are recorded as soon as the Portfolio is informed of the ex-dividend date. Interest income, adjusted for the accretion of discounts and amortization of premiums, is recorded on the accrual basis. Paydowns gains and losses on mortgage- and asset-backed securities are recorded as adjustments to interest income in the Statement of Operations.
Dividends and Distributions to Shareholders. Dividends from net investment income, if any, are declared on each day the Trust is open for business and are distributed to shareholders monthly. All dividends are reinvested in additional shares of the Portfolio. Net realized capital gains earned by the Portfolio, if any, will be distributed no less frequently than once each year.
Income dividends and capital gain distributions are determined in accordance with income tax regulations which may differ from accounting principles generally accepted in the United States of America. These differences are primarily due to differing treatments for such items as wash sales, foreign currency transactions, net operating losses, notional principal contracts, certain asset-backed securities, certain futures and forward contracts, tax straddles, and capital loss carryforwards.
Distributions classified as a tax basis return of capital, if any, are reflected in the accompanying Statements of Changes in Net Assets and have been reclassified to paid in capital. In addition, other amounts have been reclassified between undistributed net investment income, accumulated undistributed net realized gains or losses and/or paid in capital to more appropriately conform financial accounting to tax characterizations of dividend distributions.
Delayed Delivery Transactions. The Portfolio may purchase or sell securities on a when-issued or delayed delivery basis. These transactions involve a commitment by the Portfolio to purchase or sell securities for a predetermined price or yield, with payment and delivery taking place beyond the customary settlement period. When delayed delivery purchases are outstanding, the Portfolio will designate liquid assets in an amount sufficient to meet the purchase price. When purchasing a security on a delayed delivery basis, the Portfolio assumes the rights and risks of ownership of the security, including the risk of price and yield fluctuations, and takes such fluctuations into account when determining its net asset value. The Portfolio may dispose of or renegotiate a delayed delivery transaction
| | | | |
| June 30, 2004 | | Semi-Annual Report | | 11 |
Notes to Financial Statements (Cont.)
June 30, 2004 (Unaudited)
after it is entered into, and may sell when-issued securities before they are delivered, which may result in a capital gain or loss. When the Portfolio has sold a security on a delayed delivery basis, the Portfolio does not participate in future gains and losses with respect to the security.
Federal Income Taxes. The Portfolio intends to qualify as a regulated investment company and distribute all of its taxable income and net realized gains, if applicable, to shareholders. Accordingly, no provision for Federal income taxes has been made.
Foreign Currency. The accounting records of the Portfolio are maintained in U.S. dollars. The market values of foreign securities, currency holdings and other assets and liabilities are translated into U.S. dollars based on the current exchange rates each business day. Fluctuations in the value of these assets and liabilities resulting from changes in exchange rates are recorded as unrealized foreign currency gains or losses. Realized gains or losses and unrealized appreciation or depreciation on investment securities and income and expenses are translated on the respective dates of such transactions. The effect of changes in foreign currency exchange rates on investments in securities are not segregated in the Statement of Operations from the effects of changes in market prices of those securities, but are included with the net realized and unrealized gain or loss on investment securities.
Forward Currency Transactions. The Portfolio may enter into forward currency contracts and forward cross-currency contracts in connection with settling planned purchases or sales of securities, to hedge the currency exposure associated with some or all of the Portfolio’s securities or as a part of an investment strategy. A forward currency contract is an agreement between two parties to buy and sell a currency at a set price on a future date. The market value of a forward currency contract fluctuates with changes in forward currency exchange rates. Forward currency contracts are marked to market daily and the change in value is recorded by the Portfolio as an unrealized gain or loss. Realized gains or losses equal to the difference between the value of the contract at the time it was opened and the value at the time it was closed are recorded upon delivery or receipt of the currency or, if a forward currency contract is offset by entering into another forward currency contract with the same broker, upon settlement of the net gain or loss. These contracts may involve market risk in excess of the unrealized gain or loss reflected in the Portfolio’s Statement of Assets and Liabilities. In addition, the Portfolio could be exposed to risk if the counterparties are unable to meet the terms of the contracts or if the value of the currency changes unfavorably to the U.S. dollar.
Loan Agreements. The Portfolio may invest in direct debt instruments which are interests in amounts owed by a corporate, governmental, or other borrower to lenders or lending syndicates. The Portfolio’s investments in loans may be in the form of participations in loans or assignments of all or a portion of loans from third parties. A loan is often administered by a bank or other financial institution (the “lender”) that acts as agent for all holders. The agent administers the terms of the loan, as specified in the loan agreement. When investing in a loan participation, the Portfolio has the right to receive payments of principal, interest and any fees to which it is entitled only from the lender selling the loan agreement and only upon receipt by the lender of payments from the borrower. The Portfolio generally has no right to enforce compliance with the terms of the loan agreement with the borrower. As a result, the Portfolio may be subject to the credit risk of both the borrower and the lender that is selling the loan agreement. When the Portfolio purchases assignments from lenders it acquires direct rights against the borrower on the loan.
Options Contracts. The Portfolio may write call and put options on futures, swaps, securities or currencies it owns or in which it may invest. Writing put options tends to increase the Portfolio’s exposure to the underlying instrument. Writing call options tends to decrease the Portfolio’s exposure to the underlying instrument. When the Portfolio writes a call or put option, an amount equal to the premium received is recorded as a liability and subsequently marked to market to reflect the current value of the option written. These liabilities are reflected as written options outstanding in the Statement of Assets and Liabilities. Payments received or made, if any, from writing options with premiums to be determined on a future date are reflected as such on the Statement of Assets and Liabilities. Premiums received from writing options which expire are treated as realized gains. Premiums received from writing options which are exercised or closed are added to the proceeds or offset against amounts paid on the underlying future, swap, security or currency transaction to determine the realized gain or loss. The Portfolio as a writer of an option has no control over whether the underlying future, swap, security or currency may be sold (call) or purchased (put) and as a result bears the market risk of an unfavorable change in the price of the future, swap, security or currency underlying the written option. There is the risk the Portfolio may not be able to enter into a closing transaction because of an illiquid market.
The Portfolio may also purchase put and call options. Purchasing call options tends to increase the Portfolio’s exposure to the underlying instrument. Purchasing put options tends to decrease the Portfolio’s exposure to the underlying instrument. The Portfolio pays a premium which is included in the Portfolio’s Statement of Assets and Liabilities as an investment and subsequently marked to
market to reflect the current value of the option. Premiums paid for purchasing options which expire are treated as realized losses. The risk associated with purchasing put and call options is limited to the premium paid. Premiums paid for purchasing options which are exercised or closed are added to the amounts paid or offset against the proceeds on the underlying future, swap, security or currency transaction to determine the realized gain or loss.
Repurchase Agreements. The Portfolio may engage in repurchase transactions. Under the terms of a typical repurchase agreement, the Portfolio takes possession of an underlying debt obligation subject to an obligation of the seller to repurchase, and the Portfolio to resell, the obligation at an agreed-upon price and time. The market value of the collateral must be equal at all times to the total amount of the
| | | | |
| 12 | | Semi-Annual Report | | June 30, 2004 |
repurchase obligations, including interest. Generally, in the event of counterparty default, the Portfolio has the right to use the collateral to offset losses incurred.
Swap Agreements. The Portfolio may invest in swap agreements. A swap is an agreement to exchange the return generated by one instrument for the return generated by another instrument. The Portfolio may enter into interest rate, total return, forward spread lock, and credit default swap agreements to manage its exposure to interest rates and credit risk.
Interest rate swap agreements involve the exchange by the Portfolio with another party of their respective commitments to pay or receive interest, e.g., an exchange of floating rate payments for fixed rate payments with respect to the notional amount of principal.
Total return swap agreements involve commitments to pay interest in exchange for a market-linked return, both based on notional amounts. To the extent the total return of the security or index underlying the transaction exceeds or falls short of the offsetting interest rate obligation, the Portfolio will receive a payment from or make a payment to the counterparty.
Forward spread lock swap agreements involve commitments to pay or receive a settlement amount calculated as the difference between the swap spread and a fixed spread, multiplied by the notional amount times the duration of the swap. The swap spread is the difference between the benchmark swap rate (market rate) and the specific Treasury rate.
In a credit default swap, one party makes a stream of payments to another party in exchange for the right to receive a specified return in the event of a default by a third party, typically corporate issues or sovereign issues of an emerging country, on its obligation. The Portfolio may use credit default swaps to provide a measure of protection against defaults of sovereign issuers (i.e., to reduce risk where the Portfolio owns or has exposure to the sovereign issuer) or to take an active long or short position with respect to the likelihood of a particular issuer’s default.
Swaps are marked to market daily based upon quotations from market makers and the change in value, if any, is recorded as unrealized gain or loss in the Statement of Operations. Payments received or made at the beginning of the measurement period are reflected as such on the Statement of Assets and Liabilities. A liquidation payment received or made at the termination of the swap is recorded as realized gain or loss in the Statement of Operations. Net periodic payments received by the Portfolio are included as part of realized gain(loss) on the Statement of Operations. Entering into these agreements involves, to varying degrees, elements of credit, market and documentation risk in excess of the amounts recognized on the Statement of Assets and Liabilities. Such risks involve the possibility that there will be no liquid market for these agreements, that the counterparty to the agreements may default on its obligation to perform or disagree as to the meaning of contractual terms in the agreements, and that there may be unfavorable changes in interest rates.
As a result of a FASB Emerging Issues Task Force (“EITF”) consensus, No. 03-11, and related SEC staff guidance, the Portfolio has reclassified periodic payments made or received under swap agreements, which were previously included within miscellaneous income, to a component of realized gain(loss) in the Statement of Operations. For consistency, similar reclassifications have been made to amounts appearing in the previous year’s Statement of Changes in Net Assets and the per share amounts in the prior year financial highlights. Prior year net investment income ratios in the financial highlights have also been modified accordingly. This reclassification increased(decreased) net investment income by $(49,821) and $(55,321), and net realized gain by $38,955 and $25,829 and net change in unrealized appreciation by $10,865 and $29,492 for the six months ended June 30, 2004 and year ended December 31, 2003, respectively. There is no effect on the Portfolio’s net asset value, either in total or per share, or its total increase(decrease) in net assets from operations during any period.
3. Fees, Expenses, and Related Party Transactions
Investment Advisory Fee. Pacific Investment Management Company LLC (“PIMCO”) is a majority owned subsidiary partnership of Allianz Dresdner Asset Management of America L.P. and serves as investment adviser (the “Adviser”) to the Trust, pursuant to an investment advisory contract. The Adviser receives a monthly fee at an annual rate based on average daily net assets of the Portfolio. The Advisory Fee is charged at an annual rate of 0.45%.
Administration Fee. PIMCO serves as administrator (the “Administrator”), and provides administrative services to the Trust for which it receives a monthly administrative fee based on average daily net assets of the Portfolio. The Administration Fee is charged at the annual rate of 0.40%.
Servicing Fee. PA Distributors LLC (“PAD”), formerly known as PIMCO Advisors Distributors LLC, is an indirect wholly-owned subsidiary of Allianz Dresdner Asset Management of America L.P. and serves as the distributor of the Trust’s shares. The Trust is permitted to reimburse PAD on a quarterly basis, out of the Administrative Class assets of the Portfolio in the amount of 0.15% on an annual basis of the average daily net assets of that class, for payments made to financial intermediaries that provide services in connection with the distribution of shares or administration of plans or programs that use Portfolio shares as their funding medium. The effective rate paid to PAD was 0.15% during current fiscal year.
Expenses. The Trust is responsible for the following expenses: (i) salaries and other compensation of any of the Trust’s executive officers and employees who are not officers, directors, stockholders or employees of PIMCO or its subsidiaries or affiliates; (ii) taxes and governmental fees; (iii) brokerage fees and commissions and other portfolio transaction expenses; (iv) the cost of borrowing money, including interest expense and bank overdraft charges; (v) fees and expenses of the Trustees who are not “interested persons” of PIMCO or the Trust, and any counsel retained exclusively for their benefit; (vi) extraordinary expenses, including costs of litigation and indemnification expenses; (vii) organization expenses and (viii) any expenses allocated or allocable to a specific class of shares, which
| | | | |
| June 30, 2004 | | Semi-Annual Report | | 13 |
Notes to Financial Statements (Cont.)
June 30, 2004 (Unaudited)
include service fees payable with respect to the Administrative Class shares and may include certain other expenses as permitted by the Trust’s Multiple Class Plan adopted pursuant to Rule 18f-3 under the Act and subject to review and approval by the Trustees. The ratio of expenses to average net assets per share class, as disclosed in Financial Highlights, may differ from the annual portfolio operating expenses per share class as disclosed in the Prospectus for the reasons set forth above.
PIMCO has agreed to waive a portion of its administrative fees to the extent that the payment of the Portfolio’s pro rata share of organization expenses and Trustee fees cause the actual expense ratio to rise above the rates disclosed in the then-current prospectus plus 0.49 basis points as set forth below (calculated as a percentage of the Portfolio’s average daily net assets attributable to each class):
| | | |
Administrative Class | | 1.00 | % |
PIMCO may be reimbursed for these waived amounts in future periods, not to exceed thirty-six months. Expenses that have been waived and may still be reimbursed by the Administrator, to the extent the Portfolio’s annualized total portfolio operating expenses plus the amount so reimbursed does not exceed the operating expense limitation, are as follows (amounts in thousands):
| | | | | | | | | |
| | |
| Year of Waiver
|
| | | | 12/31/2002 | | | 12/31/2003 | | | 06/30/2004 |
Amount Available for Reimbursement | | $ | 4 | | $ | 0 | | $ | 0 |
Each unaffiliated Trustee receives an annual retainer of $4,000, plus $1,500 for each Board of Trustees meeting attended in person and $250 for each meeting attended telephonically, plus reimbursement of related expenses. In addition, each committee chair receives an additional annual retainer of $500. These expenses are allocated on a pro-rata basis to each Portfolio of the Trust according to its respective net assets.
4. Purchases and Sales of Securities
The length of time a Portfolio has held a particular security is not generally a consideration in investment decisions. A change in the securities held by a Portfolio is known as “portfolio turnover.” The Portfolio may engage in frequent and active trading of portfolio securities to achieve its investment objective, particularly during periods of volatile market movements. High portfolio turnover (e.g., over 100%) involves correspondingly greater expenses to the Portfolio, including brokerage commissions or dealer mark-ups and other transaction costs on the sale of securities and reinvestments in other securities. Such sales may also result in realization of taxable capital gains, including short-term capital gains (which are generally taxed at ordinary income tax rates). The trading costs and tax effects associated with portfolio turnover may adversely affect the Portfolio’s performance.
Purchases and sales of securities (excluding short-term investments) for the period ended June 30, 2004 were as follows (amounts in thousands):
| | | | | | |
| U.S Government/Agency | | All Other |
| Purchases | | Sales | | Purchases | | Sales |
| $ 0 | | $ 0 | | $ 151,690 | | $ 145,220 |
5. Transactions in Written Call and Put Options
Transactions in written call and put options were as follows (amounts in thousands):
| | | | |
| | | | Premium | |
Balance at 12/31/2003 | | $ | 0 | |
Sales | | | 70 | |
Closing Buys | | | (1 | ) |
Expirations | | | (20 | ) |
Exercised | | | 0 | |
Balance at 06/30/2004 | | $ | 49 | |
6. Federal Income Tax Matters
At June 30, 2004, the aggregate cost of investments was the same for federal income tax and financial statement purposes. The net unrealized appreciation (depreciation) of investment securities for federal income tax purposes is as follows (amounts in thousands):
| | | | | | |
Aggregate Gross
Unrealized
Appreciation | | Aggregate Gross
Unrealized
(Depreciation) | | Net Unrealized
Appreciation |
| $ 1,145 | | $ | (971) | | $ | 174 |
| | | | |
| 14 | | Semi-Annual Report | | June 30, 2004 |
7. Shares of Beneficial Interest
The Trust may issue an unlimited number of shares of beneficial interest with a $.001 par value. Changes in shares of beneficial interest were as follows (shares and amounts in thousands):
| | | | | | | | | | | | | | |
| | | Six Months Ended
06/30/2004 | | | Year Ended
12/31/2003 | |
| | | Shares | | | Amount | | | Shares | | | Amount | |
Receipts for shares sold | | | | | | | | | | | | | | |
| | | | |
Institutional Class | | 0 | | | $ | 0 | | | 0 | | | $ | 0 | |
Administrative Class | | 744 | | | | 9,527 | | | 1,871 | | | | 24,324 | |
| | | | |
Issued as reinvestment of distributions | | | | | | | | | | | | | | |
| | | | |
Institutional Class | | 0 | | | | 0 | | | 0 | | | | 0 | |
Administrative Class | | 78 | | | | 993 | | | 531 | | | | 6,826 | |
| | | | |
Cost of shares redeemed | | | | | | | | | | | | | | |
| | | | |
Institutional Class | | 0 | | | | 0 | | | 0 | | | | 0 | |
Administrative Class | | (127 | ) | | | (1,576 | ) | | (1,327 | ) | | | (17,234 | ) |
| | | | |
Net increase resulting from Portfolio share transactions | | 695 | | | $ | 8,944 | | | 1,075 | | | $ | 13,916 | |
The following schedule shows the number of shareholders each owning 5% or more of the Portfolio and the total percentage of the Portfolio held by such shareholders:
| | | | |
| | | Number | | % of Portfolio Held |
Administrative Class | | 1 | | 98 |
8. Regulatory and Litigation Matters
On February 17, 2004, the Attorney General of the State of New Jersey (“New Jersey AG”) filed a complaint against Allianz Dresdner Asset Management of America L.P. (“ADAM”), PA Distributors LLC (formerly known as PIMCO Advisors Distributors LLC) (“PAD”), PEA Capital LLC (formerly known as PIMCO Equity Advisors LLC) (“PEA”), and Pacific Investment Management Company LLC (“PIMCO”) in connection with its investigation into market timing and late trading. The complaint contends that inappropriate trading by shareholders engaged in market timing activity took place in funds in the PIMCO Funds: Multi-Manager Series (“MMS Funds”) and the PIMCO Funds: Pacific Investment Management Series (“PIMS Funds”). On June 1, 2004, the New Jersey AG dismissed PIMCO from the lawsuit.
On the same day as the dismissal of PIMCO from the lawsuit, the New Jersey AG announced that it had reached a settlement agreement with the remaining defendants (“New Jersey Settlement”). In the New Jersey Settlement, ADAM, PAD and PEA agreed, while neither admitting nor denying the allegations or conclusions of law, to: (i) pay New Jersey a civil fine of $15 million and $3 million for investigative costs and further enforcement initiatives; and (ii) implement certain changes in corporate governance.
On May 6, 2004, the Securities and Exchange Commission filed a complaint in the U.S. District Court in the Southern District of New York alleging that PA Fund Management LLC (formerly known as PIMCO Advisors Fund Management LLC) (“PAFM”), PEA, PAD, Stephen J. Treadway (at the time, the chief executive officer of PAFM and PAD as well as chairman of the Board of Trustees of the MMS Funds) and Kenneth W. Corba (the former chief executive officer of PEA and former portfolio manager of the PEA Growth and PEA Growth & Income Funds) had, among other things, violated and/or aided and abetted violations of, various antifraud provisions of the federal securities laws in connection with alleged “market timing” arrangements that improperly allowed certain hedge funds to engage in “market timing” in the PEA Growth Fund, the PEA Opportunity Fund, the PEA Innovation Fund, and the PEA Target Fund. The complaint seeks injunctive relief, disgorgement plus pre-judgment interest, monetary penalties, and an order permanently enjoining the defendants from serving as investment advisers, principal underwriters, officers, directors, or members of any advisory boards to any registered investment companies.
On February 20, 2004, a putative class action lawsuit was filed in the U.S. District Court for the District of New Jersey on behalf of certain shareholders of the PIMCO Funds against ADAM, PAD, PIMCO, PEA, the PIMS Funds, the MMS Funds, the Trust, PIMCO Commercial Mortgage Securities Trust, Inc. and certain other defendants, alleging that inappropriate market timing activity by certain shareholders caused financial injury to the shareholders of those Funds.
| | | | |
| June 30, 2004 | | Semi-Annual Report | | 15 |
Notes to Financial Statements (Cont.)
June 30, 2004 (Unaudited)
The following additional putative class action lawsuits have been filed against the PIMS Funds, the MMS Funds and/or their affiliates, each related to alleged market-timing activity in funds advised by PIMCO or its affiliates: (1) a lawsuit filed in the U.S. District Court for the District of Connecticut on February 27, 2004 (naming as defendants ADAM, PAD, PEA, the PIMS Funds, the MMS Funds, the Trust, PCM and certain other parties); (2) a lawsuit filed in the U.S. District Court for the Central District of California on March 4, 2004 (naming as defendants PIMCO, ADAM, PEA and PAD); (3) a lawsuit filed in the U.S. District Court for the Southern District of New York on March 8, 2004 (naming PIMCO, PAD and certain of their affiliates as defendants); (4) a lawsuit filed in the U.S. District Court for the Southern District of New York, on March 15, 2004 (naming PIMCO as the defendant); (5) two separate lawsuits filed in the U.S. District Court for the Central District of California on March 22, 2004, brought derivatively on behalf of the PIMCO High Yield Fund and the PIMCO Money Market Fund, respectively (each naming ADAM, PAFM and certain other parties as defendants, and the PIMCO Funds as the nominal defendant); (6) a lawsuit filed in the U.S. District Court for the Central District of California, also on March 22, 2004, brought derivatively on behalf of the PIMS Funds and the MMS Funds (naming ADAM, PIMCO, PAD and certain other parties as defendants, and the PIMS Funds and the MMS Funds as nominal defendants); (7) a lawsuit filed in the U.S. District Court for the District of New Jersey on April 20, 2004 (naming ADAM, PAD, the PIMS Funds and certain other parties as defendants); and (8) a lawsuit filed in the U.S. District Court for the Northern District of California on April 28, 2004 (naming ADAM, PIMCO, PAD, PEA and certain other parties as defendants, and the “PIMCO Funds” as nominal defendants). Each complaint for the foregoing putative class actions alleges, among other things, that inappropriate trading by shareholders engaged in market timing activities took place in certain of the funds advised by PIMCO, and each complaint seeks unspecified compensatory damages.
On February 17, 2004, a putative class action lawsuit was filed in the U.S. District Court for the District of Connecticut on behalf of certain shareholders of the PIMCO Funds against ADAM, PEA, PIMCO, PIMS Funds, MMS Funds and certain other defendants, alleging excessive investment advisory fees and the use of brokerage commissions to pay for distribution of fund shares. Three similar putative class action lawsuits were subsequently filed, each in the U.S. District Court for the District of Connecticut on March 1, 2004, April 23, 2004 and May 20, 2004, respectively.
Under Section 9(a) of the 1940 Act, if any of the various lawsuits were to result in a court injunction against PAFM, PEA, PAD, PIMCO, ADAM and/or Mr. Treadway, they and their affiliates would, in the absence of exemptive relief granted by the SEC, be barred from serving as an investment adviser/sub-adviser or principal underwriter for any registered investment company, including the Trust. ADAM and certain of its subsidiaries have responded to inquiries from the SEC concerning the status of the New Jersey Settlement under Section 9(a). If any of PAFM, PEA, PAD, PIMCO or ADAM were subject to an injunction, each of these entities and their affiliates could in turn seek exemptive relief from the SEC, as contemplated by the 1940 Act. There is no assurance, however, that such exemptive relief would be granted. The SEC also has the power by order to prohibit PAFM, PEA, PAD and PIMCO from serving as investment advisers and underwriters, if the SEC finds that such entities willfully violated the federal securities laws in connection with the allegations discussed above or aided or abetted such violations.
PIMCO, PAD and the Trust believe that these developments will not have a material adverse effect on the Portfolios or on PIMCO’s, or PAD’s ability to perform their respective investment advisory or distribution services on behalf of the Portfolios.
| | | | |
| 16 | | Semi-Annual Report | | June 30, 2004 |
Trustees and Officers
Brent R. Harris, Chairman and Trustee
R. Wesley Burns, President and Trustee
E. Philip Cannon, Trustee
Vern O. Curtis, Trustee
J. Michael Hagan, Trustee
William J. Popejoy, Trustee
Garlin G. Flynn, Secretary
John P. Hardaway, Treasurer
Investment Adviser and Administrator
Pacific Investment Management Company LLC
840 Newport Center Drive
Newport Beach, California 92660
Distributor
PA Distributors LLC
2187 Atlantic Street
Stamford, Connecticut 06902
Custodian
State Street Bank & Trust Company
801 Pennsylvania
Kansas City, Missouri 64105
Transfer Agent
Boston Financial Data Services–Midwest
330 W. 9th Street
Kansas City, Missouri 64105
Legal Counsel
Dechert LLP
1775 I Street, N.W.
Washington, D.C. 20006
Independent Registered Public Accounting Firm
PricewaterhouseCoopers LLP
1055 Broadway
Kansas City, Missouri 64105
Information about how the Fund voted proxies relating to portfolio securities held during the year July 1, 2003 through June 30, 2004 will be available no later than August 31, 2004 without charge, upon request, by calling the Trust at 1-800-927-4648 and on the SEC’s website at http://www.sec.gov.
Copies of the written Proxy Policy and the factors that PIMCO may consider in determining how to vote proxies for the Funds are available by calling the Trust at 1-800-927-4648 and on the SEC’s website at http://www.sec.gov.
PIMCO VARIABLE INSURANCE TRUST
840 NEWPORT CENTER DRIVE
NEWPORT BEACH, CA 92660

PIMCO VARIABLE INSURANCE TRUST
REAL RETURN PORTFOLIO
ADMINISTRATIVE CLASS
SEMI-ANNUAL REPORT
June 30, 2004
|
| This material is authorized for use only when preceded or accompanied by the current PIMCO Variable Insurance Trust prospectus. Investors should consider the investment objectives, risks, charges and expenses of Portfolio carefully before investing. This and other information is contained in the Portfolio’s prospectus. Please read the prospectus carefully before you invest or send money. |
Chairman’s Letter
Dear PIMCO Variable Insurance Trust Shareholder:
Bond prices were more volatile during the six-month period ended June 30, 2004. Interest rates rose sharply during the second quarter 2004, causing bonds to give back modest gains from earlier in the year. The Lehman Brothers Aggregate Bond Index, a widely used index for the high-grade bond market, was nearly flat during the first six months of 2004, returning 0.15% after losing 2.44% during the second quarter. The yield on the benchmark ten-year Treasury closed June 30, 2004 at 4.58%, up 0.75% from April 1, 2004, but up only 0.34% from where it began the six-month period on January 1, 2004.
Continued growth in employment convinced the markets that the Federal Reserve would soon begin a long anticipated tightening cycle. On June 30, 2004, the Fed met market expectations by increasing the federal funds rate 0.25%, which was the first rate increase since June 25, 2003. The central bank had held this rate at 1% for more than a year, which generated negative real short-term rates. And on August 10, 2004, the Fed increased the federal funds rate another 0.25% to 1.50%.
Investors that had profited handsomely from borrowing at low short-term rates and investing in higher-yielding longer maturity bonds surrendered some of those profits towards the latter part of the six-month period. Concern that borrowing rates would rise led investors to liquidate long positions and unwind these trades, which caused bond prices to decrease. However, substantial leverage remained among banks, hedge funds, and other investors, making bond markets somewhat vulnerable to additional Fed rate increases. There were also signs of rising inflation, which fueled anxiety that central banks might continue to raise interest rates.
On the following pages you will find a more complete review of the Portfolio in light of financial market activities as well as specific details about the total return investment performance for the six-month period.
We appreciate the trust you have placed in us, and we will continue to focus our efforts to meet your investment needs.
Sincerely,

Brent R. Harris
Chairman
August 11, 2004
| | | | |
| June 30, 2004 | | Semi-Annual Report | | 1 |
Important Information About the Portfolio
We believe that bond funds have an important role to play in a well diversified investment portfolio. It is important to note, however, that in an environment where interest rates may trend upward, rising rates will negatively impact the performance of most bond funds, and fixed income securities held by a fund are likely to decrease in value. The price volatility of fixed income securities can also increase during periods of rising interest rates resulting in increased losses to a fund. Bond funds and individual bonds with a longer duration (a measure of the expected life of a security) tend to be more sensitive to changes in interest rates, usually making them more volatile than securities or funds with shorter durations. The longer-term performance of most bond funds has benefited from capital gains in part resulting from an extended period of declining interest rates. In the event interest rates increase, these capital gains should not be expected to recur.
The Portfolio may be subject to various risks in addition to those described above. Some of these risks may include, but are not limited to, the following: real rate risk, derivative risk, small company risk, foreign security risk, high yield security risk and specific sector investment risks. The Portfolio may use derivative instruments for hedging purposes or as part of an investment strategy. Use of these instruments may involve certain costs and risks such as liquidity risk, interest rate risk, market risk, credit risk, management risk and the risk that a fund could not close out a position when it would be most advantageous to do so. A Portfolio investing in derivatives could lose more than the principal amount invested in these instruments. Investing in non-U.S. securities may entail risk due to non-U.S. economic and political developments; this risk may be enhanced when investing in emerging markets. High-yield bonds typically have a lower credit rating than other bonds. Lower rated bonds generally involve a greater risk to principal than higher rated bonds. Smaller companies may be more volatile than larger companies and may entail more risk. Concentrating investments in individual sectors may add additional risk and volatility compared to a diversified portfolio.
On the performance summary page in this semi-annual report, the Total Return Investment Performance table measures performance assuming that all dividend and capital gain distributions were reinvested. Returns do not reflect the deduction of taxes that a shareholder would pay (i) on Portfolio distributions or (ii) the redemption of Portfolio shares.
An investment in a Portfolio is not a bank deposit and is not guaranteed or insured by the Federal Deposit Insurance Corporation or any other government agency. It is possible to lose money on investments in the Funds.
The following disclosure provides important information regarding the Portfolio’s Expense Example, which appears on the Portfolio’s individual page in this semi-annual report. Please refer to this information when reviewing the Expense Example for the Portfolio.
Example
As a shareholder of the Portfolio, you incur two types of costs: (1) transaction costs, including redemption and exchange fees; and (2) ongoing costs, including advisory and administrative fees; distribution and/or service (12b-1) fees (Administrative Class only); and other Portfolio expenses. The Example is intended to help you understand your ongoing costs (in dollars) of investing in the Portfolio and to compare these costs with the ongoing costs of investing in other mutual funds.
The Example is based on an investment of $1,000 invested at the beginning of the period and held for the entire period indicated, which is from 1/1/04 to 6/30/04.
Actual Expenses
The information in the table under the heading “Actual Performance” provides information about actual account values and actual expenses. You may use the information in these columns, together with the amount you invested, to estimate the expenses that you paid over the period. Simply divide your account value by $1,000.00 (for example, an $8,600.00 account value divided by $1,000 = 8.60), then multiply the result by the number in the appropriate column for your share class, in the row entitled “Expenses Paid During Period” to estimate the expenses you paid on your account during this period.
Hypothetical Example for Comparison Purposes
The information in the table under the heading “Hypothetical Performance (5% return before expenses)” provides information about hypothetical account values and hypothetical expenses based on the Portfolio’s actual expense ratio and an assumed rate of return of 5% per year before expenses, which is not the Portfolio’s actual return. The hypothetical account values and expenses may not be used to estimate the actual ending account balance or expenses you paid for the period. You may use this information to compare the ongoing costs of investing in the Portfolio and other portfolios. To do so, compare this 5% hypothetical example with the 5% hypothetical examples that appear in the shareholder reports of the other portfolios.
Please note that the expenses shown in the table are meant to highlight your ongoing costs only and do not reflect any transactional costs. Therefore, the information under the heading “Hypothetical Performance (5% return before expenses)” is useful in comparing ongoing costs only, and will not help you determine the relative total costs of owning different portfolios. In addition, if these transactional costs were included, your costs would have been higher.
PIMCO Variable Insurance Trust is distributed by PA Distributors LLC, 2187 Atlantic Street, Stamford, CT 06902.
| | | | |
| 2 | | Semi-Annual Report | | June 30, 2004 |
Real Return Portfolio
CUMULATIVE RETURNS THROUGH JUNE 30, 2004
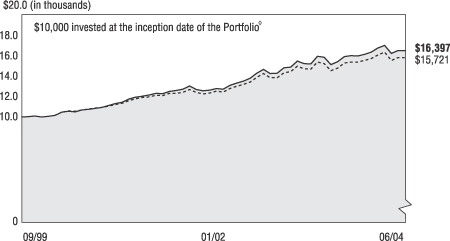
[CHART]
Real Return Lehman Brothers Global Real:
Portfolio Admin. Class U.S. TIPS Index
---------------------- -----------------------------
09/30/1999 $10,000 $10,000
10/31/1999 $10,013 $10,020
11/30/1999 $10,090 $10,081
12/31/1999 $9,997 $10,000
01/31/2000 $10,060 $10,045
02/29/2000 $10,131 $10,139
03/31/2000 $10,441 $10,434
04/30/2000 $10,545 $10,573
05/31/2000 $10,489 $10,545
06/30/2000 $10,655 $10,678
07/31/2000 $10,737 $10,769
08/31/2000 $10,822 $10,849
09/30/2000 $10,913 $10,905
10/31/2000 $11,100 $11,037
11/30/2000 $11,269 $11,197
12/31/2000 $11,407 $11,318
01/31/2001 $11,711 $11,555
02/28/2001 $11,902 $11,750
03/31/2001 $12,000 $11,863
04/30/2001 $12,122 $11,929
05/31/2001 $12,263 $12,070
06/30/2001 $12,247 $12,056
07/31/2001 $12,461 $12,257
08/31/2001 $12,534 $12,274
09/30/2001 $12,659 $12,345
10/31/2001 $12,963 $12,638
11/30/2001 $12,625 $12,357
12/31/2001 $12,506 $12,212
01/31/2002 $12,579 $12,284
02/28/2002 $12,734 $12,471
03/31/2002 $12,667 $12,393
04/30/2002 $13,045 $12,732
05/31/2002 $13,260 $12,934
06/30/2002 $13,436 $13,117
07/31/2002 $13,710 $13,334
08/31/2002 $14,199 $13,811
09/30/2002 $14,557 $14,159
10/31/2002 $14,187 $13,781
11/30/2002 $14,191 $13,771
12/31/2002 $14,728 $14,234
01/31/2003 $14,778 $14,342
02/28/2003 $15,360 $14,879
03/31/2003 $15,126 $14,638
04/30/2003 $15,102 $14,600
05/31/2003 $15,843 $15,293
06/30/2003 $15,729 $15,136
07/31/2003 $15,023 $14,438
08/31/2003 $15,298 $14,697
09/30/2003 $15,815 $15,183
10/31/2003 $15,890 $15,265
11/30/2003 $15,872 $15,275
12/31/2003 $16,029 $15,430
01/31/2004 $16,246 $15,607
02/29/2004 $16,644 $15,968
03/31/2004 $16,888 $16,223
04/30/2004 $16,106 $15,436
05/31/2004 $16,388 $15,714
06/30/2004 $16,397 $15,721
SECTOR BREAKDOWN‡
| | | |
U.S. Treasury Obligations | | 49.3 | % |
Short-Term Instruments | | 43.9 | % |
Other | | 6.8 | % |
‡ % of Total Investments as of June 30, 2004
à$10,000 invested at the beginning of the first full month following the inception of the Administrative Class.
TOTAL RETURN INVESTMENT PERFORMANCE For the period ended June 30, 2004
| | | | | | | | | | | | | |
| | | | | | | 6 Months | | | 1 Year | | | Since Inception* | |
| | |
| | Real Return Portfolio Administrative Class (Inception 09/30/99) | | 2.29 | % | | 4.24 | % | | 10.99 | % |
| | | - - - - - - - | | Lehman Brothers Global Real: U.S. TIPS Index | | 1.88 | % | | 3.86 | % | | — | |
| | | | | * Annualized. All Portfolio returns are net of fees and expenses. | | | | | | | | | |
Past performance is no guarantee of future results. The performance quoted represents past performance. Investment return and principal value will fluctuate so the Portfolio shares, when redeemed, may be worth more or less than their original cost. Current performance may be lower or higher than the performance data quoted. Performance data current to the most recent month-end is available by calling (800) 927-4648.
Please refer to page 2 herein for an explanation of the information presented in the following Expense Example.
| | | | | | | | | | |
| EXPENSE EXAMPLE | | | | Actual Performance | | | | Hypothetical Performance
(5% return before expenses) |
Beginning Account Value (01/01/04) | | | | $ | 1,000.00 | | | | $ | 1,000.00 |
Ending Account Value (06/30/04) | | | | $ | 1,022.90 | | | | $ | 1,025.00 |
Expenses Paid During Period† | | | | $ | 3.27 | | | | $ | 3.27 |
†Expenses are equal to the Portfolio’s Administrative Class annualized expense ratio of 0.65%, multiplied by the average account value over the period, multiplied by 182/366 (to reflect the one-half year period).
PORTFOLIO INSIGHTS
| • | The Real Return Portfolio seeks to achieve its investment objective by investing under normal circumstances at least 80% of its net assets in inflation-indexed bonds of varying maturities issued by the U.S. and non-U.S. governments, their agencies, or government-sponsored enterprises and corporations. |
| • | For the 6 months ended June 30, 2004, the Portfolio’s Administrative Class shares returned 2.29%, versus 1.88% for the benchmark Lehman Brothers Global Real: U.S. TIPS Index. |
| • | For the 6 months, real yields in the U.S. increased by 0.10%, compared to a 0.39% rise for conventional U.S. Treasury issues of similar maturity. |
| • | Breakeven inflation, defined as the difference between a real yield on a TIPS and a nominal yield on a Treasury of the same maturity, was 2.59% on June 30, 2004 for the 10-year maturity. This compares to a breakeven yield of 2.31% on December 31, 2003. The 12-month CPI-U change for the period ended June 30, 2004, was 3.22%. |
| • | The effective duration of the Portfolio was 6.82 years on June 30, 2004, compared to a duration of 7.51 years for the benchmark; this strategy was positive for performance as real yields rose. |
| • | The Portfolio reduced overall account duration through short positions in nominal treasuries, treasury futures, and swaps, which was positive for performance as nominal yields rose. |
| • | The Portfolio was overweight shorter maturity TIPS. This was positive for performance compared to the benchmark as the real yield curve steepened. |
| • | The Portfolio’s yield was improved by using a combination of TIPS buy-forward agreements and low duration, high quality conventional yield debt instruments. The steepness of the real yield curve made this an attractive option for the Portfolio. |
| • | Option writing added income to the Portfolio as rates stayed within our forecasted range. |
| • | An allocation to emerging market bonds was negative overall for returns, as spreads widened throughout the period. |
| | | | |
| June 30, 2004 | | Semi-Annual Report | | 3 |
Financial Highlights
Real Return Portfolio (Administrative Class)
| | | | | | | | | | | | | | | | | | | | | | | | | | | | | | | | | | | | |
Selected Per Share Data for the Year or
Period Ended: | | | | 06/30/2004+ | | | | | 12/31/2003 | | | | | 12/31/2002 | | | | | 12/31/2001 | | | | | 12/31/2000 | | | | | 09/30/1999-
12/31/1999 | |
| | | | | | | | | | | | |
Net asset value beginning of period | | | | $ | 12.36 | | | | | $ | 11.90 | | | | | $ | 10.56 | | | | | $ | 10.34 | | | | | $ | 9.80 | | | | | $ | 10.00 | |
Net investment income (a) | | | | | 0.04 | | | | | | 0.27 | | | | | | 0.48 | | | | | | 0.61 | | | | | | 0.64 | | | | | | 0.20 | |
Net realized/unrealized gain (loss) on investments (a) | | | | | 0.24 | | | | | | 0.77 | | | | | | 1.36 | | | | | | 0.38 | | | | | | 0.69 | | | | | | (0.20 | ) |
Total income from investment operations | | | | | 0.28 | | | | | | 1.04 | | | | | | 1.84 | | | | | | 0.99 | | | | | | 1.33 | | | | | | 0.00 | |
Dividends from net investment income | | | | | (0.04 | ) | | | | | (0.32 | ) | | | | | (0.48 | ) | | | | | (0.63 | ) | | | | | (0.79 | ) | | | | | (0.20 | ) |
Distributions from net realized capital gains | | | | | 0.00 | | | | | | (0.26 | ) | | | | | (0.02 | ) | | | | | (0.14 | ) | | | | | 0.00 | | | | | | 0.00 | |
Total distributions | | | | | (0.04 | ) | | | | | (0.58 | ) | | | | | (0.50 | ) | | | | | (0.77 | ) | | | | | (0.79 | ) | | | | | (0.20 | ) |
Net asset value end of period | | | | $ | 12.60 | | | | | $ | 12.36 | | | | | $ | 11.90 | | | | | $ | 10.56 | | | | | $ | 10.34 | | | | | $ | 9.80 | |
Total return | | | | | 2.29 | % | | | | | 8.84 | % | | | | | 17.77 | % | | | | | 9.63 | % | | | | | 14.11 | % | | | | | (0.03 | )% |
Net assets end of period (000s) | | | | $ | 437,833 | | | | | $ | 275,029 | | | | | $ | 90,724 | | | | | $ | 7,406 | | | | | $ | 448 | | | | | $ | 3,000 | |
Ratio of net expenses to average net assets | | | | | 0.65 | %* | | | | | 0.66 | %(d) | | | | | 0.66 | %(d) | | | | | 0.66 | %(c)(d) | | | | | 0.65 | % | | | | | 0.65 | %(b)* |
Ratio of net investment income to average net assets | | | | | 0.67 | %* | | | | | 2.21 | % | | | | | 4.19 | % | | | | | 5.63 | % | | | | | 6.69 | % | | | | | 7.72 | %* |
Portfolio turnover rate | | | | | 572 | % | | | | | 738 | % | | | | | 87 | % | | | | | 58 | % | | | | | 18 | % | | | | | 23 | % |
| (a) | Per share amounts based on average number of shares outstanding during the period. |
| (b) | If the investment manager had not reimbursed expenses, the ratio of expenses to average net assets would have been 0.92%. |
| (c) | If the investment manager had not reimbursed expenses, the ratio of expenses to average net assets would have been 0.67%. |
| (d) | Ratio of expenses to average net assets excluding interest expense is 0.65%. |
| | | | | | |
| 4 | | Semi-Annual Report | | June 30, 2004 | | See accompanying notes |
Statement of Assets and Liabilities
Real Return Portfolio
June 30, 2004 (Unaudited)
| | | | | |
| Amounts in thousands, except per share amounts | | | | |
| | |
Assets: | | | | | |
| | |
Investments, at value | | | | $ | 935,373 |
Foreign currency, at value | | | | | 267 |
Receivable for investments sold on a delayed delivery basis | | | | | 10,239 |
Unrealized appreciation on forward foreign currency contracts | | | | | 40 |
Receivable for Portfolio shares sold | | | | | 1,231 |
Interest and dividends receivable | | | | | 1,357 |
Swap premiums paid | | | | | 2,839 |
Unrealized appreciation on swap agreements | | | | | 142 |
| | | | | | 951,488 |
| | |
Liabilities: | | | | | |
| | |
Payable for investments purchased | | | | $ | 6,200 |
Payable for investments purchased on a delayed delivery basis | | | | | 460,125 |
Payable for short sale | | | | | 10,356 |
Written options outstanding | | | | | 16 |
Payable for Portfolio shares redeemed | | | | | 171 |
Accrued investment advisory fee | | | | | 93 |
Accrued administration fee | | | | | 93 |
Accrued servicing fee | | | | | 46 |
Variation margin payable | | | | | 6 |
Swap premiums received | | | | | 72 |
Unrealized depreciation on swap agreements | | | | | 833 |
Other liabilities | | | | | 1,550 |
| | | | | | 479,561 |
| | |
Net Assets | | | | $ | 471,927 |
| | |
Net Assets Consist of: | | | | | |
| | |
Paid in capital | | | | $ | 457,969 |
Undistributed net investment income | | | | | 6,218 |
Accumulated undistributed net realized gain | | | | | 5,266 |
Net unrealized appreciation | | | | | 2,474 |
| | | | | $ | 471,927 |
| | |
Net Assets: | | | | | |
| | |
Institutional Class | | | | $ | 34,094 |
Administrative Class | | | | | 437,833 |
| | |
Shares Issued and Outstanding: | | | | | |
| | |
Institutional Class | | | | | 2,706 |
Administrative Class | | | | | 34,756 |
| | |
Net Asset Value and Redemption Price Per Share
(Net Assets Per Share Outstanding) | | | | | |
| | |
Institutional Class | | | | $ | 12.60 |
Administrative Class | | | | | 12.60 |
| | |
Cost of Investments Owned | | | | $ | 931,094 |
Cost of Foreign Currency Held | | | | $ | 266 |
| | | | | | |
| See accompanying notes | | June 30, 2004 | | Semi-Annual Report | | 5 |
Statement of Operations
Real Return Portfolio
| | | | | | |
| Amounts in thousands | | | | | |
| | | | | Six Months Ended June 30, 2004 (Unaudited) | |
| | |
Investment Income: | | | | | | |
| | |
Interest | | | | $ | 2,622 | |
Total Income | | | | | 2,622 | |
| | |
Expenses: | | | | | | |
| | |
Investment advisory fees | | | | | 493 | |
Administration fees | | | | | 493 | |
Distribution and/or servicing fees - Administrative Class | | | | | 274 | |
Trustees’ fees | | | | | 3 | |
Interest expense | | | | | 5 | |
Total Expenses | | | | | 1,268 | |
| | |
Net Investment Income | | | | | 1,354 | |
| | |
Net Realized and Unrealized Gain (Loss): | | | | | | |
| | |
Net realized gain on investments | | | | | 5,427 | |
Net realized gain on futures contracts, options, and swaps | | | | | 1,406 | |
Net realized (loss) on foreign currency transactions | | | | | (52 | ) |
Net change in unrealized (depreciation) on investments | | | | | (1,518 | ) |
Net change in unrealized (depreciation) on futures contracts,
options, and swaps | | | | | (291 | ) |
Net change in unrealized appreciation on translation of
assets and liabilities denominated in foreign currencies | | | | | 90 | |
Net Gain | | | | | 5,062 | |
| | |
Net Increase in Assets Resulting from Operations | | | | $ | 6,416 | |
| | | | | | |
| 6 | | Semi-Annual Report | | June 30, 2004 | | See accompanying notes |
Statements of Changes in Net Assets
Real Return Portfolio
| | | | | | | | | | | | |
| Amounts in thousands | | | | | | | | | | |
| | | | | Six Months Ended
June 30, 2004
(Unaudited) | | | | | Year Ended
December 31, 2003 | |
Increase in Net Assets from: | | | | | | | | | | | | |
| | | | |
Operations: | | | | | | | | | | | | |
| | | | |
Net investment income | | | | $ | 1,354 | | | | | $ | 4,341 | |
Net realized gain | | | | | 6,781 | | | | | | 10,563 | |
Net change in unrealized appreciation (depreciation) | | | | | (1,719 | ) | | | | | 564 | |
Net increase resulting from operations | | | | | 6,416 | | | | | | 15,468 | |
| | | | |
Distributions to Shareholders: | | | | | | | | | | | | |
| | | | |
From net investment income | | | | | | | | | | | | |
Institutional Class | | | | | (123 | ) | | | | | (377 | ) |
Administrative Class | | | | | (1,280 | ) | | | | | (3,967 | ) |
| | | | |
From net realized capital gains | | | | | | | | | | | | |
Institutional Class | | | | | 0 | | | | | | (541 | ) |
Administrative Class | | | | | 0 | | | | | | (5,360 | ) |
Total Distributions | | | | | (1,403 | ) | | | | | (10,245 | ) |
| | | | |
Portfolio Share Transactions: | | | | | | | | | | | | |
| | | | |
Receipts for shares sold | | | | | | | | | | | | |
Institutional Class | | | | | 7,848 | | | | | | 25,638 | |
Administrative Class | | | | | 210,240 | | | | | | 258,368 | |
| | | | |
Issued as reinvestment of distributions | | | | | | | | | | | | |
Institutional Class | | | | | 123 | | | | | | 917 | |
Administrative Class | | | | | 1,288 | | | | | | 9,318 | |
| | | | |
Cost of shares redeemed | | | | | | | | | | | | |
Institutional Class | | | | | (841 | ) | | | | | (751 | ) |
Administrative Class | | | | | (53,313 | ) | | | | | (87,884 | ) |
Net increase resulting from Portfolio share transactions | | | | | 165,345 | | | | | | 205,605 | |
| | | | |
Total Increase in Net Assets | | | | | 170,358 | | | | | | 210,829 | |
| | | | |
Net Assets: | | | | | | | | | | | | |
| | | | |
Beginning of period | | | | | 301,569 | | | | | | 90,740 | |
End of period* | | | | $ | 471,927 | | | | | $ | 301,569 | |
| | | | |
*Including undistributed net investment income of: | | | | $ | 6,218 | | | | | $ | 6,267 | |
| | | | | | |
| See accompanying notes | | June 30, 2004 | | Semi-Annual Report | | 7 |
Schedule of Investments
Real Return Portfolio
June 30, 2004 (Unaudited)
| | | | |
| | | Principal | | |
| | | Amount | | Value |
| | | (000s) | | (000s) |
| | | | | | |
CORPORATE BONDS & NOTES 6.0% |
Banking & Finance 4.2% | | | | | | |
Countrywide Home Loans, Inc. | | | | | | |
1.360% due 02/23/2005 (a) | | $ | 3,600 | | $ | 3,599 |
Ford Motor Credit Co. | | | | | | |
3.035% due 10/25/2004 (a) | | | 200 | | | 201 |
1.600% due 07/18/2005 (a) | | | 300 | | | 300 |
General Motors Acceptance Corp. | | | |
2.135% due 05/18/2006 (a) | | | 1,500 | | | 1,504 |
Morgan Stanley Warehouse Facilities | | | |
1.390% due 07/06/2005 (j) | | | 6,200 | | | 6,200 |
Pemex Project Funding Master Trust | | | |
7.375% due 12/15/2014 | | | 500 | | | 512 |
8.625% due 02/01/2022 | | | 200 | | | 209 |
Phoenix Quake Wind Ltd. | | | | | | |
3.560% due 07/03/2008 (a) | | | 500 | | | 514 |
3.601% due 07/03/2008 (a) | | | 2,000 | | | 2,056 |
Residential Reinsurance Ltd. | | | | | | |
6.260% due 06/08/2006 (a) | | | 1,000 | | | 1,015 |
Travelers Property Casualty Corp. | | | |
3.750% due 03/15/2008 | | | 100 | | | 99 |
Verizon Wireless Capital LLC | | | | | | |
1.350% due 05/23/2005 (a) | | | 2,800 | | | 2,798 |
Vita Capital Ltd. | | | | | | |
2.460% due 01/01/2007 (a) | | | 700 | | | 706 |
| | | | | |
|
|
| | | | | | | 19,713 |
| | | | | |
|
|
Industrials 1.0% | | | | | | |
Alcan, Inc. | | | | | | |
1.623% due 12/08/2004 (a) | | | 1,100 | | | 1,100 |
DaimlerChrysler North America Holding Corp. |
7.750% due 06/15/2005 | | | 100 | | | 105 |
Halliburton Co. | | | | | | |
2.650% due 10/17/2005 (a) | | | 1,700 | | | 1,718 |
1.920% due 01/26/2007 (a) | | | 2,000 | | | 1,999 |
| | | | | |
|
|
| | | | | | | 4,922 |
| | | | | |
|
|
Utilities 0.8% | | | | | | |
Cleveland Electric Illuminating Co. | | | |
6.860% due 10/01/2008 | | | 100 | | | 109 |
Entergy Gulf States, Inc. | | | | | | |
2.433% due 06/18/2007 (a) | | | 1,500 | | | 1,504 |
Sprint Capital Corp. | | | | | | |
7.900% due 03/15/2005 | | | 2,200 | | | 2,281 |
| | | | | |
|
|
| | | | | | | 3,894 |
| | | | | |
|
|
Total Corporate Bonds & Notes (Cost $28,448) | | | | | | 28,529 |
| | | | | |
|
|
| | | | | | | |
MUNICIPAL BONDS & NOTES 0.2% |
| |
Badger Asset Securitization Corporate Revenue Bonds, Series 2002 | | | |
6.000% due 06/01/2017 | | | 475 | | | 430 |
|
Rhode Island Tobacco Settlement Financing Corp.
Revenue Bonds, Series 2002 |
6.000% due 06/01/2023 | | | 500 | | | 446 |
| | | | | |
|
|
Total Municipal Bonds & Notes (Cost $871) | | | | | | 876 |
| | | | | |
|
|
| | | | | | | |
U.S. GOVERNMENT AGENCIES 0.5% |
| | |
Fannie Mae | | | | | | |
3.230% due 11/01/2024 (a) | | | 25 | | | 25 |
| | |
Small Business Administration | | | | | | |
4.504% due 02/01/2014 | | | 2,284 | | | 2166 |
| | | | | |
|
|
Total U.S. Government Agencies (Cost $2,310) | | | 2,191 |
| | | | | |
|
|
| | | | | | | |
U.S. TREASURY OBLIGATIONS 97.6% |
| |
Treasury Inflation Protected Securities (b) | | | |
3.375% due 01/15/2007 | | | 16,080 | | | 17,228 |
3.625% due 01/15/2008 | | | 66,931 | | | 73,167 |
| | | | | | |
| | |
3.875% due 01/15/2009 | | $ | 25,890 | | $ | 28,872 |
4.250% due 01/15/2010 | | | 37,855 | | | 43,338 |
3.500% due 01/15/2011 | | | 23,858 | | | 26,497 |
3.375% due 01/15/2012 | | | 17,539 | | | 19,437 |
3.000% due 07/15/2012 | | | 85,345 | | | 92,292 |
1.875% due 07/15/2013 | | | 16,443 | | | 16,248 |
2.000% due 01/15/2014 | | | 43,107 | | | 42,864 |
3.625% due 04/15/2028 | | | 16,291 | | | 19,880 |
3.875% due 04/15/2029 | | | 61,425 | | | 78,346 |
3.375% due 04/15/2032 | | | 2,127 | | | 2,589 |
| | | | | |
|
|
Total U.S. Treasury Obligations (Cost $456,376) | | | 460,758 |
| | | | | |
|
|
| | | | | | | |
MORTGAGE-BACKED SECURITIES 2.1% |
| |
Bank of America Mortgage Securities, Inc. | | | |
6.500% due 02/25/2033 | | | 665 | | | 680 |
Bear Stearns Adjustable Rate Mortgage Trust |
4.368% due 01/25/2034 (a) | | | 7,700 | | | 7,744 |
Sequoia Mortgage Trust | | | | | | |
1.630% due 10/19/2026 (a) | | | 1,422 | | | 1,423 |
| | | | | |
|
|
Total Mortgage-Backed Securities (Cost $9,923) | | | 9,847 |
| | | | | |
|
|
| | | | | | | |
ASSET-BACKED SECURITIES 3.2% |
|
Ameriquest Mortgage Securities, Inc. |
1.710% due 02/25/2033 (a) | | | 617 | | | 619 |
Asset-Backed Securities Corp. Home Equity |
1.738% due 01/15/2033 (a) | | | 2,083 | | | 2,096 |
Bayview Financial Acquisition Trust | | | |
1.770% due 08/28/2034 (a) | | | 3,758 | | | 3,772 |
Bear Stearns Asset-Backed Securities, Inc. | | | |
1.750% due 03/25/2043 (a) | | | 1,128 | | | 1,130 |
Equity One ABS, Inc. | | | | | | |
1.600% due 04/25/2034 (a) | | | 2,323 | | | 2,320 |
GSAMP Trust | | | | | | |
1.620% due 03/25/2034 (a) | | | 1,000 | | | 1,000 |
Redwood Capital Ltd. | | | | | | |
3.462% due 01/01/2006 (a) | | | 1,000 | | | 1,002 |
5.012% due 01/01/2006 (a) | | | 1,000 | | | 1,002 |
Renaissance Home Equity Loan Trust | | | |
1.680% due 12/25/2032 (a) | | | 1,256 | | | 1,254 |
Residential Asset Securities Corp. | | | |
1.600% due 01/25/2034 (a) | | | 88 | | | 89 |
Structured Asset Investment Loan Trust | | | |
1.420% due 06/25/2033 (a) | | | 224 | | | 224 |
Truman Capital Mortgage Loan Trust | | | |
1.640% due 01/25/2034 (a) | | | 428 | | | 423 |
| | | | | |
|
|
Total Asset-Backed Securities (Cost $14,910) | | | | | | 14,931 |
| | | | | |
|
|
| | | | | | | |
SOVEREIGN ISSUES 0.6% |
| | |
Republic of Brazil | | | | | | |
2.062% due 04/15/2006 (a) | | | 128 | | | 126 |
2.125% due 04/15/2009 (a) | | | 118 | | | 107 |
8.000% due 04/15/2014 (a) | | | 1,525 | | | 1,400 |
11.000% due 08/17/2040 | | | 200 | | | 189 |
Republic of Colombia | | | | | | |
10.000% due 01/23/2012 | | | 350 | | | 364 |
United Mexican States | | | | | | |
6.375% due 01/16/2013 | | | 700 | | | 701 |
| | | | | |
|
|
Total Sovereign Issues (Cost $2,909) | | | | | | 2,887 |
| | | | | |
|
|
| | | | | | | |
FOREIGN CURRENCY-DENOMINATED
ISSUES (h)(i) 1.0% |
| | |
Pylon Ltd. | | | | | | |
3.553% due 12/18/2008 (a) | | EC | 700 | | | 866 |
5.953% due 12/22/2008 | | | 1,100 | | | 1,368 |
Republic of France | | | | | | |
3.000% due 07/25/2012 (b) | | | 1,579 | | | 2,082 |
| | | | | | |
| | |
Republic of Italy | | | | | | |
2.150% due 09/15/2014 (b) | | EC | 509 | | $ | 615 |
| | | | | |
|
|
Total Foreign Currency-Denominated Issues (Cost $4,858) | | | 4,931 |
| | | | | |
|
|
| | | | | | | |
PURCHASED PUT OPTIONS 0.0% |
|
Treasury Inflation Protected Securities (OTC) |
3.625% due 01/15/2008 | | | | | | |
Strike @ 99.000 Exp. 08/27/2004 | | $ | 57,000 | | | 0 |
| | | | | |
|
|
Total Purchased Put Options (Cost $9) | | | 0 |
| | | | | |
|
|
| | | | | | | |
SHORT-TERM INSTRUMENTS 87.0% |
Certificates of Deposit 3.5% | | | |
Citibank New York N.A. | | | | | | |
1.090% due 07/30/2004 | | | 900 | | | 900 |
1.190% due 08/20/2004 | | | 6,300 | | | 6,300 |
1.215% due 08/23/2004 | | | 200 | | | 200 |
Wells Fargo Bank N.A. | | | | | | |
1.090% due 07/07/2004 | | | 500 | | | 500 |
1.240% due 07/19/2004 | | | 8,700 | | | 8,700 |
| | | | | |
|
|
| | | | | | | 16,600 |
| | | | | |
|
|
Commercial Paper 83.2% | | | | | | |
Anz (Delaware), Inc. | | | | | | |
1.040% due 07/06/2004 | | | 1,200 | | | 1,200 |
ASB Bank Ltd. | | | | | | |
1.140% due 08/30/2004 | | | 2,600 | | | 2,594 |
ASK Bank Ltd. | | | | | | |
1.490% due 09/22/2004 | | | 6,400 | | | 6,378 |
Bank of Ireland | | | | | | |
1.255% due 09/01/2004 | | | 12,200 | | | 12,170 |
1.285% due 09/03/2004 | | | 1,300 | | | 1,297 |
Barclays U.S. Funding Corp. | | | | | | |
1.210% due 08/23/2004 | | | 8,900 | | | 8,884 |
1.110% due 08/25/2004 | | | 1,500 | | | 1,497 |
1.110% due 08/26/2004 | | | 2,600 | | | 2,595 |
CBA (de) Finance | | | | | | |
1.050% due 07/02/2004 | | | 900 | | | 900 |
1.050% due 07/13/2004 | | | 3,900 | | | 3,899 |
CDC Commercial Paper, Inc. | | | | | | |
1.085% due 08/04/2004 | | | 3,300 | | | 3,297 |
1.120% due 08/19/2004 | | | 900 | | | 899 |
1.120% due 08/24/2004 | | | 1,600 | | | 1,597 |
1.320% due 09/10/2004 | | | 600 | | | 598 |
1.250% due 09/16/2004 | | | 6,900 | | | 6,878 |
1.270% due 09/24/2004 | | | 300 | | | 299 |
Danske Corp. | | | | | | |
1.260% due 09/14/2004 | | | 3,300 | | | 3,290 |
1.240% due 09/17/2004 | | | 7,900 | | | 7,875 |
1.270% due 09/20/2004 | | | 100 | | | 100 |
Den Norske Bank ASA | | | | | | |
1.250% due 08/30/2004 | | | 2,000 | | | 1,995 |
European Investment Bank 1.030% due 07/02/2004 | | | 600 | | | 600 |
Fannie Mae | | | | | | |
1.000% due 07/01/2004 | | | 3,600 | | | 3,600 |
1.005% due 07/01/2004 | | | 4,400 | | | 4,400 |
1.010% due 07/01/2004 | | | 8,300 | | | 8,300 |
1.025% due 07/07/2004 | | | 19,700 | | | 19,697 |
1.040% due 07/14/2004 | | | 900 | | | 900 |
1.056% due 07/28/2004 | | | 600 | | | 599 |
1.055% due 08/04/2004 | | | 3,300 | | | 3,297 |
1.063% due 08/04/2004 | | | 3,000 | | | 2,997 |
1.100% due 08/04/2004 | | | 4,300 | | | 4,296 |
1.125% due 08/11/2004 | | | 11,600 | | | 11,585 |
1.150% due 08/18/2004 | | | 4,200 | | | 4,194 |
1.180% due 08/25/2004 | | | 13,300 | | | 13,276 |
1.185% due 08/25/2004 | | | 4,500 | | | 4,492 |
1.105% due 09/01/2004 | | | 600 | | | 598 |
1.225% due 09/01/2004 | | | 4,500 | | | 4,489 |
| | | | | | |
| 8 | | Semi-Annual Report | | June 30, 2004 | | See accompanying notes |
| | | | |
| | | Principal | | |
| | | Amount | | Value |
| | | (000s) | | (000s) |
| | | | | | |
| | |
1.230% due 09/01/2004 | | $ | 2,900 | | $ | 2,893 |
1.250% due 09/01/2004 | | | 4,500 | | | 4,489 |
1.130% due 09/08/2004 | | | 1,500 | | | 1,496 |
1.200% due 09/08/2004 | | | 200 | | | 199 |
1.405% due 09/08/2004 | | | 7,100 | | | 7,080 |
1.430% due 09/08/2004 | | | 3,800 | | | 3,789 |
1.426% due 09/22/2004 | | | 4,700 | | | 4,684 |
1.530% due 10/18/2004 | | | 4,600 | | | 4,578 |
1.530% due 10/20/2004 | | | 4,700 | | | 4,677 |
Federal Home Loan Bank | | | | | | |
1.165% due 07/16/2004 | | | 4,600 | | | 4,598 |
1.240% due 09/01/2004 | | | 4,100 | | | 4,090 |
1.250% due 09/01/2004 | | | 4,500 | | | 4,489 |
Freddie Mac | | | | | | |
1.010% due 07/15/2004 | | | 4,100 | | | 4,098 |
1.200% due 08/09/2004 | | | 4,500 | | | 4,494 |
1.120% due 08/10/2004 | | | 4,300 | | | 4,295 |
1.125% due 08/10/2004 | | | 4,200 | | | 4,195 |
1.205% due 08/20/2004 | | | 4,500 | | | 4,492 |
1.175% due 08/24/2004 | | | 4,400 | | | 4,392 |
1.180% due 08/24/2004 | | | 11,900 | | | 11,879 |
1.210% due 08/31/2004 | | | 4,500 | | | 4,489 |
1.215% due 08/31/2004 | | | 4,000 | | | 3,990 |
1.315% due 09/07/2004 | | | 3,400 | | | 3,391 |
1.320% due 09/07/2004 | | | 4,500 | | | 4,488 |
1.200% due 09/08/2004 | | | 2,100 | | | 2,094 |
1.200% due 09/14/2004 | | | 4,000 | | | 3,988 |
1.410% due 09/14/2004 | | | 4,500 | | | 4,486 |
1.440% due 09/14/2004 | | | 4,500 | | | 4,486 |
1.445% due 09/14/2004 | | | 7,900 | | | 7,876 |
1.435% due 09/21/2004 | | | 12,600 | | | 12,557 |
1.280% due 09/22/2004 | | | 1,300 | | | 1,295 |
1.465% due 09/28/2004 | | | 2,700 | | | 2,690 |
1.300% due 09/30/2004 | | | 4,400 | | | 4,383 |
1.560% due 10/20/2004 | | | 4,700 | | | 4,677 |
General Electric Capital Corp. | | | | | | |
1.050% due 07/07/2004 | | | 1,200 | | | 1,200 |
1.040% due 07/08/2004 | | | 4,400 | | | 4,399 |
1.060% due 07/12/2004 | | | 900 | | | 900 |
1.140% due 09/03/2004 | | | 100 | | | 100 |
1.300% due 09/08/2004 | | | 3,400 | | | 3,391 |
HBOS Treasury Services PLC | | | | | | |
1.055% due 07/16/2004 | | | 8,000 | | | 7,996 |
1.095% due 08/02/2004 | | | 100 | | | 100 |
1.250% due 08/25/2004 | | | 300 | | | 299 |
1.250% due 08/31/2004 | | | 100 | | | 100 |
1.335% due 09/09/2004 | | | 1,900 | | | 1,895 |
1.290% due 09/24/2004 | | | 200 | | | 199 |
1.640% due 10/26/2004 | | | 1,000 | | | 995 |
ING U.S. Funding LLC | | | | | | |
1.275% due 09/01/2004 | | | 6,100 | | | 6,085 |
1.345% due 09/09/2004 | | | 1,000 | | | 997 |
Nestle Capital Corp. | | | | | | |
1.240% due 09/14/2004 | | | 4,400 | | | 4,386 |
Pfizer, Inc. | | | | | | |
1.160% due 07/30/2004 | | | 2,900 | | | 2,897 |
Rabobank USA Financial Corp. | | | | | | |
1.240% due 09/13/2004 | | | 8,500 | | | 8,474 |
Royal Bank of Scotland | | | | | | |
1.090% due 08/06/2004 | | | 4,900 | | | 4,895 |
1.235% due 09/13/2004 | | | 1,600 | | | 1,595 |
Shell Finance (UK) PLC | | | | | | |
1.435% due 08/27/2004 | | | 2,700 | | | 2,694 |
Stadshypoket Delaware, Inc. 1.490% due 09/23/2004 | | | 400 | | | 399 |
Svenska Handelsbanken | | | | | | |
1.075% due 07/28/2004 | | | 1,300 | | | 1,299 |
1.250% due 09/01/2004 | | | 12,100 | | | 12,070 |
1.390% due 09/13/2004 | | | 200 | | | 199 |
TotalFinaElf Capital S.A. | | | | | | |
1.420% due 07/01/2004 | | | 9,700 | | | 9,700 |
UBS Finance, Inc. | | | | | | |
1.040% due 07/06/2004 | | | 2,300 | | | 2,300 |
1.340% due 09/08/2004 | | | 600 | | | 598 |
| | | | | | | |
| | |
1.245% due 09/13/2004 | | $ | 100 | | $ | 100 | |
1.270% due 09/20/2004 | | | 200 | | | 199 | |
Westpac Capital Corp. | | | | | | | |
1.030% due 07/07/2004 | | | 400 | | | 400 | |
1.385% due 09/10/2004 | | | 5,600 | | | 5,584 | |
Westpac Trust Securities NZ Ltd. | | | | |
1.030% due 07/09/2004 | | | 300 | | | 300 | |
1.220% due 08/25/2004 | | | 400 | | | 399 | |
| | | | | |
|
|
|
| | | | | | | 392,503 | |
| | | | | |
|
|
|
| | |
Repurchase Agreement 0.2% | | | | | | | |
State Street Bank | | | | | | | |
0.800% due 07/01/2004 | | | 822 | | | 822 | |
| | | | | |
|
|
|
(Dated 06/30/2004. Collateralized by Fannie Mae 2.875% due 10/15/2005 valued at $838.
Repurchase proceeds are $822.) | |
| | |
U.S. Treasury Bills 0.1% | | | | | | | |
1.354% due 09/16/2004 (c)(d) | | | 500 | | | 498 | |
| | | | | |
|
|
|
Total Short-Term Instruments (Cost $410,480) | | | | | | 410,423 | |
| | | | | |
|
|
|
| |
Total Investments 198.2% | | $ | 935,373 | |
(Cost $931,094) | | | | | | | |
| |
Written Options (f) (0.0%) | | | (16 | ) |
(Premiums $558) | | | | | | | |
| |
Other Assets and Liabilities (Net) (98.2%) | | | (463,430 | ) |
| | | | | |
|
|
|
| | |
Net Assets 100.0% | | | | | $ | 471,927 | |
| | | | | |
|
|
|
Notes to Schedule of Investments (amounts in thousands, except number of contracts):
(a) Variable rate security.
(b) Principal amount of security is adjusted for inflation.
(c) Securities with an aggregate market value of $199 have been segregated with the custodian to cover margin
requirements for the following open futures contracts at June 30, 2004:
| | | | | | | | |
| Type | | Expiration
Month | | # of
Contracts | | Unrealized
(Depreciation) | |
U.S. Treasury 10-Year Note Long Futures | | 09/2004 | | 8 | | $ | (15 | ) |
| | | | | | |
|
|
|
(d) Securities are grouped by coupon or range of coupons and represent a range of maturities.
(e) Swap agreements outstanding at June 30, 2004:
| | | | | | | | | |
Type | |
| Notional
Amount | | | |
| Unrealized
Appreciation/
(Depreciation) |
|
| Receive a fixed rate equal to 4.000% and pay floating rate based on 6-month EC-LIBOR. | | | | | | |
| Counterparty: Barclays Bank PLC | | | | | | |
| Exp. 06/17/2010 | | | EC 9,400 | | | | $ | (49 | ) |
| |
| Received a fixed rate equal to 5.000% and pay floating rate based on 6-month EC-LIBOR. | | | | |
| Counterparty: Barclays Bank PLC | | | | | | |
| Exp. 06/17/2015 | | | 27,700 | | | | | (126 | ) |
| | | | | | | | | |
| | |
| Receive a fixed rate equal to 5.000% and pay floating rate based on 6-month EC-LIBOR. | | | | | | |
| Counterparty: UBS Warburg LLC | | | | | | |
| Exp. 06/17/2015 | | | EC 8,000 | | | | $ | (19 | ) |
| | |
| Receive floating rate based on 3-month LIBOR and pay a fixed rate equal to 5.000%. | | | | | | |
| Counterparty: Bank of America | | | | | | |
| Exp. 12/15/2014 | | $ | 17,700 | | | | | (277 | ) |
| |
| Receive floating rate based on 3-month LIBOR and pay a fixed rate equal to 5.000%. | | | | |
| Counterparty: J.P. Morgan Chase & Co. | | | | | | |
| Exp. 12/15/2014 | | | 6,000 | | | | | (96 | ) |
| |
| Receive floating rate based on 3-month LIBOR and pay a fixed rate equal to 5.000%. | | | | |
| Counterparty: Goldman Sachs & Co. | | | | | | |
| Exp. 12/15/2014 | | | 12,000 | | | | | (176 | ) |
| |
| Receive floating rate based on 3-month LIBOR and pay a fixed rate equal to 5.000%. | | | | |
| Counterparty: UBS Warburg LLC | | | | | | |
| Exp. 12/15/2014 | | | 6,000 | | | | | (90 | ) |
| |
| Receive floating rate based on 3-month LIBOR and pay a fixed rate equal to 6.000%. | | | | |
| Counterparty: Bank of America | | | | | | |
| Exp. 12/18/2033 | | | 5,000 | | | | | 92 | |
| |
| Receive floating rate based on 3-month LIBOR and pay a fixed rate equal to 6.000%. | | | | |
| Counterparty: UBS Warburg LLC | | | | | | |
| Exp. 12/18/2033 | | | 4,600 | | | | | 50 | |
| | | | | | | | $ | (691 | ) |
| | | | | | |
| See accompanying notes | | June 30, 2004 | | Semi-Annual Report | | 9 |
Schedule of Investments (Cont.)
Real Return Portfolio
June 30, 2004 (Unaudited)
(f) Premiums received on written options:
| | | | | | | | | | | | | | | | | | | | | | | | |
| Name of Issuer | | Counterparty | | | | Exercise
Rate | | | | | Expiration
Date | | | | Notional
Amount | | | | Premium | | Value |
| Call - OTC 7-Year Interest Rate Swap | | J.P. Morgan Chase & Co. | | | | 4.000 | %** | | | | 10/07/2004 | | | | $ | 6,400 | | | | $ | 71 | | $ | 3 |
| Call - OTC 7-Year Interest Rate Swap | | J.P. Morgan Chase & Co. | | | | 3.800 | %** | | | | 10/07/2004 | | | | | 9,300 | | | | | 81 | | | 2 |
| Put - OTC 7-Year Interest Rate Swap | | J.P. Morgan Chase & Co. | | | | 6.500 | %* | | | | 10/07/2004 | | | | | 6,400 | | | | | 38 | | | 1 |
| Put - OTC 7-Year Interest Rate Swap | | J.P. Morgan Chase & Co. | | | | 6.000 | %* | | | | 10/07/2004 | | | | | 9,300 | | | | | 91 | | | 6 |
| Call - OTC 10-Year Interest Rate Swap | | J.P. Morgan Chase & Co. | | | | 4.000 | %** | | | | 11/02/2004 | | | | | 16,300 | | | | | 144 | | | 2 |
Put - OTC 10-Year Interest Rate Swap | | J.P. Morgan Chase & Co. | | | | 7.000 | %* | | | | 11/02/2004 | | | | | 16,300 | | | | | 133 | | | 2 |
| | | | | | | | | | | | | | | | | | | | | $ | 558 | | $ | 16 |
| | | | | | | | | | | | | | | | | | | | | | | | | |
| | | | | | | | |
* The Portfolio will pay a floating rate based on 3-month LIBOR. | | | | | | | | | | | | | | | | | | | | |
** The Portfolio will receive a floating rate based on 3-month LIBOR. | | | | | | | | | | | | | | | | | | | | |
| | | | | | | | | | | | | | | | | | | | | | | | | |
| (g) Short sales open at June 30, 2004 were as follows: | | | | | | | | | | | | | | | | | | | | | | |
| | | | | | | | | | | | | | | | | | | | | | | | | |
| Type | | | | | | Coupon (%) | | | | | Maturity | | | | Par | | | | Value | | Proceeds |
Republic of Italy | | | | | | 4.250 | | | | | 08/01/2014 | | | | $ | 2,000 | | | | $ | 2,397 | | $ | 2,373 |
U.S. Treasury Note | | | | | | 5.750 | | | | | 08/15/2010 | | | | | 3,100 | | | | | 3,381 | | | 3,328 |
U.S. Treasury Note | | | | | | 3.625 | | | | | 05/15/2013 | | | | | 300 | | | | | 281 | | | 276 |
U.S. Treasury Note | | | | | | 4.250 | | | | | 08/15/2013 | | | | | 4,400 | | | | | 4,297 | | | 4,247 |
| | | | | | | | | | | | | | | | | | | | | $ | 10,356 | | $ | 10,224 |
| | | | | | | | | | | | | | | | | | | | | | | | | |
| (h) Forward foreign currency contracts outstanding at June 30, 2004: | | | | | | | | | | | | | | | | | | | | |
| | | | | | | | | | | | | | | | | | | | | | | | | |
| Type | | Currency | | | | Principal
Amount
Covered by
Contract | | | | | Settlement
Month | | | | Unrealized
Appreciation | | | | Unrealized
(Depreciation) | | Net
Unrealized
Appreciation |
Sell | | EC | | | | 2,780 | | | | | 07/2004 | | | | $ | 40 | | | | $ | 0 | | $ | 40 |
(i) Principal amount denoted in indicated currency:
(j) Indicates a fair-valued security which has not been valued utilizing an independent quote but has been valued in good faith pursuant to guidelines established by the Board of Trustees. The aggregate value of fair-valued securities is $6,200, which represents 1.31% of net assets.
| | | | | | |
| 10 | | Semi-Annual Report | | June 30, 2004 | | See accompanying notes |
Notes to Financial Statements
June 30, 2004 (Unaudited)
1. Organization
The Real Return Portfolio (the “Portfolio”) is a series of the PIMCO Variable Insurance Trust (the “Trust”). The Trust is registered under the Investment Company Act of 1940 (the “Act”), as amended, as an open-end investment company organized as a Delaware business trust on October 3, 1997. The Portfolio offers two classes of shares: Institutional and Administrative. Each share class has identical voting rights (except that shareholders of a class have exclusive voting rights regarding any matter relating solely to that class of shares). Information presented in these financial statements pertains to the Administrative Class of the Portfolio. Certain detailed financial information for the Institutional Class is provided separately and is available upon request. The Trust is designed to be used as an investment vehicle by Separate Accounts of insurance companies that fund variable annuity contracts and variable life insurance policies and by qualified pension and retirement plans. The Portfolio commenced operations on September 30, 1999.
2. Significant Accounting Policies
The following is a summary of significant accounting policies consistently followed by the Trust in the preparation of its financial statements in conformity with accounting principles generally accepted in the United States of America. The preparation of financial statements in accordance with accounting principles generally accepted in the United States of America requires management to make estimates and assumptions that affect the reported amounts and disclosures in the financial statements. Actual results could differ from those estimates.
Security Valuation. Portfolio securities and other financial instruments for which market quotations are readily available are stated at market value. Portfolio securities and other financial instruments for which market quotes are not readily available are valued at fair value, as determined in good faith and pursuant to guidelines established by the Board of Trustees, including certain fixed income securities which may be valued with reference to securities whose prices are more readily obtainable. Market value is determined at the close of regular trading (normally, 4:00 p.m., Eastern Time) on the New York Stock Exchange on each day the New York Stock Exchange is open, or if no sales are reported, as is the case for most securities traded over-the-counter, the mean between representative bid and asked quotations obtained from a quotation reporting system or from established market makers. The prices of certain portfolio securities or other financial instruments may be determined at a time prior to the close of regular trading on the New York Stock Exchange. Fair valuation may be used if significant events occur after the close of the relevant markets and prior to the close of regular trading on the New York Stock Exchange that materially affect the values of such securities or financial instruments. Fixed income securities are normally valued on the basis of quotes obtained from brokers and dealers or pricing services. Certain fixed income securities purchased on a delayed delivery basis are marked to market daily until settlement at the forward settlement value. Short-term investments, which mature in 60 days or less are valued at amortized cost, which approximates market value. Exchange traded options, futures and options on futures are valued at the settlement price determined by the relevant exchange. Prices may be obtained from independent pricing services which use information provided by market makers or estimates of market values obtained from yield data relating to investments or securities with similar characteristics. The prices used by the Portfolio may differ from the value that would be realized if the securities were sold and the differences could be material to the financial statements.
Securities Transactions and Investment Income. Securities transactions are recorded as of the trade date. Securities purchased or sold on a when-issued or delayed delivery basis may be settled a month or more after the trade date. Realized gains and losses from securities sold are recorded on the identified cost basis. Dividend income is recorded on the ex-dividend date, except certain dividends from foreign securities where the ex-dividend date may have passed, are recorded as soon as the Portfolio is informed of the ex-dividend date. Interest income, adjusted for the accretion of discounts and amortization of premiums, is recorded on the accrual basis. Paydowns gains and losses on mortgage- and asset-backed securities are recorded as adjustments to interest income in the Statement of Operations.
Dividends and Distributions to Shareholders. Dividends from net investment income, if any, are declared on each day the Trust is open for business and are distributed to shareholders monthly. All dividends are reinvested in additional shares of the Portfolio. Net realized capital gains earned by the Portfolio, if any, will be distributed no less frequently than once each year.
Income dividends and capital gain distributions are determined in accordance with income tax regulations which may differ from accounting principles generally accepted in the United States of America. These differences are primarily due to differing treatments for such items as wash sales, foreign currency transactions, net operating losses, notional principal contracts, certain asset-backed securities, certain futures and forward contracts, tax straddles, and capital loss carryforwards.
Distributions classified as a tax basis return of capital, if any, are reflected in the accompanying Statements of Changes in Net Assets and have been reclassified to paid in capital. In addition, other amounts have been reclassified between undistributed net investment income, accumulated undistributed net realized gains or losses and/or paid in capital to more appropriately conform financial accounting to tax characterizations of dividend distributions.
Multiclass Operations. Each class offered by the Trust has equal rights as to assets. Income, non-class specific expenses, and realized and unrealized capital gains and losses are allocated to each class of shares based on the relative net assets of each class.
Delayed Delivery Transactions. The Portfolio may purchase or sell securities on a when-issued or delayed delivery basis. These transactions involve a commitment by the Portfolio to purchase or sell
| | | | |
| June 30, 2004 | | Semi-Annual Report | | 11 |
Notes to Financial Statements (Cont.)
June 30, 2004 (Unaudited)
securities for a predetermined price or yield, with payment and delivery taking place beyond the customary settlement period. When delayed delivery purchases are outstanding, the Portfolio will designate liquid assets in an amount sufficient to meet the purchase price. When purchasing a security on a delayed delivery basis, the Portfolio assumes the rights and risks of ownership of the security, including the risk of price and yield fluctuations, and takes such fluctuations into account when determining its net asset value. The Portfolio may dispose of or renegotiate a delayed delivery transaction after it is entered into, and may sell when-issued securities before they are delivered, which may result in a capital gain or loss. When the Portfolio has sold a security on a delayed delivery basis, the Portfolio does not participate in future gains and losses with respect to the security.
Federal Income Taxes. The Portfolio intends to qualify as a regulated investment company and distribute all of its taxable income and net realized gains, if applicable, to shareholders. Accordingly, no provision for Federal income taxes has been made.
Foreign Currency. The accounting records of the Portfolio are maintained in U.S. dollars. The market values of foreign securities, currency holdings and other assets and liabilities are translated into U.S. dollars based on the current exchange rates each business day. Fluctuations in the value of these assets and liabilities resulting from changes in exchange rates are recorded as unrealized foreign currency gains or losses. Realized gains or losses and unrealized appreciation or depreciation on investment securities and income and expenses are translated on the respective dates of such transactions. The effect of changes in foreign currency exchange rates on investments in securities are not segregated in the Statement of Operations from the effects of changes in market prices of those securities, but are included with the net realized and unrealized gain or loss on investment securities.
Forward Currency Transactions. The Portfolio may enter into forward currency contracts and forward cross-currency contracts in connection with settling planned purchases or sales of securities, to hedge the currency exposure associated with some or all of the Portfolio’s securities or as a part of an investment strategy. A forward currency contract is an agreement between two parties to buy and sell a currency at a set price on a future date. The market value of a forward currency contract fluctuates with changes in forward currency exchange rates. Forward currency contracts are marked to market daily and the change in value is recorded by the Portfolio as an unrealized gain or loss. Realized gains or losses equal to the difference between the value of the contract at the time it was opened and the value at the time it was closed are recorded upon delivery or receipt of the currency or, if a forward currency contract is offset by entering into another forward currency contract with the same broker, upon settlement of the net gain or loss. These contracts may involve market risk in excess of the unrealized gain or loss reflected in the Portfolio’s Statement of Assets and Liabilities. In addition, the Portfolio could be exposed to risk if the counterparties are unable to meet the terms of the contracts or if the value of the currency changes unfavorably to the U.S. dollar.
Futures Contracts. The Portfolio is authorized to enter into futures contracts. The Portfolio may use futures contracts to manage its exposure to the securities markets or to movements in interest rates and currency values. The primary risks associated with the use of futures contracts are the imperfect correlation between the change in market value of the securities held by the Portfolio and the prices of futures contracts, the possibility of an illiquid market, and the inability of the counterparty to meet the terms of the contract. Futures contracts are valued based upon their quoted daily settlement prices. Upon entering into a futures contract, the Portfolio may be required to deposit with its custodian, in a segregated account in the name of the futures broker, an amount of cash or U.S. Government and Agency Obligations in accordance with the initial margin requirements of the broker or exchange. Futures contracts are marked to market daily and an appropriate payable or receivable for the change in value (“variation margin”) is recorded by the Portfolio. Gains or losses are recognized but not considered realized until the contracts expire or are closed. Futures contracts involve, to varying degrees, risk of loss in excess of the variation margin disclosed in the Statement of Assets and Liabilities.
Inflation-Indexed Bonds. The Portfolio may invest in inflation-indexed bonds. Inflation-indexed bonds are fixed income securities whose principal value is periodically adjusted to the rate of inflation. The interest rate on these bonds is generally fixed at issuance at a rate lower than typical bonds. Over the life of an inflation-indexed bond, however, interest will be paid based on a principal value, which is adjusted for inflation. Any increase in the principal amount of an inflation-indexed bond will be included as interest income in the Statement of Operations, even though investors do not receive their principal until maturity.
Options Contracts. The Portfolio may write call and put options on futures, swaps, securities or currencies it owns or in which it may invest. Writing put options tends to increase the Portfolio’s exposure to the underlying instrument. Writing call options tends to decrease the Portfolio’s exposure to the underlying instrument. When the Portfolio writes a call or put option, an amount equal to the premium received is recorded as a liability and subsequently marked to market to reflect the current value of the option written. These liabilities are reflected as written options outstanding in the Statement of Assets and Liabilities. Payments received or made, if any, from writing options with premiums to be determined on a future date are reflected as such on the Statement of Assets and Liabilities. Premiums received from writing options which expire are treated as realized gains. Premiums received from writing options which are exercised or closed are added to the proceeds or offset against amounts paid on the underlying future, swap, security or currency transaction to determine the realized gain or loss. The Portfolio as a writer of an option has no control over whether the underlying future, swap, security or currency may be sold (call) or purchased (put) and as a result bears the market risk of an unfavorable change in the price of the future, swap, security or currency underlying the written option. There is the risk the Portfolio may not be able to enter into a closing transaction because of an illiquid market.
| | | | |
| 12 | | Semi-Annual Report | | June 30, 2004 |
The Portfolio may also purchase put and call options. Purchasing call options tends to increase the Portfolio’s exposure to the underlying instrument. Purchasing put options tends to decrease the Portfolio’s exposure to the underlying instrument. The Portfolio pays a premium which is included in the Portfolio’s Statement of Assets and Liabilities as an investment and subsequently marked to market to reflect the current value of the option. Premiums paid for purchasing options which expire are treated as realized losses. The risk associated with purchasing put and call options is limited to the premium paid. Premiums paid for purchasing options which are exercised or closed are added to the amounts paid or offset against the proceeds on the underlying future, swap, security or currency transaction to determine the realized gain or loss.
Repurchase Agreements. The Portfolio may engage in repurchase transactions. Under the terms of a typical repurchase agreement, the Portfolio takes possession of an underlying debt obligation subject to an obligation of the seller to repurchase, and the Portfolio to resell, the obligation at an agreed-upon price and time. The market value of the collateral must be equal at all times to the total amount of the repurchase obligations, including interest. Generally, in the event of counterparty default, the Portfolio has the right to use the collateral to offset losses incurred.
Short Sales. The Portfolio may enter into short sales transactions. A short sale is a transaction in which the Portfolio sells securities it does not own in anticipation of a decline in the market price of the securities. The Portfolio is obligated to deliver securities at the market price at the time the short position is closed. Possible losses from short sales may be unlimited, whereas losses from purchases cannot exceed the total amount invested.
Swap Agreements. The Portfolio may invest in swap agreements. A swap is an agreement to exchange the return generated by one instrument for the return generated by another instrument. The Portfolio may enter into interest rate, total return, forward spread lock, and credit default swap agreements to manage its exposure to interest rates and credit risk.
Interest rate swap agreements involve the exchange by the Portfolio with another party of their respective commitments to pay or receive interest, e.g., an exchange of floating rate payments for fixed rate payments with respect to the notional amount of principal.
Total return swap agreements involve commitments to pay interest in exchange for a market-linked return, both based on notional amounts. To the extent the total return of the security or index underlying the transaction exceeds or falls short of the offsetting interest rate obligation, the Portfolio will receive a payment from or make a payment to the counterparty.
Forward spread lock swap agreements involve commitments to pay or receive a settlement amount calculated as the difference between the swap spread and a fixed spread, multiplied by the notional amount times the duration of the swap. The swap spread is the difference between the benchmark swap rate (market rate) and the specific Treasury rate.
In a credit default swap, one party makes a stream of payments to another party in exchange for the right to receive a specified return in the event of a default by a third party, typically corporate issues or sovereign issues of an emerging country, on its obligation. The Portfolio may use credit default swaps to provide a measure of protection against defaults of sovereign issuers (i.e., to reduce risk where the Portfolio owns or has exposure to the sovereign issuer) or to take an active long or short position with respect to the likelihood of a particular issuer’s default.
Swaps are marked to market daily based upon quotations from market makers and the change in value, if any, is recorded as unrealized gain or loss in the Statement of Operations. Payments received or made at the beginning of the measurement period are reflected as such on the Statement of Assets and Liabilities. A liquidation payment received or made at the termination of the swap is recorded as realized gain or loss in the Statement of Operations. Net periodic payments received by the Portfolio are included as part of realized gain (loss) on the Statement of Operations. Entering into these agreements involves, to varying degrees, elements of credit, market and documentation risk in excess of the amounts recognized on the Statement of Assets and Liabilities. Such risks involve the possibility that there will be no liquid market for these agreements, that the counterparty to the agreements may default on its obligation to perform or disagree as to the meaning of contractual terms in the agreements, and that there may be unfavorable changes in interest rates.
As a result of a FASB Emerging Issues Task Force (“EITF”) consensus, No. 03-11, and related SEC staff guidance, the Portfolio has reclassified periodic payments made or received under swap agreements, which were previously included within miscellaneous income, to a component of realized gain(loss) in the Statement of Operations. For consistency, similar reclassifications have been made to amounts appearing in the previous year’s Statement of Changes in Net Assets and the per share amounts in the prior year financial highlights. Prior year net investment income ratios in the financial highlights have also been modified accordingly. There were no reclassifications to any period presented as a result of this change. There is no effect on the Portfolio’s net asset value, either in total or per share, or its total increase(decrease) in net assets from operations during any period
3. Fees, Expenses, and Related Party Transactions
Investment Advisory Fee. Pacific Investment Management Company LLC (“PIMCO”) is a majority owned subsidiary partnership of Allianz Dresdner Asset Management of America L.P. and serves as investment adviser (the “Adviser”) to the Trust, pursuant to an investment advisory contract. The Adviser receives a monthly fee at an annual rate based on average daily net assets of the Portfolio. The Advisory Fee is charged at an annual rate of 0.25%.
Administration Fee. PIMCO serves as administrator (the “Administrator”), and provides administrative services to the Trust for which it receives a monthly administrative fee based on average
| | | | |
| June 30, 2004 | | Semi-Annual Report | | 13 |
Notes to Financial Statements (Cont.)
June 30, 2004 (Unaudited)
daily net assets of the Portfolio. The Administration Fee is charged at the annual rate of 0.25%.
Servicing Fee. PA Distributors LLC (“PAD”), formerly known as PIMCO Advisors Distributors LLC, is an indirect wholly-owned subsidiary of Allianz Dresdner Asset Management of America L.P. and serves as the distributor of the Trust’s shares. The Trust is permitted to reimburse PAD on a quarterly basis, out of the Administrative Class assets of the Portfolio in the amount of 0.15% on an annual basis of the average daily net assets of that class, for payments made to financial intermediaries that provide services in connection with the distribution of shares or administration of plans or programs that use Portfolio shares as their funding medium. The effective rate paid to PAD was 0.15% during current fiscal year.
Expenses. The Trust is responsible for the following expenses: (i) salaries and other compensation of any of the Trust’s executive officers and employees who are not officers, directors, stockholders or employees of PIMCO or its subsidiaries or affiliates; (ii) taxes and governmental fees; (iii) brokerage fees and commissions and other portfolio transaction expenses; (iv) the cost of borrowing money, including interest expense and bank overdraft charges; (v) fees and expenses of the Trustees who are not “interested persons” of PIMCO or the Trust, and any counsel retained exclusively for their benefit; (vi) extraordinary expenses, including costs of litigation and indemnification expenses; (vii) organization expenses and (viii) any expenses allocated or allocable to a specific class of shares, which include service fees payable with respect to the Administrative Class shares and may include certain other expenses as permitted by the Trust’s Multiple Class Plan adopted pursuant to Rule 18f-3 under the Act and subject to review and approval by the Trustees. The ratio of expenses to average net assets per share class, as disclosed in Financial Highlights, may differ from the annual portfolio operating expenses per share class as disclosed in the Prospectus for the reasons set forth above.
PIMCO has agreed to waive a portion of its administrative fees to the extent that the payment of the Portfolio’s pro rata share of organization expenses and Trustee fees cause the actual expense ratio to rise above the rates disclosed in the then-current prospectus plus 0.49 basis points as set forth below (calculated as a percentage of the Portfolio’s average daily net assets attributable to each class):
| | | |
Institutional Class | | 0.50 | % |
Administrative Class | | 0.60 | % |
PIMCO may be reimbursed for these waived amounts in future periods, not to exceed thirty-six months.
Each unaffiliated Trustee receives an annual retainer of $4,000, plus $1,500 for each Board of Trustees meeting attended in person and $250 for each meeting attended telephonically, plus reimbursement of related expenses. In addition, each committee chair receives an additional annual retainer of $500. These expenses are allocated on a pro-rata basis to each Portfolio of the Trust according to its respective net assets.
4. Purchases and Sales of Securities
The length of time a Portfolio has held a particular security is not generally a consideration in investment decisions. A change in the securities held by a Portfolio is known as “portfolio turnover.” The Portfolio may engage in frequent and active trading of portfolio securities to achieve its investment objective, particularly during periods of volatile market movements. High portfolio turnover (e.g., over 100%) involves correspondingly greater expenses to the Portfolio, including brokerage commissions or dealer mark-ups and other transaction costs on the sale of securities and reinvestments in other securities. Such sales may also result in realization of taxable capital gains, including short-term capital gains (which are generally taxed at ordinary income tax rates). The trading costs and tax effects associated with portfolio turnover may adversely affect the Portfolio’s performance.
Purchases and sales of securities (excluding short-term investments) for the period ended June 30, 2004 were as follows (amounts in thousands):
| | | | | | |
| U.S. Government/Agency | | All Other |
| Purchases | | Sales | | Purchases | | Sales |
| $ 2,823,602 | | $ 2,675,437 | | $ 61,360 | | $ 46,138 |
5. Transactions in Written Call and Put Options
Transactions in written call and put options were as follows (amounts in thousands):
| | | |
| | | | Premium |
Balance at 12/31/2003 | | $ | 558 |
| Exercised | | | 0 |
| Balance at 06/30/2004 | | | $558 |
6. Federal Income Tax Matters
At June 30, 2004, the aggregate cost of investments was the same for federal income tax and financial statement purposes. The net unrealized appreciation (depreciation) of investment securities for federal income tax purposes is as follows (amounts in thousands):
| | | | | | |
Aggregate Gross Unrealized Appreciation | | Aggregate Gross
Unrealized
(Depreciation) | | Net Unrealized
Appreciation |
| $ 4,641 | | $ | (362) | | $ | 4,279 |
| | | | |
| 14 | | Semi-Annual Report | | June 30, 2004 |
7. Shares of Beneficial Interest
The Trust may issue an unlimited number of shares of beneficial interest with a $.001 par value. Changes in shares of beneficial interest were as follows (shares and amounts in thousands):
| | | | | | | | | | | | | | |
| | | Six Months Ended 06/30/2004 | | | Year Ended 12/31/2003 | |
| | | Shares | | | Amount | | | Shares | | | Amount | |
Receipts for shares sold | | | | | | | | | | | | | | |
| | | | |
Institutional Class | | 616 | | | $ | 7,848 | | | 2,134 | | | $ | 25,638 | |
Administrative Class | | 16,643 | | | | 210,240 | | | 21,042 | | | | 258,368 | |
| | | | |
Issued as reinvestment of distributions | | | | | | | | | | | | | | |
| | | | |
Institutional Class | | 10 | | | | 123 | | | 74 | | | | 917 | |
Administrative Class | | 102 | | | | 1,288 | | | 755 | | | | 9,318 | |
| | | | |
Cost of shares redeemed | | | | | | | | | | | | | | |
| | | | |
Institutional Class | | (67 | ) | | | (841 | ) | | (62 | ) | | | (751 | ) |
Administrative Class | | (4,240 | ) | | | (53,313 | ) | | (7,171 | ) | | | (87,884 | ) |
| | | | |
Net increase resulting from Portfolio share transactions | | 13,064 | | | $ | 165,345 | | | 16,772 | | | $ | 205,605 | |
The following schedule shows the number of shareholders each owning 5% or more of the Portfolio and the total percentage of the Portfolio held by such shareholders:
| | | | |
| | | Number | | % of Portfolio Held |
Institutional Class | | 1 | | 100 |
Administrative Class | | 5 | | 67 |
8. Regulatory and Litigation Matters
On February 17, 2004, the Attorney General of the State of New Jersey (“New Jersey AG”) filed a complaint against Allianz Dresdner Asset Management of America L.P. (“ADAM”), PA Distributors LLC (formerly known as PIMCO Advisors Distributors LLC) (“PAD”), PEA Capital LLC (formerly known as PIMCO Equity Advisors LLC) (“PEA”), and Pacific Investment Management Company LLC (“PIMCO”) in connection with its investigation into market timing and late trading. The complaint contends that inappropriate trading by shareholders engaged in market timing activity took place in funds in the PIMCO Funds: Multi-Manager Series (“MMS Funds”) and the PIMCO Funds: Pacific Investment Management Series (“PIMS Funds”). On June 1, 2004, the New Jersey AG dismissed PIMCO from the lawsuit.
On the same day as the dismissal of PIMCO from the lawsuit, the New Jersey AG announced that it had reached a settlement agreement with the remaining defendants (“New Jersey Settlement”). In the New Jersey Settlement, ADAM, PAD and PEA agreed, while neither admitting nor denying the allegations or conclusions of law, to: (i) pay New Jersey a civil fine of $15 million and $3 million for investigative costs and further enforcement initiatives; and (ii) implement certain changes in corporate governance.
On May 6, 2004, the Securities and Exchange Commission filed a complaint in the U.S. District Court in the Southern District of New York alleging that PA Fund Management LLC (formerly known as PIMCO Advisors Fund Management LLC) (“PAFM”), PEA, PAD, Stephen J. Treadway (at the time, the chief executive officer of PAFM and PAD as well as chairman of the Board of Trustees of the MMS Funds) and Kenneth W. Corba (the former chief executive officer of PEA and former portfolio manager of the PEA Growth and PEA Growth & Income Funds) had, among other things, violated and/or aided and abetted violations of, various antifraud provisions of the federal securities laws in connection with alleged “market timing” arrangements that improperly allowed certain hedge funds to engage in “market timing” in the PEA Growth Fund, the PEA Opportunity Fund, the PEA Innovation Fund, and the PEA Target Fund. The complaint seeks injunctive relief, disgorgement plus pre-judgment interest, monetary penalties, and an order permanently enjoining the defendants from serving as investment advisers, principal underwriters, officers, directors, or members of any advisory boards to any registered investment companies.
On February 20, 2004, a putative class action lawsuit was filed in the U.S. District Court for the District of New Jersey on behalf of certain shareholders of the PIMCO Funds against ADAM, PAD, PIMCO, PEA, the PIMS Funds, the MMS Funds, the Trust, PIMCO Commercial Mortgage Securities Trust, Inc. and certain other defendants, alleging that inappropriate market timing activity by certain shareholders caused financial injury to the shareholders of those Funds.
| | | | |
| June 30, 2004 | | Semi-Annual Report | | 15 |
Notes to Financial Statements (Cont.)
June 30, 2004 (Unaudited)
The following additional putative class action lawsuits have been filed against the PIMS Funds, the MMS Funds and/or their affiliates, each related to alleged market-timing activity in funds advised by PIMCO or its affiliates: (1) a lawsuit filed in the U.S. District Court for the District of Connecticut on February 27, 2004 (naming as defendants ADAM, PAD, PEA, the PIMS Funds, the MMS Funds, the Trust, PCM and certain other parties); (2) a lawsuit filed in the U.S. District Court for the Central District of California on March 4, 2004 (naming as defendants PIMCO, ADAM, PEA and PAD); (3) a lawsuit filed in the U.S. District Court for the Southern District of New York on March 8, 2004 (naming PIMCO, PAD and certain of their affiliates as defendants); (4) a lawsuit filed in the U.S. District Court for the Southern District of New York, on March 15, 2004 (naming PIMCO as the defendant); (5) two separate lawsuits filed in the U.S. District Court for the Central District of California on March 22, 2004, brought derivatively on behalf of the PIMCO High Yield Fund and the PIMCO Money Market Fund, respectively (each naming ADAM, PAFM and certain other parties as defendants, and the PIMCO Funds as the nominal defendant); (6) a lawsuit filed in the U.S. District Court for the Central District of California, also on March 22, 2004, brought derivatively on behalf of the PIMS Funds and the MMS Funds (naming ADAM, PIMCO, PAD and certain other parties as defendants, and the PIMS Funds and the MMS Funds as nominal defendants); (7) a lawsuit filed in the U.S. District Court for the District of New Jersey on April 20, 2004 (naming ADAM, PAD, the PIMS Funds and certain other parties as defendants); and (8) a lawsuit filed in the U.S. District Court for the Northern District of California on April 28, 2004 (naming ADAM, PIMCO, PAD, PEA and certain other parties as defendants, and the “PIMCO Funds” as nominal defendants). Each complaint for the foregoing putative class actions alleges, among other things, that inappropriate trading by shareholders engaged in market timing activities took place in certain of the funds advised by PIMCO, and each complaint seeks unspecified compensatory damages.
On February 17, 2004, a putative class action lawsuit was filed in the U.S. District Court for the District of Connecticut on behalf of certain shareholders of the PIMCO Funds against ADAM, PEA, PIMCO, PIMS Funds, MMS Funds and certain other defendants, alleging excessive investment advisory fees and the use of brokerage commissions to pay for distribution of fund shares. Three similar putative class action lawsuits were subsequently filed, each in the U.S. District Court for the District of Connecticut on March 1, 2004, April 23, 2004 and May 20, 2004, respectively.
Under Section 9(a) of the 1940 Act, if any of the various lawsuits were to result in a court injunction against PAFM, PEA, PAD, PIMCO, ADAM and/or Mr. Treadway, they and their affiliates would, in the absence of exemptive relief granted by the SEC, be barred from serving as an investment adviser/sub-adviser or principal underwriter for any registered investment company, including the Trust. ADAM and certain of its subsidiaries have responded to inquiries from the SEC concerning the status of the New Jersey Settlement under Section 9(a). If any of PAFM, PEA, PAD, PIMCO or ADAM were subject to an injunction, each of these entities and their affiliates could in turn seek exemptive relief from the SEC, as contemplated by the 1940 Act. There is no assurance, however, that such exemptive relief would be granted. The SEC also has the power by order to prohibit PAFM, PEA, PAD and PIMCO from serving as investment advisers and underwriters, if the SEC finds that such entities willfully violated the federal securities laws in connection with the allegations discussed above or aided or abetted such violations.
PIMCO, PAD and the Trust believe that these developments will not have a material adverse effect on the Portfolios or on PIMCO’s, or PAD’s ability to perform their respective investment advisory or distribution services on behalf of the Portfolios.
| | | | |
| 16 | | Semi-Annual Report | | June 30, 2004 |
Trustees and Officers
Brent R. Harris, Chairman and Trustee
R. Wesley Burns, President and Trustee
E. Philip Cannon, Trustee
Vern O. Curtis, Trustee
J. Michael Hagan, Trustee
William J. Popejoy, Trustee
Garlin G. Flynn, Secretary
John P. Hardaway, Treasurer
Investment Adviser and Administrator
Pacific Investment Management Company LLC
840 Newport Center Drive
Newport Beach, California 92660
Distributor
PA Distributors LLC
2187 Atlantic Street
Stamford, Connecticut 06902
Custodian
State Street Bank & Trust Company
801 Pennsylvania
Kansas City, Missouri 64105
Transfer Agent
Boston Financial Data Services–Midwest
330 W. 9th Street
Kansas City, Missouri 64105
Legal Counsel
Dechert LLP
1775 I Street, N.W.
Washington, D.C. 20006
Independent Registered Public Accounting Firm
PricewaterhouseCoopers LLP
1055 Broadway
Kansas City, Missouri 64105
Information about how the Fund voted proxies relating to portfolio securities held during the year July 1, 2003 through June 30, 2004 will be available no later than August 31, 2004 without charge, upon request, by calling the Trust at 1-800-927-4648 and on the SEC’s website at http://www.sec.gov.
Copies of the written Proxy Policy and the factors that PIMCO may consider in determining how to vote proxies for the Funds are available by calling the Trust at 1-800-927-4648 and on the SEC’s website at http://www.sec.gov.
PIMCO VARIABLE INSURANCE TRUST
840 NEWPORT CENTER DRIVE
NEWPORT BEACH, CA 92660

PIMCO VARIABLE INSURANCE TRUST
LOW DURATION PORTFOLIO
ADMINISTRATIVE CLASS
SEMI-ANNUAL REPORT
June 30, 2004
|
| This material is authorized for use only when preceded or accompanied by the current PIMCO Variable Insurance Trust prospectus. Investors should consider the investment objectives, risks, charges and expenses of Portfolio carefully before investing. This and other information is contained in the Portfolio’s prospectus. Please read the prospectus carefully before you invest or send money. |
Chairman’s Letter
Dear PIMCO Variable Insurance Trust Shareholder:
Bond prices were more volatile during the six-month period ended June 30, 2004. Interest rates rose sharply during the second quarter 2004, causing bonds to give back modest gains from earlier in the year. The Lehman Brothers Aggregate Bond Index, a widely used index for the high-grade bond market, was nearly flat during the first six months of 2004, returning 0.15% after losing 2.44% during the second quarter. The yield on the benchmark ten-year Treasury closed June 30, 2004 at 4.58%, up 0.75% from April 1, 2004, but up only 0.34% from where it began the six-month period on January 1, 2004.
Continued growth in employment convinced the markets that the Federal Reserve would soon begin a long anticipated tightening cycle. On June 30, 2004, the Fed met market expectations by increasing the federal funds rate 0.25%, which was the first rate increase since June 25, 2003. The central bank had held this rate at 1% for more than a year, which generated negative real short-term rates. And on August 10, 2004, the Fed increased the federal funds rate another 0.25% to 1.50%.
Investors that had profited handsomely from borrowing at low short-term rates and investing in higher-yielding longer maturity bonds surrendered some of those profits towards the latter part of the six-month period. Concern that borrowing rates would rise led investors to liquidate long positions and unwind these trades, which caused bond prices to decrease. However, substantial leverage remained among banks, hedge funds, and other investors, making bond markets somewhat vulnerable to additional Fed rate increases. There were also signs of rising inflation, which fueled anxiety that central banks might continue to raise interest rates.
On the following pages you will find a more complete review of the Portfolio in light of financial market activities as well as specific details about the total return investment performance for the six-month period.
We appreciate the trust you have placed in us, and we will continue to focus our efforts to meet your investment needs.
Sincerely,

Brent R. Harris
Chairman
August 11, 2004
| | | | |
| June 30, 2004 | | Semi-Annual Report | | 1 |
Important Information About the Portfolio
We believe that bond funds have an important role to play in a well diversified investment portfolio. It is important to note, however, that in an environment where interest rates may trend upward, rising rates will negatively impact the performance of most bond funds, and fixed income securities held by a fund are likely to decrease in value. The price volatility of fixed income securities can also increase during periods of rising interest rates resulting in increased losses to a fund. Bond funds and individual bonds with a longer duration (a measure of the expected life of a security) tend to be more sensitive to changes in interest rates, usually making them more volatile than securities or funds with shorter durations. The longer-term performance of most bond funds has benefited from capital gains in part resulting from an extended period of declining interest rates. In the event interest rates increase, these capital gains should not be expected to recur.
The Portfolio may be subject to various risks in addition to those described above. Some of these risks may include, but are not limited to, the following: real rate risk, derivative risk, small company risk, foreign security risk, high yield security risk and specific sector investment risks. The Portfolio may use derivative instruments for hedging purposes or as part of an investment strategy. Use of these instruments may involve certain costs and risks such as liquidity risk, interest rate risk, market risk, credit risk, management risk and the risk that a fund could not close out a position when it would be most advantageous to do so. A Portfolio investing in derivatives could lose more than the principal amount invested in these instruments. Investing in non-U.S. securities may entail risk due to non-U.S. economic and political developments; this risk may be enhanced when investing in emerging markets. High-yield bonds typically have a lower credit rating than other bonds. Lower rated bonds generally involve a greater risk to principal than higher rated bonds. Smaller companies may be more volatile than larger companies and may entail more risk. Concentrating investments in individual sectors may add additional risk and volatility compared to a diversified portfolio.
On the performance summary page in this semi-annual report, the Total Return Investment Performance table measures performance assuming that all dividend and capital gain distributions were reinvested. Returns do not reflect the deduction of taxes that a shareholder would pay (i) on Portfolio distributions or (ii) the redemption of Portfolio shares.
An investment in a Portfolio is not a bank deposit and is not guaranteed or insured by the Federal Deposit Insurance Corporation or any other government agency. It is possible to lose money on investments in the Funds.
The following disclosure provides important information regarding the Portfolio’s Expense Example, which appears on the Portfolio’s individual page in this semi-annual report. Please refer to this information when reviewing the Expense Example for the Portfolio.
Example
As a shareholder of the Portfolio, you incur two types of costs: (1) transaction costs, including redemption and exchange fees; and (2) ongoing costs, including advisory and administrative fees; distribution and/or service (12b-1) fees (Administrative Class only); and other Portfolio expenses. The Example is intended to help you understand your ongoing costs (in dollars) of investing in the Portfolio and to compare these costs with the ongoing costs of investing in other mutual funds.
The Example is based on an investment of $1,000 invested at the beginning of the period and held for the entire period indicated, which is from 1/1/04 to 6/30/04.
Actual Expenses
The information in the table under the heading “Actual Performance” provides information about actual account values and actual expenses. You may use the information in these columns, together with the amount you invested, to estimate the expenses that you paid over the period. Simply divide your account value by $1,000.00 (for example, an $8,600.00 account value divided by $1,000 = 8.60), then multiply the result by the number in the appropriate column for your share class, in the row entitled “Expenses Paid During Period” to estimate the expenses you paid on your account during this period.
Hypothetical Example for Comparison Purposes
The information in the table under the heading “Hypothetical Performance (5% return before expenses)” provides information about hypothetical account values and hypothetical expenses based on the Portfolio’s actual expense ratio and an assumed rate of return of 5% per year before expenses, which is not the Portfolio’s actual return. The hypothetical account values and expenses may not be used to estimate the actual ending account balance or expenses you paid for the period. You may use this information to compare the ongoing costs of investing in the Portfolio and other portfolios. To do so, compare this 5% hypothetical example with the 5% hypothetical examples that appear in the shareholder reports of the other portfolios.
Please note that the expenses shown in the table are meant to highlight your ongoing costs only and do not reflect any transactional costs. Therefore, the information under the heading “Hypothetical Performance (5% return before expenses)” is useful in comparing ongoing costs only, and will not help you determine the relative total costs of owning different portfolios. In addition, if these transactional costs were included, your costs would have been higher.
PIMCO Variable Insurance Trust is distributed by PA Distributors LLC, 2187 Atlantic Street, Stamford, CT 06902.
| | | | |
| 2 | | Semi-Annual Report | | June 30, 2004 |
Low Duration Portfolio
CUMULATIVE RETURNS THROUGH JUNE 30, 2004
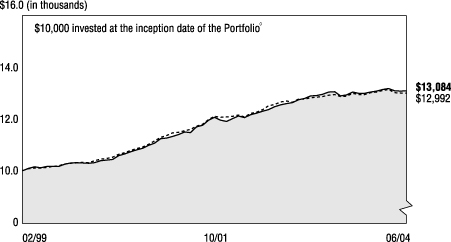
[CHART]
Low Duration Merrill Lynch
Portfolio Admin. Class 1-3 Year Treasury Index
---------------------- -----------------------
02/28/1999 $10,000 $10,000
03/31/1999 $10,082 $10,070
04/30/1999 $10,151 $10,102
05/31/1999 $10,116 $10,095
06/30/1999 $10,164 $10,127
07/31/1999 $10,165 $10,159
08/31/1999 $10,162 $10,188
09/30/1999 $10,243 $10,255
10/31/1999 $10,293 $10,282
11/30/1999 $10,303 $10,301
12/31/1999 $10,292 $10,316
01/31/2000 $10,290 $10,312
02/29/2000 $10,308 $10,381
03/31/2000 $10,386 $10,445
04/30/2000 $10,406 $10,472
05/31/2000 $10,432 $10,516
06/30/2000 $10,584 $10,625
07/31/2000 $10,646 $10,692
08/31/2000 $10,727 $10,771
09/30/2000 $10,806 $10,848
10/31/2000 $10,859 $10,906
11/30/2000 $10,971 $11,009
12/31/2000 $11,054 $11,141
01/31/2001 $11,234 $11,280
02/28/2001 $11,251 $11,354
03/31/2001 $11,314 $11,448
04/30/2001 $11,395 $11,479
05/31/2001 $11,488 $11,544
06/30/2001 $11,464 $11,583
07/31/2001 $11,681 $11,713
08/31/2001 $11,754 $11,780
09/30/2001 $11,949 $11,974
10/31/2001 $12,055 $12,087
11/30/2001 $11,947 $12,061
12/31/2001 $11,896 $12,065
01/31/2002 $12,008 $12,090
02/28/2002 $12,101 $12,148
03/31/2002 $12,043 $12,066
04/30/2002 $12,153 $12,201
05/31/2002 $12,218 $12,250
06/30/2002 $12,294 $12,353
07/31/2002 $12,355 $12,503
08/31/2002 $12,464 $12,546
09/30/2002 $12,530 $12,650
10/31/2002 $12,587 $12,679
11/30/2002 $12,625 $12,641
12/31/2002 $12,735 $12,759
01/31/2003 $12,777 $12,758
02/28/2003 $12,876 $12,811
03/31/2003 $12,889 $12,835
04/30/2003 $12,941 $12,859
05/31/2003 $13,027 $12,907
06/30/2003 $13,043 $12,927
07/31/2003 $12,883 $12,856
08/31/2003 $12,914 $12,865
09/30/2003 $13,031 $12,982
10/31/2003 $12,982 $12,934
11/30/2003 $12,981 $12,927
12/31/2003 $13,033 $13,002
01/31/2004 $13,068 $13,028
02/29/2004 $13,128 $13,091
03/31/2004 $13,164 $13,131
04/30/2004 $13,074 $13,005
05/31/2004 $13,059 $12,993
06/30/2004 $13,084 $12,992
SECTOR BREAKDOWN‡
| | | |
Short-Term Instruments | | 67.8 | % |
U.S. Government Agencies | | 9.3 | % |
Asset-Backed Securities | | 7.7 | % |
U.S. Treasury Obligations | | 5.9 | % |
Mortgage-Backed Securities | | 3.7 | % |
Corporate Bonds & Notes | | 2.5 | % |
Other | | 3.1 | % |
‡ % of Total Investments as of June 30, 2004
à$10,000 invested at the beginning of the first full month following the inception of the Administrative Class.
TOTAL RETURN INVESTMENT PERFORMANCE For the period ended June 30, 2004
| | | | | | | | | | | | | | | | |
| | | | | | | 6 Months | | | 1 Year | | | 5 Years* | | | Since Inception* | |
| | |
| | Low Duration Portfolio Administrative Class Inception (02/16/99) | | 0.39 | % | | 0.32 | % | | 5.18 | % | | 5.08 | % |
| | | - - - - - - - | | Merrill Lynch 1-3 Year Treasury Index | | –0.08 | % | | 0.50 | % | | 5.11 | % | | — | |
| | | | | * Annualized. All Portfolio returns are net of fees and expenses. | | | | | | | | | | | | |
Past performance is no guarantee of future results. The performance quoted represents past performance. Investment return and principal value will fluctuate so the Portfolio shares, when redeemed, may be worth more or less than their original cost. Current performance may be lower or higher than the performance data quoted. Performance data current to the most recent month-end is available by calling (800) 927-4648.
Please refer to page 2 herein for an explanation of the information presented in the following Expense Example.
| | | | | | | | | | |
| EXPENSE EXAMPLE | | | | Actual Performance | | | | Hypothetical Performance
(5% return before expenses) |
Beginning Account Value (01/01/04) | | | | $ | 1,000.00 | | | | $ | 1,000.00 |
Ending Account Value (06/30/04) | | | | $ | 1,003.90 | | | | $ | 1,025.00 |
Expenses Paid During Period† | | | | $ | 3.24 | | | | $ | 3.27 |
†Expenses are equal to the Portfolio’s Administrative Class annualized expense ratio of 0.65%, multiplied by the average account value over the period, multiplied by 182/366 (to reflect the one-half year period).
PORTFOLIO INSIGHTS
| • | The Low Duration Portfolio seeks to achieve its investment objective by investing under normal circumstances at least 65% of its assets in a diversified portfolio of Fixed Income Instruments of varying maturities. |
| • | The Portfolio’s Administrative Class shares returned 0.39% for the six-month period ended June 30, 2004, outperforming the Merrill Lynch 1-3 Year Treasury Index return of –0.08% for the same period. |
| • | The Portfolio’s duration was positioned below the benchmark during the period. This hurt returns in the first quarter when rates fell and helped later in the period when market sold off, resulting in an overall neutral effect on performance. |
| • | The Portfolio’s broader-than-Index maturity distribution had a positive impact on returns, as maturities within the Index fared the worst during the period. |
| • | An emphasis on mortgage-backed securities was positive for performance, as this sector outperformed Treasuries during the period. Positive security selection within the sector further enhanced returns. |
| • | The Portfolio’s limited holdings of corporate bonds did not have a significant effect on performance. |
| • | A small allocation to emerging market bonds detracted from returns. Leveraged tactical investors sold emerging market bonds as interest rates rose, which negatively impacted this asset class. |
| • | Exposure to developed non-U.S. markets, primarily short maturity Eurozone holdings, had a strong positive effect on performance. Eurozone issues benefited from expectations for lower growth and inflation in Europe. |
| | | | | | |
| | | June 30, 2004 | | Semi-Annual Report | | 3 |
Financial Highlights
Low Duration Portfolio (Administrative Class)
| | | | | | | | | | | | | | | | | | | | | | | | | | | | | | | | | | | | |
Selected Per Share Data for the
Year or Period Ended: | | | | 06/30/2004+ | | | | | 12/31/2003 | | | | | 12/31/2002 | | | | | 12/31/2001 | | | | | 12/31/2000 | | | | | 02/16/1999-
12/31/1999 | |
| | | | | | | | | | | | |
Net asset value beginning of period | | | | $ | 10.27 | | | | | $ | 10.23 | | | | | $ | 9.95 | | | | | $ | 9.82 | | | | | $ | 9.74 | | | | | $ | 10.00 | |
Net investment income (a) | | | | | 0.05 | (f) | | | | | 0.13 | (f) | | | | | 0.34 | (f) | | | | | 0.52 | (f) | | | | | 0.59 | (f) | | | | | 0.50 | |
Net realized/unrealized gain (loss) on investments (a) | | | | | (0.01 | )(f) | | | | | 0.11 | (f) | | | | | 0.35 | (f) | | | | | 0.21 | (f) | | | | | 0.11 | (f) | | | | | (0.25 | ) |
Total income from investment operations | | | | | 0.04 | | | | | | 0.24 | | | | | | 0.69 | | | | | | 0.73 | | | | | | 0.70 | | | | | | 0.25 | |
Dividends from net investment income | | | | | (0.05 | ) | | | | | (0.19 | ) | | | | | (0.35 | ) | | | | | (0.54 | ) | | | | | (0.62 | ) | | | | | (0.51 | ) |
Distributions from net realized capital gains | | | | | 0.00 | | | | | | (0.01 | ) | | | | | (0.06 | ) | | | | | (0.06 | ) | | | | | 0.00 | | | | | | 0.00 | |
Total distributions | | | | | (0.05 | ) | | | | | (0.20 | ) | | | | | (0.41 | ) | | | | | (0.60 | ) | | | | | (0.62 | ) | | | | | (0.51 | ) |
Net asset value end of period | | | | $ | 10.26 | | | | | $ | 10.27 | | | | | $ | 10.23 | | | | | $ | 9.95 | | | | | $ | 9.82 | | | | | $ | 9.74 | |
Total return | | | | | 0.39 | % | | | | | 2.34 | % | | | | | 7.05 | % | | | | | 7.61 | % | | | | | 7.41 | % | | | | | 2.56 | % |
Net assets end of period (000s) | | | | $ | 216,146 | | | | | $ | 115,419 | | | | | $ | 19,495 | | | | | $ | 5,175 | | | | | $ | 742 | | | | | $ | 5,149 | |
Ratio of net expenses to average net assets | | | | | 0.65 | %* | | | | | 0.65 | % | | | | | 0.66 | %(c)(e) | | | | | 0.69 | %(c)(d) | | | | | 0.65 | % | | | | | 0.65 | %*(b) |
Ratio of net investment income to average net assets | | | | | 0.90 | %*(f) | | | | | 1.30 | %(f) | | | | | 3.39 | %(f) | | | | | 5.19 | %(f) | | | | | 6.07 | %(f) | | | | | 5.74 | %* |
Portfolio turnover rate | | | | | 65 | % | | | | | 284 | % | | | | | 339 | % | | | | | 661 | % | | | | | 165 | % | | | | | 11 | % |
| (a) | Per share amounts based on average number of shares outstanding during the period. |
| (b) | If the investment manager had not reimbursed expenses, the ratio of expenses to average net assets would have been 0.78%. |
| (c) | Ratio of expenses to average net assets excluding interest expense is 0.65%. |
| (d) | If the investment manager had not reimbursed expenses, the ratio of expenses to average net assets would have been 0.70%. |
| (e) | If the investment manager had not reimbursed expenses, the ratio of expenses to average net assets would have been 0.67%. |
| (f) | Indicates a period in which, as a result of a change in generally accepted accounting principles, the portfolio has reclassified periodic payments made or received under certain derivative instruments, which were previously included within miscellaneous income, to a component of realized gain (loss) in the Statement of Operations. The effect of this reclassification was to (reduce) the net investment income ratio for the period ending June 30, 2004 by 0.00% and the net investment income per share by $0.00. For consistency, similar reclassifications have been made to prior period amounts, resulting in increases (reductions) to the net investment income ratio of 0.00%, (0.01)%, 0.01% and 0.00% and to the net investment income per share of $0.00, $0.00, $0.00, and $0.00 in the fiscal years ending December 31, 2003, 2002, 2001, and 2000, respectively. This change had no impact on the reported net asset value per share for any period. |
| | | | | | |
| 4 | | Semi-Annual Report | | June 30, 2004 | | See accompanying notes |
Statement of Assets and Liabilities
Low Duration Portfolio
June 30, 2004 (Unaudited)
| | | | | | |
| Amounts in thousands, except per share amounts | | | | | |
| | |
Assets: | | | | | | |
| | |
Investments, at value | | | | $ | 244,126 | |
Foreign currency, at value | | | | | 358 | |
Receivable for investments sold | | | | | 3 | |
Unrealized appreciation on forward foreign currency contracts | | | | | 17 | |
Receivable for Portfolio shares sold | | | | | 857 | |
Interest and dividends receivable | | | | | 240 | |
Variation margin receivable | | | | | 285 | |
Swap premiums paid | | | | | 2 | |
Unrealized appreciation on swap agreements | | | | | 3 | |
| | | | | | 245,891 | |
| | |
Liabilities: | | | | | | |
| | |
Payable for investments purchased | | | | $ | 20,499 | |
Unrealized depreciation on forward foreign currency contracts | | | | | 14 | |
Written options outstanding | | | | | 6 | |
Payable for Portfolio shares redeemed | | | | | 45 | |
Accrued investment advisory fee | | | | | 43 | |
Accrued administration fee | | | | | 43 | |
Accrued servicing fee | | | | | 23 | |
Recoupment payable to Manager | | | | | 3 | |
Unrealized depreciation on swap agreements | | | | | 2 | |
| | | | | | 20,678 | |
| | |
Net Assets | | | | $ | 225,213 | |
| | |
Net Assets Consist of: | | | | | | |
| | |
Paid in capital | | | | $ | 225,406 | |
Undistributed net investment income | | | | | 71 | |
Accumulated undistributed net realized (loss) | | | | | (537 | ) |
Net unrealized appreciation | | | | | 273 | |
| | | | | $ | 225,213 | |
| | |
Net Assets: | | | | | | |
| | |
Institutional Class | | | | $ | 9,067 | |
Administrative Class | | | | | 216,146 | |
| | |
Shares Issued and Outstanding: | | | | | | |
| | |
Institutional Class | | | | | 884 | |
Administrative Class | | | | | 21,073 | |
| | |
Net Asset Value and Redemption Price Per Share
(Net Assets Per Share Outstanding) | | | | | | |
| | |
Institutional Class | | | | $ | 10.26 | |
Administrative Class | | | | | 10.26 | |
| | |
Cost of Investments Owned | | | | $ | 244,105 | |
Cost of Foreign Currency Held | | | | $ | 354 | |
| | | | | | |
| See accompanying notes | | June 30, 2004 | | Semi-Annual Report | | 5 |
Statement of Operations
Low Duration Portfolio
| | | | | | |
| Amounts in thousands | | | | | |
| | | | | Six Months Ended June 30, 2004 (Unaudited) | |
Investment Income: | | | | | | |
| | |
Interest | | | | $ | 1,249 | |
Dividends | | | | | 14 | |
Miscellaneous income | | | | | 2 | |
Total Income | | | | | 1,265 | |
| | |
Expenses: | | | | | | |
| | |
Investment advisory fees | | | | | 202 | |
Administration fees | | | | | 202 | |
Distribution and/or servicing fees - Administrative Class | | | | | 119 | |
Trustees’ fees | | | | | 2 | |
Miscellaneous expense | | | | | 3 | |
Total Expenses | | | | | 528 | |
| | |
Net Investment Income | | | | | 737 | |
| | |
Net Realized and Unrealized Gain (Loss): | | | | | | |
| | |
Net realized (loss) on investments | | | | | (184 | ) |
Net realized (loss) on futures contracts, options, and swaps | | | | | (140 | ) |
Net realized (loss) on foreign currency transactions | | | | | (76 | ) |
Net change in unrealized (depreciation) on investments | | | | | (166 | ) |
Net change in unrealized appreciation on futures contracts,
options, and swaps | | | | | 91 | |
Net change in unrealized appreciation on translation of
assets and liabilities denominated in foreign currencies | | | | | 7 | |
Net (Loss) | | | | | (468 | ) |
| | |
Net Increase in Assets Resulting from Operations | | | | $ | 269 | |
| | | | | | |
| 6 | | Semi-Annual Report | | June 30, 2004 | | See accompanying notes |
Statements of Changes in Net Assets
Low Duration Portfolio
| | | | | | | | | | | | |
| Amounts in thousands | | | | | | | | | | |
| | | | | Six Months Ended June 30, 2004
(Unaudited) | | | | | Year Ended December 31, 2003 | |
Increase in Net Assets from: | | | | | | | | | | | | |
| | | | |
Operations: | | | | | | | | | | | | |
| | | | |
Net investment income | | | | $ | 737 | | | | | $ | 591 | |
Net realized gain (loss) | | | | | (400 | ) | | | | | 129 | |
Net change in unrealized appreciation (depreciation) | | | | | (68 | ) | | | | | 161 | |
Net increase resulting from operations | | | | | 269 | | | | | | 881 | |
| | | | |
Distributions to Shareholders: | | | | | | | | | | | | |
| | | | |
From net investment income | | | | | | | | | | | | |
Institutional Class | | | | | (21 | ) | | | | | 0 | |
Administrative Class | | | | | (793 | ) | | | | | (704 | ) |
| | | | |
From net realized capital gains | | | | | | | | | | | | |
Institutional Class | | | | | 0 | | | | | | 0 | |
Administrative Class | | | | | 0 | | | | | | (110 | ) |
Total Distributions | | | | | (814 | ) | | | | | (814 | ) |
| | | | |
Portfolio Share Transactions: | | | | | | | | | | | | |
| | | | |
Receipts for shares sold | | | | | | | | | | | | |
Institutional Class | | | | | 9,077 | | | | | | 0 | |
Administrative Class | | | | | 130,603 | | | | | | 109,489 | |
| | | | |
Issued as reinvestment of distributions | | | | | | | | | | | | |
Institutional Class | | | | | 21 | | | | | | 0 | |
Administrative Class | | | | | 792 | | | | | | 815 | |
| | | | |
Cost of shares redeemed | | | | | | | | | | | | |
Institutional Class | | | | | (29 | ) | | | | | 0 | |
Administrative Class | | | | | (30,136 | ) | | | | | (14,447 | ) |
Net increase resulting from Portfolio share transactions | | | | | 110,328 | | | | | | 95,857 | |
| | | | |
Total Increase in Net Assets | | | | | 109,783 | | | | | | 95,924 | |
| | | | |
Net Assets: | | | | | | | | | | | | |
| | | | |
Beginning of period | | | | | 115,430 | | | | | | 19,506 | |
End of period* | | | | $ | 225,213 | | | | | $ | 115,430 | |
| | | | |
*Including undistributed net investment income of: | | | | $ | 71 | | | | | $ | 148 | |
| | | | | | |
| See accompanying notes | | June 30, 2004 | | Semi-Annual Report | | 7 |
Schedule of Investments
Low Duration Portfolio
June 30, 2004 (Unaudited)
| | | | |
| | | Principal | | |
| | | Amount | | Value |
| | | (000s) | | (000s) |
| | | | | | |
CORPORATE BONDS & NOTES 2.7% |
Banking & Finance 1.2% | | | | | | |
CIT Group, Inc. | | | | | | |
2.489% due 07/30/2004 (a) | | $ | 100 | | $ | 100 |
Ford Motor Credit Co. | | | | | | |
6.700% due 07/16/2004 | | | 700 | | | 701 |
3.045% due 10/25/2004 (a) | | | 500 | | | 502 |
General Motors Acceptance Corp. | | | |
1.499% due 07/21/2004 (a) | | | 100 | | | 100 |
2.400% due 10/20/2005 (a) | | | 700 | | | 706 |
Pemex Project Funding Master Trust | | | |
2.640% due 01/07/2005 (a) | | | 100 | | | 100 |
Verizon Wireless Capital LLC | | | | | | |
1.350% due 05/23/2005 (a) | | | 500 | | | 500 |
| | | | | |
|
|
| | | | | | | 2,709 |
| | | | | |
|
|
| | | | | | | |
Industrials 0.6% | | | | | | |
Altria Group, Inc. | | | | | | |
7.650% due 07/01/2008 | | | 200 | | | 216 |
AOL Time Warner, Inc. | | | | | | |
6.125% due 04/15/2006 | | | 250 | | | 262 |
Clear Channel Communications, Inc. | | | |
6.000% due 11/01/2006 | | | 250 | | | 263 |
DaimlerChrysler North America Holding Corp. | | | | | | |
1.678% due 08/02/2004 (a) | | | 200 | | | 200 |
Harrah’s Operating Co., Inc. | | | | | | |
7.500% due 01/15/2009 | | | 200 | | | 219 |
International Paper Co. | | | | | | |
7.625% due 01/15/2007 | | | 250 | | | 271 |
| | | | | |
|
|
| | | | | | | 1,431 |
| | | | | |
|
|
| | | | | | | |
Utilities 0.9% | | | | | | |
Appalachian Power Co. | | | | | | |
4.800% due 06/15/2005 | | | 40 | | | 41 |
Entergy Mississippi, Inc. | | | | | | |
4.350% due 04/01/2008 | | | 100 | | | 100 |
France Telecom S.A. | | | | | | |
8.200% due 03/01/2006 | | | 100 | | | 107 |
Northern Indiana Public Service Co. | | | |
6.500% due 07/22/2004 | | | 200 | | | 200 |
Pacific Gas & Electric Co. | | | | | | |
1.810% due 04/03/2006 (a) | | | 1,300 | | | 1,301 |
Progress Energy, Inc. | | | | | | |
6.750% due 03/01/2006 | | | 250 | | | 264 |
Sprint Capital Corp. | | | | | | |
6.125% due 11/15/2008 | | | 35 | | | 37 |
| | | | | |
|
|
| | | | | | | 2,050 |
| | | | | |
|
|
Total Corporate Bonds & Notes (Cost $6,185) | | | | | | 6,190 |
| | | | |
|
|
| | | | | | | |
U.S. GOVERNMENT AGENCIES 10.0% |
| | |
Fannie Mae | | | | | | |
1.700% due 11/25/2032 (a) | | | 245 | | | 245 |
5.000% due 04/25/2033 | | | 261 | | | 262 |
1.420% due 03/25/2034 (a) | | | 777 | | | 772 |
5.090% due 09/01/2034 (a) | | | 175 | | | 179 |
4.797% due 12/01/2036 (a) | | | 169 | | | 174 |
2.625% due 09/01/2040 (a) | | | 36 | | | 37 |
1.650% due 03/25/2044 (a) | | | 1,203 | | | 1,188 |
6.000% due 06/01/2016-03/01/2033 (b) | | | 1,751 | | | 1,796 |
5.500% due 10/01/2017-07/15/2034 (b) | | | 12,174 | | | 12,136 |
6.500% due 08/01/2032-01/01/2033 (b) | | | 118 | | | 122 |
Federal Home Loan Bank | | | | | | |
5.500% due 04/17/2006 | | | 1,000 | | | 1,046 |
Federal Housing Administration | | | | | | |
7.430% due 10/01/2020 | | | 65 | | | 64 |
| | | | | | |
| | |
Freddie Mac | | | | | | |
1.488% due 07/15/2016 (a) | | $ | 1,738 | | $ | 1,740 |
5.000% due 10/01/2018 | | | 81 | | | 81 |
5.500% due 08/15/2030 | | | 183 | | | 186 |
6.000% due 09/01/2016-02/01/2033 (b) | | | 1,569 | | | 1,622 |
6.500% due 08/01/2032-07/25/2043 (b) | | | 450 | | | 471 |
Government National Mortgage Association | | | |
3.000% due 04/20/2034 (a) | | | 500 | | | 487 |
| | | | | |
|
|
Total U.S. Government Agencies (Cost $22,570) | | | 22,608 |
| |
|
|
| | | | | | | |
U.S. TREASURY OBLIGATIONS 6.4% |
| |
Treasury Inflation Protected Securities (c) | | | |
3.625% due 01/15/2008 | | | 1,745 | | | 1,908 |
3.875% due 01/15/2009 | | | 1,994 | | | 2,224 |
U.S. Treasury Note | | | | | | |
2.750% due 06/30/2006 | | | 10,300 | | | 10,310 |
| | | | | |
|
|
Total U.S. Treasury Obligations (Cost $14,393) | | | | | | 14,442 |
| | | | |
|
|
| | | | | | | |
MORTGAGE-BACKED SECURITIES 4.0% |
| |
Amortizing Residential Collateral Trust | | | |
1.620% due 07/25/2032 (a) | | | 215 | | | 215 |
Bank of America Mortgage Securities, Inc. | | | |
6.500% due 10/25/2031 | | | 321 | | | 321 |
5.667% due 10/20/2032 (a) | | | 14 | | | 15 |
Bear Stearns Adjustable Rate Mortgage Trust |
5.974% due 06/25/2032 (a) | | | 30 | | | 30 |
5.288% due 10/25/2032 (a) | | | 4 | | | 4 |
5.380% due 01/25/2033 (a) | | | 58 | | | 58 |
5.450% due 03/25/2033 (a) | | | 87 | | | 88 |
5.134% due 04/25/2033 (a) | | | 72 | | | 73 |
4.924% due 01/25/2034 (a) | | | 384 | | | 386 |
Countrywide Alternative Loan Trust | | | |
6.500% due 06/25/2033 | | | 141 | | | 145 |
6.000% due 10/25/2033 | | | 409 | | | 411 |
Countrywide Home Loans, Inc. | | | | | | |
1.570% due 04/25/2034 (a) | | | 721 | | | 716 |
Credit-Based Asset Servicing and Securitization |
1.800% due 01/25/2033 (a) | | | 374 | | | 375 |
CS First Boston Mortgage Securities Corp. | | | |
2.478% due 03/25/2032 (a) | | | 50 | | | 50 |
6.222% due 06/25/2032 (a) | | | 6 | | | 6 |
5.720% due 10/25/2032 (a) | | | 22 | | | 22 |
1.429% due 08/25/2033 (a) | | | 58 | | | 58 |
GSR Mortgage Loan Trust | | | | | | |
6.000% due 03/25/2032 | | | 21 | | | 21 |
Impac CMB Trust | | | | | | |
1.700% due 07/25/2033 (a) | | | 184 | | | 185 |
1.550% due 01/25/2034 (a) | | | 473 | | | 473 |
MASTR Asset Securitization Trust | | | |
5.500% due 09/25/2033 | | | 130 | | | 127 |
Mellon Residential Funding Corp. | | | |
1.478% due 06/15/2030 (a) | | | 1,147 | | | 1,140 |
MLCC Mortgage Investors, Inc. | | | | | | |
2.821% due 01/25/2029 (a) | | | 554 | | | 565 |
Prime Mortgage Trust | | | | | | |
1.500% due 02/25/2034 (a) | | | 70 | | | 70 |
1.700% due 02/25/2034 (a) | | | 212 | | | 212 |
Residential Funding Mortgage Securities I, Inc. |
5.603% due 09/25/2032 (a) | | | 5 | | | 5 |
Salomon Brothers Mortgage Securities VII | | | |
4.000% due 12/25/2018 | | | 772 | | | 751 |
Sequoia Mortgage Trust | | | | | | |
1.620% due 05/20/2032 (a) | | | 70 | | | 70 |
1.580% due 08/20/2032 (a) | | | 38 | | | 38 |
Structured Asset Mortgage Investments, Inc. |
1.610% due 09/19/2032 (a) | | | 96 | | | 96 |
| | | | | | |
| |
Structured Asset Securities Corp. | | | |
1.600% due 10/25/2027 (a) | | $ | 49 | | $ | 49 |
6.150% due 07/25/2032 (a) | | | 4 | | | 5 |
1.460% due 08/25/2033 (a) | | | 292 | | | 292 |
1.800% due 11/25/2033 (a) | | | 258 | | | 254 |
Washington Mutual Mortgage Securities Corp. |
6.230% due 07/25/2032 (a) | | | 12 | | | 12 |
3.052% due 02/27/2034 (a) | | | 137 | | | 137 |
3.565% due 01/25/2041 (a) | | | 13 | | | 13 |
2.624% due 08/25/2042 (a) | | | 501 | | | 506 |
Washington Mutual, Inc. | | | | | | |
5.500% due 04/26/2032 (a) | | | 107 | | | 109 |
4.820% due 10/25/2032 | | | 897 | | | 906 |
| | | | | |
|
|
| | | | | | | 9,009 |
| | | | | |
|
|
Total Mortgage-Backed Securities (Cost $9,091) | | | 9,009 |
| |
|
|
| | | | | | | |
ASSET-BACKED SECURITIES 8.5% |
| | |
ACE Securities Corp. | | | | | | |
1.640% due 06/25/2032 (a) | | | 4 | | | 4 |
Ameriquest Mortgage Securities, Inc. | | | |
1.610% due 04/25/2032 (a) | | | 118 | | | 119 |
Amortizing Residential Collateral Trust | | | |
1.590% due 07/25/2032 (a) | | | 257 | | | 257 |
Asset Backed Securities Corp. Home Equity | | | |
2.338% due 03/15/2032 (a) | | | 600 | | | 604 |
Chase Funding Mortgage Loan
Asset-Backed Certificates |
1.580% due 05/25/2030 (a) | | | 1,944 | | | 1,947 |
CIT Group Home Equity Loan Trust | | | |
1.570% due 06/25/2033 (a) | | | 34 | | | 34 |
Citifinancial Mortgage Securities, Inc. | | | |
1.400% due 05/25/2033 (a) | | | 16 | | | 16 |
Countrywide Asset-Backed Certificates | | | |
1.550% due 07/25/2018 (a) | | | 322 | | | 323 |
1.530% due 12/25/2034 (a) | | | 1,400 | | | 1,399 |
Credit-Based Asset Servicing and Securitization |
1.620% due 06/25/2032 (a) | | | 9 | | | 9 |
1.550% due 09/25/2033 (a) | | | 360 | | | 360 |
CS First Boston Mortgage Securities Corp. | | | |
1.610% due 01/25/2032 (a) | | | 55 | | | 56 |
Equity One ABS, Inc. | | | | | | |
1.580% due 11/25/2032 (a) | | | 32 | | | 32 |
First Franklin Mtg Loan Asset-Backed Certificates |
1.420% due 07/25/2033 (a) | | | 1,550 | | | 1,552 |
GSAMP Trust | | | | | | |
1.490% due 10/25/2033 (a) | | | 1,088 | | | 1,088 |
1.620% due 03/25/2034 (a) | | | 1,100 | | | 1,100 |
HFC Home Equity Loan Asset-Backed Certificates |
1.630% due 10/20/2032 (a) | | | 620 | | | 621 |
Household Mortgage Loan Trust | | | | | | |
1.580% due 05/20/2032 (a) | | | 7 | | | 7 |
Irwin Home Equity Loan Trust | | | | | | |
1.590% due 06/25/2029 (a) | | | 6 | | | 6 |
Long Beach Mortgage Loan Trust | | | |
1.750% due 11/25/2032 (a) | | | 764 | | | 766 |
MMCA Automobile Trust | | | | | | |
2.550% due 02/15/2007 | | | 698 | | | 701 |
Morgan Stanley Dean Witter Capital I, Inc. | | | |
1.630% due 07/25/2032 (a) | | | 10 | | | 10 |
Residential Asset Mortgage Products, Inc. | | | |
1.640% due 09/25/2033 (a) | | | 1,099 | | | 1,102 |
1.550% due 02/25/2034 (a) | | | 1,104 | | | 1,104 |
Residential Asset Securities Corp. | | | |
1.450% due 06/25/2023 (a) | | | 798 | | | 798 |
1.420% due 06/25/2025 (a) | | | 345 | | | 346 |
Specialty Underwriting & Residential Finance |
1.630% due 11/25/2034 (a) | | | 2,296 | | | 2,298 |
Structured Asset Investment Loan Trust | | | |
1.400% due 04/25/2033 (a) | | | 1,169 | | | 1,169 |
1.420% due 06/25/2033 (a) | | | 359 | | | 359 |
| | | | | | |
| 8 | | Semi-Annual Report | | June 30, 2004 | | See accompanying notes |
| | | | |
| | | Principal | | |
| | | Amount | | Value |
| | | (000s) | | (000s) |
| | | | | | |
| |
Truman Capital Mortgage Loan Trust | | | |
1.640% due 01/25/2034 (a) | | $ | 856 | | $ | 846 |
Vanderbilt Acquisition Loan Trust | | | |
3.280% due 01/07/2013 | | | 15 | | | 15 |
| | | | | |
|
|
Total Asset-Backed Securities (Cost $19,047) | | | | | | 19,048 |
| | | | |
|
|
| | | | | | | |
SOVEREIGN ISSUES 0.3% | | | | | | |
| | |
Republic of Brazil | | | | | | |
2.062% due 04/15/2006 (a) | | | 374 | | | 369 |
2.125% due 04/15/2009 (a) | | | 353 | | | 321 |
| | | | | |
|
|
Total Sovereign Issues (Cost $707) | | | | | | 690 |
| | | | |
|
|
| | | | | | | |
FOREIGN CURRENCY-DENOMINATED
ISSUES (g)(h) 2.7% |
| | |
Kingdom of Netherlands | | | | | | |
0.000% due 09/30/2004 | | EC | 5,000 | | | 6,053 |
| | | | | |
|
|
Total Foreign Currency-Denominated Issues (Cost $6,016) | | | 6,053 |
| |
|
|
| | | | | | | |
PREFERRED SECURITY 0.3% | | | |
| | | Shares | | |
DG Funding Trust | | | | | | |
3.360% due 12/29/2049 (a) | | | 60 | | | 645 |
| | | | | |
|
|
Total Preferred Security (Cost $632) | | | | | | 645 |
| | | | |
|
|
| | | | | | | |
SHORT-TERM INSTRUMENTS 73.5% | | | |
| | | Principal
Amount
(000s) | | |
Commercial Paper 71.0% | | | | | | |
ABN AMRO North America Finance | | | |
1.090% due 07/29/2004 | | $ | 4,500 | | | 4,496 |
Altria Group, Inc. | | | | | | |
1.800% due 10/29/2004 | | | 200 | | | 199 |
Anz (Delaware), Inc. | | | | | | |
1.040% due 07/06/2004 | | | 700 | | | 700 |
1.045% due 07/07/2004 | | | 100 | | | 100 |
Bank of Ireland | | | | | | |
1.285% due 09/03/2004 | | | 5,500 | | | 5,486 |
1.235% due 09/08/2004 | | | 600 | | | 598 |
Barclays U.S. Funding Corp. | | | | | | |
1.210% due 08/23/2004 | | | 200 | | | 200 |
1.110% due 08/25/2004 | | | 700 | | | 699 |
CBA (de) Finance | | | | | | |
1.050% due 07/02/2004 | | | 500 | | | 500 |
1.040% due 07/07/2004 | | | 3,000 | | | 2,999 |
1.050% due 07/13/2004 | | | 200 | | | 200 |
1.080% due 07/27/2004 | | | 200 | | | 200 |
1.140% due 08/09/2004 | | | 300 | | | 300 |
CDC Commercial Paper, Inc. | | | | | | |
1.050% due 07/07/2004 | | | 3,300 | | | 3,299 |
1.100% due 08/04/2004 | | | 900 | | | 899 |
1.120% due 08/24/2004 | | | 300 | | | 299 |
Danske Corp. | | | | | | |
1.070% due 07/26/2004 | | | 1,200 | | | 1,199 |
1.240% due 09/17/2004 | | | 1,000 | | | 997 |
1.250% due 09/20/2004 | | | 1,900 | | | 1,894 |
Den Norske Bank ASA | | | | | | |
1.260% due 09/20/2004 | | | 3,800 | | | 3,787 |
1.285% due 09/21/2004 | | | 1,100 | | | 1,096 |
European Investment Bank | | | | | | |
1.030% due 07/02/2004 | | | 400 | | | 400 |
1.050% due 07/16/2004 | | | 2,800 | | | 2,799 |
Fannie Mae | | | | | | |
1.030% due 07/01/2004 | | | 900 | | | 900 |
1.025% due 07/07/2004 | | | 9,600 | | | 9,598 |
1.040% due 07/14/2004 | | | 3,400 | | | 3,399 |
| | | | | | |
| | |
1.060% due 07/21/2004 | | $ | 4,800 | | $ | 4,797 |
1.055% due 08/04/2004 | | | 1,000 | | | 999 |
1.150% due 08/18/2004 | | | 800 | | | 799 |
1.105% due 09/01/2004 | | | 1,900 | | | 1,895 |
1.225% due 09/01/2004 | | | 2,000 | | | 1,995 |
1.230% due 09/01/2004 | | | 600 | | | 599 |
1.130% due 09/08/2004 | | | 1,100 | | | 1,097 |
1.430% due 09/08/2004 | | | 2,100 | | | 2,094 |
1.414% due 09/22/2004 | | | 300 | | | 299 |
1.426% due 09/22/2004 | | | 2,100 | | | 2,093 |
1.600% due 10/01/2004 | | | 1,300 | | | 1,295 |
Federal Home Loan Bank | | | | | | |
1.170% due 07/16/2004 | | | 1,300 | | | 1,299 |
1.240% due 09/01/2004 | | | 700 | | | 698 |
Ford Motor Credit Co. | | | | | | |
1.010% due 09/03/2004 | | | 1,200 | | | 1,197 |
Freddie Mac | | | | | | |
1.025% due 07/06/2004 | | | 400 | | | 400 |
1.060% due 08/03/2004 | | | 100 | | | 100 |
1.200% due 08/09/2004 | | | 500 | | | 499 |
1.120% due 08/10/2004 | | | 1,100 | | | 1,099 |
1.205% due 08/20/2004 | | | 2,100 | | | 2,096 |
1.175% due 08/24/2004 | | | 3,300 | | | 3,294 |
1.180% due 08/24/2004 | | | 4,300 | | | 4,292 |
1.315% due 09/07/2004 | | | 800 | | | 798 |
1.320% due 09/07/2004 | | | 2,100 | | | 2,094 |
1.440% due 09/14/2004 | | | 2,100 | | | 2,094 |
1.445% due 09/14/2004 | | | 3,600 | | | 3,589 |
1.436% due 09/30/2004 | | | 600 | | | 598 |
1.560% due 10/20/2004 | | | 2,200 | | | 2,189 |
General Electric Capital Corp. | | | | | | |
1.050% due 07/07/2004 | | | 100 | | | 100 |
1.040% due 07/08/2004 | | | 300 | | | 300 |
1.060% due 07/12/2004 | | | 100 | | | 100 |
1.140% due 09/03/2004 | | | 300 | | | 299 |
1.300% due 09/08/2004 | | | 3,600 | | | 3,590 |
1.460% due 09/14/2004 | | | 100 | | | 100 |
1.480% due 09/15/2004 | | | 1,600 | | | 1,595 |
HBOS Treasury Services PLC | | | | | | |
1.040% due 07/08/2004 | | | 300 | | | 300 |
1.035% due 07/09/2004 | | | 200 | | | 200 |
1.055% due 07/16/2004 | | | 600 | | | 600 |
1.080% due 07/22/2004 | | | 2,500 | | | 2,498 |
1.080% due 07/26/2004 | | | 100 | | | 100 |
1.095% due 08/02/2004 | | | 200 | | | 200 |
1.250% due 08/25/2004 | | | 700 | | | 699 |
1.150% due 09/03/2004 | | | 100 | | | 100 |
1.305% due 09/07/2004 | | | 400 | | | 399 |
1.335% due 09/09/2004 | | | 700 | | | 698 |
1.290% due 09/24/2004 | | | 300 | | | 299 |
1.580% due 10/21/2004 | | | 300 | | | 298 |
1.585% due 10/26/2004 | | | 200 | | | 199 |
ING U.S. Funding LLC | | | | | | |
1.310% due 09/02/2004 | | | 5,600 | | | 5,586 |
1.345% due 09/09/2004 | | | 600 | | | 598 |
KFW International Finance, Inc. | | | | | | |
1.095% due 08/10/2004 | | | 1,300 | | | 1,298 |
1.110% due 08/20/2004 | | | 3,400 | | | 3,395 |
National Australia Bank Ltd. | | | | | | |
1.050% due 07/02/2004 | | | 4,000 | | | 4,000 |
Nestle Capital Corp. | | | | | | |
1.035% due 07/01/2004 | | | 500 | | | 500 |
1.110% due 08/24/2004 | | | 3,100 | | | 3,095 |
1.110% due 08/26/2004 | | | 2,200 | | | 2,196 |
1.240% due 09/14/2004 | | | 300 | | | 299 |
Royal Bank of Scotland PLC | | | | | | |
1.045% due 07/06/2004 | | | 100 | | | 100 |
1.050% due 07/14/2004 | | | 100 | | | 100 |
1.070% due 07/14/2004 | | | 1,600 | | | 1,599 |
1.090% due 08/06/2004 | | | 300 | | | 300 |
1.135% due 08/26/2004 | | | 100 | | | 100 |
1.135% due 09/01/2004 | | | 1,300 | | | 1,297 |
Shell Finance (UK) PLC | | | | | | |
1.035% due 07/02/2004 | | | 800 | | | 800 |
| | | | | | | |
| | |
1.230% due 08/11/2004 | | $ | 1,800 | | $ | 1,797 | |
1.350% due 08/27/2004 | | | 3,400 | | | 3,393 | |
Spintab AB | | | | | | | |
1.490% due 09/02/2004 | | | 1,400 | | | 1,396 | |
1.260% due 09/08/2004 | | | 2,100 | | | 2,094 | |
Stadshypoket Delaware, Inc. | | | | | | | |
1.490% due 09/23/2004 | | | 2,800 | | | 2,790 | |
Svenska Handlesbanken | | | | | | | |
1.070% due 07/21/2004 | | | 200 | | | 200 | |
1.145% due 09/01/2004 | | | 1,900 | | | 1,895 | |
Svenska Handlesbanken, Inc. | | | | | | | |
1.230% due 07/22/2004 | | | 1,400 | | | 1,399 | |
1.090% due 08/03/2004 | | | 300 | | | 300 | |
1.250% due 09/01/2004 | | | 3,000 | | | 2,993 | |
TotalFinaElf Capital S.A. | | | | | | | |
1.420% due 07/01/2004 | | | 500 | | | 500 | |
Toyota Motor Credit Corp. | | | | | | | |
1.390% due 09/15/2004 | | | 3,200 | | | 3,190 | |
1.480% due 09/22/2004 | | | 1,600 | | | 1,594 | |
UBS Finance, Inc. | | | | | | | |
1.060% due 07/01/2004 | | | 400 | | | 400 | |
1.040% due 07/06/2004 | | | 100 | | | 100 | |
1.055% due 07/13/2004 | | | 100 | | | 100 | |
1.195% due 07/21/2004 | | | 1,300 | | | 1,299 | |
1.240% due 08/31/2004 | | | 100 | | | 100 | |
1.130% due 09/07/2004 | | | 400 | | | 399 | |
1.340% due 09/08/2004 | | | 1,300 | | | 1,296 | |
1.245% due 09/10/2004 | | | 100 | | | 100 | |
1.270% due 09/20/2004 | | | 200 | | | 199 | |
Westpac Capital Corp. | | | | | | | |
1.030% due 07/07/2004 | | | 100 | | | 100 | |
1.030% due 07/08/2004 | | | 600 | | | 600 | |
1.030% due 07/09/2004 | | | 100 | | | 100 | |
1.030% due 07/12/2004 | | | 100 | | | 100 | |
Westpac Trust Securities NZ Ltd. | | | | |
1.120% due 08/16/2004 | | | 700 | | | 699 | |
1.215% due 08/24/2004 | | | 1,300 | | | 1,298 | |
| | | | | |
|
|
|
| | | | | | | 159,909 | |
| | | | | |
|
|
|
| | | | | | | | |
|
Repurchase Agreement 2.2% | |
State Street Bank | | | | | | | |
0.800% due 07/01/2004 | | | 4,823 | | | 4,823 | |
| | | | | |
|
|
|
(Dated 06/30/2004. Collateralized by Freddie Mac 5.500% due 07/15/2006 valued at $4,923. Repurchase proceeds are $4,823.) | |
|
U.S. Treasury Bills 0.3% | |
1.219% due 09/02/2004- 09/16/2004 (b)(d) | | | 710 | | | 709 | |
| | | | | |
|
|
|
Total Short-Term Instruments (Cost $165,464) | | | | | | 165,441 | |
| | | | |
|
|
|
| | |
Total Investments 108.4% | | | | | $ | 244,126 | |
(Cost $244,105) | | | | | | | |
| |
Written Options (f) (0.0%) | | | (6 | ) |
(Premiums $68) | | | | | | | |
| |
Other Assets and Liabilities (Net) (8.4%) | | | (18,907 | ) |
| | | | | |
|
|
|
| |
Net Assets 100.0% | | $ | 225,213 | |
| | | | | |
|
|
|
Notes to Schedule of Investments (amounts in thousands, except number of contracts):
(a) Variable rate security.
(b) Securities are grouped by coupon or range of coupons and represent a range of maturities.
| | | | | | |
| See accompanying notes | | June 30, 2004 | | Semi-Annual Report | | 9 |
Schedule of Investments (Cont.)
Low Duration Portfolio
June 30, 2004 (Unaudited)
(c) Principal amount of security is adjusted for inflation.
(d) Securities with an aggregate market value of $708 have been segregated with the custodian to cover margin requirements for the following open futures contracts at June 30, 2004:
| | | | | | | | |
| Type | | Expiration
Month | | # of
Contracts | | Unrealized
Appreciation/
(Depreciation) | |
Eurodollar March
Long Futures | | 03/2005 | | 1 | | $ | 0 | |
Euribor December
Long Futures | | 12/2005 | | 37 | | | (30 | ) |
Euribor June
Long Futures | | 06/2005 | | 22 | | | 6 | |
Euribor September Long Futures | | 09/2005 | | 20 | | | (2 | ) |
Euribor Written Put Options Strike @ 97.000 | | 12/2004 | | 2 | | | 2 | |
Euribor Written Put Options Strike @ 97.500 | | 09/2004 | | 4 | | | 1 | |
U.S. Treasury 2-Year Note Long Futures | | 09/2004 | | 534 | | | 207 | |
| | | | | | | $ | 184 | |
(e) Swap agreements outstanding at June 30, 2004:
| | | | | | | |
| Type | | Notional
Amount | | Unrealized
Appreciation/
(Depreciation) | |
Receive floating rate based on 6-month BP-LIBOR
and pay a fixed rate equal to 5.000%. | |
Counterparty: Morgan Stanley Dean Witter & Co. | |
Exp. 03/15/2032 | | BP | 100 | | $ | (2 | ) |
|
Receive a fixed rate equal to 6.000% and pay
floating rate based on 6-month EC-LIBOR. | |
Counterparty: J.P. Morgan Chase & Co. | |
Exp. 03/15/2032 | | EC | 200 | | | 3 | |
|
Receive a fixed rate equal to 1.650% and the
Portfolio will pay to the counterparty at par in the
event of default of Republic of Panama 8.875%
due 09/30/2027. | |
Counterparty: Citibank N.A. | |
Exp. 05/30/2005 | | $ | 10 | |
| 0
|
|
| | | | | | $
| 1
|
|
(f) Premiums received on written options:
| | | | | | | | | | | | | | | | |
| Name of Issuer | | | | Exercise
Price | | | Expiration
Date | | # of
Contracts | | Premium | | Value |
Put - CBOT U.S. Treasury Note September Futures | | | | $ | 107.500 | | | 08/27/2004 | | 7 | | $ | 5 | | $ | 3 |
| | | | | | | | | | | | | | | | | |
| Name of Issuer | | Counterparty | | Exercise
Rate | | | Expiration
Date | | Notional
Amount | | Premium | | Value |
Call - OTC 7-Year Interest Rate Swap | | Goldman Sachs & Co. | | | 3.750 | %** | | 08/02/2004 | | 4,000 | | $ | 34 | | $ | 0 |
Put - OTC 7-Year Interest Rate Swap | | Goldman Sachs & Co. | | | 5.250 | %* | | 08/02/2004 | | 4,000 | | | 25 | | | 3 |
Call - OTC 7-Year Interest Rate Swap | | UBS Warburg LLC | | | 3.800 | %** | | 10/07/2004 | | 700 | | | 3 | | | 0 |
| | | | | | | | | | | | | $ | 62 | | $ | 3 |
| | | | | | | | | | | | | | | | | |
* The Portfolio will pay a floating rate based on 3-month LIBOR. | | | | | | |
**The Portfolio will receive a floating rate based on 3-month LIBOR. | | | | | | |
| (g) Forward foreign currency contracts outstanding at June 30, 2004: | | | | | | |
| | | | | | | | | | | | | | | | | |
| Type | | Currency | | Principal
Amount
Covered
by Contract | | Settlement
Month | | Unrealized
Appreciation | | Unrealized
(Depreciation) | | | Net Unrealized
Appreciation/
(Depreciation) | |
Buy | | BR | | 95 | | 08/2004 | | $ | 1 | | $ | 0 | | | $ | 1 | |
Buy | | | | 300 | | 09/2004 | | | 2 | | | 0 | | | | 2 | |
Buy | | CP | | 24,364 | | 08/2004 | | | 0 | | | 0 | | | | 0 | |
Buy | | | | 60,602 | | 09/2004 | | | 2 | | | 0 | | | | 2 | |
Sell | | EC | | 5,224 | | 07/2004 | | | 4 | | | (11 | ) | | | (7 | ) |
Buy | | H$ | | 250 | | 08/2004 | | | 0 | | | 0 | | | | 0 | |
Buy | | | | 777 | | 09/2004 | | | 0 | | | 0 | | | | 0 | |
Buy | | KW | | 37,380 | | 08/2004 | | | 1 | | | 0 | | | | 1 | |
Buy | | | | 118,000 | | 09/2004 | | | 1 | | | 0 | | | | 1 | |
Buy | | MP | | 1,121 | | 09/2004 | | | 0 | | | (2 | ) | | | (2 | ) |
Buy | | PN | | 112 | | 08/2004 | | | 0 | | | 0 | | | | 0 | |
Buy | | | | 139 | | 09/2004 | | | 0 | | | 0 | | | | 0 | |
Buy | | RP | | 2,578 | | 09/2004 | | | 0 | | | (1 | ) | | | (1 | ) |
Buy | | RR | | 915 | | 08/2004 | | | 0 | | | 0 | | | | 0 | |
Buy | | | | 2,854 | | 09/2004 | | | 0 | | | 0 | | | | 0 | |
Buy | | S$ | | 54 | | 08/2004 | | | 0 | | | 0 | | | | 0 | |
Buy | | | | 170 | | 09/2004 | | | 0 | | | 0 | | | | 0 | |
Buy | | SR | | 216 | | 08/2004 | | | 3 | | | 0 | | | | 3 | |
Sell | | | | 130 | | 08/2004 | | | 0 | | | 0 | | | | 0 | |
Buy | | | | 274 | | 09/2004 | | | 2 | | | 0 | | | | 2 | |
Sell | | | | 160 | | 09/2004 | | | 0 | | | 0 | | | | 0 | |
Buy | | SV | | 1,061 | | 08/2004 | | | 1 | | | 0 | | | | 1 | |
Buy | | | | 1,337 | | 09/2004 | | | 0 | | | 0 | | | | 0 | |
Buy | | T$ | | 1,063 | | 08/2004 | | | 0 | | | 0 | | | | 0 | |
Buy | | | | 3,321 | | 09/2004 | | | 0 | | | 0 | | | | 0 | |
| | | | | | | | | $ | 17 | | $ | (14 | ) | | $ | 3 | |
(h) Principal amount denoted in indicated currency:
| | | | |
BP | | - | | British Pound |
BR | | - | | Brazilian Real |
CP | | - | | Chilean Peso |
EC | | - | | Euro |
H$ | | - | | Hong Kong Dollar |
KW | | - | | South Korean Won |
MP | | - | | Mexican Peso |
PN | | - | | Peruvian New Sol |
RP | | - | | Indian Rupee |
RR | | - | | Russian Ruble |
S$ | | - | | Singapore Dollar |
SR | | - | | South African Rand |
SV | | - | | Slovakian Koruna |
T$ | | - | | Taiwan Dollar |
| | | | | | |
| 10 | | Semi-Annual Report | | June 30, 2004 | | See accompanying notes |
Notes to Financial Statements
June 30, 2004 (Unaudited)
1. Organization
The Low Duration Portfolio (the “Portfolio”) is a series of the PIMCO Variable Insurance Trust (the “Trust”). The Trust is registered under the Investment Company Act of 1940 (the “Act”), as amended, as an open-end investment company organized as a Delaware business trust on October 3, 1997. The Portfolio offers two classes of shares: Institutional and Administrative. Each share class has identical voting rights (except that shareholders of a class have exclusive voting rights regarding any matter relating solely to that class of shares). Information presented in these financial statements pertains to the Administrative Class of the Portfolio. Certain detailed financial information for the Institutional Class is provided separately and is available upon request. The Trust is designed to be used as an investment vehicle by Separate Accounts of insurance companies that fund variable annuity contracts and variable life insurance policies and by qualified pension and retirement plans. The Portfolio commenced operations on February 16, 1999.
2. Significant Accounting Policies
The following is a summary of significant accounting policies consistently followed by the Trust in the preparation of its financial statements in conformity with accounting principles generally accepted in the United States of America. The preparation of financial statements in accordance with accounting principles generally accepted in the United States of America requires management to make estimates and assumptions that affect the reported amounts and disclosures in the financial statements. Actual results could differ from those estimates.
Security Valuation. Portfolio securities and other financial instruments for which market quotations are readily available are stated at market value. Portfolio securities and other financial instruments for which market quotes are not readily available are valued at fair value, as determined in good faith and pursuant to guidelines established by the Board of Trustees, including certain fixed income securities which may be valued with reference to securities whose prices are more readily obtainable. Market value is determined at the close of regular trading (normally, 4:00 p.m., Eastern Time) on the New York Stock Exchange on each day the New York Stock Exchange is open, or if no sales are reported, as is the case for most securities traded over-the-counter, the mean between representative bid and asked quotations obtained from a quotation reporting system or from established market makers. The prices of certain portfolio securities or other financial instruments may be determined at a time prior to the close of regular trading on the New York Stock Exchange. Fair valuation may be used if significant events occur after the close of the relevant markets and prior to the close of regular trading on the New York Stock Exchange that materially affect the values of such securities or financial instruments. Fixed income securities are normally valued on the basis of quotes obtained from brokers and dealers or pricing services. Certain fixed income securities purchased on a delayed delivery basis are marked to market daily until settlement at the forward settlement value. Short-term investments, which mature in 60 days or less are valued at amortized cost, which approximates market value. Exchange traded options, futures and options on futures are valued at the settlement price determined by the relevant exchange. Prices may be obtained from independent pricing services which use information provided by market makers or estimates of market values obtained from yield data relating to investments or securities with similar characteristics. The prices used by the Portfolio may differ from the value that would be realized if the securities were sold and the differences could be material to the financial statements.
Securities Transactions and Investment Income. Securities transactions are recorded as of the trade date. Securities purchased or sold on a when-issued or delayed delivery basis may be settled a month or more after the trade date. Realized gains and losses from securities sold are recorded on the identified cost basis. Dividend income is recorded on the ex-dividend date, except certain dividends from foreign securities where the ex-dividend date may have passed, are recorded as soon as the Portfolio is informed of the ex-dividend date. Interest income, adjusted for the accretion of discounts and amortization of premiums, is recorded on the accrual basis. Paydowns gains and losses on mortgage- and asset-backed securities are recorded as adjustments to interest income in the Statement of Operations.
Dividends and Distributions to Shareholders. Dividends from net investment income, if any, are declared on each day the Trust is open for business and are distributed to shareholders monthly. All dividends are reinvested in additional shares of the Portfolio. Net realized capital gains earned by the Portfolio, if any, will be distributed no less frequently than once each year.
Income dividends and capital gain distributions are determined in accordance with income tax regulations which may differ from accounting principles generally accepted in the United States of America. These differences are primarily due to differing treatments for such items as wash sales, foreign currency transactions, net operating losses, notional principal contracts, certain asset-backed securities, certain futures and forward contracts, tax straddles, and capital loss carryforwards.
Distributions classified as a tax basis return of capital, if any, are reflected in the accompanying Statements of Changes in Net Assets and have been reclassified to paid in capital. In addition, other amounts have been reclassified between undistributed net investment income, accumulated undistributed net realized gains or losses and/or paid in capital to more appropriately conform financial accounting to tax characterizations of dividend distributions.
Multiclass Operations. Each class offered by the Trust has equal rights as to assets. Income, non-class specific expenses, and realized and unrealized capital gains and losses are allocated to each class of shares based on the relative net assets of each class.
Federal Income Taxes. The Portfolio intends to qualify as a regulated investment company and distribute all of its taxable income and net realized gains, if applicable, to shareholders. Accordingly, no provision for Federal income taxes has been made.
| | | | |
| June 30, 2004 | | Semi-Annual Report | | 11 |
Notes to Financial Statements (Cont.)
June 30,2004 (Unaudited)
Foreign Currency. The accounting records of the Portfolio are maintained in U.S. dollars. The market values of foreign securities, currency holdings and other assets and liabilities are translated into U.S. dollars based on the current exchange rates each business day. Fluctuations in the value of these assets and liabilities resulting from changes in exchange rates are recorded as unrealized foreign currency gains or losses. Realized gains or losses and unrealized appreciation or depreciation on investment securities and income and expenses are translated on the respective dates of such transactions. The effect of changes in foreign currency exchange rates on investments in securities are not segregated in the Statement of Operations from the effects of changes in market prices of those securities, but are included with the net realized and unrealized gain or loss on investment securities.
Forward Currency Transactions. The Portfolio may enter into forward currency contracts and forward cross-currency contracts in connection with settling planned purchases or sales of securities, to hedge the currency exposure associated with some or all of the Portfolio’s securities or as a part of an investment strategy. A forward currency contract is an agreement between two parties to buy and sell a currency at a set price on a future date. The market value of a forward currency contract fluctuates with changes in forward currency exchange rates. Forward currency contracts are marked to market daily and the change in value is recorded by the Portfolio as an unrealized gain or loss. Realized gains or losses equal to the difference between the value of the contract at the time it was opened and the value at the time it was closed are recorded upon delivery or receipt of the currency or, if a forward currency contract is offset by entering into another forward currency contract with the same broker, upon settlement of the net gain or loss. These contracts may involve market risk in excess of the unrealized gain or loss reflected in the Portfolio’s Statement of Assets and Liabilities. In addition, the Portfolio could be exposed to risk if the counterparties are unable to meet the terms of the contracts or if the value of the currency changes unfavorably to the U.S. dollar.
Futures Contracts. The Portfolio is authorized to enter into futures contracts. The Portfolio may use futures contracts to manage its exposure to the securities markets or to movements in interest rates and currency values. The primary risks associated with the use of futures contracts are the imperfect correlation between the change in market value of the securities held by the Portfolio and the prices of futures contracts, the possibility of an illiquid market, and the inability of the counterparty to meet the terms of the contract. Futures contracts are valued based upon their quoted daily settlement prices. Upon entering into a futures contract, the Portfolio may be required to deposit with its custodian, in a segregated account in the name of the futures broker, an amount of cash or U.S. Government and Agency Obligations in accordance with the initial margin requirements of the broker or exchange. Futures contracts are marked to market daily and an appropriate payable or receivable for the change in value (“variation margin”) is recorded by the Portfolio. Gains or losses are recognized but not considered realized until the contracts expire or are closed. Futures contracts involve, to varying degrees, risk of loss in excess of the variation margin disclosed in the Statement of Assets and Liabilities.
Inflation-Indexed Bonds. The Portfolio may invest in inflation-indexed bonds. Inflation-indexed bonds are fixed income securities whose principal value is periodically adjusted to the rate of inflation. The interest rate on these bonds is generally fixed at issuance at a rate lower than typical bonds. Over the life of an inflation-indexed bond, however, interest will be paid based on a principal value, which is adjusted for inflation. Any increase in the principal amount of an inflation-indexed bond will be included as interest income in the Statement of Operations, even though investors do not receive their principal until maturity.
Options Contracts. The Portfolio may write call and put options on futures, swaps, securities or currencies it owns or in which it may invest. Writing put options tends to increase the Portfolio’s exposure to the underlying instrument. Writing call options tends to decrease the Portfolio’s exposure to the underlying instrument. When the Portfolio writes a call or put option, an amount equal to the premium received is recorded as a liability and subsequently marked to market to reflect the current value of the option written. These liabilities are reflected as written options outstanding in the Statement of Assets and Liabilities. Payments received or made, if any, from writing options with premiums to be determined on a future date are reflected as such on the Statement of Assets and Liabilities. Premiums received from writing options which expire are treated as realized gains. Premiums received from writing options which are exercised or closed are added to the proceeds or offset against amounts paid on the underlying future, swap, security or currency transaction to determine the realized gain or loss. The Portfolio as a writer of an option has no control over whether the underlying future, swap, security or currency may be sold (call) or purchased (put) and as a result bears the market risk of an unfavorable change in the price of the future, swap, security or currency underlying the written option. There is the risk the Portfolio may not be able to enter into a closing transaction because of an illiquid market.
The Portfolio may also purchase put and call options. Purchasing call options tends to increase the Portfolio’s exposure to the underlying instrument. Purchasing put options tends to decrease the Portfolio’s exposure to the underlying instrument. The Portfolio pays a premium which is included in the Portfolio’s Statement of Assets and Liabilities as an investment and subsequently marked to market to reflect the current value of the option. Premiums paid for purchasing options which expire are treated as realized losses. The risk associated with purchasing put and call options is limited to the premium paid. Premiums paid for purchasing options which are exercised or closed are added to the amounts paid or offset against the proceeds on the underlying future, swap, security or currency transaction to determine the realized gain or loss.
Repurchase Agreements. The Portfolio may engage in repurchase transactions. Under the terms of a typical repurchase agreement, the Portfolio takes possession of an underlying debt obligation subject to an obligation of the seller to repurchase, and the Portfolio to resell,
| | | | |
| 12 | | Semi-Annual Report | | June 30, 2004 |
the obligation at an agreed-upon price and time. The market value of the collateral must be equal at all times to the total amount of the repurchase obligations, including interest. Generally, in the event of counterparty default, the Portfolio has the right to use the collateral to offset losses incurred.
Swap Agreements. The Portfolio may invest in swap agreements. A swap is an agreement to exchange the return generated by one instrument for the return generated by another instrument. The Portfolio may enter into interest rate, total return, forward spread lock, and credit default swap agreements to manage its exposure to interest rates and credit risk.
Interest rate swap agreements involve the exchange by the Portfolio with another party of their respective commitments to pay or receive interest, e.g., an exchange of floating rate payments for fixed rate payments with respect to the notional amount of principal.
Total return swap agreements involve commitments to pay interest in exchange for a market-linked return, both based on notional amounts. To the extent the total return of the security or index underlying the transaction exceeds or falls short of the offsetting interest rate obligation, the Portfolio will receive a payment from or make a payment to the counterparty.
Forward spread lock swap agreements involve commitments to pay or receive a settlement amount calculated as the difference between the swap spread and a fixed spread, multiplied by the notional amount times the duration of the swap. The swap spread is the difference between the benchmark swap rate (market rate) and the specific Treasury rate.
In a credit default swap, one party makes a stream of payments to another party in exchange for the right to receive a specified return in the event of a default by a third party, typically corporate issues or sovereign issues of an emerging country, on its obligation. The Portfolio may use credit default swaps to provide a measure of protection against defaults of sovereign issuers (i.e., to reduce risk where the Portfolio owns or has exposure to the sovereign issuer) or to take an active long or short position with respect to the likelihood of a particular issuer’s default.
Swaps are marked to market daily based upon quotations from market makers and the change in value, if any, is recorded as unrealized gain or loss in the Statement of Operations. Payments received or made at the beginning of the measurement period are reflected as such on the Statement of Assets and Liabilities. A liquidation payment received or made at the termination of the swap is recorded as realized gain or loss in the Statement of Operations. Net periodic payments received by the Portfolio are included as part of realized gain (loss) on the Statement of Operations. Entering into these agreements involves, to varying degrees, elements of credit, market and documentation risk in excess of the amounts recognized on the Statement of Assets and Liabilities. Such risks involve the possibility that there will be no liquid market for these agreements, that the counterparty to the agreements may default on its obligation to perform or disagree as to the meaning of contractual terms in the agreements, and that there may be unfavorable changes in interest rates.
As a result of a FASB Emerging Issues Task Force (“EITF”) consensus, No. 03-11, and related SEC staff guidance, the Portfolio has reclassified periodic payments made or received under swap agreements, which were previously included within miscellaneous income, to a component of realized gain (loss) in the Statement of Operations. For consistency, similar reclassifications have been made to amounts appearing in the previous year’s Statement of Changes in Net Assets and the per share amounts in the prior year financial highlights. Prior year net investment income ratios in the financial highlights have also been modified accordingly. This reclassification increased (decreased) net investment income by $(415) and $(314), and net realized gain by $348 and $50 and net change in unrealized appreciation by $68 and $264 for the six months ended June 30, 2004 and year ended December 31, 2003, respectively. There is no effect on the Portfolio’s net asset value, either in total or per share, or its total increase (decrease) in net assets from operations during any period.
3. Fees, Expenses, and Related Party Transactions
Investment Advisory Fee. Pacific Investment Management Company LLC (“PIMCO”) is a majority owned subsidiary partnership of Allianz Dresdner Asset Management of America L.P. and serves as investment adviser (the “Adviser”) to the Trust, pursuant to an investment advisory contract. The Adviser receives a monthly fee at an annual rate based on average daily net assets of the Portfolio. The Advisory Fee is charged at an annual rate of 0.25%.
Administration Fee. PIMCO serves as administrator (the “Administrator”), and provides administrative services to the Trust for which it receives a monthly administrative fee based on average daily net assets of the Portfolio. The Administration Fee is charged at the annual rate of 0.25%.
Servicing Fee. PA Distributors LLC (“PAD”), formerly known as PIMCO Advisors Distributors LLC, is an indirect wholly-owned subsidiary of Allianz Dresdner Asset Management of America L.P. and serves as the distributor of the Trust’s shares. The Trust is permitted to reimburse PAD on a quarterly basis, out of the Administrative Class assets of the Portfolio in the amount of 0.15% on an annual basis of the average daily net assets of that class, for payments made to financial intermediaries that provide services in connection with the distribution of shares or administration of plans or programs that use Portfolio shares as their funding medium. The effective rate paid to PAD was 0.15% during current fiscal year.
Expenses. The Trust is responsible for the following expenses: (i) salaries and other compensation of any of the Trust’s executive officers and employees who are not officers, directors, stockholders or employees of PIMCO or its subsidiaries or affiliates; (ii) taxes and governmental fees; (iii) brokerage fees and commissions and other portfolio transaction expenses; (iv) the cost of borrowing money, including interest expense and bank overdraft charges; (v) fees and expenses of the Trustees who are not “interested persons” of PIMCO or the Trust, and any counsel retained exclusively for their benefit;
| | | | |
| June 30, 2004 | | Semi-Annual Report | | 13 |
Notes to Financial Statements (Cont.)
June 30, 2004 (Unaudited)
(vi) extraordinary expenses, including costs of litigation and indemnification expenses; (vii) organization expenses and (viii) any expenses allocated or allocable to a specific class of shares, which include service fees payable with respect to the Administrative Class shares and may include certain other expenses as permitted by the Trust’s Multiple Class Plan adopted pursuant to Rule 18f-3 under the Act and subject to review and approval by the Trustees. The ratio of expenses to average net assets per share class, as disclosed in Financial Highlights, may differ from the annual portfolio operating expenses per share class as disclosed in the Prospectus for the reasons set forth above.
PIMCO has agreed to waive a portion of its administrative fees to the extent that the payment of the Portfolio’s pro rata share of organization expenses and Trustee fees cause the actual expense ratio to rise above the rates disclosed in the then-current prospectus plus 0.49 basis points as set forth below (calculated as a percentage of the Portfolio’s average daily net assets attributable to each class):
| | |
Institutional Class | | 0.50% |
Administrative Class | | 0.65% |
PIMCO may be reimbursed for these waived amounts in future periods, not to exceed thirty-six months.
Each unaffiliated Trustee receives an annual retainer of $4,000, plus $1,500 for each Board of Trustees meeting attended in person and $250 for each meeting attended telephonically, plus reimbursement of related expenses. In addition, each committee chair receives an additional annual retainer of $500. These expenses are allocated on a pro-rata basis to each Portfolio of the Trust according to its respective net assets.
4. Purchases and Sales of Securities
The length of time a Portfolio has held a particular security is not generally a consideration in investment decisions. A change in the securities held by a Portfolio is known as “portfolio turnover.” The Portfolio may engage in frequent and active trading of portfolio securities to achieve its investment objective, particularly during periods of volatile market movements. High portfolio turnover (e.g., over 100%) involves correspondingly greater expenses to the Portfolio, including brokerage commissions or dealer mark-ups and other transaction costs on the sale of securities and reinvestments in other securities. Such sales may also result in realization of taxable capital gains, including short-term capital gains (which are generally taxed at ordinary income tax rates). The trading costs and tax effects associated with portfolio turnover may adversely affect the Portfolio’s performance.
Purchases and sales of securities (excluding short-term investments) for the period ended June 30, 2004 were as follows (amounts in thousands):
| | | | | | |
| U.S. Government/Agency | | All Other |
| Purchases | | Sales | | Purchases | | Sales |
| $ 54,302 | | $ 21,503 | | $ 35,481 | | $ 13,017 |
5. Transactions in Written Call and Put Options
Transactions in written call and put options were as follows (amounts in thousands):
| | | | |
| | | | Premium | |
Balance at 12/31/2003 | | $ | 0 | |
Sales | | | 115 | |
Expirations | | | (47 | ) |
Exercised | | | 0 | |
Balance at 06/30/2004 | | $ | 68 | |
6. Federal Income Tax Matters
At June 30, 2004, the aggregate cost of investments was the same for federal income tax and financial statement purposes. The net unrealized appreciation (depreciation) of investment securities for federal income tax purposes is as follows (amounts in thousands):
| | | | | | |
Aggregate Gross
Unrealized
Appreciation | | Aggregate Gross
Unrealized
(Depreciation) | | Net Unrealized
Appreciation |
| $ 279 | | $ | (258) | | $ | 21 |
| | | | |
| 14 | | Semi-Annual Report | | June 30, 2004 |
7. Shares of Beneficial Interest
The Trust may issue an unlimited number of shares of beneficial interest with a $.001 par value. Changes in shares of beneficial interest were as follows (shares and amounts in thousands):
| | | | | | | | | | | | | | |
| | | Six Months Ended
06/30/2004 | | | Year Ended
12/31/2003 | |
| | | Shares | | | Amount | | | Shares | | | Amount | |
Receipts for shares sold | | | | | | | | | | | | | | |
| | | | |
Institutional Class | | 884 | | | $ | 9,077 | | | 0 | | | $ | 0 | |
Administrative Class | | 12,693 | | | | 130,603 | | | 10,656 | | | | 109,489 | |
| | | | |
Issued as reinvestment of distributions | | | | | | | | | | | | | | |
| | | | |
Institutional Class | | 2 | | | | 21 | | | 0 | | | | 0 | |
Administrative Class | | 77 | | | | 792 | | | 79 | | | | 815 | |
| | | | |
Cost of shares redeemed | | | | | | | | | | | | | | |
| | | | |
Institutional Class | | (3 | ) | | | (29 | ) | | 0 | | | | 0 | |
Administrative Class | | (2,931 | ) | | | (30,136 | ) | | (1,406 | ) | | | (14,447 | ) |
| | | | |
Net increase resulting from Portfolio share transactions | | 10,722 | | | $ | 110,328 | | | 9,329 | | | $ | 95,857 | |
The following schedule shows the number of shareholders each owning 5% or more of the Portfolio and the total percentage of the Portfolio held by such shareholders:
| | | | |
| | | Number | | % of Portfolio Held |
Institutional Class | | 1 | | 100 |
Administrative Class | | 7 | | 94 |
8. Regulatory and Litigation Matters
On February 17, 2004, the Attorney General of the State of New Jersey (“New Jersey AG”) filed a complaint against Allianz Dresdner Asset Management of America L.P. (“ADAM”), PA Distributors LLC (formerly known as PIMCO Advisors Distributors LLC) (“PAD”), PEA Capital LLC (formerly known as PIMCO Equity Advisors LLC) (“PEA”), and Pacific Investment Management Company LLC (“PIMCO”) in connection with its investigation into market timing and late trading. The complaint contends that inappropriate trading by shareholders engaged in market timing activity took place in funds in the PIMCO Funds: Multi-Manager Series (“MMS Funds”) and the PIMCO Funds: Pacific Investment Management Series (“PIMS Funds”). On June 1, 2004, the New Jersey AG dismissed PIMCO from the lawsuit.
On the same day as the dismissal of PIMCO from the lawsuit, the New Jersey AG announced that it had reached a settlement agreement with the remaining defendants (“New Jersey Settlement”). In the New Jersey Settlement, ADAM, PAD and PEA agreed, while neither admitting nor denying the allegations or conclusions of law, to: (i) pay New Jersey a civil fine of $15 million and $3 million for investigative costs and further enforcement initiatives; and (ii) implement certain changes in corporate governance.
On May 6, 2004, the Securities and Exchange Commission filed a complaint in the U.S. District Court in the Southern District of New York alleging that PA Fund Management LLC (formerly known as PIMCO Advisors Fund Management LLC) (“PAFM”), PEA, PAD, Stephen J. Treadway (at the time, the chief executive officer of PAFM and PAD as well as chairman of the Board of Trustees of the MMS Funds) and Kenneth W. Corba (the former chief executive officer of PEA and former portfolio manager of the PEA Growth and PEA Growth & Income Funds) had, among other things, violated and/or aided and abetted violations of, various antifraud provisions of the federal securities laws in connection with alleged “market timing” arrangements that improperly allowed certain hedge funds to engage in “market timing” in the PEA Growth Fund, the PEA Opportunity Fund, the PEA Innovation Fund, and the PEA Target Fund. The complaint seeks injunctive relief, disgorgement plus pre-judgment interest, monetary penalties, and an order permanently enjoining the defendants from serving as investment advisers, principal underwriters, officers, directors, or members of any advisory boards to any registered investment companies.
On February 20, 2004, a putative class action lawsuit was filed in the U.S. District Court for the District of New Jersey on behalf of certain shareholders of the PIMCO Funds against ADAM, PAD, PIMCO, PEA, the PIMS Funds, the MMS Funds, the Trust, PIMCO Commercial Mortgage Securities Trust, Inc. and certain other defendants, alleging that inappropriate market timing activity by certain shareholders caused financial injury to the shareholders of those Funds.
| | | | |
| June 30, 2004 | | Semi-Annual Report | | 15 |
Notes to Financial Statements (Cont.)
June 30, 2004 (Unaudited)
The following additional putative class action lawsuits have been filed against the PIMS Funds, the MMS Funds and/or their affiliates, each related to alleged market-timing activity in funds advised by PIMCO or its affiliates: (1) a lawsuit filed in the U.S. District Court for the District of Connecticut on February 27, 2004 (naming as defendants ADAM, PAD, PEA, the PIMS Funds, the MMS Funds, the Trust, PCM and certain other parties); (2) a lawsuit filed in the U.S. District Court for the Central District of California on March 4, 2004 (naming as defendants PIMCO, ADAM, PEA and PAD); (3) a lawsuit filed in the U.S. District Court for the Southern District of New York on March 8, 2004 (naming PIMCO, PAD and certain of their affiliates as defendants); (4) a lawsuit filed in the U.S. District Court for the Southern District of New York, on March 15, 2004 (naming PIMCO as the defendant); (5) two separate lawsuits filed in the U.S. District Court for the Central District of California on March 22, 2004, brought derivatively on behalf of the PIMCO High Yield Fund and the PIMCO Money Market Fund, respectively (each naming ADAM, PAFM and certain other parties as defendants, and the PIMCO Funds as the nominal defendant); (6) a lawsuit filed in the U.S. District Court for the Central District of California, also on March 22, 2004, brought derivatively on behalf of the PIMS Funds and the MMS Funds (naming ADAM, PIMCO, PAD and certain other parties as defendants, and the PIMS Funds and the MMS Funds as nominal defendants); (7) a lawsuit filed in the U.S. District Court for the District of New Jersey on April 20, 2004 (naming ADAM, PAD, the PIMS Funds and certain other parties as defendants); and (8) a lawsuit filed in the U.S. District Court for the Northern District of California on April 28, 2004 (naming ADAM, PIMCO, PAD, PEA and certain other parties as defendants, and the “PIMCO Funds” as nominal defendants). Each complaint for the foregoing putative class actions alleges, among other things, that inappropriate trading by shareholders engaged in market timing activities took place in certain of the funds advised by PIMCO, and each complaint seeks unspecified compensatory damages.
On February 17, 2004, a putative class action lawsuit was filed in the U.S. District Court for the District of Connecticut on behalf of certain shareholders of the PIMCO Funds against ADAM, PEA, PIMCO, PIMS Funds, MMS Funds and certain other defendants, alleging excessive investment advisory fees and the use of brokerage commissions to pay for distribution of fund shares. Three similar putative class action lawsuits were subsequently filed, each in the U.S. District Court for the District of Connecticut on March 1, 2004, April 23, 2004 and May 20, 2004, respectively.
Under Section 9(a) of the 1940 Act, if any of the various lawsuits were to result in a court injunction against PAFM, PEA, PAD, PIMCO, ADAM and/or Mr. Treadway, they and their affiliates would, in the absence of exemptive relief granted by the SEC, be barred from serving as an investment adviser/sub-adviser or principal underwriter for any registered investment company, including the Trust. ADAM and certain of its subsidiaries have responded to inquiries from the SEC concerning the status of the New Jersey Settlement under Section 9(a). If any of PAFM, PEA, PAD, PIMCO or ADAM were subject to an injunction, each of these entities and their affiliates could in turn seek exemptive relief from the SEC, as contemplated by the 1940 Act. There is no assurance, however, that such exemptive relief would be granted. The SEC also has the power by order to prohibit PAFM, PEA, PAD and PIMCO from serving as investment advisers and underwriters, if the SEC finds that such entities willfully violated the federal securities laws in connection with the allegations discussed above or aided or abetted such violations.
PIMCO, PAD and the Trust believe that these developments will not have a material adverse effect on the Portfolios or on PIMCO’s, or PAD’s ability to perform their respective investment advisory or distribution services on behalf of the Portfolios.
| | | | |
| 16 | | Semi-Annual Report | | June 30, 2004 |
Trustees and Officers
Brent R. Harris, Chairman and Trustee
R. Wesley Burns, President and Trustee
E. Philip Cannon, Trustee
Vern O. Curtis, Trustee
J. Michael Hagan, Trustee
William J. Popejoy, Trustee
Garlin G. Flynn, Secretary
John P. Hardaway, Treasurer
Investment Adviser and Administrator
Pacific Investment Management Company LLC
840 Newport Center Drive
Newport Beach, California 92660
Distributor
PA Distributors LLC
2187 Atlantic Street
Stamford, Connecticut 06902
Custodian
State Street Bank & Trust Company
801 Pennsylvania
Kansas City, Missouri 64105
Transfer Agent
Boston Financial Data Services–Midwest
330 W. 9th Street
Kansas City, Missouri 64105
Legal Counsel
Dechert LLP
1775 I Street, N.W.
Washington, D.C. 20006
Independent Registered Public Accounting Firm
PricewaterhouseCoopers LLP
1055 Broadway
Kansas City, Missouri 64105
Information about how the Fund voted proxies relating to portfolio securities held during the year July 1, 2003 through June 30, 2004 will be available no later than August 31, 2004 without charge, upon request, by calling the Trust at 1-800-927-4648 and on the SEC’s website at http://www.sec.gov.
Copies of the written Proxy Policy and the factors that PIMCO may consider in determining how to vote proxies for the Funds are available by calling the Trust at 1-800-927-4648 and on the SEC’s website at http://www.sec.gov.
PIMCO VARIABLE INSURANCE TRUST
840 NEWPORT CENTER DRIVE
NEWPORT BEACH, CA 92660

PIMCO VARIABLE INSURANCE TRUST
STOCKSPLUS GROWTHAND INCOME PORTFOLIO
ADMINISTRATIVE CLASS
SEMI-ANNUAL REPORT
June 30, 2004
|
| This material is authorized for use only when preceded or accompanied by the current PIMCO Variable Insurance Trust prospectus. Investors should consider the investment objectives, risks, charges and expenses of Portfolio carefully before investing. This and other information is contained in the Portfolio’s prospectus. Please read the prospectus carefully before you invest or send money. |
Chairman’s Letter
Dear PIMCO Variable Insurance Trust Shareholder:
Bond prices were more volatile during the six-month period ended June 30, 2004. Interest rates rose sharply during the second quarter 2004, causing bonds to give back modest gains from earlier in the year. The Lehman Brothers Aggregate Bond Index, a widely used index for the high-grade bond market, was nearly flat during the first six months of 2004, returning 0.15% after losing 2.44% during the second quarter. The yield on the benchmark ten-year Treasury closed June 30, 2004 at 4.58%, up 0.75% from April 1, 2004, but up only 0.34% from where it began the six-month period on January 1, 2004.
Continued growth in employment convinced the markets that the Federal Reserve would soon begin a long anticipated tightening cycle. On June 30, 2004, the Fed met market expectations by increasing the federal funds rate 0.25%, which was the first rate increase since June 25, 2003. The central bank had held this rate at 1% for more than a year, which generated negative real short-term rates. And on August 10, 2004, the Fed increased the federal funds rate another 0.25% to 1.50%.
Investors that had profited handsomely from borrowing at low short-term rates and investing in higher-yielding longer maturity bonds surrendered some of those profits towards the latter part of the six-month period. Concern that borrowing rates would rise led investors to liquidate long positions and unwind these trades, which caused bond prices to decrease. However, substantial leverage remained among banks, hedge funds, and other investors, making bond markets somewhat vulnerable to additional Fed rate increases. There were also signs of rising inflation, which fueled anxiety that central banks might continue to raise interest rates.
On the following pages you will find a more complete review of the Portfolio in light of financial market activities as well as specific details about the total return investment performance for the six-month period.
We appreciate the trust you have placed in us, and we will continue to focus our efforts to meet your investment needs.
Sincerely,

Brent R. Harris
Chairman
August 11, 2004
| | | | |
| June 30, 2004 | | Semi-Annual Report | | 1 |
Important Information About the Portfolio
We believe that bond funds have an important role to play in a well diversified investment portfolio. It is important to note, however, that in an environment where interest rates may trend upward, rising rates will negatively impact the performance of most bond funds, and fixed income securities held by a fund are likely to decrease in value. The price volatility of fixed income securities can also increase during periods of rising interest rates resulting in increased losses to a fund. Bond funds and individual bonds with a longer duration (a measure of the expected life of a security) tend to be more sensitive to changes in interest rates, usually making them more volatile than securities or funds with shorter durations. The longer-term performance of most bond funds has benefited from capital gains in part resulting from an extended period of declining interest rates. In the event interest rates increase, these capital gains should not be expected to recur.
The Portfolio may be subject to various risks in addition to those described above. Some of these risks may include, but are not limited to, the following: real rate risk, derivative risk, small company risk, foreign security risk, high yield security risk and specific sector investment risks. The Portfolio may use derivative instruments for hedging purposes or as part of an investment strategy. Use of these instruments may involve certain costs and risks such as liquidity risk, interest rate risk, market risk, credit risk, management risk and the risk that a fund could not close out a position when it would be most advantageous to do so. A Portfolio investing in derivatives could lose more than the principal amount invested in these instruments. Investing in non-U.S. securities may entail risk due to non-U.S. economic and political developments; this risk may be enhanced when investing in emerging markets. High-yield bonds typically have a lower credit rating than other bonds. Lower rated bonds generally involve a greater risk to principal than higher rated bonds. Smaller companies may be more volatile than larger companies and may entail more risk. Concentrating investments in individual sectors may add additional risk and volatility compared to a diversified portfolio.
On the performance summary page in this semi-annual report, the Total Return Investment Performance table measures performance assuming that all dividend and capital gain distributions were reinvested. Returns do not reflect the deduction of taxes that a shareholder would pay (i) on Portfolio distributions or (ii) the redemption of Portfolio shares.
An investment in a Portfolio is not a bank deposit and is not guaranteed or insured by the Federal Deposit Insurance Corporation or any other government agency. It is possible to lose money on investments in the Funds.
The following disclosure provides important information regarding the Portfolio’s Expense Example, which appears on the Portfolio’s individual page in this semi-annual report. Please refer to this information when reviewing the Expense Example for the Portfolio.
Example
As a shareholder of the Portfolio, you incur two types of costs: (1) transaction costs, including redemption and exchange fees; and (2) ongoing costs, including advisory and administrative fees; distribution and/or service (12b-1) fees (Administrative Class only); and other Portfolio expenses. The Example is intended to help you understand your ongoing costs (in dollars) of investing in the Portfolio and to compare these costs with the ongoing costs of investing in other mutual funds.
The Example is based on an investment of $1,000 invested at the beginning of the period and held for the entire period indicated, which is from 1/1/04 to 6/30/04.
Actual Expenses
The information in the table under the heading “Actual Performance” provides information about actual account values and actual expenses. You may use the information in these columns, together with the amount you invested, to estimate the expenses that you paid over the period. Simply divide your account value by $1,000.00 (for example, an $8,600.00 account value divided by $1,000 = 8.60), then multiply the result by the number in the appropriate column for your share class, in the row entitled “Expenses Paid During Period” to estimate the expenses you paid on your account during this period.
Hypothetical Example for Comparison Purposes
The information in the table under the heading “Hypothetical Performance (5% return before expenses)” provides information about hypothetical account values and hypothetical expenses based on the Portfolio’s actual expense ratio and an assumed rate of return of 5% per year before expenses, which is not the Portfolio’s actual return. The hypothetical account values and expenses may not be used to estimate the actual ending account balance or expenses you paid for the period. You may use this information to compare the ongoing costs of investing in the Portfolio and other portfolios. To do so, compare this 5% hypothetical example with the 5% hypothetical examples that appear in the shareholder reports of the other portfolios.
Please note that the expenses shown in the table are meant to highlight your ongoing costs only and do not reflect any transactional costs. Therefore, the information under the heading “Hypothetical Performance (5% return before expenses)” is useful in comparing ongoing costs only, and will not help you determine the relative total costs of owning different portfolios. In addition, if these transactional costs were included, your costs would have been higher.
PIMCO Variable Insurance Trust is distributed by PA Distributors LLC, 2187 Atlantic Street, Stamford, CT 06902.
| | | | |
| 2 | | Semi-Annual Report | | June 30, 2004 |
StocksPLUS Growth and Income Portfolio
CUMULATIVE RETURNS THROUGH JUNE 30, 2004
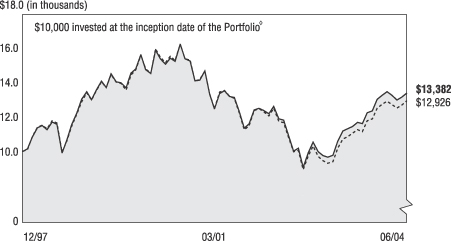
[CHART]
StocksPLUS Growth
and Income Portfolio
Admin. Class S&P 500 Index
------------------- -------------
12/31/1997 $10,000 $10,000
01/31/1998 $10,140 $10,111
02/28/1998 $10,820 $10,840
03/31/1998 $11,370 $11,395
04/30/1998 $11,490 $11,510
05/31/1998 $11,260 $11,312
06/30/1998 $11,701 $11,771
07/31/1998 $11,570 $11,646
08/31/1998 $9,906 $9,962
09/30/1998 $10,669 $10,600
10/31/1998 $11,552 $11,462
11/30/1998 $12,222 $12,157
12/31/1998 $13,011 $12,858
01/31/1999 $13,446 $13,395
02/28/1999 $12,990 $12,979
03/31/1999 $13,541 $13,498
04/30/1999 $14,052 $14,021
05/31/1999 $13,697 $13,690
06/30/1999 $14,493 $14,450
07/31/1999 $14,031 $13,999
08/31/1999 $13,968 $13,929
09/30/1999 $13,663 $13,548
10/31/1999 $14,525 $14,405
11/30/1999 $14,759 $14,698
12/31/1999 $15,594 $15,564
01/31/2000 $14,720 $14,782
02/29/2000 $14,501 $14,502
03/31/2000 $15,844 $15,920
04/30/2000 $15,355 $15,441
05/31/2000 $15,042 $15,125
06/30/2000 $15,398 $15,497
07/31/2000 $15,209 $15,255
08/31/2000 $16,210 $16,203
09/30/2000 $15,351 $15,347
10/31/2000 $15,219 $15,282
11/30/2000 $14,074 $14,077
12/31/2000 $14,113 $14,146
01/31/2001 $14,649 $14,648
02/28/2001 $13,295 $13,313
03/31/2001 $12,450 $12,469
04/30/2001 $13,336 $13,438
05/31/2001 $13,503 $13,528
06/30/2001 $13,178 $13,199
07/31/2001 $13,126 $13,069
08/31/2001 $12,332 $12,251
09/30/2001 $11,338 $11,262
10/31/2001 $11,589 $11,476
11/30/2001 $12,396 $12,357
12/31/2001 $12,499 $12,465
01/31/2002 $12,365 $12,283
02/28/2002 $12,178 $12,046
03/31/2002 $12,603 $12,499
04/30/2002 $11,877 $11,742
05/31/2002 $11,810 $11,655
06/30/2002 $10,948 $10,825
07/31/2002 $10,016 $9,981
08/31/2002 $10,178 $10,047
09/30/2002 $9,078 $8,955
10/31/2002 $9,922 $9,743
11/30/2002 $10,534 $10,316
12/31/2002 $9,972 $9,710
01/31/2003 $9,766 $9,456
02/28/2003 $9,669 $9,314
03/31/2003 $9,776 $9,404
04/30/2003 $10,592 $10,179
05/31/2003 $11,172 $10,715
06/30/2003 $11,300 $10,852
07/31/2003 $11,439 $11,043
08/31/2003 $11,675 $11,259
09/30/2003 $11,601 $11,139
10/31/2003 $12,227 $11,769
11/30/2003 $12,338 $11,873
12/31/2003 $13,001 $12,496
01/31/2004 $13,240 $12,725
02/29/2004 $13,451 $12,902
03/31/2004 $13,251 $12,707
04/30/2004 $12,970 $12,508
05/31/2004 $13,139 $12,679
06/30/2004 $13,382 $12,926
SECTOR BREAKDOWN‡
| | | |
Short-Term Instruments‡‡ | | 71.9 | % |
Mortgage-Backed Securities | | 7.2 | % |
U.S. Treasury Obligations | | 6.0 | % |
Corporate Bonds & Notes | | 5.6 | % |
U.S. Government Agencies | | 5.1 | % |
Other | | 4.2 | % |
‡ % of Total Investments as of June 30, 2004
‡‡ Primarily serving as collateral for equity-linked derivative positions.
à$10,000 invested at the beginning of the first full month following the inception of the Administrative Class.
TOTAL RETURN INVESTMENT PERFORMANCE For the period ended June 30, 2004
| | | | | | | | | | | | | | | | |
| | | | | | | 6 Months | | | 1 Year | | | 5 Years* | | | Since Inception* | |
| | |
| | StocksPLUS Growth and Income Portfolio Administrative Class (Inception 12/31/97) | | 2.93 | % | | 18.42 | % | | –1.58 | % | | 4.60 | % |
| | | - - - - - - - | | S&P 500 Index | | 3.44 | % | | 19.11 | % | | –2.20 | % | | — | |
| | | | | * Annualized. All Portfolio returns are net of fees and expenses. | | | | | | | | | | | | |
Past performance is no guarantee of future results. The performance quoted represents past performance. Investment return and principal value will fluctuate so the Portfolio shares, when redeemed, may be worth more or less than their original cost. Current performance may be lower or higher than the performance data quoted. Performance data current to the most recent month-end is available by calling (800) 927-4648.
Please refer to page 2 herein for an explanation of the information presented in the following Expense Example.
| | | | | | | | | | |
| EXPENSE EXAMPLE | | | | Actual Performance | | | | Hypothetical Performance
(5% return before expenses) |
Beginning Account Value (01/01/04) | | | | $ | 1,000.00 | | | | $ | 1,000.00 |
Ending Account Value (06/30/04) | | | | $ | 1,029.30 | | | | $ | 1,025.00 |
Expenses Paid During Period† | | | | $ | 3.28 | | | | $ | 3.27 |
†Expenses are equal to the Portfolio’s Administrative Class annualized expense ratio of 0.65%, multiplied by the average account value over the period, multiplied by 182/366 (to reflect the one-half year period).
PORTFOLIO INSIGHTS
| • | The StocksPLUS Growth and Income Portfolio seeks to achieve its investment objective by investing under normal circumstances substantially all of its assets in S&P 500 derivatives, backed by a portfolio of Fixed Income Instruments. |
| • | The Portfolio’s benchmark, the S&P 500 Index, posted a total return of 3.44% for the 6 months ended June 30, 2004. U.S. equity market sentiment was generally bullish based on strong analyst forecasts for second quarter earnings, although concerns about potentially destabilizing influences including terrorism, the situation in Iraq, inflation management, and the upcoming election loomed. |
| • | In comparison, the Portfolio’s Administrative Class underperformed the S&P 500 Index by returning 2.93% for the same period. |
| • | Interest rates rose during the first half of the year, resulting in negative fixed-income returns. While the structural yield advantage provided by non-money market holdings boosted returns, the yield contribution was eclipsed by the sharp rise in rates. |
| • | Non-U.S. positions provided important diversification; short and intermediate maturity Eurozone issues outperformed U.S. alternatives amid expectations for slower growth and lower inflation in Europe. |
| • | Exposure to real return bonds was positive for the first half of the year in general, as these securities benefited from strong demand for the inflation protection they provide. |
| • | Curve strategies detracted from performance, as the Portfolio emphasized one to five year maturities relative to five year and longer maturity instruments. Rates on one to five year yields increased more than yields of five years or longer. |
| • | Mortgage exposure provided diversification and incremental yield relative to money markets as the sector benefited from spread narrowings. |
| • | Other strategies, including small positions in emerging market bonds, corporate bonds, and municipal bonds, were neutral for performance while adding important diversification. |
| | | | |
| June 30, 2004 | | Semi-Annual Report | | 3 |
Financial Highlights
StocksPLUS Growth and Income Portfolio (Administrative Class)
| | | | | | | | | | | | | | | | | | | | | | | | | | | | | | | | | | | | |
Selected Per Share Data for the
Year or Period Ended: | | | | 06/30/2004+ | | | | | 12/31/2003 | | | | | 12/31/2002 | | | | | 12/31/2001 | | | | | 12/31/2000 | | | | | 12/31/1999 | |
| | | | | | | | | | | | |
Net asset value beginning of period | | | | $ | 9.26 | | | | | $ | 7.25 | | | | | $ | 9.35 | | | | | $ | 11.05 | | | | | $ | 13.56 | | | | | $ | 12.58 | |
Net investment income (a) | | | | | 0.05 | (e) | | | | | 0.13 | (e) | | | | | 0.26 | (e) | | | | | 0.50 | (e) | | | | | 0.82 | (e) | | | | | 0.76 | |
Net realized/unrealized gain (loss) on investments (a) | | | | | 0.22 | (e) | | | | | 2.06 | (e) | | | | | (2.14 | )(e) | | | | | (1.78 | )(e) | | | | | (2.04 | )(e) | | | | | 1.65 | |
Total income (loss) from investment operations | | | | | 0.27 | | | | | | 2.19 | | | | | | (1.88 | ) | | | | | (1.28 | ) | | | | | (1.22 | ) | | | | | 2.41 | |
Dividends from net investment income | | | | | (0.05 | ) | | | | | (0.18 | ) | | | | | (0.22 | ) | | | | | (0.42 | ) | | | | | (0.75 | ) | | | | | (0.61 | ) |
Distributions from net realized capital gains | | | | | 0.00 | | | | | | 0.00 | | | | | | 0.00 | | | | | | 0.00 | | | | | | (0.54 | ) | | | | | (0.82 | ) |
Total distributions | | | | | (0.05 | ) | | | | | (0.18 | ) | | | | | (0.22 | ) | | | | | (0.42 | ) | | | | | (1.29 | ) | | | | | (1.43 | ) |
Net asset value end of period | | | | $ | 9.48 | | | | | $ | 9.26 | | | | | $ | 7.25 | | | | | $ | 9.35 | | | | | $ | 11.05 | | | | | $ | 13.56 | |
Total return | | | | | 2.93 | % | | | | | 30.38 | % | | | | | (20.22 | )% | | | | | (11.43 | )% | | | | | (9.50 | )% | | | | | 19.85 | % |
Net assets end of period (000s) | | | | $ | 265,443 | | | | | $ | 267,880 | | | | | $ | 218,993 | | | | | $ | 259,926 | | | | | $ | 272,751 | | | | | $ | �� 230,412 | |
Ratio of net expenses to average net assets | | | | | 0.65 | %* | | | | | 0.65 | % | | | | | 0.65 | %(b) | | | | | 0.67 | %(c)(d) | | | | | 0.65 | %(b) | | | | | 0.65 | % |
Ratio of net investment income to average net assets | | | | | 1.14 | %*(e) | | | | | 1.54 | %(e) | | | | | 3.13 | %(e) | | | | | 5.02 | %(e) | | | | | 6.30 | %(e) | | | | | 5.69 | % |
Portfolio turnover rate | | | | | 48 | % | | | | | 134 | % | | | | | 192 | % | | | | | 547 | % | | | | | 350 | % | | | | | 34 | % |
| (a) | Per share amounts based on average number of shares outstanding during the period. |
| (b) | If the investment manager had not reimbursed expenses, the ratio of expenses to average net assets would have been 0.66%. |
| (c) | Ratio of expenses to average net assets excluding interest expense is 0.65%. |
| (d) | If the investment manager had not reimbursed expenses, the ratio of expenses to average net assets would have been 0.67%. |
| (e) | Indicates a period in which, as a result of a change in generally accepted accounting principles, the portfolio has reclassified periodic payments made or received under certain derivative instruments, which were previously included within miscellaneous income, to a component of realized gain(loss) in the Statement of Operations. The effect of this reclassification was to (reduce) the net investment income ratio for the period ending June 30, 2004 by (0.11)% and the net investment income per share by $(0.01). For consistency, similar reclassifications have been made to prior period amounts, resulting in increases(reductions) to the net investment income ratio of (0.65)%, 0.44%, 0.42% and 0.44% and to the net investment income per share of $(0.05), $0.04, $0.04 and $0.06 in the fiscal years ending December 31, 2003, 2002, 2001, and 2000, respectively. This change had no impact on the reported net asset value per share for any period. |
| | | | | | |
| 4 | | Semi-Annual Report | | June 30, 2004 | | See accompanying notes |
Statement of Assets and Liabilities
StocksPLUS Growth and Income Portfolio
June 30, 2004 (Unaudited)
| | | | | | |
| Amounts in thousands, except per share amounts | | | | | |
| | |
Assets: | | | | | | |
| | |
Investments, at value | | | | $ | 266,611 | |
Cash | | | | | 1 | |
Foreign currency, at value | | | | | 1,035 | |
Unrealized appreciation on forward foreign currency contracts | | | | | 13 | |
Receivable for Portfolio shares sold | | | | | 6 | |
Interest and dividends receivable | | | | | 653 | |
Variation margin receivable | | | | | 1,884 | |
| | | | | | 270,203 | |
| | |
Liabilities: | | | | | | |
| | |
Payable for Portfolio shares redeemed | | | | $ | 317 | |
Accrued investment advisory fee | | | | | 88 | |
Accrued administration fee | | | | | 22 | |
Accrued servicing fee | | | | | 33 | |
Variation margin payable | | | | | 807 | |
Recoupment payable to Manager | | | | | 4 | |
Swap premiums received | | | | | 1 | |
Other liabilities | | | | | 9 | |
| | | | | | 1,281 | |
| | |
Net Assets | | | | $ | 268,922 | |
| | |
Net Assets Consist of: | | | | | | |
| | |
Paid in capital | | | | $ | 350,143 | |
(Overdistributed) net investment income | | | | | (90 | ) |
Accumulated undistributed net realized (loss) | | | | | (82,868 | ) |
Net unrealized appreciation | | | | | 1,737 | |
| | | | | $ | 268,922 | |
| | |
Net Assets: | | | | | | |
| | |
Institutional Class | | | | $ | 3,479 | |
Administrative Class | | | | | 265,443 | |
| | |
Shares Issued and Outstanding: | | | | | | |
| | |
Institutional Class | | | | | 365 | |
Administrative Class | | | | | 28,000 | |
| | |
Net Asset Value and Redemption Price Per Share
(Net Assets Per Share Outstanding) | | | | | | |
| | |
Institutional Class | | | | $ | 9.52 | |
Administrative Class | | | | | 9.48 | |
| | |
Cost of Investments Owned | | | | $ | 266,818 | |
Cost of Foreign Currency Held | | | | $ | 1,029 | |
| | | | | | |
| See accompanying notes | | June 30, 2004 | | Semi-Annual Report | | 5 |
Statement of Operations
StocksPLUS Growth and Income Portfolio
| | | | | | |
| Amounts in thousands | | | | | |
| | | | | Six Months Ended
June 30, 2004
(Unaudited) | |
Investment Income: | | | | | | |
| | |
Interest | | | | $ | 2,379 | |
Dividends | | | | | 39 | |
Total Income | | | | | 2,418 | |
| | |
Expenses: | | | | | | |
| | |
Investment advisory fees | | | | | 538 | |
Administration fees | | | | | 135 | |
Distribution and/or servicing fees - Administrative Class | | | | | 199 | |
Trustees’ fees | | | | | 2 | |
Miscellaneous expense | | | | | 5 | |
Total Expenses | | | | | 879 | |
| | |
Net Investment Income | | | | | 1,539 | |
| | |
Net Realized and Unrealized Gain (Loss): | | | | | | |
| | |
Net realized gain on investments | | | | | 78 | |
Net realized gain on futures contracts and swaps | | | | | 16,963 | |
Net realized (loss) on foreign currency transactions | | | | | (44 | ) |
Net change in unrealized (depreciation) on investments | | | | | (442 | ) |
Net change in unrealized (depreciation) on futures contracts
and swaps | | | | | (10,257 | ) |
Net change in unrealized appreciation on translation of
assets and liabilities denominated in foreign currencies | | | | | 20 | |
Net Gain | | | | | 6,318 | |
| | |
Net Increase in Assets Resulting from Operations | | | | $ | 7,857 | |
| | | | | | |
| 6 | | Semi-Annual Report | | June 30, 2004 | | See accompanying notes |
Statements of Changes in Net Assets
StocksPLUS Growth and Income Portfolio
| | | | | | | | | | | | |
| Amounts in thousands | | | | | | | | | | |
| | | | | Six Months Ended
June 30, 2004
(Unaudited) | | | | | Year Ended
December 31, 2003 | |
Increase (Decrease) in Net Assets from: | | | | | | | | | | | | |
| | | | |
Operations: | | | | | | | | | | | | |
| | | | |
Net investment income | | | | $ | 1,539 | | | | | $ | 3,744 | |
Net realized gain | | | | | 16,997 | | | | | | 49,061 | |
Net change in unrealized appreciation (depreciation) | | | | | (10,679 | ) | | | | | 12,945 | |
Net increase resulting from operations | | | | | 7,857 | | | | | | 65,750 | |
| | | | |
Distributions to Shareholders: | | | | | | | | | | | | |
| | | | |
From net investment income | | | | | | | | | | | | |
Institutional Class | | | | | (19 | ) | | | | | (39 | ) |
Administrative Class | | | | | (1,439 | ) | | | | | (5,180 | ) |
Total Distributions | | | | | (1,458 | ) | | | | | (5,219 | ) |
| | | | |
Portfolio Share Transactions: | | | | | | | | | | | | |
| | | | |
Receipts for shares sold | | | | | | | | | | | | |
Institutional Class | | | | | 1,799 | | | | | | 1,004 | |
Administrative Class | | | | | 13,449 | | | | | | 59,278 | |
| | | | |
Issued as reinvestment of distributions | | | | | | | | | | | | |
Institutional Class | | | | | 19 | | | | | | 39 | |
Administrative Class | | | | | 1,439 | | | | | | 5,180 | |
| | | | |
Cost of shares redeemed | | | | | | | | | | | | |
Institutional Class | | | | | (603 | ) | | | | | (51 | ) |
Administrative Class | | | | | (23,663 | ) | | | | | (75,677 | ) |
Net decrease resulting from Portfolio share transactions | | | | | (7,560 | ) | | | | | (10,227 | ) |
| | | | |
Total Increase (Decrease) in Net Assets | | | | | (1,161 | ) | | | | | 50,304 | |
| | | | |
Net Assets: | | | | | | | | | | | | |
| | | | |
Beginning of period | | | | | 270,083 | | | | | | 219,779 | |
End of period* | | | | $ | 268,922 | | | | | $ | 270,083 | |
| | | | |
*Including (overdistributed) net investment income of: | | | | $ | (90 | ) | | | | $ | (171 | ) |
| | | | | | |
| See accompanying notes | | June 30, 2004 | | Semi-Annual Report | | 7 |
Schedule of Investments
StocksPLUS Growth and Income Portfolio
June 30, 2004 (Unaudited)
| | | | |
| | | Principal | | |
| | | Amount | | Value |
| | | (000s) | | (000s) |
| | | | | | |
CORPORATE BONDS & NOTES 5.6% |
Banking & Finance 2.9% | | | | | | |
Ford Motor Credit Co. | | | | | | |
7.500% due 03/15/2005 | | $ | 300 | | $ | 310 |
General Motors Acceptance Corp. | | | |
3.340% due 03/04/2005 (a) | | | 900 | | | 909 |
2.400% due 10/20/2005 (a) | | | 1,500 | | | 1,513 |
Pemex Project Funding Master Trust | | | |
2.640% due 01/07/2005 (a) | | | 3,900 | | | 3,907 |
Verizon Wireless Capital LLC | | | | | | |
1.350% due 05/23/2005 (a) | | | 1,100 | | | 1,099 |
| | | | | |
|
|
| | | | | | | 7,738 |
| | | | | |
|
|
Industrials 0.9% | | | | | | |
Alcan, Inc. | | | | | | |
1.623% due 12/08/2004 (a) | | | 1,200 | | | 1,200 |
DaimlerChrysler N.A. Holding Corp. | | | |
2.386% due 09/26/2005 (a) | | | 200 | | | 201 |
Enron Corp. | | | | | | |
8.000% due 08/15/2005 (b) | | | 1,700 | | | 663 |
Waste Management, Inc. | | | | | | |
7.000% due 10/01/2004 | | | 300 | | | 303 |
| | | | | |
|
|
| | | | | | | 2,367 |
| | | | | |
|
|
Utilities 1.8% | | | | | | |
Entergy Gulf States, Inc. | | | | | | |
2.433% due 06/18/2007 (a) | | | 2,500 | | | 2,507 |
Pacific Gas & Electric Co. | | | | | | |
1.810% due 04/03/2006 (a) | | | 2,400 | | | 2,402 |
| | | | | |
|
|
| | | | | | | 4,909 |
| | | | | |
|
|
| Total Corporate Bonds & Notes (Cost $16,005) | | | | | | 15,014 |
| | | | | |
|
|
| | | | | | | |
MUNICIPAL BONDS & NOTES 0.8% |
|
Golden State Tobacco
Securitization Corp. Revenue Bonds, Series 2003 |
5.000% due 06/01/2021 | | | 915 | | | 896 |
North Carolina State
Educational Assistance Authority Revenue Bonds,
(GTD Insured), Series 2000 |
1.470% due 06/01/2009 (a) | | | 1,279 | | | 1,281 |
| | | | | |
|
|
| Total Municipal Bonds & Notes (Cost $2,190) | | | | | | 2,177 |
| | | | | |
|
|
| | | | | | | |
U.S. GOVERNMENT AGENCIES 5.1% |
| | |
Fannie Mae | | | | | | |
6.500% due 09/01/2005 | | | 17 | | | 18 |
5.213% due 04/01/2033 (a) | | | 564 | | | 567 |
5.090% due 09/01/2034 (a) | | | 906 | | | 922 |
4.797% due 12/01/2036 (a) | | | 844 | | | 872 |
6.000% due 04/01/2013- 11/01/2033 (e) | | | 859 | | | 895 |
5.000% due 12/01/2017- 09/01/2018 (e) | | | 1,581 | | | 1,588 |
8.000% due 05/01/2030- 09/01/2031 (e) | | | 132 | | | 143 |
Freddie Mac | | | | | | |
5.500% due 11/15/2015- 08/15/2030 (e) | | | 715 | | | 725 |
6.000% due 07/01/2016- 05/01/2033 (e) | | | 2,286 | | | 2,342 |
6.500% due 08/01/2032- 10/25/2043 (e) | | | 1,429 | | | 1,492 |
Government National Mortgage Association | | | |
4.750% due 08/20/2024 (a) | | | 40 | | | 41 |
3.375% due 02/20/2027 (a) | | | 351 | | | 351 |
3.500% due 05/20/2028 (a) | | | 702 | | | 697 |
4.000% due 11/20/2029 (a) | | | 428 | | | 430 |
8.500% due 04/20/2030 | | | 10 | | | 11 |
| | | | | | |
| | |
4.375% due 04/20/2024- 04/20/2027 (a)(e) | | $ | 1,553 | | $ | 1,556 |
8.000% due 04/15/2027- 02/15/2031 (e) | | | 856 | | | 940 |
| | | | | |
|
|
Total U.S. Government Agencies
(Cost $13,668) | | | 13,590 |
| | | | | |
|
|
| | | | | | | |
U.S. TREASURY OBLIGATIONS 5.9% |
| |
Treasury Inflation Protected Securities (d) | | | |
3.625% due 01/15/2008 (c) | | | 14,196 | | | 15,518 |
3.875% due 01/15/2009 | | | 115 | | | 128 |
3.500% due 01/15/2011 | | | 324 | | | 360 |
| | | | | |
|
|
| Total U.S. Treasury Obligations (Cost $15,065) | | | | | | 16,006 |
| | | | | |
|
|
| | | | | | | |
MORTGAGE-BACKED SECURITIES 7.1% |
| |
Amortizing Residential Collateral Trust | | | |
1.620% due 07/25/2032 (a) | | | 456 | | | 457 |
Bank of America Mortgage Securities, Inc. | | | |
6.500% due 10/25/2031 | | | 643 | | | 643 |
Bear Stearns Adjustable Rate Mortgage Trust |
5.974% due 06/25/2032 (a) | | | 249 | | | 252 |
5.380% due 01/25/2033 (a) | | | 666 | | | 670 |
4.357% due 01/25/2034 (a) | | | 693 | | | 697 |
4.802% due 01/25/2034 (a) | | | 1,341 | | | 1,346 |
Countrywide Alternative Loan Trust | | | |
5.875% due 07/25/2032 | | | 10 | | | 10 |
6.000% due 10/25/2033 | | | 1,226 | | | 1,233 |
CS First Boston Mortgage Securities Corp. | | | |
1.700% due 02/25/2032 (a) | | | 140 | | | 141 |
1.430% due 03/25/2032 (a) | | | 634 | | | 632 |
1.727% due 03/25/2032 (a) | | | 1,454 | | | 1,459 |
5.738% due 05/25/2032 (a) | | | 361 | | | 367 |
5.192% due 06/25/2032 (a) | | | 113 | | | 113 |
6.222% due 06/25/2032 (a) | | | 196 | | | 199 |
DLJ Mortgage Acceptance Corp. | | | |
1.800% due 06/25/2026 (a) | | | 110 | | | 110 |
GSR Mortgage Loan Trust | | | | | | |
1.650% due 01/25/2034 (a) | | | 296 | | | 296 |
Housing Securities, Inc. | | | | | | |
1.789% due 07/25/2032 (a) | | | 41 | | | 40 |
Impac CMB Trust | | | | | | |
1.680% due 10/25/2033 (a) | | | 178 | | | 178 |
1.550% due 01/25/2034 (a) | | | 946 | | | 947 |
Mellon Residential Funding Corp. | | | |
1.478% due 06/15/2030 (a) | | | 1,491 | | | 1,481 |
Merrill Lynch Mortgage Investors, Inc. | | | |
4.910% due 12/25/2032 (a) | | | 271 | | | 271 |
Morgan Stanley Dean Witter Capital I, Inc. | | | |
5.500% due 04/25/2017 | | | 259 | | | 264 |
Prime Mortgage Trust | | | | | | |
1.500% due 02/25/2034 (a) | | | 140 | | | 140 |
1.700% due 02/25/2034 (a) | | | 424 | | | 424 |
Resecuritization Mortgage Trust | | | | | | |
1.570% due 04/26/2021 (a) | | | 21 | | | 20 |
Residential Funding Mortgage Securities I, Inc. | | | | | | |
6.500% due 03/25/2032 | | | 554 | | | 563 |
Salomon Brothers Mortgage Securities VII, Inc. | | | | | | |
4.591% due 12/25/2030 (a) | | | 510 | | | 521 |
Structured Asset Securities Corp. | | | |
1.600% due 10/25/2027 (a) | | | 642 | | | 642 |
| |
Washington Mutual Mortgage Securities Corp. | | | |
6.000% due 03/25/2017 | | | 129 | | | 131 |
5.420% due 02/25/2033 (a) | | | 1,575 | | | 1,599 |
3.052% due 02/27/2034 (a) | | | 857 | | | 858 |
2.624% due 08/25/2042 (a) | | | 2,505 | | | 2,531 |
| | | | | |
|
|
| Total Mortgage-Backed Securities (Cost $19,303) | | | | | | 19,235 |
| | | | | |
|
|
| | | | | | |
ASSET-BACKED SECURITIES 1.6% |
| |
Ameriquest Mortgage Securities, Inc. | | | |
1.610% due 06/25/2032 (a) | | $ | 108 | | $ | 108 |
Chase Funding Mortgage Loan Asset-Backed Certificates | | | | | | |
1.670% due 10/25/2032 (a) | | | 503 | | | 505 |
Countrywide Asset-Backed Certificates | | | |
1.440% due 11/25/2020 (a) | | | 225 | | | 225 |
1.560% due 05/25/2032 (a) | | | 1,011 | | | 1,013 |
CS First Boston Mortgage Securities Corp. | | | |
1.610% due 01/25/2032 (a) | | | 314 | | | 314 |
1.630% due 03/25/2034 (a) | | | 353 | | | 353 |
Home Equity Mortgage Trust | | | | | | |
1.550% due 04/25/2034 (a) | | | 536 | | | 537 |
Residential Asset Securities Corp. | | | |
1.420% due 06/25/2025 (a) | | | 691 | | | 691 |
Structured Asset Investment Loan Trust | | | |
1.440% due 08/25/2010 (a) | | | 500 | | | 500 |
| | | | | |
|
|
| Total Asset-Backed Securities (Cost $4,240) | | | | | | 4,246 |
| | | | | |
|
|
| | | | | | | |
SOVEREIGN ISSUES 1.1% | | | | | | |
| | |
Republic of Brazil | | | | | | |
2.062% due 04/15/2006 (a) | | | 832 | | | 821 |
2.125% due 04/15/2009 (a) | | | 1,235 | | | 1,123 |
United Mexican States | | | | | | |
1.840% due 01/13/2009 (a) | | | 900 | | | 919 |
| | | | | |
|
|
Total Sovereign Issues
(Cost $2,881) | | | | | | 2,863 |
| | | | | |
|
|
| | | | | | | |
PURCHASED PUT OPTIONS 0.0% | | | |
| | | # of
Contracts | | |
Eurodollar September Futures (CME) | | | |
Strike @ 97.250 Exp. 09/13/2004 | | | 216 | | | 4 |
Strike @ 93.250 Exp. 03/14/2005 | | | 36 | | | 0 |
S&P 500 Index September Futures | | | |
Strike @ 700.000 Exp. 09/17/2004 | | | 155 | | | 4 |
| | | | | |
|
|
| Total Purchased Put Options (Cost $9) | | | | | | 8 |
| | | | | |
|
|
| | | | | | | |
PREFERRED SECURITY 0.7% | | | |
| | | Shares | | |
DG Funding Trust | | | | | | |
3.360% due 12/29/2049 (a) | | | 173 | | | 1,860 |
| | | | | |
|
|
Total Preferred Security
(Cost $1,823) | | | | | | 1,860 |
| | | | | |
|
|
| | | | | | | |
SHORT-TERM INSTRUMENTS 71.2% | | | |
| | | Principal
Amount (000)s | | |
Commercial Paper 66.5% | | | | | | |
AB Spintab | | | | | | |
1.490% due 09/02/2004 | | $ | 1,400 | | | 1,396 |
Altria Group, Inc. | | | | | | |
1.800% due 10/29/2004 | | | 400 | | | 398 |
Anz (Delaware), Inc. | | | | | | |
1.060% due 07/19/2004 | | | 5,200 | | | 5,197 |
Bank of Ireland | | | | | | |
1.285% due 09/03/2004 | | | 7,300 | | | 7,281 |
Barclays U.S. Funding Corp. | | | | | | |
1.110% due 08/25/2004 | | | 200 | | | 200 |
CBA (de) Finance | | | | | | |
1.050% due 07/02/2004 | | | 4,100 | | | 4,100 |
1.080% due 07/27/2004 | | | 4,000 | | | 3,997 |
CDC Commercial Paper, Inc. | | | | | | |
1.085% due 08/04/2004 | | | 3,400 | | | 3,396 |
1.120% due 08/24/2004 | | | 2,100 | | | 2,096 |
1.320% due 09/10/2004 | | | 1,600 | | | 1,595 |
| | | | | | |
| 8 | | Semi-Annual Report | | June 30, 2004 | | See accompanying notes |
| | | | |
| | | Principal | | |
| | | Amount | | Value |
| | | (000s) | | (000s) |
| | | | | | |
| | |
Danske Corp. | | | | | | |
1.070% due 07/21/2004 | | $ | 200 | | $ | 200 |
1.070% due 07/26/2004 | | | 400 | | | 400 |
1.260% due 09/14/2004 | | | 2,500 | | | 2,492 |
1.240% due 09/17/2004 | | | 1,700 | | | 1,695 |
European Investment Bank | | | | | | |
1.050% due 07/16/2004 | | | 4,700 | | | 4,698 |
Fannie Mae | | | | | | |
1.030% due 07/01/2004 | | | 1,300 | | | 1,300 |
1.025% due 07/07/2004 | | | 2,700 | | | 2,700 |
1.040% due 07/14/2004 | | | 2,700 | | | 2,699 |
1.045% due 07/21/2004 | | | 3,200 | | | 3,198 |
1.060% due 07/21/2004 | | | 7,300 | | | 7,296 |
1.177% due 08/25/2004 | | | 2,600 | | | 2,595 |
1.180% due 08/25/2004 | | | 300 | | | 299 |
1.225% due 09/01/2004 | | | 4,600 | | | 4,589 |
1.230% due 09/01/2004 | | | 2,700 | | | 2,693 |
1.250% due 09/01/2004 | | | 2,700 | | | 2,693 |
1.200% due 09/08/2004 | | | 100 | | | 100 |
1.426% due 09/22/2004 | | | 2,700 | | | 2,691 |
1.530% due 10/18/2004 | | | 2,700 | | | 2,687 |
Federal Home Loan Bank | | | | | | |
1.250% due 07/01/2004 | | | 5,000 | | | 5,000 |
1.165% due 07/16/2004 | | | 2,700 | | | 2,699 |
1.170% due 07/16/2004 | | | 2,700 | | | 2,699 |
1.180% due 08/25/2004 | | | 800 | | | 799 |
1.240% due 09/01/2004 | | | 1,400 | | | 1,397 |
1.250% due 09/01/2004 | | | 2,700 | | | 2,693 |
Freddie Mac | | | | | | |
1.070% due 07/06/2004 | | | 2,700 | | | 2,700 |
1.200% due 08/09/2004 | | | 1,500 | | | 1,498 |
1.280% due 09/07/2004 | | | 2,700 | | | 2,693 |
1.440% due 09/14/2004 | | | 2,700 | | | 2,692 |
1.445% due 09/14/2004 | | | 500 | | | 498 |
1.435% due 09/21/2004 | | | 7,300 | | | 7,275 |
1.436% due 09/30/2004 | | | 800 | | | 797 |
1.560% due 10/20/2004 | | | 2,700 | | | 2,687 |
General Electric Capital Corp. | | | | | | |
1.040% due 07/08/2004 | | | 500 | | | 500 |
1.060% due 07/09/2004 | | | 7,500 | | | 7,498 |
1.110% due 08/13/2004 | | | 200 | | | 200 |
HBOS Treasury Services PLC | | | | | | |
1.035% due 07/01/2004 | | | 400 | | | 400 |
1.055% due 07/16/2004 | | | 100 | | | 100 |
1.055% due 07/16/2004 | | | 600 | | | 600 |
1.640% due 10/26/2004 | | | 500 | | | 497 |
KFW International Finance, Inc. | | | | | | |
1.095% due 08/10/2004 | | | 6,300 | | | 6,292 |
1.110% due 08/20/2004 | | | 3,800 | | | 3,794 |
Nestle Capital Corp. | | | | | | |
1.110% due 08/25/2004 | | | 5,100 | | | 5,091 |
1.110% due 08/26/2004 | | | 3,100 | | | 3,095 |
Pfizer, Inc. | | | | | | |
1.300% due 08/17/2004 | | | 5,200 | | | 5,191 |
Royal Bank of Scotland PLC | | | | | | |
1.030% due 07/06/2004 | | | 500 | | | 500 |
1.090% due 08/06/2004 | | | 2,100 | | | 2,098 |
1.135% due 08/26/2004 | | | 500 | | | 499 |
1.135% due 09/01/2004 | | | 3,000 | | | 2,993 |
Shell Finance (UK) PLC | | | | | | |
1.035% due 07/02/2004 | | | 7,300 | | | 7,300 |
1.230% due 08/11/2004 | | | 700 | | | 699 |
Svenska Handlesbanken | | | | | | |
1.070% due 07/21/2004 | | | 7,300 | | | 7,296 |
1.090% due 08/05/2004 | | | 700 | | | 699 |
TotalFinaElf Capital S.A. | | | | | | |
1.420% due 07/01/2004 | | | 1,700 | | | 1,700 |
UBS Finance, Inc. | | | | | | |
1.055% due 07/13/2004 | | | 800 | | | 800 |
1.195% due 07/21/2004 | | | 3,800 | | | 3,797 |
1.240% due 08/31/2004 | | | 1,100 | | | 1,097 |
1.245% due 09/13/2004 | | | 1,600 | | | 1,595 |
1.265% due 09/20/2004 | | | 700 | | | 698 |
| | | | | | |
| | |
Westpac Capital Corp. | | | | | | |
1.385% due 09/10/2004 | | $ | 3,200 | | $ | 3,191 |
| | | | | |
|
|
| | | | | | | 179,028 |
| | | | | |
|
|
| | | | | | | |
Repurchase Agreement 0.4% | | | | | | |
State Street Bank | | | | | | |
0.800% due 07/01/2004 | | | 1,060 | | | 1,060 |
| | | | | |
|
|
(Dated 06/30/2004. Collateralized by Freddie Mac 5.500% due 07/15/2006 valued at $1,082. Repurchase proceeds are $1,060.) |
| | | | | | | |
U.S. Treasury Bills 4.3% | | | | | | |
1.190% due 09/02/2004-09/16/2004 (c)(e) | | | 11,555 | | | 11,524 |
| | | | | |
|
|
| Total Short-Term Instruments (Cost $191,634) | | | | | | 191,612 |
| | | | | |
|
|
| | | | | | | |
Total Investments 99.1% | | | | | $ | 266,611 |
(Cost $266,818) | | | | | | |
| | | | | | | |
Other Assets and Liabilities (Net) 0.9% | | | 2,311 |
| | | | | |
|
|
| | | | | | | |
Net Assets 100.0% | | | | | $ | 268,922 |
| | | | | |
|
|
Notes to Schedule of Investments
(amounts in thousands, except number of contracts):
(a) Variable rate security.
(b) Security is in default.
(c) Securities with an aggregate market value of $22,977
have been segregated with the custodian to cover margin requirements for the following open futures contracts at
June 30, 2004:
| | | | | | | | | | |
| Type | | Expiration
Month | | # of
Contracts | | | | Unrealized
Appreciation/
(Depreciation) | |
Eurodollar March Long Futures | | 03/2005 | | 9 | | | | $ | (13 | ) |
Eurodollar March Long Futures | | 03/2006 | | 24 | | | | | (70 | ) |
Eurodollar June Long Futures | | 06/2005 | | 32 | | | | | (99 | ) |
Eurodollar September Long Futures | | 09/2005 | | 31 | | | | | (95 | ) |
Eurodollar December Long Futures | | 12/2004 | | 7 | | | | | (3 | ) |
Eurodollar December Long Futures | | 12/2005 | | 31 | | | | | (95 | ) |
Euribor December Long Futures | | 12/2005 | | 90 | | | | | (69 | ) |
Euribor June
Long Futures | | 06/2005 | | 76 | | | | | (15 | ) |
| | | | | | | | | | |
| Type | | Expiration
Month | | # of
Contracts | | | | Unrealized
Appreciation/
(Depreciation) | |
Euribor Purchase Put Options
Strike @ 94.500 | | 06/2005 | | 90 | | | | $ | (1 | ) |
Euribor Purchased Put Options | | | | | | | | |
Strike @ 93.000 | | 12/2004 | | 55 | | | | | (1 | ) |
Euribor Purchased Put Options | | | | | | | | |
Strike @ 95.000 | | 03/2005 | | 47 | | | | | (1 | ) |
Euribor September Long Futures | | 09/2005 | | 62 | | | | | (23 | ) |
Euribor Written Put Options | | | | | | | | |
Strike @ 97.000 | | 12/2004 | | 10 | | | | | 10 | |
Euribor Written Put Options | | | | | | | | |
Strike @ 97.500 | | 09/2004 | | 10 | | | | | 3 | |
Euro-Bobl 5-Year
Note Long Futures | | 09/2004 | | 31 | | | | | 9 | |
S & P 500 Index December | | | | | | | | |
Long Futures | | 12/2004 | | 11 | | | | | (2 | ) |
S&P 500 Index September | | | | | | | | |
Long Futures | | 09/2004 | | 883 | | | | | 2,096 | |
U.S. Treasury 10-Year
Note Long Futures | | 09/2004 | | 61 | | | | | (117 | ) |
U.S. Treasury 5-Year
Note Long Futures | | 09/2004 | | 41 | | | | | (41 | ) |
United Kingdom 90-Day LIBOR Purchased
Put Options
Strike @ 92.500 | | 09/2004 | | 64 | | | | | (1 | ) |
| | | | | | | | | $ | 1,472 | |
(d) Principal amount of security is adjusted for inflation.
(e) Securities are grouped by coupon or range of coupons and represent a range of maturities.
(f) Swap agreements outstanding at June 30, 2004:
| | | | | | | | |
Type | |
| Notional
Amount | | | |
| Unrealized
Appreciation |
Receive total return on S&P 500 Index and
pay a floating rate based on 1-month LIBOR
plus 0.040%. |
Counterparty: Credit Suisse First Boston | | | |
Exp. 04/29/2005 | | $ | 4 | | | | $ | 0 |
| |
| Receive total return on S&P 500 Index and pay a floating rate based on 1-month LIBOR plus 0.050%. | | | |
| Counterparty: Credit Suisse First Boston Exp. 06/17/2005 | | | 5 | | | | | 0 |
| | | | | | | | $ | 0 |
(g) Forward foreign currency contracts outstanding at June 30, 2004:
| | | | | | | | | | | | | | | |
| Type | | Currency | | Principal
Amount
Covered by
Contract | | Settlement Month | | Unrealized
Appreciation | | Unrealized
(Depreciation) | | Net Unrealized
Appreciation |
Sell | | EC | | 931 | | 07/2004 | | $ | 13 | | $ | 0 | | $ | 13 |
(h) Principal amount denoted in indicated currency:
| | | | | | |
| See accompanying notes | | June 30, 2004 | | Semi-Annual Report | | 9 |
Notes to Financial Statements
June 30, 2004 (Unaudited)
1. Organization
The StocksPLUS Growth and Income Portfolio (the “Portfolio”) is a series of the PIMCO Variable Insurance Trust (the “Trust”). The Trust is registered under the Investment Company Act of 1940 (the “Act”), as amended, as an open-end investment company organized as a Delaware business trust on October 3, 1997. The Portfolio offers two classes of shares: Institutional and Administrative. Each share class has identical voting rights (except that shareholders of a class have exclusive voting rights regarding any matter relating solely to that class of shares). Information presented in these financial statements pertains to the Administrative Class of the Portfolio. Certain detailed financial information for the Institutional Class is provided separately and is available upon request. The Trust is designed to be used as an investment vehicle by Separate Accounts of insurance companies that fund variable annuity contracts and variable life insurance policies and by qualified pension and retirement plans. The Portfolio commenced operations on December 31, 1997.
2. Significant Accounting Policies
The following is a summary of significant accounting policies consistently followed by the Trust in the preparation of its financial statements in conformity with accounting principles generally accepted in the United States of America. The preparation of financial statements in accordance with accounting principles generally accepted in the United States of America requires management to make estimates and assumptions that affect the reported amounts and disclosures in the financial statements. Actual results could differ from those estimates.
Security Valuation. Portfolio securities and other financial instruments for which market quotations are readily available are stated at market value. Portfolio securities and other financial instruments for which market quotes are not readily available are valued at fair value, as determined in good faith and pursuant to guidelines established by the Board of Trustees, including certain fixed income securities which may be valued with reference to securities whose prices are more readily obtainable. Market value is determined at the close of regular trading (normally, 4:00 p.m., Eastern Time) on the New York Stock Exchange on each day the New York Stock Exchange is open, or if no sales are reported, as is the case for most securities traded over-the-counter, the mean between representative bid and asked quotations obtained from a quotation reporting system or from established market makers. The prices of certain portfolio securities or other financial instruments may be determined at a time prior to the close of regular trading on the New York Stock Exchange. Fair valuation may be used if significant events occur after the close of the relevant markets and prior to the close of regular trading on the New York Stock Exchange that materially affect the values of such securities or financial instruments. Fixed income securities are normally valued on the basis of quotes obtained from brokers and dealers or pricing services. Certain fixed income securities purchased on a delayed delivery basis are marked to market daily until settlement at the forward settlement value. Short-term investments, which mature in 60 days or less are valued at amortized cost, which approximates market value. Exchange traded options, futures and options on futures are valued at the settlement price determined by the relevant exchange. Prices may be obtained from independent pricing services which use information provided by market makers or estimates of market values obtained from yield data relating to investments or securities with similar characteristics. The prices used by the Portfolio may differ from the value that would be realized if the securities were sold and the differences could be material to the financial statements.
Securities Transactions and Investment Income. Securities transactions are recorded as of the trade date. Securities purchased or sold on a when-issued or delayed delivery basis may be settled a month or more after the trade date. Realized gains and losses from securities sold are recorded on the identified cost basis. Dividend income is recorded on the ex-dividend date, except certain dividends from foreign securities where the ex-dividend date may have passed, are recorded as soon as the Portfolio is informed of the ex-dividend date. Interest income, adjusted for the accretion of discounts and amortization of premiums, is recorded on the accrual basis. Paydowns gains and losses on mortgage- and asset-backed securities are recorded as adjustments to interest income in the Statement of Operations.
Dividends and Distributions to Shareholders. Dividends from net investment income, if any, are declared and distributed to shareholders quarterly. All dividends are reinvested in additional shares of the Portfolio. Net realized capital gains earned by the Portfolio, if any, will be distributed no less frequently than once each year.
Income dividends and capital gain distributions are determined in accordance with income tax regulations which may differ from accounting principles generally accepted in the United States of America. These differences are primarily due to differing treatments for such items as wash sales, foreign currency transactions, net operating losses, notional principal contracts, certain asset-backed securities, certain futures and forward contracts, tax straddles, and capital loss carryforwards.
Distributions classified as a tax basis return of capital, if any, are reflected in the accompanying Statements of Changes in Net Assets and have been reclassified to paid in capital. In addition, other amounts have been reclassified between undistributed net investment income, accumulated undistributed net realized gains or losses and/or paid in capital to more appropriately conform financial accounting to tax characterizations of dividend distributions.
Multiclass Operations. Each class offered by the Trust has equal rights as to assets. Income, non-class specific expenses, and realized and unrealized capital gains and losses are allocated to each class of shares based on the relative net assets of each class.
Federal Income Taxes. The Portfolio intends to qualify as a regulated investment company and distribute all of its taxable
| | | | |
| 10 | | Semi-Annual Report | | June 30, 2004 |
income and net realized gains, if applicable, to shareholders. Accordingly, no provision for Federal income taxes has been made.
Foreign Currency. The accounting records of the Portfolio are maintained in U.S. dollars. The market values of foreign securities, currency holdings and other assets and liabilities are translated into U.S. dollars based on the current exchange rates each business day. Fluctuations in the value of these assets and liabilities resulting from changes in exchange rates are recorded as unrealized foreign currency gains or losses. Realized gains or losses and unrealized appreciation or depreciation on investment securities and income and expenses are translated on the respective dates of such transactions. The effect of changes in foreign currency exchange rates on investments in securities are not segregated in the Statement of Operations from the effects of changes in market prices of those securities, but are included with the net realized and unrealized gain or loss on investment securities.
Forward Currency Transactions. The Portfolio may enter into forward currency contracts and forward cross-currency contracts in connection with settling planned purchases or sales of securities, to hedge the currency exposure associated with some or all of the Portfolio’s securities or as a part of an investment strategy. A forward currency contract is an agreement between two parties to buy and sell a currency at a set price on a future date. The market value of a forward currency contract fluctuates with changes in forward currency exchange rates. Forward currency contracts are marked to market daily and the change in value is recorded by the Portfolio as an unrealized gain or loss. Realized gains or losses equal to the difference between the value of the contract at the time it was opened and the value at the time it was closed are recorded upon delivery or receipt of the currency or, if a forward currency contract is offset by entering into another forward currency contract with the same broker, upon settlement of the net gain or loss. These contracts may involve market risk in excess of the unrealized gain or loss reflected in the Portfolio’s Statement of Assets and Liabilities. In addition, the Portfolio could be exposed to risk if the counterparties are unable to meet the terms of the contracts or if the value of the currency changes unfavorably to the U.S. dollar.
Futures Contracts. The Portfolio is authorized to enter into futures contracts. The Portfolio may use futures contracts to manage its exposure to the securities markets or to movements in interest rates and currency values. The primary risks associated with the use of futures contracts are the imperfect correlation between the change in market value of the securities held by the Portfolio and the prices of futures contracts, the possibility of an illiquid market, and the inability of the counterparty to meet the terms of the contract. Futures contracts are valued based upon their quoted daily settlement prices. Upon entering into a futures contract, the Portfolio may be required to deposit with its custodian, in a segregated account in the name of the futures broker, an amount of cash or U.S. Government and Agency Obligations in accordance with the initial margin requirements of the broker or exchange. Futures contracts are marked to market daily and an appropriate payable or receivable for the change in value (“variation margin”) is recorded by the Portfolio. Gains or losses are recognized but not considered realized until the contracts expire or are closed. Futures contracts involve, to varying degrees, risk of loss in excess of the variation margin disclosed in the Statement of Assets and Liabilities.
Inflation-Indexed Bonds. The Portfolio may invest in inflation-indexed bonds. Inflation-indexed bonds are fixed income securities whose principal value is periodically adjusted to the rate of inflation. The interest rate on these bonds is generally fixed at issuance at a rate lower than typical bonds. Over the life of an inflation-indexed bond, however, interest will be paid based on a principal value, which is adjusted for inflation. Any increase in the principal amount of an inflation-indexed bond will be included as interest income in the Statement of Operations, even though investors do not receive their principal until maturity.
Options Contracts. The Portfolio may write call and put options on futures, swaps, securities or currencies it owns or in which it may invest. Writing put options tends to increase the Portfolio’s exposure to the underlying instrument. Writing call options tends to decrease the Portfolio’s exposure to the underlying instrument. When the Portfolio writes a call or put option, an amount equal to the premium received is recorded as a liability and subsequently marked to market to reflect the current value of the option written. These liabilities are reflected as written options outstanding in the Statement of Assets and Liabilities. Payments received or made, if any, from writing options with premiums to be determined on a future date are reflected as such on the Statement of Assets and Liabilities. Premiums received from writing options which expire are treated as realized gains. Premiums received from writing options which are exercised or closed are added to the proceeds or offset against amounts paid on the underlying future, swap, security or currency transaction to determine the realized gain or loss. The Portfolio as a writer of an option has no control over whether the underlying future, swap, security or currency may be sold (call) or purchased (put) and as a result bears the market risk of an unfavorable change in the price of the future, swap, security or currency underlying the written option. There is the risk the Portfolio may not be able to enter into a closing transaction because of an illiquid market.
The Portfolio may also purchase put and call options. Purchasing call options tends to increase the Portfolio’s exposure to the underlying instrument. Purchasing put options tends to decrease the Portfolio’s exposure to the underlying instrument. The Portfolio pays a premium which is included in the Portfolio’s Statement of Assets and Liabilities as an investment and subsequently marked to market to reflect the current value of the option. Premiums paid for purchasing options which expire are treated as realized losses. The risk associated with purchasing put and call options is limited to the premium paid. Premiums paid for purchasing options which are exercised or closed are added to the amounts paid or offset against the proceeds on the underlying future, swap, security or currency transaction to determine the realized gain or loss.
| | | | |
| June 30, 2004 | | Semi-Annual Report | | 11 |
Notes to Financial Statements (Cont.)
June 30, 2004 (Unaudited)
Repurchase Agreements. The Portfolio may engage in repurchase transactions. Under the terms of a typical repurchase agreement, the Portfolio takes possession of an underlying debt obligation subject to an obligation of the seller to repurchase, and the Portfolio to resell, the obligation at an agreed-upon price and time. The market value of the collateral must be equal at all times to the total amount of the repurchase obligations, including interest. Generally, in the event of counterparty default, the Portfolio has the right to use the collateral to offset losses incurred.
Swap Agreements. The Portfolio may invest in swap agreements. A swap is an agreement to exchange the return generated by one instrument for the return generated by another instrument. The Portfolio may enter into interest rate, total return, forward spread lock, and credit default swap agreements to manage its exposure to interest rates and credit risk.
Interest rate swap agreements involve the exchange by the Portfolio with another party of their respective commitments to pay or receive interest, e.g., an exchange of floating rate payments for fixed rate payments with respect to the notional amount of principal.
Total return swap agreements involve commitments to pay interest in exchange for a market-linked return, both based on notional amounts. To the extent the total return of the security or index underlying the transaction exceeds or falls short of the offsetting interest rate obligation, the Portfolio will receive a payment from or make a payment to the counterparty.
Forward spread lock swap agreements involve commitments to pay or receive a settlement amount calculated as the difference between the swap spread and a fixed spread, multiplied by the notional amount times the duration of the swap. The swap spread is the difference between the benchmark swap rate (market rate) and the specific Treasury rate.
In a credit default swap, one party makes a stream of payments to another party in exchange for the right to receive a specified return in the event of a default by a third party, typically corporate issues or sovereign issues of an emerging country, on its obligation. The Portfolio may use credit default swaps to provide a measure of protection against defaults of sovereign issuers (i.e., to reduce risk where the Portfolio owns or has exposure to the sovereign issuer) or to take an active long or short position with respect to the likelihood of a particular issuer’s default.
Swaps are marked to market daily based upon quotations from market makers and the change in value, if any, is recorded as unrealized gain or loss in the Statement of Operations. Payments received or made at the beginning of the measurement period are reflected as such on the Statement of Assets and Liabilities. A liquidation payment received or made at the termination of the swap is recorded as realized gain or loss in the Statement of Operations. Net periodic payments received by the Portfolio are included as part of realized gain(loss) on the Statement of Operations. Entering into these agreements involves, to varying degrees, elements of credit, market and documentation risk in excess of the amounts recognized on the Statement of Assets and Liabilities. Such risks involve the possibility that there will be no liquid market for these agreements, that the counterparty to the agreements may default on its obligation to perform or disagree as to the meaning of contractual terms in the agreements, and that there may be unfavorable changes in interest rates.
As a result of a FASB Emerging Issues Task Force (“EITF”) consensus, No. 03-11, and related SEC staff guidance, the Portfolio has reclassified periodic payments made or received under swap agreements, which were previously included within miscellaneous income, to a component of realized gain(loss) in the Statement of Operations. For consistency, similar reclassifications have been made to amounts appearing in the previous year’s Statement of Changes in Net Assets and the per share amounts in the prior year financial highlights. Prior year net investment income ratios in the financial highlights have also been modified accordingly. This reclassification increased(decreased) net investment income by $(286,748) and $(1,563,813), and net realized gain by $392,411 and $1,004,989 and net change in unrealized appreciation(depreciation) by $(105,663) and $558,823 for the six months ended June 30, 2004 and year ended December 31, 2003, respectively. There is no effect on the Portfolio’s net asset value, either in total or per share, or its total increase(decrease) in net assets from operations during any period.
3. Fees, Expenses, and Related Party Transactions
Investment Advisory Fee. Pacific Investment Management Company LLC (“PIMCO”) is a majority owned subsidiary partnership of Allianz Dresdner Asset Management of America L.P. and serves as investment adviser (the “Adviser”) to the Trust, pursuant to an investment advisory contract. The Adviser receives a monthly fee at an annual rate based on average daily net assets of the Portfolio. The Advisory Fee is charged at an annual rate of 0.40%.
Administration Fee. PIMCO serves as administrator (the “Administrator”), and provides administrative services to the Trust for which it receives a monthly administrative fee based on average daily net assets of the Portfolio. The Administration Fee is charged at the annual rate of 0.10%.
Servicing Fee. PA Distributors LLC (“PAD”), formerly known as PIMCO Advisors Distributors LLC, is an indirect wholly-owned subsidiary of Allianz Dresdner Asset Management of America L.P. and serves as the distributor of the Trust’s shares. The Trust is permitted to reimburse PAD on a quarterly basis, out of the Administrative Class assets of the Portfolio in the amount of 0.15% on an annual basis of the average daily net assets of that class, for payments made to financial intermediaries that provide services in connection with the distribution of shares or administration of plans or programs that use Portfolio shares as their funding medium. The effective rate paid to PAD was 0.15% during current fiscal year.
Expenses. The Trust is responsible for the following expenses: (i) salaries and other compensation of any of the Trust’s executive officers and employees who are not officers, directors, stockholders or employees of PIMCO or its subsidiaries or affiliates; (ii) taxes and governmental fees; (iii) brokerage fees and commissions and other portfolio transaction expenses; (iv) the cost of borrowing money,
| | | | |
| 12 | | Semi-Annual Report | | June 30, 2004 |
including interest expense and bank overdraft charges; (v) fees and expenses of the Trustees who are not “interested persons” of PIMCO or the Trust, and any counsel retained exclusively for their benefit; (vi) extraordinary expenses, including costs of litigation and indemnification expenses; (vii) organization expenses and (viii) any expenses allocated or allocable to a specific class of shares, which include service fees payable with respect to the Administrative Class shares and may include certain other expenses as permitted by the Trust’s Multiple Class Plan adopted pursuant to Rule 18f-3 under the Act and subject to review and approval by the Trustees. The ratio of expenses to average net assets per share class, as disclosed in Financial Highlights, may differ from the annual portfolio operating expenses per share class as disclosed in the Prospectus for the reasons set forth above.
PIMCO has agreed to waive a portion of its administrative fees to the extent that the payment of the Portfolio’s pro rata share of organization expenses and Trustee fees cause the actual expense ratio to rise above the rates disclosed in the then-current prospectus plus 0.49 basis points as set forth below (calculated as a percentage of the Portfolio’s average daily net assets attributable to each class):
| | | |
Institutional Class | | 0.50 | % |
Administrative Class | | 0.65 | % |
PIMCO may be reimbursed for these waived amounts in future periods, not to exceed thirty-six months. Expenses that have been waived and may still be reimbursed by the Administrator, to the extent the Portfolio’s annualized total portfolio operating expenses plus the amount so reimbursed does not exceed the operating expense limitation, are as follows (amounts in thousands):
| | | | | | | | | | | | |
| | | Year of Waiver
|
| | | | 12/31/2001 | | | 12/31/2002 | | | 12/31/2003 | | | 06/30/2004 |
Amount Available for Reimbursement | | $ | 0 | | $ | 28 | | $ | 0 | | $ | 0 |
Each unaffiliated Trustee receives an annual retainer of $4,000, plus $1,500 for each Board of Trustees meeting attended in person and $250 for each meeting attended telephonically, plus reimbursement of related expenses. In addition, each committee chair receives an additional annual retainer of $500. These expenses are allocated on a pro-rata basis to each Portfolio of the Trust according to its respective net assets.
4. Purchases and Sales of Securities
The length of time a Portfolio has held a particular security is not generally a consideration in investment decisions. A change in the securities held by a Portfolio is known as “portfolio turnover.” The Portfolio may engage in frequent and active trading of portfolio securities to achieve its investment objective, particularly during periods of volatile market movements. High portfolio turnover (e.g., over 100%) involves correspondingly greater expenses to the Portfolio, including brokerage commissions or dealer mark-ups and other transaction costs on the sale of securities and reinvestments in other securities. Such sales may also result in realization of taxable capital gains, including short-term capital gains (which are generally taxed at ordinary income tax rates). The trading costs and tax effects associated with portfolio turnover may adversely affect the Portfolio’s performance.
Purchases and sales of securities (excluding short-term investments) for the period ended June 30, 2004 were as follows (amounts in thousands):
| | | | | | |
| U.S. Government/Agency | | All Other |
| Purchases | | Sales | | Purchases | | Sales |
| $ 12,078 | | $ 19,735 | | $ 31,893 | | $ 25,638 |
5. Transactions in Written Call and Put Options
Transactions in written call and put options were as follows (amounts in thousands):
| | | | |
| | | | Premium | |
Balance at 12/31/2003 | | $ | 88 | |
Sales | | | 149 | |
Closing Buys | | | 0 | |
Expirations | | | (237 | ) |
| Exercised | | | 0 | |
| Balance at 06/30/2004 | | | $0 | |
6. Federal Income Tax Matters
At June 30, 2004, the aggregate cost of investments was the same for federal income tax and financial statement purposes. The net unrealized appreciation (depreciation) of investment securities for federal income tax purposes is as follows (amounts in thousands):
| | | | |
Aggregate Gross
Unrealized
Appreciation | | Aggregate Gross
Unrealized
(Depreciation) | | Net Unrealized
Depreciation |
| $ 1,166 | | $ (1,373) | | $ (207) |
| | | | |
| June 30, 2004 | | Semi-Annual Report | | 13 |
Notes to Financial Statements (Cont.)
June 30, 2004 (Unaudited)
7. Shares of Beneficial Interest
The Trust may issue an unlimited number of shares of beneficial interest with a $.001 par value. Changes in shares of beneficial interest were as follows (shares and amounts in thousands):
| | | | | | | | | | | | | | |
| | | Six Months Ended
06/30/2004 | | | Year Ended
12/31/2003 | |
| | | Shares | | | Amount | | | Shares | | | Amount | |
Receipts for shares sold | | | | | | | | | | | | | | |
| | | | |
Institutional Class | | 190 | | | $ | 1,799 | | | 131 | | | $ | 1,004 | |
Administrative Class | | 1,430 | | | | 13,448 | | | 7,716 | | | | 59,278 | |
| | | | |
Issued as reinvestment of distributions | | | | | | | | | | | | | | |
| | | | |
Institutional Class | | 2 | | | | 19 | | | 4 | | | | 39 | |
Administrative Class | | 153 | | | | 1,439 | | | 610 | | | | 5,180 | |
| | | | |
Cost of shares redeemed | | | | | | | | | | | | | | |
| | | | |
Institutional Class | | (64 | ) | | | (603 | ) | | (6 | ) | | | (51 | ) |
Administrative Class | | (2,520 | ) | | | (23,663 | ) | | (9,593 | ) | | | (75,677 | ) |
| | | | |
Net decrease resulting from Portfolio share transactions | | (809 | ) | | $ | (7,561 | ) | | (1,138 | ) | | $ | (10,227 | ) |
The following schedule shows the number of shareholders each owning 5% or more of the Portfolio and the total percentage of the Portfolio held by such shareholders:
| | | | |
| | | Number | | % of Portfolio Held |
Institutional Class | | 1 | | 98 |
Administrative Class | | 3 | | 92 |
8. Regulatory and Litigation Matters
On February 17, 2004, the Attorney General of the State of New Jersey (“New Jersey AG”) filed a complaint against Allianz Dresdner Asset Management of America L.P. (“ADAM”), PA Distributors LLC (formerly known as PIMCO Advisors Distributors LLC) (“PAD”), PEA Capital LLC (formerly known as PIMCO Equity Advisors LLC) (“PEA”), and Pacific Investment Management Company LLC (“PIMCO”) in connection with its investigation into market timing and late trading. The complaint contends that inappropriate trading by shareholders engaged in market timing activity took place in funds in the PIMCO Funds: Multi-Manager Series (“MMS Funds”) and the PIMCO Funds: Pacific Investment Management Series (“PIMS Funds”). On June 1, 2004, the New Jersey AG dismissed PIMCO from the lawsuit.
On the same day as the dismissal of PIMCO from the lawsuit, the New Jersey AG announced that it had reached a settlement agreement with the remaining defendants (“New Jersey Settlement”). In the New Jersey Settlement, ADAM, PAD and PEA agreed, while neither admitting nor denying the allegations or conclusions of law, to: (i) pay New Jersey a civil fine of $15 million and $3 million for investigative costs and further enforcement initiatives; and (ii) implement certain changes in corporate governance.
On May 6, 2004, the Securities and Exchange Commission filed a complaint in the U.S. District Court in the Southern District of New York alleging that PA Fund Management LLC (formerly known as PIMCO Advisors Fund Management LLC) (“PAFM”), PEA, PAD, Stephen J. Treadway (at the time, the chief executive officer of PAFM and PAD as well as chairman of the Board of Trustees of the MMS Funds) and Kenneth W. Corba (the former chief executive officer of PEA and former portfolio manager of the PEA Growth and PEA Growth & Income Funds) had, among other things, violated and/or aided and abetted violations of, various antifraud provisions of the federal securities laws in connection with alleged “market timing” arrangements that improperly allowed certain hedge funds to engage in “market timing” in the PEA Growth Fund, the PEA Opportunity Fund, the PEA Innovation Fund, and the PEA Target Fund. The complaint seeks injunctive relief, disgorgement plus pre-judgment interest, monetary penalties, and an order permanently enjoining the defendants from serving as investment advisers, principal underwriters, officers, directors, or members of any advisory boards to any registered investment companies.
On February 20, 2004, a putative class action lawsuit was filed in the U.S. District Court for the District of New Jersey on behalf of certain shareholders of the PIMCO Funds against ADAM, PAD, PIMCO, PEA, the PIMS Funds, the MMS Funds, the Trust, PIMCO Commercial Mortgage Securities Trust, Inc. and certain other defendants, alleging that inappropriate market timing activity by certain shareholders caused financial injury to the shareholders of those Funds.
| | | | |
| 14 | | Semi-Annual Report | | June 30, 2004 |
The following additional putative class action lawsuits have been filed against the PIMS Funds, the MMS Funds and/or their affiliates, each related to alleged market-timing activity in funds advised by PIMCO or its affiliates: (1) a lawsuit filed in the U.S. District Court for the District of Connecticut on February 27, 2004 (naming as defendants ADAM, PAD, PEA, the PIMS Funds, the MMS Funds, the Trust, PCM and certain other parties); (2) a lawsuit filed in the U.S. District Court for the Central District of California on March 4, 2004 (naming as defendants PIMCO, ADAM, PEA and PAD); (3) a lawsuit filed in the U.S. District Court for the Southern District of New York on March 8, 2004 (naming PIMCO, PAD and certain of their affiliates as defendants); (4) a lawsuit filed in the U.S. District Court for the Southern District of New York, on March 15, 2004 (naming PIMCO as the defendant); (5) two separate lawsuits filed in the U.S. District Court for the Central District of California on March 22, 2004, brought derivatively on behalf of the PIMCO High Yield Fund and the PIMCO Money Market Fund, respectively (each naming ADAM, PAFM and certain other parties as defendants, and the PIMCO Funds as the nominal defendant); (6) a lawsuit filed in the U.S. District Court for the Central District of California, also on March 22, 2004, brought derivatively on behalf of the PIMS Funds and the MMS Funds (naming ADAM, PIMCO, PAD and certain other parties as defendants, and the PIMS Funds and the MMS Funds as nominal defendants); (7) a lawsuit filed in the U.S. District Court for the District of New Jersey on April 20, 2004 (naming ADAM, PAD, the PIMS Funds and certain other parties as defendants); and (8) a lawsuit filed in the U.S. District Court for the Northern District of California on April 28, 2004 (naming ADAM, PIMCO, PAD, PEA and certain other parties as defendants, and the “PIMCO Funds” as nominal defendants). Each complaint for the foregoing putative class actions alleges, among other things, that inappropriate trading by shareholders engaged in market timing activities took place in certain of the funds advised by PIMCO, and each complaint seeks unspecified compensatory damages.
On February 17, 2004, a putative class action lawsuit was filed in the U.S. District Court for the District of Connecticut on behalf of certain shareholders of the PIMCO Funds against ADAM, PEA, PIMCO, PIMS Funds, MMS Funds and certain other defendants, alleging excessive investment advisory fees and the use of brokerage commissions to pay for distribution of fund shares. Three similar putative class action lawsuits were subsequently filed, each in the U.S. District Court for the District of Connecticut on March 1, 2004, April 23, 2004 and May 20, 2004, respectively.
Under Section 9(a) of the 1940 Act, if any of the various lawsuits were to result in a court injunction against PAFM, PEA, PAD, PIMCO, ADAM and/or Mr. Treadway, they and their affiliates would, in the absence of exemptive relief granted by the SEC, be barred from serving as an investment adviser/sub-adviser or principal underwriter for any registered investment company, including the Trust. ADAM and certain of its subsidiaries have responded to inquiries from the SEC concerning the status of the New Jersey Settlement under Section 9(a). If any of PAFM, PEA, PAD, PIMCO or ADAM were subject to an injunction, each of these entities and their affiliates could in turn seek exemptive relief from the SEC, as contemplated by the 1940 Act. There is no assurance, however, that such exemptive relief would be granted. The SEC also has the power by order to prohibit PAFM, PEA, PAD and PIMCO from serving as investment advisers and underwriters, if the SEC finds that such entities willfully violated the federal securities laws in connection with the allegations discussed above or aided or abetted such violations.
PIMCO, PAD and the Trust believe that these developments will not have a material adverse effect on the Portfolios or on PIMCO’s, or PAD’s ability to perform their respective investment advisory or distribution services on behalf of the Portfolios.
| | | | |
| June 30, 2004 | | Semi-Annual Report | | 15 |
Trustees and Officers
Brent R. Harris, Chairman and Trustee
R. Wesley Burns, President and Trustee
E. Philip Cannon, Trustee
Vern O. Curtis, Trustee
J. Michael Hagan, Trustee
William J. Popejoy, Trustee
Garlin G. Flynn, Secretary
John P. Hardaway, Treasurer
Investment Adviser and Administrator
Pacific Investment Management Company LLC
840 Newport Center Drive
Newport Beach, California 92660
Distributor
PA Distributors LLC
2187 Atlantic Street
Stamford, Connecticut 06902
Custodian
State Street Bank & Trust Company
801 Pennsylvania
Kansas City, Missouri 64105
Transfer Agent
Boston Financial Data Services–Midwest
330 W. 9th Street
Kansas City, Missouri 64105
Legal Counsel
Dechert LLP
1775 I Street, N.W.
Washington, D.C. 20006
Independent Registered Public Accounting Firm
PricewaterhouseCoopers LLP
1055 Broadway
Kansas City, Missouri 64105
Information about how the Fund voted proxies relating to portfolio securities held during the year July 1, 2003 through June 30, 2004 will be available no later than August 31, 2004 without charge, upon request, by calling the Trust at 1-800-927-4648 and on the SEC’s website at http://www.sec.gov.
Copies of the written Proxy Policy and the factors that PIMCO may consider in determining how to vote proxies for the Funds are available by calling the Trust at 1-800-927-4648 and on the SEC’s website at http://www.sec.gov.
PIMCO VARIABLE INSURANCE TRUST
840 NEWPORT CENTER DRIVE
NEWPORT BEACH, CA 92660

PIMCO VARIABLE INSURANCE TRUST
SHORT-TERM PORTFOLIO
ADMINISTRATIVE CLASS
SEMI-ANNUAL REPORT
June 30, 2004
|
| This material is authorized for use only when preceded or accompanied by the current PIMCO Variable Insurance Trust prospectus. Investors should consider the investment objectives, risks, charges and expenses of Portfolio carefully before investing. This and other information is contained in the Portfolio’s prospectus. Please read the prospectus carefully before you invest or send money. |
Chairman’s Letter
Dear PIMCO Variable Insurance Trust Shareholder:
Bond prices were more volatile during the six-month period ended June 30, 2004. Interest rates rose sharply during the second quarter 2004, causing bonds to give back modest gains from earlier in the year. The Lehman Brothers Aggregate Bond Index, a widely used index for the high-grade bond market, was nearly flat during the first six months of 2004, returning 0.15% after losing 2.44% during the second quarter. The yield on the benchmark ten-year Treasury closed June 30, 2004 at 4.58%, up 0.75% from April 1, 2004, but up only 0.34% from where it began the six-month period on January 1, 2004.
Continued growth in employment convinced the markets that the Federal Reserve would soon begin a long anticipated tightening cycle. On June 30, 2004, the Fed met market expectations by increasing the federal funds rate 0.25%, which was the first rate increase since June 25, 2003. The central bank had held this rate at 1% for more than a year, which generated negative real short-term rates. And on August 10, 2004, the Fed increased the federal funds rate another 0.25% to 1.50%.
Investors that had profited handsomely from borrowing at low short-term rates and investing in higher-yielding longer maturity bonds surrendered some of those profits towards the latter part of the six-month period. Concern that borrowing rates would rise led investors to liquidate long positions and unwind these trades, which caused bond prices to decrease. However, substantial leverage remained among banks, hedge funds, and other investors, making bond markets somewhat vulnerable to additional Fed rate increases. There were also signs of rising inflation, which fueled anxiety that central banks might continue to raise interest rates.
On the following pages you will find a more complete review of the Portfolio in light of financial market activities as well as specific details about the total return investment performance for the six-month period.
We appreciate the trust you have placed in us, and we will continue to focus our efforts to meet your investment needs.
Sincerely,

Brent R. Harris
Chairman
August 11, 2004
| | | | |
| June 30, 2004 | | Semi-Annual Report | | 1 |
Important Information About the Portfolio
We believe that bond funds have an important role to play in a well diversified investment portfolio. It is important to note, however, that in an environment where interest rates may trend upward, rising rates will negatively impact the performance of most bond funds, and fixed income securities held by a fund are likely to decrease in value. The price volatility of fixed income securities can also increase during periods of rising interest rates resulting in increased losses to a fund. Bond funds and individual bonds with a longer duration (a measure of the expected life of a security) tend to be more sensitive to changes in interest rates, usually making them more volatile than securities or funds with shorter durations. The longer-term performance of most bond funds has benefited from capital gains in part resulting from an extended period of declining interest rates. In the event interest rates increase, these capital gains should not be expected to recur.
The Portfolio may be subject to various risks in addition to those described above. Some of these risks may include, but are not limited to, the following: real rate risk, derivative risk, small company risk, foreign security risk, high yield security risk and specific sector investment risks. The Portfolio may use derivative instruments for hedging purposes or as part of an investment strategy. Use of these instruments may involve certain costs and risks such as liquidity risk, interest rate risk, market risk, credit risk, management risk and the risk that a fund could not close out a position when it would be most advantageous to do so. A Portfolio investing in derivatives could lose more than the principal amount invested in these instruments. Investing in non-U.S. securities may entail risk due to non-U.S. economic and political developments; this risk may be enhanced when investing in emerging markets. High-yield bonds typically have a lower credit rating than other bonds. Lower rated bonds generally involve a greater risk to principal than higher rated bonds. Smaller companies may be more volatile than larger companies and may entail more risk. Concentrating investments in individual sectors may add additional risk and volatility compared to a diversified portfolio.
On the performance summary page in this semi-annual report, the Total Return Investment Performance table measures performance assuming that all dividend and capital gain distributions were reinvested. Returns do not reflect the deduction of taxes that a shareholder would pay (i) on Portfolio distributions or (ii) the redemption of Portfolio shares.
An investment in a Portfolio is not a bank deposit and is not guaranteed or insured by the Federal Deposit Insurance Corporation or any other government agency. It is possible to lose money on investments in the Funds.
The following disclosure provides important information regarding the Portfolio’s Expense Example, which appears on the Portfolio’s individual page in this semi-annual report. Please refer to this information when reviewing the Expense Example for the Portfolio.
Example
As a shareholder of the Portfolio, you incur two types of costs: (1) transaction costs, including redemption and exchange fees; and (2) ongoing costs, including advisory and administrative fees; distribution and/or service (12b-1) fees (Administrative Class only); and other Portfolio expenses. The Example is intended to help you understand your ongoing costs (in dollars) of investing in the Portfolio and to compare these costs with the ongoing costs of investing in other mutual funds.
The Example is based on an investment of $1,000 invested at the beginning of the period and held for the entire period indicated, which is from 1/1/04 to 6/30/04.
Actual Expenses
The information in the table under the heading “Actual Performance” provides information about actual account values and actual expenses. You may use the information in these columns, together with the amount you invested, to estimate the expenses that you paid over the period. Simply divide your account value by $1,000.00 (for example, an $8,600.00 account value divided by $1,000 = 8.60), then multiply the result by the number in the appropriate column for your share class, in the row entitled “Expenses Paid During Period” to estimate the expenses you paid on your account during this period.
Hypothetical Example for Comparison Purposes
The information in the table under the heading “Hypothetical Performance (5% return before expenses)” provides information about hypothetical account values and hypothetical expenses based on the Portfolio’s actual expense ratio and an assumed rate of return of 5% per year before expenses, which is not the Portfolio’s actual return. The hypothetical account values and expenses may not be used to estimate the actual ending account balance or expenses you paid for the period. You may use this information to compare the ongoing costs of investing in the Portfolio and other portfolios. To do so, compare this 5% hypothetical example with the 5% hypothetical examples that appear in the shareholder reports of the other portfolios.
Please note that the expenses shown in the table are meant to highlight your ongoing costs only and do not reflect any transactional costs. Therefore, the information under the heading “Hypothetical Performance (5% return before expenses)” is useful in comparing ongoing costs only, and will not help you determine the relative total costs of owning different portfolios. In addition, if these transactional costs were included, your costs would have been higher.
PIMCO Variable Insurance Trust is distributed by PA Distributors LLC, 2187 Atlantic Street, Stamford, CT 06902.
| | | | |
| 2 | | Semi-Annual Report | | June 30, 2004 |
Short-Term Portfolio
CUMULATIVE RETURNS THROUGH JUNE 30, 2004
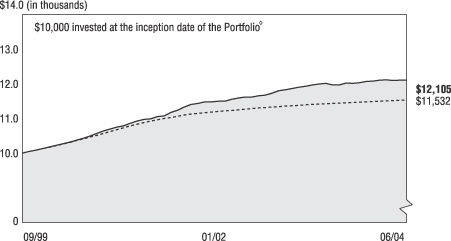
[CHART]
Short-Term Portfolio Citigroup 3-Month
Admin. Class Treasury Bill Index
------------------- -------------------
09/30/1999 $10,000 $10,000
10/31/1999 $10,042 $10,041
11/30/1999 $10,081 $10,081
12/31/1999 $10,132 $10,124
01/31/2000 $10,175 $10,169
02/29/2000 $10,218 $10,212
03/31/2000 $10,267 $10,260
04/30/2000 $10,310 $10,308
05/31/2000 $10,369 $10,359
06/30/2000 $10,426 $10,407
07/31/2000 $10,486 $10,458
08/31/2000 $10,562 $10,509
09/30/2000 $10,632 $10,562
10/31/2000 $10,692 $10,617
11/30/2000 $10,749 $10,671
12/31/2000 $10,782 $10,727
01/31/2001 $10,858 $10,783
02/28/2001 $10,920 $10,829
03/31/2001 $10,965 $10,877
04/30/2001 $10,984 $10,919
05/31/2001 $11,047 $10,959
06/30/2001 $11,066 $10,994
07/31/2001 $11,174 $11,028
08/31/2001 $11,236 $11,062
09/30/2001 $11,328 $11,094
10/31/2001 $11,399 $11,123
11/30/2001 $11,429 $11,146
12/31/2001 $11,478 $11,166
01/31/2002 $11,478 $11,183
02/28/2002 $11,493 $11,198
03/31/2002 $11,498 $11,215
04/30/2002 $11,552 $11,231
05/31/2002 $11,590 $11,248
06/30/2002 $11,613 $11,263
07/31/2002 $11,611 $11,280
08/31/2002 $11,653 $11,296
09/30/2002 $11,673 $11,312
10/31/2002 $11,721 $11,328
11/30/2002 $11,795 $11,342
12/31/2002 $11,825 $11,356
01/31/2003 $11,865 $11,368
02/28/2003 $11,899 $11,378
03/31/2003 $11,931 $11,390
04/30/2003 $11,963 $11,401
05/31/2003 $11,994 $11,412
06/30/2003 $12,007 $11,422
07/31/2003 $11,963 $11,432
08/31/2003 $11,966 $11,442
09/30/2003 $12,025 $11,450
10/31/2003 $12,015 $11,460
11/30/2003 $12,027 $11,468
12/31/2003 $12,067 $11,478
01/31/2004 $12,078 $11,487
02/29/2004 $12,099 $11,495
03/31/2004 $12,110 $11,504
04/30/2004 $12,097 $11,513
05/31/2004 $12,107 $11,522
06/30/2004 $12,105 $11,532
SECTOR BREAKDOWN‡
| | | |
Short-Term Instruments | | 75.2 | % |
Corporate Bonds & Notes | | 9.7 | % |
U.S. Government Agencies | | 5.7 | % |
Asset-Backed Securities | | 3.4 | % |
U.S. Treasury Obligation | | 2.9 | % |
Mortgage-Backed Securities | | 2.5 | % |
Other | | 0.6 | % |
‡ % of Total Investments as of June 30, 2004
à$10,000 invested at the beginning of the first full month following the inception of the Administrative Class.
TOTAL RETURN INVESTMENT PERFORMANCE For the period ended June 30, 2004
| | | | | | | | | | | | | |
| | | | | | | 6 Months | | | 1 Year | | | Since Inception* | |
| | |
| | Short-Term Portfolio Administrative Class (Inception 09/30/99) | | 0.32 | % | | 0.82 | % | | 4.10 | % |
| | | - - - - - - - | | Citigroup 3-Month Treasury Bill Index | | 0.47 | % | | 0.96 | % | | — | |
| | | | | * Annualized. All Portfolio returns are net of fees and expenses. | | | | | | | | | |
Past performance is no guarantee of future results. The performance quoted represents past performance. Investment return and principal value will fluctuate so the Portfolio shares, when redeemed, may be worth more or less than their original cost. Current performance may be lower or higher than the performance data quoted. Performance data current to the most recent month-end is available by calling (800) 927-4648.
Please refer to page 2 herein for an explanation of the information presented in the following Expense Example.
| | | | | | | | | | |
| EXPENSE EXAMPLE | | | | Actual Performance | | | | Hypothetical Performance
(5% return before expenses) |
Beginning Account Value (01/01/04) | | | | $ | 1,000.00 | | | | $ | 1,000.00 |
Ending Account Value (06/30/04) | | | | $ | 1,003.20 | | | | $ | 1,025.00 |
Expenses Paid During Period† | | | | $ | 2.99 | | | | $ | 3.02 |
†Expenses are equal to the Portfolio’s Administrative Class annualized expense ratio of 0.60%, multiplied by the average account value over the period, multiplied by 182/366 (to reflect the one-half year period).
PORTFOLIO INSIGHTS
| • | The Short-Term Portfolio seeks to achieve its investment objective by investing under normal circumstances at least 65% of its total assets in a diversified portfolio of Fixed Income Instruments of varying maturities. |
| • | The total return performance of the Portfolio’s Administrative Class was 0.32% for the six-month period ended June 30, 2004, versus a return of 0.47% for the benchmark Citigroup 3-Month Treasury Bill Index during the same period. |
| • | Interest rate strategies including a duration longer than the effective benchmark and yield curve positioning that was broader than benchmark were negative for returns as rates increased during the period. |
| • | An emphasis on mortgage securities boosted returns. Heavy demand by banks during the first quarter 2004 and a decline in volatility late in the second quarter supported mortgage performance. |
| • | An emphasis on corporate securities was slightly positive. During the first quarter, their yield advantage offset concerns about slower growth and profits, but during the second quarter returns were slightly negative as rates increased. |
| • | Emerging market (“EM”) bonds detracted from performance during the period. Heightened new issuance weighed on the sector and leveraged tactical investors sold EM bonds as rates rose. |
| • | Short maturity Eurozone issues added value amid expectations for slower growth and lower inflation in Europe. |
| | | | |
| June 30, 2004 | | Semi-Annual Report | | 3 |
Financial Highlights
Short-Term Portfolio (Administrative Class)
| | | | | | | | | | | | | | | | | | | | | | | | | | | | | | | | | | | | |
Selected Per Share Data for the
Year or Period Ended: | | | | 06/30/2004+ | | | | | 12/31/2003 | | | | | 12/31/2002 | | | | | 12/31/2001 | | | | | 12/31/2000 | | | | | 09/30/1999-
12/31/1999 | |
| | | | | | | | | | | | |
Net asset value beginning of period | | | | $ | 10.10 | | | | | $ | 10.08 | | | | | $ | 10.08 | | | | | $ | 10.01 | | | | | $ | 10.00 | | | | | $ | 10.00 | |
Net investment income (a) | | | | | 0.05 | (f) | | | | | 0.13 | (f) | | | | | 0.28 | (f) | | | | | 0.48 | (f) | | | | | 0.53 | | | | | | 0.13 | |
Net realized/unrealized gain (loss) on investments (a) | | | | | (0.02 | )(f) | | | | | 0.07 | (f) | | | | | 0.02 | (f) | | | | | 0.15 | (f) | | | | | 0.09 | | | | | | 0.00 | |
Total income from investment operations | | | | | 0.03 | | | | | | 0.20 | | | | | | 0.30 | | | | | | 0.63 | | | | | | 0.62 | | | | | | 0.13 | |
Dividends from net investment income | | | | | (0.05 | ) | | | | | (0.17 | ) | | | | | (0.29 | ) | | | | | (0.52 | ) | | | | | (0.61 | ) | | | | | (0.13 | ) |
Distributions from net realized capital gains | | | | | 0.00 | | | | | | (0.01 | ) | | | | | (0.01 | ) | | | | | (0.04 | ) | | | | | 0.00 | | | | | | 0.00 | |
Total distributions | | | | | (0.05 | ) | | | | | (0.18 | ) | | | | | (0.30 | ) | | | | | (0.56 | ) | | | | | (0.61 | ) | | | | | (0.13 | ) |
Net asset value end of period | | | | $ | 10.08 | | | | | $ | 10.10 | | | | | $ | 10.08 | | | | | $ | 10.08 | | | | | $ | 10.01 | | | | | $ | 10.00 | |
Total return | | | | | 0.32 | % | | | | | 2.05 | % | | | | | 3.02 | % | | | | | 6.45 | % | | | | | 6.42 | % | | | | | 1.32 | % |
Net assets end of period (000s) | | | | $ | 6,834 | | | | | $ | 5,948 | | | | | $ | 4,340 | | | | | $ | 1,683 | | | | | $ | 37 | | | | | $ | 3,040 | |
Ratio of net expenses to average net assets | | | | | 0.60 | %* | | | | | 0.60 | % | | | | | 0.60 | %(e) | | | | | 0.61 | %(c)(d) | | | | | 0.60 | % | | | | | 0.60 | %*(b) |
Ratio of net investment income to average net assets | | | | | 0.90 | %*(f) | | | | | 1.33 | %(f) | | | | | 2.81 | %(f) | | | | | 4.71 | %(f) | | | | | 5.27 | % | | | | | 5.17 | %* |
Portfolio turnover rate | | | | | 136 | % | | | | | 199 | % | | | | | 60 | % | | | | | 94 | % | | | | | 281 | % | | | | | N/A | |
| (a) | Per share amounts based on average number of shares outstanding during the period. |
| (b) | If the investment manager had not reimbursed expenses, the ratio of expenses to average net assets would have been 1.42%. |
| (c) | Ratio of expenses to average net assets excluding interest expense is 0.60%. |
| (d) | If the investment manager had not reimbursed expenses, the ratio of expenses to average net assets would have been 0.62%. |
| (e) | If the investment manager had not reimbursed expenses, the ratio of expenses to average net assets would have been 0.61%. |
| (f) | Indicates a period in which, as a result of a change in generally accepted accounting principles, the portfolio has reclassified periodic payments made or received under certain derivative instruments which were previously included within miscellaneous income, to a component of realized gain(loss) in the Statement of Operations. The effect of this reclassification was to (reduce) the net investment income ratio for the period ending June 30, 2004 by (0.03)% and the net investment income per share by $0.00. For consistency, similar reclassifications have been made to prior period amounts, resulting in increases(reductions) to the net investment income ratio of (0.10)%, 0.00% and (0.03)% and to the net investment income per share of $(0.01), $0.00 and $0.00 in the fiscal years ending December 31, 2003, 2002, and 2001, respectively. This change had no impact on the reported net asset value per share for any period. |
| | | | | | |
| 4 | | Semi-Annual Report | | June 30, 2004 | | See accompanying notes |
Statement of Assets and Liabilities
Short-Term Portfolio
June 30, 2004 (Unaudited)
| | | | | | |
| Amounts in thousands, except per share amounts | | | | | |
| | |
Assets: | | | | | | |
| | |
Investments, at value | | | | $ | 34,003 | |
Cash | | | | | 101 | |
Foreign currency, at value | | | | | 24 | |
Receivable for investments sold on delayed delivery basis | | | | | 794 | |
Unrealized appreciation on forward foreign currency contracts | | | | | 1 | |
Receivable for Portfolio shares sold | | | | | 2 | |
Interest and dividends receivable | | | | | 97 | |
Variation margin receivable | | | | | 11 | |
Swap premiums paid | | | | | 8 | |
Unrealized appreciation on swap agreements | | | | | 12 | |
| | | | | | 35,053 | |
| | |
Liabilities: | | | | | | |
| | |
Payable for investments purchased | | | | $ | 944 | |
Payable for short sale | | | | | 805 | |
Written options outstanding | | | | | 2 | |
Payable for Portfolio shares redeemed | | | | | 2 | |
Accrued investment advisory fee | | | | | 7 | |
Accrued administration fee | | | | | 5 | |
Accrued servicing fee | | | | | 1 | |
Recoupment payable to Manager | | | | | 1 | |
Other liabilities | | | | | 1 | |
| | | | | | 1,768 | |
| | |
Net Assets | | | | $ | 33,285 | |
| | |
Net Assets Consist of: | | | | | | |
| | |
Paid in capital | | | | $ | 33,263 | |
(Overdistributed) net investment income | | | | | (32 | ) |
Accumulated undistributed net realized gain | | | | | 65 | |
Net unrealized (depreciation) | | | | | (11 | ) |
| | | | | $ | 33,285 | |
| | |
Net Assets: | | | | | | |
| | |
Institutional Class | | | | $ | 26,451 | |
Administrative Class | | | | | 6,834 | |
| | |
Shares Issued and Outstanding: | | | | | | |
| | |
Institutional Class | | | | | 2,623 | |
Administrative Class | | | | | 678 | |
| | |
Net Asset Value and Redemption Price Per Share
(Net Assets Per Share Outstanding) | | | | | | |
| | |
Institutional Class | | | | $ | 10.08 | |
Administrative Class | | | | | 10.08 | |
| | |
Cost of Investments Owned | | | | $ | 34,018 | |
Cost of Foreign Currency Held | | | | $ | 24 | |
| | | | | | |
| See accompanying notes | | June 30, 2004 | | Semi-Annual Report | | 5 |
Statement of Operations
Short-Term Portfolio
| | | | | | |
| Amounts in thousands | | | | | |
| | | | | Six Months Ended June 30, 2004 (Unaudited) | |
Investment Income: | | | | | | |
| | |
Interest | | | | $ | 190 | |
Total Income | | | | | 190 | |
| | |
Expenses: | | | | | | |
| | |
Investment advisory fees | | | | | 32 | |
Administration fees | | | | | 25 | |
Distribution and/or servicing fees - Administrative Class | | | | | 5 | |
Total Expenses | | | | | 62 | |
| | |
Net Investment Income | | | | | 128 | |
| | |
Net Realized and Unrealized Gain (Loss): | | | | | | |
| | |
Net realized gain on investments | | | | | 5 | |
Net realized gain on futures contracts, options, and swaps | | | | | 38 | |
Net realized (loss) on foreign currency transactions | | | | | (1 | ) |
Net change in unrealized (depreciation) on investments | | | | | (35 | ) |
Net change in unrealized (depreciation) on futures contracts, options, and swaps | | | | | (26 | ) |
Net change in unrealized appreciation on translation of assets and liabilities denominated in foreign currencies | | | | | 1 | |
Net (Loss) | | | | | (18 | ) |
| | |
Net Increase in Assets Resulting from Operations | | | | $ | 110 | |
| | | | | | |
| 6 | | Semi-Annual Report | | June 30, 2004 | | See accompanying notes |
Statements of Changes in Net Assets
Short-Term Portfolio
| | | | | | | | | | | | |
| Amounts in thousands | | | | | | | | | | |
| | | | | Six Months Ended June 30, 2004 (Unaudited) | | | | | Year Ended December��31, 2003 | |
Increase in Net Assets from: | | | | | | | | | | | | |
| | | | |
Operations: | | | | | | | | | | | | |
| | | | |
Net investment income | | | | $ | 128 | | | | | $ | 207 | |
Net realized gain | | | | | 42 | | | | | | 100 | |
Net change in unrealized depreciation | | | | | (60 | ) | | | | | (13 | ) |
Net increase resulting from operations | | | | | 110 | | | | | | 294 | |
| | | | |
Distributions to Shareholders: | | | | | | | | | | | | |
| | | | |
From net investment income | | | | | | | | | | | | |
Institutional Class | | | | | (110 | ) | | | | | (160 | ) |
Administrative Class | | | | | (34 | ) | | | | | (97 | ) |
| | | | |
From net realized capital gains | | | | | | | | | | | | |
Institutional Class | | | | | 0 | | | | | | (18 | ) |
Administrative Class | | | | | 0 | | | | | | (8 | ) |
Total Distributions | | | | | (144 | ) | | | | | (283 | ) |
| | | | |
Portfolio Share Transactions: | | | | | | | | | | | | |
| | | | |
Receipts for shares sold | | | | | | | | | | | | |
Institutional Class | | | | | 14,588 | | | | | | 12,584 | |
Administrative Class | | | | | 1,448 | | | | | | 3,690 | |
| | | | |
Issued as reinvestment of distributions | | | | | | | | | | | | |
Institutional Class | | | | | 110 | | | | | | 178 | |
Administrative Class | | | | | 34 | | | | | | 105 | |
| | | | |
Cost of shares redeemed | | | | | | | | | | | | |
Institutional Class | | | | | (3,155 | ) | | | | | (2,724 | ) |
Administrative Class | | | | | (586 | ) | | | | | (2,197 | ) |
Net increase resulting from Portfolio share transactions | | | | | 12,439 | | | | | | 11,636 | |
| | | | |
Total Increase in Net Assets | | | | | 12,405 | | | | | | 11,647 | |
| | | | |
Net Assets: | | | | | | | | | | | | |
| | | | |
Beginning of period | | | | | 20,880 | | | | | | 9,233 | |
End of period* | | | | $ | 33,285 | | | | | $ | 20,880 | |
| | | | |
*Including (overdistributed) net investment income of: | | | | $ | (32 | ) | | | | $ | (16 | ) |
| | | | | | |
| See accompanying notes | | June 30, 2004 | | Semi-Annual Report | | 7 |
Schedule of Investments
Short-Term Portfolio
June 30, 2004 (Unaudited)
| | | | |
| | | Principal | | |
| | | Amount | | Value |
| | | (000s) | | (000s) |
| | | | | | |
CORPORATE BONDS & NOTES 9.9% | | | |
Banking & Finance 2.2% | | | | | | |
Bear Stearns Cos., Inc. | | | | | | |
1.940% due 09/21/2004 (a) | | $ | 100 | | $ | 100 |
Bombardier Capital, Inc. | | | | | | |
7.500% due 08/15/2004 | | | 100 | | | 100 |
Deutsche Telekom International Finance BV | | | |
8.250% due 06/15/2005 | | | 80 | | | 84 |
Ford Motor Credit Co. | | | | | | |
6.700% due 07/16/2004 | | | 250 | | | 250 |
General Motors Acceptance Corp. | | | |
5.750% due 11/05/2004 | | | 50 | | | 51 |
2.400% due 10/20/2005 (a) | | | 100 | | | 101 |
Household Finance Corp. | | | | | | |
6.700% due 11/15/2005 | | | 40 | | | 42 |
| | | | | |
|
|
| | | | | | | 728 |
| | | | | |
|
|
Industrials 3.6% | | | | | | |
Alcan, Inc. | | | | | | |
1.623% due 12/08/2004 (a) | | | 40 | | | 40 |
DaimlerChrysler North America Holding Corp. |
3.400% due 12/15/2004 | | | 220 | | | 221 |
7.400% due 01/20/2005 | | | 110 | | | 113 |
FedEx Corp. | | | | | | |
1.390% due 04/01/2005 (a) | | | 100 | | | 100 |
Fort James Corp. | | | | | | |
6.625% due 09/15/2004 | | | 10 | | | 10 |
Halliburton Co. | | | | | | |
2.650% due 10/17/2005 (a) | | | 50 | | | 51 |
MGM Mirage, Inc. | | | | | | |
6.950% due 02/01/2005 | | | 40 | | | 41 |
6.625% due 02/01/2005 | | | 20 | | | 20 |
PanAmSat Corp. | | | | | | |
6.125% due 01/15/2005 | | | 40 | | | 41 |
Petroleos Mexicanos | | | | | | |
6.500% due 02/01/2005 | | | 150 | | | 154 |
Pioneer National Resources Co. | | | | | | |
8.875% due 04/15/2005 | | | 50 | | | 52 |
TCI Communications, Inc. | | | | | | |
8.650% due 09/15/2004 | | | 40 | | | 41 |
Time Warner, Inc. | | | | | | |
7.975% due 08/15/2004 | | | 100 | | | 101 |
Tyco International Group S.A. | | | | | | |
5.875% due 11/01/2004 | | | 100 | | | 101 |
Weyerhaeuser Co. | | | | | | |
5.500% due 03/15/2005 | | | 15 | | | 15 |
Yum! Brands, Inc. | | | | | | |
7.450% due 05/15/2005 | | | 100 | | | 104 |
| | | | | |
|
|
| | | | | | | 1,205 |
| | | | | |
|
|
Utilities 4.1% | | | | | | |
Carolina Telephone & Telegraph | | | |
7.250% due 12/15/2004 | | | 200 | | | 204 |
Centerior Energy Corp. | | | | | | |
7.670% due 07/01/2004 | | | 100 | | | 100 |
Dominion Resources, Inc. | | | | | | |
2.800% due 02/15/2005 | | | 100 | | | 100 |
Edison International, Inc. | | | | | | |
6.875% due 09/15/2004 | | | 160 | | | 161 |
Entergy Gulf States, Inc. | | | | | | |
3.600% due 06/01/2008 | | | 100 | | | 97 |
Ohio Edison Co. | | | | | | |
4.000% due 05/01/2008 | | | 30 | | | 29 |
PPL Capital Funding Trust I | | | | | | |
7.290% due 05/18/2006 | | | 80 | | | 84 |
Reliant Energy Resources Corp. | | | | | | |
8.125% due 07/15/2005 | | | 100 | | | 105 |
SBC Communications, Inc. | | | | | | |
4.206% due 06/05/2005 | | | 110 | | | 112 |
Sprint Capital Corp. | | | | | | |
7.900% due 03/15/2005 | | | 360 | | | 373 |
| | | | | |
|
|
| | | | | | | 1,365 |
| | | | | |
|
|
| Total Corporate Bonds & Notes (Cost $3,302) | | | | | | 3,298 |
| | | | | |
|
|
| | | | |
U.S. GOVERNMENT AGENCIES 5.8% | �� | |
| | |
Fannie Mae | | | | |
4.500% due 02/25/2008 | | $100 | | $102 |
6.000% due 06/01/2017 | | 60 | | 63 |
5.337% due 10/01/2031 (a) | | 78 | | 80 |
1.420% due 03/25/2034 (a) | | 214 | | 213 |
1.880% due 08/25/2043 | | 36 | | 36 |
5.500% due 11/01/2016-09/01/2017 (d) | | 350 | | 359 |
Federal Home Loan Bank | | | | |
6.270% due 08/26/2004 | | 175 | | 173 |
Freddie Mac | | | | |
3.960% due 08/02/2006 | | 100 | | 100 |
4.000% due 08/02/2006 | | 100 | | 100 |
4.250% due 07/12/2006 | | 300 | | 300 |
9.500% due 12/01/2019 | | 88 | | 99 |
5.750% due 06/15/2029 | | 1 | | 1 |
6.000% due 12/15/2031 | | 100 | | 101 |
6.500% due 08/01/2032 | | 20 | | 21 |
5.500% due 08/15/2004-08/15/2030 (d) | | 41 | | 41 |
Government National Mortgage Association | | |
3.000% due 02/20/2032 (a) | | 127 | | 123 |
6.000% due 03/15/2032 | | 23 | | 24 |
| | | | |
|
| Total U.S. Government Agencies (Cost $1,946) | | 1,936 |
| | | | |
|
| | | | | |
U.S. TREASURY OBLIGATIONS 2.9% | | |
| |
Treasury Inflation Protected Securities (c) | | |
3.375% due 01/15/2007 | | 154 | | 165 |
3.625% due 01/15/2008 | | 396 | | 433 |
U.S. Treasury Note | | | | |
1.875% due 12/31/2005 | | 390 | | 387 |
| | | | |
|
| Total U.S. Treasury Obligations (Cost $989) | | | | 985 |
| | | | |
|
| | | | | |
MORTGAGE-BACKED SECURITIES 2.6% |
| |
Bank of America Mortgage Securities, Inc. | | |
6.406% due 07/25/2032 (a) | | 16 | | 16 |
5.667% due 10/20/2032 (a) | | 14 | | 14 |
Bear Stearns Adjustable Rate Mortgage Trust |
4.802% due 12/25/2033 (a) | | 39 | | 40 |
4.357% due 01/25/2034 (a) | | 38 | | 39 |
1.580% due 02/25/2034 (a) | | 61 | | 62 |
Bear Stearns Commercial Mortgage Securities |
1.500% due 05/14/2016 (a) | | 100 | | 100 |
Countrywide Home Loans, Inc. | | | | |
4.991% due 09/19/2032 (a) | | 9 | | 9 |
CS First Boston Mortgage Securities Corp. | | |
1.726% due 03/25/2032 (a) | | 150 | | 151 |
5.738% due 05/25/2032 (a) | | 11 | | 11 |
First Republic Mortgage Loan Trust | | |
1.538% due 08/15/2032 (a) | | 83 | | 83 |
Mellon Residential Funding Corp. | | |
1.678% due 12/15/2030 (a) | | 55 | | 55 |
Sequoia Mortgage Funding Co | | | | |
0.800% due 10/21/2007 (b) | | 1,842 | | 19 |
Structured Asset Mortgage Investments, Inc. | | | | |
1.610% due 09/19/2032 (a) | | 80 | | 80 |
Structured Asset Securities Corp. | | |
1.590% due 01/25/2033 (a) | | 25 | | 25 |
1.800% due 11/25/2033 (a) | | 17 | | 17 |
Structured Assets Securities Corp. | | |
1.800% due 07/25/2032 (a) | | 50 | | 50 |
Wachovia Bank Commercial Mortgage Trust | | |
1.428% due 06/15/2013 (a) | | 40 | | 40 |
Washington Mutual Mortgage Securities Corp. |
5.159% due 10/25/2032 (a) | | 12 | | 12 |
2.629% due 06/25/2042 (a) | | 42 | | 42 |
| | | | |
|
| Total Mortgage-Backed Securities (Cost $865) | | 865 |
| | | | |
|
| | | | |
ASSET-BACKED SECURITIES 3.5% | | |
| |
Ameriquest Mortgage Securities, Inc. | | |
1.460% due 06/25/2005 (a) | | $151 | | $151 |
1.450% due 11/25/2033 (a) | | 30 | | 30 |
Bear Stearns Asset-Backed Securities, Inc. | | |
1.630% due 10/25/2032 (a) | | 12 | | 12 |
CDC Mortgage Capital Trust | | | | |
1.640% due 01/25/2032 (a) | | 10 | | 10 |
1.670% due 08/25/2033 (a) | | 18 | | 18 |
Centex Home Equity Loan Trust | | | | |
1.600% due 09/25/2033 (a) | | 36 | | 36 |
Chase Funding Loan Acquisition Trust | | |
1.540% due 07/25/2030 (a) | | 7 | | 7 |
1.650% due 07/25/2031 (a) | | 5 | | 5 |
Contimortgage Home Equity Loan Trust | | |
1.418% due 04/15/2029 (a) | | 58 | | 58 |
Countrywide Asset-Backed Certificates | | |
1.670% due 05/25/2032 (a) | | 17 | | 17 |
CS First Boston Mortgage Securities Corp. | | |
1.740% due 08/25/2032 (a) | | 7 | | 7 |
Equifirst Mortgage Loan Trust | | | | |
1.400% due 01/25/2034 (a) | | 94 | | 94 |
Financial Asset Securities Corp. AAA Trust | | |
1.230% due 09/25/2033 (a) | | 5 | | 5 |
First Franklin Mortgage Loan Trust Asset-Backed Certificates | | |
1.650% due 09/25/2032 (a) | | 17 | | 17 |
2.820% due 02/25/2034 (a) | | 28 | | 28 |
First Franklin Mtg Loan Asset Backed Certificates | | |
1.420% due 07/25/2033 (a) | | 60 | | 60 |
HFC Home Equity Loan Asset-Backed Certificates | | |
1.630% due 10/20/2032 (a) | | 52 | | 52 |
Home Equity Asset Trust | | | | |
1.760% due 02/25/2033 (a) | | 35 | | 35 |
1.710% due 03/25/2033 (a) | | 20 | | 20 |
Home Equity Mortgage Trust | | | | |
1.550% due 04/25/2034 (a) | | 33 | | 34 |
Irwin Home Equity Loan Trust | | | | |
1.570% due 07/25/2032 (a) | | 30 | | 30 |
Morgan Stanley Asset-Backed Securities
Capital I, Inc. |
1.640% due 08/25/2033 (a) | | 39 | | 39 |
Morgan Stanley Dean Witter Capital I, Inc. |
1.670% due 07/25/2030 (a) | | 3 | | 3 |
Novastar Home Equity Loan | | | | |
1.630% due 09/25/2031 (a) | | 10 | | 10 |
Quest Trust | | | | |
1.291% due 06/25/2034 (a) | | 100 | | 100 |
Renaissance Home Equity Loan Trust | | |
1.740% due 08/25/2033 (a) | | 94 | | 95 |
Residential Asset Mortgage Products, Inc. |
1.630% due 12/25/2033 (a) | | 44 | | 44 |
Residential Asset Securities Corp. |
1.420% due 06/25/2025 (a) | | 86 | | 86 |
Saxon Asset Securities Trust | | | | |
1.570% due 01/25/2032 (a) | | 8 | | 8 |
1.700% due 12/25/2032 (a) | | 11 | | 12 |
Sears Credit Account Master Trust | | |
5.250% due 10/16/2008 | | 8 | | 8 |
Structured Asset Investment Loan Trust | | |
1.200% due 04/25/2033 (a) | | 13 | | 13 |
Terwin Mortgage Trust | | | | |
1.880% due 09/25/2033 (a) | | 9 | | 9 |
| | | | |
|
| Total Asset-Backed Securities (Cost $1,152) | | | | 1,153 |
| | | | |
|
| | | | | |
SOVEREIGN ISSUES 0.5% | | | | |
| | |
Republic of Brazil | | | | |
2.062% due 04/15/2006 (a) | | 93 | | 91 |
10.000% due 01/16/2007 | | 10 | | 11 |
2.125% due 04/15/2009 (a) | | 62 | | 57 |
| | | | |
|
| Total Sovereign Issues (Cost $154) | | | | 159 |
| | | | |
|
| | | | | | |
| 8 | | Semi-Annual Report | | June 30, 2004 | | See accompanying notes |
| | | | |
| | | Principal | | |
| | | Amount | | Value |
| | | (000s) | | (000s) |
| | | | | |
FOREIGN CURRENCY-DENOMINATED ISSUES (i)(j) 0.1% | | |
| | |
Tyco International Group S.A. | | | | | |
4.375% due 11/19/2004 | | EC | 20 | | $24 |
| | | | | |
|
Total Foreign Currency-Denominated Issues (Cost $24) | | 24 |
| | | | | |
|
| | | | | | |
SHORT-TERM INSTRUMENTS 76.9% | | |
Commercial Paper 76.0% | | | | | |
AB Spintab | | | | | |
1.260% due 09/08/2004 | | | $400 | | 399 |
ABN AMRO North America | | | | | |
1.040% due 07/06/2004 | | | 600 | | 600 |
1.090% due 07/29/2004 | | | 100 | | 100 |
Anz (Delaware), Inc. | | | | | |
1.060% due 07/19/2004 | | | 200 | | 200 |
Bank of Ireland | | | | | |
1.285% due 09/03/2004 | | | 900 | | 898 |
Barclays U.S. Funding Corp. | | | | | |
1.110% due 08/25/2004 | | | 100 | | 100 |
1.280% due 09/21/2004 | | | 200 | | 199 |
CBA (de) Finance | | | | | |
1.050% due 07/02/2004 | | | 100 | | 100 |
1.210% due 08/23/2004 | | | 600 | | 599 |
1.225% due 08/23/2004 | | | 200 | | 200 |
CDC Commercial Corp. | | | | | |
1.100% due 08/04/2004 | | | 600 | | 599 |
Den Norske Bank ASA | | | | | |
1.260% due 09/20/2004 | | | 500 | | 498 |
Dexia Delaware LLC | | | | | |
1.400% due 08/30/2004 | | | 300 | | 299 |
European Investment Bank | | | | | |
1.050% due 07/16/2004 | | | 600 | | 600 |
Fannie Mae | | | | | |
1.040% due 07/14/2004 | | | 300 | | 300 |
1.060% due 07/21/2004 | | | 600 | | 600 |
1.063% due 08/04/2004 | | | 300 | | 300 |
1.130% due 08/11/2004 | | | 300 | | 300 |
1.150% due 08/18/2004 | | | 300 | | 299 |
1.177% due 08/25/2004 | | | 300 | | 299 |
1.180% due 08/25/2004 | | | 500 | | 499 |
1.120% due 09/01/2004 | | | 300 | | 299 |
1.225% due 09/01/2004 | | | 200 | | 199 |
1.380% due 09/01/2004 | | | 300 | | 299 |
1.415% due 09/08/2004 | | | 300 | | 299 |
1.200% due 09/15/2004 | | | 300 | | 299 |
1.414% due 09/22/2004 | | | 100 | | 100 |
1.426% due 09/22/2004 | | | 100 | | 100 |
1.010% due 10/01/2004 | | | 300 | | 299 |
Federal Home Loan Bank | | | | | |
1.165% due 07/16/2004 | | | 200 | | 200 |
1.170% due 07/16/2004 | | | 300 | | 300 |
1.180% due 08/25/2004 | | | 100 | | 100 |
Ford Motor Credit Co. | | | | | |
1.870% due 09/03/2004 | | | 150 | | 150 |
Freddie Mac | | | | | |
1.010% due 08/12/2004 | | | 400 | | 399 |
1.150% due 08/17/2004 | | | 300 | | 300 |
1.175% due 08/24/2004 | | | 600 | | 599 |
1.180% due 08/24/2004 | | | 1,000 | | 998 |
1.260% due 09/20/2004 | | | 200 | | 199 |
1.280% due 09/22/2004 | | | 300 | | 299 |
1.465% due 09/28/2004 | | | 300 | | 299 |
1.300% due 09/30/2004 | | | 300 | | 299 |
1.560% due 10/20/2004 | | | 300 | | 298 |
General Electric Capital Corp. | | | | | |
1.040% due 07/08/2004 | | | 600 | | 600 |
1.060% due 07/12/2004 | | | 100 | | 100 |
1.300% due 09/08/2004 | | | 200 | | 199 |
HBOS Treasury Services PLC | | | | | |
1.055% due 07/16/2004 | | | 200 | | 200 |
1.290% due 09/24/2004 | | | 200 | | 199 |
1.580% due 10/21/2004 | | | 500 | | 497 |
| | | | | |
| | |
1.585% due 10/26/2004 | | $100 | | $99 | |
ING U.S. Funding LLC | | | | | |
1.040% due 07/02/2004 | | 600 | | 600 | |
1.240% due 09/10/2004 | | 100 | | 100 | |
KFW International Finance, Inc. | | | | | |
1.095% due 08/10/2004 | | 300 | | 300 | |
1.110% due 08/23/2004 | | 400 | | 399 | |
Lloyds TSB Bank PLC | | | | | |
185% due 07/21/2004 | | 700 | | 699 | |
National Australia Funding, Inc. | | | | | |
1.050% due 07/02/2004 | | 600 | | 600 | |
Nestle Capital Corp. | | | | | |
1.130% due 08/30/2004 | | 500 | | 499 | |
Royal Bank of Scotland PLC | | | | | |
1.070% due 07/14/2004 | | 600 | | 600 | |
1.235% due 09/13/2004 | | 100 | | 100 | |
Shell Finance (UK) PLC | | | | | |
1.240% due 09/14/2004 | | 600 | | 598 | |
Svenska Handlesbanken | | | | | |
1.065% due 07/14/2004 | | 600 | | 600 | |
1.070% due 07/21/2004 | | 100 | | 100 | |
1.240% due 09/13/2004 | | 100 | | 100 | |
1.295% due 09/24/2004 | | 200 | | 199 | |
Swedish National Housing Finance Corp. | | | |
1.060% due 07/16/2004 | | 400 | | 400 | |
1.090% due 07/29/2004 | | 500 | | 500 | |
Toyota Motor Credit Corp. | | | | | |
1.330% due 09/07/2004 | | 900 | | 898 | |
UBS Finance, Inc. | | | | | |
1.060% due 07/01/2004 | | 300 | | 300 | |
1.420% due 07/01/2004 | | 100 | | 100 | |
1.055% due 07/13/2004 | | 300 | | 300 | |
1.195% due 07/21/2004 | | 100 | | 100 | |
1.240% due 08/31/2004 | | 200 | | 199 | |
Westpac Capital Corp. | | | | | |
1.030% due 07/07/2004 | | 100 | | 100 | |
Westpac Trust Securities NZ Ltd. | | | |
1.215% due 08/24/2004 | | 700 | | 699 | |
| | | | |
|
|
| | | | | 25,306 | |
| | | | |
|
|
| | |
Repurchase Agreement 0.6% | | | | | |
State Street Bank | | | | | |
0.800% due 07/01/2004 | | 192 | | 192 | |
| | | | |
|
|
(Dated 06/30/2004. Collateralized by Fannie Mae 5.250% due 06/15/2006 valued at $198.
Repurchase proceeds are $192.) | |
| | |
U.S. Treasury Bills 0.3% | | | | | |
1.135% due 09/02/2004 (e) | | 85 | | 85 | |
| | | | |
|
|
| Total Short-Term Instruments (Cost $25,586) | | | | 25,583 | |
| | | | |
|
|
| | |
Total Investments 102.2% | | | | $34,003 | |
(Cost $34,018) | | | | | |
| | |
Written Options (g) (0.0%) | | | | (2 | ) |
(Premiums $6) | | | | | |
| |
Other Assets and Liabilities (Net) (2.2%) | | (716 | ) |
| | | | |
|
|
| |
Net Assets 100.0% | | $33,285 | |
| | | | |
|
|
Notes to Schedule of Investments (amounts in thousands, except number of contracts):
(a) Variable rate security.
(b) Interest only security.
(c) Principal amount of security is adjusted for inflation.
(d) Securities are grouped by coupon or range of coupons and represent a range of maturities.
(e) Securities with an aggregate market value of $85 have been segregated with the custodian to cover margin
requirements for the following open futures contracts at June 30, 2004:
| | | | | | | | |
Type | | Expiration Month | | # of
Contracts | |
| Unrealized
(Depreciation) |
|
Eurodollar June Long Futures | | 06/2005 | | 8 | | $ | 0 | |
Euribor December Long Futures | | 12/2005 | | 3 | | | (4 | ) |
Euribor June
Long Futures | | 06/2005 | | 1 | | | (1 | ) |
Euribor September Long Futures | | 09/2005 | | 1 | | | (1 | ) |
Euro-Bobl 5-Year Note Long Futures | | 09/2004 | | 3 | | | 0 | |
U.S. Treasury 10-Year Note Long Futures | | 09/2004 | | 8 | | | (1 | ) |
| | | | | | |
|
|
|
| | | | | | | $ | (7 | ) |
| | | | | | |
|
|
|
(f) Swap agreements outstanding at June 30, 2004:
| | | | | | | | |
Type | |
| Notional
Amount | | | |
| Unrealized
Appreciation |
Receive a fixed rate equal to 4.000% and
pay floating rate based on 6-month EC-LIBOR. |
| Counterparty: Merrill Lynch & Co., Inc. | | | | | |
| Exp. 03/15/2007 | | EC | 1,000 | | | | $ | 6 |
| |
| Receive a fixed rate equal to 1.000% and the Portfolio will pay to the counterparty at par in the event of default of Russian Federation, 5.000% until 03/31/2007 and 7.500% thereafter, due 03/31/2030. | | | |
Counterparty: Morgan Stanley Dean Witter & Co. |
| Exp. 07/18/2004 | | $ | 40 | | | | | 0 |
| |
| Receive a fixed rate equal to 16.500% and the Portfolio will pay to the counterparty at par in the event of default of Federative Republic of Brazil 8.000% due 04/15/2014. | | | |
| Counterparty: Merrill Lynch & Co., Inc. | | | |
| Exp. 01/16/2005 | | | 75 | | | | | 6 |
| |
| Receive a fixed rate equal to 1.000% and the Portfolio will pay to the counterparty at par in the event of default of Russian Federation, 5.000% until 03/31/2007 and 7.500% thereafter, due 03/31/2030. | | | |
| Counterparty: J.P. Morgan Chase & Co. | | | |
| Exp. 03/11/2005 | | | 40 | | | | | 0 |
| |
| Receive a fixed rate equal to 1.000% and the Portfolio will pay to the counterparty at par in the event of default of Russian Federation, 5.000% until 03/31/2007 and 7.500% thereafter, due 03/31/2030. | | | |
| Counterparty: Bear Stearns & Co., Inc. | | | |
| Exp. 03/17/2005 | | | 25 | | | | | 0 |
| |
| Receive a fixed rate equal to 0.730% and the Portfolio will pay to the counterparty at par in the event of default of the United Mexican States 11.500% due 05/15/2026. | | | |
| Counterparty: Bear Stearns & Co., Inc. | | | |
| Exp. 06/20/2005 | | | 80 | | | | | 0 |
| |
| Receive a fixed rate equal to 4.000% and pay floating rate based on 3-month LIBOR. | | | |
| Counterparty: UBS Warburg LLC | | | |
| Exp. 12/15/2006 | | | 200 | | | | | 0 |
| | | | | | | |
|
|
| | | | | | | | $ | 12 |
| | | | | | | |
|
|
| | | | | | |
| See accompanying notes | | June 30, 2004 | | Semi-Annual Report | | 9 |
Schedule of Investments (Cont.)
Short-Term Portfolio
June 30, 2004 (Unaudited)
| (g) | Premiums received on written options: |
| | | | | | | | | | | | | | | | | |
| Name of Issuer | | Counterparty | | Exercise Rate | | | Expiration
Date | | Notional
Amount | | Premium | | Value | |
Call - OTC 7-Year Interest Rate Swap | | Goldman Sachs & Co. | | 5.000 | %** | | 01/07/2005 | | $ | 140 | | $ | 3 | | $ | 2 | |
Put - OTC 7-Year Interest Rate Swap | | Goldman Sachs & Co. | | 7.000 | %* | | 01/07/2005 | | | 140 | | | 3 | | | 0 | |
| | | | | | | | | | | | |
|
|
|
| | | | | | | | | | | | | $ | 6 | | $ | 2 | |
| | | | | | | | | | | | |
|
|
|
| | | | | |
* The Portfolio will pay a floating rate based on 3-month LIBOR. | | | | | | | | | | | | | | | |
** The Portfolio will receive a floating rate based on 3-month LIBOR. | | | | | | | | | | | | | | | |
| | | | | |
| (h) Short sales open at June 30, 2004 were as follows: | | | | | | | | | | | | | | | |
| Type | | | | Coupon
(%) | | | Maturity | | Par | | Value | | Proceeds | |
U.S. Treasury Note | | | | 5.000 | | | 02/15/2011 | | $ | 200 | | $ | 210 | | $ | 206 | |
U.S. Treasury Note | | | | 4.250 | | | 08/15/2013 | | | 610 | | | 595 | | | 588 | |
| | | | | | | | | | | | |
|
|
|
| | | | | | | | | | | | | $ | 805 | | $ | 794 | |
| | | | | | | | | | | | |
|
|
|
| | | | | |
| (i) Forward foreign currency contracts outstanding at June 30, 2004: | | | | | | | | | | | | | | | |
| Type | | Currency | | Principal
Amount
Covered by
Contract | | | Settlement
Month | | Unrealized
Appreciation | | Unrealized
(Depreciation) | | Net Unrealized
Appreciation | |
Sell | | EC | | 48 | | | 07/2004 | | $ | 1 | | $ | 0 | | $ | 1 | |
| | | | | | | | | |
|
|
|
| (j) | Principal amount denoted in indicated currency: |
| | | | | | |
| 10 | | Semi-Annual Report | | June 30, 2004 | | See accompanying notes |
Notes to Financial Statements
June 30, 2004 (Unaudited)
1. Organization
The Short-Term Portfolio (the “Portfolio”) is a series of the PIMCO Variable Insurance Trust (the “Trust”). The Trust is registered under the Investment Company Act of 1940 (the “Act”), as amended, as an open-end investment company organized as a Delaware business trust on October 3, 1997. The Portfolio offers two classes of shares: Institutional and Administrative. Each share class has identical voting rights (except that shareholders of a class have exclusive voting rights regarding any matter relating solely to that class of shares). Information presented in these financial statements pertains to the Administrative Class of the Portfolio. Certain detailed financial information for the Institutional Class is provided separately and is available upon request. The Trust is designed to be used as an investment vehicle by Separate Accounts of insurance companies that fund variable annuity contracts and variable life insurance policies and by qualified pension and retirement plans. The Portfolio commenced operations on September 30, 1999.
2. Significant Accounting Policies
The following is a summary of significant accounting policies consistently followed by the Trust in the preparation of its financial statements in conformity with accounting principles generally accepted in the United States of America. The preparation of financial statements in accordance with accounting principles generally accepted in the United States of America requires management to make estimates and assumptions that affect the reported amounts and disclosures in the financial statements. Actual results could differ from those estimates.
Security Valuation. Portfolio securities and other financial instruments for which market quotations are readily available are stated at market value. Portfolio securities and other financial instruments for which market quotes are not readily available are valued at fair value, as determined in good faith and pursuant to guidelines established by the Board of Trustees, including certain fixed income securities which may be valued with reference to securities whose prices are more readily obtainable. Market value is determined at the close of regular trading (normally, 4:00 p.m., Eastern Time) on the New York Stock Exchange on each day the New York Stock Exchange is open, or if no sales are reported, as is the case for most securities traded over-the-counter, the mean between representative bid and asked quotations obtained from a quotation reporting system or from established market makers. The prices of certain portfolio securities or other financial instruments may be determined at a time prior to the close of regular trading on the New York Stock Exchange. Fair valuation may be used if significant events occur after the close of the relevant markets and prior to the close of regular trading on the New York Stock Exchange that materially affect the values of such securities or financial instruments. Fixed income securities are normally valued on the basis of quotes obtained from brokers and dealers or pricing services. Certain fixed income securities purchased on a delayed delivery basis are marked to market daily until settlement at the forward settlement value. Short-term investments, which mature in 60 days or less are valued at amortized cost, which approximates market value. Exchange traded options, futures and options on futures are valued at the settlement price determined by the relevant exchange. Prices may be obtained from independent pricing services which use information provided by market makers or estimates of market values obtained from yield data relating to investments or securities with similar characteristics. The prices used by the Portfolio may differ from the value that would be realized if the securities were sold and the differences could be material to the financial statements.
Securities Transactions and Investment Income. Securities transactions are recorded as of the trade date. Securities purchased or sold on a when-issued or delayed delivery basis may be settled a month or more after the trade date. Realized gains and losses from securities sold are recorded on the identified cost basis. Dividend income is recorded on the ex-dividend date, except certain dividends from foreign securities where the ex-dividend date may have passed, are recorded as soon as the Portfolio is informed of the ex-dividend date. Interest income, adjusted for the accretion of discounts and amortization of premiums, is recorded on the accrual basis. Paydowns gains and losses on mortgage- and asset-backed securities are recorded as adjustments to interest income in the Statement of Operations.
Dividends and Distributions to Shareholders. Dividends from net investment income, if any, are declared on each day the Trust is open for business and are distributed to shareholders monthly. All dividends are reinvested in additional shares of the Portfolio. Net realized capital gains earned by the Portfolio, if any, will be distributed no less frequently than once each year.
Income dividends and capital gain distributions are determined in accordance with income tax regulations which may differ from accounting principles generally accepted in the United States of America. These differences are primarily due to differing treatments for such items as wash sales, foreign currency transactions, net operating losses, notional principal contracts, certain asset-backed securities, certain futures and forward contracts, tax straddles, and capital loss carryforwards.
Distributions classified as a tax basis return of capital, if any, are reflected in the accompanying Statements of Changes in Net Assets and have been reclassified to paid in capital. In addition, other amounts have been reclassified between undistributed net investment income, accumulated undistributed net realized gains or losses and/or paid in capital to more appropriately conform financial accounting to tax characterizations of dividend distributions.
Multiclass Operations. Each class offered by the Trust has equal rights as to assets. Income, non-class specific expenses, and realized and unrealized capital gains and losses are allocated to each class of shares based on the relative net assets of each class.
Delayed Delivery Transactions. The Portfolio may purchase or sell securities on a when-issued or delayed delivery basis. These transactions involve a commitment by the Portfolio to purchase or
| | | | |
| June 30, 2004 | | Semi-Annual Report | | 11 |
Notes to Financial Statements (Cont.)
June 30, 2004 (Unaudited)
sell securities for a predetermined price or yield, with payment and delivery taking place beyond the customary settlement period. When delayed delivery purchases are outstanding, the Portfolio will designate liquid assets in an amount sufficient to meet the purchase price. When purchasing a security on a delayed delivery basis, the Portfolio assumes the rights and risks of ownership of the security, including the risk of price and yield fluctuations, and takes such fluctuations into account when determining its net asset value. The Portfolio may dispose of or renegotiate a delayed delivery transaction after it is entered into, and may sell when-issued securities before they are delivered, which may result in a capital gain or loss. When the Portfolio has sold a security on a delayed delivery basis, the Portfolio does not participate in future gains and losses with respect to the security.
Federal Income Taxes. The Portfolio intends to qualify as a regulated investment company and distribute all of its taxable income and net realized gains, if applicable, to shareholders. Accordingly, no provision for Federal income taxes has been made.
Foreign Currency. The accounting records of the Portfolio are maintained in U.S. dollars. The market values of foreign securities, currency holdings and other assets and liabilities are translated into U.S. dollars based on the current exchange rates each business day. Fluctuations in the value of these assets and liabilities resulting from changes in exchange rates are recorded as unrealized foreign currency gains or losses. Realized gains or losses and unrealized appreciation or depreciation on investment securities and income and expenses are translated on the respective dates of such transactions. The effect of changes in foreign currency exchange rates on investments in securities are not segregated in the Statement of Operations from the effects of changes in market prices of those securities, but are included with the net realized and unrealized gain or loss on investment securities.
Forward Currency Transactions. The Portfolio may enter into forward currency contracts and forward cross-currency contracts in connection with settling planned purchases or sales of securities, to hedge the currency exposure associated with some or all of the Portfolio’s securities or as a part of an investment strategy. A forward currency contract is an agreement between two parties to buy and sell a currency at a set price on a future date. The market value of a forward currency contract fluctuates with changes in forward currency exchange rates. Forward currency contracts are marked to market daily and the change in value is recorded by the Portfolio as an unrealized gain or loss. Realized gains or losses equal to the difference between the value of the contract at the time it was opened and the value at the time it was closed are recorded upon delivery or receipt of the currency or, if a forward currency contract is offset by entering into another forward currency contract with the same broker, upon settlement of the net gain or loss. These contracts may involve market risk in excess of the unrealized gain or loss reflected in the Portfolio’s Statement of Assets and Liabilities. In addition, the Portfolio could be exposed to risk if the counterparties are unable to meet the terms of the contracts or if the value of the currency changes unfavorably to the U.S. dollar.
Futures Contracts. The Portfolio is authorized to enter into futures contracts. The Portfolio may use futures contracts to manage its exposure to the securities markets or to movements in interest rates and currency values. The primary risks associated with the use of futures contracts are the imperfect correlation between the change in market value of the securities held by the Portfolio and the prices of futures contracts, the possibility of an illiquid market, and the inability of the counterparty to meet the terms of the contract. Futures contracts are valued based upon their quoted daily settlement prices. Upon entering into a futures contract, the Portfolio may be required to deposit with its custodian, in a segregated account in the name of the futures broker, an amount of cash or U.S. Government and Agency Obligations in accordance with the initial margin requirements of the broker or exchange. Futures contracts are marked to market daily and an appropriate payable or receivable for the change in value (“variation margin”) is recorded by the Portfolio. Gains or losses are recognized but not considered realized until the contracts expire or are closed. Futures contracts involve, to varying degrees, risk of loss in excess of the variation margin disclosed in the Statement of Assets and Liabilities.
Inflation-Indexed Bonds. The Portfolio may invest in inflation-indexed bonds. Inflation-indexed bonds are fixed income securities whose principal value is periodically adjusted to the rate of inflation. The interest rate on these bonds is generally fixed at issuance at a rate lower than typical bonds. Over the life of an inflation-indexed bond, however, interest will be paid based on a principal value, which is adjusted for inflation. Any increase in the principal amount of an inflation-indexed bond will be included as interest income in the Statement of Operations, even though investors do not receive their principal until maturity.
Options Contracts. The Portfolio may write call and put options on futures, swaps, securities or currencies it owns or in which it may invest. Writing put options tends to increase the Portfolio’s exposure to the underlying instrument. Writing call options tends to decrease the Portfolio’s exposure to the underlying instrument. When the Portfolio writes a call or put option, an amount equal to the premium received is recorded as a liability and subsequently marked to market to reflect the current value of the option written. These liabilities are reflected as written options outstanding in the Statement of Assets and Liabilities. Payments received or made, if any, from writing options with premiums to be determined on a future date are reflected as such on the Statement of Assets and Liabilities. Premiums received from writing options which expire are treated as realized gains. Premiums received from writing options which are exercised or closed are added to the proceeds or offset against amounts paid on the underlying future, swap, security or currency transaction to determine the realized gain or loss. The Portfolio as a writer of an option has no control over whether the underlying future, swap, security or currency may be sold (call) or purchased (put) and as a result bears the market risk of an unfavorable change in the price of the future, swap, security or currency underlying the written option. There is the risk the Portfolio may not be able to enter into a closing transaction because of an illiquid market.
| | | | |
| 12 | | Semi-Annual Report | | June 30, 2004 |
The Portfolio may also purchase put and call options. Purchasing call options tends to increase the Portfolio’s exposure to the underlying instrument. Purchasing put options tends to decrease the Portfolio’s exposure to the underlying instrument. The Portfolio pays a premium which is included in the Portfolio’s Statement of Assets and Liabilities as an investment and subsequently marked to market to reflect the current value of the option. Premiums paid for purchasing options which expire are treated as realized losses. The risk associated with purchasing put and call options is limited to the premium paid. Premiums paid for purchasing options which are exercised or closed are added to the amounts paid or offset against the proceeds on the underlying future, swap, security or currency transaction to determine the realized gain or loss.
Short Sales. The Portfolio may enter into short sales transactions. A short sale is a transaction in which the Portfolio sells securities it does not own in anticipation of a decline in the market price of the securities. The Portfolio is obligated to deliver securities at the market price at the time the short position is closed. Possible losses from short sales may be unlimited, whereas losses from purchases cannot exceed the total amount invested.
Repurchase Agreements. The Portfolio may engage in repurchase transactions. Under the terms of a typical repurchase agreement, the Portfolio takes possession of an underlying debt obligation subject to an obligation of the seller to repurchase, and the Portfolio to resell, the obligation at an agreed-upon price and time. The market value of the collateral must be equal at all times to the total amount of the repurchase obligations, including interest. Generally, in the event of counterparty default, the Portfolio has the right to use the collateral to offset losses incurred.
Stripped Mortgage-Backed Securities. The Portfolio may invest in stripped mortgage-backed securities (SMBS). SMBS represent a participation in, or are secured by and payable from, mortgage loans on real property, and may be structured in classes with rights to receive varying proportions of principal and interest. SMBS include interest-only securities (IOs), which receive all of the interest, and principal-only securities (POs), which receive all of the principal. If the underlying mortgage assets experience greater than anticipated payments of principal, the Portfolio may fail to recoup some or all of its initial investment in these securities. The market value of these securities is highly sensitive to changes in interest rates.
Swap Agreements. The Portfolio may invest in swap agreements. A swap is an agreement to exchange the return generated by one instrument for the return generated by another instrument. The Portfolio may enter into interest rate, total return, forward spread lock, and credit default swap agreements to manage its exposure to interest rates and credit risk.
Interest rate swap agreements involve the exchange by the Portfolio with another party of their respective commitments to pay or receive interest, e.g., an exchange of floating rate payments for fixed rate payments with respect to the notional amount of principal.
Total return swap agreements involve commitments to pay interest in exchange for a market-linked return, both based on notional amounts. To the extent the total return of the security or index underlying the transaction exceeds or falls short of the offsetting interest rate obligation, the Portfolio will receive a payment from or make a payment to the counterparty.
Forward spread lock swap agreements involve commitments to pay or receive a settlement amount calculated as the difference between the swap spread and a fixed spread, multiplied by the notional amount times the duration of the swap. The swap spread is the difference between the benchmark swap rate (market rate) and the specific Treasury rate.
In a credit default swap, one party makes a stream of payments to another party in exchange for the right to receive a specified return in the event of a default by a third party, typically corporate issues or sovereign issues of an emerging country, on its obligation. The Portfolio may use credit default swaps to provide a measure of protection against defaults of sovereign issuers (i.e., to reduce risk where the Portfolio owns or has exposure to the sovereign issuer) or to take an active long or short position with respect to the likelihood of a particular issuer’s default.
Swaps are marked to market daily based upon quotations from market makers and the change in value, if any, is recorded as unrealized gain or loss in the Statement of Operations. Payments received or made at the beginning of the measurement period are reflected as such on the Statement of Assets and Liabilities. A liquidation payment received or made at the termination of the swap is recorded as realized gain or loss in the Statement of Operations. Net periodic payments received by the Portfolio are included as part of realized gain(loss) on the Statement of Operations. Entering into these agreements involves, to varying degrees, elements of credit, market and documentation risk in excess of the amounts recognized on the Statement of Assets and Liabilities. Such risks involve the possibility that there will be no liquid market for these agreements, that the counterparty to the agreements may default on its obligation to perform or disagree as to the meaning of contractual terms in the agreements, and that there may be unfavorable changes in interest rates.
As a result of a FASB Emerging Issues Task Force (“EITF”) consensus, No. 03-11, and related SEC staff guidance, the Portfolio has reclassified periodic payments made or received under swap agreements, which were previously included within miscellaneous income, to a component of realized gain(loss) in the Statement of Operations. For consistency, similar reclassifications have been made to amounts appearing in the previous year’s Statement of Changes in Net Assets and the per share amounts in the prior year financial highlights. Prior year net investment income ratios in the financial highlights have also been modified accordingly. This reclassification increased (decreased) net investment income by $(6,562) and $(14,282), and net realized gain by $7,256 and $8,419 and net change in unrealized appreciation (depreciation) by $(695) and $5,863 for the six months ended June 30, 2004 and year ended December 31, 2003, respectively. There is no effect on the Portfolio’s net asset value, either in total or per share, or its total increase(decrease) in net assets from operations during any period.
| | | | |
| June 30, 2004 | | Semi-Annual Report | | 13 |
Notes to Financial Statements (Cont.)
June 30, 2004 (Unaudited)
3. Fees, Expenses, and Related Party Transactions
Investment Advisory Fee. Pacific Investment Management Company LLC (“PIMCO”) is a majority owned subsidiary partnership of Allianz Dresdner Asset Management of America L.P. and serves as investment adviser (the “Adviser”) to the Trust, pursuant to an investment advisory contract. The Adviser receives a monthly fee at an annual rate based on average daily net assets of the Portfolio. The Advisory Fee is charged at an annual rate of 0.25%.
Administration Fee. PIMCO serves as administrator (the “Administrator”), and provides administrative services to the Trust for which it receives a monthly administrative fee based on average daily net assets of the Portfolio. The Administration Fee is charged at the annual rate of 0.20%.
Servicing Fee. PA Distributors LLC (“PAD”), formerly known as PIMCO Advisors Distributors LLC, is an indirect wholly-owned subsidiary of Allianz Dresdner Asset Management of America L.P. and serves as the distributor of the Trust’s shares. The Trust is permitted to reimburse PAD on a quarterly basis, out of the Administrative Class assets of the Portfolio in the amount of 0.15% on an annual basis of the average daily net assets of that class, for payments made to financial intermediaries that provide services in connection with the distribution of shares or administration of plans or programs that use Portfolio shares as their funding medium. The effective rate paid to PAD was 0.15% during current fiscal year.
Expenses. The Trust is responsible for the following expenses: (i) salaries and other compensation of any of the Trust’s executive officers and employees who are not officers, directors, stockholders or employees of PIMCO or its subsidiaries or affiliates; (ii) taxes and governmental fees; (iii) brokerage fees and commissions and other portfolio transaction expenses; (iv) the cost of borrowing money, including interest expense and bank overdraft charges; (v) fees and expenses of the Trustees who are not “interested persons” of PIMCO or the Trust, and any counsel retained exclusively for their benefit; (vi) extraordinary expenses, including costs of litigation and indemnification expenses; (vii) organization expenses and (viii) any expenses allocated or allocable to a specific class of shares, which include service fees payable with respect to the Administrative Class shares and may include certain other expenses as permitted by the Trust’s Multiple Class Plan adopted pursuant to Rule 18f-3 under the Act and subject to review and approval by the Trustees. The ratio of expenses to average net assets per share class, as disclosed in Financial Highlights, may differ from the annual portfolio operating expenses per share class as disclosed in the Prospectus for the reasons set forth above.
PIMCO has agreed to waive a portion of its administrative fees to the extent that the payment of the Portfolio’s pro rata share of organization expenses and Trustee fees cause the actual expense ratio to rise above the rates disclosed in the then-current prospectus plus 0.49 basis points as set forth below (calculated as a percentage of the Portfolio’s average daily net assets attributable to each class):
| | | |
Institutional Class | | 0.50 | % |
Administrative Class | | 0.65 | % |
PIMCO may be reimbursed for these waived amounts in future periods, not to exceed thirty-six months.
Each unaffiliated Trustee receives an annual retainer of $4,000, plus $1,500 for each Board of Trustees meeting attended in person and $250 for each meeting attended telephonically, plus reimbursement of related expenses. In addition, each committee chair receives an additional annual retainer of $500. These expenses are allocated on a pro-rata basis to each Portfolio of the Trust according to its respective net assets.
4. Purchases and Sales of Securities
The length of time a Portfolio has held a particular security is not generally a consideration in investment decisions. A change in the securities held by a Portfolio is known as “portfolio turnover.” The Portfolio may engage in frequent and active trading of portfolio securities to achieve its investment objective, particularly during periods of volatile market movements. High portfolio turnover (e.g., over 100%) involves correspondingly greater expenses to the Portfolio, including brokerage commissions or dealer mark-ups and other transaction costs on the sale of securities and reinvestments in other securities. Such sales may also result in realization of taxable capital gains, including short-term capital gains (which are generally taxed at ordinary income tax rates). The trading costs and tax effects associated with portfolio turnover may adversely affect the Portfolio’s performance.
Purchases and sales of securities (excluding short-term investments) for the period ended June 30, 2004 were as follows (amounts in thousands):
| | | | | | |
| U.S Government/Agency | | All Other |
| Purchases | | Sales | | Purchases | | Sales |
| $ 7,852 | | $ 6,215 | | $ 4,347 | | $ 3,554 |
5. Transactions in Written Call and Put Options
Transactions in written call and put options were as follows (amounts in thousands):
| | | | |
| | | | Premium | |
Balance at 12/31/2003 | | $ | 26 | |
Sales | | | 5 | |
Closing Buys | | | (8 | ) |
Expirations | | | (17 | ) |
| Exercised | | | 0 | |
| Balance at 06/30/2004 | | | $6 | |
6. Federal Income Tax Matters
At June 30, 2004, the aggregate cost of investments was the same for federal income tax and financial statement purposes. The net unrealized appreciation (depreciation) of investment securities for federal income tax purposes is as follows (amounts in thousands):
| | | | |
Aggregate Gross Unrealized Appreciation | | Aggregate Gross Unrealized
(Depreciation) | | Net Unrealized Depreciation |
| $ 20 | | $ (35) | | $ (15) |
| | | | |
| 14 | | Semi-Annual Report | | June 30, 2004 |
7. Shares of Beneficial Interest
The Trust may issue an unlimited number of shares of beneficial interest with a $.001 par value. Changes in shares of beneficial interest were as follows (shares and amounts in thousands):
| | | | | | | | | | | | | | |
| | | Six Months Ended
06/30/2004 | | | Year Ended
12/31/2003 | |
| | | Shares | | | Amount | | | Shares | | | Amount | |
Receipts for shares sold | | | | | | | | | | | | | | |
| | | | |
Institutional Class | | 1,445 | | | $ | 14,588 | | | 1,245 | | | $ | 12,584 | |
Administrative Class | | 144 | | | | 1,448 | | | 365 | | | | 3,690 | |
| | | | |
Issued as reinvestment of distributions | | | | | | | | | | | | | | |
| | | | |
Institutional Class | | 11 | | | | 110 | | | 18 | | | | 178 | |
Administrative Class | | 3 | | | | 34 | | | 10 | | | | 105 | |
| | | | |
Cost of shares redeemed | | | | | | | | | | | | | | |
| | | | |
Institutional Class | | (312 | ) | | | (3,155 | ) | | (270 | ) | | | (2,724 | ) |
Administrative Class | | (58 | ) | | | (586 | ) | | (217 | ) | | | (2,197 | ) |
| | | | |
Net increase resulting from Portfolio share transactions | | 1,233 | | | $ | 12,439 | | | 1,151 | | | $ | 11,636 | |
The following schedule shows the number of shareholders each owning 5% or more of the Portfolio and the total percentage of the Portfolio held by such shareholders:
| | | | |
| | | Number | | % of Portfolio Held |
Institutional Class | | 2 | | 100 |
Administrative Class | | 1 | | 98 |
8. Regulatory and Litigation Matters
On February 17, 2004, the Attorney General of the State of New Jersey (“New Jersey AG”) filed a complaint against Allianz Dresdner Asset Management of America L.P. (“ADAM”), PA Distributors LLC (formerly known as PIMCO Advisors Distributors LLC) (“PAD”), PEA Capital LLC (formerly known as PIMCO Equity Advisors LLC) (“PEA”), and Pacific Investment Management Company LLC (“PIMCO”) in connection with its investigation into market timing and late trading. The complaint contends that inappropriate trading by shareholders engaged in market timing activity took place in funds in the PIMCO Funds: Multi-Manager Series (“MMS Funds”) and the PIMCO Funds: Pacific Investment Management Series (“PIMS Funds”). On June 1, 2004, the New Jersey AG dismissed PIMCO from the lawsuit.
On the same day as the dismissal of PIMCO from the lawsuit, the New Jersey AG announced that it had reached a settlement agreement with the remaining defendants (“New Jersey Settlement”). In the New Jersey Settlement, ADAM, PAD and PEA agreed, while neither admitting nor denying the allegations or conclusions of law, to: (i) pay New Jersey a civil fine of $15 million and $3 million for investigative costs and further enforcement initiatives; and (ii) implement certain changes in corporate governance.
On May 6, 2004, the Securities and Exchange Commission filed a complaint in the U.S. District Court in the Southern District of New York alleging that PA Fund Management LLC (formerly known as PIMCO Advisors Fund Management LLC) (“PAFM”), PEA, PAD, Stephen J. Treadway (at the time, the chief executive officer of PAFM and PAD as well as chairman of the Board of Trustees of the MMS Funds) and Kenneth W. Corba (the former chief executive officer of PEA and former portfolio manager of the PEA Growth and PEA Growth & Income Funds) had, among other things, violated and/or aided and abetted violations of, various antifraud provisions of the federal securities laws in connection with alleged “market timing” arrangements that improperly allowed certain hedge funds to engage in “market timing” in the PEA Growth Fund, the PEA Opportunity Fund, the PEA Innovation Fund, and the PEA Target Fund. The complaint seeks injunctive relief, disgorgement plus pre-judgment interest, monetary penalties, and an order permanently enjoining the defendants from serving as investment advisers, principal underwriters, officers, directors, or members of any advisory boards to any registered investment companies.
On February 20, 2004, a putative class action lawsuit was filed in the U.S. District Court for the District of New Jersey on behalf of certain shareholders of the PIMCO Funds against ADAM, PAD, PIMCO, PEA, the PIMS Funds, the MMS Funds, the Trust, PIMCO Commercial Mortgage Securities Trust, Inc. and certain other defendants, alleging that inappropriate market timing activity by certain shareholders caused financial injury to the shareholders of those Funds.
| | | | |
| June 30, 2004 | | Semi-Annual Report | | 15 |
Notes to Financial Statements (Cont.)
June 30, 2004 (Unaudited)
The following additional putative class action lawsuits have been filed against the PIMS Funds, the MMS Funds and/or their affiliates, each related to alleged market-timing activity in funds advised by PIMCO or its affiliates: (1) a lawsuit filed in the U.S. District Court for the District of Connecticut on February 27, 2004 (naming as defendants ADAM, PAD, PEA, the PIMS Funds, the MMS Funds, the Trust, PCM and certain other parties); (2) a lawsuit filed in the U.S. District Court for the Central District of California on March 4, 2004 (naming as defendants PIMCO, ADAM, PEA and PAD); (3) a lawsuit filed in the U.S. District Court for the Southern District of New York on March 8, 2004 (naming PIMCO, PAD and certain of their affiliates as defendants); (4) a lawsuit filed in the U.S. District Court for the Southern District of New York, on March 15, 2004 (naming PIMCO as the defendant); (5) two separate lawsuits filed in the U.S. District Court for the Central District of California on March 22, 2004, brought derivatively on behalf of the PIMCO High Yield Fund and the PIMCO Money Market Fund, respectively (each naming ADAM, PAFM and certain other parties as defendants, and the PIMCO Funds as the nominal defendant); (6) a lawsuit filed in the U.S. District Court for the Central District of California, also on March 22, 2004, brought derivatively on behalf of the PIMS Funds and the MMS Funds (naming ADAM, PIMCO, PAD and certain other parties as defendants, and the PIMS Funds and the MMS Funds as nominal defendants); (7) a lawsuit filed in the U.S. District Court for the District of New Jersey on April 20, 2004 (naming ADAM, PAD, the PIMS Funds and certain other parties as defendants); and (8) a lawsuit filed in the U.S. District Court for the Northern District of California on April 28, 2004 (naming ADAM, PIMCO, PAD, PEA and certain other parties as defendants, and the “PIMCO Funds” as nominal defendants). Each complaint for the foregoing putative class actions alleges, among other things, that inappropriate trading by shareholders engaged in market timing activities took place in certain of the funds advised by PIMCO, and each complaint seeks unspecified compensatory damages.
On February 17, 2004, a putative class action lawsuit was filed in the U.S. District Court for the District of Connecticut on behalf of certain shareholders of the PIMCO Funds against ADAM, PEA, PIMCO, PIMS Funds, MMS Funds and certain other defendants, alleging excessive investment advisory fees and the use of brokerage commissions to pay for distribution of fund shares. Three similar putative class action lawsuits were subsequently filed, each in the U.S. District Court for the District of Connecticut on March 1, 2004, April 23, 2004 and May 20, 2004, respectively.
Under Section 9(a) of the 1940 Act, if any of the various lawsuits were to result in a court injunction against PAFM, PEA, PAD, PIMCO, ADAM and/or Mr. Treadway, they and their affiliates would, in the absence of exemptive relief granted by the SEC, be barred from serving as an investment adviser/sub-adviser or principal underwriter for any registered investment company, including the Trust. ADAM and certain of its subsidiaries have responded to inquiries from the SEC concerning the status of the New Jersey Settlement under Section 9(a). If any of PAFM, PEA, PAD, PIMCO or ADAM were subject to an injunction, each of these entities and their affiliates could in turn seek exemptive relief from the SEC, as contemplated by the 1940 Act. There is no assurance, however, that such exemptive relief would be granted. The SEC also has the power by order to prohibit PAFM, PEA, PAD and PIMCO from serving as investment advisers and underwriters, if the SEC finds that such entities willfully violated the federal securities laws in connection with the allegations discussed above or aided or abetted such violations.
PIMCO, PAD and the Trust believe that these developments will not have a material adverse effect on the Portfolios or on PIMCO’s, or PAD’s ability to perform their respective investment advisory or distribution services on behalf of the Portfolios.
| | | | |
| 16 | | Semi-Annual Report | | June 30, 2004 |
Trustees and Officers
Brent R. Harris, Chairman and Trustee
R. Wesley Burns, President and Trustee
E. Philip Cannon, Trustee
Vern O. Curtis, Trustee
J. Michael Hagan, Trustee
William J. Popejoy, Trustee
Garlin G. Flynn, Secretary
John P. Hardaway, Treasurer
Investment Adviser and Administrator
Pacific Investment Management Company LLC
840 Newport Center Drive
Newport Beach, California 92660
Distributor
PA Distributors LLC
2187 Atlantic Street
Stamford, Connecticut 06902
Custodian
State Street Bank & Trust Company
801 Pennsylvania
Kansas City, Missouri 64105
Transfer Agent
Boston Financial Data Services–Midwest
330 W. 9th Street
Kansas City, Missouri 64105
Legal Counsel
Dechert LLP
1775 I Street, N.W.
Washington, D.C. 20006
Independent Registered Public Accounting Firm
PricewaterhouseCoopers LLP
1055 Broadway
Kansas City, Missouri 64105
Information about how the Fund voted proxies relating to portfolio securities held during the year July 1, 2003 through June 30, 2004 will be available no later than August 31, 2004 without charge, upon request, by calling the Trust at 1-800-927-4648 and on the SEC’s website at http://www.sec.gov.
Copies of the written Proxy Policy and the factors that PIMCO may consider in determining how to vote proxies for the Funds are available by calling the Trust at 1-800-927-4648 and on the SEC’s website at http://www.sec.gov.
PIMCO VARIABLE INSURANCE TRUST
840 NEWPORT CENTER DRIVE
NEWPORT BEACH, CA 92660

PIMCO VARIABLE INSURANCE TRUST
GLOBAL BOND PORTFOLIO (UNHEDGED)
ADMINISTRATIVE CLASS
SEMI-ANNUAL REPORT
June 30, 2004
|
| This material is authorized for use only when preceded or accompanied by the current PIMCO Variable Insurance Trust prospectus. Investors should consider the investment objectives, risks, charges and expenses of Portfolio carefully before investing. This and other information is contained in the Portfolio’s prospectus. Please read the prospectus carefully before you invest or send money. |
Chairman’s Letter
Dear PIMCO Variable Insurance Trust Shareholder:
Bond prices were more volatile during the six-month period ended June 30, 2004. Interest rates rose sharply during the second quarter 2004, causing bonds to give back modest gains from earlier in the year. The Lehman Brothers Aggregate Bond Index, a widely used index for the high-grade bond market, was nearly flat during the first six months of 2004, returning 0.15% after losing 2.44% during the second quarter. The yield on the benchmark ten-year Treasury closed June 30, 2004 at 4.58%, up 0.75% from April 1, 2004, but up only 0.34% from where it began the six-month period on January 1, 2004.
Continued growth in employment convinced the markets that the Federal Reserve would soon begin a long anticipated tightening cycle. On June 30, 2004, the Fed met market expectations by increasing the federal funds rate 0.25%, which was the first rate increase since June 25, 2003. The central bank had held this rate at 1% for more than a year, which generated negative real short-term rates. And on August 10, 2004, the Fed increased the federal funds rate another 0.25% to 1.50%.
Investors that had profited handsomely from borrowing at low short-term rates and investing in higher-yielding longer maturity bonds surrendered some of those profits towards the latter part of the six-month period. Concern that borrowing rates would rise led investors to liquidate long positions and unwind these trades, which caused bond prices to decrease. However, substantial leverage remained among banks, hedge funds, and other investors, making bond markets somewhat vulnerable to additional Fed rate increases. There were also signs of rising inflation, which fueled anxiety that central banks might continue to raise interest rates.
On the following pages you will find a more complete review of the Portfolio in light of financial market activities as well as specific details about the total return investment performance for the six-month period.
We appreciate the trust you have placed in us, and we will continue to focus our efforts to meet your investment needs.
Sincerely,

Brent R. Harris
Chairman
August 11, 2004
| | | | |
| June 30, 2004 | | Semi-Annual Report | | 1 |
Important Information About the Portfolio
We believe that bond funds have an important role to play in a well diversified investment portfolio. It is important to note, however, that in an environment where interest rates may trend upward, rising rates will negatively impact the performance of most bond funds, and fixed income securities held by a fund are likely to decrease in value. The price volatility of fixed income securities can also increase during periods of rising interest rates resulting in increased losses to a fund. Bond funds and individual bonds with a longer duration (a measure of the expected life of a security) tend to be more sensitive to changes in interest rates, usually making them more volatile than securities or funds with shorter durations. The longer-term performance of most bond funds has benefited from capital gains in part resulting from an extended period of declining interest rates. In the event interest rates increase, these capital gains should not be expected to recur.
The Portfolio may be subject to various risks in addition to those described above. Some of these risks may include, but are not limited to, the following: real rate risk, derivative risk, small company risk, foreign security risk, high yield security risk and specific sector investment risks. The Portfolio may use derivative instruments for hedging purposes or as part of an investment strategy. Use of these instruments may involve certain costs and risks such as liquidity risk, interest rate risk, market risk, credit risk, management risk and the risk that a fund could not close out a position when it would be most advantageous to do so. A Portfolio investing in derivatives could lose more than the principal amount invested in these instruments. Investing in non-U.S. securities may entail risk due to non-U.S. economic and political developments; this risk may be enhanced when investing in emerging markets. High-yield bonds typically have a lower credit rating than other bonds. Lower rated bonds generally involve a greater risk to principal than higher rated bonds. Smaller companies may be more volatile than larger companies and may entail more risk. Concentrating investments in individual sectors may add additional risk and volatility compared to a diversified portfolio.
On the performance summary page in this semi-annual report, the Total Return Investment Performance table measures performance assuming that all dividend and capital gain distributions were reinvested. Returns do not reflect the deduction of taxes that a shareholder would pay (i) on Portfolio distributions or (ii) the redemption of Portfolio shares.
An investment in a Portfolio is not a bank deposit and is not guaranteed or insured by the Federal Deposit Insurance Corporation or any other government agency. It is possible to lose money on investments in the Funds.
The following disclosure provides important information regarding the Portfolio’s Expense Example, which appears on the Portfolio’s individual page in this semi-annual report. Please refer to this information when reviewing the Expense Example for the Portfolio.
Example
As a shareholder of the Portfolio, you incur two types of costs: (1) transaction costs, including redemption and exchange fees; and (2) ongoing costs, including advisory and administrative fees; distribution and/or service (12b-1) fees (Administrative Class only); and other Portfolio expenses. The Example is intended to help you understand your ongoing costs (in dollars) of investing in the Portfolio and to compare these costs with the ongoing costs of investing in other mutual funds.
The Example is based on an investment of $1,000 invested at the beginning of the period and held for the entire period indicated, which is from 1/1/04 to 6/30/04.
Actual Expenses
The information in the table under the heading “Actual Performance” provides information about actual account values and actual expenses. You may use the information in these columns, together with the amount you invested, to estimate the expenses that you paid over the period. Simply divide your account value by $1,000.00 (for example, an $8,600.00 account value divided by $1,000 = 8.60), then multiply the result by the number in the appropriate column for your share class, in the row entitled “Expenses Paid During Period” to estimate the expenses you paid on your account during this period.
Hypothetical Example for Comparison Purposes
The information in the table under the heading “Hypothetical Performance (5% return before expenses)” provides information about hypothetical account values and hypothetical expenses based on the Portfolio’s actual expense ratio and an assumed rate of return of 5% per year before expenses, which is not the Portfolio’s actual return. The hypothetical account values and expenses may not be used to estimate the actual ending account balance or expenses you paid for the period. You may use this information to compare the ongoing costs of investing in the Portfolio and other portfolios. To do so, compare this 5% hypothetical example with the 5% hypothetical examples that appear in the shareholder reports of the other portfolios.
Please note that the expenses shown in the table are meant to highlight your ongoing costs only and do not reflect any transactional costs. Therefore, the information under the heading “Hypothetical Performance (5% return before expenses)” is useful in comparing ongoing costs only, and will not help you determine the relative total costs of owning different portfolios. In addition, if these transactional costs were included, your costs would have been higher.
PIMCO Variable Insurance Trust is distributed by PA Distributors LLC, 2187 Atlantic Street, Stamford, CT 06902.
| | | | |
| 2 | | Semi-Annual Report | | June 30, 2004 |
Global Bond Portfolio (Unhedged)
CUMULATIVE RETURNS THROUGH JUNE 30, 2004
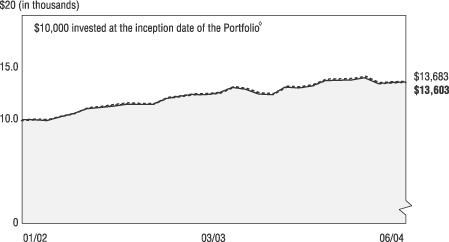
[CHART]
Global Bond J.P. Morgan
Portfolio Admin. Class Global Index (Unhedged)
---------------------- -----------------------
01/31/2002 $10,000 $10,000
02/28/2002 $9,978 $10,053
03/31/2002 $9,907 $10,009
04/30/2002 $10,267 $10,364
05/31/2002 $10,566 $10,646
06/30/2002 $11,031 $11,143
07/31/2002 $11,146 $11,266
08/31/2002 $11,291 $11,472
09/30/2002 $11,474 $11,607
10/31/2002 $11,450 $11,558
11/30/2002 $11,470 $11,562
12/31/2002 $12,016 $12,131
01/31/2003 $12,222 $12,289
02/28/2003 $12,422 $12,466
03/31/2003 $12,400 $12,497
04/30/2003 $12,566 $12,647
05/31/2003 $13,094 $13,196
06/30/2003 $12,895 $12,988
07/31/2003 $12,441 $12,582
08/31/2003 $12,401 $12,519
09/30/2003 $13,121 $13,227
10/31/2003 $13,033 $13,157
11/30/2003 $13,222 $13,366
12/31/2003 $13,749 $13,891
01/31/2004 $13,785 $13,936
02/29/2004 $13,810 $13,968
03/31/2004 $14,013 $14,165
04/30/2004 $13,461 $13,557
05/31/2004 $13,543 $13,653
06/30/2004 $13,603 $13,683
COUNTRY ALLOCATION‡
| | | |
Short-Term Instruments | | 31.9 | % |
United States | | 25.7 | % |
Germany | | 8.4 | % |
Japan | | 7.1 | % |
United Kingdom | | 6.9 | % |
Italy | | 4.1 | % |
France | | 4.0 | % |
Other | | 11.8 | % |
‡ % of Total Investments as of June 30, 2004
à$10,000 invested at the beginning of the first full month following the inception of the Administrative Class.
TOTAL RETURN INVESTMENT PERFORMANCE For the period ended June 30, 2004
| | | | | | | | | | | | | |
| | | | | | | 6 Months | | | 1 Year | | | Since Inception* | |
| | |
| | Global Bond Portfolio (Unhedged) Administrative Class (Inception 01/10/02) | | –1.07 | % | | 5.49 | % | | 13.37 | % |
| | | - - - - - - - | | J.P. Morgan Global Index (Unhedged) | | –1.50 | % | | 5.35 | % | | — | |
| | | | | * Annualized. All Portfolio returns are net of fees and expenses. | | | | | | | | | |
Past performance is no guarantee of future results. The performance quoted represents past performance. Investment return and principal value will fluctuate so the Portfolio shares, when redeemed, may be worth more or less than their original cost. Current performance may be lower or higher than the performance data quoted. Performance data current to the most recent month-end is available by calling (800) 927-4648.
Please refer to page 2 herein for an explanation of the information presented in the following Expense Example.
| | | | | | | | | | |
| EXPENSE EXAMPLE | | | | Actual Performance | | | | Hypothetical Performance (5% return before expenses) |
Beginning Account Value (01/01/04) | | | | $ | 1,000.00 | | | | $ | 1,000.00 |
Ending Account Value (06/30/04) | | | | $ | 989.30 | | | | $ | 1,025.00 |
Expenses Paid During Period† | | | | $ | 4.45 | | | | $ | 4.53 |
†Expenses are equal to the Portfolio’s Administrative Class annualized expense ratio of 0.90%, multiplied by the average account value over the period, multiplied by 182/366 (to reflect the one-half year period).
PORTFOLIO INSIGHTS
| • | The Global Bond Portfolio (Unhedged) seeks to achieve its investment objective by investing under normal circumstances at least 80% of its assets in Fixed Income Instruments of issuers located in at least three countries, one of which may be the United States. |
| • | The Portfolio’s Administrative Class shares returned –1.07% for the six-months ended June 30, 2004, outperforming the -1.50% return of the J.P. Morgan Global Index (Unhedged) for the same period. |
| • | An underweight to U.S. duration was positive for performance as yields rose given stronger growth and fears of aggressive Fed tightening. |
| • | An overweight to Euroland duration relative to benchmark was a positive for relative performance; these yields rose less as Euroland lagged global growth. |
| • | An underweight to Japanese government bonds (“JGB”) relative to benchmark was positive for returns. JGB yields rose on strong growth and speculation that the Bank of Japan’s highly accommodative monetary policy stance would soon shift. |
| • | Currency strategies detracted from performance. The yen and Canadian dollar retreated as rising U.S. rates forced market participants to unwind leveraged strategies. |
| • | Real return bonds added to returns, outperforming more volatile Treasuries of similar duration, as rates rose. |
| • | Modest holdings of mortgage securities helped returns, as heavy demand from banks supported the mortgage market. |
| • | Tactical strategies to exploit wider swap spreads in the U.S. and Europe were positive, as swap spreads widened given the rapid rise in yields. |
| | | | |
| June 30, 2004 | | Semi-Annual Report | | 3 |
Financial Highlights
Global Bond Portfolio (Unhedged) (Administrative Class)
| | | | | | | | | | | | | | | | | | |
| Selected Per Share Data for the Year or Period Ended: | | | | 06/30/2004+ | | | | | 12/31/2003 | | | | | 1/10/2002-
12/31/2002 | |
| | | | | | |
Net asset value beginning of period | | | | $ | 13.03 | | | | | $ | 11.69 | | | | | $ | 10.00 | |
Net investment income (a) | | | | | 0.13 | (d) | | | | | 0.25 | (d) | | | | | 0.28 | (d) |
Net realized/unrealized gain (loss) on investments (a) | | | | | (0.27 | )(d) | | | | | 1.42 | (d) | | | | | 1.75 | (d) |
Total income (loss) from investment operations | | | | | (0.14 | ) | | | | | 1.67 | | | | | | 2.01 | |
Dividends from net investment income | | | | | (0.12 | ) | | | | | (0.25 | ) | | | | | (0.27 | ) |
Distributions from net realized capital gains | | | | | 0.00 | | | | | | (0.08 | ) | | | | | (0.05 | ) |
Total distributions | | | | | (0.12 | ) | | | | | (0.33 | ) | | | | | (0.32 | ) |
Net asset value end of period | | | | $ | 12.77 | | | | | $ | 13.03 | | | | | $ | 11.69 | |
Total return | | | | | (1.07 | )% | | | | | 14.43 | % | | | | | 20.35 | % |
Net assets end of period (000s) | | | | $ | 34,815 | | | | | $ | 29,415 | | | | | $ | 20,456 | |
Ratio of net expenses to average net assets | | | | | 0.90 | %* | | | | | 0.92 | %(c) | | | | | 0.90 | %*(b) |
Ratio of net investment income to average net assets | | | | | 2.08 | %*(d) | | | | | 2.03 | %(d) | | | | | 2.65 | %(d) |
Portfolio turnover rate | | | | | 153 | % | | | | | 592 | % | | | | | 581 | % |
| (a) | Per share amounts based on average number of shares outstanding during the period. |
| (b) | If the investment manager had not reimbursed expenses, the ratio of expenses to average net assets would have been 1.01%. |
| (c) | Ratio of expenses to average net assets excluding interest expense is 0.90%. |
| (d) | Indicates a period in which, as a result of a change in generally accepted accounting principles, the portfolio has reclassified periodic payments made or received under certain derivative instruments, which were previously included within miscellaneous income, to a component of realized gain (loss) in the Statement of Operations. The effect of this reclassification was to increase the net investment income ratio for the period ending June 30, 2004 by 0.12% and the net investment income per share by $0.02. For consistency, similar reclassifications have been made to prior period amounts, resulting in increase to the net investment income ratio of 0.10% and 0.07% and to the net investment income per share of $0.01 and $0.01 in the fiscal year or period ending December 31, 2003, and 2002, respectively. This change had no impact on the reported net asset value per share for any period. |
| | | | | | |
| 4 | | Semi-Annual Report | | June 30, 2004 | | See accompanying notes |
Statement of Assets and Liabilities
Global Bond Portfolio (Unhedged)
June 30, 2004 (Unaudited)
| | | | | |
| Amounts in thousands, except per share amounts | | | | |
| | |
Assets: | | | | | |
| | |
Investments, at value | | | | $ | 34,729 |
Cash | | | | | 1 |
Foreign currency, at value | | | | | 593 |
Receivable for investments sold | | | | | 1 |
Receivable for investments sold on delayed delivery basis | | | | | 5,202 |
Unrealized appreciation on forward foreign currency contracts | | | | | 69 |
Receivable for Portfolio shares sold | | | | | 2 |
Interest and dividends receivable | | | | | 304 |
Variation margin receivable | | | | | 121 |
Swap premiums paid | | | | | 470 |
Unrealized appreciation on swap agreements | | | | | 71 |
Unrealized appreciation on forward volatility options | | | | | 3 |
| | | | | | 41,566 |
| | |
Liabilities: | | | | | |
| | |
Payable for investments purchased | | | | $ | 944 |
Unrealized depreciation on forward foreign currency contracts | | | | | 47 |
Payable for short sale | | | | | 5,256 |
Written options outstanding | | | | | 43 |
Payable for Portfolio shares redeemed | | | | | 67 |
Accrued investment advisory fee | | | | | 7 |
Accrued administration fee | | | | | 14 |
Accrued servicing fee | | | | | 6 |
Recoupment payable to Manager | | | | | 1 |
Swap premiums received | | | | | 190 |
Unrealized depreciation on swap agreements | | | | | 167 |
Other liabilities | | | | | 9 |
| | | | | | 6,751 |
| | |
Net Assets | | | | $ | 34,815 |
| | |
Net Assets Consist of: | | | | | |
| | |
Paid in capital | | | | $ | 32,241 |
Undistributed net investment income | | | | | 1,387 |
Accumulated undistributed net realized gain | | | | | 151 |
Net unrealized appreciation | | | | | 1,036 |
| | | | | $ | 34,815 |
| | |
Net Assets: | | | | | |
| | |
Administrative Class | | | | $ | 34,815 |
| | |
Shares Issued and Outstanding: | | | | | |
| | |
Administrative Class | | | | | 2,727 |
| | |
Net Asset Value and Redemption Price Per Share
(Net Assets Per Share Outstanding) | | | | | |
| | |
Administrative Class | | | | $ | 12.77 |
| | |
Cost of Investments Owned | | | | $ | 33,653 |
Cost of Foreign Currency Held | | | | $ | 590 |
| | | | | | |
| See accompanying notes | | June 30, 2004 | | Semi-Annual Report | | 5 |
Statement of Operations
Global Bond Portfolio (Unhedged)
| | | | | | |
| Amounts in thousands | | | | | |
| | | | | Six Months Ended June 30, 2004 (Unaudited) | |
Investment Income: | | | | | | |
| | |
Interest | | | | $ | 476 | |
Miscellaneous income | | | | | 1 | |
Total Income | | | | | 477 | |
| | |
Expenses: | | | | | | |
| | |
Investment advisory fees | | | | | 40 | |
Administration fees | | | | | 80 | |
Distribution and/or servicing fees - Administrative Class | | | | | 24 | |
Total Expenses | | | | | 144 | |
| | |
Net Investment Income | | | | | 333 | |
| | |
Net Realized and Unrealized Gain (Loss): | | | | | | |
| | |
Net realized gain on investments | | | | | 26 | |
Net realized gain on futures contracts, options, and swaps | | | | | 91 | |
Net realized (loss) on foreign currency transactions | | | | | (20 | ) |
Net change in unrealized (depreciation) on investments | | | | | (639 | ) |
Net change in unrealized appreciation on futures contracts, options, and swaps | | | | | 31 | |
Net change in unrealized (depreciation) on translation of assets and liabilities denominated in foreign currencies | | | | | (195 | ) |
Net (Loss) | | | | | (706 | ) |
| | |
Net Decrease in Assets Resulting from Operations | | | | $ | (373 | ) |
| | | | | | |
| 6 | | Semi-Annual Report | | June 30, 2004 | | See accompanying notes |
Statements of Changes in Net Assets
Global Bond Portfolio (Unhedged)
| | | | | | | | | | | | |
| Amounts in thousands | | | | | | | | | | |
| | | | | Six Months June 30, 2004
(Unaudited) | | | | | Year Ended December 31, 2003 | |
Increase in Net Assets from: | | | | | | | | | | | | |
| | | | |
Operations: | | | | | | | | | | | | |
| | | | |
Net investment income | | | | $ | 333 | | | | | $ | 464 | |
Net realized gain | | | | | 97 | | | | | | 1,588 | |
Net change in unrealized appreciation (depreciation) | | | | | (803 | ) | | | | | 845 | |
Net increase (decrease) resulting from operations | | | | | (373 | ) | | | | | 2,897 | |
| | | | |
Distributions to Shareholders: | | | | | | | | | | | | |
| | | | |
From net investment income | | | | | | | | | | | | |
Administrative Class | | | | | (303 | ) | | | | | (472 | ) |
| | | | |
From net realized capital gains | | | | | | | | | | | | |
Administrative Class | | | | | 0 | | | | | | (165 | ) |
Total Distributions | | | | | (303 | ) | | | | | (637 | ) |
| | | | |
Portfolio Share Transactions: | | | | | | | | | | | | |
| | | | |
Receipts for shares sold | | | | | | | | | | | | |
Administrative Class | | | | | 8,715 | | | | | | 29,887 | |
| | | | |
Issued as reinvestment of distributions | | | | | | | | | | | | |
Administrative Class | | | | | 308 | | | | | | 631 | |
| | | | |
Cost of shares redeemed | | | | | | | | | | | | |
Administrative Class | | | | | (2,947 | ) | | | | | (23,819 | ) |
Net increase resulting from Portfolio share transactions | | | | | 6,076 | | | | | | 6,699 | |
| | | | |
Total Increase in Net Assets | | | | | 5,400 | | | | | | 8,959 | |
| | | | |
Net Assets: | | | | | | | | | | | | |
| | | | |
Beginning of period | | | | | 29,415 | | | | | | 20,456 | |
End of period* | | | | $ | 34,815 | | | | | $ | 29,415 | |
| | | | |
*Including undistributed net investment income of: | | | | $ | 1,387 | | | | | $ | 1,357 | |
| | | | | | |
| See accompanying notes | | June 30, 2004 | | Semi-Annual Report | | 7 |
Schedule of Investments
Global Bond Portfolio (Unhedged)
June 30, 2004 (Unaudited)
| | | | |
| | | Principal | | |
| | | Amount | | Value |
| | | (000s) | | (000s) |
| | | | | | |
BRAZIL 0.4% | | | | | | |
Republic of Brazil | | | | | | |
2.125% due 04/15/2009 (a) | | $ | 76 | | $ | 69 |
2.125% due 04/15/2012 (a) | | | 67 | | | 56 |
| | | | | |
|
|
Total Brazil (Cost $129) | | | | | | 125 |
| | | | |
|
|
| | | | | | | |
CANADA (i)(j) 2.3% | | | | | | |
Commonwealth of Canada | | | | | | |
6.000% due 06/01/2008 | | C$ | 800 | | | 638 |
5.500% due 06/01/2009 | | | 100 | | | 79 |
5.500% due 06/01/2010 | | | 100 | | | 78 |
| | | | | |
|
|
Total Canada (Cost $755) | | | | | | 795 |
| | | | |
|
|
| | | | | | | |
CAYMAN ISLANDS (i)(j) 1.6% | | | |
Pylon Ltd. | | | | | | |
5.953% due 12/22/2008 | | EC | 250 | | | 312 |
Vita Capital Ltd. | | | | | | |
2.460% due 01/01/2007 (a) | | $ | 250 | | | 252 |
| | | | | |
|
|
Total Cayman Islands (Cost $554) | | | | | | 564 |
| | | | |
|
|
| | | | | | | |
FRANCE (i)(j) 4.0% | | | | | | |
Republic of France | | | | | | |
6.500% due 04/25/2011 | | EC | 1,000 | | | 1,404 |
| | | | | |
|
|
Total France (Cost $1,416) | | | | | | 1,404 |
| | | | |
|
|
| | | | | | | |
GERMANY (i)(j) 8.4% | | | | | | |
Republic of Germany | | | | | | |
5.000% due 08/19/2005 | | EC | 100 | | | 125 |
6.000% due 01/05/2006 | | | 300 | | | 384 |
6.250% due 04/26/2006 | | | 100 | | | 129 |
5.250% due 01/04/2011 | | | 900 | | | 1,182 |
6.250% due 01/04/2024 | | | 200 | | | 289 |
6.500% due 07/04/2027 | | | 200 | | | 298 |
5.500% due 01/04/2031 | | | 400 | | | 531 |
| | | | | |
|
|
Total Germany (Cost $2,517) | | | | | | 2,938 |
| | | | |
|
|
| | | | | | | |
ITALY (i)(j) 4.0% | | | | | | |
Republic of Italy | | | | | | |
9.500% due 02/01/2006 | | EC | 650 | | | 876 |
Seashell Securities PLC | | | | | | |
2.359% due 10/25/2028 (a) | | | 74 | | | 90 |
Siena Mortgages | | | | | | |
2.283% due 12/16/2038 (a) | | | 300 | | | 367 |
Telecom Italia SpA | | | | | | |
5.625% due 02/01/2007 (a) | | | 60 | | | 77 |
| | | | | |
|
|
Total Italy (Cost $1,115) | | | | | | 1,410 |
| | | | |
|
|
| | | | | | | |
JAPAN (i)(j) 7.1% | | | | | | |
Government of Japan | | | | | | |
0.300% due 12/20/2007 | | JY | 100,000 | | | 914 |
1.500% due 12/20/2011 | | | 150,000 | | | 1,387 |
1.600% due 09/20/2013 | | | 20,000 | | | 182 |
| | | | | |
|
|
Total Japan (Cost $2,443) | | | | | | 2,483 |
| | | | |
|
|
| | | | | | | |
LIBERIA 0.1% | | | | | | |
Royal Caribbean Cruises Ltd. | | | | | | |
8.125% due 07/28/2004 | | $ | 30 | | | 30 |
| | | | | |
|
|
Total Liberia (Cost $30) | | | | | | 30 |
| | | | |
|
|
| | | | | | |
LUXEMBOURG 0.3% | | | | | | |
Tyco International Group S.A. | | | | | | |
5.875% due 11/01/2004 | | $ | 100 | | $ | 101 |
| | | | | |
|
|
Total Luxembourg (Cost $101) | | | | | | 101 |
| | | | |
|
|
| | | | | | | |
MEXICO (i)(j) 0.8% | | | | | | |
Pemex Project Funding Master Trust | | | |
8.625% due 02/01/2022 | | $ | 200 | | | 209 |
United Mexican States | | | | | | |
6.750% due 06/06/2006 | | JY | 2,000 | | | 21 |
United Mexican States Series 6BR | | | |
6.750% due 06/06/2006 | | | 5,000 | | | 51 |
| | | | | |
|
|
Total Mexico (Cost $283) | | | | | | 281 |
| | | | |
|
|
| | | | | | | |
NETHERLANDS (i)(j) 2.6% | | | | | | |
Kingdom of Netherlands | | | | | | |
6.000% due 01/15/2006 | | EC | 700 | | | 897 |
| | | | | |
|
|
Total Netherlands (Cost $672) | | | | | | 897 |
| | | | |
|
|
| | | | | | | |
RUSSIA 0.2% | | | | | | |
Russian Federation | | | | | | |
10.000% due 06/26/2007 | | $ | 50 | | | 56 |
| | | | | |
|
|
Total Russia (Cost $58) | | | | | | 56 |
| | | | |
|
|
| | | | | | | |
SOUTH AFRICA 0.2% | | | | | | |
Republic of South Africa | | | | | | |
8.375% due 10/17/2006 | | $ | 53 | | | 58 |
| | | | | |
|
|
Total South Africa (Cost $60) | | | | | | 58 |
| | | | |
|
|
| | | | | | | |
SPAIN (i)(j) 3.4% | | | | | | |
Kingdom of Spain | | | | | | |
5.150% due 07/30/2009 | | EC | 900 | | | 1,174 |
| | | | | |
|
|
Total Spain (Cost $1,135) | | | | | | 1,174 |
| | | | |
|
|
| | | | | | | |
UNITED KINGDOM (i)(j) 6.9% | | | |
Holmes Financing PLC | | | | | | |
2.278% due 10/15/2009 (a) | | EC | 100 | | | 122 |
2.298% due 07/25/2010 (a) | | | 100 | | | 122 |
United Kingdom Gilt | | | | | | |
5.000% due 03/07/2012 | | BP | 500 | | | 901 |
5.000% due 09/07/2014 | | | 700 | | | 1,248 |
| | | | | |
|
|
Total United Kingdom (Cost $2,285) | | | | | | 2,393 |
| | | | |
|
|
| | | | | | | |
UNITED STATES 25.6% | | | | | | |
Asset-Backed Securities 5.9% | | | |
Ameriquest Mortgage Securities, Inc. | | | | | | |
1.510% due 03/25/2033 (a) | | $ | 75 | | | 76 |
1.010% due 08/25/2034 (a) | | | 200 | | | 200 |
Amortizing Residential Collateral Trust | | | | | | |
1.450% due 10/25/2031 (a) | | | 15 | | | 15 |
1.390% due 07/25/2032 (a) | | | 26 | | | 26 |
Centex Home Equity Loan Trust | | | | | | |
1.380% due 01/25/2034 (a) | | | 85 | | | 86 |
CS First Boston Mortgage Securities Corp. | | | | | | |
1.410% due 01/25/2032 (a) | | | 5 | | | 5 |
6.500% due 04/25/2033 | | | 47 | | | 48 |
1.430% due 05/25/2043 (a) | | | 141 | | | 141 |
| | | | | | |
| | |
Fieldstone Mortgage Investment Corp. | | | | | | |
1.390% due 01/25/2035 (a) | | $ | 92 | | $ | 92 |
First Franklin Mortgage Loan
Trust Asset-Backed Certificates | | | |
2.820% due 02/25/2034 (a) | | | 93 | | | 94 |
GSAMP Trust | | | | | | |
1.620% due 03/25/2034 (a) | | | 200 | | | 200 |
Home Equity Asset Trust | | | | | | |
1.510% due 03/25/2033 (a) | | | 20 | | | 20 |
1.240% due 08/25/2034 (a) | | | 96 | | | 96 |
Home Equity Mortgage Trust | | | | | | |
1.350% due 04/25/2034 (a) | | | 67 | | | 67 |
Irwin Home Equity Loan Trust | | | | | | |
1.620% due 06/25/2028 (a) | | | 34 | | | 34 |
Long Beach Mortgage Loan Trust | | | |
1.620% due 07/25/2033 (a) | | | 120 | | | 120 |
Morgan Stanley Dean Witter Capital I, Inc. | | | |
1.470% due 07/25/2030 (a) | | | 6 | | | 7 |
Residential Asset Mortgage Products, Inc. | | | |
1.200% due 04/25/2025 (a) | | | 196 | | | 196 |
1.430% due 12/25/2033 (a) | | | 89 | | | 88 |
Residential Asset Securities Corp. | | | |
1.200% due 08/25/2019 (a) | | | 16 | | | 16 |
Saxon Asset Securities Trust | | | | | | |
1.370% due 01/25/2032 (a) | | | 19 | | | 19 |
1.500% due 12/25/2032 (a) | | | 10 | | | 10 |
Structured Asset Investment Loan Trust | | | |
1.200% due 04/25/2033 (a) | | | 26 | | | 26 |
Structured Asset Securities Corp. | | | |
1.740% due 05/25/2034 (a) | | | 200 | | | 200 |
Truman Capital Mortgage Loan Trust | | | |
1.440% due 01/25/2034 (a) | | | 171 | | | 169 |
| | | | | |
|
|
| | | | | | | 2,051 |
| | | | | |
|
|
| | | | | | | |
Corporate Bonds & Notes 2.3% | | | |
Entergy Gulf States, Inc. | | | | | | |
2.433% due 06/18/2007 (a) | | | 50 | | | 50 |
Ford Motor Credit Co. | | | | | | |
7.500% due 03/15/2005 | | | 200 | | | 207 |
General Motors Acceptance Corp. | | | |
2.135% due 05/18/2006 (a) | | | 200 | | | 201 |
Morgan Stanley Capital I, Inc. | | | | | | |
1.378% due 04/15/2016 (a) | | | 200 | | | 200 |
Pacific Gas & Electric Co. | | | | | | |
1.810% due 04/03/2006 (a) | | | 110 | | | 110 |
UFJ Finance Aruba AEC | | | | | | |
6.750% due 07/15/2013 | | | 30 | | | 31 |
| | | | | |
|
|
| | | | | | | 799 |
| | | | | |
|
|
| | | | | | | |
Mortgage-Backed Securities 5.3% | | | |
Bear Stearns Commercial Mortgage Securities |
1.350% due 05/14/2016 (a) | | | 200 | | | 200 |
Countrywide Home Loan Mortgage Pass Through Trust |
1.380% due 08/25/2034 (a) | | | 200 | | | 200 |
Countrywide Home Loans, Inc. | | | | | | |
5.703% due 03/19/2032 (a) | | | 2 | | | 2 |
4.997% due 09/19/2032 (a) | | | 9 | | | 9 |
1.748% due 07/28/2034 (a) | | | 200 | | | 200 |
CS First Boston Mortgage Securities Corp. | | | |
1.358% due 02/15/2014 (a) | | | 200 | | | 200 |
GMAC Commercial Mortgage Securities, Inc. |
6.420% due 05/15/2035 | | | 100 | | | 108 |
GSR Mortgage Loan Trust | | | | | | |
3.492% due 06/01/2034 | | | 200 | | | 196 |
Harborview Mortgage Loan Trust | | | |
1.470% due 02/25/2034 (a) | | | 80 | | | 80 |
Mellon Residential Funding Corp. | | | |
1.678% due 12/15/2030 (a) | | | 110 | | | 110 |
| | | | | | |
| 8 | | Semi-Annual Report | | June 30, 2004 | | See accompanying notes |
| | | | |
| | | Principal | | |
| | | Amount | | Value |
| | | (000s) | | (000s) |
| | | | | | |
| | |
Sequoia Mortgage Trust | | | | | | |
1.400% due 08/20/2032 (a) | | $ | 61 | | $ | 60 |
Structured Asset Mortgage Investments, Inc. |
1.450% due 03/19/2034 (a) | | | 194 | | | 194 |
1.390% due 07/19/2034 (a) | | | 199 | | | 199 |
Structured Asset Securities Corp. | | | |
1.550% due 06/25/2017 (a) | | | 8 | | | 8 |
1.600% due 07/25/2032 (a) | | | 31 | | | 31 |
Washington Mutual Mortgage Securities Corp. |
6.000% due 03/25/2017 | | | 9 | | | 9 |
5.159% due 10/25/2032 (a) | | | 15 | | | 15 |
3.091% due 02/27/2034 (a) | | | 34 | | | 34 |
| | | | | |
|
|
| | | | | | | 1,855 |
| | | | | |
|
|
Municipal Bonds & Notes 1.1% | | | |
Connecticut State General Obligation Bonds, Series 2001 |
5.500% due 12/15/2013 | | | 100 | | | 112 |
|
New York City Transitional
Finance Authority Revenue Bonds, Series 2004 |
5.000% due 02/01/2028 | | | 25 | | | 25 |
5.000% due 02/01/2033 | | | 25 | | | 24 |
|
New York City, New York Transitional Finance
Authority Revenue Bonds, Series 2002 |
5.250% due 08/01/2011 | | | 100 | | | 110 |
|
New York, New York General Obligation Bonds,
Series 2003 |
5.250% due 06/01/2028 | | | 100 | | | 100 |
| | | | | |
|
|
| | | | | | | 371 |
| | | | | |
|
|
| |
U.S. Government Agencies 7.1% | | | |
Fannie Mae | | | | | | |
4.640% due 01/30/2008 | | | 200 | | | 200 |
5.500% due 10/01/2016-04/01/2018 (d) | | | 1076 | | | 1,104 |
5.000% due 11/01/2018 | | | 602 | | | 604 |
1.420% due 08/25/2030 (a) | | | 200 | | | 200 |
5.229% due 04/01/2033 (a) | | | 47 | | | 47 |
1.220% due 03/25/2034 (a) | | | 194 | | | 193 |
Freddie Mac | | | | | | |
5.000% due 09/15/2016 | | | 45 | | | 46 |
3.438% due 02/01/2029 (a) | | | 60 | | | 62 |
Government National Mortgage Association | | | |
4.625% due 11/20/2024 (a) | | | 16 | | | 16 |
| | | | | |
|
|
| | | | | | | 2,472 |
| | | | | |
|
|
U.S. Treasury Obligations 3.9% | | | |
Treasury Inflation Protected Securities (b) | | | |
3.500% due 01/15/2011 | | $ | 432 | | $ | 480 |
3.000% due 07/15/2012 | | | 105 | | | 113 |
2.000% due 01/15/2014 | | | 102 | | | 101 |
U.S. Treasury Note | | | | | | |
6.500% due 02/15/2010 | | | 300 | | | 338 |
U.S. Treasury Strips | | | | | | |
0.000% due 05/15/2017 | | | 430 | | | 219 |
0.000% due 08/15/2020 | | | 300 | | | 123 |
| | | | | |
|
|
| | | | | | | 1,374 |
| | | | | |
|
|
Total United States (Cost $8,998) | | | | | | 8,922 |
| | | | |
|
|
| | | | | | | |
PURCHASED CALL OPTIONS 0.0% | | | |
30-Year Interest Rate Swap (OTC) | | | |
Strike @ 5.750%** Exp. 04/27/2009 | | $ | 100 | | | 4 |
| | | | | |
|
|
Total Purchased Call Options (Cost $5) | | | | | | 4 |
| | | | |
|
|
| | | | | | | |
PURCHASED PUT OPTIONS 0.0% | | | | |
30-Year Interest Rate Swap (OTC) | | | | |
Strike @ 6.250%** Exp. 04/27/2007 | | $ | 100 | | $ | 7 | |
| | | | | |
|
|
|
Total Purchased Put Options (Cost $7) | | | | | | 7 | |
| | | | |
|
|
|
| | | | | | | | |
SHORT-TERM INSTRUMENTS 31.9% | | | | |
Commercial Paper 29.0% | | | | | | | |
Altria Group, Inc. | | | | | | | |
1.800% due 10/29/2004 | | | 100 | | | 100 | |
Bank of Ireland | | | | | | | |
1.285% due 09/03/2004 | | | 500 | | | 499 | |
Barclays U.S. Funding Corp. | | | | | | | |
1.110% due 08/25/2004 | | | 600 | | | 599 | |
CDC Commercial Corp. | | | | | | | |
1.085% due 08/04/2004 | | | 900 | | | 899 | |
Danske Corp. | | | | | | | |
1.240% due 09/14/2004 | | | 800 | | | 798 | |
Den Norske Bank ASA | | | | | | | |
1.350% due 09/08/2004 | | | 500 | | | 499 | |
Fannie Mae | | | | | | | |
1.105% due 09/01/2004 | | | 300 | | | 299 | |
1.380% due 09/01/2004 | | | 200 | | | 200 | |
1.010% due 10/01/2004 | | | 200 | | | 199 | |
Freddie Mac | | | | | | | |
1.440% due 09/14/2004 | | | 200 | | | 199 | |
General Electric Capital Corp. | | | | | | | |
1.110% due 08/13/2004 | | | 500 | | | 499 | |
1.480% due 09/15/2004 | | | 500 | | | 498 | |
HBOS Treasury Services PLC | | | | | | | |
1.095% due 08/02/2004 | | | 100 | | | 100 | |
1.475% due 09/13/2004 | | | 500 | | | 498 | |
Nestle Capital Corp. | | | | | | | |
1.110% due 08/26/2004 | | | 600 | | | 599 | |
Royal Bank of Scotland PLC | | | | | | | |
1.070% due 07/14/2004 | | | 400 | | | 400 | |
Shell Finance (UK) PLC | | | | | | | |
1.230% due 08/11/2004 | | | 800 | | | 799 | |
Svenska Handlesbanken | | | | | | | |
1.090% due 08/05/2004 | | | 900 | | | 899 | |
1.390% due 09/13/2004 | | | 100 | | | 100 | |
1.285% due 09/21/2004 | | | 500 | | | 498 | |
Toyota Motor Credit Corp. | | | | | | | |
1.390% due 09/15/2004 | | | 900 | | | 897 | |
| | | | | |
|
|
|
| | | | | | | 10,078 | |
| | | | | |
|
|
|
| |
Repurchase Agreement 0.9% | | | | |
State Street Bank | | | | | | | |
0.800% due 07/01/2004 | | | 306 | | | 306 | |
| | | | | |
|
|
|
(Dated 06/30/2004. Collateralized by Fannie Mae 1.875% due 09/15/2005 valued at $314. Repurchase proceeds are $306.) | |
|
| | |
U.S. Treasury Bills 2.0% | | | | | | | |
1.248% due 09/02/2004-09/16/2004 (c)(d) | | | 705 | | | 703 | |
| | | | | |
|
|
|
| Total Short-Term Instruments (Cost $11,089) | | | | | | 11,087 | |
| | | | |
|
|
|
| | |
Total Investments 99.8% | | | | | $ | 34,729 | |
(Cost $33,653) | | | | | | | |
| | |
Written Options (g) (0.1%) | | | | | | (43 | ) |
(Premiums $92) | | | | | | | |
| |
Other Assets and Liabilities (Net) 0.3% | | | 129 | |
| | | | | |
|
|
|
| | |
Net Assets 100.0% | | | | | $ | 34,815 | |
| | | | | |
|
|
|
Notes to Schedule of Investments (amounts in thousands, except number of contracts):
(a) Variable rate security.
(b) Principal amount of security is adjusted for inflation.
(c) Securities with an aggregate market value of $454
have been segregated with the custodian to cover margin
requirements for the following open futures contracts at June 30, 2004:
| | | | | | | | | | |
| Type | | Expiration
Month | | # of
Contracts | | | | Unrealized
Appreciation/
(Depreciation) | |
Euribor June Long Futures | | 06/2005 | | 13 | | | | $ | (8 | ) |
Euribor Purchased Put Options | | | | | | |
Strike @ 95.250 | | 12/2004 | | 4 | | | | | 0 | |
Euro-Bund 10-Year Note Long Futures | | 09/2004 | | 82 | | | | | 65 | |
Government of Japan 10-Year Note | | | | | | |
Long Futures | | 09/2004 | | 3 | | | | | (21 | ) |
U.S. Treasury 10-Year Note Long Futures | | 09/2004 | | 61 | | | | | 5 | |
U.S. Treasury 30-Year Note Short Futures | | 09/2004 | | 1 | | | | | (2 | ) |
| | | | | | | | | $ | 39 | |
(d) Securities are grouped by coupon or range of coupons and represent a range of maturities.
(e) Swap agreements outstanding at June 30, 2004:
| | | | | | | | | |
Type | |
| Notional
Amount | | | |
| Unrealized
Appreciation/
(Depreciation |
) |
Receive floating rate based on 6-month BP-LIBOR
and pay a fixed rate equal to 5.000%. | |
| Counterparty: Morgan Stanley Dean Witter & Co. | |
| Exp. 03/15/2017 | | BP | 600 | | | | $ | 5 | |
|
Receive floating rate based on 6-month BP-LIBOR
and pay a fixed rate equal to 5.000%. | |
| Counterparty: Merrill Lynch & Co., Inc. | | | | | | |
Exp. 03/15/2017 | | | 400 | | | | | 7 | |
|
Receive floating rate based on 6-month BP-LIBOR
and pay a fixed rate equal to 5.000%. | |
Counterparty: UBS Warburg LLC | | | | | | |
Exp. 03/20/2018 | | | 400 | | | | | (1 | ) |
|
Receive floating rate based on 6-month BP-LIBOR
and pay a fixed rate equal to 5.000%. | |
| Counterparty: Morgan Stanley Dean Witter & Co. | |
Exp. 03/20/2018 | | | 400 | | | | | 2 | |
|
Receive floating rate based on 6-month BP-LIBOR
and pay a fixed rate equal to 5.000%. | |
Counterparty: J.P. Morgan Chase & Co. | | | | | | |
Exp. 03/20/2018 | | | 600 | | | | | 4 | |
|
Receive a fixed rate equal to 4.000% and pay floating rate based on 6-month EC-LIBOR. | |
Counterparty: J.P. Morgan Chase & Co. | | | | | | |
Exp. 03/15/2007 | | EC | 200 | | | | | (1 | ) |
| | | | | | |
| See accompanying notes | | June 30, 2004 | | Semi-Annual Report | | 9 |
Schedule of Investments (Cont.)
Global Bond Portfolio (Unhedged)
June 30, 2004 (Unaudited)
| | | | | | | | | |
| |
| Receive a fixed rate equal to 4.000% and pay floating rate based on 6-month EC-LIBOR. | | | | |
Counterparty: Merrill Lynch & Co., Inc. | | | | | | |
Exp. 03/15/2007 | | EC | 100 | | | | $ | 0 | |
| |
| Receive a fixed rate equal to 4.000% and pay floating rate based on 6-month EC-LIBOR. | | | | |
Counterparty: Goldman Sachs & Co. | | | | | | | | | |
Exp. 03/15/2007 | | | 400 | | | | | (2 | ) |
| |
| Receive a fixed rate equal to 4.000% and pay floating rate based on 6-month EC-LIBOR. | | | | |
Counterparty: Barclays Bank PLC | | | | | | |
Exp. 03/15/2007 | | | 400 | | | | | (1 | ) |
| |
| Receive a fixed rate equal to 4.000% and pay floating rate based on 6-month EC-LIBOR. | | | | |
Counterparty: Barclays Bank PLC | | | | | | |
Exp. 12/21/2007 | | | 400 | | | | | (4 | ) |
| |
| Receive a fixed rate equal to 4.000% and pay floating rate based on 6-month EC-LIBOR. | | | | |
Counterparty: Goldman Sachs & Co. | | | | | | |
Exp. 06/17/2010 | | | 700 | | | | | (17 | ) |
|
Receive floating rate based on 6-month EC-LIBOR
and pay a fixed rate equal to 4.000%. | |
Counterparty: Barclays Bank PLC | | | | | | |
Exp. 06/17/2010 | | | 410 | | | | | 0 | |
|
Receive floating rate based on 6-month EC-LIBOR
and pay a fixed rate equal to 3.750%. | |
Counterparty: Goldman Sachs & Co. | | | | | | |
Exp. 06/17/2012 | | | 800 | | | | | 2 | |
|
Receive floating rate based on 6-month EC-LIBOR
and pay a fixed rate equal to 5.000%. | |
Counterparty: Goldman Sachs & Co. | | | | | | |
Exp. 06/17/2012 | | | 100 | | | | | (6 | ) |
|
Receive floating rate based on 6-month EC-LIBOR
and pay a fixed rate equal to 4.000%. | |
Counterparty: Citibank N.A. | | | | | | |
Exp. 12/15/2014 | | | 460 | | | | | (4 | ) |
|
Receive floating rate based on 6-month EC-LIBOR
and pay a fixed rate equal to 4.000%. | |
Counterparty: UBS Warburg LLC | | | | | | |
Exp. 12/15/2014 | | | 1,600 | | | | | (13 | ) |
|
Receive floating rate based on 6-month EC-LIBOR
and pay a fixed rate equal to 5.000%. | |
Counterparty: UBS Warburg LLC | | | | | | |
Exp. 12/15/2014 | | | 1,700 | | | | | (18 | ) |
| |
| Receive a fixed rate equal to 5.000% and pay floating rate based on 6-month EC-LIBOR. | | | | |
Counterparty: UBS Warburg LLC | | | | | | |
Exp. 06/17/2015 | | | 400 | | | | | (1 | ) |
| |
| Receive a fixed rate equal to 6.000% and pay floating rate based on 6-month EC-LIBOR. | | | | |
| Counterparty: Morgan Stanley Dean Witter & Co. | | | | | | |
Exp. 03/15/2017 | | | 1,200 | | | | | 11 | |
| |
| Receive a fixed rate equal to 6.000% and pay floating rate based on 6-month EC-LIBOR. | | | | |
Counterparty: UBS Warburg LLC | | | | | | |
Exp. 03/20/2018 | | | 500 | | | | | 3 | |
| | | | | | | | | |
| |
| Receive a fixed rate equal to 6.000% and pay floating rate based on 6-month EC-LIBOR. | | | | |
Counterparty: J.P. Morgan Chase & Co. | | | | | | |
Exp. 03/20/2018 | | EC | 1,800 | | | | $ | 1 | |
|
Receive floating rate based on 6-month EC-LIBOR
and pay a fixed rate equal to 5.500%. | |
| Counterparty: Morgan Stanley Dean Witter & Co. | |
Exp. 12/15/2031 | | | 100 | | | | | (10 | ) |
|
Receive floating rate based on 3-month H$-HIBOR
and pay a fixed rate equal to 5.753%. | |
Counterparty: Goldman Sachs & Co. | | | | | | |
Exp. 02/08/2006 | | H$ | 1,200 | | | | | 1 | |
|
Receive floating rate based on 3-month H$-HIBOR
and pay a fixed rate equal to 4.235%. | |
Counterparty: Goldman Sachs & Co. | | | | | | |
Exp. 12/17/2008 | | | 5,800 | | | | | (13 | ) |
|
Receive floating rate based on 6-month JY-LIBOR
and pay a fixed rate equal to 0.800%. | |
Counterparty: UBS Warburg LLC | | | | | | |
Exp. 03/20/2012 | | JY | 50,000 | | | | | 0 | |
|
Receive a fixed rate equal to 4.500% and pay floating rate based on 3-month SK-STIBOR. | |
Counterparty: Merrill Lynch & Co., Inc. | | | | | | |
Exp. 06/17/2008 | | SK | 2,400 | | | | | 1 | |
|
Receive a fixed rate equal to 4.500% and pay floating rate based on 3-month SK-STIBOR. | |
Counterparty: J.P. Morgan Chase & Co. | | | | | | |
Exp. 06/17/2008 | | | 5,500 | | | | | 2 | |
|
Receive a fixed rate equal to 4.500% and pay floating rate based on 3-month SK-STIBOR. | |
Counterparty: Barclays Bank PLC | | | | | | |
Exp. 06/17/2008 | | | 1,200 | | | | | 0 | |
| | |
Receive total return on Lehman Commercial Mortgage-Backed Securities Index and pay a floating rate based on 1-month LIBOR less 0.650%. | | | | | | |
Counterparty: Bear Stearns & Co., Inc. | | | | | | |
Exp. 08/01/2004 | | $ | 200 | | | | | 0 | |
| | |
| Receive a fixed rate equal to 0.960% and the Portfolio will pay to the counterparty at par in the event of default of Russian Federation, 5.000% until 03/31/2007 and 7.500% thereafter, due 03/31/2030. | | | | | | |
Counterparty: Goldman Sachs & Co. | | | | | | |
Exp. 01/28/2005 | | | 100 | | | | | 0 | |
| | |
Receive a fixed rate equal to 4.000%
and pay floating rate
based on 3-month LIBOR. | | | | | | |
Counterparty: J.P. Morgan Chase & Co. | | | | | | |
Exp. 12/15/2009 | | | 3,200 | | | | | 32 | |
|
Receive floating rate based on 3-month LIBOR
and pay a fixed rate equal to 5.000%. | |
Counterparty: Bank of America | | | | | | |
Exp. 12/15/2014 | | | 200 | | | | | (3 | ) |
|
Receive floating rate based on 3-month LIBOR
and pay a fixed rate equal to 5.000%. | |
Counterparty: J.P. Morgan Chase & Co. | | | | | | |
Exp. 12/15/2014 | | | 2,600 | | | | | (42 | ) |
| | | | | | | | | |
|
Receive floating rate based on 3-month LIBOR
and pay a fixed rate equal to 5.000%. | |
Counterparty: Goldman Sachs & Co. | | | | | | |
Exp. 12/15/2014 | | $ | 900 | | | | $ | (12 | ) |
|
Receive floating rate based on 3-month LIBOR
and pay a fixed rate equal to 5.000%. | |
Counterparty: Lehman Brothers, Inc. | | | | | | |
Exp. 12/15/2014 | | | 600 | | | | | (8 | ) |
|
Receive floating rate based on 3-month LIBOR
and pay a fixed rate equal to 6.000%. | |
Counterparty: Bank of America | | | | | | |
Exp. 12/15/2024 | | | 400 | | | | | (11 | ) |
| | | | | | | | $ | (96 | ) |
(f) Written options with premiums to be determined on a future date:
| | | | |
Type | | # of
Contracts | | Unrealized
Appreciation |
| Call & Put - OTC % U.S. Dollar Forward Delta / Neutral Straddle vs. Japanese Yen Strike and premium determined on 12/18/2007, based upon implied volatility parameter of 18.500%. | | |
| Counterparty: AIG International, Inc. | | |
| Exp. 12/18/2012 | | 50 | | $ 3 |
| | | | | | |
| 10 | | Semi-Annual Report | | June 30, 2004 | | See accompanying notes |
(g) Premiums received on written options:
| | | | | | | | | | | | | | | | | | | |
| Name of Issuer | | | | Exercise Price | | | Expiration Date | | # of
Contracts | | Premium | | | Value | |
Call - CBOT U.S. Treasury Note September Futures | | | | $ | 115.000 | | | 08/27/2004 | | | 7 | | $ | 3 | | | $ | 0 | |
| | | | | | |
| Name of Issuer | | Counterparty | | Exercise
Rate | | | Expiration Date | | Notional
Amount | | Premium | | | Value | |
Call - OTC 7-Year Interest Rate Swap | | J.P. Morgan Chase & Co. | | | 3.800 | %** | | 10/07/2004 | | $ | 1,200 | | $ | 12 | | | $ | 0 | |
Put - OTC 7-Year Interest Rate Swap | | J.P. Morgan Chase & Co. | | | 6.000 | %* | | 10/07/2004 | | | 1,200 | | | 10 | | | | 2 | |
Call - OTC 7-Year Interest Rate Swap | | Lehman Brothers, Inc. | | | 5.750 | %** | | 08/04/2005 | | | 700 | | | 31 | | | | 28 | |
Put - OTC 7-Year Interest Rate Swap | | Lehman Brothers, Inc. | | | 5.750 | %* | | 08/04/2005 | | | 700 | | | 31 | | | | 12 | |
Call - OTC 7-Year Interest Rate Swap | | Merrill Lynch & Co., Inc. | | | 4.000 | %** | | 09/23/2005 | | | 100 | | | 2 | | | | 0 | |
Put - OTC 7-Year Interest Rate Swap | | Merrill Lynch & Co., Inc. | | | 6.000 | %* | | 09/23/2005 | | | 100 | | | 3 | | | | 1 | |
| | | | | | | | | | | | | | $ | 89 | | | $ | 43 | |
| | | | | | | | | | | | | | | | | | | | |
* The Portfolio will pay a floating rate based on 3-month LIBOR. | | | | | | | | | | | | | | | | | |
**The Portfolio will receive a floating rate based on 3-month LIBOR. | | | | | | | | | | | | | | | | | |
| | | | | | | | | | | | | | | | | | | | |
| (h) Short sales open at June 30, 2004 were as follows: | | | | | | | | | | | | | | | | | |
| Type | | | | Coupon
(%) | | | Maturity | | Par | | Value | | | Proceeds | |
U.S. Treasury Note | | | | | 5.500 | | | 05/15/2009 | | $ | 200 | | $ | 215 | | | $ | 213 | |
U.S. Treasury Note | | | | | 3.000 | | | 02/15/2009 | | | 5,200 | | | 5,041 | | | | 4,989 | |
| | | | | | | | | | | | | | $ | 5,256 | | | $ | 5,202 | |
| | | | | | | | | | | | | | | | | | | | |
| (i) Forward foreign currency contracts outstanding at June 30, 2004: | | | | | | | | | | | | | | | | | |
| | | | | | | | | | | | | | | | | | | | |
| Type | | Currency | | Principal
Amount
Covered by
Contract | | | Settlement
Month | | Unrealized Appreciation | | Unrealized
(Depreciation) | | | Net Unrealized
Appreciation/
(Depreciation) | |
Buy | | A$ | | | 183 | | | 07/2004 | | $ | 0 | | $ | (1 | ) | | $ | (1 | ) |
Sell | | BP | | | 338 | | | 07/2004 | | | 2 | | | 0 | | | | 2 | |
Buy | | BR | | | 33 | | | 07/2004 | | | 0 | | | 0 | | | | 0 | |
Sell | | C$ | | | 176 | | | 07/2004 | | | 0 | | | (2 | ) | | | (2 | ) |
Buy | | CP | | | 1,246 | | | 08/2004 | | | 0 | | | 0 | | | | 0 | |
Buy | | DK | | | 2,200 | | | 09/2004 | | | 0 | | | (3 | ) | | | (3 | ) |
Buy | | EC | | | 3,321 | | | 07/2004 | | | 2 | | | (37 | ) | | | (35 | ) |
Sell | | | | | 46 | | | 07/2004 | | | 0 | | | 0 | | | | 0 | |
Buy | | H$ | | | 47 | | | 07/2004 | | | 0 | | | 0 | | | | 0 | |
Buy | | | | | 560 | | | 09/2004 | | | 0 | | | 0 | | | | 0 | |
Buy | | JY | | | 866,645 | | | 07/2004 | | | 64 | | | (1 | ) | | | 63 | |
Buy | | KW | | | 6,966 | | | 07/2004 | | | 0 | | | 0 | | | | 0 | |
Buy | | | | | 26,749 | | | 09/2004 | | | 0 | | | 0 | | | | 0 | |
Buy | | MP | | | 156 | | | 08/2004 | | | 0 | | | 0 | | | | 0 | |
Buy | | PN | | | 21 | | | 08/2004 | | | 0 | | | 0 | | | | 0 | |
Buy | | RR | | | 171 | | | 07/2004 | | | 0 | | | 0 | | | | 0 | |
Buy | | S$ | | | 10 | | | 07/2004 | | | 0 | | | 0 | | | | 0 | |
Buy | | SK | | | 2,122 | | | 09/2004 | | | 0 | | | (3 | ) | | | (3 | ) |
Buy | | SR | | | 67 | | | 08/2004 | | | 1 | | | 0 | | | | 1 | |
Sell | | | | | 24 | | | 08/2004 | | | 0 | | | 0 | | | | 0 | |
Buy | | SV | | | 364 | | | 08/2004 | | | 0 | | | 0 | | | | 0 | |
| | | | | | | | | | |
|
|
|
| | | | | | | | | | | $ | 69 | | $ | (47 | ) | | $ | 22 | |
| | | | | | | | | | |
|
|
|
(j) Principal amount denoted in indicated currency:
| | | | | | | | | | |
A$ | | - | | Australian Dollar | | KW | | - | | South Korean Won |
BP | | - | | British Pound | | MP | | - | | Mexican Peso |
BR | | - | | Brazilian Real | | PN | | - | | Peruvian New Sol |
C$ | | - | | Canadian Dollar | | RR | | - | | Russian Ruble |
CP | | - | | Chilean Peso | | S$ | | - | | Singapore Dollar |
DK | | - | | Danish Krone | | SK | | - | | Swedish Krona |
EC | | - | | Euro | | SR | | - | | South African Rand |
H$ | | - | | Hong Kong Dollar | | SV | | - | | Slovakian Koruna |
JY | | - | | Japanese Yen | | | | | | |
| | | | | | |
| See accompanying notes | | June 30, 2004 | | Semi-Annual Report | | 11 |
Notes to Financial Statements
June 30, 2004 (Unaudited)
1. Organization
The Global Bond Portfolio (Unhedged) (the “Portfolio”) is a series of the PIMCO Variable Insurance Trust (the “Trust”). The Trust is registered under the Investment Company Act of 1940 (the “Act”), as amended, as an open-end investment company organized as a Delaware business trust on October 3, 1997. The Portfolio may offer up to two classes of shares: Institutional and Administrative. Each share class has identical voting rights (except that shareholders of a class have exclusive voting rights regarding any matter relating solely to that class of shares). Information presented in these financial statements pertains to the Administrative Class of the Portfolio. The Trust is designed to be used as an investment vehicle by Separate Accounts of insurance companies that fund variable annuity contracts and variable life insurance policies and by qualified pension and retirement plans. The Portfolio commenced operations on January 10, 2002.
2. Significant Accounting Policies
The following is a summary of significant accounting policies consistently followed by the Trust in the preparation of its financial statements in conformity with accounting principles generally accepted in the United States of America. The preparation of financial statements in accordance with accounting principles generally accepted in the United States of America requires management to make estimates and assumptions that affect the reported amounts and disclosures in the financial statements. Actual results could differ from those estimates.
Security Valuation. Portfolio securities and other financial instruments for which market quotations are readily available are stated at market value. Portfolio securities and other financial instruments for which market quotes are not readily available are valued at fair value, as determined in good faith and pursuant to guidelines established by the Board of Trustees, including certain fixed income securities which may be valued with reference to securities whose prices are more readily obtainable. Market value is determined at the close of regular trading (normally, 4:00 p.m., Eastern Time) on the New York Stock Exchange on each day the New York Stock Exchange is open, or if no sales are reported, as is the case for most securities traded over-the-counter, the mean between representative bid and asked quotations obtained from a quotation reporting system or from established market makers. The prices of certain portfolio securities or other financial instruments may be determined at a time prior to the close of regular trading on the New York Stock Exchange. Fair valuation may be used if significant events occur after the close of the relevant markets and prior to the close of regular trading on the New York Stock Exchange that materially affect the values of such securities or financial instruments. Fixed income securities are normally valued on the basis of quotes obtained from brokers and dealers or pricing services. Certain fixed income securities purchased on a delayed delivery basis are marked to market daily until settlement at the forward settlement value. Short-term investments, which mature in 60 days or less are valued at amortized cost, which approximates market value. Exchange traded options, futures and options on futures are valued at the settlement price determined by the relevant exchange. Prices may be obtained from independent pricing services which use information provided by market makers or estimates of market values obtained from yield data relating to investments or securities with similar characteristics. The prices used by the Portfolio may differ from the value that would be realized if the securities were sold and the differences could be material to the financial statements.
Securities Transactions and Investment Income. Securities transactions are recorded as of the trade date. Securities purchased or sold on a when-issued or delayed delivery basis may be settled a month or more after the trade date. Realized gains and losses from securities sold are recorded on the identified cost basis. Dividend income is recorded on the ex-dividend date, except certain dividends from foreign securities where the ex-dividend date may have passed, are recorded as soon as the Portfolio is informed of the ex-dividend date. Interest income, adjusted for the accretion of discounts and amortization of premiums, is recorded on the accrual basis. Paydowns gains and losses on mortgage- and asset-backed securities are recorded as adjustments to interest income in the Statement of Operations.
Dividends and Distributions to Shareholders. Dividends from net investment income, if any, are declared on each day the Trust is open for business and are distributed to shareholders monthly. All dividends are reinvested in additional shares of the Portfolio. Net realized capital gains earned by the Portfolio, if any, will be distributed no less frequently than once each year.
Income dividends and capital gain distributions are determined in accordance with income tax regulations which may differ from accounting principles generally accepted in the United States of America. These differences are primarily due to differing treatments for such items as wash sales, foreign currency transactions, net operating losses, notional principal contracts, certain asset-backed securities, certain futures and forward contracts, tax straddles, and capital loss carryforwards.
Distributions classified as a tax basis return of capital, if any, are reflected in the accompanying Statements of Changes in Net Assets and have been reclassified to paid in capital. In addition, other amounts have been reclassified between undistributed net investment income, accumulated undistributed net realized gains or losses and/or paid in capital to more appropriately conform financial accounting to tax characterizations of dividend distributions.
Multiclass Operations. Each class offered by the Trust has equal rights as to assets. Income, non-class specific expenses, and realized and unrealized capital gains and losses are allocated to each class of shares based on the relative net assets of each class.
Delayed Delivery Transactions. The Portfolio may purchase or sell securities on a when-issued or delayed delivery basis. These transactions involve a commitment by the Portfolio to purchase or sell securities for a predetermined price or yield, with payment and delivery taking place beyond the customary settlement period. When
| | | | |
| 12 | | Semi-Annual Report | | June 30, 2004 |
delayed delivery purchases are outstanding, the Portfolio will designate liquid assets in an amount sufficient to meet the purchase price. When purchasing a security on a delayed delivery basis, the Portfolio assumes the rights and risks of ownership of the security, including the risk of price and yield fluctuations, and takes such fluctuations into account when determining its net asset value. The Portfolio may dispose of or renegotiate a delayed delivery transaction after it is entered into, and may sell when-issued securities before they are delivered, which may result in a capital gain or loss. When the Portfolio has sold a security on a delayed delivery basis, the Portfolio does not participate in future gains and losses with respect to the security.
Federal Income Taxes. The Portfolio intends to qualify as a regulated investment company and distribute all of its taxable income and net realized gains, if applicable, to shareholders. Accordingly, no provision for Federal income taxes has been made.
Foreign Currency. The accounting records of the Portfolio are maintained in U.S. dollars. The market values of foreign securities, currency holdings and other assets and liabilities are translated into U.S. dollars based on the current exchange rates each business day. Fluctuations in the value of these assets and liabilities resulting from changes in exchange rates are recorded as unrealized foreign currency gains or losses. Realized gains or losses and unrealized appreciation or depreciation on investment securities and income and expenses are translated on the respective dates of such transactions. The effect of changes in foreign currency exchange rates on investments in securities are not segregated in the Statement of Operations from the effects of changes in market prices of those securities, but are included with the net realized and unrealized gain or loss on investment securities.
Forward Currency Transactions. The Portfolio may enter into forward currency contracts and forward cross-currency contracts in connection with settling planned purchases or sales of securities, to hedge the currency exposure associated with some or all of the Portfolio’s securities or as a part of an investment strategy. A forward currency contract is an agreement between two parties to buy and sell a currency at a set price on a future date. The market value of a forward currency contract fluctuates with changes in forward currency exchange rates. Forward currency contracts are marked to market daily and the change in value is recorded by the Portfolio as an unrealized gain or loss. Realized gains or losses equal to the difference between the value of the contract at the time it was opened and the value at the time it was closed are recorded upon delivery or receipt of the currency or, if a forward currency contract is offset by entering into another forward currency contract with the same broker, upon settlement of the net gain or loss. These contracts may involve market risk in excess of the unrealized gain or loss reflected in the Portfolio’s Statement of Assets and Liabilities. In addition, the Portfolio could be exposed to risk if the counterparties are unable to meet the terms of the contracts or if the value of the currency changes unfavorably to the U.S. dollar.
Futures Contracts. The Portfolio is authorized to enter into futures contracts. The Portfolio may use futures contracts to manage its exposure to the securities markets or to movements in interest rates and currency values. The primary risks associated with the use of futures contracts are the imperfect correlation between the change in market value of the securities held by the Portfolio and the prices of futures contracts, the possibility of an illiquid market, and the inability of the counterparty to meet the terms of the contract. Futures contracts are valued based upon their quoted daily settlement prices. Upon entering into a futures contract, the Portfolio may be required to deposit with its custodian, in a segregated account in the name of the futures broker, an amount of cash or U.S. Government and Agency Obligations in accordance with the initial margin requirements of the broker or exchange. Futures contracts are marked to market daily and an appropriate payable or receivable for the change in value (“variation margin”) is recorded by the Portfolio. Gains or losses are recognized but not considered realized until the contracts expire or are closed. Futures contracts involve, to varying degrees, risk of loss in excess of the variation margin disclosed in the Statement of Assets and Liabilities.
Inflation-Indexed Bonds. The Portfolio may invest in inflation-indexed bonds. Inflation-indexed bonds are fixed income securities whose principal value is periodically adjusted to the rate of inflation. The interest rate on these bonds is generally fixed at issuance at a rate lower than typical bonds. Over the life of an inflation-indexed bond, however, interest will be paid based on a principal value, which is adjusted for inflation. Any increase in the principal amount of an inflation-indexed bond will be included as interest income in the Statement of Operations, even though investors do not receive their principal until maturity.
Options Contracts. The Portfolio may write call and put options on futures, swaps, securities or currencies it owns or in which it may invest. Writing put options tends to increase the Portfolio’s exposure to the underlying instrument. Writing call options tends to decrease the Portfolio’s exposure to the underlying instrument. When the Portfolio writes a call or put option, an amount equal to the premium received is recorded as a liability and subsequently marked to market to reflect the current value of the option written. These liabilities are reflected as written options outstanding in the Statement of Assets and Liabilities. Payments received or made, if any, from writing options with premiums to be determined on a future date are reflected as such on the Statement of Assets and Liabilities. Premiums received from writing options which expire are treated as realized gains. Premiums received from writing options which are exercised or closed are added to the proceeds or offset against amounts paid on the underlying future, swap, security or currency transaction to determine the realized gain or loss. The Portfolio as a writer of an option has no control over whether the underlying future, swap, security or currency may be sold (call) or purchased (put) and as a result bears the market risk of an unfavorable change in the price of the future, swap, security or currency underlying the written option. There is the risk the Portfolio may not be able to enter into a closing transaction because of an illiquid market.
| | | | |
| June 30, 2004 | | Semi-Annual Report | | 13 |
Notes to Financial Statements (Cont.)
June 30, 2004 (Unaudited)
The Portfolio may also purchase put and call options. Purchasing call options tends to increase the Portfolio’s exposure to the underlying instrument. Purchasing put options tends to decrease the Portfolio’s exposure to the underlying instrument. The Portfolio pays a premium which is included in the Portfolio’s Statement of Assets and Liabilities as an investment and subsequently marked to market to reflect the current value of the option. Premiums paid for purchasing options which expire are treated as realized losses. The risk associated with purchasing put and call options is limited to the premium paid. Premiums paid for purchasing options which are exercised or closed are added to the amounts paid or offset against the proceeds on the underlying future, swap, security or currency transaction to determine the realized gain or loss.
Repurchase Agreements. The Portfolio may engage in repurchase transactions. Under the terms of a typical repurchase agreement, the Portfolio takes possession of an underlying debt obligation subject to an obligation of the seller to repurchase, and the Portfolio to resell, the obligation at an agreed-upon price and time. The market value of the collateral must be equal at all times to the total amount of the repurchase obligations, including interest. Generally, in the event of counterparty default, the Portfolio has the right to use the collateral to offset losses incurred.
Short Sales. The Portfolio may enter into short sales transactions. A short sale is a transaction in which the Portfolio sells securities it does not own in anticipation of a decline in the market price of the securities. The Portfolio is obligated to deliver securities at the market price at the time the short position is closed. Possible losses from short sales may be unlimited, whereas losses from purchases cannot exceed the total amount invested.
Stripped Mortgage-Backed Securities. The Portfolio may invest in stripped mortgage-backed securities (SMBS). SMBS represent a participation in, or are secured by and payable from, mortgage loans on real property, and may be structured in classes with rights to receive varying proportions of principal and interest. SMBS include interest-only securities (IOs), which receive all of the interest, and principal-only securities (POs), which receive all of the principal. If the underlying mortgage assets experience greater than anticipated payments of principal, the Portfolio may fail to recoup some or all of its initial investment in these securities. The market value of these securities is highly sensitive to changes in interest rates.
Swap Agreements. The Portfolio may invest in swap agreements. A swap is an agreement to exchange the return generated by one instrument for the return generated by another instrument. The Portfolio may enter into interest rate, total return, forward spread lock, and credit default swap agreements to manage its exposure to interest rates and credit risk.
Interest rate swap agreements involve the exchange by the Portfolio with another party of their respective commitments to pay or receive interest, e.g., an exchange of floating rate payments for fixed rate payments with respect to the notional amount of principal.
Total return swap agreements involve commitments to pay interest in exchange for a market-linked return, both based on notional amounts. To the extent the total return of the security or index underlying the transaction exceeds or falls short of the offsetting interest rate obligation, the Portfolio will receive a payment from or make a payment to the counterparty.
Forward spread lock swap agreements involve commitments to pay or receive a settlement amount calculated as the difference between the swap spread and a fixed spread, multiplied by the notional amount times the duration of the swap. The swap spread is the difference between the benchmark swap rate (market rate) and the specific Treasury rate.
In a credit default swap, one party makes a stream of payments to another party in exchange for the right to receive a specified return in the event of a default by a third party, typically corporate issues or sovereign issues of an emerging country, on its obligation. The Portfolio may use credit default swaps to provide a measure of protection against defaults of sovereign issuers (i.e., to reduce risk where the Portfolio owns or has exposure to the sovereign issuer) or to take an active long or short position with respect to the likelihood of a particular issuer’s default.
Swaps are marked to market daily based upon quotations from market makers and the change in value, if any, is recorded as unrealized gain or loss in the Statement of Operations. Payments received or made at the beginning of the measurement period are reflected as such on the Statement of Assets and Liabilities. A liquidation payment received or made at the termination of the swap is recorded as realized gain or loss in the Statement of Operations. Net periodic payments received by the Portfolio are included as part of realized gain(loss) on the Statement of Operations. Entering into these agreements involves, to varying degrees, elements of credit, market and documentation risk in excess of the amounts recognized on the Statement of Assets and Liabilities. Such risks involve the possibility that there will be no liquid market for these agreements, that the counterparty to the agreements may default on its obligation to perform or disagree as to the meaning of contractual terms in the agreements, and that there may be unfavorable changes in interest rates.
As a result of a FASB Emerging Issues Task Force (“EITF”) consensus, No. 03-11, and related SEC staff guidance, the Portfolio has reclassified periodic payments made or received under swap agreements, which were previously included within miscellaneous income, to a component of realized gain(loss) in the Statement of Operations. For consistency, similar reclassifications have been made to amounts appearing in the previous year’s Statement of Changes in Net Assets and the per share amounts in the prior year financial highlights. Prior year net investment income ratios in the financial highlights have also been modified accordingly. This reclassification increased(decreased) net investment income by $38,636, and $22,215, and net realized (loss) by $(47,583) and $(8,749) and net change in unrealized appreciation (depreciation) by $8947 and $(13,466) for the six months ended June 30, 2004 and year ended December 31, 2003, respectively. There is no effect on the Portfolio’s net asset value, either in total or per share, or its total increase(decrease) in net assets from operations during any period.
| | | | |
| 14 | | Semi-Annual Report | | June 30, 2004 |
3. Fees, Expenses, and Related Party Transactions
Investment Advisory Fee. Pacific Investment Management Company LLC (“PIMCO”) is a majority owned subsidiary partnership of Allianz Dresdner Asset Management of America L.P and serves as investment adviser (the “Adviser”) to the Trust, pursuant to an investment advisory contract. The Adviser receives a monthly fee at an annual rate based on average daily net assets of the Portfolio. The Advisory Fee is charged at an annual rate of 0.25%.
Administration Fee. PIMCO serves as administrator (the “Administrator”), and provides administrative services to the Trust for which it receives a monthly administrative fee based on average daily net assets of the Portfolio. The Administration Fee is charged at the annual rate of 0.50%.
Servicing Fee. PA Distributors LLC (“PAD”), formerly known as PIMCO Advisors Distributors LLC, is an indirect wholly-owned subsidiary of Allianz Dresdner Asset Management of America L.P. and serves as the distributor of the Trust’s shares. The Trust is permitted to reimburse PAD on a quarterly basis, out of the Administrative Class assets of the Portfolio in the amount of 0.15% on an annual basis of the average daily net assets of that class, for payments made to financial intermediaries that provide services in connection with the distribution of shares or administration of plans or programs that use Portfolio shares as their funding medium. The effective rate paid to PAD was 0.15% during current fiscal year.
Expenses. The Trust is responsible for the following expenses: (i) salaries and other compensation of any of the Trust’s executive officers and employees who are not officers, directors, stockholders or employees of PIMCO or its subsidiaries or affiliates; (ii) taxes and governmental fees; (iii) brokerage fees and commissions and other portfolio transaction expenses; (iv) the cost of borrowing money, including interest expense and bank overdraft charges; (v) fees and expenses of the Trustees who are not “interested persons” of PIMCO or the Trust, and any counsel retained exclusively for their benefit; (vi) extraordinary expenses, including costs of litigation and indemnification expenses; (vii) organization expenses and (viii) any expenses allocated or allocable to a specific class of shares, which include service fees payable with respect to the Administrative Class shares and may include certain other expenses as permitted by the Trust’s Multiple Class Plan adopted pursuant to Rule 18f-3 under the Act and subject to review and approval by the Trustees. The ratio of expenses to average net assets per share class, as disclosed in Financial Highlights, may differ from the annual portfolio operating expenses per share class as disclosed in the Prospectus for the reasons set forth above.
PIMCO has agreed to waive a portion of its administrative fees to the extent that the payment of the Portfolio’s pro rata share of organization expenses and Trustee fees cause the actual expense ratio to rise above the rates disclosed in the then-current prospectus plus 0.49 basis points as set forth below (calculated as a percentage of the Portfolio’s average daily net assets attributable to each class):
| | |
Administrative Class | | 0.90% |
PIMCO may be reimbursed for these waived amounts in future periods, not to exceed thirty-six months. Expenses that have been waived and may still be reimbursed by the Administrator, to the extent the Portfolio’s annualized total portfolio operating expenses plus the amount so reimbursed does not exceed the operating expense limitation, are as follows (amounts in thousands):
| | | | | | | | | |
| | | | Year of Waiver |
| | | | 12/31/2002 | | | 12/31/2003 | | | 06/30/2004 |
Amount Available for Reimbursement | | $ | 4 | | $ | 0 | | $ | 0 |
Each unaffiliated Trustee receives an annual retainer of $4,000, plus $1,500 for each Board of Trustees meeting attended in person and $250 for each meeting attended telephonically, plus reimbursement of related expenses. In addition, each committee chair receives an additional annual retainer of $500. These expenses are allocated on a pro-rata basis to each Portfolio of the Trust according to its respective net assets.
4. Purchases and Sales of Securities
The length of time a Portfolio has held a particular security is not generally a consideration in investment decisions. A change in the securities held by a Portfolio is known as “portfolio turnover.” The Portfolio may engage in frequent and active trading of portfolio securities to achieve its investment objective, particularly during periods of volatile market movements. High portfolio turnover (e.g., over 100%) involves correspondingly greater expenses to the Portfolio, including brokerage commissions or dealer mark-ups and other transaction costs on the sale of securities and reinvestments in other securities. Such sales may also result in realization of taxable capital gains, including short-term capital gains (which are generally taxed at ordinary income tax rates). The trading costs and tax effects associated with portfolio turnover may adversely affect the Portfolio’s performance.
Purchases and sales of securities (excluding short-term investments) for the period ended June 30, 2004 were as follows (amounts in thousands):
| | | | | | |
| U.S Government/Agency | | All Other |
| Purchases | | Sales | | Purchases | | Sales |
| $ 31,554 | | $ 36,018 | | $ 6,937 | | $ 3,280 |
5. Transactions in Written Call and Put Options
Transactions in written call and put options were as follows (amounts in thousands):
| | | | |
| | | | Premium | |
Balance at 12/31/2003 | | $ | 104 | |
Sales | | | 40 | |
Closing Buys | | | (19 | ) |
Expirations | | | (33 | ) |
Exercised | | | 0 | |
Balance at 06/30/2004 | | $ | 92 | |
| | | | |
| June 30, 2004 | | Semi-Annual Report | | 15 |
Notes to Financial Statements (Cont.)
June 30, 2004 (Unaudited)
6. Federal Income Tax Matters
At June 30, 2004, the aggregate cost of investments was the same for federal income tax and financial statement purposes. The net unrealized appreciation (depreciation) of investment securities for federal income tax purposes is as follows (amounts in thousands):
| | | | | | | | |
Aggregate Gross
Unrealized
Appreciation | | Aggregate Gross
Unrealized
(Depreciation) | | | Net Unrealized
Appreciation |
| $ | 1,201 | | $ | (125 | ) | | $ | 1,076 |
7. Shares of Beneficial Interest
The Trust may issue an unlimited number of shares of beneficial interest with a $.001 par value. Changes in shares of beneficial interest were as follows (shares and amounts in thousands):
| | | | | | | | | | | | | | |
| | | Six Months Ended 06/30/2004 | | | Year Ended 12/31/2003 | |
| | | Shares | | | Amount | | | Shares | | | Amount | |
Receipts for shares sold | | | | | | | | | | | | | | |
| | | | |
Institutional Class | | 0 | | | $ | 0 | | | 0 | | | $ | 0 | |
Administrative Class | | 673 | | | | 8,715 | | | 2,430 | | | | 29,886 | |
| | | | |
Issued as reinvestment of distributions | | | | | | | | | | | | | | |
| | | | |
Institutional Class | | 0 | | | | 0 | | | 0 | | | | 0 | |
Administrative Class | | 24 | | | | 308 | | | 51 | | | | 631 | |
| | | | |
Cost of shares redeemed | | | | | | | | | | | | | | |
| | | | |
Institutional Class | | 0 | | | | 0 | | | 0 | | | | 0 | |
Administrative Class | | (227 | ) | | | (2,947 | ) | | (1,973 | ) | | | (23,819 | ) |
| | | | |
Net increase resulting from Portfolio share transactions | | 470 | | | $ | 6,076 | | | 508 | | | $ | 6,698 | |
The following schedule shows the number of shareholders each owning 5% or more of the Portfolio and the total percentage of the Portfolio held by such shareholders:
| | | | |
| | | Number | | % of Portfolio Held |
Administrative Class | | 3 | | 100 |
8. Regulatory and Litigation Matters
On February 17, 2004, the Attorney General of the State of New Jersey (“New Jersey AG”) filed a complaint against Allianz Dresdner Asset Management of America L.P. (“ADAM”), PA Distributors LLC (formerly known as PIMCO Advisors Distributors LLC) (“PAD”), PEA Capital LLC (formerly known as PIMCO Equity Advisors LLC) (“PEA”), and Pacific Investment Management Company LLC (“PIMCO”) in connection with its investigation into market timing and late trading. The complaint contends that inappropriate trading by shareholders engaged in market timing activity took place in funds in the PIMCO Funds: Multi-Manager Series (“MMS Funds”) and the PIMCO Funds: Pacific Investment Management Series (“PIMS Funds”). On June 1, 2004, the New Jersey AG dismissed PIMCO from the lawsuit.
On the same day as the dismissal of PIMCO from the lawsuit, the New Jersey AG announced that it had reached a settlement agreement with the remaining defendants (“New Jersey Settlement”). In the New Jersey Settlement, ADAM, PAD and PEA agreed, while neither admitting nor denying the allegations or conclusions of law, to: (i) pay New Jersey a civil fine of $15 million and $3 million for investigative costs and further enforcement initiatives; and (ii) implement certain changes in corporate governance.
On May 6, 2004, the Securities and Exchange Commission filed a complaint in the U.S. District Court in the Southern District of New York alleging that PA Fund Management LLC (formerly known as PIMCO Advisors Fund Management LLC) (“PAFM”), PEA, PAD, Stephen J. Treadway (at the time, the chief executive officer of PAFM and PAD as well as chairman of the Board of Trustees of the MMS Funds) and Kenneth W. Corba (the former chief executive officer of PEA and former portfolio manager of the PEA Growth and PEA Growth & Income Funds) had, among other things, violated and/or aided and abetted violations of, various antifraud provisions of the federal securities laws in connection with alleged “market timing”
| | | | |
| 16 | | Semi-Annual Report | | June 30, 2004 |
arrangements that improperly allowed certain hedge funds to engage in “market timing” in the PEA Growth Fund, the PEA Opportunity Fund, the PEA Innovation Fund, and the PEA Target Fund. The complaint seeks injunctive relief, disgorgement plus pre-judgment interest, monetary penalties, and an order permanently enjoining the defendants from serving as investment advisers, principal underwriters, officers, directors, or members of any advisory boards to any registered investment companies.
On February 20, 2004, a putative class action lawsuit was filed in the U.S. District Court for the District of New Jersey on behalf of certain shareholders of the PIMCO Funds against ADAM, PAD, PIMCO, PEA, the PIMS Funds, the MMS Funds, the Trust, PIMCO Commercial Mortgage Securities Trust, Inc. and certain other defendants, alleging that inappropriate market timing activity by certain shareholders caused financial injury to the shareholders of those Funds.
The following additional putative class action lawsuits have been filed against the PIMS Funds, the MMS Funds and/or their affiliates, each related to alleged market-timing activity in funds advised by PIMCO or its affiliates: (1) a lawsuit filed in the U.S. District Court for the District of Connecticut on February 27, 2004 (naming as defendants ADAM, PAD, PEA, the PIMS Funds, the MMS Funds, the Trust, PCM and certain other parties); (2) a lawsuit filed in the U.S. District Court for the Central District of California on March 4, 2004 (naming as defendants PIMCO, ADAM, PEA and PAD); (3) a lawsuit filed in the U.S. District Court for the Southern District of New York on March 8, 2004 (naming PIMCO, PAD and certain of their affiliates as defendants); (4) a lawsuit filed in the U.S. District Court for the Southern District of New York, on March 15, 2004 (naming PIMCO as the defendant); (5) two separate lawsuits filed in the U.S. District Court for the Central District of California on March 22, 2004, brought derivatively on behalf of the PIMCO High Yield Fund and the PIMCO Money Market Fund, respectively (each naming ADAM, PAFM and certain other parties as defendants, and the PIMCO Funds as the nominal defendant); (6) a lawsuit filed in the U.S. District Court for the Central District of California, also on March 22, 2004, brought derivatively on behalf of the PIMS Funds and the MMS Funds (naming ADAM, PIMCO, PAD and certain other parties as defendants, and the PIMS Funds and the MMS Funds as nominal defendants); (7) a lawsuit filed in the U.S. District Court for the District of New Jersey on April 20, 2004 (naming ADAM, PAD, the PIMS Funds and certain other parties as defendants); and (8) a lawsuit filed in the U.S. District Court for the Northern District of California on April 28, 2004 (naming ADAM, PIMCO, PAD, PEA and certain other parties as defendants, and the “PIMCO Funds” as nominal defendants). Each complaint for the foregoing putative class actions alleges, among other things, that inappropriate trading by shareholders engaged in market timing activities took place in certain of the funds advised by PIMCO, and each complaint seeks unspecified compensatory damages.
On February 17, 2004, a putative class action lawsuit was filed in the U.S. District Court for the District of Connecticut on behalf of certain shareholders of the PIMCO Funds against ADAM, PEA, PIMCO, PIMS Funds, MMS Funds and certain other defendants, alleging excessive investment advisory fees and the use of brokerage commissions to pay for distribution of fund shares. Three similar putative class action lawsuits were subsequently filed, each in the U.S. District Court for the District of Connecticut on March 1, 2004, April 23, 2004 and May 20, 2004, respectively.
Under Section 9(a) of the 1940 Act, if any of the various lawsuits were to result in a court injunction against PAFM, PEA, PAD, PIMCO, ADAM and/or Mr. Treadway, they and their affiliates would, in the absence of exemptive relief granted by the SEC, be barred from serving as an investment adviser/sub-adviser or principal underwriter for any registered investment company, including the Trust. ADAM and certain of its subsidiaries have responded to inquiries from the SEC concerning the status of the New Jersey Settlement under Section 9(a). If any of PAFM, PEA, PAD, PIMCO or ADAM were subject to an injunction, each of these entities and their affiliates could in turn seek exemptive relief from the SEC, as contemplated by the 1940 Act. There is no assurance, however, that such exemptive relief would be granted. The SEC also has the power by order to prohibit PAFM, PEA, PAD and PIMCO from serving as investment advisers and underwriters, if the SEC finds that such entities willfully violated the federal securities laws in connection with the allegations discussed above or aided or abetted such violations.
PIMCO, PAD and the Trust believe that these developments will not have a material adverse effect on the Portfolios or on PIMCO’s, or PAD’s ability to perform their respective investment advisory or distribution services on behalf of the Portfolios.
| | | | |
| June 30, 2004 | | Semi-Annual Report | | 17 |
Trustees and Officers
Brent R. Harris, Chairman and Trustee
R. Wesley Burns, President and Trustee
E. Philip Cannon, Trustee
Vern O. Curtis, Trustee
J. Michael Hagan, Trustee
William J. Popejoy, Trustee
Garlin G. Flynn, Secretary
John P. Hardaway, Treasurer
Investment Adviser and Administrator
Pacific Investment Management Company LLC
840 Newport Center Drive
Newport Beach, California 92660
Distributor
PA Distributors LLC
2187 Atlantic Street
Stamford, Connecticut 06902
Custodian
State Street Bank & Trust Company
801 Pennsylvania
Kansas City, Missouri 64105
Transfer Agent
Boston Financial Data Services–Midwest
330 W. 9th Street
Kansas City, Missouri 64105
Legal Counsel
Dechert LLP
1775 I Street, N.W.
Washington, D.C. 20006
Independent Registered Public Accounting Firm
PricewaterhouseCoopers LLP
1055 Broadway
Kansas City, Missouri 64105
Information about how the Fund voted proxies relating to portfolio securities held during the year July 1, 2003 through June 30, 2004 will be available no later than August 31, 2004 without charge, upon request, by calling the Trust at 1-800-927-4648 and on the SEC’s website at http://www.sec.gov.
Copies of the written Proxy Policy and the factors that PIMCO may consider in determining how to vote proxies for the Funds are available by calling the Trust at 1-800-927-4648 and on the SEC’s website at http://www.sec.gov.
PIMCO VARIABLE INSURANCE TRUST
840 NEWPORT CENTER DRIVE
NEWPORT BEACH, CA 92660

PIMCO VARIABLE INSURANCE TRUST
ALL ASSET PORTFOLIO
ADMINISTRATIVE CLASS
SEMI-ANNUAL REPORT
June 30, 2004
|
| This material is authorized for use only when preceded or accompanied by the current PIMCO Variable Insurance Trust prospectus. Investors should consider the investment objectives, risks, charges and expenses of Portfolio carefully before investing. This and other information is contained in the Portfolio’s prospectus. Please read the prospectus carefully before you invest or send money. |
Chairman’s Letter
Dear PIMCO Variable Insurance Trust Shareholder:
Bond prices were more volatile during the six-month period ended June 30, 2004. Interest rates rose sharply during the second quarter 2004, causing bonds to give back modest gains from earlier in the year. The Lehman Brothers Aggregate Bond Index, a widely used index for the high-grade bond market, was nearly flat during the first six months of 2004, returning 0.15% after losing 2.44% during the second quarter. The yield on the benchmark ten-year Treasury closed June 30, 2004 at 4.58%, up 0.75% from April 1, 2004, but up only 0.34% from where it began the six-month period on January 1, 2004.
Continued growth in employment convinced the markets that the Federal Reserve would soon begin a long anticipated tightening cycle. On June 30, 2004, the Fed met market expectations by increasing the federal funds rate 0.25%, which was the first rate increase since June 25, 2003. The central bank had held this rate at 1% for more than a year, which generated negative real short-term rates. And on August 10, 2004, the Fed increased the federal funds rate another 0.25% to 1.50%.
Investors that had profited handsomely from borrowing at low short-term rates and investing in higher-yielding longer maturity bonds surrendered some of those profits towards the latter part of the six-month period. Concern that borrowing rates would rise led investors to liquidate long positions and unwind these trades, which caused bond prices to decrease. However, substantial leverage remained among banks, hedge funds, and other investors, making bond markets somewhat vulnerable to additional Fed rate increases. There were also signs of rising inflation, which fueled anxiety that central banks might continue to raise interest rates.
On the following pages you will find a more complete review of the Portfolio in light of financial market activities as well as specific details about the total return investment performance for the six-month period.
We appreciate the trust you have placed in us, and we will continue to focus our efforts to meet your investment needs.
Sincerely,

Brent R. Harris
Chairman
August 11, 2004
| | | | |
| June 30, 2004 | | Semi-Annual Report | | 1 |
Important Information About the Portfolio
We believe that bond funds have an important role to play in a well diversified investment portfolio. It is important to note, however, that in an environment where interest rates may trend upward, rising rates will negatively impact the performance of most bond funds, and fixed income securities held by a fund are likely to decrease in value. The price volatility of fixed income securities can also increase during periods of rising interest rates resulting in increased losses to a fund. Bond funds and individual bonds with a longer duration (a measure of the expected life of a security) tend to be more sensitive to changes in interest rates, usually making them more volatile than securities or funds with shorter durations. The longer-term performance of most bond funds has benefited from capital gains in part resulting from an extended period of declining interest rates. In the event interest rates increase, these capital gains should not be expected to recur.
The Portfolio may be subject to various risks in addition to those described above. Some of these risks may include, but are not limited to, the following: real rate risk, derivative risk, small company risk, foreign security risk, high yield security risk and specific sector investment risks. The Portfolio may use derivative instruments for hedging purposes or as part of an investment strategy. Use of these instruments may involve certain costs and risks such as liquidity risk, interest rate risk, market risk, credit risk, management risk and the risk that a fund could not close out a position when it would be most advantageous to do so. A Portfolio investing in derivatives could lose more than the principal amount invested in these instruments. Investing in non-U.S. securities may entail risk due to non-U.S. economic and political developments; this risk may be enhanced when investing in emerging markets. High-yield bonds typically have a lower credit rating than other bonds. Lower rated bonds generally involve a greater risk to principal than higher rated bonds. Smaller companies may be more volatile than larger companies and may entail more risk. Concentrating investments in individual sectors may add additional risk and volatility compared to a diversified portfolio.
The All Asset Portfolio invest in a portfolio of mutual funds. The cost of investing in the Portfolio will generally be higher than the cost of investing in a mutual fund that invests directly in individual stocks and bonds.
On the performance summary page in this semi-annual report, the Total Return Investment Performance table measures performance assuming that all dividend and capital gain distributions were reinvested. Returns do not reflect the deduction of taxes that a shareholder would pay (i) on Portfolio distributions or (ii) the redemption of Portfolio shares.
An investment in a Portfolio is not a bank deposit and is not guaranteed or insured by the Federal Deposit Insurance Corporation or any other government agency. It is possible to lose money on investments in the Funds.
The following disclosure provides important information regarding the Portfolio’s Expense Example, which appears on the Portfolio’s individual page in this semi-annual report. Please refer to this information when reviewing the Expense Example for the Portfolio.
Example
As a shareholder of the Portfolio, you incur two types of costs: (1) transaction costs, including redemption and exchange fees; and (2) ongoing costs, including advisory and administrative fees; distribution and/or service (12b-1) fees (Administrative Class only); and other Portfolio expenses. The Example is intended to help you understand your ongoing costs (in dollars) of investing in the Portfolio and to compare these costs with the ongoing costs of investing in other mutual funds.
The Example is based on an investment of $1,000 invested at the beginning of the period and held for the entire period indicated, which is from 1/1/04 to 6/30/04.
Actual Expenses
The information in the table under the heading “Actual Performance” provides information about actual account values and actual expenses. You may use the information in these columns, together with the amount you invested, to estimate the expenses that you paid over the period. Simply divide your account value by $1,000.00 (for example, an $8,600.00 account value divided by $1,000 = 8.60), then multiply the result by the number in the appropriate column for your share class, in the row entitled “Expenses Paid During Period” to estimate the expenses you paid on your account during this period.
Hypothetical Example for Comparison Purposes
The information in the table under the heading “Hypothetical Performance (5% return before expenses)” provides information about hypothetical account values and hypothetical expenses based on the Portfolio’s actual expense ratio and an assumed rate of return of 5% per year before expenses, which is not the Portfolio’s actual return. The hypothetical account values and expenses may not be used to estimate the actual ending account balance or expenses you paid for the period. You may use this information to compare the ongoing costs of investing in the Portfolio and other portfolios. To do so, compare this 5% hypothetical example with the 5% hypothetical examples that appear in the shareholder reports of the other portfolios.
Please note that the expenses shown in the table are meant to highlight your ongoing costs only and do not reflect any transactional costs. Therefore, the information under the heading “Hypothetical Performance (5% return before expenses)” is useful in comparing ongoing costs only, and will not help you determine the relative total costs of owning different portfolios. In addition, if these transactional costs were included, your costs would have been higher.
PIMCO Variable Insurance Trust is distributed by PA Distributors LLC, 2187 Atlantic Street, Stamford, CT 06902.
| | | | |
| 2 | | Semi-Annual Report | | June 30, 2004 |
All Asset Portfolio
CUMULATIVE RETURNS THROUGH JUNE 30, 2004
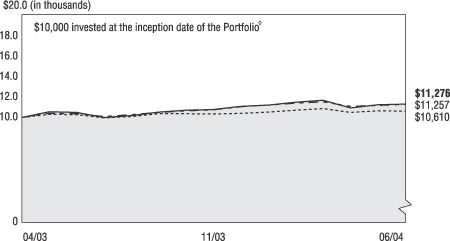
[CHART]
All Asset Lehman Global All Asset
Portfolio Admin. U.S. TIPS 1-10 Benchmark
Class Index Composite Index
---------------- --------------- ----------------
04/30/2003 $10,000 $10,000 $10,000
05/31/2003 $10,550 $10,296 $10,394
06/30/2003 $10,464 $10,275 $10,360
07/31/2003 $9,991 $9,949 $10,089
08/31/2003 $10,182 $10,081 $10,249
09/30/2003 $10,511 $10,351 $10,488
10/31/2003 $10,682 $10,368 $10,624
11/30/2003 $10,763 $10,337 $10,715
12/31/2003 $11,079 $10,397 $11,026
01/31/2004 $11,192 $10,496 $11,175
02/28/2004 $11,449 $10,701 $11,365
03/31/2004 $11,661 $10,845 $11,506
04/30/2004 $10,909 $10,488 $11,065
05/31/2004 $11,208 $10,618 $11,159
06/30/2004 $11,276 $10,610 $11,257
PIMCO Funds Allocation‡
| | | |
CommodityRealReturn Strategy | | 14.7 | % |
RealEstateRealReturn Strategy | | 12.7 | % |
StocksPLUS | | 12.0 | % |
Real Return | | 8.1 | % |
Emerging Markets Bond | | 8.0 | % |
Real Return Asset | | 8.0 | % |
Low Duration | | 7.5 | % |
International StocksPLUS TR Strategy | | 6.7 | % |
StocksPLUS Total Return | | 6.3 | % |
GNMA | | 5.1 | % |
High Yield | | 4.4 | % |
Other | | 6.5 | % |
‡ % of Total Investments as of June 30, 2004
à$10,000 invested at the beginning of the first full month following the inception of the Administrative Class.
TOTAL RETURN INVESTMENT PERFORMANCE For the period ended June 30, 2004
| | | | | | | | | | | | | |
| | | | | | | 6 Months | | | 1 Year | | | Since Inception* | |
| | |
| | All Asset Portfolio Administrative Class (Inception 04/30/03) | | 1.77 | % | | 7.76 | % | | 10.84 | % |
| | | - - - - - - - | | Lehman Global Real: U.S. TIPS 1-10 Year Index | | 2.05 | % | | 3.26 | % | | — | |
| | | - — - — | | All Asset Benchmark Composite Index | | 2.09 | % | | 8.66 | % | | — | |
| | | | | * Annualized. All Portfolio returns are net of fees and expenses. | | | | | | | | | |
Past performance is no guarantee of future results. The performance quoted represents past performance. Investment return and principal value will fluctuate so the Portfolio shares, when redeemed, may be worth more or less than their original cost. Current performance may be lower or higher than the performance data quoted. Performance data current to the most recent month-end is available by calling (800) 927-4648.
Please refer to page 2 herein for an explanation of the information presented in the following Expense Example.
| | | | | | | | | | |
| EXPENSE EXAMPLE | | | | Actual Performance | | | | Hypothetical Performance (5% return before expenses) |
Beginning Account Value (01/01/04) | | | | $ | 1,000.00 | | | | $ | 1,000.00 |
Ending Account Value (06/30/04) | | | | $ | 1,017.70 | | | | $ | 1,025.00 |
Expenses Paid During Period† | | | | $ | 2.91 | | | | $ | 2.92 |
†Expenses are equal to the Portfolio’s Administrative Class annualized expense ratio of 0.58%, multiplied by the average account value over the period, multiplied by 182/366 (to reflect the one-half year period). The expense ratio excludes the expenses of the underlying PIMCO Funds, which based upon the allocation of the Portfolio’s assets among the underlying Funds are indirectly borne by the shareholders of the Portfolio. The Underlying Fund Expenses for the Portfolio are estimated at 0.60%.
PORTFOLIO INSIGHTS
| • | The All Asset Portfolio seeks to achieve its investment objective by investing under normal circumstances substantially all of its assets in Institutional Class shares of the PIMCO Funds: Pacific Investment Management Series (“PIMS”), except the All Asset Fund and the All Asset All Authority Fund. |
| • | The Portfolio may invest in any PIMCO mutual fund except the All Asset Fund and the All Asset All Authority Fund; however, PIMCO has identified 14 core funds on which the All Asset Portfolio will focus. |
| • | For the 6 months ended June 30, 2004, the Portfolio’s Administrative Class shares were up 1.77%, versus the 2.05% return of the Lehman Global Real: U.S. TIPS 1-10 Year Index and the 2.09% return of the average performance of the benchmarks for the core funds. |
| • | The equally weighted average of the core funds returned 2.27% for the 6 months ended June 30, 2004. |
| • | The average performance of the core funds outperformed the average performance of the 14 benchmarks by 0.19%. This outperformance is a measure of the value added by PIMCO portfolio managers. |
| • | The PVIT All Asset Portfolio underperformed the average performance of the core funds by 0.50%. |
| • | While the Portfolio’s overweight to real return strategies versus other Underlying PIMS Funds contributed to performance, the Portfolio’s exposure to other strategies contributed to underperformance versus the Lehman Global Real: U.S. TIPS 1-10 Year Index. |
| • | The Lehman US TIPS, DJAIG Commodity, and Wilshire REIT indices outperformed the average performance of the 14 benchmarks. |
| • | An overweight to TIPS strategies in the beginning of the period while scaling down exposure throughout the period was positive as yields gradually rose. |
| | | | |
| June 30, 2004 | | Semi-Annual Report | | 3 |
Financial Highlights
All Asset Portfolio (Administrative Class)
| | | | | | | | | | | | |
| Selected Per Share Data for the Period Ended: | | | | 06/30/2004+ | | | | | 04/30/2003-
12/31/2003 | |
| | | | |
Net asset value beginning of period | | | | $ | 10.77 | | | | | $ | 10.00 | |
Net investment income (a) | | | | | 0.21 | | | | | | 0.53 | |
Net realized/unrealized gain (loss) on investments (a) | | | | | (0.02 | ) | | | | | 0.54 | |
Total income from investment operations | | | | | 0.19 | | | | | | 1.07 | |
Dividends from net investment income | | | | | (0.03 | ) | | | | | (0.30 | ) |
Distributions from net realized capital gains | | | | | 0.00 | | | | | | 0.00 | |
Total distributions | | | | | (0.03 | ) | | | | | (0.30 | ) |
Net asset value end of period | | | | $ | 10.93 | | | | | $ | 10.77 | |
Total return | | | | | 1.77 | % | | | | | 10.79 | % |
Net assets end of period (000s) | | | | $ | 18,845 | | | | | $ | 1,017 | |
Ratio of net expenses to average net assets | | | | | 0.58 | %*(c)(d) | | | | | 0.60 | %*(b)(c) |
Ratio of net investment income to average net assets | | | | | 3.87 | %* | | | | | 7.56 | %* |
Portfolio turnover rate | | | | | 54 | % | | | | | 136 | % |
| (a) | Per share amounts based on average number of shares outstanding during the period. |
| (b) | If the investment manager had not reimbursed expenses, the ratio of expenses to average net assets would have been 10.92%. |
| (c) | Ratio of expenses to average net assets excluding Underlying PIMS Funds’ expenses in which the Portfolio invests. |
| (d) | If the investment manager had not reimbursed expenses, the ratio of expenses to average net assets would have been 0.60%. |
| | | | | | |
| 4 | | Semi-Annual Report | | June 30, 2004 | | See accompanying notes |
Statement of Assets and Liabilities
All Asset Portfolio
June 30, 2004 (Unaudited)
| | | | | | |
| Amounts in thousands, except per share amounts | | | | | |
| | |
Assets: | | | | | | |
| | |
Investments in Affiliates, at value | | | | $ | 21,932 | |
Cash | | | | | 545 | |
Receivable for Portfolio shares sold | | | | | 353 | |
Dividends receivable from Affiliates | | | | | 20 | |
Manager reimbursement receivable | | | | | 53 | |
| | | | | | 22,903 | |
| | |
Liabilities: | | | | | | |
| | |
Payable for investments in Affiliates purchased | | | | $ | 565 | |
Accrued investment advisory fee | | | | | 3 | |
Accrued administration fee | | | | | 3 | |
Accrued servicing fee | | | | | 3 | |
| | | | | | 574 | |
| | |
Net Assets | | | | $ | 22,329 | |
| | |
Net Assets Consist of: | | | | | | |
| | |
Paid in capital | | | | $ | 21,983 | |
Undistributed net investment income | | | | | 87 | |
Accumulated undistributed net realized (loss) | | | | | (6 | ) |
Net unrealized appreciation | | | | | 265 | |
| | | | | $ | 22,329 | |
| | |
Net Assets: | | | | | | |
| | |
Administrative Class | | | | $ | 18,845 | |
Advisor Class | | | | | 10 | |
Class M | | | | | 3,474 | |
| | |
Shares Issued and Outstanding: | | | | | | |
| | |
Administrative Class | | | | | 1,724 | |
Advisor Class | | | | | 1 | |
Class M | | | | | 318 | |
| | |
Net Asset Value and Redemption Price Per Share
(Net Assets Per Share Outstanding) | | | | | | |
| | |
Administrative Class | | | | $ | 10.93 | |
Advisor Class | | | | | 10.93 | |
Class M | | | | | 10.91 | |
| | |
Cost of Investments in Affiliates Owned | | | | $ | 21,667 | |
| | | | | | |
| See accompanying notes | | June 30, 2004 | | Semi-Annual Report | | 5 |
Statement of Operations
All Asset Portfolio
| | | | | | |
| Amounts in thousands | | | | | |
| | | | | Six Months Ended June 30, 2004 (Unaudited) | |
Investment Income: | | | | | | |
| | |
Dividends from Affiliates | | | | $ | 105 | |
Total Income | | | | | 105 | |
| | |
Expenses: | | | | | | |
| | |
Investment advisory fees | | | | | 4 | |
Administration fees | | | | | 6 | |
Distribution and/or servicing fees - Administrative Class | | | | | 3 | |
Distribution and/or servicing fees - Advisor Class | | | | | 0 | |
Distribution fees - Class M | | | | | 1 | |
Total Expenses | | | | | 14 | |
| | |
Net Investment Income | | | | | 91 | |
| | |
Net Realized and Unrealized Gain (Loss): | | | | | | |
| | |
Net realized (loss) on investments in Affiliates | | | | | (17 | ) |
Net change in unrealized appreciation on investments in Affiliates | | | | | 238 | |
Net Gain | | | | | 221 | |
| | |
Net Increase in Assets Resulting from Operations | | | | $ | 312 | |
| | | | | | |
| 6 | | Semi-Annual Report | | June 30, 2004 | | See accompanying notes |
Statements of Changes in Net Assets
All Asset Portfolio
| | | | | | | | | | | | |
| Amounts in thousands | | | | | | | | | | |
| | | | | Six Months Ended June 30, 2004
(Unaudited) | | | | | Period from
April 30, 2003 to December 31, 2003 | |
Increase (Decrease) in Net Assets from: | | | | | | | | | | | | |
| | | | |
Operations: | | | | | | | | | | | | |
| | | | |
Net investment income | | | | $ | 91 | | | | | $ | 39 | |
Net realized gain (loss) on investments in Affiliates | | | | | (17 | ) | | | | | 6 | |
Net capital gain distributions received from underlying Funds | | | | | 0 | | | | | | 15 | |
Net change in unrealized appreciation on investments in Affiliates | | | | | 238 | | | | | | 27 | |
Net increase resulting from operations | | | | | 312 | | | | | | 87 | |
| | | | |
Distributions to Shareholders: | | | | | | | | | | | | |
| | | | |
From net investment income | | | | | | | | | | | | |
Administrative Class | | | | | (24 | ) | | | | | (25 | ) |
Advisor Class | | | | | 0 | | | | | | 0 | |
Class M | | | | | (4 | ) | | | | | 0 | |
Total Distributions | | | | | (28 | ) | | | | | (25 | ) |
| | | | |
Portfolio Share Transactions: | | | | | | | | | | | | |
| | | | |
Receipts for shares sold | | | | | | | | | | | | |
Administrative Class | | | | | 17,926 | | | | | | 1,543 | |
Advisor Class | | | | | 10 | | | | | | 0 | |
Class M | | | | | 3,658 | | | | | | 0 | |
| | | | |
Issued as reinvestment of distributions | | | | | | | | | | | | |
Administrative Class | | | | | 24 | | | | | | 25 | |
Advisory Class | | | | | 0 | | | | | | 0 | |
Class M | | | | | 4 | | | | | | 0 | |
| | | | |
Cost of shares redeemed | | | | | | | | | | | | |
Administrative Class | | | | | (367 | ) | | | | | (613 | ) |
Advisor Class | | | | | 0 | | | | | | 0 | |
Class M | | | | | (227 | ) | | | | | 0 | |
Net increase resulting from Portfolio share transactions | | | | | 21,028 | | | | | | 955 | |
| | | | |
Total Increase in Net Assets | | | | | 21,312 | | | | | | 1,017 | |
| | | | |
Net Assets: | | | | | | | | | | | | |
| | | | |
Beginning of period | | | | | 1,017 | | | | | | 0 | |
End of period* | | | | $ | 22,329 | | | | | $ | 1,017 | |
| | | | |
*Including undistributed net investment income of: | | | | $ | 87 | | | | | $ | 24 | |
| | | | | | |
| See accompanying notes | | June 30, 2004 | | Semi-Annual Report | | 7 |
Schedule of Investments
All Asset Portfolio
June 30, 2004 (Unaudited)
| | | | | |
PIMCO FUNDS (a) 98.2% | | | |
CommodityRealReturn Strategy | | 222,894 | | $ | 3,223 |
Convertible | | 810 | | | 10 |
Emerging Markets Bond | | 177,261 | | | 1,762 |
European Convertible Bond | | 51,283 | | | 626 |
Foreign Bond (Unhedged) | | 959 | | | 10 |
GNMA | | 102,930 | | | 1,129 |
High Yield | | 101,468 | | | 955 |
International StocksPLUS TR Strategy | | 135,120 | | | 1,462 |
Low Duration | | 161,272 | | | 1,643 |
Real Return | | 157,642 | | | 1,776 |
Real Return Asset | | 150,982 | | | 1,748 |
RealEstateRealReturn Strategy | | 259,588 | | | 2,793 |
Short-Term | | 77,249 | | | 775 |
StocksPLUS | | 272,154 | | | 2,632 |
StocksPLUS Total Return | | 114,209 | | | 1,388 |
| | | | |
|
|
| |
Total Investments 98.2% | | $ | 21,932 |
(Cost $21,667) | | | | | |
| |
Other Assets and Liabilities (Net) 1.8% | | | 397 |
| | | | |
|
|
| |
Net Assets 100.0% | | $ | 22,329 |
| | | | |
|
|
Notes to Schedule of Investments:
(a) Institutional Class of each PIMCO Fund.
| | | | | | |
| 8 | | Semi-Annual Report | | June 30, 2004 | | See accompanying notes |
Notes to Financial Statements
June 30, 2004 (Unaudited)
1. Organization
The All Asset Portfolio (the “Portfolio”) is a series of the PIMCO Variable Insurance Trust (the “Trust”). The Trust is registered under the Investment Company Act of 1940 (the “Act”), as amended, as an open-end investment company organized as a Delaware business trust on October 3, 1997. The Portfolio offers three classes of shares: Administrative, Advisor and Class M. Each share class has identical voting rights (except that shareholders of a class have exclusive voting rights regarding any matter relating solely to that class of shares). Information presented in these financial statements pertains to the Administrative Class of the Trust. The Trust is designed to be used as an investment vehicle by Separate Accounts of insurance companies that fund variable annuity contracts and variable life insurance policies and by qualified pension and retirement plans. The Portfolio commenced operations on April 30, 2003.
2. Significant Accounting Policies
The following is a summary of significant accounting policies consistently followed by the Trust in the preparation of its financial statements in conformity with accounting principles generally accepted in the United States of America. The preparation of financial statements in accordance with accounting principles generally accepted in the United States of America requires management to make estimates and assumptions that affect the reported amounts and disclosures in the financial statements. Actual results could differ from those estimates.
Security Valuation. Investments in Funds within the PIMS Funds are valued at their net asset value as reported by the underlying PIMS Funds.
Securities Transactions and Investment Income. Securities transactions are recorded as of the trade date. Securities purchased or sold on a when-issued or delayed delivery basis may be settled a month or more after the trade date. Realized gains and losses from securities sold are recorded on the identified cost basis. Dividend income is recorded on the ex-dividend date, except certain dividends from foreign securities where the ex-dividend date may have passed, are recorded as soon as the Portfolio is informed of the ex-dividend date. Interest income, adjusted for the accretion of discounts and amortization of premiums, is recorded on the accrual basis. Paydowns gains and losses on mortgage- and asset-backed securities are recorded as adjustments to interest income in the Statement of Operations.
Dividends and Distributions to Shareholders. Dividends from net investment income, if any, are declared and distributed to shareholders quarterly. All dividends are reinvested in additional shares of the Portfolio. Net realized capital gains earned by the Portfolio, if any, will be distributed no less frequently than once each year.
Income dividends and capital gain distributions are determined in accordance with income tax regulations which may differ from accounting principles generally accepted in the United States of America. These differences are primarily due to differing treatments for such items as wash sales, foreign currency transactions, net operating losses, notional principal contracts, certain asset-backed securities, certain futures and forward contracts, tax straddles, and capital loss carryforwards.
Distributions classified as a tax basis return of capital, if any, are reflected in the accompanying Statements of Changes in Net Assets and have been reclassified to paid in capital. In addition, other amounts have been reclassified between undistributed net investment income, accumulated undistributed net realized gains or losses and/or paid in capital to more appropriately conform financial accounting to tax characterizations of dividend distributions.
Federal Income Taxes. The Portfolio intends to qualify as a regulated investment company and distribute all of its taxable income and net realized gains, if applicable, to shareholders. Accordingly, no provision for Federal income taxes has been made.
Underlying PIMS Funds. The Underlying PIMS Funds are the Institutional Class shares of the PIMCO Funds: Pacific Investment Management Series, an affiliated open-end investment company, except All Asset and All Asset All Authority Funds. Though it is anticipated that the All Asset Portfolio will not currently invest in the European StocksPLUS Total Return Strategy, Far East (ex-Japan) StocksPLUS Total Return Strategy, Japanese StocksPLUS TR Strategy, StocksPLUS Municipal-Backed and StocksPLUS TR Short Strategy Funds, the Portfolio may invest in these Funds in the future, without shareholder approval, at the discretion of the Portfolio’s asset allocation sub-adviser.
3. Fees, Expenses, and Related Party Transactions
Investment Advisory Fee. Pacific Investment Management Company LLC (“PIMCO”) is a majority owned subsidiary partnership of Allianz Dresdner Asset Management of America L.P. and serves as investment adviser (the “Adviser”) to the Trust, pursuant to an investment advisory contract. The Adviser receives a monthly fee at an annual rate based on average daily net assets of the Portfolio. The Advisory Fee is charged at an annual rate of 0.20%.
PIMCO has contractually agreed, for the All Asset Portfolio’s current fiscal year, to reduce its Advisory Fee to the extent that the Underlying Fund Expenses attributable to Advisory and Administrative Fees exceed 0.60%. PIMCO may recoup these waivers in future period, not to exceed three years, provided total expenses, including such Recoupment, do not exceed the annual expense limit.
Administration Fee. PIMCO serves as administrator (the “Administrator”), and provides administrative services to the Trust for which it receives a monthly administrative fee based on average daily net assets of the Portfolio. The Administration Fee is charged at the annual rate of 0.25%.
Servicing Fee. PA Distributors LLC (“PAD”), formerly known as PIMCO Advisors Distributors LLC, is an indirect wholly-owned
| | | | |
| June 30, 2004 | | Semi-Annual Report | | 9 |
Notes to Financial Statements (Cont.)
June 30, 2004 (Unaudited)
subsidiary of Allianz Dresdner Asset Management of America L.P. and serves as the distributor of the Trust’s shares. The Trust is permitted to reimburse PAD on a quarterly basis, out of the Administrative Class assets of the Portfolio in the amount of 0.15% on an annual basis of the average daily net assets of that class, for payments made to financial intermediaries that provide services in connection with the distribution of shares or administration of plans or programs that use Portfolio shares as their funding medium. The effective rate paid to PAD was 0.15% during current fiscal year.
Expenses. The Trust is responsible for the following expenses: (i) salaries and other compensation of any of the Trust’s executive officers and employees who are not officers, directors, stockholders or employees of PIMCO or its subsidiaries or affiliates; (ii) taxes and governmental fees; (iii) brokerage fees and commissions and other portfolio transaction expenses; (iv) the cost of borrowing money, including interest expense and bank overdraft charges; (v) fees and expenses of the Trustees who are not “interested persons” of PIMCO or the Trust, and any counsel retained exclusively for their benefit; (vi) extraordinary expenses, including costs of litigation and indemnification expenses; (vii) organization expenses and (viii) any expenses allocated or allocable to a specific class of shares, which include service fees payable with respect to the Administrative Class shares and may include certain other expenses as permitted by the Trust’s Multiple Class Plan adopted pursuant to Rule 18f-3 under the Act and subject to review and approval by the Trustees. The ratio of expenses to average net assets per share class, as disclosed in Financial Highlights, may differ from the annual portfolio operating expenses per share class as disclosed in the Prospectus for the reasons set forth above.
PIMCO has agreed to waive a portion of its administrative fees to the extent that the payment of the Portfolio’s pro rata share of organization expenses and Trustee fees cause the actual expense ratio to rise above the rates disclosed in the then-current prospectus plus 0.49 basis points as set forth below (calculated as a percentage of the Portfolio’s average daily net assets attributable to each class):
| | | |
Administrative Class | | 0.60 | % |
Advisor Class | | 0.70 | % |
Class M | | 0.90 | % |
PIMCO may be reimbursed for these waived amounts in future periods, not to exceed thirty-six months. Expenses that have been waived and may still be reimbursed by the Administrator, to the extent the Portfolio’s annualized total portfolio operating expenses plus the amount so reimbursed does not exceed the operating expense limitation, are as follows (amounts in thousands):
| | | | | |
| | | | 12/31/2003 | | 06/30/2004 |
Amount Available for Reimbursement | | $ | 53 | | 0 |
Each unaffiliated Trustee receives an annual retainer of $4,000, plus $1,500 for each Board of Trustees meeting attended in person and $250 for each meeting attended telephonically, plus reimbursement of related expenses. In addition, each committee chair receives an additional annual retainer of $500. These expenses are allocated on a pro-rata basis to each Portfolio of the Trust according to its respective net assets.
4. Risk Factors of the Portfolio
Investing in the Underlying PIMS Funds through the All Asset Portfolio involves certain additional expenses and tax results that would not be present in a direct investment in the Underlying PIMS Funds. Under certain circumstances, an Underlying PIMS Funds may pay a redemption request by the All Asset Portfolio wholly or partly by a distribution in kind of securities from its portfolio, instead of cash, in accordance with the rules of the Securities and Exchange Commission. In such cases, the Portfolio may hold securities distributed by an Underlying PIMS Funds until the Adviser determines that it is appropriate to dispose of such securities.
Each of the Underlying PIMS Funds may invest in certain specified derivative securities, including: interest rate swaps; commodity swaps; credit default swaps; currency swaps; total return swaps; Forward Foreign Currency Contracts; caps and floors for hedging purposes; exchange-traded options; over-the-counter options executed with primary dealers, including long calls and puts and covered calls and financial futures and options. Certain of the Underlying PIMS Funds may invest in restricted securities, instruments issued by trusts, partnerships or other issuers, including pass-through certificated representing participation in, or debt instruments backed by, the securities owned by such issuers. There Underlying PIMS Funds also may engage in securities lending, reverse repurchase agreements and dollar roll transactions. In addition, certain of the Underlying PIMS Funds may invest in below-investment grade debt, debt obligations of foreign issuers and stocks of foreign corporations, securities in foreign investment funds or trusts, foreign derivatives securities including future contracts, options, interest rate and currency swap transactions, and various other investment vehicles, each with inherent risks.
The officers and trustees of the Trust also serve as officers and trustees of the Underlying PIMS Funds. Conflicts may arise as these companies seek to fulfill their fiduciary responsibilities to both the Portfolio and the Underlying PIMS Funds.
5. Federal Income Tax Matters
At June 30, 2004, the aggregate cost of investments was the same for federal income tax and financial statement purposes. The net unrealized appreciation (depreciation) of investment securities for federal income tax purposes is as follows (amounts in thousands):
| | | | | | |
Aggregate Gross Unrealized Appreciation | | Aggregate Gross
Unrealized
(Depreciation) | | Net Unrealized
Appreciation |
| $ 341 | | $ | (76) | | $ | 265 |
| | | | |
| 10 | | Semi-Annual Report | | June 30, 2004 |
6. Purchases and Sales of Securities
The length of time a Portfolio has held a particular security is not generally a consideration in investment decisions. A change in the securities held by a Portfolio is known as “portfolio turnover.” The Portfolio may engage in frequent and active trading of portfolio securities to achieve its investment objective, particularly during periods of volatile market movements. High portfolio turnover (e.g., over 100%) involves correspondingly greater expenses to the Portfolio, including brokerage commissions or dealer mark-ups and other transaction costs on the sale of securities and reinvestments in other securities. Such sales may also result in realization of taxable capital gains, including short-term capital gains (which are generally taxed at ordinary income tax rates). The trading costs and tax effects associated with portfolio turnover may adversely affect the Portfolio’s performance.
Purchases and sales of securities (excluding short-term investments) for the period ended June 30, 2004 were as follows (amounts in thousands):
| | | | | | |
| U.S Government/Agency | | All Other |
| Purchases | | Sales | | Purchases | | Sales |
| $ 0 | | $ 0 | | $ 22,400 | | $ 1,626 |
7. Shares of Beneficial Interest
The Trust may issue an unlimited number of shares of beneficial interest with a $.001 par value. Changes in shares of beneficial interest were as follows (shares and amounts in thousands):
| | | | | | | | | | | | | | |
| | | Six Months Ended 06/30/2004 | | | Period From
04/30/2003 to
12/31/2003 | |
| | | Shares | | | Amount | | | Shares | | | Amount | |
Receipts for shares sold | | | | | | | | | | | | | | |
| | | | |
Administrative Class | | 1,662 | | | | 17,926 | | | 149 | | | | 1,543 | |
Advisor Class | | 1 | | | | 10 | | | 0 | | | | 0 | |
Class M | | 339 | | | | 3,658 | | | 0 | | | | 0 | |
| | | | |
Issued as reinvestment of distributions | | | | | | | | | | | | | | |
| | | | |
Administrative Class | | 2 | | | | 24 | | | 2 | | | | 25 | |
Advisor Class | | 0 | | | | 0 | | | 0 | | | | 0 | |
Class M | | 0 | | | | 4 | | | 0 | | | | 0 | |
| | | | |
Cost of shares redeemed | | | | | | | | | | | | | | |
| | | | |
Administrative Class | | (34 | ) | | | (367 | ) | | (57 | ) | | | (613 | ) |
Advisor Class | | 0 | | | | 0 | | | 0 | | | | 0 | |
Class M | | (21 | ) | | | (227 | ) | | 0 | | | | 0 | |
| | | | |
Net increase resulting from Portfolio share transactions | | 1,949 | | | $ | 21,028 | | | 94 | | | $ | 955 | |
The following schedule shows the number of shareholders each owning 5% or more of the Portfolio and the total percentage of the Portfolio held by such shareholders:
| | | | |
| | | Number | | % of Portfolio Held |
Administrative Class | | 2 | | 96 |
| | | | |
| June 30, 2004 | | Semi-Annual Report | | 11 |
Notes to Financial Statements (Cont.)
June 30, 2004 (Unaudited)
8. Regulatory and Litigation Matters
On February 17, 2004, the Attorney General of the State of New Jersey (“New Jersey AG”) filed a complaint against Allianz Dresdner Asset Management of America L.P. (“ADAM”), PA Distributors LLC (formerly known as PIMCO Advisors Distributors LLC) (“PAD”), PEA Capital LLC (formerly known as PIMCO Equity Advisors LLC) (“PEA”), and Pacific Investment Management Company LLC (“PIMCO”) in connection with its investigation into market timing and late trading. The complaint contends that inappropriate trading by shareholders engaged in market timing activity took place in funds in the PIMCO Funds: Multi-Manager Series (“MMS Funds”) and the PIMCO Funds: Pacific Investment Management Series (“PIMS Funds”). On June 1, 2004, the New Jersey AG dismissed PIMCO from the lawsuit.
On the same day as the dismissal of PIMCO from the lawsuit, the New Jersey AG announced that it had reached a settlement agreement with the remaining defendants (“New Jersey Settlement”). In the New Jersey Settlement, ADAM, PAD and PEA agreed, while neither admitting nor denying the allegations or conclusions of law, to: (i) pay New Jersey a civil fine of $15 million and $3 million for investigative costs and further enforcement initiatives; and (ii) implement certain changes in corporate governance.
On May 6, 2004, the Securities and Exchange Commission filed a complaint in the U.S. District Court in the Southern District of New York alleging that PA Fund Management LLC (formerly known as PIMCO Advisors Fund Management LLC) (“PAFM”), PEA, PAD, Stephen J. Treadway (at the time, the chief executive officer of PAFM and PAD as well as chairman of the Board of Trustees of the MMS Funds) and Kenneth W. Corba (the former chief executive officer of PEA and former portfolio manager of the PEA Growth and PEA Growth & Income Funds) had, among other things, violated and/or aided and abetted violations of, various antifraud provisions of the federal securities laws in connection with alleged “market timing” arrangements that improperly allowed certain hedge funds to engage in “market timing” in the PEA Growth Fund, the PEA Opportunity Fund, the PEA Innovation Fund, and the PEA Target Fund. The complaint seeks injunctive relief, disgorgement plus pre-judgment interest, monetary penalties, and an order permanently enjoining the defendants from serving as investment advisers, principal underwriters, officers, directors, or members of any advisory boards to any registered investment companies.
On February 20, 2004, a putative class action lawsuit was filed in the U.S. District Court for the District of New Jersey on behalf of certain shareholders of the PIMCO Funds against ADAM, PAD, PIMCO, PEA, the PIMS Funds, the MMS Funds, the Trust, PIMCO Commercial Mortgage Securities Trust, Inc. and certain other defendants, alleging that inappropriate market timing activity by certain shareholders caused financial injury to the shareholders of those Funds.
The following additional putative class action lawsuits have been filed against the PIMS Funds, the MMS Funds and/or their affiliates, each related to alleged market-timing activity in funds advised by PIMCO or its affiliates: (1) a lawsuit filed in the U.S. District Court for the District of Connecticut on February 27, 2004 (naming as defendants ADAM, PAD, PEA, the PIMS Funds, the MMS Funds, the Trust, PCM and certain other parties); (2) a lawsuit filed in the U.S. District Court for the Central District of California on March 4, 2004 (naming as defendants PIMCO, ADAM, PEA and PAD); (3) a lawsuit filed in the U.S. District Court for the Southern District of New York on March 8, 2004 (naming PIMCO, PAD and certain of their affiliates as defendants); (4) a lawsuit filed in the U.S. District Court for the Southern District of New York, on March 15, 2004 (naming PIMCO as the defendant); (5) two separate lawsuits filed in the U.S. District Court for the Central District of California on March 22, 2004, brought derivatively on behalf of the PIMCO High Yield Fund and the PIMCO Money Market Fund, respectively (each naming ADAM, PAFM and certain other parties as defendants, and the PIMCO Funds as the nominal defendant); (6) a lawsuit filed in the U.S. District Court for the Central District of California, also on March 22, 2004, brought derivatively on behalf of the PIMS Funds and the MMS Funds (naming ADAM, PIMCO, PAD and certain other parties as defendants, and the PIMS Funds and the MMS Funds as nominal defendants); (7) a lawsuit filed in the U.S. District Court for the District of New Jersey on April 20, 2004 (naming ADAM, PAD, the PIMS Funds and certain other parties as defendants); and (8) a lawsuit filed in the U.S. District Court for the Northern District of California on April 28, 2004 (naming ADAM, PIMCO, PAD, PEA and certain other parties as defendants, and the “PIMCO Funds” as nominal defendants). Each complaint for the foregoing putative class actions alleges, among other things, that inappropriate trading by shareholders engaged in market timing activities took place in certain of the funds advised by PIMCO, and each complaint seeks unspecified compensatory damages.
On February 17, 2004, a putative class action lawsuit was filed in the U.S. District Court for the District of Connecticut on behalf of certain shareholders of the PIMCO Funds against ADAM, PEA, PIMCO, PIMS Funds, MMS Funds and certain other defendants, alleging excessive investment advisory fees and the use of brokerage commissions to pay for distribution of fund shares. Three similar putative class action lawsuits were subsequently filed, each in the U.S. District Court for the District of Connecticut on March 1, 2004, April 23, 2004 and May 20, 2004, respectively.
Under Section 9(a) of the 1940 Act, if any of the various lawsuits were to result in a court injunction against PAFM, PEA, PAD, PIMCO, ADAM and/or Mr. Treadway, they and their affiliates would, in the absence of exemptive relief granted by the SEC, be barred from serving as an investment adviser/sub-adviser or principal underwriter for any registered investment company, including the Trust. ADAM and certain of its subsidiaries have
| | | | |
| 12 | | Semi-Annual Report | | June 30, 2004 |
responded to inquiries from the SEC concerning the status of the New Jersey Settlement under Section 9(a). If any of PAFM, PEA, PAD, PIMCO or ADAM were subject to an injunction, each of these entities and their affiliates could in turn seek exemptive relief from the SEC, as contemplated by the 1940 Act. There is no assurance, however, that such exemptive relief would be granted. The SEC also has the power by order to prohibit PAFM, PEA, PAD and PIMCO from serving as investment advisers and underwriters, if the SEC finds that such entities willfully violated the federal securities laws in connection with the allegations discussed above or aided or abetted such violations.
PIMCO, PAD and the Trust believe that these developments will not have a material adverse effect on the Portfolios or on PIMCO’s, or PAD’s ability to perform their respective investment advisory or distribution services on behalf of the Portfolios.
| | | | |
| June 30, 2004 | | Semi-Annual Report | | 13 |
Trustees and Officers
Brent R. Harris, Chairman and Trustee
R. Wesley Burns, President and Trustee
E. Philip Cannon, Trustee
Vern O. Curtis, Trustee
J. Michael Hagan, Trustee
William J. Popejoy, Trustee
Garlin G. Flynn, Secretary
John P. Hardaway, Treasurer
Investment Sub-Adviser
Research Affiliates, LLC
800 E. Colorado Boulevard
Pasadena, California 91101
Investment Adviser and Administrator
Pacific Investment Management Company LLC
840 Newport Center Drive
Newport Beach, California 92660
Distributor
PA Distributors LLC
2187 Atlantic Street
Stamford, Connecticut 06902
Custodian
State Street Bank & Trust Company
801 Pennsylvania
Kansas City, Missouri 64105
Transfer Agent
Boston Financial Data Services–Midwest
330 W. 9th Street
Kansas City, Missouri 64105
Legal Counsel
Dechert LLP
1775 I Street, N.W.
Washington, D.C. 20006
Independent Registered Public Accounting Firm
PricewaterhouseCoopers LLP
1055 Broadway
Kansas City, Missouri 64105
Information about how the Fund voted proxies relating to portfolio securities held during the year July 1, 2003 through June 30, 2004 will be available no later than August 31, 2004 without charge, upon request, by calling the Trust at 1-800-927-4648 and on the SEC’s website at http://www.sec.gov.
Copies of the written Proxy Policy and the factors that PIMCO may consider in determining how to vote proxies for the Funds are available by calling the Trust at 1-800-927-4648 and on the SEC’s website at http://www.sec.gov.
PIMCO VARIABLE INSURANCE TRUST
840 NEWPORT CENTER DRIVE
NEWPORT BEACH, CA 92660

PIMCO VARIABLE INSURANCE TRUST
LONG-TERM U.S. GOVT. PORTFOLIO
ADMINISTRATIVE CLASS
SEMI-ANNUAL REPORT
June 30, 2004
|
| This material is authorized for use only when preceded or accompanied by the current PIMCO Variable Insurance Trust prospectus. Investors should consider the investment objectives, risks, charges and expenses of Portfolio carefully before investing. This and other information is contained in the Portfolio’s prospectus. Please read the prospectus carefully before you invest or send money. |
Chairman’s Letter
Dear PIMCO Variable Insurance Trust Shareholder:
Bond prices were more volatile during the six-month period ended June 30, 2004. Interest rates rose sharply during the second quarter 2004, causing bonds to give back modest gains from earlier in the year. The Lehman Brothers Aggregate Bond Index, a widely used index for the high-grade bond market, was nearly flat during the first six months of 2004, returning 0.15% after losing 2.44% during the second quarter. The yield on the benchmark ten-year Treasury closed June 30, 2004 at 4.58%, up 0.75% from April 1, 2004, but up only 0.34% from where it began the six-month period on January 1, 2004.
Continued growth in employment convinced the markets that the Federal Reserve would soon begin a long anticipated tightening cycle. On June 30, 2004, the Fed met market expectations by increasing the federal funds rate 0.25%, which was the first rate increase since June 25, 2003. The central bank had held this rate at 1% for more than a year, which generated negative real short-term rates. And on August 10, 2004, the Fed increased the federal funds rate another 0.25% to 1.50%.
Investors that had profited handsomely from borrowing at low short-term rates and investing in higher-yielding longer maturity bonds surrendered some of those profits towards the latter part of the six-month period. Concern that borrowing rates would rise led investors to liquidate long positions and unwind these trades, which caused bond prices to decrease. However, substantial leverage remained among banks, hedge funds, and other investors, making bond markets somewhat vulnerable to additional Fed rate increases. There were also signs of rising inflation, which fueled anxiety that central banks might continue to raise interest rates.
On the following pages you will find a more complete review of the Portfolio in light of financial market activities as well as specific details about the total return investment performance for the six-month period.
We appreciate the trust you have placed in us, and we will continue to focus our efforts to meet your investment needs.
Sincerely,

Brent R. Harris
Chairman
August 11, 2004
| | | | |
| June 30, 2004 | | Semi-Annual Report | | 1 |
Important Information About the Portfolio
We believe that bond funds have an important role to play in a well diversified investment portfolio. It is important to note, however, that in an environment where interest rates may trend upward, rising rates will negatively impact the performance of most bond funds, and fixed income securities held by a fund are likely to decrease in value. The price volatility of fixed income securities can also increase during periods of rising interest rates resulting in increased losses to a fund. Bond funds and individual bonds with a longer duration (a measure of the expected life of a security) tend to be more sensitive to changes in interest rates, usually making them more volatile than securities or funds with shorter durations. The longer-term performance of most bond funds has benefited from capital gains in part resulting from an extended period of declining interest rates. In the event interest rates increase, these capital gains should not be expected to recur.
The Portfolio may be subject to various risks in addition to those described above. Some of these risks may include, but are not limited to, the following: real rate risk, derivative risk, small company risk, foreign security risk, high yield security risk and specific sector investment risks. The Portfolio may use derivative instruments for hedging purposes or as part of an investment strategy. Use of these instruments may involve certain costs and risks such as liquidity risk, interest rate risk, market risk, credit risk, management risk and the risk that a fund could not close out a position when it would be most advantageous to do so. A Portfolio investing in derivatives could lose more than the principal amount invested in these instruments. Investing in non-U.S. securities may entail risk due to non-U.S. economic and political developments; this risk may be enhanced when investing in emerging markets. High-yield bonds typically have a lower credit rating than other bonds. Lower rated bonds generally involve a greater risk to principal than higher rated bonds. Smaller companies may be more volatile than larger companies and may entail more risk. Concentrating investments in individual sectors may add additional risk and volatility compared to a diversified portfolio.
On the performance summary page in this semi-annual report, the Total Return Investment Performance table measures performance assuming that all dividend and capital gain distributions were reinvested. Returns do not reflect the deduction of taxes that a shareholder would pay (i) on Portfolio distributions or (ii) the redemption of Portfolio shares.
An investment in a Portfolio is not a bank deposit and is not guaranteed or insured by the Federal Deposit Insurance Corporation or any other government agency. It is possible to lose money on investments in the Funds.
The following disclosure provides important information regarding the Portfolio’s Expense Example, which appears on the Portfolio’s individual page in this semi-annual report. Please refer to this information when reviewing the Expense Example for the Portfolio.
Example
As a shareholder of the Portfolio, you incur two types of costs: (1) transaction costs, including redemption and exchange fees; and (2) ongoing costs, including advisory and administrative fees; distribution and/or service (12b-1) fees (Administrative Class only); and other Portfolio expenses. The Example is intended to help you understand your ongoing costs (in dollars) of investing in the Portfolio and to compare these costs with the ongoing costs of investing in other mutual funds.
The Example is based on an investment of $1,000 invested at the beginning of the period and held for the entire period indicated, which is from 1/1/04 to 6/30/04.
Actual Expenses
The information in the table under the heading “Actual Performance” provides information about actual account values and actual expenses. You may use the information in these columns, together with the amount you invested, to estimate the expenses that you paid over the period. Simply divide your account value by $1,000.00 (for example, an $8,600.00 account value divided by $1,000 = 8.60), then multiply the result by the number in the appropriate column for your share class, in the row entitled “Expenses Paid During Period” to estimate the expenses you paid on your account during this period.
Hypothetical Example for Comparison Purposes
The information in the table under the heading “Hypothetical Performance (5% return before expenses)” provides information about hypothetical account values and hypothetical expenses based on the Portfolio’s actual expense ratio and an assumed rate of return of 5% per year before expenses, which is not the Portfolio’s actual return. The hypothetical account values and expenses may not be used to estimate the actual ending account balance or expenses you paid for the period. You may use this information to compare the ongoing costs of investing in the Portfolio and other portfolios. To do so, compare this 5% hypothetical example with the 5% hypothetical examples that appear in the shareholder reports of the other portfolios.
Please note that the expenses shown in the table are meant to highlight your ongoing costs only and do not reflect any transactional costs. Therefore, the information under the heading “Hypothetical Performance (5% return before expenses)” is useful in comparing ongoing costs only, and will not help you determine the relative total costs of owning different portfolios. In addition, if these transactional costs were included, your costs would have been higher.
PIMCO Variable Insurance Trust is distributed by PA Distributors LLC, 2187 Atlantic Street, Stamford, CT 06902.
| | | | |
| 2 | | Semi-Annual Report | | June 30, 2004 |
Long-Term U.S. Government Portfolio
CUMULATIVE RETURNS THROUGH JUNE 30, 2004
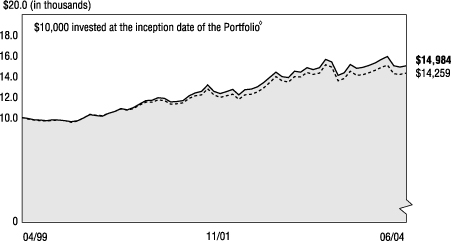
[CHART]
Long-Term U.S. Gov't Lehman Brothers
Portfolio Admin. Class Long-Term Treasury Index
---------------------- ------------------------
04/30/1999 $10,000 $10,000
05/31/1999 $9,882 $9,843
06/30/1999 $9,766 $9,739
07/31/1999 $9,730 $9,692
08/31/1999 $9,672 $9,654
09/30/1999 $9,758 $9,726
10/31/1999 $9,754 $9,731
11/30/1999 $9,686 $9,665
12/31/1999 $9,572 $9,521
01/31/2000 $9,680 $9,657
02/29/2000 $9,944 $9,949
03/31/2000 $10,257 $10,289
04/30/2000 $10,164 $10,207
05/31/2000 $10,119 $10,170
06/30/2000 $10,372 $10,391
07/31/2000 $10,582 $10,570
08/31/2000 $10,837 $10,811
09/30/2000 $10,719 $10,680
10/31/2000 $10,933 $10,846
11/30/2000 $11,270 $11,189
12/31/2000 $11,605 $11,452
01/31/2001 $11,660 $11,472
02/28/2001 $11,886 $11,668
03/31/2001 $11,831 $11,609
04/30/2001 $11,488 $11,294
05/31/2001 $11,513 $11,308
06/30/2001 $11,609 $11,406
07/31/2001 $12,079 $11,830
08/31/2001 $12,366 $12,083
09/30/2001 $12,503 $12,174
10/31/2001 $13,117 $12,771
11/30/2001 $12,517 $12,164
12/31/2001 $12,285 $11,936
01/31/2002 $12,479 $12,089
02/28/2002 $12,701 $12,230
03/31/2002 $12,176 $11,736
04/30/2002 $12,675 $12,182
05/31/2002 $12,736 $12,219
06/30/2002 $12,945 $12,439
07/31/2002 $13,333 $12,822
08/31/2002 $13,864 $13,382
09/30/2002 $14,351 $13,940
10/31/2002 $13,912 $13,539
11/30/2002 $13,842 $13,390
12/31/2002 $14,446 $13,938
01/31/2003 $14,368 $13,891
02/28/2003 $14,793 $14,312
03/31/2003 $14,608 $14,132
04/30/2003 $14,780 $14,275
05/31/2003 $15,578 $15,078
06/30/2003 $15,351 $14,848
07/31/2003 $14,062 $13,520
08/31/2003 $14,286 $13,735
09/30/2003 $15,106 $14,451
10/31/2003 $14,728 $14,049
11/30/2003 $14,813 $14,116
12/31/2003 $15,009 $14,284
01/31/2004 $15,245 $14,529
02/29/2004 $15,593 $14,819
03/31/2004 $15,865 $15,044
04/30/2004 $14,957 $14,200
05/31/2004 $14,856 $14,130
06/30/2004 $14,984 $14,259
SECTOR BREAKDOWN‡
| | | |
U.S. Government Agencies | | 28.7 | % |
U.S. Treasury Obligations | | 23.3 | % |
Mortgage-Backed Securities | | 16.4 | % |
Corporate Bonds & Notes | | 12.8 | % |
Short-Term Instruments | | 7.9 | % |
Asset-Backed Securities | | 7.5 | % |
Other | | 3.4 | % |
‡ % of Total Investments as of June 30, 2004
à$10,000 invested at the beginning of the first full month following the inception of the Administrative Class.
TOTAL RETURN INVESTMENT PERFORMANCE For the period ended June 30, 2004
| | | | | | | | | | | | | | | | |
| | | | | | | 6 Months | | | 1 Year | | | 5 Years* | | | Since Inception* | |
| | |
| | Long-Term U.S. Government Portfolio Administrative Class (Inception 04/30/99) | | –0.17 | % | | –2.39 | % | | 8.94 | % | | 8.13 | % |
| | | - - - - - - - | | Lehman Brothers Long-Term Treasury Index | | –0.17 | % | | –3.96 | % | | 7.92 | % | | — | |
| | | | | * Annualized. All Portfolio returns are net of fees and expenses. | | | | | | | | | | | | |
Past performance is no guarantee of future results. The performance quoted represents past performance. Investment return and principal value will fluctuate so the Portfolio shares, when redeemed, may be worth more or less than their original cost. Current performance may be lower or higher than the performance data quoted. Performance data current to the most recent month-end is available by calling (800) 927-4648.
Please refer to page 2 herein for an explanation of the information presented in the following Expense Example.
| | | | | | | | | | |
| EXPENSE EXAMPLE | | | | Actual Performance | | | | Hypothetical Performance
(5% return before expenses) |
Beginning Account Value (01/01/04) | | | | $ | 1,000.00 | | | | $ | 1,000.00 |
Ending Account Value (06/30/04) | | | | $ | 998.30 | | | | $ | 1,025.00 |
Expenses Paid During Period† | | | | $ | 3.28 | | | | $ | 3.32 |
†Expenses are equal to the Portfolio’s Administrative Class annualized expense ratio of 0.66%, multiplied by the average account value over the period, multiplied by 182/366 (to reflect the one-half year period).
PORTFOLIO INSIGHTS
| • | The Long-Term U.S. Government Portfolio seeks to achieve its investment objective by investing under normal circumstances at least 80% of its assets in a diversified portfolio of fixed income securities that are issued or guaranteed by the U.S. Government, its agencies or government-sponsored enterprises. |
| • | The Portfolio’s Administrative Class shares matched its benchmark, the Lehman Brothers Long-Term Treasury Index, for the 6-month period ended June 30, 2004, by returning -0.17%. |
| • | Below-Index duration enhanced performance for the first half of the year as interest rates rose; however, an overweight to intermediate maturities negatively impacted the Portfolio, as these rates experienced the most dramatic rate increases. |
| • | Modest holdings of longer duration structured mortgages detracted slightly from performance despite decreasing levels of volatility. |
| • | An allocation to longer duration corporate securities negatively impacted portfolio performance, as long maturity credit issues lagged Treasuries of similar maturities. |
| • | Allocations to real return and municipal bonds helped returns; these less volatile assets outperformed amid rising rates. |
| • | A focus on high-quality, intermediate, and long maturity agency bonds was unfavorable for portfolio returns, as the sector’s yield premiums widened relative to Treasuries. |
| | | | | | |
| | | June 30, 2004 | | Semi-Annual Report | | 3 |
Financial Highlights
Long-Term U.S. Government Portfolio (Administrative Class)
| | | | | | | | | | | | | | | | | | | | | | | | | | | | | | | | | | | | |
Selected Per Share Data for the Year or
Period Ended: | | | | 06/30/2004+ | | | | | 12/31/2003 | | | | | 12/31/2002 | | | | | 12/31/2001 | | | | | 12/31/2000 | | | | | 04/30/1999-
12/31/1999 | |
| | | | | | | | | | | | |
Net asset value beginning of period | | | | $ | 11.01 | | | | | $ | 11.09 | | | | | $ | 10.27 | | | | | $ | 10.56 | | | | | $ | 9.22 | | | | | $ | 10.00 | |
Net investment income (a) | | | | | 0.15 | | | | | | 0.30 | | | | | | 0.44 | | | | | | 0.51 | | | | | | 0.56 | | | | | | 0.36 | |
Net realized/unrealized gain (loss) on investments (a) | | | | | (0.17 | ) | | | | | 0.12 | | | | | | 1.31 | | | | | | 0.09 | | | | | | 1.34 | | | | | | (0.78 | ) |
Total income (loss) from investment operations | | | | | (0.02 | ) | | | | | 0.42 | | | | | | 1.75 | | | | | | 0.60 | | | | | | 1.90 | | | | | | (0.42 | ) |
Dividends from net investment income | | | | | (0.16 | ) | | | | | (0.33 | ) | | | | | (0.44 | ) | | | | | (0.52 | ) | | | | | (0.56 | ) | | | | | (0.36 | ) |
Distributions from net realized capital gains | | | | | 0.00 | | | | | | (0.17 | ) | | | | | (0.49 | ) | | | | | (0.37 | ) | | | | | 0.00 | | | | | | 0.00 | |
Total distributions | | | | | (0.16 | ) | | | | | (0.50 | ) | | | | | (0.93 | ) | | | | | (0.89 | ) | | | | | (0.56 | ) | | | | | (0.36 | ) |
Net asset value end of period | | | | $ | 10.83 | | | | | $ | 11.01 | | | | | $ | 11.09 | | | | | $ | 10.27 | | | | | $ | 10.56 | | | | | $ | 9.22 | |
Total return | | | | | (0.17 | )% | | | | | 3.90 | % | | | | | 17.59 | % | | | | | 5.86 | % | | | | | 21.24 | % | | | | | (4.28 | )% |
Net assets end of period (000s) | | | | $ | 83,766 | | | | | $ | 94,003 | | | | | $ | 92,256 | | | | | $ | 33,013 | | | | | $ | 9,625 | | | | | $ | 7,173 | |
Ratio of net expenses to average net assets | | | | | 0.66 | %*(d) | | | | | 0.66 | %(d) | | | | | 0.65 | %(c) | | | | | 0.65 | %(c) | | | | | 0.65 | % | | | | | 0.65 | %*(b) |
Ratio of net investment income to average net assets | | | | | 2.80 | %* | | | | | 2.72 | % | | | | | 4.05 | % | | | | | 4.75 | % | | | | | 5.70 | % | | | | | 5.55 | %* |
Portfolio turnover rate | | | | | 161 | % | | | | | 619 | % | | | | | 586 | % | | | | | 457 | % | | | | | 533 | % | | | | | 294 | % |
| (a) | Per share amounts based on average number of shares outstanding during the period. |
| (b) | If the investment manager had not reimbursed expenses, the ratio of expenses to average net assets would have been 0.71%. |
| (c) | If the investment manager had not reimbursed expenses, the ratio of expenses to average net assets would have been 0.66%. |
| (d) | Ratio of expenses to average net assets excluding interest expense is 0.65%. |
| | | | | | |
| 4 | | Semi-Annual Report | | June 30, 2004 | | See accompanying notes |
Statement of Assets and Liabilities
Long-Term U.S. Government Portfolio
June 30, 2004 (Unaudited)
| | | | | |
| Amounts in thousands, except per share amounts | | | | |
| | |
Assets: | | | | | |
| | |
Investments, at value | | | | $ | 85,724 |
Cash | | | | | 12 |
Receivable for investments sold | | | | | 700 |
Receivable for investments sold on delayed delivery basis | | | | | 18,636 |
Receivable for Portfolio shares sold | | | | | 6 |
Interest and dividends receivable | | | | | 1,077 |
Variation margin receivable | | | | | 344 |
| | | | | | 106,499 |
| | |
Liabilities: | | | | | |
| | |
Payable for investments purchased | | | | $ | 2,080 |
Payable for investments purchased on delayed delivery basis | | | | | 20,242 |
Written options outstanding | | | | | 17 |
Accrued investment advisory fee | | | | | 17 |
Accrued administration fee | | | | | 17 |
Accrued servicing fee | | | | | 8 |
| | | | | | 22,381 |
| | |
Net Assets | | | | $ | 84,118 |
| | |
Net Assets Consist of: | | | | | |
| | |
Paid in capital | | | | $ | 83,362 |
Undistributed net investment income | | | | | 80 |
Accumulated undistributed net realized gain | | | | | 579 |
Net unrealized appreciation | | | | | 97 |
| | | | | $ | 84,118 |
| | |
Net Assets: | | | | | |
| | |
Institutional Class | | | | $ | 352 |
Administrative Class | | | | | 83,766 |
| | |
Shares Issued and Outstanding: | | | | | |
| | |
Institutional Class | | | | | 32 |
Administrative Class | | | | | 7,731 |
| | |
Net Asset Value and Redemption Price Per Share
(Net Assets Per Share Outstanding) | | | | | |
| | |
Institutional Class | | | | $ | 10.83 |
Administrative Class | | | | | 10.83 |
| | |
Cost of Investments Owned | | | | $ | 86,338 |
| | | | | | |
| See accompanying notes | | June 30, 2004 | | Semi-Annual Report | | 5 |
Statement of Operations
Long-Term U.S. Government Portfolio
| | | | | | |
| Amounts in thousands | | | | | |
| | | | | Six Months Ended June 30, 2004 (Unaudited) | |
Investment Income: | | | | | | |
| | |
Interest | | | | $ | 1,538 | |
Total Income | | | | | 1,538 | |
| | |
Expenses: | | | | | | |
| | |
Investment advisory fees | | | | | 111 | |
Administration fees | | | | | 111 | |
Distribution and/or servicing fees - Administrative Class | | | | | 66 | |
Trustees’ fees | | | | | 1 | |
Interest expense | | | | | 4 | |
Total Expenses | | | | | 293 | |
| | |
Net Investment Income | | | | | 1,245 | |
| | |
Net Realized and Unrealized Gain (Loss): | | | | | | |
| | |
Net realized gain on investments | | | | | 263 | |
Net realized gain on futures contracts and options | | | | | 217 | |
Net change in unrealized (depreciation) on investments | | | | | (1,919 | ) |
Net change in unrealized appreciation on futures contracts and options | | | | | 134 | |
Net (Loss) | | | | | (1,305 | ) |
| | |
Net Decrease in Assets Resulting from Operations | | | | $ | (60 | ) |
| | | | | | |
| 6 | | Semi-Annual Report | | June 30, 2004 | | See accompanying notesS |
Statements of Changes in Net Assets
Long-Term U.S. Government Portfolio
| | | | | | | | | | | | |
| Amounts in thousands | | | | | | | | | | |
| | | | | Six Months Ended June 30, 2004 (Unaudited) | | | | | Year Ended
December 31, 2003 | |
Increase (Decrease) in Net Assets from: | | | | | | | | | | | | |
| | | | |
Operations: | | | | | | | | | | | | |
| | | | |
Net investment income | | | | $ | 1,245 | | | | | $ | 2,727 | |
Net realized gain | | | | | 480 | | | | | | 1,377 | |
Net change in unrealized (depreciation) | | | | | (1,785 | ) | | | | | (620 | ) |
Net increase (decrease) resulting from operations | | | | | (60 | ) | | | | | 3,484 | |
| | | | |
Distributions to Shareholders: | | | | | | | | | | | | |
| | | | |
From net investment income | | | | | | | | | | | | |
Institutional Class | | | | | (2 | ) | | | | | 0 | |
Administrative Class | | | | | (1,323 | ) | | | | | (3,025 | ) |
| | | | |
From net realized capital gains | | | | | | | | | | | | |
Institutional Class | | | | | 0 | | | | | | 0 | |
Administrative Class | | | | | 0 | | | | | | (1,459 | ) |
Total Distributions | | | | | (1,325 | ) | | | | | (4,484 | ) |
| | | | |
Portfolio Share Transactions: | | | | | | | | | | | | |
| | | | |
Receipts for shares sold | | | | | | | | | | | | |
Institutional Class | | | | | 339 | | | | | | 0 | |
Administrative Class | | | | | 11,160 | | | | | | 41,837 | |
| | | | |
Issued as reinvestment of distributions | | | | | | | | | | | | |
Institutional Class | | | | | 2 | | | | | | 1 | |
Administrative Class | | | | | 1,323 | | | | | | 4,476 | |
| | | | |
Cost of shares redeemed | | | | | | | | | | | | |
Institutional Class | | | | | (5 | ) | | | | | 0 | |
Administrative Class | | | | | (21,332 | ) | | | | | (43,567 | ) |
Net increase (decrease) resulting from Portfolio share transactions | | | | | (8,513 | ) | | | | | 2,747 | |
| | | | |
Total Increase (Decrease) in Net Assets | | | | | (9,898 | ) | | | | | 1,747 | |
| | | | |
Net Assets: | | | | | | | | | | | | |
| | | | |
Beginning of period | | | | | 94,016 | | | | | | 92,269 | |
End of period* | | | | $ | 84,118 | | | | | $ | 94,016 | |
| | | | |
*Including undistributed net investment income of: | | | | $ | 80 | | | | | $ | 159 | |
| | | | | | |
| See accompanying notes | | June 30, 2004 | | Semi-Annual Report | | 7 |
Schedule of Investments
Long-Term U.S. Government Portfolio
June 30, 2004 (Unaudited)
| | | | |
| | | Principal | | |
| | | Amount | | Value |
| | | (000s) | | (000s) |
| | | | | | |
CORPORATE BONDS & NOTES 13.1% | | | |
Banking & Finance 11.7% | | | | | | |
Ford Motor Credit Co. | | | | | | |
1.500% due 07/19/2004 (a) | | $ | 900 | | $ | 900 |
1.590% due 07/18/2005 (a) | | | 100 | | | 100 |
7.600% due 08/01/2005 | | | 100 | | | 105 |
General Electric Capital Corp. | | | | | | |
1.650% due 03/15/2005 (a) | | | 1,400 | | | 1,402 |
International Bank for Reconstruction
& Development |
3.500% due 10/22/2004 | | | 1,000 | | | 1,006 |
7.625% due 01/19/2023 | | | 2,700 | | | 3,336 |
Merrill Lynch & Co, Inc. | | | | | | |
6.750% due 06/01/2028 | | | 202 | | | 213 |
National Rural Utilities Cooperative
Finance Corp. |
5.250% due 07/15/2004 | | | 400 | | | 400 |
Travelers Property Casualty Corp. | | | |
6.375% due 03/15/2033 | | | 1,000 | | | 988 |
U.S. Trade Funding Corp. | | | | | | |
4.260% due 11/15/2014 | | | 909 | | | 897 |
Verizon Wireless Capital LLC | | | | | | |
1.350% due 05/23/2005 (a) | | | 500 | | | 500 |
| | | | | |
|
|
| | | | | | | 9,847 |
| | | | | |
|
|
Industrials 1.4% | | | | | | |
Continental Airlines, Inc. | | | | | | |
6.320% due 11/01/2008 | | | 1,000 | | | 967 |
DaimlerChrysler North America
Holding Corp. |
1.570% due 08/16/2004 (a) | | | 200 | | | 200 |
| | | | | |
|
|
| | | | | | | 1,167 |
| | | | | |
|
|
Total Corporate Bonds & Notes (Cost $11,102) | | | | | | 11,014 |
| | | | |
|
|
| | | | | | | |
MUNICIPAL BONDS & NOTES 3.5% | | | |
|
Chicago, Illinois Motor Fuel Tax
Revenue Bonds, (AMBAC Insured), Series 2003 |
5.000% due 01/01/2033 | | | 200 | | | 195 |
Chicago, Illinois Water Revenue Bonds,
(AMBAC Insured), Series 2001 |
5.000% due 11/01/2031 | | | 200 | | | 196 |
Dawson Ridge Metropolitan District No. 1
General Obligation Bonds, Series 1992 |
0.000% due 10/01/2022 | | | 800 | | | 305 |
Detroit City School District General
Obligation Bonds, (FGID Q-SBLF Insured), Series 2003 |
5.000% due 05/01/2033 | | | 100 | | | 98 |
Florida State Board of Education General
Obligation Bonds, (FGIC Insured), Series 2002 |
5.000% due 06/01/2031 | | | 500 | | | 494 |
Illinois Educational Facilities Authority
Revenue Bonds, Series 2003 |
5.000% due 07/01/2033 | | | 400 | | | 389 |
Irving Independent School District
General Obligation Bonds,
(PSF-GTD Insured), Series 2003 |
5.000% due 02/15/2031 | | | 200 | | | 195 |
Metropolitan Transportation Authority
Revenue Bonds, (FSA Insured), Series 2002 |
5.000% due 11/15/2032 | | | 300 | | | 295 |
New York City Municipal Water
Finance Authority Revenue Bonds, Series 2002 |
5.125% due 06/15/2034 | | | 200 | | | 198 |
New York State Triborough Bridge & Tunnels
Authority Revenue Bonds, Series 2002 |
5.000% due 11/15/2032 | | | 200 | | | 194 |
| | | | | | |
|
San Antonio, Texas Water Revenue Bonds,
(FSA Insured), Series 2002 |
5.000% due 05/15/2032 | | $ | 250 | | $ | 244 |
South Putnam School Building Corp.
Revenue Bonds, (FSA insured), Series 2003 |
5.000% due 01/15/2022 | | | 100 | | | 102 |
| | | | | |
|
|
Total Municipal Bonds & Notes (Cost $2,936) | | | | | | 2,905 |
| | | | |
|
|
| | | | | | | |
U.S. GOVERNMENT AGENCIES 29.2% | | | |
Aid-Israel | | | | | | |
5.500% due 09/18/2023 | | | 1,000 | | | 986 |
Fannie Mae | | | | | | |
2.125% due 02/10/2006 (a) | | | 1,000 | | | 991 |
4.875% due 03/11/2007 | | | 1,000 | | | 1,005 |
2.210% due 04/25/2021 (a) | | | 45 | | | 46 |
1.760% due 08/25/2021 (a) | | | 48 | | | 49 |
1.910% due 08/25/2022 (a) | | | 26 | | | 26 |
2.200% due 04/25/2032 (a) | | | 75 | | | 76 |
5.500% due 05/01/2034 | | | 397 | | | 395 |
5.000% due 07/20/2019-01/01/2034 (d) | | | 3,348 | | | 3,288 |
Federal Home Loan Bank | | | | | | |
4.250% due 09/28/2009 | | | 1,000 | | | 1,005 |
5.120% due 01/10/2013 (a) | | | 5,000 | | | 4,974 |
Federal Housing Administration | | | | | | |
6.896% due 07/01/2020 (a) | | | 535 | | | 526 |
Financing Corp. | | | | | | |
10.700% due 10/06/2017 | | | 650 | | | 976 |
Freddie Mac | | | | | | |
6.000% due 02/15/2015 | | | 165 | | | 165 |
5.200% due 03/05/2019 | | | 1,500 | | | 1,413 |
2.250% due 02/15/2021 (a) | | | 55 | | | 55 |
1.950% due 02/15/2027 (a) | | | 44 | | | 45 |
5.500% due 08/15/2030 | | | 41 | | | 41 |
1.863% due 10/25/2030 | | | 252 | | | 252 |
7.000% due 07/15/2023-12/01/2031 (d) | | | 254 | | | 269 |
Government National Mortgage Association | | | |
6.000% due 08/20/2033 | | | 1,051 | | | 978 |
5.000% due 08/20/2033-04/20/2034 (d) | | | 4,161 | | | 3,226 |
Overseas Private Investment Corp. | | | |
3.800% due 08/15/2007 | | | 1,000 | | | 967 |
5.140% due 08/15/2007 | | | 1,000 | | | 1,049 |
5.590% due 11/30/2010 | | | 700 | | | 788 |
Small Business Administration | | | | | | |
5.240% due 08/01/2023 (a) | | | 984 | | | 988 |
| | | | | |
|
|
Total U.S. Government Agencies (Cost $24,647) | | | 24,579 |
| |
|
|
| | | | | | | |
U.S. TREASURY OBLIGATIONS 23.8% | | | |
Treasury Inflation Protected Securities (c) | | | |
3.375% due 01/15/2007 (b) | | | 178 | | | 191 |
3.000% due 07/15/2012 | | | 732 | | | 791 |
3.875% due 04/15/2029 | | | 1,143 | | | 1,459 |
U.S. Treasury Bonds | | | | | | |
6.000% due 02/15/2026 | | | 7,400 | | | 7,976 |
5.500% due 08/15/2028 | | | 2,900 | | | 2,939 |
5.250% due 11/15/2028 | | | 1,900 | | | 1,862 |
U.S. Treasury Note | | | | | | |
1.750% due 12/31/2004 | | | 4,000 | | | 4,002 |
U.S. Treasury Strip | | | | | | |
0.000% due 11/15/2021 | | | 2,000 | | | 764 |
| | | | | |
|
|
Total U.S. Treasury Obligations (Cost $38,940) | | | | | | 19,984 |
| | | | |
|
|
| | | | | | | |
MORTGAGE-BACKED SECURITIES 16.7% |
Bear Stearns Adjustable Rate Mortgage Trust |
5.130% due 03/25/2033 (a) | | | 1,266 | | | 1,277 |
5.440% due 03/25/2033 (a) | | | 484 | | | 490 |
| | | | | | |
| | |
4.924% due 01/25/2034 (a) | | $ | 230 | | $ | 231 |
1.580% due 02/25/2034 (a) | | | 246 | | | 247 |
Countrywide Alternative Loan Trust | | | |
5.500% due 10/25/2033 | | | 1,042 | | | 898 |
Countrywide Home Loans, Inc. | | | | | | |
6.000% due 02/25/2033 | | | 275 | | | 277 |
5.250% due 01/25/2034 | | | 933 | | | 937 |
CS First Boston Mortgage Securities Corp. | | | |
4.960% due 11/25/2032 (a) | | | 240 | | | 244 |
1.850% due 04/25/2033 (a) | | | 338 | | | 339 |
Federal Agricultural Mortgage Corp. | | | |
7.238% due 07/25/2011 (a) | | | 184 | | | 190 |
First Republic Mortgage Loan Trust | | | |
1.590% due 11/15/2031 (a) | | | 753 | | | 755 |
GMAC Mortgage Corp. Loan Trust | | | |
1.500% due 10/25/2033 (a) | | | 337 | | | 337 |
MASTR Asset Securitization Trust | | | |
5.500% due 09/25/2033 | | | 713 | | | 697 |
Nomura Asset Acceptance Corp. | | | |
2.420% due 09/25/2028 | | | 12 | | | 12 |
Residential Accredit Loans, Inc. | | | |
1.700% due 01/25/2033 (a) | | | 152 | | | 152 |
1.700% due 03/25/2033 (a) | | | 244 | | | 244 |
Residential Funding Mortgage Securities I, Inc. |
6.500% due 03/25/2032 | | | 231 | | | 235 |
Sequoia Mortgage Trust | | | | | | |
1.620% due 06/20/2032 (a) | | | 278 | | | 278 |
1.630% due 07/20/2033 (a) | | | 903 | | | 898 |
Structured Asset Mortgage Investments, Inc. |
6.690% due 02/25/2030 (a) | | | 79 | | | 81 |
6.513% due 03/25/2032 (a) | | | 139 | | | 143 |
1.610% due 09/19/2032 (a) | | | 2,002 | | | 1,995 |
1.700% due 06/18/2033 (a) | | | 543 | | | 544 |
Structured Asset Securities Corp. | | | |
1.800% due 07/25/2032 (a) | | | 1,248 | | | 1,252 |
1.590% due 01/25/2033 (a) | | | 126 | | | 126 |
Washington Mutual Mortgage Securities Corp. |
6.000% due 03/25/2017 | | | 139 | | | 140 |
5.390% due 02/25/2031 (a) | | | 233 | | | 239 |
1.850% due 01/25/2033 (a) | | | 36 | | | 36 |
5.120% due 02/25/2033 (a) | | | 182 | | | 185 |
5.420% due 02/25/2033 (a) | | | 168 | | | 170 |
5.040% due 05/25/2033 (a) | | | 371 | | | 376 |
3.565% due 01/25/2041 (a) | | | 13 | | | 13 |
| | | | | |
|
|
Total Mortgage-Backed Securities (Cost $14,156) | | | 14,038 |
| |
|
|
| | | | | | | |
ASSET-BACKED SECURITIES 7.6% |
| | |
ACE Securities Corp. | | | | | | |
1.640% due 06/25/2032 (a) | | | 103 | | | 103 |
AmeriCredit Automobile Receivables Trust |
1.350% due 10/12/2006 (a) | | | 176 | | | 176 |
Ameriquest Mortgage Securities, Inc. | | | |
1.710% due 03/25/2033 (a) | | | 172 | | | 173 |
Argent Securities, Inc. | | | | | | |
1.550% due 03/25/2034 (a) | | | 1,281 | | | 1,282 |
Bayview Financial Acquisition Trust | | | |
1.770% due 08/28/2034 (a) | | | 626 | | | 629 |
Bear Stearns Asset-Backed Securities, Inc. | | | |
1.800% due 11/25/2042 (a) | | | 867 | | | 868 |
Countrywide Asset-Backed Certificates | | | |
1.560% due 05/25/2032 (a) | | | 30 | | | 30 |
1.420% due 09/25/2033 (a) | | | 77 | | | 77 |
CS First Boston Mortgage Securities Corp. | | | |
1.740% due 08/25/2032 (a) | | | 178 | | | 178 |
Financial Asset Securities Corp. AAA Trust | | | |
1.450% due 09/25/2033 (a) | | | 121 | | | 121 |
Home Equity Mortgage Trust | | | | | | |
1.700% due 09/25/2033 (a) | | | 69 | | | 69 |
Household Mortgage Loan Trust | | | |
1.580% due 05/20/2032 (a) | | | 316 | | | 317 |
Long Beach Mortgage Loan Trust | | | |
1.700% due 03/25/2033 (a) | | | 419 | | | 420 |
| | | | | | |
| 8 | | Semi-Annual Report | | June 30, 2004 | | See accompanying notes |
| | | | |
| | | Principal | | |
| | | Amount | | Value |
| | | (000s) | | (000s) |
| | | | | | |
| | |
Los Angeles Arena Funding LLC | | | | | | |
7.656% due 12/15/2026 (a) | | $ | 94 | | $ | 97 |
Novastar Home Equity Loan | | | | | | |
1.580% due 01/25/2031 (a) | | | 69 | | | 69 |
Renaissance Home Equity Loan Trust | | | |
1.740% due 08/25/2033 (a) | | | 79 | | | 79 |
1.800% due 12/25/2033 (a) | | | 267 | | | 269 |
Saxon Asset Securities Trust | | | | | | |
1.380% due 03/25/2018 (a) | | | 286 | | | 285 |
SMS Student Loan Trust | | | | | | |
1.940% due 10/27/2025 (a) | | | 132 | | | 132 |
Specialty Underwriting & Residential Finance |
1.630% due 06/25/2034 (a) | | | 670 | | | 671 |
Terwin Mortgage Trust | | | | | | |
1.880% due 06/25/2033 (a) | | | 376 | | | 377 |
| | | | | |
|
|
Total Asset-Backed Securities (Cost $6,421) | | | | | | 6,422 |
| | | | |
|
|
| | | | | | | |
PURCHASED CALL OPTIONS 0.0% | | | |
| | | # of
Contracts | | |
Eurodollar December Futures (CME) | | | |
Strike @ 98.000 Exp. 12/13/2004 | | | 100 | | | 9 |
Eurodollar September Futures (CME) | | | |
Strike @ 98.875 Exp. 09/13/2004 | | | 100 | | | 0 |
| | | | | |
|
|
Total Purchased Call Options (Cost $30) | | | | | | 9 |
| | | | |
|
|
| | | | | | | |
PURCHASED PUT OPTIONS 0.0% | | | |
| |
Eurodollar September Futures (CME) | | | |
Strike @ 97.250
Exp. 09/13/2004 | | | 66 | | | 1 |
| | | | | |
|
|
Total Purchased Put Options (Cost $2) | | | | | | 1 |
| | | | |
|
|
| | | | | | | |
| | | | | | | |
SHORT-TERM INSTRUMENTS 8.0% | | | | |
| | |
Commercial Paper 4.1% | | | | | | | |
Fannie Mae | | | | | | | |
1.380% due 09/01/2004 | | $ | 600 | | $ | 598 | |
1.415% due 09/08/2004 | | | 300 | | | 299 | |
1.530% due 10/18/2004 | | | 400 | | | 398 | |
Freddie Mac | | | | | | | |
1.300% due 07/01/2004 | | | 700 | | | 700 | |
1.540% due 10/18/2004 | | | 700 | | | 697 | |
1.560% due 10/20/2004 | | | 800 | | | 796 | |
| | | | | |
|
|
|
| | | | | | | 3,488 | |
| | | | | |
|
|
|
| | |
Repurchase Agreement 2.1% | | | | | | | |
State Street Bank | | | | | | | |
0.800% due 07/01/2004 | | | 1,803 | | | 1,803 | |
| | | | | |
|
|
|
(Dated 06/30/2004. Collateralized by Freddie Mac 5.500% due 07/15/2006 valued at $1,843. Repurchase proceeds are $1,803.) | |
| | |
U.S. Treasury Bills 1.8% | | | | | | | |
1.385% due 09/16/2004 (b)(d) | | | 1,485 | | | 1,481 | |
| | | | | |
|
|
|
Total Short-Term Instruments (Cost $6,772) | | | | | | 6,772 | |
| | | | |
|
|
|
| |
Total Investments 101.9% | | $ | 85,724 | |
(Cost $86.338) | | | | | | | |
| |
Written Options (e) (0.0%) | | | (17 | ) |
(Premiums $64) | | | | | | | |
| |
Other Assets and Liabilities (Net) (1.9%) | | | (1,589 | ) |
| | | | | |
|
|
|
| |
Net Assets 100.0% | | $ | 84,118 | |
| | | | | |
|
|
|
Notes to Schedule of Investments (amounts in thousands, except number of contracts):
(a) Variable rate security.
(b) Securities with an aggregate market value of $1,672 have been segregated with the custodian to cover margin requirements for the following open futures contracts at June 30, 2004:
| | | | | | | | | | |
| Type | | Expiration
Month | | # of
Contracts | | | | Unrealized
Appreciation/
(Depreciation) | |
Eurodollar March Long Futures | | 03/2005 | | 114 | | | | $ | (77 | ) |
Eurodollar September Long Futures | | 09/2005 | | 1 | | | | | 0 | |
Eurodollar December Long Futures | | 12/2004 | | 11 | | | | | (16 | ) |
U.S. Treasury 10-Year Note Long Futures | | 09/2004 | | 225 | | | | | 384 | |
U.S. Treasury 30-Year Note Long Futures | | 09/2004 | | 168 | | | | | 395 | |
U.S. Treasury 5-Year Note Short Futures | | 09/2004 | | 34 | | | | | (21 | ) |
| | | | | | | | | $ | 665 | |
(c) Principal amount of security is adjusted for inflation.
(d) Securities are grouped by coupon or range of coupons and represent a range of maturities.
(e) Premiums received on written options:
| | | | | | | | | | | | | | | | | | | | | |
| Name of Issuer | | Exercise Price | | | | Expiration
Date | | | | # of
Contracts | | | | Premium | | | | Value |
Call - CBOT U.S. Treasury Bond September Futures | | $ | 108.000 | | | | 08/27/2004 | | | | 11 | | | | $ | 9 | | | | $ | 9 |
Call - CBOT U.S. Treasury Note September Futures | | | 115.000 | | | | 08/27/2004 | | | | 15 | | | | | 19 | | | | | 0 |
Call - CBOT U.S. Treasury Note September Futures | | | 114.000 | | | | 08/27/2004 | | | | 24 | | | | | 15 | | | | | 2 |
Put - CBOT U.S. Treasury Bond September Futures | | | 100.000 | | | | 08/27/2004 | | | | 11 | | | | | 9 | | | | | 2 |
Call - CME Eurodollar December Futures | | | 98.250 | | | | 12/13/2004 | | | | 1,000 | | | | | 12 | | | | | 4 |
| | | | | | | | | | | | | | | | $ | 64 | | | | $ | 17 |
| | | | | | |
| See accompanying notes | | June 30, 2004 | | Semi-Annual Report | | 9 |
Notes to Financial Statements
June 30, 2004 (Unaudited)
1. Organization
The Long-Term U.S. Government Portfolio (the “Portfolio”) is a series of the PIMCO Variable Insurance Trust (the “Trust”). The Trust is registered under the Investment Company Act of 1940 (the “Act”), as amended, as an open-end investment company organized as a Delaware business trust on October 3, 1997. The Portfolio offers two classes of shares: Institutional and Administrative. Each share class has identical voting rights (except that shareholders of a class have exclusive voting rights regarding any matter relating solely to that class of shares). Information presented in these financial statements pertains to the Administrative Class of the Portfolio. Certain detailed financial information for the Institutional Class is provided separately and is available upon request. The Trust is designed to be used as an investment vehicle by Separate Accounts of insurance companies that fund variable annuity contracts and variable life insurance policies and by qualified pension and retirement plans. The Portfolio commenced operations on April 30, 1999.
2. Significant Accounting Policies
The following is a summary of significant accounting policies consistently followed by the Trust in the preparation of its financial statements in conformity with accounting principles generally accepted in the United States of America. The preparation of financial statements in accordance with accounting principles generally accepted in the United States of America requires management to make estimates and assumptions that affect the reported amounts and disclosures in the financial statements. Actual results could differ from those estimates.
Security Valuation. Portfolio securities and other financial instruments for which market quotations are readily available are stated at market value. Portfolio securities and other financial instruments for which market quotes are not readily available are valued at fair value, as determined in good faith and pursuant to guidelines established by the Board of Trustees, including certain fixed income securities which may be valued with reference to securities whose prices are more readily obtainable. Market value is determined at the close of regular trading (normally, 4:00 p.m., Eastern Time) on the New York Stock Exchange on each day the New York Stock Exchange is open, or if no sales are reported, as is the case for most securities traded over-the-counter, the mean between representative bid and asked quotations obtained from a quotation reporting system or from established market makers. The prices of certain portfolio securities or other financial instruments may be determined at a time prior to the close of regular trading on the New York Stock Exchange. Fair valuation may be used if significant events occur after the close of the relevant markets and prior to the close of regular trading on the New York Stock Exchange that materially affect the values of such securities or financial instruments. Fixed income securities are normally valued on the basis of quotes obtained from brokers and dealers or pricing services. Certain fixed income securities purchased on a delayed delivery basis are marked to market daily until settlement at the forward settlement value. Short-term investments, which mature in 60 days or less are valued at amortized cost, which approximates market value. Exchange traded options, futures and options on futures are valued at the settlement price determined by the relevant exchange. Prices may be obtained from independent pricing services which use information provided by market makers or estimates of market values obtained from yield data relating to investments or securities with similar characteristics. The prices used by the Portfolio may differ from the value that would be realized if the securities were sold and the differences could be material to the financial statements.
Securities Transactions and Investment Income. Securities transactions are recorded as of the trade date. Securities purchased or sold on a when-issued or delayed delivery basis may be settled a month or more after the trade date. Realized gains and losses from securities sold are recorded on the identified cost basis. Dividend income is recorded on the ex-dividend date, except certain dividends from foreign securities where the ex-dividend date may have passed, are recorded as soon as the Portfolio is informed of the ex-dividend date. Interest income, adjusted for the accretion of discounts and amortization of premiums, is recorded on the accrual basis. Paydowns gains and losses on mortgage- and asset-backed securities are recorded as adjustments to interest income in the Statement of Operations.
Dividends and Distributions to Shareholders. Dividends from net investment income, if any, are declared on each day the Trust is open for business and are distributed to shareholders monthly. All dividends are reinvested in additional shares of the Portfolio. Net realized capital gains earned by the Portfolio, if any, will be distributed no less frequently than once each year.
Income dividends and capital gain distributions are determined in accordance with income tax regulations which may differ from accounting principles generally accepted in the United States of America. These differences are primarily due to differing treatments for such items as wash sales, foreign currency transactions, net operating losses, notional principal contracts, certain asset-backed securities, certain futures and forward contracts, tax straddles, and capital loss carryforwards.
Distributions classified as a tax basis return of capital, if any, are reflected in the accompanying Statements of Changes in Net Assets and have been reclassified to paid in capital. In addition, other amounts have been reclassified between undistributed net investment income, accumulated undistributed net realized gains or losses and/or paid in capital to more appropriately conform financial accounting to tax characterizations of dividend distributions.
Multiclass Operations. Each class offered by the Trust has equal rights as to assets. Income, non-class specific expenses, and realized and unrealized capital gains and losses are allocated to each class of shares based on the relative net assets of each class.
Delayed Delivery Transactions. The Portfolio may purchase or sell securities on a when-issued or delayed delivery basis. These transactions involve a commitment by the Portfolio to purchase or
| | | | |
| 10 | | Semi-Annual Report | | June 30, 2004 |
sell securities for a predetermined price or yield, with payment and delivery taking place beyond the customary settlement period. When delayed delivery purchases are outstanding, the Portfolio will designate liquid assets in an amount sufficient to meet the purchase price. When purchasing a security on a delayed delivery basis, the Portfolio assumes the rights and risks of ownership of the security, including the risk of price and yield fluctuations, and takes such fluctuations into account when determining its net asset value. The Portfolio may dispose of or renegotiate a delayed delivery transaction after it is entered into, and may sell when-issued securities before they are delivered, which may result in a capital gain or loss. When the Portfolio has sold a security on a delayed delivery basis, the Portfolio does not participate in future gains and losses with respect to the security.
Federal Income Taxes. The Portfolio intends to qualify as a regulated investment company and distribute all of its taxable income and net realized gains, if applicable, to shareholders. Accordingly, no provision for Federal income taxes has been made.
Futures Contracts. The Portfolio is authorized to enter into futures contracts. The Portfolio may use futures contracts to manage its exposure to the securities markets or to movements in interest rates and currency values. The primary risks associated with the use of futures contracts are the imperfect correlation between the change in market value of the securities held by the Portfolio and the prices of futures contracts, the possibility of an illiquid market, and the inability of the counterparty to meet the terms of the contract. Futures contracts are valued based upon their quoted daily settlement prices. Upon entering into a futures contract, the Portfolio may be required to deposit with its custodian, in a segregated account in the name of the futures broker, an amount of cash or U.S. Government and Agency Obligations in accordance with the initial margin requirements of the broker or exchange. Futures contracts are marked to market daily and an appropriate payable or receivable for the change in value (“variation margin”) is recorded by the Portfolio. Gains or losses are recognized but not considered realized until the contracts expire or are closed. Futures contracts involve, to varying degrees, risk of loss in excess of the variation margin disclosed in the Statement of Assets and Liabilities.
Inflation-Indexed Bonds. The Portfolio may invest in inflation-indexed bonds. Inflation-indexed bonds are fixed income securities whose principal value is periodically adjusted to the rate of inflation. The interest rate on these bonds is generally fixed at issuance at a rate lower than typical bonds. Over the life of an inflation-indexed bond, however, interest will be paid based on a principal value, which is adjusted for inflation. Any increase in the principal amount of an inflation-indexed bond will be included as interest income in the Statement of Operations, even though investors do not receive their principal until maturity.
Options Contracts. The Portfolio may write call and put options on futures, swaps, securities or currencies it owns or in which it may invest. Writing put options tends to increase the Portfolio’s exposure to the underlying instrument. Writing call options tends to decrease the Portfolio’s exposure to the underlying instrument. When the Portfolio writes a call or put option, an amount equal to the premium received is recorded as a liability and subsequently marked to market to reflect the current value of the option written. These liabilities are reflected as written options outstanding in the Statement of Assets and Liabilities. Payments received or made, if any, from writing options with premiums to be determined on a future date are reflected as such on the Statement of Assets and Liabilities. Premiums received from writing options which expire are treated as realized gains. Premiums received from writing options which are exercised or closed are added to the proceeds or offset against amounts paid on the underlying future, swap, security or currency transaction to determine the realized gain or loss. The Portfolio as a writer of an option has no control over whether the underlying future, swap, security or currency may be sold (call) or purchased (put) and as a result bears the market risk of an unfavorable change in the price of the future, swap, security or currency underlying the written option. There is the risk the Portfolio may not be able to enter into a closing transaction because of an illiquid market.
The Portfolio may also purchase put and call options. Purchasing call options tends to increase the Portfolio’s exposure to the underlying instrument. Purchasing put options tends to decrease the Portfolio’s exposure to the underlying instrument. The Portfolio pays a premium which is included in the Portfolio’s Statement of Assets and Liabilities as an investment and subsequently marked to market to reflect the current value of the option. Premiums paid for purchasing options which expire are treated as realized losses. The risk associated with purchasing put and call options is limited to the premium paid. Premiums paid for purchasing options which are exercised or closed are added to the amounts paid or offset against the proceeds on the underlying future, swap, security or currency transaction to determine the realized gain or loss.
Repurchase Agreements. The Portfolio may engage in repurchase transactions. Under the terms of a typical repurchase agreement, the Portfolio takes possession of an underlying debt obligation subject to an obligation of the seller to repurchase, and the Portfolio to resell, the obligation at an agreed-upon price and time. The market value of the collateral must be equal at all times to the total amount of the repurchase obligations, including interest. Generally, in the event of counterparty default, the Portfolio has the right to use the collateral to offset losses incurred.
Swap Agreements. The Portfolio may invest in swap agreements. A swap is an agreement to exchange the return generated by one instrument for the return generated by another instrument. The Portfolio may enter into interest rate, total return, forward spread lock, and credit default swap agreements to manage its exposure to interest rates and credit risk.
Interest rate swap agreements involve the exchange by the Portfolio with another party of their respective commitments to pay or receive interest, e.g., an exchange of floating rate payments for fixed rate payments with respect to the notional amount of principal.
| | | | |
| June 30, 2004 | | Semi-Annual Report | | 11 |
Notes to Financial Statements (Cont.)
June 30, 2004 (Unaudited)
Total return swap agreements involve commitments to pay interest in exchange for a market-linked return, both based on notional amounts. To the extent the total return of the security or index underlying the transaction exceeds or falls short of the offsetting interest rate obligation, the Portfolio will receive a payment from or make a payment to the counterparty.
Forward spread lock swap agreements involve commitments to pay or receive a settlement amount calculated as the difference between the swap spread and a fixed spread, multiplied by the notional amount times the duration of the swap. The swap spread is the difference between the benchmark swap rate (market rate) and the specific Treasury rate.
In a credit default swap, one party makes a stream of payments to another party in exchange for the right to receive a specified return in the event of a default by a third party, typically corporate issues or sovereign issues of an emerging country, on its obligation. The Portfolio may use credit default swaps to provide a measure of protection against defaults of sovereign issuers (i.e., to reduce risk where the Portfolio owns or has exposure to the sovereign issuer) or to take an active long or short position with respect to the likelihood of a particular issuer’s default.
Swaps are marked to market daily based upon quotations from market makers and the change in value, if any, is recorded as unrealized gain or loss in the Statement of Operations. Payments received or made at the beginning of the measurement period are reflected as such on the Statement of Assets and Liabilities. A liquidation payment received or made at the termination of the swap is recorded as realized gain or loss in the Statement of Operations. Net periodic payments received by the Portfolio are included as part of realized gain(loss) on the Statement of Operations. Entering into these agreements involves, to varying degrees, elements of credit, market and documentation risk in excess of the amounts recognized on the Statement of Assets and Liabilities. Such risks involve the possibility that there will be no liquid market for these agreements, that the counterparty to the agreements may default on its obligation to perform or disagree as to the meaning of contractual terms in the agreements, and that there may be unfavorable changes in interest rates.
As a result of a FASB Emerging Issues Task Force (“EITF”) consensus, No. 03-11, and related SEC staff guidance, the Portfolio has reclassified periodic payments made or received under swap agreements, which were previously included within miscellaneous income, to a component of realized gain(loss) in the Statement of Operations. For consistency, similar reclassifications have been made to amounts appearing in the previous year’s Statement of Changes in Net Assets and the per share amounts in the prior year financial highlights. Prior year net investment income ratios in the financial highlights have also been modified accordingly. There were no reclassification to any period as a result of this change. There is no effect on the Portfolio’s net asset value, either in total or per share, or its total increase(decrease) in net assets from operations during any period.
3. Fees, Expenses, and Related Party Transactions
Investment Advisory Fee. Pacific Investment Management Company LLC (“PIMCO”) is a majority owned subsidiary partnership of Allianz Dresdner Asset Management of America L.P. and serves as investment adviser (the “Adviser”) to the Trust, pursuant to an investment advisory contract. The Adviser receives a monthly fee at an annual rate based on average daily net assets of the Portfolio. The Advisory Fee is charged at an annual rate of 0.25%.
Administration Fee. PIMCO serves as administrator (the “Administrator”), and provides administrative services to the Trust for which it receives a monthly administrative fee based on average daily net assets of the Portfolio. The Administration Fee is charged at the annual rate of 0.25%.
Servicing Fee. PA Distributors LLC (“PAD”), formerly known as PIMCO Advisors Distributors LLC, is an indirect wholly-owned subsidiary of Allianz Dresdner Asset Management of America L.P. and serves as the distributor of the Trust’s shares. The Trust is permitted to reimburse PAD on a quarterly basis, out of the Administrative Class assets of the Portfolio in the amount of 0.15% on an annual basis of the average daily net assets of that class, for payments made to financial intermediaries that provide services in connection with the distribution of shares or administration of plans or programs that use Portfolio shares as their funding medium. The effective rate paid to PAD was 0.15% during current fiscal year.
Expenses. The Trust is responsible for the following expenses: (i) salaries and other compensation of any of the Trust’s executive officers and employees who are not officers, directors, stockholders or employees of PIMCO or its subsidiaries or affiliates; (ii) taxes and governmental fees; (iii) brokerage fees and commissions and other portfolio transaction expenses; (iv) the cost of borrowing money, including interest expense and bank overdraft charges; (v) fees and expenses of the Trustees who are not “interested persons” of PIMCO or the Trust, and any counsel retained exclusively for their benefit; (vi) extraordinary expenses, including costs of litigation and indemnification expenses; (vii) organization expenses and (viii) any expenses allocated or allocable to a specific class of shares, which include service fees payable with respect to the Administrative Class shares and may include certain other expenses as permitted by the Trust’s Multiple Class Plan adopted pursuant to Rule 18f-3 under the Act and subject to review and approval by the Trustees. The ratio of expenses to average net assets per share class, as disclosed in Financial Highlights, may differ from the annual portfolio operating expenses per share class as disclosed in the Prospectus for the reasons set forth above.
PIMCO has agreed to waive a portion of its administrative fees to the extent that the payment of the Portfolio’s pro rata share of organization expenses and Trustee fees cause the actual expense ratio to rise above the rates disclosed in the then-current prospectus plus 0.49 basis points as set forth below (calculated as a percentage of the Portfolio’s average daily net assets attributable to each class):
| | | |
Institutional Class | | 0.50 | % |
Administrative Class | | 0.65 | % |
| | | | |
| 12 | | Semi-Annual Report | | June 30, 2004 |
PIMCO may be reimbursed for these waived amounts in future periods, not to exceed thirty-six months.
Each unaffiliated Trustee receives an annual retainer of $4,000, plus $1,500 for each Board of Trustees meeting attended in person and $250 for each meeting attended telephonically, plus reimbursement of related expenses. In addition, each committee chair receives an additional annual retainer of $500. These expenses are allocated on a pro-rata basis to each Portfolio of the Trust according to its respective net assets.
4. Purchases and Sales of Securities
The length of time a Portfolio has held a particular security is not generally a consideration in investment decisions. A change in the securities held by a Portfolio is known as “portfolio turnover.” The Portfolio may engage in frequent and active trading of portfolio securities to achieve its investment objective, particularly during periods of volatile market movements. High portfolio turnover (e.g., over 100%) involves correspondingly greater expenses to the Portfolio, including brokerage commissions or dealer mark-ups and other transaction costs on the sale of securities and reinvestments in other securities. Such sales may also result in realization of taxable capital gains, including short-term capital gains (which are generally taxed at ordinary income tax rates). The trading costs and tax effects associated with portfolio turnover may adversely affect the Portfolio’s performance.
Purchases and sales of securities (excluding short-term investments) for the period ended June 30, 2004 were as follows (amounts in thousands):
| | | | | | |
| U.S. Government/Agency | | All Other |
| Purchases | | Sales | | Purchases | | Sales |
| $162,158 | | $157,582 | | $2,850 | | $4,704 |
5. Transactions in Written Call and Put Options
Transactions in written call and put options were as follows (amounts in thousands):
| | | | |
| | | | Premium | |
Balance at 12/31/2003 | | $ | 269 | |
Sales | | | 146 | |
Closing Buys | | | (236 | ) |
| Expirations | | | (115 | ) |
| Balance at 06/30/2004 | | | $64 | |
6. Federal Income Tax Matters
At June 30, 2004, the aggregate cost of investments was the same for federal income tax and financial statement purposes. The net unrealized appreciation (depreciation) of investment securities for federal income tax purposes is as follows (amounts in thousands):
| | | | | | |
Aggregate
Gross
Unrealized
Appreciation | | Aggregate
Gross
Unrealized
(Depreciation) | | Net
Unrealized
Depreciation |
| $ 332 | | $ | (946) | | $ | (614) |
7. Shares of Beneficial Interest
The Trust may issue an unlimited number of shares of beneficial interest with a $.001 par value. Changes in shares of beneficial interest were as follows (shares and amounts in thousands):
| | | | | | | | | | | | | | |
| | | Six Months Ended
06/30/2004 | | | Year Ended
12/31/2003 | |
| | | Shares | | | Amount | | | Shares | | | Amount | |
Receipts for shares sold | | | | | | | | | | | | | | |
| | | | |
Institutional Class | | 32 | | | $ | 339 | | | 0 | | | $ | 0 | |
Administrative Class | | 989 | | | | 11,160 | | | 3,771 | | | | 41,837 | |
| | | | |
Issued as reinvestment of distributions | | | | | | | | | | | | | | |
| | | | |
Institutional Class | | 0 | | | | 2 | | | 0 | | | | 1 | |
Administrative Class | | 119 | | | | 1,323 | | | 403 | | | | 4,476 | |
| | | | |
Cost of shares redeemed | | | | | | | | | | | | | | |
| | | | |
Institutional Class | | (1 | ) | | | (5 | ) | | 0 | | | | 0 | |
Administrative Class | | (1,917 | ) | | | (21,332 | ) | | (3,950 | ) | | | (43,567 | ) |
| | | | |
Net increase (decrease) resulting from Portfolio share transactions | | (778 | ) | | $ | (8,513 | ) | | 224 | | | $ | 2,747 | |
The following schedule shows the number of shareholders each owning 5% or more of the Portfolio and the total percentage of the Portfolio held by such shareholders:
| | | | |
| | | Number | | % of Portfolio Held |
Institutional Class | | 1 | | 96 |
Administrative Class | | 4 | | 99 |
| | | | |
| June 30, 2004 | | Semi-Annual Report | | 13 |
Notes to Financial Statements (Cont.)
June 30, 2004 (Unaudited)
8. Regulatory and Litigation Matters
On February 17, 2004, the Attorney General of the State of New Jersey (“New Jersey AG”) filed a complaint against Allianz Dresdner Asset Management of America L.P. (“ADAM”), PA Distributors LLC (formerly known as PIMCO Advisors Distributors LLC) (“PAD”), PEA Capital LLC (formerly known as PIMCO Equity Advisors LLC) (“PEA”), and Pacific Investment Management Company LLC (“PIMCO”) in connection with its investigation into market timing and late trading. The complaint contends that inappropriate trading by shareholders engaged in market timing activity took place in funds in the PIMCO Funds: Multi-Manager Series (“MMS Funds”) and the PIMCO Funds: Pacific Investment Management Series (“PIMS Funds”). On June 1, 2004, the New Jersey AG dismissed PIMCO from the lawsuit.
On the same day as the dismissal of PIMCO from the lawsuit, the New Jersey AG announced that it had reached a settlement agreement with the remaining defendants (“New Jersey Settlement”). In the New Jersey Settlement, ADAM, PAD and PEA agreed, while neither admitting nor denying the allegations or conclusions of law, to: (i) pay New Jersey a civil fine of $15 million and $3 million for investigative costs and further enforcement initiatives; and (ii) implement certain changes in corporate governance.
On May 6, 2004, the Securities and Exchange Commission filed a complaint in the U.S. District Court in the Southern District of New York alleging that PA Fund Management LLC (formerly known as PIMCO Advisors Fund Management LLC) (“PAFM”), PEA, PAD, Stephen J. Treadway (at the time, the chief executive officer of PAFM and PAD as well as chairman of the Board of Trustees of the MMS Funds) and Kenneth W. Corba (the former chief executive officer of PEA and former portfolio manager of the PEA Growth and PEA Growth & Income Funds) had, among other things, violated and/or aided and abetted violations of, various antifraud provisions of the federal securities laws in connection with alleged “market timing” arrangements that improperly allowed certain hedge funds to engage in “market timing” in the PEA Growth Fund, the PEA Opportunity Fund, the PEA Innovation Fund, and the PEA Target Fund. The complaint seeks injunctive relief, disgorgement plus pre-judgment interest, monetary penalties, and an order permanently enjoining the defendants from serving as investment advisers, principal underwriters, officers, directors, or members of any advisory boards to any registered investment companies.
On February 20, 2004, a putative class action lawsuit was filed in the U.S. District Court for the District of New Jersey on behalf of certain shareholders of the PIMCO Funds against ADAM, PAD, PIMCO, PEA, the PIMS Funds, the MMS Funds, the Trust, PIMCO Commercial Mortgage Securities Trust, Inc. and certain other defendants, alleging that inappropriate market timing activity by certain shareholders caused financial injury to the shareholders of those Funds.
The following additional putative class action lawsuits have been filed against the PIMS Funds, the MMS Funds and/or their affiliates, each related to alleged market-timing activity in funds advised by PIMCO or its affiliates: (1) a lawsuit filed in the U.S. District Court for the District of Connecticut on February 27, 2004 (naming as defendants ADAM, PAD, PEA, the PIMS Funds, the MMS Funds, the Trust, PCM and certain other parties); (2) a lawsuit filed in the U.S. District Court for the Central District of California on March 4, 2004 (naming as defendants PIMCO, ADAM, PEA and PAD); (3) a lawsuit filed in the U.S. District Court for the Southern District of New York on March 8, 2004 (naming PIMCO, PAD and certain of their affiliates as defendants); (4) a lawsuit filed in the U.S. District Court for the Southern District of New York, on March 15, 2004 (naming PIMCO as the defendant); (5) two separate lawsuits filed in the U.S. District Court for the Central District of California on March 22, 2004, brought derivatively on behalf of the PIMCO High Yield Fund and the PIMCO Money Market Fund, respectively (each naming ADAM, PAFM and certain other parties as defendants, and the PIMCO Funds as the nominal defendant); (6) a lawsuit filed in the U.S. District Court for the Central District of California, also on March 22, 2004, brought derivatively on behalf of the PIMS Funds and the MMS Funds (naming ADAM, PIMCO, PAD and certain other parties as defendants, and the PIMS Funds and the MMS Funds as nominal defendants); (7) a lawsuit filed in the U.S. District Court for the District of New Jersey on April 20, 2004 (naming ADAM, PAD, the PIMS Funds and certain other parties as defendants); and (8) a lawsuit filed in the U.S. District Court for the Northern District of California on April 28, 2004 (naming ADAM, PIMCO, PAD, PEA and certain other parties as defendants, and the “PIMCO Funds” as nominal defendants). Each complaint for the foregoing putative class actions alleges, among other things, that inappropriate trading by shareholders engaged in market timing activities took place in certain of the funds advised by PIMCO, and each complaint seeks unspecified compensatory damages.
On February 17, 2004, a putative class action lawsuit was filed in the U.S. District Court for the District of Connecticut on behalf of certain shareholders of the PIMCO Funds against ADAM, PEA, PIMCO, PIMS Funds, MMS Funds and certain other defendants, alleging excessive investment advisory fees and the use of brokerage commissions to pay for distribution of fund shares. Three similar putative class action lawsuits were subsequently filed, each in the U.S. District Court for the District of Connecticut on March 1, 2004, April 23, 2004 and May 20, 2004, respectively.
Under Section 9(a) of the 1940 Act, if any of the various lawsuits were to result in a court injunction against PAFM, PEA, PAD, PIMCO, ADAM and/or Mr. Treadway, they and their affiliates would, in the absence of exemptive relief granted by the SEC, be barred from serving as an investment adviser/sub-adviser or principal underwriter for any registered investment company, including the Trust. ADAM and certain of its subsidiaries have
| | | | |
| 14 | | Semi-Annual Report | | June 30, 2004 |
responded to inquiries from the SEC concerning the status of the New Jersey Settlement under Section 9(a). If any of PAFM, PEA, PAD, PIMCO or ADAM were subject to an injunction, each of these entities and their affiliates could in turn seek exemptive relief from the SEC, as contemplated by the 1940 Act. There is no assurance, however, that such exemptive relief would be granted. The SEC also has the power by order to prohibit PAFM, PEA, PAD and PIMCO from serving as investment advisers and underwriters, if the SEC finds that such entities willfully violated the federal securities laws in connection with the allegations discussed above or aided or abetted such violations.
PIMCO, PAD and the Trust believe that these developments will not have a material adverse effect on the Portfolios or on PIMCO’s, or PAD’s ability to perform their respective investment advisory or distribution services on behalf of the Portfolios.
| | | | |
| June 30, 2004 | | Semi-Annual Report | | 15 |
Trustees and Officers
Brent R. Harris, Chairman and Trustee
R. Wesley Burns, President and Trustee
E. Philip Cannon, Trustee
Vern O. Curtis, Trustee
J. Michael Hagan, Trustee
William J. Popejoy, Trustee
Garlin G. Flynn, Secretary
John P. Hardaway, Treasurer
Investment Adviser and Administrator
Pacific Investment Management Company LLC
840 Newport Center Drive
Newport Beach, California 92660
Distributor
PA Distributors LLC
2187 Atlantic Street
Stamford, Connecticut 06902
Custodian
State Street Bank & Trust Company
801 Pennsylvania
Kansas City, Missouri 64105
Transfer Agent
Boston Financial Data Services–Midwest
330 W. 9th Street
Kansas City, Missouri 64105
Legal Counsel
Dechert LLP
1775 I Street, N.W.
Washington, D.C. 20006
Independent Registered Public Accounting Firm
PricewaterhouseCoopers LLP
1055 Broadway
Kansas City, Missouri 64105
Information about how the Fund voted proxies relating to portfolio securities held during the year July 1, 2003 through June 30, 2004 will be available no later than August 31, 2004 without charge, upon request, by calling the Trust at 1-800-927-4648 and on the SEC’s website at http://www.sec.gov.
Copies of the written Proxy Policy and the factors that PIMCO may consider in determining how to vote proxies for the Funds are available by calling the Trust at 1-800-927-4648 and on the SEC’s website at http://www.sec.gov.
PIMCO VARIABLE INSURANCE TRUST
840 NEWPORT CENTER DRIVE
NEWPORT BEACH, CA 92660

PIMCO VARIABLE INSURANCE TRUST
FOREIGN BOND PORTFOLIO (U.S. DOLLAR-HEDGED)
ADMINISTRATIVE CLASS
SEMI-ANNUAL REPORT
June 30, 2004
|
| This material is authorized for use only when preceded or accompanied by the current PIMCO Variable Insurance Trust prospectus. Investors should consider the investment objectives, risks, charges and expenses of Portfolio carefully before investing. This and other information is contained in the Portfolio’s prospectus. Please read the prospectus carefully before you invest or send money. |
Chairman’s Letter
Dear PIMCO Variable Insurance Trust Shareholder:
Bond prices were more volatile during the six-month period ended June 30, 2004. Interest rates rose sharply during the second quarter 2004, causing bonds to give back modest gains from earlier in the year. The Lehman Brothers Aggregate Bond Index, a widely used index for the high-grade bond market, was nearly flat during the first six months of 2004, returning 0.15% after losing 2.44% during the second quarter. The yield on the benchmark ten-year Treasury closed June 30, 2004 at 4.58%, up 0.75% from April 1, 2004, but up only 0.34% from where it began the six-month period on January 1, 2004.
Continued growth in employment convinced the markets that the Federal Reserve would soon begin a long anticipated tightening cycle. On June 30, 2004, the Fed met market expectations by increasing the federal funds rate 0.25%, which was the first rate increase since June 25, 2003. The central bank had held this rate at 1% for more than a year, which generated negative real short-term rates. And on August 10, 2004, the Fed increased the federal funds rate another 0.25% to 1.50%.
Investors that had profited handsomely from borrowing at low short-term rates and investing in higher-yielding longer maturity bonds surrendered some of those profits towards the latter part of the six-month period. Concern that borrowing rates would rise led investors to liquidate long positions and unwind these trades, which caused bond prices to decrease. However, substantial leverage remained among banks, hedge funds, and other investors, making bond markets somewhat vulnerable to additional Fed rate increases. There were also signs of rising inflation, which fueled anxiety that central banks might continue to raise interest rates.
On the following pages you will find a more complete review of the Portfolio in light of financial market activities as well as specific details about the total return investment performance for the six-month period.
We appreciate the trust you have placed in us, and we will continue to focus our efforts to meet your investment needs.
Sincerely,

Brent R. Harris
Chairman
August 11, 2004
| | | | |
| June 30, 2004 | | Semi-Annual Report | | 1 |
Important Information About the Portfolio
We believe that bond funds have an important role to play in a well diversified investment portfolio. It is important to note, however, that in an environment where interest rates may trend upward, rising rates will negatively impact the performance of most bond funds, and fixed income securities held by a fund are likely to decrease in value. The price volatility of fixed income securities can also increase during periods of rising interest rates resulting in increased losses to a fund. Bond funds and individual bonds with a longer duration (a measure of the expected life of a security) tend to be more sensitive to changes in interest rates, usually making them more volatile than securities or funds with shorter durations. The longer-term performance of most bond funds has benefited from capital gains in part resulting from an extended period of declining interest rates. In the event interest rates increase, these capital gains should not be expected to recur.
The Portfolio may be subject to various risks in addition to those described above. Some of these risks may include, but are not limited to, the following: real rate risk, derivative risk, small company risk, foreign security risk, high yield security risk and specific sector investment risks. The Portfolio may use derivative instruments for hedging purposes or as part of an investment strategy. Use of these instruments may involve certain costs and risks such as liquidity risk, interest rate risk, market risk, credit risk, management risk and the risk that a fund could not close out a position when it would be most advantageous to do so. A Portfolio investing in derivatives could lose more than the principal amount invested in these instruments. Investing in non-U.S. securities may entail risk due to non-U.S. economic and political developments; this risk may be enhanced when investing in emerging markets. High-yield bonds typically have a lower credit rating than other bonds. Lower rated bonds generally involve a greater risk to principal than higher rated bonds. Smaller companies may be more volatile than larger companies and may entail more risk. Concentrating investments in individual sectors may add additional risk and volatility compared to a diversified portfolio.
On the performance summary page in this semi-annual report, the Total Return Investment Performance table measures performance assuming that all dividend and capital gain distributions were reinvested. Returns do not reflect the deduction of taxes that a shareholder would pay (i) on Portfolio distributions or (ii) the redemption of Portfolio shares.
An investment in a Portfolio is not a bank deposit and is not guaranteed or insured by the Federal Deposit Insurance Corporation or any other government agency. It is possible to lose money on investments in the Funds.
The following disclosure provides important information regarding the Portfolio’s Expense Example, which appears on the Portfolio’s individual page in this semi-annual report. Please refer to this information when reviewing the Expense Example for the Portfolio.
Example
As a shareholder of the Portfolio, you incur two types of costs: (1) transaction costs, including redemption and exchange fees; and (2) ongoing costs, including advisory and administrative fees; distribution and/or service (12b-1) fees (Administrative Class only); and other Portfolio expenses. The Example is intended to help you understand your ongoing costs (in dollars) of investing in the Portfolio and to compare these costs with the ongoing costs of investing in other mutual funds.
The Example is based on an investment of $1,000 invested at the beginning of the period and held for the entire period indicated, which is from 1/1/04 to 6/30/04.
Actual Expenses
The information in the table under the heading “Actual Performance” provides information about actual account values and actual expenses. You may use the information in these columns, together with the amount you invested, to estimate the expenses that you paid over the period. Simply divide your account value by $1,000.00 (for example, an $8,600.00 account value divided by $1,000 = 8.60), then multiply the result by the number in the appropriate column for your share class, in the row entitled “Expenses Paid During Period” to estimate the expenses you paid on your account during this period.
Hypothetical Example for Comparison Purposes
The information in the table under the heading “Hypothetical Performance (5% return before expenses)” provides information about hypothetical account values and hypothetical expenses based on the Portfolio’s actual expense ratio and an assumed rate of return of 5% per year before expenses, which is not the Portfolio’s actual return. The hypothetical account values and expenses may not be used to estimate the actual ending account balance or expenses you paid for the period. You may use this information to compare the ongoing costs of investing in the Portfolio and other portfolios. To do so, compare this 5% hypothetical example with the 5% hypothetical examples that appear in the shareholder reports of the other portfolios.
Please note that the expenses shown in the table are meant to highlight your ongoing costs only and do not reflect any transactional costs. Therefore, the information under the heading “Hypothetical Performance (5% return before expenses)” is useful in comparing ongoing costs only, and will not help you determine the relative total costs of owning different portfolios. In addition, if these transactional costs were included, your costs would have been higher.
PIMCO Variable Insurance Trust is distributed by PA Distributors LLC, 2187 Atlantic Street, Stamford, CT 06902.
| | | | |
| 2 | | Semi-Annual Report | | June 30, 2004 |
Foreign Bond Portfolio (U.S. Dollar-Hedged)
CUMULATIVE RETURNS THROUGH JUNE 30, 2004
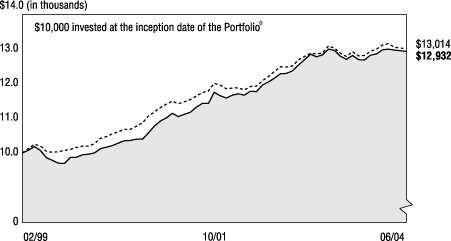
[CHART]
Foreign Bond J.P. Morgan Non-U.S.
Portfolio Admin. Class Index (Hedged)
---------------------- --------------------
02/28/1999 $10,000 $10,000
03/31/1999 $10,069 $10,119
04/30/1999 $10,186 $10,248
05/31/1999 $10,075 $10,205
06/30/1999 $9,857 $10,047
07/31/1999 $9,787 $10,021
08/31/1999 $9,706 $10,039
09/30/1999 $9,693 $10,077
10/31/1999 $9,870 $10,102
11/30/1999 $9,868 $10,160
12/31/1999 $9,942 $10,191
01/31/2000 $9,964 $10,192
02/29/2000 $9,997 $10,267
03/31/2000 $10,119 $10,417
04/30/2000 $10,170 $10,473
05/31/2000 $10,210 $10,557
06/30/2000 $10,286 $10,608
07/31/2000 $10,351 $10,684
08/31/2000 $10,356 $10,686
09/30/2000 $10,392 $10,778
10/31/2000 $10,400 $10,865
11/30/2000 $10,570 $11,058
12/31/2000 $10,773 $11,180
01/31/2001 $10,919 $11,313
02/28/2001 $11,019 $11,410
03/31/2001 $11,146 $11,496
04/30/2001 $11,051 $11,418
05/31/2001 $11,115 $11,478
06/30/2001 $11,174 $11,541
07/31/2001 $11,322 $11,646
08/31/2001 $11,425 $11,744
09/30/2001 $11,433 $11,792
10/31/2001 $11,756 $12,008
11/30/2001 $11,649 $11,956
12/31/2001 $11,591 $11,857
01/31/2002 $11,671 $11,870
02/28/2002 $11,705 $11,881
03/31/2002 $11,672 $11,820
04/30/2002 $11,783 $11,916
05/31/2002 $11,776 $11,931
06/30/2002 $11,962 $12,085
07/31/2002 $12,045 $12,202
08/31/2002 $12,158 $12,349
09/30/2002 $12,285 $12,490
10/31/2002 $12,301 $12,484
11/30/2002 $12,376 $12,507
12/31/2002 $12,540 $12,687
01/31/2003 $12,699 $12,787
02/28/2003 $12,847 $12,875
03/31/2003 $12,774 $12,859
04/30/2003 $12,829 $12,888
05/31/2003 $13,003 $13,092
06/30/2003 $12,964 $13,024
07/31/2003 $12,800 $12,880
08/31/2003 $12,699 $12,787
09/30/2003 $12,816 $12,927
10/31/2003 $12,693 $12,807
11/30/2003 $12,684 $12,818
12/31/2003 $12,823 $12,938
01/31/2004 $12,864 $12,996
02/29/2004 $12,977 $13,120
03/31/2004 $13,003 $13,156
04/30/2004 $12,973 $13,053
05/31/2004 $12,955 $13,031
06/30/2004 $12,932 $13,014
COUNTRY ALLOCATION‡
| | | |
Short-Term Instruments | | 23.0 | % |
United States | | 21.3 | % |
Germany | | 14.3 | % |
Italy | | 12.5 | % |
United Kingdom | | 8.9 | % |
Japan | | 6.3 | % |
Spain | | 4.5 | % |
Canada | | 2.7 | % |
Other | | 6.5 | % |
‡ % of Total Investments as of June 30, 2004
à$10,000 invested at the beginning of the first full month following the inception of the Administrative Class.
TOTAL RETURN INVESTMENT PERFORMANCE For the period ended June 30, 2004
| | | | | | | | | | | | | | | | |
| | | | | | | 6 Months | | | 1 Year | | | 5 Years* | | | Since Inception* | |
| | |
| | Foreign Bond Portfolio (U.S. Dollar-Hedged) Administrative Class (Inception 02/16/99) | | 0.85 | % | | –0.25 | % | | 5.58 | % | | 4.88 | % |
| | | - - - - - - - | | J.P. Morgan Non-U.S. Index (Hedged) | | 0.59 | % | | –0.08 | % | | 5.31 | % | | — | |
| | | | | * Annualized. All Portfolio returns are net of fees and expenses. | | | | | | | | | | | | |
Past performance is no guarantee of future results. The performance quoted represents past performance. Investment return and principal value will fluctuate so the Portfolio shares, when redeemed, may be worth more or less than their original cost. Current performance may be lower or higher than the performance data quoted. Performance data current to the most recent month-end is available by calling (800) 927-4648.
Please refer to page 2 herein for an explanation of the information presented in the following Expense Example.
| | | | | | | | | | |
| EXPENSE EXAMPLE | | | | Actual Performance | | | | Hypothetical Performance
(5% return before expenses) |
Beginning Account Value (01/01/04) | | | | $ | 1,000.00 | | | | $ | 1,000.00 |
Ending Account Value (06/30/04) | | | | $ | 1,008.50 | | | | $ | 1,025.00 |
Expenses Paid During Period† | | | | $ | 4.49 | | | | $ | 4.53 |
†Expenses are equal to the Portfolio’s Administrative Class annualized expense ratio of 0.90%, multiplied by the average account value over the period, multiplied by 182/366 (to reflect the one-half year period).
PORTFOLIO INSIGHTS
| • | The Foreign Bond Portfolio (U.S. Dollar-Hedged) seeks to achieve its investment objective by investing under normal circumstances at least 80% of its assets in Fixed Income Securities of issuers located outside the United States, representing at least three foreign countries. |
| • | The Portfolio’s Administrative Class shares returned 0.85% for the six-months ended June 30, 2004, outperforming the 0.59% return of the J.P. Morgan Non-U.S. Index (Hedged) for the same period. |
| • | An underweight to U.S. duration was positive for performance as yields rose given stronger growth and fears of aggressive Fed tightening. |
| • | An overweight to Euroland duration relative to benchmark was a positive for relative performance; these yields rose less as Euroland lagged global growth. |
| • | An overweight to Brazil was negative for performance. Brazilian bonds underperformed early in the year amidst political noise and the exiting of leveraged tactical investors in the asset class. |
| • | Currency strategies detracted from performance. The yen and Canadian dollar retreated as rising U.S. rates forced market participants to unwind leveraged strategies. |
| • | Real return bonds added to returns, outperforming more volatile Treasuries of similar duration, as rates rose. |
| • | Modest holdings of mortgage securities helped returns, as heavy demand from banks supported the mortgage market. |
| • | Tactical strategies to exploit wider swap spreads in the U.S. and Europe were positive, as swap spreads widened given the rapid rise in yields. |
| | | | | | |
| See accompanying notes | | June 30, 2004 | | Semi-Annual Report | | 3 |
Financial Highlights
Foreign Bond Portfolio (U.S. Dollar-Hedged) (Administrative Class)
| | | | | | | | | | | | | | | | | | | | | | | | | | | | | | | | | | | | |
Selected Per Share Data for the Year or
Period Ended: | | | | 06/30/2004+ | | | | | 12/31/2003 | | | | | 12/31/2002 | | | | | 12/31/2001 | | | | | 12/31/2000 | | | | | 02/16/1999-
12/31/1999 | |
| | | | | | | | | | | | |
Net asset value beginning of period | | | | $ | 10.03 | | | | | $ | 10.07 | | | | | $ | 9.69 | | | | | $ | 9.40 | | | | | $ | 9.42 | | | | | $ | 10.00 | |
Net investment income (a) | | | | | 0.11 | (f) | | | | | 0.26 | (f) | | | | | 0.36 | (f) | | | | | 0.42 | (f) | | | | | 0.51 | (f) | | | | | 0.41 | |
Net realized/unrealized gain (loss) on investments (a) | | | | | (0.02 | )(f) | | | | | (0.03 | )(f) | | | | | 0.42 | (f) | | | | | 0.28 | (f) | | | | | 0.25 | (f) | | | | | (0.49 | ) |
Total income (loss) from investment operations | | | | | 0.09 | | | | | | 0.23 | | | | | | 0.78 | | | | | | 0.70 | | | | | | 0.76 | | | | | | (0.08 | ) |
Dividends from net investment income | | | | | (0.11 | ) | | | | | (0.27 | ) | | | | | (0.36 | ) | | | | | (0.41 | ) | | | | | (0.52 | ) | | | | | (0.41 | ) |
Distributions from net realized capital gains | | | | | 0.00 | | | | | | 0.00 | | | | | | (0.04 | ) | | | | | 0.00 | | | | | | (0.26 | ) | | | | | (0.09 | ) |
Total distributions | | | | | (0.11 | ) | | | | | (0.27 | ) | | | | | (0.40 | ) | | | | | (0.41 | ) | | | | | (0.78 | ) | | | | | (0.50 | ) |
Net asset value end of period | | | | $ | 10.01 | | | | | $ | 10.03 | | | | | $ | 10.07 | | | | | $ | 9.69 | | | | | $ | 9.40 | | | | | $ | 9.42 | |
Total return | | | | | 0.85 | % | | | | | 2.26 | % | | | | | 8.19 | % | | | | | 7.59 | % | | | | | 8.36 | % | | | | | (0.78 | )% |
Net assets end of period (000s) | | | | $ | 33,843 | | | | | $ | 32,355 | | | | | $ | 16,776 | | | | | $ | 4,856 | | | | | $ | 924 | | | | | $ | 5,215 | |
Ratio of net expenses to average net assets | | | | | 0.90 | %* | | | | | 0.93 | %(c) | | | | | 0.93 | %(c)(e) | | | | | 0.90 | %(d) | | | | | 0.90 | % | | | | | 1.10 | %*(b)(c) |
Ratio of net investment income to average net assets | | | | | 2.29 | %*(f) | | | | | 2.53 | %(f) | | | | | 3.67 | %(f) | | | | | 4.43 | %(f) | | | | | 5.41 | %(f) | | | | | 4.83 | %* |
Portfolio turnover rate | | | | | 222 | % | | | | | 600 | % | | | | | 321 | % | | | | | 285 | % | | | | | 306 | % | | | | | 285 | % |
| (a) | Per share amounts based on average number of shares outstanding during the period. |
| (b) | If the investment manager had not reimbursed expenses, the ratio of expenses to average net assets would have been 1.25%. |
| (c) | Ratio of expense to average net assets excluding interest expense is 0.90%. |
| (d) | If the investment manager had not reimbursed expenses, the ratio of expenses to average net assets would have been 0.91%. |
| (e) | If the investment manager had not reimbursed expenses, the ratio of expenses to average net assets would have been 0.94%. |
| (f) | Indicates a period in which, as a result of a change in generally accepted accounting principles, the portfolio has reclassified periodic payments made or received under certain derivative instruments, which were previously included within miscellaneous income, to a component of realized gain(loss) in the Statement of Operations. The effect of this reclassification was to increase the net investment income ratio for the period ending June 30, 2004 by 0.14% and the net investment income per share by $0.01. For consistency, similar reclassifications have been made to prior period amounts, resulting in increases to the net investment income ratio of 0.10%, 0.10%, 0.26% and 0.03% and to the net investment income per share of $0.01, $0.01, $0.02, and $0.00 in the fiscal years ending December 31, 2003, 2002, 2001, and 2000, respectively. This change had no impact on reported net asset value per share for any period. |
| | | | | | |
| 4 | | Semi-Annual Report | | June 30, 2004 | | See accompanying notes |
Statement of Assets and Liabilities
Foreign Bond Portfolio (U.S. Dollar-Hedged)
June 30, 2004 (Unaudited)
| | | | | | |
| Amounts in thousands, except per share amounts | | | | | |
| | |
Assets: | | | | | | |
| | |
Investments, at value | | | | $ | 38,651 | |
Cash | | | | | 1 | |
Foreign currency, at value | | | | | 923 | |
Receivable for investments sold | | | | | 466 | |
Receivable for investments sold on delayed delivery basis | | | | | 7,663 | |
Unrealized appreciation on forward foreign currency contracts | | | | | 104 | |
Receivable for Portfolio shares sold | | | | | 32 | |
Interest and dividends receivable | | | | | 475 | |
Variation margin receivable | | | | | 123 | |
Swap premiums paid | | | | | 374 | |
Unrealized appreciation on swap agreements | | | | | 56 | |
Unrealized appreciation on forward volatility options | | | | | 5 | |
| | | | | | 48,873 | |
| | |
Liabilities: | | | | | | |
| | |
Payable for investments purchased | | | | $ | 674 | |
Payable for investments purchased on delayed delivery basis | | | | | 6,139 | |
Unrealized depreciation on forward foreign currency contracts | | | | | 35 | |
Payable for short sale | | | | | 7,741 | |
Written options outstanding | | | | | 64 | |
Accrued investment advisory fee | | | | | 7 | |
Accrued administration fee | | | | | 14 | |
Accrued servicing fee | | | | | 3 | |
Recoupment payable to Manager | | | | | 1 | |
Swap premiums received | | | | | 81 | |
Unrealized depreciation on swap agreements | | | | | 246 | |
Other liabilities | | | | | 12 | |
| | | | | | 15,017 | |
| | |
Net Assets | | | | $ | 33,856 | |
| | |
Net Assets Consist of: | | | | | | |
| | |
Paid in capital | | | | $ | 33,668 | |
(Overdistributed) net investment income | | | | | (1,509 | ) |
Accumulated undistributed net realized gain | | | | | 734 | |
Net unrealized appreciation | | | | | 963 | |
| | | | | $ | 33,856 | |
| | |
Net Assets: | | | | | | |
| | |
Institutional Class | | | | $ | 13 | |
Administrative Class | | | | | 33,843 | |
| | |
Shares Issued and Outstanding: | | | | | | |
| | |
Institutional Class | | | | | 1 | |
Administrative Class | | | | | 3,381 | |
| | |
Net Asset Value and Redemption Price Per Share
(Net Assets Per Share Outstanding) | | | | | | |
| | |
Institutional Class | | | | $ | 10.01 | |
Administrative Class | | | | | 10.01 | |
| | |
Cost of Investments Owned | | | | $ | 37,676 | |
Cost of Foreign Currency Held | | | | $ | 919 | |
| | | | | | |
| See accompanying notes | | June 30, 2004 | | Semi-Annual Report | | 5 |
Statement of Operations
Foreign Bond Portfolio (U.S. Dollar-Hedged)
| | | | | | |
| Amounts in thousands | | | | | |
| | | | | Six Months Ended
June 30, 2004
(Unaudited) | |
Investment Income: | | | | | | |
| | |
Interest | | | | $ | 522 | |
Dividends | | | | | 3 | |
Total Income | | | | | 525 | |
| | |
Expenses: | | | | | | |
| | |
Investment advisory fees | | | | | 41 | |
Administration fees | | | | | 82 | |
Distribution and/or servicing fees - Administrative Class | | | | | 24 | |
Miscellaneous expense | | | | | 1 | |
Total Expenses | | | | | 148 | |
| | |
Net Investment Income | | | | | 377 | |
| | |
Net Realized and Unrealized Gain (Loss): | | | | | | |
| | |
Net realized gain on investments | | | | | 113 | |
Net realized gain on futures contracts, options, and swaps | | | | | 12 | |
Net realized gain on foreign currency transactions | | | | | 552 | |
Net change in unrealized (depreciation) on investments | | | | | (1,698 | ) |
Net change in unrealized appreciation on futures contracts,
options, and swaps | | | | | 152 | |
Net change in unrealized appreciation on translation of
assets and liabilities denominated in foreign currencies | | | | | 773 | |
Net (Loss) | | | | | (96 | ) |
| | |
Net Increase in Assets Resulting from Operations | | | | $ | 281 | |
| | | | | | |
| 6 | | Semi-Annual Report | | June 30, 2004 | | See accompanying notes |
Statements of Changes in Net Assets
Foreign Bond Portfolio (U.S. Dollar-Hedged)
| | | | | | | | | | | | |
| Amounts in thousands | | | | | | | | | | |
| | | | | Six Months Ended
June 30, 2004
(Unaudited) | | | | | Year Ended
December 31, 2003 | |
Increase in Net Assets from: | | | | | | | | | | | | |
| | | | |
Operations: | | | | | | | | | | | | |
| | | | |
Net investment income | | | | $ | 377 | | | | | $ | 687 | |
Net realized gain (loss) | | | | | 677 | | | | | | (492 | ) |
Net change in unrealized appreciation (depreciation) | | | | | (773 | ) | | | | | 99 | |
Net increase resulting from operations | | | | | 281 | | | | | | 294 | |
| | | | |
Distributions to Shareholders: | | | | | | | | | | | | |
| | | | |
From net investment income | | | | | | | | | | | | |
Institutional Class | | | | | 0 | | | | | | 0 | |
Administrative Class | | | | | (346 | ) | | | | | (709 | ) |
Total Distributions | | | | | (346 | ) | | | | | (709 | ) |
| | | | |
Portfolio Share Transactions: | | | | | | | | | | | | |
| | | | |
Receipts for shares sold | | | | | | | | | | | | |
Institutional Class | | | | | 0 | | | | | | 0 | |
Administrative Class | | | | | 5,130 | | | | | | 21,710 | |
| | | | |
Issued as reinvestment of distributions | | | | | | | | | | | | |
Institutional Class | | | | | 0 | | | | | | 0 | |
Administrative Class | | | | | 346 | | | | | | 709 | |
| | | | |
Cost of shares redeemed | | | | | | | | | | | | |
Institutional Class | | | | | 0 | | | | | | 0 | |
Administrative Class | | | | | (3,923 | ) | | | | | (6,424 | ) |
Net increase resulting from Portfolio share transactions | | | | | 1,553 | | | | | | 15,995 | |
| | | | |
Total Increase in Net Assets | | | | | 1,488 | | | | | | 15,580 | |
| | | | |
Net Assets: | | | | | | | | | | | | |
| | | | |
Beginning of period | | | | | 32,368 | | | | | | 16,788 | |
End of period* | | | | $ | 33,856 | | | | | $ | 32,368 | |
| | | | |
*Including (overdistributed) net investment income of: | | | | $ | (1,509 | ) | | | | $ | (1,540 | ) |
| | | | | | |
| See accompanying notes | | June 30, 2004 | | Semi-Annual Report | | 7 |
Schedule of Investments
Foreign Bond Portfolio (U.S. Dollar-Hedged)
June 30, 2004 (Unaudited)
| | | | |
| | | Principal | | |
| | | Amount | | Value |
| | | (000s) | | (000s) |
| | | | | | |
AUSTRALIA 0.2% | | | | | | |
| | |
Crusade Global Trust | | | | | | |
1.580% due 02/15/2030 (a) | | $ | 14 | | $ | 14 |
Medallion Trust | | | | | | |
1.370% due 07/12/2031 (a) | | | 27 | | | 27 |
National Australia Bank Ltd. | | | | | | |
1.883% due 05/19/2010 (a) | | | 50 | | | 50 |
| | | | | |
|
|
Total Australia (Cost $91) | | | | | | 91 |
| | | | | |
|
|
| | | | | | | |
AUSTRIA (i)(j) 1.5% | | | | | | |
| | |
Republic of Austria | | | | | | |
5.250% due 01/04/2011 | | EC | 300 | | | 393 |
3.800% due 10/20/2013 | | | 100 | | | 117 |
| | | | | |
|
|
Total Austria (Cost $447) | | | | | | 510 |
| | | | | |
|
|
| | | | | | | |
BRAZIL 0.3% | | | | | | |
| | |
Republic of Brazil | | | | | | |
2.062% due 04/15/2006 (a) | | $ | 32 | | | 32 |
2.125% due 04/15/2009 (a) | | | 17 | | | 15 |
2.125% due 04/15/2012 (a) | | | 67 | | | 56 |
| | | | | |
|
|
Total Brazil (Cost $105) | | | | | | 103 |
| | | | | |
|
|
| | | | | | | |
CANADA (i)(j) 3.1% | | | | | | |
| | |
Commonwealth of Canada | | | | | | |
6.000% due 06/01/2008 | | C | $500 | | | 399 |
5.500% due 06/01/2009 | | | 200 | | | 157 |
5.500% due 06/01/2010 | | | 300 | | | 235 |
6.000% due 06/01/2011 | | | 300 | | | 241 |
| | | | | |
|
|
Total Canada (Cost $966) | | | | | | 1,032 |
| | | | | |
|
|
| | | | | | | |
CAYMAN ISLANDS (i)(j) 1.6% | | | |
| | |
Pylon Ltd. | | | | | | |
3.553% due 12/18/2008 (a) | | EC | 250 | | | 310 |
Vita Capital Ltd. | | | | | | |
2.460% due 01/01/2007 (a) | | $ | 250 | | | 252 |
| | | | | |
|
|
Total Cayman Islands (Cost $554) | | | | | | 562 |
| | | | | |
|
|
| | | | | | | |
DENMARK (i)(j) 0.2% | | | | | | |
| | |
Nykredit Konvertible | | | | | | |
6.000% due 10/01/2029 | | DK | 358 | | | 61 |
| | | | | |
|
|
Total Denmark (Cost $39) | | | | | | 61 |
| | | | | |
|
|
| | | | | | | |
FRANCE (i)(j) 0.8% | | | | | | |
| | |
Republic of France | | | | | | |
4.000% due 04/25/2009 | | EC | 80 | | | 99 |
4.000% due 10/25/2009 | | | 30 | | | 37 |
5.500% due 04/25/2010 | | | 110 | | | 146 |
| | | | | |
|
|
Total France (Cost $200) | | | | | | 282 |
| | | | | |
|
|
| | | | | | | |
GERMANY (i)(j) 16.3% | | | | | | |
| | |
KFW International Finance, Inc. | | | | | | |
3.500% due 11/15/2005 | | EC | 100 | | | 124 |
Landesbank Baden-Wuerttemberg AG | | | |
5.500% due 04/02/2007 | | | 30 | | | 39 |
Republic of Germany | | | | | | |
4.500% due 07/04/2009 | | | 10 | | | 13 |
5.250% due 07/04/2010 | | | 300 | | | 394 |
5.250% due 01/04/2011 | | | 300 | | | 394 |
5.000% due 01/04/2012 | | | 100 | | | 129 |
| | | | | | |
| | |
4.500% due 01/04/2013 | | EC | 80 | | $ | 100 |
6.250% due 01/04/2024 | | | 600 | | | 866 |
5.000% due 07/04/2027 | | | 590 | | | 880 |
5.625% due 01/04/2028 | | | 1,800 | | | 2,414 |
4.750% due 07/04/2028 | | | 30 | | | 36 |
5.500% due 01/04/2031 | | | 100 | | | 133 |
| | | | | |
|
|
Total Germany (Cost $5,173) | | | | | | 5,522 |
| | | | | |
|
|
| | | | | | | |
ITALY (i)(j) 14.3% | | | | | | |
| | |
First Italian Auto Transaction | | | | | | |
2.240% due 07/12/2008 (a) | | EC | 26 | | | 32 |
Republic of Italy | | | | | | |
2.125% due 02/01/2006 | | | 400 | | | 539 |
3.500% due 01/15/2008 | | | 2,700 | | | 3,311 |
4.500% due 05/01/2009 | | | 360 | | | 456 |
4.250% due 11/01/2009 | | | 60 | | | 75 |
5.500% due 11/01/2010 | | | 110 | | | 146 |
Seashell Securities PLC | | | | | | |
2.359% due 10/25/2028 (a) | | | 148 | | | 180 |
Telecom Italia SpA | | | | | | |
5.625% due 02/01/2007 (a) | | | 70 | | | 90 |
| | | | | |
|
|
Total Italy (Cost $4,738) | | | | | | 4,829 |
| | | | | |
|
|
| | | | | | | |
JAPAN (i)(j) 7.3% | | | | | | |
Government of Japan | | | | | | |
0.300% due 12/20/2007 | | JY | 60,000 | | | 548 |
1.500% due 12/20/2011 | | | 167,000 | | | 1,544 |
1.600% due 09/20/2013 | | | 30,000 | | | 273 |
Japan Financial Corp. | | | | | | |
5.875% due 03/14/2011 | | $ | 80 | | | 86 |
| | | | | |
|
|
Total Japan (Cost $2,399) | | | | | | 2,451 |
| | | | | |
|
|
| | | | | | | |
LIBERIA 0.1% | | | | | | |
| | |
Royal Caribbean Cruises Ltd. | | | | | | |
8.125% due 07/28/2004 | | $ | 30 | | | 30 |
| | | | | |
|
|
Total Liberia (Cost $30) | | | | | | 30 |
| | | | | |
|
|
| | | | | | | |
LUXEMBOURG 0.3% | | | | | | |
| | |
Tyco International Group S.A. | | | | | | |
5.875% due 11/01/2004 | | $ | 100 | | | 101 |
| | | | | |
|
|
Total Luxembourg (Cost $101) | | | | | | 101 |
| | | | | |
|
|
| | | | | | | |
MEXICO 0.3% | | | | | | |
| |
Pemex Project Funding Master Trust | | | |
8.625% due 02/01/2022 | | $ | 20 | | | 21 |
Petroleos Mexicanos | | | | | | |
8.850% due 09/15/2007 | | | 20 | | | 22 |
9.375% due 12/02/2008 | | | 30 | | | 34 |
| | | | | |
|
|
Total Mexico (Cost $70) | | | | | | 77 |
| | | | | |
|
|
| | | | | | | |
NETHERLANDS (i)(j) 0.8% | | | | | | |
| | |
Kingdom of Netherlands | | | | | | |
6.000% due 01/15/2006 | | EC | 200 | | | 256 |
| | | | | |
|
|
Total Netherlands (Cost $192) | | | | | | 256 |
| | | | | |
|
|
| | | | | | | |
NEW ZEALAND (i)(j) 0.2% | | | | | | |
| |
Commonwealth of New Zealand | | | |
4.500% due 02/15/2016 (b) | | N$ | 86 | | | 68 |
| | | | | |
|
|
Total New Zealand (Cost $47) | | | | | | 68 |
| | | | | |
|
|
| | | | | | |
PANAMA 0.1% | | | | | | |
| | |
Republic of Panama | | | | | | |
9.375% due 01/16/2023 | | $ | 40 | | $ | 41 |
| | | | | |
|
|
Total Panama (Cost $40) | | | | | | 41 |
| | | | | |
|
|
| | | | | | | |
PERU 0.1% | | | | | | |
| | |
Republic of Peru | | | | | | |
5.000% due 03/07/2017 (a) | | $ | 36 | | | 32 |
| | | | | |
|
|
Total Peru (Cost $30) | | | | | | 32 |
| | | | | |
|
|
| | | | | | | |
RUSSIA 0.2% | | | | | | |
| | |
Russian Federation | | | | | | |
10.000% due 06/26/2007 | | $ | 60 | | | 68 |
| | | | | |
|
|
Total Russia (Cost $70) | | | | | | 68 |
| | | | | |
|
|
| | | | | | | |
SOUTH AFRICA 0.3% | | | | | | |
| | |
Republic of South Africa | | | | | | |
8.375% due 10/17/2006 | | $ | 105 | | | 115 |
| | | | | |
|
|
Total South Africa (Cost $118) | | | | | | 115 |
| | | | | |
|
|
| | | | | | | |
SPAIN (i)(j) 5.1% | | | | | | |
| | |
Kingdom of Spain | | | | | | |
4.950% due 07/30/2005 | | EC | 30 | | | 38 |
5.150% due 07/30/2009 | | | 1,210 | | | 1,579 |
4.000% due 01/31/2010 | | | 100 | | | 123 |
| | | | | |
|
|
Total Spain (Cost $1,608) | | | | | | 1,740 |
| | | | | |
|
|
| | | | | | | |
SUPRANATIONAL (i)(j) 0.2% | | | |
| | |
Eurofima | | | | | | |
4.750% due 07/07/2004 | | SK | 600 | | | 80 |
| | | | | |
|
|
Total Supranational (Cost $70) | | | | | | 80 |
| | | | | |
|
|
| | | | | | | |
UNITED KINGDOM (i)(j) 10.2% | | | |
| | |
Haus Ltd. | | | | | | |
2.347% due 12/14/2037 (a) | | EC | 72 | | | 88 |
Lloyds TSB Bank PLC | | | | | | |
5.625% due 07/15/2049 | | | 40 | | | 52 |
1.500% due 11/29/2049 (a) | | $ | 100 | | | 86 |
United Kingdom Gilt | | | | | | |
5.000% due 03/07/2012 | | BP | 700 | | | 1,262 |
5.000% due 09/07/2014 | | | 1,100 | | | 1,962 |
| | | | | |
|
|
Total United Kingdom (Cost $3,461) | | | | | | 3,450 |
| | | | | |
|
|
| | | | | | | |
UNITED STATES (i)(j) 24.3% | | | | | | |
Asset-Backed Securities 3.2% |
|
Ameriquest Mortgage Securities, Inc. |
1.710% due 03/25/2033 (a) | | $ | 43 | | | 43 |
Amortizing Residential Collateral Trust |
1.650% due 10/25/2031 (a) | | | 15 | | | 15 |
1.590% due 07/25/2032 (a) | | | 26 | | | 26 |
AMRESCO Residential Securities Corp.
Mortgage Loan Trust |
1.770% due 06/25/2029 (a) | | | 5 | | | 5 |
Credit-Based Asset Servicing and Securitization |
1.620% due 06/25/2032 (a) | | | 36 | | | 36 |
CS First Boston Mortgage Securities Corp. |
1.610% due 01/25/2032 (a) | | | 9 | | | 9 |
6.500% due 04/25/2033 | | | 47 | | | 48 |
| | | | | | |
| 8 | | Semi-Annual Report | | June 30, 2004 | | See accompanying notes |
| | | | |
| | | Principal | | |
| | | Amount | | Value |
| | | (000s) | | (000s) |
| | | | | | |
|
Fieldstone Mortgage Investment Corp. |
1.590% due 01/25/2035 (a) | | $ | 92 | | $ | 92 |
First Alliance Mortgage Loan Trust |
1.320% due 12/20/2027 (a) | | | 6 | | | 6 |
First Franklin Mortgage Loan Trust Asset-Backed Certificates |
2.820% due 02/25/2034 (a) | | | 186 | | | 187 |
Home Equity Asset Trust | | | | | | |
1.710% due 03/25/2033 (a) | | | 20 | | | 20 |
1.450% due 08/25/2034 (a) | | | 96 | | | 96 |
Household Mortgage Loan Trust | | | | | | |
1.390% due 05/20/2032 (a) | | | 32 | | | 32 |
Irwin Home Equity Loan Trust | | | | | | |
1.820% due 06/25/2028 (a) | | | 34 | | | 34 |
Long Beach Mortgage Loan Trust |
1.620% due 07/25/2033 (a) | | | 30 | | | 30 |
MLCC Mortgage Investors, Inc. | | | | | | |
1.618% due 03/15/2025 (a) | | | 38 | | | 38 |
Morgan Stanley Dean Witter Capital I, Inc. |
1.670% due 07/25/2030 (a) | | | 6 | | | 6 |
1.630% due 07/25/2032 (a) | | | 22 | | | 22 |
Novastar Home Equity Loan | | | | | | |
1.575% due 04/25/2028 (a) | | | 11 | | | 11 |
1.580% due 01/25/2031 (a) | | | 10 | | | 10 |
Providian Home Equity Loan Trust |
1.590% due 06/25/2025 (a) | | | 9 | | | 9 |
Quest Trust | | | | | | |
1.291% due 06/25/2034 (a) | | | 200 | | | 200 |
Residential Asset Securities Corp. |
1.550% due 07/25/2032 (a) | | | 66 | | | 66 |
Structured Asset Investment Loan Trust |
1.200% due 04/25/2033 (a) | | | 26 | | | 26 |
| | | | | |
|
|
| | | | | | | 1,067 |
| | | | | |
|
|
Corporate Bonds & Notes 3.3% |
Comcast Corp. | | | | | | |
7.050% due 03/15/2033 | | | 100 | | | 104 |
Entergy Gulf States, Inc. | | | | | | |
2.433% due 06/18/2007 (a) | | | 100 | | | 100 |
Ford Motor Credit Co. | | | | | | |
7.500% due 03/15/2005 | | | 200 | | | T207 |
General Motors Acceptance Corp. | | | |
6.875% due 09/09/2004 | | B | P75 | | | 137 |
2.135% due 05/18/2006 (a) | | | 100 | | | 100 |
J.P. Morgan Chase & Co., Inc. | | | | | | |
6.772% due 02/15/2012 (a) | | $ | 10 | | | 10 |
KFW International Finance, Inc. | | | | | | |
1.750% due 03/23/2010 | | JY | 11,000 | | | 105 |
Morgan Stanley Capital I, Inc. | | | | | | |
1.378% due 04/15/2016 (a) | | $ | 200 | | | 200 |
Pacific Gas & Electric Co. | | | | | | |
1.810% due 04/03/2006 (a) | | | 110 | | | 110 |
UFJ Finance Aruba AEC | | | | | | |
6.750% due 07/15/2013 | | | 40 | | | 41 |
| | | | | |
|
|
| | | | | | | 1,114 |
| | | | | |
|
|
Mortgage-Backed Securities 6.0% |
Bear Stearns Adjustable Rate Mortgage Trust |
6.912% due 12/25/2040 (a) | | | 1 | | | 1 |
Bear Stearns Commercial Mortgage Securities |
1.350% due 05/14/2016 (a) | | | 200 | | | 200 |
Commercial Mortgage Asset Trust | | | |
6.975% due 01/17/2032 | | | 100 | | | 112 |
Commercial Mortgage Pass-Through Certificates |
1.408% due 07/15/2015 (a) | | | 197 | | | 197 |
1.280% due 11/15/2015 (a) | | | 199 | | | 199 |
CS First Boston Mortgage Securities Corp. |
1.082% due 08/25/2033 (a) | | | 58 | | | 58 |
First Horizon Asset Securities, Inc. | | | |
7.000% due 05/25/2030 | | | 5 | | | 5 |
GMAC Commercial Mortgage Securities, Inc. |
6.420% due 05/15/2035 | | | 100 | | | 108 |
Impac Secured Assets CMN Owner Trust |
1.490% due 08/25/2034 (a) | | | 200 | | | 200 |
| | | | | | |
| |
Mellon Residential Funding Corp. | | | |
1.678% due 12/15/2030 (a) | | $ | 110 | | $ | 110 |
Sequoia Mortgage Trust | | | | | | |
1.390% due 08/20/2032 (a) | | | 76 | | | 75 |
Structured Asset Mortgage Investments, Inc. |
1.390% due 09/19/2032 (a) | | | 199 | | | 199 |
1.421% due 09/19/2032 (a) | | | 80 | | | 80 |
1.450% due 03/19/2034 (a) | | | 194 | | | 193 |
Structured Asset Securities Corp. | | | |
1.590% due 01/25/2033 (a) | | | 25 | | | 25 |
Wachovia Bank Commercial Mortgage Trust |
1.428% due 06/15/2013 (a) | | | 200 | | | 200 |
Washington Mutual Mortgage Securities Corp. |
6.000% due 03/25/2017 | | | 9 | | | 9 |
5.159% due 10/25/2032 (a) | | | 15 | | | 15 |
3.065% due 02/27/2034 (a) | | | 51 | | | 51 |
Wells Fargo Mortgage-Backed Securities Trust |
4.614% due 09/25/2032 (a) | | | 4 | | | 4 |
| | | | | |
|
|
| | | | | | | 2,041 |
| | | | | |
|
|
Municipal Bonds & Notes 1.2% | | | |
Connecticut State General Obligation Bonds, Series 2001 |
5.500% due 12/15/2013 | | | 100 | | | 112 |
Illinois Educational Facilities Authority Revenue Bonds, Series 2003 |
5.000% due 07/01/2033 | | | 100 | | | 97 |
Lower Colorado River Authority Revenue Bonds,
(FSA Insured), Series 2003 |
5.000% due 05/15/2023 | | | 100 | | | 101 |
Seattle, Washington Water System Revenue Bonds,
(MBIA Insured), Series 2003 |
5.000% due 09/01/2033 | | | 100 | | | 97 |
| | | | | |
|
|
| | | | | | | 407 |
| | | | | |
|
|
U.S. Government Agencies 8.2% | | | |
Fannie Mae | | | | | | |
4.640% due 01/30/2008 | | | 200 | | | 200 |
1.650% due 01/25/2016 (a) | | | 15 | | | 15 |
5.500% due 11/01/2016-07/15/2034 (c) | | | 1305 | | | 1,335 |
5.000% due 09/01/2018 | | | 177 | | | 177 |
5.213% due 04/01/2033 (a) | | | 47 | | | 47 |
1.420% due 03/25/2034 (a) | | | 194 | | | 193 |
Freddie Mac | | | | | | |
6.530% due 11/26/2012 | | | 300 | | | 319 |
5.000% due 09/15/2016 | | | 45 | | | 46 |
3.430% due 02/01/2029 (a) | | | 60 | | | 62 |
Government National Mortgage Association |
4.375% due 04/20/2028 (a) | | | 5 | | | 5 |
4.000% due 04/20/2030-05/20/2030 (a)(c) | | | 33 | | | 34 |
3.250% due 06/20/2030 (a) | | | 38 | | | 38 |
Tennessee Valley Authority | | | | | | |
4.875% due 12/15/2016 | | | 300 | | | 313 |
| | | | | |
|
|
| | | | | | | 2,784 |
| | | | | |
|
|
U.S. Treasury Obligations 1.8% |
3.500% due 01/15/2011 | | | 324 | | | 360 |
1.875% due 07/15/2013 | | | 102 | | | 101 |
3.625% due 04/15/2028 | | | 116 | | | 142 |
| | | | | |
|
|
| | | | | | | 603 |
| | | | | |
|
|
Preferred Security 0.6% | | | |
| | | Shares | | |
DG Funding Trust | | | | | | |
3.360% due 12/29/2049 (a) | | | 20 | | | 215 |
| | | | | |
|
|
Total United States (Cost $8,204) | | | | | | 8,231 |
| | | | | |
|
|
| | | | | | | |
PURCHASED CALL OPTIONS 0.0% |
| | | Principal Amount (000s) | | |
30-Year Interest Rate Swap (OTC) |
Strike @ 5.750%** Exp. 04/27/2009 | | $ | 200 | | | 8 |
| | | | | |
|
|
Total Purchased Call Options
(Cost $10) | | | | | | 8 |
| | | | | |
|
|
| | | | | | | |
PURCHASED PUT OPTIONS 0.1% | |
| |
30-Year Interest Rate Swap (OTC) | | | | |
Strike @ 6.250% ** Exp. 04/27/2009 | | $ | 200 | | $ | 13 | |
| | | | | |
|
|
|
Total Purchased Put Options (Cost $14) | | | | | | 13 | |
| | | | | |
|
|
|
| | | | | | | | |
SHORT-TERM INSTRUMENTS 26.3% | |
| | |
Commercial Paper 23.3% | | | | | | | |
AB Spintab | | | | | | | |
1.260% due 09/08/2004 | | $ | 200 | | | 199 | |
Bank of Ireland | | | | | | | |
1.285% due 09/03/2004 | | | 500 | | | 499 | |
CBA (de) Finance | | | | | | | |
1.210% due 08/23/2004 | | | 200 | | | 200 | |
Fannie Mae | | | | | | | |
1.010% due 10/01/2004 | | | 200 | | | 199 | |
Freddie Mac | | | | | | | |
1.440% due 09/14/2004 | | | 200 | | | 199 | |
1.465% due 09/28/2004 | | | 300 | | | 299 | |
HBOS Treasury Services PLC | | | | | | | |
1.035% due 07/01/2004 | | | 300 | | | 300 | |
1.475% due 09/13/2004 | | | 600 | | | 598 | |
1.585% due 10/26/2004 | | | 100 | | | 99 | |
ING U.S. Funding LLC | | | | | | | |
1.325% due 09/07/2004 | | | 100 | | | 100 | |
1.345% due 09/09/2004 | | | 300 | | | 299 | |
KFW International Finance, Inc. | | | | | | | |
1.110% due 08/20/2004 | | | 400 | | | 399 | |
Lloyds TSB Bank PLC | | | | | | | |
1.185% due 07/21/2004 | | | 400 | | | 400 | |
National Australia Funding, Inc. | | | | | | | |
1.050% due 07/02/2004 | | | 900 | | | 900 | |
Royal Bank of Scotland PLC | | | | | | | |
1.030% due 07/06/2004 | | | 900 | | | 900 | |
Shell Finance (UK) PLC | | | | | | | |
1.230% due 08/11/2004 | | | 500 | | | 499 | |
Svenska Handlesbanken | | | | | | | |
1.090% due 08/05/2004 | | | 400 | | | 399 | |
1.295% due 09/24/2004 | | | 600 | | | 598 | |
Toyota Motor Credit Corp. | | | | | | | |
1.330% due 09/07/2004 | | | 400 | | | 399 | |
UBS Finance, Inc. | | | | | | | |
1.245% due 09/13/2004 | | | 400 | | | 399 | |
| | | | | |
|
|
|
| | | | | | | 7,884 | |
| | | | | |
|
|
|
| | |
Repurchase Agreement 1.8% | | | | | | | |
State Street Bank | | | | | | | |
0.800% due 07/01/2004 | | | 594 | | | 594 | |
| | | | | |
|
|
|
(Dated 06/30/2004. Collateralized by Freddie Mac 2.875% due 10/15/2005 valued at $606.
Repurchase proceeds are $594.) | |
| | |
U.S. Treasury Bills 1.2% | | | | | | | |
1.256% due 09/02/2004-09/16/2004 (c)(d) | | | 420 | | | 420 | |
| | | | | |
|
|
|
Total Short-Term Instruments (Cost $8,899) | | | | | | 8,898 | |
| | | | | |
|
|
|
| | | | | | | | |
Total Investments 114.2% | | | | | $ | 38,651 | |
(Cost $37,676) | | | | | | | |
| | |
Written Options (g) (0.2%) | | | | | | (64 | ) |
(Premiums $128) | | | | | | | |
| |
Other Assets and Liabilities (Net) (14.0%) | | | (4,731 | ) |
| | | | | |
|
|
|
| | |
Net Assets 100.0% | | | | | $ | 33,856 | |
| | | | | |
|
|
|
| | | | | | |
| See accompanying notes | | June 30, 2004 | | Semi-Annual Report | | 9 |
Schedule of Investments (Cont.)
Foreign Bond Portfolio (U.S. Dollar-Hedged)
June 30, 2004 (Unaudited)
Notes to Schedule of Investments (amounts in thousands, except number of contracts):
(a) Variable rate security.
(b) Principal amount of security is adjusted for inflation.
(c) Securities are grouped by coupon or range of coupons and represent a range of maturities.
(d) Securities with an aggregate market value of $419 have been segregated with the custodian to cover margin
requirements for the following open futures contracts at June 30, 2004:
| | | | | | | | |
| Type | | Expiration Month | | # of Contracts | | Unrealized
Appreciation/
(Depreciation) | |
Euribor June Long Futures | | 06/2005 | | 8 | | $ | (5) | |
Euro-Bund 10-Year Note Long Futures | | 09/2004 | | 55 | | | 58 | |
Government of Japan 10-Year | | | | | | |
Note Long Futures | | 09/2004 | | 5 | | | (21 | ) |
U.S. Treasury 10-Year Note Long Futures | | 09/2004 | | 66 | | | 85 | |
U.S. Treasury 5-Year Note Long Futures | | 09/2004 | | 4 | | | 1 | |
| | | | | | | $ | 118 | |
(e) Swap agreements outstanding at June 30, 2004:
| | | | | | | | | |
Type | |
| Notional
Amount | | | | | Unrealized
Appreciation/
(Depreciation |
) |
| Receive floating rate based on 6-month BP-LIBOR and pay a fixed rate equal to 5.000%. | |
Counterparty: Merrill Lynch & Co., Inc. | | | | | | |
Exp. 03/15/2017 | | BP | 200 | | $ | | | 3 | |
|
| Receive floating rate based on 6-month BP-LIBOR and pay a fixed rate equal to 5.000%. | |
Counterparty: UBS Warburg LLC | | | | | | |
Exp. 03/20/2018 | | | 300 | | | | | (1 | ) |
|
| Receive floating rate based on 6-month BP-LIBOR and pay a fixed rate equal to 5.000%. | |
| Counterparty: Morgan Stanley Dean Witter & Co. | | | | | | |
Exp. 03/20/2018 | | | 500 | | | | | 5 | |
|
| Receive floating rate based on 6-month BP-LIBOR and pay a fixed rate equal to 5.000%. | |
Counterparty: Goldman Sachs & Co. | | | | | | |
Exp. 03/20/2018 | | | 800 | | | | | 10 | |
|
| Receive floating rate based on 6-month BP-LIBOR and pay a fixed rate equal to 5.000%. | |
Counterparty: J.P. Morgan Chase & Co. | | | | | | |
Exp. 03/20/2018 | | | 600 | | | | | 4 | |
|
| Receive a fixed rate equal to 3.500% and pay floating rate based on 6-month EC-LIBOR. | |
Counterparty: UBS Warburg LLC | | | | | | |
Exp. 09/15/2005 | | EC | 2,800 | | | | | 16 | |
|
| Receive a fixed rate equal to 4.000% and pay floating rate based on 6-month EC-LIBOR. | |
Counterparty: Barclays Bank PLC | | | | | | |
Exp. 03/15/2007 | | | 200 | | | | | (1 | ) |
|
| Receive a fixed rate equal to 4.000% and pay floating rate based on 6-month EC-LIBOR. | |
Counterparty: Goldman Sachs & Co. | | | | | | |
Exp. 06/17/2010 | | | 200 | | | | | (5 | ) |
| | | | | | | | |
|
| Receive floating rate based on 6-month EC-LIBOR and pay a fixed rate equal to 5.000%. | |
Counterparty: J.P. Morgan Chase & Co. | | | | | |
Exp. 06/17/2012 | | EC | 100 | | | | (16 | ) |
|
| Receive floating rate based on 6-month EC-LIBOR and pay a fixed rate equal to 5.000%. | |
Counterparty: Citibank N.A. | | | | | |
Exp. 06/18/2012 | | | 200 | | | | (10 | ) |
|
| Receive floating rate based on 6-month EC-LIBOR and pay a fixed rate equal to 4.000%. | |
Counterparty: Citibank N.A. | | | | | |
Exp. 12/15/2014 | | | 1,080 | | | | (10 | ) |
|
| Receive floating rate based on 6-month EC-LIBOR and pay a fixed rate equal to 4.000%. | |
Counterparty: UBS Warburg LLC | | | | | |
Exp. 12/15/2014 | | | 200 | | | | (2 | ) |
|
| Receive floating rate based on 6-month EC-LIBOR and pay a fixed rate equal to 5.000%. | |
Counterparty: UBS Warburg LLC | | | | | |
Exp. 12/15/2014 | | | 2,500 | | | | (27 | ) |
|
| Receive a fixed rate equal to 6.000% and pay floating rate based on 6-month EC-LIBOR. | |
Counterparty: Goldman Sachs & Co. | | | | | |
Exp. 03/20/2018 | | | 1,000 | | | | 0 | |
|
| Receive a fixed rate equal to 6.000% and pay floating rate based on 6-month EC-LIBOR. | |
Counterparty: UBS Warburg LLC | | | | | |
Exp. 03/20/2018 | | | 400 | | | | 2 | |
|
| Receive a fixed rate equal to 6.000% and pay floating rate based on 6-month EC-LIBOR. | |
Counterparty: J.P. Morgan Chase & Co. | | | | | |
Exp. 03/20/2018 | | | 200 | | | | 1 | |
|
| Receive floating rate based on 6-month EC-LIBOR and pay a fixed rate equal to 6.000%. | |
Counterparty: Morgan Stanley Dean Witter & Co. | |
Exp. 03/15/2031 | | | 100 | | | | (18 | ) |
|
| Receive floating rate based on 6-month EC-LIBOR and pay a fixed rate equal to 6.000%. | |
Counterparty: J.P. Morgan Chase & Co. | | | | | |
Exp. 03/17/2031 | | | 100 | | | | (19 | ) |
|
| Receive floating rate based on 3-month H$-HIBOR and pay a fixed rate equal to 5.753%. | |
Counterparty: Goldman Sachs & Co. | | | | | |
Exp. 02/08/2006 | | H$ | 3,000 | | | | (22 | ) |
|
| Receive floating rate based on 3-month H$-HIBOR and pay a fixed rate equal to 4.235%. | |
Counterparty: Goldman Sachs & Co. | | | | | |
Exp. 12/17/2008 | | | 7,100 | | | | (16 | ) |
|
| Receive floating rate based on 6-month JY-LIBOR and pay a fixed rate equal to 2.020%. | |
Counterparty: Goldman Sachs & Co. | | | | | |
Exp. 05/18/2010 | | JY | 17,000 | | | | (8 | ) |
|
| Receive floating rate based on 6-month JY-LIBOR and pay a fixed rate equal to 1.300%. | |
Counterparty: Goldman Sachs & Co. | | | | | |
Exp. 09/21/2011 | | | 40,000 | | | | 4 | |
|
| Receive floating rate based on 6-month JY-LIBOR and pay a fixed rate equal to 0.800%. | |
Counterparty: UBS Warburg LLC | | | | | |
Exp. 03/20/2012 | | | 50,000 | | | | 7 | |
|
| Receive a fixed rate equal to 4.500% and pay floating rate based on 3-month SK-STIBOR. | |
Counterparty: Merrill Lynch & Co., Inc. | | | | | |
Exp. 06/17/2008 | | SK | 2,600 | | | | 1 | |
| | | | | | | | |
|
| Receive a fixed rate equal to 4.500% and pay floating rate based on 3-month SK-STIBOR. | |
Counterparty: J.P. Morgan Chase & Co. | | | | | |
Exp. 06/17/2008 | | $ | 4,100 | | | | 2 | |
|
| Receive a fixed rate equal to 4.500% and pay floating rate based on 3-month SK-STIBOR. | |
Counterparty: Barclays Bank PLC | | | | | |
Exp. 06/17/2008 | | | 2,500 | | | | 1 | |
|
| Receive total return on Lehman Commercial Mortgage-Backed Securities Index and pay a floating rate based on 1-month LIBOR less 0.650%. | |
Counterparty: Morgan Stanley Dean Witter & Co. | |
Exp. 09/30/2004 | | | 100 | | | | 0 | |
|
| Receive a fixed rate equal to 0.960% and the Portfolio will pay to the counterparty at par in the event of default of Russian Federation, 5.000% until 03/31/2007 and 7.500% thereafter, due 03/31/2030. | |
Counterparty: Goldman Sachs & Co. | | | | | |
Exp. 01/28/2005 | | | 100 | | | | 0 | |
|
| Receive floating rate based on 3-month LIBOR and pay a fixed rate equal to 4.000%. | |
Counterparty: J.P. Morgan Chase & Co. | | | | | |
Exp. 12/15/2009 | | | 1,900 | | | | (18 | ) |
|
| Receive floating rate based on 3-month LIBOR and pay a fixed rate equal to 4.000%. | |
Counterparty: Lehman Brothers, Inc. | | | | | |
Exp. 12/15/2009 | | | 100 | | | | 0 | |
|
| Receive floating rate based on 3-month LIBOR and pay a fixed rate equal to 5.000%. | |
Counterparty: Bank of America | | | | | |
Exp. 12/15/2014 | | | 1,800 | | | | (28 | ) |
|
| Receive floating rate based on 3-month LIBOR and pay a fixed rate equal to 5.000%. | |
Counterparty: Goldman Sachs & Co. | | | | | |
Exp. 12/15/2014 | | | 600 | | | | (9 | ) |
|
| Receive floating rate based on 3-month LIBOR and pay a fixed rate equal to 5.000%. | |
Counterparty: UBS Warburg LLC | | | | | |
Exp. 12/15/2014 | | | 800 | | | | (12 | ) |
|
| Receive floating rate based on 3-month LIBOR and pay a fixed rate equal to 6.000%. | |
Counterparty: Bank of America | | | | | |
| Exp. 12/15/2024 | | | 900 | | (24) | |
| | | | | | $ (190) | |
|
(f) Written options with premiums to be determined on a future date: | |
Type | |
| # of
Contracts | | Unrealized
Appreciation |
|
Call & Put–OTC % U.S. Dollar Forward Delta /Neutral Straddle vs. Japanese Yen Strike and premium determined on 12/18/2007, based upon implied volatility
parameter of 18.500%. | |
| Counterparty: AIG International, Inc. | | | | | |
| Exp. 12/18/2012 | | | 80 | | $ 5 | |
| | | | | | |
| 10 | | Semi-Annual Report | | June 30, 2004 | | See accompanying notes |
| | | | | | |
| See accompanying notes | | June 30, 2004 | | Semi-Annual Report | | 11 |
(g) Premiums received on written options:
| | | | | | | | | | | | | | | | | | | | | | | | | |
| Name of Issuer | | | | Exercise
Price | | | | | Expiration
Date | | # of Contracts | | | | Premium | | | | | | Value |
Call - CBOT U.S. Treasury Note September Futures | | | | $ | 115.000 | | | | | 08/27/2004 | | | 6 | | | | $ | 2 | | | | | | $ | 0 |
Call - CBOT U.S. Treasury Note September Futures | | | | | 114.000 | | | | | 08/27/2004 | | | 1 | | | | | 1 | | | | | | | 0 |
| | | | | | | | | | | | | | | | | | $ | 3 | | | | | | $ | 0 |
| Name of Issuer | | Counterparty | | Exercise Rate | | | | | Expiration
Date | | Notional
Amount | | | | Premium | | | | | | Value |
Call - OTC 10-Year Interest Rate Swap | | J.P. Morgan Chase & Co. | | | 4.000 | %** | | | | 10/07/2004 | | $ | 300 | | | | $ | 3 | | | | | | $ | 0 |
Call - OTC 7-Year Interest Rate Swap | | J.P. Morgan Chase & Co. | | | 3.800 | %** | | | | 10/07/2004 | | | 800 | | | | | 8 | | | | | | | 0 |
Put - OTC 10-Year Interest Rate Swap | | J.P. Morgan Chase & Co. | | | 6.000 | %* | | | | 10/07/2004 | | | 300 | | | | | 2 | | | | | | | 1 |
Put - OTC 7-Year Interest Rate Swap | | J.P. Morgan Chase & Co. | | | 6.000 | %* | | | | 10/07/2004 | | | 800 | | | | | 7 | | | | | | | 1 |
Call - OTC 7-Year Interest Rate Swap | | Lehman Brothers, Inc. | | | 5.750 | %** | | | | 08/04/2005 | | | 1,000 | | | | | 43 | | | | | | | 40 |
Put - OTC 7-Year Interest Rate Swap | | Lehman Brothers, Inc. | | | 5.750 | %* | | | | 08/04/2005 | | | 1,000 | | | | | 43 | | | | | | | 17 |
Call - OTC 7-Year Interest Rate Swap | | Merrill Lynch & Co., Inc. | | | 4.000 | %** | | | | 09/23/2005 | | | 300 | | | | | 8 | | | | | | | 1 |
Put - OTC 7-Year Interest Rate Swap | | Merrill Lynch & Co., Inc. | | | 6.000 | %* | | | | 09/23/2005 | | | 300 | | | | | 11 | | | | | | | 4 |
| | | | | | | | | | | | | | | | | | $ | 125 | | | | | | $ | 64 |
| * | The Portfolio will pay a floating rate based on 3-month LIBOR. |
**The Portfolio will receive a floating rate based on 3-month LIBOR.
(h) Short sales open at June 30, 2004 were as follows:
| | | | | | | | | | | | | | |
| Type | | Coupon (%) | | Maturity | | Par | | | | Value | | Proceeds |
U.S. Treasury Note | | 5.500 | | 05/15/2009 | | $ | 400 | | | | $ | 431 | | $ 426 |
U.S. Treasury Note | | 5.750 | | 08/15/2010 | | | 100 | | | | | 109 | | 107 |
U.S. Treasury Note | | 4.375 | | 08/15/2012 | | | 500 | | | | | 498 | | 494 |
U.S. Treasury Note | | 3.875 | | 02/15/2013 | | | 900 | | | | | 861 | | 846 |
U.S. Treasury Note | | 3.625 | | 05/15/2013 | | | 2,400 | | | | | 2,248 | | 2,212 |
U.S. Treasury Note | | 4.250 | | 08/15/2013 | | | 1,100 | | | | | 1,074 | | 1,055 |
U.S. Treasury Note | | 3.000 | | 02/15/2009 | | | 2,600 | | | | | 2,520 | | 2,524 |
| | | | | | | | | | | | $ | 7,741 | | $ 7,664 |
(i) Forward foreign currency contracts outstanding at June 30, 2004:
| | | | | | | | | | | | | | | | | | | | | | | | | |
| Type | | | | Currency | | | | | | Principal
Amount
Covered by
Contract | | | | Settlement
Month | | Unrealized
Appreciation | | Unrealized (Depreciation) | | | Net Unrealized
Appreciation/ (Depreciation) | |
Sell | | | | BP | | | | | | 1,058 | | | | 07/2004 | | $ | 5 | | $ | 0 | | | $ | 5 | |
Buy | | | | BR | | | | | | 36 | | | | 07/2004 | | | 0 | | | 0 | | | | 0 | |
Sell | | | | C$ | | | | | | 1,431 | | | | 07/2004 | | | 0 | | | (17 | ) | | | (17 | ) |
Buy | | | | CP | | | | | | 1,246 | | | | 08/2004 | | | 0 | | | 0 | | | | 0 | |
Sell | | | | DK | | | | | | 679 | | | | 09/2004 | | | 1 | | | 0 | | | | 1 | |
Buy | | | | EC | | | | | | 266 | | | | 07/2004 | | | 0 | | | (1 | ) | | | (1 | ) |
Sell | | | | | | | | | | 8,362 | | | | 07/2004 | | | 96 | | | 0 | | | | 96 | |
Buy | | | | H$ | | | | | | 47 | | | | 07/2004 | | | 0 | | | 0 | | | | 0 | |
Buy | | | | | | | | | | 420 | | | | 09/2004 | | | 0 | | | 0 | | | | 0 | |
Sell | | | | JY | | | | | | 226,587 | | | | 07/2004 | | | 0 | | | (17 | ) | | | (17 | ) |
Buy | | | | KW | | | | | | 6,966 | | | | 07/2004 | | | 0 | | | 0 | | | | 0 | |
Buy | | | | | | | | | | 27,912 | | | | 09/2004 | | | 0 | | | 0 | | | | 0 | |
Buy | | | | MP | | | | | | 156 | | | | 08/2004 | | | 0 | | | 0 | | | | 0 | |
Sell | | | | N$ | | | | | | 87 | | | | 07/2004 | | | 0 | | | 0 | | | | 0 | |
Buy | | | | PN | | | | | | 24 | | | | 08/2004 | | | 0 | | | 0 | | | | 0 | |
Buy | | | | RR | | | | | | 199 | | | | 07/2004 | | | 0 | | | 0 | | | | 0 | |
Buy | | | | S$ | | | | | | 10 | | | | 07/2004 | | | 0 | | | 0 | | | | 0 | |
Sell | | | | SK | | | | | | 559 | | | | 09/2004 | | | 1 | | | 0 | | | | 1 | |
Buy | | | | SR | | | | | | 67 | | | | 08/2004 | | | 1 | | | 0 | | | | 1 | |
Sell | | | | | | | | | | 24 | | | | 08/2004 | | | 0 | | | 0 | | | | 0 | |
Buy | | | | SV | | | | | | 364 | | | | 08/2004 | | | 0 | | | 0 | | | | 0 | |
| | | | | | | | | | | | | | | | |
|
|
|
| | | | | | | | | | | | | | | | | $ | 104 | | $ | (35 | ) | | $ | 69 | |
| | | | | | | | | | | | | | | | |
|
|
|
(j) Principal amount denoted in indicated currency:
| | | | |
BP | | - | | British Pound |
BR | | - | | Brazilian Real |
C$ | | - | | Canadian Dollar |
CP | | - | | Chilean Peso |
DK | | - | | Danish Krone |
EC | | - | | Euro |
H$ | | - | | Hong Kong Dollar |
JY | | - | | Japanese Yen |
KW | | - | | South Korean Won |
MP | | - | | Mexican Peso |
N$ | | - | | New Zealand Dollar |
PN | | - | | Peruvian New Sol |
RR | | - | | Russian Ruble |
S$ | | - | | Singapore Dollar |
SK | | - | | Swedish Krona |
SR | | - | | South African Rand |
SV | | - | | Slovakian Koruna |
Notes to Financial Statements
June 30, 2004 (Unaudited)
1. Organization
The Foreign Bond Portfolio (U.S. Dollar-Hedged) (the “Portfolio”) is a series of the PIMCO Variable Insurance Trust (the “Trust”). The Trust is registered under the Investment Company Act of 1940 (the “Act”), as amended, as an open-end investment company organized as a Delaware business trust on October 3, 1997. The Portfolio offers two classes of shares: Institutional and Administrative. Each share class has identical voting rights (except that shareholders of a class have exclusive voting rights regarding any matter relating solely to that class of shares). Information presented in these financial statements pertains to the Administrative Class of the Portfolio. Certain detailed financial information for the Institutional Class is provided separately and is available upon request. The Trust is designed to be used as an investment vehicle by Separate Accounts of insurance companies that fund variable annuity contracts and variable life insurance policies and by qualified pension and retirement plans. The Portfolio commenced operations on February 16, 1999.
2. Significant Accounting Policies
The following is a summary of significant accounting policies consistently followed by the Trust in the preparation of its financial statements in conformity with accounting principles generally accepted in the United States of America. The preparation of financial statements in accordance with accounting principles generally accepted in the United States of America requires management to make estimates and assumptions that affect the reported amounts and disclosures in the financial statements. Actual results could differ from those estimates.
Security Valuation. Portfolio securities and other financial instruments for which market quotations are readily available are stated at market value. Portfolio securities and other financial instruments for which market quotes are not readily available are valued at fair value, as determined in good faith and pursuant to guidelines established by the Board of Trustees, including certain fixed income securities which may be valued with reference to securities whose prices are more readily obtainable. Market value is determined at the close of regular trading (normally, 4:00 p.m., Eastern Time) on the New York Stock Exchange on each day the New York Stock Exchange is open, or if no sales are reported, as is the case for most securities traded over-the-counter, the mean between representative bid and asked quotations obtained from a quotation reporting system or from established market makers. The prices of certain portfolio securities or other financial instruments may be determined at a time prior to the close of regular trading on the New York Stock Exchange. Fair valuation may be used if significant events occur after the close of the relevant markets and prior to the close of regular trading on the New York Stock Exchange that materially affect the values of such securities or financial instruments. Fixed income securities are normally valued on the basis of quotes obtained from brokers and dealers or pricing services. Certain fixed income securities purchased on a delayed delivery basis are marked to market daily until settlement at the forward settlement value. Short-term investments, which mature in 60 days or less are valued at amortized cost, which approximates market value. Exchange traded options, futures and options on futures are valued at the settlement price determined by the relevant exchange. Prices may be obtained from independent pricing services which use information provided by market makers or estimates of market values obtained from yield data relating to investments or securities with similar characteristics. The prices used by the Portfolio may differ from the value that would be realized if the securities were sold and the differences could be material to the financial statements.
Securities Transactions and Investment Income. Securities transactions are recorded as of the trade date. Securities purchased or sold on a when-issued or delayed delivery basis may be settled a month or more after the trade date. Realized gains and losses from securities sold are recorded on the identified cost basis. Dividend income is recorded on the ex-dividend date, except certain dividends from foreign securities where the ex-dividend date may have passed, are recorded as soon as the Portfolio is informed of the ex-dividend date. Interest income, adjusted for the accretion of discounts and amortization of premiums, is recorded on the accrual basis. Paydowns gains and losses on mortgage- and asset-backed securities are recorded as adjustments to interest income in the Statement of Operations.
Dividends and Distributions to Shareholders. Dividends from net investment income, if any, are declared on each day the Trust is open for business and are distributed to shareholders monthly. All dividends are reinvested in additional shares of the Portfolio. Net realized capital gains earned by the Portfolio, if any, will be distributed no less frequently than once each year.
Income dividends and capital gain distributions are determined in accordance with income tax regulations which may differ from accounting principles generally accepted in the United States of America. These differences are primarily due to differing treatments for such items as wash sales, foreign currency transactions, net operating losses, notional principal contracts, certain asset-backed securities, certain futures and forward contracts, tax straddles, and capital loss carryforwards.
Distributions classified as a tax basis return of capital, if any, are reflected in the accompanying Statements of Changes in Net Assets and have been reclassified to paid in capital. In addition, other amounts have been reclassified between undistributed net investment income, accumulated undistributed net realized gains or losses and/or paid in capital to more appropriately conform financial accounting to tax characterizations of dividend distributions.
Multiclass Operations. Each class offered by the Trust has equal rights as to assets. Income, non-class specific expenses, and realized and unrealized capital gains and losses are allocated to each class of shares based on the relative net assets of each class.
Delayed Delivery Transactions. The Portfolio may purchase or sell securities on a when-issued or delayed delivery basis. These transactions involve a commitment by the Portfolio to purchase or sell securities for a predetermined price or yield, with payment and
| | | | |
| 12 | | Semi-Annual Report | | June 30, 2004 |
delivery taking place beyond the customary settlement period. When delayed delivery purchases are outstanding, the Portfolio will designate liquid assets in an amount sufficient to meet the purchase price. When purchasing a security on a delayed delivery basis, the Portfolio assumes the rights and risks of ownership of the security, including the risk of price and yield fluctuations, and takes such fluctuations into account when determining its net asset value. The Portfolio may dispose of or renegotiate a delayed delivery transaction after it is entered into, and may sell when-issued securities before they are delivered, which may result in a capital gain or loss. When the Portfolio has sold a security on a delayed delivery basis, the Portfolio does not participate in future gains and losses with respect to the security.
Federal Income Taxes. The Portfolio intends to qualify as a regulated investment company and distribute all of its taxable income and net realized gains, if applicable, to shareholders. Accordingly, no provision for Federal income taxes has been made.
Foreign Currency. The accounting records of the Portfolio are maintained in U.S. dollars. The market values of foreign securities, currency holdings and other assets and liabilities are translated into U.S. dollars based on the current exchange rates each business day. Fluctuations in the value of these assets and liabilities resulting from changes in exchange rates are recorded as unrealized foreign currency gains or losses. Realized gains or losses and unrealized appreciation or depreciation on investment securities and income and expenses are translated on the respective dates of such transactions. The effect of changes in foreign currency exchange rates on investments in securities are not segregated in the Statement of Operations from the effects of changes in market prices of those securities, but are included with the net realized and unrealized gain or loss on investment securities.
Forward Currency Transactions. The Portfolio may enter into forward currency contracts and forward cross-currency contracts in connection with settling planned purchases or sales of securities, to hedge the currency exposure associated with some or all of the Portfolio’s securities or as a part of an investment strategy. A forward currency contract is an agreement between two parties to buy and sell a currency at a set price on a future date. The market value of a forward currency contract fluctuates with changes in forward currency exchange rates. Forward currency contracts are marked to market daily and the change in value is recorded by the Portfolio as an unrealized gain or loss. Realized gains or losses equal to the difference between the value of the contract at the time it was opened and the value at the time it was closed are recorded upon delivery or receipt of the currency or, if a forward currency contract is offset by entering into another forward currency contract with the same broker, upon settlement of the net gain or loss. These contracts may involve market risk in excess of the unrealized gain or loss reflected in the Portfolio’s Statement of Assets and Liabilities. In addition, the Portfolio could be exposed to risk if the counterparties are unable to meet the terms of the contracts or if the value of the currency changes unfavorably to the U.S. dollar.
Futures Contracts. The Portfolio is authorized to enter into futures contracts. The Portfolio may use futures contracts to manage its exposure to the securities markets or to movements in interest rates and currency values. The primary risks associated with the use of futures contracts are the imperfect correlation between the change in market value of the securities held by the Portfolio and the prices of futures contracts, the possibility of an illiquid market, and the inability of the counterparty to meet the terms of the contract. Futures contracts are valued based upon their quoted daily settlement prices. Upon entering into a futures contract, the Portfolio may be required to deposit with its custodian, in a segregated account in the name of the futures broker, an amount of cash or U.S. Government and Agency Obligations in accordance with the initial margin requirements of the broker or exchange. Futures contracts are marked to market daily and an appropriate payable or receivable for the change in value (“variation margin”) is recorded by the Portfolio. Gains or losses are recognized but not considered realized until the contracts expire or are closed. Futures contracts involve, to varying degrees, risk of loss in excess of the variation margin disclosed in the Statement of Assets and Liabilities.
Inflation-Indexed Bonds. The Portfolio may invest in inflation-indexed bonds. Inflation-indexed bonds are fixed income securities whose principal value is periodically adjusted to the rate of inflation. The interest rate on these bonds is generally fixed at issuance at a rate lower than typical bonds. Over the life of an inflation-indexed bond, however, interest will be paid based on a principal value, which is adjusted for inflation. Any increase in the principal amount of an inflation-indexed bond will be included as interest income in the Statement of Operations, even though investors do not receive their principal until maturity.
Options Contracts. The Portfolio may write call and put options on futures, swaps, securities or currencies it owns or in which it may invest. Writing put options tends to increase the Portfolio’s exposure to the underlying instrument. Writing call options tends to decrease the Portfolio’s exposure to the underlying instrument. When the Portfolio writes a call or put option, an amount equal to the premium received is recorded as a liability and subsequently marked to market to reflect the current value of the option written. These liabilities are reflected as written options outstanding in the Statement of Assets and Liabilities. Payments received or made, if any, from writing options with premiums to be determined on a future date are reflected as such on the Statement of Assets and Liabilities. Premiums received from writing options which expire are treated as realized gains. Premiums received from writing options which are exercised or closed are added to the proceeds or offset against amounts paid on the underlying future, swap, security or currency transaction to determine the realized gain or loss. The Portfolio as a writer of an option has no control over whether the underlying future, swap, security or currency may be sold (call) or purchased (put) and as a result bears the market risk of an unfavorable change in the price of the future, swap, security or currency underlying the written option. There is the risk the Portfolio may not be able to enter into a closing transaction because of an illiquid market.
| | | | |
| June 30, 2004 | | Semi-Annual Report | | 13 |
Notes to Financial Statements (Cont.)
June 30, 2004 (Unaudited)
The Portfolio may also purchase put and call options. Purchasing call options tends to increase the Portfolio’s exposure to the underlying instrument. Purchasing put options tends to decrease the Portfolio’s exposure to the underlying instrument. The Portfolio pays a premium which is included in the Portfolio’s Statement of Assets and Liabilities as an investment and subsequently marked to market to reflect the current value of the option. Premiums paid for purchasing options which expire are treated as realized losses. The risk associated with purchasing put and call options is limited to the premium paid. Premiums paid for purchasing options which are exercised or closed are added to the amounts paid or offset against the proceeds on the underlying future, swap, security or currency transaction to determine the realized gain or loss.
Repurchase Agreements. The Portfolio may engage in repurchase transactions. Under the terms of a typical repurchase agreement, the Portfolio takes possession of an underlying debt obligation subject to an obligation of the seller to repurchase, and the Portfolio to resell, the obligation at an agreed-upon price and time. The market value of the collateral must be equal at all times to the total amount of the repurchase obligations, including interest. Generally, in the event of counterparty default, the Portfolio has the right to use the collateral to offset losses incurred.
Short Sales. The Portfolio may enter into short sales transactions. A short sale is a transaction in which the Portfolio sells securities it does not own in anticipation of a decline in the market price of the securities. The Portfolio is obligated to deliver securities at the market price at the time the short position is closed. Possible losses from short sales may be unlimited, whereas losses from purchases cannot exceed the total amount invested.
Swap Agreements. The Portfolio may invest in swap agreements. A swap is an agreement to exchange the return generated by one instrument for the return generated by another instrument. The Portfolio may enter into interest rate, total return, forward spread lock, and credit default swap agreements to manage its exposure to interest rates and credit risk.
Interest rate swap agreements involve the exchange by the Portfolio with another party of their respective commitments to pay or receive interest, e.g., an exchange of floating rate payments for fixed rate payments with respect to the notional amount of principal.
Total return swap agreements involve commitments to pay interest in exchange for a market-linked return, both based on notional amounts. To the extent the total return of the security or index underlying the transaction exceeds or falls short of the offsetting interest rate obligation, the Portfolio will receive a payment from or make a payment to the counterparty.
Forward spread lock swap agreements involve commitments to pay or receive a settlement amount calculated as the difference between the swap spread and a fixed spread, multiplied by the notional amount times the duration of the swap. The swap spread is the difference between the benchmark swap rate (market rate) and the specific Treasury rate.
In a credit default swap, one party makes a stream of payments to another party in exchange for the right to receive a specified return in the event of a default by a third party, typically corporate issues or sovereign issues of an emerging country, on its obligation. The Portfolio may use credit default swaps to provide a measure of protection against defaults of sovereign issuers (i.e., to reduce risk where the Portfolio owns or has exposure to the sovereign issuer) or to take an active long or short position with respect to the likelihood of a particular issuer’s default.
Swaps are marked to market daily based upon quotations from market makers and the change in value, if any, is recorded as unrealized gain or loss in the Statement of Operations. Payments received or made at the beginning of the measurement period are
reflected as such on the Statement of Assets and Liabilities. A liquidation payment received or made at the termination of the swap is recorded as realized gain or loss in the Statement of Operations. Net periodic payments received by the Portfolio are included as part of realized gain(loss) on the Statement of Operations. Entering into these agreements involves, to varying degrees, elements of credit, market and documentation risk in excess of the amounts recognized on the Statement of Assets and Liabilities. Such risks involve the possibility that there will be no liquid market for these agreements, that the counterparty to the agreements may default on its obligation to perform or disagree as to the meaning of contractual terms in the agreements, and that there may be unfavorable changes in interest rates.
As a result of a FASB Emerging Issues Task Force (“EITF”) consensus, No. 03-11, and related SEC staff guidance, the Portfolio has reclassified periodic payments made or received under swap agreements, which were previously included within miscellaneous income, to a component of realized gain(loss) in the Statement of Operations. For consistency, similar reclassifications have been made to amounts appearing in the previous year’s Statement of Changes in Net Assets and the per share amounts in the prior year financial highlights. Prior year net investment income ratios in the financial highlights have also been modified accordingly. This reclassification increased(decreased) net investment income by $46,353 and $26,213, and net realized (loss) by $(52,329) and $(14,876) and net change in unrealized appreciation(depreciation) by $5,976 and $(11,338) for the six months ended June 30, 2004 and year ended December 31, 2003, respectively. There is no effect on the Portfolio’s net asset value, either in total or per share, or its total increase(decrease) in net assets from operations during any period.
3. Fees, Expenses, and Related Party Transactions
Investment Advisory Fee. Pacific Investment Management Company LLC (“PIMCO”) is a majority owned subsidiary partnership of Allianz Dresdner Asset Management of America L.P. and serves as investment adviser (the “Adviser”) to the Trust, pursuant to an investment advisory contract. The Adviser receives a monthly fee at an annual rate based on average daily net assets of the Portfolio. The Advisory Fee is charged at an annual rate of 0.25%.
| | | | |
| 14 | | Semi-Annual Report | | June 30, 2004 |
Administration Fee. PIMCO serves as administrator (the “Administrator”), and provides administrative services to the Trust for which it receives a monthly administrative fee based on average daily net assets of the Portfolio. The Administration Fee is charged at the annual rate of 0.50%.
Servicing Fee. PA Distributors LLC (“PAD”), formerly known as PIMCO Advisors Distributors LLC, is an indirect wholly-owned subsidiary of Allianz Dresdner Asset Management of America L.P. and serves as the distributor of the Trust’s shares. The Trust is permitted to reimburse PAD on a quarterly basis, out of the Administrative Class assets of the Portfolio in the amount of 0.15% on an annual basis of the average daily net assets of that class, for payments made to financial intermediaries that provide services in connection with the distribution of shares or administration of plans or programs that use Portfolio shares as their funding medium. The effective rate paid to PAD was 0.15% during current fiscal year.
Expenses. The Trust is responsible for the following expenses: (i) salaries and other compensation of any of the Trust’s executive officers and employees who are not officers, directors, stockholders or employees of PIMCO or its subsidiaries or affiliates; (ii) taxes and governmental fees; (iii) brokerage fees and commissions and other portfolio transaction expenses; (iv) the cost of borrowing money, including interest expense and bank overdraft charges; (v) fees and expenses of the Trustees who are not “interested persons” of PIMCO or the Trust, and any counsel retained exclusively for their benefit; (vi) extraordinary expenses, including costs of litigation and indemnification expenses; (vii) organization expenses and (viii) any expenses allocated or allocable to a specific class of shares, which include service fees payable with respect to the Administrative Class shares and may include certain other expenses as permitted by the Trust’s Multiple Class Plan adopted pursuant to Rule 18f-3 under the Act and subject to review and approval by the Trustees. The ratio of expenses to average net assets per share class, as disclosed in Financial Highlights, may differ from the annual portfolio operating expenses per share class as disclosed in the Prospectus for the reasons set forth above.
PIMCO has agreed to waive a portion of its administrative fees to the extent that the payment of the Portfolio’s pro rata share of organization expenses and Trustee fees cause the actual expense ratio to rise above the rates disclosed in the then-current prospectus plus 0.49 basis points as set forth below (calculated as a percentage of the Portfolio’s average daily net assets attributable to each class):
| | | |
Institutional Class | | 0.90 | % |
Administrative Class | | 0.75 | % |
PIMCO may be reimbursed for these waived amounts in future periods, not to exceed thirty-six months.
Each unaffiliated Trustee receives an annual retainer of $4,000, plus $1,500 for each Board of Trustees meeting attended in person and $250 for each meeting attended telephonically, plus reimbursement of related expenses. In addition, each committee chair receives an additional annual retainer of $500. These expenses are allocated on a pro-rata basis to each Portfolio of the Trust according to its respective net assets.
4. Purchases and Sales of Securities
The length of time a Portfolio has held a particular security is not generally a consideration in investment decisions. A change in the securities held by a Portfolio is known as “portfolio turnover.” The Portfolio may engage in frequent and active trading of portfolio securities to achieve its investment objective, particularly during periods of volatile market movements. High portfolio turnover (e.g., over 100%) involves correspondingly greater expenses to the Portfolio, including brokerage commissions or dealer mark-ups and other transaction costs on the sale of securities and reinvestments in other securities. Such sales may also result in realization of taxable capital gains, including short-term capital gains (which are generally taxed at ordinary income tax rates). The trading costs and tax effects associated with portfolio turnover may adversely affect the Portfolio’s performance.
Purchases and sales of securities (excluding short-term investments) for the period ended June 30, 2004 were as follows (amounts in thousands):
| | | | | | |
| U.S Government/Agency | | All Other |
| Purchases | | Sales | | Purchases | | Sales |
| $41,893 | | $44,886 | | $31,637 | | $32,974 |
5. Transactions in Written Call and Put Options
Transactions in written call and put options were as follows (amounts in thousands):
| | | | |
| | | | Premium | |
Balance at 12/31/2003 | | $ | 141 | |
Sales | | | 43 | |
Closing Buys | | | (19 | ) |
Expirations | | | (37 | ) |
Exercised | | | 0 | |
Balance at 06/30/2004 | | $ | 128 | |
| | | | |
| June 30, 2004 | | Semi-Annual Report | | 15 |
Notes to Financial Statements (Cont.)
June 30, 2004 (Unaudited)
6. Federal Income Tax Matters
At June 30, 2004, the aggregate cost of investments was the same for federal income tax and financial statement purposes. The net unrealized appreciation (depreciation) of investment securities for federal income tax purposes is as follows (amounts in thousands):
| | | | | | | |
Aggregate Gross
Unrealized
Appreciation | | Aggregate Gross
Unrealized
(Depreciation) | | | Net Unrealized
Appreciation |
| $ 1,188 | | $ | (213 | ) | | $ | 975 |
7. Shares of Beneficial Interest
The Trust may issue an unlimited number of shares of beneficial interest with a $.001 par value. Changes in shares of beneficial interest were as follows (shares and amounts in thousands):
| | | | | | | | | | | | | | |
| | | Six Months Ended
06/30/2004 | | | Year Ended 12/31/2003 | |
| | | Shares | | | Amount | | | Shares | | | Amount | |
Receipts for shares sold | | | | | | | | | | | | | | |
| | | | |
Institutional Class | | 0 | | | $ | 0 | | | 0 | | | $ | 0 | |
Administrative Class | | 511 | | | | 5,130 | | | 2,126 | | | | 21,710 | |
| | | | |
Issued as reinvestment of distributions | | | | | | | | | | | | | | |
| | | | |
Institutional Class | | 0 | | | | 0 | | | 0 | | | | 0 | |
Administrative Class | | 34 | | | | 346 | | | 70 | | | | 709 | |
| | | | |
Cost of shares redeemed | | | | | | | | | | | | | | |
| | | | |
Institutional Class | | 0 | | | | 0 | | | 0 | | | | 0 | |
Administrative Class | | (390 | ) | | | (3,923 | ) | | (635 | ) | | | (6,424 | ) |
| | | | |
Net increase resulting from Portfolio share transactions | | 155 | | | $ | 1,553 | | | 1,561 | | | $ | 15,995 | |
The following schedule shows the number of shareholders each owning 5% or more of the Portfolio and the total percentage of the Portfolio held by such shareholders:
| | | | |
| | | Number | | % of Portfolio Held |
Institutional Class | | 1 | | 100 |
Administrative Class | | 3 | | 98 |
8. Regulatory and Litigation Matters
On February 17, 2004, the Attorney General of the State of New Jersey (“New Jersey AG”) filed a complaint against Allianz Dresdner Asset Management of America L.P. (“ADAM”), PA Distributors LLC (formerly known as PIMCO Advisors Distributors LLC) (“PAD”), PEA Capital LLC (formerly known as PIMCO Equity Advisors LLC) (“PEA”), and Pacific Investment Management Company LLC (“PIMCO”) in connection with its investigation into market timing and late trading. The complaint contends that inappropriate trading by shareholders engaged in market timing activity took place in funds in the PIMCO Funds: Multi-Manager Series (“MMS Funds”) and the PIMCO Funds: Pacific Investment Management Series (“PIMS Funds”). On June 1, 2004, the New Jersey AG dismissed PIMCO from the lawsuit.
On the same day as the dismissal of PIMCO from the lawsuit, the New Jersey AG announced that it had reached a settlement agreement with the remaining defendants (“New Jersey Settlement”). In the New Jersey Settlement, ADAM, PAD and PEA agreed, while neither admitting nor denying the allegations or conclusions of law, to: (i) pay New Jersey a civil fine of $15 million and $3 million for investigative costs and further enforcement initiatives; and (ii) implement certain changes in corporate governance.
On May 6, 2004, the Securities and Exchange Commission filed a complaint in the U.S. District Court in the Southern District of New York alleging that PA Fund Management LLC (formerly known as PIMCO Advisors Fund Management LLC) (“PAFM”), PEA, PAD, Stephen J. Treadway (at the time, the chief executive officer of PAFM and PAD as well as chairman of the Board of Trustees of the MMS Funds) and Kenneth W. Corba (the former chief executive officer of PEA and former portfolio manager of the PEA Growth and PEA Growth & Income Funds) had, among other things, violated
| | | | |
| 16 | | Semi-Annual Report | | June 30, 2004 |
and/or aided and abetted violations of, various antifraud provisions of the federal securities laws in connection with alleged “market timing” arrangements that improperly allowed certain hedge funds to engage in “market timing” in the PEA Growth Fund, the PEA Opportunity Fund, the PEA Innovation Fund, and the PEA Target Fund. The complaint seeks injunctive relief, disgorgement plus pre-judgment interest, monetary penalties, and an order permanently enjoining the defendants from serving as investment advisers, principal underwriters, officers, directors, or members of any advisory boards to any registered investment companies.
On February 20, 2004, a putative class action lawsuit was filed in the U.S. District Court for the District of New Jersey on behalf of certain shareholders of the PIMCO Funds against ADAM, PAD, PIMCO, PEA, the PIMS Funds, the MMS Funds, the Trust, PIMCO Commercial Mortgage Securities Trust, Inc. and certain other defendants, alleging that inappropriate market timing activity by certain shareholders caused financial injury to the shareholders of those Funds.
The following additional putative class action lawsuits have been filed against the PIMS Funds, the MMS Funds and/or their affiliates, each related to alleged market-timing activity in funds advised by PIMCO or its affiliates: (1) a lawsuit filed in the U.S. District Court for the District of Connecticut on February 27, 2004 (naming as defendants ADAM, PAD, PEA, the PIMS Funds, the MMS Funds, the Trust, PCM and certain other parties); (2) a lawsuit filed in the U.S. District Court for the Central District of California on March 4, 2004 (naming as defendants PIMCO, ADAM, PEA and PAD); (3) a lawsuit filed in the U.S. District Court for the Southern District of New York on March 8, 2004 (naming PIMCO, PAD and certain of their affiliates as defendants); (4) a lawsuit filed in the U.S. District Court for the Southern District of New York, on March 15, 2004 (naming PIMCO as the defendant); (5) two separate lawsuits filed in the U.S. District Court for the Central District of California on March 22, 2004, brought derivatively on behalf of the PIMCO High Yield Fund and the PIMCO Money Market Fund, respectively (each naming ADAM, PAFM and certain other parties as defendants, and the PIMCO Funds as the nominal defendant); (6) a lawsuit filed in the U.S. District Court for the Central District of California, also on March 22, 2004, brought derivatively on behalf of the PIMS Funds and the MMS Funds (naming ADAM, PIMCO, PAD and certain other parties as defendants, and the PIMS Funds and the MMS Funds as nominal defendants); (7) a lawsuit filed in the U.S. District Court for the District of New Jersey on April 20, 2004 (naming ADAM, PAD, the PIMS Funds and certain other parties as defendants); and (8) a lawsuit filed in the U.S. District Court for the Northern District of California on April 28, 2004 (naming ADAM, PIMCO, PAD, PEA and certain other parties as defendants, and the “PIMCO Funds” as nominal defendants). Each complaint for the foregoing putative class actions alleges, among other things, that inappropriate trading by shareholders engaged in market timing activities took place in certain of the funds advised by PIMCO, and each complaint seeks unspecified compensatory damages.
On February 17, 2004, a putative class action lawsuit was filed in the U.S. District Court for the District of Connecticut on behalf of certain shareholders of the PIMCO Funds against ADAM, PEA, PIMCO, PIMS Funds, MMS Funds and certain other defendants, alleging excessive investment advisory fees and the use of brokerage commissions to pay for distribution of fund shares. Three similar putative class action lawsuits were subsequently filed, each in the U.S. District Court for the District of Connecticut on March 1, 2004, April 23, 2004 and May 20, 2004, respectively.
Under Section 9(a) of the 1940 Act, if any of the various lawsuits were to result in a court injunction against PAFM, PEA, PAD, PIMCO, ADAM and/or Mr. Treadway, they and their affiliates would, in the absence of exemptive relief granted by the SEC, be barred from serving as an investment adviser/sub-adviser or principal underwriter for any registered investment company, including the Trust. ADAM and certain of its subsidiaries have responded to inquiries from the SEC concerning the status of the New Jersey Settlement under Section 9(a). If any of PAFM, PEA, PAD, PIMCO or ADAM were subject to an injunction, each of these entities and their affiliates could in turn seek exemptive relief from the SEC, as contemplated by the 1940 Act. There is no assurance, however, that such exemptive relief would be granted. The SEC also has the power by order to prohibit PAFM, PEA, PAD and PIMCO from serving as investment advisers and underwriters, if the SEC finds that such entities willfully violated the federal securities laws in connection with the allegations discussed above or aided or abetted such violations.
PIMCO, PAD and the Trust believe that these developments will not have a material adverse effect on the Portfolios or on PIMCO’s, or PAD’s ability to perform their respective investment advisory or distribution services on behalf of the Portfolios.
| | | | |
| June 30, 2004 | | Semi-Annual Report | | 17 |
Trustees and Officers
Brent R. Harris, Chairman and Trustee
R. Wesley Burns, President and Trustee
E. Philip Cannon, Trustee
Vern O. Curtis, Trustee
J. Michael Hagan, Trustee
William J. Popejoy, Trustee
Garlin G. Flynn, Secretary
John P. Hardaway, Treasurer
Investment Adviser and Administrator
Pacific Investment Management Company LLC
840 Newport Center Drive
Newport Beach, California 92660
Distributor
PA Distributors LLC
2187 Atlantic Street
Stamford, Connecticut 06902
Custodian
State Street Bank & Trust Company
801 Pennsylvania
Kansas City, Missouri 64105
Transfer Agent
Boston Financial Data Services–Midwest
330 W. 9th Street
Kansas City, Missouri 64105
Legal Counsel
Dechert LLP
1775 I Street, N.W.
Washington, D.C. 20006
Independent Registered Public Accounting Firm
PricewaterhouseCoopers LLP
1055 Broadway
Kansas City, Missouri 64105
Information about how the Fund voted proxies relating to portfolio securities held during the year July 1, 2003 through June 30, 2004 will be available no later than August 31, 2004 without charge, upon request, by calling the Trust at 1-800-927-4648 and on the SEC’s website at http://www.sec.gov.
Copies of the written Proxy Policy and the factors that PIMCO may consider in determining how to vote proxies for the Funds are available by calling the Trust at 1-800-927-4648 and on the SEC’s website at http://www.sec.gov.
PIMCO VARIABLE INSURANCE TRUST
840 NEWPORT CENTER DRIVE
NEWPORT BEACH, CA 92660

PIMCO VARIABLE INSURANCE TRUST
MONEY MARKET PORTFOLIO
ADMINISTRATIVE CLASS
SEMI-ANNUAL REPORT
June 30, 2004
|
| This material is authorized for use only when preceded or accompanied by the current PIMCO Variable Insurance Trust prospectus. Investors should consider the investment objectives, risks, charges and expenses of Portfolio carefully before investing. This and other information is contained in the Portfolio’s prospectus. Please read the prospectus carefully before you invest or send money. |
Chairman’s Letter
Dear PIMCO Variable Insurance Trust Shareholder:
Bond prices were more volatile during the six-month period ended June 30, 2004. Interest rates rose sharply during the second quarter 2004, causing bonds to give back modest gains from earlier in the year. The Lehman Brothers Aggregate Bond Index, a widely used index for the high-grade bond market, was nearly flat during the first six months of 2004, returning 0.15% after losing 2.44% during the second quarter. The yield on the benchmark ten-year Treasury closed June 30, 2004 at 4.58%, up 0.75% from April 1, 2004, but up only 0.34% from where it began the six-month period on January 1, 2004.
Continued growth in employment convinced the markets that the Federal Reserve would soon begin a long anticipated tightening cycle. On June 30, 2004, the Fed met market expectations by increasing the federal funds rate 0.25%, which was the first rate increase since June 25, 2003. The central bank had held this rate at 1% for more than a year, which generated negative real short-term rates. And on August 10, 2004, the Fed increased the federal funds rate another 0.25% to 1.50%.
Investors that had profited handsomely from borrowing at low short-term rates and investing in higher-yielding longer maturity bonds surrendered some of those profits towards the latter part of the six-month period. Concern that borrowing rates would rise led investors to liquidate long positions and unwind these trades, which caused bond prices to decrease. However, substantial leverage remained among banks, hedge funds, and other investors, making bond markets somewhat vulnerable to additional Fed rate increases. There were also signs of rising inflation, which fueled anxiety that central banks might continue to raise interest rates.
On the following pages you will find a more complete review of the Portfolio in light of financial market activities as well as specific details about the total return investment performance for the six-month period.
We appreciate the trust you have placed in us, and we will continue to focus our efforts to meet your investment needs.
Sincerely,

Brent R. Harris
Chairman
August 11, 2004
| | | | |
| June 30, 2004 | | Semi-Annual Report | | 1 |
Important Information About the Portfolio
We believe that bond funds have an important role to play in a well diversified investment portfolio. It is important to note, however, that in an environment where interest rates may trend upward, rising rates will negatively impact the performance of most bond funds, and fixed income securities held by a fund are likely to decrease in value. The price volatility of fixed income securities can also increase during periods of rising interest rates resulting in increased losses to a fund. Bond funds and individual bonds with a longer duration (a measure of the expected life of a security) tend to be more sensitive to changes in interest rates, usually making them more volatile than securities or funds with shorter durations. The longer-term performance of most bond funds has benefited from capital gains in part resulting from an extended period of declining interest rates. In the event interest rates increase, these capital gains should not be expected to recur.
The Portfolio may be subject to various risks in addition to those described above. Some of these risks may include, but are not limited to, the following: real rate risk, derivative risk, small company risk, foreign security risk, high yield security risk and specific sector investment risks. The Portfolio may use derivative instruments for hedging purposes or as part of an investment strategy. Use of these instruments may involve certain costs and risks such as liquidity risk, interest rate risk, market risk, credit risk, management risk and the risk that a fund could not close out a position when it would be most advantageous to do so. A Portfolio investing in derivatives could lose more than the principal amount invested in these instruments. Investing in non-U.S. securities may entail risk due to non-U.S. economic and political developments; this risk may be enhanced when investing in emerging markets. High-yield bonds typically have a lower credit rating than other bonds. Lower rated bonds generally involve a greater risk to principal than higher rated bonds. Smaller companies may be more volatile than larger companies and may entail more risk. Concentrating investments in individual sectors may add additional risk and volatility compared to a diversified portfolio.
On the performance summary page in this semi-annual report, the Total Return Investment Performance table measures performance assuming that all dividend and capital gain distributions were reinvested. Returns do not reflect the deduction of taxes that a shareholder would pay (i) on Portfolio distributions or (ii) the redemption of Portfolio shares.
An investment in a Portfolio is not a bank deposit and is not guaranteed or insured by the Federal Deposit Insurance Corporation or any other government agency. It is possible to lose money on investments in the Funds.
The following disclosure provides important information regarding the Portfolio’s Expense Example, which appears on the Portfolio’s individual page in this semi-annual report. Please refer to this information when reviewing the Expense Example for the Portfolio.
Example
As a shareholder of the Portfolio, you incur two types of costs: (1) transaction costs, including redemption and exchange fees; and (2) ongoing costs, including advisory and administrative fees; distribution and/or service (12b-1) fees (Administrative Class only); and other Portfolio expenses. The Example is intended to help you understand your ongoing costs (in dollars) of investing in the Portfolio and to compare these costs with the ongoing costs of investing in other mutual funds.
The Example is based on an investment of $1,000 invested at the beginning of the period and held for the entire period indicated, which is from 1/1/04 to 6/30/04.
Actual Expenses
The information in the table under the heading “Actual Performance” provides information about actual account values and actual expenses. You may use the information in these columns, together with the amount you invested, to estimate the expenses that you paid over the period. Simply divide your account value by $1,000.00 (for example, an $8,600.00 account value divided by $1,000 = 8.60), then multiply the result by the number in the appropriate column for your share class, in the row entitled “Expenses Paid During Period” to estimate the expenses you paid on your account during this period.
Hypothetical Example for Comparison Purposes
The information in the table under the heading “Hypothetical Performance (5% return before expenses)” provides information about hypothetical account values and hypothetical expenses based on the Portfolio’s actual expense ratio and an assumed rate of return of 5% per year before expenses, which is not the Portfolio’s actual return. The hypothetical account values and expenses may not be used to estimate the actual ending account balance or expenses you paid for the period. You may use this information to compare the ongoing costs of investing in the Portfolio and other portfolios. To do so, compare this 5% hypothetical example with the 5% hypothetical examples that appear in the shareholder reports of the other portfolios.
Please note that the expenses shown in the table are meant to highlight your ongoing costs only and do not reflect any transactional costs. Therefore, the information under the heading “Hypothetical Performance (5% return before expenses)” is useful in comparing ongoing costs only, and will not help you determine the relative total costs of owning different portfolios. In addition, if these transactional costs were included, your costs would have been higher.
PIMCO Variable Insurance Trust is distributed by PA Distributors LLC, 2187 Atlantic Street, Stamford, CT 06902.
| | | | |
| 2 | | Semi-Annual Report | | June 30, 2004 |
Money Market Portfolio
CUMULATIVE RETURNS THROUGH JUNE 30, 2004

[CHART]
Money Market Citigroup 3-Month
Portfolio Admin Class Treasury Bill Index
--------------------- -------------------
09/30/1999 $10,000 10,000
10/31/1999 $10,041 10,041
11/30/1999 $10,082 10,081
12/31/1999 $10,130 10,124
01/31/2000 $10,174 10,169
02/29/2000 $10,218 10,212
03/31/2000 $10,268 10,260
04/30/2000 $10,311 10,308
05/31/2000 $10,361 10,359
06/30/2000 $10,415 10,407
07/31/2000 $10,466 10,458
08/31/2000 $10,520 10,509
09/30/2000 $10,570 10,562
10/31/2000 $10,617 10,617
11/30/2000 $10,680 10,671
12/31/2000 $10,739 10,727
01/31/2001 $10,791 10,783
02/28/2001 $10,836 10,829
03/31/2001 $10,881 10,877
04/30/2001 $10,919 10,919
05/31/2001 $10,961 10,959
06/30/2001 $10,996 10,994
07/31/2001 $11,027 11,028
08/31/2001 $11,063 11,062
09/30/2001 $11,088 11,094
10/31/2001 $11,112 11,123
11/30/2001 $11,132 11,146
12/31/2001 $11,150 11,166
01/31/2002 $11,164 11,183
02/28/2002 $11,178 11,198
03/31/2002 $11,192 11,215
04/30/2002 $11,206 11,231
05/31/2002 $11,222 11,248
06/30/2002 $11,235 11,263
07/31/2002 $11,249 11,280
08/31/2002 $11,263 11,296
09/30/2002 $11,275 11,312
10/31/2002 $11,288 11,328
11/30/2002 $11,296 11,342
12/31/2002 $11,306 11,356
01/31/2003 $11,317 11,368
02/28/2003 $11,325 11,378
03/31/2003 $11,332 11,390
04/30/2003 $11,340 11,401
05/31/2003 $11,348 11,412
06/30/2003 $11,354 11,422
07/31/2003 $11,361 11,432
08/31/2003 $11,366 11,442
09/30/2003 $11,371 11,450
10/31/2003 $11,377 11,460
11/30/2003 $11,383 11,468
12/31/2003 $11,388 11,478
01/31/2004 $11,394 11,487
02/29/2004 $11,399 11,495
03/31/2004 $11,404 11,504
04/30/2004 $11,410 11,513
05/31/2004 $11,414 11,522
06/30/2004 $11,420 11,532
SECTOR BREAKDOWN‡
| | | |
Commercial Paper | | 79.7 | % |
Repurchase Agreements | | 10.4 | % |
Certificates of Deposit | | 8.2 | % |
Other | | 1.7 | % |
‡ % of Total Investments as of June 30, 2004
à$10,000 invested at the beginning of the first full month following the inception of the Administrative Class.
TOTAL RETURN INVESTMENT PERFORMANCE For the period ended June 30, 2004
| | | | | | | | | | | | | | | | | | | |
| | | | | | | 7-Day Yield | | | 30-Day Yield | | | 6 Months | | | 1 Year | | | Since Inception* | |
| | |
| | Money Market Portfolio Administrative Class (Inception 09/30/99) | | 0.69 | % | | 0.65 | % | | 0.28 | % | | 0.58 | % | | 2.83 | % |
| | | - - - - - - - | | Citigroup 3-Month Treasury Bill Index | | — | | | — | | | 0.47 | % | | 0.96 | % | | — | |
| | | | | * Annualized. All Portfolio returns are net of fees and expenses. | | | | | | | | | | | | | | | |
Past performance is no guarantee of future results. The performance quoted represents past performance. Investment return and principal value will fluctuate so the Portfolio shares, when redeemed, may be worth more or less than their original cost. Current performance may be lower or higher than the performance data quoted. Performance data current to the most recent month-end is available by calling (800) 927-4648.
Please refer to page 2 herein for an explanation of the information presented in the following Expense Example.
| | | | | | | | | | |
| EXPENSE EXAMPLE | | | | Actual Performance | | | | Hypothetical Performance (5% return before expenses) |
Beginning Account Value (01/01/04) | | | | $ | 1,000.00 | | | | $ | 1,000.00 |
Ending Account Value (06/30/04) | | | | $ | 1,002.80 | | | | $ | 1,025.00 |
Expenses Paid During Period† | | | | $ | 2.49 | | | | $ | 2.52 |
†Expenses are equal to the Portfolio’s Administrative Class annualized expense ratio of 0.50%, multiplied by the average account value over the period, multiplied by 182/366 (to reflect the one-half year period).
PORTFOLIO INSIGHTS
| • | The Money Market Portfolio seeks to achieve its investment objective by investing at least 95% of its total assets in a diversified portfolio of money market securities that are in the highest rating category for short-term obligations. |
| • | The total return performance of the Portfolio’s Administrative Class shares was 0.28% for the six-month period ended June 30, 2004, versus a return of 0.47% for the benchmark Citigroup 3-Month Treasury Bill Index during the same period. |
| • | Interest rates increased for shorter maturities, as markets anticipated the beginning of a tightening cycle by the Federal Reserve. The Fed met market expectations with a 0.25% rate hike at the end of June. |
| • | The Portfolio’s average duration was maintained near one-month, providing for ample liquidity and limiting the price effects from increasing yields. |
| • | U.S. issued high quality (A1/P1) commercial paper was emphasized due to attractive yields, limited interest rate sensitivity, and low credit exposure. |
| • | The Portfolio invested in high quality U.S. agency paper and short-term fixed and floating rate U.S. corporates in an attempt to boost portfolio income, while limiting credit risk. |
| • | Seven-day and thirty-day effective yields were 0.69% and 0.65%, respectively, at June 30, 2004. These yields are competitive with yields on similar duration portfolios. |
| | | | | | |
| See accompanying notes | | June 30, 2004 | | Semi-Annual Report | | 3 |
Financial Highlights
Money Market Portfolio (Administrative Class)
| | | | | | | | | | | | | | | | | | | | | | | | | | | | | | | | | | | | |
Selected Per Share Data for the Year or Period
Ended: | | | | 06/30/2004+ | | | | | 12/31/2003 | | | | | 12/31/2002 | | | | | 12/31/2001 | | | | | 12/31/2000 | | | | | 09/30/1999-
12/31/1999 | |
| | | | | | | | | | | | |
Net asset value beginning of period | | | | $ | 1.00 | | | | | $ | 1.00 | | | | | $ | 1.00 | | | | | $ | 1.00 | | | | | $ | 1.00 | | | | | $ | 1.00 | |
Net investment income (a) | | | | | 0.00 | | | | | | 0.01 | | | | | | 0.01 | | | | | | 0.04 | | | | | | 0.06 | | | | | | 0.01 | |
Net realized/unrealized gain on investments (a) | | | | | 0.00 | | | | | | 0.00 | | | | | | 0.00 | | | | | | 0.00 | | | | | | 0.00 | | | | | | 0.00 | |
Total income from investment operations | | | | | 0.00 | | | | | | 0.01 | | | | | | 0.01 | | | | | | 0.04 | | | | | | 0.06 | | | | | | 0.01 | |
Dividends from net investment income | | | | | 0.00 | | | | | | (0.01 | ) | | | | | (0.01 | ) | | | | | (0.04 | ) | | | | | (0.06 | ) | | | | | (0.01 | ) |
Distributions from net realized capital gains | | | | | 0.00 | | | | | | 0.00 | | | | | | 0.00 | | | | | | 0.00 | | | | | | 0.00 | | | | | | 0.00 | |
Total distributions | | | | | 0.00 | | | | | | (0.01 | ) | | | | | (0.01 | ) | | | | | (0.04 | ) | | | | | (0.06 | ) | | | | | (0.01 | ) |
Net asset value end of period | | | | $ | 1.00 | | | | | $ | 1.00 | | | | | $ | 1.00 | | | | | $ | 1.00 | | | | | $ | 1.00 | | | | | $ | 1.00 | |
Total return | | | | | 0.28 | % | | | | | 0.72 | % | | | | | 1.41 | % | | | | | 3.83 | % | | | | | 6.01 | % | | | | | 1.30 | % |
Net assets end of period (000s) | | | | $ | 29,272 | | | | | $ | 27,032 | | | | | $ | 25,850 | | | | | $ | 12,860 | | | | | $ | 4,334 | | | | | $ | 3,605 | |
Ratio of net expenses to average net assets | | | | | 0.50 | %* | | | | | 0.50 | % | | | | | 0.50 | % | | | | | 0.50 | %(c) | | | | | 0.50 | % | | | | | 0.50 | %(b)* |
Ratio of net investment income to average net assets | | | | | 0.57 | %* | | | | | 0.70 | % | | | | | 1.41 | % | | | | | 3.37 | % | | | | | 5.88 | % | | | | | 5.14 | %* |
| (a) | Per share amounts based on average number of shares outstanding during the period. |
| (b) | If the investment manager had not reimbursed expenses, the ratio of expenses to average net assets would have been 1.27%. |
| (c) | If the investment manager had not reimbursed expenses, the ratio of expenses to average net assets would have been 0.51%. |
| | | | | | |
| 4 | | Semi-Annual Report | | June 30, 2004 | | See accompanying notes |
Statement of Assets and Liabilities
Money Market Portfolio
June 30, 2004 (Unaudited)
| | | | | | |
| Amounts in thousands, except per share amounts | | | | | |
| | |
Assets: | | | | | | |
| | |
Investments, at value | | | | $ | 29,303 | |
Interest and dividends receivable | | | | | 2 | |
| | | | | | 29,305 | |
| | |
Liabilities: | | | | | | |
| | |
Payable for Portfolio shares redeemed | | | | | 9 | |
Accrued investment advisory fee | | | | | 4 | |
Accrued administration fee | | | | | 5 | |
Accrued servicing fee | | | | | 3 | |
| | | | | | 21 | |
| | |
Net Assets | | | | $ | 29,284 | |
| | |
Net Assets Consist of: | | | | | | |
| | |
Paid in capital | | | | $ | 29,284 | |
Undistributed net investment income | | | | | 3 | |
Accumulated undistributed net realized (loss) | | | | | (3 | ) |
| | | | | $ | 29,284 | |
| | |
Net Assets: | | | | | | |
| | |
Institutional Class | | | | $ | 12 | |
Administrative Class | | | | | 29,272 | |
| | |
Shares Issued and Outstanding: | | | | | | |
| | |
Institutional Class | | | | | 12 | |
Administrative Class | | | | | 29,272 | |
| | |
Net Asset Value and Redemption Price Per Share
(Net Assets Per Share Outstanding) | | | | | | |
| | |
Institutional Class | | | | $ | 1.00 | |
Administrative Class | | | | | 1.00 | |
| | |
Cost of Investments Owned | | | | $ | 29,303 | |
| | | | | | |
| See accompanying notes | | June 30, 2004 | | Semi-Annual Report | | 5 |
Statement of Operations
Money Market Portfolio
| | | | | |
| Amounts in thousands | | | | |
| | | | | Six Months Ended
June 30, 2004
(Unaudited) |
Investment Income: | | | | | |
| | |
Interest | | | | $ | 150 |
Total Income | | | | | 150 |
| | |
Expenses: | | | | | |
| | |
Investment advisory fees | | | | | 21 |
Administration fees | | | | | 28 |
Distribution and/or servicing fees - Administrative Class | | | | | 21 |
Total Expenses | | | | | 70 |
| | |
Net Investment Income | | | | $ | 80 |
| | | | | | |
| 6 | | Semi-Annual Report | | June 30, 2004 | | See accompanying notes |
Statements of Changes in Net Assets
Money Market Portfolio
| | | | | | | | | | | | |
| Amounts in thousands | | | | | | | | | | |
| | | | | Six Months Ended
June 30, 2004
(Unaudited) | | | | | Year Ended
December 31, 2003 | |
Increase in Net Assets from: | | | | | | | | | | | | |
| | | | |
Operations: | | | | | | | | | | | | |
| | | | |
Net investment income | | | | $ | 80 | | | | | $ | 198 | |
Net realized gain | | | | | 0 | | | | | | 6 | |
Net increase resulting from operations | | | | | 80 | | | | | | 204 | |
| | | | |
Distributions to Shareholders: | | | | | | | | | | | | |
| | | | |
From net investment income | | | | | | | | | | | | |
Institutional Class | | | | | 0 | | | | | | 0 | |
Administrative Class | | | | | (80 | ) | | | | | (203 | ) |
Total Distributions | | | | | (80 | ) | | | | | (203 | ) |
| | | | |
Portfolio Share Transactions: | | | | | | | | | | | | |
| | | | |
Receipts for shares sold | | | | | | | | | | | | |
Institutional Class | | | | | 1 | | | | | | 0 | |
Administrative Class | | | | | 11,524 | | | | | | 18,326 | |
| | | | |
Issued as reinvestment of distributions | | | | | | | | | | | | |
Institutional Class | | | | | 0 | | | | | | 0 | |
Administrative Class | | | | | 80 | | | | | | 203 | |
| | | | |
Cost of shares redeemed | | | | | | | | | | | | |
Institutional Class | | | | | 0 | | | | | | 0 | |
Administrative Class | | | | | (9,364 | ) | | | | | (17,348 | ) |
Net increase resulting from Portfolio share transactions | | | | | 2,241 | | | | | | 1,181 | |
| | | | |
Total Increase in Net Assets | | | | | 2,241 | | | | | | 1,182 | |
| | | | |
Net Assets: | | | | | | | | | | | | |
| | | | |
Beginning of period | | | | | 27,043 | | | | | | 25,861 | |
End of period* | | | | $ | 29,284 | | | | | $ | 27,043 | |
| | | | |
*Including undistributed net investment income of: | | | | $ | 3 | | | | | $ | 3 | |
| | | | | | |
| See accompanying notes | | June 30, 2004 | | Semi-Annual Report | | 7 |
Schedule of Investments
Money Market Portfolio
June 30, 2004 (Unaudited)
| | | | |
| | | Principal | | |
| | | Amount | | Value |
| | | (000s) | | (000s) |
| | | | | | |
SHORT-TERM INSTRUMENTS 100.1% |
Certificates of Deposit 8.2% | | | | | | |
Chase Manhattan Bank USA | | | | | | |
1.150% due 08/06/2004 | | $ | 600 | | $ | 600 |
Citibank New York N.A. | | | | | | |
1.190% due 08/20/2004 | | | 500 | | | 500 |
1.290% due 09/07/2004 | | | 500 | | | 500 |
1.340% due 09/10/2004 | | | 400 | | | 400 |
Well Fargo Bank N.A. | | | | | | |
1.240% due 07/19/2004 | | | 400 | | | 400 |
| | | | | |
|
|
| | | | | | | 2,400 |
| | | | | |
|
|
Commercial Paper 79.8% | | | | | | |
Anz (Delaware), Inc. | | | | | | |
1.030% due 07/08/2004 | | | 500 | | | 500 |
Barclays U.S. Funding Corp. | | | | | | |
1.110% due 08/25/2004 | | | 700 | | | 699 |
CBA (de) Finance | | | | | | |
1.150% due 08/09/2004 | | | 500 | | | 499 |
1.210% due 08/23/2004 | | | 400 | | | 399 |
CDC Commercial Corp. | | | | | | |
1.120% due 08/19/2004 | | | 700 | | | 699 |
Fannie Mae | | | | | | |
1.000% due 07/01/2004 | | | 600 | | | 600 |
1.045% due 07/14/2004 | | | 300 | | | 300 |
1.055% due 08/04/2004 | | | 500 | | | 499 |
1.155% due 08/18/2004 | | | 1,400 | | | 1,398 |
1.180% due 08/25/2004 | | | 300 | | | 299 |
1.520% due 10/15/2004 | | | 1,000 | | | 995 |
Federal Home Loan Bank | | | | | | |
1.165% due 07/16/2004 | | | 1,000 | | | 1,000 |
1.210% due 09/01/2004 | | | 600 | | | 599 |
1.410% due 09/15/2004 | | | 500 | | | 498 |
ForeningsSparbanken AB | | | | | | |
1.240% due 09/13/2004 | | | 500 | | | 499 |
1.560% due 10/21/2004 | | | 500 | | | 498 |
Freddie Mac | | | | | | |
1.030% due 07/06/2004 | | | 400 | | | 400 |
1.200% due 08/09/2004 | | | 500 | | | 499 |
1.125% due 08/10/2004 | | | 500 | | | 499 |
1.130% due 08/10/2004 | | | 1,900 | | | 1,898 |
1.150% due 08/17/2004 | | | 500 | | | 499 |
1.220% due 09/20/2004 | | | 500 | | | 499 |
1.260% due 09/24/2004 | | | 1,000 | | | 997 |
General Electric Capital Corp. | | | | | | |
1.040% due 07/08/2004 | | | 500 | | | 500 |
1.120% due 08/25/2004 | | | 500 | | | 499 |
HBOS Treasury Services PLC | | | | | | |
1.145% due 08/09/2004 | | | 500 | | | 499 |
1.235% due 09/10/2004 | | | 500 | | | 499 |
ING U.S. Funding LLC | | | | | | |
1.310% due 09/02/2004 | | | 200 | | | 200 |
1.240% due 09/10/2004 | | | 500 | | | 499 |
KFW International Finance, Inc. | | | | | | |
1.110% due 08/23/2004 | | | 700 | | | 699 |
Lloyds TSB Bank PLC | | | | | | |
1.185% due 07/21/2004 | | | 600 | | | 600 |
National Australia Bank Ltd. | | | | | | |
1.210% due 07/19/2004 | | | 500 | | | 500 |
Pfizer, Inc. | | | | | | |
1.300% due 08/18/2004 | | | 500 | | | 499 |
Rabobank USA Financial Corp. | | | | | | |
1.390% due 09/07/2004 | | | 300 | | | 299 |
Shell Finance (UK) PLC | | | | | | |
1.340% due 08/23/2004 | | | 600 | | | 599 |
Svenska Handlesbanken | | | | | | |
1.295% due 09/24/2004 | | | 600 | | | 598 |
Swedish National Housing Finance Corp. | | | | | | |
1.070% due 07/15/2004 | | | 600 | | | 600 |
Toyota Motor Credit Corp. | | | | | | |
1.480% due 09/22/2004 | | | 500 | | | 498 |
| | | | | | | |
| | |
UBS Finance, Inc. | | | | | | | |
1.130% due 09/01/2004 | | $ | 500 | | $ | 499 | |
| | | | | |
|
|
|
| | | | | | | 23,359 | |
| | | | | |
|
|
|
Repurchase Agreements 10.4% | | | | |
Credit Suisse First Boston | | | | | | | |
1.200% due 07/01/2004 | | | 2,700 | | | 2,700 | |
(Dated 06/30/2004. Collateralized by Treasury Inflation Protected Securities 3.000% due 07/15/2012 valued at $2,777. Repurchase proceeds are $2,700.) | |
State Street Bank | | | | | | | |
0.800% due 07/01/2004 | | | 345 | | | 345 | |
(Dated 06/30/2004. Collateralized by Fannie Mae 2.875% due 10/15/2005 valued at $354.
Repurchase proceeds are $345.) | |
| | | | | |
|
|
|
| | | | | | | 3,045 | |
| | | | | |
|
|
|
| | |
| U.S. Treasury Bills 1.7% 1.225% due 09/09/2004 | | | 500 | | | 499 | |
| | | | | |
|
|
|
| Total Short-Term Instruments | | | | | | 29,303 | |
(Cost $29,303) | | | | |
|
|
|
| | |
Total Investments 100.1% | | | | | $ | 29,303 | |
(Cost $29,303) | | | | | | | |
| |
Other Assets and Liabilities (Net) (0.1%) | | | (19 | ) |
| | | | | |
|
|
|
| |
Net Assets 100.0% | | $ | 29,284 | |
| | | | | |
|
|
|
| | | | | | |
| 8 | | Semi-Annual Report | | June 30, 2004 | | See accompanying notes |
Notes to Financial Statements
June 30, 2004 (Unaudited)
1. Organization
The Money Market Portfolio (the “Portfolio”) is a series of the PIMCO Variable Insurance Trust (the “Trust”). The Trust is registered under the Investment Company Act of 1940 (the “Act”), as amended, as an open-end investment company organized as a Delaware business trust on October 3, 1997. The Portfolio offers two classes of shares: Institutional and Administrative. Each share class has identical voting rights (except that shareholders of a class have exclusive voting rights regarding any matter relating solely to that class of shares). Information presented in these financial statements pertains to the Administrative Class of the Trust. Certain detailed financial information for the Institutional Class is provided separately and is available upon request. The Trust is designed to be used as an investment vehicle by Separate Accounts of insurance companies that fund variable annuity contracts and variable life insurance policies and by qualified pension and retirement plans. The Portfolio commenced operations on September 30, 1999.
2. Significant Accounting Policies
The following is a summary of significant accounting policies consistently followed by the Trust in the preparation of its financial statements in conformity with accounting principles generally accepted in the United States of America. The preparation of financial statements in accordance with accounting principles generally accepted in the United States of America requires management to make estimates and assumptions that affect the reported amounts and disclosures in the financial statements. Actual results could differ from those estimates.
Security Valuation. Portfolio securities held by the Portfolio are valued at amortized cost, which approximates current market value.
Securities Transactions and Investment Income. Securities transactions are recorded as of the trade date. Securities purchased or sold on a when-issued or delayed delivery basis may be settled a month or more after the trade date. Realized gains and losses from securities sold are recorded on the identified cost basis. Dividend income is recorded on the ex-dividend date. Interest income, adjusted for the accretion of discounts and amortization of premiums, is recorded on the accrual basis. Paydowns gains and losses on mortgage- and asset-backed securities are recorded as adjustments to interest income in the Statement of Operations.
Dividends and Distributions to Shareholders. Dividends from net investment income, if any, are declared on each day the Trust is open for business and are distributed to shareholders monthly. All dividends are reinvested in additional shares of the Portfolio. Net realized capital gains earned by the Portfolio, if any, will be distributed no less frequently than once each year.
Income dividends and capital gain distributions are determined in accordance with income tax regulations which may differ from accounting principles generally accepted in the United States of America. These differences are primarily due to differing treatments for such items as wash sales, foreign currency transactions, net operating losses, notional principal contracts, certain asset-backed securities, certain futures and forward contracts, tax straddles, and capital loss carryforwards.
Distributions classified as a tax basis return of capital, if any, are reflected in the accompanying Statements of Changes in Net Assets and have been reclassified to paid in capital. In addition, other amounts have been reclassified between undistributed net investment income, accumulated undistributed net realized gains or losses and/or paid in capital to more appropriately conform financial accounting to tax characterizations of dividend distributions.
Multiclass Operations. Each class offered by the Trust has equal rights as to assets. Income, non-class specific expenses, and realized and unrealized capital gains and losses are allocated to each class of shares based on the relative net assets of each class.
Federal Income Taxes. The Portfolio intends to qualify as a regulated investment company and distribute all of its taxable income and net realized gains, if applicable, to shareholders. Accordingly, no provision for Federal income taxes has been made.
Repurchase Agreements. The Portfolio may engage in repurchase transactions. Under the terms of a typical repurchase agreement, the Portfolio takes possession of an underlying debt obligation subject to an obligation of the seller to repurchase, and the Portfolio to resell, the obligation at an agreed-upon price and time. The market value of the collateral must be equal at all times to the total amount of the repurchase obligations, including interest. Generally, in the event of counterparty default, the Portfolio has the right to use the collateral to offset losses incurred.
3. Fees, Expenses, and Related Party Transactions
Investment Advisory Fee. Pacific Investment Management Company LLC (“PIMCO”) is a majority owned subsidiary partnership of Allianz Dresdner Asset Management of America L.P. and serves as investment adviser (the “Adviser”) to the Trust, pursuant to an investment advisory contract. The Adviser receives a monthly fee at an annual rate based on average daily net assets of the Portfolio. The Advisory Fee is charged at an annual rate of 0.15%.
Administration Fee. PIMCO serves as administrator (the “Administrator”), and provides administrative services to the Trust for which it receives a monthly administrative fee based on average daily net assets of the Portfolio. The Administration Fee is charged at the annual rate of 0.20%.
Servicing Fee. PA Distributors LLC (“PAD”), formerly known as PIMCO Advisors Distributors LLC, is an indirect wholly-owned subsidiary of Allianz Dresdner Asset Management of America L.P. and serves as the distributor of the Trust’s shares. The Trust is permitted to reimburse PAD on a quarterly basis, out of the Administrative Class assets of the Portfolio in the amount of 0.15% on an annual basis of the average daily net assets of that class, for
| | | | |
| June 30, 2004 | | Semi-Annual Report | | 9 |
Notes to Financial Statements (Cont.)
June 30, 2004 (Unaudited)
payments made to financial intermediaries that provide services in connection with the distribution of shares or administration of plans or programs that use Portfolio shares as their funding medium. The effective rate paid to PAD was 0.15% during current fiscal year.
Expenses. The Trust is responsible for the following expenses: (i) salaries and other compensation of any of the Trust’s executive officers and employees who are not officers, directors, stockholders or employees of PIMCO or its subsidiaries or affiliates; (ii) taxes and governmental fees; (iii) brokerage fees and commissions and other portfolio transaction expenses; (iv) the cost of borrowing money, including interest expense and bank overdraft charges; (v) fees and expenses of the Trustees who are not “interested persons” of PIMCO or the Trust, and any counsel retained exclusively for their benefit; (vi) extraordinary expenses, including costs of litigation and indemnification expenses; (vii) organization expenses and (viii) any expenses allocated or allocable to a specific class of shares, which include service fees payable with respect to the Administrative Class shares and may include certain other expenses as permitted by the Trust’s Multiple Class Plan adopted pursuant to Rule 18f-3 under the Act and subject to review and approval by the Trustees. The ratio of expenses to average net assets per share class, as disclosed in Financial Highlights, may differ from the annual portfolio operating expenses per share class as disclosed in the Prospectus for the reasons set forth above.
PIMCO has agreed to waive a portion of its administrative fees to the extent that the payment of the Portfolio’s pro rata share of organizational expenses and Trustee fees cause the actual expense ratio to rise above the rates disclosed in the then-current prospectus plus 0.49 basis points as set forth below (calculated as a percentage of the Portfolio’s average daily net assets attributable to each class):
| | | |
| Institutional Class | | 0.35% | |
Administrative Class | | 0.50 | % |
PIMCO may be reimbursed for these waived amounts in future periods, not to exceed thirty-six months.
Each unaffiliated Trustee receives an annual retainer of $4,000, plus $1,500 for each Board of Trustees meeting attended in person and $250 for each meeting attended telephonically, plus reimbursement of related expenses. In addition, each committee chair receives an additional annual retainer of $500. These expenses are allocated on a pro-rata basis to each Portfolio of the Trust according to its respective net assets.
4. Federal Income Tax Matters
At June 30, 2004, the aggregate cost of investments was the same for federal income tax and financial statement purposes. The net unrealized appreciation (depreciation) of investment securities for federal income tax purposes is as follows (amounts in thousands):
| | | | | | |
Aggregate Gross
Unrealized
Appreciation | | Aggregate Gross
Unrealized
(Depreciation) | | Net Unrealized
Appreciation |
| $ 0 | | $ | 0 | | $ | 0 |
5. Shares of Beneficial Interest
The Trust may issue an unlimited number of shares of beneficial interest with a $.001 par value. Changes in shares of beneficial interest were as follows (shares and amounts in thousands):
| | | | | | | | | | | | | | |
| | | Six Months Ended
06/30/2004 | | | Year Ended
12/31/2003 | |
| | | Shares | | | Amount | | | Shares | | | Amount | |
Receipts for shares sold | | | | | | | | | | | | | | |
| | | | |
Institutional Class | | 1 | | | $ | 1 | | | 0 | | | $ | 0 | |
Administrative Class | | 11,524 | | | | 11,524 | | | 18,326 | | | | 18,326 | |
| | | | |
Issued as reinvestment of distributions | | | | | | | | | | | | | | |
| | | | |
Institutional Class | | 0 | | | | 0 | | | 0 | | | | 0 | |
Administrative Class | | 80 | | | | 80 | | | 203 | | | | 203 | |
| | | | |
Cost of shares redeemed | | | | | | | | | | | | | | |
| | | | |
Institutional Class | | 0 | | | | 0 | | | 0 | | | | 0 | |
Administrative Class | | (9,364 | ) | | | (9,364 | ) | | (17,348 | ) | | | (17,348 | ) |
| | | | |
Net increase resulting from Portfolio share transactions | | 2,241 | | | $ | 2,241 | | | 1,181 | | | $ | 1,181 | |
| | | | |
| 10 | | Semi-Annual Report | | June 30, 2004 |
The following schedule shows the number of shareholders each owning 5% or more of the Portfolio and the total percentage of the Portfolio held by such shareholders:
| | | | |
| | | Number | | % of Portfolio Held |
Institutional Class | | 1 | | 100 |
Administrative Class | | 1 | | 99 |
6. Regulatory and Litigation Matters
On February 17, 2004, the Attorney General of the State of New Jersey (“New Jersey AG”) filed a complaint against Allianz Dresdner Asset Management of America L.P. (“ADAM”), PA Distributors LLC (formerly known as PIMCO Advisors Distributors LLC) (“PAD”), PEA Capital LLC (formerly known as PIMCO Equity Advisors LLC) (“PEA”), and Pacific Investment Management Company LLC (“PIMCO”) in connection with its investigation into market timing and late trading. The complaint contends that inappropriate trading by shareholders engaged in market timing activity took place in funds in the PIMCO Funds: Multi-Manager Series (“MMS Funds”) and the PIMCO Funds: Pacific Investment Management Series (“PIMS Funds”). On June 1, 2004, the New Jersey AG dismissed PIMCO from the lawsuit.
On the same day as the dismissal of PIMCO from the lawsuit, the New Jersey AG announced that it had reached a settlement agreement with the remaining defendants (“New Jersey Settlement”). In the New Jersey Settlement, ADAM, PAD and PEA agreed, while neither admitting nor denying the allegations or conclusions of law, to: (i) pay New Jersey a civil fine of $15 million and $3 million for investigative costs and further enforcement initiatives; and (ii) implement certain changes in corporate governance.
On May 6, 2004, the Securities and Exchange Commission filed a complaint in the U.S. District Court in the Southern District of New York alleging that PA Fund Management LLC (formerly known as PIMCO Advisors Fund Management LLC) (“PAFM”), PEA, PAD, Stephen J. Treadway (at the time, the chief executive officer of PAFM and PAD as well as chairman of the Board of Trustees of the MMS Funds) and Kenneth W. Corba (the former chief executive officer of PEA and former portfolio manager of the PEA Growth and PEA Growth & Income Funds) had, among other things, violated and/or aided and abetted violations of, various antifraud provisions of the federal securities laws in connection with alleged “market timing” arrangements that improperly allowed certain hedge funds to engage in “market timing” in the PEA Growth Fund, the PEA Opportunity Fund, the PEA Innovation Fund, and the PEA Target Fund. The complaint seeks injunctive relief, disgorgement plus pre-judgment interest, monetary penalties, and an order permanently enjoining the defendants from serving as investment advisers, principal underwriters, officers, directors, or members of any advisory boards to any registered investment companies.
On February 20, 2004, a putative class action lawsuit was filed in the U.S. District Court for the District of New Jersey on behalf of certain shareholders of the PIMCO Funds against ADAM, PAD, PIMCO, PEA, the PIMS Funds, the MMS Funds, the Trust, PIMCO Commercial Mortgage Securities Trust, Inc. and certain other defendants, alleging that inappropriate market timing activity by certain shareholders caused financial injury to the shareholders of those Funds.
The following additional putative class action lawsuits have been filed against the PIMS Funds, the MMS Funds and/or their affiliates, each related to alleged market-timing activity in funds advised by PIMCO or its affiliates: (1) a lawsuit filed in the U.S. District Court for the District of Connecticut on February 27, 2004 (naming as defendants ADAM, PAD, PEA, the PIMS Funds, the MMS Funds, the Trust, PCM and certain other parties); (2) a lawsuit filed in the U.S. District Court for the Central District of California on March 4, 2004 (naming as defendants PIMCO, ADAM, PEA and PAD); (3) a lawsuit filed in the U.S. District Court for the Southern District of New York on March 8, 2004 (naming PIMCO, PAD and certain of their affiliates as defendants); (4) a lawsuit filed in the U.S. District Court for the Southern District of New York, on March 15, 2004 (naming PIMCO as the defendant); (5) two separate lawsuits filed in the U.S. District Court for the Central District of California on March 22, 2004, brought derivatively on behalf of the PIMCO High Yield Fund and the PIMCO Money Market Fund, respectively (each naming ADAM, PAFM and certain other parties as defendants, and the PIMCO Funds as the nominal defendant); (6) a lawsuit filed in the U.S. District Court for the Central District of California, also on March 22, 2004, brought derivatively on behalf of the PIMS Funds and the MMS Funds (naming ADAM, PIMCO, PAD and certain other parties as defendants, and the PIMS Funds and the MMS Funds as nominal defendants); (7) a lawsuit filed in the U.S. District Court for the District of New Jersey on April 20, 2004 (naming ADAM, PAD, the PIMS Funds and certain other parties as defendants); and (8) a lawsuit filed in the U.S. District Court for the Northern District of California on April 28, 2004 (naming ADAM, PIMCO, PAD, PEA and certain other parties as defendants, and the “PIMCO Funds” as nominal defendants). Each complaint for the foregoing putative class actions alleges, among other things, that inappropriate trading by shareholders engaged in market timing activities took place in certain of the funds advised by PIMCO, and each complaint seeks unspecified compensatory damages.
On February 17, 2004, a putative class action lawsuit was filed in the U.S. District Court for the District of Connecticut on behalf of certain shareholders of the PIMCO Funds against ADAM, PEA, PIMCO, PIMS Funds, MMS Funds and certain other defendants, alleging excessive investment advisory fees and the use of brokerage commissions to pay for distribution of fund shares. Three similar putative class action lawsuits were subsequently filed, each in the U.S. District Court for the District of Connecticut on March 1, 2004, April 23, 2004 and May 20, 2004, respectively.
| | | | |
| June 30, 2004 | | Semi-Annual Report | | 11 |
Notes to Financial Statements (Cont.)
June 30, 2004 (Unaudited)
Under Section 9(a) of the 1940 Act, if any of the various lawsuits were to result in a court injunction against PAFM, PEA, PAD, PIMCO, ADAM and/or Mr. Treadway, they and their affiliates would, in the absence of exemptive relief granted by the SEC, be barred from serving as an investment adviser/sub-adviser or principal underwriter for any registered investment company, including the Trust. ADAM and certain of its subsidiaries have responded to inquiries from the SEC concerning the status of the New Jersey Settlement under Section 9(a). If any of PAFM, PEA, PAD, PIMCO or ADAM were subject to an injunction, each of these entities and their affiliates could in turn seek exemptive relief from the SEC, as contemplated by the 1940 Act. There is no assurance, however, that such exemptive relief would be granted. The SEC also has the power by order to prohibit PAFM, PEA, PAD and PIMCO from serving as investment advisers and underwriters, if the SEC finds that such entities willfully violated the federal securities laws in connection with the allegations discussed above or aided or abetted such violations.
PIMCO, PAD and the Trust believe that these developments will not have a material adverse effect on the Portfolios or on PIMCO’s, or PAD’s ability to perform their respective investment advisory or distribution services on behalf of the Portfolios.
| | | | |
| 12 | | Semi-Annual Report | | June 30, 2004 |
Trustees and Officers
Brent R. Harris, Chairman and Trustee
R. Wesley Burns, President and Trustee
E. Philip Cannon, Trustee
Vern O. Curtis, Trustee
J. Michael Hagan, Trustee
William J. Popejoy, Trustee
Garlin G. Flynn, Secretary
John P. Hardaway, Treasurer
Investment Adviser and Administrator
Pacific Investment Management Company LLC
840 Newport Center Drive
Newport Beach, California 92660
Distributor
PA Distributors LLC
2187 Atlantic Street
Stamford, Connecticut 06902
Custodian
State Street Bank & Trust Company
801 Pennsylvania
Kansas City, Missouri 64105
Transfer Agent
Boston Financial Data Services–Midwest
330 W. 9th Street
Kansas City, Missouri 64105
Legal Counsel
Dechert LLP
1775 I Street, N.W.
Washington, D.C. 20006
Independent Registered Public Accounting Firm
PricewaterhouseCoopers LLP
1055 Broadway
Kansas City, Missouri 64105
Information about how the Fund voted proxies relating to portfolio securities held during the year July 1, 2003 through June 30, 2004 will be available no later than August 31, 2004 without charge, upon request, by calling the Trust at 1-800-927-4648 and on the SEC’s website at http://www.sec.gov.
Copies of the written Proxy Policy and the factors that PIMCO may consider in determining how to vote proxies for the Funds are available by calling the Trust at 1-800-927-4648 and on the SEC’s website at http://www.sec.gov.
PIMCO VARIABLE INSURANCE TRUST
840 NEWPORT CENTER DRIVE
NEWPORT BEACH, CA 92660

PIMCO VARIABLE INSURANCE TRUST
TOTAL RETURN II PORTFOLIO
ADMINISTRATIVE CLASS
SEMI-ANNUAL REPORT
June 30, 2004
|
| This material is authorized for use only when preceded or accompanied by the current PIMCO Variable Insurance Trust prospectus. Investors should consider the investment objectives, risks, charges and expenses of Portfolio carefully before investing. This and other information is contained in the Portfolio’s prospectus. Please read the prospectus carefully before you invest or send money. |
Chairman’s Letter
Dear PIMCO Variable Insurance Trust Shareholder:
Bond prices were more volatile during the six-month period ended June 30, 2004. Interest rates rose sharply during the second quarter 2004, causing bonds to give back modest gains from earlier in the year. The Lehman Brothers Aggregate Bond Index, a widely used index for the high-grade bond market, was nearly flat during the first six months of 2004, returning 0.15% after losing 2.44% during the second quarter. The yield on the benchmark ten-year Treasury closed June 30, 2004 at 4.58%, up 0.75% from April 1, 2004, but up only 0.34% from where it began the six-month period on January 1, 2004.
Continued growth in employment convinced the markets that the Federal Reserve would soon begin a long anticipated tightening cycle. On June 30, 2004, the Fed met market expectations by increasing the federal funds rate 0.25%, which was the first rate increase since June 25, 2003. The central bank had held this rate at 1% for more than a year, which generated negative real short-term rates. And on August 10, 2004, the Fed increased the federal funds rate another 0.25% to 1.50%.
Investors that had profited handsomely from borrowing at low short-term rates and investing in higher-yielding longer maturity bonds surrendered some of those profits towards the latter part of the six-month period. Concern that borrowing rates would rise led investors to liquidate long positions and unwind these trades, which caused bond prices to decrease. However, substantial leverage remained among banks, hedge funds, and other investors, making bond markets somewhat vulnerable to additional Fed rate increases. There were also signs of rising inflation, which fueled anxiety that central banks might continue to raise interest rates.
On the following pages you will find a more complete review of the Portfolio in light of financial market activities as well as specific details about the total return investment performance for the six-month period.
We appreciate the trust you have placed in us, and we will continue to focus our efforts to meet your investment needs.
Sincerely,

Brent R. Harris
Chairman
August 11, 2004
| | | | |
| June 30, 2004 | | Semi-Annual Report | | 1 |
Important Information About the Portfolio
We believe that bond funds have an important role to play in a well diversified investment portfolio. It is important to note, however, that in an environment where interest rates may trend upward, rising rates will negatively impact the performance of most bond funds, and fixed income securities held by a fund are likely to decrease in value. The price volatility of fixed income securities can also increase during periods of rising interest rates resulting in increased losses to a fund. Bond funds and individual bonds with a longer duration (a measure of the expected life of a security) tend to be more sensitive to changes in interest rates, usually making them more volatile than securities or funds with shorter durations. The longer-term performance of most bond funds has benefited from capital gains in part resulting from an extended period of declining interest rates. In the event interest rates increase, these capital gains should not be expected to recur.
The Portfolio may be subject to various risks in addition to those described above. Some of these risks may include, but are not limited to, the following: real rate risk, derivative risk, small company risk, foreign security risk, high yield security risk and specific sector investment risks. The Portfolio may use derivative instruments for hedging purposes or as part of an investment strategy. Use of these instruments may involve certain costs and risks such as liquidity risk, interest rate risk, market risk, credit risk, management risk and the risk that a fund could not close out a position when it would be most advantageous to do so. A Portfolio investing in derivatives could lose more than the principal amount invested in these instruments. Investing in non-U.S. securities may entail risk due to non-U.S. economic and political developments; this risk may be enhanced when investing in emerging markets. High-yield bonds typically have a lower credit rating than other bonds. Lower rated bonds generally involve a greater risk to principal than higher rated bonds. Smaller companies may be more volatile than larger companies and may entail more risk. Concentrating investments in individual sectors may add additional risk and volatility compared to a diversified portfolio.
On the performance summary page in this semi-annual report, the Total Return Investment Performance table measures performance assuming that all dividend and capital gain distributions were reinvested. Returns do not reflect the deduction of taxes that a shareholder would pay (i) on Portfolio distributions or (ii) the redemption of Portfolio shares.
An investment in a Portfolio is not a bank deposit and is not guaranteed or insured by the Federal Deposit Insurance Corporation or any other government agency. It is possible to lose money on investments in the Funds.
The following disclosure provides important information regarding the Portfolio’s Expense Example, which appears on the Portfolio’s individual page in this semi-annual report. Please refer to this information when reviewing the Expense Example for the Portfolio.
Example
As a shareholder of the Portfolio, you incur two types of costs: (1) transaction costs, including redemption and exchange fees; and (2) ongoing costs, including advisory and administrative fees; distribution and/or service (12b-1) fees (Administrative Class only); and other Portfolio expenses. The Example is intended to help you understand your ongoing costs (in dollars) of investing in the Portfolio and to compare these costs with the ongoing costs of investing in other mutual funds.
The Example is based on an investment of $1,000 invested at the beginning of the period and held for the entire period indicated, which is from 1/1/04 to 6/30/04.
Actual Expenses
The information in the table under the heading “Actual Performance” provides information about actual account values and actual expenses. You may use the information in these columns, together with the amount you invested, to estimate the expenses that you paid over the period. Simply divide your account value by $1,000.00 (for example, an $8,600.00 account value divided by $1,000 = 8.60), then multiply the result by the number in the appropriate column for your share class, in the row entitled “Expenses Paid During Period” to estimate the expenses you paid on your account during this period.
Hypothetical Example for Comparison Purposes
The information in the table under the heading “Hypothetical Performance (5% return before expenses)” provides information about hypothetical account values and hypothetical expenses based on the Portfolio’s actual expense ratio and an assumed rate of return of 5% per year before expenses, which is not the Portfolio’s actual return. The hypothetical account values and expenses may not be used to estimate the actual ending account balance or expenses you paid for the period. You may use this information to compare the ongoing costs of investing in the Portfolio and other portfolios. To do so, compare this 5% hypothetical example with the 5% hypothetical examples that appear in the shareholder reports of the other portfolios.
Please note that the expenses shown in the table are meant to highlight your ongoing costs only and do not reflect any transactional costs. Therefore, the information under the heading “Hypothetical Performance (5% return before expenses)” is useful in comparing ongoing costs only, and will not help you determine the relative total costs of owning different portfolios. In addition, if these transactional costs were included, your costs would have been higher.
PIMCO Variable Insurance Trust is distributed by PA Distributors LLC, 2187 Atlantic Street, Stamford, CT 06902.
| | | | |
| 2 | | Semi-Annual Report | | June 30, 2004 |
Total Return Portfolio II
CUMULATIVE RETURNS THROUGH JUNE 30, 2004
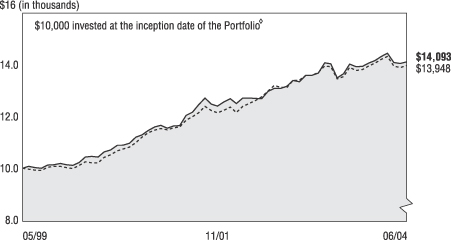
[CHART]
Total Return Portfolio Lehman Brothers Aggregate
II Admin. Class Bond Index
---------------------- -------------------------
05/31/1999 $10,000 $10,000
06/30/1999 $10,071 $9,968
07/31/1999 $10,025 $9,926
08/31/1999 $10,001 $9,921
09/30/1999 $10,127 $10,036
10/31/1999 $10,134 $10,073
11/30/1999 $10,180 $10,072
12/31/1999 $10,141 $10,024
01/31/2000 $10,115 $9,991
02/29/2000 $10,224 $10,112
03/31/2000 $10,435 $10,245
04/30/2000 $10,452 $10,215
05/31/2000 $10,436 $10,211
06/30/2000 $10,627 $10,423
07/31/2000 $10,697 $10,518
08/31/2000 $10,869 $10,670
09/30/2000 $10,883 $10,737
10/31/2000 $10,961 $10,808
11/30/2000 $11,193 $10,985
12/31/2000 $11,287 $11,189
01/31/2001 $11,448 $11,372
02/28/2001 $11,583 $11,471
03/31/2001 $11,651 $11,529
04/30/2001 $11,543 $11,481
05/31/2001 $11,625 $11,550
06/30/2001 $11,644 $11,594
07/31/2001 $12,035 $11,853
08/31/2001 $12,159 $11,989
09/30/2001 $12,444 $12,128
10/31/2001 $12,698 $12,382
11/30/2001 $12,465 $12,211
12/31/2001 $12,384 $12,134
01/31/2002 $12,553 $12,232
02/28/2002 $12,677 $12,350
03/31/2002 $12,491 $12,145
04/30/2002 $12,690 $12,381
05/31/2002 $12,693 $12,486
06/30/2002 $12,689 $12,594
07/31/2002 $12,668 $12,746
08/31/2002 $12,951 $12,961
09/30/2002 $13,068 $13,171
10/31/2002 $13,068 $13,111
11/30/2002 $13,148 $13,107
12/31/2002 $13,371 $13,378
01/31/2003 $13,322 $13,389
02/28/2003 $13,566 $13,575
03/31/2003 $13,574 $13,564
04/30/2003 $13,657 $13,676
05/31/2003 $14,046 $13,931
06/30/2003 $14,009 $13,903
07/31/2003 $13,476 $13,436
08/31/2003 $13,633 $13,525
09/30/2003 $14,002 $13,883
10/31/2003 $13,897 $13,754
11/30/2003 $13,916 $13,787
12/31/2003 $14,042 $13,927
01/31/2004 $14,138 $14,039
02/29/2004 $14,301 $14,191
03/31/2004 $14,417 $14,297
04/30/2004 $14,058 $13,925
05/31/2004 $14,025 $13,870
06/30/2004 $14,093 $13,948
| | | |
SECTOR BREAKDOWN‡ | | | |
Short-Term Instruments | | 62.4 | % |
U.S. Government Agencies | | 16.3 | % |
Corporate Bonds & Notes | | 6.2 | % |
Mortgage-Backed Securities | | 5.4 | % |
U.S. Treasury Obligations | | 4.3 | % |
Municipal Bonds & Notes | | 4.1 | % |
Other | | 1.3 | % |
‡ % of Total Investments as of June 30, 2004
à$10,000 invested at the beginning of the first full month following the inception of the Administrative Class.
TOTAL RETURN INVESTMENT PERFORMANCE For the period ended June 30, 2004
| | | | | | | | | | | | | | | | |
| | | | | | | 6 Months | | | 1 Year | | | 5 Years* | | | Since Inception* | |
| | |
| | Total Return Portfolio II Administrative Class (Inception 05/28/99) | | 0.36 | % | | 0.59 | % | | 6.95 | % | | 6.98 | % |
| | | - - - - - - - | | Lehman Brothers Aggregate Bond Index | | 0.15 | % | | 0.32 | % | | 6.95 | % | | — | |
| | | | | * Annualized. All Portfolio returns are net of fees and expenses. | | | | | | | | | | | | |
Past performance is no guarantee of future results. The performance quoted represents past performance. Investment return and principal value will fluctuate so the Portfolio shares, when redeemed, may be worth more or less than their original cost. Current performance may be lower or higher than the performance data quoted. Performance data current to the most recent month-end is available by calling (800) 927-4648.
Please refer to page 2 herein for an explanation of the information presented in the following Expense Example.
| | | | | | | | | | |
| EXPENSE EXAMPLE | | | | Actual Performance | | | | Hypothetical Performance
(5% return before expenses) |
Beginning Account Value (01/01/04) | | | | $ | 1,000.00 | | | | $ | 1,000.00 |
Ending Account Value (06/30/04) | | | | $ | 1,003.60 | | | | $ | 1,025.00 |
Expenses Paid During Period† | | | | $ | 3.24 | | | | $ | 3.27 |
†Expenses are equal to the Portfolio’s Administrative Class annualized expense ratio of 0.65%, multiplied by the average account value over the period, multiplied by 182/366 (to reflect the one-half year period).
PORTFOLIO INSIGHTS
| • | The Total Return Portfolio II seeks to achieve its investment objective by investing under normal circumstances at least 65% of its total assets in a diversified portfolio of Fixed Income Instruments of varying maturities, with quality, U.S. issuer, and U.S. dollar-denominated security restrictions. |
| • | The Portfolio’s Administrative Class shares outperformed the Lehman Brothers Aggregate Bond Index for the six-month period ended June 30, 2004, returning 0.36% versus 0.15% for the Index. |
| • | The Portfolio’s below-Index duration helped returns, as yields rose over the period. |
| • | An emphasis on short/intermediate maturities was negative, as the yield curve flattened in anticipation of Fed tightening. However, this strategy enhanced security returns via “roll down,” or price appreciation, as bonds are revalued at lower yields over time, given the steepness of the yield curve. |
| • | Substituting Real Return Bonds (TIPS-Treasury Inflation Protected Securities) for nominal Treasuries was positive as TIPS benefited from strong demand for the inflation protection they provide. |
| • | A mortgage underweight was slightly negative, as mortgages outpaced comparable Treasuries; mortgage security selection was positive, however, and more than offset this impact. |
| • | The Portfolio’s underweight to corporate securities was slightly positive, as this sector lagged Treasuries modestly on like-duration basis. |
| | | | |
| June 30, 2004 | | Semi-Annual Report | | 3 |
Financial Highlights
Total Return Portfolio II (Administrative Class)
| | | | | | | | | | | | | | | | | | | | | | | | | | | | | | | | | | | | |
Selected Per Share Data for the
Year or Period Ended: | | | | 06/30/2004+ | | | | | 12/31/2003 | | | | | 12/31/2002 | | | | | 12/31/2001 | | | | | 12/31/2000 | | | | | 05/28/1999-
12/31/1999 | |
| | | | | | | | | | | | |
Net asset value beginning of period | | | | $ | 10.31 | | | | | $ | 10.09 | | | | | $ | 10.12 | | | | | $ | 10.24 | | | | | $ | 9.82 | | | | | $ | 10.00 | |
Net investment income (a) | | | | | 0.07 | (e) | | | | | 0.17 | (e) | | | | | 0.38 | (e) | | | | | 0.48 | (e) | | | | | 0.61 | (e) | | | | | 0.32 | |
Net realized/unrealized gain (loss) on investments (a) | | | | | (0.03 | )(e) | | | | | 0.33 | (e) | | | | | 0.41 | (e) | | | | | 0.49 | (e) | | | | | 0.46 | (e) | | | | | (0.18 | ) |
Total income from investment operations | | | | | 0.04 | | | | | | 0.50 | | | | | | 0.79 | | | | | | 0.97 | | | | | | 1.07 | | | | | | 0.14 | |
Dividends from net investment income | | | | | (0.07 | ) | | | | | (0.19 | ) | | | | | (0.40 | ) | | | | | (0.48 | ) | | | | | (0.65 | ) | | | | | (0.32 | ) |
Distributions from net realized capital gains | | | | | 0.00 | | | | | | (0.09 | ) | | | | | (0.42 | ) | | | | | (0.61 | ) | | | | | 0.00 | | | | | | 0.00 | |
Total distributions | | | | | (0.07 | ) | | | | | (0.28 | ) | | | | | (0.82 | ) | | | | | (1.09 | ) | | | | | (0.65 | ) | | | | | (0.32 | ) |
Net asset value end of period | | | | $ | 10.28 | | | | | $ | 10.31 | | | | | $ | 10.09 | | | | | $ | 10.12 | | | | | $ | 10.24 | | | | | $ | 9.82 | |
Total return | | | | | 0.36 | % | | | | | 5.01 | % | | | | | 7.97 | % | | | | | 9.72 | % | | | | | 11.30 | % | | | | | 1.41 | % |
Net assets end of period (000s) | | | | $ | 17,373 | | | | | $ | 17,474 | | | | | $ | 16,882 | | | | | $ | 2,403 | | | | | $ | 2,203 | | | | | $ | 5,128 | |
Ratio of net expenses to average net assets | | | | | 0.65 | %* | | | | | 0.65 | % | | | | | 0.66 | %(d) | | | | | 0.65 | %(c) | | | | | 0.65 | % | | | | | 0.65 | %*(b) |
Ratio of net investment income to average net assets | | | | | 1.33 | %*(e) | | | | | 1.62 | %(e) | | | | | 3.71 | %(e) | | | | | 4.55 | %(e) | | | | | 6.14 | %(e) | | | | | 5.38 | %* |
Portfolio turnover rate | | | | | 116 | % | | | | | 863 | % | | | | | 418 | % | | | | | 606 | % | | | | | 937 | % | | | | | 378 | % |
| (a) | Per share amounts based on average number of shares outstanding during the period. |
| (b) | If the investment manager had not reimbursed expenses, the ratio of expenses to average net assets would have been 0.78%. |
| (c) | If the investment manager had not reimbursed expenses, the ratio of expenses to average net assets would have been 0.66%. |
| (d) | Ratio of expenses to average net assets excluding interest expense is 0.65%. |
| (e) | Indicates a period in which, as a result of a change in generally accepted accounting principles, the portfolio has reclassified periodic payments made or received under certain derivative instruments, which were previously included within miscellaneous income, to a component of realized gain (loss) in the Statement of Operations. The effect of this reclassification was to increase the net investment income ratio for the period ending June 30, 2004 by 0.08% and the net investment income per share by $0.01. For consistency, similar reclassifications have been made to prior period amounts, resulting in (reductions) to the net investment income ratio of 0.00%, (0.02)%, (0.01)% and (0.20)% and to the net investment income per share of $0.00, $0.00, $0.00 and $(0.02) in the fiscal years ending December 31, 2003, 2002, 2001, and 2000, respectively. This change had no impact on the reported net asset value per share for any period. |
| | | | | | |
| 4 | | Semi-Annual Report | | June 30, 2004 | | See accompanying notes |
Statement of Assets and Liabilities
Total Return Portfolio II
| | | | | |
| June 30, 2004 (unaudited) | | | | |
| Amounts in thousands, except per share amounts | | | | |
| | |
Assets: | | | | | |
| | |
Investments, at value | | | | $ | 18,903 |
Cash | | | | | 1 |
Receivable for investments sold on a delayed delivery basis | | | | | 625 |
Interest and dividends receivable | | | | | 43 |
Variation margin receivable | | | | | 67 |
Swap premiums paid | | | | | 1 |
Unrealized appreciation on swap agreements | | | | | 4 |
| | | | | | 19,644 |
| | |
Liabilities: | | | | | |
| | |
Payable for investments purchased | | | | $ | 1,461 |
Payable for short sale | | | | | 638 |
Written options outstanding | | | | | 14 |
Payable for Portfolio shares redeemed | | | | | 14 |
Accrued investment advisory fee | | | | | 4 |
Accrued administration fee | | | | | 4 |
Accrued servicing fee | | | | | 2 |
Variation margin payable | | | | | 2 |
Swap premiums received | | | | | 15 |
| | | | | | 2,154 |
| | |
Net Assets | | | | $ | 17,490 |
| | |
Net Assets Consist of: | | | | | |
| | |
Paid in capital | | | | $ | 17,089 |
Undistributed net investment income | | | | | 248 |
Accumulated undistributed net realized gain | | | | | 89 |
Net unrealized appreciation | | | | | 64 |
| | | | | $ | 17,490 |
| | |
Net Assets: | | | | | |
| | |
Institutional Class | | | | $ | 117 |
Administrative Class | | | | | 17,373 |
| | |
Shares Issued and Outstanding: | | | | | |
| | |
Institutional Class | | | | | 11 |
Administrative Class | | | | | 1,690 |
| | |
Net Asset Value and Redemption Price Per Share
(Net Assets Per Share Outstanding) | | | | | |
| | |
Institutional Class | | | | $ | 10.28 |
Administrative Class | | | | | 10.28 |
| | |
Cost of Investments Owned | | | | $ | 18,887 |
| | | | | | |
| See accompanying notes | | June 30, 2004 | | Semi-Annual Report | | 5 |
Statement of Operations
Total Return Portfolio II
| | | | | | |
| Amounts in thousands | | | | | |
| | | | | Six Months Ended
June 30, 2004
(Unaudited) | |
Investment Income: | | | | | | |
| | |
Interest | | | | $ | 171 | |
Dividends | | | | | 2 | |
Total Income | | | | | 173 | |
| | |
Expenses: | | | | | | |
| | |
Investment advisory fees | | | | �� | 22 | |
Administration fees | | | | | 22 | |
Distribution and/or servicing fees - Administrative Class | | | | | 13 | |
Total Expenses | | | | | 57 | |
| | |
Net Investment Income | | | | | 116 | |
| | |
Net Realized and Unrealized Gain (Loss): | | | | | | |
| | |
Net realized gain on investments | | | | | 87 | |
Net realized gain on futures contracts, options, and swaps | | | | | 13 | |
Net change in unrealized (depreciation) on investments | | | | | (115 | ) |
Net change in unrealized (depreciation) on futures contracts,
options, and swaps | | | | | (40 | ) |
Net (Loss) | | | | | (55 | ) |
| | |
Net Increase in Assets Resulting from Operations | | | | $ | 61 | |
| | | | | | |
| 6 | | Semi-Annual Report | | June 30, 2004 | | See accompanying notes |
Statements of Changes in Net Assets
Total Return Portfolio II
| | | | | | | | | | | | |
| Amounts in thousands | | | | | | | | | | |
| | | | | Six Months Ended
June 30, 2004
(Unaudited) | | | | | Year Ended
December 31, 2003 | |
Increase (Decrease) in Net Assets from: | | | | | | | | | | | | |
| | | | |
Operations: | | | | | | | | | | | | |
| | | | |
Net investment income | | | | $ | 116 | | | | | $ | 279 | |
Net realized gain | | | | | 100 | | | | | | 359 | |
Net change in unrealized appreciation (depreciation) | | | | | (155 | ) | | | | | 213 | |
Net increase resulting from operations | | | | | 61 | | | | | | 850 | |
| | | | |
Distributions to Shareholders: | | | | | | | | | | | | |
| | | | |
From net investment income | | | | | | | | | | | | |
Institutional Class | | | | | 0 | | | | | | (2 | ) |
Administrative Class | | | | | (115 | ) | | | | | (323 | ) |
| | | | |
From net realized capital gains | | | | | | | | | | | | |
Institutional Class | | | | | 0 | | | | | | 0 | |
Administrative Class | | | | | 0 | | | | | | (150 | ) |
Total Distributions | | | | | (115 | ) | | | | | (475 | ) |
| | | | |
Portfolio Share Transactions: | | | | | | | | | | | | |
| | | | |
Receipts for shares sold | | | | | | | | | | | | |
Institutional Class | | | | | 106 | | | | | | 0 | |
Administrative Class | | | | | 4 | | | | | | 0 | |
| | | | |
Issued as reinvestment of distributions | | | | | | | | | | | | |
Institutional Class | | | | | 0 | | | | | | 2 | |
Administrative Class | | | | | 115 | | | | | | 473 | |
| | | | |
Cost of shares redeemed | | | | | | | | | | | | |
Institutional Class | | | | | (6 | ) | | | | | (1,200 | ) |
Administrative Class | | | | | (164 | ) | | | | | (260 | ) |
Net increase (decrease) resulting from Portfolio share transactions | | | | | 55 | | | | | | (984 | ) |
| | | | |
Total Increase (Decrease) in Net Assets | | | | | 1 | | | | | | (609 | ) |
| | | | |
Net Assets: | | | | | | | | | | | | |
| | | | |
Beginning of period | | | | | 17,489 | | | | | | 18,099 | |
End of period* | | | | $ | 17,490 | | | | | $ | 17,489 | |
| | | | |
*Including undistributed net investment income of: | | | | $ | 248 | | | | | $ | 246 | |
| | | | | | |
| See accompanying notes | | June 30, 2004 | | Semi-Annual Report | | 7 |
Schedule of Investments
Total Return Portfolio II
June 30, 2004 (Unaudited)
| | | | |
| | | Principal | | |
| | | Amount | | Value |
| | | (000s) | | (000s) |
| | | | | | |
CORPORATE BONDS & NOTES 6.6% |
Banking & Finance 3.9% |
CIT Group, Inc. | | | | | | |
2.490% due 07/30/2004 (a) | | $ | 40 | | $ | 40 |
2.670% due 01/31/2005 (a) | | | 100 | | | 101 |
Ford Motor Credit Co. | | | | | | |
3.045% due 10/25/2004 (a) | | | 200 | | | 201 |
General Motors Acceptance Corp. | | | | | | |
1.499% due 07/21/2004 (a) | | | 100 | | | 100 |
3.158% due 05/19/2005 (a) | | | 100 | | | 101 |
UBS Preferred Funding Trust I | | | | | | |
8.622% due 10/29/2049 (a) | | | 100 | | | 119 |
Verizon Wireless Capital LLC | | | | | | |
1.350% due 05/23/2005 (a) | | | 30 | | | 30 |
| | | | | |
|
|
| | | | | | | 692 |
| | | | | |
|
|
Industrials 0.8% |
El Paso Corp. | | | | | | |
6.750% due 05/15/2009 | | | 50 | | | 46 |
Williams Cos., Inc. | | | | | | |
7.875% due 09/01/2021 | | | 100 | | | 97 |
| | | | | |
|
|
| | | | | | | 143 |
| | | | | |
|
|
Utilities 1.9% |
AEP Texas Central Co. | | | | | | |
2.500% due 02/15/2005 (a) | | | 10 | | | 10 |
Appalachian Power Co. | | | | | | |
4.800% due 06/15/2005 | | | 20 | | | 20 |
Entergy Gulf States, Inc. | | | | | | |
2.433% due 06/18/2007 (a) | | | 100 | | | 100 |
Pacific Gas & Electric Co. | | | | | | |
1.810% due 04/03/2006 (a) | | | 200 | | | 200 |
| | | | | |
|
|
| | | | | | | 330 |
| | | | | |
|
|
Total Corporate Bonds & Notes | | | 1,165 |
(Cost $1,141) | | | | |
|
|
| | | | | | | |
MUNICIPAL BONDS & NOTES 4.4% |
| |
California State Polytechnic University Revenue Bonds, Series 1972 | | | |
5.250% due 01/01/2010 | | | 100 | | | 109 |
City of Chicago, Illinois General Obligation Bonds, (MBIA Insured), Series 2003 | | | |
5.000% due 01/01/2035 | | | 100 | | | 97 |
Energy Northwest Washington
Electric Revenue Bonds, Series 2003 | | | |
5.500% due 07/01/2014 | | | 100 | | | 111 |
La Quinta, California
Redevelopment Agency Tax Allocation Bonds, (AMBAC Insured), Series 2001 |
5.100% due 09/01/2031 | | | 100 | | | 99 |
New Jersey State Tobacco Settlement
Financing Corp. Revenue Bonds, Series 2003 |
4.375% due 06/01/2019 | | | 70 | | | 68 |
New Jersey State Tobacco Settlement Financing Corp., Series 2003 | | | |
6.750% due 06/01/2039 | | | 100 | | | 90 |
New Jersey Transportation Trust Fund Revenue Bonds, Series 2003 | | | |
5.000% due 06/15/2013 | | | 50 | | | 53 |
New York State Environmental Facilities Corp.
Revenue Bonds, Series 2002 |
8.860% due 06/15/2023 (a) | | | 25 | | | 26 |
New York Transitional Finance Authority Revenue Bonds, Series 2003 | | | |
5.000% due 02/01/2033 | | | 100 | | | 97 |
University of Texas Revenue Bonds, Series 2003 |
5.000% due 08/15/2033 | | | 20 | | | 20 |
| | | | | |
|
|
Total Municipal Bonds & Notes | | | 770 |
(Cost $791) | | | | |
|
|
| | | | | | |
U.S. GOVERNMENT AGENCIES 17.6% |
| | |
Fannie Mae | | | | | | |
6.500% due 08/01/2032 | | $ | 33 | | $ | 34 |
1.420% due 03/25/2034 (a) | | | 97 | | | 97 |
5.090% due 09/01/2034 (a) | | | 58 | | | 60 |
4.797% due 12/01/2036 (a) | | | 56 | | | 58 |
6.000% due 06/01/2016-
07/25/2024 (b) | | | 280 | | | 290 |
5.000% due 06/01/2018-
07/15/2034 (b) | | | 1,128 | | | 1,112 |
5.500% due 10/01/2017-
07/15/2034 (b) | | | 1,163 | | | 1,159 |
Federal Home Loan Bank | | | | | | |
5.500% due 03/15/2015 | | | 2 | | | 2 |
Freddie Mac | | | | | | |
6.000% due 09/01/2016 | | | 22 | | | 23 |
3.579% due 07/01/2027 (a) | | | 7 | | | 7 |
3.532% due 01/01/2028 (a) | | | 7 | | | 7 |
5.500% due 08/15/2030 | | | 35 | | | 36 |
6.500% due 08/01/2032 | | | 24 | | | 26 |
5.000% due 10/01/2018-
10/15/2026 (b) | | | 111 | | | 112 |
Government National Mortgage Association | | | |
3.375% due 02/20/2027 (a) | | | 28 | | | 28 |
3.500% due 05/20/2030 (a) | | | 20 | | | 20 |
1.780% due 09/20/2030 (a) | | | 9 | | | 9 |
| | | | | |
|
|
Total U.S. Government Agencies | | | | | | 3,080 |
(Cost $3,079) | | | | |
|
|
| | | | | | | |
U.S. TREASURY OBLIGATIONS 4.7% |
| |
Treasury Inflation Protected Securities (d) | | | |
3.375% due 01/15/2007 (c) | | | 119 | | | 127 |
3.625% due 01/15/2008 | | | 163 | | | 178 |
3.875% due 01/15/2009 | | | 458 | | | 512 |
| | | | | |
|
|
Total U.S. Treasury Obligations
| | | 817 |
(Cost $799) | | | | |
|
|
| | | | | | | |
MORTGAGE-BACKED SECURITIES 5.9% |
| |
Bank of America Mortgage Securities, Inc. | | | |
6.500% due 10/25/2031 | | | 64 | | | 64 |
6.500% due 02/25/2033 | | | 15 | | | 15 |
Bear Stearns Adjustable Rate Mortgage Trust |
6.053% due 08/25/2032 (a) | | | 3 | | | 3 |
5.134% due 03/25/2033 (a) | | | 36 | | | 37 |
4.802% due 12/25/2033 (a) | | | 79 | | | 79 |
Countrywide Home Loans, Inc. | | | | | | |
5.699% due 03/19/2032 (a) | | | 3 | | | 3 |
CS First Boston Mortgage Securities Corp. | | | |
6.202% due 04/25/2032 (a) | | | 1 | | | 1 |
5.192% due 06/25/2032 (a) | | | 16 | | | 16 |
6.222% due 06/25/2032 (a) | | | 12 | | | 13 |
2.360% due 08/25/2033 (a) | | | 17 | | | 17 |
GSMPS Mortgage Loan Trust | | | | | | |
7.000% due 07/25/2043 | | | 65 | | | 68 |
GSR Mortgage Loan Trust | | | | | | |
6.000% due 03/25/2032 | | | 17 | | | 17 |
Impac CMB Trust | | | | | | |
1.700% due 07/25/2033 (a) | | | 84 | | | 84 |
1.550% due 01/25/2034 (a) | | | 95 | | | 95 |
MASTR Asset Securitization Trust | | | |
5.500% due 09/25/2033 | | | 65 | | | 63 |
Merrill Lynch Mortgage Investors, Inc. | | | |
2.825% due 01/25/2029 (a) | | | 92 | | | 94 |
1.600% due 01/20/2030 (a) | | | 4 | | | 4 |
Prime Mortgage Trust | | | | | | |
1.700% due 02/25/2034 (a) | | | 71 | | | 71 |
Residential Funding Mortgage Securities I, Inc. |
5.603% due 09/25/2032 (a) | | | 3 | | | 3 |
| | | | | | |
| |
Structured Asset Mortgage Investments, Inc. | | | |
1.610% due 09/19/2032 (a) | | $ | 8 | | $ | 8 |
Structured Asset Securities Corp. | | | | | | |
6.150% due 07/25/2032 (a) | | | 2 | | | 2 |
1.460% due 08/25/2033 (a) | | | 32 | | | 32 |
Washington Mutual Mortgage Securities Corp. |
3.052% due 02/27/2034 (a) | | | 34 | | | 34 |
2.624% due 08/25/2042 (a) | | | 200 | | | 203 |
| | | | | |
|
|
Total Mortgage-Backed Securities | | | 1,026 |
(Cost $1,032) | | | | |
|
|
| | | | | | | |
ASSET-BACKED SECURITIES 0.7% |
| |
Amortizing Residential Collateral Trust | | | |
1.570% due 06/25/2032 (a) | | | 15 | | | 15 |
CIT Group Home Equity Loan Trust | | | |
1.570% due 06/25/2033 (a) | | | 10 | | | 10 |
CS First Boston Mortgage Securities Corp. | | | |
1.610% due 01/25/2032 (a) | | | 18 | | | 18 |
Equity One ABS, Inc. | | | | | | |
1.580% due 11/25/2032 (a) | | | 17 | | | 17 |
HFC Home Equity Loan Asset-Backed Certificates |
1.630% due 10/20/2032 (a) | | | 52 | | | 52 |
Household Mortgage Loan Trust | | | | | | |
1.580% due 05/20/2032 (a) | | | 3 | | | 3 |
Irwin Home Equity Loan Trust | | | | | | |
1.590% due 06/25/2029 (a) | | | 3 | | | 3 |
Morgan Stanley Dean Witter Capital I, Inc. | | | |
1.630% due 07/25/2032 (a) | | | 5 | | | 5 |
| | | | | |
|
|
Total Asset-Backed Securities | | | | | | 123 |
(Cost $123) | | | | |
|
|
| | | | | | | |
PURCHASED PUT OPTIONS 0.0% |
| | | # of
Contracts | | |
Eurodollar December Futures (CME) | | | |
Strike @ 95.000 Exp. 12/13/2004 | | | 5 | | | 0 |
Eurodollar June Futures (CME) Strike @ 91.000 Exp. 06/13/2005 | | | 16 | | | 0 |
| | | | | |
|
|
Total Purchased Put Options | | | | | | 0 |
(Cost $0) | | | | |
|
|
| | | | | | | |
PREFERRED SECURITY 0.7% |
| | | Shares | | |
| | |
DG Funding Trust | | | | | | |
3.360% due 12/29/2049 (a) | | | 11 | | | 118 |
| | | | | |
|
|
| Total Preferred Security | | | | | | 118 |
(Cost $116) | | | | |
|
|
| | | | | | | |
SHORT-TERM INSTRUMENTS 67.5% |
| | | Principal
Amount
(000s) | | |
Certificates of Deposit 3.4% |
Citibank New York N.A. | | | | | | |
1.215% due 07/30/2004 | | | 300 | | | 300 |
Well Fargo Bank N.A. | | | | | | |
1.090% due 07/07/2004 | | | 300 | | | 300 |
| | | | | |
|
|
| | | | | | | 600 |
| | | | | |
|
|
Commercial Paper 57.1% | | | | | | |
Fannie Mae | | | | | | |
1.010% due 07/01/2004 | | | 800 | | | 800 |
1.030% due 07/01/2004 | | | 200 | | | 200 |
1.025% due 07/07/2004 | | | 300 | | | 300 |
1.045% due 07/21/2004 | | | 400 | | | 400 |
1.060% due 07/21/2004 | | | 400 | | | 400 |
1.056% due 07/28/2004 | | | 400 | | | 400 |
1.063% due 08/04/2004 | | | 100 | | | 100 |
1.150% due 08/18/2004 | | | 200 | | | 200 |
| | | | | | |
| 8 | | Semi-Annual Report | | June 30, 2004 | | See accompanying notes |
| | | | |
| | | Principal | | |
| | | Amount | | Value |
| | | (000s) | | (000s) |
| | | | | | | |
| | |
1.180% due 08/25/2004 | | $ | 200 | | $ | 200 | |
1.185% due 08/25/2004 | | | 200 | | | 200 | |
1.225% due 09/01/2004 | | | 200 | | | 199 | |
1.230% due 09/01/2004 | | | 200 | | | 199 | |
1.240% due 09/01/2004 | | | 200 | | | 199 | |
1.380% due 09/01/2004 | | | 200 | | | 200 | |
1.130% due 09/08/2004 | | | 200 | | | 199 | |
1.415% due 09/08/2004 | | | 200 | | | 199 | |
1.430% due 09/08/2004 | | | 200 | | | 199 | |
1.415% due 09/15/2004 | | | 400 | | | 399 | |
1.414% due 09/22/2004 | | | 100 | | | 100 | |
1.426% due 09/22/2004 | | | 200 | | | 199 | |
1.435% due 09/22/2004 | | | 400 | | | 399 | |
Federal Home Loan Bank | | | | | | | |
1.165% due 07/16/2004 | | | 100 | | | 100 | |
1.170% due 07/16/2004 | | | 200 | | | 200 | |
1.180% due 08/25/2004 | | | 200 | | | 200 | |
1.090% due 08/27/2004 | | | 200 | | | 200 | |
1.240% due 09/01/2004 | | | 400 | | | 399 | |
1.240% due 09/03/2004 | | | 200 | | | 199 | |
Ford Motor Credit Co. | | | | | | | |
1.010% due 09/03/2004 | | | 100 | | | 100 | |
Freddie Mac | | | | | | | |
1.010% due 07/15/2004 | | | 100 | | | 100 | |
1.200% due 08/09/2004 | | | 200 | | | 399 | |
1.150% due 08/17/2004 | | | 300 | | | 100 | |
1.195% due 08/17/2004 | | | 200 | | | 200 | |
1.175% due 08/24/2004 | | | 100 | | | 100 | |
1.210% due 08/31/2004 | | | 200 | | | 200 | |
1.275% due 09/07/2004 | | | 200 | | | 199 | |
1.410% due 09/14/2004 | | | 200 | | | 199 | |
1.440% due 09/14/2004 | | | 200 | | | 199 | |
1.445% due 09/14/2004 | | | 200 | | | 199 | |
1.465% due 09/28/2004 | | | 100 | | | 100 | |
1.436% due 09/30/2004 | | | 200 | | | 199 | |
1.540% due 10/18/2004 | | | 200 | | | 199 | |
General Electric Capital Corp. | | | | | | | |
1.050% due 07/07/2004 | | | 200 | | | 200 | |
1.300% due 09/08/2004 | | | 300 | | | 299 | |
| | | | | |
|
|
|
| | | | | | | 9,981 | |
| | | | | |
|
|
|
| | |
Repurchase Agreement 3.1% | | | | | | | |
State Street Bank | | | | | | | |
0.800% due 07/01/2004 | | | 550 | | | 550 | |
| | | | | |
|
|
|
(Dated 06/30/2004. Collateralized by Freddie Mac
5.500% due 07/15/2006 valued at $562.
Repurchase proceeds are $550.) | |
| | |
U.S. Treasury Bills 3.9% | | | | | | | |
1.256% due 09/02/2004- 09/16/2004 (b)(c) | | | 675 | | | 673 | |
| | | | | |
|
|
|
| | |
Total Short-Term Instruments
| | | | | | 11,804 | |
(Cost $11,806) | | | | |
|
|
|
| | |
Total Investments 108.1% | | | | | $ | 18,903 | |
(Cost $18,887) | | | | | | | |
| | |
Written Options (f) (0.1%) | | | | | | (14 | ) |
(Premiums $26) | | | | | | | |
| |
Other Assets and Liabilities (Net) (8.0%) | | | (1,399 | ) |
| | | | | |
|
|
|
| |
Net Assets 100.0% | | $ | 17,490 | |
| | | | | |
|
|
|
Notes to Schedule of Investments (amounts in thousands, except number of contracts):
(a) Variable rate security.
(b) Securities are grouped by coupon or range of coupons and represent a range of maturities.
(c) Securities with an aggregate market value of $501 have been segregated with the custodian to cover margin
requirements for the following open futures contracts at
June 30, 2004:
| | | | | | | | |
| Type | | Expiration
Month | | # of
Contracts | | Unrealized Appreciation/ (Depreciation) | |
Eurodollar March
Long Futures | | 03/2005 | | 6 | | $ | (8 | ) |
Eurodollar March
Long Futures | | 03/2006 | | 2 | | | (2 | ) |
Eurodollar June
Long Futures | | 06/2005 | | 8 | | | (11 | ) |
Eurodollar September
Long Futures | | 09/2005 | | 7 | | | (12 | ) |
Eurodollar December
Long Futures | | 12/2004 | | 2 | | | 1 | |
Eurodollar December
Long Futures | | 12/2005 | | 7 | | | (11 | ) |
U.S. Treasury 10-Year Note Long Futures | | 09/2004 | | 52 | | | 66 | |
U.S. Treasury 5-Year Note Long Futures | | 09/2004 | | 31 | | | 21 | |
| | | | | | |
|
|
|
| | | | | | | $ | 44 | |
| | | | | | |
|
|
|
(d) Principal amount of security is adjusted for inflation.
| (e) | Swap agreements outstanding at June 30, 2004: |
| | | | | | | | |
Type | |
| Notional
Amount | | | |
| Unrealized
Appreciation |
| Receive total return on Lehman Commercial Mortgage-Backed Securities Index and pay a floating rate based on 1-month LIBOR less 0.650%. | | | | | |
Counterparty: Bear Stearns & Co., Inc. | | | | | |
Exp. 07/01/2004 | | $ | 10 | | | | $ | 0 |
| | |
| Receive total return on Lehman Commercial Mortgage-Backed Securities Index and pay a floating rate based on 1-month LIBOR less 0.650%. | | | | | |
Counterparty: Bank of America | | | | | |
Exp. 07/31/2004 | | | 50 | | | | | 0 |
| | |
| Receive total return on Lehman Commercial Mortgage-Backed Securities Index and pay a floating rate based on 1-month LIBOR less 0.650%. | | | | | |
Counterparty: Bear Stearns & Co., Inc. | | | | | |
Exp. 08/01/2004 | | | 100 | | | | | 0 |
| | |
| Receive total return on Lehman Commercial Mortgage-Backed Securities Index and pay a floating rate based on 1-month LIBOR less 0.650%. | | | | | |
Counterparty: Bear Stearns & Co., Inc. | | | | | |
Exp. 09/01/2004 | | | 0 | | | | | 0 |
|
Receive total return on Lehman Commercial
Mortgage-Backed Securities Index and pay a
floating rate based on 1-month LIBOR less 0.650%. |
Counterparty: Morgan Stanley Dean Witter & Co. |
Exp. 09/30/2004 | | | 100 | | | | | 0 |
| | | | | | | | |
| Receive a fixed rate equal to 4.000% and pay floating rate based on 3-month LIBOR. | | | | | |
Counterparty: UBS Warburg LLC | | | | | |
Exp. 12/15/2006 | | $ | 100 | | | | $ | 0 |
| |
| Receive a fixed rate equal to 4.000% and pay floating rate based on 3-month LIBOR. | | | |
Counterparty: Barclays Bank PLC | | | | | |
Exp. 12/15/2006 | | | 200 | | | | | 0 |
| |
| Receive a fixed rate equal to 4.000% and pay floating rate based on 3-month LIBOR. | | | |
Counterparty: Bank of America | | | | | |
Exp. 12/15/2009 | | | 400 | | | | | 4 |
| | | | | |
| |
|
|
| | | | | | | | $ | 4 |
| | | | | |
| |
|
|
| | | | | | |
| See accompanying notes | | June 30, 2004 | | Semi-Annual Report | | 9 |
Schedule of Investments (Cont.)
Total Return Portfolio II
June 30, 2004 (Unaudited)
(f) Premiums received on written options:
| | | | | | | | | | | | | | | | | | | | | |
| Name of Issuer | | Exercise
Price | | | | Expiration
Date | | | | # of
Contracts | | | | Premium | | | | Value |
Call - CBOT U.S. Treasury Note September Futures | | $ | 111.500 | | | | 08/27/2004 | | | | 1 | | | | $ | 1 | | | | $ | 0 |
Call - CBOT U.S. Treasury Note September Futures | | | 115.000 | | | | 08/27/2004 | | | | 4 | | | | | 2 | | | | | 0 |
Call - CBOT U.S. Treasury Note September Futures | | | 111.000 | | | | 08/27/2004 | | | | 1 | | | | | 0 | | | | | 1 |
Call - CBOT U.S. Treasury Note September Futures | | | 114.000 | | | | 08/27/2004 | | | | 2 | | | | | 1 | | | | | 0 |
Call - CBOT U.S. Treasury Note September Futures | | | 110.000 | | | | 08/27/2004 | | | | 2 | | | | | 2 | | | | | 2 |
Put - CBOT U.S. Treasury Note September Futures | | | 107.500 | | | | 08/27/2004 | | | | 1 | | | | | 1 | | | | | 0 |
Put - CBOT U.S. Treasury Note September Futures | | | 108.000 | | | | 08/27/2004 | | | | 2 | | | | | 3 | | | | | 1 |
Put - CBOT U.S. Treasury Note September Futures | | | 105.000 | | | | 08/27/2004 | | | | 2 | | | | | 1 | | | | | 0 |
| | | | | | | | | | | | | | | | $ | 11 | | | | $ | 4 |
| | | | | | | | | | | | | | | | | | | | | | | | |
| Name of Issuer | | Counterparty | | Exercise
Rate | | | | | Expiration
Date | | | | Notional
Amount | | | | Premium | | | | Value |
Call - OTC 7-Year Interest Rate Swap | | UBS Warburg LLC | | 3.800 | %** | | | | 10/07/2004 | | | | $ | 100 | | | | $ | 1 | | | | $ | 0 |
Call - OTC 7-Year Interest Rate Swap | | Bank of America | | 6.000 | %** | | | | 10/19/2004 | | | | | 100 | | | | | 4 | | | | | 7 |
Put - OTC 7-Year Interest Rate Swap | | Bank of America | | 6.000 | %* | | | | 10/19/2004 | | | | | 100 | | | | | 4 | | | | | 0 |
Call - OTC 7-Year Interest Rate Swap | | Bank of America | | 5.200 | %** | | | | 11/02/2004 | | | | | 100 | | | | | 3 | | | | | 3 |
Put - OTC 7-Year Interest Rate Swap | | Bank of America | | 6.700 | %* | | | | 11/02/2004 | | | | | 100 | | | | | 3 | | | | | 0 |
| | | | | | | | | | | | | | | | | | | $ | 15 | | | | $ | 10 |
| * | The Portfolio will pay a floating rate based on 3-month LIBOR. |
| ** | The Portfolio will receive a floating rate based on 3-month LIBOR. |
| (g) | Short sales open at June 30, 2004 were as follows: |
| | | | | | | | | | | | | | | |
| Type | | Coupon
(%) | | Maturity | | Par | | | | Value | | Proceeds |
U.S. Treasury Bond | | 6.250 | | 08/15/2023 | | $ | 100 | | | | $ | 111 | | $ | 109 |
U.S. Treasury Bond | | 6.250 | | 05/15/2030 | | | 200 | | | | | 224 | | | 218 |
U.S. Treasury Bond | | 5.375 | | 02/15/2031 | | | 200 | | | | | 202 | | | 198 |
U.S. Treasury Note | | 4.750 | | 05/15/2014 | | | 100 | | | | | 101 | | | 100 |
| | | | | | | | | | | | $ | 638 | | $ | 625 |
| | | | | | |
| 10 | | Semi-Annual Report | | June 30, 2004 | | See accompanying notes |
Notes to Financial Statements
June 30, 2004 (Unaudited)
1. Organization
The Total Return Portfolio II (the “Portfolio”) is a series of the PIMCO Variable Insurance Trust (the “Trust”). The Trust is registered under the Investment Company Act of 1940 (the “Act”), as amended, as an open-end investment company organized as a Delaware business trust on October 3, 1997. The Portfolio offers two classes of shares: Institutional and Administrative. Each share class has identical voting rights (except that shareholders of a class have exclusive voting rights regarding any matter relating solely to that class of shares). Information presented in these financial statements pertains to the Administrative Class of the Portfolio. Certain detailed financial information for the Institutional Class is provided separately and is available upon request. The Trust is designed to be used as an investment vehicle by Separate Accounts of insurance companies that fund variable annuity contracts and variable life insurance policies and by qualified pension and retirement plans. The Portfolio commenced operations on May 28, 1999.
2. Significant Accounting Policies
The following is a summary of significant accounting policies consistently followed by the Trust in the preparation of its financial statements in conformity with accounting principles generally accepted in the United States of America. The preparation of financial statements in accordance with accounting principles generally accepted in the United States of America requires management to make estimates and assumptions that affect the reported amounts and disclosures in the financial statements. Actual results could differ from those estimates.
Security Valuation. Portfolio securities and other financial instruments for which market quotations are readily available are stated at market value. Portfolio securities and other financial instruments for which market quotes are not readily available are valued at fair value, as determined in good faith and pursuant to guidelines established by the Board of Trustees, including certain fixed income securities which may be valued with reference to securities whose prices are more readily obtainable. Market value is determined at the close of regular trading (normally, 4:00 p.m., Eastern Time) on the New York Stock Exchange on each day the New York Stock Exchange is open, or if no sales are reported, as is the case for most securities traded over-the-counter, the mean between representative bid and asked quotations obtained from a quotation reporting system or from established market makers. The prices of certain portfolio securities or other financial instruments may be determined at a time prior to the close of regular trading on the New York Stock Exchange. Fair valuation may be used if significant events occur after the close of the relevant markets and prior to the close of regular trading on the New York Stock Exchange that materially affect the values of such securities or financial instruments. Fixed income securities are normally valued on the basis of quotes obtained from brokers and dealers or pricing services. Certain fixed income securities purchased on a delayed delivery basis are marked to market daily until settlement at the forward settlement value. Short-term investments, which mature in 60 days or less are valued at amortized cost, which approximates market value. Exchange traded options, futures and options on futures are valued at the settlement price determined by the relevant exchange. Prices may be obtained from independent pricing services which use information provided by market makers or estimates of market values obtained from yield data relating to investments or securities with similar characteristics. The prices used by the Portfolio may differ from the value that would be realized if the securities were sold and the differences could be material to the financial statements.
Securities Transactions and Investment Income. Securities transactions are recorded as of the trade date. Securities purchased or sold on a when-issued or delayed delivery basis may be settled a month or more after the trade date. Realized gains and losses from securities sold are recorded on the identified cost basis. Dividend income is recorded on the ex-dividend date, except certain dividends from foreign securities where the ex-dividend date may have passed, are recorded as soon as the Portfolio is informed of the ex-dividend date. Interest income, adjusted for the accretion of discounts and amortization of premiums, is recorded on the accrual basis. Paydowns gains and losses on mortgage- and asset-backed securities are recorded as adjustments to interest income in the Statement of Operations.
Dividends and Distributions to Shareholders. Dividends from net investment income, if any, are declared on each day the Trust is open for business and are distributed to shareholders monthly. All dividends are reinvested in additional shares of the Portfolio. Net realized capital gains earned by the Portfolio, if any, will be distributed no less frequently than once each year.
Income dividends and capital gain distributions are determined in accordance with income tax regulations which may differ from accounting principles generally accepted in the United States of America. These differences are primarily due to differing treatments for such items as wash sales, foreign currency transactions, net operating losses, notional principal contracts, certain asset-backed securities, certain futures and forward contracts, tax straddles, and capital loss carryforwards.
Distributions classified as a tax basis return of capital, if any, are reflected in the accompanying Statements of Changes in Net Assets and have been reclassified to paid in capital. In addition, other amounts have been reclassified between undistributed net investment income, accumulated undistributed net realized gains or losses and/or paid in capital to more appropriately conform financial accounting to tax characterizations of dividend distributions.
Multiclass Operations. Each class offered by the Trust has equal rights as to assets. Income, non-class specific expenses, and realized and unrealized capital gains and losses are allocated to each class of shares based on the relative net assets of each class.
Delayed Delivery Transactions. The Portfolio may purchase or sell securities on a when-issued or delayed delivery basis. These transactions involve a commitment by the Portfolio to purchase or
| | | | |
| June 30, 2004 | | Semi-Annual Report | | 11 |
Notes to Financial Statements (Cont.)
June 30, 2004 (Unaudited)
sell securities for a predetermined price or yield, with payment and delivery taking place beyond the customary settlement period. When delayed delivery purchases are outstanding, the Portfolio will designate liquid assets in an amount sufficient to meet the purchase price. When purchasing a security on a delayed delivery basis, the Portfolio assumes the rights and risks of ownership of the security, including the risk of price and yield fluctuations, and takes such fluctuations into account when determining its net asset value. The Portfolio may dispose of or renegotiate a delayed delivery transaction after it is entered into, and may sell when-issued securities before they are delivered, which may result in a capital gain or loss. When the Portfolio has sold a security on a delayed delivery basis, the Portfolio does not participate in future gains and losses with respect to the security.
Federal Income Taxes. The Portfolio intends to qualify as a regulated investment company and distribute all of its taxable income and net realized gains, if applicable, to shareholders. Accordingly, no provision for Federal income taxes has been made.
Futures Contracts. The Portfolio is authorized to enter into futures contracts. The Portfolio may use futures contracts to manage its exposure to the securities markets or to movements in interest rates and currency values. The primary risks associated with the use of futures contracts are the imperfect correlation between the change in market value of the securities held by the Portfolio and the prices of futures contracts, the possibility of an illiquid market, and the inability of the counterparty to meet the terms of the contract. Futures contracts are valued based upon their quoted daily settlement prices. Upon entering into a futures contract, the Portfolio may be required to deposit with its custodian, in a segregated account in the name of the futures broker, an amount of cash or U.S. Government and Agency Obligations in accordance with the initial margin requirements of the broker or exchange. Futures contracts are marked to market daily and an appropriate payable or receivable for the change in value (“variation margin”) is recorded by the Portfolio. Gains or losses are recognized but not considered realized until the contracts expire or are closed. Futures contracts involve, to varying degrees, risk of loss in excess of the variation margin disclosed in the Statement of Assets and Liabilities.
Inflation-Indexed Bonds. The Portfolio may invest in inflation-indexed bonds. Inflation-indexed bonds are fixed income securities whose principal value is periodically adjusted to the rate of inflation. The interest rate on these bonds is generally fixed at issuance at a rate lower than typical bonds. Over the life of an inflation-indexed bond, however, interest will be paid based on a principal value, which is adjusted for inflation. Any increase in the principal amount of an inflation-indexed bond will be included as interest income in the Statement of Operations, even though investors do not receive their principal until maturity.
Options Contracts. The Portfolio may write call and put options on futures, swaps, securities or currencies it owns or in which it may invest. Writing put options tends to increase the Portfolio’s exposure to the underlying instrument. Writing call options tends to decrease the Portfolio’s exposure to the underlying instrument. When the Portfolio writes a call or put option, an amount equal to the premium received is recorded as a liability and subsequently marked to market to reflect the current value of the option written. These liabilities are reflected as written options outstanding in the Statement of Assets and Liabilities. Payments received or made, if any, from writing options with premiums to be determined on a future date are reflected as such on the Statement of Assets and Liabilities. Premiums received from writing options which expire are treated as realized gains. Premiums received from writing options which are exercised or closed are added to the proceeds or offset against amounts paid on the underlying future, swap, security or currency transaction to determine the realized gain or loss. The Portfolio as a writer of an option has no control over whether the underlying future, swap, security or currency may be sold (call) or purchased (put) and as a result bears the market risk of an unfavorable change in the price of the future, swap, security or currency underlying the written option. There is the risk the Portfolio may not be able to enter into a closing transaction because of an illiquid market.
The Portfolio may also purchase put and call options. Purchasing call options tends to increase the Portfolio’s exposure to the underlying instrument. Purchasing put options tends to decrease the Portfolio’s exposure to the underlying instrument. The Portfolio pays a premium which is included in the Portfolio’s Statement of Assets and Liabilities as an investment and subsequently marked to market to reflect the current value of the option. Premiums paid for purchasing options which expire are treated as realized losses. The risk associated with purchasing put and call options is limited to the premium paid. Premiums paid for purchasing options which are exercised or closed are added to the amounts paid or offset against the proceeds on the underlying future, swap, security or currency transaction to determine the realized gain or loss.
Repurchase Agreements. The Portfolio may engage in repurchase transactions. Under the terms of a typical repurchase agreement, the Portfolio takes possession of an underlying debt obligation subject to an obligation of the seller to repurchase, and the Portfolio to resell, the obligation at an agreed-upon price and time. The market value of the collateral must be equal at all times to the total amount of the repurchase obligations, including interest. Generally, in the event of counterparty default, the Portfolio has the right to use the collateral to offset losses incurred.
Short Sales. The Portfolio may enter into short sales transactions. A short sale is a transaction in which the Portfolio sells securities it does not own in anticipation of a decline in the market price of the securities. The Portfolio is obligated to deliver securities at the market price at the time the short position is closed. Possible losses from short sales may be unlimited, whereas losses from purchases cannot exceed the total amount invested.
Swap Agreements. The Portfolio may invest in swap agreements. A swap is an agreement to exchange the return generated by one instrument for the return generated by another instrument. The
| | | | |
| 12 | | Semi-Annual Report | | June 30, 2004 |
Portfolio may enter into interest rate, total return, forward spread lock, and credit default swap agreements to manage its exposure to interest rates and credit risk.
Interest rate swap agreements involve the exchange by the Portfolio with another party of their respective commitments to pay or receive interest, e.g., an exchange of floating rate payments for fixed rate payments with respect to the notional amount of principal.
Total return swap agreements involve commitments to pay interest in exchange for a market-linked return, both based on notional amounts. To the extent the total return of the security or index underlying the transaction exceeds or falls short of the offsetting interest rate obligation, the Portfolio will receive a payment from or make a payment to the counterparty.
Forward spread lock swap agreements involve commitments to pay or receive a settlement amount calculated as the difference between the swap spread and a fixed spread, multiplied by the notional amount times the duration of the swap. The swap spread is the difference between the benchmark swap rate (market rate) and the specific Treasury rate.
In a credit default swap, one party makes a stream of payments to another party in exchange for the right to receive a specified return in the event of a default by a third party, typically corporate issues or sovereign issues of an emerging country, on its obligation. The Portfolio may use credit default swaps to provide a measure of protection against defaults of sovereign issuers (i.e., to reduce risk where the Portfolio owns or has exposure to the sovereign issuer) or to take an active long or short position with respect to the likelihood of a particular issuer’s default.
Swaps are marked to market daily based upon quotations from market makers and the change in value, if any, is recorded as unrealized gain or loss in the Statement of Operations. Payments received or made at the beginning of the measurement period are reflected as such on the Statement of Assets and Liabilities. A liquidation payment received or made at the termination of the swap is recorded as realized gain or loss in the Statement of Operations. Net periodic payments received by the Portfolio are included as part of realized gain (loss) on the Statement of Operations. Entering into these agreements involves, to varying degrees, elements of credit, market and documentation risk in excess of the amounts recognized on the Statement of Assets and Liabilities. Such risks involve the possibility that there will be no liquid market for these agreements, that the counterparty to the agreements may default on its obligation to perform or disagree as to the meaning of contractual terms in the agreements, and that there may be unfavorable changes in interest rates.
As a result of a FASB Emerging Issues Task Force (“EITF”) consensus, No. 03-11, and related SEC staff guidance, the Portfolio has reclassified periodic payments made or received under swap agreements, which were previously included within miscellaneous income, to a component of realized gain(loss) in the Statement of Operations. For consistency, similar reclassifications have been made to amounts appearing in the previous year’s Statement of Changes in Net Assets and the per share amounts in the prior year financial highlights. Prior year net investment income ratios in the financial highlights have also been modified accordingly. This reclassification increased(decreased) net investment income by $13,839 and $(463), and net realized gain(loss) by $(14,308) and $581 and net change in unrealized appreciation(depreciation) by $469 and $(118) for the six months ended June 30, 2004 and year ended December 31, 2003, respectively. There is no effect on the Portfolio’s net asset value, either in total or per share, or its total increase(decrease) in net assets from operations during any period.
3. Fees, Expenses, and Related Party Transactions
Investment Advisory Fee. Pacific Investment Management Company LLC (“PIMCO”) is a majority owned subsidiary partnership of Allianz Dresdner Asset Management of America L.P. and serves as investment adviser (the “Adviser”) to the Trust, pursuant to an investment advisory contract. The Adviser receives a monthly fee at an annual rate based on average daily net assets of the Portfolio. The Advisory Fee is charged at an annual rate of 0.25%.
Administration Fee. PIMCO serves as administrator (the “Administrator”), and provides administrative services to the Trust for which it receives a monthly administrative fee based on average daily net assets of the Portfolio. The Administration Fee is charged at the annual rate of 0.25%.
Servicing Fee. PA Distributors LLC (“PAD”), formerly known as PIMCO Advisors Distributors LLC, is an indirect wholly-owned subsidiary of Allianz Dresdner Asset Management of America L.P. and serves as the distributor of the Trust’s shares. The Trust is permitted to reimburse PAD on a quarterly basis, out of the Administrative Class assets of the Portfolio in the amount of 0.15% on an annual basis of the average daily net assets of that class, for payments made to financial intermediaries that provide services in connection with the distribution of shares or administration of plans or programs that use Portfolio shares as their funding medium. The effective rate paid to PAD was 0.15% during current fiscal year.
Expenses. The Trust is responsible for the following expenses: (i) salaries and other compensation of any of the Trust’s executive officers and employees who are not officers, directors, stockholders or employees of PIMCO or its subsidiaries or affiliates; (ii) taxes and governmental fees; (iii) brokerage fees and commissions and other portfolio transaction expenses; (iv) the cost of borrowing money, including interest expense and bank overdraft charges; (v) fees and expenses of the Trustees who are not “interested persons” of PIMCO or the Trust, and any counsel retained exclusively for their benefit; (vi) extraordinary expenses, including costs of litigation and indemnification expenses; (vii) organization expenses and (viii) any expenses allocated or allocable to a specific class of shares, which include service fees payable with respect to the Administrative Class shares and may include certain other expenses as permitted by the Trust’s Multiple Class Plan adopted pursuant to Rule 18f-3 under the Act and subject to review and approval by the Trustees. The ratio of expenses to average net assets per share class, as disclosed in Financial Highlights, may differ from the annual portfolio operating expenses per share class as disclosed in the Prospectus for the reasons set forth above.
| | | | |
| June 30, 2004 | | Semi-Annual Report | | 13 |
Notes to Financial Statements (Cont.)
June 30, 2004 (Unaudited)
PIMCO has agreed to waive a portion of its administrative fees to the extent that the payment of the Portfolio’s pro rata share of organization expenses and Trustee fees cause the actual expense ratio to rise above the rates disclosed in the then-current prospectus plus 0.49 basis points as set forth below (calculated as a percentage of the Portfolio’s average daily net assets attributable to each class):
| | | |
Institutional Class | | 0.50 | % |
Administrative Class | | 0.65 | % |
PIMCO may be reimbursed for these waived amounts in future periods, not to exceed thirty-six months.
Each unaffiliated Trustee receives an annual retainer of $4,000, plus $1,500 for each Board of Trustees meeting attended in person and $250 for each meeting attended telephonically, plus reimbursement of related expenses. In addition, each committee chair receives an additional annual retainer of $500. These expenses are allocated on a pro-rata basis to each Portfolio of the Trust according to its respective net assets.
4. Purchases and Sales of Securities
The length of time a Portfolio has held a particular security is not generally a consideration in investment decisions. A change in the securities held by a Portfolio is known as “portfolio turnover.” The Portfolio may engage in frequent and active trading of portfolio securities to achieve its investment objective, particularly during periods of volatile market movements. High portfolio turnover (e.g., over 100%) involves correspondingly greater expenses to the Portfolio, including brokerage commissions or dealer mark-ups and other transaction costs on the sale of securities and reinvestments in other securities. Such sales may also result in realization of taxable capital gains, including short-term capital gains (which are generally taxed at ordinary income tax rates). The trading costs and tax effects associated with portfolio turnover may adversely affect the Portfolio’s performance.
Purchases and sales of securities (excluding short-term investments) for the period ended June 30, 2004 were as follows (amounts in thousands):
| | | | | | |
| U.S Government/Agency | | All Other |
| Purchases | | Sales | | Purchases | | Sales |
| $7,979 | | $7,308 | | $1,297 | | $654 |
5. Transactions in Written Call and Put Options
Transactions in written call and put options were as follows (amounts in thousands):
| | | | |
| | | | Premium | |
Balance at 12/31/2003 | | $ | 30 | |
Sales | | | 25 | |
Closing Buys | | | (5 | ) |
Expirations | | | (24 | ) |
Exercised | | | 0 | |
Balance at 06/30/2004 | | $ | 26 | |
6. Federal Income Tax Matters
At June 30, 2004, the aggregate cost of investments was the same for federal income tax and financial statement purposes. The net unrealized appreciation (depreciation) of investment securities for federal income tax purposes is as follows (amounts in thousands):
| | | | | | |
Aggregate Gross
Unrealized
Appreciation | | Aggregate Gross
Unrealized
(Depreciation) | | Net Unrealized
Appreciation |
| $ 71 | | $ | (55) | | $ | 16 |
| | | | |
| 14 | | Semi-Annual Report | | June 30, 2004 |
7. Shares of Beneficial Interest
The Trust may issue an unlimited number of shares of beneficial interest with a $.0001 par value. Changes in shares of beneficial interest were as follows (shares and amounts in thousands):
| | | | | | | | | | | | | | |
| | | Six Months Ended
06/30/2004 | | | Year Ended
12/31/2003 | |
| | | Shares | | | Amount | | | Shares | | | Amount | |
Receipts for shares sold | | | | | | | | | | | | | | |
| | | | |
Institutional Class | | 10 | | | $ | 106 | | | 0 | | | $ | 0 | |
Administrative Class | | 0 | | | | 4 | | | 0 | | | | 0 | |
| | | | |
Issued as reinvestment of distributions | | | | | | | | | | | | | | |
| | | | |
Institutional Class | | 0 | | | | 0 | | | 0 | | | | 2 | |
Administrative Class | | 11 | | | | 115 | | | 45 | | | | 473 | |
| | | | |
Cost of shares redeemed | | | | | | | | | | | | | | |
| | | | |
Institutional Class | | (1 | ) | | | (6 | ) | | (119 | ) | | | (1,200 | ) |
Administrative Class | | (15 | ) | | | (164 | ) | | (25 | ) | | | (260 | ) |
| | | | |
Net increase (decrease) resulting from Portfolio share transactions | | 5 | | | $ | 55 | | | (99 | ) | | $ | (985 | ) |
The following schedule shows the number of shareholders each owning 5% or more of the Portfolio and the total percentage of the Portfolio held by such shareholders:
| | | | |
| | | Number | | % of Portfolio Held |
Institutional Class | | 2 | | 100 |
Administrative Class | | 1 | | 100 |
8. Regulatory and Litigation Matters
On February 17, 2004, the Attorney General of the State of New Jersey (“New Jersey AG”) filed a complaint against Allianz Dresdner Asset Management of America L.P. (“ADAM”), PA Distributors LLC (formerly known as PIMCO Advisors Distributors LLC) (“PAD”), PEA Capital LLC (formerly known as PIMCO Equity Advisors LLC) (“PEA”), and Pacific Investment Management Company LLC (“PIMCO”) in connection with its investigation into market timing and late trading. The complaint contends that inappropriate trading by shareholders engaged in market timing activity took place in funds in the PIMCO Funds: Multi-Manager Series (“MMS Funds”) and the PIMCO Funds: Pacific Investment Management Series (“PIMS Funds”). On June 1, 2004, the New Jersey AG dismissed PIMCO from the lawsuit.
On the same day as the dismissal of PIMCO from the lawsuit, the New Jersey AG announced that it had reached a settlement agreement with the remaining defendants (“New Jersey Settlement”). In the New Jersey Settlement, ADAM, PAD and PEA agreed, while neither admitting nor denying the allegations or conclusions of law, to: (i) pay New Jersey a civil fine of $15 million and $3 million for investigative costs and further enforcement initiatives; and (ii) implement certain changes in corporate governance.
On May 6, 2004, the Securities and Exchange Commission filed a complaint in the U.S. District Court in the Southern District of New York alleging that PA Fund Management LLC (formerly known as PIMCO Advisors Fund Management LLC) (“PAFM”), PEA, PAD, Stephen J. Treadway (at the time, the chief executive officer of PAFM and PAD as well as chairman of the Board of Trustees of the MMS Funds) and Kenneth W. Corba (the former chief executive officer of PEA and former portfolio manager of the PEA Growth and PEA Growth & Income Funds) had, among other things, violated and/or aided and abetted violations of, various antifraud provisions of the federal securities laws in connection with alleged “market timing” arrangements that improperly allowed certain hedge funds to engage in “market timing” in the PEA Growth Fund, the PEA Opportunity Fund, the PEA Innovation Fund, and the PEA Target Fund. The complaint seeks injunctive relief, disgorgement plus pre-judgment interest, monetary penalties, and an order permanently enjoining the defendants from serving as investment advisers, principal underwriters, officers, directors, or members of any advisory boards to any registered investment companies.
On February 20, 2004, a putative class action lawsuit was filed in the U.S. District Court for the District of New Jersey on behalf of certain shareholders of the PIMCO Funds against ADAM, PAD, PIMCO, PEA, the PIMS Funds, the MMS Funds, the Trust, PIMCO Commercial Mortgage Securities Trust, Inc. and certain other defendants, alleging that inappropriate market timing activity by certain shareholders caused financial injury to the shareholders of those Funds.
| | | | |
| June 30, 2004 | | Semi-Annual Report | | 15 |
Notes to Financial Statements (Cont.)
June 30, 2004 (Unaudited)
The following additional putative class action lawsuits have been filed against the PIMS Funds, the MMS Funds and/or their affiliates, each related to alleged market-timing activity in funds advised by PIMCO or its affiliates: (1) a lawsuit filed in the U.S. District Court for the District of Connecticut on February 27, 2004 (naming as defendants ADAM, PAD, PEA, the PIMS Funds, the MMS Funds, the Trust, PCM and certain other parties); (2) a lawsuit filed in the U.S. District Court for the Central District of California on March 4, 2004 (naming as defendants PIMCO, ADAM, PEA and PAD); (3) a lawsuit filed in the U.S. District Court for the Southern District of New York on March 8, 2004 (naming PIMCO, PAD and certain of their affiliates as defendants); (4) a lawsuit filed in the U.S. District Court for the Southern District of New York, on March 15, 2004 (naming PIMCO as the defendant); (5) two separate lawsuits filed in the U.S. District Court for the Central District of California on March 22, 2004, brought derivatively on behalf of the PIMCO High Yield Fund and the PIMCO Money Market Fund, respectively (each naming ADAM, PAFM and certain other parties as defendants, and the PIMCO Funds as the nominal defendant); (6) a lawsuit filed in the U.S. District Court for the Central District of California, also on March 22, 2004, brought derivatively on behalf of the PIMS Funds and the MMS Funds (naming ADAM, PIMCO, PAD and certain other parties as defendants, and the PIMS Funds and the MMS Funds as nominal defendants); (7) a lawsuit filed in the U.S. District Court for the District of New Jersey on April 20, 2004 (naming ADAM, PAD, the PIMS Funds and certain other parties as defendants); and (8) a lawsuit filed in the U.S. District Court for the Northern District of California on April 28, 2004 (naming ADAM, PIMCO, PAD, PEA and certain other parties as defendants, and the “PIMCO Funds” as nominal defendants). Each complaint for the foregoing putative class actions alleges, among other things, that inappropriate trading by shareholders engaged in market timing activities took place in certain of the funds advised by PIMCO, and each complaint seeks unspecified compensatory damages.
On February 17, 2004, a putative class action lawsuit was filed in the U.S. District Court for the District of Connecticut on behalf of certain shareholders of the PIMCO Funds against ADAM, PEA, PIMCO, PIMS Funds, MMS Funds and certain other defendants, alleging excessive investment advisory fees and the use of brokerage commissions to pay for distribution of fund shares. Three similar putative class action lawsuits were subsequently filed, each in the U.S. District Court for the District of Connecticut on March 1, 2004, April 23, 2004 and May 20, 2004, respectively.
Under Section 9(a) of the 1940 Act, if any of the various lawsuits were to result in a court injunction against PAFM, PEA, PAD, PIMCO, ADAM and/or Mr. Treadway, they and their affiliates would, in the absence of exemptive relief granted by the SEC, be barred from serving as an investment adviser/sub-adviser or principal underwriter for any registered investment company, including the Trust. ADAM and certain of its subsidiaries have responded to inquiries from the SEC concerning the status of the New Jersey Settlement under Section 9(a). If any of PAFM, PEA, PAD, PIMCO or ADAM were subject to an injunction, each of these entities and their affiliates could in turn seek exemptive relief from the SEC, as contemplated by the 1940 Act. There is no assurance, however, that such exemptive relief would be granted. The SEC also has the power by order to prohibit PAFM, PEA, PAD and PIMCO from serving as investment advisers and underwriters, if the SEC finds that such entities willfully violated the federal securities laws in connection with the allegations discussed above or aided or abetted such violations.
PIMCO, PAD and the Trust believe that these developments will not have a material adverse effect on the Portfolios or on PIMCO’s, or PAD’s ability to perform their respective investment advisory or distribution services on behalf of the Portfolios.
| | | | |
| 16 | | Semi-Annual Report | | June 30, 2004 |
Trustees and Officers
Brent R. Harris, Chairman and Trustee
R. Wesley Burns, President and Trustee
E. Philip Cannon, Trustee
Vern O. Curtis, Trustee
J. Michael Hagan, Trustee
William J. Popejoy, Trustee
Garlin G. Flynn, Secretary
John P. Hardaway, Treasurer
Investment Adviser and Administrator
Pacific Investment Management Company LLC
840 Newport Center Drive
Newport Beach, California 92660
Distributor
PA Distributors LLC
2187 Atlantic Street
Stamford, Connecticut 06902
Custodian
State Street Bank & Trust Company
801 Pennsylvania
Kansas City, Missouri 64105
Transfer Agent
Boston Financial Data Services–Midwest
330 W. 9th Street
Kansas City, Missouri 64105
Legal Counsel
Dechert LLP
1775 I Street, N.W.
Washington, D.C. 20006
Independent Registered Public Accounting Firm
PricewaterhouseCoopers LLP
1055 Broadway
Kansas City, Missouri 64105
Information about how the Fund voted proxies relating to portfolio securities held during the year July 1, 2003 through June 30, 2004 will be available no later than August 31, 2004 without charge, upon request, by calling the Trust at 1-800-927-4648 and on the SEC’s website at http://www.sec.gov.
Copies of the written Proxy Policy and the factors that PIMCO may consider in determining how to vote proxies for the Funds are available by calling the Trust at 1-800-927-4648 and on the SEC’s website at http://www.sec.gov.
PIMCO VARIABLE INSURANCE TRUST
840 NEWPORT CENTER DRIVE
NEWPORT BEACH, CA 92660

PIMCO VARIABLE INSURANCE TRUST
ALL ASSET PORTFOLIO
CLASS M
SEMI-ANNUAL REPORT
June 30, 2004
|
| This material is authorized for use only when preceded or accompanied by the current PIMCO Variable Insurance Trust prospectus. Investors should consider the investment objectives, risks, charges and expenses of Portfolio carefully before investing. This and other information is contained in the Portfolio’s prospectus. Please read the prospectus carefully before you invest or send money. |
Chairman’s Letter
Dear PIMCO Variable Insurance Trust Shareholder:
Bond prices were more volatile during the six-month period ended June 30, 2004. Interest rates rose sharply during the second quarter 2004, causing bonds to give back modest gains from earlier in the year. The Lehman Brothers Aggregate Bond Index, a widely used index for the high-grade bond market, was nearly flat during the first six months of 2004, returning 0.15% after losing 2.44% during the second quarter. The yield on the benchmark ten-year Treasury closed June 30, 2004 at 4.58%, up 0.75% from April 1, 2004, but up only 0.34% from where it began the six-month period on January 1, 2004.
Continued growth in employment convinced the markets that the Federal Reserve would soon begin a long anticipated tightening cycle. On June 30, 2004, the Fed met market expectations by increasing the federal funds rate 0.25%, which was the first rate increase since June 25, 2003. The central bank had held this rate at 1% for more than a year, which generated negative real short-term rates. And on August 10, 2004, the Fed increased the federal funds rate another 0.25% to 1.50%.
Investors that had profited handsomely from borrowing at low short-term rates and investing in higher-yielding longer maturity bonds surrendered some of those profits towards the latter part of the six-month period. Concern that borrowing rates would rise led investors to liquidate long positions and unwind these trades, which caused bond prices to decrease. However, substantial leverage remained among banks, hedge funds, and other investors, making bond markets somewhat vulnerable to additional Fed rate increases. There were also signs of rising inflation, which fueled anxiety that central banks might continue to raise interest rates.
On the following pages you will find a more complete review of the Portfolio in light of financial market activities as well as specific details about the total return investment performance for the six-month period.
We appreciate the trust you have placed in us, and we will continue to focus our efforts to meet your investment needs.
Sincerely,

Brent R. Harris
Chairman
August 11, 2004
| | | | |
| June 30, 2004 | | Semi-Annual Report | | 1 |
Important Information About the Portfolio
We believe that bond funds have an important role to play in a well diversified investment portfolio. It is important to note, however, that in an environment where interest rates may trend upward, rising rates will negatively impact the performance of most bond funds, and fixed income securities held by a fund are likely to decrease in value. The price volatility of fixed income securities can also increase during periods of rising interest rates resulting in increased losses to a fund. Bond funds and individual bonds with a longer duration (a measure of the expected life of a security) tend to be more sensitive to changes in interest rates, usually making them more volatile than securities or funds with shorter durations. The longer-term performance of most bond funds has benefited from capital gains in part resulting from an extended period of declining interest rates. In the event interest rates increase, these capital gains should not be expected to recur.
The Portfolio may be subject to various risks in addition to those described above. Some of these risks may include, but are not limited to, the following: real rate risk, derivative risk, small company risk, foreign security risk, high yield security risk and specific sector investment risks. The Portfolio may use derivative instruments for hedging purposes or as part of an investment strategy. Use of these instruments may involve certain costs and risks such as liquidity risk, interest rate risk, market risk, credit risk, management risk and the risk that a fund could not close out a position when it would be most advantageous to do so. A Portfolio investing in derivatives could lose more than the principal amount invested in these instruments. Investing in non-U.S. securities may entail risk due to non-U.S. economic and political developments; this risk may be enhanced when investing in emerging markets. High-yield bonds typically have a lower credit rating than other bonds. Lower rated bonds generally involve a greater risk to principal than higher rated bonds. Smaller companies may be more volatile than larger companies and may entail more risk. Concentrating investments in individual sectors may add additional risk and volatility compared to a diversified portfolio.
The All Asset Portfolio invest in a portfolio of mutual funds. The cost of investing in the Portfolio will generally be higher than the cost of investing in a mutual fund that invests directly in individual stocks and bonds.
On the performance summary page in this semi-annual report, the Total Return Investment Performance table measures performance assuming that all dividend and capital gain distributions were reinvested. Returns do not reflect the deduction of taxes that a shareholder would pay (i) on Portfolio distributions or (ii) the redemption of Portfolio shares.
An investment in a Portfolio is not a bank deposit and is not guaranteed or insured by the Federal Deposit Insurance Corporation or any other government agency. It is possible to lose money on investments in the Funds.
The following disclosure provides important information regarding the Portfolio’s Expense Example, which appears on the Portfolio’s individual page in this semi-annual report. Please refer to this information when reviewing the Expense Example for the Portfolio.
Example
As a shareholder of the Portfolio, you incur two types of costs: (1) transaction costs, including redemption and exchange fees; and (2) ongoing costs, including advisory and administrative fees; distribution and/or service (12b-1) fees (Administrative Class only); and other Portfolio expenses. The Example is intended to help you understand your ongoing costs (in dollars) of investing in the Portfolio and to compare these costs with the ongoing costs of investing in other mutual funds.
The Example is based on an investment of $1,000 invested at the beginning of the period and held for the entire period indicated, which is from 1/1/04 to 6/30/04.
Actual Expenses
The information in the table under the heading “Actual Performance” provides information about actual account values and actual expenses. You may use the information in these columns, together with the amount you invested, to estimate the expenses that you paid over the period. Simply divide your account value by $1,000.00 (for example, an $8,600.00 account value divided by $1,000 = 8.60), then multiply the result by the number in the appropriate column for your share class, in the row entitled “Expenses Paid During Period” to estimate the expenses you paid on your account during this period.
Hypothetical Example for Comparison Purposes
The information in the table under the heading “Hypothetical Performance (5% return before expenses)” provides information about hypothetical account values and hypothetical expenses based on the Portfolio’s actual expense ratio and an assumed rate of return of 5% per year before expenses, which is not the Portfolio’s actual return. The hypothetical account values and expenses may not be used to estimate the actual ending account balance or expenses you paid for the period. You may use this information to compare the ongoing costs of investing in the Portfolio and other portfolios. To do so, compare this 5% hypothetical example with the 5% hypothetical examples that appear in the shareholder reports of the other portfolios.
Please note that the expenses shown in the table are meant to highlight your ongoing costs only and do not reflect any transactional costs. Therefore, the information under the heading “Hypothetical Performance (5% return before expenses)” is useful in comparing ongoing costs only, and will not help you determine the relative total costs of owning different portfolios. In addition, if these transactional costs were included, your costs would have been higher.
PIMCO Variable Insurance Trust is distributed by PA Distributors LLC, 2187 Atlantic Street, Stamford, CT 06902.
| | | | |
| 2 | | Semi-Annual Report | | June 30, 2004 |
All Asset Portfolio
TOTAL RETURN INVESTMENT PERFORMANCE For the period ended June 30, 2004
| | | | | |
| | | | | Since Inception* | |
| | | All Asset Portfolio Class M (Inception 04/30/04) | | 3.16 | % |
| | | * Cumulative. All Portfolio returns are net of fees and expenses. | | | |
Past performance is no guarantee of future results. The performance quoted represents past performance. Investment return and principal value will fluctuate so that Fund shares, when redeemed, may be worth more or less than their original cost. Current performance may be lower or higher than the performance data quoted. Performance data current to the most recent month-end is available by calling (800) 927-4648.
Please refer to page 2 herein for an explanation of the information presented in the following Expense Example.
| | | | | | | | | | |
| EXPENSE EXAMPLE | | | | Actual Performance | | | | Hypothetical Performance (5% return before expenses) |
Beginning Account Value (04/30/04) | | | | $ | 1,000.00 | | | | $ | 1,000.00 |
Ending Account Value (06/30/04) | | | | $ | 1,031.60 | | | | $ | 1,025.00 |
Expenses Paid During Period† | | | | $ | 1.51 | | | | $ | 1.50 |
†Expenses are equal to the Portfolio’s Class M annualized expense ratio of 0.89%, multiplied by the average account value over the period, multiplied by 61/366 (to reflect the period since the Portfolio commenced operation on 04/30/04). The expense ratio excludes the expenses of the underlying PIMCO Funds, which based upon the allocation of the Portfolio’s assets among the underlying Funds are indirectly borne by the shareholders of the Portfolio. The Underlying Fund Expenses for the Portfolio are estimated at 0.60%.
PORTFOLIO INSIGHTS
| • | The All Asset Portfolio seeks to achieve its investment objective by investing under normal circumstances substantially all of its assets in Institutional Class shares of the PIMCO Funds: Pacific Investment Management Series (“PIMS”), except the All Asset Fund and the All Asset All Authority Fund. |
| • | The Portfolio may invest in any PIMCO mutual fund except the All Asset Fund and the All Asset All Authority Fund; however, PIMCO has identified 14 core funds on which the All Asset Portfolio will focus. |
| • | For the period from its inception on April 30, 2004 through June 30, 2004, the Portfolio’s Class M shares returned 3.16%, versus the 1.16% return of the Lehman Global Real: U.S. TIPS 1-10 Year Index and the 2.09% return of the average performance of the benchmarks for the core funds for the same period. |
| • | The equally weighted average of the core funds returned 2.27% for the 6 months ended June 30, 2004. |
| • | The average performance of the core funds outperformed the average performance of the 14 benchmarks by 0.19%. This outperformance is a measure of the value added by PIMCO portfolio managers. |
| • | The PVIT All Asset Portfolio underperformed the average performance of the core funds by 0.50%. |
| • | The Portfolio’s overweight to real return strategies versus other Underlying PIMS Funds contributed to performance during the period since the Class M inception on April 30, 2004 through June 30, 2004; in addition, the Portfolio’s exposure to other strategies contributed to outperformance versus the Lehman Global Real: U.S. TIPS 1-10 Year Index during the two-month period. |
| • | The Lehman US TIPS, DJAIG Commodity, and Wilshire REIT indices outperformed the average performance of the 14 benchmarks. |
| • | An overweight to TIPS strategies in the beginning of the period while scaling down exposure throughout the period was positive as yields gradually rose. |
PIMCO FUNDS ALLOCATION‡
| | | |
CommodityRealReturn Strategy | | 14.7 | % |
RealEstateRealReturn Strategy | | 12.7 | % |
StocksPLUS | | 12.0 | % |
Real Return | | 8.1 | % |
Emerging Markets Bond | | 8.0 | % |
Real Return Asset | | 8.0 | % |
Low Duration | | 7.5 | % |
International StocksPLUS TR Strategy | | 6.7 | % |
StocksPLUS Total Return | | 6.3 | % |
GNMA | | 5.1 | % |
High Yield | | 4.4 | % |
Other | | 6.5 | % |
‡ % of Total Investments as of June 30, 2004
| | | | |
| June 30, 2004 | | Semi-Annual Report | | 3 |
Financial Highlights
All Asset Portfolio (Class M)
| | | | | | |
| Selected Per Share Data for the Period Ended: | | | | 04/30/2004-
06/30/2004+ | |
| | |
Net asset value beginning of period | | | | $ | 10.59 | |
Net investment income (a) | | | | | 0.07 | |
Net realized/unrealized gain on investments (a) | | | | | 0.26 | |
Total income from investment operations | | | | | 0.33 | |
Dividends from net investment income | | | | | (0.01 | ) |
Distributions from net realized capital gains | | | | | 0.00 | |
Total distributions | | | | | (0.01 | ) |
Net asset value end of period | | | | $ | 10.91 | |
Total return | | | | | 3.16 | % |
Net assets end of period (000s) | | | | $ | 3,474 | |
Ratio of net expenses to average net assets | | | | | 0.89 | %*(b)(c) |
Ratio of net investment income to average net assets | | | | | 4.38 | %* |
Portfolio turnover rate | | | | | 54 | % |
| (a) | Per share amounts based on average number of shares outstanding during the period. |
| (b) | Ratio of expenses to average net assets excluding Underlying PIMS Funds’ expenses in which the Portfolio invests. |
| (c) | If the investment manager had not reimbursed expenses, the ratio of expenses to average net assets would have been 0.90%. |
| | | | | | |
| 4 | | Semi-Annual Report | | June 30, 2004 | | See accompanying notes |
Statement of Assets and Liabilities
All Asset Portfolio
June 30, 2004 (Unaudited)
| | | | | | |
| Amounts in thousands, except per share amounts | | | | | |
| | |
Assets: | | | | | | |
| | |
Investments in Affiliates, at value | | | | $ | 21,932 | |
Cash | | | | | 545 | |
Receivable for Portfolio shares sold | | | | | 353 | |
Dividends receivable from Affiliates | | | | | 20 | |
Manager reimbursement receivable | | | | | 53 | |
| | | | | | 22,903 | |
| | |
Liabilities: | | | | | | |
| | |
Payable for investments in Affiliates purchased | | | | $ | 565 | |
Accrued investment advisory fee | | | | | 3 | |
Accrued administration fee | | | | | 3 | |
Accrued servicing fee | | | | | 3 | |
| | | | | | 574 | |
| | |
Net Assets | | | | $ | 22,329 | |
| | |
Net Assets Consist of: | | | | | | |
| | |
Paid in capital | | | | $ | 21,983 | |
Undistributed net investment income | | | | | 87 | |
Accumulated undistributed net realized (loss) | | | | | (6 | ) |
Net unrealized appreciation | | | | | 265 | |
| | | | | $ | 22,329 | |
| | |
Net Assets: | | | | | | |
| | |
Administrative Class | | | | $ | 18,845 | |
Advisor Class | | | | | 10 | |
Class M | | | | | 3,474 | |
| | |
Shares Issued and Outstanding: | | | | | | |
| | |
Administrative Class | | | | | 1,724 | |
Advisor Class | | | | | 1 | |
Class M | | | | | 318 | |
| | |
Net Asset Value and Redemption Price Per Share
(Net Assets Per Share Outstanding) | | | | | | |
| | |
Administrative Class | | | | $ | 10.93 | |
Advisor Class | | | | | 10.93 | |
Class M | | | | | 10.91 | |
| | |
Cost of Investments in Affiliates Owned | | | | $ | 21,667 | |
| | | | | | |
| See accompanying notes | | June 30, 2004 | | Semi-Annual Report | | 5 |
Statement of Operations
All Asset Portfolio
| | | | | | |
| Amounts in thousands | | | | | |
| | | | | Six Months Ended June 30, 2004 (Unaudited) | |
Investment Income: | | | | | | |
| | |
Dividends from Affiliates | | | | $ | 105 | |
Total Income | | | | | 105 | |
| | |
Expenses: | | | | | | |
| | |
Investment advisory fees | | | | | 4 | |
Administration fees | | | | | 6 | |
Distribution and/or servicing fees - Administrative Class | | | | | 3 | |
Distribution and/or servicing fees - Advisor Class | | | | | 0 | |
Distribution fees - Class M | | | | | 1 | |
Total Expenses | | | | | 14 | |
| | |
Net Investment Income | | | | | 91 | |
| | |
Net Realized and Unrealized Gain (Loss): | | | | | | |
| | |
Net realized (loss) on investments in Affiliates | | | | | (17 | ) |
Net change in unrealized appreciation on investments in Affiliates | | | | | 238 | |
Net Gain | | | | | 221 | |
| | |
Net Increase in Assets Resulting from Operations | | | | $ | 312 | |
| | | | | | |
| 6 | | Semi-Annual Report | | June 30, 2004 | | See accompanying notes |
Statements of Changes in Net Assets
All Asset Portfolio
| | | | | | | | | | | | |
| Amounts in thousands | | | | | | | | | | |
| | | | | Six Months Ended June 30, 2004
(Unaudited) | | | | | Period from
April 30, 2003 to December 31, 2003 | |
Increase (Decrease) in Net Assets from: | | | | | | | | | | | | |
| | | | |
Operations: | | | | | | | | | | | | |
| | | | |
Net investment income | | | | $ | 91 | | | | | $ | 39 | |
Net realized gain (loss) on investments in Affiliates | | | | | (17 | ) | | | | | 6 | |
Net capital gain distributions received from underlying Funds | | | | | 0 | | | | | | 15 | |
Net change in unrealized appreciation on investments in Affiliates | | | | | 238 | | | | | | 27 | |
Net increase resulting from operations | | | | | 312 | | | | | | 87 | |
| | | | |
Distributions to Shareholders: | | | | | | | | | | | | |
| | | | |
From net investment income | | | | | | | | | | | | |
Administrative Class | | | | | (24 | ) | | | | | (25 | ) |
Advisor Class | | | | | 0 | | | | | | 0 | |
Class M | | | | | (4 | ) | | | | | 0 | |
Total Distributions | | | | | (28 | ) | | | | | (25 | ) |
| | | | |
Portfolio Share Transactions: | | | | | | | | | | | | |
| | | | |
Receipts for shares sold | | | | | | | | | | | | |
Administrative Class | | | | | 17,926 | | | | | | 1,543 | |
Advisor Class | | | | | 10 | | | | | | 0 | |
Class M | | | | | 3,658 | | | | | | 0 | |
| | | | |
Issued as reinvestment of distributions | | | | | | | | | | | | |
Administrative Class | | | | | 24 | | | | | | 25 | |
Advisory Class | | | | | 0 | | | | | | 0 | |
Class M | | | | | 4 | | | | | | 0 | |
| | | | |
Cost of shares redeemed | | | | | | | | | | | | |
Administrative Class | | | | | (367 | ) | | | | | (613 | ) |
Advisor Class | | | | | 0 | | | | | | 0 | |
Class M | | | | | (227 | ) | | | | | 0 | |
Net increase resulting from Portfolio share transactions | | | | | 21,028 | | | | | | 955 | |
| | | | |
Total Increase in Net Assets | | | | | 21,312 | | | | | | 1,017 | |
| | | | |
Net Assets: | | | | | | | | | | | | |
| | | | |
Beginning of period | | | | | 1,017 | | | | | | 0 | |
End of period* | | | | $ | 22,329 | | | | | $ | 1,017 | |
| | | | |
*Including undistributed net investment income of: | | | | $ | 87 | | | | | $ | 24 | |
| | | | | | |
| See accompanying notes | | June 30, 2004 | | Semi-Annual Report | | 7 |
Schedule of Investments
All Asset Portfolio
June 30, 2004 (Unaudited)
| | | | | |
PIMCO FUNDS (a) 98.2% | | | |
CommodityRealReturn Strategy | | 222,894 | | $ | 3,223 |
Convertible | | 810 | | | 10 |
Emerging Markets Bond | | 177,261 | | | 1,762 |
European Convertible Bond | | 51,283 | | | 626 |
Foreign Bond (Unhedged) | | 959 | | | 10 |
GNMA | | 102,930 | | | 1,129 |
High Yield | | 101,468 | | | 955 |
International StocksPLUS TR Strategy | | 135,120 | | | 1,462 |
Low Duration | | 161,272 | | | 1,643 |
Real Return | | 157,642 | | | 1,776 |
Real Return Asset | | 150,982 | | | 1,748 |
RealEstateRealReturn Strategy | | 259,588 | | | 2,793 |
Short-Term | | 77,249 | | | 775 |
StocksPLUS | | 272,154 | | | 2,632 |
StocksPLUS Total Return | | 114,209 | | | 1,388 |
| | | | |
|
|
| |
Total Investments 98.2% | | $ | 21,932 |
(Cost $21,667) | | | | | |
| |
Other Assets and Liabilities (Net) 1.8% | | | 397 |
| | | | |
|
|
| |
Net Assets 100.0% | | $ | 22,329 |
| | | | |
|
|
Notes to Schedule of Investments:
(a) Institutional Class of each PIMCO Fund.
| | | | | | |
| 8 | | Semi-Annual Report | | June 30, 2004 | | See accompanying notes |
Notes to Financial Statements
June 30, 2004 (Unaudited)
1. Organization
The All Asset Portfolio (the “Portfolio”) is a series of the PIMCO Variable Insurance Trust (the “Trust”). The Trust is registered under the Investment Company Act of 1940 (the “Act”), as amended, as an open-end investment company organized as a Delaware business trust on October 3, 1997. The Portfolio offers three classes of shares: Administrative, Advisor and Class M. Each share class has identical voting rights (except that shareholders of a class have exclusive voting rights regarding any matter relating solely to that class of shares). Information presented in these financial statements pertains to the Class M of the Trust. The Trust is designed to be used as an investment vehicle by Separate Accounts of insurance companies that fund variable annuity contracts and variable life insurance policies and by qualified pension and retirement plans. The Portfolio commenced operations on April 30, 2003.
2. Significant Accounting Policies
The following is a summary of significant accounting policies consistently followed by the Trust in the preparation of its financial statements in conformity with accounting principles generally accepted in the United States of America. The preparation of financial statements in accordance with accounting principles generally accepted in the United States of America requires management to make estimates and assumptions that affect the reported amounts and disclosures in the financial statements. Actual results could differ from those estimates.
Security Valuation. Investments in Funds within the PIMS Funds are valued at their net asset value as reported by the underlying PIMS Funds.
Securities Transactions and Investment Income. Securities transactions are recorded as of the trade date. Securities purchased or sold on a when-issued or delayed delivery basis may be settled a month or more after the trade date. Realized gains and losses from securities sold are recorded on the identified cost basis. Dividend income is recorded on the ex-dividend date, except certain dividends from foreign securities where the ex-dividend date may have passed, are recorded as soon as the Portfolio is informed of the ex-dividend date. Interest income, adjusted for the accretion of discounts and amortization of premiums, is recorded on the accrual basis. Paydowns gains and losses on mortgage- and asset-backed securities are recorded as adjustments to interest income in the Statement of Operations.
Dividends and Distributions to Shareholders. Dividends from net investment income, if any, are declared and distributed to shareholders quarterly. All dividends are reinvested in additional shares of the Portfolio. Net realized capital gains earned by the Portfolio, if any, will be distributed no less frequently than once each year.
Income dividends and capital gain distributions are determined in accordance with income tax regulations which may differ from accounting principles generally accepted in the United States of America. These differences are primarily due to differing treatments for such items as wash sales, foreign currency transactions, net operating losses, notional principal contracts, certain asset-backed securities, certain futures and forward contracts, tax straddles, and capital loss carryforwards.
Distributions classified as a tax basis return of capital, if any, are reflected in the accompanying Statements of Changes in Net Assets and have been reclassified to paid in capital. In addition, other amounts have been reclassified between undistributed net investment income, accumulated undistributed net realized gains or losses and/or paid in capital to more appropriately conform financial accounting to tax characterizations of dividend distributions.
Federal Income Taxes. The Portfolio intends to qualify as a regulated investment company and distribute all of its taxable income and net realized gains, if applicable, to shareholders. Accordingly, no provision for Federal income taxes has been made.
Underlying PIMS Funds. The Underlying PIMS Funds are the Institutional Class shares of the PIMCO Funds: Pacific Investment Management Series, an affiliated open-end investment company, except All Asset and All Asset All Authority Funds. Though it is anticipated that the All Asset Portfolio will not currently invest in the European StocksPLUS Total Return Strategy, Far East (ex-Japan) StocksPLUS Total Return Strategy, Japanese StocksPLUS TR Strategy, StocksPLUS Municipal-Backed and StocksPLUS TR Short Strategy Funds, the Portfolio may invest in these Funds in the future, without shareholder approval, at the discretion of the Portfolio’s asset allocation sub-adviser.
3. Fees, Expenses, and Related Party Transactions
Investment Advisory Fee. Pacific Investment Management Company LLC (“PIMCO”) is a majority owned subsidiary partnership of Allianz Dresdner Asset Management of America L.P. and serves as investment adviser (the “Adviser”) to the Trust, pursuant to an investment advisory contract. The Adviser receives a monthly fee at an annual rate based on average daily net assets of the Portfolio. The Advisory Fee is charged at an annual rate of 0.20%.
PIMCO has contractually agreed, for the All Asset Portfolio’s current fiscal year, to reduce its Advisory Fee to the extent that the Underlying Fund Expenses attributable to Advisory and Administrative Fees exceed 0.60%. PIMCO may recoup these waivers in future period, not to exceed three years, provided total expenses, including such Recoupment, do not exceed the annual expense limit.
Administration Fee. PIMCO serves as administrator (the “Administrator”), and provides administrative services to the Trust for which it receives a monthly administrative fee based on average daily net assets of the Portfolio. The Administration Fee is charged at the annual rate of 0.25%.
Servicing Fee. PA Distributors LLC (“PAD”), formerly known as PIMCO Advisors Distributors LLC, is an indirect wholly-owned
| | | | |
| June 30, 2004 | | Semi-Annual Report | | 9 |
Notes to Financial Statements (Cont.)
June 30, 2004 (Unaudited)
subsidiary of Allianz Dresdner Asset Management of America L.P. and serves as the distributor of the Trust’s shares. The Trust is permitted to reimburse PAD on a quarterly basis, out of the Administrative Class assets of the Portfolio in the amount of 0.15% on an annual basis of the average daily net assets of that class, for payments made to financial intermediaries that provide services in connection with the distribution of shares or administration of plans or programs that use Portfolio shares as their funding medium. The effective rate paid to PAD was 0.15% during current fiscal year.
Expenses. The Trust is responsible for the following expenses: (i) salaries and other compensation of any of the Trust’s executive officers and employees who are not officers, directors, stockholders or employees of PIMCO or its subsidiaries or affiliates; (ii) taxes and governmental fees; (iii) brokerage fees and commissions and other portfolio transaction expenses; (iv) the cost of borrowing money, including interest expense and bank overdraft charges; (v) fees and expenses of the Trustees who are not “interested persons” of PIMCO or the Trust, and any counsel retained exclusively for their benefit; (vi) extraordinary expenses, including costs of litigation and indemnification expenses; (vii) organization expenses and (viii) any expenses allocated or allocable to a specific class of shares, which include service fees payable with respect to the Administrative Class shares and may include certain other expenses as permitted by the Trust’s Multiple Class Plan adopted pursuant to Rule 18f-3 under the Act and subject to review and approval by the Trustees. The ratio of expenses to average net assets per share class, as disclosed in Financial Highlights, may differ from the annual portfolio operating expenses per share class as disclosed in the Prospectus for the reasons set forth above.
PIMCO has agreed to waive a portion of its administrative fees to the extent that the payment of the Portfolio’s pro rata share of organization expenses and Trustee fees cause the actual expense ratio to rise above the rates disclosed in the then-current prospectus plus 0.49 basis points as set forth below (calculated as a percentage of the Portfolio’s average daily net assets attributable to each class):
| | | |
Administrative Class | | 0.60 | % |
Advisor Class | | 0.70 | % |
Class M | | 0.90 | % |
PIMCO may be reimbursed for these waived amounts in future periods, not to exceed thirty-six months. Expenses that have been waived and may still be reimbursed by the Administrator, to the extent the Portfolio’s annualized total portfolio operating expenses plus the amount so reimbursed does not exceed the operating expense limitation, are as follows (amounts in thousands):
| | | | | |
| | | | 12/31/2003 | | 06/30/2004 |
Amount Available for Reimbursement | | $ | 53 | | 0 |
Each unaffiliated Trustee receives an annual retainer of $4,000, plus $1,500 for each Board of Trustees meeting attended in person and $250 for each meeting attended telephonically, plus reimbursement of related expenses. In addition, each committee chair receives an additional annual retainer of $500. These expenses are allocated on a pro-rata basis to each Portfolio of the Trust according to its respective net assets.
4. Risk Factors of the Portfolio
Investing in the Underlying PIMS Funds through the All Asset Portfolio involves certain additional expenses and tax results that would not be present in a direct investment in the Underlying PIMS Funds. Under certain circumstances, an Underlying PIMS Funds may pay a redemption request by the All Asset Portfolio wholly or partly by a distribution in kind of securities from its portfolio, instead of cash, in accordance with the rules of the Securities and Exchange Commission. In such cases, the Portfolio may hold securities distributed by an Underlying PIMS Funds until the Adviser determines that it is appropriate to dispose of such securities.
Each of the Underlying PIMS Funds may invest in certain specified derivative securities, including: interest rate swaps; commodity swaps; credit default swaps; currency swaps; total return swaps; Forward Foreign Currency Contracts; caps and floors for hedging purposes; exchange-traded options; over-the-counter options executed with primary dealers, including long calls and puts and covered calls and financial futures and options. Certain of the Underlying PIMS Funds may invest in restricted securities, instruments issued by trusts, partnerships or other issuers, including pass-through certificated representing participation in, or debt instruments backed by, the securities owned by such issuers. There Underlying PIMS Funds also may engage in securities lending, reverse repurchase agreements and dollar roll transactions. In addition, certain of the Underlying PIMS Funds may invest in below-investment grade debt, debt obligations of foreign issuers and stocks of foreign corporations, securities in foreign investment funds or trusts, foreign derivatives securities including future contracts, options, interest rate and currency swap transactions, and various other investment vehicles, each with inherent risks.
The officers and trustees of the Trust also serve as officers and trustees of the Underlying PIMS Funds. Conflicts may arise as these companies seek to fulfill their fiduciary responsibilities to both the Portfolio and the Underlying PIMS Funds.
5. Federal Income Tax Matters
At June 30, 2004, the aggregate cost of investments was the same for federal income tax and financial statement purposes. The net unrealized appreciation (depreciation) of investment securities for federal income tax purposes is as follows (amounts in thousands):
| | | | | | |
Aggregate Gross Unrealized Appreciation | | Aggregate Gross
Unrealized
(Depreciation) | | Net Unrealized
Appreciation |
| $ 341 | | $ | (76) | | $ | 265 |
| | | | |
| 10 | | Semi-Annual Report | | June 30, 2004 |
6. Purchases and Sales of Securities
The length of time a Portfolio has held a particular security is not generally a consideration in investment decisions. A change in the securities held by a Portfolio is known as “portfolio turnover.” The Portfolio may engage in frequent and active trading of portfolio securities to achieve its investment objective, particularly during periods of volatile market movements. High portfolio turnover (e.g., over 100%) involves correspondingly greater expenses to the Portfolio, including brokerage commissions or dealer mark-ups and other transaction costs on the sale of securities and reinvestments in other securities. Such sales may also result in realization of taxable capital gains, including short-term capital gains (which are generally taxed at ordinary income tax rates). The trading costs and tax effects associated with portfolio turnover may adversely affect the Portfolio’s performance.
Purchases and sales of securities (excluding short-term investments) for the period ended June 30, 2004 were as follows (amounts in thousands):
| | | | | | |
| U.S Government/Agency | | All Other |
| Purchases | | Sales | | Purchases | | Sales |
| $ 0 | | $ 0 | | $ 22,400 | | $ 1,626 |
7. Shares of Beneficial Interest
The Trust may issue an unlimited number of shares of beneficial interest with a $.001 par value. Changes in shares of beneficial interest were as follows (shares and amounts in thousands):
| | | | | | | | | | | | | | |
| | | Six Months Ended 06/30/2004 | | | Period From
04/30/2003 to
12/31/2003 | |
| | | Shares | | | Amount | | | Shares | | | Amount | |
Receipts for shares sold | | | | | | | | | | | | | | |
| | | | |
Administrative Class | | 1,662 | | | | 17,926 | | | 149 | | | | 1,543 | |
Advisor Class | | 1 | | | | 10 | | | 0 | | | | 0 | |
Class M | | 339 | | | | 3,658 | | | 0 | | | | 0 | |
| | | | |
Issued as reinvestment of distributions | | | | | | | | | | | | | | |
| | | | |
Administrative Class | | 2 | | | | 24 | | | 2 | | | | 25 | |
Advisor Class | | 0 | | | | 0 | | | 0 | | | | 0 | |
Class M | | 0 | | | | 4 | | | 0 | | | | 0 | |
| | | | |
Cost of shares redeemed | | | | | | | | | | | | | | |
| | | | |
Administrative Class | | (34 | ) | | | (367 | ) | | (57 | ) | | | (613 | ) |
Advisor Class | | 0 | | | | 0 | | | 0 | | | | 0 | |
Class M | | (21 | ) | | | (227 | ) | | 0 | | | | 0 | |
| | | | |
Net increase resulting from Portfolio share transactions | | 1,949 | | | $ | 21,028 | | | 94 | | | $ | 955 | |
The following schedule shows the number of shareholders each owning 5% or more of the Portfolio and the total percentage of the Portfolio held by such shareholders:
| | | | |
| | | Number | | % of Portfolio Held |
Administrative Class | | 2 | | 96 |
| | | | |
| June 30, 2004 | | Semi-Annual Report | | 11 |
Notes to Financial Statements (Cont.)
June 30, 2004 (Unaudited)
8. Regulatory and Litigation Matters
On February 17, 2004, the Attorney General of the State of New Jersey (“New Jersey AG”) filed a complaint against Allianz Dresdner Asset Management of America L.P. (“ADAM”), PA Distributors LLC (formerly known as PIMCO Advisors Distributors LLC) (“PAD”), PEA Capital LLC (formerly known as PIMCO Equity Advisors LLC) (“PEA”), and Pacific Investment Management Company LLC (“PIMCO”) in connection with its investigation into market timing and late trading. The complaint contends that inappropriate trading by shareholders engaged in market timing activity took place in funds in the PIMCO Funds: Multi-Manager Series (“MMS Funds”) and the PIMCO Funds: Pacific Investment Management Series (“PIMS Funds”). On June 1, 2004, the New Jersey AG dismissed PIMCO from the lawsuit.
On the same day as the dismissal of PIMCO from the lawsuit, the New Jersey AG announced that it had reached a settlement agreement with the remaining defendants (“New Jersey Settlement”). In the New Jersey Settlement, ADAM, PAD and PEA agreed, while neither admitting nor denying the allegations or conclusions of law, to: (i) pay New Jersey a civil fine of $15 million and $3 million for investigative costs and further enforcement initiatives; and (ii) implement certain changes in corporate governance.
On May 6, 2004, the Securities and Exchange Commission filed a complaint in the U.S. District Court in the Southern District of New York alleging that PA Fund Management LLC (formerly known as PIMCO Advisors Fund Management LLC) (“PAFM”), PEA, PAD, Stephen J. Treadway (at the time, the chief executive officer of PAFM and PAD as well as chairman of the Board of Trustees of the MMS Funds) and Kenneth W. Corba (the former chief executive officer of PEA and former portfolio manager of the PEA Growth and PEA Growth & Income Funds) had, among other things, violated and/or aided and abetted violations of, various antifraud provisions of the federal securities laws in connection with alleged “market timing” arrangements that improperly allowed certain hedge funds to engage in “market timing” in the PEA Growth Fund, the PEA Opportunity Fund, the PEA Innovation Fund, and the PEA Target Fund. The complaint seeks injunctive relief, disgorgement plus pre-judgment interest, monetary penalties, and an order permanently enjoining the defendants from serving as investment advisers, principal underwriters, officers, directors, or members of any advisory boards to any registered investment companies.
On February 20, 2004, a putative class action lawsuit was filed in the U.S. District Court for the District of New Jersey on behalf of certain shareholders of the PIMCO Funds against ADAM, PAD, PIMCO, PEA, the PIMS Funds, the MMS Funds, the Trust, PIMCO Commercial Mortgage Securities Trust, Inc. and certain other defendants, alleging that inappropriate market timing activity by certain shareholders caused financial injury to the shareholders of those Funds.
The following additional putative class action lawsuits have been filed against the PIMS Funds, the MMS Funds and/or their affiliates, each related to alleged market-timing activity in funds advised by PIMCO or its affiliates: (1) a lawsuit filed in the U.S. District Court for the District of Connecticut on February 27, 2004 (naming as defendants ADAM, PAD, PEA, the PIMS Funds, the MMS Funds, the Trust, PCM and certain other parties); (2) a lawsuit filed in the U.S. District Court for the Central District of California on March 4, 2004 (naming as defendants PIMCO, ADAM, PEA and PAD); (3) a lawsuit filed in the U.S. District Court for the Southern District of New York on March 8, 2004 (naming PIMCO, PAD and certain of their affiliates as defendants); (4) a lawsuit filed in the U.S. District Court for the Southern District of New York, on March 15, 2004 (naming PIMCO as the defendant); (5) two separate lawsuits filed in the U.S. District Court for the Central District of California on March 22, 2004, brought derivatively on behalf of the PIMCO High Yield Fund and the PIMCO Money Market Fund, respectively (each naming ADAM, PAFM and certain other parties as defendants, and the PIMCO Funds as the nominal defendant); (6) a lawsuit filed in the U.S. District Court for the Central District of California, also on March 22, 2004, brought derivatively on behalf of the PIMS Funds and the MMS Funds (naming ADAM, PIMCO, PAD and certain other parties as defendants, and the PIMS Funds and the MMS Funds as nominal defendants); (7) a lawsuit filed in the U.S. District Court for the District of New Jersey on April 20, 2004 (naming ADAM, PAD, the PIMS Funds and certain other parties as defendants); and (8) a lawsuit filed in the U.S. District Court for the Northern District of California on April 28, 2004 (naming ADAM, PIMCO, PAD, PEA and certain other parties as defendants, and the “PIMCO Funds” as nominal defendants). Each complaint for the foregoing putative class actions alleges, among other things, that inappropriate trading by shareholders engaged in market timing activities took place in certain of the funds advised by PIMCO, and each complaint seeks unspecified compensatory damages.
On February 17, 2004, a putative class action lawsuit was filed in the U.S. District Court for the District of Connecticut on behalf of certain shareholders of the PIMCO Funds against ADAM, PEA, PIMCO, PIMS Funds, MMS Funds and certain other defendants, alleging excessive investment advisory fees and the use of brokerage commissions to pay for distribution of fund shares. Three similar putative class action lawsuits were subsequently filed, each in the U.S. District Court for the District of Connecticut on March 1, 2004, April 23, 2004 and May 20, 2004, respectively.
Under Section 9(a) of the 1940 Act, if any of the various lawsuits were to result in a court injunction against PAFM, PEA, PAD, PIMCO, ADAM and/or Mr. Treadway, they and their affiliates would, in the absence of exemptive relief granted by the SEC, be barred from serving as an investment adviser/sub-adviser or principal underwriter for any registered investment company, including the Trust. ADAM and certain of its subsidiaries have
| | | | |
| 12 | | Semi-Annual Report | | June 30, 2004 |
responded to inquiries from the SEC concerning the status of the New Jersey Settlement under Section 9(a). If any of PAFM, PEA, PAD, PIMCO or ADAM were subject to an injunction, each of these entities and their affiliates could in turn seek exemptive relief from the SEC, as contemplated by the 1940 Act. There is no assurance, however, that such exemptive relief would be granted. The SEC also has the power by order to prohibit PAFM, PEA, PAD and PIMCO from serving as investment advisers and underwriters, if the SEC finds that such entities willfully violated the federal securities laws in connection with the allegations discussed above or aided or abetted such violations.
PIMCO, PAD and the Trust believe that these developments will not have a material adverse effect on the Portfolios or on PIMCO’s, or PAD’s ability to perform their respective investment advisory or distribution services on behalf of the Portfolios.
| | | | |
| June 30, 2004 | | Semi-Annual Report | | 13 |
Trustees and Officers
Brent R. Harris, Chairman and Trustee
R. Wesley Burns, President and Trustee
E. Philip Cannon, Trustee
Vern O. Curtis, Trustee
J. Michael Hagan, Trustee
William J. Popejoy, Trustee
Garlin G. Flynn, Secretary
John P. Hardaway, Treasurer
Investment Sub-Adviser
Research Affiliates, LLC
800 E. Colorado Boulevard
Pasadena, California 91101
Investment Adviser and Administrator
Pacific Investment Management Company LLC
840 Newport Center Drive
Newport Beach, California 92660
Distributor
PA Distributors LLC
2187 Atlantic Street
Stamford, Connecticut 06902
Custodian
State Street Bank & Trust Company
801 Pennsylvania
Kansas City, Missouri 64105
Transfer Agent
Boston Financial Data Services–Midwest
330 W. 9th Street
Kansas City, Missouri 64105
Legal Counsel
Dechert LLP
1775 I Street, N.W.
Washington, D.C. 20006
Independent Registered Public Accounting Firm
PricewaterhouseCoopers LLP
1055 Broadway
Kansas City, Missouri 64105
Information about how the Fund voted proxies relating to portfolio securities held during the year July 1, 2003 through June 30, 2004 will be available no later than August 31, 2004 without charge, upon request, by calling the Trust at 1-800-927-4648 and on the SEC’s website at http://www.sec.gov.
Copies of the written Proxy Policy and the factors that PIMCO may consider in determining how to vote proxies for the Funds are available by calling the Trust at 1-800-927-4648 and on the SEC’s website at http://www.sec.gov.
PIMCO VARIABLE INSURANCE TRUST
840 NEWPORT CENTER DRIVE
NEWPORT BEACH, CA 92660

PIMCO VARIABLE INSURANCE TRUST
ALL ASSET PORTFOLIO
ADVISOR CLASS
SEMI-ANNUAL REPORT
June 30, 2004
|
| This material is authorized for use only when preceded or accompanied by the current PIMCO Variable Insurance Trust prospectus. Investors should consider the investment objectives, risks, charges and expenses of Portfolio carefully before investing. This and other information is contained in the Portfolio’s prospectus. Please read the prospectus carefully before you invest or send money. |
Chairman’s Letter
Dear PIMCO Variable Insurance Trust Shareholder:
Bond prices were more volatile during the six-month period ended June 30, 2004. Interest rates rose sharply during the second quarter 2004, causing bonds to give back modest gains from earlier in the year. The Lehman Brothers Aggregate Bond Index, a widely used index for the high-grade bond market, was nearly flat during the first six months of 2004, returning 0.15% after losing 2.44% during the second quarter. The yield on the benchmark ten-year Treasury closed June 30, 2004 at 4.58%, up 0.75% from April 1, 2004, but up only 0.34% from where it began the six-month period on January 1, 2004.
Continued growth in employment convinced the markets that the Federal Reserve would soon begin a long anticipated tightening cycle. On June 30, 2004, the Fed met market expectations by increasing the federal funds rate 0.25%, which was the first rate increase since June 25, 2003. The central bank had held this rate at 1% for more than a year, which generated negative real short-term rates. And on August 10, 2004, the Fed increased the federal funds rate another 0.25% to 1.50%.
Investors that had profited handsomely from borrowing at low short-term rates and investing in higher-yielding longer maturity bonds surrendered some of those profits towards the latter part of the six-month period. Concern that borrowing rates would rise led investors to liquidate long positions and unwind these trades, which caused bond prices to decrease. However, substantial leverage remained among banks, hedge funds, and other investors, making bond markets somewhat vulnerable to additional Fed rate increases. There were also signs of rising inflation, which fueled anxiety that central banks might continue to raise interest rates.
On the following pages you will find a more complete review of the Portfolio in light of financial market activities as well as specific details about the total return investment performance for the six-month period.
We appreciate the trust you have placed in us, and we will continue to focus our efforts to meet your investment needs.
Sincerely,

Brent R. Harris
Chairman
August 11, 2004
| | | | |
| June 30, 2004 | | Semi-Annual Report | | 1 |
Important Information About the Portfolio
We believe that bond funds have an important role to play in a well diversified investment portfolio. It is important to note, however, that in an environment where interest rates may trend upward, rising rates will negatively impact the performance of most bond funds, and fixed income securities held by a fund are likely to decrease in value. The price volatility of fixed income securities can also increase during periods of rising interest rates resulting in increased losses to a fund. Bond funds and individual bonds with a longer duration (a measure of the expected life of a security) tend to be more sensitive to changes in interest rates, usually making them more volatile than securities or funds with shorter durations. The longer-term performance of most bond funds has benefited from capital gains in part resulting from an extended period of declining interest rates. In the event interest rates increase, these capital gains should not be expected to recur.
The Portfolio may be subject to various risks in addition to those described above. Some of these risks may include, but are not limited to, the following: real rate risk, derivative risk, small company risk, foreign security risk, high yield security risk and specific sector investment risks. The Portfolio may use derivative instruments for hedging purposes or as part of an investment strategy. Use of these instruments may involve certain costs and risks such as liquidity risk, interest rate risk, market risk, credit risk, management risk and the risk that a fund could not close out a position when it would be most advantageous to do so. A Portfolio investing in derivatives could lose more than the principal amount invested in these instruments. Investing in non-U.S. securities may entail risk due to non-U.S. economic and political developments; this risk may be enhanced when investing in emerging markets. High-yield bonds typically have a lower credit rating than other bonds. Lower rated bonds generally involve a greater risk to principal than higher rated bonds. Smaller companies may be more volatile than larger companies and may entail more risk. Concentrating investments in individual sectors may add additional risk and volatility compared to a diversified portfolio.
The All Asset Portfolio invest in a portfolio of mutual funds. The cost of investing in the Portfolio will generally be higher than the cost of investing in a mutual fund that invests directly in individual stocks and bonds.
On the performance summary page in this semi-annual report, the Total Return Investment Performance table measures performance assuming that all dividend and capital gain distributions were reinvested. Returns do not reflect the deduction of taxes that a shareholder would pay (i) on Portfolio distributions or (ii) the redemption of Portfolio shares.
An investment in a Portfolio is not a bank deposit and is not guaranteed or insured by the Federal Deposit Insurance Corporation or any other government agency. It is possible to lose money on investments in the Funds.
The following disclosure provides important information regarding the Portfolio’s Expense Example, which appears on the Portfolio’s individual page in this semi-annual report. Please refer to this information when reviewing the Expense Example for the Portfolio.
Example
As a shareholder of the Portfolio, you incur two types of costs: (1) transaction costs, including redemption and exchange fees; and (2) ongoing costs, including advisory and administrative fees; distribution and/or service (12b-1) fees (Administrative Class only); and other Portfolio expenses. The Example is intended to help you understand your ongoing costs (in dollars) of investing in the Portfolio and to compare these costs with the ongoing costs of investing in other mutual funds.
The Example is based on an investment of $1,000 invested at the beginning of the period and held for the entire period indicated, which is from 1/1/04 to 6/30/04.
Actual Expenses
The information in the table under the heading “Actual Performance” provides information about actual account values and actual expenses. You may use the information in these columns, together with the amount you invested, to estimate the expenses that you paid over the period. Simply divide your account value by $1,000.00 (for example, an $8,600.00 account value divided by $1,000 = 8.60), then multiply the result by the number in the appropriate column for your share class, in the row entitled “Expenses Paid During Period” to estimate the expenses you paid on your account during this period.
Hypothetical Example for Comparison Purposes
The information in the table under the heading “Hypothetical Performance (5% return before expenses)” provides information about hypothetical account values and hypothetical expenses based on the Portfolio’s actual expense ratio and an assumed rate of return of 5% per year before expenses, which is not the Portfolio’s actual return. The hypothetical account values and expenses may not be used to estimate the actual ending account balance or expenses you paid for the period. You may use this information to compare the ongoing costs of investing in the Portfolio and other portfolios. To do so, compare this 5% hypothetical example with the 5% hypothetical examples that appear in the shareholder reports of the other portfolios.
Please note that the expenses shown in the table are meant to highlight your ongoing costs only and do not reflect any transactional costs. Therefore, the information under the heading “Hypothetical Performance (5% return before expenses)” is useful in comparing ongoing costs only, and will not help you determine the relative total costs of owning different portfolios. In addition, if these transactional costs were included, your costs would have been higher.
PIMCO Variable Insurance Trust is distributed by PA Distributors LLC, 2187 Atlantic Street, Stamford, CT 06902.
| | | | |
| 2 | | Semi-Annual Report | | June 30, 2004 |
All Asset Portfolio
TOTAL RETURN INVESTMENT PERFORMANCE For the period ended June 30, 2004
| | | | | | | |
| | | | | | | Since Inception* | |
| | | All Asset Portfolio Advisor Class (Inception 04/30/04) | | | | 3.32 | % |
| | | * Cumulative. All Portfolio returns are net of fees and expenses. | | | | | |
Past performance is no guarantee of future results. The performance quoted represents past performance. Investment return and principal value will fluctuate so that Fund shares, when redeemed, may be worth more or less than their original cost. Current performance may be lower or higher than the performance data quoted. Performance data current to the most recent month-end is available by calling (800) 927-4648.
Please refer to page 2 herein for an explanation of the information presented in the following Expense Example.
| | | | | | | | | | |
| EXPENSE EXAMPLE | | | | Actual Performance | | | | Hypothetical Performance
(5% return before expenses) |
Beginning Account Value (04/30/04) | | | | $ | 1,000.00 | | | | $ | 1,000.00 |
Ending Account Value (06/30/04) | | | | $ | 1,033.20 | | | | $ | 1,025.00 |
Expenses Paid During Period† | | | | $ | 1.15 | | | | $ | 1.15 |
†Expenses are equal to the Portfolio’s Advisor Class annualized expense ratio of 0.68%, multiplied by the average account value over the period, multiplied by 61/366 (to reflect the period since the Portfolio commenced operation on 04/30/04). The expense ratio excludes the expenses of the underlying PIMCO Funds, which based upon the allocation of the Portfolio’s assets among the underlying Funds are indirectly borne by the shareholders of the Portfolio. The Underlying Fund Expenses for the Portfolio are estimated at 0.60%.
PORTFOLIO INSIGHTS
| • | The All Asset Portfolio seeks to achieve its investment objective by investing under normal circumstances substantially all of its assets in Institutional Class shares of the PIMCO Funds: Pacific Investment Management Series (“PIMS”), except the All Asset Fund and the All Asset All Authority Fund. |
| • | The Portfolio may invest in any PIMCO mutual fund except the All Asset Fund and the All Asset All Authority Fund; however, PIMCO has identified 14 core funds on which the All Asset Portfolio will focus. |
| • | For the period from its inception on April 30, 2004 through June 30, 2004, the Portfolio’s Advisor Class shares returned 3.32%, versus the 1.16% return of the Lehman Global Real: U.S. TIPS 1-10 Year Index and the 2.09% return of the average performance of the benchmarks for the core funds for the same period. |
| • | The equally weighted average of the core funds returned 2.27% for the 6 months ended June 30, 2004. |
| • | The average performance of the core funds outperformed the average performance of the 14 benchmarks by 0.19%. This outperformance is a measure of the value added by PIMCO portfolio managers. |
| • | The PVIT All Asset Portfolio underperformed the average performance of the core funds by 0.50%. |
| • | The Portfolio’s overweight to real return strategies versus other Underlying PIMS Funds contributed to performance during the period since the Advisor Class inception on April 30, 2004 through June 30, 2004; in addition, the Portfolio’s exposure to other strategies contributed to outperformance versus the Lehman Global Real: U.S. TIPS 1-10 Year Index during the two-month period. |
| • | The Lehman US TIPS, DJAIG Commodity, and Wilshire REIT indices outperformed the average performance of the 14 benchmarks. |
| • | An overweight to TIPS strategies in the beginning of the period while scaling down exposure throughout the period was positive as yields gradually rose. |
PIMCO FUNDS ALLOCATION‡
| | | |
CommodityRealReturn Strategy | | 14.7 | % |
RealEstateRealReturn Strategy | | 12.7 | % |
StocksPLUS | | 12.0 | % |
Real Return | | 8.1 | % |
Emerging Markets Bond | | 8.0 | % |
Real Return Asset | | 8.0 | % |
Low Duration | | 7.5 | % |
International StocksPLUS TR Strategy | | 6.7 | % |
StocksPLUS Total Return | | 6.3 | % |
GNMA | | 5.1 | % |
High Yield | | 4.4 | % |
Other | | 6.5 | % |
‡% of Total Investments as of June 30, 2004
| | | | |
| June 30, 2004 | | Semi-Annual Report | | 3 |
Financial Highlights
All Asset Portfolio (Advisor Class)
| | | | | | |
| Selected Per Share Data for the Period Ended: | | | | 04/30/2004-
06/30/2004+ | |
| | |
Net asset value beginning of period | | | | $ | 10.59 | |
Net investment income (a) | | | | | 0.05 | |
Net realized/unrealized gain on investments (a) | | | | | 0.30 | |
Total income from investment operations | | | | | 0.35 | |
Dividends from net investment income | | | | | (0.01 | ) |
Distributions from net realized capital gains | | | | | 0.00 | |
Total distributions | | | | | (0.01 | ) |
Net asset value end of period | | | | $ | 10.93 | |
Total return | | | | | 3.32 | % |
Net assets end of period (000s) | | | | $ | 10 | |
Ratio of net expenses to average net assets | | | | | 0.68 | %*(b)(c) |
Ratio of net investment income to average net assets | | | | | 3.11 | %* |
Portfolio turnover rate | | | | | 54 | % |
| (a) | Per share amounts based on average number of shares outstanding during the period. |
| (b) | Ratio of expenses to average net assets excluding Underlying PIMS Funds’ expenses in which the Portfolio invests. |
| (c) | If the investment manager had not reimbursed expenses, the ratio of expenses to average net assets would have been 0.70%. |
| | | | | | |
| 4 | | Semi-Annual Report | | June 30, 2004 | | See accompanying notes |
Statement of Assets and Liabilities
All Asset Portfolio
June 30, 2004 (Unaudited)
| | | | | | |
| Amounts in thousands, except per share amounts | | | | | |
| | |
Assets: | | | | | | |
| | |
Investments in Affiliates, at value | | | | $ | 21,932 | |
Cash | | | | | 545 | |
Receivable for Portfolio shares sold | | | | | 353 | |
Dividends receivable from Affiliates | | | | | 20 | |
Manager reimbursement receivable | | | | | 53 | |
| | | | | | 22,903 | |
| | |
Liabilities: | | | | | | |
| | |
Payable for investments in Affiliates purchased | | | | $ | 565 | |
Accrued investment advisory fee | | | | | 3 | |
Accrued administration fee | | | | | 3 | |
Accrued servicing fee | | | | | 3 | |
| | | | | | 574 | |
| | |
Net Assets | | | | $ | 22,329 | |
| | |
Net Assets Consist of: | | | | | | |
| | |
Paid in capital | | | | $ | 21,983 | |
Undistributed net investment income | | | | | 87 | |
Accumulated undistributed net realized (loss) | | | | | (6 | ) |
Net unrealized appreciation | | | | | 265 | |
| | | | | $ | 22,329 | |
| | |
Net Assets: | | | | | | |
| | |
Administrative Class | | | | $ | 18,845 | |
Advisor Class | | | | | 10 | |
Class M | | | | | 3,474 | |
| | |
Shares Issued and Outstanding: | | | | | | |
| | |
Administrative Class | | | | | 1,724 | |
Advisor Class | | | | | 1 | |
Class M | | | | | 318 | |
| | |
Net Asset Value and Redemption Price Per Share
(Net Assets Per Share Outstanding) | | | | | | |
| | |
Administrative Class | | | | $ | 10.93 | |
Advisor Class | | | | | 10.93 | |
Class M | | | | | 10.91 | |
| | |
Cost of Investments in Affiliates Owned | | | | $ | 21,667 | |
| | | | | | |
| See accompanying notes | | June 30, 2004 | | Semi-Annual Report | | 5 |
Statement of Operations
All Asset Portfolio
| | | | | | |
| Amounts in thousands | | | | | |
| | | | | Six Months Ended June 30, 2004 (Unaudited) | |
Investment Income: | | | | | | |
| | |
Dividends from Affiliates | | | | $ | 105 | |
Total Income | | | | | 105 | |
| | |
Expenses: | | | | | | |
| | |
Investment advisory fees | | | | | 4 | |
Administration fees | | | | | 6 | |
Distribution and/or servicing fees - Administrative Class | | | | | 3 | |
Distribution and/or servicing fees - Advisor Class | | | | | 0 | |
Distribution fees - Class M | | | | | 1 | |
Total Expenses | | | | | 14 | |
| | |
Net Investment Income | | | | | 91 | |
| | |
Net Realized and Unrealized Gain (Loss): | | | | | | |
| | |
Net realized (loss) on investments in Affiliates | | | | | (17 | ) |
Net change in unrealized appreciation on investments in Affiliates | | | | | 238 | |
Net Gain | | | | | 221 | |
| | |
Net Increase in Assets Resulting from Operations | | | | $ | 312 | |
| | | | | | |
| 6 | | Semi-Annual Report | | June 30, 2004 | | See accompanying notes |
Statements of Changes in Net Assets
All Asset Portfolio
| | | | | | | | | | | | |
| Amounts in thousands | | | | | | | | | | |
| | | | | Six Months Ended June 30, 2004
(Unaudited) | | | | | Period from
April 30, 2003 to December 31, 2003 | |
Increase (Decrease) in Net Assets from: | | | | | | | | | | | | |
| | | | |
Operations: | | | | | | | | | | | | |
| | | | |
Net investment income | | | | $ | 91 | | | | | $ | 39 | |
Net realized gain (loss) on investments in Affiliates | | | | | (17 | ) | | | | | 6 | |
Net capital gain distributions received from underlying Funds | | | | | 0 | | | | | | 15 | |
Net change in unrealized appreciation on investments in Affiliates | | | | | 238 | | | | | | 27 | |
Net increase resulting from operations | | | | | 312 | | | | | | 87 | |
| | | | |
Distributions to Shareholders: | | | | | | | | | | | | |
| | | | |
From net investment income | | | | | | | | | | | | |
Administrative Class | | | | | (24 | ) | | | | | (25 | ) |
Advisor Class | | | | | 0 | | | | | | 0 | |
Class M | | | | | (4 | ) | | | | | 0 | |
Total Distributions | | | | | (28 | ) | | | | | (25 | ) |
| | | | |
Portfolio Share Transactions: | | | | | | | | | | | | |
| | | | |
Receipts for shares sold | | | | | | | | | | | | |
Administrative Class | | | | | 17,926 | | | | | | 1,543 | |
Advisor Class | | | | | 10 | | | | | | 0 | |
Class M | | | | | 3,658 | | | | | | 0 | |
| | | | |
Issued as reinvestment of distributions | | | | | | | | | | | | |
Administrative Class | | | | | 24 | | | | | | 25 | |
Advisory Class | | | | | 0 | | | | | | 0 | |
Class M | | | | | 4 | | | | | | 0 | |
| | | | |
Cost of shares redeemed | | | | | | | | | | | | |
Administrative Class | | | | | (367 | ) | | | | | (613 | ) |
Advisor Class | | | | | 0 | | | | | | 0 | |
Class M | | | | | (227 | ) | | | | | 0 | |
Net increase resulting from Portfolio share transactions | | | | | 21,028 | | | | | | 955 | |
| | | | |
Total Increase in Net Assets | | | | | 21,312 | | | | | | 1,017 | |
| | | | |
Net Assets: | | | | | | | | | | | | |
| | | | |
Beginning of period | | | | | 1,017 | | | | | | 0 | |
End of period* | | | | $ | 22,329 | | | | | $ | 1,017 | |
| | | | |
*Including undistributed net investment income of: | | | | $ | 87 | | | | | $ | 24 | |
| | | | | | |
| See accompanying notes | | June 30, 2004 | | Semi-Annual Report | | 7 |
Schedule of Investments
All Asset Portfolio
June 30, 2004 (Unaudited)
| | | | | |
PIMCO FUNDS (a) 98.2% | | | |
CommodityRealReturn Strategy | | 222,894 | | $ | 3,223 |
Convertible | | 810 | | | 10 |
Emerging Markets Bond | | 177,261 | | | 1,762 |
European Convertible Bond | | 51,283 | | | 626 |
Foreign Bond (Unhedged) | | 959 | | | 10 |
GNMA | | 102,930 | | | 1,129 |
High Yield | | 101,468 | | | 955 |
International StocksPLUS TR Strategy | | 135,120 | | | 1,462 |
Low Duration | | 161,272 | | | 1,643 |
Real Return | | 157,642 | | | 1,776 |
Real Return Asset | | 150,982 | | | 1,748 |
RealEstateRealReturn Strategy | | 259,588 | | | 2,793 |
Short-Term | | 77,249 | | | 775 |
StocksPLUS | | 272,154 | | | 2,632 |
StocksPLUS Total Return | | 114,209 | | | 1,388 |
| | | | |
|
|
| |
Total Investments 98.2% | | $ | 21,932 |
(Cost $21,667) | | | | | |
| |
Other Assets and Liabilities (Net) 1.8% | | | 397 |
| | | | |
|
|
| |
Net Assets 100.0% | | $ | 22,329 |
| | | | |
|
|
Notes to Schedule of Investments:
(a) Institutional Class of each PIMCO Fund.
| | | | | | |
| 8 | | Semi-Annual Report | | June 30, 2004 | | See accompanying notes |
Notes to Financial Statements
June 30, 2004 (Unaudited)
1. Organization
The All Asset Portfolio (the “Portfolio”) is a series of the PIMCO Variable Insurance Trust (the “Trust”). The Trust is registered under the Investment Company Act of 1940 (the “Act”), as amended, as an open-end investment company organized as a Delaware business trust on October 3, 1997. The Portfolio offers three classes of shares: Administrative, Advisor and Class M. Each share class has identical voting rights (except that shareholders of a class have exclusive voting rights regarding any matter relating solely to that class of shares). Information presented in these financial statements pertains to the Advisor Class of the Trust. The Trust is designed to be used as an investment vehicle by Separate Accounts of insurance companies that fund variable annuity contracts and variable life insurance policies and by qualified pension and retirement plans. The Portfolio commenced operations on April 30, 2003.
2. Significant Accounting Policies
The following is a summary of significant accounting policies consistently followed by the Trust in the preparation of its financial statements in conformity with accounting principles generally accepted in the United States of America. The preparation of financial statements in accordance with accounting principles generally accepted in the United States of America requires management to make estimates and assumptions that affect the reported amounts and disclosures in the financial statements. Actual results could differ from those estimates.
Security Valuation. Investments in Funds within the PIMS Funds are valued at their net asset value as reported by the underlying PIMS Funds.
Securities Transactions and Investment Income. Securities transactions are recorded as of the trade date. Securities purchased or sold on a when-issued or delayed delivery basis may be settled a month or more after the trade date. Realized gains and losses from securities sold are recorded on the identified cost basis. Dividend income is recorded on the ex-dividend date, except certain dividends from foreign securities where the ex-dividend date may have passed, are recorded as soon as the Portfolio is informed of the ex-dividend date. Interest income, adjusted for the accretion of discounts and amortization of premiums, is recorded on the accrual basis. Paydowns gains and losses on mortgage- and asset-backed securities are recorded as adjustments to interest income in the Statement of Operations.
Dividends and Distributions to Shareholders. Dividends from net investment income, if any, are declared and distributed to shareholders quarterly. All dividends are reinvested in additional shares of the Portfolio. Net realized capital gains earned by the Portfolio, if any, will be distributed no less frequently than once each year.
Income dividends and capital gain distributions are determined in accordance with income tax regulations which may differ from accounting principles generally accepted in the United States of America. These differences are primarily due to differing treatments for such items as wash sales, foreign currency transactions, net operating losses, notional principal contracts, certain asset-backed securities, certain futures and forward contracts, tax straddles, and capital loss carryforwards.
Distributions classified as a tax basis return of capital, if any, are reflected in the accompanying Statements of Changes in Net Assets and have been reclassified to paid in capital. In addition, other amounts have been reclassified between undistributed net investment income, accumulated undistributed net realized gains or losses and/or paid in capital to more appropriately conform financial accounting to tax characterizations of dividend distributions.
Federal Income Taxes. The Portfolio intends to qualify as a regulated investment company and distribute all of its taxable income and net realized gains, if applicable, to shareholders. Accordingly, no provision for Federal income taxes has been made.
Underlying PIMS Funds. The Underlying PIMS Funds are the Institutional Class shares of the PIMCO Funds: Pacific Investment Management Series, an affiliated open-end investment company, except All Asset and All Asset All Authority Funds. Though it is anticipated that the All Asset Portfolio will not currently invest in the European StocksPLUS Total Return Strategy, Far East (ex-Japan) StocksPLUS Total Return Strategy, Japanese StocksPLUS TR Strategy, StocksPLUS Municipal-Backed and StocksPLUS TR Short Strategy Funds, the Portfolio may invest in these Funds in the future, without shareholder approval, at the discretion of the Portfolio’s asset allocation sub-adviser.
3. Fees, Expenses, and Related Party Transactions
Investment Advisory Fee. Pacific Investment Management Company LLC (“PIMCO”) is a majority owned subsidiary partnership of Allianz Dresdner Asset Management of America L.P. and serves as investment adviser (the “Adviser”) to the Trust, pursuant to an investment advisory contract. The Adviser receives a monthly fee at an annual rate based on average daily net assets of the Portfolio. The Advisory Fee is charged at an annual rate of 0.20%.
PIMCO has contractually agreed, for the All Asset Portfolio’s current fiscal year, to reduce its Advisory Fee to the extent that the Underlying Fund Expenses attributable to Advisory and Administrative Fees exceed 0.60%. PIMCO may recoup these waivers in future period, not to exceed three years, provided total expenses, including such Recoupment, do not exceed the annual expense limit.
Administration Fee. PIMCO serves as administrator (the “Administrator”), and provides administrative services to the Trust for which it receives a monthly administrative fee based on average daily net assets of the Portfolio. The Administration Fee is charged at the annual rate of 0.25%.
Servicing Fee. PA Distributors LLC (“PAD”), formerly known as PIMCO Advisors Distributors LLC, is an indirect wholly-owned
| | | | |
| June 30, 2004 | | Semi-Annual Report | | 9 |
Notes to Financial Statements (Cont.)
June 30, 2004 (Unaudited)
subsidiary of Allianz Dresdner Asset Management of America L.P. and serves as the distributor of the Trust’s shares. The Trust is permitted to reimburse PAD on a quarterly basis, out of the Administrative Class assets of the Portfolio in the amount of 0.15% on an annual basis of the average daily net assets of that class, for payments made to financial intermediaries that provide services in connection with the distribution of shares or administration of plans or programs that use Portfolio shares as their funding medium. The effective rate paid to PAD was 0.15% during current fiscal year.
Expenses. The Trust is responsible for the following expenses: (i) salaries and other compensation of any of the Trust’s executive officers and employees who are not officers, directors, stockholders or employees of PIMCO or its subsidiaries or affiliates; (ii) taxes and governmental fees; (iii) brokerage fees and commissions and other portfolio transaction expenses; (iv) the cost of borrowing money, including interest expense and bank overdraft charges; (v) fees and expenses of the Trustees who are not “interested persons” of PIMCO or the Trust, and any counsel retained exclusively for their benefit; (vi) extraordinary expenses, including costs of litigation and indemnification expenses; (vii) organization expenses and (viii) any expenses allocated or allocable to a specific class of shares, which include service fees payable with respect to the Administrative Class shares and may include certain other expenses as permitted by the Trust’s Multiple Class Plan adopted pursuant to Rule 18f-3 under the Act and subject to review and approval by the Trustees. The ratio of expenses to average net assets per share class, as disclosed in Financial Highlights, may differ from the annual portfolio operating expenses per share class as disclosed in the Prospectus for the reasons set forth above.
PIMCO has agreed to waive a portion of its administrative fees to the extent that the payment of the Portfolio’s pro rata share of organization expenses and Trustee fees cause the actual expense ratio to rise above the rates disclosed in the then-current prospectus plus 0.49 basis points as set forth below (calculated as a percentage of the Portfolio’s average daily net assets attributable to each class):
| | | |
Administrative Class | | 0.60 | % |
Advisor Class | | 0.70 | % |
Class M | | 0.90 | % |
PIMCO may be reimbursed for these waived amounts in future periods, not to exceed thirty-six months. Expenses that have been waived and may still be reimbursed by the Administrator, to the extent the Portfolio’s annualized total portfolio operating expenses plus the amount so reimbursed does not exceed the operating expense limitation, are as follows (amounts in thousands):
| | | | | |
| | | | 12/31/2003 | | 06/30/2004 |
Amount Available for Reimbursement | | $ | 53 | | 0 |
Each unaffiliated Trustee receives an annual retainer of $4,000, plus $1,500 for each Board of Trustees meeting attended in person and $250 for each meeting attended telephonically, plus reimbursement of related expenses. In addition, each committee chair receives an additional annual retainer of $500. These expenses are allocated on a pro-rata basis to each Portfolio of the Trust according to its respective net assets.
4. Risk Factors of the Portfolio
Investing in the Underlying PIMS Funds through the All Asset Portfolio involves certain additional expenses and tax results that would not be present in a direct investment in the Underlying PIMS Funds. Under certain circumstances, an Underlying PIMS Funds may pay a redemption request by the All Asset Portfolio wholly or partly by a distribution in kind of securities from its portfolio, instead of cash, in accordance with the rules of the Securities and Exchange Commission. In such cases, the Portfolio may hold securities distributed by an Underlying PIMS Funds until the Adviser determines that it is appropriate to dispose of such securities.
Each of the Underlying PIMS Funds may invest in certain specified derivative securities, including: interest rate swaps; commodity swaps; credit default swaps; currency swaps; total return swaps; Forward Foreign Currency Contracts; caps and floors for hedging purposes; exchange-traded options; over-the-counter options executed with primary dealers, including long calls and puts and covered calls and financial futures and options. Certain of the Underlying PIMS Funds may invest in restricted securities, instruments issued by trusts, partnerships or other issuers, including pass-through certificated representing participation in, or debt instruments backed by, the securities owned by such issuers. There Underlying PIMS Funds also may engage in securities lending, reverse repurchase agreements and dollar roll transactions. In addition, certain of the Underlying PIMS Funds may invest in below-investment grade debt, debt obligations of foreign issuers and stocks of foreign corporations, securities in foreign investment funds or trusts, foreign derivatives securities including future contracts, options, interest rate and currency swap transactions, and various other investment vehicles, each with inherent risks.
The officers and trustees of the Trust also serve as officers and trustees of the Underlying PIMS Funds. Conflicts may arise as these companies seek to fulfill their fiduciary responsibilities to both the Portfolio and the Underlying PIMS Funds.
5. Federal Income Tax Matters
At June 30, 2004, the aggregate cost of investments was the same for federal income tax and financial statement purposes. The net unrealized appreciation (depreciation) of investment securities for federal income tax purposes is as follows (amounts in thousands):
| | | | | | |
Aggregate Gross Unrealized Appreciation | | Aggregate Gross
Unrealized
(Depreciation) | | Net Unrealized
Appreciation |
| $ 341 | | $ | (76) | | $ | 265 |
| | | | |
| 10 | | Semi-Annual Report | | June 30, 2004 |
6. Purchases and Sales of Securities
The length of time a Portfolio has held a particular security is not generally a consideration in investment decisions. A change in the securities held by a Portfolio is known as “portfolio turnover.” The Portfolio may engage in frequent and active trading of portfolio securities to achieve its investment objective, particularly during periods of volatile market movements. High portfolio turnover (e.g., over 100%) involves correspondingly greater expenses to the Portfolio, including brokerage commissions or dealer mark-ups and other transaction costs on the sale of securities and reinvestments in other securities. Such sales may also result in realization of taxable capital gains, including short-term capital gains (which are generally taxed at ordinary income tax rates). The trading costs and tax effects associated with portfolio turnover may adversely affect the Portfolio’s performance.
Purchases and sales of securities (excluding short-term investments) for the period ended June 30, 2004 were as follows (amounts in thousands):
| | | | | | |
| U.S Government/Agency | | All Other |
| Purchases | | Sales | | Purchases | | Sales |
| $ 0 | | $ 0 | | $ 22,400 | | $ 1,626 |
7. Shares of Beneficial Interest
The Trust may issue an unlimited number of shares of beneficial interest with a $.001 par value. Changes in shares of beneficial interest were as follows (shares and amounts in thousands):
| | | | | | | | | | | | | | |
| | | Six Months Ended 06/30/2004 | | | Period From
04/30/2003 to
12/31/2003 | |
| | | Shares | | | Amount | | | Shares | | | Amount | |
Receipts for shares sold | | | | | | | | | | | | | | |
| | | | |
Administrative Class | | 1,662 | | | | 17,926 | | | 149 | | | | 1,543 | |
Advisor Class | | 1 | | | | 10 | | | 0 | | | | 0 | |
Class M | | 339 | | | | 3,658 | | | 0 | | | | 0 | |
| | | | |
Issued as reinvestment of distributions | | | | | | | | | | | | | | |
| | | | |
Administrative Class | | 2 | | | | 24 | | | 2 | | | | 25 | |
Advisor Class | | 0 | | | | 0 | | | 0 | | | | 0 | |
Class M | | 0 | | | | 4 | | | 0 | | | | 0 | |
| | | | |
Cost of shares redeemed | | | | | | | | | | | | | | |
| | | | |
Administrative Class | | (34 | ) | | | (367 | ) | | (57 | ) | | | (613 | ) |
Advisor Class | | 0 | | | | 0 | | | 0 | | | | 0 | |
Class M | | (21 | ) | | | (227 | ) | | 0 | | | | 0 | |
| | | | |
Net increase resulting from Portfolio share transactions | | 1,949 | | | $ | 21,028 | | | 94 | | | $ | 955 | |
The following schedule shows the number of shareholders each owning 5% or more of the Portfolio and the total percentage of the Portfolio held by such shareholders:
| | | | |
| | | Number | | % of Portfolio Held |
Administrative Class | | 2 | | 96 |
| | | | |
| June 30, 2004 | | Semi-Annual Report | | 11 |
Notes to Financial Statements (Cont.)
June 30, 2004 (Unaudited)
8. Regulatory and Litigation Matters
On February 17, 2004, the Attorney General of the State of New Jersey (“New Jersey AG”) filed a complaint against Allianz Dresdner Asset Management of America L.P. (“ADAM”), PA Distributors LLC (formerly known as PIMCO Advisors Distributors LLC) (“PAD”), PEA Capital LLC (formerly known as PIMCO Equity Advisors LLC) (“PEA”), and Pacific Investment Management Company LLC (“PIMCO”) in connection with its investigation into market timing and late trading. The complaint contends that inappropriate trading by shareholders engaged in market timing activity took place in funds in the PIMCO Funds: Multi-Manager Series (“MMS Funds”) and the PIMCO Funds: Pacific Investment Management Series (“PIMS Funds”). On June 1, 2004, the New Jersey AG dismissed PIMCO from the lawsuit.
On the same day as the dismissal of PIMCO from the lawsuit, the New Jersey AG announced that it had reached a settlement agreement with the remaining defendants (“New Jersey Settlement”). In the New Jersey Settlement, ADAM, PAD and PEA agreed, while neither admitting nor denying the allegations or conclusions of law, to: (i) pay New Jersey a civil fine of $15 million and $3 million for investigative costs and further enforcement initiatives; and (ii) implement certain changes in corporate governance.
On May 6, 2004, the Securities and Exchange Commission filed a complaint in the U.S. District Court in the Southern District of New York alleging that PA Fund Management LLC (formerly known as PIMCO Advisors Fund Management LLC) (“PAFM”), PEA, PAD, Stephen J. Treadway (at the time, the chief executive officer of PAFM and PAD as well as chairman of the Board of Trustees of the MMS Funds) and Kenneth W. Corba (the former chief executive officer of PEA and former portfolio manager of the PEA Growth and PEA Growth & Income Funds) had, among other things, violated and/or aided and abetted violations of, various antifraud provisions of the federal securities laws in connection with alleged “market timing” arrangements that improperly allowed certain hedge funds to engage in “market timing” in the PEA Growth Fund, the PEA Opportunity Fund, the PEA Innovation Fund, and the PEA Target Fund. The complaint seeks injunctive relief, disgorgement plus pre-judgment interest, monetary penalties, and an order permanently enjoining the defendants from serving as investment advisers, principal underwriters, officers, directors, or members of any advisory boards to any registered investment companies.
On February 20, 2004, a putative class action lawsuit was filed in the U.S. District Court for the District of New Jersey on behalf of certain shareholders of the PIMCO Funds against ADAM, PAD, PIMCO, PEA, the PIMS Funds, the MMS Funds, the Trust, PIMCO Commercial Mortgage Securities Trust, Inc. and certain other defendants, alleging that inappropriate market timing activity by certain shareholders caused financial injury to the shareholders of those Funds.
The following additional putative class action lawsuits have been filed against the PIMS Funds, the MMS Funds and/or their affiliates, each related to alleged market-timing activity in funds advised by PIMCO or its affiliates: (1) a lawsuit filed in the U.S. District Court for the District of Connecticut on February 27, 2004 (naming as defendants ADAM, PAD, PEA, the PIMS Funds, the MMS Funds, the Trust, PCM and certain other parties); (2) a lawsuit filed in the U.S. District Court for the Central District of California on March 4, 2004 (naming as defendants PIMCO, ADAM, PEA and PAD); (3) a lawsuit filed in the U.S. District Court for the Southern District of New York on March 8, 2004 (naming PIMCO, PAD and certain of their affiliates as defendants); (4) a lawsuit filed in the U.S. District Court for the Southern District of New York, on March 15, 2004 (naming PIMCO as the defendant); (5) two separate lawsuits filed in the U.S. District Court for the Central District of California on March 22, 2004, brought derivatively on behalf of the PIMCO High Yield Fund and the PIMCO Money Market Fund, respectively (each naming ADAM, PAFM and certain other parties as defendants, and the PIMCO Funds as the nominal defendant); (6) a lawsuit filed in the U.S. District Court for the Central District of California, also on March 22, 2004, brought derivatively on behalf of the PIMS Funds and the MMS Funds (naming ADAM, PIMCO, PAD and certain other parties as defendants, and the PIMS Funds and the MMS Funds as nominal defendants); (7) a lawsuit filed in the U.S. District Court for the District of New Jersey on April 20, 2004 (naming ADAM, PAD, the PIMS Funds and certain other parties as defendants); and (8) a lawsuit filed in the U.S. District Court for the Northern District of California on April 28, 2004 (naming ADAM, PIMCO, PAD, PEA and certain other parties as defendants, and the “PIMCO Funds” as nominal defendants). Each complaint for the foregoing putative class actions alleges, among other things, that inappropriate trading by shareholders engaged in market timing activities took place in certain of the funds advised by PIMCO, and each complaint seeks unspecified compensatory damages.
On February 17, 2004, a putative class action lawsuit was filed in the U.S. District Court for the District of Connecticut on behalf of certain shareholders of the PIMCO Funds against ADAM, PEA, PIMCO, PIMS Funds, MMS Funds and certain other defendants, alleging excessive investment advisory fees and the use of brokerage commissions to pay for distribution of fund shares. Three similar putative class action lawsuits were subsequently filed, each in the U.S. District Court for the District of Connecticut on March 1, 2004, April 23, 2004 and May 20, 2004, respectively.
Under Section 9(a) of the 1940 Act, if any of the various lawsuits were to result in a court injunction against PAFM, PEA, PAD, PIMCO, ADAM and/or Mr. Treadway, they and their affiliates would, in the absence of exemptive relief granted by the SEC, be barred from serving as an investment adviser/sub-adviser or principal underwriter for any registered investment company, including the Trust. ADAM and certain of its subsidiaries have
| | | | |
| 12 | | Semi-Annual Report | | June 30, 2004 |
responded to inquiries from the SEC concerning the status of the New Jersey Settlement under Section 9(a). If any of PAFM, PEA, PAD, PIMCO or ADAM were subject to an injunction, each of these entities and their affiliates could in turn seek exemptive relief from the SEC, as contemplated by the 1940 Act. There is no assurance, however, that such exemptive relief would be granted. The SEC also has the power by order to prohibit PAFM, PEA, PAD and PIMCO from serving as investment advisers and underwriters, if the SEC finds that such entities willfully violated the federal securities laws in connection with the allegations discussed above or aided or abetted such violations.
PIMCO, PAD and the Trust believe that these developments will not have a material adverse effect on the Portfolios or on PIMCO’s, or PAD’s ability to perform their respective investment advisory or distribution services on behalf of the Portfolios.
| | | | |
| June 30, 2004 | | Semi-Annual Report | | 13 |
Trustees and Officers
Brent R. Harris, Chairman and Trustee
R. Wesley Burns, President and Trustee
E. Philip Cannon, Trustee
Vern O. Curtis, Trustee
J. Michael Hagan, Trustee
William J. Popejoy, Trustee
Garlin G. Flynn, Secretary
John P. Hardaway, Treasurer
Investment Sub-Adviser
Research Affiliates, LLC
800 E. Colorado Boulevard
Pasadena, California 91101
Investment Adviser and Administrator
Pacific Investment Management Company LLC
840 Newport Center Drive
Newport Beach, California 92660
Distributor
PA Distributors LLC
2187 Atlantic Street
Stamford, Connecticut 06902
Custodian
State Street Bank & Trust Company
801 Pennsylvania
Kansas City, Missouri 64105
Transfer Agent
Boston Financial Data Services–Midwest
330 W. 9th Street
Kansas City, Missouri 64105
Legal Counsel
Dechert LLP
1775 I Street, N.W.
Washington, D.C. 20006
Independent Registered Public Accounting Firm
PricewaterhouseCoopers LLP
1055 Broadway
Kansas City, Missouri 64105
Information about how the Fund voted proxies relating to portfolio securities held during the year July 1, 2003 through June 30, 2004 will be available no later than August 31, 2004 without charge, upon request, by calling the Trust at 1-800-927-4648 and on the SEC’s website at http://www.sec.gov.
Copies of the written Proxy Policy and the factors that PIMCO may consider in determining how to vote proxies for the Funds are available by calling the Trust at 1-800-927-4648 and on the SEC’s website at http://www.sec.gov.
PIMCO VARIABLE INSURANCE TRUST
840 NEWPORT CENTER DRIVE
NEWPORT BEACH, CA 92660

PIMCO VARIABLE INSURANCE TRUST
STOCKSPLUS GROWTHAND INCOME PORTFOLIO
INSTITUTIONAL CLASS
SEMI-ANNUAL REPORT
June 30, 2004
|
| This material is authorized for use only when preceded or accompanied by the current PIMCO Variable Insurance Trust prospectus. Investors should consider the investment objectives, risks, charges and expenses of Portfolio carefully before investing. This and other information is contained in the Portfolio’s prospectus. Please read the prospectus carefully before you invest or send money. |
Chairman’s Letter
Dear PIMCO Variable Insurance Trust Shareholder:
Bond prices were more volatile during the six-month period ended June 30, 2004. Interest rates rose sharply during the second quarter 2004, causing bonds to give back modest gains from earlier in the year. The Lehman Brothers Aggregate Bond Index, a widely used index for the high-grade bond market, was nearly flat during the first six months of 2004, returning 0.15% after losing 2.44% during the second quarter. The yield on the benchmark ten-year Treasury closed June 30, 2004 at 4.58%, up 0.75% from April 1, 2004, but up only 0.34% from where it began the six-month period on January 1, 2004.
Continued growth in employment convinced the markets that the Federal Reserve would soon begin a long anticipated tightening cycle. On June 30, 2004, the Fed met market expectations by increasing the federal funds rate 0.25%, which was the first rate increase since June 25, 2003. The central bank had held this rate at 1% for more than a year, which generated negative real short-term rates. And on August 10, 2004, the Fed increased the federal funds rate another 0.25% to 1.50%.
Investors that had profited handsomely from borrowing at low short-term rates and investing in higher-yielding longer maturity bonds surrendered some of those profits towards the latter part of the six-month period. Concern that borrowing rates would rise led investors to liquidate long positions and unwind these trades, which caused bond prices to decrease. However, substantial leverage remained among banks, hedge funds, and other investors, making bond markets somewhat vulnerable to additional Fed rate increases. There were also signs of rising inflation, which fueled anxiety that central banks might continue to raise interest rates.
On the following pages you will find a more complete review of the Portfolio in light of financial market activities as well as specific details about the total return investment performance for the six-month period.
We appreciate the trust you have placed in us, and we will continue to focus our efforts to meet your investment needs.
Sincerely,

Brent R. Harris
Chairman
August 11, 2004
| | | | |
| June 30, 2004 | | Semi-Annual Report | | 1 |
Important Information About the Portfolio
We believe that bond funds have an important role to play in a well diversified investment portfolio. It is important to note, however, that in an environment where interest rates may trend upward, rising rates will negatively impact the performance of most bond funds, and fixed income securities held by a fund are likely to decrease in value. The price volatility of fixed income securities can also increase during periods of rising interest rates resulting in increased losses to a fund. Bond funds and individual bonds with a longer duration (a measure of the expected life of a security) tend to be more sensitive to changes in interest rates, usually making them more volatile than securities or funds with shorter durations. The longer-term performance of most bond funds has benefited from capital gains in part resulting from an extended period of declining interest rates. In the event interest rates increase, these capital gains should not be expected to recur.
The Portfolio may be subject to various risks in addition to those described above. Some of these risks may include, but are not limited to, the following: real rate risk, derivative risk, small company risk, foreign security risk, high yield security risk and specific sector investment risks. The Portfolio may use derivative instruments for hedging purposes or as part of an investment strategy. Use of these instruments may involve certain costs and risks such as liquidity risk, interest rate risk, market risk, credit risk, management risk and the risk that a fund could not close out a position when it would be most advantageous to do so. A Portfolio investing in derivatives could lose more than the principal amount invested in these instruments. Investing in non-U.S. securities may entail risk due to non-U.S. economic and political developments; this risk may be enhanced when investing in emerging markets. High-yield bonds typically have a lower credit rating than other bonds. Lower rated bonds generally involve a greater risk to principal than higher rated bonds. Smaller companies may be more volatile than larger companies and may entail more risk. Concentrating investments in individual sectors may add additional risk and volatility compared to a diversified portfolio.
On the performance summary page in this semi-annual report, the Total Return Investment Performance table measures performance assuming that all dividend and capital gain distributions were reinvested. Returns do not reflect the deduction of taxes that a shareholder would pay (i) on Portfolio distributions or (ii) the redemption of Portfolio shares.
An investment in a Portfolio is not a bank deposit and is not guaranteed or insured by the Federal Deposit Insurance Corporation or any other government agency. It is possible to lose money on investments in the Funds.
The following disclosure provides important information regarding the Portfolio’s Expense Example, which appears on the Portfolio’s individual page in this semi-annual report. Please refer to this information when reviewing the Expense Example for the Portfolio.
Example
As a shareholder of the Portfolio, you incur two types of costs: (1) transaction costs, including redemption and exchange fees; and (2) ongoing costs, including advisory and administrative fees; distribution and/or service (12b-1) fees (Administrative Class only); and other Portfolio expenses. The Example is intended to help you understand your ongoing costs (in dollars) of investing in the Portfolio and to compare these costs with the ongoing costs of investing in other mutual funds.
The Example is based on an investment of $1,000 invested at the beginning of the period and held for the entire period indicated, which is from 1/1/04 to 6/30/04.
Actual Expenses
The information in the table under the heading “Actual Performance” provides information about actual account values and actual expenses. You may use the information in these columns, together with the amount you invested, to estimate the expenses that you paid over the period. Simply divide your account value by $1,000.00 (for example, an $8,600.00 account value divided by $1,000 = 8.60), then multiply the result by the number in the appropriate column for your share class, in the row entitled “Expenses Paid During Period” to estimate the expenses you paid on your account during this period.
Hypothetical Example for Comparison Purposes
The information in the table under the heading “Hypothetical Performance (5% return before expenses)” provides information about hypothetical account values and hypothetical expenses based on the Portfolio’s actual expense ratio and an assumed rate of return of 5% per year before expenses, which is not the Portfolio’s actual return. The hypothetical account values and expenses may not be used to estimate the actual ending account balance or expenses you paid for the period. You may use this information to compare the ongoing costs of investing in the Portfolio and other portfolios. To do so, compare this 5% hypothetical example with the 5% hypothetical examples that appear in the shareholder reports of the other portfolios.
Please note that the expenses shown in the table are meant to highlight your ongoing costs only and do not reflect any transactional costs. Therefore, the information under the heading “Hypothetical Performance (5% return before expenses)” is useful in comparing ongoing costs only, and will not help you determine the relative total costs of owning different portfolios. In addition, if these transactional costs were included, your costs would have been higher.
PIMCO Variable Insurance Trust is distributed by PA Distributors LLC, 2187 Atlantic Street, Stamford, CT 06902.
| | | | |
| 2 | | Semi-Annual Report | | June 30, 2004 |
StocksPLUS Growth and Income Portfolio
CUMULATIVE RETURNS THROUGH JUNE 30, 2004
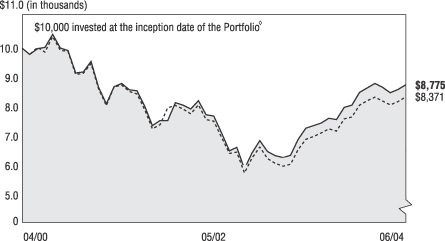
[CHART]
StocksPLUS Growth and
Income Portfolio S&P 500 Index
-------------------- -------------
04/30/2000 $10,000 $10,000
05/31/2000 $9,803 $9,795
06/30/2000 $9,999 $10,036
07/31/2000 $10,038 $9,879
08/31/2000 $10,567 $10,493
09/30/2000 $10,012 $9,939
10/31/2000 $9,927 $9,897
11/30/2000 $9,179 $9,117
12/31/2000 $9,209 $9,161
01/31/2001 $9,559 $9,486
02/28/2001 $8,676 $8,621
03/31/2001 $8,126 $8,075
04/30/2001 $8,709 $8,703
05/31/2001 $8,817 $8,761
06/30/2001 $8,605 $8,548
07/31/2001 $8,571 $8,464
08/31/2001 $8,052 $7,934
09/30/2001 $7,403 $7,293
10/31/2001 $7,567 $7,432
11/30/2001 $7,567 $8,002
12/31/2001 $8,170 $8,072
01/31/2002 $8,083 $7,955
02/28/2002 $7,961 $7,801
03/31/2002 $8,238 $8,095
04/30/2002 $7,764 $7,604
05/31/2002 $7,720 $7,548
06/30/2002 $7,158 $7,010
07/31/2002 $6,549 $6,464
08/31/2002 $6,664 $6,507
09/30/2002 $5,946 $5,799
10/31/2002 $6,488 $6,310
11/30/2002 $6,888 $6,681
12/31/2002 $6,530 $6,288
01/31/2003 $6,386 $6,124
02/28/2003 $6,323 $6,032
03/31/2003 $6,402 $6,090
04/30/2003 $6,934 $6,592
05/31/2003 $7,314 $6,939
06/30/2003 $7,397 $7,028
07/31/2003 $7,488 $7,152
08/31/2003 $7,651 $7,291
09/30/2003 $7,603 $7,214
10/31/2003 $8,011 $7,622
11/30/2003 $8,084 $7,689
12/31/2003 $8,517 $8,092
01/31/2004 $8,673 $8,241
02/29/2004 $8,820 $8,355
03/31/2004 $8,690 $8,229
04/30/2004 $8,506 $8,100
05/31/2004 $8,616 $8,211
06/30/2004 $8,775 $8,371
SECTOR BREAKDOWN‡
| | | |
Short-Term Instruments‡‡ | | 71.9 | % |
Mortgage-Backed Securities | | 7.2 | % |
U.S. Treasury Obligations | | 6.0 | % |
Corporate Bonds & Notes | | 5.6 | % |
U.S. Government Agencies | | 5.1 | % |
Other | | 4.2 | % |
‡ % of Total Investments as of June 30, 2004
‡‡ Primarily serving as collateral for equity-linked derivative positions.
à$10,000 invested at the beginning of the first full month following the inception of the Institutional Class.
TOTAL RETURN INVESTMENT PERFORMANCE For the period ended June 30, 2004
| | | | | | | | | | | | | |
| | | | | | | 6 Months | | | 1 Year | | | Since Inception* | |
| | |
| | StocksPLUS Growth and Income Portfolio Institutional Class (Inception 04/28/00) | | 3.03 | % | | 18.63 | % | | –3.09 | % |
| | | - - - - - - - | | S&P 500 Index | | 3.44 | % | | 19.11 | % | | — | |
| | | | | * Annualized. All Portfolio returns are net of fees and expenses. | | | | | | | | | |
Past performance is no guarantee of future results. The performance quoted represents past performance. Investment return and principal value will fluctuate so the Portfolio shares, when redeemed, may be worth more or less than their original cost. Current performance may be lower or higher than the performance data quoted. Performance data current to the most recent month-end is available by calling (800) 927-4648.
Please refer to page 2 herein for an explanation of the information presented in the following Expense Example.
| | | | | | | | | | |
| EXPENSE EXAMPLE | | | | Actual Performance | | | | Hypothetical Performance
(5% return before expenses) |
Beginning Account Value (01/01/04) | | | | $ | 1,000.00 | | | | $ | 1,000.00 |
Ending Account Value (06/30/04) | | | | $ | 1,030.30 | | | | $ | 1,025.00 |
Expenses Paid During Period† | | | | $ | 2.52 | | | | $ | 2.52 |
†Expenses are equal to the Portfolio’s Institutional Class annualized expense ratio of 0.50%, multiplied by the average account value over the period, multiplied by 182/366 (to reflect the one-half year period).
PORTFOLIO INSIGHTS
| • | The StocksPLUS Growth and Income Portfolio seeks to achieve its investment objective by investing under normal circumstances substantially all of its assets in S&P 500 derivatives, backed by a portfolio of Fixed Income Instruments. |
| • | The Portfolio’s benchmark, the S&P 500 Index, posted a total return of 3.44% for the 6 months ended June 30, 2004. U.S. equity market sentiment was generally bullish based on strong analyst forecasts for second quarter earnings, although concerns about potentially destabilizing influences including terrorism, the situation in Iraq, inflation management, and the upcoming election loomed. |
| • | In comparison, the Portfolio’s Institutional Class underperformed the S&P 500 Index by returning 3.03% for the same period. |
| • | Interest rates rose during the first half of the year, resulting in negative fixed-income returns. While the structural yield advantage provided by non-money market holdings boosted returns, the yield contribution was eclipsed by the sharp rise in rates. |
| • | Non-U.S. positions provided important diversification; short and intermediate maturity Eurozone issues outperformed U.S. alternatives amid expectations for slower growth and lower inflation in Europe. |
| • | Exposure to real return bonds was positive for the first half of the year in general, as these securities benefited from strong demand for the inflation protection they provide. |
| • | Curve strategies detracted from performance, as the Portfolio emphasized one to five year maturities relative to five year and longer maturity instruments. Rates on one to five year yields increased more than yields of five years or longer. |
| • | Mortgage exposure provided diversification and incremental yield relative to money markets as the sector benefited from spread narrowings. |
| • | Other strategies, including small positions in emerging market bonds, corporate bonds, and municipal bonds, were neutral for performance while adding important diversification. |
| | | | |
| June 30, 2004 | | Semi-Annual Report | | 3 |
Financial Highlights
StocksPLUS Growth and Income Portfolio (Institutional Class)
| | | | | | | | | | | | | | | | | | | | | | | | | | | | | | |
| Selected Per Share Data for the Year or Period Ended: | | | | 06/30/2004+ | | | | | 12/31/2003 | | | | | 12/31/2002 | | | | | 12/31/2001 | | | | | 04/28/2000-
12/31/2000 | |
| | | | | | | | | | |
Net asset value beginning of period | | | | $ | 9.29 | | | | | $ | 7.27 | | | | | $ | 9.36 | | | | | $ | 11.05 | | | | | $ | 13.21 | |
Net investment income (a) | | | | | 0.06 | (e) | | | | | 0.14 | (e) | | | | | 0.26 | (e) | | | | | 0.49 | (e) | | | | | 0.57 | (e) |
Net realized/unrealized gain (loss) on investments (a) | | | | | 0.22 | (e) | | | | | 2.06 | (e) | | | | | (2.13 | )(e) | | | | | (1.75 | )(e) | | | | | (1.56 | )(e) |
Total income (loss) from investment operations | | | | | 0.28 | | | | | | 2.20 | | | | | | (1.87 | ) | | | | | (1.26 | ) | | | | | (0.99 | ) |
Dividends from net investment income | | | | | (0.05 | ) | | | | | (0.18 | ) | | | | | (0.22 | ) | | | | | (0.43 | ) | | | | | (0.63 | ) |
Distributions from net realized capital gains | | | | | 0.00 | | | | | | 0.00 | | | | | | 0.00 | | | | | | 0.00 | | | | | | (0.54 | ) |
Total distributions | | | | | (0.05 | ) | | | | | (0.18 | ) | | | | | (0.22 | ) | | | | | (0.43 | ) | | | | | (1.17 | ) |
Net asset value end of period | | | | $ | 9.52 | | | | | $ | 9.29 | | | | | $ | 7.27 | | | | | $ | 9.36 | | | | | $ | 11.05 | |
Total return | | | | | 3.03 | % | | | | | 30.44 | % | | | | | (20.08 | )% | | | | | (11.28 | )% | | | | | (7.91 | )% |
Net assets end of period (000s) | | | | $ | 3,479 | | | | | $ | 2,203 | | | | | $ | 786 | | | | | $ | 187 | | | | | $ | 63 | |
Ratio of net expenses to average net assets | | | | | 0.50 | %* | | | | | 0.50 | % | | | | | 0.50 | %(d) | | | | | 0.52 | %(b)(c) | | | | | 0.50 | %* |
Ratio of net investment income to average net assets | | | | | 1.29 | %*(e) | | | | | 1.65 | %(e) | | | | | 3.28 | %(e) | | | | | 4.98 | %(e) | | | | | 6.41 | %*(e) |
Portfolio turnover rate | | | | | 48 | % | | | | | 134 | % | | | | | 192 | % | | | | | 547 | % | | | | | 350 | % |
| (a) | Per share amounts based on average number of shares outstanding during the period. |
| (b) | Ratio of expenses to average net assets excluding interest expense is 0.50%. |
| (c) | If the investment manager had not reimbursed expenses, the ratio of expenses to average net assets would have been 0.53%. |
| (d) | If the investment manager had not reimbursed expenses, the ratio of expenses to average net assets would have been 0.51%. |
| (e) | Indicates a period in which, as a result of a change in generally accepted accounting principles, the portfolio has reclassified periodic payments made or received under certain derivative instruments, which were previously included within miscellaneous income, to a component of realized gain(loss) in the Statement of Operations. The effect of this reclassification was to (reduce) the net investment income ratio for the period ending June 30, 2004 by (0.10)% and the net investment income per share by $(0.01). For consistency, similar reclassifications have been made to prior period amounts, resulting in increases(reductions) to the net investment income ratio of (0.66)%, 0.44%, 0.38% and 0.62% and to the net investment income per share of $(0.05), $0.03, $0.04 and $0.08 in the fiscal years or periods ending December 31, 2003, 2002, 2001, and 2000, respectively. This change had no impact on the reported net asset value per share for any period. |
| | | | | | |
| 4 | | Semi-Annual Report | | June 30, 2004 | | See accompanying notes |
Statement of Assets and Liabilities
StocksPLUS Growth and Income Portfolio
June 30, 2004 (Unaudited)
| | | | | | |
| Amounts in thousands, except per share amounts | | | | | |
| | |
Assets: | | | | | | |
| | |
Investments, at value | | | | $ | 266,611 | |
Cash | | | | | 1 | |
Foreign currency, at value | | | | | 1,035 | |
Unrealized appreciation on forward foreign currency contracts | | | | | 13 | |
Receivable for Portfolio shares sold | | | | | 6 | |
Interest and dividends receivable | | | | | 653 | |
Variation margin receivable | | | | | 1,884 | |
| | | | | | 270,203 | |
| | |
Liabilities: | | | | | | |
| | |
Payable for Portfolio shares redeemed | | | | $ | 317 | |
Accrued investment advisory fee | | | | | 88 | |
Accrued administration fee | | | | | 22 | |
Accrued servicing fee | | | | | 33 | |
Variation margin payable | | | | | 807 | |
Recoupment payable to Manager | | | | | 4 | |
Swap premiums received | | | | | 1 | |
Other liabilities | | | | | 9 | |
| | | | | | 1,281 | |
| | |
Net Assets | | | | $ | 268,922 | |
| | |
Net Assets Consist of: | | | | | | |
| | |
Paid in capital | | | | $ | 350,143 | |
(Overdistributed) net investment income | | | | | (90 | ) |
Accumulated undistributed net realized (loss) | | | | | (82,868 | ) |
Net unrealized appreciation | | | | | 1,737 | |
| | | | | $ | 268,922 | |
| | |
Net Assets: | | | | | | |
| | |
Institutional Class | | | | $ | 3,479 | |
Administrative Class | | | | | 265,443 | |
| | |
Shares Issued and Outstanding: | | | | | | |
| | |
Institutional Class | | | | | 365 | |
Administrative Class | | | | | 28,000 | |
| | |
Net Asset Value and Redemption Price Per Share
(Net Assets Per Share Outstanding) | | | | | | |
| | |
Institutional Class | | | | $ | 9.52 | |
Administrative Class | | | | | 9.48 | |
| | |
Cost of Investments Owned | | | | $ | 266,818 | |
Cost of Foreign Currency Held | | | | $ | 1,029 | |
| | | | | | |
| See accompanying notes | | June 30, 2004 | | Semi-Annual Report | | 5 |
Statement of Operations
StocksPLUS Growth and Income Portfolio
| | | | | | |
| Amounts in thousands | | | | | |
| | | | | Six Months Ended
June 30, 2004
(Unaudited) | |
Investment Income: | | | | | | |
| | |
Interest | | | | $ | 2,379 | |
Dividends | | | | | 39 | |
Total Income | | | | | 2,418 | |
| | |
Expenses: | | | | | | |
| | |
Investment advisory fees | | | | | 538 | |
Administration fees | | | | | 135 | |
Distribution and/or servicing fees - Administrative Class | | | | | 199 | |
Trustees’ fees | | | | | 2 | |
Miscellaneous expense | | | | | 5 | |
Total Expenses | | | | | 879 | |
| | |
Net Investment Income | | | | | 1,539 | |
| | |
Net Realized and Unrealized Gain (Loss): | | | | | | |
| | |
Net realized gain on investments | | | | | 78 | |
Net realized gain on futures contracts and swaps | | | | | 16,963 | |
Net realized (loss) on foreign currency transactions | | | | | (44 | ) |
Net change in unrealized (depreciation) on investments | | | | | (442 | ) |
Net change in unrealized (depreciation) on futures contracts
and swaps | | | | | (10,257 | ) |
Net change in unrealized appreciation on translation of
assets and liabilities denominated in foreign currencies | | | | | 20 | |
Net Gain | | | | | 6,318 | |
| | |
Net Increase in Assets Resulting from Operations | | | | $ | 7,857 | |
| | | | | | |
| 6 | | Semi-Annual Report | | June 30, 2004 | | See accompanying notes |
Statements of Changes in Net Assets
StocksPLUS Growth and Income Portfolio
| | | | | | | | | | | | |
| Amounts in thousands | | | | | | | | | | |
| | | | | Six Months Ended
June 30, 2004
(Unaudited) | | | | | Year Ended
December 31, 2003 | |
Increase (Decrease) in Net Assets from: | | | | | | | | | | | | |
| | | | |
Operations: | | | | | | | | | | | | |
| | | | |
Net investment income | | | | $ | 1,539 | | | | | $ | 3,744 | |
Net realized gain | | | | | 16,997 | | | | | | 49,061 | |
Net change in unrealized appreciation (depreciation) | | | | | (10,679 | ) | | | | | 12,945 | |
Net increase resulting from operations | | | | | 7,857 | | | | | | 65,750 | |
| | | | |
Distributions to Shareholders: | | | | | | | | | | | | |
| | | | |
From net investment income | | | | | | | | | | | | |
Institutional Class | | | | | (19 | ) | | | | | (39 | ) |
Administrative Class | | | | | (1,439 | ) | | | | | (5,180 | ) |
Total Distributions | | | | | (1,458 | ) | | | | | (5,219 | ) |
| | | | |
Portfolio Share Transactions: | | | | | | | | | | | | |
| | | | |
Receipts for shares sold | | | | | | | | | | | | |
Institutional Class | | | | | 1,799 | | | | | | 1,004 | |
Administrative Class | | | | | 13,449 | | | | | | 59,278 | |
| | | | |
Issued as reinvestment of distributions | | | | | | | | | | | | |
Institutional Class | | | | | 19 | | | | | | 39 | |
Administrative Class | | | | | 1,439 | | | | | | 5,180 | |
| | | | |
Cost of shares redeemed | | | | | | | | | | | | |
Institutional Class | | | | | (603 | ) | | | | | (51 | ) |
Administrative Class | | | | | (23,663 | ) | | | | | (75,677 | ) |
Net decrease resulting from Portfolio share transactions | | | | | (7,560 | ) | | | | | (10,227 | ) |
| | | | |
Total Increase (Decrease) in Net Assets | | | | | (1,161 | ) | | | | | 50,304 | |
| | | | |
Net Assets: | | | | | | | | | | | | |
| | | | |
Beginning of period | | | | | 270,083 | | | | | | 219,779 | |
End of period* | | | | $ | 268,922 | | | | | $ | 270,083 | |
| | | | |
*Including (overdistributed) net investment income of: | | | | $ | (90 | ) | | | | $ | (171 | ) |
| | | | | | |
| See accompanying notes | | June 30, 2004 | | Semi-Annual Report | | 7 |
Schedule of Investments
StocksPLUS Growth and Income Portfolio
June 30, 2004 (Unaudited)
| | | | |
| | | Principal | | |
| | | Amount | | Value |
| | | (000s) | | (000s) |
| | | | | | |
CORPORATE BONDS & NOTES 5.6% |
Banking & Finance 2.9% | | | | | | |
Ford Motor Credit Co. | | | | | | |
7.500% due 03/15/2005 | | $ | 300 | | $ | 310 |
General Motors Acceptance Corp. | | | |
3.340% due 03/04/2005 (a) | | | 900 | | | 909 |
2.400% due 10/20/2005 (a) | | | 1,500 | | | 1,513 |
Pemex Project Funding Master Trust | | | |
2.640% due 01/07/2005 (a) | | | 3,900 | | | 3,907 |
Verizon Wireless Capital LLC | | | | | | |
1.350% due 05/23/2005 (a) | | | 1,100 | | | 1,099 |
| | | | | |
|
|
| | | | | | | 7,738 |
| | | | | |
|
|
Industrials 0.9% | | | | | | |
Alcan, Inc. | | | | | | |
1.623% due 12/08/2004 (a) | | | 1,200 | | | 1,200 |
DaimlerChrysler N.A. Holding Corp. | | | |
2.386% due 09/26/2005 (a) | | | 200 | | | 201 |
Enron Corp. | | | | | | |
8.000% due 08/15/2005 (b) | | | 1,700 | | | 663 |
Waste Management, Inc. | | | | | | |
7.000% due 10/01/2004 | | | 300 | | | 303 |
| | | | | |
|
|
| | | | | | | 2,367 |
| | | | | |
|
|
Utilities 1.8% | | | | | | |
Entergy Gulf States, Inc. | | | | | | |
2.433% due 06/18/2007 (a) | | | 2,500 | | | 2,507 |
Pacific Gas & Electric Co. | | | | | | |
1.810% due 04/03/2006 (a) | | | 2,400 | | | 2,402 |
| | | | | |
|
|
| | | | | | | 4,909 |
| | | | | |
|
|
| Total Corporate Bonds & Notes (Cost $16,005) | | | | | | 15,014 |
| | | | | |
|
|
| | | | | | | |
MUNICIPAL BONDS & NOTES 0.8% |
|
Golden State Tobacco
Securitization Corp. Revenue Bonds, Series 2003 |
5.000% due 06/01/2021 | | | 915 | | | 896 |
North Carolina State
Educational Assistance Authority Revenue Bonds,
(GTD Insured), Series 2000 |
1.470% due 06/01/2009 (a) | | | 1,279 | | | 1,281 |
| | | | | |
|
|
| Total Municipal Bonds & Notes (Cost $2,190) | | | | | | 2,177 |
| | | | | |
|
|
| | | | | | | |
U.S. GOVERNMENT AGENCIES 5.1% |
| | |
Fannie Mae | | | | | | |
6.500% due 09/01/2005 | | | 17 | | | 18 |
5.213% due 04/01/2033 (a) | | | 564 | | | 567 |
5.090% due 09/01/2034 (a) | | | 906 | | | 922 |
4.797% due 12/01/2036 (a) | | | 844 | | | 872 |
6.000% due 04/01/2013- 11/01/2033 (e) | | | 859 | | | 895 |
5.000% due 12/01/2017- 09/01/2018 (e) | | | 1,581 | | | 1,588 |
8.000% due 05/01/2030- 09/01/2031 (e) | | | 132 | | | 143 |
Freddie Mac | | | | | | |
5.500% due 11/15/2015- 08/15/2030 (e) | | | 715 | | | 725 |
6.000% due 07/01/2016- 05/01/2033 (e) | | | 2,286 | | | 2,342 |
6.500% due 08/01/2032- 10/25/2043 (e) | | | 1,429 | | | 1,492 |
Government National Mortgage Association | | | |
4.750% due 08/20/2024 (a) | | | 40 | | | 41 |
3.375% due 02/20/2027 (a) | | | 351 | | | 351 |
3.500% due 05/20/2028 (a) | | | 702 | | | 697 |
4.000% due 11/20/2029 (a) | | | 428 | | | 430 |
8.500% due 04/20/2030 | | | 10 | | | 11 |
| | | | | | | |
| | |
4.375% due 04/20/2024- 04/20/2027 (a)(e) | | $ | 1,553 | | | $ | 1,556 |
8.000% due 04/15/2027- 02/15/2031 (e) | | | 856 | | | | 940 |
| | | | | | |
|
|
Total U.S. Government Agencies
(Cost $13,668) | | | | 13,590 |
| | | | | | |
|
|
| | | | | | | | |
U.S. TREASURY OBLIGATIONS 5.9% |
| |
Treasury Inflation Protected Securities (d) | | | | |
3.625% due 01/15/2008 (c) | | | 14,196 | | | | 15,518 |
3.875% due 01/15/2009 | | | 115 | | | | 128 |
3.500% due 01/15/2011 | | | 324 | | | | 360 |
| | | | | | |
|
|
| Total U.S. Treasury Obligations (Cost $15,065) | | | | | | | 16,006 |
| | | | | | |
|
|
| | | | | | | | |
MORTGAGE-BACKED SECURITIES 7.1% |
| |
Amortizing Residential Collateral Trust | | | | |
1.620% due 07/25/2032 (a) | | | 456 | | | | 457 |
Bank of America Mortgage Securities, Inc. | | | | |
6.500% due 10/25/2031 | | | 643 | | | | 643 |
Bear Stearns Adjustable Rate Mortgage Trust |
5.974% due 06/25/2032 (a) | | | 249 | | | | 252 |
5.380% due 01/25/2033 (a) | | | 666 | | | | 670 |
4.357% due 01/25/2034 (a) | | | 693 | | | | 697 |
4.802% due 01/25/2034 (a) | | | 1,341 | | | | 1,346 |
Countrywide Alternative Loan Trust | | | | |
5.875% due 07/25/2032 | | | 10 | | | | 10 |
6.000% due 10/25/2033 | | | 1,226 | | | | 1,233 |
CS First Boston Mortgage Securities Corp. | | | | |
1.700% due 02/25/2032 (a) | | | 140 | | | | 141 |
1.430% due 03/25/2032 (a) | | | 634 | | | | 632 |
1.727% due 03/25/2032 (a) | | | 1,454 | | | | 1,459 |
5.738% due 05/25/2032 (a) | | | 361 | | | | 367 |
5.192% due 06/25/2032 (a) | | | 113 | | | | 113 |
6.222% due 06/25/2032 (a) | | | 196 | | | | 199 |
DLJ Mortgage Acceptance Corp. | | | | |
1.800% due 06/25/2026 (a) | | | 110 | | | | 110 |
GSR Mortgage Loan Trust | | | | | | | |
1.650% due 01/25/2034 (a) | | | 296 | | | | 296 |
Housing Securities, Inc. | | | | | | | |
1.789% due 07/25/2032 (a) | | | 41 | | | | 40 |
Impac CMB Trust | | | | | | | |
1.680% due 10/25/2033 (a) | | | 178 | | | | 178 |
1.550% due 01/25/2034 (a) | | | 946 | | | | 947 |
Mellon Residential Funding Corp. | | | | |
1.478% due 06/15/2030 (a) | | | 1,491 | | | | 1,481 |
Merrill Lynch Mortgage Investors, Inc. | | | | |
4.910% due 12/25/2032 (a) | | | 271 | | | | 271 |
Morgan Stanley Dean Witter Capital I, Inc. | | | | |
5.500% due 04/25/2017 | | | 259 | | | | 264 |
Prime Mortgage Trust | | | | | | | |
1.500% due 02/25/2034 (a) | | | 140 | | | | 140 |
1.700% due 02/25/2034 (a) | | | 424 | | | | 424 |
Resecuritization Mortgage Trust | | | | | | | |
1.570% due 04/26/2021 (a) | | | 21 | | | | 20 |
Residential Funding Mortgage Securities I, Inc. | | | | | | | |
6.500% due 03/25/2032 | | | 554 | | | | 563 |
Salomon Brothers Mortgage Securities VII, Inc. | | | | | | | |
4.591% due 12/25/2030 (a) | | | 510 | | | | 521 |
Structured Asset Securities Corp. | | | | |
1.600% due 10/25/2027 (a) | | | 642 | | | | 642 |
| |
Washington Mutual Mortgage Securities Corp. | | | | |
6.000% due 03/25/2017 | | | 129 | | | | 131 |
5.420% due 02/25/2033 (a) | | | 1,575 | | | | 1,599 |
3.052% due 02/27/2034 (a) | | | 857 | | | | 858 |
2.624% due 08/25/2042 (a) | | | 2,505 | | | | 2,531 |
| | | | | | |
|
|
| Total Mortgage-Backed Securities (Cost $19,303) | | | | | | | 19,235 |
| | | | | | |
|
|
| | | | | | | |
ASSET-BACKED SECURITIES 1.6% |
| |
Ameriquest Mortgage Securities, Inc. | | | | |
1.610% due 06/25/2032 (a) | | $ | 108 | | | $ | 108 |
Chase Funding Mortgage Loan Asset-Backed Certificates | | | | | | | |
1.670% due 10/25/2032 (a) | | | 503 | | | | 505 |
Countrywide Asset-Backed Certificates | | | | |
1.440% due 11/25/2020 (a) | | | 225 | | | | 225 |
1.560% due 05/25/2032 (a) | | | 1,011 | | | | 1,013 |
CS First Boston Mortgage Securities Corp. | | | | |
1.610% due 01/25/2032 (a) | | | 314 | | | | 314 |
1.630% due 03/25/2034 (a) | | | 353 | | | | 353 |
Home Equity Mortgage Trust | | | | | | | |
1.550% due 04/25/2034 (a) | | | 536 | | | | 537 |
Residential Asset Securities Corp. | | | | |
1.420% due 06/25/2025 (a) | | | 691 | | | | 691 |
Structured Asset Investment Loan Trust | | | | |
1.440% due 08/25/2010 (a) | | | 500 | | | | 500 |
| | | | | | |
|
|
| Total Asset-Backed Securities (Cost $4,240) | | | | | | | 4,246 |
| | | | | | |
|
|
| | | | | | | | |
SOVEREIGN ISSUES 1.1% | | | | | | | |
| | |
Republic of Brazil | | | | | | | |
2.062% due 04/15/2006 (a) | | | 832 | | | | 821 |
2.125% due 04/15/2009 (a) | | | 1,235 | | | | 1,123 |
United Mexican States | | | | | | | |
1.840% due 01/13/2009 (a) | | | 900 | | | | 919 |
| | | | | | |
|
|
Total Sovereign Issues
(Cost $2,881) | | | | | | | 2,863 |
| | | | | | |
|
|
| | | | | | | | |
PURCHASED PUT OPTIONS 0.0% | | | | |
| | | # of
Contracts | | | |
Eurodollar September Futures (CME) | | | | |
Strike @ 97.250 Exp. 09/13/2004 | | | 216 | | | | 4 |
Strike @ 93.250 Exp. 03/14/2005 | | | 36 | | | | 0 |
S&P 500 Index September Futures | | | | |
Strike @ 700.000 Exp. 09/17/2004 | | | 155 | | | | 4 |
| | | | | | |
|
|
| Total Purchased Put Options (Cost $9) | | | | | | | 8 |
| | | | | | |
|
|
| | | | | | | | |
PREFERRED SECURITY 0.7% | | | | |
| | | Shares | | | |
DG Funding Trust | �� | | | | | | |
3.360% due 12/29/2049 (a) | | | 173 | | | | 1,860 |
| | | | | | |
|
|
Total Preferred Security
(Cost $1,823) | | | | | | | 1,860 |
| | | | | | |
|
|
| | | | | | | | |
SHORT-TERM INSTRUMENTS 71.2% | | | | |
| | | Principal
Amount (000)s | | | |
Commercial Paper 66.5% | | | | | | | |
AB Spintab | | | | | | | |
1.490% due 09/02/2004 | | $ | 1,400 | | | | 1,396 |
Altria Group, Inc. | | | | | | | |
1.800% due 10/29/2004 | | | 400 | | | | 398 |
Anz (Delaware), Inc. | | | | | | | |
1.060% due 07/19/2004 | | | 5,200 | | | | 5,197 |
Bank of Ireland | | | | | | | |
1.285% due 09/03/2004 | | | 7,300 | | | | 7,281 |
Barclays U.S. Funding Corp. | | | | | | | |
1.110% due 08/25/2004 | | | 200 | | | | 200 |
CBA (de) Finance | | | | | | | |
1.050% due 07/02/2004 | | | 4,100 | | | | 4,100 |
1.080% due 07/27/2004 | | | 4,000 | | | | 3,997 |
CDC Commercial Paper, Inc. | | | | | | | |
1.085% due 08/04/2004 | | | 3,400 | | | | 3,396 |
1.120% due 08/24/2004 | | | 2,100 | | | | 2,096 |
1.320% due 09/10/2004 | | | 1,600 | | | | 1,595 |
| | | | | | |
| 8 | | Semi-Annual Report | | June 30, 2004 | | See accompanying notes |
| | | | |
| | | Principal | | |
| | | Amount | | Value |
| | | (000s) | | (000s) |
| | | | | | |
| | |
Danske Corp. | | | | | | |
1.070% due 07/21/2004 | | $ | 200 | | $ | 200 |
1.070% due 07/26/2004 | | | 400 | | | 400 |
1.260% due 09/14/2004 | | | 2,500 | | | 2,492 |
1.240% due 09/17/2004 | | | 1,700 | | | 1,695 |
European Investment Bank | | | | | | |
1.050% due 07/16/2004 | | | 4,700 | | | 4,698 |
Fannie Mae | | | | | | |
1.030% due 07/01/2004 | | | 1,300 | | | 1,300 |
1.025% due 07/07/2004 | | | 2,700 | | | 2,700 |
1.040% due 07/14/2004 | | | 2,700 | | | 2,699 |
1.045% due 07/21/2004 | | | 3,200 | | | 3,198 |
1.060% due 07/21/2004 | | | 7,300 | | | 7,296 |
1.177% due 08/25/2004 | | | 2,600 | | | 2,595 |
1.180% due 08/25/2004 | | | 300 | | | 299 |
1.225% due 09/01/2004 | | | 4,600 | | | 4,589 |
1.230% due 09/01/2004 | | | 2,700 | | | 2,693 |
1.250% due 09/01/2004 | | | 2,700 | | | 2,693 |
1.200% due 09/08/2004 | | | 100 | | | 100 |
1.426% due 09/22/2004 | | | 2,700 | | | 2,691 |
1.530% due 10/18/2004 | | | 2,700 | | | 2,687 |
Federal Home Loan Bank | | | | | | |
1.250% due 07/01/2004 | | | 5,000 | | | 5,000 |
1.165% due 07/16/2004 | | | 2,700 | | | 2,699 |
1.170% due 07/16/2004 | | | 2,700 | | | 2,699 |
1.180% due 08/25/2004 | | | 800 | | | 799 |
1.240% due 09/01/2004 | | | 1,400 | | | 1,397 |
1.250% due 09/01/2004 | | | 2,700 | | | 2,693 |
Freddie Mac | | | | | | |
1.070% due 07/06/2004 | | | 2,700 | | | 2,700 |
1.200% due 08/09/2004 | | | 1,500 | | | 1,498 |
1.280% due 09/07/2004 | | | 2,700 | | | 2,693 |
1.440% due 09/14/2004 | | | 2,700 | | | 2,692 |
1.445% due 09/14/2004 | | | 500 | | | 498 |
1.435% due 09/21/2004 | | | 7,300 | | | 7,275 |
1.436% due 09/30/2004 | | | 800 | | | 797 |
1.560% due 10/20/2004 | | | 2,700 | | | 2,687 |
General Electric Capital Corp. | | | | | | |
1.040% due 07/08/2004 | | | 500 | | | 500 |
1.060% due 07/09/2004 | | | 7,500 | | | 7,498 |
1.110% due 08/13/2004 | | | 200 | | | 200 |
HBOS Treasury Services PLC | | | | | | |
1.035% due 07/01/2004 | | | 400 | | | 400 |
1.055% due 07/16/2004 | | | 100 | | | 100 |
1.055% due 07/16/2004 | | | 600 | | | 600 |
1.640% due 10/26/2004 | | | 500 | | | 497 |
KFW International Finance, Inc. | | | | | | |
1.095% due 08/10/2004 | | | 6,300 | | | 6,292 |
1.110% due 08/20/2004 | | | 3,800 | | | 3,794 |
Nestle Capital Corp. | | | | | | |
1.110% due 08/25/2004 | | | 5,100 | | | 5,091 |
1.110% due 08/26/2004 | | | 3,100 | | | 3,095 |
Pfizer, Inc. | | | | | | |
1.300% due 08/17/2004 | | | 5,200 | | | 5,191 |
Royal Bank of Scotland PLC | | | | | | |
1.030% due 07/06/2004 | | | 500 | | | 500 |
1.090% due 08/06/2004 | | | 2,100 | | | 2,098 |
1.135% due 08/26/2004 | | | 500 | | | 499 |
1.135% due 09/01/2004 | | | 3,000 | | | 2,993 |
Shell Finance (UK) PLC | | | | | | |
1.035% due 07/02/2004 | | | 7,300 | | | 7,300 |
1.230% due 08/11/2004 | | | 700 | | | 699 |
Svenska Handlesbanken | | | | | | |
1.070% due 07/21/2004 | | | 7,300 | | | 7,296 |
1.090% due 08/05/2004 | | | 700 | | | 699 |
TotalFinaElf Capital S.A. | | | | | | |
1.420% due 07/01/2004 | | | 1,700 | | | 1,700 |
UBS Finance, Inc. | | | | | | |
1.055% due 07/13/2004 | | | 800 | | | 800 |
1.195% due 07/21/2004 | | | 3,800 | | | 3,797 |
1.240% due 08/31/2004 | | | 1,100 | | | 1,097 |
1.245% due 09/13/2004 | | | 1,600 | | | 1,595 |
1.265% due 09/20/2004 | | | 700 | | | 698 |
| | | | | | |
| | |
Westpac Capital Corp. | | | | | | |
1.385% due 09/10/2004 | | $ | 3,200 | | $ | 3,191 |
| | | | | |
|
|
| | | | | | | 179,028 |
| | | | | |
|
|
| | | | | | | |
Repurchase Agreement 0.4% | | | | | | |
State Street Bank | | | | | | |
0.800% due 07/01/2004 | | | 1,060 | | | 1,060 |
| | | | | |
|
|
(Dated 06/30/2004. Collateralized by Freddie Mac 5.500% due 07/15/2006 valued at $1,082. Repurchase proceeds are $1,060.) |
| | | | | | | |
U.S. Treasury Bills 4.3% | | | | | | |
1.190% due 09/02/2004-09/16/2004 (c)(e) | | | 11,555 | | | 11,524 |
| | | | | |
|
|
| Total Short-Term Instruments (Cost $191,634) | | | | | | 191,612 |
| | | | | |
|
|
| | | | | | | |
Total Investments 99.1% | | | | | $ | 266,611 |
(Cost $266,818) | | | | | | |
| | | | | | | |
Other Assets and Liabilities (Net) 0.9% | | | 2,311 |
| | | | | |
|
|
| | | | | | | |
Net Assets 100.0% | | | | | $ | 268,922 |
| | | | | |
|
|
Notes to Schedule of Investments
(amounts in thousands, except number of contracts):
(a) Variable rate security.
(b) Security is in default.
(c) Securities with an aggregate market value of $22,977
have been segregated with the custodian to cover margin requirements for the following open futures contracts at
June 30, 2004:
| | | | | | | | | | |
| Type | | Expiration
Month | | # of
Contracts | | | | Unrealized
Appreciation/
(Depreciation) | |
Eurodollar March Long Futures | | 03/2005 | | 9 | | | | $ | (13 | ) |
Eurodollar March Long Futures | | 03/2006 | | 24 | | | | | (70 | ) |
Eurodollar June Long Futures | | 06/2005 | | 32 | | | | | (99 | ) |
Eurodollar September Long Futures | | 09/2005 | | 31 | | | | | (95 | ) |
Eurodollar December Long Futures | | 12/2004 | | 7 | | | | | (3 | ) |
Eurodollar December Long Futures | | 12/2005 | | 31 | | | | | (95 | ) |
Euribor December Long Futures | | 12/2005 | | 90 | | | | | (69 | ) |
Euribor June
Long Futures | | 06/2005 | | 76 | | | | | (15 | ) |
| | | | | | | | | | |
| Type | | Expiration
Month | | # of
Contracts | | | | Unrealized
Appreciation/
(Depreciation) | |
Euribor Purchase Put Options
Strike @ 94.500 | | 06/2005 | | 90 | | | | $ | (1 | ) |
Euribor Purchased Put Options | | | | | | | | |
Strike @ 93.000 | | 12/2004 | | 55 | | | | | (1 | ) |
Euribor Purchased Put Options | | | | | | | | |
Strike @ 95.000 | | 03/2005 | | 47 | | | | | (1 | ) |
Euribor September Long Futures | | 09/2005 | | 62 | | | | | (23 | ) |
Euribor Written Put Options | | | | | | | | |
Strike @ 97.000 | | 12/2004 | | 10 | | | | | 10 | |
Euribor Written Put Options | | | | | | | | |
Strike @ 97.500 | | 09/2004 | | 10 | | | | | 3 | |
Euro-Bobl 5-Year
Note Long Futures | | 09/2004 | | 31 | | | | | 9 | |
S & P 500 Index December | | | | | | | | |
Long Futures | | 12/2004 | | 11 | | | | | (2 | ) |
S&P 500 Index September | | | | | | | | |
Long Futures | | 09/2004 | | 883 | | | | | 2,096 | |
U.S. Treasury 10-Year
Note Long Futures | | 09/2004 | | 61 | | | | | (117 | ) |
U.S. Treasury 5-Year
Note Long Futures | | 09/2004 | | 41 | | | | | (41 | ) |
United Kingdom 90-Day LIBOR Purchased
Put Options
Strike @ 92.500 | | 09/2004 | | 64 | | | | | (1 | ) |
| | | | | | | | | $ | 1,472 | |
(d) Principal amount of security is adjusted for inflation.
(e) Securities are grouped by coupon or range of coupons and represent a range of maturities.
(f) Swap agreements outstanding at June 30, 2004:
| | | | | | | | |
Type | |
| Notional
Amount | | | |
| Unrealized
Appreciation |
Receive total return on S&P 500 Index and
pay a floating rate based on 1-month LIBOR
plus 0.040%. |
Counterparty: Credit Suisse First Boston | | | |
Exp. 04/29/2005 | | $ | 4 | | | | $ | 0 |
| |
| Receive total return on S&P 500 Index and pay a floating rate based on 1-month LIBOR plus 0.050%. | | | |
| Counterparty: Credit Suisse First Boston Exp. 06/17/2005 | | | 5 | | | | | 0 |
| | | | | | | | $ | 0 |
(g) Forward foreign currency contracts outstanding at June 30, 2004:
| | | | | | | | | | | | | | | |
| Type | | Currency | | Principal
Amount
Covered by
Contract | | Settlement Month | | Unrealized
Appreciation | | Unrealized
(Depreciation) | | Net Unrealized
Appreciation |
Sell | | EC | | 931 | | 07/2004 | | $ | 13 | | $ | 0 | | $ | 13 |
(h) Principal amount denoted in indicated currency:
| | | | | | |
| See accompanying notes | | June 30, 2004 | | Semi-Annual Report | | 9 |
Notes to Financial Statements
June 30, 2004 (Unaudited)
1. Organization
The StocksPLUS Growth and Income Portfolio (the “Portfolio”) is a series of the PIMCO Variable Insurance Trust (the “Trust”). The Trust is registered under the Investment Company Act of 1940 (the “Act”), as amended, as an open-end investment company organized as a Delaware business trust on October 3, 1997. The Portfolio offers two classes of shares: Institutional and Administrative. Each share class has identical voting rights (except that shareholders of a class have exclusive voting rights regarding any matter relating solely to that class of shares). Information presented in these financial statements pertains to the Institutional Class of the Portfolio. Certain detailed financial information for the Administrative Class is provided separately and is available upon request. The Trust is designed to be used as an investment vehicle by Separate Accounts of insurance companies that fund variable annuity contracts and variable life insurance policies and by qualified pension and retirement plans. The Portfolio commenced operations on December 31, 1997.
2. Significant Accounting Policies
The following is a summary of significant accounting policies consistently followed by the Trust in the preparation of its financial statements in conformity with accounting principles generally accepted in the United States of America. The preparation of financial statements in accordance with accounting principles generally accepted in the United States of America requires management to make estimates and assumptions that affect the reported amounts and disclosures in the financial statements. Actual results could differ from those estimates.
Security Valuation. Portfolio securities and other financial instruments for which market quotations are readily available are stated at market value. Portfolio securities and other financial instruments for which market quotes are not readily available are valued at fair value, as determined in good faith and pursuant to guidelines established by the Board of Trustees, including certain fixed income securities which may be valued with reference to securities whose prices are more readily obtainable. Market value is determined at the close of regular trading (normally, 4:00 p.m., Eastern Time) on the New York Stock Exchange on each day the New York Stock Exchange is open, or if no sales are reported, as is the case for most securities traded over-the-counter, the mean between representative bid and asked quotations obtained from a quotation reporting system or from established market makers. The prices of certain portfolio securities or other financial instruments may be determined at a time prior to the close of regular trading on the New York Stock Exchange. Fair valuation may be used if significant events occur after the close of the relevant markets and prior to the close of regular trading on the New York Stock Exchange that materially affect the values of such securities or financial instruments. Fixed income securities are normally valued on the basis of quotes obtained from brokers and dealers or pricing services. Certain fixed income securities purchased on a delayed delivery basis are marked to market daily until settlement at the forward settlement value. Short-term investments, which mature in 60 days or less are valued at amortized cost, which approximates market value. Exchange traded options, futures and options on futures are valued at the settlement price determined by the relevant exchange. Prices may be obtained from independent pricing services which use information provided by market makers or estimates of market values obtained from yield data relating to investments or securities with similar characteristics. The prices used by the Portfolio may differ from the value that would be realized if the securities were sold and the differences could be material to the financial statements.
Securities Transactions and Investment Income. Securities transactions are recorded as of the trade date. Securities purchased or sold on a when-issued or delayed delivery basis may be settled a month or more after the trade date. Realized gains and losses from securities sold are recorded on the identified cost basis. Dividend income is recorded on the ex-dividend date, except certain dividends from foreign securities where the ex-dividend date may have passed, are recorded as soon as the Portfolio is informed of the ex-dividend date. Interest income, adjusted for the accretion of discounts and amortization of premiums, is recorded on the accrual basis. Paydowns gains and losses on mortgage- and asset-backed securities are recorded as adjustments to interest income in the Statement of Operations.
Dividends and Distributions to Shareholders. Dividends from net investment income, if any, are declared and distributed to shareholders quarterly. All dividends are reinvested in additional shares of the Portfolio. Net realized capital gains earned by the Portfolio, if any, will be distributed no less frequently than once each year.
Income dividends and capital gain distributions are determined in accordance with income tax regulations which may differ from accounting principles generally accepted in the United States of America. These differences are primarily due to differing treatments for such items as wash sales, foreign currency transactions, net operating losses, notional principal contracts, certain asset-backed securities, certain futures and forward contracts, tax straddles, and capital loss carryforwards.
Distributions classified as a tax basis return of capital, if any, are reflected in the accompanying Statements of Changes in Net Assets and have been reclassified to paid in capital. In addition, other amounts have been reclassified between undistributed net investment income, accumulated undistributed net realized gains or losses and/or paid in capital to more appropriately conform financial accounting to tax characterizations of dividend distributions.
Multiclass Operations. Each class offered by the Trust has equal rights as to assets. Income, non-class specific expenses, and realized and unrealized capital gains and losses are allocated to each class of shares based on the relative net assets of each class.
Federal Income Taxes. The Portfolio intends to qualify as a regulated investment company and distribute all of its taxable
| | | | |
| 10 | | Semi-Annual Report | | June 30, 2004 |
income and net realized gains, if applicable, to shareholders. Accordingly, no provision for Federal income taxes has been made.
Foreign Currency. The accounting records of the Portfolio are maintained in U.S. dollars. The market values of foreign securities, currency holdings and other assets and liabilities are translated into U.S. dollars based on the current exchange rates each business day. Fluctuations in the value of these assets and liabilities resulting from changes in exchange rates are recorded as unrealized foreign currency gains or losses. Realized gains or losses and unrealized appreciation or depreciation on investment securities and income and expenses are translated on the respective dates of such transactions. The effect of changes in foreign currency exchange rates on investments in securities are not segregated in the Statement of Operations from the effects of changes in market prices of those securities, but are included with the net realized and unrealized gain or loss on investment securities.
Forward Currency Transactions. The Portfolio may enter into forward currency contracts and forward cross-currency contracts in connection with settling planned purchases or sales of securities, to hedge the currency exposure associated with some or all of the Portfolio’s securities or as a part of an investment strategy. A forward currency contract is an agreement between two parties to buy and sell a currency at a set price on a future date. The market value of a forward currency contract fluctuates with changes in forward currency exchange rates. Forward currency contracts are marked to market daily and the change in value is recorded by the Portfolio as an unrealized gain or loss. Realized gains or losses equal to the difference between the value of the contract at the time it was opened and the value at the time it was closed are recorded upon delivery or receipt of the currency or, if a forward currency contract is offset by entering into another forward currency contract with the same broker, upon settlement of the net gain or loss. These contracts may involve market risk in excess of the unrealized gain or loss reflected in the Portfolio’s Statement of Assets and Liabilities. In addition, the Portfolio could be exposed to risk if the counterparties are unable to meet the terms of the contracts or if the value of the currency changes unfavorably to the U.S. dollar.
Futures Contracts. The Portfolio is authorized to enter into futures contracts. The Portfolio may use futures contracts to manage its exposure to the securities markets or to movements in interest rates and currency values. The primary risks associated with the use of futures contracts are the imperfect correlation between the change in market value of the securities held by the Portfolio and the prices of futures contracts, the possibility of an illiquid market, and the inability of the counterparty to meet the terms of the contract. Futures contracts are valued based upon their quoted daily settlement prices. Upon entering into a futures contract, the Portfolio may be required to deposit with its custodian, in a segregated account in the name of the futures broker, an amount of cash or U.S. Government and Agency Obligations in accordance with the initial margin requirements of the broker or exchange. Futures contracts are marked to market daily and an appropriate payable or receivable for the change in value (“variation margin”) is recorded by the Portfolio. Gains or losses are recognized but not considered realized until the contracts expire or are closed. Futures contracts involve, to varying degrees, risk of loss in excess of the variation margin disclosed in the Statement of Assets and Liabilities.
Inflation-Indexed Bonds. The Portfolio may invest in inflation-indexed bonds. Inflation-indexed bonds are fixed income securities whose principal value is periodically adjusted to the rate of inflation. The interest rate on these bonds is generally fixed at issuance at a rate lower than typical bonds. Over the life of an inflation-indexed bond, however, interest will be paid based on a principal value, which is adjusted for inflation. Any increase in the principal amount of an inflation-indexed bond will be included as interest income in the Statement of Operations, even though investors do not receive their principal until maturity.
Options Contracts. The Portfolio may write call and put options on futures, swaps, securities or currencies it owns or in which it may invest. Writing put options tends to increase the Portfolio’s exposure to the underlying instrument. Writing call options tends to decrease the Portfolio’s exposure to the underlying instrument. When the Portfolio writes a call or put option, an amount equal to the premium received is recorded as a liability and subsequently marked to market to reflect the current value of the option written. These liabilities are reflected as written options outstanding in the Statement of Assets and Liabilities. Payments received or made, if any, from writing options with premiums to be determined on a future date are reflected as such on the Statement of Assets and Liabilities. Premiums received from writing options which expire are treated as realized gains. Premiums received from writing options which are exercised or closed are added to the proceeds or offset against amounts paid on the underlying future, swap, security or currency transaction to determine the realized gain or loss. The Portfolio as a writer of an option has no control over whether the underlying future, swap, security or currency may be sold (call) or purchased (put) and as a result bears the market risk of an unfavorable change in the price of the future, swap, security or currency underlying the written option. There is the risk the Portfolio may not be able to enter into a closing transaction because of an illiquid market.
The Portfolio may also purchase put and call options. Purchasing call options tends to increase the Portfolio’s exposure to the underlying instrument. Purchasing put options tends to decrease the Portfolio’s exposure to the underlying instrument. The Portfolio pays a premium which is included in the Portfolio’s Statement of Assets and Liabilities as an investment and subsequently marked to market to reflect the current value of the option. Premiums paid for purchasing options which expire are treated as realized losses. The risk associated with purchasing put and call options is limited to the premium paid. Premiums paid for purchasing options which are exercised or closed are added to the amounts paid or offset against the proceeds on the underlying future, swap, security or currency transaction to determine the realized gain or loss.
| | | | |
| June 30, 2004 | | Semi-Annual Report | | 11 |
Notes to Financial Statements (Cont.)
June 30, 2004 (Unaudited)
Repurchase Agreements. The Portfolio may engage in repurchase transactions. Under the terms of a typical repurchase agreement, the Portfolio takes possession of an underlying debt obligation subject to an obligation of the seller to repurchase, and the Portfolio to resell, the obligation at an agreed-upon price and time. The market value of the collateral must be equal at all times to the total amount of the repurchase obligations, including interest. Generally, in the event of counterparty default, the Portfolio has the right to use the collateral to offset losses incurred.
Swap Agreements. The Portfolio may invest in swap agreements. A swap is an agreement to exchange the return generated by one instrument for the return generated by another instrument. The Portfolio may enter into interest rate, total return, forward spread lock, and credit default swap agreements to manage its exposure to interest rates and credit risk.
Interest rate swap agreements involve the exchange by the Portfolio with another party of their respective commitments to pay or receive interest, e.g., an exchange of floating rate payments for fixed rate payments with respect to the notional amount of principal.
Total return swap agreements involve commitments to pay interest in exchange for a market-linked return, both based on notional amounts. To the extent the total return of the security or index underlying the transaction exceeds or falls short of the offsetting interest rate obligation, the Portfolio will receive a payment from or make a payment to the counterparty.
Forward spread lock swap agreements involve commitments to pay or receive a settlement amount calculated as the difference between the swap spread and a fixed spread, multiplied by the notional amount times the duration of the swap. The swap spread is the difference between the benchmark swap rate (market rate) and the specific Treasury rate.
In a credit default swap, one party makes a stream of payments to another party in exchange for the right to receive a specified return in the event of a default by a third party, typically corporate issues or sovereign issues of an emerging country, on its obligation. The Portfolio may use credit default swaps to provide a measure of protection against defaults of sovereign issuers (i.e., to reduce risk where the Portfolio owns or has exposure to the sovereign issuer) or to take an active long or short position with respect to the likelihood of a particular issuer’s default.
Swaps are marked to market daily based upon quotations from market makers and the change in value, if any, is recorded as unrealized gain or loss in the Statement of Operations. Payments received or made at the beginning of the measurement period are reflected as such on the Statement of Assets and Liabilities. A liquidation payment received or made at the termination of the swap is recorded as realized gain or loss in the Statement of Operations. Net periodic payments received by the Portfolio are included as part of realized gain(loss) on the Statement of Operations. Entering into these agreements involves, to varying degrees, elements of credit, market and documentation risk in excess of the amounts recognized on the Statement of Assets and Liabilities. Such risks involve the possibility that there will be no liquid market for these agreements, that the counterparty to the agreements may default on its obligation to perform or disagree as to the meaning of contractual terms in the agreements, and that there may be unfavorable changes in interest rates.
As a result of a FASB Emerging Issues Task Force (“EITF”) consensus, No. 03-11, and related SEC staff guidance, the Portfolio has reclassified periodic payments made or received under swap agreements, which were previously included within miscellaneous income, to a component of realized gain(loss) in the Statement of Operations. For consistency, similar reclassifications have been made to amounts appearing in the previous year’s Statement of Changes in Net Assets and the per share amounts in the prior year financial highlights. Prior year net investment income ratios in the financial highlights have also been modified accordingly. This reclassification increased(decreased) net investment income by $(286,748) and $(1,563,813), and net realized gain by $392,411 and $1,004,989 and net change in unrealized appreciation(depreciation) by $(105,663) and $558,823 for the six months ended June 30, 2004 and year ended December 31, 2003, respectively. There is no effect on the Portfolio’s net asset value, either in total or per share, or its total increase(decrease) in net assets from operations during any period.
3. Fees, Expenses, and Related Party Transactions
Investment Advisory Fee. Pacific Investment Management Company LLC (“PIMCO”) is a majority owned subsidiary partnership of Allianz Dresdner Asset Management of America L.P. and serves as investment adviser (the “Adviser”) to the Trust, pursuant to an investment advisory contract. The Adviser receives a monthly fee at an annual rate based on average daily net assets of the Portfolio. The Advisory Fee is charged at an annual rate of 0.40%.
Administration Fee. PIMCO serves as administrator (the “Administrator”), and provides administrative services to the Trust for which it receives a monthly administrative fee based on average daily net assets of the Portfolio. The Administration Fee is charged at the annual rate of 0.10%.
Servicing Fee. PA Distributors LLC (“PAD”), formerly known as PIMCO Advisors Distributors LLC, is an indirect wholly-owned subsidiary of Allianz Dresdner Asset Management of America L.P. and serves as the distributor of the Trust’s shares. The Trust is permitted to reimburse PAD on a quarterly basis, out of the Administrative Class assets of the Portfolio in the amount of 0.15% on an annual basis of the average daily net assets of that class, for payments made to financial intermediaries that provide services in connection with the distribution of shares or administration of plans or programs that use Portfolio shares as their funding medium. The effective rate paid to PAD was 0.15% during current fiscal year.
Expenses. The Trust is responsible for the following expenses: (i) salaries and other compensation of any of the Trust’s executive officers and employees who are not officers, directors, stockholders or employees of PIMCO or its subsidiaries or affiliates; (ii) taxes and governmental fees; (iii) brokerage fees and commissions and other portfolio transaction expenses; (iv) the cost of borrowing money,
| | | | |
| 12 | | Semi-Annual Report | | June 30, 2004 |
including interest expense and bank overdraft charges; (v) fees and expenses of the Trustees who are not “interested persons” of PIMCO or the Trust, and any counsel retained exclusively for their benefit; (vi) extraordinary expenses, including costs of litigation and indemnification expenses; (vii) organization expenses and (viii) any expenses allocated or allocable to a specific class of shares, which include service fees payable with respect to the Administrative Class shares and may include certain other expenses as permitted by the Trust’s Multiple Class Plan adopted pursuant to Rule 18f-3 under the Act and subject to review and approval by the Trustees. The ratio of expenses to average net assets per share class, as disclosed in Financial Highlights, may differ from the annual portfolio operating expenses per share class as disclosed in the Prospectus for the reasons set forth above.
PIMCO has agreed to waive a portion of its administrative fees to the extent that the payment of the Portfolio’s pro rata share of organization expenses and Trustee fees cause the actual expense ratio to rise above the rates disclosed in the then-current prospectus plus 0.49 basis points as set forth below (calculated as a percentage of the Portfolio’s average daily net assets attributable to each class):
| | | |
Institutional Class | | 0.50 | % |
Administrative Class | | 0.65 | % |
PIMCO may be reimbursed for these waived amounts in future periods, not to exceed thirty-six months. Expenses that have been waived and may still be reimbursed by the Administrator, to the extent the Portfolio’s annualized total portfolio operating expenses plus the amount so reimbursed does not exceed the operating expense limitation, are as follows (amounts in thousands):
| | | | | | | | | | | | |
| | | Year of Waiver
|
| | | | 12/31/2001 | | | 12/31/2002 | | | 12/31/2003 | | | 06/30/2004 |
Amount Available for Reimbursement | | $ | 0 | | $ | 28 | | $ | 0 | | $ | 0 |
Each unaffiliated Trustee receives an annual retainer of $4,000, plus $1,500 for each Board of Trustees meeting attended in person and $250 for each meeting attended telephonically, plus reimbursement of related expenses. In addition, each committee chair receives an additional annual retainer of $500. These expenses are allocated on a pro-rata basis to each Portfolio of the Trust according to its respective net assets.
4. Purchases and Sales of Securities
The length of time a Portfolio has held a particular security is not generally a consideration in investment decisions. A change in the securities held by a Portfolio is known as “portfolio turnover.” The Portfolio may engage in frequent and active trading of portfolio securities to achieve its investment objective, particularly during periods of volatile market movements. High portfolio turnover (e.g., over 100%) involves correspondingly greater expenses to the Portfolio, including brokerage commissions or dealer mark-ups and other transaction costs on the sale of securities and reinvestments in other securities. Such sales may also result in realization of taxable capital gains, including short-term capital gains (which are generally taxed at ordinary income tax rates). The trading costs and tax effects associated with portfolio turnover may adversely affect the Portfolio’s performance.
Purchases and sales of securities (excluding short-term investments) for the period ended June 30, 2004 were as follows (amounts in thousands):
| | | | | | |
| U.S. Government/Agency | | All Other |
| Purchases | | Sales | | Purchases | | Sales |
| $ 12,078 | | $ 19,735 | | $ 31,893 | | $ 25,638 |
5. Transactions in Written Call and Put Options
Transactions in written call and put options were as follows (amounts in thousands):
| | | | |
| | | Premium | |
Balance at 12/31/2003 | | $ | 88 | |
Sales | | | 149 | |
Closing Buys | | | 0 | |
Expirations | | | (237 | ) |
| Exercised | | | 0 | |
| Balance at 06/30/2004 | | $ | 0 | |
6. Federal Income Tax Matters
At June 30, 2004, the aggregate cost of investments was the same for federal income tax and financial statement purposes. The net unrealized appreciation (depreciation) of investment securities for federal income tax purposes is as follows (amounts in thousands):
| | | | |
Aggregate Gross
Unrealized
Appreciation | | Aggregate Gross
Unrealized
(Depreciation) | | Net Unrealized
Depreciation |
| $ 1,166 | | $ (1,373) | | $ (207) |
| | | | |
| June 30, 2004 | | Semi-Annual Report | | 13 |
Notes to Financial Statements (Cont.)
June 30, 2004 (Unaudited)
7. Shares of Beneficial Interest
The Trust may issue an unlimited number of shares of beneficial interest with a $.001 par value. Changes in shares of beneficial interest were as follows (shares and amounts in thousands):
| | | | | | | | | | | | | | |
| | | Six Months Ended
06/30/2004 | | | Year Ended
12/31/2003 | |
| | | Shares | | | Amount | | | Shares | | | Amount | |
Receipts for shares sold | | | | | | | | | | | | | | |
| | | | |
Institutional Class | | 190 | | | $ | 1,799 | | | 131 | | | $ | 1,004 | |
Administrative Class | | 1,430 | | | | 13,448 | | | 7,716 | | | | 59,278 | |
| | | | |
Issued as reinvestment of distributions | | | | | | | | | | | | | | |
| | | | |
Institutional Class | | 2 | | | | 19 | | | 4 | | | | 39 | |
Administrative Class | | 153 | | | | 1,439 | | | 610 | | | | 5,180 | |
| | | | |
Cost of shares redeemed | | | | | | | | | | | | | | |
| | | | |
Institutional Class | | (64 | ) | | | (603 | ) | | (6 | ) | | | (51 | ) |
Administrative Class | | (2,520 | ) | | | (23,663 | ) | | (9,593 | ) | | | (75,677 | ) |
| | | | |
Net decrease resulting from Portfolio share transactions | | (809 | ) | | $ | (7,561 | ) | | (1,138 | ) | | $ | (10,227 | ) |
The following schedule shows the number of shareholders each owning 5% or more of the Portfolio and the total percentage of the Portfolio held by such shareholders:
| | | | |
| | | Number | | % of Portfolio Held |
Institutional Class | | 1 | | 98 |
Administrative Class | | 3 | | 92 |
8. Regulatory and Litigation Matters
On February 17, 2004, the Attorney General of the State of New Jersey (“New Jersey AG”) filed a complaint against Allianz Dresdner Asset Management of America L.P. (“ADAM”), PA Distributors LLC (formerly known as PIMCO Advisors Distributors LLC) (“PAD”), PEA Capital LLC (formerly known as PIMCO Equity Advisors LLC) (“PEA”), and Pacific Investment Management Company LLC (“PIMCO”) in connection with its investigation into market timing and late trading. The complaint contends that inappropriate trading by shareholders engaged in market timing activity took place in funds in the PIMCO Funds: Multi-Manager Series (“MMS Funds”) and the PIMCO Funds: Pacific Investment Management Series (“PIMS Funds”). On June 1, 2004, the New Jersey AG dismissed PIMCO from the lawsuit.
On the same day as the dismissal of PIMCO from the lawsuit, the New Jersey AG announced that it had reached a settlement agreement with the remaining defendants (“New Jersey Settlement”). In the New Jersey Settlement, ADAM, PAD and PEA agreed, while neither admitting nor denying the allegations or conclusions of law, to: (i) pay New Jersey a civil fine of $15 million and $3 million for investigative costs and further enforcement initiatives; and (ii) implement certain changes in corporate governance.
On May 6, 2004, the Securities and Exchange Commission filed a complaint in the U.S. District Court in the Southern District of New York alleging that PA Fund Management LLC (formerly known as PIMCO Advisors Fund Management LLC) (“PAFM”), PEA, PAD, Stephen J. Treadway (at the time, the chief executive officer of PAFM and PAD as well as chairman of the Board of Trustees of the MMS Funds) and Kenneth W. Corba (the former chief executive officer of PEA and former portfolio manager of the PEA Growth and PEA Growth & Income Funds) had, among other things, violated and/or aided and abetted violations of, various antifraud provisions of the federal securities laws in connection with alleged “market timing” arrangements that improperly allowed certain hedge funds to engage in “market timing” in the PEA Growth Fund, the PEA Opportunity Fund, the PEA Innovation Fund, and the PEA Target Fund. The complaint seeks injunctive relief, disgorgement plus pre-judgment interest, monetary penalties, and an order permanently enjoining the defendants from serving as investment advisers, principal underwriters, officers, directors, or members of any advisory boards to any registered investment companies.
On February 20, 2004, a putative class action lawsuit was filed in the U.S. District Court for the District of New Jersey on behalf of certain shareholders of the PIMCO Funds against ADAM, PAD, PIMCO, PEA, the PIMS Funds, the MMS Funds, the Trust, PIMCO Commercial Mortgage Securities Trust, Inc. and certain other defendants, alleging that inappropriate market timing activity by certain shareholders caused financial injury to the shareholders of those Funds.
| | | | |
| 14 | | Semi-Annual Report | | June 30, 2004 |
The following additional putative class action lawsuits have been filed against the PIMS Funds, the MMS Funds and/or their affiliates, each related to alleged market-timing activity in funds advised by PIMCO or its affiliates: (1) a lawsuit filed in the U.S. District Court for the District of Connecticut on February 27, 2004 (naming as defendants ADAM, PAD, PEA, the PIMS Funds, the MMS Funds, the Trust, PCM and certain other parties); (2) a lawsuit filed in the U.S. District Court for the Central District of California on March 4, 2004 (naming as defendants PIMCO, ADAM, PEA and PAD); (3) a lawsuit filed in the U.S. District Court for the Southern District of New York on March 8, 2004 (naming PIMCO, PAD and certain of their affiliates as defendants); (4) a lawsuit filed in the U.S. District Court for the Southern District of New York, on March 15, 2004 (naming PIMCO as the defendant); (5) two separate lawsuits filed in the U.S. District Court for the Central District of California on March 22, 2004, brought derivatively on behalf of the PIMCO High Yield Fund and the PIMCO Money Market Fund, respectively (each naming ADAM, PAFM and certain other parties as defendants, and the PIMCO Funds as the nominal defendant); (6) a lawsuit filed in the U.S. District Court for the Central District of California, also on March 22, 2004, brought derivatively on behalf of the PIMS Funds and the MMS Funds (naming ADAM, PIMCO, PAD and certain other parties as defendants, and the PIMS Funds and the MMS Funds as nominal defendants); (7) a lawsuit filed in the U.S. District Court for the District of New Jersey on April 20, 2004 (naming ADAM, PAD, the PIMS Funds and certain other parties as defendants); and (8) a lawsuit filed in the U.S. District Court for the Northern District of California on April 28, 2004 (naming ADAM, PIMCO, PAD, PEA and certain other parties as defendants, and the “PIMCO Funds” as nominal defendants). Each complaint for the foregoing putative class actions alleges, among other things, that inappropriate trading by shareholders engaged in market timing activities took place in certain of the funds advised by PIMCO, and each complaint seeks unspecified compensatory damages.
On February 17, 2004, a putative class action lawsuit was filed in the U.S. District Court for the District of Connecticut on behalf of certain shareholders of the PIMCO Funds against ADAM, PEA, PIMCO, PIMS Funds, MMS Funds and certain other defendants, alleging excessive investment advisory fees and the use of brokerage commissions to pay for distribution of fund shares. Three similar putative class action lawsuits were subsequently filed, each in the U.S. District Court for the District of Connecticut on March 1, 2004, April 23, 2004 and May 20, 2004, respectively.
Under Section 9(a) of the 1940 Act, if any of the various lawsuits were to result in a court injunction against PAFM, PEA, PAD, PIMCO, ADAM and/or Mr. Treadway, they and their affiliates would, in the absence of exemptive relief granted by the SEC, be barred from serving as an investment adviser/sub-adviser or principal underwriter for any registered investment company, including the Trust. ADAM and certain of its subsidiaries have responded to inquiries from the SEC concerning the status of the New Jersey Settlement under Section 9(a). If any of PAFM, PEA, PAD, PIMCO or ADAM were subject to an injunction, each of these entities and their affiliates could in turn seek exemptive relief from the SEC, as contemplated by the 1940 Act. There is no assurance, however, that such exemptive relief would be granted. The SEC also has the power by order to prohibit PAFM, PEA, PAD and PIMCO from serving as investment advisers and underwriters, if the SEC finds that such entities willfully violated the federal securities laws in connection with the allegations discussed above or aided or abetted such violations.
PIMCO, PAD and the Trust believe that these developments will not have a material adverse effect on the Portfolios or on PIMCO’s, or PAD’s ability to perform their respective investment advisory or distribution services on behalf of the Portfolios.
| | | | |
| June 30, 2004 | | Semi-Annual Report | | 15 |
Trustees and Officers
Brent R. Harris, Chairman and Trustee
R. Wesley Burns, President and Trustee
E. Philip Cannon, Trustee
Vern O. Curtis, Trustee
J. Michael Hagan, Trustee
William J. Popejoy, Trustee
Garlin G. Flynn, Secretary
John P. Hardaway, Treasurer
Investment Adviser and Administrator
Pacific Investment Management Company LLC
840 Newport Center Drive
Newport Beach, California 92660
Distributor
PA Distributors LLC
2187 Atlantic Street
Stamford, Connecticut 06902
Custodian
State Street Bank & Trust Company
801 Pennsylvania
Kansas City, Missouri 64105
Transfer Agent
Boston Financial Data Services–Midwest
330 W. 9th Street
Kansas City, Missouri 64105
Legal Counsel
Dechert LLP
1775 I Street, N.W.
Washington, D.C. 20006
Independent Registered Public Accounting Firm
PricewaterhouseCoopers LLP
1055 Broadway
Kansas City, Missouri 64105
Information about how the Fund voted proxies relating to portfolio securities held during the year July 1, 2003 through June 30, 2004 will be available no later than August 31, 2004 without charge, upon request, by calling the Trust at 1-800-927-4648 and on the SEC’s website at http://www.sec.gov.
Copies of the written Proxy Policy and the factors that PIMCO may consider in determining how to vote proxies for the Funds are available by calling the Trust at 1-800-927-4648 and on the SEC’s website at http://www.sec.gov.
PIMCO VARIABLE INSURANCE TRUST
840 NEWPORT CENTER DRIVE
NEWPORT BEACH, CA 92660

PIMCO VARIABLE INSURANCE TRUST
LONG-TERM U.S. GOVERNMENT PORTFOLIO
INSTITUTIONAL CLASS
SEMI-ANNUAL REPORT
June 30, 2004
|
| This material is authorized for use only when preceded or accompanied by the current PIMCO Variable Insurance Trust prospectus. Investors should consider the investment objectives, risks, charges and expenses of Portfolio carefully before investing. This and other information is contained in the Portfolio’s prospectus. Please read the prospectus carefully before you invest or send money. |
Chairman’s Letter
Dear PIMCO Variable Insurance Trust Shareholder:
Bond prices were more volatile during the six-month period ended June 30, 2004. Interest rates rose sharply during the second quarter 2004, causing bonds to give back modest gains from earlier in the year. The Lehman Brothers Aggregate Bond Index, a widely used index for the high-grade bond market, was nearly flat during the first six months of 2004, returning 0.15% after losing 2.44% during the second quarter. The yield on the benchmark ten-year Treasury closed June 30, 2004 at 4.58%, up 0.75% from April 1, 2004, but up only 0.34% from where it began the six-month period on January 1, 2004.
Continued growth in employment convinced the markets that the Federal Reserve would soon begin a long anticipated tightening cycle. On June 30, 2004, the Fed met market expectations by increasing the federal funds rate 0.25%, which was the first rate increase since June 25, 2003. The central bank had held this rate at 1% for more than a year, which generated negative real short-term rates. And on August 10, 2004, the Fed increased the federal funds rate another 0.25% to 1.50%.
Investors that had profited handsomely from borrowing at low short-term rates and investing in higher-yielding longer maturity bonds surrendered some of those profits towards the latter part of the six-month period. Concern that borrowing rates would rise led investors to liquidate long positions and unwind these trades, which caused bond prices to decrease. However, substantial leverage remained among banks, hedge funds, and other investors, making bond markets somewhat vulnerable to additional Fed rate increases. There were also signs of rising inflation, which fueled anxiety that central banks might continue to raise interest rates.
On the following pages you will find a more complete review of the Portfolio in light of financial market activities as well as specific details about the total return investment performance for the six-month period.
We appreciate the trust you have placed in us, and we will continue to focus our efforts to meet your investment needs.
Sincerely,

Brent R. Harris
Chairman
August 11, 2004
| | | | |
| June 30, 2004 | | Semi-Annual Report | | 1 |
Important Information About the Portfolio
We believe that bond funds have an important role to play in a well diversified investment portfolio. It is important to note, however, that in an environment where interest rates may trend upward, rising rates will negatively impact the performance of most bond funds, and fixed income securities held by a fund are likely to decrease in value. The price volatility of fixed income securities can also increase during periods of rising interest rates resulting in increased losses to a fund. Bond funds and individual bonds with a longer duration (a measure of the expected life of a security) tend to be more sensitive to changes in interest rates, usually making them more volatile than securities or funds with shorter durations. The longer-term performance of most bond funds has benefited from capital gains in part resulting from an extended period of declining interest rates. In the event interest rates increase, these capital gains should not be expected to recur.
The Portfolio may be subject to various risks in addition to those described above. Some of these risks may include, but are not limited to, the following: real rate risk, derivative risk, small company risk, foreign security risk, high yield security risk and specific sector investment risks. The Portfolio may use derivative instruments for hedging purposes or as part of an investment strategy. Use of these instruments may involve certain costs and risks such as liquidity risk, interest rate risk, market risk, credit risk, management risk and the risk that a fund could not close out a position when it would be most advantageous to do so. A Portfolio investing in derivatives could lose more than the principal amount invested in these instruments. Investing in non-U.S. securities may entail risk due to non-U.S. economic and political developments; this risk may be enhanced when investing in emerging markets. High-yield bonds typically have a lower credit rating than other bonds. Lower rated bonds generally involve a greater risk to principal than higher rated bonds. Smaller companies may be more volatile than larger companies and may entail more risk. Concentrating investments in individual sectors may add additional risk and volatility compared to a diversified portfolio.
On the performance summary page in this semi-annual report, the Total Return Investment Performance table measures performance assuming that all dividend and capital gain distributions were reinvested. Returns do not reflect the deduction of taxes that a shareholder would pay (i) on Portfolio distributions or (ii) the redemption of Portfolio shares.
An investment in a Portfolio is not a bank deposit and is not guaranteed or insured by the Federal Deposit Insurance Corporation or any other government agency. It is possible to lose money on investments in the Funds.
The following disclosure provides important information regarding the Portfolio’s Expense Example, which appears on the Portfolio’s individual page in this semi-annual report. Please refer to this information when reviewing the Expense Example for the Portfolio.
Example
As a shareholder of the Portfolio, you incur two types of costs: (1) transaction costs, including redemption and exchange fees; and (2) ongoing costs, including advisory and administrative fees; distribution and/or service (12b-1) fees (Administrative Class only); and other Portfolio expenses. The Example is intended to help you understand your ongoing costs (in dollars) of investing in the Portfolio and to compare these costs with the ongoing costs of investing in other mutual funds.
The Example is based on an investment of $1,000 invested at the beginning of the period and held for the entire period indicated, which is from 1/1/04 to 6/30/04.
Actual Expenses
The information in the table under the heading “Actual Performance” provides information about actual account values and actual expenses. You may use the information in these columns, together with the amount you invested, to estimate the expenses that you paid over the period. Simply divide your account value by $1,000.00 (for example, an $8,600.00 account value divided by $1,000 = 8.60), then multiply the result by the number in the appropriate column for your share class, in the row entitled “Expenses Paid During Period” to estimate the expenses you paid on your account during this period.
Hypothetical Example for Comparison Purposes
The information in the table under the heading “Hypothetical Performance (5% return before expenses)” provides information about hypothetical account values and hypothetical expenses based on the Portfolio’s actual expense ratio and an assumed rate of return of 5% per year before expenses, which is not the Portfolio’s actual return. The hypothetical account values and expenses may not be used to estimate the actual ending account balance or expenses you paid for the period. You may use this information to compare the ongoing costs of investing in the Portfolio and other portfolios. To do so, compare this 5% hypothetical example with the 5% hypothetical examples that appear in the shareholder reports of the other portfolios.
Please note that the expenses shown in the table are meant to highlight your ongoing costs only and do not reflect any transactional costs. Therefore, the information under the heading “Hypothetical Performance (5% return before expenses)” is useful in comparing ongoing costs only, and will not help you determine the relative total costs of owning different portfolios. In addition, if these transactional costs were included, your costs would have been higher.
PIMCO Variable Insurance Trust is distributed by PA Distributors LLC, 2187 Atlantic Street, Stamford, CT 06902.
| | | | |
| 2 | | Semi-Annual Report | | June 30, 2004 |
Long-Term U.S. Government Portfolio
CUMULATIVE RETURNS THROUGH JUNE 30, 2004
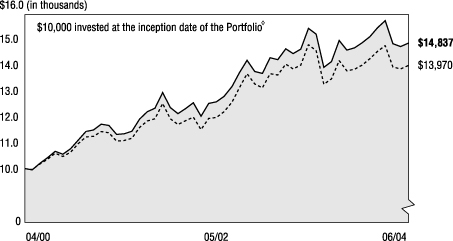
[CHART]
Long-Term U.S. Gov't Lehman Brothers
Portfolio Inst. Class Long-Term Treasury Index
--------------------- ------------------------
04/30/2000 $10,000 $10,000
05/31/2000 $9,957 $9,964
06/30/2000 $10,207 $10,180
07/31/2000 $10,414 $10,355
08/31/2000 $10,668 $10,591
09/30/2000 $10,552 $10,463
10/31/2000 $10,765 $10,626
11/30/2000 $11,097 $10,962
12/31/2000 $11,429 $11,220
01/31/2001 $11,485 $11,239
02/28/2001 $11,708 $11,431
03/31/2001 $11,657 $11,374
04/30/2001 $11,320 $11,065
05/31/2001 $11,346 $11,079
06/30/2001 $11,443 $11,174
07/31/2001 $11,908 $11,590
08/31/2001 $12,192 $11,838
09/30/2001 $12,328 $11,927
10/31/2001 $12,935 $12,512
11/30/2001 $12,346 $11,918
12/31/2001 $12,118 $11,694
01/31/2002 $12,311 $11,844
02/28/2002 $12,532 $11,982
03/31/2002 $12,016 $11,498
04/30/2002 $12,509 $11,935
05/31/2002 $12,572 $11,972
06/30/2002 $12,779 $12,187
07/31/2002 $13,164 $12,562
08/31/2002 $13,690 $13,111
09/30/2002 $14,173 $13,657
10/31/2002 $13,741 $13,265
11/30/2002 $13,674 $13,118
12/31/2002 $14,272 $13,656
01/31/2003 $14,197 $13,609
02/28/2003 $14,618 $14,021
03/31/2003 $14,437 $13,845
04/30/2003 $14,609 $13,986
05/31/2003 $15,400 $14,772
06/30/2003 $15,178 $14,547
07/31/2003 $13,905 $13,246
08/31/2003 $14,128 $13,457
09/30/2003 $14,941 $14,158
10/31/2003 $14,569 $13,764
11/30/2003 $14,655 $13,830
12/31/2003 $14,850 $13,995
01/31/2004 $15,086 $14,235
02/29/2004 $15,433 $14,518
03/31/2004 $15,703 $14,739
04/30/2004 $14,807 $13,912
05/31/2004 $14,708 $13,844
06/30/2004 $14,837 $13,970
SECTOR BREAKDOWN‡
| | | |
U.S. Government Agencies | | 28.7 | % |
U.S. Treasury Obligations | | 23.3 | % |
Mortgage-Backed Securities | | 16.4 | % |
Corporate Bonds & Notes | | 12.8 | % |
Short-Term Instruments | | 7.9 | % |
Asset-Backed Securities | | 7.5 | % |
Other | | 3.4 | % |
‡ % of Total Investments as of June 30, 2004
à$10,000 invested at the beginning of the first full month following the inception of the Institutional Class.
TOTAL RETURN INVESTMENT PERFORMANCE For the period ended June 30, 2004
| | | | | | | | | | | | | |
| | | | | | | 6 Months | | | 1 Year | | | Since Inception* | |
| | |
| | Long-Term U.S. Government Portfolio Institutional Class (Inception 04/10/00) | | –0.09 | % | | –2.25 | % | | 9.13 | % |
| | | - - - - - - - | | Lehman Brothers Long-Term Treasury Index | | –0.17 | % | | –3.96 | % | | — | |
| | | | | * Annualized. All Portfolio returns are net of fees and expenses. | | | | | | | | | |
Past performance is no guarantee of future results. The performance quoted represents past performance. Investment return and principal value will fluctuate so the Portfolio shares, when redeemed, may be worth more or less than their original cost. Current performance may be lower or higher than the performance data quoted. Performance data current to the most recent month-end is available by calling (800) 927-4648.
Please refer to page 2 herein for an explanation of the information presented in the following Expense Example.
| | | | | | | | | | |
| EXPENSE EXAMPLE | | | | Actual Performance | | | | Hypothetical Performance
(5% return before expenses) |
Beginning Account Value (01/01/04) | | | | $ | 1,000.00 | | | | $ | 1,000.00 |
Ending Account Value (06/30/04) | | | | $ | 999.10 | | | | $ | 1,025.00 |
Expenses Paid During Period† | | | | $ | 2.49 | | | | $ | 2.52 |
†Expenses are equal to the Portfolio’s Institutional Class annualized expense ratio of 0.50%, multiplied by the average account value over the period, multiplied by 182/366 (to reflect the one-half year period).
PORTFOLIO INSIGHTS
| • | The Long-Term U.S. Government Portfolio seeks to achieve its investment objective by investing under normal circumstances at least 80% of its assets in a diversified portfolio of fixed income securities that are issued or guaranteed by the U.S. Government, its agencies or government-sponsored enterprises. |
| • | The Portfolio’s Institutional Class shares outperformed its benchmark, the Lehman Brothers Long-Term Treasury Index, for the 6-month period ended June 30, 2004, by returning –0.09% versus –0.17%. |
| • | Below-Index duration enhanced performance for the first half of the year as interest rates rose; however, an overweight to intermediate maturities negatively impacted the Portfolio, as these rates experienced the most dramatic rate increases. |
| • | Modest holdings of longer duration structured mortgages detracted slightly from performance despite decreasing levels of volatility. |
| • | An allocation to longer duration corporate securities negatively impacted portfolio performance, as long maturity credit issues lagged Treasuries of similar maturities. |
| • | Allocations to real return and municipal bonds helped returns; these less volatile assets outperformed amid rising rates. |
| • | A focus on high-quality, intermediate, and long maturity agency bonds was unfavorable for portfolio returns, as the sector’s yield premiums widened relative to Treasuries. |
| | | | |
| June 30, 2004 | | Semi-Annual Report | | 3 |
Financial Highlights
Long-Term U.S. Government Portfolio (Institutional Class)
| | | | | | | | | | | | | | | | | | | | | | | | | | | | | | |
| Selected Per Share Data for the Year or Period Ended: | | | | 06/30/2004+ | | | | | 12/31/2003 | | | | | 12/31/2002 | | | | | 12/31/2001 | | | | | 04/10/2000-
12/31/2000 | |
| | | | | | | | | | |
Net asset value beginning of period | | | | $ | 11.01 | | | | | $ | 11.09 | | | | | $ | 10.27 | | | | | $ | 10.56 | | | | | $ | 9.90 | |
Net investment income (a) | | | | | 0.18 | | | | | | 0.32 | | | | | | 0.46 | | | | | | 0.54 | | | | | | 0.43 | |
Net realized/unrealized gain (loss) on investments (a) | | | | | (0.19 | ) | | | | | 0.12 | | | | | | 1.31 | | | | | | 0.08 | | | | | | 0.66 | |
Total income (loss) from investment operations | | | | | (0.01 | ) | | | | | 0.44 | | | | | | 1.77 | | | | | | 0.62 | | | | | | 1.09 | |
Dividends from net investment income | | | | | (0.17 | ) | | | | | (0.35 | ) | | | | | (0.46 | ) | | | | | (0.54 | ) | | | | | (0.43 | ) |
Distributions from net realized capital gains | | | | | 0.00 | | | | | | (0.17 | ) | | | | | (0.49 | ) | | | | | (0.37 | ) | | | | | 0.00 | |
Total distributions | | | | | (0.17 | ) | | | | | (0.52 | ) | | | | | (0.95 | ) | | | | | (0.91 | ) | | | | | (0.43 | ) |
Net asset value end of period | | | | $ | 10.83 | | | | | $ | 11.01 | | | | | $ | 11.09 | | | | | $ | 10.27 | | | | | $ | 10.56 | |
Total return | | | | | (0.09 | )% | | | | | 4.05 | % | | | | | 17.77 | % | | | | | 6.03 | % | | | | | 11.32 | % |
Net assets end of period (000s) | | | | $ | 352 | | | | | $ | 13 | | | | | $ | 13 | | | | | $ | 11 | | | | | $ | 10 | |
Ratio of net expenses to average net assets | | | | | 0.50 | %* | | | | | 0.51 | %(c) | | | | | 0.50 | %(b) | | | | | 0.50 | % | | | | | 0.50 | %* |
Ratio of net investment income to average net assets | | | | | 3.37 | %* | | | | | 2.85 | % | | | | | 4.22 | % | | | | | 5.05 | % | | | | | 5.97 | %* |
Portfolio turnover rate | | | | | 161 | % | | | | | 619 | % | | | | | 586 | % | | | | | 457 | % | | | | | 553 | % |
| (a) | Per share amounts based on average number of shares outstanding during the period. |
| (b) | If the investment manager had not reimbursed expenses, the ratio of expenses to average net assets would have been 0.51%. |
| (c) | Ratio of expenses to average net assets excluding interest expense is 0.50%. |
| | | | | | |
| 4 | | Semi-Annual Report | | June 30, 2004 | | See accompanying notes |
Statement of Assets and Liabilities
Long-Term U.S. Government Portfolio
June 30, 2004 (Unaudited)
| | | | | |
| Amounts in thousands, except per share amounts | | | | |
| | |
Assets: | | | | | |
| | |
Investments, at value | | | | $ | 85,724 |
Cash | | | | | 12 |
Receivable for investments sold | | | | | 700 |
Receivable for investments sold on delayed delivery basis | | | | | 18,636 |
Receivable for Portfolio shares sold | | | | | 6 |
Interest and dividends receivable | | | | | 1,077 |
Variation margin receivable | | | | | 344 |
| | | | | | 106,499 |
| | |
Liabilities: | | | | | |
| | |
Payable for investments purchased | | | | $ | 2,080 |
Payable for investments purchased on delayed delivery basis | | | | | 20,242 |
Written options outstanding | | | | | 17 |
Accrued investment advisory fee | | | | | 17 |
Accrued administration fee | | | | | 17 |
Accrued servicing fee | | | | | 8 |
| | | | | | 22,381 |
| | |
Net Assets | | | | $ | 84,118 |
| | |
Net Assets Consist of: | | | | | |
| | |
Paid in capital | | | | $ | 83,362 |
Undistributed net investment income | | | | | 80 |
Accumulated undistributed net realized gain | | | | | 579 |
Net unrealized appreciation | | | | | 97 |
| | | | | $ | 84,118 |
| | |
Net Assets: | | | | | |
| | |
Institutional Class | | | | $ | 352 |
Administrative Class | | | | | 83,766 |
| | |
Shares Issued and Outstanding: | | | | | |
| | |
Institutional Class | | | | | 32 |
Administrative Class | | | | | 7,731 |
| | |
Net Asset Value and Redemption Price Per Share
(Net Assets Per Share Outstanding) | | | | | |
| | |
Institutional Class | | | | $ | 10.83 |
Administrative Class | | | | | 10.83 |
| | |
Cost of Investments Owned | | | | $ | 86,338 |
| | | | | | |
| See accompanying notes | | June 30, 2004 | | Semi-Annual Report | | 5 |
Statement of Operations
Long-Term U.S. Government Portfolio
| | | | | | |
| Amounts in thousands | | | | | |
| | | | | Six Months Ended June 30, 2004 (Unaudited) | |
Investment Income: | | | | | | |
| | |
Interest | | | | $ | 1,538 | |
Total Income | | | | | 1,538 | |
| | |
Expenses: | | | | | | |
| | |
Investment advisory fees | | | | | 111 | |
Administration fees | | | | | 111 | |
Distribution and/or servicing fees - Administrative Class | | | | | 66 | |
Trustees’ fees | | | | | 1 | |
Interest expense | | | | | 4 | |
Total Expenses | | | | | 293 | |
| | |
Net Investment Income | | | | | 1,245 | |
| | |
Net Realized and Unrealized Gain (Loss): | | | | | | |
| | |
Net realized gain on investments | | | | | 263 | |
Net realized gain on futures contracts and options | | | | | 217 | |
Net change in unrealized (depreciation) on investments | | | | | (1,919 | ) |
Net change in unrealized appreciation on futures contracts and options | | | | | 134 | |
Net (Loss) | | | | | (1,305 | ) |
| | |
Net Decrease in Assets Resulting from Operations | | | | $ | (60 | ) |
| | | | | | |
| 6 | | Semi-Annual Report | | June 30, 2004 | | See accompanying notes |
Statements of Changes in Net Assets
Long-Term U.S. Government Portfolio
| | | | | | | | | | | | |
| Amounts in thousands | | | | | | | | | | |
| | | | | Six Months Ended June 30, 2004 (Unaudited) | | | | | Year Ended
December 31, 2003 | |
Increase (Decrease) in Net Assets from: | | | | | | | | | | | | |
| | | | |
Operations: | | | | | | | | | | | | |
| | | | |
Net investment income | | | | $ | 1,245 | | | | | $ | 2,727 | |
Net realized gain | | | | | 480 | | | | | | 1,377 | |
Net change in unrealized (depreciation) | | | | | (1,785 | ) | | | | | (620 | ) |
Net increase (decrease) resulting from operations | | | | | (60 | ) | | | | | 3,484 | |
| | | | |
Distributions to Shareholders: | | | | | | | | | | | | |
| | | | |
From net investment income | | | | | | | | | | | | |
Institutional Class | | | | | (2 | ) | | | | | 0 | |
Administrative Class | | | | | (1,323 | ) | | | | | (3,025 | ) |
| | | | |
From net realized capital gains | | | | | | | | | | | | |
Institutional Class | | | | | 0 | | | | | | 0 | |
Administrative Class | | | | | 0 | | | | | | (1,459 | ) |
Total Distributions | | | | | (1,325 | ) | | | | | (4,484 | ) |
| | | | |
Portfolio Share Transactions: | | | | | | | | | | | | |
| | | | |
Receipts for shares sold | | | | | | | | | | | | |
Institutional Class | | | | | 339 | | | | | | 0 | |
Administrative Class | | | | | 11,160 | | | | | | 41,837 | |
| | | | |
Issued as reinvestment of distributions | | | | | | | | | | | | |
Institutional Class | | | | | 2 | | | | | | 1 | |
Administrative Class | | | | | 1,323 | | | | | | 4,476 | |
| | | | |
Cost of shares redeemed | | | | | | | | | | | | |
Institutional Class | | | | | (5 | ) | | | | | 0 | |
Administrative Class | | | | | (21,332 | ) | | | | | (43,567 | ) |
Net increase (decrease) resulting from Portfolio share transactions | | | | | (8,513 | ) | | | | | 2,747 | |
| | | | |
Total Increase (Decrease) in Net Assets | | | | | (9,898 | ) | | | | | 1,747 | |
| | | | |
Net Assets: | | | | | | | | | | | | |
| | | | |
Beginning of period | | | | | 94,016 | | | | | | 92,269 | |
End of period* | | | | $ | 84,118 | | | | | $ | 94,016 | |
| | | | |
*Including undistributed net investment income of: | | | | $ | 80 | | | | | $ | 159 | |
| | | | | | |
| See accompanying notes | | June 30, 2004 | | Semi-Annual Report | | 7 |
Schedule of Investments
Long-Term U.S. Government Portfolio
June 30, 2004 (Unaudited)
| | | | |
| | | Principal | | |
| | | Amount | | Value |
| | | (000s) | | (000s) |
| | | | | | |
CORPORATE BONDS & NOTES 13.1% | | | |
Banking & Finance 11.7% | | | | | | |
Ford Motor Credit Co. | | | | | | |
1.500% due 07/19/2004 (a) | | $ | 900 | | $ | 900 |
1.590% due 07/18/2005 (a) | | | 100 | | | 100 |
7.600% due 08/01/2005 | | | 100 | | | 105 |
General Electric Capital Corp. | | | | | | |
1.650% due 03/15/2005 (a) | | | 1,400 | | | 1,402 |
International Bank for Reconstruction
& Development |
3.500% due 10/22/2004 | | | 1,000 | | | 1,006 |
7.625% due 01/19/2023 | | | 2,700 | | | 3,336 |
Merrill Lynch & Co, Inc. | | | | | | |
6.750% due 06/01/2028 | | | 202 | | | 213 |
National Rural Utilities Cooperative
Finance Corp. |
5.250% due 07/15/2004 | | | 400 | | | 400 |
Travelers Property Casualty Corp. | | | |
6.375% due 03/15/2033 | | | 1,000 | | | 988 |
U.S. Trade Funding Corp. | | | | | | |
4.260% due 11/15/2014 | | | 909 | | | 897 |
Verizon Wireless Capital LLC | | | | | | |
1.350% due 05/23/2005 (a) | | | 500 | | | 500 |
| | | | | |
|
|
| | | | | | | 9,847 |
| | | | | |
|
|
Industrials 1.4% | | | | | | |
Continental Airlines, Inc. | | | | | | |
6.320% due 11/01/2008 | | | 1,000 | | | 967 |
DaimlerChrysler North America
Holding Corp. |
1.570% due 08/16/2004 (a) | | | 200 | | | 200 |
| | | | | |
|
|
| | | | | | | 1,167 |
| | | | | |
|
|
| Total Corporate Bonds & Notes (Cost $11,102) | | | | | | 11,014 |
| | | | | |
|
|
| | | | | | | |
MUNICIPAL BONDS & NOTES 3.5% | | | |
|
Chicago, Illinois Motor Fuel Tax
Revenue Bonds, (AMBAC Insured), Series 2003 |
5.000% due 01/01/2033 | | | 200 | | | 195 |
Chicago, Illinois Water Revenue Bonds,
(AMBAC Insured), Series 2001 |
5.000% due 11/01/2031 | | | 200 | | | 196 |
Dawson Ridge Metropolitan District No. 1
General Obligation Bonds, Series 1992 |
0.000% due 10/01/2022 | | | 800 | | | 305 |
Detroit City School District General
Obligation Bonds, (FGID Q-SBLF Insured), Series 2003 |
5.000% due 05/01/2033 | | | 100 | | | 98 |
Florida State Board of Education General
Obligation Bonds, (FGIC Insured), Series 2002 |
5.000% due 06/01/2031 | | | 500 | | | 494 |
Illinois Educational Facilities Authority
Revenue Bonds, Series 2003 |
5.000% due 07/01/2033 | | | 400 | | | 389 |
Irving Independent School District
General Obligation Bonds,
(PSF-GTD Insured), Series 2003 |
5.000% due 02/15/2031 | | | 200 | | | 195 |
Metropolitan Transportation Authority
Revenue Bonds, (FSA Insured), Series 2002 |
5.000% due 11/15/2032 | | | 300 | | | 295 |
New York City Municipal Water
Finance Authority Revenue Bonds, Series 2002 |
5.125% due 06/15/2034 | | | 200 | | | 198 |
New York State Triborough Bridge & Tunnels
Authority Revenue Bonds, Series 2002 |
5.000% due 11/15/2032 | | | 200 | | | 194 |
| | | | | | |
|
San Antonio, Texas Water Revenue Bonds,
(FSA Insured), Series 2002 |
5.000% due 05/15/2032 | | $ | 250 | | $ | 244 |
South Putnam School Building Corp.
Revenue Bonds, (FSA insured), Series 2003 |
5.000% due 01/15/2022 | | | 100 | | | 102 |
| | | | | |
|
|
| Total Municipal Bonds & Notes (Cost $2,936) | | | | | | 2,905 |
| | | | | |
|
|
| | | | | | | |
U.S. GOVERNMENT AGENCIES 29.2% | | | |
| | |
Aid-Israel | | | | | | |
5.500% due 09/18/2023 | | | 1,000 | | | 986 |
Fannie Mae | | | | | | |
2.125% due 02/10/2006 (a) | | | 1,000 | | | 991 |
4.875% due 03/11/2007 | | | 1,000 | | | 1,005 |
2.210% due 04/25/2021 (a) | | | 45 | | | 46 |
1.760% due 08/25/2021 (a) | | | 48 | | | 49 |
1.910% due 08/25/2022 (a) | | | 26 | | | 26 |
2.200% due 04/25/2032 (a) | | | 75 | | | 76 |
5.500% due 05/01/2034 | | | 397 | | | 395 |
5.000% due 07/20/2019-01/01/2034 (d) | | | 3,348 | | | 3,288 |
Federal Home Loan Bank | | | | | | |
4.250% due 09/28/2009 | | | 1,000 | | | 1,005 |
5.120% due 01/10/2013 (a) | | | 5,000 | | | 4,974 |
Federal Housing Administration | | | | | | |
6.896% due 07/01/2020 (a) | | | 535 | | | 526 |
Financing Corp. | | | | | | |
10.700% due 10/06/2017 | | | 650 | | | 976 |
Freddie Mac | | | | | | |
6.000% due 02/15/2015 | | | 165 | | | 165 |
5.200% due 03/05/2019 | | | 1,500 | | | 1,413 |
2.250% due 02/15/2021 (a) | | | 55 | | | 55 |
1.950% due 02/15/2027 (a) | | | 44 | | | 45 |
5.500% due 08/15/2030 | | | 41 | | | 41 |
1.863% due 10/25/2030 | | | 252 | | | 252 |
7.000% due 07/15/2023-12/01/2031 (d) | | | 254 | | | 269 |
Government National Mortgage Association | | | |
6.000% due 08/20/2033 | | | 1,051 | | | 978 |
5.000% due 08/20/2033-04/20/2034 (d) | | | 4,161 | | | 3,226 |
Overseas Private Investment Corp. | | | |
3.800% due 08/15/2007 | | | 1,000 | | | 967 |
5.140% due 08/15/2007 | | | 1,000 | | | 1,049 |
5.590% due 11/30/2010 | | | 700 | | | 788 |
Small Business Administration | | | | | | |
5.240% due 08/01/2023 (a) | | | 984 | | | 988 |
| | | | | |
|
|
| Total U.S. Government Agencies (Cost $24,647) | | | 24,579 |
| | | | | |
|
|
| | | | | | | |
U.S. TREASURY OBLIGATIONS 23.8% | | | |
| |
Treasury Inflation Protected Securities (c) | | | |
3.375% due 01/15/2007 (b) | | | 178 | | | 191 |
3.000% due 07/15/2012 | | | 732 | | | 791 |
3.875% due 04/15/2029 | | | 1,143 | | | 1,459 |
U.S. Treasury Bonds | | | | | | |
6.000% due 02/15/2026 | | | 7,400 | | | 7,976 |
5.500% due 08/15/2028 | | | 2,900 | | | 2,939 |
5.250% due 11/15/2028 | | | 1,900 | | | 1,862 |
U.S. Treasury Note | | | | | | |
1.750% due 12/31/2004 | | | 4,000 | | | 4,002 |
U.S. Treasury Strip | | | | | | |
0.000% due 11/15/2021 | | | 2,000 | | | 764 |
| | | | | |
|
|
| Total U.S. Treasury Obligations (Cost $38,940) | | | | | | 19,984 |
| | | | | |
|
|
| | | | | | | |
MORTGAGE-BACKED SECURITIES 16.7% |
|
Bear Stearns Adjustable Rate Mortgage Trust |
5.130% due 03/25/2033 (a) | | | 1,266 | | | 1,277 |
5.440% due 03/25/2033 (a) | | | 484 | | | 490 |
| | | | | | |
| | |
4.924% due 01/25/2034 (a) | | $ | 230 | | $ | 231 |
1.580% due 02/25/2034 (a) | | | 246 | | | 247 |
Countrywide Alternative Loan Trust | | | |
5.500% due 10/25/2033 | | | 1,042 | | | 898 |
Countrywide Home Loans, Inc. | | | | | | |
6.000% due 02/25/2033 | | | 275 | | | 277 |
5.250% due 01/25/2034 | | | 933 | | | 937 |
CS First Boston Mortgage Securities Corp. | | | |
4.960% due 11/25/2032 (a) | | | 240 | | | 244 |
1.850% due 04/25/2033 (a) | | | 338 | | | 339 |
Federal Agricultural Mortgage Corp. | | | |
7.238% due 07/25/2011 (a) | | | 184 | | | 190 |
First Republic Mortgage Loan Trust | | | |
1.590% due 11/15/2031 (a) | | | 753 | | | 755 |
GMAC Mortgage Corp. Loan Trust | | | |
1.500% due 10/25/2033 (a) | | | 337 | | | 337 |
MASTR Asset Securitization Trust | | | |
5.500% due 09/25/2033 | | | 713 | | | 697 |
Nomura Asset Acceptance Corp. | | | |
2.420% due 09/25/2028 | | | 12 | | | 12 |
Residential Accredit Loans, Inc. | | | |
1.700% due 01/25/2033 (a) | | | 152 | | | 152 |
1.700% due 03/25/2033 (a) | | | 244 | | | 244 |
Residential Funding Mortgage Securities I, Inc. |
6.500% due 03/25/2032 | | | 231 | | | 235 |
Sequoia Mortgage Trust | | | | | | |
1.620% due 06/20/2032 (a) | | | 278 | | | 278 |
1.630% due 07/20/2033 (a) | | | 903 | | | 898 |
Structured Asset Mortgage Investments, Inc. |
6.690% due 02/25/2030 (a) | | | 79 | | | 81 |
6.513% due 03/25/2032 (a) | | | 139 | | | 143 |
1.610% due 09/19/2032 (a) | | | 2,002 | | | 1,995 |
1.700% due 06/18/2033 (a) | | | 543 | | | 544 |
Structured Asset Securities Corp. | | | |
1.800% due 07/25/2032 (a) | | | 1,248 | | | 1,252 |
1.590% due 01/25/2033 (a) | | | 126 | | | 126 |
Washington Mutual Mortgage Securities Corp. |
6.000% due 03/25/2017 | | | 139 | | | 140 |
5.390% due 02/25/2031 (a) | | | 233 | | | 239 |
1.850% due 01/25/2033 (a) | | | 36 | | | 36 |
5.120% due 02/25/2033 (a) | | | 182 | | | 185 |
5.420% due 02/25/2033 (a) | | | 168 | | | 170 |
5.040% due 05/25/2033 (a) | | | 371 | | | 376 |
3.565% due 01/25/2041 (a) | | | 13 | | | 13 |
| | | | | |
|
|
| Total Mortgage-Backed Securities (Cost $14,156) | | | 14,038 |
| | | | | |
|
|
| | | | | | | |
ASSET-BACKED SECURITIES 7.6% |
| | |
ACE Securities Corp. | | | | | | |
1.640% due 06/25/2032 (a) | | | 103 | | | 103 |
AmeriCredit Automobile Receivables Trust |
1.350% due 10/12/2006 (a) | | | 176 | | | 176 |
Ameriquest Mortgage Securities, Inc. | | | |
1.710% due 03/25/2033 (a) | | | 172 | | | 173 |
Argent Securities, Inc. | | | | | | |
1.550% due 03/25/2034 (a) | | | 1,281 | | | 1,282 |
Bayview Financial Acquisition Trust | | | |
1.770% due 08/28/2034 (a) | | | 626 | | | 629 |
Bear Stearns Asset-Backed Securities, Inc. | | | |
1.800% due 11/25/2042 (a) | | | 867 | | | 868 |
Countrywide Asset-Backed Certificates | | | |
1.560% due 05/25/2032 (a) | | | 30 | | | 30 |
1.420% due 09/25/2033 (a) | | | 77 | | | 77 |
CS First Boston Mortgage Securities Corp. | | | |
1.740% due 08/25/2032 (a) | | | 178 | | | 178 |
Financial Asset Securities Corp. AAA Trust | | | |
1.450% due 09/25/2033 (a) | | | 121 | | | 121 |
Home Equity Mortgage Trust | | | | | | |
1.700% due 09/25/2033 (a) | | | 69 | | | 69 |
Household Mortgage Loan Trust | | | |
1.580% due 05/20/2032 (a) | | | 316 | | | 317 |
Long Beach Mortgage Loan Trust | | | |
1.700% due 03/25/2033 (a) | | | 419 | | | 420 |
| | | | | | |
| 8 | | Semi-Annual Report | | June 30, 2004 | | See accompanying notes |
| | | | |
| | | Principal | | |
| | | Amount | | Value |
| | | (000s) | | (000s) |
| | | | | | |
| | |
Los Angeles Arena Funding LLC | | | | | | |
7.656% due 12/15/2026 (a) | | $ | 94 | | $ | 97 |
Novastar Home Equity Loan | | | | | | |
1.580% due 01/25/2031 (a) | | | 69 | | | 69 |
Renaissance Home Equity Loan Trust | | | |
1.740% due 08/25/2033 (a) | | | 79 | | | 79 |
1.800% due 12/25/2033 (a) | | | 267 | | | 269 |
Saxon Asset Securities Trust | | | | | | |
1.380% due 03/25/2018 (a) | | | 286 | | | 285 |
SMS Student Loan Trust | | | | | | |
1.940% due 10/27/2025 (a) | | | 132 | | | 132 |
Specialty Underwriting & Residential Finance |
1.630% due 06/25/2034 (a) | | | 670 | | | 671 |
Terwin Mortgage Trust | | | | | | |
1.880% due 06/25/2033 (a) | | | 376 | | | 377 |
| | | | | |
|
|
| Total Asset-Backed Securities (Cost $6,421) | | | | | | 6,422 |
| | | | | |
|
|
| | | | | | | |
PURCHASED CALL OPTIONS 0.0% | | | |
| | | # of
Contracts | | |
Eurodollar December Futures (CME) | | | |
Strike @ 98.000 Exp. 12/13/2004 | | | 100 | | | 9 |
Eurodollar September Futures (CME) | | | |
Strike @ 98.875 Exp. 09/13/2004 | | | 100 | | | 0 |
| | | | | |
|
|
| Total Purchased Call Options (Cost $30) | | | | | | 9 |
| | | | | |
|
|
| | | | | | | |
PURCHASED PUT OPTIONS 0.0% | | | |
| |
Eurodollar September Futures (CME) | | | |
Strike @ 97.250
Exp. 09/13/2004 | | | 66 | | | 1 |
| | | | | |
|
|
| Total Purchased Put Options (Cost $2) | | | | | | 1 |
| | | | | |
|
|
| | | | | | | |
SHORT-TERM INSTRUMENTS 8.0% | | | | |
| | |
Commercial Paper 4.1% | | | | | | | |
Fannie Mae | | | | | | | |
1.380% due 09/01/2004 | | $ | 600 | | $ | 598 | |
1.415% due 09/08/2004 | | | 300 | | | 299 | |
1.530% due 10/18/2004 | | | 400 | | | 398 | |
Freddie Mac | | | | | | | |
1.300% due 07/01/2004 | | | 700 | | | 700 | |
1.540% due 10/18/2004 | | | 700 | | | 697 | |
1.560% due 10/20/2004 | | | 800 | | | 796 | |
| | | | | |
|
|
|
| | | | | | | 3,488 | |
| | | | | |
|
|
|
| | |
Repurchase Agreement 2.1% | | | | | | | |
State Street Bank | | | | | | | |
0.800% due 07/01/2004 | | | 1,803 | | | 1,803 | |
| | | | | |
|
|
|
(Dated 06/30/2004. Collateralized by Freddie Mac 5.500% due 07/15/2006 valued at $1,843. Repurchase proceeds are $1,803.) | |
| | |
U.S. Treasury Bills 1.8% | | | | | | | |
1.385% due 09/16/2004 (b)(d) | | | 1,485 | | | 1,481 | |
| | | | | |
|
|
|
| Total Short-Term Instruments (Cost $6,772) | | | | | | 6,772 | |
| | | | | |
|
|
|
| |
Total Investments 101.9% | | $ | 85,724 | |
(Cost $86.338) | | | | | | | |
| |
Written Options (e) (0.0%) | | | (17 | ) |
(Premiums $64) | | | | | | | |
| |
Other Assets and Liabilities (Net) (1.9%) | | | (1,589 | ) |
| | | | | |
|
|
|
| |
Net Assets 100.0% | | $ | 84,118 | |
| | | | | |
|
|
|
Notes to Schedule of Investments (amounts in thousands, except number of contracts):
(a) Variable rate security.
(b) Securities with an aggregate market value of $1,672 have been segregated with the custodian to cover margin requirements for the following open futures contracts at June 30, 2004:
| | | | | | | | |
| Type | | Expiration
Month | | # of
Contracts | | Unrealized
Appreciation/
(Depreciation) | |
Eurodollar March Long Futures | | 03/2005 | | 114 | | $ | (77 | ) |
Eurodollar September Long Futures | | 09/2005 | | 1 | | | 0 | |
Eurodollar December Long Futurbes | | 12/2004 | | 11 | | | (16 | ) |
U.S. Treasury 10-Year Note Long Futures | | 09/2004 | | 225 | | | 384 | |
U.S. Treasury 30-Year Note Long Futures | | 09/2004 | | 168 | | | 395 | |
U.S. Treasury 5-Year Note Short Futures | | 09/2004 | | 34 | | | (21 | ) |
| | | | | | |
|
|
|
| | | | | | | $ | 665 | |
| | | | | | |
|
|
|
(c) Principal amount of security is adjusted for inflation.
(d) Securities are grouped by coupon or range of coupons and represent a range of maturities.
(e) Premiums received on written options:
| | | | | | | | | | | | | | | |
| Name of Issuer | | | | Exercise Price | | Expiration
Date | | # of
Contracts | | Premium | | Value |
Call - CBOT U.S. Treasury Bond September Futures | | | | $ | 108.000 | | 08/27/2004 | | 11 | | $ | 9 | | $ | 9 |
Call - CBOT U.S. Treasury Note September Futures | | | | | 115.000 | | 08/27/2004 | | 15 | | | 19 | | | 0 |
Call - CBOT U.S. Treasury Note September Futures | | | | | 114.000 | | 08/27/2004 | | 24 | | | 15 | | | 2 |
Put - CBOT U.S. Treasury Bond September Futures | | | | | 100.000 | | 08/27/2004 | | 11 | | | 9 | | | 2 |
Call - CME Eurodollar December Futures | | | | | 98.250 | | 12/13/2004 | | 1,000 | | | 12 | | | 4 |
| | | | | | | | | | | |
|
|
| | | | | | | | | | | | $ | 64 | | $ | 17 |
| | | | | | | | | | | |
|
|
| | | | | | |
| See accompanying notes | | June 30, 2004 | | Semi-Annual Report | | 9 |
Notes to Financial Statements
June 30, 2004 (Unaudited)
1. Organization
The Long-Term U.S. Government Portfolio (the “Portfolio”) is a series of the PIMCO Variable Insurance Trust (the “Trust”). The Trust is registered under the Investment Company Act of 1940 (the “Act”), as amended, as an open-end investment company organized as a Delaware business trust on October 3, 1997. The Portfolio offers two classes of shares: Institutional and Administrative. Each share class has identical voting rights (except that shareholders of a class have exclusive voting rights regarding any matter relating solely to that class of shares). Information presented in these financial statements pertains to the Institutional Class of the Portfolio. Certain detailed financial information for the Administrative Class is provided separately and is available upon request. The Trust is designed to be used as an investment vehicle by Separate Accounts of insurance companies that fund variable annuity contracts and variable life insurance policies and by qualified pension and retirement plans. The Portfolio commenced operations on April 30, 1999.
2. Significant Accounting Policies
The following is a summary of significant accounting policies consistently followed by the Trust in the preparation of its financial statements in conformity with accounting principles generally accepted in the United States of America. The preparation of financial statements in accordance with accounting principles generally accepted in the United States of America requires management to make estimates and assumptions that affect the reported amounts and disclosures in the financial statements. Actual results could differ from those estimates.
Security Valuation. Portfolio securities and other financial instruments for which market quotations are readily available are stated at market value. Portfolio securities and other financial instruments for which market quotes are not readily available are valued at fair value, as determined in good faith and pursuant to guidelines established by the Board of Trustees, including certain fixed income securities which may be valued with reference to securities whose prices are more readily obtainable. Market value is determined at the close of regular trading (normally, 4:00 p.m., Eastern Time) on the New York Stock Exchange on each day the New York Stock Exchange is open, or if no sales are reported, as is the case for most securities traded over-the-counter, the mean between representative bid and asked quotations obtained from a quotation reporting system or from established market makers. The prices of certain portfolio securities or other financial instruments may be determined at a time prior to the close of regular trading on the New York Stock Exchange. Fair valuation may be used if significant events occur after the close of the relevant markets and prior to the close of regular trading on the New York Stock Exchange that materially affect the values of such securities or financial instruments. Fixed income securities are normally valued on the basis of quotes obtained from brokers and dealers or pricing services. Certain fixed income securities purchased on a delayed delivery basis are marked to market daily until settlement at the forward settlement value. Short-term investments, which mature in 60 days or less are valued at amortized cost, which approximates market value. Exchange traded options, futures and options on futures are valued at the settlement price determined by the relevant exchange. Prices may be obtained from independent pricing services which use information provided by market makers or estimates of market values obtained from yield data relating to investments or securities with similar characteristics. The prices used by the Portfolio may differ from the value that would be realized if the securities were sold and the differences could be material to the financial statements.
Securities Transactions and Investment Income. Securities transactions are recorded as of the trade date. Securities purchased or sold on a when-issued or delayed delivery basis may be settled a month or more after the trade date. Realized gains and losses from securities sold are recorded on the identified cost basis. Dividend income is recorded on the ex-dividend date, except certain dividends from foreign securities where the ex-dividend date may have passed, are recorded as soon as the Portfolio is informed of the ex-dividend date. Interest income, adjusted for the accretion of discounts and amortization of premiums, is recorded on the accrual basis. Paydowns gains and losses on mortgage- and asset-backed securities are recorded as adjustments to interest income in the Statement of Operations.
Dividends and Distributions to Shareholders. Dividends from net investment income, if any, are declared on each day the Trust is open for business and are distributed to shareholders monthly. All dividends are reinvested in additional shares of the Portfolio. Net realized capital gains earned by the Portfolio, if any, will be distributed no less frequently than once each year.
Income dividends and capital gain distributions are determined in accordance with income tax regulations which may differ from accounting principles generally accepted in the United States of America. These differences are primarily due to differing treatments for such items as wash sales, foreign currency transactions, net operating losses, notional principal contracts, certain asset-backed securities, certain futures and forward contracts, tax straddles, and capital loss carryforwards.
Distributions classified as a tax basis return of capital, if any, are reflected in the accompanying Statements of Changes in Net Assets and have been reclassified to paid in capital. In addition, other amounts have been reclassified between undistributed net investment income, accumulated undistributed net realized gains or losses and/or paid in capital to more appropriately conform financial accounting to tax characterizations of dividend distributions.
Multiclass Operations. Each class offered by the Trust has equal rights as to assets. Income, non-class specific expenses, and realized and unrealized capital gains and losses are allocated to each class of shares based on the relative net assets of each class.
Delayed Delivery Transactions. The Portfolio may purchase or sell securities on a when-issued or delayed delivery basis. These transactions involve a commitment by the Portfolio to purchase or
| | | | |
| 10 | | Semi-Annual Report | | June 30, 2004 |
sell securities for a predetermined price or yield, with payment and delivery taking place beyond the customary settlement period. When delayed delivery purchases are outstanding, the Portfolio will designate liquid assets in an amount sufficient to meet the purchase price. When purchasing a security on a delayed delivery basis, the Portfolio assumes the rights and risks of ownership of the security, including the risk of price and yield fluctuations, and takes such fluctuations into account when determining its net asset value. The Portfolio may dispose of or renegotiate a delayed delivery transaction after it is entered into, and may sell when-issued securities before they are delivered, which may result in a capital gain or loss. When the Portfolio has sold a security on a delayed delivery basis, the Portfolio does not participate in future gains and losses with respect to the security.
Federal Income Taxes. The Portfolio intends to qualify as a regulated investment company and distribute all of its taxable income and net realized gains, if applicable, to shareholders. Accordingly, no provision for Federal income taxes has been made.
Futures Contracts. The Portfolio is authorized to enter into futures contracts. The Portfolio may use futures contracts to manage its exposure to the securities markets or to movements in interest rates and currency values. The primary risks associated with the use of futures contracts are the imperfect correlation between the change in market value of the securities held by the Portfolio and the prices of futures contracts, the possibility of an illiquid market, and the inability of the counterparty to meet the terms of the contract. Futures contracts are valued based upon their quoted daily settlement prices. Upon entering into a futures contract, the Portfolio may be required to deposit with its custodian, in a segregated account in the name of the futures broker, an amount of cash or U.S. Government and Agency Obligations in accordance with the initial margin requirements of the broker or exchange. Futures contracts are marked to market daily and an appropriate payable or receivable for the change in value (“variation margin”) is recorded by the Portfolio. Gains or losses are recognized but not considered realized until the contracts expire or are closed. Futures contracts involve, to varying degrees, risk of loss in excess of the variation margin disclosed in the Statement of Assets and Liabilities.
Inflation-Indexed Bonds. The Portfolio may invest in inflation-indexed bonds. Inflation-indexed bonds are fixed income securities whose principal value is periodically adjusted to the rate of inflation. The interest rate on these bonds is generally fixed at issuance at a rate lower than typical bonds. Over the life of an inflation-indexed bond, however, interest will be paid based on a principal value, which is adjusted for inflation. Any increase in the principal amount of an inflation-indexed bond will be included as interest income in the Statement of Operations, even though investors do not receive their principal until maturity.
Options Contracts. The Portfolio may write call and put options on futures, swaps, securities or currencies it owns or in which it may invest. Writing put options tends to increase the Portfolio’s exposure to the underlying instrument. Writing call options tends to decrease the Portfolio’s exposure to the underlying instrument. When the Portfolio writes a call or put option, an amount equal to the premium received is recorded as a liability and subsequently marked to market to reflect the current value of the option written. These liabilities are reflected as written options outstanding in the Statement of Assets and Liabilities. Payments received or made, if any, from writing options with premiums to be determined on a future date are reflected as such on the Statement of Assets and Liabilities. Premiums received from writing options which expire are treated as realized gains. Premiums received from writing options which are exercised or closed are added to the proceeds or offset against amounts paid on the underlying future, swap, security or currency transaction to determine the realized gain or loss. The Portfolio as a writer of an option has no control over whether the underlying future, swap, security or currency may be sold (call) or purchased (put) and as a result bears the market risk of an unfavorable change in the price of the future, swap, security or currency underlying the written option. There is the risk the Portfolio may not be able to enter into a closing transaction because of an illiquid market.
The Portfolio may also purchase put and call options. Purchasing call options tends to increase the Portfolio’s exposure to the underlying instrument. Purchasing put options tends to decrease the Portfolio’s exposure to the underlying instrument. The Portfolio pays a premium which is included in the Portfolio’s Statement of Assets and Liabilities as an investment and subsequently marked to market to reflect the current value of the option. Premiums paid for purchasing options which expire are treated as realized losses. The risk associated with purchasing put and call options is limited to the premium paid. Premiums paid for purchasing options which are exercised or closed are added to the amounts paid or offset against the proceeds on the underlying future, swap, security or currency transaction to determine the realized gain or loss.
Repurchase Agreements. The Portfolio may engage in repurchase transactions. Under the terms of a typical repurchase agreement, the Portfolio takes possession of an underlying debt obligation subject to an obligation of the seller to repurchase, and the Portfolio to resell, the obligation at an agreed-upon price and time. The market value of the collateral must be equal at all times to the total amount of the repurchase obligations, including interest. Generally, in the event of counterparty default, the Portfolio has the right to use the collateral to offset losses incurred.
Swap Agreements. The Portfolio may invest in swap agreements. A swap is an agreement to exchange the return generated by one instrument for the return generated by another instrument. The Portfolio may enter into interest rate, total return, forward spread lock, and credit default swap agreements to manage its exposure to interest rates and credit risk.
Interest rate swap agreements involve the exchange by the Portfolio with another party of their respective commitments to pay or receive interest, e.g., an exchange of floating rate payments for fixed rate payments with respect to the notional amount of principal.
| | | | |
| June 30, 2004 | | Semi-Annual Report | | 11 |
Notes to Financial Statements (Cont.)
June 30, 2004 (Unaudited)
Total return swap agreements involve commitments to pay interest in exchange for a market-linked return, both based on notional amounts. To the extent the total return of the security or index underlying the transaction exceeds or falls short of the offsetting interest rate obligation, the Portfolio will receive a payment from or make a payment to the counterparty.
Forward spread lock swap agreements involve commitments to pay or receive a settlement amount calculated as the difference between the swap spread and a fixed spread, multiplied by the notional amount times the duration of the swap. The swap spread is the difference between the benchmark swap rate (market rate) and the specific Treasury rate.
In a credit default swap, one party makes a stream of payments to another party in exchange for the right to receive a specified return in the event of a default by a third party, typically corporate issues or sovereign issues of an emerging country, on its obligation. The Portfolio may use credit default swaps to provide a measure of protection against defaults of sovereign issuers (i.e., to reduce risk where the Portfolio owns or has exposure to the sovereign issuer) or to take an active long or short position with respect to the likelihood of a particular issuer’s default.
Swaps are marked to market daily based upon quotations from market makers and the change in value, if any, is recorded as unrealized gain or loss in the Statement of Operations. Payments received or made at the beginning of the measurement period are reflected as such on the Statement of Assets and Liabilities. A liquidation payment received or made at the termination of the swap is recorded as realized gain or loss in the Statement of Operations. Net periodic payments received by the Portfolio are included as part of realized gain(loss) on the Statement of Operations. Entering into these agreements involves, to varying degrees, elements of credit, market and documentation risk in excess of the amounts recognized on the Statement of Assets and Liabilities. Such risks involve the possibility that there will be no liquid market for these agreements, that the counterparty to the agreements may default on its obligation to perform or disagree as to the meaning of contractual terms in the agreements, and that there may be unfavorable changes in interest rates.
As a result of a FASB Emerging Issues Task Force (“EITF”) consensus, No. 03-11, and related SEC staff guidance, the Portfolio has reclassified periodic payments made or received under swap agreements, which were previously included within miscellaneous income, to a component of realized gain(loss) in the Statement of Operations. For consistency, similar reclassifications have been made to amounts appearing in the previous year’s Statement of Changes in Net Assets and the per share amounts in the prior year financial highlights. Prior year net investment income ratios in the financial highlights have also been modified accordingly. There were no reclassification to any period as a result of this change. There is no effect on the Portfolio’s net asset value, either in total or per share, or its total increase(decrease) in net assets from operations during any period.
3. Fees, Expenses, and Related Party Transactions
Investment Advisory Fee. Pacific Investment Management Company LLC (“PIMCO”) is a majority owned subsidiary partnership of Allianz Dresdner Asset Management of America L.P. and serves as investment adviser (the “Adviser”) to the Trust, pursuant to an investment advisory contract. The Adviser receives a monthly fee at an annual rate based on average daily net assets of the Portfolio. The Advisory Fee is charged at an annual rate of 0.25%.
Administration Fee. PIMCO serves as administrator (the “Administrator”), and provides administrative services to the Trust for which it receives a monthly administrative fee based on average daily net assets of the Portfolio. The Administration Fee is charged at the annual rate of 0.25%.
Servicing Fee. PA Distributors LLC (“PAD”), formerly known as PIMCO Advisors Distributors LLC, is an indirect wholly-owned subsidiary of Allianz Dresdner Asset Management of America L.P. and serves as the distributor of the Trust’s shares. The Trust is permitted to reimburse PAD on a quarterly basis, out of the Administrative Class assets of the Portfolio in the amount of 0.15% on an annual basis of the average daily net assets of that class, for payments made to financial intermediaries that provide services in connection with the distribution of shares or administration of plans or programs that use Portfolio shares as their funding medium. The effective rate paid to PAD was 0.15% during current fiscal year.
Expenses. The Trust is responsible for the following expenses: (i) salaries and other compensation of any of the Trust’s executive officers and employees who are not officers, directors, stockholders or employees of PIMCO or its subsidiaries or affiliates; (ii) taxes and governmental fees; (iii) brokerage fees and commissions and other portfolio transaction expenses; (iv) the cost of borrowing money, including interest expense and bank overdraft charges; (v) fees and expenses of the Trustees who are not “interested persons” of PIMCO or the Trust, and any counsel retained exclusively for their benefit; (vi) extraordinary expenses, including costs of litigation and indemnification expenses; (vii) organization expenses and (viii) any expenses allocated or allocable to a specific class of shares, which include service fees payable with respect to the Administrative Class shares and may include certain other expenses as permitted by the Trust’s Multiple Class Plan adopted pursuant to Rule 18f-3 under the Act and subject to review and approval by the Trustees. The ratio of expenses to average net assets per share class, as disclosed in Financial Highlights, may differ from the annual portfolio operating expenses per share class as disclosed in the Prospectus for the reasons set forth above.
PIMCO has agreed to waive a portion of its administrative fees to the extent that the payment of the Portfolio’s pro rata share of organization expenses and Trustee fees cause the actual expense ratio to rise above the rates disclosed in the then-current prospectus plus 0.49 basis points as set forth below (calculated as a percentage of the Portfolio’s average daily net assets attributable to each class):
| | | |
Institutional Class | | 0.50 | % |
Administrative Class | | 0.65 | % |
| | | | |
| 12 | | Semi-Annual Report | | June 30, 2004 |
PIMCO may be reimbursed for these waived amounts in future periods, not to exceed thirty-six months.
Each unaffiliated Trustee receives an annual retainer of $4,000, plus $1,500 for each Board of Trustees meeting attended in person and $250 for each meeting attended telephonically, plus reimbursement of related expenses. In addition, each committee chair receives an additional annual retainer of $500. These expenses are allocated on a pro-rata basis to each Portfolio of the Trust according to its respective net assets.
4. Purchases and Sales of Securities
The length of time a Portfolio has held a particular security is not generally a consideration in investment decisions. A change in the securities held by a Portfolio is known as “portfolio turnover.” The Portfolio may engage in frequent and active trading of portfolio securities to achieve its investment objective, particularly during periods of volatile market movements. High portfolio turnover (e.g., over 100%) involves correspondingly greater expenses to the Portfolio, including brokerage commissions or dealer mark-ups and other transaction costs on the sale of securities and reinvestments in other securities. Such sales may also result in realization of taxable capital gains, including short-term capital gains (which are generally taxed at ordinary income tax rates). The trading costs and tax effects associated with portfolio turnover may adversely affect the Portfolio’s performance.
Purchases and sales of securities (excluding short-term investments) for the period ended June 30, 2004 were as follows (amounts in thousands):
| | | | | | |
| U.S. Government/Agency | | All Other |
| Purchases | | Sales | | Purchases | | Sales |
| $162,158 | | $157,582 | | $2,850 | | $4,704 |
5. Transactions in Written Call and Put Options
Transactions in written call and put options were as follows (amounts in thousands):
| | | | |
| | | | Premium | |
Balance at 12/31/2003 | | $ | 269 | |
Sales | | | 146 | |
Closing Buys | | | (236 | ) |
| Expirations | | | (115 | ) |
| Balance at 06/30/2004 | | | $64 | |
6. Federal Income Tax Matters
At June 30, 2004, the aggregate cost of investments was the same for federal income tax and financial statement purposes. The net unrealized appreciation (depreciation) of investment securities for federal income tax purposes is as follows (amounts in thousands):
| | | | | | |
Aggregate
Gross
Unrealized
Appreciation | | Aggregate
Gross
Unrealized
(Depreciation) | | Net
Unrealized
Depreciation |
| $ 332 | | $ | (946) | | $ | (614) |
7. Shares of Beneficial Interest
The Trust may issue an unlimited number of shares of beneficial interest with a $.001 par value. Changes in shares of beneficial interest were as follows (shares and amounts in thousands):
| | | | | | | | | | | | | | |
| | | Six Months Ended
06/30/2004 | | | Year Ended
12/31/2003 | |
| | | Shares | | | Amount | | | Shares | | | Amount | |
Receipts for shares sold | | | | | | | | | | | | | | |
| | | | |
Institutional Class | | 32 | | | $ | 339 | | | 0 | | | $ | 0 | |
Administrative Class | | 989 | | | | 11,160 | | | 3,771 | | | | 41,837 | |
| | | | |
Issued as reinvestment of distributions | | | | | | | | | | | | | | |
| | | | |
Institutional Class | | 0 | | | | 2 | | | 0 | | | | 1 | |
Administrative Class | | 119 | | | | 1,323 | | | 403 | | | | 4,476 | |
| | | | |
Cost of shares redeemed | | | | | | | | | | | | | | |
| | | | |
Institutional Class | | (1 | ) | | | (5 | ) | | 0 | | | | 0 | |
Administrative Class | | (1,917 | ) | | | (21,332 | ) | | (3,950 | ) | | | (43,567 | ) |
| | | | |
Net increase (decrease) resulting from Portfolio share transactions | | (778 | ) | | $ | (8,513 | ) | | 224 | | | $ | 2,747 | |
The following schedule shows the number of shareholders each owning 5% or more of the Portfolio and the total percentage of the Portfolio held by such shareholders:
| | | | |
| | | Number | | % of Portfolio Held |
Institutional Class | | 1 | | 96 |
Administrative Class | | 4 | | 99 |
| | | | |
| June 30, 2004 | | Semi-Annual Report | | 13 |
Notes to Financial Statements (Cont.)
June 30, 2004 (Unaudited)
8. Regulatory and Litigation Matters
On February 17, 2004, the Attorney General of the State of New Jersey (“New Jersey AG”) filed a complaint against Allianz Dresdner Asset Management of America L.P. (“ADAM”), PA Distributors LLC (formerly known as PIMCO Advisors Distributors LLC) (“PAD”), PEA Capital LLC (formerly known as PIMCO Equity Advisors LLC) (“PEA”), and Pacific Investment Management Company LLC (“PIMCO”) in connection with its investigation into market timing and late trading. The complaint contends that inappropriate trading by shareholders engaged in market timing activity took place in funds in the PIMCO Funds: Multi-Manager Series (“MMS Funds”) and the PIMCO Funds: Pacific Investment Management Series (“PIMS Funds”). On June 1, 2004, the New Jersey AG dismissed PIMCO from the lawsuit.
On the same day as the dismissal of PIMCO from the lawsuit, the New Jersey AG announced that it had reached a settlement agreement with the remaining defendants (“New Jersey Settlement”). In the New Jersey Settlement, ADAM, PAD and PEA agreed, while neither admitting nor denying the allegations or conclusions of law, to: (i) pay New Jersey a civil fine of $15 million and $3 million for investigative costs and further enforcement initiatives; and (ii) implement certain changes in corporate governance.
On May 6, 2004, the Securities and Exchange Commission filed a complaint in the U.S. District Court in the Southern District of New York alleging that PA Fund Management LLC (formerly known as PIMCO Advisors Fund Management LLC) (“PAFM”), PEA, PAD, Stephen J. Treadway (at the time, the chief executive officer of PAFM and PAD as well as chairman of the Board of Trustees of the MMS Funds) and Kenneth W. Corba (the former chief executive officer of PEA and former portfolio manager of the PEA Growth and PEA Growth & Income Funds) had, among other things, violated and/or aided and abetted violations of, various antifraud provisions of the federal securities laws in connection with alleged “market timing” arrangements that improperly allowed certain hedge funds to engage in “market timing” in the PEA Growth Fund, the PEA Opportunity Fund, the PEA Innovation Fund, and the PEA Target Fund. The complaint seeks injunctive relief, disgorgement plus pre-judgment interest, monetary penalties, and an order permanently enjoining the defendants from serving as investment advisers, principal underwriters, officers, directors, or members of any advisory boards to any registered investment companies.
On February 20, 2004, a putative class action lawsuit was filed in the U.S. District Court for the District of New Jersey on behalf of certain shareholders of the PIMCO Funds against ADAM, PAD, PIMCO, PEA, the PIMS Funds, the MMS Funds, the Trust, PIMCO Commercial Mortgage Securities Trust, Inc. and certain other defendants, alleging that inappropriate market timing activity by certain shareholders caused financial injury to the shareholders of those Funds.
The following additional putative class action lawsuits have been filed against the PIMS Funds, the MMS Funds and/or their affiliates, each related to alleged market-timing activity in funds advised by PIMCO or its affiliates: (1) a lawsuit filed in the U.S. District Court for the District of Connecticut on February 27, 2004 (naming as defendants ADAM, PAD, PEA, the PIMS Funds, the MMS Funds, the Trust, PCM and certain other parties); (2) a lawsuit filed in the U.S. District Court for the Central District of California on March 4, 2004 (naming as defendants PIMCO, ADAM, PEA and PAD); (3) a lawsuit filed in the U.S. District Court for the Southern District of New York on March 8, 2004 (naming PIMCO, PAD and certain of their affiliates as defendants); (4) a lawsuit filed in the U.S. District Court for the Southern District of New York, on March 15, 2004 (naming PIMCO as the defendant); (5) two separate lawsuits filed in the U.S. District Court for the Central District of California on March 22, 2004, brought derivatively on behalf of the PIMCO High Yield Fund and the PIMCO Money Market Fund, respectively (each naming ADAM, PAFM and certain other parties as defendants, and the PIMCO Funds as the nominal defendant); (6) a lawsuit filed in the U.S. District Court for the Central District of California, also on March 22, 2004, brought derivatively on behalf of the PIMS Funds and the MMS Funds (naming ADAM, PIMCO, PAD and certain other parties as defendants, and the PIMS Funds and the MMS Funds as nominal defendants); (7) a lawsuit filed in the U.S. District Court for the District of New Jersey on April 20, 2004 (naming ADAM, PAD, the PIMS Funds and certain other parties as defendants); and (8) a lawsuit filed in the U.S. District Court for the Northern District of California on April 28, 2004 (naming ADAM, PIMCO, PAD, PEA and certain other parties as defendants, and the “PIMCO Funds” as nominal defendants). Each complaint for the foregoing putative class actions alleges, among other things, that inappropriate trading by shareholders engaged in market timing activities took place in certain of the funds advised by PIMCO, and each complaint seeks unspecified compensatory damages.
On February 17, 2004, a putative class action lawsuit was filed in the U.S. District Court for the District of Connecticut on behalf of certain shareholders of the PIMCO Funds against ADAM, PEA, PIMCO, PIMS Funds, MMS Funds and certain other defendants, alleging excessive investment advisory fees and the use of brokerage commissions to pay for distribution of fund shares. Three similar putative class action lawsuits were subsequently filed, each in the U.S. District Court for the District of Connecticut on March 1, 2004, April 23, 2004 and May 20, 2004, respectively.
Under Section 9(a) of the 1940 Act, if any of the various lawsuits were to result in a court injunction against PAFM, PEA, PAD, PIMCO, ADAM and/or Mr. Treadway, they and their affiliates would, in the absence of exemptive relief granted by the SEC, be barred from serving as an investment adviser/sub-adviser or principal underwriter for any registered investment company, including the Trust. ADAM and certain of its subsidiaries have
| | | | |
| 14 | | Semi-Annual Report | | June 30, 2004 |
responded to inquiries from the SEC concerning the status of the New Jersey Settlement under Section 9(a). If any of PAFM, PEA, PAD, PIMCO or ADAM were subject to an injunction, each of these entities and their affiliates could in turn seek exemptive relief from the SEC, as contemplated by the 1940 Act. There is no assurance, however, that such exemptive relief would be granted. The SEC also has the power by order to prohibit PAFM, PEA, PAD and PIMCO from serving as investment advisers and underwriters, if the SEC finds that such entities willfully violated the federal securities laws in connection with the allegations discussed above or aided or abetted such violations.
PIMCO, PAD and the Trust believe that these developments will not have a material adverse effect on the Portfolios or on PIMCO’s, or PAD’s ability to perform their respective investment advisory or distribution services on behalf of the Portfolios.
| | | | |
| June 30, 2004 | | Semi-Annual Report | | 15 |
Trustees and Officers
Brent R. Harris, Chairman and Trustee
R. Wesley Burns, President and Trustee
E. Philip Cannon, Trustee
Vern O. Curtis, Trustee
J. Michael Hagan, Trustee
William J. Popejoy, Trustee
Garlin G. Flynn, Secretary
John P. Hardaway, Treasurer
Investment Adviser and Administrator
Pacific Investment Management Company LLC
840 Newport Center Drive
Newport Beach, California 92660
Distributor
PA Distributors LLC
2187 Atlantic Street
Stamford, Connecticut 06902
Custodian
State Street Bank & Trust Company
801 Pennsylvania
Kansas City, Missouri 64105
Transfer Agent
Boston Financial Data Services–Midwest
330 W. 9th Street
Kansas City, Missouri 64105
Legal Counsel
Dechert LLP
1775 I Street, N.W.
Washington, D.C. 20006
Independent Registered Public Accounting Firm
PricewaterhouseCoopers LLP
1055 Broadway
Kansas City, Missouri 64105
Information about how the Fund voted proxies relating to portfolio securities held during the year July 1, 2003 through June 30, 2004 will be available no later than August 31, 2004 without charge, upon request, by calling the Trust at 1-800-927-4648 and on the SEC’s website at http://www.sec.gov.
Copies of the written Proxy Policy and the factors that PIMCO may consider in determining how to vote proxies for the Funds are available by calling the Trust at 1-800-927-4648 and on the SEC’s website at http://www.sec.gov.
PIMCO VARIABLE INSURANCE TRUST
840 NEWPORT CENTER DRIVE
NEWPORT BEACH, CA 92660

PIMCO VARIABLE INSURANCE TRUST
MONEY MARKET PORTFOLIO
INSTITUTIONAL CLASS
SEMI-ANNUAL REPORT
June 30, 2004
|
| This material is authorized for use only when preceded or accompanied by the current PIMCO Variable Insurance Trust prospectus. Investors should consider the investment objectives, risks, charges and expenses of Portfolio carefully before investing. This and other information is contained in the Portfolio’s prospectus. Please read the prospectus carefully before you invest or send money. |
Chairman’s Letter
Dear PIMCO Variable Insurance Trust Shareholder:
Bond prices were more volatile during the six-month period ended June 30, 2004. Interest rates rose sharply during the second quarter 2004, causing bonds to give back modest gains from earlier in the year. The Lehman Brothers Aggregate Bond Index, a widely used index for the high-grade bond market, was nearly flat during the first six months of 2004, returning 0.15% after losing 2.44% during the second quarter. The yield on the benchmark ten-year Treasury closed June 30, 2004 at 4.58%, up 0.75% from April 1, 2004, but up only 0.34% from where it began the six-month period on January 1, 2004.
Continued growth in employment convinced the markets that the Federal Reserve would soon begin a long anticipated tightening cycle. On June 30, 2004, the Fed met market expectations by increasing the federal funds rate 0.25%, which was the first rate increase since June 25, 2003. The central bank had held this rate at 1% for more than a year, which generated negative real short-term rates. And on August 10, 2004, the Fed increased the federal funds rate another 0.25% to 1.50%.
Investors that had profited handsomely from borrowing at low short-term rates and investing in higher-yielding longer maturity bonds surrendered some of those profits towards the latter part of the six-month period. Concern that borrowing rates would rise led investors to liquidate long positions and unwind these trades, which caused bond prices to decrease. However, substantial leverage remained among banks, hedge funds, and other investors, making bond markets somewhat vulnerable to additional Fed rate increases. There were also signs of rising inflation, which fueled anxiety that central banks might continue to raise interest rates.
On the following pages you will find a more complete review of the Portfolio in light of financial market activities as well as specific details about the total return investment performance for the six-month period.
We appreciate the trust you have placed in us, and we will continue to focus our efforts to meet your investment needs.
Sincerely,

Brent R. Harris
Chairman
August 11, 2004
| | | | |
| June 30, 2004 | | Semi-Annual Report | | 1 |
Important Information About the Portfolio
We believe that bond funds have an important role to play in a well diversified investment portfolio. It is important to note, however, that in an environment where interest rates may trend upward, rising rates will negatively impact the performance of most bond funds, and fixed income securities held by a fund are likely to decrease in value. The price volatility of fixed income securities can also increase during periods of rising interest rates resulting in increased losses to a fund. Bond funds and individual bonds with a longer duration (a measure of the expected life of a security) tend to be more sensitive to changes in interest rates, usually making them more volatile than securities or funds with shorter durations. The longer-term performance of most bond funds has benefited from capital gains in part resulting from an extended period of declining interest rates. In the event interest rates increase, these capital gains should not be expected to recur.
The Portfolio may be subject to various risks in addition to those described above. Some of these risks may include, but are not limited to, the following: real rate risk, derivative risk, small company risk, foreign security risk, high yield security risk and specific sector investment risks. The Portfolio may use derivative instruments for hedging purposes or as part of an investment strategy. Use of these instruments may involve certain costs and risks such as liquidity risk, interest rate risk, market risk, credit risk, management risk and the risk that a fund could not close out a position when it would be most advantageous to do so. A Portfolio investing in derivatives could lose more than the principal amount invested in these instruments. Investing in non-U.S. securities may entail risk due to non-U.S. economic and political developments; this risk may be enhanced when investing in emerging markets. High-yield bonds typically have a lower credit rating than other bonds. Lower rated bonds generally involve a greater risk to principal than higher rated bonds. Smaller companies may be more volatile than larger companies and may entail more risk. Concentrating investments in individual sectors may add additional risk and volatility compared to a diversified portfolio.
On the performance summary page in this semi-annual report, the Total Return Investment Performance table measures performance assuming that all dividend and capital gain distributions were reinvested. Returns do not reflect the deduction of taxes that a shareholder would pay (i) on Portfolio distributions or (ii) the redemption of Portfolio shares.
An investment in a Portfolio is not a bank deposit and is not guaranteed or insured by the Federal Deposit Insurance Corporation or any other government agency. It is possible to lose money on investments in the Funds.
The following disclosure provides important information regarding the Portfolio’s Expense Example, which appears on the Portfolio’s individual page in this semi-annual report. Please refer to this information when reviewing the Expense Example for the Portfolio.
Example
As a shareholder of the Portfolio, you incur two types of costs: (1) transaction costs, including redemption and exchange fees; and (2) ongoing costs, including advisory and administrative fees; distribution and/or service (12b-1) fees (Administrative Class only); and other Portfolio expenses. The Example is intended to help you understand your ongoing costs (in dollars) of investing in the Portfolio and to compare these costs with the ongoing costs of investing in other mutual funds.
The Example is based on an investment of $1,000 invested at the beginning of the period and held for the entire period indicated, which is from 1/1/04 to 6/30/04.
Actual Expenses
The information in the table under the heading “Actual Performance” provides information about actual account values and actual expenses. You may use the information in these columns, together with the amount you invested, to estimate the expenses that you paid over the period. Simply divide your account value by $1,000.00 (for example, an $8,600.00 account value divided by $1,000 = 8.60), then multiply the result by the number in the appropriate column for your share class, in the row entitled “Expenses Paid During Period” to estimate the expenses you paid on your account during this period.
Hypothetical Example for Comparison Purposes
The information in the table under the heading “Hypothetical Performance (5% return before expenses)” provides information about hypothetical account values and hypothetical expenses based on the Portfolio’s actual expense ratio and an assumed rate of return of 5% per year before expenses, which is not the Portfolio’s actual return. The hypothetical account values and expenses may not be used to estimate the actual ending account balance or expenses you paid for the period. You may use this information to compare the ongoing costs of investing in the Portfolio and other portfolios. To do so, compare this 5% hypothetical example with the 5% hypothetical examples that appear in the shareholder reports of the other portfolios.
Please note that the expenses shown in the table are meant to highlight your ongoing costs only and do not reflect any transactional costs. Therefore, the information under the heading “Hypothetical Performance (5% return before expenses)” is useful in comparing ongoing costs only, and will not help you determine the relative total costs of owning different portfolios. In addition, if these transactional costs were included, your costs would have been higher.
PIMCO Variable Insurance Trust is distributed by PA Distributors LLC, 2187 Atlantic Street, Stamford, CT 06902.
| | | | |
| 2 | | Semi-Annual Report | | June 30, 2004 |
Money Market Portfolio
CUMULATIVE RETURNS THROUGH JUNE 30, 2004
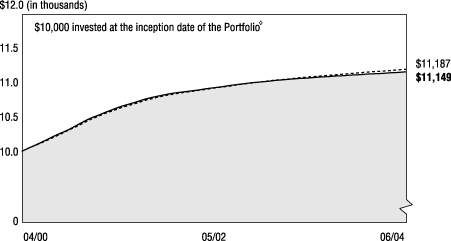
[CHART]
Money Market Portfolio Citigroup 3-Month
Inst. Class Treasury Bill Index
---------------------- -------------------
04/30/2000 $10,000 $10,000
05/31/2000 $10,050 $10,049
06/30/2000 $10,103 $10,096
07/31/2000 $10,153 $10,145
08/31/2000 $10,207 $10,195
09/30/2000 $10,257 $10,246
10/31/2000 $10,304 $10,299
11/30/2000 $10,366 $10,352
12/31/2000 $10,426 $10,407
01/31/2001 $10,478 $10,460
02/28/2001 $10,523 $10,505
03/31/2001 $10,569 $10,552
04/30/2001 $10,607 $10,592
05/31/2001 $10,649 $10,631
06/30/2001 $10,684 $10,665
07/31/2001 $10,716 $10,699
08/31/2001 $10,752 $10,731
09/30/2001 $10,778 $10,762
10/31/2001 $10,803 $10,790
11/30/2001 $10,824 $10,813
12/31/2001 $10,842 $10,832
01/31/2002 $10,857 $10,849
02/28/2002 $10,872 $10,864
03/31/2002 $10,887 $10,879
04/30/2002 $10,903 $10,895
05/31/2002 $10,919 $10,911
06/30/2002 $10,933 $10,927
07/31/2002 $10,948 $10,943
08/31/2002 $10,964 $10,958
09/30/2002 $10,977 $10,974
10/31/2002 $10,990 $10,989
11/30/2002 $10,999 $11,003
12/31/2002 $11,011 $11,016
01/31/2003 $11,023 $11,028
02/28/2003 $11,032 $11,038
03/31/2003 $11,041 $11,049
04/30/2003 $11,050 $11,060
05/31/2003 $11,059 $11,071
06/30/2003 $11,067 $11,081
07/31/2003 $11,074 $11,090
08/31/2003 $11,081 $11,099
09/30/2003 $11,087 $11,108
10/31/2003 $11,095 $11,117
11/30/2003 $11,101 $11,126
12/31/2003 $11,108 $11,134
01/31/2004 $11,115 $11,143
02/29/2004 $11,121 $11,151
03/31/2004 $11,128 $11,160
04/30/2004 $11,135 $11,169
05/31/2004 $11,141 $11,178
06/30/2004 $11,149 $11,187
SECTOR BREAKDOWN‡
| | | |
Commercial Paper | | 79.7 | % |
Repurchase Agreements | | 10.4 | % |
Certificates of Deposit | | 8.2 | % |
Other | | 1.7 | % |
‡ % of Total Investments as of June 30, 2004
à$10,000 invested at the beginning of the first full month following the inception of the Institutional Class.
TOTAL RETURN INVESTMENT PERFORMANCE For the period ended June 30, 2004
| | | | | | | | | | | | | | | | | | | |
| | | | | | | 7-Day Yield | | | 30-Day Yield | | | 6 Months | | | 1 Year | | | Since Inception* | |
| | |
| | Money Market Portfolio Institutional Class (Inception 04/10/00) | | 0.86 | % | | 0.80 | % | | 0.37 | % | | 0.75 | % | | 2.70 | % |
| | | - - - - - - - - | | Citigroup 3-Month Treasury Bill Index | | — | | | — | | | 0.47 | % | | 0.96 | % | | — | |
| | | | | * Annualized. All Portfolio returns are net of fees and expenses. | | | | | | | | | | | | | | | |
Past performance is no guarantee of future results. The performance quoted represents past performance. Investment return and principal value will fluctuate so the Portfolio shares, when redeemed, may be worth more or less than their original cost. Current performance may be lower or higher than the performance data quoted. Performance data current to the most recent month-end is available by calling (800) 927-4648.
Please refer to page 2 herein for an explanation of the information presented in the following Expense Example.
| | | | | | | | | | |
| EXPENSE EXAMPLE | | | | Actual Performance | | | | Hypothetical Performance
(5% return before expenses) |
Beginning Account Value (01/01/04) | | | | $ | 1,000.00 | | | | $ | 1,000.00 |
Ending Account Value (06/30/04) | | | | $ | 1,003.70 | | | | $ | 1,025.00 |
Expenses Paid During Period† | | | | $ | 1.74 | | | | $ | 1.76 |
†Expenses are equal to the Portfolio’s Institutional Class annualized expense ratio of 0.35%, multiplied by the average account value over the period, multiplied by 182/366 (to reflect the one-half year period).
PORTFOLIO INSIGHTS
| • | The Money Market Portfolio seeks to achieve its investment objective by investing at least 95% of its total assets in a diversified portfolio of money market securities that are in the highest rating category for short-term obligations. |
| • | The total return performance of the Portfolio’s Institutional Class shares was 0.37% for the six-month period ended June 30, 2004, versus a return of 0.47% for the benchmark Citigroup 3-Month Treasury Bill Index during the same period. |
| • | Interest rates increased for shorter maturities, as markets anticipated the beginning of a tightening cycle by the Federal Reserve. The Fed met market expectations with a 0.25% rate hike at the end of June. |
| • | The Portfolio’s average duration was maintained near one-month, providing for ample liquidity and limiting the price effects from increasing yields. |
| • | U.S. issued high quality (A1/P1) commercial paper was emphasized due to attractive yields, limited interest rate sensitivity, and low credit exposure. |
| • | The Portfolio invested in high quality U.S. agency paper and short-term fixed and floating rate U.S. corporates in an attempt to boost portfolio income, while limiting credit risk. |
| • | Seven-day and thirty-day effective yields were 0.86% and 0.80%, respectively, at June 30, 2004. These yields are competitive with yields on similar duration portfolios. |
| | | | |
| June 30, 2004 | | Semi-Annual Report | | 3 |
Financial Highlights
Money Market Portfolio (Institutional Class)
| | | | | | | | | | | | | | | | | | | | | | | | | | | | | | |
| Selected Per Share Data for the Year or Period Ended: | | | | 06/30/2004+ | | | | | 12/31/2003 | | | | | 12/31/2002 | | | | | 12/31/2001 | | | | | 04/10/2000- 12/31/2000 | |
| | | | | | | | | | |
Net asset value beginning of period | | | | $ | 1.00 | | | | | $ | 1.00 | | | | | $ | 1.00 | | | | | $ | 1.00 | | | | | $ | 1.00 | |
Net investment income (a) | | | | | 0.00 | | | | | | 0.01 | | | | | | 0.02 | | | | | | 0.04 | | | | | | 0.04 | |
Net realized/unrealized gain (loss) on investments (a) | | | | | 0.00 | | | | | | (0.00 | ) | | | | | 0.00 | | | | | | 0.00 | | | | | | 0.00 | |
Total income from investment operations | | | | | 0.00 | | | | | | 0.01 | | | | | | 0.02 | | | | | | 0.04 | | | | | | 0.04 | |
Dividends from net investment income | | | | | 0.00 | | | | | | (0.01 | ) | | | | | (0.02 | ) | | | | | (0.04 | ) | | | | | (0.04 | ) |
Distributions from net realized capital gains | | | | | 0.00 | | | | | | 0.00 | | | | | | 0.00 | | | | | | 0.00 | | | | | | 0.00 | |
Total distributions | | | | | 0.00 | | | | | | (0.01 | ) | | | | | (0.02 | ) | | | | | (0.04 | ) | | | | | (0.04 | ) |
Net asset value end of period | | | | $ | 1.00 | | | | | $ | 1.00 | | | | | $ | 1.00 | | | | | $ | 1.00 | | | | | $ | 1.00 | |
Total return | | | | | 0.37 | % | | | | | 0.88 | % | | | | | 1.56 | % | | | | | 3.99 | % | | | | | 4.60 | % |
Net assets end of period (000s) | | | | $ | 12 | | | | | $ | 11 | | | | | $ | 11 | | | | | $ | 11 | | | | | $ | 80 | |
Ratio of net expenses to average net assets | | | | | 0.35 | %* | | | | | 0.35 | % | | | | | 0.35 | % | | | | | 0.35 | % | | | | | 0.35 | %* |
Ratio of net investment income to average net assets | | | | | 0.72 | %* | | | | | 0.85 | % | | | | | 1.58 | % | | | | | 4.59 | % | | | | | 6.02 | %* |
| (a) | Per share amounts based on average number of shares outstanding during the period. |
| | | | | | |
| 4 | | Semi-Annual Report | | June 30, 2004 | | See accompanying notes |
Statement of Assets and Liabilities
Money Market Portfolio
June 30, 2004 (Unaudited)
| | | | | | |
| Amounts in thousands, except per share amounts | | | | | |
| | |
Assets: | | | | | | |
| | |
Investments, at value | | | | $ | 29,303 | |
Interest and dividends receivable | | | | | 2 | |
| | | | | | 29,305 | |
| | |
Liabilities: | | | | | | |
| | |
Payable for Portfolio shares redeemed | | | | | 9 | |
Accrued investment advisory fee | | | | | 4 | |
Accrued administration fee | | | | | 5 | |
Accrued servicing fee | | | | | 3 | |
| | | | | | 21 | |
| | |
Net Assets | | | | $ | 29,284 | |
| | |
Net Assets Consist of: | | | | | | |
| | |
Paid in capital | | | | $ | 29,284 | |
Undistributed net investment income | | | | | 3 | |
Accumulated undistributed net realized (loss) | | | | | (3 | ) |
| | | | | $ | 29,284 | |
| | |
Net Assets: | | | | | | |
| | |
Institutional Class | | | | $ | 12 | |
Administrative Class | | | | | 29,272 | |
| | |
Shares Issued and Outstanding: | | | | | | |
| | |
Institutional Class | | | | | 12 | |
Administrative Class | | | | | 29,272 | |
| | |
Net Asset Value and Redemption Price Per Share
(Net Assets Per Share Outstanding) | | | | | | |
| | |
Institutional Class | | | | $ | 1.00 | |
Administrative Class | | | | | 1.00 | |
| | |
Cost of Investments Owned | | | | $ | 29,303 | |
| | | | | | |
| See accompanying notes | | June 30, 2004 | | Semi-Annual Report | | 5 |
Statement of Operations
Money Market Portfolio
| | | | | |
| Amounts in thousands | | | | |
| | | | | Six Months Ended
June 30, 2004
(Unaudited) |
Investment Income: | | | | | |
| | |
Interest | | | | $ | 150 |
Total Income | | | | | 150 |
| | |
Expenses: | | | | | |
| | |
Investment advisory fees | | | | | 21 |
Administration fees | | | | | 28 |
Distribution and/or servicing fees - Administrative Class | | | | | 21 |
Total Expenses | | | | | 70 |
| | |
Net Investment Income | | | | $ | 80 |
| | | | | | |
| 6 | | Semi-Annual Report | | June 30, 2004 | | See accompanying notes |
Statements of Changes in Net Assets
Money Market Portfolio
| | | | | | | | | | | | |
| Amounts in thousands | | | | | | | | | | |
| | | | | Six Months Ended
June 30, 2004
(Unaudited) | | | | | Year Ended
December 31, 2003 | |
Increase in Net Assets from: | | | | | | | | | | | | |
| | | | |
Operations: | | | | | | | | | | | | |
| | | | |
Net investment income | | | | $ | 80 | | | | | $ | 198 | |
Net realized gain | | | | | 0 | | | | | | 6 | |
Net increase resulting from operations | | | | | 80 | | | | | | 204 | |
| | | | |
Distributions to Shareholders: | | | | | | | | | | | | |
| | | | |
From net investment income | | | | | | | | | | | | |
Institutional Class | | | | | 0 | | | | | | 0 | |
Administrative Class | | | | | (80 | ) | | | | | (203 | ) |
Total Distributions | | | | | (80 | ) | | | | | (203 | ) |
| | | | |
Portfolio Share Transactions: | | | | | | | | | | | | |
| | | | |
Receipts for shares sold | | | | | | | | | | | | |
Institutional Class | | | | | 1 | | | | | | 0 | |
Administrative Class | | | | | 11,524 | | | | | | 18,326 | |
| | | | |
Issued as reinvestment of distributions | | | | | | | | | | | | |
Institutional Class | | | | | 0 | | | | | | 0 | |
Administrative Class | | | | | 80 | | | | | | 203 | |
| | | | |
Cost of shares redeemed | �� | | | | | | | | | | | |
Institutional Class | | | | | 0 | | | | | | 0 | |
Administrative Class | | | | | (9,364 | ) | | | | | (17,348 | ) |
Net increase resulting from Portfolio share transactions | | | | | 2,241 | | | | | | 1,181 | |
| | | | |
Total Increase in Net Assets | | | | | 2,241 | | | | | | 1,182 | |
| | | | |
Net Assets: | | | | | | | | | | | | |
| | | | |
Beginning of period | | | | | 27,043 | | | | | | 25,861 | |
End of period* | | | | $ | 29,284 | | | | | $ | 27,043 | |
| | | | |
*Including undistributed net investment income of: | | | | $ | 3 | | | | | $ | 3 | |
| | | | | | |
| See accompanying notes | | June 30, 2004 | | Semi-Annual Report | | 7 |
Schedule of Investments
Money Market Portfolio
June 30, 2004 (Unaudited)
| | | | |
| | | Principal | | |
| | | Amount | | Value |
| | | (000s) | | (000s) |
| | | | | | |
SHORT-TERM INSTRUMENTS 100.1% |
Certificates of Deposit 8.2% | | | | | | |
Chase Manhattan Bank USA | | | | | | |
1.150% due 08/06/2004 | | $ | 600 | | $ | 600 |
Citibank New York N.A. | | | | | | |
1.190% due 08/20/2004 | | | 500 | | | 500 |
1.290% due 09/07/2004 | | | 500 | | | 500 |
1.340% due 09/10/2004 | | | 400 | | | 400 |
Well Fargo Bank N.A. | | | | | | |
1.240% due 07/19/2004 | | | 400 | | | 400 |
| | | | | |
|
|
| | | | | | | 2,400 |
| | | | | |
|
|
Commercial Paper 79.8% | | | | | | |
Anz (Delaware), Inc. | | | | | | |
1.030% due 07/08/2004 | | | 500 | | | 500 |
Barclays U.S. Funding Corp. | | | | | | |
1.110% due 08/25/2004 | | | 700 | | | 699 |
CBA (de) Finance | | | | | | |
1.150% due 08/09/2004 | | | 500 | | | 499 |
1.210% due 08/23/2004 | | | 400 | | | 399 |
CDC Commercial Corp. | | | | | | |
1.120% due 08/19/2004 | | | 700 | | | 699 |
Fannie Mae | | | | | | |
1.000% due 07/01/2004 | | | 600 | | | 600 |
1.045% due 07/14/2004 | | | 300 | | | 300 |
1.055% due 08/04/2004 | | | 500 | | | 499 |
1.155% due 08/18/2004 | | | 1,400 | | | 1,398 |
1.180% due 08/25/2004 | | | 300 | | | 299 |
1.520% due 10/15/2004 | | | 1,000 | | | 995 |
Federal Home Loan Bank | | | | | | |
1.165% due 07/16/2004 | | | 1,000 | | | 1,000 |
1.210% due 09/01/2004 | | | 600 | | | 599 |
1.410% due 09/15/2004 | | | 500 | | | 498 |
ForeningsSparbanken AB | | | | | | |
1.240% due 09/13/2004 | | | 500 | | | 499 |
1.560% due 10/21/2004 | | | 500 | | | 498 |
Freddie Mac | | | | | | |
1.030% due 07/06/2004 | | | 400 | | | 400 |
1.200% due 08/09/2004 | | | 500 | | | 499 |
1.125% due 08/10/2004 | | | 500 | | | 499 |
1.130% due 08/10/2004 | | | 1,900 | | | 1,898 |
1.150% due 08/17/2004 | | | 500 | | | 499 |
1.220% due 09/20/2004 | | | 500 | | | 499 |
1.260% due 09/24/2004 | | | 1,000 | | | 997 |
General Electric Capital Corp. | | | | | | |
1.040% due 07/08/2004 | | | 500 | | | 500 |
1.120% due 08/25/2004 | | | 500 | | | 499 |
HBOS Treasury Services PLC | | | | | | |
1.145% due 08/09/2004 | | | 500 | | | 499 |
1.235% due 09/10/2004 | | | 500 | | | 499 |
ING U.S. Funding LLC | | | | | | |
1.310% due 09/02/2004 | | | 200 | | | 200 |
1.240% due 09/10/2004 | | | 500 | | | 499 |
KFW International Finance, Inc. | | | | | | |
1.110% due 08/23/2004 | | | 700 | | | 699 |
Lloyds TSB Bank PLC | | | | | | |
1.185% due 07/21/2004 | | | 600 | | | 600 |
National Australia Bank Ltd. | | | | | | |
1.210% due 07/19/2004 | | | 500 | | | 500 |
Pfizer, Inc. | | | | | | |
1.300% due 08/18/2004 | | | 500 | | | 499 |
Rabobank USA Financial Corp. | | | | | | |
1.390% due 09/07/2004 | | | 300 | | | 299 |
Shell Finance (UK) PLC | | | | | | |
1.340% due 08/23/2004 | | | 600 | | | 599 |
Svenska Handlesbanken | | | | | | |
1.295% due 09/24/2004 | | | 600 | | | 598 |
Swedish National Housing Finance Corp. | | | | | | |
1.070% due 07/15/2004 | | | 600 | | | 600 |
Toyota Motor Credit Corp. | | | | | | |
1.480% due 09/22/2004 | | | 500 | | | 498 |
| | | | | | | |
| | |
UBS Finance, Inc. | | | | | | | |
1.130% due 09/01/2004 | | $ | 500 | | $ | 499 | |
| | | | | |
|
|
|
| | | | | | | 23,359 | |
| | | | | |
|
|
|
Repurchase Agreements 10.4% | | | | |
Credit Suisse First Boston | | | | | | | |
1.200% due 07/01/2004 | | | 2,700 | | | 2,700 | |
(Dated 06/30/2004. Collateralized by Treasury Inflation Protected Securities 3.000% due 07/15/2012 valued at $2,777. Repurchase proceeds are $2,700.) | |
State Street Bank | | | | | | | |
0.800% due 07/01/2004 | | | 345 | | | 345 | |
(Dated 06/30/2004. Collateralized by Fannie Mae 2.875% due 10/15/2005 valued at $354.
Repurchase proceeds are $345.) | |
| | | | | |
|
|
|
| | | | | | | 3,045 | |
| | | | | |
|
|
|
| | |
| U.S. Treasury Bills 1.7% 1.225% due 09/09/2004 | | | 500 | | | 499 | |
| | | | | |
|
|
|
| Total Short-Term Instruments | | | | | | 29,303 | |
(Cost $29,303) | | | | |
|
|
|
| | |
Total Investments 100.1% | | | | | $ | 29,303 | |
(Cost $29,303) | | | | | | | |
| |
Other Assets and Liabilities (Net) (0.1%) | | | (19 | ) |
| | | | | |
|
|
|
| |
Net Assets 100.0% | | $ | 29,284 | |
| | | | | |
|
|
|
| | | | | | |
| 8 | | Semi-Annual Report | | June 30, 2004 | | See accompanying notes |
Notes to Financial Statements
June 30, 2004 (Unaudited)
1. Organization
The Money Market Portfolio (the “Portfolio”) is a series of the PIMCO Variable Insurance Trust (the “Trust”). The Trust is registered under the Investment Company Act of 1940 (the “Act”), as amended, as an open-end investment company organized as a Delaware business trust on October 3, 1997. The Portfolio offers two classes of shares: Institutional and Administrative. Each share class has identical voting rights (except that shareholders of a class have exclusive voting rights regarding any matter relating solely to that class of shares). Information presented in these financial statements pertains to the Institutional Class of the Trust. Certain detailed financial information for the Administrative Class is provided separately and is available upon request. The Trust is designed to be used as an investment vehicle by Separate Accounts of insurance companies that fund variable annuity contracts and variable life insurance policies and by qualified pension and retirement plans. The Portfolio commenced operations on September 30, 1999.
2. Significant Accounting Policies
The following is a summary of significant accounting policies consistently followed by the Trust in the preparation of its financial statements in conformity with accounting principles generally accepted in the United States of America. The preparation of financial statements in accordance with accounting principles generally accepted in the United States of America requires management to make estimates and assumptions that affect the reported amounts and disclosures in the financial statements. Actual results could differ from those estimates.
Security Valuation. Portfolio securities held by the Portfolio are valued at amortized cost, which approximates current market value.
Securities Transactions and Investment Income. Securities transactions are recorded as of the trade date. Securities purchased or sold on a when-issued or delayed delivery basis may be settled a month or more after the trade date. Realized gains and losses from securities sold are recorded on the identified cost basis. Dividend income is recorded on the ex-dividend date. Interest income, adjusted for the accretion of discounts and amortization of premiums, is recorded on the accrual basis. Paydowns gains and losses on mortgage- and asset-backed securities are recorded as adjustments to interest income in the Statement of Operations.
Dividends and Distributions to Shareholders. Dividends from net investment income, if any, are declared on each day the Trust is open for business and are distributed to shareholders monthly. All dividends are reinvested in additional shares of the Portfolio. Net realized capital gains earned by the Portfolio, if any, will be distributed no less frequently than once each year.
Income dividends and capital gain distributions are determined in accordance with income tax regulations which may differ from accounting principles generally accepted in the United States of America. These differences are primarily due to differing treatments for such items as wash sales, foreign currency transactions, net operating losses, notional principal contracts, certain asset-backed securities, certain futures and forward contracts, tax straddles, and capital loss carryforwards.
Distributions classified as a tax basis return of capital, if any, are reflected in the accompanying Statements of Changes in Net Assets and have been reclassified to paid in capital. In addition, other amounts have been reclassified between undistributed net investment income, accumulated undistributed net realized gains or losses and/or paid in capital to more appropriately conform financial accounting to tax characterizations of dividend distributions.
Multiclass Operations. Each class offered by the Trust has equal rights as to assets. Income, non-class specific expenses, and realized and unrealized capital gains and losses are allocated to each class of shares based on the relative net assets of each class.
Federal Income Taxes. The Portfolio intends to qualify as a regulated investment company and distribute all of its taxable income and net realized gains, if applicable, to shareholders. Accordingly, no provision for Federal income taxes has been made.
Repurchase Agreements. The Portfolio may engage in repurchase transactions. Under the terms of a typical repurchase agreement, the Portfolio takes possession of an underlying debt obligation subject to an obligation of the seller to repurchase, and the Portfolio to resell, the obligation at an agreed-upon price and time. The market value of the collateral must be equal at all times to the total amount of the repurchase obligations, including interest. Generally, in the event of counterparty default, the Portfolio has the right to use the collateral to offset losses incurred.
3. Fees, Expenses, and Related Party Transactions
Investment Advisory Fee. Pacific Investment Management Company LLC (“PIMCO”) is a majority owned subsidiary partnership of Allianz Dresdner Asset Management of America L.P. and serves as investment adviser (the “Adviser”) to the Trust, pursuant to an investment advisory contract. The Adviser receives a monthly fee at an annual rate based on average daily net assets of the Portfolio. The Advisory Fee is charged at an annual rate of 0.15%.
Administration Fee. PIMCO serves as administrator (the “Administrator”), and provides administrative services to the Trust for which it receives a monthly administrative fee based on average daily net assets of the Portfolio. The Administration Fee is charged at the annual rate of 0.20%.
Servicing Fee. PA Distributors LLC (“PAD”), formerly known as PIMCO Advisors Distributors LLC, is an indirect wholly-owned subsidiary of Allianz Dresdner Asset Management of America L.P. and serves as the distributor of the Trust’s shares. The Trust is permitted to reimburse PAD on a quarterly basis, out of the Administrative Class assets of the Portfolio in the amount of 0.15% on an annual basis of the average daily net assets of that class, for
| | | | |
| June 30, 2004 | | Semi-Annual Report | | 9 |
Notes to Financial Statements (Cont.)
June 30, 2004 (Unaudited)
payments made to financial intermediaries that provide services in connection with the distribution of shares or administration of plans or programs that use Portfolio shares as their funding medium. The effective rate paid to PAD was 0.15% during current fiscal year.
Expenses. The Trust is responsible for the following expenses: (i) salaries and other compensation of any of the Trust’s executive officers and employees who are not officers, directors, stockholders or employees of PIMCO or its subsidiaries or affiliates; (ii) taxes and governmental fees; (iii) brokerage fees and commissions and other portfolio transaction expenses; (iv) the cost of borrowing money, including interest expense and bank overdraft charges; (v) fees and expenses of the Trustees who are not “interested persons” of PIMCO or the Trust, and any counsel retained exclusively for their benefit; (vi) extraordinary expenses, including costs of litigation and indemnification expenses; (vii) organization expenses and (viii) any expenses allocated or allocable to a specific class of shares, which include service fees payable with respect to the Administrative Class shares and may include certain other expenses as permitted by the Trust’s Multiple Class Plan adopted pursuant to Rule 18f-3 under the Act and subject to review and approval by the Trustees. The ratio of expenses to average net assets per share class, as disclosed in Financial Highlights, may differ from the annual portfolio operating expenses per share class as disclosed in the Prospectus for the reasons set forth above.
PIMCO has agreed to waive a portion of its administrative fees to the extent that the payment of the Portfolio’s pro rata share of organizational expenses and Trustee fees cause the actual expense ratio to rise above the rates disclosed in the then-current prospectus plus 0.49 basis points as set forth below (calculated as a percentage of the Portfolio’s average daily net assets attributable to each class):
| | | |
| Institutional Class | | 0.35% | |
Administrative Class | | 0.50 | % |
PIMCO may be reimbursed for these waived amounts in future periods, not to exceed thirty-six months.
Each unaffiliated Trustee receives an annual retainer of $4,000, plus $1,500 for each Board of Trustees meeting attended in person and $250 for each meeting attended telephonically, plus reimbursement of related expenses. In addition, each committee chair receives an additional annual retainer of $500. These expenses are allocated on a pro-rata basis to each Portfolio of the Trust according to its respective net assets.
4. Federal Income Tax Matters
At June 30, 2004, the aggregate cost of investments was the same for federal income tax and financial statement purposes. The net unrealized appreciation (depreciation) of investment securities for federal income tax purposes is as follows (amounts in thousands):
| | | | | | |
Aggregate Gross
Unrealized
Appreciation | | Aggregate Gross
Unrealized
(Depreciation) | | Net Unrealized
Appreciation |
| $ 0 | | $ | 0 | | $ | 0 |
5. Shares of Beneficial Interest
The Trust may issue an unlimited number of shares of beneficial interest with a $.001 par value. Changes in shares of beneficial interest were as follows (shares and amounts in thousands):
| | | | | | | | | | | | | | |
| | | Six Months Ended
06/30/2004 | | | Year Ended
12/31/2003 | |
| | | Shares | | | Amount | | | Shares | | | Amount | |
Receipts for shares sold | | | | | | | | | | | | | | |
| | | | |
Institutional Class | | 1 | | | $ | 1 | | | 0 | | | $ | 0 | |
Administrative Class | | 11,524 | | | | 11,524 | | | 18,326 | | | | 18,326 | |
| | | | |
Issued as reinvestment of distributions | | | | | | | | | | | | | | |
| | | | |
Institutional Class | | 0 | | | | 0 | | | 0 | | | | 0 | |
Administrative Class | | 80 | | | | 80 | | | 203 | | | | 203 | |
| | | | |
Cost of shares redeemed | | | | | | | | | | | | | | |
| | | | |
Institutional Class | | 0 | | | | 0 | | | 0 | | | | 0 | |
Administrative Class | | (9,364 | ) | | | (9,364 | ) | | (17,348 | ) | | | (17,348 | ) |
| | | | |
Net increase resulting from Portfolio share transactions | | 2,241 | | | $ | 2,241 | | | 1,181 | | | $ | 1,181 | |
| | | | |
| 10 | | Semi-Annual Report | | June 30, 2004 |
The following schedule shows the number of shareholders each owning 5% or more of the Portfolio and the total percentage of the Portfolio held by such shareholders:
| | | | |
| | | Number | | % of Portfolio Held |
Institutional Class | | 1 | | 100 |
Administrative Class | | 1 | | 99 |
6. Regulatory and Litigation Matters
On February 17, 2004, the Attorney General of the State of New Jersey (“New Jersey AG”) filed a complaint against Allianz Dresdner Asset Management of America L.P. (“ADAM”), PA Distributors LLC (formerly known as PIMCO Advisors Distributors LLC) (“PAD”), PEA Capital LLC (formerly known as PIMCO Equity Advisors LLC) (“PEA”), and Pacific Investment Management Company LLC (“PIMCO”) in connection with its investigation into market timing and late trading. The complaint contends that inappropriate trading by shareholders engaged in market timing activity took place in funds in the PIMCO Funds: Multi-Manager Series (“MMS Funds”) and the PIMCO Funds: Pacific Investment Management Series (“PIMS Funds”). On June 1, 2004, the New Jersey AG dismissed PIMCO from the lawsuit.
On the same day as the dismissal of PIMCO from the lawsuit, the New Jersey AG announced that it had reached a settlement agreement with the remaining defendants (“New Jersey Settlement”). In the New Jersey Settlement, ADAM, PAD and PEA agreed, while neither admitting nor denying the allegations or conclusions of law, to: (i) pay New Jersey a civil fine of $15 million and $3 million for investigative costs and further enforcement initiatives; and (ii) implement certain changes in corporate governance.
On May 6, 2004, the Securities and Exchange Commission filed a complaint in the U.S. District Court in the Southern District of New York alleging that PA Fund Management LLC (formerly known as PIMCO Advisors Fund Management LLC) (“PAFM”), PEA, PAD, Stephen J. Treadway (at the time, the chief executive officer of PAFM and PAD as well as chairman of the Board of Trustees of the MMS Funds) and Kenneth W. Corba (the former chief executive officer of PEA and former portfolio manager of the PEA Growth and PEA Growth & Income Funds) had, among other things, violated and/or aided and abetted violations of, various antifraud provisions of the federal securities laws in connection with alleged “market timing” arrangements that improperly allowed certain hedge funds to engage in “market timing” in the PEA Growth Fund, the PEA Opportunity Fund, the PEA Innovation Fund, and the PEA Target Fund. The complaint seeks injunctive relief, disgorgement plus pre-judgment interest, monetary penalties, and an order permanently enjoining the defendants from serving as investment advisers, principal underwriters, officers, directors, or members of any advisory boards to any registered investment companies.
On February 20, 2004, a putative class action lawsuit was filed in the U.S. District Court for the District of New Jersey on behalf of certain shareholders of the PIMCO Funds against ADAM, PAD, PIMCO, PEA, the PIMS Funds, the MMS Funds, the Trust, PIMCO Commercial Mortgage Securities Trust, Inc. and certain other defendants, alleging that inappropriate market timing activity by certain shareholders caused financial injury to the shareholders of those Funds.
The following additional putative class action lawsuits have been filed against the PIMS Funds, the MMS Funds and/or their affiliates, each related to alleged market-timing activity in funds advised by PIMCO or its affiliates: (1) a lawsuit filed in the U.S. District Court for the District of Connecticut on February 27, 2004 (naming as defendants ADAM, PAD, PEA, the PIMS Funds, the MMS Funds, the Trust, PCM and certain other parties); (2) a lawsuit filed in the U.S. District Court for the Central District of California on March 4, 2004 (naming as defendants PIMCO, ADAM, PEA and PAD); (3) a lawsuit filed in the U.S. District Court for the Southern District of New York on March 8, 2004 (naming PIMCO, PAD and certain of their affiliates as defendants); (4) a lawsuit filed in the U.S. District Court for the Southern District of New York, on March 15, 2004 (naming PIMCO as the defendant); (5) two separate lawsuits filed in the U.S. District Court for the Central District of California on March 22, 2004, brought derivatively on behalf of the PIMCO High Yield Fund and the PIMCO Money Market Fund, respectively (each naming ADAM, PAFM and certain other parties as defendants, and the PIMCO Funds as the nominal defendant); (6) a lawsuit filed in the U.S. District Court for the Central District of California, also on March 22, 2004, brought derivatively on behalf of the PIMS Funds and the MMS Funds (naming ADAM, PIMCO, PAD and certain other parties as defendants, and the PIMS Funds and the MMS Funds as nominal defendants); (7) a lawsuit filed in the U.S. District Court for the District of New Jersey on April 20, 2004 (naming ADAM, PAD, the PIMS Funds and certain other parties as defendants); and (8) a lawsuit filed in the U.S. District Court for the Northern District of California on April 28, 2004 (naming ADAM, PIMCO, PAD, PEA and certain other parties as defendants, and the “PIMCO Funds” as nominal defendants). Each complaint for the foregoing putative class actions alleges, among other things, that inappropriate trading by shareholders engaged in market timing activities took place in certain of the funds advised by PIMCO, and each complaint seeks unspecified compensatory damages.
On February 17, 2004, a putative class action lawsuit was filed in the U.S. District Court for the District of Connecticut on behalf of certain shareholders of the PIMCO Funds against ADAM, PEA, PIMCO, PIMS Funds, MMS Funds and certain other defendants, alleging excessive investment advisory fees and the use of brokerage commissions to pay for distribution of fund shares. Three similar putative class action lawsuits were subsequently filed, each in the U.S. District Court for the District of Connecticut on March 1, 2004, April 23, 2004 and May 20, 2004, respectively.
| | | | |
| June 30, 2004 | | Semi-Annual Report | | 11 |
Notes to Financial Statements (Cont.)
June 30, 2004 (Unaudited)
Under Section 9(a) of the 1940 Act, if any of the various lawsuits were to result in a court injunction against PAFM, PEA, PAD, PIMCO, ADAM and/or Mr. Treadway, they and their affiliates would, in the absence of exemptive relief granted by the SEC, be barred from serving as an investment adviser/sub-adviser or principal underwriter for any registered investment company, including the Trust. ADAM and certain of its subsidiaries have responded to inquiries from the SEC concerning the status of the New Jersey Settlement under Section 9(a). If any of PAFM, PEA, PAD, PIMCO or ADAM were subject to an injunction, each of these entities and their affiliates could in turn seek exemptive relief from the SEC, as contemplated by the 1940 Act. There is no assurance, however, that such exemptive relief would be granted. The SEC also has the power by order to prohibit PAFM, PEA, PAD and PIMCO from serving as investment advisers and underwriters, if the SEC finds that such entities willfully violated the federal securities laws in connection with the allegations discussed above or aided or abetted such violations.
PIMCO, PAD and the Trust believe that these developments will not have a material adverse effect on the Portfolios or on PIMCO’s, or PAD’s ability to perform their respective investment advisory or distribution services on behalf of the Portfolios.
| | | | |
| 12 | | Semi-Annual Report | | June 30, 2004 |
Trustees and Officers
Brent R. Harris, Chairman and Trustee
R. Wesley Burns, President and Trustee
E. Philip Cannon, Trustee
Vern O. Curtis, Trustee
J. Michael Hagan, Trustee
William J. Popejoy, Trustee
Garlin G. Flynn, Secretary
John P. Hardaway, Treasurer
Investment Adviser and Administrator
Pacific Investment Management Company LLC
840 Newport Center Drive
Newport Beach, California 92660
Distributor
PA Distributors LLC
2187 Atlantic Street
Stamford, Connecticut 06902
Custodian
State Street Bank & Trust Company
801 Pennsylvania
Kansas City, Missouri 64105
Transfer Agent
Boston Financial Data Services–Midwest
330 W. 9th Street
Kansas City, Missouri 64105
Legal Counsel
Dechert LLP
1775 I Street, N.W.
Washington, D.C. 20006
Independent Registered Public Accounting Firm
PricewaterhouseCoopers LLP
1055 Broadway
Kansas City, Missouri 64105
Information about how the Fund voted proxies relating to portfolio securities held during the year July 1, 2003 through June 30, 2004 will be available no later than August 31, 2004 without charge, upon request, by calling the Trust at 1-800-927-4648 and on the SEC’s website at http://www.sec.gov.
Copies of the written Proxy Policy and the factors that PIMCO may consider in determining how to vote proxies for the Funds are available by calling the Trust at 1-800-927-4648 and on the SEC’s website at http://www.sec.gov.
PIMCO VARIABLE INSURANCE TRUST
840 NEWPORT CENTER DRIVE
NEWPORT BEACH, CA 92660

PIMCO VARIABLE INSURANCE TRUST
FOREIGN BOND PORTFOLIO (U.S. DOLLAR-HEDGED)
INSTITUTIONAL CLASS
SEMI-ANNUAL REPORT
June 30, 2004
|
| This material is authorized for use only when preceded or accompanied by the current PIMCO Variable Insurance Trust prospectus. Investors should consider the investment objectives, risks, charges and expenses of Portfolio carefully before investing. This and other information is contained in the Portfolio’s prospectus. Please read the prospectus carefully before you invest or send money. |
Chairman’s Letter
Dear PIMCO Variable Insurance Trust Shareholder:
Bond prices were more volatile during the six-month period ended June 30, 2004. Interest rates rose sharply during the second quarter 2004, causing bonds to give back modest gains from earlier in the year. The Lehman Brothers Aggregate Bond Index, a widely used index for the high-grade bond market, was nearly flat during the first six months of 2004, returning 0.15% after losing 2.44% during the second quarter. The yield on the benchmark ten-year Treasury closed June 30, 2004 at 4.58%, up 0.75% from April 1, 2004, but up only 0.34% from where it began the six-month period on January 1, 2004.
Continued growth in employment convinced the markets that the Federal Reserve would soon begin a long anticipated tightening cycle. On June 30, 2004, the Fed met market expectations by increasing the federal funds rate 0.25%, which was the first rate increase since June 25, 2003. The central bank had held this rate at 1% for more than a year, which generated negative real short-term rates. And on August 10, 2004, the Fed increased the federal funds rate another 0.25% to 1.50%.
Investors that had profited handsomely from borrowing at low short-term rates and investing in higher-yielding longer maturity bonds surrendered some of those profits towards the latter part of the six-month period. Concern that borrowing rates would rise led investors to liquidate long positions and unwind these trades, which caused bond prices to decrease. However, substantial leverage remained among banks, hedge funds, and other investors, making bond markets somewhat vulnerable to additional Fed rate increases. There were also signs of rising inflation, which fueled anxiety that central banks might continue to raise interest rates.
On the following pages you will find a more complete review of the Portfolio in light of financial market activities as well as specific details about the total return investment performance for the six-month period.
We appreciate the trust you have placed in us, and we will continue to focus our efforts to meet your investment needs.
Sincerely,

Brent R. Harris
Chairman
August 11, 2004
| | | | |
| June 30, 2004 | | Semi-Annual Report | | 1 |
Important Information About the Portfolio
We believe that bond funds have an important role to play in a well diversified investment portfolio. It is important to note, however, that in an environment where interest rates may trend upward, rising rates will negatively impact the performance of most bond funds, and fixed income securities held by a fund are likely to decrease in value. The price volatility of fixed income securities can also increase during periods of rising interest rates resulting in increased losses to a fund. Bond funds and individual bonds with a longer duration (a measure of the expected life of a security) tend to be more sensitive to changes in interest rates, usually making them more volatile than securities or funds with shorter durations. The longer-term performance of most bond funds has benefited from capital gains in part resulting from an extended period of declining interest rates. In the event interest rates increase, these capital gains should not be expected to recur.
The Portfolio may be subject to various risks in addition to those described above. Some of these risks may include, but are not limited to, the following: real rate risk, derivative risk, small company risk, foreign security risk, high yield security risk and specific sector investment risks. The Portfolio may use derivative instruments for hedging purposes or as part of an investment strategy. Use of these instruments may involve certain costs and risks such as liquidity risk, interest rate risk, market risk, credit risk, management risk and the risk that a fund could not close out a position when it would be most advantageous to do so. A Portfolio investing in derivatives could lose more than the principal amount invested in these instruments. Investing in non-U.S. securities may entail risk due to non-U.S. economic and political developments; this risk may be enhanced when investing in emerging markets. High-yield bonds typically have a lower credit rating than other bonds. Lower rated bonds generally involve a greater risk to principal than higher rated bonds. Smaller companies may be more volatile than larger companies and may entail more risk. Concentrating investments in individual sectors may add additional risk and volatility compared to a diversified portfolio.
On the performance summary page in this semi-annual report, the Total Return Investment Performance table measures performance assuming that all dividend and capital gain distributions were reinvested. Returns do not reflect the deduction of taxes that a shareholder would pay (i) on Portfolio distributions or (ii) the redemption of Portfolio shares.
An investment in a Portfolio is not a bank deposit and is not guaranteed or insured by the Federal Deposit Insurance Corporation or any other government agency. It is possible to lose money on investments in the Funds.
The following disclosure provides important information regarding the Portfolio’s Expense Example, which appears on the Portfolio’s individual page in this semi-annual report. Please refer to this information when reviewing the Expense Example for the Portfolio.
Example
As a shareholder of the Portfolio, you incur two types of costs: (1) transaction costs, including redemption and exchange fees; and (2) ongoing costs, including advisory and administrative fees; distribution and/or service (12b-1) fees (Administrative Class only); and other Portfolio expenses. The Example is intended to help you understand your ongoing costs (in dollars) of investing in the Portfolio and to compare these costs with the ongoing costs of investing in other mutual funds.
The Example is based on an investment of $1,000 invested at the beginning of the period and held for the entire period indicated, which is from 1/1/04 to 6/30/04.
Actual Expenses
The information in the table under the heading “Actual Performance” provides information about actual account values and actual expenses. You may use the information in these columns, together with the amount you invested, to estimate the expenses that you paid over the period. Simply divide your account value by $1,000.00 (for example, an $8,600.00 account value divided by $1,000 = 8.60), then multiply the result by the number in the appropriate column for your share class, in the row entitled “Expenses Paid During Period” to estimate the expenses you paid on your account during this period.
Hypothetical Example for Comparison Purposes
The information in the table under the heading “Hypothetical Performance (5% return before expenses)” provides information about hypothetical account values and hypothetical expenses based on the Portfolio’s actual expense ratio and an assumed rate of return of 5% per year before expenses, which is not the Portfolio’s actual return. The hypothetical account values and expenses may not be used to estimate the actual ending account balance or expenses you paid for the period. You may use this information to compare the ongoing costs of investing in the Portfolio and other portfolios. To do so, compare this 5% hypothetical example with the 5% hypothetical examples that appear in the shareholder reports of the other portfolios.
Please note that the expenses shown in the table are meant to highlight your ongoing costs only and do not reflect any transactional costs. Therefore, the information under the heading “Hypothetical Performance (5% return before expenses)” is useful in comparing ongoing costs only, and will not help you determine the relative total costs of owning different portfolios. In addition, if these transactional costs were included, your costs would have been higher.
PIMCO Variable Insurance Trust is distributed by PA Distributors LLC, 2187 Atlantic Street, Stamford, CT 06902.
| | | | |
| 2 | | Semi-Annual Report | | June 30, 2004 |
Foreign Bond Portfolio (U.S. Dollar-Hedged)
CUMULATIVE RETURNS THROUGH JUNE 30, 2004
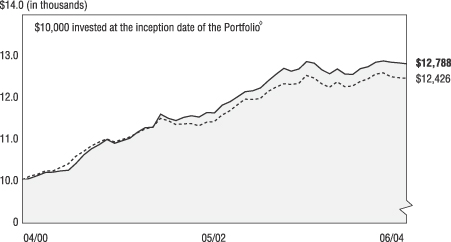
[CHART]
Foreign Bond J.P. Morgan
Portfolio Inst. Class Non-U.S. Index (Hedged)
--------------------- -----------------------
04/30/2000 $10,000 $10,000
05/31/2000 $10,041 $10,080
06/30/2000 $10,115 $10,128
07/31/2000 $10,181 $10,201
08/31/2000 $10,187 $10,203
09/30/2000 $10,223 $10,291
10/31/2000 $10,232 $10,374
11/30/2000 $10,401 $10,558
12/31/2000 $10,602 $10,675
01/31/2001 $10,747 $10,802
02/28/2001 $10,847 $10,895
03/31/2001 $10,973 $10,977
04/30/2001 $10,882 $10,903
05/31/2001 $10,947 $10,959
06/30/2001 $11,005 $11,019
07/31/2001 $11,152 $11,120
08/31/2001 $11,255 $11,213
09/30/2001 $11,264 $11,259
10/31/2001 $11,584 $11,465
11/30/2001 $11,479 $11,416
12/31/2001 $11,424 $11,321
01/31/2002 $11,504 $11,334
02/28/2002 $11,541 $11,344
03/31/2002 $11,511 $11,286
04/30/2002 $11,620 $11,377
05/31/2002 $11,615 $11,392
06/30/2002 $11,800 $11,539
07/31/2002 $11,883 $11,651
08/31/2002 $11,996 $11,791
09/30/2002 $12,123 $11,925
10/31/2002 $12,140 $11,920
11/30/2002 $12,215 $11,942
12/31/2002 $12,379 $12,114
01/31/2003 $12,538 $12,209
02/28/2003 $12,685 $12,293
03/31/2003 $12,614 $12,278
04/30/2003 $12,670 $12,305
05/31/2003 $12,843 $12,501
06/30/2003 $12,806 $12,436
07/31/2003 $12,645 $12,298
08/31/2003 $12,547 $12,209
09/30/2003 $12,664 $12,343
10/31/2003 $12,543 $12,228
11/30/2003 $12,536 $12,239
12/31/2003 $12,675 $12,354
01/31/2004 $12,716 $12,409
02/29/2004 $12,829 $12,528
03/31/2004 $12,855 $12,561
04/30/2004 $12,827 $12,463
05/31/2004 $12,810 $12,442
06/30/2004 $12,788 $12,426
COUNTRY ALLOCATION ‡
| | | |
Short-Term Instruments | | 23.0 | % |
United States | | 21.3 | % |
Germany | | 14.3 | % |
Italy | | 12.5 | % |
United Kingdom | | 8.9 | % |
Japan | | 6.3 | % |
Spain | | 4.5 | % |
Canada | | 2.7 | % |
Other | | 6.5 | % |
‡ % of Total Investments as of June 30, 2004
à$10,000 invested at the beginning of the first full month following the inception of the Institutional Class.
TOTAL RETURN INVESTMENT PERFORMANCE For the period ended June 30, 2004
| | | | | | | | | | | | | | |
| | | | | | | 6 Months | | | 1 Year | | | Since Inception* | |
| | |
| | Foreign Bond Portfolio (U.S. Dollar-Hedged) Institutional Class (Inception 04/10/00) | | 0.89 | % | | – | 0.14 | % | | 6.05 | % |
| | | - - - - - - - | | J.P. Morgan Non-U.S. Index (Hedged) | | 0.59 | % | | – | 0.08 | % | | — | |
| | | | | * Annualized. All Portfolio returns are net of fees and expenses. | | | | | | | | | | |
Past performance is no guarantee of future results. The performance quoted represents past performance. Investment return and principal value will fluctuate so the Portfolio shares, when redeemed, may be worth more or less than their original cost. Current performance may be lower or higher than the performance data quoted. Performance data current to the most recent month-end is available by calling (800) 927-4648.
Please refer to page 2 herein for an explanation of the information presented in the following Expense Example.
| | | | | | | | | | |
| EXPENSE EXAMPLE | | | | Actual Performance | | | | Hypothetical Performance
(5% return before expenses) |
Beginning Account Value (01/01/04) | | | | $ | 1,000.00 | | | | $ | 1,000.00 |
Ending Account Value (06/30/04) | | | | $ | 1,008.90 | | | | $ | 1,025.00 |
Expenses Paid During Period† | | | | $ | 3.75 | | | | $ | 3.78 |
†Expenses are equal to the Portfolio’s Institutional Class annualized expense ratio of 0.75%, multiplied by the average account value over the period, multiplied by 182/366 (to reflect the one-half year period).
PORTFOLIO INSIGHTS
| • | The Foreign Bond Portfolio (U.S. Dollar-Hedged) seeks to achieve its investment objective by investing under normal circumstances at least 80% of its assets in Fixed Income Securities of issuers located outside the United States, representing at least three foreign countries. |
| • | The Portfolio’s Institutional Class shares returned 0.89% for the six-months ended June 30, 2004, outperforming the 0.59% return of the J.P. Morgan Non-U.S. Index (Hedged) for the same period. |
| • | An underweight to U.S. duration was positive for performance as yields rose given stronger growth and fears of aggressive Fed tightening. |
| • | An overweight to Euroland duration relative to benchmark was a positive for relative performance; these yields rose less as Euroland lagged global growth. |
| • | An underweight to Japanese government bonds (“JGB”) relative to benchmark was positive for returns. JGB yields rose on strong growth and speculation that the Bank of Japan’s highly accommodative monetary policy stance would soon shift. |
| • | Currency strategies detracted from performance. The yen and Canadian dollar retreated as rising U.S. rates forced market participants to unwind leveraged strategies. |
| • | Real return bonds added to returns, outperforming more volatile Treasuries of similar duration, as rates rose. |
| • | Modest holdings of mortgage securities helped returns, as heavy demand from banks supported the mortgage market. |
| • | Tactical strategies to exploit wider swap spreads in the U.S. and Europe were positive, as swap spreads widened given the rapid rise in yields. |
| | | | |
| June 30, 2004 | | Semi-Annual Report | | 3 |
Financial Highlights
Foreign Bond Portfolio (U.S. Dollar-Hedged) (Institutional Class)
| | | | | | | | | | | | | | | | | | | | | | | | | | | | | | |
| Selected Per Share Data for the Year or Period Ended: | | | | 06/30/2004+ | | | | | 12/31/2003 | | | | | 12/31/2002 | | | | | 12/31/2001 | | | | | 04/10/2000-
12/31/2000 | |
| | | | | | | | | | |
Net asset value beginning of period | | | | $ | 10.03 | | | | | $ | 10.07 | | | | | $ | 9.69 | | | | | $ | 9.40 | | | | | $ | 9.48 | |
Net investment income (a) | | | | | 0.12 | (c) | | | | | 0.27 | (c) | | | | | 0.32 | (c) | | | | | 0.46 | (c) | | | | | 0.40 | (c) |
Net realized/unrealized gain (loss) on investments (a) | | | | | (0.03 | )(c) | | | | | (0.03 | )(c) | | | | | 0.47 | (c) | | | | | 0.26 | (c) | | | | | 0.17 | (c) |
Total income from investment operations | | | | | 0.09 | | | | | | 0.24 | | | | | | 0.79 | | | | | | 0.72 | | | | | | 0.57 | |
Dividends from net investment income | | | | | (0.11 | ) | | | | | (0.28 | ) | | | | | (0.37 | ) | | | | | (0.43 | ) | | | | | (0.39 | ) |
Distributions from net realized capital gains | | | | | 0.00 | | | | | | 0.00 | | | | | | (0.04 | ) | | | | | 0.00 | | | | | | (0.26 | ) |
Total distributions | | | | | (0.11 | ) | | | | | (0.28 | ) | | | | | (0.41 | ) | | | | | (0.43 | ) | | | | | (0.65 | ) |
Net asset value end of period | | | | $ | 10.01 | | | | | $ | 10.03 | | | | | $ | 10.07 | | | | | $ | 9.69 | | | | | $ | 9.40 | |
Total return | | | | | 0.89 | % | | | | | 2.39 | % | | | | | 8.36 | % | | | | | 7.75 | % | | | | | 6.18 | % |
Net assets end of period (000s) | | | | $ | 13 | | | | | $ | 13 | | | | | $ | 12 | | | | | $ | 935 | | | | | $ | 5,185 | |
Ratio of net expenses to average net assets | | | | | 0.75 | %* | | | | | 0.78 | %(b) | | | | | 0.75 | % | | | | | 0.75 | % | | | | | 0.74 | %* |
Ratio of net investment income to average net assets | | | | | 2.38 | %*(c) | | | | | 2.69 | %(c) | | | | | 3.36 | %(c) | | | | | 4.80 | %(c) | | | | | 5.67 | %*(c) |
Portfolio turnover rate | | | | | 222 | % | | | | | 600 | % | | | | | 321 | % | | | | | 285 | % | | | | | 306 | % |
| (a) | Per share amounts based on average number of shares outstanding during the period. |
| (b) | Ratio of expense to average net assets excluding interest expense is 0.75%. |
| (c) | Indicates a period in which, as a result of a change in generally accepted accounting principles, the portfolio has reclassified periodic payments made or received under certain derivative instruments, which were previously included within miscellaneous income, to a component of realized gain(loss) in the Statement of Operations. The effect of this reclassification was to increase the net investment income ratio for the period ending June 30, 2004 by 0.14% and the net investment income per share by $0.01. For consistency, similar reclassifications have been made to prior period amounts, resulting in increases(reductions) to the net investment income ratio of 0.09%, (0.88)%, 0.24% and 0.09% and to the net investment income per share of $0.01, $(0.09), $0.02, and $0.01 in the fiscal years or periods ending December 31, 2003, 2002, 2001, and 2000, respectively. This change had no impact on the reported net asset value per share for any period. |
| | | | | | |
| 4 | | Semi-Annual Report | | June 30, 2004 | | See accompanying notes |
Statement of Assets and Liabilities
Foreign Bond Portfolio (U.S. Dollar-Hedged)
June 30, 2004 (Unaudited)
| | | | | | |
| Amounts in thousands, except per share amounts | | | | | |
| | |
Assets: | | | | | | |
| | |
Investments, at value | | | | $ | 38,651 | |
Cash | | | | | 1 | |
Foreign currency, at value | | | | | 923 | |
Receivable for investments sold | | | | | 466 | |
Receivable for investments sold on delayed delivery basis | | | | | 7,663 | |
Unrealized appreciation on forward foreign currency contracts | | | | | 104 | |
Receivable for Portfolio shares sold | | | | | 32 | |
Interest and dividends receivable | | | | | 475 | |
Variation margin receivable | | | | | 123 | |
Swap premiums paid | | | | | 374 | |
Unrealized appreciation on swap agreements | | | | | 56 | |
Unrealized appreciation on forward volatility options | | | | | 5 | |
| | | | | | 48,873 | |
| | |
Liabilities: | | | | | | |
| | |
Payable for investments purchased | | | | $ | 674 | |
Payable for investments purchased on delayed delivery basis | | | | | 6,139 | |
Unrealized depreciation on forward foreign currency contracts | | | | | 35 | |
Payable for short sale | | | | | 7,741 | |
Written options outstanding | | | | | 64 | |
Accrued investment advisory fee | | | | | 7 | |
Accrued administration fee | | | | | 14 | |
Accrued servicing fee | | | | | 3 | |
Recoupment payable to Manager | | | | | 1 | |
Swap premiums received | | | | | 81 | |
Unrealized depreciation on swap agreements | | | | | 246 | |
Other liabilities | | | | | 12 | |
| | | | | | 15,017 | |
| | |
Net Assets | | | | $ | 33,856 | |
| | |
Net Assets Consist of: | | | | | | |
| | |
Paid in capital | | | | $ | 33,668 | |
(Overdistributed) net investment income | | | | | (1,509 | ) |
Accumulated undistributed net realized gain | | | | | 734 | |
Net unrealized appreciation | | | | | 963 | |
| | | | | $ | 33,856 | |
| | |
Net Assets: | | | | | | |
| | |
Institutional Class | | | | $ | 13 | |
Administrative Class | | | | | 33,843 | |
| | |
Shares Issued and Outstanding: | | | | | | |
| | |
Institutional Class | | | | | 1 | |
Administrative Class | | | | | 3,381 | |
| | |
Net Asset Value and Redemption Price Per Share
(Net Assets Per Share Outstanding) | | | | | | |
| | |
Institutional Class | | | | $ | 10.01 | |
Administrative Class | | | | | 10.01 | |
| | |
Cost of Investments Owned | | | | $ | 37,676 | |
Cost of Foreign Currency Held | | | | $ | 919 | |
| | | | | | |
| See accompanying notes | | June 30, 2004 | | Semi-Annual Report | | 5 |
Statement of Operations
Foreign Bond Portfolio (U.S. Dollar-Hedged)
| | | | | | |
| Amounts in thousands | | | | | |
| | | | | Six Months Ended
June 30, 2004
(Unaudited) | |
Investment Income: | | | | | | |
| | |
Interest | | | | $ | 522 | |
Dividends | | | | | 3 | |
Total Income | | | | | 525 | |
| | |
Expenses: | | | | | | |
| | |
Investment advisory fees | | | | | 41 | |
Administration fees | | | | | 82 | |
Distribution and/or servicing fees - Administrative Class | | | | | 24 | |
Miscellaneous expense | | | | | 1 | |
Total Expenses | | | | | 148 | |
| | |
Net Investment Income | | | | | 377 | |
| | |
Net Realized and Unrealized Gain (Loss): | | | | | | |
| | |
Net realized gain on investments | | | | | 113 | |
Net realized gain on futures contracts, options, and swaps | | | | | 12 | |
Net realized gain on foreign currency transactions | | | | | 552 | |
Net change in unrealized (depreciation) on investments | | | | | (1,698 | ) |
Net change in unrealized appreciation on futures contracts,
options, and swaps | | | | | 152 | |
Net change in unrealized appreciation on translation of
assets and liabilities denominated in foreign currencies | | | | | 773 | |
Net (Loss) | | | | | (96 | ) |
| | |
Net Increase in Assets Resulting from Operations | | | | $ | 281 | |
| | | | | | |
| 6 | | Semi-Annual Report | | June 30, 2004 | | See accompanying notes |
Statements of Changes in Net Assets
Foreign Bond Portfolio (U.S. Dollar-Hedged)
| | | | | | | | | | | | |
| Amounts in thousands | | | | | | | | | | |
| | | | | Six Months Ended
June 30, 2004
(Unaudited) | | | | | Year Ended
December 31, 2003 | |
Increase in Net Assets from: | | | | | | | | | | | | |
| | | | |
Operations: | | | | | | | | | | | | |
| | | | |
Net investment income | | | | $ | 377 | | | | | $ | 687 | |
Net realized gain (loss) | | | | | 677 | | | | | | (492 | ) |
Net change in unrealized appreciation (depreciation) | | | | | (773 | ) | | | | | 99 | |
Net increase resulting from operations | | | | | 281 | | | | | | 294 | |
| | | | |
Distributions to Shareholders: | | | | | | | | | | | | |
| | | | |
From net investment income | | | | | | | | | | | | |
Institutional Class | | | | | 0 | | | | | | 0 | |
Administrative Class | | | | | (346 | ) | | | | | (709 | ) |
Total Distributions | | | | | (346 | ) | | | | | (709 | ) |
| | | | |
Portfolio Share Transactions: | | | | | | | | | | | | |
| | | | |
Receipts for shares sold | | | | | | | | | | | | |
Institutional Class | | | | | 0 | | | | | | 0 | |
Administrative Class | | | | | 5,130 | | | | | | 21,710 | |
| | | | |
Issued as reinvestment of distributions | | | | | | | | | | | | |
Institutional Class | | | | | 0 | | | | | | 0 | |
Administrative Class | | | | | 346 | | | | | | 709 | |
| | | | |
Cost of shares redeemed | | | | | | | | | | | | |
Institutional Class | | | | | 0 | | | | | | 0 | |
Administrative Class | | | | | (3,923 | ) | | | | | (6,424 | ) |
Net increase resulting from Portfolio share transactions | | | | | 1,553 | | | | | | 15,995 | |
| | | | |
Total Increase in Net Assets | | | | | 1,488 | | | | | | 15,580 | |
| | | | |
Net Assets: | | | | | | | | | | | | |
| | | | |
Beginning of period | | | | | 32,368 | | | | | | 16,788 | |
End of period* | | | | $ | 33,856 | | | | | $ | 32,368 | |
| | | | |
*Including (overdistributed) net investment income of: | | | | $ | (1,509 | ) | | | | $ | (1,540 | ) |
| | | | | | |
| See accompanying notes | | June 30, 2004 | | Semi-Annual Report | | 7 |
Schedule of Investments
Foreign Bond Portfolio (U.S. Dollar-Hedged)
June 30, 2004 (Unaudited)
| | | | |
| | | Principal | | |
| | | Amount | | Value |
| | | (000s) | | (000s) |
| | | | | | |
AUSTRALIA 0.2% | | | | | | |
| | |
Crusade Global Trust | | | | | | |
1.580% due 02/15/2030 (a) | | $ | 14 | | $ | 14 |
Medallion Trust | | | | | | |
1.370% due 07/12/2031 (a) | | | 27 | | | 27 |
National Australia Bank Ltd. | | | | | | |
1.883% due 05/19/2010 (a) | | | 50 | | | 50 |
| | | | | |
|
|
| Total Australia (Cost $91) | | | | | | 91 |
| | | | | |
|
|
| | | | | | | |
AUSTRIA (i)(j) 1.5% | | | | | | |
| | |
Republic of Austria | | | | | | |
5.250% due 01/04/2011 | | EC | 300 | | | 393 |
3.800% due 10/20/2013 | | | 100 | | | 117 |
| | | | | |
|
|
Total Austria (Cost $447) | | | | | | 510 |
| | | | | |
|
|
| | | | | | | |
BRAZIL 0.3% | | | | | | |
| | |
Republic of Brazil | | | | | | |
2.062% due 04/15/2006 (a) | | $ | 32 | | | 32 |
2.125% due 04/15/2009 (a) | | | 17 | | | 15 |
2.125% due 04/15/2012 (a) | | | 67 | | | 56 |
| | | | | |
|
|
Total Brazil (Cost $105) | | | | | | 103 |
| | | | | |
|
|
| | | | | | | |
CANADA (i)(j) 3.1% | | | | | | |
| | |
Commonwealth of Canada | | | | | | |
6.000% due 06/01/2008 | | C$ | 500 | | | 399 |
5.500% due 06/01/2009 | | | 200 | | | 157 |
5.500% due 06/01/2010 | | | 300 | | | 235 |
6.000% due 06/01/2011 | | | 300 | | | 241 |
| | | | | |
|
|
Total Canada (Cost $966) | | | | | | 1,032 |
| | | | | |
|
|
| | | | | | | |
CAYMAN ISLANDS (i)(j) 1.6% | | | |
| | |
Pylon Ltd. | | | | | | |
3.553% due 12/18/2008 (a) | | EC | 250 | | | 310 |
Vita Capital Ltd. | | | | | | |
2.460% due 01/01/2007 (a) | | $ | 250 | | | 252 |
| | | | | |
|
|
| Total Cayman Islands (Cost $554) | | | | | | 562 |
| | | | | |
|
|
| | | | | | | |
DENMARK (i)(j) 0.2% | | | | | | |
| | |
Nykredit Konvertible | | | | | | |
6.000% due 10/01/2029 | | DK | 358 | | | 61 |
| | | | | |
|
|
Total Denmark (Cost $39) | | | | | | 61 |
| | | | | |
|
|
| | | | | | | |
FRANCE (i)(j) 0.8% | | | | | | |
| | |
Republic of France | | | | | | |
4.000% due 04/25/2009 | | EC | 80 | | | 99 |
4.000% due 10/25/2009 | | | 30 | | | 37 |
5.500% due 04/25/2010 | | | 110 | | | 146 |
| | | | | |
|
|
Total France (Cost $200) | | | | | | 282 |
| | | | | |
|
|
| | | | | | | |
GERMANY (i)(j) 16.3% | | | | | | |
| | |
KFW International Finance, Inc. | | | | | | |
3.500% due 11/15/2005 | | EC | 100 | | | 124 |
Landesbank Baden-Wuerttemberg AG | | | |
5.500% due 04/02/2007 | | | 30 | | | 39 |
Republic of Germany | | | | | | |
4.500% due 07/04/2009 | | | 10 | | | 13 |
5.250% due 07/04/2010 | | | 300 | | | 394 |
5.250% due 01/04/2011 | | | 300 | | | 394 |
5.000% due 01/04/2012 | | | 100 | | | 129 |
| | | | | | |
| | |
4.500% due 01/04/2013 | | EC | 80 | | $ | 100 |
6.250% due 01/04/2024 | | | 600 | | | 866 |
5.000% due 07/04/2027 | | | 590 | | | 880 |
5.625% due 01/04/2028 | | | 1,800 | | | 2,414 |
4.750% due 07/04/2028 | | | 30 | | | 36 |
5.500% due 01/04/2031 | | | 100 | | | 133 |
| | | | | |
|
|
Total Germany (Cost $5,173) | | | | | | 5,522 |
| | | | | |
|
|
| | | | | | | |
ITALY (i)(j) 14.3% | | | | | | |
| | |
First Italian Auto Transaction | | | | | | |
2.240% due 07/12/2008 (a) | | EC | 26 | | | 32 |
Republic of Italy | | | | | | |
2.125% due 02/01/2006 | | | 400 | | | 539 |
3.500% due 01/15/2008 | | | 2,700 | | | 3,311 |
4.500% due 05/01/2009 | | | 360 | | | 456 |
4.250% due 11/01/2009 | | | 60 | | | 75 |
5.500% due 11/01/2010 | | | 110 | | | 146 |
Seashell Securities PLC | | | | | | |
2.359% due 10/25/2028 (a) | | | 148 | | | 180 |
Telecom Italia SpA | | | | | | |
5.625% due 02/01/2007 (a) | | | 70 | | | 90 |
| | | | | |
|
|
Total Italy (Cost $4,738) | | | | | | 4,829 |
| | | | | |
|
|
| | | | | | | |
JAPAN (i)(j) 7.3% | | | | | | |
Government of Japan | | | | | | |
0.300% due 12/20/2007 | | JY | 60,000 | | | 548 |
1.500% due 12/20/2011 | | | 167,000 | | | 1,544 |
1.600% due 09/20/2013 | | | 30,000 | | | 273 |
Japan Financial Corp. | | | | | | |
5.875% due 03/14/2011 | | $ | 80 | | | 86 |
| | | | | |
|
|
Total Japan (Cost $2,399) | | | | | | 2,451 |
| | | | | |
|
|
| | | | | | | |
LIBERIA 0.1% | | | | | | |
| | |
Royal Caribbean Cruises Ltd. | | | | | | |
8.125% due 07/28/2004 | | $ | 30 | | | 30 |
| | | | | |
|
|
Total Liberia (Cost $30) | | | | | | 30 |
| | | | | |
|
|
| | | | | | | |
LUXEMBOURG 0.3% | | | | | | |
| | |
Tyco International Group S.A. | | | | | | |
5.875% due 11/01/2004 | | $ | 100 | | | 101 |
| | | | | |
|
|
Total Luxembourg (Cost $101) | | | | | | 101 |
| | | | | |
|
|
| | | | | | | |
MEXICO 0.3% | | | | | | |
| |
Pemex Project Funding Master Trust | | | |
8.625% due 02/01/2022 | | $ | 20 | | | 21 |
Petroleos Mexicanos | | | | | | |
8.850% due 09/15/2007 | | | 20 | | | 22 |
9.375% due 12/02/2008 | | | 30 | | | 34 |
| | | | | |
|
|
Total Mexico (Cost $70) | | | | | | 77 |
| | | | | |
|
|
| | | | | | | |
NETHERLANDS (i)(j) 0.8% | | | | | | |
| | |
Kingdom of Netherlands | | | | | | |
6.000% due 01/15/2006 | | EC | 200 | | | 256 |
| | | | | |
|
|
Total Netherlands (Cost $192) | | | | | | 256 |
| | | | | |
|
|
| | | | | | | |
NEW ZEALAND (i)(j) 0.2% | | | | | | |
| |
Commonwealth of New Zealand | | | |
4.500% due 02/15/2016 (b) | | N$ | 86 | | | 68 |
| | | | | |
|
|
Total New Zealand (Cost $47) | | | | | | 68 |
| | | | | |
|
|
| | | | | | |
PANAMA 0.1% | | | | | | |
| | |
Republic of Panama | | | | | | |
9.375% due 01/16/2023 | | $ | 40 | | $ | 41 |
| | | | | |
|
|
Total Panama (Cost $40) | | | | | | 41 |
| | | | | |
|
|
| | | | | | | |
PERU 0.1% | | | | | | |
| | |
Republic of Peru | | | | | | |
5.000% due 03/07/2017 (a) | | $ | 36 | | | 32 |
| | | | | |
|
|
Total Peru (Cost $30) | | | | | | 32 |
| | | | | |
|
|
| | | | | | | |
RUSSIA 0.2% | | | | | | |
| | |
Russian Federation | | | | | | |
10.000% due 06/26/2007 | | $ | 60 | | | 68 |
| | | | | |
|
|
Total Russia (Cost $70) | | | | | | 68 |
| | | | | |
|
|
| | | | | | | |
SOUTH AFRICA 0.3% | | | | | | |
| | |
Republic of South Africa | | | | | | |
8.375% due 10/17/2006 | | $ | 105 | | | 115 |
| | | | | |
|
|
| Total South Africa (Cost $118) | | | | | | 115 |
| | | | | |
|
|
| | | | | | | |
SPAIN (i)(j) 5.1% | | | | | | |
| | |
Kingdom of Spain | | | | | | |
4.950% due 07/30/2005 | | EC | 30 | | | 38 |
5.150% due 07/30/2009 | | | 1,210 | | | 1,579 |
4.000% due 01/31/2010 | | | 100 | | | 123 |
| | | | | |
|
|
Total Spain (Cost $1,608) | | | | | | 1,740 |
| | | | | |
|
|
| | | | | | | |
SUPRANATIONAL (i)(j) 0.2% | | | |
| | |
Eurofima | | | | | | |
4.750% due 07/07/2004 | | SK | 600 | | | 80 |
| | | | | |
|
|
Total Supranational (Cost $70) | | | | | | 80 |
| | | | | |
|
|
| | | | | | | |
UNITED KINGDOM (i)(j) 10.2% | | | |
| | |
Haus Ltd. | | | | | | |
2.347% due 12/14/2037 (a) | | EC | 72 | | | 88 |
Lloyds TSB Bank PLC | | | | | | |
5.625% due 07/15/2049 | | | 40 | | | 52 |
1.500% due 11/29/2049 (a) | | $ | 100 | | | 86 |
United Kingdom Gilt | | | | | | |
5.000% due 03/07/2012 | | BP | 700 | | | 1,262 |
5.000% due 09/07/2014 | | | 1,100 | | | 1,962 |
| | | | | |
|
|
| Total United Kingdom (Cost $3,461) | | | | | | 3,450 |
| | | | | |
|
|
| | | | | | | |
UNITED STATES (i)(j) 24.3% | | | | | | |
Asset-Backed Securities 3.2% |
|
Ameriquest Mortgage Securities, Inc. |
1.710% due 03/25/2033 (a) | | $ | 43 | | | 43 |
Amortizing Residential Collateral Trust |
1.650% due 10/25/2031 (a) | | | 15 | | | 15 |
1.590% due 07/25/2032 (a) | | | 26 | | | 26 |
AMRESCO Residential Securities Corp.
Mortgage Loan Trust |
1.770% due 06/25/2029 (a) | | | 5 | | | 5 |
Credit-Based Asset Servicing and Securitization |
1.620% due 06/25/2032 (a) | | | 36 | | | 36 |
CS First Boston Mortgage Securities Corp. |
1.610% due 01/25/2032 (a) | | | 9 | | | 9 |
6.500% due 04/25/2033 | | | 47 | | | 48 |
| | | | | | |
| 8 | | Semi-Annual Report | | June 30, 2004 | | See accompanying notes |
| | | | |
| | | Principal | | |
| | | Amount | | Value |
| | | (000s) | | (000s) |
| | | | | | | |
|
Fieldstone Mortgage Investment Corp. | |
1.590% due 01/25/2035 (a) | | $ | 92 | | $ | 92 | |
First Alliance Mortgage Loan Trust | |
1.320% due 12/20/2027 (a) | | | 6 | | | 6 | |
First Franklin Mortgage Loan Trust Asset-Backed Certificates | |
2.820% due 02/25/2034 (a) | | | 186 | | | 187 | |
Home Equity Asset Trust | | | | | | | |
1.710% due 03/25/2033 (a) | | | 20 | | | 20 | |
1.450% due 08/25/2034 (a) | | | 96 | | | 96 | |
Household Mortgage Loan Trust | | | | | | | |
1.390% due 05/20/2032 (a) | | | 32 | | | 32 | |
Irwin Home Equity Loan Trust | | | | | | | |
1.820% due 06/25/2028 (a) | | | 34 | | | 34 | |
Long Beach Mortgage Loan Trust | |
1.620% due 07/25/2033 (a) | | | 30 | | | 30 | |
MLCC Mortgage Investors, Inc. | | | | | | | |
1.618% due 03/15/2025 (a) | | | 38 | | | 38 | |
Morgan Stanley Dean Witter Capital I, Inc. | |
1.670% due 07/25/2030 (a) | | | 6 | | | 6 | |
1.630% due 07/25/2032 (a) | | | 22 | | | 22 | |
Novastar Home Equity Loan | | | | | | | |
1.575% due 04/25/2028 (a) | | | 11 | | | 11 | |
1.580% due 01/25/2031 (a) | | | 10 | | | 10 | |
Providian Home Equity Loan Trust | |
1.590% due 06/25/2025 (a) | | | 9 | | | 9 | |
Quest Trust | | | | | | | |
1.291% due 06/25/2034 (a) | | | 200 | | | 200 | |
Residential Asset Securities Corp. | |
1.550% due 07/25/2032 (a) | | | 66 | | | 66 | |
Structured Asset Investment Loan Trust | |
1.200% due 04/25/2033 (a) | | | 26 | | | 26 | |
| | | | | |
|
|
|
| | | | | | | 1,067 | |
| | | | | |
|
|
|
Corporate Bonds & Notes 3.3% | |
Comcast Corp. | | | | | | | |
7.050% due 03/15/2033 | | | 100 | | | 104 | |
Entergy Gulf States, Inc. | | | | | | | |
2.433% due 06/18/2007 (a) | | | 100 | | | 100 | |
Ford Motor Credit Co. | | | | | | | |
7.500% due 03/15/2005 | | | 200 | | | T207 | |
General Motors Acceptance Corp. | | | | |
6.875% due 09/09/2004 | | B | P75 | | | 137 | |
2.135% due 05/18/2006 (a) | | | 100 | | | 100 | |
J.P. Morgan Chase & Co., Inc. | | | | | | | |
6.772% due 02/15/2012 (a) | | $ | 10 | | | 10 | |
KFW International Finance, Inc. | | | | | | | |
1.750% due 03/23/2010 | | JY | 11,000 | | | 105 | |
Morgan Stanley Capital I, Inc. | | | | | | | |
1.378% due 04/15/2016 (a) | | $ | 200 | | | 200 | |
Pacific Gas & Electric Co. | | | | | | | |
1.810% due 04/03/2006 (a) | | | 110 | | | 110 | |
UFJ Finance Aruba AEC | | | | | | | |
6.750% due 07/15/2013 | | | 40 | | | 41 | |
| | | | | |
|
|
|
| | | | | | | 1,114 | |
| | | | | |
|
|
|
Mortgage-Backed Securities 6.0% | |
Bear Stearns Adjustable Rate Mortgage Trust | |
6.912% due 12/25/2040 (a) | | | 1 | | | 1 | |
Bear Stearns Commercial Mortgage Securities | |
1.350% due 05/14/2016 (a) | | | 200 | | | 200 | |
Commercial Mortgage Asset Trust | | | | |
6.975% due 01/17/2032 | | | 100 | | | 112 | |
Commercial Mortgage Pass-Through Certificates | |
1.408% due 07/15/2015 (a) | | | 197 | | | 197 | |
1.280% due 11/15/2015 (a) | | | 199 | | | 199 | |
CS First Boston Mortgage Securities Corp. | |
1.082% due 08/25/2033 (a) | | | 58 | | | 58 | |
First Horizon Asset Securities, Inc. | | | | |
7.000% due 05/25/2030 | | | 5 | | | 5 | |
GMAC Commercial Mortgage Securities, Inc. | |
6.420% due 05/15/2035 | | | 100 | | | 108 | |
Impac Secured Assets CMN Owner Trust | |
1.490% due 08/25/2034 (a) | | | 200 | | | 200 | |
| | | | | | | |
| |
Mellon Residential Funding Corp. | | | | |
1.678% due 12/15/2030 (a) | | $ | 110 | | $ | 110 | |
Sequoia Mortgage Trust | | | | | | | |
1.390% due 08/20/2032 (a) | | | 76 | | | 75 | |
Structured Asset Mortgage Investments, Inc. | |
1.390% due 09/19/2032 (a) | | | 199 | | | 199 | |
1.421% due 09/19/2032 (a) | | | 80 | | | 80 | |
1.450% due 03/19/2034 (a) | | | 194 | | | 193 | |
Structured Asset Securities Corp. | | | | |
1.590% due 01/25/2033 (a) | | | 25 | | | 25 | |
Wachovia Bank Commercial Mortgage Trust | |
1.428% due 06/15/2013 (a) | | | 200 | | | 200 | |
Washington Mutual Mortgage Securities Corp. | |
6.000% due 03/25/2017 | | | 9 | | | 9 | |
5.159% due 10/25/2032 (a) | | | 15 | | | 15 | |
3.065% due 02/27/2034 (a) | | | 51 | | | 51 | |
Wells Fargo Mortgage-Backed Securities Trust | |
4.614% due 09/25/2032 (a) | | | 4 | | | 4 | |
| | | | | |
|
|
|
| | | | | | | 2,041 | |
| | | | | |
|
|
|
Municipal Bonds & Notes 1.2% | | | | |
Connecticut State General Obligation Bonds, Series 2001 | |
5.500% due 12/15/2013 | | | 100 | | | 112 | |
Illinois Educational Facilities Authority Revenue Bonds, Series 2003 | |
5.000% due 07/01/2033 | | | 100 | | | 97 | |
Lower Colorado River Authority Revenue Bonds,
(FSA Insured), Series 2003 | |
5.000% due 05/15/2023 | | | 100 | | | 101 | |
Seattle, Washington Water System Revenue Bonds,
(MBIA Insured), Series 2003 | |
5.000% due 09/01/2033 | | | 100 | | | 97 | |
| | | | | |
|
|
|
| | | | | | | 407 | |
| | | | | |
|
|
|
U.S. Government Agencies 8.2% | | | | |
Fannie Mae | | | | | | | |
4.640% due 01/30/2008 | | | 200 | | | 200 | |
1.650% due 01/25/2016 (a) | | | 15 | | | 15 | |
5.500% due 11/01/2016-07/15/2034 (c) | | | 1305 | | | 1,335 | |
5.000% due 09/01/2018 | | | 177 | | | 177 | |
5.213% due 04/01/2033 (a) | | | 47 | | | 47 | |
1.420% due 03/25/2034 (a) | | | 194 | | | 193 | |
Freddie Mac | | | | | | | |
6.530% due 11/26/2012 | | | 300 | | | 319 | |
5.000% due 09/15/2016 | | | 45 | | | 46 | |
3.430% due 02/01/2029 (a) | | | 60 | | | 62 | |
Government National Mortgage Association | |
4.375% due 04/20/2028 (a) | | | 5 | | | 5 | |
4.000% due 04/20/2030-05/20/2030 (a)(c) | | | 33 | | | 34 | |
3.250% due 06/20/2030 (a) | | | 38 | | | 38 | |
Tennessee Valley Authority | | | | | | | |
4.875% due 12/15/2016 | | | 300 | | | 313 | |
| | | | | |
|
|
|
| | | | | | | 2,784 | |
| | | | | |
|
|
|
U.S. Treasury Obligations 1.8% | |
3.500% due 01/15/2011 | | | 324 | | | 360 | |
1.875% due 07/15/2013 | | | 102 | | | 101 | |
3.625% due 04/15/2028 | | | 116 | | | 142 | |
| | | | | |
|
|
|
| | | | | | | 603 | |
| | | | | |
|
|
|
Preferred Security 0.6% | | | | |
| | | Shares | | | |
DG Funding Trust | | | | | | | |
3.360% due 12/29/2049 (a) | | | 20 | | | 215 | |
| | | | | |
|
|
|
| Total United States (Cost $8,204) | | | | | | 8,231 | |
| | | | | |
|
|
|
| | | | | | | | |
PURCHASED CALL OPTIONS 0.0% | |
| | | Principal Amount (000s) | | | |
30-Year Interest Rate Swap (OTC) | |
Strike @ 5.750%** Exp. 04/27/2009 | | $ | 200 | | | 8 | |
| | | | | |
|
|
|
| Total Purchased Call Options (Cost $10) | | | | | | 8 | |
| | | | | |
|
|
|
| | | | | | | |
PURCHASED PUT OPTIONS 0.1% | |
| |
30-Year Interest Rate Swap (OTC) | | | | |
Strike @ 6.250% ** Exp. 04/27/2009 | | $ | 200 | | $ | 13 | |
| | | | | |
|
|
|
| Total Purchased Put Options (Cost $14) | | | | | | 13 | |
| | | | | |
|
|
|
| | | | | | | | |
SHORT-TERM INSTRUMENTS 26.3% | |
| | |
Commercial Paper 23.3% | | | | | | | |
AB Spintab | | | | | | | |
1.260% due 09/08/2004 | | $ | 200 | | | 199 | |
Bank of Ireland | | | | | | | |
1.285% due 09/03/2004 | | | 500 | | | 499 | |
CBA (de) Finance | | | | | | | |
1.210% due 08/23/2004 | | | 200 | | | 200 | |
Fannie Mae | | | | | | | |
1.010% due 10/01/2004 | | | 200 | | | 199 | |
Freddie Mac | | | | | | | |
1.440% due 09/14/2004 | | | 200 | | | 199 | |
1.465% due 09/28/2004 | | | 300 | | | 299 | |
HBOS Treasury Services PLC | | | | | | | |
1.035% due 07/01/2004 | | | 300 | | | 300 | |
1.475% due 09/13/2004 | | | 600 | | | 598 | |
1.585% due 10/26/2004 | | | 100 | | | 99 | |
ING U.S. Funding LLC | | | | | | | |
1.325% due 09/07/2004 | | | 100 | | | 100 | |
1.345% due 09/09/2004 | | | 300 | | | 299 | |
KFW International Finance, Inc. | | | | | | | |
1.110% due 08/20/2004 | | | 400 | | | 399 | |
Lloyds TSB Bank PLC | | | | | | | |
1.185% due 07/21/2004 | | | 400 | | | 400 | |
National Australia Funding, Inc. | | | | | | | |
1.050% due 07/02/2004 | | | 900 | | | 900 | |
Royal Bank of Scotland PLC | | | | | | | |
1.030% due 07/06/2004 | | | 900 | | | 900 | |
Shell Finance (UK) PLC | | | | | | | |
1.230% due 08/11/2004 | | | 500 | | | 499 | |
Svenska Handlesbanken | | | | | | | |
1.090% due 08/05/2004 | | | 400 | | | 399 | |
1.295% due 09/24/2004 | | | 600 | | | 598 | |
Toyota Motor Credit Corp. | | | | | | | |
1.330% due 09/07/2004 | | | 400 | | | 399 | |
UBS Finance, Inc. | | | | | | | |
1.245% due 09/13/2004 | | | 400 | | | 399 | |
| | | | | |
|
|
|
| | | | | | | 7,884 | |
| | | | | |
|
|
|
| | |
Repurchase Agreement 1.8% | | | | | | | |
State Street Bank | | | | | | | |
0.800% due 07/01/2004 | | | 594 | | | 594 | |
| | | | | |
|
|
|
(Dated 06/30/2004. Collateralized by Freddie Mac 2.875% due 10/15/2005 valued at $606.
Repurchase proceeds are $594.) | | | | |
| | |
U.S. Treasury Bills 1.2% | | | | | | | |
1.256% due 09/02/2004-09/16/2004 (c)(d) | | | 420 | | | 420 | |
| | | | | |
|
|
|
| Total Short-Term Instruments (Cost $8,899) | | | | | | 8,898 | |
| | | | | |
|
|
|
| | | | | | | | |
Total Investments 114.2% | | | | | $ | 38,651 | |
(Cost $37,676) | | | | | | | |
| | |
Written Options (g) (0.2%) | | | | | | (64 | ) |
(Premiums $128) | | | | | | | |
| |
Other Assets and Liabilities (Net) (14.0%) | | | (4,731 | ) |
| | | | | |
|
|
|
| | |
Net Assets 100.0% | | | | | $ | 33,856 | |
| | | | | |
|
|
|
| | | | | | |
| See accompanying notes | | June 30, 2004 | | Semi-Annual Report | | 9 |
Schedule of Investments (Cont.)
Foreign Bond Portfolio (U.S. Dollar-Hedged)
June 30, 2004 (Unaudited)
Notes to Schedule of Investments (amounts in thousands, except number of contracts):
(a) Variable rate security.
(b) Principal amount of security is adjusted for inflation.
(c) Securities are grouped by coupon or range of coupons and represent a range of maturities.
(d) Securities with an aggregate market value of $419 have been segregated with the custodian to cover margin
requirements for the following open futures contracts at June 30, 2004:
| | | | | | | | |
| Type | | Expiration Month | | # of Contracts | | Unrealized
Appreciation/
(Depreciation) | |
Euribor June Long Futures | | 06/2005 | | 8 | | $ | (5) | |
Euro-Bund 10-Year Note Long Futures | | 09/2004 | | 55 | | | 58 | |
Government of Japan 10-Year | | | | | | |
Note Long Futures | | 09/2004 | | 5 | | | (21 | ) |
U.S. Treasury 10-Year Note Long Futures | | 09/2004 | | 66 | | | 85 | |
U.S. Treasury 5-Year Note Long Futures | | 09/2004 | | 4 | | | 1 | |
| | | | | | | $ | 118 | |
(e) Swap agreements outstanding at June 30, 2004:
| | | | | | | | | |
Type | |
| Notional
Amount | | | | | Unrealized
Appreciation/
(Depreciation |
) |
| Receive floating rate based on 6-month BP-LIBOR and pay a fixed rate equal to 5.000%. | |
Counterparty: Merrill Lynch & Co., Inc. | | | | | | |
Exp. 03/15/2017 | | BP | 200 | | $ | | | 3 | |
|
| Receive floating rate based on 6-month BP-LIBOR and pay a fixed rate equal to 5.000%. | |
Counterparty: UBS Warburg LLC | | | | | | |
Exp. 03/20/2018 | | | 300 | | | | | (1 | ) |
|
| Receive floating rate based on 6-month BP-LIBOR and pay a fixed rate equal to 5.000%. | |
| Counterparty: Morgan Stanley Dean Witter & Co. | | | | | | |
Exp. 03/20/2018 | | | 500 | | | | | 5 | |
|
| Receive floating rate based on 6-month BP-LIBOR and pay a fixed rate equal to 5.000%. | |
Counterparty: Goldman Sachs & Co. | | | | | | |
Exp. 03/20/2018 | | | 800 | | | | | 10 | |
|
| Receive floating rate based on 6-month BP-LIBOR and pay a fixed rate equal to 5.000%. | |
Counterparty: J.P. Morgan Chase & Co. | | | | | | |
Exp. 03/20/2018 | | | 600 | | | | | 4 | |
|
| Receive a fixed rate equal to 3.500% and pay floating rate based on 6-month EC-LIBOR. | |
Counterparty: UBS Warburg LLC | | | | | | |
Exp. 09/15/2005 | | EC | 2,800 | | | | | 16 | |
|
| Receive a fixed rate equal to 4.000% and pay floating rate based on 6-month EC-LIBOR. | |
Counterparty: Barclays Bank PLC | | | | | | |
Exp. 03/15/2007 | | | 200 | | | | | (1 | ) |
|
| Receive a fixed rate equal to 4.000% and pay floating rate based on 6-month EC-LIBOR. | |
Counterparty: Goldman Sachs & Co. | | | | | | |
Exp. 06/17/2010 | | | 200 | | | | | (5 | ) |
| | | | | | | | |
|
| Receive floating rate based on 6-month EC-LIBOR and pay a fixed rate equal to 5.000%. | |
Counterparty: J.P. Morgan Chase & Co. | | | | | |
Exp. 06/17/2012 | | EC | 100 | | | | (16 | ) |
|
| Receive floating rate based on 6-month EC-LIBOR and pay a fixed rate equal to 5.000%. | |
Counterparty: Citibank N.A. | | | | | |
Exp. 06/18/2012 | | | 200 | | | | (10 | ) |
|
| Receive floating rate based on 6-month EC-LIBOR and pay a fixed rate equal to 4.000%. | |
Counterparty: Citibank N.A. | | | | | |
Exp. 12/15/2014 | | | 1,080 | | | | (10 | ) |
|
| Receive floating rate based on 6-month EC-LIBOR and pay a fixed rate equal to 4.000%. | |
Counterparty: UBS Warburg LLC | | | | | |
Exp. 12/15/2014 | | | 200 | | | | (2 | ) |
|
| Receive floating rate based on 6-month EC-LIBOR and pay a fixed rate equal to 5.000%. | |
Counterparty: UBS Warburg LLC | | | | | |
Exp. 12/15/2014 | | | 2,500 | | | | (27 | ) |
|
| Receive a fixed rate equal to 6.000% and pay floating rate based on 6-month EC-LIBOR. | |
Counterparty: Goldman Sachs & Co. | | | | | |
Exp. 03/20/2018 | | | 1,000 | | | | 0 | |
|
| Receive a fixed rate equal to 6.000% and pay floating rate based on 6-month EC-LIBOR. | |
Counterparty: UBS Warburg LLC | | | | | |
Exp. 03/20/2018 | | | 400 | | | | 2 | |
|
| Receive a fixed rate equal to 6.000% and pay floating rate based on 6-month EC-LIBOR. | |
Counterparty: J.P. Morgan Chase & Co. | | | | | |
Exp. 03/20/2018 | | | 200 | | | | 1 | |
|
| Receive floating rate based on 6-month EC-LIBOR and pay a fixed rate equal to 6.000%. | |
Counterparty: Morgan Stanley Dean Witter & Co. | |
Exp. 03/15/2031 | | | 100 | | | | (18 | ) |
|
| Receive floating rate based on 6-month EC-LIBOR and pay a fixed rate equal to 6.000%. | |
Counterparty: J.P. Morgan Chase & Co. | | | | | |
Exp. 03/17/2031 | | | 100 | | | | (19 | ) |
|
| Receive floating rate based on 3-month H$-HIBOR and pay a fixed rate equal to 5.753%. | |
Counterparty: Goldman Sachs & Co. | | | | | |
Exp. 02/08/2006 | | H$ | 3,000 | | | | (22 | ) |
|
| Receive floating rate based on 3-month H$-HIBOR and pay a fixed rate equal to 4.235%. | |
Counterparty: Goldman Sachs & Co. | | | | | |
Exp. 12/17/2008 | | | 7,100 | | | | (16 | ) |
|
| Receive floating rate based on 6-month JY-LIBOR and pay a fixed rate equal to 2.020%. | |
Counterparty: Goldman Sachs & Co. | | | | | |
Exp. 05/18/2010 | | JY | 17,000 | | | | (8 | ) |
|
| Receive floating rate based on 6-month JY-LIBOR and pay a fixed rate equal to 1.300%. | |
Counterparty: Goldman Sachs & Co. | | | | | |
Exp. 09/21/2011 | | | 40,000 | | | | 4 | |
|
| Receive floating rate based on 6-month JY-LIBOR and pay a fixed rate equal to 0.800%. | |
Counterparty: UBS Warburg LLC | | | | | |
Exp. 03/20/2012 | | | 50,000 | | | | 7 | |
|
| Receive a fixed rate equal to 4.500% and pay floating rate based on 3-month SK-STIBOR. | |
Counterparty: Merrill Lynch & Co., Inc. | | | | | |
Exp. 06/17/2008 | | SK | 2,600 | | | | 1 | |
| | | | | | | | |
|
| Receive a fixed rate equal to 4.500% and pay floating rate based on 3-month SK-STIBOR. | |
Counterparty: J.P. Morgan Chase & Co. | | | | | |
Exp. 06/17/2008 | | $ | 4,100 | | | | 2 | |
|
| Receive a fixed rate equal to 4.500% and pay floating rate based on 3-month SK-STIBOR. | |
Counterparty: Barclays Bank PLC | | | | | |
Exp. 06/17/2008 | | | 2,500 | | | | 1 | |
|
| Receive total return on Lehman Commercial Mortgage-Backed Securities Index and pay a floating rate based on 1-month LIBOR less 0.650%. | |
Counterparty: Morgan Stanley Dean Witter & Co. | |
Exp. 09/30/2004 | | | 100 | | | | 0 | |
|
| Receive a fixed rate equal to 0.960% and the Portfolio will pay to the counterparty at par in the event of default of Russian Federation, 5.000% until 03/31/2007 and 7.500% thereafter, due 03/31/2030. | |
Counterparty: Goldman Sachs & Co. | | | | | |
Exp. 01/28/2005 | | | 100 | | | | 0 | |
|
| Receive floating rate based on 3-month LIBOR and pay a fixed rate equal to 4.000%. | |
Counterparty: J.P. Morgan Chase & Co. | | | | | |
Exp. 12/15/2009 | | | 1,900 | | | | (18 | ) |
|
| Receive floating rate based on 3-month LIBOR and pay a fixed rate equal to 4.000%. | |
Counterparty: Lehman Brothers, Inc. | | | | | |
Exp. 12/15/2009 | | | 100 | | | | 0 | |
|
| Receive floating rate based on 3-month LIBOR and pay a fixed rate equal to 5.000%. | |
Counterparty: Bank of America | | | | | |
Exp. 12/15/2014 | | | 1,800 | | | | (28 | ) |
|
| Receive floating rate based on 3-month LIBOR and pay a fixed rate equal to 5.000%. | |
Counterparty: Goldman Sachs & Co. | | | | | |
Exp. 12/15/2014 | | | 600 | | | | (9 | ) |
|
| Receive floating rate based on 3-month LIBOR and pay a fixed rate equal to 5.000%. | |
Counterparty: UBS Warburg LLC | | | | | |
Exp. 12/15/2014 | | | 800 | | | | (12 | ) |
|
| Receive floating rate based on 3-month LIBOR and pay a fixed rate equal to 6.000%. | |
Counterparty: Bank of America | | | | | |
| Exp. 12/15/2024 | | | 900 | | (24) | |
| | | | | | $ (190) | |
|
(f) Written options with premiums to be determined on a future date: | |
Type | |
| # of
Contracts | | Unrealized
Appreciation |
|
Call & Put–OTC % U.S. Dollar Forward Delta /Neutral Straddle vs. Japanese Yen Strike and premium determined on 12/18/2007, based upon implied volatility
parameter of 18.500%. | |
| Counterparty: AIG International, Inc. | | | | | |
| Exp. 12/18/2012 | | | 80 | | $ 5 | |
| | | | | | |
| 10 | | Semi-Annual Report | | June 30, 2004 | | See accompanying notes |
(g) Premiums received on written options:
| | | | | | | | | | | | | | | | | | | | | | | | | |
| Name of Issuer | | | | Exercise
Price | | | | | Expiration
Date | | # of Contracts | | | | Premium | | | | | | Value |
Call - CBOT U.S. Treasury Note September Futures | | | | $ | 115.000 | | | | | 08/27/2004 | | | 6 | | | | $ | 2 | | | | | | $ | 0 |
Call - CBOT U.S. Treasury Note September Futures | | | | | 114.000 | | | | | 08/27/2004 | | | 1 | | | | | 1 | | | | | | | 0 |
| | | | | | | | | | | | | | | | | | $ | 3 | | | | | | $ | 0 |
| Name of Issuer | | Counterparty | | Exercise Rate | | | | | Expiration
Date | | Notional
Amount | | | | Premium | | | | | | Value |
Call - OTC 10-Year Interest Rate Swap | | J.P. Morgan Chase & Co. | | | 4.000 | %** | | | | 10/07/2004 | | $ | 300 | | | | $ | 3 | | | | | | $ | 0 |
Call - OTC 7-Year Interest Rate Swap | | J.P. Morgan Chase & Co. | | | 3.800 | %** | | | | 10/07/2004 | | | 800 | | | | | 8 | | | | | | | 0 |
Put - OTC 10-Year Interest Rate Swap | | J.P. Morgan Chase & Co. | | | 6.000 | %* | | | | 10/07/2004 | | | 300 | | | | | 2 | | | | | | | 1 |
Put - OTC 7-Year Interest Rate Swap | | J.P. Morgan Chase & Co. | | | 6.000 | %* | | | | 10/07/2004 | | | 800 | | | | | 7 | | | | | | | 1 |
Call - OTC 7-Year Interest Rate Swap | | Lehman Brothers, Inc. | | | 5.750 | %** | | | | 08/04/2005 | | | 1,000 | | | | | 43 | | | | | | | 40 |
Put - OTC 7-Year Interest Rate Swap | | Lehman Brothers, Inc. | | | 5.750 | %* | | | | 08/04/2005 | | | 1,000 | | | | | 43 | | | | | | | 17 |
Call - OTC 7-Year Interest Rate Swap | | Merrill Lynch & Co., Inc. | | | 4.000 | %** | | | | 09/23/2005 | | | 300 | | | | | 8 | | | | | | | 1 |
Put - OTC 7-Year Interest Rate Swap | | Merrill Lynch & Co., Inc. | | | 6.000 | %* | | | | 09/23/2005 | | | 300 | | | | | 11 | | | | | | | 4 |
| | | | | | | | | | | | | | | | | | $ | 125 | | | | | | $ | 64 |
| * | The Portfolio will pay a floating rate based on 3-month LIBOR. |
**The Portfolio will receive a floating rate based on 3-month LIBOR.
(h) Short sales open at June 30, 2004 were as follows:
| | | | | | | | | | | | | | |
| Type | | Coupon (%) | | Maturity | | Par | | | | Value | | Proceeds |
U.S. Treasury Note | | 5.500 | | 05/15/2009 | | $ | 400 | | | | $ | 431 | | $ 426 |
U.S. Treasury Note | | 5.750 | | 08/15/2010 | | | 100 | | | | | 109 | | 107 |
U.S. Treasury Note | | 4.375 | | 08/15/2012 | | | 500 | | | | | 498 | | 494 |
U.S. Treasury Note | | 3.875 | | 02/15/2013 | | | 900 | | | | | 861 | | 846 |
U.S. Treasury Note | | 3.625 | | 05/15/2013 | | | 2,400 | | | | | 2,248 | | 2,212 |
U.S. Treasury Note | | 4.250 | | 08/15/2013 | | | 1,100 | | | | | 1,074 | | 1,055 |
U.S. Treasury Note | | 3.000 | | 02/15/2009 | | | 2,600 | | | | | 2,520 | | 2,524 |
| | | | | | | | | | | | $ | 7,741 | | $ 7,664 |
(i) Forward foreign currency contracts outstanding at June 30, 2004:
| | | | | | | | | | | | | | | | | | | | | | | | | |
| Type | | | | Currency | | | | | | Principal
Amount
Covered by
Contract | | | | Settlement
Month | | Unrealized
Appreciation | | Unrealized (Depreciation) | | | Net Unrealized
Appreciation/ (Depreciation) | |
Sell | | | | BP | | | | | | 1,058 | | | | 07/2004 | | $ | 5 | | $ | 0 | | | $ | 5 | |
Buy | | | | BR | | | | | | 36 | | | | 07/2004 | | | 0 | | | 0 | | | | 0 | |
Sell | | | | C$ | | | | | | 1,431 | | | | 07/2004 | | | 0 | | | (17 | ) | | | (17 | ) |
Buy | | | | CP | | | | | | 1,246 | | | | 08/2004 | | | 0 | | | 0 | | | | 0 | |
Sell | | | | DK | | | | | | 679 | | | | 09/2004 | | | 1 | | | 0 | | | | 1 | |
Buy | | | | EC | | | | | | 266 | | | | 07/2004 | | | 0 | | | (1 | ) | | | (1 | ) |
Sell | | | | | | | | | | 8,362 | | | | 07/2004 | | | 96 | | | 0 | | | | 96 | |
Buy | | | | H$ | | | | | | 47 | | | | 07/2004 | | | 0 | | | 0 | | | | 0 | |
Buy | | | | | | | | | | 420 | | | | 09/2004 | | | 0 | | | 0 | | | | 0 | |
Sell | | | | JY | | | | | | 226,587 | | | | 07/2004 | | | 0 | | | (17 | ) | | | (17 | ) |
Buy | | | | KW | | | | | | 6,966 | | | | 07/2004 | | | 0 | | | 0 | | | | 0 | |
Buy | | | | | | | | | | 27,912 | | | | 09/2004 | | | 0 | | | 0 | | | | 0 | |
Buy | | | | MP | | | | | | 156 | | | | 08/2004 | | | 0 | | | 0 | | | | 0 | |
Sell | | | | N$ | | | | | | 87 | | | | 07/2004 | | | 0 | | | 0 | | | | 0 | |
Buy | | | | PN | | | | | | 24 | | | | 08/2004 | | | 0 | | | 0 | | | | 0 | |
Buy | | | | RR | | | | | | 199 | | | | 07/2004 | | | 0 | | | 0 | | | | 0 | |
Buy | | | | S$ | | | | | | 10 | | | | 07/2004 | | | 0 | | | 0 | | | | 0 | |
Sell | | | | SK | | | | | | 559 | | | | 09/2004 | | | 1 | | | 0 | | | | 1 | |
Buy | | | | SR | | | | | | 67 | | | | 08/2004 | | | 1 | | | 0 | | | | 1 | |
Sell | | | | | | | | | | 24 | | | | 08/2004 | | | 0 | | | 0 | | | | 0 | |
Buy | | | | SV | | | | | | 364 | | | | 08/2004 | | | 0 | | | 0 | | | | 0 | |
| | | | | | | | | | | | | | | | |
|
|
|
| | | | | | | | | | | | | | | | | $ | 104 | | $ | (35 | ) | | $ | 69 | |
| | | | | | | | | | | | | | | | |
|
|
|
(j) Principal amount denoted in indicated currency:
| | | | |
BP | | - | | British Pound |
BR | | - | | Brazilian Real |
C$ | | - | | Canadian Dollar |
CP | | - | | Chilean Peso |
DK | | - | | Danish Krone |
EC | | - | | Euro |
H$ | | - | | Hong Kong Dollar |
JY | | - | | Japanese Yen |
KW | | - | | South Korean Won |
MP | | - | | Mexican Peso |
N$ | | - | | New Zealand Dollar |
PN | | - | | Peruvian New Sol |
RR | | - | | Russian Ruble |
S$ | | - | | Singapore Dollar |
SK | | - | | Swedish Krona |
SR | | - | | South African Rand |
SV | | - | | Slovakian Koruna |
| | | | | | |
| See accompanying notes | | June 30, 2004 | | Semi-Annual Report | | 11 |
Notes to Financial Statements
June 30, 2004 (Unaudited)
1. Organization
The Foreign Bond Portfolio (U.S. Dollar-Hedged) (the “Portfolio”) is a series of the PIMCO Variable Insurance Trust (the “Trust”). The Trust is registered under the Investment Company Act of 1940 (the “Act”), as amended, as an open-end investment company organized as a Delaware business trust on October 3, 1997. The Portfolio offers two classes of shares: Institutional and Administrative. Each share class has identical voting rights (except that shareholders of a class have exclusive voting rights regarding any matter relating solely to that class of shares). Information presented in these financial statements pertains to the Institutional Class of the Portfolio. Certain detailed financial information for the Administrative Class is provided separately and is available upon request. The Trust is designed to be used as an investment vehicle by Separate Accounts of insurance companies that fund variable annuity contracts and variable life insurance policies and by qualified pension and retirement plans. The Portfolio commenced operations on February 16, 1999.
2. Significant Accounting Policies
The following is a summary of significant accounting policies consistently followed by the Trust in the preparation of its financial statements in conformity with accounting principles generally accepted in the United States of America. The preparation of financial statements in accordance with accounting principles generally accepted in the United States of America requires management to make estimates and assumptions that affect the reported amounts and disclosures in the financial statements. Actual results could differ from those estimates.
Security Valuation. Portfolio securities and other financial instruments for which market quotations are readily available are stated at market value. Portfolio securities and other financial instruments for which market quotes are not readily available are valued at fair value, as determined in good faith and pursuant to guidelines established by the Board of Trustees, including certain fixed income securities which may be valued with reference to securities whose prices are more readily obtainable. Market value is determined at the close of regular trading (normally, 4:00 p.m., Eastern Time) on the New York Stock Exchange on each day the New York Stock Exchange is open, or if no sales are reported, as is the case for most securities traded over-the-counter, the mean between representative bid and asked quotations obtained from a quotation reporting system or from established market makers. The prices of certain portfolio securities or other financial instruments may be determined at a time prior to the close of regular trading on the New York Stock Exchange. Fair valuation may be used if significant events occur after the close of the relevant markets and prior to the close of regular trading on the New York Stock Exchange that materially affect the values of such securities or financial instruments. Fixed income securities are normally valued on the basis of quotes obtained from brokers and dealers or pricing services. Certain fixed income securities purchased on a delayed delivery basis are marked to market daily until settlement at the forward settlement value. Short-term investments, which mature in 60 days or less are valued at amortized cost, which approximates market value. Exchange traded options, futures and options on futures are valued at the settlement price determined by the relevant exchange. Prices may be obtained from independent pricing services which use information provided by market makers or estimates of market values obtained from yield data relating to investments or securities with similar characteristics. The prices used by the Portfolio may differ from the value that would be realized if the securities were sold and the differences could be material to the financial statements.
Securities Transactions and Investment Income. Securities transactions are recorded as of the trade date. Securities purchased or sold on a when-issued or delayed delivery basis may be settled a month or more after the trade date. Realized gains and losses from securities sold are recorded on the identified cost basis. Dividend income is recorded on the ex-dividend date, except certain dividends from foreign securities where the ex-dividend date may have passed, are recorded as soon as the Portfolio is informed of the ex-dividend date. Interest income, adjusted for the accretion of discounts and amortization of premiums, is recorded on the accrual basis. Paydowns gains and losses on mortgage- and asset-backed securities are recorded as adjustments to interest income in the Statement of Operations.
Dividends and Distributions to Shareholders. Dividends from net investment income, if any, are declared on each day the Trust is open for business and are distributed to shareholders monthly. All dividends are reinvested in additional shares of the Portfolio. Net realized capital gains earned by the Portfolio, if any, will be distributed no less frequently than once each year.
Income dividends and capital gain distributions are determined in accordance with income tax regulations which may differ from accounting principles generally accepted in the United States of America. These differences are primarily due to differing treatments for such items as wash sales, foreign currency transactions, net operating losses, notional principal contracts, certain asset-backed securities, certain futures and forward contracts, tax straddles, and capital loss carryforwards.
Distributions classified as a tax basis return of capital, if any, are reflected in the accompanying Statements of Changes in Net Assets and have been reclassified to paid in capital. In addition, other amounts have been reclassified between undistributed net investment income, accumulated undistributed net realized gains or losses and/or paid in capital to more appropriately conform financial accounting to tax characterizations of dividend distributions.
Multiclass Operations. Each class offered by the Trust has equal rights as to assets. Income, non-class specific expenses, and realized and unrealized capital gains and losses are allocated to each class of shares based on the relative net assets of each class.
Delayed Delivery Transactions. The Portfolio may purchase or sell securities on a when-issued or delayed delivery basis. These transactions involve a commitment by the Portfolio to purchase or sell securities for a predetermined price or yield, with payment and
| | | | |
| 12 | | Semi-Annual Report | | June 30, 2004 |
delivery taking place beyond the customary settlement period. When delayed delivery purchases are outstanding, the Portfolio will designate liquid assets in an amount sufficient to meet the purchase price. When purchasing a security on a delayed delivery basis, the Portfolio assumes the rights and risks of ownership of the security, including the risk of price and yield fluctuations, and takes such fluctuations into account when determining its net asset value. The Portfolio may dispose of or renegotiate a delayed delivery transaction after it is entered into, and may sell when-issued securities before they are delivered, which may result in a capital gain or loss. When the Portfolio has sold a security on a delayed delivery basis, the Portfolio does not participate in future gains and losses with respect to the security.
Federal Income Taxes. The Portfolio intends to qualify as a regulated investment company and distribute all of its taxable income and net realized gains, if applicable, to shareholders. Accordingly, no provision for Federal income taxes has been made.
Foreign Currency. The accounting records of the Portfolio are maintained in U.S. dollars. The market values of foreign securities, currency holdings and other assets and liabilities are translated into U.S. dollars based on the current exchange rates each business day. Fluctuations in the value of these assets and liabilities resulting from changes in exchange rates are recorded as unrealized foreign currency gains or losses. Realized gains or losses and unrealized appreciation or depreciation on investment securities and income and expenses are translated on the respective dates of such transactions. The effect of changes in foreign currency exchange rates on investments in securities are not segregated in the Statement of Operations from the effects of changes in market prices of those securities, but are included with the net realized and unrealized gain or loss on investment securities.
Forward Currency Transactions. The Portfolio may enter into forward currency contracts and forward cross-currency contracts in connection with settling planned purchases or sales of securities, to hedge the currency exposure associated with some or all of the Portfolio’s securities or as a part of an investment strategy. A forward currency contract is an agreement between two parties to buy and sell a currency at a set price on a future date. The market value of a forward currency contract fluctuates with changes in forward currency exchange rates. Forward currency contracts are marked to market daily and the change in value is recorded by the Portfolio as an unrealized gain or loss. Realized gains or losses equal to the difference between the value of the contract at the time it was opened and the value at the time it was closed are recorded upon delivery or receipt of the currency or, if a forward currency contract is offset by entering into another forward currency contract with the same broker, upon settlement of the net gain or loss. These contracts may involve market risk in excess of the unrealized gain or loss reflected in the Portfolio’s Statement of Assets and Liabilities. In addition, the Portfolio could be exposed to risk if the counterparties are unable to meet the terms of the contracts or if the value of the currency changes unfavorably to the U.S. dollar.
Futures Contracts. The Portfolio is authorized to enter into futures contracts. The Portfolio may use futures contracts to manage its exposure to the securities markets or to movements in interest rates and currency values. The primary risks associated with the use of futures contracts are the imperfect correlation between the change in market value of the securities held by the Portfolio and the prices of futures contracts, the possibility of an illiquid market, and the inability of the counterparty to meet the terms of the contract. Futures contracts are valued based upon their quoted daily settlement prices. Upon entering into a futures contract, the Portfolio may be required to deposit with its custodian, in a segregated account in the name of the futures broker, an amount of cash or U.S. Government and Agency Obligations in accordance with the initial margin requirements of the broker or exchange. Futures contracts are marked to market daily and an appropriate payable or receivable for the change in value (“variation margin”) is recorded by the Portfolio. Gains or losses are recognized but not considered realized until the contracts expire or are closed. Futures contracts involve, to varying degrees, risk of loss in excess of the variation margin disclosed in the Statement of Assets and Liabilities.
Inflation-Indexed Bonds. The Portfolio may invest in inflation-indexed bonds. Inflation-indexed bonds are fixed income securities whose principal value is periodically adjusted to the rate of inflation. The interest rate on these bonds is generally fixed at issuance at a rate lower than typical bonds. Over the life of an inflation-indexed bond, however, interest will be paid based on a principal value, which is adjusted for inflation. Any increase in the principal amount of an inflation-indexed bond will be included as interest income in the Statement of Operations, even though investors do not receive their principal until maturity.
Options Contracts. The Portfolio may write call and put options on futures, swaps, securities or currencies it owns or in which it may invest. Writing put options tends to increase the Portfolio’s exposure to the underlying instrument. Writing call options tends to decrease the Portfolio’s exposure to the underlying instrument. When the Portfolio writes a call or put option, an amount equal to the premium received is recorded as a liability and subsequently marked to market to reflect the current value of the option written. These liabilities are reflected as written options outstanding in the Statement of Assets and Liabilities. Payments received or made, if any, from writing options with premiums to be determined on a future date are reflected as such on the Statement of Assets and Liabilities. Premiums received from writing options which expire are treated as realized gains. Premiums received from writing options which are exercised or closed are added to the proceeds or offset against amounts paid on the underlying future, swap, security or currency transaction to determine the realized gain or loss. The Portfolio as a writer of an option has no control over whether the underlying future, swap, security or currency may be sold (call) or purchased (put) and as a result bears the market risk of an unfavorable change in the price of the future, swap, security or currency underlying the written option. There is the risk the Portfolio may not be able to enter into a closing transaction because of an illiquid market.
| | | | |
| June 30, 2004 | | Semi-Annual Report | | 13 |
Notes to Financial Statements (Cont.)
June 30, 2004 (Unaudited)
The Portfolio may also purchase put and call options. Purchasing call options tends to increase the Portfolio’s exposure to the underlying instrument. Purchasing put options tends to decrease the Portfolio’s exposure to the underlying instrument. The Portfolio pays a premium which is included in the Portfolio’s Statement of Assets and Liabilities as an investment and subsequently marked to market to reflect the current value of the option. Premiums paid for purchasing options which expire are treated as realized losses. The risk associated with purchasing put and call options is limited to the premium paid. Premiums paid for purchasing options which are exercised or closed are added to the amounts paid or offset against the proceeds on the underlying future, swap, security or currency transaction to determine the realized gain or loss.
Repurchase Agreements. The Portfolio may engage in repurchase transactions. Under the terms of a typical repurchase agreement, the Portfolio takes possession of an underlying debt obligation subject to an obligation of the seller to repurchase, and the Portfolio to resell, the obligation at an agreed-upon price and time. The market value of the collateral must be equal at all times to the total amount of the repurchase obligations, including interest. Generally, in the event of counterparty default, the Portfolio has the right to use the collateral to offset losses incurred.
Short Sales. The Portfolio may enter into short sales transactions. A short sale is a transaction in which the Portfolio sells securities it does not own in anticipation of a decline in the market price of the securities. The Portfolio is obligated to deliver securities at the market price at the time the short position is closed. Possible losses from short sales may be unlimited, whereas losses from purchases cannot exceed the total amount invested.
Swap Agreements. The Portfolio may invest in swap agreements. A swap is an agreement to exchange the return generated by one instrument for the return generated by another instrument. The Portfolio may enter into interest rate, total return, forward spread lock, and credit default swap agreements to manage its exposure to interest rates and credit risk.
Interest rate swap agreements involve the exchange by the Portfolio with another party of their respective commitments to pay or receive interest, e.g., an exchange of floating rate payments for fixed rate payments with respect to the notional amount of principal.
Total return swap agreements involve commitments to pay interest in exchange for a market-linked return, both based on notional amounts. To the extent the total return of the security or index underlying the transaction exceeds or falls short of the offsetting interest rate obligation, the Portfolio will receive a payment from or make a payment to the counterparty.
Forward spread lock swap agreements involve commitments to pay or receive a settlement amount calculated as the difference between the swap spread and a fixed spread, multiplied by the notional amount times the duration of the swap. The swap spread is the difference between the benchmark swap rate (market rate) and the specific Treasury rate.
In a credit default swap, one party makes a stream of payments to another party in exchange for the right to receive a specified return in the event of a default by a third party, typically corporate issues or sovereign issues of an emerging country, on its obligation. The Portfolio may use credit default swaps to provide a measure of protection against defaults of sovereign issuers (i.e., to reduce risk where the Portfolio owns or has exposure to the sovereign issuer) or to take an active long or short position with respect to the likelihood of a particular issuer’s default.
Swaps are marked to market daily based upon quotations from market makers and the change in value, if any, is recorded as unrealized gain or loss in the Statement of Operations. Payments received or made at the beginning of the measurement period are
reflected as such on the Statement of Assets and Liabilities. A liquidation payment received or made at the termination of the swap is recorded as realized gain or loss in the Statement of Operations. Net periodic payments received by the Portfolio are included as part of realized gain(loss) on the Statement of Operations. Entering into these agreements involves, to varying degrees, elements of credit, market and documentation risk in excess of the amounts recognized on the Statement of Assets and Liabilities. Such risks involve the possibility that there will be no liquid market for these agreements, that the counterparty to the agreements may default on its obligation to perform or disagree as to the meaning of contractual terms in the agreements, and that there may be unfavorable changes in interest rates.
As a result of a FASB Emerging Issues Task Force (“EITF”) consensus, No. 03-11, and related SEC staff guidance, the Portfolio has reclassified periodic payments made or received under swap agreements, which were previously included within miscellaneous income, to a component of realized gain(loss) in the Statement of Operations. For consistency, similar reclassifications have been made to amounts appearing in the previous year’s Statement of Changes in Net Assets and the per share amounts in the prior year financial highlights. Prior year net investment income ratios in the financial highlights have also been modified accordingly. This reclassification increased(decreased) net investment income by $46,353 and $26,213, and net realized (loss) by $(52,329) and $(14,876) and net change in unrealized appreciation(depreciation) by $5,976 and $(11,338) for the six months ended June 30, 2004 and year ended December 31, 2003, respectively. There is no effect on the Portfolio’s net asset value, either in total or per share, or its total increase(decrease) in net assets from operations during any period.
3. Fees, Expenses, and Related Party Transactions
Investment Advisory Fee. Pacific Investment Management Company LLC (“PIMCO”) is a majority owned subsidiary partnership of Allianz Dresdner Asset Management of America L.P. and serves as investment adviser (the “Adviser”) to the Trust, pursuant to an investment advisory contract. The Adviser receives a monthly fee at an annual rate based on average daily net assets of the Portfolio. The Advisory Fee is charged at an annual rate of 0.25%.
| | | | |
| 14 | | Semi-Annual Report | | June 30, 2004 |
Administration Fee. PIMCO serves as administrator (the “Administrator”), and provides administrative services to the Trust for which it receives a monthly administrative fee based on average daily net assets of the Portfolio. The Administration Fee is charged at the annual rate of 0.50%.
Servicing Fee. PA Distributors LLC (“PAD”), formerly known as PIMCO Advisors Distributors LLC, is an indirect wholly-owned subsidiary of Allianz Dresdner Asset Management of America L.P. and serves as the distributor of the Trust’s shares. The Trust is permitted to reimburse PAD on a quarterly basis, out of the Administrative Class assets of the Portfolio in the amount of 0.15% on an annual basis of the average daily net assets of that class, for payments made to financial intermediaries that provide services in connection with the distribution of shares or administration of plans or programs that use Portfolio shares as their funding medium. The effective rate paid to PAD was 0.15% during current fiscal year.
Expenses. The Trust is responsible for the following expenses: (i) salaries and other compensation of any of the Trust’s executive officers and employees who are not officers, directors, stockholders or employees of PIMCO or its subsidiaries or affiliates; (ii) taxes and governmental fees; (iii) brokerage fees and commissions and other portfolio transaction expenses; (iv) the cost of borrowing money, including interest expense and bank overdraft charges; (v) fees and expenses of the Trustees who are not “interested persons” of PIMCO or the Trust, and any counsel retained exclusively for their benefit; (vi) extraordinary expenses, including costs of litigation and indemnification expenses; (vii) organization expenses and (viii) any expenses allocated or allocable to a specific class of shares, which include service fees payable with respect to the Administrative Class shares and may include certain other expenses as permitted by the Trust’s Multiple Class Plan adopted pursuant to Rule 18f-3 under the Act and subject to review and approval by the Trustees. The ratio of expenses to average net assets per share class, as disclosed in Financial Highlights, may differ from the annual portfolio operating expenses per share class as disclosed in the Prospectus for the reasons set forth above.
PIMCO has agreed to waive a portion of its administrative fees to the extent that the payment of the Portfolio’s pro rata share of organization expenses and Trustee fees cause the actual expense ratio to rise above the rates disclosed in the then-current prospectus plus 0.49 basis points as set forth below (calculated as a percentage of the Portfolio’s average daily net assets attributable to each class):
| | | |
Institutional Class | | 0.90 | % |
Administrative Class | | 0.75 | % |
PIMCO may be reimbursed for these waived amounts in future periods, not to exceed thirty-six months.
Each unaffiliated Trustee receives an annual retainer of $4,000, plus $1,500 for each Board of Trustees meeting attended in person and $250 for each meeting attended telephonically, plus reimbursement of related expenses. In addition, each committee chair receives an additional annual retainer of $500. These expenses are allocated on a pro-rata basis to each Portfolio of the Trust according to its respective net assets.
4. Purchases and Sales of Securities
The length of time a Portfolio has held a particular security is not generally a consideration in investment decisions. A change in the securities held by a Portfolio is known as “portfolio turnover.” The Portfolio may engage in frequent and active trading of portfolio securities to achieve its investment objective, particularly during periods of volatile market movements. High portfolio turnover (e.g., over 100%) involves correspondingly greater expenses to the Portfolio, including brokerage commissions or dealer mark-ups and other transaction costs on the sale of securities and reinvestments in other securities. Such sales may also result in realization of taxable capital gains, including short-term capital gains (which are generally taxed at ordinary income tax rates). The trading costs and tax effects associated with portfolio turnover may adversely affect the Portfolio’s performance.
Purchases and sales of securities (excluding short-term investments) for the period ended June 30, 2004 were as follows (amounts in thousands):
| | | | | | |
| U.S Government/Agency | | All Other |
| Purchases | | Sales | | Purchases | | Sales |
| $41,893 | | $44,886 | | $31,637 | | $32,974 |
5. Transactions in Written Call and Put Options
Transactions in written call and put options were as follows (amounts in thousands):
| | | | |
| | | | Premium | |
Balance at 12/31/2003 | | $ | 141 | |
Sales | | | 43 | |
Closing Buys | | | (19 | ) |
Expirations | | | (37 | ) |
Exercised | | | 0 | |
Balance at 06/30/2004 | | $ | 128 | |
| | | | |
| June 30, 2004 | | Semi-Annual Report | | 15 |
Notes to Financial Statements (Cont.)
June 30, 2004 (Unaudited)
6. Federal Income Tax Matters
At June 30, 2004, the aggregate cost of investments was the same for federal income tax and financial statement purposes. The net unrealized appreciation (depreciation) of investment securities for federal income tax purposes is as follows (amounts in thousands):
| | | | | | | |
Aggregate Gross
Unrealized
Appreciation | | Aggregate Gross
Unrealized
(Depreciation) | | | Net Unrealized
Appreciation |
| $ 1,188 | | $ | (213 | ) | | $ | 975 |
7. Shares of Beneficial Interest
The Trust may issue an unlimited number of shares of beneficial interest with a $.001 par value. Changes in shares of beneficial interest were as follows (shares and amounts in thousands):
| | | | | | | | | | | | | | |
| | | Six Months Ended
06/30/2004 | | | Year Ended 12/31/2003 | |
| | | Shares | | | Amount | | | Shares | | | Amount | |
Receipts for shares sold | | | | | | | | | | | | | | |
| | | | |
Institutional Class | | 0 | | | $ | 0 | | | 0 | | | $ | 0 | |
Administrative Class | | 511 | | | | 5,130 | | | 2,126 | | | | 21,710 | |
| | | | |
Issued as reinvestment of distributions | | | | | | | | | | | | | | |
| | | | |
Institutional Class | | 0 | | | | 0 | | | 0 | | | | 0 | |
Administrative Class | | 34 | | | | 346 | | | 70 | | | | 709 | |
| | | | |
Cost of shares redeemed | | | | | | | | | | | | | | |
| | | | |
Institutional Class | | 0 | | | | 0 | | | 0 | | | | 0 | |
Administrative Class | | (390 | ) | | | (3,923 | ) | | (635 | ) | | | (6,424 | ) |
| | | | |
Net increase resulting from Portfolio share transactions | | 155 | | | $ | 1,553 | | | 1,561 | | | $ | 15,995 | |
The following schedule shows the number of shareholders each owning 5% or more of the Portfolio and the total percentage of the Portfolio held by such shareholders:
| | | | |
| | | Number | | % of Portfolio Held |
Institutional Class | | 1 | | 100 |
Administrative Class | | 3 | | 98 |
8. Regulatory and Litigation Matters
On February 17, 2004, the Attorney General of the State of New Jersey (“New Jersey AG”) filed a complaint against Allianz Dresdner Asset Management of America L.P. (“ADAM”), PA Distributors LLC (formerly known as PIMCO Advisors Distributors LLC) (“PAD”), PEA Capital LLC (formerly known as PIMCO Equity Advisors LLC) (“PEA”), and Pacific Investment Management Company LLC (“PIMCO”) in connection with its investigation into market timing and late trading. The complaint contends that inappropriate trading by shareholders engaged in market timing activity took place in funds in the PIMCO Funds: Multi-Manager Series (“MMS Funds”) and the PIMCO Funds: Pacific Investment Management Series (“PIMS Funds”). On June 1, 2004, the New Jersey AG dismissed PIMCO from the lawsuit.
On the same day as the dismissal of PIMCO from the lawsuit, the New Jersey AG announced that it had reached a settlement agreement with the remaining defendants (“New Jersey Settlement”). In the New Jersey Settlement, ADAM, PAD and PEA agreed, while neither admitting nor denying the allegations or conclusions of law, to: (i) pay New Jersey a civil fine of $15 million and $3 million for investigative costs and further enforcement initiatives; and (ii) implement certain changes in corporate governance.
On May 6, 2004, the Securities and Exchange Commission filed a complaint in the U.S. District Court in the Southern District of New York alleging that PA Fund Management LLC (formerly known as PIMCO Advisors Fund Management LLC) (“PAFM”), PEA, PAD, Stephen J. Treadway (at the time, the chief executive officer of PAFM and PAD as well as chairman of the Board of Trustees of the MMS Funds) and Kenneth W. Corba (the former chief executive officer of PEA and former portfolio manager of the PEA Growth and PEA Growth & Income Funds) had, among other things, violated
| | | | |
| 16 | | Semi-Annual Report | | June 30, 2004 |
and/or aided and abetted violations of, various antifraud provisions of the federal securities laws in connection with alleged “market timing” arrangements that improperly allowed certain hedge funds to engage in “market timing” in the PEA Growth Fund, the PEA Opportunity Fund, the PEA Innovation Fund, and the PEA Target Fund. The complaint seeks injunctive relief, disgorgement plus pre-judgment interest, monetary penalties, and an order permanently enjoining the defendants from serving as investment advisers, principal underwriters, officers, directors, or members of any advisory boards to any registered investment companies.
On February 20, 2004, a putative class action lawsuit was filed in the U.S. District Court for the District of New Jersey on behalf of certain shareholders of the PIMCO Funds against ADAM, PAD, PIMCO, PEA, the PIMS Funds, the MMS Funds, the Trust, PIMCO Commercial Mortgage Securities Trust, Inc. and certain other defendants, alleging that inappropriate market timing activity by certain shareholders caused financial injury to the shareholders of those Funds.
The following additional putative class action lawsuits have been filed against the PIMS Funds, the MMS Funds and/or their affiliates, each related to alleged market-timing activity in funds advised by PIMCO or its affiliates: (1) a lawsuit filed in the U.S. District Court for the District of Connecticut on February 27, 2004 (naming as defendants ADAM, PAD, PEA, the PIMS Funds, the MMS Funds, the Trust, PCM and certain other parties); (2) a lawsuit filed in the U.S. District Court for the Central District of California on March 4, 2004 (naming as defendants PIMCO, ADAM, PEA and PAD); (3) a lawsuit filed in the U.S. District Court for the Southern District of New York on March 8, 2004 (naming PIMCO, PAD and certain of their affiliates as defendants); (4) a lawsuit filed in the U.S. District Court for the Southern District of New York, on March 15, 2004 (naming PIMCO as the defendant); (5) two separate lawsuits filed in the U.S. District Court for the Central District of California on March 22, 2004, brought derivatively on behalf of the PIMCO High Yield Fund and the PIMCO Money Market Fund, respectively (each naming ADAM, PAFM and certain other parties as defendants, and the PIMCO Funds as the nominal defendant); (6) a lawsuit filed in the U.S. District Court for the Central District of California, also on March 22, 2004, brought derivatively on behalf of the PIMS Funds and the MMS Funds (naming ADAM, PIMCO, PAD and certain other parties as defendants, and the PIMS Funds and the MMS Funds as nominal defendants); (7) a lawsuit filed in the U.S. District Court for the District of New Jersey on April 20, 2004 (naming ADAM, PAD, the PIMS Funds and certain other parties as defendants); and (8) a lawsuit filed in the U.S. District Court for the Northern District of California on April 28, 2004 (naming ADAM, PIMCO, PAD, PEA and certain other parties as defendants, and the “PIMCO Funds” as nominal defendants). Each complaint for the foregoing putative class actions alleges, among other things, that inappropriate trading by shareholders engaged in market timing activities took place in certain of the funds advised by PIMCO, and each complaint seeks unspecified compensatory damages.
On February 17, 2004, a putative class action lawsuit was filed in the U.S. District Court for the District of Connecticut on behalf of certain shareholders of the PIMCO Funds against ADAM, PEA, PIMCO, PIMS Funds, MMS Funds and certain other defendants, alleging excessive investment advisory fees and the use of brokerage commissions to pay for distribution of fund shares. Three similar putative class action lawsuits were subsequently filed, each in the U.S. District Court for the District of Connecticut on March 1, 2004, April 23, 2004 and May 20, 2004, respectively.
Under Section 9(a) of the 1940 Act, if any of the various lawsuits were to result in a court injunction against PAFM, PEA, PAD, PIMCO, ADAM and/or Mr. Treadway, they and their affiliates would, in the absence of exemptive relief granted by the SEC, be barred from serving as an investment adviser/sub-adviser or principal underwriter for any registered investment company, including the Trust. ADAM and certain of its subsidiaries have responded to inquiries from the SEC concerning the status of the New Jersey Settlement under Section 9(a). If any of PAFM, PEA, PAD, PIMCO or ADAM were subject to an injunction, each of these entities and their affiliates could in turn seek exemptive relief from the SEC, as contemplated by the 1940 Act. There is no assurance, however, that such exemptive relief would be granted. The SEC also has the power by order to prohibit PAFM, PEA, PAD and PIMCO from serving as investment advisers and underwriters, if the SEC finds that such entities willfully violated the federal securities laws in connection with the allegations discussed above or aided or abetted such violations.
PIMCO, PAD and the Trust believe that these developments will not have a material adverse effect on the Portfolios or on PIMCO’s, or PAD’s ability to perform their respective investment advisory or distribution services on behalf of the Portfolios.
| | | | |
| June 30, 2004 | | Semi-Annual Report | | 17 |
Trustees and Officers
Brent R. Harris, Chairman and Trustee
R. Wesley Burns, President and Trustee
E. Philip Cannon, Trustee
Vern O. Curtis, Trustee
J. Michael Hagan, Trustee
William J. Popejoy, Trustee
Garlin G. Flynn, Secretary
John P. Hardaway, Treasurer
Investment Adviser and Administrator
Pacific Investment Management Company LLC
840 Newport Center Drive
Newport Beach, California 92660
Distributor
PA Distributors LLC
2187 Atlantic Street
Stamford, Connecticut 06902
Custodian
State Street Bank & Trust Company
801 Pennsylvania
Kansas City, Missouri 64105
Transfer Agent
Boston Financial Data Services–Midwest
330 W. 9th Street
Kansas City, Missouri 64105
Legal Counsel
Dechert LLP
1775 I Street, N.W.
Washington, D.C. 20006
Independent Registered Public Accounting Firm
PricewaterhouseCoopers LLP
1055 Broadway
Kansas City, Missouri 64105
Information about how the Fund voted proxies relating to portfolio securities held during the year July 1, 2003 through June 30, 2004 will be available no later than August 31, 2004 without charge, upon request, by calling the Trust at 1-800-927-4648 and on the SEC’s website at http://www.sec.gov.
Copies of the written Proxy Policy and the factors that PIMCO may consider in determining how to vote proxies for the Funds are available by calling the Trust at 1-800-927-4648 and on the SEC’s website at http://www.sec.gov.
PIMCO VARIABLE INSURANCE TRUST
840 NEWPORT CENTER DRIVE
NEWPORT BEACH, CA 92660

PIMCO VARIABLE INSURANCE TRUST
SHORT-TERM PORTFOLIO
INSTITUTIONAL CLASS
SEMI-ANNUAL REPORT
June 30, 2004
|
| This material is authorized for use only when preceded or accompanied by the current PIMCO Variable Insurance Trust prospectus. Investors should consider the investment objectives, risks, charges and expenses of Portfolio carefully before investing. This and other information is contained in the Portfolio’s prospectus. Please read the prospectus carefully before you invest or send money. |
Chairman’s Letter
Dear PIMCO Variable Insurance Trust Shareholder:
Bond prices were more volatile during the six-month period ended June 30, 2004. Interest rates rose sharply during the second quarter 2004, causing bonds to give back modest gains from earlier in the year. The Lehman Brothers Aggregate Bond Index, a widely used index for the high-grade bond market, was nearly flat during the first six months of 2004, returning 0.15% after losing 2.44% during the second quarter. The yield on the benchmark ten-year Treasury closed June 30, 2004 at 4.58%, up 0.75% from April 1, 2004, but up only 0.34% from where it began the six-month period on January 1, 2004.
Continued growth in employment convinced the markets that the Federal Reserve would soon begin a long anticipated tightening cycle. On June 30, 2004, the Fed met market expectations by increasing the federal funds rate 0.25%, which was the first rate increase since June 25, 2003. The central bank had held this rate at 1% for more than a year, which generated negative real short-term rates. And on August 10, 2004, the Fed increased the federal funds rate another 0.25% to 1.50%.
Investors that had profited handsomely from borrowing at low short-term rates and investing in higher-yielding longer maturity bonds surrendered some of those profits towards the latter part of the six-month period. Concern that borrowing rates would rise led investors to liquidate long positions and unwind these trades, which caused bond prices to decrease. However, substantial leverage remained among banks, hedge funds, and other investors, making bond markets somewhat vulnerable to additional Fed rate increases. There were also signs of rising inflation, which fueled anxiety that central banks might continue to raise interest rates.
On the following pages you will find a more complete review of the Portfolio in light of financial market activities as well as specific details about the total return investment performance for the six-month period.
We appreciate the trust you have placed in us, and we will continue to focus our efforts to meet your investment needs.
Sincerely,

Brent R. Harris
Chairman
August 11, 2004
| | | | |
| June 30, 2004 | | Semi-Annual Report | | 1 |
Important Information About the Portfolio
We believe that bond funds have an important role to play in a well diversified investment portfolio. It is important to note, however, that in an environment where interest rates may trend upward, rising rates will negatively impact the performance of most bond funds, and fixed income securities held by a fund are likely to decrease in value. The price volatility of fixed income securities can also increase during periods of rising interest rates resulting in increased losses to a fund. Bond funds and individual bonds with a longer duration (a measure of the expected life of a security) tend to be more sensitive to changes in interest rates, usually making them more volatile than securities or funds with shorter durations. The longer-term performance of most bond funds has benefited from capital gains in part resulting from an extended period of declining interest rates. In the event interest rates increase, these capital gains should not be expected to recur.
The Portfolio may be subject to various risks in addition to those described above. Some of these risks may include, but are not limited to, the following: real rate risk, derivative risk, small company risk, foreign security risk, high yield security risk and specific sector investment risks. The Portfolio may use derivative instruments for hedging purposes or as part of an investment strategy. Use of these instruments may involve certain costs and risks such as liquidity risk, interest rate risk, market risk, credit risk, management risk and the risk that a fund could not close out a position when it would be most advantageous to do so. A Portfolio investing in derivatives could lose more than the principal amount invested in these instruments. Investing in non-U.S. securities may entail risk due to non-U.S. economic and political developments; this risk may be enhanced when investing in emerging markets. High-yield bonds typically have a lower credit rating than other bonds. Lower rated bonds generally involve a greater risk to principal than higher rated bonds. Smaller companies may be more volatile than larger companies and may entail more risk. Concentrating investments in individual sectors may add additional risk and volatility compared to a diversified portfolio.
On the performance summary page in this semi-annual report, the Total Return Investment Performance table measures performance assuming that all dividend and capital gain distributions were reinvested. Returns do not reflect the deduction of taxes that a shareholder would pay (i) on Portfolio distributions or (ii) the redemption of Portfolio shares.
An investment in a Portfolio is not a bank deposit and is not guaranteed or insured by the Federal Deposit Insurance Corporation or any other government agency. It is possible to lose money on investments in the Funds.
The following disclosure provides important information regarding the Portfolio’s Expense Example, which appears on the Portfolio’s individual page in this semi-annual report. Please refer to this information when reviewing the Expense Example for the Portfolio.
Example
As a shareholder of the Portfolio, you incur two types of costs: (1) transaction costs, including redemption and exchange fees; and (2) ongoing costs, including advisory and administrative fees; distribution and/or service (12b-1) fees (Administrative Class only); and other Portfolio expenses. The Example is intended to help you understand your ongoing costs (in dollars) of investing in the Portfolio and to compare these costs with the ongoing costs of investing in other mutual funds.
The Example is based on an investment of $1,000 invested at the beginning of the period and held for the entire period indicated, which is from 1/1/04 to 6/30/04.
Actual Expenses
The information in the table under the heading “Actual Performance” provides information about actual account values and actual expenses. You may use the information in these columns, together with the amount you invested, to estimate the expenses that you paid over the period. Simply divide your account value by $1,000.00 (for example, an $8,600.00 account value divided by $1,000 = 8.60), then multiply the result by the number in the appropriate column for your share class, in the row entitled “Expenses Paid During Period” to estimate the expenses you paid on your account during this period.
Hypothetical Example for Comparison Purposes
The information in the table under the heading “Hypothetical Performance (5% return before expenses)” provides information about hypothetical account values and hypothetical expenses based on the Portfolio’s actual expense ratio and an assumed rate of return of 5% per year before expenses, which is not the Portfolio’s actual return. The hypothetical account values and expenses may not be used to estimate the actual ending account balance or expenses you paid for the period. You may use this information to compare the ongoing costs of investing in the Portfolio and other portfolios. To do so, compare this 5% hypothetical example with the 5% hypothetical examples that appear in the shareholder reports of the other portfolios.
Please note that the expenses shown in the table are meant to highlight your ongoing costs only and do not reflect any transactional costs. Therefore, the information under the heading “Hypothetical Performance (5% return before expenses)” is useful in comparing ongoing costs only, and will not help you determine the relative total costs of owning different portfolios. In addition, if these transactional costs were included, your costs would have been higher.
PIMCO Variable Insurance Trust is distributed by PA Distributors LLC, 2187 Atlantic Street, Stamford, CT 06902.
| | | | |
| 2 | | Semi-Annual Report | | June 30, 2004 |
Short-Term Portfolio
CUMULATIVE RETURNS THROUGH JUNE 30, 2004
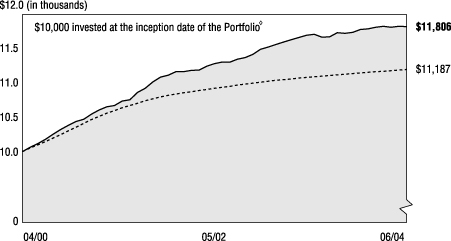
[CHART]
Short-Term Portfolio Citigroup 3-Month
Inst. Class Treasury Bill Index
-------------------- -------------------
04/30/2000 $10,000 $10,000
05/31/2000 $10,058 $10,049
06/30/2000 $10,114 $10,096
07/31/2000 $10,174 $10,145
08/31/2000 $10,249 $10,195
09/30/2000 $10,318 $10,246
10/31/2000 $10,377 $10,299
11/30/2000 $10,433 $10,352
12/31/2000 $10,464 $10,407
01/31/2001 $10,539 $10,460
02/28/2001 $10,600 $10,505
03/31/2001 $10,644 $10,552
04/30/2001 $10,664 $10,592
05/31/2001 $10,727 $10,631
06/30/2001 $10,746 $10,665
07/31/2001 $10,852 $10,699
08/31/2001 $10,914 $10,731
09/30/2001 $11,005 $10,762
10/31/2001 $11,075 $10,790
11/30/2001 $11,104 $10,813
12/31/2001 $11,153 $10,832
01/31/2002 $11,155 $10,849
02/28/2002 $11,171 $10,864
03/31/2002 $11,177 $10,879
04/30/2002 $11,230 $10,895
05/31/2002 $11,269 $10,911
06/30/2002 $11,293 $10,927
07/31/2002 $11,292 $10,943
08/31/2002 $11,335 $10,958
09/30/2002 $11,356 $10,974
10/31/2002 $11,404 $10,989
11/30/2002 $11,477 $11,003
12/31/2002 $11,508 $11,016
01/31/2003 $11,548 $11,028
02/28/2003 $11,582 $11,038
03/31/2003 $11,615 $11,049
04/30/2003 $11,648 $11,060
05/31/2003 $11,679 $11,071
06/30/2003 $11,694 $11,081
07/31/2003 $11,652 $11,090
08/31/2003 $11,656 $11,099
09/30/2003 $11,715 $11,108
10/31/2003 $11,707 $11,117
11/30/2003 $11,720 $11,126
12/31/2003 $11,761 $11,134
01/31/2004 $11,773 $11,143
02/29/2004 $11,795 $11,151
03/31/2004 $11,807 $11,160
04/30/2004 $11,796 $11,169
05/31/2004 $11,807 $11,178
06/30/2004 $11,806 $11,187
SECTOR BREAKDOWN‡
| | | |
Short-Term Instruments | | 75.2 | % |
Corporate Bonds & Notes | | 9.7 | % |
U.S. Government Agencies | | 5.7 | % |
Asset-Backed Securities | | 3.4 | % |
U.S. Treasury Obligation | | 2.9 | % |
Mortgage-Backed Securities | | 2.5 | % |
Other | | 0.6 | % |
‡ % of Total Investments as of June 30, 2004
à$10,000 invested at the beginning of the first full month following the inception of the Institutional Class.
TOTAL RETURN INVESTMENT PERFORMANCE For the period ended June 30, 2004
| | | | | | | | | | | | | |
| | | | | | | 6 Months | | | 1 Year | | | Since Inception* | |
| | |
| | Short-Term Portfolio Institutional Class (Inception 04/28/00) | | 0.39 | % | | 0.96 | % | | 4.07 | % |
| | | - - - - - - - | | Citigroup 3-Month Treasury Bill Index | | 0.47 | % | | 0.96 | % | | — | |
| | | | | * Annualized. All Portfolio returns are net of fees and expenses. | | | | | | | | | |
Past performance is no guarantee of future results. The performance quoted represents past performance. Investment return and principal value will fluctuate so the Portfolio shares, when redeemed, may be worth more or less than their original cost. Current performance may be lower or higher than the performance data quoted. Performance data current to the most recent month-end is available by calling (800) 927-4648.
Please refer to page 2 herein for an explanation of the information presented in the following Expense Example.
| | | | | | | | | | |
| EXPENSE EXAMPLE | | | | Actual Performance | | | | Hypothetical Performance
(5% return before expenses) |
Beginning Account Value (01/01/04) | | | | $ | 1,000.00 | | | | $ | 1,000.00 |
Ending Account Value (06/30/04) | | | | $ | 1,003.90 | | | | $ | 1,025.00 |
Expenses Paid During Period† | | | | $ | 2.24 | | | | $ | 2.27 |
†Expenses are equal to the Portfolio’s Institutional Class annualized expense ratio of 0.45%, multiplied by the average account value over the period, multiplied by 182/366 (to reflect the one-half year period).
PORTFOLIO INSIGHTS
| • | The Short-Term Portfolio seeks to achieve its investment objective by investing under normal circumstances at least 65% of its total assets in a diversified portfolio of Fixed Income Instruments of varying maturities. |
| • | The total return performance of the Portfolio’s Institutional Class was 0.39% for the six-month period ended June 30, 2004, versus a return of 0.47% for the benchmark Citigroup 3-Month Treasury Bill Index during the same period. |
| • | Interest rate strategies including a duration longer than the effective benchmark and yield curve positioning that was broader than benchmark were negative for returns as rates increased during the period. |
| • | An emphasis on mortgage securities boosted returns. Heavy demand by banks during the first quarter 2004 and a decline in volatility late in the second quarter supported mortgage performance. |
| • | An emphasis on corporate securities was slightly positive. During the first quarter, their yield advantage offset concerns about slower growth and profits, but during the second quarter returns were slightly negative as rates increased. |
| • | Emerging market (“EM”) bonds detracted from performance during the period. Heightened new issuance weighed on the sector and leveraged tactical investors sold EM bonds as rates rose. |
| • | Short maturity Eurozone issues added value amid expectations for slower growth and lower inflation in Europe. |
| | | | |
| June 30, 2004 | | Semi-Annual Report | | 3 |
Financial Highlights
Short-Term Portfolio (Institutional Class)
| | | | | | | | | | | | | | | | | | | | | | | | | | | | | | |
| Selected Per Share Data for the Year or Period Ended: | | | | 06/30/2004+ | | | | | 12/31/2003 | | | | | 12/31/2002 | | | | | 12/31/2001 | | | | | 04/28/2000- 12/31/2000 | |
| | | | | | | | | | |
Net asset value beginning of period | | | | $ | 10.10 | | | | | $ | 10.08 | | | | | $ | 10.08 | | | | | $ | 10.01 | | | | | $ | 10.00 | |
Net investment income (a) | | | | | 0.04 | (d) | | | | | 0.14 | (d) | | | | | 0.30 | (d) | | | | | 0.53 | (d) | | | | | 0.45 | |
Net realized/unrealized gain (loss) on investments (a) | | | | | 0.00 | (d) | | | | | 0.08 | (d) | | | | | (0.01 | )(d) | | | | | 0.12 | (d) | | | | | 0.01 | |
Total income from investment operations | | | | | 0.04 | | | | | | 0.22 | | | | | | 0.31 | | | | | | 0.65 | | | | | | 0.46 | |
Dividends from net investment income | | | | | (0.06 | ) | | | | | (0.19 | ) | | | | | (0.30 | ) | | | | | (0.54 | ) | | | | | (0.45 | ) |
Distributions from net realized capital gains | | | | | 0.00 | | | | | | (0.01 | ) | | | | | (0.01 | ) | | | | | (0.04 | ) | | | | | 0.00 | |
Total distributions | | | | | (0.06 | ) | | | | | (0.20 | ) | | | | | (0.31 | ) | | | | | (0.58 | ) | | | | | (0.45 | ) |
Net asset value end of period | | | | $ | 10.08 | | | | | $ | 10.10 | | | | | $ | 10.08 | | | | | $ | 10.08 | | | | | $ | 10.01 | |
Total return | | | | | 0.39 | % | | | | | 2.20 | % | | | | | 3.18 | % | | | | | 6.59 | % | | | | | 4.64 | % |
Net assets end of period (000s) | | | | $ | 26,451 | | | | | $ | 14,932 | | | | | $ | 4,893 | | | | | $ | 4,093 | | | | | $ | 3,388 | |
Ratio of net expenses to average net assets | | | | | 0.45 | %* | | | | | 0.45 | % | | | | | 0.45 | % | | | | | 0.47 | %(b)(c) | | | | | 0.45 | %* |
Ratio of net investment income to average net assets | | | | | 1.05 | %*(d) | | | | | 1.36 | %(d) | | | | | 2.99 | %(d) | | | | | 5.27 | %(d) | | | | | 6.56 | %* |
Portfolio turnover rate | | | | | 136 | % | | | | | 199 | % | | | | | 60 | % | | | | | 94 | % | | | | | 281 | % |
| (a) | Per share amounts based on average number of shares outstanding during the period. |
| (b) | Ratio of expenses to average net assets excluding interest expense is 0.45%. |
| (c) | If the investment manager had not reimbursed expenses, the ratio of expenses to average net assets would have been 0.46%. |
| (d) | Indicates a period in which, as a result of a change in generally accepted accounting principles, the portfolio has reclassified periodic payments made or received under certain derivative instruments, which were previously included within miscellaneous income, to a component of realized gain (loss) in the Statement of Operations. The effect of this reclassification was to (reduce) the net investment income ratio for the period ending June 30, 2004 by (0.03)% and the net investment income per share by $0.00. For consistency, similar reclassifications have been made to prior year amounts, resulting in (reductions) to the net investment income ratio of (0.09)%, 0.00% and (0.03)% and to the net investment income per share of $(0.01), $0.00 and $0.00 in the fiscal years ending December 31, 2003, 2002, and 2001, respectively. This change had no impact on the reported net asset value per share for any period. |
| | | | | | |
| 4 | | Semi-Annual Report | | June 30, 2004 | | See accompanying notes |
Statement of Assets and Liabilities
Short-Term Portfolio
June 30, 2004 (Unaudited)
| | | | | | |
| Amounts in thousands, except per share amounts | | | | | |
| | |
Assets: | | | | | | |
| | |
Investments, at value | | | | $ | 34,003 | |
Cash | | | | | 101 | |
Foreign currency, at value | | | | | 24 | |
Receivable for investments sold on delayed delivery basis | | | | | 794 | |
Unrealized appreciation on forward foreign currency contracts | | | | | 1 | |
Receivable for Portfolio shares sold | | | | | 2 | |
Interest and dividends receivable | | | | | 97 | |
Variation margin receivable | | | | | 11 | |
Swap premiums paid | | | | | 8 | |
Unrealized appreciation on swap agreements | | | | | 12 | |
| | | | | | 35,053 | |
| | |
Liabilities: | | | | | | |
| | |
Payable for investments purchased | | | | $ | 944 | |
Payable for short sale | | | | | 805 | |
Written options outstanding | | | | | 2 | |
Payable for Portfolio shares redeemed | | | | | 2 | |
Accrued investment advisory fee | | | | | 7 | |
Accrued administration fee | | | | | 5 | |
Accrued servicing fee | | | | | 1 | |
Recoupment payable to Manager | | | | | 1 | |
Other liabilities | | | | | 1 | |
| | | | | | 1,768 | |
| | |
Net Assets | | | | $ | 33,285 | |
| | |
Net Assets Consist of: | | | | | | |
| | |
Paid in capital | | | | $ | 33,263 | |
(Overdistributed) net investment income | | | | | (32 | ) |
Accumulated undistributed net realized gain | | | | | 65 | |
Net unrealized (depreciation) | | | | | (11 | ) |
| | | | | $ | 33,285 | |
| | |
Net Assets: | | | | | | |
| | |
Institutional Class | | | | $ | 26,451 | |
Administrative Class | | | | | 6,834 | |
| | |
Shares Issued and Outstanding: | | | | | | |
| | |
Institutional Class | | | | | 2,623 | |
Administrative Class | | | | | 678 | |
| | |
Net Asset Value and Redemption Price Per Share
(Net Assets Per Share Outstanding) | | | | | | |
| | |
Institutional Class | | | | $ | 10.08 | |
Administrative Class | | | | | 10.08 | |
| | |
Cost of Investments Owned | | | | $ | 34,018 | |
Cost of Foreign Currency Held | | | | $ | 24 | |
| | | | | | |
| See accompanying notes | | June 30, 2004 | | Semi-Annual Report | | 5 |
Statement of Operations
Short-Term Portfolio
| | | | | | |
| Amounts in thousands | | | | | |
| | | | | Six Months Ended June 30, 2004 (Unaudited) | |
Investment Income: | | | | | | |
| | |
Interest | | | | $ | 190 | |
Total Income | | | | | 190 | |
| | |
Expenses: | | | | | | |
| | |
Investment advisory fees | | | | | 32 | |
Administration fees | | | | | 25 | |
Distribution and/or servicing fees - Administrative Class | | | | | 5 | |
Total Expenses | | | | | 62 | |
| | |
Net Investment Income | | | | | 128 | |
| | |
Net Realized and Unrealized Gain (Loss): | | | | | | |
| | |
Net realized gain on investments | | | | | 5 | |
Net realized gain on futures contracts, options, and swaps | | | | | 38 | |
Net realized (loss) on foreign currency transactions | | | | | (1 | ) |
Net change in unrealized (depreciation) on investments | | | | | (35 | ) |
Net change in unrealized (depreciation) on futures contracts, options, and swaps | | | | | (26 | ) |
Net change in unrealized appreciation on translation of assets and liabilities denominated in foreign currencies | | | | | 1 | |
Net (Loss) | | | | | (18 | ) |
| | |
Net Increase in Assets Resulting from Operations | | | | $ | 110 | |
| | | | | | |
| 6 | | Semi-Annual Report | | June 30, 2004 | | See accompanying notes |
Statements of Changes in Net Assets
Short-Term Portfolio
| | | | | | | | | | | | |
| Amounts in thousands | | | | | | | | | | |
| | | | | Six Months Ended June 30, 2004 (Unaudited) | | | | | Year Ended December 31, 2003 | |
Increase in Net Assets from: | | | | | | | | | | | | |
| | | | |
Operations: | | | | | | | | | | | | |
| | | | |
Net investment income | | | | $ | 128 | | | | | $ | 207 | |
Net realized gain | | | | | 42 | | | | | | 100 | |
Net change in unrealized depreciation | | | | | (60 | ) | | | | | (13 | ) |
Net increase resulting from operations | | | | | 110 | | | | | | 294 | |
| | | | |
Distributions to Shareholders: | | | | | | | | | | | | |
| | | | |
From net investment income | | | | | | | | | | | �� | |
Institutional Class | | | | | (110 | ) | | | | | (160 | ) |
Administrative Class | | | | | (34 | ) | | | | | (97 | ) |
| | | | |
From net realized capital gains | | | | | | | | | | | | |
Institutional Class | | | | | 0 | | | | | | (18 | ) |
Administrative Class | | | | | 0 | | | | | | (8 | ) |
Total Distributions | | | | | (144 | ) | | | | | (283 | ) |
| | | | |
Portfolio Share Transactions: | | | | | | | | | | | | |
| | | | |
Receipts for shares sold | | | | | | | | | | | | |
Institutional Class | | | | | 14,588 | | | | | | 12,584 | |
Administrative Class | | | | | 1,448 | | | | | | 3,690 | |
| | | | |
Issued as reinvestment of distributions | | | | | | | | | | | | |
Institutional Class | | | | | 110 | | | | | | 178 | |
Administrative Class | | | | | 34 | | | | | | 105 | |
| | | | |
Cost of shares redeemed | | | | | | | | | | | | |
Institutional Class | | | | | (3,155 | ) | | | | | (2,724 | ) |
Administrative Class | | | | | (586 | ) | | | | | (2,197 | ) |
Net increase resulting from Portfolio share transactions | | | | | 12,439 | | | | | | 11,636 | |
| | | | |
Total Increase in Net Assets | | | | | 12,405 | | | | | | 11,647 | |
| | | | |
Net Assets: | | | | | | | | | | | | |
| | | | |
Beginning of period | | | | | 20,880 | | | | | | 9,233 | |
End of period* | | | | $ | 33,285 | | | | | $ | 20,880 | |
| | | | |
*Including (overdistributed) net investment income of: | | | | $ | (32 | ) | | | | $ | (16 | ) |
| | | | | | |
| See accompanying notes | | June 30, 2004 | | Semi-Annual Report | | 7 |
Schedule of Investments
Short-Term Portfolio
June 30, 2004 (Unaudited)
| | | | |
| | | Principal | | |
| | | Amount | | Value |
| | | (000s) | | (000s) |
| | | | | | |
CORPORATE BONDS & NOTES 9.9% | | | |
Banking & Finance 2.2% | | | | | | |
Bear Stearns Cos., Inc. | | | | | | |
1.940% due 09/21/2004 (a) | | $ | 100 | | $ | 100 |
Bombardier Capital, Inc. | | | | | | |
7.500% due 08/15/2004 | | | 100 | | | 100 |
Deutsche Telekom International Finance BV | | | |
8.250% due 06/15/2005 | | | 80 | | | 84 |
Ford Motor Credit Co. | | | | | | |
6.700% due 07/16/2004 | | | 250 | | | 250 |
General Motors Acceptance Corp. | | | |
5.750% due 11/05/2004 | | | 50 | | | 51 |
2.400% due 10/20/2005 (a) | | | 100 | | | 101 |
Household Finance Corp. | | | | | | |
6.700% due 11/15/2005 | | | 40 | | | 42 |
| | | | | |
|
|
| | | | | | | 728 |
| | | | | |
|
|
Industrials 3.6% | | | | | | |
Alcan, Inc. | | | | | | |
1.623% due 12/08/2004 (a) | | | 40 | | | 40 |
DaimlerChrysler North America Holding Corp. |
3.400% due 12/15/2004 | | | 220 | | | 221 |
7.400% due 01/20/2005 | | | 110 | | | 113 |
FedEx Corp. | | | | | | |
1.390% due 04/01/2005 (a) | | | 100 | | | 100 |
Fort James Corp. | | | | | | |
6.625% due 09/15/2004 | | | 10 | | | 10 |
Halliburton Co. | | | | | | |
2.650% due 10/17/2005 (a) | | | 50 | | | 51 |
MGM Mirage, Inc. | | | | | | |
6.950% due 02/01/2005 | | | 40 | | | 41 |
6.625% due 02/01/2005 | | | 20 | | | 20 |
PanAmSat Corp. | | | | | | |
6.125% due 01/15/2005 | | | 40 | | | 41 |
Petroleos Mexicanos | | | | | | |
6.500% due 02/01/2005 | | | 150 | | | 154 |
Pioneer National Resources Co. | | | | | | |
8.875% due 04/15/2005 | | | 50 | | | 52 |
TCI Communications, Inc. | | | | | | |
8.650% due 09/15/2004 | | | 40 | | | 41 |
Time Warner, Inc. | | | | | | |
7.975% due 08/15/2004 | | | 100 | | | 101 |
Tyco International Group S.A. | | | | | | |
5.875% due 11/01/2004 | | | 100 | | | 101 |
Weyerhaeuser Co. | | | | | | |
5.500% due 03/15/2005 | | | 15 | | | 15 |
Yum! Brands, Inc. | | | | | | |
7.450% due 05/15/2005 | | | 100 | | | 104 |
| | | | | |
|
|
| | | | | | | 1,205 |
| | | | | |
|
|
Utilities 4.1% | | | | | | |
Carolina Telephone & Telegraph | | | |
7.250% due 12/15/2004 | | | 200 | | | 204 |
Centerior Energy Corp. | | | | | | |
7.670% due 07/01/2004 | | | 100 | | | 100 |
Dominion Resources, Inc. | | | | | | |
2.800% due 02/15/2005 | | | 100 | | | 100 |
Edison International, Inc. | | | | | | |
6.875% due 09/15/2004 | | | 160 | | | 161 |
Entergy Gulf States, Inc. | | | | | | |
3.600% due 06/01/2008 | | | 100 | | | 97 |
Ohio Edison Co. | | | | | | |
4.000% due 05/01/2008 | | | 30 | | | 29 |
PPL Capital Funding Trust I | | | | | | |
7.290% due 05/18/2006 | | | 80 | | | 84 |
Reliant Energy Resources Corp. | | | | | | |
8.125% due 07/15/2005 | | | 100 | | | 105 |
SBC Communications, Inc. | | | | | | |
4.206% due 06/05/2005 | | | 110 | | | 112 |
Sprint Capital Corp. | | | | | | |
7.900% due 03/15/2005 | | | 360 | | | 373 |
| | | | | |
|
|
| | | | | | | 1,365 |
| | | | | |
|
|
| Total Corporate Bonds & Notes (Cost $3,302) | | | | | | 3,298 |
| | | | | |
|
|
| | | | |
U.S. GOVERNMENT AGENCIES 5.8% | | |
| | |
Fannie Mae | | | | |
4.500% due 02/25/2008 | | $100 | | $102 |
6.000% due 06/01/2017 | | 60 | | 63 |
5.337% due 10/01/2031 (a) | | 78 | | 80 |
1.420% due 03/25/2034 (a) | | 214 | | 213 |
1.880% due 08/25/2043 | | 36 | | 36 |
5.500% due 11/01/2016-09/01/2017 (d) | | 350 | | 359 |
Federal Home Loan Bank | | | | |
6.270% due 08/26/2004 | | 175 | | 173 |
Freddie Mac | | | | |
3.960% due 08/02/2006 | | 100 | | 100 |
4.000% due 08/02/2006 | | 100 | | 100 |
4.250% due 07/12/2006 | | 300 | | 300 |
9.500% due 12/01/2019 | | 88 | | 99 |
5.750% due 06/15/2029 | | 1 | | 1 |
6.000% due 12/15/2031 | | 100 | | 101 |
6.500% due 08/01/2032 | | 20 | | 21 |
5.500% due 08/15/2004-08/15/2030 (d) | | 41 | | 41 |
Government National Mortgage Association | | |
3.000% due 02/20/2032 (a) | | 127 | | 123 |
6.000% due 03/15/2032 | | 23 | | 24 |
| | | | |
|
| Total U.S. Government Agencies (Cost $1,946) | | 1,936 |
| | | | |
|
| | | | | |
U.S. TREASURY OBLIGATIONS 2.9% | | |
| |
Treasury Inflation Protected Securities (c) | | |
3.375% due 01/15/2007 | | 154 | | 165 |
3.625% due 01/15/2008 | | 396 | | 433 |
U.S. Treasury Note | | | | |
1.875% due 12/31/2005 | | 390 | | 387 |
| | | | |
|
| Total U.S. Treasury Obligations (Cost $989) | | | | 985 |
| | | | |
|
| | | | | |
MORTGAGE-BACKED SECURITIES 2.6% |
| |
Bank of America Mortgage Securities, Inc. | | |
6.406% due 07/25/2032 (a) | | 16 | | 16 |
5.667% due 10/20/2032 (a) | | 14 | | 14 |
Bear Stearns Adjustable Rate Mortgage Trust |
4.802% due 12/25/2033 (a) | | 39 | | 40 |
4.357% due 01/25/2034 (a) | | 38 | | 39 |
1.580% due 02/25/2034 (a) | | 61 | | 62 |
Bear Stearns Commercial Mortgage Securities |
1.500% due 05/14/2016 (a) | | 100 | | 100 |
Countrywide Home Loans, Inc. | | | | |
4.991% due 09/19/2032 (a) | | 9 | | 9 |
CS First Boston Mortgage Securities Corp. | | |
1.726% due 03/25/2032 (a) | | 150 | | 151 |
5.738% due 05/25/2032 (a) | | 11 | | 11 |
First Republic Mortgage Loan Trust | | |
1.538% due 08/15/2032 (a) | | 83 | | 83 |
Mellon Residential Funding Corp. | | |
1.678% due 12/15/2030 (a) | | 55 | | 55 |
Sequoia Mortgage Funding Co | | | | |
0.800% due 10/21/2007 (b) | | 1,842 | | 19 |
Structured Asset Mortgage Investments, Inc. | | | | |
1.610% due 09/19/2032 (a) | | 80 | | 80 |
Structured Asset Securities Corp. | | |
1.590% due 01/25/2033 (a) | | 25 | | 25 |
1.800% due 11/25/2033 (a) | | 17 | | 17 |
Structured Assets Securities Corp. | | |
1.800% due 07/25/2032 (a) | | 50 | | 50 |
Wachovia Bank Commercial Mortgage Trust | | |
1.428% due 06/15/2013 (a) | | 40 | | 40 |
Washington Mutual Mortgage Securities Corp. |
5.159% due 10/25/2032 (a) | | 12 | | 12 |
2.629% due 06/25/2042 (a) | | 42 | | 42 |
| | | | |
|
| Total Mortgage-Backed Securities (Cost $865) | | 865 |
| | | | |
|
| | | | |
ASSET-BACKED SECURITIES 3.5% | | |
| |
Ameriquest Mortgage Securities, Inc. | | |
1.460% due 06/25/2005 (a) | | $151 | | $151 |
1.450% due 11/25/2033 (a) | | 30 | | 30 |
Bear Stearns Asset-Backed Securities, Inc. | | |
1.630% due 10/25/2032 (a) | | 12 | | 12 |
CDC Mortgage Capital Trust | | | | |
1.640% due 01/25/2032 (a) | | 10 | | 10 |
1.670% due 08/25/2033 (a) | | 18 | | 18 |
Centex Home Equity Loan Trust | | | | |
1.600% due 09/25/2033 (a) | | 36 | | 36 |
Chase Funding Loan Acquisition Trust | | |
1.540% due 07/25/2030 (a) | | 7 | | 7 |
1.650% due 07/25/2031 (a) | | 5 | | 5 |
Contimortgage Home Equity Loan Trust | | |
1.418% due 04/15/2029 (a) | | 58 | | 58 |
Countrywide Asset-Backed Certificates | | |
1.670% due 05/25/2032 (a) | | 17 | | 17 |
CS First Boston Mortgage Securities Corp. | | |
1.740% due 08/25/2032 (a) | | 7 | | 7 |
Equifirst Mortgage Loan Trust | | | | |
1.400% due 01/25/2034 (a) | | 94 | | 94 |
Financial Asset Securities Corp. AAA Trust | | |
1.230% due 09/25/2033 (a) | | 5 | | 5 |
First Franklin Mortgage Loan Trust Asset-Backed Certificates | | |
1.650% due 09/25/2032 (a) | | 17 | | 17 |
2.820% due 02/25/2034 (a) | | 28 | | 28 |
First Franklin Mtg Loan Asset Backed Certificates | | |
1.420% due 07/25/2033 (a) | | 60 | | 60 |
HFC Home Equity Loan Asset-Backed Certificates | | |
1.630% due 10/20/2032 (a) | | 52 | | 52 |
Home Equity Asset Trust | | | | |
1.760% due 02/25/2033 (a) | | 35 | | 35 |
1.710% due 03/25/2033 (a) | | 20 | | 20 |
Home Equity Mortgage Trust | | | | |
1.550% due 04/25/2034 (a) | | 33 | | 34 |
Irwin Home Equity Loan Trust | | | | |
1.570% due 07/25/2032 (a) | | 30 | | 30 |
Morgan Stanley Asset-Backed Securities
Capital I, Inc. |
1.640% due 08/25/2033 (a) | | 39 | | 39 |
Morgan Stanley Dean Witter Capital I, Inc. |
1.670% due 07/25/2030 (a) | | 3 | | 3 |
Novastar Home Equity Loan | | | | |
1.630% due 09/25/2031 (a) | | 10 | | 10 |
Quest Trust | | | | |
1.291% due 06/25/2034 (a) | | 100 | | 100 |
Renaissance Home Equity Loan Trust | | |
1.740% due 08/25/2033 (a) | | 94 | | 95 |
Residential Asset Mortgage Products, Inc. |
1.630% due 12/25/2033 (a) | | 44 | | 44 |
Residential Asset Securities Corp. |
1.420% due 06/25/2025 (a) | | 86 | | 86 |
Saxon Asset Securities Trust | | | | |
1.570% due 01/25/2032 (a) | | 8 | | 8 |
1.700% due 12/25/2032 (a) | | 11 | | 12 |
Sears Credit Account Master Trust | | |
5.250% due 10/16/2008 | | 8 | | 8 |
Structured Asset Investment Loan Trust | | |
1.200% due 04/25/2033 (a) | | 13 | | 13 |
Terwin Mortgage Trust | | | | |
1.880% due 09/25/2033 (a) | | 9 | | 9 |
| | | | |
|
| Total Asset-Backed Securities (Cost $1,152) | | | | 1,153 |
| | | | |
|
| | | | | |
SOVEREIGN ISSUES 0.5% | | | | |
| | |
Republic of Brazil | | | | |
2.062% due 04/15/2006 (a) | | 93 | | 91 |
10.000% due 01/16/2007 | | 10 | | 11 |
2.125% due 04/15/2009 (a) | | 62 | | 57 |
| | | | |
|
| Total Sovereign Issues (Cost $154) | | | | 159 |
| | | | |
|
| | | | | | |
| 8 | | Semi-Annual Report | | June 30, 2004 | | See accompanying notes |
| | | | |
| | | Principal | | |
| | | Amount | | Value |
| | | (000s) | | (000s) |
| | | | | | | |
FOREIGN CURRENCY-DENOMINATED ISSUES (i)(j) 0.1% | | | | |
| | |
Tyco International Group S.A. | | | | | | | |
4.375% due 11/19/2004 | | EC | 20 | | | $24 | |
| | | | | | |
|
|
Total Foreign Currency-Denominated Issues (Cost $24) | | | 24 | |
| | | | | | |
|
|
| | | | | | | | |
SHORT-TERM INSTRUMENTS 76.9% | | | | |
Commercial Paper 76.0% | | | | | | | |
AB Spintab | | | | | | | |
1.260% due 09/08/2004 | | | $400 | | | 399 | |
ABN AMRO North America | | | | | | | |
1.040% due 07/06/2004 | | | 600 | | | 600 | |
1.090% due 07/29/2004 | | | 100 | | | 100 | |
Anz (Delaware), Inc. | | | | | | | |
1.060% due 07/19/2004 | | | 200 | | | 200 | |
Bank of Ireland | | | | | | | |
1.285% due 09/03/2004 | | | 900 | | | 898 | |
Barclays U.S. Funding Corp. | | | | | | | |
1.110% due 08/25/2004 | | | 100 | | | 100 | |
1.280% due 09/21/2004 | | | 200 | | | 199 | |
CBA (de) Finance | | | | | | | |
1.050% due 07/02/2004 | | | 100 | | | 100 | |
1.210% due 08/23/2004 | | | 600 | | | 599 | |
1.225% due 08/23/2004 | | | 200 | | | 200 | |
CDC Commercial Corp. | | | | | | | |
1.100% due 08/04/2004 | | | 600 | | | 599 | |
Den Norske Bank ASA | | | | | | | |
1.260% due 09/20/2004 | | | 500 | | | 498 | |
Dexia Delaware LLC | | | | | | | |
1.400% due 08/30/2004 | | | 300 | | | 299 | |
European Investment Bank | | | | | | | |
1.050% due 07/16/2004 | | | 600 | | | 600 | |
Fannie Mae | | | | | | | |
1.040% due 07/14/2004 | | | 300 | | | 300 | |
1.060% due 07/21/2004 | | | 600 | | | 600 | |
1.063% due 08/04/2004 | | | 300 | | | 300 | |
1.130% due 08/11/2004 | | | 300 | | | 300 | |
1.150% due 08/18/2004 | | | 300 | | | 299 | |
1.177% due 08/25/2004 | | | 300 | | | 299 | |
1.180% due 08/25/2004 | | | 500 | | | 499 | |
1.120% due 09/01/2004 | | | 300 | | | 299 | |
1.225% due 09/01/2004 | | | 200 | | | 199 | |
1.380% due 09/01/2004 | | | 300 | | | 299 | |
1.415% due 09/08/2004 | | | 300 | | | 299 | |
1.200% due 09/15/2004 | | | 300 | | | 299 | |
1.414% due 09/22/2004 | | | 100 | | | 100 | |
1.426% due 09/22/2004 | | | 100 | | | 100 | |
1.010% due 10/01/2004 | | | 300 | | | 299 | |
Federal Home Loan Bank | | | | | | | |
1.165% due 07/16/2004 | | | 200 | | | 200 | |
1.170% due 07/16/2004 | | | 300 | | | 300 | |
1.180% due 08/25/2004 | | | 100 | | | 100 | |
Ford Motor Credit Co. | | | | | | | |
1.870% due 09/03/2004 | | | 150 | | | 150 | |
Freddie Mac | | | | | | | |
1.010% due 08/12/2004 | | | 400 | | | 399 | |
1.150% due 08/17/2004 | | | 300 | | | 300 | |
1.175% due 08/24/2004 | | | 600 | | | 599 | |
1.180% due 08/24/2004 | | | 1,000 | | | 998 | |
1.260% due 09/20/2004 | | | 200 | | | 199 | |
1.280% due 09/22/2004 | | | 300 | | | 299 | |
1.465% due 09/28/2004 | | | 300 | | | 299 | |
1.300% due 09/30/2004 | | | 300 | | | 299 | |
1.560% due 10/20/2004 | | | 300 | | | 298 | |
General Electric Capital Corp. | | | | | | | |
1.040% due 07/08/2004 | | | 600 | | | 600 | |
1.060% due 07/12/2004 | | | 100 | | | 100 | |
1.300% due 09/08/2004 | | | 200 | | | 199 | |
HBOS Treasury Services PLC | | | | | | | |
1.055% due 07/16/2004 | | | 200 | | | 200 | |
1.290% due 09/24/2004 | | | 200 | | | 199 | |
1.580% due 10/21/2004 | | | 500 | | | 497 | |
| | | | | |
| | |
1.585% due 10/26/2004 | | $100 | | $99 | |
ING U.S. Funding LLC | | | | | |
1.040% due 07/02/2004 | | 600 | | 600 | |
1.240% due 09/10/2004 | | 100 | | 100 | |
KFW International Finance, Inc. | | | | | |
1.095% due 08/10/2004 | | 300 | | 300 | |
1.110% due 08/23/2004 | | 400 | | 399 | |
Lloyds TSB Bank PLC | | | | | |
185% due 07/21/2004 | | 700 | | 699 | |
National Australia Funding, Inc. | | | | | |
1.050% due 07/02/2004 | | 600 | | 600 | |
Nestle Capital Corp. | | | | | |
1.130% due 08/30/2004 | | 500 | | 499 | |
Royal Bank of Scotland PLC | | | | | |
1.070% due 07/14/2004 | | 600 | | 600 | |
1.235% due 09/13/2004 | | 100 | | 100 | |
Shell Finance (UK) PLC | | | | | |
1.240% due 09/14/2004 | | 600 | | 598 | |
Svenska Handlesbanken | | | | | |
1.065% due 07/14/2004 | | 600 | | 600 | |
1.070% due 07/21/2004 | | 100 | | 100 | |
1.240% due 09/13/2004 | | 100 | | 100 | |
1.295% due 09/24/2004 | | 200 | | 199 | |
Swedish National Housing Finance Corp. | | | |
1.060% due 07/16/2004 | | 400 | | 400 | |
1.090% due 07/29/2004 | | 500 | | 500 | |
Toyota Motor Credit Corp. | | | | | |
1.330% due 09/07/2004 | | 900 | | 898 | |
UBS Finance, Inc. | | | | | |
1.060% due 07/01/2004 | | 300 | | 300 | |
1.420% due 07/01/2004 | | 100 | | 100 | |
1.055% due 07/13/2004 | | 300 | | 300 | |
1.195% due 07/21/2004 | | 100 | | 100 | |
1.240% due 08/31/2004 | | 200 | | 199 | |
Westpac Capital Corp. | | | | | |
1.030% due 07/07/2004 | | 100 | | 100 | |
Westpac Trust Securities NZ Ltd. | | | |
1.215% due 08/24/2004 | | 700 | | 699 | |
| | | | |
|
|
| | | | | 25,306 | |
| | | | |
|
|
| | |
Repurchase Agreement 0.6% | | | | | |
State Street Bank | | | | | |
0.800% due 07/01/2004 | | 192 | | 192 | |
| | | | |
|
|
(Dated 06/30/2004. Collateralized by Fannie Mae 5.250% due 06/15/2006 valued at $198.
Repurchase proceeds are $192.) | |
| | |
U.S. Treasury Bills 0.3% | | | | | |
1.135% due 09/02/2004 (e) | | 85 | | 85 | |
| | | | |
|
|
| Total Short-Term Instruments (Cost $25,586) | | | | 25,583 | |
| | | | |
|
|
| | |
Total Investments 102.2% | | | | $34,003 | |
(Cost $34,018) | | | | | |
| | |
Written Options (g) (0.0%) | | | | (2 | ) |
(Premiums $6) | | | | | |
| |
Other Assets and Liabilities (Net) (2.2%) | | (716 | ) |
| | | | |
|
|
| |
Net Assets 100.0% | | $33,285 | |
| | | | |
|
|
Notes to Schedule of Investments (amounts in thousands, except number of contracts):
(a) Variable rate security.
(b) Interest only security.
(c) Principal amount of security is adjusted for inflation.
(d) Securities are grouped by coupon or range of coupons and represent a range of maturities.
(e) Securities with an aggregate market value of $85 have been segregated with the custodian to cover margin
requirements for the following open futures contracts at June 30, 2004:
| | | | | | | | |
Type | | Expiration Month | | # of
Contracts | |
| Unrealized
(Depreciation) |
|
Eurodollar June Long Futures | | 06/2005 | | 8 | | $ | 0 | |
Euribor December Long Futures | | 12/2005 | | 3 | | | (4 | ) |
Euribor June
Long Futures | | 06/2005 | | 1 | | | (1 | ) |
Euribor September Long Futures | | 09/2005 | | 1 | | | (1 | ) |
Euro-Bobl 5-Year Note Long Futures | | 09/2004 | | 3 | | | 0 | |
U.S. Treasury 10-Year Note Long Futures | | 09/2004 | | 8 | | | (1 | ) |
| | | | | | |
|
|
|
| | | | | | | $ | (7 | ) |
| | | | | | |
|
|
|
(f) Swap agreements outstanding at June 30, 2004:
| | | | | | | | |
Type | |
| Notional
Amount | | | |
| Unrealized
Appreciation |
Receive a fixed rate equal to 4.000% and
pay floating rate based on 6-month EC-LIBOR. |
| Counterparty: Merrill Lynch & Co., Inc. | | | | | |
| Exp. 03/15/2007 | | EC | 1,000 | | | | $ | 6 |
| |
| Receive a fixed rate equal to 1.000% and the Portfolio will pay to the counterparty at par in the event of default of Russian Federation, 5.000% until 03/31/2007 and 7.500% thereafter, due 03/31/2030. | | | |
Counterparty: Morgan Stanley Dean Witter & Co. |
| Exp. 07/18/2004 | | $ | 40 | | | | | 0 |
| |
| Receive a fixed rate equal to 16.500% and the Portfolio will pay to the counterparty at par in the event of default of Federative Republic of Brazil 8.000% due 04/15/2014. | | | |
| Counterparty: Merrill Lynch & Co., Inc. | | | |
| Exp. 01/16/2005 | | | 75 | | | | | 6 |
| |
| Receive a fixed rate equal to 1.000% and the Portfolio will pay to the counterparty at par in the event of default of Russian Federation, 5.000% until 03/31/2007 and 7.500% thereafter, due 03/31/2030. | | | |
| Counterparty: J.P. Morgan Chase & Co. | | | |
| Exp. 03/11/2005 | | | 40 | | | | | 0 |
| |
| Receive a fixed rate equal to 1.000% and the Portfolio will pay to the counterparty at par in the event of default of Russian Federation, 5.000% until 03/31/2007 and 7.500% thereafter, due 03/31/2030. | | | |
| Counterparty: Bear Stearns & Co., Inc. | | | |
| Exp. 03/17/2005 | | | 25 | | | | | 0 |
| |
| Receive a fixed rate equal to 0.730% and the Portfolio will pay to the counterparty at par in the event of default of the United Mexican States 11.500% due 05/15/2026. | | | |
| Counterparty: Bear Stearns & Co., Inc. | | | |
| Exp. 06/20/2005 | | | 80 | | | | | 0 |
| |
| Receive a fixed rate equal to 4.000% and pay floating rate based on 3-month LIBOR. | | | |
| Counterparty: UBS Warburg LLC | | | |
| Exp. 12/15/2006 | | | 200 | | | | | 0 |
| | | | | | | |
|
|
| | | | | | | | $ | 12 |
| | | | | | | |
|
|
| | | | | | |
| See accompanying notes | | June 30, 2004 | | Semi-Annual Report | | 9 |
Schedule of Investments (Cont.)
Short-Term Portfolio
June 30, 2004 (Unaudited)
| (g) | Premiums received on written options: |
| | | | | | | | | | | | | | | | | |
| Name of Issuer | | Counterparty | | Exercise Rate | | | Expiration
Date | | Notional
Amount | | Premium | | Value | |
Call - OTC 7-Year Interest Rate Swap | | Goldman Sachs & Co. | | 5.000 | %** | | 01/07/2005 | | $ | 140 | | $ | 3 | | $ | 2 | |
Put - OTC 7-Year Interest Rate Swap | | Goldman Sachs & Co. | | 7.000 | %* | | 01/07/2005 | | | 140 | | | 3 | | | 0 | |
| | | | | | | | | | | | |
|
|
|
| | | | | | | | | | | | | $ | 6 | | $ | 2 | |
| | | | | | | | | | | | |
|
|
|
| | | | | |
* The Portfolio will pay a floating rate based on 3-month LIBOR. | | | | | | | | | | | | | | | |
** The Portfolio will receive a floating rate based on 3-month LIBOR. | | | | | | | | | | | | | | | |
| | | | | |
| (h) Short sales open at June 30, 2004 were as follows: | | | | | | | | | | | | | | | |
| Type | | | | Coupon
(%) | | | Maturity | | Par | | Value | | Proceeds | |
U.S. Treasury Note | | | | 5.000 | | | 02/15/2011 | | $ | 200 | | $ | 210 | | $ | 206 | |
U.S. Treasury Note | | | | 4.250 | | | 08/15/2013 | | | 610 | | | 595 | | | 588 | |
| | | | | | | | | | | | |
|
|
|
| | | | | | | | | | | | | $ | 805 | | $ | 794 | |
| | | | | | | | | | | | |
|
|
|
| | | | | |
| (i) Forward foreign currency contracts outstanding at June 30, 2004: | | | | | | | | | | | | | | | |
| Type | | Currency | | Principal
Amount
Covered by
Contract | | | Settlement
Month | | Unrealized
Appreciation | | Unrealized
(Depreciation) | | Net Unrealized
Appreciation | |
Sell | | EC | | 48 | | | 07/2004 | | $ | 1 | | $ | 0 | | $ | 1 | |
| | | | | | | | | |
|
|
|
| (j) | Principal amount denoted in indicated currency: |
| | | | | | |
| 10 | | Semi-Annual Report | | June 30, 2004 | | See accompanying notes |
Notes to Financial Statements
June 30, 2004 (Unaudited)
1. Organization
The Short-Term Portfolio (the “Portfolio”) is a series of the PIMCO Variable Insurance Trust (the “Trust”). The Trust is registered under the Investment Company Act of 1940 (the “Act”), as amended, as an open-end investment company organized as a Delaware business trust on October 3, 1997. The Portfolio offers two classes of shares: Institutional and Administrative. Each share class has identical voting rights (except that shareholders of a class have exclusive voting rights regarding any matter relating solely to that class of shares). Information presented in these financial statements pertains to the Institutional Class of the Portfolio. Certain detailed financial information for the Administrative Class is provided separately and is available upon request. The Trust is designed to be used as an investment vehicle by Separate Accounts of insurance companies that fund variable annuity contracts and variable life insurance policies and by qualified pension and retirement plans. The Portfolio commenced operations on September 30, 1999.
2. Significant Accounting Policies
The following is a summary of significant accounting policies consistently followed by the Trust in the preparation of its financial statements in conformity with accounting principles generally accepted in the United States of America. The preparation of financial statements in accordance with accounting principles generally accepted in the United States of America requires management to make estimates and assumptions that affect the reported amounts and disclosures in the financial statements. Actual results could differ from those estimates.
Security Valuation. Portfolio securities and other financial instruments for which market quotations are readily available are stated at market value. Portfolio securities and other financial instruments for which market quotes are not readily available are valued at fair value, as determined in good faith and pursuant to guidelines established by the Board of Trustees, including certain fixed income securities which may be valued with reference to securities whose prices are more readily obtainable. Market value is determined at the close of regular trading (normally, 4:00 p.m., Eastern Time) on the New York Stock Exchange on each day the New York Stock Exchange is open, or if no sales are reported, as is the case for most securities traded over-the-counter, the mean between representative bid and asked quotations obtained from a quotation reporting system or from established market makers. The prices of certain portfolio securities or other financial instruments may be determined at a time prior to the close of regular trading on the New York Stock Exchange. Fair valuation may be used if significant events occur after the close of the relevant markets and prior to the close of regular trading on the New York Stock Exchange that materially affect the values of such securities or financial instruments. Fixed income securities are normally valued on the basis of quotes obtained from brokers and dealers or pricing services. Certain fixed income securities purchased on a delayed delivery basis are marked to market daily until settlement at the forward settlement value. Short-term investments, which mature in 60 days or less are valued at amortized cost, which approximates market value. Exchange traded options, futures and options on futures are valued at the settlement price determined by the relevant exchange. Prices may be obtained from independent pricing services which use information provided by market makers or estimates of market values obtained from yield data relating to investments or securities with similar characteristics. The prices used by the Portfolio may differ from the value that would be realized if the securities were sold and the differences could be material to the financial statements.
Securities Transactions and Investment Income. Securities transactions are recorded as of the trade date. Securities purchased or sold on a when-issued or delayed delivery basis may be settled a month or more after the trade date. Realized gains and losses from securities sold are recorded on the identified cost basis. Dividend income is recorded on the ex-dividend date, except certain dividends from foreign securities where the ex-dividend date may have passed, are recorded as soon as the Portfolio is informed of the ex-dividend date. Interest income, adjusted for the accretion of discounts and amortization of premiums, is recorded on the accrual basis. Paydowns gains and losses on mortgage- and asset-backed securities are recorded as adjustments to interest income in the Statement of Operations.
Dividends and Distributions to Shareholders. Dividends from net investment income, if any, are declared on each day the Trust is open for business and are distributed to shareholders monthly. All dividends are reinvested in additional shares of the Portfolio. Net realized capital gains earned by the Portfolio, if any, will be distributed no less frequently than once each year.
Income dividends and capital gain distributions are determined in accordance with income tax regulations which may differ from accounting principles generally accepted in the United States of America. These differences are primarily due to differing treatments for such items as wash sales, foreign currency transactions, net operating losses, notional principal contracts, certain asset-backed securities, certain futures and forward contracts, tax straddles, and capital loss carryforwards.
Distributions classified as a tax basis return of capital, if any, are reflected in the accompanying Statements of Changes in Net Assets and have been reclassified to paid in capital. In addition, other amounts have been reclassified between undistributed net investment income, accumulated undistributed net realized gains or losses and/or paid in capital to more appropriately conform financial accounting to tax characterizations of dividend distributions.
Multiclass Operations. Each class offered by the Trust has equal rights as to assets. Income, non-class specific expenses, and realized and unrealized capital gains and losses are allocated to each class of shares based on the relative net assets of each class.
Delayed Delivery Transactions. The Portfolio may purchase or sell securities on a when-issued or delayed delivery basis. These transactions involve a commitment by the Portfolio to purchase or
| | | | |
| June 30, 2004 | | Semi-Annual Report | | 11 |
Notes to Financial Statements (Cont.)
June 30, 2004 (Unaudited)
sell securities for a predetermined price or yield, with payment and delivery taking place beyond the customary settlement period. When delayed delivery purchases are outstanding, the Portfolio will designate liquid assets in an amount sufficient to meet the purchase price. When purchasing a security on a delayed delivery basis, the Portfolio assumes the rights and risks of ownership of the security, including the risk of price and yield fluctuations, and takes such fluctuations into account when determining its net asset value. The Portfolio may dispose of or renegotiate a delayed delivery transaction after it is entered into, and may sell when-issued securities before they are delivered, which may result in a capital gain or loss. When the Portfolio has sold a security on a delayed delivery basis, the Portfolio does not participate in future gains and losses with respect to the security.
Federal Income Taxes. The Portfolio intends to qualify as a regulated investment company and distribute all of its taxable income and net realized gains, if applicable, to shareholders. Accordingly, no provision for Federal income taxes has been made.
Foreign Currency. The accounting records of the Portfolio are maintained in U.S. dollars. The market values of foreign securities, currency holdings and other assets and liabilities are translated into U.S. dollars based on the current exchange rates each business day. Fluctuations in the value of these assets and liabilities resulting from changes in exchange rates are recorded as unrealized foreign currency gains or losses. Realized gains or losses and unrealized appreciation or depreciation on investment securities and income and expenses are translated on the respective dates of such transactions. The effect of changes in foreign currency exchange rates on investments in securities are not segregated in the Statement of Operations from the effects of changes in market prices of those securities, but are included with the net realized and unrealized gain or loss on investment securities.
Forward Currency Transactions. The Portfolio may enter into forward currency contracts and forward cross-currency contracts in connection with settling planned purchases or sales of securities, to hedge the currency exposure associated with some or all of the Portfolio’s securities or as a part of an investment strategy. A forward currency contract is an agreement between two parties to buy and sell a currency at a set price on a future date. The market value of a forward currency contract fluctuates with changes in forward currency exchange rates. Forward currency contracts are marked to market daily and the change in value is recorded by the Portfolio as an unrealized gain or loss. Realized gains or losses equal to the difference between the value of the contract at the time it was opened and the value at the time it was closed are recorded upon delivery or receipt of the currency or, if a forward currency contract is offset by entering into another forward currency contract with the same broker, upon settlement of the net gain or loss. These contracts may involve market risk in excess of the unrealized gain or loss reflected in the Portfolio’s Statement of Assets and Liabilities. In addition, the Portfolio could be exposed to risk if the counterparties are unable to meet the terms of the contracts or if the value of the currency changes unfavorably to the U.S. dollar.
Futures Contracts. The Portfolio is authorized to enter into futures contracts. The Portfolio may use futures contracts to manage its exposure to the securities markets or to movements in interest rates and currency values. The primary risks associated with the use of futures contracts are the imperfect correlation between the change in market value of the securities held by the Portfolio and the prices of futures contracts, the possibility of an illiquid market, and the inability of the counterparty to meet the terms of the contract. Futures contracts are valued based upon their quoted daily settlement prices. Upon entering into a futures contract, the Portfolio may be required to deposit with its custodian, in a segregated account in the name of the futures broker, an amount of cash or U.S. Government and Agency Obligations in accordance with the initial margin requirements of the broker or exchange. Futures contracts are marked to market daily and an appropriate payable or receivable for the change in value (“variation margin”) is recorded by the Portfolio. Gains or losses are recognized but not considered realized until the contracts expire or are closed. Futures contracts involve, to varying degrees, risk of loss in excess of the variation margin disclosed in the Statement of Assets and Liabilities.
Inflation-Indexed Bonds. The Portfolio may invest in inflation-indexed bonds. Inflation-indexed bonds are fixed income securities whose principal value is periodically adjusted to the rate of inflation. The interest rate on these bonds is generally fixed at issuance at a rate lower than typical bonds. Over the life of an inflation-indexed bond, however, interest will be paid based on a principal value, which is adjusted for inflation. Any increase in the principal amount of an inflation-indexed bond will be included as interest income in the Statement of Operations, even though investors do not receive their principal until maturity.
Options Contracts. The Portfolio may write call and put options on futures, swaps, securities or currencies it owns or in which it may invest. Writing put options tends to increase the Portfolio’s exposure to the underlying instrument. Writing call options tends to decrease the Portfolio’s exposure to the underlying instrument. When the Portfolio writes a call or put option, an amount equal to the premium received is recorded as a liability and subsequently marked to market to reflect the current value of the option written. These liabilities are reflected as written options outstanding in the Statement of Assets and Liabilities. Payments received or made, if any, from writing options with premiums to be determined on a future date are reflected as such on the Statement of Assets and Liabilities. Premiums received from writing options which expire are treated as realized gains. Premiums received from writing options which are exercised or closed are added to the proceeds or offset against amounts paid on the underlying future, swap, security or currency transaction to determine the realized gain or loss. The Portfolio as a writer of an option has no control over whether the underlying future, swap, security or currency may be sold (call) or purchased (put) and as a result bears the market risk of an unfavorable change in the price of the future, swap, security or currency underlying the written option. There is the risk the Portfolio may not be able to enter into a closing transaction because of an illiquid market.
| | | | |
| 12 | | Semi-Annual Report | | June 30, 2004 |
The Portfolio may also purchase put and call options. Purchasing call options tends to increase the Portfolio’s exposure to the underlying instrument. Purchasing put options tends to decrease the Portfolio’s exposure to the underlying instrument. The Portfolio pays a premium which is included in the Portfolio’s Statement of Assets and Liabilities as an investment and subsequently marked to market to reflect the current value of the option. Premiums paid for purchasing options which expire are treated as realized losses. The risk associated with purchasing put and call options is limited to the premium paid. Premiums paid for purchasing options which are exercised or closed are added to the amounts paid or offset against the proceeds on the underlying future, swap, security or currency transaction to determine the realized gain or loss.
Short Sales. The Portfolio may enter into short sales transactions. A short sale is a transaction in which the Portfolio sells securities it does not own in anticipation of a decline in the market price of the securities. The Portfolio is obligated to deliver securities at the market price at the time the short position is closed. Possible losses from short sales may be unlimited, whereas losses from purchases cannot exceed the total amount invested.
Repurchase Agreements. The Portfolio may engage in repurchase transactions. Under the terms of a typical repurchase agreement, the Portfolio takes possession of an underlying debt obligation subject to an obligation of the seller to repurchase, and the Portfolio to resell, the obligation at an agreed-upon price and time. The market value of the collateral must be equal at all times to the total amount of the repurchase obligations, including interest. Generally, in the event of counterparty default, the Portfolio has the right to use the collateral to offset losses incurred.
Stripped Mortgage-Backed Securities. The Portfolio may invest in stripped mortgage-backed securities (SMBS). SMBS represent a participation in, or are secured by and payable from, mortgage loans on real property, and may be structured in classes with rights to receive varying proportions of principal and interest. SMBS include interest-only securities (IOs), which receive all of the interest, and principal-only securities (POs), which receive all of the principal. If the underlying mortgage assets experience greater than anticipated payments of principal, the Portfolio may fail to recoup some or all of its initial investment in these securities. The market value of these securities is highly sensitive to changes in interest rates.
Swap Agreements. The Portfolio may invest in swap agreements. A swap is an agreement to exchange the return generated by one instrument for the return generated by another instrument. The Portfolio may enter into interest rate, total return, forward spread lock, and credit default swap agreements to manage its exposure to interest rates and credit risk.
Interest rate swap agreements involve the exchange by the Portfolio with another party of their respective commitments to pay or receive interest, e.g., an exchange of floating rate payments for fixed rate payments with respect to the notional amount of principal.
Total return swap agreements involve commitments to pay interest in exchange for a market-linked return, both based on notional amounts. To the extent the total return of the security or index underlying the transaction exceeds or falls short of the offsetting interest rate obligation, the Portfolio will receive a payment from or make a payment to the counterparty.
Forward spread lock swap agreements involve commitments to pay or receive a settlement amount calculated as the difference between the swap spread and a fixed spread, multiplied by the notional amount times the duration of the swap. The swap spread is the difference between the benchmark swap rate (market rate) and the specific Treasury rate.
In a credit default swap, one party makes a stream of payments to another party in exchange for the right to receive a specified return in the event of a default by a third party, typically corporate issues or sovereign issues of an emerging country, on its obligation. The Portfolio may use credit default swaps to provide a measure of protection against defaults of sovereign issuers (i.e., to reduce risk where the Portfolio owns or has exposure to the sovereign issuer) or to take an active long or short position with respect to the likelihood of a particular issuer’s default.
Swaps are marked to market daily based upon quotations from market makers and the change in value, if any, is recorded as unrealized gain or loss in the Statement of Operations. Payments received or made at the beginning of the measurement period are reflected as such on the Statement of Assets and Liabilities. A liquidation payment received or made at the termination of the swap is recorded as realized gain or loss in the Statement of Operations. Net periodic payments received by the Portfolio are included as part of realized gain(loss) on the Statement of Operations. Entering into these agreements involves, to varying degrees, elements of credit, market and documentation risk in excess of the amounts recognized on the Statement of Assets and Liabilities. Such risks involve the possibility that there will be no liquid market for these agreements, that the counterparty to the agreements may default on its obligation to perform or disagree as to the meaning of contractual terms in the agreements, and that there may be unfavorable changes in interest rates.
As a result of a FASB Emerging Issues Task Force (“EITF”) consensus, No. 03-11, and related SEC staff guidance, the Portfolio has reclassified periodic payments made or received under swap agreements, which were previously included within miscellaneous income, to a component of realized gain(loss) in the Statement of Operations. For consistency, similar reclassifications have been made to amounts appearing in the previous year’s Statement of Changes in Net Assets and the per share amounts in the prior year financial highlights. Prior year net investment income ratios in the financial highlights have also been modified accordingly. This reclassification increased (decreased) net investment income by $(6,562) and $(14,282), and net realized gain by $7,256 and $8,419 and net change in unrealized appreciation (depreciation) by $(695) and $5,863 for the six months ended June 30, 2004 and year ended December 31, 2003, respectively. There is no effect on the Portfolio’s net asset value, either in total or per share, or its total increase(decrease) in net assets from operations during any period.
| | | | |
| June 30, 2004 | | Semi-Annual Report | | 13 |
Notes to Financial Statements (Cont.)
June 30, 2004 (Unaudited)
3. Fees, Expenses, and Related Party Transactions
Investment Advisory Fee. Pacific Investment Management Company LLC (“PIMCO”) is a majority owned subsidiary partnership of Allianz Dresdner Asset Management of America L.P. and serves as investment adviser (the “Adviser”) to the Trust, pursuant to an investment advisory contract. The Adviser receives a monthly fee at an annual rate based on average daily net assets of the Portfolio. The Advisory Fee is charged at an annual rate of 0.25%.
Administration Fee. PIMCO serves as administrator (the “Administrator”), and provides administrative services to the Trust for which it receives a monthly administrative fee based on average daily net assets of the Portfolio. The Administration Fee is charged at the annual rate of 0.20%.
Servicing Fee. PA Distributors LLC (“PAD”), formerly known as PIMCO Advisors Distributors LLC, is an indirect wholly-owned subsidiary of Allianz Dresdner Asset Management of America L.P. and serves as the distributor of the Trust’s shares. The Trust is permitted to reimburse PAD on a quarterly basis, out of the Administrative Class assets of the Portfolio in the amount of 0.15% on an annual basis of the average daily net assets of that class, for payments made to financial intermediaries that provide services in connection with the distribution of shares or administration of plans or programs that use Portfolio shares as their funding medium. The effective rate paid to PAD was 0.15% during current fiscal year.
Expenses. The Trust is responsible for the following expenses: (i) salaries and other compensation of any of the Trust’s executive officers and employees who are not officers, directors, stockholders or employees of PIMCO or its subsidiaries or affiliates; (ii) taxes and governmental fees; (iii) brokerage fees and commissions and other portfolio transaction expenses; (iv) the cost of borrowing money, including interest expense and bank overdraft charges; (v) fees and expenses of the Trustees who are not “interested persons” of PIMCO or the Trust, and any counsel retained exclusively for their benefit; (vi) extraordinary expenses, including costs of litigation and indemnification expenses; (vii) organization expenses and (viii) any expenses allocated or allocable to a specific class of shares, which include service fees payable with respect to the Administrative Class shares and may include certain other expenses as permitted by the Trust’s Multiple Class Plan adopted pursuant to Rule 18f-3 under the Act and subject to review and approval by the Trustees. The ratio of expenses to average net assets per share class, as disclosed in Financial Highlights, may differ from the annual portfolio operating expenses per share class as disclosed in the Prospectus for the reasons set forth above.
PIMCO has agreed to waive a portion of its administrative fees to the extent that the payment of the Portfolio’s pro rata share of organization expenses and Trustee fees cause the actual expense ratio to rise above the rates disclosed in the then-current prospectus plus 0.49 basis points as set forth below (calculated as a percentage of the Portfolio’s average daily net assets attributable to each class):
| | | |
Institutional Class | | 0.50 | % |
Administrative Class | | 0.65 | % |
PIMCO may be reimbursed for these waived amounts in future periods, not to exceed thirty-six months.
Each unaffiliated Trustee receives an annual retainer of $4,000, plus $1,500 for each Board of Trustees meeting attended in person and $250 for each meeting attended telephonically, plus reimbursement of related expenses. In addition, each committee chair receives an additional annual retainer of $500. These expenses are allocated on a pro-rata basis to each Portfolio of the Trust according to its respective net assets.
4. Purchases and Sales of Securities
The length of time a Portfolio has held a particular security is not generally a consideration in investment decisions. A change in the securities held by a Portfolio is known as “portfolio turnover.” The Portfolio may engage in frequent and active trading of portfolio securities to achieve its investment objective, particularly during periods of volatile market movements. High portfolio turnover (e.g., over 100%) involves correspondingly greater expenses to the Portfolio, including brokerage commissions or dealer mark-ups and other transaction costs on the sale of securities and reinvestments in other securities. Such sales may also result in realization of taxable capital gains, including short-term capital gains (which are generally taxed at ordinary income tax rates). The trading costs and tax effects associated with portfolio turnover may adversely affect the Portfolio’s performance.
Purchases and sales of securities (excluding short-term investments) for the period ended June 30, 2004 were as follows (amounts in thousands):
| | | | | | |
| U.S. Government/Agency | | All Other |
| Purchases | | Sales | | Purchases | | Sales |
| $ 7,852 | | $ 6,215 | | $ 4,347 | | $ 3,554 |
5. Transactions in Written Call and Put Options
Transactions in written call and put options were as follows (amounts in thousands):
| | | | |
| | | Premium | |
Balance at 12/31/2003 | | $ | 26 | |
Sales | | | 5 | |
Closing Buys | | | (8 | ) |
Expirations | | | (17 | ) |
| Exercised | | | 0 | |
| Balance at 06/30/2004 | | $ | 6 | |
6. Federal Income Tax Matters
At June 30, 2004, the aggregate cost of investments was the same for federal income tax and financial statement purposes. The net unrealized appreciation (depreciation) of investment securities for federal income tax purposes is as follows (amounts in thousands):
| | | | |
Aggregate Gross Unrealized Appreciation | | Aggregate Gross Unrealized
(Depreciation) | | Net Unrealized Depreciation |
| $ 20 | | $ (35) | | $ (15) |
| | | | |
| 14 | | Semi-Annual Report | | June 30, 2004 |
7. Shares of Beneficial Interest
The Trust may issue an unlimited number of shares of beneficial interest with a $.001 par value. Changes in shares of beneficial interest were as follows (shares and amounts in thousands):
| | | | | | | | | | | | | | |
| | | Six Months Ended
06/30/2004 | | | Year Ended
12/31/2003 | |
| | | Shares | | | Amount | | | Shares | | | Amount | |
Receipts for shares sold | | | | | | | | | | | | | | |
| | | | |
Institutional Class | | 1,445 | | | $ | 14,588 | | | 1,245 | | | $ | 12,584 | |
Administrative Class | | 144 | | | | 1,448 | | | 365 | | | | 3,690 | |
| | | | |
Issued as reinvestment of distributions | | | | | | | | | | | | | | |
| | | | |
Institutional Class | | 11 | | | | 110 | | | 18 | | | | 178 | |
Administrative Class | | 3 | | | | 34 | | | 10 | | | | 105 | |
| | | | |
Cost of shares redeemed | | | | | | | | | | | | | | |
| | | | |
Institutional Class | | (312 | ) | | | (3,155 | ) | | (270 | ) | | | (2,724 | ) |
Administrative Class | | (58 | ) | | | (586 | ) | | (217 | ) | | | (2,197 | ) |
| | | | |
Net increase resulting from Portfolio share transactions | | 1,233 | | | $ | 12,439 | | | 1,151 | | | $ | 11,636 | |
The following schedule shows the number of shareholders each owning 5% or more of the Portfolio and the total percentage of the Portfolio held by such shareholders:
| | | | |
| | | Number | | % of Portfolio Held |
Institutional Class | | 2 | | 100 |
Administrative Class | | 1 | | 98 |
8. Regulatory and Litigation Matters
On February 17, 2004, the Attorney General of the State of New Jersey (“New Jersey AG”) filed a complaint against Allianz Dresdner Asset Management of America L.P. (“ADAM”), PA Distributors LLC (formerly known as PIMCO Advisors Distributors LLC) (“PAD”), PEA Capital LLC (formerly known as PIMCO Equity Advisors LLC) (“PEA”), and Pacific Investment Management Company LLC (“PIMCO”) in connection with its investigation into market timing and late trading. The complaint contends that inappropriate trading by shareholders engaged in market timing activity took place in funds in the PIMCO Funds: Multi-Manager Series (“MMS Funds”) and the PIMCO Funds: Pacific Investment Management Series (“PIMS Funds”). On June 1, 2004, the New Jersey AG dismissed PIMCO from the lawsuit.
On the same day as the dismissal of PIMCO from the lawsuit, the New Jersey AG announced that it had reached a settlement agreement with the remaining defendants (“New Jersey Settlement”). In the New Jersey Settlement, ADAM, PAD and PEA agreed, while neither admitting nor denying the allegations or conclusions of law, to: (i) pay New Jersey a civil fine of $15 million and $3 million for investigative costs and further enforcement initiatives; and (ii) implement certain changes in corporate governance.
On May 6, 2004, the Securities and Exchange Commission filed a complaint in the U.S. District Court in the Southern District of New York alleging that PA Fund Management LLC (formerly known as PIMCO Advisors Fund Management LLC) (“PAFM”), PEA, PAD, Stephen J. Treadway (at the time, the chief executive officer of PAFM and PAD as well as chairman of the Board of Trustees of the MMS Funds) and Kenneth W. Corba (the former chief executive officer of PEA and former portfolio manager of the PEA Growth and PEA Growth & Income Funds) had, among other things, violated and/or aided and abetted violations of, various antifraud provisions of the federal securities laws in connection with alleged “market timing” arrangements that improperly allowed certain hedge funds to engage in “market timing” in the PEA Growth Fund, the PEA Opportunity Fund, the PEA Innovation Fund, and the PEA Target Fund. The complaint seeks injunctive relief, disgorgement plus pre-judgment interest, monetary penalties, and an order permanently enjoining the defendants from serving as investment advisers, principal underwriters, officers, directors, or members of any advisory boards to any registered investment companies.
On February 20, 2004, a putative class action lawsuit was filed in the U.S. District Court for the District of New Jersey on behalf of certain shareholders of the PIMCO Funds against ADAM, PAD, PIMCO, PEA, the PIMS Funds, the MMS Funds, the Trust, PIMCO Commercial Mortgage Securities Trust, Inc. and certain other defendants, alleging that inappropriate market timing activity by certain shareholders caused financial injury to the shareholders of those Funds.
| | | | |
| June 30, 2004 | | Semi-Annual Report | | 15 |
Notes to Financial Statements (Cont.)
June 30, 2004 (Unaudited)
The following additional putative class action lawsuits have been filed against the PIMS Funds, the MMS Funds and/or their affiliates, each related to alleged market-timing activity in funds advised by PIMCO or its affiliates: (1) a lawsuit filed in the U.S. District Court for the District of Connecticut on February 27, 2004 (naming as defendants ADAM, PAD, PEA, the PIMS Funds, the MMS Funds, the Trust, PCM and certain other parties); (2) a lawsuit filed in the U.S. District Court for the Central District of California on March 4, 2004 (naming as defendants PIMCO, ADAM, PEA and PAD); (3) a lawsuit filed in the U.S. District Court for the Southern District of New York on March 8, 2004 (naming PIMCO, PAD and certain of their affiliates as defendants); (4) a lawsuit filed in the U.S. District Court for the Southern District of New York, on March 15, 2004 (naming PIMCO as the defendant); (5) two separate lawsuits filed in the U.S. District Court for the Central District of California on March 22, 2004, brought derivatively on behalf of the PIMCO High Yield Fund and the PIMCO Money Market Fund, respectively (each naming ADAM, PAFM and certain other parties as defendants, and the PIMCO Funds as the nominal defendant); (6) a lawsuit filed in the U.S. District Court for the Central District of California, also on March 22, 2004, brought derivatively on behalf of the PIMS Funds and the MMS Funds (naming ADAM, PIMCO, PAD and certain other parties as defendants, and the PIMS Funds and the MMS Funds as nominal defendants); (7) a lawsuit filed in the U.S. District Court for the District of New Jersey on April 20, 2004 (naming ADAM, PAD, the PIMS Funds and certain other parties as defendants); and (8) a lawsuit filed in the U.S. District Court for the Northern District of California on April 28, 2004 (naming ADAM, PIMCO, PAD, PEA and certain other parties as defendants, and the “PIMCO Funds” as nominal defendants). Each complaint for the foregoing putative class actions alleges, among other things, that inappropriate trading by shareholders engaged in market timing activities took place in certain of the funds advised by PIMCO, and each complaint seeks unspecified compensatory damages.
On February 17, 2004, a putative class action lawsuit was filed in the U.S. District Court for the District of Connecticut on behalf of certain shareholders of the PIMCO Funds against ADAM, PEA, PIMCO, PIMS Funds, MMS Funds and certain other defendants, alleging excessive investment advisory fees and the use of brokerage commissions to pay for distribution of fund shares. Three similar putative class action lawsuits were subsequently filed, each in the U.S. District Court for the District of Connecticut on March 1, 2004, April 23, 2004 and May 20, 2004, respectively.
Under Section 9(a) of the 1940 Act, if any of the various lawsuits were to result in a court injunction against PAFM, PEA, PAD, PIMCO, ADAM and/or Mr. Treadway, they and their affiliates would, in the absence of exemptive relief granted by the SEC, be barred from serving as an investment adviser/sub-adviser or principal underwriter for any registered investment company, including the Trust. ADAM and certain of its subsidiaries have responded to inquiries from the SEC concerning the status of the New Jersey Settlement under Section 9(a). If any of PAFM, PEA, PAD, PIMCO or ADAM were subject to an injunction, each of these entities and their affiliates could in turn seek exemptive relief from the SEC, as contemplated by the 1940 Act. There is no assurance, however, that such exemptive relief would be granted. The SEC also has the power by order to prohibit PAFM, PEA, PAD and PIMCO from serving as investment advisers and underwriters, if the SEC finds that such entities willfully violated the federal securities laws in connection with the allegations discussed above or aided or abetted such violations.
PIMCO, PAD and the Trust believe that these developments will not have a material adverse effect on the Portfolios or on PIMCO’s, or PAD’s ability to perform their respective investment advisory or distribution services on behalf of the Portfolios.
| | | | |
| 16 | | Semi-Annual Report | | June 30, 2004 |
Trustees and Officers
Brent R. Harris, Chairman and Trustee
R. Wesley Burns, President and Trustee
E. Philip Cannon, Trustee
Vern O. Curtis, Trustee
J. Michael Hagan, Trustee
William J. Popejoy, Trustee
Garlin G. Flynn, Secretary
John P. Hardaway, Treasurer
Investment Adviser and Administrator
Pacific Investment Management Company LLC
840 Newport Center Drive
Newport Beach, California 92660
Distributor
PA Distributors LLC
2187 Atlantic Street
Stamford, Connecticut 06902
Custodian
State Street Bank & Trust Company
801 Pennsylvania
Kansas City, Missouri 64105
Transfer Agent
Boston Financial Data Services–Midwest
330 W. 9th Street
Kansas City, Missouri 64105
Legal Counsel
Dechert LLP
1775 I Street, N.W.
Washington, D.C. 20006
Independent Registered Public Accounting Firm
PricewaterhouseCoopers LLP
1055 Broadway
Kansas City, Missouri 64105
Information about how the Fund voted proxies relating to portfolio securities held during the year July 1, 2003 through June 30, 2004 will be available no later than August 31, 2004 without charge, upon request, by calling the Trust at 1-800-927-4648 and on the SEC’s website at http://www.sec.gov.
Copies of the written Proxy Policy and the factors that PIMCO may consider in determining how to vote proxies for the Funds are available by calling the Trust at 1-800-927-4648 and on the SEC’s website at http://www.sec.gov.
PIMCO VARIABLE INSURANCE TRUST
840 NEWPORT CENTER DRIVE
NEWPORT BEACH, CA 92660

PIMCO VARIABLE INSURANCE TRUST
REAL RETURN PORTFOLIO
INSTITUTIONAL CLASS
SEMI-ANNUAL REPORT
June 30, 2004
|
| This material is authorized for use only when preceded or accompanied by the current PIMCO Variable Insurance Trust prospectus. Investors should consider the investment objectives, risks, charges and expenses of Portfolio carefully before investing. This and other information is contained in the Portfolio’s prospectus. Please read the prospectus carefully before you invest or send money. |
Chairman’s Letter
Dear PIMCO Variable Insurance Trust Shareholder:
Bond prices were more volatile during the six-month period ended June 30, 2004. Interest rates rose sharply during the second quarter 2004, causing bonds to give back modest gains from earlier in the year. The Lehman Brothers Aggregate Bond Index, a widely used index for the high-grade bond market, was nearly flat during the first six months of 2004, returning 0.15% after losing 2.44% during the second quarter. The yield on the benchmark ten-year Treasury closed June 30, 2004 at 4.58%, up 0.75% from April 1, 2004, but up only 0.34% from where it began the six-month period on January 1, 2004.
Continued growth in employment convinced the markets that the Federal Reserve would soon begin a long anticipated tightening cycle. On June 30, 2004, the Fed met market expectations by increasing the federal funds rate 0.25%, which was the first rate increase since June 25, 2003. The central bank had held this rate at 1% for more than a year, which generated negative real short-term rates. And on August 10, 2004, the Fed increased the federal funds rate another 0.25% to 1.50%.
Investors that had profited handsomely from borrowing at low short-term rates and investing in higher-yielding longer maturity bonds surrendered some of those profits towards the latter part of the six-month period. Concern that borrowing rates would rise led investors to liquidate long positions and unwind these trades, which caused bond prices to decrease. However, substantial leverage remained among banks, hedge funds, and other investors, making bond markets somewhat vulnerable to additional Fed rate increases. There were also signs of rising inflation, which fueled anxiety that central banks might continue to raise interest rates.
On the following pages you will find a more complete review of the Portfolio in light of financial market activities as well as specific details about the total return investment performance for the six-month period.
We appreciate the trust you have placed in us, and we will continue to focus our efforts to meet your investment needs.
Sincerely,

Brent R. Harris
Chairman
August 11, 2004
| | | | |
| June 30, 2004 | | Semi-Annual Report | | 1 |
Important Information About the Portfolio
We believe that bond funds have an important role to play in a well diversified investment portfolio. It is important to note, however, that in an environment where interest rates may trend upward, rising rates will negatively impact the performance of most bond funds, and fixed income securities held by a fund are likely to decrease in value. The price volatility of fixed income securities can also increase during periods of rising interest rates resulting in increased losses to a fund. Bond funds and individual bonds with a longer duration (a measure of the expected life of a security) tend to be more sensitive to changes in interest rates, usually making them more volatile than securities or funds with shorter durations. The longer-term performance of most bond funds has benefited from capital gains in part resulting from an extended period of declining interest rates. In the event interest rates increase, these capital gains should not be expected to recur.
The Portfolio may be subject to various risks in addition to those described above. Some of these risks may include, but are not limited to, the following: real rate risk, derivative risk, small company risk, foreign security risk, high yield security risk and specific sector investment risks. The Portfolio may use derivative instruments for hedging purposes or as part of an investment strategy. Use of these instruments may involve certain costs and risks such as liquidity risk, interest rate risk, market risk, credit risk, management risk and the risk that a fund could not close out a position when it would be most advantageous to do so. A Portfolio investing in derivatives could lose more than the principal amount invested in these instruments. Investing in non-U.S. securities may entail risk due to non-U.S. economic and political developments; this risk may be enhanced when investing in emerging markets. High-yield bonds typically have a lower credit rating than other bonds. Lower rated bonds generally involve a greater risk to principal than higher rated bonds. Smaller companies may be more volatile than larger companies and may entail more risk. Concentrating investments in individual sectors may add additional risk and volatility compared to a diversified portfolio.
On the performance summary page in this semi-annual report, the Total Return Investment Performance table measures performance assuming that all dividend and capital gain distributions were reinvested. Returns do not reflect the deduction of taxes that a shareholder would pay (i) on Portfolio distributions or (ii) the redemption of Portfolio shares.
An investment in a Portfolio is not a bank deposit and is not guaranteed or insured by the Federal Deposit Insurance Corporation or any other government agency. It is possible to lose money on investments in the Funds.
The following disclosure provides important information regarding the Portfolio’s Expense Example, which appears on the Portfolio’s individual page in this semi-annual report. Please refer to this information when reviewing the Expense Example for the Portfolio.
Example
As a shareholder of the Portfolio, you incur two types of costs: (1) transaction costs, including redemption and exchange fees; and (2) ongoing costs, including advisory and administrative fees; distribution and/or service (12b-1) fees (Administrative Class only); and other Portfolio expenses. The Example is intended to help you understand your ongoing costs (in dollars) of investing in the Portfolio and to compare these costs with the ongoing costs of investing in other mutual funds.
The Example is based on an investment of $1,000 invested at the beginning of the period and held for the entire period indicated, which is from 1/1/04 to 6/30/04.
Actual Expenses
The information in the table under the heading “Actual Performance” provides information about actual account values and actual expenses. You may use the information in these columns, together with the amount you invested, to estimate the expenses that you paid over the period. Simply divide your account value by $1,000.00 (for example, an $8,600.00 account value divided by $1,000 = 8.60), then multiply the result by the number in the appropriate column for your share class, in the row entitled “Expenses Paid During Period” to estimate the expenses you paid on your account during this period.
Hypothetical Example for Comparison Purposes
The information in the table under the heading “Hypothetical Performance (5% return before expenses)” provides information about hypothetical account values and hypothetical expenses based on the Portfolio’s actual expense ratio and an assumed rate of return of 5% per year before expenses, which is not the Portfolio’s actual return. The hypothetical account values and expenses may not be used to estimate the actual ending account balance or expenses you paid for the period. You may use this information to compare the ongoing costs of investing in the Portfolio and other portfolios. To do so, compare this 5% hypothetical example with the 5% hypothetical examples that appear in the shareholder reports of the other portfolios.
Please note that the expenses shown in the table are meant to highlight your ongoing costs only and do not reflect any transactional costs. Therefore, the information under the heading “Hypothetical Performance (5% return before expenses)” is useful in comparing ongoing costs only, and will not help you determine the relative total costs of owning different portfolios. In addition, if these transactional costs were included, your costs would have been higher.
PIMCO Variable Insurance Trust is distributed by PA Distributors LLC, 2187 Atlantic Street, Stamford, CT 06902.
| | | | |
| 2 | | Semi-Annual Report | | June 30, 2004 |
Real Return Portfolio
CUMULATIVE RETURNS THROUGH JUNE 30, 2004
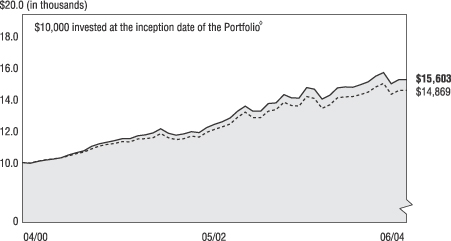
[CHART]
Real Return Lehman Brothers Global
Portfolio Inst. Class Real: U.S. TIPS Index
--------------------- ---------------------
04/30/2000 $10,000 $10,000
05/31/2000 $9,947 $9,974
06/30/2000 $10,088 $10,100
07/31/2000 $10,160 $10,186
08/31/2000 $10,242 $10,261
09/30/2000 $10,329 $10,315
10/31/2000 $10,507 $10,440
11/30/2000 $10,668 $10,591
12/31/2000 $10,800 $10,705
01/31/2001 $11,089 $10,929
02/28/2001 $11,270 $11,114
03/31/2001 $11,365 $11,220
04/30/2001 $11,482 $11,283
05/31/2001 $11,617 $11,416
06/30/2001 $11,603 $11,403
07/31/2001 $11,808 $11,593
08/31/2001 $11,879 $11,609
09/30/2001 $11,998 $11,677
10/31/2001 $12,287 $11,953
11/30/2001 $11,968 $11,687
12/31/2001 $11,857 $11,551
01/31/2002 $11,928 $11,619
02/28/2002 $12,076 $11,795
03/31/2002 $12,014 $11,722
04/30/2002 $12,374 $12,042
05/31/2002 $12,580 $12,234
06/30/2002 $12,747 $12,407
07/31/2002 $13,009 $12,612
08/31/2002 $13,475 $13,063
09/30/2002 $13,816 $13,392
10/31/2002 $13,466 $13,035
11/30/2002 $13,472 $13,026
12/31/2002 $13,984 $13,463
01/31/2003 $14,033 $13,565
02/28/2003 $14,588 $14,073
03/31/2003 $14,367 $13,845
04/30/2003 $14,346 $13,809
05/31/2003 $15,052 $14,464
06/30/2003 $14,945 $14,316
07/31/2003 $14,276 $13,656
08/31/2003 $14,540 $13,901
09/30/2003 $15,032 $14,361
10/31/2003 $15,106 $14,439
11/30/2003 $15,090 $14,447
12/31/2003 $15,242 $14,594
01/31/2004 $15,450 $14,762
02/29/2004 $15,831 $15,103
03/31/2004 $16,064 $15,345
04/30/2004 $15,322 $14,600
05/31/2004 $15,593 $14,863
06/30/2004 $15,603 $14,869
SECTOR BREAKDOWN‡
| | | |
U.S. Treasury Obligations | | 49.3 | % |
Short-Term Instruments | | 43.9 | % |
Other | | 6.8 | % |
‡ % of Total Investments as of June 30, 2004
à$10,000 invested at the beginning of the first full month following the inception of the Institutional Class.
TOTAL RETURN INVESTMENT PERFORMANCE For the period ended June 30, 2004
| | | | | | | | | | | | | |
| | | | | | | 6 Months | | | 1 Year | | | Since Inception* | |
| | |
| | Real Return Portfolio Institutional Class (Inception 04/10/00) | | 2.37 | % | | 4.40 | % | | 11.32 | % |
| | | - - - - - - - | | Lehman Brothers Global Real: U.S. TIPS Index | | 1.88 | % | | 3.86 | % | | — | |
| | | | | * Annualized. All Portfolio returns are net of fees and expenses. | | | | | | | | | |
Past performance is no guarantee of future results. The performance quoted represents past performance. Investment return and principal value will fluctuate so the Portfolio shares, when redeemed, may be worth more or less than their original cost. Current performance may be lower or higher than the performance data quoted. Performance data current to the most recent month-end is available by calling (800) 927-4648.
Please refer to page 2 herein for an explanation of the information presented in the following Expense Example.
| | | | | | | | | | |
| EXPENSE EXAMPLE | | | | Actual Performance | | | | Hypothetical Performance
(5% return before expenses) |
Beginning Account Value (01/01/04) | | | | $ | 1,000.00 | | | | $ | 1,000.00 |
Ending Account Value (06/30/04) | | | | $ | 1,023.70 | | | | $ | 1,025.00 |
Expenses Paid During Period† | | | | $ | 2.52 | | | | $ | 2.52 |
†Expenses are equal to the Portfolio’s Institutional Class annualized expense ratio of 0.50%, multiplied by the average account value over the period, multiplied by 182/366 (to reflect the one-half year period).
PORTFOLIO INSIGHTS
| • | The Real Return Portfolio seeks to achieve its investment objective by investing under normal circumstances at least 80% of its net assets in inflation-indexed bonds of varying maturities issued by the U.S. and non-U.S. governments, their agencies, or government-sponsored enterprises and corporations. |
| • | For the 6 months ended June 30, 2004, the Portfolio’s Institutional Class shares returned 2.37%, versus 1.88% for the benchmark Lehman Brothers Global Real: U.S. TIPS Index. |
| • | For the 6 months, real yields in the U.S. increased by 0.10%, compared to a 0.39% rise for conventional U.S. Treasury issues of similar maturity. |
| • | Breakeven inflation, defined as the difference between a real yield on a TIPS and a nominal yield on a Treasury of the same maturity, was 2.59% on June 30, 2004 for the 10-year maturity. This compares to a breakeven yield of 2.31% on December 31, 2003. The 12-month CPI-U change for the period ended June 30, 2004, was 3.22%. |
| • | The effective duration of the Portfolio was 6.82 years on June 30, 2004, compared to a duration of 7.51 years for the benchmark; this strategy was positive for performance as real yields rose. |
| • | The Portfolio reduced overall account duration through short positions in nominal treasuries. |
| • | The Portfolio was overweight shorter maturity TIPS. This was positive for performance compared to the benchmark as the real yield curve steepened. |
| • | The Portfolio’s yield was improved by using a combination of TIPS buy-forward agreements and low duration, high quality conventional yield debt instruments. The steepness of the real yield curve made this an attractive option for the Portfolio. |
| • | Option writing added income to the Portfolio as rates stayed within our forecasted range. |
| • | An allocation to emerging market bonds was negative overall for returns, as spreads widened throughout the period. |
| | | | |
| June 30, 2004 | | Semi-Annual Report | | 3 |
Financial Highlights
Real Return Portfolio (Institutional Class)
| | | | | | | | | | | | | | | | | | | | | | | | | | | | | | |
| Selected Per Share Data for the Year or Period Ended: | | | | 06/30/2004+ | | | | | 12/31/2003 | | | | | 12/31/2002 | | | | | 12/31/2001 | | | | | 04/10/2000-
12/31/2000 | |
| | | | | | | | | | |
Net asset value beginning of period | | | | $ | 12.36 | | | | | $ | 11.90 | | | | | $ | 10.56 | | | | | $ | 10.34 | | | | | $ | 10.11 | |
Net investment income (a) | | | | | 0.05 | | | | | | 0.25 | | | | | | 0.49 | | | | | | 0.57 | | | | | | 0.62 | |
Net realized/unrealized gain on investments (a) | | | | | 0.24 | | | | | | 0.81 | | | | | | 1.36 | | | | | | 0.43 | | | | | | 0.23 | |
Total income from investment operations | | | | | 0.29 | | | | | | 1.06 | | | | | | 1.85 | | | | | | 1.00 | | | | | | 0.85 | |
Dividends from net investment income | | | | | (0.05 | ) | | | | | (0.34 | ) | | | | | (0.49 | ) | | | | | (0.64 | ) | | | | | (0.62 | ) |
Distributions from net realized capital gains | | | | | 0.00 | | | | | | (0.26 | ) | | | | | (0.02 | ) | | | | | (0.14 | ) | | | | | 0.00 | |
Total distributions | | | | | (0.05 | ) | | | | | (0.60 | ) | | | | | (0.51 | ) | | | | | (0.78 | ) | | | | | (0.62 | ) |
Net asset value end of period | | | | $ | 12.60 | | | | | $ | 12.36 | | | | | $ | 11.90 | | | | | $ | 10.56 | | | | | $ | 10.34 | |
Total return | | | | | 2.37 | % | | | | | 9.00 | % | | | | | 17.93 | % | | | | | 9.79 | % | | | | | 8.73 | % |
Net assets end of period (000s) | | | | $ | 34,094 | | | | | $ | 26,540 | | | | | $ | 16 | | | | | $ | 14 | | | | | $ | 3,294 | |
Ratio of net expenses to average net assets | | | | | 0.50 | %* | | | | | 0.51 | %(b) | | | | | 0.51 | %(b) | | | | | 0.50 | % | | | | | 0.50 | %* |
Ratio of net investment income to average net assets | | | | | 0.82 | %* | | | | | 2.06 | % | | | | | 4.40 | % | | | | | 5.32 | % | | | | | 8.41 | %* |
Portfolio turnover rate | | | | | 572 | % | | | | | 738 | % | | | | | 87 | % | | | | | 58 | % | | | | | 18 | % |
| (a) | Per share amounts based on average number of shares outstanding during the period. |
| (b) | Ratio of expenses to average net assets excluding interest expense is 0.50%. |
| | | | | | |
| 4 | | Semi-Annual Report | | June 30, 2004 | | See accompanying notes |
Statement of Assets and Liabilities
Real Return Portfolio
June 30, 2004 (Unaudited)
| | | | | |
| Amounts in thousands, except per share amounts | | | | |
| | |
Assets: | | | | | |
| | |
Investments, at value | | | | $ | 935,373 |
Foreign currency, at value | | | | | 267 |
Receivable for investments sold on a delayed delivery basis | | | | | 10,239 |
Unrealized appreciation on forward foreign currency contracts | | | | | 40 |
Receivable for Portfolio shares sold | | | | | 1,231 |
Interest and dividends receivable | | | | | 1,357 |
Swap premiums paid | | | | | 2,839 |
Unrealized appreciation on swap agreements | | | | | 142 |
| | | | | | 951,488 |
| | |
Liabilities: | | | | | |
| | |
Payable for investments purchased | | | | $ | 6,200 |
Payable for investments purchased on a delayed delivery basis | | | | | 460,125 |
Payable for short sale | | | | | 10,356 |
Written options outstanding | | | | | 16 |
Payable for Portfolio shares redeemed | | | | | 171 |
Accrued investment advisory fee | | | | | 93 |
Accrued administration fee | | | | | 93 |
Accrued servicing fee | | | | | 46 |
Variation margin payable | | | | | 6 |
Swap premiums received | | | | | 72 |
Unrealized depreciation on swap agreements | | | | | 833 |
Other liabilities | | | | | 1,550 |
| | | | | | 479,561 |
| | |
Net Assets | | | | $ | 471,927 |
| | |
Net Assets Consist of: | | | | | |
| | |
Paid in capital | | | | $ | 457,969 |
Undistributed net investment income | | | | | 6,218 |
Accumulated undistributed net realized gain | | | | | 5,266 |
Net unrealized appreciation | | | | | 2,474 |
| | | | | $ | 471,927 |
| | |
Net Assets: | | | | | |
| | |
Institutional Class | | | | $ | 34,094 |
Administrative Class | | | | | 437,833 |
| | |
Shares Issued and Outstanding: | | | | | |
| | |
Institutional Class | | | | | 2,706 |
Administrative Class | | | | | 34,756 |
| | |
Net Asset Value and Redemption Price Per Share
(Net Assets Per Share Outstanding) | | | | | |
| | |
Institutional Class | | | | $ | 12.60 |
Administrative Class | | | | | 12.60 |
| | |
Cost of Investments Owned | | | | $ | 931,094 |
Cost of Foreign Currency Held | | | | $ | 266 |
| | | | | | |
| See accompanying notes | | June 30, 2004 | | Semi-Annual Report | | 5 |
Statement of Operations
Real Return Portfolio
| | | | | | |
| Amounts in thousands | | | | | |
| | | | | Six Months Ended June 30, 2004 (Unaudited) | |
| | |
Investment Income: | | | | | | |
| | |
Interest | | | | $ | 2,622 | |
Total Income | | | | | 2,622 | |
| | |
Expenses: | | | | | | |
| | |
Investment advisory fees | | | | | 493 | |
Administration fees | | | | | 493 | |
Distribution and/or servicing fees - Administrative Class | | | | | 274 | |
Trustees’ fees | | | | | 3 | |
Interest expense | | | | | 5 | |
Total Expenses | | | | | 1,268 | |
| | |
Net Investment Income | | | | | 1,354 | |
| | |
Net Realized and Unrealized Gain (Loss): | | | | | | |
| | |
Net realized gain on investments | | | | | 5,427 | |
Net realized gain on futures contracts, options, and swaps | | | | | 1,406 | |
Net realized (loss) on foreign currency transactions | | | | | (52 | ) |
Net change in unrealized (depreciation) on investments | | | | | (1,518 | ) |
Net change in unrealized (depreciation) on futures contracts,
options, and swaps | | | | | (291 | ) |
Net change in unrealized appreciation on translation of
assets and liabilities denominated in foreign currencies | | | | | 90 | |
Net Gain | | | | | 5,062 | |
| | |
Net Increase in Assets Resulting from Operations | | | | $ | 6,416 | |
| | | | | | |
| 6 | | Semi-Annual Report | | June 30, 2004 | | See accompanying notes |
Statements of Changes in Net Assets
Real Return Portfolio
| | | | | | | | | | | | |
| Amounts in thousands | | | | | | | | | | |
| | | | | Six Months Ended
June 30, 2004
(Unaudited) | | | | | Year Ended
December 31, 2003 | |
Increase in Net Assets from: | | | | | | | | | | | | |
| | | | |
Operations: | | | | | | | | | | | | |
| | | | |
Net investment income | | | | $ | 1,354 | | | | | $ | 4,341 | |
Net realized gain | | | | | 6,781 | | | | | | 10,563 | |
Net change in unrealized appreciation (depreciation) | | | | | (1,719 | ) | | | | | 564 | |
Net increase resulting from operations | | | | | 6,416 | | | | | | 15,468 | |
| | | | |
Distributions to Shareholders: | | | | | | | | | | | | |
| | | | |
From net investment income | | | | | | | | | | | | |
Institutional Class | | | | | (123 | ) | | | | | (377 | ) |
Administrative Class | | | | | (1,280 | ) | | | | | (3,967 | ) |
| | | | |
From net realized capital gains | | | | | | | | | | | | |
Institutional Class | | | | | 0 | | | | | | (541 | ) |
Administrative Class | | | | | 0 | | | | | | (5,360 | ) |
Total Distributions | | | | | (1,403 | ) | | | | | (10,245 | ) |
| | | | |
Portfolio Share Transactions: | | | | | | | | | | | | |
| | | | |
Receipts for shares sold | | | | | | | | | | | | |
Institutional Class | | | | | 7,848 | | | | | | 25,638 | |
Administrative Class | | | | | 210,240 | | | | | | 258,368 | |
| | | | |
Issued as reinvestment of distributions | | | | | | | | | | | | |
Institutional Class | | | | | 123 | | | | | | 917 | |
Administrative Class | | | | | 1,288 | | | | | | 9,318 | |
| | | | |
Cost of shares redeemed | | | | | | | | | | | | |
Institutional Class | | | | | (841 | ) | | | | | (751 | ) |
Administrative Class | | | | | (53,313 | ) | | | | | (87,884 | ) |
Net increase resulting from Portfolio share transactions | | | | | 165,345 | | | | | | 205,605 | |
| | | | |
Total Increase in Net Assets | | | | | 170,358 | | | | | | 210,829 | |
| | | | |
Net Assets: | | | | | | | | | | | | |
| | | | |
Beginning of period | | | | | 301,569 | | | | | | 90,740 | |
End of period* | | | | $ | 471,927 | | | | | $ | 301,569 | |
| | | | |
*Including undistributed net investment income of: | | | | $ | 6,218 | | | | | $ | 6,267 | |
| | | | | | |
| See accompanying notes | | June 30, 2004 | | Semi-Annual Report | | 7 |
Schedule of Investments
Real Return Portfolio
June 30, 2004 (Unaudited)
| | | | |
| | | Principal | | |
| | | Amount | | Value |
| | | (000s) | | (000s) |
| | | | | | |
CORPORATE BONDS & NOTES 6.0% |
Banking & Finance 4.2% | | | | | | |
Countrywide Home Loans, Inc. | | | | | | |
1.360% due 02/23/2005 (a) | | $ | 3,600 | | $ | 3,599 |
Ford Motor Credit Co. | | | | | | |
3.035% due 10/25/2004 (a) | | | 200 | | | 201 |
1.600% due 07/18/2005 (a) | | | 300 | | | 300 |
General Motors Acceptance Corp. | | | |
2.135% due 05/18/2006 (a) | | | 1,500 | | | 1,504 |
Morgan Stanley Warehouse Facilities | | | |
1.390% due 07/06/2005 (j) | | | 6,200 | | | 6,200 |
Pemex Project Funding Master Trust | | | |
7.375% due 12/15/2014 | | | 500 | | | 512 |
8.625% due 02/01/2022 | | | 200 | | | 209 |
Phoenix Quake Wind Ltd. | | | | | | |
3.560% due 07/03/2008 (a) | | | 500 | | | 514 |
3.601% due 07/03/2008 (a) | | | 2,000 | | | 2,056 |
Residential Reinsurance Ltd. | | | | | | |
6.260% due 06/08/2006 (a) | | | 1,000 | | | 1,015 |
Travelers Property Casualty Corp. | | | |
3.750% due 03/15/2008 | | | 100 | | | 99 |
Verizon Wireless Capital LLC | | | | | | |
1.350% due 05/23/2005 (a) | | | 2,800 | | | 2,798 |
Vita Capital Ltd. | | | | | | |
2.460% due 01/01/2007 (a) | | | 700 | | | 706 |
| | | | | |
|
|
| | | | | | | 19,713 |
| | | | | |
|
|
Industrials 1.0% | | | | | | |
Alcan, Inc. | | | | | | |
1.623% due 12/08/2004 (a) | | | 1,100 | | | 1,100 |
DaimlerChrysler North America Holding Corp. |
7.750% due 06/15/2005 | | | 100 | | | 105 |
Halliburton Co. | | | | | | |
2.650% due 10/17/2005 (a) | | | 1,700 | | | 1,718 |
1.920% due 01/26/2007 (a) | | | 2,000 | | | 1,999 |
| | | | | |
|
|
| | | | | | | 4,922 |
| | | | | |
|
|
Utilities 0.8% | | | | | | |
Cleveland Electric Illuminating Co. | | | |
6.860% due 10/01/2008 | | | 100 | | | 109 |
Entergy Gulf States, Inc. | | | | | | |
2.433% due 06/18/2007 (a) | | | 1,500 | | | 1,504 |
Sprint Capital Corp. | | | | | | |
7.900% due 03/15/2005 | | | 2,200 | | | 2,281 |
| | | | | |
|
|
| | | | | | | 3,894 |
| | | | | |
|
|
Total Corporate Bonds & Notes (Cost $28,448) | | | | | | 28,529 |
| | | | | |
|
|
| | | | | | | |
MUNICIPAL BONDS & NOTES 0.2% |
| |
Badger Asset Securitization Corporate Revenue Bonds, Series 2002 | | | |
6.000% due 06/01/2017 | | | 475 | | | 430 |
|
Rhode Island Tobacco Settlement Financing Corp.
Revenue Bonds, Series 2002 |
6.000% due 06/01/2023 | | | 500 | | | 446 |
| | | | | |
|
|
Total Municipal Bonds & Notes (Cost $871) | | | | | | 876 |
| | | | | |
|
|
| | | | | | | |
U.S. GOVERNMENT AGENCIES 0.5% |
| | |
Fannie Mae | | | | | | |
3.230% due 11/01/2024 (a) | | | 25 | | | 25 |
| | |
Small Business Administration | | | | | | |
4.504% due 02/01/2014 | | | 2,284 | | | 2166 |
| | | | | |
|
|
Total U.S. Government Agencies (Cost $2,310) | | | 2,191 |
| | | | | |
|
|
| | | | | | | |
U.S. TREASURY OBLIGATIONS 97.6% |
| |
Treasury Inflation Protected Securities (b) | | | |
3.375% due 01/15/2007 | | | 16,080 | | | 17,228 |
3.625% due 01/15/2008 | | | 66,931 | | | 73,167 |
| | | | | | |
| | |
3.875% due 01/15/2009 | | $ | 25,890 | | $ | 28,872 |
4.250% due 01/15/2010 | | | 37,855 | | | 43,338 |
3.500% due 01/15/2011 | | | 23,858 | | | 26,497 |
3.375% due 01/15/2012 | | | 17,539 | | | 19,437 |
3.000% due 07/15/2012 | | | 85,345 | | | 92,292 |
1.875% due 07/15/2013 | | | 16,443 | | | 16,248 |
2.000% due 01/15/2014 | | | 43,107 | | | 42,864 |
3.625% due 04/15/2028 | | | 16,291 | | | 19,880 |
3.875% due 04/15/2029 | | | 61,425 | | | 78,346 |
3.375% due 04/15/2032 | | | 2,127 | | | 2,589 |
| | | | | |
|
|
Total U.S. Treasury Obligations (Cost $456,376) | | | 460,758 |
| | | | | |
|
|
| | | | | | | |
MORTGAGE-BACKED SECURITIES 2.1% |
| |
Bank of America Mortgage Securities, Inc. | | | |
6.500% due 02/25/2033 | | | 665 | | | 680 |
Bear Stearns Adjustable Rate Mortgage Trust |
4.368% due 01/25/2034 (a) | | | 7,700 | | | 7,744 |
Sequoia Mortgage Trust | | | | | | |
1.630% due 10/19/2026 (a) | | | 1,422 | | | 1,423 |
| | | | | |
|
|
Total Mortgage-Backed Securities (Cost $9,923) | | | 9,847 |
| | | | | |
|
|
| | | | | | | |
ASSET-BACKED SECURITIES 3.2% |
|
Ameriquest Mortgage Securities, Inc. |
1.710% due 02/25/2033 (a) | | | 617 | | | 619 |
Asset-Backed Securities Corp. Home Equity |
1.738% due 01/15/2033 (a) | | | 2,083 | | | 2,096 |
Bayview Financial Acquisition Trust | | | |
1.770% due 08/28/2034 (a) | | | 3,758 | | | 3,772 |
Bear Stearns Asset-Backed Securities, Inc. | | | |
1.750% due 03/25/2043 (a) | | | 1,128 | | | 1,130 |
Equity One ABS, Inc. | | | | | | |
1.600% due 04/25/2034 (a) | | | 2,323 | | | 2,320 |
GSAMP Trust | | | | | | |
1.620% due 03/25/2034 (a) | | | 1,000 | | | 1,000 |
Redwood Capital Ltd. | | | | | | |
3.462% due 01/01/2006 (a) | | | 1,000 | | | 1,002 |
5.012% due 01/01/2006 (a) | | | 1,000 | | | 1,002 |
Renaissance Home Equity Loan Trust | | | |
1.680% due 12/25/2032 (a) | | | 1,256 | | | 1,254 |
Residential Asset Securities Corp. | | | |
1.600% due 01/25/2034 (a) | | | 88 | | | 89 |
Structured Asset Investment Loan Trust | | | |
1.420% due 06/25/2033 (a) | | | 224 | | | 224 |
Truman Capital Mortgage Loan Trust | | | |
1.640% due 01/25/2034 (a) | | | 428 | | | 423 |
| | | | | |
|
|
Total Asset-Backed Securities (Cost $14,910) | | | | | | 14,931 |
| | | | | |
|
|
| | | | | | | |
SOVEREIGN ISSUES 0.6% |
| | |
Republic of Brazil | | | | | | |
2.062% due 04/15/2006 (a) | | | 128 | | | 126 |
2.125% due 04/15/2009 (a) | | | 118 | | | 107 |
8.000% due 04/15/2014 (a) | | | 1,525 | | | 1,400 |
11.000% due 08/17/2040 | | | 200 | | | 189 |
Republic of Colombia | | | | | | |
10.000% due 01/23/2012 | | | 350 | | | 364 |
United Mexican States | | | | | | |
6.375% due 01/16/2013 | | | 700 | | | 701 |
| | | | | |
|
|
Total Sovereign Issues (Cost $2,909) | | | | | | 2,887 |
| | | | | |
|
|
| | | | | | | |
FOREIGN CURRENCY-DENOMINATED
ISSUES (h)(i) 1.0% |
| | |
Pylon Ltd. | | | | | | |
3.553% due 12/18/2008 (a) | | EC | 700 | | | 866 |
5.953% due 12/22/2008 | | | 1,100 | | | 1,368 |
Republic of France | | | | | | |
3.000% due 07/25/2012 (b) | | | 1,579 | | | 2,082 |
| | | | | | |
| | |
Republic of Italy | | | | | | |
2.150% due 09/15/2014 (b) | | EC | 509 | | $ | 615 |
| | | | | |
|
|
Total Foreign Currency-Denominated Issues (Cost $4,858) | | | 4,931 |
| | | | | |
|
|
| | | | | | | |
PURCHASED PUT OPTIONS 0.0% |
|
Treasury Inflation Protected Securities (OTC) |
3.625% due 01/15/2008 | | | | | | |
Strike @ 99.000 Exp. 08/27/2004 | | $ | 57,000 | | | 0 |
| | | | | |
|
|
Total Purchased Put Options (Cost $9) | | | 0 |
| | | | | |
|
|
| | | | | | | |
SHORT-TERM INSTRUMENTS 87.0% |
Certificates of Deposit 3.5% | | | |
Citibank New York N.A. | | | | | | |
1.090% due 07/30/2004 | | | 900 | | | 900 |
1.190% due 08/20/2004 | | | 6,300 | | | 6,300 |
1.215% due 08/23/2004 | | | 200 | | | 200 |
Wells Fargo Bank N.A. | | | | | | |
1.090% due 07/07/2004 | | | 500 | | | 500 |
1.240% due 07/19/2004 | | | 8,700 | | | 8,700 |
| | | | | |
|
|
| | | | | | | 16,600 |
| | | | | |
|
|
Commercial Paper 83.2% | | | | | | |
Anz (Delaware), Inc. | | | | | | |
1.040% due 07/06/2004 | | | 1,200 | | | 1,200 |
ASB Bank Ltd. | | | | | | |
1.140% due 08/30/2004 | | | 2,600 | | | 2,594 |
ASK Bank Ltd. | | | | | | |
1.490% due 09/22/2004 | | | 6,400 | | | 6,378 |
Bank of Ireland | | | | | | |
1.255% due 09/01/2004 | | | 12,200 | | | 12,170 |
1.285% due 09/03/2004 | | | 1,300 | | | 1,297 |
Barclays U.S. Funding Corp. | | | | | | |
1.210% due 08/23/2004 | | | 8,900 | | | 8,884 |
1.110% due 08/25/2004 | | | 1,500 | | | 1,497 |
1.110% due 08/26/2004 | | | 2,600 | | | 2,595 |
CBA (de) Finance | | | | | | |
1.050% due 07/02/2004 | | | 900 | | | 900 |
1.050% due 07/13/2004 | | | 3,900 | | | 3,899 |
CDC Commercial Paper, Inc. | | | | | | |
1.085% due 08/04/2004 | | | 3,300 | | | 3,297 |
1.120% due 08/19/2004 | | | 900 | | | 899 |
1.120% due 08/24/2004 | | | 1,600 | | | 1,597 |
1.320% due 09/10/2004 | | | 600 | | | 598 |
1.250% due 09/16/2004 | | | 6,900 | | | 6,878 |
1.270% due 09/24/2004 | | | 300 | | | 299 |
Danske Corp. | | | | | | |
1.260% due 09/14/2004 | | | 3,300 | | | 3,290 |
1.240% due 09/17/2004 | | | 7,900 | | | 7,875 |
1.270% due 09/20/2004 | | | 100 | | | 100 |
Den Norske Bank ASA | | | | | | |
1.250% due 08/30/2004 | | | 2,000 | | | 1,995 |
European Investment Bank 1.030% due 07/02/2004 | | | 600 | | | 600 |
Fannie Mae | | | | | | |
1.000% due 07/01/2004 | | | 3,600 | | | 3,600 |
1.005% due 07/01/2004 | | | 4,400 | | | 4,400 |
1.010% due 07/01/2004 | | | 8,300 | | | 8,300 |
1.025% due 07/07/2004 | | | 19,700 | | | 19,697 |
1.040% due 07/14/2004 | | | 900 | | | 900 |
1.056% due 07/28/2004 | | | 600 | | | 599 |
1.055% due 08/04/2004 | | | 3,300 | | | 3,297 |
1.063% due 08/04/2004 | | | 3,000 | | | 2,997 |
1.100% due 08/04/2004 | | | 4,300 | | | 4,296 |
1.125% due 08/11/2004 | | | 11,600 | | | 11,585 |
1.150% due 08/18/2004 | | | 4,200 | | | 4,194 |
1.180% due 08/25/2004 | | | 13,300 | | | 13,276 |
1.185% due 08/25/2004 | | | 4,500 | | | 4,492 |
1.105% due 09/01/2004 | | | 600 | | | 598 |
1.225% due 09/01/2004 | | | 4,500 | | | 4,489 |
| | | | | | |
| 8 | | Semi-Annual Report | | June 30, 2004 | | See accompanying notes |
| | | | |
| | | Principal | | |
| | | Amount | | Value |
| | | (000s) | | (000s) |
| | | | | | |
| | |
1.230% due 09/01/2004 | | $ | 2,900 | | $ | 2,893 |
1.250% due 09/01/2004 | | | 4,500 | | | 4,489 |
1.130% due 09/08/2004 | | | 1,500 | | | 1,496 |
1.200% due 09/08/2004 | | | 200 | | | 199 |
1.405% due 09/08/2004 | | | 7,100 | | | 7,080 |
1.430% due 09/08/2004 | | | 3,800 | | | 3,789 |
1.426% due 09/22/2004 | | | 4,700 | | | 4,684 |
1.530% due 10/18/2004 | | | 4,600 | | | 4,578 |
1.530% due 10/20/2004 | | | 4,700 | | | 4,677 |
Federal Home Loan Bank | | | | | | |
1.165% due 07/16/2004 | | | 4,600 | | | 4,598 |
1.240% due 09/01/2004 | | | 4,100 | | | 4,090 |
1.250% due 09/01/2004 | | | 4,500 | | | 4,489 |
Freddie Mac | | | | | | |
1.010% due 07/15/2004 | | | 4,100 | | | 4,098 |
1.200% due 08/09/2004 | | | 4,500 | | | 4,494 |
1.120% due 08/10/2004 | | | 4,300 | | | 4,295 |
1.125% due 08/10/2004 | | | 4,200 | | | 4,195 |
1.205% due 08/20/2004 | | | 4,500 | | | 4,492 |
1.175% due 08/24/2004 | | | 4,400 | | | 4,392 |
1.180% due 08/24/2004 | | | 11,900 | | | 11,879 |
1.210% due 08/31/2004 | | | 4,500 | | | 4,489 |
1.215% due 08/31/2004 | | | 4,000 | | | 3,990 |
1.315% due 09/07/2004 | | | 3,400 | | | 3,391 |
1.320% due 09/07/2004 | | | 4,500 | | | 4,488 |
1.200% due 09/08/2004 | | | 2,100 | | | 2,094 |
1.200% due 09/14/2004 | | | 4,000 | | | 3,988 |
1.410% due 09/14/2004 | | | 4,500 | | | 4,486 |
1.440% due 09/14/2004 | | | 4,500 | | | 4,486 |
1.445% due 09/14/2004 | | | 7,900 | | | 7,876 |
1.435% due 09/21/2004 | | | 12,600 | | | 12,557 |
1.280% due 09/22/2004 | | | 1,300 | | | 1,295 |
1.465% due 09/28/2004 | | | 2,700 | | | 2,690 |
1.300% due 09/30/2004 | | | 4,400 | | | 4,383 |
1.560% due 10/20/2004 | | | 4,700 | | | 4,677 |
General Electric Capital Corp. | | | | | | |
1.050% due 07/07/2004 | | | 1,200 | | | 1,200 |
1.040% due 07/08/2004 | | | 4,400 | | | 4,399 |
1.060% due 07/12/2004 | | | 900 | | | 900 |
1.140% due 09/03/2004 | | | 100 | | | 100 |
1.300% due 09/08/2004 | | | 3,400 | | | 3,391 |
HBOS Treasury Services PLC | | | | | | |
1.055% due 07/16/2004 | | | 8,000 | | | 7,996 |
1.095% due 08/02/2004 | | | 100 | | | 100 |
1.250% due 08/25/2004 | | | 300 | | | 299 |
1.250% due 08/31/2004 | | | 100 | | | 100 |
1.335% due 09/09/2004 | | | 1,900 | | | 1,895 |
1.290% due 09/24/2004 | | | 200 | | | 199 |
1.640% due 10/26/2004 | | | 1,000 | | | 995 |
ING U.S. Funding LLC | | | | | | |
1.275% due 09/01/2004 | | | 6,100 | | | 6,085 |
1.345% due 09/09/2004 | | | 1,000 | | | 997 |
Nestle Capital Corp. | | | | | | |
1.240% due 09/14/2004 | | | 4,400 | | | 4,386 |
Pfizer, Inc. | | | | | | |
1.160% due 07/30/2004 | | | 2,900 | | | 2,897 |
Rabobank USA Financial Corp. | | | | | | |
1.240% due 09/13/2004 | | | 8,500 | | | 8,474 |
Royal Bank of Scotland | | | | | | |
1.090% due 08/06/2004 | | | 4,900 | | | 4,895 |
1.235% due 09/13/2004 | | | 1,600 | | | 1,595 |
Shell Finance (UK) PLC | | | | | | |
1.435% due 08/27/2004 | | | 2,700 | | | 2,694 |
Stadshypoket Delaware, Inc. 1.490% due 09/23/2004 | | | 400 | | | 399 |
Svenska Handelsbanken | | | | | | |
1.075% due 07/28/2004 | | | 1,300 | | | 1,299 |
1.250% due 09/01/2004 | | | 12,100 | | | 12,070 |
1.390% due 09/13/2004 | | | 200 | | | 199 |
TotalFinaElf Capital S.A. | | | | | | |
1.420% due 07/01/2004 | | | 9,700 | | | 9,700 |
UBS Finance, Inc. | | | | | | |
1.040% due 07/06/2004 | | | 2,300 | | | 2,300 |
1.340% due 09/08/2004 | | | 600 | | | 598 |
| | | | | | | |
| | |
1.245% due 09/13/2004 | | $ | 100 | | $ | 100 | |
1.270% due 09/20/2004 | | | 200 | | | 199 | |
Westpac Capital Corp. | | | | | | | |
1.030% due 07/07/2004 | | | 400 | | | 400 | |
1.385% due 09/10/2004 | | | 5,600 | | | 5,584 | |
Westpac Trust Securities NZ Ltd. | | | | |
1.030% due 07/09/2004 | | | 300 | | | 300 | |
1.220% due 08/25/2004 | | | 400 | | | 399 | |
| | | | | |
|
|
|
| | | | | | | 392,503 | |
| | | | | |
|
|
|
| | |
Repurchase Agreement 0.2% | | | | | | | |
State Street Bank | | | | | | | |
0.800% due 07/01/2004 | | | 822 | | | 822 | |
| | | | | |
|
|
|
(Dated 06/30/2004. Collateralized by Fannie Mae 2.875% due 10/15/2005 valued at $838.
Repurchase proceeds are $822.) | |
| | |
U.S. Treasury Bills 0.1% | | | | | | | |
1.354% due 09/16/2004 (c)(d) | | | 500 | | | 498 | |
| | | | | |
|
|
|
Total Short-Term Instruments (Cost $410,480) | | | | | | 410,423 | |
| | | | | |
|
|
|
| |
Total Investments 198.2% | | $ | 935,373 | |
(Cost $931,094) | | | | | | | |
| |
Written Options (f) (0.0%) | | | (16 | ) |
(Premiums $558) | | | | | | | |
| |
Other Assets and Liabilities (Net) (98.2%) | | | (463,430 | ) |
| | | | | |
|
|
|
| | |
Net Assets 100.0% | | | | | $ | 471,927 | |
| | | | | |
|
|
|
Notes to Schedule of Investments (amounts in thousands, except number of contracts):
(a) Variable rate security.
(b) Principal amount of security is adjusted for inflation.
(c) Securities with an aggregate market value of $199 have been segregated with the custodian to cover margin
requirements for the following open futures contracts at June 30, 2004:
| | | | | | | | |
| Type | | Expiration
Month | | # of
Contracts | | Unrealized
(Depreciation) | |
U.S. Treasury 10-Year Note Long Futures | | 09/2004 | | 8 | | $ | (15 | ) |
| | | | | | |
|
|
|
(d) Securities are grouped by coupon or range of coupons and represent a range of maturities.
(e) Swap agreements outstanding at June 30, 2004:
| | | | | | | | | |
Type | |
| Notional
Amount | | | |
| Unrealized
Appreciation/
(Depreciation) |
|
| Receive a fixed rate equal to 4.000% and pay floating rate based on 6-month EC-LIBOR. | | | | | | |
| Counterparty: Barclays Bank PLC | | | | | | |
| Exp. 06/17/2010 | | | EC 9,400 | | | | $ | (49 | ) |
| |
| Received a fixed rate equal to 5.000% and pay floating rate based on 6-month EC-LIBOR. | | | | |
| Counterparty: Barclays Bank PLC | | | | | | |
| Exp. 06/17/2015 | | | 27,700 | | | | | (126 | ) |
| | | | | | | | | |
| | |
| Receive a fixed rate equal to 5.000% and pay floating rate based on 6-month EC-LIBOR. | | | | | | |
| Counterparty: UBS Warburg LLC | | | | | | |
| Exp. 06/17/2015 | | | EC 8,000 | | | | $ | (19 | ) |
| | |
| Receive floating rate based on 3-month LIBOR and pay a fixed rate equal to 5.000%. | | | | | | |
| Counterparty: Bank of America | | | | | | |
| Exp. 12/15/2014 | | $ | 17,700 | | | | | (277 | ) |
| |
| Receive floating rate based on 3-month LIBOR and pay a fixed rate equal to 5.000%. | | | | |
| Counterparty: J.P. Morgan Chase & Co. | | | | | | |
| Exp. 12/15/2014 | | | 6,000 | | | | | (96 | ) |
| |
| Receive floating rate based on 3-month LIBOR and pay a fixed rate equal to 5.000%. | | | | |
| Counterparty: Goldman Sachs & Co. | | | | | | |
| Exp. 12/15/2014 | | | 12,000 | | | | | (176 | ) |
| |
| Receive floating rate based on 3-month LIBOR and pay a fixed rate equal to 5.000%. | | | | |
| Counterparty: UBS Warburg LLC | | | | | | |
| Exp. 12/15/2014 | | | 6,000 | | | | | (90 | ) |
| |
| Receive floating rate based on 3-month LIBOR and pay a fixed rate equal to 6.000%. | | | | |
| Counterparty: Bank of America | | | | | | |
| Exp. 12/18/2033 | | | 5,000 | | | | | 92 | |
| |
| Receive floating rate based on 3-month LIBOR and pay a fixed rate equal to 6.000%. | | | | |
| Counterparty: UBS Warburg LLC | | | | | | |
| Exp. 12/18/2033 | | | 4,600 | | | | | 50 | |
| | | | | | | | $ | (691 | ) |
| | | | | | |
| See accompanying notes | | June 30, 2004 | | Semi-Annual Report | | 9 |
Schedule of Investments (Cont.)
Real Return Portfolio
June 30, 2004 (Unaudited)
(f) Premiums received on written options:
| | | | | | | | | | | | | | | | | | | | | | | | |
| Name of Issuer | | Counterparty | | | | Exercise
Rate | | | | | Expiration
Date | | | | Notional
Amount | | | | Premium | | Value |
| Call - OTC 7-Year Interest Rate Swap | | J.P. Morgan Chase & Co. | | | | 4.000 | %** | | | | 10/07/2004 | | | | $ | 6,400 | | | | $ | 71 | | $ | 3 |
| Call - OTC 7-Year Interest Rate Swap | | J.P. Morgan Chase & Co. | | | | 3.800 | %** | | | | 10/07/2004 | | | | | 9,300 | | | | | 81 | | | 2 |
| Put - OTC 7-Year Interest Rate Swap | | J.P. Morgan Chase & Co. | | | | 6.500 | %* | | | | 10/07/2004 | | | | | 6,400 | | | | | 38 | | | 1 |
| Put - OTC 7-Year Interest Rate Swap | | J.P. Morgan Chase & Co. | | | | 6.000 | %* | | | | 10/07/2004 | | | | | 9,300 | | | | | 91 | | | 6 |
| Call - OTC 10-Year Interest Rate Swap | | J.P. Morgan Chase & Co. | | | | 4.000 | %** | | | | 11/02/2004 | | | | | 16,300 | | | | | 144 | | | 2 |
Put - OTC 10-Year Interest Rate Swap | | J.P. Morgan Chase & Co. | | | | 7.000 | %* | | | | 11/02/2004 | | | | | 16,300 | | | | | 133 | | | 2 |
| | | | | | | | | | | | | | | | |
| |
|
|
| | | | | | | | | | | | | | | | | | | | | $ | 558 | | $ | 16 |
| | | | | | | | | | | | | | | | |
| |
|
|
| | | | | | | | | | | | | | | | | | | | | | | | | |
| | | | | | | | |
* The Portfolio will pay a floating rate based on 3-month LIBOR. | | | | | | | | | | | | | | | | | | | | |
** The Portfolio will receive a floating rate based on 3-month LIBOR. | | | | | | | | | | | | | | | | | | | | |
| | | | | | | | | | | | | | | | | | | | | | | | | |
| (g) Short sales open at June 30, 2004 were as follows: | | | | | | | | | | | | | | | | | | | | | | |
| | | | | | | | | | | | | | | | | | | | | | | | | |
| Type | | | | | | Coupon (%) | | | | | Maturity | | | | Par | | | | Value | | Proceeds |
Republic of Italy | | | | | | 4.250 | | | | | 08/01/2014 | | | | $ | 2,000 | | | | $ | 2,397 | | $ | 2,373 |
U.S. Treasury Note | | | | | | 5.750 | | | | | 08/15/2010 | | | | | 3,100 | | | | | 3,381 | | | 3,328 |
U.S. Treasury Note | | | | | | 3.625 | | | | | 05/15/2013 | | | | | 300 | | | | | 281 | | | 276 |
U.S. Treasury Note | | | | | | 4.250 | | | | | 08/15/2013 | | | | | 4,400 | | | | | 4,297 | | | 4,247 |
| | | | | | | | | | | | | | | | |
| |
|
|
| | | | | | | | | | | | | | | | | | | | | $ | 10,356 | | $ | 10,224 |
| | | | | | | | | | | | | | | | |
| |
|
|
| | | | | | | | | | | | | | | | | | | | | | | | | |
| (h) Forward foreign currency contracts outstanding at June 30, 2004: | | | | | | | | | | | | | | | | | | | | |
| | | | | | | | | | | | | | | | | | | | | | | | | |
| Type | | Currency | | | | Principal
Amount
Covered by
Contract | | | | | Settlement
Month | | | | Unrealized
Appreciation | | | | Unrealized
(Depreciation) | | Net
Unrealized
Appreciation |
Sell | | EC | | | | 2,780 | | | | | 07/2004 | | | | $ | 40 | | | | $ | 0 | | $ | 40 |
(i) Principal amount denoted in indicated currency:
(j) Indicates a fair-valued security which has not been valued utilizing an independent quote but has been valued in good faith pursuant to guidelines established by the Board of Trustees. The aggregate value of fair-valued securities is $6,200, which represents 1.31% of net assets.
| | | | | | |
| 10 | | Semi-Annual Report | | June 30, 2004 | | See accompanying notes |
Notes to Financial Statements
June 30, 2004 (Unaudited)
1. Organization
The Real Return Portfolio (the “Portfolio”) is a series of the PIMCO Variable Insurance Trust (the “Trust”). The Trust is registered under the Investment Company Act of 1940 (the “Act”), as amended, as an open-end investment company organized as a Delaware business trust on October 3, 1997. The Portfolio offers two classes of shares: Institutional and Administrative. Each share class has identical voting rights (except that shareholders of a class have exclusive voting rights regarding any matter relating solely to that class of shares). Information presented in these financial statements pertains to the Institutional Class of the Portfolio. Certain detailed financial information for the Administrative Class is provided separately and is available upon request. The Trust is designed to be used as an investment vehicle by Separate Accounts of insurance companies that fund variable annuity contracts and variable life insurance policies and by qualified pension and retirement plans. The Portfolio commenced operations on September 30, 1999.
2. Significant Accounting Policies
The following is a summary of significant accounting policies consistently followed by the Trust in the preparation of its financial statements in conformity with accounting principles generally accepted in the United States of America. The preparation of financial statements in accordance with accounting principles generally accepted in the United States of America requires management to make estimates and assumptions that affect the reported amounts and disclosures in the financial statements. Actual results could differ from those estimates.
Security Valuation. Portfolio securities and other financial instruments for which market quotations are readily available are stated at market value. Portfolio securities and other financial instruments for which market quotes are not readily available are valued at fair value, as determined in good faith and pursuant to guidelines established by the Board of Trustees, including certain fixed income securities which may be valued with reference to securities whose prices are more readily obtainable. Market value is determined at the close of regular trading (normally, 4:00 p.m., Eastern Time) on the New York Stock Exchange on each day the New York Stock Exchange is open, or if no sales are reported, as is the case for most securities traded over-the-counter, the mean between representative bid and asked quotations obtained from a quotation reporting system or from established market makers. The prices of certain portfolio securities or other financial instruments may be determined at a time prior to the close of regular trading on the New York Stock Exchange. Fair valuation may be used if significant events occur after the close of the relevant markets and prior to the close of regular trading on the New York Stock Exchange that materially affect the values of such securities or financial instruments. Fixed income securities are normally valued on the basis of quotes obtained from brokers and dealers or pricing services. Certain fixed income securities purchased on a delayed delivery basis are marked to market daily until settlement at the forward settlement value. Short-term investments, which mature in 60 days or less are valued at amortized cost, which approximates market value. Exchange traded options, futures and options on futures are valued at the settlement price determined by the relevant exchange. Prices may be obtained from independent pricing services which use information provided by market makers or estimates of market values obtained from yield data relating to investments or securities with similar characteristics. The prices used by the Portfolio may differ from the value that would be realized if the securities were sold and the differences could be material to the financial statements.
Securities Transactions and Investment Income. Securities transactions are recorded as of the trade date. Securities purchased or sold on a when-issued or delayed delivery basis may be settled a month or more after the trade date. Realized gains and losses from securities sold are recorded on the identified cost basis. Dividend income is recorded on the ex-dividend date, except certain dividends from foreign securities where the ex-dividend date may have passed, are recorded as soon as the Portfolio is informed of the ex-dividend date. Interest income, adjusted for the accretion of discounts and amortization of premiums, is recorded on the accrual basis. Paydowns gains and losses on mortgage- and asset-backed securities are recorded as adjustments to interest income in the Statement of Operations.
Dividends and Distributions to Shareholders. Dividends from net investment income, if any, are declared on each day the Trust is open for business and are distributed to shareholders monthly. All dividends are reinvested in additional shares of the Portfolio. Net realized capital gains earned by the Portfolio, if any, will be distributed no less frequently than once each year.
Income dividends and capital gain distributions are determined in accordance with income tax regulations which may differ from accounting principles generally accepted in the United States of America. These differences are primarily due to differing treatments for such items as wash sales, foreign currency transactions, net operating losses, notional principal contracts, certain asset-backed securities, certain futures and forward contracts, tax straddles, and capital loss carryforwards.
Distributions classified as a tax basis return of capital, if any, are reflected in the accompanying Statements of Changes in Net Assets and have been reclassified to paid in capital. In addition, other amounts have been reclassified between undistributed net investment income, accumulated undistributed net realized gains or losses and/or paid in capital to more appropriately conform financial accounting to tax characterizations of dividend distributions.
Multiclass Operations. Each class offered by the Trust has equal rights as to assets. Income, non-class specific expenses, and realized and unrealized capital gains and losses are allocated to each class of shares based on the relative net assets of each class.
Delayed Delivery Transactions. The Portfolio may purchase or sell securities on a when-issued or delayed delivery basis. These transactions involve a commitment by the Portfolio to purchase or sell
| | | | |
| June 30, 2004 | | Semi-Annual Report | | 11 |
Notes to Financial Statements (Cont.)
June 30, 2004 (Unaudited)
securities for a predetermined price or yield, with payment and delivery taking place beyond the customary settlement period. When delayed delivery purchases are outstanding, the Portfolio will designate liquid assets in an amount sufficient to meet the purchase price. When purchasing a security on a delayed delivery basis, the Portfolio assumes the rights and risks of ownership of the security, including the risk of price and yield fluctuations, and takes such fluctuations into account when determining its net asset value. The Portfolio may dispose of or renegotiate a delayed delivery transaction after it is entered into, and may sell when-issued securities before they are delivered, which may result in a capital gain or loss. When the Portfolio has sold a security on a delayed delivery basis, the Portfolio does not participate in future gains and losses with respect to the security.
Federal Income Taxes. The Portfolio intends to qualify as a regulated investment company and distribute all of its taxable income and net realized gains, if applicable, to shareholders. Accordingly, no provision for Federal income taxes has been made.
Foreign Currency. The accounting records of the Portfolio are maintained in U.S. dollars. The market values of foreign securities, currency holdings and other assets and liabilities are translated into U.S. dollars based on the current exchange rates each business day. Fluctuations in the value of these assets and liabilities resulting from changes in exchange rates are recorded as unrealized foreign currency gains or losses. Realized gains or losses and unrealized appreciation or depreciation on investment securities and income and expenses are translated on the respective dates of such transactions. The effect of changes in foreign currency exchange rates on investments in securities are not segregated in the Statement of Operations from the effects of changes in market prices of those securities, but are included with the net realized and unrealized gain or loss on investment securities.
Forward Currency Transactions. The Portfolio may enter into forward currency contracts and forward cross-currency contracts in connection with settling planned purchases or sales of securities, to hedge the currency exposure associated with some or all of the Portfolio’s securities or as a part of an investment strategy. A forward currency contract is an agreement between two parties to buy and sell a currency at a set price on a future date. The market value of a forward currency contract fluctuates with changes in forward currency exchange rates. Forward currency contracts are marked to market daily and the change in value is recorded by the Portfolio as an unrealized gain or loss. Realized gains or losses equal to the difference between the value of the contract at the time it was opened and the value at the time it was closed are recorded upon delivery or receipt of the currency or, if a forward currency contract is offset by entering into another forward currency contract with the same broker, upon settlement of the net gain or loss. These contracts may involve market risk in excess of the unrealized gain or loss reflected in the Portfolio’s Statement of Assets and Liabilities. In addition, the Portfolio could be exposed to risk if the counterparties are unable to meet the terms of the contracts or if the value of the currency changes unfavorably to the U.S. dollar.
Futures Contracts. The Portfolio is authorized to enter into futures contracts. The Portfolio may use futures contracts to manage its exposure to the securities markets or to movements in interest rates and currency values. The primary risks associated with the use of futures contracts are the imperfect correlation between the change in market value of the securities held by the Portfolio and the prices of futures contracts, the possibility of an illiquid market, and the inability of the counterparty to meet the terms of the contract. Futures contracts are valued based upon their quoted daily settlement prices. Upon entering into a futures contract, the Portfolio may be required to deposit with its custodian, in a segregated account in the name of the futures broker, an amount of cash or U.S. Government and Agency Obligations in accordance with the initial margin requirements of the broker or exchange. Futures contracts are marked to market daily and an appropriate payable or receivable for the change in value (“variation margin”) is recorded by the Portfolio. Gains or losses are recognized but not considered realized until the contracts expire or are closed. Futures contracts involve, to varying degrees, risk of loss in excess of the variation margin disclosed in the Statement of Assets and Liabilities.
Inflation-Indexed Bonds. The Portfolio may invest in inflation-indexed bonds. Inflation-indexed bonds are fixed income securities whose principal value is periodically adjusted to the rate of inflation. The interest rate on these bonds is generally fixed at issuance at a rate lower than typical bonds. Over the life of an inflation-indexed bond, however, interest will be paid based on a principal value, which is adjusted for inflation. Any increase in the principal amount of an inflation-indexed bond will be included as interest income in the Statement of Operations, even though investors do not receive their principal until maturity.
Options Contracts. The Portfolio may write call and put options on futures, swaps, securities or currencies it owns or in which it may invest. Writing put options tends to increase the Portfolio’s exposure to the underlying instrument. Writing call options tends to decrease the Portfolio’s exposure to the underlying instrument. When the Portfolio writes a call or put option, an amount equal to the premium received is recorded as a liability and subsequently marked to market to reflect the current value of the option written. These liabilities are reflected as written options outstanding in the Statement of Assets and Liabilities. Payments received or made, if any, from writing options with premiums to be determined on a future date are reflected as such on the Statement of Assets and Liabilities. Premiums received from writing options which expire are treated as realized gains. Premiums received from writing options which are exercised or closed are added to the proceeds or offset against amounts paid on the underlying future, swap, security or currency transaction to determine the realized gain or loss. The Portfolio as a writer of an option has no control over whether the underlying future, swap, security or currency may be sold (call) or purchased (put) and as a result bears the market risk of an unfavorable change in the price of the future, swap, security or currency underlying the written option. There is the risk the Portfolio may not be able to enter into a closing transaction because of an illiquid market.
| | | | |
| 12 | | Semi-Annual Report | | June 30, 2004 |
The Portfolio may also purchase put and call options. Purchasing call options tends to increase the Portfolio’s exposure to the underlying instrument. Purchasing put options tends to decrease the Portfolio’s exposure to the underlying instrument. The Portfolio pays a premium which is included in the Portfolio’s Statement of Assets and Liabilities as an investment and subsequently marked to market to reflect the current value of the option. Premiums paid for purchasing options which expire are treated as realized losses. The risk associated with purchasing put and call options is limited to the premium paid. Premiums paid for purchasing options which are exercised or closed are added to the amounts paid or offset against the proceeds on the underlying future, swap, security or currency transaction to determine the realized gain or loss.
Repurchase Agreements. The Portfolio may engage in repurchase transactions. Under the terms of a typical repurchase agreement, the Portfolio takes possession of an underlying debt obligation subject to an obligation of the seller to repurchase, and the Portfolio to resell, the obligation at an agreed-upon price and time. The market value of the collateral must be equal at all times to the total amount of the repurchase obligations, including interest. Generally, in the event of counterparty default, the Portfolio has the right to use the collateral to offset losses incurred.
Short Sales. The Portfolio may enter into short sales transactions. A short sale is a transaction in which the Portfolio sells securities it does not own in anticipation of a decline in the market price of the securities. The Portfolio is obligated to deliver securities at the market price at the time the short position is closed. Possible losses from short sales may be unlimited, whereas losses from purchases cannot exceed the total amount invested.
Swap Agreements. The Portfolio may invest in swap agreements. A swap is an agreement to exchange the return generated by one instrument for the return generated by another instrument. The Portfolio may enter into interest rate, total return, forward spread lock, and credit default swap agreements to manage its exposure to interest rates and credit risk.
Interest rate swap agreements involve the exchange by the Portfolio with another party of their respective commitments to pay or receive interest, e.g., an exchange of floating rate payments for fixed rate payments with respect to the notional amount of principal.
Total return swap agreements involve commitments to pay interest in exchange for a market-linked return, both based on notional amounts. To the extent the total return of the security or index underlying the transaction exceeds or falls short of the offsetting interest rate obligation, the Portfolio will receive a payment from or make a payment to the counterparty.
Forward spread lock swap agreements involve commitments to pay or receive a settlement amount calculated as the difference between the swap spread and a fixed spread, multiplied by the notional amount times the duration of the swap. The swap spread is the difference between the benchmark swap rate (market rate) and the specific Treasury rate.
In a credit default swap, one party makes a stream of payments to another party in exchange for the right to receive a specified return in the event of a default by a third party, typically corporate issues or sovereign issues of an emerging country, on its obligation. The Portfolio may use credit default swaps to provide a measure of protection against defaults of sovereign issuers (i.e., to reduce risk where the Portfolio owns or has exposure to the sovereign issuer) or to take an active long or short position with respect to the likelihood of a particular issuer’s default.
Swaps are marked to market daily based upon quotations from market makers and the change in value, if any, is recorded as unrealized gain or loss in the Statement of Operations. Payments received or made at the beginning of the measurement period are reflected as such on the Statement of Assets and Liabilities. A liquidation payment received or made at the termination of the swap is recorded as realized gain or loss in the Statement of Operations. Net periodic payments received by the Portfolio are included as part of realized gain (loss) on the Statement of Operations. Entering into these agreements involves, to varying degrees, elements of credit, market and documentation risk in excess of the amounts recognized on the Statement of Assets and Liabilities. Such risks involve the possibility that there will be no liquid market for these agreements, that the counterparty to the agreements may default on its obligation to perform or disagree as to the meaning of contractual terms in the agreements, and that there may be unfavorable changes in interest rates.
As a result of a FASB Emerging Issues Task Force (“EITF”) consensus, No. 03-11, and related SEC staff guidance, the Portfolio has reclassified periodic payments made or received under swap agreements, which were previously included within miscellaneous income, to a component of realized gain(loss) in the Statement of Operations. For consistency, similar reclassifications have been made to amounts appearing in the previous year’s Statement of Changes in Net Assets and the per share amounts in the prior year financial highlights. Prior year net investment income ratios in the financial highlights have also been modified accordingly. There were no reclassifications to any period presented as a result of this change. There is no effect on the Portfolio’s net asset value, either in total or per share, or its total increase(decrease) in net assets from operations during any period
3. Fees, Expenses, and Related Party Transactions
Investment Advisory Fee. Pacific Investment Management Company LLC (“PIMCO”) is a majority owned subsidiary partnership of Allianz Dresdner Asset Management of America L.P. and serves as investment adviser (the “Adviser”) to the Trust, pursuant to an investment advisory contract. The Adviser receives a monthly fee at an annual rate based on average daily net assets of the Portfolio. The Advisory Fee is charged at an annual rate of 0.25%.
Administration Fee. PIMCO serves as administrator (the “Administrator”), and provides administrative services to the Trust for which it receives a monthly administrative fee based on average
| | | | |
| June 30, 2004 | | Semi-Annual Report | | 13 |
Notes to Financial Statements (Cont.)
June 30, 2004 (Unaudited)
daily net assets of the Portfolio. The Administration Fee is charged at the annual rate of 0.25%.
Servicing Fee. PA Distributors LLC (“PAD”), formerly known as PIMCO Advisors Distributors LLC, is an indirect wholly-owned subsidiary of Allianz Dresdner Asset Management of America L.P. and serves as the distributor of the Trust’s shares. The Trust is permitted to reimburse PAD on a quarterly basis, out of the Administrative Class assets of the Portfolio in the amount of 0.15% on an annual basis of the average daily net assets of that class, for payments made to financial intermediaries that provide services in connection with the distribution of shares or administration of plans or programs that use Portfolio shares as their funding medium. The effective rate paid to PAD was 0.15% during current fiscal year.
Expenses. The Trust is responsible for the following expenses: (i) salaries and other compensation of any of the Trust’s executive officers and employees who are not officers, directors, stockholders or employees of PIMCO or its subsidiaries or affiliates; (ii) taxes and governmental fees; (iii) brokerage fees and commissions and other portfolio transaction expenses; (iv) the cost of borrowing money, including interest expense and bank overdraft charges; (v) fees and expenses of the Trustees who are not “interested persons” of PIMCO or the Trust, and any counsel retained exclusively for their benefit; (vi) extraordinary expenses, including costs of litigation and indemnification expenses; (vii) organization expenses and (viii) any expenses allocated or allocable to a specific class of shares, which include service fees payable with respect to the Administrative Class shares and may include certain other expenses as permitted by the Trust’s Multiple Class Plan adopted pursuant to Rule 18f-3 under the Act and subject to review and approval by the Trustees. The ratio of expenses to average net assets per share class, as disclosed in Financial Highlights, may differ from the annual portfolio operating expenses per share class as disclosed in the Prospectus for the reasons set forth above.
PIMCO has agreed to waive a portion of its administrative fees to the extent that the payment of the Portfolio’s pro rata share of organization expenses and Trustee fees cause the actual expense ratio to rise above the rates disclosed in the then-current prospectus plus 0.49 basis points as set forth below (calculated as a percentage of the Portfolio’s average daily net assets attributable to each class):
| | | |
Institutional Class | | 0.50 | % |
Administrative Class | | 0.60 | % |
PIMCO may be reimbursed for these waived amounts in future periods, not to exceed thirty-six months.
Each unaffiliated Trustee receives an annual retainer of $4,000, plus $1,500 for each Board of Trustees meeting attended in person and $250 for each meeting attended telephonically, plus reimbursement of related expenses. In addition, each committee chair receives an additional annual retainer of $500. These expenses are allocated on a pro-rata basis to each Portfolio of the Trust according to its respective net assets.
4. Purchases and Sales of Securities
The length of time a Portfolio has held a particular security is not generally a consideration in investment decisions. A change in the securities held by a Portfolio is known as “portfolio turnover.” The Portfolio may engage in frequent and active trading of portfolio securities to achieve its investment objective, particularly during periods of volatile market movements. High portfolio turnover (e.g., over 100%) involves correspondingly greater expenses to the Portfolio, including brokerage commissions or dealer mark-ups and other transaction costs on the sale of securities and reinvestments in other securities. Such sales may also result in realization of taxable capital gains, including short-term capital gains (which are generally taxed at ordinary income tax rates). The trading costs and tax effects associated with portfolio turnover may adversely affect the Portfolio’s performance.
Purchases and sales of securities (excluding short-term investments) for the period ended June 30, 2004 were as follows (amounts in thousands):
| | | | | | |
| U.S. Government/Agency | | All Other |
| Purchases | | Sales | | Purchases | | Sales |
| $ 2,823,602 | | $ 2,675,437 | | $ 61,360 | | $ 46,138 |
5. Transactions in Written Call and Put Options
Transactions in written call and put options were as follows (amounts in thousands):
| | | |
| | | | Premium |
Balance at 12/31/2003 | | $ | 558 |
| Exercised | | | 0 |
| Balance at 06/30/2004 | | | $558 |
6. Federal Income Tax Matters
At June 30, 2004, the aggregate cost of investments was the same for federal income tax and financial statement purposes. The net unrealized appreciation (depreciation) of investment securities for federal income tax purposes is as follows (amounts in thousands):
| | | | | | |
Aggregate Gross Unrealized Appreciation | | Aggregate Gross
Unrealized
(Depreciation) | | Net Unrealized
Appreciation |
| $ 4,641 | | $ | (362) | | $ | 4,279 |
| | | | |
| 14 | | Semi-Annual Report | | June 30, 2004 |
7. Shares of Beneficial Interest
The Trust may issue an unlimited number of shares of beneficial interest with a $.001 par value. Changes in shares of beneficial interest were as follows (shares and amounts in thousands):
| | | | | | | | | | | | | | |
| | | Six Months Ended 06/30/2004 | | | Year Ended 12/31/2003 | |
| | | Shares | | | Amount | | | Shares | | | Amount | |
Receipts for shares sold | | | | | | | | | | | | | | |
| | | | |
Institutional Class | | 616 | | | $ | 7,848 | | | 2,134 | | | $ | 25,638 | |
Administrative Class | | 16,643 | | | | 210,240 | | | 21,042 | | | | 258,368 | |
| | | | |
Issued as reinvestment of distributions | | | | | | | | | | | | | | |
| | | | |
Institutional Class | | 10 | | | | 123 | | | 74 | | | | 917 | |
Administrative Class | | 102 | | | | 1,288 | | | 755 | | | | 9,318 | |
| | | | |
Cost of shares redeemed | | | | | | | | | | | | | | |
| | | | |
Institutional Class | | (67 | ) | | | (841 | ) | | (62 | ) | | | (751 | ) |
Administrative Class | | (4,240 | ) | | | (53,313 | ) | | (7,171 | ) | | | (87,884 | ) |
| | | | |
Net increase resulting from Portfolio share transactions | | 13,064 | | | $ | 165,345 | | | 16,772 | | | $ | 205,605 | |
The following schedule shows the number of shareholders each owning 5% or more of the Portfolio and the total percentage of the Portfolio held by such shareholders:
| | | | |
| | | Number | | % of Portfolio Held |
Institutional Class | | 1 | | 100 |
Administrative Class | | 5 | | 67 |
8. Regulatory and Litigation Matters
On February 17, 2004, the Attorney General of the State of New Jersey (“New Jersey AG”) filed a complaint against Allianz Dresdner Asset Management of America L.P. (“ADAM”), PA Distributors LLC (formerly known as PIMCO Advisors Distributors LLC) (“PAD”), PEA Capital LLC (formerly known as PIMCO Equity Advisors LLC) (“PEA”), and Pacific Investment Management Company LLC (“PIMCO”) in connection with its investigation into market timing and late trading. The complaint contends that inappropriate trading by shareholders engaged in market timing activity took place in funds in the PIMCO Funds: Multi-Manager Series (“MMS Funds”) and the PIMCO Funds: Pacific Investment Management Series (“PIMS Funds”). On June 1, 2004, the New Jersey AG dismissed PIMCO from the lawsuit.
On the same day as the dismissal of PIMCO from the lawsuit, the New Jersey AG announced that it had reached a settlement agreement with the remaining defendants (“New Jersey Settlement”). In the New Jersey Settlement, ADAM, PAD and PEA agreed, while neither admitting nor denying the allegations or conclusions of law, to: (i) pay New Jersey a civil fine of $15 million and $3 million for investigative costs and further enforcement initiatives; and (ii) implement certain changes in corporate governance.
On May 6, 2004, the Securities and Exchange Commission filed a complaint in the U.S. District Court in the Southern District of New York alleging that PA Fund Management LLC (formerly known as PIMCO Advisors Fund Management LLC) (“PAFM”), PEA, PAD, Stephen J. Treadway (at the time, the chief executive officer of PAFM and PAD as well as chairman of the Board of Trustees of the MMS Funds) and Kenneth W. Corba (the former chief executive officer of PEA and former portfolio manager of the PEA Growth and PEA Growth & Income Funds) had, among other things, violated and/or aided and abetted violations of, various antifraud provisions of the federal securities laws in connection with alleged “market timing” arrangements that improperly allowed certain hedge funds to engage in “market timing” in the PEA Growth Fund, the PEA Opportunity Fund, the PEA Innovation Fund, and the PEA Target Fund. The complaint seeks injunctive relief, disgorgement plus pre-judgment interest, monetary penalties, and an order permanently enjoining the defendants from serving as investment advisers, principal underwriters, officers, directors, or members of any advisory boards to any registered investment companies.
On February 20, 2004, a putative class action lawsuit was filed in the U.S. District Court for the District of New Jersey on behalf of certain shareholders of the PIMCO Funds against ADAM, PAD, PIMCO, PEA, the PIMS Funds, the MMS Funds, the Trust, PIMCO Commercial Mortgage Securities Trust, Inc. and certain other defendants, alleging that inappropriate market timing activity by certain shareholders caused financial injury to the shareholders of those Funds.
| | | | |
| June 30, 2004 | | Semi-Annual Report | | 15 |
Notes to Financial Statements (Cont.)
June 30, 2004 (Unaudited)
The following additional putative class action lawsuits have been filed against the PIMS Funds, the MMS Funds and/or their affiliates, each related to alleged market-timing activity in funds advised by PIMCO or its affiliates: (1) a lawsuit filed in the U.S. District Court for the District of Connecticut on February 27, 2004 (naming as defendants ADAM, PAD, PEA, the PIMS Funds, the MMS Funds, the Trust, PCM and certain other parties); (2) a lawsuit filed in the U.S. District Court for the Central District of California on March 4, 2004 (naming as defendants PIMCO, ADAM, PEA and PAD); (3) a lawsuit filed in the U.S. District Court for the Southern District of New York on March 8, 2004 (naming PIMCO, PAD and certain of their affiliates as defendants); (4) a lawsuit filed in the U.S. District Court for the Southern District of New York, on March 15, 2004 (naming PIMCO as the defendant); (5) two separate lawsuits filed in the U.S. District Court for the Central District of California on March 22, 2004, brought derivatively on behalf of the PIMCO High Yield Fund and the PIMCO Money Market Fund, respectively (each naming ADAM, PAFM and certain other parties as defendants, and the PIMCO Funds as the nominal defendant); (6) a lawsuit filed in the U.S. District Court for the Central District of California, also on March 22, 2004, brought derivatively on behalf of the PIMS Funds and the MMS Funds (naming ADAM, PIMCO, PAD and certain other parties as defendants, and the PIMS Funds and the MMS Funds as nominal defendants); (7) a lawsuit filed in the U.S. District Court for the District of New Jersey on April 20, 2004 (naming ADAM, PAD, the PIMS Funds and certain other parties as defendants); and (8) a lawsuit filed in the U.S. District Court for the Northern District of California on April 28, 2004 (naming ADAM, PIMCO, PAD, PEA and certain other parties as defendants, and the “PIMCO Funds” as nominal defendants). Each complaint for the foregoing putative class actions alleges, among other things, that inappropriate trading by shareholders engaged in market timing activities took place in certain of the funds advised by PIMCO, and each complaint seeks unspecified compensatory damages.
On February 17, 2004, a putative class action lawsuit was filed in the U.S. District Court for the District of Connecticut on behalf of certain shareholders of the PIMCO Funds against ADAM, PEA, PIMCO, PIMS Funds, MMS Funds and certain other defendants, alleging excessive investment advisory fees and the use of brokerage commissions to pay for distribution of fund shares. Three similar putative class action lawsuits were subsequently filed, each in the U.S. District Court for the District of Connecticut on March 1, 2004, April 23, 2004 and May 20, 2004, respectively.
Under Section 9(a) of the 1940 Act, if any of the various lawsuits were to result in a court injunction against PAFM, PEA, PAD, PIMCO, ADAM and/or Mr. Treadway, they and their affiliates would, in the absence of exemptive relief granted by the SEC, be barred from serving as an investment adviser/sub-adviser or principal underwriter for any registered investment company, including the Trust. ADAM and certain of its subsidiaries have responded to inquiries from the SEC concerning the status of the New Jersey Settlement under Section 9(a). If any of PAFM, PEA, PAD, PIMCO or ADAM were subject to an injunction, each of these entities and their affiliates could in turn seek exemptive relief from the SEC, as contemplated by the 1940 Act. There is no assurance, however, that such exemptive relief would be granted. The SEC also has the power by order to prohibit PAFM, PEA, PAD and PIMCO from serving as investment advisers and underwriters, if the SEC finds that such entities willfully violated the federal securities laws in connection with the allegations discussed above or aided or abetted such violations.
PIMCO, PAD and the Trust believe that these developments will not have a material adverse effect on the Portfolios or on PIMCO’s, or PAD’s ability to perform their respective investment advisory or distribution services on behalf of the Portfolios.
| | | | |
| 16 | | Semi-Annual Report | | June 30, 2004 |
Trustees and Officers
Brent R. Harris, Chairman and Trustee
R. Wesley Burns, President and Trustee
E. Philip Cannon, Trustee
Vern O. Curtis, Trustee
J. Michael Hagan, Trustee
William J. Popejoy, Trustee
Garlin G. Flynn, Secretary
John P. Hardaway, Treasurer
Investment Adviser and Administrator
Pacific Investment Management Company LLC
840 Newport Center Drive
Newport Beach, California 92660
Distributor
PA Distributors LLC
2187 Atlantic Street
Stamford, Connecticut 06902
Custodian
State Street Bank & Trust Company
801 Pennsylvania
Kansas City, Missouri 64105
Transfer Agent
Boston Financial Data Services–Midwest
330 W. 9th Street
Kansas City, Missouri 64105
Legal Counsel
Dechert LLP
1775 I Street, N.W.
Washington, D.C. 20006
Independent Registered Public Accounting Firm
PricewaterhouseCoopers LLP
1055 Broadway
Kansas City, Missouri 64105
Information about how the Fund voted proxies relating to portfolio securities held during the year July 1, 2003 through June 30, 2004 will be available no later than August 31, 2004 without charge, upon request, by calling the Trust at 1-800-927-4648 and on the SEC’s website at http://www.sec.gov.
Copies of the written Proxy Policy and the factors that PIMCO may consider in determining how to vote proxies for the Funds are available by calling the Trust at 1-800-927-4648 and on the SEC’s website at http://www.sec.gov.
PIMCO VARIABLE INSURANCE TRUST
840 NEWPORT CENTER DRIVE
NEWPORT BEACH, CA 92660

PIMCO VARIABLE INSURANCE TRUST
TOTAL RETURN PORTFOLIO
INSTITUTIONAL CLASS
SEMI-ANNUAL REPORT
June 30, 2004
|
| This material is authorized for use only when preceded or accompanied by the current PIMCO Variable Insurance Trust prospectus. Investors should consider the investment objectives, risks, charges and expenses of Portfolio carefully before investing. This and other information is contained in the Portfolio’s prospectus. Please read the prospectus carefully before you invest or send money. |
Chairman’s Letter
Dear PIMCO Variable Insurance Trust Shareholder:
Bond prices were more volatile during the six-month period ended June 30, 2004. Interest rates rose sharply during the second quarter 2004, causing bonds to give back modest gains from earlier in the year. The Lehman Brothers Aggregate Bond Index, a widely used index for the high-grade bond market, was nearly flat during the first six months of 2004, returning 0.15% after losing 2.44% during the second quarter. The yield on the benchmark ten-year Treasury closed June 30, 2004 at 4.58%, up 0.75% from April 1, 2004, but up only 0.34% from where it began the six-month period on January 1, 2004.
Continued growth in employment convinced the markets that the Federal Reserve would soon begin a long anticipated tightening cycle. On June 30, 2004, the Fed met market expectations by increasing the federal funds rate 0.25%, which was the first rate increase since June 25, 2003. The central bank had held this rate at 1% for more than a year, which generated negative real short-term rates. And on August 10, 2004, the Fed increased the federal funds rate another 0.25% to 1.50%.
Investors that had profited handsomely from borrowing at low short-term rates and investing in higher-yielding longer maturity bonds surrendered some of those profits towards the latter part of the six-month period. Concern that borrowing rates would rise led investors to liquidate long positions and unwind these trades, which caused bond prices to decrease. However, substantial leverage remained among banks, hedge funds, and other investors, making bond markets somewhat vulnerable to additional Fed rate increases. There were also signs of rising inflation, which fueled anxiety that central banks might continue to raise interest rates.
On the following pages you will find a more complete review of the Portfolio in light of financial market activities as well as specific details about the total return investment performance for the six-month period.
We appreciate the trust you have placed in us, and we will continue to focus our efforts to meet your investment needs.
Sincerely,

Brent R. Harris
Chairman
August 11, 2004
| | | | |
| June 30, 2004 | | Semi-Annual Report | | 1 |
Important Information About the Portfolio
We believe that bond funds have an important role to play in a well diversified investment portfolio. It is important to note, however, that in an environment where interest rates may trend upward, rising rates will negatively impact the performance of most bond funds, and fixed income securities held by a fund are likely to decrease in value. The price volatility of fixed income securities can also increase during periods of rising interest rates resulting in increased losses to a fund. Bond funds and individual bonds with a longer duration (a measure of the expected life of a security) tend to be more sensitive to changes in interest rates, usually making them more volatile than securities or funds with shorter durations. The longer-term performance of most bond funds has benefited from capital gains in part resulting from an extended period of declining interest rates. In the event interest rates increase, these capital gains should not be expected to recur.
The Portfolio may be subject to various risks in addition to those described above. Some of these risks may include, but are not limited to, the following: real rate risk, derivative risk, small company risk, foreign security risk, high yield security risk and specific sector investment risks. The Portfolio may use derivative instruments for hedging purposes or as part of an investment strategy. Use of these instruments may involve certain costs and risks such as liquidity risk, interest rate risk, market risk, credit risk, management risk and the risk that a fund could not close out a position when it would be most advantageous to do so. A Portfolio investing in derivatives could lose more than the principal amount invested in these instruments. Investing in non-U.S. securities may entail risk due to non-U.S. economic and political developments; this risk may be enhanced when investing in emerging markets. High-yield bonds typically have a lower credit rating than other bonds. Lower rated bonds generally involve a greater risk to principal than higher rated bonds. Smaller companies may be more volatile than larger companies and may entail more risk. Concentrating investments in individual sectors may add additional risk and volatility compared to a diversified portfolio.
On the performance summary page in this semi-annual report, the Total Return Investment Performance table measures performance assuming that all dividend and capital gain distributions were reinvested. Returns do not reflect the deduction of taxes that a shareholder would pay (i) on Portfolio distributions or (ii) the redemption of Portfolio shares.
An investment in a Portfolio is not a bank deposit and is not guaranteed or insured by the Federal Deposit Insurance Corporation or any other government agency. It is possible to lose money on investments in the Funds.
The following disclosure provides important information regarding the Portfolio’s Expense Example, which appears on the Portfolio’s individual page in this semi-annual report. Please refer to this information when reviewing the Expense Example for the Portfolio.
Example
As a shareholder of the Portfolio, you incur two types of costs: (1) transaction costs, including redemption and exchange fees; and (2) ongoing costs, including advisory and administrative fees; distribution and/or service (12b-1) fees (Administrative Class only); and other Portfolio expenses. The Example is intended to help you understand your ongoing costs (in dollars) of investing in the Portfolio and to compare these costs with the ongoing costs of investing in other mutual funds.
The Example is based on an investment of $1,000 invested at the beginning of the period and held for the entire period indicated, which is from 1/1/04 to 6/30/04.
Actual Expenses
The information in the table under the heading “Actual Performance” provides information about actual account values and actual expenses. You may use the information in these columns, together with the amount you invested, to estimate the expenses that you paid over the period. Simply divide your account value by $1,000.00 (for example, an $8,600.00 account value divided by $1,000 = 8.60), then multiply the result by the number in the appropriate column for your share class, in the row entitled “Expenses Paid During Period” to estimate the expenses you paid on your account during this period.
Hypothetical Example for Comparison Purposes
The information in the table under the heading “Hypothetical Performance (5% return before expenses)” provides information about hypothetical account values and hypothetical expenses based on the Portfolio’s actual expense ratio and an assumed rate of return of 5% per year before expenses, which is not the Portfolio’s actual return. The hypothetical account values and expenses may not be used to estimate the actual ending account balance or expenses you paid for the period. You may use this information to compare the ongoing costs of investing in the Portfolio and other portfolios. To do so, compare this 5% hypothetical example with the 5% hypothetical examples that appear in the shareholder reports of the other portfolios.
Please note that the expenses shown in the table are meant to highlight your ongoing costs only and do not reflect any transactional costs. Therefore, the information under the heading “Hypothetical Performance (5% return before expenses)” is useful in comparing ongoing costs only, and will not help you determine the relative total costs of owning different portfolios. In addition, if these transactional costs were included, your costs would have been higher.
PIMCO Variable Insurance Trust is distributed by PA Distributors LLC, 2187 Atlantic Street, Stamford, CT 06902.
| | | | |
| 2 | | Semi-Annual Report | | June 30, 2004 |
Total Return Portfolio
CUMULATIVE RETURNS THROUGH JUNE 30, 2004
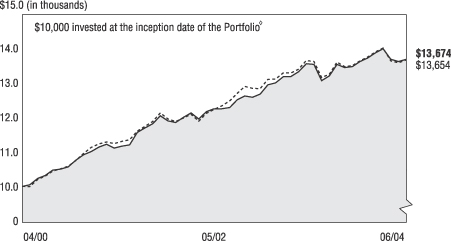
[CHART]
Total Return Lehman Brothers
Portfolio Inst. Class Aggregate Bond Index
--------------------- --------------------
04/30/2000 $10,000 $10,000
05/31/2000 $10,047 $9,995
06/30/2000 $10,233 $10,203
07/31/2000 $10,316 $10,296
08/31/2000 $10,472 $10,445
09/30/2000 $10,503 $10,511
10/31/2000 $10,567 $10,580
11/30/2000 $10,759 $10,753
12/31/2000 $10,914 $10,953
01/31/2001 $11,011 $11,132
02/28/2001 $11,141 $11,229
03/31/2001 $11,221 $11,285
04/30/2001 $11,111 $11,238
05/31/2001 $11,164 $11,306
06/30/2001 $11,202 $11,349
07/31/2001 $11,560 $11,603
08/31/2001 $11,694 $11,736
09/30/2001 $11,814 $11,872
10/31/2001 $12,042 $12,121
11/30/2001 $11,899 $11,954
12/31/2001 $11,845 $11,878
01/31/2002 $11,995 $11,974
02/28/2002 $12,129 $12,090
03/31/2002 $11,946 $11,889
04/30/2002 $12,167 $12,119
05/31/2002 $12,244 $12,222
06/30/2002 $12,248 $12,328
07/31/2002 $12,278 $12,477
08/31/2002 $12,506 $12,688
09/30/2002 $12,617 $12,893
10/31/2002 $12,573 $12,834
11/30/2002 $12,667 $12,831
12/31/2002 $12,938 $13,096
01/31/2003 $12,993 $13,107
02/28/2003 $13,179 $13,288
03/31/2003 $13,178 $13,278
04/30/2003 $13,321 $13,388
05/31/2003 $13,551 $13,637
06/30/2003 $13,529 $13,610
07/31/2003 $13,057 $13,153
08/31/2003 $13,192 $13,240
09/30/2003 $13,532 $13,590
10/31/2003 $13,437 $13,464
11/30/2003 $13,465 $13,496
12/31/2003 $13,611 $13,633
01/31/2004 $13,713 $13,743
02/29/2004 $13,863 $13,892
03/31/2004 $13,979 $13,996
04/30/2004 $13,672 $13,632
05/31/2004 $13,613 $13,577
06/30/2004 $13,674 $13,654
SECTOR BREAKDOWN‡
| | | |
Short-Term Instruments | | 62.2 | % |
U.S. Government Agencies | | 17.5 | % |
U.S. Treasury Obligations | | 4.2 | % |
Municipal Bonds & Notes | | 4.1 | % |
Mortgage-Backed Securities | | 3.5 | % |
Corporate Bonds & Notes | | 3.1 | % |
Other | | 5.4 | % |
‡ % of Total Investments as of June 30, 2004
à$10,000 invested at the beginning of the first full month following the inception of the Institutional Class.
TOTAL RETURN INVESTMENT PERFORMANCE For the period ended June 30, 2004
| | | | | | | | | | | | | |
| | | | | | | 6 Months | | | 1 Year | | | Since Inception* | |
| | |
| | Total Return Portfolio Institutional Class (Inception 04/10/00) | | 0.46 | % | | 1.07 | % | | 7.40 | % |
| | | - - - - - - - | | Lehman Brothers Aggregate Bond Index | | 0.15 | % | | 0.32 | % | | — | |
| | | | | * Annualized. All Portfolio returns are net of fees and expenses. | | | | | | | | | |
Past performance is no guarantee of future results. The performance quoted represents past performance. Investment return and principal value will fluctuate so the Portfolio shares, when redeemed, may be worth more or less than their original cost. Current performance may be lower or higher than the performance data quoted. Performance data current to the most recent month-end is available by calling (800) 927-4648.
Please refer to page 2 herein for an explanation of the information presented in the following Expense Example.
| | | | | | | | | | |
| EXPENSE EXAMPLE | | | | Actual Performance | | | | Hypothetical Performance
(5% return before expenses) |
Beginning Account Value (01/01/04) | | | | $ | 1,000.00 | | | | $ | 1,000.00 |
Ending Account Value (06/30/04) | | | | $ | 1,004.60 | | | | $ | 1,025.00 |
Expenses Paid During Period† | | | | $ | 2.49 | | | | $ | 2.52 |
† Expenses are equal to the Portfolio’s Institutional Class annualized expense ratio of 0.50%, multiplied by the average account value over the period, multiplied by 182/366 (to reflect the one-half year period).
PORTFOLIO INSIGHTS
| • | The Total Return Portfolio seeks to achieve its investment objective by investing under normal circumstances at least 65% of its total assets in a diversified portfolio of Fixed Income Instruments of varying maturities. |
| • | The Portfolio’s Institutional Class shares outperformed the Lehman Brothers Aggregate Bond Index for the six-month period ended June 30, 2004, returning 0.46% versus 0.15% for the Index. |
| • | The Portfolio’s below-Index duration helped returns, as yields rose over the period. |
| • | An emphasis on short/intermediate maturities was negative, as the yield curve flattened in anticipation of Fed tightening. However, this strategy enhanced security returns via “roll down,” or price appreciation, as bonds are revalued at lower yields over time, given the steepness of the yield curve. |
| • | Substituting Real Return Bonds (TIPS-Treasury Inflation Protected Securities) for nominal Treasuries was positive as TIPS benefited from strong demand for the inflation protection they provide. |
| • | A mortgage underweight was slightly negative as mortgages outpaced comparable Treasuries; mortgage security selection was positive, however, and more than offset this impact. |
| • | The Portfolio’s underweight to corporate securities was slightly positive, as this sector lagged Treasuries modestly on like-duration basis. |
| • | Emerging market bonds (“EM”) detracted from performance, as leveraged tactical investors sold EM bonds as rates rose. |
| • | Non-U.S. positions were slightly positive, as Eurozone issues outperformed amid expectations for slower growth and lower inflation in Europe. |
| | | | |
| June 30, 2004 | | Semi-Annual Report | | 3 |
Financial Highlights
Total Return Portfolio (Institutional Class)
| | | | | | | | | | | | | | | | | | | | | | | | | | | | | |
| Selected Per Share Data for the Year or Period Ended: | | | | 06/30/2004+ | | | | | 12/31/2003 | | | | | 12/31/2002 | | | | | 12/31/2001 | | | | | 04/10/2000-
12/31/2000 | |
| | | | | | | | | | |
Net asset value beginning of period | | | | $ | 10.36 | | | | | $ | 10.23 | | | | | $ | 9.89 | | | | | $ | 9.77 | | | | | $ 9.50 | |
Net investment income (a) | | | | | 0.09 | (b) | | | | | 0.27 | (b) | | | | | 0.43 | (b) | | | | | 0.50 | (b) | | | | 0.45 | (b) |
Net realized/unrealized gain (loss) on investments (a) | | | | | (0.04 | )(b) | | | | | 0.25 | (b) | | | | | 0.47 | (b) | | | | | 0.31 | (b) | | | | 0.27 | (b) |
Total income from investment operations | | | | | 0.05 | | | | | | 0.52 | | | | | | 0.90 | | | | | | 0.81 | | | | | 0.72 | |
Dividends from net investment income | | | | | (0.10 | ) | | | | | (0.31 | ) | | | | | (0.43 | ) | | | | | (0.50 | ) | | | | (0.45 | ) |
Distributions from net realized capital gains | | | | | 0.00 | | | | | | (0.08 | ) | | | | | (0.13 | ) | | | | | (0.19 | ) | | | | 0.00 | |
Total distributions | | | | | (0.10 | ) | | | | | (0.39 | ) | | | | | (0.56 | ) | | | | | (0.69 | ) | | | | (0.45 | ) |
Net asset value end of period | | | | $ | 10.31 | | | | | $ | 10.36 | | | | | $ | 10.23 | | | | | $ | 9.89 | | | | | $ 9.77 | |
Total return | | | | | 0.46 | % | | | | | 5.20 | % | | | | | 9.23 | % | | | | | 8.53 | % | | | | 7.82 | % |
Net assets end of period (000s) | | | | $ | 54,003 | | | | | $ | 75,540 | | | | | $ | 46,548 | | | | | $ | 35,231 | | | | | $ 625 | |
Ratio of net expenses to average net assets | | | | | 0.50 | %* | | | | | 0.50 | % | | | | | 0.50 | % | | | | | 0.50 | % | | | | 0.50 | % |
Ratio of net investment income to average net assets | | | | | 1.77 | %*(b) | | | | | 2.60 | %(b) | | | | | 4.23 | %(b) | | | | | 5.00 | %(b) | | | | 6.47 | %(b) |
Portfolio turnover rate | | | | | 143 | % | | | | | 193 | % | | | | | 222 | % | | | | | 217 | % | | | | 415 | % |
| (a) | Per share amounts based on average number of shares outstanding during the period. |
| (b) | Indicates a period in which, as a result of a change in generally accepted accounting principles, the portfolio has reclassified periodic payments made or received under certain derivative instruments, which were previously included within miscellaneous income, to a component of realized gain (loss) in the Statement of Operations. The effect of this reclassification was to increase the net investment income ratio for the period ending June 30, 2004 by 0.01% and the net investment income per share by $0.00. For consistency, similar reclassifications have been made to prior period amounts, resulting in (reductions) to the net investment income ratio of 0.00%, (0.01)%, 0.00% and (0.01)% and to the net investment income per share of $0.00, $0.00, $0.00, and $0.00 in the fiscal years or periods ending December 31, 2003, 2002, 2001, and 2000, respectively. This change had no impact on the reported net asset value per share for any period. |
| | | | | | |
| 4 | | Semi-Annual Report | | June 30, 2004 | | See accompanying notes |
Statement of Assets and Liabilities
Total Return Portfolio
June 30, 2004 (Unaudited)
| | | | | |
| Amounts in thousands, except per share amounts | | | | |
| | |
Assets: | | | | | |
| | |
Investments, at value | | | | $ | 2,390,263 |
Cash | | | | | 171 |
Foreign currency, at value | | | | | 10,470 |
Receivable for investments sold | | | | | 210 |
Receivable for investments sold on delayed delivery basis | | | | | 67,810 |
Unrealized appreciation on forward foreign currency contracts | | | | | 464 |
Receivable for Portfolio shares sold | | | | | 10,067 |
Interest and dividends receivable | | | | | 6,289 |
Variation margin receivable | | | | | 5,328 |
Swap premiums paid | | | | | 2,233 |
Unrealized appreciation on swap agreements | | | | | 1,702 |
| | | | | | 2,495,007 |
| | |
Liabilities: | | | | | |
| | |
Payable for investments purchased | | | | $ | 183,796 |
Payable for investments purchased on delayed delivery basis | | | | | 36,097 |
Unrealized depreciation on forward foreign currency contracts | | | | | 42 |
Payable for short sale | | | | | 69,211 |
Written options outstanding | | | | | 1,167 |
Payable for Portfolio shares redeemed | | | | | 343 |
Dividends payable | | | | | 585 |
Interest payable | | | | | 10 |
Accrued investment advisory fee | | | | | 442 |
Accrued administration fee | | | | | 441 |
Accrued servicing fee | | | | | 232 |
Swap premiums received | | | | | 6,057 |
Unrealized depreciation on swap agreements | | | | | 1,573 |
Other liabilities | | | | | 2 |
| | | | | | 299,998 |
| | |
Net Assets | | | | $ | 2,195,009 |
| | |
Net Assets Consist of: | | | | | |
| | |
Paid in capital | | | | $ | 2,170,033 |
Undistributed net investment income | | | | | 6,353 |
Accumulated undistributed net realized gain | | | | | 11,635 |
Net unrealized appreciation | | | | | 6,988 |
| | | | | $ | 2,195,009 |
| | |
Net Assets: | | | | | |
| | |
Institutional Class | | | | $ | 54,003 |
Administrative Class | | | | | 2,141,006 |
| | |
Shares Issued and Outstanding: | | | | | |
| | |
Institutional Class | | | | | 5,236 |
Administrative Class | | | | | 207,606 |
| | |
Net Asset Value and Redemption Price Per Share
(Net Assets Per Share Outstanding) | | | | | |
| | |
Institutional Class | | | | $ | 10.31 |
Administrative Class | | | | | 10.31 |
| | |
Cost of Investments Owned | | | | $ | 2,389,014 |
Cost of Foreign Currency Held | | | | $ | 10,415 |
| | | | | | |
| See accompanying notes | | June 30, 2004 | | Semi-Annual Report | | 5 |
Statement of Operations
Total Return Portfolio
| | | | | | |
| Amounts in thousands | | | | | |
| | | | | Six Months Ended June 30, 2004 (Unaudited) | |
Investment Income: | | | | | | |
| | |
Interest | | | | $ | 23,680 | |
Dividends | | | | | 283 | |
Miscellaneous income | | | | | 4 | |
Total Income | | | | | 23,967 | |
| | |
Expenses: | | | | | | |
| | |
Investment advisory fees | | | | | 2,611 | |
Administration fees | | | | | 2,611 | |
Distribution and/or servicing fees - Administrative Class | | | | | 1,517 | |
Trustees’ fees | | | | | 18 | |
Total Expenses | | | | | 6,757 | |
| | |
Net Investment Income | | | | | 17,210 | |
| | |
Net Realized and Unrealized Gain (Loss): | | | | | | |
| | |
Net realized gain on investments | | | | | 13,704 | |
Net realized gain on futures contracts, options, and swaps | | | | | 4,101 | |
Net realized (loss) on foreign currency transactions | | | | | (2,077 | ) |
Net change in unrealized (depreciation) on investments | | | | | (22,840 | ) |
Net change in unrealized (depreciation) on futures contracts,
options, and swaps | | | | | (5,474 | ) |
Net change in unrealized appreciation on translation of
assets and liabilities denominated in foreign currencies | | | | | 319 | |
Net (Loss) | | | | | (12,267 | ) |
| | |
Net Increase in Assets Resulting from Operations | | | | $ | 4,943 | |
| | | | | | |
| 6 | | Semi-Annual Report | | June 30, 2004 | | See accompanying notes |
Statements of Changes in Net Assets
Total Return Portfolio
| | | | | | | | | | | | |
| Amounts in thousands | | | | | | | | | | |
| | | | | Six Months Ended June 30, 2004
(Unaudited) | | | | | Year Ended December 31, 2003 | |
Increase in Net Assets from: | | | | | | | | | | | | |
| | | | |
Operations: | | | | | | | | | | | | |
| | | | |
Net investment income | | | | $ | 17,210 | | | | | $ | 40,936 | |
Net realized gain | | | | | 15,728 | | | | | | 19,113 | |
Net change in unrealized appreciation (depreciation) | | | | | (27,995 | ) | | | | | 16,279 | |
Net increase resulting from operations | | | | | 4,943 | | | | | | 76,328 | |
| | | | |
Distributions to Shareholders: | | | | | | | | | | | | |
| | | | |
From net investment income | | | | | | | | | | | | |
Institutional Class | | | | | (631 | ) | | | | | (2,155 | ) |
Administrative Class | | | | | (17,872 | ) | | | | | (44,938 | ) |
| | | | |
From net realized capital gains | | | | | | | | | | | | |
Institutional Class | | | | | 0 | | | | | | (652 | ) |
Administrative Class | | | | | 0 | | | | | | (14,348 | ) |
Total Distributions | | | | | (18,503 | ) | | | | | (62,093 | ) |
| | | | |
Portfolio Share Transactions: | | | | | | | | | | | | |
| | | | |
Receipts for shares sold | | | | | | | | | | | | |
Institutional Class | | | | | 7,078 | | | | | | 76,213 | |
Administrative Class | | | | | 355,600 | | | | | | 979,977 | |
| | | | |
Issued as reinvestment of distributions | | | | | | | | | | | | |
Institutional Class | | | | | 631 | | | | | | 2,807 | |
Administrative Class | | | | | 14,564 | | | | | | 48,536 | |
| | | | |
Cost of shares redeemed | | | | | | | | | | | | |
Institutional Class | | | | | (29,016 | ) | | | | | (50,575 | ) |
Administrative Class | | | | | (124,164 | ) | | | | | (295,164 | ) |
Net increase resulting from Portfolio share transactions | | | | | 224,693 | | | | | | 761,794 | |
| | | | |
Total Increase in Net Assets | | | | | 211,133 | | | | | | 776,029 | |
| | | | |
Net Assets: | | | | | | | | | | | | |
| | | | |
Beginning of period | | | | | 1,983,876 | | | | | | 1,207,847 | |
End of period * | | | | $ | 2,195,009 | | | | | $ | 1,983,876 | |
| | | | |
*Including undistributed net investment income of: | | | | $ | 6,353 | | | | | $ | 7,646 | |
| | | | | | |
| See accompanying notes | | June 30, 2004 | | Semi-Annual Report | | 7 |
Schedule of Investments
Total Return Portfolio
June 30, 2004 (Unaudited)
| | | | |
| | | Principal | | |
| | | Amount | | Value |
| | | (000s) | | (000s) |
| | | | | | |
CORPORATE BONDS & NOTES 3.4% |
Banking & Finance 1.0% | | | | | | |
Atlas Reinsurance II PLC | | | | | | |
3.515% due 01/07/2005 (a) | | $ | 1,250 | | $ | 1,258 |
CIT Group, Inc. | | | | | | |
2.489% due 07/30/2004 (a) | | | 2,220 | | | 2,221 |
Gemstone Investors Ltd. | | | | | | |
7.710% due 10/31/2004 | | | 700 | | | 709 |
General Motors Acceptance Corp. | | | |
1.580% due 07/20/2004 (a) | | | 500 | | | 500 |
1.499% due 07/21/2004 (a) | | | 200 | | | 200 |
1.510% due 07/30/2004 (a) | | | 600 | | | 600 |
2.400% due 10/20/2005 (a) | | | 900 | | | 908 |
Pemex Project Funding Master Trust | | | |
8.000% due 11/15/2011 | | | 100 | | | 108 |
8.625% due 02/01/2022 | | | 1,800 | | | 1,881 |
Phoenix Quake Wind Ltd. | | | | | | |
3.560% due 07/03/2008 (a) | | | 800 | | | 822 |
3.560% due 07/03/2008 (a) | | | 800 | | | 822 |
4.610% due 07/03/2008 (a) | | | 400 | | | 412 |
Premium Asset Trust | | | | | | |
1.465% due 11/27/2004 (a) | | | 100 | | | 100 |
1.521% due 09/08/2007 (a) | | | 100 | | | 96 |
Qwest Capital Funding, Inc. | | | | | | |
7.250% due 02/15/2011 | | | 657 | | | 565 |
Residential Reinsurance Ltd. | | | | | | |
6.260% due 06/08/2006 (a) | | | 8,100 | | | 8,222 |
UFJ Finance Aruba AEC | | | | | | |
6.750% due 07/15/2013 | | | 2,300 | | | 2,382 |
Vita Capital Ltd. | | | | | | |
2.460% due 01/01/2007 (a) | | | 500 | | | 504 |
| | | | | |
|
|
| | | | | | | 22,310 |
| | | | | |
|
|
Industrials 1.2% | | | | | | |
El Paso Corp. | | | | | | |
6.750% due 05/15/2009 | | | 6,000 | | | 5,460 |
7.875% due 06/15/2012 | | | 8,600 | | | 7,762 |
7.800% due 08/01/2031 | | | 1,500 | | | 1,211 |
ITT Corp. | | | | | | |
6.750% due 11/15/2005 | | | 250 | | | 259 |
United Airlines, Inc. | | | | | | |
8.030% due 07/01/2011 | | | 465 | | | 96 |
6.071% due 03/01/2013 | | | 6,920 | | | 5,745 |
1.340% due 03/02/2049 (a) | | | 1,664 | | | 1,369 |
Williams Cos., Inc. | | | | | | |
7.875% due 09/01/2021 | | | 3,500 | | | 3,386 |
| | | | | |
|
|
| | | | | | | 25,288 |
| | | | | |
|
|
Utilities 1.2% | | | | | | |
AEP Texas Central Co. | | | | | | |
2.500% due 02/15/2005 (a) | | | 900 | | | 901 |
Entergy Gulf States, Inc. | | | | | | |
6.000% due 12/01/2012 | | | 6,500 | | | 6,451 |
Pacific Gas & Electric Co. | | | | | | |
1.810% due 04/03/2006 (a) | | | 18,500 | | | 18,513 |
| | | | | |
|
|
| | | | | | | 25,865 |
| | | | | |
|
|
| Total Corporate Bonds & Notes (Cost $72,944) | | | | | | 73,463 |
| | | | | |
|
|
| | | | | | | |
MUNICIPAL BONDS & NOTES 4.4% |
| |
Badger Asset Securitization Corporate Revenue Bonds, Series 2002 | | | |
6.000% due 06/01/2017 | | | 3,700 | | | 3,351 |
| |
California State Polytechnic University Revenue Bonds, Series 1972 | | | |
5.000% due 07/01/2012 | | | 4,700 | | | 5,112 |
| |
Durham County, North Carolina General Obligation Revenue Bonds, Series 2002 | | | |
8.640% due 04/01/2021 (a) | | | 2,733 | | | 2,921 |
| |
Energy Northwest Washington Electric Revenue Bonds, Series 2003 | | | |
5.500% due 07/01/2013 | | | 1,700 | | | 1,880 |
5.500% due 07/01/2014 | | | 1,300 | | | 1,436 |
| | | | | | |
| |
Illinois State General Obligation Bonds, Series 2003 | | | |
5.100% due 06/01/2033 | | $ | 20,000 | | $ | 17,745 |
| |
Lewisville, Texas Independent School District General Obligation Bonds,
(PSF-GTD Insured), Series 2004 | | | |
5.000% due 08/15/2027 | | | 3,775 | | | 3,709 |
| |
Los Angeles, California Unified School District General Obligation Bonds,
(MBIA Insured), Series 2003 | | | |
5.000% due 01/01/2028 | | | 7,300 | | | 7,220 |
| |
Massachusetts Bay Transportation Authority Sales Tax Revenue Bonds, Series 2004 | | | |
5.000% due 07/01/2011 | | | 2,800 | | | 3,024 |
| |
Massachusetts State Water Reserve Authority Revenue Bonds, (FSA Insured), Series 2002 | | | |
5.000% due 08/01/2032 | | | 1,000 | | | 979 |
| |
Nassau County, New York Interim Finance Authority Revenue Bonds, (AMBAC Insured), Series 2004 | | | |
5.000% due 11/15/2011 | | | 4,005 | | | 4,346 |
| |
New Jersery State Tobacco Settlement Financing Corp. Revenue Bonds, Series 2003 | | | |
4.375% due 06/01/2019 | | | 4,870 | | | 4,730 |
| |
New Jersey State Tobacco Settlement Financing Corp., Series 2003 | | | |
6.750% due 06/01/2039 | | | 5,450 | | | 4,891 |
| |
New Jersey Tobacco Settlement Financing Corp. Revenue Bonds, Series 2002 | | | |
6.000% due 06/01/2037 | | | 1,530 | | | 1,245 |
| |
New York City, New York Municipal Water Finance Authority Revenue Bonds,
(FGIC Insured), Series 2003-E | | | |
5.000% due 06/15/2034 | | | 1,400 | | | 1,360 |
| |
New York City, New York Municipal Water Finance Authority Revenue Bonds,
(FSA-CR Insured), Series 2002 | | | |
5.125% due 06/15/2034 | | | 10,460 | | | 10,463 |
| |
New York City, New York Transitional Finance Authority Revenue Bonds, Series 2004 | | | |
5.000% due 11/01/2013 | | | 700 | | | 752 |
| |
New York State Environmental Facilities Corporate Revenue Bonds, Series 2002 | | | |
8.860% due 06/15/2023 (a) | | | 850 | | | 898 |
| |
Orange County, California Sanitation District Certificates of Participation Bonds,
(FGIC Insured), Series 2003 | | | |
5.000% due 02/01/2033 | | | 1,000 | | | 975 |
| |
South Carolina State Public Service Authority Revenue Bonds, (FSA Insured), Series 2004 | | | |
5.000% due 01/01/2009 | | | 700 | | | 755 |
| |
South San Antonio, Texas Independent School District General Obligation Bonds, (PSF-GTD Insured), Series 2004 | | | |
5.000% due 08/15/2029 | | | 3,150 | | | 3,132 |
|
State of California Tobacco Securitization Corp.
Revenue Bonds, Series 2003-A1 |
6.250% due 06/01/2033 | | | 2,900 | | | 2,615 |
|
State of Illinois General Obligation Bonds,
Series 2004 |
5.000% due 03/01/2034 | | | 1,000 | | | 964 |
| | | | | | |
|
State of Wisconsin General Obligation Bonds,
(MBIA Insured), Series 2004 |
5.000% due 05/01/2011 | | $ | 2,300 | | $ | 2,493 |
|
University of Texas Revenue Bonds, Series 2003 |
5.000% due 08/15/2033 | | | 1,200 | | | 1,171 |
|
Washington State General Obligation Bonds,
Series 2004 |
5.000% due 01/01/2028 | | | 9,200 | | | 9,013 |
| | | | | |
|
|
| Total Municipal Bonds & Notes (Cost $101,805) | | | | | | 97,180 |
| | | | | |
|
|
| | | | | | | |
U.S. GOVERNMENT AGENCIES 19.1% |
| | |
Fannie Mae | | | | | | |
7.000% due 04/25/2023 | | | 6,322 | | | 6,629 |
3.342% due 11/01/2025 (a) | | | 5 | | | 5 |
4.165% due 10/01/2032 (a) | | | 2,887 | | | 2,974 |
5.090% due 09/01/2034 (a) | | | 5,540 | | | 5,642 |
4.294% due 11/01/2035 (a) | | | 561 | | | 580 |
4.797% due 12/01/2036 (a) | | | 5,109 | | | 5,279 |
6.340% due 09/01/2039 (a) | | | 281 | | | 294 |
2.625% due 09/01/2040 (a) | | | 200 | | | 203 |
1.650% due 03/25/2044 (a) | | | 17,169 | | | 16,955 |
6.000% due 04/01/2013-05/01/2033 (b) | | | 18,450 | | | 19,249 |
5.500% due 04/01/2014-07/15/2034 (b) | | | 137,693 | | | 139,660 |
5.000% due 01/01/2018-07/15/2034 (b) | | | 172,900 | | | 168,192 |
6.500% due 06/01/2029-07/01/2032 (b) | | | 682 | | | 711 |
Federal Home Loan Bank | | | | | | |
5.500% due 03/15/2015 | | | 127 | | | 127 |
Federal Housing Administration | | | | | | |
7.430% due 01/25/2023 | | | 282 | | | 277 |
Freddie Mac | | | | | | |
6.250% due 08/25/2022 | | | 1,391 | | | 1,405 |
7.000% due 06/15/2023 | | | 4,385 | | | 4,592 |
8.500% due 08/01/2024 | | | 40 | | | 44 |
3.579% due 07/01/2027 (a) | | | 7 | | | 7 |
5.532% due 01/01/2028 (a) | | | 7 | | | 7 |
7.813% due 07/01/2030 (a) | | | 6 | | | 6 |
7.500% due 07/15/2030 | | | 125 | | | 131 |
1.738% due 09/15/2030 (a) | | | 92 | | | 92 |
1.688% due 11/15/2030 (a) | | | 132 | | | 132 |
6.000% due 07/01/2016-04/01/2033 (b) | | | 10,203 | | | 10,479 |
5.000% due 09/15/2016-11/01/2018 (b) | | | 7,072 | | | 7,112 |
6.500% due 04/15/2029-08/01/2032 (b) | | | 2,759 | | | 2,874 |
Government National Mortgage Association |
4.375% due 04/20/2026 (a) | | | 276 | | | 276 |
3.375% due 02/20/2027 (a) | | | 14 | | | 14 |
7.500% due 11/20/2029 | | | 563 | | | 611 |
3.500% due 05/20/2030 (a) | | | 40 | | | 40 |
1.680% due 06/20/2030 (a) | | | 10 | | | 10 |
1.780% due 09/20/2030 (a) | | | 94 | | | 94 |
2.750% due 02/20/2032 (a) | | | 3,257 | | | 3,158 |
4.000% due 10/20/2029-07/20/2030 (b) | | | 1,009 | | | 1,014 |
3.000% due 04/20/2034-06/20/2034 (b) | | | 2,200 | | | 2,144 |
Small Business Administration | | | | | | |
8.017% due 02/10/2010 | | | 360 | | | 398 |
7.449% due 08/01/2010 | | | 52 | | | 57 |
6.344% due 08/01/2011 | | | 2,032 | | | 2,136 |
6.030% due 02/10/2012 | | | 12,822 | | | 13,321 |
7.500% due 04/01/2017 | | | 2,246 | | | 2,447 |
6.290% due 01/01/2021 | | | 316 | | | 335 |
5.130% due 09/01/2023 | | | 98 | | | 98 |
| | | | | |
|
|
| Total U.S. Government Agencies (Cost $418,153) | | | | | | 419,811 |
| | | | | |
|
|
| | | | | | |
| 8 | | Semi-Annual Report | | June 30, 2004 | | See accompanying notes |
| | | | |
| | | Principal | | |
| | | Amount | | Value |
| | | (000s) | | (000s) |
| | | | | | |
U.S. TREASURY OBLIGATIONS 4.6% |
|
Treasury Inflation Protected Securities (f) |
3.375% due 01/15/2007 (c) | | $ | 3,559 | | $ | 3,814 |
3.625% due 01/15/2008 | | | 15,126 | | | 16,536 |
3.875% due 01/15/2009 | | | 25,102 | | | 27,993 |
4.250% due 01/15/2010 | | | 5,363 | | | 6,140 |
3.500% due 01/15/2011 | | | 10,585 | | | 11,755 |
3.375% due 01/15/2012 | | | 1,376 | | | 1,525 |
3.000% due 07/15/2012 | | | 15,264 | | | 16,507 |
3.875% due 04/15/2029 | | | 13,493 | | | 17,210 |
| | | | | |
|
|
| Total U.S. Treasury Obligations (Cost $99,059) | | | | | | 101,480 |
| | | | | |
|
|
| | | | | | | |
MORTGAGE-BACKED SECURITIES 3.8% |
|
Amortizing Residential Collateral Trust |
1.620% due 07/25/2032 (a) | | | 3,299 | | | 3,305 |
Aurora Loan Services | | | | | | |
2.000% due 05/25/2030 (a) | | | 47 | | | 47 |
Bank of America Mortgage Securities, Inc. |
6.500% due 10/25/2019 | | | 4,756 | | | 4,757 |
5.667% due 10/20/2032 (a) | | | 758 | | | 771 |
6.500% due 02/25/2033 | | | 1,815 | | | 1,854 |
Bear Stearns Adjustable Rate Mortgage Trust |
3.875% due 11/25/2030 (a) | | | 23 | | | 23 |
6.057% due 08/25/2032 (a) | | | 111 | | | 111 |
5.288% due 10/25/2032 (a) | | | 224 | | | 225 |
5.380% due 01/25/2033 (a) | | | 1,823 | | | 1,836 |
5.635% due 01/25/2033 (a) | | | 607 | | | 610 |
5.134% due 03/25/2033 (a) | | | 3,327 | | | 3,356 |
4.924% due 01/25/2034 (a) | | | 8,983 | | | 9,027 |
Countrywide Home Loans, Inc. | | | | | | |
1.570% due 04/25/2034 (a) | | | 6,831 | | | 6,787 |
Credit-Based Asset Servicing &
Securitization LLC |
1.710% due 09/25/2029 (a) | | | 51 | | | 51 |
CS First Boston Mortgage Securities Corp. |
6.201% due 04/25/2032 (a) | | | 131 | | | 136 |
6.222% due 06/25/2032 (a) | | | 1,644 | | | 1,668 |
5.720% due 10/25/2032 (a) | | | 930 | | | 943 |
First Nationwide Trust |
6.750% due 08/21/2031 | | | 213 | | | 218 |
Impac CMB Trust |
1.550% due 01/25/2034 (a) | | | 7,093 | | | 7,101 |
Indymac Adjustable Rate Mortgage Trust |
6.586% due 01/25/2032 (a) | | | 56 | | | 57 |
Prime Mortgage Trust |
1.500% due 02/25/2034 (a) | | | 837 | | | 839 |
1.700% due 02/25/2034 (a) | | | 3,530 | | | 3,530 |
Residential Asset Securitization Trust |
7.130% due 07/25/2031 | | | 1,057 | | | 1,056 |
Residential Funding Mortgage Securities I, Inc. |
6.500% due 12/25/2023 | | | 1,769 | | | 1,765 |
6.500% due 03/25/2032 | | | 3,623 | | | 3,682 |
5.603% due 09/25/2032 (a) | | | 302 | | | 303 |
Structured Asset Mortgage Investments, Inc. |
1.610% due 09/19/2032 (a) | | | 1,121 | | | 1,117 |
Structured Asset Securities Corp. |
7.000% due 02/25/2016 | | | 13 | | | 13 |
1.750% due 06/25/2017 (a) | | | 1,365 | | | 1,367 |
6.111% due 02/25/2032 (a) | | | 97 | | | 98 |
6.150% due 07/25/2032 (a) | | | 292 | | | 297 |
1.590% due 01/25/2033 (a) | | | 427 | | | 427 |
1.460% due 08/25/2033 (a) | | | 4,050 | | | 4,053 |
Superannuation Members Home
Loans Global Fund |
1.775% due 06/15/2026 (a) | | | 195 | | | 195 |
Torrens Trust |
1.498% due 07/15/2031 (a) | | | 834 | | | 836 |
Washington Mutual Mortgage Securities Corp. |
5.159% due 10/25/2032 (a) | | | 1,182 | | | 1,193 |
3.565% due 01/25/2041 (a) | | | 27 | | | 27 |
2.628% due 08/25/2042 (a) | | | 19,690 | | | 19,893 |
Wells Fargo Mortgage-Backed Securities Trust |
4.959% due 09/25/2032 (a) | | | 269 | | | 272 |
| | | | | |
|
|
| Total Mortgage-Backed Securities (Cost $83,988) | | | 83,846 |
| | | | | |
|
|
| | | | | | |
ASSET-BACKED SECURITIES 1.7% | | | |
| | |
ACE Securities Corp. | | | | | | |
1.640% due 06/25/2032 (a) | | $ | 287 | | $ | 288 |
Amortizing Residential Collateral Trust |
1.570% due 06/25/2032 (a) | | | 2,000 | | | 2,001 |
CDC Mortgage Capital Trust | | | | | | |
1.590% due 01/25/2033 (a) | | | 1,761 | | | 1,764 |
Conseco Finance Securitizations Corp. | | | |
1.608% due 10/15/2031 (a) | | | 247 | | | 247 |
Credit-Based Asset Servicing and
Securitization |
1.550% due 09/25/2033 (a) | | | 5,218 | | | 5,218 |
EMC Mortgage Loan Trust | | | | | | |
1.670% due 05/25/2040 (a) | | | 1,862 | | | 1,868 |
GRMT II Mortgage Loan Trust | | | | | | |
1.530% due 06/20/2032 (a) | | | 53 | | | 53 |
GSAMP Trust | | | | | | |
1.490% due 10/25/2033 (a) | | | 12,812 | | | 12,810 |
HFC Home Equity Loan Asset-Backed
Certificates |
1.630% due 10/20/2032 (a) | | | 8,159 | | | 8,173 |
Household Mortgage Loan Trust | | | |
1.580% due 05/20/2032 (a) | | | 474 | | | 475 |
Irwin Home Equity Loan Trust | | | | | | |
1.590% due 06/25/2029 (a) | | | 333 | | | 334 |
Irwin Low Balance Home Equity Loan Trust | | | |
1.675% due 06/25/2021 (a) | | | 10 | | | 10 |
Morgan Stanley Dean Witter Capital I, Inc. | | | |
1.630% due 07/25/2032 (a) | | | 645 | | | 647 |
Structured Asset Investment Loan Trust | | | |
1.420% due 06/25/2033 (a) | | | 3,006 | | | 3,008 |
Vanderbilt Acquisition Loan Trust | | | |
3.280% due 01/07/2013 | | | 764 | | | 766 |
| | | | | |
|
|
| Total Asset-Backed Securities (Cost $37,648) | | | | | | 37,662 |
| | | | | |
|
|
| | | | | | | |
SOVEREIGN ISSUES 1.9% | | | | | | |
| | |
Republic of Brazil | | | | | | |
2.062% due 04/15/2006 (a) | | | 1,824 | | | 1,800 |
11.500% due 03/12/2008 | | | 2,300 | | | 2,469 |
2.125% due 04/15/2009 (a) | | | 747 | | | 679 |
11.000% due 01/11/2012 | | | 2,840 | | | 2,871 |
11.000% due 08/17/2040 | | | 2,400 | | | 2,265 |
Republic of Panama | | | | | | |
9.625% due 02/08/2011 | | | 800 | | | 890 |
9.375% due 01/16/2023 | | | 330 | | | 338 |
8.875% due 09/30/2027 | | | 5,200 | | | 5,070 |
Republic of Peru | | | | | | |
9.125% due 02/21/2012 | | | 1,400 | | | 1,442 |
9.875% due 02/06/2015 | | | 5,100 | | | 5,355 |
Republic of South Africa | | | | | | |
9.125% due 05/19/2009 | | | 500 | | | 583 |
United Mexican States | | | | | | |
9.875% due 02/01/2010 | | | 100 | | | 120 |
8.375% due 01/14/2011 | | | 300 | | | 340 |
6.375% due 01/16/2013 | | | 930 | | | 930 |
11.375% due 09/15/2016 | | | 900 | | | 1,260 |
8.125% due 12/30/2019 | | | 4,200 | | | 4,505 |
8.300% due 08/15/2031 | | | 10,300 | | | 10,815 |
| | | | | |
|
|
| Total Sovereign Issues (Cost $40,884) | | | | | | 41,732 |
| | | | | |
|
|
| | | | | | | |
FOREIGN CURRENCY-DENOMINATED
ISSUES (i)(j) 1.7% |
| | |
Republic of Germany | | | | | | |
5.250% due 07/04/2010 | | EC | 22,200 | | | 29,051 |
5.250% due 01/04/2011 | | | 5,400 | | | 7,072 |
| | | | | |
|
|
| Total Foreign Currency-Denominated Issues (Cost $35,583) | | | 36,123 |
| | | | | |
|
|
| | | | | | | |
| | | | | | |
PURCHASED PUT OPTIONS 0.0% |
| | |
Eurodollar December Futures (CME) Strike @ 95.500 Exp. 09/13/2004 | | | 100 | | $ | 1 |
| | | | | |
|
|
| Total Purchased Put Options (Cost $1) | | | | | | 1 |
| | | | | |
|
|
| | | | | | | |
PREFERRED SECURITY 0.6% |
| | | Shares | | |
DG Funding Trust | | | | | | |
3.360% due 12/29/2049 (a) | | | 1,239 | | | 13,319 |
| | | | | |
|
|
| Total Preferred Security (Cost $13,055) | | | | | | 13,319 |
| | | | | |
|
|
| | | | | | | |
SHORT-TERM INSTRUMENTS 67.7% |
| | | Principal
Amount
(000s) | | |
Certificates of Deposit 3.8% | | | | | | |
Citibank New York N.A. | | | | | | |
1.090% due 07/30/2004 | | $ | 1,300 | | | 1,300 |
1.190% due 08/20/2004 | | | 40,000 | | | 40,000 |
Wells Fargo Bank N.A. | | | | | | |
1.090% due 07/07/2004 | | | 100 | | | 100 |
1.240% due 07/19/2004 | | | 43,200 | | | 43,200 |
| | | | | |
|
|
| | | | | | | 84,600 |
| | | | | |
|
|
Commercial Paper 60.5% | | | | | | |
Altria Group, Inc. | | | | | | |
1.800% due 10/29/2004 | | | 2,800 | | | 2,800 |
Danske Corp. | | | | | | |
1.195% due 08/20/2004 | | | 4,900 | | | 4,892 |
Fannie Mae | | | | | | |
1.000% due 07/01/2004 | | | 4,600 | | | 4,600 |
1.010% due 07/01/2004 | | | 42,700 | | | 42,700 |
1.025% due 07/07/2004 | | | 23,700 | | | 23,696 |
1.015% due 07/14/2004 | | | 15,700 | | | 15,694 |
1.040% due 07/14/2004 | | | 21,800 | | | 21,792 |
1.060% due 07/21/2004 | | | 21,700 | | | 21,687 |
1.055% due 07/28/2004 | | | 21,800 | | | 21,783 |
1.056% due 07/28/2004 | | | 43,500 | | | 43,466 |
1.055% due 08/04/2004 | | | 21,800 | | | 21,778 |
1.063% due 08/04/2004 | | | 21,700 | | | 21,678 |
1.125% due 08/11/2004 | | | 59,200 | | | 59,124 |
1.150% due 08/18/2004 | | | 12,800 | | | 12,780 |
1.180% due 08/25/2004 | | | 46,600 | | | 46,516 |
1.215% due 09/01/2004 | | | 37,600 | | | 37,508 |
1.220% due 09/01/2004 | | | 21,600 | | | 21,547 |
1.240% due 09/01/2004 | | | 21,500 | | | 21,447 |
1.250% due 09/01/2004 | | | 21,600 | | | 21,547 |
1.120% due 09/08/2004 | | | 21,700 | | | 21,640 |
1.430% due 09/08/2004 | | | 2,800 | | | 2,792 |
1.410% due 09/15/2004 | | | 30,800 | | | 30,704 |
1.435% due 09/22/2004 | | | 17,000 | | | 16,941 |
1.010% due 10/01/2004 | | | 13,300 | | | 13,248 |
1.526% due 10/20/2004 | | | 16,400 | | | 16,320 |
1.530% due 10/20/2004 | | | 21,700 | | | 21,593 |
Federal Home Loan Bank | | | | | | |
1.250% due 07/01/2004 | | | 20,000 | | | 20,000 |
1.250% due 09/01/2004 | | | 21,600 | | | 21,547 |
Ford Motor Credit Co. | | | | | | |
2.076% due 09/03/2004 | | | 14,800 | | | 14,762 |
Freddie Mac | | | | | | |
1.010% due 07/15/2004 | | | 14,000 | | | 13,995 |
1.055% due 08/03/2004 | | | 21,800 | | | 21,779 |
1.060% due 08/03/2004 | | | 21,800 | | | 21,779 |
1.120% due 08/10/2004 | | | 21,500 | | | 21,473 |
1.125% due 08/10/2004 | | | 21,500 | | | 21,473 |
1.079% due 08/23/2004 | | | 21,700 | | | 21,659 |
1.210% due 08/31/2004 | | | 21,600 | | | 21,548 |
1.215% due 08/31/2004 | | | 21,600 | | | 21,548 |
| | | | | | |
| See accompanying notes | | June 30, 2004 | | Semi-Annual Report | | 9 |
Schedule of Investments (Cont.)
Total Return Portfolio
June 30, 2004 (Unaudited)
| | | | |
| | | Principal | | |
| | | Amount | | Value |
| | | (000s) | | (000s) |
| | | | | | | |
| | |
1.275% due 09/07/2004 | | $ | 59,100 | | $ | 58,939 | |
1.320% due 09/07/2004 | | | 21,500 | | | 21,441 | |
1.200% due 09/08/2004 | | | 21,500 | | | 21,440 | |
1.200% due 09/14/2004 | | | 500 | | | 499 | |
1.440% due 09/14/2004 | | | 21,500 | | | 21,434 | |
1.450% due 09/14/2004 | | | 21,500 | | | 21,434 | |
1.260% due 09/20/2004 | | | 16,000 | | | 15,946 | |
1.435% due 09/21/2004 | | | 21,600 | | | 21,526 | |
1.280% due 09/22/2004 | | | 21,500 | | | 21,425 | |
1.465% due 09/28/2004 | | | 9,900 | | | 9,863 | |
1.298% due 09/30/2004 | | | 21,700 | | | 21,616 | |
1.300% due 09/30/2004 | | | 21,500 | | | 21,417 | |
1.436% due 09/30/2004 | | | 21,700 | | | 21,616 | |
1.520% due 10/13/2004 | | | 10,800 | | | 10,751 | |
1.560% due 10/20/2004 | | | 21,800 | | | 21,693 | |
HBOS Treasury Services PLC | | | | | | | |
1.080% due 07/23/2004 | | | 15,400 | | | 15,390 | |
1.120% due 08/24/2004 | | | 40,200 | | | 40,132 | |
Rabobank USA Financial Corp. | | | | | | | |
1.110% due 08/23/2004 | | | 5,400 | | | 5,391 | |
1.210% due 09/07/2004 | | | 21,700 | | | 21,641 | |
Stadshypotek, Inc. | | | | | | | |
1.100% due 08/06/2004 | | | 59,800 | | | 59,734 | |
TotalFinaElf Capital S.A. | | | | | | | |
1.420% due 07/01/2004 | | | 23,400 | | | 23,400 | |
UBS Finance, Inc. | | | | | | | |
1.070% due 07/15/2004 | | | 39,200 | | | 39,184 | |
| | | | | |
|
|
|
| | | | | | | 1,327,748 | |
| | | | | |
|
|
|
Repurchase Agreement 0.2% | | | | | | | |
State Street Bank | | | | | | | |
0.800% due 07/01/2004 | | | 4,012 | | | 4,012 | |
| | | | | |
|
|
|
(Dated 06/30/2004. Collateralized by Freddie Mac 5.500% due 07/15/2006 valued at $4,092. Repurchase proceeds are $4,012.) | |
U.S. Treasury Bills 3.2% | | | | | | | |
1.249% due 09/02/2004-09/16/2004 (b)(c)(d) | | | 69,485 | | | 69,286 | |
| | | | | |
|
|
|
| Total Short-Term Instruments (Cost $1,485,894) | | | | | | 1,485,646 | |
| | | | | |
|
|
|
| | | | | | | | |
Total Investments 108.9% | | $ | 2,390,263 | |
(Cost $2,389,014) | | | | | | | |
| |
Written Options (g) (0.1%) | | | (1,167 | ) |
(Premiums $2,007) | | | | | | | |
| |
Other Assets and Liabilities (Net) (8.8%) | | | (194,087 | ) |
| | | | | |
|
|
|
Net Assets 100.0% | | $ | 2,195,009 | |
| | | | | |
|
|
|
Notes to Schedule of Investments (amounts in thousands, except number of contracts):
(a) Variable rate security.
(b) Securities are grouped by coupon or range of coupons and represent a range of maturities.
(c) Securities with an aggregate market value of $19,197 have been segregated with the custodian to cover margin
requirements for the following open futures contracts at June 30, 2004:
| | | | | | | | |
| Type | | Expiration Month | | # of Contracts | | Unrealized
Appreciation/
(Depreciation) | |
Eurodollar March Long Futures | | 03/2005 | | 779 | | $ | 204 | |
Eurodollar March Long Futures | | 03/2006 | | 61 | | | (68 | ) |
| | | | | | | | | | |
| | | |
Eurodollar June Long Futures | | 06/2005 | | | 840 | | | $ | (23 | ) |
Eurodollar September Long Futures | | 09/2005 | | | 64 | | | | (87 | ) |
Eurodollar December Long Futures | | 12/2004 | | | 296 | | | | (83 | ) |
Eurodollar December Long Futures | | 12/2005 | | | 64 | | | | (80 | ) |
Euribor December Long Futures | | 12/2005 | | | 674 | | | | (605 | ) |
Euribor June Long Futures | | 06/2005 | | | 503 | | | | 15 | |
Euribor September Long Futures | | 09/2005 | | | 429 | | | | (148 | ) |
Euribor Written Put Options Strike @ 97.000 | | 12/2004 | | | 75 | | | | 75 | |
Euribor Written Put Options Strike @ 97.500 | | 09/2004 | | | 76 | | | | 25 | |
Euro-Bobl 5-Year Note Long Futures | | 09/2004 | | | 241 | | | | 14 | |
U.S. Treasury 10-Year Note Long Futures | | 09/2004 | | | 5,227 | | | | 6,120 | |
U.S. Treasury 5-Year Note Long Futures | | 09/2004 | | | 838 | | | | 565 | |
| | | | | | | | |
|
|
|
| | | | | | | | | $ | 5,924 | |
| | | | | | | | |
|
|
|
(d) Securities with an aggregate market value of $6,984 have been pledged as collateral for swap and swaption
contracts at June 30, 2004.
(e) Swap agreements outstanding at June 30, 2004:
| | | | | | |
| Type | | Notional
Amount | | Unrealized
Appreciation/ (Depreciation) | |
|
Receive a fixed rate equal to 5.000% and
pay floating rate based on 6-month BP-LIBOR. | |
Counterparty: Barclays Bank PLC | | | | |
Exp. 06/16/2011 | | BP 1,800 | | $ | (73 | ) |
|
Receive floating rate based on 6-month BP-LIBOR
and pay a fixed rate equal to 5.000%. | |
Counterparty: UBS Warburg LLC | | | | |
Exp. 03/15/2017 | | 700 | | | 1 | |
|
Receive floating rate based on 6-month BP-LIBOR
and pay a fixed rate equal to 5.000%. | |
Counterparty: J.P. Morgan Chase & Co. | |
Exp. 03/15/2017 | | 300 | | | 1 | |
|
Receive floating rate based on 6-month BP-LIBOR
and pay a fixed rate equal to 5.000%. | |
Counterparty: Goldman Sachs & Co. | | | | |
Exp. 03/15/2017 | | 1,700 | | | 12 | |
|
Receive floating rate based on 6-month BP-LIBOR
and pay a fixed rate equal to 5.000%. | |
Counterparty: J.P. Morgan Chase & Co. | |
Exp. 03/15/2032 | | 900 | | | 5 | |
|
Receive floating rate based on 6-month BP-LIBOR
and pay a fixed rate equal to 5.000%. | |
Counterparty: UBS Warburg LLC | | | | |
Exp. 03/15/2032 | | 1,100 | | | (4 | ) |
| | | | | | | | |
|
Receive a fixed rate equal to 4.000% and
pay floating rate based on 6-month EC-LIBOR. | |
Counterparty: Merrill Lynch & Co., Inc. | |
Exp. 03/15/2007 | | | EC 19,900 | | | $ | 150 | |
|
Receive a fixed rate equal to 4.000% and
pay floating rate based on 6-month EC-LIBOR. | |
Counterparty: J.P. Morgan Chase & Co. | |
Exp. 12/21/2007 | | | 108,700 | | | | (776 | ) |
|
Receive a fixed rate equal to 4.000% and
pay floating rate based on 6-month EC-LIBOR. | |
Counterparty: Citibank N.A. | | | | | |
Exp. 06/17/2008 | | | 46,800 | | | | (654 | ) |
|
Receive a fixed rate equal to 4.000% and
pay floating rate based on 6-month EC-LIBOR. | |
Counterparty: Citibank N.A. | | | | | |
Exp. 06/17/2010 | | | 5,400 | | | | (66 | ) |
|
Receive a fixed rate equal to 6.000% and
pay floating rate based on 6-month EC-LIBOR. | |
Counterparty: J.P. Morgan Chase & Co. | | | | | |
Exp. 03/15/2017 | | | 500 | | | | 10 | |
|
Receive a fixed rate equal to 6.000% and
pay floating rate based on 6-month EC-LIBOR. | |
Counterparty: Goldman Sachs & Co. | | | | | |
Exp. 03/15/2017 | | | 4,000 | | | | 77 | |
|
Receive a fixed rate equal to 6.000% and
pay floating rate based on 6-month EC-LIBOR. | |
Counterparty: J.P. Morgan Chase & Co. | | | | | |
Exp. 03/15/2032 | | | 1,500 | | | | 27 | |
|
Receive a fixed rate equal to 6.000% and
pay floating rate based on 6-month EC-LIBOR. | |
Counterparty: UBS Warburg LLC | | | | | |
Exp. 03/15/2032 | | | 1,800 | | | | 22 | |
|
Receive total return on Lehman Commercial
Mortgage-Backed Securities Index and pay
a floating rate based on 1-month LIBOR less 0.650%. | |
Counterparty: Bear Stearns & Co., Inc. | | | | | |
Exp. 07/01/2004 | | $ | 1,600 | | | | 0 | |
|
Receive total return on Lehman Commercial
Mortgage-Backed Securities Index and pay
a floating rate based on 1-month LIBOR less 0.650%. | |
Counterparty: Morgan Stanley Dean Witter & Co. | |
Exp. 09/30/2004 | | | 4,300 | | | | 0 | |
|
Receive a fixed rate equal to 0.625% and
the Portfolio will pay to the counterparty at
par in the event of default of the United Mexican States 11.500% due 05/15/2026. | |
Counterparty: Morgan Stanley Dean Witter & Co. | |
Exp. 05/20/2005 | | | 900 | | | | 3 | |
|
Receive a fixed rate equal to 0.650% and
the Portfolio will pay to the counterparty at
par in the event of default of the United
Mexican States 7.500% due 04/08/2033. | |
Counterparty: Barclays Bank PLC | | | | | |
Exp. 05/20/2005 | | | 300 | | | | 1 | |
|
Receive a fixed rate equal to 1.100% and
the Portfolio will pay to the counterparty at
par in the event of default of Republic of
Panama 9.375% due 04/01/2029. | |
Counterparty: Morgan Stanley Dean Witter & Co. | |
Exp. 06/20/2005 | | | 800 | | | | 3 | |
| | | | | | |
| 10 | | Semi-Annual Report | | June 30, 2004 | | See accompanying notes |
| | | | | |
| |
| Receive a fixed rate equal to 1.800% and the Portfolio will pay to the counterparty at par in the event of default of Republic of Panama 9.375% due 04/01/2029. | | | |
Counterparty: Morgan Stanley Dean Witter & Co. |
Exp. 06/20/2005 | | 300 | | $ | 3 |
| |
| Receive a fixed rate equal to 4.000% and pay floating rate based on 3-month LIBOR. | | | |
Counterparty: UBS Warburg LLC | | | |
Exp. 12/15/2006 | | 11,800 | | | 17 |
| |
| Receive a fixed rate equal to 4.000% and pay floating rate based on 3-month LIBOR. | | | |
Counterparty: Barclays Bank PLC | | | |
Exp. 12/15/2006 | | 25,200 | | | 19 |
| |
| Receive a fixed rate equal to 4.000% and pay floating rate based on 3-month LIBOR. | | | |
Counterparty: UBS Warburg LLC | | | |
Exp. 12/15/2009 | | 52,100 | | | 431 |
| |
| Receive a fixed rate equal to 4.000% and pay floating rate based on 3-month LIBOR. | | | |
Counterparty: Bank of America | | | |
Exp. 12/15/2009 | | 99,700 | |
| 920
|
| | | | | $
| 129
|
(f) Principal amount of security is adjusted for inflation.
(g) Premiums received on written options:
| | | | | | | | | | | | | | | | | | | | | | | | | | | |
| Name of Issuer | | | | | | Exercise
Price | | | | | Expiration Date | | | | # of
Contracts | | | | Premium | | | | Value |
Call - CBOT U.S. Treasury Note September Futures | | | | $ | 111.500 | | | | | 08/27/2004 | | | | | 62 | | | | $ | 27 | | | | $ | 4 |
Call - CBOT U.S. Treasury Note September Futures | | | | | 115.000 | | | | | 08/27/2004 | | | | | 405 | | | | | 268 | | | | | 12 |
Call - CBOT U.S. Treasury Note September Futures | | | | | 111.000 | | | | | 08/27/2004 | | | | | 106 | | | | | 53 | | | | | 53 |
Call - CBOT U.S. Treasury Note September Futures | | | | | 114.000 | | | | | 08/27/2004 | | | | | 58 | | | | | 38 | | | | | 4 |
Call - CBOT U.S. Treasury Note September Futures | | | | | 110.000 | | | | | 08/27/2004 | | | | | 261 | | | | | 237 | | | | | 224 |
Put - CBOT U.S. Treasury Note September Futures | | | | | 107.500 | | | | | 08/27/2004 | | | | | 92 | | | | | 72 | | | | | 34 |
Put - CBOT U.S. Treasury Note September Futures | | | | | 108.000 | | | | | 08/27/2004 | | | | | 184 | | | | | 229 | | | | | 124 |
Put - CBOT U.S. Treasury Note September Futures | | | | | 105.000 | | | | | 08/27/2004 | | | | | 261 | | | | | 160 | | | | | 37 |
| | | | | | | | | | | | | | | | | | | | | | $ | 1,084 | | | | $ | 492 |
| | | | | | | | | | | |
| Name of Issuer | | Counterparty | | | | Exercise
Rate | | | | | Expiration Date | | | | Notional
Amount | | | | Premium | | | | Value |
Call - OTC 7-Year Interest Rate Swap | | Goldman Sachs & Co. | | | | | 5.970 | %** | | | | 10/04/2004 | | | | $ | 6,400 | | | | $ | 257 | | | | $ | 416 |
Put - OTC 7-Year Interest Rate Swap | | Goldman Sachs & Co. | | | | | 5.970 | %* | | | | 10/04/2004 | | | | | 6,400 | | | | | 257 | | | | | 4 |
Call - OTC 7-Year Interest Rate Swap | | UBS Warburg LLC | | | | | 3.800 | %** | | | | 10/07/2004 | | | | | 9,200 | | | | | 44 | | | | | 1 |
Call - OTC 7-Year Interest Rate Swap | | Bank of America | | | | | 6.000 | %** | | | | 10/19/2004 | | | | | 1,700 | | | | | 69 | | | | | 111 |
Put - OTC 7-Year Interest Rate Swap | | Bank of America | | | | | 6.000 | %* | | | | 10/19/2004 | | | | | 1,700 | | | | | 69 | | | | | 2 |
Call - OTC 7-Year Interest Rate Swap | | Goldman Sachs & Co. | | | | | 5.500 | %** | | | | 01/07/2005 | | | | | 3,900 | | | | | 95 | | | | | 139 |
Put - OTC 7-Year Interest Rate Swap | | Goldman Sachs & Co. | | | | | 7.000 | %* | | | | 01/07/2005 | | | | | 3,900 | | | | | 132 | | | | | 2 |
| | | | | | | | | | | | | | | | | | | | | | $ | 923 | | | | $ | 675 |
| * | The Portfolio will pay a floating rate based on 3-month LIBOR. |
| ** | The Portfolio will receive a floating rate based on 3-month LIBOR. |
(h) Short sales open at June 30, 2004 were as follows:
| | | | | | | | | | | | | | | |
| Type | | Coupon
(%) | | Maturity | | Par | | | | Value | | Proceeds |
U.S. Treasury Bond | | 6.250 | | 05/15/2030 | | $ | 18,600 | | | | $ | 20,831 | | $ | 20,287 |
U.S. Treasury Bond | | 5.375 | | 02/15/2031 | | | 15,300 | | | | | 15,436 | | | 15,064 |
U.S. Treasury Note | | 3.875 | | 02/15/2013 | | | 4,900 | | | | | 4,686 | | | 4,591 |
U.S. Treasury Note | | 4.750 | | 05/15/2014 | | | 11,300 | | | | | 11,421 | | | 11,337 |
U.S. Treasury Note | | 6.250 | | 08/15/2023 | | | 15,200 | | | | | 16,837 | | | 16,531 |
| | | | | | | | | | | | $ | 69,211 | | $ | 67,810 |
(i) Forward foreign currency contracts outstanding at June 30, 2004:
| | | | | | | | | | | | | | | | | | | |
| Type | | Currency | | Principal
Amount
Covered by
Contract | | Settlement
Month | | | | Unrealized
Appreciation | | Unrealized
(Depreciation) | | | Net Unrealized
Appreciation/
(Depreciation) | |
Buy | | BR | | 636 | | 07/2004 | | | | $ | 0 | | $ | (5 | ) | | $ | (5 | ) |
Buy | | | | 1,328 | | 08/2004 | | | | | 17 | | | 0 | | | | 17 | |
Buy | | | | 1,500 | | 09/2004 | | | | | 8 | | | 0 | | | | 8 | |
Buy | | CP | | 371,861 | | 08/2004 | | | | | 1 | | | (3 | ) | | | (2 | ) |
Buy | | | | 303,010 | | 09/2004 | | | | | 8 | | | 0 | | | | 8 | |
Sell | | EC | | 12,099 | | 07/2004 | | | | | 173 | | | 0 | | | | 173 | |
Buy | | H$ | | 3,427 | | 07/2004 | | | | | 0 | | | (1 | ) | | | (1 | ) |
Buy | | | | 3,473 | | 08/2004 | | | | | 0 | | | (1 | ) | | | (1 | ) |
Buy | | | | 3,887 | | 09/2004 | | | | | 0 | | | 0 | | | | 0 | |
Buy | | JY | | 2,917,263 | | 07/2004 | | | | | 152 | | | 0 | | | | 152 | |
Buy | | KW | | 510,840 | | 07/2004 | | | | | 4 | | | 0 | | | | 4 | |
Buy | | | | 520,066 | | 08/2004 | | | | | 12 | | | 0 | | | | 12 | |
Buy | | | | 590,000 | | 09/2004 | | | | | 4 | | | 0 | | | | 4 | |
Buy | | MP | | 4,737 | | 08/2004 | | | | | 0 | | | 0 | | | | 0 | |
Buy | | | | 5,606 | | 09/2004 | | | | | 0 | | | (7 | ) | | | (7 | ) |
Buy | | PN | | 1,526 | | 08/2004 | | | | | 3 | | | 0 | | | | 3 | |
Buy | | | | 1,740 | | 09/2004 | | | | | 2 | | | 0 | | | | 2 | |
Buy | | RP | | 33,915 | | 09/2004 | | | | | 0 | | | (13 | ) | | | (13 | ) |
Buy | | RR | | 12,522 | | 07/2004 | | | | | 2 | | | 0 | | | | 2 | |
Buy | | | | 12,733 | | 08/2004 | | | | | 3 | | | 0 | | | | 3 | |
Buy | | | | 14,270 | | 09/2004 | | | | | 1 | | | 0 | | | | 1 | |
Buy | | S$ | | 743 | | 07/2004 | | | | | 0 | | | (7 | ) | | | (7 | ) |
Buy | | | | 755 | | 08/2004 | | | | | 0 | | | (2 | ) | | | (2 | ) |
Buy | | | | 852 | | 09/2004 | | | | | 0 | | | 0 | | | | 0 | |
Buy | | SR | | 2,955 | | 08/2004 | | | | | 40 | | | 0 | | | | 40 | |
Sell | | | | 1,778 | | 08/2004 | | | | | 0 | | | (1 | ) | | | (1 | ) |
Buy | | | | 3,429 | | 09/2004 | | | | | 19 | | | 0 | | | | 19 | |
Sell | | | | 2,003 | | 09/2004 | | | | | 0 | | | (1 | ) | | | (1 | ) |
Buy | | SV | | 14,486 | | 08/2004 | | | | | 10 | | | 0 | | | | 10 | |
Buy | | | | 16,715 | | 09/2004 | | | | | 5 | | | 0 | | | | 5 | |
Buy | | T$ | | 14,791 | | 08/2004 | | | | | 0 | | | (1 | ) | | | (1 | ) |
Buy | | | | 16,605 | | 09/2004 | | | | | 0 | | | 0 | | | | 0 | |
| | | | | | | | | | |
|
| |
|
|
| |
|
|
|
| | | | | | | | | | | $ | 464 | | $ | (42 | ) | | $ | 422 | |
| | | | | | | | | | |
|
| |
|
|
| |
|
|
|
| (j) | Principal amount denoted in indicated currency: |
| | | | |
BP | | - | | British Pound |
BR | | - | | Brazilian Real |
CP | | - | | Chilean Peso |
EC | | - | | Euro |
H$ | | - | | Hong Kong Dollar |
JY | | - | | Japanese Yen |
KW | | - | | South Korean Won |
MP | | - | | Mexican Peso |
PN | | - | | Peruvian New Sol |
RP | | - | | Indian Rupee |
RR | | - | | Russian Ruble |
S$ | | - | | Singapore Dollar |
SR | | - | | South African Rand |
SV | | - | | Slovakian Koruna |
T$ | | - | | Taiwan Dollar |
| | | | | | |
| See accompanying notes | | June 30, 2004 | | Semi-Annual Report | | 11 |
Notes to Financial Statements
June 30, 2004 (Unaudited)
1. Organization
The Total Return Portfolio (the “Portfolio”) is a series of the PIMCO Variable Insurance Trust (the “Trust”). The Trust is registered under the Investment Company Act of 1940 (the “Act”), as amended, as an open-end investment company organized as a Delaware business trust on October 3, 1997. The Portfolio offers two classes of shares: Institutional and Administrative. Each share class has identical voting rights (except that shareholders of a class have exclusive voting rights regarding any matter relating solely to that class of shares). Information presented in these financial statements pertains to the Institutional Class of the Portfolio. Certain detailed financial information for the Administrative Class is provided separately and is available upon request. The Trust is designed to be used as an investment vehicle by Separate Accounts of insurance companies that fund variable annuity contracts and variable life insurance policies and by qualified pension and retirement plans. The Portfolio commenced operations on December 31, 1997.
2. Significant Accounting Policies
The following is a summary of significant accounting policies consistently followed by the Trust in the preparation of its financial statements in conformity with accounting principles generally accepted in the United States of America. The preparation of financial statements in accordance with accounting principles generally accepted in the United States of America requires management to make estimates and assumptions that affect the reported amounts and disclosures in the financial statements. Actual results could differ from those estimates.
Security Valuation. Portfolio securities and other financial instruments for which market quotations are readily available are stated at market value. Portfolio securities and other financial instruments for which market quotes are not readily available are valued at fair value, as determined in good faith and pursuant to guidelines established by the Board of Trustees, including certain fixed income securities which may be valued with reference to securities whose prices are more readily obtainable. Market value is determined at the close of regular trading (normally, 4:00 p.m., Eastern Time) on the New York Stock Exchange on each day the New York Stock Exchange is open, or if no sales are reported, as is the case for most securities traded over-the-counter, the mean between representative bid and asked quotations obtained from a quotation reporting system or from established market makers. The prices of certain portfolio securities or other financial instruments may be determined at a time prior to the close of regular trading on the New York Stock Exchange. Fair valuation may be used if significant events occur after the close of the relevant markets and prior to the close of regular trading on the New York Stock Exchange that materially affect the values of such securities or financial instruments. Fixed income securities are normally valued on the basis of quotes obtained from brokers and dealers or pricing services. Certain fixed income securities purchased on a delayed delivery basis are marked to market daily until settlement at the forward settlement value. Short-term investments, which mature in 60 days or less are valued at amortized cost, which approximates market value. Exchange traded options, futures and options on futures are valued at the settlement price determined by the relevant exchange. Prices may be obtained from independent pricing services which use information provided by market makers or estimates of market values obtained from yield data relating to investments or securities with similar characteristics. The prices used by the Portfolio may differ from the value that would be realized if the securities were sold and the differences could be material to the financial statements.
Securities Transactions and Investment Income. Securities transactions are recorded as of the trade date. Securities purchased or sold on a when-issued or delayed delivery basis may be settled a month or more after the trade date. Realized gains and losses from securities sold are recorded on the identified cost basis. Dividend income is recorded on the ex-dividend date, except certain dividends from foreign securities where the ex-dividend date may have passed, are recorded as soon as the Portfolio is informed of the ex-dividend date. Interest income, adjusted for the accretion of discounts and amortization of premiums, is recorded on the accrual basis. Paydowns gains and losses on mortgage- and asset-backed securities are recorded as adjustments to interest income in the Statement of Operations.
Dividends and Distributions to Shareholders. Dividends from net investment income, if any, are declared on each day the Trust is open for business and are distributed to shareholders monthly. All dividends are reinvested in additional shares of the Portfolio. Net realized capital gains earned by the Portfolio, if any, will be distributed no less frequently than once each year.
Income dividends and capital gain distributions are determined in accordance with income tax regulations which may differ from accounting principles generally accepted in the United States of America. These differences are primarily due to differing treatments for such items as wash sales, foreign currency transactions, net operating losses, notional principal contracts, certain asset-backed securities, certain futures and forward contracts, tax straddles, and capital loss carryforwards.
Distributions classified as a tax basis return of capital, if any, are reflected in the accompanying Statements of Changes in Net Assets and have been reclassified to paid in capital. In addition, other amounts have been reclassified between undistributed net investment income, accumulated undistributed net realized gains or losses and/or paid in capital to more appropriately conform financial accounting to tax characterizations of dividend distributions.
Multiclass Operations. Each class offered by the Trust has equal rights as to assets. Income, non-class specific expenses, and realized and unrealized capital gains and losses are allocated to each class of shares based on the relative net assets of each class.
Delayed Delivery Transactions. The Portfolio may purchase or sell securities on a when-issued or delayed delivery basis. These transactions involve a commitment by the Portfolio to purchase or
| | | | |
| 12 | | Semi-Annual Report | | June 30, 2004 |
sell securities for a predetermined price or yield, with payment and delivery taking place beyond the customary settlement period. When delayed delivery purchases are outstanding, the Portfolio will designate liquid assets in an amount sufficient to meet the purchase price. When purchasing a security on a delayed delivery basis, the Portfolio assumes the rights and risks of ownership of the security, including the risk of price and yield fluctuations, and takes such fluctuations into account when determining its net asset value. The Portfolio may dispose of or renegotiate a delayed delivery transaction after it is entered into, and may sell when-issued securities before they are delivered, which may result in a capital gain or loss. When the Portfolio has sold a security on a delayed delivery basis, the Portfolio does not participate in future gains and losses with respect to the security.
Federal Income Taxes. The Portfolio intends to qualify as a regulated investment company and distribute all of its taxable income and net realized gains, if applicable, to shareholders. Accordingly, no provision for Federal income taxes has been made.
Foreign Currency. The accounting records of the Portfolio are maintained in U.S. dollars. The market values of foreign securities, currency holdings and other assets and liabilities are translated into U.S. dollars based on the current exchange rates each business day. Fluctuations in the value of these assets and liabilities resulting from changes in exchange rates are recorded as unrealized foreign currency gains or losses. Realized gains or losses and unrealized appreciation or depreciation on investment securities and income and expenses are translated on the respective dates of such transactions. The effect of changes in foreign currency exchange rates on investments in securities are not segregated in the Statement of Operations from the effects of changes in market prices of those securities, but are included with the net realized and unrealized gain or loss on investment securities.
Forward Currency Transactions. The Portfolio may enter into forward currency contracts and forward cross-currency contracts in connection with settling planned purchases or sales of securities, to hedge the currency exposure associated with some or all of the Portfolio’s securities or as a part of an investment strategy. A forward currency contract is an agreement between two parties to buy and sell a currency at a set price on a future date. The market value of a forward currency contract fluctuates with changes in forward currency exchange rates. Forward currency contracts are marked to market daily and the change in value is recorded by the Portfolio as an unrealized gain or loss. Realized gains or losses equal to the difference between the value of the contract at the time it was opened and the value at the time it was closed are recorded upon delivery or receipt of the currency or, if a forward currency contract is offset by entering into another forward currency contract with the same broker, upon settlement of the net gain or loss. These contracts may involve market risk in excess of the unrealized gain or loss reflected in the Portfolio’s Statement of Assets and Liabilities. In addition, the Portfolio could be exposed to risk if the counterparties are unable to meet the terms of the contracts or if the value of the currency changes unfavorably to the U.S. dollar.
Futures Contracts. The Portfolio is authorized to enter into futures contracts. The Portfolio may use futures contracts to manage its exposure to the securities markets or to movements in interest rates and currency values. The primary risks associated with the use of futures contracts are the imperfect correlation between the change in market value of the securities held by the Portfolio and the prices of futures contracts, the possibility of an illiquid market, and the inability of the counterparty to meet the terms of the contract. Futures contracts are valued based upon their quoted daily settlement prices. Upon entering into a futures contract, the Portfolio may be required to deposit with its custodian, in a segregated account in the name of the futures broker, an amount of cash or U.S. Government and Agency Obligations in accordance with the initial margin requirements of the broker or exchange. Futures contracts are marked to market daily and an appropriate payable or receivable for the change in value (“variation margin”) is recorded by the Portfolio. Gains or losses are recognized but not considered realized until the contracts expire or are closed. Futures contracts involve, to varying degrees, risk of loss in excess of the variation margin disclosed in the Statement of Assets and Liabilities.
Inflation-Indexed Bonds. The Portfolio may invest in inflation-indexed bonds. Inflation-indexed bonds are fixed income securities whose principal value is periodically adjusted to the rate of inflation. The interest rate on these bonds is generally fixed at issuance at a rate lower than typical bonds. Over the life of an inflation-indexed bond, however, interest will be paid based on a principal value, which is adjusted for inflation. Any increase in the principal amount of an inflation-indexed bond will be included as interest income in the Statement of Operations, even though investors do not receive their principal until maturity.
Options Contracts. The Portfolio may write call and put options on futures, swaps, securities or currencies it owns or in which it may invest. Writing put options tends to increase the Portfolio’s exposure to the underlying instrument. Writing call options tends to decrease the Portfolio’s exposure to the underlying instrument. When the Portfolio writes a call or put option, an amount equal to the premium received is recorded as a liability and subsequently marked to market to reflect the current value of the option written. These liabilities are reflected as written options outstanding in the Statement of Assets and Liabilities. Payments received or made, if any, from writing options with premiums to be determined on a future date are reflected as such on the Statement of Assets and Liabilities. Premiums received from writing options which expire are treated as realized gains. Premiums received from writing options which are exercised or closed are added to the proceeds or offset against amounts paid on the underlying future, swap, security or currency transaction to determine the realized gain or loss. The Portfolio as a writer of an option has no control over whether the underlying future, swap, security or currency may be sold (call) or purchased (put) and as a result bears the market risk of an unfavorable change in the price of the future, swap, security or currency underlying the written option. There is the risk the Portfolio may not be able to enter into a closing transaction because of an illiquid market.
| | | | |
| June 30, 2004 | | Semi-Annual Report | | 13 |
Notes to Financial Statements (Cont.)
June 30, 2004 (Unaudited)
The Portfolio may also purchase put and call options. Purchasing call options tends to increase the Portfolio’s exposure to the underlying instrument. Purchasing put options tends to decrease the Portfolio’s exposure to the underlying instrument. The Portfolio pays a premium which is included in the Portfolio’s Statement of Assets and Liabilities as an investment and subsequently marked to market to reflect the current value of the option. Premiums paid for purchasing options which expire are treated as realized losses. The risk associated with purchasing put and call options is limited to the premium paid. Premiums paid for purchasing options which are exercised or closed are added to the amounts paid or offset against the proceeds on the underlying future, swap, security or currency transaction to determine the realized gain or loss.
Repurchase Agreements. The Portfolio may engage in repurchase transactions. Under the terms of a typical repurchase agreement, the Portfolio takes possession of an underlying debt obligation subject to an obligation of the seller to repurchase, and the Portfolio to resell, the obligation at an agreed-upon price and time. The market value of the collateral must be equal at all times to the total amount of the repurchase obligations, including interest. Generally, in the event of counterparty default, the Portfolio has the right to use the collateral to offset losses incurred.
Short Sales. The Portfolio may enter into short sales transactions. A short sale is a transaction in which the Portfolio sells securities it does not own in anticipation of a decline in the market price of the securities. The Portfolio is obligated to deliver securities at the market price at the time the short position is closed. Possible losses from short sales may be unlimited, whereas losses from purchases cannot exceed the total amount invested.
Swap Agreements. The Portfolio may invest in swap agreements. A swap is an agreement to exchange the return generated by one instrument for the return generated by another instrument. The Portfolio may enter into interest rate, total return, forward spread lock, and credit default swap agreements to manage its exposure to interest rates and credit risk.
Interest rate swap agreements involve the exchange by the Portfolio with another party of their respective commitments to pay or receive interest, e.g., an exchange of floating rate payments for fixed rate payments with respect to the notional amount of principal.
Total return swap agreements involve commitments to pay interest in exchange for a market-linked return, both based on notional amounts. To the extent the total return of the security or index underlying the transaction exceeds or falls short of the offsetting interest rate obligation, the Portfolio will receive a payment from or make a payment to the counterparty.
Forward spread lock swap agreements involve commitments to pay or receive a settlement amount calculated as the difference between the swap spread and a fixed spread, multiplied by the notional amount times the duration of the swap. The swap spread is the difference between the benchmark swap rate (market rate) and the specific Treasury rate.
In a credit default swap, one party makes a stream of payments to another party in exchange for the right to receive a specified return in the event of a default by a third party, typically corporate issues or sovereign issues of an emerging country, on its obligation. The Portfolio may use credit default swaps to provide a measure of protection against defaults of sovereign issuers (i.e., to reduce risk where the Portfolio owns or has exposure to the sovereign issuer) or to take an active long or short position with respect to the likelihood of a particular issuer’s default.
Swaps are marked to market daily based upon quotations from market makers and the change in value, if any, is recorded as unrealized gain or loss in the Statement of Operations. Payments received or made at the beginning of the measurement period are reflected as such on the Statement of Assets and Liabilities. A liquidation payment received or made at the termination of the swap is recorded as realized gain or loss in the Statement of Operations. Net periodic payments received by the Portfolio are included as part of realized gain (loss) on the Statement of Operations. Entering into these agreements involves, to varying degrees, elements of credit, market and documentation risk in excess of the amounts recognized on the Statement of Assets and Liabilities. Such risks involve the possibility that there will be no liquid market for these agreements, that the counterparty to the agreements may default on its obligation to perform or disagree as to the meaning of contractual terms in the agreements, and that there may be unfavorable changes in interest rates.
As a result of a FASB Emerging Issues Task Force (“EITF”) consensus, No. 03-11, and related SEC staff guidance, the Portfolio has reclassified periodic payments made or received under swap agreements, which were previously included within miscellaneous income, to a component of realized gain (loss) in the Statement of Operations. For consistency, similar reclassifications have been made to amounts appearing in the previous year’s Statement of Changes in Net Assets and the per share amounts in the prior year financial highlights. Prior year net investment income ratios in the financial highlights have also been modified accordingly. This reclassification increased (decreased) net investment income by $157,342 and $(31,206), and net realized gain (loss) by $(137,550) and $11,058 and net change in unrealized appreciation (depreciation) by $(19,792) and $20,148 for the six months ended June 30, 2004 and year ended December 31, 2003, respectively. There is no effect on the Portfolio’s net asset value, either in total or per share, or its total increase (decrease) in net assets from operations during any period.
3. Fees, Expenses, and Related Party Transactions
Investment Advisory Fee. Pacific Investment Management Company LLC (“PIMCO”) is a majority owned subsidiary partnership of Allianz Dresdner Asset Management of America L.P. and serves as investment adviser (the “Adviser”) to the Trust, pursuant to an investment advisory contract. The Adviser receives a monthly fee at an annual rate based on average daily net assets of the Portfolio. The Advisory Fee is charged at an annual rate of 0.25%.
Administration Fee. PIMCO serves as administrator (the “Administrator”), and provides administrative services to the Trust for which it receives a monthly administrative fee based on average
| | | | |
| 14 | | Semi-Annual Report | | June 30, 2004 |
daily net assets of the Portfolio. The Administration Fee is charged at the annual rate of 0.25%.
Servicing Fee. PA Distributors LLC (“PAD”), formerly known as PIMCO Advisors Distributors LLC, is an indirect wholly-owned subsidiary of Allianz Dresdner Asset Management of America L.P. and serves as the distributor of the Trust’s shares. The Trust is permitted to reimburse PAD on a quarterly basis, out of the Administrative Class assets of the Portfolio in the amount of 0.15% on an annual basis of the average daily net assets of that class, for payments made to financial intermediaries that provide services in connection with the distribution of shares or administration of plans or programs that use Portfolio shares as their funding medium. The effective rate paid to PAD was 0.15% during current fiscal year.
Expenses. The Trust is responsible for the following expenses: (i) salaries and other compensation of any of the Trust’s executive officers and employees who are not officers, directors, stockholders or employees of PIMCO or its subsidiaries or affiliates; (ii) taxes and governmental fees; (iii) brokerage fees and commissions and other portfolio transaction expenses; (iv) the cost of borrowing money, including interest expense and back overdraft charges; (v) fees and expenses of the Trustees who are not “interested persons” of PIMCO or the Trust, and any counsel retained exclusively for their benefit; (vi) extraordinary expenses, including costs of litigation and indemnification expenses; (vii) organization expenses and (viii) any expenses allocated or allocable to a specific class of shares, which include service fees payable with respect to the Administrative Class shares and may include certain other expenses as permitted by the Trust’s Multiple Class Plan adopted pursuant to Rule 18f-3 under the Act and subject to review and approval by the Trustees. The ratio of expenses to average net assets per share class, as disclosed in Financial Highlights, may differ from the annual portfolio operating expenses per share class as disclosed in the Prospectus for the reasons set forth above.
PIMCO has agreed to waive a portion of its administrative fees to the extent that the payment of the Portfolio’s pro rata share of organization expenses and Trustee fees cause the actual expense ratio to rise above the rates disclosed in the then-current prospectus plus 0.49 basis points as set forth below (calculated as a percentage of the Portfolio’s average daily net assets attributable to each class):
| | | |
Institutional Class | | 0.50 | % |
Administrative Class | | 0.65 | % |
PIMCO may be reimbursed for these waived amounts in future periods, not to exceed thirty-six months.
Each unaffiliated Trustee receives an annual retainer of $4,000, plus $1,500 for each Board of Trustees meeting attended in person and $250 for each meeting attended telephonically, plus reimbursement of related expenses. In addition, each committee chair receives an additional annual retainer of $500. These expenses are allocated on a pro-rata basis to each Portfolio of the Trust according to its respective net assets.
4. Purchases and Sales of Securities
The length of time a Portfolio has held a particular security is not generally a consideration in investment decisions. A change in the securities held by a Portfolio is known as “portfolio turnover.” The Portfolio may engage in frequent and active trading of portfolio securities to achieve its investment objective, particularly during periods of volatile market movements. High portfolio turnover (e.g., over 100%) involves correspondingly greater expenses to the Portfolio, including brokerage commissions or dealer mark-ups and other transaction costs on the sale of securities and reinvestments in other securities. Such sales may also result in realization of taxable capital gains, including short-term capital gains (which are generally taxed at ordinary income tax rates). The trading costs and tax effects associated with portfolio turnover may adversely affect the Portfolio’s performance.
Purchases and sales of securities (excluding short-term investments) for the period ended June 30, 2004 were as follows (amounts in thousands):
| | | | | | |
| U.S Government/Agency | | All Other |
| Purchases | | Sales | | Purchases | | Sales |
| $1,049,636 | | $906,376 | | $305,244 | | $332,178 |
5. Transactions in Written Call and Put Options
Transactions in written call and put options were as follows (amounts in thousands):
| | | | |
| | | | Premium | |
Balance at 12/31/2003 | | $ | 2,357 | |
Sales | | | 2,374 | |
Closing Buys | | | (638 | ) |
Expirations | | | (2,086 | ) |
Exercised | | | 0 | |
| Balance at 06/30/2004 | | | $ 2,007 | |
6. Federal Income Tax Matters
At June 30, 2004, the aggregate cost of investments was the same for federal income tax and financial statement purposes. The net unrealized appreciation (depreciation) of investment securities for federal income tax purposes is as follows (amounts in thousands):
| | | | | |
Aggregate Gross
Unrealized
Appreciation | | Aggregate Gross
Unrealized
(Depreciation) | | Net Unrealized
Appreciation |
| $ 11,478 | | $ (10,229) | | $ | 1,249 |
| | | | |
| June 30, 2004 | | Semi-Annual Report | | 15 |
Notes to Financial Statements (Cont.)
June 30, 2004 (Unaudited)
7. Shares of Beneficial Interest
The Trust may issue an unlimited number of shares of beneficial interest with a $.001 par value. Changes in shares of beneficial interest were as follows (shares and amounts in thousands):
| | | | | | | | | | | | | | |
| | | Six Months Ended
06/30/2004 | | | Year Ended
12/31/2003 | |
| | | Shares | | | Amount | | | Shares | | | Amount | |
Receipts for shares sold | | | | | | | | | | | | | | |
| | | | |
Institutional Class | | 679 | | | $ | 7,078 | | | 7,349 | | | $ | 76,213 | |
Administrative Class | | 34,019 | | | | 355,600 | | | 94,450 | | | | 979,977 | |
| | | | |
Issued as reinvestment of distributions | | | | | | | | | | | | | | |
| | | | |
Institutional Class | | 60 | | | | 631 | | | 271 | | | | 2,807 | |
Administrative Class | | 1,399 | | | | 14,564 | | | 4,687 | | | | 48,536 | |
| | | | |
Cost of shares redeemed | | | | | | | | | | | | | | |
| | | | |
Institutional Class | | (2,792 | ) | | | (29,016 | ) | | (4,880 | ) | | | (50,575 | ) |
Administrative Class | | (11,949 | ) | | | (124,164 | ) | | (28,502 | ) | | | (295,164 | ) |
| | | | |
Net increase resulting from Portfolio share transactions | | 21,416 | | | $ | 224,693 | | | 73,375 | | | $ | 761,794 | |
The following schedule shows the number of shareholders each owning 5% or more of the Portfolio and the total percentage of the Portfolio held by such shareholders:
| | | | |
| | | Number | | % of Portfolio Held |
Institutional Class | | 2 | | 100 |
Administrative Class | | 6 | | 79 |
8. Regulatory and Litigation Matters
On February 17, 2004, the Attorney General of the State of New Jersey (“New Jersey AG”) filed a complaint against Allianz Dresdner Asset Management of America L.P. (“ADAM”), PA Distributors LLC (formerly known as PIMCO Advisors Distributors LLC) (“PAD”), PEA Capital LLC (formerly known as PIMCO Equity Advisors LLC) (“PEA”), and Pacific Investment Management Company LLC (“PIMCO”) in connection with its investigation into market timing and late trading. The complaint contends that inappropriate trading by shareholders engaged in market timing activity took place in funds in the PIMCO Funds: Multi-Manager Series (“MMS Funds”) and the PIMCO Funds: Pacific Investment Management Series (“PIMS Funds”). On June 1, 2004, the New Jersey AG dismissed PIMCO from the lawsuit.
On the same day as the dismissal of PIMCO from the lawsuit, the New Jersey AG announced that it had reached a settlement agreement with the remaining defendants (“New Jersey Settlement”). In the New Jersey Settlement, ADAM, PAD and PEA agreed, while neither admitting nor denying the allegations or conclusions of law, to: (i) pay New Jersey a civil fine of $15 million and $3 million for investigative costs and further enforcement initiatives; and (ii) implement certain changes in corporate governance.
On May 6, 2004, the Securities and Exchange Commission filed a complaint in the U.S. District Court in the Southern District of New York alleging that PA Fund Management LLC (formerly known as PIMCO Advisors Fund Management LLC) (“PAFM”), PEA, PAD, Stephen J. Treadway (at the time, the chief executive officer of PAFM and PAD as well as chairman of the Board of Trustees of the MMS Funds) and Kenneth W. Corba (the former chief executive officer of PEA and former portfolio manager of the PEA Growth and PEA Growth & Income Funds) had, among other things, violated and/or aided and abetted violations of, various antifraud provisions of the federal securities laws in connection with alleged “market timing” arrangements that improperly allowed certain hedge funds to engage in “market timing” in the PEA Growth Fund, the PEA Opportunity Fund, the PEA Innovation Fund, and the PEA Target Fund. The complaint seeks injunctive relief, disgorgement plus pre-judgment interest, monetary penalties, and an order permanently enjoining the defendants from serving as investment advisers, principal underwriters, officers, directors, or members of any advisory boards to any registered investment companies.
On February 20, 2004, a putative class action lawsuit was filed in the U.S. District Court for the District of New Jersey on behalf of certain shareholders of the PIMCO Funds against ADAM, PAD, PIMCO, PEA, the PIMS Funds, the MMS Funds, the Trust, PIMCO Commercial Mortgage Securities Trust, Inc. and certain other defendants, alleging that inappropriate market timing activity by certain shareholders caused financial injury to the shareholders of those Funds.
| | | | |
| 16 | | Semi-Annual Report | | June 30, 2004 |
The following additional putative class action lawsuits have been filed against the PIMS Funds, the MMS Funds and/or their affiliates, each related to alleged market-timing activity in funds advised by PIMCO or its affiliates: (1) a lawsuit filed in the U.S. District Court for the District of Connecticut on February 27, 2004 (naming as defendants ADAM, PAD, PEA, the PIMS Funds, the MMS Funds, the Trust, PCM and certain other parties); (2) a lawsuit filed in the U.S. District Court for the Central District of California on March 4, 2004 (naming as defendants PIMCO, ADAM, PEA and PAD); (3) a lawsuit filed in the U.S. District Court for the Southern District of New York on March 8, 2004 (naming PIMCO, PAD and certain of their affiliates as defendants); (4) a lawsuit filed in the U.S. District Court for the Southern District of New York, on March 15, 2004 (naming PIMCO as the defendant); (5) two separate lawsuits filed in the U.S. District Court for the Central District of California on March 22, 2004, brought derivatively on behalf of the PIMCO High Yield Fund and the PIMCO Money Market Fund, respectively (each naming ADAM, PAFM and certain other parties as defendants, and the PIMCO Funds as the nominal defendant); (6) a lawsuit filed in the U.S. District Court for the Central District of California, also on March 22, 2004, brought derivatively on behalf of the PIMS Funds and the MMS Funds (naming ADAM, PIMCO, PAD and certain other parties as defendants, and the PIMS Funds and the MMS Funds as nominal defendants); (7) a lawsuit filed in the U.S. District Court for the District of New Jersey on April 20, 2004 (naming ADAM, PAD, the PIMS Funds and certain other parties as defendants); and (8) a lawsuit filed in the U.S. District Court for the Northern District of California on April 28, 2004 (naming ADAM, PIMCO, PAD, PEA and certain other parties as defendants, and the “PIMCO Funds” as nominal defendants). Each complaint for the foregoing putative class actions alleges, among other things, that inappropriate trading by shareholders engaged in market timing activities took place in certain of the funds advised by PIMCO, and each complaint seeks unspecified compensatory damages.
On February 17, 2004, a putative class action lawsuit was filed in the U.S. District Court for the District of Connecticut on behalf of certain shareholders of the PIMCO Funds against ADAM, PEA, PIMCO, PIMS Funds, MMS Funds and certain other defendants, alleging excessive investment advisory fees and the use of brokerage commissions to pay for distribution of fund shares. Three similar putative class action lawsuits were subsequently filed, each in the U.S. District Court for the District of Connecticut on March 1, 2004, April 23, 2004 and May 20, 2004, respectively.
Under Section 9(a) of the 1940 Act, if any of the various lawsuits were to result in a court injunction against PAFM, PEA, PAD, PIMCO, ADAM and/or Mr. Treadway, they and their affiliates would, in the absence of exemptive relief granted by the SEC, be barred from serving as an investment adviser/sub-adviser or principal underwriter for any registered investment company, including the Trust. ADAM and certain of its subsidiaries have responded to inquiries from the SEC concerning the status of the New Jersey Settlement under Section 9(a). If any of PAFM, PEA, PAD, PIMCO or ADAM were subject to an injunction, each of these entities and their affiliates could in turn seek exemptive relief from the SEC, as contemplated by the 1940 Act. There is no assurance, however, that such exemptive relief would be granted. The SEC also has the power by order to prohibit PAFM, PEA, PAD and PIMCO from serving as investment advisers and underwriters, if the SEC finds that such entities willfully violated the federal securities laws in connection with the allegations discussed above or aided or abetted such violations.
PIMCO, PAD and the Trust believe that these developments will not have a material adverse effect on the Portfolios or on PIMCO’s, or PAD’s ability to perform their respective investment advisory or distribution services on behalf of the Portfolios.
| | | | |
| June 30, 2004 | | Semi-Annual Report | | 17 |
Trustees and Officers
Brent R. Harris, Chairman and Trustee
R. Wesley Burns, President and Trustee
E. Philip Cannon, Trustee
Vern O. Curtis, Trustee
J. Michael Hagan, Trustee
William J. Popejoy, Trustee
Garlin G. Flynn, Secretary
John P. Hardaway, Treasurer
Investment Adviser and Administrator
Pacific Investment Management Company LLC
840 Newport Center Drive
Newport Beach, California 92660
Distributor
PA Distributors LLC
2187 Atlantic Street
Stamford, Connecticut 06902
Custodian
State Street Bank & Trust Company
801 Pennsylvania
Kansas City, Missouri 64105
Transfer Agent
Boston Financial Data Services–Midwest
330 W. 9th Street
Kansas City, Missouri 64105
Legal Counsel
Dechert LLP
1775 I Street, N.W.
Washington, D.C. 20006
Independent Registered Public Accounting Firm
PricewaterhouseCoopers LLP
1055 Broadway
Kansas City, Missouri 64105
Information about how the Fund voted proxies relating to portfolio securities held during the year July 1, 2003 through June 30, 2004 will be available no later than August 31, 2004 without charge, upon request, by calling the Trust at 1-800-927-4648 and on the SEC’s website at http://www.sec.gov.
Copies of the written Proxy Policy and the factors that PIMCO may consider in determining how to vote proxies for the Funds are available by calling the Trust at 1-800-927-4648 and on the SEC’s website at http://www.sec.gov.
PIMCO VARIABLE INSURANCE TRUST
840 NEWPORT CENTER DRIVE
NEWPORT BEACH, CA 92660

PIMCO VARIABLE INSURANCE TRUST
TOTAL RETURN PORTFOLIO II
INSTITUTIONAL CLASS
SEMI-ANNUAL REPORT
June 30, 2004
|
| This material is authorized for use only when preceded or accompanied by the current PIMCO Variable Insurance Trust prospectus. Investors should consider the investment objectives, risks, charges and expenses of Portfolio carefully before investing. This and other information is contained in the Portfolio’s prospectus. Please read the prospectus carefully before you invest or send money. |
Chairman’s Letter
Dear PIMCO Variable Insurance Trust Shareholder:
Bond prices were more volatile during the six-month period ended June 30, 2004. Interest rates rose sharply during the second quarter 2004, causing bonds to give back modest gains from earlier in the year. The Lehman Brothers Aggregate Bond Index, a widely used index for the high-grade bond market, was nearly flat during the first six months of 2004, returning 0.15% after losing 2.44% during the second quarter. The yield on the benchmark ten-year Treasury closed June 30, 2004 at 4.58%, up 0.75% from April 1, 2004, but up only 0.34% from where it began the six-month period on January 1, 2004.
Continued growth in employment convinced the markets that the Federal Reserve would soon begin a long anticipated tightening cycle. On June 30, 2004, the Fed met market expectations by increasing the federal funds rate 0.25%, which was the first rate increase since June 25, 2003. The central bank had held this rate at 1% for more than a year, which generated negative real short-term rates. And on August 10, 2004, the Fed increased the federal funds rate another 0.25% to 1.50%.
Investors that had profited handsomely from borrowing at low short-term rates and investing in higher-yielding longer maturity bonds surrendered some of those profits towards the latter part of the six-month period. Concern that borrowing rates would rise led investors to liquidate long positions and unwind these trades, which caused bond prices to decrease. However, substantial leverage remained among banks, hedge funds, and other investors, making bond markets somewhat vulnerable to additional Fed rate increases. There were also signs of rising inflation, which fueled anxiety that central banks might continue to raise interest rates.
On the following pages you will find a more complete review of the Portfolio in light of financial market activities as well as specific details about the total return investment performance for the six-month period.
We appreciate the trust you have placed in us, and we will continue to focus our efforts to meet your investment needs.
Sincerely,

Brent R. Harris
Chairman
August 11, 2004
| | | | |
| June 30, 2004 | | Semi-Annual Report | | 1 |
Important Information About the Portfolio
We believe that bond funds have an important role to play in a well diversified investment portfolio. It is important to note, however, that in an environment where interest rates may trend upward, rising rates will negatively impact the performance of most bond funds, and fixed income securities held by a fund are likely to decrease in value. The price volatility of fixed income securities can also increase during periods of rising interest rates resulting in increased losses to a fund. Bond funds and individual bonds with a longer duration (a measure of the expected life of a security) tend to be more sensitive to changes in interest rates, usually making them more volatile than securities or funds with shorter durations. The longer-term performance of most bond funds has benefited from capital gains in part resulting from an extended period of declining interest rates. In the event interest rates increase, these capital gains should not be expected to recur.
The Portfolio may be subject to various risks in addition to those described above. Some of these risks may include, but are not limited to, the following: real rate risk, derivative risk, small company risk, foreign security risk, high yield security risk and specific sector investment risks. The Portfolio may use derivative instruments for hedging purposes or as part of an investment strategy. Use of these instruments may involve certain costs and risks such as liquidity risk, interest rate risk, market risk, credit risk, management risk and the risk that a fund could not close out a position when it would be most advantageous to do so. A Portfolio investing in derivatives could lose more than the principal amount invested in these instruments. Investing in non-U.S. securities may entail risk due to non-U.S. economic and political developments; this risk may be enhanced when investing in emerging markets. High-yield bonds typically have a lower credit rating than other bonds. Lower rated bonds generally involve a greater risk to principal than higher rated bonds. Smaller companies may be more volatile than larger companies and may entail more risk. Concentrating investments in individual sectors may add additional risk and volatility compared to a diversified portfolio.
On the performance summary page in this semi-annual report, the Total Return Investment Performance table measures performance assuming that all dividend and capital gain distributions were reinvested. Returns do not reflect the deduction of taxes that a shareholder would pay (i) on Portfolio distributions or (ii) the redemption of Portfolio shares.
An investment in a Portfolio is not a bank deposit and is not guaranteed or insured by the Federal Deposit Insurance Corporation or any other government agency. It is possible to lose money on investments in the Funds.
The following disclosure provides important information regarding the Portfolio’s Expense Example, which appears on the Portfolio’s individual page in this semi-annual report. Please refer to this information when reviewing the Expense Example for the Portfolio.
Example
As a shareholder of the Portfolio, you incur two types of costs: (1) transaction costs, including redemption and exchange fees; and (2) ongoing costs, including advisory and administrative fees; distribution and/or service (12b-1) fees (Administrative Class only); and other Portfolio expenses. The Example is intended to help you understand your ongoing costs (in dollars) of investing in the Portfolio and to compare these costs with the ongoing costs of investing in other mutual funds.
The Example is based on an investment of $1,000 invested at the beginning of the period and held for the entire period indicated, which is from 1/1/04 to 6/30/04.
Actual Expenses
The information in the table under the heading “Actual Performance” provides information about actual account values and actual expenses. You may use the information in these columns, together with the amount you invested, to estimate the expenses that you paid over the period. Simply divide your account value by $1,000.00 (for example, an $8,600.00 account value divided by $1,000 = 8.60), then multiply the result by the number in the appropriate column for your share class, in the row entitled “Expenses Paid During Period” to estimate the expenses you paid on your account during this period.
Hypothetical Example for Comparison Purposes
The information in the table under the heading “Hypothetical Performance (5% return before expenses)” provides information about hypothetical account values and hypothetical expenses based on the Portfolio’s actual expense ratio and an assumed rate of return of 5% per year before expenses, which is not the Portfolio’s actual return. The hypothetical account values and expenses may not be used to estimate the actual ending account balance or expenses you paid for the period. You may use this information to compare the ongoing costs of investing in the Portfolio and other portfolios. To do so, compare this 5% hypothetical example with the 5% hypothetical examples that appear in the shareholder reports of the other portfolios.
Please note that the expenses shown in the table are meant to highlight your ongoing costs only and do not reflect any transactional costs. Therefore, the information under the heading “Hypothetical Performance (5% return before expenses)” is useful in comparing ongoing costs only, and will not help you determine the relative total costs of owning different portfolios. In addition, if these transactional costs were included, your costs would have been higher.
PIMCO Variable Insurance Trust is distributed by PA Distributors LLC, 2187 Atlantic Street, Stamford, CT 06902.
| | | | |
| 2 | | Semi-Annual Report | | June 30, 2004 |
Total Return Portfolio II
CUMULATIVE RETURNS THROUGH JUNE 30, 2004
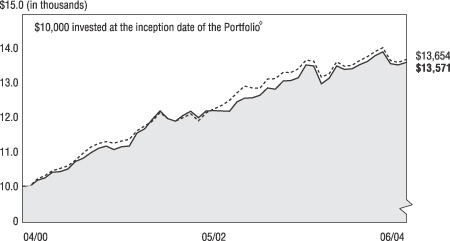
[CHART]
Total Return Lehman Brothers
Portfolio II Inst. Class Aggregate Bond Index
------------------------ --------------------
04/30/2000 $10,000 $10,000
05/31/2000 $9,986 $9,995
06/30/2000 $10,167 $10,203
07/31/2000 $10,235 $10,296
08/31/2000 $10,401 $10,445
09/30/2000 $10,416 $10,511
10/31/2000 $10,492 $10,580
11/30/2000 $10,715 $10,753
12/31/2000 $10,807 $10,953
01/31/2001 $10,963 $11,132
02/28/2001 $11,093 $11,229
03/31/2001 $11,159 $11,285
04/30/2001 $11,057 $11,238
05/31/2001 $11,137 $11,306
06/30/2001 $11,156 $11,349
07/31/2001 $11,533 $11,603
08/31/2001 $11,654 $11,736
09/30/2001 $11,927 $11,872
10/31/2001 $12,173 $12,121
11/30/2001 $11,951 $11,954
12/31/2001 $11,875 $11,878
01/31/2002 $12,038 $11,974
02/28/2002 $12,158 $12,090
03/31/2002 $11,981 $11,889
04/30/2002 $12,174 $12,119
05/31/2002 $12,178 $12,222
06/30/2002 $12,176 $12,328
07/31/2002 $12,158 $12,477
08/31/2002 $12,430 $12,688
09/30/2002 $12,544 $12,893
10/31/2002 $12,546 $12,834
11/30/2002 $12,624 $12,831
12/31/2002 $12,840 $13,096
01/31/2003 $12,795 $13,107
02/28/2003 $13,039 $13,288
03/31/2003 $13,048 $13,278
04/30/2003 $13,130 $13,388
05/31/2003 $13,505 $13,637
06/30/2003 $13,471 $13,610
07/31/2003 $12,960 $13,153
08/31/2003 $13,112 $13,240
09/30/2003 $13,469 $13,590
10/31/2003 $13,370 $13,464
11/30/2003 $13,390 $13,496
12/31/2003 $13,513 $13,633
01/31/2004 $13,607 $13,743
02/29/2004 $13,765 $13,892
03/31/2004 $13,878 $13,996
04/30/2004 $13,535 $13,632
05/31/2004 $13,505 $13,577
06/30/2004 $13,571 $13,654
SECTOR BREAKDOWN‡
| | | |
Short-Term Instruments | | 62.4 | % |
U.S. Government Agencies | | 16.3 | % |
Corporate Bonds & Notes | | 6.2 | % |
Mortgage-Backed Securities | | 5.4 | % |
U.S. Treasury Obligations | | 4.3 | % |
Municipal Bonds & Notes | | 4.1 | % |
Other | | 1.3 | % |
‡ % of Total Investments as of June 30, 2004
à$10,000 invested at the beginning of the first full month following the inception of the Institutional Class.
TOTAL RETURN INVESTMENT PERFORMANCE For the period ended June 30, 2004
| | | | | | | | | | | | | |
| | | | | | | 6 Months | | | 1 Year | | | Since Inception* | |
| | |
| | Total Return Portfolio II Institutional Class (Inception 04/10/00) | | 0.43 | % | | 0.74 | % | | 7.36 | % |
| | | - - - - - - - | | Lehman Brothers Aggregate Bond Index | | 0.15 | % | | 0.32 | % | | — | |
| | | | | * Annualized. All Portfolio returns are net of fees and expenses. | | | | | | | | | |
Past performance is no guarantee of future results. The performance quoted represents past performance. Investment return and principal value will fluctuate so the Portfolio shares, when redeemed, may be worth more or less than their original cost. Current performance may be lower or higher than the performance data quoted. Performance data current to the most recent month-end is available by calling (800) 927-4648.
Please refer to page 2 herein for an explanation of the information presented in the following Expense Example.
| | | | | | | | | | |
| EXPENSE EXAMPLE | | | | Actual Performance | | | | Hypothetical Performance
(5% return before expenses) |
Beginning Account Value (01/01/04) | | | | $ | 1,000.00 | | | | $ | 1,000.00 |
Ending Account Value (06/30/04) | | | | $ | 1,004.30 | | | | $ | 1,025.00 |
Expenses Paid During Period† | | | | $ | 2.49 | | | | $ | 2.52 |
†Expenses are equal to the Portfolio’s Institutional Class annualized expense ratio of 0.50%, multiplied by the average account value over the period, multiplied by 182/366 (to reflect the one-half year period).
PORTFOLIO INSIGHTS
| • | The Total Return Portfolio II seeks to achieve its investment objective by investing under normal circumstances at least 65% of its total assets in a diversified portfolio of Fixed Income Instruments of varying maturities, with quality, U.S. issuer, and U.S. dollar-denominated security restrictions. |
| • | The Portfolio’s Institutional Class shares outperformed the Lehman Brothers Aggregate Bond Index for the six-month period ended June 30, 2004, returning 0.43% versus 0.15% for the Index. |
| • | The Portfolio’s below-Index duration helped returns, as yields rose over the period. |
| • | An emphasis on short/intermediate maturities was negative, as the yield curve flattened in anticipation of Fed tightening. However, this strategy enhanced security returns via “roll down,” or price appreciation, as bonds are revalued at lower yields over time, given the steepness of the yield curve. |
| • | Substituting Real Return Bonds (TIPS-Treasury Inflation Protected Securities) for nominal Treasuries was positive as TIPS benefited from strong demand for the inflation protection they provide. |
| • | A mortgage underweight was slightly negative, as mortgages outpaced comparable Treasuries; mortgage security selection was positive, however, and more than offset this impact. |
| • | The Portfolio’s underweight to corporate securities was slightly positive, as this sector lagged Treasuries modestly on like-duration basis. |
| | | | |
| June 30, 2004 | | Semi-Annual Report | | 3 |
Financial Highlights
Total Return Portfolio II (Institutional Class)
| | | | | | | | | | | | | | | | | | | | | | | | | | | | | | |
| Selected Per Share Data for the Year or Period Ended: | | | | 06/30/2004+ | | | | | 12/31/2003 | | | | | 12/31/2002 | | | | | 12/31/2001 | | | | | 04/10/2000-
12/31/2000 | |
| | | | | | | | | | |
Net asset value beginning of period | | | | $ | 10.31 | | | | | $ | 10.09 | | | | | $ | 10.12 | | | | | $ | 10.24 | | | | | $ | 10.02 | |
Net investment income (a) | | | | | 0.08 | (d) | | | | | 0.16 | (d) | | | | | 0.41 | (d) | | | | | 0.50 | (d) | | | | | 0.47 | (d) |
Net realized/unrealized gain (loss) on investments (a) | | | | | (0.03 | )(d) | | | | | 0.36 | (d) | | | | | 0.39 | (d) | | | | | 0.49 | (d) | | | | | 0.25 | (d) |
Total income from investment operations | | | | | 0.05 | | | | | | 0.52 | | | | | | 0.80 | | | | | | 0.99 | | | | | | 0.72 | |
Dividends from net investment income | | | | | (0.08 | ) | | | | | (0.21 | ) | | | | | (0.41 | ) | | | | | (0.50 | ) | | | | | (0.50 | ) |
Distributions from net realized capital gains | | | | | 0.00 | | | | | | (0.09 | ) | | | | | (0.42 | ) | | | | | (0.61 | ) | | | | | 0.00 | |
Total distributions | | | | | (0.08 | ) | | | | | (0.30 | ) | | | | | (0.83 | ) | | | | | (1.11 | ) | | | | | (0.50 | ) |
Net asset value end of period | | | | $ | 10.28 | | | | | $ | 10.31 | | | | | $ | 10.09 | | | | | $ | 10.12 | | | | | $ | 10.24 | |
Total return | | | | | 0.43 | % | | | | | 5.24 | % | | | | | 8.13 | % | | | | | 9.88 | % | | | | | 7.41 | % |
Net assets end of period (000s) | | | | $ | 117 | | | | | $ | 16 | | | | | $ | 1,217 | | | | | $ | 3,845 | | | | | $ | 3,499 | |
Ratio of net expenses to average net assets | | | | | 0.50 | %* | | | | | 0.50 | % | | | | | 0.51 | %(c) | | | | | 0.50 | %(b) | | | | | 0.50 | %* |
Ratio of net investment income to average net assets | | | | | 1.59 | %*(d) | | | | | 1.56 | %(d) | | | | | 3.97 | %(d) | | | | | 4.70 | %(d) | | | | | 6.62 | %*(d) |
Portfolio turnover rate | | | | | 116 | % | | | | | 863 | % | | | | | 418 | % | | | | | 606 | % | | | | | 937 | % |
| (a) | Per share amounts based on average number of shares outstanding during the period. |
| (b) | If the investment manager had not reimbursed expenses, the ratio of expenses to average net assets would have been 0.51%. |
| (c) | Ratio of expenses to average net assets excluding interest expense is 0.50%. |
| (d) | Indicates a period in which, as a result of a change in generally accepted accounting principles, the portfolio has reclassified periodic payments made or received under certain derivative instruments, which were previously included within miscellaneous income, to a component of realized gain (loss) in the Statement of Operations. The effect of this reclassification was to increase the net investment income ratio for the period ending June 30, 2004 by 0.06% and the net investment income per share by $0.01. For consistency, similar reclassifications have been made to prior period amounts, resulting in (reductions) to the net investment income ratio of 0.00%, (0.02)%, (0.01)% and (0.28)% and to the net investment income per share of $0.00, $0.00, $0.00 and $(0.03) in the fiscal years or periods ending December 31, 2003, 2002, 2001, and 2000, respectively. This change has no impact on the reported net asset value per share for any period. |
| | | | | | |
| 4 | | Semi-Annual Report | | June 30, 2004 | | See accompanying notes |
Statement of Assets and Liabilities
Total Return Portfolio II
| | | | | |
| June 30, 2004 (unaudited) | | | | |
| Amounts in thousands, except per share amounts | | | | |
| | |
Assets: | | | | | |
| | |
Investments, at value | | | | $ | 18,903 |
Cash | | | | | 1 |
Receivable for investments sold on a delayed delivery basis | | | | | 625 |
Interest and dividends receivable | | | | | 43 |
Variation margin receivable | | | | | 67 |
Swap premiums paid | | | | | 1 |
Unrealized appreciation on swap agreements | | | | | 4 |
| | | | | | 19,644 |
| | |
Liabilities: | | | | | |
| | |
Payable for investments purchased | | | | $ | 1,461 |
Payable for short sale | | | | | 638 |
Written options outstanding | | | | | 14 |
Payable for Portfolio shares redeemed | | | | | 14 |
Accrued investment advisory fee | | | | | 4 |
Accrued administration fee | | | | | 4 |
Accrued servicing fee | | | | | 2 |
Variation margin payable | | | | | 2 |
Swap premiums received | | | | | 15 |
| | | | | | 2,154 |
| | |
Net Assets | | | | $ | 17,490 |
| | |
Net Assets Consist of: | | | | | |
| | |
Paid in capital | | | | $ | 17,089 |
Undistributed net investment income | | | | | 248 |
Accumulated undistributed net realized gain | | | | | 89 |
Net unrealized appreciation | | | | | 64 |
| | | | | $ | 17,490 |
| | |
Net Assets: | | | | | |
| | |
Institutional Class | | | | $ | 117 |
Administrative Class | | | | | 17,373 |
| | |
Shares Issued and Outstanding: | | | | | |
| | |
Institutional Class | | | | | 11 |
Administrative Class | | | | | 1,690 |
| | |
Net Asset Value and Redemption Price Per Share
(Net Assets Per Share Outstanding) | | | | | |
| | |
Institutional Class | | | | $ | 10.28 |
Administrative Class | | | | | 10.28 |
| | |
Cost of Investments Owned | | | | $ | 18,887 |
| | | | | | |
| See accompanying notes | | June 30, 2004 | | Semi-Annual Report | | 5 |
Statement of Operations
Total Return Portfolio II
| | | | | | |
| Amounts in thousands | | | | | |
| | | | | Six Months Ended
June 30, 2004
(Unaudited) | |
Investment Income: | | | | | | |
| | |
Interest | | | | $ | 171 | |
Dividends | | | | | 2 | |
Total Income | | | | | 173 | |
| | |
Expenses: | | | | | | |
| | |
Investment advisory fees | | | | | 22 | |
Administration fees | | | | | 22 | |
Distribution and/or servicing fees - Administrative Class | | | | | 13 | |
Total Expenses | | | | | 57 | |
| | |
Net Investment Income | | | | | 116 | |
| | |
Net Realized and Unrealized Gain (Loss): | | | | | | |
| | |
Net realized gain on investments | | | | | 87 | |
Net realized gain on futures contracts, options, and swaps | | | | | 13 | |
Net change in unrealized (depreciation) on investments | | | | | (115 | ) |
Net change in unrealized (depreciation) on futures contracts,
options, and swaps | | | | | (40 | ) |
Net (Loss) | | | | | (55 | ) |
| | |
Net Increase in Assets Resulting from Operations | | | | $ | 61 | |
| | | | | | |
| 6 | | Semi-Annual Report | | June 30, 2004 | | See accompanying notes |
Statements of Changes in Net Assets
Total Return Portfolio II
| | | | | | | | | | | | |
| Amounts in thousands | | | | | | | | | | |
| | | | | Six Months Ended
June 30, 2004
(Unaudited) | | | | | Year Ended
December 31, 2003 | |
Increase (Decrease) in Net Assets from: | | | | | | | | | | | | |
| | | | |
Operations: | | | | | | | | | | | | |
| | | | |
Net investment income | | | | $ | 116 | | | | | $ | 279 | |
Net realized gain | | | | | 100 | | | | | | 359 | |
Net change in unrealized appreciation (depreciation) | | | | | (155 | ) | | | | | 213 | |
Net increase resulting from operations | | | | | 61 | | | | | | 850 | |
| | | | |
Distributions to Shareholders: | | | | | | | | | | | | |
| | | | |
From net investment income | | | | | | | | | | | | |
Institutional Class | | | | | 0 | | | | | | (2 | ) |
Administrative Class | | | | | (115 | ) | | | | | (323 | ) |
| | | | |
From net realized capital gains | | | | | | | | | | | | |
Institutional Class | | | | | 0 | | | | | | 0 | |
Administrative Class | | | | | 0 | | | | | | (150 | ) |
Total Distributions | | | | | (115 | ) | | | | | (475 | ) |
| | | | |
Portfolio Share Transactions: | | | | | | | | | | | | |
| | | | |
Receipts for shares sold | | | | | | | | | | | | |
Institutional Class | | | | | 106 | | | | | | 0 | |
Administrative Class | | | | | 4 | | | | | | 0 | |
| | | | |
Issued as reinvestment of distributions | | | | | | | | | | | | |
Institutional Class | | | | | 0 | | | | | | 2 | |
Administrative Class | | | | | 115 | | | | | | 473 | |
| | | | |
Cost of shares redeemed | | | | | | | | | | | | |
Institutional Class | | | | | (6 | ) | | | | | (1,200 | ) |
Administrative Class | | | | | (164 | ) | | | | | (260 | ) |
Net increase (decrease) resulting from Portfolio share transactions | | | | | 55 | | | | | | (984 | ) |
| | | | |
Total Increase (Decrease) in Net Assets | | | | | 1 | | | | | | (609 | ) |
| | | | |
Net Assets: | | | | | | | | | | | | |
| | | | |
Beginning of period | | | | | 17,489 | | | | | | 18,099 | |
End of period* | | | | $ | 17,490 | | | | | $ | 17,489 | |
| | | | |
*Including undistributed net investment income of: | | | | $ | 248 | | | | | $ | 246 | |
| | | | | | |
| See accompanying notes | | June 30, 2004 | | Semi-Annual Report | | 7 |
Schedule of Investments
Total Return Portfolio II
June 30, 2004 (Unaudited)
| | | | |
| | | Principal | | |
| | | Amount | | Value |
| | | (000s) | | (000s) |
| | | | | | |
CORPORATE BONDS & NOTES 6.6% |
Banking & Finance 3.9% |
CIT Group, Inc. | | | | | | |
2.490% due 07/30/2004 (a) | | $ | 40 | | $ | 40 |
2.670% due 01/31/2005 (a) | | | 100 | | | 101 |
Ford Motor Credit Co. | | | | | | |
3.045% due 10/25/2004 (a) | | | 200 | | | 201 |
General Motors Acceptance Corp. | | | | | | |
1.499% due 07/21/2004 (a) | | | 100 | | | 100 |
3.158% due 05/19/2005 (a) | | | 100 | | | 101 |
UBS Preferred Funding Trust I | | | | | | |
8.622% due 10/29/2049 (a) | | | 100 | | | 119 |
Verizon Wireless Capital LLC | | | | | | |
1.350% due 05/23/2005 (a) | | | 30 | | | 30 |
| | | | | |
|
|
| | | | | | | 692 |
| | | | | |
|
|
Industrials 0.8% |
El Paso Corp. | | | | | | |
6.750% due 05/15/2009 | | | 50 | | | 46 |
Williams Cos., Inc. | | | | | | |
7.875% due 09/01/2021 | | | 100 | | | 97 |
| | | | | |
|
|
| | | | | | | 143 |
| | | | | |
|
|
Utilities 1.9% |
AEP Texas Central Co. | | | | | | |
2.500% due 02/15/2005 (a) | | | 10 | | | 10 |
Appalachian Power Co. | | | | | | |
4.800% due 06/15/2005 | | | 20 | | | 20 |
Entergy Gulf States, Inc. | | | | | | |
2.433% due 06/18/2007 (a) | | | 100 | | | 100 |
Pacific Gas & Electric Co. | | | | | | |
1.810% due 04/03/2006 (a) | | | 200 | | | 200 |
| | | | | |
|
|
| | | | | | | 330 |
| | | | | |
|
|
| Total Corporate Bonds & Notes (Cost $1,141) | | | | | | 1,165 |
| | | | | |
|
|
| | | | | | | |
MUNICIPAL BONDS & NOTES 4.4% |
| |
California State Polytechnic University Revenue Bonds, Series 1972 | | | |
5.250% due 01/01/2010 | | | 100 | | | 109 |
City of Chicago, Illinois General Obligation Bonds, (MBIA Insured), Series 2003 | | | |
5.000% due 01/01/2035 | | | 100 | | | 97 |
Energy Northwest Washington
Electric Revenue Bonds, Series 2003 | | | |
5.500% due 07/01/2014 | | | 100 | | | 111 |
La Quinta, California
Redevelopment Agency Tax Allocation Bonds, (AMBAC Insured), Series 2001 |
5.100% due 09/01/2031 | | | 100 | | | 99 |
New Jersey State Tobacco Settlement
Financing Corp. Revenue Bonds, Series 2003 |
4.375% due 06/01/2019 | | | 70 | | | 68 |
New Jersey State Tobacco Settlement Financing Corp., Series 2003 | | | |
6.750% due 06/01/2039 | | | 100 | | | 90 |
New Jersey Transportation Trust Fund Revenue Bonds, Series 2003 | | | |
5.000% due 06/15/2013 | | | 50 | | | 53 |
New York State Environmental Facilities Corp.
Revenue Bonds, Series 2002 |
8.860% due 06/15/2023 (a) | | | 25 | | | 26 |
New York Transitional Finance Authority Revenue Bonds, Series 2003 | | | |
5.000% due 02/01/2033 | | | 100 | | | 97 |
University of Texas Revenue Bonds, Series 2003 |
5.000% due 08/15/2033 | | | 20 | | | 20 |
| | | | | |
|
|
| Total Municipal Bonds & Notes (Cost $791) | | | | | | 770 |
| | | | | |
|
|
| | | | | | |
U.S. GOVERNMENT AGENCIES 17.6% |
| | |
Fannie Mae | | | | | | |
6.500% due 08/01/2032 | | $ | 33 | | $ | 34 |
1.420% due 03/25/2034 (a) | | | 97 | | | 97 |
5.090% due 09/01/2034 (a) | | | 58 | | | 60 |
4.797% due 12/01/2036 (a) | | | 56 | | | 58 |
6.000% due 06/01/2016-
07/25/2024 (b) | | | 280 | | | 290 |
5.000% due 06/01/2018-
07/15/2034 (b) | | | 1,128 | | | 1,112 |
5.500% due 10/01/2017-
07/15/2034 (b) | | | 1,163 | | | 1,159 |
Federal Home Loan Bank | | | | | | |
5.500% due 03/15/2015 | | | 2 | | | 2 |
Freddie Mac | | | | | | |
6.000% due 09/01/2016 | | | 22 | | | 23 |
3.579% due 07/01/2027 (a) | | | 7 | | | 7 |
3.532% due 01/01/2028 (a) | | | 7 | | | 7 |
5.500% due 08/15/2030 | | | 35 | | | 36 |
6.500% due 08/01/2032 | | | 24 | | | 26 |
5.000% due 10/01/2018-
10/15/2026 (b) | | | 111 | | | 112 |
Government National Mortgage Association | | | |
3.375% due 02/20/2027 (a) | | | 28 | | | 28 |
3.500% due 05/20/2030 (a) | | | 20 | | | 20 |
1.780% due 09/20/2030 (a) | | | 9 | | | 9 |
| | | | | |
|
|
| Total U.S. Government Agencies (Cost $3,079) | | | | | | 3,080 |
| | | | | |
|
|
| | | | | | | |
U.S. TREASURY OBLIGATIONS 4.7% |
| |
Treasury Inflation Protected Securities (d) | | | |
3.375% due 01/15/2007 (c) | | | 119 | | | 127 |
3.625% due 01/15/2008 | | | 163 | | | 178 |
3.875% due 01/15/2009 | | | 458 | | | 512 |
| | | | | |
|
|
| Total U.S. Treasury Obligations (Cost $799) | | | | | | 817 |
| | | | | |
|
|
| | | | | | | |
MORTGAGE-BACKED SECURITIES 5.9% |
| |
Bank of America Mortgage Securities, Inc. | | | |
6.500% due 10/25/2031 | | | 64 | | | 64 |
6.500% due 02/25/2033 | | | 15 | | | 15 |
Bear Stearns Adjustable Rate Mortgage Trust |
6.053% due 08/25/2032 (a) | | | 3 | | | 3 |
5.134% due 03/25/2033 (a) | | | 36 | | | 37 |
4.802% due 12/25/2033 (a) | | | 79 | | | 79 |
Countrywide Home Loans, Inc. | | | | | | |
5.699% due 03/19/2032 (a) | | | 3 | | | 3 |
CS First Boston Mortgage Securities Corp. | | | |
6.202% due 04/25/2032 (a) | | | 1 | | | 1 |
5.192% due 06/25/2032 (a) | | | 16 | | | 16 |
6.222% due 06/25/2032 (a) | | | 12 | | | 13 |
2.360% due 08/25/2033 (a) | | | 17 | | | 17 |
GSMPS Mortgage Loan Trust | | | | | | |
7.000% due 07/25/2043 | | | 65 | | | 68 |
GSR Mortgage Loan Trust | | | | | | |
6.000% due 03/25/2032 | | | 17 | | | 17 |
Impac CMB Trust | | | | | | |
1.700% due 07/25/2033 (a) | | | 84 | | | 84 |
1.550% due 01/25/2034 (a) | | | 95 | | | 95 |
MASTR Asset Securitization Trust | | | |
5.500% due 09/25/2033 | | | 65 | | | 63 |
Merrill Lynch Mortgage Investors, Inc. | | | |
2.825% due 01/25/2029 (a) | | | 92 | | | 94 |
1.600% due 01/20/2030 (a) | | | 4 | | | 4 |
Prime Mortgage Trust | | | | | | |
1.700% due 02/25/2034 (a) | | | 71 | | | 71 |
Residential Funding Mortgage Securities I, Inc. |
5.603% due 09/25/2032 (a) | | | 3 | | | 3 |
| | | | | | |
| |
Structured Asset Mortgage Investments, Inc. | | | |
1.610% due 09/19/2032 (a) | | $ | 8 | | $ | 8 |
Structured Asset Securities Corp. | | | | | | |
6.150% due 07/25/2032 (a) | | | 2 | | | 2 |
1.460% due 08/25/2033 (a) | | | 32 | | | 32 |
Washington Mutual Mortgage Securities Corp. |
3.052% due 02/27/2034 (a) | | | 34 | | | 34 |
2.624% due 08/25/2042 (a) | | | 200 | | | 203 |
| | | | | |
|
|
| Total Mortgage-Backed Securities (Cost $1,032) | | | 1,026 |
| | | | | |
|
|
| | | | | | | |
ASSET-BACKED SECURITIES 0.7% |
| |
Amortizing Residential Collateral Trust | | | |
1.570% due 06/25/2032 (a) | | | 15 | | | 15 |
CIT Group Home Equity Loan Trust | | | |
1.570% due 06/25/2033 (a) | | | 10 | | | 10 |
CS First Boston Mortgage Securities Corp. | | | |
1.610% due 01/25/2032 (a) | | | 18 | | | 18 |
Equity One ABS, Inc. | | | | | | |
1.580% due 11/25/2032 (a) | | | 17 | | | 17 |
HFC Home Equity Loan Asset-Backed Certificates |
1.630% due 10/20/2032 (a) | | | 52 | | | 52 |
Household Mortgage Loan Trust | | | | | | |
1.580% due 05/20/2032 (a) | | | 3 | | | 3 |
Irwin Home Equity Loan Trust | | | | | | |
1.590% due 06/25/2029 (a) | | | 3 | | | 3 |
Morgan Stanley Dean Witter Capital I, Inc. | | | |
1.630% due 07/25/2032 (a) | | | 5 | | | 5 |
| | | | | |
|
|
| Total Asset-Backed Securities (Cost $123) | | | | | | 123 |
| | | | | |
|
|
| | | | | | | |
PURCHASED PUT OPTIONS 0.0% |
| | | # of
Contracts | | |
Eurodollar December Futures (CME) | | | |
Strike @ 95.000 Exp. 12/13/2004 | | | 5 | | | 0 |
Eurodollar June Futures (CME) Strike @ 91.000 Exp. 06/13/2005 | | | 16 | | | 0 |
| | | | | |
|
|
| Total Purchased Put Options (Cost $0) | | | | | | 0 |
| | | | | |
|
|
| | | | | | | |
PREFERRED SECURITY 0.7% |
| | | Shares | | |
| | |
DG Funding Trust | | | | | | |
3.360% due 12/29/2049 (a) | | | 11 | | | 118 |
| | | | | |
|
|
| Total Preferred Security (Cost $116) | | | | | | 118 |
| | | | | |
|
|
| | | | | | | |
SHORT-TERM INSTRUMENTS 67.5% |
| | | Principal
Amount
(000s) | | |
Certificates of Deposit 3.4% |
Citibank New York N.A. | | | | | | |
1.215% due 07/30/2004 | | | 300 | | | 300 |
Well Fargo Bank N.A. | | | | | | |
1.090% due 07/07/2004 | | | 300 | | | 300 |
| | | | | |
|
|
| | | | | | | 600 |
| | | | | |
|
|
Commercial Paper 57.1% | | | | | | |
Fannie Mae | | | | | | |
1.010% due 07/01/2004 | | | 800 | | | 800 |
1.030% due 07/01/2004 | | | 200 | | | 200 |
1.025% due 07/07/2004 | | | 300 | | | 300 |
1.045% due 07/21/2004 | | | 400 | | | 400 |
1.060% due 07/21/2004 | | | 400 | | | 400 |
1.056% due 07/28/2004 | | | 400 | | | 400 |
1.063% due 08/04/2004 | | | 100 | | | 100 |
| | | | | | |
| 8 | | Semi-Annual Report | | June 30, 2004 | | See accompanying notes |
| | | | |
| | | Principal | | |
| | | Amount | | Value |
| | | (000s) | | (000s) |
| | | | | | | |
| | |
1.150% due 08/18/2004 | | $ | 200 | | $ | 200 | |
1.180% due 08/25/2004 | | | 200 | | | 200 | |
1.185% due 08/25/2004 | | | 200 | | | 200 | |
1.225% due 09/01/2004 | | | 200 | | | 199 | |
1.230% due 09/01/2004 | | | 200 | | | 199 | |
1.240% due 09/01/2004 | | | 200 | | | 199 | |
1.380% due 09/01/2004 | | | 200 | | | 200 | |
1.130% due 09/08/2004 | | | 200 | | | 199 | |
1.415% due 09/08/2004 | | | 200 | | | 199 | |
1.430% due 09/08/2004 | | | 200 | | | 199 | |
1.415% due 09/15/2004 | | | 400 | | | 399 | |
1.414% due 09/22/2004 | | | 100 | | | 100 | |
1.426% due 09/22/2004 | | | 200 | | | 199 | |
1.435% due 09/22/2004 | | | 400 | | | 399 | |
Federal Home Loan Bank | | | | | | | |
1.165% due 07/16/2004 | | | 100 | | | 100 | |
1.170% due 07/16/2004 | | | 200 | | | 200 | |
1.180% due 08/25/2004 | | | 200 | | | 200 | |
1.090% due 08/27/2004 | | | 200 | | | 200 | |
1.240% due 09/01/2004 | | | 400 | | | 399 | |
1.240% due 09/03/2004 | | | 200 | | | 199 | |
Ford Motor Credit Co. | | | | | | | |
1.010% due 09/03/2004 | | | 100 | | | 100 | |
Freddie Mac | | | | | | | |
1.010% due 07/15/2004 | | | 100 | | | 100 | |
1.200% due 08/09/2004 | | | 200 | | | 399 | |
1.150% due 08/17/2004 | | | 300 | | | 100 | |
1.195% due 08/17/2004 | | | 200 | | | 200 | |
1.175% due 08/24/2004 | | | 100 | | | 100 | |
1.210% due 08/31/2004 | | | 200 | | | 200 | |
1.275% due 09/07/2004 | | | 200 | | | 199 | |
1.410% due 09/14/2004 | | | 200 | | | 199 | |
1.440% due 09/14/2004 | | | 200 | | | 199 | |
1.445% due 09/14/2004 | | | 200 | | | 199 | |
1.465% due 09/28/2004 | | | 100 | | | 100 | |
1.436% due 09/30/2004 | | | 200 | | | 199 | |
1.540% due 10/18/2004 | | | 200 | | | 199 | |
General Electric Capital Corp. | | | | | | | |
1.050% due 07/07/2004 | | | 200 | | | 200 | |
1.300% due 09/08/2004 | | | 300 | | | 299 | |
| | | | | |
|
|
|
| | | | | | | 9,981 | |
| | | | | |
|
|
|
| | |
Repurchase Agreement 3.1% | | | | | | | |
State Street Bank | | | | | | | |
0.800% due 07/01/2004 | | | 550 | | | 550 | |
| | | | | |
|
|
|
(Dated 06/30/2004. Collateralized by Freddie Mac
5.500% due 07/15/2006 valued at $562.
Repurchase proceeds are $550.) | |
| | |
U.S. Treasury Bills 3.9% | | | | | | | |
1.256% due 09/02/2004- 09/16/2004 (b)(c) | | | 675 | | | 673 | |
| | | | | |
|
|
|
| | |
Total Short-Term Instruments
| | | | | | 11,804 | |
(Cost $11,806) | | | | |
|
|
|
| | |
Total Investments 108.1% | | | | | $ | 18,903 | |
(Cost $18,887) | | | | | | | |
| | |
Written Options (f) (0.1%) | | | | | | (14 | ) |
(Premiums $26) | | | | | | | |
| |
Other Assets and Liabilities (Net) (8.0%) | | | (1,399 | ) |
| | | | | |
|
|
|
| |
Net Assets 100.0% | | $ | 17,490 | |
| | | | | |
|
|
|
Notes to Schedule of Investments (amounts in thousands, except number of contracts):
(a) Variable rate security.
(b) Securities are grouped by coupon or range of coupons and represent a range of maturities.
(c) Securities with an aggregate market value of $501 have been segregated with the custodian to cover margin
requirements for the following open futures contracts at
June 30, 2004:
| | | | | | | | |
| Type | | Expiration
Month | | # of
Contracts | | Unrealized Appreciation/ (Depreciation) | |
Eurodollar March
Long Futures | | 03/2005 | | 6 | | $ | (8 | ) |
Eurodollar March
Long Futures | | 03/2006 | | 2 | | | (2 | ) |
Eurodollar June
Long Futures | | 06/2005 | | 8 | | | (11 | ) |
Eurodollar September
Long Futures | | 09/2005 | | 7 | | | (12 | ) |
Eurodollar December
Long Futures | | 12/2004 | | 2 | | | 1 | |
Eurodollar December
Long Futures | | 12/2005 | | 7 | | | (11 | ) |
U.S. Treasury 10-Year Note Long Futures | | 09/2004 | | 52 | | | 66 | |
U.S. Treasury 5-Year Note Long Futures | | 09/2004 | | 31 | | | 21 | |
| | | | | | |
|
|
|
| | | | | | | $ | 44 | |
| | | | | | |
|
|
|
(d) Principal amount of security is adjusted for inflation.
| (e) | Swap agreements outstanding at June 30, 2004: |
| | | | | | | | |
Type | |
| Notional
Amount | | | |
| Unrealized
Appreciation |
| Receive total return on Lehman Commercial Mortgage-Backed Securities Index and pay a floating rate based on 1-month LIBOR less 0.650%. | | | | | |
Counterparty: Bear Stearns & Co., Inc. | | | | | |
Exp. 07/01/2004 | | $ | 10 | | | | $ | 0 |
| | |
| Receive total return on Lehman Commercial Mortgage-Backed Securities Index and pay a floating rate based on 1-month LIBOR less 0.650%. | | | | | |
Counterparty: Bank of America | | | | | |
Exp. 07/31/2004 | | | 50 | | | | | 0 |
| | |
| Receive total return on Lehman Commercial Mortgage-Backed Securities Index and pay a floating rate based on 1-month LIBOR less 0.650%. | | | | | |
Counterparty: Bear Stearns & Co., Inc. | | | | | |
Exp. 08/01/2004 | | | 100 | | | | | 0 |
| | |
| Receive total return on Lehman Commercial Mortgage-Backed Securities Index and pay a floating rate based on 1-month LIBOR less 0.650%. | | | | | |
Counterparty: Bear Stearns & Co., Inc. | | | | | |
Exp. 09/01/2004 | | | 0 | | | | | 0 |
|
Receive total return on Lehman Commercial
Mortgage-Backed Securities Index and pay a
floating rate based on 1-month LIBOR less 0.650%. |
Counterparty: Morgan Stanley Dean Witter & Co. |
Exp. 09/30/2004 | | | 100 | | | | | 0 |
| | | | | | | | |
| Receive a fixed rate equal to 4.000% and pay floating rate based on 3-month LIBOR. | | | | | |
Counterparty: UBS Warburg LLC | | | | | |
Exp. 12/15/2006 | | $ | 100 | | | | $ | 0 |
| |
| Receive a fixed rate equal to 4.000% and pay floating rate based on 3-month LIBOR. | | | |
Counterparty: Barclays Bank PLC | | | | | |
Exp. 12/15/2006 | | | 200 | | | | | 0 |
| |
| Receive a fixed rate equal to 4.000% and pay floating rate based on 3-month LIBOR. | | | |
Counterparty: Bank of America | | | | | |
Exp. 12/15/2009 | | | 400 | | | | | 4 |
| | | | | | | |
|
|
| | | | | | | | $ | 4 |
| | | | | | | |
|
|
| | | | | | |
| See accompanying notes | | June 30, 2004 | | Semi-Annual Report | | 9 |
Schedule of Investments (Cont.)
Total Return Portfolio II
June 30, 2004 (Unaudited)
(f) Premiums received on written options:
| | | | | | | | | | | | | | | | | |
| Name of Issuer | | | | Exercise
Price | | | Expiration
Date | | # of
Contracts | | Premium | | Value |
Call - CBOT U.S. Treasury Note September Futures | | | | $ | 111.500 | | | 08/27/2004 | | | 1 | | $ | 1 | | $ | 0 |
Call - CBOT U.S. Treasury Note September Futures | | | | | 115.000 | | | 08/27/2004 | | | 4 | | | 2 | | | 0 |
Call - CBOT U.S. Treasury Note September Futures | | | | | 111.000 | | | 08/27/2004 | | | 1 | | | 0 | | | 1 |
Call - CBOT U.S. Treasury Note September Futures | | | | | 114.000 | | | 08/27/2004 | | | 2 | | | 1 | | | 0 |
Call - CBOT U.S. Treasury Note September Futures | | | | | 110.000 | | | 08/27/2004 | | | 2 | | | 2 | | | 2 |
Put - CBOT U.S. Treasury Note September Futures | | | | | 107.500 | | | 08/27/2004 | | | 1 | | | 1 | | | 0 |
Put - CBOT U.S. Treasury Note September Futures | | | | | 108.000 | | | 08/27/2004 | | | 2 | | | 3 | | | 1 |
Put - CBOT U.S. Treasury Note September Futures | | | | | 105.000 | | | 08/27/2004 | | | 2 | | | 1 | | | 0 |
| | | | | | | | | | | | | | $ | 11 | | $ | 4 |
| Name of Issuer | | Counterparty | | Exercise
Rate | | | Expiration
Date | | Notional
Amount | | Premium | | Value |
Call - OTC 7-Year Interest Rate Swap | | UBS Warburg LLC | | | 3.800 | %** | | 10/07/2004 | | $ | 100 | | $ | 1 | | $ | 0 |
Call - OTC 7-Year Interest Rate Swap | | Bank of America | | | 6.000 | %** | | 10/19/2004 | | | 100 | | | 4 | | | 7 |
Put - OTC 7-Year Interest Rate Swap | | Bank of America | | | 6.000 | %* | | 10/19/2004 | | | 100 | | | 4 | | | 0 |
Call - OTC 7-Year Interest Rate Swap | | Bank of America | | | 5.200 | %** | | 11/02/2004 | | | 100 | | | 3 | | | 3 |
Put - OTC 7-Year Interest Rate Swap | | Bank of America | | | 6.700 | %* | | 11/02/2004 | | | 100 | | | 3 | | | 0 |
| | | | | | | | | | | | | | $ | 15 | | $ | 10 |
| | | | | |
* The Portfolio will pay a floating rate based on 3-month LIBOR. | | | | | | | | | | | | | | | |
** The Portfolio will receive a floating rate based on 3-month LIBOR. | | | | | | | | | | | | | | | |
| | | | | |
| (g) Short sales open at June 30, 2004 were as follows: | | | | | | | | | | | | | | | |
| Type | | | | Coupon
(%) | | | Maturity | | Par | | Value | | Proceeds |
U.S. Treasury Bond | | | | | 6.250 | | | 08/15/2023 | | $ | 100 | | $ | 111 | | $ | 109 |
U.S. Treasury Bond | | | | | 6.250 | | | 05/15/2030 | | | 200 | | | 224 | | | 218 |
U.S. Treasury Bond | | | | | 5.375 | | | 02/15/2031 | | | 200 | | | 202 | | | 198 |
U.S. Treasury Note | | | | | 4.750 | | | 05/15/2014 | | | 100 | | | 101 | | | 100 |
| | | | | | | | | | | | | | $ | 638 | | $ | 625 |
| | | | | | |
| 10 | | Semi-Annual Report | | June 30, 2004 | | See accompanying notes |
Notes to Financial Statements
June 30, 2004 (Unaudited)
1. Organization
The Total Return Portfolio II (the “Portfolio”) is a series of the PIMCO Variable Insurance Trust (the “Trust”). The Trust is registered under the Investment Company Act of 1940 (the “Act”), as amended, as an open-end investment company organized as a Delaware business trust on October 3, 1997. The Portfolio offers two classes of shares: Institutional and Administrative. Each share class has identical voting rights (except that shareholders of a class have exclusive voting rights regarding any matter relating solely to that class of shares). Information presented in these financial statements pertains to the Institutional Class of the Portfolio. Certain detailed financial information for the Administrative Class is provided separately and is available upon request. The Trust is designed to be used as an investment vehicle by Separate Accounts of insurance companies that fund variable annuity contracts and variable life insurance policies and by qualified pension and retirement plans. The Portfolio commenced operations on May 28, 1999.
2. Significant Accounting Policies
The following is a summary of significant accounting policies consistently followed by the Trust in the preparation of its financial statements in conformity with accounting principles generally accepted in the United States of America. The preparation of financial statements in accordance with accounting principles generally accepted in the United States of America requires management to make estimates and assumptions that affect the reported amounts and disclosures in the financial statements. Actual results could differ from those estimates.
Security Valuation. Portfolio securities and other financial instruments for which market quotations are readily available are stated at market value. Portfolio securities and other financial instruments for which market quotes are not readily available are valued at fair value, as determined in good faith and pursuant to guidelines established by the Board of Trustees, including certain fixed income securities which may be valued with reference to securities whose prices are more readily obtainable. Market value is determined at the close of regular trading (normally, 4:00 p.m., Eastern Time) on the New York Stock Exchange on each day the New York Stock Exchange is open, or if no sales are reported, as is the case for most securities traded over-the-counter, the mean between representative bid and asked quotations obtained from a quotation reporting system or from established market makers. The prices of certain portfolio securities or other financial instruments may be determined at a time prior to the close of regular trading on the New York Stock Exchange. Fair valuation may be used if significant events occur after the close of the relevant markets and prior to the close of regular trading on the New York Stock Exchange that materially affect the values of such securities or financial instruments. Fixed income securities are normally valued on the basis of quotes obtained from brokers and dealers or pricing services. Certain fixed income securities purchased on a delayed delivery basis are marked to market daily until settlement at the forward settlement value. Short-term investments, which mature in 60 days or less are valued at amortized cost, which approximates market value. Exchange traded options, futures and options on futures are valued at the settlement price determined by the relevant exchange. Prices may be obtained from independent pricing services which use information provided by market makers or estimates of market values obtained from yield data relating to investments or securities with similar characteristics. The prices used by the Portfolio may differ from the value that would be realized if the securities were sold and the differences could be material to the financial statements.
Securities Transactions and Investment Income. Securities transactions are recorded as of the trade date. Securities purchased or sold on a when-issued or delayed delivery basis may be settled a month or more after the trade date. Realized gains and losses from securities sold are recorded on the identified cost basis. Dividend income is recorded on the ex-dividend date, except certain dividends from foreign securities where the ex-dividend date may have passed, are recorded as soon as the Portfolio is informed of the ex-dividend date. Interest income, adjusted for the accretion of discounts and amortization of premiums, is recorded on the accrual basis. Paydowns gains and losses on mortgage- and asset-backed securities are recorded as adjustments to interest income in the Statement of Operations.
Dividends and Distributions to Shareholders. Dividends from net investment income, if any, are declared on each day the Trust is open for business and are distributed to shareholders monthly. All dividends are reinvested in additional shares of the Portfolio. Net realized capital gains earned by the Portfolio, if any, will be distributed no less frequently than once each year.
Income dividends and capital gain distributions are determined in accordance with income tax regulations which may differ from accounting principles generally accepted in the United States of America. These differences are primarily due to differing treatments for such items as wash sales, foreign currency transactions, net operating losses, notional principal contracts, certain asset-backed securities, certain futures and forward contracts, tax straddles, and capital loss carryforwards.
Distributions classified as a tax basis return of capital, if any, are reflected in the accompanying Statements of Changes in Net Assets and have been reclassified to paid in capital. In addition, other amounts have been reclassified between undistributed net investment income, accumulated undistributed net realized gains or losses and/or paid in capital to more appropriately conform financial accounting to tax characterizations of dividend distributions.
Multiclass Operations. Each class offered by the Trust has equal rights as to assets. Income, non-class specific expenses, and realized and unrealized capital gains and losses are allocated to each class of shares based on the relative net assets of each class.
Delayed Delivery Transactions. The Portfolio may purchase or sell securities on a when-issued or delayed delivery basis. These transactions involve a commitment by the Portfolio to purchase or
| | | | |
| June 30, 2004 | | Semi-Annual Report | | 11 |
Notes to Financial Statements (Cont.)
June 30, 2004 (Unaudited)
sell securities for a predetermined price or yield, with payment and delivery taking place beyond the customary settlement period. When delayed delivery purchases are outstanding, the Portfolio will designate liquid assets in an amount sufficient to meet the purchase price. When purchasing a security on a delayed delivery basis, the Portfolio assumes the rights and risks of ownership of the security, including the risk of price and yield fluctuations, and takes such fluctuations into account when determining its net asset value. The Portfolio may dispose of or renegotiate a delayed delivery transaction after it is entered into, and may sell when-issued securities before they are delivered, which may result in a capital gain or loss. When the Portfolio has sold a security on a delayed delivery basis, the Portfolio does not participate in future gains and losses with respect to the security.
Federal Income Taxes. The Portfolio intends to qualify as a regulated investment company and distribute all of its taxable income and net realized gains, if applicable, to shareholders. Accordingly, no provision for Federal income taxes has been made.
Futures Contracts. The Portfolio is authorized to enter into futures contracts. The Portfolio may use futures contracts to manage its exposure to the securities markets or to movements in interest rates and currency values. The primary risks associated with the use of futures contracts are the imperfect correlation between the change in market value of the securities held by the Portfolio and the prices of futures contracts, the possibility of an illiquid market, and the inability of the counterparty to meet the terms of the contract. Futures contracts are valued based upon their quoted daily settlement prices. Upon entering into a futures contract, the Portfolio may be required to deposit with its custodian, in a segregated account in the name of the futures broker, an amount of cash or U.S. Government and Agency Obligations in accordance with the initial margin requirements of the broker or exchange. Futures contracts are marked to market daily and an appropriate payable or receivable for the change in value (“variation margin”) is recorded by the Portfolio. Gains or losses are recognized but not considered realized until the contracts expire or are closed. Futures contracts involve, to varying degrees, risk of loss in excess of the variation margin disclosed in the Statement of Assets and Liabilities.
Inflation-Indexed Bonds. The Portfolio may invest in inflation-indexed bonds. Inflation-indexed bonds are fixed income securities whose principal value is periodically adjusted to the rate of inflation. The interest rate on these bonds is generally fixed at issuance at a rate lower than typical bonds. Over the life of an inflation-indexed bond, however, interest will be paid based on a principal value, which is adjusted for inflation. Any increase in the principal amount of an inflation-indexed bond will be included as interest income in the Statement of Operations, even though investors do not receive their principal until maturity.
Options Contracts. The Portfolio may write call and put options on futures, swaps, securities or currencies it owns or in which it may invest. Writing put options tends to increase the Portfolio’s exposure to the underlying instrument. Writing call options tends to decrease the Portfolio’s exposure to the underlying instrument. When the Portfolio writes a call or put option, an amount equal to the premium received is recorded as a liability and subsequently marked to market to reflect the current value of the option written. These liabilities are reflected as written options outstanding in the Statement of Assets and Liabilities. Payments received or made, if any, from writing options with premiums to be determined on a future date are reflected as such on the Statement of Assets and Liabilities. Premiums received from writing options which expire are treated as realized gains. Premiums received from writing options which are exercised or closed are added to the proceeds or offset against amounts paid on the underlying future, swap, security or currency transaction to determine the realized gain or loss. The Portfolio as a writer of an option has no control over whether the underlying future, swap, security or currency may be sold (call) or purchased (put) and as a result bears the market risk of an unfavorable change in the price of the future, swap, security or currency underlying the written option. There is the risk the Portfolio may not be able to enter into a closing transaction because of an illiquid market.
The Portfolio may also purchase put and call options. Purchasing call options tends to increase the Portfolio’s exposure to the underlying instrument. Purchasing put options tends to decrease the Portfolio’s exposure to the underlying instrument. The Portfolio pays a premium which is included in the Portfolio’s Statement of Assets and Liabilities as an investment and subsequently marked to market to reflect the current value of the option. Premiums paid for purchasing options which expire are treated as realized losses. The risk associated with purchasing put and call options is limited to the premium paid. Premiums paid for purchasing options which are exercised or closed are added to the amounts paid or offset against the proceeds on the underlying future, swap, security or currency transaction to determine the realized gain or loss.
Repurchase Agreements. The Portfolio may engage in repurchase transactions. Under the terms of a typical repurchase agreement, the Portfolio takes possession of an underlying debt obligation subject to an obligation of the seller to repurchase, and the Portfolio to resell, the obligation at an agreed-upon price and time. The market value of the collateral must be equal at all times to the total amount of the repurchase obligations, including interest. Generally, in the event of counterparty default, the Portfolio has the right to use the collateral to offset losses incurred.
Short Sales. The Portfolio may enter into short sales transactions. A short sale is a transaction in which the Portfolio sells securities it does not own in anticipation of a decline in the market price of the securities. The Portfolio is obligated to deliver securities at the market price at the time the short position is closed. Possible losses from short sales may be unlimited, whereas losses from purchases cannot exceed the total amount invested.
Swap Agreements. The Portfolio may invest in swap agreements. A swap is an agreement to exchange the return generated by one instrument for the return generated by another instrument. The
| | | | |
| 12 | | Semi-Annual Report | | June 30, 2004 |
Portfolio may enter into interest rate, total return, forward spread lock, and credit default swap agreements to manage its exposure to interest rates and credit risk.
Interest rate swap agreements involve the exchange by the Portfolio with another party of their respective commitments to pay or receive interest, e.g., an exchange of floating rate payments for fixed rate payments with respect to the notional amount of principal.
Total return swap agreements involve commitments to pay interest in exchange for a market-linked return, both based on notional amounts. To the extent the total return of the security or index underlying the transaction exceeds or falls short of the offsetting interest rate obligation, the Portfolio will receive a payment from or make a payment to the counterparty.
Forward spread lock swap agreements involve commitments to pay or receive a settlement amount calculated as the difference between the swap spread and a fixed spread, multiplied by the notional amount times the duration of the swap. The swap spread is the difference between the benchmark swap rate (market rate) and the specific Treasury rate.
In a credit default swap, one party makes a stream of payments to another party in exchange for the right to receive a specified return in the event of a default by a third party, typically corporate issues or sovereign issues of an emerging country, on its obligation. The Portfolio may use credit default swaps to provide a measure of protection against defaults of sovereign issuers (i.e., to reduce risk where the Portfolio owns or has exposure to the sovereign issuer) or to take an active long or short position with respect to the likelihood of a particular issuer’s default.
Swaps are marked to market daily based upon quotations from market makers and the change in value, if any, is recorded as unrealized gain or loss in the Statement of Operations. Payments received or made at the beginning of the measurement period are reflected as such on the Statement of Assets and Liabilities. A liquidation payment received or made at the termination of the swap is recorded as realized gain or loss in the Statement of Operations. Net periodic payments received by the Portfolio are included as part of realized gain (loss) on the Statement of Operations. Entering into these agreements involves, to varying degrees, elements of credit, market and documentation risk in excess of the amounts recognized on the Statement of Assets and Liabilities. Such risks involve the possibility that there will be no liquid market for these agreements, that the counterparty to the agreements may default on its obligation to perform or disagree as to the meaning of contractual terms in the agreements, and that there may be unfavorable changes in interest rates.
As a result of a FASB Emerging Issues Task Force (“EITF”) consensus, No. 03-11, and related SEC staff guidance, the Portfolio has reclassified periodic payments made or received under swap agreements, which were previously included within miscellaneous income, to a component of realized gain(loss) in the Statement of Operations. For consistency, similar reclassifications have been made to amounts appearing in the previous year’s Statement of Changes in Net Assets and the per share amounts in the prior year financial highlights. Prior year net investment income ratios in the financial highlights have also been modified accordingly. This reclassification increased(decreased) net investment income by $13,839 and $(463), and net realized gain(loss) by $(14,308) and $581 and net change in unrealized appreciation(depreciation) by $469 and $(118) for the six months ended June 30, 2004 and year ended December 31, 2003, respectively. There is no effect on the Portfolio’s net asset value, either in total or per share, or its total increase(decrease) in net assets from operations during any period.
3. Fees, Expenses, and Related Party Transactions
Investment Advisory Fee. Pacific Investment Management Company LLC (“PIMCO”) is a majority owned subsidiary partnership of Allianz Dresdner Asset Management of America L.P. and serves as investment adviser (the “Adviser”) to the Trust, pursuant to an investment advisory contract. The Adviser receives a monthly fee at an annual rate based on average daily net assets of the Portfolio. The Advisory Fee is charged at an annual rate of 0.25%.
Administration Fee. PIMCO serves as administrator (the “Administrator”), and provides administrative services to the Trust for which it receives a monthly administrative fee based on average daily net assets of the Portfolio. The Administration Fee is charged at the annual rate of 0.25%.
Servicing Fee. PA Distributors LLC (“PAD”), formerly known as PIMCO Advisors Distributors LLC, is an indirect wholly-owned subsidiary of Allianz Dresdner Asset Management of America L.P. and serves as the distributor of the Trust’s shares. The Trust is permitted to reimburse PAD on a quarterly basis, out of the Administrative Class assets of the Portfolio in the amount of 0.15% on an annual basis of the average daily net assets of that class, for payments made to financial intermediaries that provide services in connection with the distribution of shares or administration of plans or programs that use Portfolio shares as their funding medium. The effective rate paid to PAD was 0.15% during current fiscal year.
Expenses. The Trust is responsible for the following expenses: (i) salaries and other compensation of any of the Trust’s executive officers and employees who are not officers, directors, stockholders or employees of PIMCO or its subsidiaries or affiliates; (ii) taxes and governmental fees; (iii) brokerage fees and commissions and other portfolio transaction expenses; (iv) the cost of borrowing money, including interest expense and bank overdraft charges; (v) fees and expenses of the Trustees who are not “interested persons” of PIMCO or the Trust, and any counsel retained exclusively for their benefit; (vi) extraordinary expenses, including costs of litigation and indemnification expenses; (vii) organization expenses and (viii) any expenses allocated or allocable to a specific class of shares, which include service fees payable with respect to the Administrative Class shares and may include certain other expenses as permitted by the Trust’s Multiple Class Plan adopted pursuant to Rule 18f-3 under the Act and subject to review and approval by the Trustees. The ratio of expenses to average net assets per share class, as disclosed in Financial Highlights, may differ from the annual portfolio operating expenses per share class as disclosed in the Prospectus for the reasons set forth above.
| | | | |
| June 30, 2004 | | Semi-Annual Report | | 13 |
Notes to Financial Statements (Cont.)
June 30, 2004 (Unaudited)
PIMCO has agreed to waive a portion of its administrative fees to the extent that the payment of the Portfolio’s pro rata share of organization expenses and Trustee fees cause the actual expense ratio to rise above the rates disclosed in the then-current prospectus plus 0.49 basis points as set forth below (calculated as a percentage of the Portfolio’s average daily net assets attributable to each class):
| | | |
Institutional Class | | 0.50 | % |
Administrative Class | | 0.65 | % |
PIMCO may be reimbursed for these waived amounts in future periods, not to exceed thirty-six months.
Each unaffiliated Trustee receives an annual retainer of $4,000, plus $1,500 for each Board of Trustees meeting attended in person and $250 for each meeting attended telephonically, plus reimbursement of related expenses. In addition, each committee chair receives an additional annual retainer of $500. These expenses are allocated on a pro-rata basis to each Portfolio of the Trust according to its respective net assets.
4. Purchases and Sales of Securities
The length of time a Portfolio has held a particular security is not generally a consideration in investment decisions. A change in the securities held by a Portfolio is known as “portfolio turnover.” The Portfolio may engage in frequent and active trading of portfolio securities to achieve its investment objective, particularly during periods of volatile market movements. High portfolio turnover (e.g., over 100%) involves correspondingly greater expenses to the Portfolio, including brokerage commissions or dealer mark-ups and other transaction costs on the sale of securities and reinvestments in other securities. Such sales may also result in realization of taxable capital gains, including short-term capital gains (which are generally taxed at ordinary income tax rates). The trading costs and tax effects associated with portfolio turnover may adversely affect the Portfolio’s performance.
Purchases and sales of securities (excluding short-term investments) for the period ended June 30, 2004 were as follows (amounts in thousands):
| | | | | | |
| U.S Government/Agency | | All Other |
| Purchases | | Sales | | Purchases | | Sales |
| $7,979 | | $7,308 | | $1,297 | | $654 |
5. Transactions in Written Call and Put Options
Transactions in written call and put options were as follows (amounts in thousands):
| | | | |
| | | | Premium | |
Balance at 12/31/2003 | | $ | 30 | |
Sales | | | 25 | |
Closing Buys | | | (5 | ) |
Expirations | | | (24 | ) |
Exercised | | | 0 | |
Balance at 06/30/2004 | | $ | 26 | |
6. Federal Income Tax Matters
At June 30, 2004, the aggregate cost of investments was the same for federal income tax and financial statement purposes. The net unrealized appreciation (depreciation) of investment securities for federal income tax purposes is as follows (amounts in thousands):
| | | | | | |
Aggregate Gross
Unrealized
Appreciation | | Aggregate Gross
Unrealized
(Depreciation) | | Net Unrealized
Appreciation |
| $ 71 | | $ | (55) | | $ | 16 |
| | | | |
| 14 | | Semi-Annual Report | | June 30, 2004 |
7. Shares of Beneficial Interest
The Trust may issue an unlimited number of shares of beneficial interest with a $.0001 par value. Changes in shares of beneficial interest were as follows (shares and amounts in thousands):
| | | | | | | | | | | | | | |
| | | Six Months Ended
06/30/2004 | | | Year Ended
12/31/2003 | |
| | | Shares | | | Amount | | | Shares | | | Amount | |
Receipts for shares sold | | | | | | | | | | | | | | |
| | | | |
Institutional Class | | 10 | | | $ | 106 | | | 0 | | | $ | 0 | |
Administrative Class | | 0 | | | | 4 | | | 0 | | | | 0 | |
| | | | |
Issued as reinvestment of distributions | | | | | | | | | | | | | | |
| | | | |
Institutional Class | | 0 | | | | 0 | | | 0 | | | | 2 | |
Administrative Class | | 11 | | | | 115 | | | 45 | | | | 473 | |
| | | | |
Cost of shares redeemed | | | | | | | | | | | | | | |
| | | | |
Institutional Class | | (1 | ) | | | (6 | ) | | (119 | ) | | | (1,200 | ) |
Administrative Class | | (15 | ) | | | (164 | ) | | (25 | ) | | | (260 | ) |
| | | | |
Net increase (decrease) resulting from Portfolio share transactions | | 5 | | | $ | 55 | | | (99 | ) | | $ | (985 | ) |
The following schedule shows the number of shareholders each owning 5% or more of the Portfolio and the total percentage of the Portfolio held by such shareholders:
| | | | |
| | | Number | | % of Portfolio Held |
Institutional Class | | 2 | | 100 |
Administrative Class | | 1 | | 100 |
8. Regulatory and Litigation Matters
On February 17, 2004, the Attorney General of the State of New Jersey (“New Jersey AG”) filed a complaint against Allianz Dresdner Asset Management of America L.P. (“ADAM”), PA Distributors LLC (formerly known as PIMCO Advisors Distributors LLC) (“PAD”), PEA Capital LLC (formerly known as PIMCO Equity Advisors LLC) (“PEA”), and Pacific Investment Management Company LLC (“PIMCO”) in connection with its investigation into market timing and late trading. The complaint contends that inappropriate trading by shareholders engaged in market timing activity took place in funds in the PIMCO Funds: Multi-Manager Series (“MMS Funds”) and the PIMCO Funds: Pacific Investment Management Series (“PIMS Funds”). On June 1, 2004, the New Jersey AG dismissed PIMCO from the lawsuit.
On the same day as the dismissal of PIMCO from the lawsuit, the New Jersey AG announced that it had reached a settlement agreement with the remaining defendants (“New Jersey Settlement”). In the New Jersey Settlement, ADAM, PAD and PEA agreed, while neither admitting nor denying the allegations or conclusions of law, to: (i) pay New Jersey a civil fine of $15 million and $3 million for investigative costs and further enforcement initiatives; and (ii) implement certain changes in corporate governance.
On May 6, 2004, the Securities and Exchange Commission filed a complaint in the U.S. District Court in the Southern District of New York alleging that PA Fund Management LLC (formerly known as PIMCO Advisors Fund Management LLC) (“PAFM”), PEA, PAD, Stephen J. Treadway (at the time, the chief executive officer of PAFM and PAD as well as chairman of the Board of Trustees of the MMS Funds) and Kenneth W. Corba (the former chief executive officer of PEA and former portfolio manager of the PEA Growth and PEA Growth & Income Funds) had, among other things, violated and/or aided and abetted violations of, various antifraud provisions of the federal securities laws in connection with alleged “market timing” arrangements that improperly allowed certain hedge funds to engage in “market timing” in the PEA Growth Fund, the PEA Opportunity Fund, the PEA Innovation Fund, and the PEA Target Fund. The complaint seeks injunctive relief, disgorgement plus pre-judgment interest, monetary penalties, and an order permanently enjoining the defendants from serving as investment advisers, principal underwriters, officers, directors, or members of any advisory boards to any registered investment companies.
On February 20, 2004, a putative class action lawsuit was filed in the U.S. District Court for the District of New Jersey on behalf of certain shareholders of the PIMCO Funds against ADAM, PAD, PIMCO, PEA, the PIMS Funds, the MMS Funds, the Trust, PIMCO Commercial Mortgage Securities Trust, Inc. and certain other defendants, alleging that inappropriate market timing activity by certain shareholders caused financial injury to the shareholders of those Funds.
| | | | |
| June 30, 2004 | | Semi-Annual Report | | 15 |
Notes to Financial Statements (Cont.)
June 30, 2004 (Unaudited)
The following additional putative class action lawsuits have been filed against the PIMS Funds, the MMS Funds and/or their affiliates, each related to alleged market-timing activity in funds advised by PIMCO or its affiliates: (1) a lawsuit filed in the U.S. District Court for the District of Connecticut on February 27, 2004 (naming as defendants ADAM, PAD, PEA, the PIMS Funds, the MMS Funds, the Trust, PCM and certain other parties); (2) a lawsuit filed in the U.S. District Court for the Central District of California on March 4, 2004 (naming as defendants PIMCO, ADAM, PEA and PAD); (3) a lawsuit filed in the U.S. District Court for the Southern District of New York on March 8, 2004 (naming PIMCO, PAD and certain of their affiliates as defendants); (4) a lawsuit filed in the U.S. District Court for the Southern District of New York, on March 15, 2004 (naming PIMCO as the defendant); (5) two separate lawsuits filed in the U.S. District Court for the Central District of California on March 22, 2004, brought derivatively on behalf of the PIMCO High Yield Fund and the PIMCO Money Market Fund, respectively (each naming ADAM, PAFM and certain other parties as defendants, and the PIMCO Funds as the nominal defendant); (6) a lawsuit filed in the U.S. District Court for the Central District of California, also on March 22, 2004, brought derivatively on behalf of the PIMS Funds and the MMS Funds (naming ADAM, PIMCO, PAD and certain other parties as defendants, and the PIMS Funds and the MMS Funds as nominal defendants); (7) a lawsuit filed in the U.S. District Court for the District of New Jersey on April 20, 2004 (naming ADAM, PAD, the PIMS Funds and certain other parties as defendants); and (8) a lawsuit filed in the U.S. District Court for the Northern District of California on April 28, 2004 (naming ADAM, PIMCO, PAD, PEA and certain other parties as defendants, and the “PIMCO Funds” as nominal defendants). Each complaint for the foregoing putative class actions alleges, among other things, that inappropriate trading by shareholders engaged in market timing activities took place in certain of the funds advised by PIMCO, and each complaint seeks unspecified compensatory damages.
On February 17, 2004, a putative class action lawsuit was filed in the U.S. District Court for the District of Connecticut on behalf of certain shareholders of the PIMCO Funds against ADAM, PEA, PIMCO, PIMS Funds, MMS Funds and certain other defendants, alleging excessive investment advisory fees and the use of brokerage commissions to pay for distribution of fund shares. Three similar putative class action lawsuits were subsequently filed, each in the U.S. District Court for the District of Connecticut on March 1, 2004, April 23, 2004 and May 20, 2004, respectively.
Under Section 9(a) of the 1940 Act, if any of the various lawsuits were to result in a court injunction against PAFM, PEA, PAD, PIMCO, ADAM and/or Mr. Treadway, they and their affiliates would, in the absence of exemptive relief granted by the SEC, be barred from serving as an investment adviser/sub-adviser or principal underwriter for any registered investment company, including the Trust. ADAM and certain of its subsidiaries have responded to inquiries from the SEC concerning the status of the New Jersey Settlement under Section 9(a). If any of PAFM, PEA, PAD, PIMCO or ADAM were subject to an injunction, each of these entities and their affiliates could in turn seek exemptive relief from the SEC, as contemplated by the 1940 Act. There is no assurance, however, that such exemptive relief would be granted. The SEC also has the power by order to prohibit PAFM, PEA, PAD and PIMCO from serving as investment advisers and underwriters, if the SEC finds that such entities willfully violated the federal securities laws in connection with the allegations discussed above or aided or abetted such violations.
PIMCO, PAD and the Trust believe that these developments will not have a material adverse effect on the Portfolios or on PIMCO’s, or PAD’s ability to perform their respective investment advisory or distribution services on behalf of the Portfolios.
| | | | |
| 16 | | Semi-Annual Report | | June 30, 2004 |
Trustees and Officers
Brent R. Harris, Chairman and Trustee
R. Wesley Burns, President and Trustee
E. Philip Cannon, Trustee
Vern O. Curtis, Trustee
J. Michael Hagan, Trustee
William J. Popejoy, Trustee
Garlin G. Flynn, Secretary
John P. Hardaway, Treasurer
Investment Adviser and Administrator
Pacific Investment Management Company LLC
840 Newport Center Drive
Newport Beach, California 92660
Distributor
PA Distributors LLC
2187 Atlantic Street
Stamford, Connecticut 06902
Custodian
State Street Bank & Trust Company
801 Pennsylvania
Kansas City, Missouri 64105
Transfer Agent
Boston Financial Data Services–Midwest
330 W. 9th Street
Kansas City, Missouri 64105
Legal Counsel
Dechert LLP
1775 I Street, N.W.
Washington, D.C. 20006
Independent Registered Public Accounting Firm
PricewaterhouseCoopers LLP
1055 Broadway
Kansas City, Missouri 64105
Information about how the Fund voted proxies relating to portfolio securities held during the year July 1, 2003 through June 30, 2004 will be available no later than August 31, 2004 without charge, upon request, by calling the Trust at 1-800-927-4648 and on the SEC’s website at http://www.sec.gov.
Copies of the written Proxy Policy and the factors that PIMCO may consider in determining how to vote proxies for the Funds are available by calling the Trust at 1-800-927-4648 and on the SEC’s website at http://www.sec.gov.
PIMCO VARIABLE INSURANCE TRUST
840 NEWPORT CENTER DRIVE
NEWPORT BEACH, CA 92660

PIMCO VARIABLE INSURANCE TRUST
LOW DURATION PORTFOLIO
INSTITUTIONAL CLASS
SEMI-ANNUAL REPORT
June 30, 2004
|
| This material is authorized for use only when preceded or accompanied by the current PIMCO Variable Insurance Trust prospectus. Investors should consider the investment objectives, risks, charges and expenses of Portfolio carefully before investing. This and other information is contained in the Portfolio’s prospectus. Please read the prospectus carefully before you invest or send money. |
Chairman’s Letter
Dear PIMCO Variable Insurance Trust Shareholder:
Bond prices were more volatile during the six-month period ended June 30, 2004. Interest rates rose sharply during the second quarter 2004, causing bonds to give back modest gains from earlier in the year. The Lehman Brothers Aggregate Bond Index, a widely used index for the high-grade bond market, was nearly flat during the first six months of 2004, returning 0.15% after losing 2.44% during the second quarter. The yield on the benchmark ten-year Treasury closed June 30, 2004 at 4.58%, up 0.75% from April 1, 2004, but up only 0.34% from where it began the six-month period on January 1, 2004.
Continued growth in employment convinced the markets that the Federal Reserve would soon begin a long anticipated tightening cycle. On June 30, 2004, the Fed met market expectations by increasing the federal funds rate 0.25%, which was the first rate increase since June 25, 2003. The central bank had held this rate at 1% for more than a year, which generated negative real short-term rates. And on August 10, 2004, the Fed increased the federal funds rate another 0.25% to 1.50%.
Investors that had profited handsomely from borrowing at low short-term rates and investing in higher-yielding longer maturity bonds surrendered some of those profits towards the latter part of the six-month period. Concern that borrowing rates would rise led investors to liquidate long positions and unwind these trades, which caused bond prices to decrease. However, substantial leverage remained among banks, hedge funds, and other investors, making bond markets somewhat vulnerable to additional Fed rate increases. There were also signs of rising inflation, which fueled anxiety that central banks might continue to raise interest rates.
On the following pages you will find a more complete review of the Portfolio in light of financial market activities as well as specific details about the total return investment performance for the six-month period.
We appreciate the trust you have placed in us, and we will continue to focus our efforts to meet your investment needs.
Sincerely,

Brent R. Harris
Chairman
August 11, 2004
| | | | |
| June 30, 2004 | | Semi-Annual Report | | 1 |
Important Information About the Portfolio
We believe that bond funds have an important role to play in a well diversified investment portfolio. It is important to note, however, that in an environment where interest rates may trend upward, rising rates will negatively impact the performance of most bond funds, and fixed income securities held by a fund are likely to decrease in value. The price volatility of fixed income securities can also increase during periods of rising interest rates resulting in increased losses to a fund. Bond funds and individual bonds with a longer duration (a measure of the expected life of a security) tend to be more sensitive to changes in interest rates, usually making them more volatile than securities or funds with shorter durations. The longer-term performance of most bond funds has benefited from capital gains in part resulting from an extended period of declining interest rates. In the event interest rates increase, these capital gains should not be expected to recur.
The Portfolio may be subject to various risks in addition to those described above. Some of these risks may include, but are not limited to, the following: real rate risk, derivative risk, small company risk, foreign security risk, high yield security risk and specific sector investment risks. The Portfolio may use derivative instruments for hedging purposes or as part of an investment strategy. Use of these instruments may involve certain costs and risks such as liquidity risk, interest rate risk, market risk, credit risk, management risk and the risk that a fund could not close out a position when it would be most advantageous to do so. A Portfolio investing in derivatives could lose more than the principal amount invested in these instruments. Investing in non-U.S. securities may entail risk due to non-U.S. economic and political developments; this risk may be enhanced when investing in emerging markets. High-yield bonds typically have a lower credit rating than other bonds. Lower rated bonds generally involve a greater risk to principal than higher rated bonds. Smaller companies may be more volatile than larger companies and may entail more risk. Concentrating investments in individual sectors may add additional risk and volatility compared to a diversified portfolio.
On the performance summary page in this semi-annual report, the Total Return Investment Performance table measures performance assuming that all dividend and capital gain distributions were reinvested. Returns do not reflect the deduction of taxes that a shareholder would pay (i) on Portfolio distributions or (ii) the redemption of Portfolio shares.
An investment in a Portfolio is not a bank deposit and is not guaranteed or insured by the Federal Deposit Insurance Corporation or any other government agency. It is possible to lose money on investments in the Funds.
The following disclosure provides important information regarding the Portfolio’s Expense Example, which appears on the Portfolio’s individual page in this semi-annual report. Please refer to this information when reviewing the Expense Example for the Portfolio.
Example
As a shareholder of the Portfolio, you incur two types of costs: (1) transaction costs, including redemption and exchange fees; and (2) ongoing costs, including advisory and administrative fees; distribution and/or service (12b-1) fees (Administrative Class only); and other Portfolio expenses. The Example is intended to help you understand your ongoing costs (in dollars) of investing in the Portfolio and to compare these costs with the ongoing costs of investing in other mutual funds.
The Example is based on an investment of $1,000 invested at the beginning of the period and held for the entire period indicated, which is from 1/1/04 to 6/30/04.
Actual Expenses
The information in the table under the heading “Actual Performance” provides information about actual account values and actual expenses. You may use the information in these columns, together with the amount you invested, to estimate the expenses that you paid over the period. Simply divide your account value by $1,000.00 (for example, an $8,600.00 account value divided by $1,000 = 8.60), then multiply the result by the number in the appropriate column for your share class, in the row entitled “Expenses Paid During Period” to estimate the expenses you paid on your account during this period.
Hypothetical Example for Comparison Purposes
The information in the table under the heading “Hypothetical Performance (5% return before expenses)” provides information about hypothetical account values and hypothetical expenses based on the Portfolio’s actual expense ratio and an assumed rate of return of 5% per year before expenses, which is not the Portfolio’s actual return. The hypothetical account values and expenses may not be used to estimate the actual ending account balance or expenses you paid for the period. You may use this information to compare the ongoing costs of investing in the Portfolio and other portfolios. To do so, compare this 5% hypothetical example with the 5% hypothetical examples that appear in the shareholder reports of the other portfolios.
Please note that the expenses shown in the table are meant to highlight your ongoing costs only and do not reflect any transactional costs. Therefore, the information under the heading “Hypothetical Performance (5% return before expenses)” is useful in comparing ongoing costs only, and will not help you determine the relative total costs of owning different portfolios. In addition, if these transactional costs were included, your costs would have been higher.
PIMCO Variable Insurance Trust is distributed by PA Distributors LLC, 2187 Atlantic Street, Stamford, CT 06902.
| | | | |
| 2 | | Semi-Annual Report | | June 30, 2004 |
Low Duration Portfolio
CUMULATIVE RETURNS THROUGH JUNE 30, 2004
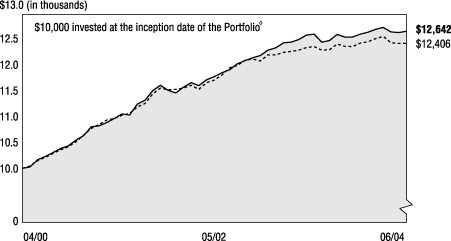
[CHART]
Low Duration Merrill Lynch
Portfolio Inst. Class 1-3 Year Treasury Index
--------------------- -----------------------
04/30/2000 $10,000 $10,000
05/31/2000 $10,026 $10,041
06/30/2000 $10,165 $10,145
07/31/2000 $10,226 $10,209
08/31/2000 $10,305 $10,285
09/30/2000 $10,382 $10,359
10/31/2000 $10,434 $10,414
11/30/2000 $10,544 $10,513
12/31/2000 $10,626 $10,638
01/31/2001 $10,800 $10,771
02/28/2001 $10,818 $10,841
03/31/2001 $10,879 $10,932
04/30/2001 $10,959 $10,961
05/31/2001 $11,049 $11,023
06/30/2001 $11,028 $11,060
07/31/2001 $11,238 $11,184
08/31/2001 $11,309 $11,249
09/30/2001 $11,498 $11,434
10/31/2001 $11,602 $11,542
11/30/2001 $11,499 $11,517
12/31/2001 $11,452 $11,521
01/31/2002 $11,561 $11,545
02/28/2002 $11,652 $11,600
03/31/2002 $11,597 $11,522
04/30/2002 $11,705 $11,651
05/31/2002 $11,769 $11,697
06/30/2002 $11,843 $11,795
07/31/2002 $11,904 $11,939
08/31/2002 $12,010 $11,980
09/30/2002 $12,076 $12,079
10/31/2002 $12,133 $12,107
11/30/2002 $12,171 $12,070
12/31/2002 $12,279 $12,184
01/31/2003 $12,321 $12,183
02/28/2003 $12,418 $12,233
03/31/2003 $12,432 $12,256
04/30/2003 $12,483 $12,279
05/31/2003 $12,568 $12,325
06/30/2003 $12,584 $12,343
07/31/2003 $12,431 $12,276
08/31/2003 $12,463 $12,285
09/30/2003 $12,577 $12,396
10/31/2003 $12,532 $12,350
11/30/2003 $12,533 $12,344
12/31/2003 $12,584 $12,415
01/31/2004 $12,619 $12,440
02/29/2004 $12,678 $12,500
03/31/2004 $12,715 $12,539
04/30/2004 $12,630 $12,418
05/31/2004 $12,617 $12,407
06/30/2004 $12,642 $12,406
SECTOR BREAKDOWN‡
| | | |
Short-Term Instruments | | 67.8 | % |
U.S. Government Agencies | | 9.3 | % |
Asset-Backed Securities | | 7.7 | % |
U.S. Treasury Obligations | | 5.9 | % |
Mortgage-Backed Securities | | 3.7 | % |
Corporate Bonds & Notes | | 2.5 | % |
Other | | 3.1 | % |
‡ % of Total Investments as of June 30, 2004
à$10,000 invested at the beginning of the first full month following the inception of the Institutional Class.
TOTAL RETURN INVESTMENT PERFORMANCE For the period ended June 30, 2004
| | | | | | | | | | | | | |
| | | | | | | 6 Months | | | 1 Year | | | Since Inception* | |
| | |
| | Low Duration Portfolio Institutional Class (Inception 04/10/00) | | 0.46 | % | | 0.46 | % | | 5.69 | % |
| | | - - - - - - - | | Merrill Lynch 1-3 Year Treasury Index | | –0.08 | % | | 0.50 | % | | — | |
| | | | | * Annualized. All Portfolio returns are net of fees and expenses. | | | | | | | | | |
Past performance is no guarantee of future results. The performance quoted represents past performance. Investment return and principal value will fluctuate so the Portfolio shares, when redeemed, may be worth more or less than their original cost. Current performance may be lower or higher than the performance data quoted. Performance data current to the most recent month-end is available by calling (800) 927-4648.
Please refer to page 2 herein for an explanation of the information presented in the following Expense Example.
| | | | | | | | | | |
| EXPENSE EXAMPLE | | | | Actual Performance | | | | Hypothetical Performance
(5% return before expenses) |
Beginning Account Value (01/01/04) | | | | $ | 1,000.00 | | | | $ | 1,000.00 |
Ending Account Value (06/30/04) | | | | $ | 1,004.60 | | | | $ | 1,025.00 |
Expenses Paid During Period† | | | | $ | 2.49 | | | | $ | 2.52 |
†Expenses are equal to the Portfolio’s Institutional Class annualized expense ratio of 0.50%, multiplied by the average account value over the period, multiplied by 182/366 (to reflect the one-half year period).
PORTFOLIO INSIGHTS
| • | The Low Duration Portfolio seeks to achieve its investment objective by investing under normal circumstances at least 65% of its assets in a diversified portfolio of Fixed Income Instruments of varying maturities. |
| • | The Portfolio’s Institutional Class shares returned 0.46% for the six-month period ended June 30, 2004, outperforming the Merrill Lynch 1-3 Year Treasury Index return of –0.08% for the same period. |
| • | The Portfolio’s duration was positioned below the benchmark during the period. This hurt returns in the first quarter when rates fell and helped later in the period when market sold off, resulting in an overall neutral effect on performance. |
| • | The Portfolio’s broader-than-Index maturity distribution had a positive impact on returns, as maturities within the Index fared the worst during the period. |
| • | An emphasis on mortgage-backed securities was positive for performance, as this sector outperformed Treasuries during the period. Positive security selection within the sector further enhanced returns. |
| • | The Portfolio’s limited holdings of corporate bonds did not have a significant effect on performance. |
| • | A small allocation to emerging market bonds detracted from returns. Leveraged tactical investors sold emerging market bonds as interest rates rose, which negatively impacted this asset class. |
| • | Exposure to developed non-U.S. markets, primarily short maturity Eurozone holdings, had a strong positive effect on performance. Eurozone issues benefited from expectations for lower growth and inflation in Europe. |
| | | | |
| June 30, 2004 | | Semi-Annual Report | | 3 |
Financial Highlights
Low Duration Portfolio (Institutional Class)
| | | | | | | | | | | | | | | | | | | | | | | | | | | | | | |
| Selected Per Share Data for the Year or Period Ended: | | | | 06/30/2004+ | | | | | 12/31/2003 | | | | | 12/31/2002 | | | | | 12/31/2001 | | | | | 04/10/2000-
12/31/2000 | |
| | | | | | | | | | |
Net asset value beginning of period | | | | $ | 10.27 | | | | | $ | 10.23 | | | | | $ | 9.95 | | | | | $ | 9.82 | | | | | $ | 9.70 | |
Net investment income (a) | | | | | 0.06 | (c) | | | | | 0.17 | (c) | | | | | 0.38 | (c) | | | | | 0.60 | (c) | | | | | 0.46 | (c) |
Net realized/unrealized gain (loss) on investments (a) | | | | | (0.01 | )(c) | | | | | 0.08 | (c) | | | | | 0.33 | (c) | | | | | 0.15 | (c) | | | | | 0.12 | (c) |
Total income from investment operations | | | | | 0.05 | | | | | | 0.25 | | | | | | 0.71 | | | | | | 0.75 | | | | | | 0.58 | |
Dividends from net investment income | | | | | (0.06 | ) | | | | | (0.20 | ) | | | | | (0.37 | ) | | | | | (0.56 | ) | | | | | (0.46 | ) |
Distributions from net realized capital gains | | | | | 0.00 | | | | | | (0.01 | ) | | | | | (0.06 | ) | | | | | (0.06 | ) | | | | | 0.00 | |
Total distributions | | | | | (0.06 | ) | | | | | (0.21 | ) | | | | | (0.43 | ) | | | | | (0.62 | ) | | | | | (0.46 | ) |
Net asset value end of period | | | | $ | 10.26 | | | | | $ | 10.27 | | | | | $ | 10.23 | | | | | $ | 9.95 | | | | | $ | 9.82 | |
Total return | | | | | 0.46 | % | | | | | 2.49 | % | | | | | 7.22 | % | | | | | 7.77 | % | | | | | 6.13 | % |
Net assets end of period (000s) | | | | $ | 9,067 | | | | | $ | 11 | | | | | $ | 11 | | | | | $ | 468 | | | | | $ | 5,430 | |
Ratio of net expenses to average net assets | | | | | 0.50 | %* | | | | | 0.50 | % | | | | | 0.51 | %(b) | | | | | 0.55 | %(b) | | | | | 0.50 | %* |
Ratio of net investment income to average net assets | | | | | 1.08 | %*(c) | | | | | 1.68 | %(c) | | | | | 3.78 | %(c) | | | | | 6.01 | %(c) | | | | | 6.49 | %*(c) |
Portfolio turnover rate | | | | | 65 | % | | | | | 284 | % | | | | | 339 | % | | | | | 661 | % | | | | | 165 | % |
| (a) | Per share amounts based on average number of shares outstanding during the period. |
| (b) | Ratio of expenses to average net assets excluding interest expense is 0.50%. |
| (c) | Indicates a period in which, as a result of a change in generally accepted accounting principles, the portfolio has reclassified periodic payments made or received under certain derivative instruments, which were previously included within miscellaneous income, to a component of realized gain(loss) in the Statement of Operations. The effect of this reclassification was to (reduce) the net investment income ratio for the period ending June 30, 2004 by 0.00% and the net investment income per share by $0.00. For consistency, similar reclassifications have been made to prior period amounts, resulting in increases(reductions) to the net investment income ratio of 0.00%, (0.01)%, 0.02% and 0.00% and to the net investment income per share of $0.00, $0.00, $0.00 and $0.00 in the fiscal years or periods ending December 31, 2003, 2002, 2001, and 2000, respectively. This change had no impact on the reported net asset value per share for any period. |
| | | | | | |
| 4 | | Semi-Annual Report | | June 30, 2004 | | See accompanying notes |
Statement of Assets and Liabilities
Low Duration Portfolio
June 30, 2004 (Unaudited)
| | | | | | |
| Amounts in thousands, except per share amounts | | | | | |
| | |
Assets: | | | | | | |
| | |
Investments, at value | | | | $ | 244,126 | |
Foreign currency, at value | | | | | 358 | |
Receivable for investments sold | | | | | 3 | |
Unrealized appreciation on forward foreign currency contracts | | | | | 17 | |
Receivable for Portfolio shares sold | | | | | 857 | |
Interest and dividends receivable | | | | | 240 | |
Variation margin receivable | | | | | 285 | |
Swap premiums paid | | | | | 2 | |
Unrealized appreciation on swap agreements | | | | | 3 | |
| | | | | | 245,891 | |
| | |
Liabilities: | | | | | | |
| | |
Payable for investments purchased | | | | $ | 20,499 | |
Unrealized depreciation on forward foreign currency contracts | | | | | 14 | |
Written options outstanding | | | | | 6 | |
Payable for Portfolio shares redeemed | | | | | 45 | |
Accrued investment advisory fee | | | | | 43 | |
Accrued administration fee | | | | | 43 | |
Accrued servicing fee | | | | | 23 | |
Recoupment payable to Manager | | | | | 3 | |
Unrealized depreciation on swap agreements | | | | | 2 | |
| | | | | | 20,678 | |
| | |
Net Assets | | | | $ | 225,213 | |
| | |
Net Assets Consist of: | | | | | | |
| | |
Paid in capital | | | | $ | 225,406 | |
Undistributed net investment income | | | | | 71 | |
Accumulated undistributed net realized (loss) | | | | | (537 | ) |
Net unrealized appreciation | | | | | 273 | |
| | | | | $ | 225,213 | |
| | |
Net Assets: | | | | | | |
| | |
Institutional Class | | | | $ | 9,067 | |
Administrative Class | | | | | 216,146 | |
| | |
Shares Issued and Outstanding: | | | | | | |
| | |
Institutional Class | | | | | 884 | |
Administrative Class | | | | | 21,073 | |
| | |
Net Asset Value and Redemption Price Per Share
(Net Assets Per Share Outstanding) | | | | | | |
| | |
Institutional Class | | | | $ | 10.26 | |
Administrative Class | | | | | 10.26 | |
| | |
Cost of Investments Owned | | | | $ | 244,105 | |
Cost of Foreign Currency Held | | | | $ | 354 | |
| | | | | | |
| See accompanying notes | | June 30, 2004 | | Semi-Annual Report | | 5 |
Statement of Operations
Low Duration Portfolio
| | | | | | |
| Amounts in thousands | | | | | |
| | | | | Six Months Ended June 30, 2004 (Unaudited) | |
Investment Income: | | | | | | |
| | |
Interest | | | | $ | 1,249 | |
Dividends | | | | | 14 | |
Miscellaneous income | | | | | 2 | |
Total Income | | | | | 1,265 | |
| | |
Expenses: | | | | | | |
| | |
Investment advisory fees | | | | | 202 | |
Administration fees | | | | | 202 | |
Distribution and/or servicing fees - Administrative Class | | | | | 119 | |
Trustees’ fees | | | | | 2 | |
Miscellaneous expense | | | | | 3 | |
Total Expenses | | | | | 528 | |
| | |
Net Investment Income | | | | | 737 | |
| | |
Net Realized and Unrealized Gain (Loss): | | | | | | |
| | |
Net realized (loss) on investments | | | | | (184 | ) |
Net realized (loss) on futures contracts, options, and swaps | | | | | (140 | ) |
Net realized (loss) on foreign currency transactions | | | | | (76 | ) |
Net change in unrealized (depreciation) on investments | | | | | (166 | ) |
Net change in unrealized appreciation on futures contracts,
options, and swaps | | | | | 91 | |
Net change in unrealized appreciation on translation of
assets and liabilities denominated in foreign currencies | | | | | 7 | |
Net (Loss) | | | | | (468 | ) |
| | |
Net Increase in Assets Resulting from Operations | | | | $ | 269 | |
| | | | | | |
| 6 | | Semi-Annual Report | | June 30, 2004 | | See accompanying notes |
Statements of Changes in Net Assets
Low Duration Portfolio
| | | | | | | | | | | | |
| Amounts in thousands | | | | | | | | | | |
| | | | | Six Months Ended June 30, 2004
(Unaudited) | | | | | Year Ended December 31, 2003 | |
Increase in Net Assets from: | | | | | | | | | | | | |
| | | | |
Operations: | | | | | | | | | | | | |
| | | | |
Net investment income | | | | $ | 737 | | | | | $ | 591 | |
Net realized gain (loss) | | | | | (400 | ) | | | | | 129 | |
Net change in unrealized appreciation (depreciation) | | | | | (68 | ) | | | | | 161 | |
Net increase resulting from operations | | | | | 269 | | | | | | 881 | |
| | | | |
Distributions to Shareholders: | | | | | | | | | | | | |
| | | | |
From net investment income | | | | | | | | | | | | |
Institutional Class | | | | | (21 | ) | | | | | 0 | |
Administrative Class | | | | | (793 | ) | | | | | (704 | ) |
| | | | |
From net realized capital gains | | | | | | | | | | | | |
Institutional Class | | | | | 0 | | | | | | 0 | |
Administrative Class | | | | | 0 | | | | | | (110 | ) |
Total Distributions | | | | | (814 | ) | | | | | (814 | ) |
| | | | |
Portfolio Share Transactions: | | | | | | | | | | | | |
| | | | |
Receipts for shares sold | | | | | | | | | | | | |
Institutional Class | | | | | 9,077 | | | | | | 0 | |
Administrative Class | | | | | 130,603 | | | | | | 109,489 | |
| | | | |
Issued as reinvestment of distributions | | | | | | | | | | | | |
Institutional Class | | | | | 21 | | | | | | 0 | |
Administrative Class | | | | | 792 | | | | | | 815 | |
| | | | |
Cost of shares redeemed | | | | | | | | | | | | |
Institutional Class | | | | | (29 | ) | | | | | 0 | |
Administrative Class | | | | | (30,136 | ) | | | | | (14,447 | ) |
Net increase resulting from Portfolio share transactions | | | | | 110,328 | | | | | | 95,857 | |
| | | | |
Total Increase in Net Assets | | | | | 109,783 | | | | | | 95,924 | |
| | | | |
Net Assets: | | | | | | | | | | | | |
| | | | |
Beginning of period | | | | | 115,430 | | | | | | 19,506 | |
End of period* | | | | $ | 225,213 | | | | | $ | 115,430 | |
| | | | |
*Including undistributed net investment income of: | | | | $ | 71 | | | | | $ | 148 | |
| | | | | | |
| See accompanying notes | | June 30, 2004 | | Semi-Annual Report | | 7 |
Schedule of Investments
Low Duration Portfolio
June 30, 2004 (Unaudited)
| | | | |
| | | Principal | | |
| | | Amount | | Value |
| | | (000s) | | (000s) |
| | | | | | |
CORPORATE BONDS & NOTES 2.7% |
Banking & Finance 1.2% | | | | | | |
CIT Group, Inc. | | | | | | |
2.489% due 07/30/2004 (a) | | $ | 100 | | $ | 100 |
Ford Motor Credit Co. | | | | | | |
6.700% due 07/16/2004 | | | 700 | | | 701 |
3.045% due 10/25/2004 (a) | | | 500 | | | 502 |
General Motors Acceptance Corp. | | | |
1.499% due 07/21/2004 (a) | | | 100 | | | 100 |
2.400% due 10/20/2005 (a) | | | 700 | | | 706 |
Pemex Project Funding Master Trust | | | |
2.640% due 01/07/2005 (a) | | | 100 | | | 100 |
Verizon Wireless Capital LLC | | | | | | |
1.350% due 05/23/2005 (a) | | | 500 | | | 500 |
| | | | | |
|
|
| | | | | | | 2,709 |
| | | | | |
|
|
| | | | | | | |
Industrials 0.6% | | | | | | |
Altria Group, Inc. | | | | | | |
7.650% due 07/01/2008 | | | 200 | | | 216 |
AOL Time Warner, Inc. | | | | | | |
6.125% due 04/15/2006 | | | 250 | | | 262 |
Clear Channel Communications, Inc. | | | |
6.000% due 11/01/2006 | | | 250 | | | 263 |
DaimlerChrysler North America Holding Corp. | | | | | | |
1.678% due 08/02/2004 (a) | | | 200 | | | 200 |
Harrah’s Operating Co., Inc. | | | | | | |
7.500% due 01/15/2009 | | | 200 | | | 219 |
International Paper Co. | | | | | | |
7.625% due 01/15/2007 | | | 250 | | | 271 |
| | | | | |
|
|
| | | | | | | 1,431 |
| | | | | |
|
|
| | | | | | | |
Utilities 0.9% | | | | | | |
Appalachian Power Co. | | | | | | |
4.800% due 06/15/2005 | | | 40 | | | 41 |
Entergy Mississippi, Inc. | | | | | | |
4.350% due 04/01/2008 | | | 100 | | | 100 |
France Telecom S.A. | | | | | | |
8.200% due 03/01/2006 | | | 100 | | | 107 |
Northern Indiana Public Service Co. | | | |
6.500% due 07/22/2004 | | | 200 | | | 200 |
Pacific Gas & Electric Co. | | | | | | |
1.810% due 04/03/2006 (a) | | | 1,300 | | | 1,301 |
Progress Energy, Inc. | | | | | | |
6.750% due 03/01/2006 | | | 250 | | | 264 |
Sprint Capital Corp. | | | | | | |
6.125% due 11/15/2008 | | | 35 | | | 37 |
| | | | | |
|
|
| | | | | | | 2,050 |
| | | | | |
|
|
Total Corporate Bonds & Notes (Cost $6,185) | | | | | | 6,190 |
| | | | |
|
|
| | | | | | | |
U.S. GOVERNMENT AGENCIES 10.0% |
| | |
Fannie Mae | | | | | | |
1.700% due 11/25/2032 (a) | | | 245 | | | 245 |
5.000% due 04/25/2033 | | | 261 | | | 262 |
1.420% due 03/25/2034 (a) | | | 777 | | | 772 |
5.090% due 09/01/2034 (a) | | | 175 | | | 179 |
4.797% due 12/01/2036 (a) | | | 169 | | | 174 |
2.625% due 09/01/2040 (a) | | | 36 | | | 37 |
1.650% due 03/25/2044 (a) | | | 1,203 | | | 1,188 |
6.000% due 06/01/2016-03/01/2033 (b) | | | 1,751 | | | 1,796 |
5.500% due 10/01/2017-07/15/2034 (b) | | | 12,174 | | | 12,136 |
6.500% due 08/01/2032-01/01/2033 (b) | | | 118 | | | 122 |
Federal Home Loan Bank | | | | | | |
5.500% due 04/17/2006 | | | 1,000 | | | 1,046 |
Federal Housing Administration | | | | | | |
7.430% due 10/01/2020 | | | 65 | | | 64 |
| | | | | | |
| | |
Freddie Mac | | | | | | |
1.488% due 07/15/2016 (a) | | $ | 1,738 | | $ | 1,740 |
5.000% due 10/01/2018 | | | 81 | | | 81 |
5.500% due 08/15/2030 | | | 183 | | | 186 |
6.000% due 09/01/2016-02/01/2033 (b) | | | 1,569 | | | 1,622 |
6.500% due 08/01/2032-07/25/2043 (b) | | | 450 | | | 471 |
Government National Mortgage Association | | | |
3.000% due 04/20/2034 (a) | | | 500 | | | 487 |
| | | | | |
|
|
Total U.S. Government Agencies (Cost $22,570) | | | 22,608 |
| |
|
|
| | | | | | | |
U.S. TREASURY OBLIGATIONS 6.4% |
| |
Treasury Inflation Protected Securities (c) | | | |
3.625% due 01/15/2008 | | | 1,745 | | | 1,908 |
3.875% due 01/15/2009 | | | 1,994 | | | 2,224 |
U.S. Treasury Note | | | | | | |
2.750% due 06/30/2006 | | | 10,300 | | | 10,310 |
| | | | | |
|
|
Total U.S. Treasury Obligations (Cost $14,393) | | | | | | 14,442 |
| | | | |
|
|
| | | | | | | |
MORTGAGE-BACKED SECURITIES 4.0% |
| |
Amortizing Residential Collateral Trust | | | |
1.620% due 07/25/2032 (a) | | | 215 | | | 215 |
Bank of America Mortgage Securities, Inc. | | | |
6.500% due 10/25/2031 | | | 321 | | | 321 |
5.667% due 10/20/2032 (a) | | | 14 | | | 15 |
Bear Stearns Adjustable Rate Mortgage Trust |
5.974% due 06/25/2032 (a) | | | 30 | | | 30 |
5.288% due 10/25/2032 (a) | | | 4 | | | 4 |
5.380% due 01/25/2033 (a) | | | 58 | | | 58 |
5.450% due 03/25/2033 (a) | | | 87 | | | 88 |
5.134% due 04/25/2033 (a) | | | 72 | | | 73 |
4.924% due 01/25/2034 (a) | | | 384 | | | 386 |
Countrywide Alternative Loan Trust | | | |
6.500% due 06/25/2033 | | | 141 | | | 145 |
6.000% due 10/25/2033 | | | 409 | | | 411 |
Countrywide Home Loans, Inc. | | | | | | |
1.570% due 04/25/2034 (a) | | | 721 | | | 716 |
Credit-Based Asset Servicing and Securitization |
1.800% due 01/25/2033 (a) | | | 374 | | | 375 |
CS First Boston Mortgage Securities Corp. | | | |
2.478% due 03/25/2032 (a) | | | 50 | | | 50 |
6.222% due 06/25/2032 (a) | | | 6 | | | 6 |
5.720% due 10/25/2032 (a) | | | 22 | | | 22 |
1.429% due 08/25/2033 (a) | | | 58 | | | 58 |
GSR Mortgage Loan Trust | | | | | | |
6.000% due 03/25/2032 | | | 21 | | | 21 |
Impac CMB Trust | | | | | | |
1.700% due 07/25/2033 (a) | | | 184 | | | 185 |
1.550% due 01/25/2034 (a) | | | 473 | | | 473 |
MASTR Asset Securitization Trust | | | |
5.500% due 09/25/2033 | | | 130 | | | 127 |
Mellon Residential Funding Corp. | | | |
1.478% due 06/15/2030 (a) | | | 1,147 | | | 1,140 |
MLCC Mortgage Investors, Inc. | | | | | | |
2.821% due 01/25/2029 (a) | | | 554 | | | 565 |
Prime Mortgage Trust | | | | | | |
1.500% due 02/25/2034 (a) | | | 70 | | | 70 |
1.700% due 02/25/2034 (a) | | | 212 | | | 212 |
Residential Funding Mortgage Securities I, Inc. |
5.603% due 09/25/2032 (a) | | | 5 | | | 5 |
Salomon Brothers Mortgage Securities VII | | | |
4.000% due 12/25/2018 | | | 772 | | | 751 |
Sequoia Mortgage Trust | | | | | | |
1.620% due 05/20/2032 (a) | | | 70 | | | 70 |
1.580% due 08/20/2032 (a) | | | 38 | | | 38 |
Structured Asset Mortgage Investments, Inc. |
1.610% due 09/19/2032 (a) | | | 96 | | | 96 |
| | | | | | |
| |
Structured Asset Securities Corp. | | | |
1.600% due 10/25/2027 (a) | | $ | 49 | | $ | 49 |
6.150% due 07/25/2032 (a) | | | 4 | | | 5 |
1.460% due 08/25/2033 (a) | | | 292 | | | 292 |
1.800% due 11/25/2033 (a) | | | 258 | | | 254 |
Washington Mutual Mortgage Securities Corp. |
6.230% due 07/25/2032 (a) | | | 12 | | | 12 |
3.052% due 02/27/2034 (a) | | | 137 | | | 137 |
3.565% due 01/25/2041 (a) | | | 13 | | | 13 |
2.624% due 08/25/2042 (a) | | | 501 | | | 506 |
Washington Mutual, Inc. | | | | | | |
5.500% due 04/26/2032 (a) | | | 107 | | | 109 |
4.820% due 10/25/2032 | | | 897 | | | 906 |
| | | | | |
|
|
| | | | | | | 9,009 |
| | | | | |
|
|
Total Mortgage-Backed Securities (Cost $9,091) | | | 9,009 |
| |
|
|
| | | | | | | |
ASSET-BACKED SECURITIES 8.5% |
| | |
ACE Securities Corp. | | | | | | |
1.640% due 06/25/2032 (a) | | | 4 | | | 4 |
Ameriquest Mortgage Securities, Inc. | | | |
1.610% due 04/25/2032 (a) | | | 118 | | | 119 |
Amortizing Residential Collateral Trust | | | |
1.590% due 07/25/2032 (a) | | | 257 | | | 257 |
Asset Backed Securities Corp. Home Equity | | | |
2.338% due 03/15/2032 (a) | | | 600 | | | 604 |
Chase Funding Mortgage Loan
Asset-Backed Certificates |
1.580% due 05/25/2030 (a) | | | 1,944 | | | 1,947 |
CIT Group Home Equity Loan Trust | | | |
1.570% due 06/25/2033 (a) | | | 34 | | | 34 |
Citifinancial Mortgage Securities, Inc. | | | |
1.400% due 05/25/2033 (a) | | | 16 | | | 16 |
Countrywide Asset-Backed Certificates | | | |
1.550% due 07/25/2018 (a) | | | 322 | | | 323 |
1.530% due 12/25/2034 (a) | | | 1,400 | | | 1,399 |
Credit-Based Asset Servicing and Securitization |
1.620% due 06/25/2032 (a) | | | 9 | | | 9 |
1.550% due 09/25/2033 (a) | | | 360 | | | 360 |
CS First Boston Mortgage Securities Corp. | | | |
1.610% due 01/25/2032 (a) | | | 55 | | | 56 |
Equity One ABS, Inc. | | | | | | |
1.580% due 11/25/2032 (a) | | | 32 | | | 32 |
First Franklin Mtg Loan Asset-Backed Certificates |
1.420% due 07/25/2033 (a) | | | 1,550 | | | 1,552 |
GSAMP Trust | | | | | | |
1.490% due 10/25/2033 (a) | | | 1,088 | | | 1,088 |
1.620% due 03/25/2034 (a) | | | 1,100 | | | 1,100 |
HFC Home Equity Loan Asset-Backed Certificates |
1.630% due 10/20/2032 (a) | | | 620 | | | 621 |
Household Mortgage Loan Trust | | | | | | |
1.580% due 05/20/2032 (a) | | | 7 | | | 7 |
Irwin Home Equity Loan Trust | | | | | | |
1.590% due 06/25/2029 (a) | | | 6 | | | 6 |
Long Beach Mortgage Loan Trust | | | |
1.750% due 11/25/2032 (a) | | | 764 | | | 766 |
MMCA Automobile Trust | | | | | | |
2.550% due 02/15/2007 | | | 698 | | | 701 |
Morgan Stanley Dean Witter Capital I, Inc. | | | |
1.630% due 07/25/2032 (a) | | | 10 | | | 10 |
Residential Asset Mortgage Products, Inc. | | | |
1.640% due 09/25/2033 (a) | | | 1,099 | | | 1,102 |
1.550% due 02/25/2034 (a) | | | 1,104 | | | 1,104 |
Residential Asset Securities Corp. | | | |
1.450% due 06/25/2023 (a) | | | 798 | | | 798 |
1.420% due 06/25/2025 (a) | | | 345 | | | 346 |
Specialty Underwriting & Residential Finance |
1.630% due 11/25/2034 (a) | | | 2,296 | | | 2,298 |
Structured Asset Investment Loan Trust | | | |
1.400% due 04/25/2033 (a) | | | 1,169 | | | 1,169 |
1.420% due 06/25/2033 (a) | | | 359 | | | 359 |
| | | | | | |
| 8 | | Semi-Annual Report | | June 30, 2004 | | See accompanying notes |
| | | | |
| | | Principal | | |
| | | Amount | | Value |
| | | (000s) | | (000s) |
| | | | | | |
| |
Truman Capital Mortgage Loan Trust | | | |
1.640% due 01/25/2034 (a) | | $ | 856 | | $ | 846 |
Vanderbilt Acquisition Loan Trust | | | |
3.280% due 01/07/2013 | | | 15 | | | 15 |
| | | | | |
|
|
Total Asset-Backed Securities (Cost $19,047) | | | | | | 19,048 |
| | | | |
|
|
| | | | | | | |
SOVEREIGN ISSUES 0.3% | | | | | | |
| | |
Republic of Brazil | | | | | | |
2.062% due 04/15/2006 (a) | | | 374 | | | 369 |
2.125% due 04/15/2009 (a) | | | 353 | | | 321 |
| | | | | |
|
|
Total Sovereign Issues (Cost $707) | | | | | | 690 |
| | | | |
|
|
| | | | | | | |
FOREIGN CURRENCY-DENOMINATED
ISSUES (g)(h) 2.7% |
| | |
Kingdom of Netherlands | | | | | | |
0.000% due 09/30/2004 | | EC | 5,000 | | | 6,053 |
| | | | | |
|
|
Total Foreign Currency-Denominated Issues (Cost $6,016) | | | 6,053 |
| |
|
|
| | | | | | | |
PREFERRED SECURITY 0.3% | | | |
| | | Shares | | |
DG Funding Trust | | | | | | |
3.360% due 12/29/2049 (a) | | | 60 | | | 645 |
| | | | | |
|
|
Total Preferred Security (Cost $632) | | | | | | 645 |
| | | | |
|
|
| | | | | | | |
SHORT-TERM INSTRUMENTS 73.5% | | | |
| | | Principal
Amount
(000s) | | |
Commercial Paper 71.0% | | | | | | |
ABN AMRO North America Finance | | | |
1.090% due 07/29/2004 | | $ | 4,500 | | | 4,496 |
Altria Group, Inc. | | | | | | |
1.800% due 10/29/2004 | | | 200 | | | 199 |
Anz (Delaware), Inc. | | | | | | |
1.040% due 07/06/2004 | | | 700 | | | 700 |
1.045% due 07/07/2004 | | | 100 | | | 100 |
Bank of Ireland | | | | | | |
1.285% due 09/03/2004 | | | 5,500 | | | 5,486 |
1.235% due 09/08/2004 | | | 600 | | | 598 |
Barclays U.S. Funding Corp. | | | | | | |
1.210% due 08/23/2004 | | | 200 | | | 200 |
1.110% due 08/25/2004 | | | 700 | | | 699 |
CBA (de) Finance | | | | | | |
1.050% due 07/02/2004 | | | 500 | | | 500 |
1.040% due 07/07/2004 | | | 3,000 | | | 2,999 |
1.050% due 07/13/2004 | | | 200 | | | 200 |
1.080% due 07/27/2004 | | | 200 | | | 200 |
1.140% due 08/09/2004 | | | 300 | | | 300 |
CDC Commercial Paper, Inc. | | | | | | |
1.050% due 07/07/2004 | | | 3,300 | | | 3,299 |
1.100% due 08/04/2004 | | | 900 | | | 899 |
1.120% due 08/24/2004 | | | 300 | | | 299 |
Danske Corp. | | | | | | |
1.070% due 07/26/2004 | | | 1,200 | | | 1,199 |
1.240% due 09/17/2004 | | | 1,000 | | | 997 |
1.250% due 09/20/2004 | | | 1,900 | | | 1,894 |
Den Norske Bank ASA | | | | | | |
1.260% due 09/20/2004 | | | 3,800 | | | 3,787 |
1.285% due 09/21/2004 | | | 1,100 | | | 1,096 |
European Investment Bank | | | | | | |
1.030% due 07/02/2004 | | | 400 | | | 400 |
1.050% due 07/16/2004 | | | 2,800 | | | 2,799 |
Fannie Mae | | | | | | |
1.030% due 07/01/2004 | | | 900 | | | 900 |
1.025% due 07/07/2004 | | | 9,600 | | | 9,598 |
1.040% due 07/14/2004 | | | 3,400 | | | 3,399 |
| | | | | | |
| | |
1.060% due 07/21/2004 | | $ | 4,800 | | $ | 4,797 |
1.055% due 08/04/2004 | | | 1,000 | | | 999 |
1.150% due 08/18/2004 | | | 800 | | | 799 |
1.105% due 09/01/2004 | | | 1,900 | | | 1,895 |
1.225% due 09/01/2004 | | | 2,000 | | | 1,995 |
1.230% due 09/01/2004 | | | 600 | | | 599 |
1.130% due 09/08/2004 | | | 1,100 | | | 1,097 |
1.430% due 09/08/2004 | | | 2,100 | | | 2,094 |
1.414% due 09/22/2004 | | | 300 | | | 299 |
1.426% due 09/22/2004 | | | 2,100 | | | 2,093 |
1.600% due 10/01/2004 | | | 1,300 | | | 1,295 |
Federal Home Loan Bank | | | | | | |
1.170% due 07/16/2004 | | | 1,300 | | | 1,299 |
1.240% due 09/01/2004 | | | 700 | | | 698 |
Ford Motor Credit Co. | | | | | | |
1.010% due 09/03/2004 | | | 1,200 | | | 1,197 |
Freddie Mac | | | | | | |
1.025% due 07/06/2004 | | | 400 | | | 400 |
1.060% due 08/03/2004 | | | 100 | | | 100 |
1.200% due 08/09/2004 | | | 500 | | | 499 |
1.120% due 08/10/2004 | | | 1,100 | | | 1,099 |
1.205% due 08/20/2004 | | | 2,100 | | | 2,096 |
1.175% due 08/24/2004 | | | 3,300 | | | 3,294 |
1.180% due 08/24/2004 | | | 4,300 | | | 4,292 |
1.315% due 09/07/2004 | | | 800 | | | 798 |
1.320% due 09/07/2004 | | | 2,100 | | | 2,094 |
1.440% due 09/14/2004 | | | 2,100 | | | 2,094 |
1.445% due 09/14/2004 | | | 3,600 | | | 3,589 |
1.436% due 09/30/2004 | | | 600 | | | 598 |
1.560% due 10/20/2004 | | | 2,200 | | | 2,189 |
General Electric Capital Corp. | | | | | | |
1.050% due 07/07/2004 | | | 100 | | | 100 |
1.040% due 07/08/2004 | | | 300 | | | 300 |
1.060% due 07/12/2004 | | | 100 | | | 100 |
1.140% due 09/03/2004 | | | 300 | | | 299 |
1.300% due 09/08/2004 | | | 3,600 | | | 3,590 |
1.460% due 09/14/2004 | | | 100 | | | 100 |
1.480% due 09/15/2004 | | | 1,600 | | | 1,595 |
HBOS Treasury Services PLC | | | | | | |
1.040% due 07/08/2004 | | | 300 | | | 300 |
1.035% due 07/09/2004 | | | 200 | | | 200 |
1.055% due 07/16/2004 | | | 600 | | | 600 |
1.080% due 07/22/2004 | | | 2,500 | | | 2,498 |
1.080% due 07/26/2004 | | | 100 | | | 100 |
1.095% due 08/02/2004 | | | 200 | | | 200 |
1.250% due 08/25/2004 | | | 700 | | | 699 |
1.150% due 09/03/2004 | | | 100 | | | 100 |
1.305% due 09/07/2004 | | | 400 | | | 399 |
1.335% due 09/09/2004 | | | 700 | | | 698 |
1.290% due 09/24/2004 | | | 300 | | | 299 |
1.580% due 10/21/2004 | | | 300 | | | 298 |
1.585% due 10/26/2004 | | | 200 | | | 199 |
ING U.S. Funding LLC | | | | | | |
1.310% due 09/02/2004 | | | 5,600 | | | 5,586 |
1.345% due 09/09/2004 | | | 600 | | | 598 |
KFW International Finance, Inc. | | | | | | |
1.095% due 08/10/2004 | | | 1,300 | | | 1,298 |
1.110% due 08/20/2004 | | | 3,400 | | | 3,395 |
National Australia Bank Ltd. | | | | | | |
1.050% due 07/02/2004 | | | 4,000 | | | 4,000 |
Nestle Capital Corp. | | | | | | |
1.035% due 07/01/2004 | | | 500 | | | 500 |
1.110% due 08/24/2004 | | | 3,100 | | | 3,095 |
1.110% due 08/26/2004 | | | 2,200 | | | 2,196 |
1.240% due 09/14/2004 | | | 300 | | | 299 |
Royal Bank of Scotland PLC | | | | | | |
1.045% due 07/06/2004 | | | 100 | | | 100 |
1.050% due 07/14/2004 | | | 100 | | | 100 |
1.070% due 07/14/2004 | | | 1,600 | | | 1,599 |
1.090% due 08/06/2004 | | | 300 | | | 300 |
1.135% due 08/26/2004 | | | 100 | | | 100 |
1.135% due 09/01/2004 | | | 1,300 | | | 1,297 |
Shell Finance (UK) PLC | | | | | | |
1.035% due 07/02/2004 | | | 800 | | | 800 |
| | | | | | | |
| | |
1.230% due 08/11/2004 | | $ | 1,800 | | $ | 1,797 | |
1.350% due 08/27/2004 | | | 3,400 | | | 3,393 | |
Spintab AB | | | | | | | |
1.490% due 09/02/2004 | | | 1,400 | | | 1,396 | |
1.260% due 09/08/2004 | | | 2,100 | | | 2,094 | |
Stadshypoket Delaware, Inc. | | | | | | | |
1.490% due 09/23/2004 | | | 2,800 | | | 2,790 | |
Svenska Handlesbanken | | | | | | | |
1.070% due 07/21/2004 | | | 200 | | | 200 | |
1.145% due 09/01/2004 | | | 1,900 | | | 1,895 | |
Svenska Handlesbanken, Inc. | | | | | | | |
1.230% due 07/22/2004 | | | 1,400 | | | 1,399 | |
1.090% due 08/03/2004 | | | 300 | | | 300 | |
1.250% due 09/01/2004 | | | 3,000 | | | 2,993 | |
TotalFinaElf Capital S.A. | | | | | | | |
1.420% due 07/01/2004 | | | 500 | | | 500 | |
Toyota Motor Credit Corp. | | | | | | | |
1.390% due 09/15/2004 | | | 3,200 | | | 3,190 | |
1.480% due 09/22/2004 | | | 1,600 | | | 1,594 | |
UBS Finance, Inc. | | | | | | | |
1.060% due 07/01/2004 | | | 400 | | | 400 | |
1.040% due 07/06/2004 | | | 100 | | | 100 | |
1.055% due 07/13/2004 | | | 100 | | | 100 | |
1.195% due 07/21/2004 | | | 1,300 | | | 1,299 | |
1.240% due 08/31/2004 | | | 100 | | | 100 | |
1.130% due 09/07/2004 | | | 400 | | | 399 | |
1.340% due 09/08/2004 | | | 1,300 | | | 1,296 | |
1.245% due 09/10/2004 | | | 100 | | | 100 | |
1.270% due 09/20/2004 | | | 200 | | | 199 | |
Westpac Capital Corp. | | | | | | | |
1.030% due 07/07/2004 | | | 100 | | | 100 | |
1.030% due 07/08/2004 | | | 600 | | | 600 | |
1.030% due 07/09/2004 | | | 100 | | | 100 | |
1.030% due 07/12/2004 | | | 100 | | | 100 | |
Westpac Trust Securities NZ Ltd. | | | | |
1.120% due 08/16/2004 | | | 700 | | | 699 | |
1.215% due 08/24/2004 | | | 1,300 | | | 1,298 | |
| | | | | |
|
|
|
| | | | | | | 159,909 | |
| | | | | |
|
|
|
| | | | | | | | |
|
Repurchase Agreement 2.2% | |
State Street Bank | | | | | | | |
0.800% due 07/01/2004 | | | 4,823 | | | 4,823 | |
| | | | | |
|
|
|
(Dated 06/30/2004. Collateralized by Freddie Mac 5.500% due 07/15/2006 valued at $4,923. Repurchase proceeds are $4,823.) | |
|
U.S. Treasury Bills 0.3% | |
1.219% due 09/02/2004- 09/16/2004 (b)(d) | | | 710 | | | 709 | |
| | | | | |
|
|
|
Total Short-Term Instruments (Cost $165,464) | | | | | | 165,441 | |
| | | | |
|
|
|
| | |
Total Investments 108.4% | | | | | $ | 244,126 | |
(Cost $244,105) | | | | | | | |
| |
Written Options (f) (0.0%) | | | (6 | ) |
(Premiums $68) | | | | | | | |
| |
Other Assets and Liabilities (Net) (8.4%) | | | (18,907 | ) |
| | | | | |
|
|
|
| |
Net Assets 100.0% | | $ | 225,213 | |
| | | | | |
|
|
|
Notes to Schedule of Investments (amounts in thousands, except number of contracts):
(a) Variable rate security.
(b) Securities are grouped by coupon or range of coupons and represent a range of maturities.
| | | | | | |
| See accompanying notes | | June 30, 2004 | | Semi-Annual Report | | 9 |
Schedule of Investments (Cont.)
Low Duration Portfolio
June 30, 2004 (Unaudited)
(c) Principal amount of security is adjusted for inflation.
(d) Securities with an aggregate market value of $708 have been segregated with the custodian to cover margin requirements for the following open futures contracts at June 30, 2004:
| | | | | | | | |
| Type | | Expiration
Month | | # of
Contracts | | Unrealized
Appreciation/
(Depreciation) | |
Eurodollar March
Long Futures | | 03/2005 | | 1 | | $ | 0 | |
Euribor December
Long Futures | | 12/2005 | | 37 | | | (30 | ) |
Euribor June
Long Futures | | 06/2005 | | 22 | | | 6 | |
Euribor September Long Futures | | 09/2005 | | 20 | | | (2 | ) |
Euribor Written Put Options Strike @ 97.000 | | 12/2004 | | 2 | | | 2 | |
Euribor Written Put Options Strike @ 97.500 | | 09/2004 | | 4 | | | 1 | |
U.S. Treasury 2-Year Note Long Futures | | 09/2004 | | 534 | | | 207 | |
| | | | | | | $ | 184 | |
(e) Swap agreements outstanding at June 30, 2004:
| | | | | | | |
| Type | | Notional
Amount | | Unrealized
Appreciation/
(Depreciation) | |
Receive floating rate based on 6-month BP-LIBOR
and pay a fixed rate equal to 5.000%. | |
Counterparty: Morgan Stanley Dean Witter & Co. | |
Exp. 03/15/2032 | | BP | 100 | | $ | (2 | ) |
|
Receive a fixed rate equal to 6.000% and pay
floating rate based on 6-month EC-LIBOR. | |
Counterparty: J.P. Morgan Chase & Co. | |
Exp. 03/15/2032 | | EC | 200 | | | 3 | |
|
Receive a fixed rate equal to 1.650% and the
Portfolio will pay to the counterparty at par in the
event of default of Republic of Panama 8.875%
due 09/30/2027. | |
Counterparty: Citibank N.A. | |
Exp. 05/30/2005 | | $ | 10 | |
| 0
|
|
| | | | | | $
| 1
|
|
(f) Premiums received on written options:
| | | | | | | | | | | | | | | | |
| Name of Issuer | | | | Exercise
Price | | | Expiration
Date | | # of
Contracts | | Premium | | Value |
Put - CBOT U.S. Treasury Note September Futures | | | | $ | 107.500 | | | 08/27/2004 | | 7 | | $ | 5 | | $ | 3 |
| | | | | | | | | | | | | | | | | |
| Name of Issuer | | Counterparty | | Exercise
Rate | | | Expiration
Date | | Notional
Amount | | Premium | | Value |
Call - OTC 7-Year Interest Rate Swap | | Goldman Sachs & Co. | | | 3.750 | %** | | 08/02/2004 | | 4,000 | | $ | 34 | | $ | 0 |
Put - OTC 7-Year Interest Rate Swap | | Goldman Sachs & Co. | | | 5.250 | %* | | 08/02/2004 | | 4,000 | | | 25 | | | 3 |
Call - OTC 7-Year Interest Rate Swap | | UBS Warburg LLC | | | 3.800 | %** | | 10/07/2004 | | 700 | | | 3 | | | 0 |
| | | | | | | | | | | | | $ | 62 | | $ | 3 |
| | | | | | | | | | | | | | | | | |
* The Portfolio will pay a floating rate based on 3-month LIBOR. | | | | | | |
**The Portfolio will receive a floating rate based on 3-month LIBOR. | | | | | | |
| (g) Forward foreign currency contracts outstanding at June 30, 2004: | | | | | | |
| | | | | | | | | | | | | | | | | |
| Type | | Currency | | Principal
Amount
Covered
by Contract | | Settlement
Month | | Unrealized
Appreciation | | Unrealized
(Depreciation) | | | Net Unrealized
Appreciation/
(Depreciation) | |
Buy | | BR | | 95 | | 08/2004 | | $ | 1 | | $ | 0 | | | $ | 1 | |
Buy | | | | 300 | | 09/2004 | | | 2 | | | 0 | | | | 2 | |
Buy | | CP | | 24,364 | | 08/2004 | | | 0 | | | 0 | | | | 0 | |
Buy | | | | 60,602 | | 09/2004 | | | 2 | | | 0 | | | | 2 | |
Sell | | EC | | 5,224 | | 07/2004 | | | 4 | | | (11 | ) | | | (7 | ) |
Buy | | H$ | | 250 | | 08/2004 | | | 0 | | | 0 | | | | 0 | |
Buy | | | | 777 | | 09/2004 | | | 0 | | | 0 | | | | 0 | |
Buy | | KW | | 37,380 | | 08/2004 | | | 1 | | | 0 | | | | 1 | |
Buy | | | | 118,000 | | 09/2004 | | | 1 | | | 0 | | | | 1 | |
Buy | | MP | | 1,121 | | 09/2004 | | | 0 | | | (2 | ) | | | (2 | ) |
Buy | | PN | | 112 | | 08/2004 | | | 0 | | | 0 | | | | 0 | |
Buy | | | | 139 | | 09/2004 | | | 0 | | | 0 | | | | 0 | |
Buy | | RP | | 2,578 | | 09/2004 | | | 0 | | | (1 | ) | | | (1 | ) |
Buy | | RR | | 915 | | 08/2004 | | | 0 | | | 0 | | | | 0 | |
Buy | | | | 2,854 | | 09/2004 | | | 0 | | | 0 | | | | 0 | |
Buy | | S$ | | 54 | | 08/2004 | | | 0 | | | 0 | | | | 0 | |
Buy | | | | 170 | | 09/2004 | | | 0 | | | 0 | | | | 0 | |
Buy | | SR | | 216 | | 08/2004 | | | 3 | | | 0 | | | | 3 | |
Sell | | | | 130 | | 08/2004 | | | 0 | | | 0 | | | | 0 | |
Buy | | | | 274 | | 09/2004 | | | 2 | | | 0 | | | | 2 | |
Sell | | | | 160 | | 09/2004 | | | 0 | | | 0 | | | | 0 | |
Buy | | SV | | 1,061 | | 08/2004 | | | 1 | | | 0 | | | | 1 | |
Buy | | | | 1,337 | | 09/2004 | | | 0 | | | 0 | | | | 0 | |
Buy | | T$ | | 1,063 | | 08/2004 | | | 0 | | | 0 | | | | 0 | |
Buy | | | | 3,321 | | 09/2004 | | | 0 | | | 0 | | | | 0 | |
| | | | | | | | | $ | 17 | | $ | (14 | ) | | $ | 3 | |
(h) Principal amount denoted in indicated currency:
| | | | |
BP | | - | | British Pound |
BR | | - | | Brazilian Real |
CP | | - | | Chilean Peso |
EC | | - | | Euro |
H$ | | - | | Hong Kong Dollar |
KW | | - | | South Korean Won |
MP | | - | | Mexican Peso |
PN | | - | | Peruvian New Sol |
RP | | - | | Indian Rupee |
RR | | - | | Russian Ruble |
S$ | | - | | Singapore Dollar |
SR | | - | | South African Rand |
SV | | - | | Slovakian Koruna |
T$ | | - | | Taiwan Dollar |
| | | | | | |
| 10 | | Semi-Annual Report | | June 30, 2004 | | See accompanying notes |
Notes to Financial Statements
June 30, 2004 (Unaudited)
1. Organization
The Low Duration Portfolio (the “Portfolio”) is a series of the PIMCO Variable Insurance Trust (the “Trust”). The Trust is registered under the Investment Company Act of 1940 (the “Act”), as amended, as an open-end investment company organized as a Delaware business trust on October 3, 1997. The Portfolio offers two classes of shares: Institutional and Administrative. Each share class has identical voting rights (except that shareholders of a class have exclusive voting rights regarding any matter relating solely to that class of shares). Information presented in these financial statements pertains to the Institutional Class of the Portfolio. Certain detailed financial information for the Administrative Class is provided separately and is available upon request. The Trust is designed to be used as an investment vehicle by Separate Accounts of insurance companies that fund variable annuity contracts and variable life insurance policies and by qualified pension and retirement plans. The Portfolio commenced operations on February 16, 1999.
2. Significant Accounting Policies
The following is a summary of significant accounting policies consistently followed by the Trust in the preparation of its financial statements in conformity with accounting principles generally accepted in the United States of America. The preparation of financial statements in accordance with accounting principles generally accepted in the United States of America requires management to make estimates and assumptions that affect the reported amounts and disclosures in the financial statements. Actual results could differ from those estimates.
Security Valuation. Portfolio securities and other financial instruments for which market quotations are readily available are stated at market value. Portfolio securities and other financial instruments for which market quotes are not readily available are valued at fair value, as determined in good faith and pursuant to guidelines established by the Board of Trustees, including certain fixed income securities which may be valued with reference to securities whose prices are more readily obtainable. Market value is determined at the close of regular trading (normally, 4:00 p.m., Eastern Time) on the New York Stock Exchange on each day the New York Stock Exchange is open, or if no sales are reported, as is the case for most securities traded over-the-counter, the mean between representative bid and asked quotations obtained from a quotation reporting system or from established market makers. The prices of certain portfolio securities or other financial instruments may be determined at a time prior to the close of regular trading on the New York Stock Exchange. Fair valuation may be used if significant events occur after the close of the relevant markets and prior to the close of regular trading on the New York Stock Exchange that materially affect the values of such securities or financial instruments. Fixed income securities are normally valued on the basis of quotes obtained from brokers and dealers or pricing services. Certain fixed income securities purchased on a delayed delivery basis are marked to market daily until settlement at the forward settlement value. Short-term investments, which mature in 60 days or less are valued at amortized cost, which approximates market value. Exchange traded options, futures and options on futures are valued at the settlement price determined by the relevant exchange. Prices may be obtained from independent pricing services which use information provided by market makers or estimates of market values obtained from yield data relating to investments or securities with similar characteristics. The prices used by the Portfolio may differ from the value that would be realized if the securities were sold and the differences could be material to the financial statements.
Securities Transactions and Investment Income. Securities transactions are recorded as of the trade date. Securities purchased or sold on a when-issued or delayed delivery basis may be settled a month or more after the trade date. Realized gains and losses from securities sold are recorded on the identified cost basis. Dividend income is recorded on the ex-dividend date, except certain dividends from foreign securities where the ex-dividend date may have passed, are recorded as soon as the Portfolio is informed of the ex-dividend date. Interest income, adjusted for the accretion of discounts and amortization of premiums, is recorded on the accrual basis. Paydowns gains and losses on mortgage- and asset-backed securities are recorded as adjustments to interest income in the Statement of Operations.
Dividends and Distributions to Shareholders. Dividends from net investment income, if any, are declared on each day the Trust is open for business and are distributed to shareholders monthly. All dividends are reinvested in additional shares of the Portfolio. Net realized capital gains earned by the Portfolio, if any, will be distributed no less frequently than once each year.
Income dividends and capital gain distributions are determined in accordance with income tax regulations which may differ from accounting principles generally accepted in the United States of America. These differences are primarily due to differing treatments for such items as wash sales, foreign currency transactions, net operating losses, notional principal contracts, certain asset-backed securities, certain futures and forward contracts, tax straddles, and capital loss carryforwards.
Distributions classified as a tax basis return of capital, if any, are reflected in the accompanying Statements of Changes in Net Assets and have been reclassified to paid in capital. In addition, other amounts have been reclassified between undistributed net investment income, accumulated undistributed net realized gains or losses and/or paid in capital to more appropriately conform financial accounting to tax characterizations of dividend distributions.
Multiclass Operations. Each class offered by the Trust has equal rights as to assets. Income, non-class specific expenses, and realized and unrealized capital gains and losses are allocated to each class of shares based on the relative net assets of each class.
Federal Income Taxes. The Portfolio intends to qualify as a regulated investment company and distribute all of its taxable income and net realized gains, if applicable, to shareholders. Accordingly, no provision for Federal income taxes has been made.
| | | | |
| June 30, 2004 | | Semi-Annual Report | | 11 |
Notes to Financial Statements (Cont.)
June 30,2004 (Unaudited)
Foreign Currency. The accounting records of the Portfolio are maintained in U.S. dollars. The market values of foreign securities, currency holdings and other assets and liabilities are translated into U.S. dollars based on the current exchange rates each business day. Fluctuations in the value of these assets and liabilities resulting from changes in exchange rates are recorded as unrealized foreign currency gains or losses. Realized gains or losses and unrealized appreciation or depreciation on investment securities and income and expenses are translated on the respective dates of such transactions. The effect of changes in foreign currency exchange rates on investments in securities are not segregated in the Statement of Operations from the effects of changes in market prices of those securities, but are included with the net realized and unrealized gain or loss on investment securities.
Forward Currency Transactions. The Portfolio may enter into forward currency contracts and forward cross-currency contracts in connection with settling planned purchases or sales of securities, to hedge the currency exposure associated with some or all of the Portfolio’s securities or as a part of an investment strategy. A forward currency contract is an agreement between two parties to buy and sell a currency at a set price on a future date. The market value of a forward currency contract fluctuates with changes in forward currency exchange rates. Forward currency contracts are marked to market daily and the change in value is recorded by the Portfolio as an unrealized gain or loss. Realized gains or losses equal to the difference between the value of the contract at the time it was opened and the value at the time it was closed are recorded upon delivery or receipt of the currency or, if a forward currency contract is offset by entering into another forward currency contract with the same broker, upon settlement of the net gain or loss. These contracts may involve market risk in excess of the unrealized gain or loss reflected in the Portfolio’s Statement of Assets and Liabilities. In addition, the Portfolio could be exposed to risk if the counterparties are unable to meet the terms of the contracts or if the value of the currency changes unfavorably to the U.S. dollar.
Futures Contracts. The Portfolio is authorized to enter into futures contracts. The Portfolio may use futures contracts to manage its exposure to the securities markets or to movements in interest rates and currency values. The primary risks associated with the use of futures contracts are the imperfect correlation between the change in market value of the securities held by the Portfolio and the prices of futures contracts, the possibility of an illiquid market, and the inability of the counterparty to meet the terms of the contract. Futures contracts are valued based upon their quoted daily settlement prices. Upon entering into a futures contract, the Portfolio may be required to deposit with its custodian, in a segregated account in the name of the futures broker, an amount of cash or U.S. Government and Agency Obligations in accordance with the initial margin requirements of the broker or exchange. Futures contracts are marked to market daily and an appropriate payable or receivable for the change in value (“variation margin”) is recorded by the Portfolio. Gains or losses are recognized but not considered realized until the contracts expire or are closed. Futures contracts involve, to varying degrees, risk of loss in excess of the variation margin disclosed in the Statement of Assets and Liabilities.
Inflation-Indexed Bonds. The Portfolio may invest in inflation-indexed bonds. Inflation-indexed bonds are fixed income securities whose principal value is periodically adjusted to the rate of inflation. The interest rate on these bonds is generally fixed at issuance at a rate lower than typical bonds. Over the life of an inflation-indexed bond, however, interest will be paid based on a principal value, which is adjusted for inflation. Any increase in the principal amount of an inflation-indexed bond will be included as interest income in the Statement of Operations, even though investors do not receive their principal until maturity.
Options Contracts. The Portfolio may write call and put options on futures, swaps, securities or currencies it owns or in which it may invest. Writing put options tends to increase the Portfolio’s exposure to the underlying instrument. Writing call options tends to decrease the Portfolio’s exposure to the underlying instrument. When the Portfolio writes a call or put option, an amount equal to the premium received is recorded as a liability and subsequently marked to market to reflect the current value of the option written. These liabilities are reflected as written options outstanding in the Statement of Assets and Liabilities. Payments received or made, if any, from writing options with premiums to be determined on a future date are reflected as such on the Statement of Assets and Liabilities. Premiums received from writing options which expire are treated as realized gains. Premiums received from writing options which are exercised or closed are added to the proceeds or offset against amounts paid on the underlying future, swap, security or currency transaction to determine the realized gain or loss. The Portfolio as a writer of an option has no control over whether the underlying future, swap, security or currency may be sold (call) or purchased (put) and as a result bears the market risk of an unfavorable change in the price of the future, swap, security or currency underlying the written option. There is the risk the Portfolio may not be able to enter into a closing transaction because of an illiquid market.
The Portfolio may also purchase put and call options. Purchasing call options tends to increase the Portfolio’s exposure to the underlying instrument. Purchasing put options tends to decrease the Portfolio’s exposure to the underlying instrument. The Portfolio pays a premium which is included in the Portfolio’s Statement of Assets and Liabilities as an investment and subsequently marked to market to reflect the current value of the option. Premiums paid for purchasing options which expire are treated as realized losses. The risk associated with purchasing put and call options is limited to the premium paid. Premiums paid for purchasing options which are exercised or closed are added to the amounts paid or offset against the proceeds on the underlying future, swap, security or currency transaction to determine the realized gain or loss.
Repurchase Agreements. The Portfolio may engage in repurchase transactions. Under the terms of a typical repurchase agreement, the Portfolio takes possession of an underlying debt obligation subject to an obligation of the seller to repurchase, and the Portfolio to resell,
| | | | |
| 12 | | Semi-Annual Report | | June 30, 2004 |
the obligation at an agreed-upon price and time. The market value of the collateral must be equal at all times to the total amount of the repurchase obligations, including interest. Generally, in the event of counterparty default, the Portfolio has the right to use the collateral to offset losses incurred.
Swap Agreements. The Portfolio may invest in swap agreements. A swap is an agreement to exchange the return generated by one instrument for the return generated by another instrument. The Portfolio may enter into interest rate, total return, forward spread lock, and credit default swap agreements to manage its exposure to interest rates and credit risk.
Interest rate swap agreements involve the exchange by the Portfolio with another party of their respective commitments to pay or receive interest, e.g., an exchange of floating rate payments for fixed rate payments with respect to the notional amount of principal.
Total return swap agreements involve commitments to pay interest in exchange for a market-linked return, both based on notional amounts. To the extent the total return of the security or index underlying the transaction exceeds or falls short of the offsetting interest rate obligation, the Portfolio will receive a payment from or make a payment to the counterparty.
Forward spread lock swap agreements involve commitments to pay or receive a settlement amount calculated as the difference between the swap spread and a fixed spread, multiplied by the notional amount times the duration of the swap. The swap spread is the difference between the benchmark swap rate (market rate) and the specific Treasury rate.
In a credit default swap, one party makes a stream of payments to another party in exchange for the right to receive a specified return in the event of a default by a third party, typically corporate issues or sovereign issues of an emerging country, on its obligation. The Portfolio may use credit default swaps to provide a measure of protection against defaults of sovereign issuers (i.e., to reduce risk where the Portfolio owns or has exposure to the sovereign issuer) or to take an active long or short position with respect to the likelihood of a particular issuer’s default.
Swaps are marked to market daily based upon quotations from market makers and the change in value, if any, is recorded as unrealized gain or loss in the Statement of Operations. Payments received or made at the beginning of the measurement period are reflected as such on the Statement of Assets and Liabilities. A liquidation payment received or made at the termination of the swap is recorded as realized gain or loss in the Statement of Operations. Net periodic payments received by the Portfolio are included as part of realized gain (loss) on the Statement of Operations. Entering into these agreements involves, to varying degrees, elements of credit, market and documentation risk in excess of the amounts recognized on the Statement of Assets and Liabilities. Such risks involve the possibility that there will be no liquid market for these agreements, that the counterparty to the agreements may default on its obligation to perform or disagree as to the meaning of contractual terms in the agreements, and that there may be unfavorable changes in interest rates.
As a result of a FASB Emerging Issues Task Force (“EITF”) consensus, No. 03-11, and related SEC staff guidance, the Portfolio has reclassified periodic payments made or received under swap agreements, which were previously included within miscellaneous income, to a component of realized gain (loss) in the Statement of Operations. For consistency, similar reclassifications have been made to amounts appearing in the previous year’s Statement of Changes in Net Assets and the per share amounts in the prior year financial highlights. Prior year net investment income ratios in the financial highlights have also been modified accordingly. This reclassification increased (decreased) net investment income by $(415) and $(314), and net realized gain by $348 and $50 and net change in unrealized appreciation by $68 and $264 for the six months ended June 30, 2004 and year ended December 31, 2003, respectively. There is no effect on the Portfolio’s net asset value, either in total or per share, or its total increase (decrease) in net assets from operations during any period.
3. Fees, Expenses, and Related Party Transactions
Investment Advisory Fee. Pacific Investment Management Company LLC (“PIMCO”) is a majority owned subsidiary partnership of Allianz Dresdner Asset Management of America L.P. and serves as investment adviser (the “Adviser”) to the Trust, pursuant to an investment advisory contract. The Adviser receives a monthly fee at an annual rate based on average daily net assets of the Portfolio. The Advisory Fee is charged at an annual rate of 0.25%.
Administration Fee. PIMCO serves as administrator (the “Administrator”), and provides administrative services to the Trust for which it receives a monthly administrative fee based on average daily net assets of the Portfolio. The Administration Fee is charged at the annual rate of 0.25%.
Servicing Fee. PA Distributors LLC (“PAD”), formerly known as PIMCO Advisors Distributors LLC, is an indirect wholly-owned subsidiary of Allianz Dresdner Asset Management of America L.P. and serves as the distributor of the Trust’s shares. The Trust is permitted to reimburse PAD on a quarterly basis, out of the Administrative Class assets of the Portfolio in the amount of 0.15% on an annual basis of the average daily net assets of that class, for payments made to financial intermediaries that provide services in connection with the distribution of shares or administration of plans or programs that use Portfolio shares as their funding medium. The effective rate paid to PAD was 0.15% during current fiscal year.
Expenses. The Trust is responsible for the following expenses: (i) salaries and other compensation of any of the Trust’s executive officers and employees who are not officers, directors, stockholders or employees of PIMCO or its subsidiaries or affiliates; (ii) taxes and governmental fees; (iii) brokerage fees and commissions and other portfolio transaction expenses; (iv) the cost of borrowing money, including interest expense and bank overdraft charges; (v) fees and expenses of the Trustees who are not “interested persons” of PIMCO or the Trust, and any counsel retained exclusively for their benefit;
| | | | |
| June 30, 2004 | | Semi-Annual Report | | 13 |
Notes to Financial Statements (Cont.)
June 30, 2004 (Unaudited)
(vi) extraordinary expenses, including costs of litigation and indemnification expenses; (vii) organization expenses and (viii) any expenses allocated or allocable to a specific class of shares, which include service fees payable with respect to the Administrative Class shares and may include certain other expenses as permitted by the Trust’s Multiple Class Plan adopted pursuant to Rule 18f-3 under the Act and subject to review and approval by the Trustees. The ratio of expenses to average net assets per share class, as disclosed in Financial Highlights, may differ from the annual portfolio operating expenses per share class as disclosed in the Prospectus for the reasons set forth above.
PIMCO has agreed to waive a portion of its administrative fees to the extent that the payment of the Portfolio’s pro rata share of organization expenses and Trustee fees cause the actual expense ratio to rise above the rates disclosed in the then-current prospectus plus 0.49 basis points as set forth below (calculated as a percentage of the Portfolio’s average daily net assets attributable to each class):
| | |
Institutional Class | | 0.50% |
Administrative Class | | 0.65% |
PIMCO may be reimbursed for these waived amounts in future periods, not to exceed thirty-six months.
Each unaffiliated Trustee receives an annual retainer of $4,000, plus $1,500 for each Board of Trustees meeting attended in person and $250 for each meeting attended telephonically, plus reimbursement of related expenses. In addition, each committee chair receives an additional annual retainer of $500. These expenses are allocated on a pro-rata basis to each Portfolio of the Trust according to its respective net assets.
4. Purchases and Sales of Securities
The length of time a Portfolio has held a particular security is not generally a consideration in investment decisions. A change in the securities held by a Portfolio is known as “portfolio turnover.” The Portfolio may engage in frequent and active trading of portfolio securities to achieve its investment objective, particularly during periods of volatile market movements. High portfolio turnover (e.g., over 100%) involves correspondingly greater expenses to the Portfolio, including brokerage commissions or dealer mark-ups and other transaction costs on the sale of securities and reinvestments in other securities. Such sales may also result in realization of taxable capital gains, including short-term capital gains (which are generally taxed at ordinary income tax rates). The trading costs and tax effects associated with portfolio turnover may adversely affect the Portfolio’s performance.
Purchases and sales of securities (excluding short-term investments) for the period ended June 30, 2004 were as follows (amounts in thousands):
| | | | | | |
| U.S. Government/Agency | | All Other |
| Purchases | | Sales | | Purchases | | Sales |
| $ 54,302 | | $ 21,503 | | $ 35,481 | | $ 13,017 |
5. Transactions in Written Call and Put Options
Transactions in written call and put options were as follows (amounts in thousands):
| | | | |
| | | | Premium | |
Balance at 12/31/2003 | | $ | 0 | |
Sales | | | 115 | |
Expirations | | | (47 | ) |
Exercised | | | 0 | |
Balance at 06/30/2004 | | $ | 68 | |
6. Federal Income Tax Matters
At June 30, 2004, the aggregate cost of investments was the same for federal income tax and financial statement purposes. The net unrealized appreciation (depreciation) of investment securities for federal income tax purposes is as follows (amounts in thousands):
| | | | | | |
Aggregate Gross
Unrealized
Appreciation | | Aggregate Gross
Unrealized
(Depreciation) | | Net Unrealized
Appreciation |
| $ 279 | | $ | (258) | | $ | 21 |
| | | | |
| 14 | | Semi-Annual Report | | June 30, 2004 |
7. Shares of Beneficial Interest
The Trust may issue an unlimited number of shares of beneficial interest with a $.001 par value. Changes in shares of beneficial interest were as follows (shares and amounts in thousands):
| | | | | | | | | | | | | | |
| | | Six Months Ended
06/30/2004 | | | Year Ended
12/31/2003 | |
| | | Shares | | | Amount | | | Shares | | | Amount | |
Receipts for shares sold | | | | | | | | | | | | | | |
| | | | |
Institutional Class | | 884 | | | $ | 9,077 | | | 0 | | | $ | 0 | |
Administrative Class | | 12,693 | | | | 130,603 | | | 10,656 | | | | 109,489 | |
| | | | |
Issued as reinvestment of distributions | | | | | | | | | | | | | | |
| | | | |
Institutional Class | | 2 | | | | 21 | | | 0 | | | | 0 | |
Administrative Class | | 77 | | | | 792 | | | 79 | | | | 815 | |
| | | | |
Cost of shares redeemed | | | | | | | | | | | | | | |
| | | | |
Institutional Class | | (3 | ) | | | (29 | ) | | 0 | | | | 0 | |
Administrative Class | | (2,931 | ) | | | (30,136 | ) | | (1,406 | ) | | | (14,447 | ) |
| | | | |
Net increase resulting from Portfolio share transactions | | 10,722 | | | $ | 110,328 | | | 9,329 | | | $ | 95,857 | |
The following schedule shows the number of shareholders each owning 5% or more of the Portfolio and the total percentage of the Portfolio held by such shareholders:
| | | | |
| | | Number | | % of Portfolio Held |
Institutional Class | | 1 | | 100 |
Administrative Class | | 7 | | 94 |
8. Regulatory and Litigation Matters
On February 17, 2004, the Attorney General of the State of New Jersey (“New Jersey AG”) filed a complaint against Allianz Dresdner Asset Management of America L.P. (“ADAM”), PA Distributors LLC (formerly known as PIMCO Advisors Distributors LLC) (“PAD”), PEA Capital LLC (formerly known as PIMCO Equity Advisors LLC) (“PEA”), and Pacific Investment Management Company LLC (“PIMCO”) in connection with its investigation into market timing and late trading. The complaint contends that inappropriate trading by shareholders engaged in market timing activity took place in funds in the PIMCO Funds: Multi-Manager Series (“MMS Funds”) and the PIMCO Funds: Pacific Investment Management Series (“PIMS Funds”). On June 1, 2004, the New Jersey AG dismissed PIMCO from the lawsuit.
On the same day as the dismissal of PIMCO from the lawsuit, the New Jersey AG announced that it had reached a settlement agreement with the remaining defendants (“New Jersey Settlement”). In the New Jersey Settlement, ADAM, PAD and PEA agreed, while neither admitting nor denying the allegations or conclusions of law, to: (i) pay New Jersey a civil fine of $15 million and $3 million for investigative costs and further enforcement initiatives; and (ii) implement certain changes in corporate governance.
On May 6, 2004, the Securities and Exchange Commission filed a complaint in the U.S. District Court in the Southern District of New York alleging that PA Fund Management LLC (formerly known as PIMCO Advisors Fund Management LLC) (“PAFM”), PEA, PAD, Stephen J. Treadway (at the time, the chief executive officer of PAFM and PAD as well as chairman of the Board of Trustees of the MMS Funds) and Kenneth W. Corba (the former chief executive officer of PEA and former portfolio manager of the PEA Growth and PEA Growth & Income Funds) had, among other things, violated and/or aided and abetted violations of, various antifraud provisions of the federal securities laws in connection with alleged “market timing” arrangements that improperly allowed certain hedge funds to engage in “market timing” in the PEA Growth Fund, the PEA Opportunity Fund, the PEA Innovation Fund, and the PEA Target Fund. The complaint seeks injunctive relief, disgorgement plus pre-judgment interest, monetary penalties, and an order permanently enjoining the defendants from serving as investment advisers, principal underwriters, officers, directors, or members of any advisory boards to any registered investment companies.
On February 20, 2004, a putative class action lawsuit was filed in the U.S. District Court for the District of New Jersey on behalf of certain shareholders of the PIMCO Funds against ADAM, PAD, PIMCO, PEA, the PIMS Funds, the MMS Funds, the Trust, PIMCO Commercial Mortgage Securities Trust, Inc. and certain other defendants, alleging that inappropriate market timing activity by certain shareholders caused financial injury to the shareholders of those Funds.
| | | | |
| June 30, 2004 | | Semi-Annual Report | | 15 |
Notes to Financial Statements (Cont.)
June 30, 2004 (Unaudited)
The following additional putative class action lawsuits have been filed against the PIMS Funds, the MMS Funds and/or their affiliates, each related to alleged market-timing activity in funds advised by PIMCO or its affiliates: (1) a lawsuit filed in the U.S. District Court for the District of Connecticut on February 27, 2004 (naming as defendants ADAM, PAD, PEA, the PIMS Funds, the MMS Funds, the Trust, PCM and certain other parties); (2) a lawsuit filed in the U.S. District Court for the Central District of California on March 4, 2004 (naming as defendants PIMCO, ADAM, PEA and PAD); (3) a lawsuit filed in the U.S. District Court for the Southern District of New York on March 8, 2004 (naming PIMCO, PAD and certain of their affiliates as defendants); (4) a lawsuit filed in the U.S. District Court for the Southern District of New York, on March 15, 2004 (naming PIMCO as the defendant); (5) two separate lawsuits filed in the U.S. District Court for the Central District of California on March 22, 2004, brought derivatively on behalf of the PIMCO High Yield Fund and the PIMCO Money Market Fund, respectively (each naming ADAM, PAFM and certain other parties as defendants, and the PIMCO Funds as the nominal defendant); (6) a lawsuit filed in the U.S. District Court for the Central District of California, also on March 22, 2004, brought derivatively on behalf of the PIMS Funds and the MMS Funds (naming ADAM, PIMCO, PAD and certain other parties as defendants, and the PIMS Funds and the MMS Funds as nominal defendants); (7) a lawsuit filed in the U.S. District Court for the District of New Jersey on April 20, 2004 (naming ADAM, PAD, the PIMS Funds and certain other parties as defendants); and (8) a lawsuit filed in the U.S. District Court for the Northern District of California on April 28, 2004 (naming ADAM, PIMCO, PAD, PEA and certain other parties as defendants, and the “PIMCO Funds” as nominal defendants). Each complaint for the foregoing putative class actions alleges, among other things, that inappropriate trading by shareholders engaged in market timing activities took place in certain of the funds advised by PIMCO, and each complaint seeks unspecified compensatory damages.
On February 17, 2004, a putative class action lawsuit was filed in the U.S. District Court for the District of Connecticut on behalf of certain shareholders of the PIMCO Funds against ADAM, PEA, PIMCO, PIMS Funds, MMS Funds and certain other defendants, alleging excessive investment advisory fees and the use of brokerage commissions to pay for distribution of fund shares. Three similar putative class action lawsuits were subsequently filed, each in the U.S. District Court for the District of Connecticut on March 1, 2004, April 23, 2004 and May 20, 2004, respectively.
Under Section 9(a) of the 1940 Act, if any of the various lawsuits were to result in a court injunction against PAFM, PEA, PAD, PIMCO, ADAM and/or Mr. Treadway, they and their affiliates would, in the absence of exemptive relief granted by the SEC, be barred from serving as an investment adviser/sub-adviser or principal underwriter for any registered investment company, including the Trust. ADAM and certain of its subsidiaries have responded to inquiries from the SEC concerning the status of the New Jersey Settlement under Section 9(a). If any of PAFM, PEA, PAD, PIMCO or ADAM were subject to an injunction, each of these entities and their affiliates could in turn seek exemptive relief from the SEC, as contemplated by the 1940 Act. There is no assurance, however, that such exemptive relief would be granted. The SEC also has the power by order to prohibit PAFM, PEA, PAD and PIMCO from serving as investment advisers and underwriters, if the SEC finds that such entities willfully violated the federal securities laws in connection with the allegations discussed above or aided or abetted such violations.
PIMCO, PAD and the Trust believe that these developments will not have a material adverse effect on the Portfolios or on PIMCO’s, or PAD’s ability to perform their respective investment advisory or distribution services on behalf of the Portfolios.
| | | | |
| 16 | | Semi-Annual Report | | June 30, 2004 |
Trustees and Officers
Brent R. Harris, Chairman and Trustee
R. Wesley Burns, President and Trustee
E. Philip Cannon, Trustee
Vern O. Curtis, Trustee
J. Michael Hagan, Trustee
William J. Popejoy, Trustee
Garlin G. Flynn, Secretary
John P. Hardaway, Treasurer
Investment Adviser and Administrator
Pacific Investment Management Company LLC
840 Newport Center Drive
Newport Beach, California 92660
Distributor
PA Distributors LLC
2187 Atlantic Street
Stamford, Connecticut 06902
Custodian
State Street Bank & Trust Company
801 Pennsylvania
Kansas City, Missouri 64105
Transfer Agent
Boston Financial Data Services–Midwest
330 W. 9th Street
Kansas City, Missouri 64105
Legal Counsel
Dechert LLP
1775 I Street, N.W.
Washington, D.C. 20006
Independent Registered Public Accounting Firm
PricewaterhouseCoopers LLP
1055 Broadway
Kansas City, Missouri 64105
Information about how the Fund voted proxies relating to portfolio securities held during the year July 1, 2003 through June 30, 2004 will be available no later than August 31, 2004 without charge, upon request, by calling the Trust at 1-800-927-4648 and on the SEC’s website at http://www.sec.gov.
Copies of the written Proxy Policy and the factors that PIMCO may consider in determining how to vote proxies for the Funds are available by calling the Trust at 1-800-927-4648 and on the SEC’s website at http://www.sec.gov.
PIMCO VARIABLE INSURANCE TRUST
840 NEWPORT CENTER DRIVE
NEWPORT BEACH, CA 92660

PIMCO VARIABLE INSURANCE TRUST
HIGH YIELD PORTFOLIO
INSTITUTIONAL CLASS
SEMI-ANNUAL REPORT
June 30, 2004
|
| This material is authorized for use only when preceded or accompanied by the current PIMCO Variable Insurance Trust prospectus. Investors should consider the investment objectives, risks, charges and expenses of Portfolio carefully before investing. This and other information is contained in the Portfolio’s prospectus. Please read the prospectus carefully before you invest or send money. |
Chairman’s Letter
Dear PIMCO Variable Insurance Trust Shareholder:
Bond prices were more volatile during the six-month period ended June 30, 2004. Interest rates rose sharply during the second quarter 2004, causing bonds to give back modest gains from earlier in the year. The Lehman Brothers Aggregate Bond Index, a widely used index for the high-grade bond market, was nearly flat during the first six months of 2004, returning 0.15% after losing 2.44% during the second quarter. The yield on the benchmark ten-year Treasury closed June 30, 2004 at 4.58%, up 0.75% from April 1, 2004, but up only 0.34% from where it began the six-month period on January 1, 2004.
Continued growth in employment convinced the markets that the Federal Reserve would soon begin a long anticipated tightening cycle. On June 30, 2004, the Fed met market expectations by increasing the federal funds rate 0.25%, which was the first rate increase since June 25, 2003. The central bank had held this rate at 1% for more than a year, which generated negative real short-term rates. And on August 10, 2004, the Fed increased the federal funds rate another 0.25% to 1.50%.
Investors that had profited handsomely from borrowing at low short-term rates and investing in higher-yielding longer maturity bonds surrendered some of those profits towards the latter part of the six-month period. Concern that borrowing rates would rise led investors to liquidate long positions and unwind these trades, which caused bond prices to decrease. However, substantial leverage remained among banks, hedge funds, and other investors, making bond markets somewhat vulnerable to additional Fed rate increases. There were also signs of rising inflation, which fueled anxiety that central banks might continue to raise interest rates.
On the following pages you will find a more complete review of the Portfolio in light of financial market activities as well as specific details about the total return investment performance for the six-month period.
We appreciate the trust you have placed in us, and we will continue to focus our efforts to meet your investment needs.
Sincerely,

Brent R. Harris
Chairman
August 11, 2004
| | | | |
| June 30, 2004 | | Semi-Annual Report | | 1 |
Important Information About the Portfolio
We believe that bond funds have an important role to play in a well diversified investment portfolio. It is important to note, however, that in an environment where interest rates may trend upward, rising rates will negatively impact the performance of most bond funds, and fixed income securities held by a fund are likely to decrease in value. The price volatility of fixed income securities can also increase during periods of rising interest rates resulting in increased losses to a fund. Bond funds and individual bonds with a longer duration (a measure of the expected life of a security) tend to be more sensitive to changes in interest rates, usually making them more volatile than securities or funds with shorter durations. The longer-term performance of most bond funds has benefited from capital gains in part resulting from an extended period of declining interest rates. In the event interest rates increase, these capital gains should not be expected to recur.
The Portfolio may be subject to various risks in addition to those described above. Some of these risks may include, but are not limited to, the following: real rate risk, derivative risk, small company risk, foreign security risk, high yield security risk and specific sector investment risks. The Portfolio may use derivative instruments for hedging purposes or as part of an investment strategy. Use of these instruments may involve certain costs and risks such as liquidity risk, interest rate risk, market risk, credit risk, management risk and the risk that a fund could not close out a position when it would be most advantageous to do so. A Portfolio investing in derivatives could lose more than the principal amount invested in these instruments. Investing in non-U.S. securities may entail risk due to non-U.S. economic and political developments; this risk may be enhanced when investing in emerging markets. High-yield bonds typically have a lower credit rating than other bonds. Lower rated bonds generally involve a greater risk to principal than higher rated bonds. Smaller companies may be more volatile than larger companies and may entail more risk. Concentrating investments in individual sectors may add additional risk and volatility compared to a diversified portfolio.
On the performance summary page in this semi-annual report, the Total Return Investment Performance table measures performance assuming that all dividend and capital gain distributions were reinvested. Returns do not reflect the deduction of taxes that a shareholder would pay (i) on Portfolio distributions or (ii) the redemption of Portfolio shares.
An investment in a Portfolio is not a bank deposit and is not guaranteed or insured by the Federal Deposit Insurance Corporation or any other government agency. It is possible to lose money on investments in the Funds.
The following disclosure provides important information regarding the Portfolio’s Expense Example, which appears on the Portfolio’s individual page in this semi-annual report. Please refer to this information when reviewing the Expense Example for the Portfolio.
Example
As a shareholder of the Portfolio, you incur two types of costs: (1) transaction costs, including redemption and exchange fees; and (2) ongoing costs, including advisory and administrative fees; distribution and/or service (12b-1) fees (Administrative Class only); and other Portfolio expenses. The Example is intended to help you understand your ongoing costs (in dollars) of investing in the Portfolio and to compare these costs with the ongoing costs of investing in other mutual funds.
The Example is based on an investment of $1,000 invested at the beginning of the period and held for the entire period indicated, which is from 1/1/04 to 6/30/04.
Actual Expenses
The information in the table under the heading “Actual Performance” provides information about actual account values and actual expenses. You may use the information in these columns, together with the amount you invested, to estimate the expenses that you paid over the period. Simply divide your account value by $1,000.00 (for example, an $8,600.00 account value divided by $1,000 = 8.60), then multiply the result by the number in the appropriate column for your share class, in the row entitled “Expenses Paid During Period” to estimate the expenses you paid on your account during this period.
Hypothetical Example for Comparison Purposes
The information in the table under the heading “Hypothetical Performance (5% return before expenses)” provides information about hypothetical account values and hypothetical expenses based on the Portfolio’s actual expense ratio and an assumed rate of return of 5% per year before expenses, which is not the Portfolio’s actual return. The hypothetical account values and expenses may not be used to estimate the actual ending account balance or expenses you paid for the period. You may use this information to compare the ongoing costs of investing in the Portfolio and other portfolios. To do so, compare this 5% hypothetical example with the 5% hypothetical examples that appear in the shareholder reports of the other portfolios.
Please note that the expenses shown in the table are meant to highlight your ongoing costs only and do not reflect any transactional costs. Therefore, the information under the heading “Hypothetical Performance (5% return before expenses)” is useful in comparing ongoing costs only, and will not help you determine the relative total costs of owning different portfolios. In addition, if these transactional costs were included, your costs would have been higher.
PIMCO Variable Insurance Trust is distributed by PA Distributors LLC, 2187 Atlantic Street, Stamford, CT 06902.
| | | | |
| 2 | | Semi-Annual Report | | June 30, 2004 |
High Yield Portfolio
CUMULATIVE RETURNS THROUGH JUNE 30, 2004
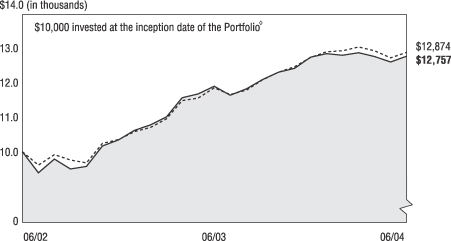
[CHART]
High Yield Merrill Lynch U.S. High
Portfolio Inst. Class Yield BB-B Rated Index
--------------------- -----------------------
06/30/2002 $10,000 $10,000
07/31/2002 $9,392 $9,611
08/31/2002 $9,785 $9,914
09/30/2002 $9,499 $9,764
10/31/2002 $9,570 $9,675
11/30/2002 $10,168 $10,237
12/31/2002 $10,343 $10,349
01/31/2003 $10,618 $10,581
02/28/2003 $10,774 $10,703
03/31/2003 $11,002 $10,946
04/30/2003 $11,559 $11,473
05/31/2003 $11,666 $11,550
06/30/2003 $11,894 $11,847
07/31/2003 $11,634 $11,651
08/31/2003 $11,816 $11,784
09/30/2003 $12,083 $12,077
10/31/2003 $12,296 $12,297
11/30/2003 $12,407 $12,454
12/31/2003 $12,731 $12,724
01/31/2004 $12,831 $12,888
02/29/2004 $12,788 $12,916
03/31/2004 $12,865 $13,030
04/30/2004 $12,750 $12,920
05/31/2004 $12,593 $12,713
06/30/2004 $12,757 $12,874
SECTOR BREAKDOWN‡
| | | |
Industrials | | 56.6 | % |
Utilities | | 12.7 | % |
Banking & Finance | | 10.8 | % |
Short-Term Instruments | | 6.5 | % |
Sovereign Issues | | 5.8 | % |
Other | | 7.6 | % |
‡ % of Total Investments as of June 30, 2004
à$10,000 invested at the beginning of the first full month following the inception of the Institutional Class.
TOTAL RETURN INVESTMENT PERFORMANCE For the period ended June 30, 2004
| | | | | | | | | | | | | |
| | | | | | | 6 Months | | | 1 Year | | | Since Inception* | |
| | |
| | High Yield Portfolio Institutional Class (Inception 07/01/02) | | 0.20 | % | | 7.25 | % | | 12.95 | % |
| | | - - - - - - - | | Merrill Lynch U.S. High Yield BB-B Rated Index | | 1.18 | % | | 8.67 | % | | — | |
| | | | | * Annualized. All Portfolio returns are net of fees and expenses. | | | | | | | | | |
Past performance is no guarantee of future results. The performance quoted represents past performance. Investment return and principal value will fluctuate so the Portfolio shares, when redeemed, may be worth more or less than their original cost. Current performance may be lower or higher than the performance data quoted. Performance data current to the most recent month-end is available by calling (800) 927-4648.
Please refer to page 2 herein for an explanation of the information presented in the following Expense Example.
| | | | | | | | | | |
| EXPENSE EXAMPLE | | | | Actual Performance | | | | Hypothetical Performance
(5% return before expenses) |
Beginning Account Value (01/01/04) | | | | $ | 1,000.00 | | | | $ | 1,000.00 |
Ending Account Value (06/30/04) | | | | $ | 1,002.00 | | | | $ | 1,025.00 |
Expenses Paid During Period† | | | | $ | 3.04 | | | | $ | 3.07 |
†Expenses are equal to the Portfolio’s Institutional Class annualized expense ratio of 0.61%, multiplied by the average account value over the period, multiplied by 182/366 (to reflect the one-half year period).
PORTFOLIO INSIGHTS
| • | The High Yield Portfolio seeks to achieve its investment objective by investing under normal circumstances at least 80% of its assets in a diversified portfolio of high yield securities rated below investment grade but rated at least Caa (subject to a maximum of 5% of total assets in securities rated Caa) by Moody’s or S&P, or, if unrated, determined by PIMCO to be of comparable quality. |
| • | The Portfolio’s Institutional Class shares returned 0.20% for the six-month period ended June 30, 2004, compared to 1.18% for the Merrill Lynch U.S. High Yield BB-B Rated Index. |
| • | During the semi-annual period, chemical issues outperformed the high yield market by more than 3%, thus the Portfolio’s underweight to the sector hurt performance. |
| • | An overweight to telecom, with an emphasis on large-cap issues, was a detriment to relative performance as this sector was one of the worst performers during the period. |
| • | Although an overweight to the cable/pay TV sector was a slight detractor to performance, security selection was a strong positive and more than offset the negative impact. |
| • | As the airline sector fell lower, due in part to high fuel prices and the threat of terrorism, an emphasis on higher quality secured issues boosted returns. |
| • | Modest exposure to emerging market sovereign debt detracted from performance, as this asset class declined approximately 2.25% over the 6-month period. |
| | | | |
| June 30, 2004 | | Semi-Annual Report | | 3 |
Financial Highlights
High Yield Portfolio (Institutional Class)
| | | | | | | | | | | | | | | | | | |
| Selected Per Share Data for the Year or Period Ended: | | | | 06/30/2004+ | | | | | 12/31/2003 | | | | | 07/01/2002-
12/31/2002 | |
| | | | | | |
Net asset value beginning of period | | | | $ | 8.19 | | | | | $ | 7.17 | | | | | $ | 7.25 | |
Net investment income (a) | | | | | 0.26 | (d) | | | | | 0.57 | (d) | | | | | 0.29 | (d) |
Net realized/unrealized gain (loss) on investments (a) | | | | | (0.24 | )(d) | | | | | 1.03 | (d) | | | | | (0.06 | )(d) |
Total income from investment operations | | | | | 0.02 | | | | | | 1.60 | | | | | | 0.23 | |
Dividends from net investment income | | | | | (0.28 | ) | | | | | (0.58 | ) | | | | | (0.31 | ) |
Distributions from net realized capital gains | | | | | 0.00 | | | | | | 0.00 | | | | | | 0.00 | |
Total distributions | | | | | (0.28 | ) | | | | | (0.58 | ) | | | | | (0.31 | ) |
Net asset value end of period | | | | $ | 7.93 | | | | | $ | 8.19 | | | | | $ | 7.17 | |
Total return | | | | | 0.20 | % | | | | | 23.08 | % | | | | | 3.43 | % |
Net assets end of period (000s) | | | | $ | 319 | | | | | $ | 13 | | | | | $ | 10 | |
Ratio of net expenses to average net assets | | | | | 0.61 | %*(c) | | | | | 0.60 | % | | | | | 0.60 | %*(b) |
Ratio of net investment income to average net assets | | | | | 6.54 | %*(d) | | | | | 7.36 | %(d) | | | | | 8.59 | %(d) |
Portfolio turnover rate | | | | | 49 | % | | | | | 97 | % | | | | | 102 | % |
| (a) | Per share amounts based on average number of shares outstanding during the period. |
| (b) | If the investment manager had not reimbursed expenses, the ratio of expenses to average net assets would have been 0.61%. |
| (c) | Ratio of Expenses to average net assets excluding interest expense is 0.60%. |
| (d) | Indicates a period in which, as a result of a change in generally accepted accounting principles, the portfolio has reclassified periodic payments made or received under certain derivative instruments, which were previously included within miscellaneous income, to a a component of realized gain(loss) in the Statement of Operations. The effect of this reclassification was to (reduce) the net investment income ratio for the period ending June 30, 2004 by (0.09)% and the net investment income per share by $(0.01). For consistency, similar reclassifications have been made to prior period amounts, resulting in (reductions) to the net investment income ratio of (0.08)% and (0.11)% and to the net investment income per share of $(0.01) and $(0.01) in the fiscal years or periods ending December 31, 2003, and 2002, respectively. This change had no impact on the reported net asset value per share for any period. |
| | | | | | |
| 4 | | Semi-Annual Report | | June 30, 2004 | | See accompanying notes |
Statement of Assets and Liabilities
High Yield Portfolio
June 30, 2004 (Unaudited)
| | | | | | |
| Amounts in thousands, except per share amounts | | | | | |
| | |
Assets: | | | | | | |
| | |
Investments, at value | | | | $ | 330,645 | |
Cash | | | | | 14 | |
Foreign currency, at value | | | | | 2,543 | |
Receivable for investments sold | | | | | 2,465 | |
Unrealized appreciation on forward foreign currency contracts | | | | | 101 | |
Receivable for Portfolio shares sold | | | | | 173 | |
Interest and dividends receivable | | | | | 6,596 | |
Variation margin receivable | | | | | 100 | |
Unrealized appreciation on swap agreements | | | | | 21 | |
| | | | | | 342,658 | |
| | |
Liabilities: | | | | | | |
| | |
Payable for investments purchased | | | | $ | 2,859 | |
Unrealized depreciation on forward foreign currency contracts | | | | | 9 | |
Written options outstanding | | | | | 398 | |
Payable for Portfolio shares redeemed | | | | | 12 | |
Dividends payable | | | | | 4 | |
Accrued investment advisory fee | | | | | 67 | |
Accrued administration fee | | | | | 94 | |
Accrued servicing fee | | | | | 32 | |
Recoupment payable to Manager | | | | | 2 | |
Unrealized depreciation on swap agreements | | | | | 171 | |
| | | | | | 3,648 | |
| | |
Net Assets | | | | $ | 339,010 | |
| | |
Net Assets Consist of: | | | | | | |
| | |
Paid in capital | | | | $ | 330,728 | |
(Overdistributed) net investment income | | | | | (2,710 | ) |
Accumulated undistributed net realized gain | | | | | 11,543 | |
Net unrealized (depreciation) | | | | | (551 | ) |
| | | | | $ | 339,010 | |
| | |
Net Assets: | | | | | | |
| | |
Institutional Class | | | | $ | 319 | |
Administrative Class | | | | | 338,692 | |
| | |
Shares Issued and Outstanding: | | | | | | |
| | |
Institutional Class | | | | | 40 | |
Administrative Class | | | | | 42,722 | |
| | |
Net Asset Value and Redemption Price Per Share
(Net Assets Per Share Outstanding) | | | | | | |
| | |
Institutional Class | | | | $ | 7.93 | |
Administrative Class | | | | | 7.93 | |
| | |
Cost of Investments Owned | | | | $ | 332,203 | |
Cost of Foreign Currency Held | | | | $ | 2,530 | |
| | | | | | |
| See accompanying notes | | June 30, 2004 | | Semi-Annual Report | | 5 |
Statement of Operations
High Yield Portfolio
| | | | | | |
| Amounts in thousands | | | | | |
| | | | | Six Months Ended
June 30, 2004
(Unaudited) | |
Investment Income: | | | | | | |
| | |
Interest | | | | $ | 26,945 | |
Dividends | | | | | 384 | |
Miscellaneous income | | | | | 105 | |
Total Income | | | | | 27,434 | |
| | |
Expenses: | | | | | | |
| | |
Investment advisory fees | | | | | 937 | |
Administration fees | | | | | 1,312 | |
Distribution and/or servicing fees - Administrative Class | | | | | 562 | |
Trustees’ fees | | | | | 8 | |
Interest expense | | | | | 5 | |
Miscellaneous expense | | | | | 2 | |
Total Expenses | | | | | 2,826 | |
| | |
Net Investment Income | | | | | 24,608 | |
| | |
Net Realized and Unrealized Gain (Loss): | | | | | | |
| | |
Net realized gain on investments | | | | | 32,492 | |
Net realized gain on futures contracts, options, and swaps | | | | | 2,120 | |
Net realized gain on foreign currency transactions | | | | | 754 | |
Net change in unrealized (depreciation) on investments | | | | | (60,044 | ) |
Net change in unrealized (depreciation) on futures contracts,
options, and swaps | | | | | (331 | ) |
Net change in unrealized appreciation on translation of
assets and liabilities denominated in foreign currencies | | | | | 738 | |
Net (Loss) | | | | | (24,271 | ) |
| | |
Net Increase in Assets Resulting from Operations | | | | $ | 337 | |
| | | | | | |
| 6 | | Semi-Annual Report | | June 30, 2004 | | See accompanying notes |
Statements of Changes in Net Assets
High Yield Portfolio
| | | | | | | | | | | | |
| Amounts in thousands | | | | | | | | | | |
| | | | | Six Months Ended
June 30, 2004
(Unaudited) | | | | | Year Ended
December 31, 2003 | |
Increase (Decrease) in Net Assets from: | | | | | | | | | | | | |
| | | | |
Operations: | | | | | | | | | | | | |
| | | | |
Net investment income | | | | $ | 24,608 | | | | | $ | 51,650 | |
Net realized gain | | | | | 35,366 | | | | | | 15,242 | |
Net change in unrealized appreciation (depreciation) | | | | | (59,637 | ) | | | | | 74,319 | |
Net increase resulting from operations | | | | | 337 | | | | | | 141,211 | |
| | | | |
Distributions to Shareholders: | | | | | | | | | | | | |
| | | | |
From net investment income | | | | | | | | | | | | |
Institutional Class | | | | | (3 | ) | | | | | (1 | ) |
Administrative Class | | | | | (24,831 | ) | | | | | (52,189 | ) |
Total Distributions | | | | | (24,834 | ) | | | | | (52,190 | ) |
| | | | |
Portfolio Share Transactions: | | | | | | | | | | | | |
| | | | |
Receipts for shares sold | | | | | | | | | | | | |
Institutional Class | | | | | 298 | | | | | | 0 | |
Administrative Class | | | | | 155,987 | | | | | | 820,631 | |
| | | | |
Issued as reinvestment of distributions | | | | | | | | | | | | |
Institutional Class | | | | | 3 | | | | | | 1 | |
Administrative Class | | | | | 21,323 | | | | | | 52,190 | |
| | | | |
Cost of shares redeemed | | | | | | | | | | | | |
Institutional Class | | | | | (1 | ) | | | | | 0 | |
Administrative Class | | | | | (769,715 | ) | | | | | (487,714 | ) |
Net increase (decrease) resulting from Portfolio share transactions | | | | | (592,105 | ) | | | | | 385,108 | |
| | | | |
Total Increase (Decrease) in Net Assets | | | | | (616,602 | ) | | | | | 474,129 | |
| | | | |
Net Assets: | | | | | | | | | | | | |
| | | | |
Beginning of period | | | | | 955,612 | | | | | | 481,483 | |
End of period* | | | | $ | 339,010 | | | | | $ | 955,612 | |
| | | | |
*Including (overdistributed) net investment income of: | | | | $ | (2,710 | ) | | | | $ | (2,484 | ) |
| | | | | | |
| See accompanying notes | | June 30, 2004 | | Semi-Annual Report | | 7 |
Schedule of Investments
High Yield Portfolio
June 30, 2004 (Unaudited)
| | | | |
| | | Principal | | |
| | | Amount | | Value |
| | | (000s) | | (000s) |
| | | | | | |
CORPORATE BONDS & NOTES 78.2% |
Banking & Finance 10.6% | | | | | | |
AES Ironwood LLC | | | | | | |
8.857% due 11/30/2025 | | $ | 1,645 | | $ | 1,752 |
BCP Caylux Holdings Luxembourg S.A. | | | |
9.625% due 06/15/2014 | | | 1,425 | | | 1,484 |
Bluewater Finance Ltd. | | | | | | |
10.250% due 02/15/2012 | | | 1,675 | | | 1,775 |
Bombardier Capital, Inc. | | | | | | |
7.090% due 03/30/2007 (i) | | | 1,000 | | | 1,008 |
Cedar Brakes II LLC | | | | | | |
9.875% due 09/01/2013 | | | 572 | | | 573 |
Choctaw Resort Development Enterprise |
9.250% due 04/01/2009 | | | 1,050 | | | 1,134 |
Dow Jones TRAC-X N.A. High Yield Index |
7.375% due 03/25/2009 | | | 3,520 | | | 3,445 |
8.000% due 03/25/2009 | | | 3,500 | | | 3,402 |
Eircom Funding | | | | | | |
8.250% due 08/15/2013 | | | 800 | | | 836 |
FINOVA Group, Inc. | | | | | | |
7.500% due 11/15/2009 | | | 1,380 | | | 762 |
Ford Motor Credit Co. | | | | | | |
7.000% due 10/01/2013 | | | 1,650 | | | 1,668 |
Forest City Enterprises, Inc. | | | | | | |
7.625% due 06/01/2015 | | | 425 | | | 429 |
General Motors Acceptance Corp. |
7.000% due 02/01/2012 | | | 400 | | | 412 |
6.875% due 08/28/2012 | | | 825 | | | 841 |
8.000% due 11/01/2031 | | | 425 | | | 437 |
JET Equipment Trust | | | | | | |
10.000% due 06/15/2012 (b) | | | 800 | | | 540 |
7.630% due 08/15/2012 (b) | | | 403 | | | 259 |
JSG Funding PLC | | | | | | |
9.625% due 10/01/2012 | | | 1,840 | | | 2,024 |
Mizuho Preferred Capital Co. | | | | | | |
9.870% due 06/30/2008 (c) | | | 1,575 | | | 1,783 |
8.790% due 12/29/2049 (c) | | | 700 | | | 770 |
Qwest Capital Funding, Inc. | | | | | | |
7.250% due 02/15/2011 | | | 2,600 | | | 2,236 |
7.750% due 02/15/2031 | | | 140 | | | 111 |
Riggs Capital Trust | | | | | | |
8.625% due 12/31/2026 | | | 150 | | | 151 |
8.875% due 03/15/2027 | | | 550 | | | 554 |
Rotech Healthcare, Inc. | | | | | | |
9.500% due 04/01/2012 | | | 2,000 | | | 2,145 |
Targeted Return Index Securities Trust |
4.149% due 08/01/2015 (b) | | | 3,225 | | | 3,352 |
UGS Corp. | | | | | | |
10.000% due 06/01/2012 | | | 375 | | | 401 |
Universal City Development Partners |
11.750% due 04/01/2010 | | | 550 | | | 639 |
Ventas Capital Corp. | | | | | | |
8.750% due 05/01/2009 | | | 825 | | | 895 |
| | | | | |
|
|
| | | | | | | 35,818 |
| | | | | |
|
|
Industrials 55.2% | | | | | | |
Abitibi-Consolidated, Inc. | | | | | | |
6.950% due 12/15/2006 | | | 700 | | | 721 |
6.950% due 04/01/2008 | | | 250 | | | 254 |
5.250% due 06/20/2008 | | | 375 | | | 358 |
8.550% due 08/01/2010 | | | 350 | | | 371 |
6.000% due 06/20/2013 | | | 400 | | | 356 |
8.850% due 08/01/2030 | | | 1,053 | | | 1,031 |
Ahold Finance USA, Inc. |
8.250% due 07/15/2010 | | | 150 | | | 159 |
Alderwoods Group, Inc. | | | | | | |
12.250% due 01/02/2009 | | | 1,000 | | | 1,110 |
Allied Waste North America, Inc. |
8.875% due 04/01/2008 | | | 600 | | | 660 |
8.500% due 12/01/2008 | | | 350 | | | 385 |
10.000% due 08/01/2009 | | | 1 | | | 1 |
6.375% due 04/15/2011 | | | 700 | | | 689 |
9.250% due 09/01/2012 | | | 2,500 | | | 2,812 |
7.875% due 04/15/2013 | | | 300 | | | 315 |
7.375% due 04/15/2014 | | | 400 | | | 391 |
| | | | | | |
|
American Media Operations, Inc. |
10.250% due 05/01/2009 | | $ | 1,900 | | $ | 1,981 |
American Tower Escrow Corp. | | | | | | |
0.000% due 08/01/2008 | | | 3,150 | | | 2,315 |
AmeriGas Partners LP | | | | | | |
10.000% due 04/15/2006 | | | 120 | | | 130 |
8.830% due 04/19/2010 | | | 488 | | | 523 |
8.875% due 05/20/2011 | | | 200 | | | 214 |
Arco Chemical Co. | | | | | | |
10.250% due 11/01/2010 | | | 50 | | | 51 |
ArvinMeritor, Inc. | | | | | | |
6.625% due 06/15/2007 | | | 250 | | | 257 |
8.750% due 03/01/2012 | | | 1,050 | | | 1,144 |
Aviall, Inc. | | | | | | |
7.625% due 07/01/2011 | | | 650 | | | 679 |
Boise Cascade Corp. | | | | | | |
7.000% due 11/01/2013 | | | 500 | | | 514 |
Boyd Gaming Corp. | | | | | | |
7.750% due 12/15/2012 | | | 900 | | | 913 |
Cablevision Systems Corp. | | | | | | |
8.000% due 04/15/2012 | | | 1,000 | | | 990 |
Canwest Media, Inc. | | | | | | |
10.625% due 05/15/2011 | | | 1,645 | | | 1,853 |
CCO Holdings LLC | | | | | | |
8.750% due 11/15/2013 | | | 3,000 | | | 2,887 |
Chesapeake Energy Corp. | | | | | | |
8.375% due 11/01/2008 | | | 650 | | | 705 |
7.500% due 06/15/2014 | | | 1,000 | | | 1,035 |
Circus & Eldorado Joint Venture Silver Legacy Capital Corp. | | | | | | |
10.125% due 03/01/2012 | | | 575 | | | 581 |
Colorado Interstate Gas Co. | | | | | | |
6.850% due 06/15/2037 | | | 200 | | | 206 |
Commonwealth Brands, Inc. | | | | | | |
9.750% due 04/15/2008 | | | 650 | | | 699 |
10.625% due 09/01/2008 | | | 850 | | | 914 |
Continental Airlines, Inc. | | | | | | |
7.461% due 04/01/2015 | | | 81 | | | 76 |
7.373% due 12/15/2015 | | | 342 | | | 273 |
6.545% due 02/02/2019 | | | 169 | | | 158 |
Crown Castle International Corp. |
9.375% due 08/01/2011 | | | 380 | | | 420 |
10.750% due 08/01/2011 | | | 1,000 | | | 1,125 |
Crown European Holdings S.A. | | | | | | |
9.500% due 03/01/2011 | | | 2,025 | | | 2,217 |
10.875% due 03/01/2013 | | | 450 | | | 515 |
CSC Holdings, Inc. | | | | | | |
8.125% due 07/15/2009 | | | 250 | | | 261 |
8.125% due 08/15/2009 | | | 2,305 | | | 2,409 |
7.625% due 04/01/2011 | | | 1,000 | | | 1,007 |
6.750% due 04/15/2012 | | | 1,250 | | | 1,206 |
Delhaize America, Inc. | | | | | | |
8.125% due 04/15/2011 | | | 1,725 | | | 1,892 |
Dex Media West LLC | | | | | | |
8.500% due 08/15/2010 | | | 1,150 | | | 1,259 |
9.875% due 08/15/2013 | | | 1,650 | | | 1,819 |
Dimon, Inc. | | | | | | |
7.750% due 06/01/2013 | | | 150 | | | 140 |
DirecTV Holdings LLC | | | | | | |
8.375% due 03/15/2013 | | | 1,375 | | | 1,528 |
Dobson Communications Corp. | | | | | | |
8.875% due 10/01/2013 | | | 650 | | | 497 |
Dresser, Inc. |
9.375% due 04/15/2011 | | | 1,650 | | | 1,774 |
Dunlop Standard Aerospace Holdings PLC | | | |
11.875% due 05/15/2009 | | | 1,048 | | | 1,119 |
Dura Operating Corp. | | | | | | |
8.625% due 04/15/2012 | | | 1,875 | | | 1,922 |
Dynegy Danskammer & Roseton LLC | | | |
7.270% due 11/08/2010 | | | 1,100 | | | 1,050 |
7.670% due 11/08/2016 | | | 1,400 | | | 1,218 |
Dynegy Holdings, Inc. | | | | | | |
9.875% due 07/15/2010 | | | 600 | | | 648 |
10.125% due 07/15/2013 | | | 1,150 | | | 1,251 |
| | | | | | |
| | |
EchoStar DBS Corp. | | | | | | |
10.375% due 10/01/2007 | | $ | 550 | | $ | 591 |
El Paso CGP Co. | | | | | | |
7.500% due 08/15/2006 | | | 1,200 | | | 1,191 |
6.500% due 06/01/2008 | | | 250 | | | 226 |
7.625% due 09/01/2008 | | | 750 | | | 697 |
7.750% due 06/15/2010 | | | 250 | | | 227 |
9.625% due 05/15/2012 | | | 200 | | | 191 |
7.750% due 10/15/2035 | | | 400 | | | 316 |
El Paso Corp. | | | | | | |
7.000% due 05/15/2011 | | | 100 | | | 88 |
7.875% due 06/15/2012 | | | 2,155 | | | 1,945 |
7.375% due 12/15/2012 | | | 300 | | | 262 |
7.800% due 08/01/2031 | | | 700 | | | 565 |
El Paso Production Holding Co. | | | | | | |
7.750% due 06/01/2013 | | | 1,650 | | | 1,522 |
Encore Acquisition Co. | | | | | | |
6.250% due 04/15/2014 | | | 550 | | | 520 |
Equistar Chemicals LP | | | | | | |
10.125% due 09/01/2008 | | | 430 | | | 473 |
8.750% due 02/15/2009 | | | 1,435 | | | 1,503 |
10.625% due 05/01/2011 | | | 400 | | | 446 |
Evergreen Resources, Inc. | | | | | | |
5.875% due 03/15/2012 | | | 700 | | | 710 |
EXCO Resources, Inc. | | | | | | |
7.250% due 01/15/2011 | | | 500 | | | 510 |
Extendicare Health Services | | | | | | |
9.500% due 07/01/2010 | | | 800 | | | 892 |
Ferrellgas Partners LP | | | | | | |
6.990% due 08/01/2005 (i) | | | 1,000 | | | 1,013 |
8.870% due 08/01/2009 (i)(l) | | | 1,200 | | | 1,273 |
6.750% due 05/01/2014 | | | 400 | | | 388 |
Fimep S.A. | | | | | | |
10.500% due 02/15/2013 | | | 385 | | | 441 |
Fisher Scientific International | | | | | | |
8.000% due 09/01/2013 | | | 650 | | | 699 |
Fresenius Medical Care | | | | | | |
7.875% due 06/15/2011 | | | 2,250 | | | 2,396 |
General Motors Corp. | | | | | | |
8.250% due 07/15/2023 | | | 450 | | | 472 |
Georgia-Pacific Corp. | | | | | | |
8.125% due 06/15/2023 | | | 600 | | | 619 |
8.000% due 01/15/2024 | | | 2,750 | | | 2,764 |
8.875% due 05/15/2031 | | | 650 | | | 697 |
Grief Brothers Corp. | | | | | | |
8.875% due 08/01/2012 | | | 400 | | | 432 |
GulfTerra Energy Partners LP | | | | | | |
8.500% due 06/01/2010 | | | 649 | | | 709 |
Hanover Compressor Co. | | | | | | |
9.000% due 06/01/2014 | | | 500 | | | 521 |
Hanover Equipment Trust | | | | | | |
8.500% due 09/01/2008 | | | 2,300 | | | 2,444 |
HCA, Inc. | | | | | | |
7.875% due 02/01/2011 | | | 950 | | | 1,043 |
6.250% due 02/15/2013 | | | 1,350 | | | 1,344 |
6.750% due 07/15/2013 | | | 625 | | | 641 |
HealthSouth Corp. | | | | | | |
8.500% due 02/01/2008 (b) | | | 110 | | | 109 |
8.375% due 10/01/2011 (b) | | | 1,000 | | | 972 |
Hilton Hotels Corp. | | | | | | |
7.625% due 12/01/2012 | | | 1,500 | | | 1,620 |
HMH Properties, Inc. | | | | | | |
7.875% due 08/01/2008 | | | 550 | | | 566 |
Hollinger International Publishing |
9.000% due 12/15/2010 | | | 2,550 | | | 2,958 |
Hollinger Participation Trust | | | | | | |
12.125% due 11/15/2010 (d) | | | 389 | | | 398 |
Horizon Lines LLC | | | | | | |
9.000% due 11/01/2012 | | | 275 | | | 277 |
Host Marriott LP | | | | | | |
9.500% due 01/15/2007 | | | 250 | | | 274 |
9.250% due 10/01/2007 | | | 1,200 | | | 1,329 |
7.125% due 11/01/2013 | | | 185 | | | 182 |
Ingles Markets, Inc. | | | | | | |
8.875% due 12/01/2011 | | | 1,000 | | | 1,032 |
| | | | | | |
| 8 | | Semi-Annual Report | | June 30, 2004 | | See accompanying notes |
| | | | |
| | | Principal | | |
| | | Amount | | Value |
| | | (000s) | | (000s) |
| | | | | | |
| | |
Insight Midwest LP | | | | | | |
9.750% due 10/01/2009 | | $ | 445 | | $ | 472 |
9.750% due 10/01/2009 | | | 900 | | | 954 |
10.500% due 11/01/2010 | | | 765 | | | 838 |
10.500% due 11/01/2010 | | | 150 | | | 164 |
Invensys PLC | | | | | | |
9.875% due 03/15/2011 | | | 650 | | | 650 |
ISP Chemco, Inc. | | | | | | |
10.250% due 07/01/2011 | | | 1,465 | | | 1,637 |
Johnsondiversey, Inc. | | | | | | |
9.625% due 05/15/2012 | | | 390 | | | 427 |
K&F Industries, Inc. | | | | | | |
9.625% due 12/15/2010 | | | 350 | | | 385 |
K2, Inc. | | | | | | |
7.375% due 07/01/2014 | | | 150 | | | 153 |
Legrand S.A. | | | | | | |
8.500% due 02/15/2025 | | | 550 | | | 569 |
Mail Well I Corp. | | | | | | |
9.625% due 03/15/2012 | | | 1,000 | | | 1,080 |
Mandalay Resort Group | | | | | | |
6.500% due 07/31/2009 | | | 750 | | | 766 |
9.375% due 02/15/2010 | | | 1,900 | | | 2,080 |
7.625% due 07/15/2013 | | | 200 | | | 200 |
MCI, Inc. | | | | | | |
5.908% due 05/01/2007 | | | 300 | | | 292 |
6.688% due 05/01/2009 | | | 1,590 | | | 1,475 |
7.735% due 05/01/2014 | | | 257 | | | 231 |
Mediacom Broadband LLC | | | | | | |
11.000% due 07/15/2013 | | | 1,515 | | | 1,621 |
Merisant Co. | | | | | | |
9.500% due 07/15/2013 | | | 700 | | | 749 |
Meritor Automotive, Inc. | | | | | | |
6.800% due 02/15/2009 | | | 250 | | | 256 |
MGM Mirage, Inc. | | | | | | |
6.000% due 10/01/2009 | | | 350 | | | 345 |
8.375% due 02/01/2011 | | | 2,050 | | | 2,153 |
Midwest Generation LLC | | | | | | |
8.300% due 07/02/2009 | | | 300 | | | 306 |
8.560% due 01/02/2016 | | | 3,575 | | | 3,593 |
8.750% due 05/01/2034 | | | 1,250 | | | 1,269 |
Nalco Co. | | | | | | |
7.750% due 11/15/2011 | | | 2,750 | | | 2,894 |
Newpark Resources, Inc. | | | | | | |
8.625% due 12/15/2007 | | | 890 | | | 908 |
Norampac, Inc. | | | | | | |
6.750% due 06/01/2013 | | | 650 | | | 640 |
Owens-Brockway Glass Container, Inc. | | | |
8.875% due 02/15/2009 | | | 400 | | | 434 |
7.750% due 05/15/2011 | | | 150 | | | 157 |
8.750% due 11/15/2012 | | | 1,550 | | | 1,690 |
8.250% due 05/15/2013 | | | 850 | | | 882 |
PacifiCare Health Systems, Inc. | | | | | | |
10.750% due 06/01/2009 | | | 417 | | | 477 |
PanAmSat Corp. | | | | | | |
8.500% due 02/01/2012 | | | 625 | | | 713 |
Park Place Entertainment Corp. | | | | | | |
9.375% due 02/15/2007 | | | 1,475 | | | 1,606 |
7.875% due 03/15/2010 | | | 600 | | | 636 |
7.000% due 04/15/2013 | | | 1,400 | | | 1,418 |
Peabody Energy Corp. | | | | | | |
6.875% due 03/15/2013 | | | 1,800 | | | 1,832 |
Plains Exploration & Production Co | | | |
7.125% due 06/15/2014 | | | 1,625 | | | 1,662 |
Premcor Refining Group, Inc. | | | | | | |
6.750% due 02/01/2011 | | | 1,000 | | | 1,033 |
6.750% due 05/01/2014 | | | 300 | | | 299 |
Pride International, Inc. | | | | | | |
9.375% due 05/01/2007 | | | 1,330 | | | 1,360 |
Primedia, Inc. | | | | | | |
7.625% due 04/01/2008 | | | 350 | | | 348 |
6.565% due 05/15/2010 | | | 150 | | | 153 |
8.000% due 05/15/2013 | | | 1,250 | | | 1,181 |
Quebecor Media, Inc. | | | | | | |
11.125% due 07/15/2011 | | | 1,400 | | | 1,605 |
Qwest Communications International, Inc. | | | |
7.250% due 02/15/2011 | | | 2,400 | | | 2,250 |
7.500% due 02/15/2014 | | | 1,800 | | | 1,634 |
| | | | | | |
| | |
Qwest Corp. | | | | | | |
7.200% due 11/01/2004 | | $ | 470 | | $ | 476 |
8.875% due 03/15/2012 | | | 1,650 | | | 1,790 |
Rayovac Corp. | | | | | | |
8.500% due 10/01/2013 | | | 850 | | | 897 |
Rogers Cablesystems, Inc. | | | | | | |
10.000% due 03/15/2005 | | | 235 | | | 245 |
Roundy’s, Inc. | | | | | | |
8.875% due 06/15/2012 | | | 1,900 | | | 2,024 |
Safety-Kleen Corp. | | | | | | |
9.250% due 06/01/2008 (b) | | | 1,450 | | | 4 |
9.250% due 05/15/2009 (b) | | | 250 | | | 13 |
Saks, Inc. | | | | | | |
8.250% due 11/15/2008 | | | 1 | | | 1 |
Sinclair Broadcast Group, Inc. | | | | | | |
8.750% due 12/15/2011 | | | 800 | | | 860 |
Six Flags, Inc. | | | | | | |
9.750% due 04/15/2013 | | | 1,600 | | | 1,616 |
Sonat, Inc. | | | | | | |
7.625% due 07/15/2011 | | | 2,650 | | | 2,378 |
SPX Corp. | | | | | | |
6.250% due 06/15/2011 | | | 650 | | | 635 |
7.500% due 01/01/2013 | | | 1,875 | | | 1,931 |
Starwood Hotels & Resorts Worldwide, Inc. | | | |
7.375% due 05/01/2007 | | | 550 | | | 582 |
7.875% due 05/01/2012 | | | 900 | | | 968 |
Station Casinos, Inc. | | | | | | |
6.000% due 04/01/2012 | | | 825 | | | 802 |
6.500% due 02/01/2014 | | | 225 | | | 218 |
Stone Container Corp. | | | | | | |
11.500% due 08/15/2006 | | | 450 | | | 454 |
9.750% due 02/01/2011 | | | 525 | | | 580 |
8.375% due 07/01/2012 | | | 650 | | | 683 |
Suburban Propane Partners LP | | | | | | |
6.875% due 12/15/2013 | | | 500 | | | 486 |
Tenet Healthcare Corp. | | | | | | |
6.375% due 12/01/2011 | | | 975 | | | 858 |
7.375% due 02/01/2013 | | | 2,975 | | | 2,707 |
9.875% due 07/01/2014 | | | 450 | | | 460 |
Tenneco Automotive, Inc. | | | | | | |
10.250% due 07/15/2013 | | | 525 | | | 596 |
10.250% due 07/15/2013 | | | 1,075 | | | 1,220 |
Time Warner Telecom, Inc. | | | | | | |
9.750% due 07/15/2008 | | | 950 | | | 893 |
10.125% due 02/01/2011 | | | 500 | | | 458 |
Toys “R” Us, Inc. | | | | | | |
7.625% due 08/01/2011 | | | 750 | | | 757 |
7.875% due 04/15/2013 | | | 550 | | | 555 |
Triad Hospitals, Inc. | | | | | | |
7.000% due 05/15/2012 | | | 500 | | | 506 |
7.000% due 11/15/2013 | | | 550 | | | 525 |
Trinity Industries, Inc. | | | | | | |
6.500% due 03/15/2014 | | | 900 | | | 828 |
TRW Automotive, Inc. | | | | | | |
9.375% due 02/15/2013 | | | 1,220 | | | 1,382 |
Tyco International Group S.A. | | | | | | |
6.750% due 02/15/2011 | | | 668 | | | 727 |
U.S. Airways, Inc. | | | | | | |
9.625% due 09/01/2003 (b) | | | 1,016 | | | 295 |
9.330% due 01/01/2006 (b) | | | 84 | | | 22 |
United Airlines, Inc. | | | | | | |
6.201% due 09/01/2008 | | | 225 | | | 185 |
7.730% due 07/01/2010 | | | 800 | | | 654 |
7.186% due 04/01/2011 (b) | | | 196 | | | 163 |
6.602% due 09/01/2013 | | | 500 | | | 417 |
Valero Energy Corp. | | | | | | |
7.800% due 06/14/2010 | | | 400 | | | 387 |
Vintage Petroleum, Inc. | | | | | | |
7.875% due 05/15/2011 | | | 1,125 | | | 1,159 |
8.250% due 05/01/2012 | | | 790 | | | 841 |
Westlake Chemical Corp. | | | | | | |
8.750% due 07/15/2011 | | | 400 | | | 436 |
Williams Cos., Inc. | | | | | | |
8.625% due 06/01/2010 | | | 2,450 | | | 2,707 |
8.125% due 03/15/2012 | | | 450 | | | 483 |
7.625% due 07/15/2019 | | | 3,200 | | | 3,096 |
7.875% due 09/01/2021 | | | 700 | | | 677 |
8.750% due 03/15/2032 | | | 1,000 | | | 1,005 |
| | | | | | |
| | |
Young Broadcasting, Inc. | | | | | | |
8.500% due 12/15/2008 | | $ | 574 | | $ | 607 |
8.500% due 12/15/2008 | | | 350 | | | 370 |
10.000% due 03/01/2011 | | | 580 | | | 593 |
| | | | | |
|
|
| | | | | | | 187,165 |
| | | | | |
|
|
Utilities 12.4% | | | | | | |
ACC Escrow Corp. | | | | | | |
10.000% due 08/01/2011 | | | 1,600 | | | 1,388 |
AES Corp. | | | | | | |
9.375% due 09/15/2010 | | | 300 | | | 321 |
8.875% due 02/15/2011 | | | 825 | | | 860 |
8.750% due 05/15/2013 | | | 2,850 | | | 3,067 |
8.540% due 11/30/2019 | | | 335 | | | 347 |
Calpine Corp. | | | | | | |
8.500% due 07/15/2010 | | | 1,175 | | | 978 |
Centerpoint Energy, Inc. | | | | | | |
7.250% due 09/01/2010 | | | 1,200 | | | 1,278 |
Cincinnati Bell, Inc. | | | | | | |
7.250% due 07/15/2013 | | | 1,475 | | | 1,387 |
8.375% due 01/15/2014 | | | 900 | | | 806 |
CMS Energy Corp. | | | | | | |
7.000% due 01/15/2005 | | | 1,950 | | | 1,970 |
8.900% due 07/15/2008 | | | 100 | | | 105 |
7.500% due 01/15/2009 | | | 2,200 | | | 2,200 |
7.750% due 08/01/2010 | | | 1,200 | | | 1,200 |
DPL, Inc. | | | | | | |
6.875% due 09/01/2011 | | | 1,100 | | | 1,114 |
Edison International, Inc. | | | | | | |
6.875% due 09/15/2004 | | | 1,000 | | | 1,009 |
El Paso Energy Partners | | | | | | |
8.500% due 06/01/2011 | | | 321 | | | 349 |
IPALCO Enterprises, Inc. | | | | | | |
8.375% due 11/14/2008 | | | 1,050 | | | 1,145 |
8.625% due 11/14/2011 | | | 490 | | | 534 |
MSW Energy Holdings LLC | | | | | | |
7.375% due 09/01/2010 | | | 650 | | | 650 |
Nextel Communications, Inc. | | | | | | |
9.500% due 02/01/2011 | | | 1 | | | 1 |
6.875% due 10/31/2013 | | | 2,300 | | | 2,291 |
7.375% due 08/01/2015 | | | 1,875 | | | 1,903 |
Northwestern Bell Telephone | | | | | | |
7.750% due 05/01/2030 | | | 713 | | | 631 |
Northwestern Corp. | | | | | | |
7.250% due 03/03/2008 | | | 650 | | | 621 |
NRG Energy, Inc. | | | | | | |
8.000% due 12/15/2013 | | | 2,150 | | | 2,182 |
PSEG Energy Holdings, Inc. | | | | | | |
7.750% due 04/16/2007 | | | 700 | | | 737 |
8.625% due 02/15/2008 | | | 350 | | | 378 |
10.000% due 10/01/2009 | | | 690 | | | 783 |
8.500% due 06/15/2011 | | | 2,050 | | | 2,204 |
Qwest Capital Funding, Inc. | | | | | | |
7.900% due 08/15/2010 | | | 700 | | | 623 |
Reliant Resources, Inc. | | | | | | |
9.250% due 07/15/2010 | | | 1,975 | | | 2,118 |
9.500% due 07/15/2013 | | | 350 | | | 379 |
Rogers Wireless Communications, Inc. |
6.375% due 03/01/2014 | | | 350 | | | 324 |
Rural Cellular Corp. | | | | | | |
8.250% due 03/15/2012 | | | 950 | | | 976 |
SESI LLC | | | | | | |
8.875% due 05/15/2011 | | | 615 | | | 666 |
South Point Energy Corp. | | | | | | |
8.400% due 05/30/2012 | | | 1,659 | | | 1,444 |
TECO Energy, Inc. | | | | | | |
7.500% due 06/15/2010 | | | 1,950 | | | 1,979 |
Time Warner Telecom Holdings, Inc. | | | |
9.250% due 02/15/2014 | | | 500 | | | 483 |
Triton PCS, Inc. | | | | | | |
8.500% due 06/01/2013 | | | 575 | | | 546 |
| | | | | |
|
|
| | | | | | | 41,977 |
| | | | | |
|
|
| Total Corporate Bonds & Notes (Cost $266,069) | | | | | | 264,960 |
| | | | | |
|
|
| | | | | | |
| See accompanying notes | | June 30, 2004 | | Semi-Annual Report | | 9 |
Schedule of Investments (Cont.)
High Yield Portfolio
June 30, 2004 (Unaudited)
| | | | |
| | | Principal | | |
| | | Amount | | Value |
| | | (000s) | | (000s) |
| | | | | | |
MUNICIPAL BONDS & NOTES 0.2% |
New Jersey Tobacco Settlement Funding Corp. Revenue Bonds, Series 2003 |
6.375% due 06/01/2032 | | $ | 650 | | $ | 583 |
| | | | | |
|
|
| Total Municipal Bonds & Notes (Cost $623) | | | | | | 583 |
| | | | | |
|
|
| | | | | | | |
MORTGAGE-BACKED SECURITIES 0.2% |
Continental Airlines, Inc. | | | | | | |
6.920% due 04/02/2013 (i)(l) | | | 840 | | | 829 |
| | | | | |
|
|
| Total Mortgage-Backed Securities (Cost $752) | | | 829 |
| | | | | |
|
|
| | | | | | | |
ASSET-BACKED SECURITIES 3.9% |
| | |
Allegheny Energy, Inc. | | | | | | |
5.350% due 06/08/2011 (c) | | | 36 | | | 37 |
5.430% due 06/08/2011 (c) | | | 180 | | | 183 |
5.640% due 06/08/2011 (c) | | | 1,584 | | | 1,615 |
Aquila, Inc. | | | | | | |
8.000% due 04/15/2006 (c) | | | 465 | | | 480 |
Brenntag | | | | | | |
3.880% due 02/28/2012 (c) | | | 1,250 | | | 1,268 |
Centennial Communications | | | | | | |
3.875% due 01/20/2011 (c) | | | 38 | | | 38 |
3.910% due 01/20/2011 (c) | | | 754 | | | 759 |
3.910% due 01/20/2011 (c) | | | 71 | | | 71 |
4.050% due 01/20/2011 (c) | | | 35 | | | 36 |
DirecTV Holdings LLC | | | | | | |
3.350% due 03/06/2010 (c) | | | 330 | | | 335 |
3.950% due 04/06/2010 (c) | | | 322 | | | 327 |
Inmarsat Ventures PLC | | | | | | |
4.111% due 10/10/2010 (c) | | | 600 | | | 607 |
4.611% due 10/10/2011 (c) | | | 600 | | | 607 |
Invensys PLC | | | | | | |
4.611% due 08/05/2009 (c) | | | 87 | | | 89 |
4.611% due 09/30/2009 (c) | | | 313 | | | 317 |
5.861% due 12/30/2009 (c) | | | 900 | | | 925 |
Midwest Generation LLC | | | | | | |
4.380% due 04/27/2011 (c) | | | 1,000 | | | 1,013 |
4.570% due 04/27/2011 (c) | | | 1,000 | | | 1,013 |
NRG Energy, Inc. | | | | | | |
5.500% due 05/08/2010 (c) | | | 378 | | | 390 |
5.070% due 12/23/2010 (c) | | | 213 | | | 220 |
Qwest Corp. | | | | | | |
6.500% due 06/30/2007 (c) | | | 1,850 | | | 1,925 |
Tucson Electric Power Co. | | | | | | |
5.000% due 03/30/2009 (c) | | | 1,000 | | | 1,011 |
| | | | | |
|
|
| Total Asset-Backed Securities (Cost $13,090) | | | | | | 13,266 |
| | | | | |
|
|
| | | | | | | |
SOVEREIGN ISSUES 5.7% |
| | |
Republic of Brazil | | | | | | |
2.062% due 04/15/2006 (c) | | | 1,056 | | | 1,042 |
11.000% due 01/11/2012 | | | 800 | | | 809 |
8.000% due 04/15/2014 (c) | | | 3,987 | | | 3,662 |
8.250% due 01/20/2034 | | | 1,100 | | | 835 |
10.250% due 06/17/2013 | | | 200 | | | 194 |
11.000% due 08/17/2040 | | | 2,750 | | | 2,595 |
Republic of Guatemala | | | | | | |
9.250% due 08/01/2013 | | | 225 | | | 245 |
Republic of Panama | | | | | | |
9.625% due 02/08/2011 | | | 850 | | | 946 |
9.375% due 07/23/2012 | | | 375 | | | 412 |
8.875% due 09/30/2027 | | | 1,050 | | | 1,024 |
| | | | | | |
| | |
Republic of Peru | | | | | | |
9.125% due 01/15/2008 | | $ | 600 | | $ | 654 |
9.125% due 02/21/2012 | | | 1,550 | | | 1,596 |
9.875% due 02/06/2015 | | | 350 | | | 367 |
4.500% due 03/07/2017 (c) | | | 600 | | | 487 |
5.000% due 03/07/2017 (c) | | | 228 | | | 199 |
Republic of Ukraine | | | | | | |
11.000% due 03/15/2007 | | | 342 | | | 369 |
6.875% due 03/04/2011 | | | 500 | | | 472 |
7.650% due 06/11/2013 | | | 300 | | | 286 |
Russian Federation | | | | | | |
5.000% due 03/31/2030 (c) | | | 3,435 | | | 3,145 |
| | | | | |
|
|
| Total Sovereign Issues (Cost $20,262) | | | | | | 19,339 |
| | | | | |
|
|
| | | | | | | |
FOREIGN CURRENCY-DENOMINATED
ISSUES (j)(k) 1.2% |
| | |
El Paso Corp. | | | | | | |
5.750% due 03/14/2006 | | EC | 700 | | | 818 |
Johnsondiversey, Inc. | | | | | | |
9.625% due 05/15/2012 | | | 350 | | | 462 |
JSG Funding PLC | | | | | | |
10.125% due 10/01/2012 | | | 650 | | | 862 |
Kronos International, Inc. | | | | | | |
8.875% due 06/30/2009 | | | 300 | | | 390 |
Lighthouse International Co. S.A. | | | |
8.000% due 04/30/2014 | | | 1,420 | | | 1,676 |
| | | | | |
|
|
| Total Foreign Currency-Denominated Issues (Cost $3,708) | | | 4,208 |
| | | | | |
|
|
| | | | | | | |
CONVERTIBLE BONDS & NOTES 0.9% |
Banking & Finance 0.5% | | | | | | |
Fiat Finance Luxembourg S.A. | | | | | | |
3.250% due 01/09/2007 | | $ | 1,600 | | | 1,612 |
| | | | | |
|
|
Industrials 0.2% | | | | | | |
Dimon, Inc. | | | | | | |
6.250% due 03/31/2007 | | | 850 | | | 769 |
| | | | | |
|
|
Utilities 0.2% | | | | | | |
Rogers Communication, Inc. | | | | | | |
2.000% due 11/26/2005 | | | 665 | | | 631 |
| | | | | |
|
|
| Total Convertible Bonds & Notes (Cost $2,880) | | | 3,012 |
| | | | | |
|
|
| | | | | | | |
COMMON STOCKS 0.3% |
| | | Shares | | |
Communications 0.2% | | | | | | |
MCI, Inc. | | | 38,968 | | | 562 |
| | | | | |
|
|
Industrials 0.1% | | | | | | |
Dobson Communications Corp. | | | 85,601 | | | 279 |
| | | | | |
|
|
| Total Common Stocks (Cost $1,253) | | | | | | 841 |
| | | | | |
|
|
| | | | | | | |
CONVERTIBLE PREFERRED STOCK 0.0% |
| | |
Dobson Communications Corp. | | | | | | |
6.000% due 08/19/2016 | | | 650 | | | 71 |
| | | | | |
|
|
| Total Convertible Preferred Stock (Cost $109) | | | 71 |
| | | | | |
|
|
| | | | | | | |
PREFERRED SECURITY 0.3% |
| | |
Riggs Capital Trust II | | | | | | |
8.875% due 03/15/2027 | | | 950,000 | | | 957 |
| | | | | |
|
|
| Total Preferred Security (Cost $900) | | | | | | 957 |
| | | | | |
|
|
| | | | | | | |
PREFERRED STOCK 0.3% | |
| | |
Fresenius Medical Care | | | | | | | |
7.875% due 02/01/2008 | | | 1,050 | | $ | 1,110 | |
| | | | | |
|
|
|
| Total Preferred Stock (Cost $1,082) | | | | | | 1,110 | |
| | | | | |
|
|
|
| | | | | | | | |
PURCHASED PUT OPTIONS 0.0% | |
| | | # of Contracts | | | |
Eurodollar September Futures (CME) | | | | |
Strike @ 96.500
Exp. 09/13/2004 | | | 400 | | | 2 | |
| | | | | |
|
|
|
| Total Purchased Put Options (Cost $4) | | | | | | 2 | |
| | | | | |
|
|
|
| | | | | | | | |
SHORT-TERM INSTRUMENTS 6.3% | |
| | | Principal Amount (000s) | | | |
Commercial Paper 5.0% | | | | | | | |
Barclays U.S. Funding Corp. | | | | | | | |
1.280% due 09/27/2004 | | $ | 1,600 | | | 1,594 | |
CDC Commercial Corp. | | | | | | | |
1.260% due 09/22/2004 | | | 4,000 | | | 3,986 | |
Freddie Mac | | | | | | | |
1.200% due 08/09/2004 | | | 900 | | | 899 | |
1.410% due 09/14/2004 | | | 200 | | | 200 | |
1.560% due 10/20/2004 | | | 3,400 | | | 3,383 | |
General Electric Capital Corp. | | | | | | | |
1.460% due 09/14/2004 | | | 1,600 | | | 1,595 | |
1.480% due 09/15/2004 | | | 900 | | | 897 | |
HBOS Treasury Services PLC | | | | | | | |
1.290% due 09/24/2004 | | | 600 | | | 598 | |
TotalFinaElf Capital S.A. | | | | | | | |
1.420% due 07/01/2004 | | | 3,000 | | | 3,000 | |
UBS Finance, Inc. | | | | | | | |
1.245% due 07/21/2004 | | | 900 | | | 900 | |
| | | | | |
|
|
|
| | | | | | | 17,052 | |
| | | | | |
|
|
|
| | |
Repurchase Agreement 0.9% | | | | | | | |
State Street Bank | | | | | | | |
0.800% due 07/01/2004 | | | 3,019 | | | 3,019 | |
| | | | | |
|
|
|
(Dated 06/30/2004. Collateralized by Freddie Mac
5.500% due 07/15/2006 valued at $3,080.
Repurchase proceeds are $3,019.) | |
U.S. Treasury Bills 0.4% | | | | | | | |
1.205% due 09/02/2004-09/16/2004 (a)(e)(f) | | | 1,400 | | | 1,396 | |
| | | | | |
|
|
|
| Total Short-Term Instruments (Cost $21,471) | | | | | | 21,467 | |
| | | | | |
|
|
|
| | |
Total Investments 97.5% | | | | | $ | 330,645 | |
(Cost $332,203) | | | | | | | |
| | |
Written Options (h) (0.1%) | | | | | | (398 | ) |
(Premiums $2,085) | | | | | | | |
| |
Other Assets and Liabilities (Net) 2.6% | | | 8,763 | |
| | |
|
|
|
| |
Net Assets 100.0% | | $ | 339,010 | |
| | | | | |
|
|
|
| | | | | | |
| 10 | | Semi-Annual Report | | June 30, 2004 | | See accompanying notes |
Notes to Schedule of Investments
(amounts in thousands, except number of contracts):
(a) Securities are grouped by coupon or range of coupons and represent a range of maturities.
(b) Security is in default.
(c) Variable rate security.
(d) Payment in-kind bond security.
(e) Securities with an aggregate market value of $649 have been segregated with the custodian to cover margin requirements for the following open futures contracts at June 30, 2004:
| | | | | | | | |
| Type | | Expiration
Month | | # of
Contracts | | Unrealized (Depreciation) | |
Eurodollar March Long Futures | | 03/2005 | | 20 | | $ | (44 | ) |
Eurodollar March Long Futures | | 03/2006 | | 34 | | | (106 | ) |
Eurodollar June Long Futures | | 06/2005 | | 34 | | | (109 | ) |
Eurodollar September Long Futures | | 09/2005 | | 34 | | | (109 | ) |
Eurodollar December Long Futures | | 12/2005 | | 34 | | | (109 | ) |
Euribor June Long Futures | | 06/2005 | | 118 | | | (47 | ) |
Euribor Purchased Put Options Strike @ 89.000 | | 03/2005 | | 310 | | | (4 | ) |
Euribor September Long Futures | | 09/2005 | | 71 | | | (112 | ) |
| | | | | | |
|
|
|
| | | | | | | $ | (640 | ) |
| | | | | | |
|
|
|
(f) Securities with an aggregate market value of $748 have been pledged as collateral for swap and swaption contracts at June 30, 2004.
(g) Swap agreements outstanding at June 30, 2004:
| | | | | | | |
| Type | | Notional
Amount | | Appreciation/
(Depreciation) | |
|
Receive a fixed rate equal to 1.350% and the Portfolio will pay to the counterparty at par in the event of default of Republic of Peru 9.125% due 02/21/2012. | |
Counterparty: UBS Warburg LLC | | | | |
Exp. 09/20/2004 | | $ | 5,000 | | $ | 7 | |
|
| Receive a fixed rate equal to 1.400% and the Portfolio will pay to the counterparty at par in the event of default of Tyco International Group S.A. 2.750% due 01/15/2018. | |
Counterparty: Morgan Stanley Dean Witter & Co. | |
Exp. 09/20/2004 | | | 4,000 | | | 12 | |
|
Receive a fixed rate equal to 2.600% and the Portfolio will pay to the counterparty at par in the event of default of Bombardier, Inc.
6.750% due 05/01/2012. | |
Counterparty: Goldman Sachs & Co. | |
Exp. 09/20/2004 | | | 1,286 | | | (11 | ) |
| | | | | | | | |
|
Receive a fixed rate equal to 2.600% and the
Portfolio will pay to the counterparty at par in the
event of default of Clear Channel Communications, Inc.
7.650% due 09/15/2010. | |
Counterparty: Goldman Sachs & Co. | |
Exp. 09/20/2004 | | $ | 1,286 | | | $ | (11 | ) |
|
Receive a fixed rate equal to 2.600% and the
Portfolio will pay to the counterparty at par in the
event of default of Comcast Cable Communications, Inc.
6.750% due 01/30/2011. | |
Counterparty: Goldman Sachs & Co. | |
Exp. 09/20/2004 | | | 1,286 | | | | (11 | ) |
|
Receive a fixed rate equal to 2.600% and the Portfolio will pay to the counterparty at par in the
event of default of Cox Communications, Inc.
7.750% due 11/01/2010. | |
Counterparty: Goldman Sachs & Co. | |
Exp. 09/20/2004 | | | 1,286 | | | | (11 | ) |
|
Receive a fixed rate equal to 2.600% and the
Portfolio will pay to the counterparty at par
in the event of default of Harrah’s Operating Co.
8.000% due 02/01/2011. | |
Counterparty: Goldman Sachs & Co. | |
Exp. 09/20/2004 | | | 1,286 | | | | (11 | ) |
|
Receive a fixed rate equal to 2.600% and the
Portfolio will pay to the counterparty at par
in the event of default of Sprint Capital Corp.
6.875% due 11/15/2028. | |
Counterparty: Goldman Sachs & Co. | |
Exp. 09/20/2004 | | | 1,286 | | | | (11 | ) |
|
Receive a fixed rate equal to 2.600% and the
Portfolio will pay to the counterparty at par in the event of default of Time Warner, Inc.
6.875% due 05/01/2012. | |
Counterparty: Goldman Sachs & Co. | |
Exp. 09/20/2004 | | | 1,286 | | | | (11 | ) |
|
Receive a fixed rate equal to 1.000% and the
Portfolio will pay to the counterparty at par
in the event of default of Russian Federation
5.000% due 03/31/2030. | |
Counterparty: Morgan Stanley Dean Witter & Co. | |
Exp. 09/30/2004 | | | 5,000 | | | | 2 | |
|
Receive a fixed rate equal to 0.720% and the
Portfolio will pay to the counterparty at par
in the event of default of Russian Federation,
5.000% until 03/31/2007 and 7.500% thereafter,
due 03/31/2030. | |
Counterparty: Goldman Sachs & Co. | |
Exp. 10/21/2004 | | | 4,000 | | | | (2 | ) |
|
Receive a fixed rate equal to 4.100% and the
Portfolio will pay to the counterparty at par
in the event of default of Dow Jones TRAC-X NA High Yield Series. | |
Counterparty: J.P. Morgan Chase & Co. | |
Exp. 03/20/2009 | | | 5,000 | | | | (92 | ) |
| | | | | | |
|
|
|
| | | | | | | $ | (150 | ) |
| | | | | | |
|
|
|
| | | | | | |
| See accompanying notes | | June 30, 2004 | | Semi-Annual Report | | 11 |
Schedule of Investments (Cont.)
High Yield Portfolio
June 30, 2004 (Unaudited)
(h) Premiums received on written options:
| | | | | | | | | | | | | | | | | | | |
| Name of Issuer | | Exercise
Price | | | Expiration
Date | | # of
Contracts | | Premium | | | Value | |
Call - CBOT U.S. Treasury Note September Futures | | $ | 115.000 | | | 08/27/2004 | | | 76 | | $ | 36 | | | $ | 2 | |
| | | | | | |
Name of Issuer | | Counterparty | | Exercise
Rate | | | Expiration
Date | | Notional
Amount | | Premium | | | Value | |
Put - OTC 7-Year Interest Rate Swap | | Greenwich Capital Markets, Inc. | | | 5.250 | %* | | 07/19/2004 | | $ | 21,400 | | $ | 128 | | | $ | 3 | |
Call - OTC 7-Year Interest Rate Swap | | J.P. Morgan Chase & Co. | | | 4.500 | %** | | 08/02/2004 | | | 5,600 | | | 19 | | | | 12 | |
Call - OTC 10-Year Interest Rate Swap | | Bear Stearns & Co., Inc. | | | 4.000 | %** | | 10/07/2004 | | | 27,000 | | | 416 | | | | 1 | |
Put - OTC 10-Year Interest Rate Swap | | Bear Stearns & Co., Inc. | | | 6.500 | %* | | 10/07/2004 | | | 27,000 | | | 797 | | | | 9 | |
Call - OTC 7-Year Interest Rate Swap | | Wachovia Bank N.A. | | | 5.500 | %** | | 01/07/2005 | | | 5,900 | | | 285 | | | | 210 | |
Call - OTC 7-Year Interest Rate Swap | | Goldman Sachs & Co. | | | 5.000 | %** | | 01/07/2005 | | | 9,100 | | | 215 | | | | 157 | |
Put - OTC 7-Year Interest Rate Swap | | Goldman Sachs & Co. | | | 7.000 | %* | | 01/07/2005 | | | 9,100 | | | 190 | | | | 4 | |
| | | | | | | | | | | | | | $ | 2,050 | | | $ | 396 | |
| * The Portfolio will pay a floating rate based on 3-month LIBOR. | |
| **The Portfolio will receive a floating rate based on 3-month LIBOR. | |
| (i) Restricted security or securities as of June 30, 2004: | |
| Issuer Description | | | | | | | Acquisition
Date | | Cost as of June 30, 2004 | | Market
Value as of
June 30, 2004 | | | Market Value
as Percentage
of Net Assets | |
Bombardier Capital, Inc. | | | | | | | | 08/11/2003 | | $ | 1,008 | | $ | 1,008 | | | | 0.30 | % |
Continental Airlines, Inc. | | | | | | | | 07/01/2003 | | | 752 | | | 829 | | | | 0.24 | |
Ferrellgas Partners LP | | | | | | | | 06/30/2003 | | | 990 | | | 1,013 | | | | 0.30 | |
Ferrellgas Partners LP | | | | | | | | 06/30/2003 | | | 1,334 | | | 1,273 | | | | 0.38 | |
| | | | | | | | | | | $ | 4,084 | | $ | 4,123 | | | | 1.22 | % |
| | | |
(j) Forward foreign currency contracts outstanding at June 30, 2004: | | | | | | | | | | | |
| | | | | | |
| Type | | Currency | | Principal
Amount
Covered by
Contract | | | Settlement
Month | | Unrealized
Appreciation | | Unrealized
(Depreciation) | | | Net
Unrealized
Appreciation | |
Buy | | EC | | | 1,152 | | | 07/2004 | | $ | 6 | | $ | (5 | ) | | $ | 1 | |
Sell | | | | | 6,621 | | | 07/2004 | | | 86 | | | (4 | ) | | | 82 | |
Buy | | JY | | | 167,529 | | | 07/2004 | | | 9 | | | 0 | | | | 9 | |
| | | | | | | | | | | $ | 101 | | $ | (9 | ) | | $ | 92 | |
(k) Principal amount denoted in indicated currency:
EC - Euro
JY - Japanese Yen
(l) Indicates a fair-valued security which has not been valued utilizing an independent quote but has been valued in good faith pursuant to guidelines established by the Board of Trustees. The aggregate value of fair-valued securities is $2,102, which represents 0.62% of net assets.
| | | | | | |
| 12 | | Semi-Annual Report | | June 30, 2004 | | See accompanying notes |
Notes to Financial Statements
June 30, 2004 (Unaudited)
1. Organization
The High Yield Portfolio (the “Portfolio”) is a series of the PIMCO Variable Insurance Trust (the “Trust”). The Trust is registered under the Investment Company Act of 1940 (the “Act”), as amended, as an open-end investment company organized as a Delaware business trust on October 3, 1997. The Portfolio offers two classes of shares: Institutional and Administrative. Each share class has identical voting rights (except that shareholders of a class have exclusive voting rights regarding any matter relating solely to that class of shares). Information presented in these financial statements pertains to the Institutional Class of the Portfolio. Certain detailed financial information for the Administrative Class is provided separately and is available upon request. The Trust is designed to be used as an investment vehicle by Separate Accounts of insurance companies that fund variable annuity contracts and variable life insurance policies and by qualified pension and retirement plans. The Portfolio commenced operations on April 30, 1998.
2. Significant Accounting Policies
The following is a summary of significant accounting policies consistently followed by the Trust in the preparation of its financial statements in conformity with accounting principles generally accepted in the United States of America. The preparation of financial statements in accordance with accounting principles generally accepted in the United States of America requires management to make estimates and assumptions that affect the reported amounts and disclosures in the financial statements. Actual results could differ from those estimates.
Security Valuation. Portfolio securities and other financial instruments for which market quotations are readily available are stated at market value. Portfolio securities and other financial instruments for which market quotes are not readily available are valued at fair value, as determined in good faith and pursuant to guidelines established by the Board of Trustees, including certain fixed income securities which may be valued with reference to securities whose prices are more readily obtainable. Market value is determined at the close of regular trading (normally, 4:00 p.m., Eastern Time) on the New York Stock Exchange on each day the New York Stock Exchange is open, or if no sales are reported, as is the case for most securities traded over-the-counter, the mean between representative bid and asked quotations obtained from a quotation reporting system or from established market makers. The prices of certain portfolio securities or other financial instruments may be determined at a time prior to the close of regular trading on the New York Stock Exchange. Fair valuation may be used if significant events occur after the close of the relevant markets and prior to the close of regular trading on the New York Stock Exchange that materially affect the values of such securities or financial instruments. Fixed income securities are normally valued on the basis of quotes obtained from brokers and dealers or pricing services. Certain fixed income securities purchased on a delayed delivery basis are marked to market daily until settlement at the forward settlement value. Short-term investments, which mature in 60 days or less are valued at amortized cost, which approximates market value. Exchange traded options, futures and options on futures are valued at the settlement price determined by the relevant exchange. Prices may be obtained from independent pricing services which use information provided by market makers or estimates of market values obtained from yield data relating to investments or securities with similar characteristics. The prices used by the Portfolio may differ from the value that would be realized if the securities were sold and the differences could be material to the financial statements.
Securities Transactions and Investment Income. Securities transactions are recorded as of the trade date. Securities purchased or sold on a when-issued or delayed delivery basis may be settled a month or more after the trade date. Realized gains and losses from securities sold are recorded on the identified cost basis. Dividend income is recorded on the ex-dividend date, except certain dividends from foreign securities where the ex-dividend date may have passed, are recorded as soon as the Portfolio is informed of the ex-dividend date. Interest income, adjusted for the accretion of discounts and amortization of premiums, is recorded on the accrual basis. Paydowns gains and losses on mortgage- and asset-backed securities are recorded as adjustments to interest income in the Statement of Operations.
Dividends and Distributions to Shareholders. Dividends from net investment income, if any, are declared on each day the Trust is open for business and are distributed to shareholders monthly. All dividends are reinvested in additional shares of the Portfolio. Net realized capital gains earned by the Portfolio, if any, will be distributed no less frequently than once each year.
Income dividends and capital gain distributions are determined in accordance with income tax regulations which may differ from accounting principles generally accepted in the United States of America. These differences are primarily due to differing treatments for such items as wash sales, foreign currency transactions, net operating losses, notional principal contracts, certain asset-backed securities, certain futures and forward contracts, tax straddles, and capital loss carryforwards.
Distributions classified as a tax basis return of capital, if any, are reflected in the accompanying Statements of Changes in Net Assets and have been reclassified to paid in capital. In addition, other amounts have been reclassified between undistributed net investment income, accumulated undistributed net realized gains or losses and/or paid in capital to more appropriately conform financial accounting to tax characterizations of dividend distributions.
Multiclass Operations. Each class offered by the Trust has equal rights as to assets. Income, non-class specific expenses, and realized and unrealized capital gains and losses are allocated to each class of shares based on the relative net assets of each class.
Federal Income Taxes. The Portfolio intends to qualify as a regulated investment company and distribute all of its taxable
| | | | |
| June 30, 2004 | | Semi-Annual Report | | 13 |
Notes to Financial Statements (Cont.)
June 30, 2004 (Unaudited)
income and net realized gains, if applicable, to shareholders. Accordingly, no provision for Federal income taxes has been made.
Foreign Currency. The accounting records of the Portfolio are maintained in U.S. dollars. The market values of foreign securities, currency holdings and other assets and liabilities are translated into U.S. dollars based on the current exchange rates each business day. Fluctuations in the value of these assets and liabilities resulting from changes in exchange rates are recorded as unrealized foreign currency gains or losses. Realized gains or losses and unrealized appreciation or depreciation on investment securities and income and expenses are translated on the respective dates of such transactions. The effect of changes in foreign currency exchange rates on investments in securities are not segregated in the Statement of Operations from the effects of changes in market prices of those securities, but are included with the net realized and unrealized gain or loss on investment securities.
Forward Currency Transactions. The Portfolio may enter into forward currency contracts and forward cross-currency contracts in connection with settling planned purchases or sales of securities, to hedge the currency exposure associated with some or all of the Portfolio’s securities or as a part of an investment strategy. A forward currency contract is an agreement between two parties to buy and sell a currency at a set price on a future date. The market value of a forward currency contract fluctuates with changes in forward currency exchange rates. Forward currency contracts are marked to market daily and the change in value is recorded by the Portfolio as an unrealized gain or loss. Realized gains or losses equal to the difference between the value of the contract at the time it was opened and the value at the time it was closed are recorded upon delivery or receipt of the currency or, if a forward currency contract is offset by entering into another forward currency contract with the same broker, upon settlement of the net gain or loss. These contracts may involve market risk in excess of the unrealized gain or loss reflected in the Portfolio’s Statement of Assets and Liabilities. In addition, the Portfolio could be exposed to risk if the counterparties are unable to meet the terms of the contracts or if the value of the currency changes unfavorably to the U.S. dollar.
Futures Contracts. The Portfolio is authorized to enter into futures contracts. The Portfolio may use futures contracts to manage its exposure to the securities markets or to movements in interest rates and currency values. The primary risks associated with the use of futures contracts are the imperfect correlation between the change in market value of the securities held by the Portfolio and the prices of futures contracts, the possibility of an illiquid market, and the inability of the counterparty to meet the terms of the contract. Futures contracts are valued based upon their quoted daily settlement prices. Upon entering into a futures contract, the Portfolio may be required to deposit with its custodian, in a segregated account in the name of the futures broker, an amount of cash or U.S. Government and Agency Obligations in accordance with the initial margin requirements of the broker or exchange. Futures contracts are marked to market daily and an appropriate payable or receivable for the change in value (“variation margin”) is recorded by the Portfolio. Gains or losses are recognized but not considered realized until the contracts expire or are closed. Futures contracts involve, to varying degrees, risk of loss in excess of the variation margin disclosed in the Statement of Assets and Liabilities.
Loan Agreements. The Portfolio may invest in direct debt instruments which are interests in amounts owed by a corporate, governmental, or other borrower to lenders or lending syndicates. The Portfolio’s investments in loans may be in the form of participations in loans or assignments of all or a portion of loans from third parties. A loan is often administered by a bank or other financial institution (the “lender”) that acts as agent for all holders. The agent administers the terms of the loan, as specified in the loan agreement. When investing in a loan participation, the Portfolio has the right to receive payments of principal, interest and any fees to which it is entitled only from the lender selling the loan agreement and only upon receipt by the lender of payments from the borrower. The Portfolio generally has no right to enforce compliance with the terms of the loan agreement with the borrower. As a result, the Portfolio may be subject to the credit risk of both the borrower and the lender that is selling the loan agreement. When the Portfolio purchases assignments from lenders it acquires direct rights against the borrower on the loan.
Options Contracts. The Portfolio may write call and put options on futures, swaps, securities or currencies it owns or in which it may invest. Writing put options tends to increase the Portfolio’s exposure to the underlying instrument. Writing call options tends to decrease the Portfolio’s exposure to the underlying instrument. When the Portfolio writes a call or put option, an amount equal to the premium received is recorded as a liability and subsequently marked to market to reflect the current value of the option written. These liabilities are reflected as written options outstanding in the Statement of Assets and Liabilities. Payments received or made, if any, from writing options with premiums to be determined on a future date are reflected as such on the Statement of Assets and Liabilities. Premiums received from writing options which expire are treated as realized gains. Premiums received from writing options which are exercised or closed are added to the proceeds or offset against amounts paid on the underlying future, swap, security or currency transaction to determine the realized gain or loss. The Portfolio as a writer of an option has no control over whether the underlying future, swap, security or currency may be sold (call) or purchased (put) and as a result bears the market risk of an unfavorable change in the price of the future, swap, security or currency underlying the written option. There is the risk the Portfolio may not be able to enter into a closing transaction because of an illiquid market.
The Portfolio may also purchase put and call options. Purchasing call options tends to increase the Portfolio’s exposure to the underlying instrument. Purchasing put options tends to decrease the Portfolio’s exposure to the underlying instrument. The Portfolio pays a premium which is included in the Portfolio’s Statement of Assets and Liabilities as an investment and subsequently marked to market to reflect the current value of the option. Premiums paid for
| | | | |
| 14 | | Semi-Annual Report | | June 30, 2004 |
purchasing options which expire are treated as realized losses. The risk associated with purchasing put and call options is limited to the premium paid. Premiums paid for purchasing options which are exercised or closed are added to the amounts paid or offset against the proceeds on the underlying future, swap, security or currency transaction to determine the realized gain or loss.
Payment In-Kind Securities. The Portfolio may invest in payment in-kind securities. Payment-in-kind securities (PIKs) give the issuer the option at each interest payment date of making interest payments in either cash or additional debt securities. Those additional debt securities usually have the same terms, including maturity dates and interest rates, and associated risks as the original bonds. The daily market quotations of the original bonds include the accrued interest (referred to as a dirty price) and require an adjustment in an amount equal to the accrued interest to the unrealized appreciation or depreciation on investment in the Statements of Assets and Liabilities.
Repurchase Agreements. The Portfolio may engage in repurchase transactions. Under the terms of a typical repurchase agreement, the Portfolio takes possession of an underlying debt obligation subject to an obligation of the seller to repurchase, and the Portfolio to resell, the obligation at an agreed-upon price and time. The market value of the collateral must be equal at all times to the total amount of the repurchase obligations, including interest. Generally, in the event of counterparty default, the Portfolio has the right to use the collateral to offset losses incurred.
Restricted Securities. The Portfolio is permitted to invest in securities that are subject to legal or contractual restrictions on resale. These securities generally may be resold in transactions exempt from registration or to the public if the securities are registered. Disposal of these securities may involve time-consuming negotiations and expenses, and prompt sale at an acceptable price may be difficult.
Swap Agreements. The Portfolio may invest in swap agreements. A swap is an agreement to exchange the return generated by one instrument for the return generated by another instrument. The Portfolio may enter into interest rate, total return, forward spread lock, and credit default swap agreements to manage its exposure to interest rates and credit risk.
Interest rate swap agreements involve the exchange by the Portfolio with another party of their respective commitments to pay or receive interest, e.g., an exchange of floating rate payments for fixed rate payments with respect to the notional amount of principal.
Total return swap agreements involve commitments to pay interest in exchange for a market-linked return, both based on notional amounts. To the extent the total return of the security or index underlying the transaction exceeds or falls short of the offsetting interest rate obligation, the Portfolio will receive a payment from or make a payment to the counterparty.
Forward spread lock swap agreements involve commitments to pay or receive a settlement amount calculated as the difference between the swap spread and a fixed spread, multiplied by the notional amount times the duration of the swap. The swap spread is the difference between the benchmark swap rate (market rate) and the specific Treasury rate.
In a credit default swap, one party makes a stream of payments to another party in exchange for the right to receive a specified return in the event of a default by a third party, typically corporate issues or sovereign issues of an emerging country, on its obligation. The Portfolio may use credit default swaps to provide a measure of protection against defaults of sovereign issuers (i.e., to reduce risk where the Portfolio owns or has exposure to the sovereign issuer) or to take an active long or short position with respect to the likelihood of a particular issuer’s default.
Swaps are marked to market daily based upon quotations from market makers and the change in value, if any, is recorded as unrealized gain or loss in the Statement of Operations. Payments received or made at the beginning of the measurement period are reflected as such on the Statement of Assets and Liabilities. A liquidation payment received or made at the termination of the swap is recorded as realized gain or loss in the Statement of Operations. Net periodic payments received by the Portfolio are included as part of realized gain (loss) on the Statement of Operations. Entering into these agreements involves, to varying degrees, elements of credit, market and documentation risk in excess of the amounts recognized on the Statement of Assets and Liabilities. Such risks involve the possibility that there will be no liquid market for these agreements, that the counterparty to the agreements may default on its obligation to perform or disagree as to the meaning of contractual terms in the agreements, and that there may be unfavorable changes in interest rates.
As a result of a FASB Emerging Issues Task Force (“EITF”) consensus, No. 03-11, and related SEC staff guidance, the Portfolio has reclassified periodic payments made or received under swap agreements, which were previously included within miscellaneous income, to a component of realized gain (loss) in the Statement of Operations. For consistency, similar reclassifications have been made to amounts appearing in the previous year’s Statement of Changes in Net Assets and the per share amounts in the prior year financial highlights. Prior year net investment income ratios in the financial highlights have also been modified accordingly. This reclassification increased (decreased) net investment income by $(360,176), and $(526,777), and net realized gain by $377,876 and $505,063 and net change in unrealized appreciation (depreciation) by $(17,699) and $21,714 for the six months ended June 30, 2004 and year ended December 31, 2003, respectively. There is no effect on the Portfolio’s net asset value, either in total or per share, or its total increase (decrease) in net assets from operations during any period.
3. Fees, Expenses, and Related Party Transactions
Investment Advisory Fee. Pacific Investment Management Company LLC (“PIMCO”) is a majority owned subsidiary partnership of Allianz Dresdner Asset Management of America L.P. and serves as investment adviser (the “Adviser”) to the Trust, pursuant to an investment advisory contract. The Adviser receives a monthly fee at
| | | | |
| June 30, 2004 | | Semi-Annual Report | | 15 |
Notes to Financial Statements (Cont.)
June 30, 2004 (Unaudited)
an annual rate based on average daily net assets of the Portfolio. The Advisory Fee is charged at an annual rate of 0.25%.
Administration Fee. PIMCO serves as administrator (the “Administrator”), and provides administrative services to the Trust for which it receives a monthly administrative fee based on average daily net assets of the Portfolio. The Administration Fee is charged at the annual rate of 0.35%.
Servicing Fee. PA Distributors LLC (“PAD”), formerly known as PIMCO Advisors Distributors LLC, is an indirect wholly-owned subsidiary of Allianz Dresdner Asset Management of America L.P. and serves as the distributor of the Trust’s shares. The Trust is permitted to reimburse PAD on a quarterly basis, out of the Administrative Class assets of the Portfolio in the amount of 0.15% on an annual basis of the average daily net assets of that class, for payments made to financial intermediaries that provide services in connection with the distribution of shares or administration of plans or programs that use Portfolio shares as their funding medium. The effective rate paid to PAD was 0.15% during current fiscal year.
Expenses. The Trust is responsible for the following expenses: (i) salaries and other compensation of any of the Trust’s executive officers and employees who are not officers, directors, stockholders or employees of PIMCO or its subsidiaries or affiliates; (ii) taxes and governmental fees; (iii) brokerage fees and commissions and other portfolio transaction expenses; (iv) the cost of borrowing money, including interest expense and bank overdraft charges; (v) fees and expenses of the Trustees who are not “interested persons” of PIMCO or the Trust, and any counsel retained exclusively for their benefit; (vi) extraordinary expenses, including costs of litigation and indemnification expenses; (vii) organization expenses and (viii) any expenses allocated or allocable to a specific class of shares, which include service fees payable with respect to the Administrative Class shares and may include certain other expenses as permitted by the Trust’s Multiple Class Plan adopted pursuant to Rule 18f-3 under the Act and subject to review and approval by the Trustees. The ratio of expenses to average net assets per share class, as disclosed in Financial Highlights, may differ from the annual portfolio operating expenses per share class as disclosed in the Prospectus for the reasons set forth above.
PIMCO has agreed to waive a portion of its administrative fees to the extent that the payment of the Portfolio’s pro rata share of organization expenses and Trustee fees cause the actual expense ratio to rise above the rates disclosed in the then-current prospectus plus 0.49 basis points as set forth below (calculated as a percentage of the Portfolio’s average daily net assets attributable to each class):
| | | |
Institutional Class | | 0.60 | % |
Administrative Class | | 0.75 | % |
PIMCO may be reimbursed for these waived amounts in future periods, not to exceed thirty-six months.
Each unaffiliated Trustee receives an annual retainer of $4,000, plus $1,500 for each Board of Trustees meeting attended in person and $250 for each meeting attended telephonically, plus reimbursement of related expenses. In addition, each committee chair receives an additional annual retainer of $500. These expenses are allocated on a pro-rata basis to each Portfolio of the Trust according to its respective net assets.
4. Purchases and Sales of Securities
The length of time a Portfolio has held a particular security is not generally a consideration in investment decisions. A change in the securities held by a Portfolio is known as “portfolio turnover.” The Portfolio may engage in frequent and active trading of portfolio securities to achieve its investment objective, particularly during periods of volatile market movements. High portfolio turnover (e.g., over 100%) involves correspondingly greater expenses to the Portfolio, including brokerage commissions or dealer mark-ups and other transaction costs on the sale of securities and reinvestments in other securities. Such sales may also result in realization of taxable capital gains, including short-term capital gains (which are generally taxed at ordinary income tax rates). The trading costs and tax effects associated with portfolio turnover may adversely affect the Portfolio’s performance.
Purchases and sales of securities (excluding short-term investments) for the period ended June 30, 2004 were as follows (amounts in thousands):
| | | | | | |
| U.S. Government/Agency | | All Other |
| Purchases | | Sales | | Purchases | | Sales |
| $ 249 | | $ 0 | | $ 322,435 | | $ 849,926 |
5. Transactions in Written Call and Put Options
Transactions in written call and put options were as follows (amounts in thousands):
| | | |
| | | Premium | |
Balance at 12/31/2003 | | $1,902 | |
Sales | | 961 | |
Closing Buys | | (418 | ) |
Expirations | | (360 | ) |
| Exercised | | 0 | |
| Balance at 06/30/2004 | | $2,085 | |
6. In-Kind Transactions
For the six months ended June 30, 2004, the following Funds realized gain or losses from in-kind redemptions of approximately (amounts in thousands):
| | |
| Realized Gains | | Realized Losses |
| $ 29,020 | | $ (5,409) |
| | | | |
| 16 | | Semi-Annual Report | | June 30, 2004 |
7. Federal Income Tax Matters
At June 30, 2004, the aggregate cost of investments was the same for federal income tax and financial statement purposes. The net unrealized appreciation (depreciation) of investment securities for federal income tax purposes is as follows (amounts in thousands):
| | | | |
Aggregate Gross
Unrealized Appreciation | | Aggregate Gross
Unrealized
(Depreciation) | | Net Unrealized
Depreciation |
| $ 6,756 | | $ (8,314) | | $ (1,558) |
8. Shares of Beneficial Interest
The Trust may issue an unlimited number of shares of beneficial interest with a $.001 par value. Changes in shares of beneficial interest were as follows (shares and amounts in thousands):
| | | | | | | | | | | | | | |
| | | Six Months Ended
06/30/2004 | | | Year Ended
12/31/2003 | |
| | | Shares | | | Amount | | | Shares | | | Amount | |
Receipts for shares sold | | | | | | | | | | | | | | |
| | | | |
Institutional Class | | 38 | | | $ | 298 | | | 0 | | | $ | 0 | |
Administrative Class | | 19,173 | | | | 155,987 | | | 106,916 | | | | 820,631 | |
| | | | |
Issued as reinvestment of distributions | | | | | | | | | | | | | | |
| | | | |
Institutional Class | | 0 | | | | 3 | | | 1 | | | | 1 | |
Administrative Class | | 2,632 | | | | 21,323 | | | 6,690 | | | | 52,190 | |
| | | | |
Cost of shares redeemed | | | | | | | | | | | | | | |
| | | | |
Institutional Class | | 0 | | | | (1 | ) | | 0 | | | | 0 | |
Administrative Class | | (95,728 | ) | | | (769,715 | ) | | (64,075 | ) | | | (487,714 | ) |
| | | | |
Net increase (decrease) resulting from Portfolio share transactions | | (73,885 | ) | | $ | (592,105 | ) | | 49,532 | | | $ | 385,108 | |
The following schedule shows the number of shareholders each owning 5% or more of the Portfolio and the total percentage of the Portfolio held by such shareholders:
| | | | |
| | | Number | | % of Portfolio Held |
Institutional Class | | 1 | | 96 |
Administrative Class | | 3 | | 89 |
9. Regulatory and Litigation Matters
On February 17, 2004, the Attorney General of the State of New Jersey (“New Jersey AG”) filed a complaint against Allianz Dresdner Asset Management of America L.P. (“ADAM”), PA Distributors LLC (formerly known as PIMCO Advisors Distributors LLC) (“PAD”), PEA Capital LLC (formerly known as PIMCO Equity Advisors LLC) (“PEA”), and Pacific Investment Management Company LLC (“PIMCO”) in connection with its investigation into market timing and late trading. The complaint contends that inappropriate trading by shareholders engaged in market timing activity took place in funds in the PIMCO Funds: Multi-Manager Series (“MMS Funds”) and the PIMCO Funds: Pacific Investment Management Series (“PIMS Funds”). On June 1, 2004, the New Jersey AG dismissed PIMCO from the lawsuit.
On the same day as the dismissal of PIMCO from the lawsuit, the New Jersey AG announced that it had reached a settlement agreement with the remaining defendants (“New Jersey Settlement”). In the New Jersey Settlement, ADAM, PAD and PEA agreed, while neither admitting nor denying the allegations or conclusions of law, to: (i) pay New Jersey a civil fine of $15 million and $3 million for investigative costs and further enforcement initiatives; and (ii) implement certain changes in corporate governance.
On May 6, 2004, the Securities and Exchange Commission filed a complaint in the U.S. District Court in the Southern District of New York alleging that PA Fund Management LLC (formerly known as PIMCO Advisors Fund Management LLC) (“PAFM”), PEA, PAD, Stephen J. Treadway (at the time, the chief executive officer of PAFM and PAD as well as chairman of the Board of Trustees of the MMS Funds) and Kenneth W. Corba (the former chief executive officer of PEA and former portfolio manager of the PEA Growth and PEA Growth & Income Funds) had, among other things, violated and/or aided and abetted violations of, various antifraud provisions of the federal securities laws in connection with alleged “market timing”
| | | | |
| June 30, 2004 | | Semi-Annual Report | | 17 |
Notes to Financial Statements (Cont.)
June 30, 2004 (Unaudited)
arrangements that improperly allowed certain hedge funds to engage in “market timing” in the PEA Growth Fund, the PEA Opportunity Fund, the PEA Innovation Fund, and the PEA Target Fund. The complaint seeks injunctive relief, disgorgement plus pre-judgment interest, monetary penalties, and an order permanently enjoining the defendants from serving as investment advisers, principal underwriters, officers, directors, or members of any advisory boards to any registered investment companies.
On February 20, 2004, a putative class action lawsuit was filed in the U.S. District Court for the District of New Jersey on behalf of certain shareholders of the PIMCO Funds against ADAM, PAD, PIMCO, PEA, the PIMS Funds, the MMS Funds, the Trust, PIMCO Commercial Mortgage Securities Trust, Inc. and certain other defendants, alleging that inappropriate market timing activity by certain shareholders caused financial injury to the shareholders of those Funds.
The following additional putative class action lawsuits have been filed against the PIMS Funds, the MMS Funds and/or their affiliates, each related to alleged market-timing activity in funds advised by PIMCO or its affiliates: (1) a lawsuit filed in the U.S. District Court for the District of Connecticut on February 27, 2004 (naming as defendants ADAM, PAD, PEA, the PIMS Funds, the MMS Funds, the Trust, PCM and certain other parties); (2) a lawsuit filed in the U.S. District Court for the Central District of California on March 4, 2004 (naming as defendants PIMCO, ADAM, PEA and PAD); (3) a lawsuit filed in the U.S. District Court for the Southern District of New York on March 8, 2004 (naming PIMCO, PAD and certain of their affiliates as defendants); (4) a lawsuit filed in the U.S. District Court for the Southern District of New York, on March 15, 2004 (naming PIMCO as the defendant); (5) two separate lawsuits filed in the U.S. District Court for the Central District of California on March 22, 2004, brought derivatively on behalf of the PIMCO High Yield Fund and the PIMCO Money Market Fund, respectively (each naming ADAM, PAFM and certain other parties as defendants, and the PIMCO Funds as the nominal defendant); (6) a lawsuit filed in the U.S. District Court for the Central District of California, also on March 22, 2004, brought derivatively on behalf of the PIMS Funds and the MMS Funds (naming ADAM, PIMCO, PAD and certain other parties as defendants, and the PIMS Funds and the MMS Funds as nominal defendants); (7) a lawsuit filed in the U.S. District Court for the District of New Jersey on April 20, 2004 (naming ADAM, PAD, the PIMS Funds and certain other parties as defendants); and (8) a lawsuit filed in the U.S. District Court for the Northern District of California on April 28, 2004 (naming ADAM, PIMCO, PAD, PEA and certain other parties as defendants, and the “PIMCO Funds” as nominal defendants). Each complaint for the foregoing putative class actions alleges, among other things, that inappropriate trading by shareholders engaged in market timing activities took place in certain of the funds advised by PIMCO, and each complaint seeks unspecified compensatory damages.
On February 17, 2004, a putative class action lawsuit was filed in the U.S. District Court for the District of Connecticut on behalf of certain shareholders of the PIMCO Funds against ADAM, PEA, PIMCO, PIMS Funds, MMS Funds and certain other defendants, alleging excessive investment advisory fees and the use of brokerage commissions to pay for distribution of fund shares. Three similar putative class action lawsuits were subsequently filed, each in the U.S. District Court for the District of Connecticut on March 1, 2004, April 23, 2004 and May 20, 2004, respectively.
Under Section 9(a) of the 1940 Act, if any of the various lawsuits were to result in a court injunction against PAFM, PEA, PAD, PIMCO, ADAM and/or Mr. Treadway, they and their affiliates would, in the absence of exemptive relief granted by the SEC, be barred from serving as an investment adviser/sub-adviser or principal underwriter for any registered investment company, including the Trust. ADAM and certain of its subsidiaries have responded to inquiries from the SEC concerning the status of the New Jersey Settlement under Section 9(a). If any of PAFM, PEA, PAD, PIMCO or ADAM were subject to an injunction, each of these entities and their affiliates could in turn seek exemptive relief from the SEC, as contemplated by the 1940 Act. There is no assurance, however, that such exemptive relief would be granted. The SEC also has the power by order to prohibit PAFM, PEA, PAD and PIMCO from serving as investment advisers and underwriters, if the SEC finds that such entities willfully violated the federal securities laws in connection with the allegations discussed above or aided or abetted such violations.
PIMCO, PAD and the Trust believe that these developments will not have a material adverse effect on the Portfolios or on PIMCO’s, or PAD’s ability to perform their respective investment advisory or distribution services on behalf of the Portfolios.
| | | | |
| 18 | | Semi-Annual Report | | June 30, 2004 |
Trustees and Officers
Brent R. Harris, Chairman and Trustee
R. Wesley Burns, President and Trustee
E. Philip Cannon, Trustee
Vern O. Curtis, Trustee
J. Michael Hagan, Trustee
William J. Popejoy, Trustee
Garlin G. Flynn, Secretary
John P. Hardaway, Treasurer
Investment Adviser and Administrator
Pacific Investment Management Company LLC
840 Newport Center Drive
Newport Beach, California 92660
Distributor
PA Distributors LLC
2187 Atlantic Street
Stamford, Connecticut 06902
Custodian
State Street Bank & Trust Company
801 Pennsylvania
Kansas City, Missouri 64105
Transfer Agent
Boston Financial Data Services–Midwest
330 W. 9th Street
Kansas City, Missouri 64105
Legal Counsel
Dechert LLP
1775 I Street, N.W.
Washington, D.C. 20006
Independent Registered Public Accounting Firm
PricewaterhouseCoopers LLP
1055 Broadway
Kansas City, Missouri 64105
Information about how the Fund voted proxies relating to portfolio securities held during the year July 1, 2003 through June 30, 2004 will be available no later than August 31, 2004 without charge, upon request, by calling the Trust at 1-800-927-4648 and on the SEC’s website at http://www.sec.gov.
Copies of the written Proxy Policy and the factors that PIMCO may consider in determining how to vote proxies for the Funds are available by calling the Trust at 1-800-927-4648 and on the SEC’s website at http://www.sec.gov.
PIMCO VARIABLE INSURANCE TRUST
840 NEWPORT CENTER DRIVE
NEWPORT BEACH, CA 92660
| | | | | | |
| | |
Item 2. | | Code of Ethics—Not applicable. | | |
| | |
Item 3. | | Audit Committee Financial Expert—Not applicable. | | |
| | |
Item 4. | | Principal Accountant Fees and Services—Not applicable. | | |
| |
Item 5. | | Audit Committee of Listed Registrants—Not applicable. |
| |
Item 6. | | Schedule of Investments—Not applicable. |
| |
Item 7. | | Disclosure of Proxy Voting Policies and Procedures for Closed-End Management Investment Companies—Not applicable. |
| |
Item 8. | | Purchases of Equity Securities by Closed-End Management Investment Company and Affiliated Purchases—Not applicable. |
| |
Item 9. | | Submission of Matters to a Vote of Security Holders—Not applicable. |
| |
Item 10. | | Controls and Procedures |
| | |
| | | (a) | | The principal executive officer and principal financial officer of PIMCO Variable Insurance Trust (“Trust”) have concluded that the Trust’s disclosure controls and procedures (as defined in Rule 30a-3(c) under the Investment Company Act) provide reasonable assurances that material information relating to the Trust is made known to them by the appropriate persons, based on their evaluation of these controls and procedures as of a date within 90 days of the filing of this report. |
| | |
| | | (b) | | There were no changes in the Trust’s internal control over financial reporting that occurred during the Trust’s most recent fiscal half-year that have materially affected, or are reasonably likely to materially affect, the Trust’s internal control over financial reporting. |
| | |
Item 11. | | Exhibits | | |
| | |
| | | (a)(1) | | Exhibit 99. CODE—Not applicable. |
| | |
| | | (a)(2) | | Exhibit 99.CERT—Certifications pursuant to Section 302 of the Sarbanes-Oxley Act of 2002. |
| | |
| | | (b) | | Exhibit 99.906CERT—Certifications pursuant to Section 906 of the Sarbanes-Oxley Act of 2002. |
Signatures
Pursuant to the requirements of the Securities Exchange Act of 1934 and the Investment Company Act of 1940, the registrant has duly caused this report to be signed on its behalf by the undersigned, thereunto duly authorized.
| | |
| PIMCO Variable Insurance Trust |
| |
By: | | /s/ R. WESLEY BURNS
|
| | | R. Wesley Burns |
| | | President, Principal Executive Officer |
| |
Date: | | September 7, 2004 |
Pursuant to the requirements of the Securities Exchange Act of 1934 and the Investment Company Act of 1940, this report has been signed below by the following persons on behalf of the registrant and in the capacities and on the dates indicated.
| | |
| |
By: | | /s/ R. WESLEY BURNS
|
| | | R. Wesley Burns |
| | | President, Principal Executive Officer |
| |
Date: | | September 7, 2004 |
| |
By: | | /s/ JOHN P. HARDAWAY
|
| | | John P. Hardaway |
| | | Treasurer, Principal Financial Officer |
| |
Date: | | September 7, 2004 |