UNITED STATES
SECURITIES AND EXCHANGE COMMISSION
Washington, D.C. 20549
FORM N-CSR
CERTIFIED SHAREHOLDER REPORT OF REGISTERED MANAGEMENT INVESTMENT COMPANIES
Investment Company Act file number: 811-08629
HARTFORD SERIES FUND, INC.
(Exact name of registrant as specified in charter)
690 Lee Road, Wayne, Pennsylvania 19087
(Address of Principal Executive Offices) (Zip Code)
Thomas R. Phillips, Esquire
Hartford Funds Management Company, LLC
690 Lee Road
Wayne, Pennsylvania 19087
(Name and Address of Agent for Service)
Copy to:
John V. O’Hanlon, Esquire
Dechert LLP
One International Place, 40th Floor
100 Oliver Street
Boston, Massachusetts 02110-2605
Registrant’s telephone number, including area code: (610) 386-4068
Date of fiscal year end: December 31
Date of reporting period: December 31, 2023
Form N-CSR is to be used by management investment companies to file reports with the Commission not later than 10 days after the transmission to stockholders of any report that is required to be transmitted to stockholders under Rule 30e-1 under the Investment Company Act of 1940 (17 CFR 270.30e-1). The Commission may use the information provided on Form N-CSR in its regulatory, disclosure review, inspection, and policymaking roles.
A registrant is required to disclose the information specified by Form N-CSR, and the Commission will make this information public. A registrant is not required to respond to the collection of information contained in Form N-CSR unless the Form displays a currently valid Office of Management and Budget (“OMB”) control number. Please direct comments concerning the accuracy of the information collection burden estimate and any suggestions for reducing the burden to Secretary, Securities and Exchange Commission, 100 F Street, NE, Washington, DC 20549-1090. The OMB has reviewed this collection of information under the clearance requirements of 44 U.S.C. § 3507.
Item 1. Reports to Stockholders.

Hartford HLS Funds
Annual Report
December 31, 2023
| ■ Hartford Balanced HLS Fund |
| ■ Hartford Capital Appreciation HLS Fund |
| ■ Hartford Disciplined Equity HLS Fund |
| ■ Hartford Dividend and Growth HLS Fund |
| ■ Hartford Healthcare HLS Fund |
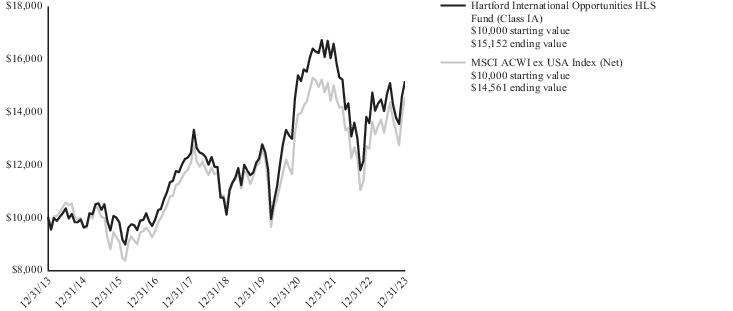
| ■ Hartford International Opportunities HLS Fund |
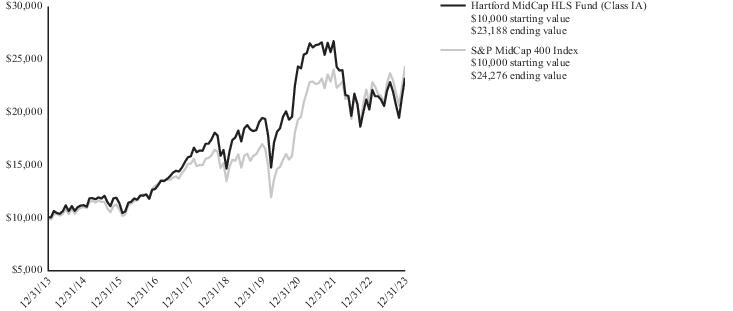
| ■ Hartford MidCap HLS Fund |
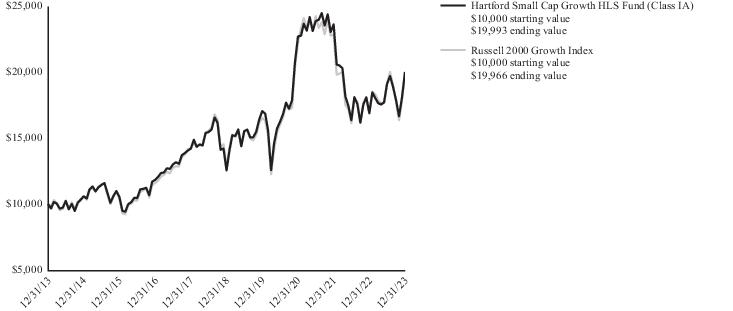
| ■ Hartford Small Cap Growth HLS Fund |
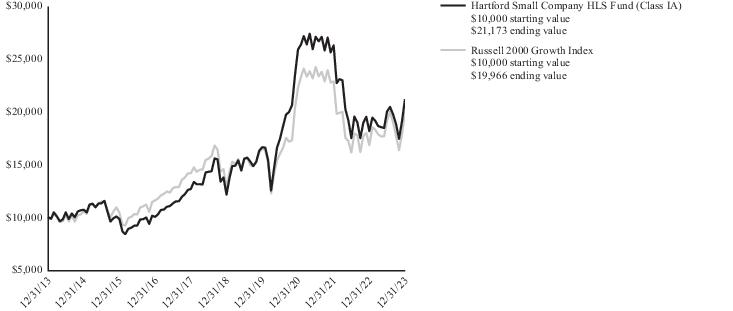
| ■ Hartford Small Company HLS Fund |
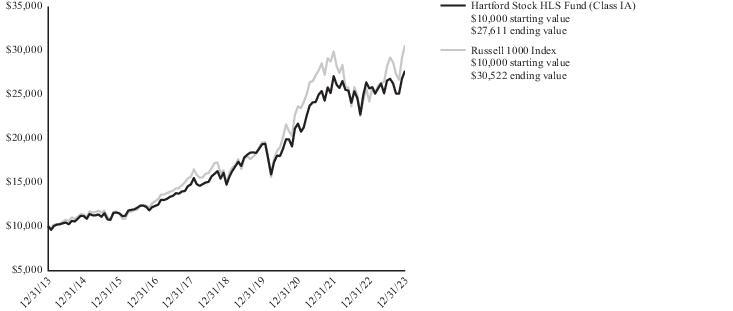
| ■ Hartford Stock HLS Fund |
| ■ Hartford Total Return Bond HLS Fund |
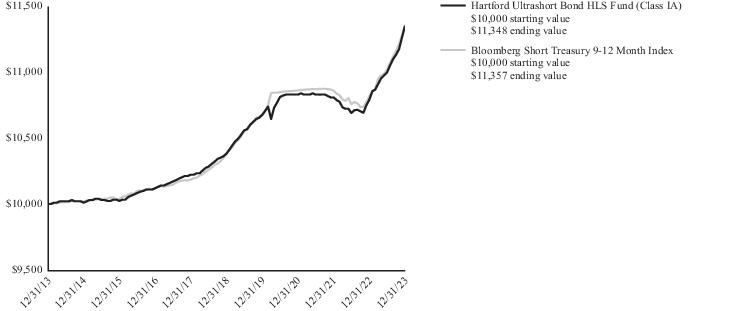
| ■ Hartford Ultrashort Bond HLS Fund |
A MESSAGE FROM THE PRESIDENT
Dear Shareholders
Thank you for investing in Hartford HLS Funds. The following is the Funds’ Annual Report covering the period from January 1, 2023 to December 31, 2023.
Market Review
During the 12 months ended December 31, 2023, U.S. stocks, as measured by the S&P 500 Index,1 gained 26.29%. While performance was strong during the period, it was a turbulent, up-and-down ride for investors almost from start to finish. For example, a January 2023 equity rally followed a surprise drop in the Consumer Price Index (CPI),2 briefly raising hopes for an early pivot by the Federal Reserve (Fed) on its interest-rate hiking strategy. Nonetheless, Fed Chair Jerome Powell quickly reaffirmed the central bank's higher-for-longer policy stance, triggering a February 2023 sell-off.
Similarly, a promising late-spring equity rally lost steam in the face of rising U.S. Treasury yields, sending stocks lower in mid-July 2023. But in mid-December 2023, when the Fed began signaling the possibility of rate cuts in 2024, stocks rose once again, right up until the end of the month. The push and pull between investor optimism versus the Fed's periodic declarations of policy resolve became something of a regular feature of market performance during the period.
The March 2023 banking crisis prompted by the collapse of Silicon Valley Bank and Signature Bank provided a major jolt to investor confidence as the impact of higher interest rates briefly raised the specter of U.S. financial instability. The Fed’s quick action to provide extra liquidity to the banking system, in combination with the balm of continued price moderation, went a long way in quelling fears of financial contagion.
Indeed, the June 2023 CPI report showed an annual inflation rate of only 3%, leaving the Fed with plenty of room to pause rate hikes in the same month. By November 2023, annual inflation was rising by 3.1%.
Yet another jolt to markets occurred in May 2023 as an unexpectedly positive forward-guidance report from chipmaker NVIDIA helped kick off a fresh equity rally, lifting the value of several growth-oriented companies linked to artificial-intelligence technology. The rally continued through July 2023 before finally cooling off amidst a sudden surge in U.S. Treasury yields. In mid-October 2023, the bellwether 10-Year Treasury note closed at 4.98% amid a growing sense that hoped-for interest-rate cuts would be delayed once more in the face of unexpected economic resilience.
By December 2023, continued progress on the inflation front prompted the Fed, once again, to pause rate hikes and, for the first time, to publicly declare the likelihood of interest-rate cuts sometime in 2024. Markets interpreted the Fed pivot as a signal to launch yet another equity rally, one that saw the S&P 500 Index close at 4,781.58 on December 27, 2023, only 15 points below its all-time high.
As of the end of the period, market participants found themselves closely reexamining the Federal Open Market Committee December 2023 meeting minutes for clues of future direction—mindful that any near-term resumption in inflation or even a hint of recession could change the timetable for rate cuts. With market volatility likely to persist, it’s more important than ever to maintain a strong relationship with your financial professional.
Thank you again for investing in Hartford HLS Funds. For the most up-to-date information on our funds, please take advantage of all the resources available at hartfordfunds.com.
James Davey
President
Hartford HLS Funds
| 1 | S&P 500 Index is a market capitalization-weighted price index composed of 500 widely held common stocks. Indices are unmanaged and not available
for direct investment. Past performance does not guarantee future results. |
| 2 | The Consumer Price Index (CPI) in the United States is defined by the Bureau of Labor Statistics as a measure of the average change over time in the prices
paid by urban consumers for a market basket of consumer goods and services. |
Table of Contents
The views expressed in each Fund’s Manager Discussion contained in the Fund Overview section are views of that Fund’s portfolio Manager(s) through the end of the period and are subject to change based on market and other conditions, and we disclaim any responsibility to update the views contained herein. These views may contain statements that are “forward-looking” statements. Actual results may differ materially from those projected in the “forward-looking” statements. Each Fund’s Manager Discussion is for informational purposes only and does not represent an offer, recommendation or solicitation to buy, hold or sell any security. The specific securities identified and described, if any, do not represent all of the securities purchased or sold and you should not assume that investments in the securities identified and discussed will be profitable. Holdings and characteristics are subject to change. Fund performance reflected in each Fund’s Manager Discussion reflects the returns of such Fund’s Class IA shares. Returns for such Fund’s other classes differ only to the extent that the classes do not have the same expenses.
Hartford Balanced HLS Fund
Fund Overview
December 31, 2023 (Unaudited)
Inception 03/31/1983
Sub-advised by Wellington Management Company LLP | Investment objective – The Fund seeks long-term total return. |
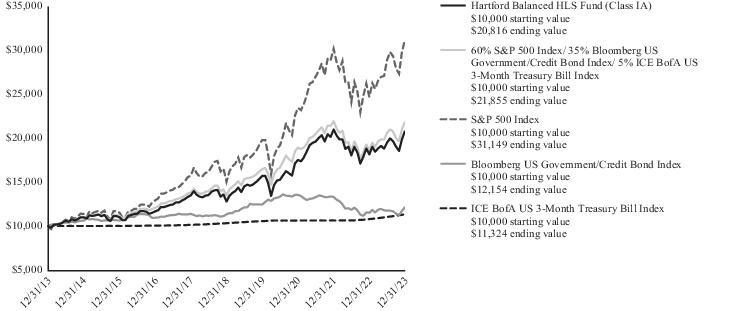
Comparison of Change in Value of $10,000 Investment (12/31/2013 - 12/31/2023)
The chart above represents the hypothetical growth of a $10,000 investment in Class IA shares. Returns for Class IB shares differ only to the extent that Class IA shares and Class IB shares do not have the same expenses.
| Average Annual Total Returns |
| for the Periods Ended 12/31/2023 |
| | 1 Year | 5 Years | 10 Years |
| Class IA | 14.78% | 10.26% | 7.61% |
| Class IB | 14.50% | 9.99% | 7.34% |
| 60% S&P 500 Index/ 35% Bloomberg US Government/Credit Bond Index/ 5% ICE BofA US 3-Month Treasury Bill Index1 | 17.75% | 10.16% | 8.13% |
| S&P 500 Index | 26.29% | 15.69% | 12.03% |
| Bloomberg US Government/Credit Bond Index | 5.72% | 1.41% | 1.97% |
| ICE BofA US 3-Month Treasury Bill Index | 5.01% | 1.88% | 1.25% |
| 1 | Calculated by Hartford Funds Management Company, LLC |
PERFORMANCE DATA QUOTED REPRESENTS PAST PERFORMANCE AND DOES NOT GUARANTEE FUTURE RESULTS. The investment return and principal value of the investment will fluctuate so that investors’ shares, when redeemed, may be worth more or less than their original cost. The chart and table do not reflect the deductions of taxes, sales charges or other fees which may be applied at the variable contract level or by a qualified pension or retirement plan. Any such additional sales charges or other fees or expenses would lower the contract’s or plan’s performance. Current performance may be lower or higher than the performance data quoted. To obtain performance data current to the most recent month-end, please visit our website hartfordfunds.com.
Total returns presented above were calculated using the applicable class' net asset value available to shareholders for sale or redemption of Fund shares on 12/31/2023, which may exclude investment transactions as of this date. All share class returns assume the reinvestment of all distributions at net asset value and the deduction of all fund expenses. The total returns presented in the Financial Highlights section of the report are calculated in the same manner, but also take into account certain adjustments that are necessary under generally accepted accounting principles. As a result, the total returns in the Financial Highlights section may differ from the total returns presented above.
You cannot invest directly in an index.
See "Benchmark Glossary" for benchmark descriptions.
Performance information may reflect expense waivers/reimbursements without which performance would have been lower.
As shown in the Fund’s current prospectus, the total annual fund operating expense ratios for Class IA shares and Class IB shares were 0.66% and 0.91%, respectively. Gross and net expenses are the same. Actual expenses may be higher or lower. Please see the accompanying Financial Highlights for expense ratios for the period ended 12/31/2023.
Class IA shares and Class IB shares of the Fund are closed to certain qualified pension and retirement plans. For more information, please see the Fund’s statutory prospectus.
Hartford Balanced HLS Fund
Fund Overview – (continued)
December 31, 2023 (Unaudited)
Portfolio Managers
Adam H. Illfelder, CFA
Senior Managing Director and Equity Portfolio Manager
Wellington Management Company LLP
Loren L. Moran, CFA
Senior Managing Director and Fixed Income Portfolio Manager
Wellington Management Company LLP
Matthew C. Hand, CFA
Senior Managing Director and Equity Portfolio Manager
Wellington Management Company LLP
Manager Discussion
How did the Fund perform during the period?
The Class IA shares of Hartford Balanced HLS Fund returned 14.78% for the twelve-month period ended December 31, 2023, underperforming the Fund’s custom benchmark, which is comprised of 60% S&P 500 Index/ 35% Bloomberg US Government/Credit Bond Index/ 5% ICE BofA US 3-Month Treasury Bill Index, which returned 17.75% for the same period. Individually, the S&P 500 Index, Bloomberg US Government/Credit Bond Index, and ICE BofA US 3-Month Treasury Bill Index returned 26.29%, 5.72%, and 5.01%, respectively, during the period. For the same period, the Class IA shares of the Fund also underperformed the 15.59% average return of the Lipper Mixed-Asset Target Allocation Growth Funds peer group, a group of funds that hold between 60%-80% in equity securities, with the remainder invested in bonds, cash, and cash equivalents.
Why did the Fund perform this way?
United States (U.S.) equities, as measured by the S&P 500 Index, rose during the twelve-month period ended on December 31, 2023 amid easing inflation, optimism for lower interest rates, strong performances in select mega-cap technology companies, and steady Gross Domestic Product (GDP) growth. U.S. equities advanced during the first quarter. The collapse of two U.S. regional banks prompted swift policy actions by federal regulators, which helped stabilize liquidity and stem the potential for broader contagion. Shares of large technology companies surged, helping growth stocks to significantly outperform their value counterparts. The U.S. Federal Reserve (Fed) slowed its pace of policy tightening, raising interest rates by 0.25% in February and March, to a range between 4.75% – 5%. U.S. equities rose again in the second quarter, largely driven by a potent rally in a narrow group of mega-cap technology companies that benefited from investor optimism about their earnings potential and growth prospects and exuberance surrounding generative artificial intelligence (AI). U.S. equities fell in the third quarter, pressured by rising Treasury yields amid views that the Fed would keep interest rates elevated for a prolonged period. Even as household budgets were strained by tightening credit conditions and lofty prices, markets dialed back the probability of recession as cooling inflation, a solid job market, and resilient consumer spending increased the potential that the U.S. economy could achieve a “soft landing.” Economic data released during the third quarter indicated healthy momentum in the
U.S. economy after GDP in the second quarter grew at a 2.1% annualized rate. U.S. equities registered their largest quarterly return in three years for the fourth quarter as gains broadened beyond those of the “Magnificent Seven” stocks that dominated the stock market’s performance for most of the year. A rapid descent in inflation prompted the Fed to pivot from its “higher-for-longer” policy stance in December, sending Treasury yields lower and driving stocks higher. The Fed’s Summary of Economic Projections implied that policymakers anticipate 75 basis points of interest-rate cuts in 2024.
During the twelve-month period, nine of the eleven sectors within the S&P 500 Index posted positive results, with the Information Technology (57.65%), Communication Services (55.80%), and Consumer Discretionary (42.23%) sectors performing the best. Conversely, the Utilities (-7.08%) and Energy (-1.33%) sectors performed the worst with negative returns.
Global fixed income sectors generated positive total returns during the trailing twelve months ended December 31, 2023 despite elevated interest rate volatility over most of the period. The Bloomberg US Aggregate Bond Index returned 5.53% during the period. Higher-yielding sectors generally performed best, benefiting from their coupon advantage, and spread tightening. Global sovereign debt yields ended mixed. Yields rose earlier in the period amid multiple rate increases from the Fed and other major central banks across Europe, while Asian central banks pursued more dovish approaches. Yields plunged by the end of the period in response to accommodative central bank policy expectations amid weaker economic data, including moderating inflation.
The underperformance of the equity portion of the Fund versus the S&P 500 Index was mainly driven by security selection during the period. Weak selection within the Information Technology, Consumer Discretionary, and Industrials sectors was partially offset by stronger selection in the Financials, Healthcare, and Real Estate sectors. Sector allocation, a result of our bottom-up stock selection process, also detracted from relative performance due to the Fund’s overweight position in the Healthcare sector, underweight position to the Information Technology sector, and overweight position to the Financials sector. This was partially offset by the Fund’s underweights to the Consumer Staples, Energy, and Utilities sectors.
Hartford Balanced HLS Fund
Fund Overview – (continued)
December 31, 2023 (Unaudited)
From a security selection perspective, within the equity portion of the Fund, not holding NVIDIA (Information Technology) and Meta Platforms (Communication Services), as well as an overweight position in Pfizer (Healthcare), were the top detractors from relative performance during the period. Not owning benchmark constituents NVIDIA or Meta Platforms weighed on relative performance as shares of both companies rose during the period. NVIDIA reported strong quarterly revenue over the period driven by data center demand on the growing need of chips for generative artificial intelligence and language learning models. Meta Platforms also reported strong quarterly results consecutively throughout the period. The company boosted its stock buyback authorization by $40 billion earlier in the period and went through layoffs as part of their cost cutting initiative which significantly benefited the company’s operating margin. Shares of Pfizer fell during the period. The company reported mixed results for their obesity and diabetes drugs study. Soft demand for Covid related products added further pressure to the company's shares.
Top contributors to relative performance within the equity portion of the Fund during the period included an overweight position in Salesforce (Information Technology), an out-of-benchmark position in Ares Management (Financials), as well as an overweight position in Alphabet (Communication Services). Shares of Salesforce rose as the company reported quarterly earnings which beat expectations consecutively. Strong demand, cost cutting measures including layoffs, and their price increase announcement all benefited the profitability outlook for the company. Shares of Ares Management rose during the period on the back of fundraising momentum, new commitments, and easing inflation in 2023. Shares of Alphabet rose during the period as quarterly earnings beat expectations consecutively. Revenue growth in the cloud computing unit, stabilizing ad demand, potential upside driven by AI, and cost management all contributed positively to the positive market sentiment.
The fixed-income portion of the Fund outperformed the Bloomberg US Government/Credit Bond Index during the period. Security selection within investment-grade corporate credit was the primary driver of relative outperformance, particularly within the Industrials, Financial Institutions, and Utilities sectors. An overweight to the Financial Institutions sector also contributed positively to relative returns. An underweight to the Industrials sector and an overweight to the Utilities sector detracted from performance over the period. Within non-corporate credit, an underweight to supranational bonds and security selection within taxable municipal bonds contributed positively to relative performance over the period. Additionally, out-of-benchmark allocations to commercial mortgage-backed securities (CMBS) had a positive impact on relative performance. Conversely, out-of-benchmark exposure to agency mortgage-backed securities (agency MBS) detracted from relative performance during the period. Asset backed securities (ABS) had a negligible impact on performance. Duration and yield curve positioning had a positive impact on relative performance over the period where credit spread duration positioning detracted from performance.
Derivatives were not used in a significant manner in the Fund during the period and did not have a material impact on performance during the period.
What is the outlook as of the end of the period?
In the equity allocation of the Fund, as of the end of the period, we continue to focus on seeking high-quality businesses that we believe have attractive valuation and capital returns. We take a balanced approach to portfolio construction—not leaning too heavily on any one scenario—and we always strive to upgrade the quality of the positions within the Fund. Within equities, the Fund ended the period with its largest overweight in the Financials sector and the largest underweight in the Consumer Staples sector.
In the fixed income portion of the Fund, we maintain a very modestly procyclical stance as of the end of the period. Markets enjoyed a substantial boost in the latter part of 2023 on the back of receding inflation data and dovish pivots from global central banks that drove a full embrace of expectations for a soft landing with modestly below trend growth, a gradual rise in unemployment and easing monetary policy to minimize the impact to the real economy. That said, we believe valuations for risk assets and lower yields have priced in much of this good news and we remain cognizant of the balance of risks around the real economy, monetary policy and geopolitics. In our view, the lagged impacts of a rapid tightening campaign are finally starting to show signs of slowing economic growth but have had a less pronounced impact on inflation than expected. Central banks remain in an uneasy position with resilient employment leads and inflation still above target and an unclear path toward achieving/sustaining 2% inflation. On balance, we are beginning to see early signs of weakening growth as consumer demand ebbs alongside the depletion of excess savings that support a softer landing.
Investment grade credit fundamentals remain strong but appear to have peaked and have shown some deterioration both in leverage and interest coverage, in our view. While financial conditions tightened meaningfully in 2022 and 2023, we believe the lagged impacts are still emerging. Corporate fundamentals have been more resilient than expected post the Silicon Valley Bank failure given the success of the Fed’s Bank Term Funding Program and substantial excess savings for the consumer. The Investment Grade cohort has maintained high-quality balance sheets and has been relatively insulated from rising rates given long term debt maturity profiles. We have seen a substantial change in issuance activity from corporates given higher rates as many issuers shy away from issuing longer duration debt. We believe this supply response, at a time where all in yields are attractive to many long duration buyers, has driven a substantial flattening in credit curves.
Our concerns around the economic cycle, coupled with relatively tight credit valuations, has pushed us to reduce the Fund’s exposure to cyclical issuers with less resilient cash flow generation profiles and highly levered balance sheets as of the end of the period. While headline index spreads have tightened to around the 25th percentile, we believe there is substantial variability underlying this cohort with the greatest value in the intermediate duration part of the market and within the financial sector. Despite higher all-in yields, we are most cautious on the long duration segment given weakening fundamentals and tight spreads that offer little cushion against widening. From a sector perspective, as of the end of the period, we maintained an overweight in the Utilities sector and some parts of insurance where valuations are attractive in our view. In non-corporate credit, as of the
Hartford Balanced HLS Fund
Fund Overview – (continued)
December 31, 2023 (Unaudited)
end of the period, we are positive on taxable municipals as we think the sector still provides diversification and comprises high-quality issuers that have benefited from fiscal support.
Important Risks
Investing involves risk, including the possible loss of principal. Security prices fluctuate in value depending on general market and economic conditions and the prospects of individual companies. • Fixed income security risks include credit, liquidity, call, duration, event, and interest-rate risk. As interest rates rise, bond prices generally fall. • Foreign investments may be more volatile and less liquid than U.S. investments and are subject to the risk of currency fluctuations and adverse political, economic and regulatory developments. • Obligations of U.S. Government agencies are supported by varying degrees of credit but are generally not backed by the full faith and credit of the U.S. Government. • Mortgage-related and asset-backed securities' risks include credit, interest-rate, prepayment, and extension risk. • To the extent the Fund focuses on one or more sectors, the Fund may be subject to increased volatility and risk of loss if adverse developments occur.
| Composition by Security Type(1) |
| as of 12/31/2023 |
| Category | Percentage of
Net Assets |
| Equity Securities | |
| Common Stocks | 66.0% |
| Fixed Income Securities | |
| Asset & Commercial Mortgage-Backed Securities | 1.4% |
| Corporate Bonds | 12.4 |
| Municipal Bonds | 0.8 |
| U.S. Government Agencies(2) | 0.8 |
| U.S. Government Securities | 17.8 |
| Total | 33.2% |
| Short-Term Investments | 0.3 |
| Other Assets & Liabilities | 0.5 |
| Total | 100.0% |
| (1) | For Fund compliance purposes, the Fund may not use the same classification system. These classifications are used for financial reporting purposes. |
| (2) | All, or a portion of the securities categorized as U.S. Government Agencies, were agency mortgage-backed securities as of December 31, 2023. |
Hartford Capital Appreciation HLS Fund
Fund Overview
December 31, 2023 (Unaudited)
Inception 04/02/1984
Sub-advised by Wellington Management Company LLP | Investment objective – The Fund seeks growth of capital. |
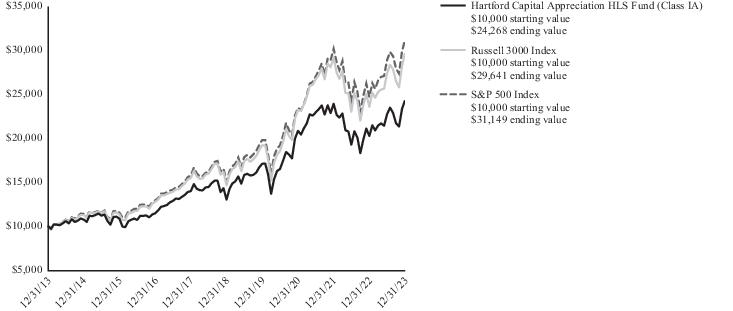
Comparison of Change in Value of $10,000 Investment (12/31/2013 - 12/31/2023)
The chart above represents the hypothetical growth of a $10,000 investment in Class IA shares. Returns for the Fund’s other classes differ only to the extent that the classes do not have the same expenses.
| Average Annual Total Returns |
| for the Periods Ended 12/31/2023 |
| | 1 Year | 5 Years | 10 Years |
| Class IA | 20.00% | 13.30% | 9.27% |
| Class IB | 19.70% | 13.02% | 9.00% |
| Class IC | 19.38% | 12.73% | 8.73% |
| Russell 3000 Index | 25.96% | 15.16% | 11.48% |
| S&P 500 Index | 26.29% | 15.69% | 12.03% |
PERFORMANCE DATA QUOTED REPRESENTS PAST PERFORMANCE AND DOES NOT GUARANTEE FUTURE RESULTS. The investment return and principal value of the investment will fluctuate so that investors’ shares, when redeemed, may be worth more or less than their original cost. The chart and table do not reflect the deductions of taxes, sales charges or other fees which may be applied at the variable contract level or by a qualified pension or retirement plan. Any such additional sales charges or other fees or expenses would lower the contract’s or plan’s performance. Current performance may be lower or higher than the performance data quoted. To obtain performance data current to the most recent month-end, please visit our website hartfordfunds.com.
Total returns presented above were calculated using the applicable class' net asset value available to shareholders for sale or redemption of Fund shares on 12/31/2023, which may exclude investment transactions as of this date. All share class returns assume the reinvestment of all distributions at net asset value and the deduction of all fund expenses. The total returns presented in the Financial Highlights section of the report are calculated in the same manner, but also take into account certain adjustments that are necessary under generally accepted accounting principles. As a result, the total returns in the Financial Highlights section may differ from the total returns presented above.
Class IC shares commenced operations on 04/30/2014. Class IC shares performance prior to that date reflects Class IA shares performance adjusted to reflect the 12b-1 fee of 0.25% and the administrative services fee of 0.25% applicable to Class IC shares. The performance after such date reflects actual Class IC shares performance.
You cannot invest directly in an index.
See "Benchmark Glossary" for benchmark descriptions.
As shown in the Fund’s current prospectus, the total annual fund operating expense ratios for Class IA shares, Class IB shares and Class IC shares were 0.67%, 0.92% and 1.17%, respectively. Gross and net expenses are the same. Actual expenses may be higher or lower. Please see the accompanying Financial Highlights for expense ratios for the period ended 12/31/2023.
Class IA shares and IB shares of the Fund are closed to certain qualified pension and retirement plans. For more information, please see the Fund’s statutory prospectus.
Hartford Capital Appreciation HLS Fund
Fund Overview – (continued)
December 31, 2023 (Unaudited)
Portfolio Managers
Gregg R. Thomas, CFA
Senior Managing Director and Director, Investment Strategy
Wellington Management Company LLP
Thomas S. Simon, CFA, FRM
Senior Managing Director and Portfolio Manager
Wellington Management Company LLP
Manager Discussion
How did the Fund perform during the period?
The Class IA shares of the Hartford Capital Appreciation HLS Fund returned 20.00% for the twelve-month period ended December 31, 2023, underperforming the Fund’s primary benchmark, the Russell 3000 Index, which returned 25.96% for the same period, and the Fund’s secondary benchmark, the S&P 500 Index, which returned 26.29% for the same period. For the same period, the Class IA shares of the Fund underperformed the 21.37% average return of the Lipper Multi-Cap Core Funds peer group, a group of funds with investment strategies similar to those of the Fund.
Why did the Fund perform this way?
United States (U.S.) equities, as measured by the Russell 3000 Index, posted positive results over the trailing twelve-month period ended December 31, 2023. U.S. equities advanced during the first quarter. The collapse of two U.S. regional banks prompted swift policy actions by federal regulators, which helped stabilize liquidity and stem the potential for broader contagion. Shares of large technology companies surged, helping growth stocks to significantly outperform their value counterparts. The U.S. Federal Reserve (Fed) slowed its pace of policy tightening, raising interest rates by 25 basis points (bps) in February and March, to a range between 4.75% – 5%.
U.S. equities rose again in the second quarter, largely driven by a potent rally in a narrow group of mega-cap technology companies that benefited from investor optimism about their earnings potential and growth prospects and exuberance surrounding generative artificial intelligence (AI). U.S. equities fell in the third quarter, pressured by rising Treasury yields amid views that the Fed would keep interest rates elevated for a prolonged period. Even as household budgets were strained by tightening credit conditions and lofty prices, markets dialed back the probability of recession as cooling inflation, a solid job market, and resilient consumer spending increased the potential that the U.S. economy could achieve a “soft landing.” Economic data released during the third quarter indicated healthy momentum in the U.S. economy after Gross Domestic Product in the second quarter grew at a surprisingly strong 2.1% annualized rate.
U.S. equities registered their largest quarterly return in three years for the fourth quarter as gains broadened beyond those of the “Magnificent Seven” stocks that dominated the stock market’s performance for most of the year. A rapid descent in inflation prompted the Fed to pivot from its “higher-for-longer” policy stance in
December, sending Treasury yields lower and driving stocks higher. The Fed’s Summary of Economic Projections implied that policymakers anticipate 75 bps of interest-rate cuts in 2024.
Returns varied by market cap during the period; mid-cap and small-cap equities, as measured by the S&P MidCap 400 Index and Russell 2000 Index, respectively, underperformed large-cap equities, as measured by the S&P 500 Index. Nine of eleven sectors in the Russell 3000 Index had positive returns during the period. The Information Technology (56.3%), Communication Services (53.1%), and Consumer Discretionary (40.0%) sectors were the top performers.
Security selection was the driver of the Fund’s underperformance relative to the Russell 3000 Index during the period. Weak stock selection in the Information Technology, Consumer Discretionary, and Industrials sectors was partially offset by stronger selection in the Energy, Communication Services, and Materials sectors during the period. Sector allocation, a residual of the bottom-up security selection process, also detracted from relative performance during the period. An underweight exposure to the Information Technology sector detracted most, while an underweight exposure to the Energy sector contributed positively to relative performance.
Style had a negative impact on relative performance during the period, driven by the Fund’s overweight exposure to what we view to be lower risk companies relative to the Russell 3000 Index. This was partially offset by the positive impact from the Fund’s overweight exposure to the most liquid names and its smaller cap footprint relative to the Russell 3000 Index.
The largest detractors from performance relative to the Russell 3000 Index during the period were underweight positions in Apple (Information Technology) and NVIDIA (Information Technology) along with an overweight position in Pfizer (Healthcare). Shares of iPhone maker Apple ended the period higher on the back of growing revenue in its Services and iPhones segments, with the iPhone install base reaching an all-time high early in the year. We increased the Fund’s exposure to Apple over the period but the Fund remained underweight relative to the benchmark. NVIDIA is a supplier of graphics processing units for PCs, workstations, gaming consoles, and mobile devices. Shares benefited from strong earnings over the period driven by surging demand for chips used in AI and learning language models. We maintain the Fund’s underweight position relative to the benchmark as of the end of the period. Pfizer is a U.S.-based pharmaceutical company. Shares fell over the period as declining demand for the company’s COVID-19 products weighed on its revenue outlook for the year. We reduced the Fund’s overweight position
Hartford Capital Appreciation HLS Fund
Fund Overview – (continued)
December 31, 2023 (Unaudited)
relative to the Russell 3000 Index during the period. Pfizer (Healthcare) and FMC (Materials) were the top detractors from absolute performance during the period.
The largest contributors to performance relative to the Russell 3000 Index over the period were not holding Exxon Mobil (Energy) or Chevron (Energy) as well as an overweight position in Meta Platforms (Communication Services). Exxon Mobil and Chevron are both American multinational oil and gas corporations. Shares of both companies declined over the year as oil prices fell amid concerns about global fuel demand. Oil production outside OPEC reached record levels. We continue to not hold Exxon Mobil or Chevron in the Fund as of the end of the period. Shares of U.S.-based social networking company Meta Platforms gained over the period as user engagement, bolstered by an improved AI powered recommendation engine, continued to exceed market expectations and top line acceleration and capital discipline have helped drive earnings growth. We maintained the Fund’s overweight position relative to the Russell 3000 Index as of the end of the period. Meta Platforms (Communication Services) and Microsoft (Information Technology) were the top contributors to absolute performance for the period.
During the period, the Fund, at times, used derivative instruments such as equity index futures to equitize cash or hedge market risk. During the period, the use of equity index futures contributed positively to performance relative to the Russell 3000 Index during the period.
What is the outlook as of the end of the period?
While equities rallied to finish out 2023, we believe the potential for downside risk remains as investors balance the impact a variety of macroeconomic uncertainties may have on equity markets. We expect volatility to persist as investors react to the ramifications of different central bank decisions across the globe, a challenging growth backdrop in China, and ever evolving geopolitical tensions. As allocators, we have a keen focus on risk management, and we seek to balance risks in the portfolio such that security selection drives results.
The Fund maintains structural exposures to sleeve managers that use a “quality” approach, a “value” approach, and a “growth” approach. We look to the sleeve managers’ stock selection skills to help navigate evolving markets and to seek to differentiate companies poised to perform well in this current market from those that may be more challenged. Within the growth universe, we remain wary of heightened speculative risks associated with longer duration growth stocks and rely on our sleeve managers to seek to find stocks with strong long-term fundamentals. Within the value universe, we continue to be mindful of exposure to companies with elevated risk of becoming insolvent. We look to the value sleeve managers' security selection processes to seek to identify attractively valued companies that we believe are more likely to benefit in the current market environment while avoiding those that are not. We seek to balance these allocations with exposure to the quality sleeve manager who looks to own stable businesses. We continue to be mindful of the possible impacts that persistently higher interest rates could have on historically stable business models. We seek to create a portfolio diversified across style and philosophies to help navigate through changing market environments.
At the end of the period, the Fund’s largest overweights were to the Industrials and Healthcare sectors, while the largest underweights were to the Information Technology and Consumer Discretionary sectors, relative to the Russell 3000 Index.
Important Risks
Investing involves risk, including the possible loss of principal. Security prices fluctuate in value depending on general market and economic conditions and the prospects of individual companies. The Fund's strategy for allocating assets among portfolio management teams may not work as intended. • Mid-cap securities can have greater risks and volatility than large-cap securities. • Foreign investments may be more volatile and less liquid than U.S. investments and are subject to the risk of currency fluctuations and adverse political, economic and regulatory developments. These risks are generally greater for investments in emerging markets. • To the extent the Fund focuses on one or more sectors, the Fund may be subject to increased volatility and risk of loss if adverse developments occur.
| Composition by Sector(1) |
| as of 12/31/2023 |
| Sector | Percentage
of Net Assets |
| Equity Securities | |
| Communication Services | 8.6% |
| Consumer Discretionary | 8.5 |
| Consumer Staples | 7.1 |
| Energy | 3.0 |
| Financials | 13.1 |
| Health Care | 14.9 |
| Industrials | 12.8 |
| Information Technology | 21.1 |
| Materials | 3.2 |
| Real Estate | 3.3 |
| Utilities | 2.3 |
| Total | 97.9% |
| Short-Term Investments | 0.9 |
| Other Assets & Liabilities | 1.2 |
| Total | 100.0% |
| (1) | A sector may be comprised of several industries. For Fund compliance purposes, the Fund may not use the same classification system. These sector classifications are used for financial reporting purposes. |
Hartford Disciplined Equity HLS Fund
Fund Overview
December 31, 2023 (Unaudited)
Inception 05/29/1998
Sub-advised by Wellington Management Company LLP | Investment objective – The Fund seeks growth of capital. |
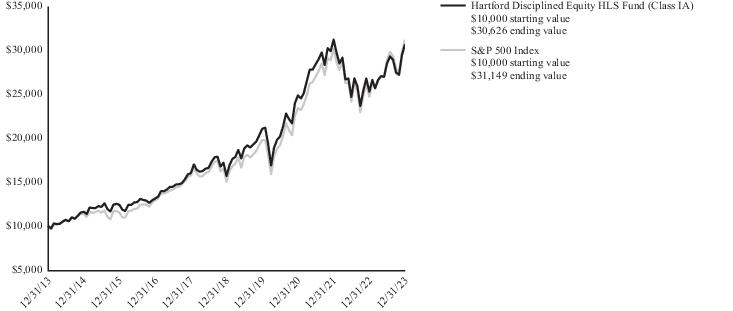
Comparison of Change in Value of $10,000 Investment (12/31/2013 - 12/31/2023)
The chart above represents the hypothetical growth of a $10,000 investment in Class IA shares. Returns for the Fund’s other classes differ only to the extent that the classes do not have the same expenses.
| Average Annual Total Returns |
| for the Periods Ended 12/31/2023 |
| | 1 Year | 5 Years | 10 Years |
| Class IA | 21.24% | 14.32% | 11.84% |
| Class IB | 20.95% | 14.03% | 11.56% |
| Class IC | 20.66% | 13.75% | 11.29% |
| S&P 500 Index | 26.29% | 15.69% | 12.03% |
PERFORMANCE DATA QUOTED REPRESENTS PAST PERFORMANCE AND DOES NOT GUARANTEE FUTURE RESULTS. The investment return and principal value of the investment will fluctuate so that investors’ shares, when redeemed, may be worth more or less than their original cost. The chart and table do not reflect the deductions of taxes, sales charges or other fees which may be applied at the variable contract level or by a qualified pension or retirement plan. Any such additional sales charges or other fees or expenses would lower the contract’s or plan’s performance. Current performance may be lower or higher than the performance data quoted. To obtain performance data current to the most recent month-end, please visit our website hartfordfunds.com.
Total returns presented above were calculated using the applicable class' net asset value available to shareholders for sale or redemption of Fund shares on 12/31/2023, which may exclude investment transactions as of this date. All share class returns assume the reinvestment of all distributions at net asset value and the deduction of all fund expenses. The total returns presented in the Financial Highlights section of the report are calculated in the same manner, but also take into account certain adjustments that are necessary under generally accepted accounting principles. As a result, the total returns in the Financial Highlights section may differ from the total returns presented above.
Class IC shares commenced operations on 09/18/2020. Class IC shares performance prior to that date reflects Class IA shares performance adjusted to reflect the 12b-1 fee of 0.25% and the administrative services fee of 0.25% applicable to Class IC shares. The performance after such date reflects actual Class IC shares performance.
You cannot invest directly in an index.
See "Benchmark Glossary" for benchmark descriptions.
As shown in the Fund’s current prospectus, the total annual fund operating expense ratios for Class IA shares, Class IB shares and Class IC shares were 0.59%, 0.84% and 1.09%, respectively. Gross and net expenses are the same. Actual expenses may be higher or lower. Please see the accompanying Financial Highlights for expense ratios for the period ended 12/31/2023.
Class IA shares and Class IB shares of the Fund are closed to certain qualified pension and retirement plans. For more information, please see the Fund’s statutory prospectus.
Hartford Disciplined Equity HLS Fund
Fund Overview – (continued)
December 31, 2023 (Unaudited)
Portfolio Managers
Mammen Chally, CFA*
Senior Managing Director and Equity Portfolio Manager
Wellington Management Company LLP
David A. Siegle, CFA
Managing Director and Equity Research Analyst
Wellington Management Company LLP
Douglas W. McLane, CFA
Senior Managing Director and Equity Portfolio Manager
Wellington Management Company LLP
| * | Mammen Chally, CFA announced his plan to retire and withdraw from the partnership of Wellington Management Company LLP's parent company, and effective June 30, 2024, he will no longer serve as a portfolio manager for the Fund. Mr. Chally’s portfolio management responsibilities will transition to Douglas W. McLane, CFA in the months leading up to his departure. |
Manager Discussion
How did the Fund perform during the period?
The Class IA shares of the Hartford Disciplined Equity HLS Fund returned 21.24% for the twelve-month period ended December 31, 2023, underperforming the Fund’s benchmark, the S&P 500 Index, which returned 26.29% for the same period. For the same period, the Class IA shares of the Fund underperformed the 24.34% average return of the Lipper Large-Cap Core Funds peer group, a group of funds with investment strategies similar to those of the Fund.
Why did the Fund perform this way?
United States (U.S.) equities, as measured by the S&P 500 Index, rose during the twelve-month period ended on December 31, 2023, amid easing inflation, optimism for lower interest rates, strong performances in select mega-cap technology companies, and steady Gross Domestic Product (GDP) growth. U.S. equities advanced during the first quarter. The collapse of two U.S. regional banks prompted swift policy actions by federal regulators, which helped stabilize liquidity and stem the potential for broader contagion. Shares of large technology companies surged, helping growth stocks to significantly outperform their value counterparts. The U.S. Federal Reserve (Fed) slowed its pace of policy tightening, raising interest rates by 25 basis points (bps) in February and March, to a range between 4.75% – 5%. U.S. equities rose again in the second quarter, largely driven by a potent rally in a narrow group of mega-cap technology companies that benefited from investor optimism about their earnings potential and growth prospects and exuberance surrounding generative artificial intelligence (AI). U.S. equities fell in the third quarter, pressured by rising Treasury yields amid views that the Fed would keep interest rates elevated for a prolonged period. Even as household budgets were strained by tightening credit conditions and lofty prices, markets dialed back the probability of recession as cooling inflation, a solid job market, and resilient consumer spending increased the potential that the U.S. economy could achieve a “soft landing.” Economic data released during the third quarter indicated healthy momentum in the U.S. economy after GDP in the second quarter grew at a 2.1% annualized rate. U.S. equities registered their largest quarterly return in three years for the fourth quarter as gains broadened beyond those
of the “Magnificent Seven” stocks that dominated the stock market’s performance for most of the year. A rapid descent in inflation prompted the Fed to pivot from its “higher-for-longer” policy stance in December, sending Treasury yields lower and driving stocks higher. The Fed’s Summary of Economic Projections implied that policymakers anticipate 75 bps of interest-rate cuts in 2024.
Returns varied by market-cap during the period, as large-cap stocks, as measured by the S&P 500 Index, outperformed mid-cap stocks, as measured by the S&P MidCap 400 Index, and small-cap stocks, as measured by the Russell 2000 Index. During the twelve-month period, nine out of eleven sectors within the S&P 500 Index rose, led by the Information Technology (58%), Communication Services (56%), and Consumer Discretionary (42%) sectors. Utilities was the bottom performing sector, down (-7%) during the period.
Security selection was the primary driver of relative underperformance during the period. Selection within the Information Technology, Industrials, and Consumer Discretionary sectors detracted most while selection within the Healthcare, Communication Services, and Real Estate sectors contributed positively. Sector allocation, which is a residual of the bottom-up security selection process, also detracted from relative performance during the period. The overweight allocations to the Healthcare and Consumer Staples sectors and an underweight allocation to the Communication Services sector detracted the most. This was partially offset by underweight allocations to the Energy, Materials, and Real Estate sectors.
Top detractors from benchmark-relative performance over the period were underweight positions in NVIDIA (Information Technology) and Tesla (Consumer Discretionary) and an overweight in Meta Platforms (Communication Services). Shares of NVIDIA rose over the period after the chipmaker provided second-quarter revenue and gross margin outlook sharply above estimates, driven by strong data center demand on the growing need of chips for generative AI and language learning models. At the end of May, the company became the first chipmaker to achieve a $1 trillion market valuation. Shares of Tesla ended the period higher. The company's Model Y was the number one selling vehicle globally in the first quarter, with unit volume climbing 69% year-over-year, becoming the first Electric Vehicle to claim that
Hartford Disciplined Equity HLS Fund
Fund Overview – (continued)
December 31, 2023 (Unaudited)
title. Additionally, during a meeting with Foreign Minister Qin Gang in Beijing, CEO Elon Musk said he was willing to expand his business in China. Shares of Meta Platforms rose over the period after the company reported consistently positive results that beat expectations. Most recently, Meta reported the third quarter revenue of $34.15 billion, up 23%, and net income more than doubling to $11.58 billion. The company had a 40% operating margin in the third quarter, a two-year high, which was largely due to cost cutting efforts through a reduction in workforce.
The largest contributors to benchmark-relative performance over the period were not owning Johnson & Johnson (Healthcare) and Exxon Mobil (Energy) and an overweight position in Palo Alto Networks (Information Technology). Shares of Johnson & Johnson fell during the period. The federal court voted against Johnson & Johnson’s attempt to use bankruptcy law via shell company LTL Management to transfer accountability for lawsuits related to their talc-based products. Johnson & Johnson now faces liabilities for over 38,000 lawsuits alleging that the company failed to warn consumers about cancer risks associated with these products. Shares of Exxon Mobil fell after a volatile year. The company fell as oil prices decreased on the back of have a negative view of sentiment that has taken over due to worries that the market is oversupplied from record oil production outside OPEC, notably the U.S. producing at a record pace. The company also reported third quarter 2023 earnings that saw earnings per share (EPS) and revenue miss consensus estimates while later announcing a target annual project spend of $22 – $27 billion through 2027. Shares of cybersecurity company Palo Alto Networks rose after revenue and earnings for the fiscal second quarter beat consensus estimates, driven by strength in the Product business. Management raised EPS guidance for fiscal year 2023 above the expected range.
Derivatives were not used in the Fund during the period.
What is the outlook as of the end of the period?
With increasingly dovish commentary and an updated Fed "dot plot" indicating several rate cuts in 2024, we believe the U.S. market has now fully embraced that the dramatic rate cycle which began in March 2022 has come to an end. There has been constructive evidence that inflationary trends are in fact moving downward towards the Fed's stated goal of 2%, yet what remains to be seen is the precise onset, cadence, and true depth of how interest rate cuts will be enacted. We believe any disappointment in the degree or timing of rate cuts could leave increasingly expectant markets susceptible to short-term weakness.
In our view, labor markets have remained resilient and continue to underpin the U.S. economy, and unemployment levels have not risen to the higher levels many expected would be required for the Federal Open Market Committee (FOMC) to reach its inflationary target. We believe that job security and employment prospects continue to provide confidence to the U.S. consumer, yet incremental challenges from rising student loan obligations, increased credit utilization at still-high rates and the complete drawdown of "excess savings" from all but the higher-end cohorts does remove some of the support that the U.S. consumer carried through last year.
An easing in the cost of capital for companies and consumers alike may be constructive for the U.S. economy and could lead to an improved housing market, increased merger and acquisition activity, and increasing levels of investment which we believe may benefit more rate-sensitive sectors, including the Financials sector. Further, we believe robust and continued innovation within the Technology sector promises to provide opportunities for driving productivity within the U.S. workforce as companies continue to explore the burgeoning capabilities that AI promises to bring.
In our view, 2024 will also bring pivotal elections in both Congress and the Executive branch that have important ramifications for the direction of markets. Given 2023 will have seen the U.S. government generate a budget deficit at close to 8% of GDP, the largest of any developed nation and well above the 3.7% level in 2022, the expected debate over fiscal restraint will be an important outcome for this market.
At the end of the period, the Fund’s largest overweights were to the Healthcare, Utilities, and Financials sectors, while the largest underweights were to the Industrials, Materials, and Real Estate sectors, relative to the benchmark.
Important Risks
Investing involves risk, including the possible loss of principal. Security prices fluctuate in value depending on general market and economic conditions and the prospects of individual companies.
| Composition by Sector(1) |
| as of 12/31/2023 |
| Sector | Percentage
of Net Assets |
| Equity Securities | |
| Communication Services | 9.0% |
| Consumer Discretionary | 10.6 |
| Consumer Staples | 5.5 |
| Energy | 3.5 |
| Financials | 13.6 |
| Health Care | 14.6 |
| Industrials | 7.5 |
| Information Technology | 28.4 |
| Materials | 1.5 |
| Real Estate | 1.7 |
| Utilities | 3.2 |
| Total | 99.1% |
| Short-Term Investments | 0.1 |
| Other Assets & Liabilities | 0.8 |
| Total | 100.0% |
| (1) | A sector may be comprised of several industries. For Fund compliance purposes, the Fund may not use the same classification system. These sector classifications are used for financial reporting purposes. |
Hartford Dividend and Growth HLS Fund
Fund Overview
December 31, 2023 (Unaudited)
Inception 03/09/1994
Sub-advised by Wellington Management Company LLP | Investment objective – The Fund seeks a high level of current income consistent with growth of capital. |
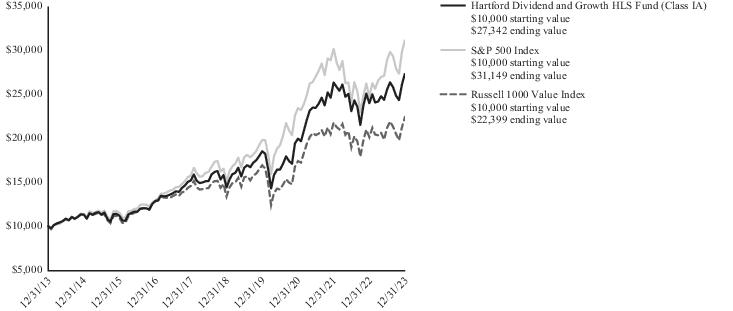
Comparison of Change in Value of $10,000 Investment (12/31/2013 - 12/31/2023)
The chart above represents the hypothetical growth of a $10,000 investment in Class IA shares. Returns for Class IB shares differ only to the extent that Class IA shares and Class IB shares do not have the same expenses.
| Average Annual Total Returns |
| for the Periods Ended 12/31/2023 |
| | 1 Year | 5 Years | 10 Years |
| Class IA | 14.18% | 13.72% | 10.58% |
| Class IB | 13.89% | 13.44% | 10.31% |
| S&P 500 Index | 26.29% | 15.69% | 12.03% |
| Russell 1000 Value Index | 11.46% | 10.91% | 8.40% |
PERFORMANCE DATA QUOTED REPRESENTS PAST PERFORMANCE AND DOES NOT GUARANTEE FUTURE RESULTS. The investment return and principal value of the investment will fluctuate so that investors’ shares, when redeemed, may be worth more or less than their original cost. The chart and table do not reflect the deductions of taxes, sales charges or other fees which may be applied at the variable contract level or by a qualified pension or retirement plan. Any such additional sales charges or other fees or expenses would lower the contract’s or plan’s performance. Current performance may be lower or higher than the performance data quoted. To obtain performance data current to the most recent month-end, please visit our website hartfordfunds.com.
Total returns presented above were calculated using the applicable class' net asset value available to shareholders for sale or redemption of Fund shares on 12/31/2023, which may exclude investment transactions as of this date. All share class returns assume the reinvestment of all distributions at net asset value and the deduction of all fund expenses. The total returns presented in the Financial Highlights section of the report are calculated in the same manner, but also take into account certain adjustments that are necessary under generally accepted accounting principles. As a result, the total returns in the Financial Highlights section may differ from the total returns presented above.
You cannot invest directly in an index.
See "Benchmark Glossary" for benchmark descriptions.
As shown in the Fund’s current prospectus, the total annual fund operating expense ratios for Class IA shares and Class IB shares were 0.65% and 0.90%, respectively. Gross and net expenses are the same. Actual expenses may be higher or lower. Please see the accompanying Financial Highlights for expense ratios for the period ended 12/31/2023.
Class IA shares and Class IB shares of the Fund are closed to certain qualified pension and retirement plans. For more information, please see the Fund’s statutory prospectus.
Hartford Dividend and Growth HLS Fund
Fund Overview – (continued)
December 31, 2023 (Unaudited)
Portfolio Managers
Matthew G. Baker
Senior Managing Director and Equity Portfolio Manager
Wellington Management Company LLP
Nataliya Kofman
Senior Managing Director and Equity Portfolio Manager
Wellington Management Company LLP
Brian J. Schmeer, CFA
Vice President and Equity Research Analyst
Wellington Management Company LLP
Manager Discussion
How did the Fund perform during the period?
The Class IA shares of the Hartford Dividend and Growth HLS Fund returned 14.18% for the twelve-month period ended December 31, 2023, underperforming the Fund’s primary benchmark, the S&P 500 Index, which returned 26.29% for the same period, and outperforming the Fund’s secondary benchmark, the Russell 1000 Value Index, which returned 11.46% for the same period. For the same period, the Class IA shares of the Fund outperformed the 11.40% average return of the Lipper Equity Income Funds peer group, a group of funds with investment strategies similar to those of the Fund.
Why did the Fund perform this way?
United States (U.S.) equities, as measured by the S&P 500 Index, rose during the twelve-month period ended on December 31, 2023, amid easing inflation, optimism for lower interest rates, strong performances in select mega-cap technology companies, and steady Gross Domestic Product (GDP) growth. U.S. equities advanced during the first quarter. The collapse of two U.S. regional banks prompted swift policy actions by federal regulators, which helped stabilize liquidity and stem the potential for broader contagion. Shares of large technology companies surged, helping growth stocks to significantly outperform their value counterparts. The U.S. Federal Reserve (Fed) slowed its pace of policy tightening, raising interest rates by 25 basis points (bps) in February and March, to a range between 4.75% – 5%. In the second quarter, U.S. equities rose again largely driven by a potent rally in a narrow group of mega-cap technology companies that benefited from investor optimism about their earnings potential and growth prospects and exuberance surrounding generative artificial intelligence (AI). U.S. equities fell in the third quarter, pressured by rising Treasury yields amid views that the Fed would keep interest rates elevated for a prolonged period. Even as household budgets were strained by tightening credit conditions and lofty prices, markets dialed back the probability of recession as cooling inflation, a solid job market, and resilient consumer spending increased the potential that the U.S. economy could achieve a “soft landing.” Economic data released during the third quarter indicated healthy momentum in the U.S. economy after GDP in the second quarter grew at a surprisingly strong 2.1% annualized rate.
U.S. equities registered their largest quarterly return in three years for the fourth quarter as gains broadened beyond those of the “Magnificent Seven” stocks that dominated the stock market’s performance for most of the year. A rapid descent in inflation prompted the Fed to pivot from its “higher-for-longer” policy stance in December, sending Treasury yields lower and driving stocks higher. The Fed’s Summary of Economic Projections implied that policymakers anticipate 75 bps of interest-rate cuts in 2024.
Returns varied by market cap during the period, as large-cap stocks, as measured by the S&P 500 Index, outperformed small-cap and mid-cap stocks, as measured by the Russell 2000 Index and S&P MidCap 400 Index, respectively. During the twelve-month period, nine out of eleven sectors within the S&P 500 Index rose, led by the Information Technology (58%), Communication Services (56%), and Consumer Discretionary (42%) sectors. Conversely, Energy (-1%) and Utilities (-7%) were the lone sectors with negative performance.
Sector allocation, a result of our bottom-up stock selection process, was the primary driver of the Fund’s underperformance relative to the S&P 500 Index over the period. Underweight allocations to the Information Technology, Consumer Discretionary, and an overweight allocation to the Utilities sectors detracted the most from relative performance but was marginally offset by an overweight allocation to the Communication Services sector. Security selection also detracted from relative returns during the period. Selection within the Information Technology, Healthcare, and Consumer Discretionary sectors contributed negatively while selection within the Energy and Utilities sectors contributed positively.
Top detractors from performance relative to the S&P 500 Index over the period included lack of exposure to benchmark constituents NVIDIA (Information Technology), Meta Platforms (Communication Services), and Amazon.com (Consumer Discretionary). Shares of NVIDIA surged over the period after the chipmaker provided third-quarter revenue forecast above expectations, indicating that demand for chips used in AI computing remains robust. The company also reported second-quarter revenue and gross margin outlook sharply above estimates, driven by strong data center demand on the growing need of chips for generative AI and language learning models. At the end of May, the company became the first chipmaker to achieve a $1 trillion market valuation. Shares of Meta Platforms rose over the period. The company reported better-than-forecast revenue
Hartford Dividend and Growth HLS Fund
Fund Overview – (continued)
December 31, 2023 (Unaudited)
for the fourth quarter and boosted its stock buyback authorization by $40 billion. Strong full year results were buoyed by a rebound in online advertising and cost cutting. Shares of Amazon.com ended the period higher. Ongoing demand for AI is expected to benefit Amazon Web Services and increase demand for its cloud computing platforms. The e-commerce giant reported third quarter results that beat consensus estimates as revenue rose 13% compared to the prior quarter. The company saw sales growth within its Amazon Web Services (AWS) business as well as its third-party seller services and advertising units.
The Fund’s top contributors to performance relative to S&P 500 Index during the period were an overweight position in Alphabet (Communication Services), and lack of exposure to benchmark constituents Johnson & Johnson (Healthcare) and Exxon Mobil (Energy). Shares of Alphabet rose over the period on the back of the company’s moves in the rapidly expanding AI arena, like integrating generative AI results directly on top of Alphabet’s search results, and the incorporation of generative AI capabilities across its product suite. Quarterly results also topped consensus estimates due to revenue growth in the Search and Alphabet Cloud segments. Shares of Johnson & Johnson fell over the period. Shares were pressured by the announcement of slow production of COVID-19 vaccines due to weakening demand as well as mixed quarterly-earnings results that showed declining sales driven by waning COVID-19 vaccines and foreign exchange (FX) challenges. Additionally, costs related to the company’s spin-off of its consumer-health business as well as ongoing talc litigations remained an overhang. Shares of Exxon Mobil fell as oil prices decreased on the back of have a negative view of sentiment that has taken over due to worries that the market is oversupplied from record oil production outside OPEC, notably the U.S. producing at a record pace. The company also reported third quarter 2023 earnings that saw earnings per share and revenue miss consensus estimates.
The Fund did not utilize derivatives during the period.
What is the outlook as of the end of the period?
U.S. equities rallied to end the year. Broad gains were driven by declining yields and expectations for interest rate cuts in 2024. While we see a path for the Fed to cease rate increases, we believe the magnitude of rate cuts forecast for 2024 is likely too high. Despite an improving inflation environment, persistent labor market tightness and wage growth seem inconsistent with the expectation for a continual moderation in inflation in our view. Currently, we are not ruling out the potential for an inflation reacceleration in the latter half of the year.
Given the current wide range of outcomes, we remain focused on seeking to find companies with consistent pricing power, strong balance sheets, and sustainable and growing cash flows trading at attractive valuations. As of the end of the period, we remain cautious on valuation. We continue to believe that opportunistically investing in out of favor growth and cyclical names with positive risk/reward skews may provide upside potential while maintaining an overweight to more defensive segments (e.g., insurance, Healthcare services, consumer defensive) may provide the opportunity for upside participation while potentially insulating the portfolio from valuation-driven corrections.
Important Risks
Investing involves risk, including the possible loss of principal. Security prices fluctuate in value depending on general market and economic conditions and the prospects of individual companies. • For dividend-paying stocks, dividends are not guaranteed and may decrease without notice. • Different investment styles may go in and out of favor, which may cause the Fund to underperform the broader stock market. • Foreign investments may be more volatile and less liquid than U.S. investments and are subject to the risk of currency fluctuations and adverse political, economic and regulatory developments. • To the extent the Fund focuses on one or more sectors, the Fund may be subject to increased volatility and risk of loss if adverse developments occur. • Integration of environmental, social, and/or governance (ESG) characteristics into the investment process may not work as intended.
| Composition by Sector(1) |
| as of 12/31/2023 |
| Sector | Percentage
of Net Assets |
| Equity Securities | |
| Communication Services | 9.2% |
| Consumer Discretionary | 3.2 |
| Consumer Staples | 6.6 |
| Energy | 7.5 |
| Financials | 16.7 |
| Health Care | 14.7 |
| Industrials | 7.5 |
| Information Technology | 19.6 |
| Materials | 4.7 |
| Real Estate | 3.3 |
| Utilities | 5.3 |
| Total | 98.3% |
| Short-Term Investments | 0.8 |
| Other Assets & Liabilities | 0.9 |
| Total | 100.0% |
| (1) | A sector may be comprised of several industries. For Fund compliance purposes, the Fund may not use the same classification system. These sector classifications are used for financial reporting purposes. |
Hartford Healthcare HLS Fund
Fund Overview
December 31, 2023 (Unaudited)
Inception 05/01/2000
Sub-advised by Wellington Management Company LLP | Investment objective – The Fund seeks long-term capital appreciation. |
Comparison of Change in Value of $10,000 Investment (12/31/2013 - 12/31/2023)
The chart above represents the hypothetical growth of a $10,000 investment in Class IA shares. Returns for Class IB shares differ only to the extent that Class IA shares and Class IB shares do not have the same expenses.
| Average Annual Total Returns |
| for the Periods Ended 12/31/2023 |
| | 1 Year | 5 Years | 10 Years |
| Class IA | 4.11% | 10.88% | 10.18% |
| Class IB | 3.81% | 10.61% | 9.89% |
| S&P Composite 1500 Health Care Index | 1.92% | 11.24% | 11.32% |
| S&P 500 Index | 26.29% | 15.69% | 12.03% |
PERFORMANCE DATA QUOTED REPRESENTS PAST PERFORMANCE AND DOES NOT GUARANTEE FUTURE RESULTS. The investment return and principal value of the investment will fluctuate so that investors’ shares, when redeemed, may be worth more or less than their original cost. The chart and table do not reflect the deductions of taxes, sales charges or other fees which may be applied at the variable contract level or by a qualified pension or retirement plan. Any such additional sales charges or other fees or expenses would lower the contract’s or plan’s performance. Current performance may be lower or higher than the performance data quoted. To obtain performance data current to the most recent month-end, please visit our website hartfordfunds.com.
Total returns presented above were calculated using the applicable class' net asset value available to shareholders for sale or redemption of Fund shares on 12/31/2023, which may exclude investment transactions as of this date. All share class returns assume the reinvestment of all distributions at net asset value and the deduction of all fund expenses. The total returns presented in the Financial Highlights section of the report are calculated in the same manner, but also take into account certain adjustments that are necessary under generally accepted accounting principles. As a result, the total returns in the Financial Highlights section may differ from the total returns presented above.
You cannot invest directly in an index.
See "Benchmark Glossary" for benchmark descriptions.
As shown in the Fund’s current prospectus, the total annual fund operating expense ratios for Class IA shares and Class IB shares were 0.91% and 1.16%, respectively. Gross and net expenses are the same. Actual expenses may be higher or lower. Please see the accompanying Financial Highlights for expense ratios for the period ended 12/31/2023.
Class IA shares and Class IB shares of the Fund are closed to certain qualified pension and retirement plans. For more information, please see the Fund’s statutory prospectus.
Hartford Healthcare HLS Fund
Fund Overview – (continued)
December 31, 2023 (Unaudited)
Portfolio Managers
Rebecca D. Sykes, CFA
Senior Managing Director and Global Industry Analyst
Wellington Management Company LLP
Wen Shi, PhD, CFA
Managing Director and Global Industry Analyst
Wellington Management Company LLP
David M. Khtikian, CFA
Managing Director and Global Industry Analyst
Wellington Management Company LLP
Fayyaz Mujtaba
Managing Director and Global Industry Analyst
Wellington Management Company LLP
Manager Discussion
How did the Fund perform during the period?
The Class IA shares of Hartford Healthcare HLS Fund returned 4.11% for the twelve-month period ended December 31, 2023, outperforming the S&P Composite 1500 Health Care Index, which returned 1.92% for the same period, while underperforming the S&P 500 Index, which returned 26.29% for the same period. For the same period, the Class IA shares of the Fund underperformed the 4.89% average return of the Lipper Global Health and Biotechnology peer group, a group of funds with investment strategies similar to those of the Fund.
Why did the Fund perform this way?
United States (U.S.) healthcare equities returned 1.92% for the period as measured by the S&P Composite 1500 Health Care Index, underperforming both the broader U.S. equity market, which returned 26.29% as measured by the S&P 500 Index, and the global equity market, which returned 24.42% during the period, as measured by the MSCI World Index. Within the S&P Composite 1500 Health Care Index, medical technology returned 4%, large-cap biopharma returned 2%, healthcare services returned 1%, mid-cap biopharma returned -8%, and small-cap biopharma returned -15% during the period.
The Fund outperformed the S&P Composite 1500 Health Care Index over the period, which was due primarily to favorable security selection decisions. Security selection was strongest in large-cap biopharma, mid-cap biopharma, and small-cap biopharma, while selection in medical technology was weakest. Sector allocation detracted from the Fund’s performance relative to the S&P Composite 1500 Health Care Index. The Fund’s overweight to mid-cap biopharma and small-cap biopharma detracted from relative performance during the period. This was partially offset by positive results from an overweight to healthcare services.
Johnson & Johnson (large-cap biopharma), Bristol-Myers Squibb (large-cap biopharma), and Seagen (large-cap biopharma) were the top contributors to performance relative to the S&P Composite 1500 Health Care Index over the period. Not holding a position in Johnson & Johnson, a constituent of the S&P Composite 1500 Health Care
Index, contributed positively to relative performance, as shares were pressured by multiple challenges over the year, including slowing demand for COVID-19 vaccines, costs related to the company’s spin-off of its consumer-health business, ongoing overhang from talc litigations, IRA drug price negotiations, and patent cliff challenges. An underweight to Bristol-Myers Squibb contributed positively to relative performance, as shares declined during the period. The company continued to suffer from patent cliff challenges. Bristol-Myers Squibb reported third quarter revenue decreased 2% year-over-year driven by multiple myeloma drug Revlimid. Globally, Revlimid sales fell 41% largely due to generic erosion. Six out of eight launch products missed revenue expectations and management downgraded mid-term launch product sales guidance. Shares of Seagen rose during the period on news that Pfizer would acquire the company at a premium of $229 per share for a total value of $43 billion. The acquisition was completed in December. Eli Lilly, Vertex Pharmaceuticals, and Zoetis were the top absolute contributors to the Fund’s performance during the period.
Intuitive Surgical (medical technology), AdaptHealth (healthcare services), and Aclaris Therapeutics (small-cap biopharma) detracted from results relative to the S&P Composite 1500 Health Care Index over the period. Not owning Intuitive Surgical detracted from relative performance as shares rose on the back of strong first quarter 2023 revenues driven by higher-than-expected procedure growth. Management raised procedure growth guidance for the full year and provided an improved outlook given the expectation of a return to normal utilization trend as patients return to healthcare providers post the COVID-19 pandemic. Shares of AdaptHealth fell after the company reported fourth quarter 2022 results showing weaker than expected earnings and revenues. Management of AdaptHealth cited larger impacts from revenue mix and cost pressures than previously expected and ultimately lowered its revenue outlook for 2023. We subsequently eliminated the position in the Fund. Shares of Aclaris Therapeutics fell during the period, most recently as the company announced disappointing top-line results from its Phase 2b study of oral MK2 inhibitor zunsemetinib for the treatment of rheumatoid arthritis. The results did not meet the primary endpoint of an ACR20 response after 12 weeks nor did they meet the secondary endpoints of
Hartford Healthcare HLS Fund
Fund Overview – (continued)
December 31, 2023 (Unaudited)
ACR50 response, ACR70 response or DAS28-CRP. The trial will now be discontinued. Top detractors from absolute performance included Pfizer, Illumina, and AdaptHealth.
Derivatives were not used in the Fund during the period.
What is the outlook as of the end of the period?
As of the end of the period, we have a positive outlook across the Healthcare opportunity set. We believe groundbreaking innovation, supportive valuations and business models positioned to show resilience through the cycle may benefit long-term investors in the sector.
Biopharma remains a rich environment for innovation in our view. We are excited about developments in GLP-1 and next generation metabolic medicines, ADCs for cancer treatment, and various forms of genetic medicines. We remain selective in large-cap biopharma, where regulatory challenges (patent cliffs, IRA) affect companies inequitably. We believe small and mid-cap biopharma companies remain well positioned as sources of innovation and potential solutions to pipeline gaps for larger companies. Market sentiment may continue to improve with a more supportive interest rate backdrop and increasing merger and acquisition activity in our view. In the U.S., we continue to watch next steps in Inflation Reduction Act policy implementation, but we believe valuations remain attractive and recent clinical readouts continue to support robust growth assumptions for major indications.
We believe medical technology innovation has never been stronger due to advancements in technology development, engineering capabilities and integrated informatics. We believe recent volatility and disruption across the subsector have created new investment opportunity, particularly across many small and mid-cap companies and life science tools companies, where valuations look attractive. Many stocks hit by GLP-1 fears last year saw a modest recovery in the fourth quarter; we continue to monitor these stocks and anticipate incremental opportunity to invest behind market mispricing in the future.
We believe healthcare services companies remain well-positioned to help solve the societal challenge of rising healthcare costs, and some may benefit from the ongoing transition from a fee-for-service to a fee-for-value care system. We believe managed care remains attractive in light of better clarity on cost and Medicaid reenrollment trends. Broadly, we favor companies focused on improving patient outcomes while reining in costs.
Important Risks
Investing involves risk, including the possible loss of principal. Security prices fluctuate in value depending on general market and economic conditions and the prospects of individual companies. • Risks of focusing investments on the healthcare related sector include regulatory and legal developments, changes in funding or subsidies, patent and intellectual property considerations, intense competitive pressures, rapid technological changes, long and costly process for obtaining product approval by government agencies, potential product obsolescence, rising cost of medical products and services, and price volatility risk. • Small- and mid-cap securities can have greater risks and volatility than large-cap securities. • Foreign investments may be
more volatile and less liquid than U.S. investments and are subject to the risk of currency fluctuations and adverse political, economic and regulatory developments. These risks may be greater, and include additional risks, for investments in emerging markets.
| Composition by Subsector(1) |
| as of 12/31/2023 |
| Subsector | Percentage of
Net Assets |
| Equity Securities | |
| Biotechnology | 17.7% |
| Commercial Services & Supplies | 0.5 |
| Health Care Equipment & Supplies | 15.3 |
| Health Care Providers & Services | 23.5 |
| Health Care Technology | 0.6 |
| Life Sciences Tools & Services | 12.6 |
| Pharmaceuticals | 28.6 |
| Total | 98.8% |
| Short-Term Investments | 0.7 |
| Other Assets & Liabilities | 0.5 |
| Total | 100.0% |
| (1) | For Fund compliance purposes, the Fund may not use the same classification system. These subsector classifications are used for financial reporting purposes. |
Hartford International Opportunities HLS Fund
Fund Overview
December 31, 2023 (Unaudited)
Inception 07/02/1990
Sub-advised by Wellington Management Company LLP | Investment objective – The Fund seeks long-term growth of capital. |
Comparison of Change in Value of $10,000 Investment (12/31/2013 - 12/31/2023)
The chart above represents the hypothetical growth of a $10,000 investment in Class IA shares. Returns for Class IB shares differ only to the extent that Class IA shares and Class IB shares do not have the same expenses.
| Average Annual Total Returns |
| for the Periods Ended 12/31/2023 |
| | 1 Year | 5 Years | 10 Years |
| Class IA | 11.72% | 8.47% | 4.24% |
| Class IB | 11.45% | 8.20% | 3.98% |
| MSCI ACWI ex USA Index (Net) | 15.62% | 7.08% | 3.83% |
PERFORMANCE DATA QUOTED REPRESENTS PAST PERFORMANCE AND DOES NOT GUARANTEE FUTURE RESULTS. The investment return and principal value of the investment will fluctuate so that investors’ shares, when redeemed, may be worth more or less than their original cost. The chart and table do not reflect the deductions of taxes, sales charges or other fees which may be applied at the variable contract level or by a qualified pension or retirement plan. Any such additional sales charges or other fees or expenses would lower the contract’s or plan’s performance. Current performance may be lower or higher than the performance data quoted. To obtain performance data current to the most recent month-end, please visit our website hartfordfunds.com.
Total returns presented above were calculated using the applicable class' net asset value available to shareholders for sale or redemption of Fund shares on 12/31/2023, which may exclude investment transactions as of this date. All share class returns assume the reinvestment of all distributions at net asset value and the deduction of all fund expenses. The total returns presented in the Financial Highlights section of the report are calculated in the same manner, but also take into account certain adjustments that are necessary under generally accepted accounting principles. As a result, the total returns in the Financial Highlights section may differ from the total returns presented above.
You cannot invest directly in an index.
See "Benchmark Glossary" for benchmark descriptions.
As shown in the Fund’s current prospectus, the total annual fund operating expense ratios for Class IA shares and Class IB shares were 0.75% and 1.00%, respectively. Gross and net expenses are the same. Actual expenses may be higher or lower. Please see the accompanying Financial Highlights for expense ratios for the period ended 12/31/2023.
Class IA shares and Class IB shares of the Fund are closed to certain qualified pension and retirement plans. For more information, please see the Fund’s statutory prospectus.
Hartford International Opportunities HLS Fund
Fund Overview – (continued)
December 31, 2023 (Unaudited)
Portfolio Managers
Nicolas M. Choumenkovitch*
Senior Managing Director and Equity Portfolio Manager
Wellington Management Company LLP
Tara C. Stilwell, CFA
Senior Managing Director and Equity Portfolio Manager
Wellington Management Company LLP
| * | Nicolas M. Choumenkovitch announced his plan to retire and withdraw from the partnership of Wellington Management Company LLP's parent company, and effective June 30, 2024, he will no longer serve as a portfolio manager for the Fund. Mr. Choumenkovitch’s portfolio management responsibilities will transition to Tara C. Stilwell, CFA in the months leading up to his departure. |
Manager Discussion
How did the Fund perform during the period?
The Class IA shares of the Hartford International Opportunities HLS Fund returned 11.72% for the twelve-month period ended December 31, 2023, underperforming the Fund’s benchmark, the MSCI ACWI ex USA Index (Net), which returned 15.62% for the same period. For the same period, the Class IA shares of the Fund underperformed the 15.97% average return of the Lipper International Large-Cap Growth Fund peer group, a group of funds with investment strategies similar to those of the Fund.
Why did the Fund perform this way?
For the twelve-month period ended December 31, 2023, international equities rose 15.62% as measured by the MSCI ACWI ex USA Index (Net) amid easing inflation, optimism for lower interest rates, and resilient economic performance amid major geopolitical events. Global equities rose in the first quarter. Economic growth, consumer spending, and labor markets were surprisingly resilient against a backdrop of seismic changes in the global economy, including sweeping sanctions against Russia, a reshaping of global energy flows, and a banking crisis that rekindled fears of a global recession. Major central banks continued to raise interest rates, but financial stresses and persistent inflation muddied the outlook for central bank policy. Global equities also rose in the second quarter as declining energy prices helped reduce headline inflation in most countries, easing the strains on households and businesses. However, persistently high core consumer prices kept pressure on central banks to keep interest rates higher for longer. Global equities fell in the third quarter as market sentiment was dented by concerns about the health of China’s economy, increasing energy prices, and rising government bond yields amid the prospect of an extended period of high interest rates. In a potential step toward phasing out Japan’s ultra-easy monetary policy, the Bank of Japan (BOJ) allowed greater flexibility for government bond yields to fluctuate but ultimately held rates stable. Global equities ended the fourth quarter higher. The U.S. Federal Reserve (Fed) surprised markets by signaling lower interest rates in 2024, sparking a stock rally that rippled across the globe and increasing speculation for sharp reductions in policy rates across developed markets in 2024. China’s economy rebounded, with third-quarter Gross Domestic Product (GDP) expanding by 4.9% from a year ago. Nonetheless, a deepening slump in the property sector
burdened the country’s recovery and investor sentiment. The Brent crude oil price dropped below $80 per barrel amid higher U.S. output and OPEC+ countries struggling to agree on production cuts.
Within the MSCI ACWI ex USA Index (Net), all eleven sectors posted positive returns during the period; the Information Technology (36.88%), Industrials (23.80%), and Financials (17.01%) sectors posted the largest gains.
Security selection detracted from the Fund’s performance relative to the MSCI ACWI ex USA Index (Net) during the period. Weak security selection in the Consumer Discretionary, Consumer Staples, and Utilities sectors detracted from the Fund’s performance relative to the MSCI ACWI ex USA Index (Net), while stronger selection in the Industrials, Information Technology, and Real Estate sectors contributed positively to performance during the period. Sector allocation, a result of our bottom-up security selection process, contributed positively to relative performance during the period. The Fund’s underweight to the Real Estate sector as well as overweights to the Industrials and Information Technology sectors benefited results, while overweights to the Healthcare and Utilities sectors detracted from performance during the period. On a regional basis, security selection was weakest within Emerging Markets and the United Kingdom for the period.
Top detractors to the Fund’s performance relative to the MSCI ACWI ex USA Index (Net) during the period included Anglo American (Materials), Meituan (Consumer Discretionary), and Li Ning (Consumer Discretionary). Shares of Anglo American fell over the period. The British multinational mining company cut its production outlook through 2026 to levels significantly below estimates in an effort to reduce costs. Notably, the company also lowered its 2024 output target for copper. Shares of Chinese food delivery and services platform, Meituan, fell during the period. This came as management said it expects fourth-quarter revenue growth for its core food delivery business to slow versus the preceding quarter. It noted persistent consumer caution and warmer winter weather in China as causes. The company also reported third-quarter adjusted net income that beat consensus estimates. We eliminated the Fund’s position in Meituan during the period. Shares of Li Ning, a Chinese sportswear company, fell during the period. Despite posting revenue gains for the first half of 2023, the company reported third quarter 2023 retail sales that missed market expectation and lowered its full-year revenue guidance for 2023, citing weak sales on channel conflicts and worsening
Hartford International Opportunities HLS Fund
Fund Overview – (continued)
December 31, 2023 (Unaudited)
macroeconomic conditions. Unauthorized sales outside its designated markets had also negatively affected the company's revenue and margins in the second half of 2023. We eliminated the Fund’s position in Li Ning during the period.
Larsen & Toubro (Industrials), Ferrari (Consumer Discretionary), and BAE Systems (Industrials) were among the top contributors to performance relative to the MSCI ACWI ex USA Index (Net) during the period. Shares of Larsen & Toubro, the Indian conglomerate, rose during the period. The company released first quarter 2024 results that saw earnings per share (EPS) and revenue beat consensus estimates while management reiterated full-year guidance. Saudi Aramco picked the company as one of the contractors for its $10B expansion project for unconventional gas production. The company also announced that it will begin chip design and manufacturing through a new venture, L&T Semiconductor Technologies. Shares of Ferrari rose during the period. The Italian automaker released strong quarterly results throughout the year due to higher pricing and robust demand in the Americas and China. Management maintained their full-year upbeat guidance. Shares of BAE Systems, a British multinational defense, security, and aerospace company, rose over the period. The company was awarded 3.95 billion pounds by the U.K. government for the next phase of its nuclear-powered attack submarine program. The company also saw new potential business opportunities with the emergence of the heightened military conflict between Israel and Hamas.
Derivatives were not used in the Fund during the period.
What is the outlook as of the end of the period?
International markets were largely positive in the fourth quarter, as declining inflation and lower bond yields improved investor sentiment. As we look towards 2024, we believe volatility may remain elevated as the market continues to be acutely focused on macroeconomic issues such as the direction and level of rates, and geopolitical tensions in certain regions around the world. Given the uncertainty around the outlook for markets, we continue to take a moderate pace to our decision-making and seek to maintain a well-balanced portfolio.
Although we believe markets will likely continue to be choppy as we get more clarity on the path forward, we are seeking to take advantage of the volatility by investing in companies with improving or sustainable returns on capital that we believe are underappreciated by the market.
At the end of the period, the Fund’s largest overweights were in the Information Technology and Industrials sectors relative to the MSCI ACWI ex USA Index (Net), while the Fund’s largest underweights were to the Materials and Communications Services sectors. From a regional perspective, the Fund’s largest overweights were to the United Kingdom and Developed EU & Middle East ex UK, and the Fund was most underweight to Emerging Markets, relative to the MSCI ACWI ex USA Index (Net).
Important Risks
Investing involves risk, including the possible loss of principal. Security prices fluctuate in value depending on general market and economic conditions and the prospects of individual companies. • Foreign
investments may be more volatile and less liquid than U.S. investments and are subject to the risk of currency fluctuations and adverse political, economic and regulatory developments. These risks may be greater, and include additional risks, for investments in emerging markets or if the Fund focuses in a particular geographic region or country. • Mid-cap securities can have greater risks and volatility than large-cap securities. • The Fund may have high portfolio turnover, which could increase its transaction costs. • To the extent the Fund focuses on one or more sectors, the Fund may be subject to increased volatility and risk of loss if adverse developments occur. • Integration of environmental, social, and/or governance (ESG) characteristics into the investment process may not work as intended.
| Composition by Sector(1) |
| as of 12/31/2023 |
| Sector | Percentage
of Net Assets |
| Equity Securities | |
| Communication Services | 3.4% |
| Consumer Discretionary | 10.3 |
| Consumer Staples | 6.7 |
| Energy | 7.0 |
| Financials | 19.3 |
| Health Care | 9.7 |
| Industrials | 15.6 |
| Information Technology | 17.0 |
| Materials | 6.1 |
| Real Estate | 0.6 |
| Utilities | 3.2 |
| Total | 98.9% |
| Short-Term Investments | 0.4 |
| Other Assets & Liabilities | 0.7 |
| Total | 100.0% |
| (1) | A sector may be comprised of several industries. For Fund compliance purposes, the Fund may not use the same classification system. These sector classifications are used for financial reporting purposes. |
Fund Overview
December 31, 2023 (Unaudited)
Inception 07/14/1997
Sub-advised by Wellington Management Company LLP | Investment objective – The Fund seeks long-term growth of capital. |
Comparison of Change in Value of $10,000 Investment (12/31/2013 - 12/31/2023)
The chart above represents the hypothetical growth of a $10,000 investment in Class IA shares. Returns for Class IB shares differ only to the extent that Class IA shares and Class IB shares do not have the same expenses.
| Average Annual Total Returns |
| for the Periods Ended 12/31/2023 |
| | 1 Year | 5 Years | 10 Years |
| Class IA | 14.87% | 9.70% | 8.77% |
| Class IB | 14.54% | 9.42% | 8.50% |
| S&P MidCap 400 Index | 16.44% | 12.62% | 9.27% |
PERFORMANCE DATA QUOTED REPRESENTS PAST PERFORMANCE AND DOES NOT GUARANTEE FUTURE RESULTS. The investment return and principal value of the investment will fluctuate so that investors’ shares, when redeemed, may be worth more or less than their original cost. The chart and table do not reflect the deductions of taxes, sales charges or other fees which may be applied at the variable contract level or by a qualified pension or retirement plan. Any such additional sales charges or other fees or expenses would lower the contract’s or plan’s performance. Current performance may be lower or higher than the performance data quoted. To obtain performance data current to the most recent month-end, please visit our website hartfordfunds.com.
Total returns presented above were calculated using the applicable class' net asset value available to shareholders for sale or redemption of Fund shares on 12/31/2023, which may exclude investment transactions as of this date. All share class returns assume the reinvestment of all distributions at net asset value and the deduction of all fund expenses. The total returns presented in the Financial Highlights section of the report are calculated in the same manner, but also take into account certain adjustments that are necessary under generally accepted accounting principles. As a result, the total returns in the Financial Highlights section may differ from the total returns presented above.
You cannot invest directly in an index.
See "Benchmark Glossary" for benchmark descriptions.
As shown in the Fund’s current prospectus, the total annual fund operating expense ratios for Class IA shares and Class IB shares were 0.72% and 0.97%, respectively. Gross and net expenses are the same. Actual expenses may be higher or lower. Please see the accompanying Financial Highlights for expense ratios for the period ended 12/31/2023.
Class IA shares and Class IB shares of the Fund are closed to certain qualified pension and retirement plans. For more information, please see the Fund’s statutory prospectus.
Fund Overview – (continued)
December 31, 2023 (Unaudited)
Portfolio Managers
Philip W. Ruedi, CFA
Senior Managing Director and Equity Portfolio Manager
Wellington Management Company LLP
Mark A. Whitaker, CFA
Senior Managing Director and Equity Portfolio Manager
Wellington Management Company LLP
Manager Discussion
How did the Fund perform during the period?
The Class IA shares of the Hartford MidCap HLS Fund returned 14.87% for the twelve-month period ended December 31, 2023, underperforming the Fund’s benchmark, the S&P MidCap 400 Index, which returned 16.44% for the same period. For the same period, the Class IA shares of the Fund underperformed the 21.18% average return of the Lipper Mid-Cap Growth Funds peer group, a group of funds with investment strategies similar to those of the Fund.
Why did the Fund perform this way?
United States (U.S.) equities, as measured by the S&P 500 Index, rose during the twelve-month period ended on December 31, 2023, amid easing inflation, optimism for lower interest rates, strong performances in select mega-cap technology companies, and steady Gross Domestic Product (GDP) growth. U.S. equities advanced during the first quarter. The collapse of two U.S. regional banks prompted swift policy actions by federal regulators, which helped stabilize liquidity and stem the potential for broader contagion. Shares of large technology companies surged, helping growth stocks to significantly outperform their value counterparts. The U.S. Federal Reserve (Fed) slowed its pace of policy tightening, raising interest rates by 25 basis points (bps) in February and March, to a range between 4.75% – 5%. U.S. equities rose again in the second quarter, largely driven by a potent rally in a narrow group of mega-cap technology companies that benefited from investor optimism about their earnings potential and growth prospects and exuberance surrounding generative artificial intelligence (AI). U.S. equities fell in the third quarter, pressured by rising Treasury yields amid views that the Fed would keep interest rates elevated for a prolonged period. Economic data released during the third quarter indicated healthy momentum in the U.S. economy after GDP in the second quarter grew at a 2.1% annualized rate. U.S. equities registered their largest quarterly return in three years for the fourth quarter as gains broadened beyond those of the “Magnificent Seven” stocks that dominated the stock market’s performance for most of the year. A rapid descent in inflation prompted the Fed to pivot from its “higher-for-longer” policy stance in December, sending Treasury yields lower and driving stocks higher. The Fed’s Summary of Economic Projections implied that policymakers anticipate 75 bps of interest-rate cuts in 2024.
Returns during the period varied by market cap. Mid-cap stocks, as measured by the S&P MidCap 400 Index, underperformed large-cap and small-cap stocks, as measured by the S&P 500 Index and the Russell 2000 Index. Within the S&P MidCap 400 Index, nine out of the eleven sectors posted positive returns during the period. The
Industrials (+31.49%), Information Technology (+28.47%), and Communication Discretionary (+24.28%) sectors performed the best, while the Utilities (-13.21%) and Communication Services (-7.49%) sectors performed the worst.
The Fund underperformed the S& P MidCap 400 Index during the period primarily because of negative security selection. Selection effects were particularly weak within the Financials, Healthcare, and Consumer Discretionary sectors. This was partially offset by strong selection in the Information Technology and Communication Services sectors, which contributed positively to performance during the period. Sector allocation, a result of our bottom-up stock selection process, contributed positively to the Fund’s performance relative to the S&P MidCap 400 Index during the period. This was primarily due to an overweight allocation to the Information Technology sector and an underweight to the Utilities and Financials sectors. This positive contribution was partially offset by an overweight to the Healthcare sector and underweight to the Consumer Discretionary and Materials sectors which detracted from performance.
Top detractors from the Fund’s relative performance for the period included Insulet (Healthcare), Chewy (Consumer Discretionary), and First Republic Bank (Financials). Insulet is an innovative medical device company dedicated to making the lives of people with diabetes and other conditions easier with its Omnipod product platform. Shares of Insulet fell over the period on concerns that the uptake of weight loss drugs could lower incidence rates of diabetes and soften demand for the company’s insulin pumps. Shares of online pet retailer Chewy fell over the period despite reporting positive earnings for the first and second quarter. The company announced David Reeder as the new CFO in December and laid off hundreds of employees in November. Management provided cautious commentary regarding customers trading down to lower-priced pet food amid high inflation and a decrease in active customers of 0.6% year over year. Shares of First Republic Bank fell sharply during the first quarter on fears a wave of banking failures could hit the regional lender. U.S. officials determined First Republic Bank was stable enough to operate without immediate intervention at the onset of the banking turmoil. News then surfaced that officials were considering additional support to allow First Republic Bank more time to make balance sheet adjustments. The share price has bottomed out and not recovered as of the end of the period.
Top contributors to relative performance during the period included MongoDB (Information Technology), Apellis Pharmaceuticals (Healthcare), and Fair Isaac (Information Technology). Shares of MongoDB, a source-available, cross-platform, document-oriented
Fund Overview – (continued)
December 31, 2023 (Unaudited)
database program, rose over the period primarily after the company reported blowout fiscal first-quarter earnings and lifted its full-year guidance. The company also acquired 2,300 new customers, their highest in over two years. MongoDB also introduced an AI-Powered automation feature for Query. Shares of Apellis Pharmaceuticals rose over the period despite a volatile year. Shares fell sharply as management disclosed that six occurrences of retinal vasculitis had been reported in patients following the first injection of the company’s new eye injection medication Syfovre. However, Syfovre rebounded, and the company reported strong third-quarter 2023 revenue results for the new drug which treats geographic atrophy secondary to age-related macular degeneration. Shares of data analytics company, Fair Isaac (FICO), rose over the period after the company reported positive third and fourth quarter earnings that beat analysts’ expectations. Software revenues, which include FICO’s analytics and digital decisioning technology, as well as associated professional services, increased 11.2% year over year to $194.2 million. The company also raised fiscal year 2023 guidance and expected revenues to be $1.675 billion.
Derivatives were not used in a significant manner in the Fund during the period and did not have a material impact on performance during the period.
What is the outlook as of the end of the period?
Our belief that business fundamentals will drive stock prices moving forward remains unchanged. While rate expectations have continued to drive market sentiment in the short-term, the valuation paradigm of negative real interest rates has changed dramatically in our view. Within this environment, we are choosing to focus on businesses that we believe have more control over their own destiny.
At the end of the period, the Fund’s largest overweights were to the Healthcare and Information Technology sectors and most underweight to Real Estate, Materials and Financials sectors relative to the S&P MidCap 400 Index.
Important Risks
Investing involves risk, including the possible loss of principal. Security prices fluctuate in value depending on general market and economic conditions and the prospects of individual companies. • Mid-cap securities can have greater risks and volatility than large-cap securities. • To the extent the Fund focuses on one or more sectors, the Fund may be subject to increased volatility and risk of loss if adverse developments occur. • Integration of environmental, social, and/or governance (ESG) characteristics into the investment process may not work as intended.
| Composition by Sector(1) |
| as of 12/31/2023 |
| Sector | Percentage
of Net Assets |
| Equity Securities | |
| Communication Services | 1.7% |
| Consumer Discretionary | 12.4 |
| Consumer Staples | 1.5 |
| Energy | 4.3 |
| Financials | 11.6 |
| Health Care | 21.4 |
| Industrials | 20.4 |
| Information Technology | 21.8 |
| Materials | 2.4 |
| Real Estate | 1.3 |
| Utilities | 0.8 |
| Total | 99.6% |
| Short-Term Investments | 0.0 * |
| Other Assets & Liabilities | 0.4 |
| Total | 100.0% |
| * | Percentage rounds to zero. |
| (1) | A sector may be comprised of several industries. For Fund compliance purposes, the Fund may not use the same classification system. These sector classifications are used for financial reporting purposes. |
Hartford Small Cap Growth HLS Fund
Fund Overview
December 31, 2023 (Unaudited)
Inception 05/02/1994
Sub-advised by Wellington Management Company LLP | Investment objective – The Fund seeks long-term capital appreciation. |
Comparison of Change in Value of $10,000 Investment (12/31/2013 - 12/31/2023)
The chart above represents the hypothetical growth of a $10,000 investment in Class IA shares. Returns for Class IB shares differ only to the extent that Class IA shares and Class IB shares do not have the same expenses.
| Average Annual Total Returns |
| for the Periods Ended 12/31/2023 |
| | 1 Year | 5 Years | 10 Years |
| Class IA | 18.42% | 9.78% | 7.17% |
| Class IB | 18.14% | 9.50% | 6.91% |
| Russell 2000 Growth Index | 18.66% | 9.22% | 7.16% |
PERFORMANCE DATA QUOTED REPRESENTS PAST PERFORMANCE AND DOES NOT GUARANTEE FUTURE RESULTS. The investment return and principal value of the investment will fluctuate so that investors’ shares, when redeemed, may be worth more or less than their original cost. The chart and table do not reflect the deductions of taxes, sales charges or other fees which may be applied at the variable contract level or by a qualified pension or retirement plan. Any such additional sales charges or other fees or expenses would lower the contract’s or plan’s performance. Current performance may be lower or higher than the performance data quoted. To obtain performance data current to the most recent month-end, please visit our website hartfordfunds.com.
Total returns presented above were calculated using the applicable class' net asset value available to shareholders for sale or redemption of Fund shares on 12/31/2023, which may exclude investment transactions as of this date. All share class returns assume the reinvestment of all distributions at net asset value and the deduction of all fund expenses. The total returns presented in the Financial Highlights section of the report are calculated in the same manner, but also take into account certain adjustments that are necessary under generally accepted accounting principles. As a result, the total returns in the Financial Highlights section may differ from the total returns presented above.
You cannot invest directly in an index.
See "Benchmark Glossary" for benchmark descriptions.
As shown in the Fund’s current prospectus, the total annual fund operating expense ratios for Class IA shares and Class IB shares were 0.64% and 0.89%, respectively. Gross and net expenses are the same. Actual expenses may be higher or lower. Please see the accompanying Financial Highlights for expense ratios for the period ended 12/31/2023.
The Fund is closed to new investors, subject to certain exceptions. For more information, please see the Fund’s statutory prospectus.
Hartford Small Cap Growth HLS Fund
Fund Overview – (continued)
December 31, 2023 (Unaudited)
Portfolio Managers
Mammen Chally, CFA*
Senior Managing Director and Equity Portfolio Manager
Wellington Management Company LLP
David A. Siegle, CFA
Managing Director and Equity Research Analyst
Wellington Management Company LLP
Douglas W. McLane, CFA
Senior Managing Director and Equity Portfolio Manager
Wellington Management Company LLP
| * | Mammen Chally, CFA announced his plan to retire and withdraw from the partnership of Wellington Management Company LLP’s parent company, and effective June 30, 2024, he will no longer serve as a portfolio manager for the Fund. Mr. Chally’s portfolio management responsibilities will transition to David A. Siegle, CFA in the months leading up to his departure. |
Manager Discussion
How did the Fund perform during the period?
The Class IA shares of the Hartford Small Cap Growth HLS Fund returned 18.42% for the twelve-month period ended December 31, 2023, underperforming the Fund’s benchmark, the Russell 2000 Growth Index, which returned 18.66% for the same period. For the same period, the Class IA shares of the Fund outperformed the 16.76% average return of the Lipper Small-Cap Growth Funds peer group, a group of funds with investment strategies similar to those of the Fund.
Why did the Fund perform this way?
United States (U.S.) equities, as measured by the S&P 500 Index, rose during the twelve-month period ended on December 31, 2023 amid easing inflation, optimism for lower interest rates, strong performances in select mega-cap technology companies, and steady Gross Domestic Product (GDP) growth. U.S. equities advanced during the first quarter. The collapse of two U.S. regional banks prompted swift policy actions by federal regulators, which helped stabilize liquidity and stem the potential for broader contagion. Shares of large technology companies surged, helping growth stocks to significantly outperform their value counterparts. The U.S. Federal Reserve (Fed) slowed its pace of policy tightening, raising interest rates by 25 basis points (bps) in February and March, to a range between 4.75% – 5%. U.S. equities rose again in the second quarter, largely driven by a potent rally in a narrow group of mega-cap technology companies that benefited from investor optimism about their earnings potential, growth prospects, and exuberance surrounding generative artificial intelligence (AI). U.S. equities fell in the third quarter, pressured by rising Treasury yields amid views that the Fed would keep interest rates elevated for a prolonged period. Even as household budgets were strained by tightening credit conditions and lofty prices, markets dialed back the probability of recession as cooling inflation, a solid job market, and resilient consumer spending increased the potential that the U.S. economy could achieve a “soft landing.” Economic data released during the third quarter indicated healthy momentum in the U.S. economy after GDP in the second quarter grew at a 2.1% annualized rate. U.S. equities registered their largest quarterly return
in three years for the fourth quarter as gains broadened beyond those of the “Magnificent Seven” stocks that dominated the stock market’s performance for most of the year. A rapid descent in inflation prompted the Fed to pivot from its “higher-for-longer” policy stance in December, sending Treasury yields lower and driving stocks higher. The Fed’s Summary of Economic Projections implied that policymakers anticipate 75 bps of interest-rate cuts in 2024.
Returns varied by market-cap during the period, as large-cap stocks, as measured by the S&P 500 Index, outperformed mid-cap stocks, as measured by the S&P MidCap 400 Index and small-cap stocks, as measured by the Russell 2000 Index. Ten of the eleven sectors in the Russell 2000 Growth Index had positive returns during the period. Consumer staples (+28%), Information Technology (26%), and Industrials (25%) rose the most during the period, while Utilities (-2%) was the worst performing sector during the period.
Security selection was the primary driver of relative underperformance. Selection was weakest within the Industrials, Healthcare, and Communication Services sectors while selection was strongest in the Information Technology, Consumer Staples, and Consumer Discretionary sectors. Sector allocation, which is a result of our bottom-up security selection process, contributed positively to relative performance. This was driven by the Fund’s lack of exposure to the Utilities sector, an underweight allocation to the Healthcare sector, and an overweight allocation to the Industrials sector. An underweight allocation to the Materials sector detracted from relative performance.
The top contributors to relative performance were overweight positions in ImmunoGen (Healthcare), Wingstop (Consumer Discretionary), and Sovos Brands (Consumer Staples). Shares of ImmunoGen rose as the company reported strong topline results from a Phase 3 study of antibody-drug conjugate Elahere compared to chemotherapy for the treatment of a specific type of ovarian cancer. We eliminated the position at the end of the period. Shares of Wingstop rose over the period as the company reported third quarter results that beat expectations. Shares of Sovos Brands, a consumer-packaged food
Hartford Small Cap Growth HLS Fund
Fund Overview – (continued)
December 31, 2023 (Unaudited)
company, rallied after Campbell Soup announced it would be acquiring the company for $2.7 billion in cash. We eliminated the position at the end of the period.
The top detractors from relative performance included overweight positions in Ventyx Biosciences (Healthcare) and Aclaris Therapeutics (Healthcare) and an out-of-benchmark position in Western Alliance Bancorp (Financials). Shares of Ventyx Biosciences, a clinical-stage biopharmaceutical company, fell during the period after the company announced results of its phase two trial on psoriasis treatments. The company stated that the results did not support further development of the drug due to the magnitude of efficacy observed, causing share price to reach its lowest level. We eliminated the position at the end of the period. Shares of Aclaris Therapeutics fell during the period as the company announced disappointing top-line results from its Phase 2b study of oral MK2 inhibitor zunsemetinib for the treatment of rheumatoid arthritis and noting that the trial will be discontinued. We eliminated the position at the end of the period. Shares of Western Alliance fell sharply and then finished the period higher. The company came under pressure along with other small lenders after the failure of Silicon Valley Bank caused concerns that other banks would need to sell long-term assets at steep losses to meet liquidity needs. We eliminated the position at the end of the period.
Derivatives were not used in the Fund during the period.
What is the outlook as of the end of the period?
With increasingly dovish commentary and an updated Fed "dot plot" indicating several rate cuts in 2024, we believe the U.S. market has now fully embraced that the dramatic rate cycle which began in March 2022 has come to an end. There has been constructive evidence that inflationary trends are in fact moving downward towards the Fed's stated goal of 2%, yet what remains to be seen is the precise onset, cadence, and true depth of how interest rate cuts will be enacted. We believe any disappointment in the degree or timing of rate cuts could leave increasingly expectant markets susceptible to short-term weakness.
In our view, labor markets have remained resilient and continue to underpin the U.S. economy, and unemployment levels have not risen to the higher levels many expected would be required for the Federal Open Market Committee (FOMC) to reach its inflationary target. We believe that job security and employment prospects continue to provide confidence to the U.S. consumer, yet incremental challenges from rising student loan obligations, increased credit utilization at still-high rates and the complete drawdown of "excess savings" from all but the higher-end cohorts does remove some of the support that the U.S. consumer carried through last year.
An easing in the cost of capital for companies and consumers alike may be constructive for the U.S. economy and could lead to an improved housing market, increased merger and acquisition activity, and increasing levels of investment which we believe may benefit more rate-sensitive sectors, including the Financials sector. Further, robust and continued innovation within the Technology sector promises to provide opportunities for driving productivity within the U.S. workforce as companies continue to explore the burgeoning capabilities that AI promises to bring.
In our view, 2024 will also bring pivotal elections in both Congress and the Executive branch that have important ramifications for the direction of markets. The expected debate over fiscal restraint will be an important outcome for the market, as the U.S. government generated a budget deficit near 8% in 2023, which is the largest of any other developed nation and well above the 3.7% level in 2022.
At the end of the period, the Fund’s largest overweights were to the Information Technology, Consumer Discretionary, and Industrials sectors, while the Fund’s largest underweights were to the Utilities, Consumer Staples, and Communication Services sectors relative to the benchmark.
Important Risks
Investing involves risk, including the possible loss of principal. Security prices fluctuate in value depending on general market and economic conditions and the prospects of individual companies. • Small-cap securities can have greater risks, including liquidity risk, and volatility than large-cap securities. • Different investment styles may go in and out of favor, which may cause the Fund to underperform the broader stock market. • To the extent the Fund focuses on one or more sectors, the Fund may be subject to increased volatility and risk of loss if adverse developments occur.
| Composition by Sector(1) |
| as of 12/31/2023 |
| Sector | Percentage
of Net Assets |
| Equity Securities | |
| Communication Services | 1.5% |
| Consumer Discretionary | 12.1 |
| Consumer Staples | 3.0 |
| Energy | 4.4 |
| Financials | 6.7 |
| Health Care | 22.4 |
| Industrials | 20.2 |
| Information Technology | 23.3 |
| Materials | 4.3 |
| Real Estate | 1.6 |
| Total | 99.5% |
| Short-Term Investments | 0.9 |
| Other Assets & Liabilities | (0.4) |
| Total | 100.0% |
| (1) | A sector may be comprised of several industries. For Fund compliance purposes, the Fund may not use the same classification system. These sector classifications are used for financial reporting purposes. |
Hartford Small Company HLS Fund
Fund Overview
December 31, 2023 (Unaudited)
Inception 08/09/1996
Sub-advised by Wellington Management Company LLP | Investment objective – The Fund seeks growth of capital. |
Comparison of Change in Value of $10,000 Investment (12/31/2013 - 12/31/2023)
The chart above represents the hypothetical growth of a $10,000 investment in Class IA shares. Returns for Class IB shares differ only to the extent that Class IA shares and Class IB shares do not have the same expenses.
| Average Annual Total Returns |
| for the Periods Ended 12/31/2023 |
| | 1 Year | 5 Years | 10 Years |
| Class IA | 16.74% | 11.77% | 7.79% |
| Class IB | 16.46% | 11.51% | 7.53% |
| Russell 2000 Growth Index | 18.66% | 9.22% | 7.16% |
PERFORMANCE DATA QUOTED REPRESENTS PAST PERFORMANCE AND DOES NOT GUARANTEE FUTURE RESULTS. The investment return and principal value of the investment will fluctuate so that investors’ shares, when redeemed, may be worth more or less than their original cost. The chart and table do not reflect the deductions of taxes, sales charges or other fees which may be applied at the variable contract level or by a qualified pension or retirement plan. Any such additional sales charges or other fees or expenses would lower the contract’s or plan’s performance. Current performance may be lower or higher than the performance data quoted. To obtain performance data current to the most recent month-end, please visit our website hartfordfunds.com.
Total returns presented above were calculated using the applicable class' net asset value available to shareholders for sale or redemption of Fund shares on 12/31/2023, which may exclude investment transactions as of this date. All share class returns assume the reinvestment of all distributions at net asset value and the deduction of all fund expenses. The total returns presented in the Financial Highlights section of the report are calculated in the same manner, but also take into account certain adjustments that are necessary under generally accepted accounting principles. As a result, the total returns in the Financial Highlights section may differ from the total returns presented above.
You cannot invest directly in an index.
See "Benchmark Glossary" for benchmark descriptions.
As shown in the Fund’s current prospectus, the total annual fund operating expense ratios for Class IA shares and Class IB shares were 0.79% and 1.04%, respectively. Gross and net expenses are the same. Actual expenses may be higher or lower. Please see the accompanying Financial Highlights for expense ratios for the period ended 12/31/2023.
The Fund is closed to new investors, subject to certain exceptions. For more information, please see the Fund’s statutory prospectus.
Hartford Small Company HLS Fund
Fund Overview – (continued)
December 31, 2023 (Unaudited)
Portfolio Manager
Ranjit Ramachandran, CFA
Managing Director and Equity Portfolio Manager
Wellington Management Company LLP
Manager Discussion
How did the Fund perform during the period?
The Class IA shares of the Hartford Small Company HLS Fund returned 16.74% for the twelve-month period ended December 31, 2023, underperforming the Fund’s benchmark, the Russell 2000 Growth Index which returned 18.66% for the same period. For the same period, the Class IA shares of the Fund underperformed the 16.76% average return of the Lipper Small-Cap Growth Funds peer group, a group of funds with investment strategies similar to those of the Fund.
Why did the Fund perform this way?
United States (U.S.) equities, as measured by the S&P 500 Index, rose during the twelve-month period ended on December 31, 2023 amid easing inflation, optimism for lower interest rates, strong performances in select mega-cap technology companies, and steady Gross Domestic Product (GDP) growth. The U.S. Federal Reserve (Fed) raised interest rates by 25 basis points (bps) four times through July, before holding rates steady through the remainder of the year, slowing its pace of policy tightening. U.S. equities advanced during the first quarter. The collapse of two U.S. regional banks prompted swift policy actions by federal regulators, which helped stabilize liquidity and stem the potential for broader contagion. U.S. equities rose again in the second quarter, largely driven by a potent rally in a narrow group of mega-cap technology companies that benefited from investor optimism about reported earnings, future growth prospects and excitement surrounding the potential for generative artificial intelligence (AI). U.S. equities fell in the third quarter, pressured by rising Treasury yields amid views that the Fed would keep interest rates elevated for a prolonged period. Even as household budgets were strained by tightening credit conditions and lofty prices, markets dialed back the probability of recession as cooling inflation, a solid job market, and resilient consumer spending increased the potential that the U.S. economy could achieve a “soft landing.” Economic data released during the third quarter indicated healthy momentum in the U.S. economy after GDP in the second quarter grew at a 2.1% annualized rate. U.S. equities registered their largest quarterly return in three years for the fourth quarter as gains broadened beyond those of the “Magnificent Seven” stocks that dominated the stock market’s performance for most of the year. A rapid descent in inflation prompted the Fed to pivot from its “higher-for-longer” policy stance in December, sending Treasury yields lower and driving stocks higher. The Fed’s Summary of Economic Projections implied that policymakers anticipate 75 bps of interest-rate cuts in 2024.
Returns varied by market-cap, as large-cap stocks, as measured by the S&P 500 Index, outperformed mid-cap stocks and small-cap stocks, as measured by the S&P MidCap 400 Index and Russell 2000 Index, respectively. Ten of the eleven sectors in the Russell 2000 Growth Index had positive returns during the period. The Consumer
Staples (+28%), Information Technology (+26%), and Industrials (+25%) sectors rose the most during the period, while the Utilities (-2%) sector was the worst performing sector during the period.
Security selection and sector allocation drove relative underperformance in the period. Selection within the Information Technology, Healthcare, and Communication Services sectors detracted most, while more favorable selection within the Consumer Staples and Consumer Discretionary sectors partially offset weak results. Sector allocation, which is the result of bottom-up stock selection, also detracted from relative performance. An underweight allocation to the Information Technology sector detracted, while a lack of exposure to the Utilities sector contributed positively.
Top detractors from relative performance during the period included Calix (Information Technology), not owning benchmark constituent Super Micro Computer (Information Technology), and Ameresco (Industrials). Calix is a telecommunications company that offers cloud-based software systems and services to support the delivery of broadband services. The share price declined early in the period as supply chain challenges weighed on the company’s near-term operational efficiency. We maintained an overweight position in the Fund to end the period. Shares of Super Micro Computer, which was not held, ended the period higher after the U.S.-based IT solutions provider reported better-than-expected fiscal third-quarter results. Shares were further supported by the market's optimistic outlook on AI. The share price of Ameresco, an integrated electric Energy company, moved lower in the period. Management of Ameresco released disappointing third quarter results and reduced guidance citing supply chain delays and administrative bottlenecks that had delayed project revenues. We remained constructive on the company’s long-term positioning, benefiting from the Energy transition, and held an overweight position in the Fund as of the end of the period.
Top contributors to relative performance during the period included Wingstop (Consumer Discretionary), elf Beauty (Consumer Staples), and Verra Mobility (Industrials). The share price of elf Beauty rose after surpassing consensus estimates on both the top and bottom-line metrics for four consecutive periods. Sales growth was driven by strong performance in the Cosmetics and Skincare segments across retail and e-commerce channels, while gross margin growth was supported by price increases and an improved product mix. The company also significantly raised its 2023 sales guidance and announced the acquisition of Naturium Skincare, a skincare company with a sizable presence at notable department stores. The share price of Wingstop, a franchisor and operator of restaurants, rose in the period after management released solid results citing strength in international volume growth. We remained constructive on Wingstop’s path to drive unit growth upside however we trimmed out the position during the period on strength. The share price of Verra Mobility, a toll management and photo enforcement technology company, rose after
Hartford Small Company HLS Fund
Fund Overview – (continued)
December 31, 2023 (Unaudited)
management announced strong results driven by strong recurring revenue growth and free cash flow generation. We maintained positions in all three securities in the Fund as of the end the of the period.
Derivatives were not used in a significant manner in the Fund during the period and did not have a material impact on performance during the period.
What is the outlook as of the end of the period?
U.S. equities rallied to end the year. We believe market narrowness has subsided however volatility remains elevated. Broad sector gains were driven by reports of cooling inflation, declining yields, and continued economic resilience. The Fed maintained the pause in rate rises as its tone shifted to dovish, leading the market to price in multiple rate cuts for 2024. The perspective of a lower rate environment provided an additional tailwind for interest rate sensitive sectors like Real Estate and Information Technology.
We continue to monitor the impact of higher rates on the cost of capital for companies. We believe inflation is moderating but remains above the Fed's target, supported by strength in services and the labor market. In our view, whether or not the Fed remains anchored to two percent inflation is expected to drive the path of interest rates going forward. We believe that policy makers will be keeping a close eye on macroeconomic indicators to drive decisions. We continue to seek to take advantage of the current market volatility by investing in what we view to be well-managed companies displaying fundamental momentum and attractive risk rewards, while being cognizant of the downside risks.
At the end of the period, the Fund’s largest overweights were to the Industrials, Consumer Discretionary, and Real Estate sectors, while the Fund’s largest underweights were to the Information Technology, Financials, and Utilities sectors, relative to the benchmark.
Important Risks
Investing involves risk, including the possible loss of principal. Security prices fluctuate in value depending on general market and economic conditions and the prospects of individual companies. • Small-cap securities can have greater risks, including liquidity risk, and volatility than large-cap securities. • Different investment styles may go in and out of favor, which may cause the Fund to underperform the broader stock market. • Foreign investments may be more volatile and less liquid than U.S. investments and are subject to the risk of currency fluctuations and adverse political, economic and regulatory developments. • To the extent the Fund focuses on one or more sectors, the Fund may be subject to increased volatility and risk of loss if adverse developments occur. • Integration of environmental, social, and/or governance (ESG) characteristics into the investment process may not work as intended. • The Fund may have high portfolio turnover, which could increase its transaction costs.
| Composition by Sector(1) |
| as of 12/31/2023 |
| Sector | Percentage
of Net Assets |
| Equity Securities | |
| Communication Services | 3.4% |
| Consumer Discretionary | 12.8 |
| Consumer Staples | 4.7 |
| Energy | 5.1 |
| Financials | 4.7 |
| Health Care | 22.9 |
| Industrials | 22.8 |
| Information Technology | 17.3 |
| Materials | 3.1 |
| Real Estate | 3.0 |
| Total | 99.8% |
| Short-Term Investments | 0.6 |
| Other Assets & Liabilities | (0.4) |
| Total | 100.0% |
| (1) | A sector may be comprised of several industries. For Fund compliance purposes, the Fund may not use the same classification system. These sector classifications are used for financial reporting purposes. |
Fund Overview
December 31, 2023 (Unaudited)
Inception 08/31/1977
Sub-advised by Wellington Management Company LLP | Investment objective – The Fund seeks long-term growth of capital. |
Comparison of Change in Value of $10,000 Investment (12/31/2013 - 12/31/2023)
The chart above represents the hypothetical growth of a $10,000 investment in Class IA shares. Returns for Class IB shares differ only to the extent that Class IA shares and Class IB shares do not have the same expenses.
| Average Annual Total Returns |
| for the Periods Ended 12/31/2023 |
| | 1 Year | 5 Years | 10 Years |
| Class IA | 7.72% | 13.44% | 10.69% |
| Class IB | 7.45% | 13.15% | 10.41% |
| Russell 1000 Index | 26.53% | 15.52% | 11.80% |
PERFORMANCE DATA QUOTED REPRESENTS PAST PERFORMANCE AND DOES NOT GUARANTEE FUTURE RESULTS. The investment return and principal value of the investment will fluctuate so that investors’ shares, when redeemed, may be worth more or less than their original cost. The chart and table do not reflect the deductions of taxes, sales charges or other fees which may be applied at the variable contract level or by a qualified pension or retirement plan. Any such additional sales charges or other fees or expenses would lower the contract’s or plan’s performance. Current performance may be lower or higher than the performance data quoted. To obtain performance data current to the most recent month-end, please visit our website hartfordfunds.com.
Total returns presented above were calculated using the applicable class' net asset value available to shareholders for sale or redemption of Fund shares on 12/31/2023, which may exclude investment transactions as of this date. All share class returns assume the reinvestment of all distributions at net asset value and the deduction of all fund expenses. The total returns presented in the Financial Highlights section of the report are calculated in the same manner, but also take into account certain adjustments that are necessary under generally accepted accounting principles. As a result, the total returns in the Financial Highlights section may differ from the total returns presented above.
You cannot invest directly in an index.
See "Benchmark Glossary" for benchmark descriptions.
As shown in the Fund’s current prospectus, the total annual fund operating expense ratios for Class IA shares and Class IB shares were 0.51% and 0.76%, respectively. Gross and net expenses are the same. Actual expenses may be higher or lower. Please see the accompanying Financial Highlights for expense ratios for the period ended 12/31/2023.
Class IA shares and Class IB shares of the Fund are closed to certain qualified pension and retirement plans. For more information, please see the Fund’s statutory prospectus.
Fund Overview – (continued)
December 31, 2023 (Unaudited)
Portfolio Managers
Donald J. Kilbride
Senior Managing Director and Equity Portfolio Manager
Wellington Management Company LLP
Peter C. Fisher
Senior Managing Director and Equity Portfolio Manager
Wellington Management Company LLP
Manager Discussion
How did the Fund perform during the period?
The Class IA shares of the Hartford Stock HLS Fund returned 7.72% for the twelve-month period ended December 31, 2023, underperforming the Fund’s benchmark, the Russell 1000 Index, which returned 26.53% for the same period. For the same period, the Class IA shares of the Fund also underperformed the 24.34% average return of the Lipper Large-Cap Core Funds peer group, a group of funds with investment strategies similar to those of the Fund.
Why did the Fund perform this way?
United States (U.S.) equities, as measured by the S&P 500 Index, rose during the twelve-month period ended on December 31, 2023 amid easing inflation, optimism for lower interest rates, strong performances in select mega-cap technology companies, and steady Gross Domestic Product (GDP) growth. U.S. equities advanced during the first quarter. The collapse of two U.S. regional banks prompted swift policy actions by federal regulators, which helped stabilize liquidity and stem the potential for broader contagion. Shares of large technology companies surged, helping growth stocks to significantly outperform their value counterparts. The U.S. Federal Reserve (Fed) slowed its pace of policy tightening, raising interest rates by 25 basis points (bps) in February and March, to a range between 4.75% – 5%. U.S. equities rose again in the second quarter, largely driven by a potent rally in a narrow group of mega-cap technology companies that benefited from investor optimism about their earnings potential and growth prospects and exuberance surrounding generative artificial intelligence. U.S. equities fell in the third quarter, pressured by rising Treasury yields amid views that the Fed would keep interest rates elevated for a prolonged period. Even as household budgets were strained by tightening credit conditions and lofty prices, markets dialed back the probability of recession as cooling inflation, a solid job market, and resilient consumer spending increased the potential that the U.S. economy could achieve a “soft landing.” Economic data released during the third quarter indicated healthy momentum in the U.S. economy after GDP in the second quarter grew at a 2.1% annualized rate. U.S. equities registered their largest quarterly return in three years for the fourth quarter as gains broadened beyond those of the “Magnificent Seven” stocks that dominated the stock market’s performance for most of the year. A rapid descent in inflation prompted the Fed to pivot from its “higher-for-longer” policy stance in December, sending Treasury yields lower and driving stocks higher. The Fed’s Summary of Economic Projections implied that policymakers anticipate 75 bps of interest-rate cuts in 2024.
Returns varied by market capitalization during the period, as large-cap equities, as measured by the S&P 500 Index, outperformed both small- and mid-cap equities, as measured by the Russell 2000 Index and the S&P MidCap 400 Index, respectively. During the twelve-month period, nine of the eleven sectors within the Russell 1000 Index rose, led by the Information Technology (57.24%), Communication Services (54.20%), and Consumer Discretionary (40.89%) sectors. Conversely, the Utilities (-7.01%) and Energy (-1.21%) sectors fell over the same period.
Security selection detracted from the Fund’s performance versus the Russell 1000 Index during the period. Weak security selection in the Industrials, Consumer Discretionary, and Information Technology sectors was partially offset by stronger selection in the Materials and Consumer Staples sectors. Sector allocation, a residual of the bottom-up stock selection process, also detracted from relative results. This was driven by the Fund’s underweight exposure to the Information Technology sector and overweight exposure to the Consumer Staples sector, as well as a lack of exposure to the Communication Services sector. The relative underperformance was partially offset by a lack of exposure to the Energy sector, an underweight to the Utilities sector, and an overweight exposure to the Financials sector in the Fund.
The Fund’s positions in Northrop Grumman (Industrials) and NIKE (Consumer Discretionary), along with not holding benchmark constituents NVIDIA (Information Technology), Meta Platforms (Communication Services), Apple (Information Technology) and Amazon.com (Consumer Discretionary), were the top detractors from performance relative to the Russell 1000 Index during the period. Shares of U.S.-based aerospace and defense company Northrop Grumman were down after a strong year in 2022 and on jitters around the upcoming U.S. election in the second half of 2024. Shares of NIKE, a U.S.-based manufacturer of athletic apparel, fell over the period due to a sluggish economic recovery in China, inventory challenges, and an uncertain macroeconomic outlook. The Fund continued to hold overweight exposures to Northrop Grumman and NIKE at the end of the period. Shares of each of NVIDIA, Meta Platforms, Apple and Amazon.com rose over the period.
Top contributors to the Fund’s performance relative to the Russell 1000 Index during the period included positions in Costco Wholesale (Consumer Staples) and Ecolab (Materials), along with not holding benchmark constituents Exxon Mobil (Energy), Chevron (Energy), Bristol-Myers Squibb (Healthcare) and Abbvie (Healthcare). The share price of Costco Wholesale, a U.S.-based retailer which operates membership warehouse clubs, rose in during the period. The company
Fund Overview – (continued)
December 31, 2023 (Unaudited)
continued to execute, growing both top and bottom lines by increasing volumes and continuously improving the customer experience. Shares of Ecolab, a U.S.-based chemical company providing water, hygiene, and infection prevention solutions, ended the period higher on strong pricing momentum and accelerating volumes, as well as continued margin expansion from productivity enhancements. The company’s focus on high growth areas like R&D, as well as on innovation and enhanced digital/service offerings, are expected to drive growth going forward. As of the end of the period, the Fund continued to hold overweight positions in Costco Wholesale and Ecolab. Shares of each of Exxon Mobil (Energy), Chevron (Energy), Bristol-Myers Squibb (Healthcare) and Abbvie (Healthcare) fell during the period.
Derivatives were not used in a significant manner in the Fund during the period and did not have a material impact on performance during the period.
What is the outlook as of the end of the period?
Going forward, we will continue to focus on companies that we believe are high quality and are expected to grow their dividends.
As of the end of the period, the Fund was most overweight to the Industrials and Consumer Staples sectors and most underweight to the Information Technology and Communication Services sectors relative to the Russell 1000 Index.
Important Risks
Investing involves risk, including the possible loss of principal. Security prices fluctuate in value depending on general market and economic conditions and the prospects of individual companies. • For dividend-paying stocks, dividends are not guaranteed and may decrease without notice. • Foreign investments may be more volatile and less liquid than U.S. investments and are subject to the risk of currency fluctuations and adverse political, economic and regulatory developments. • The Fund may also hold a limited number of securities so it may be exposed to more risks and volatility than a fund that invests in a greater number of companies.
| Composition by Sector(1) |
| as of 12/31/2023 |
| Sector | Percentage
of Net Assets |
| Equity Securities | |
| Consumer Discretionary | 10.6% |
| Consumer Staples | 14.8 |
| Financials | 14.6 |
| Health Care | 18.9 |
| Industrials | 21.2 |
| Information Technology | 10.9 |
| Materials | 5.2 |
| Real Estate | 3.3 |
| Total | 99.5% |
| Short-Term Investments | 0.2 |
| Other Assets & Liabilities | 0.3 |
| Total | 100.0% |
| (1) | A sector may be comprised of several industries. For Fund compliance purposes, the Fund may not use the same classification system. These sector classifications are used for financial reporting purposes. |
Hartford Total Return Bond HLS Fund
Fund Overview
December 31, 2023 (Unaudited)
Inception 08/31/1977
Sub-advised by Wellington Management Company LLP | Investment objective – The Fund seeks a competitive total return, with income as a secondary objective. |
Comparison of Change in Value of $10,000 Investment (12/31/2013 - 12/31/2023)
The chart above represents the hypothetical growth of a $10,000 investment in Class IA shares. Returns for Class IB shares differ only to the extent that Class IA shares and Class IB shares do not have the same expenses.
| Average Annual Total Returns |
| for the Periods Ended 12/31/2023 |
| | 1 Year | 5 Years | 10 Years |
| Class IA | 6.97% | 1.86% | 2.32% |
| Class IB | 6.69% | 1.59% | 2.07% |
| Bloomberg US Aggregate Bond Index | 5.53% | 1.10% | 1.81% |
PERFORMANCE DATA QUOTED REPRESENTS PAST PERFORMANCE AND DOES NOT GUARANTEE FUTURE RESULTS. The investment return and principal value of the investment will fluctuate so that investors’ shares, when redeemed, may be worth more or less than their original cost. The chart and table do not reflect the deductions of taxes, sales charges or other fees which may be applied at the variable contract level or by a qualified pension or retirement plan. Any such additional sales charges or other fees or expenses would lower the contract’s or plan’s performance. Current performance may be lower or higher than the performance data quoted. To obtain performance data current to the most recent month-end, please visit our website hartfordfunds.com.
Total returns presented above were calculated using the applicable class' net asset value available to shareholders for sale or redemption of Fund shares on 12/31/2023, which may exclude investment transactions as of this date. All share class returns assume the reinvestment of all distributions at net asset value and the deduction of all fund expenses. The total returns presented in the Financial Highlights section of the report are calculated in the same manner, but also take into account certain adjustments that are necessary under generally accepted accounting principles. As a result, the total returns in the Financial Highlights section may differ from the total returns presented above.
You cannot invest directly in an index.
See "Benchmark Glossary" for benchmark descriptions.
As shown in the Fund’s current prospectus, the total annual fund operating expense ratios for Class IA shares and Class IB shares were 0.50% and 0.75%, respectively. Gross and net expenses are the same. Actual expenses may be higher or lower. Please see the accompanying Financial Highlights for expense ratios for the period ended 12/31/2023.
Class IA shares and Class IB shares of the Fund are closed to certain qualified pension and retirement plans. For more information, please see the Fund’s statutory prospectus.
Hartford Total Return Bond HLS Fund
Fund Overview – (continued)
December 31, 2023 (Unaudited)
Portfolio Managers
Joseph F. Marvan, CFA
Senior Managing Director and Fixed Income Portfolio Manager
Wellington Management Company LLP
Campe Goodman, CFA
Senior Managing Director and Fixed Income Portfolio Manager
Wellington Management Company LLP
Robert D. Burn, CFA
Senior Managing Director and Fixed Income Portfolio Manager
Wellington Management Company LLP
Manager Discussion
How did the Fund perform during the period?
The Class IA shares of the Hartford Total Return Bond HLS Fund returned 6.97% for the twelve-month period ended December 31, 2023, outperforming the Fund’s benchmark, the Bloomberg US Aggregate Bond Index, which returned 5.53% for the same period. For the same period, the Class IA shares of the Fund also outperformed the 5.84% average return of the Lipper Core Bond Funds peer group, a group of funds with investment strategies like those of the Fund.
Why did the Fund perform this way?
Global fixed income sectors generated positive total returns during the trailing twelve months ended December 31, 2023 despite elevated interest rate volatility over most of the period. The Bloomberg US Aggregate Bond Index returned 5.53% during the period. Higher-yielding sectors generally performed best, benefiting from their coupon advantage and spread tightening. Global sovereign debt yields ended mixed. Yields rose earlier in the period amid multiple rate increases from the Federal Reserve (Fed) and other major central banks across Europe, while Asian central banks pursued more dovish approaches. Yields plunged by the end of the period in response to accommodative central bank policy expectations amid weaker economic data, including moderating inflation.
Despite concerns about tighter lending standards following turmoil in the banking sector earlier in the period, credit sectors produced positive excess returns over duration-equivalent government bonds as spreads narrowed, particularly high yield and emerging markets debt.
Most securitized sectors’ performance rebounded by the end of the period as markets absorbed the Federal Deposit Insurance Corporation (FDIC) asset sales of mortgage-backed securities and sentiment improved. Over the period, U.S. investment-grade corporate spreads compressed by 31 basis points (bps) and U.S. high-yield corporate spreads tightened by 146 bps, according to Bloomberg Index data.
The earlier part of the period witnessed a “higher for longer” policy rates narrative from major central banks. By the end of the year, market participants grew confident that major central banks have concluded their rate hiking cycles. The Fed maintained its aggressive stance for most of the period but ended the year with a more overall
cautious approach to further rate hikes. The European Central Bank (ECB) and the Bank of England (BOE) delivered several consecutive rate increases but pivoted more dovish by the end of the period, though both attempted to downplay the extent of expected rate cuts. The Bank of Japan (BOJ) was the notable exception in terms of staying the course in retaining an accommodative policy, despite rising core inflation, though it widened its yield curve control (YCC) range.
Global economic data remained resilient over much of the period, though it increasingly diverged across regions while inflation decelerated but at levels well above central bank targets and wages remained elevated. The United Kingdom dealt with the highest inflation among developed markets for most of the period. U.S. labor market strength persisted, and consumer spread remained robust. Tighter financing conditions and weaker demand weighed down global industrial production and manufacturing activity, particularly in the Eurozone, Japan, and China. Germany entered a technical recession with a second consecutive negative Gross Domestic Product (GDP) print in the first quarter. The People’s Bank of China (PBOC) reduced the required reserve ratio to loosen interbank funding conditions following a tepid COVID-19 recovery. China’s economy regained momentum by the end of the period, but weakness persisted in the Real Estate sector.
The U.S. dollar ended mixed versus most currencies over the period after the Fed adopted a more dovish tone later in the year, and central banks increasingly charted different policy courses. European currencies generally ended higher versus the greenback. Particularly, the Swiss franc was a notable outperformer. The Japanese yen depreciated versus the U.S. dollar as the BOJ remained the outlier among major G10 central banks in maintaining its ultra-loose monetary policy. Emerging market currencies broadly gained versus the greenback.
The Fund’s corporate credit positioning and allocation to securitized sectors, particularly non-agency residential mortgage-backed securities (RMBS) were the largest contributors to relative outperformance. Exposure to high yield, particularly an allocation to Industrials, contributed positively as spreads tightened. The Fund’s security selection within investment grade credit, particularly Financials, had a positive impact on relative returns. Within securitized sectors, an allocation to RMBS benefited results as housing data improved despite affordability challenges. Agency Mortgage-Backed
Hartford Total Return Bond HLS Fund
Fund Overview – (continued)
December 31, 2023 (Unaudited)
Securities (MBS) pass-throughs had a positive impact on relative performance benefiting from reduced interest rate volatility and tighter spreads over the later part of period. The Fund’s overweight to commercial backed mortgage-backed securities (CMBS) modestly aided performance. Allocations to collateralized loan obligations (collateralized loan obligations (CLOs) and an overweight to Asset Backed Securities (ABS), also had a positive impact on relative returns.
During the period, the Fund implemented tactical duration and yield curve positions which had a positive overall impact on relative performance, in the aggregate. The Fund maintained exposure to Treasury Inflation-Protected Securities (TIPS) which benefited relative performance during the period.
Select exposure to emerging markets debt detracted slightly from performance over the period. An allocation to developed non-U.S. Dollar sovereign issuers benefited results.
During the period, the Fund used Treasury futures, interest rate swaps, and options to manage duration and yield curve positioning. Treasury derivatives overall had a negative impact on performance. The Fund also used currency forwards and futures to implement non-U.S. rate and currency positions during the period. The Fund’s currency positions, in aggregate had a negative impact on results. Credit default swap index (CDX) positions were used to manage credit exposure during the period. High yield and investment-grade CDX positions had a positive impact on performance during the period, while emerging markets CDX positions detracted modestly from overall relative results.
What is the outlook as of the end of the period?
We believe the “rolling recession” in the U.S. will continue, with slower consumer and government spending while manufacturing and housing find a bottom. With inflation falling, we believe the path of real policy rates will depend on the pace of Fed easing; we believe a large gap exists between Fed forward guidance and market implied cuts. As of the end of the period, the Fund is positioned with a slightly long duration and a close to neutral risk profile, while preserving high-quality, liquid instruments to seek to take advantage of future dislocations. We believe corporate fundamentals are expected to deteriorate at the margin, albeit from a strong starting point, with margins under pressure as recent strength in pricing power subsides. Spreads appear tight, but elevated yields may continue to bolster demand for fixed income in our view.
As of the end of the period, we maintain an underweight to investment grade credit in the Fund due to better observed opportunities in various out-of-benchmark sectors, including high-quality securitized credit (residential housing benefits from low supply), BB high yield (more insulated from default risk than CCCs), and select emerging markets (where we see compelling valuations and improving fundamentals). As of the end of the period, we are overweight agency MBS in the Fund (focus on relative value opportunities and enhancing cash flow stability). While fixed income markets rallied sharply to close out 2023, we believe there is scope for yields to remain supported by
expected weaker growth and as central banks pivot to more accommodative monetary policies and we maintain an above average duration profile in the Fund as of the end of the period.
With continued uncertainty around growth, inflation, and the Fed’s reaction function, we are seeking to be cautious but nimble and seeking to take advantage of numerous perceived market inefficiencies. We believe bouts of volatility may generate greater idiosyncratic dispersion and may create better entry points to add credit exposure. We are closely monitoring several risks to our outlook which could lead us to adjust the portfolio’s exposures.
Important Risks
Investing involves risk, including the possible loss of principal. Security prices fluctuate in value depending on general market and economic conditions and the prospects of individual companies. The Fund may allocate a portion of its assets to specialist portfolio managers, which may not work as intended. • Fixed income security risks include credit, liquidity, call, duration, event and interest-rate risk. As interest rates rise, bond prices generally fall. • The risks associated with mortgage-related and asset-backed securities as well as collateralized loan obligations (CLOs) include credit, interest-rate, prepayment, liquidity, default and extension risk. • The purchase of securities in the To-Be-Announced (TBA) market can result in higher portfolio turnover and related expenses as well as price and counterparty risk. • Derivatives are generally more volatile and sensitive to changes in market or economic conditions than other securities; their risks include currency, leverage, liquidity, index, pricing, regulatory and counterparty risk. • Foreign investments may be more volatile and less liquid than U.S. investments and are subject to the risk of currency fluctuations and adverse political, economic and regulatory developments. These risks may be greater for investments in emerging markets. • Investments in high-yield (“junk”) bonds involve greater risk of price volatility, illiquidity, and default than higher-rated debt securities. • Obligations of U.S. Government agencies are supported by varying degrees of credit but are generally not backed by the full faith and credit of the U.S. Government. • Restricted securities may be more difficult to sell and price than other securities. • Changes related to LIBOR could have an adverse impact on financial instruments that reference this rate. • The Fund may have high portfolio turnover, which could increase its transaction costs.
Hartford Total Return Bond HLS Fund
Fund Overview – (continued)
December 31, 2023 (Unaudited)
| Composition by Security Type(1) |
| as of 12/31/2023 |
| Category | Percentage of
Net Assets |
| Equity Securities | |
| Common Stocks | 0.0% * |
| Preferred Stocks | 0.1 |
| Total | 0.1% |
| Fixed Income Securities | |
| Asset & Commercial Mortgage-Backed Securities | 20.6% |
| Corporate Bonds | 30.9 |
| Foreign Government Obligations | 3.0 |
| Municipal Bonds | 1.4 |
| Senior Floating Rate Interests | 0.0 * |
| U.S. Government Agencies(2) | 46.2 |
| U.S. Government Securities | 14.0 |
| Total | 116.1% |
| Short-Term Investments | 0.3 |
| Other Assets & Liabilities | (16.5) |
| Total | 100.0% |
| * | Percentage rounds to zero. |
| (1) | For Fund compliance purposes, the Fund may not use the same classification system. These classifications are used for financial reporting purposes. |
| (2) | All, or a portion of the securities categorized as U.S. Government Agencies, were agency mortgage-backed securities as of December 31, 2023. |
Hartford Ultrashort Bond HLS Fund
Fund Overview
December 31, 2023 (Unaudited)
Inception 06/30/1980
Sub-advised by Wellington Management Company LLP | Investment objective – The Fund seeks total return and income consistent with preserving capital and maintaining liquidity. |
Comparison of Change in Value of $10,000 Investment (12/31/2013 - 12/31/2023)
The chart above represents the hypothetical growth of a $10,000 investment in Class IA shares. Returns for Class IB shares differ only to the extent that Class IA shares and Class IB shares do not have the same expenses.
| Average Annual Total Returns |
| for the Periods Ended 12/31/2023 |
| | 1 Year | 5 Years | 10 Years |
| Class IA | 5.18% | 1.80% | 1.27% |
| Class IB | 4.99% | 1.55% | 1.02% |
| Bloomberg Short Treasury 9-12 Month Index | 5.01% | 1.82% | 1.28% |
PERFORMANCE DATA QUOTED REPRESENTS PAST PERFORMANCE AND DOES NOT GUARANTEE FUTURE RESULTS. The investment return and principal value of the investment will fluctuate so that investors’ shares, when redeemed, may be worth more or less than their original cost. The chart and table do not reflect the deductions of taxes, sales charges or other fees which may be applied at the variable contract level or by a qualified pension or retirement plan. Any such additional sales charges or other fees or expenses would lower the contract’s or plan’s performance. Current performance may be lower or higher than the performance data quoted. To obtain performance data current to the most recent month-end, please visit our website hartfordfunds.com.
Total returns presented above were calculated using the applicable class' net asset value available to shareholders for sale or redemption of Fund shares on 12/31/2023, which may exclude investment transactions as of this date. All share class returns assume the reinvestment of all distributions at net asset value and the deduction of all fund expenses. The total returns presented in the Financial Highlights section of the report are calculated in the same manner, but also take into account certain adjustments that are necessary under generally accepted accounting principles. As a result, the total returns in the Financial Highlights section may differ from the total returns presented above.
You cannot invest directly in an index.
See "Benchmark Glossary" for benchmark descriptions.
As shown in the Fund’s current prospectus, the total annual fund operating expense ratios for Class IA shares and Class IB shares were 0.43% and 0.68%, respectively. Gross and net expenses are the same. Actual expenses may be higher or lower. Please see the accompanying Financial Highlights for expense ratios for the period ended 12/31/2023.
Class IA shares and Class IB shares of the Fund are closed to certain qualified pension and retirement plans. For more information, please see the Fund’s statutory prospectus.
Hartford Ultrashort Bond HLS Fund
Fund Overview – (continued)
December 31, 2023 (Unaudited)
Portfolio Managers
Timothy E. Smith*
Senior Managing Director and Fixed Income Portfolio Manager
Wellington Management Company LLP
Marc K. Piccuirro, CFA
Senior Managing Director and Fixed Income Portfolio Manager
Wellington Management Company LLP
| * | Timothy E. Smith, CFA announced his plan to retire and withdraw from the partnership of Wellington Management Company LLP’s parent company, and effective June 30, 2024, he will no longer serve as a portfolio manager for the Fund. Mr. Smith’s portfolio management responsibilities will transition to Marc K. Piccuirro, CFA in the months leading up to his departure. |
Manager Discussion
How did the Fund perform during the period?
The Class IA shares of Hartford Ultrashort Bond HLS Fund returned 5.18% for the twelve-month period ended December 31, 2023, outperforming the Fund’s benchmark, the Bloomberg Short Treasury 9-12 Month Index, which returned 5.01% for the same period. For the same period, the Class IA shares of the Fund underperformed the 5.78% average return of the Lipper Short Investment Grade Debt Funds peer group, a group of funds that invest primarily in investment grade issues with dollar-weighted average maturities of one to five years.
Why did the Fund perform this way?
Global fixed income sectors generated positive total returns during the trailing twelve months ended December 31, 2023, despite elevated interest rate volatility over most of the period. The Bloomberg US Aggregate Bond Index returned 5.53% during the period. Higher-yielding sectors generally performed best, benefiting from their coupon advantage and spread tightening. Global sovereign debt yields ended mixed. Yields rose earlier in the period amid multiple rate increases from the Federal Reserve (Fed) and other major central banks across Europe, while Asian central banks pursued more dovish approaches. Yields plunged by the end of the period in response to accommodative central bank policy expectations amid weaker economic data, including moderating inflation.
Despite concerns about tighter lending standards following turmoil in the banking sector earlier in the period, credit sectors produced positive excess returns over duration-equivalent government bonds as spreads narrowed, particularly high yield and emerging markets debt. Most securitized sectors’ performance rebounded by the end of the period as markets absorbed the Federal Deposit Insurance Corporation (FDIC) asset sales of mortgage-backed securities and sentiment improved. Over the period, U.S. investment-grade corporate spreads compressed by 31 basis points (bps) and U.S. high-yield corporate spreads tightened by 146 (bps), according to Bloomberg Index data.
The earlier part of the period witnessed a “higher for longer” policy rates narrative from major central banks. By the end of the year, market participants grew confident that major central banks have
concluded their rate hiking cycles. The Fed maintained its aggressive stance for most of the period but ended the year with a more overall cautious approach to further rate hikes.
The Fund’s out-of-benchmark allocation to investment grade corporate bonds, particularly financial institutions, was the primary contributor to the Fund’s relative outperformance during the period. An out-of-benchmark allocation to asset-backed securities (ABS) also had positive impact on relative returns, as the sector broadly outperformed duration-equivalent Treasuries over the period. However, this relative outperformance was slightly offset by the Fund's duration and yield curve positioning, which detracted from relative returns given heightened rate volatility in the trailing twelve-months ended December 31, 2023.
During the period, derivatives were not used in a significant manner in the Fund and did not have a material impact on performance.
What is the outlook as of the end of the period?
As of the end of the period, the Fund was positioned with a neutral risk posture. We believe all-in front-end yields remain attractive despite the sharp rally in rates to close out 2023. We continue to add risk selectively but remain attentive to potential challenges from macroeconomic uncertainty. We believe the U.S. economy has shown impressive resilience in the wake of the tighter policy backdrop which is supportive of a “soft-landing” narrative.
Spreads are generally trading tight to historical medians and are not pricing in any potential for a significant slowdown in growth and credit conditions over the next 6-12 months, in our view. Periods of spread weakness may present buying opportunities. We expect the Fed to start easing in 2024, although our expectation of the exact timing and number of cuts remains dependent on economic data and can change with any surprises to inflation or labor – two metrics which drive the Fed’s data-dependent decision-making process.
Our outlook for credit fundamentals is that we are past peak fundamentals and expect greater credit dispersion but starting from a position of strength. Aggregate investment grade credit metrics still look healthy, with stable leverage and margins while interest coverage has declined, in our view. From a more forward-looking perspective, we believe earnings growth will likely decelerate in 2024. We believe short-end valuations are cheaper than longer tenors, and Financials/Utilities spreads are attractive relative to the Industrials
Hartford Ultrashort Bond HLS Fund
Fund Overview – (continued)
December 31, 2023 (Unaudited)
sector, where spreads are offering less value in our view. Attractive prospective total returns on corporate bonds relative to other asset classes could bring in yield and total return buyers over time, in our view. We are positive on the agency-Mortgage-Backed Securities (MBS) sector given appealing valuations relative to history. Technical backdrop remains weak as marginal buyers are more spread sensitive. As of the end of the period, we are constructive on the securitized sectors, particularly ABS and Non-Agency Residential Mortgage-Backed Securities (NA RMBS). As of the end of the period, we are negative on the Commercial Mortgage-Backed Securities (CMBS) outlook based on what we consider to be the stiff challenges facing commercial real estate due to tighter financial conditions from substantially higher borrowing costs and regional bank stress.
Important Risks
Investing involves risk, including the possible loss of principal. Security prices fluctuate in value depending on general market and economic conditions and the prospects of individual companies. • Fixed income security risks include credit, liquidity, call, duration, event, and interest-rate risk. As interest rates rise, bond prices generally fall. • The risks associated with mortgage-related and asset-backed securities include credit, interest-rate, prepayment, liquidity, default and extension risk. • Obligations of U.S. Government agencies are supported by varying degrees of credit but are generally not backed by the full faith and credit of the U.S. Government. • Restricted securities may be more difficult to sell and price than other securities. • Repurchase agreements may increase the Fund's risk and volatility.
| Composition by Security Type(1) |
| as of 12/31/2023 |
| Category | Percentage of
Net Assets |
| Fixed Income Securities | |
| Asset & Commercial Mortgage-Backed Securities | 37.2% |
| Corporate Bonds | 33.7 |
| U.S. Government Agencies(2) | 6.9 |
| U.S. Government Securities | 15.7 |
| Total | 93.5% |
| Short-Term Investments | 5.8 |
| Other Assets & Liabilities | 0.7 |
| Total | 100.0% |
| (1) | For Fund compliance purposes, the Fund may not use the same classification system. These classifications are used for financial reporting purposes. |
| (2) | All, or a portion of the securities categorized as U.S. Government Agencies, were agency mortgage-backed securities as of December 31, 2023. |
Benchmark Glossary (Unaudited)
| Bloomberg US Government/Credit Bond Index (reflects no deduction for fees, expenses or taxes) measures the non-securitized component of the US Aggregate Index. It includes investment grade, US dollar-denominated, fixed-rate Treasuries, government-related and corporate securities. |
| Bloomberg Short Treasury 9-12 Month Index (reflects no deduction for fees, expenses or taxes) includes aged US Treasury bills, notes and bonds with a remaining maturity from 1 up to (but not including) 12 months. It excludes zero coupon strips. |
| Bloomberg US Aggregate Bond Index (reflects no deduction for fees, expenses or taxes) is composed of securities that cover the US investment grade fixed rate bond market, with index components for government and corporate securities, mortgage pass-through securities, and asset-backed securities. |
| ICE BofA US 3-Month Treasury Bill Index (reflects no deduction for fees, expenses or taxes) is comprised of a single issue purchased at the beginning of the month and held for a full month. At the end of the month that issue is sold and rolled into a newly selected issue. The issue selected at each month-end rebalancing is the outstanding Treasury Bill that matures closest to, but not beyond, three months from the rebalancing date. To qualify for selection, an issue must have settled on or before the month-end rebalancing date. |
| MSCI ACWI ex USA Index (Net) (reflects reinvested dividends net of withholding taxes but reflects no deduction for fees, expenses or other taxes) is designed to capture large and mid cap securities across developed markets (excluding the US) and emerging market countries. |
| Russell 1000 Index (reflects no deduction for fees, expenses or taxes) is designed to measure the performance of the 1,000 largest companies in the Russell 3000 Index. The Russell 3000 Index is designed to measure the performance of the 3,000 largest US companies based on total market capitalizations. |
| Russell 3000 Index (reflects no deduction for fees, expenses or taxes) is designed to measure the performance of the 3,000 largest US companies based on total market capitalization. |
| Russell 2000 Growth Index (reflects no deduction for fees, expenses or taxes) is designed to measure the performance of those Russell 2000 Index companies with higher price-to-book ratios and higher forecasted growth values. The Russell 2000 Index is an index comprised of 2,000 of the smallest US-domiciled company common stocks based on a combination of their market capitalization and current index membership. |
| Russell 1000 Value Index (reflects no deduction for fees, expenses or taxes) is designed to measure the performance of those Russell 1000 Index companies with lower price-to-book ratios and lower forecasted growth values. The Russell 1000 Index is designed to measure the performance of the 1,000 largest companies in the Russell 3000 Index based on their market capitalization and current index membership. |
| S& P Composite 1500 Health Care Index (reflects no deduction for fees, expenses or taxes) is a float-adjusted market capitalization-weighted index comprised of those companies included in the S&P Composite 1500 that are classified as members of the Global Industry Classification Standard (GICS®) health care sector. |
| S&P MidCap 400 Index (reflects no deduction for fees, expenses or taxes) is a float-adjusted market capitalization-weighted index designed to measure the performance of the mid-cap segment of the market. The index is composed of 400 constituent companies. |
| S&P 500 Index (reflects no deduction for fees, expenses or taxes) is a float-adjusted market capitalization-weighted index composed of 500 widely held common stocks. |
| Additional Information Regarding Bloomberg Index(es). “Bloomberg®” and the above referenced Bloomberg index(es) are service marks of Bloomberg Finance L.P. and its affiliates, including Bloomberg Index Services Limited (“BISL”), the administrator of the index (collectively, “Bloomberg”), and have been licensed for use for certain purposes by Hartford Funds Management Company, LLC ("HFMC"). The Funds are not sponsored, endorsed, sold or promoted by Bloomberg. Bloomberg does not make any representation or warranty, express or implied, to the owners of or counterparties to the Funds or any member of the public regarding the advisability of investing in securities generally or in the Funds particularly. The only relationship of Bloomberg to HFMC is the licensing of certain trademarks, trade names and service marks and of the above referenced Bloomberg index(es), which is determined, composed and calculated by BISL without regard to HFMC or the Funds. Bloomberg has no obligation to take the needs of HFMC or the owners of the Funds into consideration in determining, composing or calculating the above referenced Bloomberg index(es). Bloomberg is not responsible for and has not participated in the determination of the timing of, prices at, or quantities of the Funds to be issued. Bloomberg shall not have any obligation or liability, including, without limitation, to the Funds' customers, in connection with the administration, marketing or trading of the Funds. |
| BLOOMBERG DOES NOT GUARANTEE THE ACCURACY AND/OR THE COMPLETENESS OF THE ABOVE REFERENCED BLOOMBERG INDEX(ES) OR ANY DATA RELATED THERETO AND SHALL HAVE NO LIABILITY FOR ANY ERRORS, OMISSIONS OR INTERRUPTIONS THEREIN. BLOOMBERG DOES NOT MAKE ANY WARRANTY, EXPRESS OR IMPLIED, AS TO RESULTS TO BE OBTAINED BY HFMC, OWNERS OF THE FUNDS OR ANY OTHER PERSON OR ENTITY FROM THE USE OF THE ABOVE REFERENCED BLOOMBERG INDEX(ES) OR ANY DATA RELATED THERETO. BLOOMBERG DOES NOT MAKE ANY EXPRESS OR IMPLIED WARRANTIES AND EXPRESSLY DISCLAIMS ALL WARRANTIES OF MERCHANTABILITY OR FITNESS FOR A PARTICULAR PURPOSE OR USE WITH RESPECT TO THE ABOVE REFERENCED BLOOMBERG INDEX(ES) OR ANY DATA RELATED THERETO. WITHOUT LIMITING ANY OF THE FOREGOING, TO THE MAXIMUM EXTENT ALLOWED BY LAW, BLOOMBERG, ITS LICENSORS, AND ITS AND THEIR RESPECTIVE EMPLOYEES, CONTRACTORS, AGENTS, SUPPLIERS, AND VENDORS SHALL HAVE NO LIABILITY OR RESPONSIBILITY WHATSOEVER FOR ANY INJURY OR |
Benchmark Glossary (Unaudited) – (continued)
| DAMAGES --WHETHER DIRECT, INDIRECT, CONSEQUENTIAL, INCIDENTAL, PUNITIVE OR OTHERWISE --ARISING IN CONNECTION WITH THE ABOVE REFERENCED BLOOMBERG INDEX(ES) OR ANY DATA OR VALUES RELATING THERETO --WHETHER ARISING FROM THEIR NEGLIGENCE OR OTHERWISE, EVEN IF NOTIFIED OF THE POSSIBILITY THEREOF. |
Additional Information Regarding MSCI Indices.
Neither MSCI nor any other party involved in or related to compiling, computing or creating the MSCI data makes any express or implied warranties or representations with respect to such data (or the results to be obtained by the use thereof), and all such parties hereby expressly disclaim all warranties of originality, accuracy, completeness, merchantability or fitness for a particular purpose with respect to any of such data. Without limiting any of the foregoing, in no event shall MSCI, any of its affiliates or any third party involved in or related to compiling, computing or creating the data have any liability for any direct, indirect, special, punitive, consequential or any other damages (including lost profits) even if notified of the possibility of such damages. No further distribution or dissemination of the MSCI data is permitted without MSCI’s express written consent. |
Expense Examples (Unaudited)
Your Fund's Expenses
As a shareholder of a Fund, you incur two types of costs: (1) transaction costs and (2) ongoing costs, including investment management fees, distribution and/or service (12b-1) fees, if any, and other fund expenses. This example is intended to help you understand your ongoing costs (in dollars) of investing in a Fund and to compare these costs with the ongoing costs of investing in other mutual funds. The example is based on an investment of $1,000 invested at the beginning of the period and held for the entire period of July 1, 2023 through December 31, 2023. To the extent a Fund was subject to acquired fund fees and expenses during the period, acquired fund fees and expenses are not included in the annualized expense ratios below.
Actual Expenses
The first set of columns of the table below provides information about actual account values and actual expenses. You may use this information, together with the amount you invested, to estimate the expenses that you paid over the period. Simply divide your account value by $1,000 (for example, an $8,600 account value divided by $1,000 = 8.6), then multiply the result by the number in the line under the heading entitled “Expenses Paid During The Period” to estimate the expenses you paid on your account during this period.
Hypothetical Example for Comparison Purposes
The second set of columns of the table below provides information about hypothetical account values and hypothetical expenses based on a Fund’s actual expense ratio and an assumed rate of return of 5% per year before expenses, which is not the Fund’s actual return. The hypothetical account values and expenses may not be used to estimate the actual ending account balance or expenses you paid for the period. You may use this information to compare the ongoing costs of investing in a Fund and other funds. To do so, compare this 5% hypothetical example with the 5% hypothetical examples that appear in the shareholder reports of the other funds.
Please note that the expenses shown in the table are meant to highlight your ongoing costs only and do not reflect any transactional costs, such as sales charges (loads) or fees which may be applied at the variable life insurance, variable annuity, or qualified retirement plan product level. Therefore, the second set of columns of the table is useful in comparing ongoing costs only, and will not help you determine the relative total costs of owning different funds. In addition, if these transactional costs were included, your costs would be higher. Expenses for a class of a Fund are equal to the class' annualized expense ratio multiplied by average account value over the period, multiplied by 184/365 (to reflect the one-half year period).
| | Actual Return | | Hypothetical (5% return before expenses) |
| | Beginning
Account Value
July 1, 2023 | | Ending
Account Value
December 31, 2023 | | Expenses paid
during the period
July 1, 2023
through
December 31, 2023 | | Beginning
Account Value
July 1, 2023 | | Ending
Account Value
December 31, 2023 | | Expenses paid
during the period
July 1, 2023
through
December 31, 2023 | | Annualized
expense
ratio |
| Hartford Balanced HLS Fund |
| Class IA | $ 1,000.00 | | $ 1,070.00 | | $ 3.29 | | $ 1,000.00 | | $ 1,022.03 | | $ 3.21 | | 0.63% |
| Class IB | $ 1,000.00 | | $ 1,068.30 | | $ 4.59 | | $ 1,000.00 | | $ 1,020.77 | | $ 4.48 | | 0.88% |
| Hartford Capital Appreciation HLS Fund |
| Class IA | $ 1,000.00 | | $ 1,069.80 | | $ 3.50 | | $ 1,000.00 | | $ 1,021.83 | | $ 3.41 | | 0.67% |
| Class IB | $ 1,000.00 | | $ 1,068.60 | | $ 4.80 | | $ 1,000.00 | | $ 1,020.57 | | $ 4.69 | | 0.92% |
| Class IC | $ 1,000.00 | | $ 1,067.00 | | $ 6.10 | | $ 1,000.00 | | $ 1,019.31 | | $ 5.96 | | 1.17% |
| Hartford Disciplined Equity HLS Fund |
| Class IA | $ 1,000.00 | | $ 1,076.10 | | $ 3.09 | | $ 1,000.00 | | $ 1,022.23 | | $ 3.01 | | 0.59% |
| Class IB | $ 1,000.00 | | $ 1,074.90 | | $ 4.39 | | $ 1,000.00 | | $ 1,020.97 | | $ 4.28 | | 0.84% |
| Class IC | $ 1,000.00 | | $ 1,073.90 | | $ 5.70 | | $ 1,000.00 | | $ 1,019.71 | | $ 5.55 | | 1.09% |
| Hartford Dividend and Growth HLS Fund |
| Class IA | $ 1,000.00 | | $ 1,073.10 | | $ 3.45 | | $ 1,000.00 | | $ 1,021.88 | | $ 3.36 | | 0.66% |
| Class IB | $ 1,000.00 | | $ 1,071.80 | | $ 4.75 | | $ 1,000.00 | | $ 1,020.62 | | $ 4.63 | | 0.91% |
| Hartford Healthcare HLS Fund |
| Class IA | $ 1,000.00 | | $ 1,021.30 | | $ 4.74 | | $ 1,000.00 | | $ 1,020.52 | | $ 4.74 | | 0.93% |
| Class IB | $ 1,000.00 | | $ 1,019.30 | | $ 6.01 | | $ 1,000.00 | | $ 1,019.26 | | $ 6.01 | | 1.18% |
| Hartford International Opportunities HLS Fund |
| Class IA | $ 1,000.00 | | $ 1,032.80 | | $ 3.89 | | $ 1,000.00 | | $ 1,021.37 | | $ 3.87 | | 0.76% |
| Class IB | $ 1,000.00 | | $ 1,031.90 | | $ 5.17 | | $ 1,000.00 | | $ 1,020.11 | | $ 5.14 | | 1.01% |
| Hartford MidCap HLS Fund |
| Class IA | $ 1,000.00 | | $ 1,055.80 | | $ 3.78 | | $ 1,000.00 | | $ 1,021.53 | | $ 3.72 | | 0.73% |
| Class IB | $ 1,000.00 | | $ 1,054.50 | | $ 5.07 | | $ 1,000.00 | | $ 1,020.27 | | $ 4.99 | | 0.98% |
Expense Examples (Unaudited) – (continued)
| | Actual Return | | Hypothetical (5% return before expenses) |
| | Beginning
Account Value
July 1, 2023 | | Ending
Account Value
December 31, 2023 | | Expenses paid
during the period
July 1, 2023
through
December 31, 2023 | | Beginning
Account Value
July 1, 2023 | | Ending
Account Value
December 31, 2023 | | Expenses paid
during the period
July 1, 2023
through
December 31, 2023 | | Annualized
expense
ratio |
| Hartford Small Cap Growth HLS Fund |
| Class IA | $ 1,000.00 | | $ 1,047.70 | | $ 3.36 | | $ 1,000.00 | | $ 1,021.88 | | $ 3.31 | | 0.65% |
| Class IB | $ 1,000.00 | | $ 1,046.10 | | $ 4.69 | | $ 1,000.00 | | $ 1,020.62 | | $ 4.63 | | 0.91% |
| Hartford Small Company HLS Fund |
| Class IA | $ 1,000.00 | | $ 1,058.90 | | $ 4.15 | | $ 1,000.00 | | $ 1,021.17 | | $ 4.08 | | 0.80% |
| Class IB | $ 1,000.00 | | $ 1,058.20 | | $ 5.45 | | $ 1,000.00 | | $ 1,019.91 | | $ 5.35 | | 1.05% |
| Hartford Stock HLS Fund |
| Class IA | $ 1,000.00 | | $ 1,041.30 | | $ 2.62 | | $ 1,000.00 | | $ 1,022.63 | | $ 2.60 | | 0.51% |
| Class IB | $ 1,000.00 | | $ 1,040.10 | | $ 3.91 | | $ 1,000.00 | | $ 1,021.37 | | $ 3.87 | | 0.76% |
| Hartford Total Return Bond HLS Fund |
| Class IA | $ 1,000.00 | | $ 1,041.60 | | $ 2.57 | | $ 1,000.00 | | $ 1,022.68 | | $ 2.55 | | 0.50% |
| Class IB | $ 1,000.00 | | $ 1,039.80 | | $ 3.86 | | $ 1,000.00 | | $ 1,021.42 | | $ 3.82 | | 0.75% |
| Hartford Ultrashort Bond HLS Fund |
| Class IA | $ 1,000.00 | | $ 1,032.10 | | $ 2.25 | | $ 1,000.00 | | $ 1,022.99 | | $ 2.24 | | 0.44% |
| Class IB | $ 1,000.00 | | $ 1,030.20 | | $ 3.53 | | $ 1,000.00 | | $ 1,021.73 | | $ 3.52 | | 0.69% |
Hartford Balanced HLS Fund
Schedule of Investments
December 31, 2023
| Shares or Principal Amount | | Market Value† |
| ASSET & COMMERCIAL MORTGAGE-BACKED SECURITIES - 1.4% |
| | Asset-Backed - Automobile - 0.3% |
| $ 889,484 | CFMT LLC 1.39%, 09/22/2031(1) | $ 862,467 |
| 1,845,000 | Enterprise Fleet Financing LLC 6.40%, 03/20/2030(1) | 1,886,166 |
| | Ford Credit Auto Owner Trust | |
| 275,000 | 1.61%, 10/17/2033(1) | 252,485 |
| 260,000 | 1.91%, 10/17/2033(1) | 238,563 |
| 555,357 | SFS Auto Receivables Securitization Trust 5.89%, 03/22/2027(1) | 556,475 |
| 1,260,000 | Wheels Fleet Lease Funding 1 LLC 6.46%, 08/18/2038(1) | 1,275,365 |
| | | | 5,071,521 |
| | Asset-Backed - Student Loan - 0.1% |
| 1,490,414 | Navient Private Education Refi Loan Trust 5.51%, 10/15/2071(1) | 1,490,125 |
| | Commercial Mortgage-Backed Securities - 0.1% |
| 1,460,000 | BX Trust 6.77%, 10/15/2036, 1 mo. USD Term SOFR + 1.41%(1)(2) | 1,412,346 |
| 289,976 | Life Mortgage Trust 6.18%, 03/15/2038, 1 mo. USD Term SOFR + 0.81%(1)(2) | 284,317 |
| 375,000 | SFAVE Commercial Mortgage Securities Trust 4.14%, 01/05/2043(1)(3) | 280,552 |
| | | | 1,977,215 |
| | Other Asset-Backed Securities - 0.8% |
| 81,766 | Aaset Trust 3.84%, 05/15/2039(1) | 61,820 |
| 62,490 | Affirm Asset Securitization Trust 1.07%, 08/15/2025(1) | 61,782 |
| | Castlelake Aircraft Structured Trust | |
| 134,960 | 3.47%, 01/15/2046(1) | 123,876 |
| 353,476 | 3.97%, 04/15/2039(1) | 307,988 |
| | CF Hippolyta Issuer LLC | |
| 772,807 | 1.53%, 03/15/2061(1) | 692,444 |
| 410,193 | 1.69%, 07/15/2060(1) | 379,125 |
| 160,216 | 1.98%, 03/15/2061(1) | 136,221 |
| 195,426 | 5.97%, 08/15/2062(1) | 192,285 |
| 1,323,079 | Home Partners of America Trust 2.30%, 12/17/2026(1) | 1,190,915 |
| 171,994 | Horizon Aircraft Finance II Ltd. 3.72%, 07/15/2039(1) | 151,695 |
| 260,558 | Horizon Aircraft Finance III Ltd. 3.43%, 11/15/2039(1) | 204,536 |
| 1,155,000 | Kubota Credit Owner Trust 5.28%, 01/18/2028(1) | 1,168,344 |
| 141,341 | MACH 1 Cayman Ltd. 3.47%, 10/15/2039(1) | 122,092 |
| 85,514 | MAPS Ltd. 4.46%, 03/15/2044(1) | 76,571 |
| | New Economy Assets Phase 1 Sponsor LLC | |
| 1,530,000 | 1.91%, 10/20/2061(1) | 1,339,453 |
| 480,000 | 2.41%, 10/20/2061(1) | 389,879 |
| 2,794,000 | Retained Vantage Data Centers Issuer LLC 5.00%, 09/15/2048(1) | 2,623,871 |
| 484,791 | SCF Equipment Leasing LLC 0.83%, 08/21/2028(1) | 477,711 |
| 2,550,000 | Stack Infrastructure Issuer LLC 5.90%, 07/25/2048(1) | 2,534,983 |
| 133,966 | Start II Ltd. 4.09%, 03/15/2044(1) | 121,643 |
| | | | 12,357,234 |
| | Whole Loan Collateral CMO - 0.1% |
| 53,668 | Angel Oak Mortgage Trust 2.62%, 11/25/2059(1)(3) | 51,771 |
| | Federal National Mortgage Association Connecticut Avenue Securities | |
| 280,000 | 6.89%, 10/25/2041, 30 day USD SOFR Average + 1.55%(1)(2) | 279,820 |
| Shares or Principal Amount | | Market Value† |
| ASSET & COMMERCIAL MORTGAGE-BACKED SECURITIES - 1.4% - (continued) |
| | Whole Loan Collateral CMO - 0.1% - (continued) |
| $ 119,365 | 11.35%, 10/25/2028, 30 day USD SOFR Average + 6.01%(2) | $ 127,198 |
| | Flagstar Mortgage Trust | |
| 588,198 | 2.00%, 09/25/2041(1)(3) | 492,825 |
| 278,901 | 4.00%, 05/25/2048(1)(3) | 257,237 |
| 206,931 | MetLife Securitization Trust 3.00%, 04/25/2055(1)(3) | 193,688 |
| 83,540 | Mill City Mortgage Loan Trust 2.75%, 01/25/2061(1)(3) | 81,814 |
| 406,152 | Seasoned Credit Risk Transfer Trust 3.50%, 10/25/2058 | 383,900 |
| | Towd Point Mortgage Trust | |
| 169,870 | 2.75%, 06/25/2057(1)(3) | 162,822 |
| 65,123 | 3.00%, 01/25/2058(1)(3) | 63,233 |
| | | | 2,094,308 |
| | Total Asset & Commercial Mortgage-Backed Securities
(cost $23,648,353) | $ 22,990,403 |
| CORPORATE BONDS - 12.4% |
| | Aerospace/Defense - 0.3% |
| | HEICO Corp. | |
| 2,328,000 | 5.25%, 08/01/2028 | $ 2,378,968 |
| 2,325,000 | 5.35%, 08/01/2033 | 2,388,039 |
| 560,000 | Lockheed Martin Corp. 4.85%, 09/15/2041 | 539,804 |
| | | | 5,306,811 |
| | Airlines - 0.0% |
| 91,359 | United Airlines Pass-Through Trust 4.60%, 09/01/2027 | 86,769 |
| | Auto Manufacturers - 0.0% |
| 270,000 | Daimler Truck Finance North America LLC 5.15%, 01/16/2026(1) | 270,829 |
| | Beverages - 0.1% |
| 990,000 | Anheuser-Busch InBev Worldwide, Inc. 4.38%, 04/15/2038 | 941,370 |
| | Biotechnology - 0.0% |
| 385,000 | Gilead Sciences, Inc. 5.55%, 10/15/2053 | 418,450 |
| | Commercial Banks - 3.3% |
| | Bank of America Corp. | |
| 1,570,000 | 1.73%, 07/22/2027, (1.73% fixed rate until 07/22/2026; 6 mo. USD SOFR + 0.96% thereafter)(4) | 1,438,972 |
| 1,215,000 | 2.30%, 07/21/2032, (2.30% fixed rate until 07/21/2031; 6 mo. USD SOFR + 1.22% thereafter)(4) | 993,368 |
| 1,799,000 | 3.42%, 12/20/2028, (3.42% fixed rate until 12/20/2027; 3 mo. USD Term SOFR + 1.30% thereafter)(4) | 1,693,844 |
| 1,610,000 | 3.59%, 07/21/2028, (3.59% fixed rate until 07/21/2027; 3 mo. USD Term SOFR + 1.63% thereafter)(4) | 1,528,199 |
| 2,239,000 | 5.82%, 09/15/2029, (5.82% fixed rate until 09/15/2028; 6 mo. USD SOFR + 1.57% thereafter)(4) | 2,312,730 |
| 574,000 | 5.87%, 09/15/2034, (5.87% fixed rate until 09/15/2033; 6 mo. USD SOFR + 1.84% thereafter)(4) | 602,362 |
The accompanying notes are an integral part of these financial statements.
Hartford Balanced HLS Fund
Schedule of Investments – (continued)
December 31, 2023
| Shares or Principal Amount | | Market Value† |
| CORPORATE BONDS - 12.4% - (continued) |
| | Commercial Banks - 3.3% - (continued) |
| $ 2,494,000 | Bank of New York Mellon Corp. 4.97%, 04/26/2034, (4.97% fixed rate until 04/26/2033; 6 mo. USD SOFR + 1.61% thereafter)(4) | $ 2,487,213 |
| | BNP Paribas SA | |
| 830,000 | 2.82%, 11/19/2025, (2.82% fixed rate until 11/19/2024; 3 mo. USD Term SOFR + 1.37% thereafter)(1)(4) | 808,840 |
| 1,640,000 | 5.89%, 12/05/2034, (5.89% fixed rate until 12/05/2033; 6 mo. USD SOFR + 1.87% thereafter)(1)(4) | 1,716,470 |
| 2,445,000 | BPCE SA 6.71%, 10/19/2029, (6.71% fixed rate until 10/19/2028; 6 mo. USD SOFR + 2.27% thereafter)(1)(4) | 2,576,716 |
| 2,505,000 | Commonwealth Bank of Australia 5.07%, 09/14/2028(1) | 2,563,604 |
| 2,733,000 | Credit Agricole SA 6.32%, 10/03/2029, (6.32% fixed rate until 10/03/2028; 6 mo. USD SOFR + 1.86% thereafter)(1)(4) | 2,866,772 |
| 2,737,000 | Credit Suisse AG 7.50%, 02/15/2028 | 3,000,254 |
| | Danske Bank AS | |
| 1,865,000 | 1.62%, 09/11/2026, (1.62% fixed rate until 09/11/2025; 1 yr. USD CMT + 1.35% thereafter)(1)(4) | 1,740,614 |
| 1,555,000 | 6.26%, 09/22/2026, (6.26% fixed rate until 09/22/2025; 1 yr. USD CMT + 1.18% thereafter)(1)(4) | 1,582,038 |
| 1,960,000 | Deutsche Bank AG 6.82%, 11/20/2029, (6.82% fixed rate until 11/20/2028; 6 mo. USD SOFR + 2.51% thereafter)(4) | 2,065,550 |
| 1,150,000 | Goldman Sachs Group, Inc. 6.25%, 02/01/2041 | 1,284,570 |
| | JP Morgan Chase & Co. | |
| 620,000 | 2.52%, 04/22/2031, (2.52% fixed rate until 04/22/2030; 6 mo. USD SOFR + 2.04% thereafter)(4) | 536,991 |
| 390,000 | 3.11%, 04/22/2041, (3.11% fixed rate until 04/22/2040; 3 mo. USD Term SOFR + 2.46% thereafter)(4) | 301,210 |
| 705,000 | 3.70%, 05/06/2030, (3.70% fixed rate until 05/06/2029; 3 mo. USD Term SOFR + 1.42% thereafter)(4) | 663,455 |
| 805,000 | 4.45%, 12/05/2029, (4.45% fixed rate until 12/05/2028; 3 mo. USD Term SOFR + 1.59% thereafter)(4) | 789,157 |
| | M&T Bank Corp. | |
| 940,000 | 4.55%, 08/16/2028, (4.55% fixed rate until 08/16/2027; 6 mo. USD SOFR + 1.78% thereafter)(4) | 904,356 |
| 2,195,000 | 7.41%, 10/30/2029, (7.41% fixed rate until 10/30/2028; 6 mo. USD SOFR + 2.80% thereafter)(4) | 2,363,345 |
| 1,040,000 | Manufacturers & Traders Trust Co. 4.70%, 01/27/2028 | 1,011,252 |
| | Morgan Stanley | |
| 1,450,000 | 3.13%, 07/27/2026 | 1,388,890 |
| 1,000,000 | 3.70%, 10/23/2024 | 987,015 |
| 1,372,000 | 5.95%, 01/19/2038, (5.95% fixed rate until 01/19/2033; 5 yr. USD CMT + 2.43% thereafter)(4) | 1,390,128 |
| | Standard Chartered PLC | |
| 1,130,000 | 0.99%, 01/12/2025, (0.99% fixed rate until 01/12/2024; 1 yr. USD CMT + 0.78% thereafter)(1)(4) | 1,128,350 |
| Shares or Principal Amount | | Market Value† |
| CORPORATE BONDS - 12.4% - (continued) |
| | Commercial Banks - 3.3% - (continued) |
| $ 3,215,000 | 1.21%, 03/23/2025, (1.21% fixed rate until 03/23/2024; 1 yr. USD CMT + 0.88% thereafter)(1)(4) | $ 3,177,384 |
| 1,545,000 | UBS AG 5.65%, 09/11/2028 | 1,603,649 |
| | UBS Group AG | |
| 1,695,000 | 1.49%, 08/10/2027, (1.49% fixed rate until 08/10/2026; 1 yr. USD CMT + 0.85% thereafter)(1)(4) | 1,532,172 |
| 320,000 | 6.30%, 09/22/2034, (6.30% fixed rate until 09/22/2033; 1 yr. USD CMT + 2.00% thereafter)(1)(4) | 339,647 |
| | Wells Fargo & Co. | |
| 4,344,000 | 4.48%, 01/16/2024 | 4,341,589 |
| 1,750,000 | 4.61%, 04/25/2053, (4.61% fixed rate until 04/25/2052; 6 mo. USD SOFR + 2.13% thereafter)(4) | 1,581,933 |
| 1,665,000 | 6.30%, 10/23/2029, (6.30% fixed rate until 10/23/2028; 6 mo. USD SOFR + 1.79% thereafter)(4) | 1,756,375 |
| | | | 57,059,014 |
| | Commercial Services - 0.3% |
| | Ashtead Capital, Inc. | |
| 2,285,000 | 2.45%, 08/12/2031(1) | 1,863,502 |
| 600,000 | 5.50%, 08/11/2032(1) | 593,772 |
| 380,000 | 5.55%, 05/30/2033(1) | 376,828 |
| 475,000 | 5.95%, 10/15/2033(1) | 484,846 |
| 691,000 | ERAC USA Finance LLC 5.40%, 05/01/2053(1) | 728,341 |
| 570,000 | UL Solutions, Inc. 6.50%, 10/20/2028(1) | 599,878 |
| | | | 4,647,167 |
| | Construction Materials - 0.0% |
| | Carrier Global Corp. | |
| 205,000 | 5.90%, 03/15/2034(1) | 222,253 |
| 140,000 | 6.20%, 03/15/2054(1) | 162,630 |
| | | | 384,883 |
| | Diversified Financial Services - 0.7% |
| | American Express Co. | |
| 3,843,000 | 5.04%, 05/01/2034, (5.04% fixed rate until 05/01/2033; 6 mo. USD SOFR + 1.84% thereafter)(4) | 3,844,250 |
| 195,000 | 6.49%, 10/30/2031, (6.49% fixed rate until 10/30/2030; 6 mo. USD SOFR + 1.94% thereafter)(4) | 211,769 |
| 1,715,000 | Aviation Capital Group LLC 1.95%, 09/20/2026(1) | 1,551,683 |
| 2,615,000 | Blackstone Holdings Finance Co. LLC 2.55%, 03/30/2032(1) | 2,136,646 |
| | Capital One Financial Corp. | |
| 580,000 | 6.31%, 06/08/2029, (6.31% fixed rate until 06/08/2028; 6 mo. USD SOFR + 2.64% thereafter)(4) | 595,823 |
| 535,000 | 7.15%, 10/29/2027, (7.15% fixed rate until 10/29/2026; 6 mo. USD SOFR + 2.44% thereafter)(4) | 555,651 |
| | Intercontinental Exchange, Inc. | |
| 2,185,000 | 4.00%, 09/15/2027 | 2,143,797 |
| 816,000 | 4.35%, 06/15/2029 | 811,760 |
| | Nasdaq, Inc. | |
| 175,000 | 5.95%, 08/15/2053 | 188,729 |
| 165,000 | 6.10%, 06/28/2063 | 178,941 |
| | | | 12,219,049 |
The accompanying notes are an integral part of these financial statements.
Hartford Balanced HLS Fund
Schedule of Investments – (continued)
December 31, 2023
| Shares or Principal Amount | | Market Value† |
| CORPORATE BONDS - 12.4% - (continued) |
| | Electric - 1.4% |
| $ 1,200,000 | American Transmission Systems, Inc. 2.65%, 01/15/2032(1) | $ 1,017,113 |
| | Arizona Public Service Co. | |
| 182,000 | 3.35%, 05/15/2050(5) | 129,286 |
| 90,000 | 3.75%, 05/15/2046 | 68,686 |
| 221,000 | 4.25%, 03/01/2049 | 179,323 |
| 940,000 | 4.35%, 11/15/2045 | 793,194 |
| 1,960,000 | Cleveland Electric Illuminating Co. 3.50%, 04/01/2028(1) | 1,836,717 |
| 360,000 | Dominion Energy South Carolina, Inc. 6.63%, 02/01/2032(5) | 407,372 |
| | Dominion Energy, Inc. | |
| 55,000 | 3.38%, 04/01/2030 | 50,707 |
| 2,595,000 | 4.35%, 01/15/2027, (4.35% fixed rate until 01/15/2027; 5 yr. USD CMT + 3.20% thereafter)(4)(5)(6) | 2,302,965 |
| 607,000 | 5.38%, 11/15/2032 | 624,392 |
| | Georgia Power Co. | |
| 3,073,000 | 4.70%, 05/15/2032 | 3,065,322 |
| 245,000 | 4.75%, 09/01/2040 | 227,777 |
| 826,000 | 5.13%, 05/15/2052 | 820,587 |
| 75,000 | Metropolitan Edison Co. 5.20%, 04/01/2028(1) | 75,607 |
| 625,000 | NextEra Energy Capital Holdings, Inc. 5.75%, 09/01/2025 | 631,141 |
| | Pacific Gas & Electric Co. | |
| 3,949,825 | 4.50%, 07/01/2040 | 3,348,572 |
| 1,552,900 | 4.55%, 07/01/2030 | 1,478,778 |
| 789,000 | 6.75%, 01/15/2053 | 861,430 |
| | Pennsylvania Electric Co. | |
| 241,000 | 3.60%, 06/01/2029(1) | 223,787 |
| 60,000 | 5.15%, 03/30/2026(1) | 59,924 |
| 860,000 | San Diego Gas & Electric Co. 3.70%, 03/15/2052 | 668,238 |
| | SCE Recovery Funding LLC | |
| 400,209 | 0.86%, 11/15/2033 | 340,971 |
| 220,000 | 1.94%, 05/15/2040 | 165,612 |
| 125,000 | 2.51%, 11/15/2043 | 86,248 |
| 1,156,000 | Sempra 4.13%, 04/01/2052, (4.13% fixed rate until 01/01/2027; 5 yr. USD CMT + 2.87% thereafter)(4) | 992,043 |
| 1,241,000 | Southern California Edison Co. 5.88%, 12/01/2053 | 1,340,632 |
| 1,528,768 | Texas Electric Market Stabilization Funding N LLC 4.27%, 08/01/2036(1) | 1,478,066 |
| | | | 23,274,490 |
| | Entertainment - 0.2% |
| 3,341,000 | Warnermedia Holdings, Inc. 4.05%, 03/15/2029 | 3,171,265 |
| | Food - 0.0% |
| 480,000 | Sigma Alimentos SA de CV 4.13%, 05/02/2026(1) | 467,830 |
| | Gas - 0.3% |
| 330,000 | Boston Gas Co. 3.15%, 08/01/2027(1) | 310,364 |
| 2,017,000 | CenterPoint Energy Resources Corp. 5.25%, 03/01/2028 | 2,069,922 |
| 1,870,000 | KeySpan Gas East Corp. 2.74%, 08/15/2026(1) | 1,744,330 |
| 790,000 | Southern Co. Gas Capital Corp. 5.75%, 09/15/2033 | 831,542 |
| | | | 4,956,158 |
| | Healthcare - Products - 0.3% |
| | Alcon Finance Corp. | |
| 4,706,000 | 3.00%, 09/23/2029(1) | 4,287,954 |
| Shares or Principal Amount | | Market Value† |
| CORPORATE BONDS - 12.4% - (continued) |
| | Healthcare - Products - 0.3% - (continued) |
| $ 200,000 | 5.38%, 12/06/2032(1) | $ 206,715 |
| 200,000 | 5.75%, 12/06/2052(1) | 215,902 |
| | | | 4,710,571 |
| | Healthcare - Services - 0.5% |
| 285,000 | Children's Hospital 2.93%, 07/15/2050 | 188,406 |
| 714,000 | Dignity Health 3.81%, 11/01/2024 | 701,776 |
| | Humana, Inc. | |
| 820,000 | 5.50%, 03/15/2053 | 852,073 |
| 963,000 | 5.88%, 03/01/2033 | 1,028,309 |
| 1,170,000 | 5.95%, 03/15/2034 | 1,254,694 |
| 2,190,000 | Providence St Joseph Health Obligated Group 5.40%, 10/01/2033 | 2,235,076 |
| 175,000 | Sutter Health 2.29%, 08/15/2030 | 150,236 |
| 320,000 | Toledo Hospital 5.75%, 11/15/2038 | 318,671 |
| | UnitedHealth Group, Inc. | |
| 355,000 | 2.00%, 05/15/2030 | 307,303 |
| 645,000 | 4.20%, 05/15/2032 | 632,318 |
| 95,000 | 4.75%, 05/15/2052 | 91,712 |
| | | | 7,760,574 |
| | Insurance - 0.7% |
| | American International Group, Inc. | |
| 437,000 | 3.40%, 06/30/2030 | 402,694 |
| 375,000 | 4.38%, 06/30/2050 | 336,171 |
| 2,815,000 | Athene Global Funding 2.50%, 03/24/2028(1) | 2,497,862 |
| 1,665,000 | Athene Holding Ltd. 5.88%, 01/15/2034 | 1,683,027 |
| | Corebridge Financial, Inc. | |
| 1,404,000 | 4.35%, 04/05/2042 | 1,193,697 |
| 1,020,000 | 5.75%, 01/15/2034 | 1,047,642 |
| 135,000 | 6.05%, 09/15/2033(1) | 140,859 |
| 275,000 | Corebridge Global Funding 5.90%, 09/19/2028(1) | 283,579 |
| 1,200,000 | Equitable Financial Life Global Funding 1.40%, 08/27/2027(1) | 1,043,326 |
| 2,450,000 | MetLife, Inc. 5.38%, 07/15/2033 | 2,559,252 |
| | | | 11,188,109 |
| | Investment Company Security - 0.0% |
| 1,120,000 | JAB Holdings BV 3.75%, 05/28/2051(1) | 765,308 |
| | Lodging - 0.1% |
| 2,003,000 | Genting New York LLC/GENNY Capital, Inc. 3.30%, 02/15/2026(1) | 1,825,570 |
| | Machinery-Diversified - 0.2% |
| 4,040,000 | John Deere Capital Corp. 5.15%, 09/08/2033 | 4,259,481 |
| | Media - 0.2% |
| 2,405,000 | Comcast Corp. 3.25%, 11/01/2039 | 1,956,028 |
| 567,000 | Discovery Communications LLC 4.00%, 09/15/2055 | 405,104 |
| | Time Warner Cable LLC | |
| 395,000 | 6.55%, 05/01/2037 | 389,999 |
| 250,000 | 7.30%, 07/01/2038 | 258,386 |
| | | | 3,009,517 |
| | Mining - 0.3% |
| | Glencore Funding LLC | |
| 345,000 | 5.70%, 05/08/2033(1) | 358,667 |
| 3,540,000 | 6.38%, 10/06/2030(1) | 3,805,184 |
| 757,000 | 6.50%, 10/06/2033(1) | 827,133 |
| | | | 4,990,984 |
| | Oil & Gas - 0.5% |
| | Equinor ASA | |
| 85,000 | 2.88%, 04/06/2025 | 82,929 |
The accompanying notes are an integral part of these financial statements.
Hartford Balanced HLS Fund
Schedule of Investments – (continued)
December 31, 2023
| Shares or Principal Amount | | Market Value† |
| CORPORATE BONDS - 12.4% - (continued) |
| | Oil & Gas - 0.5% - (continued) |
| $ 2,470,000 | 3.00%, 04/06/2027 | $ 2,363,630 |
| | Occidental Petroleum Corp. | |
| 969,000 | 6.13%, 01/01/2031 | 1,006,003 |
| 1,928,000 | 6.20%, 03/15/2040 | 1,990,660 |
| 762,000 | 6.45%, 09/15/2036 | 808,261 |
| | QatarEnergy | |
| 935,000 | 2.25%, 07/12/2031(1) | 795,021 |
| 780,000 | 3.13%, 07/12/2041(1) | 598,670 |
| 615,000 | Saudi Arabian Oil Co. 3.50%, 04/16/2029(1) | 581,772 |
| | | | 8,226,946 |
| | Pharmaceuticals - 0.2% |
| | Bayer U.S. Finance LLC | |
| 495,000 | 6.13%, 11/21/2026(1) | 503,543 |
| 555,000 | 6.25%, 01/21/2029(1) | 567,841 |
| 113,000 | CVS Health Corp. 4.30%, 03/25/2028 | 111,215 |
| 2,063,000 | Pfizer Investment Enterprises Pte. Ltd. 5.11%, 05/19/2043 | 2,062,074 |
| | | | 3,244,673 |
| | Pipelines - 0.4% |
| | Columbia Pipelines Operating Co. LLC | |
| 375,000 | 5.93%, 08/15/2030(1) | 388,278 |
| 676,000 | 6.50%, 08/15/2043(1) | 726,230 |
| 369,000 | Enbridge, Inc. 6.70%, 11/15/2053 | 430,839 |
| | Energy Transfer LP | |
| 180,000 | 4.95%, 06/15/2028 | 179,468 |
| 750,000 | 5.00%, 05/15/2050 | 671,949 |
| 945,000 | 5.35%, 05/15/2045 | 880,403 |
| | Enterprise Products Operating LLC | |
| 100,000 | 3.70%, 01/31/2051 | 79,884 |
| 145,000 | 3.95%, 01/31/2060 | 118,073 |
| 1,762,588 | Galaxy Pipeline Assets Bidco Ltd. 2.16%, 03/31/2034(1) | 1,528,343 |
| | Gray Oak Pipeline LLC | |
| 606,000 | 2.60%, 10/15/2025(1) | 574,496 |
| 100,000 | 3.45%, 10/15/2027(1) | 93,055 |
| 795,000 | Targa Resources Corp. 6.15%, 03/01/2029 | 832,351 |
| | | | 6,503,369 |
| | Real Estate - 0.1% |
| 2,175,000 | Jones Lang LaSalle, Inc. 6.88%, 12/01/2028 | 2,298,603 |
| | Real Estate Investment Trusts - 1.2% |
| 2,410,000 | American Tower Trust #1 5.49%, 03/15/2028(1) | 2,446,284 |
| | Extra Space Storage LP | |
| 435,000 | 5.50%, 07/01/2030 | 445,478 |
| 935,000 | 5.90%, 01/15/2031 | 977,193 |
| 2,612,000 | GLP Capital LP/GLP Financing II, Inc. 6.75%, 12/01/2033 | 2,818,040 |
| 2,718,000 | LXP Industrial Trust 6.75%, 11/15/2028 | 2,859,065 |
| 4,761,000 | Realty Income Corp. 4.90%, 07/15/2033 | 4,761,933 |
| | SBA Tower Trust | |
| 545,000 | 1.63%, 05/15/2051(1) | 486,825 |
| 300,000 | 1.88%, 07/15/2050(1) | 278,397 |
| 470,000 | 2.84%, 01/15/2050(1) | 453,867 |
| | VICI Properties LP/VICI Note Co., Inc. | |
| 2,646,000 | 4.13%, 08/15/2030(1) | 2,410,308 |
| 1,842,000 | 5.75%, 02/01/2027(1) | 1,842,963 |
| | | | 19,780,353 |
| | Semiconductors - 0.1% |
| 2,704,000 | Broadcom, Inc. 3.47%, 04/15/2034(1) | 2,356,639 |
| Shares or Principal Amount | | Market Value† |
| CORPORATE BONDS - 12.4% - (continued) |
| | Software - 0.2% |
| $ 985,000 | Microsoft Corp. 4.50%, 06/15/2047(1) | $ 967,463 |
| 3,844,000 | Oracle Corp. 3.65%, 03/25/2041 | 3,067,606 |
| | | | 4,035,069 |
| | Telecommunications - 0.4% |
| | AT&T, Inc. | |
| 835,000 | 3.50%, 09/15/2053 | 608,709 |
| 84,000 | 3.65%, 06/01/2051 | 63,548 |
| 146,000 | 3.85%, 06/01/2060 | 109,363 |
| 817,000 | 4.30%, 02/15/2030 | 801,259 |
| 200,000 | 4.30%, 12/15/2042 | 174,560 |
| 700,000 | Sprint Spectrum Co. LLC/Sprint Spectrum Co. II LLC/Sprint Spectrum Co. III LLC 4.74%, 09/20/2029(1) | 693,996 |
| | T-Mobile USA, Inc. | |
| 3,005,000 | 3.38%, 04/15/2029 | 2,791,872 |
| 41,000 | 5.75%, 01/15/2054 | 43,570 |
| | Verizon Communications, Inc. | |
| 500,000 | 2.88%, 11/20/2050 | 340,765 |
| 760,000 | 2.99%, 10/30/2056 | 504,753 |
| 513,000 | 3.00%, 11/20/2060 | 336,333 |
| | | | 6,468,728 |
| | Trucking & Leasing - 0.4% |
| 2,185,000 | DAE Funding LLC 1.55%, 08/01/2024(1) | 2,126,758 |
| | Penske Truck Leasing Co. LP/PTL Finance Corp. | |
| 2,850,000 | 3.95%, 03/10/2025(1) | 2,797,873 |
| 885,000 | 5.55%, 05/01/2028(1) | 899,339 |
| 1,195,000 | 5.70%, 02/01/2028(1) | 1,221,758 |
| | | | 7,045,728 |
| | Total Corporate Bonds
(cost $211,451,345) | $ 211,674,307 |
| MUNICIPAL BONDS - 0.8% |
| | Airport - 0.1% |
| | Dallas Fort Worth International Airport, TX, Rev | |
| 60,000 | 4.09%, 11/01/2051 | $ 52,394 |
| 375,000 | 4.51%, 11/01/2051 | 350,063 |
| 710,000 | Port Auth of New York & New Jersey, NY, Rev 3.18%, 07/15/2060(5) | 498,148 |
| | | | 900,605 |
| | General - 0.1% |
| 174,655 | Chicago Transit Auth Sales & Transfer Tax Receipts, IL, Rev 6.90%, 12/01/2040 | 198,759 |
| 540,000 | Kansas Dev Finance Auth, KS, Rev, (BAM) 2.77%, 05/01/2051 | 384,012 |
| 1,250,000 | Philadelphia Auth for Industrial Dev, PA, Rev, (NATL Insured) 6.55%, 10/15/2028 | 1,331,759 |
| | | | 1,914,530 |
| | General Obligation - 0.3% |
| 5,505,000 | State of Illinois, IL, GO 5.10%, 06/01/2033 | 5,446,866 |
| | Tobacco - 0.0% |
| 145,000 | Golden State Tobacco Securitization Corp., CA, Rev, (ST APPROP Insured) 3.00%, 06/01/2046 | 131,958 |
| | Transportation - 0.1% |
| 875,000 | Illinois State Toll Highway Auth, IL, Rev 6.18%, 01/01/2034 | 961,268 |
| | Metropolitan Transportation Auth, NY, Rev | |
| 25,000 | 6.20%, 11/15/2026 | 25,513 |
The accompanying notes are an integral part of these financial statements.
Hartford Balanced HLS Fund
Schedule of Investments – (continued)
December 31, 2023
| Shares or Principal Amount | | Market Value† |
| MUNICIPAL BONDS - 0.8% - (continued) |
| | Transportation - 0.1% - (continued) |
| $ 375,000 | 6.67%, 11/15/2039 | $ 413,215 |
| 785,000 | 6.81%, 11/15/2040 | 869,758 |
| | | | 2,269,754 |
| | Utilities - 0.1% |
| 925,000 | Texas Natural Gas Securitization Finance Corp., TX, Rev 5.10%, 04/01/2035 | 942,703 |
| | Utility - Electric - 0.1% |
| 785,000 | Illinois Municipal Electric Agency, IL, Rev 6.83%, 02/01/2035 | 839,226 |
| 824,000 | Municipal Electric Auth of Georgia, GA, Rev 6.64%, 04/01/2057 | 940,254 |
| | | | 1,779,480 |
| | Total Municipal Bonds
(cost $14,585,406) | | $ 13,385,896 |
| U.S. GOVERNMENT AGENCIES - 0.8% |
| | Mortgage-Backed Agencies - 0.8% |
| | Federal Home Loan Mortgage Corp. - 0.3% |
| 563,030 | 2.00%, 05/01/2036 | $ 509,116 |
| 305,026 | 2.00%, 07/01/2036 | 275,849 |
| 7,259 | 4.00%, 03/01/2041 | 7,075 |
| 34,083 | 4.00%, 04/01/2047 | 33,097 |
| 123,768 | 4.00%, 05/01/2049 | 119,472 |
| 144,612 | 4.00%, 07/01/2049 | 140,845 |
| 795,000 | 4.43%, 02/25/2033(3) | 794,972 |
| 215,830 | 4.50%, 08/01/2052 | 209,509 |
| 334,052 | 4.50%, 10/01/2052 | 324,282 |
| 843,819 | 5.00%, 11/01/2043 | 849,058 |
| 974,688 | 5.00%, 04/01/2053 | 965,255 |
| 280,923 | 5.50%, 03/01/2053 | 282,561 |
| 840,319 | 5.50%, 09/01/2053 | 849,741 |
| 1,682 | 5.59%, 04/01/2029, 1 yr. USD CMT + 2.24%(2) | 1,669 |
| 280,555 | 8.14%, 10/25/2050, 30 day USD SOFR Average + 2.80%(1)(2) | 284,494 |
| | | | 5,646,995 |
| | Federal National Mortgage Association - 0.3% |
| 170,130 | 2.00%, 04/01/2036 | 153,862 |
| 68,217 | 2.00%, 06/01/2036 | 61,670 |
| 241,571 | 2.00%, 09/01/2036 | 218,409 |
| 133,887 | 2.00%, 03/01/2037 | 120,819 |
| 70,905 | 4.00%, 03/01/2046 | 68,597 |
| 90,411 | 4.00%, 01/01/2049 | 87,665 |
| 31,508 | 4.00%, 08/01/2049 | 30,506 |
| 92,035 | 4.00%, 08/01/2051 | 89,638 |
| 48,716 | 4.50%, 03/01/2038 | 48,648 |
| 18,591 | 4.50%, 11/01/2039 | 18,588 |
| 12,701 | 4.50%, 04/01/2040 | 12,697 |
| 40,368 | 4.50%, 08/01/2040 | 40,361 |
| 11,098 | 4.50%, 02/01/2041 | 11,096 |
| 231,310 | 4.50%, 04/01/2041 | 231,255 |
| 98,691 | 4.50%, 06/01/2041 | 98,382 |
| 154,399 | 4.50%, 07/01/2041 | 154,372 |
| 24,551 | 4.50%, 09/01/2041 | 24,539 |
| 33,222 | 4.50%, 07/01/2044 | 32,940 |
| 157,450 | 4.50%, 08/01/2052 | 152,838 |
| 773,225 | 4.50%, 09/01/2052 | 752,767 |
| 959,301 | 5.00%, 08/01/2043 | 964,863 |
| 236,940 | 5.00%, 08/01/2052 | 234,970 |
| 354,643 | 5.00%, 09/01/2052 | 351,694 |
| 236,849 | 5.00%, 10/01/2052 | 234,985 |
| Shares or Principal Amount | | Market Value† |
| U.S. GOVERNMENT AGENCIES - 0.8% - (continued) |
| | Mortgage-Backed Agencies - 0.8% - (continued) |
| | Federal National Mortgage Association - 0.3% - (continued) |
| $ 278,809 | 5.50%, 08/01/2053 | $ 280,367 |
| 56,225 | 5.84%, 10/25/2024, 30 day USD SOFR Average + 0.51(2) | 55,853 |
| | | | 4,532,381 |
| | Government National Mortgage Association - 0.2% |
| 2,173,603 | 2.50%, 10/20/2049 | 1,917,877 |
| 30,981 | 5.00%, 07/15/2037 | 31,033 |
| 45 | 6.00%, 06/15/2024 | 45 |
| 1,220 | 6.00%, 07/15/2026 | 1,231 |
| 608 | 6.00%, 03/15/2028 | 621 |
| 917 | 6.00%, 04/15/2028 | 941 |
| 22,303 | 6.00%, 05/15/2028 | 22,690 |
| 10,590 | 6.00%, 07/15/2028 | 10,838 |
| 3,760 | 6.00%, 08/15/2028 | 3,857 |
| 21,650 | 6.00%, 09/15/2028 | 22,019 |
| 31,451 | 6.00%, 10/15/2028 | 31,946 |
| 26,733 | 6.00%, 11/15/2028 | 27,172 |
| 20,937 | 6.00%, 12/15/2028 | 21,403 |
| 467 | 6.00%, 12/15/2031 | 480 |
| 8,499 | 6.00%, 09/15/2032 | 8,787 |
| 3,868 | 6.00%, 11/15/2032 | 3,972 |
| 1,452 | 6.00%, 04/15/2033 | 1,476 |
| 37,775 | 6.00%, 06/15/2033 | 38,937 |
| 12,476 | 6.00%, 10/15/2033 | 12,939 |
| 1,018 | 6.00%, 11/15/2033 | 1,056 |
| 18,668 | 6.00%, 10/15/2034 | 18,979 |
| 45,331 | 6.00%, 01/15/2035 | 46,073 |
| 5,294 | 6.00%, 05/15/2035 | 5,434 |
| 6,033 | 6.00%, 06/15/2035 | 6,132 |
| 83 | 6.50%, 03/15/2026 | 84 |
| 232 | 6.50%, 01/15/2028 | 237 |
| 16,625 | 6.50%, 03/15/2028 | 17,084 |
| 29,119 | 6.50%, 04/15/2028 | 29,799 |
| 7,747 | 6.50%, 05/15/2028 | 7,892 |
| 45,818 | 6.50%, 06/15/2028 | 47,034 |
| 3,803 | 6.50%, 10/15/2028 | 3,922 |
| 832 | 6.50%, 02/15/2035 | 860 |
| 1,954 | 7.00%, 11/15/2031 | 1,988 |
| 1,152 | 7.00%, 03/15/2032 | 1,172 |
| 414,347 | 7.00%, 11/15/2032 | 433,644 |
| 43,046 | 7.00%, 01/15/2033 | 44,689 |
| 50,805 | 7.00%, 05/15/2033 | 52,433 |
| 6,775 | 7.00%, 07/15/2033 | 6,972 |
| 56,388 | 7.00%, 11/15/2033 | 58,289 |
| 19,784 | 7.50%, 09/16/2035 | 20,164 |
| 30 | 8.00%, 09/15/2026 | 30 |
| 1,436 | 8.00%, 12/15/2026 | 1,456 |
| 15 | 8.00%, 09/15/2027 | 15 |
| 1,223 | 8.00%, 07/15/2029 | 1,264 |
| 1,093 | 8.00%, 12/15/2029 | 1,105 |
| 2,666 | 8.00%, 01/15/2030 | 2,669 |
| 1,129 | 8.00%, 02/15/2030 | 1,127 |
| 532 | 8.00%, 03/15/2030 | 532 |
| 5,140 | 8.00%, 04/15/2030 | 5,133 |
| 2,853 | 8.00%, 05/15/2030 | 2,864 |
| 14,686 | 8.00%, 06/15/2030 | 14,854 |
| 814 | 8.00%, 07/15/2030 | 815 |
| 21,808 | 8.00%, 08/15/2030 | 21,967 |
The accompanying notes are an integral part of these financial statements.
Hartford Balanced HLS Fund
Schedule of Investments – (continued)
December 31, 2023
| Shares or Principal Amount | | Market Value† |
| U.S. GOVERNMENT AGENCIES - 0.8% - (continued) |
| | Mortgage-Backed Agencies - 0.8% - (continued) |
| | Government National Mortgage Association - 0.2% - (continued) |
| $ 10,349 | 8.00%, 09/15/2030 | $ 10,365 |
| 45,255 | 8.00%, 12/15/2030 | 45,657 |
| | | | 3,072,054 |
| | Total U.S. Government Agencies
(cost $12,787,075) | | $ 13,251,430 |
| U.S. GOVERNMENT SECURITIES - 17.8% |
| | U.S. Treasury Securities - 17.8% |
| | U.S. Treasury Bonds - 6.0% |
| 17,710,000 | 2.50%, 02/15/2045(7) | $ 13,466,518 |
| 2,041,900 | 2.75%, 11/15/2047 | 1,596,590 |
| 12,698,700 | 2.88%, 05/15/2052 | 10,160,944 |
| 400,000 | 3.25%, 05/15/2042 | 352,266 |
| 5,288,500 | 3.38%, 08/15/2042 | 4,733,414 |
| 6,479,900 | 3.63%, 02/15/2053 | 6,012,638 |
| 7,381,500 | 3.63%, 05/15/2053 | 6,857,875 |
| 13,551,800 | 3.88%, 02/15/2043 | 12,968,437 |
| 5,468,500 | 3.88%, 05/15/2043 | 5,232,671 |
| 6,040,000 | 4.00%, 11/15/2042 | 5,891,359 |
| 11,935,900 | 4.00%, 11/15/2052 | 11,831,927 |
| 3,401,900 | 4.13%, 08/15/2053 | 3,455,055 |
| 12,050,000 | 4.38%, 02/15/2038 | 12,701,453 |
| 4,191,000 | 4.38%, 08/15/2043 | 4,293,811 |
| 1,333,000 | 4.75%, 11/15/2043 | 1,434,850 |
| 1,744,000 | 4.75%, 11/15/2053 | 1,964,998 |
| | | | 102,954,806 |
| | U.S. Treasury Notes - 11.8% |
| 290,000 | 0.25%, 05/31/2025 | 273,155 |
| 3,825,000 | 0.38%, 11/30/2025 | 3,553,066 |
| 1,080,000 | 0.88%, 09/30/2026 | 992,419 |
| 150,000 | 1.25%, 05/31/2028 | 134,127 |
| 603,000 | 1.25%, 09/30/2028 | 534,974 |
| 1,020,000 | 1.38%, 10/31/2028 | 908,796 |
| 4,505,600 | 1.50%, 01/31/2027 | 4,184,400 |
| 530,000 | 1.50%, 11/30/2028 | 474,474 |
| 2,115,000 | 1.63%, 10/31/2026 | 1,981,078 |
| 285,000 | 2.63%, 04/15/2025 | 278,064 |
| 2,980,000 | 2.63%, 05/31/2027 | 2,854,048 |
| 590,000 | 2.63%, 07/31/2029 | 553,148 |
| 935,000 | 2.75%, 05/15/2025 | 912,976 |
| 6,970,000 | 2.75%, 04/30/2027 | 6,708,625 |
| 890,000 | 2.75%, 05/31/2029 | 841,224 |
| 2,320,000 | 2.88%, 06/15/2025 | 2,267,800 |
| 1,245,000 | 3.13%, 08/15/2025 | 1,220,392 |
| 897,000 | 3.13%, 08/31/2027 | 872,368 |
| 6,555,000 | 3.25%, 06/30/2027 | 6,409,817 |
| 326,000 | 3.25%, 06/30/2029 | 315,889 |
| 414,000 | 3.50%, 09/15/2025 | 407,984 |
| 3,074,000 | 3.50%, 04/30/2028 | 3,027,770 |
| 635,000 | 3.50%, 04/30/2030 | 621,481 |
| 3,936,500 | 3.63%, 03/31/2028 | 3,896,828 |
| 1,369,000 | 3.63%, 05/31/2028 | 1,355,684 |
| 512,000 | 3.63%, 03/31/2030 | 504,740 |
| 620,000 | 3.75%, 05/31/2030 | 615,350 |
| 1,633,000 | 3.75%, 06/30/2030 | 1,620,561 |
| 3,008,000 | 3.88%, 03/31/2025 | 2,981,915 |
| 5,750,000 | 3.88%, 04/30/2025 | 5,699,014 |
| 5,122,000 | 3.88%, 11/30/2027 | 5,114,997 |
| 7,157,100 | 3.88%, 12/31/2027 | 7,150,949 |
| 685,000 | 3.88%, 11/30/2029 | 684,545 |
| 904,700 | 3.88%, 08/15/2033 | 905,407 |
| 1,100,000 | 4.00%, 12/15/2025 | 1,094,371 |
| Shares or Principal Amount | | Market Value† |
| U.S. GOVERNMENT SECURITIES - 17.8% - (continued) |
| | U.S. Treasury Securities - 17.8% - (continued) |
| | U.S. Treasury Notes - 11.8% - (continued) |
| $ 2,186,000 | 4.00%, 02/15/2026 | $ 2,176,607 |
| 3,969,700 | 4.00%, 02/29/2028 | 3,985,982 |
| 3,580,000 | 4.00%, 06/30/2028 | 3,600,138 |
| 150,000 | 4.00%, 10/31/2029 | 150,885 |
| 483,900 | 4.00%, 07/31/2030 | 487,227 |
| 260,000 | 4.13%, 06/15/2026 | 260,030 |
| 12,608,900 | 4.13%, 09/30/2027 | 12,697,556 |
| 3,381,200 | 4.13%, 10/31/2027 | 3,404,974 |
| 4,725,200 | 4.13%, 07/31/2028 | 4,778,359 |
| 754,300 | 4.13%, 08/31/2030 | 764,848 |
| 14,100,000 | 4.25%, 05/31/2025 | 14,049,879 |
| 4,965,700 | 4.38%, 08/31/2028 | 5,076,652 |
| 4,531,000 | 4.38%, 11/30/2028 | 4,641,089 |
| 130,000 | 4.38%, 11/30/2030 | 133,880 |
| 3,325,000 | 4.50%, 11/15/2033 | 3,498,004 |
| 3,700,000 | 4.63%, 06/30/2025 | 3,709,395 |
| 730,000 | 4.63%, 10/15/2026 | 741,178 |
| 866,000 | 4.63%, 11/15/2026 | 880,073 |
| 4,485,000 | 4.63%, 09/30/2028 | 4,633,741 |
| 4,671,000 | 4.75%, 07/31/2025 | 4,692,895 |
| 22,276,000 | 4.88%, 11/30/2025 | 22,511,812 |
| 14,162,000 | 4.88%, 10/31/2028 | 14,797,077 |
| 927,000 | 4.88%, 10/31/2030 | 981,896 |
| 9,805,900 | 5.00%, 08/31/2025 | 9,897,830 |
| 5,874,000 | 5.00%, 09/30/2025 | 5,935,035 |
| | | | 200,439,478 |
| | Total U.S. Government Securities
(cost $308,648,578) | | $ 303,394,284 |
| COMMON STOCKS - 66.0% |
| | Automobiles & Components - 0.9% |
| 462,946 | Gentex Corp. | $ 15,119,816 |
| | Banks - 4.2% |
| 186,277 | JP Morgan Chase & Co. | 31,685,718 |
| 145,489 | M&T Bank Corp. | 19,943,632 |
| 123,970 | PNC Financial Services Group, Inc. | 19,196,754 |
| | | | 70,826,104 |
| | Capital Goods - 4.7% |
| 172,792 | Emerson Electric Co. | 16,817,845 |
| 151,490 | Fortune Brands Innovations, Inc. | 11,534,449 |
| 52,280 | General Dynamics Corp. | 13,575,547 |
| 224,548 | Johnson Controls International PLC | 12,942,947 |
| 62,479 | L3Harris Technologies, Inc. | 13,159,327 |
| 79,106 | Middleby Corp.* | 11,642,030 |
| | | | 79,672,145 |
| | Consumer Discretionary Distribution & Retail - 1.9% |
| 255,903 | LKQ Corp. | 12,229,604 |
| 55,781 | Tractor Supply Co. | 11,994,589 |
| 304,479 | Victoria's Secret & Co.* | 8,080,873 |
| | | | 32,305,066 |
| | Consumer Durables & Apparel - 0.7% |
| 85,170 | Lennar Corp. Class A | 12,693,737 |
| | Consumer Services - 2.6% |
| 93,116 | Airbnb, Inc. Class A* | 12,676,812 |
| 373,055 | H&R Block, Inc. | 18,044,670 |
| 135,460 | Starbucks Corp. | 13,005,515 |
| | | | 43,726,997 |
| | Energy - 1.1% |
| 160,320 | ConocoPhillips | 18,608,342 |
The accompanying notes are an integral part of these financial statements.
Hartford Balanced HLS Fund
Schedule of Investments – (continued)
December 31, 2023
| Shares or Principal Amount | | Market Value† |
| COMMON STOCKS - 66.0% - (continued) |
| | Equity Real Estate Investment Trusts (REITs) - 1.4% |
| 109,127 | Crown Castle, Inc. REIT | $ 12,570,339 |
| 244,641 | Gaming & Leisure Properties, Inc. REIT | 12,073,034 |
| | | | 24,643,373 |
| | Financial Services - 7.4% |
| 139,109 | Ares Management Corp. Class A | 16,542,842 |
| 127,877 | Intercontinental Exchange, Inc. | 16,423,243 |
| 134,390 | KKR & Co., Inc. | 11,134,212 |
| 41,520 | LPL Financial Holdings, Inc. | 9,450,782 |
| 153,778 | Morgan Stanley | 14,339,799 |
| 142,360 | Raymond James Financial, Inc. | 15,873,140 |
| 41,263 | S&P Global, Inc. | 18,177,177 |
| 93,964 | Visa, Inc. Class A | 24,463,527 |
| | | | 126,404,722 |
| | Food, Beverage & Tobacco - 0.9% |
| 463,682 | Keurig Dr Pepper, Inc. | 15,449,884 |
| | Health Care Equipment & Services - 5.9% |
| 52,444 | Align Technology, Inc.* | 14,369,656 |
| 243,266 | Boston Scientific Corp.* | 14,063,207 |
| 262,347 | Centene Corp.* | 19,468,771 |
| 44,203 | Elevance Health, Inc. | 20,844,367 |
| 60,895 | UnitedHealth Group, Inc. | 32,059,391 |
| | | | 100,805,392 |
| | Household & Personal Products - 0.7% |
| 254,075 | Unilever PLC ADR | 12,317,556 |
| | Insurance - 2.1% |
| 72,277 | Chubb Ltd. | 16,334,602 |
| 285,749 | MetLife, Inc. | 18,896,581 |
| | | | 35,231,183 |
| | Materials - 0.8% |
| 385,329 | Axalta Coating Systems Ltd.* | 13,089,626 |
| | Media & Entertainment - 5.2% |
| 425,469 | Alphabet, Inc. Class C* | 59,961,346 |
| 100,533 | Electronic Arts, Inc. | 13,753,920 |
| 168,554 | Omnicom Group, Inc. | 14,581,607 |
| | | | 88,296,873 |
| | Pharmaceuticals, Biotechnology & Life Sciences - 4.7% |
| 183,812 | AstraZeneca PLC ADR | 12,379,738 |
| 39,825 | Eli Lilly & Co. | 23,214,789 |
| 659,163 | Pfizer, Inc. | 18,977,303 |
| 36,308 | Roche Holding AG | 10,554,500 |
| 36,593 | Vertex Pharmaceuticals, Inc.* | 14,889,326 |
| | | | 80,015,656 |
| | Real Estate Management & Development - 0.9% |
| 160,891 | CBRE Group, Inc. Class A* | 14,977,343 |
| | Semiconductors & Semiconductor Equipment - 4.7% |
| 70,423 | Analog Devices, Inc. | 13,983,191 |
| 22,905 | Broadcom, Inc. | 25,567,706 |
| 81,505 | NXP Semiconductors NV | 18,720,068 |
| 146,103 | QUALCOMM, Inc. | 21,130,877 |
| | | | 79,401,842 |
| | Software & Services - 9.4% |
| 72,564 | Accenture PLC Class A | 25,463,433 |
| 161,530 | Amdocs Ltd. | 14,196,872 |
| 256,263 | Microsoft Corp. | 96,365,139 |
| 93,009 | Salesforce, Inc.* | 24,474,388 |
| | | | 160,499,832 |
| Shares or Principal Amount | | Market Value† |
| COMMON STOCKS - 66.0% - (continued) |
| | Technology Hardware & Equipment - 3.4% |
| 449,499 | Cisco Systems, Inc. | $ 22,708,689 |
| 606,815 | Corning, Inc. | 18,477,517 |
| 91,724 | F5, Inc.* | 16,416,762 |
| | | | 57,602,968 |
| | Transportation - 1.8% |
| 220,915 | Knight-Swift Transportation Holdings, Inc. | 12,735,750 |
| 111,741 | United Parcel Service, Inc. Class B | 17,569,037 |
| | | | 30,304,787 |
| | Utilities - 0.6% |
| 301,517 | Exelon Corp. | 10,824,460 |
| | Total Common Stocks
(cost $722,505,188) | | $ 1,122,817,704 |
| | Total Long-Term Investments
(cost $1,293,625,945) | | $ 1,687,514,024 |
| SHORT-TERM INVESTMENTS - 0.3% |
| | Repurchase Agreements - 0.2% |
| $ 3,851,967 | Fixed Income Clearing Corp. Repurchase Agreement dated 12/29/2023 at 5.32%, due on 01/02/2024 with a maturity value of $3,854,244; collateralized by U.S. Treasury Inflation Index Note at 0.13%, maturing 07/15/2031, with a market value of $3,929,086 | $ 3,851,967 |
| | Securities Lending Collateral - 0.1% |
| 105,277 | Goldman Sachs Financial Square Funds, Government Fund, Institutional Class, 5.25%(8) | 105,277 |
| 350,925 | HSBC U.S. Government Money Market Fund, Institutional Class, 5.31%(8) | 350,925 |
| 105,278 | Invesco Government & Agency Portfolio, Institutional Class, 5.28%(8) | 105,278 |
| 105,278 | Morgan Stanley Institutional Liquidity Funds, Government Portfolio, Institutional Class, 5.27%(8) | 105,278 |
| | | | 666,758 |
| | Total Short-Term Investments
(cost $4,518,725) | $ 4,518,725 |
| | Total Investments
(cost $1,298,144,670) | 99.5% | $ 1,692,032,749 |
| | Other Assets and Liabilities | 0.5% | 8,553,451 |
| | Total Net Assets | 100.0% | $ 1,700,586,200 |
| Note: | Percentage of investments as shown is the ratio of the total market value to total net assets. |
| | Prices of foreign equities that are principally traded on certain foreign markets will generally be adjusted daily pursuant to a fair value pricing service approved by Hartford Funds Management Company, LLC in order to reflect an adjustment for factors occurring after the close of certain foreign markets but before the close of the New York Stock Exchange. |
| | The Fund may refer to any one or more of the industry classifications used by one or more widely recognized market indices, ratings group and/or as defined by Fund management. Industry classifications may not be identical across all security types. |
| | Equity industry classifications used in this report are the Global Industry Classification Standard, which was developed by and is the exclusive property and service mark of MSCI, Inc. and Standard & Poor’s. |
The accompanying notes are an integral part of these financial statements.
Hartford Balanced HLS Fund
Schedule of Investments – (continued)
December 31, 2023
For Fund compliance purposes, the Fund may not use the same classification system. These classifications are used for financial reporting purposes.
See “Glossary” for abbreviation descriptions.
| * | Non-income producing. |
| (1) | Security was purchased pursuant to Rule 144A under the Securities Act of 1933 and may be sold in transactions that are exempt from registration (typically only to qualified institutional buyers) or in a public offering registered under the Securities Act of 1933. At December 31, 2023, the aggregate value of these securities was $100,599,130, representing 5.9% of net assets. |
| (2) | Variable rate securities; the rate reported is the coupon rate in effect at December 31, 2023. Base lending rates may be subject to a floor or cap. |
| (3) | Variable or floating rate security, which interest rate adjusts periodically based on changes in current interest rates and prepayments on the underlying pool of assets. Rate shown is the rate in effect as of period end. |
| (4) | Fixed to variable rate investment. The rate shown reflects the fixed rate in effect at December 31, 2023. Rate will reset at a future date. Base lending rates may be subject to a floor or cap. |
| (5) | Represents entire or partial securities on loan. See Note 8 in the accompanying Notes to Financial Statements for securities lending information. |
| (6) | Perpetual maturity security. Maturity date shown is the next call date or final legal maturity date, whichever comes first. |
| (7) | All, or a portion of the security, was pledged as collateral in connection with futures contracts. As of December 31, 2023, the market value of securities pledged was $216,711. |
| (8) | Current yield as of period end. |
| Futures Contracts Outstanding at December 31, 2023 |
| Description | | Number of
Contracts | | Expiration
Date | | Current
Notional
Amount | | Value and
Unrealized
Appreciation/
(Depreciation) |
| Long position contracts: |
| U.S. Treasury 5-Year Note Future | | 79 | | 03/28/2024 | | $ 8,593,102 | | $ 213,236 |
| Total futures contracts | | $ 213,236 |
† See Significant Accounting Policies of accompanying Notes to Financial Statements regarding valuation of investments.
The accompanying notes are an integral part of these financial statements.
Hartford Balanced HLS Fund
Schedule of Investments – (continued)
December 31, 2023
Fair Value Summary
The following is a summary of the fair valuations according to the inputs used as of December 31, 2023 in valuing the Fund’s investments.
| Description | | Total | | Level 1 | | Level 2 | | Level 3(1) |
| Assets | | | | | | | | |
| Asset & Commercial Mortgage-Backed Securities | | $ 22,990,403 | | $ — | | $ 22,990,403 | | $ — |
| Corporate Bonds | | 211,674,307 | | — | | 211,674,307 | | — |
| Municipal Bonds | | 13,385,896 | | — | | 13,385,896 | | — |
| U.S. Government Agencies | | 13,251,430 | | — | | 13,251,430 | | — |
| U.S. Government Securities | | 303,394,284 | | — | | 303,394,284 | | — |
| Common Stocks | | | | | | | | |
| Automobiles & Components | | 15,119,816 | | 15,119,816 | | — | | — |
| Banks | | 70,826,104 | | 70,826,104 | | — | | — |
| Capital Goods | | 79,672,145 | | 79,672,145 | | — | | — |
| Consumer Discretionary Distribution & Retail | | 32,305,066 | | 32,305,066 | | — | | — |
| Consumer Durables & Apparel | | 12,693,737 | | 12,693,737 | | — | | — |
| Consumer Services | | 43,726,997 | | 43,726,997 | | — | | — |
| Energy | | 18,608,342 | | 18,608,342 | | — | | — |
| Equity Real Estate Investment Trusts (REITs) | | 24,643,373 | | 24,643,373 | | — | | — |
| Financial Services | | 126,404,722 | | 126,404,722 | | — | | — |
| Food, Beverage & Tobacco | | 15,449,884 | | 15,449,884 | | — | | — |
| Health Care Equipment & Services | | 100,805,392 | | 100,805,392 | | — | | — |
| Household & Personal Products | | 12,317,556 | | 12,317,556 | | — | | — |
| Insurance | | 35,231,183 | | 35,231,183 | | — | | — |
| Materials | | 13,089,626 | | 13,089,626 | | — | | — |
| Media & Entertainment | | 88,296,873 | | 88,296,873 | | — | | — |
| Pharmaceuticals, Biotechnology & Life Sciences | | 80,015,656 | | 69,461,156 | | 10,554,500 | | — |
| Real Estate Management & Development | | 14,977,343 | | 14,977,343 | | — | | — |
| Semiconductors & Semiconductor Equipment | | 79,401,842 | | 79,401,842 | | — | | — |
| Software & Services | | 160,499,832 | | 160,499,832 | | — | | — |
| Technology Hardware & Equipment | | 57,602,968 | | 57,602,968 | | — | | — |
| Transportation | | 30,304,787 | | 30,304,787 | | — | | — |
| Utilities | | 10,824,460 | | 10,824,460 | | — | | — |
| Short-Term Investments | | 4,518,725 | | 666,758 | | 3,851,967 | | — |
| Futures Contracts(2) | | 213,236 | | 213,236 | | — | | — |
| Total | | $ 1,692,245,985 | | $ 1,113,143,198 | | $ 579,102,787 | | $ — |
| (1) | For the year ended December 31, 2023, there were no transfers in and out of Level 3. |
| (2) | Derivative instruments (excluding purchased and written options, if applicable) are valued at the unrealized appreciation/(depreciation) on the investments. |
The accompanying notes are an integral part of these financial statements.
Hartford Capital Appreciation HLS Fund
Schedule of Investments
December 31, 2023
| Shares or Principal Amount | | Market Value† |
| COMMON STOCKS - 97.6% |
| | Automobiles & Components - 0.2% |
| 184,920 | Mobileye Global, Inc. Class A* | $ 8,010,734 |
| | Banks - 1.0% |
| 146,742 | M&T Bank Corp. | 20,115,394 |
| 1,510,010 | New York Community Bancorp, Inc. | 15,447,402 |
| | | | 35,562,796 |
| | Capital Goods - 8.4% |
| 213,532 | AerCap Holdings NV* | 15,869,698 |
| 65,875 | Airbus SE | 10,176,922 |
| 89,001 | AMETEK, Inc. | 14,675,375 |
| 64,372 | Axon Enterprise, Inc.* | 16,629,219 |
| 81,489 | Dover Corp. | 12,533,823 |
| 103,749 | Emerson Electric Co. | 10,097,890 |
| 42,138 | General Dynamics Corp. | 10,941,975 |
| 350,600 | HF Global, Inc.*(1)(2) | 9,921,980 |
| 189,331 | Honeywell International, Inc. | 39,704,604 |
| 53,783 | IDEX Corp. | 11,676,827 |
| 32,443 | Lockheed Martin Corp. | 14,704,465 |
| 51,283 | Middleby Corp.* | 7,547,319 |
| 93,012 | Northrop Grumman Corp. | 43,542,638 |
| 226,622 | RTX Corp. | 19,067,975 |
| 51,143 | Snap-on, Inc. | 14,772,144 |
| 1,261,500 | Techtronic Industries Co. Ltd. | 15,030,878 |
| 70,672 | Toro Co. | 6,783,805 |
| 205,113 | Westinghouse Air Brake Technologies Corp. | 26,028,840 |
| | | | 299,706,377 |
| | Commercial & Professional Services - 1.8% |
| 38,238 | Ceridian HCM Holding, Inc.* | 2,566,535 |
| 310,203 | Copart, Inc.* | 15,199,947 |
| 368,444 | Genpact Ltd. | 12,788,691 |
| 178,230 | Leidos Holdings, Inc. | 19,291,615 |
| 66,400 | Verisk Analytics, Inc. | 15,860,304 |
| | | | 65,707,092 |
| | Consumer Discretionary Distribution & Retail - 4.2% |
| 413,211 | Amazon.com, Inc.* | 62,783,279 |
| 5,164 | AutoZone, Inc.* | 13,352,090 |
| 149,911 | Chewy, Inc. Class A* | 3,542,397 |
| 50,155 | Floor & Decor Holdings, Inc. Class A* | 5,595,292 |
| 113,141 | Ross Stores, Inc. | 15,657,583 |
| 479,206 | TJX Cos., Inc. | 44,954,315 |
| 115,140 | Tory Burch LLC*(1)(2) | 4,857,742 |
| | | | 150,742,698 |
| | Consumer Durables & Apparel - 2.0% |
| 23,568 | Deckers Outdoor Corp.* | 15,753,558 |
| 365,541 | NIKE, Inc. Class B | 39,686,786 |
| 881 | NVR, Inc.* | 6,167,397 |
| 256,763 | Steven Madden Ltd. | 10,784,046 |
| | | | 72,391,787 |
| | Consumer Services - 2.1% |
| 368,496 | DraftKings, Inc. Class A* | 12,989,484 |
| 286,502 | Las Vegas Sands Corp. | 14,098,764 |
| 112,319 | McDonald's Corp. | 33,303,707 |
| 172,718 | Wyndham Hotels & Resorts, Inc. | 13,888,254 |
| | | | 74,280,209 |
| | Consumer Staples Distribution & Retail - 0.9% |
| 135,429 | Dollar Tree, Inc.* | 19,237,689 |
| 196,438 | Sysco Corp. | 14,365,511 |
| | | | 33,603,200 |
| | Energy - 3.0% |
| 291,150 | Canadian Natural Resources Ltd. | 19,076,148 |
| 31,911 | Cheniere Energy, Inc. | 5,447,527 |
| 105,105 | ConocoPhillips | 12,199,537 |
| 103,375 | Diamondback Energy, Inc. | 16,031,395 |
| 354,629 | Enbridge, Inc. | 12,766,162 |
| Shares or Principal Amount | | Market Value† |
| COMMON STOCKS - 97.6% - (continued) |
| | Energy - 3.0% - (continued) |
| 325,479 | Halliburton Co. | $ 11,766,066 |
| 509,161 | Schlumberger NV | 26,496,738 |
| 55,604 | Targa Resources Corp. | 4,830,320 |
| | | | 108,613,893 |
| | Equity Real Estate Investment Trusts (REITs) - 3.0% |
| 270,036 | American Tower Corp. REIT | 58,295,372 |
| 50,975 | AvalonBay Communities, Inc. REIT | 9,543,539 |
| 17,404 | Equinix, Inc. REIT | 14,017,007 |
| 61,176 | Extra Space Storage, Inc. REIT | 9,808,348 |
| 331,771 | UDR, Inc. REIT | 12,703,512 |
| 27,271 | Welltower, Inc. REIT | 2,459,026 |
| | | | 106,826,804 |
| | Financial Services - 7.3% |
| 201,877 | American Express Co. | 37,819,637 |
| 271,692 | Bank of New York Mellon Corp. | 14,141,568 |
| 18,046 | BlackRock, Inc. | 14,649,743 |
| 213,079 | Block, Inc.* | 16,481,661 |
| 260,529 | Charles Schwab Corp. | 17,924,395 |
| 413,379 | Equitable Holdings, Inc. | 13,765,521 |
| 49,129 | FleetCor Technologies, Inc.* | 13,884,347 |
| 89,276 | KKR & Co., Inc. | 7,396,517 |
| 225,929 | Morgan Stanley | 21,067,879 |
| 171,037 | Raymond James Financial, Inc. | 19,070,625 |
| 258,953 | Tradeweb Markets, Inc. Class A | 23,533,649 |
| 160,392 | Visa, Inc. Class A | 41,758,057 |
| 204,420 | Voya Financial, Inc. | 14,914,483 |
| 29,478 | WEX, Inc.* | 5,734,945 |
| | | | 262,143,027 |
| | Food, Beverage & Tobacco - 2.9% |
| 233,362 | Coca-Cola Co. | 13,752,023 |
| 150,332 | General Mills, Inc. | 9,792,626 |
| 205,533 | Kraft Heinz Co. | 7,600,610 |
| 138,765 | Monster Beverage Corp.* | 7,994,252 |
| 197,945 | PepsiCo, Inc. | 33,618,979 |
| 155,856 | Philip Morris International, Inc. | 14,662,932 |
| 283,309 | Tyson Foods, Inc. Class A | 15,227,859 |
| | | | 102,649,281 |
| | Health Care Equipment & Services - 8.0% |
| 44,245 | Align Technology, Inc.* | 12,123,130 |
| 269,657 | Centene Corp.* | 20,011,246 |
| 300,678 | Dentsply Sirona, Inc. | 10,701,130 |
| 93,204 | Dexcom, Inc.* | 11,565,684 |
| 17,051 | Elevance Health, Inc. | 8,040,570 |
| 106,945 | Encompass Health Corp. | 7,135,371 |
| 39,541 | Humana, Inc. | 18,102,265 |
| 26,997 | Inari Medical, Inc.* | 1,752,645 |
| 51,406 | Insulet Corp.* | 11,154,074 |
| 39,241 | Intuitive Surgical, Inc.* | 13,238,344 |
| 256,901 | Medtronic PLC | 21,163,504 |
| 132,354 | Quest Diagnostics, Inc. | 18,248,970 |
| 57,576 | Shockwave Medical, Inc.* | 10,971,683 |
| 110,053 | Stryker Corp. | 32,956,471 |
| 39,361 | Teleflex, Inc. | 9,814,272 |
| 140,660 | UnitedHealth Group, Inc. | 74,053,270 |
| 26,593 | Veeva Systems, Inc. Class A* | 5,119,684 |
| | | | 286,152,313 |
| | Household & Personal Products - 3.3% |
| 458,524 | Colgate-Palmolive Co. | 36,548,948 |
| 51,553 | elf Beauty, Inc.* | 7,441,160 |
| 1,174,412 | Kenvue, Inc. | 25,285,090 |
| 218,166 | Procter & Gamble Co. | 31,970,046 |
| 340,355 | Unilever PLC | 16,476,921 |
| | | | 117,722,165 |
The accompanying notes are an integral part of these financial statements.
Hartford Capital Appreciation HLS Fund
Schedule of Investments – (continued)
December 31, 2023
| Shares or Principal Amount | | Market Value† |
| COMMON STOCKS - 97.6% - (continued) |
| | Insurance - 4.5% |
| 167,619 | Allstate Corp. | $ 23,463,307 |
| 106,517 | American International Group, Inc. | 7,216,527 |
| 292,408 | Chubb Ltd. | 66,084,208 |
| 116,176 | Globe Life, Inc. | 14,140,943 |
| 185,995 | Marsh & McLennan Cos., Inc. | 35,240,473 |
| 222,045 | MetLife, Inc. | 14,683,836 |
| | | | 160,829,294 |
| | Materials - 3.2% |
| 171,364 | CRH PLC | 11,793,147 |
| 166,348 | FMC Corp. | 10,488,241 |
| 91,561 | Linde PLC | 37,605,018 |
| 96,681 | PPG Industries, Inc. | 14,458,644 |
| 48,155 | Reliance Steel & Aluminum Co. | 13,467,990 |
| 258,028 | Rio Tinto PLC ADR | 19,212,765 |
| 33,185 | Vulcan Materials Co. | 7,533,327 |
| | | | 114,559,132 |
| | Media & Entertainment - 8.0% |
| 757,284 | Alphabet, Inc. Class A* | 105,785,002 |
| 203,978 | Alphabet, Inc. Class C* | 28,746,620 |
| 22,916 | Charter Communications, Inc. Class A* | 8,906,991 |
| 80,750 | Electronic Arts, Inc. | 11,047,407 |
| 125,662 | Liberty Media Corp.-Liberty Formula One Class C* | 7,933,042 |
| 206,955 | Meta Platforms, Inc. Class A* | 73,253,792 |
| 36,606 | Netflix, Inc.* | 17,822,729 |
| 148,274 | Omnicom Group, Inc. | 12,827,184 |
| 205,376 | Pinterest, Inc. Class A* | 7,607,127 |
| 25,979 | Roku, Inc.* | 2,381,235 |
| 53,364 | Spotify Technology SA* | 10,027,629 |
| | | | 286,338,758 |
| | Pharmaceuticals, Biotechnology & Life Sciences - 6.9% |
| 111,592 | Agilent Technologies, Inc. | 15,514,636 |
| 9,740 | Alnylam Pharmaceuticals, Inc.* | 1,864,333 |
| 102,777 | Apellis Pharmaceuticals, Inc.* | 6,152,231 |
| 322,063 | AstraZeneca PLC ADR | 21,690,943 |
| 189,232 | Danaher Corp. | 43,776,931 |
| 50,582 | Eli Lilly & Co. | 29,485,259 |
| 267,686 | Exact Sciences Corp.* | 19,803,410 |
| 45,182 | Jazz Pharmaceuticals PLC* | 5,557,386 |
| 155,701 | Johnson & Johnson | 24,404,575 |
| 128,882 | Novartis AG | 13,018,434 |
| 898,036 | Pfizer, Inc. | 25,854,456 |
| 195,029 | PTC Therapeutics, Inc.* | 5,374,999 |
| 41,215 | Sarepta Therapeutics, Inc.* | 3,974,363 |
| 111,279 | Ultragenyx Pharmaceutical, Inc.* | 5,321,362 |
| 65,099 | United Therapeutics Corp.* | 14,314,619 |
| 27,130 | Vertex Pharmaceuticals, Inc.* | 11,038,926 |
| | | | 247,146,863 |
| | Real Estate Management & Development - 0.3% |
| 19,785 | CBRE Group, Inc. Class A* | 1,841,786 |
| 93,490 | CoStar Group, Inc.* | 8,170,091 |
| | | | 10,011,877 |
| | Semiconductors & Semiconductor Equipment - 5.7% |
| 167,883 | ARM Holdings PLC ADR*(3) | 12,615,568 |
| 25,039 | Broadcom, Inc. | 27,949,784 |
| 17,027 | First Solar, Inc.* | 2,933,412 |
| 388,273 | Micron Technology, Inc. | 33,135,218 |
| 8,591 | Monolithic Power Systems, Inc. | 5,419,031 |
| 100,754 | NVIDIA Corp. | 49,895,396 |
| 95,139 | NXP Semiconductors NV | 21,851,525 |
| 155,185 | QUALCOMM, Inc. | 22,444,406 |
| 61,413 | Rambus, Inc.* | 4,191,437 |
| 146,600 | Texas Instruments, Inc. | 24,989,436 |
| | | | 205,425,213 |
| Shares or Principal Amount | | Market Value† |
| COMMON STOCKS - 97.6% - (continued) |
| | Software & Services - 10.5% |
| 97,760 | Accenture PLC Class A | $ 34,304,962 |
| 25,631 | Adobe, Inc.* | 15,291,455 |
| 14,954 | ANSYS, Inc.* | 5,426,507 |
| 199,956 | Cognizant Technology Solutions Corp. Class A | 15,102,677 |
| 52,865 | Datadog, Inc. Class A* | 6,416,754 |
| 103,953 | Dynatrace, Inc.* | 5,685,190 |
| 11,543 | HubSpot, Inc.* | 6,701,173 |
| 426,026 | Microsoft Corp. | 160,202,817 |
| 31,867 | MongoDB, Inc.* | 13,028,823 |
| 153,473 | Oracle Corp. | 16,180,658 |
| 90,817 | Salesforce, Inc.* | 23,897,585 |
| 27,048 | ServiceNow, Inc.* | 19,109,141 |
| 5,611 | Sharecare, Inc. Earnout*(1)(2) | 61 |
| 274,531 | Shopify, Inc. Class A* | 21,385,965 |
| 56,107 | Snowflake, Inc. Class A* | 11,165,293 |
| 75,298 | Workday, Inc. Class A* | 20,786,766 |
| | | | 374,685,827 |
| | Technology Hardware & Equipment - 4.9% |
| 591,779 | Apple, Inc. | 113,935,211 |
| 89,756 | CDW Corp. | 20,403,334 |
| 350,520 | Flex Ltd.* | 10,676,839 |
| 125,657 | Samsung Electronics Co. Ltd. | 7,626,977 |
| 202,675 | Seagate Technology Holdings PLC | 17,302,365 |
| 14,831 | Zebra Technologies Corp. Class A* | 4,053,757 |
| | | | 173,998,483 |
| | Telecommunication Services - 0.6% |
| 128,757 | T-Mobile U.S., Inc. | 20,643,610 |
| | Transportation - 2.6% |
| 220,012 | Delta Air Lines, Inc. | 8,851,083 |
| 30,071 | FedEx Corp. | 7,607,061 |
| 28,688 | JB Hunt Transport Services, Inc. | 5,730,141 |
| 301,908 | Knight-Swift Transportation Holdings, Inc. | 17,404,996 |
| 223,273 | Uber Technologies, Inc.* | 13,746,918 |
| 72,047 | Union Pacific Corp. | 17,696,184 |
| 146,742 | United Parcel Service, Inc. Class B | 23,072,245 |
| | | | 94,108,628 |
| | Utilities - 2.3% |
| 388,788 | AES Corp. | 7,484,169 |
| 170,850 | Duke Energy Corp. | 16,579,284 |
| 245,113 | Edison International | 17,523,128 |
| 628,069 | Exelon Corp. | 22,547,677 |
| 1,290,474 | Iberdrola SA | 16,926,867 |
| | | | 81,061,125 |
| | Total Common Stocks
(cost $2,567,791,909) | | $ 3,492,921,186 |
| CONVERTIBLE PREFERRED STOCKS - 0.0% |
| | Software & Services - 0.0% |
| 58 | Magic Leap, Inc. Class A*(1)(2)(4) | $ 167 |
| | Total Convertible Preferred Stocks
(cost $679,566) | | $ 167 |
| EXCHANGE-TRADED FUNDS - 0.3% |
| | Other Investment Pools & Funds - 0.3% |
| 39,331 | iShares Russell 1000 Growth ETF | $ 11,923,979 |
| | Total Exchange-Traded Funds
(cost $11,920,514) | | $ 11,923,979 |
| | Total Long-Term Investments
(cost $2,580,391,989) | | $ 3,504,845,332 |
The accompanying notes are an integral part of these financial statements.
Hartford Capital Appreciation HLS Fund
Schedule of Investments – (continued)
December 31, 2023
| Shares or Principal Amount | | Market Value† |
| SHORT-TERM INVESTMENTS - 0.9% |
| | Repurchase Agreements - 0.6% |
| $ 21,275,928 | Fixed Income Clearing Corp. Repurchase Agreement dated 12/29/2023 at 5.32%, due on 01/02/2024 with a maturity value of $21,288,504; collateralized by U.S. Treasury Inflation Index Note at 0.13%, maturing 07/15/2031, with a market value of $21,701,499 | $ 21,275,928 |
| | Securities Lending Collateral - 0.3% |
| 1,715,803 | Goldman Sachs Financial Square Funds, Government Fund, Institutional Class, 5.25%(5) | 1,715,803 |
| 5,719,343 | HSBC U.S. Government Money Market Fund, Institutional Class, 5.31%(5) | 5,719,343 |
| 1,715,803 | Invesco Government & Agency Portfolio, Institutional Class, 5.28%(5) | 1,715,803 |
| 1,715,803 | Morgan Stanley Institutional Liquidity Funds, Government Portfolio, Institutional Class, 5.27%(5) | 1,715,803 |
| | | | 10,866,752 |
| | Total Short-Term Investments
(cost $32,142,680) | $ 32,142,680 |
| | Total Investments
(cost $2,612,534,669) | 98.8% | $ 3,536,988,012 |
| | Other Assets and Liabilities | 1.2% | 42,593,258 |
| | Total Net Assets | 100.0% | $ 3,579,581,270 |
| Note: | Percentage of investments as shown is the ratio of the total market value to total net assets. |
| | Prices of foreign equities that are principally traded on certain foreign markets will generally be adjusted daily pursuant to a fair value pricing service approved by Hartford Funds Management Company, LLC in order to reflect an adjustment for factors occurring after the close of certain foreign markets but before the close of the New York Stock Exchange. |
Equity industry classifications used in this report are the Global Industry Classification Standard, which was developed by and is the exclusive property and service mark of MSCI, Inc. and Standard & Poor’s.
For Fund compliance purposes, the Fund may not use the same classification system. These classifications are used for financial reporting purposes.
See “Glossary” for abbreviation descriptions.
| * | Non-income producing. |
| (1) | Investment in securities not registered under the Securities Act of 1933 (excluding securities acquired pursuant to Rule 144A and Regulation S). At the end of the period, the value of such restricted securities amounted to $14,779,950 or 0.4% of net assets. |
Period
Acquired | | Security Name | | Shares/
Par Value | | Total Cost | | Market Value |
| 06/2015 | | HF Global, Inc. | | 350,600 | | $ 4,713,607 | | $ 9,921,980 |
| 12/2015 | | Magic Leap, Inc. Class A Convertible Preferred | | 58 | | 679,566 | | 167 |
| 07/2021 | | Sharecare, Inc. Earnout | | 5,611 | | — | | 61 |
| 11/2013 | | Tory Burch LLC | | 115,140 | | 9,024,247 | | 4,857,742 |
| | | | | | | $ 14,417,420 | | $ 14,779,950 |
| (2) | Investment valued using significant unobservable inputs. |
| (3) | Represents entire or partial securities on loan. See Note 8 in the accompanying Notes to Financial Statements for securities lending information. |
| (4) | Currently no rate available. |
| (5) | Current yield as of period end. |
| Futures Contracts Outstanding at December 31, 2023 |
| Description | | Number of
Contracts | | Expiration
Date | | Current
Notional
Amount | | Value and
Unrealized
Appreciation/
(Depreciation) |
| Long position contracts: |
| Nasdaq 100 E-MINI Future | | 261 | | 03/15/2024 | | $ 88,862,670 | | $ 1,923,011 |
| Total futures contracts | | $ 1,923,011 |
† See Significant Accounting Policies of accompanying Notes to Financial Statements regarding valuation of investments.
The accompanying notes are an integral part of these financial statements.
Hartford Capital Appreciation HLS Fund
Schedule of Investments – (continued)
December 31, 2023
Fair Value Summary
The following is a summary of the fair valuations according to the inputs used as of December 31, 2023 in valuing the Fund’s investments.
| Description | | Total | | Level 1 | | Level 2 | | Level 3(1) |
| Assets | | | | | | | | |
| Common Stocks | | | | | | | | |
| Automobiles & Components | | $ 8,010,734 | | $ 8,010,734 | | $ — | | $ — |
| Banks | | 35,562,796 | | 35,562,796 | | — | | — |
| Capital Goods | | 299,706,377 | | 264,576,597 | | 25,207,800 | | 9,921,980 |
| Commercial & Professional Services | | 65,707,092 | | 65,707,092 | | — | | — |
| Consumer Discretionary Distribution & Retail | | 150,742,698 | | 145,884,956 | | — | | 4,857,742 |
| Consumer Durables & Apparel | | 72,391,787 | | 72,391,787 | | — | | — |
| Consumer Services | | 74,280,209 | | 74,280,209 | | — | | — |
| Consumer Staples Distribution & Retail | | 33,603,200 | | 33,603,200 | | — | | — |
| Energy | | 108,613,893 | | 108,613,893 | | — | | — |
| Equity Real Estate Investment Trusts (REITs) | | 106,826,804 | | 106,826,804 | | — | | — |
| Financial Services | | 262,143,027 | | 262,143,027 | | — | | — |
| Food, Beverage & Tobacco | | 102,649,281 | | 102,649,281 | | — | | — |
| Health Care Equipment & Services | | 286,152,313 | | 286,152,313 | | — | | — |
| Household & Personal Products | | 117,722,165 | | 101,245,244 | | 16,476,921 | | — |
| Insurance | | 160,829,294 | | 160,829,294 | | — | | — |
| Materials | | 114,559,132 | | 102,765,985 | | 11,793,147 | | — |
| Media & Entertainment | | 286,338,758 | | 286,338,758 | | — | | — |
| Pharmaceuticals, Biotechnology & Life Sciences | | 247,146,863 | | 234,128,429 | | 13,018,434 | | — |
| Real Estate Management & Development | | 10,011,877 | | 10,011,877 | | — | | — |
| Semiconductors & Semiconductor Equipment | | 205,425,213 | | 205,425,213 | | — | | — |
| Software & Services | | 374,685,827 | | 374,685,766 | | — | | 61 |
| Technology Hardware & Equipment | | 173,998,483 | | 166,371,506 | | 7,626,977 | | — |
| Telecommunication Services | | 20,643,610 | | 20,643,610 | | — | | — |
| Transportation | | 94,108,628 | | 94,108,628 | | — | | — |
| Utilities | | 81,061,125 | | 64,134,258 | | 16,926,867 | | — |
| Convertible Preferred Stocks | | 167 | | — | | — | | 167 |
| Exchange-Traded Funds | | 11,923,979 | | 11,923,979 | | — | | — |
| Short-Term Investments | | 32,142,680 | | 10,866,752 | | 21,275,928 | | — |
| Futures Contracts(2) | | 1,923,011 | | 1,923,011 | | — | | — |
| Total | | $ 3,538,911,023 | | $ 3,411,804,999 | | $ 112,326,074 | | $ 14,779,950 |
| (1) | For the year ended December 31, 2023, there were no transfers in and out of Level 3. |
| (2) | Derivative instruments (excluding purchased and written options, if applicable) are valued at the unrealized appreciation/(depreciation) on the investments. |
Level 3 investments at the beginning and/or end of the period in relation to net assets were not significant and accordingly, a reconciliation of Level 3 assets for the year ended December 31, 2023 is not presented.
The accompanying notes are an integral part of these financial statements.
Hartford Disciplined Equity HLS Fund
Schedule of Investments
December 31, 2023
| Shares or Principal Amount | | Market Value† |
| COMMON STOCKS - 98.9% |
| | Automobiles & Components - 0.7% |
| 72,870 | Tesla, Inc.* | $ 18,106,738 |
| | Banks - 4.8% |
| 1,283,361 | Bank of America Corp. | 43,210,765 |
| 380,510 | JP Morgan Chase & Co. | 64,724,751 |
| 144,412 | PNC Financial Services Group, Inc. | 22,362,198 |
| | | | 130,297,714 |
| | Capital Goods - 6.7% |
| 181,901 | AMETEK, Inc. | 29,993,656 |
| 81,805 | Deere & Co. | 32,711,365 |
| 131,323 | IDEX Corp. | 28,511,536 |
| 129,357 | Illinois Tool Works, Inc. | 33,883,773 |
| 418,894 | Johnson Controls International PLC | 24,145,050 |
| 398,198 | RTX Corp. | 33,504,380 |
| | | | 182,749,760 |
| | Commercial & Professional Services - 0.8% |
| 133,944 | Republic Services, Inc. | 22,088,705 |
| | Consumer Discretionary Distribution & Retail - 7.2% |
| 864,144 | Amazon.com, Inc.* | 131,298,039 |
| 9,870 | AutoZone, Inc.* | 25,519,971 |
| 386,834 | TJX Cos., Inc. | 36,288,898 |
| 38,805 | Tory Burch LLC*(1)(2) | 1,637,184 |
| | | | 194,744,092 |
| | Consumer Durables & Apparel - 1.3% |
| 318,035 | NIKE, Inc. Class B | 34,529,060 |
| | Consumer Services - 1.4% |
| 133,255 | McDonald's Corp. | 39,511,440 |
| | Energy - 3.5% |
| 289,308 | ConocoPhillips | 33,579,980 |
| 227,766 | EOG Resources, Inc. | 27,548,298 |
| 121,880 | Phillips 66 | 16,227,103 |
| 337,912 | Schlumberger NV | 17,584,940 |
| | | | 94,940,321 |
| | Equity Real Estate Investment Trusts (REITs) - 1.7% |
| 108,149 | AvalonBay Communities, Inc. REIT | 20,247,656 |
| 188,295 | Prologis, Inc. REIT | 25,099,723 |
| | | | 45,347,379 |
| | Financial Services - 5.7% |
| 167,711 | American Express Co. | 31,418,979 |
| 364,329 | Charles Schwab Corp. | 25,065,835 |
| 136,040 | Mastercard, Inc. Class A | 58,022,421 |
| 434,429 | Morgan Stanley | 40,510,504 |
| | | | 155,017,739 |
| | Food, Beverage & Tobacco - 2.3% |
| 129,386 | Constellation Brands, Inc. Class A | 31,279,066 |
| 535,502 | Monster Beverage Corp.* | 30,850,270 |
| | | | 62,129,336 |
| | Health Care Equipment & Services - 5.2% |
| 350,065 | Abbott Laboratories | 38,531,655 |
| 486,762 | Boston Scientific Corp.* | 28,139,711 |
| 143,289 | UnitedHealth Group, Inc. | 75,437,360 |
| | | | 142,108,726 |
| | Household & Personal Products - 3.2% |
| 201,339 | Estee Lauder Cos., Inc. Class A | 29,445,829 |
| 398,545 | Procter & Gamble Co. | 58,402,784 |
| | | | 87,848,613 |
| | Insurance - 3.1% |
| 256,051 | Arch Capital Group Ltd.* | 19,016,908 |
| Shares or Principal Amount | | Market Value† |
| COMMON STOCKS - 98.9% - (continued) |
| | Insurance - 3.1% - (continued) |
| 159,984 | Chubb Ltd. | $ 36,156,384 |
| 186,676 | Progressive Corp. | 29,733,753 |
| | | | 84,907,045 |
| | Materials - 1.5% |
| 32,881 | Linde PLC | 13,504,556 |
| 178,840 | PPG Industries, Inc. | 26,745,522 |
| | | | 40,250,078 |
| | Media & Entertainment - 9.0% |
| 964,627 | Alphabet, Inc. Class A* | 134,748,745 |
| 220,381 | Meta Platforms, Inc. Class A* | 78,006,059 |
| 65,575 | Netflix, Inc.* | 31,927,156 |
| | | | 244,681,960 |
| | Pharmaceuticals, Biotechnology & Life Sciences - 9.4% |
| 129,961 | Danaher Corp. | 30,065,178 |
| 99,871 | Eli Lilly & Co. | 58,216,803 |
| 437,004 | Merck & Co., Inc. | 47,642,176 |
| 25,846 | Regeneron Pharmaceuticals, Inc.* | 22,700,283 |
| 64,032 | Thermo Fisher Scientific, Inc. | 33,987,545 |
| 77,045 | Vertex Pharmaceuticals, Inc.* | 31,348,840 |
| 157,812 | Zoetis, Inc. | 31,147,355 |
| | | | 255,108,180 |
| | Semiconductors & Semiconductor Equipment - 8.0% |
| 49,587 | Broadcom, Inc. | 55,351,489 |
| 50,280 | KLA Corp. | 29,227,764 |
| 201,611 | NVIDIA Corp. | 99,841,799 |
| 202,302 | Texas Instruments, Inc. | 34,484,399 |
| | | | 218,905,451 |
| | Software & Services - 11.7% |
| 84,996 | Accenture PLC Class A | 29,825,946 |
| 530,228 | Microsoft Corp. | 199,386,937 |
| 44,619 | Roper Technologies, Inc. | 24,324,940 |
| 142,575 | Salesforce, Inc.* | 37,517,186 |
| 102,901 | Workday, Inc. Class A* | 28,406,850 |
| | | | 319,461,859 |
| | Technology Hardware & Equipment - 8.5% |
| 844,460 | Apple, Inc. | 162,583,884 |
| 138,917 | CDW Corp. | 31,578,612 |
| 114,679 | Motorola Solutions, Inc. | 35,904,848 |
| | | | 230,067,344 |
| | Utilities - 3.2% |
| 402,582 | American Electric Power Co., Inc. | 32,697,710 |
| 314,043 | Duke Energy Corp. | 30,474,733 |
| 246,292 | Eversource Energy | 15,201,142 |
| 463,466 | PG&E Corp. | 8,356,292 |
| | | | 86,729,877 |
| | Total Common Stocks
(cost $1,683,939,592) | | $ 2,689,531,417 |
| CONVERTIBLE PREFERRED STOCKS - 0.2% |
| | Software & Services - 0.2% |
| 1,871,878 | Essence Group Holdings Corp. Series 3*(1)(2)(3) | $ 3,294,505 |
| 287,204 | Lookout, Inc. Series F*(1)(2)(3) | 2,630,789 |
| | Total Convertible Preferred Stocks
(cost $6,240,761) | | $ 5,925,294 |
| | Total Long-Term Investments
(cost $1,690,180,353) | | $ 2,695,456,711 |
The accompanying notes are an integral part of these financial statements.
Hartford Disciplined Equity HLS Fund
Schedule of Investments – (continued)
December 31, 2023
| Shares or Principal Amount | | Market Value† |
| SHORT-TERM INVESTMENTS - 0.1% |
| | Repurchase Agreements - 0.1% |
| $ 2,337,621 | Fixed Income Clearing Corp. Repurchase Agreement dated 12/29/2023 at 5.32%, due on 01/02/2024 with a maturity value of $2,339,003; collateralized by U.S. Treasury Inflation Index Note at 0.13%, maturing 07/15/2031, with a market value of $2,384,437 | $ 2,337,621 |
| | Total Short-Term Investments
(cost $2,337,621) | $ 2,337,621 |
| | Total Investments
(cost $1,692,517,974) | 99.2% | $ 2,697,794,332 |
| | Other Assets and Liabilities | 0.8% | 21,827,527 |
| | Total Net Assets | 100.0% | $ 2,719,621,859 |
| Note: | Percentage of investments as shown is the ratio of the total market value to total net assets. |
| | Equity industry classifications used in this report are the Global Industry Classification Standard, which was developed by and is the exclusive property and service mark of MSCI, Inc. and Standard & Poor’s. |
| | For Fund compliance purposes, the Fund may not use the same classification system. These classifications are used for financial reporting purposes. |
See “Glossary” for abbreviation descriptions.
| * | Non-income producing. |
| (1) | Investment in securities not registered under the Securities Act of 1933 (excluding securities acquired pursuant to Rule 144A and Regulation S). At the end of the period, the value of such restricted securities amounted to $7,562,478 or 0.3% of net assets. |
Period
Acquired | | Security Name | | Shares/
Par Value | | Total Cost | | Market Value |
| 05/2014 | | Essence Group Holdings Corp. Series 3 Convertible Preferred | | 1,871,878 | | $ 2,960,001 | | $ 3,294,505 |
| 07/2014 | | Lookout, Inc. Series F Convertible Preferred | | 287,204 | | 3,280,760 | | 2,630,789 |
| 11/2013 | | Tory Burch LLC | | 38,805 | | 3,041,403 | | 1,637,184 |
| | | | | | | $ 9,282,164 | | $ 7,562,478 |
| (2) | Investment valued using significant unobservable inputs. |
| (3) | Currently no rate available. |
| † | See Significant Accounting Policies of accompanying Notes to Financial Statements regarding valuation of investments. |
Fair Value Summary
The following is a summary of the fair valuations according to the inputs used as of December 31, 2023 in valuing the Fund’s investments.
| Description | | Total | | Level 1 | | Level 2 | | Level 3(1) |
| Assets | | | | | | | | |
| Common Stocks | | | | | | | | |
| Automobiles & Components | | $ 18,106,738 | | $ 18,106,738 | | $ — | | $ — |
| Banks | | 130,297,714 | | 130,297,714 | | — | | — |
| Capital Goods | | 182,749,760 | | 182,749,760 | | — | | — |
| Commercial & Professional Services | | 22,088,705 | | 22,088,705 | | — | | — |
| Consumer Discretionary Distribution & Retail | | 194,744,092 | | 193,106,908 | | — | | 1,637,184 |
| Consumer Durables & Apparel | | 34,529,060 | | 34,529,060 | | — | | — |
| Consumer Services | | 39,511,440 | | 39,511,440 | | — | | — |
| Energy | | 94,940,321 | | 94,940,321 | | — | | — |
| Equity Real Estate Investment Trusts (REITs) | | 45,347,379 | | 45,347,379 | | — | | — |
| Financial Services | | 155,017,739 | | 155,017,739 | | — | | — |
| Food, Beverage & Tobacco | | 62,129,336 | | 62,129,336 | | — | | — |
| Health Care Equipment & Services | | 142,108,726 | | 142,108,726 | | — | | — |
| Household & Personal Products | | 87,848,613 | | 87,848,613 | | — | | — |
| Insurance | | 84,907,045 | | 84,907,045 | | — | | — |
| Materials | | 40,250,078 | | 40,250,078 | | — | | — |
| Media & Entertainment | | 244,681,960 | | 244,681,960 | | — | | — |
| Pharmaceuticals, Biotechnology & Life Sciences | | 255,108,180 | | 255,108,180 | | — | | — |
| Semiconductors & Semiconductor Equipment | | 218,905,451 | | 218,905,451 | | — | | — |
| Software & Services | | 319,461,859 | | 319,461,859 | | — | | — |
| Technology Hardware & Equipment | | 230,067,344 | | 230,067,344 | | — | | — |
| Utilities | | 86,729,877 | | 86,729,877 | | — | | — |
| Convertible Preferred Stocks | | 5,925,294 | | — | | — | | 5,925,294 |
| Short-Term Investments | | 2,337,621 | | — | | 2,337,621 | | — |
| Total | | $ 2,697,794,332 | | $ 2,687,894,233 | | $ 2,337,621 | | $ 7,562,478 |
| (1) | For the year ended December 31, 2023, there were no transfers in and out of Level 3. |
Level 3 investments at the beginning and/or end of the period in relation to net assets were not significant and accordingly, a reconciliation of Level 3 assets for the year ended December 31, 2023 is not presented.
The accompanying notes are an integral part of these financial statements.
Hartford Dividend and Growth HLS Fund
Schedule of Investments
December 31, 2023
| Shares or Principal Amount | | Market Value† |
| COMMON STOCKS - 98.3% |
| | Banks - 5.8% |
| 1,311,749 | Bank of America Corp. | $ 44,166,589 |
| 470,743 | JP Morgan Chase & Co. | 80,073,384 |
| 99,899 | PNC Financial Services Group, Inc. | 15,469,360 |
| 1,273,705 | Wells Fargo & Co. | 62,691,760 |
| | | | 202,401,093 |
| | Capital Goods - 6.7% |
| 206,767 | Airbus SE | 31,943,099 |
| 140,381 | General Dynamics Corp. | 36,452,734 |
| 657,726 | Johnson Controls International PLC | 37,911,327 |
| 78,985 | Lockheed Martin Corp. | 35,799,161 |
| 498,333 | Otis Worldwide Corp. | 44,585,854 |
| 362,458 | Westinghouse Air Brake Technologies Corp. | 45,995,920 |
| | | | 232,688,095 |
| | Consumer Discretionary Distribution & Retail - 3.2% |
| 106,794 | Home Depot, Inc. | 37,009,461 |
| 145,436 | Lowe's Cos., Inc. | 32,366,782 |
| 445,315 | TJX Cos., Inc. | 41,775,000 |
| | | | 111,151,243 |
| | Consumer Staples Distribution & Retail - 1.1% |
| 275,284 | Sysco Corp. | 20,131,519 |
| 102,620 | Walmart, Inc. | 16,178,043 |
| | | | 36,309,562 |
| | Energy - 7.5% |
| 409,081 | Chevron Corp. | 61,018,522 |
| 554,925 | ConocoPhillips | 64,410,145 |
| 274,929 | Diamondback Energy, Inc. | 42,635,989 |
| 894,103 | TotalEnergies SE ADR | 60,244,660 |
| 906,790 | Williams Cos., Inc. | 31,583,496 |
| | | | 259,892,812 |
| | Equity Real Estate Investment Trusts (REITs) - 3.3% |
| 255,766 | American Tower Corp. REIT | 55,214,764 |
| 1,159,325 | Host Hotels & Resorts, Inc. REIT | 22,572,058 |
| 122,825 | Public Storage REIT | 37,461,625 |
| | | | 115,248,447 |
| | Financial Services - 7.5% |
| 247,022 | American Express Co. | 46,277,102 |
| 40,370 | BlackRock, Inc. | 32,772,366 |
| 339,834 | Charles Schwab Corp. | 23,380,579 |
| 514,437 | Morgan Stanley | 47,971,250 |
| 116,764 | S&P Global, Inc. | 51,436,877 |
| 226,905 | Visa, Inc. Class A | 59,074,717 |
| | | | 260,912,891 |
| | Food, Beverage & Tobacco - 3.5% |
| 767,294 | Keurig Dr Pepper, Inc. | 25,566,236 |
| 298,783 | Mondelez International, Inc. Class A | 21,640,852 |
| 506,559 | Philip Morris International, Inc. | 47,657,071 |
| 503,176 | Tyson Foods, Inc. Class A | 27,045,710 |
| | | | 121,909,869 |
| | Health Care Equipment & Services - 7.2% |
| 165,989 | Becton Dickinson & Co. | 40,473,098 |
| 100,726 | Elevance Health, Inc. | 47,498,353 |
| 128,691 | HCA Healthcare, Inc. | 34,834,080 |
| 598,814 | Medtronic PLC | 49,330,297 |
| 147,930 | UnitedHealth Group, Inc. | 77,880,707 |
| | | | 250,016,535 |
| | Household & Personal Products - 2.0% |
| 943,100 | Kenvue, Inc. | 20,304,943 |
| 978,307 | Unilever PLC ADR | 47,428,323 |
| | | | 67,733,266 |
| Shares or Principal Amount | | Market Value† |
| COMMON STOCKS - 98.3% - (continued) |
| | Insurance - 3.4% |
| 560,443 | American International Group, Inc. | $ 37,970,013 |
| 149,608 | Chubb Ltd. | 33,811,408 |
| 592,300 | Principal Financial Group, Inc. | 46,596,241 |
| | | | 118,377,662 |
| | Materials - 4.7% |
| 2,704,120 | Amcor PLC | 26,067,717 |
| 633,789 | BHP Group Ltd. ADR(1) | 43,294,127 |
| 346,680 | Celanese Corp. | 53,863,672 |
| 631,131 | FMC Corp. | 39,792,809 |
| | | | 163,018,325 |
| | Media & Entertainment - 8.3% |
| 1,436,905 | Alphabet, Inc. Class A* | 200,721,259 |
| 1,283,236 | Comcast Corp. Class A | 56,269,899 |
| 97,305 | Omnicom Group, Inc. | 8,417,855 |
| 257,609 | Walt Disney Co. | 23,259,517 |
| | | | 288,668,530 |
| | Pharmaceuticals, Biotechnology & Life Sciences - 7.5% |
| 257,907 | Agilent Technologies, Inc. | 35,856,810 |
| 696,893 | AstraZeneca PLC ADR | 46,935,744 |
| 686,869 | Bristol-Myers Squibb Co. | 35,243,248 |
| 491,042 | Merck & Co., Inc. | 53,533,399 |
| 430,571 | Novartis AG ADR | 43,474,754 |
| 1,588,917 | Pfizer, Inc. | 45,744,920 |
| | | | 260,788,875 |
| | Semiconductors & Semiconductor Equipment - 5.8% |
| 29,320 | Broadcom, Inc. | 32,728,450 |
| 596,852 | Intel Corp. | 29,991,813 |
| 553,988 | Micron Technology, Inc. | 47,277,336 |
| 376,636 | QUALCOMM, Inc. | 54,472,865 |
| 214,636 | Texas Instruments, Inc. | 36,586,852 |
| | | | 201,057,316 |
| | Software & Services - 9.1% |
| 143,282 | Accenture PLC Class A | 50,279,087 |
| 837,887 | Cognizant Technology Solutions Corp. Class A | 63,285,605 |
| 531,486 | Microsoft Corp. | 199,859,995 |
| | | | 313,424,687 |
| | Technology Hardware & Equipment - 4.7% |
| 498,867 | Apple, Inc. | 96,046,864 |
| 1,283,397 | Cisco Systems, Inc. | 64,837,216 |
| | | | 160,884,080 |
| | Telecommunication Services - 0.9% |
| 805,550 | Verizon Communications, Inc. | 30,369,235 |
| | Transportation - 0.8% |
| 915,025 | Southwest Airlines Co. | 26,425,922 |
| | Utilities - 5.3% |
| 468,178 | American Electric Power Co., Inc. | 38,025,417 |
| 265,881 | Constellation Energy Corp. | 31,078,830 |
| 432,375 | Duke Energy Corp. | 41,957,670 |
| 797,652 | Exelon Corp. | 28,635,707 |
| 580,416 | Sempra | 43,374,488 |
| | | | 183,072,112 |
| | Total Common Stocks
(cost $2,072,305,358) | | $ 3,404,350,557 |
The accompanying notes are an integral part of these financial statements.
Hartford Dividend and Growth HLS Fund
Schedule of Investments – (continued)
December 31, 2023
| Shares or Principal Amount | | Market Value† |
| SHORT-TERM INVESTMENTS - 0.8% |
| | Repurchase Agreements - 0.3% |
| $ 11,022,799 | Fixed Income Clearing Corp. Repurchase Agreement dated 12/29/2023 at 5.32%, due on 01/02/2024 with a maturity value of $11,029,315; collateralized by U.S. Treasury Inflation Index Note at 0.13%, maturing 07/15/2031, with a market value of $11,243,339 | $ 11,022,799 |
| | Securities Lending Collateral - 0.5% |
| 2,519,678 | Goldman Sachs Financial Square Funds, Government Fund, Institutional Class, 5.25%(2) | 2,519,678 |
| 8,398,925 | HSBC U.S. Government Money Market Fund, Institutional Class, 5.31%(2) | 8,398,925 |
| 2,673,802 | Invesco Government & Agency Portfolio, Institutional Class, 5.28%(2) | 2,673,802 |
| 2,519,678 | Morgan Stanley Institutional Liquidity Funds, Government Portfolio, Institutional Class, 5.27%(2) | 2,519,678 |
| | | | 16,112,083 |
| | Total Short-Term Investments
(cost $27,134,882) | $ 27,134,882 |
| | Total Investments
(cost $2,099,440,240) | 99.1% | $ 3,431,485,439 |
| | Other Assets and Liabilities | 0.9% | 32,159,917 |
| | Total Net Assets | 100.0% | $ 3,463,645,356 |
| Note: | Percentage of investments as shown is the ratio of the total market value to total net assets. |
| | Prices of foreign equities that are principally traded on certain foreign markets will generally be adjusted daily pursuant to a fair value pricing service approved by Hartford Funds Management Company, LLC in order to reflect an adjustment for factors occurring after the close of certain foreign markets but before the close of the New York Stock Exchange. |
| | Equity industry classifications used in this report are the Global Industry Classification Standard, which was developed by and is the exclusive property and service mark of MSCI, Inc. and Standard & Poor’s. |
| | For Fund compliance purposes, the Fund may not use the same classification system. These classifications are used for financial reporting purposes. |
| | See “Glossary” for abbreviation descriptions. |
| * | Non-income producing. |
| (1) | Represents entire or partial securities on loan. See Note 8 in the accompanying Notes to Financial Statements for securities lending information. |
| (2) | Current yield as of period end. |
| † | See Significant Accounting Policies of accompanying Notes to Financial Statements regarding valuation of investments. |
Fair Value Summary
The following is a summary of the fair valuations according to the inputs used as of December 31, 2023 in valuing the Fund’s investments.
| Description | | Total | | Level 1 | | Level 2 | | Level 3(1) |
| Assets | | | | | | | | |
| Common Stocks | | | | | | | | |
| Banks | | $ 202,401,093 | | $ 202,401,093 | | $ — | | $ — |
| Capital Goods | | 232,688,095 | | 200,744,996 | | 31,943,099 | | — |
| Consumer Discretionary Distribution & Retail | | 111,151,243 | | 111,151,243 | | — | | — |
| Consumer Staples Distribution & Retail | | 36,309,562 | | 36,309,562 | | — | | — |
| Energy | | 259,892,812 | | 259,892,812 | | — | | — |
| Equity Real Estate Investment Trusts (REITs) | | 115,248,447 | | 115,248,447 | | — | | — |
| Financial Services | | 260,912,891 | | 260,912,891 | | — | | — |
| Food, Beverage & Tobacco | | 121,909,869 | | 121,909,869 | | — | | — |
| Health Care Equipment & Services | | 250,016,535 | | 250,016,535 | | — | | — |
| Household & Personal Products | | 67,733,266 | | 67,733,266 | | — | | — |
| Insurance | | 118,377,662 | | 118,377,662 | | — | | — |
| Materials | | 163,018,325 | | 163,018,325 | | — | | — |
| Media & Entertainment | | 288,668,530 | | 288,668,530 | | — | | — |
| Pharmaceuticals, Biotechnology & Life Sciences | | 260,788,875 | | 260,788,875 | | — | | — |
| Semiconductors & Semiconductor Equipment | | 201,057,316 | | 201,057,316 | | — | | — |
| Software & Services | | 313,424,687 | | 313,424,687 | | — | | — |
| Technology Hardware & Equipment | | 160,884,080 | | 160,884,080 | | — | | — |
| Telecommunication Services | | 30,369,235 | | 30,369,235 | | — | | — |
| Transportation | | 26,425,922 | | 26,425,922 | | — | | — |
| Utilities | | 183,072,112 | | 183,072,112 | | — | | — |
| Short-Term Investments | | 27,134,882 | | 16,112,083 | | 11,022,799 | | — |
| Total | | $ 3,431,485,439 | | $ 3,388,519,541 | | $ 42,965,898 | | $ — |
| (1) | For the year ended December 31, 2023, there were no transfers in and out of Level 3. |
The accompanying notes are an integral part of these financial statements.
Hartford Healthcare HLS Fund
Schedule of Investments
December 31, 2023
| Shares or Principal Amount | | Market Value† |
| COMMON STOCKS - 98.8% |
| | Biotechnology - 17.7% |
| 22,144 | Alkermes PLC* | $ 614,275 |
| 4,692 | Alnylam Pharmaceuticals, Inc.* | 898,096 |
| 10,562 | Apellis Pharmaceuticals, Inc.* | 632,241 |
| 2,787 | Argenx SE ADR* | 1,060,258 |
| 5,109 | Ascendis Pharma AS ADR*(1) | 643,479 |
| 6,199 | Biogen, Inc.* | 1,604,115 |
| 4,972 | Blueprint Medicines Corp.* | 458,617 |
| 10,555 | Bridgebio Pharma, Inc.* | 426,105 |
| 14,251 | Celldex Therapeutics, Inc.* | 565,195 |
| 13,315 | Crinetics Pharmaceuticals, Inc.* | 473,748 |
| 11,780 | Cytokinetics, Inc.* | 983,512 |
| 9,770 | Exact Sciences Corp.* | 722,785 |
| 1,750 | Genmab AS* | 557,993 |
| 13,612 | Genus PLC | 376,507 |
| 9,510 | Gilead Sciences, Inc. | 770,405 |
| 8,697 | Immunocore Holdings PLC ADR*(1) | 594,179 |
| 2,050 | Karuna Therapeutics, Inc.* | 648,846 |
| 5,588 | Legend Biotech Corp. ADR* | 336,230 |
| 15,545 | Merus NV* | 427,488 |
| 4,091 | Moderna, Inc.* | 406,850 |
| 6,882 | Morphic Holding, Inc.* | 198,752 |
| 4,881 | Prothena Corp. PLC* | 177,376 |
| 8,883 | PTC Therapeutics, Inc.* | 244,815 |
| 1,752 | Regeneron Pharmaceuticals, Inc.* | 1,538,764 |
| 20,630 | Revolution Medicines, Inc.* | 591,668 |
| 13,995 | Rocket Pharmaceuticals, Inc.* | 419,430 |
| 24,674 | Roivant Sciences Ltd.* | 277,089 |
| 8,054 | Sage Therapeutics, Inc.* | 174,530 |
| 4,733 | Sarepta Therapeutics, Inc.* | 456,403 |
| 23,400 | Sichuan Kelun-Biotech Biopharmaceutical Co. Ltd.* | 307,955 |
| 18,320 | Syndax Pharmaceuticals, Inc.* | 395,895 |
| 7,716 | Ultragenyx Pharmaceutical, Inc.* | 368,979 |
| 4,126 | United Therapeutics Corp.* | 907,266 |
| 7,215 | Vaxcyte, Inc.* | 453,102 |
| 19,399 | Veracyte, Inc.* | 533,666 |
| 8,684 | Vertex Pharmaceuticals, Inc.* | 3,533,433 |
| 9,815 | Xenon Pharmaceuticals, Inc.* | 452,079 |
| 12,073 | Zai Lab Ltd. ADR* | 329,955 |
| | | | 24,562,081 |
| | Environmental & Facilities Services - 0.5% |
| 7,662 | Veralto Corp. | 630,276 |
| | Health Care Distributors - 1.8% |
| 12,230 | Cencora, Inc. | 2,511,797 |
| | Health Care Equipment - 15.3% |
| 22,016 | Abbott Laboratories | 2,423,301 |
| 4,759 | Becton Dickinson & Co. | 1,160,387 |
| 62,359 | Boston Scientific Corp.* | 3,604,974 |
| 18,672 | Dexcom, Inc.* | 2,317,008 |
| 5,617 | DiaSorin SpA | 578,909 |
| 30,312 | Edwards Lifesciences Corp.* | 2,311,290 |
| 15,100 | Hologic, Inc.* | 1,078,895 |
| 9,576 | Inari Medical, Inc.* | 621,674 |
| 1,175 | Inspire Medical Systems, Inc.* | 239,030 |
| 6,110 | Insulet Corp.* | 1,325,748 |
| 4,462 | QuidelOrtho Corp.* | 328,849 |
| 3,714 | Shockwave Medical, Inc.* | 707,740 |
| 7,417 | Smith & Nephew PLC | 101,888 |
| 11,952 | Stryker Corp. | 3,579,146 |
| 3,152 | Teleflex, Inc. | 785,920 |
| | | | 21,164,759 |
| | Health Care Facilities - 4.5% |
| 13,191 | Acadia Healthcare Co., Inc.* | 1,025,732 |
| 17,767 | Encompass Health Corp. | 1,185,415 |
| Shares or Principal Amount | | Market Value† |
| COMMON STOCKS - 98.8% - (continued) |
| | Health Care Facilities - 4.5% - (continued) |
| 12,081 | HCA Healthcare, Inc. | $ 3,270,085 |
| 23,776 | Surgery Partners, Inc.* | 760,594 |
| | | | 6,241,826 |
| | Health Care Services - 3.0% |
| 7,984 | Addus HomeCare Corp.* | 741,315 |
| 43,152 | agilon health, Inc.* | 541,558 |
| 7,247 | Guardant Health, Inc.* | 196,031 |
| 6,442 | Laboratory Corp. of America Holdings | 1,464,202 |
| 22,270 | Option Care Health, Inc.* | 750,276 |
| 21,565 | Privia Health Group, Inc.* | 496,642 |
| | | | 4,190,024 |
| | Health Care Technology - 0.6% |
| 26,150 | Evolent Health, Inc. Class A* | 863,734 |
| | Life Sciences Tools & Services - 12.6% |
| 15,832 | Agilent Technologies, Inc. | 2,201,123 |
| 24,584 | Avantor, Inc.* | 561,253 |
| 6,716 | Bio-Techne Corp. | 518,206 |
| 22,693 | Danaher Corp. | 5,249,799 |
| 7,082 | ICON PLC* | 2,004,702 |
| 9,242 | Illumina, Inc.* | 1,286,856 |
| 4,870 | Repligen Corp.* | 875,626 |
| 1,344 | Tecan Group AG | 549,840 |
| 6,125 | Thermo Fisher Scientific, Inc. | 3,251,089 |
| 3,124 | Waters Corp.* | 1,028,514 |
| | | | 17,527,008 |
| | Managed Health Care - 14.2% |
| 42,417 | Centene Corp.* | 3,147,766 |
| 327,135 | Hapvida Participacoes e Investimentos SA*(2) | 299,459 |
| 6,871 | Humana, Inc. | 3,145,612 |
| 6,490 | Molina Healthcare, Inc.* | 2,344,902 |
| 20,268 | UnitedHealth Group, Inc. | 10,670,494 |
| | | | 19,608,233 |
| | Pharmaceuticals - 28.6% |
| 38,616 | AstraZeneca PLC ADR | 2,600,788 |
| 31,900 | Chugai Pharmaceutical Co. Ltd. | 1,205,128 |
| 61,335 | Daiichi Sankyo Co. Ltd. | 1,679,151 |
| 21,409 | Eisai Co. Ltd. | 1,065,979 |
| 57,814 | Elanco Animal Health, Inc.* | 861,429 |
| 21,350 | Eli Lilly & Co. | 12,445,342 |
| 41,786 | GSK PLC | 771,753 |
| 73,794 | Merck & Co., Inc. | 8,045,022 |
| 10,333 | Novartis AG | 1,043,741 |
| 18,000 | Otsuka Holdings Co. Ltd. | 673,146 |
| 145,962 | Pfizer, Inc. | 4,202,246 |
| 12,820 | Structure Therapeutics, Inc. ADR* | 522,543 |
| 7,550 | UCB SA | 658,146 |
| 24,428 | Verona Pharma PLC ADR* | 485,629 |
| 16,847 | Zoetis, Inc. | 3,325,092 |
| | | | 39,585,135 |
| | Total Common Stocks
(cost $100,280,479) | | $ 136,884,873 |
| RIGHTS - 0.0% |
| | Health Care Equipment - 0.0% |
| 885 | Abiomed, Inc. CVR*(3)(4) | $ 903 |
| | Total Rights
(cost $903) | | $ 903 |
| | Total Long-Term Investments
(cost $100,281,382) | | $ 136,885,776 |
The accompanying notes are an integral part of these financial statements.
Hartford Healthcare HLS Fund
Schedule of Investments – (continued)
December 31, 2023
| Shares or Principal Amount | | Market Value† |
| SHORT-TERM INVESTMENTS - 0.7% |
| | Repurchase Agreements - 0.3% |
| $ 345,839 | Fixed Income Clearing Corp. Repurchase Agreement dated 12/29/2023 at 5.32%, due on 01/02/2024 with a maturity value of $346,043; collateralized by U.S. Treasury Inflation Index Note at 0.13%, maturing 07/15/2031, with a market value of $352,842 | $ 345,839 |
| | Securities Lending Collateral - 0.4% |
| 94,711 | Goldman Sachs Financial Square Funds, Government Fund, Institutional Class, 5.25%(5) | 94,711 |
| 315,705 | HSBC U.S. Government Money Market Fund, Institutional Class, 5.31%(5) | 315,705 |
| 94,712 | Invesco Government & Agency Portfolio, Institutional Class, 5.28%(5) | 94,712 |
| 94,712 | Morgan Stanley Institutional Liquidity Funds, Government Portfolio, Institutional Class, 5.27%(5) | 94,712 |
| | | | 599,840 |
| | Total Short-Term Investments
(cost $945,679) | $ 945,679 |
| | Total Investments
(cost $101,227,061) | 99.5% | $ 137,831,455 |
| | Other Assets and Liabilities | 0.5% | 744,101 |
| | Total Net Assets | 100.0% | $ 138,575,556 |
| Note: | Percentage of investments as shown is the ratio of the total market value to total net assets. |
| | Prices of foreign equities that are principally traded on certain foreign markets will generally be adjusted daily pursuant to a fair value pricing service approved by Hartford Funds Management Company, LLC in order to reflect an adjustment for factors occurring after the close of certain foreign markets but before the close of the New York Stock Exchange. |
| | Equity industry classifications used in this report are the Global Industry Classification Standard, which was developed by and is the exclusive property and service mark of MSCI, Inc. and Standard & Poor’s. |
| | For Fund compliance purposes, the Fund may not use the same classification system. These classifications are used for financial reporting purposes. |
| | See “Glossary” for abbreviation descriptions. |
| * | Non-income producing. |
| (1) | Represents entire or partial securities on loan. See Note 8 in the accompanying Notes to Financial Statements for securities lending information. |
| (2) | Security was purchased pursuant to Rule 144A under the Securities Act of 1933 and may be sold in transactions that are exempt from registration (typically only to qualified institutional buyers) or in a public offering registered under the Securities Act of 1933. At December 31, 2023, the aggregate value of this security was $299,459, representing 0.2% of net assets. |
| (3) | Investment valued using significant unobservable inputs. |
| (4) | Currently no expiration date available. |
| (5) | Current yield as of period end. |
| † | See Significant Accounting Policies of accompanying Notes to Financial Statements regarding valuation of investments. |
Fair Value Summary
The following is a summary of the fair valuations according to the inputs used as of December 31, 2023 in valuing the Fund’s investments.
| Description | | Total | | Level 1 | | Level 2 | | Level 3(1) |
| Assets | | | | | | | | |
| Common Stocks | | | | | | | | |
| Biotechnology | | $ 24,562,081 | | $ 23,696,133 | | $ 865,948 | | $ — |
| Environmental & Facilities Services | | 630,276 | | 630,276 | | — | | — |
| Health Care Distributors | | 2,511,797 | | 2,511,797 | | — | | — |
| Health Care Equipment | | 21,164,759 | | 20,483,962 | | 680,797 | | — |
| Health Care Facilities | | 6,241,826 | | 6,241,826 | | — | | — |
| Health Care Services | | 4,190,024 | | 4,190,024 | | — | | — |
| Health Care Technology | | 863,734 | | 863,734 | | — | | — |
| Life Sciences Tools & Services | | 17,527,008 | | 16,977,168 | | 549,840 | | — |
| Managed Health Care | | 19,608,233 | | 19,308,774 | | 299,459 | | — |
| Pharmaceuticals | | 39,585,135 | | 32,488,091 | | 7,097,044 | | — |
| Rights | | 903 | | — | | — | | 903 |
| Short-Term Investments | | 945,679 | | 599,840 | | 345,839 | | — |
| Total | | $ 137,831,455 | | $ 127,991,625 | | $ 9,838,927 | | $ 903 |
| (1) | For the year ended December 31, 2023, there were no transfers in and out of Level 3. |
Level 3 investments at the beginning and/or end of the period in relation to net assets were not significant and accordingly, a reconciliation of Level 3 assets for the year ended December 31, 2023 is not presented.
The accompanying notes are an integral part of these financial statements.
Hartford International Opportunities HLS Fund
Schedule of Investments
December 31, 2023
| Shares or Principal Amount | | Market Value† |
| COMMON STOCKS - 97.3% |
| | Australia - 2.2% |
| 260,426 | Rio Tinto PLC | $ 19,370,763 |
| | Brazil - 1.5% |
| 1,020,448 | Localiza Rent a Car SA | 13,360,515 |
| | Canada - 5.7% |
| 131,825 | Cameco Corp. | 5,683,682 |
| 156,247 | Canadian Pacific Kansas City Ltd. | 12,362,504 |
| 635,206 | Cenovus Energy, Inc. | 10,584,769 |
| 4,109 | Constellation Software, Inc. | 10,187,672 |
| 83,352 | RB Global, Inc. | 5,577,768 |
| 41,321 | TFI International, Inc. | 5,620,691 |
| | | | 50,017,086 |
| | China - 4.9% |
| 214,500 | BYD Co. Ltd. Class H | 5,916,904 |
| 449,126 | ENN Energy Holdings Ltd. | 3,316,547 |
| 326,810 | KE Holdings, Inc. ADR | 5,297,590 |
| 601,538 | Proya Cosmetics Co. Ltd. Class A | 8,431,165 |
| 520,191 | Tencent Holdings Ltd. | 19,639,734 |
| | | | 42,601,940 |
| | Denmark - 1.8% |
| 147,464 | Novo Nordisk AS Class B | 15,281,865 |
| | France - 12.5% |
| 101,123 | Airbus SE | 15,622,328 |
| 446,089 | AXA SA | 14,567,681 |
| 205,153 | BNP Paribas SA | 14,246,985 |
| 255,688 | Bureau Veritas SA | 6,468,837 |
| 54,079 | Capgemini SE | 11,302,053 |
| 2,872 | Hermes International SCA | 6,104,478 |
| 20,389 | L'Oreal SA | 10,163,928 |
| 6,870 | LVMH Moet Hennessy Louis Vuitton SE | 5,582,128 |
| 50,982 | Pernod Ricard SA | 9,009,631 |
| 250,059 | Renault SA | 10,227,395 |
| 351,434 | Vallourec SACA* | 5,458,853 |
| | | | 108,754,297 |
| | Germany - 10.6% |
| 61,688 | adidas AG | 12,535,414 |
| 434,444 | Deutsche Telekom AG | 10,445,470 |
| 366,557 | Infineon Technologies AG | 15,308,379 |
| 52,902 | Merck KGaA | 8,422,762 |
| 305,472 | RWE AG | 13,902,917 |
| 87,183 | SAP SE | 13,419,341 |
| 99,456 | Siemens AG | 18,658,869 |
| | | | 92,693,152 |
| | Hong Kong - 1.3% |
| 187,700 | Hong Kong Exchanges & Clearing Ltd. | 6,438,159 |
| 410,496 | Prudential PLC | 4,631,497 |
| | | | 11,069,656 |
| | India - 3.7% |
| 847,908 | Axis Bank Ltd. | 11,221,528 |
| 259,924 | Larsen & Toubro Ltd. | 11,007,222 |
| 319,021 | Reliance Industries Ltd. | 9,901,756 |
| | | | 32,130,506 |
| | Indonesia - 0.9% |
| 12,242,600 | Bank Central Asia Tbk. PT | 7,476,551 |
| | Italy - 1.7% |
| 21,040 | Ferrari NV | 7,103,241 |
| 294,250 | UniCredit SpA | 8,012,337 |
| | | | 15,115,578 |
| Shares or Principal Amount | | Market Value† |
| COMMON STOCKS - 97.3% - (continued) |
| | Japan - 12.6% |
| 309,400 | Bandai Namco Holdings, Inc. | $ 6,187,452 |
| 265,500 | Dai-ichi Life Holdings, Inc. | 5,632,030 |
| 39,700 | Fast Retailing Co. Ltd. | 9,816,968 |
| 33,400 | Hoya Corp. | 4,159,607 |
| 245,300 | ITOCHU Corp. | 9,993,484 |
| 32,322 | Keyence Corp. | 14,200,873 |
| 1,690,100 | Mitsubishi UFJ Financial Group, Inc. | 14,504,655 |
| 152,100 | Oriental Land Co. Ltd. | 5,653,297 |
| 217,400 | Recruit Holdings Co. Ltd. | 9,089,737 |
| 219,300 | Sony Group Corp. | 20,752,984 |
| 600,399 | T&D Holdings, Inc. | 9,531,606 |
| | | | 109,522,693 |
| | Jersey - 0.4% |
| 410,017 | Arcadium Lithium PLC CDI* | 3,132,142 |
| | Netherlands - 6.2% |
| 26,833 | ASML Holding NV | 20,255,896 |
| 600,842 | Shell PLC | 19,769,669 |
| 98,760 | Wolters Kluwer NV | 14,050,534 |
| | | | 54,076,099 |
| | South Africa - 1.2% |
| 426,107 | Anglo American PLC | 10,664,052 |
| | South Korea - 3.1% |
| 449,495 | Samsung Electronics Co. Ltd. | 27,282,905 |
| | Spain - 1.2% |
| 814,955 | Iberdrola SA | 10,689,587 |
| | Switzerland - 5.4% |
| 141,678 | Alcon, Inc. | 11,084,315 |
| 233,582 | Novartis AG | 23,594,232 |
| 8,768 | Partners Group Holding AG | 12,678,089 |
| | | | 47,356,636 |
| | Taiwan - 3.3% |
| 1,518,806 | Taiwan Semiconductor Manufacturing Co. Ltd. | 29,117,847 |
| | Thailand - 1.3% |
| 2,914,973 | Kasikornbank PCL | 11,529,227 |
| | United Kingdom - 11.5% |
| 152,194 | AstraZeneca PLC | 20,529,425 |
| 1,129,782 | BAE Systems PLC | 15,992,053 |
| 2,089,380 | HSBC Holdings PLC | 16,903,000 |
| 140,816 | London Stock Exchange Group PLC | 16,646,074 |
| 185,706 | Reckitt Benckiser Group PLC | 12,814,347 |
| 357,356 | Unilever PLC | 17,299,956 |
| | | | 100,184,855 |
| | United States - 4.3% |
| 18,870 | ARM Holdings PLC ADR*(1) | 1,417,986 |
| 139,788 | CRH PLC | 9,620,109 |
| 29,766 | CyberArk Software Ltd.* | 6,520,242 |
| 25,435 | Linde PLC | 10,346,970 |
| 542,379 | Tenaris SA | 9,433,688 |
| | | | 37,338,995 |
| | Total Common Stocks
(cost $692,381,530) | | $ 848,766,947 |
The accompanying notes are an integral part of these financial statements.
Hartford International Opportunities HLS Fund
Schedule of Investments – (continued)
December 31, 2023
| Shares or Principal Amount | | Market Value† |
| PREFERRED STOCKS - 1.6% |
| | Brazil - 1.6% |
| 4,042,700 | Banco Bradesco SA (Preference Shares)(2) | $ 14,097,658 |
| | Total Preferred Stocks
(cost $11,727,947) | | $ 14,097,658 |
| RIGHTS - 0.0% |
| | Brazil - 0.0% |
| 3,661 | Localiza Rent a Car SA Expires 02/05/2024* | $ 15,073 |
| | Total Rights
(cost $—) | | $ 15,073 |
| WARRANTS - 0.0% |
| | Canada - 0.0% |
| 5,095 | Constellation Software, Inc. Expires 03/31/2040*(3) | $ — |
| | Total Warrants
(cost $—) | | $ — |
| | Total Long-Term Investments
(cost $704,109,477) | | $ 862,879,678 |
| SHORT-TERM INVESTMENTS - 0.4% |
| | Repurchase Agreements - 0.2% |
| $ 1,934,551 | Fixed Income Clearing Corp. Repurchase Agreement dated 12/29/2023 at 5.32%, due on 01/02/2024 with a maturity value of $1,935,695; collateralized by U.S. Treasury Bond at 4.38%, maturing 05/15/2040, with a market value of $1,973,324 | $ 1,934,551 |
| | Securities Lending Collateral - 0.2% |
| 222,069 | Goldman Sachs Financial Square Funds, Government Fund, Institutional Class, 5.25%(4) | 222,069 |
| 740,229 | HSBC U.S. Government Money Market Fund, Institutional Class, 5.31%(4) | 740,229 |
| 222,069 | Invesco Government & Agency Portfolio, Institutional Class, 5.28%(4) | 222,069 |
| 222,069 | Morgan Stanley Institutional Liquidity Funds, Government Portfolio, Institutional Class, 5.27%(4) | 222,069 |
| | | | 1,406,436 |
| | Total Short-Term Investments
(cost $3,340,987) | $ 3,340,987 |
| | Total Investments
(cost $707,450,464) | 99.3% | $ 866,220,665 |
| | Other Assets and Liabilities | 0.7% | 6,103,267 |
| | Total Net Assets | 100.0% | $ 872,323,932 |
| Note: | Percentage of investments as shown is the ratio of the total market value to total net assets. |
| | Prices of foreign equities that are principally traded on certain foreign markets will generally be adjusted daily pursuant to a fair value pricing service approved by Hartford Funds Management Company, LLC in order to reflect an adjustment for factors occurring after the close of certain foreign markets but before the close of the New York Stock Exchange. |
| | Equity industry classifications used in this report are the Global Industry Classification Standard, which was developed by and is the exclusive property and service mark of MSCI, Inc. and Standard & Poor’s. |
| | For Fund compliance purposes, the Fund may not use the same classification system. These classifications are used for financial reporting purposes. |
| | See “Glossary” for abbreviation descriptions. |
| | |
| * | Non-income producing. |
| (1) | Represents entire or partial securities on loan. See Note 8 in the accompanying Notes to Financial Statements for securities lending information. |
| (2) | Currently no rate available. |
| (3) | Investment valued using significant unobservable inputs. |
| (4) | Current yield as of period end. |
| † | See Significant Accounting Policies of accompanying Notes to Financial Statements regarding valuation of investments. |
The accompanying notes are an integral part of these financial statements.
Hartford International Opportunities HLS Fund
Schedule of Investments – (continued)
December 31, 2023
Fair Value Summary
The following is a summary of the fair valuations according to the inputs used as of December 31, 2023 in valuing the Fund’s investments.
| Description | | Total | | Level 1 | | Level 2 | | Level 3(1) |
| Assets | | | | | | | | |
| Common Stocks | | | | | | | | |
| Australia | | $ 19,370,763 | | $ — | | $ 19,370,763 | | $ — |
| Brazil | | 13,360,515 | | — | | 13,360,515 | | — |
| Canada | | 50,017,086 | | 50,017,086 | | — | | — |
| China | | 42,601,940 | | 5,297,590 | | 37,304,350 | | — |
| Denmark | | 15,281,865 | | — | | 15,281,865 | | — |
| France | | 108,754,297 | | — | | 108,754,297 | | — |
| Germany | | 92,693,152 | | — | | 92,693,152 | | — |
| Hong Kong | | 11,069,656 | | — | | 11,069,656 | | — |
| India | | 32,130,506 | | — | | 32,130,506 | | — |
| Indonesia | | 7,476,551 | | — | | 7,476,551 | | — |
| Italy | | 15,115,578 | | — | | 15,115,578 | | — |
| Japan | | 109,522,693 | | — | | 109,522,693 | | — |
| Jersey | | 3,132,142 | | 3,132,142 | | — | | — |
| Netherlands | | 54,076,099 | | — | | 54,076,099 | | — |
| South Africa | | 10,664,052 | | — | | 10,664,052 | | — |
| South Korea | | 27,282,905 | | — | | 27,282,905 | | — |
| Spain | | 10,689,587 | | — | | 10,689,587 | | — |
| Switzerland | | 47,356,636 | | — | | 47,356,636 | | — |
| Taiwan | | 29,117,847 | | — | | 29,117,847 | | — |
| Thailand | | 11,529,227 | | 11,529,227 | | — | | — |
| United Kingdom | | 100,184,855 | | 15,992,053 | | 84,192,802 | | — |
| United States | | 37,338,995 | | 7,938,228 | | 29,400,767 | | — |
| Preferred Stocks | | 14,097,658 | | — | | 14,097,658 | | — |
| Rights | | 15,073 | | 15,073 | | — | | — |
| Warrants | | — | | — | | — | | — |
| Short-Term Investments | | 3,340,987 | | 1,406,436 | | 1,934,551 | | — |
| Total | | $ 866,220,665 | | $ 95,327,835 | | $ 770,892,830 | | $ — |
| (1) | For the year ended December 31, 2023, there were no transfers in and out of Level 3. |
Level 3 investments at the beginning and/or end of the period in relation to net assets were not significant and accordingly, a reconciliation of Level 3 assets for the year ended December 31, 2023 is not presented.
The accompanying notes are an integral part of these financial statements.
Schedule of Investments
December 31, 2023
| Shares or Principal Amount | | Market Value† |
| COMMON STOCKS - 99.6% |
| | Automobiles & Components - 1.5% |
| 116,012 | BorgWarner, Inc. | $ 4,159,030 |
| 95,531 | Visteon Corp.* | 11,931,822 |
| | | | 16,090,852 |
| | Banks - 0.5% |
| 37,270 | M&T Bank Corp. | 5,108,972 |
| | Capital Goods - 12.4% |
| 8,598 | Acuity Brands, Inc. | 1,761,128 |
| 71,794 | Axon Enterprise, Inc.* | 18,546,544 |
| 52,924 | Builders FirstSource, Inc.* | 8,835,133 |
| 157,345 | Fortive Corp. | 11,585,312 |
| 161,731 | Graco, Inc. | 14,031,782 |
| 56,166 | IDEX Corp. | 12,194,200 |
| 140,644 | Ingersoll Rand, Inc. | 10,877,407 |
| 45,725 | Lennox International, Inc. | 20,462,852 |
| 44,732 | Lincoln Electric Holdings, Inc. | 9,727,421 |
| 30,943 | Watsco, Inc. | 13,258,147 |
| 119,457 | Westinghouse Air Brake Technologies Corp. | 15,159,093 |
| | | | 136,439,019 |
| | Commercial & Professional Services - 3.1% |
| 173,522 | Ceridian HCM Holding, Inc.* | 11,646,797 |
| 358,473 | Genpact Ltd. | 12,442,598 |
| 80,681 | Robert Half, Inc. | 7,093,473 |
| 42,135 | TransUnion | 2,895,096 |
| | | | 34,077,964 |
| | Consumer Discretionary Distribution & Retail - 3.6% |
| 169,974 | CarMax, Inc.* | 13,043,805 |
| 247,127 | Chewy, Inc. Class A* | 5,839,611 |
| 70,403 | Floor & Decor Holdings, Inc. Class A* | 7,854,159 |
| 345,716 | Valvoline, Inc.* | 12,992,007 |
| | | | 39,729,582 |
| | Consumer Durables & Apparel - 3.6% |
| 23,308 | Deckers Outdoor Corp.* | 15,579,767 |
| 3,436 | NVR, Inc.* | 24,053,546 |
| | | | 39,633,313 |
| | Consumer Services - 3.7% |
| 91,759 | Choice Hotels International, Inc. | 10,396,295 |
| 509,214 | DraftKings, Inc. Class A* | 17,949,793 |
| 91,719 | Hyatt Hotels Corp. Class A | 11,961,075 |
| | | | 40,307,163 |
| | Consumer Staples Distribution & Retail - 0.7% |
| 109,828 | BJ's Wholesale Club Holdings, Inc.* | 7,321,134 |
| | Energy - 4.3% |
| 354,648 | Coterra Energy, Inc. | 9,050,617 |
| 438,461 | Marathon Oil Corp. | 10,593,218 |
| 221,486 | Ovintiv, Inc. | 9,727,665 |
| 210,633 | Targa Resources Corp. | 18,297,689 |
| | | | 47,669,189 |
| | Equity Real Estate Investment Trusts (REITs) - 1.3% |
| 88,572 | Lamar Advertising Co. Class A, REIT | 9,413,432 |
| 82,343 | Rexford Industrial Realty, Inc. REIT | 4,619,442 |
| | | | 14,032,874 |
| | Financial Services - 8.7% |
| 34,413 | Credit Acceptance Corp.*(1) | 18,332,837 |
| 75,970 | Hamilton Lane, Inc. Class A | 8,618,037 |
| 5,409 | Morningstar, Inc. | 1,548,272 |
| 537,157 | Nuvei Corp. | 14,105,743 |
| 247,125 | Shift4 Payments, Inc. Class A* | 18,371,273 |
| Shares or Principal Amount | | Market Value† |
| COMMON STOCKS - 99.6% - (continued) |
| | Financial Services - 8.7% - (continued) |
| 154,007 | Tradeweb Markets, Inc. Class A | $ 13,996,156 |
| 108,733 | WEX, Inc.* | 21,154,005 |
| | | | 96,126,323 |
| | Food, Beverage & Tobacco - 0.8% |
| 99,720 | Post Holdings, Inc.* | 8,781,343 |
| | Health Care Equipment & Services - 7.1% |
| 113,968 | Acadia Healthcare Co., Inc.* | 8,862,152 |
| 798,307 | agilon health, Inc.* | 10,018,753 |
| 296,691 | Inari Medical, Inc.* | 19,261,180 |
| 34,496 | Molina Healthcare, Inc.* | 12,463,750 |
| 63,824 | Shockwave Medical, Inc.* | 12,162,301 |
| 78,424 | Veeva Systems, Inc. Class A* | 15,098,188 |
| | | | 77,866,324 |
| | Insurance - 2.4% |
| 12,418 | Markel Group, Inc.* | 17,632,318 |
| 70,969 | W R Berkley Corp. | 5,018,928 |
| 2,557 | White Mountains Insurance Group Ltd. | 3,848,310 |
| | | | 26,499,556 |
| | Materials - 2.4% |
| 86,849 | Ball Corp. | 4,995,554 |
| 35,401 | Celanese Corp. | 5,500,253 |
| 231,506 | Element Solutions, Inc. | 5,357,049 |
| 217,081 | Graphic Packaging Holding Co. | 5,351,047 |
| 117,906 | Silgan Holdings, Inc. | 5,335,247 |
| | | | 26,539,150 |
| | Media & Entertainment - 1.7% |
| 13,334 | Cable One, Inc. | 7,421,571 |
| 184,419 | Pinterest, Inc. Class A* | 6,830,880 |
| 50,577 | Roku, Inc.* | 4,635,888 |
| | | | 18,888,339 |
| | Pharmaceuticals, Biotechnology & Life Sciences - 14.3% |
| 51,838 | Alnylam Pharmaceuticals, Inc.* | 9,922,312 |
| 357,465 | Apellis Pharmaceuticals, Inc.* | 21,397,855 |
| 148,170 | Bio-Techne Corp. | 11,432,797 |
| 243,550 | Exact Sciences Corp.* | 18,017,829 |
| 45,534 | ICON PLC* | 12,889,309 |
| 89,456 | Jazz Pharmaceuticals PLC* | 11,003,088 |
| 3,414 | Mettler-Toledo International, Inc.* | 4,141,046 |
| 105,210 | Neurocrine Biosciences, Inc.* | 13,862,470 |
| 377,541 | PTC Therapeutics, Inc.* | 10,405,030 |
| 50,494 | Repligen Corp.* | 9,078,821 |
| 106,810 | Sarepta Therapeutics, Inc.* | 10,299,688 |
| 229,621 | Ultragenyx Pharmaceutical, Inc.* | 10,980,476 |
| 65,836 | United Therapeutics Corp.* | 14,476,678 |
| | | | 157,907,399 |
| | Semiconductors & Semiconductor Equipment - 4.4% |
| 31,931 | First Solar, Inc.* | 5,501,073 |
| 48,090 | Lattice Semiconductor Corp.* | 3,317,729 |
| 99,822 | MKS Instruments, Inc. | 10,268,689 |
| 23,817 | Monolithic Power Systems, Inc. | 15,023,287 |
| 34,507 | Onto Innovation, Inc.* | 5,276,121 |
| 99,137 | Rambus, Inc.* | 6,766,100 |
| 21,718 | Silicon Laboratories, Inc.* | 2,872,640 |
| | | | 49,025,639 |
| | Software & Services - 15.6% |
| 37,814 | ANSYS, Inc.* | 13,721,944 |
| 48,837 | CyberArk Software Ltd.* | 10,697,745 |
| 189,544 | Datadog, Inc. Class A* | 23,006,851 |
| 358,345 | Dynatrace, Inc.* | 19,597,888 |
| 19,276 | Fair Isaac Corp.* | 22,437,457 |
The accompanying notes are an integral part of these financial statements.
Schedule of Investments – (continued)
December 31, 2023
| Shares or Principal Amount | | Market Value† |
| COMMON STOCKS - 99.6% - (continued) |
| | Software & Services - 15.6% - (continued) |
| 38,777 | HubSpot, Inc.* | $ 22,511,599 |
| 564,354 | Informatica, Inc. Class A* | 16,022,010 |
| 48,300 | MongoDB, Inc.* | 19,747,455 |
| 50,728 | PTC, Inc.* | 8,875,371 |
| 87,869 | Unity Software, Inc.* | 3,592,963 |
| 58,884 | VeriSign, Inc.* | 12,127,749 |
| | | | 172,339,032 |
| | Technology Hardware & Equipment - 1.8% |
| 39,092 | CDW Corp. | 8,886,393 |
| 31,996 | F5, Inc.* | 5,726,644 |
| 179,132 | Flex Ltd.* | 5,456,361 |
| | | | 20,069,398 |
| | Transportation - 4.9% |
| 130,777 | Expeditors International of Washington, Inc. | 16,634,835 |
| 63,615 | JB Hunt Transport Services, Inc. | 12,706,460 |
| 149,034 | Knight-Swift Transportation Holdings, Inc. | 8,591,810 |
| 220,857 | U-Haul Holding Co. | 15,557,167 |
| | | | 53,490,272 |
| | Utilities - 0.8% |
| 41,678 | Atmos Energy Corp. | 4,830,480 |
| 162,598 | NiSource, Inc. | 4,316,977 |
| | | | 9,147,457 |
| | Total Common Stocks
(cost $806,609,255) | | $ 1,097,090,294 |
| SHORT-TERM INVESTMENTS - 0.0% |
| | Repurchase Agreements - 0.0% |
| $ 40,384 | Fixed Income Clearing Corp. Repurchase Agreement dated 12/29/2023 at 5.32%, due on 01/02/2024 with a maturity value of $40,408; collateralized by U.S. Treasury Inflation Index Note at 0.13%, maturing 07/15/2031, with a market value of $41,239 | $ 40,384 |
| | Securities Lending Collateral - 0.0% |
| 16,350 | Goldman Sachs Financial Square Funds, Government Fund, Institutional Class, 5.25%(2) | 16,350 |
| 54,500 | HSBC U.S. Government Money Market Fund, Institutional Class, 5.31%(2) | 54,500 |
| Shares or Principal Amount | | Market Value† |
| SHORT-TERM INVESTMENTS - 0.0% - (continued) |
| | Securities Lending Collateral - 0.0% - (continued) |
| 16,350 | Invesco Government & Agency Portfolio, Institutional Class, 5.28%(2) | $ 16,350 |
| 16,350 | Morgan Stanley Institutional Liquidity Funds, Government Portfolio, Institutional Class, 5.27%(2) | 16,350 |
| | | | 103,550 |
| | Total Short-Term Investments
(cost $143,934) | $ 143,934 |
| | Total Investments
(cost $806,753,189) | 99.6% | $ 1,097,234,228 |
| | Other Assets and Liabilities | 0.4% | 3,921,762 |
| | Total Net Assets | 100.0% | $ 1,101,155,990 |
| Note: | Percentage of investments as shown is the ratio of the total market value to total net assets. |
| | Prices of foreign equities that are principally traded on certain foreign markets will generally be adjusted daily pursuant to a fair value pricing service approved by Hartford Funds Management Company, LLC in order to reflect an adjustment for factors occurring after the close of certain foreign markets but before the close of the New York Stock Exchange. |
| | Equity industry classifications used in this report are the Global Industry Classification Standard, which was developed by and is the exclusive property and service mark of MSCI, Inc. and Standard & Poor’s. |
| | For Fund compliance purposes, the Fund may not use the same classification system. These classifications are used for financial reporting purposes. |
| | See “Glossary” for abbreviation descriptions. |
| * | Non-income producing. |
| (1) | Represents entire or partial securities on loan. See Note 8 in the accompanying Notes to Financial Statements for securities lending information. |
| (2) | Current yield as of period end. |
| † | See Significant Accounting Policies of accompanying Notes to Financial Statements regarding valuation of investments. |
The accompanying notes are an integral part of these financial statements.
Schedule of Investments – (continued)
December 31, 2023
Fair Value Summary
The following is a summary of the fair valuations according to the inputs used as of December 31, 2023 in valuing the Fund’s investments.
| Description | | Total | | Level 1 | | Level 2 | | Level 3(1) |
| Assets | | | | | | | | |
| Common Stocks | | | | | | | | |
| Automobiles & Components | | $ 16,090,852 | | $ 16,090,852 | | $ — | | $ — |
| Banks | | 5,108,972 | | 5,108,972 | | — | | — |
| Capital Goods | | 136,439,019 | | 136,439,019 | | — | | — |
| Commercial & Professional Services | | 34,077,964 | | 34,077,964 | | — | | — |
| Consumer Discretionary Distribution & Retail | | 39,729,582 | | 39,729,582 | | — | | — |
| Consumer Durables & Apparel | | 39,633,313 | | 39,633,313 | | — | | — |
| Consumer Services | | 40,307,163 | | 40,307,163 | | — | | — |
| Consumer Staples Distribution & Retail | | 7,321,134 | | 7,321,134 | | — | | — |
| Energy | | 47,669,189 | | 47,669,189 | | — | | — |
| Equity Real Estate Investment Trusts (REITs) | | 14,032,874 | | 14,032,874 | | — | | — |
| Financial Services | | 96,126,323 | | 96,126,323 | | — | | — |
| Food, Beverage & Tobacco | | 8,781,343 | | 8,781,343 | | — | | — |
| Health Care Equipment & Services | | 77,866,324 | | 77,866,324 | | — | | — |
| Insurance | | 26,499,556 | | 26,499,556 | | — | | — |
| Materials | | 26,539,150 | | 26,539,150 | | — | | — |
| Media & Entertainment | | 18,888,339 | | 18,888,339 | | — | | — |
| Pharmaceuticals, Biotechnology & Life Sciences | | 157,907,399 | | 157,907,399 | | — | | — |
| Semiconductors & Semiconductor Equipment | | 49,025,639 | | 49,025,639 | | — | | — |
| Software & Services | | 172,339,032 | | 172,339,032 | | — | | — |
| Technology Hardware & Equipment | | 20,069,398 | | 20,069,398 | | — | | — |
| Transportation | | 53,490,272 | | 53,490,272 | | — | | — |
| Utilities | | 9,147,457 | | 9,147,457 | | — | | — |
| Short-Term Investments | | 143,934 | | 103,550 | | 40,384 | | — |
| Total | | $ 1,097,234,228 | | $ 1,097,193,844 | | $ 40,384 | | $ — |
| (1) | For the year ended December 31, 2023, there were no transfers in and out of Level 3. |
The accompanying notes are an integral part of these financial statements.
Hartford Small Cap Growth HLS Fund
Schedule of Investments
December 31, 2023
| Shares or Principal Amount | | Market Value† |
| COMMON STOCKS - 99.0% |
| | Automobiles & Components - 1.6% |
| 27,487 | Patrick Industries, Inc. | $ 2,758,321 |
| 77,907 | Visteon Corp.* | 9,730,584 |
| | | | 12,488,905 |
| | Banks - 1.2% |
| 113,830 | Synovus Financial Corp. | 4,285,699 |
| 63,728 | Triumph Financial, Inc.* | 5,109,711 |
| | | | 9,395,410 |
| | Capital Goods - 14.5% |
| 63,231 | Applied Industrial Technologies, Inc. | 10,919,361 |
| 182,906 | AZEK Co., Inc.* | 6,996,154 |
| 46,388 | Boise Cascade Co. | 6,000,752 |
| 55,781 | Chart Industries, Inc.* | 7,604,624 |
| 33,265 | Comfort Systems USA, Inc. | 6,841,613 |
| 26,448 | Curtiss-Wright Corp. | 5,892,350 |
| 207,851 | Fluor Corp.* | 8,141,524 |
| 200,736 | FTAI Aviation Ltd. | 9,314,150 |
| 14,493 | Herc Holdings, Inc. | 2,157,863 |
| 720,684 | Hillman Solutions Corp.* | 6,637,500 |
| 34,636 | ITT, Inc. | 4,132,767 |
| 75,327 | John Bean Technologies Corp. | 7,491,270 |
| 133,949 | Rush Enterprises, Inc. Class A | 6,737,635 |
| 311,607 | Shoals Technologies Group, Inc. Class A* | 4,842,373 |
| 84,002 | SPX Technologies, Inc.* | 8,485,042 |
| 79,037 | WillScot Mobile Mini Holdings Corp.* | 3,517,146 |
| 163,153 | Zurn Elkay Water Solutions Corp. Class C | 4,798,330 |
| | | | 110,510,454 |
| | Commercial & Professional Services - 5.7% |
| 17,239 | CACI International, Inc. Class A* | 5,583,022 |
| 56,234 | Casella Waste Systems, Inc. Class A* | 4,805,758 |
| 50,630 | Ceridian HCM Holding, Inc.* | 3,398,286 |
| 34,514 | Clean Harbors, Inc.* | 6,023,038 |
| 129,192 | ExlService Holdings, Inc.* | 3,985,573 |
| 24,582 | Insperity, Inc. | 2,881,502 |
| 56,408 | KBR, Inc. | 3,125,567 |
| 26,198 | TriNet Group, Inc.* | 3,115,728 |
| 444,566 | Verra Mobility Corp.* | 10,238,355 |
| | | | 43,156,829 |
| | Consumer Discretionary Distribution & Retail - 2.5% |
| 65,176 | Boot Barn Holdings, Inc.* | 5,002,910 |
| 23,520 | Burlington Stores, Inc.* | 4,574,169 |
| 188,682 | Chewy, Inc. Class A* | 4,458,556 |
| 64,119 | Etsy, Inc.* | 5,196,845 |
| | | | 19,232,480 |
| | Consumer Durables & Apparel - 3.9% |
| 67,017 | Century Communities, Inc. | 6,107,929 |
| 33,246 | Crocs, Inc.* | 3,105,509 |
| 21,454 | PVH Corp. | 2,619,963 |
| 124,504 | SharkNinja, Inc. | 6,370,870 |
| 261,981 | VF Corp. | 4,925,243 |
| 122,730 | YETI Holdings, Inc.* | 6,354,959 |
| | | | 29,484,473 |
| | Consumer Services - 4.1% |
| 26,370 | Duolingo, Inc.* | 5,982,034 |
| 314,462 | European Wax Center, Inc. Class A* | 4,273,539 |
| 53,177 | Texas Roadhouse, Inc. | 6,499,825 |
| 24,350 | Wingstop, Inc. | 6,247,723 |
| 102,166 | Wyndham Hotels & Resorts, Inc. | 8,215,168 |
| | | | 31,218,289 |
| | Energy - 4.4% |
| 88,903 | Cactus, Inc. Class A | 4,036,196 |
| 30,622 | Chord Energy Corp. | 5,090,295 |
| 30,913 | Gulfport Energy Corp.* | 4,117,612 |
| 125,086 | Helmerich & Payne, Inc. | 4,530,615 |
| Shares or Principal Amount | | Market Value† |
| COMMON STOCKS - 99.0% - (continued) |
| | Energy - 4.4% - (continued) |
| 256,942 | Magnolia Oil & Gas Corp. Class A | $ 5,470,295 |
| 124,667 | SM Energy Co. | 4,827,106 |
| 52,844 | Weatherford International PLC* | 5,169,729 |
| | | | 33,241,848 |
| | Equity Real Estate Investment Trusts (REITs) - 1.6% |
| 190,214 | Phillips Edison & Co., Inc. REIT | 6,939,007 |
| 49,986 | Ryman Hospitality Properties, Inc. REIT | 5,501,459 |
| | | | 12,440,466 |
| | Financial Services - 4.4% |
| 357,137 | MGIC Investment Corp. | 6,889,173 |
| 240,277 | Remitly Global, Inc.* | 4,666,179 |
| 28,118 | Shift4 Payments, Inc. Class A* | 2,090,292 |
| 176,224 | StepStone Group, Inc. Class A | 5,609,210 |
| 110,903 | Stifel Financial Corp. | 7,668,943 |
| 33,726 | WEX, Inc.* | 6,561,393 |
| | | | 33,485,190 |
| | Food, Beverage & Tobacco - 1.5% |
| 12,676 | Boston Beer Co., Inc. Class A* | 4,380,699 |
| 81,470 | Freshpet, Inc.* | 7,068,337 |
| | | | 11,449,036 |
| | Health Care Equipment & Services - 9.7% |
| 108,130 | AtriCure, Inc.* | 3,859,160 |
| 120,074 | Encompass Health Corp. | 8,011,337 |
| 93,256 | Ensign Group, Inc. | 10,464,256 |
| 88,284 | Haemonetics Corp.* | 7,549,165 |
| 98,975 | HealthEquity, Inc.* | 6,562,043 |
| 80,035 | Inari Medical, Inc.* | 5,195,872 |
| 22,491 | Inspire Medical Systems, Inc.* | 4,575,344 |
| 52,947 | iRhythm Technologies, Inc.* | 5,667,447 |
| 59,705 | Lantheus Holdings, Inc.* | 3,701,710 |
| 213,123 | Option Care Health, Inc.* | 7,180,114 |
| 97,157 | Owens & Minor, Inc.* | 1,872,215 |
| 45,467 | QuidelOrtho Corp.* | 3,350,918 |
| 166,777 | RadNet, Inc.* | 5,798,836 |
| | | | 73,788,417 |
| | Household & Personal Products - 1.5% |
| 80,352 | elf Beauty, Inc.* | 11,598,008 |
| | Insurance - 0.6% |
| 42,521 | Selective Insurance Group, Inc. | 4,229,989 |
| | Materials - 4.3% |
| 200,100 | Axalta Coating Systems Ltd.* | 6,797,397 |
| 123,102 | Cabot Corp. | 10,279,017 |
| 47,771 | FMC Corp. | 3,011,962 |
| 367,430 | Livent Corp.*(1) | 6,606,391 |
| 88,146 | Louisiana-Pacific Corp. | 6,243,381 |
| | | | 32,938,148 |
| | Media & Entertainment - 1.5% |
| 131,626 | Bumble, Inc. Class A* | 1,940,167 |
| 444,654 | Eventbrite, Inc. Class A* | 3,717,308 |
| 325,962 | ZoomInfo Technologies, Inc.* | 6,027,037 |
| | | | 11,684,512 |
| | Pharmaceuticals, Biotechnology & Life Sciences - 12.7% |
| 86,153 | Akero Therapeutics, Inc.* | 2,011,673 |
| 234,945 | Alkermes PLC* | 6,517,374 |
| 260,176 | Amicus Therapeutics, Inc.* | 3,691,897 |
| 50,050 | Apogee Therapeutics, Inc.*(1) | 1,398,397 |
| 72,130 | Blueprint Medicines Corp.* | 6,653,271 |
| 72,143 | Bridgebio Pharma, Inc.* | 2,912,413 |
| 99,523 | Celldex Therapeutics, Inc.* | 3,947,082 |
| 134,084 | Crinetics Pharmaceuticals, Inc.* | 4,770,709 |
| 291,419 | Cytek Biosciences, Inc.* | 2,657,741 |
| 92,134 | Cytokinetics, Inc.* | 7,692,268 |
The accompanying notes are an integral part of these financial statements.
Hartford Small Cap Growth HLS Fund
Schedule of Investments – (continued)
December 31, 2023
| Shares or Principal Amount | | Market Value† |
| COMMON STOCKS - 99.0% - (continued) |
| | Pharmaceuticals, Biotechnology & Life Sciences - 12.7% -
(continued) |
| 127,191 | Denali Therapeutics, Inc.* | $ 2,729,519 |
| 888,166 | Geron Corp.*(1) | 1,874,030 |
| 41,914 | Intellia Therapeutics, Inc.* | 1,277,958 |
| 103,096 | Intra-Cellular Therapies, Inc.* | 7,383,735 |
| 59,680 | Ionis Pharmaceuticals, Inc.* | 3,019,211 |
| 68,487 | Kymera Therapeutics, Inc.* | 1,743,679 |
| 28,908 | MoonLake Immunotherapeutics*(1) | 1,745,754 |
| 66,591 | Morphic Holding, Inc.* | 1,923,148 |
| 49,262 | Nuvalent, Inc. Class A* | 3,625,191 |
| 51,235 | Prothena Corp. PLC* | 1,861,880 |
| 61,584 | RayzeBio, Inc.* | 3,828,677 |
| 172,750 | Revolution Medicines, Inc.* | 4,954,470 |
| 122,845 | Rocket Pharmaceuticals, Inc.* | 3,681,665 |
| 56,456 | Sage Therapeutics, Inc.* | 1,223,401 |
| 36,043 | Structure Therapeutics, Inc. ADR* | 1,469,113 |
| 54,019 | Ultragenyx Pharmaceutical, Inc.* | 2,583,189 |
| 103,828 | Vaxcyte, Inc.* | 6,520,398 |
| 107,225 | Veracyte, Inc.* | 2,949,760 |
| | | | 96,647,603 |
| | Semiconductors & Semiconductor Equipment - 5.1% |
| 28,986 | Axcelis Technologies, Inc.* | 3,759,194 |
| 49,418 | Cirrus Logic, Inc.* | 4,111,083 |
| 173,751 | Credo Technology Group Holding Ltd.* | 3,382,932 |
| 77,119 | FormFactor, Inc.* | 3,216,634 |
| 54,404 | MKS Instruments, Inc. | 5,596,540 |
| 43,976 | Onto Innovation, Inc.* | 6,723,930 |
| 80,943 | Power Integrations, Inc. | 6,646,230 |
| 83,627 | Rambus, Inc.* | 5,707,543 |
| | | | 39,144,086 |
| | Software & Services - 13.8% |
| 63,803 | Agilysys, Inc.* | 5,411,770 |
| 89,197 | Alarm.com Holdings, Inc.* | 5,763,910 |
| 83,706 | Altair Engineering, Inc. Class A* | 7,043,860 |
| 26,311 | Appfolio, Inc. Class A* | 4,558,118 |
| 105,471 | Blackbaud, Inc.* | 9,144,336 |
| 84,641 | Braze, Inc. Class A* | 4,496,976 |
| 287,544 | CCC Intelligent Solutions Holdings, Inc.* | 3,275,126 |
| 106,289 | DoubleVerify Holdings, Inc.* | 3,909,309 |
| 47,368 | Five9, Inc.* | 3,727,388 |
| 299,765 | Grid Dynamics Holdings, Inc.* | 3,995,867 |
| 51,275 | Guidewire Software, Inc.* | 5,591,026 |
| 130,828 | Intapp, Inc.* | 4,974,081 |
| 74,758 | Perficient, Inc.* | 4,920,572 |
| 219,077 | PowerSchool Holdings, Inc. Class A* | 5,161,454 |
| 41,065 | Rapid7, Inc.* | 2,344,812 |
| 206,984 | Sprinklr, Inc. Class A* | 2,492,087 |
| 99,055 | Sprout Social, Inc. Class A* | 6,085,939 |
| 31,850 | SPS Commerce, Inc.* | 6,173,804 |
| 207,189 | Squarespace, Inc. Class A* | 6,839,309 |
| 111,315 | Varonis Systems, Inc.* | 5,040,343 |
| 38,226 | Workiva, Inc.* | 3,881,086 |
| | | | 104,831,173 |
| | Technology Hardware & Equipment - 4.4% |
| 57,740 | Fabrinet * | 10,989,654 |
| 48,818 | Insight Enterprises, Inc.* | 8,650,061 |
| 12,383 | Littelfuse, Inc. | 3,313,196 |
| 39,844 | Novanta, Inc.* | 6,710,128 |
| 14,505 | Super Micro Computer, Inc.* | 4,123,191 |
| | | | 33,786,230 |
| | Total Common Stocks
(cost $588,919,154) | | $ 754,751,546 |
| Shares or Principal Amount | | Market Value† |
| EXCHANGE-TRADED FUNDS - 0.5% |
| | Other Investment Pools & Funds - 0.5% |
| 13,827 | iShares Russell 2000 Growth ETF | $ 3,487,446 |
| | Total Exchange-Traded Funds
(cost $2,800,306) | | $ 3,487,446 |
| | Total Long-Term Investments
(cost $591,719,460) | | $ 758,238,992 |
| SHORT-TERM INVESTMENTS - 0.9% |
| | Repurchase Agreements - 0.1% |
| $ 803,940 | Fixed Income Clearing Corp. Repurchase Agreement dated 12/29/2023 at 5.32%, due on 01/02/2024 with a maturity value of $804,415; collateralized by U.S. Treasury Inflation Index Note at 0.13%, maturing 07/15/2031, with a market value of $820,042 | $ 803,940 |
| | Securities Lending Collateral - 0.8% |
| 1,008,416 | Goldman Sachs Financial Square Funds, Government Fund, Institutional Class, 5.25%(2) | 1,008,416 |
| 3,361,387 | HSBC U.S. Government Money Market Fund, Institutional Class, 5.31%(2) | 3,361,387 |
| 1,008,416 | Invesco Government & Agency Portfolio, Institutional Class, 5.28%(2) | 1,008,416 |
| 1,008,416 | Morgan Stanley Institutional Liquidity Funds, Government Portfolio, Institutional Class, 5.27%(2) | 1,008,416 |
| | | | 6,386,635 |
| | Total Short-Term Investments
(cost $7,190,575) | $ 7,190,575 |
| | Total Investments
(cost $598,910,035) | 100.4% | $ 765,429,567 |
| | Other Assets and Liabilities | (0.4)% | (2,947,823) |
| | Total Net Assets | 100.0% | $ 762,481,744 |
| Note: | Percentage of investments as shown is the ratio of the total market value to total net assets. |
| | Equity industry classifications used in this report are the Global Industry Classification Standard, which was developed by and is the exclusive property and service mark of MSCI, Inc. and Standard & Poor’s. |
| | For Fund compliance purposes, the Fund may not use the same classification system. These classifications are used for financial reporting purposes. |
| | See “Glossary” for abbreviation descriptions. |
| * | Non-income producing. |
| (1) | Represents entire or partial securities on loan. See Note 8 in the accompanying Notes to Financial Statements for securities lending information. |
| (2) | Current yield as of period end. |
| † | See Significant Accounting Policies of accompanying Notes to Financial Statements regarding valuation of investments. |
The accompanying notes are an integral part of these financial statements.
Hartford Small Cap Growth HLS Fund
Schedule of Investments – (continued)
December 31, 2023
Fair Value Summary
The following is a summary of the fair valuations according to the inputs used as of December 31, 2023 in valuing the Fund’s investments.
| Description | | Total | | Level 1 | | Level 2 | | Level 3(1) |
| Assets | | | | | | | | |
| Common Stocks | | | | | | | | |
| Automobiles & Components | | $ 12,488,905 | | $ 12,488,905 | | $ — | | $ — |
| Banks | | 9,395,410 | | 9,395,410 | | — | | — |
| Capital Goods | | 110,510,454 | | 110,510,454 | | — | | — |
| Commercial & Professional Services | | 43,156,829 | | 43,156,829 | | — | | — |
| Consumer Discretionary Distribution & Retail | | 19,232,480 | | 19,232,480 | | — | | — |
| Consumer Durables & Apparel | | 29,484,473 | | 29,484,473 | | — | | — |
| Consumer Services | | 31,218,289 | | 31,218,289 | | — | | — |
| Energy | | 33,241,848 | | 33,241,848 | | — | | — |
| Equity Real Estate Investment Trusts (REITs) | | 12,440,466 | | 12,440,466 | | — | | — |
| Financial Services | | 33,485,190 | | 33,485,190 | | — | | — |
| Food, Beverage & Tobacco | | 11,449,036 | | 11,449,036 | | — | | — |
| Health Care Equipment & Services | | 73,788,417 | | 73,788,417 | | — | | — |
| Household & Personal Products | | 11,598,008 | | 11,598,008 | | — | | — |
| Insurance | | 4,229,989 | | 4,229,989 | | — | | — |
| Materials | | 32,938,148 | | 32,938,148 | | — | | — |
| Media & Entertainment | | 11,684,512 | | 11,684,512 | | — | | — |
| Pharmaceuticals, Biotechnology & Life Sciences | | 96,647,603 | | 96,647,603 | | — | | — |
| Semiconductors & Semiconductor Equipment | | 39,144,086 | | 39,144,086 | | — | | — |
| Software & Services | | 104,831,173 | | 104,831,173 | | — | | — |
| Technology Hardware & Equipment | | 33,786,230 | | 33,786,230 | | — | | — |
| Exchange-Traded Funds | | 3,487,446 | | 3,487,446 | | — | | — |
| Short-Term Investments | | 7,190,575 | | 6,386,635 | | 803,940 | | — |
| Total | | $ 765,429,567 | | $ 764,625,627 | | $ 803,940 | | $ — |
| (1) | For the year ended December 31, 2023, there were no transfers in and out of Level 3. |
The accompanying notes are an integral part of these financial statements.
Hartford Small Company HLS Fund
Schedule of Investments
December 31, 2023
| Shares or Principal Amount | | Market Value† |
| COMMON STOCKS - 99.5% |
| | Automobiles & Components - 0.9% |
| 29,804 | Visteon Corp.* | $ 3,722,520 |
| | Banks - 1.0% |
| 151,415 | Cadence Bank | 4,480,370 |
| | Capital Goods - 15.8% |
| 17,326 | Acuity Brands, Inc. | 3,548,885 |
| 97,756 | Ameresco, Inc. Class A* | 3,095,933 |
| 62,501 | Applied Industrial Technologies, Inc. | 10,793,298 |
| 224,873 | AZEK Co., Inc.* | 8,601,392 |
| 28,028 | Comfort Systems USA, Inc. | 5,764,519 |
| 31,836 | Curtiss-Wright Corp. | 7,092,742 |
| 238,396 | Fluor Corp.* | 9,337,971 |
| 26,745 | Middleby Corp.* | 3,936,062 |
| 101,695 | Rush Enterprises, Inc. Class A | 5,115,258 |
| 275,126 | Shoals Technologies Group, Inc. Class A* | 4,275,458 |
| 222,642 | Zurn Elkay Water Solutions Corp. Class C | 6,547,901 |
| | | | 68,109,419 |
| | Commercial & Professional Services - 7.0% |
| 142,812 | Aris Water Solutions, Inc. Class A | 1,198,193 |
| 54,385 | Casella Waste Systems, Inc. Class A* | 4,647,742 |
| 244,153 | ExlService Holdings, Inc.* | 7,532,120 |
| 53,719 | TriNet Group, Inc.* | 6,388,800 |
| 456,863 | Verra Mobility Corp.* | 10,521,555 |
| | | | 30,288,410 |
| | Consumer Discretionary Distribution & Retail - 2.0% |
| 37,993 | Boot Barn Holdings, Inc.* | 2,916,343 |
| 100,127 | Global-e Online Ltd.* | 3,968,033 |
| 43,094 | Tory Burch LLC*(1)(2) | 1,818,137 |
| | | | 8,702,513 |
| | Consumer Durables & Apparel - 3.5% |
| 44,085 | Crocs, Inc.* | 4,117,980 |
| 90,846 | Skyline Champion Corp.* | 6,746,224 |
| 84,875 | YETI Holdings, Inc.* | 4,394,827 |
| | | | 15,259,031 |
| | Consumer Services - 6.4% |
| 84,116 | Boyd Gaming Corp. | 5,266,503 |
| 17,338 | Duolingo, Inc.* | 3,933,125 |
| 150,547 | European Wax Center, Inc. Class A* | 2,045,934 |
| 109,507 | H&R Block, Inc. | 5,296,853 |
| 40,654 | Wingstop, Inc. | 10,431,003 |
| 101,681 | WW International, Inc.* | 889,709 |
| | | | 27,863,127 |
| | Energy - 5.1% |
| 125,958 | Cactus, Inc. Class A | 5,718,493 |
| 31,100 | Chord Energy Corp. | 5,169,753 |
| 87,195 | Seadrill Ltd.* | 4,122,580 |
| 220,806 | Viper Energy, Inc. | 6,928,892 |
| | | | 21,939,718 |
| | Equity Real Estate Investment Trusts (REITs) - 3.0% |
| 155,027 | Phillips Edison & Co., Inc. REIT | 5,655,385 |
| 67,215 | Ryman Hospitality Properties, Inc. REIT | 7,397,683 |
| | | | 13,053,068 |
| | Financial Services - 2.4% |
| 173,159 | Hannon Armstrong Sustainable Infrastructure Capital, Inc. REIT | 4,775,725 |
| 52,908 | PJT Partners, Inc. Class A | 5,389,738 |
| | | | 10,165,463 |
| | Food, Beverage & Tobacco - 2.4% |
| 124,077 | Celsius Holdings, Inc.* | 6,764,678 |
| 87,414 | TreeHouse Foods, Inc.* | 3,623,310 |
| | | | 10,387,988 |
| Shares or Principal Amount | | Market Value† |
| COMMON STOCKS - 99.5% - (continued) |
| | Health Care Equipment & Services - 10.3% |
| 52,921 | Acadia Healthcare Co., Inc.* | $ 4,115,136 |
| 149,588 | Cross Country Healthcare, Inc.* | 3,386,672 |
| 59,593 | Glaukos Corp.* | 4,737,048 |
| 73,665 | Haemonetics Corp.* | 6,299,094 |
| 56,653 | HealthEquity, Inc.* | 3,756,094 |
| 71,623 | Inari Medical, Inc.* | 4,649,765 |
| 24,646 | Inspire Medical Systems, Inc.* | 5,013,736 |
| 13,837 | Lantheus Holdings, Inc.* | 857,894 |
| 189,421 | PROCEPT BioRobotics Corp.*(3) | 7,938,634 |
| 19,353 | Shockwave Medical, Inc.* | 3,687,908 |
| | | | 44,441,981 |
| | Household & Personal Products - 2.3% |
| 68,968 | elf Beauty, Inc.* | 9,954,841 |
| | Insurance - 1.0% |
| 385,011 | SiriusPoint Ltd.* | 4,466,128 |
| | Materials - 3.1% |
| 111,349 | Cabot Corp. | 9,297,641 |
| 233,375 | Livent Corp.*(3) | 4,196,083 |
| | | | 13,493,724 |
| | Media & Entertainment - 3.4% |
| 134,752 | Cargurus, Inc.* | 3,255,608 |
| 125,955 | Criteo SA ADR* | 3,189,180 |
| 504,899 | Eventbrite, Inc. Class A* | 4,220,956 |
| 62,004 | Ziff Davis, Inc.* | 4,166,049 |
| | | | 14,831,793 |
| | Pharmaceuticals, Biotechnology & Life Sciences - 12.6% |
| 27,195 | Akero Therapeutics, Inc.* | 635,003 |
| 152,307 | Amicus Therapeutics, Inc.* | 2,161,236 |
| 43,047 | Apellis Pharmaceuticals, Inc.* | 2,576,793 |
| 9,645 | Ascendis Pharma AS ADR* | 1,214,788 |
| 35,907 | Blueprint Medicines Corp.* | 3,312,062 |
| 76,618 | Celldex Therapeutics, Inc.* | 3,038,670 |
| 82,854 | Crinetics Pharmaceuticals, Inc.* | 2,947,945 |
| 51,152 | Cytokinetics, Inc.* | 4,270,681 |
| 163,556 | Immatics NV* | 1,722,245 |
| 36,780 | Immunocore Holdings PLC ADR* | 2,512,810 |
| 62,743 | ImmunoGen, Inc.* | 1,860,330 |
| 42,255 | Intellia Therapeutics, Inc.* | 1,288,355 |
| 73,278 | Intra-Cellular Therapies, Inc.* | 5,248,170 |
| 40,351 | Kymera Therapeutics, Inc.* | 1,027,337 |
| 52,662 | Merus NV* | 1,448,205 |
| 36,891 | Morphic Holding, Inc.* | 1,065,412 |
| 26,650 | Prothena Corp. PLC* | 968,461 |
| 51,847 | PTC Therapeutics, Inc.* | 1,428,903 |
| 51,757 | Revance Therapeutics, Inc.* | 454,944 |
| 59,624 | Revolution Medicines, Inc.* | 1,710,016 |
| 138,276 | Rocket Pharmaceuticals, Inc.* | 4,144,132 |
| 27,592 | Structure Therapeutics, Inc. ADR* | 1,124,650 |
| 111,370 | Syndax Pharmaceuticals, Inc.* | 2,406,706 |
| 57,314 | Vaxcyte, Inc.* | 3,599,319 |
| 111,224 | Verona Pharma PLC ADR* | 2,211,133 |
| | | | 54,378,306 |
| | Semiconductors & Semiconductor Equipment - 3.1% |
| 32,058 | MKS Instruments, Inc. | 3,297,807 |
| 24,789 | SiTime Corp.* | 3,026,241 |
| 40,196 | Synaptics, Inc.* | 4,585,560 |
| 12,505 | Universal Display Corp. | 2,391,706 |
| | | | 13,301,314 |
| | Software & Services - 10.8% |
| 162,922 | Clearwater Analytics Holdings, Inc. Class A* | 3,263,328 |
| 27,920 | CyberArk Software Ltd.* | 6,115,876 |
| 192,242 | DoubleVerify Holdings, Inc.* | 7,070,661 |
| 69,391 | Five9, Inc.* | 5,460,378 |
The accompanying notes are an integral part of these financial statements.
Hartford Small Company HLS Fund
Schedule of Investments – (continued)
December 31, 2023
| Shares or Principal Amount | | Market Value† |
| COMMON STOCKS - 99.5% - (continued) |
| | Software & Services - 10.8% - (continued) |
| 62,626 | Intapp, Inc.* | $ 2,381,040 |
| 251,884 | Jamf Holding Corp.* | 4,549,025 |
| 19,464 | Manhattan Associates, Inc.* | 4,190,988 |
| 294,896 | PowerSchool Holdings, Inc. Class A* | 6,947,750 |
| 35,140 | RingCentral, Inc. Class A* | 1,193,003 |
| 86,055 | Sprout Social, Inc. Class A* | 5,287,219 |
| | | | 46,459,268 |
| | Technology Hardware & Equipment - 3.4% |
| 139,576 | Calix, Inc.* | 6,098,076 |
| 35,868 | ePlus, Inc.* | 2,863,701 |
| 34,462 | Novanta, Inc.* | 5,803,745 |
| | | | 14,765,522 |
| | Total Common Stocks
(cost $361,630,707) | | $ 430,064,504 |
| EXCHANGE-TRADED FUNDS - 0.3% |
| | Other Investment Pools & Funds - 0.3% |
| 5,371 | iShares Russell 2000 Growth ETF | $ 1,354,674 |
| | Total Exchange-Traded Funds
(cost $1,149,907) | | $ 1,354,674 |
| | Total Long-Term Investments
(cost $362,780,614) | | $ 431,419,178 |
| SHORT-TERM INVESTMENTS - 0.6% |
| | Repurchase Agreements - 0.1% |
| $ 169,619 | Fixed Income Clearing Corp. Repurchase Agreement dated 12/29/2023 at 5.32%, due on 01/02/2024 with a maturity value of $169,719; collateralized by U.S. Treasury Inflation Index Note at 0.13%, maturing 07/15/2031, with a market value of $173,079 | $ 169,619 |
| | Securities Lending Collateral - 0.5% |
| 349,070 | Goldman Sachs Financial Square Funds, Government Fund, Institutional Class, 5.25%(4) | 349,070 |
| 1,163,567 | HSBC U.S. Government Money Market Fund, Institutional Class, 5.31%(4) | 1,163,567 |
| 349,070 | Invesco Government & Agency Portfolio, Institutional Class, 5.28%(4) | 349,070 |
| 349,069 | Morgan Stanley Institutional Liquidity Funds, Government Portfolio, Institutional Class, 5.27%(4) | 349,069 |
| | | | 2,210,776 |
| | Total Short-Term Investments
(cost $2,380,395) | $ 2,380,395 |
| | Total Investments
(cost $365,161,009) | 100.4% | $ 433,799,573 |
| | Other Assets and Liabilities | (0.4)% | (1,628,414) |
| | Total Net Assets | 100.0% | $ 432,171,159 |
| Note: | Percentage of investments as shown is the ratio of the total market value to total net assets. |
| | Equity industry classifications used in this report are the Global Industry Classification Standard, which was developed by and is the exclusive property and service mark of MSCI, Inc. and Standard & Poor’s. |
| | For Fund compliance purposes, the Fund may not use the same classification system. These classifications are used for financial reporting purposes. |
| | See “Glossary” for abbreviation descriptions. |
| * | Non-income producing. |
| (1) | Investment in securities not registered under the Securities Act of 1933 (excluding securities acquired pursuant to Rule 144A and Regulation S). At the end of the period, the value of such restricted securities amounted to $1,818,137 or 0.4% of net assets. |
Period
Acquired | | Security Name | | Shares/
Par Value | | Total Cost | | Market Value |
| 11/2013 | | Tory Burch LLC | | 43,094 | | $ 3,377,559 | | $ 1,818,137 |
| (2) | Investment valued using significant unobservable inputs. |
| (3) | Represents entire or partial securities on loan. See Note 8 in the accompanying Notes to Financial Statements for securities lending information. |
| (4) | Current yield as of period end. |
| † | See Significant Accounting Policies of accompanying Notes to Financial Statements regarding valuation of investments. |
The accompanying notes are an integral part of these financial statements.
Hartford Small Company HLS Fund
Schedule of Investments – (continued)
December 31, 2023
Fair Value Summary
The following is a summary of the fair valuations according to the inputs used as of December 31, 2023 in valuing the Fund’s investments.
| Description | | Total | | Level 1 | | Level 2 | | Level 3(1) |
| Assets | | | | | | | | |
| Common Stocks | | | | | | | | |
| Automobiles & Components | | $ 3,722,520 | | $ 3,722,520 | | $ — | | $ — |
| Banks | | 4,480,370 | | 4,480,370 | | — | | — |
| Capital Goods | | 68,109,419 | | 68,109,419 | | — | | — |
| Commercial & Professional Services | | 30,288,410 | | 30,288,410 | | — | | — |
| Consumer Discretionary Distribution & Retail | | 8,702,513 | | 6,884,376 | | — | | 1,818,137 |
| Consumer Durables & Apparel | | 15,259,031 | | 15,259,031 | | — | | — |
| Consumer Services | | 27,863,127 | | 27,863,127 | | — | | — |
| Energy | | 21,939,718 | | 21,939,718 | | — | | — |
| Equity Real Estate Investment Trusts (REITs) | | 13,053,068 | | 13,053,068 | | — | | — |
| Financial Services | | 10,165,463 | | 10,165,463 | | — | | — |
| Food, Beverage & Tobacco | | 10,387,988 | | 10,387,988 | | — | | — |
| Health Care Equipment & Services | | 44,441,981 | | 44,441,981 | | — | | — |
| Household & Personal Products | | 9,954,841 | | 9,954,841 | | — | | — |
| Insurance | | 4,466,128 | | 4,466,128 | | — | | — |
| Materials | | 13,493,724 | | 13,493,724 | | — | | — |
| Media & Entertainment | | 14,831,793 | | 14,831,793 | | — | | — |
| Pharmaceuticals, Biotechnology & Life Sciences | | 54,378,306 | | 54,378,306 | �� | — | | — |
| Semiconductors & Semiconductor Equipment | | 13,301,314 | | 13,301,314 | | — | | — |
| Software & Services | | 46,459,268 | | 46,459,268 | | — | | — |
| Technology Hardware & Equipment | | 14,765,522 | | 14,765,522 | | — | | — |
| Exchange-Traded Funds | | 1,354,674 | | 1,354,674 | | — | | — |
| Short-Term Investments | | 2,380,395 | | 2,210,776 | | 169,619 | | — |
| Total | | $ 433,799,573 | | $ 431,811,817 | | $ 169,619 | | $ 1,818,137 |
| (1) | For the year ended December 31, 2023, there were no transfers in and out of Level 3. |
Level 3 investments at the beginning and/or end of the period in relation to net assets were not significant and accordingly, a reconciliation of Level 3 assets for the year ended December 31, 2023 is not presented.
The accompanying notes are an integral part of these financial statements.
Schedule of Investments
December 31, 2023
| Shares or Principal Amount | | Market Value† |
| COMMON STOCKS - 99.5% |
| | Banks - 1.1% |
| 94,403 | PNC Financial Services Group, Inc. | $ 14,618,305 |
| | Capital Goods - 12.6% |
| 33,450 | Deere & Co. | 13,375,652 |
| 131,420 | General Dynamics Corp. | 34,125,831 |
| 205,192 | Honeywell International, Inc. | 43,030,814 |
| 43,029 | Lockheed Martin Corp. | 19,502,464 |
| 84,018 | Northrop Grumman Corp. | 39,332,187 |
| 225,792 | RTX Corp. | 18,998,139 |
| | | | 168,365,087 |
| | Commercial & Professional Services - 1.8% |
| 101,859 | Automatic Data Processing, Inc. | 23,730,091 |
| | Consumer Discretionary Distribution & Retail - 4.9% |
| 74,397 | Home Depot, Inc. | 25,782,280 |
| 419,177 | TJX Cos., Inc. | 39,322,995 |
| | | | 65,105,275 |
| | Consumer Durables & Apparel - 2.8% |
| 346,512 | NIKE, Inc. Class B | 37,620,808 |
| | Consumer Services - 2.9% |
| 132,553 | McDonald's Corp. | 39,303,290 |
| | Consumer Staples Distribution & Retail - 2.4% |
| 49,486 | Costco Wholesale Corp. | 32,664,719 |
| | Equity Real Estate Investment Trusts (REITs) - 3.3% |
| 112,771 | American Tower Corp. REIT | 24,345,003 |
| 64,825 | Public Storage REIT | 19,771,625 |
| | | | 44,116,628 |
| | Financial Services - 8.7% |
| 191,537 | American Express Co. | 35,882,542 |
| 88,053 | Mastercard, Inc. Class A | 37,555,485 |
| 162,512 | Visa, Inc. Class A | 42,309,999 |
| | | | 115,748,026 |
| | Food, Beverage & Tobacco - 6.9% |
| 487,181 | Coca-Cola Co. | 28,709,576 |
| 798,270 | Diageo PLC | 28,973,337 |
| 201,452 | PepsiCo, Inc. | 34,214,608 |
| | | | 91,897,521 |
| | Health Care Equipment & Services - 11.5% |
| 301,236 | Abbott Laboratories | 33,157,047 |
| 299,242 | Medtronic PLC | 24,651,556 |
| 156,503 | Stryker Corp. | 46,866,388 |
| 93,884 | UnitedHealth Group, Inc. | 49,427,109 |
| | | | 154,102,100 |
| | Household & Personal Products - 5.5% |
| 484,759 | Colgate-Palmolive Co. | 38,640,140 |
| 239,190 | Procter & Gamble Co. | 35,050,903 |
| | | | 73,691,043 |
| | Insurance - 4.8% |
| 124,238 | Chubb Ltd. | 28,077,788 |
| 193,917 | Marsh & McLennan Cos., Inc. | 36,741,454 |
| | | | 64,819,242 |
| | Materials - 5.2% |
| 149,214 | Ecolab, Inc. | 29,596,597 |
| 97,910 | Linde PLC | 40,212,616 |
| | | | 69,809,213 |
| Shares or Principal Amount | | Market Value† |
| COMMON STOCKS - 99.5% - (continued) |
| | Pharmaceuticals, Biotechnology & Life Sciences - 7.4% |
| 182,818 | Danaher Corp. | $ 42,293,116 |
| 195,378 | Johnson & Johnson | 30,623,548 |
| 169,046 | Merck & Co., Inc. | 18,429,395 |
| 260,683 | Pfizer, Inc. | 7,505,063 |
| | | | 98,851,122 |
| | Semiconductors & Semiconductor Equipment - 2.4% |
| 188,044 | Texas Instruments, Inc. | 32,053,980 |
| | Software & Services - 8.5% |
| 117,695 | Accenture PLC Class A | 41,300,352 |
| 24,041 | Intuit, Inc. | 15,026,346 |
| 153,813 | Microsoft Corp. | 57,839,841 |
| | | | 114,166,539 |
| | Transportation - 6.8% |
| 269,526 | Canadian National Railway Co. | 33,877,631 |
| 134,985 | Union Pacific Corp. | 33,155,016 |
| 156,250 | United Parcel Service, Inc. Class B | 24,567,187 |
| | | | 91,599,834 |
| | Total Common Stocks
(cost $704,085,310) | | $ 1,332,262,823 |
| SHORT-TERM INVESTMENTS - 0.2% |
| | Repurchase Agreements - 0.2% |
| $ 2,928,065 | Fixed Income Clearing Corp. Repurchase Agreement dated 12/29/2023 at 5.32%, due on 01/02/2024 with a maturity value of $2,929,796; collateralized by U.S. Treasury Inflation Index Note at 0.13%, maturing 07/15/2031, with a market value of $2,986,665 | $ 2,928,065 |
| | Total Short-Term Investments
(cost $2,928,065) | $ 2,928,065 |
| | Total Investments
(cost $707,013,375) | 99.7% | $ 1,335,190,888 |
| | Other Assets and Liabilities | 0.3% | 4,421,973 |
| | Total Net Assets | 100.0% | $ 1,339,612,861 |
| Note: | Percentage of investments as shown is the ratio of the total market value to total net assets. |
| | Prices of foreign equities that are principally traded on certain foreign markets will generally be adjusted daily pursuant to a fair value pricing service approved by Hartford Funds Management Company, LLC in order to reflect an adjustment for factors occurring after the close of certain foreign markets but before the close of the New York Stock Exchange. |
| | Equity industry classifications used in this report are the Global Industry Classification Standard, which was developed by and is the exclusive property and service mark of MSCI, Inc. and Standard & Poor’s. |
| | For Fund compliance purposes, the Fund may not use the same classification system. These classifications are used for financial reporting purposes. |
| | See “Glossary” for abbreviation descriptions. |
† See Significant Accounting Policies of accompanying Notes to Financial Statements regarding valuation of investments.
The accompanying notes are an integral part of these financial statements.
Schedule of Investments – (continued)
December 31, 2023
Fair Value Summary
The following is a summary of the fair valuations according to the inputs used as of December 31, 2023 in valuing the Fund’s investments.
| Description | | Total | | Level 1 | | Level 2 | | Level 3(1) |
| Assets | | | | | | | | |
| Common Stocks | | | | | | | | |
| Banks | | $ 14,618,305 | | $ 14,618,305 | | $ — | | $ — |
| Capital Goods | | 168,365,087 | | 168,365,087 | | — | | — |
| Commercial & Professional Services | | 23,730,091 | | 23,730,091 | | — | | — |
| Consumer Discretionary Distribution & Retail | | 65,105,275 | | 65,105,275 | | — | | — |
| Consumer Durables & Apparel | | 37,620,808 | | 37,620,808 | | — | | — |
| Consumer Services | | 39,303,290 | | 39,303,290 | | — | | — |
| Consumer Staples Distribution & Retail | | 32,664,719 | | 32,664,719 | | — | | — |
| Equity Real Estate Investment Trusts (REITs) | | 44,116,628 | | 44,116,628 | | — | | — |
| Financial Services | | 115,748,026 | | 115,748,026 | | — | | — |
| Food, Beverage & Tobacco | | 91,897,521 | | 62,924,184 | | 28,973,337 | | — |
| Health Care Equipment & Services | | 154,102,100 | | 154,102,100 | | — | | — |
| Household & Personal Products | | 73,691,043 | | 73,691,043 | | — | | — |
| Insurance | | 64,819,242 | | 64,819,242 | | — | | — |
| Materials | | 69,809,213 | | 69,809,213 | | — | | — |
| Pharmaceuticals, Biotechnology & Life Sciences | | 98,851,122 | | 98,851,122 | | — | | — |
| Semiconductors & Semiconductor Equipment | | 32,053,980 | | 32,053,980 | | — | | — |
| Software & Services | | 114,166,539 | | 114,166,539 | | — | | — |
| Transportation | | 91,599,834 | | 91,599,834 | | — | | — |
| Short-Term Investments | | 2,928,065 | | — | | 2,928,065 | | — |
| Total | | $ 1,335,190,888 | | $ 1,303,289,486 | | $ 31,901,402 | | $ — |
| (1) | For the year ended December 31, 2023, there were no transfers in and out of Level 3. |
The accompanying notes are an integral part of these financial statements.
Hartford Total Return Bond HLS Fund
Schedule of Investments
December 31, 2023
| Shares or Principal Amount | | Market Value† |
| ASSET & COMMERCIAL MORTGAGE-BACKED SECURITIES - 20.6% |
| | Asset-Backed - Automobile - 2.9% |
| | American Credit Acceptance Receivables Trust | |
| $ 131,414 | 4.55%, 10/13/2026(1) | $ 131,264 |
| 1,315,000 | 6.09%, 11/12/2027(1) | 1,322,671 |
| 2,375,000 | AmeriCredit Automobile Receivables Trust 2.58%, 09/18/2025 | 2,353,657 |
| 3,025,063 | ARI Fleet Lease Trust 5.41%, 02/17/2032(1) | 3,019,283 |
| 1,510,000 | Avis Budget Rental Car Funding AESOP LLC 5.90%, 08/21/2028(1) | 1,541,470 |
| 3,958,951 | Carvana Auto Receivables Trust 4.13%, 04/12/2027 | 3,897,162 |
| 2,267,987 | Chesapeake Funding II LLC 5.65%, 05/15/2035(1) | 2,274,067 |
| 2,831,737 | CPS Auto Receivables Trust 5.91%, 08/16/2027(1) | 2,833,449 |
| | DT Auto Owner Trust | |
| 1,030,000 | 5.19%, 10/16/2028(1) | 1,021,057 |
| 1,135,000 | 5.41%, 02/15/2029(1) | 1,129,295 |
| 1,580,000 | Enterprise Fleet Financing LLC 5.42%, 10/22/2029(1) | 1,595,744 |
| | Exeter Automobile Receivables Trust | |
| 493,460 | 2.18%, 06/15/2026 | 491,862 |
| 1,234,757 | 2.58%, 09/15/2025(1) | 1,222,284 |
| 543,490 | 2.73%, 12/15/2025(1) | 536,311 |
| 1,500,000 | 4.57%, 01/15/2027 | 1,492,166 |
| 649,000 | 6.03%, 08/16/2027 | 650,118 |
| | Flagship Credit Auto Trust | |
| 2,031,000 | 4.69%, 07/17/2028(1) | 1,989,921 |
| 570,000 | 5.05%, 01/18/2028(1) | 564,239 |
| 365,000 | GLS Auto Receivables Issuer Trust 4.92%, 01/15/2027(1) | 362,075 |
| 3,980,000 | Hertz Vehicle Financing III LLC 5.94%, 02/25/2028(1) | 4,054,744 |
| 1,831,005 | Prestige Auto Receivables Trust 1.62%, 11/16/2026(1) | 1,808,236 |
| | Santander Drive Auto Receivables Trust | |
| 2,995,000 | 4.42%, 11/15/2027 | 2,958,663 |
| 955,000 | 4.43%, 03/15/2027 | 943,679 |
| 660,000 | 4.72%, 06/15/2027 | 653,927 |
| 1,210,000 | 4.98%, 02/15/2028 | 1,201,087 |
| 2,000,000 | 5.61%, 07/17/2028 | 2,009,840 |
| 2,615,000 | 5.95%, 01/17/2028 | 2,627,602 |
| 985,000 | SFS Auto Receivables Securitization Trust 5.71%, 01/22/2030(1) | 992,666 |
| 569,878 | Tricolor Auto Securitization Trust 6.48%, 08/17/2026(1) | 569,458 |
| | Westlake Automobile Receivables Trust | |
| 1,930,000 | 1.65%, 02/17/2026(1) | 1,899,276 |
| 2,285,000 | 4.31%, 09/15/2027(1) | 2,258,056 |
| 655,000 | 5.41%, 01/18/2028(1) | 651,899 |
| 1,090,000 | World Omni Auto Receivables Trust 5.03%, 05/15/2029 | 1,088,965 |
| | | | 52,146,193 |
| | Asset-Backed - Finance & Insurance - 0.3% |
| 4,175,000 | Cirrus Funding Ltd. 4.80%, 01/25/2037(1) | 4,094,873 |
| 758,203 | Fieldstone Mortgage Investment Trust 6.01%, 05/25/2036, 1 mo. USD Term SOFR + 0.65%(2) | 522,873 |
| 340,217 | Securitized Asset-Backed Receivables LLC Trust 5.65%, 07/25/2036, 1 mo. USD Term SOFR + 0.29%(2) | 115,064 |
| | | | 4,732,810 |
| Shares or Principal Amount | | Market Value† |
| ASSET & COMMERCIAL MORTGAGE-BACKED SECURITIES - 20.6% - (continued) |
| | Asset-Backed - Home Equity - 0.2% |
| | GSAA Home Equity Trust | |
| $ 4,272,867 | 5.63%, 02/25/2037, 1 mo. USD Term SOFR + 0.27%(2) | $ 1,175,209 |
| 1,892,301 | 5.83%, 11/25/2036, 1 mo. USD Term SOFR + 0.47%(2) | 431,635 |
| 487,122 | 5.98%, 06/25/2036(3) | 126,920 |
| 1,174,621 | Morgan Stanley Mortgage Loan Trust 5.81%, 11/25/2036, 1 mo. USD Term SOFR + 0.45%(2) | 328,500 |
| | Soundview Home Loan Trust | |
| 1,586,219 | 5.65%, 07/25/2037, 1 mo. USD Term SOFR + 0.29%(2) | 1,361,156 |
| 325,696 | 5.97%, 11/25/2036, 1 mo. USD Term SOFR + 0.61%(2) | 305,763 |
| | | | 3,729,183 |
| | Asset-Backed - Student Loan - 0.2% |
| | Navient Private Education Refi Loan Trust | |
| 1,821,815 | 1.11%, 02/18/2070(1) | 1,552,471 |
| 2,295,793 | 5.51%, 10/15/2071(1) | 2,295,348 |
| | | | 3,847,819 |
| | Commercial Mortgage-Backed Securities - 3.2% |
| | BBCMS Mortgage Trust | |
| 24,008,816 | 1.45%, 02/15/2050(3)(4) | 860,550 |
| 925,000 | 3.66%, 04/15/2055(3) | 838,661 |
| 1,000,000 | 4.60%, 06/15/2055(3) | 973,669 |
| 1,300,000 | 5.44%, 12/15/2055(3) | 1,342,575 |
| 425,000 | 5.71%, 12/15/2055(3) | 447,170 |
| | Benchmark Mortgage Trust | |
| 17,946,232 | 0.46%, 07/15/2051(3)(4) | 266,781 |
| 8,226,157 | 0.52%, 01/15/2051(3)(4) | 135,821 |
| 8,575,947 | 1.02%, 08/15/2052(3)(4) | 297,798 |
| 24,373,990 | 1.19%, 03/15/2062(3)(4) | 1,212,206 |
| 10,359,067 | 1.51%, 01/15/2054(3)(4) | 822,533 |
| 2,692,063 | 1.78%, 07/15/2053(3)(4) | 175,200 |
| 2,335,000 | BPR Trust 8.59%, 08/15/2024, 1 mo. USD Term SOFR + 3.23%(1)(2) | 2,324,744 |
| 4,393,411 | BX Trust 7.81%, 08/15/2039, 1 mo. USD Term SOFR + 2.45%(1)(2) | 4,405,024 |
| 2,920,000 | CAMB Commercial Mortgage Trust 8.21%, 12/15/2037, 1 mo. USD Term SOFR + 2.60%(1)(2) | 2,800,912 |
| 3,344,985 | CD Mortgage Trust 2.46%, 08/10/2049 | 3,119,759 |
| | Citigroup Commercial Mortgage Trust | |
| 16,411,661 | 0.89%, 07/10/2047(3)(4) | 37,494 |
| 19,847,039 | 1.01%, 04/10/2048(3)(4) | 183,917 |
| 2,357,000 | 4.06%, 11/15/2049(3) | 1,783,644 |
| | Commercial Mortgage Trust | |
| 1,633,881 | 0.15%, 02/10/2047(3)(4) | 5 |
| 841,000 | 2.82%, 01/10/2039(1) | 737,432 |
| 55,051 | 2.85%, 10/15/2045 | 50,193 |
| 860,000 | 3.90%, 01/10/2039(1)(3) | 672,005 |
| 394,694 | 4.07%, 02/10/2047(3) | 393,947 |
| 74,129 | 4.24%, 02/10/2047(3) | 73,984 |
| 11,781 | Credit Suisse First Boston Mortgage Securities Corp. 4.88%, 04/15/2037 | 11,617 |
| | CSAIL Commercial Mortgage Trust | |
| 51,942,005 | 0.71%, 06/15/2057(3)(4) | 296,272 |
| 2,227,055 | 0.89%, 11/15/2048(3)(4) | 28,516 |
| 6,897,403 | 1.86%, 01/15/2049(3)(4) | 213,942 |
| 4,255,958 | DBJPM Mortgage Trust 1.71%, 09/15/2053(3)(4) | 240,220 |
| 4,340,000 | GS Mortgage Securities Corp. Trust 2.95%, 11/05/2034(1) | 3,106,310 |
| | GS Mortgage Securities Trust | |
| 2,875,542 | 0.37%, 07/10/2046(3)(4) | 29 |
The accompanying notes are an integral part of these financial statements.
Hartford Total Return Bond HLS Fund
Schedule of Investments – (continued)
December 31, 2023
| Shares or Principal Amount | | Market Value† |
| ASSET & COMMERCIAL MORTGAGE-BACKED SECURITIES - 20.6% - (continued) |
| | Commercial Mortgage-Backed Securities - 3.2% - (continued) |
| $ 713,735 | 1.70%, 08/10/2044(1)(3)(4) | $ 3 |
| 2,215,000 | 4.99%, 04/10/2047(1)(3) | 1,781,838 |
| | JP Morgan Chase Commercial Mortgage Securities Trust | |
| 1,416,196 | 2.73%, 10/15/2045(1)(3) | 1,246,253 |
| 1,400,000 | 2.81%, 01/16/2037(1) | 1,173,813 |
| 1,290,924 | 3.78%, 12/15/2047(1)(3) | 826,936 |
| | JPMBB Commercial Mortgage Securities Trust | |
| 3,559,896 | 0.54%, 05/15/2048(3)(4) | 19,589 |
| 15,588,668 | 0.58%, 09/15/2047(3)(4) | 36,339 |
| | Morgan Stanley Bank of America Merrill Lynch Trust | |
| 9,218,230 | 0.95%, 12/15/2047(3)(4) | 33,279 |
| 1,259,417 | 0.96%, 10/15/2048(3)(4) | 11,064 |
| | Morgan Stanley Capital I Trust | |
| 7,058,914 | 1.32%, 06/15/2050(3)(4) | 196,277 |
| 1,460,000 | 4.94%, 07/15/2049(1)(3) | 1,038,475 |
| 82,680 | 5.26%, 10/12/2052(1)(3) | 30,466 |
| 1,890,000 | NJ Trust 6.70%, 01/06/2029(1)(3) | 1,947,547 |
| 790,000 | SFAVE Commercial Mortgage Securities Trust 3.87%, 01/05/2043(1)(3) | 581,176 |
| 5,410,000 | SG Commercial Mortgage Securities Trust 2.63%, 03/15/2037(1) | 4,852,758 |
| 3,530,000 | TYSN Mortgage Trust 6.80%, 12/10/2033(1)(3) | 3,677,453 |
| 3,272,621 | UBS Commercial Mortgage Trust 1.07%, 08/15/2050(3)(4) | 98,091 |
| | Wells Fargo Commercial Mortgage Trust | |
| 24,635,394 | 0.87%, 09/15/2057(3)(4) | 291,318 |
| 13,951,496 | 1.06%, 05/15/2048(3)(4) | 105,600 |
| 3,085,000 | 2.94%, 10/15/2049 | 2,900,272 |
| 430,000 | 4.14%, 05/15/2048(3) | 368,683 |
| | Wells Fargo NA | |
| 19,830,198 | 0.59%, 11/15/2062(3)(4) | 557,776 |
| 9,646,171 | 0.64%, 11/15/2062(3)(4) | 299,403 |
| 32,577,689 | 0.71%, 11/15/2050(3)(4) | 718,514 |
| 3,683,369 | 0.76%, 11/15/2054(3)(4) | 81,547 |
| 17,777,249 | 0.81%, 09/15/2062(3)(4) | 647,531 |
| 33,789,334 | 0.88%, 01/15/2063(3)(4) | 1,374,989 |
| 12,571,430 | 0.89%, 05/15/2062(3)(4) | 468,291 |
| 5,560,967 | 0.99%, 02/15/2056(3)(4) | 355,110 |
| 20,567,926 | 1.76%, 03/15/2063(3)(4) | 1,830,667 |
| 2,545,000 | 2.04%, 02/15/2054 | 2,090,047 |
| | WFRBS Commercial Mortgage Trust | |
| 184,818 | 3.72%, 05/15/2047 | 183,838 |
| 14,155 | 4.05%, 03/15/2047 | 14,118 |
| 710,000 | 5.00%, 06/15/2044(1)(3) | 361,286 |
| | | | 58,053,277 |
| | Other Asset-Backed Securities - 6.6% |
| 416,249 | AASET Trust 3.35%, 01/16/2040(1) | 367,514 |
| 1,535,000 | Affirm Asset Securitization Trust 6.61%, 01/18/2028(1) | 1,543,776 |
| 3,005,000 | Aligned Data Centers Issuer LLC 6.00%, 08/17/2048(1) | 2,977,201 |
| 771,758 | Amur Equipment Finance Receivables XI LLC 5.30%, 06/21/2028(1) | 769,567 |
| 885,000 | Arbor Realty Commercial Real Estate Notes Ltd. 6.58%, 05/15/2036, 1 mo. USD Term SOFR + 1.21%(1)(2) | 875,389 |
| 590,905 | Avant Loans Funding Trust 1.21%, 07/15/2030(1) | 586,697 |
| 2,590,000 | Benefit Street Partners CLO XXXI Ltd. 7.73%, 04/25/2036, 3 mo. USD Term SOFR + 2.35%(1)(2) | 2,594,732 |
| Shares or Principal Amount | | Market Value† |
| ASSET & COMMERCIAL MORTGAGE-BACKED SECURITIES - 20.6% - (continued) |
| | Other Asset-Backed Securities - 6.6% - (continued) |
| | CF Hippolyta Issuer LLC | |
| $ 381,691 | 1.53%, 03/15/2061(1) | $ 342,000 |
| 905,504 | 1.69%, 07/15/2060(1) | 836,921 |
| 1,024,149 | 1.99%, 07/15/2060(1) | 873,204 |
| 579,438 | 5.97%, 08/15/2062(1) | 570,124 |
| 690,000 | CNH Equipment Trust 4.77%, 10/15/2030 | 685,749 |
| 4,485,000 | Columbia Cent CLO 27 Ltd. 6.83%, 01/25/2035, 3 mo. USD Term SOFR + 1.45%(1)(2) | 4,455,946 |
| 1,150,000 | DLLAA LLC 5.64%, 02/22/2028(1) | 1,168,606 |
| | Domino's Pizza Master Issuer LLC | |
| 2,262,000 | 2.66%, 04/25/2051(1) | 2,000,646 |
| 1,395,625 | 3.67%, 10/25/2049(1) | 1,274,095 |
| 3,111,250 | 4.12%, 07/25/2048(1) | 3,022,775 |
| | Elmwood CLO Ltd. | |
| 2,155,000 | 7.64%, 04/16/2036, 3 mo. USD Term SOFR + 2.25%(1)(2) | 2,152,209 |
| 3,085,000 | 7.80%, 10/17/2036, 3 mo. USD Term SOFR + 2.40%(1)(2) | 3,092,660 |
| 3,267,261 | First Franklin Mortgage Loan Trust 5.95%, 04/25/2036, 1 mo. USD Term SOFR + 0.59%(2) | 2,941,009 |
| 4,842,613 | FirstKey Homes Trust 4.25%, 07/17/2039(1) | 4,650,282 |
| 1,830,000 | Golub Capital Partners CLO 68B Ltd. 8.20%, 07/25/2036, 3 mo. USD Term SOFR + 2.80%(1)(2) | 1,837,810 |
| 2,358,722 | GSAMP Trust 5.56%, 01/25/2037, 1 mo. USD Term SOFR + 0.20%(2) | 1,340,911 |
| 1,390,000 | Invesco U.S. CLO Ltd. 7.71%, 04/21/2036, 3 mo. USD Term SOFR + 2.30%(1)(2) | 1,390,424 |
| 6,910 | Marlette Funding Trust 1.06%, 09/15/2031(1) | 6,895 |
| 55,224 | Morgan Stanley ABS Capital I, Inc. Trust 5.77%, 06/25/2036, 1 mo. USD Term SOFR + 0.41%(2) | 45,346 |
| 3,150,000 | New Economy Assets Phase 1 Sponsor LLC 1.91%, 10/20/2061(1) | 2,757,697 |
| 333,711 | NRZ Excess Spread-Collateralized Notes 3.84%, 12/25/2025(1) | 318,098 |
| 3,005,000 | Octagon 61 Ltd. 7.77%, 04/20/2036, 3 mo. USD Term SOFR + 2.35%(1)(2) | 3,004,799 |
| | PRET LLC | |
| 1,617,850 | 1.87%, 07/25/2051(1)(5) | 1,506,887 |
| 1,069,425 | 2.49%, 07/25/2051(1)(5) | 1,029,784 |
| | Pretium Mortgage Credit Partners LLC | |
| 2,961,512 | 1.99%, 02/25/2061(1)(5) | 2,805,334 |
| 3,374,152 | 2.98%, 01/25/2052(1)(5) | 3,346,484 |
| | Progress Residential Trust | |
| 3,295,138 | 1.51%, 10/17/2038(1) | 2,957,293 |
| 1,122,476 | 3.20%, 04/17/2039(1) | 1,049,392 |
| 1,796,018 | 4.30%, 03/17/2040(1) | 1,716,937 |
| 876,228 | 4.45%, 06/17/2039(1) | 848,482 |
| 1,395,187 | 4.75%, 10/27/2039(1) | 1,360,101 |
| 4,425,000 | Retained Vantage Data Centers Issuer LLC 5.00%, 09/15/2048(1) | 4,155,557 |
| 4,490,000 | RR 23 Ltd. 8.00%, 10/15/2035, 3 mo. USD Term SOFR + 2.65%(1)(2) | 4,484,989 |
| 392,576 | Sapphire Aviation Finance II Ltd. 3.23%, 03/15/2040(1) | 334,911 |
| 3,354,094 | Seasoned Credit Risk Transfer Trust 3.50%, 03/25/2058 | 2,990,639 |
| 5,775,000 | Sound Point CLO XXIX Ltd. 6.71%, 04/25/2034, 3 mo. USD Term SOFR + 1.33%(1)(2) | 5,721,547 |
| 2,905,000 | Stack Infrastructure Issuer LLC 5.90%, 07/25/2048(1) | 2,887,892 |
| 1,435,000 | Summit Issuer LLC 2.29%, 12/20/2050(1) | 1,327,862 |
The accompanying notes are an integral part of these financial statements.
Hartford Total Return Bond HLS Fund
Schedule of Investments – (continued)
December 31, 2023
| Shares or Principal Amount | | Market Value† |
| ASSET & COMMERCIAL MORTGAGE-BACKED SECURITIES - 20.6% - (continued) |
| | Other Asset-Backed Securities - 6.6% - (continued) |
| $ 6,615,000 | Symphony CLO XXV Ltd. 6.64%, 04/19/2034, 3 mo. USD Term SOFR + 1.24%(1)(2) | $ 6,562,239 |
| 2,580,000 | Texas Debt Capital CLO Ltd. 7.72%, 04/20/2036, 3 mo. USD Term SOFR + 2.30%(1)(2) | 2,586,316 |
| 3,148,862 | Tricon Residential Trust 4.85%, 07/17/2040(1) | 3,073,657 |
| | VCAT LLC | |
| 1,578,985 | 1.74%, 05/25/2051(1)(5) | 1,493,001 |
| 467,812 | 2.12%, 03/27/2051(1)(5) | 463,583 |
| 5,775,000 | Venture 42 CLO Ltd. 6.79%, 04/15/2034, 3 mo. USD Term SOFR + 1.39%(1)(2) | 5,716,407 |
| 1,732,177 | VOLT XCIV LLC 2.24%, 02/27/2051(1)(5) | 1,688,481 |
| 1,747,489 | Voya CLO Ltd. 6.56%, 01/18/2029, 3 mo. USD Term SOFR + 1.16%(1)(2) | 1,746,131 |
| 4,554,178 | Wellfleet CLO X Ltd. 6.85%, 07/20/2032, 3 mo. USD Term SOFR + 1.43%(1)(2) | 4,538,202 |
| 1,955,137 | Wendy's Funding LLC 3.88%, 03/15/2048(1) | 1,817,010 |
| 1,359,300 | Wingstop Funding LLC 2.84%, 12/05/2050(1) | 1,222,964 |
| | | | 117,915,164 |
| | Whole Loan Collateral CMO - 7.2% |
| 2,298,621 | 510 Asset-Backed Trust 2.12%, 06/25/2061(1)(5) | 2,231,328 |
| | Angel Oak Mortgage Trust | |
| 1,248,956 | 0.91%, 01/25/2066(1)(3) | 1,045,803 |
| 891,062 | 0.99%, 04/25/2053(1)(3) | 813,973 |
| 1,114,472 | 0.99%, 04/25/2066(1)(3) | 922,711 |
| 1,885,590 | 1.82%, 11/25/2066(1)(3) | 1,596,626 |
| 1,282,810 | Arroyo Mortgage Trust 3.35%, 04/25/2049(1)(3) | 1,207,523 |
| | Banc of America Funding Trust | |
| 1,963,586 | 5.77%, 05/25/2037(3) | 1,689,087 |
| 551,438 | 6.07%, 05/20/2047, 1 mo. USD Term SOFR + 0.71%(2) | 498,575 |
| 78,519 | 6.35%, 01/25/2037(5) | 70,307 |
| 453,821 | BCAP LLC Trust 5.83%, 03/25/2037, 1 mo. USD Term SOFR + 0.47%(2) | 388,437 |
| 422,492 | Bear Stearns ALT-A Trust 5.97%, 01/25/2036, 1 mo. USD Term SOFR + 0.61%(2) | 386,326 |
| 102,427 | Bear Stearns ARM Trust 7.67%, 10/25/2035, 1 yr. USD CMT + 2.30%(2) | 95,779 |
| 167,156 | Bear Stearns Mortgage Funding Trust 5.83%, 10/25/2036, 1 mo. USD Term SOFR + 0.47%(2) | 139,277 |
| | BRAVO Residential Funding Trust | |
| 718,838 | 0.94%, 02/25/2049(1)(3) | 623,122 |
| 577,432 | 0.97%, 03/25/2060(1)(3) | 526,613 |
| | CHL Mortgage Pass-Through Trust | |
| 918,563 | 4.43%, 09/25/2047(3) | 803,175 |
| 220,090 | 4.44%, 11/20/2035(3) | 197,717 |
| | COLT Mortgage Loan Trust | |
| 1,897,136 | 0.91%, 06/25/2066(1)(3) | 1,536,190 |
| 4,272,566 | 1.11%, 10/25/2066(1)(3) | 3,533,127 |
| 3,695,142 | 4.55%, 04/25/2067(1)(3) | 3,625,762 |
| | Countrywide Alternative Loan Trust | |
| 588,319 | 5.75%, 05/25/2036 | 231,435 |
| 112,492 | 6.01%, 01/25/2036, 1 mo. USD Term SOFR + 0.65%(2) | 99,229 |
| 580,455 | 6.11%, 11/25/2035, 1 mo. USD Term SOFR + 0.75%(2) | 460,495 |
| 971,272 | CSFB Mortgage-Backed Pass-Through Certificates 5.50%, 06/25/2035 | 717,824 |
| Shares or Principal Amount | | Market Value† |
| ASSET & COMMERCIAL MORTGAGE-BACKED SECURITIES - 20.6% - (continued) |
| | Whole Loan Collateral CMO - 7.2% - (continued) |
| | CSMC Trust | |
| $ 1,682,204 | 0.94%, 05/25/2066(1)(3) | $ 1,333,200 |
| 1,176,657 | 1.80%, 12/27/2060(1)(3) | 1,055,727 |
| 2,082,097 | 1.84%, 10/25/2066(1)(3) | 1,754,283 |
| 4,814,364 | 2.27%, 11/25/2066(1)(3) | 4,116,952 |
| 1,320,173 | 3.25%, 04/25/2047(1)(3) | 1,188,977 |
| 754,994 | Deephaven Residential Mortgage Trust 0.90%, 04/25/2066(1)(3) | 644,985 |
| | Ellington Financial Mortgage Trust | |
| 763,913 | 0.93%, 06/25/2066(1)(3) | 609,255 |
| 2,237,193 | 2.21%, 01/25/2067(1)(3) | 1,863,329 |
| | Federal National Mortgage Association Connecticut Avenue Securities | |
| 390,145 | 7.60%, 11/25/2039, 30 day USD SOFR Average + 2.26%(1)(2) | 393,526 |
| 588,247 | 7.89%, 07/25/2042, 30 day USD SOFR Average + 2.55%(1)(2) | 603,136 |
| 1,305,000 | 8.04%, 07/25/2043, 30 day USD SOFR Average + 2.70%(1)(2) | 1,329,796 |
| 1,244,000 | 8.44%, 06/25/2043, 30 day USD SOFR Average + 3.10%(1)(2) | 1,299,068 |
| 721,272 | 9.00%, 07/25/2029, 30 day USD SOFR Average + 3.66%(2) | 746,705 |
| 1,246,987 | 9.80%, 05/25/2029, 30 day USD SOFR Average + 4.46%(2) | 1,315,317 |
| | GCAT Trust | |
| 1,568,404 | 1.04%, 05/25/2066(1)(3) | 1,252,765 |
| 1,407,269 | 1.92%, 08/25/2066(1)(3) | 1,225,943 |
| 16,351 | GMACM Mortgage Loan Trust 3.36%, 04/19/2036(3) | 12,596 |
| | GSR Mortgage Loan Trust | |
| 670,558 | 4.63%, 01/25/2036(3) | 607,775 |
| 784,032 | 5.77%, 01/25/2037, 1 mo. USD Term SOFR + 0.41%(2) | 187,387 |
| | HarborView Mortgage Loan Trust | |
| 526,414 | 5.85%, 01/19/2038, 1 mo. USD Term SOFR + 0.49%(2) | 458,687 |
| 1,875,805 | 5.95%, 12/19/2036, 1 mo. USD Term SOFR + 0.59%(2) | 1,752,307 |
| 4,693,974 | Imperial Fund Mortgage Trust 3.64%, 03/25/2067(1)(5) | 4,315,262 |
| 639,687 | IndyMac INDX Mortgage Loan Trust 3.55%, 03/25/2036(3) | 460,947 |
| 104,631 | JP Morgan Mortgage Trust 4.66%, 04/25/2037(3) | 76,796 |
| | Legacy Mortgage Asset Trust | |
| 1,151,829 | 1.75%, 04/25/2061(1)(5) | 1,048,065 |
| 1,514,664 | 1.75%, 07/25/2061(1)(5) | 1,422,965 |
| 2,866,388 | 7.25%, 11/25/2059(1)(5) | 2,865,570 |
| 543,718 | Lehman XS Trust 5.89%, 07/25/2046, 1 mo. USD Term SOFR + 0.53%(2) | 489,789 |
| 2,016,156 | LSTAR Securities Investment Ltd. 8.27%, 02/01/2026, 1 mo. USD Term SOFR + 2.91%(1)(2) | 1,976,768 |
| 147,545 | MASTR Adjustable Rate Mortgages Trust 5.39%, 11/21/2034(3) | 138,078 |
| 1,952,035 | MFA LLC 2.36%, 03/25/2060(1)(5) | 1,905,902 |
| | MFA Trust | |
| 204,459 | 1.01%, 01/26/2065(1)(3) | 183,147 |
| 1,153,526 | 1.03%, 11/25/2064(1)(3) | 973,983 |
| 830,185 | 1.15%, 04/25/2065(1)(3) | 734,385 |
| | New Residential Mortgage Loan Trust | |
| 667,750 | 0.94%, 10/25/2058(1)(3) | 589,303 |
| 316,177 | 2.49%, 09/25/2059(1)(3) | 290,890 |
| 1,163,874 | 3.50%, 08/25/2059(1)(3) | 1,089,085 |
| 1,344,344 | 3.75%, 11/26/2035(1)(3) | 1,270,740 |
The accompanying notes are an integral part of these financial statements.
Hartford Total Return Bond HLS Fund
Schedule of Investments – (continued)
December 31, 2023
| Shares or Principal Amount | | Market Value† |
| ASSET & COMMERCIAL MORTGAGE-BACKED SECURITIES - 20.6% - (continued) |
| | Whole Loan Collateral CMO - 7.2% - (continued) |
| $ 1,381,026 | 3.75%, 11/25/2056(1)(3) | $ 1,298,286 |
| 1,291,584 | 4.00%, 05/25/2057(1)(3) | 1,220,061 |
| 933,105 | 4.00%, 12/25/2057(1)(3) | 887,274 |
| 1,419,346 | 6.22%, 01/25/2048, 1 mo. USD Term SOFR + 0.86%(1)(2) | 1,367,141 |
| 1,161,288 | 6.97%, 06/25/2057, 1 mo. USD Term SOFR + 1.61%(1)(2) | 1,153,078 |
| 3,319,652 | NMLT Trust 1.19%, 05/25/2056(1)(3) | 2,697,463 |
| | OBX Trust | |
| 2,667,921 | 1.05%, 07/25/2061(1)(3) | 2,041,512 |
| 2,496,040 | 1.10%, 05/25/2061(1)(3) | 1,919,293 |
| 3,893,256 | 2.31%, 11/25/2061(1)(3) | 3,341,204 |
| | Preston Ridge Partners Mortgage LLC | |
| 2,065,814 | 1.79%, 06/25/2026(1)(5) | 1,952,093 |
| 1,742,659 | 1.79%, 07/25/2026(1)(5) | 1,642,798 |
| 3,344,100 | 1.87%, 04/25/2026(1)(5) | 3,193,210 |
| 1,577,336 | 2.49%, 10/25/2026(1)(5) | 1,494,474 |
| 566,829 | 5.36%, 11/25/2025(1)(5) | 567,522 |
| 3,395,275 | 5.95%, 10/25/2025(1)(5) | 3,384,295 |
| 550,936 | RBSGC Mortgage Loan Trust 6.25%, 01/25/2037 | 506,648 |
| 366,929 | Residential Accredit Loans, Inc. Trust 6.00%, 12/25/2035 | 317,761 |
| | Seasoned Credit Risk Transfer Trust | |
| 1,986,026 | 2.50%, 08/25/2059 | 1,642,989 |
| 1,765,189 | 3.50%, 11/25/2057 | 1,626,849 |
| 4,732,650 | 3.50%, 07/25/2058 | 4,317,642 |
| 940,238 | 3.50%, 08/25/2058 | 852,835 |
| 3,602,484 | 3.50%, 10/25/2058 | 3,237,475 |
| | Starwood Mortgage Residential Trust | |
| 562,592 | 0.94%, 05/25/2065(1)(3) | 501,410 |
| 3,068,814 | 1.92%, 11/25/2066(1)(3) | 2,524,854 |
| 1,567,799 | Toorak Mortgage Corp. Ltd. 3.24%, 06/25/2024(1)(5) | 1,535,601 |
| 5,114,557 | Towd Point Mortgage Trust 2.92%, 11/30/2060(1)(3) | 4,283,441 |
| | Verus Securitization Trust | |
| 1,040,229 | 0.92%, 02/25/2064(1)(3) | 915,867 |
| 1,407,393 | 0.94%, 07/25/2066(1)(3) | 1,135,120 |
| 902,505 | 1.03%, 02/25/2066(1)(3) | 779,377 |
| 2,128,464 | 1.82%, 11/25/2066(1)(3) | 1,842,240 |
| 4,812,376 | 1.83%, 10/25/2066(1)(3) | 4,182,784 |
| 684,898 | 4.13%, 02/25/2067(1)(5) | 638,077 |
| | WaMu Mortgage Pass-Through Certificates Trust | |
| 582,461 | 3.81%, 06/25/2037(3) | 495,949 |
| 1,329,694 | 4.40%, 12/25/2046, 1 yr. USD MTA + 0.82%(2) | 1,073,050 |
| 253,404 | 6.31%, 06/25/2044, 1 mo. USD Term SOFR + 0.95%(2) | 230,681 |
| | | | 127,824,186 |
| | Total Asset & Commercial Mortgage-Backed Securities
(cost $396,658,171) | $ 368,248,632 |
| CORPORATE BONDS - 30.9% |
| | Advertising - 0.1% |
| 2,335,000 | Lamar Media Corp. 3.63%, 01/15/2031 | $ 2,074,647 |
| | Aerospace/Defense - 0.2% |
| | Boeing Co. | |
| 820,000 | 5.04%, 05/01/2027 | 827,689 |
| 1,350,000 | 5.15%, 05/01/2030 | 1,376,106 |
| 845,000 | Northrop Grumman Corp. 5.15%, 05/01/2040 | 858,454 |
| | | | 3,062,249 |
| Shares or Principal Amount | | Market Value† |
| CORPORATE BONDS - 30.9% - (continued) |
| | Agriculture - 0.4% |
| | Philip Morris International, Inc. | |
| $ 1,455,000 | 4.88%, 02/15/2028 | $ 1,471,900 |
| 580,000 | 5.13%, 11/17/2027 | 590,768 |
| 2,180,000 | 5.13%, 02/15/2030 | 2,220,400 |
| 1,230,000 | 5.38%, 02/15/2033 | 1,262,993 |
| 830,000 | 5.63%, 11/17/2029 | 871,287 |
| 1,190,000 | 5.63%, 09/07/2033 | 1,244,988 |
| | | | 7,662,336 |
| | Apparel - 0.3% |
| 550,000 | Hanesbrands, Inc. 4.88%, 05/15/2026(1) | 530,462 |
| 570,000 | Tapestry, Inc. 7.05%, 11/27/2025 | 583,040 |
| 3,550,000 | William Carter Co. 5.63%, 03/15/2027(1) | 3,505,558 |
| | | | 4,619,060 |
| | Beverages - 0.1% |
| | Bacardi Ltd./Bacardi-Martini BV | |
| 150,000 | 5.25%, 01/15/2029(1) | 149,937 |
| 875,000 | 5.40%, 06/15/2033(1) | 881,964 |
| | | | 1,031,901 |
| | Biotechnology - 0.4% |
| | Amgen, Inc. | |
| 445,000 | 5.25%, 03/02/2030 | 458,068 |
| 2,755,000 | 5.25%, 03/02/2033 | 2,828,528 |
| | Royalty Pharma PLC | |
| 2,900,000 | 2.15%, 09/02/2031 | 2,370,426 |
| 750,000 | 2.20%, 09/02/2030 | 631,912 |
| | | | 6,288,934 |
| | Chemicals - 0.2% |
| | Celanese U.S. Holdings LLC | |
| 1,600,000 | 6.17%, 07/15/2027 | 1,640,514 |
| 1,529,000 | 6.33%, 07/15/2029 | 1,603,828 |
| 975,000 | 6.55%, 11/15/2030 | 1,032,097 |
| | | | 4,276,439 |
| | Commercial Banks - 7.6% |
| 1,400,000 | ABN AMRO Bank NV 6.34%, 09/18/2027, (6.34% fixed rate until 09/18/2026; 1 yr. USD CMT + 1.65% thereafter)(1)(6) | 1,431,766 |
| 2,660,000 | ANZ New Zealand International Ltd. 5.36%, 08/14/2028(1) | 2,721,963 |
| EUR 800,000 | Banca Comerciala Romana SA 7.63%, 05/19/2027, (7.63% fixed rate until 05/19/2026; 3 mo. EURIBOR + 4.54% thereafter)(6)(7) | 930,027 |
| 1,575,000 | Banca Transilvania SA 8.88%, 04/27/2027, (8.88% fixed rate until 04/27/2026; 1 yr. EURIBOR ICE Swap + 5.58% thereafter)(6)(7) | 1,827,953 |
| | Bank of America Corp. | |
| $ 1,515,000 | 1.90%, 07/23/2031, (1.90% fixed rate until 07/23/2030; 6 mo. USD SOFR + 1.53% thereafter)(6) | 1,241,464 |
| 355,000 | 1.92%, 10/24/2031, (1.92% fixed rate until 10/24/2030; 6 mo. USD SOFR + 1.37% thereafter)(6) | 288,662 |
| 2,150,000 | 2.30%, 07/21/2032, (2.30% fixed rate until 07/21/2031; 6 mo. USD SOFR + 1.22% thereafter)(6) | 1,757,812 |
| 965,000 | 2.57%, 10/20/2032, (2.57% fixed rate until 10/20/2031; 6 mo. USD SOFR + 1.21% thereafter)(6) | 801,614 |
| 1,715,000 | 2.59%, 04/29/2031, (2.59% fixed rate until 04/29/2030; 6 mo. USD SOFR + 2.15% thereafter)(6) | 1,480,175 |
The accompanying notes are an integral part of these financial statements.
Hartford Total Return Bond HLS Fund
Schedule of Investments – (continued)
December 31, 2023
| Shares or Principal Amount | | Market Value† |
| CORPORATE BONDS - 30.9% - (continued) |
| | Commercial Banks - 7.6% - (continued) |
| $ 5,090,000 | 2.69%, 04/22/2032, (2.69% fixed rate until 04/22/2031; 6 mo. USD SOFR + 1.32% thereafter)(6) | $ 4,305,405 |
| 2,615,000 | 3.19%, 07/23/2030, (3.19% fixed rate until 07/23/2029; 3 mo. USD Term SOFR + 1.44% thereafter)(6) | 2,373,698 |
| 205,000 | 3.42%, 12/20/2028, (3.42% fixed rate until 12/20/2027; 3 mo. USD Term SOFR + 1.30% thereafter)(6) | 193,017 |
| 1,630,000 | 4.95%, 07/22/2028, (4.95% fixed rate until 07/22/2027; 6 mo. USD SOFR + 2.04% thereafter)(6) | 1,631,052 |
| 1,920,000 | 5.20%, 04/25/2029, (5.20% fixed rate until 04/25/2028; 6 mo. USD SOFR + 1.63% thereafter)(6) | 1,933,446 |
| 2,205,000 | 5.93%, 09/15/2027, (5.93% fixed rate until 09/15/2026; 6 mo. USD SOFR + 1.34% thereafter)(6) | 2,250,756 |
| 3,685,000 | Bank of Ireland Group PLC 6.25%, 09/16/2026, (6.25% fixed rate until 09/16/2025; 1 yr. USD CMT + 2.65% thereafter)(1)(6) | 3,723,878 |
| 2,090,000 | Bank of New York Mellon Corp. 6.32%, 10/25/2029, (6.32% fixed rate until 10/25/2028; 6 mo. USD SOFR + 1.60% thereafter)(6) | 2,222,121 |
| 1,920,000 | Barclays PLC 9.63%, 12/15/2029, (9.63% fixed rate until 12/15/2029; 5 yr. Swap Rate + 5.78% thereafter)(6)(8) | 2,002,368 |
| | BNP Paribas SA | |
| 915,000 | 5.13%, 01/13/2029, (5.13% fixed rate until 01/13/2028; 1 yr. USD CMT + 1.45% thereafter)(1)(6) | 922,457 |
| 740,000 | 5.34%, 06/12/2029, (5.34% fixed rate until 06/12/2028; 1 yr. USD CMT + 1.50% thereafter)(1)(6) | 751,311 |
| 2,170,000 | 5.89%, 12/05/2034, (5.89% fixed rate until 12/05/2033; 6 mo. USD SOFR + 1.87% thereafter)(1)(6) | 2,271,183 |
| | BPCE SA | |
| 3,770,000 | 6.71%, 10/19/2029, (6.71% fixed rate until 10/19/2028; 6 mo. USD SOFR + 2.27% thereafter)(1)(6) | 3,973,097 |
| 3,010,000 | 7.00%, 10/19/2034, (7.00% fixed rate until 10/19/2033; 6 mo. USD SOFR + 2.59% thereafter)(1)(6) | 3,272,191 |
| 745,000 | Credit Agricole SA 6.32%, 10/03/2029, (6.32% fixed rate until 10/03/2028; 6 mo. USD SOFR + 1.86% thereafter)(1)(6) | 781,466 |
| | Danske Bank AS | |
| 655,000 | 1.62%, 09/11/2026, (1.62% fixed rate until 09/11/2025; 1 yr. USD CMT + 1.35% thereafter)(1)(6) | 611,315 |
| 1,970,000 | 5.38%, 01/12/2024(1) | 1,969,549 |
| | Deutsche Bank AG | |
| 410,000 | 2.13%, 11/24/2026, (2.13% fixed rate until 11/24/2025; 6 mo. USD SOFR + 1.87% thereafter)(6) | 384,390 |
| 495,000 | 2.31%, 11/16/2027, (2.31% fixed rate until 11/16/2026; 6 mo. USD SOFR + 1.22% thereafter)(6) | 452,838 |
| 625,000 | 3.74%, 01/07/2033, (3.74% fixed rate until 10/07/2031; 6 mo. USD SOFR + 2.26% thereafter)(6) | 513,575 |
| Shares or Principal Amount | | Market Value† |
| CORPORATE BONDS - 30.9% - (continued) |
| | Commercial Banks - 7.6% - (continued) |
| $ 380,000 | 7.08%, 02/10/2034, (7.08% fixed rate until 11/10/2032; 6 mo. USD SOFR + 3.65% thereafter)(6) | $ 391,352 |
| | Goldman Sachs Group, Inc. | |
| 2,260,000 | 2.38%, 07/21/2032, (2.38% fixed rate until 07/21/2031; 6 mo. USD SOFR + 1.25% thereafter)(6)(9) | 1,857,953 |
| 4,045,000 | 2.62%, 04/22/2032, (2.62% fixed rate until 04/22/2031; 6 mo. USD SOFR + 1.28% thereafter)(6) | 3,401,268 |
| 1,475,000 | 4.22%, 05/01/2029, (4.22% fixed rate until 05/01/2028; 3 mo. USD Term SOFR + 1.56% thereafter)(6) | 1,428,318 |
| | HSBC Holdings PLC | |
| 1,150,000 | 2.21%, 08/17/2029, (2.21% fixed rate until 08/17/2028; 6 mo. USD SOFR + 1.29% thereafter)(6) | 1,004,793 |
| 1,395,000 | 4.58%, 06/19/2029, (4.58% fixed rate until 06/19/2028; 3 mo. USD Term SOFR + 1.80% thereafter)(6) | 1,353,961 |
| 410,000 | 4.76%, 03/29/2033, (4.76% fixed rate until 03/29/2032; 6 mo. USD SOFR + 2.53% thereafter)(6) | 382,593 |
| 4,800,000 | 5.40%, 08/11/2033, (5.40% fixed rate until 08/11/2032; 6 mo. USD SOFR + 2.87% thereafter)(6) | 4,829,590 |
| 1,565,000 | 5.89%, 08/14/2027, (5.89% fixed rate until 08/14/2026; 6 mo. USD SOFR + 1.57% thereafter)(6) | 1,587,601 |
| 765,000 | 6.16%, 03/09/2029, (6.16% fixed rate until 03/09/2028; 6 mo. USD SOFR + 1.97% thereafter)(6) | 790,298 |
| 1,900,000 | 6.55%, 06/20/2034, (6.55% fixed rate until 06/20/2033; 6 mo. USD SOFR + 2.98% thereafter)(6) | 1,989,411 |
| 1,515,000 | 7.40%, 11/13/2034, (7.40% fixed rate until 11/13/2033; 6 mo. USD SOFR + 3.02% thereafter)(6) | 1,664,299 |
| 300,000 | Huntington Bancshares, Inc. 6.21%, 08/21/2029, (6.21% fixed rate until 08/21/2028; 3 mo. USD SOFR + 2.02% thereafter)(6) | 309,607 |
| 825,000 | Huntington National Bank 5.65%, 01/10/2030 | 832,760 |
| | Intesa Sanpaolo SpA | |
| 1,485,000 | 6.63%, 06/20/2033(1) | 1,525,229 |
| 1,740,000 | 7.80%, 11/28/2053(1) | 1,917,374 |
| | JP Morgan Chase & Co. | |
| 1,270,000 | 2.55%, 11/08/2032, (2.55% fixed rate until 11/08/2031; 6 mo. USD SOFR + 1.18% thereafter)(6) | 1,062,140 |
| 1,025,000 | 3.51%, 01/23/2029, (3.51% fixed rate until 01/23/2028; 3 mo. USD Term SOFR + 1.21% thereafter)(6) | 972,221 |
| 170,000 | 3.70%, 05/06/2030, (3.70% fixed rate until 05/06/2029; 3 mo. USD Term SOFR + 1.42% thereafter)(6) | 159,982 |
| 930,000 | 3.96%, 01/29/2027, (3.96% fixed rate until 01/29/2026; 3 mo. USD Term SOFR + 1.51% thereafter)(6) | 908,748 |
| 2,230,000 | 4.01%, 04/23/2029, (4.01% fixed rate until 04/23/2028; 3 mo. USD Term SOFR + 1.38% thereafter)(6) | 2,147,534 |
The accompanying notes are an integral part of these financial statements.
Hartford Total Return Bond HLS Fund
Schedule of Investments – (continued)
December 31, 2023
| Shares or Principal Amount | | Market Value† |
| CORPORATE BONDS - 30.9% - (continued) |
| | Commercial Banks - 7.6% - (continued) |
| $ 390,000 | 4.85%, 07/25/2028, (4.85% fixed rate until 07/25/2027; 6 mo. USD SOFR + 1.99% thereafter)(6) | $ 390,401 |
| 1,515,000 | 5.30%, 07/24/2029, (5.30% fixed rate until 07/24/2028; 6 mo. USD SOFR + 1.45% thereafter)(6) | 1,538,700 |
| 960,000 | 6.07%, 10/22/2027, (6.07% fixed rate until 10/22/2026; 6 mo. USD SOFR + 1.33% thereafter)(6) | 988,037 |
| 280,000 | 6.09%, 10/23/2029, (6.09% fixed rate until 10/23/2028; 6 mo. USD SOFR + 1.57% thereafter)(6) | 294,627 |
| | M&T Bank Corp. | |
| 2,240,000 | 5.05%, 01/27/2034, (5.05% fixed rate until 01/27/2033; 6 mo. USD SOFR + 1.85% thereafter)(6) | 2,126,309 |
| 1,705,000 | 7.41%, 10/30/2029, (7.41% fixed rate until 10/30/2028; 6 mo. USD SOFR + 2.80% thereafter)(6) | 1,835,765 |
| 1,580,000 | Manufacturers & Traders Trust Co. 4.70%, 01/27/2028 | 1,536,326 |
| EUR 1,700,000 | mBank SA 0.97%, 09/21/2027, (0.97% fixed rate until 09/21/2026; 3 mo. EURIBOR + 1.25% thereafter)(6)(7) | 1,621,459 |
| | Morgan Stanley | |
| $ 4,185,000 | 1.79%, 02/13/2032, (1.79% fixed rate until 02/13/2031; 6 mo. USD SOFR + 1.03% thereafter)(6) | 3,347,197 |
| 1,960,000 | 1.93%, 04/28/2032, (1.93% fixed rate until 04/28/2031; 6 mo. USD SOFR + 1.02% thereafter)(6) | 1,579,516 |
| 860,000 | 3.59%, 07/22/2028(3) | 821,767 |
| 460,000 | 3.62%, 04/01/2031, (3.62% fixed rate until 04/01/2030; 6 mo. USD SOFR + 3.12% thereafter)(6) | 424,066 |
| 2,235,000 | 5.16%, 04/20/2029, (5.16% fixed rate until 04/20/2028; 6 mo. USD SOFR + 1.59% thereafter)(6) | 2,249,649 |
| 455,000 | 5.45%, 07/20/2029, (5.45% fixed rate until 07/20/2028; 6 mo. USD SOFR + 1.63% thereafter)(6) | 464,027 |
| 4,505,000 | 6.41%, 11/01/2029, (6.41% fixed rate until 11/01/2028; 6 mo. USD SOFR + 1.83% thereafter)(6) | 4,780,507 |
| | OTP Bank Nyrt | |
| EUR 1,570,000 | 7.35%, 03/04/2026, (7.35% fixed rate until 03/04/2025; 3 mo. EURIBOR + 4.52% thereafter)(6)(7) | 1,778,958 |
| $ 815,000 | 7.50%, 05/25/2027, (7.50% fixed rate until 05/25/2026; 1 yr. USD CMT + 3.71% thereafter)(6)(7) | 840,053 |
| | PNC Financial Services Group, Inc. | |
| 580,000 | 5.07%, 01/24/2034, (5.07% fixed rate until 01/24/2033; 6 mo. USD SOFR + 1.93% thereafter)(6) | 568,527 |
| 485,000 | 6.88%, 10/20/2034, (6.88% fixed rate until 10/20/2033; 6 mo. USD SOFR + 2.28% thereafter)(6) | 539,428 |
| 4,795,000 | Societe Generale SA 6.22%, 06/15/2033, (6.22% fixed rate until 06/15/2032; 1 yr. USD CMT + 3.20% thereafter)(1)(6) | 4,792,569 |
| | Standard Chartered PLC | |
| 1,875,000 | 7.02%, 02/08/2030, (7.02% fixed rate until 02/08/2029; 1 yr. USD CMT + 2.20% thereafter)(1)(6) | 1,980,745 |
| Shares or Principal Amount | | Market Value† |
| CORPORATE BONDS - 30.9% - (continued) |
| | Commercial Banks - 7.6% - (continued) |
| $ 865,000 | 7.77%, 11/16/2028, (7.77% fixed rate until 11/16/2027; 1 yr. USD CMT + 3.45% thereafter)(1)(6) | $ 935,673 |
| | UBS Group AG | |
| 575,000 | 2.10%, 02/11/2032, (2.10% fixed rate until 02/11/2031; 1 yr. USD CMT + 1.00% thereafter)(1)(6) | 459,408 |
| 865,000 | 3.09%, 05/14/2032, (3.09% fixed rate until 05/14/2031; 6 mo. USD SOFR + 1.73% thereafter)(1)(6) | 738,201 |
| 640,000 | 4.19%, 04/01/2031, (4.19% fixed rate until 04/01/2030; 6 mo. USD SOFR + 3.73% thereafter)(1)(6) | 596,693 |
| 1,595,000 | 4.75%, 05/12/2028, (4.75% fixed rate until 05/12/2027; 1 yr. USD CMT + 1.75% thereafter)(1)(6) | 1,571,824 |
| 1,895,000 | 6.25%, 09/22/2029, (6.25% fixed rate until 09/22/2028; 1 yr. USD CMT + 1.80% thereafter)(1)(6) | 1,976,150 |
| 760,000 | 6.44%, 08/11/2028, (6.44% fixed rate until 08/11/2027; 6 mo. USD SOFR + 3.70% thereafter)(1)(6) | 789,714 |
| 2,785,000 | 6.54%, 08/12/2033, (6.54% fixed rate until 08/12/2032; 6 mo. USD SOFR + 3.92% thereafter)(1)(6) | 2,971,913 |
| | Wells Fargo & Co. | |
| 1,445,000 | 2.57%, 02/11/2031, (2.57% fixed rate until 02/11/2030; 3 mo. USD Term SOFR + 1.26% thereafter)(6) | 1,250,509 |
| 1,140,000 | 2.88%, 10/30/2030, (2.88% fixed rate until 10/30/2029; 3 mo. USD Term SOFR + 1.43% thereafter)(6) | 1,014,796 |
| 2,855,000 | 3.35%, 03/02/2033, (3.35% fixed rate until 03/02/2032; 6 mo. USD SOFR + 1.50% thereafter)(6) | 2,500,805 |
| 1,050,000 | 4.81%, 07/25/2028, (4.81% fixed rate until 07/25/2027; 6 mo. USD SOFR + 1.98% thereafter)(6) | 1,042,702 |
| 1,705,000 | 4.90%, 07/25/2033, (4.90% fixed rate until 07/25/2032; 6 mo. USD SOFR + 2.10% thereafter)(6) | 1,663,311 |
| 265,000 | 5.39%, 04/24/2034, (5.39% fixed rate until 04/24/2033; 6 mo. USD SOFR + 2.02% thereafter)(6) | 266,619 |
| 3,320,000 | 5.57%, 07/25/2029, (5.57% fixed rate until 07/25/2028; 6 mo. USD SOFR + 1.74% thereafter)(6) | 3,393,357 |
| 765,000 | 6.49%, 10/23/2034, (6.49% fixed rate until 10/23/2033; 6 mo. USD SOFR + 2.06% thereafter)(6) | 833,882 |
| | | | 136,041,771 |
| | Commercial Services - 1.0% |
| | Ashtead Capital, Inc. | |
| 1,190,000 | 4.00%, 05/01/2028(1) | 1,120,696 |
| 4,990,000 | 4.38%, 08/15/2027(1) | 4,794,531 |
| 1,405,000 | 5.50%, 08/11/2032(1) | 1,390,417 |
| 210,000 | 5.55%, 05/30/2033(1) | 208,247 |
| | Howard University | |
| 1,000,000 | 2.70%, 10/01/2029 | 888,931 |
| 1,000,000 | 2.90%, 10/01/2031 | 864,404 |
| 720,000 | 3.48%, 10/01/2041 | 536,109 |
| | Service Corp. International | |
| 2,500,000 | 3.38%, 08/15/2030 | 2,178,767 |
| 385,000 | 4.63%, 12/15/2027 | 372,487 |
| 4,561,000 | 5.13%, 06/01/2029 | 4,469,780 |
The accompanying notes are an integral part of these financial statements.
Hartford Total Return Bond HLS Fund
Schedule of Investments – (continued)
December 31, 2023
| Shares or Principal Amount | | Market Value† |
| CORPORATE BONDS - 30.9% - (continued) |
| | Commercial Services - 1.0% - (continued) |
| | United Rentals North America, Inc. | |
| $ 140,000 | 4.00%, 07/15/2030 | $ 128,973 |
| 445,000 | 4.88%, 01/15/2028 | 433,992 |
| | | | 17,387,334 |
| | Construction Materials - 0.4% |
| 3,340,000 | Builders FirstSource, Inc. 5.00%, 03/01/2030(1) | 3,225,535 |
| | Standard Industries, Inc. | |
| 535,000 | 3.38%, 01/15/2031(1) | 460,201 |
| 3,370,000 | 4.38%, 07/15/2030(1) | 3,101,022 |
| | | | 6,786,758 |
| | Distribution/Wholesale - 0.0% |
| 700,000 | LKQ Corp. 5.75%, 06/15/2028 | 716,592 |
| | Diversified Financial Services - 1.2% |
| 2,015,000 | American Express Co. 6.34%, 10/30/2026, (6.34% fixed rate until 10/30/2025; 6 mo. USD SOFR + 1.33% thereafter)(6) | 2,055,032 |
| | Capital One Financial Corp. | |
| 895,000 | 1.88%, 11/02/2027, (1.88% fixed rate until 11/02/2026; 6 mo. USD SOFR + 0.86% thereafter)(6) | 805,418 |
| 2,145,000 | 3.27%, 03/01/2030, (3.27% fixed rate until 03/01/2029; 6 mo. USD SOFR + 1.79% thereafter)(6) | 1,917,626 |
| 1,325,000 | 5.25%, 07/26/2030, (5.25% fixed rate until 07/26/2029; 6 mo. USD SOFR + 2.60% thereafter)(6) | 1,304,331 |
| 615,000 | 5.47%, 02/01/2029, (5.47% fixed rate until 02/01/2028; 6 mo. USD SOFR + 2.08% thereafter)(6) | 613,468 |
| 551,000 | 5.82%, 02/01/2034, (5.82% fixed rate until 02/01/2033; 6 mo. USD SOFR + 2.60% thereafter)(6) | 549,307 |
| 1,500,000 | 6.31%, 06/08/2029, (6.31% fixed rate until 06/08/2028; 6 mo. USD SOFR + 2.64% thereafter)(6) | 1,540,922 |
| 975,000 | 6.38%, 06/08/2034, (6.38% fixed rate until 06/08/2033; 6 mo. USD SOFR + 2.86% thereafter)(6) | 1,005,009 |
| 1,095,000 | 7.62%, 10/30/2031, (7.62% fixed rate until 10/30/2030; 6 mo. USD SOFR + 3.07% thereafter)(6) | 1,205,021 |
| 2,205,000 | Discover Financial Services 7.96%, 11/02/2034, (7.96% fixed rate until 11/02/2033; 6 mo. USD SOFR + 3.37% thereafter)(6) | 2,456,722 |
| 7,400,000 | GTP Acquisition Partners I LLC 3.48%, 06/15/2050(1) | 7,194,777 |
| 455,000 | Intercontinental Exchange, Inc. 4.35%, 06/15/2029 | 452,636 |
| 845,000 | Nasdaq, Inc. 5.55%, 02/15/2034 | 879,597 |
| | | | 21,979,866 |
| | Electric - 4.2% |
| 1,235,000 | Alabama Power Co. 3.45%, 10/01/2049 | 932,112 |
| 2,815,000 | Ameren Corp. 5.00%, 01/15/2029 | 2,829,073 |
| | Arizona Public Service Co. | |
| 450,000 | 5.55%, 08/01/2033 | 465,606 |
| 990,000 | 6.35%, 12/15/2032 | 1,072,669 |
| | Berkshire Hathaway Energy Co. | |
| 705,000 | 1.65%, 05/15/2031 | 566,256 |
| 850,000 | 4.60%, 05/01/2053 | 759,415 |
| | Cleco Corporate Holdings LLC | |
| 1,225,000 | 3.38%, 09/15/2029 | 1,075,003 |
| 75,000 | 4.97%, 05/01/2046 | 63,083 |
| Shares or Principal Amount | | Market Value† |
| CORPORATE BONDS - 30.9% - (continued) |
| | Electric - 4.2% - (continued) |
| | Consolidated Edison Co. of New York, Inc. | |
| $ 1,050,000 | 3.20%, 12/01/2051 | $ 745,659 |
| 450,000 | 5.50%, 03/15/2034 | 473,046 |
| | Dominion Energy, Inc. | |
| 1,008,000 | 3.38%, 04/01/2030 | 929,317 |
| 4,152,000 | 5.38%, 11/15/2032 | 4,270,962 |
| 65,000 | 6.30%, 03/15/2033 | 69,646 |
| 1,320,000 | Duke Energy Carolinas LLC 4.25%, 12/15/2041 | 1,168,665 |
| | Duke Energy Corp. | |
| 3,200,000 | 2.55%, 06/15/2031 | 2,735,059 |
| 1,160,000 | 4.50%, 08/15/2032 | 1,124,742 |
| 400,000 | 5.00%, 08/15/2052 | 374,968 |
| 780,000 | Duke Energy Indiana LLC 3.25%, 10/01/2049 | 567,999 |
| | Duke Energy Progress LLC | |
| 490,000 | 4.00%, 04/01/2052 | 404,399 |
| 670,000 | 4.38%, 03/30/2044 | 592,959 |
| | Edison International | |
| 270,000 | 4.13%, 03/15/2028 | 260,902 |
| 635,000 | 5.25%, 11/15/2028 | 639,028 |
| 3,125,000 | 6.95%, 11/15/2029 | 3,394,982 |
| 755,000 | Emera, Inc. 6.75%, 06/15/2076 | 739,263 |
| 1,185,000 | Enel Finance International NV 5.00%, 06/15/2032(1) | 1,157,789 |
| | Evergy, Inc. | |
| 730,000 | 2.45%, 09/15/2024 | 713,388 |
| 715,000 | 2.90%, 09/15/2029 | 647,503 |
| | Eversource Energy | |
| 2,255,000 | 5.13%, 05/15/2033 | 2,270,686 |
| 380,000 | 5.45%, 03/01/2028 | 390,912 |
| 1,265,000 | 5.95%, 02/01/2029 | 1,325,594 |
| | Georgia Power Co. | |
| 250,000 | 2.65%, 09/15/2029 | 226,643 |
| 940,000 | 4.30%, 03/15/2042 | 833,987 |
| 450,000 | 4.70%, 05/15/2032 | 448,876 |
| 85,000 | 4.95%, 05/17/2033 | 85,839 |
| 845,000 | Investment Energy Resources Ltd. 6.25%, 04/26/2029(1) | 798,246 |
| 1,465,000 | IPALCO Enterprises, Inc. 3.70%, 09/01/2024 | 1,441,710 |
| 2,065,000 | Kentucky Power Co. 7.00%, 11/15/2033(1) | 2,223,431 |
| 645,000 | Monongahela Power Co. 5.85%, 02/15/2034(1) | 678,127 |
| 305,000 | National Grid PLC 5.60%, 06/12/2028 | 314,486 |
| 870,000 | National Rural Utilities Cooperative Finance Corp. 5.80%, 01/15/2033 | 922,998 |
| | NextEra Energy Capital Holdings, Inc. | |
| 1,235,000 | 1.88%, 01/15/2027 | 1,136,311 |
| 1,145,000 | 2.25%, 06/01/2030 | 980,003 |
| 1,780,000 | 4.63%, 07/15/2027 | 1,777,649 |
| 410,000 | 5.00%, 02/28/2030 | 414,917 |
| 1,035,000 | 5.00%, 07/15/2032 | 1,042,147 |
| 1,705,000 | NRG Energy, Inc. 2.45%, 12/02/2027(1) | 1,537,847 |
| 705,000 | Oglethorpe Power Corp. 4.50%, 04/01/2047 | 600,306 |
| 755,000 | Ohio Edison Co. 5.50%, 01/15/2033(1) | 765,552 |
| 1,000,000 | Oncor Electric Delivery Co. LLC 5.65%, 11/15/2033(1) | 1,067,908 |
| | Pacific Gas & Electric Co. | |
| 3,780,000 | 2.50%, 02/01/2031 | 3,124,399 |
| 320,000 | 3.50%, 08/01/2050 | 221,703 |
| 260,000 | 4.40%, 03/01/2032 | 240,820 |
| 2,255,000 | 4.55%, 07/01/2030 | 2,147,367 |
| 529,000 | 5.25%, 03/01/2052 | 471,823 |
| 895,000 | 5.90%, 06/15/2032 | 911,691 |
| 3,475,000 | 6.10%, 01/15/2029 | 3,599,122 |
| 1,195,000 | 6.15%, 01/15/2033 | 1,240,805 |
The accompanying notes are an integral part of these financial statements.
Hartford Total Return Bond HLS Fund
Schedule of Investments – (continued)
December 31, 2023
| Shares or Principal Amount | | Market Value† |
| CORPORATE BONDS - 30.9% - (continued) |
| | Electric - 4.2% - (continued) |
| $ 1,365,000 | 6.40%, 06/15/2033 | $ 1,438,926 |
| 340,000 | PPL Capital Funding, Inc. 4.13%, 04/15/2030 | 324,265 |
| 465,000 | Public Service Enterprise Group, Inc. 6.13%, 10/15/2033 | 500,779 |
| | Puget Energy, Inc. | |
| 885,000 | 2.38%, 06/15/2028 | 791,782 |
| 2,070,000 | 3.65%, 05/15/2025 | 2,017,096 |
| 130,000 | 4.10%, 06/15/2030 | 119,281 |
| 130,000 | 4.22%, 03/15/2032 | 117,650 |
| 1,085,000 | Sempra 5.40%, 08/01/2026 | 1,099,890 |
| | Southern California Edison Co. | |
| 1,390,000 | 2.85%, 08/01/2029 | 1,268,180 |
| 355,000 | 5.30%, 03/01/2028 | 364,738 |
| | Southern Co. | |
| 210,000 | 3.70%, 04/30/2030 | 198,131 |
| 1,170,000 | 5.20%, 06/15/2033 | 1,195,675 |
| 1,275,000 | Southwestern Electric Power Co. 5.30%, 04/01/2033 | 1,277,515 |
| | Virginia Electric & Power Co. | |
| 356,000 | 2.45%, 12/15/2050 | 219,623 |
| 1,145,000 | 5.00%, 04/01/2033 | 1,160,950 |
| 720,000 | Xcel Energy, Inc. 4.60%, 06/01/2032 | 703,071 |
| | | | 74,812,950 |
| | Energy-Alternate Sources - 0.3% |
| 2,650,000 | Energo-Pro AS 8.50%, 02/04/2027(1) | 2,595,860 |
| 1,085,000 | FS Luxembourg SARL 10.00%, 12/15/2025(1) | 1,112,686 |
| 1,422,000 | Greenko Power II Ltd. 4.30%, 12/13/2028(7) | 1,280,156 |
| | | | 4,988,702 |
| | Engineering & Construction - 0.3% |
| 1,615,000 | IHS Holding Ltd. 6.25%, 11/29/2028(1) | 1,305,727 |
| 3,127,589 | International Airport Finance SA 12.00%, 03/15/2033(1)(9) | 3,197,960 |
| | | | 4,503,687 |
| | Entertainment - 0.3% |
| | Warnermedia Holdings, Inc. | |
| 455,000 | 4.28%, 03/15/2032 | 416,971 |
| 400,000 | 5.39%, 03/15/2062 | 344,601 |
| | WMG Acquisition Corp. | |
| 725,000 | 3.75%, 12/01/2029(1) | 659,729 |
| 4,525,000 | 3.88%, 07/15/2030(1) | 4,093,420 |
| | | | 5,514,721 |
| | Environmental Control - 0.3% |
| 4,475,000 | Clean Harbors, Inc. 4.88%, 07/15/2027(1) | 4,385,946 |
| 1,145,000 | Veralto Corp. 5.35%, 09/18/2028(1) | 1,170,367 |
| | | | 5,556,313 |
| | Food - 0.3% |
| 411,000 | Conagra Brands, Inc. 4.85%, 11/01/2028 | 410,683 |
| 345,000 | General Mills, Inc. 4.95%, 03/29/2033 | 349,889 |
| 1,200,000 | Minerva Luxembourg SA 8.88%, 09/13/2033(1) | 1,268,753 |
| 3,070,000 | NBM U.S. Holdings, Inc. 7.00%, 05/14/2026(1) | 3,104,608 |
| 695,000 | Sysco Corp. 5.75%, 01/17/2029 | 724,551 |
| | | | 5,858,484 |
| | Gas - 0.5% |
| 365,000 | Atmos Energy Corp. 5.90%, 11/15/2033 | 396,707 |
| 1,440,000 | Brooklyn Union Gas Co. 6.39%, 09/15/2033(1) | 1,506,099 |
| 1,120,000 | KeySpan Gas East Corp. 5.99%, 03/06/2033(1) | 1,140,595 |
| Shares or Principal Amount | | Market Value† |
| CORPORATE BONDS - 30.9% - (continued) |
| | Gas - 0.5% - (continued) |
| | NiSource, Inc. | |
| $ 500,000 | 3.49%, 05/15/2027 | $ 481,775 |
| 1,690,000 | 3.60%, 05/01/2030 | 1,574,360 |
| 585,000 | 5.25%, 03/30/2028 | 596,876 |
| 1,045,000 | 5.40%, 06/30/2033 | 1,079,447 |
| 985,000 | Southern California Gas Co. 5.20%, 06/01/2033 | 1,014,743 |
| 280,000 | Southern Co. Gas Capital Corp. 5.75%, 09/15/2033 | 294,724 |
| 780,000 | Southwest Gas Corp. 2.20%, 06/15/2030 | 664,147 |
| | | | 8,749,473 |
| | Hand/Machine Tools - 0.2% |
| | Regal Rexnord Corp. | |
| 3,055,000 | 6.05%, 04/15/2028(1) | 3,094,907 |
| 740,000 | 6.30%, 02/15/2030(1) | 760,151 |
| | | | 3,855,058 |
| | Healthcare - Products - 0.6% |
| | Alcon Finance Corp. | |
| 1,164,000 | 2.75%, 09/23/2026(1) | 1,094,133 |
| 560,000 | 3.00%, 09/23/2029(1) | 510,254 |
| 455,000 | 5.38%, 12/06/2032(1) | 470,276 |
| 340,000 | 5.75%, 12/06/2052(1) | 367,034 |
| 3,220,000 | Avantor Funding, Inc. 4.63%, 07/15/2028(1) | 3,111,164 |
| 745,000 | GE HealthCare Technologies, Inc. 5.86%, 03/15/2030 | 783,533 |
| | Haleon U.S. Capital LLC | |
| 1,005,000 | 3.38%, 03/24/2029 | 951,143 |
| 265,000 | 3.63%, 03/24/2032 | 244,831 |
| 2,812,000 | Hologic, Inc. 4.63%, 02/01/2028(1) | 2,698,712 |
| | | | 10,231,080 |
| | Healthcare - Services - 0.7% |
| | Centene Corp. | |
| 850,000 | 2.45%, 07/15/2028 | 758,498 |
| 95,000 | 3.38%, 02/15/2030 | 85,197 |
| 435,000 | 4.25%, 12/15/2027 | 419,316 |
| 5,230,000 | 4.63%, 12/15/2029 | 5,014,464 |
| 470,000 | CommonSpirit Health 3.35%, 10/01/2029 | 429,638 |
| 1,760,000 | HCA, Inc. 3.38%, 03/15/2029 | 1,625,414 |
| | Humana, Inc. | |
| 1,170,000 | 3.70%, 03/23/2029 | 1,125,204 |
| 240,000 | 5.75%, 12/01/2028 | 250,695 |
| | Kaiser Foundation Hospitals | |
| 355,000 | 2.81%, 06/01/2041 | 267,880 |
| 900,000 | 3.00%, 06/01/2051 | 643,998 |
| 200,000 | Sutter Health 3.36%, 08/15/2050 | 149,086 |
| | UnitedHealth Group, Inc. | |
| 1,280,000 | 2.75%, 05/15/2040 | 968,827 |
| 190,000 | 3.50%, 08/15/2039 | 161,970 |
| 240,000 | 4.95%, 05/15/2062 | 237,682 |
| 365,000 | 5.35%, 02/15/2033 | 386,607 |
| 260,000 | 6.05%, 02/15/2063 | 301,095 |
| | | | 12,825,571 |
| | Home Builders - 0.2% |
| | Taylor Morrison Communities, Inc. | |
| 540,000 | 5.13%, 08/01/2030(1) | 522,385 |
| 2,558,000 | 5.75%, 01/15/2028(1) | 2,566,928 |
| | | | 3,089,313 |
| | Household Products - 0.0% |
| 840,000 | Kenvue, Inc. 5.05%, 03/22/2053 | 872,708 |
| | Insurance - 0.8% |
| 580,000 | Aon Corp./Aon Global Holdings PLC 5.35%, 02/28/2033 | 596,034 |
| | Athene Global Funding | |
| 1,985,000 | 2.65%, 10/04/2031(1) | 1,615,582 |
The accompanying notes are an integral part of these financial statements.
Hartford Total Return Bond HLS Fund
Schedule of Investments – (continued)
December 31, 2023
| Shares or Principal Amount | | Market Value† |
| CORPORATE BONDS - 30.9% - (continued) |
| | Insurance - 0.8% - (continued) |
| $ 3,010,000 | 2.72%, 01/07/2029(1) | $ 2,619,995 |
| 970,000 | Athene Holding Ltd. 5.88%, 01/15/2034 | 980,502 |
| | Corebridge Financial, Inc. | |
| 650,000 | 3.85%, 04/05/2029 | 612,689 |
| 280,000 | 6.05%, 09/15/2033(1) | 292,152 |
| 3,090,000 | Equitable Financial Life Global Funding 1.80%, 03/08/2028(1) | 2,710,012 |
| 670,000 | Equitable Holdings, Inc. 4.35%, 04/20/2028 | 647,481 |
| 560,000 | Marsh & McLennan Cos., Inc. 4.75%, 03/15/2039 | 545,516 |
| | Metropolitan Life Global Funding I | |
| 2,485,000 | 2.40%, 01/11/2032(1) | 2,064,304 |
| 770,000 | 5.15%, 03/28/2033(1) | 784,971 |
| 600,000 | Protective Life Global Funding 5.47%, 12/08/2028(1) | 616,625 |
| 830,000 | Willis North America, Inc. 3.60%, 05/15/2024 | 822,369 |
| | | | 14,908,232 |
| | Internet - 0.5% |
| | Gen Digital, Inc. | |
| 3,060,000 | 5.00%, 04/15/2025(1) | 3,029,400 |
| 1,900,000 | 6.75%, 09/30/2027(1) | 1,932,247 |
| | Go Daddy Operating Co. LLC/GD Finance Co., Inc. | |
| 770,000 | 3.50%, 03/01/2029(1) | 695,418 |
| 3,995,000 | 5.25%, 12/01/2027(1) | 3,914,733 |
| | | | 9,571,798 |
| | Iron/Steel - 0.0% |
| 620,000 | Vale Overseas Ltd. 6.13%, 06/12/2033 | 643,394 |
| | IT Services - 0.3% |
| 5,541,000 | Booz Allen Hamilton, Inc. 3.88%, 09/01/2028(1) | 5,225,776 |
| | Machinery-Diversified - 0.1% |
| 445,000 | Ingersoll Rand, Inc. 5.70%, 08/14/2033 | 471,098 |
| 1,221,000 | Otis Worldwide Corp. 2.57%, 02/15/2030 | 1,088,984 |
| | | | 1,560,082 |
| | Media - 1.1% |
| | Charter Communications Operating LLC/Charter Communications Operating Capital | |
| 695,000 | 2.25%, 01/15/2029 | 603,637 |
| 640,000 | 3.50%, 03/01/2042 | 446,629 |
| 645,000 | 4.80%, 03/01/2050 | 499,911 |
| 290,000 | 5.13%, 07/01/2049 | 236,157 |
| 2,225,000 | 6.48%, 10/23/2045 | 2,193,773 |
| 55,000 | 6.83%, 10/23/2055 | 55,100 |
| 1,484,000 | Comcast Corp. 2.94%, 11/01/2056 | 981,147 |
| 1,105,000 | Cox Communications, Inc. 2.60%, 06/15/2031(1) | 937,766 |
| | Discovery Communications LLC | |
| 545,000 | 3.63%, 05/15/2030 | 494,711 |
| 1,970,000 | 4.00%, 09/15/2055 | 1,407,504 |
| 790,000 | 5.20%, 09/20/2047 | 682,703 |
| 2,196,000 | 5.30%, 05/15/2049 | 1,891,435 |
| | Paramount Global | |
| 710,000 | 4.38%, 03/15/2043 | 526,252 |
| 1,300,000 | 4.95%, 01/15/2031 | 1,234,640 |
| 1,000,000 | 5.25%, 04/01/2044 | 803,897 |
| | Sirius XM Radio, Inc. | |
| 1,425,000 | 4.00%, 07/15/2028(1) | 1,316,970 |
| 590,000 | 4.13%, 07/01/2030(1) | 524,967 |
| Shares or Principal Amount | | Market Value† |
| CORPORATE BONDS - 30.9% - (continued) |
| | Media - 1.1% - (continued) |
| $ 2,900,000 | Time Warner Cable Enterprises LLC 8.38%, 07/15/2033 | $ 3,359,951 |
| 780,000 | Time Warner Cable LLC 6.55%, 05/01/2037 | 770,125 |
| | | | 18,967,275 |
| | Mining - 0.4% |
| 2,575,000 | Anglo American Capital PLC 2.63%, 09/10/2030(1) | 2,193,988 |
| 1,020,000 | Corp. Nacional del Cobre de Chile 5.95%, 01/08/2034(1) | 1,033,923 |
| | Glencore Funding LLC | |
| 600,000 | 2.63%, 09/23/2031(1) | 510,000 |
| 405,000 | 2.85%, 04/27/2031(1) | 350,270 |
| 2,150,000 | 6.38%, 10/06/2030(1) | 2,311,059 |
| 145,000 | Southern Copper Corp. 6.75%, 04/16/2040 | 162,376 |
| | | | 6,561,616 |
| | Office/Business Equipment - 0.3% |
| | CDW LLC/CDW Finance Corp. | |
| 485,000 | 2.67%, 12/01/2026 | 453,553 |
| 5,768,000 | 3.25%, 02/15/2029 | 5,274,230 |
| | | | 5,727,783 |
| | Oil & Gas - 1.5% |
| | Aker BP ASA | |
| 1,367,000 | 2.00%, 07/15/2026(1) | 1,260,366 |
| 465,000 | 3.10%, 07/15/2031(1) | 398,388 |
| 525,000 | 5.60%, 06/13/2028(1) | 535,646 |
| 1,055,000 | 6.00%, 06/13/2033(1) | 1,097,854 |
| | BP Capital Markets America, Inc. | |
| 115,000 | 2.94%, 06/04/2051 | 80,030 |
| 2,025,000 | 4.81%, 02/13/2033 | 2,045,671 |
| 1,140,000 | 4.89%, 09/11/2033 | 1,161,839 |
| | ConocoPhillips Co. | |
| 365,000 | 4.03%, 03/15/2062 | 297,807 |
| 580,000 | 5.05%, 09/15/2033 | 597,105 |
| 1,050,000 | 5.70%, 09/15/2063 | 1,141,897 |
| 600,000 | Diamondback Energy, Inc. 6.25%, 03/15/2033 | 641,823 |
| | Ecopetrol SA | |
| 790,000 | 4.63%, 11/02/2031 | 670,097 |
| 3,050,000 | 8.63%, 01/19/2029 | 3,250,028 |
| | Energian Israel Finance Ltd. | |
| 735,000 | 4.88%, 03/30/2026(7) | 676,200 |
| 695,000 | 5.88%, 03/30/2031(7) | 585,675 |
| 680,000 | 8.50%, 09/30/2033(7) | 648,550 |
| | Equinor ASA | |
| 675,000 | 3.63%, 04/06/2040 | 584,648 |
| 320,000 | 3.70%, 04/06/2050 | 265,377 |
| | Hess Corp. | |
| 417,000 | 7.13%, 03/15/2033 | 482,839 |
| 430,000 | 7.30%, 08/15/2031 | 496,873 |
| 2,045,000 | Leviathan Bond Ltd. 6.50%, 06/30/2027(7) | 1,918,955 |
| 630,000 | Marathon Oil Corp. 6.60%, 10/01/2037 | 667,622 |
| | Occidental Petroleum Corp. | |
| 167,000 | 6.13%, 01/01/2031 | 173,377 |
| 1,820,000 | 6.63%, 09/01/2030 | 1,935,588 |
| 85,000 | 7.50%, 05/01/2031 | 95,314 |
| 785,000 | Ovintiv, Inc. 6.63%, 08/15/2037 | 814,735 |
| | Patterson-UTI Energy, Inc. | |
| 1,310,000 | 5.15%, 11/15/2029 | 1,252,620 |
| 565,000 | 7.15%, 10/01/2033 | 599,983 |
| | Shell International Finance BV | |
| 215,000 | 2.88%, 11/26/2041 | 163,467 |
| 620,000 | 3.00%, 11/26/2051 | 443,629 |
| 575,000 | 3.25%, 04/06/2050 | 433,926 |
| 2,200,000 | Viper Energy, Inc. 5.38%, 11/01/2027(1) | 2,158,939 |
| | | | 27,576,868 |
The accompanying notes are an integral part of these financial statements.
Hartford Total Return Bond HLS Fund
Schedule of Investments – (continued)
December 31, 2023
| Shares or Principal Amount | | Market Value† |
| CORPORATE BONDS - 30.9% - (continued) |
| | Packaging & Containers - 0.3% |
| $ 6,115,000 | Ball Corp. 6.00%, 06/15/2029 | $ 6,244,669 |
| | Pharmaceuticals - 0.2% |
| 1,560,000 | Bayer U.S. Finance LLC 6.38%, 11/21/2030(1) | 1,604,160 |
| | CVS Health Corp. | |
| 1,095,000 | 2.70%, 08/21/2040 | 783,366 |
| 435,000 | 4.13%, 04/01/2040 | 374,706 |
| 755,000 | 5.13%, 02/21/2030 | 767,740 |
| 525,000 | 5.25%, 01/30/2031 | 539,145 |
| | | | 4,069,117 |
| | Pipelines - 1.6% |
| 630,000 | Cheniere Energy Partners LP 4.50%, 10/01/2029 | 601,306 |
| 1,370,000 | Columbia Pipelines Holding Co. LLC 6.04%, 08/15/2028(1) | 1,415,308 |
| | Columbia Pipelines Operating Co. LLC | |
| 820,000 | 5.93%, 08/15/2030(1) | 849,035 |
| 1,255,000 | 6.04%, 11/15/2033(1) | 1,316,444 |
| 800,000 | 6.54%, 11/15/2053(1) | 884,435 |
| 1,485,000 | EIG Pearl Holdings SARL 3.55%, 08/31/2036(1) | 1,291,950 |
| | Enbridge, Inc. | |
| 2,520,000 | 5.70%, 03/08/2033 | 2,624,619 |
| 655,000 | 6.00%, 11/15/2028 | 688,289 |
| 1,540,000 | 8.50%, 01/15/2084, (8.50% fixed rate until 10/15/2033; 5 yr. USD CMT + 4.43% thereafter)(6) | 1,638,107 |
| | Energy Transfer LP | |
| 1,060,000 | 5.25%, 04/15/2029 | 1,069,096 |
| 870,000 | 6.05%, 12/01/2026 | 894,129 |
| 1,785,000 | 6.40%, 12/01/2030 | 1,908,484 |
| 125,000 | EQM Midstream Partners LP 6.50%, 07/01/2027(1) | 127,261 |
| 528,146 | Galaxy Pipeline Assets Bidco Ltd. 2.94%, 09/30/2040(1) | 434,548 |
| | Greensaif Pipelines Bidco SARL | |
| 2,130,000 | 6.13%, 02/23/2038(1) | 2,225,451 |
| 1,690,000 | 6.51%, 02/23/2042(1) | 1,784,104 |
| 405,000 | MPLX LP 1.75%, 03/01/2026 | 379,021 |
| | ONEOK, Inc. | |
| 210,000 | 3.10%, 03/15/2030 | 188,815 |
| 855,000 | 3.40%, 09/01/2029 | 788,656 |
| 335,000 | 4.35%, 03/15/2029 | 325,924 |
| 705,000 | 6.10%, 11/15/2032 | 750,482 |
| | Targa Resources Corp. | |
| 65,000 | 4.20%, 02/01/2033 | 59,910 |
| 185,000 | 6.13%, 03/15/2033 | 195,199 |
| 865,000 | 6.15%, 03/01/2029 | 905,639 |
| 570,000 | 6.25%, 07/01/2052 | 590,314 |
| | Targa Resources Partners LP/Targa Resources Partners Finance Corp. | |
| 840,000 | 4.00%, 01/15/2032 | 768,436 |
| 280,000 | 4.88%, 02/01/2031 | 271,676 |
| 400,000 | Transcontinental Gas Pipe Line Co. LLC 3.25%, 05/15/2030 | 363,094 |
| | Western Midstream Operating LP | |
| 580,000 | 4.75%, 08/15/2028 | 566,259 |
| 980,000 | 6.15%, 04/01/2033 | 1,018,773 |
| | Williams Cos., Inc. | |
| 1,490,000 | 4.65%, 08/15/2032 | 1,453,365 |
| 725,000 | 5.65%, 03/15/2033 | 758,837 |
| | | | 29,136,966 |
| | Real Estate Investment Trusts - 0.9% |
| | American Tower Corp. | |
| 320,000 | 2.70%, 04/15/2031 | 275,200 |
| Shares or Principal Amount | | Market Value† |
| CORPORATE BONDS - 30.9% - (continued) |
| | Real Estate Investment Trusts - 0.9% - (continued) |
| $ 1,145,000 | 3.80%, 08/15/2029 | $ 1,087,727 |
| 880,000 | 5.80%, 11/15/2028 | 914,102 |
| | Crown Castle, Inc. | |
| 960,000 | 2.90%, 03/15/2027 | 898,030 |
| 2,780,000 | 4.80%, 09/01/2028 | 2,745,766 |
| 785,000 | 5.00%, 01/11/2028 | 782,730 |
| 710,000 | 5.60%, 06/01/2029 | 726,732 |
| 1,135,000 | Equinix, Inc. 3.20%, 11/18/2029 | 1,043,843 |
| | GLP Capital LP/GLP Financing II, Inc. | |
| 435,000 | 4.00%, 01/15/2031 | 391,780 |
| 1,025,000 | 5.30%, 01/15/2029 | 1,018,102 |
| 1,535,000 | 5.75%, 06/01/2028 | 1,547,151 |
| 2,240,000 | SBA Tower Trust 2.84%, 01/15/2050(1) | 2,163,110 |
| 2,187,000 | VICI Properties LP 4.95%, 02/15/2030 | 2,116,646 |
| | | | 15,710,919 |
| | Retail - 0.5% |
| | AutoZone, Inc. | |
| 765,000 | 4.75%, 08/01/2032 | 758,669 |
| 235,000 | 4.75%, 02/01/2033 | 231,809 |
| 670,000 | 6.55%, 11/01/2033 | 745,404 |
| | FirstCash, Inc. | |
| 3,352,000 | 4.63%, 09/01/2028(1) | 3,129,167 |
| 1,735,000 | 5.63%, 01/01/2030(1) | 1,661,149 |
| 1,755,000 | O'Reilly Automotive, Inc. 4.70%, 06/15/2032 | 1,739,150 |
| | | | 8,265,348 |
| | Semiconductors - 0.3% |
| | Intel Corp. | |
| 350,000 | 3.10%, 02/15/2060 | 242,467 |
| 500,000 | 5.90%, 02/10/2063 | 559,914 |
| | Marvell Technology, Inc. | |
| 1,720,000 | 2.45%, 04/15/2028 | 1,553,899 |
| 85,000 | 2.95%, 04/15/2031 | 74,399 |
| 370,000 | 5.95%, 09/15/2033 | 393,327 |
| 385,000 | NXP BV/NXP Funding LLC 5.55%, 12/01/2028 | 396,726 |
| 410,000 | NXP BV/NXP Funding LLC/NXP USA, Inc. 4.30%, 06/18/2029 | 398,745 |
| 1,035,000 | Qorvo, Inc. 3.38%, 04/01/2031(1) | 886,165 |
| | | | 4,505,642 |
| | Software - 1.3% |
| 4,249,000 | Black Knight InfoServ LLC 3.63%, 09/01/2028(1) | 4,033,363 |
| 3,542,000 | Fair Isaac Corp. 4.00%, 06/15/2028(1) | 3,350,320 |
| | MSCI, Inc. | |
| 668,000 | 3.63%, 11/01/2031(1) | 587,895 |
| 392,000 | 3.88%, 02/15/2031(1) | 358,104 |
| 1,870,000 | 4.00%, 11/15/2029(1) | 1,757,386 |
| | Open Text Corp. | |
| 3,075,000 | 3.88%, 12/01/2029(1) | 2,757,024 |
| 2,515,000 | 6.90%, 12/01/2027(1) | 2,614,984 |
| 600,000 | Open Text Holdings, Inc. 4.13%, 12/01/2031(1) | 530,535 |
| | Oracle Corp. | |
| 405,000 | 2.95%, 04/01/2030 | 365,840 |
| 2,900,000 | 3.85%, 04/01/2060 | 2,112,337 |
| 745,000 | 4.10%, 03/25/2061 | 570,227 |
| 70,000 | 4.13%, 05/15/2045 | 57,331 |
| 1,400,000 | 6.15%, 11/09/2029 | 1,508,045 |
| 3,245,000 | SS&C Technologies, Inc. 5.50%, 09/30/2027(1) | 3,197,595 |
| | | | 23,800,986 |
| | Telecommunications - 0.6% |
| | AT&T, Inc. | |
| 2,044,000 | 3.55%, 09/15/2055 | 1,477,762 |
| 1,266,000 | 3.80%, 12/01/2057 | 945,304 |
The accompanying notes are an integral part of these financial statements.
Hartford Total Return Bond HLS Fund
Schedule of Investments – (continued)
December 31, 2023
| Shares or Principal Amount | | Market Value† |
| CORPORATE BONDS - 30.9% - (continued) |
| | Telecommunications - 0.6% - (continued) |
| $ 3,170,000 | Nokia OYJ 4.38%, 06/12/2027 | $ 3,069,366 |
| 885,000 | Rogers Communications, Inc. 3.80%, 03/15/2032 | 815,328 |
| | T-Mobile USA, Inc. | |
| 2,235,000 | 3.88%, 04/15/2030 | 2,121,243 |
| 815,000 | 5.05%, 07/15/2033 | 822,876 |
| 830,000 | 5.75%, 01/15/2034 | 882,389 |
| | | | 10,134,268 |
| | Trucking & Leasing - 0.4% |
| 3,775,000 | DAE Funding LLC 1.55%, 08/01/2024(1) | 3,674,376 |
| | Penske Truck Leasing Co. LP/PTL Finance Corp. | |
| 1,145,000 | 2.70%, 11/01/2024(1) | 1,113,603 |
| 1,185,000 | 4.00%, 07/15/2025(1) | 1,159,153 |
| 1,170,000 | 4.40%, 07/01/2027(1) | 1,141,597 |
| 430,000 | 6.05%, 08/01/2028(1) | 446,337 |
| | | | 7,535,066 |
| | Total Corporate Bonds
(cost $564,314,045) | $ 552,931,752 |
| FOREIGN GOVERNMENT OBLIGATIONS - 3.0% |
| | Angola - 0.1% |
| | Angola Government International Bonds | |
| 1,600,000 | 8.00%, 11/26/2029(7) | $ 1,419,040 |
| 310,000 | 8.75%, 04/14/2032(1) | 272,175 |
| | | | 1,691,215 |
| | Benin - 0.1% |
| EUR 2,640,000 | Benin Government International Bonds 4.95%, 01/22/2035(1) | 2,289,575 |
| | Bermuda - 0.1% |
| | Bermuda Government International Bonds | |
| $ 735,000 | 2.38%, 08/20/2030(1) | 629,079 |
| 1,825,000 | 5.00%, 07/15/2032(1) | 1,810,400 |
| | | | 2,439,479 |
| | Brazil - 0.5% |
| BRL 42,374,000 | Brazil Notas do Tesouro Nacional 10.00%, 01/01/2031 | 8,614,893 |
| | Chile - 0.1% |
| EUR 1,605,000 | Chile Government International Bonds 1.25%, 01/22/2051 | 989,704 |
| | Colombia - 0.2% |
| | Colombia Government International Bonds | |
| $ 2,685,000 | 5.00%, 06/15/2045 | 2,079,828 |
| 395,000 | 5.20%, 05/15/2049 | 308,383 |
| 1,180,000 | 5.63%, 02/26/2044 | 990,626 |
| | | | 3,378,837 |
| | Costa Rica - 0.1% |
| 1,140,000 | Costa Rica Government International Bonds 6.55%, 04/03/2034(1) | 1,179,900 |
| | Hungary - 0.4% |
| | Hungary Government International Bonds | |
| EUR 5,610,000 | 1.63%, 04/28/2032(7) | 5,023,155 |
| $ 2,010,000 | 6.13%, 05/22/2028(1) | 2,087,763 |
| | | | 7,110,918 |
| | Indonesia - 0.2% |
| | Indonesia Government International Bonds | |
| EUR 3,795,000 | 1.10%, 03/12/2033 | 3,304,519 |
| 240,000 | 2.15%, 07/18/2024(7) | 261,490 |
| | | | 3,566,009 |
| Shares or Principal Amount | | Market Value† |
| FOREIGN GOVERNMENT OBLIGATIONS - 3.0% - (continued) |
| | Ivory Coast - 0.1% |
| EUR 1,965,000 | Ivory Coast Government International Bonds 4.88%, 01/30/2032(7) | $ 1,823,655 |
| | Mexico - 0.0% |
| $ 290,000 | Mexico Government International Bonds 6.34%, 05/04/2053 | 295,226 |
| | North Macedonia - 0.2% |
| | North Macedonia Government International Bonds | |
| EUR 1,825,000 | 2.75%, 01/18/2025(7) | 1,964,232 |
| 2,165,000 | 3.68%, 06/03/2026(1) | 2,314,479 |
| | | | 4,278,711 |
| | Panama - 0.0% |
| $ 590,000 | Panama Government International Bonds 6.88%, 01/31/2036 | 588,313 |
| | Philippines - 0.2% |
| | Philippines Government International Bonds | |
| EUR 3,315,000 | 1.20%, 04/28/2033 | 2,929,103 |
| 710,000 | 1.75%, 04/28/2041 | 546,351 |
| | | | 3,475,454 |
| | Poland - 0.0% |
| $ 670,000 | Bank Gospodarstwa Krajowego 5.38%, 05/22/2033(1) | 678,785 |
| | Romania - 0.5% |
| | Romania Government International Bonds | |
| EUR 2,970,000 | 2.63%, 12/02/2040(1) | 2,196,691 |
| 6,785,000 | 2.75%, 04/14/2041(7) | 5,018,502 |
| 1,315,000 | 3.38%, 02/08/2038(7) | 1,134,006 |
| | | | 8,349,199 |
| | Saudi Arabia - 0.2% |
| | Saudi Government International Bonds | |
| 1,140,000 | 2.00%, 07/09/2039(7) | 971,225 |
| $ 2,000,000 | 5.00%, 01/18/2053(1) | 1,882,636 |
| | | | 2,853,861 |
| | Total Foreign Government Obligations
(cost $64,526,650) | | $ 53,603,734 |
| MUNICIPAL BONDS - 1.4% |
| | Development - 0.3% |
| 4,650,000 | New York Transportation Dev Corp., NY, Rev 4.25%, 09/01/2035 | $ 4,531,789 |
| | General - 0.6% |
| 720,000 | Chicago Transit Auth Sales Tax Receipts Fund, IL, Rev 3.91%, 12/01/2040 | 623,181 |
| 5,445,000 | Philadelphia Auth for Industrial Dev, PA, Rev, (NATL Insured) 6.55%, 10/15/2028 | 5,801,144 |
| 4,130,000 | State Board of Administration Finance Corp., FL, Rev 1.26%, 07/01/2025 | 3,918,668 |
| | | | 10,342,993 |
| | School District - 0.2% |
| | Chicago Board of Education, IL, GO | |
| 1,115,000 | 6.14%, 12/01/2039 | 1,054,958 |
| 2,280,000 | 6.32%, 11/01/2029 | 2,282,811 |
| | | | 3,337,769 |
| | Transportation - 0.2% |
| 2,790,000 | Metropolitan Transportation Auth, NY, Rev 6.81%, 11/15/2040 | 3,091,244 |
The accompanying notes are an integral part of these financial statements.
Hartford Total Return Bond HLS Fund
Schedule of Investments – (continued)
December 31, 2023
| Shares or Principal Amount | | Market Value† |
| MUNICIPAL BONDS - 1.4% - (continued) |
| | Utilities - 0.1% |
| $ 2,395,000 | Texas Natural Gas Securitization Finance Corp., TX, Rev 5.10%, 04/01/2035 | $ 2,440,835 |
| | Utility - Electric - 0.0% |
| 731,000 | Municipal Electric Auth of Georgia, GA, Rev 6.64%, 04/01/2057 | 834,133 |
| | Total Municipal Bonds
(cost $26,378,582) | | $ 24,578,763 |
| SENIOR FLOATING RATE INTERESTS - 0.0%(10) |
| | Oil & Gas Services - 0.0% |
| 749,867 | PES Holdings LLC 0.00%, 12/31/2024, U.S. (Fed) Prime Rate + 1.50%(11)(12) | $ 7,499 |
| | Total Senior Floating Rate Interests
(cost $749,867) | $ 7,499 |
| U.S. GOVERNMENT AGENCIES - 46.2% |
| | Mortgage-Backed Agencies - 46.2% |
| | Federal Home Loan Mortgage Corp. - 7.9% |
| 45,482 | 0.00%, 11/15/2036(13)(14) | $ 37,068 |
| 19,138,185 | 0.60%, 03/25/2027(3)(4) | 307,396 |
| 4,783,817 | 0.63%, 10/25/2026(3)(4) | 64,636 |
| 17,216,296 | 0.72%, 12/25/2030(3)(4) | 685,660 |
| 10,113,330 | 0.75%, 06/25/2027(3)(4) | 212,695 |
| 4,230,217 | 0.88%, 11/25/2030(3)(4) | 199,856 |
| 2,142,168 | 1.00%, 02/25/2051 | 1,796,895 |
| 7,725,528 | 1.02%, 10/25/2030(3)(4) | 412,388 |
| 12,817,440 | 1.12%, 06/25/2030(3)(4) | 739,703 |
| 9,316,210 | 1.50%, 05/15/2037(4) | 541,063 |
| 844,748 | 1.50%, 11/01/2051 | 658,391 |
| 6,234,921 | 1.57%, 05/25/2030(3)(4) | 486,359 |
| 645,008 | 1.75%, 10/15/2042 | 554,642 |
| 1,526,789 | 2.00%, 05/01/2036 | 1,379,593 |
| 637,527 | 2.00%, 06/01/2036 | 576,053 |
| 307,550 | 2.00%, 12/01/2040 | 264,807 |
| 1,914,641 | 2.00%, 05/01/2041 | 1,641,396 |
| 2,118,974 | 2.00%, 12/01/2041 | 1,811,269 |
| 1,699,988 | 2.00%, 10/01/2050 | 1,398,119 |
| 1,620,667 | 2.00%, 02/01/2051 | 1,347,109 |
| 8,504,739 | 2.00%, 03/01/2051 | 6,999,360 |
| 2,864,290 | 2.00%, 04/01/2051 | 2,351,028 |
| 1,620,331 | 2.00%, 05/01/2051 | 1,347,744 |
| 692,273 | 2.00%, 08/01/2051 | 567,146 |
| 699,709 | 2.00%, 11/01/2051 | 577,398 |
| 3,125,285 | 2.00%, 04/01/2052 | 2,586,611 |
| 3,758,580 | 2.00%, 06/15/2052(4) | 462,033 |
| 196,352 | 2.50%, 05/15/2028(4) | 7,210 |
| 964,837 | 2.50%, 05/01/2050 | 835,237 |
| 1,118,429 | 2.50%, 06/01/2050 | 962,806 |
| 6,403,737 | 2.50%, 07/01/2050 | 5,503,099 |
| 1,969,721 | 2.50%, 11/01/2050 | 1,687,687 |
| 597,940 | 2.50%, 02/01/2051 | 517,869 |
| 2,022,978 | 2.50%, 03/01/2051 | 1,733,419 |
| 2,473,404 | 2.50%, 03/25/2051(4) | 347,805 |
| 747,935 | 2.50%, 05/01/2051 | 639,974 |
| 930,566 | 2.50%, 07/01/2051 | 798,051 |
| 657,965 | 2.50%, 08/01/2051 | 562,980 |
| 1,160,949 | 2.50%, 10/01/2051 | 993,488 |
| 2,973,674 | 2.50%, 03/15/2052(4) | 418,942 |
| 1,922,338 | 2.50%, 03/25/2052 | 1,706,451 |
| 3,679,740 | 2.50%, 04/01/2052 | 3,135,413 |
| 423,330 | 3.00%, 03/15/2028(4) | 17,567 |
| 634,273 | 3.00%, 08/01/2029 | 612,917 |
| 160,442 | 3.00%, 05/15/2032(4) | 3,125 |
| 2,020,617 | 3.00%, 10/01/2032 | 1,931,533 |
| 317,654 | 3.00%, 03/15/2033(4) | 26,237 |
| Shares or Principal Amount | | Market Value† |
| U.S. GOVERNMENT AGENCIES - 46.2% - (continued) |
| | Mortgage-Backed Agencies - 46.2% - (continued) |
| | Federal Home Loan Mortgage Corp. - 7.9% - (continued) |
| $ 1,298,906 | 3.00%, 04/01/2033 | $ 1,235,121 |
| 1,946,148 | 3.00%, 11/01/2036 | 1,815,577 |
| 1,100,568 | 3.00%, 01/01/2037 | 1,026,769 |
| 2,025,000 | 3.00%, 03/25/2040 | 1,766,132 |
| 575,244 | 3.00%, 05/15/2046 | 531,826 |
| 3,611,979 | 3.00%, 11/01/2046 | 3,292,914 |
| 925,390 | 3.00%, 12/01/2046 | 843,279 |
| 803,513 | 3.00%, 07/01/2050 | 717,382 |
| 313,827 | 3.00%, 08/01/2051 | 280,618 |
| 2,836,995 | 3.00%, 09/25/2051(4) | 456,720 |
| 2,126,523 | 3.00%, 10/01/2051 | 1,902,342 |
| 810,513 | 3.00%, 01/01/2052 | 727,862 |
| 1,025,929 | 3.00%, 05/01/2052 | 916,264 |
| 363,470 | 3.25%, 11/15/2041 | 336,438 |
| 78,133 | 3.50%, 09/15/2026(4) | 2,314 |
| 73,464 | 3.50%, 03/15/2027(4) | 1,660 |
| 849,537 | 3.50%, 05/15/2034(4) | 64,136 |
| 1,364,551 | 3.50%, 08/01/2034 | 1,312,161 |
| 476,975 | 3.50%, 03/15/2041(4) | 14,590 |
| 432,353 | 3.50%, 10/15/2045 | 394,873 |
| 358,960 | 3.50%, 06/01/2046 | 335,880 |
| 1,114,723 | 3.50%, 12/15/2046 | 1,007,586 |
| 1,227,731 | 3.50%, 10/01/2047 | 1,148,767 |
| 458,538 | 3.50%, 12/01/2047 | 428,443 |
| 6,618,187 | 3.50%, 03/01/2048 | 6,197,804 |
| 199,010 | 3.50%, 08/01/2048 | 186,216 |
| 390,286 | 4.00%, 08/01/2025 | 385,401 |
| 129,842 | 4.00%, 12/15/2026(4) | 2,262 |
| 204,648 | 4.00%, 07/15/2027(4) | 4,013 |
| 142,802 | 4.00%, 03/15/2028(4) | 3,718 |
| 87,823 | 4.00%, 06/15/2028(4) | 2,589 |
| 300,197 | 4.00%, 07/15/2030(4) | 20,468 |
| 1,289,348 | 4.00%, 05/25/2040(4) | 192,696 |
| 1,307,438 | 4.00%, 09/15/2041 | 1,253,962 |
| 1,139,097 | 4.00%, 05/01/2042 | 1,113,343 |
| 378,714 | 4.00%, 08/01/2042 | 369,368 |
| 569,641 | 4.00%, 09/01/2042 | 555,584 |
| 29,464 | 4.00%, 07/01/2044 | 28,875 |
| 105,266 | 4.00%, 06/01/2045 | 101,755 |
| 427,570 | 4.00%, 02/01/2046 | 413,312 |
| 141,216 | 4.00%, 04/01/2047 | 137,130 |
| 117,273 | 4.00%, 09/01/2048 | 113,263 |
| 2,587,973 | 4.00%, 04/01/2049 | 2,487,887 |
| 512,810 | 4.00%, 05/01/2049 | 495,009 |
| 1,930,908 | 4.00%, 07/01/2049 | 1,868,506 |
| 196,885 | 4.50%, 09/01/2044 | 194,991 |
| 979,104 | 4.75%, 07/15/2039 | 960,767 |
| 405,045 | 5.00%, 09/15/2033(4) | 57,623 |
| 3,856 | 5.00%, 03/01/2039 | 3,928 |
| 117,853 | 5.00%, 08/01/2039 | 120,063 |
| 2,770 | 5.00%, 09/01/2039 | 2,791 |
| 6,858 | 5.00%, 12/01/2039 | 6,949 |
| 6,153 | 5.00%, 04/01/2041 | 6,268 |
| 13,977 | 5.00%, 04/01/2044 | 14,238 |
| 10,088 | 5.00%, 05/01/2044 | 10,183 |
| 510,398 | 5.00%, 02/15/2048(4) | 100,656 |
| 595,457 | 5.00%, 08/01/2052 | 590,504 |
| 17,097,144 | 5.00%, 09/01/2052 | 16,946,819 |
| 1,670,336 | 5.00%, 04/01/2053 | 1,664,511 |
| 10,200 | 5.50%, 03/01/2028 | 10,257 |
| 26,040 | 5.50%, 04/01/2033 | 26,875 |
| 346,315 | 5.50%, 05/01/2034 | 357,425 |
| 6,189 | 5.50%, 05/01/2037 | 6,388 |
| 17,319 | 5.50%, 11/01/2037 | 17,875 |
| 32,158 | 5.50%, 02/01/2038 | 33,193 |
| 13,578 | 5.50%, 04/01/2038 | 14,015 |
The accompanying notes are an integral part of these financial statements.
Hartford Total Return Bond HLS Fund
Schedule of Investments – (continued)
December 31, 2023
| Shares or Principal Amount | | Market Value† |
| U.S. GOVERNMENT AGENCIES - 46.2% - (continued) |
| | Mortgage-Backed Agencies - 46.2% - (continued) |
| | Federal Home Loan Mortgage Corp. - 7.9% - (continued) |
| $ 17,391 | 5.50%, 06/01/2038 | $ 17,949 |
| 1,820,425 | 5.50%, 08/01/2038 | 1,878,865 |
| 183,317 | 5.50%, 09/01/2038 | 189,205 |
| 3,540 | 5.50%, 12/01/2039 | 3,654 |
| 47,596 | 5.50%, 02/01/2040 | 49,125 |
| 159,239 | 5.50%, 05/01/2040 | 164,354 |
| 153,563 | 5.50%, 08/01/2040 | 158,495 |
| 810,186 | 5.50%, 06/01/2041 | 836,208 |
| 660,063 | 5.50%, 10/15/2046(4) | 133,702 |
| 2,332,530 | 5.50%, 02/01/2053 | 2,353,306 |
| 777 | 6.00%, 07/01/2029 | 805 |
| 83,866 | 6.00%, 10/01/2032 | 87,163 |
| 18,153 | 6.00%, 11/01/2032 | 18,797 |
| 102,956 | 6.00%, 12/01/2032 | 106,785 |
| 7,934 | 6.00%, 11/01/2033 | 8,285 |
| 17,759 | 6.00%, 01/01/2034 | 18,406 |
| 8,075 | 6.00%, 02/01/2034 | 8,429 |
| 82,409 | 6.00%, 08/01/2034 | 86,261 |
| 87,061 | 6.00%, 09/01/2034 | 91,123 |
| 103,756 | 6.00%, 01/01/2035 | 107,789 |
| 509,598 | 6.00%, 11/01/2037 | 533,351 |
| 1,343,787 | 6.00%, 12/01/2052 | 1,383,334 |
| 668,230 | 6.00%, 03/01/2053 | 687,525 |
| 112 | 6.50%, 08/01/2032 | 117 |
| 261,866 | 6.50%, 07/15/2036 | 267,235 |
| 57,035 | 6.50%, 12/01/2037 | 60,297 |
| 1,543,549 | 6.50%, 11/01/2053 | 1,589,100 |
| 28 | 7.50%, 09/01/2029 | 28 |
| 1,432,000 | 8.24%, 04/25/2042, 30 day USD SOFR Average + 2.90%(1)(2) | 1,470,350 |
| 1,310,000 | 8.59%, 04/25/2043, 30 day USD SOFR Average + 3.25%(1)(2) | 1,363,491 |
| 2,005,000 | 8.69%, 05/25/2042, 30 day USD SOFR Average + 3.35%(1)(2) | 2,084,877 |
| 4,410,000 | 8.69%, 06/25/2043, 30 day USD SOFR Average + 3.35%(1)(2) | 4,649,794 |
| 470,000 | 8.84%, 03/25/2042, 30 day USD SOFR Average + 3.50%(1)(2) | 486,647 |
| 3,815,000 | 8.84%, 05/25/2043, 30 day USD SOFR Average + 3.50%(1)(2) | 4,031,664 |
| 620,000 | 8.89%, 08/25/2042, 30 day USD SOFR Average + 3.55%(1)(2) | 641,006 |
| 1,705,000 | 9.04%, 09/25/2042, 30 day USD SOFR Average + 3.70%(1)(2) | 1,793,528 |
| 1,525,000 | 9.34%, 07/25/2042, 30 day USD SOFR Average + 4.00%(1)(2) | 1,598,651 |
| 2,440,000 | 9.84%, 06/25/2042, 30 day USD SOFR Average + 4.50%(1)(2) | 2,627,221 |
| | | | 141,674,284 |
| | Federal National Mortgage Association - 14.6% |
| 50,735 | 0.00%, 03/25/2036(13)(14) | 43,714 |
| 439,234 | 0.00%, 06/25/2036(13)(14) | 383,139 |
| 379,944 | 0.00%, 06/25/2041(13)(14) | 288,866 |
| 7,595,603 | 0.30%, 01/25/2030(3)(4) | 79,632 |
| 8,068,654 | 1.41%, 05/25/2029(3)(4) | 379,097 |
| 1,060,606 | 1.48%, 05/25/2046(3)(4) | 58,942 |
| 5,719,477 | 1.50%, 09/01/2051 | 4,461,476 |
| 331,955 | 1.50%, 10/01/2051 | 258,674 |
| 439,559 | 1.50%, 04/01/2052 | 342,976 |
| 1,101,110 | 1.70%, 04/25/2055(3)(4) | 55,216 |
| 1,049,346 | 1.75%, 12/25/2042 | 919,512 |
| 1,580,452 | 2.00%, 05/01/2036 | 1,428,069 |
| 2,369,531 | 2.00%, 06/01/2036 | 2,141,088 |
| 1,774,895 | 2.00%, 08/01/2036 | 1,603,748 |
| 1,116,465 | 2.00%, 09/01/2036 | 1,008,798 |
| Shares or Principal Amount | | Market Value† |
| U.S. GOVERNMENT AGENCIES - 46.2% - (continued) |
| | Mortgage-Backed Agencies - 46.2% - (continued) |
| | Federal National Mortgage Association - 14.6% - (continued) |
| $ 811,926 | 2.00%, 12/01/2036 | $ 733,620 |
| 632,031 | 2.00%, 09/25/2039 | 555,173 |
| 1,290,400 | 2.00%, 09/01/2040 | 1,111,273 |
| 2,892,314 | 2.00%, 12/01/2040 | 2,490,733 |
| 1,166,553 | 2.00%, 04/01/2041 | 1,001,348 |
| 399,745 | 2.00%, 05/01/2041 | 342,740 |
| 1,531,897 | 2.00%, 10/01/2041 | 1,310,575 |
| 7,592,161 | 2.00%, 12/01/2050 | 6,247,172 |
| 9,546,233 | 2.00%, 02/01/2051 | 7,851,993 |
| 14,059,280 | 2.00%, 03/01/2051 | 11,545,719 |
| 14,458,040 | 2.00%, 04/01/2051 | 11,872,912 |
| 1,585,553 | 2.00%, 05/01/2051 | 1,300,287 |
| 536,207 | 2.00%, 07/01/2051 | 440,069 |
| 703,571 | 2.00%, 10/01/2051 | 583,770 |
| 3,681,820 | 2.00%, 03/25/2052(4) | 462,069 |
| 24,525 | 2.00%, 04/01/2052 | 20,069 |
| 732,919 | 2.01%, 06/25/2055(3)(4) | 43,170 |
| 827,052 | 2.03%, 08/25/2044(3)(4) | 36,095 |
| 800,230 | 2.25%, 04/01/2033 | 670,744 |
| 185,621 | 2.50%, 06/25/2028(4) | 6,683 |
| 2,128,936 | 2.50%, 09/01/2040 | 1,897,263 |
| 90,578 | 2.50%, 01/01/2043 | 79,815 |
| 2,125,494 | 2.50%, 02/01/2043 | 1,872,850 |
| 716,283 | 2.50%, 03/01/2043 | 631,233 |
| 1,558,588 | 2.50%, 05/01/2043 | 1,361,007 |
| 1,227,683 | 2.50%, 06/01/2043 | 1,081,854 |
| 680,991 | 2.50%, 04/01/2045 | 593,332 |
| 974,905 | 2.50%, 04/01/2050 | 836,967 |
| 1,118,752 | 2.50%, 06/01/2050 | 960,813 |
| 192,320 | 2.50%, 07/01/2050 | 164,871 |
| 1,744,810 | 2.50%, 09/01/2050 | 1,496,324 |
| 3,034,000 | 2.50%, 10/01/2050 | 2,624,031 |
| 1,281,333 | 2.50%, 01/01/2051 | 1,105,071 |
| 3,040,480 | 2.50%, 02/25/2051(4) | 488,528 |
| 20,070,637 | 2.50%, 05/01/2051 | 17,223,050 |
| 2,516,047 | 2.50%, 06/01/2051 | 2,144,068 |
| 1,450,177 | 2.50%, 07/01/2051 | 1,242,725 |
| 996,027 | 2.50%, 09/01/2051 | 852,435 |
| 6,724,795 | 2.50%, 10/01/2051 | 5,750,258 |
| 14,273,664 | 2.50%, 11/01/2051 | 12,301,917 |
| 1,721,128 | 2.50%, 12/01/2051 | 1,481,181 |
| 1,659,471 | 2.50%, 01/01/2052 | 1,429,251 |
| 2,474,597 | 2.50%, 03/01/2052 | 2,115,053 |
| 1,719,148 | 2.50%, 04/01/2052 | 1,471,012 |
| 3,135,296 | 2.50%, 06/25/2052(4) | 468,712 |
| 2,320,036 | 2.50%, 09/25/2052(4) | 354,320 |
| 2,190,978 | 2.50%, 01/01/2057 | 1,864,917 |
| 138,208 | 3.00%, 02/25/2027(4) | 1,621 |
| 150,026 | 3.00%, 09/25/2027(4) | 5,131 |
| 876,679 | 3.00%, 01/25/2028(4) | 28,518 |
| 1,889,353 | 3.00%, 04/25/2033(4) | 119,986 |
| 533,910 | 3.00%, 08/01/2033 | 510,151 |
| 1,300,416 | 3.00%, 03/01/2037 | 1,211,449 |
| 1,695,453 | 3.00%, 03/25/2043 | 1,509,424 |
| 1,839,155 | 3.00%, 04/25/2043 | 1,666,964 |
| 1,165,219 | 3.00%, 09/01/2048 | 1,059,213 |
| 1,209,979 | 3.00%, 08/25/2049 | 1,096,515 |
| 171,341 | 3.00%, 12/01/2049 | 153,749 |
| 790,480 | 3.00%, 02/01/2050 | 712,915 |
| 2,782,544 | 3.00%, 08/01/2050 | 2,493,670 |
| 1,126,799 | 3.00%, 10/01/2050 | 1,007,610 |
| 1,536,976 | 3.00%, 12/01/2050 | 1,374,403 |
| 501,122 | 3.00%, 04/01/2051 | 447,807 |
| 1,481,218 | 3.00%, 05/01/2051 | 1,336,806 |
| 289,089 | 3.00%, 06/01/2051 | 256,632 |
| 359,928 | 3.00%, 07/01/2051 | 319,951 |
The accompanying notes are an integral part of these financial statements.
Hartford Total Return Bond HLS Fund
Schedule of Investments – (continued)
December 31, 2023
| Shares or Principal Amount | | Market Value† |
| U.S. GOVERNMENT AGENCIES - 46.2% - (continued) |
| | Mortgage-Backed Agencies - 46.2% - (continued) |
| | Federal National Mortgage Association - 14.6% - (continued) |
| $ 4,047,613 | 3.00%, 08/01/2051 | $ 3,616,984 |
| 2,801,330 | 3.00%, 09/01/2051 | 2,496,260 |
| 4,348,338 | 3.00%, 10/01/2051 | 3,876,272 |
| 4,683,152 | 3.00%, 11/01/2051 | 4,158,208 |
| 2,189,022 | 3.00%, 12/01/2051 | 1,956,073 |
| 995,513 | 3.00%, 01/01/2052 | 885,934 |
| 1,172,854 | 3.00%, 04/01/2052 | 1,050,786 |
| 1,480,156 | 3.00%, 05/01/2052 | 1,322,819 |
| 153,693 | 3.50%, 05/25/2027(4) | 5,385 |
| 261,528 | 3.50%, 10/25/2027(4) | 10,756 |
| 401,289 | 3.50%, 05/25/2030(4) | 24,615 |
| 108,948 | 3.50%, 08/25/2030(4) | 5,369 |
| 121,631 | 3.50%, 02/25/2031(4) | 3,187 |
| 315,923 | 3.50%, 09/25/2035(4) | 29,885 |
| 1,957,871 | 3.50%, 11/25/2039(4) | 173,854 |
| 1,678,000 | 3.50%, 01/25/2042 | 1,547,142 |
| 2,179,123 | 3.50%, 11/25/2042 | 2,020,165 |
| 657,412 | 3.50%, 10/01/2044 | 615,646 |
| 651,694 | 3.50%, 02/01/2045 | 608,972 |
| 584,512 | 3.50%, 01/01/2046 | 546,261 |
| 438,618 | 3.50%, 03/01/2046 | 409,866 |
| 1,016,378 | 3.50%, 09/01/2046 | 950,444 |
| 481,986 | 3.50%, 10/01/2046 | 450,384 |
| 364,884 | 3.50%, 10/25/2046(4) | 63,576 |
| 556,467 | 3.50%, 11/01/2046 | 522,867 |
| 742,791 | 3.50%, 05/01/2047 | 694,091 |
| 1,657,163 | 3.50%, 09/01/2047 | 1,550,307 |
| 305,292 | 3.50%, 12/01/2047 | 287,042 |
| 1,053,265 | 3.50%, 01/01/2048 | 984,183 |
| 250,095 | 3.50%, 02/01/2048 | 234,895 |
| 1,160,333 | 3.50%, 07/01/2048 | 1,084,253 |
| 2,503,176 | 3.50%, 04/01/2052 | 2,312,632 |
| 4,157,014 | 3.50%, 09/01/2057 | 3,775,791 |
| 2,374,636 | 3.50%, 05/01/2058 | 2,156,868 |
| 2,361,936 | 3.50%, 12/25/2058 | 2,152,613 |
| 1,620,000 | 3.52%, 11/01/2032 | 1,509,142 |
| 135,093 | 4.00%, 06/01/2025 | 132,833 |
| 69,057 | 4.00%, 10/01/2025 | 68,167 |
| 1,327,679 | 4.00%, 10/01/2040 | 1,296,225 |
| 540,321 | 4.00%, 11/01/2040 | 527,403 |
| 403,686 | 4.00%, 12/01/2040 | 394,177 |
| 196,994 | 4.00%, 02/01/2041 | 192,274 |
| 541,202 | 4.00%, 03/01/2041 | 527,782 |
| 1,336,699 | 4.00%, 06/01/2041 | 1,318,432 |
| 198,284 | 4.00%, 03/25/2042(4) | 23,547 |
| 231,633 | 4.00%, 08/01/2042 | 225,601 |
| 542,604 | 4.00%, 09/01/2042 | 528,477 |
| 123,059 | 4.00%, 11/25/2042(4) | 12,050 |
| 75,346 | 4.00%, 03/01/2045 | 72,732 |
| 454,943 | 4.00%, 07/01/2045 | 439,308 |
| 293,779 | 4.00%, 03/01/2046 | 284,218 |
| 121,347 | 4.00%, 05/01/2046 | 117,136 |
| 532,709 | 4.00%, 06/01/2046 | 514,059 |
| 510,476 | 4.00%, 04/01/2047 | 492,934 |
| 1,267,105 | 4.00%, 10/01/2047 | 1,223,132 |
| 3,080,458 | 4.00%, 06/01/2048 | 2,973,724 |
| 585,755 | 4.00%, 09/01/2048 | 564,094 |
| 374,604 | 4.00%, 01/01/2049 | 363,224 |
| 3,352,816 | 4.00%, 04/01/2049 | 3,205,820 |
| 130,546 | 4.00%, 08/01/2049 | 126,394 |
| 2,357,644 | 4.00%, 04/01/2050 | 2,269,971 |
| 381,330 | 4.00%, 08/01/2051 | 371,397 |
| 1,561,469 | 4.00%, 06/01/2052 | 1,485,003 |
| 1,163,291 | 4.03%, 06/01/2028 | 1,148,036 |
| 1,475,000 | 4.19%, 04/01/2028 | 1,463,554 |
| 571,672 | 4.37%, 05/01/2028 | 573,460 |
| Shares or Principal Amount | | Market Value† |
| U.S. GOVERNMENT AGENCIES - 46.2% - (continued) |
| | Mortgage-Backed Agencies - 46.2% - (continued) |
| | Federal National Mortgage Association - 14.6% - (continued) |
| $ 1,065,000 | 4.41%, 04/01/2030 | $ 1,062,693 |
| 1,380,916 | 4.46%, 05/01/2028 | 1,384,753 |
| 30,197 | 4.50%, 04/01/2025 | 30,034 |
| 39,197 | 4.50%, 07/25/2027(4) | 523 |
| 349,607 | 4.50%, 09/01/2035 | 350,691 |
| 1,171,542 | 4.50%, 12/01/2037 | 1,173,493 |
| 1,140,858 | 4.50%, 08/01/2040 | 1,140,304 |
| 1,108,864 | 4.50%, 10/01/2040 | 1,108,671 |
| 538,617 | 4.50%, 10/01/2041 | 538,523 |
| 1,297,075 | 4.50%, 08/25/2043(4) | 245,153 |
| 464,933 | 4.50%, 09/01/2043 | 464,851 |
| 589,842 | 4.50%, 04/01/2049 | 581,725 |
| 2,547,999 | 4.50%, 01/01/2051 | 2,516,088 |
| 1,811,931 | 4.50%, 03/01/2053 | 1,758,863 |
| 710,762 | 4.51%, 05/01/2033 | 710,990 |
| 678,512 | 4.64%, 10/01/2033 | 686,117 |
| 380,000 | 4.75%, 04/01/2028 | 385,695 |
| 14,572 | 5.00%, 06/01/2025 | 14,655 |
| 169,476 | 5.00%, 04/25/2038 | 165,748 |
| 2,003,543 | 5.00%, 07/01/2052 | 1,986,888 |
| 1,320,319 | 5.00%, 08/01/2052 | 1,309,338 |
| 16,313,484 | 5.00%, 09/01/2052 | 16,162,837 |
| 2,050,000 | 5.07%, 12/01/2028 | 2,117,715 |
| 81,040 | 5.50%, 06/01/2033 | 83,519 |
| 64,483 | 5.50%, 08/01/2033 | 66,458 |
| 434,649 | 5.50%, 09/01/2033 | 447,951 |
| 396,638 | 5.50%, 12/01/2033 | 408,778 |
| 274,679 | 5.50%, 01/01/2034 | 283,088 |
| 1,483,634 | 5.50%, 11/01/2035 | 1,529,104 |
| 412,192 | 5.50%, 04/01/2036 | 424,834 |
| 324,302 | 5.50%, 09/01/2036 | 334,226 |
| 237,501 | 5.50%, 04/25/2037 | 243,284 |
| 1,251,378 | 5.50%, 11/25/2040(4) | 155,818 |
| 878,327 | 5.50%, 06/25/2042(4) | 187,004 |
| 1,164,065 | 5.50%, 08/25/2044(4) | 203,686 |
| 809,466 | 5.50%, 11/01/2052 | 815,351 |
| 4,607,323 | 5.50%, 12/01/2052 | 4,642,873 |
| 2,385,977 | 5.50%, 06/01/2053 | 2,400,781 |
| 28,799 | 5.54%, 05/25/2042(3)(4) | 2,052 |
| 183,334 | 6.00%, 12/01/2032 | 190,186 |
| 149,055 | 6.00%, 01/01/2033 | 154,336 |
| 20,963 | 6.00%, 02/01/2033 | 21,559 |
| 144,604 | 6.00%, 03/01/2033 | 149,788 |
| 363,384 | 6.00%, 02/01/2037 | 379,822 |
| 740,704 | 6.00%, 01/25/2042(4) | 60,956 |
| 1,428,225 | 6.00%, 05/01/2053 | 1,472,720 |
| 137 | 6.50%, 05/01/2031 | 141 |
| 505 | 6.50%, 09/01/2031 | 524 |
| 519 | 6.50%, 07/01/2032 | 533 |
| 2,641,119 | 6.50%, 11/01/2053 | 2,719,061 |
| 475 | 7.00%, 07/01/2029 | 490 |
| 63 | 7.00%, 12/01/2030 | 65 |
| 65 | 7.00%, 03/01/2032 | 67 |
| 448 | 7.00%, 09/01/2032 | 462 |
| 451 | 7.50%, 06/01/2027 | 456 |
| 5,818 | 7.50%, 03/01/2030 | 5,923 |
| 5,529 | 7.50%, 04/01/2030 | 5,557 |
| 578 | 7.50%, 06/01/2030 | 592 |
| 992 | 7.50%, 07/01/2030 | 1,014 |
| 293 | 7.50%, 08/01/2030 | 299 |
| 3,091 | 7.50%, 05/01/2031 | 3,129 |
| 3,793 | 7.50%, 06/01/2031 | 3,795 |
| 378 | 7.50%, 08/01/2031 | 383 |
| 14,811 | 7.50%, 09/01/2031 | 14,819 |
| 34 | 7.50%, 05/01/2032 | 35 |
| | | | 261,625,092 |
The accompanying notes are an integral part of these financial statements.
Hartford Total Return Bond HLS Fund
Schedule of Investments – (continued)
December 31, 2023
| Shares or Principal Amount | | Market Value† |
| U.S. GOVERNMENT AGENCIES - 46.2% - (continued) |
| | Mortgage-Backed Agencies - 46.2% - (continued) |
| | Government National Mortgage Association - 7.5% |
| $ 2,500,409 | 2.00%, 10/20/2050 | $ 2,119,443 |
| 4,797,105 | 2.00%, 12/20/2050 | 4,066,182 |
| 11,225,000 | 2.00%, 01/20/2054(15) | 9,513,187 |
| 444,528 | 2.50%, 12/16/2039 | 410,023 |
| 842,895 | 2.50%, 07/20/2041 | 750,680 |
| 2,673,132 | 2.50%, 10/20/2049 | 2,358,636 |
| 1,986,416 | 2.50%, 11/20/2049 | 1,746,940 |
| 1,574,004 | 2.50%, 03/20/2051 | 1,377,938 |
| 2,241,105 | 2.50%, 09/20/2051 | 1,961,950 |
| 7,480,954 | 2.50%, 10/20/2051 | 6,548,786 |
| 4,820,000 | 2.50%, 01/20/2054(15) | 4,220,512 |
| 171,736 | 3.00%, 09/20/2028(4) | 5,997 |
| 2,320,477 | 3.00%, 05/20/2035(4) | 132,992 |
| 267,810 | 3.00%, 02/16/2043(4) | 32,923 |
| 1,413,949 | 3.00%, 03/15/2045 | 1,271,099 |
| 67,621 | 3.00%, 04/15/2045 | 60,793 |
| 1,190,465 | 3.00%, 07/15/2045 | 1,070,421 |
| 26,612 | 3.00%, 08/15/2045 | 23,923 |
| 7,577,820 | 3.00%, 04/20/2051 | 6,889,777 |
| 2,268,765 | 3.00%, 08/20/2051 | 2,060,246 |
| 2,889,738 | 3.00%, 09/20/2051 | 2,620,019 |
| 7,388,626 | 3.00%, 12/20/2051 | 6,694,857 |
| 1,520,867 | 3.00%, 02/20/2052 | 1,374,289 |
| 3,677,913 | 3.00%, 07/20/2052 | 3,332,191 |
| 58,636 | 3.50%, 02/16/2027(4) | 1,475 |
| 177,422 | 3.50%, 03/20/2027(4) | 5,622 |
| 124,619 | 3.50%, 07/20/2040(4) | 2,959 |
| 135,835 | 3.50%, 02/20/2041(4) | 2,500 |
| 503,438 | 3.50%, 04/20/2042(4) | 20,425 |
| 1,481,447 | 3.50%, 10/20/2042(4) | 228,833 |
| 180,794 | 3.50%, 11/15/2042 | 170,974 |
| 4,380 | 3.50%, 12/15/2042 | 4,142 |
| 104,983 | 3.50%, 02/15/2043 | 99,281 |
| 5,280 | 3.50%, 03/15/2043 | 4,993 |
| 866,141 | 3.50%, 04/15/2043 | 819,077 |
| 2,013,031 | 3.50%, 05/15/2043 | 1,904,065 |
| 129,774 | 3.50%, 05/20/2043(4) | 20,273 |
| 526,474 | 3.50%, 07/20/2043(4) | 82,427 |
| 1,083,160 | 3.50%, 03/20/2044 | 1,027,983 |
| 1,392,577 | 3.50%, 06/20/2046 | 1,313,739 |
| 354,219 | 3.50%, 07/20/2046 | 334,144 |
| 368,120 | 3.50%, 10/20/2046 | 347,198 |
| 1,472,564 | 3.50%, 02/20/2047 | 1,388,649 |
| 432,433 | 3.50%, 08/20/2047 | 407,560 |
| 301,404 | 3.50%, 11/20/2047 | 284,000 |
| 370,991 | 3.50%, 03/20/2048 | 349,505 |
| 1,134,672 | 3.50%, 07/20/2049 | 1,068,097 |
| 10,779,000 | 3.50%, 01/20/2054(15) | 10,045,523 |
| 877,784 | 3.88%, 08/15/2042 | 850,190 |
| 33,582 | 4.00%, 12/16/2026(4) | 402 |
| 524,789 | 4.00%, 05/20/2029(4) | 12,853 |
| 1,602,530 | 4.00%, 07/20/2040 | 1,571,714 |
| 1,760,082 | 4.00%, 09/20/2040 | 1,726,255 |
| 2,788,155 | 4.00%, 10/20/2040 | 2,732,536 |
| 735,577 | 4.00%, 12/20/2040 | 720,524 |
| 157,864 | 4.00%, 05/16/2042(4) | 16,163 |
| 2,268,140 | 4.00%, 09/16/2042(4) | 448,648 |
| 278,065 | 4.00%, 03/20/2043(4) | 49,209 |
| 126,056 | 4.00%, 01/20/2044(4) | 20,015 |
| 906,528 | 4.00%, 01/16/2046(4) | 141,362 |
| 819,368 | 4.00%, 03/20/2047(4) | 119,386 |
| 401,728 | 4.00%, 11/20/2047 | 385,728 |
| 1,106,056 | 4.00%, 03/20/2048 | 1,062,612 |
| 2,822,909 | 4.00%, 07/20/2048 | 2,715,002 |
| 6,950,000 | 4.00%, 01/20/2054(15) | 6,639,422 |
| 50,100 | 4.50%, 11/15/2039 | 49,350 |
| Shares or Principal Amount | | Market Value† |
| U.S. GOVERNMENT AGENCIES - 46.2% - (continued) |
| | Mortgage-Backed Agencies - 46.2% - (continued) |
| | Government National Mortgage Association - 7.5% - (continued) |
| $ 495,280 | 4.50%, 05/15/2040 | $ 492,821 |
| 1,771,846 | 4.50%, 05/20/2040 | 1,773,874 |
| 91,218 | 4.50%, 07/15/2041 | 89,828 |
| 440,376 | 4.50%, 04/20/2045(4) | 89,396 |
| 1,625,837 | 4.50%, 08/20/2045(4) | 282,632 |
| 154,357 | 4.50%, 01/20/2046 | ��� 154,373 |
| 1,116,692 | 4.50%, 01/20/2047(4) | 137,847 |
| 1,195,026 | 4.50%, 05/20/2048(4) | 171,170 |
| 343,146 | 4.50%, 05/20/2052 | 335,422 |
| 1,001,094 | 4.50%, 08/20/2052 | 977,934 |
| 915,566 | 4.50%, 09/20/2052 | 894,196 |
| 4,112,791 | 4.50%, 10/20/2052 | 4,016,585 |
| 1,047,703 | 5.00%, 02/16/2040(4) | 211,184 |
| 932,966 | 5.00%, 05/20/2040 | 950,711 |
| 740,684 | 5.00%, 06/20/2040 | 754,768 |
| 290,732 | 5.00%, 07/20/2040 | 296,262 |
| 556,297 | 5.00%, 06/15/2041 | 576,764 |
| 602,490 | 5.00%, 10/16/2041(4) | 93,582 |
| 787,244 | 5.00%, 03/15/2044 | 818,022 |
| 219,551 | 5.00%, 01/16/2047(4) | 48,170 |
| 3,897,054 | 5.00%, 07/15/2052 | 3,835,171 |
| 204,385 | 5.50%, 03/15/2033 | 206,765 |
| 327,878 | 5.50%, 04/15/2033 | 331,696 |
| 311,145 | 5.50%, 05/15/2033 | 314,730 |
| 427,840 | 5.50%, 10/20/2034 | 445,302 |
| 733,264 | 5.50%, 03/20/2039(4) | 112,856 |
| 737,924 | 5.50%, 02/16/2047(4) | 117,057 |
| 467,562 | 5.50%, 02/20/2047(4) | 78,719 |
| 13,050,000 | 5.50%, 01/20/2054(15) | 13,136,660 |
| 417 | 6.00%, 01/15/2029 | 424 |
| 360 | 6.00%, 04/15/2029 | 362 |
| 15,017 | 6.00%, 12/15/2031 | 15,291 |
| 360 | 6.00%, 10/15/2032 | 374 |
| 9,217 | 6.00%, 06/15/2033 | 9,427 |
| 197 | 6.00%, 03/15/2034 | 202 |
| 16,566 | 6.00%, 08/15/2034 | 17,086 |
| 26,584 | 6.00%, 09/15/2034 | 27,582 |
| 18,915 | 6.00%, 02/15/2035 | 19,593 |
| 31,405 | 6.00%, 03/15/2036 | 32,537 |
| 36,991 | 6.00%, 05/15/2036 | 37,829 |
| 81,650 | 6.00%, 06/15/2036 | 83,983 |
| 8,916 | 6.00%, 06/15/2037 | 9,172 |
| 20,831 | 6.00%, 08/15/2037 | 21,485 |
| 31,045 | 6.00%, 08/15/2039 | 31,736 |
| 745,523 | 6.00%, 09/20/2040(4) | 132,662 |
| 53,831 | 6.00%, 06/15/2041 | 55,751 |
| 724,164 | 6.00%, 02/20/2046(4) | 125,859 |
| 11,843 | 6.50%, 06/15/2028 | 12,175 |
| 527 | 6.50%, 08/15/2028 | 540 |
| 1,399 | 6.50%, 09/15/2028 | 1,439 |
| 721 | 6.50%, 11/15/2028 | 742 |
| 2,885 | 6.50%, 12/15/2028 | 2,972 |
| 6,273 | 6.50%, 02/15/2029 | 6,454 |
| 56,020 | 6.50%, 03/15/2029 | 57,789 |
| 14,038 | 6.50%, 04/15/2029 | 14,471 |
| 4,756 | 6.50%, 05/15/2029 | 4,894 |
| 75,304 | 6.50%, 06/15/2029 | 77,129 |
| 2,269 | 6.50%, 07/15/2029 | 2,344 |
| 92 | 6.50%, 03/15/2031 | 94 |
| 72,895 | 6.50%, 04/15/2031 | 75,107 |
| 20,698 | 6.50%, 05/15/2031 | 21,375 |
| 4,343 | 6.50%, 06/15/2031 | 4,471 |
| 88,031 | 6.50%, 07/15/2031 | 90,735 |
| 14,852 | 6.50%, 08/15/2031 | 15,311 |
| 23,395 | 6.50%, 09/15/2031 | 24,188 |
| 74,948 | 6.50%, 10/15/2031 | 77,152 |
The accompanying notes are an integral part of these financial statements.
Hartford Total Return Bond HLS Fund
Schedule of Investments – (continued)
December 31, 2023
| Shares or Principal Amount | | Market Value† |
| U.S. GOVERNMENT AGENCIES - 46.2% - (continued) |
| | Mortgage-Backed Agencies - 46.2% - (continued) |
| | Government National Mortgage Association - 7.5% - (continued) |
| $ 146,281 | 6.50%, 11/15/2031 | $ 150,528 |
| 29,851 | 6.50%, 12/15/2031 | 31,288 |
| 93,836 | 6.50%, 01/15/2032 | 97,081 |
| 16,495 | 6.50%, 02/15/2032 | 17,148 |
| 24,976 | 6.50%, 03/15/2032 | 25,711 |
| 91,941 | 6.50%, 04/15/2032 | 94,905 |
| 213 | 6.50%, 05/15/2032 | 220 |
| 12,679 | 6.50%, 06/15/2032 | 13,041 |
| 177 | 7.00%, 02/15/2031 | 179 |
| 79 | 7.00%, 06/15/2031 | 80 |
| 57 | 7.00%, 08/15/2031 | 58 |
| | | | 133,124,092 |
| | Uniform Mortgage-Backed Security - 16.2% |
| 25,605,000 | 2.00%, 01/01/2054(15) | 20,932,087 |
| 3,925,000 | 2.50%, 01/01/2039(15) | 3,611,460 |
| 9,193,000 | 2.50%, 01/01/2054(15) | 7,826,978 |
| 1,010,000 | 3.00%, 01/01/2039(15) | 952,241 |
| 2,085,000 | 3.50%, 01/01/2039(15) | 2,003,555 |
| 58,232,000 | 4.50%, 01/01/2054(15) | 56,510,062 |
| 14,175,000 | 5.00%, 01/01/2054(15) | 14,038,787 |
| 48,855,000 | 5.50%, 01/01/2054(15) | 49,103,092 |
| 96,910,000 | 6.00%, 01/01/2054(15) | 98,469,645 |
| 10,935,000 | 6.50%, 01/01/2054(15) | 11,206,239 |
| 23,500,000 | 7.00%, 01/01/2054(15) | 24,239,883 |
| | | | 288,894,029 |
| | Total U.S. Government Agencies
(cost $850,280,780) | | $ 825,317,497 |
| U.S. GOVERNMENT SECURITIES - 14.0% |
| | U.S. Treasury Securities - 14.0% |
| | U.S. Treasury Bonds - 12.2% |
| 24,645,000 | 1.25%, 05/15/2050 | $ 13,356,435 |
| 5,115,000 | 1.88%, 11/15/2051 | 3,251,222 |
| 7,090,000 | 2.25%, 08/15/2046 | 5,063,534 |
| 15,065,000 | 2.25%, 02/15/2052 | 10,497,833 |
| 7,860,000 | 2.38%, 11/15/2049 | 5,667,797 |
| 90,455,000 | 2.88%, 08/15/2045(16) | 73,236,750 |
| 6,175,000 | 3.00%, 02/15/2047 | 5,070,254 |
| 20,715,000 | 3.13%, 08/15/2044(17) | 17,609,368 |
| 14,975,000 | 3.38%, 08/15/2042 | 13,403,210 |
| 26,860,000 | 3.38%, 05/15/2044(18) | 23,773,198 |
| 35,500,000 | 3.38%, 11/15/2048 | 31,072,207 |
| 3,565,000 | 3.63%, 08/15/2043 | 3,289,687 |
| 12,035,000 | 3.63%, 05/15/2053 | 11,181,267 |
| 1,635,000 | 3.75%, 11/15/2043 | 1,533,643 |
| | | | 218,006,405 |
| | U.S. Treasury Inflation-Protected Bonds - 0.8% |
| 22,809,864 | 0.25%, 02/15/2050(19) | 14,997,932 |
| | U.S. Treasury Inflation-Protected Notes - 1.0% |
| 7,058,922 | 0.75%, 07/15/2028(19) | 6,763,743 |
| 10,875,199 | 1.38%, 07/15/2033(19) | 10,578,113 |
| | | | 17,341,856 |
| | Total U.S. Government Securities
(cost $321,788,804) | | $ 250,346,193 |
| COMMON STOCKS - 0.0% |
| | Energy - 0.0% |
| 30,559 | PES Energy Liquidating Trust*(20) | $ — |
| | Total Common Stocks
(cost $265,121) | | $ — |
| Shares or Principal Amount | | Market Value† |
| PREFERRED STOCKS - 0.1% |
| | Banks - 0.1% |
| 2,242 | U.S. Bancorp Series A, 6.68%(8) | $ 1,834,472 |
| | Total Preferred Stocks
(cost $1,591,820) | | $ 1,834,472 |
| | Total Long-Term Investments
(cost $2,226,553,840) | | $ 2,076,868,542 |
| SHORT-TERM INVESTMENTS - 0.3% |
| | Repurchase Agreements - 0.3% |
| $ 5,363,968 | Fixed Income Clearing Corp. Repurchase Agreement dated 12/29/2023 at 5.32%, due on 01/02/2024 with a maturity value of $5,367,139; collateralized by U.S. Treasury Inflation Index Note at 0.13%, maturing 07/15/2031, with a market value of $5,471,267 | $ 5,363,968 |
| | Securities Lending Collateral - 0.0% |
| 28,912 | Goldman Sachs Financial Square Funds, Government Fund, Institutional Class, 5.25%(21) | 28,912 |
| 96,375 | HSBC U.S. Government Money Market Fund, Institutional Class, 5.31%(21) | 96,375 |
| 28,913 | Invesco Government & Agency Portfolio, Institutional Class, 5.28%(21) | 28,913 |
| 28,913 | Morgan Stanley Institutional Liquidity Funds, Government Portfolio, Institutional Class, 5.27%(21) | 28,913 |
| | | | 183,113 |
| | Total Short-Term Investments
(cost $5,547,081) | $ 5,547,081 |
| | Total Investments
(cost $2,232,100,921) | 116.5% | $ 2,082,415,623 |
| | Other Assets and Liabilities | (16.5)% | (294,803,625) |
| | Total Net Assets | 100.0% | $ 1,787,611,998 |
| Note: | Percentage of investments as shown is the ratio of the total market value to total net assets. |
| | The Fund may refer to any one or more of the industry classifications used by one or more widely recognized market indices, ratings group and/or as defined by Fund management. Industry classifications may not be identical across all security types. |
| | Equity industry classifications used in this report are the Global Industry Classification Standard, which was developed by and is the exclusive property and service mark of MSCI, Inc. and Standard & Poor’s. |
| | For Fund compliance purposes, the Fund may not use the same classification system. These classifications are used for financial reporting purposes. |
| | See “Glossary” for abbreviation descriptions. |
| * | Non-income producing. |
| (1) | Security was purchased pursuant to Rule 144A under the Securities Act of 1933 and may be sold in transactions that are exempt from registration (typically only to qualified institutional buyers) or in a public offering registered under the Securities Act of 1933. At December 31, 2023, the aggregate value of these securities was $523,624,590, representing 29.3% of net assets. |
| (2) | Variable rate securities; the rate reported is the coupon rate in effect at December 31, 2023. Base lending rates may be subject to a floor or cap. |
The accompanying notes are an integral part of these financial statements.
Hartford Total Return Bond HLS Fund
Schedule of Investments – (continued)
December 31, 2023
| (3) | Variable or floating rate security, which interest rate adjusts periodically based on changes in current interest rates and prepayments on the underlying pool of assets. Rate shown is the rate in effect as of period end. |
| (4) | Securities disclosed are interest-only strips. |
| (5) | Security is a “step-up” bond where coupon increases or steps up at a predetermined date. Rate shown is current coupon rate. |
| (6) | Fixed to variable rate investment. The rate shown reflects the fixed rate in effect at December 31, 2023. Rate will reset at a future date. Base lending rates may be subject to a floor or cap. |
| (7) | Security is exempt from registration under Regulation S under the Securities Act of 1933, which exempts from registration securities offered and sold outside of the United States. Security may not be offered or sold in the United States except pursuant to an exemption from, or in a transaction not subject to, the registration requirements of the Securities Act of 1933. At December 31, 2023, the aggregate value of these securities was $29,723,291, representing 1.7% of net assets. |
| (8) | Perpetual maturity security. Maturity date shown is the next call date or final legal maturity date, whichever comes first. |
| (9) | Represents entire or partial securities on loan. See Note 8 in the accompanying Notes to Financial Statements for securities lending information. |
| (10) | Senior floating rate interests generally pay interest rates which are periodically adjusted by reference to a base short-term, floating lending rate plus a premium. The base lending rates are primarily the Secured Overnight Financing Rate ("SOFR") and secondarily, the prime rate offered by one or more major United States banks (the "Prime Rate"). Senior floating rate interests often require prepayments from excess cash flows or permit the borrower to repay at its election. The rate at which the borrower repays cannot be predicted with accuracy. As a result, the actual remaining maturity may be substantially less than the stated maturities shown. Base lending rates may be subject to a floor or cap. Unless otherwise noted, the interest rate disclosed for these securities represents the rate in effect as of December 31, 2023. |
| (11) | Non-income producing. For long-term debt securities, items identified are in default as to payment of interest and/or principal. |
| (12) | Security has the ability to pay in kind (“PIK”) or pay income in cash. When applicable, separate rates of such payments are disclosed. |
| (13) | Securities disclosed are principal-only strips. |
| (14) | Security is a zero-coupon bond. |
| (15) | Represents or includes a TBA transaction. |
| (16) | All, or a portion of the security, was pledged as collateral in connection with forward foreign currency exchange contracts. As of December 31, 2023, the market value of securities pledged was $72,059. |
| (17) | All, or a portion of the security, was pledged as collateral in connection with futures contracts. As of December 31, 2023, the market value of securities pledged was $7,140,656. |
| (18) | All, or a portion of the security, was pledged as collateral in connection with centrally cleared swap contracts. As of December 31, 2023, the market value of securities pledged was $5,841,516. |
| (19) | The principal amount for these securities are adjusted for inflation and the interest payments equal a fixed percentage of the inflation-adjusted principal amount. |
| (20) | Investment valued using significant unobservable inputs. |
| (21) | Current yield as of period end. |
| Futures Contracts Outstanding at December 31, 2023 |
| Description | | Number of
Contracts | | Expiration
Date | | Current
Notional
Amount | | Value and
Unrealized
Appreciation/
(Depreciation) |
| Long position contracts: |
| U.S. Treasury 2-Year Note Future | | 836 | | 03/28/2024 | | $ 172,144,156 | | $ 1,820,706 |
| U.S. Treasury 5-Year Note Future | | 2,393 | | 03/28/2024 | | 260,294,837 | | 6,462,409 |
| U.S. Treasury 10-Year Note Future | | 198 | | 03/19/2024 | | 22,352,344 | | (14,844) |
| U.S. Treasury 10-Year Ultra Future | | 200 | | 03/19/2024 | | 23,603,125 | | 107,060 |
| Total | | | | | | | | $ 8,375,331 |
| Short position contracts: |
| Canadian 10-Year Bond Future | | 533 | | 03/19/2024 | | $ 49,951,278 | | $ (2,137,631) |
| Euro BTP Future | | 91 | | 03/07/2024 | | 11,969,745 | | (353,034) |
| Euro BUXL 30-Year Bond Future | | 81 | | 03/07/2024 | | 12,672,597 | | (804,543) |
| Euro-BUND Future | | 147 | | 03/07/2024 | | 22,268,154 | | (564,875) |
| U.S. Treasury Long Bond Future | | 136 | | 03/19/2024 | | 16,991,500 | | (1,306,056) |
| U.S. Treasury Ultra Bond Future | | 264 | | 03/19/2024 | | 35,268,750 | | (3,410,575) |
| Total | | | | | | | | $ (8,576,714) |
| Total futures contracts | | $ (201,383) |
| TBA Sale Commitments Outstanding at December 31, 2023 |
| Description | | Principal
Amount | | Maturity
Date | | Market
Value† | | Unrealized
Appreciation/
(Depreciation) |
| Government National Mortgage Association, 3.00% | | $ 8,029,000 | | 01/20/2054 | | $ (7,276,524) | | $ (181,979) |
The accompanying notes are an integral part of these financial statements.
Hartford Total Return Bond HLS Fund
Schedule of Investments – (continued)
December 31, 2023
| TBA Sale Commitments Outstanding at December 31, 2023 – (continued) |
| Description | | Principal
Amount | | Maturity
Date | | Market
Value† | | Unrealized
Appreciation/
(Depreciation) |
| Government National Mortgage Association, 4.50% | | $ 2,250,000 | | 01/20/2054 | | $ (2,197,090) | | $ 352 |
| Government National Mortgage Association, 5.00% | | 10,900,000 | | 01/20/2054 | | (10,835,281) | | (18,734) |
| Uniform Mortgage-Backed Security, 2.00% | | 1,100,000 | | 01/01/2039 | | (987,698) | | (13,038) |
| Uniform Mortgage-Backed Security, 2.50% | | 5,368,000 | | 01/01/2054 | | (4,570,349) | | (145,010) |
| Uniform Mortgage-Backed Security, 3.00% | | 15,305,000 | | 01/01/2054 | | (13,559,735) | | (404,166) |
| Uniform Mortgage-Backed Security, 3.50% | | 2,031,000 | | 01/01/2054 | | (1,865,505) | | (48,712) |
| Uniform Mortgage-Backed Security, 4.00% | | 11,660,000 | | 01/01/2054 | | (11,041,929) | | (114,162) |
| Uniform Mortgage-Backed Security, 4.50% | | 3,936,000 | | 01/01/2039 | | (3,916,935) | | (53,107) |
| Uniform Mortgage-Backed Security, 5.50% | | 4,116,000 | | 01/01/2054 | | (4,136,901) | | (59,071) |
| Total TBA sale commitments (proceeds receivable $59,350,320) | | $ (60,387,947) | | $ (1,037,627) |
| At December 31, 2023, the aggregate market value of TBA Sale Commitments represents (3.4)% of total net assets. |
| Centrally Cleared Credit Default Swap Contracts Outstanding at December 31, 2023 |
| Reference Entity | | Notional
Amount(1) | | (Pay)/Receive
Fixed Rate | | Expiration
Date | | Periodic
Payment
Frequency | | Upfront
Premiums
Paid | | Upfront
Premiums
Received | | Value † | | Unrealized
Appreciation/
(Depreciation) |
| Credit default swaps on indices: | | |
| Buy protection: | | |
| CDX.EM.S40.V1 | | USD | 13,270,000 | | (1.00%) | | 12/20/2028 | | Quarterly | | $ 630,769 | | $ — | | $ 378,721 | | $ (252,048) |
| Total | | $ 630,769 | | $ — | | $ 378,721 | | $ (252,048) |
Credit default swaps on single-name
issues: | | | | | | | | | | | | | | | | | |
| Buy protection: | | |
| Brazil Republic | | USD | 9,365,000 | | (1.00%) | | 06/20/2028 | | Quarterly | | $ 425,805 | | $ — | | $ 57,497 | | $ (368,308) |
| Total | | | | | | | | | | | $ 425,805 | | $ — | | $ 57,497 | | $ (368,308) |
| Total centrally cleared credit default swap contracts | | $ 1,056,574 | | $ — | | $ 436,218 | | $ (620,356) |
| (1) | The maximum potential amount the Fund could be required to pay as a seller of credit protection or receive as a buyer of credit protection if a credit event occurs as defined under the terms of that particular swap agreement. |
| Centrally Cleared Interest Rate Swap Contracts Outstanding at December 31, 2023 |
Payments made
by Fund | | Payments received
by Fund | | Notional
Amount | | Expiration
Date | | Periodic
Payment
Frequency | | Upfront
Premiums
Paid | | Upfront
Premiums
Received | | Value † | | Unrealized
Appreciation/
(Depreciation) |
| 2.97% Fixed | | 12 Mo. USD SOFR | | USD | 12,140,000 | | 03/15/2053 | | Annual | | $ 38,126 | | $ — | | $ 1,030,655 | | $ 992,529 |
| 2.88% Fixed | | 12 Mo. USD SOFR | | USD | 3,745,000 | | 03/15/2053 | | Annual | | 42,412 | | — | | 382,617 | | 340,205 |
| 3.25% Fixed | | 12 Mo. USD SOFR | | USD | 6,235,000 | | 06/21/2053 | | Annual | | — | | (66,704) | | 161,817 | | 228,521 |
| 3.59% Fixed | | 12 Mo. USD SOFR | | USD | 9,465,000 | | 09/20/2053 | | Annual | | 40,290 | | — | | (415,705) | | (455,995) |
| Total centrally cleared interest rate swaps contracts | | $ 120,828 | | $ (66,704) | | $ 1,159,384 | | $ 1,105,260 |
| Foreign Currency Contracts Outstanding at December 31, 2023 |
Amount and Description of
Currency to be Purchased | | Amount and Description of
Currency to be Sold | | Counterparty | | Settlement
Date | | Appreciation/
(Depreciation) |
| 8,006,196 | USD | | 40,057,000 | BRL | | DEUT | | 03/20/2024 | | $ (177,860) |
| 1,957,866 | USD | | 1,779,000 | EUR | | CBK | | 03/20/2024 | | (12,428) |
| 35,215,834 | USD | | 31,997,000 | EUR | | DEUT | | 03/20/2024 | | (221,764) |
| Total foreign currency contracts | | $ (412,052) |
† See Significant Accounting Policies of accompanying Notes to Financial Statements regarding valuation of investments.
The accompanying notes are an integral part of these financial statements.
Hartford Total Return Bond HLS Fund
Schedule of Investments – (continued)
December 31, 2023
Fair Value Summary
The following is a summary of the fair valuations according to the inputs used as of December 31, 2023 in valuing the Fund’s investments.
| Description | | Total | | Level 1 | | Level 2 | | Level 3(1) |
| Assets | | | | | | | | |
| Asset & Commercial Mortgage-Backed Securities | | $ 368,248,632 | | $ — | | $ 368,248,632 | | $ — |
| Corporate Bonds | | 552,931,752 | | — | | 552,931,752 | | — |
| Foreign Government Obligations | | 53,603,734 | | — | | 53,603,734 | | — |
| Municipal Bonds | | 24,578,763 | | — | | 24,578,763 | | — |
| Senior Floating Rate Interests | | 7,499 | | — | | 7,499 | | — |
| U.S. Government Agencies | | 825,317,497 | | — | | 825,317,497 | | — |
| U.S. Government Securities | | 250,346,193 | | — | | 250,346,193 | | — |
| Common Stocks | | | | | | | | |
| Energy | | — | | — | | — | | — |
| Preferred Stocks | | 1,834,472 | | 1,834,472 | | — | | — |
| Short-Term Investments | | 5,547,081 | | 183,113 | | 5,363,968 | | — |
| Futures Contracts(2) | | 8,390,175 | | 8,390,175 | | — | | — |
| Swaps - Interest Rate(2) | | 1,561,255 | | — | | 1,561,255 | | — |
| Total | | $ 2,092,367,053 | | $ 10,407,760 | | $ 2,081,959,293 | | $ — |
| Liabilities | | | | | | | | |
| Foreign Currency Contracts(2) | | $ (412,052) | | $ — | | $ (412,052) | | $ — |
| Futures Contracts(2) | | (8,591,558) | | (8,591,558) | | — | | — |
| Swaps - Credit Default(2) | | (620,356) | | — | | (620,356) | | — |
| Swaps - Interest Rate(2) | | (455,995) | | — | | (455,995) | | — |
| TBA Sale Commitments | | (60,387,947) | | — | | (60,387,947) | | — |
| Total | | $ (70,467,908) | | $ (8,591,558) | | $ (61,876,350) | | $ — |
| (1) | For the year ended December 31, 2023, there were no transfers in and out of Level 3. |
| (2) | Derivative instruments (excluding purchased and written options, if applicable) are valued at the unrealized appreciation/(depreciation) on the investments. |
Level 3 investments at the beginning and/or end of the period in relation to net assets were not significant and accordingly, a reconciliation of Level 3 assets for the year ended December 31, 2023 is not presented.
The accompanying notes are an integral part of these financial statements.
Hartford Ultrashort Bond HLS Fund
Schedule of Investments
December 31, 2023
| Shares or Principal Amount | | Market Value† |
| ASSET & COMMERCIAL MORTGAGE-BACKED SECURITIES - 37.2% |
| | Asset-Backed - Automobile - 24.9% |
| | Ally Auto Receivables Trust | |
| $ 818,547 | 4.62%, 10/15/2025 | $ 816,892 |
| 411,154 | 5.29%, 06/16/2025 | 410,887 |
| 2,505,000 | 5.76%, 11/15/2026 | 2,508,264 |
| | American Credit Acceptance Receivables Trust | |
| 617,579 | 5.45%, 09/14/2026(1) | 616,377 |
| 434,631 | 5.89%, 10/13/2026(1) | 434,633 |
| 752,852 | 6.00%, 03/12/2027(1) | 753,537 |
| | AmeriCredit Automobile Receivables Trust | |
| 506,507 | 0.68%, 10/19/2026 | 499,294 |
| 1,969,000 | 1.01%, 01/19/2027 | 1,844,312 |
| 1,876,648 | 2.45%, 11/18/2026 | 1,840,219 |
| 306,298 | 4.20%, 12/18/2025 | 305,268 |
| 2,190,357 | 5.84%, 10/19/2026 | 2,190,502 |
| | ARI Fleet Lease Trust | |
| 127,203 | 0.37%, 03/15/2030(1) | 126,939 |
| 1,423,283 | 5.41%, 02/17/2032(1) | 1,420,563 |
| 475,000 | 6.05%, 07/15/2032(1) | 480,329 |
| 1,335,000 | Bank of America Auto Trust 5.83%, 05/15/2026(1) | 1,336,842 |
| | BMW Vehicle Lease Trust | |
| 295,929 | 5.27%, 02/25/2025 | 295,750 |
| 1,435,000 | 5.95%, 08/25/2025 | 1,439,066 |
| 1,040,000 | BMW Vehicle Owner Trust 5.72%, 04/27/2026 | 1,041,686 |
| 760,000 | Bridgecrest Lending Auto Securitization Trust 6.34%, 07/15/2026 | 760,933 |
| | Capital One Prime Auto Receivables Trust | |
| 366,241 | 2.71%, 06/16/2025 | 364,942 |
| 610,284 | 5.20%, 05/15/2026 | 609,093 |
| | CarMax Auto Owner Trust | |
| 865,000 | 4.75%, 10/15/2027 | 861,642 |
| 594,959 | 5.23%, 01/15/2026 | 593,917 |
| 1,398,399 | 5.50%, 06/15/2026 | 1,396,962 |
| 1,220,000 | 5.72%, 11/16/2026 | 1,222,618 |
| | Carvana Auto Receivables Trust | |
| 41,573 | 0.35%, 06/12/2028 | 41,419 |
| 342,472 | 0.49%, 03/10/2026 | 337,063 |
| 310,665 | 0.70%, 01/10/2028 | 296,815 |
| 200,910 | 0.83%, 09/11/2028 | 198,779 |
| 224,959 | 4.42%, 12/10/2025 | 224,408 |
| 610,000 | 5.77%, 04/12/2027(1) | 611,945 |
| 430,000 | 6.09%, 11/10/2026(1) | 430,869 |
| 1,855,000 | 6.23%, 01/11/2027(1) | 1,861,687 |
| 856,478 | 6.41%, 09/10/2027(1) | 860,423 |
| | Chesapeake Funding II LLC | |
| 117,188 | 0.87%, 08/15/2032(1) | 116,383 |
| 1,509,212 | 5.65%, 05/15/2035(1) | 1,513,258 |
| 363,097 | 5.68%, 04/15/2033, 30 day USD SOFR Average + 0.34%(1)(2) | 361,781 |
| 1,945,000 | Citizens Auto Receivables Trust 6.09%, 10/15/2026(1) | 1,950,519 |
| | CPS Auto Receivables Trust | |
| 261,087 | 2.88%, 06/15/2026(1) | 259,825 |
| 217,398 | 4.18%, 04/15/2030(1) | 216,566 |
| 708,306 | 5.54%, 03/16/2026(1) | 707,444 |
| 1,141,721 | 5.91%, 08/16/2027(1) | 1,142,411 |
| 428,385 | 6.13%, 09/15/2026(1) | 429,068 |
| 847,042 | 6.40%, 06/15/2027(1) | 849,901 |
| 434,316 | Credit Acceptance Auto Loan Trust 1.00%, 05/15/2030(1) | 428,407 |
| 362,789 | Drive Auto Receivables Trust 1.02%, 06/15/2027 | 360,810 |
| | DT Auto Owner Trust | |
| 189,021 | 2.88%, 06/15/2026(1) | 188,372 |
| 1,631,384 | 5.48%, 04/15/2027(1) | 1,628,336 |
| Shares or Principal Amount | | Market Value† |
| ASSET & COMMERCIAL MORTGAGE-BACKED SECURITIES - 37.2% - (continued) |
| | Asset-Backed - Automobile - 24.9% - (continued) |
| $ 1,051,753 | 5.88%, 04/15/2027(1) | $ 1,052,173 |
| 1,110,011 | 6.29%, 08/16/2027(1) | 1,114,678 |
| | Enterprise Fleet Financing LLC | |
| 855,763 | 0.48%, 05/20/2027(1) | 837,570 |
| 340,922 | 4.38%, 07/20/2029(1) | 337,148 |
| 928,028 | 5.51%, 01/22/2029(1) | 928,981 |
| 1,435,000 | 5.56%, 04/22/2030(1) | 1,438,987 |
| 1,397,679 | 5.76%, 10/22/2029(1) | 1,401,890 |
| 188,470 | 5.79%, 06/20/2024(1) | 188,504 |
| 3,320,000 | 6.40%, 03/20/2030(1) | 3,394,077 |
| 77,687 | Enterprise Fleet Funding LLC 0.44%, 12/21/2026(1) | 76,840 |
| | Exeter Automobile Receivables Trust | |
| 750,000 | 5.60%, 08/17/2026 | 749,084 |
| 139,116 | 5.61%, 06/16/2025 | 139,092 |
| 28,046 | 5.73%, 11/17/2025 | 28,042 |
| 495,000 | 6.04%, 07/15/2026 | 495,531 |
| 530,000 | 6.07%, 12/15/2025 | 530,196 |
| 491,545 | 6.11%, 09/15/2025 | 491,662 |
| 294,822 | FHF Trust 0.83%, 12/15/2026(1) | 284,818 |
| 2,255,000 | Fifth Third Auto Trust 5.80%, 11/16/2026 | 2,258,673 |
| | First Investors Auto Owner Trust | |
| 484,104 | 0.48%, 03/15/2027(1) | 475,940 |
| 859,106 | 2.03%, 01/15/2027(1) | 844,130 |
| | Flagship Credit Auto Trust | |
| 240,870 | 0.36%, 07/15/2027(1) | 238,228 |
| 541,991 | 0.81%, 07/17/2026(1) | 534,096 |
| 64,774 | 3.28%, 08/15/2025(1) | 64,687 |
| 113,911 | 4.06%, 10/15/2025(1) | 113,774 |
| 1,310,245 | 5.76%, 04/15/2027(1) | 1,308,006 |
| 1,275,000 | 5.89%, 07/15/2027(1) | 1,276,595 |
| 743,735 | Ford Credit Auto Lease Trust 5.19%, 06/15/2025 | 742,892 |
| | Ford Credit Auto Owner Trust | |
| 117,181 | 3.44%, 02/15/2025 | 117,027 |
| 202,389 | 4.52%, 04/15/2025 | 202,079 |
| 820,709 | 5.14%, 03/15/2026 | 819,019 |
| 673,193 | 5.37%, 08/15/2025 | 672,711 |
| 1,790,000 | 5.57%, 06/15/2026 | 1,791,672 |
| | Foursight Capital Automobile Receivables Trust | |
| 641,586 | 4.49%, 03/16/2026(1) | 640,043 |
| 327,082 | 5.43%, 10/15/2026(1) | 326,096 |
| 1,550,000 | 5.99%, 05/15/2028(1) | 1,559,336 |
| | GLS Auto Receivables Issuer Trust | |
| 351,500 | 3.55%, 01/15/2026(1) | 350,266 |
| 387,881 | 4.59%, 05/15/2026(1) | 386,450 |
| 1,356,944 | 5.70%, 01/15/2027(1) | 1,354,709 |
| 1,712,113 | 5.98%, 08/17/2026(1) | 1,712,031 |
| 1,340,000 | GLS Auto Select Receivables Trust 6.37%, 06/15/2028(1) | 1,351,565 |
| | GM Financial Automobile Leasing Trust | |
| 1,500,000 | 1.96%, 02/20/2026 | 1,476,739 |
| 785,000 | 5.16%, 04/20/2026 | 784,943 |
| 347,628 | 5.27%, 06/20/2025 | 347,357 |
| 610,411 | 5.44%, 10/20/2025 | 609,954 |
| 2,735,000 | 5.58%, 01/20/2026 | 2,738,822 |
| | GM Financial Consumer Automobile Receivables Trust | |
| 957,917 | 4.60%, 11/17/2025 | 954,929 |
| 680,522 | 5.10%, 05/18/2026 | 678,895 |
| 1,187,175 | 5.19%, 03/16/2026 | 1,184,626 |
| 1,300,000 | 5.74%, 09/16/2026 | 1,302,412 |
| 2,510,000 | 5.89%, 11/16/2026 | 2,523,464 |
| | Honda Auto Receivables Owner Trust | |
| 820,000 | 5.41%, 04/15/2026 | 819,968 |
The accompanying notes are an integral part of these financial statements.
Hartford Ultrashort Bond HLS Fund
Schedule of Investments – (continued)
December 31, 2023
| Shares or Principal Amount | | Market Value† |
| ASSET & COMMERCIAL MORTGAGE-BACKED SECURITIES - 37.2% - (continued) |
| | Asset-Backed - Automobile - 24.9% - (continued) |
| $ 2,250,000 | 5.87%, 06/22/2026 | $ 2,264,166 |
| | Hyundai Auto Lease Securitization Trust | |
| 1,585,000 | 5.05%, 01/15/2026(1) | 1,580,862 |
| 314,134 | 5.20%, 04/15/2025(1) | 313,740 |
| 628,615 | 5.47%, 09/15/2025(1) | 628,198 |
| 1,920,000 | 5.85%, 03/16/2026(1) | 1,929,893 |
| | Hyundai Auto Receivables Trust | |
| 1,095,152 | 5.19%, 12/15/2025 | 1,093,609 |
| 2,030,000 | 5.77%, 05/15/2026 | 2,035,511 |
| 1,267,150 | LAD Auto Receivables Trust 6.09%, 06/15/2026(1) | 1,268,442 |
| 1,664,115 | Mercedes-Benz Auto Lease Trust 5.24%, 11/17/2025 | 1,661,240 |
| 1,065,000 | Mercedes-Benz Auto Receivables Trust 4.51%, 11/15/2027 | 1,058,278 |
| | Nissan Auto Lease Trust | |
| 2,410,000 | 4.91%, 01/15/2026 | 2,401,026 |
| 781,788 | 5.74%, 08/15/2025 | 782,404 |
| | Nissan Auto Receivables Owner Trust | |
| 392,310 | 4.50%, 08/15/2025 | 391,054 |
| 910,808 | 5.34%, 02/17/2026 | 909,061 |
| | Porsche Financial Auto Securitization Trust | |
| 1,427,085 | 5.42%, 12/22/2026(1) | 1,425,373 |
| 1,015,000 | 5.88%, 11/23/2026(1) | 1,020,406 |
| | Santander Drive Auto Receivables Trust | |
| 901,688 | 1.26%, 02/16/2027 | 884,866 |
| 496,727 | 5.36%, 05/15/2026 | 496,363 |
| 147,521 | 5.81%, 01/15/2026 | 147,517 |
| 508,731 | 6.08%, 08/17/2026 | 509,645 |
| 600,000 | 6.08%, 05/17/2027 | 602,053 |
| 3,609,052 | 6.18%, 02/16/2027 | 3,618,748 |
| 895,000 | SBNA Auto Lease Trust 6.27%, 04/20/2026(1) | 901,173 |
| 821,748 | SFS Auto Receivables Securitization Trust 5.89%, 03/22/2027(1) | 823,402 |
| | Tesla Auto Lease Trust | |
| 855,000 | 5.86%, 08/20/2025(1) | 856,591 |
| 1,435,000 | 6.02%, 09/22/2025(1) | 1,440,325 |
| 1,930,000 | Tesla Electric Vehicle Trust 5.54%, 12/21/2026(1) | 1,935,586 |
| 939,933 | Toyota Auto Receivables Owner Trust 5.28%, 05/15/2026 | 938,531 |
| 833,193 | Toyota Lease Owner Trust 5.30%, 08/20/2025(1) | 831,903 |
| 176,212 | United Auto Credit Securitization Trust 5.57%, 07/10/2025(1) | 176,111 |
| 970,000 | USAA Auto Owner Trust 5.83%, 07/15/2026(1) | 972,211 |
| 899,343 | Volkswagen Auto Loan Enhanced Trust 5.50%, 12/21/2026 | 899,648 |
| | Westlake Automobile Receivables Trust | |
| 1,600,000 | 1.23%, 04/15/2026(1) | 1,546,632 |
| 245,787 | 3.36%, 08/15/2025(1) | 245,454 |
| 799,571 | 5.24%, 07/15/2025(1) | 799,169 |
| 1,085,349 | 5.51%, 06/15/2026(1) | 1,083,986 |
| 3,255,000 | 5.80%, 02/16/2027(1) | 3,265,114 |
| 1,080,000 | 5.89%, 02/16/2027(1) | 1,084,943 |
| 1,285,000 | 5.96%, 10/15/2026(1) | 1,289,065 |
| | Wheels Fleet Lease Funding 1 LLC | |
| 1,740,000 | 5.80%, 04/18/2038(1) | 1,745,036 |
| 1,000,000 | 6.46%, 08/18/2038(1) | 1,012,195 |
| | World Omni Auto Receivables Trust | |
| 373,827 | 2.77%, 10/15/2025 | 372,061 |
| 848,197 | 5.18%, 07/15/2026 | 846,438 |
| 493,433 | 5.25%, 11/16/2026 | 492,445 |
| 850,684 | World Omni Automobile Lease Securitization Trust 5.47%, 11/17/2025 | 850,287 |
| Shares or Principal Amount | | Market Value† |
| ASSET & COMMERCIAL MORTGAGE-BACKED SECURITIES - 37.2% - (continued) |
| | Asset-Backed - Automobile - 24.9% - (continued) |
| | World Omni Select Auto Trust | |
| $ 1,411,256 | 0.53%, 03/15/2027 | $ 1,385,497 |
| 1,613,950 | 5.92%, 03/15/2027 | 1,614,468 |
| | | | 139,670,089 |
| | Asset-Backed - Finance & Insurance - 0.4% |
| 238,546 | BWAY Mortgage Trust 2.81%, 03/10/2033(1) | 232,467 |
| 231,801 | Donlen Fleet Lease Funding 2 LLC 0.56%, 12/11/2034(1) | 228,360 |
| 51,921 | Ellington Financial Mortgage Trust 2.74%, 11/25/2059(1)(3) | 49,148 |
| 100,991 | FCI Funding LLC 1.13%, 04/15/2033(1) | 98,443 |
| 1,689,491 | John Deere Owner Trust 5.28%, 03/16/2026 | 1,686,676 |
| 71,874 | Residential Mortgage Loan Trust 2.38%, 01/26/2060(1)(3) | 68,482 |
| | | | 2,363,576 |
| | Other Asset-Backed Securities - 8.8% |
| | Affirm Asset Securitization Trust | |
| 449,216 | 4.55%, 06/15/2027(1) | 444,196 |
| 975,000 | 6.61%, 01/18/2028(1) | 980,574 |
| 210,452 | Amur Equipment Finance Receivables IX LLC 0.75%, 11/20/2026(1) | 208,062 |
| 534,012 | Amur Equipment Finance Receivables XI LLC 5.30%, 06/21/2028(1) | 532,496 |
| 146,766 | Atalaya Equipment Leasing Trust 1.23%, 05/15/2026(1) | 145,406 |
| 675,000 | Auxilior Term Funding LLC 6.18%, 12/15/2028(1) | 677,526 |
| | BHG Securitization Trust | |
| 973,337 | 1.71%, 02/20/2035(1) | 947,462 |
| 255,731 | 5.32%, 10/17/2035(1) | 254,056 |
| | CCG Receivables Trust | |
| 109,136 | 0.30%, 06/14/2027(1) | 107,838 |
| 419,500 | 0.54%, 03/14/2029(1) | 407,179 |
| 1,901,982 | 3.91%, 07/16/2029(1) | 1,878,823 |
| 1,691,042 | 5.82%, 09/16/2030(1) | 1,701,593 |
| | CNH Equipment Trust | |
| 945,000 | 5.34%, 09/15/2026 | 943,345 |
| 895,209 | 5.42%, 07/15/2026 | 894,107 |
| 1,720,000 | Daimler Trucks Retail Trust 6.03%, 09/15/2025 | 1,723,305 |
| | Dell Equipment Finance Trust | |
| 534,475 | 0.53%, 12/22/2026(1) | 530,129 |
| 700,000 | 5.84%, 01/22/2029(1) | 701,609 |
| 605,000 | 6.10%, 04/23/2029(1) | 608,704 |
| | Dext ABS LLC | |
| 314,273 | 1.12%, 02/15/2028(1) | 305,925 |
| 269,419 | 5.68%, 04/15/2024(1) | 269,350 |
| 2,495,000 | 6.56%, 05/15/2034(1) | 2,506,944 |
| 900,000 | DLLAA LLC 5.93%, 07/20/2026(1) | 903,857 |
| | DLLAD LLC | |
| 1,928,817 | 0.64%, 09/21/2026(1) | 1,860,800 |
| 1,248,138 | 5.19%, 04/20/2026(1) | 1,243,905 |
| 1,530,000 | DLLMT LLC 5.78%, 11/20/2025(1) | 1,530,218 |
| 751,482 | DLLST LLC 3.40%, 01/21/2025(1) | 746,321 |
| 1,890,000 | Granite Park Equipment Leasing LLC 6.51%, 05/20/2030(1) | 1,905,460 |
| 1,175,000 | GreatAmerica Leasing Receivables 5.35%, 02/16/2026(1) | 1,173,938 |
| 1,241,109 | GreatAmerica Leasing Receivables Funding LLC 4.92%, 05/15/2025(1) | 1,236,077 |
| | HPEFS Equipment Trust | |
| 322,196 | 3.15%, 09/20/2029(1) | 321,068 |
| 663,595 | 5.26%, 08/20/2029(1) | 662,714 |
| 760,000 | 5.43%, 08/20/2029(1) | 760,459 |
| 1,030,000 | 6.04%, 01/21/2031(1) | 1,037,430 |
The accompanying notes are an integral part of these financial statements.
Hartford Ultrashort Bond HLS Fund
Schedule of Investments – (continued)
December 31, 2023
| Shares or Principal Amount | | Market Value† |
| ASSET & COMMERCIAL MORTGAGE-BACKED SECURITIES - 37.2% - (continued) |
| | Other Asset-Backed Securities - 8.8% - (continued) |
| $ 2,110,000 | John Deere Owner Trust 5.59%, 06/15/2026 | $ 2,111,212 |
| | Kubota Credit Owner Trust | |
| 789,473 | 5.40%, 02/17/2026(1) | 788,345 |
| 2,950,000 | 5.61%, 07/15/2026(1) | 2,958,876 |
| | Marlette Funding Trust | |
| 41,210 | 4.25%, 08/15/2032(1) | 41,146 |
| 211,207 | 5.18%, 11/15/2032(1) | 210,615 |
| 1,110,760 | 6.04%, 06/15/2033(1) | 1,109,103 |
| 1,075,399 | 6.07%, 04/15/2033(1) | 1,074,514 |
| 1,221,625 | 6.49%, 09/15/2033(1) | 1,222,921 |
| | MMAF Equipment Finance LLC | |
| 180,461 | 2.01%, 12/12/2024(1) | 179,634 |
| 1,168,684 | 5.57%, 09/09/2025(1) | 1,167,179 |
| 1,650,000 | 5.79%, 11/13/2026(1) | 1,655,497 |
| 436,382 | New York City Tax Lien Trust 2.10%, 11/10/2034(1) | 425,522 |
| 2,225,000 | PFS Financing Corp. 0.77%, 08/15/2026(1) | 2,155,547 |
| | SCF Equipment Leasing LLC | |
| 452,226 | 6.24%, 07/20/2028(1) | 452,317 |
| 1,935,000 | 6.56%, 01/22/2030(1) | 1,949,283 |
| 217,334 | SoFi Consumer Loan Program Trust 5.81%, 05/15/2031(1) | 217,058 |
| 1,545,000 | Verizon Master Trust 5.23%, 11/22/2027 | 1,544,963 |
| | | | 49,414,608 |
| | Whole Loan Collateral CMO - 3.1% |
| 574,736 | Angel Oak Mortgage Trust 2.53%, 01/26/2065(1)(3) | 529,649 |
| | BRAVO Residential Funding Trust | |
| 323,751 | 0.94%, 02/25/2049(1)(3) | 280,643 |
| 359,467 | 0.97%, 03/25/2060(1)(3) | 327,831 |
| 1,134,019 | 1.70%, 04/25/2060(1)(3) | 1,016,262 |
| 175,598 | Bunker Hill Loan Depositary Trust 2.72%, 11/25/2059(1)(4) | 170,615 |
| 78,652 | CFMT LLC 3.17%, 07/25/2054(1)(3) | 76,937 |
| | COLT Mortgage Loan Trust | |
| 1,577,352 | 1.11%, 10/25/2066(1)(3) | 1,304,365 |
| 416,298 | 1.33%, 10/26/2065(1)(3) | 371,234 |
| 1,940,568 | 1.40%, 10/25/2066(1)(3) | 1,547,017 |
| 92,813 | 1.51%, 04/27/2065(1)(3) | 86,670 |
| 1,067,083 | 1.73%, 11/26/2066(1)(3) | 880,522 |
| 1,214,486 | CSMC Trust 3.57%, 07/25/2049(1)(4) | 1,131,910 |
| 421,828 | Ellington Financial Mortgage Trust 0.93%, 06/25/2066(1)(3) | 336,427 |
| | GCAT Trust | |
| 2,714,896 | 1.26%, 07/25/2066(1)(3) | 2,119,972 |
| 607,684 | 1.92%, 08/25/2066(1)(3) | 529,384 |
| | MFA Trust | |
| 278,348 | 1.01%, 01/26/2065(1)(3) | 249,334 |
| 505,399 | 1.03%, 11/25/2064(1)(3) | 426,735 |
| | New Residential Mortgage Loan Trust | |
| 1,400,919 | 1.16%, 11/27/2056(1)(3) | 1,159,254 |
| 407,209 | 4.00%, 08/27/2057(1)(3) | 387,370 |
| 34,131 | OBX Trust 6.12%, 06/25/2057, 1 mo. USD Term SOFR + 0.76%(1)(2) | 32,486 |
| 1,834,099 | SG Residential Mortgage Trust 1.16%, 07/25/2061(1)(3) | 1,432,229 |
| | Starwood Mortgage Residential Trust | |
| 252,098 | 0.94%, 05/25/2065(1)(3) | 224,682 |
| 33,701 | 2.28%, 02/25/2050(1)(3) | 31,672 |
| | Towd Point Mortgage Trust | |
| 63,839 | 2.16%, 01/25/2052(1)(3) | 63,472 |
| 424,674 | 2.75%, 06/25/2057(1)(3) | 407,055 |
| 814,822 | 3.75%, 03/25/2058(1)(3) | 796,372 |
| Shares or Principal Amount | | Market Value† |
| ASSET & COMMERCIAL MORTGAGE-BACKED SECURITIES - 37.2% - (continued) |
| | Whole Loan Collateral CMO - 3.1% - (continued) |
| $ 143,786 | 5.76%, 02/25/2057, 1 mo. USD Term SOFR + 0.71%(1)(2) | $ 145,216 |
| | Verus Securitization Trust | |
| 1,112,341 | 1.63%, 10/25/2066(1)(3) | 923,176 |
| 134,549 | 3.64%, 11/25/2059(1)(4) | 130,373 |
| 212,402 | 3.69%, 11/25/2059(1)(3) | 206,392 |
| | | | 17,325,256 |
| | Total Asset & Commercial Mortgage-Backed Securities
(cost $211,568,361) | $ 208,773,529 |
| CORPORATE BONDS - 33.7% |
| | Aerospace/Defense - 0.2% |
| 900,000 | Litton Industries, Inc. 7.75%, 03/15/2026 | $ 945,024 |
| | Agriculture - 0.5% |
| 1,700,000 | Cargill, Inc. 3.50%, 04/22/2025(1) | 1,670,798 |
| 1,225,000 | Philip Morris International, Inc. 5.13%, 11/15/2024 | 1,223,240 |
| | | | 2,894,038 |
| | Auto Manufacturers - 0.9% |
| | Daimler Truck Finance North America LLC | |
| 565,000 | 5.15%, 01/16/2026(1) | 566,734 |
| 875,000 | 5.60%, 08/08/2025(1)(5) | 880,786 |
| 1,500,000 | General Motors Financial Co., Inc. 5.99%, 10/15/2024, 3 mo. USD SOFR + 0.62%(2) | 1,497,435 |
| 1,000,000 | Hyundai Capital America 6.25%, 11/03/2025(1) | 1,014,879 |
| 1,225,000 | Mercedes-Benz Finance North America LLC 5.50%, 11/27/2024(1) | 1,226,198 |
| | | | 5,186,032 |
| | Beverages - 0.7% |
| 1,725,000 | Constellation Brands, Inc. 3.60%, 05/09/2024 | 1,712,121 |
| 730,000 | Diageo Capital PLC 5.20%, 10/24/2025 | 735,699 |
| 1,750,000 | JDE Peet's NV 0.80%, 09/24/2024(1) | 1,682,756 |
| | | | 4,130,576 |
| | Chemicals - 0.3% |
| 1,225,000 | Linde, Inc. 4.80%, 12/05/2024 | 1,222,252 |
| 580,000 | Nutrien Ltd. 5.95%, 11/07/2025 | 589,759 |
| | | | 1,812,011 |
| | Commercial Banks - 17.9% |
| 1,600,000 | ABN AMRO Bank NV 6.34%, 09/18/2027, (6.34% fixed rate until 09/18/2026; 1 yr. USD CMT + 1.65% thereafter)(1)(6) | 1,636,304 |
| 1,750,000 | ANZ New Zealand International Ltd. 6.00%, 02/18/2025, 3 mo. USD SOFR + 0.60%(1)(2)(5) | 1,749,671 |
| 1,400,000 | Banco Santander SA 3.89%, 05/24/2024 | 1,390,129 |
| | Bank of America Corp. | |
| 1,025,000 | 3.84%, 04/25/2025, (3.84% fixed rate until 04/25/2024; 6 mo. USD SOFR + 1.11% thereafter)(6) | 1,018,409 |
| 925,000 | 5.08%, 01/20/2027, (5.08% fixed rate until 01/20/2026; 6 mo. USD SOFR + 1.29% thereafter)(6) | 923,281 |
| 1,700,000 | 6.05%, 02/04/2025, 3 mo. USD SOFR + 0.66%(2) | 1,698,586 |
| 1,525,000 | 6.07%, 04/22/2025, 3 mo. USD SOFR + 0.69%(2) | 1,524,577 |
| 2,000,000 | Bank of America NA 5.65%, 08/18/2025 | 2,024,972 |
The accompanying notes are an integral part of these financial statements.
Hartford Ultrashort Bond HLS Fund
Schedule of Investments – (continued)
December 31, 2023
| Shares or Principal Amount | | Market Value† |
| CORPORATE BONDS - 33.7% - (continued) |
| | Commercial Banks - 17.9% - (continued) |
| | Bank of New York Mellon | |
| $ 430,000 | 5.15%, 05/22/2026, (5.15% fixed rate until 05/22/2025; 6 mo. USD SOFR + 1.07% thereafter)(6) | $ 429,971 |
| 1,000,000 | 5.22%, 11/21/2025, (5.22% fixed rate until 11/21/2024; 6 mo. USD SOFR + 0.80% thereafter)(6) | 999,780 |
| 750,000 | Bank of New York Mellon Corp. 5.64%, 04/26/2024, 3 mo. USD SOFR + 0.26%(2) | 749,713 |
| | Bank of Nova Scotia | |
| 1,400,000 | 2.44%, 03/11/2024(5) | 1,391,478 |
| 3,675,000 | 5.77%, 07/31/2024, 3 mo. USD SOFR + 0.38%(2) | 3,674,576 |
| | Banque Federative du Credit Mutuel SA | |
| 1,000,000 | 4.52%, 07/13/2025(1)(5) | 990,728 |
| 1,250,000 | 4.94%, 01/26/2026(1) | 1,245,947 |
| 875,000 | 5.90%, 07/13/2026(1) | 893,641 |
| 950,000 | Barclays PLC 7.33%, 11/02/2026, (7.33% fixed rate until 11/02/2025; 1 yr. USD CMT + 3.05% thereafter)(6) | 981,450 |
| 1,400,000 | Citigroup, Inc. 6.07%, 01/25/2026, 3 mo. USD SOFR + 0.69%(2) | 1,391,671 |
| | Citizens Bank NA | |
| 1,025,000 | 4.12%, 05/23/2025, (4.12% fixed rate until 05/23/2024; 6 mo. USD SOFR + 1.4% thereafter)(6) | 1,000,355 |
| 750,000 | 6.06%, 10/24/2025, (6.06% fixed rate until 10/24/2024; 6 mo. USD SOFR + 1.45% thereafter)(6) | 731,708 |
| 1,250,000 | Commonwealth Bank of Australia 5.08%, 01/10/2025 | 1,251,348 |
| 2,190,000 | Credit Agricole SA 5.59%, 07/05/2026(1) | 2,228,041 |
| 750,000 | Credit Suisse AG 4.75%, 08/09/2024 | 745,319 |
| | Danske Bank AS | |
| 1,180,000 | 6.26%, 09/22/2026, (6.26% fixed rate until 09/22/2025; 1 yr. USD CMT + 1.18% thereafter)(1)(6) | 1,200,518 |
| 750,000 | 6.47%, 01/09/2026, (6.47% fixed rate until 01/09/2025; 1 yr. USD CMT + 2.10% thereafter)(1)(6) | 755,416 |
| 1,350,000 | DNB Bank ASA 2.97%, 03/28/2025, (2.97% fixed rate until 03/28/2024; 6 mo. USD SOFR + 0.81% thereafter)(1)(6) | 1,341,307 |
| 1,880,000 | Fifth Third Bank NA 5.85%, 10/27/2025, (5.85% fixed rate until 10/27/2024; 6 mo. USD SOFR + 1.23% thereafter)(6) | 1,875,050 |
| | Goldman Sachs Group, Inc. | |
| 1,250,000 | 5.70%, 11/01/2024 | 1,252,895 |
| 1,750,000 | 5.80%, 08/10/2026, (5.80% fixed rate until 08/10/2025; 3 mo. USD SOFR + 1.08% thereafter)(6) | 1,767,243 |
| 1,500,000 | 5.92%, 09/10/2024, 3 mo. USD SOFR + 0.50%(2) | 1,498,088 |
| 1,250,000 | HSBC Holdings PLC 7.34%, 11/03/2026, (7.34% fixed rate until 11/03/2025; 6 mo. USD SOFR + 3.03% thereafter)(6) | 1,297,843 |
| 1,025,000 | HSBC USA, Inc. 3.75%, 05/24/2024 | 1,017,272 |
| | Huntington National Bank | |
| 1,175,000 | 4.01%, 05/16/2025, (4.01% fixed rate until 05/16/2024; 6 mo. USD SOFR + 1.21% thereafter)(6) | 1,157,594 |
| 1,250,000 | 5.70%, 11/18/2025, (5.70% fixed rate until 11/18/2024; 6 mo. USD SOFR + 1.22% thereafter)(6) | 1,236,043 |
| Shares or Principal Amount | | Market Value† |
| CORPORATE BONDS - 33.7% - (continued) |
| | Commercial Banks - 17.9% - (continued) |
| | JP Morgan Chase & Co. | |
| $ 1,350,000 | 3.85%, 06/14/2025, (3.85% fixed rate until 06/14/2024; 6 mo. USD SOFR + 0.98% thereafter)(6) | $ 1,339,234 |
| 850,000 | 5.55%, 12/15/2025, (5.55% fixed rate until 12/15/2024; 6 mo. USD SOFR + 1.07% thereafter)(6) | 850,420 |
| 2,000,000 | 5.95%, 06/01/2025, 6 mo. USD SOFR + 0.54%(2) | 1,993,211 |
| 1,250,000 | KeyBank NA 5.74%, 06/14/2024, 3 mo. USD SOFR + 0.32%(2) | 1,239,790 |
| | Macquarie Group Ltd. | |
| 1,500,000 | 6.08%, 10/14/2025, 3 mo. USD SOFR + 0.71%(1)(2) | 1,490,074 |
| 1,200,000 | 6.21%, 11/22/2024(1) | 1,206,956 |
| | Manufacturers & Traders Trust Co. | |
| 2,310,000 | 4.65%, 01/27/2026 | 2,262,145 |
| 1,850,000 | 5.40%, 11/21/2025 | 1,837,923 |
| | Morgan Stanley | |
| 1,350,000 | 3.62%, 04/17/2025, (3.62% fixed rate until 04/17/2024; 6 mo. USD SOFR + 1.16% thereafter)(6) | 1,341,900 |
| 1,225,000 | 5.05%, 01/28/2027, (5.05% fixed rate until 01/28/2026; 6 mo. USD SOFR + 1.30% thereafter)(6) | 1,226,491 |
| 750,000 | 6.01%, 01/24/2025, 6 mo. USD SOFR + 0.63%(2) | 748,891 |
| | Morgan Stanley Bank NA | |
| 1,250,000 | 4.75%, 04/21/2026 | 1,249,798 |
| 1,500,000 | 5.48%, 07/16/2025 | 1,513,881 |
| | National Australia Bank Ltd. | |
| 1,225,000 | 4.97%, 01/12/2026 | 1,233,865 |
| 1,400,000 | 5.75%, 01/12/2025, 3 mo. USD SOFR + 0.38%(1)(2) | 1,397,416 |
| 3,725,000 | National Bank of Canada 5.88%, 08/06/2024, 3 mo. USD SOFR + 0.49%(2) | 3,724,929 |
| 1,000,000 | National Securities Clearing Corp. 5.15%, 05/30/2025(1) | 1,005,189 |
| 1,290,000 | NatWest Markets PLC 5.93%, 08/12/2024, 3 mo. USD SOFR + 0.53%(1)(2) | 1,289,699 |
| | PNC Financial Services Group, Inc. | |
| 1,325,000 | 3.90%, 04/29/2024 | 1,317,274 |
| 1,510,000 | 5.67%, 10/28/2025, (5.67% fixed rate until 10/28/2024; 6 mo. USD SOFR + 1.09% thereafter)(6) | 1,509,383 |
| | Royal Bank of Canada | |
| 875,000 | 5.20%, 07/20/2026 | 885,347 |
| 950,000 | 5.66%, 10/25/2024 | 952,242 |
| 1,925,000 | 5.67%, 01/19/2024, 3 mo. USD SOFR + 0.30%(2) | 1,925,000 |
| 1,475,000 | 5.70%, 10/07/2024, 3 mo. USD SOFR + 0.34%(2) | 1,472,373 |
| | Societe Generale SA | |
| 1,350,000 | 4.35%, 06/13/2025(1)(5) | 1,337,982 |
| 925,000 | 6.45%, 01/12/2027, (6.45% fixed rate until 01/12/2026; 1 yr. USD CMT + 2.30% thereafter)(1)(6) | 941,455 |
| | Standard Chartered PLC | |
| 1,225,000 | 6.17%, 01/09/2027, (6.17% fixed rate until 01/09/2026; 1 yr. USD CMT + 2.05% thereafter)(1)(5)(6) | 1,243,533 |
| 850,000 | 7.78%, 11/16/2025, (7.78% fixed rate until 11/16/2024; 1 yr. USD CMT + 3.10% thereafter)(1)(6) | 866,311 |
The accompanying notes are an integral part of these financial statements.
Hartford Ultrashort Bond HLS Fund
Schedule of Investments – (continued)
December 31, 2023
| Shares or Principal Amount | | Market Value† |
| CORPORATE BONDS - 33.7% - (continued) |
| | Commercial Banks - 17.9% - (continued) |
| $ 1,500,000 | State Street Corp. 5.75%, 11/04/2026, (5.75% fixed rate until 11/04/2025; 6 mo. USD SOFR + 1.35% thereafter)(6) | $ 1,523,528 |
| 2,200,000 | Sumitomo Mitsui Trust Bank Ltd. 5.86%, 09/16/2024, 3 mo. USD SOFR + 0.44%(1)(2) | 2,198,184 |
| | Toronto-Dominion Bank | |
| 1,000,000 | 2.35%, 03/08/2024 | 994,053 |
| 925,000 | 5.10%, 01/09/2026 | 931,666 |
| 2,200,000 | 5.77%, 09/10/2024, 3 mo. USD SOFR + 0.35%(2) | 2,201,185 |
| | Truist Financial Corp. | |
| 1,500,000 | 5.82%, 06/09/2025, 3 mo. USD SOFR + 0.40%(2) | 1,477,601 |
| 1,250,000 | 5.90%, 10/28/2026, (5.90% fixed rate until 10/28/2025; 6 mo. USD SOFR + 1.63% thereafter)(6) | 1,260,314 |
| | UBS AG | |
| 1,400,000 | 5.84%, 01/13/2025, 3 mo. USD SOFR + 0.47%(1)(2) | 1,397,049 |
| 2,200,000 | 5.84%, 08/09/2024, 3 mo. USD SOFR + 0.45%(1)(2) | 2,203,665 |
| 1,750,000 | Wells Fargo Bank NA 5.55%, 08/01/2025 | 1,767,825 |
| | | | 100,428,706 |
| | Diversified Financial Services - 1.5% |
| | American Express Co. | |
| 2,050,000 | 3.38%, 05/03/2024 | 2,034,313 |
| 1,300,000 | 3.95%, 08/01/2025 | 1,279,157 |
| 1,250,000 | 4.99%, 05/01/2026, (4.99% fixed rate until 05/01/2025; 6 mo. USD SOFR + 1.00% thereafter)(6) | 1,246,604 |
| 975,000 | Capital One Financial Corp. 4.99%, 07/24/2026, (4.99% fixed rate until 07/24/2025; 6 mo. USD SOFR + 2.16% thereafter)(6) | 963,901 |
| 1,750,000 | Charles Schwab Corp. 5.88%, 08/24/2026(5) | 1,795,248 |
| 1,085,000 | Consumers Securitization Funding LLC 5.55%, 03/01/2028 | 1,089,452 |
| | | | 8,408,675 |
| | Electric - 1.8% |
| 1,250,000 | American Electric Power Co., Inc. 5.70%, 08/15/2025 | 1,258,480 |
| 1,350,000 | Eversource Energy 4.20%, 06/27/2024 | 1,339,679 |
| 1,520,000 | Mississippi Power Co. 5.74%, 06/28/2024, 3 mo. USD SOFR + 0.30%(2) | 1,518,885 |
| | NextEra Energy Capital Holdings, Inc. | |
| 1,500,000 | 4.26%, 09/01/2024 | 1,485,302 |
| 980,000 | 5.75%, 09/01/2025 | 989,630 |
| 525,000 | 6.05%, 03/01/2025 | 529,742 |
| 500,000 | Pennsylvania Electric Co. 5.15%, 03/30/2026(1) | 499,370 |
| 1,700,000 | Sempra 5.40%, 08/01/2026 | 1,723,331 |
| 1,000,000 | Southern Co. 5.15%, 10/06/2025 | 1,002,301 |
| | | | 10,346,720 |
| | Food - 0.2% |
| 1,155,000 | Mondelez International, Inc. 2.13%, 03/17/2024 | 1,145,896 |
| | Healthcare - Products - 0.3% |
| 1,550,000 | GE HealthCare Technologies, Inc. 5.55%, 11/15/2024 | 1,550,543 |
| | Healthcare - Services - 0.6% |
| 1,580,000 | CommonSpirit Health 2.76%, 10/01/2024 | 1,544,869 |
| 545,000 | Elevance Health, Inc. 5.35%, 10/15/2025 | 548,478 |
| 1,395,000 | UnitedHealth Group, Inc. 5.15%, 10/15/2025 | 1,410,498 |
| | | | 3,503,845 |
| Shares or Principal Amount | | Market Value† |
| CORPORATE BONDS - 33.7% - (continued) |
| | Household Products - 0.4% |
| $ 2,540,000 | Haleon U.S. Capital LLC 3.02%, 03/24/2024 | $ 2,524,010 |
| | Insurance - 4.2% |
| | Athene Global Funding | |
| 3,500,000 | 5.96%, 08/19/2024, 3 mo. USD SOFR + 0.56%(1)(2) | 3,486,109 |
| 2,620,000 | 6.11%, 05/24/2024, 3 mo. USD SOFR + 0.70%(1)(2) | 2,618,369 |
| 1,625,000 | Brighthouse Financial Global Funding 6.13%, 04/12/2024, 3 mo. USD SOFR + 0.76%(1)(2) | 1,621,668 |
| 705,000 | Corebridge Financial, Inc. 3.50%, 04/04/2025 | 687,382 |
| 725,000 | Corebridge Global Funding 5.75%, 07/02/2026(1) | 734,487 |
| 1,540,000 | Equitable Financial Life Global Funding 5.50%, 12/02/2025(1) | 1,540,300 |
| 1,225,000 | Jackson National Life Global Funding 5.50%, 01/09/2026(1) | 1,223,604 |
| 1,550,000 | MassMutual Global Funding II 5.73%, 04/12/2024, 3 mo. USD SOFR + 0.36%(1)(2) | 1,550,417 |
| 1,225,000 | Metropolitan Life Global Funding I 5.00%, 01/06/2026(1) | 1,229,506 |
| 1,350,000 | New York Life Global Funding 3.15%, 06/06/2024(1) | 1,336,608 |
| 1,250,000 | Pacific Life Global Funding II 5.50%, 08/28/2026(1) | 1,273,538 |
| | Principal Life Global Funding II | |
| 2,500,000 | 5.79%, 08/23/2024, 3 mo. USD SOFR + 0.38%(1)(2) | 2,498,952 |
| 645,000 | 5.82%, 04/12/2024, 3 mo. USD SOFR + 0.45%(1)(2) | 644,716 |
| | Protective Life Global Funding | |
| 1,375,000 | 3.22%, 03/28/2025(1) | 1,341,221 |
| 1,525,000 | 5.37%, 01/06/2026(1) | 1,536,236 |
| | | | 23,323,113 |
| | IT Services - 0.2% |
| 875,000 | Hewlett Packard Enterprise Co. 5.90%, 10/01/2024 | 877,331 |
| | Machinery - Construction & Mining - 0.2% |
| 1,100,000 | Caterpillar Financial Services Corp. 5.69%, 09/13/2024, 3 mo. USD SOFR + 0.27%(2) | 1,099,799 |
| | Media - 0.2% |
| 1,020,000 | Comcast Corp. 5.25%, 11/07/2025 | 1,030,317 |
| | Oil & Gas - 0.6% |
| 1,400,000 | Occidental Petroleum Corp. 5.88%, 09/01/2025 | 1,407,875 |
| 1,750,000 | Ovintiv, Inc. 5.65%, 05/15/2025 | 1,757,776 |
| | | | 3,165,651 |
| | Pharmaceuticals - 0.5% |
| 460,000 | Bayer U.S. Finance LLC 6.13%, 11/21/2026(1) | 467,939 |
| 1,225,000 | CVS Health Corp. 5.00%, 02/20/2026 | 1,231,241 |
| 1,050,000 | Pfizer Investment Enterprises Pte. Ltd. 4.65%, 05/19/2025 | 1,046,555 |
| | | | 2,745,735 |
| | Pipelines - 1.3% |
| 245,000 | Columbia Pipelines Holding Co. LLC 6.06%, 08/15/2026(1) | 250,903 |
| 2,100,000 | Enbridge, Inc. 6.03%, 02/16/2024, 3 mo. USD SOFR + 0.63%(2) | 2,100,605 |
| 350,000 | Energy Transfer LP 4.25%, 04/01/2024 | 348,659 |
| 925,000 | Enterprise Products Operating LLC 5.05%, 01/10/2026 | 933,731 |
The accompanying notes are an integral part of these financial statements.
Hartford Ultrashort Bond HLS Fund
Schedule of Investments – (continued)
December 31, 2023
| Shares or Principal Amount | | Market Value† |
| CORPORATE BONDS - 33.7% - (continued) |
| | Pipelines - 1.3% - (continued) |
| $ 2,050,000 | ONEOK, Inc. 5.55%, 11/01/2026 | $ 2,086,514 |
| 1,700,000 | Williams Cos., Inc. 5.40%, 03/02/2026 | 1,717,804 |
| | | | 7,438,216 |
| | REITS - 0.2% |
| 1,220,000 | Public Storage Operating Co. 5.85%, 04/23/2024, 3 mo. USD SOFR + 0.47%(2) | 1,219,928 |
| | Retail - 0.1% |
| 800,000 | AutoZone, Inc. 5.05%, 07/15/2026 | 805,345 |
| | Semiconductors - 0.4% |
| 1,120,000 | Analog Devices, Inc. 5.69%, 10/01/2024, 3 mo. USD SOFR + 0.25%(2) | 1,120,031 |
| 885,000 | Intel Corp. 4.88%, 02/10/2026 | 891,868 |
| | | | 2,011,899 |
| | Software - 0.1% |
| 275,000 | Oracle Corp. 5.80%, 11/10/2025 | 279,348 |
| | Telecommunications - 0.2% |
| 455,000 | NTT Finance Corp. 4.14%, 07/26/2024(1) | 451,950 |
| 800,000 | Sprint LLC 7.13%, 06/15/2024 | 803,459 |
| | | | 1,255,409 |
| | Trucking & Leasing - 0.2% |
| 1,000,000 | Penske Truck Leasing Co. LP/PTL Finance Corp. 5.75%, 05/24/2026(1) | 1,008,324 |
| | Total Corporate Bonds
(cost $188,985,676) | $ 189,136,491 |
| U.S. GOVERNMENT AGENCIES - 6.9% |
| | Mortgage-Backed Agencies - 6.9% |
| | Federal Home Loan Banks - 3.5% |
| 5,000,000 | 4.75%, 03/08/2024 | $ 4,994,294 |
| 1,500,000 | 4.88%, 06/14/2024 | 1,497,686 |
| 3,000,000 | 5.00%, 01/10/2024 | 2,999,710 |
| 5,000,000 | 5.46%, 07/19/2024 | 4,995,815 |
| 5,000,000 | 5.55%, 07/19/2024 | 4,998,835 |
| | | | 19,486,340 |
| | Federal Home Loan Mortgage Corp. - 1.0% |
| 642,265 | 1.00%, 05/15/2041 | 587,342 |
| 255,700 | 1.75%, 04/15/2027 | 247,446 |
| 50,911 | 3.00%, 05/15/2043 | 50,107 |
| 322,273 | 3.50%, 11/15/2025 | 316,801 |
| 2,087,430 | 3.50%, 05/15/2026 | 2,050,003 |
| 29,435 | 3.50%, 11/15/2042 | 29,242 |
| 2,180,237 | 4.00%, 03/15/2037 | 2,147,990 |
| | | | 5,428,931 |
| | Federal National Mortgage Association - 2.2% |
| 423,101 | 1.75%, 09/25/2041 | 394,951 |
| 3,075,240 | 3.00%, 07/25/2043 | 3,038,421 |
| 2,119,260 | 3.06%, 06/25/2024(3) | 2,094,932 |
| 907,364 | 3.50%, 08/25/2026 | 889,969 |
| 932,704 | 3.50%, 11/01/2034 | 913,824 |
| 1,003,997 | 3.50%, 11/25/2038 | 980,044 |
| 1,140,166 | 4.00%, 09/25/2039 | 1,121,671 |
| 1,598,881 | 4.00%, 07/25/2040 | 1,573,823 |
| 1,682,159 | 4.00%, 06/25/2041 | 1,644,370 |
| | | | 12,652,005 |
| Shares or Principal Amount | | Market Value† |
| U.S. GOVERNMENT AGENCIES - 6.9% - (continued) |
| | Mortgage-Backed Agencies - 6.9% - (continued) |
| | Government National Mortgage Association - 0.2% |
| $ 357,771 | 2.50%, 09/20/2046 | $ 332,754 |
| 987,243 | 3.50%, 01/20/2052 | 956,998 |
| | | | 1,289,752 |
| | Total U.S. Government Agencies
(cost $38,934,465) | | $ 38,857,028 |
| U.S. GOVERNMENT SECURITIES - 15.7% |
| | U.S. Treasury Securities - 15.7% |
| | U.S. Treasury Notes - 15.7% |
| 10,000,000 | 0.75%, 11/15/2024 | $ 9,650,391 |
| 51,250,000 | 2.00%, 04/30/2024 | 50,713,477 |
| 13,050,000 | 2.38%, 02/29/2024 | 12,988,533 |
| 15,000,000 | 2.50%, 01/31/2024 | 14,965,551 |
| | Total U.S. Government Securities
(cost $88,570,204) | | $ 88,317,952 |
| | Total Long-Term Investments
(cost $528,058,706) | | $ 525,085,000 |
| SHORT-TERM INVESTMENTS - 5.8% |
| | Commercial Paper - 0.9% |
| 1,000,000 | AT&T, Inc. 5.78%, 03/19/2024(1)(7) | $ 987,404 |
| 3,100,000 | Australia & New Zealand Banking Group Ltd. 5.70%, 04/22/2024(1)(7) | 3,047,241 |
| 1,000,000 | Societe Generale SA 5.03%, 01/18/2024(1)(7) | 997,526 |
| | | | 5,032,171 |
| | Repurchase Agreements - 0.4% |
| 2,355,948 | Fixed Income Clearing Corp. Repurchase Agreement dated 12/29/2023 at 5.32%, due on 01/02/2024 with a maturity value of $2,357,341; collateralized by U.S. Treasury Inflation Index Note at 0.13%, maturing 07/15/2031, with a market value of $2,403,153 | 2,355,948 |
| | Securities Lending Collateral - 0.5% |
| 475,478 | Goldman Sachs Financial Square Funds, Government Fund, Institutional Class, 5.25%(8) | 475,478 |
| 1,584,929 | HSBC U.S. Government Money Market Fund, Institutional Class, 5.31%(8) | 1,584,929 |
| 475,479 | Invesco Government & Agency Portfolio, Institutional Class, 5.28%(8) | 475,479 |
| 475,479 | Morgan Stanley Institutional Liquidity Funds, Government Portfolio, Institutional Class, 5.27%(8) | 475,479 |
| | | | 3,011,365 |
| | U.S. Treasury Securities - 4.0% |
| | U.S. Treasury Bills - 4.0% |
| 4,000,000 | 5.03%, 01/16/2024(7) | 3,991,200 |
| 5,000,000 | 5.29%, 04/30/2024(7) | 4,913,852 |
| 6,000,000 | 5.33%, 04/23/2024(7) | 5,902,965 |
The accompanying notes are an integral part of these financial statements.
Hartford Ultrashort Bond HLS Fund
Schedule of Investments – (continued)
December 31, 2023
| Shares or Principal Amount | | Market Value† |
| SHORT-TERM INVESTMENTS - 5.8% - (continued) |
| | U.S. Treasury Securities - 4.0% - (continued) |
| | U.S. Treasury Bills - 4.0 - (continued) |
| $ 2,500,000 | 5.36%, 02/27/2024(7) | $ 2,478,882 |
| 5,000,000 | 5.36%, 04/16/2024(7) | 4,924,045 |
| | | | 22,210,944 |
| | Total Short-Term Investments
(cost $32,607,140) | $ 32,610,428 |
| | Total Investments
(cost $560,665,846) | 99.3% | $ 557,695,428 |
| | Other Assets and Liabilities | 0.7% | 4,088,389 |
| | Total Net Assets | 100.0% | $ 561,783,817 |
| Note: | Percentage of investments as shown is the ratio of the total market value to total net assets. |
| | The Fund may refer to any one or more of the industry classifications used by one or more widely recognized market indices, ratings group and/or as defined by Fund management. Industry classifications may not be identical across all security types. |
| | For Fund compliance purposes, the Fund may not use the same classification system. These classifications are used for financial reporting purposes. |
| | See “Glossary” for abbreviation descriptions. |
| (1) | Security was purchased pursuant to Rule 144A under the Securities Act of 1933 and may be sold in transactions that are exempt from registration (typically only to qualified institutional buyers) or in a public offering registered under the Securities Act of 1933. At December 31, 2023, the aggregate value of these securities was $196,701,300, representing 35.0% of net assets. |
| (2) | Variable rate securities; the rate reported is the coupon rate in effect at December 31, 2023. Base lending rates may be subject to a floor or cap. |
| (3) | Variable or floating rate security, which interest rate adjusts periodically based on changes in current interest rates and prepayments on the underlying pool of assets. Rate shown is the rate in effect as of period end. |
| (4) | Security is a “step-up” bond where coupon increases or steps up at a predetermined date. Rate shown is current coupon rate. |
| (5) | Represents entire or partial securities on loan. See Note 8 in the accompanying Notes to Financial Statements for securities lending information. |
| (6) | Fixed to variable rate investment. The rate shown reflects the fixed rate in effect at December 31, 2023. Rate will reset at a future date. Base lending rates may be subject to a floor or cap. |
| (7) | The rate shown represents current yield to maturity. |
| (8) | Current yield as of period end. |
| † | See Significant Accounting Policies of accompanying Notes to Financial Statements regarding valuation of investments. |
Fair Value Summary
The following is a summary of the fair valuations according to the inputs used as of December 31, 2023 in valuing the Fund’s investments.
| Description | | Total | | Level 1 | | Level 2 | | Level 3(1) |
| Assets | | | | | | | | |
| Asset & Commercial Mortgage-Backed Securities | | $ 208,773,529 | | $ — | | $ 208,773,529 | | $ — |
| Corporate Bonds | | 189,136,491 | | — | | 189,136,491 | | — |
| U.S. Government Agencies | | 38,857,028 | | — | | 38,857,028 | | — |
| U.S. Government Securities | | 88,317,952 | | — | | 88,317,952 | | — |
| Short-Term Investments | | 32,610,428 | | 3,011,365 | | 29,599,063 | | — |
| Total | | $ 557,695,428 | | $ 3,011,365 | | $ 554,684,063 | | $ — |
| (1) | For the year ended December 31, 2023, there were no transfers in and out of Level 3. |
The accompanying notes are an integral part of these financial statements.
GLOSSARY: (abbreviations used in preceding Schedules of Investments)
| Counterparty Abbreviations: |
| CBK | Citibank NA |
| DEUT | Deutsche Bank Securities, Inc. |
| Currency Abbreviations: |
| BRL | Brazil Real |
| EUR | Euro Member Countries |
| USD | United States Dollar |
| Index Abbreviations: |
| CDX.EM | Credit Derivatives Emerging Markets |
| CMT | Constant Maturity Treasury Index |
| ICE | Intercontinental Exchange, Inc. |
| MTA | Monthly Treasury Average Index |
| Municipal Abbreviations: |
| Auth | Authority |
| Dev | Development |
| GO | General Obligation |
| Rev | Revenue |
| Other Abbreviations: |
| ADR | American Depositary Receipt |
| ARM | Adjustable Rate Mortgage |
| ASA | Allmennaksjeselskap |
| BAM | Build America Mutual Assurance Corp. |
| CDI | Chess Depositary Interest |
| CLO | Collateralized Loan Obligation |
| CMO | Collateralized Mortgage Obligation |
| CVR | Contingent Value Rights |
| ETF | Exchange-Traded Fund |
| EURIBOR | Euro Interbank Offered Rate |
| KGaA | Kommanditgesellschaft Auf Aktien |
| NATL | National Public Finance Guarantee Corp. |
| Nyrt | New York REIT Inc |
| PT | Perseroan Terbatas |
| REIT | Real Estate Investment Trust |
| SOFR | Secured Overnight Financing Rate |
| ST APPROP | State Appropriation |
| TBA | To Be Announced |
Statements of Assets and Liabilities
December 31, 2023
| | Hartford
Balanced
HLS Fund | | Hartford
Capital
Appreciation
HLS Fund | | Hartford
Disciplined
Equity
HLS Fund | | Hartford
Dividend and
Growth
HLS Fund | | Hartford
Healthcare
HLS Fund | | Hartford
International
Opportunities
HLS Fund |
| Assets: | | | | | | | | | | | |
| Investments in securities, at market value(1) | $ 1,688,180,782 | | $ 3,515,712,084 | | $ 2,695,456,711 | | $ 3,420,462,640 | | $ 137,485,616 | | $ 864,286,114 |
| Repurchase agreements | 3,851,967 | | 21,275,928 | | 2,337,621 | | 11,022,799 | | 345,839 | | 1,934,551 |
| Cash | 14,765,695 | | 81,429,934 | | 8,966,467 | | 42,225,161 | | 1,324,567 | | 7,415,191 |
| Cash collateral due from broker on futures contracts | — | | 4,619,700 | | — | | — | | — | | — |
| Cash collateral held for securities on loan | 35,093 | | 571,934 | | — | | — | | 31,570 | | 74,022 |
| Foreign currency | 80 | | 1,052,096 | | — | | 7,549 | | 46,699 | | 1,330,530 |
| Receivables: | | | | | | | | | | | |
| Investment securities sold | 5,354,505 | | 2,291,246 | | 16,753,523 | | — | | 83,602 | | 132 |
| Fund shares sold | 25,105 | | 107,515 | | 154,471 | | 14,150,936 | | 35,958 | | 130,262 |
| Dividends and interest | 6,435,912 | | 3,322,279 | | 1,554,338 | | 4,729,775 | | 108,812 | | 874,849 |
| Securities lending income | 964 | | 9,129 | | — | | 2,274 | | 102 | | 792 |
| Variation margin on futures contracts | 6,751 | | 118,539 | | — | | — | | — | | — |
| Tax reclaims | 933,572 | | 142,375 | | 40,275 | | 1,038,967 | | 35,995 | | 1,275,479 |
| Other assets | 11,162 | | 20,119 | | 16,982 | | 19,216 | | 4,217 | | 7,588 |
| Total assets | 1,719,601,588 | | 3,630,672,878 | | 2,725,280,388 | | 3,493,659,317 | | 139,502,977 | | 877,329,510 |
| Liabilities: | | | | | | | | | | | |
| Obligation to return securities lending collateral | 701,851 | | 11,438,686 | | — | | 16,112,083 | | 631,410 | | 1,480,458 |
| Payables: | | | | | | | | | | | |
| Investment securities purchased | 6,212,388 | | 12,087,110 | | — | | — | | — | | — |
| Fund shares redeemed | 11,105,710 | | 25,394,240 | | 4,129,219 | | 11,880,618 | | 155,619 | | 1,951,764 |
| Investment management fees | 861,161 | | 1,955,775 | | 1,296,517 | | 1,820,243 | | 98,228 | | 523,261 |
| Transfer agent fees | 961 | | 1,505 | | 1,530 | | 1,141 | | 1,069 | | 1,326 |
| Accounting services fees | 44,587 | | 88,442 | | 67,578 | | 85,228 | | 4,434 | | 23,780 |
| Board of Directors' fees | 10,181 | | 21,335 | | 16,277 | | 20,394 | | 815 | | 5,196 |
| Foreign taxes | — | | — | | — | | — | | — | | 938,470 |
| Distribution fees | 8,168 | | 15,885 | | 14,302 | | 15,576 | | 1,216 | | 3,342 |
| Accrued expenses | 70,381 | | 88,630 | | 133,106 | | 78,678 | | 34,630 | | 77,981 |
| Total liabilities | 19,015,388 | | 51,091,608 | | 5,658,529 | | 30,013,961 | | 927,421 | | 5,005,578 |
| Net assets | $ 1,700,586,200 | | $ 3,579,581,270 | | $ 2,719,621,859 | | $ 3,463,645,356 | | $ 138,575,556 | | $ 872,323,932 |
| Summary of Net Assets: | | | | | | | | | | | |
| Capital stock and paid-in-capital | $ 1,214,012,930 | | $ 2,647,565,496 | | $ 1,620,929,019 | | $ 1,949,462,040 | | $ 102,381,739 | | $ 765,336,494 |
| Distributable earnings (loss) | 486,573,270 | | 932,015,774 | | 1,098,692,840 | | 1,514,183,316 | | 36,193,817 | | 106,987,438 |
| Net assets | $ 1,700,586,200 | | $ 3,579,581,270 | | $ 2,719,621,859 | | $ 3,463,645,356 | | $ 138,575,556 | | $ 872,323,932 |
| Shares authorized | 9,500,000,000 | | 5,450,000,000 | | 3,610,000,000 | | 4,000,000,000 | | 800,000,000 | | 2,625,000,000 |
| Par value | $ 0.0010 | | $ 0.0010 | | $ 0.0010 | | $ 0.0010 | | $ 0.0010 | | $ 0.0010 |
| Class IA: Net asset value per share | $ 28.76 | | $ 46.05 | | $ 18.86 | | $ 22.63 | | $ 16.41 | | $ 15.13 |
| Shares outstanding | 52,233,684 | | 69,359,816 | | 125,788,765 | | 136,338,016 | | 6,643,188 | | 52,275,825 |
| Net Assets | $ 1,502,119,458 | | $ 3,194,008,172 | | $ 2,371,805,392 | | $ 3,085,357,001 | | $ 109,010,324 | | $ 791,134,962 |
| Class IB: Net asset value per share | $ 29.46 | | $ 44.87 | | $ 18.52 | | $ 22.42 | | $ 14.42 | | $ 15.45 |
| Shares outstanding | 6,737,389 | | 8,269,105 | | 15,318,242 | | 16,872,994 | | 2,049,588 | | 5,255,590 |
| Net Assets | $ 198,466,742 | | $ 371,021,415 | | $ 283,694,844 | | $ 378,288,355 | | $ 29,565,232 | | $ 81,188,970 |
| Class IC: Net asset value per share | $ — | | $ 45.18 | | $ 18.86 | | $ — | | $ — | | $ — |
| Shares outstanding | — | | 322,075 | | 3,400,030 | | — | | — | | — |
| Net Assets | $ — | | $ 14,551,683 | | $ 64,121,623 | | $ — | | $ — | | $ — |
| Cost of investments | $ 1,298,144,670 | | $ 2,612,534,669 | | $ 1,692,517,974 | | $ 2,099,440,240 | | $ 101,227,061 | | $ 707,450,464 |
| Cost of foreign currency | $ 75 | | $ 1,058,338 | | $ — | | $ 7,297 | | $ 45,105 | | $ 1,329,518 |
| (1) Includes Investment in securities on loan, at market value | $ 670,421 | | $ 10,853,794 | | $ — | | $ 12,220,659 | | $ 612,390 | | $ 1,403,784 |
The accompanying notes are an integral part of these financial statements.
Statements of Assets and Liabilities – (continued)
December 31, 2023
| | Hartford
MidCap
HLS Fund | | Hartford
Small Cap
Growth
HLS Fund | | Hartford
Small
Company
HLS Fund | | Hartford
Stock
HLS Fund | | Hartford
Total Return
Bond
HLS Fund | | Hartford
Ultrashort
Bond
HLS Fund |
| Assets: | | | | | | | | | | | |
| Investments in securities, at market value(1) | $ 1,097,193,844 | | $ 764,625,627 | | $ 433,629,954 | | $ 1,332,262,823 | | $ 2,077,051,655 | | $ 555,339,480 |
| Repurchase agreements | 40,384 | | 803,940 | | 169,619 | | 2,928,065 | | 5,363,968 | | 2,355,948 |
| Cash | 213,815 | | 3,178,764 | | 652,092 | | 11,225,961 | | 23,887,176 | | 9,027,963 |
| Cash collateral due from broker on foreign currency contracts | — | | — | | — | | — | | 160,000 | | — |
| Cash collateral held for securities on loan | 5,450 | | 336,139 | | 116,357 | | — | | 9,637 | | 158,493 |
| Foreign currency | — | | — | | — | | — | | 584,552 | | — |
| Receivables: | | | | | | | | | | | |
| Investment securities sold | 73,611,660 | | 6,986,990 | | — | | — | | 92,514,739 | | — |
| Fund shares sold | 358,504 | | 1,490,229 | | 138,407 | | 27,614 | | 159,149 | | 205,436 |
| Dividends and interest | 232,677 | | 184,197 | | 242,657 | | 2,203,531 | | 15,128,764 | | 3,332,542 |
| Securities lending income | 122 | | 4,268 | | 1,455 | | — | | 507 | | 2,073 |
| Variation margin on futures contracts | — | | — | | — | | — | | 1,005,250 | | — |
| Variation margin on centrally cleared swap contracts | — | | — | | — | | — | | 191,186 | | — |
| Other assets | 8,808 | | 11,207 | | 5,737 | | 9,484 | | 12,826 | | 6,475 |
| Total assets | 1,171,665,264 | | 777,621,361 | | 434,956,278 | | 1,348,657,478 | | 2,216,069,409 | | 570,428,410 |
| Liabilities: | | | | | | | | | | | |
| Unrealized depreciation on foreign currency contracts | — | | — | | — | | — | | 412,052 | | — |
| Obligation to return securities lending collateral | 109,000 | | 6,722,774 | | 2,327,133 | | — | | 192,750 | | 3,169,858 |
| Cash collateral due to broker on TBA sale commitments | — | | — | | — | | — | | 1,435,000 | | — |
| TBA sale commitments, at market value | — | | — | | — | | — | | 60,387,947 | | — |
| Payables: | | | | | | | | | | | |
| Investment securities purchased | — | | 1,249,200 | | — | | — | | 360,956,148 | | 4,913,890 |
| Fund shares redeemed | 69,622,731 | | 6,707,597 | | 125,437 | | 8,394,779 | | 4,234,291 | | 285,720 |
| Investment management fees | 678,773 | | 385,273 | | 267,438 | | 546,228 | | 711,810 | | 189,960 |
| Transfer agent fees | 1,259 | | 1,266 | | 1,013 | | 960 | | 1,047 | | 966 |
| Accounting services fees | 31,022 | | 20,975 | | 13,461 | | 35,351 | | 46,904 | | 17,671 |
| Board of Directors' fees | 6,725 | | 4,304 | | 2,416 | | 8,021 | | 10,664 | | 3,502 |
| Distribution fees | 3,790 | | 7,930 | | 1,658 | | 4,558 | | 6,842 | | 3,104 |
| Accrued expenses | 55,974 | | 40,298 | | 46,563 | | 54,720 | | 61,956 | | 59,922 |
| Total liabilities | 70,509,274 | | 15,139,617 | | 2,785,119 | | 9,044,617 | | 428,457,411 | | 8,644,593 |
| Net assets | $ 1,101,155,990 | | $ 762,481,744 | | $ 432,171,159 | | $ 1,339,612,861 | | $ 1,787,611,998 | | $ 561,783,817 |
| Summary of Net Assets: | | | | | | | | | | | |
| Capital stock and paid-in-capital | $ 818,573,161 | | $ 634,141,427 | | $ 460,765,890 | | $ 673,856,273 | | $ 2,063,725,123 | | $ 554,187,718 |
| Distributable earnings (loss) | 282,582,829 | | 128,340,317 | | (28,594,731) | | 665,756,588 | | (276,113,125) | | 7,596,099 |
| Net assets | $ 1,101,155,990 | | $ 762,481,744 | | $ 432,171,159 | | $ 1,339,612,861 | | $ 1,787,611,998 | | $ 561,783,817 |
| Shares authorized | 2,400,000,000 | | 700,000,000 | | 1,500,000,000 | | 4,000,000,000 | | 5,000,000,000 | | 14,000,000,000 |
| Par value | $ 0.0010 | | $ 0.0010 | | $ 0.0010 | | $ 0.0010 | | $ 0.0010 | | $ 0.0010 |
| Class IA: Net asset value per share | $ 27.35 | | $ 25.71 | | $ 15.83 | | $ 96.68 | | $ 9.57 | | $ 10.34 |
| Shares outstanding | 36,922,526 | | 22,163,436 | | 24,764,321 | | 12,709,206 | | 169,440,797 | | 47,034,832 |
| Net Assets | $ 1,009,740,566 | | $ 569,737,574 | | $ 392,111,876 | | $ 1,228,741,314 | | $ 1,621,072,296 | | $ 486,164,678 |
| Class IB: Net asset value per share | $ 25.63 | | $ 24.03 | | $ 13.09 | | $ 96.60 | | $ 9.52 | | $ 10.33 |
| Shares outstanding | 3,566,348 | | 8,022,047 | | 3,061,096 | | 1,147,761 | | 17,495,399 | | 7,322,895 |
| Net Assets | $ 91,415,424 | | $ 192,744,170 | | $ 40,059,283 | | $ 110,871,547 | | $ 166,539,702 | | $ 75,619,139 |
| Cost of investments | $ 806,753,189 | | $ 598,910,035 | | $ 365,161,009 | | $ 707,013,375 | | $ 2,232,100,921 | | $ 560,665,846 |
| Cost of foreign currency | $ — | | $ — | | $ — | | $ — | | $ 582,161 | | $ — |
| Proceeds of TBA sale commitments | $ — | | $ — | | $ — | | $ — | | $ 59,350,320 | | $ — |
| (1) Includes Investment in securities on loan, at market value | $ 106,546 | | $ 6,340,632 | | $ 2,205,196 | | $ — | | $ 184,460 | | $ 3,026,454 |
The accompanying notes are an integral part of these financial statements.
Statements of Operations
For the Year Ended December 31, 2023
| | Hartford
Balanced
HLS Fund | | Hartford
Capital
Appreciation
HLS Fund | | Hartford
Disciplined
Equity
HLS Fund | | Hartford
Dividend and
Growth
HLS Fund | | Hartford
Healthcare
HLS Fund | | Hartford
International
Opportunities
HLS Fund |
| Investment Income: | | | | | | | | | | | |
| Dividends | $ 20,389,335 | | $ 50,908,685 | | $ 38,146,383 | | $ 76,624,227 | | $ 1,426,803 | | $ 20,889,142 |
| Interest | 23,291,252 | | 3,583,297 | | 893,838 | | 2,562,224 | | 79,193 | | 733,447 |
| Securities lending — net | 8,277 | | 45,642 | | — | | 7,666 | | 832 | | 67,707 |
| Foreign withholding tax reclaims | — | | 499,518 | | — | | 752,746 | | — | | — |
| Less: Foreign tax withheld | (108,891) | | (386,981) | | — | | (769,026) | | (18,147) | | (1,702,895) |
| Total investment income, net | 43,579,973 | | 54,650,161 | | 39,040,221 | | 79,177,837 | | 1,488,681 | | 19,987,401 |
| Expenses: | | | | | | | | | | | |
| Investment management fees | 10,623,058 | | 22,563,468 | | 14,842,444 | | 21,069,331 | | 1,207,068 | | 6,235,391 |
| Administrative services fees | | | | | | | | | | | |
| Class IC | — | | 35,475 | | 156,859 | | — | | — | | — |
| Transfer agent fees | | | | | | | | | | | |
| Class IA | 5,086 | | 8,074 | | 8,061 | | 6,155 | | 4,903 | | 7,080 |
| Class IB | 672 | | 945 | | 981 | | 768 | | 1,329 | | 738 |
| Class IC | — | | 37 | | 223 | | — | | — | | — |
| Distribution fees | | | | | | | | | | | |
| Class IB | 491,162 | | 907,556 | | 690,889 | | 926,323 | | 75,681 | | 204,900 |
| Class IC | — | | 35,475 | | 156,858 | | — | | — | | — |
| Custodian fees | 8,858 | | 16,607 | | 11,160 | | 32,177 | | 7,540 | | 44,419 |
| Registration and filing fees | 12,493 | | 18,278 | | 18,317 | | 12,453 | | 12,429 | | 12,950 |
| Accounting services fees | 247,127 | | 483,732 | | 367,166 | | 468,999 | | 28,380 | | 134,787 |
| Board of Directors' fees | 46,444 | | 96,735 | | 72,455 | | 92,967 | | 3,916 | | 24,141 |
| Audit and tax fees | 41,392 | | 48,584 | | 26,936 | | 41,897 | | 27,200 | | 51,848 |
| Other expenses | 118,724 | | 148,195 | | 106,448 | | 176,344 | | 18,872 | | 93,159 |
| Total expenses (before waivers, reimbursements and fees paid indirectly) | 11,595,016 | | 24,363,161 | | 16,458,797 | | 22,827,414 | | 1,387,318 | | 6,809,413 |
| Management fee waivers | (504,734) | | — | | — | | — | | — | | — |
| Commission recapture | (539) | | (18,825) | | (17,629) | | (42,308) | | (1,121) | | (114) |
| Total waivers, reimbursements and fees paid indirectly | (505,273) | | (18,825) | | (17,629) | | (42,308) | | (1,121) | | (114) |
| Total expenses | 11,089,743 | | 24,344,336 | | 16,441,168 | | 22,785,106 | | 1,386,197 | | 6,809,299 |
| Net Investment Income (Loss) | 32,490,230 | | 30,305,825 | | 22,599,053 | | 56,392,731 | | 102,484 | | 13,178,102 |
| Net Realized Gain (Loss) on Investments, Other Financial Instruments and Foreign Currency Transactions on: | | | | | | | | | | | |
| Investments | 97,033,462 | | 37,763,336 | | 98,054,024 | | 182,382,109 | | 747,537 | | (10,667,321) |
| Less: Foreign taxes paid on realized capital gains | — | | — | | — | | — | | — | | (181,038) |
| Futures contracts | (353,508) | | 23,375,548 | | — | | — | | — | | — |
| Other foreign currency transactions | 20,086 | | 54,440 | | 4,816 | | 67,103 | | 6,824 | | (108,284) |
| Net Realized Gain (Loss) on Investments, Other Financial Instruments and Foreign Currency Transactions | 96,700,040 | | 61,193,324 | | 98,058,840 | | 182,449,212 | | 754,361 | | (10,956,643) |
| Net Changes in Unrealized Appreciation (Depreciation) of Investments, Other Financial Instruments and Foreign Currency Transactions of: | | | | | | | | | | | |
| Investments* | 102,079,849 | | 537,245,502 | | 382,165,001 | | 204,891,228 | | 4,321,911 | | 93,757,445 |
| Futures contracts | 145,825 | | 5,522,019 | | — | | — | | — | | — |
| Translation of other assets and liabilities in foreign currencies | 65,859 | | 5,542 | | (517) | | (2,078) | | 5,893 | | 76,642 |
| Net Changes in Unrealized Appreciation (Depreciation) of Investments, Other Financial Instruments and Foreign Currency Transactions | 102,291,533 | | 542,773,063 | | 382,164,484 | | 204,889,150 | | 4,327,804 | | 93,834,087 |
| Net Gain (Loss) on Investments, Other Financial Instruments and Foreign Currency Transactions | 198,991,573 | | 603,966,387 | | 480,223,324 | | 387,338,362 | | 5,082,165 | | 82,877,444 |
| Net Increase (Decrease) in Net Assets Resulting from Operations | $ 231,481,803 | | $ 634,272,212 | | $ 502,822,377 | | $ 443,731,093 | | $ 5,184,649 | | $ 96,055,546 |
| * Includes change in unrealized appreciation (depreciation) on deferred capital gains tax | $ — | | $ — | | $ — | | $ — | | $ — | | $ (661,664) |
The accompanying notes are an integral part of these financial statements.
Statements of Operations – (continued)
For the Year Ended December 31, 2023
| | Hartford
MidCap
HLS Fund | | Hartford
Small Cap
Growth
HLS Fund | | Hartford
Small
Company
HLS Fund | | Hartford
Stock
HLS Fund | | Hartford
Total Return
Bond
HLS Fund | | Hartford
Ultrashort
Bond
HLS Fund |
| Investment Income: | | | | | | | | | | | |
| Dividends | $ 7,160,152 | | $ 4,803,408 | | $ 3,153,423 | | $ 26,253,099 | | $ 144,383 | | $ — |
| Interest | 57,543 | | 452,496 | | 168,938 | | 1,105,830 | | 75,217,097 | | 25,769,055 |
| Securities lending — net | 34,487 | | 49,384 | | 50,787 | | 12,556 | | 24,299 | | 57,302 |
| Less: Foreign tax withheld | (19,993) | | — | | — | | (83,760) | | (46,057) | | — |
| Total investment income, net | 7,232,189 | | 5,305,288 | | 3,373,148 | | 27,287,725 | | 75,339,722 | | 25,826,357 |
| Expenses: | | | | | | | | | | | |
| Investment management fees | 8,028,663 | | 4,421,209 | | 3,131,104 | | 6,459,593 | | 8,370,447 | | 2,351,718 |
| Transfer agent fees | | | | | | | | | | | |
| Class IA | 6,732 | | 5,487 | | 5,491 | | 5,273 | | 5,745 | | 5,062 |
| Class IB | 569 | | 1,797 | | 554 | | 479 | | 609 | | 788 |
| Distribution fees | | | | | | | | | | | |
| Class IB | 223,018 | | 444,215 | | 95,096 | | 278,443 | | 423,182 | | 198,023 |
| Custodian fees | 11,657 | | 4,980 | | 15,616 | | 6,243 | | 20,798 | | 3,626 |
| Registration and filing fees | 13,860 | | 23,033 | | 13,159 | | 12,493 | | 14,504 | | 12,391 |
| Accounting services fees | 166,628 | | 118,570 | | 73,791 | | 199,155 | | 261,517 | | 101,970 |
| Board of Directors' fees | 30,803 | | 19,399 | | 11,309 | | 37,272 | | 48,781 | | 16,072 |
| Audit and tax fees | 29,843 | | 30,125 | | 32,960 | | 29,847 | | 46,269 | | 42,191 |
| Other expenses | 62,969 | | 78,544 | | 43,789 | | 87,634 | | 131,519 | | 67,284 |
| Total expenses (before waivers, reimbursements and fees paid indirectly) | 8,574,742 | | 5,147,359 | | 3,422,869 | | 7,116,432 | | 9,323,371 | | 2,799,125 |
| Commission recapture | (7,507) | | (8,034) | | (4,452) | | (949) | | — | | — |
| Total waivers, reimbursements and fees paid indirectly | (7,507) | | (8,034) | | (4,452) | | (949) | | — | | — |
| Total expenses | 8,567,235 | | 5,139,325 | | 3,418,417 | | 7,115,483 | | 9,323,371 | | 2,799,125 |
| Net Investment Income (Loss) | (1,335,046) | | 165,963 | | (45,269) | | 20,172,242 | | 66,016,351 | | 23,027,232 |
| Net Realized Gain (Loss) on Investments, Other Financial Instruments and Foreign Currency Transactions on: | | | | | | | | | | | |
| Investments | 38,354,045 | | 65,187,923 | | (425,762) | | 38,162,945 | | (42,944,016) | | (343,867) |
| Purchased options contracts | — | | — | | — | | — | | 13,993 | | — |
| Futures contracts | — | | — | | — | | — | | 802,745 | | — |
| Written options contracts | — | | — | | — | | — | | 797,022 | | — |
| Swap contracts | — | | — | | — | | — | | (2,476,518) | | — |
| Foreign currency contracts | — | | — | | — | | — | | (1,972,233) | | — |
| Other foreign currency transactions | — | | — | | — | | 3,350 | | 39,208 | | — |
| Net Realized Gain (Loss) on Investments, Other Financial Instruments and Foreign Currency Transactions | 38,354,045 | | 65,187,923 | | (425,762) | | 38,166,295 | | (45,739,799) | | (343,867) |
| Net Changes in Unrealized Appreciation (Depreciation) of Investments, Other Financial Instruments and Foreign Currency Transactions of: | | | | | | | | | | | |
| Investments | 121,099,139 | | 56,908,462 | | 65,100,374 | | 39,506,263 | | 98,253,844 | | 6,491,205 |
| Futures contracts | — | | — | | — | | — | | (3,188,748) | | — |
| Swap contracts | — | | — | | — | | — | | 1,069,399 | | — |
| Foreign currency contracts | — | | — | | — | | — | | 333,563 | | — |
| Translation of other assets and liabilities in foreign currencies | — | | — | | — | | — | | 69,017 | | — |
| Net Changes in Unrealized Appreciation (Depreciation) of Investments, Other Financial Instruments and Foreign Currency Transactions | 121,099,139 | | 56,908,462 | | 65,100,374 | | 39,506,263 | | 96,537,075 | | 6,491,205 |
| Net Gain (Loss) on Investments, Other Financial Instruments and Foreign Currency Transactions | 159,453,184 | | 122,096,385 | | 64,674,612 | | 77,672,558 | | 50,797,276 | | 6,147,338 |
| Net Increase (Decrease) in Net Assets Resulting from Operations | $ 158,118,138 | | $ 122,262,348 | | $ 64,629,343 | | $ 97,844,800 | | $ 116,813,627 | | $ 29,174,570 |
The accompanying notes are an integral part of these financial statements.
Statements of Changes in Net Assets
| | Hartford Balanced
HLS Fund | | Hartford Capital
Appreciation HLS Fund |
| | For the
Year Ended
December 31,
2023 | | For the
Year Ended
December 31,
2022 | | For the
Year Ended
December 31,
2023 | | For the
Year Ended
December 31,
2022 |
| Operations: | | | | | | | |
| Net investment income (loss) | $ 32,490,230 | | $ 26,443,021 | | $ 30,305,825 | | $ 25,227,055 |
| Net realized gain (loss) on investments, other financial instruments and foreign currency transactions | 96,700,040 | | 49,601,120 | | 61,193,324 | | 35,912,012 |
| Net changes in unrealized appreciation (depreciation) of investments, other financial instruments and foreign currency transactions | 102,291,533 | | (366,145,089) | | 542,773,063 | | (739,642,523) |
| Net Increase (Decrease) in Net Assets Resulting from Operations | 231,481,803 | | (290,100,948) | | 634,272,212 | | (678,503,456) |
| Distributions to Shareholders: | | | | | | | |
| Class IA | (69,414,974) | | (235,269,227) | | (78,837,685) | | (462,293,161) |
| Class IB | (8,456,331) | | (30,348,829) | | (8,520,079) | | (55,511,710) |
| Class IC | — | | — | | (296,738) | | (4,579,357) |
| Total distributions | (77,871,305) | | (265,618,056) | | (87,654,502) | | (522,384,228) |
| Capital Share Transactions: | | | | | | | |
| Sold | 10,003,506 | | 8,695,096 | | 23,301,060 | | 25,635,408 |
| Issued on reinvestment of distributions | 77,871,305 | | 265,618,056 | | 87,654,502 | | 522,384,228 |
| Redeemed | (240,296,963) | | (227,999,344) | | (486,206,250) | | (449,319,830) |
| Net increase (decrease) from capital share transactions | (152,422,152) | | 46,313,808 | | (375,250,688) | | 98,699,806 |
| Net Increase (Decrease) in Net Assets | 1,188,346 | | (509,405,196) | | 171,367,022 | | (1,102,187,878) |
| Net Assets: | | | | | | | |
| Beginning of period | 1,699,397,854 | | 2,208,803,050 | | 3,408,214,248 | | 4,510,402,126 |
| End of period | $ 1,700,586,200 | | $ 1,699,397,854 | | $ 3,579,581,270 | | $ 3,408,214,248 |
The accompanying notes are an integral part of these financial statements.
Statements of Changes in Net Assets – (continued)
| | Hartford Disciplined
Equity HLS Fund | | Hartford Dividend
and Growth HLS Fund |
| | For the
Year Ended
December 31,
2023 | | For the
Year Ended
December 31,
2022 | | For the
Year Ended
December 31,
2023 | | For the
Year Ended
December 31,
2022 |
| Operations: | | | | | | | |
| Net investment income (loss) | $ 22,599,053 | | $ 24,296,026 | | $ 56,392,731 | | $ 54,037,563 |
| Net realized gain (loss) on investments, other financial instruments and foreign currency transactions | 98,058,840 | | 17,190,322 | | 182,449,212 | | 297,761,610 |
| Net changes in unrealized appreciation (depreciation) of investments, other financial instruments and foreign currency transactions | 382,164,484 | | (683,467,246) | | 204,889,150 | | (710,962,468) |
| Net Increase (Decrease) in Net Assets Resulting from Operations | 502,822,377 | | (641,980,898) | | 443,731,093 | | (359,163,295) |
| Distributions to Shareholders: | | | | | | | |
| Class IA | (33,301,220) | | (157,383,630) | | (304,312,836) | | (385,201,370) |
| Class IB | (3,393,798) | | (19,344,478) | | (37,252,934) | | (48,643,796) |
| Class IC | (593,693) | | (4,180,932) | | — | | — |
| Total distributions | (37,288,711) | | (180,909,040) | | (341,565,770) | | (433,845,166) |
| Capital Share Transactions: | | | | | | | |
| Sold | 28,670,757 | | 23,277,374 | | 112,252,518 | | 68,294,388 |
| Issued on reinvestment of distributions | 37,288,711 | | 180,909,040 | | 341,565,770 | | 433,845,166 |
| Redeemed | (343,402,110) | | (321,060,931) | | (457,436,112) | | (469,123,286) |
| Net increase (decrease) from capital share transactions | (277,442,642) | | (116,874,517) | | (3,617,824) | | 33,016,268 |
| Net Increase (Decrease) in Net Assets | 188,091,024 | | (939,764,455) | | 98,547,499 | | (759,992,193) |
| Net Assets: | | | | | | | |
| Beginning of period | 2,531,530,835 | | 3,471,295,290 | | 3,365,097,857 | | 4,125,090,050 |
| End of period | $ 2,719,621,859 | | $ 2,531,530,835 | | $ 3,463,645,356 | | $ 3,365,097,857 |
The accompanying notes are an integral part of these financial statements.
Statements of Changes in Net Assets – (continued)
| | Hartford Healthcare
HLS Fund | | Hartford International
Opportunities HLS Fund |
| | For the
Year Ended
December 31,
2023 | | For the
Year Ended
December 31,
2022 | | For the
Year Ended
December 31,
2023 | | For the
Year Ended
December 31,
2022 |
| Operations: | | | | | | | |
| Net investment income (loss) | $ 102,484 | | $ 145,148 | | $ 13,178,102 | | $ 15,784,982 |
| Net realized gain (loss) on investments, other financial instruments and foreign currency transactions | 754,361 | | 1,846,494 | | (10,956,643) | | (46,855,748) |
| Net changes in unrealized appreciation (depreciation) of investments, other financial instruments and foreign currency transactions | 4,327,804 | | (25,407,435) | | 93,834,087 | | (179,451,974) |
| Net Increase (Decrease) in Net Assets Resulting from Operations | 5,184,649 | | (23,415,793) | | 96,055,546 | | (210,522,740) |
| Distributions to Shareholders: | | | | | | | |
| Class IA | (1,980,484) | | (28,988,229) | | (9,247,593) | | (160,928,347) |
| Class IB | (532,405) | | (8,169,954) | | (713,800) | | (16,407,281) |
| Total distributions | (2,512,889) | | (37,158,183) | | (9,961,393) | | (177,335,628) |
| Capital Share Transactions: | | | | | | | |
| Sold | 7,780,186 | | 6,630,344 | | 44,323,068 | | 47,734,594 |
| Issued on reinvestment of distributions | 2,512,889 | | 37,158,183 | | 9,961,393 | | 177,335,628 |
| Redeemed | (27,456,846) | | (35,537,767) | | (139,444,400) | | (142,819,227) |
| Net increase (decrease) from capital share transactions | (17,163,771) | | 8,250,760 | | (85,159,939) | | 82,250,995 |
| Net Increase (Decrease) in Net Assets | (14,492,011) | | (52,323,216) | | 934,214 | | (305,607,373) |
| Net Assets: | | | | | | | |
| Beginning of period | 153,067,567 | | 205,390,783 | | 871,389,718 | | 1,176,997,091 |
| End of period | $ 138,575,556 | | $ 153,067,567 | | $ 872,323,932 | | $ 871,389,718 |
The accompanying notes are an integral part of these financial statements.
Statements of Changes in Net Assets – (continued)
| | Hartford MidCap
HLS Fund | | Hartford Small
Cap Growth HLS Fund |
| | For the
Year Ended
December 31,
2023 | | For the
Year Ended
December 31,
2022 | | For the
Year Ended
December 31,
2023 | | For the
Year Ended
December 31,
2022 |
| Operations: | | | | | | | |
| Net investment income (loss) | $ (1,335,046) | | $ 690,460 | | $ 165,963 | | $ (1,008,274) |
| Net realized gain (loss) on investments, other financial instruments and foreign currency transactions | 38,354,045 | | 74,948,149 | | 65,187,923 | | (99,052,280) |
| Net changes in unrealized appreciation (depreciation) of investments, other financial instruments and foreign currency transactions | 121,099,139 | | (554,367,328) | | 56,908,462 | | (278,930,155) |
| Net Increase (Decrease) in Net Assets Resulting from Operations | 158,118,138 | | (478,728,719) | | 122,262,348 | | (378,990,709) |
| Distributions to Shareholders: | | | | | | | |
| Class IA | (75,946,142) | | (198,350,672) | | — | | (145,857,718) |
| Class IB | (6,787,836) | | (15,789,357) | | — | | (32,638,843) |
| Total distributions | (82,733,978) | | (214,140,029) | | — | | (178,496,561) |
| Capital Share Transactions: | | | | | | | |
| Sold | 60,088,138 | | 63,623,913 | | 63,486,537 | | 139,734,072 |
| Issued on reinvestment of distributions | 82,733,978 | | 214,140,029 | | — | | 178,496,561 |
| Redeemed | (257,158,457) | | (548,099,232) | | (116,208,760) | | (446,544,953) |
| Net increase (decrease) from capital share transactions | (114,336,341) | | (270,335,290) | | (52,722,223) | | (128,314,320) |
| Net Increase (Decrease) in Net Assets | (38,952,181) | | (963,204,038) | | 69,540,125 | | (685,801,590) |
| Net Assets: | | | | | | | |
| Beginning of period | 1,140,108,171 | | 2,103,312,209 | | 692,941,619 | | 1,378,743,209 |
| End of period | $ 1,101,155,990 | | $ 1,140,108,171 | | $ 762,481,744 | | $ 692,941,619 |
The accompanying notes are an integral part of these financial statements.
Statements of Changes in Net Assets – (continued)
| | Hartford Small
Company HLS Fund | | Hartford Stock
HLS Fund |
| | For the
Year Ended
December 31,
2023 | | For the
Year Ended
December 31,
2022 | | For the
Year Ended
December 31,
2023 | | For the
Year Ended
December 31,
2022 |
| Operations: | | | | | | | |
| Net investment income (loss) | $ (45,269) | | $ (512,101) | | $ 20,172,242 | | $ 19,719,564 |
| Net realized gain (loss) on investments, other financial instruments and foreign currency transactions | (425,762) | | (94,443,730) | | 38,166,295 | | 65,100,542 |
| Net changes in unrealized appreciation (depreciation) of investments, other financial instruments and foreign currency transactions | 65,100,374 | | (102,599,925) | | 39,506,263 | | (172,384,563) |
| Net Increase (Decrease) in Net Assets Resulting from Operations | 64,629,343 | | (197,555,756) | | 97,844,800 | | (87,564,457) |
| Distributions to Shareholders: | | | | | | | |
| Class IA | — | | (84,063,157) | | (75,334,720) | | (152,615,340) |
| Class IB | — | | (9,738,834) | | (6,552,438) | | (13,746,384) |
| Total distributions | — | | (93,801,991) | | (81,887,158) | | (166,361,724) |
| Capital Share Transactions: | | | | | | | |
| Sold | 16,462,850 | | 21,831,381 | | 8,876,972 | | 15,189,069 |
| Issued on reinvestment of distributions | — | | 93,801,991 | | 81,887,158 | | 166,361,724 |
| Redeemed | (66,515,923) | | (57,302,976) | | (171,396,875) | | (172,242,382) |
| Net increase (decrease) from capital share transactions | (50,053,073) | | 58,330,396 | | (80,632,745) | | 9,308,411 |
| Net Increase (Decrease) in Net Assets | 14,576,270 | | (233,027,351) | | (64,675,103) | | (244,617,770) |
| Net Assets: | | | | | | | |
| Beginning of period | 417,594,889 | | 650,622,240 | | 1,404,287,964 | | 1,648,905,734 |
| End of period | $ 432,171,159 | | $ 417,594,889 | | $ 1,339,612,861 | | $ 1,404,287,964 |
The accompanying notes are an integral part of these financial statements.
Statements of Changes in Net Assets – (continued)
| | Hartford Total
Return Bond HLS Fund | | Hartford Ultrashort
Bond HLS Fund |
| | For the
Year Ended
December 31,
2023 | | For the
Year Ended
December 31,
2022 | | For the
Year Ended
December 31,
2023 | | For the
Year Ended
December 31,
2022 |
| Operations: | | | | | | | |
| Net investment income (loss) | $ 66,016,351 | | $ 55,453,467 | | $ 23,027,232 | | $ 7,005,852 |
| Net realized gain (loss) on investments, other financial instruments and foreign currency transactions | (45,739,799) | | (134,142,364) | | (343,867) | | (321,079) |
| Net changes in unrealized appreciation (depreciation) of investments, other financial instruments and foreign currency transactions | 96,537,075 | | (238,543,750) | | 6,491,205 | | (8,625,157) |
| Net Increase (Decrease) in Net Assets Resulting from Operations | 116,813,627 | | (317,232,647) | | 29,174,570 | | (1,940,384) |
| Distributions to Shareholders: | | | | | | | |
| Class IA | (55,199,293) | | (72,553,255) | | (6,533,801) | | (1,268,070) |
| Class IB | (5,333,502) | | (7,592,524) | | (786,067) | | — |
| Total distributions | (60,532,795) | | (80,145,779) | | (7,319,868) | | (1,268,070) |
| Capital Share Transactions: | | | | | | | |
| Sold | 147,641,434 | | 112,677,907 | | 35,193,599 | | 48,023,827 |
| Issued on reinvestment of distributions | 60,532,795 | | 80,145,779 | | 7,319,868 | | 1,268,070 |
| Redeemed | (244,649,710) | | (311,169,627) | | (115,577,370) | | (136,101,507) |
| Net increase (decrease) from capital share transactions | (36,475,481) | | (118,345,941) | | (73,063,903) | | (86,809,610) |
| Net Increase (Decrease) in Net Assets | 19,805,351 | | (515,724,367) | | (51,209,201) | | (90,018,064) |
| Net Assets: | | | | | | | |
| Beginning of period | 1,767,806,647 | | 2,283,531,014 | | 612,993,018 | | 703,011,082 |
| End of period | $ 1,787,611,998 | | $ 1,767,806,647 | | $ 561,783,817 | | $ 612,993,018 |
The accompanying notes are an integral part of these financial statements.
| | | — Selected Per-Share Data(1) — | | — Ratios and Supplemental Data — |
| Class | | Net
Asset
Value at
Beginning
of Period | | Net
Investment
Income
(Loss) | | Net
Realized
and
Unrealized
Gain (Loss)
on
Investments | | Total from
Investment
Operations | | Dividends
from Net
Investment
Income | | Distributions
from
Capital
Gains | | Total
Dividends
and
Distributions | | Net
Asset
Value at
End of
Period | | Total
Return(2) | | Net
Assets
at End
of Period
(000s) | | Ratio of
Expenses
to
Average
Net
Assets
Before
Adjust-
ments(3) | | Ratio of
Expenses
to
Average
Net
Assets
After
Adjust-
ments(3) | | Ratio of
Net
Investment
Income
(Loss) to
Average
Net Assets | | Portfolio
Turnover |
| Hartford Balanced HLS Fund |
| For the Year Ended December 31, 2023 |
| IA | | $ 26.27 | | $ 0.54 | | $ 3.28 | | $ 3.82 | | $ (0.53) | | $ (0.80) | | $ (1.33) | | $ 28.76 | | 14.78% | | $ 1,502,119 | | 0.66% | | 0.63% | | 1.96% | | 57% (4) |
| IB | | 26.88 | | 0.48 | | 3.35 | | 3.83 | | (0.45) | | (0.80) | | (1.25) | | 29.46 | | 14.50 | | 198,467 | | 0.91 | | 0.88 | | 1.71 | | 57 (4) |
| For the Year Ended December 31, 2022 |
| IA | | $ 35.47 | | $ 0.44 | | $ (5.08) | | $ (4.64) | | $ (0.53) | | $ (4.03) | | $ (4.56) | | $ 26.27 | | (13.42)% | | $ 1,499,116 | | 0.65% | | 0.62% | | 1.44% | | 53% (4) |
| IB | | 36.18 | | 0.37 | | (5.19) | | (4.82) | | (0.45) | | (4.03) | | (4.48) | | 26.88 | | (13.66) | | 200,282 | | 0.90 | | 0.87 | | 1.19 | | 53 (4) |
| For the Year Ended December 31, 2021 |
| IA | | $ 31.56 | | $ 0.44 | | $ 5.70 | | $ 6.14 | | $ (0.35) | | $ (1.88) | | $ (2.23) | | $ 35.47 | | 19.64% | | $ 1,948,846 | | 0.66% | | 0.63% | | 1.29% | | 48% (4) |
| IB | | 32.15 | | 0.36 | | 5.81 | | 6.17 | | (0.26) | | (1.88) | | (2.14) | | 36.18 | | 19.37 | | 259,957 | | 0.91 | | 0.88 | | 1.04 | | 48 (4) |
| For the Year Ended December 31, 2020 |
| IA | | $ 30.27 | | $ 0.48 | | $ 2.92 | | $ 3.40 | | $ (0.51) | | $ (1.60) | | $ (2.11) | | $ 31.56 | | 11.62% | | $ 1,809,745 | | 0.66% | | 0.63% | | 1.63% | | 43% (4) |
| IB | | 30.80 | | 0.41 | | 2.97 | | 3.38 | | (0.43) | | (1.60) | | (2.03) | | 32.15 | | 11.35 | | 242,476 | | 0.91 | | 0.88 | | 1.38 | | 43 (4) |
| For the Year Ended December 31, 2019 |
| IA | | $ 27.47 | | $ 0.54(5) | | $ 5.47(5) | | $ 6.01 | | $ (0.56) | | $ (2.65) | | $ (3.21) | | $ 30.27 | | 22.80% | | $ 1,849,582 | | 0.66% | | 0.63% | | 1.81% (5) | | 38% |
| IB | | 27.91 | | 0.47 (5) | | 5.55 (5) | | 6.02 | | (0.48) | | (2.65) | | (3.13) | | 30.80 | | 22.47 | | 247,264 | | 0.91 | | 0.88 | | 1.56 (5) | | 38 |
| Hartford Capital Appreciation HLS Fund |
| For the Year Ended December 31, 2023 |
| IA | | $ 39.37 | | $ 0.38 | | $ 7.42 | | $ 7.80 | | $ (0.38) | | $ (0.74) | | $ (1.12) | | $ 46.05 | | 19.97% | | $ 3,194,008 | | 0.67% | | 0.67% | | 0.88% | | 49% |
| IB | | 38.39 | | 0.26 | | 7.23 | | 7.49 | | (0.27) | | (0.74) | | (1.01) | | 44.87 | | 19.67 | | 371,021 | | 0.92 | | 0.92 | | 0.63 | | 49 |
| IC | | 38.65 | | 0.16 | | 7.27 | | 7.43 | | (0.16) | | (0.74) | | (0.90) | | 45.18 | | 19.38 | | 14,552 | | 1.17 | | 1.17 | | 0.38 | | 49 |
| For the Year Ended December 31, 2022 |
| IA | | $ 54.26 | | $ 0.32 | | $ (8.52) | | $ (8.20) | | $ (0.41) | | $ (6.28) | | $ (6.69) | | $ 39.37 | | (15.28)% | | $ 3,034,471 | | 0.67% | | 0.67% | | 0.71% | | 64% |
| IB | | 53.10 | | 0.20 | | (8.33) | | (8.13) | | (0.30) | | (6.28) | | (6.58) | | 38.39 | | (15.48) | | 359,906 | | 0.92 | | 0.92 | | 0.46 | | 64 |
| IC | | 53.33 | | 0.07 | | (8.35) | | (8.28) | | (0.12) | | (6.28) | | (6.40) | | 38.65 | | (15.71) | | 13,837 | | 1.17 | | 1.17 | | 0.16 | | 64 |
| For the Year Ended December 31, 2021 |
| IA | | $ 51.85 | | $ 0.33 | | $ 7.27 | | $ 7.60 | | $ (0.26) | | $ (4.93) | | $ (5.19) | | $ 54.26 | | 14.76% | | $ 3,986,182 | | 0.67% | | 0.67% | | 0.61% | | 58% |
| IB | | 50.85 | | 0.19 | | 7.11 | | 7.30 | | (0.12) | | (4.93) | | (5.05) | | 53.10 | | 14.45 | | 483,113 | | 0.92 | | 0.92 | | 0.36 | | 58 |
| IC | | 51.08 | | 0.06 | | 7.14 | | 7.20 | | (0.02) | | (4.93) | | (4.95) | | 53.33 | | 14.18 | | 41,107 | | 1.17 | | 1.17 | | 0.11 | | 58 |
| For the Year Ended December 31, 2020 |
| IA | | $ 46.05 | | $ 0.42 | | $ 9.37 | | $ 9.79 | | $ (0.45) | | $ (3.54) | | $ (3.99) | | $ 51.85 | | 21.91% | | $ 4,024,340 | | 0.68% | | 0.68% | | 0.91% | | 80% |
| IB | | 45.24 | | 0.30 | | 9.18 | | 9.48 | | (0.33) | | (3.54) | | (3.87) | | 50.85 | | 21.62 | | 487,576 | | 0.93 | | 0.93 | | 0.66 | | 80 |
| IC | | 45.45 | | 0.19 | | 9.20 | | 9.39 | | (0.22) | | (3.54) | | (3.76) | | 51.08 | | 21.32 | | 39,361 | | 1.18 | | 1.18 | | 0.41 | | 80 |
| For the Year Ended December 31, 2019 |
| IA | | $ 39.89 | | $ 0.48 | | $ 11.47 | | $ 11.95 | | $ (0.53) | | $ (5.26) | | $ (5.79) | | $ 46.05 | | 31.28% | | $ 3,847,850 | | 0.68% | | 0.68% | | 1.06% | | 56% |
| IB | | 39.28 | | 0.36 | | 11.28 | | 11.64 | | (0.42) | | (5.26) | | (5.68) | | 45.24 | | 30.96 | | 474,982 | | 0.93 | | 0.93 | | 0.81 | | 56 |
| IC | | 39.54 | | 0.25 | | 11.34 | | 11.59 | | (0.42) | | (5.26) | | (5.68) | | 45.45 | | 30.63 | | 35,043 | | 1.18 | | 1.18 | | 0.56 | | 56 |
| Hartford Disciplined Equity HLS Fund |
| For the Year Ended December 31, 2023 |
| IA | | $ 15.78 | | $ 0.16 | | $ 3.18 | | $ 3.34 | | $ (0.15) | | $ (0.11) | | $ (0.26) | | $ 18.86 | | 21.24% | | $ 2,371,805 | | 0.59% | | 0.59% | | 0.90% | | 22% |
| IB | | 15.50 | | 0.11 | | 3.12 | | 3.23 | | (0.10) | | (0.11) | | (0.21) | | 18.52 | | 20.95 | | 283,695 | | 0.84 | | 0.84 | | 0.66 | | 22 |
| IC | | 15.78 | | 0.07 | | 3.18 | | 3.25 | | (0.06) | | (0.11) | | (0.17) | | 18.86 | | 20.66 | | 64,122 | | 1.09 | | 1.09 | | 0.41 | | 22 |
| For the Year Ended December 31, 2022 |
| IA | | $ 20.85 | | $ 0.16 | | $ (4.06) | | $ (3.90) | | $ (0.18) | | $ (0.99) | | $ (1.17) | | $ 15.78 | | (18.96)% | | $ 2,196,538 | | 0.59% | | 0.59% | | 0.90% | | 13% |
| IB | | 20.51 | | 0.11 | | (4.00) | | (3.89) | | (0.13) | | (0.99) | | (1.12) | | 15.50 | | (19.20) | | 272,407 | | 0.84 | | 0.84 | | 0.65 | | 13 |
| IC | | 20.85 | | 0.07 | | (4.06) | | (3.99) | | (0.09) | | (0.99) | | (1.08) | | 15.78 | | (19.40) | | 62,585 | | 1.09 | | 1.09 | | 0.40 | | 13 |
The accompanying notes are an integral part of these financial statements.
Financial Highlights – (continued)
| | | — Selected Per-Share Data(1) — | | — Ratios and Supplemental Data — |
| Class | | Net
Asset
Value at
Beginning
of Period | | Net
Investment
Income
(Loss) | | Net
Realized
and
Unrealized
Gain (Loss)
on
Investments | | Total from
Investment
Operations | | Dividends
from Net
Investment
Income | | Distributions
from
Capital
Gains | | Total
Dividends
and
Distributions | | Net
Asset
Value at
End of
Period | | Total
Return(2) | | Net
Assets
at End
of Period
(000s) | | Ratio of
Expenses
to
Average
Net
Assets
Before
Adjust-
ments(3) | | Ratio of
Expenses
to
Average
Net
Assets
After
Adjust-
ments(3) | | Ratio of
Net
Investment
Income
(Loss) to
Average
Net Assets | | Portfolio
Turnover |
| Hartford Disciplined Equity HLS Fund – (continued) |
| For the Year Ended December 31, 2021 |
| IA | | $ 17.40 | | $ 0.13 | | $ 4.29 | | $ 4.42 | | $ (0.12) | | $ (0.85) | | $ (0.97) | | $ 20.85 | | 25.52% | | $ 2,997,803 | | 0.60% | | 0.60% | | 0.64% | | 14% |
| IB | | 17.13 | | 0.08 | | 4.21 | | 4.29 | | (0.06) | | (0.85) | | (0.91) | | 20.51 | | 25.21 | | 385,018 | | 0.85 | | 0.85 | | 0.39 | | 14 |
| IC | | 17.40 | | 0.03 | | 4.28 | | 4.31 | | (0.01) | | (0.85) | | (0.86) | | 20.85 | | 24.92 | | 88,474 | | 1.10 | | 1.10 | | 0.14 | | 14 |
| For the Year Ended December 31, 2020 |
| IA | | $ 15.97 | | $ 0.12 | | $ 2.64 | | $ 2.76 | | $ (0.06) | | $ (1.27) | | $ (1.33) | | $ 17.40 | | 18.04% | | $ 2,701,619 | | 0.66% | | 0.66% | | 0.75% | | 23% |
| IB | | 15.76 | | 0.08 | | 2.60 | | 2.68 | | (0.04) | | (1.27) | | (1.31) | | 17.13 | | 17.78 | | 365,246 | | 0.91 | | 0.91 | | 0.50 | | 23 |
| IC (6) | | 15.34 | | 0.01 | | 2.08 | | 2.09 | | (0.03) | | — | | (0.03) | | 17.40 | | 13.60 (7) | | 78,487 | | 1.11 (8) | | 1.11 (8) | | 0.23 (8) | | 23 |
| For the Year Ended December 31, 2019 |
| IA | | $ 13.59 | | $ 0.13 | | $ 4.26 | | $ 4.39 | | $ (0.14) | | $ (1.87) | | $ (2.01) | | $ 15.97 | | 34.12% | | $ 573,688 | | 0.78% | | 0.78% | | 0.82% | | 15% |
| IB | | 13.44 | | 0.09 | | 4.20 | | 4.29 | | (0.10) | | (1.87) | | (1.97) | | 15.76 | | 33.76 | | 80,224 | | 1.03 | | 1.03 | | 0.57 | | 15 |
| Hartford Dividend and Growth HLS Fund |
| For the Year Ended December 31, 2023 |
| IA | | $ 22.04 | | $ 0.38 | | $ 2.58 | | $ 2.96 | | $ (0.34) | | $ (2.03) | | $ (2.37) | | $ 22.63 | | 14.18% | | $ 3,085,357 | | 0.66% | | 0.66% | | 1.69% | | 27% |
| IB | | 21.86 | | 0.32 | | 2.56 | | 2.88 | | (0.29) | | (2.03) | | (2.32) | | 22.42 | | 13.89 | | 378,288 | | 0.91 | | 0.91 | | 1.44 | | 27 |
| For the Year Ended December 31, 2022 |
| IA | | $ 27.58 | | $ 0.38 | | $ (2.83) | | $ (2.45) | | $ (0.40) | | $ (2.69) | | $ (3.09) | | $ 22.04 | | (8.93)% | | $ 2,986,097 | | 0.65% | | 0.65% | | 1.52% | | 23% |
| IB | | 27.38 | | 0.31 | | (2.80) | | (2.49) | | (0.34) | | (2.69) | | (3.03) | | 21.86 | | (9.15) | | 379,001 | | 0.90 | | 0.90 | | 1.27 | | 23 |
| For the Year Ended December 31, 2021 |
| IA | | $ 22.19 | | $ 0.35 | | $ 6.67 | | $ 7.02 | | $ (0.34) | | $ (1.29) | | $ (1.63) | | $ 27.58 | | 32.00% | | $ 3,654,208 | | 0.66% | | 0.66% | | 1.36% | | 21% |
| IB | | 22.04 | | 0.28 | | 6.62 | | 6.90 | | (0.27) | | (1.29) | | (1.56) | | 27.38 | | 31.68 | | 470,882 | | 0.91 | | 0.91 | | 1.12 | | 21 |
| For the Year Ended December 31, 2020 |
| IA | | $ 22.08 | | $ 0.40 | | $ 1.18 | | $ 1.58 | | $ (0.39) | | $ (1.08) | | $ (1.47) | | $ 22.19 | | 7.77% | | $ 3,109,772 | | 0.68% | | 0.68% | | 1.95% | | 24% |
| IB | | 21.96 | | 0.34 | | 1.16 | | 1.50 | | (0.34) | | (1.08) | | (1.42) | | 22.04 | | 7.45 | | 412,528 | | 0.93 | | 0.93 | | 1.70 | | 24 |
| For the Year Ended December 31, 2019 |
| IA | | $ 19.91 | | $ 0.41 | | $ 4.91 | | $ 5.32 | | $ (0.40) | | $ (2.75) | | $ (3.15) | | $ 22.08 | | 28.60% | | $ 2,916,542 | | 0.68% | | 0.68% | | 1.85% | | 19% |
| IB | | 19.82 | | 0.35 | | 4.89 | | 5.24 | | (0.35) | | (2.75) | | (3.10) | | 21.96 | | 28.30 | | 393,014 | | 0.93 | | 0.93 | | 1.60 | | 19 |
| Hartford Healthcare HLS Fund |
| For the Year Ended December 31, 2023 |
| IA | | $ 16.05 | | $ 0.02 | | $ 0.63 | | $ 0.65 | | $ (0.08) | | $ (0.21) | | $ (0.29) | | $ 16.41 | | 4.11% | | $ 109,010 | | 0.92% | | 0.92% | | 0.13% | | 28% |
| IB | | 14.14 | | (0.02) | | 0.55 | | 0.53 | | (0.04) | | (0.21) | | (0.25) | | 14.42 | | 3.81 | | 29,565 | | 1.17 | | 1.17 | | (0.12) | | 28 |
| For the Year Ended December 31, 2022 |
| IA | | $ 23.57 | | $ 0.03 | | $ (2.90) | | $ (2.87) | | $ — | | $ (4.65) | | $ (4.65) | | $ 16.05 | | (11.24)% | | $ 120,656 | | 0.91% | | 0.91% | | 0.14% | | 34% |
| IB | | 21.47 | | (0.02) | | (2.66) | | (2.68) | | — | | (4.65) | | (4.65) | | 14.14 | | (11.47) | | 32,411 | | 1.16 | | 1.16 | | (0.11) | | 34 |
| For the Year Ended December 31, 2021 |
| IA | | $ 23.88 | | $ (0.01) | | $ 2.44 | | $ 2.43 | | $ (0.06) | | $ (2.68) | | $ (2.74) | | $ 23.57 | | 10.01% | | $ 164,964 | | 0.92% | | 0.92% | | (0.05)% | | 51% |
| IB | | 21.97 | | (0.07) | | 2.25 | | 2.18 | | — | | (2.68) | | (2.68) | | 21.47 | | 9.76 | | 40,427 | | 1.17 | | 1.17 | | (0.30) | | 51 |
| For the Year Ended December 31, 2020 |
| IA | | $ 23.67 | | $ 0.02 | | $ 4.94 | | $ 4.96 | | $ (0.13) | | $ (4.62) | | $ (4.75) | | $ 23.88 | | 23.10% | | $ 190,371 | | 0.91% | | 0.91% | | 0.07% | | 42% |
| IB | | 22.12 | | (0.04) | | 4.58 | | 4.54 | | (0.07) | | (4.62) | | (4.69) | | 21.97 | | 22.79 | | 43,662 | | 1.16 | | 1.16 | | (0.18) | | 42 |
| For the Year Ended December 31, 2019 |
| IA | | $ 20.56 | | $ 0.03 | | $ 6.31 | | $ 6.34 | | $ — | | $ (3.23) | | $ (3.23) | | $ 23.67 | | 33.95% | | $ 191,260 | | 0.91% | | 0.91% | | 0.11% | | 42% |
| IB | | 19.44 | | (0.03) | | 5.94 | | 5.91 | | — | | (3.23) | | (3.23) | | 22.12 | | 33.68 | | 41,992 | | 1.16 | | 1.16 | | (0.16) | | 42 |
The accompanying notes are an integral part of these financial statements.
Financial Highlights – (continued)
| | | — Selected Per-Share Data(1) — | | — Ratios and Supplemental Data — |
| Class | | Net
Asset
Value at
Beginning
of Period | | Net
Investment
Income
(Loss) | | Net
Realized
and
Unrealized
Gain (Loss)
on
Investments | | Total from
Investment
Operations | | Dividends
from Net
Investment
Income | | Distributions
from
Capital
Gains | | Total
Dividends
and
Distributions | | Net
Asset
Value at
End of
Period | | Total
Return(2) | | Net
Assets
at End
of Period
(000s) | | Ratio of
Expenses
to
Average
Net
Assets
Before
Adjust-
ments(3) | | Ratio of
Expenses
to
Average
Net
Assets
After
Adjust-
ments(3) | | Ratio of
Net
Investment
Income
(Loss) to
Average
Net Assets | | Portfolio
Turnover |
| Hartford International Opportunities HLS Fund |
| For the Year Ended December 31, 2023 |
| IA | | $ 13.71 | | $ 0.22 | | $ 1.37 | | $ 1.59 | | $ (0.17) | | $ — | | $ (0.17) | | $ 15.13 | | 11.72% | | $ 791,135 | | 0.76% | | 0.76% | | 1.54% | | 54% |
| IB | | 13.99 | | 0.19 | | 1.40 | | 1.59 | | (0.13) | | — | | (0.13) | | 15.45 | | 11.45 | | 81,189 | | 1.01 | | 1.01 | | 1.29 | | 54 |
| For the Year Ended December 31, 2022 |
| IA | | $ 20.90 | | $ 0.27 | | $ (4.13) | | $ (3.86) | | $ (0.29) | | $ (3.04) | | $ (3.33) | | $ 13.71 | | (18.14)% | | $ 787,084 | | 0.75% | | 0.75% | | 1.69% | | 91% |
| IB | | 21.21 | | 0.24 | | (4.19) | | (3.95) | | (0.23) | | (3.04) | | (3.27) | | 13.99 | | (18.32) | | 84,305 | | 1.00 | | 1.00 | | 1.44 | | 91 |
| For the Year Ended December 31, 2021 |
| IA | | $ 19.58 | | $ 0.22 | | $ 1.31 | | $ 1.53 | | $ (0.21) | | $ — | | $ (0.21) | | $ 20.90 | | 7.82% | | $ 1,064,640 | | 0.73% | | 0.73% | | 1.09% | | 95% |
| IB | | 19.86 | | 0.18 | | 1.32 | | 1.50 | | (0.15) | | — | | (0.15) | | 21.21 | | 7.57 | | 112,357 | | 0.98 | | 0.98 | | 0.84 | | 95 |
| For the Year Ended December 31, 2020 |
| IA | | $ 16.56 | | $ 0.10 | | $ 3.24 | | $ 3.34 | | $ (0.32) | | $ — | | $ (0.32) | | $ 19.58 | | 20.45% | | $ 1,095,213 | | 0.76% | | 0.76% | | 0.61% | | 107% |
| IB | | 16.80 | | 0.06 | | 3.27 | | 3.33 | | (0.27) | | — | | (0.27) | | 19.86 | | 20.09 | | 143,449 | | 1.01 | | 1.01 | | 0.36 | | 107 |
| For the Year Ended December 31, 2019 |
| IA | | $ 13.91 | | $ 0.27 | | $ 3.30 | | $ 3.57 | | $ (0.30) | | $ (0.62) | | $ (0.92) | | $ 16.56 | | 26.43% | | $ 1,093,030 | | 0.74% | | 0.74% | | 1.74% | | 88% |
| IB | | 14.09 | | 0.24 | | 3.35 | | 3.59 | | (0.26) | | (0.62) | | (0.88) | | 16.80 | | 26.14 | | 135,655 | | 0.99 | | 0.99 | | 1.48 | | 88 |
| Hartford MidCap HLS Fund |
| For the Year Ended December 31, 2023 |
| IA | | $ 25.69 | | $ (0.03) | | $ 3.67 | | $ 3.64 | | $ (0.01) | | $ (1.97) | | $ (1.98) | | $ 27.35 | | 14.83% | | $ 1,009,741 | | 0.73% | | 0.73% | | (0.10)% | | 40% |
| IB | | 24.24 | | (0.09) | | 3.45 | | 3.36 | | — | | (1.97) | | (1.97) | | 25.63 | | 14.54 | | 91,415 | | 0.98 | | 0.98 | | (0.35) | | 40 |
| For the Year Ended December 31, 2022 |
| IA | | $ 40.31 | | $ 0.02 | | $ (9.57) | | $ (9.55) | | $ (0.29) | | $ (4.78) | | $ (5.07) | | $ 25.69 | | (24.27)% | | $ 1,051,771 | | 0.71% | | 0.71% | | 0.06% | | 44% |
| IB | | 38.35 | | (0.05) | | (9.09) | | (9.14) | | (0.19) | | (4.78) | | (4.97) | | 24.24 | | (24.46) | | 88,337 | | 0.96 | | 0.96 | | (0.18) | | 44 |
| For the Year Ended December 31, 2021 |
| IA | | $ 43.44 | | $ 0.29 | | $ 3.97 | | $ 4.26 | | $ — | | $ (7.39) | | $ (7.39) | | $ 40.31 | | 9.91% | | $ 1,973,242 | | 0.69% | | 0.69% | | 0.65% | | 28% |
| IB | | 41.76 | | 0.15 | | 3.83 | | 3.98 | | — | | (7.39) | | (7.39) | | 38.35 | | 9.62 | | 130,071 | | 0.94 | | 0.94 | | 0.37 | | 28 |
| For the Year Ended December 31, 2020 |
| IA | | $ 38.17 | | $ 0.03 | | $ 8.90 | | $ 8.93 | | $ (0.02) | | $ (3.64) | | $ (3.66) | | $ 43.44 | | 25.10% | | $ 2,377,320 | | 0.70% | | 0.70% | | 0.07% | | 50% |
| IB | | 36.90 | | (0.04) | | 8.54 | | 8.50 | | — | | (3.64) | | (3.64) | | 41.76 | | 24.80 | | 140,632 | | 0.95 | | 0.95 | | (0.11) | | 50 |
| For the Year Ended December 31, 2019 |
| IA | | $ 33.77 | | $ 0.05 | | $ 10.56 | | $ 10.61 | | $ (0.07) | | $ (6.14) | | $ (6.21) | | $ 38.17 | | 32.87% | | $ 2,045,156 | | 0.69% | | 0.69% | | 0.12% | | 29% |
| IB | | 32.85 | | (0.05) | | 10.24 | | 10.19 | | — | | (6.14) | | (6.14) | | 36.90 | | 32.49 | | 55,049 | | 0.94 | | 0.94 | | (0.12) | | 29 |
| Hartford Small Cap Growth HLS Fund |
| For the Year Ended December 31, 2023 |
| IA | | $ 21.71 | | $ 0.02 | | $ 3.98 | | $ 4.00 | | $ — | | $ — | | $ — | | $ 25.71 | | 18.42% | | $ 569,738 | | 0.65% | | 0.65% | | 0.08% | | 63% |
| IB | | 20.35 | | (0.04) | | 3.72 | | 3.68 | | — | | — | | — | | 24.03 | | 18.08 | | 192,744 | | 0.90 | | 0.90 | | (0.16) | | 63 |
| For the Year Ended December 31, 2022 |
| IA | | $ 36.60 | | $ (0.02) | | $ (10.09) | | $ (10.11) | | $ — | | $ (4.78) | | $ (4.78) | | $ 21.71 | | (28.46)% | | $ 522,920 | | 0.64% | | 0.64% | | (0.06)% | | 52% |
| IB | | 34.77 | | (0.07) | | (9.57) | | (9.64) | | — | | (4.78) | | (4.78) | | 20.35 | | (28.61) | | 170,021 | | 0.89 | | 0.89 | | (0.30) | | 52 |
| For the Year Ended December 31, 2021 |
| IA | | $ 38.15 | | $ (0.04) | | $ 1.68 | | $ 1.64 | | $ — | | $ (3.19) | | $ (3.19) | | $ 36.60 | | 4.02% | | $ 1,153,860 | | 0.63% | | 0.63% | | (0.11)% | | 44% |
| IB | | 36.48 | | (0.13) | | 1.61 | | 1.48 | | — | | (3.19) | | (3.19) | | 34.77 | | 3.76 | | 224,883 | | 0.88 | | 0.88 | | (0.36) | | 44 |
| For the Year Ended December 31, 2020 |
| IA | | $ 29.72 | | $ (0.02) | | $ 9.57 | | $ 9.55 | | $ — | | $ (1.12) | | $ (1.12) | | $ 38.15 | | 33.20% | | $ 1,224,012 | | 0.67% | | 0.67% | | (0.07)% | | 61% |
| IB | | 28.53 | | (0.09) | | 9.16 | | 9.07 | | — | | (1.12) | | (1.12) | | 36.48 | | 32.89 | | 201,033 | | 0.92 | | 0.92 | | (0.34) | | 61 |
The accompanying notes are an integral part of these financial statements.
Financial Highlights – (continued)
| | | — Selected Per-Share Data(1) — | | — Ratios and Supplemental Data — |
| Class | | Net
Asset
Value at
Beginning
of Period | | Net
Investment
Income
(Loss) | | Net
Realized
and
Unrealized
Gain (Loss)
on
Investments | | Total from
Investment
Operations | | Dividends
from Net
Investment
Income | | Distributions
from
Capital
Gains | | Total
Dividends
and
Distributions | | Net
Asset
Value at
End of
Period | | Total
Return(2) | | Net
Assets
at End
of Period
(000s) | | Ratio of
Expenses
to
Average
Net
Assets
Before
Adjust-
ments(3) | | Ratio of
Expenses
to
Average
Net
Assets
After
Adjust-
ments(3) | | Ratio of
Net
Investment
Income
(Loss) to
Average
Net Assets | | Portfolio
Turnover |
| Hartford Small Cap Growth HLS Fund – (continued) |
| For the Year Ended December 31, 2019 |
| IA | | $ 26.76 | | $ 0.03 | | $ 8.61 | | $ 8.64 | | $ — | | $ (5.68) | | $ (5.68) | | $ 29.72 | | 35.81% | | $ 954,063 | | 0.64% | | 0.64% | | 0.11% | | 42% |
| IB | | 25.95 | | (0.04) | | 8.30 | | 8.26 | | — | | (5.68) | | (5.68) | | 28.53 | | 35.45 | | 381,057 | | 0.89 | | 0.89 | | (0.14) | | 42 |
| Hartford Small Company HLS Fund |
| For the Year Ended December 31, 2023 |
| IA | | $ 13.57 | | $ (0.00) (9) | | $ 2.26 | | $ 2.26 | | $ — | | $ — | | $ — | | $ 15.83 | | 16.65% | | $ 392,112 | | 0.80% | | 0.80% | | 0.01% | | 39% |
| IB | | 11.24 | | (0.03) | | 1.88 | | 1.85 | | — | | — | | — | | 13.09 | | 16.46 | | 40,059 | | 1.05 | | 1.05 | | (0.24) | | 39 |
| For the Year Ended December 31, 2022 |
| IA | | $ 24.57 | | $ (0.01) | | $ (7.33) | | $ (7.34) | | $ — | | $ (3.66) | | $ (3.66) | | $ 13.57 | | (30.88)% | | $ 379,584 | | 0.79% | | 0.79% | | (0.08)% | | 87% |
| IB | | 21.25 | | (0.05) | | (6.30) | | (6.35) | | — | | (3.66) | | (3.66) | | 11.24 | | (31.07) | | 38,011 | | 1.04 | | 1.04 | | (0.33) | | 87 |
| For the Year Ended December 31, 2021 |
| IA | | $ 27.44 | | $ (0.14) | | $ 0.66 | | $ 0.52 | | $ — | | $ (3.39) | | $ (3.39) | | $ 24.57 | | 1.56% | | $ 590,597 | | 0.77% | | 0.77% | | (0.51)% | | 111% |
| IB | | 24.23 | | (0.19) | | 0.60 | | 0.41 | | — | | (3.39) | | (3.39) | | 21.25 | | 1.30 | | 60,025 | | 1.02 | | 1.02 | | (0.79) | | 111 |
| For the Year Ended December 31, 2020 |
| IA | | $ 20.45 | | $ (0.07) | | $ 10.38 | | $ 10.31 | | $ — | | $ (3.32) | | $ (3.32) | | $ 27.44 | | 55.52% | | $ 540,764 | | 0.81% | | 0.81% | | (0.32)% | | 105% |
| IB | | 18.44 | | (0.11) | | 9.22 | | 9.11 | | — | | (3.32) | | (3.32) | | 24.23 | | 55.03 | | 67,898 | | 1.06 | | 1.06 | | (0.56) | | 105 |
| For the Year Ended December 31, 2019 |
| IA | | $ 18.38 | | $ (0.05) | | $ 6.36 | | $ 6.31 | | $ — | | $ (4.24) | | $ (4.24) | | $ 20.45 | | 37.00% | | $ 572,642 | | 0.79% | | 0.79% | | (0.23)% | | 79% |
| IB | | 16.94 | | (0.09) | | 5.83 | | 5.74 | | — | | (4.24) | | (4.24) | | 18.44 | | 36.77 | | 51,691 | | 1.04 | | 1.04 | | (0.49) | | 79 |
| Hartford Stock HLS Fund |
| For the Year Ended December 31, 2023 |
| IA | | $ 95.62 | | $ 1.45 | | $ 5.62 | | $ 7.07 | | $ (1.25) | | $ (4.76) | | $ (6.01) | | $ 96.68 | | 7.72% | | $ 1,228,741 | | 0.51% | | 0.51% | | 1.53% | | 8% |
| IB | | 95.55 | | 1.21 | | 5.61 | | 6.82 | | (1.01) | | (4.76) | | (5.77) | | 96.60 | | 7.45 | | 110,872 | | 0.76 | | 0.76 | | 1.28 | | 8 |
| For the Year Ended December 31, 2022 |
| IA | | $113.91 | | $ 1.40 | | $ (7.51) | | $ (6.11) | | $ (1.62) | | $ (10.56) | | $ (12.18) | | $ 95.62 | | (5.14)% | | $ 1,286,070 | | 0.51% | | 0.51% | | 1.37% | | 10% |
| IB | | 113.84 | | 1.14 | | (7.50) | | (6.36) | | (1.37) | | (10.56) | | (11.93) | | 95.55 | | (5.37) | | 118,218 | | 0.76 | | 0.76 | | 1.12 | | 10 |
| For the Year Ended December 31, 2021 |
| IA | | $ 95.52 | | $ 1.38 | | $ 22.20 | | $ 23.58 | | $ (1.30) | | $ (3.89) | | $ (5.19) | | $ 113.91 | | 24.98% | | $ 1,506,206 | | 0.51% | | 0.51% | | 1.32% | | 15% |
| IB | | 95.48 | | 1.12 | | 22.15 | | 23.27 | | (1.02) | | (3.89) | | (4.91) | | 113.84 | | 24.67 | | 142,700 | | 0.76 | | 0.76 | | 1.07 | | 15 |
| For the Year Ended December 31, 2020 |
| IA | | $ 92.58 | | $ 1.39 | | $ 9.21 | | $ 10.60 | | $ (1.48) | | $ (6.18) | | $ (7.66) | | $ 95.52 | | 12.08% | | $ 1,360,099 | | 0.52% | | 0.52% | | 1.57% | | 15% |
| IB | | 92.57 | | 1.17 | | 9.17 | | 10.34 | | (1.25) | | (6.18) | | (7.43) | | 95.48 | | 11.79 | | 129,670 | | 0.77 | | 0.77 | | 1.32 | | 15 |
| For the Year Ended December 31, 2019 |
| IA | | $ 78.10 | | $ 1.43 | | $ 22.40 | | $ 23.83 | | $ (1.46) | | $ (7.89) | | $ (9.35) | | $ 92.58 | | 31.22% | | $ 1,375,643 | | 0.51% | | 0.51% | | 1.59% | | 15% |
| IB | | 78.11 | | 1.20 | | 22.39 | | 23.59 | | (1.24) | | (7.89) | | (9.13) | | 92.57 | | 30.89 | | 133,951 | | 0.76 | | 0.76 | | 1.34 | | 15 |
| Hartford Total Return Bond HLS Fund |
| For the Year Ended December 31, 2023 |
| IA | | $ 9.27 | | $ 0.35 | | $ 0.28 | | $ 0.63 | | $ (0.33) | | $ — | | $ (0.33) | | $ 9.57 | | 6.97% | | $ 1,621,072 | | 0.50% | | 0.50% | | 3.77% | | 52% (10) |
| IB | | 9.22 | | 0.33 | | 0.27 | | 0.60 | | (0.30) | | — | | (0.30) | | 9.52 | | 6.69 | | 166,540 | | 0.75 | | 0.75 | | 3.51 | | 52 (10) |
| For the Year Ended December 31, 2022 |
| IA | | $ 11.29 | | $ 0.29 | | $ (1.88) | | $ (1.59) | | $ (0.31) | | $ (0.12) | | $ (0.43) | | $ 9.27 | | (14.21)% | | $ 1,592,156 | | 0.50% | | 0.50% | | 2.87% | | 58% (10) |
| IB | | 11.22 | | 0.26 | | (1.87) | | (1.61) | | (0.27) | | (0.12) | | (0.39) | | 9.22 | | (14.41) | | 175,651 | | 0.75 | | 0.75 | | 2.62 | | 58 (10) |
The accompanying notes are an integral part of these financial statements.
Financial Highlights – (continued)
| | | — Selected Per-Share Data(1) — | | — Ratios and Supplemental Data — |
| Class | | Net
Asset
Value at
Beginning
of Period | | Net
Investment
Income
(Loss) | | Net
Realized
and
Unrealized
Gain (Loss)
on
Investments | | Total from
Investment
Operations | | Dividends
from Net
Investment
Income | | Distributions
from
Capital
Gains | | Total
Dividends
and
Distributions | | Net
Asset
Value at
End of
Period | | Total
Return(2) | | Net
Assets
at End
of Period
(000s) | | Ratio of
Expenses
to
Average
Net
Assets
Before
Adjust-
ments(3) | | Ratio of
Expenses
to
Average
Net
Assets
After
Adjust-
ments(3) | | Ratio of
Net
Investment
Income
(Loss) to
Average
Net Assets | | Portfolio
Turnover |
| Hartford Total Return Bond HLS Fund – (continued) |
| For the Year Ended December 31, 2021 |
| IA | | $ 11.98 | | $ 0.24 | | $ (0.35) | | $ (0.11) | | $ (0.29) | | $ (0.29) | | $ (0.58) | | $ 11.29 | | (0.95)% | | $ 2,045,579 | | 0.50% | | 0.50% | | 2.09% | | 61% (10) |
| IB | | 11.91 | | 0.21 | | (0.35) | | (0.14) | | (0.26) | | (0.29) | | (0.55) | | 11.22 | | (1.18) | | 237,952 | | 0.75 | | 0.75 | | 1.84 | | 61 (10) |
| For the Year Ended December 31, 2020 |
| IA | | $ 11.44 | | $ 0.29 | | $ 0.73 | | $ 1.02 | | $ (0.45) | | $ (0.03) | | $ (0.48) | | $ 11.98 | | 9.03% | | $ 2,110,986 | | 0.51% | | 0.51% | | 2.45% | | 62% (10) |
| IB | | 11.38 | | 0.26 | | 0.72 | | 0.98 | | (0.42) | | (0.03) | | (0.45) | | 11.91 | | 8.71 | | 265,900 | | 0.76 | | 0.76 | | 2.19 | | 62 (10) |
| For the Year Ended December 31, 2019 |
| IA | | $ 10.76 | | $ 0.36(11) | | $ 0.77(11) | | $ 1.13 | | $ (0.45) | | $ — | | $ (0.45) | | $ 11.44 | | 10.65% | | $ 1,873,182 | | 0.51% | | 0.51% | | 3.16% (11) | | 61% |
| IB | | 10.70 | | 0.33 (11) | | 0.77 (11) | | 1.10 | | (0.42) | | — | | (0.42) | | 11.38 | | 10.32 | | 214,338 | | 0.76 | | 0.76 | | 2.91 (11) | | 61 |
| Hartford Ultrashort Bond HLS Fund |
| For the Year Ended December 31, 2023 |
| IA | | $ 9.96 | | $ 0.40 | | $ 0.11 | | $ 0.51 | | $ (0.13) | | $ — | | $ (0.13) | | $ 10.34 | | 5.18% | | $ 486,165 | | 0.44% | | 0.44% | | 3.95% | | 56% |
| IB | | 9.95 | | 0.37 | | 0.11 | | 0.48 | | (0.10) | | — | | (0.10) | | 10.33 | | 4.88 | | 75,619 | | 0.69 | | 0.69 | | 3.70 | | 56 |
| For the Year Ended December 31, 2022 |
| IA | | $ 10.00 | | $ 0.11 | | $ (0.13) | | $ (0.02) | | $ (0.02) | | $ — | | $ (0.02) | | $ 9.96 | | (0.17)% | | $ 529,433 | | 0.43% | | 0.43% | | 1.10% | | 66% |
| IB | | 9.99 | | 0.08 | | (0.12) | | (0.04) | | — | | — | | — | | 9.95 | | (0.40) | | 83,560 | | 0.68 | | 0.68 | | 0.84 | | 66 |
| For the Year Ended December 31, 2021 |
| IA | | $ 10.09 | | $ 0.02 | | $ (0.04) | | $ (0.02) | | $ (0.07) | | $ — | | $ (0.07) | | $ 10.00 | | (0.19)% | | $ 605,732 | | 0.44% | | 0.44% | | 0.15% | | 73% |
| IB | | 10.09 | | (0.01) | | (0.04) | | (0.05) | | (0.05) | | — | | (0.05) | | 9.99 | | (0.46) | | 97,279 | | 0.69 | | 0.69 | | (0.10) | | 73 |
| For the Year Ended December 31, 2020 |
| IA | | $ 10.19 | | $ 0.10 | | $ 0.05 | | $ 0.15 | | $ (0.25) | | $ — | | $ (0.25) | | $ 10.09 | | 1.44% | | $ 657,375 | | 0.46% | | 0.46% | | 0.95% | | 76% |
| IB | | 10.18 | | 0.07 | | 0.06 | | 0.13 | | (0.22) | | — | | (0.22) | | 10.09 | | 1.27 | | 110,250 | | 0.71 | | 0.71 | | 0.67 | | 76 |
| For the Year Ended December 31, 2019 |
| IA | | $ 10.10 | | $ 0.23 | | $ 0.05 | | $ 0.28 | | $ (0.19) | | $ — | | $ (0.19) | | $ 10.19 | | 2.81% | | $ 393,590 | | 0.45% | | 0.45% | | 2.21% | | 70% |
| IB | | 10.09 | | 0.20 | | 0.06 | | 0.26 | | (0.17) | | — | | (0.17) | | 10.18 | | 2.54 | | 57,142 | | 0.70 | | 0.70 | | 1.96 | | 70 |
| FINANCIAL HIGHLIGHTS FOOTNOTES |
| (1) | Information presented relates to a share outstanding throughout the indicated period. Net investment income (loss) per share amounts are calculated based on average shares outstanding unless otherwise noted. |
| (2) | The figures do not include sales charges or other fees which may be applied at the variable contract level or by a qualified pension or retirement plan. Any such additional sales charges or other fees would lower the Fund’s performance. |
| (3) | Adjustments include waivers and reimbursements, if applicable. Ratios do not include fees paid indirectly (see Expenses in the accompanying Notes to Financial Statements). |
| (4) | Portfolio turnover excludes TBA roll transactions. Had TBA roll transactions been included, the portfolio turnover rate would have been 59%, 61%, 49% and 48% for the fiscal years ended December 31, 2023, December 31, 2022, December 31, 2021 and December 31, 2020, respectively. |
| (5) | FASB issued ASU 2017-08 to amend the amortization period to the earliest call date for purchased callable debt securities held at a premium. Effective January 1, 2019, the Fund amended its amortization policy and the effect of this change for the year ended December 31, 2019 was an increase to net investment income per share for less than $0.005, decrease to net realized and unrealized gain (loss) on investments for less than $(0.005) and a decrease to ratio of net investment income to average net assets for less than 0.005% for each class of shares. Per share data and ratios for periods prior to December 31, 2019 have not been restated to reflect this change in presentation. |
| (6) | Commenced operations on September 18, 2020. |
| (7) | Not annualized. |
| (8) | Annualized. |
| (9) | Per share amount is less than $0.005. |
| (10) | Portfolio turnover excludes TBA roll transactions. Had TBA roll transactions been included, the portfolio turnover rate would have been 422%, 431%, 494% and 564% for the fiscal years ended December 31, 2023, December 31, 2022, December 31, 2021 and December 31, 2020, respectively. |
| (11) | FASB issued ASU 2017-08 to amend the amortization period to the earliest call date for purchased callable debt securities held at a premium. Effective January 1, 2019, the Fund amended its amortization policy and the effect of this change for the year ended December 31, 2019 was a decrease to net investment income per share for less than $(0.005), increase to net realized and unrealized gain (loss) on investments for less than $0.005 and a decrease to ratio of net investment income to average net assets of (0.01)% for each class of shares. Per share data and ratios for periods prior to December 31, 2019 have not been restated to reflect this change in presentation. |
The accompanying notes are an integral part of these financial statements.
Notes to Financial Statements
December 31, 2023
| 1. | Organization: |
| | Hartford Series Fund, Inc. and Hartford HLS Series Fund II, Inc. (each, a "Company" and collectively, the “Companies”) are each an open-end registered management investment company comprised of eleven and one series, respectively, as of December 31, 2023. Financial statements for the series of each Company listed below (each, a "Fund" and collectively, the "Funds") are included in this report. |
| | |
| Hartford Series Fund, Inc.: |
| Hartford Balanced HLS Fund (the "Balanced HLS Fund") |
| Hartford Capital Appreciation HLS Fund (the "Capital Appreciation HLS Fund") |
| Hartford Disciplined Equity HLS Fund (the "Disciplined Equity HLS Fund") |
| Hartford Dividend and Growth HLS Fund (the "Dividend and Growth HLS Fund") |
| Hartford Healthcare HLS Fund (the "Healthcare HLS Fund") |
| Hartford International Opportunities HLS Fund (the "International Opportunities HLS Fund") |
| Hartford MidCap HLS Fund (the "MidCap HLS Fund") |
| Hartford Small Company HLS Fund (the "Small Company HLS Fund") |
| Hartford Stock HLS Fund (the "Stock HLS Fund") |
| Hartford Total Return Bond HLS Fund (the "Total Return Bond HLS Fund") |
| Hartford Ultrashort Bond HLS Fund (the "Ultrashort Bond HLS Fund") |
| Hartford HLS Series Fund II, Inc.: |
| Hartford Small Cap Growth HLS Fund (the "Small Cap Growth HLS Fund") |
The assets of each Fund are separate, and a shareholder's interest is limited to the Fund in which shares are held. Each Company is organized under the laws of the State of Maryland and is registered with the U.S. Securities and Exchange Commission (the "SEC") under the Investment Company Act of 1940, as amended (the "1940 Act"). Each Fund serves as an underlying investment option for certain variable annuity and variable life insurance separate accounts of insurance companies and certain qualified pension or retirement plans. Owners of variable annuity contracts and policyholders of variable life insurance contracts may choose the Funds if permitted in the variable insurance contract prospectus. In addition, participants in certain qualified pension or retirement plans may choose the Funds if permitted by their plans.
Each Fund is a diversified open-end management investment company. Each Fund applies specialized accounting and reporting standards under Accounting Standards Codification Topic 946, "Financial Services – Investment Companies."
Each Fund has registered for sale Class IA and IB shares. Each of Capital Appreciation HLS Fund and Disciplined Equity HLS Fund also has registered for sale Class IC shares. Class IA and Class IB shares of each Fund are closed to certain investors. The Small Cap Growth HLS Fund and Small Company HLS Fund are closed to new investors, subject to certain exceptions set forth in the Funds' prospectus. Each class is offered at the per share net asset value (“NAV”) without a sales charge. Class IB shares are subject to distribution and service fees charged pursuant to a Distribution Plan adopted in accordance with Rule 12b-1 under the 1940 Act. Class IC shares are subject to distribution fees charged pursuant to a Distribution Plan adopted in accordance with Rule 12b-1 under the 1940 Act and Class IC shares are also subject to an administrative services fee.
| 2. | Significant Accounting Policies: |
| | The following is a summary of significant accounting policies of each Fund used in the preparation of its financial statements, which are in accordance with United States Generally Accepted Accounting Principles ("U.S. GAAP"). The preparation of financial statements in accordance with U.S. GAAP may require management to make estimates and assumptions that affect the reported amounts of assets and liabilities and disclosure of contingent assets and liabilities at the date of the financial statements and the reported amounts of increases and decreases in net assets from operations during the reporting period. Actual results could differ from those estimates. |
| a) | Determination of Net Asset Value – The NAV of each class of each Fund’s shares is determined as of the close of regular trading on the New York Stock Exchange (the "Exchange") (normally 4:00 p.m. Eastern Time) (the "NYSE Close") on each day that the Exchange is open ("Valuation Date"). If the Exchange is closed due to weather or other extraordinary circumstances on a day it would typically be open for business, each Fund may treat such day as a typical business day and accept purchase and redemption orders and calculate each Fund’s NAV in accordance with applicable law. The NAV of each class of each Fund's shares is determined by dividing the value of the Fund’s net assets attributable to the class of shares by the number of shares outstanding for that class. Information that becomes known to the Funds after the NAV has been calculated on a particular day will not generally be used to retroactively adjust the NAV determined earlier that day. |
Notes to Financial Statements – (continued)
December 31, 2023
| b) | Investment Valuation and Fair Value Measurements – For purposes of calculating the NAV of each class of each Fund, portfolio securities and other assets held in the Fund’s portfolio for which market prices are readily available are valued at market value. Market value is generally determined on the basis of official close price or last reported trade price. If no trades were reported, market value is based on prices obtained from a quotation reporting system, established market makers (including evaluated prices), or independent pricing services. Pricing vendors may use matrix pricing or valuation models that utilize certain inputs and assumptions to derive values, including transaction data, credit quality information, general market conditions, news, and other factors and assumptions. |
| | With respect to a Fund's investments that do not have readily available market prices, the respective Company's Board of Directors (the "Board") has designated Hartford Funds Management Company, LLC (the "Investment Manager" or "HFMC") as its valuation designee to perform fair valuations pursuant to Rule 2a-5 under the 1940 Act (the "Valuation Designee"). |
| | If market prices are not readily available or deemed unreliable, the Valuation Designee determines the fair value of the security or other instrument in good faith under policies and procedures approved by and under the supervision of the Board ("Valuation Procedures"). |
| | The Valuation Designee has delegated the day-to-day responsibility for implementing the Valuation Procedures to the Valuation Committee (the "Valuation Committee"). The Valuation Committee will consider all available relevant factors in determining an investment’s fair value. The Valuation Designee reports fair value matters to the Audit Committee of the Board. |
| | Prices of foreign equities that are principally traded on certain foreign markets will generally be adjusted daily pursuant to a fair value pricing service in order to reflect an adjustment for the factors occurring after the close of certain foreign markets but before the NYSE Close. Securities and other instruments that are primarily traded on foreign markets may trade on days that are not business days of the Funds. The value of the foreign securities or other instruments in which a Fund invests may change on days when a shareholder will not be able to purchase or redeem shares of the Fund. |
| | Fixed income investments (other than short-term obligations) and non-exchange traded derivatives held by a Fund are normally valued at prices supplied by independent pricing services in accordance with the Valuation Procedures. Short-term investments maturing in 60 days or less are generally valued at amortized cost, which approximates fair value. |
| | Exchange-traded derivatives, such as options, futures and options on futures, are valued at the last sale price determined by the exchange where such instruments principally trade as of the close of such exchange ("Exchange Close"). If a last sale price is not available, the value will be the mean of the most recently quoted bid and ask prices as of the Exchange Close. If a mean of the bid and ask prices cannot be calculated for the day, the value will be the most recently quoted bid price as of the Exchange Close. Over-the-counter derivatives are normally valued based on prices supplied by independent pricing services in accordance with the Valuation Procedures. |
| | Investments valued in currencies other than U.S. dollars are converted to U.S. dollars using the prevailing spot currency exchange rates obtained from independent pricing services for calculation of the NAV. As a result, the NAV of a Fund’s shares may be affected by changes in the value of currencies in relation to the U.S. dollar. The value of securities or other instruments traded in markets outside the United States or denominated in currencies other than the U.S. dollar may be affected significantly on a day that the Exchange is closed and the market value may change on days when an investor is not able to purchase or redeem shares of a Fund. |
| | Foreign currency contracts represent agreements to exchange currencies on specific future dates at predetermined rates. Foreign currency contracts are valued using foreign currency exchange rates and forward rates as provided by an independent pricing service on the Valuation Date. |
| | Shares of investment companies listed and traded on an exchange are valued in the same manner as any exchange-listed equity security. Investments in investment companies that are not listed or traded on an exchange ("Non-Traded Funds"), if any, are valued at the respective NAV of each Non-Traded Fund on the Valuation Date. Such Non-Traded Funds and listed investment companies may use fair value pricing as disclosed in their prospectuses. |
| | Financial instruments for which prices are not available from an independent pricing service may be valued using quotations obtained from one or more dealers that make markets in the respective financial instrument in accordance with the Valuation Procedures. |
Notes to Financial Statements – (continued)
December 31, 2023
| | U.S. GAAP defines fair value as the price that a Fund would receive to sell an asset or pay to transfer a liability in an orderly transaction between market participants. The U.S. GAAP fair value measurement standards require disclosure of a fair value hierarchy for each major category of assets and liabilities. Various inputs are used in determining the fair value of each Fund’s investments. These inputs are summarized into three broad hierarchy levels. This hierarchy is based on whether the valuation inputs are observable or unobservable. These levels are: |
| • | Level 1 – Quoted prices in active markets for identical investments. Level 1 may include exchange traded instruments, such as domestic equities, some foreign equities, options, futures, mutual funds, exchange traded funds, rights and warrants. |
| • | Level 2 – Observable inputs other than Level 1 prices, such as quoted prices for similar investments; quoted prices in markets that are not active; or other inputs that are observable or can be corroborated by observable market data. Level 2 may include debt investments that are traded less frequently than exchange traded instruments and which are valued using independent pricing services; foreign equities, which are principally traded on certain foreign markets and are adjusted daily pursuant to a fair value pricing service in order to reflect an adjustment for the factors occurring after the close of certain foreign markets but before the NYSE Close; senior floating rate interests, which are valued using an aggregate of dealer bids; short-term investments, which are valued at amortized cost; and swaps, which are valued based upon the terms of each swap contract. |
| • | Level 3 – Significant unobservable inputs that are supported by limited or no market activity. Level 3 may include financial instruments whose values are determined using indicative market quotes or require significant management judgment or estimation. These unobservable valuation inputs may include estimates for current yields, maturity/duration, prepayment speed, and indicative market quotes for comparable investments along with other assumptions relating to credit quality, collateral value, complexity of the investment structure, general market conditions and liquidity. This category may include investments where trading has been halted or there are certain restrictions on trading. While these investments are priced using unobservable inputs, the valuation of these investments reflects the best available data and management believes the prices are a reasonable representation of exit price. |
Valuation levels are not necessarily indicative of the risk associated with investing in such investments. Individual investments within any of the above mentioned asset classes may be assigned a different hierarchical level than those presented above, as individual circumstances dictate.
For additional information, refer to the Fair Value Summary and the Level 3 roll-forward reconciliation, if applicable, which follows each Fund's Schedule of Investments.
| c) | Investment Transactions and Investment Income – Investment transactions are recorded as of the trade date (the date the order to buy or sell is executed) for financial reporting purposes. Investments purchased or sold on a when-issued or delayed-delivery basis may be settled a month or more after the trade date. Realized gains and losses are determined on the basis of identified cost. |
| | The trade date for senior floating rate interests purchased in the primary loan market is considered the date on which the loan allocations are determined. The trade date for senior floating rate interests purchased in the secondary loan market is the date on which the transaction is entered into. |
| | Dividend income from domestic securities is accrued on the ex-dividend date. In general, dividend income from foreign securities is recorded on the ex-date; however, dividend notifications in certain foreign jurisdictions may not be available in a timely manner and as a result, such Fund will record the dividend as soon as the relevant details (i.e., rate per share, payment date, shareholders of record, etc.) are publicly available. Interest income, including amortization of premium, accretion of discounts, inflation adjustments and additional principal received in-kind in lieu of cash, is accrued on a daily basis. Paydown gains and losses on mortgage-related and other asset-backed securities are included in interest income in the Statements of Operations, as applicable. |
| | The Capital Appreciation HLS Fund and the Dividend and Growth HLS Fund filed claims to recover taxes withheld on prior year reclaims (EU reclaims) related to French taxes withheld on dividend income from 2009, 2010 and 2011. The Capital Appreciation HLS Fund and the Dividend and Growth HLS Fund received EU reclaims with related interest in the amount of $499,518 and $752,746, respectively, which is recorded on the Statement of Operations as Foreign withholding tax reclaims. |
Please refer to Note 8 for Securities Lending information.
| d) | Taxes – A Fund may be subject to taxes imposed on realized gains on securities of certain foreign countries in which such Fund invests. A Fund may also be subject to taxes withheld on foreign dividends and interest from securities in which such Fund invests. The amount of any foreign taxes withheld and foreign tax expense is included on the accompanying Statements of Operations as a reduction to net investment income or net realized or unrealized gain (loss) on investments in these securities, if applicable. |
| e) | Foreign Currency Transactions – Assets and liabilities denominated in currencies other than U.S. dollars are translated into U.S. dollars at the exchange rates in effect on the Valuation Date. Purchases and sales of investments, income and expenses are translated into U.S. dollars at the exchange rates on the dates of such transactions. |
Notes to Financial Statements – (continued)
December 31, 2023
| | A Fund does not isolate that portion of portfolio investment valuation resulting from fluctuations in the foreign currency exchange rates from the fluctuations arising from changes in the market prices of investments held. Exchange rate fluctuations are included with the net realized and unrealized gain or loss on investments in the accompanying financial statements. |
| | Net realized foreign exchange gains or losses arise from sales of foreign currencies and the difference between asset and liability amounts initially stated in foreign currencies and the U.S. dollar value of the amounts actually received or paid. Net unrealized foreign exchange gains or losses arise from changes in the value of other assets and liabilities at the end of the reporting period, resulting from changes in the exchange rates. |
| f) | Joint Trading Account – A Fund may invest cash balances into a joint trading account that may be invested in one or more repurchase agreements. |
| g) | Fund Share Valuation and Dividend Distributions to Shareholders – Orders for each class of each Fund’s shares are executed in accordance with the investment instructions of the contract holders and plan participants. The NAV of each class of each Fund’s shares is determined as of the close of business on each business day of the Exchange (see Note 2(a)). The NAV is determined separately for each class of shares of each Fund by dividing the Fund's net assets attributable to that class by the number of shares of the class outstanding. Each class of shares offered by each Fund has equal rights as to assets and voting privileges (except that shareholders of a class have exclusive voting rights regarding any matter relating solely to that class of shares). Income and non-class specific expenses are allocated daily to each class on the basis of the relative net assets of the class of the Fund. Realized and unrealized gains and losses are allocated daily based on the relative net assets of each class of shares of each Fund. |
| | Orders for the purchase of a Fund's shares received prior to the close of the Exchange on any day the Exchange is open for business are priced at the NAV determined as of the close of the Exchange. Orders received after the close of the Exchange, or on a day on which the Exchange and/or the Funds are not open for business, are priced at the next determined NAV. |
| | Dividends are declared pursuant to a policy adopted by the respective Company's Board of Directors. Dividends and/or distributions to shareholders are recorded on ex-date. The policy of each Fund is to pay dividends from net investment income and realized capital gains, if any, at least once per year. Income dividends and capital gains distributions are determined in accordance with federal income tax regulations, which may differ from U.S. GAAP with respect to character and timing (see Federal Income Taxes: Distributions and Components of Distributable Earnings and Reclassification of Capital Accounts notes). |
| 3. | Securities and Other Investments: |
| a) | Restricted Securities – Each Fund may invest in securities that are subject to legal or contractual restrictions on resale. These securities generally may be resold in transactions exempt from registration or to the public if the securities are registered. Disposal of these securities may involve time-consuming negotiations and expense, and prompt sale at an acceptable price may be difficult. Information regarding restricted securities, if applicable, is included at the end of each Fund's Schedule of Investments. |
| b) | Investments Purchased on a When-Issued or Delayed-Delivery Basis – Delivery and payment for investments that have been purchased by a Fund on a forward commitment, or when-issued or delayed-delivery basis, take place beyond the customary settlement period. A Fund may dispose of or renegotiate a delayed-delivery transaction after it is entered into, and may sell delayed-delivery investments before they are delivered, which may result in a realized gain or loss. During this period, such investments are subject to market fluctuations. See each Fund’s Schedule of Investments, if applicable, for when-issued or delayed-delivery investments as of December 31, 2023. |
| | A Fund may enter into to-be announced ("TBA") commitments. TBA commitments are forward agreements for the purchase or sale of mortgage-backed securities for a fixed price, with payment and delivery on an agreed-upon future settlement date. The specific securities to be delivered are not identified at the trade date; however, delivered securities must meet specified terms, including issuer, rate and mortgage terms. Although a Fund may enter into TBA commitments with the intention of acquiring or delivering securities for its portfolio, the Fund can extend the settlement date, roll the transaction, or dispose of a commitment prior to settlement if deemed appropriate to do so. If the TBA commitment is closed through the acquisition of an offsetting TBA commitment, a Fund realizes a gain or loss. In a TBA roll transaction, a Fund generally purchases or sells the initial TBA commitment prior to the agreed upon settlement date and enters into a new TBA commitment for future delivery or receipt of the mortgage-backed securities. TBA commitments involve a risk of loss if the value of the security to be purchased or sold declines or increases, respectively, prior to settlement date. See each Fund's Schedule of Investments, if applicable, for TBA commitments as of December 31, 2023. |
| c) | Senior Floating Rate Interests – Certain Funds may invest in senior floating rate interests. Senior floating rate interests generally hold the most senior position in the capital structure of a business entity (the "Borrower"), are typically secured by specific collateral and have a claim on the assets and/or stock of the Borrower that is senior to that held by subordinated debt holders and stockholders of the Borrower. Senior floating rate interests are typically structured and administered by a financial institution that acts as the agent of the lenders participating |
Notes to Financial Statements – (continued)
December 31, 2023
| | in the senior floating rate interest. A Fund may invest in multiple series or tranches of a senior floating rate interest, which may have varying terms and carry different associated risks. A Fund may also enter into unfunded loan commitments, which are contractual obligations for future funding. Unfunded loan commitments may include revolving credit facilities, which may obligate the Fund to supply additional cash to the Borrower on demand. Unfunded loan commitments represent a future obligation in full. A Fund may receive a commitment fee based on the undrawn portion of the underlying line of credit portion of a senior floating rate interest. In certain circumstances, a Fund may receive various fees upon the restructure of a senior floating rate interest by a borrower. Fees earned/paid may be recorded as a component of income or realized gain/loss in the Statements of Operations. |
| | Senior floating rate interests are typically rated below-investment-grade, which suggests they are more likely to default and generally pay higher interest rates than investment-grade loans. A default could lead to non-payment of income, which would result in a reduction of income to a Fund, and there can be no assurance that the liquidation of any collateral would satisfy the Borrower’s obligation in the event of non-payment of scheduled interest or principal payments, or that such collateral could be readily liquidated. See each Fund's Schedule of Investments, if applicable, for outstanding senior floating rate interests as of December 31, 2023. |
| d) | Mortgage-Related and Other Asset-Backed Securities – A Fund may invest in mortgage-related and other asset-backed securities. These securities include mortgage pass-through securities, collateralized mortgage obligations, commercial mortgage-backed securities, stripped mortgage-backed securities, asset-backed securities, collateralized debt obligations and other securities that directly or indirectly represent a participation in, or are secured by and payable from, mortgage loans on real property. Mortgage-related securities are created from pools of residential or commercial mortgage loans, including mortgage loans made by savings and loan institutions, mortgage bankers, commercial banks and others. Asset-backed securities are created from many types of assets, including auto loans, credit card receivables, home equity loans, and student loans. These securities provide a monthly payment that consists of both interest and principal payments. Interest payments may be determined by fixed or adjustable rates. The rate of prepayments on underlying mortgages will affect the price and volatility of a mortgage-related security, and may have the effect of shortening or extending the effective duration of the security relative to what was anticipated at the time of purchase. The timely payment of principal and interest of certain mortgage-related securities is guaranteed by the full faith and credit of the United States Government. Mortgage-related and other asset-backed securities created and guaranteed by non-governmental issuers, including government-sponsored corporations, may be supported by various forms of insurance or guarantees, but there can be no assurance that the private insurers or guarantors can meet their obligations under the insurance policies or guarantee arrangements. See each Fund's Schedule of Investments, if applicable, for mortgage-related and other asset-backed securities as of December 31, 2023. |
| e) | Inflation-Indexed Bonds – A Fund may invest in inflation-indexed bonds. Inflation-indexed bonds are fixed income investments whose principal value is periodically adjusted to the rate of inflation. The interest rate on these bonds is generally fixed at issuance at a rate lower than typical bonds. Over the life of an inflation-indexed bond, however, interest will be paid based on a principal value, which is adjusted for inflation. Any increase or decrease in the principal amount of an inflation-indexed bond will be included as interest income on the Statements of Operations, even though investors do not receive the principal amount until maturity. See each Fund's Schedule of Investments, if applicable, for inflation-indexed bonds as of December 31, 2023. |
| f) | Repurchase Agreements – A repurchase agreement is an agreement between two parties whereby one party sells the other a security at a specified price with a commitment to repurchase the security later at an agreed-upon price, date and interest payment. Each Fund is permitted to enter into fully collateralized repurchase agreements. Each Company's Board of Directors has delegated to the sub-adviser(s), as applicable, the responsibility of evaluating the creditworthiness of the banks and securities dealers with which the Funds will engage in repurchase agreements. The sub-adviser(s) will monitor such transactions to ensure that the value of underlying collateral will be at least equal to the total amount of the repurchase obligation as required by the valuation provision of the repurchase agreement, including the accrued interest. Repurchase agreements carry the risk that the market value of the securities declines below the repurchase price. A Fund could also lose money if it is unable to recover the securities and the value of any collateral held. In the event the borrower commences bankruptcy proceedings, a court may characterize the transaction as a loan. If a Fund has not perfected a security interest in the underlying collateral, the Fund may be required to return the underlying collateral to the borrower’s estate and be treated as an unsecured creditor. As an unsecured creditor, the Fund could lose some or all of the principal and interest involved in the transaction. See each Fund's Schedule of Investments, if applicable, for repurchase agreements as of December 31, 2023. |
| 4. | Financial Derivative Instruments: |
| | The following disclosures contain information on how and why a Fund may use derivative instruments, the credit-risk-related contingent features in certain derivative instruments, and how derivative instruments affect a Fund’s financial position and results of operations. The location and fair value amounts of these instruments on the Statements of Assets and Liabilities and the realized gains and losses and changes in unrealized gains and losses on the Statements of Operations, each categorized by type of derivative contract, are included in the following Additional |
Notes to Financial Statements – (continued)
December 31, 2023
Derivative Instrument Information footnote. The derivative instruments outstanding as of period-end are disclosed in the notes to the Schedules of Investments, if applicable. The amounts of realized gains and losses and changes in unrealized gains and losses on derivative instruments during the period are disclosed in the Statements of Operations.
| a) | Futures Contracts – A Fund may enter into futures contracts. A futures contract is an agreement between two parties to buy or sell an asset at a set price on a future date. A Fund may use futures contracts to manage risk or obtain exposure to the investment markets, commodities, or movements in interest rates and currency values. The primary risks associated with the use of futures contracts are the imperfect correlation between the change in market value of the investments held by a Fund and the prices of futures contracts and the possibility of an illiquid market. Upon entering into a futures contract, a Fund is required to deposit with a futures commission merchant ("FCM") an amount of cash or U.S. Government or Agency Obligations in accordance with the initial margin requirements of the broker or exchange. Futures contracts are marked to market daily and an appropriate amount equal to the change in value ("variation margin") is paid or received by a Fund. Gains or losses are recognized but not considered realized until the contracts expire or are closed. Futures contracts involve, to varying degrees, risk of loss in excess of the variation margin disclosed on the Statements of Assets and Liabilities. |
| | During the year ended December 31, 2023, each of Balanced HLS Fund, Capital Appreciation HLS Fund and Total Return Bond HLS Fund had used Futures Contracts. |
| b) | Foreign Currency Contracts – A Fund may enter into foreign currency contracts that obligate the Fund to purchase or sell currencies at specified future dates. Foreign currency contracts may be used in connection with settling purchases or sales of securities to hedge the currency exposure associated with some or all of a Fund’s investments and/or as part of an investment strategy. Foreign currency contracts are marked to market daily and the change in value is recorded by a Fund as an unrealized gain or loss. A Fund will record a realized gain or loss when the foreign currency contract is settled. |
| | Foreign currency contracts involve elements of market risk in excess of the amounts reflected in the Statements of Assets and Liabilities. In addition, risks may arise upon entering into these contracts from the potential inability of the counterparties to meet the terms of the contracts and from unanticipated movements in the value of the foreign currencies relative to the U.S. dollar. Upon entering into a foreign currency contract, a Fund may be required to post margin equal to its outstanding exposure thereunder. |
During the year ended December 31, 2023, the Total Return Bond HLS Fund had used Foreign Currency Contracts.
| c) | Options Contracts – An option contract is a contract sold by one party to another party that offers the buyer the right, but not the obligation, to buy (call) or sell (put) an investment or other financial asset at an agreed-upon price during a specific period of time or on a specific date. Option contracts are either over-the-counter ("OTC") options or executed in a registered exchange ("exchange-traded options"). A Fund may write (sell) covered call and put options on futures, swaps ("swaptions"), securities, commodities or currencies. Writing put options may increase a Fund’s exposure to the underlying instrument. Writing call options may decrease a Fund’s exposure to the underlying instrument. Premiums received from writing options that expire are treated as realized gains. Premiums received from writing options that are exercised or closed are added to the proceeds or offset amounts paid on the underlying futures, swaps, investments or currency transactions to determine the realized gain or loss. A Fund, as a writer of an option, has no control over whether the underlying instrument may be sold (call) or purchased (put) and as a result bears the market risk of an unfavorable change in the price of the instrument underlying the written option. There is the risk a Fund may not be able to enter into a closing transaction because of an illiquid market. A Fund may also purchase put and call options. Purchasing call options may increase a Fund’s exposure to the underlying instrument. Purchasing put options may decrease a Fund’s exposure to the underlying instrument. A Fund pays a premium, which is included on the Fund’s Statements of Assets and Liabilities as an investment and is subsequently marked to market to reflect the current value of the option. Premiums paid for purchasing options that expire are treated as realized losses. Certain options may be purchased with premiums to be determined on a future date. The premiums for these options are based upon implied volatility parameters at specified terms. The risk associated with purchasing put and call options is generally limited to the premium paid. Premiums paid for purchasing options that are exercised or closed are added to the amounts paid or offset against the proceeds on the underlying investment transaction to determine the realized gain or loss. Entering into OTC options also exposes a Fund to counterparty risk. Counterparty risk is the possibility that the counterparty to the agreements may default on its obligation to perform or disagree as to the meaning of the contractual terms in the agreements. |
During the year ended December 31, 2023, the Total Return Bond HLS Fund had used Options Contracts.
| d) | Swap Contracts – A Fund may invest in swap contracts. Swap contracts are agreements to exchange or swap investment cash flows, assets, foreign currencies or market-linked returns at specified future intervals. Swap contracts are either privately negotiated in the over-the-counter market ("OTC swaps") or cleared through a central counterparty or derivatives clearing organization ("centrally cleared swaps"). A Fund may enter into credit default, total return, cross-currency, interest rate, inflation and other forms of swap contracts to manage its exposure to credit, currency, interest rate, commodity and inflation risk. Swap contracts are also used to gain exposure to certain markets. In connection with these contracts, investments or cash may be identified as collateral or margin in accordance with the terms of the |
Notes to Financial Statements – (continued)
December 31, 2023
| | respective swap contracts and/or master netting arrangement to provide assets of value and recourse in the event of default or bankruptcy/insolvency. |
| | Swaps are valued in accordance with the Valuation Procedures. Changes in market value, if any, are reflected as a component of net changes in unrealized appreciation or depreciation on the Statements of Operations. Daily changes in valuation of centrally cleared swaps, if any, are recorded as a receivable or payable for the change in value ("variation margin") on the Statements of Assets and Liabilities. Realized gains or losses on centrally cleared swaps are recorded upon the termination of the swaps. OTC swap payments received or paid at the beginning of the measurement period are reflected as such on the Statements of Assets and Liabilities and represent premiums paid or received upon entering into the swap contract to compensate for differences between the stated terms of the swap contract and prevailing market conditions (credit spreads, currency exchange rates, interest rates and other relevant factors). These upfront premiums are recorded as realized gains or losses on the Statements of Operations upon termination or maturity of the swap. A liquidation payment received or made at the termination or maturity of the swap is recorded as a realized gain or loss on the Statements of Operations. Net periodic payments received or paid by a Fund are included as part of realized gains or losses on the Statements of Operations. |
| | Entering into these contracts involves, to varying degrees, elements of liquidation, counterparty, credit and market risk in excess of the amounts recognized on the Statements of Assets and Liabilities. Such risks involve the possibility that there will be no liquid market for these contracts, that the counterparty to the contracts may default on its obligation to perform or disagree as to the meaning of contractual terms in the contracts, and that there may be unfavorable changes in market conditions (credit spreads, currency exchange rates, interest rates and other relevant factors). |
| | A Fund’s maximum risk of loss from counterparty risk for OTC swaps is the net value of the discounted cash flows to be received from the counterparty over the contract’s remaining life, and current market value, to the extent that amount is positive. The risk is mitigated by having a master netting arrangement between a Fund and the counterparty, which allows for the netting of payments made or received (although such amounts are presented on a gross basis within the Statements of Assets and Liabilities, as applicable) as well as the posting of collateral to a Fund to cover the Fund’s exposure to the counterparty. In a centrally cleared swap, while a Fund enters into an agreement with a clearing broker to execute contracts with a counterparty, the performance of the swap is guaranteed by the central clearinghouse, which reduces the Fund’s exposure to counterparty risk. However, the Fund is still exposed to a certain amount of counterparty risk through the clearing broker and clearinghouse. The clearinghouse attempts to minimize this risk to its participants through the use of mandatory margin requirements, daily cash settlements and other procedures. Likewise, the clearing broker reduces its risk through margin requirements and required segregation of customer balances. |
| | Credit Default Swap Contracts – The credit default swap market allows a Fund to manage credit risk through buying and selling credit protection on a specific issuer, asset or basket of assets. Certain credit default swaps involve the exchange of a fixed rate premium for protection against the loss in value of an underlying investment or index in the event of a credit event, such as payment default or bankruptcy. |
| | Under a credit default swap contract, one party acts as guarantor by receiving the fixed periodic payment in exchange for the commitment to purchase the underlying investment at par if the defined credit event occurs. Upon the occurrence of a defined credit event, the difference between the value of the reference obligation and the swap’s notional amount is recorded as realized gain or loss on swap transactions in the Statements of Operations. A "buyer" of credit protection agrees to pay a counterparty to assume the credit risk of an issuer upon the occurrence of certain events. The "seller" of the protection receives periodic payments and agrees to assume the credit risk of an issuer upon the occurrence of certain events. Although specified events are contract specific, credit events are generally defined as bankruptcy, failure to pay, restructuring, obligation acceleration, obligation default or repudiation/moratorium. A "seller’s" exposure is limited to the total notional amount of the credit default swap contract. These potential amounts would be partially offset by any recovery values of the respective referenced obligations or upfront payments received upon entering into the contract. |
| | Implied credit spreads, represented in absolute terms, utilized in determining the market value of credit default swap contracts on corporate issues, sovereign government issues or U.S. municipal issues as of year-end are disclosed in the notes to the Schedules of Investments, as applicable, and serve as an indicator of the current status of the payment/performance risk and represent the likelihood or risk of default for the credit derivative. The implied credit spread of a particular referenced entity reflects the cost of buying/selling protection and there may also be upfront payments required to be made to enter into the contract. Wider credit spreads represent a deterioration of the referenced entity’s credit soundness and a greater likelihood or risk of default or other credit event occurring as defined under the terms of the contract. For credit default swap contracts on credit indices, the quoted market prices and resulting values serve as the indicator of the current status of the payment/performance risk. Increasing market values, in absolute terms when compared to the notional amount of the swap, represent a deterioration of the referenced equity’s credit soundness and a greater likelihood or risk of default or other credit event occurring as defined under the terms of the contract. |
| | During the year ended December 31, 2023, the Total Return Bond HLS Fund had used Credit Default Swap Contracts. |
Notes to Financial Statements – (continued)
December 31, 2023
| | Interest Rate Swap Contracts – Certain Funds are subject to interest rate risk exposure in the normal course of pursuing its investment objectives. A Fund may use interest rate swaps to hedge interest rate and duration risk across a portfolio at particular duration points to maintain its ability to generate income at prevailing market rates. In a typical interest rate swap, one party agrees to make regular payments equal to a floating interest rate, based on a specified interest rate or benchmark (e.g., Secured Overnight Financing Rate (“SOFR”)), multiplied by a notional amount, in return for payments equal to a fixed rate multiplied by the same amount, for a specific period of time. The net interest received or paid on interest rate swap contracts is recorded as a realized gain or loss. Interest rate swaps are marked to market daily and the change, if any, is recorded as an unrealized gain or loss in the Statements of Operations. When the interest rate swap contract is terminated early, a Fund records a realized gain or loss equal to the difference between the current market value and the upfront premium or cost. |
| | If an interest rate swap contract provides for payments in different currencies, the parties might agree to exchange the notional amount as well. Interest rate swaps may also depend on other prices or rates, such as the value of an index. The risks of interest rate swaps include changes in market conditions, which will affect the value of the contract or the cash flows and the possible inability of the counterparty to fulfill its obligations under the contract. A Fund’s maximum risk of loss from counterparty credit risk is the discounted net value of the cash flows to be received from the counterparty over the contract’s remaining life, to the extent that amount is positive. |
During the year ended December 31, 2023, the Total Return Bond HLS Fund had used Interest Rate Swap Contracts.
| e) | Additional Derivative Instrument Information: |
| | Balanced HLS Fund |
| | |
| The Effect of Derivative Instruments on the Statement of Assets and Liabilities as of December 31, 2023: |
| | Risk Exposure Category |
| | Interest Rate
Contracts | | Foreign
Currency
Contracts | | Credit
Contracts | | Equity
Contracts | | Commodity
Contracts | | Total |
| Assets: | | | | | | | | | | | |
| Unrealized appreciation on futures contracts(1) | $ 213,236 | | $ — | | $ — | | $ — | | $ — | | $ 213,236 |
| Total | $ 213,236 | | $ — | | $ — | | $ — | | $ — | | $ 213,236 |
| (1) | Amount represents the cumulative appreciation and depreciation on futures contracts as disclosed within the Schedule of Investments under the open “Futures Contracts” section. Only current day’s variation margin, if any, is reported within the Statement of Assets and Liabilities. |
| The Effect of Derivative Instruments on the Statement of Operations for the year ended December 31, 2023: |
| | Risk Exposure Category |
| | Interest Rate
Contracts | | Foreign
Currency
Contracts | | Credit
Contracts | | Equity
Contracts | | Commodity
Contracts | | Total |
| Realized Gain (Loss) on Derivatives Recognized as a Result of Operations: | | | | | | | | | | | |
| Net realized gain (loss) on futures contracts | $ (353,508) | | $ — | | $ — | | $ — | | $ — | | $ (353,508) |
| Total | $ (353,508) | | $ — | | $ — | | $ — | | $ — | | $ (353,508) |
| Net Change in Unrealized Appreciation (Depreciation) on Derivatives Recognized as a Result of Operations: | | | | | | | | | | | |
| Net change in unrealized appreciation (depreciation) of futures contracts | $ 145,825 | | $ — | | $ — | | $ — | | $ — | | $ 145,825 |
| Total | $ 145,825 | | $ — | | $ — | | $ — | | $ — | | $ 145,825 |
For the year ended December 31, 2023, the average monthly amount or number per contract outstanding for each derivative type was as follows:
| Derivative Description | | Average Notional
Par, Contracts
or Face Amount |
| Futures Contracts Number of Long Contracts | | 249 |
| Futures Contracts Number of Short Contracts | | (37) |
Notes to Financial Statements – (continued)
December 31, 2023
Capital Appreciation HLS Fund
| The Effect of Derivative Instruments on the Statement of Assets and Liabilities as of December 31, 2023: |
| | Risk Exposure Category |
| | Interest Rate
Contracts | | Foreign
Currency
Contracts | | Credit
Contracts | | Equity
Contracts | | Commodity
Contracts | | Total |
| Assets: | | | | | | | | | | | |
| Unrealized appreciation on futures contracts(1) | $ — | | $ — | | $ — | | $ 1,923,011 | | $ — | | $ 1,923,011 |
| Total | $ — | | $ — | | $ — | | $ 1,923,011 | | $ — | | $ 1,923,011 |
| (1) | Amount represents the cumulative appreciation and depreciation on futures contracts as disclosed within the Schedule of Investments under the open “Futures Contracts” section. Only current day’s variation margin, if any, is reported within the Statement of Assets and Liabilities. |
| The Effect of Derivative Instruments on the Statement of Operations for the year ended December 31, 2023: |
| | Risk Exposure Category |
| | Interest Rate
Contracts | | Foreign
Currency
Contracts | | Credit
Contracts | | Equity
Contracts | | Commodity
Contracts | | Total |
| Realized Gain (Loss) on Derivatives Recognized as a Result of Operations: | | | | | | | | | | | |
| Net realized gain (loss) on futures contracts | $ — | | $ — | | $ — | | $ 23,375,548 | | $ — | | $ 23,375,548 |
| Total | $ — | | $ — | | $ — | | $ 23,375,548 | | $ — | | $ 23,375,548 |
| Net Change in Unrealized Appreciation (Depreciation) on Derivatives Recognized as a Result of Operations: | | | | | | | | | | | |
| Net change in unrealized appreciation (depreciation) of futures contracts | $ — | | $ — | | $ — | | $ 5,522,019 | | $ — | | $ 5,522,019 |
| Total | $ — | | $ — | | $ — | | $ 5,522,019 | | $ — | | $ 5,522,019 |
For the year ended December 31, 2023, the average monthly amount or number per contract outstanding for each derivative type was as follows:
| Derivative Description | | Average Notional
Par, Contracts
or Face Amount |
| Futures Contracts Number of Long Contracts | | 225 |
Total Return Bond HLS Fund
| The Effect of Derivative Instruments on the Statement of Assets and Liabilities as of December 31, 2023: |
| | Risk Exposure Category |
| | Interest Rate
Contracts | | Foreign
Currency
Contracts | | Credit
Contracts | | Equity
Contracts | | Commodity
Contracts | | Total |
| Assets: | | | | | | | | | | | |
| Unrealized appreciation on futures contracts(1) | $ 8,390,175 | | $ — | | $ — | | $ — | | $ — | | $ 8,390,175 |
| Unrealized appreciation on swap contracts(2) | 1,561,255 | | — | | — | | — | | — | | 1,561,255 |
| Total | $ 9,951,430 | | $ — | | $ — | | $ — | | $ — | | $ 9,951,430 |
| Liabilities: | | | | | | | | | | | |
| Unrealized depreciation on futures contracts(1) | $ 8,591,558 | | $ — | | $ — | | $ — | | $ — | | $ 8,591,558 |
| Unrealized depreciation on foreign currency contracts | — | | 412,052 | | — | | — | | — | | 412,052 |
| Unrealized depreciation on swap contracts(2) | 455,995 | | — | | 620,356 | | — | | — | | 1,076,351 |
| Total | $ 9,047,553 | | $ 412,052 | | $ 620,356 | | $ — | | $ — | | $ 10,079,961 |
| (1) | Amount represents the cumulative appreciation and depreciation on futures contracts as disclosed within the Schedule of Investments under the open “Futures Contracts” section. Only current day’s variation margin, if any, is reported within the Statement of Assets and Liabilities. |
| (2) | Amount represents the cumulative appreciation and depreciation on centrally cleared swaps, if applicable, as disclosed within the Schedule of Investments. Only the current day’s variation margin, if any, are reported within the Statements of Assets and Liabilities. OTC swaps are reported within the Statement of Assets and Liabilities within Unrealized appreciation and depreciation on OTC swap contracts, if applicable. |
Notes to Financial Statements – (continued)
December 31, 2023
Total Return Bond HLS Fund – (continued)
| The Effect of Derivative Instruments on the Statement of Operations for the year ended December 31, 2023: |
| | Risk Exposure Category |
| | Interest Rate
Contracts | | Foreign
Currency
Contracts | | Credit
Contracts | | Equity
Contracts | | Commodity
Contracts | | Total |
| Realized Gain (Loss) on Derivatives Recognized as a Result of Operations: | | | | | | | | | | | |
| Net realized gain (loss) on purchased options contracts | $ 13,993 | | $ — | | $ — | | $ — | | $ — | | $ 13,993 |
| Net realized gain (loss) on futures contracts | 802,745 | | — | | — | | — | | — | | 802,745 |
| Net realized gain (loss) on written options contracts | 797,022 | | — | | — | | — | | — | | 797,022 |
| Net realized gain (loss) on swap contracts | (554,799) | | — | | (1,921,719) | | — | | — | | (2,476,518) |
| Net realized gain (loss) on foreign currency contracts | — | | (1,972,233) | | — | | — | | — | | (1,972,233) |
| Total | $ 1,058,961 | | $ (1,972,233) | | $ (1,921,719) | | $ — | | $ — | | $ (2,834,991) |
| Net Change in Unrealized Appreciation (Depreciation) on Derivatives Recognized as a Result of Operations: | | | | | | | | | | | |
| Net change in unrealized appreciation (depreciation) of futures contracts | $ (3,188,748) | | $ — | | $ — | | $ — | | $ — | | $ (3,188,748) |
| Net change in unrealized appreciation (depreciation) of swap contracts | 1,105,260 | | — | | (35,861) | | — | | — | | 1,069,399 |
| Net change in unrealized appreciation (depreciation) of foreign currency contracts | — | | 333,563 | | — | | — | | — | | 333,563 |
| Total | $ (2,083,488) | | $ 333,563 | | $ (35,861) | | $ — | | $ — | | $ (1,785,786) |
For the year ended December 31, 2023, the average monthly amount or number per contract outstanding for each derivative type was as follows:
| Derivative Description | | Average Notional
Par, Contracts
or Face Amount |
| Purchased Options at Notional Amount | | $ 2,105,333 |
| Futures Contracts Number of Long Contracts | | 3,219 |
| Futures Contracts Number of Short Contracts | | (1,580) |
| Written Options at Notional Amount | | $ (22,400,833) |
| Swap Contracts at Notional Amount | | $ 65,908,607 |
| Foreign Currency Contracts Purchased at Contract Amount | | $ 2,191,608 |
| Foreign Currency Contracts Sold at Contract Amount | | $ 44,072,643 |
| f) | Balance Sheet Offsetting Information – Set forth below are tables which disclose both gross information and net information about instruments and transactions eligible for offset in the financial statements, and instruments and transactions that are subject to a master netting arrangement, as well as amounts related to margin, reflected as financial collateral (including cash collateral), held at clearing brokers, counterparties and a Fund's custodian. The master netting arrangements allow the clearing brokers to net any collateral held in or on behalf of a Fund, or liabilities or payment obligations of the clearing brokers to a Fund, against any liabilities or payment obligations of a Fund to the clearing brokers. A Fund is required to deposit financial collateral (including cash collateral) at the Fund's custodian on behalf of clearing brokers and counterparties to continually meet the original and maintenance requirements established by the clearing brokers and counterparties. Such requirements are specific to the respective clearing broker or counterparty. Certain master netting arrangements may not be enforceable in a bankruptcy. |
| | The following tables present a Fund's derivative assets and liabilities, presented on a gross basis as no amounts are netted within the Statements of Assets and Liabilities, by counterparty net of amounts available for offset under a master netting agreement or similar agreement ("MNA") and net of the related collateral received/pledged by a Fund as of December 31, 2023: |
| | |
| Balanced HLS Fund | | | | |
| Derivative Financial Instruments: | | Assets | | Liabilities |
| Futures contracts | | $ 213,236 | | $ — |
| Total gross amount of derivative assets and liabilities in the Statement of Assets and Liabilities | | 213,236 | | — |
| Derivatives not subject to a MNA | | (213,236) | | — |
| Total gross amount of assets and liabilities subject to MNA or similar agreements | | $ — | | $ — |
Notes to Financial Statements – (continued)
December 31, 2023
| Capital Appreciation HLS Fund | | | | |
| Derivative Financial Instruments: | | Assets | | Liabilities |
| Futures contracts | | $ 1,923,011 | | $ — |
| Total gross amount of derivative assets and liabilities in the Statement of Assets and Liabilities | | 1,923,011 | | — |
| Derivatives not subject to a MNA | | (1,923,011) | | — |
| Total gross amount of assets and liabilities subject to MNA or similar agreements | | $ — | | $ — |
| Total Return Bond HLS Fund | | | | |
| Derivative Financial Instruments: | | Assets | | Liabilities |
| Foreign currency contracts | | $ — | | $ (412,052) |
| Futures contracts | | 8,390,175 | | (8,591,558) |
| Swap contracts | | 1,561,255 | | (1,076,351) |
| Total gross amount of derivative assets and liabilities in the Statement of Assets and Liabilities | | 9,951,430 | | (10,079,961) |
| Derivatives not subject to a MNA | | (9,951,430) | | 9,667,909 |
| Total gross amount of assets and liabilities subject to MNA or similar agreements | | $ — | | $ (412,052) |
| Counterparty | | Gross Amount
of Liabilities | | Financial
Instruments
and Derivatives
Available
for Offset | | Non-cash
Collateral
Pledged* | | Cash
Collateral
Pledged* | | Net Amount
of Liabilities |
| Citibank NA | | $ (12,428) | | $ — | | $ — | | $ — | | $ (12,428) |
| Deutsche Bank Securities, Inc. | | (399,624) | | — | | 72,059 | | 160,000 | | (167,565) |
| Total | | $ (412,052) | | $ — | | $ 72,059 | | $ 160,000 | | $ (179,993) |
| * | In some instances, the actual collateral received and/or pledged may be more than the amount shown. |
| 5. | Principal Risks: |
| | A Fund’s investments expose it to various types of risks associated with financial instruments and the markets. A Fund may be exposed to the risks described below. Each Fund’s prospectus provides details of its principal risks. |
| | The market values of equity securities, such as common stocks and preferred stocks, or equity related derivative investments, such as futures and options, may decline due to general market conditions which are not specifically related to a particular company, such as real or perceived adverse economic conditions, changes in the general outlook for corporate earnings, changes in interest or currency rates or adverse investor sentiment generally. The market value of equity securities may also decline due to factors which affect a particular industry or industries, such as labor shortages or increased production costs and competitive conditions within an industry. Equity securities and equity related investments generally have greater market price volatility than fixed income securities. The extent of each Fund’s exposure to market risk is the market value of the investments held as shown in the Fund’s Schedule of Investments. |
| | A widespread health crisis, such as a global pandemic, could cause substantial market volatility, exchange trading suspensions or restrictions and closures of securities exchanges and businesses, impact the ability to complete redemptions, and adversely impact Fund performance. The outbreak of COVID-19, a respiratory disease caused by a novel coronavirus, negatively affected the worldwide economy, created supply chain disruptions and labor shortages, and impacted the financial health of individual companies and the market in significant and unforeseen ways. The future impact of COVID-19, if any, remains unclear. The effects to public health, business and market conditions resulting from COVID-19 pandemic have had, and may continue to have, a significant negative impact on the performance of a Fund's investments, including exacerbating other pre-existing political, social and economic risks. |
| | The banking sector has recently been subject to increased market volatility. As a result, a Fund’s investments in the banking sector may be subject to increased volatility risk. |
| | Certain investments held by a Fund expose the Fund to various risks which may include, but are not limited to, interest rate, prepayment, and extension risks. Interest rate risk is the risk that fixed income securities will decline in value because of changes in interest rates. As nominal interest rates rise, the values of certain fixed income securities held by a Fund are likely to decrease. A nominal interest rate can be described as the sum of a real interest rate and an expected inflation rate. Fixed income securities with longer durations tend to be more sensitive to changes in interest rates, usually making them more volatile than securities with shorter durations. Duration is useful primarily as a measure of the sensitivity of a fixed income security’s market price to interest rate (i.e., yield) movements. Senior floating rate interests and securities subject |
Notes to Financial Statements – (continued)
December 31, 2023
| | to prepayment and extension risk generally offer less potential for gains when interest rates decline. Rising interest rates may cause prepayments to occur at a slower than expected rate, thereby effectively lengthening the maturity of the security and making the security more sensitive to interest rate changes. Prepayment and extension risk are major risks of mortgage-backed securities, senior floating rate interests and certain asset-backed securities. For certain asset-backed securities, the actual maturity may be less than the stated maturity shown in the Schedule of Investments, if applicable. As a result, the timing of income recognition relating to these securities may vary based upon the actual maturity. |
| | Investing in the securities of non-U.S. issuers, whether directly or indirectly, involves certain considerations and risks not typically associated with securities of U.S. issuers. Such risks include, but are not limited to: generally less liquid and less efficient securities markets; generally greater price volatility; exchange rate fluctuations; imposition of restrictions on the expatriation of funds or other protectionist measures; less publicly available information about issuers; the imposition of withholding or other taxes; higher transaction and custody costs; settlement delays and risk of loss attendant in settlement procedures; difficulties in enforcing contractual obligations; less regulation of securities markets; different accounting, disclosure and reporting requirements; more substantial governmental involvement in the economy; higher inflation rates; and greater social, economic and political uncertainties. Non-U.S. issuers may also be affected by political, social, economic or diplomatic developments in a foreign country or region or the U.S. (including the imposition of sanctions, tariffs, or other governmental restrictions). These risks are heightened for investments in issuers from countries with less developed markets. |
| | Securities lending involves the risk that a Fund may lose money because the borrower of the loaned securities fails to return the securities in a timely manner or at all. A Fund could also lose money in the event of a decline in the value of the collateral provided for the loaned securities or a decline in the value of any investments made with cash collateral. These events could also trigger adverse tax consequences for a Fund that lends its holdings. |
| | Credit risk depends largely on the perceived financial health of bond issuers. In general, the credit rating is inversely related to the credit risk of the issuer. Higher rated bonds generally are deemed to have less credit risk, while lower or unrated bonds are deemed to have higher risk of default. The share price, yield and total return of a fund that holds securities with higher credit risk may be more volatile than those of a fund that holds bonds with lower credit risk. A Fund may be exposed to counterparty risk, or the risk that an institution or other entity with which a Fund has unsettled or open transactions will default. |
| | Geopolitical events, including the invasion of Ukraine by Russia and the conflict between Israel and Hamas, have injected uncertainty into the global financial markets. Investments in Russia are subject to political, economic, legal, market and currency risks, as well as the risks related to the economic sanctions on Russia imposed by the United States and/or other countries. Such sanctions which affect companies in many sectors, including energy, financial services and defense, among others, have adversely affected and could continue to adversely affect the global energy and financial markets and, thus, have adversely affected and could continue to adversely affect the value of a Fund’s investments, even beyond any direct exposure the Fund may have to Russian issuers or the adjoining geographic regions. In addition, certain transactions have or may be prohibited and/or existing investments have or may become illiquid (e.g., because transacting in certain existing investments is prohibited), which could cause a Fund to sell other portfolio holdings at a disadvantageous time or price in order to meet redemptions. |
| a) | Each Fund intends to continue to qualify as a Regulated Investment Company ("RIC") under Subchapter M of the Internal Revenue Code ("IRC") by distributing substantially all of its taxable net investment income and net realized capital gains to its shareholders each year. Each Fund has distributed substantially all of its income and capital gains in prior years, if applicable, and intends to distribute substantially all of its income and capital gains during the calendar year ending December 31, 2023. Accordingly, no provision for federal income or excise taxes has been made in the accompanying financial statements. Distributions from short-term capital gains are treated as ordinary income distributions for federal income tax purposes. |
| b) | Net Investment Income (Loss), Net Realized Gains (Losses) and Distributions – Net investment income (loss) and net realized gains (losses) may differ for financial statement and tax purposes primarily because of losses deferred due to wash sale adjustments, foreign currency gains and losses, adjustments related to Passive Foreign Investment Companies ("PFICs"), non-taxable distributions from underlying investments, RICs, certain derivatives, losses deferred due to straddle adjustments and partnerships. The character of distributions made during the year from net investment income or net realized gains may differ from their ultimate characterization for federal income tax purposes. Also, due to the timing of dividend distributions, the fiscal year in which amounts are distributed may differ from the year that the income or realized gains (losses) were recorded by each Fund. |
Notes to Financial Statements – (continued)
December 31, 2023
| c) | Distributions and Components of Distributable Earnings – The tax character of distributions paid by each Fund for the years ended December 31, 2023 and December 31, 2022 are as follows: |
| | |
| | | For the Year Ended
December 31, 2023 | | For the Year Ended
December 31, 2022 |
| Fund | | Ordinary
Income | | Long-Term
Capital Gains(1) | | Ordinary
Income | | Long-Term
Capital Gains(1) |
| Balanced HLS Fund | | $ 30,261,139 | | $ 47,610,166 | | $ 42,466,612 | | $ 223,151,444 |
| Capital Appreciation HLS Fund | | 33,627,880 | | 54,026,622 | | 64,891,675 | | 457,492,553 |
| Disciplined Equity HLS Fund | | 20,367,256 | | 16,921,455 | | 35,832,973 | | 145,076,067 |
| Dividend and Growth HLS Fund | | 52,723,896 | | 288,841,874 | | 72,697,937 | | 361,147,229 |
| Healthcare HLS Fund | | 615,343 | | 1,897,546 | | 3,816,291 | | 33,341,892 |
| International Opportunities HLS Fund | | 9,961,393 | | — | | 40,967,010 | | 136,368,618 |
| MidCap HLS Fund | | 5,954,860 | | 76,779,118 | | 12,084,551 | | 202,055,478 |
| Small Cap Growth HLS Fund | | — | | — | | 7,681,251 | | 170,815,310 |
| Small Company HLS Fund | | — | | — | | 11,972,762 | | 81,829,229 |
| Stock HLS Fund | | 17,000,012 | | 64,887,146 | | 26,880,254 | | 139,481,470 |
| Total Return Bond HLS Fund | | 60,532,795 | | — | | 61,202,717 | | 18,943,062 |
| Ultrashort Bond HLS Fund | | 7,319,868 | | — | | 1,268,070 | | — |
| | | | | | | | | |
| (1) | The Funds designate these distributions as long-term capital gains dividends pursuant to IRC Sec 852(b)(3)(c). |
As of December 31, 2023, the components of total accumulated earnings (deficit) for each Fund on a tax basis are as follows:
| Fund | | Undistributed
Ordinary
Income | | Undistributed
Long-Term
Capital Gains | | Accumulated
Capital and
Other Losses | | Other
Temporary
Differences | | Unrealized
Appreciation
(Depreciation)
on Investments | | Total
Accumulated
Earnings
(Deficit) |
| Balanced HLS Fund | | $ 3,134,004 | | $ 95,974,977 | | $ — | | $ (1,519,193) | | $ 388,983,482 | | $ 486,573,270 |
| Capital Appreciation HLS Fund | | 39,194,625 | | 22,411,908 | | — | | — | | 870,409,241 | | 932,015,774 |
| Disciplined Equity HLS Fund | | 2,702,190 | | 96,848,015 | | — | | — | | 999,142,635 | | 1,098,692,840 |
| Dividend and Growth HLS Fund | | 5,540,876 | | 182,085,110 | | — | | — | | 1,326,557,330 | | 1,514,183,316 |
| Healthcare HLS Fund | | 108,182 | | 883,464 | | — | | — | | 35,202,171 | | 36,193,817 |
| International Opportunities HLS Fund | | 12,920,512 | | — | | (58,513,302) | | — | | 152,580,228 | | 106,987,438 |
| MidCap HLS Fund | | 4,779,454 | | 15,797,013 | | — | | — | | 262,006,362 | | 282,582,829 |
| Small Cap Growth HLS Fund | | 1,900,938 | | — | | (31,482,735) | | — | | 157,922,114 | | 128,340,317 |
| Small Company HLS Fund | | — | | — | | (92,046,243) | | — | | 63,451,512 | | (28,594,731) |
| Stock HLS Fund | | 3,174,631 | | 38,162,198 | | — | | — | | 624,419,759 | | 665,756,588 |
| Total Return Bond HLS Fund | | 62,668,039 | | — | | (184,990,325) | | (1,139,771) | | (152,651,068) | | (276,113,125) |
| Ultrashort Bond HLS Fund | | 23,071,439 | | — | | (12,504,922) | | — | | (2,970,418) | | 7,596,099 |
| d) | Reclassification of Capital Accounts – The Funds may record reclassifications in their capital accounts. These reclassifications have no impact on the total net assets of the Funds. The reclassifications are a result of permanent differences between U.S. GAAP and tax accounting for such items as net operating losses, subsequent adjustments to wash sales, non-taxable distributions from underlying investments, and partnerships. Adjustments are made to reflect the impact these items have on the current and future earnings distributions to shareholders. Therefore, the source of the Funds' distributions may be shown in the accompanying Statements of Changes in Net Assets as from distributable earnings or from capital depending on the type of book and tax differences that exist. For the year ended December 31, 2023, the Funds recorded reclassifications to increase (decrease) the accounts listed below: |
| | |
| Fund | | Paid-in-Capital | | Distributable
Earnings (Loss) |
| Capital Appreciation HLS Fund | | $ (15,642) | | $ 15,642 |
| Disciplined Equity HLS Fund | | (5,272) | | 5,272 |
| Small Cap Growth HLS Fund | | 10,291 | | (10,291) |
| Small Company HLS Fund | | (451,373) | | 451,373 |
| e) | Capital Loss Carryforward – Under the Regulated Investment Company Modernization Act of 2010, funds are permitted to carry forward capital losses for an unlimited period. |
Notes to Financial Statements – (continued)
December 31, 2023
| | At December 31, 2023 (tax year end), each Fund's capital loss carryforwards for U.S. federal income tax purposes were as follows: |
| | |
| Fund | | Short-Term
Capital Loss
Carryforward with
No Expiration | | Long-Term
Capital Loss
Carryforward with
No Expiration |
| International Opportunities HLS Fund | | $ 52,013,759 | | $ 6,499,543 |
| Small Cap Growth HLS Fund | | 31,482,735 | | — |
| Small Company HLS Fund | | 87,607,448 | | 4,438,795 |
| Total Return Bond HLS Fund* | | 96,162,694 | | 88,827,631 |
| Ultrashort Bond HLS Fund | | 672,779 | | 11,832,143 |
| * | Future utilization of losses are subject to limitation under current tax laws. |
During the year ended December 31, 2023, the Small Cap Growth Fund utilized $64,593,901 and the Small Company Fund utilized $1,002,753 of prior year capital loss carryforward.
The Balanced HLS Fund, Capital Appreciation HLS Fund, Disciplined Equity HLS Fund, Dividend And Growth HLS Fund, Healthcare HLS Fund, MidCap HLS Fund, and Stock HLS Fund had no capital loss carryforward for U.S. federal tax purposes as of December 31, 2023.
| f) | Tax Basis of Investments – The aggregate cost of investments for federal income tax purposes at December 31, 2023 is different from book purposes primarily due to wash sale loss deferrals, PFICs mark-to-market adjustments, partnership adjustments and non-taxable distributions from underlying investments. The net unrealized appreciation/(depreciation) on investments for tax purposes, which consists of gross unrealized appreciation and depreciation was also different from book purposes primarily due to wash sale loss deferrals and mark-to-market adjustments on swaps, forwards, futures, PFICs, partnership adjustments and nontaxable distributions from underlying investments. Both the cost and unrealized appreciation and depreciation for federal income tax purposes are disclosed below: |
| | |
| Fund | | Tax Cost | | Gross Unrealized
Appreciation | | Gross Unrealized
(Depreciation) | | Net Unrealized
Appreciation
(Depreciation) |
| Balanced HLS Fund | | $ 1,303,152,757 | | $ 415,971,393 | | $ (27,091,401) | | $ 388,879,992 |
| Capital Appreciation HLS Fund | | 2,666,576,186 | | 916,844,035 | | (46,432,209) | | 870,411,826 |
| Disciplined Equity HLS Fund | | 1,698,650,656 | | 1,031,320,109 | | (32,176,433) | | 999,143,676 |
| Dividend and Growth HLS Fund | | 2,104,928,361 | | 1,357,679,877 | | (31,122,799) | | 1,326,557,078 |
| Healthcare HLS Fund | | 102,632,516 | | 43,332,287 | | (8,133,348) | | 35,198,939 |
| International Opportunities HLS Fund | | 712,755,109 | | 168,590,880 | | (15,125,324) | | 153,465,556 |
| MidCap HLS Fund | | 835,227,866 | | 301,522,029 | | (39,515,667) | | 262,006,362 |
| Small Cap Growth HLS Fund | | 607,507,453 | | 182,951,524 | | (25,029,410) | | 157,922,114 |
| Small Company HLS Fund | | 370,348,061 | | 96,312,783 | | (32,861,271) | | 63,451,512 |
| Stock HLS Fund | | 710,771,129 | | 627,861,846 | | (3,442,087) | | 624,419,759 |
| Total Return Bond HLS Fund | | 2,232,668,690 | | 25,104,752 | | (177,824,241) | | (152,719,489) |
| Ultrashort Bond HLS Fund | | 560,665,846 | | 1,467,646 | | (4,438,064) | | (2,970,418) |
| g) | Accounting for Uncertainty in Income Taxes – Pursuant to provisions set forth by U.S. GAAP, HFMC reviews each Fund’s tax positions for all open tax years. As of December 31, 2023, HFMC had reviewed the open tax years and concluded that there was no reason to record a liability for net unrecognized tax obligations relating to uncertain income tax positions. Each Fund files U.S. tax returns. Although the statute of limitations for examining a Fund’s U.S. tax returns remains open for three years, no examination is currently in progress. The Funds recognize interest and penalties, if any, related to unrecognized tax benefits as income tax expense on the Statements of Operations. During the year ended December 31, 2023, the Funds did not incur any interest or penalties. HFMC is not aware of any tax positions for which it is reasonably possible that the total amounts of unrecognized tax obligations will significantly change in the next twelve months. |
| a) | Investment Management Agreement – HFMC serves as each Fund’s investment manager. Each Company, on behalf of its respective Funds, has entered into an Investment Management Agreement with HFMC. HFMC is an indirect subsidiary of The Hartford Financial Services Group, Inc. (“The Hartford”). HFMC has overall investment supervisory responsibility for each Fund. In addition, HFMC provides administrative personnel, services, equipment, facilities and office space for proper operation of each Fund. HFMC has contracted with Wellington Management Company LLP (“Wellington Management”) under a sub-advisory agreement and Wellington Management performs the daily investment of the assets of each Fund, in accordance with the Fund’s investment objective and policies. HFMC pays a sub-advisory fee to Wellington Management out of its management fee. |
Notes to Financial Statements – (continued)
December 31, 2023
The schedule below reflects the rates of compensation paid to HFMC for investment management services rendered as of December 31, 2023; the rates are accrued daily and paid monthly based on each Fund’s average daily net assets, at the following annual rates:
| Fund | | Management Fee Rates |
| Balanced HLS Fund* | | 0.6800% on first $250 million and; |
| | | 0.6550% on next $250 million and; |
| | | 0.6450% on next $500 million and; |
| | | 0.5950% on next $4 billion and; |
| | | 0.5925% on next $5 billion and; |
| | | 0.5900% over $10 billion |
| Capital Appreciation HLS Fund | | 0.7750% on first $250 million and; |
| | | 0.7250% on next $250 million and; |
| | | 0.6750% on next $500 million and; |
| | | 0.6250% on next $1.5 billion and; |
| | | 0.6200% on next $2.5 billion and; |
| | | 0.6150% on next $5 billion and; |
| | | 0.6100% over $10 billion |
| Disciplined Equity HLS Fund | | 0.6000% on first $1 billion and; |
| | | 0.5500% on next $4 billion and; |
| | | 0.5300% on next $5 billion and; |
| | | 0.5000% over $10 billion |
| Dividend and Growth HLS Fund | | 0.6900% on first $250 million and; |
| | | 0.6425% on next $250 million and; |
| | | 0.6325% on next $500 million and; |
| | | 0.6250% on next $1.5 billion and; |
| | | 0.6200% on next $2.5 billion and; |
| | | 0.6150% on next $5 billion and; |
| | | 0.6100% over $10 billion |
| Healthcare HLS Fund | | 0.8500% on first $250 million and; |
| | | 0.8000% on next $250 million and; |
| | | 0.7500% on next $4.5 billion and; |
| | | 0.7475% on next $5 billion and; |
| | | 0.7450% over $10 billion |
| International Opportunities HLS Fund | | 0.7750% on first $250 million and; |
| | | 0.7250% on next $250 million and; |
| | | 0.6750% on next $500 million and; |
| | | 0.6250% on next $1.5 billion and; |
| | | 0.6200% on next $2.5 billion and; |
| | | 0.6150% on next $5 billion and; |
| | | 0.6100% over $10 billion |
| MidCap HLS Fund | | 0.7750% on first $250 million and; |
| | | 0.7250% on next $250 million and; |
| | | 0.6750% on next $500 million and; |
| | | 0.6250% on next $4 billion and; |
| | | 0.6225% on next $5 billion and; |
| | | 0.6200% over $10 billion |
| Small Cap Growth HLS Fund | | 0.7000% on first $100 million and; |
| | | 0.6000% on next $4.9 billion and; |
| | | 0.5800% on next $5 billion and; |
| | | 0.5700% over $10 billion |
| Small Company HLS Fund | | 0.7750% on first $250 million and; |
| | | 0.7250% on next $250 million and; |
| | | 0.6750% on next $500 million and; |
| | | 0.6000% on next $500 million and; |
| | | 0.5500% on next $3.5 billion and; |
| | | 0.5300% on next $5 billion and; |
| | | 0.5200% over $10 billion |
Notes to Financial Statements – (continued)
December 31, 2023
| Fund | | Management Fee Rates |
| Stock HLS Fund | | 0.5250% on first $250 million and; |
| | | 0.5000% on next $250 million and; |
| | | 0.4750% on next $500 million and; |
| | | 0.4500% on next $4 billion and; |
| | | 0.4475% on next $5 billion and; |
| | | 0.4450% over $10 billion |
| Total Return Bond HLS Fund | | 0.5250% on first $250 million and; |
| | | 0.5000% on next $250 million and; |
| | | 0.4750% on next $500 million and; |
| | | 0.4500% on next $1.5 billion and; |
| | | 0.4450% on next $2.5 billion and; |
| | | 0.4300% on next $5 billion and; |
| | | 0.4200% over $10 billion |
| Ultrashort Bond HLS Fund | | 0.4000% on first $5 billion and; |
| | | 0.3800% on next $5 billion and; |
| | | 0.3700% over $10 billion |
| * | HFMC voluntarily waived a portion of its contractual management fee equal to 0.03% as an annual percentage rate of the Balanced HLS Fund’s average daily net assets from January 1, 2023 through December 31, 2023. |
| b) | Accounting Services Agreement – HFMC provides the Funds with accounting services pursuant to a fund accounting agreement by and between each Company, on behalf of its respective Funds, and HFMC. HFMC has delegated certain accounting and administrative service functions to State Street Bank and Trust Company ("State Street"). In consideration of services rendered and expenses assumed pursuant to the fund accounting agreement, each Fund pays HFMC a fee. The fund accounting fee for each Fund is equal to the greater of: (A) the sum of (i) the sub-accounting fee payable by HFMC with respect to the Fund; (ii) the fee payable for tax preparation services for the Fund; and (iii) the amount of expenses that HFMC allocates for providing the fund accounting services to the Fund; plus a target profit margin; or (B) $40,000 per year; provided, however, that to the extent the annual amount of the fund accounting fee exceeds 0.02% of the Fund’s average net assets (calculated during its current fiscal year), HFMC shall waive such portion of the fund accounting fee. |
| c) | Operating Expenses – Allocable expenses incurred by each Company are allocated to each series within such Company, and allocated to classes within each such series, in proportion to the average daily net assets of such series and classes, except where allocation of certain expenses is more fairly made directly to a Fund or to specific classes within a Fund. |
| d) | Fees Paid Indirectly – Hartford HLS Series Fund II, Inc. and Hartford Series Fund, Inc., on behalf of its series except Total Return Bond HLS Fund and Ultrashort Bond HLS Fund, have entered into agreements with State Street Global Markets, LLC and Russell Implementation Services, Inc. to partially recapture non-discounted trade commissions. Such rebates are used to pay a portion of the Funds’ expenses. For the year ended December 31, 2023, these amounts, if any, are included in the Statements of Operations. |
| | The ratio of expenses to average net assets in the accompanying financial highlights excludes the reduction in expenses related to fees paid indirectly. The annualized expense ratio after waivers reflecting the reduction for fees paid indirectly for the period is as follows: |
| | |
| Fund | | Class IA | | Class IB | | Class IC |
| Balanced HLS Fund | | 0.63% | | 0.88% | | N/A |
| Capital Appreciation HLS Fund | | 0.67% | | 0.92% | | 1.17% |
| Disciplined Equity HLS Fund | | 0.59% | | 0.84% | | 1.09% |
| Dividend and Growth HLS Fund | | 0.65% | | 0.90% | | N/A |
| Healthcare HLS Fund | | 0.92% | | 1.17% | | N/A |
| International Opportunities HLS Fund | | 0.76% | | 1.01% | | N/A |
| MidCap HLS Fund | | 0.73% | | 0.98% | | N/A |
| Small Cap Growth HLS Fund | | 0.65% | | 0.90% | | N/A |
| Small Company HLS Fund | | 0.80% | | 1.05% | | N/A |
| Stock HLS Fund | | 0.51% | | 0.76% | | N/A |
| Total Return Bond HLS Fund | | 0.50% | | 0.75% | | N/A |
| Ultrashort Bond HLS Fund | | 0.44% | | 0.69% | | N/A |
| e) | Distribution Plans for Class IB and Class IC Shares – Hartford Funds Distributors, LLC ("HFD"), an indirect subsidiary of The Hartford, is the principal underwriter and distributor of each Fund. Each Company, on behalf of its respective Funds, has adopted a Distribution Plan pursuant to Rule 12b-1 of the 1940 Act for Class IB shares and Hartford Series Fund, Inc. on behalf of certain Funds, has adopted a Distribution Plan pursuant to Rule 12b-1 of the 1940 Act for Class IC shares. |
Notes to Financial Statements – (continued)
December 31, 2023
| | Pursuant to the Class IB Distribution Plans, a Fund may pay HFD a fee of up to 0.25% of the average daily net assets of the Fund attributable to its Class IB shares for distribution financing activities and shareholder account servicing activities. The entire amount of the fee may be used for shareholder servicing expenses and/or distribution expenses. Pursuant to the Class IC Distribution Plans, a Fund may pay HFD a fee of up to 0.25% of the average daily net assets of the Fund attributable to its Class IC shares for distribution financing activities. |
| | Each Board has the authority to suspend or reduce these payments at any point in time. The distribution fees paid during the period can be found on the Statements of Operations. Each Fund's 12b-1 fees are accrued daily and paid monthly or at such other intervals as the respective Company's Board of Directors may determine. |
| f) | Administrative Services Fee for Class IC Shares – Certain Funds may pay an administrative services fee to third party insurance companies annually up to 0.25% of the average daily net assets of the Fund attributable to its Class IC shares for recordkeeping and/or other administrative services provided to such Class IC shares. The total administrative services fees paid during the period are shown on the Statements of Operations. These fees are accrued daily and paid monthly. |
| g) | Other Related Party Transactions – Certain officers of each Company are directors and/or officers of HFMC and/or The Hartford or its subsidiaries. For the year ended December 31, 2023, a portion of each Company’s Chief Compliance Officer’s ("CCO") compensation was paid by all of the investment companies in the Hartford fund complex. The portion allocated to each Fund, as represented in "Other expenses" on the Statements of Operations, is outlined in the table below. |
| | |
| Fund | | CCO Compensation
Paid by Fund |
| Balanced HLS Fund | | $ 3,816 |
| Capital Appreciation HLS Fund | | 7,959 |
| Disciplined Equity HLS Fund | | 5,927 |
| Dividend and Growth HLS Fund | | 7,609 |
| Healthcare HLS Fund | | 322 |
| International Opportunities HLS Fund | | 1,981 |
| MidCap HLS Fund | | 2,636 |
| Small Cap Growth HLS Fund | | 1,664 |
| Small Company HLS Fund | | 953 |
| Stock HLS Fund | | 3,029 |
| Total Return Bond HLS Fund | | 3,933 |
| Ultrashort Bond HLS Fund | | 1,308 |
Hartford Administrative Services Company (“HASCO”), an indirect subsidiary of The Hartford, provides transfer agent services to each Fund. Pursuant to a sub-transfer agency agreement between HASCO and SS&C GIDS, Inc. ("SS&C", formerly known as DST Asset Manager Solutions, Inc.), HASCO has delegated certain transfer agent, dividend disbursing agent and shareholder servicing agent functions to SS&C. The costs and expenses of such delegation are borne by HASCO, not by the Funds. Each Fund pays HASCO a fixed fee annually, plus out of pocket expenses for providing such services. The accrued amount shown in the Statements of Operations reflects the amounts charged by HASCO. These fees are accrued daily and paid monthly.
For the year ended December 31, 2023, the effective rate of compensation paid to HASCO for transfer agency services as a percentage of each Class' average daily net assets is as follows:
| Fund | | Class IA | | Class IB | | Class IC |
| Balanced HLS Fund | | 0.00%* | | 0.00%* | | N/A |
| Capital Appreciation HLS Fund | | 0.00%* | | 0.00%* | | 0.00%* |
| Disciplined Equity HLS Fund | | 0.00%* | | 0.00%* | | 0.00%* |
| Dividend and Growth HLS Fund | | 0.00%* | | 0.00%* | | N/A |
| Healthcare HLS Fund | | 0.00%* | | 0.00%* | | N/A |
| International Opportunities HLS Fund | | 0.00%* | | 0.00%* | | N/A |
| MidCap HLS Fund | | 0.00%* | | 0.00%* | | N/A |
| Small Cap Growth HLS Fund | | 0.00%* | | 0.00%* | | N/A |
| Small Company HLS Fund | | 0.00%* | | 0.00%* | | N/A |
| Stock HLS Fund | | 0.00%* | | 0.00%* | | N/A |
| Total Return Bond HLS Fund | | 0.00%* | | 0.00%* | | N/A |
| Ultrashort Bond HLS Fund | | 0.00%* | | 0.00%* | | N/A |
| * | Percentage rounds to zero. |
Notes to Financial Statements – (continued)
December 31, 2023
| 8. | Securities Lending: |
| | Each Company has entered into a securities lending agency agreement ("lending agreement") with Citibank, N.A. ("Citibank"). A Fund may lend portfolio securities to certain borrowers in U.S. and non-U.S. markets in an amount not to exceed one-third (33 1/3%) of the value of its total assets. A Fund may lend portfolio securities, provided that the borrower provides collateral that is maintained in an amount at least equal to the current market value of the securities loaned. Cash collateral is invested for the benefit of a Fund by the Fund’s lending agent pursuant to collateral investment guidelines. The collateral is marked to market daily, in an amount at least equal to the current market value of the securities loaned. The contractual maturities of the securities lending transactions are considered overnight and continuous. |
| | A Fund is subject to certain risks while its securities are on loan, including the following: (i) the risk that the borrower defaults on the loan and the collateral is inadequate to cover the Fund’s loss; (ii) the risk that the earnings on the collateral invested are not sufficient to pay fees incurred in connection with the loan; (iii) the Fund could lose money in the event of a decline in the value of the collateral provided for loaned securities or a decline in the value of any investments made with cash collateral; (iv) the risk that the borrower may use the loaned securities to cover a short sale, which may in turn place downward pressure on the market prices of the loaned securities; (v) the risk that return of loaned securities could be delayed and interfere with portfolio management decisions; (vi) the risk that any efforts to restrict or recall the securities for purposes of voting may not be effective; and (vii) operational risks (i.e., the risk of losses resulting from problems in the settlement and accounting process especially so in certain international markets). These events could also trigger adverse tax consequences for the Fund. |
| | A Fund retains loan fees and the interest on cash collateral investments but is required to pay the borrower a rebate for the use of cash collateral. In cases where the lent security is of high value to borrowers, there may be a negative rebate (i.e., a net payment from the borrower to the applicable Fund). Upon termination of a loan, a Fund is required to return to the borrower an amount equal to the cash collateral, plus any rebate owed to the borrowers. |
| | The net income earned on the securities lending (after payment of rebates and Citibank’s fee) is included on the Statements of Operations as Investment Income from securities lending. A Fund also receives payments from the borrower during the period of the loan, equivalent to dividends and interest earned on the securities loaned, which are recorded as Investment Income from dividends or interest, respectively, on the Statements of Operations. |
| | The following table presents for each Fund that lends its portfolio securities the market value of the securities on loan and the cash and non-cash collateral posted by the borrower as of December 31, 2023. |
| | |
| Fund | | Investment Securities on Loan, at market value,
Presented on the Statements of Assets and Liabilities | | Cash
Collateral(1) | | Non-Cash
Collateral(1) |
| Balanced HLS Fund | | $ 670,421 | | $ 701,851 | | $ — |
| Capital Appreciation HLS Fund | | 10,853,794 | | 11,438,686 | | — |
| Disciplined Equity HLS Fund | | — | | — | | — |
| Dividend and Growth HLS Fund | | 12,220,659 | | 16,112,083 | | — |
| Healthcare HLS Fund | | 612,390 | | 631,410 | | — |
| International Opportunities HLS Fund | | 1,403,784 | | 1,480,458 | | — |
| MidCap HLS Fund | | 106,546 | | 109,000 | | — |
| Small Cap Growth HLS Fund | | 6,340,632 | | 6,722,774 | | — |
| Small Company HLS Fund | | 2,205,196 | | 2,327,133 | | — |
| Stock HLS Fund | | — | | — | | — |
| Total Return Bond HLS Fund | | 184,460 | | 192,750 | | — |
| Ultrashort Bond HLS Fund | | 3,026,454 | | 3,169,858 | | — |
| (1) | It is each Fund’s policy to obtain additional collateral from, or return excess collateral to, the borrower by the end of the next business day following the valuation date of the securities loaned. Therefore, the value of the collateral held may be temporarily less than that required under the lending contract due to timing. Pursuant to the lending agreement, the borrower will provide collateral in an amount at least equal to the current market value of securities loaned. |
Notes to Financial Statements – (continued)
December 31, 2023
| 9. | Investment Transactions: |
| | For the year ended December 31, 2023, the cost of purchases and proceeds from sales of investment securities (excluding short-term investments) were as follows: |
| | |
| Fund | | Cost of Purchases
Excluding U.S.
Government
Obligations | | Sales Proceeds
Excluding U.S.
Government
Obligations | | Cost of Purchases
For U.S. Government
Obligations | | Sales Proceeds
For U.S. Government
Obligations | | Total Cost of
Purchases | | Total Sales
Proceeds |
| Balanced HLS Fund | | $ 503,841,923 | | $��672,343,074 | | $ 436,469,198 | | $ 447,243,144 | | $ 940,311,121 | | $ 1,119,586,218 |
| Capital Appreciation HLS Fund | | 1,688,588,598 | | 2,107,268,623 | | — | | — | | 1,688,588,598 | | 2,107,268,623 |
| Disciplined Equity HLS Fund | | 565,592,443 | | 853,406,200 | | — | | — | | 565,592,443 | | 853,406,200 |
| Dividend and Growth HLS Fund | | 879,041,559 | | 1,175,589,735 | | — | | — | | 879,041,559 | | 1,175,589,735 |
| Healthcare HLS Fund | | 39,878,117 | | 58,492,167 | | — | | — | | 39,878,117 | | 58,492,167 |
| International Opportunities HLS Fund | | 458,208,605 | | 531,949,006 | | — | | — | | 458,208,605 | | 531,949,006 |
| MidCap HLS Fund | | 453,810,218 | | 655,190,505 | | — | | — | | 453,810,218 | | 655,190,505 |
| Small Cap Growth HLS Fund | | 450,704,563 | | 497,037,296 | | — | | — | | 450,704,563 | | 497,037,296 |
| Small Company HLS Fund | | 160,850,747 | | 208,747,682 | | — | | — | | 160,850,747 | | 208,747,682 |
| Stock HLS Fund | | 111,778,794 | | 229,084,653 | | — | | — | | 111,778,794 | | 229,084,653 |
| Total Return Bond HLS Fund | | 476,901,527 | | 478,405,728 | | 418,549,957 | | 427,041,230 | | 895,451,484 | | 905,446,958 |
| Ultrashort Bond HLS Fund | | 254,975,870 | | 273,215,738 | | 60,975,822 | | 19,020,429 | | 315,951,692 | | 292,236,167 |
| 10. | Capital Share Transactions: |
| | The following information is for the years ended December 31, 2023 and December 31, 2022: |
| | |
| | For the Year Ended
December 31, 2023 | | For the Year Ended
December 31, 2022 |
| | Shares | | Amount | | Shares | | Amount |
| Balanced HLS Fund | | | | | | | |
| Class IA | | | | | | | |
| Shares Sold | 330,989 | | $ 9,054,110 | | 219,884 | | $ 6,632,090 |
| Shares Issued for Reinvested Dividends | 2,502,161 | | 69,414,975 | | 8,609,461 | | 235,269,227 |
| Shares Redeemed | (7,667,422) | | (210,959,860) | | (6,702,016) | | (201,054,701) |
| Net Increase (Decrease) | (4,834,272) | | (132,490,775) | | 2,127,329 | | 40,846,616 |
| Class IB | | | | | | | |
| Shares Sold | 33,899 | | $ 949,396 | | 62,482 | | $ 2,063,006 |
| Shares Issued for Reinvested Dividends | 298,556 | | 8,456,330 | | 1,086,696 | | 30,348,829 |
| Shares Redeemed | (1,045,841) | | (29,337,103) | | (883,907) | | (26,944,643) |
| Net Increase (Decrease) | (713,386) | | (19,931,377) | | 265,271 | | 5,467,192 |
| Total Net Increase (Decrease) | (5,547,658) | | $ (152,422,152) | | 2,392,600 | | $ 46,313,808 |
| Capital Appreciation HLS Fund | | | | | | | |
| Class IA | | | | | | | |
| Shares Sold | 473,051 | | $ 20,021,492 | | 478,265 | | $ 21,183,735 |
| Shares Issued for Reinvested Dividends | 1,796,937 | | 78,837,685 | | 11,514,100 | | 462,293,161 |
| Shares Redeemed | (9,984,492) | | (427,051,346) | | (8,387,017) | | (373,524,847) |
| Net Increase (Decrease) | (7,714,504) | | (328,192,169) | | 3,605,348 | | 109,952,049 |
| Class IB | | | | | | | |
| Shares Sold | 64,617 | | $ 2,662,403 | | 79,217 | | $ 3,581,150 |
| Shares Issued for Reinvested Dividends | 200,428 | | 8,520,079 | | 1,419,968 | | 55,511,710 |
| Shares Redeemed | (1,371,172) | | (56,730,261) | | (1,222,050) | | (53,739,530) |
| Net Increase (Decrease) | (1,106,127) | | (45,547,779) | | 277,135 | | 5,353,330 |
| Class IC | | | | | | | |
| Shares Sold | 14,723 | | $ 617,165 | | 20,134 | | $ 870,523 |
| Shares Issued for Reinvested Dividends | 6,980 | | 296,738 | | 116,731 | | 4,579,357 |
| Shares Redeemed | (57,612) | | (2,424,643) | | (549,701) | | (22,055,453) |
| Net Increase (Decrease) | (35,909) | | (1,510,740) | | (412,836) | | (16,605,573) |
| Total Net Increase (Decrease) | (8,856,540) | | $ (375,250,688) | | 3,469,647 | | $ 98,699,806 |
Notes to Financial Statements – (continued)
December 31, 2023
| | For the Year Ended
December 31, 2023 | | For the Year Ended
December 31, 2022 |
| | Shares | | Amount | | Shares | | Amount |
| Disciplined Equity HLS Fund | | | | | | | |
| Class IA | | | | | | | |
| Shares Sold | 1,003,054 | | $ 16,899,096 | | 1,053,612 | | $ 18,127,590 |
| Shares Issued for Reinvested Dividends | 1,830,969 | | 33,301,220 | | 9,490,549 | | 157,383,630 |
| Shares Redeemed | (16,274,982) | | (280,156,696) | | (15,060,986) | | (265,431,648) |
| Net Increase (Decrease) | (13,440,959) | | (229,956,380) | | (4,516,825) | | (89,920,428) |
| Class IB | | | | | | | |
| Shares Sold | 641,095 | | $ 10,655,506 | | 225,041 | | $ 3,936,722 |
| Shares Issued for Reinvested Dividends | 191,373 | | 3,393,798 | | 1,186,882 | | 19,344,478 |
| Shares Redeemed | (3,088,023) | | (51,869,515) | | (2,609,863) | | (45,206,359) |
| Net Increase (Decrease) | (2,255,555) | | (37,820,211) | | (1,197,940) | | (21,925,159) |
| Class IC | | | | | | | |
| Shares Sold | 63,911 | | $ 1,116,155 | | 65,269 | | $ 1,213,062 |
| Shares Issued for Reinvested Dividends | 33,253 | | 593,693 | | 252,005 | | 4,180,932 |
| Shares Redeemed | (663,616) | | (11,375,899) | | (594,398) | | (10,422,924) |
| Net Increase (Decrease) | (566,452) | | (9,666,051) | | (277,124) | | (5,028,930) |
| Total Net Increase (Decrease) | (16,262,966) | | $ (277,442,642) | | (5,991,889) | | $ (116,874,517) |
| Dividend and Growth HLS Fund | | | | | | | |
| Class IA | | | | | | | |
| Shares Sold | 4,494,734 | | $ 100,289,824 | | 2,440,332 | | $ 60,072,245 |
| Shares Issued for Reinvested Dividends | 14,145,906 | | 304,312,836 | | 17,111,680 | | 385,201,370 |
| Shares Redeemed | (17,777,058) | | (396,753,813) | | (16,574,436) | | (410,801,466) |
| Net Increase (Decrease) | 863,582 | | 7,848,847 | | 2,977,576 | | 34,472,149 |
| Class IB | | | | | | | |
| Shares Sold | 531,618 | | $ 11,962,694 | | 336,645 | | $ 8,222,143 |
| Shares Issued for Reinvested Dividends | 1,752,329 | | 37,252,934 | | 2,181,673 | | 48,643,796 |
| Shares Redeemed | (2,747,117) | | (60,682,299) | | (2,378,170) | | (58,321,820) |
| Net Increase (Decrease) | (463,170) | | (11,466,671) | | 140,148 | | (1,455,881) |
| Total Net Increase (Decrease) | 400,412 | | $ (3,617,824) | | 3,117,724 | | $ 33,016,268 |
| Healthcare HLS Fund | | | | | | | |
| Class IA | | | | | | | |
| Shares Sold | 443,435 | | $ 6,991,320 | | 330,069 | | $ 5,869,382 |
| Shares Issued for Reinvested Dividends | 125,905 | | 1,980,484 | | 1,893,418 | | 28,988,229 |
| Shares Redeemed | (1,442,733) | | (22,801,995) | | (1,704,922) | | (31,464,215) |
| Net Increase (Decrease) | (873,393) | | (13,830,191) | | 518,565 | | 3,393,396 |
| Class IB | | | | | | | |
| Shares Sold | 57,081 | | $ 788,866 | | 47,033 | | $ 760,962 |
| Shares Issued for Reinvested Dividends | 38,468 | | 532,405 | | 605,182 | | 8,169,954 |
| Shares Redeemed | (337,821) | | (4,654,851) | | (243,296) | | (4,073,552) |
| Net Increase (Decrease) | (242,272) | | (3,333,580) | | 408,919 | | 4,857,364 |
| Total Net Increase (Decrease) | (1,115,665) | | $ (17,163,771) | | 927,484 | | $ 8,250,760 |
| International Opportunities HLS Fund | | | | | | | |
| Class IA | | | | | | | |
| Shares Sold | 2,929,809 | | $ 42,214,909 | | 2,701,606 | | $ 43,715,504 |
| Shares Issued for Reinvested Dividends | 659,130 | | 9,247,593 | | 11,991,680 | | 160,928,347 |
| Shares Redeemed | (8,710,915) | | (125,239,364) | | (8,230,906) | | (131,059,144) |
| Net Increase (Decrease) | (5,121,976) | | (73,776,862) | | 6,462,380 | | 73,584,707 |
| Class IB | | | | | | | |
| Shares Sold | 143,998 | | $ 2,108,159 | | 255,274 | | $ 4,019,090 |
| Shares Issued for Reinvested Dividends | 49,812 | | 713,800 | | 1,197,612 | | 16,407,281 |
| Shares Redeemed | (964,939) | | (14,205,036) | | (722,909) | | (11,760,083) |
| Net Increase (Decrease) | (771,129) | | (11,383,077) | | 729,977 | | 8,666,288 |
| Total Net Increase (Decrease) | (5,893,105) | | $ (85,159,939) | | 7,192,357 | | $ 82,250,995 |
Notes to Financial Statements – (continued)
December 31, 2023
| | For the Year Ended
December 31, 2023 | | For the Year Ended
December 31, 2022 |
| | Shares | | Amount | | Shares | | Amount |
| MidCap HLS Fund | | | | | | | |
| Class IA | | | | | | | |
| Shares Sold | 2,161,425 | | $ 57,430,387 | | 1,926,333 | | $ 60,792,609 |
| Shares Issued for Reinvested Dividends | 2,997,228 | | 75,946,142 | | 7,357,221 | | 198,350,672 |
| Shares Redeemed | (9,184,929) | | (245,433,066) | | (17,288,434) | | (534,589,256) |
| Net Increase (Decrease) | (4,026,276) | | (112,056,537) | | (8,004,880) | | (275,445,975) |
| Class IB | | | | | | | |
| Shares Sold | 105,589 | | $ 2,657,751 | | 98,754 | | $ 2,831,304 |
| Shares Issued for Reinvested Dividends | 285,432 | | 6,787,836 | | 620,163 | | 15,789,357 |
| Shares Redeemed | (469,063) | | (11,725,391) | | (465,863) | | (13,509,976) |
| Net Increase (Decrease) | (78,042) | | (2,279,804) | | 253,054 | | 5,110,685 |
| Total Net Increase (Decrease) | (4,104,318) | | $ (114,336,341) | | (7,751,826) | | $ (270,335,290) |
| Small Cap Growth HLS Fund | | | | | | | |
| Class IA | | | | | | | |
| Shares Sold | 1,944,732 | | $ 45,345,538 | | 3,682,957 | | $ 101,103,808 |
| Shares Issued for Reinvested Dividends | — | | — | | 6,286,971 | | 145,857,718 |
| Shares Redeemed | (3,863,762) | | (90,872,333) | | (17,409,584) | | (418,561,213) |
| Net Increase (Decrease) | (1,919,030) | | (45,526,795) | | (7,439,656) | | (171,599,687) |
| Class IB | | | | | | | |
| Shares Sold | 826,265 | | $ 18,140,999 | | 1,507,838 | | $ 38,630,264 |
| Shares Issued for Reinvested Dividends | — | | — | | 1,500,636 | | 32,638,843 |
| Shares Redeemed | (1,160,707) | | (25,336,427) | | (1,118,910) | | (27,983,740) |
| Net Increase (Decrease) | (334,442) | | (7,195,428) | | 1,889,564 | | 43,285,367 |
| Total Net Increase (Decrease) | (2,253,472) | | $ (52,722,223) | | (5,550,092) | | $ (128,314,320) |
| Small Company HLS Fund | | | | | | | |
| Class IA | | | | | | | |
| Shares Sold | 1,007,689 | | $ 14,341,000 | | 1,044,667 | | $ 18,816,229 |
| Shares Issued for Reinvested Dividends | — | | — | | 5,781,510 | | 84,063,157 |
| Shares Redeemed | (4,223,323) | | (60,681,730) | | (2,885,740) | | (50,472,696) |
| Net Increase (Decrease) | (3,215,634) | | (46,340,730) | | 3,940,437 | | 52,406,690 |
| Class IB | | | | | | | |
| Shares Sold | 178,421 | | $ 2,121,850 | | 207,806 | | $ 3,015,152 |
| Shares Issued for Reinvested Dividends | — | | — | | 807,532 | | 9,738,834 |
| Shares Redeemed | (498,957) | | (5,834,193) | | (458,458) | | (6,830,280) |
| Net Increase (Decrease) | (320,536) | | (3,712,343) | | 556,880 | | 5,923,706 |
| Total Net Increase (Decrease) | (3,536,170) | | $ (50,053,073) | | 4,497,317 | | $ 58,330,396 |
| Stock HLS Fund | | | | | | | |
| Class IA | | | | | | | |
| Shares Sold | 79,681 | | $ 7,536,323 | | 116,363 | | $ 12,078,931 |
| Shares Issued for Reinvested Dividends | 810,289 | | 75,334,720 | | 1,608,971 | | 152,615,340 |
| Shares Redeemed | (1,630,067) | | (154,860,279) | | (1,498,739) | | (152,487,895) |
| Net Increase (Decrease) | (740,097) | | (71,989,236) | | 226,595 | | 12,206,376 |
| Class IB | | | | | | | |
| Shares Sold | 14,367 | | $ 1,340,649 | | 30,369 | | $ 3,110,138 |
| Shares Issued for Reinvested Dividends | 70,725 | | 6,552,438 | | 145,284 | | 13,746,384 |
| Shares Redeemed | (174,534) | | (16,536,596) | | (191,911) | | (19,754,487) |
| Net Increase (Decrease) | (89,442) | | (8,643,509) | | (16,258) | | (2,897,965) |
| Total Net Increase (Decrease) | (829,539) | | $ (80,632,745) | | 210,337 | | $ 9,308,411 |
| Total Return Bond HLS Fund | | | | | | | |
| Class IA | | | | | | | |
| Shares Sold | 15,176,034 | | $ 142,684,898 | | 10,735,180 | | $ 108,243,934 |
| Shares Issued for Reinvested Dividends | 6,106,117 | | 55,199,293 | | 7,581,322 | | 72,553,256 |
| Shares Redeemed | (23,541,416) | | (219,847,805) | | (27,849,075) | | (277,496,565) |
| Net Increase (Decrease) | (2,259,265) | | (21,963,614) | | (9,532,573) | | (96,699,375) |
Notes to Financial Statements – (continued)
December 31, 2023
| | For the Year Ended
December 31, 2023 | | For the Year Ended
December 31, 2022 |
| | Shares | | Amount | | Shares | | Amount |
| Class IB | | | | | | | |
| Shares Sold | 531,491 | | $ 4,956,536 | | 440,393 | | $ 4,433,973 |
| Shares Issued for Reinvested Dividends | 592,611 | | 5,333,502 | | 796,697 | | 7,592,523 |
| Shares Redeemed | (2,673,019) | | (24,801,905) | | (3,401,588) | | (33,673,062) |
| Net Increase (Decrease) | (1,548,917) | | (14,511,867) | | (2,164,498) | | (21,646,566) |
| Total Net Increase (Decrease) | (3,808,182) | | $ (36,475,481) | | (11,697,071) | | $ (118,345,941) |
| Ultrashort Bond HLS Fund | | | | | | | |
| Class IA | | | | | | | |
| Shares Sold | 2,730,430 | | $ 27,707,145 | | 3,581,498 | | $ 35,571,225 |
| Shares Issued for Reinvested Dividends | 646,911 | | 6,533,801 | | 128,217 | | 1,268,070 |
| Shares Redeemed | (9,506,009) | | (96,390,807) | | (11,136,975) | | (110,402,716) |
| Net Increase (Decrease) | (6,128,668) | | (62,149,861) | | (7,427,260) | | (73,563,421) |
| Class IB | | | | | | | |
| Shares Sold | 738,435 | | $ 7,486,454 | | 1,255,473 | | $ 12,452,602 |
| Shares Issued for Reinvested Dividends | 77,828 | | 786,067 | | — | | — |
| Shares Redeemed | (1,895,524) | | (19,186,563) | | (2,595,085) | | (25,698,791) |
| Net Increase (Decrease) | (1,079,261) | | (10,914,042) | | (1,339,612) | | (13,246,189) |
| Total Net Increase (Decrease) | (7,207,929) | | $ (73,063,903) | | (8,766,872) | | $ (86,809,610) |
| 11. | Line of Credit: |
| | Each Fund participates in a committed line of credit pursuant to a credit agreement dated March 2, 2023. Each Fund may borrow under the line of credit for temporary or emergency purposes. The Funds (together with certain other Hartford Funds) may borrow up to $350 million in the aggregate, subject to asset coverage and other limitations specified in the credit agreement. The interest rate on borrowings varies depending on the nature of the loan. The facility also charges certain fees, such as a commitment fee. From January 1, 2022 through March 2, 2023, the Funds (together with certain other Hartford Funds) had a similar agreement that enabled them to participate in a $350 million committed line of credit. The fees incurred by the Funds in connection with the committed lines of credit during the period appear in the Statements of Operations under "Other expenses." During and as of the year ended December 31, 2023, none of the Funds had borrowings under these facilities. |
| 12. | Indemnifications: |
| | Under each Company’s organizational documents, the Company shall indemnify its officers and directors to the full extent required or permitted under Maryland General Corporation Law and federal securities laws. In addition, each Company, on behalf of its respective Funds, may enter into contracts that contain a variety of indemnifications. Each Company’s maximum exposure under these arrangements is unknown. However, as of the date of these financial statements, each Company has not had prior claims or losses pursuant to these contracts and expects the risk of loss to be remote. |
| 13. | Regulatory Update: |
| | The SEC adopted rule and form amendments that will change the format and content of the Funds' annual and semi-annual reports. Certain information, including the financial statements, will not appear in the Funds' new tailored shareholder reports but will be available online, delivered free of charge upon request, and filed on a semi-annual basis on Form N-CSR. The rule and form amendments have a compliance date of July 24, 2024. At this time, Management is evaluating with the SEC impact of these rule and form amendment changes. |
| 14. | Subsequent Events: |
| | In connection with the preparation of the financial statements of the Funds as of and for the year ended December 31, 2023, events and transactions subsequent to December 31, 2023, through the date the financial statements were issued have been evaluated by the Funds’ management for possible adjustment and/or disclosure. |
| | At a meeting held February 13-14, 2024, the Board of Directors of Hartford HLS Series Fund II, Inc. approved the reorganization of Hartford Small Cap Growth HLS Fund (the “Existing Fund”), a series of Hartford HLS Series Fund II, Inc., into a newly created “shell” series of Hartford Series Fund, Inc. (the “Shell Fund”). The Shell Fund will be identical to the Existing Fund, except for its registrant. It is anticipated that immediately |
Notes to Financial Statements – (continued)
December 31, 2023
before the opening of business on April 29, 2024, all of the assets and liabilities of the Existing Fund will be transferred to the Shell Fund solely in exchange for shares of the Shell Fund. The Existing Fund will distribute the shares of the Shell Fund received in the exchange to its shareholders, and then the Existing Fund will be liquidated.
Report of Independent Registered Public Accounting Firm
To the Board of Directors of Hartford Series Fund, Inc. and Hartford HLS Series Fund II, Inc. and Shareholders of Hartford Balanced HLS Fund, Hartford Capital Appreciation HLS Fund, Hartford Disciplined Equity HLS Fund, Hartford Dividend and Growth HLS Fund, Hartford Healthcare HLS Fund, Hartford International Opportunities HLS Fund, Hartford MidCap HLS Fund, Hartford Small Cap Growth HLS Fund, Hartford Small Company HLS Fund, Hartford Stock HLS Fund, Hartford Total Return Bond HLS Fund, and Hartford Ultrashort Bond HLS Fund
Opinions on the Financial Statements
We have audited the accompanying statements of assets and liabilities, including the schedules of investments, of Hartford Balanced HLS Fund, Hartford Capital Appreciation HLS Fund, Hartford Disciplined Equity HLS Fund, Hartford Dividend and Growth HLS Fund, Hartford Healthcare HLS Fund, Hartford International Opportunities HLS Fund, Hartford MidCap HLS Fund, Hartford Small Company HLS Fund, Hartford Stock HLS Fund, Hartford Total Return Bond HLS Fund, and Hartford Ultrashort Bond HLS Fund (constituting Hartford Series Fund, Inc.) and Hartford Small Cap Growth HLS Fund (constituting Hartford HLS Series Fund II, Inc.) (hereafter collectively referred to as the “Funds”) as of December 31, 2023, the related statements of operations for the year ended December 31, 2023, the statements of changes in net assets for each of the two years in the period ended December 31, 2023, including the related notes, and the financial highlights for each of the periods indicated therein ended on or subsequent to December 31, 2020 (collectively referred to as the “financial statements”). In our opinion, the financial statements present fairly, in all material respects, the financial position of each of the Funds as of December 31, 2023, the results of each of their operations for the year then ended, the changes in each of their net assets for each of the two years in the period ended December 31, 2023 and each of the financial highlights for each of the periods indicated therein ended on or subsequent to December 31, 2020 in conformity with accounting principles generally accepted in the United States of America.
The financial statements of the Funds as of and for the year ended December 31, 2019 and the financial highlights for each of the periods ended on or prior to December 31, 2019 (not presented herein, other than the financial highlights) were audited by other auditors whose report dated February 25, 2020 expressed an unqualified opinion on those financial statements and financial highlights.
Basis for Opinions
These financial statements are the responsibility of the Funds’ management. Our responsibility is to express an opinion on the Funds’ financial statements based on our audits. We are a public accounting firm registered with the Public Company Accounting Oversight Board (United States) (PCAOB) and are required to be independent with respect to the Funds in accordance with the U.S. federal securities laws and the applicable rules and regulations of the Securities and Exchange Commission and the PCAOB.
We conducted our audits of these financial statements in accordance with the standards of the PCAOB. Those standards require that we plan and perform the audit to obtain reasonable assurance about whether the financial statements are free of material misstatement, whether due to error or fraud.
Our audits included performing procedures to assess the risks of material misstatement of the financial statements, whether due to error or fraud, and performing procedures that respond to those risks. Such procedures included examining, on a test basis, evidence regarding the amounts and disclosures in the financial statements. Our audits also included evaluating the accounting principles used and significant estimates made by management, as well as evaluating the overall presentation of the financial statements.
Our procedures included confirmation of securities owned as of December 31, 2023 by correspondence with the custodian, transfer agent and brokers; when replies were not received from brokers, we performed other auditing procedures. We believe that our audits provide a reasonable basis for our opinions.
/s/PricewaterhouseCoopers LLP
Philadelphia, Pennsylvania
February 14, 2024
We have served as the auditor of one or more investment companies in the Hartford Funds group of investment companies since 2020.
Directors and Officers of each Company (Unaudited)
Each of Hartford Series Fund, Inc. and Hartford HLS Series Fund II, Inc. (each a, “Company”) is governed by a Board of Directors (the “Directors”). The following tables present certain information regarding the Directors and officers of each Company as of December 31, 2023. For more information regarding the Directors and officers, please refer to the Statement of Additional Information, which is available, without charge, upon request by calling 1-888-843-7824.
NAME, YEAR OF BIRTH
AND ADDRESS(1) | | POSITION
HELD WITH
EACH COMPANY | | TERM OF
OFFICE(2) AND
LENGTH OF
TIME SERVED | | PRINCIPAL OCCUPATION(S)
DURING PAST 5 YEARS | | NUMBER OF
PORTFOLIOS
IN FUND
COMPLEX(3)
OVERSEEN
BY DIRECTOR | | OTHER DIRECTORSHIPS
FOR PUBLIC COMPANIES
AND OTHER REGISTERED
INVESTMENT COMPANIES HELD
BY DIRECTOR |
| NON-INTERESTED DIRECTORS |
HILARY E. ACKERMANN
(1956) | | Director | | Since 2014 | | Ms. Ackermann served as Chief Risk Officer at Goldman Sachs Bank USA from October 2008 to November 2011. | | 83 | | Ms. Ackermann served as a Director of Dynegy, Inc. from October 2012 until its acquisition by Vistra Energy Corporation ("Vistra") in 2018, and since that time she has served as a Director of Vistra. Ms. Ackermann serves as a Director of Credit Suisse Holdings (USA), Inc. from January 2017 to December 2022. |
ROBIN C. BEERY
(1967) | | Director | | Since 2017 | | Ms. Beery has served as a consultant to ArrowMark Partners (an alternative asset manager) since March 2015 and since November 2018 has been employed by ArrowMark Partners as a Senior Advisor. Previously, she was Executive Vice President, Head of Distribution, for Janus Capital Group, and Chief Executive Officer and President of the Janus Mutual Funds (a global asset manager) from September 2009 to August 2014. | | 83 | | Ms. Beery serves as an independent Director of UMB Financial Corporation (January 2015 to present), has chaired the Compensation Committee since April 2017, and has been a member of the Compensation Committee and the Risk Committee since January 2015. |
DERRICK D. CEPHAS
(1952) | | Director | | Since 2020 | | Mr. Cephas currently serves as Of Counsel to Squire Patton Boggs LLP, an international law firm with 45 offices in 20 countries. Until his retirement in October 2020, Mr. Cephas was a Partner of Weil, Gotshal & Manges LLP, an international law firm headquartered in New York, where he served as the Head of the Financial Institutions Practice (April 2011 to October 2020). | | 83 | | Mr. Cephas currently serves as a Director of Claros Mortgage Trust, Inc., a real estate investment trust and is a member of the Compensation Committee and the Nominating and Governance Committee. |
CHRISTINE R. DETRICK
(1958) | | Director and Chair of the Board | | Director since
2016; Chair of
the Board since
2021 | | From 2002 until 2012, Ms. Detrick was a Senior Partner, Leader of the Financial Services Practice, and a Senior Advisor at Bain & Company (“Bain”). Before joining Bain, she served in various senior management roles for other financial services firms and was a consultant at McKinsey and Company. | | 83 | | Ms. Detrick currently serves as a Director of Charles River Associates (May 2020 to present); currently serves as a Director of Capital One Financial Corporation (since November 2021); and currently serves as a Director and Chair of Altus Power, Inc (since December 2021). |
Directors and Officers of each Company (Unaudited) – (continued)
NAME, YEAR OF BIRTH
AND ADDRESS(1) | | POSITION
HELD WITH
EACH COMPANY | | TERM OF
OFFICE(2) AND
LENGTH OF
TIME SERVED | | PRINCIPAL OCCUPATION(S)
DURING PAST 5 YEARS | | NUMBER OF
PORTFOLIOS
IN FUND
COMPLEX(3)
OVERSEEN
BY DIRECTOR | | OTHER DIRECTORSHIPS
FOR PUBLIC COMPANIES
AND OTHER REGISTERED
INVESTMENT COMPANIES HELD
BY DIRECTOR |
JOHN J. GAUTHIER
(1961) | | Director | | Since 2022 | | Mr. Gauthier currently is the Principal Owner of JJG Advisory, LLC, an investment consulting firm, and Co-Founder and Principal Owner of Talcott Capital Partners (a placement agent for investment managers serving insurance companies). From 2008 to 2018, Mr. Gauthier served as a Senior Vice President (2008-2010), Executive Vice President (2010-2012), and President (2012-2018) of Allied World Assurance, LTD, AG (a global provider of property, casualty and specialty insurance and reinsurance solutions). | | 83 | | Mr. Gauthier serves as a Director of Reinsurance Group of America, Inc. (from 2018 to present); currently serves as a Director of Hamilton Insurance Group, Ltd. (October 2023 to present); and chairs the Investment Committee and is a member of the Audit and Risk Committees. |
ANDREW A. JOHNSON
(1962) | | Director | | Since 2020 | | Mr. Johnson currently serves as a Diversity and Inclusion Advisor at Neuberger Berman, a private, global investment management firm. Prior to his current role, Mr. Johnson served as Chief Investment Officer and Head of Global Investment Grade Fixed Income at Neuberger Berman (January 2009 to December 2018). | | 83 | | Mr. Johnson currently serves as a Director of AGNC Investment Corp., a real estate investment trust. |
PAUL L. ROSENBERG
(1953) | | Director | | Since 2020 | | Mr. Rosenberg is a Partner of The Bridgespan Group, a global nonprofit consulting firm that is a social impact advisor to nonprofits, non-governmental organizations, philanthropists and institutional investors (October 2007 to present). | | 83 | | None |
DAVID SUNG
(1953) | | Director | | Since 2017 | | Mr. Sung was a Partner at Ernst & Young LLP from October 1995 to July 2014. | | 83 | | Mr. Sung serves as a Trustee of Ironwood Institutional Multi-Strategy Fund, LLC and Ironwood Multi-Strategy Fund, LLC (October 2015 to present). |
| OFFICERS AND INTERESTED DIRECTOR |
JAMES E. DAVEY(4)
(1964) | | Director, President and Chief Executive Officer | | President and Chief Executive Officer since 2010; Director since 2012 | | Mr. Davey serves as Executive Vice President of The Hartford Financial Services Group, Inc. Mr. Davey has served in various positions within The Hartford and its subsidiaries and joined The Hartford in 2002. Additionally, Mr. Davey serves as Director, Chairman, President, and Senior Managing Director for Hartford Funds Management Group, Inc. ("HFMG"). Mr. Davey also serves as President, Manager, Chairman of the Board, and Senior Managing Director for Hartford Funds Management Company, LLC (“HFMC”); Manager, Chairman of the Board, and President of Lattice Strategies LLC (“Lattice”); Chairman of the Board, Manager, and Senior Managing Director of Hartford Funds Distributors, LLC (“HFD”); and Chairman of the Board, President and Senior Managing Director of Hartford Administrative Services Company (“HASCO”), each of which is an affiliate of HFMG. | | 83 | | None |
AMY N. FURLONG
(1979) | | Vice President | | Since 2018 | | Ms. Furlong serves as Vice President and Assistant Treasurer of HFMC (since September 2019). From 2018 through March 15, 2021, Ms. Furlong served as the Treasurer of the Company and resumed her position as Treasurer from January 9, 2023 through September 10, 2023. Ms. Furlong has served in various positions within The Hartford and its subsidiaries in connection with the operation of the Hartford Funds. Ms. Furlong joined The Hartford in 2004. | | N/A | | N/A |
Directors and Officers of each Company (Unaudited) – (continued)
NAME, YEAR OF BIRTH
AND ADDRESS(1) | | POSITION
HELD WITH
EACH COMPANY | | TERM OF
OFFICE(2) AND
LENGTH OF
TIME SERVED | | PRINCIPAL OCCUPATION(S)
DURING PAST 5 YEARS | | NUMBER OF
PORTFOLIOS
IN FUND
COMPLEX(3)
OVERSEEN
BY DIRECTOR | | OTHER DIRECTORSHIPS
FOR PUBLIC COMPANIES
AND OTHER REGISTERED
INVESTMENT COMPANIES HELD
BY DIRECTOR |
WALTER F. GARGER
(1965) | | Vice President and Chief Legal Officer | | Since 2016 | | Mr. Garger serves as Secretary, Managing Director and General Counsel of HFMG, HFMC, HFD, and HASCO (since 2013). Mr. Garger also serves as Secretary and General Counsel of Lattice (since July 2016). Mr. Garger has served in various positions within The Hartford and its subsidiaries in connection with the operation of the Hartford Funds. Mr. Garger joined The Hartford in 1995. | | N/A | | N/A |
THEODORE J. LUCAS
(1966) | | Vice President | | Since 2017 | | Mr. Lucas serves as Executive Vice President of HFMG (since July 2016) and as Executive Vice President of Lattice (since June 2017). Previously, Mr. Lucas served as Managing Partner of Lattice (2003 to 2016). | | N/A | | N/A |
JOSEPH G. MELCHER
(1973) | | Vice President, Chief Compliance Officer and AML Compliance Officer | | Vice President and Chief Compliance Officer since 2013; AML Compliance Officer since August 1, 2022 | | Mr. Melcher serves as Executive Vice President of HFMG and HASCO (since December 2013). Mr. Melcher also serves as Executive Vice President (since December 2013) and Chief Compliance Officer (since December 2012) of HFMC, serves as Executive Vice President and Chief Compliance Officer of Lattice (since July 2016), serves as Executive Vice President of HFD (since December 2013), and has served as President and Chief Executive Officer of HFD (from April 2018 to June 2019). | | N/A | | N/A |
VERNON J. MEYER
(1964) | | Vice President | | Since 2006 | | Mr. Meyer serves as Managing Director and Chief Investment Officer of HFMC and Managing Director of HFMG (since 2013). Mr. Meyer also serves as Senior Vice President-Investments of Lattice (since March 2019). Mr. Meyer has served in various positions within The Hartford and its subsidiaries in connection with the operation of the Hartford Funds. Mr. Meyer joined The Hartford in 2004. | | N/A | | N/A |
ALICE A. PELLEGRINO
(1960) | | Vice President and Assistant Secretary | | Since 2016 | | Ms. Pellegrino is Deputy General Counsel for HFMG (since April 2022) and currently serves as Vice President of HFMG (since December 2013). Ms. Pellegrino also serves as Vice President and Assistant Secretary of Lattice (since June 2017). Ms. Pellegrino has served in various positions within The Hartford and its subsidiaries in connection with the operation of the Hartford Funds. Ms. Pellegrino joined The Hartford in 2007. | | N/A | | N/A |
ANKIT PURI
(1984) | | Vice President and Treasurer | | Effective September 11, 2023 | | Effective September 11, 2023, Mr. Puri serves as Vice President and Treasurer of each Company. Prior to joining HFMC in 2023, Mr. Puri was a Fund Accounting Director, Investment Management Services, at SEI Investments (July 2021 through August 2023), an Associate Director, Fund Accounting Policy at The Vanguard Group (September 2020 to June 2021), and served in various positions at Ernst & Young LLP (October 2014 through September 2020). | | N/A | | N/A |
THOMAS R. PHILLIPS
(1960) | | Vice President and Secretary | | Since 2017 | | Mr. Phillips is Deputy General Counsel for HFMG and currently serves as a Senior Vice President (since June 2021) and Assistant Secretary (since June 2017) for HFMG. Mr. Phillips also serves as Vice President of HFMC (since June 2021). Prior to joining HFMG in 2017, Mr. Phillips was a Director and Chief Legal Officer of Saturna Capital Corporation from 2014–2016. Prior to that, Mr. Phillips was a Partner and Deputy General Counsel of Lord, Abbett & Co. LLC. | | N/A | | N/A |
| (1) | The address for each officer and Director is c/o Hartford Funds 690 Lee Road, Wayne, Pennsylvania 19087. |
| (2) | Term of Office: Each Director holds an indefinite term until his or her retirement, resignation, removal, or death. Directors generally must retire no later than December 31 of the year in which the Director turns 75 years of age. Each Fund officer generally serves until his or her resignation, removal, or death. |
| (3) | The portfolios of the “Fund Complex” are the Hartford Schroders Private Opportunities Fund and the operational series of The Hartford Mutual Funds, Inc., The Hartford Mutual Funds II, Inc., Hartford Series Fund, Inc., Hartford HLS Series Fund II, Inc., Lattice Strategies Trust, and Hartford Funds Exchange-Traded Trust. |
| (4) | “Interested person,” as defined in the 1940 Act, of each Company because of the person’s affiliation with, or equity ownership of, HFMC, HFD or affiliated companies. |
HOW TO OBTAIN A COPY OF EACH FUND’S PROXY VOTING POLICIES AND VOTING RECORDS (UNAUDITED)
A description of the policies and procedures that each Fund uses to determine how to vote proxies relating to portfolio securities and information about how each Fund voted proxies relating to portfolio securities during the most recent twelve-month period ended June 30 are available (1) without charge, upon request, by calling 888-843-7824 and (2) on the SEC’s website at http://www.sec.gov.
QUARTERLY PORTFOLIO HOLDINGS INFORMATION (UNAUDITED)
Each Fund files its complete schedule of portfolio holdings with the SEC for the first and third quarters of each fiscal year as an exhibit to its reports on Form N-PORT. Each Fund’s portfolio holdings filed as an exhibit to Form N-PORT for the most recent first and third quarter of the Fund’s fiscal year are available (1) without charge, upon request, by calling 888-843-7824, (2) on the Funds' website, hartfordfunds.com, and (3) on the SEC’s website at http://www.sec.gov.
Approval of Investment Management and Investment Sub-Advisory Agreements (Unaudited)
Hartford Series Fund, Inc. and Hartford HLS Series Fund II, Inc.
Hartford Balanced HLS Fund
Hartford Capital Appreciation HLS Fund
Hartford Disciplined Equity HLS Fund
Hartford Dividend and Growth HLS Fund
Hartford Healthcare HLS Fund
Hartford International Opportunities HLS Fund
Hartford MidCap HLS Fund
Hartford Small Cap Growth HLS Fund
Hartford Small Company HLS Fund
Hartford Stock HLS Fund
Hartford Total Return Bond HLS Fund
Hartford Ultrashort Bond HLS Fund
(each, a “Fund” and collectively, the “Funds”)
Section 15(c) of the Investment Company Act of 1940, as amended (the “1940 Act”), requires that each mutual fund’s board of directors, including a majority of those directors who are not “interested persons” of the mutual fund, as defined in the 1940 Act (the “Independent Directors”), annually review and consider the continuation of the mutual fund’s investment advisory and sub-advisory agreements. At their meeting held on September 6-7, 2023, the Boards of Directors (collectively, the “Board”) of Hartford Series Fund, Inc. (“HLS”) and Hartford HLS Series Fund II, Inc. (“HLS II”), including the Independent Directors, unanimously voted to approve (i) the continuation of an investment management agreement (the “Management Agreement”) by and between each of HLS and HLS II, on behalf of each of their respective series listed above, and Hartford Funds Management Company, LLC (“HFMC”); and (ii) the continuation of investment sub-advisory agreements (each, a “Sub-Advisory Agreement” and together with the Management Agreement, the “Agreements”) between HFMC and each Fund’s sub-adviser, Wellington Management Company LLP (the “Sub-adviser,” and together with HFMC, the “Advisers”), with respect to each Fund.
In the months preceding the September 6-7, 2023 meeting, the Board requested and reviewed written responses from the Advisers to questions posed to the Advisers on behalf of the Independent Directors and supporting materials relating to those questions and responses. In addition, the Board considered such additional information as it deemed reasonably necessary to evaluate the Agreements, as applicable, with respect to each Fund, which included information furnished to the Board and its committees at their meetings throughout the year and in between regularly scheduled meetings on particular matters as the need arose, as well as information specifically prepared in connection with the approval of the continuation of the Agreements that was presented at the Board’s meetings held on June 13-14, 2023 and September 6-7, 2023. Information provided to the Board and its committees at their meetings throughout the year included, among other things, reports on Fund performance, legal, compliance and risk management matters, sales and marketing activity, shareholder services, and the other services provided to each Fund by the Advisers and their affiliates. The members of the Board also considered the materials and presentations by Fund officers and representatives of HFMC received at the Board’s meetings on June 13-14, 2023 and September 6-7, 2023 concerning the Agreements and at the special meeting of the Board’s Investment Committee on May 10-11, 2023 concerning Fund-by-Fund performance and other investment-related matters.
The Independent Directors, advised by independent legal counsel throughout the evaluation process, engaged service providers to assist them with evaluating the Agreements with respect to each Fund, as applicable. Broadridge Financial Solutions, Inc. (“Broadridge”), an independent provider of investment company data, was retained to provide the Board with reports on how each Fund’s contractual management fees, actual management fees, total expense ratios and investment performance compared to those of an appropriate group of investment companies selected by Broadridge. The Independent Directors also engaged an independent financial services consultant (the “Consultant”) to assist them in evaluating each Fund’s contractual management fees, actual management fees, total expense ratios and investment performance. In addition, the Consultant previously reviewed the profitability methodologies utilized by HFMC in connection with the continuation of the Management Agreement.
In determining whether to approve the continuation of the Agreements for a Fund, the members of the Board reviewed and evaluated information and factors they believed to be relevant and appropriate through the exercise of their reasonable business judgment. While individual members of the Board may have weighed certain factors differently, the Board’s determination to approve the continuation of the Agreements was based on a comprehensive consideration of all information provided to the Board throughout the year and specifically with respect to the continuation of the Agreements. The Board was also furnished with an analysis of its fiduciary obligations in connection with its evaluation of the Agreements. Throughout the evaluation process, the Board was assisted by counsel for the Funds and the Independent Directors were also separately assisted by independent legal counsel. In connection with their deliberations, the Independent Directors met separately with independent legal counsel and the Consultant on June 6, 2023 and in executive session on several occasions to consider their responsibilities under relevant laws and regulations and
Approval of Investment Management and Investment Sub-Advisory Agreements (Unaudited) – (continued)
to discuss the materials presented and other matters deemed relevant to their consideration of the approval of the continuation of the Agreements. As a result of the discussions that occurred during the June 6, 2023 and June 13-14, 2023 meetings, the Independent Directors presented HFMC and its affiliates with requests for additional information on certain topics. HFMC responded to these requests with additional information in connection with the September 6-7, 2023 meeting. A more detailed summary of the important, but not necessarily all, factors the Board considered with respect to its approval of the continuation of the Agreements is provided below.
Nature, Extent and Quality of Services Provided by the Advisers
The Board requested and considered information concerning the nature, extent and quality of the services provided to each Fund by the Advisers. The Board considered, among other things, the terms of the Agreements and the range of services provided by the Advisers. The Board considered the Advisers’ professional personnel who provide services to the Funds, including each Adviser’s ability and experience in attracting and retaining qualified personnel to service the Funds. The Board considered each Adviser’s reputation and overall financial strength, as well as each Adviser’s willingness to consider and implement organizational and operational changes designed to enhance services to the funds managed by HFMC and its affiliates (the “Hartford funds”). In addition, the Board considered the quality of each Adviser’s communications with the Board and responsiveness to Board inquiries and requests made from time to time with respect to the Funds and other Hartford funds.
The Board also requested and evaluated information concerning each Adviser’s regulatory and compliance environment. In this regard, the Board reviewed information about each Adviser’s compliance policies and procedures and compliance history, and a report from the Funds’ Chief Compliance Officer about each Adviser’s compliance with applicable laws and regulations, including responses to regulatory developments and any compliance or other issues raised by regulators. The Board also noted the Advisers’ support of the Funds’ compliance control structure, as applicable, including the resources devoted by the Advisers in support of the Funds’ obligations pursuant to Rule 38a-1 under the 1940 Act and the Funds’ risk management programs, as well as the efforts of the Advisers to address cybersecurity risks. The Board also considered HFMC’s investments in business continuity planning designed to benefit the Funds. The Board also noted HFMC’s commitment to maintaining high quality systems and expending substantial resources to prepare for and respond to ongoing changes to the market, regulatory and control environments in which the Funds and their service providers operate.
With respect to HFMC, the Board noted that, under the Management Agreement, HFMC is responsible for the management of the Funds, including oversight of fund operations and service providers, and the provision of investment advisory and administrative services in connection with selecting, monitoring and supervising the Sub-adviser. In this regard, the Board evaluated information about the nature and extent of responsibilities retained and risks assumed by HFMC that were not delegated to, or assumed by, the Sub-adviser. The Board considered HFMC’s ongoing monitoring of people, process and performance, including its quarterly reviews of each of the Hartford funds, semi-annual meetings with the leaders of each Fund’s portfolio management team, and ongoing oversight of the Hartford funds’ portfolio managers. The Board noted that HFMC has demonstrated a record of initiating changes to the portfolio management and/or investment strategies of the Hartford funds when warranted. The Board considered HFMC’s periodic due diligence reviews of the Sub-adviser and ongoing oversight of the Sub-adviser’s investment approach and results, process for monitoring best execution of portfolio trades and other trading operations by the Sub-adviser, and approach to risk management with respect to the Funds. The Board considered HFMC’s oversight of the securities lending program for the Funds that engage in securities lending and noted the income earned by the Funds that participate in such program. The Board also considered HFMC’s day-to-day oversight of each Fund’s compliance with its investment objective and policies as well as with applicable laws and regulations, noting that regulatory and other developments had over time led to an increase in the scope of HFMC’s oversight in this regard. Moreover, the Board considered HFMC’s oversight of potential conflicts of interest between the Funds’ investments and those of other funds or accounts, if any, managed by the Funds’ portfolio management personnel.
In addition, the Board considered HFMC’s overall strategic plan for, and ongoing commitment to review and re-assess, the Hartford funds product line-up. The Board considered that HFMC is responsible for providing the Funds’ officers.
With respect to the Sub-adviser, which provides certain day-to-day portfolio management services for the Funds, subject to oversight by HFMC, the Board considered, among other things, the Sub-adviser’s investment personnel, investment philosophy and process, investment research capabilities and resources, performance record, trade execution capabilities and experience, including with respect to environmental, social and/or governance (ESG) investing, to the extent applicable. The Board considered the experience of each Fund’s portfolio manager(s), the number of accounts managed by the portfolio manager(s), and the Sub-adviser’s method for compensating the portfolio manager(s). The Board also considered the Sub-adviser’s succession planning practices to ensure continuity of portfolio management services provided to the Funds and HFMC’s oversight of these practices.
The Board considered the benefits to shareholders of investing in a fund that is part of the family of Hartford funds. The Board considered HFMC’s efforts to provide investors in the Hartford funds with a broad range of investment styles and asset classes.
Approval of Investment Management and Investment Sub-Advisory Agreements (Unaudited) – (continued)
Based on these considerations, the Board concluded that it was satisfied with the nature, extent and quality of the services provided to each Fund by HFMC and the Sub-adviser.
Performance of each Fund and the Advisers
The Board considered the investment performance of each Fund. In this regard, the Board reviewed the performance of each Fund over different time periods and evaluated HFMC’s analysis of each Fund’s performance for these time periods. The Board considered information and materials provided to the Board by the Advisers concerning Fund performance, as well as information from Broadridge comparing the investment performance of each Fund to an appropriate universe of peer funds. The Board noted that while it found the comparative data provided by Broadridge generally useful in evaluating a Hartford fund’s investment performance, the Board recognized the limitations of such data, including that notable differences may exist between a Hartford fund and its peers. For details regarding each Fund’s performance, see the Fund-by-Fund synopsis below.
The Board considered the detailed investment analytics reports provided by HFMC’s Investment Advisory Group throughout the year, including in connection with the approval of the continuation of the Agreements. These reports included, among other things, information on each Fund’s gross returns and net returns, the Fund’s investment performance compared to one or more appropriate benchmarks and relevant groups or categories of peer funds, various statistics concerning the Fund’s portfolio, a narrative summary of various factors affecting Fund performance, and commentary on the effect of current and recent market conditions. The Board also noted that the Hartford Capital Appreciation HLS Fund utilizes a multiple sleeve structure whereby each sleeve uses a different investment style and considered the performance attributions of the underlying portfolio managers. The Board considered the Advisers’ work with the Investment Committee, which assists the Board in evaluating the performance of each Fund at periodic meetings throughout the year and specifically with respect to the approval of the continuation of the Agreements. The Board considered that the Investment Committee, in its evaluation of investment performance at meetings throughout the year, focused particular attention on information indicating less favorable performance of certain Hartford funds for specific time periods and discussed with the Advisers the reasons for such performance as well as any specific actions that the Advisers had taken, or had agreed to take, to seek to enhance Fund investment performance and the results of those actions. The Board also considered the analysis provided by the Consultant relating to each Fund’s performance track record.
Based on these considerations, the Board concluded that it had continued confidence in HFMC’s and the Sub-adviser’s overall capabilities to manage the Funds.
Costs of the Services and Profitability of the Advisers
The Board reviewed information regarding HFMC’s cost to provide investment management and related services to each Fund and HFMC’s profitability, both overall and for each Fund, on a pre-tax basis without regard to distribution expenses. The Board also requested and reviewed information about the profitability to HFMC and its affiliates from all services provided to each Fund and all aspects of their relationship with the Fund, including information regarding profitability trends over time and information provided by Broadridge analyzing the profitability of investment managers to other fund complexes. The Board also requested and received information relating to the operations and profitability of the Sub-adviser. The Board considered representations from HFMC and the Sub-adviser that the Sub-adviser’s fees were negotiated at arm’s length on a Fund-by-Fund basis and that the sub-advisory fees are paid by HFMC and not the Funds. Accordingly, the Board concluded that the profitability of the Sub-adviser is a less relevant factor with respect to the Board’s consideration of the Sub-Advisory Agreements.
The Board considered that the Consultant had previously reviewed the methodologies and estimates used by HFMC in calculating profitability in connection with the continuation of the Management Agreement, including a description of the methodology used to allocate certain expenses. The Board noted that the Consultant previously reported that such process is reasonable, sound and consistent with common industry practice. The Board noted that HFMC’s process for calculating and reporting Fund profitability is consistent with the process previously reviewed by the Consultant.
Based on these considerations, the Board concluded that the profits realized by HFMC and its affiliates from their relationships with each Fund were not excessive.
Comparison of Fees and Services Provided by the Advisers
The Board considered comparative information with respect to the services rendered to and the management fees to be paid by each Fund to HFMC and the total expense ratios of the Fund. The Board also considered comparative information with respect to the sub-advisory fees to be paid by HFMC to the Sub-adviser with respect to each Fund. In this regard, the Board requested and reviewed information from HFMC and the Sub-adviser relating to the management and sub-advisory fees, including the sub-advisory fee schedule for each Fund and the amount of the management fee retained by HFMC, and total operating expenses for each Fund. The Board also reviewed information from Broadridge comparing each Fund’s contractual
Approval of Investment Management and Investment Sub-Advisory Agreements (Unaudited) – (continued)
management fees, actual management fees and total expense ratios relative to an appropriate group of funds selected by Broadridge. The Board considered such information from Broadridge in consultation with the Consultant. For details regarding each Fund’s fees and expenses, see the Fund-by-Fund synopsis below.
The Board considered the methodology used by Broadridge to select the funds included in the expense groups. While the Board recognized that comparisons between a Fund and its peer funds may be imprecise given, among other differences, the different service levels and characteristics of mutual funds and the different business models and cost structures of the Advisers, the comparative information provided by Broadridge assisted the Board in evaluating the reasonableness of each Fund’s fees and total operating expenses. In addition, the Board considered the analysis and views of the Consultant relating to each Fund’s fees and total operating expenses and expense groups.
The Board also received information regarding fees charged by the Sub-adviser to any other clients with investment strategies similar to those of the Funds, including any institutional separate account clients and registered fund clients for which the Sub-adviser serves as either primary investment adviser or sub-adviser. The Board considered the explanations provided by the Sub-adviser about any differences between the Sub-adviser’s services to the Funds and the services the Sub-adviser provides to other types of clients. In this regard, the Board reviewed information about the generally broader scope of services and compliance, reporting and other legal burdens and risks of managing registered funds compared with those associated with managing assets of non-registered fund clients such as institutional separate accounts.
Based on these considerations, the Board concluded that each Fund’s fees and total operating expenses, in conjunction with the information about quality of services, profitability, economies of scale, and other matters considered, were reasonable in light of the services provided.
Economies of Scale
The Board considered information regarding economies of scale, including the extent to which economies of scale may be realized as a Fund grows and whether fee levels reflect these economies of scale for the benefit of shareholders of the Fund. The Board reviewed the breakpoints in the management fee schedule for each Fund, if any, which reduce fee rates as the Fund’s assets grow over time. The Board recognized that a Fund with assets beyond the highest breakpoint level will continue to benefit from economies of scale because additional assets are charged the lowest breakpoint fee resulting in lower effective management fee rates. The Board also recognized that a fee schedule that reaches a breakpoint at a lower asset level provides shareholders with the benefit of anticipated or potential economies of scale. The Board considered that fee waivers that reduce a Fund’s expenses at all asset levels can have the same effect as breakpoints in sharing economies of scale with shareholders and provide protection from an increase in expenses if the Fund’s assets decline. In addition, the Board considered that initially setting competitive fee rates, pricing a Fund to scale at inception and making additional investments intended to enhance services available to shareholders are other means of sharing anticipated or potential economies of scale with shareholders. The Board also considered that HFMC has been active in managing expenses of the Hartford funds in recent years, which has resulted in benefits being realized by shareholders. The Board also noted that, for the Hartford Healthcare HLS Fund, the Fund’s current low asset levels have kept the Fund from fully realizing the benefits of anticipated or potential economies of scale. The Board considered that the Funds are closed to certain investors.
The Board reviewed and evaluated materials from Broadridge and the Consultant showing how management fee schedules of peer funds reflect economies of scale for the benefit of shareholders as a peer fund’s assets hypothetically increase over time. Based on information provided by HFMC, Broadridge, and the Consultant, the Board recognized that there is no uniform methodology for establishing breakpoints or uniform pattern in asset levels that trigger breakpoints or the amounts of breakpoints triggered.
After considering all of the information available to it, the Board concluded that it was satisfied with the extent to which economies of scale, if any, would be shared for the benefit of each Fund’s shareholders based on currently available information and the effective management fees and total expense ratios for the Fund at its current and reasonably anticipated asset levels. The Board noted, however, that it would continue to monitor any future growth in each Fund’s assets and the appropriateness of additional management fee breakpoints or other methods to share benefits from economies of scale as part of its future review of the Agreements.
Other Benefits
The Board considered other benefits to the Advisers and their affiliates from their relationships with the Funds.
The Board noted that HFMC receives fees for fund accounting and related services from the Funds, and the Board considered information on the profitability to HFMC from providing such services to the Funds. The Board also considered that Hartford Administrative Services Company (“HASCO”), the Funds’ transfer agent and an affiliate of HFMC, receives transfer agency compensation from the Funds, and the Board reviewed
Approval of Investment Management and Investment Sub-Advisory Agreements (Unaudited) – (continued)
information about the profitability to HASCO of the Funds’ transfer agency function. The Board considered information provided by HFMC indicating that the transfer agency fees charged by HASCO to the Funds were fair and reasonable based on available industry data about fees charged by transfer agents to other mutual funds. The Board also noted that HFMC and HASCO had delegated certain fund accounting services and transfer agency services, respectively, to external service providers, subject to oversight.
The Board also considered that Hartford Funds Distributors, LLC (“HFD”), an affiliate of HFMC, serves as principal underwriter of the Funds. The Board noted that, as principal underwriter, HFD receives distribution and service fees from the Funds.
The Board considered the benefits, if any, to the Sub-adviser from any use of a Fund’s brokerage commissions to obtain soft dollar research.
Fund-by-Fund Factors
For purposes of evaluating a Fund’s performance, the Board considered the Fund’s performance relative to similarly managed funds and the Fund’s performance relative to its benchmark. In particular, the Board considered the Fund’s performance of its Class IA shares (net of all fees and expenses), as of March 31, 2023, and compared that performance to the Fund’s peer universe, which includes all funds within the same classification or category, as determined by Broadridge. The Board considered the Fund’s performance relative to its peer universe by evaluating its quintile ranking, with the 1st quintile representing the top performing funds within a peer universe and the 5th quintile representing the lowest performing funds. For purposes of evaluating the Fund’s performance relative to its benchmark, the Board considered the Fund’s performance of its Class IA shares (net of all fees and expenses) as of March 31, 2023. The Board considered Fund performance to be “in line with” a Fund’s benchmark where it was 50 basis points above or below the benchmark return. With respect to fees and expenses, the Board considered the Fund’s contractual management fee, actual management fee, and total operating expenses of its Class IA shares, as compared to the Fund’s expense peer group, which includes a group of similarly sized funds selected by Broadridge.
Hartford Balanced HLS Fund
| • | The Board noted that the Fund’s performance was in the 1st quintile versus its peer universe for the 1- and 5-year periods and the 2nd quintile for the 3-year period. The Board also noted that the Fund’s performance was above its custom blended benchmark for the 1- and 3-year periods and in line with its benchmark for the 5-year period. |
| • | The Board noted that the Fund’s contractual management fee and actual management fee were in the 4th quintile of its expense group and its total expenses were in the 2nd quintile. The Board noted that HFMC had voluntarily agreed to waive a portion of its management fee for the Fund. |
Hartford Capital Appreciation HLS Fund
| • | The Board noted that the Fund’s performance was in the 1st quintile versus its peer universe for the 1-year period and the 4th quintile for the 3- and 5-year periods. The Board also noted that the Fund’s performance was above its benchmark for the 1-year period and below its benchmark for the 3- and 5-year periods. |
| • | The Board noted that the Fund’s contractual management fee, actual management fee, and total expenses were in the 2nd quintile of its expense group. |
Hartford Disciplined Equity HLS Fund
| • | The Board noted that the Fund’s performance was in the 4th quintile versus its peer universe for the 1-year period and the 3rd quintile for the 3- and 5-year periods. The Board also noted that the Fund’s performance was below its benchmark for the 1-, 3- and 5-year periods. The Board noted upcoming changes to the Fund’s portfolio management team. |
| • | The Board noted that the Fund’s contractual management fee, actual management fee and its total expenses were in the 2nd quintile of its expense group. |
Approval of Investment Management and Investment Sub-Advisory Agreements (Unaudited) – (continued)
Hartford Dividend and Growth HLS Fund
| • | The Board noted that the Fund’s performance was in the 5th quintile versus its peer universe for the 1-year period, the 2nd quintile for the 3-year period, and the 1st quintile for the 5-year period. The Board also noted that the Fund’s performance was in line with its benchmark for the 1-year period, above its benchmark for the 3-year period, and below its benchmark for the 5-year period. The Board noted recent changes to the Fund’s portfolio management team. |
| • | The Board noted that the Fund’s contractual management fee and actual management fee were in the 4th quintile of its expense group and its total expenses were in the 3rd quintile. |
Hartford Healthcare HLS Fund
| • | The Board noted that the Fund’s performance was in the 4th quintile versus its peer universe for the 1-, 3- and 5-year periods. The Board also noted that the Fund’s performance was below its benchmark for the 1-, 3- and 5-year periods. The Board noted recent changes to the Fund’s portfolio management team. |
| • | The Board noted that the Fund’s contractual management fee and its total expenses were in the 2nd quintile, while its actual management fee was in the 4th quintile. |
Hartford International Opportunities HLS Fund
| • | The Board noted that the Fund’s performance was in the 4th quintile versus its peer universe for the 1- and 5-year periods and the 1st quintile for the 3-year period. The Board also noted that the Fund’s performance was below its benchmark for the 1-year period, above its benchmark for the 3-year period, and in line with its benchmark for the 5-year period. The Board noted upcoming changes to the Fund’s portfolio management team. |
| • | The Board noted that the Fund’s contractual management fee, actual management fee and total expenses were in the 1st quintile of its expense group. |
Hartford MidCap HLS Fund
| • | The Board noted that the Fund’s performance was in the 4th quintile versus its peer universe for the 1- and 3-year periods and the 5th quintile for the 5-year period. The Board also noted that the Fund’s performance was below its benchmark for the 1-, 3- and 5-year periods. |
| • | The Board noted that the Fund’s contractual management fee and actual management fee were in the 2nd quintile of its expense group, while its total expenses were in the 1st quintile. |
Hartford Small Cap Growth HLS Fund
| • | The Board noted that the Fund’s performance was in the 3rd quintile versus its peer universe for the 1-year period and the 5th quintile for the 3- and 5-year periods. The Board also noted that the Fund’s performance was below its benchmark for the 1- and 3-year periods and in line with its benchmark for the 5-year period. The Board noted upcoming changes to the Fund’s portfolio management team. |
| • | The Board noted that the Fund’s contractual management fee, actual management fee, and total expenses were in the 1st quintile of its expense group. |
Hartford Small Company HLS Fund
| • | The Board noted that the Fund’s performance was in the 5th quintile versus its peer universe for the 1-year period, the 4th quintile for the 3-year period, and the 2nd quintile for the 5-year period. The Board also noted that the Fund’s performance was below its benchmark for the 1-year period and above its benchmark for the 3- and 5-year periods. The Board noted recent changes to the Fund’s portfolio management team. |
| • | The Board noted that the Fund’s contractual management fee and total expenses were in the 1st quintile of its expense group, while its actual management fee was in the 2nd quintile. |
Approval of Investment Management and Investment Sub-Advisory Agreements (Unaudited) – (continued)
Hartford Stock HLS Fund
| • | The Board noted that the Fund’s performance was in the 2nd quintile versus its peer universe for the 1-year period, the 3rd quintile for the 3-year period, and the 1st quintile for the 5-year period. The Board also noted that the Fund’s performance was above its benchmark for the 1- and 5-year periods and below its benchmark for the 3-year period. |
| • | The Board noted that the Fund’s contractual management fee and actual management fee were in the 1st quintile while its total expenses were in the 2nd quintile of its expense group. |
Hartford Total Return Bond HLS Fund
| • | The Board noted that the Fund’s performance was in the 2nd quintile versus its peer universe for the 1-year period and the 1st quintile for the 3- and 5-year periods. The Board also noted that the Fund’s performance was in line with its benchmark for the 1- and 5-year periods and above its benchmark for the 3-year period. |
| • | The Board noted that the Fund’s contractual management fee, actual management fee, and its total expenses were in the 3rd quintile of its expense group. |
Hartford Ultrashort Bond HLS Fund
| • | The Board noted that the Fund’s performance was in the 2nd quintile versus its peer universe for the 1-year period and the 1st quintile for the 3- and 5-year periods. The Board also noted that the Fund’s performance was in line with its benchmark for the 1-, 3- and 5-year periods. The Board noted recent and upcoming changes to the Fund’s portfolio management team. |
| • | The Board noted that the Fund’s contractual management fee, actual management fee and total expenses were in the 2nd quintile of its expense group. |
* * * *
Based upon the review of the factors summarized above, among others, the Board concluded that it is in the best interests of each Fund and its shareholders for the Board to approve the continuation of the Agreements for an additional year. In reaching this decision, the Board did not assign relative weights to the factors discussed above or deem any one or group of them to be controlling in and of themselves.
THIS PRIVACY POLICY IS NOT PART OF THIS REPORT
Customer Privacy Notice
The Hartford Financial Services Group, Inc. and Affiliates
(herein called “we, our, and us”)
This Privacy Policy applies to our United States Operations
We value your trust. We are committed to the responsible:
| a) | management; |
| b) | use; and |
| c) | protection; |
of Personal Information.
This notice describes how we collect, disclose, and protect Personal Information.
We collect Personal Information to:
| a) | service your Transactions with us; and |
| b) | support our business functions. |
We may obtain Personal Information from:
| a) | You; |
| b) | your Transactions with us; and |
| c) | third parties such as a consumer-reporting agency. |
Based on the type of product or service You apply for or get from us, Personal Information such as:
| a) | your name; |
| b) | your address; |
| c) | your income; |
| d) | your payment; or |
| e) | your credit history; |
may be gathered from sources such as applications, Transactions, and consumer reports.
To serve You and service our business, we may share certain Personal Information.
We will share Personal Information, only as allowed by law, with affiliates such as:
| a) | our insurance companies; |
| b) | our employee agents; |
| c) | our brokerage firms; and |
| d) | our administrators. |
As allowed by law, we may share Personal Financial Information with our affiliates to:
| a) | market our products; or |
| b) | market our services; |
to You without providing You with an option to prevent these disclosures.
We may also share Personal Information, only as allowed by law, with unaffiliated third parties including:
| a) | independent agents; |
| b) | brokerage firms; |
| c) | insurance companies; |
| d) | administrators; and |
| e) | service providers; |
who help us serve You and service our business.
When allowed by law, we may share certain Personal Financial Information with other unaffiliated third parties who assist us by performing services or functions such as:
| a) | taking surveys; |
| b) | marketing our products or services; or |
| c) | offering financial products or services under a joint agreement |
between us and one or more financial institutions.
We, and third parties we partner with, may track some of the pages You visit through the use of:
| a) | cookies; |
| b) | pixel tagging; or |
| c) | other technologies; |
and currently do not process or comply with any web browser’s “do not track” signal or other similar mechanism that indicates a request to disable online tracking of individual users who visit our websites or use our services.
For more information, our Online Privacy Policy, which governs information we collect on our website and our affiliate websites, is available at https://www.thehartford.com/online-privacy-policy.
We will not sell or share your Personal Financial Information with anyone for purposes unrelated to our business functions without offering You the opportunity to:
| a) | “opt-out;” or |
| b) | “opt-in;” |
as required by law.
We only disclose Personal Health Information with:
| a) | your authorization; or |
| b) | as otherwise allowed or required by law. |
Our employees have access to Personal Information in the course of doing their jobs, such as:
| a) | underwriting policies; |
| b) | paying claims; |
| c) | developing new products; or |
| d) | advising customers of our products and services. |
We use manual and electronic security procedures to maintain:
| a) | the confidentiality; and |
Personal Information that we have. We use these procedures to guard against unauthorized access.
Some techniques we use to protect Personal Information include:
| d) | firewall technology; and |
| e) | the use of detection software. |
We are responsible for and must:
| a) | identify information to be protected; |
| b) | provide an adequate level of protection for that data; and |
| c) | grant access to protected data only to those people who must use |
it in the performance of their job-related duties.
Employees who violate our privacy policies and procedures may be subject to discipline, which may include termination of their employment with us.
We will continue to follow our Privacy Policy regarding Personal Information even when a business relationship no longer exists between us.
As used in this Privacy Notice:
Application means your request for our product or service.
Personal Financial Information means financial information such as:
| d) | policy or claim information. |
Personal Financial Information may include Social Security Numbers, Driver’s license numbers, or other government-issued identification numbers, or credit, debit card, or bank account numbers.
Personal Health Information means health information such as:
| a) | your medical records; or |
| b) | information about your illness, disability or injury. |
Personal Information means information that identifies You personally and is not otherwise available to the public. It includes:
| a) | Personal Financial Information; and |
| b) | Personal Health Information. |
Transaction means your business dealings with us, such as:
| b) | your request for us to pay a claim; and |
| c) | your request for us to take an action on your account. |
You means an individual who has given us Personal Information in conjunction with:
a financial product or service from us if the product or service is used mainly for personal, family, or household purposes.
If you have any questions or comments about this privacy notice, please feel free to contact us at The Hartford – Consumer Rights and Privacy Compliance Unit, One Hartford Plaza, Mail Drop: HO1-09, Hartford, CT 06155, or at ConsumerPrivacyInquiriesMailbox@thehartford.com.
This Customer Privacy Notice is being provided on behalf of The Hartford Financial Services Group, Inc. and its affiliates (including the following as of February 2024), to the extent required by the Gramm-Leach-Bliley Act and implementing regulations:
1stAGChoice, Inc.; Access CoverageCorp, Inc.; Access CoverageCorp Technologies, Inc.; Business Management Group, Inc.; Cervus Claim Solutions, LLC; First State Insurance Company; FTC Resolution Company LLC; Hart Re Group L.L.C.; Hartford Accident and Indemnity Company; Hartford Administrative Services Company; Hartford (Asia) Limited; Hartford Casualty General Agency, Inc.; Hartford Casualty Insurance Company; Hartford Corporate Underwriters Limited; Hartford Fire General Agency, Inc.; Hartford Fire Insurance Company; Hartford Funds Distributors, LLC; Hartford Funds Management Company, LLC; Hartford Funds Management Group, Inc.; Hartford Holdings, Inc.; Hartford Insurance Company of Illinois; Hartford Insurance Company of the Midwest; Hartford Insurance Company of the Southeast; Hartford Insurance, Ltd.; Hartford Integrated Technologies, Inc.; Hartford Investment Management Company; Hartford Life and Accident Insurance Company; Hartford Lloyd’s Corporation; Hartford Lloyd’s Insurance Company; Hartford Management, Ltd.; Hartford Management (UK) Limited; Hartford Productivity Services LLC; Hartford of the Southeast General Agency, Inc.; Hartford of Texas General Agency, Inc.; Hartford Residual Market, L.C.C.; Hartford Specialty Insurance Services of Texas, LLC; Hartford STAG Ventures LLC; Hartford Strategic Investments, LLC; Hartford Underwriters General Agency, Inc.; Hartford Underwriters Insurance Company; Hartford Underwriting Agency Limited; Heritage Holdings, Inc.; Heritage Reinsurance Company, Ltd.; HLA LLC; Horizon Management Group, LLC; HRA Brokerage Services, Inc.; Lattice Strategies LLC; Maxum Casualty Insurance Company; Maxum Indemnity Company; Maxum Specialty Services Corporation; Millennium Underwriting Limited; MPC Resolution Company LLC; Navigators Holdings (UK) Limited; Navigators Insurance Company; Navigators Management Company, Inc.; Navigators Specialty Insurance Company; Navigators Underwriting Limited; New England Insurance Company; New England Reinsurance Corporation; New Ocean Insurance Co., Ltd.; NIC Investments (Chile) SpA; Nutmeg Insurance Agency, Inc.; Nutmeg Insurance Company; Pacific Insurance Company, Limited; Property and Casualty Insurance Company of Hartford; Sentinel Insurance Company, Ltd.; The Navigators Group, Inc.; Trumbull Flood Management, L.L.C.; Trumbull Insurance Company; Twin City Fire Insurance Company; Y-Risk, LLC.
Revised February 2024
[This page is intentionally left blank]
Series of Hartford Series Fund, Inc. and Hartford HLS Series Fund II, Inc. (each a “Fund” and collectively, the “Funds”) are not subsidiaries of The Hartford Financial Services Group, Inc. (“The Hartford”) but are underwritten, distributed by and advised by subsidiaries of The Hartford. Investments in the Funds are not guaranteed by The Hartford or any other entity.
This report is submitted for the general information of the shareholders of the Funds referenced in this report. It is not authorized for distribution to persons who are not shareholders of one or more Funds referenced in this report unless preceded or accompanied by a current prospectus for the relevant Funds. Nothing herein contained is to be considered an offer of sale or a solicitation of an offer to buy shares of any Fund listed in this report.
The information cannot be used or relied upon for the purpose of avoiding IRS penalties. These materials are not intended to provide tax, accounting or legal advice. As with all matters of a tax or legal nature, you should consult your own tax or legal counsel for advice.
Investors should carefully consider a Fund’s investment objectives, risks, charges and expenses. This and other important information is contained in the Fund’s prospectus and summary prospectus, which can be obtained by visiting hartfordfunds.com. Please read it carefully before investing.
The Funds are distributed by Hartford Funds Distributors, LLC.
HLSAR23 02/24 Printed in the U.S.A.
(b) Not applicable
Item 2. Code of Ethics.
The registrant, as of the end of the period covered by this report, has adopted a code of ethics that applies to the registrant’s principal executive officer, principal financial officer, principal accounting officer or controller, or persons performing similar functions, regardless of whether these individuals are employed by the registrant or a third party. There have been no amendments, during the period covered by this report, to a provision of the code of ethics that applies to the registrant’s principal executive officer, principal financial officer, principal accounting officer or controller, or persons performing similar functions, regardless of whether these individuals are employed by the registrant or a third party, and that relates to any element of the code of ethics description. The registrant has not granted any waivers, including an implicit waiver, from a provision of the code of ethics that applies to the registrant’s principal executive officer, principal financial officer, principal accounting officer or controller, or persons performing similar functions, regardless of whether these individuals are employed by the registrant or a third party, that relates to one or more of the items set forth in paragraph (b) of this item’s instructions. A copy of the code of ethics is filed herewith.
Item 3. Audit Committee Financial Expert.
The Board of Directors of the registrant (the “Board”) has designated David Sung as an Audit Committee Financial Expert. Mr. Sung is considered by the Board to be an independent director.
Item 4. Principal Accountant Fees and Services.
| | (a) | Audit Fees: The aggregate fees billed for each of the last two fiscal years for professional services rendered by the principal accountant for the audit of the registrant’s annual financial statements or services that are normally provided by the accountant in connection with statutory and regulatory filings or engagements for those fiscal years were: |
$274,352 for the fiscal year ended December 31, 2022; $314,046 for the fiscal year ended December 31, 2023.
| | (b) | Audit Related Fees: The aggregate fees billed in each of the last two fiscal years for assurance and related services by the principal accountant that are reasonably related to the performance of the audit of the registrant’s financial statements and are not reported under paragraph (a) of this Item were: |
$0 for the fiscal year ended December 31, 2022; $0 for the fiscal year ended December 31, 2023.
| | (c) | Tax Fees: The aggregate fees billed in each of the last two fiscal years for professional services rendered by the principal accountant for tax compliance, tax advice, and tax planning were: |
$50,677 for the fiscal year ended December 31, 2022; $50,677 for the fiscal year ended December 31, 2023. Tax-related services were principally in connection with, but not limited to, general tax services and excise tax services.
| | (d) | All Other Fees: The aggregate fees billed in each of the last two fiscal years for products and services provided by the principal accountant, other than the services reported in paragraphs (a) through (c) of this Item were: |
$946 for the fiscal year ended December 31, 2022; $846 for the fiscal year ended December 31, 2023. These fees were principally in connection with, but not limited to, general audit related products and services and an accounting research tool subscription.
| | (e) | (1) The Pre-Approval Policies and Procedures (the “Policy”) adopted by the Audit Committee of the registrant (also, the “Fund”) sets forth the procedures pursuant to which services performed by the independent registered public accounting firm for the registrant may be pre-approved. The following summarizes the pre-approval requirements under the Policy. |
| | a) | The Audit Committee must pre-approve all audit services and non-audit services that the independent registered public accounting firm provides to the Fund. |
| | b) | The Audit Committee must pre-approve any engagement of the independent registered public accounting firm to provide non-audit services to any Service Affiliate (which is defined to include any entity controlling, controlled by, or under common control with the investment adviser that provides ongoing services to the Fund) during the period of the independent registered public accounting firm’s engagement to provide audit services to the Fund, if the non-audit services to the Service Affiliate directly impact the Fund’s operations and financial reporting. |
| | c) | The Audit Committee, from time to time, may designate one or more of its members who are Independent Directors (each a “Designated Member”) to consider, on the Audit Committee’s behalf, any non-audit services, whether to the Fund or to any Service Affiliate, that have not been pre-approved by the Audit Committee. The Designated Member also shall review, on the Audit Committee’s behalf, any proposed material change in the nature or extent of any non-audit services previously approved. In considering any requested non-audit services or proposed material change in such services, the Designated Member shall not authorize services which would exceed $50,000 in fees for such services. |
| | d) | The independent registered public accounting firm may not provide specified prohibited non-audit services set forth in the Policy to the Fund, the Fund’s investment adviser, the Service Affiliates or any other member of the investment company complex. |
| | (e) | (2) One hundred percent of the services described in items 4(b) through 4(d) were approved in accordance with the Audit Committee’s Pre-Approval Policy. As a result, none of such services was approved pursuant to paragraph (c)(7)(i)(C) of Rule 2-01 of Regulation S-X. |
| | (f) | None of the hours expended on the principal accountant’s engagement to audit the registrant’s financial statements for the year ended December 31, 2023, were attributed to work performed by persons other than the principal accountant’s full-time, permanent employees. |
| | (g) | The aggregate non-audit fees billed by the registrant’s accountant for services rendered to the registrant, and rendered to the registrant’s investment adviser (not including any sub-adviser whose role is primarily portfolio management and is subcontracted with or overseen by another investment adviser), and any entity controlling, controlled by, or under common control with the adviser that provides ongoing services to the registrant for each of the last two fiscal years of the registrant were: |
The aggregate non-audit fees billed by the registrant’s accountant for services rendered to the registrant: $51,623 for the fiscal year ended December 31, 2022; $51,523 for the fiscal year ended December 31, 2023.
The aggregate non-audit fees billed by the registrant’s accountant for services rendered to the registrant’s investment adviser (not including any sub-adviser whose role is primarily portfolio management and is subcontracted with or overseen by another investment adviser), and any entity controlling, controlled by, or under common control with the adviser was $120,925 for the fiscal year ended December 31, 2022 and $121,199 for the fiscal year ended December 31, 2023.
| | (h) | The registrant’s audit committee of the board of directors has considered whether the provision of non-audit services that were rendered to the registrant’s investment adviser (not including any sub-adviser whose role is primarily portfolio management and is subcontracted with or overseen by another investment adviser), and any entity controlling, controlled by, or under common control with the investment adviser that provides |
| | ongoing services to the registrant that were not pre-approved pursuant to paragraph (c)(7)(ii) of Rule 2-01 of Regulation S-X is compatible with maintaining the principal accountant’s independence. |
Item 5. Audit Committee of Listed Registrants.
Not applicable.
Item 6. Investments.
| | (a) | The Schedule of Investments in securities of unaffiliated issuers as of the close of the reporting period is included as part of the annual report filed under Item 1 of this form. |
Item 7. Disclosure of Proxy Voting Policies and Procedures for Closed-End Management Investment Companies.
Not applicable.
Item 8. Portfolio Managers of Closed-End Management Investment Companies.
Not applicable.
Item 9. Purchases of Equity Securities by Closed-End Management Investment Company and Affiliated Purchasers.
Not applicable.
Item 10. Submission of Matters to a Vote of Security Holders.
There have been no material changes to the procedures by which the shareholders may recommend nominees to the registrant’s board of directors, where those changes were implemented after the registrant last provided disclosure in response to the requirements of Item 407(c)(2)(iv) of Regulation S-K (17 CFR 229.407) (as required by Item 22(b)(15) of Schedule 14A (17 CFR 240.14a-101)), or this Item.
Item 11. Controls and Procedures.
| (a) | The registrant’s principal executive and principal financial officers, or persons performing similar functions, have concluded that the registrant’s disclosure controls and procedures (as defined in Rule 30a-3(c) under the Investment Company Act of 1940, as amended (the “1940 Act”) (17 CFR 270.30a-3(c))) are generally effective to provide reasonable assurance, as of a date within 90 days of the filing date of the report that includes the disclosure required by this paragraph, based on their evaluation of these controls and procedures required by Rule 30a-3(b) under the 1940 Act (17 CFR 270.30a-3(b)) and Rules 13a-15(b) or 15d-15(b) under the Securities Exchange Act of 1934, as amended (17 CFR 240.13a-15(b) or 240.15d-15(b)). |
| (b) | There were no changes in the registrant’s internal control over financial reporting (as defined in Rule 30a-3(d) under the 1940 Act (17 CFR 270.30a-3(d)) that occurred during the period covered by this report that have materially affected, or are reasonably likely to materially affect, the registrant’s internal control over financial reporting. |
Item 12. Disclosure of Securities Lending Activities for Closed-End Management Investment Companies.
Not applicable.
Item 13. Exhibits.
(a)(1) Code of Ethics is filed herewith.
(a)(2) Separate certifications for each principal executive officer and principal financial officer of the registrant as required by Rule 30a-2(a) under the 1940 Act (17 CFR 270.30a-2(a)) and Section 302 of the Sarbanes-Oxley Act of 2002 are attached hereto.
(a)(3) Not applicable.
(a)(4) Not applicable.
(b) Certifications pursuant to Rule 30a-2(b) under the 1940 Act and Section 906 of the Sarbanes-Oxley Act of 2002 are attached hereto.
SIGNATURES
Pursuant to the requirements of the Securities Exchange Act of 1934 and the Investment Company Act of 1940, the registrant has duly caused this report to be signed on its behalf by the undersigned, thereunto duly authorized.
| | | | | | |
| | | | HARTFORD SERIES FUND, INC. |
| | | |
Date: February 23, 2024 | | | | By: | | /s/ James E. Davey |
| | | | | | James E. Davey |
| | | | | | President and Chief Executive Officer |
Pursuant to the requirements of the Securities Exchange Act of 1934 and the Investment Company Act of 1940, this report has been signed below by the following persons on behalf of the registrant and in the capacities and on the dates indicated.
| | | | | | |
| Date: February 23, 2024 | | | | By: | | /s/ James E. Davey |
| | | | | | James E. Davey |
| | | | | | President and Chief Executive Officer |
| | | |
| Date: February 23, 2024 | | | | By: | | /s/ Ankit Puri |
| | | | | | Ankit Puri |
| | | | | | Treasurer |
| | | | | | (Principal Financial Officer and Principal Accounting Officer) |