UNITED STATES
SECURITIES AND EXCHANGE COMMISSION
Washington, D.C. 20549
FORM N-CSR
CERTIFIED SHAREHOLDER REPORT OF REGISTERED MANAGEMENT INVESTMENT COMPANIES
Investment Company Act file number
Hartford Series Fund, Inc.
(Exact name of registrant as specified in charter)
690 Lee Road, Wayne, Pennsylvania 19087
(Address of Principal Executive Offices) (Zip Code)
Thomas R. Phillips, Esquire
Hartford Funds Management Company, LLC
690 Lee Road
Wayne, Pennsylvania 19087
(Name and Address of Agent for Service)
Copy to:
John V. O’Hanlon, Esquire
Dechert LLP
One International Place, 40th Floor
100 Oliver Street
Boston, Massachusetts 02110-2605
Registrant's telephone number, including area code:
Date of reporting period:
Form N-CSR is to be used by management investment companies to file reports with the Commission not later than 10 days after the transmission to stockholders of any report that is required to be transmitted to stockholders under Rule 30e-1 under the Investment Company Act of 1940 (17 CFR 270.30e-1). The Commission may use the information provided on Form N-CSR in its regulatory, disclosure review, inspection, and policymaking roles.
A registrant is required to disclose the information specified by Form N-CSR, and the Commission will make this information public. A registrant is not required to respond to the collection of information contained in Form N-CSR unless the Form displays a currently valid Office of Management and Budget (“OMB”) control number. Please direct comments concerning the accuracy of the information collection burden estimate and any suggestions for reducing the burden to Secretary, Securities and Exchange Commission, 100 F Street, NE, Washington, DC 20549-1090. The OMB has reviewed this collection of information under the clearance requirements of 44 U.S.C. § 3507.
Item 1. Reports to Stockholders.
(a)
Annual Shareholder Report
December 31, 2024
Hartford Balanced HLS Fund
Class IA/HADAX
This annual shareholder report contains important information about the Hartford Balanced HLS Fund (the "Fund") for the period of January 1, 2024 to December 31, 2024. You can find additional information about the Fund at hartfordfunds.com/reports-hls. You can also request this information by contacting us by calling 1‑888‑843‑7824.
What were the Fund costs for the last year?
(Based on a hypothetical $10,000 investment)
| Class Name | Costs of a $10,000 investment* | Costs paid as a percentage
of a $10,000 investment* |
| Class IA | $67 | 0.63% |
| * | This does not reflect any transactional costs, such as sales charges (loads) or fees which may be applied at the variable life insurance, variable annuity, or qualified retirement plan product level. |
How did the Fund perform last year and what impacted its performance?
Management's Discussion of Fund Performance
United States (U.S.) equities, as measured by the S&P 500 Index, rose over the twelve-month period ending December 31, 2024, with the S&P 500 Index reaching new highs, driven by the performance of a select group of artificial intelligence (AI) related, mega-cap technology companies. Most fixed income sectors generated positive total returns during the trailing twelve-months ended December 31, 2024, as coupon income and spread tightening helped offset the impact of rising United States Treasury yields. Most spread sectors produced positive excess returns over duration-equivalent government bonds as spreads narrowed, supported by more accommodative central bank policies. Fund performance described below is relative to the Fund’s blended benchmark, 60% S&P 500 Index/ 35% Bloomberg US Government/Credit Bond Index/ 5% ICE BofA US 3-Month Treasury Bill Index (the "Blended Benchmark"), for the trailing twelve-month period ended December 31, 2024.
Top Contributors to Performance
Equity security selection within the Financials, Energy, and Healthcare sectors contributed positively to relative performance.
Within the equity portion of the Fund, the Fund’s overweight to the Financials sector and underweight allocation to the Materials sector also contributed to relative performance.
Top equity contributors over the period were overweight positions in Targa Resources (Energy), Broadcom (Information Technology) and Corning (Information Technology).
In the fixed income portion of the Fund, security selection within Investment-Grade Corporate Credit was the primary contributor to relative performance, particularly within the Industrials, Utilities, and Financials sectors. An overweight to Financial Institutions also contributed to relative returns. Within Non-Corporate Credit, security selection within Taxable Municipal Bonds contributed to relative performance over the period.
Overweight allocation to and security selection within Asset-Backed Securities (ABS) had a positive impact on relative performance. Duration and yield curve positioning had a positive impact on relative performance over the period.
Top Detractors to Performance
Within the equity portion of the Fund, security selection was the primary relative detractor during the period, driven by weak selection within the Information Technology, Consumer Discretionary, and Industrials sectors.
Sector allocation, a result of our bottom-up stock selection process, was also a relative detractor in the equity portion of the Fund during the period due to the Fund’s overweight allocation to the Healthcare sector and underweight allocation to the Information Technology sector.
The largest equity detractors over the period were not owning S&P 500 Index constituents NVIDIA (Information Technology) and Meta Platforms (Communication Services), as well as an overweight position in Elevance Health (Healthcare).
In the fixed income portion of the Fund, an underweight to the Industrials sector detracted from performance over the period.
The views expressed in this section reflect the opinions of the Fund's sub-adviser, Wellington Management Company LLP, as of the date of this report and are subject to change based on changes in market, economic or other conditions. These views are not intended to be a forecast of future events and are no guarantee of future results.
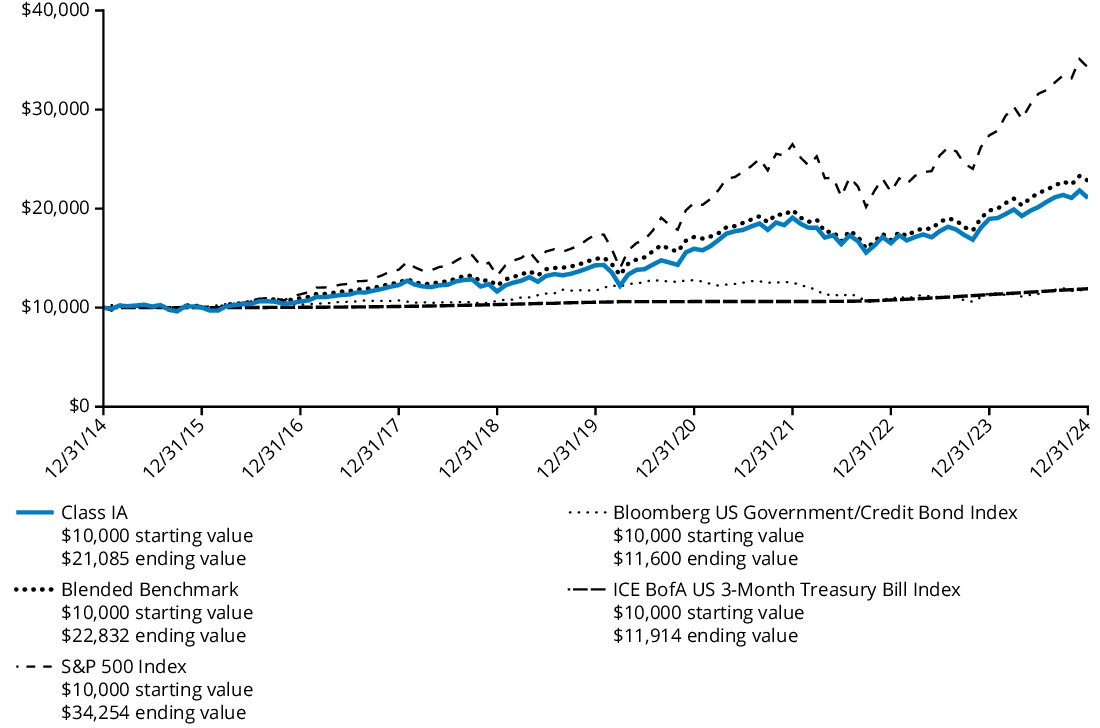
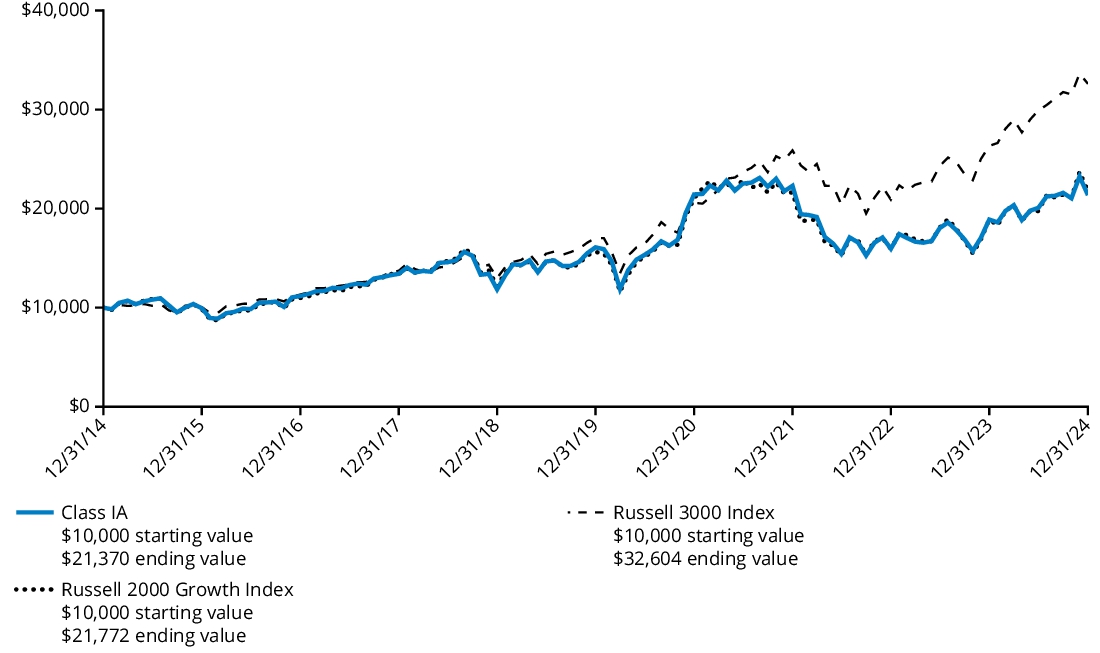
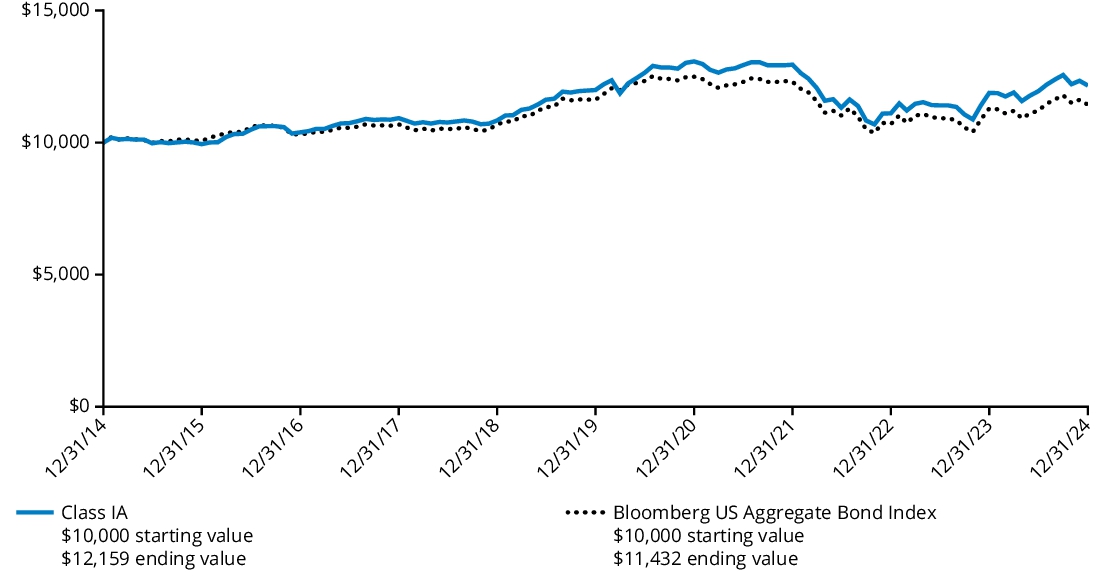
Comparison of Change in Value of $ 10,000 Investment
The graph below represents the hypothetical growth of a $10,000 investment in Class IA shares and the comparative indices. Performance information for the Fund in the graph and table reflects fee waivers, if any. Absent any applicable waivers, performance would have been lower. The Fund’s past performance is not a good predictor of the Fund’s future performance.
Average Annual Total Returns
For the Periods Ended December 31, 2024 | 1 Year | 5 Years | 10 Years |
| Class IA | 11.21% | 8.09% | 7.75% |
| Blended Benchmark | 15.25% | 8.88% | 8.61% |
| S&P 500 Index | 25.02% | 14.53% | 13.10% |
| Bloomberg US Government/Credit Bond Index | 1.18% | (0.21)% | 1.50% |
| ICE BofA US 3-Month Treasury Bill Index | 5.25% | 2.46% | 1.77% |
The Blended Benchmark serves as the Fund’s performance index because the Fund’s investment manager, Hartford Funds Management Company, LLC ("HFMC"), believes it is more representative of the Fund’s investment strategy. The Blended Benchmark is calculated by HFMC. The S&P 500 Index, one of the indices included in the Fund’s blended benchmark, serves as the Fund’s regulatory index and provides a broad measure of market performance.
The Fund’s past performance is not a good predictor of the Fund’s future performance. The Fund's performance in the graph and table do not reflect the deductions of taxes, sales charges or other fees which may be applied at the variable contract level or by a qualified pension or retirement plan. Any such additional sales charges or other fees or expenses would lower the contract’s or plan’s performance. Visit hartfordfunds.com for the most recent performance information.
Key Fund Statistics as of December 31, 2024
| Fund's net assets | $1,648,620,113 |
| Total number of portfolio holdings (excluding derivatives, if any) | 494 |
| Total investment management fees paid | $10,193,370 |
| Portfolio turnover rate (excludes to be announced (TBA) roll transactions) | 50% |
Graphical Representation of Holdings as of December 31, 2024
The table below shows the investment makeup of the Fund, representing the percentage of net assets of the Fund.
Composition by Security Type
| Common Stocks | 64.6 | % |
| U.S. Government Securities | 20.9 | % |
| Corporate Bonds | 10.4 | % |
| Asset & Commercial Mortgage-Backed Securities | 1.0 | % |
| Municipal Bonds | 0.5 | % |
| U.S. Government Agencies^ | 0.5 | % |
| Foreign Government Obligations | 0.2 | % |
| Short-Term Investments | 0.4 | % |
| Other Assets & Liabilities | 1.5 | % |
| Total | 100.0 | % |
^ | All, or a portion of the securities categorized as U.S. Government Agencies, were agency mortgage-backed securities. |
Availability of Additional Information
For additional information about the Fund, including its prospectus, financial information, holdings, and proxy voting information, please visit the Fund’s website at the website address included at the beginning of this report.
The Fund is distributed by Hartford Funds Distributors, LLC (HFD).
Annual Shareholder Report
December 31, 2024
Hartford Balanced HLS Fund
Class IB/HAIBX
This annual shareholder report contains important information about the Hartford Balanced HLS Fund (the "Fund") for the period of January 1, 2024 to December 31, 2024. You can find additional information about the Fund at hartfordfunds.com/reports-hls. You can also request this information by contacting us by calling 1‑888‑843‑7824.
What were the Fund costs for the last year?
(Based on a hypothetical $10,000 investment)
| Class Name | Costs of a $10,000 investment* | Costs paid as a percentage
of a $10,000 investment* |
| Class IB | $93 | 0.88% |
| * | This does not reflect any transactional costs, such as sales charges (loads) or fees which may be applied at the variable life insurance, variable annuity, or qualified retirement plan product level. |
How did the Fund perform last year and what impacted its performance?
Management's Discussion of Fund Performance
United States (U.S.) equities, as measured by the S&P 500 Index, rose over the twelve-month period ending December 31, 2024, with the S&P 500 Index reaching new highs, driven by the performance of a select group of artificial intelligence (AI) related, mega-cap technology companies. Most fixed income sectors generated positive total returns during the trailing twelve-months ended December 31, 2024, as coupon income and spread tightening helped offset the impact of rising United States Treasury yields. Most spread sectors produced positive excess returns over duration-equivalent government bonds as spreads narrowed, supported by more accommodative central bank policies. Fund performance described below is relative to the Fund’s blended benchmark, 60% S&P 500 Index/ 35% Bloomberg US Government/Credit Bond Index/ 5% ICE BofA US 3-Month Treasury Bill Index (the "Blended Benchmark"), for the trailing twelve-month period ended December 31, 2024.
Top Contributors to Performance
Equity security selection within the Financials, Energy, and Healthcare sectors contributed positively to relative performance.
Within the equity portion of the Fund, the Fund’s overweight to the Financials sector and underweight allocation to the Materials sector also contributed to relative performance.
Top equity contributors over the period were overweight positions in Targa Resources (Energy), Broadcom (Information Technology) and Corning (Information Technology).
In the fixed income portion of the Fund, security selection within Investment-Grade Corporate Credit was the primary contributor to relative performance, particularly within the Industrials, Utilities, and Financials sectors. An overweight to Financial Institutions also contributed to relative returns. Within Non-Corporate Credit, security selection within Taxable Municipal Bonds contributed to relative performance over the period.
Overweight allocation to and security selection within Asset-Backed Securities (ABS) had a positive impact on relative performance. Duration and yield curve positioning had a positive impact on relative performance over the period.
Top Detractors to Performance
Within the equity portion of the Fund, security selection was the primary relative detractor during the period, driven by weak selection within the Information Technology, Consumer Discretionary, and Industrials sectors.
Sector allocation, a result of our bottom-up stock selection process, was also a relative detractor in the equity portion of the Fund during the period due to the Fund’s overweight allocation to the Healthcare sector and underweight allocation to the Information Technology sector.
The largest equity detractors over the period were not owning S&P 500 Index constituents NVIDIA (Information Technology) and Meta Platforms (Communication Services), as well as an overweight position in Elevance Health (Healthcare).
In the fixed income portion of the Fund, an underweight to the Industrials sector detracted from performance over the period.
The views expressed in this section reflect the opinions of the Fund's sub-adviser, Wellington Management Company LLP, as of the date of this report and are subject to change based on changes in market, economic or other conditions. These views are not intended to be a forecast of future events and are no guarantee of future results.
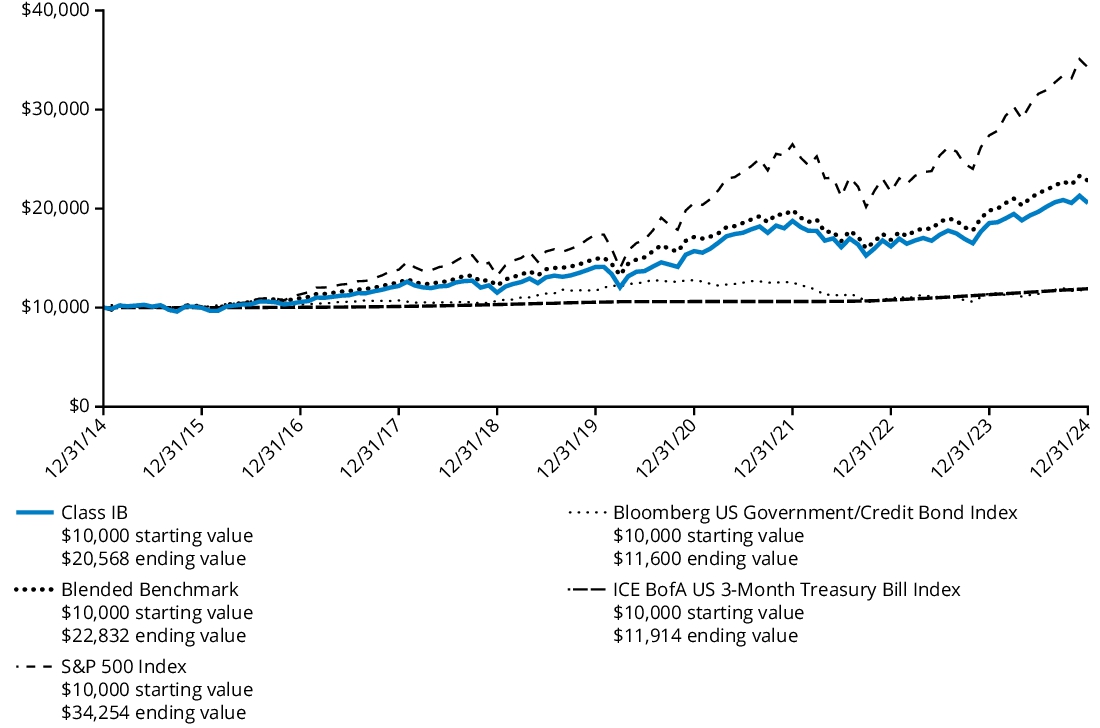
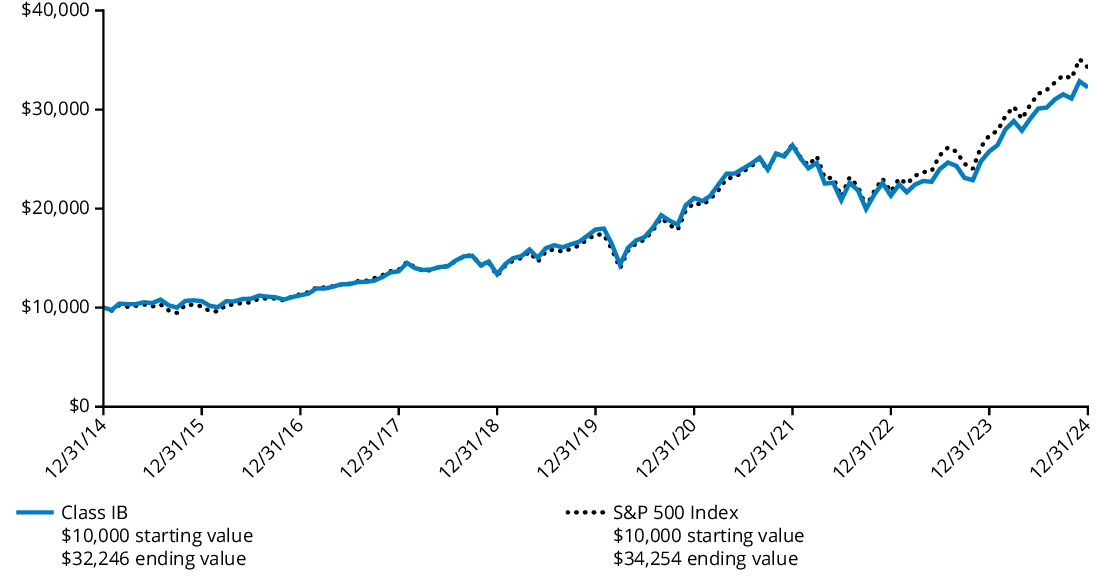
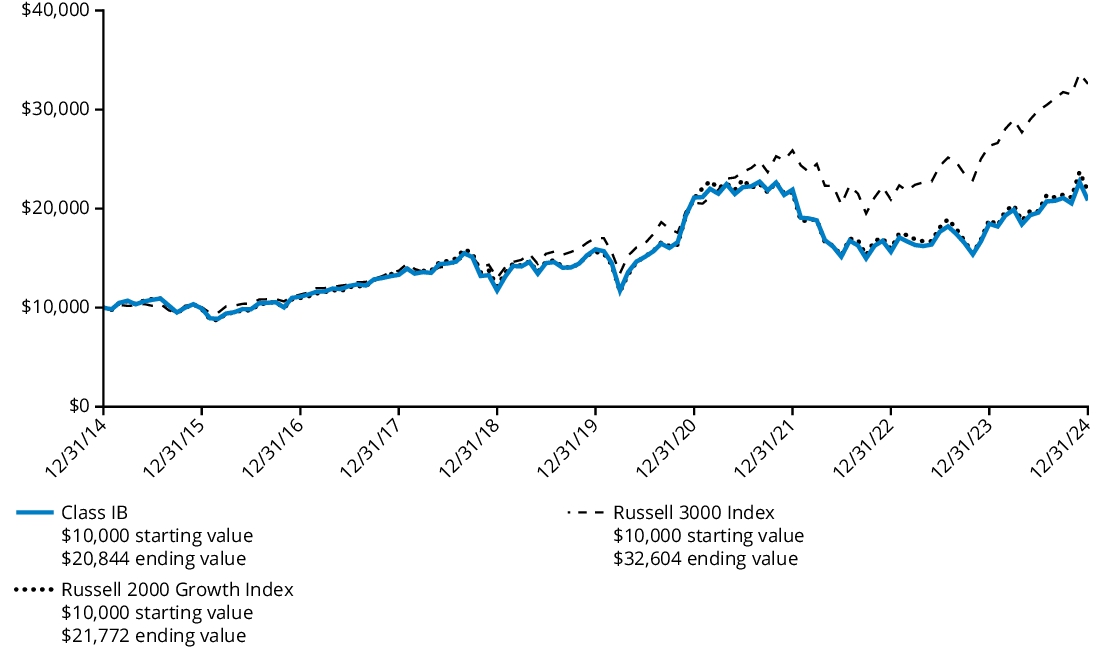
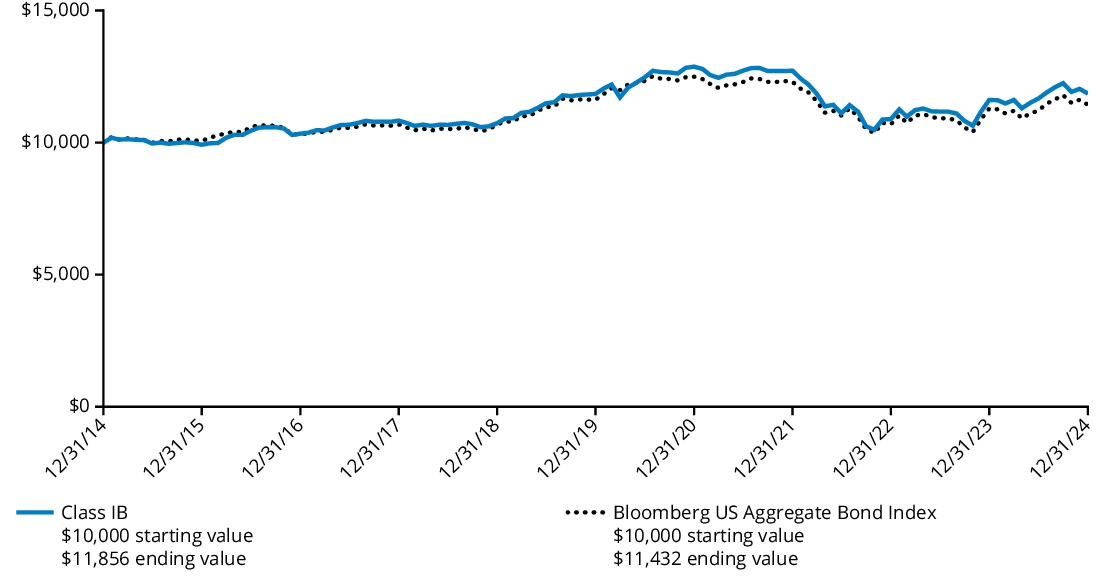
Comparison of Change in Value of $ 10,000 Investment
The graph below represents the hypothetical growth of a $10,000 investment in Class IB shares and the comparative indices. Performance information for the Fund in the graph and table reflects fee waivers, if any. Absent any applicable waivers, performance would have been lower. The Fund’s past performance is not a good predictor of the Fund’s future performance.
Average Annual Total Returns
For the Periods Ended December 31, 2024 | 1 Year | 5 Years | 10 Years |
| Class IB | 10.94% | 7.83% | 7.48% |
| Blended Benchmark | 15.25% | 8.88% | 8.61% |
| S&P 500 Index | 25.02% | 14.53% | 13.10% |
| Bloomberg US Government/Credit Bond Index | 1.18% | (0.21)% | 1.50% |
| ICE BofA US 3-Month Treasury Bill Index | 5.25% | 2.46% | 1.77% |
The Blended Benchmark serves as the Fund’s performance index because the Fund’s investment manager, Hartford Funds Management Company, LLC ("HFMC"), believes it is more representative of the Fund’s investment strategy. The Blended Benchmark is calculated by HFMC. The S&P 500 Index, one of the indices included in the Fund’s blended benchmark, serves as the Fund’s regulatory index and provides a broad measure of market performance.
The Fund’s past performance is not a good predictor of the Fund’s future performance. The Fund's performance in the graph and table do not reflect the deductions of taxes, sales charges or other fees which may be applied at the variable contract level or by a qualified pension or retirement plan. Any such additional sales charges or other fees or expenses would lower the contract’s or plan’s performance. Visit hartfordfunds.com for the most recent performance information.
Key Fund Statistics as of December 31, 2024
| Fund's net assets | $1,648,620,113 |
| Total number of portfolio holdings (excluding derivatives, if any) | 494 |
| Total investment management fees paid | $10,193,370 |
| Portfolio turnover rate (excludes to be announced (TBA) roll transactions) | 50% |
Graphical Representation of Holdings as of December 31, 2024
The table below shows the investment makeup of the Fund, representing the percentage of net assets of the Fund.
Composition by Security Type
| Common Stocks | 64.6 | % |
| U.S. Government Securities | 20.9 | % |
| Corporate Bonds | 10.4 | % |
| Asset & Commercial Mortgage-Backed Securities | 1.0 | % |
| Municipal Bonds | 0.5 | % |
| U.S. Government Agencies^ | 0.5 | % |
| Foreign Government Obligations | 0.2 | % |
| Short-Term Investments | 0.4 | % |
| Other Assets & Liabilities | 1.5 | % |
| Total | 100.0 | % |
^ | All, or a portion of the securities categorized as U.S. Government Agencies, were agency mortgage-backed securities. |
Availability of Additional Information
For additional information about the Fund, including its prospectus, financial information, holdings, and proxy voting information, please visit the Fund’s website at the website address included at the beginning of this report.
The Fund is distributed by Hartford Funds Distributors, LLC (HFD).
Annual Shareholder Report
December 31, 2024
Hartford Capital Appreciation HLS Fund
Class IA/HIACX
This annual shareholder report contains important information about the Hartford Capital Appreciation HLS Fund (the "Fund") for the period of January 1, 2024 to December 31, 2024. You can find additional information about the Fund at hartfordfunds.com/reports-hls. You can also request this information by contacting us by calling 1‑888‑843‑7824.
What were the Fund costs for the last year?
(Based on a hypothetical $10,000 investment)
| Class Name | Costs of a $10,000 investment* | Costs paid as a percentage
of a $10,000 investment* |
| Class IA | $74 | 0.67% |
| * | This does not reflect any transactional costs, such as sales charges (loads) or fees which may be applied at the variable life insurance, variable annuity, or qualified retirement plan product level. |
How did the Fund perform last year and what impacted its performance?
Management's Discussion of Fund Performance
United States (U.S.) equities, as measured by the Russell 3000 Index, rose over the twelve-month period ending December 31, 2024. Financial markets adjusted to expectations of fewer interest rate cuts by the U.S. Federal Reserve (Fed) amid persistent inflation, sustained economic growth and a resilient labor market supporting consumer spending. Despite strong first-quarter results, the labor market cooled with reduced hiring and fewer job openings. Concerns about slowing economic activity and a cooling labor market led the (Fed) to implement a 50 basis point interest rate cut in September. Stocks rallied in November following Donald Trump’s presidential election victory, which shifted political power to the Republican Party and paved the way for major policy initiatives, including tax and spending cuts, deregulation, and nationalist trade policies. Fund performance described below is relative to the Russell 3000 Index for the trailing twelve-month period ended December 31, 2024.
Top Contributors to Performance
The Fund’s underweight allocations to the Healthcare and Consumer Discretionary sectors and overweight allocation to the Communication Services sector contributed to relative results.
Security selection within the Information Technology and Communication Services sectors contributed to relative performance.
Top individual contributors over the period were an overweight position in Apple (Information Technology), not holding Intel (Information Technology), and an out-of-benchmark position in ARM Holdings (Information Technology).
Top Detractors to Performance
Security selection was the primary detractor to relative performance during the period, driven by selection within the Consumer Staples, Consumer Discretionary, and Financials sectors.
An underweight allocation to the Information Technology sector and overweight exposures to the Materials and Real Estate sectors detracted from relative performance.
From a factor style perspective, the Fund’s underweight exposure to stocks with higher momentum detracted from relative performance.
The largest individual detractors over the period were overweight positions in American Tower (Real Estate) and Nike (Consumer Discretionary), as well as an underweight position in NVIDIA (Information Technology).
The views expressed in this section reflect the opinions of the Fund's sub-adviser, Wellington Management Company LLP, as of the date of this report and are subject to change based on changes in market, economic or other conditions. These views are not intended to be a forecast of future events and are no guarantee of future results.
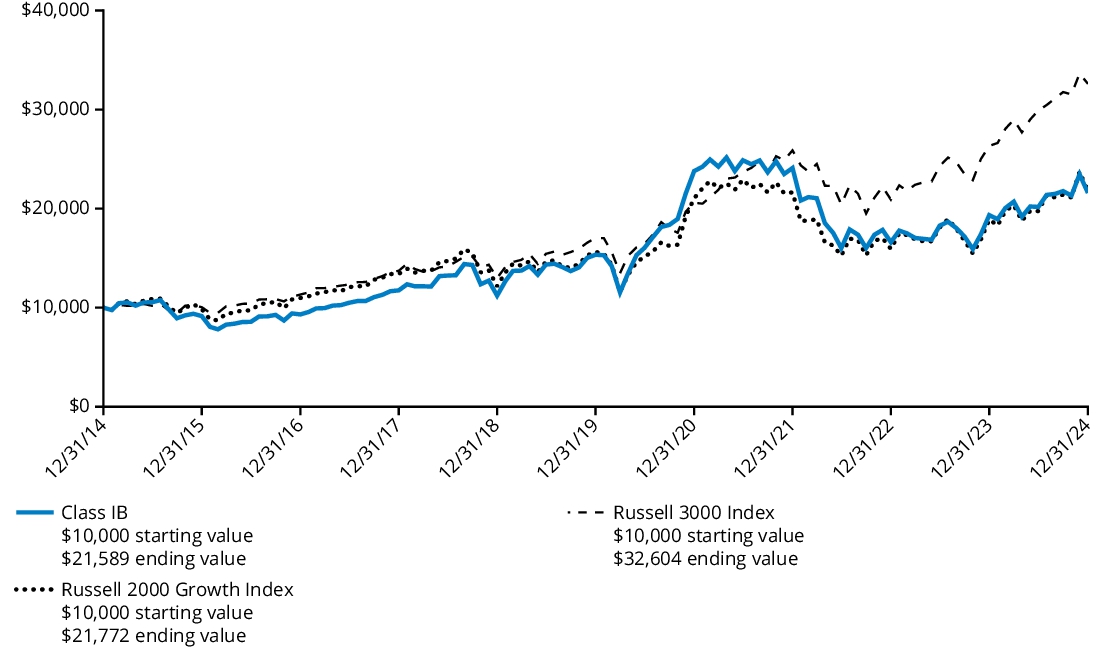
Comparison of Change in Value of $ 10,000 Investment
The graph below represents the hypothetical growth of a $10,000 investment in Class IA shares and the comparative indices. The Fund’s past performance is not a good predictor of the Fund’s future performance.
Average Annual Total Returns
For the Periods Ended December 31, 2024 | 1 Year | 5 Years | 10 Years |
| Class IA | 21.19% | 11.50% | 10.61% |
| Russell 3000 Index | 23.81% | 13.86% | 12.55% |
| S&P 500 Index | 25.02% | 14.53% | 13.10% |
The Fund’s past performance is not a good predictor of the Fund’s future performance. The Fund's performance in the graph and table do not reflect the deductions of taxes, sales charges or other fees which may be applied at the variable contract level or by a qualified pension or retirement plan. Any such additional sales charges or other fees or expenses would lower the contract’s or plan’s performance. Visit hartfordfunds.com for the most recent performance information.
Key Fund Statistics as of December 31, 2024
| Fund's net assets | $3,759,915,745 |
| Total number of portfolio holdings (excluding derivatives, if any) | 157 |
| Total investment management fees paid | $24,128,372 |
| Portfolio turnover rate | 72% |
Graphical Representation of Holdings as of December 31, 2024
The table below shows the investment makeup of the Fund, representing the percentage of net assets of the Fund.
| Information Technology | 29.4 | % |
| Financials | 12.4 | % |
| Consumer Discretionary | 11.3 | % |
| Communication Services | 10.7 | % |
| Health Care | 9.7 | % |
| Industrials | 8.0 | % |
| Consumer Staples | 5.8 | % |
| Materials | 3.4 | % |
| Energy | 3.3 | % |
| Real Estate | 2.3 | % |
| Utilities | 1.6 | % |
| Short-Term Investments | 0.4 | % |
| Other Assets & Liabilities | 1.7 | % |
| Total | 100.0 | % |
* | For Fund compliance purposes, the Fund may not use the same classification system. These classifications are used for financial reporting purposes. |
Availability of Additional Information
For additional information about the Fund, including its prospectus, financial information, holdings, and proxy voting information, please visit the Fund’s website at the website address included at the beginning of this report.
The Fund is distributed by Hartford Funds Distributors, LLC (HFD).
Annual Shareholder Report
December 31, 2024
Hartford Capital Appreciation HLS Fund
Class IB/HIBCX
This annual shareholder report contains important information about the Hartford Capital Appreciation HLS Fund (the "Fund") for the period of January 1, 2024 to December 31, 2024. You can find additional information about the Fund at hartfordfunds.com/reports-hls. You can also request this information by contacting us by calling 1‑888‑843‑7824.
What were the Fund costs for the last year?
(Based on a hypothetical $10,000 investment)
| Class Name | Costs of a $10,000 investment* | Costs paid as a percentage
of a $10,000 investment* |
| Class IB | $102 | 0.92% |
| * | This does not reflect any transactional costs, such as sales charges (loads) or fees which may be applied at the variable life insurance, variable annuity, or qualified retirement plan product level. |
How did the Fund perform last year and what impacted its performance?
Management's Discussion of Fund Performance
United States (U.S.) equities, as measured by the Russell 3000 Index, rose over the twelve-month period ending December 31, 2024. Financial markets adjusted to expectations of fewer interest rate cuts by the U.S. Federal Reserve (Fed) amid persistent inflation, sustained economic growth and a resilient labor market supporting consumer spending. Despite strong first-quarter results, the labor market cooled with reduced hiring and fewer job openings. Concerns about slowing economic activity and a cooling labor market led the (Fed) to implement a 50 basis point interest rate cut in September. Stocks rallied in November following Donald Trump’s presidential election victory, which shifted political power to the Republican Party and paved the way for major policy initiatives, including tax and spending cuts, deregulation, and nationalist trade policies. Fund performance described below is relative to the Russell 3000 Index for the trailing twelve-month period ended December 31, 2024.
Top Contributors to Performance
The Fund’s underweight allocations to the Healthcare and Consumer Discretionary sectors and overweight allocation to the Communication Services sector contributed to relative results.
Security selection within the Information Technology and Communication Services sectors contributed to relative performance.
Top individual contributors over the period were an overweight position in Apple (Information Technology), not holding Intel (Information Technology), and an out-of-benchmark position in ARM Holdings (Information Technology).
Top Detractors to Performance
Security selection was the primary detractor to relative performance during the period, driven by selection within the Consumer Staples, Consumer Discretionary, and Financials sectors.
An underweight allocation to the Information Technology sector and overweight exposures to the Materials and Real Estate sectors detracted from relative performance.
From a factor style perspective, the Fund’s underweight exposure to stocks with higher momentum detracted from relative performance.
The largest individual detractors over the period were overweight positions in American Tower (Real Estate) and Nike (Consumer Discretionary), as well as an underweight position in NVIDIA (Information Technology).
The views expressed in this section reflect the opinions of the Fund's sub-adviser, Wellington Management Company LLP, as of the date of this report and are subject to change based on changes in market, economic or other conditions. These views are not intended to be a forecast of future events and are no guarantee of future results.
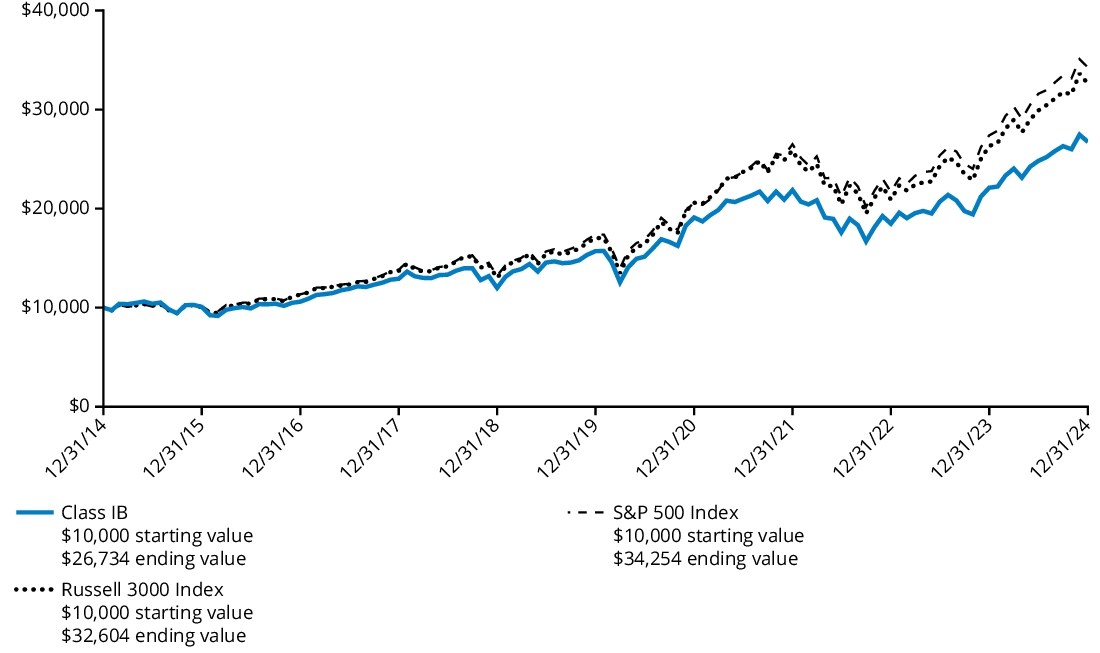
Comparison of Change in Value of $ 10,000 Investment
The graph below represents the hypothetical growth of a $10,000 investment in Class IB shares and the comparative indices. The Fund’s past performance is not a good predictor of the Fund’s future performance.
Average Annual Total Returns
For the Periods Ended December 31, 2024 | 1 Year | 5 Years | 10 Years |
| Class IB | 20.90% | 11.22% | 10.33% |
| Russell 3000 Index | 23.81% | 13.86% | 12.55% |
| S&P 500 Index | 25.02% | 14.53% | 13.10% |
The Fund’s past performance is not a good predictor of the Fund’s future performance. The Fund's performance in the graph and table do not reflect the deductions of taxes, sales charges or other fees which may be applied at the variable contract level or by a qualified pension or retirement plan. Any such additional sales charges or other fees or expenses would lower the contract’s or plan’s performance. Visit hartfordfunds.com for the most recent performance information.
Key Fund Statistics as of December 31, 2024
| Fund's net assets | $3,759,915,745 |
| Total number of portfolio holdings (excluding derivatives, if any) | 157 |
| Total investment management fees paid | $24,128,372 |
| Portfolio turnover rate | 72% |
Graphical Representation of Holdings as of December 31, 2024
The table below shows the investment makeup of the Fund, representing the percentage of net assets of the Fund.
| Information Technology | 29.4 | % |
| Financials | 12.4 | % |
| Consumer Discretionary | 11.3 | % |
| Communication Services | 10.7 | % |
| Health Care | 9.7 | % |
| Industrials | 8.0 | % |
| Consumer Staples | 5.8 | % |
| Materials | 3.4 | % |
| Energy | 3.3 | % |
| Real Estate | 2.3 | % |
| Utilities | 1.6 | % |
| Short-Term Investments | 0.4 | % |
| Other Assets & Liabilities | 1.7 | % |
| Total | 100.0 | % |
* | For Fund compliance purposes, the Fund may not use the same classification system. These classifications are used for financial reporting purposes. |
Availability of Additional Information
For additional information about the Fund, including its prospectus, financial information, holdings, and proxy voting information, please visit the Fund’s website at the website address included at the beginning of this report.
The Fund is distributed by Hartford Funds Distributors, LLC (HFD).
Annual Shareholder Report
December 31, 2024
Hartford Capital Appreciation HLS Fund
Class IC/HCPCX
This annual shareholder report contains important information about the Hartford Capital Appreciation HLS Fund (the "Fund") for the period of January 1, 2024 to December 31, 2024. You can find additional information about the Fund at hartfordfunds.com/reports-hls. You can also request this information by contacting us by calling 1‑888‑843‑7824.
What were the Fund costs for the last year?
(Based on a hypothetical $10,000 investment)
| Class Name | Costs of a $10,000 investment* | Costs paid as a percentage
of a $10,000 investment* |
| Class IC | $129 | 1.17% |
| * | This does not reflect any transactional costs, such as sales charges (loads) or fees which may be applied at the variable life insurance, variable annuity, or qualified retirement plan product level. |
How did the Fund perform last year and what impacted its performance?
Management's Discussion of Fund Performance
United States (U.S.) equities, as measured by the Russell 3000 Index, rose over the twelve-month period ending December 31, 2024. Financial markets adjusted to expectations of fewer interest rate cuts by the U.S. Federal Reserve (Fed) amid persistent inflation, sustained economic growth and a resilient labor market supporting consumer spending. Despite strong first-quarter results, the labor market cooled with reduced hiring and fewer job openings. Concerns about slowing economic activity and a cooling labor market led the (Fed) to implement a 50 basis point interest rate cut in September. Stocks rallied in November following Donald Trump’s presidential election victory, which shifted political power to the Republican Party and paved the way for major policy initiatives, including tax and spending cuts, deregulation, and nationalist trade policies. Fund performance described below is relative to the Russell 3000 Index for the trailing twelve-month period ended December 31, 2024.
Top Contributors to Performance
The Fund’s underweight allocations to the Healthcare and Consumer Discretionary sectors and overweight allocation to the Communication Services sector contributed to relative results.
Security selection within the Information Technology and Communication Services sectors contributed to relative performance.
Top individual contributors over the period were an overweight position in Apple (Information Technology), not holding Intel (Information Technology), and an out-of-benchmark position in ARM Holdings (Information Technology).
Top Detractors to Performance
Security selection was the primary detractor to relative performance during the period, driven by selection within the Consumer Staples, Consumer Discretionary, and Financials sectors.
An underweight allocation to the Information Technology sector and overweight exposures to the Materials and Real Estate sectors detracted from relative performance.
From a factor style perspective, the Fund’s underweight exposure to stocks with higher momentum detracted from relative performance.
The largest individual detractors over the period were overweight positions in American Tower (Real Estate) and Nike (Consumer Discretionary), as well as an underweight position in NVIDIA (Information Technology).
The views expressed in this section reflect the opinions of the Fund's sub-adviser, Wellington Management Company LLP, as of the date of this report and are subject to change based on changes in market, economic or other conditions. These views are not intended to be a forecast of future events and are no guarantee of future results.
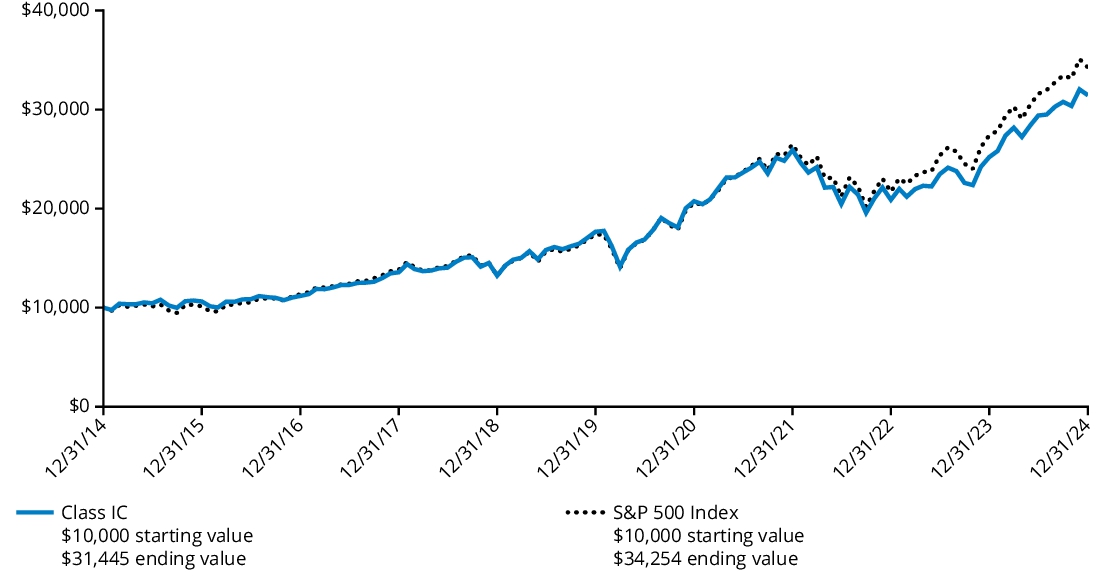
Comparison of Change in Value of $ 10,000 Investment
The graph below represents the hypothetical growth of a $10,000 investment in Class IC shares and the comparative indices. The Fund’s past performance is not a good predictor of the Fund’s future performance.
Average Annual Total Returns
For the Periods Ended December 31, 2024 | 1 Year | 5 Years | 10 Years |
| Class IC | 20.60% | 10.95% | 10.06% |
| Russell 3000 Index | 23.81% | 13.86% | 12.55% |
| S&P 500 Index | 25.02% | 14.53% | 13.10% |
The Fund’s past performance is not a good predictor of the Fund’s future performance. The Fund's performance in the graph and table do not reflect the deductions of taxes, sales charges or other fees which may be applied at the variable contract level or by a qualified pension or retirement plan. Any such additional sales charges or other fees or expenses would lower the contract’s or plan’s performance. Visit hartfordfunds.com for the most recent performance information.
Key Fund Statistics as of December 31, 2024
| Fund's net assets | $3,759,915,745 |
| Total number of portfolio holdings (excluding derivatives, if any) | 157 |
| Total investment management fees paid | $24,128,372 |
| Portfolio turnover rate | 72% |
Graphical Representation of Holdings as of December 31, 2024
The table below shows the investment makeup of the Fund, representing the percentage of net assets of the Fund.
| Information Technology | 29.4 | % |
| Financials | 12.4 | % |
| Consumer Discretionary | 11.3 | % |
| Communication Services | 10.7 | % |
| Health Care | 9.7 | % |
| Industrials | 8.0 | % |
| Consumer Staples | 5.8 | % |
| Materials | 3.4 | % |
| Energy | 3.3 | % |
| Real Estate | 2.3 | % |
| Utilities | 1.6 | % |
| Short-Term Investments | 0.4 | % |
| Other Assets & Liabilities | 1.7 | % |
| Total | 100.0 | % |
* | For Fund compliance purposes, the Fund may not use the same classification system. These classifications are used for financial reporting purposes. |
Availability of Additional Information
For additional information about the Fund, including its prospectus, financial information, holdings, and proxy voting information, please visit the Fund’s website at the website address included at the beginning of this report.
The Fund is distributed by Hartford Funds Distributors, LLC (HFD).
Annual Shareholder Report
December 31, 2024
Hartford Disciplined Equity HLS Fund
Class IA/HIAGX
This annual shareholder report contains important information about the Hartford Disciplined Equity HLS Fund (the "Fund") for the period of January 1, 2024 to December 31, 2024. You can find additional information about the Fund at hartfordfunds.com/reports-hls. You can also request this information by contacting us by calling 1‑888‑843‑7824.
What were the Fund costs for the last year?
(Based on a hypothetical $10,000 investment)
| Class Name | Costs of a $10,000 investment* | Costs paid as a percentage
of a $10,000 investment* |
| Class IA | $66 | 0.59% |
| * | This does not reflect any transactional costs, such as sales charges (loads) or fees which may be applied at the variable life insurance, variable annuity, or qualified retirement plan product level. |
How did the Fund perform last year and what impacted its performance?
Management's Discussion of Fund Performance
United States (U.S.) equities, as measured by the S&P 500 Index, rose over the twelve-month period ending December 31, 2024, with the S&P 500 Index reaching new highs, driven by the performance of a select group of artificial intelligence (AI) related, mega-cap technology companies. Moderating inflationary pressures and a cooling labor market led the U.S. Federal Reserve (Fed) to begin easing monetary policy in September, delivering its first rate cut in four years. Subsequently, in the fourth quarter, the Fed cut interest rates twice before signaling a slower pace of cuts in 2025 amid concerns of reaccelerating inflation. In November, Donald Trump won the presidential election, paving the way for major policy initiatives, including a protectionist trade agenda. Fund performance described below is relative to the S&P 500 Index for the trailing twelve-month period ended December 31, 2024.
Top Contributors to Performance
Security selection was the primary contributor to relative performance during the period, driven by strong selection within the Information Technology, Healthcare, and Communication Services sectors.
Top individual contributors over the period were overweight positions in Broadcom (Information Technology) and GE Vernova (Industrials) and not owning benchmark constituent Intel (Information Technology).
Underweight allocations to the Energy, Materials, and Consumer Staples sectors were additive to relative results.
Top Detractors to Performance
Sector allocation, a result of the team’s bottom-up stock selection process, was a detractor to relative performance during the period due to the Fund’s overweight allocation to the Healthcare sector and underweights to the Information Technology and Financials sectors.
Weak security selection within the Consumer Staples, Consumer Discretionary, and Energy sectors detracted from relative results.
The largest individual detractors over the period were overweight positions in Estee Lauder (Consumer Staples) and CDW (Information Technology), and an underweight position in Tesla (Consumer Discretionary).
The views expressed in this section reflect the opinions of the Fund's sub-adviser, Wellington Management Company LLP, as of the date of this report and are subject to change based on changes in market, economic or other conditions. These views are not intended to be a forecast of future events and are no guarantee of future results.
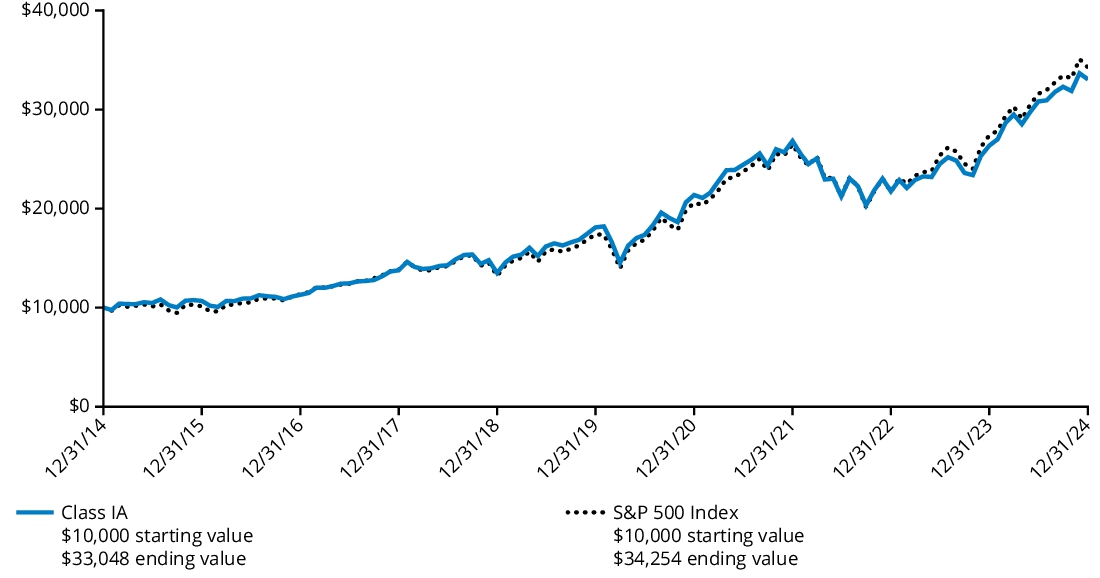
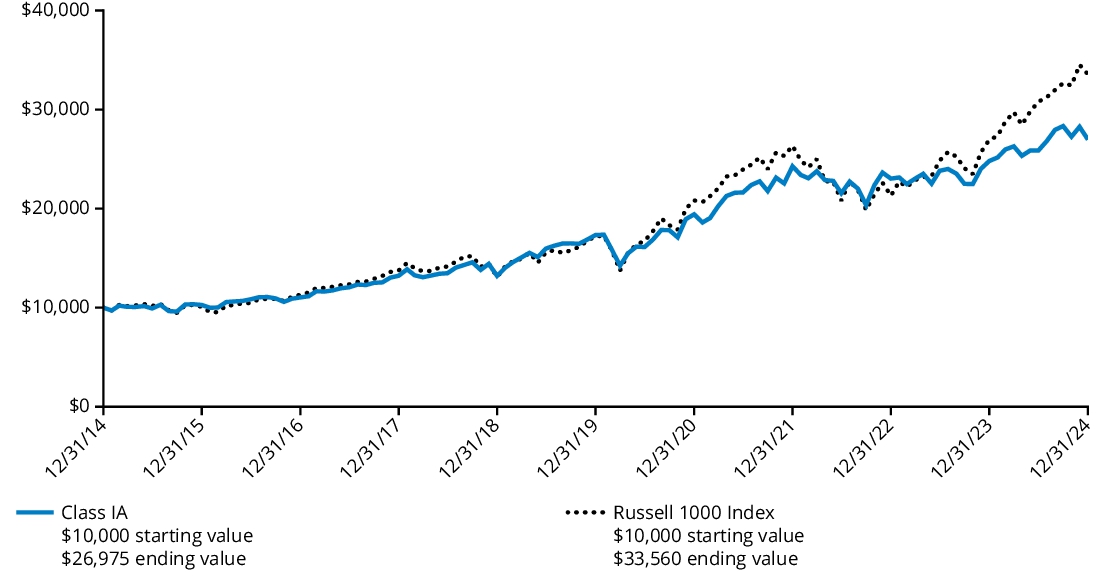
Comparison of Change in Value of $ 10,000 Investment
The graph below represents the hypothetical growth of a $10,000 investment in Class IA shares and the comparative index. The Fund’s past performance is not a good predictor of the Fund’s future performance.
Average Annual Total Returns
For the Periods Ended December 31, 2024 | 1 Year | 5 Years | 10 Years |
| Class IA | 25.37% | 12.79% | 12.70% |
| S&P 500 Index | 25.02% | 14.53% | 13.10% |
The Fund’s past performance is not a good predictor of the Fund’s future performance. The Fund's performance in the graph and table do not reflect the deductions of taxes, sales charges or other fees which may be applied at the variable contract level or by a qualified pension or retirement plan. Any such additional sales charges or other fees or expenses would lower the contract’s or plan’s performance. Visit hartfordfunds.com for the most recent performance information.
Key Fund Statistics as of December 31, 2024
| Fund's net assets | $2,982,324,711 |
| Total number of portfolio holdings (excluding derivatives, if any) | 72 |
| Total investment management fees paid | $16,647,833 |
| Portfolio turnover rate | 27% |
Graphical Representation of Holdings as of December 31, 2024
The table below shows the investment makeup of the Fund, representing the percentage of net assets of the Fund.
| Information Technology | 31.8 | % |
| Consumer Discretionary | 12.0 | % |
| Financials | 12.0 | % |
| Health Care | 12.0 | % |
| Communication Services | 9.7 | % |
| Industrials | 8.4 | % |
| Consumer Staples | 4.5 | % |
| Utilities | 3.2 | % |
| Energy | 2.9 | % |
| Materials | 1.7 | % |
| Real Estate | 1.7 | % |
| Short-Term Investments | 0.0 | %† |
| Other Assets & Liabilities | 0.1 | % |
| Total | 100.0 | % |
* | For Fund compliance purposes, the Fund may not use the same classification system. These classifications are used for financial reporting purposes. |
† | Percentage rounds to zero. |
Availability of Additional Information
For additional information about the Fund, including its prospectus, financial information, holdings, and proxy voting information, please visit the Fund’s website at the website address included at the beginning of this report.
The Fund is distributed by Hartford Funds Distributors, LLC (HFD).
Annual Shareholder Report
December 31, 2024
Hartford Disciplined Equity HLS Fund
Class IB/HBGIX
This annual shareholder report contains important information about the Hartford Disciplined Equity HLS Fund (the "Fund") for the period of January 1, 2024 to December 31, 2024. You can find additional information about the Fund at hartfordfunds.com/reports-hls. You can also request this information by contacting us by calling 1‑888‑843‑7824.
What were the Fund costs for the last year?
(Based on a hypothetical $10,000 investment)
| Class Name | Costs of a $10,000 investment* | Costs paid as a percentage
of a $10,000 investment* |
| Class IB | $95 | 0.84% |
| * | This does not reflect any transactional costs, such as sales charges (loads) or fees which may be applied at the variable life insurance, variable annuity, or qualified retirement plan product level. |
How did the Fund perform last year and what impacted its performance?
Management's Discussion of Fund Performance
United States (U.S.) equities, as measured by the S&P 500 Index, rose over the twelve-month period ending December 31, 2024, with the S&P 500 Index reaching new highs, driven by the performance of a select group of artificial intelligence (AI) related, mega-cap technology companies. Moderating inflationary pressures and a cooling labor market led the U.S. Federal Reserve (Fed) to begin easing monetary policy in September, delivering its first rate cut in four years. Subsequently, in the fourth quarter, the Fed cut interest rates twice before signaling a slower pace of cuts in 2025 amid concerns of reaccelerating inflation. In November, Donald Trump won the presidential election, paving the way for major policy initiatives, including a protectionist trade agenda. Fund performance described below is relative to the S&P 500 Index for the trailing twelve-month period ended December 31, 2024.
Top Contributors to Performance
Security selection was the primary contributor to relative performance during the period, driven by strong selection within the Information Technology, Healthcare, and Communication Services sectors.
Top individual contributors over the period were overweight positions in Broadcom (Information Technology) and GE Vernova (Industrials) and not owning benchmark constituent Intel (Information Technology).
Underweight allocations to the Energy, Materials, and Consumer Staples sectors were additive to relative results.
Top Detractors to Performance
Sector allocation, a result of the team’s bottom-up stock selection process, was a detractor to relative performance during the period due to the Fund’s overweight allocation to the Healthcare sector and underweights to the Information Technology and Financials sectors.
Weak security selection within the Consumer Staples, Consumer Discretionary, and Energy sectors detracted from relative results.
The largest individual detractors over the period were overweight positions in Estee Lauder (Consumer Staples) and CDW (Information Technology), and an underweight position in Tesla (Consumer Discretionary).
The views expressed in this section reflect the opinions of the Fund's sub-adviser, Wellington Management Company LLP, as of the date of this report and are subject to change based on changes in market, economic or other conditions. These views are not intended to be a forecast of future events and are no guarantee of future results.
Comparison of Change in Value of $ 10,000 Investment
The graph below represents the hypothetical growth of a $10,000 investment in Class IB shares and the comparative index. The Fund’s past performance is not a good predictor of the Fund’s future performance.
Average Annual Total Returns
For the Periods Ended December 31, 2024 | 1 Year | 5 Years | 10 Years |
| Class IB | 25.10% | 12.51% | 12.42% |
| S&P 500 Index | 25.02% | 14.53% | 13.10% |
The Fund’s past performance is not a good predictor of the Fund’s future performance. The Fund's performance in the graph and table do not reflect the deductions of taxes, sales charges or other fees which may be applied at the variable contract level or by a qualified pension or retirement plan. Any such additional sales charges or other fees or expenses would lower the contract’s or plan’s performance. Visit hartfordfunds.com for the most recent performance information.
Key Fund Statistics as of December 31, 2024
| Fund's net assets | $2,982,324,711 |
| Total number of portfolio holdings (excluding derivatives, if any) | 72 |
| Total investment management fees paid | $16,647,833 |
| Portfolio turnover rate | 27% |
Graphical Representation of Holdings as of December 31, 2024
The table below shows the investment makeup of the Fund, representing the percentage of net assets of the Fund.
| Information Technology | 31.8 | % |
| Consumer Discretionary | 12.0 | % |
| Financials | 12.0 | % |
| Health Care | 12.0 | % |
| Communication Services | 9.7 | % |
| Industrials | 8.4 | % |
| Consumer Staples | 4.5 | % |
| Utilities | 3.2 | % |
| Energy | 2.9 | % |
| Materials | 1.7 | % |
| Real Estate | 1.7 | % |
| Short-Term Investments | 0.0 | %† |
| Other Assets & Liabilities | 0.1 | % |
| Total | 100.0 | % |
* | For Fund compliance purposes, the Fund may not use the same classification system. These classifications are used for financial reporting purposes. |
† | Percentage rounds to zero. |
Availability of Additional Information
For additional information about the Fund, including its prospectus, financial information, holdings, and proxy voting information, please visit the Fund’s website at the website address included at the beginning of this report.
The Fund is distributed by Hartford Funds Distributors, LLC (HFD).
Annual Shareholder Report
December 31, 2024
Hartford Disciplined Equity HLS Fund
Class IC/HLSCX
This annual shareholder report contains important information about the Hartford Disciplined Equity HLS Fund (the "Fund") for the period of January 1, 2024 to December 31, 2024. You can find additional information about the Fund at hartfordfunds.com/reports-hls. You can also request this information by contacting us by calling 1‑888‑843‑7824.
What were the Fund costs for the last year?
(Based on a hypothetical $10,000 investment)
| Class Name | Costs of a $10,000 investment* | Costs paid as a percentage
of a $10,000 investment* |
| Class IC | $122 | 1.09% |
| * | This does not reflect any transactional costs, such as sales charges (loads) or fees which may be applied at the variable life insurance, variable annuity, or qualified retirement plan product level. |
How did the Fund perform last year and what impacted its performance?
Management's Discussion of Fund Performance
United States (U.S.) equities, as measured by the S&P 500 Index, rose over the twelve-month period ending December 31, 2024, with the S&P 500 Index reaching new highs, driven by the performance of a select group of artificial intelligence (AI) related, mega-cap technology companies. Moderating inflationary pressures and a cooling labor market led the U.S. Federal Reserve (Fed) to begin easing monetary policy in September, delivering its first rate cut in four years. Subsequently, in the fourth quarter, the Fed cut interest rates twice before signaling a slower pace of cuts in 2025 amid concerns of reaccelerating inflation. In November, Donald Trump won the presidential election, paving the way for major policy initiatives, including a protectionist trade agenda. Fund performance described below is relative to the S&P 500 Index for the trailing twelve-month period ended December 31, 2024.
Top Contributors to Performance
Security selection was the primary contributor to relative performance during the period, driven by strong selection within the Information Technology, Healthcare, and Communication Services sectors.
Top individual contributors over the period were overweight positions in Broadcom (Information Technology) and GE Vernova (Industrials) and not owning benchmark constituent Intel (Information Technology).
Underweight allocations to the Energy, Materials, and Consumer Staples sectors were additive to relative results.
Top Detractors to Performance
Sector allocation, a result of the team’s bottom-up stock selection process, was a detractor to relative performance during the period due to the Fund’s overweight allocation to the Healthcare sector and underweights to the Information Technology and Financials sectors.
Weak security selection within the Consumer Staples, Consumer Discretionary, and Energy sectors detracted from relative results.
The largest individual detractors over the period were overweight positions in Estee Lauder (Consumer Staples) and CDW (Information Technology), and an underweight position in Tesla (Consumer Discretionary).
The views expressed in this section reflect the opinions of the Fund's sub-adviser, Wellington Management Company LLP, as of the date of this report and are subject to change based on changes in market, economic or other conditions. These views are not intended to be a forecast of future events and are no guarantee of future results.
Comparison of Change in Value of $ 10,000 Investment
The graph below represents the hypothetical growth of a $10,000 investment in Class IC shares and the comparative index. The Fund’s past performance is not a good predictor of the Fund’s future performance.
Average Annual Total Returns
For the Periods Ended December 31, 2024 | 1 Year | 5 Years | 10 Years |
| Class IC | 24.76% | 12.23% | 12.14% |
| S&P 500 Index | 25.02% | 14.53% | 13.10% |
Class IC shares commenced operations on September 18, 2020. Class IC shares performance prior to that date reflects the Fund's Class IA shares performance adjusted to reflect the 12b-1 fee of 0.25% and the administrative services fee of 0.25% applicable to Class IC shares.
The Fund’s past performance is not a good predictor of the Fund’s future performance. The Fund's performance in the graph and table do not reflect the deductions of taxes, sales charges or other fees which may be applied at the variable contract level or by a qualified pension or retirement plan. Any such additional sales charges or other fees or expenses would lower the contract’s or plan’s performance. Visit hartfordfunds.com for the most recent performance information.
Key Fund Statistics as of December 31, 2024
| Fund's net assets | $2,982,324,711 |
| Total number of portfolio holdings (excluding derivatives, if any) | 72 |
| Total investment management fees paid | $16,647,833 |
| Portfolio turnover rate | 27% |
Graphical Representation of Holdings as of December 31, 2024
The table below shows the investment makeup of the Fund, representing the percentage of net assets of the Fund.
| Information Technology | 31.8 | % |
| Consumer Discretionary | 12.0 | % |
| Financials | 12.0 | % |
| Health Care | 12.0 | % |
| Communication Services | 9.7 | % |
| Industrials | 8.4 | % |
| Consumer Staples | 4.5 | % |
| Utilities | 3.2 | % |
| Energy | 2.9 | % |
| Materials | 1.7 | % |
| Real Estate | 1.7 | % |
| Short-Term Investments | 0.0 | %† |
| Other Assets & Liabilities | 0.1 | % |
| Total | 100.0 | % |
* | For Fund compliance purposes, the Fund may not use the same classification system. These classifications are used for financial reporting purposes. |
† | Percentage rounds to zero. |
Availability of Additional Information
For additional information about the Fund, including its prospectus, financial information, holdings, and proxy voting information, please visit the Fund’s website at the website address included at the beginning of this report.
The Fund is distributed by Hartford Funds Distributors, LLC (HFD).
Annual Shareholder Report
December 31, 2024
Hartford Dividend and Growth HLS Fund
Class IA/HIADX
This annual shareholder report contains important information about the Hartford Dividend and Growth HLS Fund (the "Fund") for the period of January 1, 2024 to December 31, 2024. You can find additional information about the Fund at hartfordfunds.com/reports-hls. You can also request this information by contacting us by calling 1‑888‑843‑7824.
What were the Fund costs for the last year?
(Based on a hypothetical $10,000 investment)
| Class Name | Costs of a $10,000 investment* | Costs paid as a percentage
of a $10,000 investment* |
| Class IA | $70 | 0.66% |
| * | This does not reflect any transactional costs, such as sales charges (loads) or fees which may be applied at the variable life insurance, variable annuity, or qualified retirement plan product level. |
How did the Fund perform last year and what impacted its performance?
Management's Discussion of Fund Performance
United States (U.S.) equities, as measured by the S&P 500 Index, rose over the twelve-month period ending December 31, 2024, with the S&P 500 Index reaching new highs, driven by the performance of a select group of artificial intelligence (AI) related, mega-cap technology companies. Moderating inflationary pressures and a cooling labor market led the U.S. Federal Reserve (Fed) to begin easing monetary policy in September, delivering its first rate cut in four years. Subsequently, in the fourth quarter, the Fed cut interest rates twice before signaling a slower pace of cuts in 2025 amid concerns of reaccelerating inflation. In November, Donald Trump won the presidential election, paving the way for major policy initiatives, including a protectionist trade agenda. Fund performance described below is relative to the S&P 500 Index for the trailing twelve-month period ended December 31, 2024.
Top Contributors to Performance
Security selection within the Financials, Utilities, and Industrials sectors contributed positively to relative performance.
The Fund’s overweight allocation to the Financials sector contributed to relative performance.
Top individual contributors over the period were overweight allocations to Wells Fargo (Financials), Micron Technology (Information Technology) and Constellation Energy (Utilities).
Top Detractors to Performance
Security selection was the primary detractor from relative performance during the period, driven by weak selection within the Information Technology, Materials, and Communication Services sectors.
The largest individual detractors over the period were not owning NVIDIA (Information Technology), an underweight allocation to Broadcom (Information Technology), and an overweight allocation to Celanese (Materials)
Sector allocation, a result of our bottom-up stock selection process, was also a detractor from relative performance during the period due to the Fund’s underweight allocation to the Information Technology sector and overweight allocation to the Energy sector.
The views expressed in this section reflect the opinions of the Fund's sub-adviser, Wellington Management Company LLP, as of the date of this report and are subject to change based on changes in market, economic or other conditions. These views are not intended to be a forecast of future events and are no guarantee of future results.
Comparison of Change in Value of $ 10,000 Investment
The graph below represents the hypothetical growth of a $10,000 investment in Class IA shares and the comparative indices. The Fund’s past performance is not a good predictor of the Fund’s future performance.
Average Annual Total Returns
For the Periods Ended December 31, 2024 | 1 Year | 5 Years | 10 Years |
| Class IA | 12.67% | 10.75% | 10.55% |
| S&P 500 Index | 25.02% | 14.53% | 13.10% |
| Russell 1000 Value Index | 14.37% | 8.68% | 8.49% |
The S&P 500 Index serves as the Fund’s performance and regulatory index and provides a broad measure of market performance. The Russell 1000 Value Index serves as the Fund’s secondary performance index.
The Fund’s past performance is not a good predictor of the Fund’s future performance. The Fund's performance in the graph and table do not reflect the deductions of taxes, sales charges or other fees which may be applied at the variable contract level or by a qualified pension or retirement plan. Any such additional sales charges or other fees or expenses would lower the contract’s or plan’s performance. Visit hartfordfunds.com for the most recent performance information.
Key Fund Statistics as of December 31, 2024
| Fund's net assets | $3,288,765,231 |
| Total number of portfolio holdings (excluding derivatives, if any) | 75 |
| Total investment management fees paid | $21,909,493 |
| Portfolio turnover rate | 31% |
Graphical Representation of Holdings as of December 31, 2024
The table below shows the investment makeup of the Fund, representing the percentage of net assets of the Fund.
| Information Technology | 19.1 | % |
| Financials | 18.0 | % |
| Health Care | 14.0 | % |
| Industrials | 11.1 | % |
| Communication Services | 7.0 | % |
| Consumer Staples | 6.7 | % |
| Energy | 6.1 | % |
| Utilities | 5.8 | % |
| Consumer Discretionary | 5.1 | % |
| Materials | 2.8 | % |
| Real Estate | 2.7 | % |
| Short-Term Investments | 0.5 | % |
| Other Assets & Liabilities | 1.1 | % |
| Total | 100.0 | % |
* | For Fund compliance purposes, the Fund may not use the same classification system. These classifications are used for financial reporting purposes. |
Availability of Additional Information
For additional information about the Fund, including its prospectus, financial information, holdings, and proxy voting information, please visit the Fund’s website at the website address included at the beginning of this report.
The Fund is distributed by Hartford Funds Distributors, LLC (HFD).
Annual Shareholder Report
December 31, 2024
Hartford Dividend and Growth HLS Fund
Class IB/HDGBX
This annual shareholder report contains important information about the Hartford Dividend and Growth HLS Fund (the "Fund") for the period of January 1, 2024 to December 31, 2024. You can find additional information about the Fund at hartfordfunds.com/reports-hls. You can also request this information by contacting us by calling 1‑888‑843‑7824.
What were the Fund costs for the last year?
(Based on a hypothetical $10,000 investment)
| Class Name | Costs of a $10,000 investment* | Costs paid as a percentage
of a $10,000 investment* |
| Class IB | $97 | 0.91% |
| * | This does not reflect any transactional costs, such as sales charges (loads) or fees which may be applied at the variable life insurance, variable annuity, or qualified retirement plan product level. |
How did the Fund perform last year and what impacted its performance?
Management's Discussion of Fund Performance
United States (U.S.) equities, as measured by the S&P 500 Index, rose over the twelve-month period ending December 31, 2024, with the S&P 500 Index reaching new highs, driven by the performance of a select group of artificial intelligence (AI) related, mega-cap technology companies. Moderating inflationary pressures and a cooling labor market led the U.S. Federal Reserve (Fed) to begin easing monetary policy in September, delivering its first rate cut in four years. Subsequently, in the fourth quarter, the Fed cut interest rates twice before signaling a slower pace of cuts in 2025 amid concerns of reaccelerating inflation. In November, Donald Trump won the presidential election, paving the way for major policy initiatives, including a protectionist trade agenda. Fund performance described below is relative to the S&P 500 Index for the trailing twelve-month period ended December 31, 2024.
Top Contributors to Performance
Security selection within the Financials, Utilities, and Industrials sectors contributed positively to relative performance.
The Fund’s overweight allocation to the Financials sector contributed to relative performance.
Top individual contributors over the period were overweight allocations to Wells Fargo (Financials), Micron Technology (Information Technology) and Constellation Energy (Utilities).
Top Detractors to Performance
Security selection was the primary detractor from relative performance during the period, driven by weak selection within the Information Technology, Materials, and Communication Services sectors.
The largest individual detractors over the period were not owning NVIDIA (Information Technology), an underweight allocation to Broadcom (Information Technology), and an overweight allocation to Celanese (Materials)
Sector allocation, a result of our bottom-up stock selection process, was also a detractor from relative performance during the period due to the Fund’s underweight allocation to the Information Technology sector and overweight allocation to the Energy sector.
The views expressed in this section reflect the opinions of the Fund's sub-adviser, Wellington Management Company LLP, as of the date of this report and are subject to change based on changes in market, economic or other conditions. These views are not intended to be a forecast of future events and are no guarantee of future results.
Comparison of Change in Value of $ 10,000 Investment
The graph below represents the hypothetical growth of a $10,000 investment in Class IB shares and the comparative indices. The Fund’s past performance is not a good predictor of the Fund’s future performance.
Average Annual Total Returns
For the Periods Ended December 31, 2024 | 1 Year | 5 Years | 10 Years |
| Class IB | 12.42% | 10.48% | 10.28% |
| S&P 500 Index | 25.02% | 14.53% | 13.10% |
| Russell 1000 Value Index | 14.37% | 8.68% | 8.49% |
The S&P 500 Index serves as the Fund’s performance and regulatory index and provides a broad measure of market performance. The Russell 1000 Value Index serves as the Fund’s secondary performance index.
The Fund’s past performance is not a good predictor of the Fund’s future performance. The Fund's performance in the graph and table do not reflect the deductions of taxes, sales charges or other fees which may be applied at the variable contract level or by a qualified pension or retirement plan. Any such additional sales charges or other fees or expenses would lower the contract’s or plan’s performance. Visit hartfordfunds.com for the most recent performance information.
Key Fund Statistics as of December 31, 2024
| Fund's net assets | $3,288,765,231 |
| Total number of portfolio holdings (excluding derivatives, if any) | 75 |
| Total investment management fees paid | $21,909,493 |
| Portfolio turnover rate | 31% |
Graphical Representation of Holdings as of December 31, 2024
The table below shows the investment makeup of the Fund, representing the percentage of net assets of the Fund.
| Information Technology | 19.1 | % |
| Financials | 18.0 | % |
| Health Care | 14.0 | % |
| Industrials | 11.1 | % |
| Communication Services | 7.0 | % |
| Consumer Staples | 6.7 | % |
| Energy | 6.1 | % |
| Utilities | 5.8 | % |
| Consumer Discretionary | 5.1 | % |
| Materials | 2.8 | % |
| Real Estate | 2.7 | % |
| Short-Term Investments | 0.5 | % |
| Other Assets & Liabilities | 1.1 | % |
| Total | 100.0 | % |
* | For Fund compliance purposes, the Fund may not use the same classification system. These classifications are used for financial reporting purposes. |
Availability of Additional Information
For additional information about the Fund, including its prospectus, financial information, holdings, and proxy voting information, please visit the Fund’s website at the website address included at the beginning of this report.
The Fund is distributed by Hartford Funds Distributors, LLC (HFD).
Annual Shareholder Report
December 31, 2024
Hartford Healthcare HLS Fund
Class IA/HIAHX
This annual shareholder report contains important information about the Hartford Healthcare HLS Fund (the "Fund") for the period of January 1, 2024 to December 31, 2024. You can find additional information about the Fund at hartfordfunds.com/reports-hls. You can also request this information by contacting us by calling 1‑888‑843‑7824.
What were the Fund costs for the last year?
(Based on a hypothetical $10,000 investment)
| Class Name | Costs of a $10,000 investment* | Costs paid as a percentage
of a $10,000 investment* |
| Class IA | $93 | 0.93% |
| * | This does not reflect any transactional costs, such as sales charges (loads) or fees which may be applied at the variable life insurance, variable annuity, or qualified retirement plan product level. |
How did the Fund perform last year and what impacted its performance?
Management's Discussion of Fund Performance
United States (U.S.) equities, as measured by the S&P 500 Index, rose over the trailing twelve-month period ending December 31, 2024, with the S&P 500 Index reaching new highs, driven by the performance of a select group of artificial intelligence (AI) related, mega-cap technology companies. Moderating inflationary pressures and a cooling labor market led the U.S. Federal Reserve (Fed) to begin easing monetary policy in September, delivering its first rate cut in four years. Subsequently, in the fourth quarter, the Fed cut interest rates twice before signaling a slower pace of cuts in 2025 amid concerns of reaccelerating inflation. In November, Donald Trump won the presidential election, paving the way for major policy initiatives. Fund performance described below is relative to the Fund’s performance index, the S&P Composite 1500 Health Care Index, for the trailing twelve-month period ended December 31, 2024.
Top Contributors to Performance
Security selection within the large-cap Biopharma and small-cap Biopharma subsectors contributed positively to relative performance.
Top individual contributors over the period were not owning benchmark constituent CVS Health (Healthcare Services), an overweight to Boston Scientific (Medical Technology) and the Fund’s out-of-benchmark position in Argenx (large-cap Biopharma).
Top Detractors to Performance
Security selection was the primary detractor to relative performance during the period, driven by weak selection within the Healthcare Services and mid-cap Biopharma subsectors.
Sector allocation, a result of the team’s bottom-up stock selection process, was a modest detractor to relative performance during the period, largely due to the Fund’s underweight allocation to the Medical Technology sector.
The largest individual detractors over the period were an overweight position in Acadia Healthcare (Healthcare Services), the Fund’s out-of-benchmark position in agilon health (Healthcare Services), and an overweight in Dexcom (Medical Technology).
The views expressed in this section reflect the opinions of the Fund's sub-adviser, Wellington Management Company LLP, as of the date of this report and are subject to change based on changes in market, economic or other conditions. These views are not intended to be a forecast of future events and are no guarantee of future results.
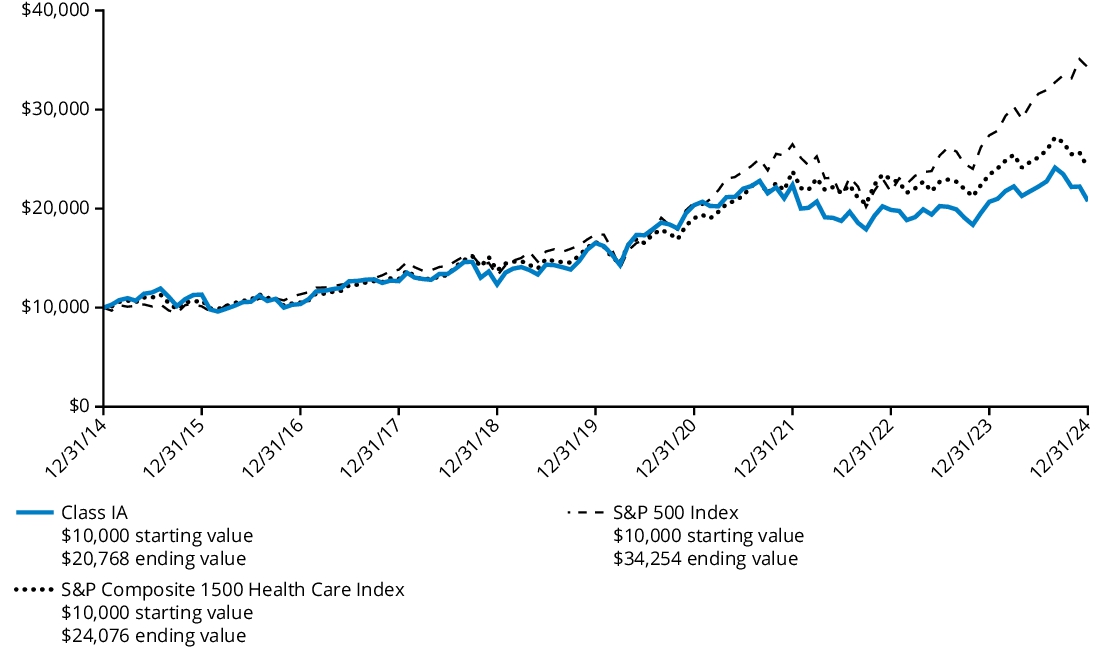
Comparison of Change in Value of $ 10,000 Investment
The graph below represents the hypothetical growth of a $10,000 investment in Class IA shares and the comparative indices. The Fund’s past performance is not a good predictor of the Fund’s future performance.
Average Annual Total Returns
For the Period Ended December 31, 2024 | 1 Year | 5 Years | 10 Years |
| Class IA | 0.39% | 4.67% | 7.58% |
| S&P Composite 1500 Health Care Index | 2.81% | 7.70% | 9.18% |
| S&P 500 Index | 25.02% | 14.53% | 13.10% |
The S&P Composite 1500 Health Care Index serves as the Fund’s performance index because the Fund’s investment manager believes it is more representative of the Fund’s investment strategy. The S&P 500 Index serves as the Fund’s regulatory index and provides a broad measure of market performance.
The Fund’s past performance is not a good predictor of the Fund’s future performance. The Fund's performance in the graph and table do not reflect the deductions of taxes, sales charges or other fees which may be applied at the variable contract level or by a qualified pension or retirement plan. Any such additional sales charges or other fees or expenses would lower the contract’s or plan’s performance. Visit hartfordfunds.com for the most recent performance information.
Key Fund Statistics as of December 31, 2024
| Fund's net assets | $117,615,958 |
| Total number of portfolio holdings (excluding derivatives, if any) | 99 |
| Total investment management fees paid | $1,168,859 |
| Portfolio turnover rate | 42% |
Graphical Representation of Holdings as of December 31, 2024
The table below shows the investment makeup of the Fund, representing the percentage of net assets of the Fund.
Composition by subsector *
| Pharmaceuticals | 27.0 | % |
| Health Care Providers & Services | 23.8 | % |
| Biotechnology | 22.0 | % |
| Health Care Equipment & Services & Supplies | 16.0 | % |
| Life Sciences Tools & Services | 10.3 | % |
| Health Care Technology | 0.3 | % |
| Other Assets & Liabilities | 0.6 | % |
| Total | 100.0 | % |
* | For Fund compliance purposes, the Fund may not use the same classification system. These classifications are used for financial reporting purposes. |
Availability of Additional Information
For additional information about the Fund, including its prospectus, financial information, holdings, and proxy voting information, please visit the Fund’s website at the website address included at the beginning of this report.
The Fund is distributed by Hartford Funds Distributors, LLC (HFD).
Annual Shareholder Report
December 31, 2024
Hartford Healthcare HLS Fund
Class IB/HBGHX
This annual shareholder report contains important information about the Hartford Healthcare HLS Fund (the "Fund") for the period of January 1, 2024 to December 31, 2024. You can find additional information about the Fund at hartfordfunds.com/reports-hls. You can also request this information by contacting us by calling 1‑888‑843‑7824.
What were the Fund costs for the last year?
(Based on a hypothetical $10,000 investment)
| Class Name | Costs of a $10,000 investment* | Costs paid as a percentage
of a $10,000 investment* |
| Class IB | $118 | 1.18% |
| * | This does not reflect any transactional costs, such as sales charges (loads) or fees which may be applied at the variable life insurance, variable annuity, or qualified retirement plan product level. |
How did the Fund perform last year and what impacted its performance?
Management's Discussion of Fund Performance
United States (U.S.) equities, as measured by the S&P 500 Index, rose over the trailing twelve-month period ending December 31, 2024, with the S&P 500 Index reaching new highs, driven by the performance of a select group of artificial intelligence (AI) related, mega-cap technology companies. Moderating inflationary pressures and a cooling labor market led the U.S. Federal Reserve (Fed) to begin easing monetary policy in September, delivering its first rate cut in four years. Subsequently, in the fourth quarter, the Fed cut interest rates twice before signaling a slower pace of cuts in 2025 amid concerns of reaccelerating inflation. In November, Donald Trump won the presidential election, paving the way for major policy initiatives. Fund performance described below is relative to the Fund’s performance index, the S&P Composite 1500 Health Care Index, for the trailing twelve-month period ended December 31, 2024.
Top Contributors to Performance
Security selection within the large-cap Biopharma and small-cap Biopharma subsectors contributed positively to relative performance.
Top individual contributors over the period were not owning benchmark constituent CVS Health (Healthcare Services), an overweight to Boston Scientific (Medical Technology) and the Fund’s out-of-benchmark position in Argenx (large-cap Biopharma).
Top Detractors to Performance
Security selection was the primary detractor to relative performance during the period, driven by weak selection within the Healthcare Services and mid-cap Biopharma subsectors.
Sector allocation, a result of the team’s bottom-up stock selection process, was a modest detractor to relative performance during the period, largely due to the Fund’s underweight allocation to the Medical Technology sector.
The largest individual detractors over the period were an overweight position in Acadia Healthcare (Healthcare Services), the Fund’s out-of-benchmark position in agilon health (Healthcare Services), and an overweight in Dexcom (Medical Technology).
The views expressed in this section reflect the opinions of the Fund's sub-adviser, Wellington Management Company LLP, as of the date of this report and are subject to change based on changes in market, economic or other conditions. These views are not intended to be a forecast of future events and are no guarantee of future results.
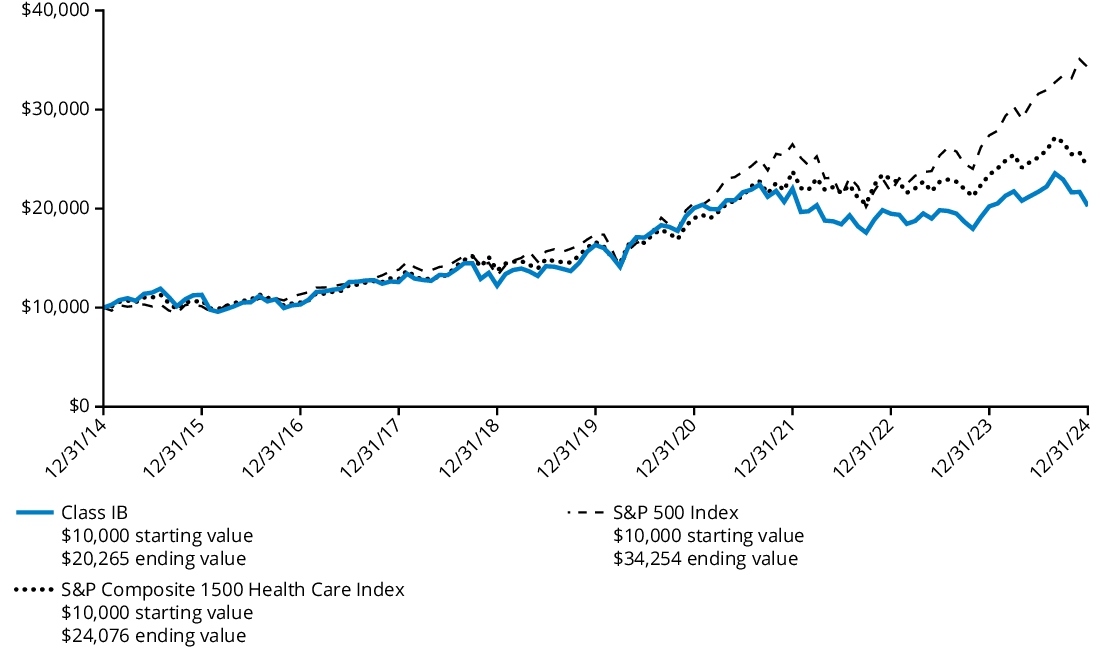
Comparison of Change in Value of $ 10,000 Investment
The graph below represents the hypothetical growth of a $10,000 investment in Class IB shares and the comparative indices. The Fund’s past performance is not a good predictor of the Fund’s future performance.
Average Annual Total Returns
For the Period Ended December 31, 2024 | 1 Year | 5 Years | 10 Years |
| Class IB | 0.19% | 4.41% | 7.32% |
| S&P Composite 1500 Health Care Index | 2.81% | 7.70% | 9.18% |
| S&P 500 Index | 25.02% | 14.53% | 13.10% |
The S&P Composite 1500 Health Care Index serves as the Fund’s performance index because the Fund’s investment manager believes it is more representative of the Fund’s investment strategy. The S&P 500 Index serves as the Fund’s regulatory index and provides a broad measure of market performance.
The Fund’s past performance is not a good predictor of the Fund’s future performance. The Fund's performance in the graph and table do not reflect the deductions of taxes, sales charges or other fees which may be applied at the variable contract level or by a qualified pension or retirement plan. Any such additional sales charges or other fees or expenses would lower the contract’s or plan’s performance. Visit hartfordfunds.com for the most recent performance information.
Key Fund Statistics as of December 31, 2024
| Fund's net assets | $117,615,958 |
| Total number of portfolio holdings (excluding derivatives, if any) | 99 |
| Total investment management fees paid | $1,168,859 |
| Portfolio turnover rate | 42% |
Graphical Representation of Holdings as of December 31, 2024
The table below shows the investment makeup of the Fund, representing the percentage of net assets of the Fund.
Composition by subsector *
| Pharmaceuticals | 27.0 | % |
| Health Care Providers & Services | 23.8 | % |
| Biotechnology | 22.0 | % |
| Health Care Equipment & Services & Supplies | 16.0 | % |
| Life Sciences Tools & Services | 10.3 | % |
| Health Care Technology | 0.3 | % |
| Other Assets & Liabilities | 0.6 | % |
| Total | 100.0 | % |
* | For Fund compliance purposes, the Fund may not use the same classification system. These classifications are used for financial reporting purposes. |
Availability of Additional Information
For additional information about the Fund, including its prospectus, financial information, holdings, and proxy voting information, please visit the Fund’s website at the website address included at the beginning of this report.
The Fund is distributed by Hartford Funds Distributors, LLC (HFD).
Annual Shareholder Report
December 31, 2024
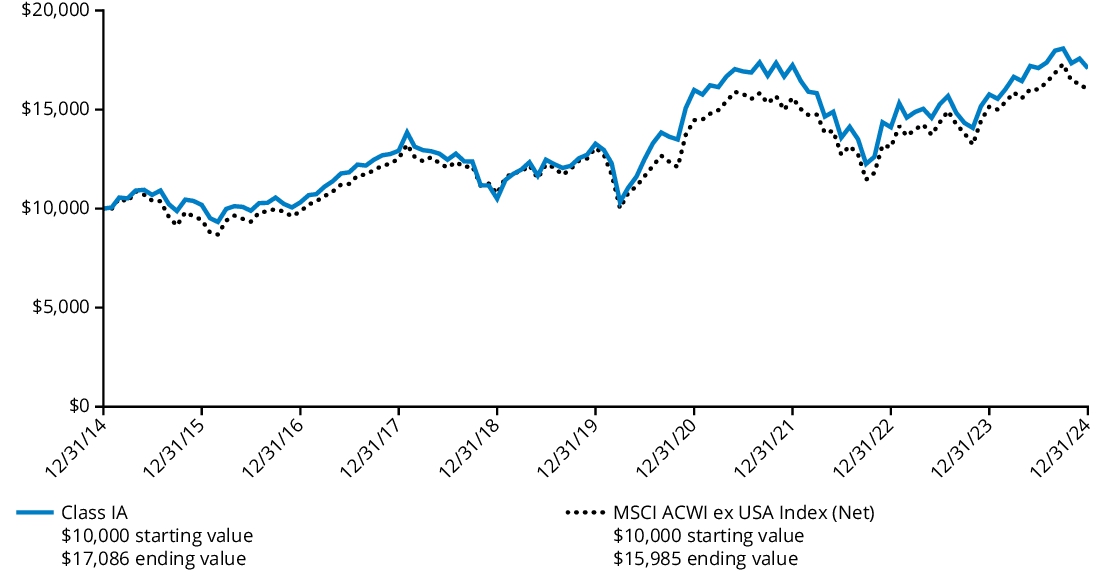
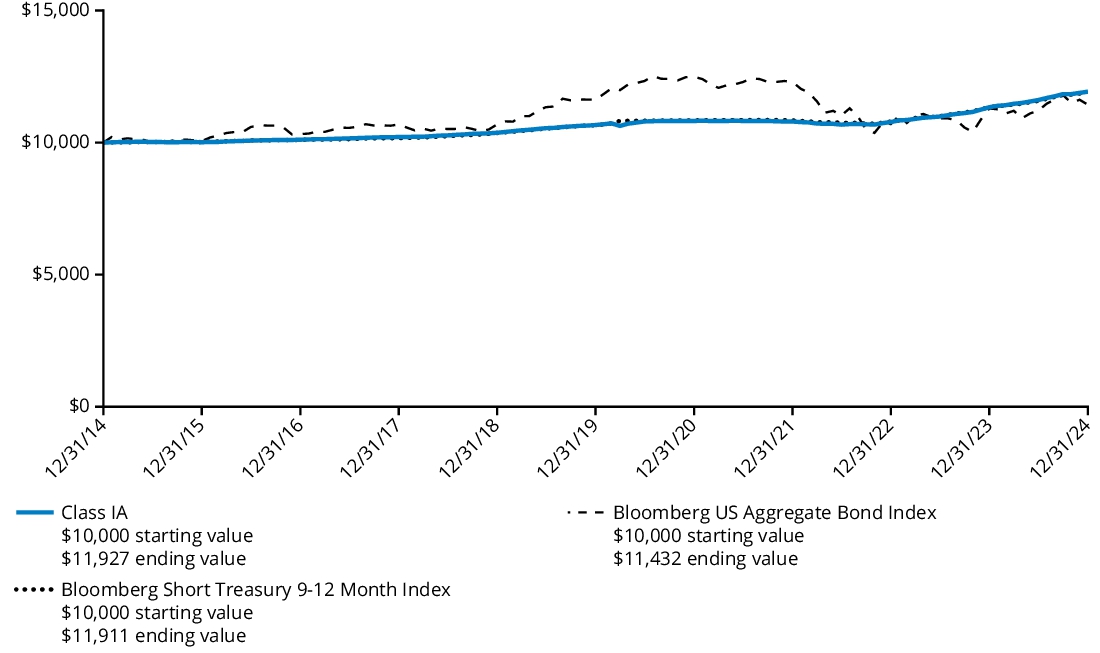
Hartford International Opportunities HLS Fund
Class IA/HIAOX
This annual shareholder report contains important information about the Hartford International Opportunities HLS Fund (the "Fund") for the period of January 1, 2024 to December 31, 2024. You can find additional information about the Fund at hartfordfunds.com/reports-hls. You can also request this information by contacting us by calling 1‑888‑843‑7824.
What were the Fund costs for the last year?
(Based on a hypothetical $10,000 investment)
| Class Name | Costs of a $10,000 investment* | Costs paid as a percentage
of a $10,000 investment* |
| Class IA | $79 | 0.76% |
| * | This does not reflect any transactional costs, such as sales charges (loads) or fees which may be applied at the variable life insurance, variable annuity, or qualified retirement plan product level. |
How did the Fund perform last year and what impacted its performance?
Management's Discussion of Fund Performance
International equities, as measured by the MSCI ACWI ex USA Index (Net), rose over the twelve-month period ending December 31, 2024, with the MSCI ACWI ex USA Index (Net) reaching new highs, driven by strong earnings from select mega-cap tech companies. Declining inflation in the United States (U.S.), European Union, and United Kingdom allowed central banks to begin easing policy rates. Japan faced political and economic uncertainty, while China’s rebound was limited by its property sector. In November, Donald Trump won the presidential election, and the anticipated changes from the new U.S. administration reverberated globally, impacting foreign policy, trade dynamics, inflation, and economic growth. Fund performance described below is relative to the MSCI ACWI ex USA Index (Net) for the trailing twelve-month period ended December 31, 2024.
Top Contributors to Performance
Security selection was the primary contributor to relative performance during the period, driven by strong selection within the Consumer Discretionary, Communication Services, and Materials sectors.
Top individual contributors over the period were overweight positions in Spotify Technology (Communication Services), Taiwan Semiconductor Manufacturing (Information Technology), and Tencent Holdings (Communication Services).
Sector allocation, a result of the team’s bottom-up stock selection process, also contributed to relative performance, mainly driven by the Fund’s underweight allocation to the Materials and Consumer Staples sectors, along with an overweight allocation to the Information Technology sector.
Top Detractors to Performance
Security selection within the Financials, Utilities, and Information Technology sectors detracted from relative results during the period.
The largest individual detractors over the period were overweight positions in RWE (Utilities), Infineon Technologies (Information Technology), and Localiza Rent A Car (Industrials).
An underweight allocation to the Financials sector and an overweight allocation to the Energy sector detracted from relative performance.
The views expressed in this section reflect the opinions of the Fund's sub-adviser, Wellington Management Company LLP, as of the date of this report and are subject to change based on changes in market, economic or other conditions. These views are not intended to be a forecast of future events and are no guarantee of future results.
Comparison of Change in Value of $ 10,000 Investment
The graph below represents the hypothetical growth of a $10,000 investment in Class IA shares and the comparative index. The Fund’s past performance is not a good predictor of the Fund’s future performance.
Average Annual Total Returns
For the Periods Ended December 31, 2024 | 1 Year | 5 Years | 10 Years |
| Class IA | 8.40% | 5.18% | 5.50% |
| MSCI ACWI ex USA Index (Net) | 5.53% | 4.10% | 4.80% |
The Fund’s past performance is not a good predictor of the Fund’s future performance. The Fund's performance in the graph and table do not reflect the deductions of taxes, sales charges or other fees which may be applied at the variable contract level or by a qualified pension or retirement plan. Any such additional sales charges or other fees or expenses would lower the contract’s or plan’s performance. Visit hartfordfunds.com for the most recent performance information.
Key Fund Statistics as of December 31, 2024
| Fund's net assets | $825,917,475 |
| Total number of portfolio holdings (excluding derivatives, if any) | 87 |
| Total investment management fees paid | $6,240,585 |
| Portfolio turnover rate | 43% |
Graphical Representation of Holdings as of December 31, 2024
The table below shows the investment makeup of the Fund, representing the percentage of net assets of the Fund.
| Japan | 14.7 | % |
| Germany | 12.9 | % |
| United Kingdom | 11.5 | % |
| Canada | 9.2 | % |
| United States | 7.8 | % |
| France | 7.3 | % |
| China | 6.1 | % |
| Taiwan | 4.3 | % |
| Netherlands | 4.0 | % |
| India | 3.5 | % |
| Other** | 16.9 | % |
| Short-Term Investments | 0.7 | % |
| Other Assets & Liabilities | 1.1 | % |
| Total | 100.0 | % |
| * | For Fund compliance purposes, the Fund may not use the same classification system. These classifications are used for financial reporting purposes. |
| ** | Ten largest country/geographic regions are presented. Additional country/geographic regions are found in Other. |
Availability of Additional Information
For additional information about the Fund, including its prospectus, financial information, holdings, and proxy voting information, please visit the Fund’s website at the website address included at the beginning of this report.
The Fund is distributed by Hartford Funds Distributors, LLC (HFD).
Annual Shareholder Report
December 31, 2024
Hartford International Opportunities HLS Fund
Class IB/HBIOX
This annual shareholder report contains important information about the Hartford International Opportunities HLS Fund (the "Fund") for the period of January 1, 2024 to December 31, 2024. You can find additional information about the Fund at hartfordfunds.com/reports-hls. You can also request this information by contacting us by calling 1‑888‑843‑7824.
What were the Fund costs for the last year?
(Based on a hypothetical $10,000 investment)
| Class Name | Costs of a $10,000 investment* | Costs paid as a percentage
of a $10,000 investment* |
| Class IB | $105 | 1.01% |
| * | This does not reflect any transactional costs, such as sales charges (loads) or fees which may be applied at the variable life insurance, variable annuity, or qualified retirement plan product level. |
How did the Fund perform last year and what impacted its performance?
Management's Discussion of Fund Performance
International equities, as measured by the MSCI ACWI ex USA Index (Net), rose over the twelve-month period ending December 31, 2024, with the MSCI ACWI ex USA Index (Net) reaching new highs, driven by strong earnings from select mega-cap tech companies. Declining inflation in the United States (U.S.), European Union, and United Kingdom allowed central banks to begin easing policy rates. Japan faced political and economic uncertainty, while China’s rebound was limited by its property sector. In November, Donald Trump won the presidential election, and the anticipated changes from the new U.S. administration reverberated globally, impacting foreign policy, trade dynamics, inflation, and economic growth. Fund performance described below is relative to the MSCI ACWI ex USA Index (Net) for the trailing twelve-month period ended December 31, 2024.
Top Contributors to Performance
Security selection was the primary contributor to relative performance during the period, driven by strong selection within the Consumer Discretionary, Communication Services, and Materials sectors.
Top individual contributors over the period were overweight positions in Spotify Technology (Communication Services), Taiwan Semiconductor Manufacturing (Information Technology), and Tencent Holdings (Communication Services).
Sector allocation, a result of the team’s bottom-up stock selection process, also contributed to relative performance, mainly driven by the Fund’s underweight allocation to the Materials and Consumer Staples sectors, along with an overweight allocation to the Information Technology sector.
Top Detractors to Performance
Security selection within the Financials, Utilities, and Information Technology sectors detracted from relative results during the period.
The largest individual detractors over the period were overweight positions in RWE (Utilities), Infineon Technologies (Information Technology), and Localiza Rent A Car (Industrials).
An underweight allocation to the Financials sector and an overweight allocation to the Energy sector detracted from relative performance.
The views expressed in this section reflect the opinions of the Fund's sub-adviser, Wellington Management Company LLP, as of the date of this report and are subject to change based on changes in market, economic or other conditions. These views are not intended to be a forecast of future events and are no guarantee of future results.
Comparison of Change in Value of $ 10,000 Investment
The graph below represents the hypothetical growth of a $10,000 investment in Class IB shares and the comparative index. The Fund’s past performance is not a good predictor of the Fund’s future performance.
Average Annual Total Returns
For the Periods Ended December 31, 2024 | 1 Year | 5 Years | 10 Years |
| Class IB | 8.08% | 4.91% | 5.24% |
| MSCI ACWI ex USA Index (Net) | 5.53% | 4.10% | 4.80% |
The Fund’s past performance is not a good predictor of the Fund’s future performance. The Fund's performance in the graph and table do not reflect the deductions of taxes, sales charges or other fees which may be applied at the variable contract level or by a qualified pension or retirement plan. Any such additional sales charges or other fees or expenses would lower the contract’s or plan’s performance. Visit hartfordfunds.com for the most recent performance information.
Key Fund Statistics as of December 31, 2024
| Fund's net assets | $825,917,475 |
| Total number of portfolio holdings (excluding derivatives, if any) | 87 |
| Total investment management fees paid | $6,240,585 |
| Portfolio turnover rate | 43% |
Graphical Representation of Holdings as of December 31, 2024
The table below shows the investment makeup of the Fund, representing the percentage of net assets of the Fund.
| Japan | 14.7 | % |
| Germany | 12.9 | % |
| United Kingdom | 11.5 | % |
| Canada | 9.2 | % |
| United States | 7.8 | % |
| France | 7.3 | % |
| China | 6.1 | % |
| Taiwan | 4.3 | % |
| Netherlands | 4.0 | % |
| India | 3.5 | % |
| Other** | 16.9 | % |
| Short-Term Investments | 0.7 | % |
| Other Assets & Liabilities | 1.1 | % |
| Total | 100.0 | % |
| * | For Fund compliance purposes, the Fund may not use the same classification system. These classifications are used for financial reporting purposes. |
| ** | Ten largest country/geographic regions are presented. Additional country/geographic regions are found in Other. |
Availability of Additional Information
For additional information about the Fund, including its prospectus, financial information, holdings, and proxy voting information, please visit the Fund’s website at the website address included at the beginning of this report.
The Fund is distributed by Hartford Funds Distributors, LLC (HFD).
Annual Shareholder Report
December 31, 2024
Hartford MidCap HLS Fund
Class IA/HIMCX
This annual shareholder report contains important information about the Hartford MidCap HLS Fund (the "Fund") for the period of January 1, 2024 to December 31, 2024. You can find additional information about the Fund at hartfordfunds.com/reports-hls. You can also request this information by contacting us by calling 1‑888‑843‑7824.
This report describes changes to the Fund that occurred during the reporting period.
What were the Fund costs for the last year?
(Based on a hypothetical $10,000 investment)
| Class Name | Costs of a $10,000 investment* | Costs paid as a percentage
of a $10,000 investment* |
| Class IA | $77 | 0.75% |
| * | This does not reflect any transactional costs, such as sales charges (loads) or fees which may be applied at the variable life insurance, variable annuity, or qualified retirement plan product level. |
How did the Fund perform last year and what impacted its performance?
Management's Discussion of Fund Performance
United States (U.S.) equities, as measured by the S&P 500 Index, rose over the twelve-month period ending December 31, 2024, with the S&P 500 Index reaching new highs, driven by the performance of a select group of artificial intelligence (AI) related, mega-cap technology companies. Moderating inflationary pressures and a cooling labor market led the U.S. Federal Reserve (Fed) to begin easing monetary policy in September, delivering its first rate cut in four years. Subsequently, in the fourth quarter, the Fed cut interest rates twice before signaling a slower pace of cuts in 2025 amid concerns of reaccelerating inflation. In November, Donald Trump won the presidential election, paving the way for major policy initiatives, including a protectionist trade agenda. Fund performance described below is relative to the Fund’s prior performance index, the S&P MidCap 400 Index, for the trailing twelve-month period ended December 31, 2024. Effective December 31, 2024, the Fund changed its performance index to the Russell Midcap Growth Index.
Top Contributors to Performance
Sector allocation, a result of the team’s bottom-up stock selection process, contributed to relative performance during the period driven by the Fund’s overweight allocation to the Information Technology sector and underweight allocations to the Materials and Real Estate sectors.
Security selection within the Energy, Utilities, and Consumer Discretionary sectors contributed positively to relative performance.
Top individual contributors over the period were out-of-benchmark positions in Targa Resources (Energy), Axon Enterprise (Industrials), and Palantir Technologies (Information Technology).
Top Detractors to Performance
Security selection was the primary detractor to relative performance during the period, driven by weak selection within the Information Technology, Healthcare, and Financials sectors.
An overweight allocation to the Healthcare sector, and an underweight to the Financials sector detracted from relative performance.
The largest individual detractors over the period were not holding Super Micro Computers (Information Technology) and our out-of-benchmark allocations to Dexcom (Healthcare) and MongoDB (Information Technology).
The views expressed in this section reflect the opinions of the Fund's sub-adviser, Wellington Management Company LLP, as of the date of this report and are subject to change based on changes in market, economic or other conditions. These views are not intended to be a forecast of future events and are no guarantee of future results.
Comparison of Change in Value of $ 10,000 Investment
The graph below represents the hypothetical growth of a $10,000 investment in Class IA shares and the comparative indices. The Fund’s past performance is not a good predictor of the Fund’s future performance.
Average Annual Total Returns
For the Periods Ended December 31, 2024 | 1 Year | 5 Years | 10 Years |
| Class IA | 6.28% | 4.91% | 8.27% |
| Russell Midcap Growth Index | 22.10% | 11.47% | 11.54% |
| Russell 3000 Index | 23.81% | 13.86% | 12.55% |
| S&P MidCap 400 Index | 13.93% | 10.34% | 9.68% |
Effective December 31, 2024, the Russell Midcap Growth Index replaced the S&P MidCap 400 Index as the Fund’s performance index because the Fund’s investment manager believes it is more representative of the Fund’s investment strategy. The Russell 3000 Index serves as the Fund’s regulatory index and provides a broad measure of market performance.
The Fund’s past performance is not a good predictor of the Fund’s future performance. The Fund's performance in the graph and table do not reflect the deductions of taxes, sales charges or other fees which may be applied at the variable contract level or by a qualified pension or retirement plan. Any such additional sales charges or other fees or expenses would lower the contract’s or plan’s performance. Visit hartfordfunds.com for the most recent performance information.
Key Fund Statistics as of December 31, 2024
| Fund's net assets | $832,993,496 |
| Total number of portfolio holdings (excluding derivatives, if any) | 85 |
| Total investment management fees paid | $6,869,921 |
| Portfolio turnover rate | 75% |
Graphical Representation of Holdings as of December 31, 2024
The table below shows the investment makeup of the Fund, representing the percentage of net assets of the Fund.
| Information Technology | 29.0 | % |
| Industrials | 19.3 | % |
| Consumer Discretionary | 15.7 | % |
| Financials | 12.0 | % |
| Health Care | 9.9 | % |
| Energy | 4.5 | % |
| Utilities | 2.9 | % |
| Communication Services | 2.6 | % |
| Consumer Staples | 2.4 | % |
| Real Estate | 0.7 | % |
| Materials | 0.6 | % |
| Short-Term Investments | 0.1 | % |
| Other Assets & Liabilities | 0.3 | % |
| Total | 100.0 | % |
* | For Fund compliance purposes, the Fund may not use the same classification system. These classifications are used for financial reporting purposes. |
Material Fund Changes
This is a summary of certain changes to the Fund since the beginning of the reporting period.
Effective December 31, 2024, the Fund’s principal investment strategy and principal risks were modified to reflect the investment team’s focus on quality companies with sustainable growth potential. These changes were announced in supplements to the Fund’s summary prospectus and statutory prospectus dated September 24, 2024.
For more complete information, you may review the Fund’s current prospectus dated April 29, 2024, as may be amended, supplemented or restated, and the Fund’s next prospectus, which we expect to be available by May 1, 2025, at hartfordfunds.com/reports‑hls, upon request by calling 1-888-843-7824 or sending an e-mail to orders@mysummaryprospectus.com.
Availability of Additional Information
For additional information about the Fund, including its prospectus, financial information, holdings, and proxy voting information, please visit the Fund’s website at the website address included at the beginning of this report.
The Fund is distributed by Hartford Funds Distributors, LLC (HFD).
Annual Shareholder Report
December 31, 2024
Hartford MidCap HLS Fund
Class IB/HBMCX
This annual shareholder report contains important information about the Hartford MidCap HLS Fund (the "Fund") for the period of January 1, 2024 to December 31, 2024. You can find additional information about the Fund at hartfordfunds.com/reports-hls. You can also request this information by contacting us by calling 1‑888‑843‑7824.
This report describes changes to the Fund that occurred during the reporting period.
What were the Fund costs for the last year?
(Based on a hypothetical $10,000 investment)
| Class Name | Costs of a $10,000 investment* | Costs paid as a percentage
of a $10,000 investment* |
| Class IB | $103 | 1.00% |
| * | This does not reflect any transactional costs, such as sales charges (loads) or fees which may be applied at the variable life insurance, variable annuity, or qualified retirement plan product level. |
How did the Fund perform last year and what impacted its performance?
Management's Discussion of Fund Performance
United States (U.S.) equities, as measured by the S&P 500 Index, rose over the twelve-month period ending December 31, 2024, with the S&P 500 Index reaching new highs, driven by the performance of a select group of artificial intelligence (AI) related, mega-cap technology companies. Moderating inflationary pressures and a cooling labor market led the U.S. Federal Reserve (Fed) to begin easing monetary policy in September, delivering its first rate cut in four years. Subsequently, in the fourth quarter, the Fed cut interest rates twice before signaling a slower pace of cuts in 2025 amid concerns of reaccelerating inflation. In November, Donald Trump won the presidential election, paving the way for major policy initiatives, including a protectionist trade agenda. Fund performance described below is relative to the Fund’s prior performance index, the S&P MidCap 400 Index, for the trailing twelve-month period ended December 31, 2024. Effective December 31, 2024, the Fund changed its performance index to the Russell Midcap Growth Index.
Top Contributors to Performance
Sector allocation, a result of the team’s bottom-up stock selection process, contributed to relative performance during the period driven by the Fund’s overweight allocation to the Information Technology sector and underweight allocations to the Materials and Real Estate sectors.
Security selection within the Energy, Utilities, and Consumer Discretionary sectors contributed positively to relative performance.
Top individual contributors over the period were out-of-benchmark positions in Targa Resources (Energy), Axon Enterprise (Industrials), and Palantir Technologies (Information Technology).
Top Detractors to Performance
Security selection was the primary detractor to relative performance during the period, driven by weak selection within the Information Technology, Healthcare, and Financials sectors.
An overweight allocation to the Healthcare sector, and an underweight to the Financials sector detracted from relative performance.
The largest individual detractors over the period were not holding Super Micro Computers (Information Technology) and our out-of-benchmark allocations to Dexcom (Healthcare) and MongoDB (Information Technology).
The views expressed in this section reflect the opinions of the Fund's sub-adviser, Wellington Management Company LLP, as of the date of this report and are subject to change based on changes in market, economic or other conditions. These views are not intended to be a forecast of future events and are no guarantee of future results.
Comparison of Change in Value of $ 10,000 Investment
The graph below represents the hypothetical growth of a $10,000 investment in Class IB shares and the comparative indices. The Fund’s past performance is not a good predictor of the Fund’s future performance.
Average Annual Total Returns
For the Periods Ended December 31, 2024 | 1 Year | 5 Years | 10 Years |
| Class IB | 6.03% | 4.65% | 8.00% |
| Russell Midcap Growth Index | 22.10% | 11.47% | 11.54% |
| Russell 3000 Index | 23.81% | 13.86% | 12.55% |
| S&P MidCap 400 Index | 13.93% | 10.34% | 9.68% |
Effective December 31, 2024, the Russell Midcap Growth Index replaced the S&P MidCap 400 Index as the Fund’s performance index because the Fund’s investment manager believes it is more representative of the Fund’s investment strategy. The Russell 3000 Index serves as the Fund’s regulatory index and provides a broad measure of market performance.
The Fund’s past performance is not a good predictor of the Fund’s future performance. The Fund's performance in the graph and table do not reflect the deductions of taxes, sales charges or other fees which may be applied at the variable contract level or by a qualified pension or retirement plan. Any such additional sales charges or other fees or expenses would lower the contract’s or plan’s performance. Visit hartfordfunds.com for the most recent performance information.
Key Fund Statistics as of December 31, 2024
| Fund's net assets | $832,993,496 |
| Total number of portfolio holdings (excluding derivatives, if any) | 85 |
| Total investment management fees paid | $6,869,921 |
| Portfolio turnover rate | 75% |
Graphical Representation of Holdings as of December 31, 2024
The table below shows the investment makeup of the Fund, representing the percentage of net assets of the Fund.
| Information Technology | 29.0 | % |
| Industrials | 19.3 | % |
| Consumer Discretionary | 15.7 | % |
| Financials | 12.0 | % |
| Health Care | 9.9 | % |
| Energy | 4.5 | % |
| Utilities | 2.9 | % |
| Communication Services | 2.6 | % |
| Consumer Staples | 2.4 | % |
| Real Estate | 0.7 | % |
| Materials | 0.6 | % |
| Short-Term Investments | 0.1 | % |
| Other Assets & Liabilities | 0.3 | % |
| Total | 100.0 | % |
* | For Fund compliance purposes, the Fund may not use the same classification system. These classifications are used for financial reporting purposes. |
Material Fund Changes
This is a summary of certain changes to the Fund since the beginning of the reporting period.
Effective December 31, 2024, the Fund’s principal investment strategy and principal risks were modified to reflect the investment team’s focus on quality companies with sustainable growth potential. These changes were announced in supplements to the Fund’s summary prospectus and statutory prospectus dated September 24, 2024.
For more complete information, you may review the Fund’s current prospectus dated April 29, 2024, as may be amended, supplemented or restated, and the Fund’s next prospectus, which we expect to be available by May 1, 2025, at hartfordfunds.com/reports‑hls, upon request by calling 1-888-843-7824 or sending an e-mail to orders@mysummaryprospectus.com.
Availability of Additional Information
For additional information about the Fund, including its prospectus, financial information, holdings, and proxy voting information, please visit the Fund’s website at the website address included at the beginning of this report.
The Fund is distributed by Hartford Funds Distributors, LLC (HFD).
Annual Shareholder Report
December 31, 2024
Hartford Small Cap Growth HLS Fund
Class IA/HISCX
This annual shareholder report contains important information about the Hartford Small Cap Growth HLS Fund (the "Fund") for the period of January 1, 2024 to December 31, 2024. You can find additional information about the Fund at hartfordfunds.com/reports-hls. You can also request this information by contacting us by calling 1‑888‑843‑7824.
What were the Fund costs for the last year?
(Based on a hypothetical $10,000 investment)
| Class Name | Costs of a $10,000 investment* | Costs paid as a percentage
of a $10,000 investment* |
| Class IA | $69 | 0.65% |
| * | This does not reflect any transactional costs, such as sales charges (loads) or fees which may be applied at the variable life insurance, variable annuity, or qualified retirement plan product level. |
How did the Fund perform last year and what impacted its performance?
Management's Discussion of Fund Performance
United States (U.S.) equities, as measured by the S&P 500 Index, rose over the twelve-month period ending December 31, 2024, with the S&P 500 Index reaching new highs, driven by the performance of a select group of artificial intelligence (AI) related, mega-cap technology companies. Moderating inflationary pressures and a cooling labor market led the U.S. Federal Reserve (Fed) to begin easing monetary policy in September, delivering its first rate cut in four years. Subsequently, in the fourth quarter, the Fed cut interest rates twice before signaling a slower pace of cuts in 2025 amid concerns of reaccelerating inflation. In November, Donald Trump won the presidential election, paving the way for major policy initiatives, including a protectionist trade agenda. Fund performance described below is relative to the Fund’s performance index, the Russell 2000 Growth Index, for the trailing twelve-month period ended December 31, 2024.
Top Contributors to Performance
Sector allocation, a result of the team’s bottom-up stock selection process, contributed to relative performance over the period due to the Fund’s overweight allocation to the Information Technology sector, a lack of exposure to the Utilities sector, and an underweight allocation to the Energy sector.
Security selection within the Industrials, Financials, and Consumer Staples sectors contributed positively to performance.
Top individual contributors over the period were overweight positions in FTAI Aviation (Industrials) and RadNet (Healthcare) and an out-of-benchmark position in Freshpet (Consumer Staples).
Top Detractors to Performance
Security selection was the primary detractor from relative performance, driven by weak selection within the Information Technology, Communication Services, and Consumer Discretionary sectors.
The largest individual detractors over the period were underweight positions in MicroStrategy (Information Technology) and Rocket Labs USA (Industrials) and not owning Sprouts Farmers Market (Consumer Staples).
Underweight allocations to the Consumer Staples and Communication Services sectors and an overweight allocation to the Consumer Discretionary sector detracted from relative performance.
The views expressed in this section reflect the opinions of the Fund's sub-adviser, Wellington Management Company LLP, as of the date of this report and are subject to change based on changes in market, economic or other conditions. These views are not intended to be a forecast of future events and are no guarantee of future results.
Comparison of Change in Value of $ 10,000 Investment
The graph below represents the hypothetical growth of a $10,000 investment in Class IA shares and the comparative indices. The Fund’s past performance is not a good predictor of the Fund’s future performance.
Average Annual Total Returns
For the Periods Ended December 31, 2024 | 1 Year | 5 Years | 10 Years |
| Class IA | 13.12% | 5.84% | 7.89% |
| Russell 2000 Growth Index | 15.15% | 6.86% | 8.09% |
| Russell 3000 Index | 23.81% | 13.86% | 12.55% |
The Russell 2000 Growth Index serves as the Fund’s performance index because the Fund’s investment manager believes it is more representative of the Fund’s investment strategy. The Russell 3000 Index serves as the Fund’s regulatory index and provides a broad measure of market performance.
The Fund’s past performance is not a good predictor of the Fund’s future performance. The Fund's performance in the graph and table do not reflect the deductions of taxes, sales charges or other fees which may be applied at the variable contract level or by a qualified pension or retirement plan. Any such additional sales charges or other fees or expenses would lower the contract’s or plan’s performance. Visit hartfordfunds.com for the most recent performance information.
Key Fund Statistics as of December 31, 2024
| Fund's net assets | $564,312,441 |
| Total number of portfolio holdings (excluding derivatives, if any) | 164 |
| Total investment management fees paid | $4,687,126 |
| Portfolio turnover rate | 69% |
Graphical Representation of Holdings as of December 31, 2024
The table below shows the investment makeup of the Fund, representing the percentage of net assets of the Fund.
| Health Care | 24.3 | % |
| Industrials | 24.0 | % |
| Information Technology | 19.5 | % |
| Consumer Discretionary | 10.0 | % |
| Financials | 9.5 | % |
| Materials | 3.9 | % |
| Consumer Staples | 3.0 | % |
| Real Estate | 2.4 | % |
| Energy | 2.3 | % |
| Communication Services | 0.4 | % |
| Short-Term Investments | 1.2 | % |
| Other Assets & Liabilities | (0.5 | )% |
| Total | 100.0 | % |
* | For Fund compliance purposes, the Fund may not use the same classification system. These classifications are used for financial reporting purposes. |
Availability of Additional Information
For additional information about the Fund, including its prospectus, financial information, holdings, and proxy voting information, please visit the Fund’s website at the website address included at the beginning of this report.
The Fund is distributed by Hartford Funds Distributors, LLC (HFD).
Annual Shareholder Report
December 31, 2024
Hartford Small Cap Growth HLS Fund
Class IB/HBSGX
This annual shareholder report contains important information about the Hartford Small Cap Growth HLS Fund (the "Fund") for the period of January 1, 2024 to December 31, 2024. You can find additional information about the Fund at hartfordfunds.com/reports-hls. You can also request this information by contacting us by calling 1‑888‑843‑7824.
What were the Fund costs for the last year?
(Based on a hypothetical $10,000 investment)
| Class Name | Costs of a $10,000 investment* | Costs paid as a percentage
of a $10,000 investment* |
| Class IB | $96 | 0.90% |
| * | This does not reflect any transactional costs, such as sales charges (loads) or fees which may be applied at the variable life insurance, variable annuity, or qualified retirement plan product level. |
How did the Fund perform last year and what impacted its performance?
Management's Discussion of Fund Performance
United States (U.S.) equities, as measured by the S&P 500 Index, rose over the twelve-month period ending December 31, 2024, with the S&P 500 Index reaching new highs, driven by the performance of a select group of artificial intelligence (AI) related, mega-cap technology companies. Moderating inflationary pressures and a cooling labor market led the U.S. Federal Reserve (Fed) to begin easing monetary policy in September, delivering its first rate cut in four years. Subsequently, in the fourth quarter, the Fed cut interest rates twice before signaling a slower pace of cuts in 2025 amid concerns of reaccelerating inflation. In November, Donald Trump won the presidential election, paving the way for major policy initiatives, including a protectionist trade agenda. Fund performance described below is relative to the Fund’s performance index, the Russell 2000 Growth Index, for the trailing twelve-month period ended December 31, 2024.
Top Contributors to Performance
Sector allocation, a result of the team’s bottom-up stock selection process, contributed to relative performance over the period due to the Fund’s overweight allocation to the Information Technology sector, a lack of exposure to the Utilities sector, and an underweight allocation to the Energy sector.
Security selection within the Industrials, Financials, and Consumer Staples sectors contributed positively to performance.
Top individual contributors over the period were overweight positions in FTAI Aviation (Industrials) and RadNet (Healthcare) and an out-of-benchmark position in Freshpet (Consumer Staples).
Top Detractors to Performance
Security selection was the primary detractor from relative performance, driven by weak selection within the Information Technology, Communication Services, and Consumer Discretionary sectors.
The largest individual detractors over the period were underweight positions in MicroStrategy (Information Technology) and Rocket Labs USA (Industrials) and not owning Sprouts Farmers Market (Consumer Staples).
Underweight allocations to the Consumer Staples and Communication Services sectors and an overweight allocation to the Consumer Discretionary sector detracted from relative performance.
The views expressed in this section reflect the opinions of the Fund's sub-adviser, Wellington Management Company LLP, as of the date of this report and are subject to change based on changes in market, economic or other conditions. These views are not intended to be a forecast of future events and are no guarantee of future results.
Comparison of Change in Value of $ 10,000 Investment
The graph below represents the hypothetical growth of a $10,000 investment in Class IB shares and the comparative indices. The Fund’s past performance is not a good predictor of the Fund’s future performance.
Average Annual Total Returns
For the Periods Ended December 31, 2024 | 1 Year | 5 Years | 10 Years |
| Class IB | 12.84% | 5.58% | 7.62% |
| Russell 2000 Growth Index | 15.15% | 6.86% | 8.09% |
| Russell 3000 Index | 23.81% | 13.86% | 12.55% |
The Russell 2000 Growth Index serves as the Fund’s performance index because the Fund’s investment manager believes it is more representative of the Fund’s investment strategy. The Russell 3000 Index serves as the Fund’s regulatory index and provides a broad measure of market performance.
The Fund’s past performance is not a good predictor of the Fund’s future performance. The Fund's performance in the graph and table do not reflect the deductions of taxes, sales charges or other fees which may be applied at the variable contract level or by a qualified pension or retirement plan. Any such additional sales charges or other fees or expenses would lower the contract’s or plan’s performance. Visit hartfordfunds.com for the most recent performance information.
Key Fund Statistics as of December 31, 2024
| Fund's net assets | $564,312,441 |
| Total number of portfolio holdings (excluding derivatives, if any) | 164 |
| Total investment management fees paid | $4,687,126 |
| Portfolio turnover rate | 69% |
Graphical Representation of Holdings as of December 31, 2024
The table below shows the investment makeup of the Fund, representing the percentage of net assets of the Fund.
| Health Care | 24.3 | % |
| Industrials | 24.0 | % |
| Information Technology | 19.5 | % |
| Consumer Discretionary | 10.0 | % |
| Financials | 9.5 | % |
| Materials | 3.9 | % |
| Consumer Staples | 3.0 | % |
| Real Estate | 2.4 | % |
| Energy | 2.3 | % |
| Communication Services | 0.4 | % |
| Short-Term Investments | 1.2 | % |
| Other Assets & Liabilities | (0.5 | )% |
| Total | 100.0 | % |
* | For Fund compliance purposes, the Fund may not use the same classification system. These classifications are used for financial reporting purposes. |
Availability of Additional Information
For additional information about the Fund, including its prospectus, financial information, holdings, and proxy voting information, please visit the Fund’s website at the website address included at the beginning of this report.
The Fund is distributed by Hartford Funds Distributors, LLC (HFD).
Annual Shareholder Report
December 31, 2024
Hartford Small Company HLS Fund
Class IA/HIASX
This annual shareholder report contains important information about the Hartford Small Company HLS Fund (the "Fund") for the period of January 1, 2024 to December 31, 2024. You can find additional information about the Fund at hartfordfunds.com/reports-hls. You can also request this information by contacting us by calling 1‑888‑843‑7824.
What were the Fund costs for the last year?
(Based on a hypothetical $10,000 investment)
| Class Name | Costs of a $10,000 investment* | Costs paid as a percentage
of a $10,000 investment* |
| Class IA | $85 | 0.80% |
| * | This does not reflect any transactional costs, such as sales charges (loads) or fees which may be applied at the variable life insurance, variable annuity, or qualified retirement plan product level. |
How did the Fund perform last year and what impacted its performance?
Management's Discussion of Fund Performance
United States (U.S.) equities, as measured by the S&P 500 Index, rose over the twelve-month period ending December 31, 2024, with the S&P 500 reaching new highs, driven by the performance of a select group of artificial intelligence (AI) related, mega-cap technology companies. Moderating inflationary pressures and a cooling labor market led the U.S. Federal Reserve (Fed) to begin easing monetary policy in September, delivering its first rate cut in four years. Subsequently, in the fourth quarter, the Fed cut interest rates twice before signaling a slower pace of cuts in 2025 amid concerns of reaccelerating inflation. In November, Donald Trump won the presidential election, paving the way for major policy initiatives, including a protectionist trade agenda. Fund performance described below is relative to the Fund’s performance index, the Russell 2000 Growth Index, for the trailing twelve-month period ended December 31, 2024.
Top Contributors to Performance
Security selection within the Healthcare, Energy, and Consumer Staples sectors contributed positively to relative performance.
An overweight to the Industrials sector, not holding securities in the Utilities sector, and an underweight allocation to the Materials sector contributed to relative performance.
Top individual contributors over the period were an overweight position in PROCEPT BioRobotics (Healthcare) and out-of-benchmark positions in Viper Energy (Energy) and Celsius Holdings (Consumer Discretionary).
Top Detractors to Performance
Sector allocation, a result of the team’s bottom-up stock selection process, detracted from relative performance mainly driven by the Fund’s underweight allocations to the Information Technology and Consumer Staples sectors.
Security selection within the Information Technology, Communication Services, and Materials sectors detracted from relative results during the period.
The largest individual detractors over the period were not holding Super Micro Computer (Information Technology), and out-of-benchmark positions in DoubleVerify (Information Technology) and Five9 (Information Technology).
The views expressed in this section reflect the opinions of the Fund's sub-adviser, Wellington Management Company LLP, as of the date of this report and are subject to change based on changes in market, economic or other conditions. These views are not intended to be a forecast of future events and are no guarantee of future results.
Comparison of Change in Value of $ 10,000 Investment
The graph below represents the hypothetical growth of a $10,000 investment in Class IA shares and the comparative indices. The Fund’s past performance is not a good predictor of the Fund’s future performance.
Average Annual Total Returns
For the Periods Ended December 31, 2024 | 1 Year | 5 Years | 10 Years |
| Class IA | 12.00% | 7.36% | 8.28% |
| Russell 2000 Growth Index | 15.15% | 6.86% | 8.09% |
| Russell 3000 Index | 23.81% | 13.86% | 12.55% |
The Russell 2000 Growth Index serves as the Fund’s performance index because the Fund’s investment manager believes it is more representative of the Fund’s investment strategy. The Russell 3000 Index serves as the Fund’s regulatory index and provides a broad measure of market performance.
The Fund’s past performance is not a good predictor of the Fund’s future performance. The Fund's performance in the graph and table do not reflect the deductions of taxes, sales charges or other fees which may be applied at the variable contract level or by a qualified pension or retirement plan. Any such additional sales charges or other fees or expenses would lower the contract’s or plan’s performance. Visit hartfordfunds.com for the most recent performance information.
Key Fund Statistics as of December 31, 2024
| Fund's net assets | $426,729,696 |
| Total number of portfolio holdings (excluding derivatives, if any) | 116 |
| Total investment management fees paid | $3,266,450 |
| Portfolio turnover rate | 41% |
Graphical Representation of Holdings as of December 31, 2024
The table below shows the investment makeup of the Fund, representing the percentage of net assets of the Fund.
| Health Care | 27.6 | % |
| Industrials | 24.8 | % |
| Information Technology | 17.5 | % |
| Consumer Discretionary | 9.7 | % |
| Financials | 7.3 | % |
| Communication Services | 3.1 | % |
| Energy | 3.1 | % |
| Real Estate | 3.1 | % |
| Materials | 2.2 | % |
| Consumer Staples | 1.3 | % |
| Short-Term Investments | 1.3 | % |
| Other Assets & Liabilities | (1.0 | )% |
| Total | 100.0 | % |
* | For Fund compliance purposes, the Fund may not use the same classification system. These classifications are used for financial reporting purposes. |
Availability of Additional Information
For additional information about the Fund, including its prospectus, financial information, holdings, and proxy voting information, please visit the Fund’s website at the website address included at the beginning of this report.
The Fund is distributed by Hartford Funds Distributors, LLC (HFD).
Annual Shareholder Report
December 31, 2024
Hartford Small Company HLS Fund
Class IB/HDMBX
This annual shareholder report contains important information about the Hartford Small Company HLS Fund (the "Fund") for the period of January 1, 2024 to December 31, 2024. You can find additional information about the Fund at hartfordfunds.com/reports-hls. You can also request this information by contacting us by calling 1‑888‑843‑7824.
What were the Fund costs for the last year?
(Based on a hypothetical $10,000 investment)
| Class Name | Costs of a $10,000 investment* | Costs paid as a percentage
of a $10,000 investment* |
| Class IB | $111 | 1.05% |
| * | This does not reflect any transactional costs, such as sales charges (loads) or fees which may be applied at the variable life insurance, variable annuity, or qualified retirement plan product level. |
How did the Fund perform last year and what impacted its performance?
Management's Discussion of Fund Performance
United States (U.S.) equities, as measured by the S&P 500 Index, rose over the twelve-month period ending December 31, 2024, with the S&P 500 reaching new highs, driven by the performance of a select group of artificial intelligence (AI) related, mega-cap technology companies. Moderating inflationary pressures and a cooling labor market led the U.S. Federal Reserve (Fed) to begin easing monetary policy in September, delivering its first rate cut in four years. Subsequently, in the fourth quarter, the Fed cut interest rates twice before signaling a slower pace of cuts in 2025 amid concerns of reaccelerating inflation. In November, Donald Trump won the presidential election, paving the way for major policy initiatives, including a protectionist trade agenda. Fund performance described below is relative to the Fund’s performance index, the Russell 2000 Growth Index, for the trailing twelve-month period ended December 31, 2024.
Top Contributors to Performance
Security selection within the Healthcare, Energy, and Consumer Staples sectors contributed positively to relative performance.
An overweight to the Industrials sector, not holding securities in the Utilities sector, and an underweight allocation to the Materials sector contributed to relative performance.
Top individual contributors over the period were an overweight position in PROCEPT BioRobotics (Healthcare) and out-of-benchmark positions in Viper Energy (Energy) and Celsius Holdings (Consumer Discretionary).
Top Detractors to Performance
Sector allocation, a result of the team’s bottom-up stock selection process, detracted from relative performance mainly driven by the Fund’s underweight allocations to the Information Technology and Consumer Staples sectors.
Security selection within the Information Technology, Communication Services, and Materials sectors detracted from relative results during the period.
The largest individual detractors over the period were not holding Super Micro Computer (Information Technology), and out-of-benchmark positions in DoubleVerify (Information Technology) and Five9 (Information Technology).
The views expressed in this section reflect the opinions of the Fund's sub-adviser, Wellington Management Company LLP, as of the date of this report and are subject to change based on changes in market, economic or other conditions. These views are not intended to be a forecast of future events and are no guarantee of future results.
Comparison of Change in Value of $ 10,000 Investment
The graph below represents the hypothetical growth of a $10,000 investment in Class IB shares and the comparative indices. The Fund’s past performance is not a good predictor of the Fund’s future performance.
Average Annual Total Returns
For the Periods Ended December 31, 2024 | 1 Year | 5 Years | 10 Years |
| Class IB | 11.61% | 7.07% | 8.00% |
| Russell 2000 Growth Index | 15.15% | 6.86% | 8.09% |
| Russell 3000 Index | 23.81% | 13.86% | 12.55% |
The Russell 2000 Growth Index serves as the Fund’s performance index because the Fund’s investment manager believes it is more representative of the Fund’s investment strategy. The Russell 3000 Index serves as the Fund’s regulatory index and provides a broad measure of market performance.
The Fund’s past performance is not a good predictor of the Fund’s future performance. The Fund's performance in the graph and table do not reflect the deductions of taxes, sales charges or other fees which may be applied at the variable contract level or by a qualified pension or retirement plan. Any such additional sales charges or other fees or expenses would lower the contract’s or plan’s performance. Visit hartfordfunds.com for the most recent performance information.
Key Fund Statistics as of December 31, 2024
| Fund's net assets | $426,729,696 |
| Total number of portfolio holdings (excluding derivatives, if any) | 116 |
| Total investment management fees paid | $3,266,450 |
| Portfolio turnover rate | 41% |
Graphical Representation of Holdings as of December 31, 2024
The table below shows the investment makeup of the Fund, representing the percentage of net assets of the Fund.
| Health Care | 27.6 | % |
| Industrials | 24.8 | % |
| Information Technology | 17.5 | % |
| Consumer Discretionary | 9.7 | % |
| Financials | 7.3 | % |
| Communication Services | 3.1 | % |
| Energy | 3.1 | % |
| Real Estate | 3.1 | % |
| Materials | 2.2 | % |
| Consumer Staples | 1.3 | % |
| Short-Term Investments | 1.3 | % |
| Other Assets & Liabilities | (1.0 | )% |
| Total | 100.0 | % |
* | For Fund compliance purposes, the Fund may not use the same classification system. These classifications are used for financial reporting purposes. |
Availability of Additional Information
For additional information about the Fund, including its prospectus, financial information, holdings, and proxy voting information, please visit the Fund’s website at the website address included at the beginning of this report.
The Fund is distributed by Hartford Funds Distributors, LLC (HFD).
Annual Shareholder Report
December 31, 2024
Hartford Stock HLS Fund
Class IA/HSTAX
This annual shareholder report contains important information about the Hartford Stock HLS Fund (the "Fund") for the period of January 1, 2024 to December 31, 2024. You can find additional information about the Fund at hartfordfunds.com/reports-hls. You can also request this information by contacting us by calling 1‑888‑843‑7824.
What were the Fund costs for the last year?
(Based on a hypothetical $10,000 investment)
| Class Name | Costs of a $10,000 investment* | Costs paid as a percentage
of a $10,000 investment* |
| Class IA | $53 | 0.51% |
| * | This does not reflect any transactional costs, such as sales charges (loads) or fees which may be applied at the variable life insurance, variable annuity, or qualified retirement plan product level. |
How did the Fund perform last year and what impacted its performance?
Management's Discussion of Fund Performance
United States (U.S.) equities, as measured by the S&P 500 Index, rose over the twelve-month period ending December 31, 2024, with the S&P 500 reaching new highs, driven by the performance of a select group of artificial intelligence (AI) related, mega-cap technology companies. Moderating inflationary pressures and a cooling labor market led the U.S. Federal Reserve (Fed) to begin easing monetary policy in September, delivering its first rate cut in four years. Subsequently, in the fourth quarter, the Fed cut interest rates twice before signaling a slower pace of cuts in 2025 amid concerns of reaccelerating inflation. In November, Donald Trump won the presidential election, paving the way for major policy initiatives, including a protectionist trade agenda. Fund performance described below is relative to the Russell 1000 Index for the trailing twelve-month period ended December 31, 2024.
Top Contributors to Performance
Security selection within the Materials, Communication Services, and Healthcare sectors contributed positively to relative performance.
The Fund’s underweight allocation to the Energy sector contributed to relative performance.
Top individual contributors over the period were an overweight position in American Express (Financials), a new position in Apple (Information Technology) and not holding benchmark constituent, Intel (Information Technology).
Top Detractors to Performance
Security selection was the primary detractor to relative performance during the period, driven by weak selection within the Consumer Discretionary, Industrials, and Information Technology sectors.
The largest individual detractors over the period were not owning NVIDIA (Information Technology), an overweight position in Nike (Consumer Discretionary), and an out-of-benchmark position in Canadian National Railway (Industrials).
Sector allocation, a result of our bottom-up stock selection process, was also a detractor to relative performance during the period due to the Fund’s overweight allocation to the Healthcare sector and underweight allocation to the Information Technology sector.
The views expressed in this section reflect the opinions of the Fund's sub-adviser, Wellington Management Company LLP, as of the date of this report and are subject to change based on changes in market, economic or other conditions. These views are not intended to be a forecast of future events and are no guarantee of future results.
Comparison of Change in Value of $ 10,000 Investment
The graph below represents the hypothetical growth of a $10,000 investment in Class IA shares and the comparative index. The Fund’s past performance is not a good predictor of the Fund’s future performance.
Average Annual Total Returns
For the Periods Ended December 31, 2024 | 1 Year | 5 Years | 10 Years |
| Class IA | 8.74% | 9.25% | 10.43% |
| Russell 1000 Index | 24.51% | 14.28% | 12.87% |
The Fund’s past performance is not a good predictor of the Fund’s future performance. The Fund's performance in the graph and table do not reflect the deductions of taxes, sales charges or other fees which may be applied at the variable contract level or by a qualified pension or retirement plan. Any such additional sales charges or other fees or expenses would lower the contract’s or plan’s performance. Visit hartfordfunds.com for the most recent performance information.
Key Fund Statistics as of December 31, 2024
| Fund's net assets | $1,281,798,512 |
| Total number of portfolio holdings (excluding derivatives, if any) | 44 |
| Total investment management fees paid | $6,498,021 |
| Portfolio turnover rate | 16% |
Graphical Representation of Holdings as of December 31, 2024
The table below shows the investment makeup of the Fund, representing the percentage of net assets of the Fund.
| Health Care | 18.9 | % |
| Industrials | 16.6 | % |
| Information Technology | 16.0 | % |
| Financials | 13.9 | % |
| Consumer Staples | 13.5 | % |
| Consumer Discretionary | 11.2 | % |
| Materials | 4.7 | % |
| Real Estate | 1.9 | % |
| Communication Services | 1.7 | % |
| Short-Term Investments | 0.4 | % |
| Other Assets & Liabilities | 1.2 | % |
| Total | 100.0 | % |
* | For Fund compliance purposes, the Fund may not use the same classification system. These classifications are used for financial reporting purposes. |
Availability of Additional Information
For additional information about the Fund, including its prospectus, financial information, holdings, and proxy voting information, please visit the Fund’s website at the website address included at the beginning of this report.
The Fund is distributed by Hartford Funds Distributors, LLC (HFD).
Annual Shareholder Report
December 31, 2024
Hartford Stock HLS Fund
Class IB/HIBSX
This annual shareholder report contains important information about the Hartford Stock HLS Fund (the "Fund") for the period of January 1, 2024 to December 31, 2024. You can find additional information about the Fund at hartfordfunds.com/reports-hls. You can also request this information by contacting us by calling 1‑888‑843‑7824.
What were the Fund costs for the last year?
(Based on a hypothetical $10,000 investment)
| Class Name | Costs of a $10,000 investment* | Costs paid as a percentage
of a $10,000 investment* |
| Class IB | $79 | 0.76% |
| * | This does not reflect any transactional costs, such as sales charges (loads) or fees which may be applied at the variable life insurance, variable annuity, or qualified retirement plan product level. |
How did the Fund perform last year and what impacted its performance?
Management's Discussion of Fund Performance
United States (U.S.) equities, as measured by the S&P 500 Index, rose over the twelve-month period ending December 31, 2024, with the S&P 500 reaching new highs, driven by the performance of a select group of artificial intelligence (AI) related, mega-cap technology companies. Moderating inflationary pressures and a cooling labor market led the U.S. Federal Reserve (Fed) to begin easing monetary policy in September, delivering its first rate cut in four years. Subsequently, in the fourth quarter, the Fed cut interest rates twice before signaling a slower pace of cuts in 2025 amid concerns of reaccelerating inflation. In November, Donald Trump won the presidential election, paving the way for major policy initiatives, including a protectionist trade agenda. Fund performance described below is relative to the Russell 1000 Index for the trailing twelve-month period ended December 31, 2024.
Top Contributors to Performance
Security selection within the Materials, Communication Services, and Healthcare sectors contributed positively to relative performance.
The Fund’s underweight allocation to the Energy sector contributed to relative performance.
Top individual contributors over the period were an overweight position in American Express (Financials), a new position in Apple (Information Technology) and not holding benchmark constituent, Intel (Information Technology).
Top Detractors to Performance
Security selection was the primary detractor to relative performance during the period, driven by weak selection within the Consumer Discretionary, Industrials, and Information Technology sectors.
The largest individual detractors over the period were not owning NVIDIA (Information Technology), an overweight position in Nike (Consumer Discretionary), and an out-of-benchmark position in Canadian National Railway (Industrials).
Sector allocation, a result of our bottom-up stock selection process, was also a detractor to relative performance during the period due to the Fund’s overweight allocation to the Healthcare sector and underweight allocation to the Information Technology sector.
The views expressed in this section reflect the opinions of the Fund's sub-adviser, Wellington Management Company LLP, as of the date of this report and are subject to change based on changes in market, economic or other conditions. These views are not intended to be a forecast of future events and are no guarantee of future results.
Comparison of Change in Value of $ 10,000 Investment
The graph below represents the hypothetical growth of a $10,000 investment in Class IB shares and the comparative index. The Fund’s past performance is not a good predictor of the Fund’s future performance.
Average Annual Total Returns
For the Periods Ended December 31, 2024 | 1 Year | 5 Years | 10 Years |
| Class IB | 8.47% | 8.98% | 10.16% |
| Russell 1000 Index | 24.51% | 14.28% | 12.87% |
The Fund’s past performance is not a good predictor of the Fund’s future performance. The Fund's performance in the graph and table do not reflect the deductions of taxes, sales charges or other fees which may be applied at the variable contract level or by a qualified pension or retirement plan. Any such additional sales charges or other fees or expenses would lower the contract’s or plan’s performance. Visit hartfordfunds.com for the most recent performance information.
Key Fund Statistics as of December 31, 2024
| Fund's net assets | $1,281,798,512 |
| Total number of portfolio holdings (excluding derivatives, if any) | 44 |
| Total investment management fees paid | $6,498,021 |
| Portfolio turnover rate | 16% |
Graphical Representation of Holdings as of December 31, 2024
The table below shows the investment makeup of the Fund, representing the percentage of net assets of the Fund.
| Health Care | 18.9 | % |
| Industrials | 16.6 | % |
| Information Technology | 16.0 | % |
| Financials | 13.9 | % |
| Consumer Staples | 13.5 | % |
| Consumer Discretionary | 11.2 | % |
| Materials | 4.7 | % |
| Real Estate | 1.9 | % |
| Communication Services | 1.7 | % |
| Short-Term Investments | 0.4 | % |
| Other Assets & Liabilities | 1.2 | % |
| Total | 100.0 | % |
* | For Fund compliance purposes, the Fund may not use the same classification system. These classifications are used for financial reporting purposes. |
Availability of Additional Information
For additional information about the Fund, including its prospectus, financial information, holdings, and proxy voting information, please visit the Fund’s website at the website address included at the beginning of this report.
The Fund is distributed by Hartford Funds Distributors, LLC (HFD).
Annual Shareholder Report
December 31, 2024
Hartford Total Return Bond HLS Fund
Class IA/HIABX
This annual shareholder report contains important information about the Hartford Total Return Bond HLS Fund (the "Fund") for the period of January 1, 2024 to December 31, 2024. You can find additional information about the Fund at hartfordfunds.com/reports-hls. You can also request this information by contacting us by calling 1‑888‑843‑7824.
What were the Fund costs for the last year?
(Based on a hypothetical $10,000 investment)
| Class Name | Costs of a $10,000 investment* | Costs paid as a percentage
of a $10,000 investment* |
| Class IA | $52 | 0.51% |
| * | This does not reflect any transactional costs, such as sales charges (loads) or fees which may be applied at the variable life insurance, variable annuity, or qualified retirement plan product level. |
How did the Fund perform last year and what impacted its performance?
Management's Discussion of Fund Performance
Most United States (U.S.) fixed income credit sectors including Investment Grade Corporates, High Yield, and Securitized Credit generated positive total returns during the trailing twelve months ending December 31, 2024, as coupon income and spread tightening helped offset the impact of rising U.S. Treasury yields. Most spread sectors produced positive excess returns over duration-equivalent government bonds as spreads narrowed, supported by more accommodative central bank policies, with higher-yielding and emerging market sectors leading the outperformance. Global sovereign yields rose, and yield curves steepened across most regions outside of Asia by the end of the period. Geopolitical tensions rose in Europe and the Middle East, amplified further by uncertainty following the Republican sweep in the U.S. elections and President-elect Donald Trump’s economic plans. Fund performance described below is relative to the Bloomberg US Aggregate Bond Index for the trailing twelve-month period ended December 31, 2024.
Top Contributors to Performance
The Fund’s allocation to structured finance sectors had a positive impact on results. An allocation to Non-Agency Residential Mortgage-Backed Securities (RMBS) was a positive contributor. An overweight to agency MBS pass-throughs also had a positive impact. Exposure to other securitized sectors including Commercial Mortgage-Backed Securities (CMBS) and Collateralized Loan Obligations (CLOs) contributed positively to relative performance.
Corporate credit positioning contributed positively to relative results overall. The Fund’s out-of-benchmark exposure to high yield credit aided results, led by industrials. Security selection within investment credit also benefited performance.
Overall duration and yield curve positioning was the top positive contributor to relative results. The use of emerging market credit default swaps had a neutral impact.
Top Detractors to Performance
The Fund’s allocation to Treasury Inflation Protected Securities (TIPS) detracted from relative results during the period.
An overall underweight in investment grade industrial corporates detracted from relative results.
The views expressed in this section reflect the opinions of the Fund's sub-adviser, Wellington Management Company LLP, as of the date of this report and are subject to change based on changes in market, economic or other conditions. These views are not intended to be a forecast of future events and are no guarantee of future results.
Comparison of Change in Value of $ 10,000 Investment
The graph below represents the hypothetical growth of a $10,000 investment in Class IA shares and the comparative index. The Fund’s past performance is not a good predictor of the Fund’s future performance.
Average Annual Total Returns
For the Periods Ended December 31, 2024 | 1 Year | 5 Years | 10 Years |
| Class IA | 2.33% | 0.28% | 1.97% |
| Bloomberg US Aggregate Bond Index | 1.25% | (0.33)% | 1.35% |
The Fund’s past performance is not a good predictor of the Fund’s future performance. The Fund's performance in the graph and table do not reflect the deductions of taxes, sales charges or other fees which may be applied at the variable contract level or by a qualified pension or retirement plan. Any such additional sales charges or other fees or expenses would lower the contract’s or plan’s performance. Visit hartfordfunds.com for the most recent performance information.
Key Fund Statistics as of December 31, 2024
| Fund's net assets | $1,724,145,553 |
| Total number of portfolio holdings | 1,437 |
| Total investment management fees paid | $8,354,211 |
| Portfolio turnover rate (excludes to be announced (TBA) roll transactions) | 50% |
Graphical Representation of Holdings as of December 31, 2024
The table below shows the investment makeup of the Fund, representing the percentage of net assets of the Fund.
Composition by Security Type
| U.S. Government Agencies^ | 41.2 | % |
| Corporate Bonds | 23.7 | % |
| U.S. Government Securities | 21.9 | % |
| Asset & Commercial Mortgage-Backed Securities | 18.2 | % |
| Foreign Government Obligations | 3.0 | % |
| Municipal Bonds | 1.3 | % |
| Preferred Stocks | 0.1 | % |
| Common Stocks | 0.0 | %† |
| Senior Floating Rate Interests | 0.0 | %† |
| Short-Term Investments | 0.8 | % |
| Other Assets & Liabilities | (10.2 | )% |
| Total | 100.0 | % |
^ | All, or a portion of the securities categorized as U.S. Government Agencies, were agency mortgage-backed securities. |
† | Percentage rounds to zero. |
Availability of Additional Information
For additional information about the Fund, including its prospectus, financial information, holdings, and proxy voting information, please visit the Fund’s website at the website address included at the beginning of this report.
The Fund is distributed by Hartford Funds Distributors, LLC (HFD).
Annual Shareholder Report
December 31, 2024
Hartford Total Return Bond HLS Fund
Class IB/HBNBX
This annual shareholder report contains important information about the Hartford Total Return Bond HLS Fund (the "Fund") for the period of January 1, 2024 to December 31, 2024. You can find additional information about the Fund at hartfordfunds.com/reports-hls. You can also request this information by contacting us by calling 1‑888‑843‑7824.
What were the Fund costs for the last year?
(Based on a hypothetical $10,000 investment)
| Class Name | Costs of a $10,000 investment* | Costs paid as a percentage
of a $10,000 investment* |
| Class IB | $77 | 0.76% |
| * | This does not reflect any transactional costs, such as sales charges (loads) or fees which may be applied at the variable life insurance, variable annuity, or qualified retirement plan product level. |
How did the Fund perform last year and what impacted its performance?
Management's Discussion of Fund Performance
Most United States (U.S.) fixed income credit sectors including Investment Grade Corporates, High Yield, and Securitized Credit generated positive total returns during the trailing twelve months ending December 31, 2024, as coupon income and spread tightening helped offset the impact of rising U.S. Treasury yields. Most spread sectors produced positive excess returns over duration-equivalent government bonds as spreads narrowed, supported by more accommodative central bank policies, with higher-yielding and emerging market sectors leading the outperformance. Global sovereign yields rose, and yield curves steepened across most regions outside of Asia by the end of the period. Geopolitical tensions rose in Europe and the Middle East, amplified further by uncertainty following the Republican sweep in the U.S. elections and President-elect Donald Trump’s economic plans. Fund performance described below is relative to the Bloomberg US Aggregate Bond Index for the trailing twelve-month period ended December 31, 2024.
Top Contributors to Performance
The Fund’s allocation to structured finance sectors had a positive impact on results. An allocation to Non-Agency Residential Mortgage-Backed Securities (RMBS) was a positive contributor. An overweight to agency MBS pass-throughs also had a positive impact. Exposure to other securitized sectors including Commercial Mortgage-Backed Securities (CMBS) and Collateralized Loan Obligations (CLOs) contributed positively to relative performance.
Corporate credit positioning contributed positively to relative results overall. The Fund’s out-of-benchmark exposure to high yield credit aided results, led by industrials. Security selection within investment credit also benefited performance.
Overall duration and yield curve positioning was the top positive contributor to relative results. The use of emerging market credit default swaps had a neutral impact.
Top Detractors to Performance
The Fund’s allocation to Treasury Inflation Protected Securities (TIPS) detracted from relative results during the period.
An overall underweight in investment grade industrial corporates detracted from relative results.
The views expressed in this section reflect the opinions of the Fund's sub-adviser, Wellington Management Company LLP, as of the date of this report and are subject to change based on changes in market, economic or other conditions. These views are not intended to be a forecast of future events and are no guarantee of future results.
Comparison of Change in Value of $ 10,000 Investment
The graph below represents the hypothetical growth of a $10,000 investment in Class IB shares and the comparative index. The Fund’s past performance is not a good predictor of the Fund’s future performance.
Average Annual Total Returns
For the Periods Ended December 31, 2024 | 1 Year | 5 Years | 10 Years |
| Class IB | 2.07% | 0.02% | 1.72% |
| Bloomberg US Aggregate Bond Index | 1.25% | (0.33)% | 1.35% |
The Fund’s past performance is not a good predictor of the Fund’s future performance. The Fund's performance in the graph and table do not reflect the deductions of taxes, sales charges or other fees which may be applied at the variable contract level or by a qualified pension or retirement plan. Any such additional sales charges or other fees or expenses would lower the contract’s or plan’s performance. Visit hartfordfunds.com for the most recent performance information.
Key Fund Statistics as of December 31, 2024
| Fund's net assets | $1,724,145,553 |
| Total number of portfolio holdings | 1,437 |
| Total investment management fees paid | $8,354,211 |
| Portfolio turnover rate (excludes to be announced (TBA) roll transactions) | 50% |
Graphical Representation of Holdings as of December 31, 2024
The table below shows the investment makeup of the Fund, representing the percentage of net assets of the Fund.
Composition by Security Type
| U.S. Government Agencies^ | 41.2 | % |
| Corporate Bonds | 23.7 | % |
| U.S. Government Securities | 21.9 | % |
| Asset & Commercial Mortgage-Backed Securities | 18.2 | % |
| Foreign Government Obligations | 3.0 | % |
| Municipal Bonds | 1.3 | % |
| Preferred Stocks | 0.1 | % |
| Common Stocks | 0.0 | %† |
| Senior Floating Rate Interests | 0.0 | %† |
| Short-Term Investments | 0.8 | % |
| Other Assets & Liabilities | (10.2 | )% |
| Total | 100.0 | % |
^ | All, or a portion of the securities categorized as U.S. Government Agencies, were agency mortgage-backed securities. |
† | Percentage rounds to zero. |
Availability of Additional Information
For additional information about the Fund, including its prospectus, financial information, holdings, and proxy voting information, please visit the Fund’s website at the website address included at the beginning of this report.
The Fund is distributed by Hartford Funds Distributors, LLC (HFD).
Annual Shareholder Report
December 31, 2024
Hartford Ultrashort Bond HLS Fund
Class IA/HUBAX
This annual shareholder report contains important information about the Hartford Ultrashort Bond HLS Fund (the "Fund") for the period of January 1, 2024 to December 31, 2024. You can find additional information about the Fund at hartfordfunds.com/reports-hls. You can also request this information by contacting us by calling 1‑888‑843‑7824.
What were the Fund costs for the last year?
(Based on a hypothetical $10,000 investment)
| Class Name | Costs of a $10,000 investment* | Costs paid as a percentage
of a $10,000 investment* |
| Class IA | $46 | 0.45% |
| * | This does not reflect any transactional costs, such as sales charges (loads) or fees which may be applied at the variable life insurance, variable annuity, or qualified retirement plan product level. |
How did the Fund perform last year and what impacted its performance?
Management's Discussion of Fund Performance
Most United States (U.S.) fixed income credit sectors including Investment Grade Corporates and Securitized Credit generated positive total returns during the trailing twelve months ending December 31, 2024, as coupon income and spread tightening helped offset the impact of rising U.S. Treasury yields. Most spread sectors produced positive excess returns over duration-equivalent government bonds as spreads narrowed, supported by more accommodative central bank policies, with higher-yielding sectors leading the outperformance. Intermediate and longer-term U.S. interest rates increased while short term rates declined as the Federal Open Market Committee (FOMC) embarked on a rate cutting cycle causing the yield curve to steepen by the end of the period. Fund performance described below is relative to the Fund’s performance index, the Bloomberg Short Treasury 9-12 Month Index, for the trailing twelve-month period ended December 31, 2024.
Top Contributors to Performance
The Fund’s allocation to structured finance sectors was the primary contributor to relative performance. An out-of-benchmark allocation to Asset-Backed Securities (ABS), particularly Autos and Equipment, contributed significantly to relative performance. Additionally, the Fund’s allocation to Non-Agency Residential Mortgage-Backed Securities (RMBS) also had a positive impact.
Corporate credit positioning contributed to relative performance, led by positioning in Financials and Industrials. Within Financials, positioning in Banking and Insurance were key contributors, while positioning in Energy contributed within Industrials.
Top Detractors to Performance
The views expressed in this section reflect the opinions of the Fund's sub-adviser, Wellington Management Company LLP, as of the date of this report and are subject to change based on changes in market, economic or other conditions. These views are not intended to be a forecast of future events and are no guarantee of future results.
Comparison of Change in Value of $ 10,000 Investment
The graph below represents the hypothetical growth of a $10,000 investment in Class IA shares and the comparative indices. The Fund’s past performance is not a good predictor of the Fund’s future performance.
Average Annual Total Returns
For the Periods Ended December 31, 2024 | 1 Year | 5 Years | 10 Years |
| Class IA | 5.20% | 2.26% | 1.78% |
| Bloomberg Short Treasury 9-12 Month Index | 5.05% | 2.24% | 1.76% |
| Bloomberg US Aggregate Bond Index | 1.25% | (0.33)% | 1.35% |
The Bloomberg Short Treasury 9-12 Month Index serves as the Fund’s performance index because the Fund’s investment manager believes it is more representative of the Fund’s investment strategy. The Bloomberg US Aggregate Bond Index serves as the Fund’s regulatory index and provides a broad measure of market performance.
The Fund’s past performance is not a good predictor of the Fund’s future performance. The Fund's performance in the graph and table do not reflect the deductions of taxes, sales charges or other fees which may be applied at the variable contract level or by a qualified pension or retirement plan. Any such additional sales charges or other fees or expenses would lower the contract’s or plan’s performance. Visit hartfordfunds.com for the most recent performance information.
Key Fund Statistics as of December 31, 2024
| Fund's net assets | $527,964,640 |
| Total number of portfolio holdings (excluding derivatives, if any) | 359 |
| Total investment management fees paid | $2,187,324 |
| Portfolio turnover rate | 63% |
Graphical Representation of Holdings as of December 31, 2024
The table below shows the investment makeup of the Fund, representing the percentage of net assets of the Fund.
Composition by Security Type
| Asset & Commercial Mortgage-Backed Securities | 34.4 | % |
| Corporate Bonds | 21.8 | % |
| U.S. Government Securities | 18.7 | % |
| U.S. Government Agencies^ | 4.0 | % |
| Municipal Bonds | 0.3 | % |
| Short-Term Investments | 20.3 | % |
| Other Assets & Liabilities | 0.5 | % |
| Total | 100.0 | % |
^ | All, or a portion of the securities categorized as U.S. Government Agencies, were agency mortgage-backed securities. |
Availability of Additional Information
For additional information about the Fund, including its prospectus, financial information, holdings, and proxy voting information, please visit the Fund’s website at the website address included at the beginning of this report.
The Fund is distributed by Hartford Funds Distributors, LLC (HFD).
Annual Shareholder Report
December 31, 2024
Hartford Ultrashort Bond HLS Fund
Class IB/HUBBX
This annual shareholder report contains important information about the Hartford Ultrashort Bond HLS Fund (the "Fund") for the period of January 1, 2024 to December 31, 2024. You can find additional information about the Fund at hartfordfunds.com/reports-hls. You can also request this information by contacting us by calling 1‑888‑843‑7824.
What were the Fund costs for the last year?
(Based on a hypothetical $10,000 investment)
| Class Name | Costs of a $10,000 investment* | Costs paid as a percentage
of a $10,000 investment* |
| Class IB | $72 | 0.70% |
| * | This does not reflect any transactional costs, such as sales charges (loads) or fees which may be applied at the variable life insurance, variable annuity, or qualified retirement plan product level. |
How did the Fund perform last year and what impacted its performance?
Management's Discussion of Fund Performance
Most United States (U.S.) fixed income credit sectors including Investment Grade Corporates and Securitized Credit generated positive total returns during the trailing twelve months ending December 31, 2024, as coupon income and spread tightening helped offset the impact of rising U.S. Treasury yields. Most spread sectors produced positive excess returns over duration-equivalent government bonds as spreads narrowed, supported by more accommodative central bank policies, with higher-yielding sectors leading the outperformance. Intermediate and longer-term U.S. interest rates increased while short term rates declined as the Federal Open Market Committee (FOMC) embarked on a rate cutting cycle causing the yield curve to steepen by the end of the period. Fund performance described below is relative to the Fund’s performance index, the Bloomberg Short Treasury 9-12 Month Index, for the trailing twelve-month period ended December 31, 2024.
Top Contributors to Performance
The Fund’s allocation to structured finance sectors was the primary contributor to relative performance. An out-of-benchmark allocation to Asset-Backed Securities (ABS), particularly Autos and Equipment, contributed significantly to relative performance. Additionally, the Fund’s allocation to Non-Agency Residential Mortgage-Backed Securities (RMBS) also had a positive impact.
Corporate credit positioning contributed to relative performance, led by positioning in Financials and Industrials. Within Financials, positioning in Banking and Insurance were key contributors, while positioning in Energy contributed within Industrials.
Top Detractors to Performance
The views expressed in this section reflect the opinions of the Fund's sub-adviser, Wellington Management Company LLP, as of the date of this report and are subject to change based on changes in market, economic or other conditions. These views are not intended to be a forecast of future events and are no guarantee of future results.
Comparison of Change in Value of $ 10,000 Investment
The graph below represents the hypothetical growth of a $10,000 investment in Class IB shares and the comparative indices. The Fund’s past performance is not a good predictor of the Fund’s future performance.
Average Annual Total Returns
For the Periods Ended December 31, 2024 | 1 Year | 5 Years | 10 Years |
| Class IB | 4.91% | 2.01% | 1.52% |
| Bloomberg Short Treasury 9-12 Month Index | 5.05% | 2.24% | 1.76% |
| Bloomberg US Aggregate Bond Index | 1.25% | (0.33)% | 1.35% |
The Bloomberg Short Treasury 9-12 Month Index serves as the Fund’s performance index because the Fund’s investment manager believes it is more representative of the Fund’s investment strategy. The Bloomberg US Aggregate Bond Index serves as the Fund’s regulatory index and provides a broad measure of market performance.
The Fund’s past performance is not a good predictor of the Fund’s future performance. The Fund's performance in the graph and table do not reflect the deductions of taxes, sales charges or other fees which may be applied at the variable contract level or by a qualified pension or retirement plan. Any such additional sales charges or other fees or expenses would lower the contract’s or plan’s performance. Visit hartfordfunds.com for the most recent performance information.
Key Fund Statistics as of December 31, 2024
| Fund's net assets | $527,964,640 |
| Total number of portfolio holdings (excluding derivatives, if any) | 359 |
| Total investment management fees paid | $2,187,324 |
| Portfolio turnover rate | 63% |
Graphical Representation of Holdings as of December 31, 2024
The table below shows the investment makeup of the Fund, representing the percentage of net assets of the Fund.
Composition by Security Type
| Asset & Commercial Mortgage-Backed Securities | 34.4 | % |
| Corporate Bonds | 21.8 | % |
| U.S. Government Securities | 18.7 | % |
| U.S. Government Agencies^ | 4.0 | % |
| Municipal Bonds | 0.3 | % |
| Short-Term Investments | 20.3 | % |
| Other Assets & Liabilities | 0.5 | % |
| Total | 100.0 | % |
^ | All, or a portion of the securities categorized as U.S. Government Agencies, were agency mortgage-backed securities. |
Availability of Additional Information
For additional information about the Fund, including its prospectus, financial information, holdings, and proxy voting information, please visit the Fund’s website at the website address included at the beginning of this report.
The Fund is distributed by Hartford Funds Distributors, LLC (HFD).
(b) Not applicable
Item 2. Code of Ethics.
The registrant, as of the end of the period covered by this report, has adopted a code of ethics that applies to the registrant’s principal executive officer, principal financial officer, principal accounting officer or controller, or persons performing similar functions, regardless of whether these individuals are employed by the registrant or a third party. There have been no amendments, during the period covered by this report, to a provision of the code of ethics that applies to the registrant’s principal executive officer, principal financial officer, principal accounting officer or controller, or persons performing similar functions, regardless of whether these individuals are employed by the registrant or a third party, and that relates to any element of the code of ethics description. The registrant has not granted any waivers, including an implicit waiver, from a provision of the code of ethics that applies to the registrant’s principal executive officer, principal financial officer, principal accounting officer or controller, or persons performing similar functions, regardless of whether these individuals are employed by the registrant or a third party, that relates to one or more of the items set forth in paragraph (b) of this item’s instructions. A copy of the code of ethics is filed herewith.
Item 3. Audit Committee Financial Expert.
The Board of Directors of the registrant (the “Board”) has designated David Sung as an Audit Committee Financial Expert. Mr. Sung is considered by the Board to be an independent director.
Item 4. Principal Accountant Fees and Services.
| | (a) | Audit Fees: The aggregate fees billed for each of the last two fiscal years for professional services rendered by the principal accountant for the audit of the registrant’s annual financial statements or services that are normally provided by the accountant in connection with statutory and regulatory filings or engagements for those fiscal years were: |
$349,321 for the fiscal year ended December 31, 2024; $314,046 for the fiscal year ended December 31, 2023.
| | (b) | Audit Related Fees: The aggregate fees billed in each of the last two fiscal years for assurance and related services by the principal accountant that are reasonably related to the performance of the audit of the registrant’s financial statements and are not reported under paragraph (a) of this Item were: |
$0 for the fiscal year ended December 31, 2024; $0 for the fiscal year ended December 31, 2023.
| | (c) | Tax Fees: The aggregate fees billed in each of the last two fiscal years for professional services rendered by the principal accountant for tax compliance, tax advice, and tax planning were: |
$58,056 for the fiscal year ended December 31, 2024; $50,677 for the fiscal year ended December 31, 2023. Tax-related services were principally in connection with, but not limited to, general tax services and excise tax services.
| | (d) | All Other Fees: The aggregate fees billed in each of the last two fiscal years for products and services provided by the principal accountant, other than the services reported in paragraphs (a) through (c) of this Item were: |
$303 for the fiscal year ended December 31, 2024; $846 for the fiscal year ended December 31, 2023. These fees were principally in connection with, but not limited to, general audit related products and services and an accounting research tool subscription.
| | (e) | (1) The Pre-Approval Policies and Procedures (the “Policy”) adopted by the Audit Committee of the registrant (also, the “Fund”) sets forth the procedures pursuant to which services performed by the independent registered public accounting firm for the registrant may be pre-approved. The following summarizes the pre-approval requirements under the Policy. |
| | a) | The Audit Committee must pre-approve all audit services and non-audit services that the independent registered public accounting firm provides to the Fund. |
| | b) | The Audit Committee must pre-approve any engagement of the independent registered public accounting firm to provide non-audit services to any Service Affiliate (which is defined to include any entity controlling, controlled by, or under common control with the investment adviser that provides ongoing services to the Fund) during the period of the independent registered public accounting firm’s engagement to provide audit services to the Fund, if the non-audit services to the Service Affiliate directly impact the Fund’s operations and financial reporting. |
| | c) | The Audit Committee, from time to time, may designate one or more of its members who are Independent Directors (each a “Designated Member”) to consider, on the Audit Committee’s behalf, any non-audit services, whether to the Fund or to any Service Affiliate, that have not been pre-approved by the Audit Committee. The Designated Member also shall review, on the Audit Committee’s behalf, any proposed material change in the nature or extent of any non-audit services previously approved. In considering any requested non-audit services or proposed material change in such services, the Designated Member shall not authorize services which would exceed $50,000 in fees for such services. |
| | d) | The independent registered public accounting firm may not provide specified prohibited non-audit services set forth in the Policy to the Fund, the Fund’s investment adviser, the Service Affiliates or any other member of the investment company complex. |
| | (e) | (2) One hundred percent of the services described in items 4(b) through 4(d) were approved in accordance with the Audit Committee’s Pre-Approval Policy. As a result, none of such services was approved pursuant to paragraph (c)(7)(i)(C) of Rule 2-01 of Regulation S-X. |
| | (f) | Less than 50% of the hours expended on the principal accountant’s engagement to audit the registrant’s financial statements for the year ended December 31, 2024, were attributed to work performed by persons other than the principal accountant’s full-time, permanent employees. |
| | (g) | The aggregate non-audit fees billed by the registrant’s accountant for services rendered to the registrant, and rendered to the registrant’s investment adviser (not including any sub-adviser whose role is primarily portfolio management and is subcontracted with or overseen by another investment adviser), and any entity controlling, controlled by, or under common control with the adviser that provides ongoing services to the registrant for each of the last two fiscal years of the registrant were: |
The aggregate non-audit fees billed by the registrant’s accountant for services rendered to the registrant: $58,359 for the fiscal year ended December 31, 2024; $51,523 for the fiscal year ended December 31, 2023.
The aggregate non-audit fees billed by the registrant’s accountant for services rendered to the registrant’s investment adviser (not including any sub-adviser whose role is primarily portfolio management and is subcontracted with or overseen by another investment adviser), and any entity controlling, controlled by, or under common control with the adviser was $121,199 for the fiscal year ended December 31, 2024 and $121,199 for the fiscal year ended December 31, 2023.
| | (h) | The registrant’s audit committee of the board of directors has considered whether the provision of non-audit services that were rendered to the registrant’s investment adviser (not including any sub-adviser whose role is primarily portfolio management and is subcontracted with or overseen by another investment adviser), and any entity controlling, controlled by, or under common control with the investment adviser that provides |
| | ongoing services to the registrant that were not pre-approved pursuant to paragraph (c)(7)(ii) of Rule 2-01 of Regulation S-X is compatible with maintaining the principal accountant’s independence. |
Item 5. Audit Committee of Listed Registrants.
Not applicable.
Item 6. Investments.
| | (a) | The Schedule of Investments in securities of unaffiliated issuers as of the close of the reporting period is included in the Annual Financial Statements and Other Information filed under Item 7 of this form. |
Item 7. Financial Statements and Financial Highlights for Open-End Management Investment Companies.
Item 8. Changes in and Disagreements with Accountants for Open-End Management Investment Companies.
Item 9. Proxy Disclosures for Open-End Management Investment Companies.
Item 10. Remuneration Paid to Directors, Officers, and Others of Open-End Management Investment Companies.
Item 11. Statement Regarding Basis for Approval of Investment Advisory Contract.
Hartford HLS Funds
Annual Financial Statements
and Other Information
◼Hartford Balanced HLS Fund |
◼Hartford Capital Appreciation HLS Fund |
◼Hartford Disciplined Equity HLS Fund |
◼Hartford Dividend and Growth HLS Fund |
◼Hartford Healthcare HLS Fund |
◼Hartford International Opportunities HLS Fund |
◼Hartford MidCap HLS Fund |
◼Hartford Small Cap Growth HLS Fund |
◼Hartford Small Company HLS Fund |
|
◼Hartford Total Return Bond HLS Fund |
◼Hartford Ultrashort Bond HLS Fund |
Table of Contents
| |
Please note that this report includes responses to Items 7-11 of Form N-CSR, which is a reporting form filed with the U.S. Securities and Exchange Commission by mutual funds and exchange traded funds. Certain Form N-CSR items listed below may not be applicable. | |
| |
| |
| |
| |
| |
| |
| |
| |
| |
| |
| |
| |
| |
| |
| |
| |
| |
| |
| |
| |
| |
| |
| |
| |
| |
| |
| |
| |
| |
| |
| |
| |
| |
| |
| |
| |
| |
| |
| |
| |
| |
Item 7. Financial Statements and Financial Highlights for Open-End Management Investment Companies.
Hartford Balanced HLS Fund
Schedule of InvestmentsDecember 31, 2024
Shares or Principal Amount | | |
ASSET & COMMERCIAL MORTGAGE-BACKED SECURITIES - 1.0% |
| Asset-Backed - Automobile - 0.3% |
| CFMT LLC 1.39%, 09/22/2031(1) | |
| Enterprise Fleet Financing LLC 6.40%, | |
| Ford Credit Auto Owner Trust | |
| | |
| | |
| SFS Auto Receivables Securitization Trust | |
| Wheels Fleet Lease Funding 1 LLC | |
| | |
| | |
| | | |
| Asset-Backed - Student Loan - 0.1% |
| Navient Private Education Refi Loan Trust | |
| Other Asset-Backed Securities - 0.5% |
| Aaset Trust 3.84%, 05/15/2039(1) | |
| Castlelake Aircraft Structured Trust | |
| | |
| | |
| | |
| | |
| | |
| | |
| Home Partners of America Trust 2.30%, | |
| Horizon Aircraft Finance II Ltd. 3.72%, | |
| Horizon Aircraft Finance III Ltd. 3.43%, | |
| Kubota Credit Owner Trust 5.28%, | |
| MACH 1 Cayman Ltd. 3.47%, 10/15/2039(1) | |
| MAPS Ltd. 4.46%, 03/15/2044(1) | |
| New Economy Assets - Phase 1 Sponsor LLC | |
| Retained Vantage Data Centers Issuer LLC | |
| Start II Ltd. 4.09%, 03/15/2044(1) | |
| | | |
| Whole Loan Collateral CMO - 0.1% |
| Angel Oak Mortgage Trust 2.62%, | |
| Federal Home Loan Mortgage Corp. Seasoned Credit Risk Transfer Trust 3.50%, 10/25/2058 | |
| Federal National Mortgage Association Connecticut Avenue Securities Trust | |
| 6.12%, 10/25/2041, 30 day USD SOFR | |
| 10.58%, 10/25/2028, 30 day USD SOFR | |
| | |
| | |
| | |
| MetLife Securitization Trust 3.00%, | |
| Mill City Mortgage Loan Trust 2.75%, | |
Shares or Principal Amount | | |
ASSET & COMMERCIAL MORTGAGE-BACKED SECURITIES - 1.0% - (continued) |
| Whole Loan Collateral CMO - 0.1% - (continued) |
| Towd Point Mortgage Trust | |
| | |
| | |
| | | |
| Total Asset & Commercial Mortgage-Backed Securities
(cost $15,851,597) | |
|
| |
| Boeing Co. 6.86%, 05/01/2054 | |
| HEICO Corp. 5.35%, 08/01/2033 | |
| Lockheed Martin Corp. 4.85%, 09/15/2041 | |
| | | |
| |
| United Airlines Pass-Through Trust 4.60%, 09/01/2027 | |
| |
| Tapestry, Inc. 5.10%, 03/11/2030 | |
| |
| Coca-Cola Consolidated, Inc. 5.45%, 06/01/2034 | |
| |
| Banco Santander SA 5.37%, 07/15/2028, (5.37% fixed rate until 07/15/2027; 1 yr. USD CMT + 0.95% thereafter)(4) | |
| | |
| 3.59%, 07/21/2028, (3.59% fixed rate until 07/21/2027; 3 mo. USD Term SOFR + | |
| 5.82%, 09/15/2029, (5.82% fixed rate until 09/15/2028; 6 mo. USD SOFR + 1.57% | |
| 5.87%, 09/15/2034, (5.87% fixed rate until 09/15/2033; 6 mo. USD SOFR + 1.84% | |
| Canadian Imperial Bank of Commerce | |
| 4.51%, 09/11/2027, (4.51% fixed rate until 09/11/2026; 6 mo. USD SOFR + 0.93% | |
| 4.63%, 09/11/2030, (4.63% fixed rate until 09/11/2029; 6 mo. USD SOFR + 1.34% | |
| | |
| Citizens Financial Group, Inc. 5.84%, 01/23/2030, (5.84% fixed rate until 01/23/2029; 6 mo. USD SOFR + 2.01% | |
| Commonwealth Bank of Australia 5.07%, | |
| | |
| 4.63%, 09/11/2028, (4.63% fixed rate until 09/11/2027; 6 mo. USD SOFR + 1.21% | |
| 6.32%, 10/03/2029, (6.32% fixed rate until 10/03/2028; 6 mo. USD SOFR + 1.86% | |
| | |
| 1.62%, 09/11/2026, (1.62% fixed rate until 09/11/2025; 1 yr. USD CMT + 1.35% | |
The accompanying notes are an integral part of these financial statements.
Hartford Balanced HLS Fund
Schedule of Investments – (continued)December 31, 2024
Shares or Principal Amount | | |
CORPORATE BONDS - 10.4% - (continued) |
| Commercial Banks - 2.3% - (continued) |
| 5.71%, 03/01/2030, (5.71% fixed rate until 03/01/2029; 1 yr. USD CMT + 1.40% | |
| Goldman Sachs Group, Inc. 6.25%, 02/01/2041 | |
| | |
| 2.52%, 04/22/2031, (2.52% fixed rate until 04/22/2030; 6 mo. USD SOFR + 2.04% | |
| 3.11%, 04/22/2041, (3.11% fixed rate until 04/22/2040; 3 mo. USD Term SOFR + | |
| 3.70%, 05/06/2030, (3.70% fixed rate until 05/06/2029; 3 mo. USD Term SOFR + | |
| 4.45%, 12/05/2029, (4.45% fixed rate until 12/05/2028; 3 mo. USD Term SOFR + | |
| Lloyds Banking Group PLC 5.09%, 11/26/2028, (5.09% fixed rate until 11/26/2027; 1 yr. USD CMT + 0.85% | |
| | |
| 5.47%, 01/18/2035, (5.47% fixed rate until 01/18/2034; 6 mo. USD SOFR + 1.73% | |
| 5.95%, 01/19/2038, (5.95% fixed rate until 01/19/2033; 5 yr. USD CMT + 2.43% | |
| Standard Chartered PLC 5.01%, 10/15/2030, (5.01% fixed rate until 10/15/2029; 1 yr. USD CMT + 1.15% thereafter)(1)(4) | |
| | |
| | |
| | |
| | |
| 1.49%, 08/10/2027, (1.49% fixed rate until 08/10/2026; 1 yr. USD CMT + 0.85% | |
| 6.30%, 09/22/2034, (6.30% fixed rate until 09/22/2033; 1 yr. USD CMT + 2.00% | |
| | |
| 4.61%, 04/25/2053, (4.61% fixed rate until 04/25/2052; 6 mo. USD SOFR + 2.13% | |
| 6.30%, 10/23/2029, (6.30% fixed rate until 10/23/2028; 6 mo. USD SOFR + 1.79% | |
| | | |
| Commercial Services - 0.3% |
| | |
| | |
| | |
| | |
| | |
| | |
| ERAC USA Finance LLC 5.20%, 10/30/2034(1) | |
| | | |
| Diversified Financial Services - 0.7% |
| Aviation Capital Group LLC 1.95%, | |
Shares or Principal Amount | | |
CORPORATE BONDS - 10.4% - (continued) |
| Diversified Financial Services - 0.7% - (continued) |
| Blackstone Holdings Finance Co. LLC 2.55%, | |
| Capital One Financial Corp. | |
| 5.70%, 02/01/2030, (5.70% fixed rate until 02/01/2029; 6 mo. USD SOFR + 1.91% | |
| 5.88%, 07/26/2035, (5.88% fixed rate until 07/26/2034; 6 mo. USD SOFR + 1.99% | |
| 6.05%, 02/01/2035, (6.05% fixed rate until 02/01/2034; 6 mo. USD SOFR + 2.26% | |
| 6.31%, 06/08/2029, (6.31% fixed rate until 06/08/2028; 6 mo. USD SOFR + 2.64% | |
| 7.62%, 10/30/2031, (7.62% fixed rate until 10/30/2030; 6 mo. USD SOFR + 3.07% | |
| | |
| | |
| | |
| | | |
| |
| American Transmission Systems, Inc. 2.65%, | |
| Cleveland Electric Illuminating Co. 3.50%, | |
| Dominion Energy South Carolina, Inc. 6.63%, 02/01/2032 | |
| Dominion Energy, Inc. 5.38%, 11/15/2032 | |
| | |
| | |
| | |
| Eversource Energy 5.95%, 07/15/2034 | |
| FirstEnergy Pennsylvania Electric Co. | |
| | |
| | |
| | |
| | |
| | |
| | |
| | |
| Pacific Gas & Electric Co. | |
| | |
| | |
| Public Service Enterprise Group, Inc. 5.20%, 04/01/2029 | |
| San Diego Gas & Electric Co. 3.70%, 03/15/2052 | |
| | |
| | |
| | |
| | |
| Sempra 4.13%, 04/01/2052, (4.13% fixed rate until 01/01/2027; 5 yr. USD CMT + 2.87% | |
| Texas Electric Market Stabilization Funding N | |
| | | |
The accompanying notes are an integral part of these financial statements.
Hartford Balanced HLS Fund
Schedule of Investments – (continued)December 31, 2024
Shares or Principal Amount | | |
CORPORATE BONDS - 10.4% - (continued) |
| |
| Warnermedia Holdings, Inc. | |
| | |
| | |
| | | |
| |
| Tyson Foods, Inc. 5.70%, 03/15/2034 | |
| |
| Boston Gas Co. 3.15%, 08/01/2027(1) | |
| CenterPoint Energy Resources Corp. 5.40%, 07/01/2034 | |
| KeySpan Gas East Corp. 2.74%, 08/15/2026(1) | |
| Southern Co. Gas Capital Corp. 5.75%, 09/15/2033 | |
| | | |
| Healthcare - Products - 0.1% |
| Alcon Finance Corp. 5.75%, 12/06/2052(1) | |
| Smith & Nephew PLC 5.40%, 03/20/2034 | |
| | | |
| Healthcare - Services - 0.2% |
| Children's Hospital 2.93%, 07/15/2050 | |
| Providence St. Joseph Health Obligated Group 5.40%, 10/01/2033 | |
| Sutter Health 2.29%, 08/15/2030 | |
| Toledo Hospital 5.75%, 11/15/2038 | |
| | |
| | |
| | |
| | |
| | |
| | |
| | | |
| |
| American International Group, Inc. | |
| | |
| | |
| | |
| | |
| | |
| | |
| | |
| | |
| | |
| Beacon Funding Trust 6.27%, 08/15/2054(1) | |
| Brighthouse Financial Global Funding 5.65%, | |
| CNO Global Funding 4.88%, 12/10/2027(1) | |
| Corebridge Financial, Inc. 4.35%, 04/05/2042 | |
| Corebridge Global Funding | |
| | |
| | |
| Equitable Financial Life Global Funding | |
| GA Global Funding Trust 5.20%, 12/09/2031(1) | |
| Pricoa Global Funding I 4.65%, 08/27/2031(1) | |
| RGA Global Funding 5.45%, 05/24/2029(1) | |
| | | |
| Investment Company Security - 0.1% |
| Abu Dhabi Developmental Holding Co. PJSC | |
Shares or Principal Amount | | |
CORPORATE BONDS - 10.4% - (continued) |
| |
| Charter Communications Operating LLC/Charter Communications Operating Capital | |
| | |
| | |
| | |
| Comcast Corp. 3.25%, 11/01/2039 | |
| | |
| | |
| | |
| | | |
| |
| Anglo American Capital PLC | |
| | |
| | |
| | |
| | |
| | |
| | |
| | |
| | |
| | |
| | | |
| |
| Equinor ASA 2.88%, 04/06/2025 | |
| | |
| | |
| | |
| | | |
| |
| CVS Health Corp. 4.30%, 03/25/2028 | |
| |
| Columbia Pipelines Holding Co. LLC | |
| | |
| | |
| Columbia Pipelines Operating Co. LLC | |
| | |
| | |
| | |
| | |
| | |
| | |
| | |
| Galaxy Pipeline Assets Bidco Ltd. 2.16%, | |
| | |
| | |
| | |
| Greensaif Pipelines Bidco SARL | |
| | |
| | |
| ONEOK, Inc. 4.75%, 10/15/2031 | |
| | |
| | |
| | |
| | | |
| Real Estate Investment Trusts - 0.8% |
| American Tower Corp. 5.00%, 01/31/2030 | |
| American Tower Trust I 5.49%, 03/15/2053(1) | |
| | |
| | |
The accompanying notes are an integral part of these financial statements.
Hartford Balanced HLS Fund
Schedule of Investments – (continued)December 31, 2024
Shares or Principal Amount | | |
CORPORATE BONDS - 10.4% - (continued) |
| Real Estate Investment Trusts - 0.8% - (continued) |
| | |
| GLP Capital LP/GLP Financing II, Inc. 6.75%, 12/01/2033 | |
| LXP Industrial Trust 6.75%, 11/15/2028 | |
| Prologis Targeted U.S. Logistics Fund LP | |
| | |
| | |
| | |
| | |
| | |
| | |
| | |
| | | |
| |
| | |
| | |
| | |
| | |
| | |
| Intel Corp. 5.60%, 02/21/2054 | |
| | | |
| |
| Constellation Software, Inc. | |
| | |
| | |
| | |
| | |
| | |
| | |
| | |
| | |
| | |
| | |
| | | |
| Telecommunications - 0.2% |
| | |
| | |
| | |
| | |
| | |
| | |
| Sprint Spectrum Co. LLC/Sprint Spectrum Co. II LLC/Sprint Spectrum Co. III LLC 4.74%, | |
| | | |
| Total Corporate Bonds
(cost $175,496,285) | |
FOREIGN GOVERNMENT OBLIGATIONS - 0.2% |
| |
| Israel Government International Bonds 5.38%, 03/12/2029 | |
| |
| Mexico Government International Bonds | |
| | |
| | |
| | | |
| Total Foreign Government Obligations
(cost $3,457,653) | | |
Shares or Principal Amount | | |
|
| |
| Dallas Fort Worth International Airport, TX, Rev 4.09%, 11/01/2051 | |
| Port Auth of New York & New Jersey, NY, Rev | |
| | | |
| |
| Chicago Transit Auth Sales & Transfer Tax Receipts, IL, Rev 6.90%, 12/01/2040 | |
| Kansas Dev Finance Auth, KS, Rev, (BAM) 2.77%, 05/01/2051 | |
| Philadelphia Auth for Industrial Dev, PA, Rev, (NPFG) 6.55%, 10/15/2028 | |
| | | |
| General Obligation - 0.2% |
| State of Illinois, IL, GO 5.10%, 06/01/2033 | |
| |
| Golden State Tobacco Securitization Corp., CA, Rev 3.00%, 06/01/2046 | |
| |
| Metropolitan Transportation Auth, NY, Rev | |
| | |
| | |
| | |
| | | |
| |
| Texas Natural Gas Securitization Finance Corp., TX, Rev 5.10%, 04/01/2035 | |
| Utility - Electric - 0.1% |
| Illinois Municipal Electric Agency, IL, Rev 6.83%, 02/01/2035 | |
| Municipal Electric Auth of Georgia, GA, Rev 6.64%, 04/01/2057 | |
| | | |
| Total Municipal Bonds
(cost $9,780,991) | | |
U.S. GOVERNMENT AGENCIES - 0.5% |
| Mortgage-Backed Agencies - 0.5% |
| Federal Home Loan Mortgage Corp. - 0.2% |
| | |
| | |
| | |
| | |
| | |
| 6.98%, 04/01/2029, 1 yr. USD CMT + | |
| | | |
| Federal National Mortgage Association - 0.0% |
| | |
| | |
| | | |
| Government National Mortgage Association - 0.2% |
| | |
| | |
| | |
| | |
| | |
| | |
The accompanying notes are an integral part of these financial statements.
Hartford Balanced HLS Fund
Schedule of Investments – (continued)December 31, 2024
Shares or Principal Amount | | |
U.S. GOVERNMENT AGENCIES - 0.5% - (continued) |
| Mortgage-Backed Agencies - 0.5% - (continued) |
| Government National Mortgage Association - 0.2% - (continued) |
| | |
| | |
| | |
| | |
| | |
| | |
| | |
| | |
| | |
| | |
| | |
| | |
| | |
| | |
| | |
| | |
| | |
| | |
| | |
| | |
| | |
| | |
| | |
| | |
| | |
| | |
| | |
| | |
| | |
| | |
| | |
| | |
| | |
| | |
| | |
| | |
| | |
| | |
| | |
| | |
| | |
| | |
| | |
| | |
| | |
| | |
| | |
| | |
| | | |
| Uniform Mortgage-Backed Security - 0.1% |
| | |
| | |
| | | |
| Total U.S. Government Agencies
(cost $8,519,517) | | |
U.S. GOVERNMENT SECURITIES - 20.9% |
| U.S. Treasury Securities - 20.9% |
| U.S. Treasury Bonds - 6.1% |
| | |
| | |
| | |
Shares or Principal Amount | | |
U.S. GOVERNMENT SECURITIES - 20.9% - (continued) |
| U.S. Treasury Securities - 20.9% - (continued) |
| U.S. Treasury Bonds - 6.1% - (continued) |
| | |
| | |
| | |
| | |
| | |
| | |
| | |
| | |
| | |
| | |
| | |
| | |
| | |
| | |
| | |
| | |
| | |
| | |
| | |
| | |
| | |
| | |
| | | |
| U.S. Treasury Notes - 14.8% |
| | |
| | |
| | |
| | |
| | |
| | |
| | |
| | |
| | |
| | |
| | |
| | |
| | |
| | |
| | |
| | |
| | |
| | |
| | |
| | |
| | |
| | |
| | |
| | |
| | |
| | |
| | |
| | |
| | |
| | |
| | |
| | |
| | |
| | |
| | |
| | |
| | |
| | |
The accompanying notes are an integral part of these financial statements.
Hartford Balanced HLS Fund
Schedule of Investments – (continued)December 31, 2024
Shares or Principal Amount | | |
U.S. GOVERNMENT SECURITIES - 20.9% - (continued) |
| U.S. Treasury Securities - 20.9% - (continued) |
| U.S. Treasury Notes - 14.8% - (continued) |
| | |
| | |
| | |
| | |
| | |
| | |
| | |
| | |
| | |
| | |
| | |
| | |
| | |
| | |
| | |
| | |
| | |
| | |
| | |
| | |
| | |
| | |
| | |
| | |
| | |
| | |
| | |
| | |
| | |
| | |
| | |
| | | |
| Total U.S. Government Securities
(cost $356,931,564) | | |
|
| Automobiles & Components - 0.8% |
| | |
| |
| | |
| | |
| | | |
| |
| | |
| | |
| | |
| Fortune Brands Innovations, Inc. | |
| Johnson Controls International PLC | |
| L3Harris Technologies, Inc. | |
| | |
| | | |
| Consumer Discretionary Distribution & Retail - 0.6% |
| | |
| Consumer Durables & Apparel - 0.6% |
| | |
| |
| | |
| | |
Shares or Principal Amount | | |
COMMON STOCKS - 64.6% - (continued) |
| Consumer Services - 3.0% - (continued) |
| | |
| Wyndham Hotels & Resorts, Inc. | |
| | | |
| |
| | |
| | |
| | | |
| Equity Real Estate Investment Trusts (REITs) - 1.3% |
| | |
| Gaming & Leisure Properties, Inc. REIT | |
| | | |
| Financial Services - 7.1% |
| Ares Management Corp. Class A | |
| | |
| Intercontinental Exchange, Inc. | |
| | |
| LPL Financial Holdings, Inc. | |
| | |
| | |
| Raymond James Financial, Inc. | |
| | |
| | | |
| Food, Beverage & Tobacco - 0.8% |
| | |
| Health Care Equipment & Services - 6.2% |
| | |
| | |
| | |
| Edwards Lifesciences Corp.* | |
| | |
| | |
| | | |
| Household & Personal Products - 1.4% |
| | |
| | |
| | | |
| |
| | |
| | |
| | | |
| |
| Axalta Coating Systems Ltd.* | |
| Media & Entertainment - 5.2% |
| | |
| | |
| | |
| | | |
| Pharmaceuticals, Biotechnology & Life Sciences - 4.5% |
| | |
| | |
| | |
| | |
| Vertex Pharmaceuticals, Inc.* | |
| | | |
| Real Estate Management & Development - 0.7% |
| CBRE Group, Inc. Class A* | |
The accompanying notes are an integral part of these financial statements.
Hartford Balanced HLS Fund
Schedule of Investments – (continued)December 31, 2024
Shares or Principal Amount | | |
COMMON STOCKS - 64.6% - (continued) |
| Semiconductors & Semiconductor Equipment - 4.0% |
| | |
| | |
| | |
| | | |
| Software & Services - 10.9% |
| | |
| | |
| | |
| | |
| | |
| | |
| | | |
| Technology Hardware & Equipment - 3.1% |
| | |
| | |
| | |
| | | |
| |
| Knight-Swift Transportation Holdings, Inc. | |
| | |
| United Parcel Service, Inc. Class B | |
| | | |
| Total Common Stocks
(cost $657,481,960) | | |
| Total Long-Term Investments
(cost $1,227,519,567) | | |
SHORT-TERM INVESTMENTS - 0.4% |
| Repurchase Agreements - 0.4% |
| Fixed Income Clearing Corp. Repurchase Agreement dated 12/31/2024 at 4.45%, due on 01/02/2025 with a maturity value of $5,822,469; collateralized by U.S. Treasury Inflation Index Note at 0.13%, maturing 04/15/2027, with a market value of $5,937,570 | |
| Securities Lending Collateral - 0.0% |
| Goldman Sachs Financial Square Funds, Government Fund, Institutional Class, | |
| HSBC U.S. Government Money Market Fund, Institutional Class, 4.41%(8) | |
| Invesco Government & Agency Portfolio, Institutional Class, 4.42%(8) | |
| Morgan Stanley Institutional Liquidity Funds, Government Portfolio, Institutional Class, 4.42%(8) | |
| | | |
| Total Short-Term Investments
(cost $5,892,090) | |
| Total Investments
(cost $1,233,411,657) | | |
| Other Assets and Liabilities | | |
| | | |
Note:
Percentage of investments as shown is the ratio of the total market value to net assets.
Prices of foreign equities that are principally traded on certain foreign markets will generally be adjusted daily pursuant to a fair value pricing service approved by Hartford Funds Management Company, LLC in order to reflect an adjustment for factors occurring after the close of certain foreign markets but before the close of the New York Stock Exchange.
The Fund may refer to any one or more of the industry classifications used by one or more widely recognized market indices, ratings group and/or as defined by Fund management. Industry classifications may not be identical across all security types.
Equity industry classifications used in this report are the Global Industry Classification Standard, which was developed by and is the exclusive property and service mark of MSCI, Inc. and Standard & Poor’s.
For Fund compliance purposes, the Fund may not use the same classification system. These classifications are used for financial reporting purposes.
See “Glossary” for abbreviation descriptions.
| |
| Security was purchased pursuant to Rule 144A under the Securities Act of 1933 and may be sold in transactions that are exempt from registration (typically only to qualified institutional buyers) or in a public offering registered under the Securities Act of 1933. At December 31, 2024, the aggregate value of these securities was $95,587,985, representing 5.8% of net assets. |
| Variable or floating rate security, which interest rate adjusts periodically based on changes in current interest rates and prepayments on the underlying pool of assets. Rate shown is the rate in effect as of period end. |
| Variable rate securities; the rate reported is the coupon rate in effect at December 31, 2024. Base lending rates may be subject to a floor or cap. |
| Fixed to variable rate investment. The rate shown reflects the fixed rate in effect at December 31, 2024. Rate will reset at a future date. Base lending rates may be subject to a floor or cap. |
| Represents entire or partial securities on loan. See Note 8 in the accompanying Notes to Financial Statements for securities lending information. |
| Represents or includes a TBA transaction. |
| All, or a portion of the security, was pledged as collateral in connection with futures contracts. As of December 31, 2024, the market value of securities pledged was $253,245. |
| Current yield as of period end. |
The accompanying notes are an integral part of these financial statements.
Hartford Balanced HLS Fund
Schedule of Investments – (continued)December 31, 2024
Futures Contracts Outstanding at December 31, 2024 |
| | | | Value and
Unrealized
Appreciation/
(Depreciation) |
|
U.S. Treasury 2-Year Note Future | | | | |
| |
† See Significant Accounting Policies of accompanying Notes to Financial Statements regarding valuation of investments.
The following is a summary of the fair valuations according to the inputs used as of December 31, 2024 in valuing the Fund’s investments.
| | | | |
| | | | |
Asset & Commercial Mortgage-Backed Securities | | | | |
| | | | |
Foreign Government Obligations | | | | |
| | | | |
| | | | |
U.S. Government Securities | | | | |
| | | | |
| | | | |
| | | | |
| | | | |
Consumer Discretionary Distribution & Retail | | | | |
Consumer Durables & Apparel | | | | |
| | | | |
| | | | |
Equity Real Estate Investment Trusts (REITs) | | | | |
| | | | |
| | | | |
Health Care Equipment & Services | | | | |
Household & Personal Products | | | | |
| | | | |
| | | | |
| | | | |
Pharmaceuticals, Biotechnology & Life Sciences | | | | |
Real Estate Management & Development | | | | |
Semiconductors & Semiconductor Equipment | | | | |
| | | | |
Technology Hardware & Equipment | | | | |
| | | | |
| | | | |
| | | | |
| | | | |
| For the year ended December 31, 2024, there were no transfers in and out of Level 3. |
| Derivative instruments (excluding purchased and written options, if applicable) are valued at the unrealized appreciation/(depreciation) on the investments. |
The accompanying notes are an integral part of these financial statements.
Hartford Capital Appreciation HLS Fund
Schedule of InvestmentsDecember 31, 2024
Shares or Principal Amount | | |
|
| Automobiles & Components - 1.7% |
| | |
| | |
| | | |
| |
| | |
| | |
| | | |
| |
| | |
| | |
| Builders FirstSource, Inc.* | |
| | |
| | |
| | |
| | |
| | |
| | |
| Honeywell International, Inc. | |
| | |
| | |
| | |
| Rockwell Automation, Inc. | |
| Techtronic Industries Co. Ltd. | |
| Vertiv Holdings Co. Class A | |
| | | |
| Consumer Discretionary Distribution & Retail - 5.1% |
| | |
| Dick's Sporting Goods, Inc. | |
| | |
| | |
| | |
| | | |
| Consumer Durables & Apparel - 1.5% |
| | |
| | |
| | | |
| |
| | |
| DraftKings, Inc. Class A* | |
| | |
| | |
| Royal Caribbean Cruises Ltd. | |
| | |
| Wyndham Hotels & Resorts, Inc. | |
| | | |
| Consumer Staples Distribution & Retail - 0.7% |
| | |
| | |
| | | |
| |
| | |
| Canadian Natural Resources Ltd. | |
| | |
| | |
| | |
| | |
| | |
| | |
| | |
| | | |
| Equity Real Estate Investment Trusts (REITs) - 2.1% |
| American Tower Corp. REIT | |
| AvalonBay Communities, Inc. REIT | |
Shares or Principal Amount | | |
COMMON STOCKS - 97.7% - (continued) |
| Equity Real Estate Investment Trusts (REITs) - 2.1% - (continued) |
| | |
| | |
| | |
| | | |
| Financial Services - 7.0% |
| | |
| | |
| | |
| | |
| | |
| | |
| | |
| Raymond James Financial, Inc. | |
| | |
| | |
| Tradeweb Markets, Inc. Class A | |
| | |
| | |
| | | |
| Food, Beverage & Tobacco - 3.1% |
| Archer-Daniels-Midland Co. | |
| | |
| Constellation Brands, Inc. Class A | |
| | |
| | |
| Tyson Foods, Inc. Class A | |
| | | |
| Health Care Equipment & Services - 3.8% |
| | |
| | |
| Edwards Lifesciences Corp.* | |
| | |
| Intuitive Surgical, Inc.* | |
| | |
| | |
| | |
| | | |
| Household & Personal Products - 2.0% |
| | |
| | |
| | |
| | |
| | | |
| |
| | |
| | |
| | |
| Marsh & McLennan Cos., Inc. | |
| | |
| | |
| | | |
| |
| | |
| | |
| | |
| | |
| | |
| | |
| | |
| | |
| | | |
| Media & Entertainment - 10.2% |
| | |
The accompanying notes are an integral part of these financial statements.
Hartford Capital Appreciation HLS Fund
Schedule of Investments – (continued)December 31, 2024
Shares or Principal Amount | | |
COMMON STOCKS - 97.7% - (continued) |
| Media & Entertainment - 10.2% - (continued) |
| | |
| | |
| Liberty Media Corp.-Liberty Formula One | |
| Live Nation Entertainment, Inc.* | |
| Meta Platforms, Inc. Class A | |
| | |
| | |
| | |
| | |
| | | |
| Pharmaceuticals, Biotechnology & Life Sciences - 5.9% |
| Agilent Technologies, Inc. | |
| | |
| | |
| Charles River Laboratories International, Inc.* | |
| | |
| | |
| | |
| | |
| Neurocrine Biosciences, Inc.* | |
| | |
| | |
| | |
| United Therapeutics Corp.* | |
| Vertex Pharmaceuticals, Inc.* | |
| | | |
| Real Estate Management & Development - 0.2% |
| Zillow Group, Inc. Class C* | |
| Semiconductors & Semiconductor Equipment - 11.8% |
| | |
| | |
| | |
| | |
| | |
| | |
| | |
| | |
| | |
| | |
| | |
| | |
| | | |
| Software & Services - 9.2% |
| | |
| | |
| | |
| | |
| | |
| | |
| | |
| | |
| | |
| | | |
| Technology Hardware & Equipment - 8.4% |
| | |
| | |
| | |
| | | |
| Telecommunication Services - 0.5% |
| | |
| |
| | |
Shares or Principal Amount | | |
COMMON STOCKS - 97.7% - (continued) |
| Transportation - 2.2% - (continued) |
| Knight-Swift Transportation Holdings, Inc. | |
| | |
| | |
| United Parcel Service, Inc. Class B | |
| | | |
| |
| | |
| | |
| | |
| | |
| | | |
| Total Common Stocks
(cost $2,558,045,077) | | |
CONVERTIBLE PREFERRED STOCKS - 0.0% |
| Software & Services - 0.0% |
| Magic Leap, Inc. Class A*(1)(2)(3) | |
| Total Convertible Preferred Stocks
(cost $679,566) | | |
EXCHANGE-TRADED FUNDS - 0.2% |
| Other Investment Pools & Funds - 0.2% |
| iShares Russell 1000 Growth ETF | |
| Total Exchange-Traded Funds
(cost $6,793,790) | | |
| Total Long-Term Investments
(cost $2,565,518,433) | | |
SHORT-TERM INVESTMENTS - 0.4% |
| Repurchase Agreements - 0.4% |
| Fixed Income Clearing Corp. Repurchase Agreement dated 12/31/2024 at 4.45%, due on 01/02/2025 with a maturity value of $13,945,690; collateralized by U.S. Treasury Inflation Index Note at 0.13%, maturing 04/15/2027, with a market value of $14,221,196 | |
| Total Short-Term Investments
(cost $13,942,243) | |
| Total Investments
(cost $2,579,460,676) | | |
| Other Assets and Liabilities | | |
| | | |
Note:
Percentage of investments as shown is the ratio of the total market value to net assets.
Prices of foreign equities that are principally traded on certain foreign markets will generally be adjusted daily pursuant to a fair value pricing service approved by Hartford Funds Management Company, LLC in order to reflect an adjustment for factors occurring after the close of certain foreign markets but before the close of the New York Stock Exchange.
Equity industry classifications used in this report are the Global Industry Classification Standard, which was developed by and is the exclusive property and service mark of MSCI, Inc. and Standard & Poor’s.
For Fund compliance purposes, the Fund may not use the same classification system. These classifications are used for financial reporting purposes.
See “Glossary” for abbreviation descriptions.
The accompanying notes are an integral part of these financial statements.
Hartford Capital Appreciation HLS Fund
Schedule of Investments – (continued)December 31, 2024
| |
| Investment in securities not registered under the Securities Act of 1933 (excluding securities acquired pursuant to Rule 144A and Regulation S). At the end of the period, the value of such restricted securities amounted to $13,861,967 or 0.4% of net assets. |
| | | | |
| | | | |
| Magic Leap, Inc. Class A Convertible Preferred | | | |
| | | | |
| | | | |
| Investment valued using significant unobservable inputs. |
| Currently no rate available. |
Futures Contracts Outstanding at December 31, 2024 |
| | | | Value and
Unrealized
Appreciation/
(Depreciation) |
|
| | | | |
| |
† See Significant Accounting Policies of accompanying Notes to Financial Statements regarding valuation of investments.
The accompanying notes are an integral part of these financial statements.
Hartford Capital Appreciation HLS Fund
Schedule of Investments – (continued)December 31, 2024
Fair Value Summary
The following is a summary of the fair valuations according to the inputs used as of December 31, 2024 in valuing the Fund’s investments.
| | | | |
| | | | |
| | | | |
| | | | |
| | | | |
| | | | |
Consumer Discretionary Distribution & Retail | | | | |
Consumer Durables & Apparel | | | | |
| | | | |
Consumer Staples Distribution & Retail | | | | |
| | | | |
Equity Real Estate Investment Trusts (REITs) | | | | |
| | | | |
| | | | |
Health Care Equipment & Services | | | | |
Household & Personal Products | | | | |
| | | | |
| | | | |
| | | | |
Pharmaceuticals, Biotechnology & Life Sciences | | | | |
Real Estate Management & Development | | | | |
Semiconductors & Semiconductor Equipment | | | | |
| | | | |
Technology Hardware & Equipment | | | | |
Telecommunication Services | | | | |
| | | | |
| | | | |
Convertible Preferred Stocks | | | | |
| | | | |
| | | | |
| | | | |
| | | | |
| | | | |
| | | | |
| For the year ended December 31, 2024, there were no transfers in and out of Level 3. |
| Derivative instruments (excluding purchased and written options, if applicable) are valued at the unrealized appreciation/(depreciation) on the investments. |
Level 3 investments at the beginning and/or end of the period in relation to net assets were not significant and accordingly, a reconciliation of Level 3 assets for the year ended December 31, 2024 is not presented.
The accompanying notes are an integral part of these financial statements.
Hartford Disciplined Equity HLS Fund
Schedule of InvestmentsDecember 31, 2024
Shares or Principal Amount | | |
|
| Automobiles & Components - 1.6% |
| | |
| |
| | |
| | |
| | |
| | | |
| |
| | |
| Builders FirstSource, Inc.* | |
| | |
| | |
| | |
| | |
| | |
| | |
| | |
| | | |
| Commercial & Professional Services - 0.9% |
| | |
| Consumer Discretionary Distribution & Retail - 7.0% |
| | |
| | |
| | |
| | |
| | | |
| Consumer Durables & Apparel - 1.2% |
| | |
| | |
| | | |
| |
| Marriott International, Inc. Class A | |
| | |
| | | |
| |
| | |
| | |
| | |
| | | |
| Equity Real Estate Investment Trusts (REITs) - 1.7% |
| | |
| | |
| | | |
| Financial Services - 4.5% |
| | |
| | |
| | |
| | | |
| Food, Beverage & Tobacco - 2.1% |
| Brown-Forman Corp. Class B | |
| Constellation Brands, Inc. Class A | |
| | |
| | | |
| Health Care Equipment & Services - 5.5% |
| | |
| | |
| | |
| | |
| | | |
Shares or Principal Amount | | |
COMMON STOCKS - 99.7% - (continued) |
| Household & Personal Products - 2.4% |
| Estee Lauder Cos., Inc. Class A | |
| | |
| | | |
| |
| | |
| | |
| | |
| | | |
| |
| | |
| | |
| | | |
| Media & Entertainment - 8.9% |
| | |
| Meta Platforms, Inc. Class A | |
| | |
| | | |
| Pharmaceuticals, Biotechnology & Life Sciences - 6.4% |
| | |
| | |
| | |
| Thermo Fisher Scientific, Inc. | |
| Vertex Pharmaceuticals, Inc.* | |
| | | |
| Semiconductors & Semiconductor Equipment - 11.1% |
| | |
| | |
| | |
| | |
| | | |
| Software & Services - 10.3% |
| | |
| | |
| | |
| | |
| | |
| | | |
| Technology Hardware & Equipment - 10.3% |
| | |
| | |
| | |
| | | |
| Telecommunication Services - 0.8% |
| | |
| |
| | |
| |
| | |
| | |
| | |
| | | |
| Total Common Stocks
(cost $1,638,205,607) | | |
CONVERTIBLE PREFERRED STOCKS - 0.2% |
| Health Care Equipment & Services - 0.1% |
| Lumeris Group Holdings Corp.*(1)(2)(3) | |
The accompanying notes are an integral part of these financial statements.
Hartford Disciplined Equity HLS Fund
Schedule of Investments – (continued)December 31, 2024
Shares or Principal Amount | | |
CONVERTIBLE PREFERRED STOCKS - 0.2% - (continued) |
| Software & Services - 0.1% |
| Lookout, Inc. Series F*(1)(2)(3) | |
| Total Convertible Preferred Stocks
(cost $6,240,761) | | |
| Total Long-Term Investments
(cost $1,644,446,368) | | |
SHORT-TERM INVESTMENTS - 0.0% |
| Repurchase Agreements - 0.0% |
| Fixed Income Clearing Corp. Repurchase Agreement dated 12/31/2024 at 4.45%, due on 01/02/2025 with a maturity value of $1,541,003; collateralized by U.S. Treasury Inflation Index Note at 0.13%, maturing 04/15/2027, with a market value of $1,571,512 | |
| Total Short-Term Investments
(cost $1,540,622) | |
| Total Investments
(cost $1,645,986,990) | | |
| Other Assets and Liabilities | | |
| | | |
Note:
Percentage of investments as shown is the ratio of the total market value to net assets.
Equity industry classifications used in this report are the Global Industry Classification Standard, which was developed by and is the exclusive property and service mark of MSCI, Inc. and Standard & Poor’s.
For Fund compliance purposes, the Fund may not use the same classification system. These classifications are used for financial reporting purposes.
See “Glossary” for abbreviation descriptions.
| |
| Investment in securities not registered under the Securities Act of 1933 (excluding securities acquired pursuant to Rule 144A and Regulation S). At the end of the period, the value of such restricted securities amounted to $7,081,001 or 0.2% of net assets. |
| | | | |
| Lookout, Inc. Series F Convertible Preferred | | | |
| Lumeris Group Holdings Corp. Convertible Preferred | | | |
| | | | |
| | | | |
| Investment valued using significant unobservable inputs. |
| Currently no rate available. |
| See Significant Accounting Policies of accompanying Notes to Financial Statements regarding valuation of investments. |
The accompanying notes are an integral part of these financial statements.
Hartford Disciplined Equity HLS Fund
Schedule of Investments – (continued)December 31, 2024
Fair Value Summary
The following is a summary of the fair valuations according to the inputs used as of December 31, 2024 in valuing the Fund’s investments.
| | | | |
| | | | |
| | | | |
| | | | |
| | | | |
| | | | |
Commercial & Professional Services | | | | |
Consumer Discretionary Distribution & Retail | | | | |
Consumer Durables & Apparel | | | | |
| | | | |
| | | | |
Equity Real Estate Investment Trusts (REITs) | | | | |
| | | | |
| | | | |
Health Care Equipment & Services | | | | |
Household & Personal Products | | | | |
| | | | |
| | | | |
| | | | |
Pharmaceuticals, Biotechnology & Life Sciences | | | | |
Semiconductors & Semiconductor Equipment | | | | |
| | | | |
Technology Hardware & Equipment | | | | |
Telecommunication Services | | | | |
| | | | |
| | | | |
Convertible Preferred Stocks | | | | |
| | | | |
| | | | |
| For the year ended December 31, 2024, there were no transfers in and out of Level 3. |
Level 3 investments at the beginning and/or end of the period in relation to net assets were not significant and accordingly, a reconciliation of Level 3 assets for the year ended December 31, 2024 is not presented.
The accompanying notes are an integral part of these financial statements.
Hartford Dividend and Growth HLS Fund
Schedule of InvestmentsDecember 31, 2024
Shares or Principal Amount | | |
|
| |
| | |
| | |
| | |
| | | |
| |
| | |
| | |
| | |
| Honeywell International, Inc. | |
| | |
| | |
| Westinghouse Air Brake Technologies Corp. | |
| | | |
| Consumer Discretionary Distribution & Retail - 4.0% |
| | |
| | |
| | |
| | | |
| |
| | |
| | |
| | | |
| Consumer Staples Distribution & Retail - 0.6% |
| | |
| |
| | |
| | |
| | |
| | |
| | |
| | | |
| Equity Real Estate Investment Trusts (REITs) - 2.7% |
| American Tower Corp. REIT | |
| AvalonBay Communities, Inc. REIT | |
| | |
| | | |
| Financial Services - 6.4% |
| | |
| | |
| | |
| | |
| | |
| | | |
| Food, Beverage & Tobacco - 3.8% |
| | |
| Philip Morris International, Inc. | |
| Tyson Foods, Inc. Class A | |
| | | |
| Health Care Equipment & Services - 6.4% |
| | |
| | |
| | |
| | |
| | |
| | | |
| Household & Personal Products - 2.3% |
| | |
Shares or Principal Amount | | |
COMMON STOCKS - 98.4% - (continued) |
| Household & Personal Products - 2.3% - (continued) |
| | |
| | |
| | | |
| |
| American International Group, Inc. | |
| | |
| Principal Financial Group, Inc. | |
| | | |
| |
| | |
| | |
| | |
| | | |
| Media & Entertainment - 7.0% |
| | |
| | |
| | |
| | | |
| Pharmaceuticals, Biotechnology & Life Sciences - 7.6% |
| Agilent Technologies, Inc. | |
| | |
| | |
| | |
| | |
| | |
| | | |
| Semiconductors & Semiconductor Equipment - 4.7% |
| | |
| | |
| | |
| | | |
| Software & Services - 8.7% |
| | |
| Cognizant Technology Solutions Corp. Class A | |
| | |
| | |
| | | |
| Technology Hardware & Equipment - 5.7% |
| | |
| | |
| | | |
| |
| | |
| JB Hunt Transport Services, Inc. | |
| | | |
| |
| American Electric Power Co., Inc. | |
| | |
| | |
| | |
| | | |
| Total Common Stocks
(cost $2,049,113,332) | | |
The accompanying notes are an integral part of these financial statements.
Hartford Dividend and Growth HLS Fund
Schedule of Investments – (continued)December 31, 2024
Shares or Principal Amount | | |
SHORT-TERM INVESTMENTS - 0.5% |
| Repurchase Agreements - 0.3% |
| Fixed Income Clearing Corp. Repurchase Agreement dated 12/31/2024 at 4.45%, due on 01/02/2025 with a maturity value of $9,600,745; collateralized by U.S. Treasury Inflation Index Note at 0.13%, maturing 04/15/2027, with a market value of $9,790,460 | |
| Securities Lending Collateral - 0.2% |
| Goldman Sachs Financial Square Funds, Government Fund, Institutional Class, | |
| HSBC U.S. Government Money Market Fund, Institutional Class, 4.41%(2) | |
| Invesco Government & Agency Portfolio, Institutional Class, 4.42%(2) | |
| Morgan Stanley Institutional Liquidity Funds, Government Portfolio, Institutional Class, | |
| | | |
| Total Short-Term Investments
(cost $17,207,340) | |
| Total Investments
(cost $2,066,320,672) | | |
| Other Assets and Liabilities | | |
| | | |
Note:
Percentage of investments as shown is the ratio of the total market value to net assets.
Prices of foreign equities that are principally traded on certain foreign markets will generally be adjusted daily pursuant to a fair value pricing service approved by Hartford Funds Management Company, LLC in order to reflect an adjustment for factors occurring after the close of certain foreign markets but before the close of the New York Stock Exchange.
Equity industry classifications used in this report are the Global Industry Classification Standard, which was developed by and is the exclusive property and service mark of MSCI, Inc. and Standard & Poor’s.
For Fund compliance purposes, the Fund may not use the same classification system. These classifications are used for financial reporting purposes.
See “Glossary” for abbreviation descriptions.
| |
| Represents entire or partial securities on loan. See Note 8 in the accompanying Notes to Financial Statements for securities lending information. |
| Current yield as of period end. |
| See Significant Accounting Policies of accompanying Notes to Financial Statements regarding valuation of investments. |
The following is a summary of the fair valuations according to the inputs used as of December 31, 2024 in valuing the Fund’s investments.
| | | | |
| | | | |
| | | | |
| | | | |
| | | | |
Consumer Discretionary Distribution & Retail | | | | |
| | | | |
Consumer Staples Distribution & Retail | | | | |
| | | | |
Equity Real Estate Investment Trusts (REITs) | | | | |
| | | | |
| | | | |
Health Care Equipment & Services | | | | |
Household & Personal Products | | | | |
| | | | |
| | | | |
| | | | |
Pharmaceuticals, Biotechnology & Life Sciences | | | | |
Semiconductors & Semiconductor Equipment | | | | |
| | | | |
Technology Hardware & Equipment | | | | |
| | | | |
| | | | |
| | | | |
| | | | |
| For the year ended December 31, 2024, there were no transfers in and out of Level 3. |
The accompanying notes are an integral part of these financial statements.
Hartford Healthcare HLS Fund
Schedule of InvestmentsDecember 31, 2024
Shares or Principal Amount | | |
|
| |
| | |
| Akero Therapeutics, Inc.* | |
| Alnylam Pharmaceuticals, Inc.* | |
| | |
| Amicus Therapeutics, Inc.* | |
| Apellis Pharmaceuticals, Inc.* | |
| Apogee Therapeutics, Inc.* | |
| | |
| | |
| Avidity Biosciences, Inc.* | |
| | |
| Blueprint Medicines Corp.* | |
| Celldex Therapeutics, Inc.* | |
| Crinetics Pharmaceuticals, Inc.* | |
| | |
| | |
| | |
| | |
| | |
| | |
| Immunocore Holdings PLC ADR* | |
| Ionis Pharmaceuticals, Inc.* | |
| Janux Therapeutics, Inc.* | |
| Kymera Therapeutics, Inc.* | |
| | |
| MoonLake Immunotherapeutics* | |
| | |
| Nurix Therapeutics, Inc.* | |
| | |
| | |
| Regeneron Pharmaceuticals, Inc.* | |
| REVOLUTION Medicines, Inc.* | |
| Rocket Pharmaceuticals, Inc.* | |
| Sarepta Therapeutics, Inc.* | |
| | |
| Scholar Rock Holding Corp.* | |
| Sichuan Kelun-Biotech Biopharmaceutical Co. Ltd.* | |
| Soleno Therapeutics, Inc.* | |
| Spyre Therapeutics, Inc.* | |
| Ultragenyx Pharmaceutical, Inc.* | |
| United Therapeutics Corp.* | |
| | |
| Vertex Pharmaceuticals, Inc.* | |
| Xenon Pharmaceuticals, Inc.* | |
| | |
| | | |
| Health Care Distributors - 2.1% |
| | |
| Health Care Equipment - 15.5% |
| | |
| | |
| | |
| Edwards Lifesciences Corp.* | |
| | |
| | |
| | |
| Intuitive Surgical, Inc.* | |
| | |
| | | |
| Health Care Facilities - 4.7% |
| Acadia Healthcare Co., Inc.* | |
| Ardent Health Partners, Inc.* | |
| | |
| | |
Shares or Principal Amount | | |
COMMON STOCKS - 99.4% - (continued) |
| Health Care Facilities - 4.7% - (continued) |
| | |
| | |
| | | |
| Health Care Services - 3.3% |
| | |
| | |
| | |
| LifeStance Health Group, Inc.* | |
| Option Care Health, Inc.* | |
| Privia Health Group, Inc.* | |
| | | |
| Health Care Supplies - 0.5% |
| | |
| Health Care Technology - 0.3% |
| Evolent Health, Inc. Class A* | |
| Life Sciences Tools & Services - 10.3% |
| Agilent Technologies, Inc. | |
| | |
| | |
| | |
| | |
| | |
| Thermo Fisher Scientific, Inc. | |
| | |
| | | |
| Managed Health Care - 13.7% |
| Alignment Healthcare, Inc.* | |
| | |
| | |
| | |
| | |
| | |
| | | |
| |
| | |
| | |
| | |
| | |
| | |
| Elanco Animal Health, Inc.* | |
| | |
| | |
| | |
| | |
| | |
| | |
| Structure Therapeutics, Inc. ADR* | |
| | |
| | |
| | | |
| Total Common Stocks
(cost $84,693,859) | | |
The accompanying notes are an integral part of these financial statements.
Hartford Healthcare HLS Fund
Schedule of Investments – (continued)December 31, 2024
Shares or Principal Amount | | |
|
| Health Care Equipment - 0.0% |
| Abiomed, Inc. CVR*(1)(2)(3) | |
| | | |
| Total Long-Term Investments
(cost $84,694,762) | | |
| Total Investments
(cost $84,694,762) | | |
| Other Assets and Liabilities | | |
| | | |
Note:
Percentage of investments as shown is the ratio of the total market value to net assets.
Prices of foreign equities that are principally traded on certain foreign markets will generally be adjusted daily pursuant to a fair value pricing service approved by Hartford Funds Management Company, LLC in order to reflect an adjustment for factors occurring after the close of certain foreign markets but before the close of the New York Stock Exchange.
Equity industry classifications used in this report are the Global Industry Classification Standard, which was developed by and is the exclusive property and service mark of MSCI, Inc. and Standard & Poor’s.
For Fund compliance purposes, the Fund may not use the same classification system. These classifications are used for financial reporting purposes.
See “Glossary” for abbreviation descriptions.
| |
| Investment in securities not registered under the Securities Act of 1933 (excluding securities acquired pursuant to Rule 144A and Regulation S). At the end of the period, the value of such restricted securities amounted to $903 or 0.0% of net assets. |
| Investment valued using significant unobservable inputs. |
| Currently no expiration date available. |
| See Significant Accounting Policies of accompanying Notes to Financial Statements regarding valuation of investments. |
The following is a summary of the fair valuations according to the inputs used as of December 31, 2024 in valuing the Fund’s investments.
| | | | |
| | | | |
| | | | |
| | | | |
| | | | |
| | | | |
| | | | |
| | | | |
| | | | |
| | | | |
Life Sciences Tools & Services | | | | |
| | | | |
| | | | |
| | | | |
| | | | |
| For the year ended December 31, 2024, there were no transfers in and out of Level 3. |
Level 3 investments at the beginning and/or end of the period in relation to net assets were not significant and accordingly, a reconciliation of Level 3 assets for the year ended December 31, 2024 is not presented.
The accompanying notes are an integral part of these financial statements.
Hartford International Opportunities HLS Fund
Schedule of InvestmentsDecember 31, 2024
Shares or Principal Amount | | |
|
| |
| | |
| | |
| | |
| | | |
| |
| | |
| Canadian Pacific Kansas City Ltd. | |
| | |
| Constellation Software, Inc. | |
| | |
| | |
| | |
| | |
| | | |
| |
| | |
| |
| | |
| | |
| | |
| Proya Cosmetics Co. Ltd. Class A | |
| | |
| | | |
| |
| | |
| |
| | |
| | |
| | |
| | |
| | |
| | |
| | |
| | | |
| |
| | |
| | |
| | |
| | |
| | |
| | |
| | |
| | |
| | | |
| |
| | |
| Hong Kong Exchanges & Clearing Ltd. | |
| | | |
| |
| | |
| | |
| | |
| | | |
| |
| Bank Central Asia Tbk. PT | |
| |
| | |
Shares or Principal Amount | | |
COMMON STOCKS - 98.2% - (continued) |
| Italy - 3.0% - (continued) |
| | |
| | |
| | | |
| |
| | |
| | |
| | |
| | |
| Mitsubishi UFJ Financial Group, Inc. | |
| Nomura Research Institute Ltd. | |
| | |
| Recruit Holdings Co. Ltd. | |
| Renesas Electronics Corp.* | |
| | |
| | |
| Sumitomo Mitsui Trust Group, Inc. | |
| | |
| | | |
| |
| | |
| | |
| | |
| | | |
| |
| Singapore Telecommunications Ltd. | |
| |
| | |
| |
| | |
| Shinhan Financial Group Co. Ltd. | |
| | | |
| |
| Cie Financiere Richemont SA Class A | |
| | |
| Partners Group Holding AG | |
| | | |
| |
| Taiwan Semiconductor Manufacturing Co. Ltd. | |
| |
| | |
| | |
| | |
| | |
| London Stock Exchange Group PLC | |
| Reckitt Benckiser Group PLC | |
| | |
| | |
| | | |
| |
| | |
| | |
| | |
| | |
| | |
The accompanying notes are an integral part of these financial statements.
Hartford International Opportunities HLS Fund
Schedule of Investments – (continued)December 31, 2024
Shares or Principal Amount | | |
COMMON STOCKS - 98.2% - (continued) |
| United States - 7.8% - (continued) |
| | |
| | |
| | | |
| Total Common Stocks
(cost $660,762,933) | | |
|
| |
| Constellation Software, Inc. Expires | |
| | | |
| Total Long-Term Investments
(cost $660,762,933) | | |
SHORT-TERM INVESTMENTS - 0.7% |
| Repurchase Agreements - 0.3% |
| Fixed Income Clearing Corp. Repurchase Agreement dated 12/31/2024 at 4.45%, due on 01/02/2025 with a maturity value of $2,962,515; collateralized by U.S. Treasury Inflation Index Note at 0.13%, maturing 04/15/2027, with a market value of $3,021,049 | |
| Securities Lending Collateral - 0.4% |
| Goldman Sachs Financial Square Funds, Government Fund, Institutional Class, | |
| HSBC U.S. Government Money Market Fund, Institutional Class, 4.41%(5) | |
| Invesco Government & Agency Portfolio, Institutional Class, 4.42%(5) | |
| Morgan Stanley Institutional Liquidity Funds, Government Portfolio, Institutional Class, | |
| | | |
| Total Short-Term Investments
(cost $5,975,548) | |
| Total Investments
(cost $666,738,481) | | |
| Other Assets and Liabilities | | |
| | | |
Note:
Percentage of investments as shown is the ratio of the total market value to net assets.
Prices of foreign equities that are principally traded on certain foreign markets will generally be adjusted daily pursuant to a fair value pricing service approved by Hartford Funds Management Company, LLC in order to reflect an adjustment for factors occurring after the close of certain foreign markets but before the close of the New York Stock Exchange.
Equity industry classifications used in this report are the Global Industry Classification Standard, which was developed by and is the exclusive property and service mark of MSCI, Inc. and Standard & Poor’s.
For Fund compliance purposes, the Fund may not use the same classification system. These classifications are used for financial reporting purposes.
See “Glossary” for abbreviation descriptions.
| |
| Security was purchased pursuant to Rule 144A under the Securities Act of 1933 and may be sold in transactions that are exempt from registration (typically only to qualified institutional buyers) or in a public offering registered under the Securities Act of 1933. At December 31, 2024, the aggregate value of this security was $5,188,927, representing 0.6% of net assets. |
| Represents entire or partial securities on loan. See Note 8 in the accompanying Notes to Financial Statements for securities lending information. |
| Investment in securities not registered under the Securities Act of 1933 (excluding securities acquired pursuant to Rule 144A and Regulation S). At the end of the period, the value of such restricted securities amounted to $0 or 0.0% of net assets. |
| | | | |
| Constellation Software, Inc. Expires 03/31/2040 Warrants | | | |
| Investment valued using significant unobservable inputs. |
| Current yield as of period end. |
| See Significant Accounting Policies of accompanying Notes to Financial Statements regarding valuation of investments. |
The accompanying notes are an integral part of these financial statements.
Hartford International Opportunities HLS Fund
Schedule of Investments – (continued)December 31, 2024
Fair Value Summary
The following is a summary of the fair valuations according to the inputs used as of December 31, 2024 in valuing the Fund’s investments.
| For the year ended December 31, 2024, there were no transfers in and out of Level 3. |
Level 3 investments at the beginning and/or end of the period in relation to net assets were not significant and accordingly, a reconciliation of Level 3 assets for the year ended December 31, 2024 is not presented.
The accompanying notes are an integral part of these financial statements.
Schedule of InvestmentsDecember 31, 2024
Shares or Principal Amount | | |
|
| |
| | |
| | |
| Builders FirstSource, Inc.* | |
| | |
| | |
| | |
| | |
| Lennox International, Inc. | |
| Vertiv Holdings Co. Class A | |
| | |
| Westinghouse Air Brake Technologies Corp. | |
| | | |
| Commercial & Professional Services - 5.3% |
| | |
| | |
| | |
| | |
| | |
| | | |
| Consumer Discretionary Distribution & Retail - 4.7% |
| Boot Barn Holdings, Inc.* | |
| Floor & Decor Holdings, Inc. Class A* | |
| O'Reilly Automotive, Inc.* | |
| | |
| | |
| | | |
| Consumer Durables & Apparel - 4.5% |
| | |
| | |
| | | |
| |
| | |
| | |
| DraftKings, Inc. Class A* | |
| Hyatt Hotels Corp. Class A | |
| | | |
| Consumer Staples Distribution & Retail - 1.0% |
| Casey's General Stores, Inc. | |
| |
| | |
| | |
| | |
| | |
| | | |
| Equity Real Estate Investment Trusts (REITs) - 0.7% |
| Lamar Advertising Co. Class A, REIT | |
| Financial Services - 9.2% |
| Ares Management Corp. Class A | |
| Coinbase Global, Inc. Class A* | |
| Hamilton Lane, Inc. Class A | |
| | |
| Rocket Cos., Inc. Class A* | |
| Tradeweb Markets, Inc. Class A | |
| | | |
| Food, Beverage & Tobacco - 0.5% |
| | |
| Health Care Equipment & Services - 4.1% |
| IDEXX Laboratories, Inc.* | |
Shares or Principal Amount | | |
COMMON STOCKS - 99.6% - (continued) |
| Health Care Equipment & Services - 4.1% - (continued) |
| | |
| | |
| Veeva Systems, Inc. Class A* | |
| | | |
| Household & Personal Products - 0.9% |
| | |
| |
| | |
| | |
| Ryan Specialty Holdings, Inc. | |
| | |
| White Mountains Insurance Group Ltd. | |
| | | |
| |
| | |
| Media & Entertainment - 2.6% |
| | |
| Trade Desk, Inc. Class A* | |
| | | |
| Pharmaceuticals, Biotechnology & Life Sciences - 5.8% |
| | |
| | |
| Mettler-Toledo International, Inc.* | |
| | |
| | |
| | | |
| Semiconductors & Semiconductor Equipment - 4.9% |
| | |
| | |
| | |
| | |
| Monolithic Power Systems, Inc. | |
| | |
| | | |
| Software & Services - 23.3% |
| | |
| Clearwater Analytics Holdings, Inc. Class A* | |
| | |
| | |
| | |
| | |
| Guidewire Software, Inc.* | |
| | |
| Informatica, Inc. Class A* | |
| | |
| Palantir Technologies, Inc. Class A* | |
| Procore Technologies, Inc.* | |
| | |
| Tyler Technologies, Inc.* | |
| | |
| | | |
| Technology Hardware & Equipment - 0.8% |
| | |
| |
| Expeditors International of Washington, Inc. | |
| | |
| | | |
The accompanying notes are an integral part of these financial statements.
Schedule of Investments – (continued)December 31, 2024
Shares or Principal Amount | | |
COMMON STOCKS - 99.6% - (continued) |
| |
| | |
| | |
| | | |
| Total Common Stocks
(cost $636,713,932) | | |
SHORT-TERM INVESTMENTS - 0.1% |
| Repurchase Agreements - 0.1% |
| Fixed Income Clearing Corp. Repurchase Agreement dated 12/31/2024 at 4.45%, due on 01/02/2025 with a maturity value of $841,073; collateralized by U.S. Treasury Inflation Index Note at 0.13%, maturing 04/15/2027, with a market value of $857,879 | |
| Total Short-Term Investments
(cost $840,865) | |
| Total Investments
(cost $637,554,797) | | |
| Other Assets and Liabilities | | |
| | | |
Note:
Percentage of investments as shown is the ratio of the total market value to net assets.
Prices of foreign equities that are principally traded on certain foreign markets will generally be adjusted daily pursuant to a fair value pricing service approved by Hartford Funds Management Company, LLC in order to reflect an adjustment for factors occurring after the close of certain foreign markets but before the close of the New York Stock Exchange.
Equity industry classifications used in this report are the Global Industry Classification Standard, which was developed by and is the exclusive property and service mark of MSCI, Inc. and Standard & Poor’s.
For Fund compliance purposes, the Fund may not use the same classification system. These classifications are used for financial reporting purposes.
See “Glossary” for abbreviation descriptions.
| |
| See Significant Accounting Policies of accompanying Notes to Financial Statements regarding valuation of investments. |
The following is a summary of the fair valuations according to the inputs used as of December 31, 2024 in valuing the Fund’s investments.
| | | | |
| | | | |
| | | | |
| | | | |
Commercial & Professional Services | | | | |
Consumer Discretionary Distribution & Retail | | | | |
Consumer Durables & Apparel | | | | |
| | | | |
Consumer Staples Distribution & Retail | | | | |
| | | | |
Equity Real Estate Investment Trusts (REITs) | | | | |
| | | | |
| | | | |
Health Care Equipment & Services | | | | |
Household & Personal Products | | | | |
| | | | |
| | | | |
| | | | |
Pharmaceuticals, Biotechnology & Life Sciences | | | | |
Semiconductors & Semiconductor Equipment | | | | |
| | | | |
Technology Hardware & Equipment | | | | |
| | | | |
| | | | |
| | | | |
| | | | |
| For the year ended December 31, 2024, there were no transfers in and out of Level 3. |
The accompanying notes are an integral part of these financial statements.
Hartford Small Cap Growth HLS Fund
Schedule of InvestmentsDecember 31, 2024
Shares or Principal Amount | | |
|
| Automobiles & Components - 1.4% |
| Modine Manufacturing Co.* | |
| | |
| | | |
| |
| | |
| | |
| | | |
| |
| Applied Industrial Technologies, Inc. | |
| Archer Aviation, Inc. Class A* | |
| | |
| | |
| Bloom Energy Corp. Class A*(1) | |
| | |
| | |
| | |
| | |
| | |
| John Bean Technologies Corp. | |
| | |
| | |
| NEXTracker, Inc. Class A* | |
| | |
| | |
| Rush Enterprises, Inc. Class A | |
| | |
| | |
| | |
| | |
| | | |
| Commercial & Professional Services - 5.8% |
| ACV Auctions, Inc. Class A* | |
| CACI International, Inc. Class A* | |
| Casella Waste Systems, Inc. Class A* | |
| | |
| Huron Consulting Group, Inc.* | |
| | |
| | |
| | |
| | | |
| Consumer Discretionary Distribution & Retail - 2.8% |
| Abercrombie & Fitch Co. Class A* | |
| Boot Barn Holdings, Inc.* | |
| | |
| | |
| Wayfair, Inc. Class A*(1) | |
| | | |
| Consumer Durables & Apparel - 3.6% |
| | |
| Century Communities, Inc. | |
| Installed Building Products, Inc. | |
| | |
| Smith Douglas Homes Corp.* | |
| | |
| | | |
| |
| Sweetgreen, Inc. Class A* | |
| | |
| Wyndham Hotels & Resorts, Inc. | |
| | | |
| |
| | |
| | |
Shares or Principal Amount | | |
COMMON STOCKS - 98.1% - (continued) |
| Energy - 2.3% - (continued) |
| Kodiak Gas Services, Inc. | |
| | |
| | | |
| Equity Real Estate Investment Trusts (REITs) - 2.4% |
| | |
| | |
| Phillips Edison & Co., Inc. REIT | |
| Ryman Hospitality Properties, Inc. REIT | |
| | | |
| Financial Services - 5.9% |
| | |
| Hamilton Lane, Inc. Class A | |
| | |
| | |
| StepStone Group, Inc. Class A | |
| | |
| | |
| | | |
| Food, Beverage & Tobacco - 0.9% |
| | |
| Health Care Equipment & Services - 10.0% |
| Acadia Healthcare Co., Inc.* | |
| | |
| | |
| | |
| | |
| | |
| | |
| Hims & Hers Health, Inc.* | |
| Inspire Medical Systems, Inc.* | |
| iRhythm Technologies, Inc.* | |
| | |
| Merit Medical Systems, Inc.* | |
| Option Care Health, Inc.* | |
| PROCEPT BioRobotics Corp.* | |
| | |
| | | |
| Household & Personal Products - 2.1% |
| | |
| | |
| | | |
| |
| | |
| White Mountains Insurance Group Ltd. | |
| | | |
| |
| | |
| Axalta Coating Systems Ltd.* | |
| | |
| Carpenter Technology Corp. | |
| | |
| | |
| | | |
| Media & Entertainment - 0.4% |
| | |
| Pharmaceuticals, Biotechnology & Life Sciences - 14.3% |
| Akero Therapeutics, Inc.* | |
| Amicus Therapeutics, Inc.* | |
| Apellis Pharmaceuticals, Inc.* | |
| Apogee Therapeutics, Inc.* | |
| Avidity Biosciences, Inc.* | |
| Axsome Therapeutics, Inc.* | |
The accompanying notes are an integral part of these financial statements.
Hartford Small Cap Growth HLS Fund
Schedule of Investments – (continued)December 31, 2024
Shares or Principal Amount | | |
COMMON STOCKS - 98.1% - (continued) |
| Pharmaceuticals, Biotechnology & Life Sciences - 14.3% - (continued) |
| | |
| Blueprint Medicines Corp.* | |
| Celldex Therapeutics, Inc.* | |
| Crinetics Pharmaceuticals, Inc.* | |
| | |
| | |
| Denali Therapeutics, Inc.* | |
| | |
| | |
| | |
| Ionis Pharmaceuticals, Inc.* | |
| Janux Therapeutics, Inc.* | |
| Kymera Therapeutics, Inc.* | |
| MBX Biosciences, Inc.*(1) | |
| Nurix Therapeutics, Inc.* | |
| | |
| Protagonist Therapeutics, Inc.* | |
| | |
| REVOLUTION Medicines, Inc.* | |
| Rocket Pharmaceuticals, Inc.* | |
| Scholar Rock Holding Corp.* | |
| Soleno Therapeutics, Inc.* | |
| Spyre Therapeutics, Inc.* | |
| Structure Therapeutics, Inc. ADR* | |
| | |
| Ultragenyx Pharmaceutical, Inc.* | |
| | |
| | |
| | |
| | |
| | | |
| Semiconductors & Semiconductor Equipment - 4.8% |
| | |
| Credo Technology Group Holding Ltd.* | |
| | |
| | |
| | |
| | |
| | |
| | | |
| Software & Services - 11.5% |
| | |
| | |
| | |
| | |
| | |
| CCC Intelligent Solutions Holdings, Inc.* | |
| Clearwater Analytics Holdings, Inc. Class A* | |
| Grid Dynamics Holdings, Inc.* | |
| Guidewire Software, Inc.* | |
| Informatica, Inc. Class A* | |
| | |
| | |
| | |
| | |
| Sprout Social, Inc. Class A* | |
| | |
| | |
| | |
| | |
| | | |
| Technology Hardware & Equipment - 3.2% |
| | |
| | |
Shares or Principal Amount | | |
COMMON STOCKS - 98.1% - (continued) |
| Technology Hardware & Equipment - 3.2% - (continued) |
| Insight Enterprises, Inc.* | |
| Napco Security Technologies, Inc. | |
| | |
| | |
| | | |
| |
| Knight-Swift Transportation Holdings, Inc. | |
| Total Common Stocks
(cost $421,274,107) | | |
EXCHANGE-TRADED FUNDS - 1.2% |
| Other Investment Pools & Funds - 1.2% |
| iShares Russell 2000 Growth ETF (1) | |
| Total Exchange-Traded Funds
(cost $6,953,068) | | |
| Total Long-Term Investments
(cost $428,227,175) | | |
SHORT-TERM INVESTMENTS - 1.2% |
| Repurchase Agreements - 0.1% |
| Fixed Income Clearing Corp. Repurchase Agreement dated 12/31/2024 at 4.45%, due on 01/02/2025 with a maturity value of $691,969; collateralized by U.S. Treasury Inflation Index Note at 0.13%, maturing 04/15/2027, with a market value of $705,682 | |
| Securities Lending Collateral - 1.1% |
| Goldman Sachs Financial Square Funds, Government Fund, Institutional Class, | |
| HSBC U.S. Government Money Market Fund, Institutional Class, 4.41%(2) | |
| Invesco Government & Agency Portfolio, Institutional Class, 4.42%(2) | |
| Morgan Stanley Institutional Liquidity Funds, Government Portfolio, Institutional Class, | |
| | | |
| Total Short-Term Investments
(cost $6,594,976) | |
| Total Investments
(cost $434,822,151) | | |
| Other Assets and Liabilities | | |
| | | |
Note:
Percentage of investments as shown is the ratio of the total market value to net assets.
Equity industry classifications used in this report are the Global Industry Classification Standard, which was developed by and is the exclusive property and service mark of MSCI, Inc. and Standard & Poor’s.
For Fund compliance purposes, the Fund may not use the same classification system. These classifications are used for financial reporting purposes.
See “Glossary” for abbreviation descriptions.
The accompanying notes are an integral part of these financial statements.
Hartford Small Cap Growth HLS Fund
Schedule of Investments – (continued)December 31, 2024
| Represents entire or partial securities on loan. See Note 8 in the accompanying Notes to Financial Statements for securities lending information. |
| Current yield as of period end. |
| See Significant Accounting Policies of accompanying Notes to Financial Statements regarding valuation of investments. |
The following is a summary of the fair valuations according to the inputs used as of December 31, 2024 in valuing the Fund’s investments.
| | | | |
| | | | |
| | | | |
| | | | |
| | | | |
| | | | |
Commercial & Professional Services | | | | |
Consumer Discretionary Distribution & Retail | | | | |
Consumer Durables & Apparel | | | | |
| | | | |
| | | | |
Equity Real Estate Investment Trusts (REITs) | | | | |
| | | | |
| | | | |
Health Care Equipment & Services | | | | |
Household & Personal Products | | | | |
| | | | |
| | | | |
| | | | |
Pharmaceuticals, Biotechnology & Life Sciences | | | | |
Semiconductors & Semiconductor Equipment | | | | |
| | | | |
Technology Hardware & Equipment | | | | |
| | | | |
| | | | |
| | | | |
| | | | |
| For the year ended December 31, 2024, there were no transfers in and out of Level 3. |
The accompanying notes are an integral part of these financial statements.
Hartford Small Company HLS Fund
Schedule of InvestmentsDecember 31, 2024
Shares or Principal Amount | | |
|
| Automobiles & Components - 0.6% |
| | |
| |
| | |
| |
| | |
| | |
| Applied Industrial Technologies, Inc. | |
| Archer Aviation, Inc.*(1) | |
| | |
| Comfort Systems USA, Inc. | |
| | |
| | |
| NEXTracker, Inc. Class A* | |
| Rush Enterprises, Inc. Class A | |
| Shoals Technologies Group, Inc. Class A* | |
| Zurn Elkay Water Solutions Corp. | |
| | | |
| Commercial & Professional Services - 7.8% |
| Aris Water Solutions, Inc. Class A | |
| Casella Waste Systems, Inc. Class A* | |
| ExlService Holdings, Inc.* | |
| | |
| | |
| | | |
| Consumer Discretionary Distribution & Retail - 3.4% |
| Abercrombie & Fitch Co. Class A* | |
| Boot Barn Holdings, Inc.* | |
| | |
| | |
| | | |
| Consumer Durables & Apparel - 1.7% |
| | |
| |
| | |
| | |
| | |
| Sweetgreen, Inc. Class A* | |
| | |
| | | |
| |
| | |
| | |
| | | |
| Equity Real Estate Investment Trusts (REITs) - 3.1% |
| American Healthcare, Inc. REIT | |
| | |
| Phillips Edison & Co., Inc. REIT | |
| Ryman Hospitality Properties, Inc. REIT | |
| | | |
| Financial Services - 3.9% |
| | |
| HA Sustainable Infrastructure Capital, Inc. | |
| Hamilton Lane, Inc. Class A | |
| PJT Partners, Inc. Class A | |
| | | |
| Health Care Equipment & Services - 11.2% |
| Acadia Healthcare Co., Inc.* | |
| Alignment Healthcare, Inc.* | |
| | |
| | |
| | |
Shares or Principal Amount | | |
COMMON STOCKS - 98.8% - (continued) |
| Health Care Equipment & Services - 11.2% - (continued) |
| | |
| Hims & Hers Health, Inc.* | |
| Inspire Medical Systems, Inc.* | |
| | |
| PROCEPT BioRobotics Corp.* | |
| | |
| | | |
| Household & Personal Products - 1.3% |
| | |
| |
| | |
| |
| | |
| Media & Entertainment - 3.1% |
| | |
| | |
| | |
| | | |
| Pharmaceuticals, Biotechnology & Life Sciences - 16.4% |
| Akero Therapeutics, Inc.* | |
| Amicus Therapeutics, Inc.* | |
| Apellis Pharmaceuticals, Inc.* | |
| Apogee Therapeutics, Inc.* | |
| Avidity Biosciences, Inc.* | |
| | |
| Blueprint Medicines Corp.* | |
| Celldex Therapeutics, Inc.* | |
| Crinetics Pharmaceuticals, Inc.* | |
| | |
| | |
| | |
| | |
| Immunocore Holdings PLC ADR* | |
| | |
| Intellia Therapeutics, Inc.* | |
| Intra-Cellular Therapies, Inc.* | |
| Janux Therapeutics, Inc.* | |
| Kymera Therapeutics, Inc.* | |
| | |
| Nurix Therapeutics, Inc.* | |
| | |
| Protagonist Therapeutics, Inc.* | |
| | |
| | |
| REVOLUTION Medicines, Inc.* | |
| Rocket Pharmaceuticals, Inc.* | |
| | |
| Scholar Rock Holding Corp.* | |
| Soleno Therapeutics, Inc.* | |
| Structure Therapeutics, Inc. ADR* | |
| | |
| | |
| | |
| | | |
| Semiconductors & Semiconductor Equipment - 4.1% |
| Credo Technology Group Holding Ltd.* | |
| | |
| | |
| | |
| | |
| | | |
| Software & Services - 9.0% |
| | |
The accompanying notes are an integral part of these financial statements.
Hartford Small Company HLS Fund
Schedule of Investments – (continued)December 31, 2024
Shares or Principal Amount | | |
COMMON STOCKS - 98.8% - (continued) |
| Software & Services - 9.0% - (continued) |
| Clearwater Analytics Holdings, Inc. Class A* | |
| | |
| DoubleVerify Holdings, Inc.* | |
| Informatica, Inc. Class A* | |
| | |
| | |
| SentinelOne, Inc. Class A* | |
| Sprout Social, Inc. Class A* | |
| | | |
| Technology Hardware & Equipment - 4.4% |
| | |
| | |
| | |
| Ingram Micro Holding Corp.* | |
| | |
| | |
| | | |
| Total Common Stocks
(cost $332,398,804) | | |
EXCHANGE-TRADED FUNDS - 0.9% |
| Other Investment Pools & Funds - 0.9% |
| iShares Russell 2000 Growth ETF (1) | |
| Total Exchange-Traded Funds
(cost $4,054,342) | | |
| Total Long-Term Investments
(cost $336,453,146) | | |
SHORT-TERM INVESTMENTS - 1.3% |
| Repurchase Agreements - 0.1% |
| Fixed Income Clearing Corp. Repurchase Agreement dated 12/31/2024 at 4.45%, due on 01/02/2025 with a maturity value of $314,624; collateralized by U.S. Treasury Inflation Index Note at 0.13%, maturing 04/15/2027, with a market value of $320,865 | |
| Securities Lending Collateral - 1.2% |
| Goldman Sachs Financial Square Funds, Government Fund, Institutional Class, | |
| HSBC U.S. Government Money Market Fund, Institutional Class, 4.41%(4) | |
| Invesco Government & Agency Portfolio, Institutional Class, 4.42%(4) | |
| Morgan Stanley Institutional Liquidity Funds, Government Portfolio, Institutional Class, | |
| | | |
| Total Short-Term Investments
(cost $5,602,237) | |
| Total Investments
(cost $342,055,383) | | |
| Other Assets and Liabilities | | |
| | | |
Note:
Percentage of investments as shown is the ratio of the total market value to net assets.
Equity industry classifications used in this report are the Global Industry Classification Standard, which was developed by and is the exclusive property and service mark of MSCI, Inc. and Standard & Poor’s.
For Fund compliance purposes, the Fund may not use the same classification system. These classifications are used for financial reporting purposes.
See “Glossary” for abbreviation descriptions.
| |
| Represents entire or partial securities on loan. See Note 8 in the accompanying Notes to Financial Statements for securities lending information. |
| Investment in securities not registered under the Securities Act of 1933 (excluding securities acquired pursuant to Rule 144A and Regulation S). At the end of the period, the value of such restricted securities amounted to $2,411,542 or 0.6% of net assets. |
| Investment valued using significant unobservable inputs. |
| Current yield as of period end. |
| See Significant Accounting Policies of accompanying Notes to Financial Statements regarding valuation of investments. |
The accompanying notes are an integral part of these financial statements.
Hartford Small Company HLS Fund
Schedule of Investments – (continued)December 31, 2024
Fair Value Summary
The following is a summary of the fair valuations according to the inputs used as of December 31, 2024 in valuing the Fund’s investments.
| | | | |
| | | | |
| | | | |
| | | | |
| | | | |
| | | | |
Commercial & Professional Services | | | | |
Consumer Discretionary Distribution & Retail | | | | |
Consumer Durables & Apparel | | | | |
| | | | |
| | | | |
Equity Real Estate Investment Trusts (REITs) | | | | |
| | | | |
Health Care Equipment & Services | | | | |
Household & Personal Products | | | | |
| | | | |
| | | | |
| | | | |
Pharmaceuticals, Biotechnology & Life Sciences | | | | |
Semiconductors & Semiconductor Equipment | | | | |
| | | | |
Technology Hardware & Equipment | | | | |
| | | | |
| | | | |
| | | | |
| For the year ended December 31, 2024, there were no transfers in and out of Level 3. |
Level 3 investments at the beginning and/or end of the period in relation to net assets were not significant and accordingly, a reconciliation of Level 3 assets for the year ended December 31, 2024 is not presented.
The accompanying notes are an integral part of these financial statements.
Schedule of InvestmentsDecember 31, 2024
Shares or Principal Amount | | |
|
| |
| | |
| | |
| Honeywell International, Inc. | |
| | |
| | |
| | | |
| Commercial & Professional Services - 2.4% |
| Automatic Data Processing, Inc. | |
| Consumer Discretionary Distribution & Retail - 4.8% |
| | |
| | |
| | | |
| Consumer Durables & Apparel - 2.6% |
| | |
| |
| | |
| Equity Real Estate Investment Trusts (REITs) - 1.9% |
| American Tower Corp. REIT | |
| | |
| | | |
| Financial Services - 9.3% |
| | |
| | |
| | |
| | |
| | | |
| Food, Beverage & Tobacco - 8.8% |
| | |
| | |
| | |
| | |
| | | |
| Health Care Equipment & Services - 11.3% |
| | |
| | |
| | |
| | |
| | | |
| Household & Personal Products - 4.7% |
| | |
| | |
| | | |
| |
| | |
| Marsh & McLennan Cos., Inc. | |
| | | |
| |
| | |
| | |
| | | |
| Media & Entertainment - 1.7% |
| | |
| Pharmaceuticals, Biotechnology & Life Sciences - 7.6% |
| | |
Shares or Principal Amount | | |
COMMON STOCKS - 98.4% - (continued) |
| Pharmaceuticals, Biotechnology & Life Sciences - 7.6% - (continued) |
| | |
| | |
| | |
| | | |
| Semiconductors & Semiconductor Equipment - 2.7% |
| | |
| Software & Services - 8.8% |
| | |
| | |
| | |
| | | |
| Technology Hardware & Equipment - 4.5% |
| | |
| |
| Canadian National Railway Co. | |
| | |
| United Parcel Service, Inc. Class B | |
| | | |
| Total Common Stocks
(cost $694,901,363) | | |
SHORT-TERM INVESTMENTS - 0.4% |
| Repurchase Agreements - 0.4% |
| Fixed Income Clearing Corp. Repurchase Agreement dated 12/31/2024 at 4.45%, due on 01/02/2025 with a maturity value of $4,945,920; collateralized by U.S. Treasury Inflation Index Note at 0.13%, maturing 04/15/2027, with a market value of $5,043,662 | |
| Total Short-Term Investments
(cost $4,944,698) | |
| Total Investments
(cost $699,846,061) | | |
| Other Assets and Liabilities | | |
| | | |
Note:
Percentage of investments as shown is the ratio of the total market value to net assets.
Prices of foreign equities that are principally traded on certain foreign markets will generally be adjusted daily pursuant to a fair value pricing service approved by Hartford Funds Management Company, LLC in order to reflect an adjustment for factors occurring after the close of certain foreign markets but before the close of the New York Stock Exchange.
Equity industry classifications used in this report are the Global Industry Classification Standard, which was developed by and is the exclusive property and service mark of MSCI, Inc. and Standard & Poor’s.
For Fund compliance purposes, the Fund may not use the same classification system. These classifications are used for financial reporting purposes.
See “Glossary” for abbreviation descriptions.
† See Significant Accounting Policies of accompanying Notes to Financial Statements regarding valuation of investments.
The accompanying notes are an integral part of these financial statements.
Schedule of Investments – (continued)December 31, 2024
Fair Value Summary
The following is a summary of the fair valuations according to the inputs used as of December 31, 2024 in valuing the Fund’s investments.
| | | | |
| | | | |
| | | | |
| | | | |
Commercial & Professional Services | | | | |
Consumer Discretionary Distribution & Retail | | | | |
Consumer Durables & Apparel | | | | |
| | | | |
Equity Real Estate Investment Trusts (REITs) | | | | |
| | | | |
| | | | |
Health Care Equipment & Services | | | | |
Household & Personal Products | | | | |
| | | | |
| | | | |
| | | | |
Pharmaceuticals, Biotechnology & Life Sciences | | | | |
Semiconductors & Semiconductor Equipment | | | | |
| | | | |
Technology Hardware & Equipment | | | | |
| | | | |
| | | | |
| | | | |
| For the year ended December 31, 2024, there were no transfers in and out of Level 3. |
The accompanying notes are an integral part of these financial statements.
Hartford Total Return Bond HLS Fund
Schedule of InvestmentsDecember 31, 2024
Shares or Principal Amount | | |
ASSET & COMMERCIAL MORTGAGE-BACKED SECURITIES - 18.2% |
| Asset-Backed - Automobile - 1.5% |
| American Credit Acceptance Receivables Trust 6.09%, 11/12/2027(1) | |
| ARI Fleet Lease Trust 5.41%, 02/17/2032(1) | |
| Avis Budget Rental Car Funding AESOP LLC | |
| | |
| | |
| | |
| Carvana Auto Receivables Trust 4.13%, 04/12/2027 | |
| CPS Auto Receivables Trust 5.91%, | |
| Credit Acceptance Auto Loan Trust 5.68%, | |
| DT Auto Owner Trust 5.41%, 02/15/2029(1) | |
| Enterprise Fleet Financing LLC 5.16%, | |
| Flagship Credit Auto Trust | |
| | |
| | |
| GLS Auto Receivables Issuer Trust | |
| | |
| | |
| Hertz Vehicle Financing III LLC 5.94%, | |
| Santander Drive Auto Receivables Trust | |
| | |
| | |
| SFS Auto Receivables Securitization Trust | |
| Westlake Automobile Receivables Trust | |
| World Omni Auto Receivables Trust 5.03%, 05/15/2029 | |
| | | |
| Asset-Backed - Home Equity - 0.3% |
| Fieldstone Mortgage Investment Trust 4.99%, 05/25/2036, 1 mo. USD Term | |
| | |
| 4.61%, 02/25/2037, 1 mo. USD Term | |
| 4.81%, 11/25/2036, 1 mo. USD Term | |
| | |
| GSAMP Trust 4.54%, 01/25/2037, 1 mo. | |
| Morgan Stanley ABS Capital I, Inc. Trust 4.75%, 06/25/2036, 1 mo. USD Term | |
| Morgan Stanley Mortgage Loan Trust 4.79%, 11/25/2036, 1 mo. USD Term | |
| Securitized Asset-Backed Receivables LLC Trust 4.63%, 07/25/2036, 1 mo. USD | |
| Soundview Home Loan Trust | |
| 4.63%, 07/25/2037, 1 mo. USD Term | |
| 4.95%, 11/25/2036, 1 mo. USD Term | |
| | | |
Shares or Principal Amount | | |
ASSET & COMMERCIAL MORTGAGE-BACKED SECURITIES - 18.2% - (continued) |
| Asset-Backed - Student Loan - 0.2% |
| Navient Private Education Refi Loan Trust | |
| | |
| | |
| | | |
| Commercial Mortgage-Backed Securities - 3.7% |
| 280 Park Avenue Mortgage Trust 6.90%, 09/15/2034, 1 mo. USD Term SOFR + | |
| | |
| | |
| | |
| | |
| | |
| | |
| | |
| | |
| | |
| | |
| | |
| BOCA Commercial Mortgage Trust 6.74%, 08/15/2041, 1 mo. USD Term SOFR + | |
| | |
| | |
| 7.63%, 08/15/2039, 1 mo. USD Term | |
| | |
| 6.85%, 08/15/2039, 1 mo. USD Term | |
| 7.44%, 03/15/2041, 1 mo. USD Term | |
| CAMB Commercial Mortgage Trust 7.25%, 12/15/2037, 1 mo. USD Term SOFR + | |
| CD Mortgage Trust 2.46%, 08/10/2049 | |
| Citigroup Commercial Mortgage Trust | |
| | |
| | |
| Commercial Mortgage Trust | |
| | |
| | |
| | |
| Credit Suisse First Boston Mortgage Securities Corp. 4.88%, 04/15/2037 | |
| CSAIL Commercial Mortgage Trust | |
| | |
| | |
| | |
| DBJPM Mortgage Trust 1.70%, | |
| | |
| | |
| | |
| GS Mortgage Securities Corp. II 5.70%, | |
| GS Mortgage Securities Corp. Trust 2.95%, | |
| GS Mortgage Securities Trust | |
| | |
| 4.74%, 08/10/2044(1)(3)(4) | |
| | |
| HTL Commercial Mortgage Trust | |
| | |
| | |
The accompanying notes are an integral part of these financial statements.
Hartford Total Return Bond HLS Fund
Schedule of Investments – (continued)December 31, 2024
Shares or Principal Amount | | |
ASSET & COMMERCIAL MORTGAGE-BACKED SECURITIES - 18.2% - (continued) |
| Commercial Mortgage-Backed Securities - 3.7% - (continued) |
| JP Morgan Chase Commercial Mortgage Securities Trust | |
| | |
| | |
| | |
| JPMBB Commercial Mortgage Securities Trust | |
| | |
| | |
| Morgan Stanley Bank of America Merrill Lynch Trust 0.95%, 10/15/2048(3)(4) | |
| Morgan Stanley Capital I Trust | |
| | |
| | |
| | |
| | |
| NJ Trust 6.48%, 01/06/2029(1)(3) | |
| ROCK Trust 5.93%, 11/13/2041(1) | |
| SG Commercial Mortgage Securities Trust | |
| TYSN Mortgage Trust 6.58%, | |
| UBS Commercial Mortgage Trust 1.06%, | |
| Wells Fargo Commercial Mortgage Trust | |
| | |
| | |
| | |
| | |
| | |
| | |
| | |
| | |
| | |
| | |
| | |
| | |
| | |
| | |
| WFRBS Commercial Mortgage Trust 5.00%, | |
| | | |
| Other Asset-Backed Securities - 5.0% |
| AASET Trust 3.35%, 01/16/2040(1) | |
| Affirm Asset Securitization Trust 6.61%, | |
| Aligned Data Centers Issuer LLC 6.00%, | |
| Battalion CLO 18 Ltd. 6.82%, 03/13/2037, 3 mo. USD Term SOFR + 2.20%(1)(2) | |
| Benefit Street Partners CLO XXXI Ltd. 6.98%, 04/25/2036, 3 mo. USD Term | |
| Blue Owl Asset Leasing Trust LLC 5.41%, | |
| | |
| | |
| | |
| | |
| | |
| Cirrus Funding Ltd. 4.80%, 01/25/2037(1) | |
| Columbia Cent CLO 27 Ltd. 6.08%, 01/25/2035, 3 mo. USD Term SOFR + | |
| DLLAA LLC 5.64%, 02/22/2028(1) | |
Shares or Principal Amount | | |
ASSET & COMMERCIAL MORTGAGE-BACKED SECURITIES - 18.2% - (continued) |
| Other Asset-Backed Securities - 5.0% - (continued) |
| Domino's Pizza Master Issuer LLC | |
| | |
| | |
| | |
| Elmwood CLO 19 Ltd. 7.05%, 10/17/2036, 3 mo. USD Term SOFR + 2.40%(1)(2) | |
| Elmwood CLO 23 Ltd. 6.90%, 04/16/2036, 3 mo. USD Term SOFR + 2.25%(1)(2) | |
| FirstKey Homes Trust 4.25%, 07/17/2039(1) | |
| Golub Capital Partners CLO 68B Ltd. 7.43%, 07/25/2036, 3 mo. USD Term | |
| Invesco U.S. CLO Ltd. 6.92%, 04/21/2036, 3 mo. USD Term SOFR + 2.30%(1)(2) | |
| Madison Park Funding LXVII Ltd. 6.14%, 04/25/2037, 3 mo. USD Term SOFR + | |
| New Economy Assets - Phase 1 Sponsor LLC 1.91%, 10/20/2061(1) | |
| NRZ Excess Spread-Collateralized Notes | |
| Octagon 61 Ltd. 6.97%, 04/20/2036, 3 mo. USD Term SOFR + 2.35%(1)(2) | |
| Progress Residential Trust | |
| | |
| | |
| | |
| | |
| | |
| Retained Vantage Data Centers Issuer LLC | |
| RR 23 Ltd. 7.31%, 10/15/2035, 3 mo. USD | |
| Sapphire Aviation Finance II Ltd. 3.23%, | |
| SCF Equipment Leasing LLC 5.56%, | |
| Stack Infrastructure Issuer LLC | |
| | |
| | |
| Summit Issuer LLC 2.29%, 12/20/2050(1) | |
| Symphony CLO XXV Ltd. 5.86%, 04/19/2034, 3 mo. USD Term SOFR + | |
| Texas Debt Capital CLO Ltd. 6.92%, 04/20/2036, 3 mo. USD Term SOFR + | |
| Tricon Residential Trust 4.85%, | |
| Wendy's Funding LLC 3.88%, 03/15/2048(1) | |
| | |
| | |
| | |
| | | |
| Whole Loan Collateral CMO - 7.5% |
| | |
| | |
| | |
| | |
| | |
| | |
| Arroyo Mortgage Trust 3.35%, | |
| Banc of America Funding Trust | |
| 5.08%, 05/20/2047, 1 mo. USD Term | |
The accompanying notes are an integral part of these financial statements.
Hartford Total Return Bond HLS Fund
Schedule of Investments – (continued)December 31, 2024
Shares or Principal Amount | | |
ASSET & COMMERCIAL MORTGAGE-BACKED SECURITIES - 18.2% - (continued) |
| Whole Loan Collateral CMO - 7.5% - (continued) |
| | |
| | |
| BCAP LLC Trust 4.81%, 03/25/2037, 1 mo. | |
| Bear Stearns ALT-A Trust 4.95%, 01/25/2036, 1 mo. USD Term SOFR + | |
| Bear Stearns ARM Trust 7.08%, 10/25/2035, 1 yr. USD CMT + 2.30%(2) | |
| Bear Stearns Mortgage Funding Trust 4.81%, 10/25/2036, 1 mo. USD Term | |
| BRAVO Residential Funding Trust | |
| | |
| | |
| CHL Mortgage Pass-Through Trust | |
| | |
| | |
| | |
| | |
| | |
| | |
| Countrywide Alternative Loan Trust | |
| 4.99%, 01/25/2036, 1 mo. USD Term | |
| 5.09%, 11/25/2035, 1 mo. USD Term | |
| | |
| CSFB Mortgage-Backed Pass-Through Certificates 5.50%, 06/25/2035 | |
| | |
| | |
| | |
| | |
| | |
| | |
| Deephaven Residential Mortgage Trust | |
| Ellington Financial Mortgage Trust | |
| | |
| | |
| Federal Home Loan Mortgage Corp. Seasoned Credit Risk Transfer Trust | |
| | |
| | |
| | |
| | |
| | |
| | |
| Federal National Mortgage Association Connecticut Avenue Securities Trust | |
| 6.37%, 02/25/2044, 30 day USD SOFR | |
| 6.83%, 11/25/2039, 30 day USD SOFR | |
| 7.66%, 06/25/2043, 30 day USD SOFR | |
| 7.67%, 10/25/2041, 30 day USD SOFR | |
| 7.72%, 12/25/2041, 30 day USD SOFR | |
| 8.23%, 07/25/2029, 30 day USD SOFR | |
| 9.03%, 05/25/2029, 30 day USD SOFR | |
Shares or Principal Amount | | |
ASSET & COMMERCIAL MORTGAGE-BACKED SECURITIES - 18.2% - (continued) |
| Whole Loan Collateral CMO - 7.5% - (continued) |
| 9.07%, 01/25/2042, 30 day USD SOFR | |
| First Franklin Mortgage Loan Trust 4.93%, 04/25/2036, 1 mo. USD Term SOFR + | |
| | |
| | |
| | |
| GMACM Mortgage Loan Trust 3.79%, | |
| | |
| | |
| 4.75%, 01/25/2037, 1 mo. USD Term | |
| HarborView Mortgage Loan Trust | |
| 4.86%, 01/19/2038, 1 mo. USD Term | |
| 4.96%, 12/19/2036, 1 mo. USD Term | |
| Imperial Fund Mortgage Trust 3.64%, | |
| IndyMac INDX Mortgage Loan Trust 3.96%, | |
| JP Morgan Mortgage Trust 5.67%, | |
| Legacy Mortgage Asset Trust | |
| | |
| | |
| Lehman XS Trust 4.87%, 07/25/2046, 1 mo. | |
| MASTR Adjustable Rate Mortgages Trust | |
| | |
| | |
| | |
| | |
| New Residential Mortgage Loan Trust | |
| | |
| | |
| | |
| | |
| | |
| | |
| | |
| 5.20%, 01/25/2048, 1 mo. USD Term | |
| 5.95%, 06/25/2057, 1 mo. USD Term | |
| NMLT Trust 1.19%, 05/25/2056(1)(3) | |
| | |
| | |
| | |
| | |
| | |
| | |
| | |
| | |
| | |
| Pretium Mortgage Credit Partners LLC | |
| | |
| | |
| | |
| | |
| | |
| | |
The accompanying notes are an integral part of these financial statements.
Hartford Total Return Bond HLS Fund
Schedule of Investments – (continued)December 31, 2024
Shares or Principal Amount | | |
ASSET & COMMERCIAL MORTGAGE-BACKED SECURITIES - 18.2% - (continued) |
| Whole Loan Collateral CMO - 7.5% - (continued) |
| | |
| | |
| RALI Trust 6.00%, 12/25/2035 | |
| RBSGC Mortgage Loan Trust 6.25%, 01/25/2037 | |
| Starwood Mortgage Residential Trust | |
| | |
| | |
| Towd Point Mortgage Trust 2.92%, | |
| Verus Securitization Trust | |
| | |
| | |
| | |
| | |
| | |
| | |
| | |
| VOLT XCIV LLC 5.24%, 02/27/2051(1)(5) | |
| WaMu Mortgage Pass-Through Certificates Trust | |
| | |
| 4.26%, 12/25/2046, 1 yr. USD MTA + | |
| 5.29%, 06/25/2044, 1 mo. USD Term | |
| | | |
| Total Asset & Commercial Mortgage-Backed Securities
(cost $331,915,983) | |
|
| |
| Lamar Media Corp. 3.63%, 01/15/2031 | |
| |
| BAE Systems PLC 5.13%, 03/26/2029(1) | |
| | |
| | |
| | |
| | |
| | |
| | |
| | |
| L3Harris Technologies, Inc. | |
| | |
| | |
| | |
| | |
| Northrop Grumman Corp. 5.15%, 05/01/2040 | |
| RTX Corp. 4.13%, 11/16/2028 | |
| | | |
| |
| BAT Capital Corp. 5.83%, 02/20/2031 | |
| Philip Morris International, Inc. | |
| | |
| | |
| | |
| | |
| | |
| | |
| | |
| | | |
Shares or Principal Amount | | |
CORPORATE BONDS - 23.7% - (continued) |
| |
| Hanesbrands, Inc. 4.88%, 05/15/2026(1) | |
| | |
| | |
| | |
| William Carter Co. 5.63%, 03/15/2027(1) | |
| | | |
| Auto Manufacturers - 0.0% |
| Mercedes-Benz Finance North America LLC | |
| |
| Anheuser-Busch InBev Worldwide, Inc. 4.75%, 01/23/2029 | |
| Bacardi Ltd./Bacardi-Martini BV 5.25%, | |
| | | |
| |
| Gilead Sciences, Inc. 4.80%, 11/15/2029 | |
| Royalty Pharma PLC 2.15%, 09/02/2031 | |
| | | |
| |
| NOVA Chemicals Corp. 7.00%, | |
| OCP SA 6.75%, 05/02/2034(1) | |
| | | |
| |
| Banca Comerciala Romana SA 7.63%, 05/19/2027, (7.63% fixed rate until 05/19/2026; 3 mo. EURIBOR + 4.54% | |
| Banca Transilvania SA 8.88%, 04/27/2027, (8.88% fixed rate until 04/27/2026; 1 yr. EURIBOR ICE Swap + 5.58% | |
| | |
| 1.90%, 07/23/2031, (1.90% fixed rate until 07/23/2030; 6 mo. USD SOFR + | |
| 1.92%, 10/24/2031, (1.92% fixed rate until 10/24/2030; 6 mo. USD SOFR + | |
| 2.30%, 07/21/2032, (2.30% fixed rate until 07/21/2031; 6 mo. USD SOFR + | |
| 2.48%, 09/21/2036, (2.48% fixed rate until 09/21/2031; 5 yr. USD CMT + | |
| 2.57%, 10/20/2032, (2.57% fixed rate until 10/20/2031; 6 mo. USD SOFR + | |
| 2.59%, 04/29/2031, (2.59% fixed rate until 04/29/2030; 6 mo. USD SOFR + | |
| 2.69%, 04/22/2032, (2.69% fixed rate until 04/22/2031; 6 mo. USD SOFR + | |
| 3.19%, 07/23/2030, (3.19% fixed rate until 07/23/2029; 3 mo. USD Term SOFR + 1.44% thereafter)(6) | |
| 4.95%, 07/22/2028, (4.95% fixed rate until 07/22/2027; 6 mo. USD SOFR + | |
The accompanying notes are an integral part of these financial statements.
Hartford Total Return Bond HLS Fund
Schedule of Investments – (continued)December 31, 2024
Shares or Principal Amount | | |
CORPORATE BONDS - 23.7% - (continued) |
| Commercial Banks - 5.4% - (continued) |
| 5.20%, 04/25/2029, (5.20% fixed rate until 04/25/2028; 6 mo. USD SOFR + | |
| 5.52%, 10/25/2035, (5.52% fixed rate until 10/25/2034; 6 mo. USD SOFR + | |
| 5.93%, 09/15/2027, (5.93% fixed rate until 09/15/2026; 6 mo. USD SOFR + | |
| Bank of Ireland Group PLC | |
| 5.60%, 03/20/2030, (5.60% fixed rate until 03/20/2029; 6 mo. USD SOFR + | |
| 6.25%, 09/16/2026, (6.25% fixed rate until 09/16/2025; 1 yr. USD CMT + | |
| Bank of New York Mellon Corp. | |
| 4.98%, 03/14/2030, (4.98% fixed rate until 03/14/2029; 6 mo. USD SOFR + | |
| 5.06%, 07/22/2032, (5.06% fixed rate until 07/22/2031; 6 mo. USD SOFR + | |
| 5.19%, 03/14/2035, (5.19% fixed rate until 03/14/2034; 6 mo. USD SOFR + | |
| 6.32%, 10/25/2029, (6.32% fixed rate until 10/25/2028; 6 mo. USD SOFR + | |
| | |
| 5.28%, 11/19/2030, (5.28% fixed rate until 11/19/2029; 6 mo. USD SOFR + | |
| 5.91%, 11/19/2035, (5.91% fixed rate until 11/19/2034; 6 mo. USD SOFR + | |
| | |
| 5.72%, 01/18/2030, (5.72% fixed rate until 01/18/2029; 6 mo. USD SOFR + | |
| 5.94%, 05/30/2035, (5.94% fixed rate until 05/30/2034; 6 mo. USD SOFR + | |
| 6.51%, 01/18/2035, (6.51% fixed rate until 01/18/2034; 6 mo. USD SOFR + | |
| 6.71%, 10/19/2029, (6.71% fixed rate until 10/19/2028; 6 mo. USD SOFR + | |
| 7.00%, 10/19/2034, (7.00% fixed rate until 10/19/2033; 6 mo. USD SOFR + | |
| Citigroup, Inc. 5.17%, 02/13/2030, (5.17% fixed rate until 02/13/2029; 6 mo. USD SOFR + 1.36% thereafter)(6) | |
| Citizens Financial Group, Inc. | |
| 5.72%, 07/23/2032, (5.72% fixed rate until 07/23/2031; 6 mo. USD SOFR + | |
| 5.84%, 01/23/2030, (5.84% fixed rate until 01/23/2029; 6 mo. USD SOFR + | |
| 6.65%, 04/25/2035, (6.65% fixed rate until 04/25/2034; 6 mo. USD SOFR + | |
Shares or Principal Amount | | |
CORPORATE BONDS - 23.7% - (continued) |
| Commercial Banks - 5.4% - (continued) |
| Credit Agricole SA 6.25%, 01/10/2035, (6.25% fixed rate until 01/10/2034; 6 mo. USD SOFR + 2.67% thereafter)(1)(6) | |
| Danske Bank AS 1.62%, 09/11/2026, (1.62% fixed rate until 09/11/2025; 1 yr. USD CMT + 1.35% thereafter)(1)(6) | |
| Goldman Sachs Group, Inc. | |
| 2.38%, 07/21/2032, (2.38% fixed rate until 07/21/2031; 6 mo. USD SOFR + | |
| 2.62%, 04/22/2032, (2.62% fixed rate until 04/22/2031; 6 mo. USD SOFR + | |
| 4.69%, 10/23/2030, (4.69% fixed rate until 10/23/2029; 6 mo. USD SOFR + | |
| 5.02%, 10/23/2035, (5.02% fixed rate until 10/23/2034; 6 mo. USD SOFR + | |
| 5.05%, 07/23/2030, (5.05% fixed rate until 07/23/2029; 6 mo. USD SOFR + | |
| 5.73%, 04/25/2030, (5.73% fixed rate until 04/25/2029; 6 mo. USD SOFR + | |
| | |
| 2.21%, 08/17/2029, (2.21% fixed rate until 08/17/2028; 6 mo. USD SOFR + | |
| 2.85%, 06/04/2031, (2.85% fixed rate until 06/04/2030; 6 mo. USD SOFR + | |
| 4.58%, 06/19/2029, (4.58% fixed rate until 06/19/2028; 3 mo. USD Term SOFR + 1.80% thereafter)(6) | |
| 5.29%, 11/19/2030, (5.29% fixed rate until 11/19/2029; 6 mo. USD SOFR + | |
| 5.40%, 08/11/2033, (5.40% fixed rate until 08/11/2032; 6 mo. USD SOFR + | |
| 5.89%, 08/14/2027, (5.89% fixed rate until 08/14/2026; 6 mo. USD SOFR + | |
| Intesa Sanpaolo SpA 7.80%, 11/28/2053(1) | |
| | |
| 2.55%, 11/08/2032, (2.55% fixed rate until 11/08/2031; 6 mo. USD SOFR + | |
| 2.58%, 04/22/2032, (2.58% fixed rate until 04/22/2031; 3 mo. USD Term SOFR + 1.25% thereafter)(6) | |
| 3.70%, 05/06/2030, (3.70% fixed rate until 05/06/2029; 3 mo. USD Term SOFR + 1.42% thereafter)(6) | |
| 4.01%, 04/23/2029, (4.01% fixed rate until 04/23/2028; 3 mo. USD Term SOFR + 1.38% thereafter)(6) | |
| 4.51%, 10/22/2028, (4.51% fixed rate until 10/22/2027; 6 mo. USD SOFR + | |
| 4.85%, 07/25/2028, (4.85% fixed rate until 07/25/2027; 6 mo. USD SOFR + | |
The accompanying notes are an integral part of these financial statements.
Hartford Total Return Bond HLS Fund
Schedule of Investments – (continued)December 31, 2024
Shares or Principal Amount | | |
CORPORATE BONDS - 23.7% - (continued) |
| Commercial Banks - 5.4% - (continued) |
| 4.95%, 10/22/2035, (4.95% fixed rate until 10/22/2034; 6 mo. USD SOFR + | |
| 5.00%, 07/22/2030, (5.00% fixed rate until 07/22/2029; 6 mo. USD SOFR + | |
| 5.29%, 07/22/2035, (5.29% fixed rate until 07/22/2034; 6 mo. USD SOFR + | |
| 5.30%, 07/24/2029, (5.30% fixed rate until 07/24/2028; 6 mo. USD SOFR + | |
| 5.34%, 01/23/2035, (5.34% fixed rate until 01/23/2034; 6 mo. USD SOFR + | |
| 5.58%, 04/22/2030, (5.58% fixed rate until 04/22/2029; 6 mo. USD SOFR + | |
| 6.07%, 10/22/2027, (6.07% fixed rate until 10/22/2026; 6 mo. USD SOFR + | |
| 6.09%, 10/23/2029, (6.09% fixed rate until 10/23/2028; 6 mo. USD SOFR + | |
| M&T Bank Corp. 7.41%, 10/30/2029, (7.41% fixed rate until 10/30/2028; 6 mo. USD SOFR + 2.80% thereafter)(6) | |
| mBank SA 0.97%, 09/21/2027, (0.97% fixed rate until 09/21/2026; 3 mo. EURIBOR + | |
| | |
| 1.79%, 02/13/2032, (1.79% fixed rate until 02/13/2031; 6 mo. USD SOFR + | |
| 1.93%, 04/28/2032, (1.93% fixed rate until 04/28/2031; 6 mo. USD SOFR + | |
| 3.62%, 04/01/2031, (3.62% fixed rate until 04/01/2030; 6 mo. USD SOFR + | |
| 5.45%, 07/20/2029, (5.45% fixed rate until 07/20/2028; 6 mo. USD SOFR + | |
| 5.66%, 04/18/2030, (5.66% fixed rate until 04/18/2029; 6 mo. USD SOFR + | |
| 6.41%, 11/01/2029, (6.41% fixed rate until 11/01/2028; 6 mo. USD SOFR + | |
| | |
| 7.35%, 03/04/2026, (7.35% fixed rate until 03/04/2025; 3 mo. EURIBOR + | |
| 7.50%, 05/25/2027, (7.50% fixed rate until 05/25/2026; 1 yr. USD CMT + | |
| PNC Financial Services Group, Inc. 4.81%, 10/21/2032, (4.81% fixed rate until 10/21/2031; 6 mo. USD SOFR + 1.26% | |
| | |
| 5.01%, 10/15/2030, (5.01% fixed rate until 10/15/2029; 1 yr. USD CMT + | |
Shares or Principal Amount | | |
CORPORATE BONDS - 23.7% - (continued) |
| Commercial Banks - 5.4% - (continued) |
| 7.02%, 02/08/2030, (7.02% fixed rate until 02/08/2029; 1 yr. USD CMT + | |
| 7.77%, 11/16/2028, (7.77% fixed rate until 11/16/2027; 1 yr. USD CMT + | |
| | |
| 4.19%, 04/01/2031, (4.19% fixed rate until 04/01/2030; 6 mo. USD SOFR + | |
| 4.75%, 05/12/2028, (4.75% fixed rate until 05/12/2027; 1 yr. USD CMT + | |
| 6.25%, 09/22/2029, (6.25% fixed rate until 09/22/2028; 1 yr. USD CMT + | |
| 6.44%, 08/11/2028, (6.44% fixed rate until 08/11/2027; 6 mo. USD SOFR + | |
| 6.54%, 08/12/2033, (6.54% fixed rate until 08/12/2032; 6 mo. USD SOFR + | |
| | |
| 2.88%, 10/30/2030, (2.88% fixed rate until 10/30/2029; 3 mo. USD Term SOFR + 1.43% thereafter)(6) | |
| 3.35%, 03/02/2033, (3.35% fixed rate until 03/02/2032; 6 mo. USD SOFR + | |
| 4.90%, 07/25/2033, (4.90% fixed rate until 07/25/2032; 6 mo. USD SOFR + | |
| 5.39%, 04/24/2034, (5.39% fixed rate until 04/24/2033; 6 mo. USD SOFR + | |
| 5.50%, 01/23/2035, (5.50% fixed rate until 01/23/2034; 6 mo. USD SOFR + | |
| 5.57%, 07/25/2029, (5.57% fixed rate until 07/25/2028; 6 mo. USD SOFR + | |
| 6.49%, 10/23/2034, (6.49% fixed rate until 10/23/2033; 6 mo. USD SOFR + | |
| | | |
| Commercial Services - 0.8% |
| | |
| | |
| | |
| | |
| | |
| | |
| | |
| | |
| | |
| | |
| Service Corp. International | |
| | |
| | |
| | |
| | |
| United Rentals North America, Inc. 4.00%, 07/15/2030 | |
| | | |
The accompanying notes are an integral part of these financial statements.
Hartford Total Return Bond HLS Fund
Schedule of Investments – (continued)December 31, 2024
Shares or Principal Amount | | |
CORPORATE BONDS - 23.7% - (continued) |
| Construction Materials - 0.4% |
| Builders FirstSource, Inc. 5.00%, | |
| Standard Industries, Inc. | |
| | |
| | |
| Trane Technologies Financing Ltd. 5.10%, 06/13/2034 | |
| | | |
| Diversified Financial Services - 0.3% |
| Capital One Financial Corp. | |
| 3.27%, 03/01/2030, (3.27% fixed rate until 03/01/2029; 6 mo. USD SOFR + | |
| 6.31%, 06/08/2029, (6.31% fixed rate until 06/08/2028; 6 mo. USD SOFR + | |
| 7.62%, 10/30/2031, (7.62% fixed rate until 10/30/2030; 6 mo. USD SOFR + | |
| Discover Financial Services 7.96%, 11/02/2034, (7.96% fixed rate until 11/02/2033; 6 mo. USD SOFR + 3.37% | |
| | | |
| |
| Alabama Power Co. 3.45%, 10/01/2049 | |
| American Electric Power Co., Inc. 6.95%, 12/15/2054, (6.95% fixed rate until 09/15/2034; 5 yr. USD CMT + 2.68% | |
| Baltimore Gas & Electric Co. 5.65%, 06/01/2054 | |
| Cleco Corporate Holdings LLC 3.38%, 09/15/2029 | |
| Consolidated Edison Co. of New York, Inc. | |
| | |
| | |
| Duke Energy Carolinas LLC | |
| | |
| | |
| | |
| | |
| | |
| | |
| Duke Energy Florida LLC 1.75%, 06/15/2030 | |
| Duke Energy Indiana LLC 3.25%, 10/01/2049 | |
| Duke Energy Ohio, Inc. 5.55%, 03/15/2054 | |
| | |
| | |
| | |
| | |
| | |
| | |
| | |
| | |
| Energo-Pro AS 8.50%, 02/04/2027(1) | |
| Evergy, Inc. 2.90%, 09/15/2029 | |
| Eversource Energy 5.13%, 05/15/2033 | |
| | |
| | |
| | |
| Investment Energy Resources Ltd. 6.25%, | |
Shares or Principal Amount | | |
CORPORATE BONDS - 23.7% - (continued) |
| Electric - 2.6% - (continued) |
| Jersey Central Power & Light Co. 5.10%, | |
| Monongahela Power Co. 5.85%, | |
| National Grid PLC 5.60%, 06/12/2028 | |
| NextEra Energy Capital Holdings, Inc. | |
| | |
| | |
| Niagara Mohawk Power Corp. 5.29%, | |
| NSTAR Electric Co. 5.40%, 06/01/2034 | |
| Oglethorpe Power Corp. 5.80%, | |
| Ohio Edison Co. 5.50%, 01/15/2033(1) | |
| Pacific Gas & Electric Co. | |
| | |
| | |
| | |
| | |
| | |
| | |
| | |
| Public Service Co. of Oklahoma 5.20%, 01/15/2035 | |
| Public Service Electric & Gas Co. 5.45%, 03/01/2054 | |
| Public Service Enterprise Group, Inc. | |
| | |
| | |
| | |
| | |
| | |
| | |
| Southern California Edison Co. | |
| | |
| | |
| | |
| | |
| | |
| Southern Co. 4.85%, 03/15/2035 | |
| Virginia Electric & Power Co. | |
| | |
| | |
| | |
| | |
| | |
| Wisconsin Power & Light Co. 5.38%, 03/30/2034 | |
| Xcel Energy, Inc. 4.60%, 06/01/2032 | |
| | | |
| Engineering & Construction - 0.7% |
| GTP Acquisition Partners I LLC 3.48%, | |
| IHS Holding Ltd. 6.25%, 11/29/2028(1) | |
| International Airport Finance SA 12.00%, | |
| | | |
| |
| Warnermedia Holdings, Inc. | |
| | |
| | |
| | |
| | |
| | |
The accompanying notes are an integral part of these financial statements.
Hartford Total Return Bond HLS Fund
Schedule of Investments – (continued)December 31, 2024
Shares or Principal Amount | | |
CORPORATE BONDS - 23.7% - (continued) |
| Entertainment - 0.6% - (continued) |
| | |
| | |
| | |
| | | |
| Environmental Control - 0.5% |
| | |
| | |
| | |
| | |
| | |
| | |
| | |
| Veralto Corp. 5.50%, 09/18/2026 | |
| | |
| | |
| | |
| | | |
| |
| Cencosud SA 5.95%, 05/28/2031(1) | |
| Conagra Brands, Inc. 4.85%, 11/01/2028 | |
| Minerva Luxembourg SA 4.38%, | |
| NBM U.S. Holdings, Inc. 7.00%, | |
| Tyson Foods, Inc. 5.40%, 03/15/2029 | |
| | | |
| |
| Brooklyn Union Gas Co. 3.87%, | |
| KeySpan Gas East Corp. 5.99%, | |
| | |
| | |
| | |
| Southern California Gas Co. 5.60%, 04/01/2054 | |
| | | |
| Hand/Machine Tools - 0.1% |
| | |
| | |
| | |
| | | |
| Healthcare - Products - 0.6% |
| | |
| | |
| | |
| Avantor Funding, Inc. 4.63%, 07/15/2028(1) | |
| Hologic, Inc. 4.63%, 02/01/2028(1) | |
| | |
| | |
| | |
| Solventum Corp. 5.40%, 03/01/2029(1) | |
| | | |
| Healthcare - Services - 0.6% |
| | |
| | |
| | |
| | |
| CommonSpirit Health 3.35%, 10/01/2029 | |
| HCA, Inc. 3.38%, 03/15/2029 | |
| Icon Investments Six DAC 5.81%, 05/08/2027 | |
| Kaiser Foundation Hospitals | |
| | |
Shares or Principal Amount | | |
CORPORATE BONDS - 23.7% - (continued) |
| Healthcare - Services - 0.6% - (continued) |
| | |
| | |
| | |
| | |
| | |
| | |
| | |
| | |
| | | |
| |
| Taylor Morrison Communities, Inc. | |
| | |
| | |
| | | |
| Household Products - 0.0% |
| Haleon U.S. Capital LLC 3.38%, 03/24/2029 | |
| |
| Arthur J Gallagher & Co. 4.85%, 12/15/2029 | |
| | |
| | |
| | |
| | |
| CNO Global Funding 4.88%, 12/10/2027(1) | |
| Corebridge Financial, Inc. 3.85%, 04/05/2029 | |
| Corebridge Global Funding | |
| | |
| | |
| Equitable Financial Life Global Funding | |
| Equitable Holdings, Inc. 4.35%, 04/20/2028 | |
| Marsh & McLennan Cos., Inc. 4.75%, 03/15/2039 | |
| | | |
| |
| | |
| | |
| | |
| Go Daddy Operating Co. LLC/GD Finance Co., Inc. | |
| | |
| | |
| | | |
| Investment Company Security - 0.1% |
| Ares Strategic Income Fund 5.70%, | |
| |
| Insight Enterprises, Inc. 6.63%, | |
| Machinery - Construction & Mining - 0.1% |
| Caterpillar Financial Services Corp. 4.70%, 11/15/2029 | |
| Machinery-Diversified - 0.1% |
| | |
| | |
| | |
| Otis Worldwide Corp. 2.57%, 02/15/2030 | |
| | | |
The accompanying notes are an integral part of these financial statements.
Hartford Total Return Bond HLS Fund
Schedule of Investments – (continued)December 31, 2024
Shares or Principal Amount | | |
CORPORATE BONDS - 23.7% - (continued) |
| |
| Charter Communications Operating LLC/Charter Communications Operating Capital | |
| | |
| | |
| | |
| | |
| | |
| | |
| | |
| | |
| | |
| | |
| | |
| Discovery Communications LLC 3.63%, 05/15/2030 | |
| | |
| | |
| | |
| | |
| | |
| | |
| | |
| Time Warner Cable Enterprises LLC 8.38%, 07/15/2033 | |
| | |
| | |
| | |
| | | |
| |
| | |
| | |
| | |
| | |
| Rio Tinto Alcan, Inc. 6.13%, 12/15/2033 | |
| | | |
| |
| | |
| | |
| | |
| BP Capital Markets America, Inc. | |
| | |
| | |
| | |
| | |
| | |
| | |
| | |
| | |
| | |
| | |
| | |
| | |
| | |
| Coterra Energy, Inc. 5.40%, 02/15/2035 | |
| | |
| | |
| | |
| | |
| | |
| | |
| | |
| | |
| Energean Israel Finance Ltd. | |
| | |
| | |
Shares or Principal Amount | | |
CORPORATE BONDS - 23.7% - (continued) |
| Oil & Gas - 1.8% - (continued) |
| | |
| | |
| | |
| EOG Resources, Inc. 5.65%, 12/01/2054 | |
| Equinor ASA 3.63%, 04/06/2040 | |
| | |
| | |
| | |
| Leviathan Bond Ltd. 6.50%, 06/30/2027(7) | |
| Patterson-UTI Energy, Inc. | |
| | |
| | |
| Saudi Arabian Oil Co. 5.88%, 07/17/2064(1) | |
| Shell Finance U.S., Inc. 3.25%, 04/06/2050 | |
| Shell International Finance BV | |
| | |
| | |
| | |
| | |
| | |
| | |
| Viper Energy, Inc. 5.38%, 11/01/2027(1) | |
| | | |
| Packaging & Containers - 0.4% |
| Ball Corp. 6.00%, 06/15/2029 | |
| |
| | |
| | |
| | |
| Bayer U.S. Finance LLC 6.38%, | |
| Bristol-Myers Squibb Co. 5.55%, 02/22/2054 | |
| Cardinal Health, Inc. 5.00%, 11/15/2029 | |
| Cencora, Inc. 4.85%, 12/15/2029 | |
| | |
| | |
| | |
| | |
| | |
| | |
| | |
| | |
| | |
| 6.75%, 12/10/2054, (6.75% fixed rate until 09/10/2034; 5 yr. USD CMT + | |
| 7.00%, 03/10/2055, (7.00% fixed rate until 12/10/2029; 5 yr. USD CMT + | |
| | |
| | |
| | |
| | |
| | | |
| |
| Columbia Pipelines Holding Co. LLC | |
| | |
| | |
| Columbia Pipelines Operating Co. LLC | |
| | |
| | |
| EIG Pearl Holdings SARL 3.55%, | |
The accompanying notes are an integral part of these financial statements.
Hartford Total Return Bond HLS Fund
Schedule of Investments – (continued)December 31, 2024
Shares or Principal Amount | | |
CORPORATE BONDS - 23.7% - (continued) |
| Pipelines - 0.9% - (continued) |
| | |
| | |
| | |
| | |
| | |
| | |
| | |
| Enterprise Products Operating LLC 3.30%, 02/15/2053 | |
| EQM Midstream Partners LP 6.50%, | |
| Galaxy Pipeline Assets Bidco Ltd. | |
| | |
| | |
| | |
| Greensaif Pipelines Bidco SARL | |
| | |
| | |
| | |
| Hess Midstream Operations LP | |
| | |
| | |
| | |
| | |
| | |
| | |
| | |
| | |
| Targa Resources Partners LP/Targa Resources Partners Finance Corp. 4.00%, 01/15/2032 | |
| | |
| | |
| | |
| | |
| | | |
| Real Estate Investment Trusts - 0.3% |
| | |
| | |
| | |
| | |
| | |
| | |
| | |
| Iron Mountain, Inc. 6.25%, 01/15/2033(1) | |
| SBA Tower Trust 2.84%, 01/15/2050(1) | |
| | | |
| |
| | |
| | |
| | |
| | |
| | |
| | |
| | |
| | |
| O'Reilly Automotive, Inc. 4.70%, 06/15/2032 | |
| | | |
| |
| | |
| | |
| | |
| Foundry JV Holdco LLC 6.15%, | |
Shares or Principal Amount | | |
CORPORATE BONDS - 23.7% - (continued) |
| Semiconductors - 0.6% - (continued) |
| | |
| | |
| | |
| | |
| | |
| | |
| | |
| Marvell Technology, Inc. 2.45%, 04/15/2028 | |
| Microchip Technology, Inc. | |
| | |
| | |
| Qorvo, Inc. 3.38%, 04/01/2031(1) | |
| | | |
| |
| Constellation Software, Inc. 5.46%, | |
| Fair Isaac Corp. 4.00%, 06/15/2028(1) | |
| MSCI, Inc. 3.63%, 11/01/2031(1) | |
| | |
| | |
| | |
| Open Text Holdings, Inc. 4.13%, | |
| | |
| | |
| | |
| | |
| SS&C Technologies, Inc. 5.50%, | |
| | | |
| Telecommunications - 0.3% |
| | |
| | |
| | |
| | |
| | |
| | |
| Network i2i Ltd. 5.65%, 01/15/2025, (5.65% fixed rate until 01/15/2025; 5 yr. USD CMT + 4.27% thereafter)(6)(7)(8) | |
| | |
| | |
| | |
| | |
| | |
| | | |
| Trucking & Leasing - 0.0% |
| Penske Truck Leasing Co. LP/PTL Finance Corp. 4.00%, 07/15/2025(1) | |
| Total Corporate Bonds
(cost $421,706,573) | |
FOREIGN GOVERNMENT OBLIGATIONS - 3.0% |
| |
| Bermuda Government International Bonds | |
| | |
| | |
| | | |
| |
| Brazil Notas do Tesouro Nacional 10.00%, 01/01/2031 | |
The accompanying notes are an integral part of these financial statements.
Hartford Total Return Bond HLS Fund
Schedule of Investments – (continued)December 31, 2024
Shares or Principal Amount | | |
FOREIGN GOVERNMENT OBLIGATIONS - 3.0% - (continued) |
| |
| Bulgaria Government International Bonds | |
| | |
| | |
| | | |
| |
| Chile Government International Bonds 1.25%, 01/22/2051 | |
| |
| Colombia Government International Bonds | |
| | |
| | |
| | |
| | |
| | | |
| |
| Costa Rica Government International Bonds | |
| |
| Hungary Government International Bonds | |
| | |
| | |
| | | |
| |
| Indonesia Government International Bonds 1.10%, 03/12/2033 | |
| |
| Israel Government International Bonds | |
| |
| Ivory Coast Government International Bonds 4.88%, 01/30/2032(7) | |
| |
| Mexico Government International Bonds | |
| | |
| | |
| | |
| | |
| | |
| | |
| | |
| | | |
| |
| North Macedonia Government International Bonds | |
| | |
| | |
| | | |
| |
| Panama Government International Bonds | |
| | |
| | |
| | |
| | | |
| |
| Peru Government International Bonds | |
| | |
| | |
| | |
| | | |
Shares or Principal Amount | | |
FOREIGN GOVERNMENT OBLIGATIONS - 3.0% - (continued) |
| |
| Philippines Government International Bonds | |
| | |
| | |
| | | |
| |
| Bank Gospodarstwa Krajowego 5.38%, | |
| |
| Romania Government International Bonds | |
| | |
| | |
| | |
| | | |
| |
| Saudi Government International Bonds | |
| |
| Uruguay Government International Bonds 4.38%, 01/23/2031 | |
| Total Foreign Government Obligations
(cost $62,809,576) | | |
|
| |
| New York Transportation Dev Corp., NY, Rev 4.25%, 09/01/2035 | |
| |
| Philadelphia Auth for Industrial Dev, PA, Rev, (NPFG) 6.55%, 10/15/2028 | |
| State Board of Administration Finance Corp., FL, Rev 1.26%, 07/01/2025(9) | |
| | | |
| |
| Chicago Board of Education, IL, GO | |
| | |
| | |
| | | |
| |
| Metropolitan Transportation Auth, NY, Rev 6.81%, 11/15/2040 | |
| |
| Texas Natural Gas Securitization Finance Corp., TX, Rev 5.10%, 04/01/2035 | |
| Utility - Electric - 0.0% |
| Municipal Electric Auth of Georgia, GA, Rev 6.64%, 04/01/2057 | |
| Total Municipal Bonds
(cost $23,782,876) | | |
SENIOR FLOATING RATE INTERESTS - 0.0%(10) |
| Oil & Gas Services - 0.0% |
| PES Holdings LLC 3.00%, 12/31/2024, U.S. (Fed) Prime Rate + 3.00%(11)(12) | |
| Total Senior Floating Rate Interests
(cost $770,737) | |
The accompanying notes are an integral part of these financial statements.
Hartford Total Return Bond HLS Fund
Schedule of Investments – (continued)December 31, 2024
Shares or Principal Amount | | |
U.S. GOVERNMENT AGENCIES - 41.2% |
| Mortgage-Backed Agencies - 41.2% |
| Federal Home Loan Mortgage Corp. - 8.7% |
| 0.00%, 11/15/2036(13)(14) | |
| | |
| | |
| | |
| | |
| | |
| | |
| | |
| | |
| | |
| | |
| | |
| | |
| | |
| | |
| | |
| | |
| | |
| | |
| | |
| | |
| | |
| | |
| | |
| | |
| | |
| | |
| | |
| | |
| | |
| | |
| | |
| | |
| | |
| | |
| | |
| | |
| | |
| | |
| | |
| | |
| | |
| | |
| | |
| | |
| | |
| | |
| | |
| | |
| | |
| | |
| | |
| | |
| | |
| | |
| | |
| | |
| | |
| | |
| | |
| | |
| | |
| | |
| | |
| | |
| | |
Shares or Principal Amount | | |
U.S. GOVERNMENT AGENCIES - 41.2% - (continued) |
| Mortgage-Backed Agencies - 41.2% - (continued) |
| Federal Home Loan Mortgage Corp. - 8.7% - (continued) |
| | |
| | |
| | |
| | |
| | |
| | |
| | |
| | |
| | |
| | |
| | |
| | |
| | |
| | |
| | |
| | |
| | |
| | |
| | |
| | |
| | |
| | |
| | |
| | |
| | |
| | |
| | |
| | |
| | |
| | |
| | |
| | |
| | |
| | |
| | |
| | |
| | |
| | |
| | |
| | |
| | |
| | |
| | |
| | |
| | |
| | |
| | |
| | |
| | |
| | |
| | |
| | |
| | |
| | |
| | |
| | |
| | |
| | |
| | |
| | |
| | |
| | |
| | |
| | |
| | |
| | |
The accompanying notes are an integral part of these financial statements.
Hartford Total Return Bond HLS Fund
Schedule of Investments – (continued)December 31, 2024
Shares or Principal Amount | | |
U.S. GOVERNMENT AGENCIES - 41.2% - (continued) |
| Mortgage-Backed Agencies - 41.2% - (continued) |
| Federal Home Loan Mortgage Corp. - 8.7% - (continued) |
| | |
| | |
| | |
| | |
| | |
| | |
| | |
| | |
| | |
| | |
| | |
| | |
| | |
| | |
| | |
| | |
| | |
| | |
| | |
| | |
| 7.47%, 04/25/2042, 30 day USD SOFR | |
| | |
| 7.92%, 05/25/2042, 30 day USD SOFR | |
| 7.92%, 06/25/2043, 30 day USD SOFR | |
| 7.97%, 10/25/2041, 30 day USD SOFR | |
| 8.07%, 03/25/2042, 30 day USD SOFR | |
| 8.07%, 05/25/2043, 30 day USD SOFR | |
| 8.12%, 08/25/2042, 30 day USD SOFR | |
| 8.22%, 11/25/2041, 30 day USD SOFR | |
| 8.27%, 09/25/2042, 30 day USD SOFR | |
| 8.57%, 07/25/2042, 30 day USD SOFR | |
| 9.23%, 06/25/2042, 30 day USD SOFR | |
| | | |
| Federal National Mortgage Association - 14.6% |
| 0.00%, 03/25/2036(13)(14) | |
| 0.00%, 06/25/2041(13)(14) | |
| | |
| 1.32%, 10/25/2049, 30 day USD SOFR | |
| 1.42%, 06/25/2045, 30 day USD SOFR | |
| | |
| | |
| | |
| | |
| | |
| | |
| | |
| | |
| | |
| | |
| | |
| | |
| | |
Shares or Principal Amount | | |
U.S. GOVERNMENT AGENCIES - 41.2% - (continued) |
| Mortgage-Backed Agencies - 41.2% - (continued) |
| Federal National Mortgage Association - 14.6% - (continued) |
| | |
| | |
| | |
| | |
| | |
| | |
| | |
| | |
| | |
| | |
| | |
| | |
| | |
| | |
| | |
| | |
| | |
| | |
| | |
| | |
| | |
| | |
| | |
| | |
| | |
| | |
| | |
| | |
| | |
| | |
| | |
| | |
| | |
| | |
| | |
| | |
| | |
| | |
| | |
| | |
| | |
| | |
| | |
| | |
| | |
| | |
| | |
| | |
| | |
| | |
| | |
| | |
| | |
| | |
| | |
| | |
| | |
| | |
| | |
| | |
| | |
| | |
| | |
| | |
| | |
| | |
The accompanying notes are an integral part of these financial statements.
Hartford Total Return Bond HLS Fund
Schedule of Investments – (continued)December 31, 2024
Shares or Principal Amount | | |
U.S. GOVERNMENT AGENCIES - 41.2% - (continued) |
| Mortgage-Backed Agencies - 41.2% - (continued) |
| Federal National Mortgage Association - 14.6% - (continued) |
| | |
| | |
| | |
| | |
| | |
| | |
| | |
| | |
| | |
| | |
| | |
| | |
| | |
| | |
| | |
| | |
| | |
| | |
| | |
| | |
| | |
| | |
| | |
| | |
| | |
| | |
| | |
| | |
| | |
| | |
| | |
| | |
| | |
| | |
| | |
| | |
| | |
| | |
| | |
| | |
| | |
| | |
| | |
| | |
| | |
| | |
| | |
| | |
| | |
| | |
| | |
| | |
| | |
| | |
| | |
| | |
| | |
| | |
| | |
| | |
| | |
| | |
| | |
| | |
| | |
| | |
Shares or Principal Amount | | |
U.S. GOVERNMENT AGENCIES - 41.2% - (continued) |
| Mortgage-Backed Agencies - 41.2% - (continued) |
| Federal National Mortgage Association - 14.6% - (continued) |
| | |
| | |
| | |
| | |
| | |
| | |
| | |
| | |
| | |
| | |
| | |
| | |
| | |
| | |
| | |
| | |
| | |
| | |
| | |
| | |
| | |
| | |
| | |
| | |
| | |
| | |
| | |
| | |
| | |
| | |
| | |
| | |
| | |
| | |
| | |
| | |
| | |
| | |
| | |
| | |
| | |
| | |
| | |
| | |
| | |
| | |
| | |
| | |
| | |
| | |
| | |
| | |
| | |
| | |
| | |
| | |
| | |
| | |
| | |
| | |
| | |
| | |
| | | |
| Government National Mortgage Association - 8.9% |
| | |
| | |
The accompanying notes are an integral part of these financial statements.
Hartford Total Return Bond HLS Fund
Schedule of Investments – (continued)December 31, 2024
Shares or Principal Amount | | |
U.S. GOVERNMENT AGENCIES - 41.2% - (continued) |
| Mortgage-Backed Agencies - 41.2% - (continued) |
| Government National Mortgage Association - 8.9% - (continued) |
| | |
| | |
| | |
| | |
| | |
| | |
| | |
| | |
| | |
| | |
| | |
| | |
| | |
| | |
| | |
| | |
| | |
| | |
| | |
| | |
| | |
| | |
| | |
| | |
| | |
| | |
| | |
| | |
| | |
| | |
| | |
| | |
| | |
| | |
| | |
| | |
| | |
| | |
| | |
| | |
| | |
| | |
| | |
| | |
| | |
| | |
| | |
| | |
| | |
| | |
| | |
| | |
| | |
| | |
| | |
| | |
| | |
| | |
| | |
| | |
| | |
| | |
| | |
| | |
| | |
| | |
The accompanying notes are an integral part of these financial statements.
Hartford Total Return Bond HLS Fund
Schedule of Investments – (continued)December 31, 2024
Shares or Principal Amount | | |
U.S. GOVERNMENT AGENCIES - 41.2% - (continued) |
| Mortgage-Backed Agencies - 41.2% - (continued) |
| Government National Mortgage Association - 8.9% - (continued) |
| | |
| | |
| | |
| | |
| | |
| | |
| | |
| | |
| | |
| | |
| | |
| | |
| | |
| | | |
| Uniform Mortgage-Backed Security - 9.0% |
| | |
| | |
| | |
| | |
| | |
| | |
| | | |
| Total U.S. Government Agencies
(cost $752,922,073) | | |
U.S. GOVERNMENT SECURITIES - 21.9% |
| U.S. Treasury Securities - 21.9% |
| U.S. Treasury Bonds - 10.4% |
| | |
| | |
| | |
| | |
| | |
| | |
| | |
| 3.38%, 05/15/2044(16)(17) | |
| | |
| | |
| | |
| | |
| | | |
| U.S. Treasury Inflation-Indexed Bonds - 0.9% |
| | |
| | |
| | |
| | |
| | | |
| U.S. Treasury Inflation-Indexed Notes - 1.5% |
| | |
| | |
| | | |
| U.S. Treasury Notes - 9.1% |
| | |
| | |
| | |
| | |
| | |
| | |
| | | |
| Total U.S. Government Securities
(cost $463,319,088) | | |
Shares or Principal Amount | | |
|
| |
| PES Energy Liquidating Trust*(20)(21) | |
| Total Common Stocks
(cost $265,121) | | |
|
| |
| U.S. Bancorp Series A, 5.94%(22) | |
| Total Preferred Stocks
(cost $1,591,820) | | |
| Total Long-Term Investments
(cost $2,059,083,847) | | |
SHORT-TERM INVESTMENTS - 0.8% |
| Repurchase Agreements - 0.6% |
| Fixed Income Clearing Corp. Repurchase Agreement dated 12/31/2024 at 4.45%, due on 01/02/2025 with a maturity value of $10,290,181; collateralized by U.S. Treasury Inflation Index Note at 0.13%, maturing 04/15/2027, with a market value of $10,493,582 | |
| Securities Lending Collateral - 0.2% |
| Goldman Sachs Financial Square Funds, Government Fund, Institutional Class, | |
| HSBC U.S. Government Money Market Fund, Institutional Class, 4.41%(23) | |
| Invesco Government & Agency Portfolio, Institutional Class, 4.42%(23) | |
| Morgan Stanley Institutional Liquidity Funds, Government Portfolio, Institutional Class, 4.42%(23) | |
| | | |
| Total Short-Term Investments
(cost $14,016,255) | |
| Total Investments
(cost $2,073,100,102) | | |
| Other Assets and Liabilities | | |
| | | |
Note:
Percentage of investments as shown is the ratio of the total market value to net assets.
The Fund may refer to any one or more of the industry classifications used by one or more widely recognized market indices, ratings group and/or as defined by Fund management. Industry classifications may not be identical across all security types.
Equity industry classifications used in this report are the Global Industry Classification Standard, which was developed by and is the exclusive property and service mark of MSCI, Inc. and Standard & Poor’s.
For Fund compliance purposes, the Fund may not use the same classification system. These classifications are used for financial reporting purposes.
See “Glossary” for abbreviation descriptions.
The accompanying notes are an integral part of these financial statements.
Hartford Total Return Bond HLS Fund
Schedule of Investments – (continued)December 31, 2024
| Security was purchased pursuant to Rule 144A under the Securities Act of 1933 and may be sold in transactions that are exempt from registration (typically only to qualified institutional buyers) or in a public offering registered under the Securities Act of 1933. At December 31, 2024, the aggregate value of these securities was $451,135,505, representing 26.2% of net assets. |
| Variable rate securities; the rate reported is the coupon rate in effect at December 31, 2024. Base lending rates may be subject to a floor or cap. |
| Variable or floating rate security, which interest rate adjusts periodically based on changes in current interest rates and prepayments on the underlying pool of assets. Rate shown is the rate in effect as of period end. |
| Securities disclosed are interest-only strips. |
| Security is a “step-up” bond where coupon increases or steps up at a predetermined date. Rate shown is current coupon rate. |
| Fixed to variable rate investment. The rate shown reflects the fixed rate in effect at December 31, 2024. Rate will reset at a future date. Base lending rates may be subject to a floor or cap. |
| Security is exempt from registration under Regulation S under the Securities Act of 1933, which exempts from registration securities offered and sold outside of the United States. Security may not be offered or sold in the United States except pursuant to an exemption from, or in a transaction not subject to, the registration requirements of the Securities Act of 1933. At December 31, 2024, the aggregate value of these securities was $25,827,556, representing 1.5% of net assets. |
| Perpetual maturity security. Maturity date shown is the next call date or final legal maturity date, whichever comes first. |
| Represents entire or partial securities on loan. See Note 8 in the accompanying Notes to Financial Statements for securities lending information. |
| Senior floating rate interests generally pay interest rates which are periodically adjusted by reference to a base short-term, floating lending rate plus a premium. The base lending rates are primarily the Secured Overnight Financing Rate ("SOFR") and secondarily, the prime rate offered by one or more major United States banks (the "Prime Rate"). Senior floating rate interests often require prepayments from excess cash flows or permit the borrower to repay at its election. The rate at which the borrower repays cannot be predicted with accuracy. As a result, the actual remaining maturity may be substantially less than the stated maturities shown. Base lending rates may be subject to a floor or cap. Unless otherwise noted, the interest rate disclosed for these securities represents the rate in effect as of December 31, 2024. |
| Non-income producing. For long-term debt securities, items identified are in default as to payment of interest and/or principal. |
| Security has the ability to pay in kind (“PIK”) or pay income in cash. When applicable, separate rates of such payments are disclosed. |
| Securities disclosed are principal-only strips. |
| Security is a zero-coupon bond. |
| Represents or includes a TBA transaction. |
| All, or a portion of the security, was pledged as collateral in connection with centrally cleared swap contracts. As of December 31, 2024, the market value of securities pledged was $4,619,662. |
| All, or a portion of the security, was pledged as collateral in connection with TBAs. As of December 31, 2024, the market value of securities pledged was $1,080,353. |
| All, or a portion of the security, was pledged as collateral in connection with futures contracts. As of December 31, 2024, the market value of securities pledged was $4,959,521. |
| The principal amount for these securities are adjusted for inflation and the interest payments equal a fixed percentage of the inflation-adjusted principal amount. |
| Investment in securities not registered under the Securities Act of 1933 (excluding securities acquired pursuant to Rule 144A and Regulation S). At the end of the period, the value of such restricted securities amounted to $0 or 0.0% of net assets. |
| | | | |
| PES Energy Liquidating Trust | | | |
| Investment valued using significant unobservable inputs. |
| Perpetual security with no stated maturity date. |
| Current yield as of period end. |
Futures Contracts Outstanding at December 31, 2024 |
| | | | Value and
Unrealized
Appreciation/
(Depreciation) |
|
Australian 10-Year Bond Future | | | | |
U.S. Treasury 10-Year Ultra Future | | | | |
U.S. Treasury Long Bond Future | | | | |
U.S. Treasury Ultra Bond Future | | | | |
| | | | |
Short position contracts: |
Canadian 10-Year Bond Future | | | | |
Euro BUXL 30-Year Bond Future | | | | |
| | | | |
| | | | |
U.S. Treasury 2-Year Note Future | | | | |
U.S. Treasury 5-Year Note Future | | | | |
The accompanying notes are an integral part of these financial statements.
Hartford Total Return Bond HLS Fund
Schedule of Investments – (continued)December 31, 2024
Futures Contracts Outstanding at December 31, 2024 – (continued) |
| | | | Value and Unrealized Appreciation/ (Depreciation) |
Short position contracts – (continued): |
U.S. Treasury 10-Year Note Future | | | | |
| | | | |
| |
TBA Sale Commitments Outstanding at December 31, 2024 |
| | | | Unrealized
Appreciation/
(Depreciation) |
Government National Mortgage Association, 3.00% | | | | |
Government National Mortgage Association, 5.00% | | | | |
Uniform Mortgage-Backed Security, 2.00% | | | | |
Uniform Mortgage-Backed Security, 2.00% | | | | |
Uniform Mortgage-Backed Security, 2.50% | | | | |
Uniform Mortgage-Backed Security, 3.00% | | | | |
Uniform Mortgage-Backed Security, 3.00% | | | | |
Uniform Mortgage-Backed Security, 3.50% | | | | |
Uniform Mortgage-Backed Security, 4.00% | | | | |
Uniform Mortgage-Backed Security, 4.50% | | | | |
Uniform Mortgage-Backed Security, 4.50% | | | | |
Total TBA sale commitments (proceeds receivable $99,703,875) | | |
At December 31, 2024, the aggregate market value of TBA Sale Commitments represents (5.7)% of total net assets. |
Centrally Cleared Interest Rate Swap Contracts Outstanding at December 31, 2024 |
| | | | | | | | Unrealized
Appreciation/
(Depreciation) |
| | | | | | | | | |
| | | | | | | | | |
| | | | | | | | | |
| | | | | | | | | |
| | | | | | | | | |
| | | | | | | | | |
Total centrally cleared interest rate swaps contracts | | | | |
Foreign Currency Contracts Outstanding at December 31, 2024 |
Amount and Description of
Currency to be Purchased | Amount and Description of
Currency to be Sold | | | Appreciation/
(Depreciation) |
| | | | | | |
| | | | | | |
Total foreign currency contracts | |
† See Significant Accounting Policies of accompanying Notes to Financial Statements regarding valuation of investments.
The accompanying notes are an integral part of these financial statements.
Hartford Total Return Bond HLS Fund
Schedule of Investments – (continued)December 31, 2024
Fair Value Summary
The following is a summary of the fair valuations according to the inputs used as of December 31, 2024 in valuing the Fund’s investments.
| | | | |
| | | | |
Asset & Commercial Mortgage-Backed Securities | | | | |
| | | | |
Foreign Government Obligations | | | | |
| | | | |
Senior Floating Rate Interests | | | | |
| | | | |
U.S. Government Securities | | | | |
| | | | |
| | | | |
| | | | |
| | | | |
Foreign Currency Contracts(2) | | | | |
| | | | |
| | | | |
| | | | |
| | | | |
| | | | |
| | | | |
| | | | |
| For the year ended December 31, 2024, there were no transfers in and out of Level 3. |
| Derivative instruments (excluding purchased and written options, if applicable) are valued at the unrealized appreciation/(depreciation) on the investments. |
Level 3 investments at the beginning and/or end of the period in relation to net assets were not significant and accordingly, a reconciliation of Level 3 assets for the year ended December 31, 2024 is not presented.
The accompanying notes are an integral part of these financial statements.
Hartford Ultrashort Bond HLS Fund
Schedule of InvestmentsDecember 31, 2024
Shares or Principal Amount | | |
ASSET & COMMERCIAL MORTGAGE-BACKED SECURITIES - 34.4% |
| Asset-Backed - Automobile - 20.8% |
| Ally Auto Receivables Trust 5.76%, 11/15/2026 | |
| American Credit Acceptance Receivables Trust | |
| American Heritage Auto Receivables Trust | |
| AmeriCredit Automobile Receivables Trust | |
| | |
| | |
| | |
| | |
| | |
| | |
| | |
| | |
| | |
| Bank of America Auto Trust 5.83%, | |
| BMW Vehicle Owner Trust 5.47%, 02/25/2028 | |
| Bridgecrest Lending Auto Securitization Trust | |
| | |
| | |
| Capital One Prime Auto Receivables Trust | |
| | |
| | |
| | |
| | |
| | |
| | |
| | |
| | |
| | |
| | |
| Carvana Auto Receivables Trust | |
| | |
| | |
| | |
| | |
| | |
| | |
| | |
| | |
| | |
| | |
| Chesapeake Funding II LLC 5.65%, | |
| Citizens Auto Receivables Trust | |
| | |
| | |
| | |
| | |
| CPS Auto Receivables Trust | |
| | |
| | |
| | |
| | |
| | |
| | |
| | |
| | |
| Enterprise Fleet Financing LLC | |
| | |
| | |
| | |
| | |
Shares or Principal Amount | | |
ASSET & COMMERCIAL MORTGAGE-BACKED SECURITIES - 34.4% - (continued) |
| Asset-Backed - Automobile - 20.8% - (continued) |
| | |
| | |
| | |
| | |
| Exeter Automobile Receivables Trust | |
| | |
| | |
| FHF Trust 0.83%, 12/15/2026(1) | |
| Fifth Third Auto Trust 5.80%, 11/16/2026 | |
| First Investors Auto Owner Trust 2.03%, | |
| Flagship Credit Auto Trust | |
| | |
| | |
| Ford Credit Auto Lease Trust | |
| | |
| | |
| Ford Credit Auto Owner Trust | |
| | |
| | |
| | |
| | |
| Foursight Capital Automobile Receivables Trust | |
| GLS Auto Receivables Issuer Trust | |
| | |
| | |
| | |
| GLS Auto Select Receivables Trust 6.37%, | |
| GM Financial Automobile Leasing Trust | |
| | |
| | |
| | |
| | |
| GM Financial Consumer Automobile Receivables Trust | |
| | |
| | |
| | |
| | |
| | |
| Honda Auto Receivables Owner Trust | |
| | |
| | |
| | |
| Huntington Auto Trust 5.50%, 03/15/2027(1) | |
| Hyundai Auto Lease Securitization Trust | |
| | |
| | |
| | |
| | |
| Hyundai Auto Receivables Trust | |
| | |
| | |
| | |
| LAD Auto Receivables Trust 5.44%, | |
| Mercedes-Benz Auto Lease Trust | |
| | |
| | |
| Mercedes-Benz Auto Receivables Trust 4.51%, 11/15/2027 | |
The accompanying notes are an integral part of these financial statements.
Hartford Ultrashort Bond HLS Fund
Schedule of Investments – (continued)December 31, 2024
Shares or Principal Amount | | |
ASSET & COMMERCIAL MORTGAGE-BACKED SECURITIES - 34.4% - (continued) |
| Asset-Backed - Automobile - 20.8% - (continued) |
| | |
| | |
| | |
| Nissan Auto Receivables Owner Trust | |
| | |
| | |
| Porsche Financial Auto Securitization Trust | |
| | |
| | |
| Porsche Innovative Lease Owner Trust 4.77%, | |
| Santander Drive Auto Receivables Trust | |
| | |
| | |
| | |
| | |
| | |
| | |
| | |
| | |
| SFS Auto Receivables Securitization Trust | |
| | |
| | |
| | |
| | |
| | |
| | |
| Tesla Electric Vehicle Trust 5.54%, 12/21/2026(1) | |
| Toyota Auto Receivables Owner Trust | |
| | |
| | |
| | |
| | |
| | |
| | |
| USAA Auto Owner Trust 5.83%, 07/15/2026(1) | |
| Volkswagen Auto Loan Enhanced Trust | |
| | |
| | |
| Westlake Automobile Receivables Trust | |
| | |
| | |
| | |
| | |
| | |
| | |
| Westlake Flooring Master Trust 5.43%, | |
| Wheels Fleet Lease Funding 1 LLC | |
| | |
| | |
| World Omni Auto Receivables Trust 5.25%, 11/16/2026 | |
| World Omni Automobile Lease Securitization Trust 5.47%, 11/17/2025 | |
| World Omni Select Auto Trust 5.92%, 03/15/2027 | |
| | | |
| Commercial Mortgage-Backed Securities - 0.5% |
| BWAY Mortgage Trust 2.81%, 03/10/2033(1) | |
| FREMF Mortgage Trust 3.72%, 10/25/2048(1)(2) | |
| | | |
Shares or Principal Amount | | |
ASSET & COMMERCIAL MORTGAGE-BACKED SECURITIES - 34.4% - (continued) |
| Other Asset-Backed Securities - 10.3% |
| Affirm Asset Securitization Trust | |
| | |
| | |
| Amur Equipment Finance Receivables XI LLC | |
| Amur Equipment Finance Receivables XIII LLC | |
| Apidos CLO XXXII Ltd. 5.72%, 01/20/2033, 3 mo. USD Term SOFR + 1.10%(1)(3) | |
| Auxilior Term Funding LLC 6.18%, 12/15/2028(1) | |
| Bain Capital Credit CLO Ltd. 5.84%, 10/23/2034, 3 mo. USD Term SOFR + | |
| | |
| | |
| | |
| Blue Owl Asset Leasing Trust LLC 4.87%, | |
| Carlyle U.S. CLO Ltd. 5.81%, 10/15/2031, 3 mo. USD Term SOFR + 1.15%(1)(3) | |
| | |
| | |
| | |
| | |
| | |
| | |
| | |
| | |
| | |
| Daimler Trucks Retail Trust | |
| | |
| | |
| Dell Equipment Finance Trust | |
| | |
| | |
| | |
| Dext ABS LLC 6.56%, 05/15/2034(1) | |
| DLLAA LLC 5.93%, 07/20/2026(1) | |
| Dllad LLC 5.50%, 08/20/2027(1) | |
| | |
| | |
| | |
| DLLMT LLC 5.78%, 11/20/2025(1) | |
| DLLST LLC 5.33%, 01/20/2026(1) | |
| GoldenTree Loan Management U.S. CLO 4 Ltd. 5.78%, 04/24/2031, 3 mo. USD Term SOFR + | |
| Granite Park Equipment Leasing LLC 6.51%, | |
| GreatAmerica Leasing Receivables Funding LLC | |
| | |
| | |
| | |
| | |
| | |
| | |
| | |
| | |
| | |
| | |
| Kubota Credit Owner Trust | |
| | |
| | |
The accompanying notes are an integral part of these financial statements.
Hartford Ultrashort Bond HLS Fund
Schedule of Investments – (continued)December 31, 2024
Shares or Principal Amount | | |
ASSET & COMMERCIAL MORTGAGE-BACKED SECURITIES - 34.4% - (continued) |
| Other Asset-Backed Securities - 10.3% - (continued) |
| | |
| Madison Park Funding XXIV Ltd. 5.74%, 10/20/2029, 3 mo. USD Term SOFR + | |
| MMAF Equipment Finance LLC | |
| | |
| | |
| Octagon Investment Partners 36 Ltd. 5.89%, 04/15/2031, 3 mo. USD Term SOFR + | |
| Octagon Investment Partners 39 Ltd. 5.77%, 10/20/2030, 3 mo. USD Term SOFR + | |
| Octagon Investment Partners XVII Ltd. 5.89%, 01/25/2031, 3 mo. USD Term SOFR + | |
| Race Point IX CLO Ltd. 5.86%, 10/15/2030, 3 mo. USD Term SOFR + 1.20%(1)(3) | |
| Rad CLO 7 Ltd. 6.00%, 04/17/2036, 3 mo. USD | |
| SCF Equipment Leasing LLC 6.56%, | |
| Tesla Sustainable Energy Trust 4.83%, | |
| Verizon Master Trust 4.89%, 04/13/2028 | |
| Volvo Financial Equipment LLC 4.29%, | |
| Voya CLO Ltd. 5.82%, 07/20/2032, 3 mo. USD | |
| | | |
| Whole Loan Collateral CMO - 2.8% |
| Angel Oak Mortgage Trust 2.53%, | |
| BRAVO Residential Funding Trust | |
| | |
| | |
| | |
| Bunker Hill Loan Depositary Trust 2.72%, | |
| | |
| | |
| | |
| | |
| | |
| | |
| CSMC Trust 3.57%, 07/25/2049(1)(4) | |
| Ellington Financial Mortgage Trust | |
| | |
| | |
| | |
| | |
| | |
| | |
| | |
| | |
| New Residential Mortgage Loan Trust | |
| | |
| | |
| | |
| 5.10%, 06/25/2057, 1 mo. USD Term SOFR + | |
| | |
Shares or Principal Amount | | |
ASSET & COMMERCIAL MORTGAGE-BACKED SECURITIES - 34.4% - (continued) |
| Whole Loan Collateral CMO - 2.8% - (continued) |
| Residential Mortgage Loan Trust 2.38%, | |
| SG Residential Mortgage Trust 1.16%, | |
| Starwood Mortgage Residential Trust | |
| | |
| | |
| Towd Point Mortgage Trust | |
| | |
| | |
| 5.05%, 02/25/2057, 1 mo. USD Term SOFR + | |
| Verus Securitization Trust | |
| | |
| | |
| | | |
| Total Asset & Commercial Mortgage-Backed Securities
(cost $183,581,437) | |
|
| |
| Litton Industries, Inc. 7.75%, 03/15/2026 | |
| |
| Cargill, Inc. 3.50%, 04/22/2025(1)(5) | |
| Auto Manufacturers - 1.0% |
| American Honda Finance Corp. 4.95%, 01/09/2026 | |
| Daimler Truck Finance North America LLC | |
| | |
| | |
| | |
| | |
| | |
| | | |
| |
| Diageo Capital PLC 5.20%, 10/24/2025 | |
| |
| International Flavors & Fragrances, Inc. 1.23%, | |
| Nutrien Ltd. 5.95%, 11/07/2025 | |
| | | |
| |
| ABN AMRO Bank NV 6.34%, 09/18/2027, (6.34% fixed rate until 09/18/2026; 1 yr. USD CMT + 1.65% thereafter)(1)(6) | |
| ANZ New Zealand International Ltd. 5.13%, 02/18/2025, 3 mo. USD SOFR + 0.60%(1)(3) | |
| Bank of America Corp. 5.08%, 01/20/2027, (5.08% fixed rate until 01/20/2026; 6 mo. USD SOFR + 1.29% thereafter)(6) | |
| Bank of America NA 5.65%, 08/18/2025 | |
| Bank of New York Mellon 5.15%, 05/22/2026, (5.15% fixed rate until 05/22/2025; 6 mo. USD SOFR + 1.07% thereafter)(6) | |
| Banque Federative du Credit Mutuel SA | |
| | |
| | |
| | |
The accompanying notes are an integral part of these financial statements.
Hartford Ultrashort Bond HLS Fund
Schedule of Investments – (continued)December 31, 2024
Shares or Principal Amount | | |
CORPORATE BONDS - 21.8% - (continued) |
| Commercial Banks - 9.9% - (continued) |
| Barclays PLC 7.33%, 11/02/2026, (7.33% fixed rate until 11/02/2025; 1 yr. USD CMT + 3.05% | |
| BPCE SA 5.20%, 01/18/2027(1) | |
| Canadian Imperial Bank of Commerce 5.24%, 06/28/2027 | |
| Citibank NA 4.93%, 08/06/2026 | |
| Citigroup, Inc. 5.27%, 01/25/2026, 3 mo. USD | |
| Commonwealth Bank of Australia 5.08%, 01/10/2025 | |
| Credit Agricole SA 5.59%, 07/05/2026(1) | |
| | |
| 6.26%, 09/22/2026, (6.26% fixed rate until 09/22/2025; 1 yr. USD CMT + 1.18% | |
| 6.47%, 01/09/2026, (6.47% fixed rate until 01/31/2025; 1 yr. USD CMT + 2.10% | |
| Goldman Sachs Bank USA 5.41%, 05/21/2027, (5.41% fixed rate until 05/21/2026; 6 mo. USD SOFR + 0.75% thereafter)(6) | |
| Goldman Sachs Group, Inc. 5.80%, 08/10/2026, (5.80% fixed rate until 08/10/2025; 6 mo. USD SOFR + 1.08% thereafter)(6) | |
| HSBC Holdings PLC 7.34%, 11/03/2026, (7.34% fixed rate until 11/03/2025; 6 mo. USD SOFR | |
| Lloyds Banking Group PLC 5.46%, 01/05/2028, (5.46% fixed rate until 01/05/2027; 1 yr. USD CMT + 1.38% thereafter)(6) | |
| Manufacturers & Traders Trust Co. | |
| | |
| | |
| Morgan Stanley 5.05%, 01/28/2027, (5.05% fixed rate until 01/28/2026; 6 mo. USD SOFR | |
| | |
| | |
| | |
| National Australia Bank Ltd. | |
| | |
| 5.04%, 01/12/2025, 3 mo. USD SOFR + | |
| National Securities Clearing Corp. 5.15%, | |
| PNC Bank NA 4.78%, 01/15/2027, (4.78% fixed rate until 01/15/2026; 6 mo. USD SOFR + | |
| Royal Bank of Canada 5.20%, 07/20/2026 | |
| | |
| | |
| 6.45%, 01/12/2027, (6.45% fixed rate until 01/12/2026; 1 yr. USD CMT + 2.30% | |
| Standard Chartered PLC 6.17%, 01/09/2027, (6.17% fixed rate until 01/09/2026; 1 yr. USD CMT + 2.05% thereafter)(1)(6) | |
| State Street Corp. 5.75%, 11/04/2026, (5.75% fixed rate until 11/04/2025; 6 mo. USD SOFR | |
| Toronto-Dominion Bank 5.10%, 01/09/2026 | |
Shares or Principal Amount | | |
CORPORATE BONDS - 21.8% - (continued) |
| Commercial Banks - 9.9% - (continued) |
| Truist Financial Corp. 5.90%, 10/28/2026, (5.90% fixed rate until 10/28/2025; 6 mo. USD SOFR + 1.63% thereafter)(6) | |
| | |
| | |
| | |
| | | |
| Diversified Financial Services - 0.7% |
| | |
| | |
| 4.99%, 05/01/2026, (4.99% fixed rate until 05/01/2025; 6 mo. USD SOFR + 1.00% | |
| Capital One Financial Corp. 4.99%, 07/24/2026, (4.99% fixed rate until 07/24/2025; 6 mo. USD SOFR + 2.16% thereafter)(6) | |
| | | |
| |
| Alliant Energy Finance LLC 5.40%, | |
| American Electric Power Co., Inc. 5.70%, 08/15/2025 | |
| Consumers Securitization Funding LLC 5.55%, 03/01/2028 | |
| Emera U.S. Finance LP 3.55%, 06/15/2026 | |
| FirstEnergy Pennsylvania Electric Co. 5.15%, | |
| NextEra Energy Capital Holdings, Inc. | |
| | |
| | |
| | |
| Southern California Edison Co. 5.35%, 03/01/2026 | |
| Southern Co. 5.15%, 10/06/2025 | |
| | | |
| |
| Spire, Inc. 5.30%, 03/01/2026 | |
| Healthcare - Services - 1.4% |
| Elevance Health, Inc. 5.35%, 10/15/2025 | |
| PeaceHealth Obligated Group 1.38%, 11/15/2025 | |
| | |
| | |
| | |
| | | |
| |
| | |
| | |
| | |
| Corebridge Financial, Inc. 3.50%, 04/04/2025 | |
| Corebridge Global Funding 5.75%, | |
| Equitable Financial Life Global Funding 5.50%, | |
| Jackson National Life Global Funding | |
| | |
| | |
| Metropolitan Life Global Funding I 5.00%, | |
| Pacific Life Global Funding II 5.50%, | |
The accompanying notes are an integral part of these financial statements.
Hartford Ultrashort Bond HLS Fund
Schedule of Investments – (continued)December 31, 2024
Shares or Principal Amount | | |
CORPORATE BONDS - 21.8% - (continued) |
| Insurance - 2.5% - (continued) |
| Protective Life Global Funding | |
| | |
| | |
| | | |
| |
| Occidental Petroleum Corp. 5.88%, 09/01/2025 | |
| Ovintiv, Inc. 5.65%, 05/15/2025 | |
| | | |
| |
| Bayer U.S. Finance LLC 6.13%, 11/21/2026(1) | |
| CVS Health Corp. 5.00%, 02/20/2026 | |
| | | |
| |
| Columbia Pipelines Holding Co. LLC 6.06%, | |
| Enterprise Products Operating LLC 5.05%, 01/10/2026 | |
| Gray Oak Pipeline LLC 2.60%, 10/15/2025(1) | |
| ONEOK, Inc. 5.55%, 11/01/2026 | |
| Williams Cos., Inc. 5.40%, 03/02/2026 | |
| | | |
| |
| AutoZone, Inc. 5.05%, 07/15/2026 | |
| |
| Nationwide Building Society 3.90%, | |
| |
| Intel Corp. 4.88%, 02/10/2026 | |
| |
| Oracle Corp. 5.80%, 11/10/2025 | |
| Trucking & Leasing - 0.2% |
| Penske Truck Leasing Co. LP/PTL Finance Corp. 5.75%, 05/24/2026(1) | |
| Total Corporate Bonds
(cost $114,477,987) | |
|
| |
| New Jersey Transportation Trust Fund Auth, NJ, Rev 5.09%, 06/15/2025 | |
| Total Municipal Bonds
(cost $1,630,000) | | |
U.S. GOVERNMENT AGENCIES - 4.0% |
| Mortgage-Backed Agencies - 4.0% |
| Federal Home Loan Mortgage Corp. - 0.6% |
| | |
| | |
| | |
| | |
| | |
| | |
| | | |
| Federal National Mortgage Association - 0.8% |
| | |
| | |
| | |
Shares or Principal Amount | | |
U.S. GOVERNMENT AGENCIES - 4.0% - (continued) |
| Mortgage-Backed Agencies - 4.0% - (continued) |
| Federal National Mortgage Association - 0.8% - (continued) |
| | |
| | |
| | |
| | |
| | | |
| Government National Mortgage Association - 2.6% |
| | |
| | |
| | |
| | |
| | |
| | | |
| Total U.S. Government Agencies
(cost $20,851,623) | | |
U.S. GOVERNMENT SECURITIES - 18.7% |
| U.S. Treasury Securities - 18.7% |
| U.S. Treasury Notes - 18.7% |
| | |
| | |
| | |
| | |
| Total U.S. Government Securities
(cost $98,726,170) | | |
| Total Long-Term Investments
(cost $419,267,217) | | |
SHORT-TERM INVESTMENTS - 20.3% |
| Repurchase Agreements - 0.0% |
| Fixed Income Clearing Corp. Repurchase Agreement dated 12/31/2024 at 4.45%, due on 01/02/2025 with a maturity value of $40,658; collateralized by U.S. Treasury Inflation Index Note at 0.13%, maturing 04/15/2027, with a market value of $41,671 | |
| Securities Lending Collateral - 0.1% |
| Goldman Sachs Financial Square Funds, Government Fund, Institutional Class, | |
| HSBC U.S. Government Money Market Fund, Institutional Class, 4.41%(7) | |
| Invesco Government & Agency Portfolio, Institutional Class, 4.42%(7) | |
| Morgan Stanley Institutional Liquidity Funds, Government Portfolio, Institutional Class, | |
| | | |
| U.S. Treasury Securities - 20.2% |
| U.S. Treasury Bills - 20.2% |
| | |
| | |
| | |
| | |
| | |
| | |
| | |
| | |
| | |
| | |
The accompanying notes are an integral part of these financial statements.
Hartford Ultrashort Bond HLS Fund
Schedule of Investments – (continued)December 31, 2024
Shares or Principal Amount | | |
SHORT-TERM INVESTMENTS - 20.3% - (continued) |
| U.S. Treasury Securities - 20.2% - (continued) |
| U.S. Treasury Bills - 20.2 - (continued) |
| | |
| | |
| | |
| | |
| | | |
| Total Short-Term Investments
(cost $106,878,139) | |
| Total Investments
(cost $526,145,356) | | |
| Other Assets and Liabilities | | |
| | | |
Note:
Percentage of investments as shown is the ratio of the total market value to net assets.
The Fund may refer to any one or more of the industry classifications used by one or more widely recognized market indices, ratings group and/or as defined by Fund management. Industry classifications may not be identical across all security types.
For Fund compliance purposes, the Fund may not use the same classification system. These classifications are used for financial reporting purposes.
See “Glossary” for abbreviation descriptions.
| Security was purchased pursuant to Rule 144A under the Securities Act of 1933 and may be sold in transactions that are exempt from registration (typically only to qualified institutional buyers) or in a public offering registered under the Securities Act of 1933. At December 31, 2024, the aggregate value of these securities was $158,777,974, representing 30.1% of net assets. |
| Variable or floating rate security, which interest rate adjusts periodically based on changes in current interest rates and prepayments on the underlying pool of assets. Rate shown is the rate in effect as of period end. |
| Variable rate securities; the rate reported is the coupon rate in effect at December 31, 2024. Base lending rates may be subject to a floor or cap. |
| Security is a “step-up” bond where coupon increases or steps up at a predetermined date. Rate shown is current coupon rate. |
| Represents entire or partial securities on loan. See Note 8 in the accompanying Notes to Financial Statements for securities lending information. |
| Fixed to variable rate investment. The rate shown reflects the fixed rate in effect at December 31, 2024. Rate will reset at a future date. Base lending rates may be subject to a floor or cap. |
| Current yield as of period end. |
| The rate shown represents current yield to maturity. |
| See Significant Accounting Policies of accompanying Notes to Financial Statements regarding valuation of investments. |
The following is a summary of the fair valuations according to the inputs used as of December 31, 2024 in valuing the Fund’s investments.
| | | | |
| | | | |
Asset & Commercial Mortgage-Backed Securities | | | | |
| | | | |
| | | | |
| | | | |
U.S. Government Securities | | | | |
| | | | |
| | | | |
| For the year ended December 31, 2024, there were no transfers in and out of Level 3. |
The accompanying notes are an integral part of these financial statements.
GLOSSARY: (abbreviations used in preceding Schedules of Investments)
Counterparty Abbreviations: |
| Deutsche Bank Securities, Inc. |
| |
|
| |
| |
| |
|
| Constant Maturity Treasury Index |
| Intercontinental Exchange, Inc. |
| Monthly Treasury Average Index |
| |
|
| |
| |
| |
| |
|
| American Depositary Receipt |
| |
| |
| Build America Mutual Assurance Co. |
| Collateralized Loan Obligation |
| Collateralized Mortgage Obligation |
| |
| |
| Euro Interbank Offered Rate |
| Kommanditgesellschaft Auf Aktien |
| Morgan Stanley Capital International |
| National Public Finance Guarantee Corp. |
| |
| Private Joint Stock Company |
| |
| Real Estate Investment Trust |
| Secured Overnight Financing Rate |
| |
| |
Statements of Assets and LiabilitiesDecember 31, 2024
| | Hartford
Capital
Appreciation
HLS Fund | Hartford
Disciplined
Equity
HLS Fund | Hartford
Dividend and
Growth
HLS Fund | Hartford
Healthcare
HLS Fund | Hartford
International
Opportunities
HLS Fund |
| | | | | | |
Investments in securities, at market value(1) | | | | | | |
| | | | | | |
| | | | | | |
Cash collateral due from broker on futures contracts | | | | | | |
Cash collateral held for securities on loan | | | | | | |
| | | | | | |
| | | | | | |
Investment securities sold | | | | | | |
| | | | | | |
| | | | | | |
Securities lending income | | | | | | |
Variation margin on futures contracts | | | | | | |
| | | | | | |
| | | | | | |
| | | | | | |
| | | | | | |
| | | | | | |
Obligation to return securities lending collateral | | | | | | |
| | | | | | |
Investment securities purchased | | | | | | |
| | | | | | |
Investment management fees | | | | | | |
| | | | | | |
| | | | | | |
Chief Compliance Officer fees | | | | | | |
| | | | | | |
Variation margin on futures contracts | | | | | | |
| | | | | | |
| | | | | | |
| | | | | | |
| | | | | | |
| | | | | | |
| | | | | | |
Capital stock and paid-in-capital | | | | | | |
Distributable earnings (loss) | | | | | | |
| | | | | | |
| | | | | | |
| | | | | | |
Class IA:Net asset value per share | | | | | | |
| | | | | | |
| | | | | | |
Class IB:Net asset value per share | | | | | | |
| | | | | | |
| | | | | | |
Class IC:Net asset value per share | | | | | | |
| | | | | | |
| | | | | | |
| | | | | | |
| | | | | | |
(1) Includes Investment in securities on loan, at market value | | | | | | |
The accompanying notes are an integral part of these financial statements.
Statements of Assets and Liabilities – (continued)December 31, 2024
| | Hartford
Small Cap
Growth
HLS Fund | Hartford
Small
Company
HLS Fund | | Hartford
Total Return
Bond
HLS Fund | Hartford
Ultrashort
Bond
HLS Fund |
| | | | | | |
Investments in securities, at market value(1) | | | | | | |
| | | | | | |
| | | | | | |
Cash collateral held for securities on loan | | | | | | |
| | | | | | |
Unrealized appreciation on foreign currency contracts | | | | | | |
| | | | | | |
Investment securities sold | | | | | | |
| | | | | | |
| | | | | | |
Securities lending income | | | | | | |
Variation margin on futures contracts | | | | | | |
Variation margin on centrally cleared swap contracts | | | | | | |
| | | | | | |
| | | | | | |
| | | | | | |
| | | | | | |
Obligation to return securities lending collateral | | | | | | |
Cash collateral due to broker on swap contracts | | | | | | |
Cash collateral due to broker on TBA sale commitments | | | | | | |
TBA sale commitments, at market value | | | | | | |
| | | | | | |
Investment securities purchased | | | | | | |
| | | | | | |
Investment management fees | | | | | | |
| | | | | | |
| | | | | | |
Chief Compliance Officer fees | | | | | | |
| | | | | | |
| | | | | | |
| | | | | | |
| | | | | | |
| | | | | | |
| | | | | | |
Capital stock and paid-in-capital | | | | | | |
Distributable earnings (loss) | | | | | | |
| | | | | | |
| | | | | | |
| | | | | | |
Class IA:Net asset value per share | | | | | | |
| | | | | | |
| | | | | | |
Class IB:Net asset value per share | | | | | | |
| | | | | | |
| | | | | | |
| | | | | | |
| | | | | | |
Proceeds of TBA sale commitments | | | | | | |
(1) Includes Investment in securities on loan, at market value | | | | | | |
The accompanying notes are an integral part of these financial statements.
Statements of OperationsFor the Year Ended December 31, 2024
| | Hartford
Capital
Appreciation
HLS Fund | Hartford
Disciplined
Equity
HLS Fund | Hartford
Dividend and
Growth
HLS Fund | Hartford
Healthcare
HLS Fund | Hartford
International
Opportunities
HLS Fund |
| | | | | | |
| | | | | | |
| | | | | | |
| | | | | | |
Foreign withholding tax reclaims | | | | | | |
Less: Foreign tax withheld | | | | | | |
Total investment income, net | | | | | | |
| | | | | | |
Investment management fees | | | | | | |
Administrative services fees | | | | | | |
| | | | | | |
| | | | | | |
| | | | | | |
| | | | | | |
| | | | | | |
| | | | | | |
| | | | | | |
| | | | | | |
| | | | | | |
Registration and filing fees | | | | | | |
| | | | | | |
| | | | | | |
Chief Compliance Officer fees | | | | | | |
| | | | | | |
| | | | | | |
Total expenses (before waivers, reimbursements and fees paid indirectly) | | | | | | |
| | | | | | |
| | | | | | |
Total waivers, reimbursements and fees paid indirectly | | | | | | |
| | | | | | |
Net Investment Income (Loss) | | | | | | |
Net Realized Gain (Loss) on Investments, Other Financial Instruments and Foreign Currency Transactions on: | | | | | | |
| | | | | | |
Less: Foreign taxes paid on realized capital gains | | | | | | |
| | | | | | |
Other foreign currency transactions | | | | | | |
Net Realized Gain (Loss) on Investments, Other Financial Instruments and Foreign Currency Transactions | | | | | | |
Net Changes in Unrealized Appreciation (Depreciation) of Investments, Other Financial Instruments and Foreign Currency Transactions of: | | | | | | |
| | | | | | |
| | | | | | |
Translation of other assets and liabilities in foreign currencies | | | | | | |
Net Changes in Unrealized Appreciation (Depreciation) of Investments, Other Financial Instruments and Foreign Currency Transactions | | | | | | |
Net Gain (Loss) on Investments, Other Financial Instruments and Foreign Currency Transactions | | | | | | |
Net Increase (Decrease) in Net Assets Resulting from Operations | | | | | | |
* Includes change in unrealized appreciation (depreciation) on deferred capital gains tax | | | | | | |
The accompanying notes are an integral part of these financial statements.
Statements of Operations – (continued)For the Year Ended December 31, 2024
| | Hartford
Small Cap
Growth
HLS Fund | Hartford
Small
Company
HLS Fund | | Hartford
Total Return
Bond
HLS Fund | Hartford
Ultrashort
Bond
HLS Fund |
| | | | | | |
| | | | | | |
| | | | | | |
| | | | | | |
Less: Foreign tax withheld | | | | | | |
Total investment income, net | | | | | | |
| | | | | | |
Investment management fees | | | | | | |
| | | | | | |
| | | | | | |
| | | | | | |
| | | | | | |
| | | | | | |
| | | | | | |
Registration and filing fees | | | | | | |
| | | | | | |
| | | | | | |
Chief Compliance Officer fees | | | | | | |
| | | | | | |
| | | | | | |
Total expenses (before waivers, reimbursements and fees paid indirectly) | | | | | | |
| | | | | | |
Total waivers, reimbursements and fees paid indirectly | | | | | | |
| | | | | | |
Net Investment Income (Loss) | | | | | | |
Net Realized Gain (Loss) on Investments, Other Financial Instruments and Foreign Currency Transactions on: | | | | | | |
| | | | | | |
Purchased options contracts | | | | | | |
| | | | | | |
Written options contracts | | | | | | |
| | | | | | |
Foreign currency contracts | | | | | | |
Other foreign currency transactions | | | | | | |
Net Realized Gain (Loss) on Investments, Other Financial Instruments and Foreign Currency Transactions | | | | | | |
Net Changes in Unrealized Appreciation (Depreciation) of Investments, Other Financial Instruments and Foreign Currency Transactions of: | | | | | | |
| | | | | | |
| | | | | | |
| | | | | | |
Foreign currency contracts | | | | | | |
Translation of other assets and liabilities in foreign currencies | | | | | | |
Net Changes in Unrealized Appreciation (Depreciation) of Investments, Other Financial Instruments and Foreign Currency Transactions | | | | | | |
Net Gain (Loss) on Investments, Other Financial Instruments and Foreign Currency Transactions | | | | | | |
Net Increase (Decrease) in Net Assets Resulting from Operations | | | | | | |
The accompanying notes are an integral part of these financial statements.
Statements of Changes in Net Assets
| Hartford Balanced
HLS Fund | Hartford Capital
Appreciation HLS Fund |
| For the
Year Ended
December 31,
2024 | For the
Year Ended
December 31,
2023 | For the
Year Ended
December 31,
2024 | For the
Year Ended
December 31,
2023 |
| | | | |
Net investment income (loss) | | | | |
Net realized gain (loss) on investments, other financial instruments and foreign currency transactions | | | | |
Net changes in unrealized appreciation (depreciation) of investments, other financial instruments and foreign currency transactions | | | | |
Net Increase (Decrease) in Net Assets Resulting from Operations | | | | |
Distributions to Shareholders: | | | | |
| | | | |
| | | | |
| | | | |
| | | | |
Capital Share Transactions: | | | | |
| | | | |
Issued on reinvestment of distributions | | | | |
| | | | |
Net increase (decrease) from capital share transactions | | | | |
Net Increase (Decrease) in Net Assets | | | | |
| | | | |
| | | | |
| | | | |
The accompanying notes are an integral part of these financial statements.
Statements of Changes in Net Assets – (continued)
| Hartford Disciplined
Equity HLS Fund | Hartford Dividend
and Growth HLS Fund |
| For the
Year Ended
December 31,
2024 | For the
Year Ended
December 31,
2023 | For the
Year Ended
December 31,
2024 | For the
Year Ended
December 31,
2023 |
| | | | |
Net investment income (loss) | | | | |
Net realized gain (loss) on investments and foreign currency transactions | | | | |
Net changes in unrealized appreciation (depreciation) of investments and foreign currency transactions | | | | |
Net Increase (Decrease) in Net Assets Resulting from Operations | | | | |
Distributions to Shareholders: | | | | |
| | | | |
| | | | |
| | | | |
| | | | |
Capital Share Transactions: | | | | |
| | | | |
Issued on reinvestment of distributions | | | | |
| | | | |
Net increase (decrease) from capital share transactions | | | | |
Net Increase (Decrease) in Net Assets | | | | |
| | | | |
| | | | |
| | | | |
The accompanying notes are an integral part of these financial statements.
Statements of Changes in Net Assets – (continued)
| Hartford Healthcare
HLS Fund | Hartford International
Opportunities HLS Fund |
| For the
Year Ended
December 31,
2024 | For the
Year Ended
December 31,
2023 | For the
Year Ended
December 31,
2024 | For the
Year Ended
December 31,
2023 |
| | | | |
Net investment income (loss) | | | | |
Net realized gain (loss) on investments and foreign currency transactions | | | | |
Net changes in unrealized appreciation (depreciation) of investments and foreign currency transactions | | | | |
Net Increase (Decrease) in Net Assets Resulting from Operations | | | | |
Distributions to Shareholders: | | | | |
| | | | |
| | | | |
| | | | |
Capital Share Transactions: | | | | |
| | | | |
Issued on reinvestment of distributions | | | | |
| | | | |
Net increase (decrease) from capital share transactions | | | | |
Net Increase (Decrease) in Net Assets | | | | |
| | | | |
| | | | |
| | | | |
The accompanying notes are an integral part of these financial statements.
Statements of Changes in Net Assets – (continued)
| | Hartford Small
Cap Growth HLS Fund |
| For the
Year Ended
December 31,
2024 | For the
Year Ended
December 31,
2023 | For the
Year Ended
December 31,
2024 | For the
Year Ended
December 31,
2023 |
| | | | |
Net investment income (loss) | | | | |
Net realized gain (loss) on investments | | | | |
Net changes in unrealized appreciation (depreciation) of investments | | | | |
Net Increase (Decrease) in Net Assets Resulting from Operations | | | | |
Distributions to Shareholders: | | | | |
| | | | |
| | | | |
| | | | |
Capital Share Transactions: | | | | |
| | | | |
Issued on reinvestment of distributions | | | | |
| | | | |
Net increase (decrease) from capital share transactions | | | | |
Net Increase (Decrease) in Net Assets | | | | |
| | | | |
| | | | |
| | | | |
The accompanying notes are an integral part of these financial statements.
Statements of Changes in Net Assets – (continued)
| Hartford Small
Company HLS Fund | |
| For the
Year Ended
December 31,
2024 | For the
Year Ended
December 31,
2023 | For the
Year Ended
December 31,
2024 | For the
Year Ended
December 31,
2023 |
| | | | |
Net investment income (loss) | | | | |
Net realized gain (loss) on investments and foreign currency transactions | | | | |
Net changes in unrealized appreciation (depreciation) of investments | | | | |
Net Increase (Decrease) in Net Assets Resulting from Operations | | | | |
Distributions to Shareholders: | | | | |
| | | | |
| | | | |
| | | | |
Capital Share Transactions: | | | | |
| | | | |
Issued on reinvestment of distributions | | | | |
| | | | |
Net increase (decrease) from capital share transactions | | | | |
Net Increase (Decrease) in Net Assets | | | | |
| | | | |
| | | | |
| | | | |
The accompanying notes are an integral part of these financial statements.
Statements of Changes in Net Assets – (continued)
| Hartford Total
Return Bond HLS Fund | Hartford Ultrashort
Bond HLS Fund |
| For the
Year Ended
December 31,
2024 | For the
Year Ended
December 31,
2023 | For the
Year Ended
December 31,
2024 | For the
Year Ended
December 31,
2023 |
| | | | |
Net investment income (loss) | | | | |
Net realized gain (loss) on investments, other financial instruments and foreign currency transactions | | | | |
Net changes in unrealized appreciation (depreciation) of investments, other financial instruments and foreign currency transactions | | | | |
Net Increase (Decrease) in Net Assets Resulting from Operations | | | | |
Distributions to Shareholders: | | | | |
| | | | |
| | | | |
| | | | |
Capital Share Transactions: | | | | |
| | | | |
Issued on reinvestment of distributions | | | | |
| | | | |
Net increase (decrease) from capital share transactions | | | | |
Net Increase (Decrease) in Net Assets | | | | |
| | | | |
| | | | |
| | | | |
The accompanying notes are an integral part of these financial statements.
| — Selected Per-Share Data(1) — | — Ratios and Supplemental Data — |
| Net
Asset
Value at
Beginning
of Period | Net
Investment
Income
(Loss) | Net
Realized
and
Unrealized
Gain (Loss)
on
Investments | Total from
Investment
Operations | Dividends
from Net
Investment
Income | Distributions
from
Capital
Gains | Total
Dividends
and
Distributions | Net
Asset
Value at
End of
Period | | Net
Assets
at End
of Period
(000s) | Ratio of
Expenses
to
Average
Net
Assets
Before
Adjust-
| Ratio of
Expenses
to
Average
Net
Assets
After
Adjust-
| Ratio of
Net
Investment
Income
(Loss) to
Average
Net Assets | |
Hartford Balanced HLS Fund |
For the Year Ended December 31, 2024 |
| | | | | | | | | | | | | | |
| | | | | | | | | | | | | | |
For the Year Ended December 31, 2023 |
| | | | | | | | | | | | | | |
| | | | | | | | | | | | | | |
For the Year Ended December 31, 2022 |
| | | | | | | | | | | | | | |
| | | | | | | | | | | | | | |
For the Year Ended December 31, 2021 |
| | | | | | | | | | | | | | |
| | | | | | | | | | | | | | |
For the Year Ended December 31, 2020 |
| | | | | | | | | | | | | | |
| | | | | | | | | | | | | | |
Hartford Capital Appreciation HLS Fund |
For the Year Ended December 31, 2024 |
| | | | | | | | | | | | | | |
| | | | | | | | | | | | | | |
| | | | | | | | | | | | | | |
For the Year Ended December 31, 2023 |
| | | | | | | | | | | | | | |
| | | | | | | | | | | | | | |
| | | | | | | | | | | | | | |
For the Year Ended December 31, 2022 |
| | | | | | | | | | | | | | |
| | | | | | | | | | | | | | |
| | | | | | | | | | | | | | |
For the Year Ended December 31, 2021 |
| | | | | | | | | | | | | | |
| | | | | | | | | | | | | | |
| | | | | | | | | | | | | | |
For the Year Ended December 31, 2020 |
| | | | | | | | | | | | | | |
| | | | | | | | | | | | | | |
| | | | | | | | | | | | | | |
Hartford Disciplined Equity HLS Fund |
For the Year Ended December 31, 2024 |
| | | | | | | | | | | | | | |
| | | | | | | | | | | | | | |
| | | | | | | | | | | | | | |
For the Year Ended December 31, 2023 |
| | | | | | | | | | | | | | |
| | | | | | | | | | | | | | |
| | | | | | | | | | | | | | |
The accompanying notes are an integral part of these financial statements.
Financial Highlights – (continued)
| — Selected Per-Share Data(1) — | — Ratios and Supplemental Data — |
| Net Asset Value at Beginning of Period | Net Investment Income (Loss) | Net Realized and Unrealized Gain (Loss) on Investments | Total from Investment Operations | Dividends from Net Investment Income | Distributions from Capital Gains | Total Dividends and Distributions | Net Asset Value at End of Period | | Net Assets at End of Period (000s) | Ratio of Expenses to Average Net Assets Before Adjust- ments(3) | Ratio of Expenses to Average Net Assets After Adjust- ments(3) | Ratio of Net Investment Income (Loss) to Average Net Assets | |
Hartford Disciplined Equity HLS Fund – (continued) |
For the Year Ended December 31, 2022 |
| | | | | | | | | | | | | | |
| | | | | | | | | | | | | | |
| | | | | | | | | | | | | | |
For the Year Ended December 31, 2021 |
| | | | | | | | | | | | | | |
| | | | | | | | | | | | | | |
| | | | | | | | | | | | | | |
For the Year Ended December 31, 2020 |
| | | | | | | | | | | | | | |
| | | | | | | | | | | | | | |
| | | | | | | | | | | | | | |
Hartford Dividend and Growth HLS Fund |
For the Year Ended December 31, 2024 |
| | | | | | | | | | | | | | |
| | | | | | | | | | | | | | |
For the Year Ended December 31, 2023 |
| | | | | | | | | | | | | | |
| | | | | | | | | | | | | | |
For the Year Ended December 31, 2022 |
| | | | | | | | | | | | | | |
| | | | | | | | | | | | | | |
For the Year Ended December 31, 2021 |
| | | | | | | | | | | | | | |
| | | | | | | | | | | | | | |
For the Year Ended December 31, 2020 |
| | | | | | | | | | | | | | |
| | | | | | | | | | | | | | |
Hartford Healthcare HLS Fund |
For the Year Ended December 31, 2024 |
| | | | | | | | | | | | | | |
| | | | | | | | | | | | | | |
For the Year Ended December 31, 2023 |
| | | | | | | | | | | | | | |
| | | | | | | | | | | | | | |
For the Year Ended December 31, 2022 |
| | | | | | | | | | | | | | |
| | | | | | | | | | | | | | |
For the Year Ended December 31, 2021 |
| | | | | | | | | | | | | | |
| | | | | | | | | | | | | | |
For the Year Ended December 31, 2020 |
| | | | | | | | | | | | | | |
| | | | | | | | | | | | | | |
The accompanying notes are an integral part of these financial statements.
Financial Highlights – (continued)
| — Selected Per-Share Data(1) — | — Ratios and Supplemental Data — |
| Net Asset Value at Beginning of Period | Net Investment Income (Loss) | Net Realized and Unrealized Gain (Loss) on Investments | Total from Investment Operations | Dividends from Net Investment Income | Distributions from Capital Gains | Total Dividends and Distributions | Net Asset Value at End of Period | | Net Assets at End of Period (000s) | Ratio of Expenses to Average Net Assets Before Adjust- ments(3) | Ratio of Expenses to Average Net Assets After Adjust- ments(3) | Ratio of Net Investment Income (Loss) to Average Net Assets | |
Hartford International Opportunities HLS Fund |
For the Year Ended December 31, 2024 |
| | | | | | | | | | | | | | |
| | | | | | | | | | | | | | |
For the Year Ended December 31, 2023 |
| | | | | | | | | | | | | | |
| | | | | | | | | | | | | | |
For the Year Ended December 31, 2022 |
| | | | | | | | | | | | | | |
| | | | | | | | | | | | | | |
For the Year Ended December 31, 2021 |
| | | | | | | | | | | | | | |
| | | | | | | | | | | | | | |
For the Year Ended December 31, 2020 |
| | | | | | | | | | | | | | |
| | | | | | | | | | | | | | |
|
For the Year Ended December 31, 2024 |
| | | | | | | | | | | | | | |
| | | | | | | | | | | | | | |
For the Year Ended December 31, 2023 |
| | | | | | | | | | | | | | |
| | | | | | | | | | | | | | |
For the Year Ended December 31, 2022 |
| | | | | | | | | | | | | | |
| | | | | | | | | | | | | | |
For the Year Ended December 31, 2021 |
| | | | | | | | | | | | | | |
| | | | | | | | | | | | | | |
For the Year Ended December 31, 2020 |
| | | | | | | | | | | | | | |
| | | | | | | | | | | | | | |
Hartford Small Cap Growth HLS Fund |
For the Year Ended December 31, 2024 |
| | | | | | | | | | | | | | |
| | | | | | | | | | | | | | |
For the Year Ended December 31, 2023 |
| | | | | | | | | | | | | | |
| | | | | | | | | | | | | | |
For the Year Ended December 31, 2022 |
| | | | | | | | | | | | | | |
| | | | | | | | | | | | | | |
For the Year Ended December 31, 2021 |
| | | | | | | | | | | | | | |
| | | | | | | | | | | | | | |
The accompanying notes are an integral part of these financial statements.
Financial Highlights – (continued)
| — Selected Per-Share Data(1) — | — Ratios and Supplemental Data — |
| Net Asset Value at Beginning of Period | Net Investment Income (Loss) | Net Realized and Unrealized Gain (Loss) on Investments | Total from Investment Operations | Dividends from Net Investment Income | Distributions from Capital Gains | Total Dividends and Distributions | Net Asset Value at End of Period | | Net Assets at End of Period (000s) | Ratio of Expenses to Average Net Assets Before Adjust- ments(3) | Ratio of Expenses to Average Net Assets After Adjust- ments(3) | Ratio of Net Investment Income (Loss) to Average Net Assets | |
Hartford Small Cap Growth HLS Fund – (continued) |
For the Year Ended December 31, 2020 |
| | | | | | | | | | | | | | |
| | | | | | | | | | | | | | |
Hartford Small Company HLS Fund |
For the Year Ended December 31, 2024 |
| | | | | | | | | | | | | | |
| | | | | | | | | | | | | | |
For the Year Ended December 31, 2023 |
| | | | | | | | | | | | | | |
| | | | | | | | | | | | | | |
For the Year Ended December 31, 2022 |
| | | | | | | | | | | | | | |
| | | | | | | | | | | | | | |
For the Year Ended December 31, 2021 |
| | | | | | | | | | | | | | |
| | | | | | | | | | | | | | |
For the Year Ended December 31, 2020 |
| | | | | | | | | | | | | | |
| | | | | | | | | | | | | | |
|
For the Year Ended December 31, 2024 |
| | | | | | | | | | | | | | |
| | | | | | | | | | | | | | |
For the Year Ended December 31, 2023 |
| | | | | | | | | | | | | | |
| | | | | | | | | | | | | | |
For the Year Ended December 31, 2022 |
| | | | | | | | | | | | | | |
| | | | | | | | | | | | | | |
For the Year Ended December 31, 2021 |
| | | | | | | | | | | | | | |
| | | | | | | | | | | | | | |
For the Year Ended December 31, 2020 |
| | | | | | | | | | | | | | |
| | | | | | | | | | | | | | |
Hartford Total Return Bond HLS Fund |
For the Year Ended December 31, 2024 |
| | | | | | | | | | | | | | |
| | | | | | | | | | | | | | |
For the Year Ended December 31, 2023 |
| | | | | | | | | | | | | | |
| | | | | | | | | | | | | | |
The accompanying notes are an integral part of these financial statements.
Financial Highlights – (continued)
| — Selected Per-Share Data(1) — | — Ratios and Supplemental Data — |
| Net Asset Value at Beginning of Period | Net Investment Income (Loss) | Net Realized and Unrealized Gain (Loss) on Investments | Total from Investment Operations | Dividends from Net Investment Income | Distributions from Capital Gains | Total Dividends and Distributions | Net Asset Value at End of Period | | Net Assets at End of Period (000s) | Ratio of Expenses to Average Net Assets Before Adjust- ments(3) | Ratio of Expenses to Average Net Assets After Adjust- ments(3) | Ratio of Net Investment Income (Loss) to Average Net Assets | |
Hartford Total Return Bond HLS Fund – (continued) |
For the Year Ended December 31, 2022 |
| | | | | | | | | | | | | | |
| | | | | | | | | | | | | | |
For the Year Ended December 31, 2021 |
| | | | | | | | | | | | | | |
| | | | | | | | | | | | | | |
For the Year Ended December 31, 2020 |
| | | | | | | | | | | | | | |
| | | | | | | | | | | | | | |
Hartford Ultrashort Bond HLS Fund |
For the Year Ended December 31, 2024 |
| | | | | | | | | | | | | | |
| | | | | | | | | | | | | | |
For the Year Ended December 31, 2023 |
| | | | | | | | | | | | | | |
| | | | | | | | | | | | | | |
For the Year Ended December 31, 2022 |
| | | | | | | | | | | | | | |
| | | | | | | | | | | | | | |
For the Year Ended December 31, 2021 |
| | | | | | | | | | | | | | |
| | | | | | | | | | | | | | |
For the Year Ended December 31, 2020 |
| | | | | | | | | | | | | | |
| | | | | | | | | | | | | | |
FINANCIAL HIGHLIGHTS FOOTNOTES |
| Information presented relates to a share outstanding throughout the indicated period. Net investment income (loss) per share amounts are calculated based on average shares outstanding unless otherwise noted. |
| The figures do not include sales charges or other fees which may be applied at the variable contract level or by a qualified pension or retirement plan. Any such additional sales charges or other fees would lower the Fund’s performance. |
| Adjustments include waivers and reimbursements, if applicable. Ratios do not include fees paid indirectly (see Expenses in the accompanying Notes to Financial Statements). |
| Portfolio turnover excludes TBA roll transactions. Had TBA roll transactions been included, the portfolio turnover rate would have been 55%, 59%, 61%, 49% and 48% for the fiscal years ended December 31, 2024, December 31, 2023, December 31, 2022, December 31, 2021 and December 31, 2020, respectively. |
| Commenced operations on September 18, 2020. |
| |
| |
| Per share amount is less than $0.005. |
| Portfolio turnover excludes TBA roll transactions. Had TBA roll transactions been included, the portfolio turnover rate would have been 354%, 422%, 431%, 494% and 564% for the fiscal years ended December 31, 2024, December 31, 2023, December 31, 2022, December 31, 2021 and December 31, 2020, respectively. |
The accompanying notes are an integral part of these financial statements.
Notes to Financial Statements December 31, 2024
The Hartford Series Fund, Inc. (the "Company") is an open-end registered management investment company comprised of twelve series, as of December 31, 2024. Financial statements for the series of the Company listed below (each, a "Fund" and collectively, the "Funds") are included in this report.
Hartford Series Fund, Inc.: |
Hartford Balanced HLS Fund (the "Balanced HLS Fund") |
Hartford Capital Appreciation HLS Fund (the "Capital Appreciation HLS Fund") |
Hartford Disciplined Equity HLS Fund (the "Disciplined Equity HLS Fund") |
Hartford Dividend and Growth HLS Fund (the "Dividend and Growth HLS Fund") |
Hartford Healthcare HLS Fund (the "Healthcare HLS Fund") |
Hartford International Opportunities HLS Fund (the "International Opportunities HLS Fund") |
Hartford MidCap HLS Fund (the "MidCap HLS Fund") |
Hartford Small Cap Growth HLS Fund (the "Small Cap Growth HLS Fund") |
Hartford Small Company HLS Fund (the "Small Company HLS Fund") |
Hartford Stock HLS Fund (the "Stock HLS Fund") |
Hartford Total Return Bond HLS Fund (the "Total Return Bond HLS Fund") |
Hartford Ultrashort Bond HLS Fund (the "Ultrashort Bond HLS Fund") |
The assets of each Fund are separate, and a shareholder's interest is limited to the Fund in which shares are held. The Company is organized under the laws of the State of Maryland and is registered with the U.S. Securities and Exchange Commission (the "SEC") under the Investment Company Act of 1940, as amended (the "1940 Act"). Each Fund serves as an underlying investment option for certain variable annuity and variable life insurance separate accounts of insurance companies and certain qualified pension or retirement plans. Owners of variable annuity contracts and policyholders of variable life insurance contracts may choose the Funds if permitted in the variable insurance contract prospectus. In addition, participants in certain qualified pension or retirement plans may choose the Funds if permitted by their plans.
Each Fund is a diversified open-end management investment company. Each Fund applies specialized accounting and reporting standards under Accounting Standards Codification Topic 946, "Financial Services – Investment Companies."
At a meeting held February 13-14, 2024, the Board of Directors of Hartford HLS Series Fund II, Inc. approved the reorganization of the Hartford Small Cap Growth HLS Fund, a series of Hartford HLS Series Fund II, Inc., into a newly created “shell” series of the Company. Effective immediately before the opening of business on April 29, 2024, the Small Cap Growth HLS Fund, a series of the Company, acquired all of the assets and liabilities of the Hartford Small Cap Growth HLS Fund (the “Predecessor Fund”), a series of Hartford HLS Series Fund II, Inc., in a tax-free reorganization and adopted the accounting and performance history of the Predecessor Fund (the “Reorganization”). The only material change between the Predecessor Fund and the Small Cap Growth HLS Fund is that it is a series of the Company instead of a series of Hartford HLS Series Fund II, Inc.
Each Fund has registered for sale Class IA and IB shares. Each of Capital Appreciation HLS Fund and Disciplined Equity HLS Fund also has registered for sale Class IC shares. Class IA and Class IB shares of each Fund are closed to certain investors. The Small Cap Growth HLS Fund and Small Company HLS Fund are closed to new investors, subject to certain exceptions set forth in the Funds' prospectus. Each class is offered at the per share net asset value (“NAV”) without a sales charge. Class IB shares are subject to distribution and service fees charged pursuant to a Distribution Plan adopted in accordance with Rule 12b-1 under the 1940 Act. Class IC shares are subject to distribution fees charged pursuant to a Distribution Plan adopted in accordance with Rule 12b-1 under the 1940 Act and Class IC shares are also subject to an administrative services fee.
2.
Significant Accounting Policies:
The following is a summary of significant accounting policies of each Fund used in the preparation of its financial statements, which are in accordance with United States Generally Accepted Accounting Principles ("U.S. GAAP"). The preparation of financial statements in accordance with U.S. GAAP may require management to make estimates and assumptions that affect the reported amounts of assets and liabilities and disclosure of contingent assets and liabilities at the date of the financial statements and the reported amounts of increases and decreases in net assets from operations during the reporting period. Actual results could differ from those estimates.
a)
Determination of Net Asset Value – The NAV of each class of each Fund’s shares is determined as of the close of regular trading on the New York Stock Exchange (the "Exchange") (normally 4:00 p.m. Eastern Time) (the "NYSE Close") on each day that the Exchange is open
Notes to Financial Statements – (continued) December 31, 2024
("Valuation Date"). If the Exchange is closed due to weather or other extraordinary circumstances on a day it would typically be open for business, each Fund may treat such day as a typical business day and accept purchase and redemption orders and calculate each Fund’s NAV in accordance with applicable law. The NAV of each class of each Fund's shares is determined by dividing the value of the Fund’s net assets attributable to the class of shares by the number of shares outstanding for that class. Information that becomes known to the Funds after the NAV has been calculated on a particular day will not generally be used to retroactively adjust the NAV determined earlier that day.
b)
Investment Valuation and Fair Value Measurements – For purposes of calculating the NAV of each class of each Fund, portfolio securities and other assets held in the Fund’s portfolio for which market prices are readily available are valued at market value. Market value is generally determined on the basis of official close price or last reported trade price. If no trades were reported, market value is based on prices obtained from a quotation reporting system, established market makers (including evaluated prices), or independent pricing services. Pricing vendors may use matrix pricing or valuation models that utilize certain inputs and assumptions to derive values, including transaction data, credit quality information, general market conditions, news, and other factors and assumptions.
With respect to a Fund's investments that do not have readily available market prices, the Company's Board of Directors (the "Board") has designated Hartford Funds Management Company, LLC (the "Investment Manager" or "HFMC") as its valuation designee to perform fair valuations pursuant to Rule 2a-5 under the 1940 Act (the "Valuation Designee").
If market prices are not readily available or deemed unreliable, the Valuation Designee determines the fair value of the security or other instrument in good faith under policies and procedures approved by and under the supervision of the Board ("Valuation Procedures").
The Valuation Designee has delegated the day-to-day responsibility for implementing the Valuation Procedures to the Valuation Committee (the "Valuation Committee"). The Valuation Committee will consider all available relevant factors in determining an investment’s fair value. The Valuation Designee reports fair value matters to the Audit Committee of the Board.
Prices of foreign equities that are principally traded on certain foreign markets will generally be adjusted daily pursuant to a fair value pricing service in order to reflect an adjustment for the factors occurring after the close of certain foreign markets but before the NYSE Close. Securities and other instruments that are primarily traded on foreign markets may trade on days that are not business days of the Funds. The value of the foreign securities or other instruments in which a Fund invests may change on days when a shareholder will not be able to purchase or redeem shares of the Fund.
Fixed income investments (other than short-term obligations) and non-exchange traded derivatives held by a Fund are normally valued at prices supplied by independent pricing services in accordance with the Valuation Procedures. Short-term investments maturing in 60 days or less are generally valued at amortized cost, which approximates fair value.
Exchange-traded derivatives, such as options, futures and options on futures, are valued at the last sale price determined by the exchange where such instruments principally trade as of the close of such exchange ("Exchange Close"). If a last sale price is not available, the value will be the mean of the most recently quoted bid and ask prices as of the Exchange Close. If a mean of the bid and ask prices cannot be calculated for the day, the value will be the most recently quoted bid price as of the Exchange Close. Over-the-counter derivatives are normally valued based on prices supplied by independent pricing services in accordance with the Valuation Procedures.
Investments valued in currencies other than U.S. dollars are converted to U.S. dollars using the prevailing spot currency exchange rates obtained from independent pricing services for calculation of the NAV. As a result, the NAV of a Fund’s shares may be affected by changes in the value of currencies in relation to the U.S. dollar. The value of securities or other instruments traded in markets outside the United States or denominated in currencies other than the U.S. dollar may be affected significantly on a day that the Exchange is closed and the market value may change on days when an investor is not able to purchase or redeem shares of a Fund.
Foreign currency contracts represent agreements to exchange currencies on specific future dates at predetermined rates. Foreign currency contracts are valued using foreign currency exchange rates and forward rates as provided by an independent pricing service on the Valuation Date.
Shares of investment companies listed and traded on an exchange are valued in the same manner as any exchange-listed equity security. Investments in investment companies that are not listed or traded on an exchange ("Non-Traded Funds"), if any, are valued at the respective NAV of each Non-Traded Fund on the Valuation Date. Such Non-Traded Funds and listed investment companies may use fair value pricing as disclosed in their prospectuses.
Financial instruments for which prices are not available from an independent pricing service may be valued using quotations obtained from one or more dealers that make markets in the respective financial instrument in accordance with the Valuation Procedures.
Notes to Financial Statements – (continued) December 31, 2024
U.S. GAAP defines fair value as the price that a Fund would receive to sell an asset or pay to transfer a liability in an orderly transaction between market participants. The U.S. GAAP fair value measurement standards require disclosure of a fair value hierarchy for each major category of assets and liabilities. Various inputs are used in determining the fair value of each Fund’s investments. These inputs are summarized into three broad hierarchy levels. This hierarchy is based on whether the valuation inputs are observable or unobservable. These levels are:
•
Level 1 – Quoted prices in active markets for identical investments. Level 1 may include exchange traded instruments, such as domestic equities, some foreign equities, options, futures, mutual funds, exchange traded funds, rights and warrants.
•
Level 2 – Observable inputs other than Level 1 prices, such as quoted prices for similar investments; quoted prices in markets that are not active; or other inputs that are observable or can be corroborated by observable market data. Level 2 may include debt investments that are traded less frequently than exchange traded instruments and which are valued using independent pricing services; foreign equities, which are principally traded on certain foreign markets and are adjusted daily pursuant to a fair value pricing service in order to reflect an adjustment for the factors occurring after the close of certain foreign markets but before the NYSE Close; senior floating rate interests, which are valued using an aggregate of dealer bids; short-term investments, which are valued at amortized cost; and swaps, which are valued based upon the terms of each swap contract.
•
Level 3 – Significant unobservable inputs that are supported by limited or no market activity. Level 3 may include financial instruments whose values are determined using indicative market quotes or require significant management judgment or estimation. These unobservable valuation inputs may include estimates for current yields, maturity/duration, prepayment speed, and indicative market quotes for comparable investments along with other assumptions relating to credit quality, collateral value, complexity of the investment structure, general market conditions and liquidity. This category may include investments where trading has been halted or there are certain restrictions on trading. While these investments are priced using unobservable inputs, the valuation of these investments reflects the best available data and management believes the prices are a reasonable representation of exit price.
Valuation levels are not necessarily indicative of the risk associated with investing in such investments. Individual investments within any of the above mentioned asset classes may be assigned a different hierarchical level than those presented above, as individual circumstances dictate.
For additional information, refer to the Fair Value Summary and the Level 3 roll-forward reconciliation, if applicable, which follows each Fund's Schedule of Investments.
c)
Investment Transactions and Investment Income – Investment transactions are recorded as of the trade date (the date the order to buy or sell is executed) for financial reporting purposes. Investments purchased or sold on a when-issued or delayed-delivery basis may be settled a month or more after the trade date. Realized gains and losses are determined on the basis of identified cost.
The trade date for senior floating rate interests purchased in the primary loan market is considered the date on which the loan allocations are determined. The trade date for senior floating rate interests purchased in the secondary loan market is the date on which the transaction is entered into.
Dividend income from domestic securities is accrued on the ex-dividend date. In general, dividend income from foreign securities is recorded on the ex-date; however, dividend notifications in certain foreign jurisdictions may not be available in a timely manner and as a result, a Fund will record the dividend as soon as the relevant details (i.e., rate per share, payment date, shareholders of record, etc.) are publicly available. Interest income, including amortization of premium, accretion of discounts, inflation adjustments and additional principal received in-kind in lieu of cash, is accrued on a daily basis. Paydown gains and losses on mortgage-related and other asset-backed securities are included in interest income in the Statements of Operations, as applicable.
The Dividend and Growth HLS Fund filed claims to recover taxes withheld on prior year reclaims (EU reclaims) related to French taxes withheld on dividend income from 2009, 2010 and 2011. The Dividend and Growth HLS Fund received EU reclaims with related interest in the amount of $1,525,293, which is recorded on the Statement of Operations as Foreign withholding tax reclaims.
Idle cash and currency balances may be swept into overnight sweep accounts held in a demand deposit account at State Street Bank and Trust Company ("State Street") that earn interest, which are classified as interest income on the Statements of Operations.
Please refer to Note 8 for Securities Lending information.
d)
Taxes – A Fund may be subject to taxes imposed on realized gains on securities of certain foreign countries in which such Fund invests. A Fund may also be subject to taxes withheld on foreign dividends and interest from securities in which such Fund invests. The amount of any foreign taxes withheld and foreign tax expense is included on the accompanying Statements of Operations as a reduction to net investment income or net realized or unrealized gain (loss) on investments in these securities, if applicable.
Notes to Financial Statements – (continued) December 31, 2024
e)
Foreign Currency Transactions – Assets and liabilities denominated in currencies other than U.S. dollars are translated into U.S. dollars at the exchange rates in effect on the Valuation Date. Purchases and sales of investments, income and expenses are translated into U.S. dollars at the exchange rates on the dates of such transactions.
A Fund does not isolate that portion of portfolio investment valuation resulting from fluctuations in the foreign currency exchange rates from the fluctuations arising from changes in the market prices of investments held. Exchange rate fluctuations are included with the net realized and unrealized gain or loss on investments in the accompanying financial statements.
Net realized foreign exchange gains or losses arise from sales of foreign currencies and the difference between asset and liability amounts initially stated in foreign currencies and the U.S. dollar value of the amounts actually received or paid. Net unrealized foreign exchange gains or losses arise from changes in the value of other assets and liabilities at the end of the reporting period, resulting from changes in the exchange rates.
f)
Joint Trading Account – A Fund may invest cash balances into a joint trading account that may be invested in one or more repurchase agreements.
g)
Fund Share Valuation and Dividend Distributions to Shareholders – Orders for each class of each Fund’s shares are executed in accordance with the investment instructions of the contract holders and plan participants. The NAV of each class of each Fund’s shares is determined as of the close of business on each business day of the Exchange (see Note 2(a)). The NAV is determined separately for each class of shares of each Fund by dividing the Fund's net assets attributable to that class by the number of shares of the class outstanding. Each class of shares offered by each Fund has equal rights as to assets and voting privileges (except that shareholders of a class have exclusive voting rights regarding any matter relating solely to that class of shares). Income and non-class specific expenses are allocated daily to each class on the basis of the relative net assets of the class of the Fund. Realized and unrealized gains and losses are allocated daily based on the relative net assets of each class of shares of each Fund.
Orders for the purchase of a Fund's shares received prior to the close of the Exchange on any day the Exchange is open for business are priced at the NAV determined as of the close of the Exchange. Orders received after the close of the Exchange, or on a day on which the Exchange and/or the Funds are not open for business, are priced at the next determined NAV.
Dividends are declared pursuant to a policy adopted by the Company's Board of Directors. Dividends and/or distributions to shareholders are recorded on ex-date. The policy of each Fund is to pay dividends from net investment income and realized capital gains, if any, at least once per year. Income dividends and capital gains distributions are determined in accordance with federal income tax regulations, which may differ from U.S. GAAP with respect to character and timing (see Federal Income Taxes: Distributions and Components of Distributable Earnings and Reclassification of Capital Accounts notes).
3.
Securities and Other Investments:
a)
Restricted Securities – Each Fund may invest in securities that are subject to legal or contractual restrictions on resale. These securities generally may be resold in transactions exempt from registration or to the public if the securities are registered. Disposal of these securities may involve time-consuming negotiations and expense, and prompt sale at an acceptable price may be difficult. Information regarding restricted securities, if applicable, is included at the end of each Fund's Schedule of Investments.
b)
Investments Purchased on a When-Issued or Delayed-Delivery Basis – Delivery and payment for investments that have been purchased by a Fund on a forward commitment, or when-issued or delayed-delivery basis, take place beyond the customary settlement period. A Fund may dispose of or renegotiate a delayed-delivery transaction after it is entered into, and may sell delayed-delivery investments before they are delivered, which may result in a realized gain or loss. During this period, such investments are subject to market fluctuations. See each Fund’s Schedule of Investments, if applicable, for when-issued or delayed-delivery investments as of December 31, 2024.
A Fund may enter into to-be announced ("TBA") commitments. TBA commitments are forward agreements for the purchase or sale of mortgage-backed securities for a fixed price, with payment and delivery on an agreed-upon future settlement date. The specific securities to be delivered are not identified at the trade date; however, delivered securities must meet specified terms, including issuer, rate and mortgage terms. Although a Fund may enter into TBA commitments with the intention of acquiring or delivering securities for its portfolio, the Fund can extend the settlement date, roll the transaction, or dispose of a commitment prior to settlement if deemed appropriate to do so. If the TBA commitment is closed through the acquisition of an offsetting TBA commitment, a Fund realizes a gain or loss. In a TBA roll transaction, a Fund generally purchases or sells the initial TBA commitment prior to the agreed upon settlement date and enters into a new TBA commitment for future delivery or receipt of the mortgage-backed securities. TBA commitments involve a risk of loss if the value of the security to be purchased or sold declines or increases, respectively, prior to settlement date. See each Fund's Schedule of Investments, if applicable, for TBA commitments as of December 31, 2024.
Notes to Financial Statements – (continued) December 31, 2024
c)
Senior Floating Rate Interests – Certain Funds may invest in senior floating rate interests. Senior floating rate interests generally hold the most senior position in the capital structure of a business entity (the "Borrower"), are typically secured by specific collateral and have a claim on the assets and/or stock of the Borrower that is senior to that held by subordinated debt holders and stockholders of the Borrower. Senior floating rate interests are typically structured and administered by a financial institution that acts as the agent of the lenders participating in the senior floating rate interest. A Fund may invest in multiple series or tranches of a senior floating rate interest, which may have varying terms and carry different associated risks. A Fund may also enter into unfunded loan commitments, which are contractual obligations for future funding. Unfunded loan commitments may include revolving credit facilities, which may obligate the Fund to supply additional cash to the Borrower on demand. Unfunded loan commitments represent a future obligation in full. A Fund may receive a commitment fee based on the undrawn portion of the underlying line of credit portion of a senior floating rate interest. In certain circumstances, a Fund may receive various fees upon the restructure of a senior floating rate interest by a borrower. Fees earned/paid may be recorded as a component of income or realized gain/loss in the Statements of Operations.
Senior floating rate interests are typically rated below-investment-grade, which suggests they are more likely to default and generally pay higher interest rates than investment-grade loans. A default could lead to non-payment of income, which would result in a reduction of income to a Fund, and there can be no assurance that the liquidation of any collateral would satisfy the Borrower’s obligation in the event of non-payment of scheduled interest or principal payments, or that such collateral could be readily liquidated. See each Fund's Schedule of Investments, if applicable, for outstanding senior floating rate interests as of December 31, 2024.
d)
Mortgage-Related and Other Asset-Backed Securities – A Fund may invest in mortgage-related and other asset-backed securities. These securities include mortgage pass-through securities, collateralized mortgage obligations, commercial mortgage-backed securities, stripped mortgage-backed securities, asset-backed securities, collateralized debt obligations and other securities that directly or indirectly represent a participation in, or are secured by and payable from, mortgage loans on real property. Mortgage-related securities are created from pools of residential or commercial mortgage loans, including mortgage loans made by savings and loan institutions, mortgage bankers, commercial banks and others. Asset-backed securities are created from many types of assets, including auto loans, credit card receivables, home equity loans, and student loans. These securities provide a monthly payment that consists of both interest and principal payments. Interest payments may be determined by fixed or adjustable rates. The rate of prepayments on underlying mortgages will affect the price and volatility of a mortgage-related security, and may have the effect of shortening or extending the effective duration of the security relative to what was anticipated at the time of purchase. The timely payment of principal and interest of certain mortgage-related securities is guaranteed by the full faith and credit of the United States Government. Mortgage-related and other asset-backed securities created and guaranteed by non-governmental issuers, including government-sponsored corporations, may be supported by various forms of insurance or guarantees, but there can be no assurance that the private insurers or guarantors can meet their obligations under the insurance policies or guarantee arrangements. See each Fund's Schedule of Investments, if applicable, for mortgage-related and other asset-backed securities as of December 31, 2024.
e)
Inflation-Indexed Bonds – Certain Funds may invest in inflation-indexed bonds. Inflation-indexed bonds are fixed income investments whose principal value is periodically adjusted to the rate of inflation. The interest rate on these bonds is generally fixed at issuance at a rate lower than typical bonds. Over the life of an inflation-indexed bond, however, interest will be paid based on a principal value, which is adjusted for inflation. Any increase or decrease in the principal amount of an inflation-indexed bond will be included as interest income on the Statements of Operations, even though investors do not receive the principal amount until maturity. See each Fund's Schedule of Investments, if applicable, for inflation-indexed bonds as of December 31, 2024.
f)
Repurchase Agreements – A repurchase agreement is an agreement between two parties whereby one party sells the other a security at a specified price with a commitment to repurchase the security later at an agreed-upon price, date and interest payment. Each Fund is permitted to enter into fully collateralized repurchase agreements. The Company's Board of Directors has delegated to the sub-adviser, as applicable, the responsibility of evaluating the creditworthiness of the banks and securities dealers with which the Funds will engage in repurchase agreements. The sub-adviser will monitor such transactions to ensure that the value of underlying collateral will be at least equal to the total amount of the repurchase obligation as required by the valuation provision of the repurchase agreement, including the accrued interest. Repurchase agreements carry the risk that the market value of the securities declines below the repurchase price. A Fund could also lose money if it is unable to recover the securities and the value of any collateral held. In the event the borrower commences bankruptcy proceedings, a court may characterize the transaction as a loan. If a Fund has not perfected a security interest in the underlying collateral, the Fund may be required to return the underlying collateral to the borrower’s estate and be treated as an unsecured creditor. As an unsecured creditor, the Fund could lose some or all of the principal and interest involved in the transaction. See each Fund's Schedule of Investments, if applicable, for repurchase agreements as of December 31, 2024.
Notes to Financial Statements – (continued) December 31, 2024
4.
Financial Derivative Instruments:
The following disclosures contain information on how and why a Fund may use derivative instruments, the credit-risk-related contingent features in certain derivative instruments, and how derivative instruments affect a Fund’s financial position and results of operations. The location and fair value amounts of these instruments on the Statements of Assets and Liabilities and the realized gains and losses and changes in unrealized gains and losses on the Statements of Operations, each categorized by type of derivative contract, are included in the following Additional Derivative Instrument Information footnote. The derivative instruments outstanding as of period-end are disclosed in the notes to the Schedules of Investments, if applicable. The amounts of realized gains and losses and changes in unrealized gains and losses on derivative instruments during the period are disclosed in the Statements of Operations.
a)
Futures Contracts – A Fund may enter into futures contracts. A futures contract is an agreement between two parties to buy or sell an asset at a set price on a future date. A Fund may use futures contracts to manage risk or obtain exposure to the investment markets, commodities, or movements in interest rates and currency values. The primary risks associated with the use of futures contracts are the imperfect correlation between the change in market value of the investments held by a Fund and the prices of futures contracts and the possibility of an illiquid market. Upon entering into a futures contract, a Fund is required to deposit with a futures commission merchant ("FCM") an amount of cash or U.S. Government or Agency Obligations in accordance with the initial margin requirements of the broker or exchange. Futures contracts are marked to market daily and an appropriate amount equal to the change in value ("variation margin") is paid or received by a Fund. Gains or losses are recognized but not considered realized until the contracts expire or are closed. Futures contracts involve, to varying degrees, risk of loss in excess of the variation margin disclosed on the Statements of Assets and Liabilities.
During the year ended December 31, 2024, each of Balanced HLS Fund, Capital Appreciation HLS Fund and Total Return Bond HLS Fund had used Futures Contracts.
b)
Foreign Currency Contracts – A Fund may enter into foreign currency contracts that obligate the Fund to purchase or sell currencies at specified future dates. Foreign currency contracts may be used in connection with settling purchases or sales of securities to hedge the currency exposure associated with some or all of a Fund’s investments and/or as part of an investment strategy. Foreign currency contracts are marked to market daily and the change in value is recorded by a Fund as an unrealized gain or loss. A Fund will record a realized gain or loss when the foreign currency contract is settled.
Foreign currency contracts involve elements of market risk in excess of the amounts reflected in the Statements of Assets and Liabilities. In addition, risks may arise upon entering into these contracts from the potential inability of the counterparties to meet the terms of the contracts and from unanticipated movements in the value of the foreign currencies relative to the U.S. dollar. Upon entering into a foreign currency contract, a Fund may be required to post margin equal to its outstanding exposure thereunder.
During the year ended December 31, 2024, the Total Return Bond HLS Fund had used Foreign Currency Contracts.
c)
Options Contracts – An option contract is a contract sold by one party to another party that offers the buyer the right, but not the obligation, to buy (call) or sell (put) an investment or other financial asset at an agreed-upon price during a specific period of time or on a specific date. Option contracts are either over-the-counter ("OTC") options or executed in a registered exchange ("exchange-traded options"). A Fund may write (sell) covered call and put options on futures, swaps ("swaptions"), securities, commodities or currencies. Writing put options may increase a Fund’s exposure to the underlying instrument. Writing call options may decrease a Fund’s exposure to the underlying instrument. Premiums received from writing options that expire are treated as realized gains. Premiums received from writing options that are exercised or closed are added to the proceeds or offset amounts paid on the underlying futures, swaps, investments or currency transactions to determine the realized gain or loss. A Fund, as a writer of an option, has no control over whether the underlying instrument may be sold (call) or purchased (put) and as a result bears the market risk of an unfavorable change in the price of the instrument underlying the written option. There is the risk a Fund may not be able to enter into a closing transaction because of an illiquid market. A Fund may also purchase put and call options. Purchasing call options may increase a Fund’s exposure to the underlying instrument. Purchasing put options may decrease a Fund’s exposure to the underlying instrument. A Fund pays a premium, which is included on the Fund’s Statements of Assets and Liabilities as an investment and is subsequently marked to market to reflect the current value of the option. Premiums paid for purchasing options that expire are treated as realized losses. Certain options may be purchased with premiums to be determined on a future date. The premiums for these options are based upon implied volatility parameters at specified terms. The risk associated with purchasing put and call options is generally limited to the premium paid. Premiums paid for purchasing options that are exercised or closed are added to the amounts paid or offset against the proceeds on the underlying investment transaction to determine the realized gain or loss. Entering into OTC options also exposes a Fund to counterparty risk. Counterparty risk is the possibility that the counterparty to the agreements may default on its obligation to perform or disagree as to the meaning of the contractual terms in the agreements.
During the year ended December 31, 2024, the Total Return Bond HLS Fund had used Options Contracts.
Notes to Financial Statements – (continued) December 31, 2024
d)
Swap Contracts – A Fund may invest in swap contracts. Swap contracts are agreements to exchange or swap investment cash flows, assets, foreign currencies or market-linked returns at specified future intervals. Swap contracts are either privately negotiated in the over-the-counter market ("OTC swaps") or cleared through a central counterparty or derivatives clearing organization ("centrally cleared swaps"). A Fund may enter into credit default, total return, cross-currency, interest rate, inflation and other forms of swap contracts to manage its exposure to credit, currency, interest rate, commodity and inflation risk. Swap contracts are also used to gain exposure to certain markets. In connection with these contracts, investments or cash may be identified as collateral or margin in accordance with the terms of the respective swap contracts and/or master netting arrangement to provide assets of value and recourse in the event of default or bankruptcy/insolvency.
Swaps are valued in accordance with the Valuation Procedures. Changes in market value, if any, are reflected as a component of net changes in unrealized appreciation or depreciation on the Statements of Operations. Daily changes in valuation of centrally cleared swaps, if any, are recorded as a receivable or payable for the change in value ("variation margin") on the Statements of Assets and Liabilities. Realized gains or losses on centrally cleared swaps are recorded upon the termination of the swaps. OTC swap payments received or paid at the beginning of the measurement period are reflected as such on the Statements of Assets and Liabilities and represent premiums paid or received upon entering into the swap contract to compensate for differences between the stated terms of the swap contract and prevailing market conditions (credit spreads, currency exchange rates, interest rates and other relevant factors). These upfront premiums are recorded as realized gains or losses on the Statements of Operations upon termination or maturity of the swap. A liquidation payment received or made at the termination or maturity of the swap is recorded as a realized gain or loss on the Statements of Operations. Net periodic payments received or paid by a Fund are included as part of realized gains or losses on the Statements of Operations.
Entering into these contracts involves, to varying degrees, elements of liquidation, counterparty, credit and market risk in excess of the amounts recognized on the Statements of Assets and Liabilities. Such risks involve the possibility that there will be no liquid market for these contracts, that the counterparty to the contracts may default on its obligation to perform or disagree as to the meaning of contractual terms in the contracts, and that there may be unfavorable changes in market conditions (credit spreads, currency exchange rates, interest rates and other relevant factors).
A Fund’s maximum risk of loss from counterparty risk for OTC swaps is the net value of the discounted cash flows to be received from the counterparty over the contract’s remaining life, and current market value, to the extent that amount is positive. The risk is mitigated by having a master netting arrangement between a Fund and the counterparty, which allows for the netting of payments made or received (although such amounts are presented on a gross basis within the Statements of Assets and Liabilities, as applicable) as well as the posting of collateral to a Fund to cover the Fund’s exposure to the counterparty. In a centrally cleared swap, while a Fund enters into an agreement with a clearing broker to execute contracts with a counterparty, the performance of the swap is guaranteed by the central clearinghouse, which reduces the Fund’s exposure to counterparty risk. However, the Fund is still exposed to a certain amount of counterparty risk through the clearing broker and clearinghouse. The clearinghouse attempts to minimize this risk to its participants through the use of mandatory margin requirements, daily cash settlements and other procedures. Likewise, the clearing broker reduces its risk through margin requirements and required segregation of customer balances.
Credit Default Swap Contracts – The credit default swap market allows a Fund to manage credit risk through buying and selling credit protection on a specific issuer, asset or basket of assets. Certain credit default swaps involve the exchange of a fixed rate premium for protection against the loss in value of an underlying investment or index in the event of a credit event, such as payment default or bankruptcy.
Under a credit default swap contract, one party acts as guarantor by receiving the fixed periodic payment in exchange for the commitment to purchase the underlying investment at par if the defined credit event occurs. Upon the occurrence of a defined credit event, the difference between the value of the reference obligation and the swap’s notional amount is recorded as realized gain or loss on swap transactions in the Statements of Operations. A "buyer" of credit protection agrees to pay a counterparty to assume the credit risk of an issuer upon the occurrence of certain events. The "seller" of the protection receives periodic payments and agrees to assume the credit risk of an issuer upon the occurrence of certain events. Although specified events are contract specific, credit events are generally defined as bankruptcy, failure to pay, restructuring, obligation acceleration, obligation default or repudiation/moratorium. A "seller’s" exposure is limited to the total notional amount of the credit default swap contract. These potential amounts would be partially offset by any recovery values of the respective referenced obligations or upfront payments received upon entering into the contract.
Implied credit spreads, represented in absolute terms, utilized in determining the market value of credit default swap contracts on corporate issues, sovereign government issues or U.S. municipal issues as of year-end are disclosed in the notes to the Schedules of Investments, as applicable, and serve as an indicator of the current status of the payment/performance risk and represent the likelihood or risk of default for the credit derivative. The implied credit spread of a particular referenced entity reflects the cost of buying/selling protection and there may also be upfront payments required to be made to enter into the contract. Wider credit spreads represent a deterioration of the referenced entity’s credit soundness and a greater likelihood or risk of default or other credit event occurring as defined under the terms of the contract. For credit default swap contracts on credit indices, the quoted market prices and resulting values serve as the indicator of the current status
Notes to Financial Statements – (continued) December 31, 2024
of the payment/performance risk. Increasing market values, in absolute terms when compared to the notional amount of the swap, represent a deterioration of the referenced equity’s credit soundness and a greater likelihood or risk of default or other credit event occurring as defined under the terms of the contract.
During the year ended December 31, 2024, the Total Return Bond HLS Fund had used Credit Default Swap Contracts.
Interest Rate Swap Contracts – A Fund may use interest rate swaps to hedge interest rate and duration risk. In a typical interest rate swap, one party agrees to make regular payments equal to a floating interest rate, based on a specified interest rate or benchmark (e.g. Secured Overnight Financing Rate (“SOFR”)), multiplied by a notional amount, in return for payments equal to a fixed rate multiplied by the same amount, for a specific period of time. The net interest received or paid on interest rate swap contracts is recorded as a realized gain or loss. Interest rate swaps are marked to market daily and the change, if any, is recorded as an unrealized gain or loss in the Statements of Operations. When the interest rate swap contract is terminated early, a Fund records a realized gain or loss equal to the difference between the current market value and the upfront premium or cost.
If an interest rate swap contract provides for payments in different currencies, the parties might agree to exchange the notional amount as well. Interest rate swaps may also depend on other prices or rates, such as the value of an index. The risks of interest rate swaps include changes in market conditions, which will affect the value of the contract or the cash flows and the possible inability of the counterparty to fulfill its obligations under the contract. A Fund’s maximum risk of loss from counterparty credit risk is the discounted net value of the cash flows to be received from the counterparty over the contract’s remaining life, to the extent that amount is positive.
During the year ended December 31, 2024, the Total Return Bond HLS Fund had used Interest Rate Swap Contracts.
e)
Additional Derivative Instrument Information:
The Effect of Derivative Instruments on the Statement of Assets and Liabilities as of December 31, 2024: |
| |
| | | | | | |
| | | | | | |
Unrealized appreciation on futures contracts(1) | | | | | | |
| | | | | | |
| Amount represents the cumulative appreciation and depreciation on futures contracts as disclosed within the Schedule of Investments under the open “Futures Contracts” section. Only current day’s variation margin, if any, is reported within the Statement of Assets and Liabilities. |
The Effect of Derivative Instruments on the Statement of Operations for the year ended December 31, 2024: |
| |
| | | | | | |
Realized Gain (Loss) on Derivatives Recognized as a Result of Operations: | | | | | | |
Net realized gain (loss) on futures contracts | | | | | | |
| | | | | | |
Net Change in Unrealized Appreciation (Depreciation) on Derivatives Recognized as a Result of Operations: | | | | | | |
Net change in unrealized appreciation (depreciation) of futures contracts | | | | | | |
| | | | | | |
For the year ended December 31, 2024, the average monthly amount or number per contract outstanding for each derivative type was as follows:
| Average Notional
Par, Contracts
or Face Amount |
Futures Contracts Number of Long Contracts | |
Futures Contracts Number of Short Contracts | |
Notes to Financial Statements – (continued) December 31, 2024
Capital Appreciation HLS Fund
The Effect of Derivative Instruments on the Statement of Assets and Liabilities as of December 31, 2024: |
| |
| | | | | | |
| | | | | | |
Unrealized depreciation on futures contracts(1) | | | | | | |
| | | | | | |
| Amount represents the cumulative appreciation and depreciation on futures contracts as disclosed within the Schedule of Investments under the open “Futures Contracts” section. Only current day’s variation margin, if any, is reported within the Statement of Assets and Liabilities. |
The Effect of Derivative Instruments on the Statement of Operations for the year ended December 31, 2024: |
| |
| | | | | | |
Realized Gain (Loss) on Derivatives Recognized as a Result of Operations: | | | | | | |
Net realized gain (loss) on futures contracts | | | | | | |
| | | | | | |
Net Change in Unrealized Appreciation (Depreciation) on Derivatives Recognized as a Result of Operations: | | | | | | |
Net change in unrealized appreciation (depreciation) of futures contracts | | | | | | |
| | | | | | |
For the year ended December 31, 2024, the average monthly amount or number per contract outstanding for each derivative type was as follows:
| Average Notional
Par, Contracts
or Face Amount |
Futures Contracts Number of Long Contracts | |
Total Return Bond HLS Fund
The Effect of Derivative Instruments on the Statement of Assets and Liabilities as of December 31, 2024: |
| |
| | | | | | |
| | | | | | |
Unrealized appreciation on futures contracts(1) | | | | | | |
Unrealized appreciation on foreign currency contracts | | | | | | |
Unrealized appreciation on swap contracts(2) | | | | | | |
| | | | | | |
| | | | | | |
Unrealized depreciation on futures contracts(1) | | | | | | |
| | | | | | |
| Amount represents the cumulative appreciation and depreciation on futures contracts as disclosed within the Schedule of Investments under the open “Futures Contracts” section. Only current day’s variation margin, if any, is reported within the Statement of Assets and Liabilities. |
| Amount represents the cumulative appreciation and depreciation on centrally cleared swaps, if applicable, as disclosed within the Schedule of Investments. Only the current day’s variation margin, if any, is reported within the Statements of Assets and Liabilities. OTC swaps are reported within the Statement of Assets and Liabilities within Unrealized appreciation and depreciation on OTC swap contracts, if applicable. |
Notes to Financial Statements – (continued) December 31, 2024
Total Return Bond HLS Fund – (continued)
The Effect of Derivative Instruments on the Statement of Operations for the year ended December 31, 2024: |
| |
| | | | | | |
Realized Gain (Loss) on Derivatives Recognized as a Result of Operations: | | | | | | |
Net realized gain (loss) on purchased options contracts | | | | | | |
Net realized gain (loss) on futures contracts | | | | | | |
Net realized gain (loss) on written options contracts | | | | | | |
Net realized gain (loss) on swap contracts | | | | | | |
Net realized gain (loss) on foreign currency contracts | | | | | | |
| | | | | | |
Net Change in Unrealized Appreciation (Depreciation) on Derivatives Recognized as a Result of Operations: | | | | | | |
Net change in unrealized appreciation (depreciation) of futures contracts | | | | | | |
Net change in unrealized appreciation (depreciation) of swap contracts | | | | | | |
Net change in unrealized appreciation (depreciation) of foreign currency contracts | | | | | | |
| | | | | | |
For the year ended December 31, 2024, the average monthly amount or number per contract outstanding for each derivative type was as follows:
| Average Notional
Par, Contracts
or Face Amount |
Purchased Options at Notional Amount | |
Futures Contracts Number of Long Contracts | |
Futures Contracts Number of Short Contracts | |
Written Options at Notional Amount | |
Swap Contracts at Notional Amount | |
Foreign Currency Contracts Purchased at Contract Amount | |
Foreign Currency Contracts Sold at Contract Amount | |
f)
Balance Sheet Offsetting Information – Set forth below are tables which disclose both gross information and net information about instruments and transactions eligible for offset in the financial statements, and instruments and transactions that are subject to a master netting arrangement, as well as amounts related to margin, reflected as financial collateral (including cash collateral), held at clearing brokers, counterparties and a Fund's custodian. The master netting arrangements allow the clearing brokers to net any collateral held in or on behalf of a Fund, or liabilities or payment obligations of the clearing brokers to a Fund, against any liabilities or payment obligations of the Fund to the clearing brokers. A Fund is required to deposit financial collateral (including cash collateral) at the Fund's custodian on behalf of clearing brokers and counterparties to continually meet the original and maintenance requirements established by the clearing brokers and counterparties. Such requirements are specific to the respective clearing broker or counterparty. Certain master netting arrangements may not be enforceable in a bankruptcy.
The following tables present a Fund's derivative assets and liabilities, presented on a gross basis as no amounts are netted within the Statements of Assets and Liabilities, by counterparty net of amounts available for offset under a master netting agreement or similar agreement ("MNA") and net of the related collateral received/pledged by a Fund as of December 31, 2024:
| | |
Derivative Financial Instruments: | | |
| | |
Total gross amount of derivative assets and liabilities in the Statement of Assets and Liabilities | | |
Derivatives not subject to a MNA | | |
Total gross amount of assets and liabilities subject to MNA or similar agreements | | |
Notes to Financial Statements – (continued) December 31, 2024
Capital Appreciation HLS Fund | | |
Derivative Financial Instruments: | | |
| | |
Total gross amount of derivative assets and liabilities in the Statement of Assets and Liabilities | | |
Derivatives not subject to a MNA | | |
Total gross amount of assets and liabilities subject to MNA or similar agreements | | |
Total Return Bond HLS Fund | | |
Derivative Financial Instruments: | | |
Foreign currency contracts | | |
| | |
| | |
Total gross amount of derivative assets and liabilities in the Statement of Assets and Liabilities | | |
Derivatives not subject to a MNA | | |
Total gross amount of assets and liabilities subject to MNA or similar agreements | | |
| | Financial
Instruments
and Derivatives
Available
for Offset | | | |
Deutsche Bank Securities, Inc. | | | | | |
| | | | | |
| | | | | |
| | | | | |
| | | | | |
| In some instances, the actual collateral received and/or pledged may be more than the amount shown. |
A Fund’s investments expose it to various types of risks associated with financial instruments and the markets. A Fund may be exposed to the risks described below. Each Fund’s prospectus provides details of its principal risks.
The market values of equity securities, such as common stocks and preferred stocks, or equity related derivative investments, such as futures and options, may decline due to general market conditions which are not specifically related to a particular company, such as real or perceived adverse economic conditions, changes in the general outlook for corporate earnings, changes in interest or currency rates or adverse investor sentiment generally. The market value of equity securities may also decline due to factors which affect a particular industry or industries, such as labor shortages or increased production costs and competitive conditions within an industry. Equity securities and equity related investments generally have greater market price volatility than fixed income securities.
Certain investments held by a Fund expose the Fund to various risks which may include, but are not limited to, interest rate, prepayment, and extension risks. Interest rate risk is the risk that fixed income securities will decline in value because of changes in interest rates. As nominal interest rates rise, the values of certain fixed income securities held by a Fund are likely to decrease. A nominal interest rate can be described as the sum of a real interest rate and an expected inflation rate. Fixed income securities with longer durations tend to be more sensitive to changes in interest rates, usually making them more volatile than securities with shorter durations. Duration is useful primarily as a measure of the sensitivity of a fixed income security’s market price to interest rate (i.e., yield) movements. Senior floating rate interests and securities subject to prepayment and extension risk generally offer less potential for gains when interest rates decline. Rising interest rates may cause prepayments to occur at a slower than expected rate, thereby effectively lengthening the maturity of the security and making the security more sensitive to interest rate changes. Prepayment and extension risk are major risks of mortgage-backed securities, senior floating rate interests and certain asset-backed securities. For certain asset-backed securities, the actual maturity may be less than the stated maturity shown in the Schedule of Investments, if applicable. As a result, the timing of income recognition relating to these securities may vary based upon the actual maturity.
Investing in the securities of non-U.S. issuers, whether directly or indirectly, involves certain considerations and risks not typically associated with securities of U.S. issuers. Such risks include, but are not limited to: generally less liquid and less efficient securities markets; generally greater price volatility; exchange rate fluctuations; imposition of restrictions on the expatriation of funds or other protectionist measures; less publicly available information about issuers; the imposition of withholding or other taxes; higher transaction and custody costs; settlement delays and risk of loss attendant in settlement procedures; difficulties in enforcing contractual obligations; less regulation of securities markets; different accounting, disclosure and reporting requirements; more substantial governmental involvement in the economy; higher inflation rates; and
Notes to Financial Statements – (continued) December 31, 2024
greater social, economic and political uncertainties. Non-U.S. issuers may also be affected by political, social, economic or diplomatic developments in a foreign country or region or the U.S. (including the imposition of sanctions, tariffs, or other governmental restrictions). These risks are heightened for investments in issuers from countries with less developed markets.
Credit risk depends largely on the perceived financial health of bond issuers. In general, the credit rating is inversely related to the credit risk of the issuer. Higher rated bonds generally are deemed to have less credit risk, while lower or unrated bonds are deemed to have higher risk of default. The share price, yield and total return of a fund that holds securities with higher credit risk may be more volatile than those of a fund that holds bonds with lower credit risk. A Fund may be exposed to counterparty risk, or the risk that an institution or other entity with which a Fund has unsettled or open transactions will default.
Geopolitical events, including the invasion of Ukraine by Russia and the conflict between Israel and Hamas, have injected uncertainty into the global financial markets. Investments in Russia are subject to political, economic, legal, market and currency risks, as well as the risks related to the economic sanctions on Russia imposed by the United States and/or other countries. Such sanctions which affect companies in many sectors, including energy, financial services and defense, among others, have adversely affected and could continue to adversely affect the global energy and financial markets and, thus, have adversely affected and could continue to adversely affect the value of a Fund’s investments, even beyond any direct exposure the Fund may have to Russian issuers or the adjoining geographic regions. In addition, certain transactions have or may be prohibited and/or existing investments have or may become illiquid (e.g., because transacting in certain existing investments is prohibited), which could cause a Fund to sell other portfolio holdings at a disadvantageous time or price in order to meet redemptions.
A widespread health crisis, such as a global pandemic, could cause substantial market volatility, exchange trading suspensions or restrictions and closures of securities exchanges and businesses, impact the ability to complete redemptions, and adversely impact Fund performance.
a)
Each Fund intends to continue to qualify as a Regulated Investment Company ("RIC") under Subchapter M of the Internal Revenue Code ("IRC") by distributing substantially all of its taxable net investment income and net realized capital gains to its shareholders each year. Each Fund has distributed substantially all of its income and capital gains in prior years, if applicable, and intends to distribute substantially all of its income and capital gains during the calendar year ending December 31, 2024. Accordingly, no provision for federal income or excise taxes has been made in the accompanying financial statements. Distributions from short-term capital gains are treated as ordinary income distributions for federal income tax purposes.
b)
Net Investment Income (Loss), Net Realized Gains (Losses) and Distributions – Net investment income (loss) and net realized gains (losses) may differ for financial statement and tax purposes primarily because of losses deferred due to wash sale adjustments, foreign currency gains and losses, adjustments related to Passive Foreign Investment Companies ("PFICs"), reclassification of dividend income, RICs, certain derivatives, losses deferred due to straddle adjustments and partnerships. The character of distributions made during the year from net investment income or net realized gains may differ from their ultimate characterization for federal income tax purposes. Also, due to the timing of dividend distributions, the fiscal year in which amounts are distributed may differ from the year that the income or realized gains (losses) were recorded by each Fund.
c)
Distributions and Components of Distributable Earnings – The tax character of distributions paid by each Fund for the years ended December 31, 2024 and December 31, 2023 are as follows:
| For the Year Ended
December 31, 2024 | For the Year Ended
December 31, 2023 |
| | | | |
| | | | |
Capital Appreciation HLS Fund | | | | |
Disciplined Equity HLS Fund | | | | |
Dividend and Growth HLS Fund | | | | |
| | | | |
International Opportunities HLS Fund | | | | |
| | | | |
Small Cap Growth HLS Fund | | | | |
| | | | |
| | | | |
Total Return Bond HLS Fund | | | | |
| | | | |
| | | | |
| The Funds designate these distributions as long-term capital gains dividends pursuant to IRC Sec 852(b)(3)(c). |
Notes to Financial Statements – (continued) December 31, 2024
As of December 31, 2024, the components of total accumulated earnings (deficit) for each Fund on a tax basis are as follows:
| Undistributed
Ordinary
Income | Undistributed
Long-Term
Capital Gains | Accumulated
Capital and
Other Losses | Other
Temporary
Differences | Unrealized
Appreciation
(Depreciation)
on Investments | Total
Accumulated
Earnings
(Deficit) |
| | | | | | |
Capital Appreciation HLS Fund | | | | | | |
Disciplined Equity HLS Fund | | | | | | |
Dividend and Growth HLS Fund | | | | | | |
| | | | | | |
International Opportunities HLS Fund | | | | | | |
| | | | | | |
Small Cap Growth HLS Fund | | | | | | |
| | | | | | |
| | | | | | |
Total Return Bond HLS Fund | | | | | | |
| | | | | | |
d)
Reclassification of Capital Accounts – The Funds may record reclassifications in their capital accounts. These reclassifications have no impact on the total net assets of the Funds. The reclassifications are a result of permanent differences between U.S. GAAP and tax accounting for such items as net operating losses, subsequent adjustments to wash sales, reclassification of dividend income, and partnerships. Adjustments are made to reflect the impact these items have on the current and future earnings distributions to shareholders. Therefore, the source of the Funds' distributions may be shown in the accompanying Statements of Changes in Net Assets as from distributable earnings or from capital depending on the type of book and tax differences that exist. For the year ended December 31, 2024, the Funds recorded reclassifications to increase (decrease) the accounts listed below:
| | Distributable
Earnings (Loss) |
Capital Appreciation HLS Fund | | |
Disciplined Equity HLS Fund | | |
| | |
| | |
e)
Capital Loss Carryforward – Under the Regulated Investment Company Modernization Act of 2010, funds are permitted to carry forward capital losses for an unlimited period.
At December 31, 2024 (tax year end), each Fund's capital loss carryforwards for U.S. federal income tax purposes were as follows:
| Short-Term
Capital Loss
Carryforward with
No Expiration | Long-Term
Capital Loss
Carryforward with
No Expiration |
| | |
Total Return Bond HLS Fund | | |
| | |
During the year ended December 31, 2024, the International Opportunities HLS Fund utilized $58,513,302, Small Cap Growth HLS Fund utilized $31,478,898, Small Company HLS Fund utilized $26,845,140, Total Return Bond HLS Fund utilized $5,554,300 and Ultrashort Bond HLS Fund utilized $165,400 of prior year capital loss carryforwards.
The Balanced HLS Fund, Capital Appreciation HLS Fund, Disciplined Equity HLS Fund, Dividend and Growth HLS Fund, Healthcare HLS Fund, International Opportunities HLS Fund, MidCap HLS Fund, Small Cap Growth HLS Fund and Stock HLS Fund had no capital loss carryforwards for U.S. federal tax purposes as of December 31, 2024.
f)
Tax Basis of Investments – The aggregate cost of investments for federal income tax purposes at December 31, 2024 is different from book purposes primarily due to wash sale loss deferrals, PFICs mark-to-market adjustments, partnership adjustments and reclassification of dividend income. The net unrealized appreciation/(depreciation) on investments for tax purposes, which consists of gross unrealized appreciation and depreciation is also different from book purposes primarily due to wash sale loss deferrals and mark-to-market
Notes to Financial Statements – (continued) December 31, 2024
adjustments on derivatives, mark-to-market adjustments on PFICs, partnerships adjustments, and reclassification of dividend income. Both the cost and unrealized appreciation and depreciation for federal income tax purposes are disclosed below:
| | Gross Unrealized
Appreciation | Gross Unrealized
(Depreciation) | Net Unrealized
Appreciation
(Depreciation) |
| | | | |
Capital Appreciation HLS Fund | | | | |
Disciplined Equity HLS Fund | | | | |
Dividend and Growth HLS Fund | | | | |
| | | | |
International Opportunities HLS Fund | | | | |
| | | | |
Small Cap Growth HLS Fund | | | | |
| | | | |
| | | | |
Total Return Bond HLS Fund | | | | |
| | | | |
g)
Accounting for Uncertainty in Income Taxes – Pursuant to provisions set forth by U.S. GAAP, HFMC reviews each Fund’s tax positions for all open tax years. As of December 31, 2024, HFMC had reviewed the open tax years and concluded that there was no reason to record a liability for net unrecognized tax obligations relating to uncertain income tax positions. Each Fund files U.S. tax returns. Although the statute of limitations for examining a Fund’s U.S. tax returns remains open for three years, no examination is currently in progress. The Funds recognize interest and penalties, if any, related to unrecognized tax benefits as income tax expense on the Statements of Operations. During the year ended December 31, 2024, the Funds did not incur any interest or penalties. HFMC is not aware of any tax positions for which it is reasonably possible that the total amounts of unrecognized tax obligations will significantly change in the next twelve months.
a)
Investment Management Agreement – HFMC serves as each Fund’s investment manager. The Company, on behalf of each Fund, has entered into an Investment Management Agreement with HFMC. HFMC is an indirect subsidiary of The Hartford Financial Services Group, Inc. (“The Hartford”). HFMC has overall investment supervisory responsibility for each Fund. In addition, HFMC provides administrative personnel, services, equipment, facilities and office space for proper operation of each Fund. HFMC has contracted with Wellington Management Company LLP (“Wellington Management”) under a sub-advisory agreement and Wellington Management performs the daily investment of the assets of each Fund in accordance with the Fund’s investment objective and policies. Each Fund pays a fee to HFMC. HFMC pays a sub-advisory fee to Wellington Management out of its management fee.
Notes to Financial Statements – (continued) December 31, 2024
The schedule below reflects the rates of compensation paid to HFMC for investment management services rendered as of December 31, 2024; the rates are accrued daily and paid monthly based on each Fund’s average daily net assets, at the following annual rates:
| |
| 0.6800% on first $250 million and; |
| 0.6550% on next $250 million and; |
| 0.6450% on next $500 million and; |
| 0.5950% on next $4 billion and; |
| 0.5925% on next $5 billion and; |
| |
Capital Appreciation HLS Fund | 0.7750% on first $250 million and; |
| 0.7250% on next $250 million and; |
| 0.6750% on next $500 million and; |
| 0.6250% on next $1.5 billion and; |
| 0.6200% on next $2.5 billion and; |
| 0.6150% on next $5 billion and; |
| |
Disciplined Equity HLS Fund | 0.6000% on first $1 billion and; |
| 0.5500% on next $4 billion and; |
| 0.5300% on next $5 billion and; |
| |
Dividend and Growth HLS Fund | 0.6900% on first $250 million and; |
| 0.6425% on next $250 million and; |
| 0.6325% on next $500 million and; |
| 0.6250% on next $1.5 billion and; |
| 0.6200% on next $2.5 billion and; |
| 0.6150% on next $5 billion and; |
| |
| 0.8500% on first $250 million and; |
| 0.8000% on next $250 million and; |
| 0.7500% on next $4.5 billion and; |
| 0.7475% on next $5 billion and; |
| |
International Opportunities HLS Fund | 0.7750% on first $250 million and; |
| 0.7250% on next $250 million and; |
| 0.6750% on next $500 million and; |
| 0.6250% on next $1.5 billion and; |
| 0.6200% on next $2.5 billion and; |
| 0.6150% on next $5 billion and; |
| |
| 0.7750% on first $250 million and; |
| 0.7250% on next $250 million and; |
| 0.6750% on next $500 million and; |
| 0.6250% on next $4 billion and; |
| 0.6225% on next $5 billion and; |
| |
Small Cap Growth HLS Fund | 0.7000% on first $100 million and; |
| 0.6000% on next $4.9 billion and; |
| 0.5800% on next $5 billion and; |
| |
| 0.7750% on first $250 million and; |
| 0.7250% on next $250 million and; |
| 0.6750% on next $500 million and; |
| 0.6000% on next $500 million and; |
| 0.5500% on next $3.5 billion and; |
| 0.5300% on next $5 billion and; |
| |
Notes to Financial Statements – (continued) December 31, 2024
| |
| 0.5250% on first $250 million and; |
| 0.5000% on next $250 million and; |
| 0.4750% on next $500 million and; |
| 0.4500% on next $4 billion and; |
| 0.4475% on next $5 billion and; |
| |
Total Return Bond HLS Fund | 0.5250% on first $250 million and; |
| 0.5000% on next $250 million and; |
| 0.4750% on next $500 million and; |
| 0.4500% on next $1.5 billion and; |
| 0.4450% on next $2.5 billion and; |
| 0.4300% on next $5 billion and; |
| |
| 0.4000% on first $5 billion and; |
| 0.3800% on next $5 billion and; |
| |
*
HFMC voluntarily waived a portion of its contractual management fee equal to 0.03% as an annual percentage rate of the Balanced HLS Fund’s average daily net assets from January 1, 2024 through December 31, 2024.
b)
Accounting Services Agreement – HFMC provides the Funds with accounting services pursuant to a fund accounting agreement by and between the Company, on behalf of each Fund, and HFMC. HFMC has delegated certain accounting and administrative service functions to State Street. In consideration of services rendered and expenses assumed pursuant to the fund accounting agreement, each Fund pays HFMC a fee. The fund accounting fee for each Fund is equal to the greater of: (A) the sum of (i) the sub-accounting fee payable by HFMC with respect to the Fund; (ii) the fee payable for tax preparation services for the Fund; and (iii) the amount of expenses that HFMC allocates for providing the fund accounting services to the Fund; plus a target profit margin; or (B) $40,000 per year; provided, however, that to the extent the annual amount of the fund accounting fee exceeds 0.02% of the Fund’s average net assets (calculated during its current fiscal year), HFMC shall waive such portion of the fund accounting fee.
c)
Operating Expenses – Allocable expenses incurred by the Company are allocated to each series within the Company, and allocated to classes within each such series, in proportion to the average daily net assets of such series and classes, except where allocation of certain expenses is more fairly made directly to a Fund or to specific classes within a Fund.
d)
Fees Paid Indirectly – Each Fund, except Total Return Bond HLS Fund and Ultrashort Bond HLS Fund, has entered into agreements with State Street Global Markets, LLC and Russell Implementation Services, Inc. to partially recapture non-discounted trade commissions. Such rebates are used to pay a portion of a Fund’s expenses. For the year ended December 31, 2024, these amounts, if any, are included in the Statements of Operations.
The ratio of expenses to average net assets in the accompanying financial highlights excludes the reduction in expenses related to fees paid indirectly. The impacted annualized expense ratio after waivers reflecting the reduction for fees paid indirectly for the period is as follows for MidCap HLS Fund: Class IA (0.74%) and Class IB (0.99%). The amount of fees recaptured by the other funds did not impact the ratio of expenses to average net assets in the financial highlights.
e)
Distribution Plans for Class IB and Class IC Shares – Hartford Funds Distributors, LLC ("HFD"), an indirect subsidiary of The Hartford, is the principal underwriter and distributor of each Fund. The Company has adopted a Distribution Plan pursuant to Rule 12b-1 of the 1940 Act for Class IB shares of the Funds and for certain Funds, has adopted a Distribution Plan pursuant to Rule 12b-1 of the 1940 Act for Class IC shares.
Pursuant to the Class IB Distribution Plans, a Fund may pay HFD a fee of up to 0.25% of the average daily net assets of the Fund attributable to its Class IB shares for distribution financing activities and shareholder account servicing activities. The entire amount of the fee may be used for shareholder servicing expenses and/or distribution expenses. Pursuant to the Class IC Distribution Plans, a Fund may pay HFD a fee of up to 0.25% of the average daily net assets of the Fund attributable to its Class IC shares for distribution financing activities.
The Board has the authority to suspend or reduce these payments at any point in time. The distribution fees paid during the period can be found on the Statements of Operations. Each Fund's 12b-1 fees are accrued daily and paid monthly or at such other intervals as the Company's Board of Directors may determine.
f)
Administrative Services Fee for Class IC Shares – Certain Funds may pay an administrative services fee to third party insurance companies annually up to 0.25% of the average daily net assets of the Fund attributable to its Class IC shares for recordkeeping and/or other
Notes to Financial Statements – (continued) December 31, 2024
administrative services provided to such Class IC shares. The total administrative services fees paid during the period are shown on the Statements of Operations. These fees are accrued daily and paid monthly.
g)
Remuneration Paid to Directors, Officers, and others – Certain officers of the Company are directors and/or officers of HFMC and/or The Hartford or its subsidiaries. For the year ended December 31, 2024, a portion of the Company's Chief Compliance Officer’s ("CCO") compensation was paid by each Fund, which is included on the Statement of Operations as Chief Compliance Officer fees.
h)
Hartford Administrative Services Company (“HASCO”), an indirect subsidiary of The Hartford, provides transfer agent services to each Fund. Pursuant to a sub-transfer agency agreement between HASCO and SS&C GIDS, Inc. ("SS&C"), HASCO has delegated certain transfer agent, dividend disbursing agent and shareholder servicing agent functions to SS&C. The costs and expenses of such delegation are borne by HASCO, not by the Funds. Each Fund pays HASCO a fixed fee annually, plus out of pocket expenses for providing such services. The accrued amount shown in the Statements of Operations reflects the amounts charged by HASCO. These fees are accrued daily and paid monthly.
For the year ended December 31, 2024, the effective rate of compensation paid to HASCO for transfer agency services as a percentage of each Class' average daily net assets is as follows:
| | | |
| | | |
Capital Appreciation HLS Fund | | | |
Disciplined Equity HLS Fund | | | |
Dividend and Growth HLS Fund | | | |
| | | |
International Opportunities HLS Fund | | | |
| | | |
Small Cap Growth HLS Fund | | | |
| | | |
| | | |
Total Return Bond HLS Fund | | | |
| | | |
| Percentage rounds to zero. |
For the year ended December 31, 2024, Citibank, N.A. ("Citibank") served as the securities lending agent pursuant to a securities lending agency agreement ("lending agreement"). A Fund may lend portfolio securities to certain borrowers in U.S. and non-U.S. markets in an amount not to exceed one-third (33 1/3%) of the value of its total assets. A Fund may lend portfolio securities, provided that the borrower provides collateral that is maintained in an amount at least equal to the current market value of the securities loaned. Cash collateral is invested for the benefit of a Fund by the Fund’s lending agent pursuant to collateral investment guidelines. The collateral is marked to market daily, in an amount at least equal to the current market value of the securities loaned. The contractual maturities of the securities lending transactions are considered overnight and continuous.
A Fund is subject to certain risks while its securities are on loan, including the following: (i) the risk that the borrower defaults on the loan and the collateral is inadequate to cover the Fund’s loss; (ii) the risk that the earnings on the collateral invested are not sufficient to pay fees incurred in connection with the loan; (iii) the Fund could lose money in the event of a decline in the value of the collateral provided for loaned securities or a decline in the value of any investments made with cash collateral; (iv) the risk that the borrower may use the loaned securities to cover a short sale, which may in turn place downward pressure on the market prices of the loaned securities; (v) the risk that return of loaned securities could be delayed and interfere with portfolio management decisions; (vi) the risk that any efforts to restrict or recall the securities for purposes of voting may not be effective; and (vii) operational risks (i.e., the risk of losses resulting from problems in the settlement and accounting process especially so in certain international markets). These events could also trigger adverse tax consequences for a Fund.
A Fund retains loan fees and the interest on cash collateral investments but is required to pay the borrower a rebate for the use of cash collateral. In cases where the lent security is of high value to borrowers, there may be a negative rebate (i.e., a net payment from the borrower to the applicable Fund). Upon termination of a loan, a Fund is required to return to the borrower an amount equal to the cash collateral, plus any rebate owed to the borrowers.
The net income earned on the securities lending (after payment of rebates and Citibank’s fee) is included on the Statements of Operations as Investment Income from securities lending. A Fund also receives payments from the borrower during the period of the loan, equivalent to dividends and interest earned on the securities loaned, which are recorded as Investment Income from dividends or interest, respectively, on the Statements of Operations.
Notes to Financial Statements – (continued) December 31, 2024
The following table presents for each Fund that lends its portfolio securities the market value of the securities on loan and the cash and non-cash collateral posted by the borrower as of December 31, 2024.
| Investment Securities on Loan, at market value,
Presented on the Statements of Assets and Liabilities | | |
| | | |
Capital Appreciation HLS Fund | | | |
Disciplined Equity HLS Fund | | | |
Dividend and Growth HLS Fund | | | |
| | | |
International Opportunities HLS Fund | | | |
| | | |
Small Cap Growth HLS Fund | | | |
| | | |
| | | |
Total Return Bond HLS Fund | | | |
| | | |
| It is each Fund’s policy to obtain additional collateral from, or return excess collateral to, the borrower by the end of the next business day following the valuation date of the securities loaned. Therefore, the value of the collateral held may be temporarily less than that required under the lending contract due to timing. Pursuant to the lending agreement, the borrower will provide collateral in an amount at least equal to the current market value of securities loaned. |
9.
Investment Transactions:
For the year ended December 31, 2024, the cost of purchases and proceeds from sales of investment securities (excluding short-term investments) were as follows:
| Cost of Purchases
Excluding U.S.
Government
Obligations | Sales Proceeds
Excluding U.S.
Government
Obligations | Cost of Purchases
For U.S. Government
Obligations | Sales Proceeds
For U.S. Government
Obligations | | |
| | | | | | |
Capital Appreciation HLS Fund | | | | | | |
Disciplined Equity HLS Fund | | | | | | |
Dividend and Growth HLS Fund | | | | | | |
| | | | | | |
International Opportunities HLS Fund | | | | | | |
| | | | | | |
Small Cap Growth HLS Fund | | | | | | |
| | | | | | |
| | | | | | |
Total Return Bond HLS Fund | | | | | | |
| | | | | | |
10.
Capital Share Transactions:
The following information is for the years ended December 31, 2024 and December 31, 2023:
| For the Year Ended
December 31, 2024 | For the Year Ended
December 31, 2023 |
| | | | |
| | | | |
| | | | |
| | | | |
Shares Issued for Reinvested Dividends | | | | |
| | | | |
| | | | |
| | | | |
| | | | |
Shares Issued for Reinvested Dividends | | | | |
| | | | |
| | | | |
Total Net Increase (Decrease) | | | | |
Notes to Financial Statements – (continued) December 31, 2024
| For the Year Ended December 31, 2024 | For the Year Ended December 31, 2023 |
| | | | |
Capital Appreciation HLS Fund | | | | |
| | | | |
| | | | |
Shares Issued for Reinvested Dividends | | | | |
| | | | |
| | | | |
| | | | |
| | | | |
Shares Issued for Reinvested Dividends | | | | |
| | | | |
| | | | |
| | | | |
| | | | |
Shares Issued for Reinvested Dividends | | | | |
| | | | |
| | | | |
Total Net Increase (Decrease) | | | | |
Disciplined Equity HLS Fund | | | | |
| | | | |
| | | | |
Shares Issued for Reinvested Dividends | | | | |
| | | | |
| | | | |
| | | | |
| | | | |
Shares Issued for Reinvested Dividends | | | | |
| | | | |
| | | | |
| | | | |
| | | | |
Shares Issued for Reinvested Dividends | | | | |
| | | | |
| | | | |
Total Net Increase (Decrease) | | | | |
Dividend and Growth HLS Fund | | | | |
| | | | |
| | | | |
Shares Issued for Reinvested Dividends | | | | |
| | | | |
| | | | |
| | | | |
| | | | |
Shares Issued for Reinvested Dividends | | | | |
| | | | |
| | | | |
Total Net Increase (Decrease) | | | | |
| | | | |
| | | | |
| | | | |
Shares Issued for Reinvested Dividends | | | | |
| | | | |
| | | | |
Notes to Financial Statements – (continued) December 31, 2024
| For the Year Ended December 31, 2024 | For the Year Ended December 31, 2023 |
| | | | |
| | | | |
| | | | |
Shares Issued for Reinvested Dividends | | | | |
| | | | |
| | | | |
Total Net Increase (Decrease) | | | | |
International Opportunities HLS Fund | | | | |
| | | | |
| | | | |
Shares Issued for Reinvested Dividends | | | | |
| | | | |
| | | | |
| | | | |
| | | | |
Shares Issued for Reinvested Dividends | | | | |
| | | | |
| | | | |
Total Net Increase (Decrease) | | | | |
| | | | |
| | | | |
| | | | |
Shares Issued for Reinvested Dividends | | | | |
| | | | |
| | | | |
| | | | |
| | | | |
Shares Issued for Reinvested Dividends | | | | |
| | | | |
| | | | |
Total Net Increase (Decrease) | | | | |
Small Cap Growth HLS Fund | | | | |
| | | | |
| | | | |
Shares Issued for Reinvested Dividends | | | | |
| | | | |
| | | | |
| | | | |
| | | | |
Shares Issued for Reinvested Dividends | | | | |
| | | | |
| | | | |
Total Net Increase (Decrease) | | | | |
| | | | |
| | | | |
| | | | |
| | | | |
| | | | |
| | | | |
| | | | |
| | | | |
| | | | |
Total Net Increase (Decrease) | | | | |
Notes to Financial Statements – (continued) December 31, 2024
| For the Year Ended December 31, 2024 | For the Year Ended December 31, 2023 |
| | | | |
| | | | |
| | | | |
| | | | |
Shares Issued for Reinvested Dividends | | | | |
| | | | |
| | | | |
| | | | |
| | | | |
Shares Issued for Reinvested Dividends | | | | |
| | | | |
| | | | |
Total Net Increase (Decrease) | | | | |
Total Return Bond HLS Fund | | | | |
| | | | |
| | | | |
Shares Issued for Reinvested Dividends | | | | |
| | | | |
| | | | |
| | | | |
| | | | |
Shares Issued for Reinvested Dividends | | | | |
| | | | |
| | | | |
Total Net Increase (Decrease) | | | | |
| | | | |
| | | | |
| | | | |
Shares Issued for Reinvested Dividends | | | | |
| | | | |
| | | | |
| | | | |
| | | | |
Shares Issued for Reinvested Dividends | | | | |
| | | | |
| | | | |
Total Net Increase (Decrease) | | | | |
Each Fund participates in a committed line of credit pursuant to a credit agreement dated February 29, 2024. Each Fund may borrow under the line of credit for temporary or emergency purposes. The Funds (together with certain other Hartford Funds) may borrow up to $350 million in the aggregate, subject to asset coverage and other limitations specified in the credit agreement. The interest rate on borrowings varies depending on the nature of the loan. The facility also charges certain fees, such as a commitment fee. From January 1, 2024 through February 29, 2024, the Funds (together with certain other Hartford Funds) had a similar agreement that enabled them to participate in a $350 million committed line of credit. The fees incurred by the Funds in connection with the committed lines of credit during the period appear in the Statements of Operations under "Other expenses." During and as of the year ended December 31, 2024, none of the Funds had borrowings under these facilities.
Under the Company’s organizational documents, the Company shall indemnify its officers and directors to the full extent required or permitted under Maryland General Corporation Law and federal securities laws. In addition, the Company, on behalf of each Fund, may enter into contracts that contain a variety of indemnifications. The Company’s maximum exposure under these arrangements is unknown. However, as of the date of these financial statements, the Company has not had prior claims or losses pursuant to these contracts and expects the risk of loss to be remote.
Notes to Financial Statements – (continued) December 31, 2024
Operating segments are components of an entity that engage in business activities, have discrete financial information available, and have their operating results regularly reviewed by a chief operating decision maker (“CODM”) when assessing segment performance and making decisions about segment resources. The President and Chief Executive Officer of the Company acts as the Funds' CODM. Each Fund operates through a single operating and reporting segment pursuant to its investment objective and principal investment strategy. A Fund's prospectus describes the Fund's fees, investment objective, principal investment strategy and principal risks, among other items. Each Fund’s portfolio composition, total returns, expense ratios and changes in net assets used by the CODM to assess segment performance and make resource allocations are consistent with the information presented within such Fund's financial statements. The accompanying financial statements detail each Fund’s segment assets, liabilities, revenues, and expenses.
Management has evaluated all subsequent transactions and events through the date on which these financial statements were issued and has determined that no additional items require disclosure in these financial statements.
Report of Independent Registered Public Accounting Firm
To the Board of Directors of Hartford Series Fund, Inc. and Shareholders of Hartford Balanced HLS Fund, Hartford Capital Appreciation HLS Fund, Hartford Disciplined Equity HLS Fund, Hartford Dividend and Growth HLS Fund, Hartford Healthcare HLS Fund, Hartford International Opportunities HLS Fund, Hartford MidCap HLS Fund, Hartford Small Cap Growth HLS Fund, Hartford Small Company HLS Fund, Hartford Stock HLS Fund, Hartford Total Return Bond HLS Fund, and Hartford Ultrashort Bond HLS Fund
Opinions on the Financial Statements
We have audited the accompanying statements of assets and liabilities, including the schedules of investments, of Hartford Balanced HLS Fund, Hartford Capital Appreciation HLS Fund, Hartford Disciplined Equity HLS Fund, Hartford Dividend and Growth HLS Fund, Hartford Healthcare HLS Fund, Hartford International Opportunities HLS Fund, Hartford MidCap HLS Fund, Hartford Small Cap Growth HLS Fund, Hartford Small Company HLS Fund, Hartford Stock HLS Fund, Hartford Total Return Bond HLS Fund, and Hartford Ultrashort Bond HLS Fund (constituting Hartford Series Fund, Inc., hereafter collectively referred to as the “Funds”) as of December 31, 2024, the related statements of operations for the year ended December 31, 2024, the statements of changes in net assets for each of the two years in the period ended December 31, 2024, including the related notes, and the financial highlights for each of the periods indicated therein (collectively referred to as the “financial statements”). In our opinion, the financial statements present fairly, in all material respects, the financial position of each of the Funds as of December 31, 2024, the results of each of their operations for the year then ended, the changes in each of their net assets for each of the two years in the period ended December 31, 2024 and each of the financial highlights for each of the periods indicated therein in conformity with accounting principles generally accepted in the United States of America.
These financial statements are the responsibility of the Funds’ management. Our responsibility is to express an opinion on the Funds’ financial statements based on our audits. We are a public accounting firm registered with the Public Company Accounting Oversight Board (United States) (PCAOB) and are required to be independent with respect to the Funds in accordance with the U.S. federal securities laws and the applicable rules and regulations of the Securities and Exchange Commission and the PCAOB.
We conducted our audits of these financial statements in accordance with the standards of the PCAOB. Those standards require that we plan and perform the audit to obtain reasonable assurance about whether the financial statements are free of material misstatement, whether due to error or fraud.
Our audits included performing procedures to assess the risks of material misstatement of the financial statements, whether due to error or fraud, and performing procedures that respond to those risks. Such procedures included examining, on a test basis, evidence regarding the amounts and disclosures in the financial statements. Our audits also included evaluating the accounting principles used and significant estimates made by management, as well as evaluating the overall presentation of the financial statements. Our procedures included confirmation of securities owned as of December 31, 2024 by correspondence with the custodian, transfer agent and brokers; when replies were not received from brokers, we performed other auditing procedures. We believe that our audits provide a reasonable basis for our opinions.
/s/PricewaterhouseCoopers LLP
Philadelphia, Pennsylvania
February 14, 2025
We have served as the auditor of one or more investment companies in the Hartford Funds group of investment companies since 2020.
Item 8. Changes in and Disagreements with Accountants for Open-End Management Investment Companies.
Not applicable. There were no changes in or disagreements with accountants during the period.
Item 9. Proxy Disclosures for Open-End Management Investment Companies.
Not applicable. There were no matters submitted to a vote of shareholders during the period.
Item 10. Remuneration Paid to Directors, Officers, and Others of Open-End Management Investment Companies.
The response to this item is included under Item 7 of this form.
Item 11. Statement Regarding Basis for Approval of Investment Advisory Contract.Approval of Investment Management and Investment Sub-Advisory Agreements (Unaudited)
Hartford Series Fund, Inc.
Hartford Balanced HLS Fund
Hartford Capital Appreciation HLS Fund
Hartford Disciplined Equity HLS Fund
Hartford Dividend and Growth HLS Fund
Hartford Healthcare HLS Fund
Hartford International Opportunities HLS Fund
Hartford MidCap HLS Fund
Hartford Small Cap Growth HLS Fund
Hartford Small Company HLS Fund
Hartford Stock HLS Fund
Hartford Total Return Bond HLS Fund
Hartford Ultrashort Bond HLS Fund
(each, a “Fund” and collectively, the “Funds”)
Section 15(c) of the Investment Company Act of 1940, as amended (the “1940 Act”), requires that each mutual fund’s board of directors, including a majority of those directors who are not “interested persons” of the mutual fund, as defined in the 1940 Act (the “Independent Directors”), annually review and consider the continuation of the mutual fund’s investment advisory and sub-advisory agreements. At its meeting held on September 11-12, 2024, the Board of Directors (the “Board”) of Hartford Series Fund, Inc. (“HLS”), including the Independent Directors, unanimously voted to approve (i) the continuation of an investment management agreement (the “Management Agreement”) by and between HLS, on behalf of each of its series listed above, and Hartford Funds Management Company, LLC (“HFMC”); and (ii) the continuation of an investment sub-advisory agreement (the “Sub-Advisory Agreement” and together with the Management Agreement, the “Agreements”) between HFMC and each Fund’s sub-adviser, Wellington Management Company LLP (the “Sub-adviser,” and together with HFMC, the “Advisers”), with respect to each Fund.
In the months preceding the September 11-12, 2024 meeting, the Board requested and reviewed written responses from the Advisers to questions posed to the Advisers on behalf of the Independent Directors and supporting materials relating to those questions and responses. In addition, the Board considered such additional information as it deemed reasonably necessary to evaluate the Agreements, as applicable, with respect to each Fund, which included information furnished to the Board and its committees at their meetings throughout the year and in between regularly scheduled meetings on particular matters as the need arose, as well as information specifically prepared in connection with the approval of the continuation of the Agreements that was presented at the Board’s meetings held on June 11, 2024 and September 11-12, 2024. Information provided to the Board and its committees at their meetings throughout the year included, among other things, reports on Fund performance, legal, compliance and risk management matters, sales and marketing activity, shareholder services, and the other services provided to each Fund by the Advisers and their affiliates. The members of the Board also considered the materials and presentations by Fund officers and representatives of HFMC received at the Board’s meetings on June 11, 2024 and September 11-12, 2024 concerning the Agreements and at the special meeting of the Board’s Investment Committee on May 23, 2024 concerning Fund-by-Fund performance and other investment-related matters.
The Independent Directors engaged service providers to assist them with evaluating the Agreements with respect to each Fund, as applicable. Broadridge Financial Solutions, Inc. (“Broadridge”), an independent provider of investment company data, was retained to provide the Board with reports on how each Fund’s contractual management fees, actual management fees, total expense ratios and investment performance compared to those of an appropriate group of investment companies selected by Broadridge. The Independent Directors also engaged an independent consultant (the “Consultant”) to assist them in evaluating each Fund’s fees and expenses.
In determining whether to approve the continuation of the Agreements for a Fund, the members of the Board reviewed and evaluated information and factors they believed to be relevant and appropriate through the exercise of their reasonable business judgment. While individual members of the Board may have weighed certain factors differently, the Board’s determination to approve the continuation of the Agreements was based on a comprehensive consideration of all information provided to the Board throughout the year and specifically with respect to the continuation of the Agreements. The Board was also furnished with an analysis of its fiduciary obligations in connection with its evaluation of the Agreements. Throughout the evaluation process, the Board was assisted by counsel for the Funds and the Independent Directors were also separately assisted by independent legal counsel. In connection with their deliberations, the Independent Directors met separately with independent legal counsel and the Consultant on June 7, 2024 and in executive session on several occasions to consider their responsibilities under relevant laws and regulations and to discuss the materials presented and other matters deemed relevant to their consideration of the approval of the continuation of the Agreements. As a result of the discussions that occurred during the June 7, 2024 and June 11, 2024 meetings, the Independent Directors presented HFMC and
Item 11. Statement Regarding Basis for Approval of Investment Advisory Contract.Approval of Investment Management and Investment Sub-Advisory Agreements (Unaudited) – (continued)
its affiliates with requests for additional information on certain topics. HFMC responded to these requests with additional information in connection with the September 11-12, 2024 meeting. A more detailed summary of the important, but not necessarily all, factors the Board considered with respect to its approval of the continuation of the Agreements is provided below.
Nature, Extent and Quality of Services Provided by the Advisers
The Board requested and considered information concerning the nature, extent and quality of the services provided to each Fund by the Advisers. The Board considered, among other things, the terms of the Agreements and the range of services provided by the Advisers. The Board considered the Advisers’ professional personnel who provide services to the Funds, including each Adviser’s ability and experience in attracting and retaining qualified personnel to service the Funds. The Board considered each Adviser’s reputation and overall financial strength, as well as each Adviser’s willingness to consider and implement organizational and operational changes designed to enhance services to the funds managed by HFMC and its affiliates (the “Hartford funds”). In addition, the Board considered the quality of each Adviser’s communications with the Board and responsiveness to Board inquiries and requests made from time to time with respect to the Funds and other Hartford funds.
The Board also requested and evaluated information concerning each Adviser’s regulatory and compliance environment. In this regard, the Board reviewed information about each Adviser’s compliance policies and procedures and compliance history, and a report from the Funds’ Chief Compliance Officer about each Adviser’s compliance with applicable laws and regulations, including responses to regulatory developments and any compliance or other issues raised by regulators. The Board also noted the Advisers’ support of the Funds’ compliance control structure, as applicable, including the resources devoted by the Advisers in support of the Funds’ obligations pursuant to Rule 38a-1 under the 1940 Act and the Funds’ risk management programs, as well as the efforts of the Advisers to address cybersecurity risks. The Board also considered HFMC’s investments in business continuity planning designed to benefit the Funds. The Board also noted HFMC’s commitment to maintaining high quality systems and expending substantial resources to prepare for and respond to ongoing changes to the market, regulatory and control environments in which the Funds and their service providers operate.
With respect to HFMC, the Board noted that, under the Management Agreement, HFMC is responsible for the management of the Funds, including oversight of fund operations and service providers, and the provision of investment advisory and administrative services in connection with selecting, monitoring and supervising the Sub-adviser. In this regard, the Board evaluated information about the nature and extent of responsibilities retained and risks assumed by HFMC that were not delegated to, or assumed by, the Sub-adviser. The Board considered HFMC’s ongoing monitoring of people, process and performance, including its quarterly reviews of each of the Hartford funds, semi-annual meetings with the leaders of each Fund’s portfolio management team, and ongoing oversight of the Hartford funds’ portfolio managers. The Board noted that HFMC has demonstrated a record of initiating changes to the portfolio management and/or investment strategies of the Hartford funds when warranted. The Board considered HFMC’s periodic due diligence reviews of the Sub-adviser and ongoing oversight of the Sub-adviser’s investment approach and results, process for monitoring best execution of portfolio trades and other trading operations by the Sub-adviser, and approach to risk management with respect to the Funds. The Board considered HFMC’s oversight of the securities lending program for the Funds that engage in securities lending and noted the income earned by the Funds that participate in such program. The Board also considered HFMC’s day-to-day oversight of each Fund’s compliance with its investment objective and policies as well as with applicable laws and regulations, noting that regulatory and other developments had over time led to an increase in the scope of HFMC’s oversight in this regard. Moreover, the Board considered HFMC’s oversight of potential conflicts of interest between the Funds’ investments and those of other funds or accounts, if any, managed by the Funds’ portfolio management personnel.
In addition, the Board considered HFMC’s overall strategic plan for, and ongoing commitment to review and re-assess, the Hartford funds product line-up. The Board considered that HFMC is responsible for providing the Funds’ officers.
With respect to the Sub-adviser, which provides certain day-to-day portfolio management services for the Funds, subject to oversight by HFMC, the Board considered, among other things, the Sub-adviser’s investment personnel, investment philosophy and process, investment research capabilities and resources, performance record, trade execution capabilities and experience. The Board considered the experience of each Fund’s portfolio manager(s), the number of accounts managed by the portfolio manager(s), and the Sub-adviser’s method for compensating the portfolio manager(s). The Board also considered the Sub-adviser’s succession planning practices to ensure continuity of portfolio management services provided to the Funds and HFMC’s oversight of these practices.
The Board considered the benefits to shareholders of investing in a fund that is part of the family of Hartford funds. The Board considered HFMC’s efforts to provide investors in the Hartford funds with a broad range of investment styles and asset classes.
Based on these considerations, the Board concluded that it was satisfied with the nature, extent and quality of the services provided to each Fund by HFMC and the Sub-adviser.
Item 11. Statement Regarding Basis for Approval of Investment Advisory Contract.Approval of Investment Management and Investment Sub-Advisory Agreements (Unaudited) – (continued)
Performance of each Fund and the Advisers
The Board considered the investment performance of each Fund. In this regard, the Board reviewed the performance of each Fund over different time periods and evaluated HFMC’s analysis of each Fund’s performance for these time periods. The Board considered information and materials provided to the Board by the Advisers concerning Fund performance, as well as information from Broadridge comparing the investment performance of each Fund to an appropriate universe of peer funds. The Board noted that while it found the comparative data provided by Broadridge generally useful in evaluating a Hartford fund’s investment performance, the Board recognized the limitations of such data, including that notable differences may exist between a Hartford fund and its peers. For details regarding each Fund’s performance, see the Fund-by-Fund synopsis below.
The Board considered the detailed investment analytics reports provided by HFMC’s Investment Advisory Group throughout the year, including in connection with the approval of the continuation of the Agreements. These reports included, among other things, information on each Fund’s gross returns and net returns, the Fund’s investment performance compared to one or more appropriate benchmarks and relevant groups or categories of peer funds, various statistics concerning the Fund’s portfolio, a narrative summary of various factors affecting Fund performance, and commentary on the effect of current and recent market conditions. The Board also noted that the Hartford Capital Appreciation HLS Fund utilizes a multiple sleeve structure whereby each sleeve uses a different investment style and considered the performance attributions of the underlying portfolio managers. The Board considered the Advisers’ work with the Investment Committee, which assists the Board in evaluating the performance of each Fund at periodic meetings throughout the year and specifically with respect to the approval of the continuation of the Agreements. The Board considered that the Investment Committee, in its evaluation of investment performance at meetings throughout the year, focused particular attention on information indicating less favorable performance of certain Hartford funds for specific time periods and discussed with HFMC’s Investment Advisory Group the reasons for such performance as well as any specific actions that the Advisers had taken, or had agreed to take, to seek to enhance Fund investment performance and the results of those actions. The Board also considered information provided by the Consultant relating to each Fund’s performance track record.
Based on these considerations, the Board concluded that it had continued confidence in HFMC’s and the Sub-adviser’s overall capabilities to manage the Funds.
Costs of the Services and Profitability of the Advisers
The Board reviewed information regarding HFMC’s cost to provide investment management and related services to each Fund and HFMC’s profitability, both overall and for each Fund, on a pre-tax basis without regard to distribution expenses. The Board also requested and reviewed information about the profitability to HFMC and its affiliates from all services provided to each Fund and all aspects of their relationship with the Fund, including information regarding profitability trends over time and information provided by Broadridge analyzing the profitability of investment managers to other fund complexes. The Board also requested and received information relating to the operations and profitability of the Sub-adviser. The Board considered representations from HFMC and the Sub-adviser that the Sub-adviser’s fees were negotiated at arm’s length on a Fund-by-Fund basis and that the sub-advisory fees are paid by HFMC and not the Funds. Accordingly, the Board concluded that the profitability of the Sub-adviser is a less relevant factor with respect to the Board’s consideration of the Sub-Advisory Agreement.
The Board considered that the Independent Directors’ prior independent consultant had previously reviewed the methodologies and estimates used by HFMC in calculating profitability in connection with the continuation of the Management Agreement, including a description of the methodology used to allocate certain expenses. The Board noted that the prior independent consultant previously reported that such process is reasonable, sound and consistent with common industry practice. The Board noted that HFMC’s process for calculating and reporting Fund profitability is consistent with the process previously reviewed by the prior independent consultant.
Based on these considerations, the Board concluded that the profits realized by HFMC and its affiliates from their relationships with each Fund were not excessive.
Comparison of Fees and Services Provided by the Advisers
The Board considered comparative information with respect to the services rendered to and the management fees to be paid by each Fund to HFMC and the total expense ratios of the Fund. The Board also considered comparative information with respect to the sub-advisory fees to be paid by HFMC to the Sub-adviser with respect to each Fund. In this regard, the Board requested and reviewed information from HFMC and the Sub-adviser relating to the management and sub-advisory fees, including the sub-advisory fee schedule for each Fund and the amount of the management fee retained
Item 11. Statement Regarding Basis for Approval of Investment Advisory Contract.Approval of Investment Management and Investment Sub-Advisory Agreements (Unaudited) – (continued)
by HFMC, and total operating expenses for each Fund. The Board also reviewed information from Broadridge comparing each Fund’s contractual management fees, actual management fees and total expense ratios relative to an appropriate group of funds selected by Broadridge. For details regarding each Fund’s fees and expenses, see the Fund-by-Fund synopsis below.
The Board considered the methodology used by Broadridge to select the funds included in the expense groups. While the Board recognized that comparisons between a Fund and its peer funds may be imprecise given, among other differences, the different service levels and characteristics of mutual funds and the different business models and cost structures of the Advisers, the comparative information provided by Broadridge assisted the Board in evaluating the reasonableness of each Fund’s fees and total operating expenses. In addition, the Board considered the independent analysis and views of the Consultant regarding each Fund’s fees and total operating expenses in the context of the Fund’s investment performance.
The Board also received information regarding fees charged by the Sub-adviser to any other clients with investment strategies similar to those of the Funds, including any institutional separate account clients and registered fund clients for which the Sub-adviser serves as either primary investment adviser or sub-adviser. The Board considered the explanations provided by the Sub-adviser about any differences between the Sub-adviser’s services to the Funds and the services the Sub-adviser provides to other types of clients. In this regard, the Board reviewed information about the generally broader scope of services and compliance, reporting and other legal burdens and risks of managing registered funds compared with those associated with managing assets of non-registered fund clients such as institutional separate accounts.
Based on these considerations, the Board concluded that each Fund’s fees and total operating expenses, in conjunction with the information about quality of services, profitability, economies of scale, and other matters considered, were reasonable in light of the services provided.
The Board considered information regarding economies of scale, including the extent to which economies of scale may be realized as a Fund grows and whether fee levels reflect these economies of scale for the benefit of shareholders of the Fund. The Board reviewed the breakpoints in the management fee schedule for each Fund, which reduce fee rates as the Fund’s assets grow over time. The Board recognized that a Fund with assets beyond the highest breakpoint level will continue to benefit from economies of scale because additional assets are charged the lowest breakpoint fee resulting in lower effective management fee rates. The Board also recognized that a fee schedule that reaches a breakpoint at a lower asset level provides shareholders with the benefit of anticipated or potential economies of scale. The Board considered that fee waivers that reduce a Fund’s expenses at all asset levels can have the same effect as breakpoints in sharing economies of scale with shareholders and provide protection from an increase in expenses if the Fund’s assets decline. In addition, the Board considered that initially setting competitive fee rates, pricing a Fund to scale at inception and making additional investments intended to enhance services available to shareholders are other means of sharing anticipated or potential economies of scale with shareholders. The Board also considered that HFMC has been active in managing expenses of the Hartford funds in recent years, which has resulted in benefits being realized by shareholders. The Board also noted that, for the Hartford Healthcare HLS Fund, the Fund’s current low asset levels have kept the Fund from fully realizing the benefits of anticipated or potential economies of scale. The Board considered HFMC’s assessment of the low asset levels for the Hartford Healthcare HLS Fund. The Board considered that the Funds are closed to certain investors.
The Board reviewed and evaluated materials from Broadridge showing how management fee schedules of peer funds reflect economies of scale for the benefit of shareholders as a peer fund’s assets hypothetically increase over time. Based on information provided by HFMC and Broadridge, the Board recognized that there is no uniform methodology for establishing breakpoints or uniform pattern in asset levels that trigger breakpoints or the amounts of breakpoints triggered.
After considering all of the information available to it, the Board concluded that it was satisfied with the extent to which economies of scale, if any, would be shared for the benefit of each Fund’s shareholders based on currently available information and the effective management fees and total expense ratios for the Fund at its current and reasonably anticipated asset levels. The Board noted, however, that it would continue to monitor any future growth in each Fund’s assets and the appropriateness of additional management fee breakpoints or other methods to share benefits from economies of scale as part of its future review of the Agreements.
The Board considered other benefits to the Advisers and their affiliates from their relationships with the Funds.
Item 11. Statement Regarding Basis for Approval of Investment Advisory Contract.Approval of Investment Management and Investment Sub-Advisory Agreements (Unaudited) – (continued)
The Board noted that HFMC receives fees for fund accounting and related services from the Funds, and the Board considered information on the profitability to HFMC from providing such services to the Funds. The Board also considered that Hartford Administrative Services Company (“HASCO”), the Funds’ transfer agent and an affiliate of HFMC, receives transfer agency compensation from the Funds, and the Board reviewed information about the profitability to HASCO of the Funds’ transfer agency function. The Board considered information provided by HFMC indicating that the transfer agency fees charged by HASCO to the Funds were fair and reasonable based on available industry data about fees charged by transfer agents to other mutual funds. The Board also noted that HFMC and HASCO had delegated certain fund accounting services and transfer agency services, respectively, to external service providers, subject to oversight.
The Board also considered that Hartford Funds Distributors, LLC (“HFD”), an affiliate of HFMC, serves as principal underwriter of the Funds. The Board noted that, as principal underwriter, HFD receives distribution and service fees from the Funds. The Board considered that HFD has entered into an agreement with the Sub-adviser and Wellington Trust Company NA to provide certain marketing support services in connection with certain collective investment trust vehicles managed by the Sub-adviser.
The Board considered the benefits, if any, to the Sub-adviser from any use of a Fund’s brokerage commissions to obtain soft dollar research.
For purposes of evaluating a Fund’s performance, the Board considered the Fund’s performance relative to similarly managed funds and the Fund’s performance relative to its benchmark. In particular, the Board considered the Fund’s performance of its Class IA shares (net of all fees and expenses), as of March 31, 2024, and compared that performance to the Fund’s peer universe, which includes all funds within the same classification or category, as determined by Broadridge. The Board considered the Fund’s performance relative to its peer universe by evaluating its quintile ranking, with the 1st quintile representing the top performing funds within a peer universe and the 5th quintile representing the lowest performing funds. For purposes of evaluating the Fund’s performance relative to its benchmark, the Board considered the Fund’s performance of its Class IA shares (net of all fees and expenses) as of March 31, 2024. The Board considered Fund performance to be “in line with” a Fund’s benchmark where it was 50 basis points above or below the benchmark return. With respect to fees and expenses, the Board considered the Fund’s contractual management fee, actual management fee, and total operating expenses of its Class IA shares, as compared to the Fund’s expense peer group, which includes a group of similarly sized funds selected by Broadridge.
Hartford Balanced HLS Fund
•
The Board noted that the Fund’s performance was in the 3rd quintile versus its peer universe for the 1-year period and the 1st quintile for the 3- and 5-year periods. The Board also noted that the Fund’s performance was below its custom blended benchmark for the 1-year period and in line with its benchmark for the 3- and 5-year periods.
•
The Board noted that the Fund’s contractual management fee and actual management fee were in the 4th quintile of its expense group and its total expenses were in the 3rd quintile. The Board noted that HFMC had voluntarily agreed to waive a portion of its management fee for the Fund.
Hartford Capital Appreciation HLS Fund
•
The Board noted that the Fund’s performance was in the 4th quintile versus its peer universe for the 1- and 5-year periods and the 5th quintile for the 3-year period. The Board also noted that the Fund’s performance was below its benchmark for the 1-, 3- and 5-year periods. The Board noted recent changes to the Fund’s portfolio management team.
•
The Board noted that the Fund’s contractual management fee, actual management fee, and total expenses were in the 3rd quintile of its expense group.
Hartford Disciplined Equity HLS Fund
•
The Board noted that the Fund’s performance was in the 2nd quintile versus its peer universe for the 1-year period, the 4th quintile for the 3-year period, and the 3rd quintile for the 5-year period. The Board also noted that the Fund’s performance was below its benchmark for the 1-, 3- and 5-year periods. The Board noted upcoming changes to the Fund’s portfolio management team.
•
The Board noted that the Fund’s contractual management fee was in the 1st quintile of its expense group, while its actual management fee and total expenses were in the 2nd quintile.
Item 11. Statement Regarding Basis for Approval of Investment Advisory Contract.Approval of Investment Management and Investment Sub-Advisory Agreements (Unaudited) – (continued)
Hartford Dividend and Growth HLS Fund
•
The Board noted that the Fund’s performance was in the 1st quintile versus its peer universe for the 1- and 5-year periods and the 2nd quintile for the 3-year period. The Board also noted that the Fund’s performance was below its benchmark for the 1-, 3- and 5-year periods.
•
The Board noted that the Fund’s contractual management fee was in the 4th quintile of its expense group, while its actual management fee and its total expenses were in the 3rd quintile.
Hartford Healthcare HLS Fund
•
The Board noted that the Fund’s performance was in the 2nd quintile versus its peer universe for the 1- and 5-year periods and the 3rd quintile for the 3-year period. The Board also noted that the Fund’s performance was in line with its benchmark for the 1-year period and below its benchmark for the 3- and 5-year periods. The Board noted recent changes to the Fund’s portfolio management team.
•
The Board noted that the Fund’s contractual management fee was in the 2nd quintile of its expense group, while its actual management fee was in the 4th quintile and total expenses were in the 3rd quintile.
Hartford International Opportunities HLS Fund
•
The Board noted that the Fund’s performance was in the 5th quintile versus its peer universe for the 1-year period and the 3rd quintile for the 3- and 5-year periods. The Board also noted that the Fund’s performance was below its benchmark for the 1- and 3-year periods and in line with its benchmark for the 5-year period. The Board noted upcoming changes to the Fund’s portfolio management team.
•
The Board noted that the Fund’s contractual management fee, actual management fee and total expenses were in the 1st quintile of its expense group.
•
The Board noted that the Fund’s performance was in the 5th quintile versus its peer universe for the 1-, 3- and 5-year periods. The Board also noted that the Fund’s performance was below its benchmark for the 1-, 3- and 5-year periods. The Board noted upcoming changes to the Fund’s portfolio management team.
•
The Board noted that the Fund’s contractual management fee was in the 2nd quintile of its expense group, while its actual management fee and total expenses were in the 3rd quintile.
Hartford Small Cap Growth HLS Fund
•
The Board noted that the Fund’s performance was in the 2nd quintile versus its peer universe for the 1-year period, the 3rd quintile for the 3-year period, and the 4th quintile for the 5-year period. The Board also noted that the Fund’s performance was above its benchmark for the 1-year period, in line with its benchmark for the 3-year period, and below its benchmark for the 5-year period. The Board noted upcoming changes to the Fund’s portfolio management team.
•
The Board noted that the Fund’s contractual management fee, actual management fee and total expenses were in the 1st quintile of its expense group.
Hartford Small Company HLS Fund
•
The Board noted that the Fund’s performance was in the 3rd quintile versus its peer universe for the 1-year period, the 4th quintile for the 3-year period, and the 2nd quintile for the 5-year period. The Board also noted that the Fund’s performance was above its benchmark for the 1- and 5-year periods and below its benchmark for the 3-year period.
•
The Board noted that the Fund’s contractual management fee and total expenses were in the 1st quintile of its expense group, while its actual management fee was in the 2nd quintile.
Item 11. Statement Regarding Basis for Approval of Investment Advisory Contract.Approval of Investment Management and Investment Sub-Advisory Agreements (Unaudited) – (continued)
Hartford Stock HLS Fund
•
The Board noted that the Fund’s performance was in the 5th quintile versus its peer universe for the 1- and 5-year periods and the 3rd quintile for the 3-year period. The Board also noted that the Fund’s performance was below its benchmark for the 1-, 3- and 5-year periods.
•
The Board noted that the Fund’s contractual management fee, actual management fee and total expenses were in the 1st quintile of its expense group.
Hartford Total Return Bond HLS Fund
•
The Board noted that the Fund’s performance was in the 1st quintile versus its peer universe for the 1-, 3- and 5-year periods. The Board also noted that the Fund’s performance was above its benchmark for the 1-year period and in line with its benchmark for the 3- and 5-year periods. The Board noted recent changes to the Fund’s portfolio management team.
•
The Board noted that the Fund’s contractual management fee, actual management fee, and its total expenses were in the 3rd quintile of its expense group.
Hartford Ultrashort Bond HLS Fund
•
The Board noted that the Fund’s performance was in the 2nd quintile versus its peer universe for the 1-year period, the 3rd quintile for the 3-year period, and the 1st quintile for the 5-year period. The Board also noted that the Fund’s performance was in line with its benchmark for the 1-, 3- and 5-year periods. The Board noted upcoming changes to the Fund’s portfolio management team.
•
The Board noted that the Fund’s contractual management fee, actual management fee and total expenses were in the 1st quintile of its expense group.
Based upon the review of the factors summarized above, among others, the Board concluded that it is in the best interests of each Fund and its shareholders for the Board to approve the continuation of the Agreements for an additional year. In reaching this decision, the Board did not assign relative weights to the factors discussed above or deem any one or group of them to be controlling in and of themselves.
Index Glossary for Indices Included in the Annual Shareholder Reports (Unaudited)
Bloomberg US Government/Credit Bond Index (reflects no deduction for fees, expenses or taxes) measures the non-securitized component of the US Aggregate Index. It includes investment grade, US dollar-denominated, fixed-rate Treasuries, government-related and corporate securities. |
Bloomberg Short Treasury 9-12 Month Index (reflects no deduction for fees, expenses or taxes) includes aged US Treasury bills, notes and bonds with a remaining maturity from 1 up to (but not including) 12 months. It excludes zero coupon strips. |
Bloomberg US Aggregate Bond Index (reflects no deduction for fees, expenses or taxes) is composed of securities that cover the US investment grade fixed rate bond market, with index components for government and corporate securities, mortgage pass-through securities, and asset-backed securities. |
ICE BofA US 3-Month Treasury Bill Index (reflects no deduction for fees, expenses or taxes) is comprised of a single issue purchased at the beginning of the month and held for a full month. At the end of the month that issue is sold and rolled into a newly selected issue. The issue selected at each month-end rebalancing is the outstanding Treasury Bill that matures closest to, but not beyond, three months from the rebalancing date. To qualify for selection, an issue must have settled on or before the month-end rebalancing date. |
MSCI ACWI ex USA Index (Net) (reflects reinvested dividends net of withholding taxes but reflects no deduction for fees, expenses or other taxes) is designed to capture large and mid cap securities across developed markets (excluding the US) and emerging market countries. |
Russell 1000 Index (reflects no deduction for fees, expenses or taxes) is designed to measure the performance of the 1,000 largest companies in the Russell 3000 Index. The Russell 3000 Index is designed to measure the performance of the 3,000 largest US companies based on total market capitalizations. |
Russell 3000 Index (reflects no deduction for fees, expenses or taxes) is designed to measure the performance of the 3,000 largest US companies based on total market capitalization. |
Russell 2000 Growth Index (reflects no deduction for fees, expenses or taxes) is designed to measure the performance of those Russell 2000 Index companies with higher price-to-book ratios and higher forecasted growth values. The Russell 2000 Index is an index comprised of 2,000 of the smallest US-domiciled company common stocks based on a combination of their market capitalization and current index membership. |
Russell 1000 Value Index (reflects no deduction for fees, expenses or taxes) is designed to measure the performance of those Russell 1000 Index companies with lower price-to-book ratios and lower forecasted growth values. The Russell 1000 Index is designed to measure the performance of the 1,000 largest companies in the Russell 3000 Index based on their market capitalization and current index membership. |
Russell Midcap Growth Index (reflects no deduction for fees, expenses or taxes) is designed to measure the performance of the mid-cap growth segment of the US equity universe. It includes those Russell Midcap Index companies with relatively higher price-to-book ratios, higher I/B/E/S forecast medium term (2 year) growth and higher sales per share historical growth (5 years). |
S&P Composite 1500 Health Care Index (reflects no deduction for fees, expenses or taxes) is a float-adjusted market capitalization-weighted index comprised of those companies included in the S&P Composite 1500 that are classified as members of the Global Industry Classification Standard (GICS®) health care sector. |
S&P MidCap 400 Index (reflects no deduction for fees, expenses or taxes) is a float-adjusted market capitalization-weighted index designed to measure the performance of the mid-cap segment of the market. The index is composed of 400 constituent companies. |
S&P 500 Index (reflects no deduction for fees, expenses or taxes) is a float-adjusted market capitalization-weighted index composed of 500 widely held common stocks. |
Additional Information Regarding Bloomberg Index(es). “Bloomberg®” and the above referenced Bloomberg index(es) are service marks of Bloomberg Finance L.P. and its affiliates, including Bloomberg Index Services Limited (“BISL”), the administrator of the index (collectively, “Bloomberg”), and have been licensed for use for certain purposes by Hartford Funds Management Company, LLC ("HFMC"). The Funds are not sponsored, endorsed, sold or promoted by Bloomberg. Bloomberg does not make any representation or warranty, express or implied, to the owners of or counterparties to the Funds or any member of the public regarding the advisability of investing in securities generally or in the Funds particularly. The only relationship of Bloomberg to HFMC is the licensing of certain trademarks, trade names and service marks and of the above referenced Bloomberg index(es), which is determined, composed and calculated by BISL without regard to HFMC or the Funds. Bloomberg has no obligation to take the needs of HFMC or the owners of the Funds into consideration in determining, composing or calculating the above referenced Bloomberg index(es). Bloomberg is not responsible for and has not participated in the determination of the timing of, prices at, or quantities of the Funds to be issued. Bloomberg shall not have any obligation or liability, including, without limitation, to the Funds' customers, in connection with the administration, marketing or trading of the Funds. |
BLOOMBERG DOES NOT GUARANTEE THE ACCURACY AND/OR THE COMPLETENESS OF THE ABOVE REFERENCED BLOOMBERG INDEX(ES) OR ANY DATA RELATED THERETO AND SHALL HAVE NO LIABILITY FOR ANY ERRORS, OMISSIONS OR INTERRUPTIONS THEREIN. BLOOMBERG DOES NOT MAKE ANY WARRANTY, EXPRESS OR IMPLIED, AS TO RESULTS TO BE OBTAINED BY HFMC, OWNERS OF THE FUNDS OR ANY OTHER PERSON OR ENTITY FROM THE USE OF THE ABOVE REFERENCED BLOOMBERG INDEX(ES) OR ANY DATA RELATED THERETO. BLOOMBERG DOES NOT MAKE ANY EXPRESS OR IMPLIED WARRANTIES AND EXPRESSLY DISCLAIMS ALL WARRANTIES OF MERCHANTABILITY OR FITNESS FOR A PARTICULAR PURPOSE OR USE WITH RESPECT TO THE ABOVE REFERENCED |
Index Glossary for Indices Included in the Annual Shareholder Reports (Unaudited) – (continued)
BLOOMBERG INDEX(ES) OR ANY DATA RELATED THERETO. WITHOUT LIMITING ANY OF THE FOREGOING, TO THE MAXIMUM EXTENT ALLOWED BY LAW, BLOOMBERG, ITS LICENSORS, AND ITS AND THEIR RESPECTIVE EMPLOYEES, CONTRACTORS, AGENTS, SUPPLIERS, AND VENDORS SHALL HAVE NO LIABILITY OR RESPONSIBILITY WHATSOEVER FOR ANY INJURY OR DAMAGES --WHETHER DIRECT, INDIRECT, CONSEQUENTIAL, INCIDENTAL, PUNITIVE OR OTHERWISE --ARISING IN CONNECTION WITH THE ABOVE REFERENCED BLOOMBERG INDEX(ES) OR ANY DATA OR VALUES RELATING THERETO --WHETHER ARISING FROM THEIR NEGLIGENCE OR OTHERWISE, EVEN IF NOTIFIED OF THE POSSIBILITY THEREOF. |
Additional Information Regarding MSCI Indices.
Neither MSCI nor any other party involved in or related to compiling, computing or creating the MSCI data makes any express or implied warranties or representations with respect to such data (or the results to be obtained by the use thereof), and all such parties hereby expressly disclaim all warranties of originality, accuracy, completeness, merchantability or fitness for a particular purpose with respect to any of such data. Without limiting any of the foregoing, in no event shall MSCI, any of its affiliates or any third party involved in or related to compiling, computing or creating the data have any liability for any direct, indirect, special, punitive, consequential or any other damages (including lost profits) even if notified of the possibility of such damages. No further distribution or dissemination of the MSCI data is permitted without MSCI’s express written consent. |
Series of Hartford Series Fund, Inc. (each a “Fund” and collectively, the “Funds”) are not subsidiaries of The Hartford Financial Services Group, Inc. (“The Hartford”) but are underwritten, distributed by and advised by subsidiaries of The Hartford. Investments in the Funds are not guaranteed by The Hartford or any other entity.
This report is submitted for the general information of the shareholders of the Funds referenced in this report. It is not authorized for distribution to persons who are not shareholders of one or more Funds referenced in this report unless preceded or accompanied by a current prospectus for the relevant Funds. Nothing herein contained is to be considered an offer of sale or a solicitation of an offer to buy shares of any Fund listed in this report.
The information cannot be used or relied upon for the purpose of avoiding IRS penalties. These materials are not intended to provide tax, accounting or legal advice. As with all matters of a tax or legal nature, you should consult your own tax or legal counsel for advice.
Investors should carefully consider a Fund’s investment objectives, risks, charges and expenses. This and other important information is contained in the Fund’s prospectus and summary prospectus, which can be obtained by visiting hartfordfunds.com. Please read it carefully before investing.
The Funds are distributed by Hartford Funds Distributors, LLC.
HLSAR24 02/25 Printed in the U.S.A.
Item 12. Disclosure of Proxy Voting Policies and Procedures for Closed-End Management Investment Companies.
Not applicable.
Item 13. Portfolio Managers of Closed-End Management Investment Companies.
Not applicable.
Item 14. Purchases of Equity Securities by Closed-End Management Investment Company and Affiliated Purchasers.
Not applicable.
Item 15. Submission of Matters to a Vote of Security Holders.
There have been no material changes to the procedures by which the shareholders may recommend nominees to the registrant’s board of directors, where those changes were implemented after the registrant last provided disclosure in response to the requirements of Item 407(c)(2)(iv) of Regulation S-K (17 CFR 229.407) (as required by Item 22(b)(15) of Schedule 14A (17 CFR 240.14a-101)), or this Item.
Item 16. Controls and Procedures.
| (a) | The registrant’s principal executive and principal financial officers, or persons performing similar functions, have concluded that the registrant’s disclosure controls and procedures (as defined in Rule 30a-3(c) under the Investment Company Act of 1940, as amended (the “1940 Act”) (17 CFR 270.30a-3(c))) are generally effective to provide |
| | reasonable assurance, as of a date within 90 days of the filing date of the report that includes the disclosure required by this paragraph, based on their evaluation of these controls and procedures required by Rule 30a-3(b) under the 1940 Act (17 CFR 270.30a-3(b)) and Rules 13a-15(b) or 15d-15(b) under the Securities Exchange Act of 1934, as amended (17 CFR 240.13a-15(b) or 240.15d-15(b)). |
| (b) | There were no changes in the registrant’s internal control over financial reporting (as defined in Rule 30a-3(d) under the 1940 Act (17 CFR 270.30a-3(d)) that occurred during the period covered by this report that have materially affected, or are reasonably likely to materially affect, the registrant’s internal control over financial reporting. |
Item 17. Disclosure of Securities Lending Activities for Closed-End Management Investment Companies.
Not applicable.
Item 18. Recovery of Erroneously Awarded Compensation.
Not applicable.
Item 19. Exhibits.
SIGNATURES
Pursuant to the requirements of the Securities Exchange Act of 1934 and the Investment Company Act of 1940, the registrant has duly caused this report to be signed on its behalf by the undersigned, thereunto duly authorized.
| | | | | | |
| | | | HARTFORD SERIES FUND, INC. |
| | | |
| Date: February 24, 2025 | | | | By: | | /s/ Gregory A. Frost |
| | | | | | Gregory A. Frost |
| | | | | | President and Chief Executive Officer |
Pursuant to the requirements of the Securities Exchange Act of 1934 and the Investment Company Act of 1940, this report has been signed below by the following persons on behalf of the registrant and in the capacities and on the dates indicated.
| | | | | | |
| Date: February 24, 2025 | | | | By: | | /s/ Gregory A. Frost |
| | | | | | Gregory A. Frost |
| | | | | | President and Chief Executive Officer |
| | | | | | |
| Date: February 24, 2025 | | | | By: | | /s/ Ankit Puri |
| | | | | | Ankit Puri |
| | | | | | Treasurer |
| | | | | | (Principal Financial Officer and Principal Accounting Officer) |