Exhibit 99.1

CONNECTING YOUR BUSINESS TO MORE BUSINESSSM
Investor Presentation September 2005
Safe Harbor Statement . . .
Statements made during today’s presentation may include certain forward-looking statements within the meaning of the Private Securities Litigation Reform Act of 1995. These statements are based on management’s current expectations and are subject to risks and uncertainties. These risks include the risks summarized in the Company’s filings with the SEC, including the section entitled “Risk Factors” in its Annual Report on Form 10-K.
Time Warner Telecom Inc. is under no obligation, and expressly disclaims any obligation, to update or alter its forward-looking statements whether as a result of new information, future events or otherwise.
Comments and discussions related to financial performance and trends are based on the information from our second quarter 2005 earnings call and press release. Please see our Q2 2005 earnings release at www.twtelecom.com.
2

Time Warner Telecom . . . Connecting Your Business to More Business
Company Overview
3
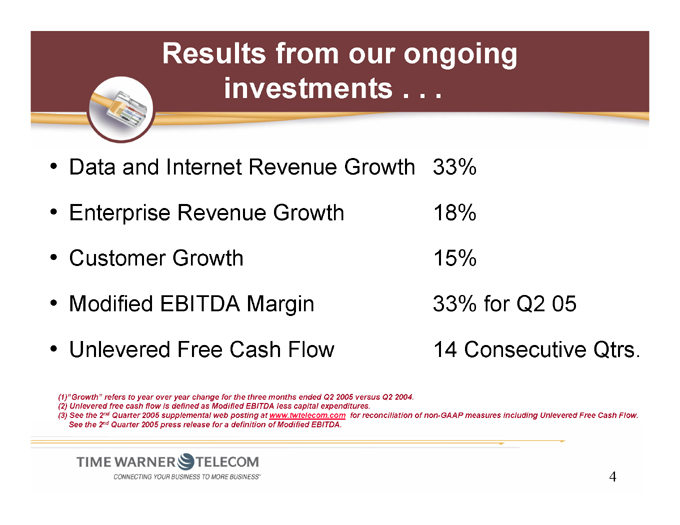
Results from our ongoing investments . . .
Data and Internet Revenue Growth 33%
Enterprise Revenue Growth 18%
Customer Growth 15%
Modified EBITDA Margin 33% for Q2 05
Unlevered Free Cash Flow 14 Consecutive Qtrs.
(1) ”Growth” refers to year over year change for the three months ended Q2 2005 versus Q2 2004. (2) Unlevered free cash flow is defined as Modified EBITDA less capital expenditures.
(3) See the 2nd Quarter 2005 supplemental web posting at www.twtelecom.com for reconciliation of non-GAAP measures including Unlevered Free Cash Flow.
See the 2nd Quarter 2005 press release for a definition of Modified EBITDA.
4
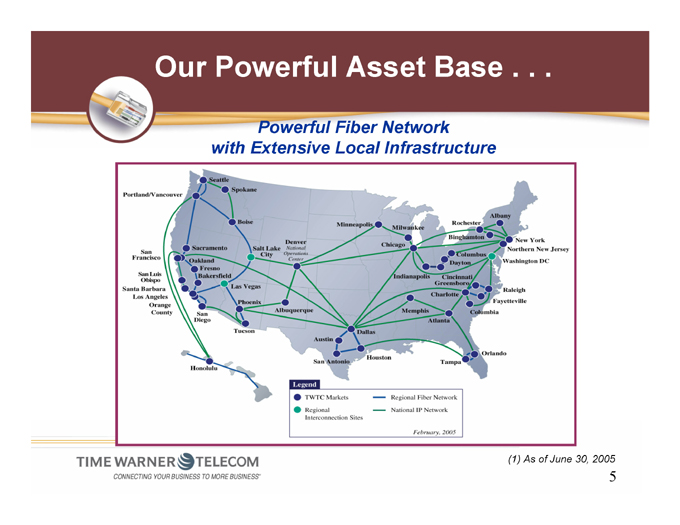
Our Powerful Asset Base . . .
Powerful Fiber Network with Extensive Local Infrastructure
(1) As of June 30, 2005
5
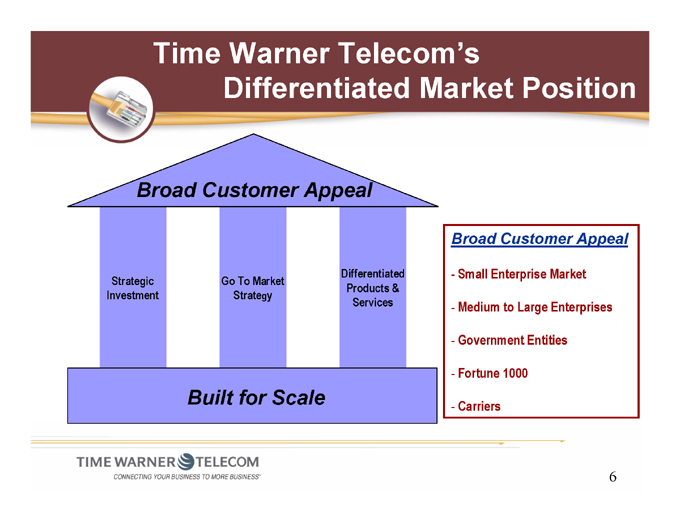
Time Warner Telecom’s
Differentiated Market Position
Broad Customer Appeal
Strategic Investment
Go To Market Strategy
Differentiated Products & Services
Built for Scale
Broad Customer Appeal
Small Enterprise Market
Medium to Large Enterprises
Government Entities
Fortune 1000
Carriers
6
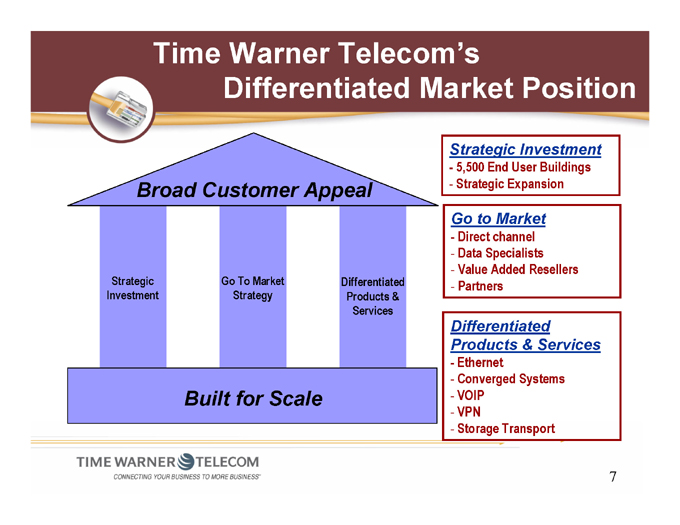
Time Warner Telecom’s
Differentiated Market Position
Broad Customer Appeal
Strategic Investment
Go To Market Strategy
Differentiated Products & Services
Built for Scale
Strategic Investment
5,500 End User Buildings
Strategic Expansion
Go to Market
Direct channel
Data Specialists
Value Added Resellers
Partners
Differentiated Products & Services
Ethernet
Converged Systems
VOIP
VPN
Storage Transport
7
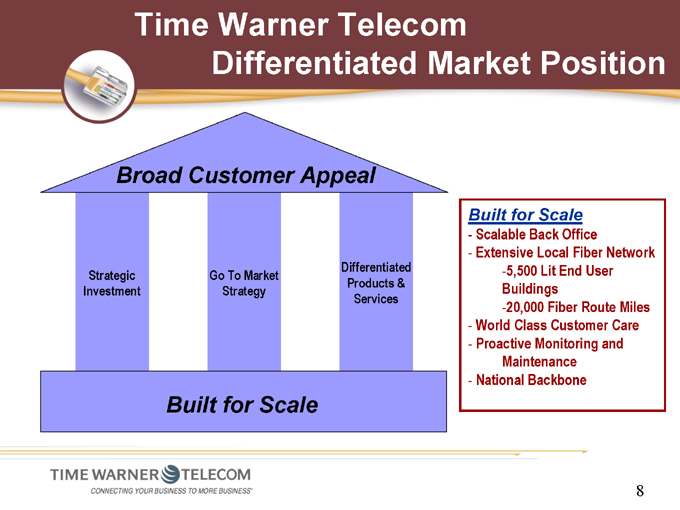
Time Warner Telecom
Differentiated Market Position
Broad Customer Appeal
Strategic Investment
Go To Market Strategy
Differentiated Products & Services
Built for Scale
Built for Scale
Scalable Back Office
Extensive Local Fiber Network -5,500 Lit End User Buildings -20,000 Fiber Route Miles
World Class Customer Care
Proactive Monitoring and Maintenance
National Backbone
8
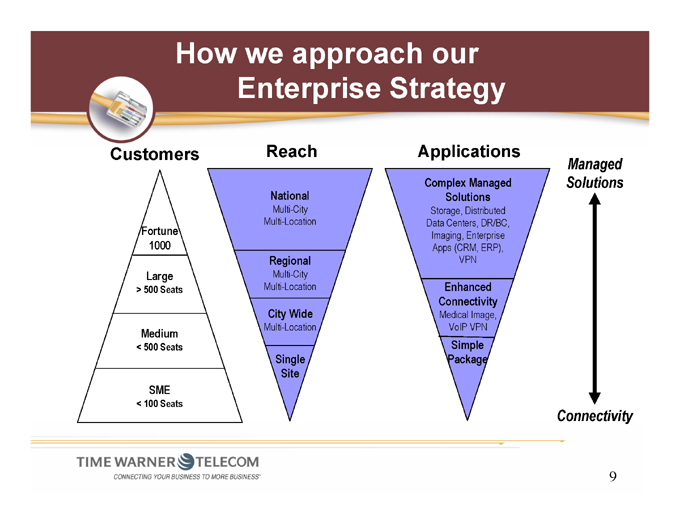
How we approach our Enterprise Strategy
Customers
Fortune 1000
Large
> 500 Seats
Medium
< 500 Seats
SME
< 100 Seats
Reach
National
Multi-City Multi-Location
Regional
Multi-City Multi-Location
City Wide
Multi-Location
Single Site
Applications
Complex Managed Solutions
Storage, Distributed Data Centers, DR/BC, Imaging, Enterprise Apps (CRM, ERP), VPN
Enhanced Connectivity
Medical Image, VoIP VPN
Simple Package
Managed Solutions
Connectivity
9
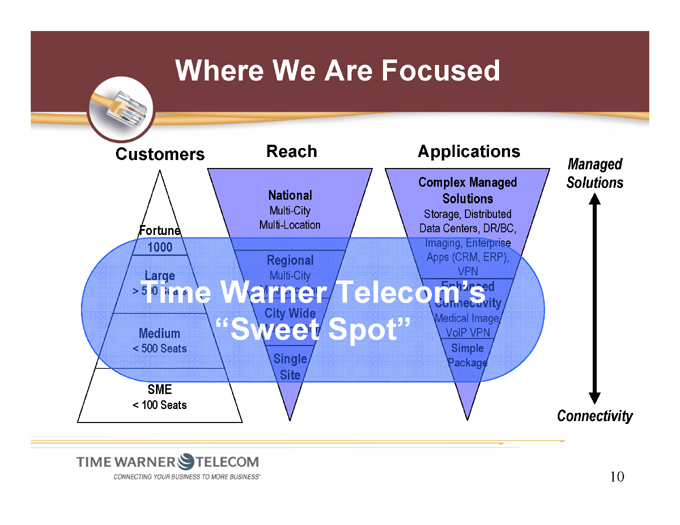
Where We Are Focused
Customers
Fortune 1000 Large
>Time500 Seats
Medium
< 500 Seats
SME
< 100 Seats
Reach
National
Multi-City Multi-Location
Regional
Multi-City Multi-Location
City Wide
Multi-Location
Single Site
Time Warner Telecom’s “Sweet Spot”
Applications
Complex Managed Solutions
Storage, Distributed Data Centers, DR/BC, Imaging, Enterprise Apps (CRM, ERP), VPN
Enhanced Connectivity
Medical Image, VoIP VPN
Simple Package
Managed Solutions
Connectivity
10
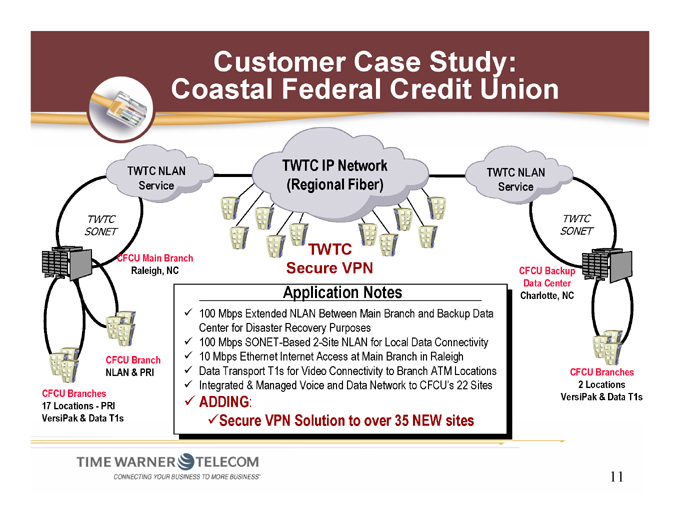
Customer Case Study: Coastal Federal Credit Union
CFCU Branches 17 Locations—PRI VersiPak & Data T1s
CFCU Branch NLAN & PRI
CFCU Main Branch Raleigh, NC
TWTC SONET
TWTC NLAN
Service
TWTC IP Network (Regional Fiber)
TWTC Secure VPN
TWTC NLAN
Service
TWTC SONET
CFCU Backup Data Center Charlotte, NC
CFCU Branches 2 Locations VersiPak & Data T1s
Application Notes
100 Mbps Extended NLAN Between Main Branch and Backup Data Center for Disaster Recovery Purposes
100 Mbps SONET-Based 2-Site NLAN for Local Data Connectivity
10 Mbps Ethernet Internet Access at Main Branch in Raleigh
Data Transport T1s for Video Connectivity to Branch ATM Locations
Integrated & Managed Voice and Data Network to CFCU’s 22 Sites
ADDING:
Secure VPN Solution to over 35 NEW sites
11
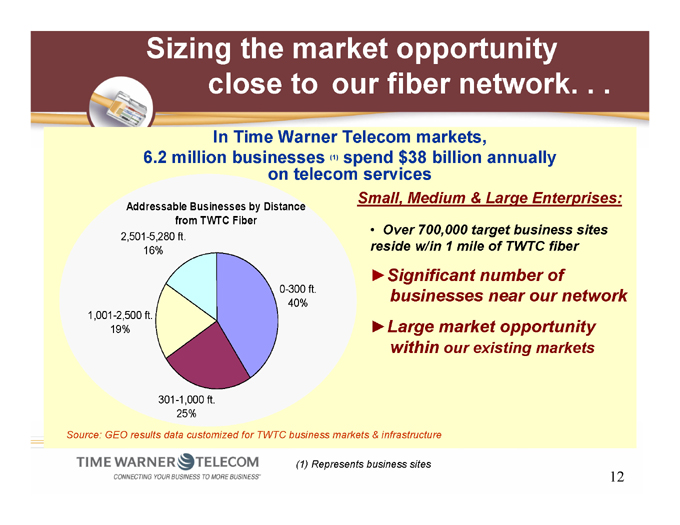
Sizing the market opportunity close to our fiber network. . .
In Time Warner Telecom markets,
6.2 million businesses (1) spend $38 billion annually on telecom services
Addressable Businesses by Distance from TWTC Fiber
2,501-5,280 ft.
16%
1,001-2,500 ft.
19%
301-1,000 ft.
25%
0-300 ft.
40%
Small, Medium & Large Enterprises:
Over 700,000 target business sites reside w/in 1 mile of TWTC fiber
Significant number of businesses near our network
Large market opportunity within our existing markets
Source: GEO results data customized for TWTC business markets & infrastructure
(1) Represents business sites
12

TWTC’s Ongoing Focus . . .
Unique Asset Base Access to Customer never more critical
Industry-Leading Portfolio Making businesses run more efficiently
Leveraging Infrastructure Focused on capital efficiency and cash flow
Innovative solutions Enabling technology for customer networks
13
Time Warner Telecom . . . Connecting Your Business to More Business
Product and Services
14
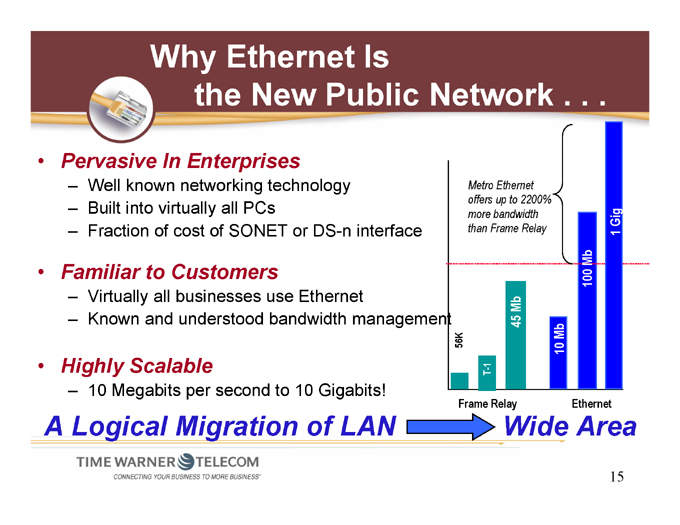
Why Ethernet Is the New Public Network . . .
Pervasive In Enterprises
Well known networking technology
Built into virtually all PCs
Fraction of cost of SONET or DS-n interface
Familiar to Customers
Virtually all businesses use Ethernet
Known and understood bandwidth management
Highly Scalable
10 Megabits per second to 10 Gigabits!
Metro Ethernet offers up to 2200% more bandwidth than Frame Relay
56K
T-1
45 Mb
10 Mb
100 Mb
1 Gig
Frame Relay Ethernet
A Logical Migration of LAN Wide Area
15
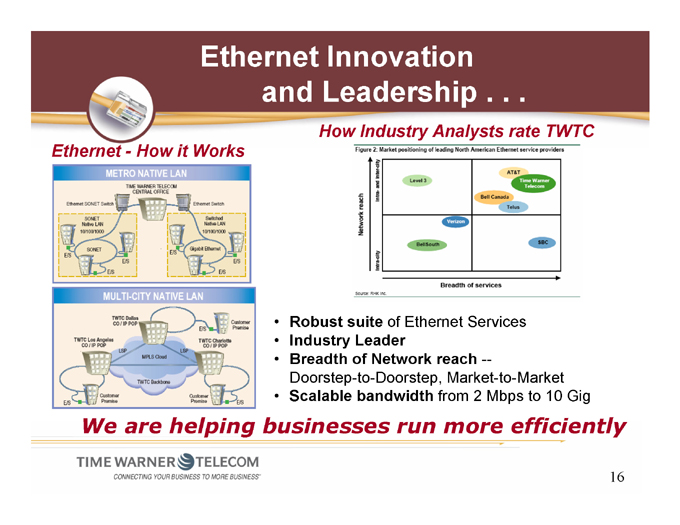
Ethernet Innovation and Leadership . . .
How Industry Analysts rate TWTC
Ethernet—How it Works
Robust suite of Ethernet Services
Industry Leader
Breadth of Network reach —
Doorstep-to-Doorstep, Market-to-Market Scalable bandwidth from 2 Mbps to 10 Gig
We are helping businesses run more efficiently
16
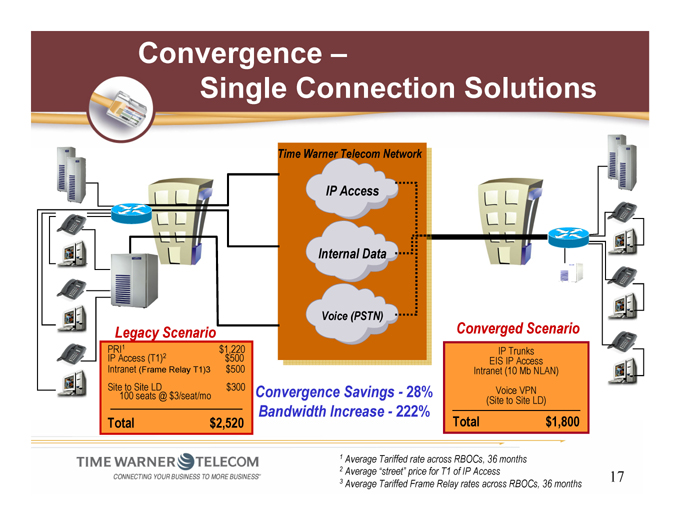
Convergence –
Single Connection Solutions
Time Warner Telecom Network
IP Access
Internal Data
Voice (PSTN)
Legacy Scenario
PRI1 $1,220
IP Access (T1)2 $500
Intranet (Frame Relay T1)3 $500
Site to Site LD $300
100 seats @ $3/seat/mo
Total $ 2,520
Convergence Savings—28% Bandwidth Increase—222%
Converged Scenario
IP Trunks
EIS IP Access
Intranet (10 Mb NLAN)
Voice VPN
(Site to Site LD)
Total $1,800
1 Average Tariffed rate across RBOCs, 36 months
2 Average “street” price for T1 of IP Access
3 Average Tariffed Frame Relay rates across RBOCs, 36 months
17

Time Warner Telecom . . . Connecting Your Business to More Business
Financial Overview
18
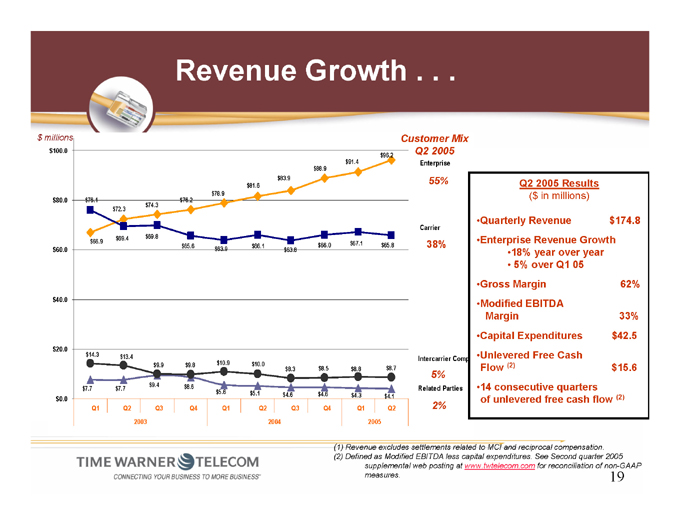
Revenue Growth . . .. $millions
$100.0 $80.0 $60.0 $40.0 $20.0 $0.0 $96.2 $91.4 $88.9 $83.9 $81.6 $78.9 $76.1 $76.2 $74.3 $72.3 $69.4 $69.8 $66.9 $67.1 $65.6 $66.1 $66.0 $65.8 $63.9 $63.8
Customer Mix Q2 2005
Enterprise
55%
Carrier
38% $14.3 $13.4 $9.9 $9.8 $10.9 $10.0 $8.3 $8.5 $8.8 $8.7 $9.4 $8.6 $7.7 $7.7 $5.6 $5.1 $4.6 $4.6 $4.3 $4.1
Q1 Q2 Q3 Q4 Q1 Q2 Q3 Q4 Q1 Q2 2003 2004 2005
Intercarrier Comp
5%
Related Parties
2%
Q2 2005 Results
($ in millions)
Quarterly Revenue $174.8
Enterprise Revenue Growth
18% year over year
5% over Q1 05
Gross Margin 62%
Modified EBITDA
Margin 33%
Capital Expenditures $42.5
Unlevered Free Cash Flow (2) $15.6
14 consecutive quarters of unlevered free cash flow(2)
(1) Revenue excludes settlements related to MCI and reciprocal compensation. (2) Defined as Modified EBITDA less capital expenditures. See Second quarter 2005 supplemental web posting at www.twtelecom.com for reconciliation of non-GAAP measures. 19
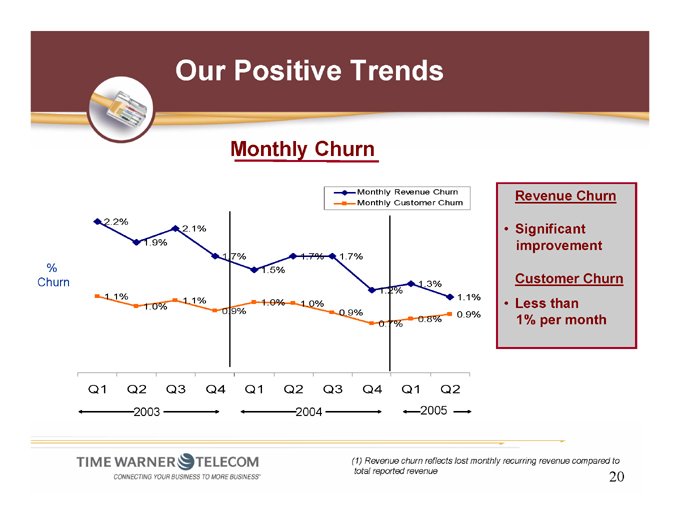
Our Positive Trends
Monthly Churn
% Churn
2.2%
2.1% 1.9%
1.7% 1.7% 1.7% 1.5%
1.3% 1.2% 1.1% 1.1% 1.1% 1.0% 1.0% 1.0%
Monthly Revenue Churn Monthly Customer Churn
0.9% 0.9% 0.9% 0.8% 0.7%
Q1 Q2 Q3 Q4 Q1 Q2 Q3 Q4 Q1 Q2
2003 2004 2005
Revenue Churn
Significant improvement
Customer Churn
Less than 1% per month
(1) Revenue churn reflects lost monthly recurring revenue compared to total reported revenue 20
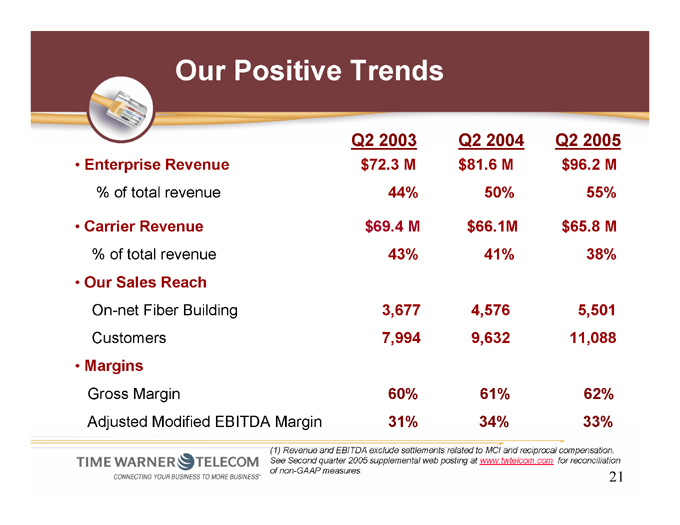
Our Positive Trends
Q2 2003 Q2 2004 Q2 2005
Enterprise Revenue $72.3 M $81.6 M $96.2 M
% of total revenue 44% 50% 55%
Carrier Revenue $69.4 M $66.1M $65.8 M
% of total revenue 43% 41% 38%
Our Sales Reach
On-net Fiber Building 3,677 4,576 5,501
Customers 7,994 9,632 11,088
Margins
Gross Margin 60% 61% 62%
Adjusted Modified EBITDA Margin 31% 34% 33%
(1) Revenue and EBITDA exclude settlements related to MCI and reciprocal compensation. See Second quarter 2005 supplemental web posting at www.twtelcom.com for reconciliation of non-GAAP measures. 21
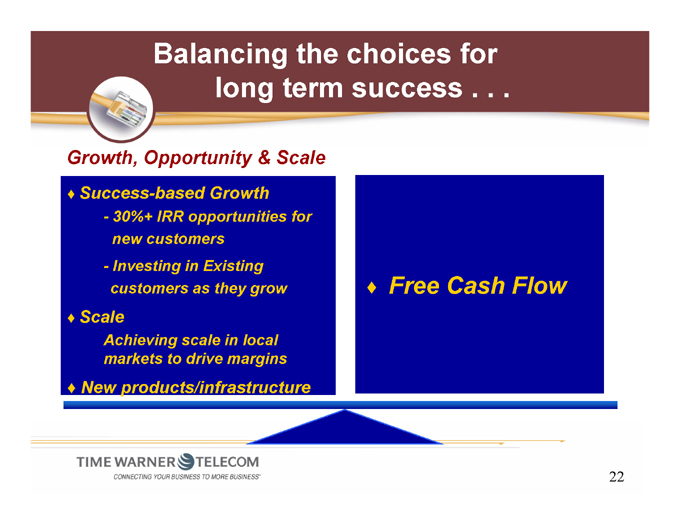
Balancing the choices for long term success . . .
Growth, Opportunity & Scale
Success-based Growth
- 30%+ IRR opportunities for new customers
- Investing in Existing customers as they grow
Scale
Achieving scale in local markets to drive margins
New products/infrastructure
Free Cash Flow
22
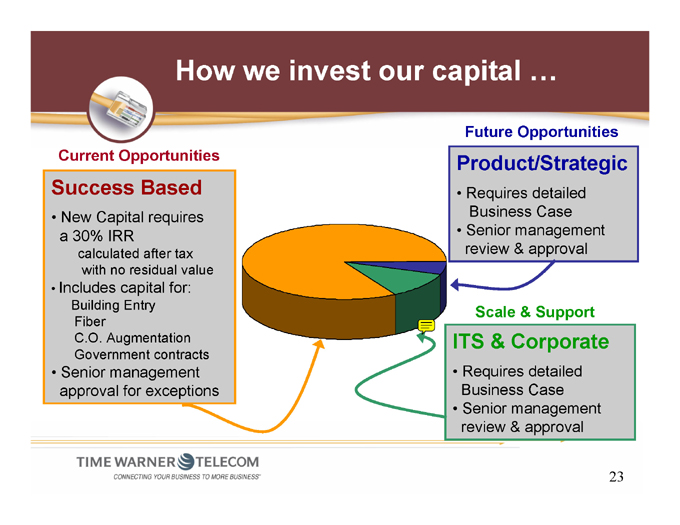
How we invest our capital …
Current Opportunities
Success Based
New Capital requires a 30% IRR calculated after tax with no residual value
Includes capital for:
Building Entry Fiber C.O. Augmentation Government contracts
Senior management approval for exceptions
Future Opportunities
Product/Strategic
Requires detailed Business Case
Senior management review & approval
Scale & Support
ITS & Corporate
Requires detailed Business Case
Senior management review & approval
23
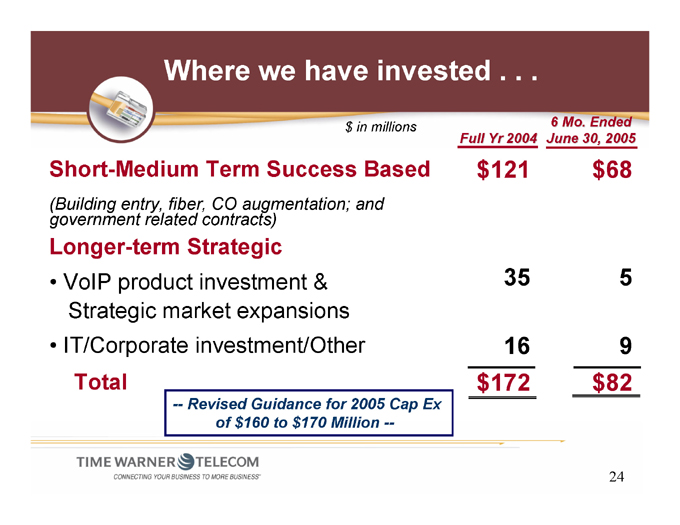
Where we have invested . . .
$ in millions Full Yr 2004 6 Mo. Ended June 30, 2005
Short-Medium Term Success Based $121 $68
(Building entry, fiber, CO augmentation; and
government related contracts)
Longer-term Strategic
VoIP product investment & 35 5
Strategic market expansions
IT/Corporate investment/Other 16 9
Total $172 $82
— Revised Guidance for 2005 Cap Ex of $160 to $170 Million —
24
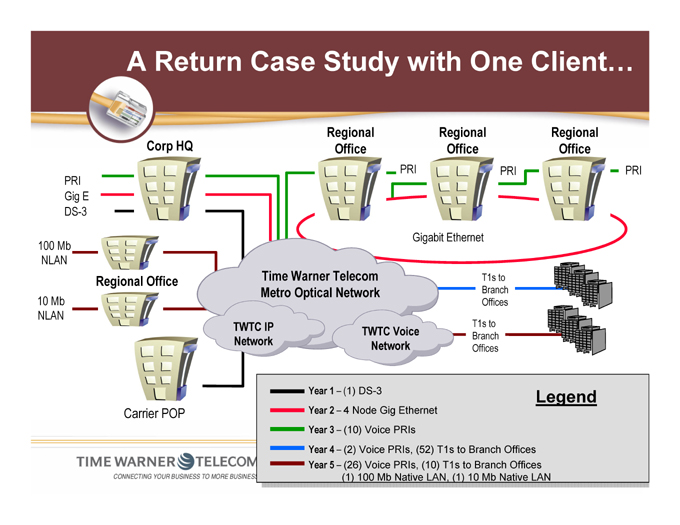
A Return Case Study with One Client…
10 Mb NLAN
100 Mb NLAN
PRI Gig E DS-3
Corp HQ
Regional Office
PRI
Regional Office
PRI
Regional Office
PRI
Regional Office
Carrier POP
Time Warner Telecom Metro Optical Network
TWTC IP Network
TWTC Voice Network
Gigabit Ethernet
T1s to Branch Offices
T1s to Branch Offices
Legend
Year 1 – (1) DS-3
Year 2 – 4 Node Gig Ethernet
Year 3 – (10) Voice PRIs
Year 4 – (2) Voice PRIs, (52) T1s to Branch Offices
Year 5 – (26) Voice PRIs, (10) T1s to Branch Offices
(1) 100 Mb Native LAN, (1) 10 Mb Native LAN
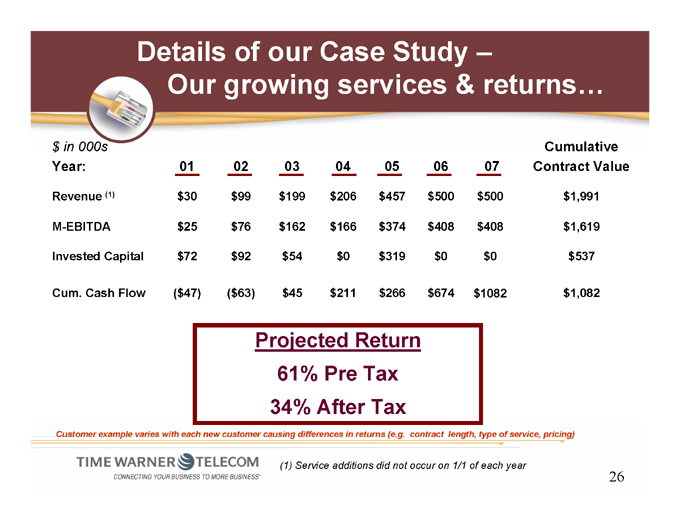
Details of our Case Study –
Our growing services & returns…
$ in 000s Year: 01 02 03 04 05 06 07 Cumulative Contract Value
Revenue (1) $30 $99 $199 $206 $457 $500 $500 $1,991
M-EBITDA $25 $76 $162 $166 $374 $408 $408 $1,619
Invested Capital $72 $92 $54 $0 $319 $0 $0 $537
Cum. Cash Flow ($47) ($63) $45 $211 $266 $674 $1082 $1,082
Projected Return 61% Pre Tax 34% After Tax
Customer example varies with each new customer causing differences in returns (e.g. contract length, type of service, pricing)
(1) Service additions did not occur on 1/1 of each year
26
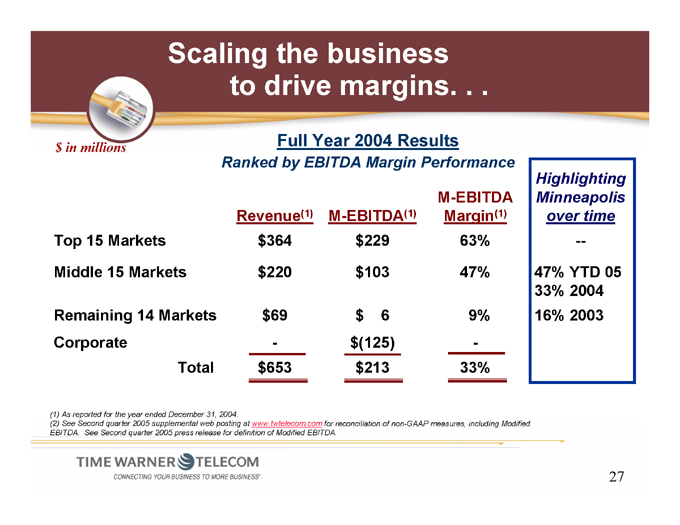
Scaling the business to drive margins. . .
$ in millions Full Year 2004 Results
Ranked by EBITDA Margin Performance
M-EBITDA Revenue(1) M-EBITDA(1) Margin(1) Top 15 Markets $364 $229 63%
Middle 15 Markets $220 $103 47%
Remaining 14 Markets $69 $ 6 9% Corporate - $(125) -Total $653 $213 33%
Highlighting Minneapolis over time
—
47% YTD 05 33% 2004 16% 2003
(1) As reported for the year ended December 31, 2004.
(2) See Second quarter 2005 supplemental web posting at www.twtelecom.com for reconciliation of non-GAAP measures, including Modified EBITDA. See Second quarter 2005 press release for definition of Modified EBITDA.
27
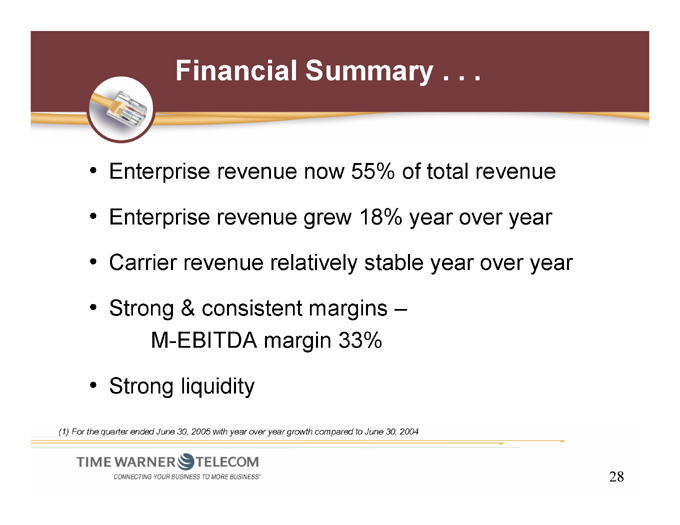
Financial Summary .. . .
Enterprise revenue now 55% of total revenue Enterprise revenue grew 18% year over year Carrier revenue relatively stable year over year
Strong & consistent margins –M-EBITDA margin 33%
Strong liquidity
(1) For the quarter ended June 30, 2005 with year over year growth compared to June 30, 2004
28

Questions & Answers