UNITED STATES
SECURITIES AND EXCHANGE COMMISSION
Washington, D.C. 20549
FORM 10-Q
| x | QUARTERLY REPORT PURSUANT TO SECTION 13 OR 15(d) OF THE SECURITIES EXCHANGE ACT OF 1934 |
For the quarterly period ended September 30, 2011
OR
| ¨ | TRANSITION REPORT PURSUANT TO SECTION 13 OR 15(d) OF THE SECURITIES EXCHANGE ACT OF 1934 |
For the transition period from to
Commission File Number 1-34243
tw telecom inc.
(Exact name of Registrant as specified in its charter)
| | |
| Delaware | | 84-1500624 |
(State or other jurisdiction of incorporation or organization) | | (I.R.S. Employer Identification Number) |
| |
10475 Park Meadows Drive Littleton, Colorado | | 80124 |
| (Address of principal executive offices) | | (Zip Code) |
Registrant’s telephone number, including area code: (303) 566-1000
Indicate by check mark whether the Registrant: (1) has filed all reports required to be filed by Section 13 or 15(d) of the Securities Exchange Act of 1934 during the preceding 12 months (or for such shorter period that the registrant was required to file such reports), and (2) has been subject to such filing requirements for the past 90 days. Yes x No ¨
Indicate by check mark whether the Registrant has submitted electronically and posted on its corporate Web site, if any, every Interactive Data File required to be submitted and posted pursuant to Rule 405 of Regulation S-T (Section 232.405 of this chapter) during the preceding 12 months (or for such shorter period that the Registrant was required to submit and post such files). Yes x No ¨
Indicate by check mark whether the Registrant is a large accelerated filer, an accelerated filer, a non-accelerated filer, or a smaller reporting company. See the definitions of “large accelerated filer,” “accelerated filer” and “smaller reporting company” in Rule 12b-2 of the Exchange Act.
| | | | | | |
| Large accelerated filer | | x | | Accelerated filer | | ¨ |
| | | |
| Non-accelerated filer | | ¨ (Do not check if a smaller reporting company) | | Smaller reporting company | | ¨ |
Indicate by check mark whether the Registrant is a shell company (as defined in Rule 12b-2 of the Exchange Act). Yes ¨ No x
The number of shares outstanding oftw telecom inc.’s common stock as of October 31, 2011 was 149,359,863 shares.
INDEX TO FORM 10-Q
2
Part I. Financial Information
Item 1. Financial Statements
tw telecom inc.
CONDENSED CONSOLIDATED BALANCE SHEETS
| | | | | | | | |
| | | September 30,
2011 | | | December 31,
2010 | |
| | | (unaudited) | | | | |
| | | (amounts in thousands, except per share amounts) | |
| ASSETS | | | | | | | | |
Current assets: | | | | | | | | |
Cash and cash equivalents | | $ | 339,741 | | | $ | 356,922 | |
Investments | | | 129,352 | | | | 118,672 | |
Receivables, less allowances of $7,660 and $7,898, respectively | | | 92,254 | | | | 81,598 | |
Prepaid expenses and other current assets | | | 22,842 | | | | 16,935 | |
Deferred income taxes | | | 40,428 | | | | 40,428 | |
| | | | | | | | |
Total current assets | | | 624,617 | | | | 614,555 | |
| | | | | | | | |
Property, plant and equipment | | | 3,958,489 | | | | 3,732,050 | |
Less accumulated depreciation | | | (2,541,885 | ) | | | (2,375,438 | ) |
| | | | | | | | |
| | | 1,416,604 | | | | 1,356,612 | |
| | | | | | | | |
Deferred income taxes | | | 194,081 | | | | 224,795 | |
Goodwill | | | 412,694 | | | | 412,694 | |
Intangible assets, net of accumulated amortization | | | 19,417 | | | | 24,444 | |
Other assets, net | | | 25,290 | | | | 17,854 | |
| | | | | | | | |
Total assets | | $ | 2,692,703 | | | $ | 2,650,954 | |
| | | | | | | | |
| LIABILITIES AND STOCKHOLDERS’ EQUITY | | | | | | | | |
| | |
Current liabilities: | | | | | | | | |
Accounts payable | | $ | 66,356 | | | $ | 53,436 | |
Deferred revenue | | | 41,724 | | | | 37,888 | |
Accrued taxes, franchise and other fees | | | 68,708 | | | | 68,663 | |
Accrued interest | | | 7,459 | | | | 15,208 | |
Accrued payroll and benefits | | | 39,738 | | | | 41,772 | |
Accrued carrier costs | | | 28,816 | | | | 35,049 | |
Current portion debt and capital lease obligations | | | 7,742 | | | | 7,202 | |
Other current liabilities | | | 37,404 | | | | 42,570 | |
| | | | | | | | |
Total current liabilities | | | 297,947 | | | | 301,788 | |
| | | | | | | | |
| | |
Long-term debt and capital lease obligations, net | | | 1,349,481 | | | | 1,338,297 | |
Long-term deferred revenue | | | 22,330 | | | | 14,864 | |
Other long-term liabilities | | | 33,636 | | | | 29,364 | |
| | |
Commitments and contingencies (Note 8) | | | | | | | | |
| | |
Stockholders’ equity: | | | | | | | | |
Preferred stock, $0.01 par value, 20,000 shares authorized, no shares issued and outstanding | | | — | | | | — | |
Common stock, $0.01 par value, 439,800 shares authorized and 151,953 shares issued | | | 1,520 | | | | 1,520 | |
Additional paid-in capital | | | 1,817,624 | | | | 1,802,946 | |
Treasury stock, 2,621 and 2,707 shares, at cost, respectively | | | (48,086 | ) | | | (45,821 | ) |
Accumulated deficit | | | (780,931 | ) | | | (790,175 | ) |
Accumulated other comprehensive loss | | | (818 | ) | | | (1,829 | ) |
| | | | | | | | |
Total stockholders’ equity | | | 989,309 | | | | 966,641 | |
| | | | | | | | |
Total liabilities and stockholders’ equity | | $ | 2,692,703 | | | $ | 2,650,954 | |
| | | | | | | | |
See accompanying notes to condensed consolidated financial statements.
3
tw telecom inc.
CONDENSED CONSOLIDATED STATEMENTS OF OPERATIONS
(Unaudited)
| | | | | | | | | | | | | | | | |
| | | Three Months Ended
September 30, | | | Nine Months Ended
September 30, | |
| | | 2011 | | | 2010 | | | 2011 | | | 2010 | |
| | | (amounts in thousands, except per share amounts) | |
Revenue: | | | | | | | | | | | | | | | | |
Data and Internet services | | $ | 164,670 | | | $ | 138,838 | | | $ | 475,025 | | | $ | 402,111 | |
Network services | | | 86,878 | | | | 90,151 | | | | 265,287 | | | | 269,699 | |
Voice services | | | 85,220 | | | | 82,944 | | | | 251,880 | | | | 250,979 | |
Intercarrier compensation | | | 7,688 | | | | 8,361 | | | | 23,192 | | | | 25,565 | |
| | | | | | | | | | | | | | | | |
Total revenue | | | 344,456 | | | | 320,294 | | | | 1,015,384 | | | | 948,354 | |
| | | | | | | | | | | | | | | | |
| | | | |
Costs and expenses (a): | | | | | | | | | | | | | | | | |
Operating (exclusive of depreciation, amortization, and accretion shown separately below) | | | 144,161 | | | | 133,237 | | | | 425,141 | | | | 394,411 | |
Selling, general and administrative | | | 82,085 | | | | 78,452 | | | | 241,684 | | | | 230,364 | |
Depreciation, amortization, and accretion | | | 70,940 | | | | 71,612 | | | | 210,757 | | | | 217,030 | |
| | | | | | | | | | | | | | | | |
Total costs and expenses | | | 297,186 | | | | 283,301 | | | | 877,582 | | | | 841,805 | |
| | | | | | | | | | | | | | | | |
| | | | |
Operating income | | | 47,270 | | | | 36,993 | | | | 137,802 | | | | 106,549 | |
| | | | |
Interest expense | | | (21,930 | ) | | | (19,634 | ) | | | (65,747 | ) | | | (60,324 | ) |
Debt extinguishment costs | | | — | | | | — | | | | — | | | | (17,070 | ) |
Interest income | | | 126 | | | | 209 | | | | 443 | | | | 438 | |
Other income | | | — | | | | 825 | | | | — | | | | 825 | |
| | | | | | | | | | | | | | | | |
Income before income taxes | | | 25,466 | | | | 18,393 | | | | 72,498 | | | | 30,418 | |
Income tax expense (benefit) | | | 10,873 | | | | 2,314 | | | | 30,979 | | | | (292,966 | ) |
| | | | | | | | | | | | | | | | |
| | | | |
Net income | | $ | 14,593 | | | $ | 16,079 | | | $ | 41,519 | | | $ | 323,384 | |
| | | | | | | | | | | | | | | | |
| | | | |
Earnings per share: | | | | | | | | | | | | | | | | |
Basic | | $ | 0.10 | | | $ | 0.11 | | | $ | 0.28 | | | $ | 2.14 | |
| | | | | | | | | | | | | | | | |
Diluted | | $ | 0.10 | | | $ | 0.10 | | | $ | 0.27 | | | $ | 1.98 | |
| | | | | | | | | | | | | | | | |
| | | | |
Weighted average shares outstanding: | | | | | | | | | | | | | | | | |
Basic | | | 147,084 | | | | 149,374 | | | | 147,528 | | | | 149,456 | |
| | | | | | | | | | | | | | | | |
Diluted | | | 148,999 | | | | 151,698 | | | | 149,734 | | | | 171,741 | |
| | | | | | | | | | | | | | | | |
| | |
(a) Includes non-cash stock-based employee compensation expense (Note 7): | | | | | | | | | |
Operating | | $ | 565 | | | $ | 825 | | | $ | 1,737 | | | $ | 2,332 | |
| | | | | | | | | | | | | | | | |
Selling, general and administrative | | $ | 6,248 | | | $ | 6,102 | | | $ | 19,357 | | | $ | 18,301 | |
| | | | | | | | | | | | | | | | |
See accompanying notes to condensed consolidated financial statements.
4
tw telecom inc.
CONDENSED CONSOLIDATED STATEMENTS OF CASH FLOWS
(Unaudited)
| | | | | | | | |
| | | Nine Months Ended
September 30, | |
| | | 2011 | | | 2010 | |
| | | (amounts in thousands) | |
Cash flows from operating activities: | | | | | | | | |
Net income | | $ | 41,519 | | | $ | 323,384 | |
Adjustments to reconcile net income to net cash provided by operating activities: | | | | | | | | |
Depreciation, amortization, and accretion | | | 210,757 | | | | 217,030 | |
Deferred income taxes | | | 29,783 | | | | (295,094 | ) |
Stock-based compensation expense | | | 21,094 | | | | 20,633 | |
Extinguishment costs, amortization of discount on debt and deferred debt issue costs and other | | | 17,374 | | | | 32,120 | |
Changes in operating assets and liabilities: | | | | | | | | |
Receivables, prepaid expenses and other assets | | | (24,590 | ) | | | (8,469 | ) |
Accounts payable, deferred revenue, and other liabilities | | | (4,154 | ) | | | 5,968 | |
| | | | | | | | |
Net cash provided by operating activities | | | 291,783 | | | | 295,572 | |
| | | | | | | | |
| | |
Capital expenditures | | | (254,094 | ) | | | (243,726 | ) |
Purchases of investments | | | (195,311 | ) | | | (167,861 | ) |
Proceeds from sale of investments | | | 182,725 | | | | 93,449 | |
Other investing activities, net | | | 3,876 | | | | (6,514 | ) |
| | | | | | | | |
Net cash used in investing activities | | | (262,804 | ) | | | (324,652 | ) |
| | | | | | | | |
Cash flows from financing activities: | | | | | | | | |
Net proceeds (tax withholdings) from issuance of common stock upon exercise of stock options and vesting of restricted stock awards and units | | | 9,044 | | | | 2,198 | |
Purchases of treasury stock | | | (50,000 | ) | | | (11,705 | ) |
Retirement of debt obligations | | | — | | | | (413,683 | ) |
Net proceeds from issuance of debt | | | — | | | | 417,425 | |
Payment of debt and capital lease obligations | | | (5,204 | ) | | | (5,546 | ) |
| | | | | | | | |
Net cash used in financing activities | | | (46,160 | ) | | | (11,311 | ) |
| | | | | | | | |
Decrease in cash and cash equivalents | | | (17,181 | ) | | | (40,391 | ) |
Cash and cash equivalents at beginning of period | | | 356,922 | | | | 445,907 | |
| | | | | | | | |
Cash and cash equivalents at end of period | | $ | 339,741 | | | $ | 405,516 | |
| | | | | | | | |
Supplemental disclosures of cash flow information: | | | | | | | | |
Cash paid for interest | | $ | 57,596 | | | $ | 55,398 | |
| | | | | | | | |
Cash paid for debt extinguishment costs | | $ | — | | | $ | 13,677 | |
| | | | | | | | |
Cash paid for income taxes, net of refunds | | $ | 3,013 | | | $ | 3,952 | |
| | | | | | | | |
Addition of capital lease obligation | | $ | 2,000 | | | $ | — | |
| | | | | | | | |
See accompanying notes to condensed consolidated financial statements.
5
tw telecom inc.
CONDENSED CONSOLIDATED STATEMENT OF CHANGES IN STOCKHOLDERS’ EQUITY
Nine Months Ended September 30, 2011
(Unaudited)
| | | | | | | | | | | | | | | | | | | | | | | | | | | | | | | | |
| | | Common Stock | | | Treasury Stock | | | Additional
paid-in
capital | | | Accumulated
deficit | | | Accumulated
other
comprehensive
income (loss) | | | Total
stockholders’
equity | |
| | | Shares | | | Amount | | | Shares | | | Amount | | | | | |
| | | (amounts in thousands) | |
Balance at December 31, 2010 | | | 151,953 | | | $ | 1,520 | | | | (2,707 | ) | | $ | (45,821 | ) | | $ | 1,802,946 | | | $ | (790,175 | ) | | $ | (1,829 | ) | | $ | 966,941 | |
Net income | | | — | | | | — | | | | — | | | | — | | | | — | | | | 41,519 | | | | — | | | | 41,519 | |
Unrealized gain on cash flow hedging activities, net of tax of $752 | | | — | | | | — | | | | — | | | | — | | | | — | | | | — | | | | 1,023 | | | | 1,023 | |
Unrealized loss on available-for-sale securities | | | — | | | | — | | | | — | | | | — | | | | — | | | | — | | | | (12 | ) | | | (12 | ) |
| | | | | | | | | | | | | | | | | | | | | | | | | | | | | | | | |
Total comprehensive income | | | — | | | | — | | | | — | | | | — | | | | — | | | | — | | | | — | | | | 42,530 | |
Purchases of treasury stock | | | — | | | | — | | | | (2,693 | ) | | | (50,000 | ) | | | — | | | | — | | | | — | | | | (50,000 | ) |
Exercise of stock options net of withholdings to satisfy employee tax obligations upon vesting of stock awards | | | — | | | | — | | | | 1,337 | | | | 23,331 | | | | (7,310 | ) | | | (6,977 | ) | | | — | | | | 9,044 | |
Stock-based compensation | | | — | | | | — | | | | 1,442 | | | | 24,404 | | | | 21,988 | | | | (25,298 | ) | | | — | | | | 21,094 | |
| | | | | | | | | | | | | | | | | | | | | | | | | | | | | | | | |
Balance at September 30, 2011 | | | 151,953 | | | $ | 1,520 | | | | (2,621 | ) | | $ | (48,086 | ) | | $ | 1,817,624 | | | $ | (780,931 | ) | | $ | (818 | ) | | $ | 989,309 | |
| | | | | | | | | | | | | | | | | | | | | | | | | | | | | | | | |
See accompanying notes to condensed consolidated financial statements.
6
tw telecom inc.
NOTES TO CONDENSED CONSOLIDATED FINANCIAL STATEMENTS
1. Organization and Summary of Significant Accounting Policies
Description of Business and Capital Structure
tw telecom inc. (together with its wholly-owned subsidiaries, the “Company”) is a leading national provider of managed network services, specializing in data, Internet Protocol (“IP”), voice and network access services to enterprise organizations and carriers throughout the United States.
The Company has one class of common stock outstanding with one vote per share. The Company also is authorized to issue shares of preferred stock. The Company’s Board of Directors has the authority to establish voting powers, preferences, and special rights for the preferred stock. No shares of preferred stock have been issued.
Basis of Presentation
The accompanying unaudited interim condensed consolidated financial statements have been prepared pursuant to the rules and regulations of the Securities and Exchange Commission (the “SEC”) for quarterly reports on Form 10-Q and do not include all of the information and note disclosures required by U.S. generally accepted accounting principles (“U.S. GAAP”) for complete financial statements. These condensed consolidated financial statements should therefore be read in conjunction with the consolidated financial statements and notes thereto included in our Annual Report on Form 10-K for the year ended December 31, 2010 filed with the SEC. The accompanying unaudited interim condensed consolidated financial statements have been prepared in accordance with U.S. GAAP and include all adjustments of a normal, recurring nature that are, in the opinion of management, necessary to present fairly the financial position and results of operations for the interim periods presented. The results of operations for an interim period are not necessarily indicative of the results of operations for a full fiscal year.
Use of Estimates
The preparation of financial statements in conformity with U.S. GAAP requires management to make estimates and assumptions that affect the reported amounts of assets and liabilities at the date of the financial statements and the reported amounts of revenue and expenses during the reporting period. Actual results could differ from those estimates.
Recently Adopted Accounting Pronouncements
Effective January 1, 2011, the Company adopted the accounting standard update regarding revenue recognition for multiple deliverable arrangements. The new standard requires an entity to allocate revenue in an arrangement that includes elements with stand-alone value using its best estimate of selling price for each element if neither vendor specific objective evidence nor third party evidence of selling price exists. The adoption of this standard update did not have a material effect on the Company’s condensed consolidated balance sheets or statements of operations for the nine months ended September 30, 2011.
Recently Issued Accounting Pronouncements
In June 2011, the Financial Accounting Standards Board (the “FASB”) issued an accounting standard update that eliminates the current option to report other comprehensive income and its components in the statement of stockholders’ equity. Instead, an entity will be required to present items of net income and other comprehensive income in one continuous statement or in two separate but consecutive statements. The standard is effective for fiscal years beginning after December 15, 2011. The Company will adopt this accounting standard update in the three months ended March 31, 2012. This update affects presentation and disclosure, and therefore adoption will not affect the Company’s consolidated financial position, results of operations or cash flows.
7
tw telecom inc.
NOTES TO CONDENSED CONSOLIDATED FINANCIAL STATEMENTS – (Continued)
In September 2011, the FASB issued an accounting standard update intended to simplify goodwill impairment testing. Entities will have the option to perform a qualitative assessment on goodwill impairment to determine if a quantitative assessment is necessary. The accounting standard update is effective for fiscal years beginning after December 15, 2011. The Company will adopt the new guidance effective January 1, 2012. This update affects testing steps only and therefore adoption will not affect the Company’s consolidated financial position, results of operations or cash flows.
Revenue
The Company’s revenue is derived primarily from business communications services, including data, Internet, voice and network access services. Data and Internet services include services that enable customers to connect their internal computer networks and to access external networks, including Internet access at high speeds using Ethernet protocol, metropolitan and wide area Ethernet and virtual private network solutions.
Voice services include traditional and next generation voice capabilities, including voice services from stand alone and bundled products, long distance, toll free services and voice over IP (“VoIP”). Network services are point-to-point services that transmit voice, data and images as well as enable transmission for storage using state-of-the-art fiber optics, and collocation services that provide secure space with controlled climate and power where customers can locate their equipment to connect to the Company’s network in facilities equipped for enterprise information technology environmental requirements. The Company also provides converged services, which fully integrate a combination of certain communication applications including IP Virtual Private Network (“VPN”), voice, Internet, security and managed router service into a single managed IP solution. The various components of converged services are classified into the pertinent service categories in the condensed consolidated statements of operations.
Intercarrier compensation is comprised of switched access services and reciprocal compensation. Switched access represents the compensation from another carrier for the delivery of traffic from a long distance carrier’s point of presence to an end-user’s premises provided through the Company’s switching facilities. The Federal Communications Commission (“FCC”) and state public utility commissions regulate switched access rates in their respective jurisdictions. Reciprocal compensation represents compensation from local exchange carriers (“LECs”) for local exchange traffic originated on another LEC’s facilities and terminated on the Company’s facilities.
The Company’s customers include, among others, enterprise organizations in the distribution, health care, finance, service and manufacturing industries, state, local and federal government entities, system integrators, and communication service providers, including incumbent local exchange carriers (“ILECs”), competitive local exchange carriers (“CLECs”), wireless communications companies, Internet service providers (“ISPs”) and cable companies.
Revenue for data and Internet, network and the majority of voice services is generally billed in advance on a monthly fixed rate basis and recognized over the period the services are provided. Revenue for the majority of intercarrier compensation and certain components of voice services, such as long distance, is generally billed on a transactional basis in arrears based on a customer’s actual usage and estimates are used to recognize revenue in the period earned.
The Company evaluates whether receivables are reasonably assured of collection based on certain factors, including the likelihood of billing being disputed by customers. If there is a billing dispute with a customer, revenue generally is not recognized until the dispute is resolved. The Company does not recognize revenue associated with contract termination charges until cash is received.
The Company classifies certain taxes and fees billed to customers and remitted to government authorities on a gross versus net basis in revenue and expense. In making this determination, the Company assesses, among other things, whether the Company is the primary obligor or principal taxpayer for the taxes and fees assessed in
8
tw telecom inc.
NOTES TO CONDENSED CONSOLIDATED FINANCIAL STATEMENTS – (Continued)
each jurisdiction where the Company does business. In jurisdictions where the Company determines that it is the principal taxpayer, the Company records the taxes and fees on a gross basis, including the taxes and fees in revenue and expense. In jurisdictions where the Company determines that it is merely a collection agent for the government authority, the Company records the taxes on a net basis. The total amounts classified as revenue associated with such taxes and fees were approximately $16.3 million and $12.8 million for the three months ended September 30, 2011 and 2010, respectively, and approximately $46.7 million and $38.2 million for the nine months ended September 30, 2011 and 2010, respectively.
Significant Customers
The Company has substantial business relationships with a few large customers, including major telecommunications carriers. The Company’s 10 largest customers accounted for an aggregate of 19% and 20% of the Company’s total revenue for the nine months ended September 30, 2011 and 2010, respectively. No individual customer accounted for 10% or more of total revenue for the nine months ended September 30, 2011 or 2010. The Company’s largest customer (AT&T Inc., a carrier) represented 4% of the Company’s total revenue in each of the nine months ended September 30, 2011 and 2010.
2. Earnings Per Common Share and Potential Common Share
Basic earnings per common share (“EPS”) is measured as the income allocated to common stockholders divided by the weighted average outstanding common shares for the period. Diluted EPS is similar to basic EPS but presents the dilutive effect on a per share basis of potential common shares (such as convertible securities and stock options) as if they had been converted to shares at the beginning of the period presented. Potential common shares that have an anti-dilutive effect (e.g., those that increase income per share or decrease loss per share) are excluded from diluted EPS.
The following is a reconciliation of the number of shares used in the basic and diluted EPS computations:
| | | | | | | | | | | | | | | | |
| | | Three Months Ended
September 30, | | | Nine Months Ended
September 30, | |
| | | 2011 | | | 2010 | | | 2011 | | | 2010 | |
| | | (amounts in thousands, except per share amounts) | |
Numerator | | | | | | | | | | | | | | | | |
Net income | | $ | 14,593 | | | $ | 16,079 | | | $ | 41,519 | | | $ | 323,384 | |
Allocation of net income to unvested restricted stock awards | | | (281 | ) | | | (217 | ) | | | (777 | ) | | | (4,190 | ) |
| | | | | | | | | | | | | | | | |
Net income allocated to common stockholders, basic | | | 14,312 | | | | 15,862 | | | | 40,742 | | | | 319,194 | |
Adjustment for assumed dilution: | | | | | | | | | | | | | | | | |
Interest expense on convertible debentures, net of tax | | | — | | | | — | | | | — | | | | 20,893 | |
| | | | | | | | | | | | | | | | |
Net income allocated to common stockholders, diluted | | $ | 14,312 | | | $ | 15,862 | | | $ | 40,742 | | | $ | 340,087 | |
| | | | | | | | | | | | | | | | |
Denominator | | | | | | | | | | | | | | | | |
Basic weighted average shares outstanding | | | 147,084 | | | | 149,374 | | | | 147,528 | | | | 149,456 | |
| | | | |
Dilutive potential common shares: | | | | | | | | | | | | | | | | |
Shares from assumed conversion of convertible debentures | | | — | | | | — | | | | — | | | | 20,050 | |
Stock options | | | 1,382 | | | | 1,727 | | | | 1,611 | | | | 1,727 | |
Unvested restricted stock units | | | 533 | | | | 597 | | | | 595 | | | | 508 | |
| | | | | | | | | | | | | | | | |
Diluted weighted average shares outstanding | | | 148,999 | | | | 151,698 | | | | 149,734 | | | | 171,741 | |
| | | | | | | | | | | | | | | | |
Basic earnings per share | | $ | 0.10 | | | $ | 0.11 | | | $ | 0.28 | | | $ | 2.14 | |
| | | | | | | | | | | | | | | | |
Diluted earnings per share | | $ | 0.10 | | | $ | 0.10 | | | $ | 0.27 | | | $ | 1.98 | |
| | | | | | | | | | | | | | | | |
9
tw telecom inc.
NOTES TO CONDENSED CONSOLIDATED FINANCIAL STATEMENTS – (Continued)
Options to purchase shares of the Company’s common stock, restricted stock awards and restricted stock units to be settled in common stock upon vesting and shares of common stock subject to issuance upon conversion of the Company’s Convertible Senior Debentures due 2026 (“Convertible Debentures”), which were excluded from the computation of diluted weighted average shares outstanding if their inclusion would be anti-dilutive, totaled 25.9 million shares and 28.2 million shares for the three months ended September 30, 2011 and 2010, respectively, and 26.1 million shares and 8.9 million shares for the nine months ended September 30, 2011 and 2010, respectively.
3. Investments
The Company’s investments at September 30, 2011 and December 31, 2010 are summarized as follows:
| | | | | | | | |
| | | September 30,
2011 | | | December 31,
2010 | |
| | | (amounts in thousands) | |
Cash equivalents: | | | | | | | | |
U.S. Treasury money market mutual funds | | $ | 289,900 | | | $ | 323,206 | |
Corporate debt securities | | | 15,598 | | | | 30,495 | |
Certificates of deposit | | | 4,650 | | | | — | |
| | | | | | | | |
Total cash equivalents | | | 310,148 | | | | 353,701 | |
| | |
Investments: | | | | | | | | |
Corporate debt securities | | | 97,188 | | | | 88,471 | |
Debt securities issued by U.S. Government and Treasury agencies | | | 32,164 | | | | 30,201 | |
| | | | | | | | |
Total investments | | | 129,352 | | | | 118,672 | |
| | | | | | | | |
Total cash equivalents and investments | | $ | 439,500 | | | $ | 472,373 | |
| | | | | | | | |
At September 30, 2011 and December 31, 2010, the carrying values of investments included in cash and cash equivalents approximated fair value. The aggregate fair value of available-for-sale securities by major security type is included in Note 6. The amortized cost basis of the available-for-sale securities was not materially different from their aggregate fair value. The contractual maturities of the Company’s available-for-sale securities are all within one year.
Proceeds from the sale and maturity of available-for-sale securities were $97.6 million and $70.1 million during the three months ended September 30, 2011 and 2010, respectively, and $182.7 million and $93.4 million during the nine months ended September 30, 2011 and 2010, respectively. Gains and losses on investments are calculated using the specific identification method and are recognized during the period the investment is sold. The Company recognized no material unrealized or realized net gains or losses during the three or nine months ended September 30, 2011 or 2010.
10
tw telecom inc.
NOTES TO CONDENSED CONSOLIDATED FINANCIAL STATEMENTS – (Continued)
4. Long-Term Debt and Capital Lease Obligations
The components of long-term debt and capital lease obligations at September 30, 2011 and December 31, 2010 were as follows:
| | | | | | | | |
| | | September 30,
2011 | | | December 31,
2010 | |
| | | (amounts in thousands) | |
Term Loan B - January 2013 tranche, due 2013 | | $ | 102,324 | | | $ | 103,130 | |
Term Loan B - extended tranche, due 2016 | | | 469,176 | | | | 472,870 | |
8% Senior Notes, due 2018 | | | 430,000 | | | | 430,000 | |
2 3/8% Convertible Senior Debentures, due 2026 (1) | | | 373,744 | | | | 373,744 | |
Capital lease obligations | | | 16,594 | | | | 15,260 | |
| | | | | | | | |
Total obligations | | | 1,391,838 | | | | 1,395,004 | |
| | |
Unamortized discounts | | | (34,615 | ) | | | (49,505 | ) |
Current portion | | | (7,742 | ) | | | (7,202 | ) |
| | | | | | | | |
Total long-term debt and capital lease obligations | | $ | 1,349,481 | | | $ | 1,338,297 | |
| | | | | | | | |
| (1) | The Convertible Debentures are redeemable in whole or in part at the Company’s option at any time on or after April 6, 2013 at a redemption price equal to 100% of the principal amount of the debentures to be redeemed, plus accrued and unpaid interest. Holders of the Convertible Senior Debentures have the option to require the Company to purchase all or part of the Convertible Debentures on April 1, 2013, April 1, 2016, or April 1, 2021, or at any time prior to April 1, 2026 to convert the debentures into shares of the Company’s common stock. Upon conversion, the Company will have the right to deliver, in lieu of shares of common stock, cash or a combination of cash and shares of common stock. |
As of September 30, 2011,tw telecom inc. and its wholly-owned subsidiary,tw telecom holdings inc. (“Holdings”), were in compliance with all of their debt covenants.
5. Derivative Instruments
Holdings’ variable rate Term Loan B due 2013 and 2016 (the “Term Loan”) exposes the Company to variability in interest payments due to changes in interest rates. In order to mitigate interest rate fluctuations on the Term Loan, Holdings has entered into an interest rate swap agreement. The interest rate swap agreement effectively converts a portion of Holdings’ floating-rate debt to a fixed-rate basis for the term of the agreement to reduce the impact of interest rate changes on future interest expense. The Company has designated its interest rate swap agreement as a cash flow hedge.
If certain correlation and risk reduction criteria are met, the derivative is deemed to be highly effective in offsetting the changes in cash flows of the hedged item on a retrospective and prospective basis, and may be specifically designated as a hedge of exposure to changes in cash flow. For derivative instruments that are designated and qualify as a cash flow hedge, the effective portion of the gain or loss on the derivative instrument is reported as a component of other comprehensive income or loss. Amounts excluded from the assessment of hedge effectiveness, if any, as well as the ineffective portion of the gain or loss, are reported in results of operations immediately. The Company performs a quarterly assessment to determine whether its derivative instrument is highly effective in offsetting changes in cash flows of the hedged item. If the derivative instrument is determined to be not highly effective as a hedge, or if a derivative instrument ceases to be a highly effective hedge, hedge accounting is discontinued prospectively with respect to that derivative instrument.
11
tw telecom inc.
NOTES TO CONDENSED CONSOLIDATED FINANCIAL STATEMENTS – (Continued)
The following table reflects the terms of Holdings’ interest rate swap agreement in effect at September 30, 2011:
| | | | | | | | | | | | | | | | |
Term | | | Notional
Amount | | | Fixed
Rate | | | Total Weighted
Average Rate,
Including Spread | |
Beginning | | End | | | | |
November 28, 2008 | | | November 28, 2011 | | | $ | 100 million | | | | 2.96 | % | | | 5.94 | % |
The following table summarizes the fair value of derivatives reported in the condensed consolidated balance sheets:
| | | | | | | | | | |
| | | Liability Derivatives | |
Derivatives - Cash Flow Hedges | | Balance Sheet Location | | September 30,
2011 | | | December 31,
2010 | |
| | | | | (amounts in thousands) | |
Interest rate swap agreement | | Other current liabilities……………………. | | $ | 458 | | | $ | 2,412 | |
| | | | | | | | | | |
Total fair value of derivatives designated as cash flow hedges | | $ | 458 | | | $ | 2,412 | |
| | | | | | | | | | |
The unrecognized losses for the interest rate swap agreement included in accumulated other comprehensive loss at September 30, 2011 and December 31, 2010 were $0.5 million and $2.4 million, respectively. Based on the fair value of the interest rate swap of $0.5 million at September 30, 2011, the Company expects to recognize in interest expense approximately $0.5 million of net losses on the interest rate swap agreement through the expiration date on November 28, 2011 upon payment of interest associated with the Term Loan. Actual amounts ultimately recognized in interest expense depend on the interest rates in effect when settlements on the interest rate swap agreement occur each month. The variable rate, including the applicable spread, in effect at September 30, 2011 for the Term Loan, excluding the impact of the interest rate swap agreement, was 2.0% on the tranche due January 2013 and 3.5% on the tranche due December 2016. The effect of the interest rate swap agreements on the condensed consolidated statements of operations was as follows for the three and nine months ended September 30, 2011 and 2010:
| | | | | | | | | | | | | | | | |
| | | Three Months Ended September 30, | | | Nine Months Ended September 30, | |
| | | 2011 | | | 2010 | | | 2011 | | | 2010 | |
| | | (amounts in thousands) | |
Gain/(Loss) recognized in other comprehensive income/(loss) (effective portion) | | $ | (10 | ) | | $ | (458 | ) | | $ | (116 | ) | | $ | (1,873 | ) |
| | | | | | | | | | | | | | | | |
Gain/(Loss) reclassified from accumulated other comprehensive loss into interest expense (effective portion) | | $ | (705 | ) | | $ | (677 | ) | | $ | (2,070 | ) | | $ | (3,027 | ) |
| | | | | | | | | | | | | | | | |
Gain/(Loss) recognized in income (ineffective portion and amount excluded from effectiveness testing) | | $ | — | | | $ | — | | | $ | — | | | $ | — | |
| | | | | | | | | | | | | | | | |
6. Fair Value Measurements
Fair value, as defined by relevant accounting standards, is the price that would be received from selling an asset or paid to transfer a liability in an orderly transaction between market participants at the measurement date. When determining the fair value measurements for assets and liabilities required to be recorded at fair value, the Company considers the principal or most advantageous market in which it would complete a transaction and considers assumptions that market participants would use when pricing the asset or liability, such as inherent risk, transfer restrictions and risk of nonperformance.
12
tw telecom inc.
NOTES TO CONDENSED CONSOLIDATED FINANCIAL STATEMENTS – (Continued)
Fair Value Hierarchy
Relevant accounting standards set forth a fair value hierarchy that requires an entity to maximize the use of observable inputs and minimize the use of unobservable inputs when measuring fair value. A financial instrument’s categorization within the fair value hierarchy is based upon the lowest level of input that is significant to the fair value measurement. Relevant accounting standards establish three levels of inputs that may be used to measure fair value:
| | • | | Level 1—Quoted prices in active markets for identical assets or liabilities. Level 1 assets that are measured at fair value on a recurring basis consist of the Company’s investment in U.S. Treasury money market mutual funds that are traded in an active market with sufficient volume and frequency of transactions, and are included as a component of cash and cash equivalents in the condensed consolidated balance sheets. |
| | • | | Level 2—Observable inputs other than Level 1 prices such as quoted prices for similar assets or liabilities; quoted prices in markets with insufficient volume or infrequent transactions (less active markets); or model-derived valuations in which all significant inputs are observable or can be derived principally from or corroborated by observable market data for substantially the full term of the assets or liabilities. Level 2 assets that are measured at fair value on a recurring basis consist of the Company’s investments in certificates of deposit, corporate debt securities and debt securities issued by U.S. government and treasury agencies using observable inputs in less active markets and are included as a component of cash equivalents and investments in the condensed consolidated balance sheets. Level 2 liabilities that are measured at fair value on a recurring basis include the Company’s interest rate swap agreement priced using discounted cash flow techniques that use observable market inputs, such as LIBOR-based yield curves, forward rates, and credit ratings, and are included as a component of other current liabilities in the condensed consolidated balance sheets. |
| | • | | Level 3—Unobservable inputs to the valuation methodology that are significant to the measurement of fair value of assets or liabilities. The Company did not have any Level 3 assets that were measured at fair value at September 30, 2011 and December 31, 2010. |
13
tw telecom inc.
NOTES TO CONDENSED CONSOLIDATED FINANCIAL STATEMENTS – (Continued)
The following table reflects assets and liabilities that are measured and carried at fair value on a recurring basis at September 30, 2011 and December 31, 2010:
| | | | | | | | | | | | | | | | |
| | | Fair Value Measurements
September 30, 2011 | | | Assets/Liabilities
at Fair Value | |
| | | Level 1 | | | Level 2 | | | Level 3 | | |
| | | (amounts in thousands) | |
Assets | | | | | | | | | | | | | | | | |
U.S. Treasury money market mutual funds | | $ | 289,900 | | | $ | — | | | $ | — | | | $ | 289,900 | |
Corporate debt securities | | | — | | | | 15,598 | | | | — | | | | 15,598 | |
Certificates of deposit | | | — | | | | 4,650 | | | | — | | | | 4,650 | |
| | | | | | | | | | | | | | | | |
Investments included in cash and cash equivalents | | | 289,900 | | | | 20,248 | | | | — | | | | 310,148 | |
Corporate debt securities | | | — | | | | 97,188 | | | | — | | | | 97,188 | |
Debt securities issued by U.S. Government and Treasury agencies | | | — | | | | 32,164 | | | | — | | | | 32,164 | |
| | | | | | | | | | | | | | | | |
Short-term investments | | | — | | | | 129,352 | | | | — | | | | 129,352 | |
| | | | | | | | | | | | | | | | |
Total assets | | $ | 289,900 | | | $ | 149,600 | | | $ | — | | | $ | 439,500 | |
| | | | | | | | | | | | | | | | |
Liabilities | | | | | | | | | | | | | | | | |
Interest rate swap agreement | | $ | — | | | $ | 458 | | | $ | — | | | $ | 458 | |
| | | | | | | | | | | | | | | | |
Total liabilities | | $ | — | | | $ | 458 | | | $ | — | | | $ | 458 | |
| | | | | | | | | | | | | | | | |
| | | | | | | | | | | | | | | | |
| | | Fair Value Measurements
At December 31, 2010 | | | Assets/Liabilities
at Fair Value | |
| | | Level 1 | | | Level 2 | | | Level 3 | | |
| | | (amounts in thousands) | |
Assets | | | | | | | | | | | | | | | | |
U.S. Treasury money market mutual funds | | $ | 323,206 | | | $ | — | | | $ | — | | | $ | 323,206 | |
Corporate debt securities | | | — | | | | 30,495 | | | | — | | | | 30,495 | |
| | | | | | | | | | | | | | | | |
Investments included in cash and cash equivalents | | | 323,206 | | | | 30,495 | | | | — | | | | 353,701 | |
Corporate debt securities | | | — | | | | 88,471 | | | | — | | | | 88,471 | |
Debt securities issued by U.S. Government agencies | | | — | | | | 30,201 | | | | — | | | | 30,201 | |
| | | | | | | | | | | | | | | | |
Short-term investments | | | — | | | | 118,672 | | | | — | | | | 118,672 | |
| | | | | | | | | | | | | | | | |
Total assets | | $ | 323,206 | | | $ | 149,167 | | | $ | — | | | $ | 472,373 | |
| | | | | | | | | | | | | | | | |
Liabilities | | | | | | | | | | | | | | | | |
Interest rate swap agreement | | $ | — | | | $ | 2,412 | | | $ | — | | | $ | 2,412 | |
| | | | | | | | | | | | | | | | |
Total liabilities | | $ | — | | | $ | 2,412 | | | $ | — | | | $ | 2,412 | |
| | | | | | | | | | | | | | | | |
Although the Company’s long-term debt has not been listed on any securities exchange or inter-dealer automated quotation system, the Company has estimated the fair value of its long-term debt based on indicative pricing published by certain investment banks. While the Company believes these approximations to be reasonably accurate at the time published, indicative pricing can vary widely depending on volume traded by any given investment bank and other factors. The following table summarizes the carrying amounts and estimated fair values of the Company’s long-term debt, including the current portion.
14
tw telecom inc.
NOTES TO CONDENSED CONSOLIDATED FINANCIAL STATEMENTS – (Continued)
| | | | | | | | | | | | | | | | |
| | | September 30, 2011 | | | December 31, 2010 | |
| | | Carrying
Value | | | Fair Value | | | Carrying
Value | | | Fair Value | |
| | | (amounts in thousands) | |
Term Loan B - January 2013 tranche | | $ | 102,324 | | | $ | 100,277 | | | $ | 103,130 | | | $ | 101,841 | |
Term Loan B - Extended tranche, due 2016 | | | 469,176 | | | | 455,101 | | | | 472,870 | | | | 472,870 | |
8% Senior Notes, net of discount | | | 427,518 | | | | 446,662 | | | | 427,227 | | | | 459,025 | |
2 3/8% Convertible Senior Debentures, net of discount | | | 341,611 | | | | 406,447 | | | | 327,012 | | | | 412,987 | |
| | | | | | | | | | | | | | | | |
Total debt | | $ | 1,340,629 | | | $ | 1,408,487 | | | $ | 1,330,239 | | | $ | 1,446,723 | |
| | | | | | | | | | | | | | | | |
7. Stock-Based Compensation
During the nine months ended September 30, 2011, the Company granted restricted stock awards and restricted stock units with respect to 2.1 million shares and no stock options. As of September 30, 2011, the Company had 4.3 million restricted stock awards and restricted stock units that were unvested and 6.8 million options outstanding, of which 4.9 million were exercisable.
As of September 30, 2011, there was $49.1 million of total unrecognized compensation expense related to unvested restricted stock awards and restricted stock units, which is expected to be recognized over a weighted-average period of 1.5 years and $6.6 million of total unrecognized compensation expense related to unvested stock options, which is expected to be recognized over a weighted-average period of 1.25 years.
8. Commitments and Contingencies
Management routinely reviews the Company’s exposure to liabilities incurred in the normal course of its business operations. Where a probable contingency exists and the amount can be reasonably estimated, the Company records the estimated liability. Considerable judgment is required in analyzing and recording such liabilities and actual results may vary from the estimates.
The Company’s pending legal proceedings are limited to litigation incidental to its business. In the opinion of management, the ultimate resolution of these matters will not have a material adverse effect on the Company’s financial statements.
9. Supplemental Guarantor Information
In March 2010, Holdings (“Issuer”) issued 8% Senior Notes due 2018 (the “2018 Notes”) with a principal amount of $430 million. The 2018 Notes are unsecured obligations of the Issuer and are guaranteed bytw telecom inc. (“Parent Guarantor”) and substantially all of the Issuer’s subsidiaries (“Combined Subsidiary Guarantors”). The guarantees are joint and several. A significant amount of the Issuer’s cash flow is generated by the Combined Subsidiary Guarantors. As a result, funds necessary to meet the Issuer’s debt service obligations are provided in large part by distributions or advances from the Combined Subsidiary Guarantors. The 2018 Notes are governed by an indenture that contains certain restrictive covenants. These restrictions affect, and in many respects significantly limit or prohibit, among other things, the ability of the Parent Guarantor, the Issuer and its subsidiaries to incur indebtedness, make prepayments of certain indebtedness, pay dividends, make investments, engage in transactions with stockholders and affiliates, issue capital stock of subsidiaries, create liens, sell assets, and engage in mergers and consolidations.
The following information sets forth the Company’s Condensed Consolidating Balance Sheets as of September 30, 2011 and December 31, 2010, Condensed Consolidating Statements of Operations for the three and nine months ended September 30, 2011 and 2010, and Condensed Consolidating Statements of Cash Flows for the nine months ended September 30, 2011 and 2010.
15
tw telecom inc.
NOTES TO CONDENSED CONSOLIDATED FINANCIAL STATEMENTS – (Continued)
tw telecom inc.
CONDENSED CONSOLIDATING BALANCE SHEET
September 30, 2011
| | | | | | | | | | | | | | | | | | | | |
| | | Parent
Guarantor | | | Issuer | | | Combined
Subsidiary
Guarantors | | | Eliminations | | | Consolidated | |
| | | (amounts in thousands) | |
| ASSETS | | | | | | | | | | | | | | | | | | | | |
Current assets: | | | | | | | | | | | | | | | | | | | | |
Cash and cash equivalents | | $ | 24,542 | | | $ | 315,199 | | | $ | — | | | $ | — | | | $ | 339,741 | |
Investments | | | — | | | | 129,352 | | | | — | | | | — | | | | 129,352 | |
Receivables, net | | | — | | | | — | | | | 92,254 | | | | — | | | | 92,254 | |
Prepaid expenses and other current assets | | | — | | | | 14,882 | | | | 7,960 | | | | — | | | | 22,842 | |
Deferred income taxes | | | — | | | | 40,408 | | | | 20 | | | | — | | | | 40,428 | |
| | | | | | | | | | | | | | | | | | | | |
Total current assets | | | 24,542 | | | | 499,841 | | | | 100,234 | | | | — | | | | 624,617 | |
| | | | | | | | | | | | | | | | | | | | |
Property, plant and equipment, net | | | — | | | | 53,180 | | | | 1,363,424 | | | | — | | | | 1,416,604 | |
Deferred income taxes | | | — | | | | 193,576 | | | | 505 | | | | — | | | | 194,081 | |
Goodwill | | | — | | | | — | | | | 412,694 | | | | — | | | | 412,694 | |
Intangible and other assets, net | | | 1,647 | | | | 13,505 | | | | 29,555 | | | | — | | | | 44,707 | |
| | | | | | | | | | | | | | | | | | | | |
| | | | | |
Total assets | | $ | 26,189 | | | $ | 760,102 | | | $ | 1,906,412 | | | $ | — | | | $ | 2,692,703 | |
| | | | | | | | | | | | | | | | | | | | |
| LIABILITIES AND STOCKHOLDERS’ EQUITY (DEFICIT) | | | | | | | | | | | | | | | | | | | | |
| | | | | |
Current liabilities: | | | | | | | | | | | | | | | | | | | | |
Accounts payable | | $ | — | | | $ | 17,370 | | | $ | 48,986 | | | $ | — | | | $ | 66,356 | |
Other current liabilities | | | 4,438 | | | | 49,905 | | | | 177,248 | | | | — | | | | 231,591 | |
Intercompany payable (receivable) | | | (1,835,552 | ) | | | (611,298 | ) | | | 2,446,850 | | | | — | | | | — | |
| | | | | | | | | | | | | | | | | | | | |
Total current liabilities | | | (1,831,114 | ) | | | (544,023 | ) | | | 2,673,084 | | | | — | | | | 297,947 | |
| | | | | | | | | | | | | | | | | | | | |
Losses in subsidiary in excess of investment | | | 526,383 | | | | 996,479 | | | | — | | | | (1,522,862 | ) | | | — | |
Long-term debt and capital lease obligations, net | | | 341,611 | | | | 994,012 | | | | 13,858 | | | | — | | | | 1,349,481 | |
Long-term deferred revenue | | | — | | | | — | | | | 22,330 | | | | — | | | | 22,330 | |
Other long-term liabilities | | | — | | | | 6,684 | | | | 26,952 | | | | — | | | | 33,636 | |
Stockholders’ equity (deficit) | | | 989,309 | | | | (693,050 | ) | | | (829,812 | ) | | | 1,522,862 | | | | 989,309 | |
| | | | | | | | | | | | | | | | | | | | |
| | | | | |
Total liabilities and stockholders’ equity (deficit) | | $ | 26,189 | | | $ | 760,102 | | | $ | 1,906,412 | | | $ | — | | | $ | 2,692,703 | |
| | | | | | | | | | | | | | | | | | | | |
16
tw telecom inc.
NOTES TO CONDENSED CONSOLIDATED FINANCIAL STATEMENTS – (Continued)
tw telecom inc.
CONDENSED CONSOLIDATING BALANCE SHEET
December 31, 2010
| | | | | | | | | | | | | | | | | | | | |
| | | Parent
Guarantor | | | Issuer | | | Combined
Subsidiary
Guarantors | | | Eliminations | | | Consolidated | |
| | | (amounts in thousands) | |
| ASSETS | | | | | | | | | | | | | | | | | | | | |
Current assets: | | | | | | | | | | | | | | | | | | | | |
Cash and cash equivalents | | $ | 24,542 | | | $ | 332,380 | | | $ | — | | | $ | — | | | $ | 356,922 | |
Investments | | | — | | | | 118,672 | | | | — | | | | — | | | | 118,672 | |
Receivables, net | | | — | | | | — | | | | 81,598 | | | | — | | | | 81,598 | |
Prepaid expenses and other current assets | | | — | | | | 10,002 | | | | 6,933 | | | | — | | | | 16,935 | |
Deferred income taxes | | | — | | | | 40,408 | | | | 20 | | | | — | | | | 40,428 | |
| | | | | | | | | | | | | | | | | | | | |
Total current assets | | | 24,542 | | | | 501,462 | | | | 88,551 | | | | — | | | | 614,555 | |
| | | | | | | | | | | | | | | | | | | | |
Property, plant and equipment, net | | | — | | | | 42,063 | | | | 1,314,549 | | | | — | | | | 1,356,612 | |
Deferred income taxes | | | — | | | | 224,290 | | | | 505 | | | | — | | | | 224,795 | |
Goodwill | | | — | | | | — | | | | 412,694 | | | | — | | | | 412,694 | |
Intangible and other assets, net | | | 2,471 | | | | 15,326 | | | | 24,501 | | | | — | | | | 42,298 | |
| | | | | | | | | | | | | | | | | | | | |
| | | | | |
Total assets | | $ | 27,013 | | | $ | 783,411 | | | $ | 1,840,800 | | | $ | — | | | $ | 2,650,954 | |
| | | | | | | | | | | | | | | | | | | | |
| LIABILITIES AND STOCKHOLDERS’ EQUITY (DEFICIT) | | | | | | | | | | | | | | | | | | | | |
Current liabilities: | | | | | | | | | | | | | | | | | | | | |
Accounts payable | | $ | — | | | $ | 6,179 | | | $ | 47,257 | | | $ | — | | | $ | 53,436 | |
Other current liabilities | | | 2,219 | | | | 65,719 | | | | 180,414 | | | | — | | | | 248,352 | |
Intercompany payable (receivable) | | | (1,850,975 | ) | | | (609,054 | ) | | | 2,460,029 | | | | — | | | | — | |
| | | | | | | | | | | | | | | | | | | | |
Total current liabilities | | | (1,848,756 | ) | | | (537,156 | ) | | | 2,687,700 | | | | — | | | | 301,788 | |
| | | | | | | | | | | | | | | | | | | | |
Losses in subsidiary in excess of investment | | | 582,116 | | | | 1,054,580 | | | | — | | | | (1,636,696 | ) | | | — | |
Long-term debt and capital lease obligations, net | | | 327,012 | | | | 997,227 | | | | 14,058 | | | | — | | | | 1,338,297 | |
Long-term deferred revenue | | | — | | | | — | | | | 14,864 | | | | — | | | | 14,864 | |
Other long-term liabilities | | | — | | | | 4,073 | | | | 25,291 | | | | — | | | | 29,364 | |
Stockholders’ equity (deficit) | | | 966,641 | | | | (735,583 | ) | | | (901,113 | ) | | | 1,636,696 | | | | 966,641 | |
| | | | | | | | | | | | | | | | | | | | |
| | | | | |
Total liabilities and stockholders’ equity (deficit) | | $ | 27,013 | | | $ | 783,141 | | | $ | 1,840,800 | | | $ | — | | | $ | 2,650,954 | |
| | | | | | | | | | | | | | | | | | | | |
17
tw telecom inc.
NOTES TO CONDENSED CONSOLIDATED FINANCIAL STATEMENTS – (Continued)
tw telecom inc.
CONDENSED CONSOLIDATING STATEMENT OF OPERATIONS
Three Months Ended September 30, 2011
| | | | | | | | | | | | | | | | | | | | |
| | | Parent
Guarantor | | | Issuer | | | Combined
Subsidiary
Guarantors | | | Eliminations | | | Consolidated | |
| | | (amounts in thousands) | |
Total revenue | | $ | — | | | $ | — | | | $ | 344,456 | | | $ | — | | | $ | 344,456 | |
| | | | | |
Costs and expenses: | | | | | | | | | | | | | | | | | | | | |
Operating, selling, general and administrative | | | — | | | | 48,117 | | | | 178,129 | | | | — | | | | 226,246 | |
Depreciation, amortization and accretion | | | — | | | | 5,189 | | | | 65,751 | | | | — | | | | 70,940 | |
Corporate expense allocation | | | — | | | | (53,306 | ) | | | 53,306 | | | | — | | | | — | |
| | | | | | | | | | | | | | | | | | | | |
Total costs and expenses | | | — | | | | — | | | | 297,186 | | | | — | | | | 297,186 | |
| | | | | | | | | | | | | | | | | | | | |
| | | | | |
Operating income | | | — | | | | — | | | | 47,270 | | | | — | | | | 47,270 | |
| | | | | |
Interest expense, net | | | (7,464 | ) | | | (11,771 | ) | | | (2,569 | ) | | | — | | | | (21,804 | ) |
Interest expense allocation | | | 7,464 | | | | 11,771 | | | | (19,235 | ) | | | — | | | | — | |
| | | | | | | | | | | | | | | | | | | | |
| | | | | |
Income before income taxes and equity in undistributed earnings of subsidiaries | | | — | | | | — | | | | 25,466 | | | | — | | | | 25,466 | |
Income tax expense | | | — | | | | 10,425 | | | | 448 | | | | — | | | | 10,873 | |
| | | | | | | | | | | | | | | | | | | | |
| | | | | |
Net income (loss) before equity in undistributed earnings of subsidiaries | | | — | | | | (10,425 | ) | | | 25,018 | | | | — | | | | 14,593 | |
| | | | | |
Equity in undistributed earnings of subsidiaries | | | 14,593 | | | | 25,018 | | | | — | | | | (39,611 | ) | | | — | |
| | | | | | | | | | | | | | | | | | | | |
| | | | | |
Net income | | $ | 14,593 | | | $ | 14,593 | | | $ | 25,018 | | | $ | (39,611 | ) | | $ | 14,593 | |
| | | | | | | | | | | | | | | | | | | | |
18
tw telecom inc.
NOTES TO CONDENSED CONSOLIDATED FINANCIAL STATEMENTS – (Continued)
tw telecom inc.
CONDENSED CONSOLIDATING STATEMENT OF OPERATIONS
Three Months Ended September 30, 2010
| | | | | | | | | | | | | | | | | | | | |
| | | Parent
Guarantor | | | Issuer | | | Combined
Subsidiary
Guarantors | | | Eliminations | | | Consolidated | |
| | | (amounts in thousands) | |
Total revenue | | $ | — | | | $ | — | | | $ | 320,294 | | | $ | — | | | $ | 320,294 | |
| | | | | |
Costs and expenses: | | | | | | | | | | | | | | | | | | | | |
Operating, selling, general and administrative | | | — | | | | 46,428 | | | | 165,261 | | | | — | | | | 211,689 | |
Depreciation, amortization and accretion | | | — | | | | 5,178 | | | | 66,434 | | | | — | | | | 71,612 | |
Corporate expense allocation | | | — | | | | (51,606 | ) | | | 51,606 | | | | — | | | | — | |
| | | | | | | | | | | | | | | | | | | | |
Total costs and expenses | | | — | | | | — | | | | 283,301 | | | | — | | | | 283,301 | |
| | | | | | | | | | | | | | | | | | | | |
| | | | | |
Operating income | | | — | | | | — | | | | 36,993 | | | | — | | | | 36,993 | |
| | | | | |
Interest expense, net | | | (7,059 | ) | | | (9,689 | ) | | | (2,677 | ) | | | — | | | | (19,425 | ) |
Other income | | | — | | | | 825 | | | | — | | | | — | | | | 825 | |
Interest expense and other income allocation | | | 7,059 | | | | 8,864 | | | | (15,923 | ) | | | — | | | | — | |
| | | | | | | | | | | | | | | | | | | | |
| | | | | |
Income before income taxes and equity in undistributed earnings of subsidiaries | | | — | | | | — | | | | 18,393 | | | | — | | | | 18,393 | |
Income tax (benefit) expense | | | — | | | | 1,846 | | | | 468 | | | | — | | | | 2,314 | |
| | | | | | | | | | | | | | | | | | | | |
| | | | | |
Net income before equity in undistributed earnings of subsidiaries | | | — | | | | (1,846 | ) | | | 17,925 | | | | — | | | | 16,079 | |
| | | | | |
Equity in undistributed earnings of subsidiaries | | | 16,079 | | | | 17,925 | | | | — | | | | (34,004 | ) | | | — | |
| | | | | | | | | | | | | | | | | | | | |
| | | | | |
Net income | | $ | 16,079 | | | $ | 16,079 | | | $ | 17,925 | | | $ | (34,004 | ) | | $ | 16,079 | |
| | | | | | | | | | | | | | | | | | | | |
19
tw telecom inc.
NOTES TO CONDENSED CONSOLIDATED FINANCIAL STATEMENTS – (Continued)
tw telecom inc.
CONDENSED CONSOLIDATING STATEMENT OF OPERATIONS
Nine Months Ended September 30, 2011
| | | | | | | | | | | | | | | | | | | | |
| | | Parent
Guarantor | | | Issuer | | | Combined
Subsidiary
Guarantors | | | Eliminations | | | Consolidated | |
| | | (amounts in thousands) | |
Total revenue | | $ | — | | | $ | — | | | $ | 1,015,384 | | | $ | — | | | $ | 1,015,384 | |
| | | | | |
Costs and expenses: | | | | | | | | | | | | | | | | | | | | |
Operating, selling, general and administrative | | | — | | | | 143,496 | | | | 523,329 | | | | — | | | | 666,825 | |
Depreciation, amortization and accretion | | | — | | | | 15,353 | | | | 195,404 | | | | — | | | | 210,757 | |
Corporate expense allocation | | | — | | | | (158,849 | ) | | | 158,849 | | | | — | | | | — | |
| | | | | | | | | | | | | | | | | | | | |
Total costs and expenses | | | — | | | | — | | | | 877,582 | | | | — | | | | 877,582 | |
| | | | | | | | | | | | | | | | | | | | |
| | | | | |
Operating income | | | — | | | | — | | | | 137,802 | | | | — | | | | 137,802 | |
| | | | | |
Interest expense, net | | | (22,080 | ) | | | (33,084 | ) | | | (10,140 | ) | | | — | | | | (65,304 | ) |
Interest expense allocation | | | 22,080 | | | | 33,084 | | | | (55,164 | ) | | | — | | | | — | |
| | | | | | | | | | | | | | | | | | | | |
Income before income taxes and equity in undistributed earnings of subsidiaries | | | — | | | | — | | | | 72,498 | | | | — | | | | 72,498 | |
Income tax expense | | | — | | | | 29,785 | | | | 1,194 | | | | — | | | | 30,979 | |
| | | | | | | | | | | | | | | | | | | | |
| | | | | |
Net income (loss) before equity in undistributed earnings of subsidiaries | | | — | | | | (29,785 | ) | | | 71,304 | | | | — | | | | 41,519 | |
| | | | | |
Equity in undistributed earnings of subsidiaries | | | 41,519 | | | | 71,304 | | | | — | | | | (112,823 | ) | | | — | |
| | | | | | | | | | | | | | | | | | | | |
| | | | | |
Net income | | $ | 41,519 | | | $ | 41,519 | | | $ | 71,304 | | | $ | (112,823 | ) | | $ | 41,519 | |
| | | | | | | | | | | | | | | | | | | | |
20
tw telecom inc.
NOTES TO CONDENSED CONSOLIDATED FINANCIAL STATEMENTS – (Continued)
tw telecom inc.
CONDENSED CONSOLIDATING STATEMENT OF OPERATIONS
Nine Months Ended September 30, 2010
| | | | | | | | | | | | | | | | | | | | |
| | | Parent
Guarantor | | | Issuer | | | Combined
Subsidiary
Guarantors | | | Eliminations | | | Consolidated | |
| | | (amounts in thousands) | |
Total revenue | | $ | — | | | $ | — | | | $ | 948,354 | | | $ | — | | | $ | 948,354 | |
| | | | | |
Costs and expenses: | | | | | | | | | | | | | | | | | | | | |
Operating, selling, general and administrative | | | — | | | | 137,614 | | | | 487,161 | | | | — | | | | 624,775 | |
Depreciation, amortization and accretion | | | — | | | | 14,266 | | | | 202,764 | | | | — | | | | 217,030 | |
Corporate expense allocation | | | — | | | | (151,880 | ) | | | 151,880 | | | | — | | | | — | |
| | | | | | | | | | | | | | | | | | | | |
Total costs and expenses | | | — | | | | — | | | | 841,805 | | | | — | | | | 841,805 | |
| | | | | | | | | | | | | | | | | | | | |
| | | | | |
Operating income | | | — | | | | — | | | | 106,549 | | | | — | | | | 106,549 | |
| | | | | |
Interest expense, net | | | (20,892 | ) | | | (28,952 | ) | | | (10,042 | ) | | | — | | | | (59,886 | ) |
Debt extinguishment costs | | | — | | | | (17,070 | ) | | | — | | | | — | | | | (17,070 | ) |
Other income | | | — | | | | 825 | | | | — | | | | | | | | 825 | |
Interest expense and other income allocation | | | 20,892 | | | | 45,197 | | | | (66,089 | ) | | | — | | | | — | |
| | | | | | | | | | | | | | | | | | | | |
| | | | | |
Income before income taxes and equity in undistributed earnings of subsidiaries | | | — | | | | — | | | | 30,418 | | | | — | | | | 30,418 | |
Income tax benefit | | | — | | | | (290,241 | ) | | | (2,725 | ) | | | — | | | | (292,966 | ) |
| | | | | | | | | | | | | | | | | | | | |
| | | | | |
Net income before equity in undistributed earnings of subsidiaries | | | — | | | | 290,241 | | | | 33,143 | | | | — | | | | 323,384 | |
| | | | | |
Equity in undistributed earnings of subsidiaries | | | 323,384 | | | | 33,143 | | | | — | | | | (356,527 | ) | | | — | |
| | | | | | | | | | | | | | | | | | | | |
| | | | | |
Net income | | $ | 323,384 | | | $ | 323,384 | | | $ | 33,143 | | | $ | (356,527 | ) | | $ | 323,384 | |
| | | | | | | | | | | | | | | | | | | | |
21
tw telecom inc.
NOTES TO CONDENSED CONSOLIDATED FINANCIAL STATEMENTS – (Continued)
tw telecom inc.
CONDENSED CONSOLIDATING STATEMENT OF CASH FLOWS
Nine Months Ended September 30, 2011
| | | | | | | | | | | | | | | | | | | | |
| | | Parent
Guarantor | | | Issuer | | | Combined
Subsidiary
Guarantors | | | Eliminations | | | Consolidated | |
| | | (amounts in thousands) | |
Cash flows from operating activities: | | | | | | | | | | | | | | | | | | | | |
Net income | | $ | 41,519 | | | $ | 41,519 | | | $ | 71,304 | | | $ | (112,823 | ) | | $ | 41,519 | |
Adjustments to reconcile net income to net cash provided by operating activities: | | | | | | | | | | | | | | | | | | | | |
Depreciation, amortization, and accretion | | | — | | | | 15,353 | | | | 195,404 | | | | — | | | | 210,757 | |
Deferred income taxes | | | — | | | | 29,783 | | | | — | | | | — | | | | 29,783 | |
Stock-based compensation | | | — | | | | — | | | | 21,094 | | | | — | | | | 21,094 | |
Intercompany and equity investment changes | | | (18,205 | ) | | | (60,344 | ) | | | (34,274 | ) | | | 112,823 | | | | — | |
Amortization of discount on debt and deferred debt issue costs and other | | | 15,423 | | | | 1,951 | | | | — | | | | — | | | | 17,374 | |
Changes in operating assets and liabilities | | | 2,219 | | | | (3,239 | ) | | | (27,724 | ) | | | — | | | | (28,744 | ) |
| | | | | | | | | | | | | | | | | | | | |
| | | | | |
Net cash provided by operating activities | | | 40,956 | | | | 25,023 | | | | 225,804 | | | | — | | | | 291,783 | |
| | | | | | | | | | | | | | | | | | | | |
Cash flows from investing activities: | | | | | | | | | | | | | | | | | | | | |
Capital expenditures | | | — | | | | (29,962 | ) | | | (224,132 | ) | | | — | | | | (254,094 | ) |
Purchases of investments | | | — | | | | (195,311 | ) | | | — | | | | — | | | | (195,311 | ) |
Proceeds from sale of investments | | | — | | | | 182,725 | | | | — | | | | — | | | | 182,725 | |
Other investing activities, net | | | — | | | | 4,960 | | | | (1,084 | ) | | | — | | | | 3,876 | |
| | | | | | | | | | | | | | | | | | | | |
| | | | | |
Net cash used in investing activities | | | — | | | | (37,588 | ) | | | (225,216 | ) | | | — | | | | (262,804 | ) |
| | | | | | | | | | | | | | | | | | | | |
| | | | | |
Cash flows from financing activities: | | | | | | | | | | | | | | | | | | | | |
Net proceeds (tax withholdings) from issuance of common stock upon exercise of stock options and vesting of restricted stock awards and units | | | 9,044 | | | | — | | | | — | | | | — | | | | 9,044 | |
Purchases of treasury stock | | | (50,000 | ) | | | — | | | | — | | | | — | | | | (50,000 | ) |
Payment of debt and capital lease obligations | | | — | | | | (4,616 | ) | | | (588 | ) | | | — | | | | (5,204 | ) |
| | | | | | | | | | | | | | | | | | | | |
Net cash used in financing activities | | | (40,956 | ) | | | (4,616 | ) | | | (588 | ) | | | — | | | | (46,160 | ) |
| | | | | | | | | | | | | | | | | | | | |
Increase in cash and cash equivalents | | | — | | | | (17,181 | ) | | | — | | | | — | | | | (17,181 | ) |
Cash and cash equivalents at beginning of period | | | 24,542 | | | | 332,380 | | | | — | | | | — | | | | 356,922 | |
| | | | | | | | | | | | | | | | | | | | |
Cash and cash equivalents at end of period | | $ | 24,542 | | | $ | 315,199 | | | $ | — | | | $ | — | | | $ | 339,741 | |
| | | | | | | | | | | | | | | | | | | | |
22
tw telecom inc.
NOTES TO CONDENSED CONSOLIDATED FINANCIAL STATEMENTS – (Continued)
tw telecom inc.
CONDENSED CONSOLIDATING STATEMENT OF CASH FLOWS
Nine Months Ended September 30, 2010
| | | | | | | | | | | | | | | | | | | | |
| | | Parent
Guarantor | | | Issuer | | | Combined
Subsidiary
Guarantors | | | Eliminations | | | Consolidated | |
| | | (amounts in thousands) | |
Cash flows from operating activities: | | | | | | | | | | | | | | | | | | | | |
Net income | | $ | 323,384 | | | $ | 323,384 | | | $ | 33,143 | | | $ | (356,527 | ) | | $ | 323,384 | |
Adjustments to reconcile net income to net cash provided by operating activities: | | | | | | | | | | | | | | | | | | | | |
Depreciation, amortization, and accretion | | | — | | | | 14,266 | | | | 202,764 | | | | — | | | | 217,030 | |
Deferred income taxes | | | — | | | | (294,514 | ) | | | (580 | ) | | | | | | | (295,094 | ) |
Intercompany and equity investment changes | | | (330,326 | ) | | | 84 | | | | (26,285 | ) | | | 356,527 | | | | — | |
Stock based compensation expense | | | — | | | | — | | | | 20,633 | | | | — | | | | 20,633 | |
Extinguishment costs, amortization of discount on debt and deferred debt issue costs and other | | | 14,237 | | | | 17,883 | | | | — | | | | — | | | | 32,120 | |
Changes in operating assets and liabilities | | | 2,219 | | | | (8,298 | ) | | | 3,578 | | | | — | | | | (2,501 | ) |
| | | | | | | | | | | | | | | | | | | | |
| | | | | |
Net cash provided by operating activities | | | 9,514 | | | | 52,805 | | | | 233,253 | | | | — | | | | 295,572 | |
| | | | | | | | | | | | | | | | | | | | |
Cash flows from investing activities: | | | | | | | | | | | | | | | | | | | | |
Capital expenditures | | | — | | | | (17,848 | ) | | | (225,878 | ) | | | — | | | | (243,726 | ) |
Purchases of investments | | | — | | | | (167,861 | ) | | | — | | | | — | | | | (167,861 | ) |
Proceeds from sale of investments | | | — | | | | 93,449 | | | | — | | | | — | | | | 93,449 | |
Other investing activities | | | — | | | | 538 | | | | (7,052 | ) | | | — | | | | (6,514 | ) |
| | | | | | | | | | | | | | | | | | | | |
| | | | | |
Net cash used in investing activities | | | — | | | | (91,722 | ) | | | (232,930 | ) | | | — | | | | (324,652 | ) |
| | | | | | | | | | | | | | | | | | | | |
| | | | | |
Cash flows from financing activities: | | | | | | | | | | | | | | | | | | | | |
Net proceeds (tax withholdings) from issuance of common stock upon exercise of stock options and vesting of restricted stock awards and units | | | 2,198 | | | | — | | | | — | | | | — | | | | 2,198 | |
Purchases of treasury stock | | | (11,705 | ) | | | — | | | | — | | | | — | | | | (11,705 | ) |
Retirement of debt obligations | | | (6 | ) | | | (413,677 | ) | | | — | | | | — | | | | (413,683 | ) |
Net proceeds from issuance of debt | | | — | | | | 417,425 | | | | — | | | | — | | | | 417,425 | |
Payment of debt and capital lease obligations | | | — | | | | (5,223 | ) | | | (323 | ) | | | — | | | | (5,546 | ) |
| | | | | | | | | | | | | | | | | | | | |
Net cash used in (provided by) financing activities | | | (9,513 | ) | | | (1,475 | ) | | | (323 | ) | | | — | | | | (11,311 | ) |
| | | | | | | | | | | | | | | | | | | | |
Increase in cash and cash equivalents | | | 1 | | | | (40,392 | ) | | | — | | | | — | | | | (40,391 | ) |
Cash and cash equivalents at beginning of period | | | 24,540 | | | | 421,367 | | | | — | | | | — | | | | 445,907 | |
| | | | | | | | | | | | | | | | | | | | |
Cash and cash equivalents at end of period | | $ | 24,541 | | | $ | 380,975 | | | $ | — | | | $ | — | | | $ | 405,516 | |
| | | | | | | | | | | | | | | | | | | | |
23
tw telecom inc.
Item 2. Management’s Discussion and Analysis of Financial Condition and Results of Operations
The following discussion and analysis provides information regarding the results of operations and financial condition of the Company and should be read in conjunction with the accompanying condensed consolidated financial statements and notes thereto. This discussion and analysis also should be read in conjunction withManagement’s Discussion and Analysis of Financial Condition and Results of Operationsand the consolidated financial statements included in Part II of our Annual Report on Form 10-K/A for the year ended December 31, 2010. References in this item to “we,” “our,” or “us” are to the Company and its subsidiaries on a consolidated basis unless the context otherwise requires.
Cautions Concerning Forward-Looking Statements
This document contains certain “forward-looking statements” within the meaning of Section 27A of the Securities Act of 1933, as amended, Section 21E of the Securities Exchange Act of 1934, as amended, and the Private Securities Litigation Reform Act of 1995, including statements regarding, among other items, our expected financial position, expected capital expenditures, the impact of the economic downturn and other changes to macro-economic trends, activities and results, expected revenue mix, expected revenue growth, the impact of accounting changes, future tax benefits, expense and effective tax rate, expense trends, future liquidity and capital resources, product plans, growth or stability from particular customer segments, the effects of consolidation in the telecommunications industry and other customer and competitive impacts, anticipated customer disconnections and customer and revenue churn, Modified EBITDA trends, margin growth, expected network expansion and grooming, regulatory changes and business and financing plans. These forward-looking statements are based on management’s current expectations and are naturally subject to risks, uncertainties, and changes in circumstances, certain of which are beyond our control. Actual results may differ materially from those expressed or implied by such forward-looking statements.
The words “believe,” “plan,” “target,” “expect,” “intend,” and “anticipate,” and expressions of similar substance identify forward-looking statements. Although we believe that the expectations reflected in such forward-looking statements are reasonable, we can give no assurance that those expectations will prove to be correct. Important factors that may cause actual results to differ materially from the expectations described in this report are set forth under “Risk Factors” in Item 1A and elsewhere in our Annual Report on Form 10-K/A for the year ended December 31, 2010, in Item 1A and elsewhere in our quarterly report on Form 10-Q/A for the quarters ended March 31, 2011 and June 30, 2011 and in this report. In addition, actual results may differ from our expectations due to the timing of disconnections, disputes and service installations, which may affect the extent to which those factors impact our results in a particular period, increased customer disconnections and churn, increased customer disputes, increased competition, inability to obtain rights to build networks into commercial buildings, the current or a future economic downturn, delays in launching new products, unanticipated capital investment opportunities or needs, decreased demand for our products, further declines in the prices of and revenue from our services due to competitive pressures, industry consolidation and other industry conditions, an ownership change that results in limitations on our use of net operating losses under Section 382 of the Internal Revenue Code, increases in the price we pay for and the extent of our use of facilities of ILECs, increased costs from healthcare reform and higher taxes or further deregulation of the ILECs and other adverse regulatory rulings or legislative developments. Readers are cautioned not to place undue reliance on these forward-looking statements, which speak only as of their dates. We undertake no obligation to publicly update or revise any forward-looking statements, whether as a result of new information, future events, or otherwise.
Overview
We are a leading national provider of managed network services, including business Ethernet, converged and VPN services to enterprise organizations and carriers across the U.S. and globally. Our customers include, among others, enterprise organizations in the distribution, health care, finance, service and manufacturing
24
tw telecom inc.
industries, state, local and federal government entities, system integrators, and communications service providers, including ILECs, CLECs, wireless communications companies, ISPs and cable companies.
Through our subsidiaries, we serve 75 metropolitan markets that are connected by our regional fiber facilities and national IP backbone. Our fiber network spanned approximately 27,000 route miles (including over 20,000 metropolitan route miles) as of September 30, 2011 connecting to 14,872 buildings served directly by our local fiber facilities. During the first quarter of 2011, we completed an initiative to convert our fiber records into a new centralized fiber management system, which resulted in approximately 1,000 fewer route miles than previously reported as of December 31, 2010. Also as of the first quarter of 2011 to better reflect our reach, we modified our on-network (“on-net”) building count to include all locations served directly by our fiber network, including previously excluded locations without electronics and ILEC local serving offices (“LSOs”). Inclusion of these locations and LSOs resulted in the addition of approximately 1,400 locations to our on-net buildings from those we previously reported as of December 31, 2010. We added approximately 1,642 new buildings directly connected to our network in the nine months ended September 30, 2011 as a result of sales to customers at these locations. We continue to expand our fiber footprint within our existing markets by connecting our network into additional locations. We have also expanded our fiber footprint through acquisitions to increase our network density and reach. We continue to expand our data, voice and IP networking capabilities between our markets, supporting secure end-to-end Ethernet and VPN connections for customers.
Our objective is to be the leading national provider of high quality business network solutions leveraging our integrated network, operational capabilities, dedicated people, local presence, personalized customer experience and advanced support systems to meet the complex and evolving needs of our customers and increase shareholder value. The key elements of our business strategy include:
| | • | | Leveraging our local fiber assets and national IP backbone and integrating other carriers’ facilities to enable our customers to connect to any of their locations with our network solutions, and using our local presence and local sales, sales engineering, customer support and operation resources, backed by a national organization, to provide personalized service and customized solutions for our customers; |
| | • | | Focusing our service offerings to deliver secure end-to-end managed solutions to our customers with a predictable, quality service experience, emphasizing Ethernet and IP VPN services, Internet-based services and converged service offerings and developing our intelligent network and service capabilities, the initial phase of which was launched in a controlled introduction in the third quarter of 2011, to meet the complex and evolving needs of our customers; |
| | • | | Delivering a differentiated customer care strategy by engaging all of our employees and continually incorporating customer feedback to provide the best possible customer service; |
| | • | | Enhancing our multi-channel sales strategy; |
| | • | | Enabling enterprise cloud computing and other developing IT strategies by leveraging our fiber network and data services portfolio and the numerous third party and customer data centers connected to our network; |
| | • | | Employing a disciplined capital allocation strategy to invest for growth in the near and long term to broaden our reach and capabilities and increase operational efficiencies; and |
| | • | | Investing in our people to drive the execution of our strategies. |
Our revenue is derived primarily from business communications services, including data and high-speed Internet access, voice and network services. We serve both business enterprise and carrier customers. Although we analyze revenue by customer type, we present our financial results as one segment across the U.S. because our business is centrally managed.
25
tw telecom inc.
Total Revenue
Our revenue has grown for 28 consecutive quarters through September 30, 2011 including throughout the latest recession. Our revenue growth is dependent upon selling services to new and existing customers, retaining revenue from existing customers through retention programs aimed at reducing disconnections, renewing customers’ contracts upon contract expiration and upselling services to existing customers to mitigate the impact of price reductions associated with contract renewals.
Although our revenue grew throughout the recession, our annual rate of revenue growth declined in 2008 and 2009 over the respective prior years primarily due to impacts of the economic environment that resulted in lower demand, disconnections and repricing of expiring customer contracts to current market levels upon renewal, among other factors. This trend began to change in 2010. In the year ended December 31, 2010, our revenue grew 5.1% over the prior year, which represented an increase over the growth rate of 4.5% in the year ended December 31, 2009. In the nine months ended September 30, 2011, our year-over-year revenue growth rate continued to expand to 7.1%, compared to a 5.0% year-over-year growth rate for the nine months ended September 30, 2010. This higher growth rate was due to higher demand and lower revenue churn that we believe was due to an increase in demand for our newer and enhanced services, our customer experience initiatives to increase customer loyalty and retention to reduce churn and improved economic conditions.
Revenue for data and Internet, network and the majority of our voice services is generally billed in advance on a monthly fixed rate basis and recognized over the period the services are provided. Revenue for the majority of intercarrier compensation and certain components of voice services, such as long distance, is generally billed on a transactional basis in arrears based on a customer’s actual usage and estimates are used to recognize revenue in the period earned. In the ordinary course of business, there is often a time lag between the time that a sale, or “booking” (i.e., signed contract or service order), is made and the time that revenue commences due to the time required to obtain or build necessary facilities, obtain rights to install equipment in multi-tenant buildings and other factors related to service installation, some of which are not within our control. Our installation timeframes are generally longer for the more complex solutions delivered to our customers. In some situations, the timing of service installations may be subject to factors that our customers control, such as their readiness for us to install equipment on their premises or the readiness of their equipment. Due to all of these factors, installation intervals may range between one month for single-site, less complex services to 12 months or longer for more complex solutions.
Enterprise Customer Revenue
Revenue from enterprise customers has increased sequentially for 37 consecutive quarters through September 30, 2011 and increased 10% for the three months ended September 30, 2011 as compared to the same period in 2010 primarily due to increased installations of our data and Internet services such as Ethernet and IP-based services. Revenue from our enterprise customers represented at least 75% of our total revenue for the past 10 consecutive quarters with an increase to 78% in the three months ended September 30, 2011. We expect our future revenue growth to come primarily from our enterprise customer base and to be driven in part by the increasingly web-based economy and developing IT strategies such as cloud computing, collaboration, data center connectivity and disaster recovery that require the reliable connectivity and network capacity that we provide. Our national footprint and new and enhanced service capabilities enable us to serve customers with multi-point, multi-city locations.
Carrier Customer Revenue
Revenue from carrier customers has increased sequentially for seven of the past nine quarters. Carrier revenue increased 1% for the three months ended September 30, 2011 as compared to the same period in 2010 primarily due to installed sales of Ethernet services to wireline and wireless carriers to serve their end users’
26
tw telecom inc.
needs, largely offset by churn. Our carrier revenue represented 22% of total revenue for eight consecutive quarters through March 31, 2011 and declined to 21% and 20% of total revenue in the three months ended June 30 and September 30, 2011, respectively. In the three months ended September 30, 2011, approximately 30% of carrier revenue was from wireless providers. Our carrier revenue historically has been impacted by pricing declines in connection with carrier customer contract renewals, disconnections resulting from price competition from other carriers, customer cost cutting measures and carrier consolidation. We expect these impacts on our carrier revenue to continue.
Intercarrier Compensation Revenue
Intercarrier compensation revenue, which consists of switched access and reciprocal compensation, represented 3% of our total revenue for 11 consecutive quarters through the three months ended December 31, 2010 and declined to 2% of total revenue in the subsequent quarters, including the three months ended September 30, 2011. Intercarrier compensation revenue is likely to continue to decline in the future as a percentage of total revenue due to federal and state mandated rate reductions and proposed changes in the regulatory regime for intercarrier compensation (see the first risk factor in Part II Item 1A. Risk Factors). Intercarrier compensation revenue may also fluctuate from quarter to quarter based on variations in minutes of use originating and terminating on our network and changes in customer dispute activity.
Revenue and Customer Churn
Revenue churn, defined as the average lost recurring monthly billing for the period from a customer’s partial or complete disconnection of services (excluding pricing declines upon contract renewals and lost usage revenue) compared to reported revenue for the period, is a measure used by management to evaluate revenue retention. Customer and service disconnections occur as part of the normal course of business and are primarily associated with price competition from other providers, customers moving facilities to other locations, and customer cost cutting, business contractions, financial difficulties and consolidation, among other reasons. Beginning in late 2007 through 2009, we saw an increase in disconnections that we believe was due to the economic downturn resulting in average monthly revenue churn of 1.2% and 1.3% in the years ended December 31, 2008 and 2009, respectively. Revenue churn improved in the year ended December 31, 2010 to pre-recession levels of 1.0% of monthly revenue and continued at 1.0% of monthly revenue in the nine months ended September 30, 2011. We believe that the improvement in revenue churn is a result of improved economic conditions as well as measures we put in place to increase revenue retention. As a component of revenue churn, revenue lost from customers fully disconnecting services was 0.2% of monthly revenue for the nine months ended September 30, 2011, consistent with the same period in 2010. We cannot predict the total impact on revenue from future customer disconnections or the timing of such disconnections or whether these favorable churn trends will continue.
Customer churn, defined as the average monthly customer turnover for the period compared to the average monthly customer count for the period, was 1.0% for the nine months ended September 30, 2011 compared with 1.1% and 1.3% for the years ended December 31, 2010 and 2009, respectively. The majority of this churn came from our smaller customers, which we expect to continue.
Pricing
We experience significant price competition across our service categories that impacts our revenue. This competition is particularly intense for traditional inter-city point-to-point services, carrier point of presence (“POP”) to POP and POP to customer premise legacy dedicated services, data center to data center dedicated services Internet access, long distance service and integrated service bundles. We also believe that technology advancements in the telecommunications industry have resulted in lower unit costs for some electronics and equipment that drives customer demand for higher bandwidth at the same or lower prices.
27
tw telecom inc.
In our industry, service agreements typically range from two to five years, with fixed pricing for the contract term. When contracts are renewed with no changes to the services, pricing may be reduced to current market levels as a renewal incentive. In addition, during the terms of agreements, customers often purchase additional services or increase or decrease the capacity of existing services, subject to applicable early termination charges, depending on their business needs. During periods of economic downturn, our customers’ needs may contract, resulting in fewer service additions.
Pricing of Special Access Services
We provide special access services to customers over our own fiber facilities in competition with ILECs, and we also purchase special access and other services from ILECs to extend the reach of our network. The ILECs have argued before the FCC that the high capacity telecommunications services that they sell, including special access services we buy from them, should no longer be subject to regulations governing price and quality of service. We have advocated that the FCC should modify its special access pricing flexibility rules to return these services to price-cap regulation to protect against unreasonable price increases. The FCC is reviewing its regulation of special access pricing in a pending proceeding commenced in 2005 that has not yet resulted in proposed rules. As part of a group of CLECs, we filed a petition requesting a federal appeals court to require the FCC to complete this long-outstanding proceeding within six months. We cannot predict when the FCC will act on interstate special access pricing regulation or the impact of any such action.
If the special access services we buy from the ILECs were to be further deregulated, ILECs would have a greater ability to continue to increase the price and reduce the service quality of special access services they sell to us. As the prices we must pay for special access services increase, our margins may be adversely affected.
In addition, the FCC has granted petitions for forbearance from regulation of certain special access services, including Ethernet services offered by the ILECs as special access with the result that prices we would pay for the Ethernet and OC-n high capacity data services of the petitioning carriers are no longer price regulated and could increase. We continue to pursue and implement commercial arrangements with the ILECs and cable companies for these services on acceptable terms and conditions.
We entered into a two year wholesale service agreement through May 31, 2012 with a large ILEC under which that ILEC supplies us with tariffed special access and other services for end-user access and transport that was intended to stabilize the prices we pay for these services. This agreement replaced a prior agreement for these services that expired in May 2010. Beginning in mid-2010, the expiration of certain regulatory conditions to the ILEC’s previous merger increased its tariff pricing resulting in higher costs for some special access services subject to wholesale service agreements. In addition, Verizon Communications Inc., another of our significant suppliers of special access service, has increased its prices for special access services that we use to reach certain customer locations in their service area.
Pole Attachment Order
In April 2011, the FCC adopted reforms to its pole attachment rules to reduce costs and streamline the process for gaining access to pole attachments controlled by utility companies. Concluding that the prior disparity in pole attachment rental rates between cable television attachments and telecommunications attachments distorted incentives to invest in broadband infrastructure, the FCC adopted cost formula changes that would set the rate for telecommunications pole attachments at or near the rate paid by cable companies. In addition, the FCC adopted timelines by which utility companies must complete their survey and make-ready work to allow for requested attachments. We believe that these new rules will have a favorable impact on our pole attachment costs, will reduce previous cost advantages that favored cable competitors and improve the timeliness of our access to pole attachments. A number of utility companies have filed legal challenges to the
28
tw telecom inc.
rules in a federal appellate court. We and other telecommunications and cable television companies have filed petitions to intervene in the proceeding to support the FCC’s position. The extent of the potential favorable impact on our costs and the outcome of the challenge are not yet known.
Quarterly and Other Financial Trends
Although our business is not inherently seasonal in nature, historically our revenue and expense in the first quarter of the year has been impacted by some seasonal factors that may cause fluctuations from the prior quarter. First quarter installations and the associated revenue have sometimes been impacted by the slowing of our customers’ purchasing activities at the end of the fourth quarter. In the first quarter of 2011, we did not experience the seasonal slowing of revenue that we have historically experienced. Our historical experience with quarterly fluctuations may not necessarily be indicative of future results. Our expenses are also impacted in the first quarter by the resetting of payroll taxes and other employee-related cost increases.
Because we do not generally recognize revenue subject to billing disputes until the dispute is resolved, the timing of filing disputes and dispute resolutions may positively or negatively affect our revenue in a particular quarter. The timing of disconnections may also impact our results in a particular quarter, with disconnections early in the quarter having a greater impact. The timing of capital and other expenditures may affect our margins or cash flow. The convergence of any of these or other factors such as fluctuations in usage, increases or decreases in certain taxes and fees or pricing declines upon contract renewals in a particular quarter may result in our revenue and expenses growing more or less than previous trends, may impact our margins and other financial results and may not be indicative of future financial performance.
We have undertaken a number of initiatives to increase revenue growth, margins and cash flows that require both capital and operating investments. These operating investments in the nine months ended September 30, 2011 included expansion of our sales and sales support staff as well as IT and technical personnel and contract labor to support growing sales volumes and customer installations, support new product roll-outs and to design and implement platforms for our network and services, some of which must be incurred in advance of anticipated revenue. We increased our capital spending in 2010 compared to 2009 to fund new service portfolio enhancements, incremental success-based expenditures to support higher sales, including sales to wireless providers, strategic fiber expansions and corporate and IT initiatives that support the evolution of our services, enable our customer experience and drive increased scale and efficiency. We are continuing to invest in these types of growth initiatives in 2011. We cannot predict whether these and other initiatives will be sufficient to maintain our current financial performance or increase revenue growth, margins and cash flows.
Due to the quality of our customer base, successful collection efforts, internal controls, bad debt recoveries and our revenue recognition policies, including recognition of contract termination charges upon cash receipt, our bad debt expense was less than 1% of our total revenue for the nine months ended September 30, 2011 and the years ended December 31, 2010, 2009 and 2008. We cannot assure that we will be able to continue to maintain bad debt expense at this low level.
Our Modified EBITDA (see Note 2 to the table under “Results of Operations” for a definition of Modified EBITDA) has increased for 18 consecutive quarters due to the contribution from revenue growth and the initiatives described above, among other factors. Modified EBITDA grew 8.2% and 7.4%, in the three and nine months ended September 30, 2011, respectively, and 6.2%, 9.4% and 17.7% in the years ended December 31, 2010, 2009 and 2008, respectively, each compared to the respective period in the prior year. Modified EBITDA margin was 36.3% and 36.4% for the three and nine months ended September 30, 2011, respectively, and grew over the respective periods in 2010. These margins include the absorption of higher costs associated with the expansion of our employee base for sales, sales support, IT and technical personnel, increases in special access costs and increases in revenue and expenses for certain taxes and fees that are reported on a gross versus net basis
29
tw telecom inc.
(see “Revenue” in Note 1 to the condensed consolidated financial statements) . We expect that future growth in Modified EBITDA will come from revenue growth and continued cost efficiency initiatives; however, this growth may be impacted by competitive pressures, higher employee costs, higher special access costs, fuel and energy as well as any future inflationary pressures.
Critical Accounting Policies and Estimates
For a description of our critical accounting policies and estimates, see Item 7 in our Annual Report on Form 10-K/A for the year ended December 31, 2010, “Management’s Discussion and Analysis of Financial Condition and Results of Operations.”
30
tw telecom inc.
Results of Operations
The following table sets forth certain data from our unaudited condensed consolidated financial statements presented in thousands of dollars and expressed as a percentage of total revenue. This table should be read together with our condensed consolidated financial statements, including the notes thereto, appearing elsewhere in this report:
| | | | | | | | | | | | | | | | | | | | | | | | | | | | | | | | |
| | | Three Months Ended September 30, | | | Nine Months Ended September 30, | |
| | | 2011 | | | 2010 | | | 2011 | | | 2010 | |
| | | (amounts in thousands, except per share amounts) | |
Statements of Operations Data: | | | | | | | | | | | | | | | | | | | | | | | | | | | | | | | | |
Revenue: | | | | | | | | | | | | | | | | | | | | | | | | | | | | | | | | |
Data and Internet services | | $ | 164,670 | | | | 48 | % | | $ | 138,838 | | | | 43 | % | | $ | 475,025 | | | | 47 | % | | $ | 402,111 | | | | 42 | % |
Network services | | | 86,878 | | | | 25 | | | | 90,151 | | | | 28 | | | | 265,287 | | | | 26 | | | | 269,699 | | | | 28 | |
Voice services | | | 85,220 | | | | 25 | | | | 82,944 | | | | 26 | | | | 251,880 | | | | 25 | | | | 250,979 | | | | 27 | |
Intercarrier compensation | | | 7,688 | | | | 2 | | | | 8,361 | | | | 3 | | | | 23,192 | | | | 2 | | | | 25,565 | | | | 3 | |
| | | | | | | | | | | | | | | | | | | | | | | | | | | | | | | | |
Total revenue | | | 344,456 | | | | 100 | | | | 320,294 | | | | 100 | | | | 1,015,384 | | | | 100 | | | | 948,354 | | | | 100 | |
| | | | | | | | | | | | | | | | | | | | | | | | | | | | | | | | |
Costs and expenses (1): | | | | | | | | | | | | | | | | | | | | | | | | | | | | | | | | |
Operating (exclusive of depreciation, amortization, and accretion shown separately below) (1) | | | 144,161 | | | | 42 | | | | 133,237 | | | | 42 | | | | 425,141 | | | | 42 | | | | 394,411 | | | | 42 | |
Selling, general, and administrative (1) | | | 82,085 | | | | 24 | | | | 78,452 | | | | 24 | | | | 241,684 | | | | 24 | | | | 230,364 | | | | 24 | |
Depreciation, amortization, and accretion | | | 70,940 | | | | 21 | | | | 71,612 | | | | 22 | | | | 210,757 | | | | 21 | | | | 217,030 | | | | 23 | |
| | | | | | | | | | | | | | | | | | | | | | | | | | | | | | | | |
Total costs and expenses | | | 297,186 | | | | 86 | | | | 283,301 | | | | 88 | | | | 877,582 | | | | 86 | | | | 841,805 | | | | 89 | |
| | | | | | | | | | | | | | | | | | | | | | | | | | | | | | | | |
Operating income | | | 47,270 | | | | 14 | | | | 36,993 | | | | 12 | | | | 137,802 | | | | 14 | | | | 106,549 | | | | 11 | |
| | | | | | | | |
Interest expense | | | (21,930 | ) | | | (6 | ) | | | (19,634 | ) | | | (6 | ) | | | (65,747 | ) | | | (6 | ) | | | (60,324 | ) | | | (6 | ) |
Debt extinguishment costs | | | — | | | | — | | | | — | | | | — | | | | — | | | | — | | | | (17,070 | ) | | | (2 | ) |
Interest income | | | 126 | | | | — | | | | 209 | | | | — | | | | 443 | | | | — | | | | 438 | | | | — | |
Other income | | | — | | | | — | | | | 825 | | | | — | | | | — | | | | — | | | | 825 | | | | — | |
| | | | | | | | | | | | | | | | | | | | | | | | | | | | | | | | |
Income before income taxes | | | 25,466 | | | | 7 | | | | 18,393 | | | | 6 | | | | 72,498 | | | | 7 | | | | 30,418 | | | | 3 | |
Income tax expense (benefit) | | | 10,873 | | | | (3 | ) | | | 2,314 | | | | (1 | ) | | | 30,979 | | | | (3 | ) | | | (292,966 | ) | | | 31 | |
| | | | | | | | | | | | | | | | | | | | | | | | | | | | | | | | |
Net income | | $ | 14,593 | | | | 4 | % | | $ | 16,079 | | | | 5 | % | | $ | 41,519 | | | | 4 | % | | $ | 323,384 | | | | 34 | % |
| | | | | | | | | | | | | | | | | | | | | | | | | | | | | | | | |
Net income per share, basic | | $ | 0.10 | | | | | | | $ | 0.11 | | | | | | | $ | 0.28 | | | | | | | $ | 2.14 | | | | | |
| | | | | | | | | | | | | | | | | | | | | | | | | | | | | | | | |
Net income per share, dilulted | | $ | 0.10 | | | | | | | $ | 0.10 | | | | | | | $ | 0.27 | | | | | | | $ | 1.98 | | | | | |
| | | | | | | | | | | | | | | | | | | | | | | | | | | | | | | | |
Weighted average shares outstanding, basic | | | 147,084 | | | | | | | | 149,374 | | | | | | | | 147,528 | | | | | | | | 149,456 | | | | | |
Weighted average shares outstanding, diluted | | | 148,999 | | | | | | | | 151,698 | | | | | | | | 149,734 | | | | | | | | 171,741 | | | | | |
| | | | | | | | |
Modified EBITDA and Modified EBITDA margin (2)(3) | | $ | 125,023 | | | | 36 | % | | $ | 115,532 | | | | 36 | % | | $ | 369,653 | | | | 36 | % | | $ | 344,212 | | | | 36 | % |
Net cash provided by operating activities | | $ | 75,925 | | | | | | | $ | 105,433 | | | | | | | $ | 291,783 | | | | | | | $ | 295,572 | | | | | |
Net cash used in investing activities | | $ | (80,615 | ) | | | | | | $ | (43,819 | ) | | | | | | $ | (262,804 | ) | | | | | | $ | (324,652 | ) | | | | |
Net cash used in financing activities | | $ | (34,800 | ) | | | | | | $ | (8,731 | ) | | | | | | $ | (46,160 | ) | | | | | | $ | (11,311 | ) | | | | |
31
tw telecom inc.
| (1) | Includes the following non-cash stock-based employee compensation: |
| | | | | | | | | | | | | | | | |
| | | Three Months Ended
September 30, | | | Nine Months Ended
September 30, | |
| | | 2011 | | | 2010 | | | 2011 | | | 2010 | |
| | | (amounts in thousands) | |
Operating | | $ | 565 | | | $ | 825 | | | $ | 1,737 | | | $ | 2,332 | |
Selling, general, and administrative | | $ | 6,248 | | | $ | 6,102 | | | $ | 19,357 | | | $ | 18,301 | |
| (2) | “Modified EBITDA” is a non-GAAP financial measure and is defined by us as net income (loss) before depreciation, amortization and accretion expense, interest expense, interest income, debt extinguishment costs, other income (loss), impairment charges, income tax expense (benefit), cumulative effect of change in accounting principle, and non-cash stock-based compensation. Modified EBITDA is not intended to replace operating income (loss), net income (loss), cash flow and other measures of financial performance and liquidity reported in accordance with accounting principles generally accepted in the United States. Rather, Modified EBITDA is a measure of operating performance and liquidity that investors may consider in addition to such measures. Other companies may define Modified EBITDA or similar terms differently. Our management believes that Modified EBITDA is a standard measure of operating performance and liquidity that is commonly reported and widely used by analysts, investors, and other interested parties in the telecommunications industry because it eliminates many differences in financial, capitalization, and tax structures, as well as non-cash and non-operating charges to earnings. We believe that Modified EBITDA trends are a valuable indicator of whether our operations are able to produce sufficient operating cash flow to fund working capital needs, service debt obligations, and fund capital expenditures. We currently use Modified EBITDA for these purposes. Modified EBITDA also is used internally by our management to assess ongoing operations and is a measure used to test compliance with certain covenants of our 2018 Notes, our revolving credit facility (“Revolver”) and our Term Loan. The definition of EBITDA under our Revolver, our Term Loan and our 2018 Notes differs, but not materially, from the definition of Modified EBITDA used in this table. Modified EBITDA as used in this document may not be comparable to similarly titled measures reported by other companies due to differences in accounting and disclosure policies. The reconciliation between net income and Modified EBITDA is as follows: |
| | | | | | | | | | | | | | | | |
| | | Three Months Ended
September 30, | | | Nine Months Ended
September 30, | |
| | | 2011 | | | 2010 | | | 2011 | | | 2010 | |
| | | (amounts in thousands) | |
Net income | | $ | 14,593 | | | $ | 16,079 | | | $ | 41,519 | | | $ | 323,384 | |
Income tax expense (benefit) | | | 10,873 | | | | 2,314 | | | | 30,979 | | | | (292,966 | ) |
Interest income | | | (126 | ) | | | (209 | ) | | | (443 | ) | | | (438 | ) |
Other income | | | — | | | | (825 | ) | | | — | | | | (825 | ) |
Interest expense | | | 21,930 | | | | 19,634 | | | | 65,747 | | | | 60,324 | |
Debt extinguishment costs | | | — | | | | — | | | | — | | | | 17,070 | |
Depreciation, amortization, and accretion | | | 70,940 | | | | 71,612 | | | | 210,757 | | | | 217,030 | |
Non-cash stock-based compensation | | | 6,813 | | | | 6,927 | | | | 21,094 | | | | 20,633 | |
| | | | | | | | | | | | | | | | |
Modified EBITDA | | $ | 125,023 | | | $ | 115,532 | | | $ | 369,653 | | | $ | 344,212 | |
| | | | | | | | | | | | | | | | |
32
tw telecom inc.
The reconciliation between net cash provided by operations and Modified EBITDA, as a measure of liquidity, is as follows:
| | | | | | | | | | | | | | | | |
| | | Three Months Ended
September 30, | | | Nine Months Ended
September 30, | |
| | | 2011 | | | 2010 | | | 2011 | | | 2010 | |
| | | (amounts in thousands) | |
Net cash provided by operations | | $ | 75,925 | | | $ | 105,433 | | | $ | 291,783 | | | $ | 295,572 | |
Income tax expense (benefit) | | | 10,873 | | | | 2,314 | | | | 30,979 | | | | (292,966 | ) |
Deferred income taxes | | | (10,426 | ) | | | (647 | ) | | | (29,783 | ) | | | 295,094 | |
Interest income | | | (126 | ) | | | (209 | ) | | | (443 | ) | | | (438 | ) |
Interest expense | | | 21,930 | | | | 19,634 | | | | 65,747 | | | | 60,324 | |
Discount on debt, amortization of deferred debt issue costs and other | | | (5,887 | ) | | | (5,441 | ) | | | (17,374 | ) | | | (15,875 | ) |
Changes in operating assets and liabilities | | | 32,734 | | | | (5,552 | ) | | | 28,744 | | | | 2,501 | |
| | | | | | | | | | | | | | | | |
Modified EBITDA | | $ | 125,023 | | | $ | 115,532 | | | $ | 369,653 | | | $ | 344,212 | |
| | | | | | | | | | | | | | | | |
| (3) | Modified EBITDA margin represents Modified EBITDA as a percentage of revenue. |
Three Months Ended September 30, 2011 Compared to Three Months Ended September 30, 2010
Revenue.Total revenue increased $24.2 million, or 8%, to $344.5 million for the three months ended September 30, 2011, from $320.3 million for the comparable period in 2010. The primary driver of this growth in revenue was increased data and Internet services revenue from installed services to enterprise customers.
Data and Internet services revenue increased $25.8 million, or 19%, to $164.7 million for the three months ended September 30, 2011, from $138.8 million for the comparable period in 2010. The increase in data and Internet services revenue primarily resulted from installed Ethernet and IP-based product sales to enterprise customers.
Revenue from network services decreased $3.3 million, or 4%, to $86.9 million for the three months ended September 30, 2011, compared to $90.2 million for the comparable period in 2010. The decrease resulted primarily from customer disconnections and re-pricing of renewed customer contracts largely in transport services partially offset by growth in high capacity and collocation services and an increase in certain taxes and fees remitted to government authorities that we classify on a gross versus net basis in revenue and expense.
Voice services revenue increased $2.3 million, or 3%, to $85.2 million for the three months ended September 30, 2011 from $82.9 million for the comparable period in 2010. The increase in voice services revenue resulted primarily from installed sales of converged and other voice services and a related increase in certain taxes and fees partially offset by customer disconnections and a reduction in usage-based services. Revenue based on the minutes of service used by customers included in voice services was 3% and 4% of our total revenue for the three months ended September 30, 2011 and 2010, respectively.
Intercarrier compensation revenue, which consists of switched access and reciprocal compensation, decreased $0.7 million, or 8%, to $7.7 million for the three months ended September 30, 2011, from $8.4 million for the comparable period in 2010. The decrease was primarily due to a decline in minutes of use terminated on our network and rate reductions.
Operating Expenses.Our operating expenses consist of costs directly related to the operation and maintenance of our network and the provisioning of our services. These costs, which are net of costs capitalized for labor and overhead on capital projects, include the salaries and related expenses of customer care,
33
tw telecom inc.
provisioning, network maintenance, technical field and network operations and engineering personnel, costs to repair and maintain our network, costs paid to other carriers for access to their facilities, costs for interconnection, and facilities leased and associated utilities. We carry a significant portion of our traffic on our own fiber infrastructure, which enhances our ability to minimize and control access costs, which are the costs to purchase network services from other carriers. Operating expenses increased by $10.9 million, or 8%, to $144.2 million for the three months ended September 30, 2011, from $133.2 million for the comparable period in 2010. The increase in operating expenses was primarily due to higher network access costs, an increase in certain taxes and fees, and higher employee costs resulting from increased operating personnel and annual merit-based salary increases somewhat offset by a decrease in franchise fee expense. Operating expenses represented 42% of total revenue for both the three months ended September 30, 2011 and 2010.
Selling, General, and Administrative Expenses.Selling, general, and administrative expenses consist of salaries and related costs for employees and other expenses related to sales and marketing, bad debt, information technology, billing, regulatory, administrative and legal functions. Selling, general, and administrative expenses increased by $3.6 million, or 5%, to $82.1 million for the three months ended September 30, 2011, from $78.5 million for the comparable period in 2010. The increase was primarily due to higher employee costs resulting from incentive-based compensation for sales employees due to increased customer installations of service, expansion of our sales and sales support employee base and annual merit-based salary increases. Selling, general, and administrative expenses represented 24% of total revenue for both the three months ended September 30, 2011 and 2010.
Depreciation, Amortization, and Accretion Expense.Depreciation, amortization, and accretion expense decreased $0.7 million, or 1%, to $70.9 million for the three months ended September 30, 2011, from $71.6 million for the comparable period in 2010. The decrease was attributable to fully depreciated assets partially offset by additions to property, plant and equipment made during 2011 and 2010.
Interest Expense.Interest expense increased $2.3 million, or 12%, to $21.9 million for the three months ended September 30, 2011, from $19.6 million for the comparable period in 2010. The increase is primarily due to higher effective interest rates on our variable rate Term Loan as a result of the refinancing completed in the fourth quarter of 2010 that extended the term of a portion of that loan and an increase in non-cash interest expense associated with our Convertible Debentures.
Other Income.During the three months ended September 30, 2010, we recognized a gain of $0.8 million resulting from proceeds received upon liquidation of previously impaired commercial paper. There was no such gain during the three months ended September 30, 2011.
Income Before Income Taxes.Income before income taxes was $25.5 million for the three months ended September 30, 2011 compared to $18.4 million for the comparable period in 2010. The increase in income before income taxes of $7.1 million resulted primarily from an increase in Modified EBITDA slightly offset by the increase in interest expense.
Income Tax Expense (Benefit).Income tax expense was $10.9 million for the three months ended September 30, 2011, compared to $2.3 million in the comparable period in 2010. This change primarily resulted from a higher effective tax rate and an increase in income before income taxes during the three months ended September 30, 2011. We expect our 2011 effective tax rate to be approximately 45%.
Net Income and Modified EBITDA.Net income was $14.6 million for the three months ended September 30, 2011 compared to $16.1 million for the comparable period in 2010. The decrease in net income of $1.5 million resulted from an increase in income tax expense, partially offset by an increase in income before income taxes, as discussed above. Modified EBITDA increased $9.5 million to $125.0 million, or 36% of total revenue, for the three months ended September 30, 2011, from $115.5 million, or 36% of total revenue, for the comparable period
34
tw telecom inc.
in 2010. The increase in Modified EBITDA was primarily the result of the contribution from revenue growth as discussed above. For the three months ended September 30, 2011 and 2010, Modified EBITDA has been sufficient to cover our capital expenditures and service our debt, and we expect to generate sufficient Modified EBITDA in the foreseeable future to cover our expected capital expenditures and debt service requirements along with cash on hand. See Note 2 to the table under “Results of Operations” for a definition of Modified EBITDA and a reconciliation between net income and Modified EBITDA and net cash provided by operations and Modified EBITDA.
Nine Months Ended September 30, 2011 Compared to Nine Months Ended September 30, 2010
Revenue.Total revenue increased $67.0 million, or 7%, to $1,015.4 million for the nine months ended September 30, 2011, from $948.4 million for the comparable period in 2010. The primary driver of this growth in revenue was increased data and Internet services revenue from installed services to enterprise customers.
Data and Internet services revenue increased $72.9 million, or 18%, to $475.0 million for the nine months ended September 30, 2011, from $402.1 million for the comparable period in 2010. The increase in data and Internet services revenue primarily resulted from installed Ethernet and IP-based product sales to enterprise customers.
Revenue from network services decreased $4.4 million, or 2%, to $265.3 million for the nine months ended September 30, 2011, from $269.7 million for the comparable period in 2010. The decrease resulted primarily from re-pricing of renewed customer contracts and customer disconnections of transport services, partially offset by growth in high capacity and collocation services.
Voice services revenue increased $0.9 million to $251.9 million for the nine months ended September 30, 2011 from $251.0 million for the comparable period in 2010. The increase in voice services revenue resulted primarily from new installed sales of converged and other voice services and an increase in certain taxes and fees remitted to government authorities that we classify on a gross versus net basis in revenue and expense, partially offset by customer disconnections and a reduction in usage-based services. Revenue based on the minutes of service used by customers included in voice services was 3% and 4% of our total revenue for the nine months ended September 30, 2011 and 2010, respectively.
Intercarrier compensation revenue, which consists of switched access and reciprocal compensation, decreased $2.4 million, or 9%, to $23.2 million for the nine months ended September 30, 2011, from $25.6 million for the comparable period in 2010. The decrease was primarily due to fluctuations in dispute settlements, rate reductions and a decline in minutes of use terminated on our network.
Operating Expenses.Operating expenses increased by $30.7 million, or 8%, to $425.1 million for the nine months ended September 30, 2011, from $394.4 million for the comparable period in 2010. The increase in operating expenses is primarily due to increased network access costs, certain taxes and fees and higher employee costs resulting from increased operating personnel and annual merit-based salary increases. Operating expenses represented 42% of total revenue for both the nine months ended September 30, 2011 and 2010.
Selling, General, and Administrative Expenses.Selling, general, and administrative expenses increased by $11.3 million, or 5%, to $241.7 million for the nine months ended September 30, 2011, from $230.4 million for the comparable period in 2010. The increase was primarily due to higher employee costs resulting from incentive-based compensation for sales employees due to increased customer installations of service, expansion of our sales, sales support and IT employee base, annual merit-based salary increases and non-cash stock-based compensation. Selling, general, and administrative expenses represented 24% of total revenue for both the nine months ended September 30, 2011 and 2010.
35
tw telecom inc.
Depreciation, Amortization, and Accretion Expense.Depreciation, amortization, and accretion expense decreased $6.3 million, or 3%, to $210.8 million for the nine months ended September 30, 2011, from $217.0 million for the comparable period in 2010. The decrease was attributable to fully depreciated assets partially offset by additions to property, plant and equipment made during 2011 and 2010.
Interest Expense.Interest expense increased $5.4 million, or 9%, to $65.7 million for the nine months ended September 30, 2011, from $60.3 million for the comparable period in 2010. The increase is primarily due to higher effective interest rates on our variable rate Term Loan as a result of the refinancing completed in the fourth quarter of 2010 that extended the term of a portion of that loan and an increase in non-cash interest expense associated with our Convertible Debentures somewhat offset by lower effective interest rates on our 2018 Notes as a result of the debt refinancing that we completed in the first quarter of 2010.
Debt Extinguishment Costs.Debt extinguishment costs were $17.1 million for the nine months ended September 30, 2010, which resulted from the early retirement of $400 million principal amount of our 9 1/4% Senior Notes due February 2014 (the “2014 Notes”) and primarily consisted of $13.7 million in cash paid for call premiums and $3.6 million in non-cash write offs of deferred debt issuance costs. There were no such costs in the nine months ended September 30, 2011.
Other Income.During the nine months ended September 30, 2010, we recognized a gain of $0.8 million resulting from proceeds received upon liquidation of previously impaired commercial paper. There was no such gain during the nine months ended September 30, 2011.
Income Before Income Taxes.Income before income taxes was $72.5 million for the nine months ended September 30, 2011 compared to $30.4 million for the comparable period in 2010. The increase in income before income taxes of $42.1 million primarily resulted from debt extinguishment costs in the prior year period that did not recur, an increase in Modified EBITDA and lower depreciation, amortization and accretion, partially offset by an increase in interest expense.
Income Tax Expense (Benefit).Income tax expense was $31.0 million for the nine months ended September 30, 2011, compared to an income tax benefit of $293.0 million in the comparable period in 2010. This change primarily related to a $299.0 million non-cash income tax benefit resulting from the recognition of the value of deferred tax assets during the nine months ended September 30, 2010, as well as a higher effective tax rate and an increase in income before income taxes during the nine months ended September 30, 2011. We expect our 2011 effective tax rate to be approximately 45%.
Net Income and Modified EBITDA.Net income was $41.5 million for the nine months ended September 30, 2011 compared to $323.4 million for the comparable period in 2010. The decrease in net income of $281.9 million resulted from the income tax expense (benefit) items described above, partially offset by the increase in income before income tax expense. Modified EBITDA increased $25.4 million to $369.7 million, or 36% of total revenue, for the nine months ended September 30, 2011, from $344.2 million, or 36% of total revenue, for the comparable period in 2010. The increase in Modified EBITDA was primarily the result of the contribution from revenue growth, partially offset by an increase in employee expenses as discussed above. For the nine months ended September 30, 2011 and 2010, Modified EBITDA has been sufficient to cover our capital expenditures and service our debt, and we expect to generate sufficient Modified EBITDA in the foreseeable future to cover our expected capital expenditures and debt service requirements along with cash on hand.
Liquidity and Capital Resources
Historically, we have generated cash flow from operations consisting primarily of payments received from customers for the provision of business communications services offset by payments to other telecommunications carriers, payments to employees, and payments for interest and other operating, selling,
36
tw telecom inc.
general, and administrative costs. We have also generated cash from debt and equity financing activities and have used funds to service or repay our debt obligations, make capital expenditures to expand our network and fund acquisitions. In 2010 and 2011, we also used cash to repurchase our common stock and may continue to do so in the future.
At September 30, 2011, we had approximately $1.4 billion of total debt and capital lease obligations and $469.1 million of cash, cash equivalents and short-term investments compared to approximately $1.3 billion of total debt and capital lease obligations and $475.6 million of cash, cash equivalents and short-term investments at December 31, 2010. Net debt (defined as total debt and capital lease obligations less cash, cash equivalents and short-term investments) increased $18.2 million from December 31, 2010 primarily due to an increase in our total debt resulting from accretion of the discount on our Convertible Debentures, capital expenditures and repurchases of our common stock partially offset by cash provided by operating activities resulting from higher Modified EBITDA and cash proceeds from stock option exercises.
Working capital, defined as current assets less current liabilities, was $326.7 million as of September 30, 2011, an increase of $13.9 million from December 31, 2010. Our working capital ratio, defined as current assets divided by current liabilities, was 2.10 as of September 30, 2011 compared to 2.04 as of December 31, 2010. The increase in working capital is primarily a result of cash provided by operating activities resulting from higher Modified EBITDA.
Cash Flow Activity
Cash and cash equivalents were $339.7 million and $405.5 million as of September 30, 2011 and 2010, respectively. In addition, we had investments of $129.4 million and $101.9 million as of September 30, 2011 and 2010, respectively, which were short-term in nature and generally available to fund our operations. The change in cash and cash equivalents during the periods presented was as follows:
| | | | | | | | |
| | | Nine Months Ended September 30, | |
| | | 2011 | | | 2010 | |
| | | (amounts in thousands) | |
Cash provided by operating activities | | $ | 291,783 | | | $ | 295,572 | |
Cash used in investing activities | | | (262,804 | ) | | | (324,652 | ) |
Cash used in financing activities | | | (46,160 | ) | | | (11,311 | ) |
| | | | | | | | |
Decrease in cash and cash equivalents | | $ | (17,181 | ) | | $ | (40,391 | ) |
| | | | | | | | |
Operations.Cash provided by operating activities was $291.8 million for the nine months ended September 30, 2011 compared to $295.6 million for the same period in 2010. This decrease in cash provided by operating activities primarily related to changes in working capital that are largely due to the timing of payments to vendors and collection of receivables somewhat offset by higher Modified EBITDA.
Investing.Cash used in investing activities was $262.8 million for the nine months ended September 30, 2011 compared to $324.7 million for the same period in 2010, primarily a result of the net decrease in cash used for the purchase and sale of investments in 2011. Our balances of cash, cash equivalents and investments shift over time based on our cash requirements and market interest yields. Cash used for capital expenditures for the nine months ended September 30, 2011 was $254.1 million, the majority of which was success-based spending initiatives (see “Capital Expenditures and Requirements” below), compared to $243.7 million for the nine months ended September 30, 2010.
Financing.Cash used in financing activities was $46.2 million for the nine months ended September 30, 2011, primarily consisting of repurchases of $50.0 million of our common stock, payments of $5.2 million on the Term Loan and capital lease obligations partially offset by proceeds of $9.0 million from exercises of stock
37
tw telecom inc.
options net of withholding taxes paid by us on behalf of employees in net share settlements of primarily restricted stock. Cash used in financing activities was $11.3 million for the nine months ended September 30, 2010, primarily consisting of repurchases of $11.7 million of our common stock and payments of $5.5 million on the Term Loan and capital lease obligations partially offset by net proceeds of $3.7 million from issuance of the 2018 Notes and retirement of the 2014 Notes.
As of September 30, 2011, we had the following indebtedness outstanding or available:
| | | | | | | | |
Instrument | | Principal Amount
Outstanding | | | Aggregate Annual
Estimated Interest
Payments | |
| | | (amounts in thousands) | |
8% Senior Notes due 2018 | | $ | 430,000 | | | $ | 34,400 | |
2 3/8% Convertible Senior Debentures due 2026 (1) | | | 373,744 | | | | 8,876 | |
Term Loan, Eurodollar rate + 3.25% due 2016 (2) | | | 469,176 | | | | 18,866 | |
Term Loan, Eurodollar rate + 1.75%-2.0% due 2013 (3) | | | 102,324 | | | | 2,558 | |
Undrawn $80 million Revolver expires 2014 | | | — | | | | — | |
| (1) | The Convertible Debentures are redeemable in whole or in part at our option at any time on or after April 6, 2013 at a redemption price equal to 100% of the principal amount of the debentures to be redeemed, plus accrued and unpaid interest. Holders of the Convertible Debentures have the option to require us to purchase all or part of the Convertible Debentures on April 1, 2013, April 1, 2016, or April 1, 2021, or at any time prior to April 1, 2026 to convert the debentures into shares of our common stock. Upon conversion, we will have the right to deliver, in lieu of shares of common stock, cash or a combination of cash and shares of common stock. |
| (2) | The aggregate annual interest payments are based on the weighted average effective interest rate, including the interest rate swap described below, of 4.02% at September 30, 2011. |
| (3) | As of September 30, 2011, a spread of 1.75% over the applicable Eurodollar rate was in effect. The aggregate annual interest payments are based on the weighted average effective interest rate, including the interest rate swap described below, of 2.50% at September 30, 2011. |
On November 5, 2008, we entered into a three year interest rate swap commencing November 28, 2008 with a 2.96% fixed interest rate that hedges the interest rate on the second $100 million of the Term Loan resulting in a total rate, based on a weighted average rate of the applicable spread for the Term Loan due 2016 and the Term Loan due 2013, of 5.94% on a notional amount of $100 million. We may enter into interest rate swaps in the future if we determine that it would be advisable to hedge any portion of the interest rate fluctuation risk with respect to our floating rate indebtedness.
38
tw telecom inc.
The following diagram summarizes our corporate structure in relation to our outstanding indebtedness and credit facility as of September 30, 2011. The diagram does not depict all aspects of ownership structure among the operating and holding entities, but rather summarizes the significant elements relative to our debt in order to provide a basic overview.
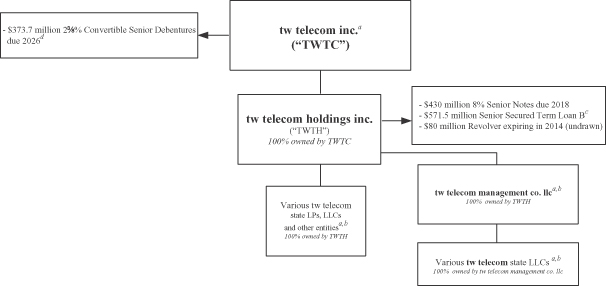
| a | TWTC and substantially all of these subsidiaries guarantee the 2018 Notes on an unsecured basis and the Revolver and Term Loan on a secured basis. |
| b | The assets and equity interests of these subsidiaries are pledged to secure the Revolver and the Term Loan. |
| c | The Term Loan matures in two separate tranches: as of September 30, 2011, approximately $469.2 million matures in December 2016 and approximately $102.3 million matures in January 2013. Such principal amounts are reduced by quarterly principal payments over the respective terms of the two tranches. |
| d | The Convertible Debentures are redeemable in whole or in part at our option at any time on or after April 6, 2013 at a redemption price equal to 100% of the principal amount of the debentures to be redeemed, plus accrued and unpaid interest. Holders of the Convertible Debentures have the option to require us to purchase all or part of the Convertible Debentures on April 1, 2013, April 1, 2016, or April 1, 2021, or at any time prior to April 1, 2026 to convert the debentures into shares of our common stock. |
Capital Expenditures and Requirements
Our total capital expenditures were $256.1 million for the nine months ended September 30, 2011 compared to $243.7 million for the same period in 2010, with the majority of capital expenditures in each period for success-based initiatives. In each of the years ended 2005 through 2010, over 75% of our total annual capital expenditures, excluding capital expenditures for integration and branding, were for success-based opportunities that are directly linked to new installations and capacity requirements. Success-based spending consists of short-to-medium length capital projects, in terms of anticipated time between capital spending and return on investment, driven by customer opportunities. This includes costs to connect to new customer locations with our fiber network and increase capacity in our network, IP backbone enhancements, collocation facility expansion and central office infrastructure to serve growing customer demands. These types of expenditures fluctuate as our volume of sales and service installations increases or decreases.
39
tw telecom inc.
For the full year 2011, we expect total capital expenditures to be approximately $340 million to $350 million (see “Capital Resources” below for discussion of anticipated funding sources), the majority of which we expect to be for success-based investments for new sales opportunities such as building additions, network and increased connectivity to wireless providers and the balance of which we expect to be for longer-term investments for strategic fiber network expansions and key IT initiatives to support our network platform, products and customer experience. Included in our expected capital expenditures are amounts we must spend to replace older network components, especially electronics, that we expect will continue to grow over time. We expect quarterly fluctuations in our capital spending due to the timing of large projects and other external factors such as customer readiness, permitting and weather. We generally do not make long-term commitments for capital expenditures and have the ability to adjust our capital expenditures if our cash from operations is lower than anticipated or in response to a change in demand.
Capital Resources
Based on current assumptions, we expect to generate sufficient cash from operations along with available cash on hand, including cash equivalents, investments, and borrowing capacity under our undrawn Revolver, to provide sufficient funds to meet our expected capital expenditure and liquidity needs to operate our business and service our debt for the foreseeable future. We believe that as of September 30, 2011, the absence of significant debt maturities until 2013, the extension of a significant portion of our Term Loan from January 2013 to December 2016, the replacement of our 2014 Notes with the 2018 Notes, the absence of financial maintenance covenants in our Term Loan, $339.7 million in cash and cash equivalents, $129.4 million in short-term investments and an $80 million undrawn Revolver, provide us flexibility to make investments that we deem appropriate for ongoing operations. However, if our assumptions prove incorrect or if there are other factors that negatively affect our cash position such as material unanticipated losses, a significant reduction in demand for our products, an acceleration of customer disconnections or other adverse factors or if we make material acquisitions or enter into joint ventures, we may need to seek additional sources of funds through financing or other means. There is no assurance that other sources of financing on acceptable terms will be available to us in the future.
Our ability to draw upon the available commitments under our Revolver is subject to compliance with all of the covenants contained in the credit agreement and our continued ability to make certain representations and warranties. In the case of the Revolver, the covenants include financial covenants, such as leverage and interest coverage ratios and limitations on capital expenditures that are primarily derived from Modified EBITDA and debt levels. We are required to comply with these ratios as a condition to any borrowing under the Revolver and for as long as any loans are outstanding under the Revolver. The representations and warranties include the absence of liens on our properties other than certain permitted liens, the absence of litigation or other developments that have or could reasonably be expected to have a material adverse effect on us and our subsidiaries as a whole, and continued effectiveness of the documents granting security for the loans.
A lack of revenue growth or an inability to control costs could negatively impact Modified EBITDA and cause our failure to meet the required minimum ratios under the Revolver, if we have loans outstanding under the Revolver or wish to draw on it. Although we currently believe that we will continue to be in compliance with the covenants, various factors, including deterioration of the economy, increased competition and pricing pressure and loss of revenue from significant customers, an acceleration of customer disconnections, a significant reduction in demand for our products without adequate reductions in capital expenditures and operating expenses, or an uninsured catastrophic loss of physical assets or other risk factors could cause us to fail to meet our covenants. If our revenue growth is not sufficient to sustain the Modified EBITDA performance required to meet the debt covenants described above, and we have loans outstanding under the Revolver or wish to draw on it, we would have to consider cost cutting or other measures to maintain required Modified EBITDA levels or to enhance liquidity.
40
tw telecom inc.
The Revolver, Term Loan and 2018 Notes limit our ability to declare cash dividends, incur indebtedness, incur liens on property and undertake acquisitions, among other things. The Revolver, Term Loan and 2018 Notes also include cross default provisions under which we are deemed to be in default if we default under any of the other material outstanding obligations. If we are in default under any of the covenants under the Term Loan and Revolver, we also could potentially be subject to an acceleration of the repayment date of the Term Loan and the Revolver if we have borrowed under that facility. Covenant defaults under the Revolver and Term Loan agreements also may constitute an event of default under the indenture for the 2018 Notes. In addition, the lenders under the Revolver may require prepayment of outstanding revolving loans if a change of control and ratings decline occurs as defined in the Revolver agreement. We are required to offer to prepay the 2018 Notes and the Term Loans on an individual basis if a change of control and a debt rating decline occurs as defined in the indenture for the 2018 Notes and the Term Loan agreement. If we do not comply with the covenants under the Revolver, we would not be able to draw funds under the Revolver, outstanding revolving loans could be accelerated or the lenders could cancel the Revolver unless the respective lenders agree to further modify the covenants. Although we believe our relationships with our lenders are good, there is no assurance that we would be able to obtain the necessary covenant modifications on acceptable terms or at all. As of September 30, 2011, we were in compliance with all of our debt covenants. If our plans or assumptions change or prove to be inaccurate, or the foregoing sources of funds prove to be insufficient to fund our growth and operations, or if we consummate acquisitions or joint ventures, we would be required to seek additional capital. Additional sources of financing may include public or private debt, equity financing by us or our subsidiaries or other financing arrangements. There is no assurance that we would be able to obtain additional financing on terms acceptable to us or at all. Other risks, such as a rating downgrade on our debt, could further impact our potential access to financing sources.
Our revenue and costs are partially dependent upon factors that are outside our control, including, among other factors, general economic conditions, regulatory changes, adverse changes in customers’ financial condition, changes in technology and increased competition. As a result, our actual revenue and costs may vary from expected amounts, possibly to a material degree, and these variations would likely affect the level of our future capital expenditures and expansion plans.
Possible Future Uses of Cash.Our financial performance and cash, cash equivalent and short-term investments of $469.1 million allow us flexibility to make strategic choices in the use of our cash. In order to reduce future cash interest payments, as well as future amounts due at maturity or mandatory redemption and reduce our leverage, we or our affiliates may, from time to time, enter into additional interest rate swap agreements or purchase or redeem our outstanding 2018 Notes or Convertible Debentures for cash or equity securities in the open market or privately negotiated transactions or engage in other transactions to reduce the principal amount of outstanding 2018 Notes or Convertible Debentures. We also may seek to refinance or otherwise replace or prepay all or a portion of our Term Loan and Revolver or may seek to refinance our otherwise replace our Convertible Debentures. In January 2013 when $102.3 million of our Term Loan matures, we will evaluate various options for refinancing that indebtedness depending on market conditions or we could use cash to repay that indebtedness in whole or in part. Under the terms of our Revolver, which is more restrictive than our Term Loan and the indenture for the 2018 Notes, we currently may repurchase a portion of our 2018 Notes or Convertible Debentures if we meet a minimum current liquidity test of $300 million and other tests, which we met as of September 30, 2011, and do not use the Revolver proceeds for this purpose. As of September 30, 2011, we completed the repurchase of $50 million of our common stock that our Board of Directors authorized on February 4, 2011. See Part II, Item 2, “Unregistered Shares of Equity Securities and Use of Proceeds” for repurchases through September 30, 2011. Our Revolver permits annual repurchases of up to $50 million of our common stock in the aggregate if after the transaction we have a minimum of $225 million in cash and cash equivalents, have not used that basket for other permissible purposes and meet certain other conditions, which conditions we met as of September 30, 2011. Unused amounts under this covenant can be carried over to subsequent years. This test under the Revolver is more restrictive than our other debt agreements. We may
41
tw telecom inc.
consider repurchasing additional shares of our common stock in public or private transactions or may consider paying dividends to the extent permitted by our debt covenants. Additionally, we may consider merger and acquisition opportunities that could impact our cash usage. We will evaluate any such transactions in light of market conditions, taking into account our liquidity and prospects for access to capital, benefits to us of any such transaction and contractual constraints.
Risk Management.As of September 30, 2011, our cash, cash equivalents and short-term investments were held in financial institutions, U.S. Treasury money market mutual funds, certificates of deposit, debt securities issued by U.S. government and treasury agencies, and corporate debt securities, some of which are guaranteed by the federal government’s Temporary Liquidity Guarantee Program. Although we actively monitor the depository institutions and the performance and quality of our investments and the mutual funds that hold our cash and cash equivalents, we are exposed to risks resulting from deterioration in the financial condition or failure of financial institutions holding our cash deposits, decisions of our investment advisors and the investment managers of the money market funds and defaults in securities underlying the funds and investments. We prioritize safety over investment return in choosing the investment vehicles for cash, cash equivalents and investments and have diversified these investments to the extent practical to minimize our exposure to any one investment vehicle or financial institution. We may change the nature of our cash, cash equivalent and short-term investments as market conditions change.
Off-Balance Sheet Arrangements.As of September 30, 2011, we did not have any off-balance sheet arrangements, as defined in Item 303(a)(4)(ii) of SEC Regulation S-K.
Commitments.Our long-term commitments have not materially changed from those disclosed in our Annual Report on Form 10-K/A for the year ended December 31, 2010.
Item 3. Quantitative and Qualitative Disclosures About Market Risk
For quantitative and qualitative disclosures about market risk, see Item 7A, “Quantitative and Qualitative Disclosures About Market Risk” in our Annual Report on Form 10-K/A for the year ended December 31, 2010. Our exposures to market risk have not changed materially since December 31, 2010.
Item 4. Controls and Procedures
Disclosure Controls and Procedures
Our management, with the participation of our Chief Executive Officer and Chief Financial Officer, evaluated the effectiveness of the design and operation of our disclosure controls and procedures, as defined in Rules 13a-15(e) and 15d-15(e) under the Securities Exchange Act of 1934 as of September 30, 2011 and concluded that our disclosure controls and procedures were effective as of that date. Management recognizes that any disclosure controls and procedures no matter how well designed and operated, can only provide reasonable assurance of achieving their objectives and management necessarily applies its judgment in evaluating the cost-benefit relationship of possible controls and procedures.
Our Chief Executive Officer and Chief Financial Officer, as a consequence of the restatement of certain historical financial results referenced below, subsequently concluded that our disclosure controls and procedures were not effective to provide reasonable assurance as of September 30, 2011 because management has concluded that a deficiency in the internal control over the assessment of income tax planning strategies in connection with our deferred tax asset constitutes a material weakness in internal control over financial reporting. Notwithstanding this material weakness, management, based upon the work performed during the restatement process, has concluded that our Condensed Consolidated Financial Statements included in this Form 10-Q are
42
tw telecom inc.
fairly stated in all material respects in accordance with U.S. generally accepted accounting principles for each of the periods presented herein.
For additional information regarding the restatement of certain of our historical financial results and the material weakness identified by management, see Note 2 to the Annual Consolidated Financial Statements and “Item 9A. Controls and Procedures” in our Amendment No. 2 to our Annual Report on Form 10-K/A for the year ended December 31, 2010.
Changes in Internal Controls
There were no changes in our internal control over financial reporting that occurred during the three months ended September 30, 2011 that have materially affected, or are reasonably likely to materially affect, our internal control over financial reporting, as the circumstances that led to the restatement had not yet been identified. However, as a result of the identification of the specific issue that led to the restatement of certain historical financial results in our Annual Report on Form 10-K for the year ended December 31, 2010 and our reports on Form 10-Q for the periods ended March 31, 2011 and June 30, 2011, we will put into place remediation steps to address the material weakness and to improve our internal control over financial reporting. Specifically, we will routinely evaluate the necessity for third party tax specialists’ advice or assistance and utilize such advice or assistance as deemed appropriate when dealing with material and complex tax accounting matters in connection with the preparation of our financial statements, including tax planning strategies related to our valuation allowance.
Part II. Other Information
Item 1. Legal Proceedings
We are party to various claims and legal and regulatory proceedings in the ordinary course of business. We do not believe that these claims or proceedings, individually or in the aggregate, are material or will have a material adverse effect on our business, financial condition or results of operations.
Item 1A. Risk Factors
The following replaces and amends the fourteenth Risk Factor in our Form 10-K/A for the year ended December 31, 2010:
We have experienced reductions in switched access and reciprocal compensation revenue as a result of regulatory changes and expect to experience further such reduction in the future.
Over time, FCC and state regulations have had the result of reducing our switched access and reciprocal compensation revenue. For several years, the FCC has been considering proposals for an integrated intercarrier compensation regime under which all traffic exchanged between carriers would be subject to a unified rate or to “bill and keep,” meaning that the exchange of traffic would generate no revenue or expense. In addition, some states have adopted, and other states are considering, rules that cap CLECs’ switched access rates. Switched access and reciprocal compensation have both been declining over time and together represented 2% of our total revenue for the nine months ended September 30, 2011. On October 27, 2011, the FCC adopted an Order mandating intercarrier compensation reform. Although the details of the Order have not been released, we are aware that the Order provides for intercarrier compensation rates to transition to bill and keep over a period of at least six years, which will result in decreases in our intercarrier compensation revenue. There is no assurance that we will be able to compensate for the reduction in our intercarrier compensation revenue with other revenue sources. The details of the Order, when released, may include other provisions that positively or negatively impact our revenue or expense.
43
tw telecom inc.
The following replaces and amends the fourth to the last risk factor in our Form 10-K/A for the year ended December 31, 2010:
Terrorism or other business disruptions could affect our future operating results.
Our operating results and financial condition could be materially and adversely affected if there is a catastrophic event such as a terrorist attack on the United States, cyber-attacks or other breaches of network or information technology (IT) or a major earthquake, fire, hurricane, flood or similar event that affects our central offices, corporate headquarters, network operations centers or other facilities. Although we have implemented measures that are designed to mitigate the effects of such events, we cannot predict the impact of such events. We maintain insurance coverage for some of these events; however, the potential liabilities associated with these events could exceed the insurance coverage we maintain. Our inability to operate our networks as a result of such events, even for a limited period of time, may result in significant expenses and/or loss of customers and associated revenue. The inability to obtain equipment, fiber optics or other network components may affect our ability to provision new services to customers, expand our networks or replace obsolete equipment. In addition, a failure to protect the privacy of customer and employee confidential data against breaches of network or IT security could result in damage our reputation.
There have been widely reported disruptions in the manufacturing industry due to the catastrophic earthquake and tsunami in Japan during the first quarter of 2011 and the floods in Thailand in October 2011. We were advised by our major supply vendors that they did not anticipate a shortage of components for their equipment or in supplies of fiber optic cable as a result of the conditions in Japan, and we have not yet experienced any disruption, but there is risk that we could experience longer lead times in obtaining such equipment or fiber in the future. There is also risk that supplies of equipment from vendors with facilities impacted by the floods in Thailand could be disrupted. If that occurs, we believe that we can obtain alternate equipment from other vendors. We continue to monitor the situation with our vendors in order to be able to anticipate possible interruptions in equipment or other supplies.
Item 2. Unregistered Sales of Equity Securities and Use of Proceeds
The following table presents our purchases of equity securities reportable during the three months ended September 30, 2011:
| | | | | | | | | | | | | | | | |
Period | | Total Number of
Shares Purchased | | | Average Price
Paid per Share | | | Total Number of Shares
Purchased as Part of
Publicly Announced
Plans or Programs (1) | | | Maximum Number (or
Approximate Dollar
Value) of Shares that
May Yet Be Purchased
Under the Plans or
Programs (1) | |
July 1 - July 31, 2011 | | | 364,867 | | | $ | 19.87 | | | | 364,867 | | | | 27,337,925 | |
August 1 - August 31, 2011 | | | 1,509,681 | | | $ | 18.12 | | | | 1,509,681 | | | | — | |
September 1 - September 30, 2011 | | | — | | | $ | — | | | | — | | | | — | |
| | | | | | | | | | | | | | | | |
Total | | | 1,874,548 | | | | | | | | 1,874,548 | | | | | |
| | | | | | | | | | | | | | | | |
| (1) | On February 4, 2011, our Board of Directors authorized the repurchase of up to $50 million of our common stock. As of September 30, 2011, we had repurchased $50 million of our common stock under the authorization. |
Item 6. Exhibits
The exhibits listed on the accompanying Exhibit Index are filed or incorporated by reference as part of this report and the Exhibit Index is incorporated herein by reference.
44
Signature
Pursuant to the requirements of the Securities Exchange Act of 1934, the Registrant has duly caused this report to be signed on its behalf by the undersigned thereunto duly authorized.
| | | | |
| | tw telecom inc. |
| | |
| Date: November 9, 2011 | | By: | | /S/ JILL R. STUART |
| | | | Jill R. Stuart Sr. Vice President, Accounting and Finance and Chief Accounting Officer |
45
EXHIBIT INDEX
| | |
Exhibit
Number | | Description of Exhibit |
| |
| 3.1 – | | Restated Certificate of Incorporation of the Company (filed as Exhibit 3.1 to the Company’s Quarterly Report on Form 10-Q for the quarter ended June 30, 2007)* |
| |
| 3.2 – | | Certificate of Amendment to Restated Certificate of Incorporation of the Company (filed as Exhibit 3.2 to the Company’s Quarterly Report on Form 10-Q for the quarter ended March 31, 2008)* |
| |
| 3.3 – | | Amended By-laws of the Company (filed as Exhibit 99.1 to the Company’s Current Report on Form 8-K dated September 17, 2007)* |
| |
| 4.1 – | | Indenture dated March 17, 2010 amongtw telecom holdings inc., tw telecom inc.,the Subsidiary Guarantors parties thereto and Wells Fargo Bank, National Association, as Trustee for the 8% Senior Notes due 2018 (filed as Exhibit 4.1 to the Company’s Current Report on Form 8-K dated March 17, 2010)* |
| |
| 4.2 – | | Amendment and Restatement Agreement (including Amended and Restated Credit Agreement), dated as of December 2, 2010, among the Company,tw telecom holdings inc., the Subsidiary Guarantors parties thereto, the Consenting Lenders and Wells Fargo Bank, National Association, as administrative and collateral agent (filed as Exhibit 99.1 to the Company’s Current Report on Form 8-K dated December 2, 2010)* |
| |
| 4.3 – | | Certification of Designations of Series A Junior Participating Preferred Stock oftw telecom inc.(filed as Exhibit 4.6 to the Company’s Quarterly Report on Form 10-Q for the quarter ended March 31, 2009)* |
| |
| 4.4 – | | Rights Agreement dated as of January 20, 2009 betweentw telecom inc.and Wells Fargo Bank, National Association, as Trustee (filed as Exhibit 4.1 to the Company’s Current Report on Form 8-K dated January 20, 2009)* |
| |
| 4.5 – | | Indenture dated March 29, 2006, between Time Warner Telecom Inc. and Wells Fargo Bank, National Association, as Trustee (filed as Exhibit 4.1 to the Company’s Quarterly Report on Form 10-Q for the quarter ended March 31, 2006)* |
| |
| 4.6 – | | First Supplemental Indenture dated March 29, 2006 between Time Warner Telecom Inc. and Wells Fargo Bank, National Association, creating 2.375% Convertible Senior Debentures due 2026 (filed as Exhibit 4.2 to the Company’s Quarterly Report on Form 10-Q for the quarter ended March 31, 2006)* |
| |
| 31.1 – | | Certification of Chief Executive Officer pursuant to Item 601(b)(31) of Regulation S-K, as adopted pursuant to Section 302 of the Sarbanes-Oxley Act of 2002 |
| |
| 31.2 – | | Certification of Chief Financial Officer pursuant to Item 601(b)(31) of Regulation S-K, as adopted pursuant to Section 302 of the Sarbanes-Oxley Act of 2002 |
| |
| 32.1 – | | Certification of Chief Executive Officer pursuant to 18 U.S.C. Section 1350, as adopted pursuant to Section 906 of the Sarbanes-Oxley Act of 2002 |
| |
| 32.2 – | | Certification of Chief Financial Officer pursuant to 18 U.S.C. Section 1350, as adopted pursuant to Section 906 of the Sarbanes-Oxley Act of 2002 |
| |
| 101.INS – | | XBRL Instance Document** |
| |
| 101.SCH – | | XBRL Taxonomy Extension Schema Document** |
| |
| 101.CAL – | | XBRL Taxonomy Extension Calculation Linkbase Document** |
| |
| 101.DEF – | | XBRL Taxonomy Extension Definition Linkbase Document** |
| |
| 101.LAB – | | XBRL Taxonomy Extension Label Linkbase Document** |
| |
| 101.PRE – | | XBRL Taxonomy Extension Presentation Linkbase Document** |
46
| * | Incorporated by reference. |
| ** | Pursuant to Rule 406T of Regulation S-T, these Interactive Data Files are deemed not filed or part of a registration statement or prospectus for purposes of Sections 11 or 12 of the Securities Act of 1933, as amended, are deemed not filed for purposes of Section 18 of the Securities Exchange Act of 1934, as amended, and otherwise are not subject to the liability under these sections. |
47