Evergreen Investment Company, Inc.
A copy of the restated shareholder report is available on EvergreenInvestments.com. If you have questions regarding this restatement, please contact your financial advisor or an Evergreen Client Service representative at 800-343-2898.
FUND AT A GLANCE
as of October 31, 2008
MANAGEMENT TEAM
Investment Advisor:
Evergreen Investment Management Company, LLC
Sub-Advisors:
Evergreen International Advisors; Tattersall Advisory Group, Inc.
Portfolio Managers:
Robert A. Calhoun, CFA; Michael Lee; Anthony Norris; Alex Perrin; Peter Wilson; Parham M. Behrooz, CFA; Andrew Cestone; Todd C. Kuimjian, CFA
CURRENT INVESTMENT STYLE

Source: Morningstar, Inc.
Morningstar’s style box is based on a portfolio date as of 9/30/2008.
The Fixed Income style box placement is based on a fund’s average effective maturity or duration and the average credit rating of the bond portfolio.
PERFORMANCE AND RETURNS
Portfolio inception date: 11/30/1972
| | Class A | | Class B | | Class C | | Class I |
Class inception date | | 5/20/2005 | | 5/20/2005 | | 5/20/2005 | | 11/30/1972 |
|
|
|
|
|
|
|
|
|
Nasdaq symbol | | EKDLX | | EKDMX | | EKDCX | | EKDYX |
|
|
|
|
|
|
|
|
|
6-month return with sales charge | | -22.71% | | -23.05% | | -19.95% | | N/A |
|
|
|
|
|
|
|
|
|
6-month return w/o sales charge | | -18.84% | | -19.10% | | -19.16% | | -18.73% |
|
|
|
|
|
|
|
|
|
Average annual return* | | | | | | | | |
|
|
|
|
|
|
|
|
|
1-year with sales charge | | -25.97% | | -26.54% | | -23.60% | | N/A |
|
|
|
|
|
|
|
|
|
1-year w/o sales charge | | -22.26% | | -22.86% | | -22.86% | | -22.06% |
|
|
|
|
|
|
|
|
|
5-year | | -2.15% | | -2.00% | | -1.70% | | -1.01% |
|
|
|
|
|
|
|
|
|
10-year | | 2.16% | | 2.39% | | 2.39% | | 2.75% |
|
|
|
|
|
|
|
|
|
Maximum sales charge | | 4.75% | | 5.00% | | 1.00% | | N/A |
| | Front-end | | CDSC | | CDSC | | |
|
|
|
|
|
|
|
|
|
* | Adjusted for maximum applicable sales charge, unless noted. |
Past performance is no guarantee of future results. The performance quoted represents past performance and current performance may be lower or higher. The investment return and principal value of an investment will fluctuate so that investors’ shares, when redeemed, may be worth more or less than their original cost. To obtain performance information current to the most recent month-end for Classes A, B, C or I, please go to EvergreenInvestments.com/fundperformance. The performance of each class may vary based on differences in loads, fees and expenses paid by the shareholders investing in each class. Performance includes the reinvestment of income dividends and capital gain distributions. Performance shown does not reflect the deduction of taxes that a shareholder would pay on fund distributions or the redemption of fund shares.
Historical performance shown for Class I prior to 5/23/2005 is based on the performance of the fund’s predecessor closed-end fund, Vestaur Securities Fund. Historical performance shown for Classes A, B and C prior to their inception is based on the performance of Class I. The historical returns for Classes A, B and C have not been adjusted to reflect the effect of each class’ 12b-1 fee. These fees are 0.25% for Class A and 1.00% for Classes B and C. Class I does not, and Vestaur Securities Fund did not, pay a 12b-1 fee. If these fees had been reflected, returns for Classes A, B and C would have been lower.
The advisor is waiving its advisory fee and reimbursing the fund for a portion of other expenses. Had the fee not been waived and expenses not reimbursed, returns would have been lower. Returns reflect expense limits previously in effect for Class A, without which returns for Class A would have been lower.
Class I shares are only offered, subject to the minimum initial purchase requirements, in the following manner: (1) to investment advisory clients of EIMC (or its advisory affiliates), (2) to employer- or state-sponsored benefit plans, including but not limited to, retirement plans, defined benefit plans, deferred compensation plans, or savings plans, (3) to fee-based mutual fund wrap accounts, (4) through arrangements entered into on behalf of the Evergreen funds with certain financial services firms, (5) to certain institutional investors, and (6) to persons who owned Class Y shares in registered name in an Evergreen fund on or before December 31, 1994 or who owned shares of any SouthTrust fund in registered name as of March 18, 2005 or who owned shares of Vestaur Securities Fund as of May 20, 2005.
Class I shares are only available to institutional shareholders with a minimum of $1 million investment, which may be waived in certain situations.
4
FUND AT A GLANCE continued
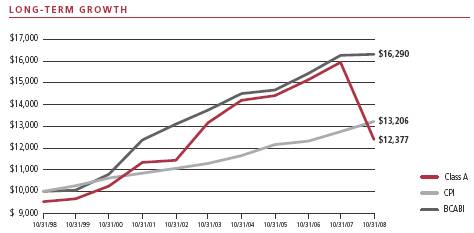
Comparison of a $10,000 investment in the Evergreen Core Plus Bond Fund Class A shares versus a similar investment in the Barclays Capital Aggregate Bond Index (BCABI) and the Consumer Price Index (CPI).
The BCABI is an unmanaged market index and does not include transaction costs associated with buying and selling securities, any mutual fund fees or expenses or any taxes. The CPI is a commonly used measure of inflation and does not represent an investment return. It is not possible to invest directly in an index.
The fund’s investment objective may be changed without a vote of the fund’s shareholders.
Foreign investments may contain more risk due to the inherent risks associated with changing political climates, foreign market instability and foreign currency fluctuations. Risks of international investing are magnified in emerging or developing markets.
Asset-backed and mortgage-backed securities are generally subject to higher prepayment risks than other types of debt securities, which can limit the potential for gain in a declining interest rate environment and increase the potential for loss in a rising interest rate environment. Mortgage-backed securities may also be structured so that they are particularly sensitive to interest rates. A high rate of defaults on the mortgages held by a mortgage pool may limit the pool’s ability to make payments to the fund if the fund holds securities that are subordinate to other interest in the same mortgage pool; the risk of such defaults is generally higher in mortgage pools that include subprime mortgages.
Derivatives involve additional risks including interest rate risk, credit risk, the risk of improper valuation and the risk of non-correlation to the relevant instruments they are designed to hedge or to closely track.
High yield, lower-rated bonds may contain more risk due to the increased possibility of default.
The return of principal is not guaranteed due to fluctuation in the fund’s NAV caused by changes in the price of individual bonds held by the fund and the buying and selling of bonds by the fund. Bond funds have the same inflation, interest rate and credit risks as individual bonds. Generally, the value of bond funds rises when prevailing interest rates fall, and falls when interest rates rise.
U.S. government guarantees apply only to certain securities held in the fund’s portfolio and not to the fund’s shares.
All data is as of October 31, 2008, and subject to change.
5
ABOUT YOUR FUND’S EXPENSES
The Example below is intended to describe the fees and expenses borne by shareholders and the impact of those costs on your investment.
Example
As a shareholder of the fund, you incur two types of costs: (1) transaction costs, including sales charges (loads), redemption fees and exchange fees; and (2) ongoing costs, including management fees, distribution (12b-1) fees and other fund expenses. This Example is intended to help you understand your ongoing costs (in dollars) of investing in the fund and to compare these costs with the ongoing costs of investing in other mutual funds. The Example is based on an investment of $1,000 invested at the beginning of the period and held for the entire period from May 1, 2008 to October 31, 2008.
The example illustrates your fund’s costs in two ways:
The section in the table under the heading “Actual” provides information about actual account values and actual expenses. You may use the information in these columns, together with the amount you invested, to estimate the expenses that you paid over the period. Simply divide your account value by $1,000 (for example, an $8,600 account value divided by $1,000 = 8.6), then multiply the result by the number in the appropriate column for your share class, in the column entitled “Expenses Paid During Period” to estimate the expenses you paid on your account during this period.
• Hypothetical example for comparison purposes |
The section in the table under the heading “Hypothetical (5% return before expenses)” provides information about hypothetical account values and hypothetical expenses based on the fund’s actual expense ratio and an assumed rate of return of 5% per year before expenses, which is not the fund’s actual return. The hypothetical account values and expenses may not be used to estimate the actual ending account balance or expenses you paid for the period. You may use this information to compare the ongoing costs of investing in the fund and other funds. To do so, compare this 5% hypothetical example with the 5% hypothetical examples that appear in the shareholder reports of the other funds.
Please note that the expenses shown in the table are meant to highlight your ongoing costs only and do not reflect any transactional costs, such as sales charges (loads), redemption fees or exchange fees. Therefore, the section in the table under the heading “Hypothetical (5% return before expenses)” is useful in comparing ongoing costs only, and will not help you determine the relative total costs of owning different funds. In addition, if these transactional costs were included, your costs would have been higher.
| Beginning
Account Value
5/1/2008 | Ending
Account Value
10/31/2008 | Expenses Paid
During Period* |
|
|
|
|
Actual | | | | | | |
Class A | $1,000.00 | | $ | 799.13 | | $4.17 |
Class B | $1,000.00 | | $ | 795.98 | | $7.56 |
Class C | $1,000.00 | | $ | 795.98 | | $7.56 |
Class I | $1,000.00 | | $ | 800.18 | | $3.04 |
Hypothetical | | | | | | |
(5% return before expenses) | | | | | | |
Class A | $1,000.00 | | $ | 1,020.57 | | $4.69 |
Class B | $1,000.00 | | $ | 1,016.79 | | $8.49 |
Class C | $1,000.00 | | $ | 1,016.79 | | $8.49 |
Class I | $1,000.00 | | $ | 1,021.83 | | $3.41 |
|
|
|
|
|
|
|
* | For each class of the fund, expenses are equal to the annualized expense ratio of each class (0.92% for Class A, 1.67% for Class B, 1.67% for Class C and 0.67% for Class I), multiplied by the average account value over the period, multiplied by 184 / 365 days. |
6
FINANCIAL HIGHLIGHTS
(For a share outstanding throughout each period)
CLASS A | | Six Months Ended
October 31, 2008
(unaudited) | | Year Ended April 30, | | Year Ended
November 30,
20052, 3 | |
|
2008 | | 2007 | | 20061 |
|
|
|
|
|
|
|
|
|
|
| |
Net asset value, beginning of period | | $ | 13.40 | | $ | 14.45 | | $ | 14.25 | | $ | 14.53 | | $ | 14.83 | |
|
|
|
|
|
|
|
|
|
|
|
|
|
|
|
| |
Income from investment operations | | | | | | | | | | | | | | | | |
Net investment income (loss) | | | 0.37 | | | 0.74 | | | 0.81 | | | 0.33 | | | 0.41 | 4 |
Net realized and unrealized gains or losses on investments | | | (2.85 | ) | | (1.07 | ) | | 0.23 | | | (0.27 | ) | | (0.28 | ) |
| |
|
|
|
|
|
|
|
|
|
|
|
|
|
| |
Total from investment operations | | | (2.48 | ) | | (0.33 | ) | | 1.04 | | | 0.06 | | | 0.13 | |
|
|
|
|
|
|
|
|
|
|
|
|
|
|
|
| |
Distributions to shareholders from | | | | | | | | | | | | | | | | |
Net investment income | | | (0.36 | ) | | (0.51 | ) | | (0.83 | ) | | (0.34 | ) | | (0.43 | ) |
Tax basis return of capital | | | 0 | | | (0.21 | ) | | (0.01 | ) | | 0 | | | 0 | |
| |
|
|
|
|
|
|
|
|
|
|
|
|
|
| |
Total distributions to shareholders | | | (0.36 | ) | | (0.72 | ) | | (0.84 | ) | | (0.34 | ) | | (0.43 | ) |
|
|
|
|
|
|
|
|
|
|
|
|
|
|
|
| |
Net asset value, end of period | | $ | 10.56 | | $ | 13.40 | | $ | 14.45 | | $ | 14.25 | | $ | 14.53 | |
|
|
|
|
|
|
|
|
|
|
|
|
|
|
|
| |
Total return5 | | | (18.84 | )% | | (2.38 | )% | | 7.49 | % | | 0.43 | % | | 0.89 | % |
|
|
|
|
|
|
|
|
|
|
|
|
|
|
|
| |
Ratios and supplemental data | | | | | | | | | | | | | | | | |
Net assets, end of period (thousands) | | $ | 122,950 | | $ | 167,732 | | $ | 199,442 | | $ | 213,268 | | $ | 226,450 | |
Ratios to average net assets | | | | | | | | | | | | | | | | |
Expenses including waivers/reimbursements but excluding expense reductions | | | 0.92 | %6 | | 0.92 | % | | 0.94 | % | | 0.96 | %6 | | 0.97 | %6 |
Expenses excluding waivers/reimbursements and expense reductions | | | 1.18 | %6 | | 1.15 | % | | 1.16 | % | | 1.19 | %6 | | 1.15 | %6 |
Net investment income (loss) | | | 5.84 | %6 | | 5.23 | % | | 5.65 | % | | 5.43 | %6 | | 5.28 | %6 |
Portfolio turnover rate | | | 96 | %7 | | 374 | %7 | | 70 | % | | 30 | % | | 55 | % |
|
|
|
|
|
|
|
|
|
|
|
|
|
|
|
| |
1 | For the five months ended April 30, 2006. The Fund changed its fiscal year end from November 30 to April 30, effective April 30, 2006. |
2 | For the period from May 20, 2005 (commencement of class operations), to November 30, 2005. |
3 | Effective at the close of business on May 20, 2005, the Fund acquired the net assets of Vestaur Securities Fund. Vestaur Securities Fund became the accounting and performance survivor in this transaction. Class A shares of Vestaur Securities Fund did not exist prior to the transaction. As a result, accounting and performance information for Class A shares commenced on May 20, 2005. |
4 | Net investment income (loss) per share is based on average shares outstanding during the period. |
5 | Excluding applicable sales charges |
7 | Portfolio turnover rate includes mortgage dollar roll activity. |
See Notes to Financial Statements
7
FINANCIAL HIGHLIGHTS
(For a share outstanding throughout each period)
CLASS B | | Six Months Ended
October 31, 2008
(unaudited) | | Year Ended April 30, | | Year Ended
November 30,
20052, 3 | |
|
2008 | | 2007 | | 20061 |
|
|
|
|
|
|
|
|
|
|
|
| |
Net asset value, beginning of period | | $ | 13.40 | | $ | 14.45 | | $ | 14.25 | | $ | 14.53 | | $ | 14.83 | |
|
|
|
|
|
|
|
|
|
|
|
|
|
|
|
| |
Income from investment operations | | | | | | | | | | | | | | | | |
Net investment income (loss) | | | 0.33 | | | 0.64 | | | 0.70 | | | 0.28 | | | 0.36 | 4 |
Net realized and unrealized gains or losses on investments | | | (2.86 | ) | | (1.07 | ) | | 0.23 | | | (0.26 | ) | | (0.28 | ) |
| |
|
|
|
|
|
|
|
|
|
|
|
|
|
| |
Total from investment operations | | | (2.53 | ) | | (0.43 | ) | | 0.93 | | | 0.02 | | | 0.08 | |
|
|
|
|
|
|
|
|
|
|
|
|
|
|
|
| |
Distributions to shareholders from | | | | | | | | | | | | | | | | |
Net investment income | | | (0.31 | ) | | (0.41 | ) | | (0.72 | ) | | (0.30 | ) | | (0.38 | ) |
Tax basis return of capital | | | 0 | | | (0.21 | ) | | (0.01 | ) | | 0 | | | 0 | |
| |
|
|
|
|
|
|
|
|
|
|
|
|
|
| |
Total distributions to shareholders | | | (0.31 | ) | | (0.62 | ) | | (0.73 | ) | | (0.30 | ) | | (0.38 | ) |
|
|
|
|
|
|
|
|
|
|
|
|
|
|
|
| |
Net asset value, end of period | | $ | 10.56 | | $ | 13.40 | | $ | 14.45 | | $ | 14.25 | | $ | 14.53 | |
|
|
|
|
|
|
|
|
|
|
|
|
|
|
|
| |
Total return5 | | | (19.10 | )% | | (3.18 | )% | | 6.71 | % | | 0.14 | % | | 0.52 | % |
|
|
|
|
|
|
|
|
|
|
|
|
|
|
|
| |
Ratios and supplemental data | | | | | | | | | | | | | | | | |
Net assets, end of period (thousands) | | $ | 8,743 | | $ | 13,618 | | $ | 16,102 | | $ | 18,277 | | $ | 20,439 | |
Ratios to average net assets | | | | | | | | | | | | | | | | |
Expenses including waivers/reimbursements but excluding expense reductions | | | 1.67 | %6 | | 1.67 | % | | 1.67 | % | | 1.67 | %6 | | 1.67 | %6 |
Expenses excluding waivers/reimbursements and expense reductions | | | 1.93 | %6 | | 1.85 | % | | 1.85 | % | | 1.89 | %6 | | 1.85 | %6 |
Net investment income (loss) | | | 5.09 | %6 | | 4.49 | % | | 4.91 | % | | 4.72 | %6 | | 4.58 | %6 |
Portfolio turnover rate | | | 96 | %7 | | 374 | %7 | | 70 | % | | 30 | % | | 55 | % |
|
|
|
|
|
|
|
|
|
|
|
|
|
|
|
| |
1 | For the five months ended April 30, 2006. The Fund changed its fiscal year end from November 30 to April 30, effective April 30, 2006. |
2 | For the period from May 20, 2005 (commencement of class operations), to November 30, 2005. |
3 | Effective at the close of business on May 20, 2005, the Fund acquired the net assets of Vestaur Securities Fund. Vestaur Securities Fund became the accounting and performance survivor in this transaction. Class B shares of Vestaur Securities Fund did not exist prior to the transaction. As a result, accounting and performance information for Class B shares commenced on May 20, 2005. |
4 | Net investment income (loss) per share is based on average shares outstanding during the period. |
5 | Excluding applicable sales charges |
7 | Portfolio turnover rate includes mortgage dollar roll activity. |
See Notes to Financial Statements
8
FINANCIAL HIGHLIGHTS
(For a share outstanding throughout each period)
CLASS C | | Six Months Ended
October 31, 2008
(unaudited) | | Year Ended April 30, | | Year Ended
November 30,
20052, 3 | |
|
2008 | | 2007 | | 20061 |
|
|
|
|
|
|
|
|
|
|
| |
Net asset value, beginning of period | | $ | 13.40 | | $ | 14.45 | | $ | 14.25 | | $ | 14.53 | | $ | 14.83 | |
|
|
|
|
|
|
|
|
|
|
|
|
|
|
|
| |
Income from investment operations | | | | | | | | | | | | | | | | |
Net investment income (loss) | | | 0.33 | | | 0.63 | | | 0.70 | | | 0.28 | | | 0.36 | 4 |
Net realized and unrealized gains or losses on investments | | | (2.86 | ) | | (1.06 | ) | | 0.23 | | | (0.26 | ) | | (0.28 | ) |
| |
|
|
|
|
|
|
|
|
|
|
|
|
|
| |
Total from investment operations | | | (2.53 | ) | | (0.43 | ) | | 0.93 | | | 0.02 | | | 0.08 | |
|
|
|
|
|
|
|
|
|
|
|
|
|
|
|
| |
Distributions to shareholders from | | | | | | | | | | | | | | | | |
Net investment income | | | (0.31 | ) | | (0.41 | ) | | (0.72 | ) | | (0.30 | ) | | (0.38 | ) |
Tax basis return of capital | | | 0 | | | (0.21 | ) | | (0.01 | ) | | 0 | | | 0 | |
| |
|
|
|
|
|
|
|
|
|
|
|
|
|
| |
Total distributions to shareholders | | | (0.31 | ) | | (0.62 | ) | | (0.73 | ) | | (0.30 | ) | | (0.38 | ) |
|
|
|
|
|
|
|
|
|
|
|
|
|
|
|
| |
Net asset value, end of period | | $ | 10.56 | | $ | 13.40 | | $ | 14.45 | | $ | 14.25 | | $ | 14.53 | |
|
|
|
|
|
|
|
|
|
|
|
|
|
|
|
| |
Total return5 | | | (19.16 | )% | | (3.11 | )% | | 6.71 | % | | 0.14 | % | | 0.52 | % |
|
|
|
|
|
|
|
|
|
|
|
|
|
|
|
| |
Ratios and supplemental data | | | | | | | | | | | | | | | | |
Net assets, end of period (thousands) | | $ | 15,125 | | $ | 21,699 | | $ | 24,157 | | $ | 25,972 | | $ | 27,764 | |
Ratios to average net assets | | | | | | | | | | | | | | | | |
Expenses including waivers/reimbursements but excluding expense reductions | | | 1.67 | %6 | | 1.67 | % | | 1.67 | % | | 1.67 | %6 | | 1.67 | %6 |
Expenses excluding waivers/reimbursements and expense reductions | | | 1.93 | %6 | | 1.85 | % | | 1.85 | % | | 1.89 | %6 | | 1.85 | %6 |
Net investment income (loss) | | | 5.09 | %6 | | 4.48 | % | | 4.91 | % | | 4.72 | %6 | | 4.58 | %6 |
Portfolio turnover rate | | | 96 | %7 | | 374 | %7 | | 70 | % | | 30 | % | | 55 | % |
|
|
|
|
|
|
|
|
|
|
|
|
|
|
|
| |
1 | For the five months ended April 30, 2006. The Fund changed its fiscal year end from November 30 to April 30, effective April 30, 2006. |
2 | For the period from May 20, 2005 (commencement of class operations), to November 30, 2005. |
3 | Effective at the close of business on May 20, 2005, the Fund acquired the net assets of Vestaur Securities Fund. Vestaur Securities Fund became the accounting and performance survivor in this transaction. Class C shares of Vestaur Securities Fund did not exist prior to the transaction. As a result, accounting and performance information for Class C shares commenced on May 20, 2005. |
4 | Net investment income (loss) per share is based on average shares outstanding during the period. |
5 | Excluding applicable sales charges |
7 | Portfolio turnover rate includes mortgage dollar roll activity. |
See Notes to Financial Statements
9
FINANCIAL HIGHLIGHTS
(For a share outstanding throughout each period)
| | Six Months Ended
October 31, 2008
(unaudited) | | Year Ended April 30, | | Year Ended November 30, | |
| | |
| |
| |
CLASS I | | | 2008 | | 2007 | | 20061 | | 20052 | | 20042 | | 20032 | |
|
|
|
|
|
|
|
|
|
|
|
|
|
|
| |
Net asset value, beginning of period | | $ | 13.40 | | $ | 14.45 | | $ | 14.25 | | $ | 14.53 | | $ | 15.14 | | $ | 15.14 | | $ | 14.27 | |
|
|
|
|
|
|
|
|
|
|
|
|
|
|
|
|
|
|
|
|
|
| |
Income from investment operations | | | | | | | | | | | | | | | | | | | | | | |
Net investment income (loss) | | | 0.38 | | | 0.76 | | | 0.83 | | | 0.34 | | | 0.79 | 3 | | 0.93 | | | 0.95 | |
Net realized and unrealized gains or losses on investments | | | (2.84 | ) | | (1.05 | ) | | 0.25 | | | (0.26 | ) | | (0.41 | ) | | 0.02 | | | 0.91 | |
| |
|
|
|
|
|
|
|
|
|
|
|
|
|
|
|
|
|
|
|
| |
Total from investment operations | | | (2.46 | ) | | (0.29 | ) | | 1.08 | | | 0.08 | | | 0.38 | | | 0.95 | | | 1.86 | |
|
|
|
|
|
|
|
|
|
|
|
|
|
|
|
|
|
|
|
|
|
| |
Distributions to shareholders from | | | | | | | | | | | | | | | | | | | | | | |
Net investment income | | | (0.38 | ) | | (0.55 | ) | | (0.87 | ) | | (0.36 | ) | | (0.86 | ) | | (0.95 | ) | | (0.99 | ) |
Tax basis return of capital | | | 0 | | | (0.21 | ) | | (0.01 | ) | | 0 | | | (0.13 | )4 | | 0 | | | 0 | |
| |
|
|
|
|
|
|
|
|
|
|
|
|
|
|
|
|
|
|
|
| |
Total distributions to shareholders | | | (0.38 | ) | | (0.76 | ) | | (0.88 | ) | | (0.36 | ) | | (0.99 | ) | | (0.95 | ) | | (0.99 | ) |
|
|
|
|
|
|
|
|
|
|
|
|
|
|
|
|
|
|
|
|
|
| |
Net asset value, end of period | | $ | 10.56 | | $ | 13.40 | | $ | 14.45 | | $ | 14.25 | | $ | 14.53 | | $ | 15.14 | | $ | 15.14 | |
|
|
|
|
|
|
|
|
|
|
|
|
|
|
|
|
|
|
|
|
|
| |
Total return | | | (18.73 | )% | | (2.13 | )% | | 7.78 | % | | 0.55 | % | | 2.82 | % | | 6.47 | % | | 13.43 | % |
|
|
|
|
|
|
|
|
|
|
|
|
|
|
|
|
|
|
|
|
|
| |
Ratios and supplemental data | | | | | | | | | | | | | | | | | | | | | | |
Net assets, end of period (thousands) | | $ | 35,228 | | $ | 47,668 | | $ | 56,478 | | $ | 61,711 | | $ | 65,893 | | $ | 97,235 | | $ | 97,277 | |
Ratios to average net assets | | | | | | | | | | | | | | | | | | | | | | |
Expenses including waivers/reimbursements but excluding expense reductions | | | 0.67 | %5 | | 0.67 | % | | 0.67 | % | | 0.67 | %5 | | 0.79 | % | | 0.94 | % | | 0.91 | % |
Expenses excluding waivers/reimbursements and expense reductions | | | 0.93 | %5 | | 0.85 | % | | 0.85 | % | | 0.89 | %5 | | 0.88 | % | | 0.97 | % | | 0.94 | % |
Net investment income (loss) | | | 6.09 | %5 | | 5.48 | % | | 5.91 | % | | 5.72 | %5 | | 5.50 | % | | 6.10 | % | | 6.43 | % |
Portfolio turnover rate | | | 96 | %6 | | 374 | %6 | | 70 | % | | 30 | % | | 55 | % | | 23 | % | | 45 | % |
|
|
|
|
|
|
|
|
|
|
|
|
|
|
|
|
|
|
|
|
|
| |
1 | For the five months ended April 30, 2006. The Fund changed its fiscal year end from November 30 to April 30, effective April 30, 2006. |
2 | Effective at the close of business on May 20, 2005, the Fund acquired the net assets of Vestaur Securities Fund. Vestaur Securities Fund became the accounting and performance survivor in this transaction. The financial highlights for the periods prior to May 23, 2005 are those of Vestaur Securities Fund. The per share information has been restated to give effect to this transaction. Total return performance reflects the total return of Vestaur Securities Fund based on its net asset value. |
3 | Net investment income (loss) per share is based on average shares outstanding during the period. |
4 | Return of capital relates to former Vestaur Securities Fund shareholders and is based on average shares outstanding from December 1, 2004 through May 20, 2005. |
6 | Portfolio turnover rate includes mortgage dollar roll activity. |
See Notes to Financial Statements
10
SCHEDULE OF INVESTMENTS
October 31, 2008 (unaudited)
| | Principal
Amount | | Value | |
|
|
|
|
| |
AGENCY COMMERCIAL MORTGAGE-BACKED SECURITIES 1.8% | | | | | | | |
FIXED-RATE 1.8% | | | | | | | |
FHLMC, Ser. M009, Class A, 5.40%, 10/15/2021 ## (cost $3,112,998) | | $ | 3,109,888 | | $ | 3,212,763 | |
| | | | |
|
| |
AGENCY MORTGAGE-BACKED COLLATERALIZED MORTGAGE OBLIGATIONS 4.3% | | | | | | | |
FIXED-RATE 4.3% | | | | | | | |
FHLMC: | | | | | | | |
Ser. 2594, Class QE, 5.00%, 08/15/2031 | | | 2,395,000 | | | 2,328,003 | |
Ser. 2647, Class PC, 5.00%, 11/15/2031 | | | 2,500,000 | | | 2,426,008 | |
FNMA: | | | | | | | |
Ser. 2002-T12, Class A3, 7.50%, 05/25/2042 | | | 16,443 | | | 17,375 | |
Ser. 2003-129, Class PW, 4.50%, 07/25/2033 | | | 2,800,000 | | | 2,802,648 | |
Ser. 2003-W4, Class 4A, 7.50%, 10/25/2042 | | | 168,706 | | | 174,854 | |
| | | | |
|
| |
Total Agency Mortgage-Backed Collateralized Mortgage Obligations (cost $7,572,671) | | | | | | 7,748,888 | |
| | | | |
|
| |
AGENCY MORTGAGE-BACKED PASS THROUGH SECURITIES 20.9% | | | | | | | |
FIXED-RATE 20.9% | | | | | | | |
FHLMC: | | | | | | | |
5.00%, 09/15/2028 | | | 210,000 | | | 208,502 | |
6.50%, 09/25/2043 | | | 100,264 | | | 105,138 | |
7.50%, 09/01/2013-08/25/2042 | | | 140,884 | | | 146,840 | |
9.00%, 12/01/2016 | | | 107,494 | | | 116,051 | |
9.50%, 12/01/2022 | | | 16,140 | | | 17,824 | |
FHLMC 30 year: | | | | | | | |
5.00%, TBA # | | | 11,475,000 | | | 10,860,009 | |
5.50%, TBA # | | | 5,430,000 | | | 5,296,797 | |
FNMA: | | | | | | | |
5.69%, 11/01/2011 | | | 5,052,449 | | | 5,201,951 | |
6.27%, 02/01/2011 ## | | | 3,306,397 | | | 3,401,240 | |
6.45%, 09/01/2016 | | | 1,726,933 | | | 1,761,972 | |
7.87%, 07/01/2026 | | | 2,972,506 | | | 3,274,132 | |
9.00%, 02/01/2025-09/01/2030 | | | 160,609 | | | 175,617 | |
10.00%, 09/01/2010-04/01/2021 | | | 77,241 | | | 87,857 | |
FNMA 15 year: | | | | | | | |
4.50%, TBA # | | | 3,705,000 | | | 3,526,697 | |
5.00%, TBA # | | | 620,000 | | | 606,147 | |
5.50%, TBA # | | | 2,940,000 | | | 2,931,271 | |
GNMA: | | | | | | | |
8.00%, 03/15/2022-08/15/2024 | | | 56,979 | | | 61,061 | |
8.25%, 05/15/2020 | | | 53,287 | | | 57,147 | |
8.50%, 09/15/2024-01/15/2027 | | | 27,275 | | | 29,318 | |
9.00%, 12/15/2019 | | | 56,877 | | | 61,968 | |
9.50%, 09/15/2019 | | | 9,970 | | | 11,015 | |
10.00%, 01/15/2019-03/15/2020 | | | 28,552 | | | 33,043 | |
| | | | |
|
| |
Total Agency Mortgage-Backed Pass Through Securities (cost $38,428,670) | | | | | | 37,971,597 | |
| | | | |
|
| |
See Notes to Financial Statements
11
SCHEDULE OF INVESTMENTS continued
October 31, 2008 (unaudited)
| | Principal
Amount | | Value | |
|
|
|
|
| |
AGENCY REPERFORMING MORTGAGE-BACKED COLLATERALIZED MORTGAGE OBLIGATIONS 0.8% | | | | | | | |
| | | | | | | |
FIXED-RATE 0.8% | | | | | | | |
FNMA: | | | | | | | |
Ser. 2003-W02, Class 2A9, 5.90%, 07/25/2042 | | $ | 149,800 | | $ | 148,801 | |
Ser. 2003-W12, Class 1A8, 4.55%, 06/25/2043 | | | 1,353,473 | | | 1,250,445 | |
| | | | |
|
| |
Total Agency Reperforming Mortgage-Backed Collateralized Mortgage Obligations
(cost $1,427,947) | | | | | | 1,399,246 | |
| | | | |
|
| |
ASSET-BACKED SECURITIES 2.0% | | | | | | | |
Acacia CDO, Ltd.: | | | | | | | |
Ser. 05A, Class E, FRN, 5.60%, 11/08/2039 144A o | | | 3,000,000 | | | 225,000 | |
Ser. 10A, Class C, FRN, 4.12%, 09/07/2046 144A | | | 1,021,393 | | | 17,180 | |
C-Bass, Ltd., Ser. 13A, Class D, FRN, 5.17%, 03/17/2040 144A | | | 1,735,000 | | | 61,246 | |
Deutsche Alt-A Securities, Inc., Mtge. Loan Trust, Ser. 2006-AB2, Class A3, 6.27%, 06/25/2036 | | | 1,500,000 | | | 761,110 | |
Deutsche Alt-A Securities, NIM, Ser. 2007-0A1, Class N1, 6.50%, 02/25/2047 144A o | | | 138,736 | | | 2,775 | |
GSAA Home Equity Trust, Ser. 2007-5, Class 1AV1, FRN, 3.36%, 03/25/2047 | | | 48,466 | | | 40,943 | |
MASTR Asset Backed Securities Trust, Ser. 2005-AB1, Class A4, 5.65%, 10/25/2032 | | | 2,500,000 | | | 1,390,235 | |
Nautilus RMBS CDO, Ltd., Ser. 2005-1A, Class A3, FRN, 5.83%, 07/07/2040 144A o | | | 2,560,890 | | | 385,414 | |
Nomura Asset Acceptance Corp., Ser. 2006-AP1, Class A2, 5.52%, 01/25/2036 | | | 1,078,000 | | | 820,311 | |
| | | | |
|
| |
Total Asset-Backed Securities (cost $9,014,951) | | | | | | 3,704,214 | |
| | | | |
|
| |
COMMERCIAL MORTGAGE-BACKED SECURITIES 14.5% | | | | | | | |
FIXED-RATE 12.3% | | | | | | | |
American Home Mtge. Investment Trust: | | | | | | | |
Ser. 2005-2, Class LV-A, 5.66%, 08/25/2035 | | | 726,492 | | | 464,153 | |
Ser. 2005-2, Class 5A4C, 5.41%, 09/25/2035 | | | 1,000,000 | | | 454,700 | |
Banc of America Comml. Mtge., Inc.: | | | | | | | |
Ser. 2000-2, Class F, 7.92%, 09/15/2032 | | | 3,000,000 | | | 2,849,082 | |
Ser. 2003-7, Class B6, 4.75%, 09/25/2018 | | | 218,067 | | | 103,632 | |
Ser. 2007-04, Class A4, 5.74%, 02/10/2051 | | | 50,000 | | | 37,686 | |
Citigroup Comml. Mtge. Trust, Ser. 2007-C6, Class C, 5.70%, 07/10/2017 | | | 855,000 | | | 395,340 | |
Commercial Mtge. Pass-Through Cert., Ser. 2007-C9, Class B, 5.82%, 12/10/2049 | | | 910,000 | | | 436,531 | |
Crown Castle Towers, LLC, Ser. 2006-1A, Class C, 5.47%, 11/15/2036 144A | | | 1,920,000 | | | 1,428,538 | |
GE Capital Comml. Mtge. Corp., Ser. 2007-C1, Class C, 5.70%, 12/10/2049 | | | 2,500,000 | | | 1,172,479 | |
Goldman Sachs Mtge. Securities Corp., Ser. 2007-GG10, Class A2, 5.78%, 08/10/2045 | | | 3,665,000 | | | 3,203,530 | |
Greenwich Capital Comml. Funding Corp.: | | | | | | | |
Ser. 2004-GG1, Class A7, 5.32%, 06/10/2036 | | | 4,000,000 | | | 3,445,758 | |
Ser. 2007-GG11, Class AM, 5.87%, 08/10/2017 | | | 80,000 | | | 48,721 | |
GS Mtge. Securities Corp., Ser. 2007-GG10, Class AM, 5.80%, 08/10/2045 | | | 2,700,000 | | | 1,666,762 | |
See Notes to Financial Statements
12
SCHEDULE OF INVESTMENTS continued
October 31, 2008 (unaudited)
| | Principal
Amount | | Value | |
|
|
|
|
| |
COMMERCIAL MORTGAGE-BACKED SECURITIES continued | | | | | | | |
FIXED-RATE continued | | | | | | | |
JPMorgan Chase & Co. Comml. Mtge. Securities Corp.: | | | | | | | |
Ser. 2004-CB9, Class A1, 3.48%, 06/12/2041 | | $ | 2,384,935 | | $ | 2,337,962 | |
Ser. 2006-LDP8, Class B, 5.52%, 05/15/2045 | | | 1,000,000 | | | 536,287 | |
Ser. 2007-LD12, Class A2, 5.83%, 02/15/2051 | | | 3,045,000 | | | 2,721,373 | |
Morgan Stanley Capital I, Inc., Ser. 2001-TOP5, Class G, 6.00%, 10/15/2035 144A | | | 1,042,000 | | | 692,993 | |
Prima Capital Securitization, Ltd., Ser. 2006, Class D, 5.88%, 12/28/2048 | | | 1,085,000 | | | 451,393 | |
| | | | |
|
| |
| | | | | | 22,446,920 | |
| | | | |
|
| |
FLOATING-RATE 2.2% | | | | | | | |
Capmark, Ltd., Ser. 2006-7A, Class B, 4.93%, 08/20/2036 144A | | | 500,000 | | | 230,015 | |
Citigroup Comml. Mtge. Trust, Ser. 2006-C4, Class AJ, 5.72%, 03/15/2049 | | | 450,000 | | | 278,874 | |
Credit Suisse Mtge. Capital Cert., Ser. 2006-C1, Class AM, 5.55%, 02/15/2039 | | | 2,835,000 | | | 1,856,235 | |
JPMorgan Chase & Co. Comml. Mtge. Securities Corp., Ser. 2007-CB19, Class A4, 5.75%, 02/12/2049 | | | 2,105,000 | | | 1,585,471 | |
MASTR Reperforming Loan Trust, Ser. 2006-2, Class B3, 5.88%, 05/25/2036 144A | | | 421,503 | | | 45,248 | |
| | | | |
|
| |
| | | | | | 3,995,843 | |
| | | | |
|
| |
Total Commercial Mortgage-Backed Securities (cost $36,056,867) | | | | | | 26,442,763 | |
| | | | |
|
| |
CORPORATE BONDS 26.6% | | | | | | | |
CONSUMER DISCRETIONARY 2.7% | | | | | | | |
Auto Components 0.1% | | | | | | | |
Cooper Standard Automotive, Inc., 7.00%, 12/15/2012 | | | 10,000 | | | 6,350 | |
Cooper Tire & Rubber Co., 7.625%, 03/15/2027 | | | 110,000 | | | 55,550 | |
Goodyear Tire & Rubber Co., 9.00%, 07/01/2015 | | | 60,000 | | | 48,000 | |
| | | | |
|
| |
| | | | | | 109,900 | |
| | | | |
|
| |
Automobiles 0.0% | | | | | | | |
Ford Motor Co., 7.875%, 06/15/2010 | | | 25,000 | | | 16,802 | |
General Motors Corp., 6.75%, 12/01/2014 | | | 15,000 | | | 7,583 | |
| | | | |
|
| |
| | | | | | 24,385 | |
| | | | |
|
| |
Diversified Consumer Services 0.0% | | | | | | | |
Carriage Services, Inc., 7.875%, 01/15/2015 | | | 35,000 | | | 29,400 | |
Sotheby’s, 7.75%, 06/15/2015 144A | | | 20,000 | | | 13,029 | |
| | | | |
|
| |
| | | | | | 42,429 | |
| | | | |
|
| |
Hotels, Restaurants & Leisure 0.2% | | | | | | | |
Boyd Gaming Corp., 7.75%, 12/15/2012 | | | 5,000 | | | 4,125 | |
Caesars Entertainment, Inc.: | | | | | | | |
7.875%, 03/15/2010 | | | 70,000 | | | 39,900 | |
8.125%, 05/15/2011 | | | 20,000 | | | 7,200 | |
Inn of the Mountain Gods Resort & Casino, 12.00%, 11/15/2010 | | | 35,000 | | | 15,575 | |
Isle of Capri Casinos, Inc., 7.00%, 03/01/2014 | | | 110,000 | | | 53,900 | |
MGM MIRAGE, 8.50%, 09/15/2010 | | | 15,000 | | | 10,463 | |
See Notes to Financial Statements
13
SCHEDULE OF INVESTMENTS continued
October 31, 2008 (unaudited)
| | Principal
Amount | | Value | |
|
|
|
|
| |
CORPORATE BONDS continued | | | | | | | |
CONSUMER DISCRETIONARY continued | | | | | | | |
Hotels, Restaurants & Leisure continued | | | | | | | |
Pokagon Gaming Authority, 10.375%, 06/15/2014 144A | | $ | 59,000 | | $ | 53,985 | |
Seneca Gaming Corp., 7.25%, 05/01/2012 | | | 50,000 | | | 33,750 | |
Shingle Springs Tribal Gaming Authority, 9.375%, 06/15/2015 144A | | | 80,000 | | | 39,600 | |
Universal City Development Partners, Ltd., 11.75%, 04/01/2010 | | | 50,000 | | | 40,125 | |
| | | | |
|
| |
| | | | | | 298,623 | |
| | | | |
|
| |
Household Durables 0.2% | | | | | | | |
Centex Corp., 5.80%, 09/15/2009 | | | 65,000 | | | 58,175 | |
D.R. Horton, Inc.: | | | | | | | |
4.875%, 01/15/2010 | | | 25,000 | | | 21,563 | |
8.00%, 02/01/2009 | | | 50,000 | | | 48,500 | |
9.75%, 09/15/2010 | | | 65,000 | | | 61,262 | |
Hovnanian Enterprises, Inc.: | | | | | | | |
6.00%, 01/15/2010 | | | 20,000 | | | 15,900 | |
6.50%, 01/15/2014 | | | 15,000 | | | 4,575 | |
11.50%, 05/01/2013 144A | | | 5,000 | | | 4,075 | |
Lennar Corp.: | | | | | | | |
5.125%, 10/01/2010 | | | 90,000 | | | 68,850 | |
7.625%, 03/01/2009 | | | 25,000 | | | 23,000 | |
Libbey, Inc., FRN, 9.93%, 06/01/2011 | | | 80,000 | | | 52,000 | |
Meritage Homes Corp., 7.00%, 05/01/2014 | | | 45,000 | | | 27,675 | |
Pulte Homes, Inc.: | | | | | | | |
7.875%, 08/01/2011 | | | 5,000 | | | 4,263 | |
8.125%, 03/01/2011 | | | 15,000 | | | 13,125 | |
| | | | |
|
| |
| | | | | | 402,963 | |
| | | | |
|
| |
Internet & Catalog Retail 0.0% | | | | | | | |
Ticketmaster Entertainment, Inc., 10.75%, 08/01/2016 144A | | | 20,000 | | | 16,900 | |
| | | | |
|
| |
Media 0.7% | | | | | | | |
Charter Communications, Inc.: | | | | | | | |
8.00%, 04/30/2012 144A | | | 20,000 | | | 15,500 | |
10.875%, 09/15/2014 144A | | | 195,000 | | | 159,412 | |
CSC Holdings, Inc., 7.625%, 04/01/2011 | | | 55,000 | | | 50,875 | |
Idearc, Inc., 8.00%, 11/15/2016 | | | 155,000 | | | 22,281 | |
Lamar Media Corp.: | | | | | | | |
6.625%, 08/15/2015 | | | 5,000 | | | 3,700 | |
7.25%, 01/01/2013 | | | 10,000 | | | 7,900 | |
Mediacom, LLC, 7.875%, 02/15/2011 | | | 25,000 | | | 21,375 | |
R.H. Donnelley Corp., 11.75%, 05/15/2015 144A | | | 85,000 | | | 33,575 | |
Sinclair Broadcast Group, Inc., 8.00%, 03/15/2012 | | | 40,000 | | | 33,100 | |
Time Warner, Inc., 7.625%, 04/15/2031 | | | 1,100,000 | | | 881,625 | |
| | | | |
|
| |
| | | | | | 1,229,343 | |
| | | | |
|
| |
See Notes to Financial Statements
14
SCHEDULE OF INVESTMENTS continued
October 31, 2008 (unaudited)
| | Principal
Amount | | Value | |
|
|
|
|
| |
CORPORATE BONDS continued | | | | | | | |
CONSUMER DISCRETIONARY continued | | | | | | | |
Multiline Retail 0.8% | | | | | | | |
Kohl’s Corp., 6.875%, 12/15/2037 | | $ | 575,000 | | $ | 391,899 | |
Macy’s, Inc.: | | | | | | | |
6.375%, 03/15/2037 | | | 700,000 | | | 357,307 | |
7.45%, 09/15/2011 | | | 500,000 | | | 409,537 | |
7.875%, 07/15/2015 | | | 20,000 | | | 15,071 | |
Neiman Marcus Group, Inc., 9.00%, 10/15/2015 | | | 35,000 | | | 24,150 | |
Target Corp., 6.50%, 10/15/2037 | | | 450,000 | | | 324,750 | |
| | | | |
|
| |
| | | | | | 1,522,714 | |
| | | | |
|
| |
Specialty Retail 0.6% | | | | | | | |
American Achievement Corp., 8.25%, 04/01/2012 144A | | | 125,000 | | | 125,312 | |
Best Buy Co., Inc., 6.75%, 07/15/2013 144A | | | 15,000 | | | 14,138 | |
Home Depot, Inc., 5.875%, 12/16/2036 | | | 1,530,000 | | | 917,425 | |
Payless ShoeSource, Inc., 8.25%, 08/01/2013 | | | 25,000 | | | 18,875 | |
| | | | |
|
| |
| | | | | | 1,075,750 | |
| | | | |
|
| |
Textiles, Apparel & Luxury Goods 0.1% | | | | | | | |
Oxford Industries, Inc., 8.875%, 06/01/2011 | | | 225,000 | | | 185,625 | |
| | | | |
|
| |
CONSUMER STAPLES 0.1% | | | | | | | |
Food & Staples Retailing 0.0% | | | | | | | |
Rite Aid Corp., 10.375%, 07/15/2016 | | | 5,000 | | | 3,500 | |
| | | | |
|
| |
Food Products 0.1% | | | | | | | |
Del Monte Foods Co.: | | | | | | | |
6.75%, 02/15/2015 | | | 15,000 | | | 12,450 | |
8.625%, 12/15/2012 | | | 70,000 | | | 63,700 | |
Pilgrim’s Pride Corp., 7.625%, 05/01/2015 | | | 45,000 | | | 15,525 | |
Tyson Foods, Inc., 7.35%, 04/01/2016 | | | 30,000 | | | 22,371 | |
| | | | |
|
| |
| | | | | | 114,046 | |
| | | | |
|
| |
Personal Products 0.0% | | | | | | | |
Central Garden & Pet Co., 9.125%, 02/01/2013 | | | 10,000 | | | 6,150 | |
| | | | |
|
| |
ENERGY 2.4% | | | | | | | |
Energy Equipment & Services 0.2% | | | | | | | |
Bristow Group, Inc., 7.50%, 09/15/2017 | | | 50,000 | | | 37,750 | |
GulfMark Offshore, Inc., 7.75%, 07/15/2014 | | | 55,000 | | | 40,975 | |
Hornbeck Offshore Services, Inc., Ser. B, 6.125%, 12/01/2014 | | | 140,000 | | | 103,600 | |
Parker Drilling Co., 9.625%, 10/01/2013 | | | 83,000 | | | 69,720 | |
PHI, Inc., 7.125%, 04/15/2013 | | | 125,000 | | | 92,500 | |
| | | | |
|
| |
| | | | | | 344,545 | |
| | | | |
|
| |
See Notes to Financial Statements
15
SCHEDULE OF INVESTMENTS continued
October 31, 2008 (unaudited)
| | Principal
Amount | | Value | |
|
|
|
|
| |
CORPORATE BONDS continued | | | | | | | |
ENERGY continued | | | | | | | |
Oil, Gas & Consumable Fuels 2.2% | | | | | | | |
Chesapeake Energy Corp., 6.875%, 01/15/2016 | | $ | 220,000 | | $ | 177,650 | |
El Paso Corp.: | | | | | | | |
7.25%, 06/01/2018 | | | 20,000 | | | 15,100 | |
7.42%, 02/15/2037 | | | 60,000 | | | 39,362 | |
EnCana Corp., 6.625%, 08/15/2037 | | | 1,225,000 | | | 867,851 | |
Encore Acquisition Co.: | | | | | | | |
6.00%, 07/15/2015 | | | 65,000 | | | 42,900 | |
6.25%, 04/15/2014 | | | 30,000 | | | 21,300 | |
Exco Resources, Inc., 7.25%, 01/15/2011 | | | 105,000 | | | 85,575 | |
Ferrellgas Partners, LP, 6.75%, 05/01/2014 144A | | | 70,000 | | | 50,050 | |
Forest Oil Corp.: | | | | | | | |
7.25%, 06/15/2019 144A | | | 35,000 | | | 23,975 | |
7.25%, 06/15/2019 | | | 30,000 | | | 20,550 | |
Frontier Oil Corp., 6.625%, 10/01/2011 | | | 35,000 | | | 31,150 | |
Kinder Morgan Energy Partners, LP, 7.40%, 03/15/2031 | | | 1,125,000 | | | 857,665 | |
Newfield Exploration Co.: | | | | | | | |
6.625%, 04/15/2016 | | | 55,000 | | | 40,975 | |
7.125%, 05/15/2018 | | | 30,000 | | | 21,337 | |
Peabody Energy Corp.: | | | | | | | |
5.875%, 04/15/2016 | | | 155,000 | | | 120,125 | |
7.875%, 11/01/2026 | | | 25,000 | | | 19,688 | |
Petrohawk Energy Corp., 7.875%, 06/01/2015 144A | | | 130,000 | | | 88,725 | |
Plains Exploration & Production Co.: | | | | | | | |
7.625%, 06/01/2018 | | | 40,000 | | | 26,400 | |
7.75%, 06/15/2015 | | | 40,000 | | | 29,400 | |
Quicksilver Resources, Inc., 8.25%, 08/01/2015 | | | 35,000 | | | 24,500 | |
Sabine Pass LNG, LP, 7.25%, 11/30/2013 | | | 190,000 | | | 135,850 | |
SandRidge Energy, Inc., 8.00%, 06/01/2018 144A | | | 15,000 | | | 10,050 | |
Southwestern Energy Co., 7.50%, 02/01/2018 144A | | | 20,000 | | | 16,500 | |
Sunoco, Inc., 9.00%, 11/01/2024 | | | 500,000 | | | 453,697 | |
Tesoro Corp., 6.50%, 06/01/2017 | | | 145,000 | | | 97,875 | |
Williams Cos.: | | | | | | | |
7.125%, 09/01/2011 | | | 135,000 | | | 121,575 | |
8.125%, 03/15/2012 | | | 10,000 | | | 9,150 | |
XTO Energy, Inc., 6.75%, 08/01/2037 | | | 700,000 | | | 520,108 | |
| | | | |
|
| |
| | | | | | 3,969,083 | |
| | | | |
|
| |
FINANCIALS 15.6% | | | | | | | |
Capital Markets 5.1% | | | | | | | |
American Capital Strategies, Ltd., Ser. A, 5.92%, 09/01/2009 + o | | | 3,500,000 | | | 3,340,155 | |
E*TRADE Financial Corp.: | | | | | | | |
12.50%, 11/30/2017 144A | | | 50,000 | | | 44,250 | |
12.50%, 11/30/2017 | | | 5,000 | | | 4,525 | |
See Notes to Financial Statements
16
SCHEDULE OF INVESTMENTS continued
October 31, 2008 (unaudited)
| | Principal
Amount | | Value | |
|
|
|
|
| |
CORPORATE BONDS continued | | | | | | | |
FINANCIALS continued | | | | | | | |
Capital Markets continued | | | | | | | |
Goldman Sachs Group, Inc.: | | | | | | | |
5.125%, 01/15/2015 | | $ | 5,000 | | $ | 4,155 | |
5.30%, 02/14/2012 | | | 1,200,000 | | | 1,090,820 | |
6.15%, 04/01/2018 | | | 104,000 | | | 86,298 | |
6.75%, 10/01/2037 | | | 1,000,000 | | | 652,839 | |
Lehman Brothers Holdings, Inc., 6.875%, 05/02/2018 • | | | 15,000 | | | 2,025 | |
Merrill Lynch & Co., Inc.: | | | | | | | |
6.05%, 08/15/2012 | | | 1,325,000 | | | 1,207,075 | |
7.75%, 05/14/2038 | | | 575,000 | | | 473,957 | |
Morgan Stanley: | | | | | | | |
5.625%, 01/09/2012 | | | 1,425,000 | | | 1,241,025 | |
5.95%, 12/28/2017 | | | 1,125,000 | | | 902,620 | |
6.625%, 04/01/2018 | | | 100,000 | | | 83,335 | |
FRN, 5.23%, 10/15/2015 | | | 15,000 | | | 9,897 | |
| | | | | |
| |
| | | | | | 9,142,976 | |
| | | | | |
| |
Commercial Banks 3.9% | | | | | | | |
BankAmerica Capital II, 8.00%, 12/15/2026 | | | 1,000,000 | | | 773,902 | |
FBOP Corp., 10.00%, 01/15/2009 144A | | | 4,000,000 | | | 4,027,040 | |
National City Corp., 5.80%, 06/07/2017 | | | 1,700,000 | | | 1,289,868 | |
SunTrust Banks, Inc., 6.00%, 09/11/2017 | | | 1,300,000 | | | 1,079,356 | |
| | | | | |
| |
| | | | | | 7,170,166 | |
| | | | | |
| |
Consumer Finance 2.2% | | | | | | | |
American Express Credit Co., 7.30%, 08/20/2013 | | | 55,000 | | | 48,594 | |
American Water Capital Corp., 6.09%, 10/15/2017 | | | 850,000 | | | 658,081 | |
Daimler Financial Services AG, 4.875%, 06/15/2010 | | | 100,000 | | | 85,975 | |
Ford Motor Credit Co., LLC: | | | | | | | |
5.70%, 01/15/2010 | | | 345,000 | | | 256,157 | |
5.80%, 01/12/2009 | | | 80,000 | | | 74,177 | |
9.75%, 09/15/2010 | | | 75,000 | | | 51,022 | |
General Electric Capital Corp.: | | | | | | | |
5.625%, 05/01/2018 | | | 40,000 | | | 32,987 | |
5.875%, 01/14/2038 | | | 85,000 | | | 60,806 | |
6.15%, 08/07/2037 | | | 20,000 | | | 14,747 | |
General Motors Acceptance Corp., LLC: | | | | | | | |
5.85%, 01/14/2009 | | | 50,000 | | | 46,463 | |
6.875%, 09/15/2011 | | | 250,000 | | | 146,495 | |
6.875%, 08/28/2012 | | | 200,000 | | | 109,539 | |
7.75%, 01/19/2010 | | | 85,000 | | | 63,681 | |
8.00%, 11/01/2031 | | | 190,000 | | | 86,270 | |
FRN, 4.05%, 05/15/2009 | | | 190,000 | | | 165,589 | |
See Notes to Financial Statements
17
SCHEDULE OF INVESTMENTS continued
October 31, 2008 (unaudited)
| | Principal
Amount | | Value | |
|
|
|
|
| |
CORPORATE BONDS continued | | | | | | | |
FINANCIALS continued | | | | | | | |
Consumer Finance continued | | | | | | | |
International Lease Finance Corp.: | | | | | | | |
4.375%, 11/01/2009 | | $ | 10,000 | | $ | 8,411 | |
4.75%, 07/01/2009 | | | 10,000 | | | 8,825 | |
4.75%, 01/13/2012 | | | 10,000 | | | 6,563 | |
4.875%, 09/01/2010 | | | 40,000 | | | 28,021 | |
5.125%, 11/01/2010 | | | 15,000 | | | 10,329 | |
5.75%, 06/15/2011 | | | 17,000 | | | 11,655 | |
6.375%, 03/15/2009 | | | 13,000 | | | 11,848 | |
MBNA Corp., Ser. A, 8.28%, 12/01/2026 | | | 1,750,000 | | | 1,373,377 | |
Sprint Capital Corp., 6.875%, 11/15/2028 | | | 1,180,000 | | | 691,689 | |
| | | | | |
| |
| | | | | | 4,051,301 | |
| | | | | |
| |
Diversified Financial Services 0.8% | | | | | | | |
Citigroup, Inc.: | | | | | | | |
5.50%, 08/27/2012 | | | 650,000 | | | 602,010 | |
6.50%, 08/19/2013 | | | 50,000 | | | 47,446 | |
JPMorgan Chase & Co., 6.40%, 05/15/2038 | | | 750,000 | | | 645,812 | |
Leucadia National Corp.: | | | | | | | |
7.125%, 03/15/2017 | | | 15,000 | | | 12,900 | |
8.125%, 09/15/2015 | | | 190,000 | | | 169,100 | |
| | | | | |
| |
| | | | | | 1,477,268 | |
| | | | | |
| |
Insurance 0.5% | | | | | | | |
Prudential Financial, Inc., 6.10%, 06/15/2017 | | | 1,200,000 | | | 964,348 | |
| | | | | |
| |
Real Estate Investment Trusts (REITs) 3.0% | | | | | | | |
BRE Properties, Inc., 5.50%, 03/15/2017 | | | 1,200,000 | | | 796,801 | |
Camden Property Trust, 5.00%, 06/15/2015 | | | 3,500,000 | | | 2,466,867 | |
Colonial Realty, Ltd., 6.25%, 06/15/2014 | | | 1,370,000 | | | 1,220,597 | |
ERP Operating, LP, 5.75%, 06/15/2017 | | | 1,000,000 | | | 682,494 | |
Host Marriott Corp.: | | | | | | | |
7.125%, 11/01/2013 | | | 110,000 | | | 86,900 | |
Ser. Q, 6.75%, 06/01/2016 | | | 120,000 | | | 87,600 | |
Omega Healthcare Investors, Inc.: | | | | | | | |
7.00%, 04/01/2014 | | | 65,000 | | | 54,275 | |
7.00%, 01/15/2016 | | | 105,000 | | | 83,738 | |
Ventas, Inc., 7.125%, 06/01/2015 | | | 45,000 | | | 39,150 | |
| | | | | |
| |
| | | | | | 5,518,422 | |
| | | | | |
| |
Thrifts & Mortgage Finance 0.1% | | | | | | | |
Residential Capital, LLC: | | | | | | | |
8.50%, 05/15/2010 144A | | | 30,000 | | | 14,700 | |
9.625%, 05/15/2015 144A | | | 92,000 | | | 23,460 | |
See Notes to Financial Statements
18
SCHEDULE OF INVESTMENTS continued
October 31, 2008 (unaudited)
| | Principal
Amount | | Value | |
|
|
|
|
| |
CORPORATE BONDS continued | | | | | | | |
FINANCIALS continued | | | | | | | |
Thrifts & Mortgage Finance continued | | | | | | | |
Residential Capital, LLC: | | | | | | | |
Step Bond: | | | | | | | |
8.125%, 11/21/2008 †† | | $ | 25,000 | | $ | 23,250 | |
8.375%, 06/30/2010 †† | | | 195,000 | | | 42,900 | |
| | | | | |
| |
| | | | | | 104,310 | |
| | | | | |
| |
HEALTH CARE 1.8% | | | | | | | |
Biotechnology 0.7% | | | | | | | |
Amgen, Inc., 6.375%, 06/01/2037 | | | 1,500,000 | | | 1,215,582 | |
| | | | | |
| |
Health Care Providers & Services 1.1% | | | | | | | |
HCA, Inc., 9.25%, 11/15/2016 | | | 295,000 | | | 251,487 | |
Humana, Inc., 7.20%, 06/15/2018 | | | 65,000 | | | 52,015 | |
Omnicare, Inc., 6.125%, 06/01/2013 | | | 165,000 | | | 136,125 | |
UnitedHealth Group, Inc., 5.375%, 03/15/2016 | | | 1,000,000 | | | 754,557 | |
WellPoint, Inc., 6.375%, 06/15/2037 | | | 1,300,000 | | | 932,584 | |
| | | | | |
| |
| | | | | | 2,126,768 | |
| | | | | |
| |
INDUSTRIALS 0.8% | | | | | | | |
Aerospace & Defense 0.4% | | | | | | | |
Alliant Techsystems, Inc., 6.75%, 04/01/2016 | | | 45,000 | | | 37,350 | |
DRS Technologies, Inc.: | | | | | | | |
6.625%, 02/01/2016 | | | 65,000 | | | 64,675 | |
7.625%, 02/01/2018 | | | 10,000 | | | 9,950 | |
L-3 Communications Holdings, Inc.: | | | | | | | |
5.875%, 01/15/2015 | | | 560,000 | | | 462,000 | |
6.375%, 10/15/2015 | | | 185,000 | | | 154,475 | |
| | | | | |
| |
| | | | | | 728,450 | |
| | | | | |
| |
Building Products 0.0% | | | | | | | |
Ply Gem Industries, Inc., 11.75%, 06/15/2013 144A | | | 20,000 | | | 13,300 | |
| | | | | |
| |
Commercial Services & Supplies 0.2% | | | | | | | |
Browning-Ferris Industries, Inc.: | | | | | | | |
7.40%, 09/15/2035 | | | 105,000 | | | 79,275 | |
9.25%, 05/01/2021 | | | 95,000 | | | 89,775 | |
Corrections Corporation of America, 6.75%, 01/31/2014 | | | 5,000 | | | 4,350 | |
Geo Group, Inc., 8.25%, 07/15/2013 | | | 5,000 | | | 4,400 | |
Mobile Mini, Inc., 6.875%, 05/01/2015 | | | 70,000 | | | 50,750 | |
Toll Corp.: | | | | | | | |
8.25%, 02/01/2011 | | | 125,000 | | | 108,750 | |
8.25%, 12/01/2011 | | | 5,000 | | | 4,275 | |
| | | | | |
| |
| | | | | | 341,575 | |
| | | | | |
| |
Machinery 0.1% | | | | | | | |
Commercial Vehicle Group, Inc., 8.00%, 07/01/2013 | | | 260,000 | | | 167,700 | |
| | | | | |
| |
See Notes to Financial Statements
19
SCHEDULE OF INVESTMENTS continued
October 31, 2008 (unaudited)
| | Principal
Amount | | Value | |
|
|
|
|
| |
CORPORATE BONDS continued | | | | | | | |
INDUSTRIALS continued | | | | | | | |
Road & Rail 0.1% | | | | | | | |
CSX Corp., 8.375%, 10/15/2014 | | $ | 45,000 | | $ | 45,221 | |
Kansas City Southern, 7.50%, 06/15/2009 | | | 50,000 | | | 48,250 | |
| | | | |
|
| |
| | | | | | 93,471 | |
| | | | |
|
| |
Trading Companies & Distributors 0.0% | | | | | | | |
United Rentals, Inc., 6.50%, 02/15/2012 | | | 50,000 | | | 35,250 | |
| | | | |
|
| |
INFORMATION TECHNOLOGY 0.3% | | | | | | | |
Communications Equipment 0.0% | | | | | | | |
EchoStar Corp.: | | | | | | | |
6.625%, 10/01/2014 | | | 25,000 | | | 20,125 | |
7.125%, 02/01/2016 | | | 10,000 | | | 8,075 | |
7.75%, 05/31/2015 | | | 25,000 | | | 20,437 | |
| | | | |
|
| |
| | | | | | 48,637 | |
| | | | |
|
| |
Electronic Equipment & Instruments 0.2% | | | | | | | |
Da-Lite Screen Co., Inc., 9.50%, 05/15/2011 | | | 50,000 | | | 44,750 | |
Jabil Circuit, Inc., 8.25%, 03/15/2018 | | | 270,000 | | | 206,550 | |
Sanmina-SCI Corp., 8.125%, 03/01/2016 | | | 5,000 | | | 3,175 | |
| | | | |
|
| |
| | | | | | 254,475 | |
| | | | |
|
| |
IT Services 0.1% | | | | | | | |
First Data, 9.875%, 09/24/2015 | | | 5,000 | | | 3,225 | |
Lender Processing Services, Inc., 8.125%, 07/01/2016 | | | 40,000 | | | 34,400 | |
SunGard Data Systems, Inc., 4.875%, 01/15/2014 | | | 135,000 | | | 104,625 | |
Unisys Corp., 6.875%, 03/15/2010 | | | 55,000 | | | 42,694 | |
| | | | |
|
| |
| | | | | | 184,944 | |
| | | | |
|
| |
Semiconductors & Semiconductor Equipment 0.0% | | | | | | | |
Spansion, Inc., FRN, 5.94%, 06/01/2013 144A | | | 120,000 | | | 26,400 | |
| | | | |
|
| |
MATERIALS 0.6% | | | | | | | |
Chemicals 0.2% | | | | | | | |
ARCO Chemical Co.: | | | | | | | |
9.80%, 02/01/2020 | | | 120,000 | | | 57,000 | |
10.25%, 11/01/2010 | | | 10,000 | | | 9,350 | |
Huntsman, LLC: | | | | | | | |
7.375%, 01/01/2015 | | | 15,000 | | | 13,125 | |
11.625%, 10/15/2010 | | | 85,000 | | | 84,362 | |
Koppers Holdings, Inc.: | | | | | | | |
9.875%, 10/15/2013 | | | 10,000 | | | 9,050 | |
Sr. Disc. Note, Step Bond, 0.00%, 11/15/2014 † | | | 95,000 | | | 76,475 | |
Millenium America, Inc., 7.625%, 11/15/2026 | | | 95,000 | | | 19,475 | |
Momentive Performance Materials, Inc.: | | | | | | | |
9.75%, 12/01/2014 | | | 5,000 | | | 2,825 | |
10.125%, 12/01/2014 | | | 120,000 | | | 58,200 | |
See Notes to Financial Statements
20
SCHEDULE OF INVESTMENTS continued
October 31, 2008 (unaudited)
| | Principal
Amount | | Value | |
|
|
|
|
| |
CORPORATE BONDS continued | | | | | | | |
MATERIALS continued | | | | | | | |
Chemicals continued | | | | | | | |
Mosaic Co.: | | | | | | | |
7.30%, 01/15/2028 | | $ | 60,000 | | $ | 42,857 | |
7.625%, 12/01/2016 144A | | | 80,000 | | | 69,962 | |
Tronox Worldwide, LLC, 9.50%, 12/01/2012 | | | 95,000 | | | 21,375 | |
| | | | |
|
| |
| | | | | | 464,056 | |
| | | | |
|
| |
Construction Materials 0.1% | | | | | | | |
CPG International, Inc.: | | | | | | | |
10.50%, 07/01/2013 | | | 160,000 | | | 104,000 | |
FRN, 9.90%, 07/01/2012 | | | 35,000 | | | 22,575 | |
CRH America, Inc., 8.125%, 07/15/2018 | | | 25,000 | | | 20,575 | |
Texas Industries, Inc., 7.25%, 07/15/2013 144A | | | 25,000 | | | 19,750 | |
| | | | |
|
| |
| | | | | | 166,900 | |
| | | | |
|
| |
Containers & Packaging 0.1% | | | | | | | |
Berry Plastics Holdings Corp., 8.875%, 09/15/2014 | | | 23,000 | | | 12,075 | |
Exopack Holding Corp., 11.25%, 02/01/2014 | | | 135,000 | | | 104,625 | |
Graphic Packaging International, Inc., 8.50%, 08/15/2011 | | | 95,000 | | | 79,800 | |
Smurfit-Stone Container Corp., 8.375%, 07/01/2012 | | | 30,000 | | | 15,450 | |
| | | | |
|
| |
| | | | | | 211,950 | |
| | | | |
|
| |
Metals & Mining 0.1% | | | | | | | |
Freeport-McMoRan Copper & Gold, Inc.: | | | | | | | |
8.25%, 04/01/2015 | | | 25,000 | | | 20,023 | |
8.375%, 04/01/2017 | | | 140,000 | | | 110,052 | |
| | | | |
|
| |
| | | | | | 130,075 | |
| | | | |
|
| |
Paper & Forest Products 0.1% | | | | | | | |
Georgia Pacific Corp.: | | | | | | | |
8.125%, 05/15/2011 | | | 30,000 | | | 25,500 | |
8.875%, 05/15/2031 | | | 5,000 | | | 3,250 | |
International Paper Co., 7.95%, 06/15/2018 | | | 115,000 | | | 93,284 | |
Verso Paper Holdings, LLC, 9.125%, 08/01/2014 | | | 125,000 | | | 66,875 | |
| | | | |
|
| |
| | | | | | 188,909 | |
| | | | |
|
| |
TELECOMMUNICATION SERVICES 1.5% | | | | | | | |
Diversified Telecommunication Services 0.5% | | | | | | | |
Citizens Communications Co., 7.875%, 01/15/2027 | | | 50,000 | | | 25,250 | |
FairPoint Communications, Inc., 13.125%, 04/01/2018 144A | | | 15,000 | | | 10,650 | |
New Jersey Bell Telephone Co., 7.85%, 11/15/2029 | | | 750,000 | | | 639,279 | |
Qwest Corp.: | | | | | | | |
6.50%, 06/01/2017 | | | 50,000 | | | 36,000 | |
7.50%, 06/15/2023 | | | 35,000 | | | 22,750 | |
7.875%, 09/01/2011 | | | 130,000 | | | 113,425 | |
8.875%, 03/15/2012 | | | 65,000 | | | 57,200 | |
| | | | |
|
| |
| | | | | | 904,554 | |
| | | | |
|
| |
See Notes to Financial Statements
21
SCHEDULE OF INVESTMENTS continued
October 31, 2008 (unaudited)
| | Principal
Amount | | Value | |
|
|
|
|
| |
CORPORATE BONDS continued | | | | | | | |
TELECOMMUNICATION SERVICES continued | | | | | | | |
Wireless Telecommunication Services 1.0% | | | | | | | |
AT&T Wireless, 8.125%, 05/01/2012 | | $ | 1,600,000 | | $ | 1,587,232 | |
Centennial Communications Corp., 8.125%, 02/01/2014 | | | 100,000 | | | 86,000 | |
Cricket Communications, Inc., 9.375%, 11/01/2014 | | | 65,000 | | | 53,138 | |
Sprint Nextel Corp.: | | | | | | | |
6.90%, 05/01/2019 | | | 25,000 | | | 17,654 | |
Ser. D, 7.375%, 08/01/2015 | | | 130,000 | | | 71,537 | |
Ser. E, 6.875%, 10/31/2013 | | | 60,000 | | | 34,650 | |
| | | | |
|
| |
| | | | | | 1,850,211 | |
| | | | |
|
| |
UTILITIES 0.8% | | | | | | | |
Electric Utilities 0.8% | | | | | | | |
Allegheny Energy Supply Co., 8.25%, 04/15/2012 144A | | | 165,000 | | | 151,800 | |
Aquila, Inc., Step Bond, 11.875%, 07/01/2012 †† | | | 348,000 | | | 341,286 | |
CMS Energy Corp., 8.50%, 04/15/2011 | | | 15,000 | | | 14,389 | |
Edison Mission Energy, 7.00%, 05/15/2017 | | | 5,000 | | | 3,981 | |
Energy Future Holdings Corp.: | | | | | | | |
10.875%, 11/01/2017 144A | | | 105,000 | | | 81,375 | |
11.25%, 11/01/2017 144A | | | 60,000 | | | 37,800 | |
Mirant Mid-Atlantic, LLC, Ser. C, 10.06%, 12/30/2028 | | | 43,843 | | | 39,021 | |
Mirant North America, LLC, 7.375%, 12/31/2013 | | | 215,000 | | | 188,931 | |
NRG Energy, Inc., 7.375%, 02/01/2016 | | | 150,000 | | | 129,750 | |
Orion Power Holdings, Inc., 12.00%, 05/01/2010 | | | 205,000 | | | 198,850 | |
Public Service Company of New Mexico, 7.95%, 04/01/2015 | | | 20,000 | | | 16,343 | |
Reliant Energy, Inc.: | | | | | | | |
6.75%, 12/15/2014 | | | 210,000 | | | 184,013 | |
7.625%, 06/15/2014 | | | 20,000 | | | 15,500 | |
7.875%, 06/15/2017 | | | 5,000 | | | 3,850 | |
| | | | |
|
| |
| | | | | | 1,406,889 | |
| | | | |
|
| |
Independent Power Producers & Energy Traders 0.0% | | | | | | | |
AES Corp.: | | | | | | | |
8.00%, 10/15/2017 | | | 5,000 | | | 3,875 | |
8.00%, 06/01/2020 144A | | | 30,000 | | | 22,200 | |
| | | | |
|
| |
| | | | | | 26,075 | |
| | | | |
|
| |
Multi-Utilities 0.0% | | | | | | | |
PNM Resources, Inc., 9.25%, 05/15/2015 | | | 15,000 | | | 12,525 | |
| | | | |
|
| |
Total Corporate Bonds (cost $60,039,015) | | | | | | 48,373,443 | |
| | | | |
|
| |
FOREIGN BONDS – CORPORATE (PRINCIPAL AMOUNT DENOMINATED IN CURRENCY INDICATED) 2.4% | | | | | | | |
CONSUMER DISCRETIONARY 0.1% | | | | | | | |
Media 0.1% | | | | | | | |
Central European Media Enterprise, Ltd., 8.25%, 05/15/2012 EUR | | | 170,000 | | | 153,591 | |
| | | | |
|
| |
See Notes to Financial Statements
22
SCHEDULE OF INVESTMENTS continued
October 31, 2008 (unaudited)
| | Principal
Amount | | Value | |
|
|
|
|
| |
FOREIGN BONDS – CORPORATE (PRINCIPAL AMOUNT DENOMINATED IN CURRENCY INDICATED) continued | | | | | | | |
CONSUMER STAPLES 0.2% | | | | | | | |
Beverages 0.0% | | | | | | | |
Canandaigua Brands, Inc., 8.50%, 11/15/2009 GBP | | | 50,000 | | $ | 79,133 | |
| | | | |
|
| |
Food & Staples Retailing 0.2% | | | | | | | |
Carrefour SA, 3.625%, 05/06/2013 EUR | | | 250,000 | | | 290,549 | |
| | | | |
|
| |
FINANCIALS 1.6% | | | | | | | |
Capital Markets 0.1% | | | | | | | |
Ahold Finance USA, Inc., 6.50%, 03/14/2017 GBP | | | 65,000 | | | 94,737 | |
| | | | |
|
| |
Commercial Banks 0.6% | | | | | | | |
KfW Bankengruppe, 15.50%, 01/25/2010 TRY | | | 240,000 | | | 145,539 | |
Kreditanstalt fur Wiederaufbau: | | | | | | | |
5.25%, 01/12/2012 GBP | | | 65,000 | | | 106,935 | |
6.375%, 02/17/2015 NZD | | | 585,000 | | | 343,503 | |
Landwirtschaftliche Rentenbank: | | | | | | | |
4.375%, 11/27/2017 EUR | | | 150,000 | | | 188,143 | |
5.75%, 01/21/2015 AUD | | | 610,000 | | | 404,268 | |
| | | | |
|
| |
| | | | | | 1,188,388 | |
| | | | |
|
| |
Consumer Finance 0.5% | | | | | | | |
ABB International Finance, Ltd., 6.50%, 11/30/2011 EUR | | | 250,000 | | | 322,868 | |
BMW Finance Corp., 4.25%, 01/22/2014 EUR | | | 300,000 | | | 314,379 | |
Toyota Motor Credit Corp., 5.125%, 01/17/2012 GBP | | | 205,000 | | | 328,424 | |
Virgin Media Finance plc, 9.75%, 04/15/2014 GBP | | | 50,000 | | | 46,430 | |
| | | | |
|
| |
| | | | | | 1,012,101 | |
| | | | |
|
| |
Diversified Financial Services 0.3% | | | | | | | |
Dubai Holding Commercial Operations Group, LLC, 6.00%, 02/01/2017 GBP | | | 100,000 | | | 103,930 | |
European Investment Bank: | | | | | | | |
3.625%, 10/15/2013 EUR | | | 70,000 | | | 87,324 | |
6.00%, 07/15/2009 NZD | | | 450,000 | | | 261,835 | |
General Electric Capital Corp., 3.375%, 02/08/2012 EUR | | | 120,000 | | | 134,488 | |
| | | | |
|
| |
| | | | | | 587,577 | |
| | | | |
|
| |
Thrifts & Mortgage Finance 0.1% | | | | | | | |
Totalkredit, FRN, 5.68%, 01/01/2015 DKK | | | 596,874 | | | 99,801 | |
| | | | |
|
| |
INDUSTRIALS 0.1% | | | | | | | |
Aerospace & Defense 0.1% | | | | | | | |
Bombardier, Inc., 7.25%, 11/15/2016 EUR | | | 70,000 | | | 56,340 | |
| | | | |
|
| |
Machinery 0.0% | | | | | | | |
Savcio Holdings, Ltd., 8.00%, 02/15/2013 EUR | | | 50,000 | | | 49,230 | |
| | | | |
|
| |
MATERIALS 0.1% | | | | | | | |
Containers & Packaging 0.1% | | | | | | | |
Owens-Illinois European Group BV, 6.875%, 03/31/2017 EUR | | | 70,000 | | | 69,924 | |
| | | | |
|
| |
See Notes to Financial Statements
23
SCHEDULE OF INVESTMENTS continued
October 31, 2008 (unaudited)
| | Principal
Amount | | Value | |
|
|
|
|
| |
FOREIGN BONDS – CORPORATE (PRINCIPAL AMOUNT DENOMINATED IN CURRENCY INDICATED) continued | | | | | | | |
MATERIALS continued | | | | | | | |
Metals & Mining 0.0% | | | | | | | |
New World Resources NV, 7.375%, 05/15/2015 EUR | | | 60,000 | | $ | 44,283 | |
| | | | |
|
| |
TELECOMMUNICATION SERVICES 0.2% | | | | | | | |
Diversified Telecommunication Services 0.2% | | | | | | | |
France Telecom, 7.50%, 03/14/2011 GBP | | | 270,000 | | | 454,634 | |
| | | | |
|
| |
UTILITIES 0.1% | | | | | | | |
Multi-Utilities 0.1% | | | | | | | |
Veolia Environnement SA, 4.00%, 02/12/2016 EUR | | | 200,000 | | | 205,111 | |
| | | | |
|
| |
Total Foreign Bonds – Corporate (Principal Amount Denominated in Currency Indicated) (cost $5,561,654) | | | 4,385,399 | |
| | | | |
|
| |
FOREIGN BONDS – GOVERNMENT (PRINCIPAL AMOUNT DENOMINATED IN CURRENCY INDICATED) 5.4% | | | | | | | |
Australia: | | | | | | | |
6.00%, 05/01/2012 AUD | | | 400,000 | | | 270,136 | |
6.00%, 10/14/2015 AUD | | | 670,000 | | | 454,664 | |
6.00%, 02/15/2017 AUD | | | 300,000 | | | 212,140 | |
Brazil: | | | | | | | |
7.375%, 02/03/2015 EUR | | | 60,000 | | | 67,761 | |
10.25%, 01/10/2028 BRL | | | 350,000 | | | 113,531 | |
Canada, 4.25%, 02/27/2013 EUR | | | 100,000 | | | 127,518 | |
Colombia, 11.50%, 05/31/2011 EUR | | | 50,000 | | | 64,929 | |
France: | | | | | | | |
2.25%, 07/25/2020 EUR | | | 456,561 | | | 534,131 | |
3.75%, 04/25/2017 EUR | | | 400,000 | | | 492,428 | |
4.25%, 04/25/2019 EUR | | | 755,000 | | | 946,963 | |
Germany, 4.25%, 07/04/2018 EUR | | | 670,000 | | | 875,591 | |
Hungary, 6.75%, 04/12/2010 HUF | | | 20,500,000 | | | 93,786 | |
Korea, 5.25%, 03/10/2027 KRW | | | 465,000,000 | | | 349,308 | |
Malaysia: | | | | | | | |
3.83%, 09/28/2011 MYR | | | 1,450,000 | | | 406,973 | |
3.87%, 04/13/2010 MYR | | | 650,000 | | | 183,180 | |
Mexico: | | | | | | | |
4.25%, 06/16/2015 EUR | | | 100,000 | | | 101,590 | |
5.50%, 02/17/2020 EUR | | | 320,000 | | | 315,580 | |
8.00%, 12/07/2023 MXN | | | 5,200,000 | | | 380,656 | |
10.00%, 12/05/2024 MXN | | | 2,015,000 | | | 174,310 | |
Morocco, 5.375%, 06/27/2017 EUR | | | 65,000 | | | 65,643 | |
Netherlands, 4.00%, 07/15/2016 EUR | | | 850,000 | | | 1,063,420 | |
Norway, 5.00%, 05/15/2015 NOK | | | 3,900,000 | | | 613,173 | |
Philippines, 6.25%, 03/15/2016 EUR | | | 200,000 | | | 212,507 | |
Singapore, 4.375%, 01/15/2009 SGD | | | 595,000 | | | 403,925 | |
South Africa, 5.25%, 05/16/2013 EUR | | | 100,000 | | | 97,466 | |
See Notes to Financial Statements
24
SCHEDULE OF INVESTMENTS continued
October 31, 2008 (unaudited)
| | Principal
Amount | | Value | |
|
|
|
|
| |
FOREIGN BONDS – GOVERNMENT (PRINCIPAL AMOUNT DENOMINATED IN CURRENCY INDICATED) continued | | | | | | | |
Sweden, 3.75%, 08/12/2017 SEK | | | 2,850,000 | | $ | 377,181 | |
Turkey, 4.75%, 07/06/2012 EUR | | | 290,000 | | | 308,681 | |
Ukraine, 4.95%, 10/13/2015 EUR | | | 50,000 | | | 25,450 | |
United Kingdom, 5.00%, 03/07/2012 GBP | | | 280,000 | | | 471,788 | |
| | | | |
|
| |
Total Foreign Bonds – Government (Principal Amount Denominated in Currency Indicated) (cost $11,680,819) | | | | | | 9,804,409 | |
| | | | |
|
| |
WHOLE LOAN MORTGAGE-BACKED COLLATERALIZED MORTGAGE OBLIGATIONS 1.2% | | | | | | | |
FIXED-RATE 1.2% | | | | | | | |
Banc of America Mtge. Securities, Inc., Ser. 2005-D, Class 2A6, 4.79%, 05/25/2035 | | $ | 3,255,000 | | | 2,170,547 | |
Harborview NIM Corp., Ser. 2006-14, Class N2, 8.35%, 03/19/2038 144A o | | | 469,183 | | | 79,522 | |
| | | | |
|
| |
Total Whole Loan Mortgage-Backed Collateralized Mortgage Obligations (cost $3,634,428) | | | | | | 2,250,069 | |
| | | | |
|
| |
WHOLE LOAN MORTGAGE-BACKED PASS THROUGH SECURITIES 13.5% | | | | | | | |
FIXED-RATE 6.3% | | | | | | | |
Countrywide Alternative Loan Trust, Inc., Ser. 2005-50CB, Class 1A1, 5.50%, 11/25/2035 | | | 1,630,624 | | | 1,082,454 | |
CSMC Mtge. Backed Trust, Ser. 2007-4R, Class 1A1, 5.69%, 10/26/2036 144A | | | 405,000 | | | 306,747 | |
First Horizon Mtge. Pass Through Trust, Ser. 2007-AR2, Class 2A1, 5.88%, 07/25/2037 | | | 2,666,751 | | | 1,735,016 | |
GSAA Home Equity Trust, Ser. 2007-10, Class A1A, 6.00%, 11/25/2037 | | | 1,259,162 | | | 818,259 | |
GSR Mtge. Loan Trust, Ser. 2006-8F, Class 4A3, 6.50%, 09/25/2036 | | | 580,000 | | | 494,561 | |
Morgan Stanley Capital I, Inc., Ser. 2007-13, Class 5A1, 5.50%, 10/25/2037 | | | 3,413,753 | | | 2,179,952 | |
PHH Alternative Mtge. Trust, Ser. 2007-01, Class 21A, 6.00%, 02/25/2037 | | | 747,749 | | | 517,712 | |
Residential Accredited Loans, Inc., Ser. 2007-QS10, Class A1, 6.50%, 09/25/2037 | | | 855,537 | | | 511,885 | |
Washington Mutual, Inc., Ser. 2005-AR3, Class A1, 4.64%, 03/25/2035 | | | 2,896,449 | | | 2,145,857 | |
Wells Fargo Mtge. Backed Securities Trust, Ser. 2006-AR10, Class 5A1, 5.59%, 07/25/2036 | | | 2,326,066 | | | 1,727,134 | |
| | | | |
|
| |
| | | | | | 11,519,577 | |
| | | | |
|
| |
FLOATING-RATE 7.2% | | | | | | | |
American Home Mtge. Assets: | | | | | | | |
Ser. 2006-2, Class 1A1, 3.625%, 09/25/2046 | | | 135,806 | | | 71,750 | |
Ser. 2007-1, Class A1, 3.37%, 02/25/2047 | | | 25,593 | | | 12,023 | |
Citigroup Mtge. Loan Trust, Inc., Ser. 2005-7, Class 2A3A, 5.16%, 09/25/2035 | | | 2,948,739 | | | 2,236,866 | |
Lehman XS Trust, Ser. 2006-18N, Class A5A, 3.43%, 12/25/2036 | | | 145,000 | | | 76,624 | |
MASTR Adjustable Rate Mtge. Trust, Ser. 2006-OA2, Class 4A1B, 4.06%, 12/25/2046 | | | 54,629 | | | 24,414 | |
MASTR Reperforming Loan Trust, Ser. 2006-2, Class 1A1, 5.89%, 05/25/2046 144A | | | 2,369,477 | | | 2,017,002 | |
Merrill Lynch Countrywide Comml. Mtge. Trust, Ser. 2007-8,Class A3, 5.96%, 07/12/2017 | | | 3,530,000 | | | 2,703,819 | |
See Notes to Financial Statements
25
SCHEDULE OF INVESTMENTS continued
October 31, 2008 (unaudited)
| | Principal
Amount | | Value | |
|
|
|
|
|
|
| |
WHOLE LOAN MORTGAGE-BACKED PASS THROUGH SECURITIES continued | | | | | | | |
FLOATING-RATE continued | | | | | | | |
Residential Funding Mtge. Securities, Ser. 2007-SA3, Class 2A1, 5.77%, 07/27/2037 | | $ | 3,323,542 | | $ | 2,118,726 | |
Washington Mutual, Inc. Mtge. Pass-Through Cert.: | | | | | | | |
Ser. 2006-AR02, Class A1A, 3.61%, 04/25/2046 | | | 403,893 | | | 214,041 | |
Ser. 2006-AR09, Class 2A, 3.51%, 11/25/2046 | | | 50,246 | | | 23,217 | |
Ser. 2006-AR17, Class 1A1B, 3.48%, 12/25/2046 | | | 2,356,743 | | | 922,558 | |
Ser. 2007-HY7, Class 3A2, 5.90%, 07/25/2037 | | | 2,746,804 | | | 1,870,231 | |
Ser. 2007-OA5, Class 1A1B, 3.42%, 06/25/2047 | | | 2,118,559 | | | 807,920 | |
| | | | |
|
| |
| | | | | | 13,099,191 | |
| | | | |
|
| |
Total Whole Loan Mortgage-Backed Pass Through Securities (cost $36,044,305) | | | | | | 24,618,768 | |
| | | | |
|
| |
WHOLE LOAN SUBORDINATE COLLATERALIZED MORTGAGE OBLIGATIONS 0.3% | | | | | | | |
FIXED-RATE 0.1% | | | | | | | |
Financial Asset Securitization, Inc., Ser. 1997-NAM2, Class B-2, 7.88%, 07/25/2027 | | | 217,752 | | | 217,113 | |
| | | | |
|
| |
FLOATING-RATE 0.2% | | | | | | | |
Harborview Mtge. Loan Trust: | | | | | | | |
Ser. 2004-7, Class B4, 5.43%, 11/19/2034 | | | 2,350,369 | | | 300,717 | |
Ser. 2005-8, Class 2B3, 5.02%, 09/19/2035 o | | | 1,057,969 | | | 107,035 | |
| | | | |
|
| |
| | | | | | 407,752 | |
| | | | |
|
| |
Total Whole Loan Subordinate Collateralized Mortgage Obligations (cost $3,096,429) | | | | | | 624,865 | |
| | | | |
|
| |
U.S. TREASURY OBLIGATIONS 2.0% | | | | | | | |
U.S. Treasury Bond, 6.00%, 02/15/2026 | | | 1,495,000 | | | 1,704,651 | |
U.S. Treasury Note, 4.00%, 08/15/2018 | | | 1,975,000 | | | 1,978,241 | |
| | | | |
|
| |
Total U.S. Treasury Obligations (cost $3,768,762) | | | | | | 3,682,892 | |
| | | | |
|
| |
YANKEE OBLIGATIONS – CORPORATE 3.0% | | | | | | | |
CONSUMER DISCRETIONARY 0.0% | | | | | | | |
Media 0.0% | | | | | | | |
Videotron, Ltd., 9.125%, 04/15/2018 144A | | | 5,000 | | | 4,463 | |
| | | | |
|
| |
CONSUMER STAPLES 0.1% | | | | | | | |
Beverages 0.1% | | | | | | | |
Companhia Brasileira de Bebidas, 8.75%, 09/15/2013 | | | 115,000 | | | 108,675 | |
| | | | |
|
| |
Food Products 0.0% | | | | | | | |
Sadia Overseas, Ltd., 6.875%, 05/24/2017 144A | | | 100,000 | | | 61,000 | |
| | | | |
|
| |
ENERGY 0.3% | | | | | | | |
Energy Equipment & Services 0.1% | | | | | | | |
Forbes Energy Services, Ltd., 11.00%, 02/15/2015 | | | 180,000 | | | 126,000 | |
| | | | |
|
| |
See Notes to Financial Statements
26
SCHEDULE OF INVESTMENTS continued
October 31, 2008 (unaudited)
| | | Principal
Amount | | | Value | |
|
|
|
|
|
|
| |
YANKEE OBLIGATIONS – CORPORATE continued | | | | | | | |
ENERGY continued | | | | | | | |
Oil, Gas & Consumable Fuels 0.2% | | | | | | | |
Connacher Oil & Gas, Ltd., 10.25%, 12/15/2015 144A | | $ | 55,000 | | $ | 38,775 | |
Griffin Coal Mining Co., Ltd.: | | | | | | | |
9.50%, 12/01/2016 | | | 40,000 | | | 16,191 | |
9.50%, 12/01/2016 144A | | | 410,000 | | | 170,150 | |
OPTI Canada, Inc., 7.875%, 12/15/2014 | | | 245,000 | | | 148,225 | |
| | | | |
|
| |
| | | | | | 373,341 | |
| | | | |
|
| |
FINANCIALS 0.3% | | | | | | | |
Consumer Finance 0.1% | | | | | | | |
Avago Technologies Finance, Ltd., FRN, 8.31%, 06/01/2013 | | | 30,000 | | | 25,687 | |
KazMunaiGaz Finance Sub BV, 8.375%, 07/02/2013 144A | | | 100,000 | | | 67,500 | |
Petroplus Finance, Ltd., 6.75%, 05/01/2014 144A | | | 25,000 | | | 16,875 | |
Virgin Media Finance plc, 8.75%, 04/15/2014 | | | 10,000 | | | 7,050 | |
| | | | |
|
| |
| | | | | | 117,112 | |
| | | | |
|
| |
Diversified Financial Services 0.2% | | | | | | | |
Corporacion Andina De Fomento, 5.75%, 01/12/2017 | | | 55,000 | | | 41,666 | |
FMG Finance Property, Ltd., 10.625%, 09/01/2016 144A | | | 245,000 | | | 169,050 | |
Preferred Term Securities XII, Ltd., FRN, 10.00%, 12/24/2033 + | | | 1,000,000 | | | 11,970 | |
Ship Finance International, Ltd., 8.50%, 12/15/2013 | | | 115,000 | | | 91,569 | |
Trapeza CDO, LLC, Ser. 2004-7A, Class B1, FRN, 5.09%, 01/25/2035 144A | | | 1,000,000 | | | 194,750 | |
| | | | |
|
| |
| | | | | | 509,005 | |
| | | | |
|
| |
INDUSTRIALS 0.1% | | | | | | | |
Road & Rail 0.1% | | | | | | | |
Kansas City Southern de Mexico: | | | | | | | |
7.375%, 06/01/2014 | | | 160,000 | | | 126,000 | |
9.375%, 05/01/2012 | | | 135,000 | | | 114,750 | |
| | | | |
|
| |
| | | | | | 240,750 | |
| | | | |
|
| |
INFORMATION TECHNOLOGY 0.1% | | | | | | | |
Communications Equipment 0.1% | | | | | | | |
Nortel Networks Corp.: | | | | | | | |
10.75%, 07/15/2016 144A | | | 175,000 | | | 93,187 | |
FRN, 9.00%, 07/15/2011 | | | 25,000 | | | 13,688 | |
| | | | |
|
| |
| | | | | | 106,875 | |
| | | | |
|
| |
MATERIALS 0.7% | | | | | | | |
Metals & Mining 0.7% | | | | | | | |
ArcelorMittal SA, 5.375%, 06/01/2013 144A | | | 1,200,000 | | | 976,010 | |
Evraz Group SA, 9.50%, 04/24/2018 144A | | | 100,000 | | | 42,500 | |
Novelis, Inc., 7.25%, 02/15/2015 | | | 250,000 | | | 168,750 | |
Vedanta Resource plc, 9.50%, 07/18/2018 144A | | | 165,000 | | | 73,425 | |
| | | | |
|
| |
| | | | | | 1,260,685 | |
| | | | |
|
| |
See Notes to Financial Statements
27
SCHEDULE OF INVESTMENTS continued
October 31, 2008 (unaudited)
| | Principal
Amount | | Value | |
|
|
|
|
|
|
| |
YANKEE OBLIGATIONS – CORPORATE continued | | | | | | | |
MATERIALS continued | | | | | | | |
Paper & Forest Products 0.0% | | | | | | | |
Cascades, Inc., 7.25%, 02/15/2013 | | $ | 40,000 | | $ | 22,400 | |
| | | | |
|
| |
TELECOMMUNICATION SERVICES 1.2% | | | | | | | |
Diversified Telecommunication Services 0.5% | | | | | | | |
Telecom Italia SpA, 6.20%, 07/18/2011 | | | 200,000 | | | 169,797 | |
Telefonica Emisiones, 7.05%, 06/20/2036 | | | 1,000,000 | | | 794,850 | |
| | | | |
|
| |
| | | | | | 964,647 | |
| | | | |
|
| |
Wireless Telecommunication Services 0.7% | | | | | | | |
Inmarsat, plc, Sr. Disc. Note, Step Bond, 0.00%, 11/15/2012 † | | | 30,000 | | | 24,000 | |
Intelsat, Ltd.: | | | | | | | |
8.50%, 04/15/2013 144A | | | 95,000 | | | 83,125 | |
8.875%, 01/15/2015 144A | | | 65,000 | | | 55,575 | |
Vimpel Communications: | | | | | | | |
8.25%, 05/23/2016 | | | 100,000 | | | 51,250 | |
8.25%, 05/23/2016 144A | | | 100,000 | | | 51,500 | |
8.375%, 04/30/2013 144A | | | 15,000 | | | 9,007 | |
9.125%, 04/30/2018 144A | | | 115,000 | | | 59,494 | |
Vodafone Group plc, 5.625%, 02/27/2017 | | | 1,200,000 | | | 981,100 | |
| | | | |
|
| |
| | | | | | 1,315,051 | |
| | | | |
|
| |
UTILITIES 0.2% | | | | | | | |
Electric Utilities 0.1% | | | | | | | |
Enersis SA, 7.375%, 01/15/2014 | | | 115,000 | | | 107,953 | |
| | | | |
|
| |
Multi-Utilities 0.1% | | | | | | | |
National Power Corp.: | | | | | | | |
6.875%, 11/02/2016 | | | 200,000 | | | 135,644 | |
FRN, 7.06%, 08/23/2011 | | | 130,000 | | | 108,604 | |
| | | | |
|
| |
| | | | | | 244,248 | |
| | | | |
|
| |
Total Yankee Obligations – Corporate (cost $8,988,202) | | | | | | 5,562,205 | |
| | | | |
|
| |
YANKEE OBLIGATIONS – GOVERNMENT 1.4% | | | | | | | |
Argentina, 12.25%, 06/19/2018 • | | | 159,188 | | | 28,654 | |
Brazil: | | | | | | | |
7.125%, 01/20/2037 | | | 370,000 | | | 341,695 | |
8.25%, 01/20/2034 | | | 410,000 | | | 399,750 | |
Chile, 7.125%, 01/11/2012 | | | 125,000 | | | 131,762 | |
China, 4.75%, 10/29/2013 | | | 100,000 | | | 94,609 | |
Colombia: | | | | | | | |
7.375%, 01/27/2017 | | | 100,000 | | | 90,500 | |
8.125%, 05/21/2024 | | | 175,000 | | | 160,125 | |
Emirates of Abu Dhabi, 5.50%, 08/02/2012 | | | 200,000 | | | 195,770 | |
Indonesia, 6.75%, 03/10/2014 | | | 90,000 | | | 62,100 | |
Mexico, 8.375%, 01/14/2011 | | | 190,000 | | | 201,875 | |
See Notes to Financial Statements
28
SCHEDULE OF INVESTMENTS continued
October 31, 2008 (unaudited)
| | Principal
Amount | | Value | |
|
|
|
|
| |
YANKEE OBLIGATIONS – GOVERNMENT continued | | | | | | | |
Peru: | | | | | | | |
8.375%, 05/03/2016 | | $ | 275,000 | | $ | 268,125 | |
8.75%, 11/21/2033 | | | 35,000 | | | 32,025 | |
Russia: | | | | | | | |
11.00%, 07/24/2018 | | | 55,000 | | | 68,887 | |
Sr. Disc. Note, Step Bond, 7.50%, 03/31/2030 † | | | 147,000 | | | 128,717 | |
Turkey, 7.00%, 09/26/2016 | | | 200,000 | | | 163,000 | |
Venezuela, 10.75%, 09/19/2013 | | | 180,000 | | | 123,300 | |
| | | | |
|
| |
Total Yankee Obligations – Government (cost $3,044,453) | | | | | | 2,490,894 | |
| | | | |
|
| |
| | | | | | | |
|
|
|
|
|
|
| |
| | Shares | | Value | |
|
|
|
|
| |
PREFERRED STOCKS 0.0% | | | | | | | |
FINANCIALS 0.0% | | | | | | | |
Diversified Financial Services 0.0% | | | | | | | |
First Republic Capital Corp., 10.50% 144A (cost $55,855) | | | 50 | | | 38,500 | |
| | | | |
|
| |
| | | | | | | |
|
|
|
|
|
|
| |
| | Principal
Amount | | Value | |
|
|
|
|
| |
CONVERTIBLE DEBENTURES 0.0% | | | | | | | |
INFORMATION TECHNOLOGY 0.0% | | | | | | | |
Communications Equipment 0.0% | | | | | | | |
Nortel Networks Corp., 2.125%, 04/15/2014 (cost $36,685) | | $ | 55,000 | | | 19,525 | |
| | | | |
|
| |
| | | | | | | |
|
|
|
|
|
|
| |
| | Shares | | Value | |
|
|
|
|
| |
CLOSED END MUTUAL FUND SHARES 2.3% | | | | | | | |
Blackrock Core Bond Trust | | | 63,250 | | | 604,037 | |
BlackRock Income Opportunity Trust | | | 75,485 | | | 615,958 | |
BlackRock Income Trust | | | 80,175 | | | 440,161 | |
MFS Charter Income Trust | | | 108,400 | | | 772,892 | |
MFS Intermediate Income Trust | | | 113,237 | | | 670,363 | |
MFS Multimarket Income Trust | | | 100,954 | | | 474,484 | |
Putnam Premier Income Trust | | | 105,043 | | | 504,206 | |
Van Kampen Bond Fund | | | 5,325 | | | 76,574 | |
| | | | |
|
| |
Total Closed End Mutual Fund Shares (cost $4,822,778) | | | | | | 4,158,675 | |
| | | | |
|
| |
| | | | | | | |
|
|
|
|
|
|
| |
| | Principal
Amount | | Value | |
|
|
|
|
| |
LOANS 0.4% | | | | | | | |
CONSUMER DISCRETIONARY 0.2% | | | | | | | |
Ford Motor Co., FRN, 7.59%, 12/15/2013 < | | $ | 109,746 | | | 60,753 | |
General Motors Corp., FRN, 5.80%, 11/29/2013 < | | | 119,734 | | | 66,484 | |
See Notes to Financial Statements
29
SCHEDULE OF INVESTMENTS continued
October 31, 2008 (unaudited)
| | Principal
Amount | | Value | |
|
|
|
|
| |
LOANS continued | | | | | | | |
CONSUMER DISCRETIONARY continued | | | | | | | |
Idearc, Inc. | | | | | | | |
FRN, 5.12%-5.77%, 11/17/2014 | | $ | 76,686 | | $ | 31,058 | |
N/A, 11/13/2013 < | | | 10,000 | | | 4,276 | |
Newsday, LLC, 9.75%, 07/15/2013 | | | 35,000 | | | 29,018 | |
Tropicana Entertainment, LLC, FRN, 7.25%, 01/03/2012 | | | 190,000 | | | 87,400 | |
| | | | |
|
| |
| | | | | | 278,989 | |
| | | | |
|
| |
CONSUMER STAPLES 0.0% | | | | | | | |
Merisant Co., FRN, 6.30%, 01/11/2010 | | | 54,899 | | | 50,831 | |
| | | | |
|
| |
ENERGY 0.0% | | | | | | | |
Semgroup Energy Partners, N/A, 07/20/2012 < | | | 50,000 | | | 38,954 | |
| | | | |
|
| |
FINANCIALS 0.0% | | | | | | | |
Realogy Corp., FRN, 09/01/2014 | | | 29,925 | | | 18,630 | |
| | | | |
|
| |
INDUSTRIALS 0.1% | | | | | | | |
Clarke American Corp., FRN, 6.26%-6.38%, 02/28/2014 | | | 129,020 | | | 84,722 | |
Neff Corp., FRN, 6.40%, 11/30/2014 | | | 185,000 | | | 80,470 | |
| | | | |
|
| |
| | | | | | 165,192 | |
| | | | |
|
| |
MATERIALS 0.1% | | | | | | | |
Georgia Pacific Corp., N/A, 12/22/2012 < | | | 25,000 | | | 20,766 | |
Graham Packaging Co., 7.71%, 10/07/2011 < | | | 25,000 | | | 19,657 | |
Lyondell Chemical Co., FRN, 8.04%, 12/20/2014 | | | 339,173 | | | 203,965 | |
| | | | |
|
| |
| | | | | | 244,388 | |
| | | | |
|
| |
Total Loans (cost $1,150,752) | | | | | | 796,984 | |
| | | | |
|
| |
DEPOSITORY SHARES 1.2% | | | | | | | |
FINANCIALS 1.2% | | | | | | | |
Bank of America Corp., FRN, 8.00%, 12/29/2049 | | | 20,000 | | | 14,996 | |
Citigroup, Inc., FRN, 8.40%, 04/29/2049 | | | 850,000 | | | 591,898 | |
JPMorgan Chase & Co., FRN, 7.90%, 12/31/2049 | | | 805,000 | | | 654,083 | |
PNC Financial Services Group, Inc., 8.70%, 12/31/2049 144A | | | 300,000 | | | 244,840 | |
Wells Fargo Capital XIII, FRN, 7.70%, 12/29/2049 ° | | | 800,000 | | | 654,604 | |
| | | | |
|
| |
Total Depository Shares (cost $2,764,677) | | | | | | 2,160,421 | |
| | | | |
|
| |
| | | | | | | |
|
|
|
|
|
|
| |
| | Shares | | Value | |
|
|
|
|
| |
SHORT-TERM INVESTMENTS 9.8% | | | | | | | |
MUTUAL FUND SHARES 9.8% | | | | | | | |
Evergreen Institutional Money Market Fund, Class I, 3.21% q ø ## (cost $17,867,052) | | | 17,867,052 | | | 17,867,052 | |
| | | | |
|
| |
Total Investments (cost $258,169,970) 113.8% | | | | | | 207,313,572 | |
Other Assets and Liabilities (13.8%) | | | | | | (25,266,576 | ) |
| | | | |
|
| |
Net Assets 100.0% | | | | | $ | 182,046,996 | |
| | | | |
|
| |
See Notes to Financial Statements
30
SCHEDULE OF INVESTMENTS continued
October 31, 2008 (unaudited)
## | All or a portion of this security has been segregated for when-issued, delayed delivery securities and/or unfunded loans. |
# | When-issued or delayed delivery security |
144A | Security that may be sold to qualified institutional buyers under Rule 144A of the Securities Act of 1933, as amended. This security has been determined to be liquid under guidelines established by the Board of Trustees, unless otherwise noted. |
o | Security is valued at fair value as determined by the investment advisor in good faith, according to procedures approved by the Board of Trustees. |
+ | Security is deemed illiquid and is valued using market quotations when readily available, unless otherwise noted. |
• | Security which has defaulted on payment of interest and/or principal. The Fund has stopped accruing interest on this security. |
†† | The rate shown is the stated rate at the current period end. |
† | Security initially issued in zero coupon form which converts to coupon form at a specified rate and date. An effective interest rate is applied to recognize interest income daily for the bond. This rate is based on total expected interest to be earned over the life of the bond which consists of the aggregate coupon-interest payments and discount at acquisition. The rate shown is the stated rate at the current period end. |
< | All or a portion of the position represents an unfunded loan commitment. |
° | Investment in non-controlled affiliate. At October 31, 2008, the Fund owned shares of Wells Fargo & Co. with a cost basis of $800,000. The Fund did not earn any income from Wells Fargo & Co. for the period from October 3, 2008 to October 31, 2008. |
q | Rate shown is the 7-day annualized yield at period end. |
ø | Evergreen Investment Management Company, LLC is the investment advisor to both the Fund and the money market fund. |
Summary of Abbreviations |
AUD | Australian Dollar |
BRL | Brazil Real |
CDO | Collateralized Debt Obligation |
DKK | Danish Krone |
EUR | Euro |
FHLMC | Federal Home Loan Mortgage Corp. |
FNMA | Federal National Mortgage Association |
FRN | Floating Rate Note |
GBP | Great British Pound |
GNMA | Government National Mortgage Association |
HUF | Hungarian Forint |
KRW | Republic of Korea Won |
MASTR | Mortgage Asset Securitization Transactions, Inc. |
MXN | Mexican Peso |
MYR | Malaysian Ringgit |
NIM | Net Interest Margin |
NOK | Norwegian Krone |
NZD | New Zealand Dollar |
SEK | Swedish Krona |
SGD | Singapore Dollar |
TBA | To Be Announced |
TRY | Turkey New Lira |
See Notes to Financial Statements
31
SCHEDULE OF INVESTMENTS continued
October 31, 2008 (unaudited)
The following table shows the percent of total investments by credit quality based on Moody’s and Standard & Poor’s ratings as of October 31, 2008*:
AAA | 53.4 | % |
AA | 10.9 | % |
A | 10.7 | % |
BBB | 10.4 | % |
BB | 11.5 | % |
B | 2.8 | % |
CCC | 0.2 | % |
NR | 0.1 | % |
|
| |
| 100.0 | % |
|
| |
The following table shows the percent of total investments based on effective maturity as of October 31, 2008*:
Less than 1 year | 14.4 | % |
1 to 3 year(s) | 11.0 | % |
3 to 5 years | 10.2 | % |
5 to 10 years | 52.1 | % |
10 to 20 years | 6.6 | % |
20 to 30 years | 5.7 | % |
|
| |
| 100.0 | % |
|
| |
* | Calculations exclude equity securities, collateral from securities on loan and segregated cash and cash equivalents, as applicable. |
See Notes to Financial Statements
32
STATEMENT OF ASSETS AND LIABILITIES
October 31, 2008 (unaudited)
Assets | | | | |
Investments in securities, at value (cost $ 240,302,918) | | $ | 189,446,520 | |
Investments in affiliated money market fund, at value (cost $ 17,867,052) | | | 17,867,052 | |
|
|
|
| |
Total investments | | | 207,313,572 | |
Foreign currency, at value (cost $ 190,891) | | | 186,480 | |
Receivable for securities sold | | | 24,006,871 | |
Principal paydown receivable | | | 99,051 | |
Receivable for Fund shares sold | | | 36,817 | |
Dividends and interest receivable | | | 2,696,545 | |
Unrealized gains on forward foreign currency exchange contracts | | | 1,588,854 | |
Unrealized gains on credit default swap transactions | | | 10,155 | |
Receivable from investment advisor | | | 2,077 | |
Prepaid expenses and other assets | | | 171,382 | |
|
|
|
| |
Total assets | | | 236,111,804 | |
|
|
|
| |
Liabilities | | | | |
Dividends payable | | | 370,505 | |
Payable for securities purchased | | | 49,991,880 | |
Payable for Fund shares redeemed | | | 362,693 | |
Unrealized losses on total return swap transactions | | | 909,694 | |
Unrealized losses on credit default swap transactions | | | 1,869,385 | |
Unrealized losses on forward foreign currency exchange contracts | | | 188,382 | |
Premiums received on credit default swap transactions | | | 266,259 | |
Distribution Plan expenses payable | | | 4,547 | |
Due to other related parties | | | 4,092 | |
Accrued expenses and other liabilities | | | 97,371 | |
|
|
|
| |
Total liabilities | | | 54,064,808 | |
|
|
|
| |
Net assets | | $ | 182,046,996 | |
|
|
|
| |
Net assets represented by | | | | |
Paid-in capital | | $ | 277,760,757 | |
Overdistributed net investment income | | | (273,268 | ) |
Accumulated net realized losses on investments | | | (43,148,540 | ) |
Net unrealized losses on investments | | | (52,291,953 | ) |
|
|
|
| |
Total net assets | | $ | 182,046,996 | |
|
|
|
| |
Net assets consists of | | | | |
Class A | | $ | 122,950,087 | |
Class B | | | 8,743,105 | |
Class C | | | 15,125,344 | |
Class I | | | 35,228,460 | |
|
|
|
| |
Total net assets | | $ | 182,046,996 | |
|
|
|
| |
Shares outstanding (unlimited number of shares authorized) | | | | |
Class A | | | 11,640,915 | |
Class B | | | 828,104 | |
Class C | | | 1,431,992 | |
Class I | | | 3,334,979 | |
|
|
|
| |
Net asset value per share | | | | |
Class A | | $ | 10.56 | |
Class A — Offering price (based on sales charge of 4.75%) | | $ | 11.09 | |
Class B | | $ | 10.56 | |
Class C | | $ | 10.56 | |
Class I | | $ | 10.56 | |
|
|
|
| |
See Notes to Financial Statements
33
STATEMENT OF OPERATIONS
Six Months Ended October 31, 2008 (unaudited)
Investment income | | | | |
Interest (net of foreign withholding taxes of $ 236) | | $ | 7,481,149 | |
Income from affiliate | | | 226,811 | |
Dividends | | | 214,965 | |
|
|
|
| |
Total investment income | | | 7,922,925 | |
|
|
|
| |
Expenses | | | | |
Advisory fee | | | 516,949 | |
Distribution Plan expenses | | | | |
Class A | | | 195,883 | |
Class B | | | 60,827 | |
Class C | | | 99,403 | |
Administrative services fee | | | 116,534 | |
Transfer agent fees | | | 287,051 | |
Trustees’ fees and expenses | | | 2,588 | |
Printing and postage expenses | | | 31,924 | |
Custodian and accounting fees | | | 68,533 | |
Registration and filing fees | | | 35,922 | |
Professional fees | | | 20,892 | |
Other | | | 5,282 | |
|
|
|
| |
Total expenses | | | 1,441,788 | |
Less: Expense reductions | | | (527 | ) |
Fee waivers | | | (305,165 | ) |
|
|
|
| |
Net expenses | | | 1,136,096 | |
|
|
|
| |
Net investment income | | | 6,786,829 | |
|
|
|
| |
Net realized and unrealized gains or losses on investments | | | | |
Net realized gains or losses on: | | | | |
Securities | | | (6,765,338 | ) |
Foreign currency related transactions | | | 57,608 | |
Credit default swap transactions | | | (2,441,540 | ) |
Total return swap transactions | | | (2,294,707 | ) |
|
|
|
| |
Net realized losses on investments | | | (11,443,977 | ) |
Net change in unrealized gains or losses on investments | | | (39,261,425 | ) |
|
|
|
| |
Net realized and unrealized gains or losses on investments | | | (50,705,402 | ) |
|
|
|
| |
Net decrease in net assets resulting from operations | | $ | (43,918,573 | ) |
|
|
|
| |
See Notes to Financial Statements
34
STATEMENTS OF CHANGES IN NET ASSETS
| | Six Months Ended | | | |
| | October 31, 2008 | | Year Ended | |
| | (unaudited) | | April 30, 2008 | |
|
|
|
|
| |
Operations | | | | | | | | | | | |
Net investment income | | | | $ | 6,786,829 | | | | $ | 14,337,171 | |
Net realized losses on investments | | | | | (11,443,977 | ) | | | | (7,394,918 | ) |
Net change in unrealized gains or losses on investments | | | | | (39,261,425 | ) | | | | (13,145,686 | ) |
|
|
|
|
|
|
|
|
|
|
| |
Net decrease in net assets resulting from operations | | | | | (43,918,573 | ) | | | | (6,203,433 | ) |
|
|
|
|
|
|
|
|
|
|
| |
Distributions to shareholders from | | | | | | | | | | | |
Net investment income | | | | | | | | | | | |
Class A | | | | | (4,415,338 | ) | | | | (6,841,784 | ) |
Class B | | | | | (295,536 | ) | | | | (438,612 | ) |
Class C | | | | | (484,181 | ) | | | | (691,872 | ) |
Class I | | | | | (1,305,422 | ) | | | | (2,077,072 | ) |
Tax return of capital | | | | | | | | | | | |
Class A | | | | | 0 | | | | | (2,666,944 | ) |
Class B | | | | | 0 | | | | | (214,425 | ) |
Class C | | | | | 0 | | | | | (338,870 | ) |
Class I | | | | | 0 | | | | | (757,769 | ) |
|
|
|
|
|
|
|
|
|
|
| |
Total distributions to shareholders | | | | | (6,500,477 | ) | | | | (14,027,348 | ) |
|
|
|
|
|
|
|
|
|
|
| |
| | Shares | | | | | Shares | | | | |
|
|
|
|
|
|
|
|
|
|
| |
Capital share transactions | | | | | | | | | | | |
Proceeds from shares sold | | | | | | | | | | | |
Class A | | 90,765 | | | 1,165,218 | | 645,781 | | | 9,130,480 | |
Class B | | 23,858 | | | 310,359 | | 207,305 | | | 2,925,612 | |
Class C | | 28,559 | | | 344,488 | | 225,175 | | | 3,194,094 | |
Class I | | 24,866 | | | 309,606 | | 62,125 | | | 874,257 | |
|
|
|
|
|
|
|
|
|
|
| |
| | | | | 2,129,671 | | | | | 16,124,443 | |
|
|
|
|
|
|
|
|
|
|
| |
Net asset value of shares issued in reinvestment of distributions | | | | | | | | | | | |
Class A | | 244,124 | | | 3,002,563 | | 449,451 | | | 6,347,504 | |
Class B | | 15,567 | | | 192,053 | | 29,046 | | | 410,033 | |
Class C | | 24,516 | | | 301,609 | | 44,486 | | | 628,139 | |
Class I | | 58,414 | | | 718,096 | | 108,074 | | | 1,526,367 | |
|
|
|
|
|
|
|
|
|
|
| |
| | | | | 4,214,321 | | | | | 8,912,043 | |
|
|
|
|
|
|
|
|
|
|
| |
Automatic conversion of Class B shares to Class A shares | | | | | | | | | | | |
Class A | | 18,791 | | | 238,512 | | 51,162 | | | 717,162 | |
Class B | | (18,791 | ) | | (238,512 | ) | (51,162 | ) | | (717,162 | ) |
|
|
|
|
|
|
|
|
|
|
| |
| | | | | 0 | | | | | 0 | |
|
|
|
|
|
|
|
|
|
|
| |
Payment for shares redeemed | | | | | | | | | | | |
Class A | | (1,226,313 | ) | | (15,208,685 | ) | (2,435,890 | ) | | (34,383,483 | ) |
Class B | | (209,152 | ) | | (2,584,484 | ) | (283,010 | ) | | (3,986,296 | ) |
Class C | | (240,031 | ) | | (2,953,355 | ) | (322,517 | ) | | (4,543,748 | ) |
Class I | | (304,641 | ) | | (3,849,224 | ) | (522,589 | ) | | (7,353,155 | ) |
|
|
|
|
|
|
|
|
|
|
| |
| | | | | (24,595,748 | ) | | | | (50,266,682 | ) |
|
|
|
|
|
|
|
|
|
|
| |
Net decrease in net assets resulting from capital share transactions | | | | | (18,251,756 | ) | | | | (25,230,196 | ) |
|
|
|
|
|
|
|
|
|
|
| |
Total decrease in net assets | | | | | (68,670,806 | ) | | | | (45,460,977 | ) |
See Notes to Financial Statements
35
STATEMENTS OF CHANGES IN NET ASSETS continued
| | Six Months Ended | | | |
| | October 31, 2008 | | Year Ended | |
| | (unaudited) | | April 30, 2008 | |
|
|
|
|
| |
Net assets | | | | | | | | | | | |
Beginning of period | | | | $ | 250,717,802 | | | | $ | 296,178,779 | |
|
|
|
|
|
|
|
|
|
|
| |
End of period | | | | $ | 182,046,996 | | | | $ | 250,717,802 | |
|
|
|
|
|
|
|
|
|
|
| |
Overdistributed net investment income | | | | $ | (273,268 | ) | | | $ | (323,900 | ) |
|
|
|
|
|
|
|
|
|
|
| |
See Notes to Financial Statements
36
NOTES TO FINANCIAL STATEMENTS (unaudited)
1. ORGANIZATION
Evergreen Core Plus Bond Fund (the “Fund”) is a diversified series of Evergreen Fixed Income Trust (the “Trust”), a Delaware statutory trust organized on September 18, 1997. The Trust is an open-end management investment company registered under the Investment Company Act of 1940, as amended (the “1940 Act”).
The Fund offers Class A, Class B, Class C and Class I shares. Class A shares are sold with a front-end sales charge. However, Class A share investments of $1 million or more are not subject to a front-end sales charge but are subject to a contingent deferred sales charge of 1.00% upon redemption within 18 months. Class B shares are sold without a front-end sales charge but are subject to a contingent deferred sales charge that is payable upon redemption and decreases depending on how long the shares have been held. Class C shares are sold without a front-end sales charge but are subject to a contingent deferred sales charge that is payable upon redemption within one year. Class I shares are sold without a front-end sales charge or contingent deferred sales charge. Each class of shares, except Class I shares, pays an ongoing distribution fee.
2. SIGNIFICANT ACCOUNTING POLICIES
The following is a summary of significant accounting policies consistently followed by the Fund in the preparation of its financial statements. The policies are in conformity with generally accepted accounting principles in the United States of America, which require management to make estimates and assumptions that affect amounts reported herein. Actual results could differ from these estimates.
a. Valuation of investments
Portfolio debt securities acquired with more than 60 days to maturity are fair valued using matrix pricing methods determined by an independent pricing service which takes into consideration such factors as similar security prices, yields, maturities, liquidity and ratings. Securities for which valuations are not readily available from an independent pricing service may be valued by brokers which use prices provided by market makers or estimates of market value obtained from yield data relating to investments or securities with similar characteristics.
Listed equity securities are usually valued at the last sales price or official closing price on the national securities exchange where the securities are principally traded.
Short-term securities with remaining maturities of 60 days or less at the time of purchase are valued at amortized cost, which approximates market value.
Investments in open-end mutual funds are valued at net asset value. Securities for which market quotations are not readily available or not reflective of current market value are valued at fair value as determined by the investment advisor in good faith, according to procedures approved by the Board of Trustees.
37
NOTES TO FINANCIAL STATEMENTS (unaudited) continued
b. Repurchase agreements
Securities pledged as collateral for repurchase agreements are held by the custodian bank or in a segregated account in the Fund’s name until the agreements mature. Collateral for certain tri-party repurchase agreements is held at the counterparty’s custodian in a segregated account for the benefit of the Fund and the counterparty. Each agreement requires that the market value of the collateral be sufficient to cover payments of interest and principal. However, in the event of default or bankruptcy by the other party to the agreement, retention of the collateral may be subject to legal proceedings. The Fund will enter into repurchase agreements with banks and other financial institutions, which are deemed by the investment advisor to be creditworthy pursuant to guidelines established by the Board of Trustees. In certain instances, the Fund’s securities lending agent may provide collateral in the form of repurchase agreements.
c. Foreign currency translation
All assets and liabilities denominated in foreign currencies are translated into U.S. dollar amounts at the date of valuation. Purchases and sales of portfolio securities and income items denominated in foreign currencies are translated into U.S. dollar amounts on the respective dates of such transactions. The Fund does not separately account for that portion of the results of operations resulting from changes in foreign exchange rates on investments and the fluctuations arising from changes in market prices of securities held. Such fluctuations are included with the net realized and unrealized gains or losses on investments.
d. Futures contracts
In order to gain exposure to, or protect against changes in, security values, the Fund may buy and sell futures contracts. The primary risks associated with the use of futures contracts are the imperfect correlation between changes in market values of securities held by the Fund and the prices of futures contracts, and the possibility of an illiquid market.
Futures contracts are valued based upon their quoted daily settlement prices. The aggregate principal amounts of the contracts are not recorded in the financial statements. Fluctuations in the value of the contracts are recorded in the Statement of Assets and Liabilities as an asset or liability and in the Statement of Operations as unrealized gains or losses until the contracts are closed, at which point they are recorded as net realized gains or losses on futures contracts.
e. Forward foreign currency contracts
A forward foreign currency contract is an agreement between two parties to purchase or sell a specific currency for an agreed-upon price at a future date. The Fund enters into forward foreign currency contracts to facilitate transactions in foreign-denominated securities and to attempt to minimize the risk to the Fund from adverse changes in the relationship between currencies. Forward foreign currency contracts are recorded at the forward rate and marked-to-market daily. When the contracts are closed, realized gains
38
NOTES TO FINANCIAL STATEMENTS (unaudited) continued
and losses arising from such transactions are recorded as realized gains or losses on foreign currency related transactions. The Fund could be exposed to risks if the counterparties to the contracts are unable to meet the terms of their contracts or if the value of the foreign currency changes unfavorably.
f. When-issued and delayed delivery transactions
The Fund records when-issued or delayed delivery securities as of trade date and maintains security positions such that sufficient liquid assets will be available to make payment for the securities purchased. Securities purchased on a when-issued or delayed delivery basis are marked-to-market daily and begin earning interest on the settlement date. Losses may occur on these transactions due to changes in market conditions or the failure of counterparties to perform under the contract.
g. Loans
The Fund may purchase loans through an agent, by assignment from another holder of the loan or as a participation interest in another holder’s portion of the loan. Loans are purchased on a when-issued or delayed delivery basis. Interest income is accrued based on the terms of the securities. Fees earned on loan purchasing activities are recorded as income when earned. Loans involve interest rate risk, liquidity risk and credit risk, including the potential default or insolvency of the borrower.
h. Securities lending
The Fund may lend its securities to certain qualified brokers in order to earn additional income. The Fund receives compensation in the form of fees or interest earned on the investment of any cash collateral received. The Fund also continues to receive interest and dividends on the securities loaned. The Fund receives collateral in the form of cash or securities with a market value at least equal to the market value of the securities on loan, including accrued interest. In the event of default or bankruptcy by the borrower, the Fund could experience delays and costs in recovering the loaned securities or in gaining access to the collateral. The Fund has the right under the lending agreement to recover the securities from the borrower on demand.
i. Dollar roll transactions
The Fund may enter into dollar roll transactions with respect to mortgage-backed securities. In a dollar roll transaction, the Fund sells mortgage-backed securities to financial institutions and simultaneously agrees to accept substantially similar (same type, coupon and maturity) securities at a later date at an agreed upon price. The Fund will use the proceeds generated from the transactions to invest in short-term investments, which may enhance the Fund’s current yield and total return. The Fund accounts for dollar roll transactions as purchases and sales. The Fund could be exposed to risks if the counterparty defaults on its obligation to perform under the terms of the agreement, if the Fund receives inferior securities in comparison to what was sold to the counterparty at redelivery or if there are variances in paydown speed between the mortgage-related pools.
39
NOTES TO FINANCIAL STATEMENTS (unaudited) continued
j. Credit default swaps
The Fund may enter into credit default swap contracts. Credit default swaps involve an exchange of a stream of payments for protection against the loss in value of an underlying security or index in the event of default or bankruptcy. Under the terms of the swap, one party acts as a guarantor and receives a periodic stream of payments that is a fixed percentage applied to a notional principal amount over the term of the swap. The guarantor agrees to purchase the notional amount of the underlying instrument or index, at par, if a credit event occurs during the term of the swap. An index credit default swap references all the names in the index, and if there is a default, the credit event is settled based on that name’s weight in the index. The Fund may enter into credit default swaps as either the guarantor or the counterparty.
Any premiums paid or received on the transactions are recorded as an asset or liability on the Statement of Assets and Liabilities and amortized. The value of the swap contract is marked-to-market daily based on quotations from an independent pricing service or market makers and any change in value is recorded as an unrealized gain or loss. Periodic payments made or received are recorded as realized gains or losses. In addition, payments received or made as a result of a credit event or termination of the contract are recognized as realized gains or losses. As guarantor, the Fund is subject to investment exposure on the notional amount of the swap and has assumed the risk of default of the underlying security or index. As counterparty, the Fund could be exposed to risks if the guarantor defaults on its obligation to perform, or if there are unfavorable changes in the fluctuation of interest rates or in the price of the underlying security or index.
k. Total return swaps
The Fund may enter into total return swap contracts. Total return swaps involve commitments to pay interest in exchange for a market-linked return, both based on notional amounts. To the extent the total return of the security or index underlying the transaction exceeds or falls short of the offsetting interest rate obligation, the Fund will receive a payment from, or make a payment to, the counterparty.
The value of the swap contract is marked-to-market daily based upon quotations from an independent pricing service or market makers and any change in value is recorded as an unrealized gain or loss. Periodic payments made or received are recorded as realized gains or losses. The Fund could be exposed to risks if the counterparty defaults on its obligation to perform, or if there are unfavorable changes in the fluctuation of interest rates or in the price of the underlying security or index.
l. Security transactions and investment income
Security transactions are recorded on trade date. Realized gains and losses are computed using the specific cost of the security sold. Interest income is recorded on the accrual basis and includes accretion of discounts and amortization of premiums. Dividend income is
40
NOTES TO FINANCIAL STATEMENTS (unaudited) continued
recorded on the ex-dividend date. Foreign income and capital gains realized on some securities may be subject to foreign taxes, which are accrued as applicable.
m. Federal and other taxes
The Fund intends to continue to qualify as a regulated investment company and distribute all of its taxable income, including any net capital gains (which have already been offset by available capital loss carryovers). Accordingly, no provision for federal taxes is required. The Fund has adopted the provisions of FASB Interpretation No. 48, Accounting for Uncertainty in Income Taxes (“FIN 48”) which prescribes a minimum threshold for financial statement recognition of the benefit of a tax position taken or expected to be taken in a tax return. The Fund’s financial statements have not been impacted by the adoption of FIN 48.
n. Distributions
Distributions to shareholders from net investment income are accrued daily and paid monthly. Distributions from net realized gains, if any, are recorded on the ex-dividend date. Such distributions are determined in conformity with income tax regulations, which may differ from generally accepted accounting principles.
o. Class allocations
Income, common expenses and realized and unrealized gains and losses are allocated to the classes based on the relative net assets of each class. Distribution fees, if any, are calculated daily at the class level based on the appropriate net assets of each class and the specific expense rates applicable to each class.
3. ADVISORY FEE AND OTHER TRANSACTIONS WITH AFFILIATES
Evergreen Investment Management Company, LLC (“EIMC”), an indirect, whollyowned subsidiary of Wachovia Corporation (“Wachovia”), is the investment advisor to the Fund and is paid a fee at an annual rate of 2% of the Fund’s gross investment income plus an amount determined by applying percentage rates to the average daily net assets of the Fund, starting at 0.31% and declining to 0.16% as average daily net assets increase. For the six months ended October 31, 2008, the advisory fee was equivalent to 0.44% of the Fund’s average daily net assets (on an annualized basis).
Tattersall Advisory Group, Inc., an indirect, wholly-owned subsidiary of Wachovia, is an investment sub-advisor to the Fund and is paid by EIMC for its services to the Fund.
First International Advisors, Inc. d/b/a Evergreen International Advisors, an indirect, wholly-owned subsidiary of Wachovia, is also an investment sub-advisor to the Fund and is paid by EIMC for its services to the Fund.
On October 3, 2008, Wells Fargo & Company (“Wells Fargo”) and Wachovia announced that Wells Fargo agreed to acquire Wachovia in a whole company transaction that will include all of Wachovia’s banking and other businesses. In connection with this
41
NOTES TO FINANCIAL STATEMENTS (unaudited) continued
transaction, Wachovia issued preferred shares to Wells Fargo representing approximately a 40% voting interest in Wachovia. Due to its ownership of preferred shares, Wells Fargo may be deemed to control EIMC. If Wells Fargo is deemed to control EIMC, then the existing advisory agreement between the Fund and EIMC and the sub-advisory agreements between EIMC and the Fund’s sub-advisors would have terminated automatically in connection with the issuance of preferred shares. To address this possibility, on October 20, 2008 the Board of Trustees approved an interim advisory agreement with EIMC and interim sub-advisory agreements with each sub-advisor with the same terms and conditions as the existing agreements, which became effective upon the issuance of the preferred shares. EIMC’s receipt of the advisory fees under the interim advisory agreement is subject to the approval by shareholders of the Fund of a new advisory agreement with EIMC.
From time to time, EIMC may voluntarily or contractually waive its fee and/or reimburse expenses in order to limit operating expenses. During the six months ended October 31, 2008, EIMC voluntarily waived its advisory fee in the amount of $305,165.
The Fund may invest in money market funds which are advised by EIMC. Income earned on these investments is included in income from affiliate on the Statement of Operations.
EIMC also serves as the administrator to the Fund and is paid an annual rate determined by applying percentage rates to the aggregate average daily net assets of the Evergreen funds (excluding money market funds) starting at 0.10% and declining to 0.05% as the aggregate average daily net assets of the Evergreen funds (excluding money market funds) increase. For the six months ended October 31, 2008, the administrative services fee was equivalent to 0.10% of the Fund’s average daily net assets (on an annualized basis).
Evergreen Service Company, LLC (“ESC”), an indirect, wholly-owned subsidiary of Wachovia, is the transfer and dividend disbursing agent for the Fund. ESC receives account fees that vary based on the type of account held by the shareholders in the Fund. For the six months ended October 31, 2008, the transfer agent fees were equivalent to an annual rate of 0.25% of the Fund’s average daily net assets.
4. DISTRIBUTION PLANS
EIS serves as distributor of the Fund’s shares. The Fund has adopted Distribution Plans, as allowed by Rule 12b-1 of the 1940 Act, for each class of shares, except Class I. Under the Distribution Plans, the Fund is permitted to pay distribution fees at an annual rate of up to 0.75% of the average daily net assets for Class A shares and up to 1.00% of the average daily net assets for each of Class B and Class C shares. However, currently the distribution fees for Class A shares are limited to 0.25% of the average daily net assets of the class.
For the six months ended October 31, 2008, EIS received $1,415 from the sale of Class A shares and $23,505 and $924 in contingent deferred sales charges from redemptions of Class B and Class C shares, respectively.
42
NOTES TO FINANCIAL STATEMENTS (unaudited) continued
5. INVESTMENT TRANSACTIONS
Cost of purchases and proceeds from sales of investment securities (excluding short-term securities) were as follows for the six months ended October 31, 2008:
Cost of Purchases | | Proceeds from Sales |
|
|
|
U.S.
Government | | Non-U.S.
Government | | U.S.
Government | | Non-U.S.
Government |
|
|
|
|
|
|
|
$118,308,917 | | $102,441,548 | | $128,407,566 | | $106,923,126 |
|
|
|
|
|
|
|
On May 1, 2008, the Fund implemented Statement of Financial Accounting Standards No. 157, Fair Value Measurements (“FAS 157”). FAS 157 establishes a single authoritative definition of fair value, establishes a framework for measuring fair value and expands disclosures about fair value measurements. FAS 157 establishes a fair value hierarchy based upon the various inputs used in determining the value of the Fund’s investments. These inputs are summarized into three broad levels as follows:
Level 1 – quoted prices in active markets for identical securities Level 2 – other significant observable inputs (including quoted prices for similar securities, interest rates, prepayment speeds, credit risk, etc.) Level 3 – significant unobservable inputs (including the Fund’s own assumptions in determining the fair value of investments) |
The inputs or methodologies used for valuing securities are not necessarily an indication of the risk associated with investing in those securities.
As of October 31, 2008, the inputs used in valuing the Fund’s assets, which are carried at fair value, were as follows:
Valuation Inputs | | Investments in
Securities | | Other Financial
Instruments* |
|
|
|
|
| |
Level 1 – Quoted Prices | | $ | 25,708,619 | | $ | 1,400,472 | |
Level 2 – Other Significant Observable Inputs | | | 181,868,677 | | | (2,768,924 | ) |
Level 3 – Significant Unobservable Inputs | | | 571,971 | | | 0 | |
|
|
|
|
|
|
| |
Total | | $ | 208,149,267 | | $ | (1,368,452 | ) |
|
|
|
|
|
|
| |
* | Other financial instruments include forwards and swap contracts. |
The following is a reconciliation of assets in which significant unobservable inputs (Level 3) were used in determining fair value:
| | Investments
in Securities |
|
|
|
| |
Balance as of May 1, 2008 | | $ | 2,379,017 | |
Realized gain (loss) | | | 0 | |
Change in unrealized appreciation (depreciation) | | | (862,413 | ) |
Net purchases (sales) | | | (592,541 | ) |
Transfers in and/or out of Level 3 | | | (352,092 | ) |
|
|
|
|
| |
Balance as of October 31, 2008 | | $ | 571,971 | |
|
|
|
|
| |
As of October 31, 2008, the Fund had unfunded loan commitments of $117,135.
43
NOTES TO FINANCIAL STATEMENTS (unaudited) continued
At October 31, 2008, the Fund had forward foreign currency exchange contracts outstanding as follows:
Forward Foreign Currency Exchange Contracts to Buy:
Exchange
Date | | Contracts to
Receive | | U.S. Value at
October 31, 2008 | | In Exchange for
U.S. $ | | Unrealized
Gain (Loss) |
|
|
|
|
|
|
|
|
|
|
11/04/2008 | | 50,877,970 | JPY | | $ | 517,789 | | | $ | 470,000 | | | $ | 47,789 | |
11/04/2008 | | 205,539,570 | JPY | | | 2,091,795 | | | | 1,935,000 | | | | 156,795 | |
12/15/2008 | | 451,514 | EUR | | | 573,784 | | | | 562,000 | | | | 11,784 | |
02/04/2009 | | 203,982,000 | JPY | | | 2,069,407 | | | | 2,089,123 | | | | (19,716 | ) |
|
|
|
|
|
|
|
|
|
|
|
|
|
|
|
|
Exchange
Date | | Contracts to
Receive | | U.S. Value at
October 31, 2008 | | In Exchange for | | U.S. Value at
October 31, 2008 | | Unrealized
Gain (Loss) |
|
|
|
|
|
|
|
|
|
|
|
|
11/04/2008 | | 203,047,000 | JPY | | $ | 2,066,426 | | | 1,300,000 | EUR | | $ | 1,654,249 | | | $ | 412,177 | |
11/04/2008 | | 30,400,000 | JPY | | | 309,383 | | | 198,211 | EUR | | | 252,223 | | | | 57,160 | |
11/04/2008 | | 663,287 | EUR | | | 844,033 | | | 91,600,000 | JPY | | | 932,221 | | | | (88,188 | ) |
11/04/2008 | | 530,000 | EUR | | | 674,425 | | | 72,782,250 | JPY | | | 740,711 | | | | (66,286 | ) |
11/04/2008 | | 595,424 | EUR | | | 757,677 | | | 69,094,750 | JPY | | | 702,878 | | | | 54,799 | |
11/13/2008 | | 31,497,000 | JPY | | | 320,649 | | | 151,065 | GBP | | | 243,826 | | | | 76,823 | |
11/13/2008 | | 65,969,905 | JPY | | | 671,594 | | | 347,000 | GBP | | | 560,075 | | | | 111,519 | |
11/19/2008 | | 39,000,000 | JPY | | | 397,116 | | | 513,834 | NZD | | | 299,428 | | | | 97,688 | |
12/15/2008 | | 78,601,600 | JPY | | | 801,333 | | | 1,120,000 | AUD | | | 741,231 | | | | 60,102 | |
12/15/2008 | | 210,000 | AUD | | | 138,981 | | | 14,712,600 | JPY | | | 149,993 | | | | (11,012 | ) |
01/21/2009 | | 72,436 | EUR | | | 91,997 | | | 19,460,000 | HUF | | | 95,177 | | | | (3,180 | ) |
01/21/2009 | | 19,460,000 | HUF | | | 95,177 | | | 70,380 | EUR | | | 89,385 | | | | 5,792 | |
|
|
|
|
|
|
|
|
|
|
|
|
|
|
|
|
|
|
|
Forward Foreign Currency Exchange Contracts to Sell:
Exchange
Date | | Contracts to
Deliver | | U.S. Value at
October 31, 2008 | | In Exchange for
U.S. $ | | Unrealized
Gain (Loss) |
|
|
|
|
|
|
|
|
|
11/04/2008 | | 203,982,290 | JPY | | $ | 2,075,944 | | | $ | 2,080,178 | | | $ | 4,234 | |
11/04/2008 | | 52,435,250 | JPY | | | 533,638 | | | | 562,685 | | | | 29,047 | |
11/12/2008 | | 545,000 | NZD | | | 317,886 | | | | 376,786 | | | | 58,900 | |
11/12/2008 | | 575,000 | AUD | | | 381,714 | | | | 506,345 | | | | 124,631 | |
11/12/2008 | | 866,493 | EUR | | | 1,102,254 | | | | 1,300,000 | | | | 197,746 | |
12/15/2008 | | 600,000 | EUR | | | 762,479 | | | | 820,500 | | | | 58,021 | |
12/15/2008 | | 215,000 | GBP | | | 346,383 | | | | 370,230 | | | | 23,847 | |
|
|
|
|
|
|
|
|
|
|
|
|
|
|
|
|
During the six months ended October 31, 2008 the Fund loaned securities to certain brokers and earned $10,860 in affiliated income relating to securities lending activity which is included in income from affiliate on the Statement of Operations.
44
NOTES TO FINANCIAL STATEMENTS (unaudited) continued
At October 31, 2008, the Fund had the following credit default swap contracts outstanding:
Expiration | | Counterparty | | Reference Debt
Obligation | | Notional
Amount | | Fixed
Payments
Made by
the Fund | | Frequency of
Payments
Made | | Unrealized
Gain (Loss) |
|
|
|
|
|
|
|
|
|
|
|
|
|
12/20/2013 | | Deutsche Bank | | Expedia, Inc., 7.46%, | | $40,000 | | | 3.50% | | Quarterly | | $ | 2,006 | |
| | | | 08/01/2018 | | | | | | | | | | | |
12/20/2013 | | Goldman Sachs | | Humana, Inc., 7.46%, | | 40,000 | | | 3.75% | | Quarterly | | | (1,488 | ) |
| | | | 12/22/2008 | | | | | | | | | | | |
12/20/2013 | | Goldman Sachs | | Sun Microsystems, Inc., | | 40,000 | | | 1.55% | | Quarterly | | | (184 | ) |
| | | | 0.75%, 02/01/2014 | | | | | | | | | | | |
12/20/2013 | | JPMorgan | | Expedia, Inc., 7.46%, | | 20,000 | | | 5.35% | | Quarterly | | | (485 | ) |
| | | | 08/01/2018 | | | | | | | | | | | |
12/20/2013 | | UBS | | Motorola, Inc., 6.50%, | | 25,000 | | | 2.58% | | Quarterly | | | 1,065 | |
| | | | 09/01/2025 | | | | | | | | | | | |
12/20/2013 | | UBS | | Motorola, Inc., 6.50%, | | 35,000 | | | 2.55% | | Quarterly | | | 1,535 | |
| | | | 09/01/2025 | | | | | | | | | | | |
12/20/2013 | | UBS | | Pulte Homes, Inc., | | 15,000 | | | 2.43% | | Quarterly | | | 810 | |
| | | | 5.25%, 01/15/2014 | | | | | | | | | | | |
12/20/2013 | | UBS | | Pulte Homes, Inc., | | 55,000 | | | 2.45% | | Quarterly | | | 2,925 | |
| | | | 5.25%, 01/15/2014 | | | | | | | | | | | |
|
|
|
|
|
|
|
|
|
|
|
|
|
|
|
|
Expiration | | Counterparty | | Reference Debt
Obligation | | Notional
Amount | | Fixed
Payments
Received by
the Fund | | Frequency of
Payments
Received | | Unrealized
Gain (Loss) |
|
|
|
|
|
|
|
|
|
|
|
|
|
03/20/2009 | | CitiBank | | AIG, 6.25%, 05/01/2036 | | $1,000,000 | | 1.55% | | Quarterly | | $ | (66,268 | ) |
03/20/2009 | | Goldman Sachs | | Morgan Stanley, 6.60%, | | 500,000 | | 1.75% | | Quarterly | | | (7,559 | ) |
| | | | 04/01/2012 | | | | | | | | | | |
09/10/2010 | | Goldman Sachs | | Duke Realty, Ltd., 5.40%, | | 500,000 | | 0.75% | | Quarterly | | | (50,867 | ) |
| | | | 08/15/2014 | | | | | | | | | | |
06/20/2012 | | Morgan Stanley | | Dow Jones CDX, North | | 984,000 | | 0.35% | | Quarterly | | | (58,339 | ) |
| | | | American Investment | | | | | | | | | | |
| | | | Grade Index | | | | | | | | | | |
09/20/2012 | | Morgan Stanley | | Duke Realty, Ltd., 5.40%, | | 500,000 | | 0.90% | | Quarterly | | | (97,659 | ) |
| | | | 08/15/2014 | | | | | | | | | | |
06/20/2013 | | Bank of America | | Dow Jones CDX, North | | 10,000 | | 3.25% | | Quarterly | | | 583 | |
| | | | American Investment | | | | | | | | | | |
| | | | Grade Index | | | | | | | | | | |
09/20/2013 | | Deutsche Bank | | General Electric Co., | | 15,000 | | 4.00% | | Quarterly | | | (709 | ) |
| | | | 4.25%, 05/15/2011 | | | | | | | | | | |
12/20/2013 | | CitiBank | | General Electric Capital | | 5,000 | | 4.90% | | Quarterly | | | (75 | ) |
| | | | Corp., 6.00%, 06/15/2012 | | | | | | | | | | |
12/20/2013 | | CitiBank | | General Electric Capital | | 25,000 | | 6.65% | | Quarterly | | | 1,231 | |
| | | | Corp., 6.00%, 06/15/2012 | | | | | | | | | | |
12/20/2013 | | Goldman Sachs | | General Electric Capital | | 20,000 | | 4.50% | | Quarterly | | | (586 | ) |
| | | | Corp., 6.00%, 06/15/2012 | | | | | | | | | | |
12/13/2049 | | CitiBank | | CMBX North America | | 5,000 | | 1.47% | | Monthly | | | (589 | ) |
| | | | AJ Index | | | | | | | | | | |
12/13/2049 | | Deutsche Bank | | CMBX North America | | 30,000 | | 1.47% | | Monthly | | | (4,503 | ) |
| | | | AJ Index | | | | | | | | | | |
|
|
|
|
|
|
|
|
|
|
|
|
|
|
|
45
NOTES TO FINANCIAL STATEMENTS (unaudited) continued
Expiration | | Counterparty | | Reference Debt
Obligation | | Notional
Amount | | Fixed
Payments
Received by
the Fund | | Frequency of
Payments
Received | | Unrealized
Gain (Loss) |
|
|
|
|
|
|
|
|
|
|
|
|
|
12/13/2049 | | Goldman Sachs | | CMBX North America | | $ 45,000 | | 1.47% | | Monthly | | $ | (7,878 | ) |
| | | | AJ Index | | | | | | | | | | |
12/13/2049 | | UBS | | CMBX North America | | 200,000 | | 0.27% | | Monthly | | | (86,192 | ) |
| | | | AA Index | | | | | | | | | | |
12/25/2051 | | Goldman Sachs | | CMBX North America | | 3,500,000 | | 1.65% | | Monthly | | | (1,486,004 | ) |
| | | | AA Index | | | | | | | | | | |
|
|
|
|
|
|
|
|
|
|
|
|
|
|
|
At October 31, 2008, the Fund had the following total return swap contracts outstanding:
Expiration | | Notional
Amount | | Counterparty | | Swap Description | | Unrealized
Gain (Loss) |
|
|
|
|
|
|
|
|
|
03/01/2009 | | $5,950,000 | | JPMorgan | | Agreement dated 08/27/2008 to receive the spread return on the Barclays CMBS AAA 8.5+yr Index plus 70 basis points multiplied by the notional amount and to pay the negative spread return. | | | $(909,694 | ) |
|
|
|
|
|
|
|
|
|
|
|
On October 31, 2008, the aggregate cost of securities for federal income tax purposes was $258,257,621. The gross unrealized appreciation and depreciation on securities based on tax cost was $696,176 and $51,640,225, respectively, with a net unrealized depreciation of $50,944,049.
As of April 30, 2008, the Fund had $31,625,704 in capital loss carryovers for federal income tax purposes expiring as follows:
| | | | Expiration | | | | |
|
|
|
|
|
|
|
|
|
2009 | | 2010 | | 2013 | | 2015 | | 2016 |
|
|
|
|
|
|
|
|
|
$14,769,764 | | $4,586,980 | | $4,295,612 | | $3,669,132 | | $4,304,216 |
|
|
|
|
|
|
|
|
|
These losses are subject to certain limitations prescribed by the Internal Revenue Code.
For income tax purposes, capital losses incurred after October 31 within the Fund’s fiscal year are deemed to arise on the first business day of the following fiscal year. As of April 30, 2008, the Fund incurred and elected to defer post-October losses of $10,904.
6. INTERFUND LENDING
Pursuant to an Exemptive Order issued by the SEC, the Fund may participate in an interfund lending program with certain funds in the Evergreen fund family. This program allows the Fund to borrow from, or lend money to, other participating funds. During the six months ended October 31, 2008, the Fund did not participate in the interfund lending program.
7. EXPENSE REDUCTIONS
Through expense offset arrangements with ESC and the Fund’s custodian, a portion of fund expenses has been reduced.
46
NOTES TO FINANCIAL STATEMENTS (unaudited) continued
8. DEFERRED TRUSTEES’ FEES
Each Trustee of the Fund may defer any or all compensation related to performance of his or her duties as a Trustee. The Trustees’ deferred balances are allocated to deferral accounts, which are included in the accrued expenses for the Fund. The investment performance of the deferral accounts is based on the investment performance of certain Evergreen funds. Any gains earned or losses incurred in the deferral accounts are reported in the Fund’s Trustees’ fees and expenses. At the election of the Trustees, the deferral account will be paid either in one lump sum or in quarterly installments for up to ten years.
9. FINANCING AGREEMENT
The Fund and certain other Evergreen funds share in a $100 million unsecured revolving credit commitment for temporary and emergency purposes, including the funding of redemptions, as permitted by each participating fund’s borrowing restrictions. Borrowings under this facility bear interest at 0.50% per annum above the Federal Funds rate. All of the participating funds are charged an annual commitment fee of 0.09% on the unused balance, which is allocated pro rata. Prior to June 27, 2008, the annual commitment fee was 0.08%. During the six months ended October 31, 2008, the Fund had no borrowings.
10. REGULATORY MATTERS AND LEGAL PROCEEDINGS
The Evergreen funds, EIMC and certain of EIMC’s affiliates are involved in various legal actions, including private litigation and class action lawsuits, and are and may in the future be subject to regulatory inquiries and investigations.
The SEC and the Secretary of the Commonwealth, Securities Division, of the Commonwealth of Massachusetts are conducting separate investigations of EIMC, EIS and Evergreen Ultra Short Opportunities Fund (the “Ultra Short Fund”) concerning alleged issues surrounding the drop in net asset value of the Ultra Short Fund in May and June 2008. In addition, three purported class actions have been filed in the U.S. District Court for the District of Massachusetts relating to the same events; defendants include various Evergreen entities, including EIMC and EIS, and Evergreen Fixed Income Trust and its Trustees. The cases generally allege that investors in the Ultra Short Fund suffered losses as a result of (i) misleading statements in Ultra Short Fund’s registration statement and prospectus, (ii) the failure to accurately price securities in the Ultra Short Fund at different points in time and (iii) the failure of the Ultra Short Fund’s risk disclosures and description of its investment strategy to inform investors adequately of the actual risks of the fund.
EIMC does not expect that any of the legal actions, inquiries or investigations currently pending or threatened will have a material adverse impact on the financial position or operations of the Fund to which these financial statements relate. Any publicity surrounding or resulting from any legal actions or regulatory inquiries involving EIMC or its affiliates or any of the Evergreen Funds could result in reduced sales or increased
47
NOTES TO FINANCIAL STATEMENTS (unaudited) continued
redemptions of Evergreen fund shares, which could increase Evergreen fund transaction costs or operating expenses or have other adverse consequences on the Evergreen funds, including the Fund.
11. NEW ACCOUNTING PRONOUNCEMENTS
In March 2008, FASB issued Statement of Financial Accounting Standards No. 161, Disclosures about Derivative Instruments and Hedging Activities (“FAS 161”), an amendment of FASB Statement No. 133. FAS 161 requires enhanced disclosures about (a) how and why a fund uses derivative instruments, (b) how derivative instruments and hedging activities are accounted for, and (c) how derivative instruments and related hedging activities affect a fund’s financial position, financial performance, and cash flows. Management of the Fund does not believe the adoption of FAS 161 will materially impact the financial statement amounts, but will require additional disclosures. This will include qualitative and quantitative disclosures on derivative positions existing at period end and the effect of using derivatives during the reporting period . FAS 161 is effective for financial statements issued for fiscal years and interim periods beginning after November 15, 2008.
In September 2008, FASB issued FASB Staff Position No. FAS 133-1 and FIN 45-4, Disclosures about Credit Derivatives and Certain Guarantees: An Amendment of FASB Statement No. 133 and FASB Interpretation No. 45; and Clarification of the Effective Date of FASB Statement No. 161. This FASB Staff Position (1) amends FASB Statement No. 133 to require disclosures by sellers of credit derivatives, including credit derivatives embedded in a hybrid instrument (2) amends FASB Interpretation No. 45 to require additional disclosure about the current status of the payment/performance risk of a guarantee and (3) clarifies the effective date of FAS 161. Management of the Fund does not believe the adoption of this FASB Staff Position will materially impact the financial statement amounts, but will require additional disclosures. This FASB Staff Position is effective for reporting periods (annual or interim) ending after November 15, 2008.
12. REGULATORY MATTERS AND LEGAL PROCEEDINGS
The Evergreen funds, EIMC and certain of EIMC’s affiliates are involved in various legal actions, including private litigation and class action lawsuits, and are and may in the future be subject to regulatory inquiries and investigations.
EIMC and EIS have reached final settlements with the Securities and Exchange Commission (“SEC”) and the Securities Division of the Secretary of the Commonwealth of Massachusetts (“Commonwealth”) primarily relating to the liquidation of Evergreen Ultra Short Opportunities Fund (“Ultra Short Fund”). The claims settled include the following: first, that during the period February 2007 through Ultra Short Fund’s liquidation on June 18, 2008, Ultra Short Fund’s former portfolio management team failed to properly take into account readily-available information in valuing certain non-agency residential mortgage-backed securities held by the Ultra Short Fund, resulting in the Ultra
48
NOTES TO FINANCIAL STATEMENTS (unaudited) continued
Short Fund’s net asset value (“NAV”) being overstated during the period; second, that EIMC and EIS acted inappropriately when, in an effort to explain the decline in Ultra Short Fund’s NAV, certain information regarding the decline was communicated to some, but not all, shareholders and financial intermediaries; third, that the Ultra Short Fund portfolio management team did not adhere to regulatory requirements for affiliated cross trades in executing trades with other Evergreen funds; and finally, that from at least September 2007 to August 2008, EIS did not preserve certain text and instant messages transmitted via personal digital assistant devices. In settling these matters, EIMC and EIS have agreed to payments totaling $41.125 million, up to $40.125 million of which will be distributed to eligible shareholders of Ultra Short Fund pursuant to a methodology and plan approved by the regulators. EIMC and EIS neither admitted nor denied the regulators’ conclusions.
Three purported class actions have also been filed in the U.S. District Court for the District of Massachusetts relating to the same events; defendants include various Evergreen entities, including EIMC and EIS, and Evergreen Fixed Income Trust and its Trustees. The cases generally allege that investors in the Ultra Short Fund suffered losses as a result of (i) misleading statements in Ultra Short Fund’s registration statement and prospectus, (ii) the failure to accurately price securities in the Ultra Short Fund at different points in time and (iii) the failure of the Ultra Short Fund’s risk disclosures and description of its investment strategy to inform investors adequately of the actual risks of the fund.
EIMC does not expect that any of the legal actions, inquiries or settlement of regulatory matters will have a material adverse impact on the financial position or operations of the Fund to which these financial statements relate. Any publicity surrounding or resulting from any legal actions or regulatory inquiries involving EIMC or its affiliates or any of the Evergreen Funds could result in reduced sales or increased redemptions of Evergreen fund shares, which could increase Evergreen fund transaction costs or operating expenses or have other adverse consequences on the Evergreen funds, including the Fund.
49
ADDITIONAL INFORMATION (unaudited)
SPECIAL MEETING OF SHAREHOLDERS
On February 12, 2009, a Special Meeting of Shareholders for the Fund was held to consider a number of proposals. On December 1, 2008, the record date for the meeting, the Fund had $165,652,581 of net assets outstanding of which $91,806,172 (55.42%) of net assets were represented at the meeting.
Proposal 1a — To consider and act upon a new investment advisory agreement with Evergreen Investment Management Company, LLC:
|
|
|
|
Net assets voted “For” | | $ | 83,568,661 |
Net assets voted “Against” | | $ | 3,019,103 |
Net assets voted “Abstain” | | $ | 5,218,408 |
|
|
|
|
Proposal 1b — To consider and act upon a new sub-advisory agreement with First International Advisors, LLC:
|
|
|
|
Net assets voted “For” | | $ | 82,790,188 |
Net assets voted “Against” | | $ | 3,590,032 |
Net assets voted “Abstain” | | $ | 5,425,835 |
|
|
|
|
Proposal 1c — To consider and act upon a new sub-advisory agreement with Tattersall Advisory Group, Inc.:
|
|
|
|
Net assets voted “For” | | $ | 82,268,266 |
Net assets voted “Against” | | $ | 3,523,920 |
Net assets voted “Abstain” | | $ | 6,013,917 |
|
|
|
|
50
ADDITIONAL INFORMATION (unaudited) continued
INFORMATION ABOUT THE REVIEW AND APPROVAL OF THE FUND’S INVESTMENT ADVISORY AGREEMENT
Each year, the Fund’s Board of Trustees determines whether to approve the continuation of the Fund’s investment advisory agreements. In September 2008, the Trustees, including a majority of the Trustees who are not “interested persons” (as that term is defined in the 1940 Act) of the Fund, Tattersall Advisory Group, Inc. (“TAG”), First International Advisers, Inc., d/b/a Evergreen International Advisors (together with TAG, the “Sub-Advisors”), or EIMC (the “independent Trustees”), approved the continuation of the Fund’s investment advisory agreements. (References below to the “Fund” are to Evergreen Core Plus Bond Fund; references to the “funds” are to the Evergreen funds generally.)
At the same time, the Trustees considered the continuation of the investment advisory agreements for all of the funds. The description below refers in many cases to the Trustees’ process for considering, and conclusions regarding, all of the funds’ agreements. In all of its deliberations, the Board of Trustees and the independent Trustees were advised by independent counsel to the independent Trustees and counsel to the funds.
The review process. In connection with its review of the funds’ investment advisory agreements, the Board of Trustees requests and evaluates, and EIMC and any sub-advisors furnish, such information as the Trustees consider to be reasonably necessary in the circumstances. The Trustees began their 2008 review process at the time of the last advisory contract-renewal process in September 2007. In the course of their 2007 review, the Trustees identified a number of funds that had experienced either short-term or longer-term performance issues. During the 2008 review process, the Trustees monitored each of these funds in particular for changes in performance and for the results of any changes in a fund’s investment process or investment team. In addition, during the course of the year, the Trustees regularly reviewed information regarding the investment performance of all of the funds, paying particular attention to funds whose performance since September 2007 indicated short-term or longer-term performance issues.
In spring 2008, a committee of the Board of Trustees (the “Committee”), working with EIMC management, determined generally the types of information the Board would review as part of its 2008 review process and set a timeline detailing the information required and the dates for its delivery to the Trustees. The Board engaged the independent data provider Keil Fiduciary Strategies LLC (“Keil”) to provide fund-specific and industry-wide data containing information of a nature and in a format generally prescribed by the Committee, and the Committee worked with Keil and EIMC to develop appropriate groups of peer funds for each fund. The Committee also identified a number of expense, performance, and other issues and requested specific information as to those issues.
51
ADDITIONAL INFORMATION (unaudited) continued
The Trustees reviewed, with the assistance of an independent industry consultant retained by the independent Trustees, the information that EIMC, the Sub-Advisors, and Keil provided. The Trustees formed small groups to review individual funds in greater detail. In addition, the Trustees considered information regarding, among other things, brokerage practices of the funds, the use of derivatives by the funds, strategic planning for the funds, analyst and research support available to the portfolio management teams, and information regarding the various fall-out benefits received directly and indirectly by EIMC and its affiliates from the funds. The Trustees requested and received additional information following that review.
The Committee met several times by telephone during the 2008 review process to consider the information provided by EIMC. The Committee then met with representatives of EIMC. In addition, over the period of this review, the independent Trustees discussed the continuation of the funds’ advisory agreements with representatives of EIMC and in multiple private sessions with independent legal counsel at which no personnel of EIMC were present. At a meeting of the full Board of Trustees in September, the Committee reported the results of its discussions with EIMC, and the full Board met with representatives of EIMC and engaged in further review of the materials provided to it, and approved the continuation of each of the advisory and sub-advisory agreements.
In considering the continuation of the agreements, the Trustees did not identify any particular information or consideration that was all-important or controlling, and each Trustee attributed different weights to various factors. The Trustees evaluated information provided to them both in terms of the funds generally and with respect to each fund, including the Fund, specifically as they considered appropriate. Although the Trustees considered the continuation of the agreements as part of the larger process of considering the continuation of the advisory contracts for all of the funds, their determination to continue the advisory agreements for each of the funds was ultimately made on a fund-by-fund basis.
This summary describes a number of the most important, but not necessarily all, of the factors considered by the Board and the independent Trustees.
Information reviewed. The Board of Trustees and committees of the Board of Trustees meet periodically during the course of the year. At those meetings, EIMC presents a wide variety of information regarding the services it performs, the investment performance of the funds, and other aspects of the business and operations of the funds. At those meetings, and in the process of considering the continuation of the agreements, the Trustees considered information regarding, for example, the funds’ investment results; the portfolio management teams for the funds and the experience of the members of those teams, and any recent changes in the membership of the teams; portfolio trading practices; compliance by the funds, EIMC, and the Sub-Advisors with applicable laws and regulations and with the funds’ and EIMC’s compliance policies and procedures; risk evaluation and over-
52
ADDITIONAL INFORMATION (unaudited) continued
sight procedures at EIMC; services provided by affiliates of EIMC to the funds and shareholders of the funds; and other information relating to the nature, extent, and quality of services provided by EIMC and the Sub-Advisors. The Trustees considered a number of changes in portfolio management personnel at EIMC and its advisory affiliates in the year since September 2007. The Trustees also considered changes in personnel at the funds and EIMC, including the appointment of a new Chief Compliance Officer for the funds in June of 2007 and a new Chief Investment Officer at EIMC in August of 2008.
The Trustees considered the rates at which the funds pay investment advisory fees, and the efforts generally by EIMC and its affiliates as sponsors of the funds. The data provided by Keil showed the management fees paid by each fund in comparison to the management fees of other peer mutual funds, in addition to data regarding the investment performance of the funds in comparison to other peer mutual funds. The Trustees were assisted by an independent industry consultant in reviewing the information presented to them.
The Trustees noted that, in certain cases, EIMC and/or its affiliates provide advisory services to other clients that are comparable to the advisory services they provide to certain funds. The Trustees considered the information EIMC provided regarding the rates at which those other clients pay advisory fees to EIMC or its affiliates for such services. Fees charged to those other clients were generally lower than those charged to the respective funds. In respect of these other accounts, EIMC noted that the compliance, reporting, and other legal burdens of providing investment advice to mutual funds generally exceed those required to provide advisory services to non-mutual fund clients such as retirement or pension plans. The Trustees also considered the investment performance of those other accounts managed by EIMC and its affiliates, where applicable, and concluded that the performance of those accounts did not suggest any substantial difference in the quality of the service provided by EIMC and its affiliates to those accounts.
The Trustees considered the transfer agency fees paid by the funds to an affiliate of EIMC. They reviewed information presented to them showing that the transfer agency fees charged to the funds were generally consistent with industry norms.
The Trustees also considered that EIMC serves as administrator to the funds and receives a fee for its services as administrator. In their comparison of the advisory fee paid by the funds with those paid by other mutual funds, the Trustees considered administrative fees paid by the funds and those other mutual funds. The Board considered that EIS, an affiliate of EIMC, serves as distributor to the funds generally and receives fees from the funds for those services. They considered other so-called “fall-out” benefits to EIMC and its affiliates due to their other relationships with the funds, including, for example, soft-dollar services received by EIMC attributable to transactions entered into by EIMC for the benefit of the funds and brokerage commissions received by Wachovia Securities, LLC, an affiliate of EIMC, from transactions effected by it for the funds. The Trustees also noted that the funds pay sub-transfer agency fees to various financial institutions that hold fund
53
ADDITIONAL INFORMATION (unaudited) continued
shares in omnibus accounts, and that Wachovia Securities, LLC and its affiliates receive such payments from the funds in respect of client accounts they hold in omnibus arrangements, and that an affiliate of EIMC receives fees for administering the sub-transfer agency payment program. In reviewing the services provided by an affiliate of EIMC, the Trustees noted that an affiliate of EIMC had won recognition from Dalbar customer service each year since 1998, and also won recognition from National Quality Review for customer service and for accuracy in processing transactions in 2008. They also considered that Wachovia Securities, LLC and its affiliates receive distribution-related fees and shareholder servicing payments (including amounts derived from payments under the funds’ Rule 12b-1 plans) in respect of shares sold or held through it. The Trustees also noted that an affiliate of EIMC receives compensation for serving as a securities lending agent for a number of the funds.
In the period leading up to the Trustees’ approval of continuation of the investment advisory agreements, the Trustees were mindful of the financial condition of Wachovia Corporation (“Wachovia”), EIMC’s parent company. They considered the possibility that a significant adverse change in Wachovia’s financial condition could impair the ability of EIMC or its affiliates to perform services for the funds at the same level as in the past. The Trustees concluded that any change in Wachovia’s financial condition had not to date had any such effect, but determined to monitor EIMC’s and its affiliates’ performance, and financial conditions generally, going forward in order to identify any such impairment that may develop and to take appropriate action.
Nature and quality of the services provided. The Trustees considered that EIMC and its affiliates generally provide a comprehensive investment management service to the funds. They noted that EIMC and the Sub-Advisors formulate and implement an investment program for the Fund. They noted that EIMC makes its personnel available to serve as officers of the funds, and concluded that the reporting and management functions provided by EIMC with respect to the funds were generally satisfactory. The Trustees considered the investment philosophy of the Fund’s portfolio management team, and considered the in-house research capabilities of EIMC and its affiliates, as well as other resources available to EIMC, including research services available to it from third parties. The Board considered the managerial and financial resources available to EIMC and its affiliates, and the commitment that the Wachovia organization has made to the funds generally. On the basis of these factors, they determined that the nature and scope of the services provided by EIMC and the Sub-Advisors were consistent with their respective duties under the investment advisory agreements and appropriate and consistent with the investment programs and best interests of the funds.
The Trustees noted the resources EIMC and its affiliates have committed to the regulatory, compliance, accounting, tax and oversight of tax reporting, and shareholder servicing functions, and the number and quality of staff committed to those functions, which they
54
ADDITIONAL INFORMATION (unaudited) continued
concluded were appropriate and generally in line with EIMC’s responsibilities to the Fund and to the funds generally. The Board and the disinterested Trustees concluded, within the context of their overall conclusions regarding the funds’ advisory agreements, that they were generally satisfied with the nature, extent, and quality of the services provided by the Sub-Advisors and EIMC, including services provided by EIMC under its administrative services agreements with the funds.
Investment performance. The Trustees considered the investment performance of each fund, both by comparison to other comparable mutual funds and to broad market indices. Although the Trustees considered the performance of all share classes, the Trustees noted that, for the one-, three-, and ten-year periods ended December 31, 2007, the Fund’s Class I shares (the Fund’s oldest share class) had underperformed the Fund’s benchmark index, the Barclays Capital Aggregate Bond Index, and had outperformed the Fund’s benchmark index for the five-year period ended December 31, 2007. The Trustees also noted that the Fund’s Class I shares had performed in the third quintile of the mutual funds against which the Trustees compared the Fund’s performance for each of the periods except during the three-year period ended December 31, 2007, in which the Fund’s Class I shares performed in the second quintile.
The Trustees discussed each fund’s performance with representatives of EIMC. In each instance where a fund experienced a substantial period of underperformance relative to its benchmark index and/or the non-Evergreen fund peers against which the Trustees compared the fund’s performance, the Trustees considered EIMC’s explanation of the reasons for the relative underperformance and the steps being taken to address the relative underperformance. The Trustees also noted that EIMC had appointed a new Chief Investment Officer in August of 2008 who had not yet had sufficient time to evaluate and direct remedial efforts with respect to funds that have experienced a substantial period of relative underperformance. The Trustees emphasized that the continuation of the investment advisory agreement for a fund should not be taken as any indication that the Trustees did not believe investment performance for any specific fund might not be improved, and they noted that they would continue to monitor closely the investment performance of the funds going forward.
Advisory and administrative fees. The Trustees recognized that EIMC does not seek to provide the lowest cost investment advisory service, but to provide a high quality, full-service investment management product at a reasonable price. They also noted that EIMC has in many cases sought to set its investment advisory fees at levels consistent with industry norms. The Trustees noted that, in certain cases, a fund’s management fees were higher than many or most other mutual funds in the same Keil peer group. However, in each case, the Trustees determined on the basis of the information presented that the level of management fees was not excessive. The Trustees also noted that the Fund’s management fee was lower than the management fees paid by a majority of the mutual funds
55
ADDITIONAL INFORMATION (unaudited) continued
against which the Trustees compared the Fund’s management fee, and that the level of profitability realized by EIMC in respect of the fee did not appear excessive.
Economies of scale. The Trustees noted the possibility that economies of scale would be achieved by EIMC in managing the funds as the funds grow. The Trustees noted that the Fund had implemented breakpoints in its advisory fee structure. The Trustees noted that they would continue to review the appropriate levels of breakpoints in the future, but concluded that the breakpoints as implemented appeared to be a reasonable step toward the realization of economies of scale by the Fund.
Profitability. The Trustees considered information provided to them regarding the profitability to the EIMC organization of the investment advisory, administration, and transfer agency (with respect to the open-end funds only) fees paid to EIMC and its affiliates by each of the funds. They considered that the information provided to them was necessarily estimated, and that the profitability information provided to them, especially on a fund-by-fund basis, did not necessarily provide a definitive tool for evaluating the appropriateness of each fund’s advisory fee. They noted that the levels of profitability of the funds to EIMC varied widely, depending on among other things the size and type of fund. They considered the profitability of the funds in light of such factors as, for example, the information they had received regarding the relation of the fees paid by the funds to those paid by other mutual funds, the investment performance of the funds, and the amount of revenues involved. In light of these factors, the Trustees concluded that the profitability of any of the funds, individually or in the aggregate, should not prevent the Trustees from approving the continuation of the agreements.
Matters Relating to Approval of Interim Investment Advisory and Sub-Advisory Agreements. Following the Trustees’ approval of the continuation of the funds’ investment advisory agreements, Wells Fargo & Company (“Wells Fargo”) announced that it had agreed to acquire Wachovia in a whole company transaction that will include all of Wachovia’s banking and other businesses, including EIMC. As a result of this transaction, the funds’ investment advisory and sub-advisory agreements were expected to terminate. Accordingly, on October 20, 2008 the Board of Trustees approved interim investment advisory and sub-advisory agreements for the funds. In approving these interim advisory arrangements, the Trustees noted EIMC’s representation that the scope and quality of the services provided to the funds during the term of the interim contracts would be at least equivalent to the scope and quality of the services provided under the previous advisory agreements and that the terms of the interim agreements are substantially similar to the funds’ previous advisory agreements except that the interim agreements will be in effect for a period of no more than 150 days and certain advisory fees will be placed in escrow until new advisory agreements are approved.
56
This page left intentionally blank
57
This page left intentionally blank
58
This page left intentionally blank
59
TRUSTEES AND OFFICERS
TRUSTEES1 | | |
Charles A. Austin III
Trustee
DOB: 10/23/1934
Term of office since: 1991
Other directorships: None | | Investment Counselor, Anchor Capital Advisors, LLC. (investment advice); Director, The Andover Companies (insurance); Trustee, Arthritis Foundation of New England; Former Director, The Francis Ouimet Society (scholarship program); Former Director, Executive Vice President and Treasurer, State Street Research & Management Company (investment advice) |
|
|
|
K. Dun Gifford
Trustee
DOB: 10/23/1938
Term of office since: 1974
Other directorships: None | | Chairman and President, Oldways Preservation and Exchange Trust (education); Trustee, Chairman of the Finance Committee, Member of the Executive Committee, and Former Treasurer, Cambridge College |
|
|
|
Dr. Leroy Keith, Jr.
Trustee
DOB: 2/14/1939
Term of office since: 1983
Other directorships: Trustee,
Phoenix Fund Complex
(consisting of 53 portfolios
as of 12/31/2007) | | Managing Director, Almanac Capital Management (commodities firm); Trustee, Phoenix Fund Complex; Director, Diversapack Co. (packaging company); Former Partner, Stonington Partners, Inc. (private equity fund); Former Director, Obagi Medical Products Co.; Former Director, Lincoln Educational Services |
|
|
|
Carol A. Kosel1
Trustee
DOB: 12/25/1963
Term of office since: 2008
Other directorships: None | | Former Consultant to the Evergreen Boards of Trustees; Former Vice President and Senior Vice President, Evergreen Investments, Inc.; Former Treasurer, Evergreen Funds; Former Treasurer, Vestaur Securities Fund |
|
|
|
Gerald M. McDonnell
Trustee
DOB: 7/14/1939
Term of office since: 1988
Other directorships: None | | Former Manager of Commercial Operations, CMC Steel (steel producer) |
|
|
|
Patricia B. Norris
Trustee
DOB: 4/9/1948
Term of office since: 2006
Other directorships: None | | President and Director of Buckleys of Kezar Lake, Inc. (real estate company); Former President and Director of Phillips Pond Homes Association (home community); Former Partner, PricewaterhouseCoopers, LLP (independent registered public accounting firm) |
|
|
|
William Walt Pettit2
Trustee
DOB: 8/26/1955
Term of office since: 1988
Other directorships: None | | Partner and Vice President, Kellam & Pettit, P.A. (law firm); Director, Superior Packaging Corp. (packaging company); Member, Superior Land, LLC (real estate holding company), Member, K&P Development, LLC (real estate development); Former Director, National Kidney Foundation of North Carolina, Inc. (non-profit organization) |
|
|
|
David M. Richardson
Trustee
DOB: 9/19/1941
Term of office since: 1982
Other directorships: None | | President, Richardson, Runden LLC (executive recruitment advisory services); Director, J&M Cumming Paper Co. (paper merchandising); Trustee, NDI Technologies, LLP (communications); Former Consultant, AESC (The Association of Executive Search Consultants) |
|
|
|
Dr. Russell A. Salton III
Trustee
DOB: 6/2/1947
Term of office since: 1984
Other directorships: None | | President/CEO, AccessOne MedCard, Inc. |
|
|
|
60
TRUSTEES AND OFFICERS continued
Michael S. Scofield
Trustee
DOB: 2/20/1943
Term of office since: 1984
Other directorships: None | | Retired Attorney, Law Offices of Michael S. Scofield; Former Director and Chairman, Branded Media Corporation (multi-media branding company) |
|
|
|
Richard J. Shima
Trustee
DOB: 8/11/1939
Term of office since: 1993
Other directorships: None | | Independent Consultant; Director, Hartford Hospital; Trustee, Greater Hartford YMCA; Former Director, Trust Company of CT; Former Director, Old State House Association; Former Trustee, Saint Joseph College (CT) |
|
|
|
Richard K. Wagoner, CFA3
Trustee
DOB: 12/12/1937
Term of office since: 1999
Other directorships: None | | Member and Former President, North Carolina Securities Traders Association; Member, Financial Analysts Society |
|
|
|
| | |
OFFICERS | | |
| | |
W. Douglas Munn4
President
DOB: 4/21/1963
Term of office since: 2009 | | Principal occupations: Chief Operating Officer, Wells Fargo Funds Management, LLC; former Chief Operating Officer, Evergreen Investment Company, Inc. |
|
|
|
Kasey Phillips5
Treasurer
DOB: 12/12/1970
Term of office since: 2005 | | Principal occupations: Senior Vice President, Evergreen Investment Management Company, LLC; Former Vice President, Evergreen Investment Services, Inc.; Former Assistant Vice President, Evergreen Investment Services, Inc. |
|
|
|
Michael H. Koonce5
Secretary
DOB: 4/20/1960
Term of office since: 2000 | | Principal occupations: Senior Vice President and General Counsel, Evergreen Investment Services, Inc.; Secretary, Senior Vice President and General Counsel, Evergreen Investment Management Company, LLC and Evergreen Service Company, LLC; Senior Vice President and Assistant General Counsel, Wachovia Corporation |
|
|
|
Robert Guerin5
Chief Compliance Officer
DOB: 9/20/1965
Term of office since: 2007 | | Principal occupations: Chief Compliance Officer, Evergreen Funds and Senior Vice President of Evergreen Investments Co., Inc.; Former Managing Director and Senior Compliance Officer, Babson Capital Management LLC; Former Principal and Director, Compliance and Risk Management, State Street Global Advisors; Former Vice President and Manager, Sales Practice Compliance, Deutsche Asset Management |
|
|
|
1 | Each Trustee, except Mses. Kosel and Norris, serves until a successor is duly elected or qualified or until his or her death, resignation, retirement or removal from office. As new Trustees, Ms. Kosel’s and Ms. Norris’ initial terms end December 31, 2010 and June 30, 2009, respectively, at which times they may be re-elected by Trustees to serve until a successor is duly elected or qualified or until her death, resignation, retirement or removal from office by the Trustees. Each Trustee, except Ms. Kosel, oversaw 94 Evergreen funds as of December 31, 2007. Ms. Kosel became a Trustee on January 1, 2008. Correspondence for each Trustee may be sent to Evergreen Board of Trustees, P.O. Box 20083, Charlotte, NC 28202. |
2 | It is possible that Mr. Pettit may be viewed as an “interested person” of the Fund, as defined in the 1940 Act, because of his law firm’s representation of affiliates of Wells Fargo & Company (“Wells Fargo”). Wells Fargo and Wachovia Corporation announced on October 3, 2008 that Wells Fargo agreed to acquire Wachovia Corporation in a whole company transaction that will include the Fund’s investment advisor, EIMC. The Trustees are treating Mr. Pettit as an interested trustee for the time being. |
3 | Mr. Wagoner is an “interested person” of the Fund because of his ownership of shares in Wachovia Corporation, the parent to the Fund’s investment advisor. |
4 | The address of the Officer is 401 S. Tryon Street, 20th Floor, Charlotte, NC 28288. |
5 | The address of the Officer is 200 Berkeley Street, Boston, MA 02116. |
Additional information about the Fund’s Board of Trustees and Officers can be found in the Statement of Additional Information (SAI) and is available upon request without charge by calling 800.343.2898.
61
564353 rv6 12/2008
Item 2 – Code of Ethics
Not required for this semi-annual filing.
Item 3 – Audit Committee Financial Expert
Not required for this semi-annual filing.
Items 4 – Principal Accountant Fees and Services
Not required for this semi-annual filing.
Items 5 c Audit Committee of Listed Registrants
Not applicable.
Item 6 – Schedule of Investments
Please see schedule of investments contained in the Report to Stockholders included under Item 1 of this Form N-CSR.
Item 7 – Disclosure of Proxy Voting Policies and Procedures for Closed-End Management Investment Companies.
Not applicable.
Item 8 – Portfolio Managers of Closed-End Management Investment Companies.
Not applicable.
Item 9 – Purchases of Equity Securities by Closed-End Management Investment Company and Affiliated Purchasers.
Not applicable.
Item 10 – Submission of Matters to a Vote of Security Holders
There have been no material changes to the procedures by which shareholders may recommend nominees to the Registrant’s board of trustees that have been implemented since the Registrant last provided disclosure in response to the requirements of this Item.
Item 11 - Controls and Procedures
(a) The Registrant's principal executive officer and principal financial officer have evaluated the Registrant's disclosure controls and procedures (as defined in Rule 30a-3(c) under the Investment Company Act of 1940) within 90 days of this filing and have concluded that the Registrant's disclosure controls and procedures were effective, as of that date, in ensuring that information required to be disclosed by the Registrant in this Form N-CSR was recorded, processed, summarized, and reported timely.
(b) There has been no changes in the Registrant's internal controls over financial reporting (as defined in Rule 30a-3(d) under the Investment Company Act of 1940) that occurred during the second fiscal quarter of the period covered by this report that has materially affected, or is reasonably likely to affect, the Registrant’s internal control over financial reporting.
Item 12 - Exhibits
File the exhibits listed below as part of this Form. Letter or number the exhibits in the sequence indicated.
(a) Any code of ethics, or amendment thereto, that is the subject of the disclosure required by Item 2, to the extent that the Registrant intends to satisfy the Item 2 requirements through filing of an exhibit.
(b)(1) Separate certifications for the Registrant's principal executive officer and principal financial officer, as required by Section 302 of the Sarbanes-Oxley Act of 2002 and Rule 30a-2(a) under the Investment Company Act of 1940, are attached as EX99.CERT.
(b)(2) Separate certifications for the Registrant's principal executive officer and principal financial officer, as required by Section 1350 of Title 18 of United States Code, as adopted pursuant to Section 906 of the Sarbanes-Oxley Act of 2002, and Rule 30a-2(b) under the Investment Company Act of 1940, are attached as EX99.906CERT. The certifications furnished pursuant to this paragraph are not deemed to be "filed" for purposes of Section 18 of the Securities Exchange Act of 1934, or otherwise subject to the liability of that section. Such certifications are not deemed to be incorporated by reference into any filing under the Securities Act of 1933 or the Securities Exchange Act of 1934, except to the extent that the Registrant specifically incorporates them by reference.
Pursuant to the requirements of the Securities Exchange Act of 1934 and the Investment Company Act of 1940, the Registrant has duly caused this report to be signed on its behalf by the undersigned, thereunto duly authorized.
By: /s/ W. Douglas Munn
W. Douglas Munn
Principal Executive Officer
Date: June 12, 2009
Pursuant to the requirements of the Securities Exchange Act of 1934 and the Investment Company Act of 1940, this report has been signed below by the following persons on behalf of the Registrant and in the capacities and on the dates indicated.
By: /s/ W. Douglas Munn
W. Douglas Munn
Principal Executive Officer
Date: June 12, 2009
By: /s/ Kasey Phillips
Kasey Phillips
Principal Financial Officer
Date: June 12, 2009