obligations are placed on non-accrual status, any related interest income may be reduced by writing off interest receivables when the collection of all or a portion of interest has become doubtful based on consistently applied procedures. If the issuer subsequently resumes interest payments or when the collectibility of interest is reasonably assured, the debt obligation is removed from non-accrual status. Dividend income is recorded on the ex-dividend date or in the case of some foreign securities, on the date when the Fund is made aware of the dividend. Foreign income and capital gains realized on some securities may be subject to foreign taxes, which are accrued as applicable.
The Fund intends to continue to qualify as a regulated investment company and distribute all of its taxable income, including any net capital gains (which have already been offset by available capital loss carryovers). Accordingly, no provision for federal taxes is required. The Fund’s income and excise tax returns and all financial records supporting those returns for the prior three fiscal years are subject to examination by the federal, Massachusetts and Delaware revenue authorities.
Distributions to shareholders from net investment income are accrued daily and paid monthly. Distributions from net realized gains, if any, are recorded on the ex-dividend date. Such distributions are determined in conformity with income tax regulations, which may differ from generally accepted accounting principles.
Reclassifications have been made to the Fund’s components of net assets to reflect income and gains available for distribution (or available capital loss carryovers, as applicable) under income tax regulations. The primary permanent differences causing such reclassifications are due to certain capital loss carryovers assumed as a result of acquisitions and expiration of capital loss carryovers. During the year ended April 30, 2009, the following amounts were reclassified:
Income, common expenses and realized and unrealized gains and losses are allocated to the classes based on the relative net assets of each class. Distribution fees, if any, are calculated daily at the class level based on the appropriate net assets of each class and the specific expense rates applicable to each class.
Evergreen Investment Management Company, LLC (“EIMC”), a subsidiary of Wells Fargo & Company (“Wells Fargo”), is the investment advisor to the Fund and is paid a fee at an annual rate of 2% of the Fund’s gross investment income plus an amount deter-
NOTES TO FINANCIAL STATEMENTS continued
mined by applying percentage rates to the average daily net assets of the Fund, starting at 0.31% and declining to 0.16% as average daily net assets increase. For the year ended April 30, 2009, the advisory fee was equivalent to an annual rate of 0.54% of the Fund’s average daily net assets.
Tattersall Advisory Group, Inc., an affiliate of EIMC and an indirect, wholly-owned subsidiary of Wells Fargo, is an investment sub-advisor to the Fund and is paid by EIMC for its services to the Fund.
On October 3, 2008, Wells Fargo and Wachovia Corporation (“Wachovia”) announced that Wells Fargo agreed to acquire Wachovia in a whole company transaction that would include all of Wachovia’s banking and other businesses. In connection with this transaction, Wachovia issued preferred shares to Wells Fargo representing approximately a 40% voting interest in Wachovia. Due to its ownership of preferred shares, Wells Fargo may have been deemed to control EIMC. If Wells Fargo was deemed to control EIMC, then the existing advisory agreement between the Fund and EIMC and the sub-advisory agreement between EIMC and the Fund’s sub-advisor would have terminated automatically in connection with the issuance of preferred shares. To address this possibility, on October 20, 2008 the Board of Trustees approved an interim advisory agreement with EIMC and an interim sub-advisory agreement with the sub-advisor with the same terms and conditions as the existing agreements, which became effective upon the issuance of the preferred shares. EIMC’s receipt of the advisory fees under the interim advisory agreement was subject to the approval by shareholders of the Fund of a new advisory agreement with EIMC.
On December 31, 2008, Wachovia merged with and into Wells Fargo and as a result of the merger, EIMC, Tattersall Advisory Group, Inc., Evergreen Investment Services, Inc. (“EIS”) and Evergreen Service Company, LLC (“ESC”) became subsidiaries of Wells Fargo. After the merger, a new interim advisory agreement with the same terms and conditions between the Fund and EIMC went into effect. In addition, a new interim sub-advisory agreement with the same terms and conditions became effective with the sub-advisor to the Fund.
Shareholders approved the new advisory agreement between the Fund and EIMC on February 12, 2009. In addition, on the same date, shareholders also approved a new sub-advisory agreement with the sub-advisor.
From time to time, EIMC may voluntarily or contractually waive its fee and/or reimburse expenses in order to limit operating expenses. During the year ended April 30, 2009, EIMC contractually and voluntarily waived its advisory fee in the amounts of $412,002 and $202,215, respectively.
The Fund may invest in money market funds which are advised by EIMC. Income earned on these investments is included in income from affiliated issuers on the Statement of Operations.
41
NOTES TO FINANCIAL STATEMENTS continued
EIMC also serves as the administrator to the Fund providing the Fund with facilities, equipment and personnel. EIMC is paid an annual rate determined by applying percentage rates to the aggregate average daily net assets of the Evergreen funds (excluding money market funds) starting at 0.10% and declining to 0.05% as the aggregate average daily net assets of the Evergreen funds (excluding money market funds) increase. For the year ended April 30, 2009, the administrative services fee was equivalent to an annual rate of 0.10% of the Fund’s average daily net assets.
ESC, an affiliate of EIMC and a subsidiary of Wells Fargo, is the transfer and dividend disbursing agent for the Fund. ESC receives account fees that vary based on the type of account held by the shareholders in the Fund. For the year ended April 30, 2009, the transfer agent fees were equivalent to an annual rate of 0.22% of the Fund’s average daily net assets.
The Fund has placed a portion of its portfolio transactions with brokerage firms that are affiliates of Wells Fargo. During the year ended April 30, 2009, the Fund paid brokerage commissions of $2,399 to Wachovia Securities, LLC, a broker-dealer affiliated with Wells Fargo.
4. DISTRIBUTION PLANS
EIS, an affiliate of EIMC and a subsidiary of Wells Fargo, serves as distributor of the Fund’s shares. The Fund has adopted Distribution Plans, as allowed by Rule 12b-1 of the 1940 Act, for each class of shares, except Class I. Under the Distribution Plans, the Fund is permitted to pay distribution fees at an annual rate of up to 0.75% of the average daily net assets for Class A shares and up to 1.00% of the average daily net assets for each of Class B and Class C shares. However, currently the distribution fees for Class A shares are limited to 0.25% of the average daily net assets of the class.
For the year ended April 30, 2009, EIS received $20,523 from the sale of Class A shares and $16,896, $168,577 and $3,690 in contingent deferred sales charges from redemptions of Class A, Class B and Class C shares, respectively.
5. ACQUISITION
Effective at the close of business on September 19, 2008, the Fund acquired the net assets of Evergreen Select High Yield Bond Fund in a tax-free exchange for Class A and Class I shares of the Fund. Shares were issued to Class A and Class I shareholders of Evergreen Select High Yield Bond Fund at an exchange ratio of 2.80 and 2.80 for Class A and Class I shares, respectively, of the Fund. The acquired net assets consisted primarily of portfolio securities with unrealized depreciation of $10,172,034. The aggregate net assets of the Fund and Evergreen Select High Yield Bond Fund immediately prior to the acquisition were $440,185,205 and $94,017,018, respectively. The aggregate net assets of the Fund immediately after the acquisition were $534,202,223.
42
NOTES TO FINANCIAL STATEMENTS continued
6. INVESTMENT TRANSACTIONS
Cost of purchases and proceeds from sales of investment securities (excluding short-term securities) were as follows for the year ended April 30, 2009:
Cost of Purchases | Proceeds from Sales |
|
|
U.S. | Non-U.S. | U.S. | Non-U.S. |
Government | Government | Government | Government |
|
|
|
|
$5,334,866 | $494,474,089 | $2,996,821 | $536,647,412 |
|
|
|
|
On May 1, 2008, the Fund implemented Statement of Financial Accounting Standards No. 157, Fair Value Measurements (“FAS 157”). FAS 157 establishes a single authoritative definition of fair value, establishes a framework for measuring fair value and expands disclosures about fair value measurements. FAS 157 establishes a fair value hierarchy based upon the various inputs used in determining the value of the Fund’s investments. These inputs are summarized into three broad levels as follows:
Level 1 – quoted prices in active markets for identical securities Level 2 – other significant observable inputs (including quoted prices for similar securities, interest rates, prepayment speeds, credit risk, etc.) Level 3 – significant unobservable inputs (including the Fund’s own assumptions in determining the fair value of investments) |
The inputs or methodologies used for valuing securities are not necessarily an indication of the risk associated with investing in those securities.
As of April 30, 2009, the inputs used in valuing the Fund’s assets, which are carried at fair value, were as follows:
Valuation Inputs | | Investments in
Securities | | Other Financial
Instruments* | |
|
|
|
|
| |
Level 1 – Quoted Prices | | $ | 42,870,636 | | | $ | 0 | | |
Level 2 – Other Significant Observable Inputs | | | 373,719,188 | | | | 494,821 | | |
Level 3 – Significant Unobservable Inputs | | | 0 | | | | 0 | | |
|
|
|
|
|
|
|
|
| |
Total | | $ | 416,589,824 | | | $ | 494,821 | | |
|
|
|
|
|
|
|
|
| |
* | Other financial instruments include forwards and swap contracts. |
43
NOTES TO FINANCIAL STATEMENTS continued
As of April 30, 2009, the Fund had unfunded loan commitments of $10,738,955.
On April 30, 2009, the aggregate cost of securities for federal income tax purposes was $491,339,495. The gross unrealized appreciation and depreciation on securities based on tax cost was $16,117,204 and $90,866,875, respectively, with a net unrealized depreciation of $74,749,671.
As of April 30, 2009, the Fund had $194,204,789 in capital loss carryovers for federal income tax purposes expiring as follows:
Expiration |
|
2010 | 2011 | 2013 | 2014 | 2015 | 2016 | 2017 |
|
|
|
|
|
|
|
$116,376,746 | $15,936,101 | $904,358 | $6,309,078 | $6,135,718 | $4,801,509 | $43,741,279 |
|
|
|
|
|
|
|
Certain portions of the capital loss carryovers of the Fund were assumed as a result of acquisitions. These losses are subject to certain limitations prescribed by the Internal Revenue Code.
For income tax purposes, capital losses incurred after October 31 within the Fund’s fiscal year are deemed to arise on the first business day of the following fiscal year. As of April 30, 2009, the Fund incurred and will elect to defer post-October losses of $61,384,655.
7. DERIVATIVE TRANSACTIONS
At April 30, 2009, the Fund had forward foreign currency exchange contracts outstanding as follows:
Forward Foreign Currency Exchange Contracts to Sell:
Exchange
Date | | Contracts to
Deliver | | U.S. Value at
April 30, 2009 | | In Exchange for
U.S. $ | | Unrealized
Gain (Loss) |
|
|
|
|
|
|
|
|
|
|
08/06/2009 | | 470,000 EUR | | $ | 621,611 | | | $ | 611,945 | | | $ | (9,666 | ) |
08/06/2009 | | 878,680 EUR | | | 1,162,122 | | | | 1,131,739 | | | | (30,383 | ) |
08/06/2009 | | 194,146 EUR | | | 256,773 | | | | 243,653 | | | | (13,120 | ) |
10/01/2009 | | 224,061 EUR | | | 296,312 | | | | 297,116 | | | | 804 | |
10/15/2009 | | 593,976 EUR | | | 785,493 | | | | 781,316 | | | | (4,177 | ) |
10/15/2009 | | 256,090 EUR | | | 338,662 | | | | 335,849 | | | | (2,813 | ) |
10/15/2009 | | 754,300 EUR | | | 997,511 | | | | 1,001,182 | | | | 3,671 | |
10/15/2009 | | 147,107 EUR | | | 194,539 | | | | 193,342 | | | | (1,197 | ) |
10/15/2009 | | 431,704 EUR | | | 570,900 | | | | 572,237 | | | | 1,337 | |
|
|
|
|
|
|
|
|
|
|
|
|
|
|
|
44
NOTES TO FINANCIAL STATEMENTS continued
The Fund enters into credit default swap contracts as a substitute for taking a position in the underlying security or basket of securities or to potentially enhance the Fund’s total return. At April 30, 2009, the Fund had the following credit default swap contracts outstanding:
Credit default swaps on debt obligations – Buy protection
Expiration | | Counterparty | | Reference
Debt
Obligation | | Rating of
Reference
Debt
Obligation* | | Notional
Amount | | Fixed
Payments
Made
by the Fund | | Frequency of
Payments
Made | | Market
Value | | Upfront
Premiums
Paid/
(Received) | | Unrealized
Gain (Loss) | |
|
|
|
|
|
|
|
|
|
|
|
|
|
|
|
|
|
|
|
|
|
06/20/2014 | | Deutsche | | Humana, Inc., | | BBB | | $ | 510,000 | | 1.00% | | Quarterly | | $ | 52,883 | | $ | 57,344 | | $ | (4,461 | ) |
| | Bank | | 6.30%, | | | | | | | | | | | | | | | | | | | |
| | | | 08/01/2018 ## | | | | | | | | | | | | | | | | | | | |
06/20/2014 | | Goldman | | Motorola, 6.50%, | | BB+ | | | 1,270,000 | | 1.00% | | Quarterly | | | 52,442 | | | 127,937 | | | (75,495 | ) |
| | Sachs | | 09/01/2025 # | | | | | | | | | | | | | | | | | | | |
06/20/2014 | | UBS | | Expedia, 7.46%, | | BB | | | 1,695,000 | | 5.00% | | Quarterly | | | (90,002 | ) | | (53,274 | ) | | (36,728 | ) |
| | | | 08/15/2018 # | | | | | | | | | | | | | | | | | | | |
06/20/2014 | | UBS | | Motorola, 6.50%, | | BB+ | | | 890,000 | | 1.00% | | Quarterly | | | 36,751 | | | 84,609 | | | (47,858 | ) |
| | | | 09/01/2025 # | | | | | | | | | | | | | | | | | | | |
|
|
|
|
|
|
|
|
|
|
|
|
|
|
|
|
|
|
|
|
|
|
|
|
Credit default swaps on an index – Buy protection
Expiration | | Counterparty | | Reference
Index | | Rating of
Reference
Index*@ | | Notional
Amount | | Fixed
Payments
Made
by the Fund | | Frequency of
Payments
Made | | Market
Value | | Upfront
Premiums
Paid/
(Received) | | Unrealized
Gain (Loss) | |
|
|
|
|
|
|
|
|
|
|
|
|
|
|
|
|
|
|
|
|
12/20/2013 | | Deutsche
Bank | | Dow Jones CDX
North American
Investment Grade
Index ## | | B | | $ | 2,825,000 | | 3.35% | | Monthly | | $ | 216,403 | | $ | 528,861 | | $ | (312,458 | ) |
|
|
|
|
|
|
|
|
|
|
|
|
|
|
|
|
|
|
|
|
|
|
|
|
Credit default swaps on debt obligations – Sell protection
Expiration | | Counterparty | | Reference
Debt
Obligation | | Rating of
Reference
Debt
Obligation* | | Notional
Amount | | Fixed
Payments
Received
by the Fund | | Frequency of
Payments
Received | | Market
Value | | Upfront
Premiums
Paid/
(Received) | | Unrealized
Gain (Loss) | |
|
|
|
|
|
|
|
|
|
|
|
|
|
|
|
|
|
|
|
|
09/20/2013 | | Deutsche | | GE Capital, | | AA+ | | $ | 430,000 | | 4.00% | | Quarterly | | $ | (39,367 | ) | $ | 0 | | $ | (39,367 | ) |
| | Bank | | 6.00%, | | | | | | | | | | | | | | | | | | | |
| | | | 06/15/2012 # | | | | | | | | | | | | | | | | | | | |
12/20/2013 | | CitiBank | | GE Capital, | | AA+ | | | 655,000 | | 6.65% | | Quarterly | | | 592 | | | 0 | | | 592 | |
| | | | 6.00%, | | | | | | | | | | | | | | | | | | | |
| | | | 06/15/2012 # | | | | | | | | | | | | | | | | | | | |
12/20/2013 | | Goldman | | GE Capital, | | AA+ | | | 545,000 | | 4.50% | | Quarterly | | | (41,460 | ) | | 0 | | | (41,460 | ) |
| | Sachs | | 6.00%, | | | | | | | | | | | | | | | | | | | |
| | | | 06/15/2012 # | | | | | | | | | | | | | | | | | | | |
|
|
|
|
|
|
|
|
|
|
|
|
|
|
|
|
|
|
|
|
|
|
|
|
* | Reflects the ratings of a nationally recognized ratings agency at period end. A rating of D would most likely indicate a trigger event of default has occurred although circumstances including bankruptcy, failure to pay, obligation default, obligation acceleration, repudiation/moratorium and restructuring may also cause a credit event to take place. |
@ | Rating represents an average rating for the underlying securities within the index. |
# | The Fund entered into the swap contract for speculative purposes. |
## | The Fund entered into the swap contract for hedging purposes. |
45
NOTES TO FINANCIAL STATEMENTS continued
Credit default swaps on debt obligations – Sell protection (continued)
Expiration | | Counterparty | | Reference
Debt
Obligation | | Rating of
Reference
Debt
Obligation* | | Notional
Amount | | Fixed
Payments
Received
by the Fund | | Frequency of
Payments
Received | | Market
Value | | Upfront
Premiums
Paid/
(Received) | | Unrealized
Gain (Loss) | |
|
|
|
|
|
|
|
|
|
|
|
|
|
|
|
|
|
|
|
|
03/20/2014 | | Goldman | | GE Capital, | | AA+ | | $ | 425,000 | | 5.10% | | Quarterly | | $ | (21,960 | ) | $ | 0 | | $ | (21,960 | ) |
| | Sachs | | 5.625%, | | | | | | | | | | | | | | | | | | | |
| | | | 09/15/2017 # | | | | | | | | | | | | | | | | | | | |
06/20/2014 | | Credit Suisse | | GE Capital, | | AA+ | | | 500,000 | | 5.00% | | Quarterly | | | (27,998 | ) | | (40,901 | ) | | 12,903 | |
| | First Boston | | 5.625%, | | | | | | | | | | | | | | | | | | | |
| | | | 09/15/2017 # | | | | | | | | | | | | | | | | | | | |
06/20/2014 | | Deutsche | | GE Capital, | | AA+ | | | 455,000 | | 5.00% | | Quarterly | | | (25,479 | ) | | (43,975 | ) | | 18,496 | |
| | Bank | | 5.625%, | | | | | | | | | | | | | | | | | | | |
| | | | 09/15/2017 # | | | | | | | | | | | | | | | | | | | |
06/20/2014 | | Goldman | | GE Capital, | | AA+ | | | 1,280,000 | | 5.00% | | Quarterly | | | (71,676 | ) | | (101,413 | ) | | 29,737 | |
| | Sachs | | 5.625%, | | | | | | | | | | | | | | | | | | | |
| | | | 06/15/2017 # | | | | | | | | | | | | | | | | | | | |
|
|
|
|
|
|
|
|
|
|
|
|
|
|
|
|
|
|
|
|
|
|
|
|
Credit default swaps on an index – Sell protection
Expiration | | Counterparty | | Reference
Index | | Rating of
Reference
Index*@ | | Notional
Amount | | Fixed
Payments
Received
by the Fund | | Frequency of
Payments
Received | | Market
Value | | Upfront
Premiums
Paid/
(Received) | | Unrealized
Gain (Loss) | |
|
|
|
|
|
|
|
|
|
|
|
|
|
|
|
|
|
|
|
|
12/13/2049 | | Credit Suisse | | Markit CMBX | | AAA | | $ | 2,485,000 | | 0.08% | | Monthly | | $ | (661,474 | ) | $ | (857,186 | ) | $ | 195,712 | |
| | First Boston | | North America | | | | | | | | | | | | | | | | | | | |
| | | | AAA.3 Index # | | | | | | | | | | | | | | | | | | | |
12/13/2049 | | Goldman | | Markit CMBX | | AAA | | | 7,240,000 | | 0.08% | | Monthly | | | (1,927,192 | ) | | (2,799,904 | ) | | 872,712 | |
| | Sachs | | North America | | | | | | | | | | | | | | | | | | | |
| | | | AAA.3 Index # | | | | | | | | | | | | | | | | | | | |
|
|
|
|
|
|
|
|
|
|
|
|
|
|
|
|
|
|
|
|
|
|
|
|
* | Reflects the ratings of a nationally recognized ratings agency at period end. A rating of D would most likely indicate a trigger event of default has occurred although circumstances including bankruptcy, failure to pay, obligation default, obligation acceleration, repudiation/moratorium and restructuring may also cause a credit event to take place. |
@ | Rating represents an average rating for the underlying securities within the index. |
# | The Fund entered into the swap contract for speculative purposes. |
The total notional amount of credit default swaps in the tables above are representative of the volume of derivative activity during the year ended April 30, 2009.
Certain of the Fund’s derivative transactions may contain provisions for early termination in the event the net assets of the Fund declines below specific levels identified by the counterparty. If these levels are triggered, the counterparty may terminate the transaction and seek payment or request full collaterization of the derivative transaction in net liability positions. On April 30, 2009, the aggregate fair value of all derivative instruments with net asset contingent features that were in a liability position amounted to $2,906,608. As of April 30, 2009, the Fund had segregated $2,514,000 as cash collateral for outstanding swap transactions.
46
NOTES TO FINANCIAL STATEMENTS continued
A summary of derivative instruments by primary risk exposure is outlined in the following tables.
The fair value of derivative instruments as of April 30, 2009 was as follows:
| | Asset Derivatives | | Liability Derivatives | |
| |
|
|
|
|
Derivatives not accounted
for as hedging instruments
under Statement 133 | | Balance Sheet
Location | | Fair Value | | Balance Sheet
Location | | Fair Value | |
|
|
|
|
|
|
|
|
|
|
Forward foreign currency contracts | | Unrealized gains on forward foreign currency exchange contracts, Net assets – Net unrealized losses on investments | | $ | 5,812 | | Unrealized losses on forward foreign currency exchange contracts, Net assets – Net unrealized losses on investments | | $ | 61,356 | |
| |
Credit contracts | | Unrealized gains on credit default swap transactions, Net assets – Net unrealized losses on investments | | | 1,130,152 | | Unrealized losses on credit default swap transactions, Net assets – Net unrealized losses on investments | | | 579,787 | |
|
|
|
|
|
|
|
|
|
|
|
|
| | | | $ | 1,135,964 | | | | $ | 641,143 | |
|
|
|
|
|
|
|
|
|
|
|
|
The effect of derivative instruments on the Statement of Operations for the year ended April 30, 2009 was as follows:
| | Amount of Realized Gains or Losses
on Derivatives Recognized in Income | |
| |
|
|
Derivatives not accounted for as hedging
instruments under Statement 133 | | Forward
Currency
Contracts | | Credit
Default
Swaps | | Total | |
|
|
|
|
|
|
|
|
Forward foreign currency contracts | | $ | (60,030 | ) | $ | 0 | | $ | (60,030 | ) |
Credit contracts | | | 0 | | | 994,841 | | | 994,841 | |
|
|
|
|
|
|
|
|
|
|
|
| | $ | (60,030 | ) | $ | 994,841 | | $ | 934,811 | |
|
|
|
|
|
|
|
|
|
|
|
| | Change in Unrealized Gains or Losses
on Derivatives Recognized in Income | |
| |
|
|
Derivatives not accounted for as hedging
instruments under Statement 133 | | Forward
Currency
Contracts | | Credit
Default
Swaps | | Total | |
|
|
|
|
|
|
|
|
Forward foreign currency contracts | | $ | 16,511 | | $ | 0 | | $ | 16,511 | |
Credit contracts | | | 0 | | | 462,222 | | | 462,222 | |
|
|
|
|
|
|
|
|
|
|
|
| | $ | 16,511 | | $ | 462,222 | | $ | 478,733 | |
|
|
|
|
|
|
|
|
|
|
|
8. INTERFUND LENDING
Pursuant to an Exemptive Order issued by the SEC, the Fund may participate in an interfund lending program with certain funds in the Evergreen fund family. This program allows the Fund to borrow from, or lend money to, other participating funds. During the year ended April 30, 2009, the Fund did not participate in the interfund lending program.
47
NOTES TO FINANCIAL STATEMENTS continued
9. DISTRIBUTIONS TO SHAREHOLDERS
As of April 30, 2009, the components of distributable earnings on a tax basis were as follows:
| | Capital Loss | |
| | Carryovers | |
| | and | |
Undistributed | Unrealized | Post-October | Temporary Book/ |
Ordinary Income | Depreciation | Losses | Tax Differences |
|
|
|
|
$4,232,149 | $74,745,179 | $255,589,444 | $(1,647,307) |
|
|
|
|
The differences between the components of distributable earnings on a tax basis and the amounts reflected in the Statement of Assets and Liabilities are primarily due to wash sales, premium amortization, forward contracts and swap contracts. The temporary book/tax differences are a result of timing differences between book and tax recognition of income and/or expenses.
The tax character of distributions paid were $41,573,324 and $41,122,951 of ordinary income for the years ended April 30, 2009 and April 30, 2008, respectively.
10. EXPENSE REDUCTIONS
Through expense offset arrangements with ESC and the Fund’s custodian, a portion of fund expenses has been reduced.
11. DEFERRED TRUSTEES’ FEES
Each Trustee of the Fund may defer any or all compensation related to performance of his or her duties as a Trustee. The Trustees’ deferred balances are allocated to deferral accounts, which are included in the accrued expenses for the Fund. The investment performance of the deferral accounts is based on the investment performance of certain Evergreen funds. Any gains earned or losses incurred in the deferral accounts are reported in the Fund’s Trustees’ fees and expenses. At the election of the Trustees, the deferral account will be paid either in one lump sum or in quarterly installments for up to ten years.
12. FINANCING AGREEMENT
The Fund and certain other Evergreen funds share in an unsecured revolving credit commitment for temporary and emergency purposes, including the funding of redemptions, as permitted by each participating fund’s borrowing restrictions. Borrowings under this facility bear interest at 0.50% per annum above the Federal Funds rate. All of the participating funds are charged an annual commitment fee on the unused balance, which is allocated pro rata. The credit facility is for $100 million with an annual commitment fee of 0.09%. Prior to June 27, 2008, the annual commitment fee was 0.08%.
48
NOTES TO FINANCIAL STATEMENTS continued
During the year ended April 30, 2009, the Fund had average borrowings outstanding of $181,649 at an average rate of 0.97% and paid interest of $1,762.
13. REGULATORY MATTERS AND LEGAL PROCEEDINGS
The Evergreen funds, EIMC and certain of EIMC’s affiliates are involved in various legal actions, including private litigation and class action lawsuits, and are and may in the future be subject to regulatory inquiries and investigations.
EIMC and EIS have reached final settlements with the Securities and Exchange Commission (“SEC”) and the Securities Division of the Secretary of the Commonwealth of Massachusetts (“Commonwealth”) primarily relating to the liquidation of Evergreen Ultra Short Opportunities Fund (“Ultra Short Fund”). The claims settled include the following: first, that during the period February 2007 through Ultra Short Fund’s liquidation on June 18, 2008, Ultra Short Fund’s former portfolio management team failed to properly take into account readily-available information in valuing certain non-agency residential mortgage-backed securities held by the Ultra Short Fund, resulting in the Ultra Short Fund’s net asset value (“NAV”) being overstated during the period; second, that EIMC and EIS acted inappropriately when, in an effort to explain the decline in Ultra Short Fund’s NAV, certain information regarding the decline was communicated to some, but not all, shareholders and financial intermediaries; third, that the Ultra Short Fund portfolio management team did not adhere to regulatory requirements for affiliated cross trades in executing trades with other Evergreen funds; and finally, that from at least September 2007 to August 2008, EIS did not preserve certain text and instant messages transmitted via personal digital assistant devices. In settling these matters, EIMC and EIS have agreed to payments totaling $41.125 million, up to $40.125 million of which will be distributed to eligible shareholders of Ultra Short Fund pursuant to a methodology and plan approved by the regulators. EIMC and EIS neither admitted nor denied the regulators’ conclusions.
Three purported class actions have also been filed in the U.S. District Court for the District of Massachusetts relating to the same events; defendants include various Evergreen entities, including EIMC and EIS, and Evergreen Fixed Income Trust and its Trustees. The cases generally allege that investors in the Ultra Short Fund suffered losses as a result of (i) misleading statements in Ultra Short Fund’s registration statement and prospectus, (ii) the failure to accurately price securities in the Ultra Short Fund at different points in time and (iii) the failure of the Ultra Short Fund’s risk disclosures and description of its investment strategy to inform investors adequately of the actual risks of the fund.
EIMC does not expect that any of the legal actions, inquiries or settlement of regulatory matters will have a material adverse impact on the financial position or operations of the Fund to which these financial statements relate. Any publicity surrounding or resulting from any legal actions or regulatory inquiries involving EIMC or its affiliates or any of the
49
NOTES TO FINANCIAL STATEMENTS continued
Evergreen Funds could result in reduced sales or increased redemptions of Evergreen fund shares, which could increase Evergreen fund transaction costs or operating expenses or have other adverse consequences on the Evergreen funds, including the Fund.
14. NEW ACCOUNTING PRONOUNCEMENT
In April 2009, FASB issued FASB Staff Position No. FAS 157-4, Determining Fair Value When the Volume and Level of Activity for the Asset or Liability Have Significantly Decreased and Identifying Transactions That Are Not Orderly (“FAS 157-4”). FAS 157-4 provides additional guidance for determining fair value when the volume and level of activity for an asset or a liability have significantly decreased and identifying transactions that are not orderly. FAS 157-4 requires enhanced disclosures about the inputs and valuation technique(s) used to measure fair value and a discussion of changes in valuation techniques and related inputs, if any, during the period. In addition, the three-level hierarchy disclosure and the level three roll-forward disclosure will be expanded for each major category of assets. Management of the Fund does not believe the adoption of FAS 157-4 will materially impact the financial statement amounts, but will require additional disclosures. FAS 157-4 is effective for interim and annual reporting periods ending after June 15, 2009.
15. SUBSEQUENT EVENT
Effective after the close of business on June 30, 2009, Class B shares of the Fund will be closed to new accounts and additional purchases by existing shareholders. After the close of business on June 30, 2009, existing shareholders of Class B shares of the Fund may continue to exchange their Class B shares for Class B shares of other Evergreen Funds subject to the limitations described in each fund’s prospectus and may also continue to add to their accounts through dividend reinvestment. All other Class B share features and attributes, including, but not limited to, the 12b-1 fee, contingent deferred sales charge and conversion after a number of years to Class A shares, remain unchanged. Shareholders of the Fund may continue to redeem Fund shares in the manner described in the Fund’s prospectus.
50
REPORT OF INDEPENDENT REGISTERED PUBLIC ACCOUNTING FIRM
Board of Trustees and Shareholders
Evergreen Fixed Income Trust
We have audited the accompanying statement of assets and liabilities, including the schedule of investments, of the Evergreen High Income Fund, a series of the Evergreen Fixed Income Trust, as of April 30, 2009 and the related statement of operations for the year then ended, statements of changes in net assets for each of the years in the two-year period then ended and the financial highlights for each of the years in the five-year period then ended. These financial statements and financial highlights are the responsibility of the Fund’s management. Our responsibility is to express an opinion on these financial statements and financial highlights based on our audits.
We conducted our audits in accordance with the standards of the Public Company Accounting Oversight Board (United States). Those standards require that we plan and perform the audit to obtain reasonable assurance about whether the financial statements and financial highlights are free of material misstatement. An audit includes examining, on a test basis, evidence supporting the amounts and disclosures in the financial statements. Our procedures included confirmation of securities owned as of April 30, 2009 by correspondence with the custodian and brokers, or by other appropriate auditing procedures where replies from brokers were not received. An audit also includes assessing the accounting principles used and significant estimates made by management, as well as evaluating the overall financial statement presentation. We believe that our audits provide a reasonable basis for our opinion.
In our opinion, the financial statements and financial highlights referred to above present fairly, in all material respects, the financial position of the Evergreen High Income Fund as of April 30, 2009, the results of its operations, changes in its net assets and financial highlights for each of the years described above, in conformity with U.S. generally accepted accounting principles.

Boston, Massachusetts
June 29, 2009
51
ADDITIONAL INFORMATION (unaudited)
SPECIAL MEETING OF SHAREHOLDERS
On February 12, 2009, a Special Meeting of Shareholders for the Fund was held to consider the following proposals. The results of the proposals are indicated below.
Proposal 1a — To consider and act upon a new investment advisory agreement with Evergreen Investment Management Company, LLC:
| | | | |
|
|
|
|
|
Net assets voted “For” | | $ | 169,673,020 | |
Net assets voted “Against” | | $ | 6,355,686 | |
Net assets voted “Abstain” | | $ | 8,884,050 | |
|
|
|
|
|
Proposal 1b — To consider and act upon a new sub-advisory agreement with Tattersall Advisory Group, Inc.
| | | | |
|
|
|
|
|
Net assets voted “For” | | $ | 167,655,937 | |
Net assets voted “Against” | | $ | 7,595,556 | |
Net assets voted “Abstain” | | $ | 9,661,261 | |
|
|
|
|
|
52
This page left intentionally blank
53
This page left intentionally blank
54
This page left intentionally blank
55
TRUSTEES AND OFFICERS
TRUSTEES1 | | |
Charles A. Austin III
Trustee
DOB: 10/23/1934
Term of office since: 1991
Other directorships: None | | Investment Counselor, Anchor Capital Advisors, LLC. (investment advice); Director, The Andover Companies (insurance); Trustee, Arthritis Foundation of New England; Former Director, The Francis Ouimet Society (scholarship program); Former Director, Executive Vice President and Treasurer, State Street Research & Management Company (investment advice) |
|
|
|
K. Dun Gifford
Trustee
DOB: 10/23/1938
Term of office since: 1974
Other directorships: None | | Chairman and President, Oldways Preservation and Exchange Trust (education); Trustee, Member of the Executive Committee, Former Chairman of the Finance Committee, and Former Treasurer, Cambridge College |
|
|
|
Dr. Leroy Keith, Jr.
Trustee
DOB: 2/14/1939
Term of office since: 1983
Other directorships: Trustee,
Phoenix Fund Complex
(consisting of 50 portfolios
as of 12/31/2008) | | Managing Director, Almanac Capital Management (commodities firm); Trustee, Phoenix Fund Complex; Director, Diversapack Co. (packaging company); Former Partner, Stonington Partners, Inc. (private equity fund); Former Director, Obagi Medical Products Co.; Former Director, Lincoln Educational Services |
|
|
|
Carol A. Kosel
Trustee
DOB: 12/25/1963
Term of office since: 2008
Other directorships: None | | Former Consultant to the Evergreen Boards of Trustees; Former Vice President and Senior Vice President, Evergreen Investments, Inc.; Former Treasurer, Evergreen Funds; Former Treasurer, Vestaur Securities Fund |
|
|
|
Gerald M. McDonnell
Trustee
DOB: 7/14/1939
Term of office since: 1988
Other directorships: None | | Former Manager of Commercial Operations, CMC Steel (steel producer) |
|
|
|
Patricia B. Norris
Trustee
DOB: 4/9/1948
Term of office since: 2006
Other directorships: None | | President and Director of Buckleys of Kezar Lake, Inc. (real estate company); Former President and Director of Phillips Pond Homes Association (home community); Former Partner, PricewaterhouseCoopers, LLP (independent registered public accounting firm) |
|
|
|
William Walt Pettit2
Trustee
DOB: 8/26/1955
Term of office since: 1988
Other directorships: None | | Partner and Vice President, Kellam & Pettit, P.A. (law firm); Director, Superior Packaging Corp. (packaging company); Member, Superior Land, LLC (real estate holding company), Member, K&P Development, LLC (real estate development); Former Director, National Kidney Foundation of North Carolina, Inc. (non-profit organization) |
|
|
|
David M. Richardson
Trustee
DOB: 9/19/1941
Term of office since: 1982
Other directorships: None | | President, Richardson, Runden LLC (executive recruitment advisory services); Director, J&M Cumming Paper Co. (paper merchandising); Former Trustee, NDI Technologies, LLP (communications); Former Consultant, AESC (The Association of Executive Search Consultants) |
|
|
|
Russell A. Salton III, MD
Trustee
DOB: 6/2/1947
Term of office since: 1984
Other directorships: None | | President/CEO, AccessOne MedCard, Inc. |
|
|
|
56
TRUSTEES AND OFFICERS continued
Michael S. Scofield
Trustee
DOB: 2/20/1943
Term of office since: 1984
Other directorships: None | | Retired Attorney, Law Offices of Michael S. Scofield; Former Director and Chairman, Branded Media Corporation (multi-media branding company) |
|
|
|
Richard J. Shima
Trustee
DOB: 8/11/1939
Term of office since: 1993
Other directorships: None | | Independent Consultant; Director, Hartford Hospital; Trustee, Greater Hartford YMCA; Former Director, Trust Company of CT; Former Trustee, Saint Joseph College (CT) |
|
|
|
Richard K. Wagoner, CFA3
Trustee
DOB: 12/12/1937
Term of office since: 1999
Other directorships: None | | Member and Former President, North Carolina Securities Traders Association; Member, Financial Analysts Society |
|
|
|
OFFICERS | | |
W. Douglas Munn4
President
DOB: 4/21/1963
Term of office since: 2009 | | Principal occupations: Chief Operating Officer, Wells Fargo Funds Management, LLC; former Chief Operating Officer, Evergreen Investment Company, Inc. |
|
|
|
Kasey Phillips4
Treasurer
DOB: 12/12/1970
Term of office since: 2005 | | Principal occupations: Senior Vice President, Evergreen Investment Management Company, LLC; Former Vice President, Evergreen Investment Services, Inc. |
|
|
|
Michael H. Koonce4
Secretary
DOB: 4/20/1960
Term of office since: 2000 | | Principal occupations: Senior Vice President and General Counsel, Evergreen Investment Services, Inc.; Secretary, Senior Vice President and General Counsel, Evergreen Investment Management Company, LLC and Evergreen Service Company, LLC |
|
|
|
Robert Guerin4
Chief Compliance Officer
DOB: 9/20/1965
Term of office since: 2007 | | Principal occupations: Chief Compliance Officer, Evergreen Funds and Senior Vice President of Evergreen Investment Company, Inc.; Former Managing Director and Senior Compliance Officer, Babson Capital Management LLC; Former Principal and Director, Compliance and Risk Management, State Street Global Advisors; Former Vice President and Manager, Sales Practice Compliance, Deutsche Asset Management |
|
|
|
1 | Each Trustee serves until a successor is duly elected or qualified or until his or her death, resignation, retirement or removal from office. Each Trustee oversaw 77 Evergreen funds as of December 31, 2008. Correspondence for each Trustee may be sent to Evergreen Board of Trustees, P.O. Box 20083, Charlotte, NC 28202. |
2 | It is possible that Mr. Pettit may be viewed as an “interested person” of the Evergreen funds, as defined in the 1940 Act, because of his law firm’s previous representation of affiliates of Wells Fargo & Company (“Wells Fargo”), the parent to the Evergreen funds’ investment advisor, EIMC. The Trustees are treating Mr. Pettit as an interested trustee for the time being. |
3 | Mr. Wagoner is an “interested person” of the Evergreen funds because of his ownership of shares in Wells Fargo & Company, the parent to the Evergreen funds’ investment advisor. |
4 | The address of the Officer is 200 Berkeley Street, Boston, MA 02116. |
Additional information about the Fund’s Board of Trustees and Officers can be found in the Statement of Additional Information (SAI) and is available upon request without charge by calling 800.343.2898.
57
566660 rv6 06/2009
Evergreen U.S. Government Fund
| | table of contents |
1 | | LETTER TO SHAREHOLDERS |
4 | | FUND AT A GLANCE |
6 | | PORTFOLIO MANAGER COMMENTARY |
9 | | ABOUT YOUR FUND’S EXPENSES |
10 | | FINANCIAL HIGHLIGHTS |
14 | | SCHEDULE OF INVESTMENTS |
21 | | STATEMENT OF ASSETS AND LIABILITIES |
22 | | STATEMENT OF OPERATIONS |
23 | | STATEMENTS OF CHANGES IN NET ASSETS |
25 | | STATEMENT OF CASH FLOWS |
26 | | NOTES TO FINANCIAL STATEMENTS |
37 | | REPORT OF INDEPENDENT REGISTERED PUBLIC ACCOUNTING FIRM |
38 | | ADDITIONAL INFORMATION |
40 | | TRUSTEES AND OFFICERS |
This annual report must be preceded or accompanied by a prospectus of the Evergreen fund contained herein. The prospectus contains more complete information, including fees and expenses, and should be read carefully before investing or sending money.
The fund will file its complete schedule of portfolio holdings with the SEC for the first and third quarters of each fiscal year on Form N-Q. The fund’s Form N-Q will be available on the SEC’s Web site at http://www.sec.gov. In addition, the fund’s Form N-Q may be reviewed and copied at the SEC’s Public Reference Room in Washington, D.C. Information on the operation of the Public Reference Room may be obtained by calling 800.SEC.0330.
A description of the fund’s proxy voting policies and procedures, as well as information regarding how the fund voted proxies relating to portfolio securities during the most recent 12-month period ended June 30, is available by visiting our Web site at EvergreenInvestments.com or by visiting the SEC’s Web site at http://www.sec.gov. The fund’s proxy voting policies and procedures are also available without charge, upon request, by calling 800.343.2898.
Mutual Funds:
| NOT FDIC INSURED | MAY LOSE VALUE | NOT BANK GUARANTEED |
Evergreen InvestmentsSM is a service mark of Evergreen Investment Management Company, LLC. Copyright 2009, Evergreen Investment Management Company, LLC.
Evergreen Investment Management Company, LLC is a subsidiary of Wells Fargo & Company and is an affiliate of Wells Fargo & Company’s other Broker Dealer subsidiaries.
Evergreen mutual funds are distributed by Evergreen Investment Services, Inc. 200 Berkeley Street, Boston, MA 02116
LETTER TO SHAREHOLDERS
June 2009

W. Douglas Munn
President and Chief Executive Officer
Dear Shareholder:
We are pleased to provide the Annual Report for Evergreen U.S. Government Fund for the twelve-month period ended April 30, 2009 (the “period”).
The year 2008 saw home prices fall and job losses persist, as economic conditions deteriorated due to the credit crisis. The crisis reached a crucial point in September 2008, when federal officials allowed for the fall of Lehman Brothers, which history will likely judge as a colossal policy failure. Indeed, the collateral damage from this event led to further collapse. Previously venerable financial institutions fell like dominos in the ensuing weeks as distrust prevailed and counter-party risk, whether real or imagined, escalated. Inter-bank lending ceased to exist, and the credit markets froze. Volatility continued to dominate trading patterns through the end of 2008, as losses mounted within the equity markets. Weak economic data, falling profit forecasts, and uncertainty about the auto industry compounded worries about the credit crisis.
In early 2009, layoff announcements accelerated; further pressuring personal consumption and business investment. The fixed income markets worried about deflation during the period, evidenced by investor willingness to accept virtually nothing for short-term loans to the government. Concerns about federal spending also increased, with yields climbing for longer-term U.S. Treasuries during the first quarter of 2009. International markets were hit hard as economies in both developed and emerging countries struggled. Equity markets were affected by the weakness in economic data and corporate profits, although during April 2009, stocks rallied off their March 2009 lows with international and small cap stocks leading the gains. However, given the still unresolved issues of credit availability, rising unemployment, declining home values, looming auto bankruptcies, and the possibility for more bank re-capitalizations, we believe investors need to prepare for a potential re-test of the March 2009 lows in the coming months.
The unprecedented economic and financial turmoil has been met with an unprecedented policy response, as the Federal Reserve Board, the U.S. Treasury, the Federal Deposit Insurance Corporation and the Federal Housing Administration have allocated more than $11 trillion to combat the crisis. Perhaps most important, the Public-Private Investment Program (the “PPIP”) has been designed to help rid banks of toxic assets from their balance sheets. The measures taken to address this crisis have merely treated the symptoms, but the announcement of this program gets to the root cause: the distressed assets on (and off) bank balance sheets. The PPIP is designed to use
1
LETTER TO SHAREHOLDERS continued
government subsidies to attract private purchases of currently illiquid mortgage-related loans and securities held by banks. As a market returns for these assets, banks will be positioned to improve capital ratios, increase lending activity, and potentially buy their way out of the increasingly restrictive Troubled Asset Relief Program. We believe that the successful implementation of this program is critical for a sustainable expansion to ensue. As the lagged effects of the massive policy response take hold, we look for pent-up consumer demand to combine with government spending to help push Gross Domestic Product back into positive territory by the fourth quarter of 2009.
During a volatile and challenging period in the capital markets, the investment managers of Evergreen’s intermediate and long-term bond funds paid careful attention to risk management in a rapidly changing market environment. The management of Evergreen U.S. Government Fund, Evergreen Core Bond Fund and Evergreen Core Plus Bond Fund focused on interest-rate movements, Fed policy and general economic trends in managing their portfolios. Meanwhile, the management of Evergreen High Income Fund positioned the portfolio relatively conservatively during a period of growing risk aversion. Evergreen Diversified Income Builder Fund’s manager maintained an emphasis on better-quality, high-yield corporate bonds while also increasing the exposure to dividend-paying stocks.
As we look back over the extraordinary series of events during the period, we believe it is important for all investors to keep perspective and remain focused on their long-term goals. We continue to urge investors to work with their financial advisors to pursue fully diversified strategies in order to participate in future market gains and limit the risks of potential losses. Investors should keep in mind that the economy and the financial markets have had long and successful histories of adaptability, recovery, innovation and growth. Proper asset allocation decisions can have significant impacts on the returns of long-term portfolios.
Please visit us at EvergreenInvestments.com for more information about our funds and other investment products available to you. Thank you for doing business with Evergreen Investments.
Sincerely,

W. Douglas Munn
President and Chief Executive Officer
Evergreen Funds
2
LETTER TO SHAREHOLDERS continued
Notices to Shareholders:
| • | Effective after the close of business on June 30, 2009, Class B shares of the Fund will be closed to new accounts and additional purchases by existing shareholders. After the close of business on June 30, 2009, existing shareholders of Class B shares of the Fund may continue to exchange their Class B shares for Class B shares of other Evergreen Funds subject to the limitations described in each fund’s prospectus and may also continue to add to their accounts through dividend reinvestment. All other Class B share features and attributes, including, but not limited to, the 12b-1 fee, contingent deferred sales charge and conversion after a number of years to Class A shares, remain unchanged. Shareholders of the Fund may continue to redeem Fund shares in the manner described in the Fund’s prospectus. |
| • | Effective January 1, 2009, W. Douglas Munn became President and Chief Executive Officer of the Evergreen Funds. |
| • | On December 31, 2008, Wachovia Corporation merged with and into Wells Fargo & Company (“Wells Fargo”). As a result of the merger, Evergreen Investment Management Company, LLC (“EIMC”), Tattersall Advisory Group, Inc., First International Advisors, LLC, Metropolitan West Capital Management, LLC, Evergreen Investment Services, Inc. and Evergreen Service Company, LLC, are subsidiaries of Wells Fargo. |
3
FUND AT A GLANCE
as of April 30, 2009
MANAGEMENT TEAM
Investment Advisor:
Evergreen Investment Management Company, LLC
Sub-Advisor:
Tattersall Advisory Group, Inc.
Portfolio Managers:
Christopher Y. Kauffman, CFA; Todd C. Kuimjian, CFA; Richard Applebach, CFA; Karen DiMeglio
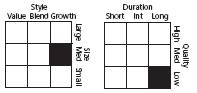
CURRENT INVESTMENT STYLE

Source: Morningstar, Inc.
Morningstar’s style box is based on a portfolio date as of 3/31/2009.
The Fixed Income style box placement is based on a fund’s average effective maturity or duration and the average credit rating of the bond portfolio.
PERFORMANCE AND RETURNS
Portfolio inception date: 1/11/1993
| Class A | Class B | Class C | Class I |
Class inception date | 1/11/1993 | 1/11/1993 | 9/2/1994 | 9/2/1993 |
|
|
|
|
|
Nasdaq symbol | EUSAX | EUSBX | EUSCX | EUSYX |
|
|
|
|
|
Average annual return* | | | | |
|
|
|
|
|
1-year with sales charge | -7.00% | -7.80% | -4.03% | N/A |
|
|
|
|
|
1-year w/o sales charge | -2.36% | -3.09% | -3.09% | -2.12% |
|
|
|
|
|
5-year | 1.88% | 1.79% | 2.14% | 3.16% |
|
|
|
|
|
10-year | 3.62% | 3.37% | 3.37% | 4.40% |
|
|
|
|
|
Maximum sales charge | 4.75%
Front-end | 5.00%
CDSC | 1.00%
CDSC | N/A |
|
|
|
|
|
* | Adjusted for maximum applicable sales charge, unless noted. |
Past performance is no guarantee of future results. The performance quoted represents past performance and current performance may be lower or higher. The investment return and principal value of an investment will fluctuate so that investors’ shares, when redeemed, may be worth more or less than their original cost. To obtain performance information current to the most recent month-end for Classes A, B, C or I, please go to EvergreenInvestments.com/fundperformance. The performance of each class may vary based on differences in loads, fees and expenses paid by the shareholders investing in each class. Performance includes the reinvestment of income dividends and capital gain distributions. Performance shown does not reflect the deduction of taxes that a shareholder would pay on fund distributions or the redemption of fund shares.
The fund incurs a 12b-1 fee of 0.25% for Class A and 1.00% for Classes B and C. Class I does not pay a 12b-1 fee.
The returns shown for Class B shares do not reflect the conversion of Class B shares to Class A shares after eight years.
Returns reflect expense limits previously in effect, without which returns would have been lower.
Class I shares are only offered, subject to the minimum initial purchase requirements, in the following manner: (1) to investment advisory clients of EIMC (or its advisory affiliates), (2) to employer- or state-sponsored benefit plans, including but not limited to, retirement plans, defined benefit plans, deferred compensation plans, or savings plans, (3) to fee-based mutual fund wrap
4
FUND AT A GLANCE continued

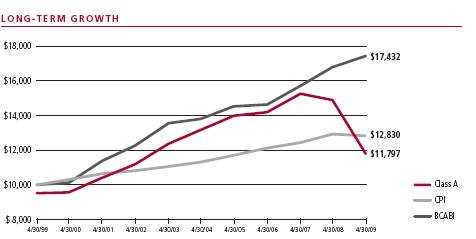
Comparison of a $10,000 investment in the Evergreen U.S. Government Fund Class A shares versus a similar investment in the Barclays Capital Intermediate Government Index (BCITGBI) and the Consumer Price Index (CPI).
The BCITGBI is an unmanaged market index and does not include transaction costs associated with buying and selling securities, any mutual fund fees or expenses or any taxes. The CPI is a commonly used measure of inflation and does not represent an investment return. It is not possible to invest directly in an index.
accounts, (4) through arrangements entered into on behalf of the Evergreen funds with certain financial services firms, (5) to certain institutional investors, and (6) to persons who owned Class Y shares in registered name in an Evergreen fund on or before December 31, 1994 or who owned shares of any SouthTrust fund in registered name as of March 18, 2005 or who owned shares of Vestaur Securities Fund as of May 20, 2005.
Class I shares are only available to institutional shareholders with a minimum of $1 million investment, which may be waived in certain situations.
The fund’s investment objective may be changed without a vote of the fund’s shareholders.
Asset-backed and mortgage-backed securities are generally subject to higher prepayment risks than other types of debt securities, which can limit the potential for gain in a declining interest rate environment and increase the potential for loss in a rising interest rate environment. Mortgage-backed securities may also be structured so that they are particularly sensitive to interest rates.
Derivatives involve additional risks including interest rate risk, credit risk, the risk of improper valuation and the risk of non-correlation to the relevant instruments they are designed to hedge or to closely track.
Leverage may disproportionately increase a fund’s portfolio losses and reduce opportunities for gain when interest rates, stock prices, or currency rates are changing.
The return of principal is not guaranteed due to fluctuation in the fund’s NAV caused by changes in the price of individual bonds held by the fund and the buying and selling of bonds by the fund. Bond funds have the same inflation, interest rate and credit risks as individual bonds. Generally, the value of bond funds rises when prevailing interest rates fall, and falls when interest rates rise.
U.S. government guarantees apply only to certain securities held in the fund’s portfolio and not to the fund’s shares.
All data is as of April 30, 2009, and subject to change.
5
PORTFOLIO MANAGER COMMENTARY
The fund’s Class A shares returned -2.36% for the twelve-month period ended April 30, 2009, excluding any applicable sales charges. During the same period, the BCITGBI returned 6.65%.
The fund’s objective is to seek to achieve a high level of current income consistent with stability of principal.
Investment process
In an unprecedented environment of credit scarcity and foundering financial services companies, the federal government and the Federal Reserve Board (the “Fed”) stepped in over the course of the fiscal year with plans aimed at supporting the U.S. financial system. In addition to the Troubled Asset Relief Program (“TARP”) created in the fall of 2008, the government added and expanded the Term Asset-Backed Securities Loan Facility (“TALF”) as well as the Public-Private Investment Program (“PPIP”) just to name a few. The Fed is using all available tools, including a low Fed Funds rate and quantitative easing policies to support the economy. All of this intervention left many investors focused on how these plans would influence market prices rather than economic or business climate fundamentals. As the fiscal year came to a close, it appeared to us that further price improvement in non-agency residential and commercial mortgage-backed securities may largely depend on how much leverage is applied by buyers through TALF and PPIP. Prior to the current crisis, market prices historically have reflected the fundamentals of the securities. In the last 12 to 18 months, however, prices in many sectors have been depressed, reflecting forced selling by leveraged investors.
With these trends as a backdrop, the fund began the year with a longer average duration versus the index and an overweight to mortgage-backed securities as some signs of a market recovery boosted investor confidence and aided longer maturities and spread sectors. As a flight to quality took hold in earnest in the summer and fall of 2008, we maintained the fund’s emphasis on high-quality U.S. government agency mortgage-backed securities. We also increased the fund’s investment in U.S. Treasuries and cash two-fold, and significantly decreased investment in non-U.S. government securities. By fiscal year end, with investors remaining concerned about the future of the economy and the credit-worthiness of many securities, the fund continued to hold an overweight in U.S. government mortgage-backed securities, moving between 30-year and 15-year securities depending on relative value. The fund also continued its investment in ‘seasoned’ mortgage securities—those securities that were issued several years ago—as these securities tend to have less principal prepayments when interest rates decline. The fund maintained a small investment in non-agency mortgage and asset-backed securities of approximately 2% as market prices remained well below the expected value of the cash flows to be received over time. Finally, the fund continued to utilize a small amount of leverage to take advantage of the yield available in short-term U.S. government agency floater investments that have been held by the fund for a long period of time.
6
PORTFOLIO MANAGER COMMENTARY continued
Contributors to performance
Throughout the year, the fund maintained an overweight to agency mortgage-backed securities (“MBS”) relative to agency debentures. While the performance of MBS was volatile over the period, it did outperform agency debentures for the full fiscal year, boosted by government purchases in the later part of the year. The fund benefited from this overweight as well as security selection within the MBS sector. Specifically, the investment in 30-year fixed rate agency MBS pass-through securities provided the greatest contribution, followed by the fund’s continued investment in Fannie Mae delegated underwriting and servicing bonds, which have been favored of late because they offer both underlying collateral and the agency’s guarantee.
Detractors from performance
The fund held a relative underweight to Treasuries during the period. Treasuries benefited as investor’s shunned all risky assets and the fund’s underweight held back returns. In addition, an overweight to longer maturity Treasuries relative to shorter maturities held back results. The fund had a small position in non-agency mortgage bonds or residential mortgage-backed securities (“RMBS”). This sector came under extreme pressure during the year due to rising delinquencies and defaults, declining credit quality and shrinking investor interest. This exposure was a negative for the fund. The fund’s return was also negatively affected because of its small exposure to commercial mortgage-backed securities (“CMBS”). Much like the RMBS market, CMBS bonds were hurt in the massive deleveraging that took place across the financial system. Forced selling by investors pushed prices to distressed levels. Within the agency sector, premium U.S. agency mortgage-backed securities were also problematic. The fund favored these bonds in the first half of the fiscal year, because of their relatively high ratings. But as yield spreads narrowed among these types of bonds in the second half of the fiscal year, investors began to favor the lower-priced, lower-quality alternatives that held the potential to outperform.
Portfolio management outlook
The economy has continued to deteriorate since the beginning of the fiscal year as demand for homes, automobiles, and industrial goods reached lows not seen since the early 1980s recession. This decline in demand led to a 6% contraction in annualized Gross Domestic Product for the fourth quarter of 2008. It has also resulted in the highest level of continuing unemployment claims since 1967. Toward the end of the fiscal year, there were some signs of stabilization in the housing sector, which may indicate the economy is beginning to stabilize, albeit at a low level. While the economic and business climates have deteriorated, the huge response of the U.S. government and Fed through capital commitments to the financial system, public funding to investment managers to purchase out-of-favor investments, and an economic stimulus plan have assisted in stabilizing bond prices and increased the possibility that real estate values may stop declining. While the positive effects of such historical government intervention have
7
PORTFOLIO MANAGER COMMENTARY continued
yielded improved market pricing, it remains to be seen what the longer-term affects of these actions might be.
Given the continued market uncertainty, we currently expect to maintain the fund’s duration very close to that of the benchmark index. The fund’s exposure to U.S. government-agency mortgage-backed securities may largely depend on the relative spread to U.S. Treasuries; if spreads widen due to even greater supply than the government is willing to purchase, we would likely add to positions. If the yield spread narrows to a level where we believe they are overvalued, then we may reduce the fund’s exposure. If spreads widen, we may shift the fund’s mortgage security investment into securities that tend to outperform.
This commentary reflects the views and opinions of the fund’s portfolio manager(s) on the date indicated and may include statements that constitute “forward-looking statements” under the U.S. Securities laws. Forward-looking statements include, among other things, projections, estimates, and information about possible or future results related to the fund, markets, or regulatory developments. The views expressed above are not guarantees of future performance or economic results and involve certain risks, uncertainties, and assumptions that could cause actual outcomes and results to differ materially from the views expressed herein. The views expressed above are subject to change at any time based upon economic, market, or other conditions and Evergreen undertakes no obligation to update the views expressed herein. Any discussions of specific securities should not be considered a recommendation to buy or sell those securities. The views expressed herein (including any forward-looking statements) may not be relied upon as investment advice or as an indication of the fund’s trading intent.
8
ABOUT YOUR FUND’S EXPENSES
The Example below is intended to describe the fees and expenses borne by shareholders and the impact of those costs on your investment.
Example
As a shareholder of the fund, you incur two types of costs: (1) transaction costs, including sales charges (loads), redemption fees and exchange fees; and (2) ongoing costs, including management fees, distribution (12b-1) fees and other fund expenses. This Example is intended to help you understand your ongoing costs (in dollars) of investing in the fund and to compare these costs with the ongoing costs of investing in other mutual funds. The Example is based on an investment of $1,000 invested at the beginning of the period and held for the entire period from November 1, 2008 to April 30, 2009.
The example illustrates your fund’s costs in two ways:
• Actual expenses
The section in the table under the heading “Actual” provides information about actual account values and actual expenses. You may use the information in these columns, together with the amount you invested, to estimate the expenses that you paid over the period. Simply divide your account value by $1,000 (for example, an $8,600 account value divided by $1,000 = 8.6), then multiply the result by the number in the appropriate column for your share class, in the column entitled “Expenses Paid During Period” to estimate the expenses you paid on your account during this period.
• Hypothetical example for comparison purposes
The section in the table under the heading “Hypothetical (5% return before expenses)” provides information about hypothetical account values and hypothetical expenses based on the fund’s actual expense ratio and an assumed rate of return of 5% per year before expenses, which is not the fund’s actual return. The hypothetical account values and expenses may not be used to estimate the actual ending account balance or expenses you paid for the period. You may use this information to compare the ongoing costs of investing in the fund and other funds. To do so, compare this 5% hypothetical example with the 5% hypothetical examples that appear in the shareholder reports of the other funds.
Please note that the expenses shown in the table are meant to highlight your ongoing costs only and do not reflect any transactional costs, such as sales charges (loads), redemption fees or exchange fees. Therefore, the section in the table under the heading “Hypothetical (5% return before expenses)” is useful in comparing ongoing costs only, and will not help you determine the relative total costs of owning different funds. In addition, if these transactional costs were included, your costs would have been higher.
| Beginning
Account Value
11/1/2008 | Ending
Account Value
4/30/2009 | Expenses Paid
During Period* |
|
|
|
|
Actual | | | |
Class A | $1,000.00 | $1,039.21 | $4.50 |
Class B | $1,000.00 | $1,035.36 | $8.28 |
Class C | $1,000.00 | $1,035.36 | $8.28 |
Class I | $1,000.00 | $1,040.50 | $3.24 |
Hypothetical
(5% return before expenses) | | | |
Class A | $1,000.00 | $1,020.38 | $4.46 |
Class B | $1,000.00 | $1,016.66 | $8.20 |
Class C | $1,000.00 | $1,016.66 | $8.20 |
Class I | $1,000.00 | $1,021.62 | $3.21 |
|
|
|
|
* | For each class of the fund, expenses are equal to the annualized expense ratio of each class (0.89% for Class A, 1.64% for Class B, 1.64% for Class C and 0.64% for Class I), multiplied by the average account value over the period, multiplied by 181 / 365 days. |
9
FINANCIAL HIGHLIGHTS
(For a share outstanding throughout each period)
| | Year Ended April 30, | |
| |
| |
CLASS A | | | 2009 | | | 2008 | | | 2007 | | | 2006 | | | 2005 | |
|
|
|
|
|
|
|
|
|
|
|
|
|
|
|
| |
Net asset value, beginning of period | | $ | 10.02 | | $ | 9.97 | | $ | 9.81 | | $ | 10.09 | | $ | 9.96 | |
|
|
|
|
|
|
|
|
|
|
|
|
|
|
|
| |
Income from investment operations | | | | | | | | | | | | | | | | |
Net investment income (loss) | | | 0.35 | | | 0.46 | | | 0.44 | | | 0.32 | 1 | | 0.24 | 1 |
Net realized and unrealized gains or losses on investments | | | (0.58 | ) | | 0.06 | | | 0.17 | | | (0.24 | ) | | 0.19 | |
| |
|
|
|
|
|
|
|
|
|
|
|
|
|
| |
Total from investment operations | | | (0.23 | ) | | 0.52 | | | 0.61 | | | 0.08 | | | 0.43 | |
|
|
|
|
|
|
|
|
|
|
|
|
|
|
|
| |
Distributions to shareholders from | | | | | | | | | | | | | | | | |
Net investment income | | | (0.35 | ) | | (0.47 | ) | | (0.45 | ) | | (0.36 | ) | | (0.30 | ) |
|
|
|
|
|
|
|
|
|
|
|
|
|
|
|
| |
Net asset value, end of period | | $ | 9.44 | | $ | 10.02 | | $ | 9.97 | | $ | 9.81 | | $ | 10.09 | |
|
|
|
|
|
|
|
|
|
|
|
|
|
|
|
| |
Total return2 | | | (2.36 | )% | | 5.47 | % | | 6.37 | % | | 0.82 | % | | 4.37 | % |
|
|
|
|
|
|
|
|
|
|
|
|
|
|
|
| |
Ratios and supplemental data | | | | | | | | | | | | | | | | |
Net assets, end of period (thousands) | | $ | 172,070 | | $ | 207,060 | | $ | 73,875 | | $ | 77,581 | | $ | 93,826 | |
Ratios to average net assets | | | | | | | | | | | | | | | | |
Expenses including waivers/reimbursements but excluding expense reductions | | | 0.88 | % | | 0.91 | % | | 0.95 | % | | 0.98 | % | | 1.00 | % |
Expenses excluding waivers/reimbursements and expense reductions | | | 0.88 | % | | 0.96 | % | | 0.99 | % | | 0.99 | % | | 1.00 | % |
Net investment income (loss) | | | 3.63 | % | | 4.59 | % | | 4.60 | % | | 3.18 | % | | 2.38 | % |
Portfolio turnover rate | | | 318 | %3 | | 377 | %3 | | 97 | % | | 53 | % | | 110 | % |
|
|
|
|
|
|
|
|
|
|
|
|
|
|
|
| |
1 | Net investment income (loss) per share is based on average shares outstanding during the period. |
2 | Excluding applicable sales charges |
3 | Portfolio turnover rate includes mortgage dollar roll activity. |
See Notes to Financial Statements
10
FINANCIAL HIGHLIGHTS
(For a share outstanding throughout each period)
| | Year Ended April 30, | |
| |
| |
CLASS B | | | 2009 | | | 2008 | | | 2007 | | | 2006 | | | 2005 | |
|
|
|
|
|
|
|
|
|
|
|
|
|
|
|
| |
Net asset value, beginning of period | | $ | 10.02 | | $ | 9.97 | | $ | 9.81 | | $ | 10.09 | | $ | 9.96 | |
|
|
|
|
|
|
|
|
|
|
|
|
|
|
|
| |
Income from investment operations | | | | | | | | | | | | | | | | |
Net investment income (loss) | | | 0.27 | | | 0.38 | | | 0.38 | 1 | | 0.24 | 1 | | 0.17 | 1 |
Net realized and unrealized gains or losses on investments | | | (0.57 | ) | | 0.07 | | | 0.16 | | | (0.23 | ) | | 0.19 | |
| |
|
|
|
|
|
|
|
|
|
|
|
|
|
| |
Total from investment operations | | | (0.30 | ) | | 0.45 | | | 0.54 | | | 0.01 | | | 0.36 | |
|
|
|
|
|
|
|
|
|
|
|
|
|
|
|
| |
Distributions to shareholders from | | | | | | | | | | | | | | | | |
Net investment income | | | (0.28 | ) | | (0.40 | ) | | (0.38 | ) | | (0.29 | ) | | (0.23 | ) |
|
|
|
|
|
|
|
|
|
|
|
|
|
|
|
| |
Net asset value, end of period | | $ | 9.44 | | $ | 10.02 | | $ | 9.97 | | $ | 9.81 | | $ | 10.09 | |
|
|
|
|
|
|
|
|
|
|
|
|
|
|
|
| |
Total return2 | | | (3.09 | )% | | 4.69 | % | | 5.60 | % | | 0.12 | % | | 3.64 | % |
|
|
|
|
|
|
|
|
|
|
|
|
|
|
|
| |
Ratios and supplemental data | | | | | | | | | | | | | | | | |
Net assets, end of period (thousands) | | $ | 13,311 | | $ | 12,201 | | $ | 12,653 | | $ | 16,747 | | $ | 25,452 | |
Ratios to average net assets | | | | | | | | | | | | | | | | |
Expenses including waivers/reimbursements but excluding expense reductions | | | 1.63 | % | | 1.66 | % | | 1.69 | % | | 1.69 | % | | 1.70 | % |
Expenses excluding waivers/reimbursements and expense reductions | | | 1.63 | % | | 1.66 | % | | 1.69 | % | | 1.69 | % | | 1.70 | % |
Net investment income (loss) | | | 2.82 | % | | 3.84 | % | | 3.83 | % | | 2.45 | % | | 1.67 | % |
Portfolio turnover rate | | | 318 | %3 | | 377 | %3 | | 97 | % | | 53 | % | | 110 | % |
|
|
|
|
|
|
|
|
|
|
|
|
|
|
|
| |
1 | Net investment income (loss) per share is based on average shares outstanding during the period. |
2 | Excluding applicable sales charges |
3 | Portfolio turnover rate includes mortgage dollar roll activity. |
See Notes to Financial Statements
11
FINANCIAL HIGHLIGHTS
(For a share outstanding throughout each period)
| | Year Ended April 30, | |
| |
| |
CLASS C | | | 2009 | | | 2008 | | | 2007 | | | 2006 | | | 2005 | |
|
|
|
|
|
|
|
|
|
|
|
|
|
|
|
| |
Net asset value, beginning of period | | $ | 10.02 | | $ | 9.97 | | $ | 9.81 | | $ | 10.09 | | $ | 9.96 | |
|
|
|
|
|
|
|
|
|
|
|
|
|
|
|
| |
Income from investment operations | | | | | | | | | | | | | | | | |
Net investment income (loss) | | | 0.28 | | | 0.38 | 1 | | 0.38 | 1 | | 0.25 | 1 | | 0.17 | 1 |
Net realized and unrealized gains or losses on investments | | | (0.58 | ) | | 0.07 | | | 0.16 | | | (0.24 | ) | | 0.19 | |
| |
|
|
|
|
|
|
|
|
|
|
|
|
|
| |
Total from investment operations | | | (0.30 | ) | | 0.45 | | | 0.54 | | | 0.01 | | | 0.36 | |
|
|
|
|
|
|
|
|
|
|
|
|
|
|
|
| |
Distributions to shareholders from | | | | | | | | | | | | | | | | |
Net investment income | | | (0.28 | ) | | (0.40 | ) | | (0.38 | ) | | (0.29 | ) | | (0.23 | ) |
|
|
|
|
|
|
|
|
|
|
|
|
|
|
|
| |
Net asset value, end of period | | $ | 9.44 | | $ | 10.02 | | $ | 9.97 | | $ | 9.81 | | $ | 10.09 | |
|
|
|
|
|
|
|
|
|
|
|
|
|
|
|
| |
Total return2 | | | (3.09 | )% | | 4.69 | % | | 5.60 | % | | 0.12 | % | | 3.64 | % |
|
|
|
|
|
|
|
|
|
|
|
|
|
|
|
| |
Ratios and supplemental data | | | | | | | | | | | | | | | | |
Net assets, end of period (thousands) | | $ | 21,291 | | $ | 11,746 | | $ | 7,669 | | $ | 7,973 | | $ | 9,820 | |
Ratios to average net assets | | | | | | | | | | | | | | | | |
Expenses including waivers/reimbursements but excluding expense reductions | | | 1.64 | % | | 1.66 | % | | 1.69 | % | | 1.69 | % | | 1.70 | % |
Expenses excluding waivers/reimbursements and expense reductions | | | 1.64 | % | | 1.66 | % | | 1.69 | % | | 1.69 | % | | 1.70 | % |
Net investment income (loss) | | | 2.76 | % | | 3.81 | % | | 3.86 | % | | 2.47 | % | | 1.67 | % |
Portfolio turnover rate | | | 318 | %3 | | 377 | %3 | | 97 | % | | 53 | % | | 110 | % |
|
|
|
|
|
|
|
|
|
|
|
|
|
|
|
| |
1 | Net investment income (loss) per share is based on average shares outstanding during the period. |
2 | Excluding applicable sales charges |
3 | Portfolio turnover rate includes mortgage dollar roll activity. |
See Notes to Financial Statements
12
FINANCIAL HIGHLIGHTS
(For a share outstanding throughout each period)
| | Year Ended April 30, | |
| |
| |
CLASS I | | | 2009 | | | 2008 | | | 2007 | | | 2006 | | | 2005 | |
|
|
|
|
|
|
|
|
|
|
|
|
|
|
|
| |
Net asset value, beginning of period | | $ | 10.02 | | $ | 9.97 | | $ | 9.81 | | $ | 10.09 | | $ | 9.96 | |
|
|
|
|
|
|
|
|
|
|
|
|
|
|
|
| |
Income from investment operations | | | | | | | | | | | | | | | | |
Net investment income (loss) | | | 0.38 | | | 0.49 | | | 0.47 | | | 0.35 | 1 | | 0.27 | 1 |
Net realized and unrealized gains or losses on investments | | | (0.58 | ) | | 0.06 | | | 0.17 | | | (0.24 | ) | | 0.19 | |
| |
|
|
|
|
|
|
|
|
|
|
|
|
|
| |
Total from investment operations | | | (0.20 | ) | | 0.55 | | | 0.64 | | | 0.11 | | | 0.46 | |
|
|
|
|
|
|
|
|
|
|
|
|
|
|
|
| |
Distributions to shareholders from | | | | | | | | | | | | | | | | |
Net investment income | | | (0.38 | ) | | (0.50 | ) | | (0.48 | ) | | (0.39 | ) | | (0.33 | ) |
|
|
|
|
|
|
|
|
|
|
|
|
|
|
|
| |
Net asset value, end of period | | $ | 9.44 | | $ | 10.02 | | $ | 9.97 | | $ | 9.81 | | $ | 10.09 | |
|
|
|
|
|
|
|
|
|
|
|
|
|
|
|
| |
Total return | | | (2.12 | )% | | 5.74 | % | | 6.66 | % | | 1.12 | % | | 4.68 | % |
|
|
|
|
|
|
|
|
|
|
|
|
|
|
|
| |
Ratios and supplemental data | | | | | | | | | | | | | | | | |
Net assets, end of period (thousands) | | $ | 423,516 | | $ | 733,387 | | $ | 479,015 | | $ | 436,890 | | $ | 436,431 | |
Ratios to average net assets | | | | | | | | | | | | | | | | |
Expenses including waivers/reimbursements but excluding expense reductions | | | 0.63 | % | | 0.66 | % | | 0.69 | % | | 0.69 | % | | 0.70 | % |
Expenses excluding waivers/reimbursements and expense reductions | | | 0.63 | % | | 0.66 | % | | 0.69 | % | | 0.69 | % | | 0.70 | % |
Net investment income (loss) | | | 3.92 | % | | 4.82 | % | | 4.88 | % | | 3.48 | % | | 2.69 | % |
Portfolio turnover rate | | | 318 | %2 | | 377 | %2 | | 97 | % | | 53 | % | | 110 | % |
|
|
|
|
|
|
|
|
|
|
|
|
|
|
|
| |
1 | Net investment income (loss) per share is based on average shares outstanding during the period. |
2 | Portfolio turnover rate includes mortgage dollar roll activity. |
See Notes to Financial Statements
13
SCHEDULE OF INVESTMENTS
April 30, 2009
| | Principal | | | |
| | Amount | | Value | |
|
|
|
|
| |
AGENCY COMMERCIAL MORTGAGE-BACKED SECURITIES 15.1% | | | | | | | |
FIXED-RATE 15.1% | | | | | | | |
FNMA: | | | | | | | |
4.75%, 07/01/2012 | | $ | 948,462 | | $ | 972,080 | |
4.79%, 05/01/2039 # o | | | 2,338,000 | | | 2,387,332 | |
5.08%, 02/01/2016 | | | 3,679,531 | | | 3,852,488 | |
5.15%, 11/01/2017 | | | 4,067,024 | | | 4,195,237 | |
5.18%, 05/01/2039 # o | | | 3,424,000 | | | 3,583,901 | |
5.37%, 12/01/2024 | | | 901,471 | | | 933,356 | |
5.55%, 05/01/2016 | | | 3,300,000 | | | 3,526,226 | |
5.63%, 02/01/2018 | | | 1,164,610 | | | 1,249,960 | |
5.64%, 12/01/2013 | | | 3,000,000 | | | 3,188,787 | |
5.66%, 12/01/2016 | | | 1,732,000 | | | 1,823,134 | |
5.67%, 03/01/2016-11/01/2021 | | | 12,583,871 | | | 13,465,898 | |
5.68%, 08/01/2016-04/01/2021 ## | | | 12,494,675 | | | 13,469,246 | |
5.70%, 03/01/2016 | | | 1,017,521 | | | 1,095,660 | |
5.75%, 05/01/2021 | | | 3,836,979 | | | 4,107,729 | |
5.79%, 10/01/2017-12/01/2017 | | | 3,260,443 | | | 3,531,100 | |
5.82%, 12/01/2036 | | | 836,000 | | | 879,659 | |
5.94%, 10/01/2016 | | | 1,577,953 | | | 1,719,357 | |
5.95%, 06/01/2024 | | | 1,934,501 | | | 2,094,481 | |
5.97%, 12/01/2017 | | | 1,380,837 | | | 1,510,748 | |
5.99%, 09/01/2018 | | | 1,733,000 | | | 1,860,222 | |
6.07%, 09/01/2013 | | | 3,050,487 | | | 3,329,424 | |
6.08%, 01/01/2019 | | | 4,888,584 | | | 5,198,184 | |
6.18%, 06/01/2013 | | | 9,282,311 | | | 9,692,891 | |
6.32%, 08/01/2012 | | | 2,894,490 | | | 3,119,284 | |
6.35%, 10/01/2009 | | | 455,595 | | | 455,226 | |
6.65%, 05/01/2016 | | | 1,577,244 | | | 1,733,029 | |
7.48%, 01/01/2025 | | | 1,113,180 | | | 1,148,999 | |
Ser. 2002-M1, Class C, 6.17%, 02/25/2016 | | | 787,991 | | | 818,871 | |
| | | | |
|
| |
Total Agency Commercial Mortgage-Backed Securities (cost $91,905,107) | | | | | | 94,942,509 | |
| | | | |
|
| |
AGENCY MORTGAGE-BACKED COLLATERALIZED MORTGAGE OBLIGATIONS 12.2% | | | | | | | |
FIXED-RATE 3.7% | | | | | | | |
FHLMC: | | | | | | | |
Ser. 0243, Class 6, IO, 6.00%, 12/15/2032 | | | 275,981 | | | 28,619 | |
Ser. 1758, Class G, 5.50%, 10/15/2009 | | | 16 | | | 16 | |
Ser. 2043, Class ZP, 6.50%, 04/15/2028 | | | 471,992 | | | 501,960 | |
Ser. 2046, Class G, 6.50%, 04/15/2028 | | | 259,148 | | | 276,458 | |
Ser. 2058, Class TE, 6.50%, 05/15/2028 | | | 266,451 | | | 283,700 | |
Ser. 2072, Class A, 6.50%, 07/15/2028 | | | 974,611 | | | 1,020,331 | |
Ser. 2078, Class PE, 6.50%, 08/15/2028 | | | 484,877 | | | 514,698 | |
Ser. 2173, Class Z, 6.50%, 07/15/2029 | | | 727,116 | | | 771,041 | |
Ser. 2262, Class Z, 7.50%, 10/15/2030 | | | 226,009 | | | 245,729 | |
See Notes to Financial Statements
14
SCHEDULE OF INVESTMENTS continued
April 30, 2009
| | Principal | | | |
| | Amount | | Value | |
|
|
|
|
| |
AGENCY MORTGAGE-BACKED COLLATERALIZED MORTGAGE OBLIGATIONS continued | | | | | | | |
FIXED-RATE continued | | | | | | | |
FHLMC: | | | | | | | |
Ser. 2326, Class ZP, 6.50%, 06/15/2031 | | $ | 20,746 | | $ | 21,986 | |
Ser. 2461 Class PZ, 6.50%, 06/15/2032 | | | 764,645 | | | 808,804 | |
Ser. 3098, Class KI, IO, 5.50%, 11/15/2024 | | | 502,282 | | | 14,335 | |
Ser. T-57, Class 1A1, 6.50%, 07/25/2043 | | | 2,968,881 | | | 3,155,613 | |
FNMA: | | | | | | | |
Ser. 0342, Class 2, IO, 6.00%, 09/01/2033 | | | 106,279 | | | 16,241 | |
Ser. 1993-215, Class ZQ, 6.50%, 11/25/2023 | | | 513,171 | | | 544,185 | |
Ser. 1999, Class LH, 6.50%, 11/25/2029 | | | 334,998 | | | 355,447 | |
Ser. 2001-82, Class ZA, 6.50%, 01/25/2032 | | | 226,580 | | | 236,317 | |
Ser. 2002-09, Class PC, 6.00%, 03/25/2017 | | | 506,028 | | | 530,788 | |
Ser. 2002-56, Class KW, 6.00%, 04/25/2023 | | | 805,423 | | | 819,634 | |
Ser. 2002-T1, Class A3, 7.50%, 11/25/2031 | | | 1,974,327 | | | 2,128,380 | |
Ser. 2002-W4, Class A4, 6.25%, 05/25/2042 | | | 2,118,703 | | | 2,247,139 | |
Ser. 2003-033, Class IA, IO, 6.50%, 05/25/2033 | | | 266,564 | | | 39,299 | |
Ser. 2003-046, Class IH, IO, 5.50%, 06/25/2033 | | | 2,440,582 | | | 237,347 | |
Ser. 2004-W1, Class 2A2, 7.00%, 12/25/2033 | | | 4,228,568 | | | 4,542,412 | |
Ser. 2005-071, Class DB, 4.50%, 08/25/2025 | | | 4,000,000 | | | 4,085,120 | |
| | | | |
|
| |
| | | | | | 23,425,599 | |
| | | | |
|
| |
FLOATING-RATE 8.5% | | | | | | | |
FHLMC: | | | | | | | |
Ser. 06, Class B, 1.04%, 03/25/2023 | | | 516,092 | | | 514,606 | |
Ser. 1220, Class A, 0.85%, 02/15/2022 | | | 179,916 | | | 178,786 | |
Ser. 1370, Class JA, 1.65%, 09/15/2022 | | | 191,588 | | | 191,845 | |
Ser. 1498, Class I, 1.65%, 04/15/2023 | | | 131,309 | | | 131,425 | |
Ser. 1533, Class FA, 1.60%, 06/15/2023 | | | 44,131 | | | 44,097 | |
Ser. 1671, Class TA, 1.00%, 02/15/2024 | | | 334,004 | | | 330,676 | |
Ser. 1939, Class FB, 1.50%, 04/15/2027 | | | 344,095 | | | 342,560 | |
Ser. 2030, Class F, 0.95%, 02/15/2028 | | | 661,887 | | | 648,997 | |
Ser. 2181, Class PF, 0.85%, 05/15/2029 | | | 314,734 | | | 309,608 | |
Ser. 2315, Class FD, 0.95%, 04/15/2027 | | | 230,725 | | | 227,324 | |
Ser. 2380, Class FL, 1.05%, 11/15/2031 | | | 10,659,566 | | | 10,567,564 | |
Ser. 2691, Class FC, 1.15%, 10/15/2033 | | | 2,089,495 | | | 2,062,227 | |
Ser. 3136, Class SA, IIFRN, 84.15%, 04/15/2036 | | | 1,601,357 | | | 2,059,475 | |
Ser. 3425, Class JS, IIFRN, 31.49%, 10/15/2035 | | | 163,245 | | | 165,729 | |
Ser. T-67, Class 1A1C, 4.45%, 03/25/2036 | | | 10,331,533 | | | 10,262,172 | |
Ser. T-67, Class 2A1C, 4.41%, 03/25/2036 | | | 8,039,104 | | | 7,981,085 | |
Ser. T-75, Class A1, 0.48%, 11/25/2036 | | | 9,654,094 | | | 9,177,423 | |
FNMA: | | | | | | | |
Ser. 1991, Class F, 1.32%, 05/25/2021 | | | 497,369 | | | 493,964 | |
Ser. 1991-156, Class F, 1.77%, 11/25/2021 | | | 106,913 | | | 107,449 | |
Ser. 1994-84, Class F, 1.07%, 02/25/2024 | | | 431,677 | | | 423,538 | |
Ser. 1997-49, Class F, 0.97%, 06/17/2027 | | | 309,395 | | | 305,329 | |
See Notes to Financial Statements
15
SCHEDULE OF INVESTMENTS continued
April 30, 2009
| | Principal | | | |
| | Amount | | Value | |
|
|
|
|
| |
AGENCY MORTGAGE-BACKED COLLATERALIZED MORTGAGE OBLIGATIONS continued | | | | | | | |
FLOATING-RATE continued | | | | | | | |
FNMA: | | | | | | | |
Ser. 1999-49, Class F, 0.84%, 05/25/2018 | | $ | 627,316 | | $ | 627,071 | |
Ser. 2000-32, Class FM, 0.90%, 10/18/2030 | | | 363,048 | | | 360,149 | |
Ser. 2002-07, Class FB, 0.84%, 02/25/2028 | | | 218,041 | | | 213,477 | |
Ser. 2002-W5, Class A27, 0.94%, 11/25/2030 | | | 1,277,801 | | | 1,275,179 | |
Ser. 2003-011, Class DF, 0.89%, 02/25/2033 | | | 1,821,669 | | | 1,788,511 | |
Ser. 2003-011, Class FE, 0.94%, 12/25/2033 | | | 482,727 | | | 476,721 | |
Ser. 2006-72, Class GS, IIFRN, 45.47%, 08/25/2036 | | | 652,237 | | | 759,700 | |
Ser. G91, Class FA, 1.37%, 04/25/2021 | | | 17,115 | | | 17,096 | |
Ser. G93, Class FH, 1.62%, 04/25/2023 | | | 112,028 | | | 112,817 | |
GNMA: | | | | | | | |
Ser. 1999-40, Class FL, 1.05%, 02/17/2029 | | | 162,441 | | | 161,274 | |
Ser. 2000-36, Class FG, 0.95%, 11/20/2030 | | | 289,418 | | | 285,733 | |
Ser. 2002-15, Class F, 1.00%, 02/16/2032 | | | 486,038 | | | 475,521 | |
Ser. 2002-26, Class C, 5.99%, 02/16/2024 | | | 238,911 | | | 241,392 | |
Ser. 2006-47, Class SA, IO, 6.75%, 08/16/2036 | | | 1,197,435 | | | 82,779 | |
| | | | |
|
| |
| | | | | | 53,403,299 | |
| | | | |
|
| |
Total Agency Mortgage-Backed Collateralized Mortgage Obligations (cost $77,684,829) | | | | | | 76,828,898 | |
| | | | |
|
| |
AGENCY MORTGAGE-BACKED PASS THROUGH SECURITIES 35.9% | | | | | | | |
FIXED-RATE 30.9% | | | | | | | |
FHLMC: | | | | | | | |
5.50%, 05/01/2038 | | | 33,427,577 | | | 34,615,474 | |
5.87%, 02/01/2037 | | | 10,239,794 | | | 10,680,975 | |
6.00%, 10/01/2032-11/01/2038 | | | 28,064,887 | | | 29,330,329 | |
6.50%, 04/01/2018-07/01/2031 | | | 1,859,729 | | | 1,966,272 | |
7.00%, 12/01/2023-05/01/2029 | | | 169,123 | | | 181,761 | |
7.50%, 04/01/2023-08/01/2028 | | | 1,121,626 | | | 1,227,893 | |
8.00%, 08/01/2023-11/01/2028 | | | 371,459 | | | 404,264 | |
8.50%, 07/01/2022-08/01/2026 | | | 70,224 | | | 77,139 | |
9.00%, 01/01/2017-10/01/2024 | | | 156,067 | | | 172,393 | |
9.50%, 09/01/2016-05/01/2021 | | | 47,886 | | | 53,323 | |
10.00%, 08/01/2017-08/01/2020 | | | 1,630 | | | 1,843 | |
10.50%, 02/01/2019-05/01/2020 | | | 111,248 | | | 126,091 | |
FHLMC 30 year: | | | | | | | |
5.50%, TBA # | | | 15,000,000 | | | 15,482,813 | |
6.00%, TBA # | | | 17,240,000 | | | 17,956,538 | |
FNMA: | | | | | | | |
4.98%, 01/01/2020 | | | 876,676 | | | 914,960 | |
5.24%, 12/01/2012 | | | 589,367 | | | 612,520 | |
5.39%, 01/01/2024 | | | 3,576,918 | | | 3,737,132 | |
5.50%, 05/01/2037 | | | 17,471,496 | | | 18,037,955 | |
See Notes to Financial Statements
16
SCHEDULE OF INVESTMENTS continued
April 30, 2009
| | Principal
Amount | | Value | |
|
|
|
|
| |
AGENCY MORTGAGE-BACKED PASS THROUGH SECURITIES continued | | | | | | | |
FIXED-RATE continued | | | | | | | |
FNMA: | | | | | | | |
5.55%, 09/01/2019 | | $ | 4,949,930 | | $ | 5,058,319 | |
6.00%, 03/01/2024 | | | 490,739 | | | 515,295 | |
6.50%, 06/01/2017-06/01/2047 | | | 9,019,593 | | | 9,558,530 | |
7.00%, 11/01/2026-09/01/2047 | | | 5,112,281 | | | 5,455,051 | |
7.50%, 12/01/2017-01/01/2033 | | | 1,781,864 | | | 1,944,580 | |
8.00%, 08/01/2020-02/01/2030 | | | 1,859,766 | | | 2,039,315 | |
8.50%, 08/01/2014-08/01/2029 | | | 356,998 | | | 391,960 | |
9.00%, 06/01/2021-04/01/2025 | | | 234,595 | | | 255,468 | |
9.50%, 10/01/2020-02/01/2023 | | | 26,522 | | | 29,500 | |
11.00%, 01/01/2016 | | | 6,573 | | | 6,799 | |
11.25%, 02/01/2016 | | | 34,877 | | | 37,389 | |
FNMA 15 year, 4.00%, TBA # | | | 28,000,000 | | | 28,280,000 | |
GNMA: | | | | | | | |
6.00%, 05/15/2011-08/20/2034 | | | 3,071,415 | | | 3,200,585 | |
6.50%, 12/15/2025-09/20/2033 | | | 483,785 | | | 510,261 | |
7.00%, 12/15/2022-05/15/2032 | | | 414,414 | | | 444,292 | |
7.34%, 10/20/2021-09/20/2022 | | | 490,061 | | | 523,198 | |
7.50%, 02/15/2022-06/15/2032 | | | 645,151 | | | 694,367 | |
8.00%, 04/15/2023-06/15/2025 | | | 55,421 | | | 60,134 | |
8.50%, 07/15/2016 | | | 2,007 | | | 2,169 | |
9.00%, 11/15/2016-04/15/2021 | | | 97,498 | | | 105,730 | |
10.00%, 12/15/2018 | | | 25,071 | | | 27,513 | |
14.00%, 02/15/2012-06/15/2012 | | | 149,460 | | | 170,761 | |
| | | | |
|
| |
| | | | | | 194,890,891 | |
| | | | |
|
| |
FLOATING-RATE 5.0% | | | | | | | |
FHLB, 4.16%, 07/01/2032 | | | 4,572,711 | | | 4,603,408 | |
FNMA: | | | | | | | |
2.71%, 04/01/2029-10/01/2041 | | | 4,020,443 | | | 3,970,089 | |
2.91%, 01/01/2041 | | | 1,713,533 | | | 1,702,704 | |
3.75%, 02/01/2035 | | | 8,268,138 | | | 8,262,442 | |
4.14%, 01/01/2038 | | | 4,517,339 | | | 4,547,257 | |
4.54%, 01/01/2011 | | | 2,956 | | | 2,961 | |
4.63%, 11/01/2018 | | | 210,792 | | | 216,487 | |
4.75%, 07/01/2025 | | | 266,451 | | | 270,938 | |
5.35%, 05/01/2030 | | | 300,977 | | | 309,805 | |
SBA: | | | | | | | |
0.58%, 08/25/2031 | | | 872,369 | | | 849,495 | |
0.60%, 09/25/2030-11/25/2030 | | | 1,440,273 | | | 1,404,707 | |
0.625%, 03/25/2027-03/25/2035 | | | 461,691 | | | 446,224 | |
0.66%, 11/25/2029 | | | 4,952,406 | | | 4,717,133 | |
| | | | |
|
| |
| | | | | | 31,303,650 | |
| | | | |
|
| |
Total Agency Mortgage-Backed Pass Through Securities (cost $222,748,518) | | | | | | 226,194,541 | |
| | | | |
|
| |
See Notes to Financial Statements
17
SCHEDULE OF INVESTMENTS continued
April 30, 2009
| | Principal
Amount | | Value | |
|
|
|
|
| |
AGENCY REPERFORMING MORTGAGE-BACKED PASS THROUGH SECURITIES 1.7% | | | | | | | |
FIXED-RATE 1.7% | | | | | | | |
FHLMC, Ser. T-60, Class 1A-1, 6.50%, 03/25/2044 | | $ | 926,422 | | $ | 975,763 | |
FNMA: | | | | | | | |
Ser. 2001-T4, Class A1, 7.50%, 07/25/2041 | | | 1,279,349 | | | 1,351,913 | |
Ser. 2002-T16, Class A1, 6.50%, 07/25/2042 | | | 3,317,542 | | | 3,526,092 | |
Ser. 2002-W3, Class A5, 7.50%, 01/25/2028 | | | 310,839 | | | 336,711 | |
Ser. 2002-W8, Class A4, 7.00%, 06/25/2017 | | | 921,035 | | | 963,439 | |
Ser. 2003-W1, Class 1A-1, 6.50%, 12/25/2042 | | | 1,632,989 | | | 1,735,101 | |
Ser. 2004-T1, Class 1A-2, 6.50%, 01/25/2044 | | | 1,477,070 | | | 1,604,025 | |
| | | | |
|
| |
Total Agency Reperforming Mortgage-Backed Pass Through Securities (cost $10,265,990) | | | | | | 10,493,044 | |
| | | | |
|
| |
ASSET-BACKED SECURITIES 0.2% | | | | | | | |
Argent Securities, Inc., Ser. 2004-W8, Class A2, FRN, 0.92%, 05/25/2034 + | | | 778,579 | | | 300,361 | |
Countrywide Asset-Backed Certificates: | | | | | | | |
Ser. 2005-16, Class 2AF2, 5.38%, 02/25/2030 + | | | 368,558 | | | 194,224 | |
Ser. 2005-17, Class 1AF2, 5.36%, 05/25/2036 + | | | 219,732 | | | 99,631 | |
HSBC Home Equity Loan Trust, Ser. 2005-3, Class A1, FRN, 0.71%, 01/20/2035 + | | | 300,438 | | | 180,588 | |
Lehman XS Trust: | | | | | | | |
Ser. 2005-02, Class 2A1B, 5.18%, 08/25/2035 + | | | 60,690 | | | 59,261 | |
Ser. 2005-04, Class 2A1B, 5.17%, 10/25/2035 + | | | 110,734 | | | 102,403 | |
Ser. 2005-10, Class 2A3B, 5.55%, 01/25/2036 + | | | 305,736 | | | 180,669 | |
NovaStar ABS CDO, Ltd., Ser. 2007-1A, Class A2, FRN, 5.82%, 02/08/2047 144A o • + | | | 4,000,000 | | | 0 | |
Popular Mtge. Trust, Ser. 2005-A, Class B3, 5.68%, 01/25/2036 + | | | 336,330 | | | 281,939 | |
| | | | |
|
| |
Total Asset-Backed Securities (cost $6,474,377) | | | | | | 1,399,076 | |
| | | | |
|
| |
COMMERCIAL MORTGAGE-BACKED SECURITIES 0.9% | | | | | | | |
FIXED-RATE 0.4% | | | | | | | |
Banc of America Comml. Mtge. Securities, Inc., Ser. 2006-05, Class A2, 5.32%, 10/10/2011 | | | 1,025,000 | | | 904,532 | |
GE Capital Comml. Mtge. Corp., Ser. 2005-C3, Class A2, 4.85%, 07/10/2045 | | | 660,000 | | | 641,127 | |
LB-UBS Comml. Mtge. Trust, Ser. 2005-C5, Class A2, 4.89%, 09/15/2030 | | | 790,000 | | | 741,273 | |
| | | | |
|
| |
| | | | | | 2,286,932 | |
| | | | |
|
| |
FLOATING-RATE 0.5% | | | | | | | |
Credit Suisse First Boston Mtge. Securities: | | | | | | | |
Ser. 2004-TF2A, Class H, 1.15%, 11/15/2019 144A | | | 1,900,000 | | | 1,307,693 | |
Ser. 2004-TF2A, Class J, 1.40%, 11/15/2019 144A | | | 1,828,000 | | | 993,740 | |
Ser. 2005-TFLA, Class J, 1.40%, 02/15/2020 144A | | | 961,000 | | | 891,492 | |
Trapeza CDO, LLC, Ser. 2004-7A, Class B1, FRN, 2.64%, 01/25/2035 144A | | | 2,200,000 | | | 74,074 | |
| | | | |
|
| |
| | | | | | 3,266,999 | |
| | | | |
|
| |
Total Commercial Mortgage-Backed Securities (cost $9,373,822) | | | | | | 5,553,931 | |
| | | | |
|
| |
See Notes to Financial Statements
18
SCHEDULE OF INVESTMENTS continued
April 30, 2009
| | Principal
Amount | | Value | |
|
|
|
|
| |
U.S. TREASURY OBLIGATIONS 34.3% | | | | | | | |
U.S. Treasury Bonds, 1.75%, 03/31/2014 | | $ | 5,800,000 | | $ | 5,736,565 | |
U.S. Treasury Notes: | | | | | | | |
1.125%, 01/15/2012 | | | 41,000,000 | | | 40,859,083 | |
1.50%, 12/31/2013 | | | 95,000,000 | | | 93,278,220 | |
3.75%, 11/15/2018 | | | 17,200,000 | | | 18,088,260 | |
4.25%, 11/15/2017 | | | 40,375,000 | | | 44,295,816 | |
4.75%, 08/15/2017 | | | 12,100,000 | | | 13,710,825 | |
| | | | |
|
| |
Total U.S. Treasury Obligations (cost $216,507,497) | | | | | | 215,968,769 | |
| | | | |
|
| |
WHOLE LOAN MORTGAGE-BACKED COLLATERALIZED MORTGAGE OBLIGATIONS 0.2% | | | | | | | |
FIXED-RATE 0.2% | | | | | | | |
Countrywide Home Loans, Inc., Ser. 2006-18, Class 2A5, 6.00%, 12/25/2036 + | | | 4,050,000 | | | 968,841 | |
Residential Accredit Loans, Inc., Ser. 2006-QS5, Class A2, 6.00%, 05/25/2036 + | | | 86,294 | | | 86,135 | |
Residential Asset Securitization Trust, Ser. 2006-A9CB, Class A5, 6.00%, 07/25/2036 + | | | 736,541 | | | 341,962 | |
| | | | |
|
| |
| | | | | | 1,396,938 | |
| | | | |
|
| |
FLOATING-RATE 0.0% | | | | | | | |
Deutsche Securities, Inc.: | | | | | | | |
Ser. 2006-AB2, Class A7, 5.96%, 06/25/2036 + | | | 117,003 | | | 111,095 | |
Ser. 2006-AB3, Class A7, 6.36%, 07/25/2036 + | | | 54,929 | | | 55,068 | |
| | | | |
|
| |
| | | | | | 166,163 | |
| | | | |
|
| |
Total Whole Loan Mortgage-Backed Collateralized Mortgage Obligations (cost $5,023,254) | | | | | | 1,563,101 | |
| | | | |
|
| |
WHOLE LOAN SUBORDINATE COLLATERALIZED MORTGAGE OBLIGATIONS 0.7% | | | | | | | |
FIXED-RATE 0.7% | | | | | | | |
Countrywide Alternative Loan Trust, Ser. 2004-2CB, Class M, 5.68%, 03/25/2034 + (cost $10,537,601) | | | 10,568,978 | | | 4,474,809 | |
| | | | |
|
| |
YANKEE OBLIGATIONS – CORPORATE 0.1% | | | | | | | |
FINANCIALS 0.1% | | | | | | | |
Diversified Financial Services 0.1% | | | | | | | |
MMCAPS Funding XIX, Ltd., FRN, 1.89%, 01/12/2038 144A + | | | 5,000,000 | | | 168,500 | |
Preferred Term Securities XIV, Ltd., FRN, 2.89%, 06/24/2034 144A + | | | 7,500,000 | | | 653,100 | |
| | | | |
|
| |
Total Yankee Obligations – Corporate (cost $12,048,113) | | | | | | 821,600 | |
| | | | |
|
| |
| | | | | | | |
|
|
|
|
|
|
| |
| | | Shares | | | Value | |
|
|
|
|
|
|
| |
SHORT-TERM INVESTMENTS 9.1% | | | | | | | |
MUTUAL FUND SHARES 9.1% | | | | | | | |
Evergreen Institutional U.S. Government Money Market Fund, Class I, 0.23% q ø ## (cost $57,324,375) | | | 57,324,375 | | | 57,324,375 | |
| | | | |
|
| |
See Notes to Financial Statements
19
SCHEDULE OF INVESTMENTS continued
April 30, 2009
| |
Value
| |
|
|
| |
Total Investments (cost $719,893,483) 110.4% | | $ | 695,564,653 | |
Other Assets and Liabilities (10.4%) | | | (65,376,580 | ) |
| |
|
| |
Net Assets 100.0% | | $ | 630,188,073 | |
| |
|
| |
# | When-issued or delayed delivery security |
o | Security is valued at fair value as determined by the investment advisor in good faith, according to procedures approved by the Board of Trustees. |
## | All or a portion of this security has been segregated for when-issued or delayed delivery securities. |
+ | Security is deemed illiquid. |
144A | Security that may be sold to qualified institutional buyers under Rule 144A of the Securities Act of 1933, as amended. This security has been determined to be liquid under guidelines established by the Board of Trustees, unless otherwise noted. |
• | Security which has defaulted on payment of interest and/or principal. The Fund has stopped accruing interest on this security. |
q | Rate shown is the 7-day annualized yield at period end. |
ø | Evergreen Investment Management Company, LLC is the investment advisor to both the Fund and the money market fund. |
Summary of Abbreviations
CDO | Collateralized Debt Obligation |
FHLB | Federal Home Loan Bank |
FHLMC | Federal Home Loan Mortgage Corp. |
FNMA | Federal National Mortgage Association |
FRN | Floating Rate Note |
GNMA | Government National Mortgage Association |
IIFRN | Indexed Inverse Floating Rate Note |
IO | Interest Only |
SBA | Small Business Administration |
TBA | To Be Announced |
The following table shows the percent of total investments by credit quality based on Moody’s and Standard & Poor’s ratings as of April 30, 2009 (unaudited)*:
AAA | 98.3 | % |
AA | 0.6 | % |
A | 0.6 | % |
B | 0.1 | % |
C | 0.4 | % |
|
| |
| 100.0 | % |
|
| |
The following table shows the percent of total investments based on effective maturity as of April 30, 2009 (unaudited)*:
Less than 1 year | 11.0 | % |
1 to 3 year(s) | 27.4 | % |
3 to 5 years | 29.5 | % |
5 to 10 years | 30.0 | % |
10 to 20 years | 2.1 | % |
|
| |
| 100.0 | % |
|
| |
* | Calculations exclude equity securities, collateral from securities on loan and segregated cash and cash equivalents, as applicable. |
See Notes to Financial Statements
20
STATEMENT OF ASSETS AND LIABILITIES
April 30, 2009
Assets | | | | |
Investments in unaffiliated issuers, at value (cost $662,569,108) | | $ | 638,240,278 | |
Investments in affiliated issuers, at value (cost $57,324,375) | | | 57,324,375 | |
|
|
|
| |
Total investments | | | 695,564,653 | |
Receivable for securities sold | | | 77,596,973 | |
Principal paydown receivable | | | 274,098 | |
Receivable for Fund shares sold | | | 388,956 | |
Interest receivable | | | 3,577,487 | |
Prepaid expenses and other assets | | | 30,095 | |
|
|
|
| |
Total assets | | | 777,432,262 | |
|
|
|
| |
Liabilities | | | | |
Dividends payable | | | 886,189 | |
Payable for securities purchased | | | 145,315,941 | |
Payable for Fund shares redeemed | | | 955,503 | |
Advisory fee payable | | | 6,940 | |
Distribution Plan expenses payable | | | 2,127 | |
Due to other related parties | | | 2,887 | |
Accrued expenses and other liabilities | | | 74,602 | |
|
|
|
| |
Total liabilities | | | 147,244,189 | |
|
|
|
| |
Net assets | | $ | 630,188,073 | |
|
|
|
| |
Net assets represented by | | | | |
Paid-in capital | | $ | 696,755,011 | |
Overdistributed net investment income | | | (137,023 | ) |
Accumulated net realized losses on investments | | | (42,101,085 | ) |
Net unrealized losses on investments | | | (24,328,830 | ) |
|
|
|
| |
Total net assets | | $ | 630,188,073 | |
|
|
|
| |
Net assets consists of | | | | |
Class A | | $ | 172,070,144 | |
Class B | | | 13,310,693 | |
Class C | | | 21,291,197 | |
Class I | | | 423,516,039 | |
|
|
|
| |
Total net assets | | $ | 630,188,073 | |
|
|
|
| |
Shares outstanding (unlimited number of shares authorized) | | | | |
Class A | | | 18,232,679 | |
Class B | | | 1,410,547 | |
Class C | | | 2,256,248 | |
Class I | | | 44,876,356 | |
|
|
|
| |
Net asset value per share | | | | |
Class A | | $ | 9.44 | |
Class A — Offering price (based on sales charge of 4.75%) | | $ | 9.91 | |
Class B | | $ | 9.44 | |
Class C | | $ | 9.44 | |
Class I | | $ | 9.44 | |
|
|
|
| |
See Notes to Financial Statements
21
STATEMENT OF OPERATIONS
Year Ended April 30, 2009
Investment income | | | | |
Interest | | $ | 34,262,627 | |
Income from affiliated issuers | | | 1,229,702 | |
Securities lending | | | 81,214 | |
Dividends | | | 41,875 | |
|
|
|
| |
Total investment income | | | 35,615,418 | |
|
|
|
| |
Expenses | | | | |
Advisory fee | | | 3,107,037 | |
Distribution Plan expenses | | | | |
Class A | | | 463,900 | |
Class B | | | 126,147 | |
Class C | | | 180,968 | |
Administrative services fee | | | 785,686 | |
Transfer agent fees | | | 549,017 | |
Trustees’ fees and expenses | | | 28,302 | |
Printing and postage expenses | | | 50,399 | |
Custodian and accounting fees | | | 257,204 | |
Registration and filing fees | | | 64,584 | |
Professional fees | | | 66,241 | |
Other | | | 16,448 | |
|
|
|
| |
Total expenses | | | 5,695,933 | |
Less: Expense reductions | | | (2,510 | ) |
Fee waivers | | | (310 | ) |
|
|
|
| |
Net expenses | | | 5,693,113 | |
|
|
|
| |
Net investment income | | | 29,922,305 | |
|
|
|
| |
Net realized and unrealized gains or losses on investments | | | | |
Net realized losses on: | | | | |
Securities in unaffiliated issuers | | | (31,503,094 | ) |
Credit default swap transactions | | | (2,772,683 | ) |
|
|
|
| |
Net realized losses on investments | | | (34,275,777 | ) |
|
|
|
| |
Net change in unrealized gains or losses on: | | | | |
Securities in unaffiliated issuers | | | (26,992,026 | ) |
Credit default swap transactions | | | 2,103,856 | |
|
|
|
| |
Net change in unrealized gain or losses on investments | | | (24,888,170 | ) |
|
|
|
| |
Net realized and unrealized gains or losses on investments | | | (59,163,947 | ) |
|
|
|
| |
Net decrease in net assets resulting from operations | | $ | (29,241,642 | ) |
|
|
|
| |
See Notes to Financial Statements
22
STATEMENTS OF CHANGES IN NET ASSETS
| | Year Ended April 30, | |
| |
| |
| | 2009 | | 2008 | |
|
|
|
|
| |
Operations | | | | | | | | | | | | | |
Net investment income | | | | | $ | 29,922,305 | | | | | $ | 39,849,593 | |
Net realized gains or losses on investments | | | | | | (34,275,777 | ) | | | | | 7,046,299 | |
Net change in unrealized gains or losses on investments | | | | | | (24,888,170 | ) | | | | | 472,997 | |
|
|
|
|
|
|
|
|
|
|
|
|
| |
Net increase (decrease) in net assets resulting from operations | | | | | | (29,241,642 | ) | | | | | 47,368,889 | |
|
|
|
|
|
|
|
|
|
|
|
|
| |
Distributions to shareholders from | | | | | | | | | | | | | |
Net investment income | | | | | | | | | | | | | |
Class A | | | | | | (6,819,713 | ) | | | | | (10,087,979 | ) |
Class B | | | | | | (366,392 | ) | | | | | (468,754 | ) |
Class C | | | | | | (518,623 | ) | | | | | (374,996 | ) |
Class I | | | | | | (22,550,187 | ) | | | | | (30,246,347 | ) |
|
|
|
|
|
|
|
|
|
|
|
|
| |
Total distributions to shareholders | | | | | | (30,254,915 | ) | | | | | (41,178,076 | ) |
|
|
|
|
|
|
|
|
|
|
|
|
| |
| | | Shares | | | | | | Shares | | | | |
|
|
|
|
|
|
|
|
|
|
|
|
| |
Capital share transactions | | | | | | | | | | | | | |
Proceeds from shares sold | | | | | | | | | | | | | |
Class A | | | 2,713,607 | | | 25,884,276 | | | 1,615,301 | | | 16,164,426 | |
Class B | | | 1,023,651 | | | 9,719,270 | | | 458,141 | | | 4,614,620 | |
Class C | | | 2,612,050 | | | 24,792,580 | | | 692,521 | | | 6,954,001 | |
Class I | | | 17,968,062 | | | 172,741,248 | | | 38,278,593 | | | 382,122,548 | |
|
|
|
|
|
|
|
|
|
|
|
|
| |
| | | | | | 233,137,374 | | | | | | 409,855,595 | |
|
|
|
|
|
|
|
|
|
|
|
|
| |
Net asset value of shares issued in reinvestment of distributions | | | | | | | | | | | | | |
Class A | | | 540,965 | | | 5,170,310 | | | 767,662 | | | 7,668,531 | |
Class B | | | 24,348 | | | 232,189 | | | 30,791 | | | 307,403 | |
Class C | | | 30,723 | | | 292,221 | | | 24,717 | | | 247,292 | |
Class I | | | 1,308,472 | | | 12,564,379 | | | 2,067,300 | | | 20,671,365 | |
|
|
|
|
|
|
|
|
|
|
|
|
| |
| | | | | | 18,259,099 | | | | | | 28,894,591 | |
|
|
|
|
|
|
|
|
|
|
|
|
| |
Automatic conversion of Class B shares to Class A shares | | | | | | | | | | | | | |
Class A | | | 200,480 | | | 1,921,196 | | | 138,726 | | | 1,389,206 | |
Class B | | | (200,480 | ) | | (1,921,196 | ) | | (138,726 | ) | | (1,389,206 | ) |
|
|
|
|
|
|
|
|
|
|
|
|
| |
| | | | | | 0 | | | | | | 0 | |
|
|
|
|
|
|
|
|
|
|
|
|
| |
Payment for shares redeemed | | | | | | | | | | | | | |
Class A | | | (5,877,165 | ) | | (56,184,976 | ) | | (9,513,821 | ) | | (94,322,134 | ) |
Class B | | | (654,012 | ) | | (6,228,684 | ) | | (402,896 | ) | | (4,016,244 | ) |
Class C | | | (1,558,204 | ) | | (14,776,537 | ) | | (315,032 | ) | | (3,142,442 | ) |
Class I | | | (47,557,926 | ) | | (448,915,695 | ) | | (15,253,417 | ) | | (152,479,467 | ) |
|
|
|
|
|
|
|
|
|
|
|
|
| |
| | | | | | (526,105,892 | ) | | | | | (253,960,287 | ) |
|
|
|
|
|
|
|
|
|
|
|
|
| |
Net asset value of shares issued in acquisition | | | | | | | | | �� | | | | |
Class A | | | 0 | | | 0 | | | 20,234,248 | | | 200,202,084 | |
|
|
|
|
|
|
|
|
|
|
|
|
| |
Net increase (decrease) in net assets resulting from capital share transactions | | | | | | (274,709,419 | ) | | | | | 384,991,983 | |
|
|
|
|
|
|
|
|
|
|
|
|
| |
Total increase (decrease) in net assets | | | | | | (334,205,976 | ) | | | | | 391,182,796 | |
See Notes to Financial Statements
23
STATEMENTS OF CHANGES IN NET ASSETS continued
| | Year Ended April 30, | |
| |
| |
| | 2009 | | 2008 | |
|
|
|
|
| |
Net assets | | | | | | | | | | | | | |
Beginning of period | | | | | $ | 964,394,049 | | | | | $ | 573,211,253 | |
|
|
|
|
|
|
|
|
|
|
|
|
| |
End of period | | | | | $ | 630,188,073 | | | | | $ | 964,394,049 | |
|
|
|
|
|
|
|
|
|
|
|
|
| |
Undistributed (overdistributed) net investment income | | | | | $ | (137,023 | ) | | | | $ | 944,150 | |
|
|
|
|
|
|
|
|
|
|
|
|
| |
See Notes to Financial Statements
24
STATEMENT OF CASH FLOWS
April 30, 2009
Increase in cash: | | | | |
Cash flows from operating activities: | | | | |
Net decrease in net assets resulting from operations | | $ | (29,241,642 | ) |
Adjustments to reconcile net decrease in net assets from operations to net cash provided by operating activities: | | | | |
Purchase of investment securities (including mortgage dollar rolls) | | | (2,927,629,782 | ) |
Proceeds from disposition of investment securities (including mortgage dollar rolls) | | | 3,418,238,812 | |
Paydowns | | | 85,934,556 | |
Amortization | | | 355,543 | |
Swap payments made | | | (2,772,683 | ) |
Sale of short-term investment securities, net | | | 46,473,683 | |
Decrease in interest receivable | | | 1,471,482 | |
Decrease in receivable for securities sold | | | 319,988,295 | |
Decrease in receivable for securities lending income | | | 12,406 | |
Decrease in receivable for Fund shares sold | | | 1,086,980 | |
Decrease in prepaid expenses and other assets | | | 22,036 | |
Decrease in payable for securities purchased | | | (648,766,077 | ) |
Decrease in payable for Fund shares redeemed | | | (2,526,162 | ) |
Decrease in payable for securities on loan | | | (15,578,053 | ) |
Decrease in premiums received on swaps | | | (581,694 | ) |
Decrease in advisory fees payable | | | (3,317 | ) |
Decrease due to other related parties | | | (305 | ) |
Decrease in accrued expenses and other liabilities | | | (22,277 | ) |
Unrealized depreciation on investments | | | 24,888,170 | |
Net realized loss on swaps | | | 2,772,683 | |
Net realized loss on securities in unaffiliated issuers | | | 31,503,094 | |
|
|
|
| |
Net cash provided by operating activities | | | 305,625,748 | |
|
|
|
| |
Cash flows from financing activities: | | | | |
Decrease in additional paid-in capital | | | (292,968,518 | ) |
Cash distributions paid | | | (12,221,079 | ) |
|
|
|
| |
Net cash used in financing activities | | | (305,189,597 | ) |
|
|
|
| |
Net increase in cash | | | 436,151 | |
|
|
|
| |
Cash: | | | | |
Beginning of period | | $ | (436,151 | ) |
|
|
|
| |
Ending of period | | $ | 0 | |
|
|
|
| |
See Notes to Financial Statements
25
NOTES TO FINANCIAL STATEMENTS
1. ORGANIZATION
Evergreen U.S. Government Fund (the “Fund”) is a diversified series of Evergreen Fixed Income Trust (the “Trust”), a Delaware statutory trust organized on September 18, 1997. The Trust is an open-end management investment company registered under the Investment Company Act of 1940, as amended (the “1940 Act”).
The Fund offers Class A, Class B, Class C and Class I shares. Class A shares are sold with a front-end sales charge. However, Class A share investments of $1 million or more are not subject to a front-end sales charge but are subject to a contingent deferred sales charge of 1.00% upon redemption within 18 months. Class B shares are sold without a front-end sales charge but are subject to a contingent deferred sales charge that is payable upon redemption and decreases depending on how long the shares have been held. Class C shares are sold without a front-end sales charge but are subject to a contingent deferred sales charge that is payable upon redemption within one year. Class I shares are sold without a front-end sales charge or contingent deferred sales charge. Each class of shares, except Class I shares, pays an ongoing distribution fee.
2. SIGNIFICANT ACCOUNTING POLICIES
The following is a summary of significant accounting policies consistently followed by the Fund in the preparation of its financial statements. The policies are in conformity with generally accepted accounting principles in the United States of America, which require management to make estimates and assumptions that affect amounts reported herein. Actual results could differ from these estimates.
a. Valuation of investments
Portfolio debt securities acquired with more than 60 days to maturity are fair valued using matrix pricing methods determined by an independent pricing service which takes into consideration such factors as similar security prices, yields, maturities, liquidity and ratings. Securities for which valuations are not readily available from an independent pricing service may be valued by brokers which use prices provided by market makers or estimates of fair market value obtained from yield data relating to investments or securities with similar characteristics.
Listed equity securities are usually valued at the last sales price or official closing price on the national securities exchange where the securities are principally traded. Non-listed equity securities are valued using evaluated prices determined by an independent pricing service which takes into consideration such factors as similar security prices, spreads, liquidity, benchmark quotes and market conditions. Securities for which valuations are not readily available from an independent pricing service may be valued by brokers who use prices provided by market makers or estimates of fair market value obtained from yield data relating to investments or securities with similar characteristics.
Short-term securities of sufficient credit quality with remaining maturities of 60 days or less at the time of purchase are valued at amortized cost, which approximates fair value.
26
NOTES TO FINANCIAL STATEMENTS continued
Investments in open-end mutual funds are valued at net asset value. Securities for which market quotations are not readily available or not reflective of current fair value are valued at fair value as determined by the investment advisor in good faith, according to procedures approved by the Board of Trustees.
b. Repurchase agreements
Securities pledged as collateral for repurchase agreements are held by the custodian bank or in a segregated account in the Fund’s name until the agreements mature. Collateral for certain tri-party repurchase agreements is held at the counterparty’s custodian in a segregated account for the benefit of the Fund and the counterparty. Each agreement requires that the market value of the collateral be sufficient to cover payments of interest and principal. However, in the event of default or bankruptcy by the other party to the agreement, retention of the collateral may be subject to legal proceedings. The Fund will enter into repurchase agreements with banks and other financial institutions, which are deemed by the investment advisor to be creditworthy pursuant to guidelines established by the Board of Trustees. In certain instances, the Fund’s securities lending agent may provide collateral in the form of repurchase agreements.
c. Reverse repurchase agreements
To obtain short-term financing, the Fund may enter into reverse repurchase agreements with banks and other financial institutions, which are deemed by the investment advisor to be creditworthy. At the time the Fund enters into a reverse repurchase agreement, it will establish a segregated account with the custodian containing qualified assets having a value not less than the repurchase price, including accrued interest. If the counterparty to the transaction is rendered insolvent, the Fund may be delayed or limited in the repurchase of the collateral securities.
d. When-issued and delayed delivery transactions
The Fund records when-issued or delayed delivery securities as of trade date and maintains security positions such that sufficient liquid assets will be available to make payment for the securities purchased. Securities purchased on a when-issued or delayed delivery basis are marked-to-market daily and begin earning interest on the settlement date. Losses may occur on these transactions due to changes in market conditions or the failure of counterparties to perform under the contract.
e. Securities lending
The Fund may lend its securities to certain qualified brokers in order to earn additional income. The Fund receives compensation in the form of fees or interest earned on the investment of any cash collateral received. The Fund also continues to receive interest and dividends on the securities loaned. The Fund receives collateral in the form of cash or securities with a market value at least equal to the market value of the securities on loan, including accrued interest. In the event of default or bankruptcy by the borrower, the Fund could experience delays and costs in recovering the loaned securities or in gaining
27
NOTES TO FINANCIAL STATEMENTS continued
access to the collateral. In addition, the investment of any cash collateral received may lose all or part of its value. The Fund has the right under the lending agreement to recover the securities from the borrower on demand.
f. Dollar roll transactions
The Fund may enter into dollar roll transactions with respect to mortgage-backed securities. In a dollar roll transaction, the Fund sells mortgage-backed securities to financial institutions and simultaneously agrees to accept substantially similar (same type, coupon and maturity) securities at a later date at an agreed upon price. The Fund will use the proceeds generated from the transactions to invest in short-term investments, which may enhance the Fund’s current yield and total return. The Fund accounts for dollar roll transactions as purchases and sales. The Fund could be exposed to risks if the counterparty defaults on its obligation to perform under the terms of the agreement, if the Fund receives inferior securities in comparison to what was sold to the counterparty at redelivery or if there are variances in paydown speed between the mortgage-related pools.
g. Credit default swaps
The Fund is subject to credit risk in the normal course of pursuing its investment objectives. The Fund may enter into credit default swap contracts for hedging or speculative purposes to provide or receive a measure of protection against default on a referenced entity, obligation or index. Credit default swaps involve an exchange of a stream of payments for protection against the loss in value of an underlying security or index. Under the terms of the swap, one party acts as a guarantor (referred to as the seller of protection) and receives a periodic stream of payments, provided that there is no credit event, from another party (referred to as the buyer of protection) that is a fixed percentage applied to a notional principal amount over the term of the swap. An index credit default swap references all the names in the index, and if a credit event is triggered, the credit event is settled based on that name’s weight in the index. A credit event includes bankruptcy, failure to pay, obligation default, obligation acceleration, repudiation/moratorium, and restructuring. The Fund may enter into credit default swaps as either the seller of protection or the buyer of protection. As the seller of protection, the Fund is subject to investment exposure on the notional amount of the swap and has assumed the risk of default of the underlying security or index. As the buyer of protection, the Fund could be exposed to risks if the seller of the protection defaults on its obligation to perform, or if there are unfavorable changes in the fluctuation of interest rates or in the price of the underlying security or index. The maximum potential amount of future payments (undiscounted) that the Fund as the seller of protection could be required to make under the credit default swap contract would be an amount equal to the notional amount of the swap contract. The Fund’s maximum risk of loss from counterparty risk, either as the protection seller or as the protection buyer, is the fair value of the contract. This risk is mitigated by having a master netting arrangement between the Fund and the counterparty and by having the counterparty post collateral to cover the Fund’s exposure to the counterparty.
28
NOTES TO FINANCIAL STATEMENTS continued
If the Fund is the seller of protection and a credit event occurs, as defined under the terms of that particular swap agreement, the Fund will pay to the buyer of protection the notional amount of the swap and take delivery of the referenced obligation or underlying securities comprising the referenced index. If the Fund is the buyer of protection and a credit event occurs, as defined under the terms of that particular swap agreement, the Fund will receive from the seller of protection the notional amount of the swap and deliver the referenced obligation or underlying securities comprising the referenced index.
Any premiums paid or received on the transactions are recorded as an asset or liability on the Statement of Assets and Liabilities and amortized. The value of the swap contract is marked-to-market daily based on quotations from an independent pricing service or market makers and any change in value is recorded as an unrealized gain or loss. Periodic payments made or received are recorded as realized gains or losses. In addition, payments received or made as a result of a credit event or termination of the contract are recognized as realized gains or losses.
Certain credit default swap contracts entered into by the Fund provide for conditions that result in events of default or termination that enable the counterparty to the agreement to cause an early termination of the transactions under those agreements. Any election by the counterparty to terminate early may impact the amounts reported on the financial statements.
h. Total return swaps
The Fund is subject to interest rate risk and equity price risk in the normal course of pursuing its investment objectives. The Fund may enter into total return swap contracts for hedging or speculative purposes. Total return swaps involve commitments to pay interest in exchange for a market-linked return, both based on notional amounts. To the extent the total return of the security or index underlying the transaction exceeds or falls short of the offsetting interest rate obligation, the Fund will receive a payment from, or make a payment to, the counterparty.
The value of the swap contract is marked-to-market daily based upon quotations from an independent pricing service or from brokers which use prices provided by market makers and any change in value is recorded as an unrealized gain or loss. Periodic payments made or received are recorded as realized gains or losses. The Fund could be exposed to risks if the counterparty defaults on its obligation to perform, or if there are unfavorable changes in the fluctuation of interest rates or in the price of the underlying security or index. The Fund’s maximum risk of loss from counterparty risk is the fair value of the contract. This risk is mitigated by having a master netting arrangement between the Fund and the counterparty and by having the counterparty post collateral to cover the Fund’s exposure to the counterparty.
Certain total return swap contracts entered into by the Fund provide for conditions that result in events of default or termination that enable the counterparty to the agreement to
29
NOTES TO FINANCIAL STATEMENTS continued
cause an early termination of the transactions under those agreements. Any election by the counterparty to terminate early may impact the amounts reported on the financial statements.
i. Security transactions and investment income
Security transactions are recorded on trade date. Realized gains and losses are computed using the specific cost of the security sold. Interest income is recorded on the accrual basis and includes accretion of discounts and amortization of premiums. Dividend income is recorded on the ex-dividend date.
j. Federal and other taxes
The Fund intends to continue to qualify as a regulated investment company and distribute all of its taxable income, including any net capital gains (which have already been offset by available capital loss carryovers). Accordingly, no provision for federal taxes is required. The Fund’s income and excise tax returns and all financial records supporting those returns for the prior three fiscal years are subject to examination by the federal, Massachusetts and Delaware revenue authorities.
k. Distributions
Distributions to shareholders from net investment income are accrued daily and paid monthly. Distributions from net realized gains, if any, are recorded on the ex-dividend date. Such distributions are determined in conformity with income tax regulations, which may differ from generally accepted accounting principles.
Reclassifications have been made to the Fund’s components of net assets to reflect income and gains available for distribution (or available capital loss carryovers, as applicable) under income tax regulations. The primary permanent differences causing such reclassifications are due to mortgage paydown gains and losses. During the year ended April 30, 2009, the following amounts were reclassified:
|
|
|
|
|
Overdistributed net investment income | | $ | (748,563 | ) |
Accumulated net realized losses on investments | | | 748,563 | |
|
|
|
|
|
l. Class allocations
Income, common expenses and realized and unrealized gains and losses are allocated to the classes based on the relative net assets of each class. Distribution fees, if any, are calculated daily at the class level based on the appropriate net assets of each class and the specific expense rates applicable to each class.
3. ADVISORY FEE AND OTHER TRANSACTIONS WITH AFFILIATES
Evergreen Investment Management Company, LLC (“EIMC”), a subsidiary of Wells Fargo & Company (“Wells Fargo”), is the investment advisor to the Fund and is paid an annual fee starting at 0.42% and declining to 0.35% as average daily net assets increase.
30
NOTES TO FINANCIAL STATEMENTS continued
For the year ended April 30, 2009, the advisory fee was equivalent to an annual rate of 0.40% of the Fund’s average daily net assets.
Tattersall Advisory Group, Inc., an affiliate of EIMC and an indirect, wholly-owned subsidiary of Wells Fargo, is an investment sub-advisor to the Fund and is paid by EIMC for its services to the Fund.
On October 3, 2008, Wells Fargo and Wachovia Corporation (“Wachovia”) announced that Wells Fargo agreed to acquire Wachovia in a whole company transaction that would include all of Wachovia’s banking and other businesses. In connection with this transaction, Wachovia issued preferred shares to Wells Fargo representing approximately a 40% voting interest in Wachovia. Due to its ownership of preferred shares, Wells Fargo may have been deemed to control EIMC. If Wells Fargo was deemed to control EIMC, then the existing advisory agreement between the Fund and EIMC and the sub-advisory agreement between EIMC and the Fund’s sub-advisor would have terminated automatically in connection with the issuance of preferred shares. To address this possibility, on October 20, 2008 the Board of Trustees approved an interim advisory agreement with EIMC and an interim sub-advisory agreement with the sub-advisor with the same terms and conditions as the existing agreements, which became effective upon the issuance of the preferred shares. EIMC’s receipt of the advisory fees under the interim advisory agreement was subject to the approval by shareholders of the Fund of a new advisory agreement with EIMC.
On December 31, 2008, Wachovia merged with and into Wells Fargo and as a result of the merger, EIMC, Tattersall Advisory Group, Inc., Evergreen Investment Services, Inc. (“EIS”) and Evergreen Service Company, LLC (“ESC”) became subsidiaries of Wells Fargo. After the merger, a new interim advisory agreement with the same terms and conditions between the Fund and EIMC went into effect. In addition, a new interim sub-advisory agreement with the same terms and conditions became effective with the sub-advisor to the Fund.
Shareholders approved the new advisory agreement between the Fund and EIMC on February 12, 2009. In addition, on the same date, shareholders also approved a new sub-advisory agreement with the sub-advisor.
From time to time, EIMC may voluntarily or contractually waive its fee and/or reimburse expenses in order to limit operating expenses. During the year ended April 30, 2009, EIMC voluntarily waived its advisory fee in the amount of $310.
The Fund may invest in money market funds which are advised by EIMC. Income earned on these investments is included in income from affiliated issuers on the Statement of Operations.
EIMC also serves as the administrator to the Fund providing the Fund with facilities, equipment and personnel. EIMC is paid an annual rate determined by applying
31
NOTES TO FINANCIAL STATEMENTS continued
percentage rates to the aggregate average daily net assets of the Evergreen funds (excluding money market funds) starting at 0.10% and declining to 0.05% as the aggregate average daily net assets of the Evergreen funds (excluding money market funds) increase. For the year ended April 30, 2009, the administrative services fee was equivalent to an annual rate of 0.10% of the Fund’s average daily net assets.
ESC, an affiliate of EIMC and a subsidiary of Wells Fargo, is the transfer and dividend disbursing agent for the Fund. ESC receives account fees that vary based on the type of account held by the shareholders in the Fund.
4. DISTRIBUTION PLANS
EIS, an affiliate of EIMC and a subsidiary of Wells Fargo, serves as distributor of the Fund’s shares. The Fund has adopted Distribution Plans, as allowed by Rule 12b-1 of the 1940 Act, for each class of shares, except Class I. Under the Distribution Plans, the Fund is permitted to pay distribution fees at an annual rate of up to 0.75% of the average daily net assets for Class A shares and up to 1.00% of the average daily net assets for each of Class B and Class C shares. However, currently the distribution fees for Class A shares are limited to 0.25% of the average daily net assets of the class.
For the year ended April 30, 2009, EIS received $8,244 from the sale of Class A shares and $1,718, $45,909 and $7,885 in contingent deferred sales charges from redemptions of Class A, Class B and Class C shares, respectively.
5. ACQUISITION
Effective at the close of business on May 18, 2007, the Fund acquired the net assets of Atlas U.S. Government and Mortgage Securities Fund in a tax-free exchange for Class A shares of the Fund. Shares were issued to shareholders of Atlas U.S. Government and Mortgage Securities Fund at an exchange ratio of 1.00 for Class A shares of the Fund. The acquired net assets consisted primarily of portfolio securities with unrealized depreciation of $2,360,830. The aggregate net assets of the Fund and Atlas U.S. Government and Mortgage Securities Fund immediately prior to the acquisition were $570,150,705 and $200,202,084, respectively. The aggregate net assets of the Fund immediately after the acquisition were $770,352,789.
6. INVESTMENT TRANSACTIONS
Cost of purchases and proceeds from sales of investment securities (excluding short-term securities) were as follows for the year ended April 30, 2009:
Cost of Purchases | Proceeds from Sales |
|
|
U.S. | Non-U.S. | U.S. | Non-U.S. |
Government | Government | Government | Government |
|
|
|
|
$2,927,629,782 | $0 | $3,348,058,954 | $68,491,959 |
|
|
|
|
32
NOTES TO FINANCIAL STATEMENTS continued
On May 1, 2008, the Fund implemented Statement of Financial Accounting Standards No. 157, Fair Value Measurements (“FAS 157”). FAS 157 establishes a single authoritative definition of fair value, establishes a framework for measuring fair value and expands disclosures about fair value measurements. FAS 157 establishes a fair value hierarchy based upon the various inputs used in determining the value of the Fund’s investments. These inputs are summarized into three broad levels as follows:
Level 1 – quoted prices in active markets for identical securities Level 2 – other significant observable inputs (including quoted prices for similar securities, interest rates, prepayment speeds, credit risk, etc.) Level 3 – significant unobservable inputs (including the Fund’s own assumptions in determining the fair value of investments) |
The inputs or methodologies used for valuing securities are not necessarily an indication of the risk associated with investing in those securities.
As of April 30, 2009, the inputs used in valuing the Fund’s assets, which are carried at fair value, were as follows:
Valuation Inputs | | Investments in
Securities | |
|
|
|
|
|
Level 1 – Quoted Prices | | $ | 335,012,494 | |
Level 2 – Other Significant Observable Inputs | | | 354,580,926 | |
Level 3 – Significant Unobservable Inputs | | | 5,971,233 | |
|
|
|
|
|
Total | | $ | 695,564,653 | |
|
|
|
|
|
The following is a reconciliation of assets in which significant unobservable inputs (Level 3) were used in determining fair value:
| | Investments in |
| | Securities |
|
|
|
|
|
|
Balance as of May 1, 2008 | | | $ | 2,782,920 | |
Realized gain (loss) | | | | 0 | |
Change in unrealized appreciation (depreciation) | | | | (2,744,593 | ) |
Net purchases (sales) | | | | 5,932,906 | |
Transfers in and/or out of Level 3 | | | | 0 | |
|
|
|
|
|
|
Balance as of April 30, 2009 | | | $ | 5,971,233 | |
|
|
|
|
|
|
Change in unrealized gains or losses included in earnings relating to securities still held at April 30, 2009 | | | $ | (2,744,593 | ) |
|
|
|
|
|
|
On April 30, 2009, the aggregate cost of securities for federal income tax purposes was $721,447,092. The gross unrealized appreciation and depreciation on securities based on tax cost was $9,998,198 and $35,880,637, respectively, with a net unrealized depreciation of $25,882,439.
As of April 30, 2009, the Fund had $36,841,676 in capital loss carryovers for federal income tax purposes with $1,572,729 expiring in 2014, $6,995,014 expiring in 2015 and $28,273,933 expiring in 2017.
33
NOTES TO FINANCIAL STATEMENTS continued
For income tax purposes, capital losses incurred after October 31 within the Fund’s fiscal year are deemed to arise on the first business day of the following fiscal year. As of April 30, 2009, the Fund incurred and will elect to defer post-October capital losses of $3,705,800.
7. DERIVATIVE TRANSACTIONS
The fair value, realized gains or losses and change in unrealized gains or losses on derivative instruments are reflected in the appropriate financial statements.
As of April 30, 2009, the Fund did not have any open credit default swaps but had an average notional balance of $2,000,000 during the year ended April 30, 2009.
8. INTERFUND LENDING
Pursuant to an Exemptive Order issued by the SEC, the Fund may participate in an interfund lending program with certain funds in the Evergreen fund family. This program allows the Fund to borrow from, or lend money to, other participating funds. During the year ended April 30, 2009, the Fund did not participate in the interfund lending program.
9. DISTRIBUTIONS TO SHAREHOLDERS
As of April 30, 2009, the components of distributable earnings on a tax basis were as follows:
| | Capital Loss | |
| | Carryovers | |
| | and | |
Undistributed | Unrealized | Post-October | Temporary Book/ |
Ordinary Income | Depreciation | Losses | Tax Differences |
|
|
|
|
$785,078 | $25,882,439 | $40,547,476 | $(922,101) |
|
|
|
|
The differences between the components of distributable earnings on a tax basis and the amounts reflected in the Statement of Assets and Liabilities are primarily due to wash sales. The temporary book/tax differences are a result of timing differences between book and tax recognition of income and/or expenses.
The tax character of distributions paid were $30,254,915 and $41,178,076 of ordinary income for the years ended April 30, 2009 and April 30, 2008, respectively.
10. EXPENSE REDUCTIONS
Through expense offset arrangements with ESC and the Fund’s custodian, a portion of fund expenses has been reduced.
11. DEFERRED TRUSTEES’ FEES
Each Trustee of the Fund may defer any or all compensation related to performance of his or her duties as a Trustee. The Trustees’ deferred balances are allocated to deferral accounts, which are included in the accrued expenses for the Fund. The investment
34
NOTES TO FINANCIAL STATEMENTS continued
performance of the deferral accounts is based on the investment performance of certain Evergreen funds. Any gains earned or losses incurred in the deferral accounts are reported in the Fund’s Trustees’ fees and expenses. At the election of the Trustees, the deferral account will be paid either in one lump sum or in quarterly installments for up to ten years.
12. FINANCING AGREEMENT
The Fund and certain other Evergreen funds share in a $100 million unsecured revolving credit commitment for temporary and emergency purposes, including the funding of redemptions, as permitted by each participating fund’s borrowing restrictions. Borrowings under this facility bear interest at 0.50% per annum above the Federal Funds rate. All of the participating funds are charged an annual commitment fee of 0.09% on the unused balance, which is allocated pro rata. Prior to June 27, 2008, the annual commitment fee was 0.08%. During the year ended April 30, 2009, the Fund had no borrowings.
13. REGULATORY MATTERS AND LEGAL PROCEEDINGS
The Evergreen funds, EIMC and certain of EIMC’s affiliates are involved in various legal actions, including private litigation and class action lawsuits, and are and may in the future be subject to regulatory inquiries and investigations.
EIMC and EIS have reached final settlements with the Securities and Exchange Commission (“SEC”) and the Securities Division of the Secretary of the Commonwealth of Massachusetts (“Commonwealth”) primarily relating to the liquidation of Evergreen Ultra Short Opportunities Fund (“Ultra Short Fund”). The claims settled include the following: first, that during the period February 2007 through Ultra Short Fund’s liquidation on June 18, 2008, Ultra Short Fund’s former portfolio management team failed to properly take into account readily-available information in valuing certain non-agency residential mortgage-backed securities held by the Ultra Short Fund, resulting in the Ultra Short Fund’s net asset value (“NAV”) being overstated during the period; second, that EIMC and EIS acted inappropriately when, in an effort to explain the decline in Ultra Short Fund’s NAV, certain information regarding the decline was communicated to some, but not all, shareholders and financial intermediaries; third, that the Ultra Short Fund portfolio management team did not adhere to regulatory requirements for affiliated cross trades in executing trades with other Evergreen funds; and finally, that from at least September 2007 to August 2008, EIS did not preserve certain text and instant messages transmitted via personal digital assistant devices. In settling these matters, EIMC and EIS have agreed to payments totaling $41.125 million, up to $40.125 million of which will be distributed to eligible shareholders of Ultra Short Fund pursuant to a methodology and plan approved by the regulators. EIMC and EIS neither admitted nor denied the regulators’ conclusions.
Three purported class actions have also been filed in the U.S. District Court for the District of Massachusetts relating to the same events; defendants include various
35
NOTES TO FINANCIAL STATEMENTS continued
Evergreen entities, including EIMC and EIS, and Evergreen Fixed Income Trust and its Trustees. The cases generally allege that investors in the Ultra Short Fund suffered losses as a result of (i) misleading statements in Ultra Short Fund’s registration statement and prospectus, (ii) the failure to accurately price securities in the Ultra Short Fund at different points in time and (iii) the failure of the Ultra Short Fund’s risk disclosures and description of its investment strategy to inform investors adequately of the actual risks of the fund.
EIMC does not expect that any of the legal actions, inquiries or settlement of regulatory matters will have a material adverse impact on the financial position or operations of the Fund to which these financial statements relate. Any publicity surrounding or resulting from any legal actions or regulatory inquiries involving EIMC or its affiliates or any of the Evergreen Funds could result in reduced sales or increased redemptions of Evergreen fund shares, which could increase Evergreen fund transaction costs or operating expenses or have other adverse consequences on the Evergreen funds, including the Fund.
14. NEW ACCOUNTING PRONOUNCEMENT
In April 2009, FASB issued FASB Staff Position No. FAS 157-4, Determining Fair Value When the Volume and Level of Activity for the Asset or Liability Have Significantly Decreased and Identifying Transactions That Are Not Orderly (“FAS 157-4”). FAS 157-4 provides additional guidance for determining fair value when the volume and level of activity for an asset or a liability have significantly decreased and identifying transactions that are not orderly. FAS 157-4 requires enhanced disclosures about the inputs and valuation technique(s) used to measure fair value and a discussion of changes in valuation techniques and related inputs, if any, during the period. In addition, the three-level hierarchy disclosure and the level three roll-forward disclosure will be expanded for each major category of assets. Management of the Fund does not believe the adoption of FAS 157-4 will materially impact the financial statement amounts, but will require additional disclosures. FAS 157-4 is effective for interim and annual reporting periods ending after June 15, 2009.
15. SUBSEQUENT EVENT
Effective after the close of business on June 30, 2009, Class B shares of the Fund will be closed to new accounts and additional purchases by existing shareholders. After the close of business on June 30, 2009, existing shareholders of Class B shares of the Fund may continue to exchange their Class B shares for Class B shares of other Evergreen Funds subject to the limitations described in each fund’s prospectus and may also continue to add to their accounts through dividend reinvestment. All other Class B share features and attributes, including, but not limited to, the 12b-1 fee, contingent deferred sales charge and conversion after a number of years to Class A shares, remain unchanged. Shareholders of the Fund may continue to redeem Fund shares in the manner described in the Fund’s prospectus.
36
REPORT OF INDEPENDENT REGISTERED PUBLIC ACCOUNTING FIRM
Board of Trustees and Shareholders
Evergreen Fixed Income Trust
We have audited the accompanying statement of assets and liabilities, including the schedule of investments, of the Evergreen U.S. Government Fund, a series of the Evergreen Fixed Income Trust, as of April 30, 2009 and the related statement of operations for the year then ended, statements of changes in net assets for each of the years in the two-year period then ended, statement of cash flows for the year then ended, and the financial highlights for each of the years in the five-year period then ended. These financial statements and financial highlights are the responsibility of the Fund’s management. Our responsibility is to express an opinion on these financial statements and financial highlights based on our audits.
We conducted our audits in accordance with the standards of the Public Company Accounting Oversight Board (United States). Those standards require that we plan and perform the audit to obtain reasonable assurance about whether the financial statements and financial highlights are free of material misstatement. An audit includes examining, on a test basis, evidence supporting the amounts and disclosures in the financial statements. Our procedures included confirmation of securities owned as of April 30, 2009 by correspondence with the custodian and brokers, or by other appropriate auditing procedures where replies from brokers were not received. An audit also includes assessing the accounting principles used and significant estimates made by management, as well as evaluating the overall financial statement presentation. We believe that our audits provide a reasonable basis for our opinion.
In our opinion, the financial statements and financial highlights referred to above present fairly, in all material respects, the financial position of the Evergreen U.S. Government Fund as of April 30, 2009, the results of its operations, changes in its net assets, its cash flows and financial highlights for each of the years described above, in conformity with U.S. generally accepted accounting principles.

Boston, Massachusetts
June 29, 2009
37
ADDITIONAL INFORMATION (unaudited)
SPECIAL MEETING OF SHAREHOLDERS
On February 12, 2009, a Special Meeting of Shareholders for the Fund was held to consider the following proposals. The results of the proposals are indicated below.
Proposal 1a — To consider and act upon a new Investment Advisory Agreement with Evergreen Investment Management Company, LLC:
|
|
|
Net assets voted “For” | $ | 360,805,411 |
Net assets voted “Against” | $ | 3,455,834 |
Net assets voted “Abstain” | $ | 7,993,792 |
|
|
|
Proposal 1b — To consider and act upon a new Sub-Advisory Agreement with Tattersall Advisory Group, Inc.
|
|
|
Net assets voted “For” | $ | 358,852,049 |
Net assets voted “Against” | $ | 4,069,387 |
Net assets voted “Abstain” | $ | 9,333,601 |
|
|
|
38
This page left intentionally blank
39
TRUSTEES AND OFFICERS
TRUSTEES1 | | |
Charles A. Austin III
Trustee
DOB: 10/23/1934
Term of office since: 1991
Other directorships: None | | Investment Counselor, Anchor Capital Advisors, LLC. (investment advice); Director, The Andover Companies (insurance); Trustee, Arthritis Foundation of New England; Former Director, The Francis Ouimet Society (scholarship program); Former Director, Executive Vice President and Treasurer, State Street Research & Management Company (investment advice) |
|
|
|
K. Dun Gifford
Trustee
DOB: 10/23/1938
Term of office since: 1974
Other directorships: None | | Chairman and President, Oldways Preservation and Exchange Trust (education); Trustee, Member of the Executive Committee, Former Chairman of the Finance Committee, and Former Treasurer, Cambridge College |
|
|
|
Dr. Leroy Keith, Jr.
Trustee
DOB: 2/14/1939
Term of office since: 1983
Other directorships: Trustee,
Phoenix Fund Complex
(consisting of 50 portfolios
as of 12/31/2008) | | Managing Director, Almanac Capital Management (commodities firm); Trustee, Phoenix Fund Complex; Director, Diversapack Co. (packaging company); Former Partner, Stonington Partners, Inc. (private equity fund); Former Director, Obagi Medical Products Co.; Former Director, Lincoln Educational Services |
|
|
|
Carol A. Kosel
Trustee
DOB: 12/25/1963
Term of office since: 2008
Other directorships: None | | Former Consultant to the Evergreen Boards of Trustees; Former Vice President and Senior Vice President, Evergreen Investments, Inc.; Former Treasurer, Evergreen Funds; Former Treasurer, Vestaur Securities Fund |
|
|
|
Gerald M. McDonnell
Trustee
DOB: 7/14/1939
Term of office since: 1988
Other directorships: None | | Former Manager of Commercial Operations, CMC Steel (steel producer) |
|
|
|
Patricia B. Norris
Trustee
DOB: 4/9/1948
Term of office since: 2006
Other directorships: None | | President and Director of Buckleys of Kezar Lake, Inc. (real estate company); Former President and Director of Phillips Pond Homes Association (home community); Former Partner, PricewaterhouseCoopers, LLP (independent registered public accounting firm) |
|
|
|
William Walt Pettit2
Trustee
DOB: 8/26/1955
Term of office since: 1988
Other directorships: None | | Partner and Vice President, Kellam & Pettit, P.A. (law firm); Director, Superior Packaging Corp. (packaging company); Member, Superior Land, LLC (real estate holding company), Member, K&P Development, LLC (real estate development); Former Director, National Kidney Foundation of North Carolina, Inc. (non-profit organization) |
|
|
|
David M. Richardson
Trustee
DOB: 9/19/1941
Term of office since: 1982
Other directorships: None | | President, Richardson, Runden LLC (executive recruitment advisory services); Director, J&M Cumming Paper Co. (paper merchandising); Former Trustee, NDI Technologies, LLP (communications); Former Consultant, AESC (The Association of Executive Search Consultants) |
|
|
|
Russell A. Salton III, MD
Trustee
DOB: 6/2/1947
Term of office since: 1984
Other directorships: None | | President/CEO, AccessOne MedCard, Inc. |
|
|
|
40
TRUSTEES AND OFFICERS continued
Michael S. Scofield
Trustee
DOB: 2/20/1943
Term of office since: 1984
Other directorships: None | | Retired Attorney, Law Offices of Michael S. Scofield; Former Director and Chairman, Branded Media Corporation (multi-media branding company) |
|
|
|
Richard J. Shima
Trustee
DOB: 8/11/1939
Term of office since: 1993
Other directorships: None | | Independent Consultant; Director, Hartford Hospital; Trustee, Greater Hartford YMCA; Former Director, Trust Company of CT; Former Trustee, Saint Joseph College (CT) |
|
|
|
Richard K. Wagoner, CFA3
Trustee
DOB: 12/12/1937
Term of office since: 1999
Other directorships: None | | Member and Former President, North Carolina Securities Traders Association; Member, Financial Analysts Society |
|
|
|
| | |
OFFICERS | | |
W. Douglas Munn4
President
DOB: 4/21/1963
Term of office since: 2009 | | Principal occupations: Chief Operating Officer, Wells Fargo Funds Management, LLC; former Chief Operating Officer, Evergreen Investment Company, Inc. |
|
|
|
Kasey Phillips4
Treasurer
DOB: 12/12/1970
Term of office since: 2005 | | Principal occupations: Senior Vice President, Evergreen Investment Management Company, LLC; Former Vice President, Evergreen Investment Services, Inc. |
|
|
|
Michael H. Koonce4
Secretary
DOB: 4/20/1960
Term of office since: 2000 | | Principal occupations: Senior Vice President and General Counsel, Evergreen Investment Services, Inc.; Secretary, Senior Vice President and General Counsel, Evergreen Investment Management Company, LLC and Evergreen Service Company, LLC |
|
|
|
Robert Guerin4
Chief Compliance Officer
DOB: 9/20/1965
Term of office since: 2007 | | Principal occupations: Chief Compliance Officer, Evergreen Funds and Senior Vice President of Evergreen Investment Company, Inc.; Former Managing Director and Senior Compliance Officer, Babson Capital Management LLC; Former Principal and Director, Compliance and Risk Management, State Street Global Advisors; Former Vice President and Manager, Sales Practice Compliance, Deutsche Asset Management |
|
|
|
1 | Each Trustee serves until a successor is duly elected or qualified or until his or her death, resignation, retirement or removal from office. Each Trustee oversaw 77 Evergreen funds as of December 31, 2008. Correspondence for each Trustee may be sent to Evergreen Board of Trustees, P.O. Box 20083, Charlotte, NC 28202. |
2 | It is possible that Mr. Pettit may be viewed as an “interested person” of the Evergreen funds, as defined in the 1940 Act, because of his law firm’s previous representation of affiliates of Wells Fargo & Company (“Wells Fargo”), the parent to the Evergreen funds’ investment advisor, EIMC. The Trustees are treating Mr. Pettit as an interested trustee for the time being. |
3 | Mr. Wagoner is an “interested person” of the Evergreen funds because of his ownership of shares in Wells Fargo & Company, the parent to the Evergreen funds’ investment advisor. |
4 | The address of the Officer is 200 Berkeley Street, Boston, MA 02116. |
Additional information about the Fund’s Board of Trustees and Officers can be found in the Statement of Additional Information (SAI) and is available upon request without charge by calling 800.343.2898.
41

566663 rv6 06/2009
Item 2 - Code of Ethics
(a) The Registrant has adopted a code of ethics that applies to the Registrant’s principal executive officer and principal financial officer.
(b) During the period covered by this report, there were no amendments to the provisions of the code of ethics adopted in 2.(a) above.
(c) During the period covered by this report, there were no implicit or explicit waivers to the provisions of the code of ethics adopted in 2.(a) above.
Item 3 - Audit Committee Financial Expert
Charles A. Austin III and Patricia B. Norris have been determined by the Registrant’s Board of Trustees to be audit committee financial experts within the meaning of Section 407 of the Sarbanes-Oxley Act. These financial experts are independent of management.
Items 4 – Principal Accountant Fees and Services
The following table represents fees for professional audit services rendered by KPMG LLP, for the audits of each of the four series of the Registrant’s annual financial statements for the fiscal years ended April 30, 2009 and April 30, 2008, and fees billed for other services rendered by KPMG LLP.
| | 2009 | | 2008 |
| |
| |
|
Audit fees | | $ | 154,400 | | $ | 126,400 |
Audit-related fees (1) | | $ | 7,500 | | $ | 6,200 |
Tax fees (2) | | $ | 4,500 | | $ | 8,182 |
Non-audit fees (3) | | $ | 720,000 | | $ | 1,162,374 |
All other fees | | $ | 0 | | $ | 0 |
(1) | Audit-related fees consists primarily of fees for merger activity. |
(2) | Tax fees consists of fees for tax consultation, tax compliance and tax review. |
(3) | Non-audit fees consists of the aggregate fees for non-audit services rendered to the Fund, EIMC (not including any sub-advisor whose role is primarily portfolio management and is subcontracted with or overseen by another investment advisor) and EIS. |
Evergreen Funds
Evergreen Global Dividend Opportunity Fund
Evergreen Income Advantage Fund
Evergreen International Balanced Income Fund
Evergreen Multi-Sector Income Fund
Evergreen Utilities and High Income Fund
Audit and Non-Audit Services Pre-Approval Policy
I. Statement of Principles
Under the Sarbanes-Oxley Act of 2002 (the “Act”), the Audit Committee of the Board of Trustees/Directors is responsible for the appointment, compensation and oversight of the work of the independent auditor. As part of this responsibility, the Audit Committee is required to pre-approve the audit and non-audit services performed by the independent auditor for the Funds, as well as non-audit services performed by the independent auditor for the Funds’ investment adviser or any of its control affiliates that relates directly to the Funds’ operations and financial reporting, in order to assure that they do not impair the auditor’s independence from the Funds. To implement these provisions of the Act, the Securities and Exchange Commission (the “SEC”) has issued rules specifying the types of services that an independent auditor may not provide to its audit client, as well as regarding the audit committee’s administration of the engagement of the independent auditor. Accordingly, the Audit Committee has adopted, and the Board of
Trustees has ratified, the Audit and Non-Audit Services Pre Approval Policy (the “Policy”), which sets forth the procedures and the conditions pursuant to which services proposed to be performed by the independent auditor may be pre-approved.
The SEC’s rules establish two different approaches to pre-approving services, which the SEC considers to be equally valid. Proposed services either: may be pre-approved by the Audit Committee pursuant to detailed pre-approval policies and procedures that describe the types of services for which the independent auditor may be engaged (“general pre-approval”); or may be expressly pre-approved by the Audit Committee (“specific pre-approval”). The Audit Committee believes that the combination of these two approaches expressed in this Policy will result in an effective and efficient procedure to pre-approve services performed by the independent auditor. As set forth in this Policy, unless a type of service has received general pre-approval, it will require specific pre-approval by the Audit Committee if it is to be provided by the independent auditor.
For both types of pre-approval, the Audit Committee will consider whether such services are consistent with the SEC’s rules on auditor independence. The Audit Committee will also consider whether the independent auditor is best positioned to provide the most effective and efficient service, for reasons such as its familiarity with the Funds’ business people, culture, accounting systems, risk profile and other factors, and whether the service might enhance the Funds’ ability to manage or control risk or improve audit quality. All such factors will be considered as a whole, and no one factor should necessarily be determinative.
The Audit Committee is also mindful of the relationship between fees for audit and non-audit services in deciding whether to pre-approve any such services and may determine, for each fiscal year, the ratio between the total amount of fees for Audit, Audit-related and Tax services and the total amount of fees for certain permissible non-audit services classified as All Other services.
The appendices to this Policy describe the Audit, Audit-related, Tax and All Other services that have the general pre-approval of the Audit Committee. The term of any general pre-approval is 12 months from the date of pre-approval, unless the Audit Committee considers a different period and states otherwise. The Audit Committee will annually review and pre-approve the services that may be provided by the independent auditor without obtaining specific pre-approval from the Audit Committee. The Audit Committee will add or subtract to the list of general pre-approved services from time to time, based on subsequent determinations.
The purpose of this Policy is to set forth the procedures by which the Audit Committee intends to fulfill its responsibilities. It does not delegate the Audit Committee’s responsibilities to pre-approve services performed by the independent auditor to management.
The independent auditor has reviewed this Policy and believes that implementation of the policy will not adversely affect the auditor’s independence.
II. Delegation
As provided in the Act and the SEC’s rules, the Audit Committee may delegate either type of pre-approval authority to one or more of its members. The member to whom such authority is delegated must report, for informational purposes only, any pre-approval decisions to the Audit Committee at its next scheduled meeting.
III. Audit Services
The annual Audit services engagement terms and fees will be subject to the specific pre-approval of the Audit Committee. Audit services include the annual financial statement audit and other procedures required to be performed by the independent auditor to be able to form an opinion on the Funds’ financial statements. These other procedures include information systems and procedural reviews and testing performed in order to understand and place reliance on the systems of internal control, and consultations relating to the audit. Audit services also include the attestation engagement for the independent auditor’s report on management’s report on internal controls for financial reporting. The Audit Committee will
monitor the Audit services engagement as necessary, but on no less than on a quarterly basis, and will also approve, if necessary, any changes in terms, conditions and fees resulting from changes in audit scope, Fund service providers or other items.
In addition to the annual Audit services engagement approved by the Audit Committee, the Audit Committee may grant general pre-approval for other Audit services, which are those services that only the independent auditor reasonably can provide. Other Audit services may include services associated with SEC registration statements, periodic reports and other documents filed with the SEC or other documents issued in connection with mergers or acquisitions.
The Audit Committee has pre-approved the Audit services in Appendix A. All other audit services not listed in Appendix A must be specifically pre-approved by the Audit Committee.
IV. Audit-related Services
Audit-related services are assurance and related services that are reasonably related to the performance of the audit or review of the Funds’ financial statements or that are traditionally performed by the independent auditor. Because the Audit Committee believes that the provision of Audit-related services does not impair the independence of the auditor and is consistent with SEC’s rules on auditor independence, the Audit Committee may grant general pre-approval for Audit-related services. Audit-related services include, among others, due diligence services pertaining to potential business acquisitions/dispositions; accounting consultations related to accounting, financial reporting or disclosure matters not classified as “Audit services”; assistance with understanding and implementing new accounting and financial reporting guidance from rulemaking authorities; agreed-upon or expanded audit procedures related to accounting records required to respond to or comply with financial, accounting or regulatory reporting matters; and assistance with internal control reporting requirements.
The Audit Committee has pre-approved the Audit-related services in Appendix B. All other Audit-related services not listed in appendix B must be specifically pre-approved by the Audit Committee.
V. Tax Services
The Audit Committee believes that the independent auditor can provide Tax services to the Funds such as tax compliance, tax planning and tax advice without impairing the auditor’s independence, and the SEC has stated that the independent auditor may provide such services. Hence, the Audit Committee believes it may grant general pre-approval to those Tax services that have historically been provided by the auditor, that the Audit Committee has reviewed and believes would not impair the independence of the auditor, and that are consistent with the SEC’s rules on auditor independence. The Audit Committee will not permit the retention of the independent auditor in connection with a transaction initially recommended by the independent auditor, the sole business purpose of which may be tax avoidance and the tax treatment of which may not be supported in the Internal Revenue Code and related regulations. The Audit Committee will consult with the Director of Fund Administration, the Senior Vice President of Tax Services or outside counsel to determine that the tax planning and reporting positions are consistent with this policy.
Pursuant to the preceding paragraph, the Audit Committee has pre-approved the Tax services in Appendix C. All Tax services involving large and complex transactions not listed in Appendix C must be specifically pre-approved by the Audit Committee, including: tax services proposed to be provide by the independent auditor to any executive officer or director of the Funds, in his or her individual capacity, where such services are paid for by the Funds or the investment advisor.
VI. All Other Services
The Audit Committee believes, based on the SEC’s rules prohibiting the independent auditor from providing specific non-audit services, that other types of non-audit services are permitted. Accordingly, the Audit Committee believes it may grant general pre-approval to those permissible non-audit services classified as All Other services that it believes are routine and recurring services, would not impair the independence of the auditor and are consistent with the SEC’s rules on auditor independence.
The Audit Committee has pre-approved the All Other services in Appendix C. Permissible All Other services not listed in Appendix C must be specifically pre-approved by the Audit Committee.
A list of the SEC’s prohibited non-audit services is attached to this policy as Exhibit 1. The SEC’s rules and relevant guidance should be consulted to determine the precise definitions of these services and the applicability of exceptions to certain of the prohibitions.
VII. Pre-Approval Fee Levels or Budgeted Amounts
Fee levels or budgeted amounts for all services to be provided by the independent auditor subject to general pre-approval will be established annually by the Audit Committee. Fee levels or budgeted amounts for services to be provided by the independent auditor subject to specific pre-approval will be established at the time of the specific pre-approval. Any proposed fees exceeding these levels or amounts will require specific pre-approval by the Audit Committee. The Audit Committee is mindful of the overall relationship of fees for audit and non-audit services in determining whether to pre-approve any such services. For each fiscal year, the Audit Committee may determine to ratio between the total amount of fees for Audit, Audit-related and Tax services, and the total amount of fees for services classified as All Other services.
VIII. Procedures
All requests or applications for services to be provided by the independent auditor that do not require specific approval by the Audit Committee will be submitted to the Director of Fund Administration or Assistant Director of Fund Administration and must include a detailed description of the services to be rendered. The Director/Assistant Director of Fund Administration will determine whether such services are included within the list of services that have received the general pre-approval of the Audit Committee. The Audit Committee will be informed on a quarterly basis (or more frequent if requested by the Audit Committee) of any such services rendered by the independent auditor.
Requests or applications to provide services that require specific approval by the Audit Committee will be submitted to the Audit Committee by both the independent auditor and the Director/Assistant Director of Fund Administration, and must include a joint statement as to whether, in their view, the request or application is consistent with the SEC’s rules on auditor independence.
The Director/Assistant Director of Fund Administration will report to the Audit Committee at each of its regular meetings regarding all services provided by the independent auditor that are subject to this policy since the last such report was rendered, including: (1) a general description of the services; (2) actual billed and projected fees; and (3) the means by which such services were pre-approved by the Audit Committee, as well as the date of approval and any related fee level or budgeted amount to which the services are subject.
The Audit Committee has designated the Chief Compliance Officer to monitor the performance of all services provided by the independent auditor and to determine whether such services are in compliance with this policy. The Chief Compliance Officer will report to the Audit Committee on a periodic basis on the results of its monitoring. Both the Chief Compliance Officer and management will immediately report to the chairman of the Audit Committee any breach of this policy that comes to the attention of the Chief Compliance Officer or any member of management.
IX. Additional Requirements
The Audit Committee has determined to take additional measures on an annual basis to meet its responsibility to oversee the work of the independent auditor and to assure the auditor’s independence from the Funds, such as reviewing a formal written statement from the independent auditor delineating all relationships between the independent auditor and the Funds, the Funds’ investment advisor and related parties of the investment advisor, consistent with Independence Standards Board Standard No. 1, and discussing with the independent auditor its methods and procedures for ensuring independence.
Items 5 – Audit Committee of Listed Registrants
On January 1, 2009, Patricia B. Norris replaced Charles A. Austin III as chair of the Audit Committee.
Item 6 – Schedule of Investments
Please see schedule of investments contained in the Report to Stockholders included under Item 1 of this Form N-CSR.
Item 7 – Disclosure of Proxy Voting Policies and Procedures for Closed-End Management Investment Companies.
Not applicable.
Item 8 – Portfolio Managers of Closed-End Management Investment Companies.
Not applicable.
Item 9 – Purchases of Equity Securities by Closed-End Management Investment Company and Affiliated Purchasers.
Not applicable.
Item 10 – Submission of Matters to a Vote of Security Holders
There have been no material changes to the procedures by which shareholders may recommend nominees to the Registrant’s board of trustees that have been implemented since the Registrant last provided disclosure in response to the requirements of this Item.
Item 11 - Controls and Procedures
(a) | The Registrant’s principal executive officer and principal financial officer have evaluated the Registrant’s disclosure controls and procedures (as defined in Rule 30a-3(c) under the Investment Company Act of 1940) within 90 days of this filing and have concluded that the Registrant’s disclosure controls and procedures were effective, as of that date, in ensuring that information required to be disclosed by the Registrant in this Form N-CSR was recorded, processed, summarized, and reported timely. |
(b) | There has been no changes in the Registrant’s internal controls over financial reporting (as defined in Rule 30a-3(d) under the Investment Company Act of 1940) that occurred during the second fiscal quarter of the period covered by this report that has materially affected, or is reasonably likely to affect, the Registrant’s internal control over financial reporting . |
Item 12 - Exhibits
File the exhibits listed below as part of this Form. Letter or number the exhibits in the sequence indicated.
(a) | Any code of ethics, or amendment thereto, that is the subject of the disclosure required by Item 2, to the extent that the Registrant intends to satisfy the Item 2 requirements through filing of an exhibit. |
(b)(1) | Separate certifications for the Registrant’s principal executive officer and principal financial officer, as required by Section 302 of the Sarbanes-Oxley Act of 2002 and Rule 30a-2(a) under the Investment Company Act of 1940, are attached as EX99.CERT. |
(b)(2) | Separate certifications for the Registrant’s principal executive officer and principal financial officer, as required by Section 1350 of Title 18 of United States Code, as adopted pursuant to Section 906 of the Sarbanes-Oxley Act of 2002, and Rule 30a-2(b) under the Investment Company Act of 1940, are attached as EX99.906CERT. The certifications furnished pursuant to this paragraph are not deemed to be “filed” for purposes of Section 18 of the Securities Exchange Act of 1934, or otherwise subject to the liability of that section. Such certifications are not deemed to be incorporated by reference into any filing under the Securities Act of 1933 or the Securities Exchange Act of 1934, except to the extent that the Registrant specifically incorporates them by reference. |
Pursuant to the requirements of the Securities Exchange Act of 1934 and the Investment Company Act of 1940, the Registrant has duly caused this report to be signed on its behalf by the undersigned, thereunto duly authorized.
Evergreen Fixed Income Trust
| | |
By: | /s/ W. Douglas Munn | | | |
|
| | | |
| W. Douglas Munn
Principal Executive Officer | | | |
Date: June 29, 2009
Pursuant to the requirements of the Securities Exchange Act of 1934 and the Investment Company Act of 1940, this report has been signed below by the following persons on behalf of the Registrant and in the capacities and on the dates indicated.
| | |
By: | /s/ W. Douglas Munn | | | |
|
| | | |
| W. Douglas Munn
Principal Executive Officer | | | |
Date: June 29, 2009
| | |
By: | /s/ Kasey Phillips | | | |
|
| | | |
| Kasey Phillips
Principal Financial Officer | | | |
Date: June 29, 2009