Source: Morningstar, Inc.
Morningstar’s style box is based on a portfolio date as of 3/31/2008.
The Fixed Income style box placement is based on a fund's average effective maturity or duration and the average credit rating of the bond portfolio.
The fund incurs a 12b-1 fee of 0.25% for Class A and 1.00% for Classes B and C. Class I does not pay a 12b-1 fee.
The advisor is reimbursing a portion of the 12b-1 fee for Class A. Had the fee not been reimbursed, returns for Class A would have been lower. Returns reflect expense limits previously in effect for all classes, without which returns would have been lower.
PORTFOLIO MANAGER COMMENTARY
The fund’s Class A shares returned -0.92% for the twelve-month period ended April 30, 2008, excluding any applicable sales charges. During the same period, the MLHYMI returned -0.76%.
The fund’s objective is to seek high income.
Investment Process
At the beginning of this past fiscal year, the high yield market had been providing excess returns and outperforming other fixed income sectors, but toward the end of June of 2007, problems with subprime collateral losses prompted investors to seek opportunities in the higher-quality markets. As a result, a typical “flight to quality” pattern occurred, with Treasury yields moving sharply lower and non-Treasury yield spreads increasing. We continued to implement a fundamental bottom-up security valuation style, reducing positions for which prices were above expected value and adding to positions for which prices were below expected value.
During the third quarter of 2007, many U.S. and foreign-based hedge fund and mutual fund managers announced that they were unable to meet investor redemptions because of their subprime investments. This situation raised concerns that subprime credit risks were spreading and would impair overall economic growth or, worse, the creditworthiness of banks and broker/dealers. Investors reasoned that unexpected losses incurred by banks and broker/dealers would increase the cost of lending to businesses. In response, investors typically raised their return requirements and demanded wider yield spreads across a broad range of fixed income investments, including high yield, which drove prices lower. During this period, we maintained a conservative portfolio, keeping duration, or sensitivity to interest rate changes, relatively short. The shorter duration was composed of purchases of callable and tendered bonds, which outperformed other high yield securities as yield spreads widened throughout most of the quarter.
As we moved into December of 2007, the high yield market continued its focus on how increased mortgage security write-downs in 2008 would affect business lending. Such concerns have prompted a number of measures from the U.S. Government to reduce defaults among subprime borrowers. Though the direct effect of reducing the number of foreclosures was considered positive, U.S. Treasury action signaled another level of government
Class I shares are only offered, subject to the minimum initial purchase requirements, in the following manner: (1) to investment advisory clients of EIMC (or its advisory affiliates), (2) to employer- or state-sponsored benefit plans, including but not limited to, retirement plans, defined benefit plans, deferred compensation plans, or savings plans, (3) to fee-based mutual fund wrap accounts, (4) through arrangements entered into on behalf of the Evergreen funds with certain financial services firms, (5) to certain institutional investors, and (6) to persons who owned Class Y shares in registered name in an Evergreen fund on or before December 31, 1994 or who owned shares of any SouthTrust fund in registered name as of March 18, 2005 or who owned shares of Vestaur Securities Fund as of May 20, 2005.
Class I shares are only available to institutional shareholders with a minimum of $1 million investment, which may be waived in certain situations.
The fund’s investment objective may be changed without a vote of the fund’s shareholders.
Foreign investments may contain more risk due to the inherent risks associated with changing political climates, foreign market instability and foreign currency fluctuations.
Derivatives involve additional risks including interest rate risk, credit risk, the risk of improper valuation and the risk of non-correlation to the relevant instruments they are designed to hedge or to closely track.
High yield, lower-rated bonds may contain more risk due to the increased possibility of default.
Loans are subject to risks similar to those associated with other below investment grade bond investments, such as credit risk (e.g. risk of issuer default), below investment grade bond risk (e.g. risk of greater volatility in value) and risk that the loan may become illiquid or difficult to price.
The return of principal is not guaranteed due to fluctuation in the fund’s NAV caused by changes in the price of individual bonds held by the fund and the buying and selling of bonds by the fund. Bond funds have the same inflation, interest rate and credit risks as individual bonds. Generally, the value of bond funds rises when prevailing interest rates fall, and falls when interest rates rise.
†Copyright 2008. Merrill Lynch, Pierce, Fenner & Smith Incorporated. All rights reserved.
All data is as of April 30, 2008, and subject to change.
5
PORTFOLIO MANAGER COMMENTARY continued
intervention and left many investors more confused about how to value investments. This negative sentiment, along with the usual illiquidity associated with the last weeks of 2007, raised hopes that the Federal Reserve Board (the “Fed”) would reconfirm its commitment to market liquidity. Such measures were made by both the Fed and European Central Banks which provided additional liquidity to the market and lowered year-end cost of funds. While these actions were considered positive, the high yield market continued to reflect concern about the effect of further securitized investment write-downs and the ability of financial institutions to make loans and underwrite non-investment grade financings in 2008. To reduce credit risk in this environment, we broadened the fund’s diversification by adding 15 issuers, and reduced exposure to lower-quality, CCC-rated securities by more than 2%. The fund continued to have an overweight to B-rated securities and an underweight to both BB- and CCC-rated securities.
In the first quarter of 2008, the high yield market continued to post very negative performance. Most of the underperformance resulted from increased risk aversion on the part of investors rather than specific high yield market events. While the Fed attempted to shore up investor confidence by lowering short-term interest rates and providing additional funding to the commercial banking system, it was not until the Central Bank provided direct funding to investment banks and offered partial collateral guarantees to JPMorgan in its purchase of Bear Stearns that investors began to become more confident that the U.S. financial system was sound.
Throughout the first quarter of 2008, the management of Evergreen High Income Fund emphasized broad diversification, and the fund’s relative weight in all but two of 70 industries in the benchmark was within 2.5%. This diversification strategy was helpful in providing consistent performance. Because of market volatility, the fund was able to purchase selected high yield bonds at prices that were below their expected downside value, as investors sold issues at distressed prices. In some cases, prices for these newly purchased securities recovered. In other situations, the securities remained lower than their expected value. In still other instances, the securities were sold because of concerns that specific company risks could lead to defaults.
Contributors to Performance
Overall risk positioning relative to the market and security selection benefited the fund’s performance. As market performance deteriorated, the fund’s conservative positioning with its short duration was a significant contributor. Security selection also added to results and performance was enhanced by energy companies Chesapeake Energy Corporation and Encore Acquisition; health care companies HCA and Universal Healthcare; and Utility companies Aquila, Inc. and Allegheny Energy. Investments in natural gas and non-airline transportation also added to performance as commodity prices continued to benefit oil field services companies such as Gulfmark Offshore and Hornbeck Marine and other transportation companies such as H-Lines Finance and Ship Finance International benefited from increased international trade. Investment in L-3 Communications also contributed to performance as continued demand for defense services provided continued stable cash flow in this Aerospace/Defense company.
Detractors from Performance
As the liquidity crunch broadened, mortgage companies originating prime mortgages were also unable to obtain financing. Thornburg Mortgage was a notable detractor due to this financing freeze. Much of Thornburg’s financing had been obtained through short-term and mortgage-backed financing. When these financing sources were no longer available, the high yield market significantly discounted the price of Thornburg’s bonds to reflect the substantial increase in the potential for default. In this environment, a portion of the
6
PORTFOLIO MANAGER COMMENTARY continued
Thornburg position was sold at a loss. Security selection in broadcasting companies was disappointing, as Young Broadcasting underperformed because of lower advertising revenues. Cable provider Charter Communications and other cable companies also performed poorly on prospects for slower subscriber growth in 2008. Among financial companies, Rescap and GMAC were volatile because of their exposure to subprime mortgages which were notable detractors from performance. In related auto investments, Metaldyne was also disappointing in its performance. A slight overweight in gaming and leisure held back results, as did positions in Isle of Capri Casinos and Trump Entertainment—though this was partially offset by not holding Harrah’s Operating Company. Among metals and mining companies, Griffin Coal Mining and Novelis also underperformed.
Outlook
At the end of the fiscal year, high yield spreads appeared to be indicating very slow economic growth in the coming quarters. Should these spreads widen, particularly if the economy goes into a recession, high yield securities are likely to underperform relative to U.S. Treasuries. On a more positive note, certain factors could keep high yield spreads at current levels. High yield spreads have widened more over the last six- and nine-month periods than in any six- and nine-month period in the past 10 years. In addition, because of the Fed’s lower interest rate policy, short-term interest rates have declined to a point where the difference between the short-term cost of borrowing and core inflation (inflation after removing the effects of food and energy price increases) is essentially zero. When this situation has occurred in the past, the high yield market has outperformed over the following 24-month period. Defaults are currently at a historically low level, and while they may increase over the next 12 to 24 months, this increase may already be discounted in current high yield market yield spreads. As a result, the high yield market could offer investors attractive returns, even if defaults increase over the next year.
This commentary reflects the views and opinions of the fund’s portfolio manager(s) on the date indicated and may include statements that constitute “forward-looking statements” under the U.S. Securities laws. Forward-looking statements include, among other things, projections, estimates, and information about possible or future results related to the fund, markets, or regulatory developments. The views expressed above are not guarantees of future performance or economic results and involve certain risks, uncertainties, and assumptions that could cause actual outcomes and results to differ materially from the views expressed herein. The views expressed above are subject to change at any time based upon economic, market, or other conditions and Evergreen undertakes no obligation to update the views expressed herein. Any discussions of specific securities should not be considered a recommendation to buy or sell those securities. The views expressed herein (including any forward-looking statements) may not be relied upon as investment advice or as an indication of the fund’s trading intent.
You should carefully consider the fund’s investment objectives, policies, risks, charges and expenses before investing. To obtain a prospectus, which contains this and other important information visit www.EvergreenInvestments.com or call 1.800.847.5397.
Please read the prospectus carefully before investing.
7
ABOUT YOUR FUND’S EXPENSES
The Example below is intended to describe the fees and expenses borne by shareholders and the impact of those costs on your investment.
Example
As a shareholder of the fund, you incur two types of costs: (1) transaction costs, including sales charges (loads), redemption fees and exchange fees; and (2) ongoing costs, including management fees, distribution (12b-1) fees and other fund expenses. This Example is intended to help you understand your ongoing costs (in dollars) of investing in the fund and to compare these costs with the ongoing costs of investing in other mutual funds. The Example is based on an investment of $1,000 invested at the beginning of the period and held for the entire period from November 1, 2007 to April 30, 2008.
The example illustrates your fund’s costs in two ways:
• Actual expenses
The section in the table under the heading “Actual” provides information about actual account values and actual expenses. You may use the information in these columns, together with the amount you invested, to estimate the expenses that you paid over the period. Simply divide your account value by $1,000 (for example, an $8,600 account value divided by $1,000 = 8.6), then multiply the result by the number in the appropriate column for your share class, in the column entitled “Expenses Paid During Period” to estimate the expenses you paid on your account during this period.
• Hypothetical example for comparison purposes
The section in the table under the heading “Hypothetical (5% return before expenses)” provides information about hypothetical account values and hypothetical expenses based on the fund’s actual expense ratio and an assumed rate of return of 5% per year before expenses, which is not the fund’s actual return. The hypothetical account values and expenses may not be used to estimate the actual ending account balance or expenses you paid for the period. You may use this information to compare the ongoing costs of investing in the fund and other funds. To do so, compare this 5% hypothetical example with the 5% hypothetical examples that appear in the shareholder reports of the other funds.
Please note that the expenses shown in the table are meant to highlight your ongoing costs only and do not reflect any transactional costs, such as sales charges (loads), redemption fees or exchange fees. Therefore, the section in the table under the heading “Hypothetical (5% return before expenses)” is useful in comparing ongoing costs only, and will not help you determine the relative total costs of owning different funds. In addition, if these transactional costs were included, your costs would have been higher.
| | Beginning
Account
Value
11/1/2007 | | Ending
Account
Value
4/30/2008 | | Expenses
Paid During
Period* |
|
|
|
|
|
|
|
|
|
|
|
|
|
Actual | | | | | | | | | | | | |
Class A | | $ | 1,000.00 | | | $ | 985.32 | | | $ | 5.38 | |
Class B | | $ | 1,000.00 | | | $ | 981.70 | | | $ | 9.07 | |
Class C | | $ | 1,000.00 | | | $ | 981.70 | | | $ | 9.07 | |
Class I | | $ | 1,000.00 | | | $ | 986.59 | | | $ | 4.10 | |
Hypothetical | | | | | | | | | | | | |
(5% return before expenses) | | | | | | | | | | | | |
Class A | | $ | 1,000.00 | | | $ | 1,019.44 | | | $ | 5.47 | |
Class B | | $ | 1,000.00 | | | $ | 1,015.71 | | | $ | 9.22 | |
Class C | | $ | 1,000.00 | | | $ | 1,015.71 | | | $ | 9.22 | |
Class I | | $ | 1,000.00 | | | $ | 1,020.74 | | | $ | 4.17 | |
|
|
|
|
|
|
|
|
|
|
|
|
|
* | For each class of the fund, expenses are equal to the annualized expense ratio of each class (1.09% for Class A, 1.84% for Class B, 1.84% for Class C and 0.83% for Class I), multiplied by the average account value over the period, multiplied by 182 / 366 days. |
8
FINANCIAL HIGHLIGHTS
(For a share outstanding throughout each period)
| | Year Ended April 30, |
| |
|
CLASS A | | 2008 | | 2007 | | 2006 | | 2005 | | 2004 |
|
|
|
|
|
|
|
|
|
|
|
Net asset value, beginning of period | | $ | 3.40 | | $ | 3.31 | | $ | 3.32 | | $ | 3.43 | | $ | 3.30 |
|
|
|
|
|
|
|
|
|
|
|
|
|
|
|
|
Income from investment operations | | | | | | | | | | | | | | | |
Net investment income (loss) | | | 0.25 | | | 0.241 | | | 0.23 | | | 0.24 | | | 0.25 |
Net realized and unrealized gains or losses on investments | | | (0.28) | | | 0.09 | | | 0 | | | (0.10) | | | 0.14 |
| |
|
|
|
|
|
|
|
|
|
|
|
|
|
|
Total from investment operations | | | (0.03) | | | 0.33 | | | 0.23 | | | 0.14 | | | 0.39 |
|
|
|
|
|
|
|
|
|
|
|
|
|
|
|
|
Distributions to shareholders from | | | | | | | | | | | | | | | |
Net investment income | | | (0.24) | | | (0.24) | | | (0.24) | | | (0.25) | | | (0.26) |
|
|
|
|
|
|
|
|
|
|
|
|
|
|
|
|
Net asset value, end of period | | $ | 3.13 | | $ | 3.40 | | $ | 3.31 | | $ | 3.32 | | $ | 3.43 |
|
|
|
|
|
|
|
|
|
|
|
|
|
|
|
|
Total return2 | | | (0.92)% | | | 10.35% | | | 7.01% | | | 4.14% | | | 12.25% |
|
|
|
|
|
|
|
|
|
|
|
|
|
|
|
|
Ratios and supplemental data | | | | | | | | | | | | | | | |
Net assets, end of period (thousands) | | $ | 270,758 | | $ | 335,411 | | $ | 388,523 | | $ | 467,714 | | $ | 530,526 |
Ratios to average net assets | | | | | | | | | | | | | | | |
Expenses including waivers/reimbursements but excluding expense reductions | | | 1.07% | | | 1.06% | | | 1.04% | | | 1.04% | | | 1.01% |
Expenses excluding waivers/reimbursements and expense reductions | | | 1.12% | | | 1.10% | | | 1.05% | | | 1.04% | | | 1.02% |
Net investment income (loss) | | | 7.82% | | | 7.19% | | | 6.95% | | | 7.16% | | | 7.42% |
Portfolio turnover rate | | | 110% | | | 48% | | | 67% | | | 65% | | | 71% |
|
|
|
|
|
|
|
|
|
|
|
|
|
|
|
|
1 | Net investment income (loss) per share is based on average shares outstanding during the period. |
2 | Excluding applicable sales charges |
See Notes to Financial Statements
9
FINANCIAL HIGHLIGHTS
(For a share outstanding throughout each period)
| | Year Ended April 30, |
| |
|
CLASS B | | | 2008 | | | 2007 | | | 2006 | | | 2005 | | | 2004 |
|
|
|
|
|
|
|
|
|
|
|
|
|
|
|
|
Net asset value, beginning of period | | $ | 3.40 | | $ | 3.31 | | $ | 3.32 | | $ | 3.43 | | $ | 3.30 |
|
|
|
|
|
|
|
|
|
|
|
|
|
|
|
|
Income from investment operations | | | | | | | | | | | | | | | |
Net investment income (loss) | | | 0.22 | | | 0.211 | | | 0.211 | | | 0.22 | | | 0.231 |
Net realized and unrealized gains or losses on investments | | | (0.28) | | | 0.09 | | | (0.01)2 | | | (0.10) | | | 0.14 |
| |
|
|
|
|
|
|
|
|
|
|
|
|
|
|
Total from investment operations | | | (0.06) | | | 0.30 | | | 0.20 | | | 0.12 | | | 0.37 |
|
|
|
|
|
|
|
|
|
|
|
|
|
|
|
|
Distributions to shareholders from | | | | | | | | | | | | | | | |
Net investment income | | | (0.21) | | | (0.21) | | | (0.21) | | | (0.23) | | | (0.24) |
|
|
|
|
|
|
|
|
|
|
|
|
|
|
|
|
Net asset value, end of period | | $ | 3.13 | | $ | 3.40 | | $ | 3.31 | | $ | 3.32 | | $ | 3.43 |
|
|
|
|
|
|
|
|
|
|
|
|
|
|
|
|
Total return3 | | | (1.65)% | | | 9.55% | | | 6.27% | | | 3.42% | | | 11.46% |
|
|
|
|
|
|
|
|
|
|
|
|
|
|
|
|
Ratios and supplemental data | | | | | | | | | | | | | | | |
Net assets, end of period (thousands) | | $ | 108,327 | | $ | 150,609 | | $ | 176,663 | | $ | 211,950 | | $ | 247,741 |
Ratios to average net assets | | | | | | | | | | | | | | | |
Expenses including waivers/reimbursements but excluding expense reductions | | | 1.82% | | | 1.80% | | | 1.75% | | | 1.74% | | | 1.72% |
Expenses excluding waivers/reimbursements and expense reductions | | | 1.82% | | | 1.80% | | | 1.75% | | | 1.74% | | | 1.72% |
Net investment income (loss) | | | 7.06% | | | 6.46% | | | 6.25% | | | 6.46% | | | 6.71% |
Portfolio turnover rate | | | 110% | | | 48% | | | 67% | | | 65% | | | 71% |
|
|
|
|
|
|
|
|
|
|
|
|
|
|
|
|
1 | Net investment income (loss) per share is based on average shares outstanding during the period. |
2 | The per share net realized and unrealized gains or losses is not in accord with the net realized and unrealized gains or losses for the period due to the timing of sales and redemptions of fund shares in relation to fluctuating market values of the portfolio. |
3 | Excluding applicable sales charges |
See Notes to Financial Statements
10
FINANCIAL HIGHLIGHTS
(For a share outstanding throughout each period)
| | Year Ended April 30, |
| |
|
CLASS C | | 2008 | | 2007 | | 2006 | | 2005 | | 2004 |
|
|
|
|
|
|
|
|
|
|
|
Net asset value, beginning of period | | $ | 3.40 | | $ | 3.31 | | $ | 3.32 | | $ | 3.43 | | $ | 3.30 |
|
|
|
|
|
|
|
|
|
|
|
|
|
|
|
|
Income from investment operations | | | | | | | | | | | | | | | |
Net investment income (loss) | | | 0.22 | | | 0.211 | | | 0.21 | | | 0.22 | | | 0.23 |
Net realized and unrealized gains or losses on investments | | | (0.28) | | | 0.09 | | | (0.01)2 | | | (0.10) | | | 0.14 |
| |
|
|
|
|
|
|
|
|
|
|
|
|
|
|
Total from investment operations | | | (0.06) | | | 0.30 | | | 0.20 | | | 0.12 | | | 0.37 |
|
|
|
|
|
|
|
|
|
|
|
|
|
|
|
|
Distributions to shareholders from | | | | | | | | | | | | | | | |
Net investment income | | | (0.21) | | | (0.21) | | | (0.21) | | | (0.23) | | | (0.24) |
|
|
|
|
|
|
|
|
|
|
|
|
|
|
|
|
Net asset value, end of period | | $ | 3.13 | | $ | 3.40 | | | $3.31 | | $ | 3.32 | | $ | 3.43 |
|
|
|
|
|
|
|
|
|
|
|
|
|
|
|
|
Total return3 | | | (1.65)% | | | 9.55% | | | 6.27% | | | 3.42% | | | 11.46% |
|
|
|
|
|
|
|
|
|
|
|
|
|
|
|
|
Ratios and supplemental data | | | | | | | | | | | | | | | |
Net assets, end of period (thousands) | | $ | 118,638 | | $ | 161,941 | | $ | 201,975 | | $ | 281,810 | | $ | 381,525 |
Ratios to average net assets | | | | | | | | | | | | | | | |
Expenses including waivers/reimbursements but excluding expense reductions | | | 1.82% | | | 1.80% | | | 1.75% | | | 1.74% | | | 1.72% |
Expenses excluding waivers/reimbursements and expense reductions | | | 1.82% | | | 1.80% | | | 1.75% | | | 1.74% | | | 1.72% |
Net investment income (loss) | | | 7.06% | | | 6.46% | | | 6.25% | | | 6.47% | | | 6.72% |
Portfolio turnover rate | | | 110% | | | 48% | | | 67% | | | 65% | | | 71% |
|
|
|
|
|
|
|
|
|
|
|
|
|
|
|
|
1 | Net investment income (loss) per share is based on average shares outstanding during the period. |
2 | The per share net realized and unrealized gains or losses is not in accord with the net realized and unrealized gains or losses for the period due to the timing of sales and redemptions of Fund shares in relation to fluctuating market values for the portfolio. |
3 | Excluding applicable sales charges |
See Notes to Financial Statements
11
FINANCIAL HIGHLIGHTS
(For a share outstanding throughout each period)
| | Year Ended April 30, |
| |
|
CLASS I | | 2008 | | 2007 | | 2006 | | 2005 | | 2004 |
|
|
|
|
|
|
|
|
|
|
|
Net asset value, beginning of period | | $ | 3.40 | | $ | 3.31 | | $ | 3.32 | | $ | 3.43 | | $ | 3.30 |
|
|
|
|
|
|
|
|
|
|
|
|
|
|
|
|
Income from investment operations | | | | | | | | | | | | | | | |
Net investment income (loss) | | | 0.26 | | | 0.251 | | | 0.24 | | | 0.26 | | | 0.26 |
Net realized and unrealized gains or losses on investments | | | (0.29) | | | 0.09 | | | 0 | | | (0.11) | | | 0.14 |
| |
|
|
|
|
|
|
|
|
|
|
|
|
|
|
Total from investment operations | | | (0.03) | | | 0.34 | | | 0.24 | | | 0.15 | | | 0.40 |
|
|
|
|
|
|
|
|
|
|
|
|
|
|
|
|
Distributions to shareholders from | | | | | | | | | | | | | | | |
Net investment income | | | (0.24) | | | (0.25) | | | (0.25) | | | (0.26) | | | (0.27) |
|
|
|
|
|
|
|
|
|
|
|
|
|
|
|
|
Net asset value, end of period | | $ | 3.13 | | $ | 3.40 | | $ | 3.31 | | $ | 3.32 | | $ | 3.43 |
|
|
|
|
|
|
|
|
|
|
|
|
|
|
|
|
Total return | | | (0.66)% | | | 10.65% | | | 7.33% | | | 4.45% | | | 12.58% |
|
|
|
|
|
|
|
|
|
|
|
|
|
|
|
|
Ratios and supplemental data | | | | | | | | | | | | | | | |
Net assets, end of period (thousands) | | $ | 25,729 | | $ | 27,147 | | $ | 50,365 | | $ | 60,412 | | $ | 37,894 |
Ratios to average net assets | | | | | | | | | | | | | | | |
Expenses including waivers/reimbursements but excluding expense reductions | | | 0.82% | | | 0.80% | | | 0.75% | | | 0.74% | | | 0.72% |
Expenses excluding waivers/reimbursements and expense reductions | | | 0.82% | | | 0.80% | | | 0.75% | | | 0.74% | | | 0.72% |
Net investment income (loss) | | | 8.05% | | | 7.42% | | | 7.23% | | | 7.46% | | | 7.73% |
Portfolio turnover rate | | | 110% | | | 48% | | | 67% | | | 65% | | | 71% |
|
|
|
|
|
|
|
|
|
|
|
|
|
|
|
|
1 | Net investment income (loss) per share is based on average shares outstanding during the period. |
See Notes to Financial Statements
12
SCHEDULE OF INVESTMENTS
April 30, 2008
| | | Principal
Amount | | |
Value |
|
|
|
|
|
|
|
CORPORATE BONDS 79.3% | | | | | | |
CONSUMER DISCRETIONARY 18.0% | | | | | | |
Auto Components 1.6% | | | | | | |
Cooper Standard Automotive, Inc.: | | | | | | |
7.00%, 12/15/2012 ρ | | $ | 210,000 | | $ | 193,620 |
8.375%, 12/15/2014 | | | 1,035,000 | | | 859,050 |
Cooper Tire & Rubber Co., 7.625%, 03/15/2027 | | | 2,715,000 | | | 2,307,750 |
Goodyear Tire & Rubber Co., 9.00%, 07/01/2015 ρ | | | 1,139,000 | | | 1,244,357 |
Metaldyne Corp.: | | | | | | |
10.00%, 11/01/2013 | | | 5,100,000 | | | 3,302,250 |
11.00%, 06/15/2012 | | | 1,772,000 | | | 655,640 |
| | | | |
|
|
| | | | | | 8,562,667 |
| | | | |
|
|
Automobiles 1.6% | | | | | | |
Ford Motor Co., 7.70%, 05/15/2097 | | | 5,630,000 | | | 3,743,950 |
General Motors Corp.: | | | | | | |
7.20%, 01/15/2011 ρ | | | 4,030,000 | | | 3,576,625 |
8.25%, 07/15/2023 ρ | | | 1,470,000 | | | 1,106,175 |
| | | | |
|
|
| | | | | | 8,426,750 |
| | | | |
|
|
Diversified Consumer Services 0.2% | | | | | | |
Education Management, LLC, 8.75%, 06/01/2014 | | | 1,040,000 | | | 930,800 |
Service Corporation International, 6.75%, 04/01/2015 | | | 85,000 | | | 85,531 |
| | | | |
|
|
| | | | | | 1,016,331 |
| | | | |
|
|
Hotels, Restaurants & Leisure 4.9% | | | | | | |
Caesars Entertainment, Inc.: | | | | | | |
7.875%, 03/15/2010 ρ | | | 1,625,000 | | | 1,535,625 |
8.125%, 05/15/2011 ρ | | | 590,000 | | | 502,238 |
Fontainebleau Las Vegas Holdings, LLC, 10.25%, 06/15/2015 ρ 144A | | | 5,272,000 | | | 3,809,020 |
Inn of the Mountain Gods Resort & Casino, 12.00%, 11/15/2010 | | | 2,095,000 | | | 1,822,650 |
Isle of Capri Casinos, Inc., 7.00%, 03/01/2014 ρ | | | 6,725,000 | | | 5,211,875 |
Pinnacle Entertainment, Inc., 8.75%, 10/01/2013 | | | 175,000 | | | 178,500 |
Pokagon Gaming Authority, 10.375%, 06/15/2014 144A ρ | | | 2,670,000 | | | 2,863,575 |
Seneca Gaming Corp., 7.25%, 05/01/2012 | | | 565,000 | | | 548,756 |
Shingle Springs Tribal Gaming Authority, 9.375%, 06/15/2015 144A ρ | | | 2,615,000 | | | 2,327,350 |
Six Flags, Inc.: | | | | | | |
8.875%, 02/01/2010 ρ | | | 660,000 | | | 551,100 |
9.625%, 06/01/2014 ρ | | | 1,000,000 | | | 665,000 |
Trump Entertainment Resorts, Inc., 8.50%, 06/01/2015 ρ | | | 6,440,000 | | | 4,169,900 |
Universal City Development Partners, Ltd., 11.75%, 04/01/2010 | | | 1,320,000 | | | 1,369,500 |
| | | | |
|
|
| | | | | | 25,555,089 |
| | | | |
|
|
Household Durables 2.2% | | | | | | |
Centex Corp.: | | | | | | |
4.875%, 08/15/2008 | | | 1,220,000 | | | 1,207,887 |
5.80%, 09/15/2009 | | | 380,000 | | | 364,922 |
See Notes to Financial Statements
13
SCHEDULE OF INVESTMENTS continued
April 30, 2008
| | | Principal Amount | | | Value |
|
|
|
|
|
|
|
CORPORATE BONDS continued | | | | | | |
CONSUMER DISCRETIONARY continued | | | | | | |
Household Durables continued | | | | | | |
D.R. Horton, Inc.: | | | | | | |
4.875%, 01/15/2010 | | $ | 580,000 | | $ | 553,900 |
5.00%, 01/15/2009 | | | 1,300,000 | | | 1,267,500 |
8.00%, 02/01/2009 | | | 620,000 | | | 620,000 |
Hovnanian Enterprises, Inc.: | | | | | | |
6.00%, 01/15/2010 ρ | | | 695,000 | | | 545,575 |
6.50%, 01/15/2014 | | | 804,000 | | | 574,860 |
KB Home: | | | | | | |
7.75%, 02/01/2010 ρ | | | 915,000 | | | 903,563 |
8.625%, 12/15/2008 | | | 555,000 | | | 563,325 |
Libbey, Inc., FRN, 11.91%, 06/01/2011 ρ | | | 1,315,000 | | | 1,324,862 |
Meritage Homes Corp., 7.00%, 05/01/2014 | | | 565,000 | | | 485,194 |
Pulte Homes, Inc.: | | | | | | |
4.875%, 07/15/2009 | | | 2,570,000 | | | 2,492,900 |
7.875%, 08/01/2011 | | | 160,000 | | | 156,800 |
Standard Pacific Corp., 5.125%, 04/01/2009 | | | 615,000 | | | 550,425 |
| | | | |
|
|
| | | | | | 11,611,713 |
| | | | |
|
|
Media 4.8% | | | | | | |
Cablevision Systems Corp., Ser. B, 8.00%, 04/15/2012 | | | 1,830,000 | | | 1,830,000 |
Charter Communications, Inc., 10.875%, 09/15/2014 144A ρ | | | 3,760,000 | | | 3,995,000 |
CSC Holdings, Inc., 7.625%, 04/01/2011 | | | 1,640,000 | | | 1,660,500 |
Idearc, Inc., 8.00%, 11/15/2016 | | | 5,060,000 | | | 3,314,300 |
Lamar Media Corp.: | | | | | | |
6.625%, 08/15/2015 ρ | | | 3,470,000 | | | 3,287,825 |
7.25%, 01/01/2013 | | | 165,000 | | | 164,175 |
Mediacom Broadband, LLC, 8.50%, 10/15/2015 ρ | | | 580,000 | | | 536,500 |
Mediacom, LLC, 7.875%, 02/15/2011 | | | 515,000 | | | 489,250 |
Ion Media Networks, Inc., FRN, 8.96%, 01/15/2013 144A | | | 2,950,000 | | | 1,777,375 |
R.H. Donnelley Corp., Ser. A-4, 8.875%, 10/15/2017 144A | | | 2,980,000 | | | 1,937,000 |
Sinclair Broadcast Group, Inc., 8.00%, 03/15/2012 ρ | | | 480,000 | | | 487,800 |
Sirius Satellite Radio, Inc., 9.625%, 08/01/2013 ρ | | | 1,685,000 | | | 1,428,038 |
XM Satellite Radio Holdings, Inc., 9.75%, 05/01/2014 ρ | | | 1,705,000 | | | 1,649,587 |
Young Broadcasting, Inc., 8.75%, 01/15/2014 | | | 4,700,000 | | | 2,773,000 |
| | | | |
|
|
| | | | | | 25,330,350 |
| | | | |
|
|
Multi-line Retail 0.3% | | | | | | |
Neiman Marcus Group, Inc., 9.00%, 10/15/2015 | | | 1,310,000 | | | 1,368,950 |
| | | | |
|
|
Specialty Retail 1.3% | | | | | | |
American Achievement Corp., 8.25%, 04/01/2012 | | | 2,760,000 | | | 2,442,600 |
Home Depot, Inc., 5.875%, 12/16/2036 | | | 650,000 | | | 545,104 |
Michaels Stores, Inc., 10.00%, 11/01/2014 ρ | | | 1,080,000 | | | 1,053,000 |
Payless ShoeSource, Inc., 8.25%, 08/01/2013 | | | 2,935,000 | | | 2,663,513 |
| | | | |
|
|
| | | | | | 6,704,217 |
| | | | |
|
|
See Notes to Financial Statements
14
SCHEDULE OF INVESTMENTS continued
April 30, 2008
| | | Principal
Amount | | | Value |
|
|
|
|
|
|
|
CORPORATE BONDS continued | | | | | | |
CONSUMER DISCRETIONARY continued | | | | | | |
Textiles, Apparel & Luxury Goods 1.1% | | | | | | |
AAC Group Holdings Corp., Sr. Disc. Note, Step Bond, 0.00%, 10/01/2012 † | | $ | 435,000 | | $ | 341,475 |
Oxford Industries, Inc., 8.875%, 06/01/2011 | | | 4,762,000 | | | 4,559,615 |
Unifi, Inc., 11.50%, 05/15/2014 ρ | | | 835,000 | | | 680,525 |
| | | | |
|
|
| | | | | | 5,581,615 |
| | | | |
|
|
CONSUMER STAPLES 1.9% | | | | | | |
Beverages 0.1% | | | | | | |
Constellation Brands, Inc., 8.375%, 12/15/2014 | | | 285,000 | | | 303,525 |
| | | | |
|
|
Food & Staples Retailing 0.3% | | | | | | |
Ingles Markets, Inc., 8.875%, 12/01/2011 | | | 885,000 | | | 902,700 |
Rite Aid Corp., 8.125%, 05/01/2010 ρ | | | 570,000 | | | 572,850 |
| | | | |
|
|
| | | | | | 1,475,550 |
| | | | |
|
|
Food Products 0.9% | | | | | | |
Dean Foods Co., 6.625%, 05/15/2009 | | | 190,000 | | | 190,950 |
Del Monte Foods Co.: | | | | | | |
6.75%, 02/15/2015 ρ | | | 2,070,000 | | | 2,007,900 |
8.625%, 12/15/2012 ρ | | | 1,240,000 | | | 1,289,600 |
Pilgrim’s Pride Corp.: | | | | | | |
7.625%, 05/01/2015 | | | 140,000 | | | 133,700 |
8.375%, 05/01/2017 | | | 1,525,000 | | | 1,364,875 |
| | | | |
|
|
| | | | | | 4,987,025 |
| | | | |
|
|
Household Products 0.1% | | | | | | |
Church & Dwight Co., 6.00%, 12/15/2012 | | | 480,000 | | | 475,200 |
| | | | |
|
|
Personal Products 0.5% | | | | | | |
Central Garden & Pet Co., 9.125%, 02/01/2013 | | | 3,265,000 | | | 2,775,250 |
| | | | |
|
|
ENERGY 9.9% | | | | | | |
Energy Equipment & Services 2.7% | | | | | | |
Bristow Group, Inc., 7.50%, 09/15/2017 | | | 1,160,000 | | | 1,203,500 |
Dresser-Rand Group, Inc., 7.375%, 11/01/2014 ρ | | | 1,689,000 | | | 1,697,445 |
GulfMark Offshore, Inc., 7.75%, 07/15/2014 | | | 1,465,000 | | | 1,523,600 |
Hornbeck Offshore Services, Inc., Ser. B, 6.125%, 12/01/2014 | | | 4,210,000 | | | 4,115,275 |
Parker Drilling Co., 9.625%, 10/01/2013 | | | 1,870,000 | | | 1,972,850 |
PHI, Inc., 7.125%, 04/15/2013 | | | 4,100,000 | | | 3,854,000 |
| | | | |
|
|
| | | | | | 14,366,670 |
| | | | |
|
|
Oil, Gas & Consumable Fuels 7.2% | | | | | | |
Chesapeake Energy Corp., 6.875%, 01/15/2016 ρ | | | 4,390,000 | | | 4,455,850 |
Clayton Williams Energy, Inc., 7.75%, 08/01/2013 | | | 1,565,000 | | | 1,471,100 |
Delta Petroleum Corp., 7.00%, 04/01/2015 | | | 1,705,000 | | | 1,517,450 |
El Paso Corp., 7.00%, 06/15/2017 | | | 1,025,000 | | | 1,074,796 |
See Notes to Financial Statements
15
SCHEDULE OF INVESTMENTS continued
April 30, 2008
| | | Principal
Amount | | | Value |
|
|
|
|
|
|
|
CORPORATE BONDS continued | | | | | | |
ENERGY continued | | | | | | |
Oil, Gas & Consumable Fuels continued | | | | | | |
Encore Acquisition Co.: | | | | | | |
6.00%, 07/15/2015 | | $ | 3,360,000 | | $ | 3,108,000 |
6.25%, 04/15/2014 ρ | | | 720,000 | | | 680,400 |
Energy Partners, Ltd., 9.75%, 04/15/2014 ρ | | | 920,000 | | | 855,600 |
Exco Resources, Inc., 7.25%, 01/15/2011 | | | 2,260,000 | | | 2,260,000 |
Forbes Energy Services, LLC, 11.00%, 02/15/2015 144A | | | 2,790,000 | | | 2,803,950 |
Forest Oil Corp., 7.25%, 06/15/2019 ρ | | | 875,000 | | | 907,812 |
Frontier Oil Corp., 6.625%, 10/01/2011 | | | 770,000 | | | 770,000 |
Mariner Energy, Inc., 8.00%, 05/15/2017 | | | 622,000 | | | 614,225 |
Peabody Energy Corp.: | | | | | | |
5.875%, 04/15/2016 | | | 3,750,000 | | | 3,656,250 |
7.875%, 11/01/2026 | | | 375,000 | | | 389,063 |
Plains All American Pipeline, LP, 6.50%, 05/01/2018 144A | | | 570,000 | | | 583,202 |
Plains Exploration & Production Co., 7.75%, 06/15/2015 | | | 1,000,000 | | | 1,030,000 |
Sabine Pass LNG, LP: | | | | | | |
7.25%, 11/30/2013 | | | 3,915,000 | | | 3,640,950 |
7.50%, 11/30/2016 | | | 260,000 | | | 239,200 |
Southwestern Energy Co., 7.50%, 02/01/2018 144A | | | 180,000 | | | 191,700 |
Tesoro Corp.: | | | | | | |
6.50%, 06/01/2017 | | | 2,135,000 | | | 1,969,537 |
6.625%, 11/01/2015 | | | 820,000 | | | 774,900 |
Williams Cos., 8.125%, 03/15/2012 | | | 4,060,000 | | | 4,466,000 |
| | | | |
|
|
| | | | | | 37,459,985 |
| | | | |
|
|
FINANCIALS 13.8% | | | | | | |
Capital Markets 0.4% | | | | | | |
E*TRADE Financial Corp.: | | | | | | |
7.375%, 09/15/2013 | | | 990,000 | | | 809,325 |
8.00%, 06/15/2011 | | | 180,000 | | | 161,100 |
12.50%, 11/30/2017 144A | | | 935,000 | | | 971,231 |
| | | | |
|
|
| | | | | | 1,941,656 |
| | | | |
|
|
Consumer Finance 8.0% | | | | | | |
CCH II Capital Corp., 10.25%, 09/15/2010 | | | 7,360,000 | | | 7,117,912 |
Ford Motor Credit Co., LLC: | | | | | | |
5.70%, 01/15/2010 | | | 3,980,000 | | | 3,726,490 |
5.80%, 01/12/2009 | | | 1,400,000 | | | 1,369,155 |
7.375%, 10/28/2009 | | | 4,965,000 | | | 4,781,072 |
9.75%, 09/15/2010 | | | 3,255,000 | | | 3,163,860 |
General Motors Acceptance Corp., LLC: | | | | | | |
5.625%, 05/15/2009 ρ | | | 1,035,000 | | | 973,373 |
6.875%, 09/15/2011 | | | 405,000 | | | 337,736 |
6.875%, 08/28/2012 | | | 8,645,000 | | | 6,864,433 |
7.25%, 03/02/2011 | | | 400,000 | | | 339,527 |
See Notes to Financial Statements
16
SCHEDULE OF INVESTMENTS continued
April 30, 2008
| | | Principal
Amount | | | Value |
|
|
|
|
|
|
|
CORPORATE BONDS continued | | | | | | |
FINANCIALS continued | | | | | | |
Consumer Finance continued | | | | | | |
General Motors Acceptance Corp., LLC: | | | | | | |
7.75%, 01/19/2010 | | $ | 1,620,000 | | $ | 1,491,161 |
8.00%, 11/01/2031 | | | 3,715,000 | | | 2,816,917 |
FRN: | | | | | | |
3.75%, 09/23/2008 | | | 1,645,000 | | | 1,614,183 |
4.32%, 05/15/2009 | | | 2,750,000 | | | 2,509,598 |
Qwest Capital Funding, Inc., 6.50%, 11/15/2018 | | | 620,000 | | | 520,800 |
Sprint Capital Corp., 6.875%, 11/15/2028 | | | 2,490,000 | | | 1,940,641 |
Toll Corp.: | | | | | | |
8.25%, 02/01/2011 | | | 2,145,000 | | | 2,075,287 |
8.25%, 12/01/2011 | | | 410,000 | | | 393,600 |
| | | | |
|
|
| | | | | | 42,035,745 |
| | | | |
|
|
Diversified Financial Services 1.5% | | | | | | |
Citigroup, Inc., FRN, 8.40%, 04/29/2049 | | | 1,495,000 | | | 1,514,928 |
JPMorgan Chase & Co., FRN, 7.90%, 12/31/2049 | | | 985,000 | | | 1,006,663 |
Leucadia National Corp.: | | | | | | |
7.125%, 03/15/2017 | | | 205,000 | | | 196,800 |
8.125%, 09/15/2015 | | | 4,210,000 | | | 4,315,250 |
Biomet, Inc., 11.625%, 10/15/2017 144A | | | 610,000 | | | 651,175 |
| | | | |
|
|
| | | | | | 7,684,816 |
| | | | |
|
|
Real Estate Investment Trusts 2.0% | | | | | | |
Host Marriott Corp.: | | | | | | |
7.125%, 11/01/2013 ρ | | | 2,250,000 | | | 2,252,813 |
Ser. Q, 6.75%, 06/01/2016 | | | 2,755,000 | | | 2,706,787 |
Omega Healthcare Investors, Inc.: | | | | | | |
7.00%, 04/01/2014 | | | 3,980,000 | | | 3,905,375 |
7.00%, 01/15/2016 | | | 435,000 | | | 422,494 |
Ventas, Inc., 7.125%, 06/01/2015 | | | 920,000 | | | 926,900 |
| | | | |
|
|
| | | | | | 10,214,369 |
| | | | |
|
|
Thrifts & Mortgage Finance 1.9% | | | | | | |
Residential Capital, LLC: | | | | | | |
FRN, 3.49%, 06/09/2008 ρ | | | 790,000 | | | 739,638 |
Step Bond: | | | | | | |
8.125%, 11/21/2008 Š | | | 1,295,000 | | | 1,081,325 |
8.375%, 06/30/2010 Š | | | 15,240,000 | | | 8,343,900 |
| | | | |
|
|
| | | | | | 10,164,863 |
| | | | |
|
|
HEALTH CARE 3.2% | | | | | | |
Health Care Providers & Services 3.2% | | | | | | |
HCA, Inc.: | | | | | | |
6.375%, 01/15/2015 | | | 50,000 | | | 44,750 |
8.75%, 09/01/2010 | | | 1,365,000 | | | 1,409,363 |
9.25%, 11/15/2016 | | | 8,195,000 | | | 8,830,112 |
See Notes to Financial Statements |
17
SCHEDULE OF INVESTMENTS continued
April 30, 2008
| | | Principal
Amount | | | Value |
|
|
|
|
|
|
|
CORPORATE BONDS continued | | | | | | |
HEALTH CARE continued | | | | | | |
Health Care Providers & Services continued | | | | | | |
Omnicare, Inc.: | | | | | | |
6.125%, 06/01/2013 | | $ | 3,360,000 | | $ | 3,074,400 |
6.875%, 12/15/2015 | | | 3,755,000 | | | 3,445,212 |
| | | | |
|
|
| | | | | | 16,803,837 |
| | | | |
|
|
INDUSTRIALS 7.7% | | | | | | |
Aerospace & Defense 4.3% | | | | | | |
Alliant Techsystems, Inc., 6.75%, 04/01/2016 | | | 410,000 | | | 407,950 |
DAE Aviation Holdings, 11.25%, 08/01/2015 144A | | | 860,000 | | | 878,275 |
DRS Technologies, Inc., 6.625%, 02/01/2016 | | | 975,000 | | | 970,125 |
Hexcel Corp., 6.75%, 02/01/2015 | | | 1,585,000 | | | 1,583,019 |
L-3 Communications Holdings, Inc.: | | | | | | |
5.875%, 01/15/2015 | | | 12,010,000 | | | 11,709,750 |
6.375%, 10/15/2015 | | | 4,265,000 | | | 4,238,343 |
Vought Aircraft Industries, Inc., 8.00%, 07/15/2011 ρ | | | 2,950,000 | | | 2,817,250 |
| | | | |
|
|
| | | | | | 22,604,712 |
| | | | |
|
|
Commercial Services & Supplies 1.4% | | | | | | |
Browning-Ferris Industries, Inc.: | | | | | | |
7.40%, 09/15/2035 | | | 1,975,000 | | | 1,807,125 |
9.25%, 05/01/2021 | | | 2,360,000 | | | 2,454,400 |
Geo Group, Inc., 8.25%, 07/15/2013 | | | 650,000 | | | 674,375 |
Mobile Mini, Inc., 6.875%, 05/01/2015 ρ | | | 1,295,000 | | | 1,097,512 |
Norcross Safety Products, LLC, Ser. B, 9.875%, 08/15/2011 | | | 1,500,000 | | | 1,579,695 |
| | | | |
|
|
| | | | | | 7,613,107 |
| | | | |
|
|
Machinery 0.9% | | | | | | |
Commercial Vehicle Group, Inc., 8.00%, 07/01/2013 | | | 5,370,000 | | | 4,631,625 |
| | | | |
|
|
Road & Rail 0.8% | | | | | | |
Avis Budget Car Rental, LLC, 7.75%, 05/15/2016 | | | 85,000 | | | 75,438 |
Hertz Global Holdings, Inc.: | | | | | | |
8.875%, 01/01/2014 | | | 1,440,000 | | | 1,458,000 |
10.50%, 01/01/2016 ρ | | | 40,000 | | | 40,450 |
Kansas City Southern: | | | | | | |
7.50%, 06/15/2009 | | | 1,070,000 | | | 1,102,100 |
9.50%, 10/01/2008 | | | 1,355,000 | | | 1,375,325 |
| | | | |
|
|
| | | | | | 4,051,313 |
| | | | |
|
|
Trading Companies & Distributors 0.3% | | | | | | |
Neff Corp., 10.00%, 06/01/2015 ρ | | | 240,000 | | | 118,800 |
United Rentals, Inc., 6.50%, 02/15/2012 | | | 1,325,000 | | | 1,248,813 |
| | | | |
|
|
| | | | | | 1,367,613 |
| | | | |
|
|
See Notes to Financial Statements
18
SCHEDULE OF INVESTMENTS continued
April 30, 2008
| | | Principal
Amount | | | Value |
|
|
|
|
|
|
|
| CORPORATE BONDS continued | | | | | | |
| INFORMATION TECHNOLOGY 3.5% | | | | | | |
| Electronic Equipment & Instruments 1.7% | | | | | | |
| Da-Lite Screen Co., Inc., 9.50%, 05/15/2011 | | $ | 2,765,000 | | $ | 2,640,575 |
| Jabil Circuit, Inc.: | | | | | | |
| 5.875%, 07/15/2010 | | | 535,000 | | | 525,589 |
| 8.25%, 03/15/2018 144A | | | 4,075,000 | | | 4,095,375 |
| Sanmina-SCI Corp.: | | | | | | |
| 6.75%, 03/01/2013 | | | 440,000 | | | 400,400 |
| 8.125%, 03/01/2016 | | | 695,000 | | | 642,875 |
| FRN, 5.55%, 06/15/2010 144A | | | 563,000 | | | 558,778 |
| | | | | |
|
|
| | | | | | | 8,863,592 |
| | | | | |
|
|
| IT Services 1.3% | | | | | | |
| First Data Corp., 9.875%, 09/24/2015 144A | | | 3,010,000 | | | 2,742,862 |
| ipayment, Inc., 9.75%, 05/15/2014 | | | 1,660,000 | | | 1,435,900 |
| SunGard Data Systems, Inc.: | | | | | | |
| 4.875%, 01/15/2014 | | | 2,505,000 | | | 2,210,662 |
| 10.25%, 08/15/2015 | | | 50,000 | | | 53,375 |
| Unisys Corp., 6.875%, 03/15/2010 | | | 715,000 | | | 690,869 |
| | | | | |
|
|
| | | | | | | 7,133,668 |
| | | | | |
|
|
| Office Electronics 0.1% | | | | | | |
| Xerox Corp., 6.35%, 05/15/2018 | | | 555,000 | | | 558,829 |
| | | | | |
|
|
| Semiconductors & Semiconductor Equipment 0.4% | | | | | | |
| Freescale Semiconductor, Inc.: | | | | | | |
| 8.875%, 12/15/2014 | | | 85,000 | | | 75,225 |
| 9.125%, 12/15/2014 ρ | | | 720,000 | | | 595,800 |
| Spansion, Inc., FRN, 6.20%, 06/01/2013 144A | | | 1,785,000 | | | 1,347,675 |
| | | | | |
|
|
| | | | | | | 2,018,700 |
| | | | | |
|
|
| MATERIALS 9.1% | | | | | | |
| Chemicals 4.0% | | | | | | |
| ARCO Chemical Co.: | | | | | | |
| 9.80%, 02/01/2020 ρ | | | 1,150,000 | | | 1,012,000 |
| 10.25%, 11/01/2010 | | | 190,000 | | | 194,750 |
| Huntsman, LLC, 11.625%, 10/15/2010 | | | 1,970,000 | | | 2,078,350 |
| Koppers Holdings, Inc.: | | | | | | |
| 9.875%, 10/15/2013 | | | 225,000 | | | 239,625 |
| Sr. Disc. Note, Step Bond, 0.00%, 11/15/2014 † | | | 2,100,000 | | | 1,848,000 |
| MacDermid, Inc., 9.50%, 04/15/2017 144A | | | 3,071,000 | | | 2,948,160 |
| Millenium America, Inc., 7.625%, 11/15/2026 | | | 2,265,000 | | | 1,466,587 |
| Momentive Performance Materials, Inc.: | | | | | | |
| 9.75%, 12/01/2014 | | | 2,425,000 | | | 2,364,375 |
| 10.125%, 12/01/2014 | | | 1,095,000 | | | 1,048,463 |
| | | | | | | |
See Notes to Financial Statements
19
SCHEDULE OF INVESTMENTS continued
April 30, 2008
| | | Principal
Amount | | | Value |
|
|
|
|
|
|
|
CORPORATE BONDS continued | | | | | | |
MATERIALS continued | | | | | | |
Chemicals continued | | | | | | |
Mosaic Co.: | | | | | | |
7.30%, 01/15/2028 | | $ | 1,325,000 | | $ | 1,291,875 |
7.875%, 12/01/2016 144A | | | 1,990,000 | | | 2,189,000 |
Tronox Worldwide, LLC, 9.50%, 12/01/2012 | | | 4,844,000 | | | 4,190,060 |
| | | | |
|
|
| | | | | | 20,871,245 |
| | | | |
|
|
Construction Materials 0.7% | | | | | | |
CPG International, Inc.: | | | | | | |
10.50%, 07/01/2013 | | | 3,395,000 | | | 2,919,700 |
FRN, 11.47%, 07/01/2012 | | | 625,000 | | | 510,938 |
| | | | |
|
|
| | | | | | 3,430,638 |
| | | | |
|
|
Containers & Packaging 2.7% | | | | | | |
Berry Plastics Holdings Corp.: | | | | | | |
6.68%, 09/15/2014 | | | 605,000 | | | 517,275 |
7.57%, 02/15/2015 144A | | | 720,000 | | | 698,400 |
8.875%, 09/15/2014 | | | 580,000 | | | 545,200 |
Exopack Holding Corp., 11.25%, 02/01/2014 | | | 3,115,000 | | | 2,990,400 |
Graham Packaging Co.: | | | | | | |
8.50%, 10/15/2012 ρ | | | 2,105,000 | | | 2,073,425 |
9.875%, 10/15/2014 | | | 1,515,000 | | | 1,431,675 |
Graphic Packaging International, Inc.: | | | | | | |
8.50%, 08/15/2011 ρ | | | 2,375,000 | | | 2,410,625 |
9.50%, 08/15/2013 | | | 505,000 | | | 505,000 |
Smurfit-Stone Container Corp., 8.375%, 07/01/2012 | | | 3,390,000 | | | 3,118,800 |
| | | | |
|
|
| | | | | | 14,290,800 |
| | | | |
|
|
Metals & Mining 0.8% | | | | | | |
Freeport-McMoRan Copper & Gold, Inc., 8.375%, 04/01/2017 | | | 2,705,000 | | | 2,995,787 |
Indalex Holdings Corp., 11.50%, 02/01/2014 | | | 1,870,000 | | | 1,467,950 |
| | | | |
|
|
| | | | | | 4,463,737 |
| | | | |
|
|
Paper & Forest Products 0.9% | | | | | | |
Georgia Pacific Corp., 8.875%, 05/15/2031 | | | 2,240,000 | | | 2,195,200 |
Verso Paper Holdings, LLC, 11.375%, 08/01/2016 | | | 2,462,000 | | | 2,535,860 |
| | | | |
|
|
| | | | | | 4,731,060 |
| | | | |
|
|
TELECOMMUNICATION SERVICES 4.9% | | | | | | |
Diversified Telecommunication Services 1.7% | | | | | | |
Citizens Communications Co., 7.875%, 01/15/2027 | | | 1,085,000 | | | 968,363 |
FairPoint Communications, Inc., 13.125%, 04/01/2018 144A ρ | | | 890,000 | | | 903,350 |
Qwest Corp.: | | | | | | |
6.50%, 06/01/2017 | | | 550,000 | | | 518,375 |
7.50%, 06/15/2023 | | | 635,000 | | | 584,200 |
See Notes to Financial Statements
20
SCHEDULE OF INVESTMENTS continued
April 30, 2008
| | | Principal
Amount | | | Value |
|
|
|
|
|
|
|
CORPORATE BONDS continued | | | | | | |
TELECOMMUNICATION SERVICES continued | | | | | | |
Diversified Telecommunication Services continued | | | | | | |
Qwest Corp.: | | | | | | |
7.875%, 09/01/2011 | | $ | 2,680,000 | | $ | 2,760,400 |
8.875%, 03/15/2012 | | | 1,365,000 | | | 1,446,900 |
West Corp., 11.00%, 10/15/2016 ρ | | | 1,870,000 | | | 1,671,312 |
| | | | |
|
|
| | | | | | 8,852,900 |
| | | | |
|
|
Wireless Telecommunication Services 3.2% | | | | | | |
Centennial Communications Corp., 8.125%, 02/01/2014 ρ | | | 3,535,000 | | | 3,535,000 |
Cricket Communications, Inc., 9.375%, 11/01/2014 ρ | | | 1,725,000 | | | 1,701,281 |
MetroPCS Communications, Inc., 9.25%, 11/01/2014 | | | 3,430,000 | | | 3,387,125 |
Rural Cellular Corp., 8.25%, 03/15/2012 | | | 3,600,000 | | | 3,762,000 |
Sprint Nextel Corp.: | | | | | | |
6.375%, 05/01/2009 | | | 1,235,000 | | | 1,216,763 |
6.90%, 05/01/2019 | | | 355,000 | | | 293,401 |
Ser. D, 7.375%, 08/01/2015 | | | 1,990,000 | | | 1,593,075 |
Ser. F, 5.95%, 03/15/2014 | | | 2,015,000 | | | 1,573,528 |
| | | | |
|
|
| | | | | | 17,062,173 |
| | | | |
|
|
UTILITIES 7.3% | | | | | | |
Electric Utilities 7.2% | | | | | | |
Allegheny Energy Supply Co., 8.25%, 04/15/2012 144A | | | 3,965,000 | | | 4,242,550 |
Aquila, Inc., Step Bond, 14.875%, 07/01/2012 Š | | | 5,510,000 | | | 6,722,200 |
CMS Energy Corp.: | | | | | | |
6.55%, 07/17/2017 | | | 300,000 | | | 296,172 |
8.50%, 04/15/2011 | | | 325,000 | | | 349,684 |
Edison Mission Energy: | | | | | | |
7.00%, 05/15/2017 | | | 335,000 | | | 340,025 |
7.20%, 05/15/2019 | | | 480,000 | | | 486,000 |
Energy Future Holdings Corp.: | | | | | | |
10.875%, 11/01/2017 144A ρ | | | 2,710,000 | | | 2,899,700 |
11.25%, 11/01/2017 144A | | | 1,625,000 | | | 1,710,313 |
Mirant Americas Generation, LLC, 8.50%, 10/01/2021 ρ | | | 500,000 | | | 492,500 |
Mirant Mid-Atlantic, LLC, Ser. C, 10.06%, 12/30/2028 | | | 433,561 | | | 498,595 |
Mirant North America, LLC, 7.375%, 12/31/2013 ρ | | | 4,625,000 | | | 4,821,563 |
NRG Energy, Inc., 7.375%, 02/01/2016 | | | 3,870,000 | | | 3,995,775 |
Orion Power Holdings, Inc., 12.00%, 05/01/2010 | | | 4,665,000 | | | 5,166,487 |
Reliant Energy, Inc.: | | | | | | |
6.75%, 12/15/2014 | | | 4,926,000 | | | 5,110,725 |
7.875%, 06/15/2017 ρ | | | 90,000 | | | 94,275 |
Texas Competitive Electric Holdings Co., LLC: | | | | | | |
10.25%, 11/01/2015 144A | | | 300,000 | | | 314,250 |
10.50%, 11/01/2016 144A | | | 50,000 | | | 51,438 |
| | | | |
|
|
| | | | | | 37,592,252 |
| | | | |
|
|
See Notes to Financial Statements
21
SCHEDULE OF INVESTMENTS continued
April 30, 2008
| | | Principal
Amount | | |
Value |
|
|
|
|
|
|
|
CORPORATE BONDS continued | | | | | | |
UTILITIES continued | | | | | | |
Independent Power Producers & Energy Traders 0.1% | | | | | | |
Dynegy Holdings, Inc., 7.50%, 06/01/2015 ρ | | $ | 370,000 | | $ | 370,000 |
| | | | |
|
|
Total Corporate Bonds (cost $435,246,599) | | | | | | 415,354,137 |
| | | | |
|
|
WHOLE LOAN MORTGAGE-BACKED PASS THROUGH SECURITIES 0.5% | | | | | | |
Lehman XS Trust, Ser. 2006-18N, Class A5A, 3.07%, 12/25/2036 (cost $2,548,975) | | | 3,565,000 | | | 2,576,603 |
| | | | |
|
|
YANKEE OBLIGATIONS – CORPORATE 11.2% | | | | | | |
CONSUMER DISCRETIONARY 0.0% | | | | | | |
Media 0.0% | | | | | | |
Videotron, Ltd., 9.125%, 04/15/2018 144A | | | 155,000 | | | 165,850 |
| | | | |
|
|
ENERGY 2.6% | | | | | | |
Oil, Gas & Consumable Fuels 2.6% | | | | | | |
Connacher Oil & Gas, Ltd., 10.25%, 12/15/2015 144A | | | 1,280,000 | | | 1,363,200 |
Griffin Coal Mining Co., Ltd.: | | | | | | |
9.50%, 12/01/2016 144A | | | 7,530,000 | | | 5,948,700 |
9.50%, 12/01/2016 | | | 1,180,000 | | | 932,200 |
OPTI Canada, Inc.: | | | | | | |
7.875%, 12/15/2014 | | | 3,170,000 | | | 3,241,325 |
8.25%, 12/15/2014 | | | 1,965,000 | | | 2,038,687 |
| | | | |
|
|
| | | | | | 13,524,112 |
| | | | |
|
|
FINANCIALS 2.4% | | | | | | |
Consumer Finance 0.8% | | | | | | |
Avago Technologies Finance, Ltd.: | | | | | | |
10.125%, 12/01/2013 | | | 220,000 | | | 235,400 |
FRN, 8.58%, 06/01/2013 | | | 870,000 | | | 872,175 |
Petroplus Finance, Ltd., 6.75%, 05/01/2014 144A ρ | | | 710,000 | | | 670,950 |
Virgin Media Finance plc, 9.125%, 08/15/2016 | | | 2,380,000 | | | 2,308,600 |
| | | | |
|
|
| | | | | | 4,087,125 |
| | | | |
|
|
Diversified Financial Services 1.6% | | | | | | |
FMG Finance Property, Ltd., 10.625%, 09/01/2016 144A | | | 4,610,000 | | | 5,266,925 |
Preferred Term Securities XII, Ltd., FRN, 10.00%, 12/24/2033 | | | 720,000 | | | 512,150 |
Ship Finance International, Ltd., 8.50%, 12/15/2013 ρ | | | 2,400,000 | | | 2,436,000 |
| | | | |
|
|
| | | | | | 8,215,075 |
| | | | |
|
|
INDUSTRIALS 1.1% | | | | | | |
ROAD & RAIL 1.1% | | | | | | |
Kansas City Southern de Mexico: | | | | | | |
7.375%, 06/01/2014 144A | | | 2,815,000 | | | 2,677,769 |
9.375%, 05/01/2012 | | | 3,133,000 | | | 3,281,817 |
| | | | |
|
|
| | | | | | 5,959,586 |
| | | | |
|
|
See Notes to Financial Statements
22
SCHEDULE OF INVESTMENTS continued
April 30, 2008
| | | Principal
Amount | | |
Value |
|
|
|
|
|
|
|
YANKEE OBLIGATIONS – CORPORATE continued | | | | | | |
INFORMATION TECHNOLOGY 1.2% | | | | | | |
Communications Equipment 0.9% | | | | | | |
Nortel Networks Corp., 10.125%, 07/15/2013 ρ | | $ | 4,760,000 | | $ | 4,688,600 |
| | | | |
|
|
Semiconductors & Semiconductor Equipment 0.3% | | | | | | |
Sensata Technologies, Inc., 8.00%, 05/01/2014 | | | 1,375,000 | | | 1,289,063 |
| | | | |
|
|
MATERIALS 2.6% | | | | | | |
Metals & Mining 2.0% | | | | | | |
Evraz Group SA: | | | | | | |
8.875%, 04/24/2013 144A | | | 630,000 | | | 641,025 |
9.50%, 04/24/2018 144A | | | 2,005,000 | | | 2,055,015 |
Novelis, Inc., 7.25%, 02/15/2015 | | | 8,535,000 | | | 7,852,200 |
| | | | |
|
|
| | | | | | 10,548,240 |
| | | | |
|
|
Paper & Forest Products 0.6% | | | | | | |
Abitibi Consolidated Company of Canada, 13.75%, 04/01/2011 144A | | | 1,450,000 | | | 1,529,750 |
Corporacion Durango SAB de CV, 10.50%, 10/05/2017 144A ρ | | | 2,295,000 | | | 1,732,725 |
| | | | |
|
|
| | | | | | 3,262,475 |
| | | | |
|
|
TELECOMMUNICATION SERVICES 1.3% | | | | | | |
Wireless Telecommunication Services 1.3% | | | | | | |
Inmarsat, plc, Sr. Disc. Note, Step Bond, 0.00%, 11/15/2012 † | | | 1,270,000 | | | 1,258,888 |
Intelsat, Ltd.: | | | | | | |
9.25%, 06/15/2016 ρ | | | 1,290,000 | | | 1,307,738 |
11.25%, 06/15/2016 | | | 1,660,000 | | | 1,691,125 |
Vimpel Communications: | | | | | | |
8.375%, 04/30/2013 144A | | | 330,000 | | | 330,257 |
9.125%, 04/30/2018 144A | | | 2,035,000 | | | 2,040,083 |
| | | | |
|
|
| | | | | | 6,628,091 |
| | | | |
|
|
Total Yankee Obligations – Corporate (cost $60,799,365) | | | | | | 58,368,217 |
| | | | |
|
|
|
|
|
|
|
|
|
| | | Shares | | | Value |
|
|
|
|
|
|
|
COMMON STOCKS 0.2% | | | | | | |
INDUSTRIALS 0.0% | | | | | | |
Airlines 0.0% | | | | | | |
Delta Air Lines, Inc. * | | | 17,215 | | | 146,500 |
| | | | |
|
|
INFORMATION TECHNOLOGY 0.1% | | | | | | |
Communications Equipment 0.0% | | | | | | |
Cisco Systems, Inc. * | | | 5,955 | | | 152,686 |
| | | | |
|
|
Electronic Equipment & Instruments 0.1% | | | | | | |
Jabil Circuit, Inc. | | | 14,321 | | | 155,813 |
| | | | |
|
|
Software 0.0% | | | | | | |
Microsoft Corp. | | | 4,400 | | | 125,488 |
| | | | |
|
|
See Notes to Financial Statements
23
SCHEDULE OF INVESTMENTS continued
April 30, 2008
| | | Shares | | | Value |
|
|
|
|
|
|
|
COMMON STOCKS continued | | | | | | |
MATERIALS 0.0% | | | | | | |
Chemicals 0.0% | | | | | | |
Tronox, Inc., Class A ρ | | | 49,854 | | $ | 159,533 |
| | | | |
|
|
TELECOMMUNICATION SERVICES 0.1% | | | | | | |
Wireless Telecommunication Services 0.1% | | | | | | |
Sprint Nextel Corp. | | | 21,636 | | | 172,871 |
| | | | |
|
|
Total Common Stocks (cost $1,192,645) | | | | | | 912,891 |
| | | | |
|
|
PREFERRED STOCKS 0.5% | | | | | | |
FINANCIALS 0.5% | | | | | | |
Thrifts & Mortgage Finance 0.5% | | | | | | |
Fannie Mae, Ser. S, 8.25% | | | 68,420 | | | 1,713,237 |
Freddie Mac, Ser. Z, 8.375% ρ | | | 29,805 | | | 763,008 |
| | | | |
|
|
Total Preferred Stocks (cost $2,463,218) | | | | | | 2,476,245 |
| | | | |
|
|
WARRANTS 0.0% | | | | | | |
CONSUMER DISCRETIONARY 0.0% | | | | | | |
Media 0.0% | | | | | | |
Metricom, Inc., Expiring 02/15/2010 * + o (cost $318,090) | | | 1,500 | | | 0 |
| | | | | |
|
|
|
|
|
|
|
|
|
| | | Principal
Amount | | | Value |
|
|
|
|
|
|
|
CONVERTIBLE DEBENTURES 0.2% | | | | | | |
CONSUMER DISCRETIONARY 0.2% | | | | | | |
Media 0.2% | | | | | | |
Sinclair Broadcast Group, Inc., 3.00%, 05/15/2027 (cost $1,176,525) | | $ | 1,260,000 | | | 1,176,525 |
| | | | |
|
|
LOANS 4.1% | | | | | | |
CONSUMER DISCRETIONARY 1.1% | | | | | | |
Dana Holding Corp., FRN, 6.55%, 01/31/2015 < | | | 285,000 | | | 274,745 |
Fontainebleau Resorts, LLC, FRN, 5.55%, 06/06/2014 | | | 585,000 | | | 493,319 |
Idearc, Inc., FRN, 4.80%, 11/17/2014 < | | | 909,307 | | | 753,406 |
Metaldyne Corp., FRN: | | | | | | |
7.06%, 01/11/2012 < | | | 864,205 | | | 648,154 |
7.06%, 01/11/2014 < | | | 1,380,774 | | | 1,039,184 |
Ion Media Networks, Inc., FRN, 6.05%, 01/15/2012 < | | | 3,175,000 | | | 2,612,803 |
| | | | |
|
|
| | | | | | 5,821,611 |
| | | | |
|
|
ENERGY 0.1% | | | | | | |
Saint Acquisition Corp., FRN, 2.80%, 06/05/2014 | | | 725,000 | | | 540,640 |
| | | | |
|
|
INDUSTRIALS 1.0% | | | | | | |
Clarke American Corp., FRN, 5.30%, 02/28/2014 | | | 3,225,372 | | | 2,732,406 |
Neff Corp., FRN, 6.30%, 11/30/2014 < | | | 3,655,000 | | | 2,679,883 |
| | | | |
|
|
| | | | | | 5,412,289 |
| | | | |
|
|
See Notes to Financial Statements
24
SCHEDULE OF INVESTMENTS continued
April 30, 2008
| | | Principal
Amount | | | Value |
|
|
|
|
|
|
|
LOANS continued | | | | | | |
INFORMATION TECHNOLOGY 0.0% | | | | | | |
Freescale Semiconductor, Inc., FRN, 4.80%, 12/01/2013 < | | $ | 272,942 | | $ | 235,958 |
| | | | |
|
|
MATERIALS 1.6% | | | | | | |
Abitibi Consolidated Co. of Canada, FRN, 10.80%, 03/31/2009 < | | | 2,324,731 | | | 2,299,485 |
Boise Paper Holdings, LLC, FRN, 5.55%, 02/15/2015 | | | 375,000 | | | 368,734 |
MacDermid, Inc., FRN, 5.05%, 04/15/2014 | | | 1,370,000 | | | 1,894,720 |
Wimar Co., FRN, 5.30%, 01/03/2012 | | | 3,800,000 | | | 3,599,474 |
| | | | |
|
|
| | | | | | 8,162,413 |
| | | | |
|
|
TELECOMMUNICATION SERVICES 0.3% | | | | | | |
Telesat Canada, Inc., FRN, 5.80%, 09/01/2014 | | | 1,545,000 | | | 1,465,603 |
| | | | |
|
|
UTILITIES 0.0% | | | | | | |
Energy Future Holdings Corp., FRN, 5.80%, 10/10/2014 | | | 1,739 | | | 1,661 |
| | | | |
|
|
Total Loans (cost $21,547,611) | | | | | | 21,640,175 |
| | | | |
|
|
SHORT-TERM INVESTMENTS 11.9% | | | | | | |
CORPORATE BONDS 1.0% | | | | | | |
Commercial Banks 0.5% | | | | | | |
First Tennessee Bank, FRN, 2.75%, 08/15/2008 ρρ | | | 2,500,000 | | | 2,498,583 |
| | | | |
|
|
Insurance 0.5% | | | | | | |
Metropolitan Life Global Funding, 2.87%, 08/21/2008 ρρ | | | 2,750,000 | | | 2,748,873 |
| | | | |
|
|
| | | | | | 5,247,456 |
| | | | |
|
|
| | | | | | |
|
|
|
|
|
|
|
| | | Shares | | | Value |
|
|
|
|
|
|
|
MUTUAL FUND SHARES 10.9% | | | | | | |
Evergreen Institutional Money Market Fund, Class I, 2.78% q ø ρρ | | | 57,237,813 | | | 57,237,813 |
| | | | | |
|
|
Total Short-Term Investments (cost $62,487,813) | | | | | | 62,485,269 |
| | | | |
|
|
Total Investments (cost $587,780,841) 107.9% | | | | | | 564,990,062 |
Other Assets and Liabilities (7.9%) | | | | | | (41,538,031) |
| | | | |
|
|
Net Assets 100.0% | | | | | $ | 523,452,031 |
| | | | |
|
|
ρ | All or a portion of this security is on loan. |
144A | Security that may be sold to qualified institutional buyers under Rule 144A of the Securities Act of 1933, as amended. This security has been determined to be liquid under guidelines established by the Board of Trustees, unless otherwise noted. |
Š | The rate shown is the stated rate at the current period end. |
† | Security initially issued in zero coupon form which converts to coupon form at a specified rate and date. An effective interest rate is applied to recognize interest income daily for the bond. This rate is based on total expected interest to be earned over the life of the bond which consists of the aggregate coupon-interest payments and discount at acquisition. The rate shown is the stated rate at the current period end. |
* | Non-income producing security |
+ | Security is deemed illiquid. |
o | Security is valued at fair value as determined by the investment advisor in good faith, according to procedures approved by the Board of Trustees. |
See Notes to Financial Statements
25
SCHEDULE OF INVESTMENTS continued
April 30, 2008
< | All or a portion of the position represents an unfunded loan commitment. |
q | Rate shown is the 7-day annualized yield at period end. |
ø | Evergreen Investment Management Company, LLC is the investment advisor to both the Fund and the money market fund. |
ρρ | All or a portion of this security represents investment of cash collateral received from securities on loan. |
Summary of Abbreviations
The following table shows the percent of total investments (excluding equity positions and collateral from securities on loan) by credit quality based on Moody’s and Standard & Poor’s ratings as of April 30, 2008 (unaudited):
AAA | 2.0% |
AA | 0.5% |
BBB | 6.1% |
BB | 28.9% |
B | 48.8% |
CCC | 13.2% |
NR | 0.5% |
|
|
| 100.0% |
|
|
The following table shows the percent of total investments (excluding equity positions and collateral from securities on loan) based on effective maturity as of April 30, 2008 (unaudited):
Less than 1 year | 4.7% |
1 to 3 year(s) | 14.6% |
3 to 5 years | 17.3% |
5 to 10 years | 55.8% |
10 to 20 years | 4.5% |
20 to 30 years | 1.9% |
Greater than 30 years | 1.2% |
|
|
| 100.0% |
|
|
See Notes to Financial Statements
26
STATEMENT OF ASSETS AND LIABILITIES
April 30, 2008
Assets | | | |
Investments in securities, at value (cost $530,543,028) including $54,009,717 of securities loaned | | $ | 507,752,249 |
Investments in affiliated money market fund, at value (cost $57,237,813) | | | 57,237,813 |
|
|
|
|
Total investments | | | 564,990,062 |
Cash | | | 2,232,781 |
Segregated cash | | | 840,000 |
Foreign currency, at value (cost $ 10,170) | | | 9,968 |
Receivable for securities sold | | | 12,435,315 |
Receivable for Fund shares sold | | | 473,500 |
Interest receivable | | | 12,367,021 |
Receivable for securities lending income | | | 32,715 |
Premiums paid on credit default swap transactions | | | 197,575 |
Unrealized gains on forward foreign currency exchange contracts | | | 5,774 |
Unrealized gains on credit default swap transactions | | | 145,865 |
Prepaid expenses and other assets | | | 134,551 |
|
|
|
|
Total assets | | | 593,865,127 |
|
|
|
|
Liabilities | | | |
Dividends payable | | | 1,333,820 |
Payable for securities purchased | | | 11,746,429 |
Payable for Fund shares redeemed | | | 988,085 |
Unrealized losses on credit default swap transactions | | | 57,722 |
Unrealized losses on forward foreign currency exchange contracts | | | 77,829 |
Premiums received on credit default swap transactions | | | 361,875 |
Payable for securities on loan | | | 55,723,220 |
Advisory fee payable | | | 7,079 |
Distribution Plan expenses payable | | | 8,007 |
Due to other related parties | | | 1,806 |
Accrued expenses and other liabilities | | | 107,224 |
|
|
|
|
Total liabilities | | | 70,413,096 |
|
|
|
|
Net assets | | $ | 523,452,031 |
|
|
|
|
Net assets represented by | | | |
Paid-in capital | | $ | 675,685,644 |
Overdistributed net investment income | | | (137,343) |
Accumulated net realized losses on investments | | | (129,321,381) |
Net unrealized losses on investments | | | (22,774,889) |
|
|
|
|
Total net assets | | $ | 523,452,031 |
|
|
|
|
Net assets consists of | | | |
Class A | | $ | 270,757,652 |
Class B | | | 108,327,434 |
Class C | | | 118,638,384 |
Class I | | | 25,728,561 |
|
|
|
|
Total net assets | | $ | 523,452,031 |
|
|
|
|
Shares outstanding (unlimited number of shares authorized) | | | |
Class A | | | 86,551,729 |
Class B | | | 34,628,983 |
Class C | | | 37,924,656 |
Class I | | | 8,224,745 |
|
|
|
|
See Notes to Financial Statements
27
STATEMENT OF ASSETS AND LIABILITIES continued
April 30, 2008
Net asset value per share | | | |
Class A | | $ | 3.13 |
Class A — Offering price (based on sales charge of 4.75%) | | $ | 3.29 |
Class B | | $ | 3.13 |
Class C | | $ | 3.13 |
Class I | | $ | 3.13 |
|
|
|
|
See Notes to Financial Statements
28
STATEMENT OF OPERATIONS
Year Ended April 30, 2008
Investment income | | | |
Interest | | $ | 51,070,852 |
Income from affiliate | | | 806,978 |
Dividends | | | 131,665 |
Securities lending | | | 89,289 |
|
|
|
|
Total investment income | | | 52,098,784 |
|
|
|
|
Expenses | | | |
Advisory fee | | | 2,726,891 |
Distribution Plan expenses | | | |
Class A | | | 863,727 |
Class B | | | 1,269,446 |
Class C | | | 1,357,713 |
Administrative services fee | | | 584,506 |
Transfer agent fees | | | 1,081,492 |
Trustees’ fees and expenses | | | 13,781 |
Printing and postage expenses | | | 83,645 |
Custodian and accounting fees | | | 187,149 |
Registration and filing fees | | | 67,293 |
Professional fees | | | 53,000 |
Other | | | 17,141 |
|
|
|
|
Total expenses | | | 8,305,784 |
Less: Expense reductions | | | (56,703) |
Expense reimbursements | | | (134,895) |
|
|
|
|
Net expenses | | | 8,114,186 |
|
|
|
|
Net investment income | | | 43,984,598 |
|
|
|
|
Net realized and unrealized gains or losses on investments | | | |
Net realized losses on: | | | |
Securities | | | (5,360,974) |
Foreign currency related transactions | | | (192) |
Credit default swap transactions | | | (69,538) |
|
|
|
|
Net realized losses on investments | | | (5,430,704) |
Net change in unrealized gains or losses on investments | | | (48,995,205) |
|
|
|
|
Net realized and unrealized gains or losses on investments | | | (54,425,909) |
|
|
|
|
Net decrease in net assets resulting from operations | | $ | (10,441,311) |
|
|
|
|
See Notes to Financial Statements
29
STATEMENTS OF CHANGES IN NET ASSETS
| | Year Ended April 30, |
| |
|
| | 2008 | | 2007 |
|
|
|
|
|
Operations | | | | | | | | | | | | |
Net investment income | | | | | $ | 43,984,598 | | | | | $ | 50,178,085 |
Net realized gains or losses on investments | | | | | | (5,430,704) | | | | | | 2,935,671 |
Net change in unrealized gains or losses on investments | | | | | | (48,995,205) | | | | | | 14,090,164 |
|
|
|
|
|
|
|
|
|
|
|
|
|
Net increase (decrease) in net assets resulting from operations | | | | | | (10,441,311) | | | | | | 67,203,920 |
|
|
|
|
|
|
|
|
|
|
|
|
|
Distributions to shareholders from | | | | | | | | | | | | |
Net investment income | | | | | | | | | | | | |
Class A | | | | | | (21,361,094) | | | | | | (25,511,393) |
Class B | | | | | | (8,349,395) | | | | | | (10,353,425) |
Class C | | | | | | (8,933,701) | | | | | | (11,450,486) |
Class I | | | | | | (2,478,761) | | | | | | (2,935,746) |
|
|
|
|
|
|
|
|
|
|
|
|
|
Total distributions to shareholders | | | | | | (41,122,951) | | | | | | (50,251,050) |
|
|
|
|
|
|
|
|
|
|
|
|
|
| | | Shares | | | | | | Shares | | | |
|
|
|
|
|
|
|
|
|
|
|
|
|
Capital share transactions | | | | | | | | | | | | |
Proceeds from shares sold | | | | | | | | | | | | |
Class A | | | 12,599,402 | | | 40,291,644 | | | 8,872,464 | | | 29,361,786 |
Class B | | | 1,910,604 | | | 6,190,668 | | | 2,878,309 | | | 9,532,702 |
Class C | | | 2,426,301 | | | 7,745,868 | | | 3,575,958 | | | 11,831,397 |
Class I | | | 7,743,024 | | | 26,003,845 | | | 2,598,618 | | | 8,626,874 |
|
|
|
|
|
|
|
|
|
|
|
|
|
| | | | | | 80,232,025 | | | | | | 59,352,759 |
|
|
|
|
|
|
|
|
|
|
|
|
|
Net asset value of shares issued in reinvestment of distributions | | | | | | | | | | | | |
Class A | | | 4,412,555 | | | 14,183,006 | | | 5,100,535 | | | 16,899,566 |
Class B | | | 1,242,980 | | | 3,995,001 | | | 1,480,905 | | | 4,906,603 |
Class C | | | 1,440,882 | | | 4,631,294 | | | 1,774,970 | | | 5,879,356 |
Class I | | | 267,966 | | | 864,515 | | | 418,042 | | | 1,382,768 |
|
|
|
|
|
|
|
|
|
|
|
|
|
| | | | | | 23,673,816 | | | | | | 29,068,293 |
|
|
|
|
|
|
|
|
|
|
|
|
|
Automatic conversion of Class B shares to Class A shares | | | | | | | | | | | | |
Class A | | | 1,175,830 | | | 3,743,609 | | | 1,001,277 | | | 3,327,267 |
Class B | | | (1,175,830) | | | (3,743,609) | | | (1,001,277) | | | (3,327,267) |
|
|
|
|
|
|
|
|
|
|
|
|
|
| | | | | | 0 | | | | | | 0 |
|
|
|
|
|
|
|
|
|
|
|
|
|
Payment for shares redeemed | | | | | | | | | | | | |
Class A | | | (30,235,841) | | | (97,809,031) | | | (33,580,433) | | | (111,126,729) |
Class B | | | (11,623,756) | | | (37,443,587) | | | (12,379,615) | | | (40,950,431) |
Class C | | | (13,549,920) | | | (43,714,958) | | | (18,676,545) | | | (61,740,275) |
Class I | | | (7,767,528) | | | (25,028,336) | | | (10,228,849) | | | (33,976,494) |
|
|
|
|
|
|
|
|
|
|
|
|
|
| | | | | | (203,995,912) | | | | | | (247,793,929) |
|
|
|
|
|
|
|
|
|
|
|
|
|
Net decrease in net assets resulting from capital share transactions | | | | | | (100,090,071) | | | | | | (159,372,877) |
|
|
|
|
|
|
|
|
|
|
|
|
|
Total decrease in net assets | | | | | | (151,654,333) | | | | | | (142,420,007) |
Net assets | | | | | | | | | | | | |
Beginning of period | | | | | | 675,106,364 | | | | | | 817,526,371 |
|
|
|
|
|
|
|
|
|
|
|
|
|
End of period | | | | | $ | 523,452,031 | | | | | $ | 675,106,364 |
|
|
|
|
|
|
|
|
|
|
|
|
|
Overdistributed net investment income | | | | | $ | (137,343) | | | | | $ | (955,531) |
|
|
|
|
|
|
|
|
|
|
|
|
|
See Notes to Financial Statements
30
NOTES TO FINANCIAL STATEMENTS
1. ORGANIZATION
Evergreen High Income Fund (formerly Evergreen High Yield Bond Fund) (the “Fund”) is a diversified series of Evergreen Fixed Income Trust (the “Trust”), a Delaware statutory trust organized on September 18, 1997. The Trust is an open-end management investment company registered under the Investment Company Act of 1940, as amended (the “1940 Act”).
The Fund offers Class A, Class B, Class C and Class I shares. Class A shares are sold with a front-end sales charge. However, Class A share investments of $1 million or more are not subject to a front-end sales charge but are subject to a contingent deferred sales charge of 1.00% upon redemption within 18 months. Class B shares are sold without a front-end sales charge but are subject to a contingent deferred sales charge that is payable upon redemption and decreases depending on how long the shares have been held. Class C shares are sold without a front-end sales charge but are subject to a contingent deferred sales charge that is payable upon redemption within one year. Class I shares are sold without a front-end sales charge or contingent deferred sales charge. Each class of shares, except Class I shares, pays an ongoing distribution fee.
2. SIGNIFICANT ACCOUNTING POLICIES
The following is a summary of significant accounting policies consistently followed by the Fund in the preparation of its financial statements. The policies are in conformity with generally accepted accounting principles in the United States of America, which require management to make estimates and assumptions that affect amounts reported herein. Actual results could differ from these estimates.
a. Valuation of investments
Portfolio debt securities acquired with more than 60 days to maturity are fair valued using matrix pricing methods determined by an independent pricing service which takes into consideration such factors as similar security prices, yields, maturities, liquidity and ratings. Securities for which valuations are not readily available from an independent pricing service may be valued by brokers which use prices provided by market makers or estimates of market value obtained from yield data relating to investments or securities with similar characteristics.
Listed equity securities are usually valued at the last sales price or official closing price on the national securities exchange where the securities are principally traded.
Foreign securities traded on an established exchange are valued at the last sales price on the exchange where the security is primarily traded. If there has been no sale, the securities are valued at the mean between bid and asked prices. Foreign securities may be valued at fair value according to procedures approved by the Board of Trustees if the closing price is not reflective of current market values due to trading or events occurring in the foreign markets between the close of the established exchange and the valuation time of the Fund. In addition, substantial changes in values in the U.S. markets subsequent to the close of a
31
NOTES TO FINANCIAL STATEMENTS continued
foreign market may also affect the values of securities traded in the foreign market. The value of foreign securities may be adjusted if such movements in the U.S. market exceed a specified threshold.
Short-term securities with remaining maturities of 60 days or less at the time of purchase are valued at amortized cost, which approximates market value.
Investments in open-end mutual funds are valued at net asset value. Securities for which market quotations are not readily available or not reflective of current market value are valued at fair value as determined by the investment advisor in good faith, according to procedures approved by the Board of Trustees.
b. Repurchase agreements
Securities pledged as collateral for repurchase agreements are held by the custodian bank or in a segregated account in the Fund’s name until the agreements mature. Collateral for certain tri-party repurchase agreements is held at the counterparty’s custodian in a segregated account for the benefit of the Fund and the counterparty. Each agreement requires that the market value of the collateral be sufficient to cover payments of interest and principal. However, in the event of default or bankruptcy by the other party to the agreement, retention of the collateral may be subject to legal proceedings. The Fund will only enter into repurchase agreements with banks and other financial institutions, which are deemed by the investment advisor to be creditworthy pursuant to guidelines established by the Board of Trustees. In certain instances, the Fund’s securities lending agent may provide collateral in the form of repurchase agreements.
c. Foreign currency translation
All assets and liabilities denominated in foreign currencies are translated into U.S. dollar amounts at the date of valuation. Purchases and sales of portfolio securities and income items denominated in foreign currencies are translated into U.S. dollar amounts on the respective dates of such transactions. The Fund does not separately account for that portion of the results of operations resulting from changes in foreign exchange rates on investments and the fluctuations arising from changes in market prices of securities held. Such fluctuations are included with the net realized and unrealized gains or losses on investments.
d. Forward foreign currency contracts
A forward foreign currency contract is an agreement between two parties to purchase or sell a specific currency for an agreed-upon price at a future date. The Fund enters into forward foreign currency contracts to facilitate transactions in foreign-denominated securities and to attempt to minimize the risk to the Fund from adverse changes in the relationship between currencies. Forward foreign currency contracts are recorded at the forward rate and marked-to-market daily. When the contracts are closed, realized gains and losses arising from such transactions are recorded as realized gains or losses on foreign currency related transactions. The Fund could be exposed to risks if the counterparties to
32
NOTES TO FINANCIAL STATEMENTS continued
the contracts are unable to meet the terms of their contracts or if the value of the foreign currency changes unfavorably.
e. When-issued and delayed delivery transactions
The Fund records when-issued or delayed delivery securities as of trade date and maintains security positions such that sufficient liquid assets will be available to make payment for the securities purchased. Securities purchased on a when-issued or delayed delivery basis are marked-to-market daily and begin earning interest on the settlement date. Losses may occur on these transactions due to changes in market conditions or the failure of counterparties to perform under the contract.
f. Loans
The Fund may purchase loans through an agent, by assignment from another holder of the loan or as a participation interest in another holder’s portion of the loan. Loans are purchased on a when-issued or delayed delivery basis. Interest income is accrued based on the terms of the securities. Fees earned on loan purchasing activities are recorded as income when earned. Loans involve interest rate risk, liquidity risk and credit risk, including the potential default or insolvency of the borrower.
g. Securities lending
The Fund may lend its securities to certain qualified brokers in order to earn additional income. The Fund receives compensation in the form of fees or interest earned on the investment of any cash collateral received. The Fund also continues to receive interest and dividends on the securities loaned. The Fund receives collateral in the form of cash or securities with a market value at least equal to the market value of the securities on loan. In the event of default or bankruptcy by the borrower, the Fund could experience delays and costs in recovering the loaned securities or in gaining access to the collateral. The Fund has the right under the lending agreement to recover the securities from the borrower on demand.
h. Credit default swaps
The Fund may enter into credit default swap contracts. Credit default swaps involve an exchange of a stream of payments for protection against the loss in value of an underlying security or index in the event of default or bankruptcy. Under the terms of the swap, one party acts as a guarantor and receives a periodic stream of payments that is a fixed percentage applied to a notional principal amount over the term of the swap. In return, the counterparty agrees to purchase the notional amount of the underlying instrument or index, at par, if a credit event occurs during the term of the swap. The Fund may enter into credit default swaps as either the guarantor or the counterparty.
Any premiums paid or received on the transactions are recorded as an asset or liability on the Statement of Assets and Liabilities and amortized. The value of the swap contract is marked-to-market daily based on quotations from an independent pricing service or market makers and any change in value is recorded as an unrealized gain or loss. Periodic
33
NOTES TO FINANCIAL STATEMENTS continued
payments made or received are recorded as realized gains or losses. In addition, payments received or made as a result of a credit event or termination of the contract are recognized as realized gains or losses. The Fund could be exposed to risks if the counterparty defaults on its obligation to perform, or if there are unfavorable changes in the fluctuation of interest rates or in the price of the underlying security or index.
i. Security transactions and investment income
Security transactions are recorded on trade date. Realized gains and losses are computed using the specific cost of the security sold. Interest income is recorded on the accrual basis and includes accretion of discounts and amortization of premiums. Dividend income is recorded on the ex-dividend date.
j. Federal and other taxes
The Fund intends to continue to qualify as a regulated investment company and distribute all of its taxable income, including any net capital gains (which have already been offset by available capital loss carryovers). Accordingly, no provision for federal taxes is required. The Fund has adopted the provisions of FASB Interpretation No. 48, Accounting for Uncertainty in Income Taxes (“FIN 48”) which prescribes a minimum threshold for financial statement recognition of the benefit of a tax position taken or expected to be taken in a tax return. The Fund’s financial statements have not been impacted by the adoption of FIN 48. The Fund’s income and excise tax returns and all financial records supporting those returns are subject to examination by the federal, Massachusetts and Delaware revenue authorities for all taxable years beginning after April 30, 2004.
k. Distributions
Distributions to shareholders from net investment income are accrued daily and paid monthly. Distributions from net realized gains, if any, are recorded on the ex-dividend date. Such distributions are determined in conformity with income tax regulations, which may differ from generally accepted accounting principles.
Reclassifications have been made to the Fund’s components of net assets to reflect income and gains available for distribution (or available capital loss carryovers, as applicable) under income tax regulations. The primary permanent differences causing such reclassifications are due to expiration of capital loss carryovers, premium amortization and consent fees. During the year ended April 30, 2008, the following amounts were reclassified:
|
|
|
|
Paid-in capital | | $ | (14,290,217) |
Overdistributed net investment income | | | (2,043,459) |
Accumulated net realized losses on investments | | | 16,333,676 |
|
|
|
|
l. Class allocations
Income, common expenses and realized and unrealized gains and losses are allocated to the classes based on the relative net assets of each class. Distribution fees, if any, are calcu-
34
NOTES TO FINANCIAL STATEMENTS continued
lated daily at the class level based on the appropriate net assets of each class and the specific expense rates applicable to each class.
3. ADVISORY FEE AND OTHER TRANSACTIONS WITH AFFILIATES
Evergreen Investment Management Company, LLC (“EIMC”), an indirect, wholly-owned subsidiary of Wachovia Corporation (“Wachovia”), is the investment advisor to the Fund and is paid a fee at an annual rate of 2% of the Fund’s gross investment income plus an amount determined by applying percentage rates to the average daily net assets of the Fund, starting at 0.31% and declining to 0.16% as average daily net assets increase. For the year ended April 30, 2008, the advisory fee was equivalent to 0.46% of the Fund’s average daily net assets.
Tattersall Advisory Group, Inc., an indirect, wholly-owned subsidiary of Wachovia, is an investment sub-advisor to the Fund and is paid by EIMC for its services to the Fund.
From time to time, EIMC may voluntarily or contractually waive its fee and/or reimburse expenses in order to limit operating expenses. During the year ended April 30, 2008, EIMC voluntarily reimbursed Distribution Plan expenses (see Note 4) relating to Class A shares in the amount of $134,895.
The Fund may invest in money market funds which are advised by EIMC. Income earned on these investments is included in income from affiliate on the Statement of Operations.
Effective January 1, 2008, EIMC replaced Evergreen Investment Services, Inc. (“EIS”), an indirect, wholly-owned subsidiary of Wachovia, as the administrator to the Fund upon the assignment of the Fund’s Administrative Services Agreement from EIS to EIMC. There were no changes to the services being provided or fees being paid by the Fund. The administrator provides the Fund with facilities, equipment and personnel and is paid an annual rate determined by applying percentage rates to the aggregate average daily net assets of the Evergreen funds (excluding money market funds) starting at 0.10% and declining to 0.05% as the aggregate average daily net assets of the Evergreen funds (excluding money market funds) increase.
Evergreen Service Company, LLC (“ESC”), an indirect, wholly-owned subsidiary of Wachovia, is the transfer and dividend disbursing agent for the Fund. ESC receives account fees that vary based on the type of account held by the shareholders in the Fund. For the year ended April 30, 2008, the transfer agent fees were equivalent to an annual rate of 0.18% of the Fund’s average daily net assets.
The Fund has placed a portion of its portfolio transactions with brokerage firms that are affiliates of Wachovia. During the year ended April 30, 2008, the Fund paid brokerage commissions of $1,785 to Wachovia Securities, LLC.
35
NOTES TO FINANCIAL STATEMENTS continued
4. DISTRIBUTION PLANS
EIS serves as distributor of the Fund’s shares. The Fund has adopted Distribution Plans, as allowed by Rule 12b-1 of the 1940 Act, for each class of shares, except Class I. Under the Distribution Plans, distribution fees are paid at an annual rate of 0.25% of the average daily net assets for Class A and 1.00% of the average daily net assets for each of Class B and Class C shares. Prior to April 1, 2008, distribution fees were paid at an annual rate of 0.30% of the average daily net assets for Class A shares.
For the year ended April 30, 2008, EIS received $13,497 from the sale of Class A shares and $23,958, $303,734 and $4,725 in contingent deferred sales charges from redemptions of Class A, Class B and Class C shares, respectively.
5. INVESTMENT TRANSACTIONS
Cost of purchases and proceeds from sales of investment securities (excluding short-term securities) were $625,022,947 and $658,314,263, respectively, for the year ended April 30, 2008.
As of year ended April 30, 2008, the Fund had unfunded loan commitments of $3,994,402.
At April 30, 2008, the Fund had forward foreign currency exchange contracts outstanding as follows:
Forward Foreign Currency Exchange Contracts to Sell:
Exchange
Date | | Contracts to Deliver | | U.S. Value at
April 30, 2008 | | In Exchange
for U.S. $ | | Unrealized
Gain (Loss) |
|
|
|
|
|
|
|
|
|
5/14/2008 | | 756,000 EUR | | $ | 1,176,133 | | $ | 1,099,110 | | $ | (77,023) |
5/14/2008 | | 8,379 EUR | | | 13,034 | | | 12,228 | | | (806) |
7/8/2008 | | 404,800 EUR | | | 628,159 | | | 633,933 | | | 5,774 |
|
|
|
|
|
|
|
|
|
|
|
|
During the year ended April 30, 2008, the Fund loaned securities to certain brokers and earned $134,312 in affiliated income relating to securities lending activity which is included in income from affiliate on the Statement of Operations. At April 30, 2008, the value of securities on loan and the total value of collateral received for securities loaned amounted to $54,009,717 and $55,723,220, respectively.
36
NOTES TO FINANCIAL STATEMENTS continued
At April 30, 2008, the Fund had the following credit default swap contracts outstanding:
Expiration | | Counterparty | | Reference Debt
Obligation/Index | | | Notional
Amount | | Fixed
Payments
Received
by the Fund | | Frequency
of Payments
Received | | | Unrealized
Gain |
|
|
|
|
|
|
|
|
|
|
|
|
|
|
|
12/20/2012 | | Goldman Sachs | | Dow Jones CDX,
North American
Investment
Grade Index | | $ | 2,265,000 | | 3.75% | | Quarterly | | $ | 5,894 |
12/20/2012 | | UBS | | Dow Jones CDX,
North American
Investment
Grade Index | | | 1,525,000 | | 3.75% | | Quarterly | | | 3,968 |
06/20/2013 | | Lehman Brothers | | Centex Corp.,
5.25%,
06/15/2015 | | | 740,000 | | 5.12% | | Quarterly | | | 42,884 |
12/13/2049 | | Goldman Sachs | | Markit CMBX
North America
AJ.3 Index | | | 375,000 | | 1.47% | | Quarterly | | | 39,114 |
12/13/2049 | | UBS | | Markit CMBX
North America
AAA.3 Index | | | 375,000 | | 0.08% | | Quarterly | | | 41,948 |
Expiration | | Counterparty | | Reference Debt
Obligation/Index | | | Notional
Amount | | Fixed
Payments
Made
by the Fund | | Frequency
of Payments
Made | | | Unrealized
Gain (Loss) |
|
|
|
|
|
|
|
|
|
|
|
|
|
|
|
12/20/2012 | | JPMorgan | | Dow Jones CDX
North American
Investment
Grade Index | | $ | 3,790,000 | | 3.75% | | Quarterly | | $ | 12,057 |
06/20/2013 | | Lehman Brothers | | Pulte, Inc., 5.25%,
1/15/2014 | | | 740,000 | | 4.17% | | Quarterly | | | (48,583) |
06/20/2013 | | Bank of America | | Dow Jones CDX
North American
Investment
Grade Index | | | 580,000 | | 5.00% | | Quarterly | | | (2,739) |
06/20/2013 | | UBS | | Dow Jones CDX
North American
Investment
Grade Index | | | 1,355,000 | | 5.00% | | Quarterly | | | (6,400) |
On April 30, 2008, the aggregate cost of securities for federal income tax purposes was $589,638,464. The gross unrealized appreciation and depreciation on securities based on tax cost was $7,160,272 and $31,808,674, respectively, with a net unrealized depreciation of $24,648,402.
37
NOTES TO FINANCIAL STATEMENTS continued
As of April 30, 2008, the Fund had $118,191,291 in capital loss carryovers for federal income tax purposes expiring as follows:
Expiration |
|
2009 | 2010 | 2011 | 2014 | 2015 |
|
|
|
|
|
$38,451,200 | $57,513,490 | $15,936,101 | $1,353,885 | $4,936,615 |
|
|
|
|
|
These losses are subject to certain limitations prescribed by the Internal Revenue Code.
For income tax purposes, capital and currency losses incurred after October 31 within the Fund’s fiscal year are deemed to arise on the first business day of the following fiscal year. As of April 30, 2008, the Fund incurred and will elect to defer post-October capital and currency losses of $9,272,466 and $192, respectively.
6. INTERFUND LENDING
Pursuant to an Exemptive Order issued by the SEC, the Fund may participate in an inter-fund lending program with certain funds in the Evergreen fund family. This program allows the Fund to borrow from, or lend money to, other participating funds. During the year ended April 30, 2008, the Fund did not participate in the interfund lending program.
7. DISTRIBUTIONS TO SHAREHOLDERS
As of April 30, 2008, the components of distributable earnings on a tax basis were as follows:
Undistributed
Ordinary
Income | Unrealized
Depreciation | Capital Loss
Carryovers and
Post-October Losses | Temporary
Book/Tax
Differences |
|
|
|
|
$1,264,240 | $24,648,600 | $127,463,949 | $(1,385,304) |
|
|
|
|
The differences between the components of distributable earnings on a tax basis and the amounts reflected in the Statement of Assets and Liabilities are primarily due to wash sales, passive foreign investment companies, forward contracts and swap contracts. The temporary book/tax differences are a result of timing differences between book and tax recognition of income and/or expenses.
The tax character of distributions paid were $41,122,951 and $50,251,050 of ordinary income for the years ended April 30, 2008 and April 30, 2007, respectively.
8. EXPENSE REDUCTIONS
Through expense offset arrangements with ESC and the Fund’s custodian, a portion of fund expenses has been reduced.
9. DEFERRED TRUSTEES‘ FEES
Each Trustee of the Fund may defer any or all compensation related to performance of his or her duties as a Trustee. The Trustees’ deferred balances are allocated to deferral accounts, which are included in the accrued expenses for the Fund. The investment
38
NOTES TO FINANCIAL STATEMENTS continued
performance of the deferral accounts is based on the investment performance of certain Evergreen funds. Any gains earned or losses incurred in the deferral accounts are reported in the Fund’s Trustees’ fees and expenses. At the election of the Trustees, the deferral account will be paid either in one lump sum or in quarterly installments for up to ten years.
10. FINANCING AGREEMENT
The Fund and certain other Evergreen funds share in an unsecured revolving credit commitment for temporary and emergency purposes, including the funding of redemptions, as permitted by each participating fund’s borrowing restrictions. Borrowings under this facility bear interest at 0.50% per annum above the Federal Funds rate. All of the participating funds are charged an annual commitment fee on the unused balance, which is allocated pro rata. The credit facility is for $100 million with an annual commitment fee of 0.08%. During the year ended April 30, 2008, the Fund had no borrowings.
11. REGULATORY MATTERS AND LEGAL PROCEEDINGS
Pursuant to an administrative order issued by the SEC on September 19, 2007, EIMC, EIS, ESC (collectively, the “Evergreen Entities”), Wachovia Securities, LLC and the SEC have entered into an agreement settling allegations of (i) improper short-term trading arrangements in effect prior to May 2003 involving former officers and employees of EIMC and certain broker-dealers, (ii) insufficient systems for monitoring exchanges and enforcing exchange limitations as stated in certain funds’ prospectuses, and (iii) inadequate e-mail retention practices. Under the settlement, the Evergreen Entities were censured and have paid approximately $32 million in disgorgement and penalties. This amount, along with a fine assessed by the SEC against Wachovia Securities, LLC will be distributed pursuant to a plan to be developed by an independent distribution consultant and approved by the SEC. The Evergreen Entities neither admitted nor denied the allegations and findings set forth in its settlement with the SEC.
In addition, the Evergreen funds and EIMC and certain of its affiliates are involved in various legal actions, including private litigation and class action lawsuits. EIMC does not expect that any of such legal actions currently pending or threatened will have a material adverse impact on the financial position or operations of any of the Evergreen funds or on EIMC’s ability to provide services to the Evergreen funds.
Although EIMC believes that none of the matters discussed above will have a material adverse impact on the Evergreen funds, there can be no assurance that these matters and any publicity surrounding or resulting from them will not result in reduced sales or increased redemptions of Evergreen fund shares, which could increase Evergreen fund transaction costs or operating expenses, or that they will not have other adverse consequences on the Evergreen funds.
39
NOTES TO FINANCIAL STATEMENTS continued
12. NEW ACCOUNTING PRONOUNCEMENTS
In September 2006, FASB issued Statement of Financial Accounting Standards No. 157, Fair Value Measurements (“FAS 157”). FAS 157 establishes a single authoritative definition of fair value, establishes a framework for measuring fair value and expands disclosures about fair value measurements. FAS 157 applies to fair value measurements already required or permitted by existing standards. The change to current generally accepted accounting principles from the application of FAS 157 relates to the definition of fair value, the methods used to measure fair value, and the expanded disclosures about fair value measurements. Management of the Fund does not believe the adoption of FAS 157 will materially impact the financial statement amounts, however, additional disclosures may be required about the inputs used to develop the measurements and the effect of certain of the measurements on changes in net assets for the period. FAS 157 is effective for financial statements issued for fiscal years beginning after November 15, 2007 and interim periods within those fiscal years.
In March 2008, FASB issued Statement of Financial Accounting Standards No. 161, Disclosures about Derivative Instruments and Hedging Activities (“FAS 161”), an amendment of FASB Statement No. 133. FAS 161 requires enhanced disclosures about (a) how and why a fund uses derivative instruments, (b) how derivative instruments and hedging activities are accounted for, and (c) how derivative instruments and related hedging activities affect a fund’s financial position, financial performance, and cash flows. Management of the Fund does not believe the adoption of FAS 161 will materially impact the financial statement amounts, but will require additional disclosures. This will include qualitative and quantitative disclosures on derivative positions existing at period end and the effect of using derivatives during the reporting period. FAS 161 is effective for financial statements issued for fiscal years and interim periods beginning after November 15, 2008.
40
REPORT OF INDEPENDENT REGISTERED PUBLIC ACCOUNTING FIRM
Board of Trustees and Shareholders
Evergreen Fixed Income Trust
We have audited the accompanying statement of assets and liabilities, including the schedule of investments, of the Evergreen High Income Fund, formerly Evergreen High Yield Bond Fund, a series of the Evergreen Fixed Income Trust, as of April 30, 2008 and the related statement of operations for the year then ended, statements of changes in net assets for each of the years in the two-year period then ended and the financial highlights for each of the years in the five-year period then ended. These financial statements and financial highlights are the responsibility of the Fund’s management. Our responsibility is to express an opinion on these financial statements and financial highlights based on our audits.
We conducted our audits in accordance with the standards of the Public Company Accounting Oversight Board (United States). Those standards require that we plan and perform the audit to obtain reasonable assurance about whether the financial statements and financial highlights are free of material misstatement. An audit includes examining, on a test basis, evidence supporting the amounts and disclosures in the financial statements. Our procedures included confirmation of securities owned as of April 30, 2008 by correspondence with the custodian and brokers, or by other appropriate auditing procedures where replies from brokers were not received. An audit also includes assessing the accounting principles used and significant estimates made by management, as well as evaluating the overall financial statement presentation. We believe that our audits provide a reasonable basis for our opinion.
In our opinion, the financial statements and financial highlights referred to above present fairly, in all material respects, the financial position of the Evergreen High Income Fund as of April 30, 2008, the results of its operations, changes in its net assets and financial highlights for each of the years described above, in conformity with U.S. generally accepted accounting principles.

Boston, Massachusetts
June 27, 2008
41
This page left intentionally blank
42
This page left intentionally blank
43
TRUSTEES AND OFFICERS
TRUSTEES1 | | |
Charles A. Austin III
Trustee
DOB: 10/23/1934
Term of office since: 1991
Other directorships: None | | Investment Counselor, Anchor Capital Advisors, LLC. (investment advice); Director, The Andover Companies (insurance); Trustee, Arthritis Foundation of New England; Former Director, The Francis Ouimet Society (scholarship program); Former Director, Executive Vice President and Treasurer, State Street Research & Management Company (investment advice) |
|
|
|
K. Dun Gifford
Trustee
DOB: 10/23/1938
Term of office since: 1974
Other directorships: None | | Chairman and President, Oldways Preservation and Exchange Trust (education); Trustee, Chairman of the Finance Committee, Member of the Executive Committee, and Former Treasurer, Cambridge College |
|
|
|
Dr. Leroy Keith, Jr.
Trustee
DOB: 2/14/1939
Term of office since: 1983
Other directorships: Trustee,
Phoenix Fund Complex
(consisting of 53 portfolios
as of 12/31/2007) | | Managing Director, Almanac Capital Management (commodities firm); Trustee, Phoenix Fund Complex; Director, Diversapack Co. (packaging company); Former Partner, Stonington Partners, Inc. (private equity fund); Former Director, Obagi Medical Products Co.; Former Director, Lincoln Educational Services |
|
|
|
Carol A. Kosel1
Trustee
DOB: 12/25/1963
Term of office since: 2008
Other directorships: None | | Former Consultant to the Evergreen Boards of Trustees; Former Vice President and Senior Vice President, Evergreen Investments, Inc.; Former Treasurer, Evergreen Funds; Former Treasurer, Vestaur Securities Fund |
|
|
|
Gerald M. McDonnell
Trustee
DOB: 7/14/1939
Term of office since: 1988
Other directorships: None | | Former Manager of Commercial Operations, CMC Steel (steel producer) |
|
|
|
Patricia B. Norris
Trustee
DOB: 4/9/1948
Term of office since: 2006
Other directorships: None | | President and Director of Buckleys of Kezar Lake, Inc. (real estate company); Former President and Director of Phillips Pond Homes Association (home community); Former Partner, PricewaterhouseCoopers, LLP (independent registered public accounting firm) |
|
|
|
William Walt Pettit
Trustee
DOB: 8/26/1955
Term of office since: 1988
Other directorships: None | | Partner and Vice President, Kellam & Pettit, P.A. (law firm); Director, Superior Packaging Corp. (packaging company); Member, Superior Land, LLC (real estate holding company), Member, K&P Development, LLC (real estate development); Former Director, National Kidney Foundation of North Carolina, Inc. (non-profit organization) |
|
|
|
David M. Richardson
Trustee
DOB: 9/19/1941
Term of office since: 1982
Other directorships: None | | President, Richardson, Runden LLC (executive recruitment advisory services); Director, J&M Cumming Paper Co. (paper merchandising); Trustee, NDI Technologies, LLP (communications); Former Consultant, AESC (The Association of Executive Search Consultants) |
|
|
|
Dr. Russell A. Salton III
Trustee
DOB: 6/2/1947
Term of office since: 1984
Other directorships: None | | President/CEO, AccessOne MedCard, Inc. |
|
|
|
44
TRUSTEES AND OFFICERS continued
Michael S. Scofield
Trustee
DOB: 2/20/1943
Term of office since: 1984
Other directorships: None | | Retired Attorney, Law Offices of Michael S. Scofield; Former Director and Chairman, Branded Media Corporation (multi-media branding company) |
|
|
|
Richard J. Shima
Trustee
DOB: 8/11/1939
Term of office since: 1993
Other directorships: None | | Independent Consultant; Director, Hartford Hospital; Trustee, Greater Hartford YMCA; Former Director, Trust Company of CT; Former Director, Old State House Association; Former Trustee, Saint Joseph College (CT) |
|
|
|
Richard K. Wagoner, CFA2
Trustee
DOB: 12/12/1937
Term of office since: 1999
Other directorships: None | | Member and Former President, North Carolina Securities Traders Association; Member, Financial Analysts Society |
|
|
|
OFFICERS
Dennis H. Ferro3
President
DOB: 6/20/1945
Term of office since: 2003 | | Principal occupations: President and Chief Executive Officer, Evergreen Investment Company, Inc. and Executive Vice President, Wachovia Bank, N.A.; former Chief Investment Officer, Evergreen Investment Company, Inc. |
|
|
|
Kasey Phillips4
Treasurer
DOB: 12/12/1970
Term of office since: 2005 | | Principal occupations: Senior Vice President, Evergreen Investment Management Company, LLC; Former Vice President, Evergreen Investment Services, Inc.; Former Assistant Vice President, Evergreen Investment Services, Inc. |
|
|
|
Michael H. Koonce4
Secretary
DOB: 4/20/1960
Term of office since: 2000 | | Principal occupations: Senior Vice President and General Counsel, Evergreen Investment Services, Inc.; Secretary, Senior Vice President and General Counsel, Evergreen Investment Management Company, LLC and Evergreen Service Company, LLC; Senior Vice President and Assistant General Counsel, Wachovia Corporation |
|
|
|
Robert Guerin4
Chief Compliance Officer
DOB: 9/20/1965
Term of office since: 2007 | | Principal occupations: Chief Compliance Officer, Evergreen Funds and Senior Vice President of Evergreen Investments Co., Inc.; Former Managing Director and Senior Compliance Officer, Babson Capital Management LLC; Former Principal and Director, Compliance and Risk Management, State Street Global Advisors; Former Vice President and Manager, Sales Practice Compliance, Deutsche Asset Management |
|
|
|
1 | Each Trustee, except Mses. Kosel and Norris, serves until a successor is duly elected or qualified or until his or her death, resignation, retirement or removal from office. As new Trustees, Ms. Kosel’s and Ms. Norris’ initial terms end December 31, 2010 and June 30, 2009, respectively, at which times they may be re-elected by Trustees to serve until a successor is duly elected or qualified or until her death, resignation, retirement or removal from office by the Trustees. Each Trustee, except Ms. Kosel, oversaw 94 Evergreen funds as of December 31, 2007. Ms. Kosel became a Trustee on January 1, 2008. Correspondence for each Trustee may be sent to Evergreen Board of Trustees, P.O. Box 20083, Charlotte, NC 28202. |
2 | Mr. Wagoner is an “interested person”of the Fund because of his ownership of shares in Wachovia Corporation, the parent to the Fund’s investment advisor. |
3 | The address of the Officer is 401 S. Tryon Street, 20th Floor, Charlotte, NC 28288. |
4 | The address of the Officer is 200 Berkeley Street, Boston, MA 02116. |
Additional information about the Fund’s Board of Trustees and Officers can be found in the Statement of Additional Information (SAI) and is available upon request without charge by calling 800.343.2898.
45
566660 rv5 06/2008
Evergreen U.S. Government Fund

| | table of contents |
1 | | LETTER TO SHAREHOLDERS |
4 | | FUND AT A GLANCE |
5 | | PORTFOLIO MANAGER COMMENTARY |
7 | | ABOUT YOUR FUND’S EXPENSES |
8 | | FINANCIAL HIGHLIGHTS |
12 | | SCHEDULE OF INVESTMENTS |
21 | | STATEMENT OF ASSETS AND LIABILITIES |
22 | | STATEMENT OF OPERATIONS |
23 | | STATEMENTS OF CHANGES IN NET ASSETS |
24 | | STATEMENT OF CASH FLOWS |
25 | | NOTES TO FINANCIAL STATEMENTS |
34 | | REPORT OF INDEPENDENT REGISTERED PUBLIC ACCOUNTING FIRM |
36 | | TRUSTEES AND OFFICERS |
This annual report must be preceded or accompanied by a prospectus of the Evergreen fund contained herein. The prospectus contains more complete information, including fees and expenses, and should be read carefully before investing or sending money.
The fund will file its complete schedule of portfolio holdings with the SEC for the first and third quarters of each fiscal year on Form N-Q. The fund’s Form N-Q will be available on the SEC’s Web site at http://www.sec.gov. In addition, the fund’s Form N-Q may be reviewed and copied at the SEC’s Public Reference Room in Washington, D.C. Information on the operation of the Public Reference Room may be obtained by calling 800.SEC.0330.
A description of the fund’s proxy voting policies and procedures, as well as information regarding how the fund voted proxies relating to portfolio securities during the most recent 12-month period ended June 30, is available by visiting our Web site at EvergreenInvestments.com or by visiting the SEC’s Web site at http://www.sec.gov. The fund’s proxy voting policies and procedures are also available without charge, upon request, by calling 800.343.2898.
Mutual Funds:
| NOT FDIC INSURED | | MAY LOSE VALUE | | NOT BANK GUARANTEED |
Evergreen InvestmentsSM is a service mark of Evergreen Investment Management Company, LLC. Copyright 2008, Evergreen Investment Management Company, LLC.
Evergreen Investment Management Company, LLC is a subsidiary of Wachovia Corporation and is an affiliate of Wachovia Corporation’s other Broker Dealer subsidiaries.
Evergreen mutual funds are distributed by Evergreen Investment Services, Inc. 200 Berkeley Street, Boston, MA 02116
LETTER TO SHAREHOLDERS
June 2008

Dennis H. Ferro
President and Chief Executive Officer
Dear Shareholder:
We are pleased to provide the Annual Report for Evergreen U.S. Government Fund for the twelve-month period ended April 30, 2008 (the “twelve-month period”).
The fiscal year witnessed a dramatic change in fixed income markets as problems that first surfaced in housing and the subprime mortgages raised questions about the strength of the domestic economy and the risks of credit-sensitive investments. Corporate bonds and asset-backed securities performed well early in the period, with gains in economic output, corporate profits and employment encouraging optimism. The backdrop for investing began to change, however, by the summer of 2007 amid widening worries about problems in the financials sector. Major financial institutions began to report substantial losses from their exposures to subprime mortgages and banks started to tighten their credit standards and to restrict their lending. With fears of a dramatic downturn hovering over the market, fixed income investors sought out the highest-quality securities and attempted to avoid credit risk. As a consequence, the prices of corporate bonds and many asset-backed securities fell, while Treasuries rallied in a general flight to quality over much of the period. These general trends later reversed themselves in the final month of the twelve-month period, with high yield corporate bonds and other credit-sensitive securities rallying in April 2008 following a series of actions by the U.S. Federal Reserve Board (the “Fed”) to stabilize the markets. Equities, meanwhile, tended to move in the same general direction as corporate bonds over the fiscal year. Stock prices rose very early in the period before falling in late 2007 and early 2008
1
LETTER TO SHAREHOLDERS continued
and then rallying again in April. For the full twelve-month period, stock valuations fell across all market capitalizations, investment styles and regions. At the same time, the prices of gold, oil and other commodities surged while the U.S. dollar weakened further.
The U.S. economy grew briskly early in 2007, but then slowed significantly in late 2007 and early 2008. Economic growth decelerated as lending for ordinary consumer and commercial activity dried up, accentuating the weakening effects of declining home prices. Corporate profits, employment and other key economic indicators showed clear evidence of deterioration. Gross Domestic Product growth decelerated to a paltry 0.6% rate during the final quarter of 2007 and a marginally better 0.9% pace for the first quarter of 2008. Much of the strength early in 2008 came from exports and government spending, rather than from any noticeable improvements in consumer spending, business investment or housing. To reinvigorate the economy and stimulate lending activity, the Fed became increasingly aggressive, taking a series of steps to pour liquidity into the financial system. Starting in September 2007 and continuing through April 2008, the Fed cut the key fed funds rate seven different times, lowering the influential short-term rate from 5.25% to 2%. In March 2008, the central bank also opened its lending facilities to securities firms as well as commercial banks and intervened to help JPMorgan Chase & Co. purchase the collapsing investment bank Bear Stearns Cos. Meanwhile, Congress and the Bush administration rushed through a $168 billion fiscal stimulus bill, which included tax rebate checks, in an effort to boost growth in the second half of 2008.
During the twelve-month period, managers of Evergreen’s intermediate- and long-term bond funds paid careful attention to risk management in a changing market environment. The teams supervising the higher-credit quality funds—including Evergreen U.S. Government Fund, Evergreen Core
2
LETTER TO SHAREHOLDERS continued
Bond Fund, Evergreen Core Plus Bond Fund and Evergreen Institutional Mortgage Portfolio—monitored Fed policy and interest-rate movements as well as general macroeconomic trends in managing their portfolios. Meanwhile, the managers of Evergreen High Income Fund and Evergreen Select High Yield Bond Fund tended to position their credit-sensitive portfolios relatively conservatively during a period of growing risk aversion. After repositioning their portfolio early in the fiscal year, the managers of Evergreen Diversified Income Builder Fund maintained an emphasis on better-quality, high yield corporate bonds and also increased their exposure to dividend-paying stocks.
The experiences in the capital markets during the twelve-month period have underscored the value of a well-diversified, long-term investment strategy to help soften the effects of volatility in any one market or asset class. As always, we encourage investors to maintain diversified investment portfolios in pursuit of their long-term investment goals.
Please visit us at EvergreenInvestments.com for more information about our funds and other investment products available to you. Thank you for your continued support of Evergreen Investments.
Sincerely,

Dennis H. Ferro
President and Chief Executive Officer
Evergreen Investment Company, Inc.
Special Notice to Shareholders:
Please visit our Web site at EvergreenInvestments.com for statements from President and Chief Executive Officer, Dennis Ferro, regarding the firm’s recent settlement with the Securities and Exchange Commission (SEC) and prior settlement with the Financial Industry Regulatory Authority (FINRA).
3
FUND AT A GLANCE
as of April 30, 2008
MANAGEMENT TEAM
Investment Advisor:
• Evergreen Investment Management Company, LLC |
Sub-Advisor:
• Tattersall Advisory Group, Inc. |
Portfolio Managers:
CURRENT INVESTMENT STYLE

Source: Morningstar, Inc.
Morningstar’s style box is based on a portfolio date as of 3/31/2008.
The Fixed Income style box placement is based on a fund’s average effective maturity or duration and the average credit rating of the bond portfolio.
PERFORMANCE AND RETURNS | | | | | | | | |
Portfolio inception date: 1/11/1993 | | | | | | | | |
| | Class A | | Class B | | Class C | | Class I |
Class inception date | | 1/11/1993 | | 1/11/1993 | | 9/2/1994 | | 9/2/1993 |
|
|
|
|
|
|
|
|
|
Nasdaq symbol | | EUSAX | | EUSBX | | EUSCX | | EUSYX |
|
|
|
|
|
|
|
|
|
Average annual return* | | | | | | | | |
|
|
|
|
|
|
|
|
|
1-year with sales charge | | 0.43% | | -0.31% | | 3.69% | | N/A |
|
|
|
|
|
|
|
|
|
1-year w/o sales charge | | 5.47% | | 4.69% | | 4.69% | | 5.74% |
|
|
|
|
|
|
|
|
|
5-year | | 2.43% | | 2.35% | | 2.70% | | 3.73% |
|
|
|
|
|
|
|
|
|
10-year | | 4.41% | | 4.16% | | 4.16% | | 5.20% |
|
|
|
|
|
|
|
|
|
Maximum sales charge | | 4.75% | | 5.00% | | 1.00% | | N/A |
| | Front-end | | CDSC | | CDSC | | |
|
|
|
|
|
|
|
|
|
* | Adjusted for maximum applicable sales charge, unless noted. |
Past performance is no guarantee of future results. The performance quoted represents past performance and current performance may be lower or higher. The investment return and principal value of an investment will fluctuate so that investors’ shares, when redeemed, may be worth more or less than their original cost. To obtain performance information current to the most recent month-end for Classes A, B, C or I, please go to EvergreenInvestments.com/fundperformance. The performance of each class may vary based on differences in loads, fees and expenses paid by the shareholders investing in each class. Performance includes the reinvestment of income dividends and capital gain distributions. Performance shown does not reflect the deduction of taxes that a shareholder would pay on fund distributions or the redemption of fund shares.
The fund incurs a 12b-1 fee of 0.25% for Class A and 1.00% for Classes B and C. Class I does not pay a 12b-1 fee.
The advisor is reimbursing a portion of the 12b-1 fee for Class A. Had the fee not been reimbursed, returns for Class A would have been lower. Returns reflect expense limits previously in effect for all classes, without which returns would have been lower.
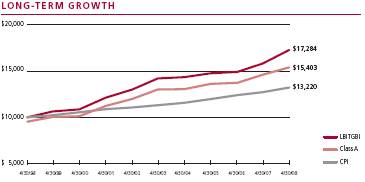
Comparison of a $10,000 investment in the Evergreen U.S. Government Fund Class A shares versus a similar investment in the Lehman Brothers Intermediate Government Bond Index (LBITGBI) and the Consumer Price Index (CPI).
The LBITGBI is an unmanaged market index and does not include transaction costs associated with buying and selling securities, any mutual fund fees or expenses or any taxes. The CPI is a commonly used measure of inflation and does not represent an investment return. It is not possible to invest directly in an index.
4
PORTFOLIO MANAGER COMMENTARY
The fund’s Class A shares returned 5.47% for the twelve-month period ended April 30, 2008, excluding any applicable sales charges. During the same period, the LBITGBI returned 9.26%.
The fund’s objective is to seek to achieve a high level of current income consistent with stability of principal.
The fund’s underperformance relative to the benchmark was largely due to its exposure to mortgage-backed securities (MBS) during a period when all securitized assets significantly lagged U.S. Treasuries. The fiscal year began in May 2007 amid evidence that the domestic economy was continuing to expand after weathering a housing slump earlier in the year. Corporate bonds continued to perform well as investors sought out higher yields. The Federal Reserve Board (the “Fed”) indicated it was more concerned about inflationary pressures than about any potential drags on the economy, and it held the key fed funds rate unchanged at the 5.25% level where it had been for more than a year. That environment began to change in June 2007 amid mounting evidence that weakness in housing and problems in subprime mortgages were becoming more of a threat to the economy. Many major financial institutions, both domestic and international, began reporting significant losses from their subprime mortgage investments. Problems originating in the subprime market led to a massive deleveraging of the financial system and a seizing up of the fixed income markets. Investors typically sought out higher-quality bonds, most notably Treasuries, as evidence accumulated of a growing liquidity crunch affecting lending activities. In this general flight to quality, Treasuries outperformed all other sectors of the fixed income markets for the remainder of the fiscal year as the financial markets remained mired in a liquidity crunch. To relieve this credit crunch and inject liquidity into the financial markets, the Fed, in a series of actions starting in September 2007 and continuing through the end of the fiscal year in April 2008, provided funds to financial institutions. The Fed also lowered the fed funds rate from 5.25% to 2.00% and announced a series of other policy moves to ease lending activity.
For most of the period, we kept the fund’s duration—or exposure to changes in interest rates—consistent with that of the LBITGBI, and this neutral duration position had minimal impact on results. The fund typically invests in a diversified mix of government-backed bonds
Class I shares are only offered, subject to the minimum initial purchase requirements, in the following manner: (1) to investment advisory clients of EIMC (or its advisory affiliates), (2) to employer- or state-sponsored benefit plans, including but not limited to, retirement plans, defined benefit plans, deferred compensation plans, or savings plans, (3) to fee-based mutual fund wrap accounts, (4) through arrangements entered into on behalf of the Evergreen funds with certain financial services firms, (5) to certain institutional investors, and (6) to persons who owned Class Y shares in registered name in an Evergreen fund on or before December 31, 1994 or who owned shares of any SouthTrust fund in registered name as of March 18, 2005 or who owned shares of Vestaur Securities Fund as of May 20, 2005.
Class I shares are only available to institutional shareholders with a minimum of $1 million investment, which may be waived in certain situations.
The fund’s investment objective may be changed without a vote of the fund’s shareholders.
Asset-backed and mortgage-backed securities are generally subject to higher prepayment risks than other types of debt securities, which can limit the potential for gain in a declining interest rate environment and increase the potential for loss in a rising interest rate environment. Mortgage-backed securities may also be structured so that they are particularly sensitive to interest rates.
Derivatives involve additional risks including interest rate risk, credit risk, the risk of improper valuation and the risk of non-correlation to the relevant instruments they are designed to hedge or to closely track.
The return of principal is not guaranteed due to fluctuation in the fund’s NAV caused by changes in the price of individual bonds held by the fund and the buying and selling of bonds by the fund. Bond funds have the same inflation, interest rate and credit risks as individual bonds. Generally, the value of bond funds rises when prevailing interest rates fall, and falls when interest rates rise.
U.S. government guarantees apply only to certain securities held in the fund’s portfolio and not to the fund’s shares.
Leverage may disproportionately increase a fund’s portfolio losses and reduce opportunities for gain when interest rates, stock prices, or currency rates are changing.
All data is as of April 30, 2008, and subject to change.
5
PORTFOLIO MANAGER COMMENTARY continued
including pass-through mortgages and FNMA Delegated Underwriting and Servicing (DUS) bonds which have yield advantages—or spreads—over Treasuries. In most environments this strategy has provided additional yield to the fund and added to the overall performance relative to the market. In a liquidity crisis and flight to quality, however, these high-quality assets are often the ones that are most affected. The fund held a minimal allocation to U.S. Treasuries and Agency Debentures over the course of the year, particularly as yield spreads widened last fall. For most major sectors of the market, yield spreads reached record levels in November 2007. As we moved into 2008, problems in the subprime market continued to weigh on investors and confidence in the financial system remained low. Financial institutions typically continued to struggle as they attempted to value the subprime mortgages held on their balance sheets and shore up capital positions. Spread sectors, which were already historically cheap, underperformed even more in the first three months of 2008 and the fund’s performance was negatively impacted. While the fund did not own any subprime mortgages, performance, nevertheless, was hurt by the fallout from the subprime crisis. The use of MBS and DUS bonds in place of Agency debt tended to detract from results during a period in which the markets did not reward any credit risk.
The Fed’s efforts to provide liquidity and shore up the financial system began to take hold in mid-March 2008 and the market tone began to improve. In the last months of the fiscal year, spreads on securitized government bonds began to narrow significantly and the performance of the fund began to improve.
6
ABOUT YOUR FUND’S EXPENSES
The Example below is intended to describe the fees and expenses borne by shareholders and the impact of those costs on your investment.
Example
As a shareholder of the fund, you incur two types of costs: (1) transaction costs, including sales charges (loads), redemption fees and exchange fees; and (2) ongoing costs, including management fees, distribution (12b-1) fees and other fund expenses. This Example is intended to help you understand your ongoing costs (in dollars) of investing in the fund and to compare these costs with the ongoing costs of investing in other mutual funds. The Example is based on an investment of $1,000 invested at the beginning of the period and held for the entire period from November 1, 2007 to April 30, 2008.
The example illustrates your fund’s costs in two ways:
The section in the table under the heading “Actual” provides information about actual account values and actual expenses. You may use the information in these columns, together with the amount you invested, to estimate the expenses that you paid over the period. Simply divide your account value by $1,000 (for example, an $8,600 account value divided by $1,000 = 8.6), then multiply the result by the number in the appropriate column for your share class, in the column entitled “Expenses Paid During Period” to estimate the expenses you paid on your account during this period.
• Hypothetical example for comparison purposes |
The section in the table under the heading “Hypothetical (5% return before expenses)” provides information about hypothetical account values and hypothetical expenses based on the fund’s actual expense ratio and an assumed rate of return of 5% per year before expenses, which is not the fund’s actual return. The hypothetical account values and expenses may not be used to estimate the actual ending account balance or expenses you paid for the period. You may use this information to compare the ongoing costs of investing in the fund and other funds. To do so, compare this 5% hypothetical example with the 5% hypothetical examples that appear in the shareholder reports of the other funds.
Please note that the expenses shown in the table are meant to highlight your ongoing costs only and do not reflect any transactional costs, such as sales charges (loads), redemption fees or exchange fees. Therefore, the section in the table under the heading “Hypothetical (5% return before expenses)” is useful in comparing ongoing costs only, and will not help you determine the relative total costs of owning different funds. In addition, if these transactional costs were included, your costs would have been higher.
| | Beginning
Account
Value
11/1/2007 | | Ending
Account
Value
4/30/2008 | | Expenses
Paid During
Period* |
|
|
|
|
|
|
|
Actual | | | | | | | | | | | | | | | |
Class A | | | $ | 1,000.00 | | | | $ | 1,029.93 | | | | $ | 4.59 | |
Class B | | | $ | 1,000.00 | | | | $ | 1,026.16 | | | | $ | 8.36 | |
Class C | | | $ | 1,000.00 | | | | $ | 1,026.16 | | | | $ | 8.36 | |
Class I | | | $ | 1,000.00 | | | | $ | 1,031.26 | | | | $ | 3.33 | |
Hypothetical | | | | | | | | | | | | | | | |
(5% return before expenses) | | | | | | | | | | | | | | | |
Class A | | | $ | 1,000.00 | | | | $ | 1,020.34 | | | | $ | 4.57 | |
Class B | | | $ | 1,000.00 | | | | $ | 1,016.61 | | | | $ | 8.32 | |
Class C | | | $ | 1,000.00 | | | | $ | 1,016.61 | | | | $ | 8.32 | |
Class I | | | $ | 1,000.00 | | | | $ | 1,021.58 | | | | $ | 3.32 | |
|
|
|
|
|
|
|
|
|
|
|
|
|
|
|
|
* | For each class of the fund, expenses are equal to the annualized expense ratio of each class (0.91% for Class A, 1.66% for Class B, 1.66% for Class C and 0.66% for Class I), multiplied by the average account value over the period, multiplied by 182 / 366 days. |
7
FINANCIAL HIGHLIGHTS
(For a share outstanding throughout each period)
| | Year Ended April 30, |
| |
|
CLASS A | | 2008 | | 2007 | | 2006 | | 2005 | | 2004 |
|
|
|
|
|
|
|
|
|
|
|
Net asset value, beginning of period | | $ | 9.97 | | $ | 9.81 | | $ | 10.09 | | $ | 9.96 | | $ | 10.22 |
|
|
|
|
|
|
|
|
|
|
|
|
|
|
|
|
Income from investment operations | | | | | | | | | | | | | | | |
Net investment income (loss) | | | 0.46 | | | 0.44 | | | 0.321 | | | 0.241 | | | 0.191 |
Net realized and unrealized gains or losses on investments | | | 0.06 | | | 0.17 | | | (0.24) | | | 0.19 | | | (0.16) |
| |
|
|
|
|
|
|
|
|
|
|
|
|
|
|
Total from investment operations | | | 0.52 | | | 0.61 | | | 0.08 | | | 0.43 | | | 0.03 |
|
|
|
|
|
|
|
|
|
|
|
|
|
|
|
|
Distributions to shareholders from | | | | | | | | | | | | | | | |
Net investment income | | | (0.47) | | | (0.45) | | | (0.36) | | | (0.30) | | | (0.29) |
|
|
|
|
|
|
|
|
|
|
|
|
|
|
|
|
Net asset value, end of period | | $ | 10.02 | | $ | 9.97 | | $ | 9.81 | | $ | 10.09 | | $ | 9.96 |
|
|
|
|
|
|
|
|
|
|
|
|
|
|
|
|
Total return2 | | | 5.47% | | | 6.37% | | | 0.82% | | | 4.37% | | | 0.30% |
|
|
|
|
|
|
|
|
|
|
|
|
|
|
|
|
Ratios and supplemental data | | | | | | | | | | | | | | | |
Net assets, end of period (thousands) | | $ | 207,060 | | $ | 73,875 | | $ | 77,581 | | $ | 93,826 | | $ | 109,172 |
Ratios to average net assets | | | | | | | | | | | | | | | |
Expenses including waivers/reimbursements but excluding expense reductions | | | 0.91% | | | 0.95% | | | 0.98% | | | 1.00% | | | 1.01% |
Expenses excluding waivers/reimbursements and expense reductions | | | 0.96% | | | 0.99% | | | 0.99% | | | 1.00% | | | 1.01% |
Net investment income (loss) | | | 4.59% | | | 4.60% | | | 3.18% | | | 2.38% | | | 1.86% |
Portfolio turnover rate | | | 377%3 | | | 97% | | | 53% | | | 110% | | | 55% |
|
|
|
|
|
|
|
|
|
|
|
|
|
|
|
|
1 | Net investment income (loss) per share is based on average shares outstanding during the period. |
2 | Excluding applicable sales charges |
3 | Portfolio turnover rate includes mortgage dollar roll activity. |
See Notes to Financial Statements
8
FINANCIAL HIGHLIGHTS
(For a share outstanding throughout each period)
| | Year Ended April 30, |
| |
|
CLASS B | | 2008 | | 2007 | | 2006 | | 2005 | | 2004 |
|
|
|
|
|
|
|
|
|
|
|
Net asset value, beginning of period | | $ | 9.97 | | $ | 9.81 | | $ | 10.09 | | $ | 9.96 | | $ | 10.22 |
|
|
|
|
|
|
|
|
|
|
|
|
|
|
|
|
Income from investment operations | | | | | | | | | | | | | | | |
Net investment income (loss) | | | 0.38 | | | 0.381 | | | 0.241 | | | 0.171 | | | 0.121 |
Net realized and unrealized gains or losses on investments | | | 0.07 | | | 0.16 | | | (0.23) | | | 0.19 | | | (0.16) |
| |
|
|
|
|
|
|
|
|
|
|
|
|
|
|
Total from investment operations | | | 0.45 | | | 0.54 | | | 0.01 | | | 0.36 | | | (0.04) |
|
|
|
|
|
|
|
|
|
|
|
|
|
|
|
|
Distributions to shareholders from | | | | | | | | | | | | | | | |
Net investment income | | | (0.40) | | | (0.38) | | | (0.29) | | | (0.23) | | | (0.22) |
|
|
|
|
|
|
|
|
|
|
|
|
|
|
|
|
Net asset value, end of period | | $ | 10.02 | | $ | 9.97 | | $ | 9.81 | | $ | 10.09 | | $ | 9.96 |
|
|
|
|
|
|
|
|
|
|
|
|
|
|
|
|
Total return2 | | | 4.69% | | | 5.60% | | | 0.12% | | | 3.64% | | | (0.40)% |
|
|
|
|
|
|
|
|
|
|
|
|
|
|
|
|
Ratios and supplemental data | | | | | | | | | | | | | | | |
Net assets, end of period (thousands) | | $ | 12,201 | | $ | 12,653 | | $ | 16,747 | | $ | 25,452 | | $ | 37,270 |
Ratios to average net assets | | | | | | | | | | | | | | | |
Expenses including waivers/reimbursements but excluding expense reductions | | | 1.66% | | | 1.69% | | | 1.69% | | | 1.70% | | | 1.71% |
Expenses excluding waivers/reimbursements and expense reductions | | | 1.66% | | | 1.69% | | | 1.69% | | | 1.70% | | | 1.71% |
Net investment income (loss) | | | 3.84% | | | 3.83% | | | 2.45% | | | 1.67% | | | 1.16% |
Portfolio turnover rate | | | 377%3 | | | 97% | | | 53% | | | 110% | | | 55% |
|
|
|
|
|
|
|
|
|
|
|
|
|
|
|
|
1 | Net investment income (loss) per share is based on average shares outstanding during the period. |
2 | Excluding applicable sales charges |
3 | Portfolio turnover rate includes mortgage dollar roll activity. |
See Notes to Financial Statements
9
FINANCIAL HIGHLIGHTS
(For a share outstanding throughout each period)
| | Year Ended April 30, |
| |
|
CLASS C | | | 2008 | | | 2007 | | | 2006 | | | 2005 | | | 2004 |
|
|
|
|
|
|
|
|
|
|
|
|
|
|
|
|
Net asset value, beginning of period | | $ | 9.97 | | $ | 9.81 | | $ | 10.09 | | $ | 9.96 | | $ | 10.22 |
|
|
|
|
|
|
|
|
|
|
|
|
|
|
|
|
Income from investment operations | | | | | | | | | | | | | | | |
Net investment income (loss) | | | 0.381 | | | 0.381 | | | 0.251 | | | 0.171 | | | 0.121 |
Net realized and unrealized gains or losses on investments | | | 0.07 | | | 0.16 | | | (0.24) | | | 0.19 | | | (0.16) |
| |
|
|
|
|
|
|
|
|
|
|
|
|
|
|
Total from investment operations | | | 0.45 | | | 0.54 | | | 0.01 | | | 0.36 | | | (0.04) |
|
|
|
|
|
|
|
|
|
|
|
|
|
|
|
|
Distributions to shareholders from | | | | | | | | | | | | | | | |
Net investment income | | | (0.40) | | | (0.38) | | | (0.29) | | | (0.23) | | | (0.22) |
|
|
|
|
|
|
|
|
|
|
|
|
|
|
|
|
Net asset value, end of period | | $ | 10.02 | | $ | 9.97 | | $ | 9.81 | | $ | 10.09 | | $ | 9.96 |
|
|
|
|
|
|
|
|
|
|
|
|
|
|
|
|
Total return2 | | | 4.69% | | | 5.60% | | | 0.12% | | | 3.64% | | | (0.40)% |
|
|
|
|
|
|
|
|
|
|
|
|
|
|
|
|
Ratios and supplemental data | | | | | | | | | | | | | | | |
Net assets, end of period (thousands) | | $ | 11,746 | | $ | 7,669 | | $ | 7,973 | | $ | 9,820 | | $ | 14,207 |
Ratios to average net assets | | | | | | | | | | | | | | | |
Expenses including waivers/reimbursements but excluding expense reductions | | | 1.66% | | | 1.69% | | | 1.69% | | | 1.70% | | | 1.71% |
Expenses excluding waivers/reimbursements and expense reductions | | | 1.66% | | | 1.69% | | | 1.69% | | | 1.70% | | | 1.71% |
Net investment income (loss) | | | 3.81% | | | 3.86% | | | 2.47% | | | 1.67% | | | 1.17% |
Portfolio turnover rate | | | 377%3 | | | 97% | | | 53% | | | 110% | | | 55% |
|
|
|
|
|
|
|
|
|
|
|
|
|
|
|
|
1 | Net investment income (loss) per share is based on average shares outstanding during the period. |
2 | Excluding applicable sales charges |
3 | Portfolio turnover rate includes mortgage dollar roll activity. |
See Notes to Financial Statements
10
FINANCIAL HIGHLIGHTS
(For a share outstanding throughout each period)
| | Year Ended April 30, |
| |
|
CLASS I | | | 2008 | | | 2007 | | | 2006 | | | 2005 | | | 2004 |
|
|
|
|
|
|
|
|
|
|
|
|
|
|
|
|
Net asset value, beginning of period | | $ | 9.97 | | $ | 9.81 | | $ | 10.09 | | $ | 9.96 | | $ | 10.22 |
|
|
|
|
|
|
|
|
|
|
|
|
|
|
|
|
Income from investment operations | | | | | | | | | | | | | | | |
Net investment income (loss) | | | 0.49 | | | 0.47 | | | 0.351 | | | 0.271 | | | 0.221 |
Net realized and unrealized gains or losses on investments | | | 0.06 | | | 0.17 | | | (0.24) | | | 0.19 | | | (0.16) |
| |
|
|
|
|
|
|
|
|
|
|
|
|
|
|
Total from investment operations | | | 0.55 | | | 0.64 | | | 0.11 | | | 0.46 | | | 0.06 |
|
|
|
|
|
|
|
|
|
|
|
|
|
|
|
|
Distributions to shareholders from | | | | | | | | | | | | | | | |
Net investment income | | | (0.50) | | | (0.48) | | | (0.39) | | | (0.33) | | | (0.32) |
|
|
|
|
|
|
|
|
|
|
|
|
|
|
|
|
Net asset value, end of period | | $ | 10.02 | | $ | 9.97 | | $ | 9.81 | | $ | 10.09 | | $ | 9.96 |
|
|
|
|
|
|
|
|
|
|
|
|
|
|
|
|
Total return | | | 5.74% | | | 6.66% | | | 1.12% | | | 4.68% | | | 0.60% |
|
|
|
|
|
|
|
|
|
|
|
|
|
|
|
|
Ratios and supplemental data | | | | | | | | | | | | | | | |
Net assets, end of period (thousands) | | $ | 733,387 | | $ | 479,015 | | $ | 436,890 | | $ | 436,431 | | $ | 427,356 |
Ratios to average net assets | | | | | | | | | | | | | | | |
Expenses including waivers/reimbursements but excluding expense reductions | | | 0.66% | | | 0.69% | | | 0.69% | | | 0.70% | | | 0.71% |
Expenses excluding waivers/reimbursements and expense reductions | | | 0.66% | | | 0.69% | | | 0.69% | | | 0.70% | | | 0.71% |
Net investment income (loss) | | | 4.82% | | | 4.88% | | | 3.48% | | | 2.69% | | | 2.15% |
Portfolio turnover rate | | | 377%2 | | | 97% | | | 53% | | | 110% | | | 55% |
|
|
|
|
|
|
|
|
|
|
|
|
|
|
|
|
1 | Net investment income (loss) per share is based on average shares outstanding during the period. |
2 | Portfolio turnover rate includes mortgage dollar roll activity. |
See Notes to Financial Statements
11
SCHEDULE OF INVESTMENTS
April 30, 2008
| | | Principal
Amount | | | Value |
|
|
|
|
|
|
|
AGENCY COMMERCIAL MORTGAGE-BACKED SECURITIES 12.8% | | | | | | |
FIXED-RATE 11.9% | | | | | | |
FNMA: | | | | | | |
4.75%, 07/01/2012 | | $ | 963,315 | | $ | 974,615 |
5.08%, 02/01/2016-03/01/2016 ## | | | 11,253,653 | | | 11,302,306 |
5.15%, 11/01/2017 | | | 4,148,023 | | | 4,188,561 |
5.31%, 04/01/2016 | | | 3,200,000 | | | 3,273,816 |
5.37%, 12/01/2024 | | | 912,017 | | | 906,470 |
5.50%, 04/01/2016 | | | 7,680,000 | | | 7,946,837 |
5.55%, 05/01/2016 | | | 3,300,000 | | | 3,424,644 |
5.63%, 02/01/2018 | | | 1,177,723 | | | 1,172,306 |
5.64%, 12/01/2013 | | | 3,000,000 | | | 3,139,783 |
5.65%, 08/01/2022 | | | 1,589,636 | | | 1,620,113 |
5.66%, 12/01/2016 | | | 1,732,000 | | | 1,786,600 |
5.67%, 03/01/2016-11/01/2021 ## | | | 12,692,960 | | | 13,139,796 |
5.68%, 08/01/2016-04/01/2021 ## | | | 12,670,839 | | | 13,151,339 |
5.70%, 03/01/2016 | | | 1,030,902 | | | 1,079,203 |
5.75%, 05/01/2021 | | | 3,887,734 | | | 4,006,393 |
5.79%, 10/01/2017-12/01/2017 | | | 3,295,345 | | | 3,398,689 |
5.82%, 12/01/2036 | | | 846,722 | | | 868,933 |
5.94%, 03/01/2017 | | | 7,043,878 | | | 7,514,796 |
5.95%, 06/01/2024 | | | 1,959,036 | | | 2,041,964 |
5.97%, 12/01/2017 | | | 1,395,428 | | | 1,441,812 |
6.07%, 09/01/2013 | | | 3,099,286 | | | 3,247,370 |
6.08%, 01/01/2019 | | | 6,204,504 | | | 6,464,597 |
6.18%, 06/01/2013 | | | 9,376,856 | | | 9,904,679 |
6.32%, 08/01/2012 | | | 2,935,170 | | | 3,122,112 |
6.35%, 08/01/2009-10/01/2009 | | | 1,054,325 | | | 1,068,475 |
6.65%, 05/01/2016 | | | 1,602,337 | | | 1,746,794 |
6.80%, 04/01/2017 o | | | 392,577 | | | 392,577 |
7.48%, 01/01/2025 | | | 1,144,356 | | | 1,243,767 |
Ser. 2002-M1, Class C, 6.17%, 02/25/2016 | | | 878,180 | | | 910,185 |
| | | | |
|
|
| | | | | | 114,479,532 |
| | | | |
|
|
FLOATING-RATE 0.9% | | | | | | |
FHLMC, 5.80%, 03/01/2037 | | | 8,669,792 | | | 8,870,454 |
| | | | |
|
|
Total Agency Commercial Mortgage-Backed Securities (cost $121,965,050) | | | | | | 123,349,986 |
| | | | |
|
|
AGENCY MORTGAGE-BACKED COLLATERALIZED MORTGAGE | | | | | | |
OBLIGATIONS 28.3% | | | | | | |
FIXED-RATE 2.5% | | | | | | |
FHLMC: | | | | | | |
Ser. 0243, Class 6, IO, 6.00%, 12/15/2032 | | | 332,412 | | | 73,759 |
Ser. 1807, Class C, 6.00%, 12/15/2008 | | | 34,397 | | | 34,630 |
Ser. 2043, Class ZP, 6.50%, 04/15/2028 | | | 529,701 | | | 549,441 |
Ser. 2046, Class G, 6.50%, 04/15/2028 | | | 305,608 | | | 318,214 |
Ser. 2058, Class TE, 6.50%, 05/15/2028 | | | 317,819 | | | 330,535 |
Ser. 2072, Class A, 6.50%, 07/15/2028 | | | 1,168,167 | | | 1,219,799 |
See Notes to Financial Statements
12
SCHEDULE OF INVESTMENTS continued
April 30, 2008
| | | Principal
Amount | | | Value |
|
|
|
|
|
|
|
AGENCY MORTGAGE-BACKED COLLATERALIZED MORTGAGE OBLIGATIONS continued | | | | | | |
FIXED-RATE continued | | | | | | |
FHLMC: | | | | | | |
Ser. 2078, Class PE, 6.50%, 08/15/2028 | | $ | 587,330 | | $ | 610,194 |
Ser. 2173, Class Z, 6.50%, 07/15/2029 | | | 823,721 | | | 858,400 |
Ser. 2262, Class Z, 7.50%, 10/15/2030 | | | 260,291 | | | 276,601 |
Ser. 2326, Class ZP, 6.50%, 06/15/2031 | | | 26,063 | | | 27,118 |
Ser. 2367, Class BC, 6.00%, 04/15/2016 | | | 1,108 | | | 1,106 |
Ser. 2461 Class PZ, 6.50%, 06/15/2032 | | | 708,949 | | | 742,021 |
Ser. 3098, Class KI, IO, 5.50%, 11/15/2024 | | | 894,449 | | | 51,807 |
Ser. T-57, Class 1A1, 6.50%, 07/25/2043 | | | 2,616,176 | | | 2,709,008 |
FNMA: | | | | | | |
Ser. 0342, Class 2, IO, 6.00%, 09/01/2033 | | | 122,811 | | | 30,664 |
Ser. 1993-215, Class ZQ, 6.50%, 11/25/2023 | | | 615,380 | | | 648,328 |
Ser. 1999, Class LH, 6.50%, 11/25/2029 | | | 387,785 | | | 403,351 |
Ser. 2001-82, Class ZA, 6.50%, 01/25/2032 | | | 266,890 | | | 278,229 |
Ser. 2002-09, Class PC, 6.00%, 03/25/2017 | | | 640,403 | | | 666,004 |
Ser. 2002-56, Class KW, 6.00%, 04/25/2023 | | | 1,190,000 | | | 1,218,219 |
Ser. 2002-W4, Class A4, 6.25%, 05/25/2042 | | | 2,437,208 | | | 2,569,099 |
Ser. 2002-W5, Class A7, 6.25%, 08/25/2030 | | | 830,478 | | | 830,895 |
Ser. 2003-033, Class IA, IO, 6.50%, 05/25/2033 | | | 320,570 | | | 75,582 |
Ser. 2003-046, Class IH, IO, 5.50%, 06/25/2033 | | | 2,914,591 | | | 700,036 |
Ser. 2003-084, Class PW, 3.00%, 06/25/2022 | | | 81,336 | | | 81,166 |
Ser. 2004-W1, Class 2A2, 7.00%, 12/25/2033 | | | 4,794,669 | | | 5,131,256 |
Ser. 2005-071, Class DB, 4.50%, 08/25/2025 | | | 4,000,000 | | | 3,914,388 |
GNMA, Ser. 2002-025, Class B, 6.21%, 03/16/2021 | | | 217,838 | | | 219,767 |
| | | | |
|
|
| | | | | | 24,569,617 |
| | | | |
|
|
FLOATING-RATE 25.8% | | | | | | |
FHLMC: | | | | | | |
Ser. 06, Class B, 3.54%, 03/25/2023 | | | 634,222 | | | 631,342 |
Ser. 1220, Class A, 3.10%, 02/15/2022 | | | 263,970 | | | 262,684 |
Ser. 1370, Class JA, 3.90%, 09/15/2022 | | | 239,645 | | | 241,658 |
Ser. 1498, Class I, 3.90%, 04/15/2023 | | | 154,588 | | | 155,934 |
Ser. 1533, Class FA, 3.85%, 06/15/2023 | | | 54,445 | | | 54,822 |
Ser. 1616, Class FB, 4.46%, 11/15/2008 | | | 164,363 | | | 164,508 |
Ser. 1671, Class TA, 3.25%, 02/15/2024 | | | 459,744 | | | 456,466 |
Ser. 1687, Class FA, 4.61%, 02/15/2009 | | | 915,118 | | | 917,166 |
Ser. 1699, Class FB, 3.75%, 03/15/2024 | | | 930,646 | | | 934,145 |
Ser. 1939, Class FB, 3.75%, 04/15/2027 | | | 377,908 | | | 379,329 |
Ser. 2005-S001, Class 1A2, 3.05%, 09/25/2035 | | | 3,177,143 | | | 3,134,294 |
Ser. 2030, Class F, 3.22%, 02/15/2028 | | | 776,835 | | | 764,902 |
Ser. 2156, Class FQ, 3.07%, 05/15/2029 | | | 4,283,481 | | | 4,260,114 |
Ser. 2181, Class PF, 3.12%, 05/15/2029 | | | 368,243 | | | 360,676 |
Ser. 2315, Class FD, 3.22%, 04/15/2027 | | | 269,655 | | | 265,486 |
Ser. 2325 Class FP, 3.62%, 06/15/2031 | | | 5,292,252 | | | 5,301,244 |
See Notes to Financial Statements
13
SCHEDULE OF INVESTMENTS continued
April 30, 2008
| | | Principal
Amount | | | Value |
|
|
|
|
|
|
|
AGENCY MORTGAGE-BACKED COLLATERALIZED MORTGAGE OBLIGATIONS continued | | | | | | |
FLOATING-RATE continued | | | | | | |
FHLMC: | | | | | | |
Ser. 2334, Class FO, 3.69%, 07/15/2031 ## | | $ | 10,168,137 | | $ | 10,194,167 |
Ser. 2380, Class FL, 3.32%, 11/15/2031 ## | | | 12,412,878 | | | 12,348,151 |
Ser. 2388, Class FG, 3.22%, 12/31/2031 | | | 2,566,634 | | | 2,551,507 |
Ser. 2395, Class FD, 3.32%, 05/15/2029 | | | 3,186,603 | | | 3,175,635 |
Ser. 2399, Class XF, 3.67%, 01/15/2032 | | | 12,125,818 | | | 12,216,435 |
Ser. 2401, Class FA, 3.37%, 07/15/2029 | | | 1,111,200 | | | 1,098,033 |
Ser. 2436, Class FA, 3.72%, 03/15/2032 | | | 11,463,519 | | | 11,573,642 |
Ser. 2481, Class FE, 3.72%, 03/15/2032 | | | 10,636,054 | | | 10,684,981 |
Ser. 2504, Class FP, 3.22%, 03/15/2032 | | | 2,150,032 | | | 2,118,910 |
Ser. 2515, Class FP, 3.12%, 10/15/2032 | | | 2,035,267 | | | 2,002,929 |
Ser. 2691, Class FC, 3.42%, 10/15/2033 | | | 2,089,554 | | | 2,076,475 |
Ser. 3136, Class SA, IIFRN, 46.40%, 04/15/2036 | | | 2,015,329 | | | 3,942,968 |
Ser. 3425, Class JS, IIFRN, 17.90%, 10/15/2035 | | | 455,098 | | | 420,554 |
Ser. T-66, Class 2A1, 7.12%, 01/25/2036 ## o | | | 27,430,686 | | | 29,200,513 |
Ser. T-67, Class 1A1C, 7.23%, 03/25/2036 ## o | | | 28,934,137 | | | 31,102,750 |
Ser. T-67, Class 2A1C, 7.17%, 03/25/2036 | | | 8,567,058 | | | 9,268,022 |
Ser. T-75, Class A1, 2.94%, 11/25/2036 ## | | | 13,804,059 | | | 13,594,928 |
FNMA: | | | | | | |
Ser. 1991, Class F: | | | | | | |
3.76%, 05/25/2021 | | | 592,732 | | | 599,235 |
4.21%, 11/25/2021 | | | 130,682 | | | 132,440 |
Ser. 1991, Class FA, 3.81%, 04/25/2021 | | | 21,942 | | | 21,951 |
Ser. 1993-221, Class FH, 4.01%, 12/25/2008 | | | 434,417 | | | 435,616 |
Ser. 1994-84, Class F, 3.51%, 02/25/2024 | | | 471,462 | | | 466,078 |
Ser. 1997-34, Class F, 3.56%, 10/25/2023 | | | 2,648,923 | | | 2,657,082 |
Ser. 1997-49, Class F, 3.22%, 06/17/2027 | | | 392,459 | | | 385,273 |
Ser. 1999-49, Class F, 3.30%, 05/25/2018 | | | 780,667 | | | 777,787 |
Ser. 2000-32, Class FM, 3.18%, 10/18/2030 | | | 420,048 | | | 412,399 |
Ser. 2001-53, Class CF, 3.30%, 10/25/2031 | | | 33,002 | | | 32,944 |
Ser. 2002-07, Class FB, 3.30%, 02/25/2028 | | | 254,915 | | | 249,776 |
Ser. 2002-13, Class FE, 3.80%, 02/27/2031 | | | 3,475,831 | | | 3,475,240 |
Ser. 2002-41, Class F, 3.45%, 07/25/2032 | | | 3,021,347 | | | 2,998,780 |
Ser. 2002-52, Class FG, 3.40%, 09/25/2032 ## | | | 11,357,600 | | | 11,159,978 |
Ser. 2002-67, Class FA, 3.90%, 11/25/2032 | | | 8,352,194 | | | 8,512,449 |
Ser. 2002-68, Class FN, 3.18%, 10/18/2032 | | | 3,811,636 | | | 3,846,509 |
Ser. 2002-77, Class F, 3.50%, 12/25/2032 ## | | | 13,362,145 | | | 13,216,472 |
Ser. 2002-77, Class FA, 3.73%, 10/18/2030 | | | 6,305,295 | | | 6,431,897 |
Ser. 2002-77, Class FG, 3.28%, 12/18/2032 | | | 1,332,102 | | | 1,343,272 |
Ser. 2002-W5, Class A27, 3.40%, 11/25/2030 | | | 1,908,743 | | | 1,900,898 |
Ser. 2003-011, Class DF, 3.35%, 02/25/2033 | | | 2,264,482 | | | 2,270,115 |
Ser. 2003-011, Class FE, 3.40%, 12/25/2033 | | | 545,456 | | | 531,585 |
Ser. 2003-024, Class FL, 3.35%, 04/25/2018 | | | 2,629,358 | | | 2,619,471 |
Ser. 2003-102, Class FT, 3.30%, 10/25/2033 | | | 2,276,688 | | | 2,273,489 |
See Notes to Financial Statements
14
SCHEDULE OF INVESTMENTS continued
April 30, 2008
| | | Principal
Amount | | | Value |
|
|
|
|
|
|
|
AGENCY MORTGAGE-BACKED COLLATERALIZED MORTGAGE OBLIGATIONS continued | | | | | | |
FLOATING-RATE continued | | | | | | |
FNMA: | | | | | | |
Ser. 2006-72, Class GS, IIFRN, 26.24%, 08/25/2036 | | $ | 1,067,768 | | $ | 1,283,873 |
Ser. G93, Class FH, 4.06%, 04/25/2023 | | | 132,363 | | | 133,546 |
GNMA: | | | | | | |
Ser. 1999-40, Class FL, 3.32%, 02/17/2029 | | | 188,339 | | | 186,113 |
Ser. 1999-43, Class FA, 3.16%, 11/16/2029 | | | 926,966 | | | 919,484 |
Ser. 2000-36, Class FG, 3.30%, 11/20/2030 | | | 343,437 | | | 337,517 |
Ser. 2001-21, Class FB, 3.11%, 01/16/2027 | | | 467,484 | | | 459,780 |
Ser. 2001-22, Class FG, 3.06%, 05/16/2031 | | | 768,539 | | | 758,920 |
Ser. 2002-15, Class F, 3.26%, 02/16/2032 | | | 602,849 | | | 594,240 |
Ser. 2002-26, Class C, 6.01%, 02/16/2024 | | | 981,021 | | | 1,057,310 |
Ser. 2006-47, Class SA, IO, 4.09%, 08/16/2036 | | | 1,420,304 | | | 138,172 |
| | | | |
|
|
| | | | | | 248,475,061 |
| | | | |
|
|
Total Agency Mortgage-Backed Collateralized Mortgage Obligations (cost $270,799,508) | | | | | | 273,044,678 |
| | | | |
|
|
AGENCY MORTGAGE-BACKED PASS THROUGH SECURITIES 71.1% | | | | | | |
FIXED-RATE 58.7% | | | | | | |
FHLMC: | | | | | | |
6.00%, 05/01/2018-10/01/2032 | | | 2,823,638 | | | 2,922,940 |
6.50%, 04/01/2018-07/01/2031 | | | 2,442,275 | | | 2,557,708 |
7.00%, 12/01/2023-05/01/2029 | | | 201,701 | | | 214,494 |
7.50%, 04/01/2023-08/01/2028 | | | 1,270,640 | | | 1,375,441 |
8.00%, 08/01/2023-11/01/2028 | | | 442,951 | | | 478,444 |
8.50%, 07/01/2022-08/01/2026 | | | 75,166 | | | 83,184 |
9.00%, 01/01/2017-10/01/2024 | | | 183,100 | | | 201,509 |
9.50%, 09/01/2016-05/01/2021 | | | 57,572 | | | 63,772 |
10.00%, 08/01/2017-08/01/2020 | | | 2,254 | | | 2,588 |
10.50%, 02/01/2019-05/01/2020 | | | 116,701 | | | 136,371 |
FHLMC 15 year, 5.50%, TBA # | | | 30,000,000 | | | 30,412,500 |
FHLMC 30 year: | | | | | | |
5.50%, TBA # | | | 120,000,000 | | | 120,468,720 |
6.00%, TBA # | | | 90,340,000 | | | 92,189,170 |
6.50%, TBA # | | | 44,800,000 | | | 46,242,000 |
FNMA: | | | | | | |
4.12%, 09/01/2010 | | | 1,399,292 | | | 1,401,412 |
4.98%, 01/01/2020 | | | 934,001 | | | 922,578 |
5.00%, 06/01/2033-03/01/2034 | | | 6,535,756 | | | 6,452,838 |
5.07%, 04/01/2038 ## | | | 20,927,599 | | | 21,038,581 |
5.12%, 01/01/2016 | | | 2,494,488 | | | 2,548,039 |
5.24%, 12/01/2012 | | | 732,084 | | | 745,789 |
5.39%, 01/01/2024 | | | 3,722,848 | | | 3,759,914 |
5.50%, 05/01/2024-05/01/2037 ## | | | 42,546,709 | | | 42,735,107 |
5.55%, 09/01/2019 | | | 6,485,747 | | | 6,514,797 |
5.75%, 02/01/2009 | | | 1,742,549 | | | 1,770,429 |
See Notes to Financial Statements
15
SCHEDULE OF INVESTMENTS continued
April 30, 2008
| | | Principal
Amount | | | Value |
|
|
|
|
|
|
|
AGENCY MORTGAGE-BACKED PASS THROUGH SECURITIES continued | | | | | | |
FIXED-RATE continued | | | | | | |
FNMA: | | | | | | |
6.00%, 03/01/2024 ## | | $ | 571,618 | | $ | 593,268 |
6.00%, 11/01/2028-04/01/2033 | | | 20,875,140 | | | 21,498,101 |
6.50%, 06/01/2017-01/01/2048 | | | 20,550,104 | | | 21,211,299 |
7.00%, 11/01/2026-10/01/2047 | | | 17,112,477 | | | 17,872,969 |
7.50%, 12/01/2017-01/01/2033 | | | 2,139,806 | | | 2,312,338 |
8.00%, 08/01/2020-02/01/2030 | | | 2,179,517 | | | 2,360,665 |
8.50%, 08/01/2014-08/01/2029 | | | 377,274 | | | 414,189 |
9.00%, 06/01/2021-04/01/2025 | | | 265,627 | | | 287,588 |
9.50%, 10/01/2020-02/01/2023 | | | 32,139 | | | 35,482 |
11.00%, 01/01/2016 | | | 24,964 | | | 26,431 |
11.25%, 02/01/2016 | | | 85,378 | | | 96,725 |
FNMA 30 year: | | | | | | |
5.00%, TBA # | | | 88,125,000 | | | 86,417,578 |
6.00%, TBA # | | | 20,000,000 | | | 20,351,563 |
GNMA: | | | | | | |
6.00%, 02/15/2009-08/20/2034 | | | 3,965,857 | | | 4,078,858 |
6.50%, 12/15/2025-09/20/2033 | | | 553,237 | | | 575,336 |
7.00%, 12/15/2022-05/15/2032 | | | 453,684 | | | 486,319 |
7.34%, 10/20/2021-09/20/2022 | | | 552,821 | | | 590,236 |
7.50%, 02/15/2022-06/15/2032 | | | 805,579 | | | 870,420 |
8.00%, 04/15/2023-06/15/2025 | | | 87,979 | | | 96,285 |
8.50%, 07/15/2016 | | | 2,198 | | | 2,402 |
9.00%, 03/15/2009-04/15/2021 | | | 105,223 | | | 115,209 |
10.00%, 12/15/2018 | | | 63,990 | | | 72,560 |
14.00%, 02/15/2012-06/15/2012 | | | 204,853 | | | 238,272 |
| | | | |
|
|
| | | | | | 565,842,418 |
| | | | |
|
|
FLOATING-RATE 12.4% | | | | | | |
FHLMC, 5.89%, 02/01/2037 ## | | | 11,702,971 | | | 12,004,289 |
FNMA: | | | | | | |
4.125%, 12/25/2025 ## | | | 13,283,954 | | | 13,348,630 |
5.17%, 02/01/2035 ## | | | 9,369,923 | | | 9,419,897 |
5.22%, 01/01/2038 | | | 5,286,753 | | | 5,322,166 |
5.23%, 07/01/2032 | | | 3,866,892 | | | 3,962,754 |
5.27%, 11/01/2030 | | | 564,330 | | | 577,562 |
5.28%, 04/01/2029-10/01/2041 | | | 5,105,516 | | | 5,196,213 |
5.33%, 09/01/2041 ## | | | 7,436,174 | | | 7,482,010 |
5.48%, 06/01/2040-01/01/2041 | | | 6,416,379 | | | 6,500,246 |
6.52%, 01/01/2011 | | | 10,765 | | | 10,925 |
6.54%, 11/01/2033-04/01/2036 ## | | | 29,570,387 | | | 31,549,223 |
6.58%, 11/01/2018 | | | 260,232 | | | 277,605 |
6.74%, 07/01/2025 | | | 280,499 | | | 289,492 |
7.35%, 05/01/2030 | | | 307,927 | | | 322,548 |
See Notes to Financial Statements
16
SCHEDULE OF INVESTMENTS continued
April 30, 2008
| | | Principal
Amount | | | Value |
|
|
|
|
|
|
|
AGENCY MORTGAGE-BACKED PASS THROUGH SECURITIES continued | | | | | | |
FLOATING-RATE continued | | | | | | |
SBA: | | | | | | |
2.58%, 08/25/2031 | | $ | 905,315 | | $ | 903,458 |
2.60%, 09/25/2030-11/25/2030 | | | 1,497,163 | | | 1,495,836 |
2.625%, 03/25/2027-03/25/2035 | | | 3,199,143 | | | 3,241,975 |
2.66%, 10/25/2029-11/25/2029 | | | 10,284,204 | | | 10,311,832 |
2.68%, 10/25/2031 | | | 7,038,593 | | | 7,174,931 |
| | | | |
|
|
| | | | | | 119,391,592 |
| | | | |
|
|
Total Agency Mortgage-Backed Pass Through Securities (cost $679,320,403) | | | | | | 685,234,010 |
| | | | |
|
|
AGENCY REPERFORMING MORTGAGE-BACKED PASS THROUGH SECURITIES 2.1% | | | | | | |
FHLMC: | | | | | | |
Ser. 2406, Class FP, 3.70%, 01/15/2032 | | | 3,624,405 | | | 3,654,437 |
Ser. 2406, Class PF, 3.70%, 12/15/2031 | | | 3,491,926 | | | 3,502,297 |
Ser. T-60, Class 1A-1, 6.50%, 03/25/2044 | | | 1,033,181 | | | 1,093,674 |
FNMA: | | | | | | |
Ser. 2001-T4, Class A1, 7.50%, 07/25/2041 | | | 244,236 | | | 261,927 |
Ser. 2002-T1, Class A3, 7.50%, 11/25/2031 | | | 2,233,587 | | | 2,394,364 |
Ser. 2002-T16, Class A1, 6.50%, 07/25/2042 | | | 3,665,858 | | | 3,980,132 |
Ser. 2002-W3, Class A5, 7.50%, 01/25/2028 | | | 361,194 | | | 387,805 |
Ser. 2002-W8, Class A4, 7.00%, 06/25/2017 | | | 1,108,204 | | | 1,192,517 |
Ser. 2003-W1, Class 1A-1, 6.50%, 12/25/2042 | | | 1,839,750 | | | 1,909,067 |
Ser. 2004-T1, Class 1A-2, 6.50%, 01/25/2044 | | | 1,641,300 | | | 1,733,918 |
| | | | |
|
|
Total Agency Reperforming Mortgage-Backed Pass Through Securities (cost $19,939,812) | | | | | | 20,110,138 |
| | | | |
|
|
ASSET-BACKED SECURITIES 0.6% | | | | | | |
Argent Securities, Inc., Ser. 2004-W8, Class A2, FRN, 3.375%, 05/25/2034 | | | 778,579 | | | 766,724 |
Countrywide Asset-Backed Certificates: | | | | | | |
Ser. 2005-16, Class 2AF2, 5.38%, 02/25/2030 | | | 370,000 | | | 367,489 |
Ser. 2005-17, Class 1AF2, 5.36%, 05/25/2036 | | | 250,000 | | | 250,800 |
HSBC Home Equity Loan Trust, Ser. 2005-3, Class A1, FRN, 3.06%, | | | | | | |
01/20/2035 | | | 350,456 | | | 341,682 |
Lehman XS Trust: | | | | | | |
Ser. 2005-02, Class 2A1B, 5.18%, 08/25/2035 | | | 242,476 | | | 244,062 |
Ser. 2005-04, Class 2A1B, 5.17%, 10/25/2035 | | | 215,919 | | | 210,473 |
Ser. 2005-10, Class 2A3B, 5.55%, 01/25/2036 | | | 369,495 | | | 363,695 |
NovaStar ABS CDO, Ltd., Ser. 2007-1A, Class A2, FRN, 3.59%, 02/08/2047 | | | | | | |
144A + » • | | | 4,000,000 | | | 2,782,920 |
Popular Mtge. Trust, Ser. 2005-A, Class B3, 5.68%, 01/25/2036 | | | 380,000 | | | 381,733 |
| | | | |
|
|
Total Asset-Backed Securities (cost $6,963,808) | | | | | | 5,709,578 |
| | | | |
|
|
See Notes to Financial Statements
17
SCHEDULE OF INVESTMENTS continued
April 30, 2008
| | | Principal
Amount | | | Value |
|
|
|
|
|
|
|
COMMERCIAL MORTGAGE-BACKED SECURITIES 2.4% | | | | | | |
FIXED-RATE 1.4% | | | | | | |
Banc of America Comml. Mtge. Securities, Inc., Ser. 2006-05, Class A2, 5.32%, 10/10/2011 | | $ | 1,025,000 | | $ | 1,015,857 |
First Union-Lehman Brothers-Bank of America, Ser. 1998-C2, Class A2, 6.56%, 11/18/2035 | | | 37,601 | | | 37,528 |
GE Capital Comml. Mtge. Corp., Ser. 2005-C3, Class A2, 4.85%, 07/10/2045 | | | 660,000 | | | 660,091 |
JPMorgan Chase & Co. Comml. Mtge. Securities Corp., Ser. 2005-LDP4, Class A2, 4.79%, 10/15/2042 | | | 950,000 | | | 945,844 |
LB-UBS Comml. Mtge. Trust, Ser. 2005-C5, Class A2, 4.89%, 09/15/2030 | | | 790,000 | | | 790,000 |
Morgan Stanley Capital, Inc., Ser. 1998-HF2, Class F, 6.01%, 11/15/2030 144A | | | 5,935,000 | | | 5,985,614 |
Prima Capital Securitization, Ltd., Ser. 2006, Class D, 5.88%, 12/28/2048 | | | 3,618,000 | | | 3,737,394 |
| | | | |
|
|
| | | | | | 13,172,328 |
| | | | |
|
|
FLOATING-RATE 1.0% | | | | | | |
Credit Suisse First Boston Mtge. Securities: | | | | | | |
Ser. 2004-TF2A, Class H, 3.42%, 11/15/2019 144A | | | 1,900,000 | | | 1,907,553 |
Ser. 2004-TF2A, Class J, 3.67%, 11/15/2019 144A | | | 1,828,000 | | | 1,835,266 |
Ser. 2005-TFLA, Class J, 3.67%, 02/15/2020 144A | | | 961,000 | | | 973,238 |
Merrill Lynch Floating Trust, Ser. 2006-1, Class A1, 2.79%, 06/15/2022 144A | | | 5,578,824 | | | 5,529,674 |
| | | | |
|
|
| | | | | | 10,245,731 |
| | | | |
|
|
Total Commercial Mortgage-Backed Securities (cost $23,225,026) | | | | | | 23,418,059 |
| | | | |
|
|
U.S. TREASURY OBLIGATIONS 4.9% | | | | | | |
U.S. Treasury Bonds, 5.50%, 08/15/2028 | | | 6,500,000 | | | 7,344,493 |
U.S. Treasury Notes: | | | | | | |
4.25%, 11/15/2017 ρ | | | 18,000,000 | | | 18,703,134 |
4.75%, 12/31/2008-08/15/2017 ρ | | | 20,600,000 | | | 21,712,310 |
| | | | |
|
|
Total U.S. Treasury Obligations (cost $47,829,139) | | | | | | 47,759,937 |
| | | | |
|
|
WHOLE LOAN MORTGAGE-BACKED COLLATERALIZED | | | | | | |
MORTGAGE OBLIGATIONS 5.3% | | | | | | |
FIXED-RATE 3.6% | | | | | | |
Citigroup Mtge. Loan Trust, Inc., Ser. 2003-HE2, Class M6, 5.54%, 03/25/2036 | | | 168,189 | | | 168,927 |
Countrywide Alternative Loan Trust: | | | | | | |
Ser. 2004-1T1, Class A6, 5.75%, 02/25/2034 | | | 5,000,000 | | | 5,325,250 |
Ser. 2005-46CB, Class A14, 5.50%, 10/25/2035 | | | 10,000,000 | | | 8,927,247 |
Countrywide Home Loans, Inc., Ser. 2006-18, Class 2A5, 6.00%, 12/25/2036 | | | 4,050,000 | | | 3,699,365 |
Credit Suisse Mtge. Capital Cert., Ser. 2006-9, Class 4A1, 6.00%, 11/25/2036 | | | 10,534,909 | | | 10,252,606 |
Residential Accredit Loans, Inc.: | | | | | | |
Ser. 2006-QS4, Class A4, 6.00%, 04/25/2036 | | | 5,000,000 | | | 4,599,544 |
Ser. 2006-QS5, Class A2, 6.00%, 05/25/2036 | | | 423,850 | | | 423,886 |
Residential Asset Securitization Trust, Ser. 2006-A9CB, Class A5, 6.00%, 07/25/2036 | | | 881,513 | | | 874,484 |
| | | | |
|
|
| | | | | | 34,271,309 |
| | | | |
|
|
See Notes to Financial Statements
18
SCHEDULE OF INVESTMENTS continued
April 30, 2008
| | | Principal
Amount | | | Value |
|
|
|
|
|
|
|
WHOLE LOAN MORTGAGE-BACKED COLLATERALIZED MORTGAGE OBLIGATIONS continued | | | | | | |
FLOATING-RATE 1.7% | | | | | | |
Countrywide Home Loans, Inc., Ser. 2004-29, Class 3A1, 5.93%, 02/25/2035 | | $ | 8,265,006 | | $ | 8,279,838 |
Credit Suisse First Boston Mtge. Securities Corp., Ser. 2003 AR2, 5.35%, 02/25/2033 | | | 8,107,650 | | | 7,974,604 |
Deutsche Securities, Inc.: | | | | | | |
Ser. 2006-AB2, Class A7, 5.96%, 06/25/2036 | | | 335,693 | | | 335,944 |
Ser. 2006-AB3, Class A7, 6.36%, 07/25/2036 | | | 109,626 | | | 109,748 |
| | | | |
|
|
| | | | | | 16,700,134 |
| | | | |
|
|
Total Whole Loan Mortgage-Backed Collateralized Mortgage Obligations (cost $52,583,417) | | | | | | 50,971,443 |
| | | | |
|
|
WHOLE LOAN SUBORDINATE COLLATERALIZED | | | | | | |
MORTGAGE OBLIGATIONS 0.9% | | | | | | |
FIXED-RATE 0.9% | | | | | | |
Countrywide Alternative Loan Trust, Ser. 2004-2CB, Class M, 5.67%, 03/25/2034 (cost $10,911,537) | | | 10,944,028 | | | 9,185,067 |
| | | | |
|
|
YANKEE OBLIGATIONS–CORPORATE 3.4% | | | | | | |
FINANCIALS 3.4% | | | | | | |
Diversified Financial Services 3.4% | | | | | | |
MMCAPS Funding XIX, Ltd, FRN, 3.46%, 01/12/2038 144A | | | 5,000,000 | | | 3,781,100 |
Preferred Term Securities IV, Ltd., FRN, 5.05%, 12/23/2031 144A | | | 4,312,610 | | | 4,121,173 |
Preferred Term Securities V, Ltd., FRN, 4.71%, 04/03/2032 144A | | | 4,877,100 | | | 4,642,999 |
Preferred Term Securities VI, Ltd., FRN, 4.41%, 07/03/2032 144A | | | 835,709 | | | 826,642 |
Preferred Term Securities XII, Ltd., FRN, 4.42%, 12/24/2033 144A | | | 5,000,000 | | | 4,762,400 |
Preferred Term Securities XIV, Ltd., FRN: | | | | | | |
3.40%, 06/24/2034 144A | | | 1,050,000 | | | 1,062,466 |
4.37%, 06/24/2034 144A | | | 12,500,000 | | | 11,565,625 |
Trapeza CDO, LLC, Ser. 2004-7A, Class B1, FRN, 4.47%, 01/25/2035 144A | | | 2,200,000 | | | 2,041,226 |
| | | | |
|
|
Total Yankee Obligations–Corporate (cost $35,433,631) | | | | | | 32,803,631 |
| | | | |
|
|
| | | | | | |
|
|
|
|
|
|
|
| | | Shares | | | Value |
|
|
|
|
|
|
|
PREFERRED STOCKS 0.2% | | | | | | |
FINANCIALS 0.2% | | | | | | |
Thrifts & Mortgage Finance 0.2% | | | | | | |
Freddie Mac, Ser. Z, 8.375% ρ (cost $2,000,000) | | | 80,000 | | | 2,048,000 |
| | | | |
|
|
SHORT-TERM INVESTMENTS 10.8% | | | | | | |
MUTUAL FUND SHARES 10.8% | | | | | | |
Evergreen Institutional Money Market Fund, Class I, 2.78% ø q ρρ | | | 15,578,053 | | | 15,578,053 |
Evergreen Institutional U.S. Government Money Market Fund, Class I, 2.22% ø q ## | | | 88,220,005 | | | 88,220,005 |
| | | | |
|
|
Total Short-Term Investments (cost $103,798,058) | | | | | | 103,798,058 |
| | | | |
|
|
See Notes to Financial Statements
19
SCHEDULE OF INVESTMENTS continued
April 30, 2008
| | | | | | Value |
|
|
|
|
|
|
|
| | | | | | |
Total Investments (cost $1,374,769,389) 142.8% | | | | | $ | 1,377,432,585 |
Other Assets and Liabilities (42.8%) | | | | | | (413,038,536) |
| | | | |
|
|
Net Assets 100.0% | | | | | $ | 964,394,049 |
| | | | |
|
|
## | | All or a portion of this security has been segregated for when-issued or delayed delivery securities. |
o | | Security is valued at fair value as determined by the investment advisor in good faith, according to procedures approved by the Board of Trustees. |
# | | When-issued or delayed delivery security |
144A | | Security that may be sold to qualified institutional buyers under Rule 144A of the Securities Act of 1933, as amended.
This security has been determined to be liquid under guidelines established by the Board of Trustees, unless otherwise noted. |
+ | | Security is deemed illiquid and is valued using market quotations when readily available, unless otherwise noted. |
» | | Security has defaulted on its payment of interest and/or principal subsequent to the date of this report and is currently valued at a fair value price of $0 as determined by the investment advisor, in good faith, according to procedures approved by the Board of Trustees. |
• | | The fund has stopped accruing interest on this security. |
ρ | | All or a portion of this security is on loan. |
ø | | Evergreen Investment Management Company, LLC is the investment advisor to both the Fund and the money market fund. |
q | | Rate shown is the 7-day annualized yield at period end. |
ρρ | | All or a portion of this security represents investment of cash collateral received from securities on loan. |
Summary of Abbreviations |
CDO | Collateralized Debt Obligation |
FHLMC | Federal Home Loan Mortgage Corp. |
FNMA | Federal National Mortgage Association |
FRN | Floating Rate Note |
GNMA | Government National Mortgage Association |
IIFRN | Indexed Inverse Floating Rate Note |
IO | Interest Only |
SBA | Small Business Administration |
TBA | To Be Announced |
The following table shows the percent of total investments (excluding equity positions, collateral from securities on loan and segregated cash and cash equivalents) based on effective maturity as of April 30, 2008 (unaudited):
Less than 1 year | | 11.9% |
1 to 3 year(s) | | 11.2% |
3 to 5 years | | 25.2% |
5 to 10 years | | 49.8% |
10 to 20 years | | 1.4% |
Greater than 30 years | | 0.5% |
| |
|
| | 100.0% |
| |
|
The following table shows the percent of total investments (excluding equity positions, collateral from securities on loan and segregated cash and cash equivalents) by credit quality based on on Moody’s and Standard & Poor’s ratings as of April 30, 2008 (unaudited):
AAA | | 92.0% |
AA | | 1.0% |
A | | 7.0% |
| |
|
| | 100.0% |
| |
|
See Notes to Financial Statements
20
STATEMENT OF ASSETS AND LIABILITIES
April 30, 2008
Assets | | | |
Investments in securities, at value (cost $1,270,971,331) including $37,281,299 of securities loaned | | $ | 1,273,634,527 |
Investments in affiliated money market funds, at value (cost $103,798,058) | | | 103,798,058 |
|
|
|
|
Total investments | | | 1,377,432,585 |
Receivable for securities sold | | | 397,139,212 |
Principal paydown receivable | | | 720,154 |
Receivable for Fund shares sold | | | 1,475,936 |
Interest receivable | | | 5,048,969 |
Receivable for securities lending income | | | 12,406 |
Prepaid expenses and other assets | | | 52,131 |
|
|
|
|
Total assets | | | 1,781,881,393 |
|
|
|
|
Liabilities | | | |
Dividends payable | | | 1,111,452 |
Payable for securities purchased | | | 794,082,018 |
Payable for Fund shares redeemed | | | 3,481,665 |
Unrealized losses on credit default swap transactions | | | 2,103,856 |
Premiums received on credit default swap transactions | | | 581,694 |
Payable for securities on loan | | | 15,578,053 |
Due to custodian bank | | | 436,151 |
Advisory fee payable | | | 10,257 |
Distribution Plan expenses payable | | | 2,060 |
Due to other related parties | | | 3,192 |
Accrued expenses and other liabilities | | | 96,946 |
|
|
|
|
Total liabilities | | | 817,487,344 |
|
|
|
|
Net assets | | $ | 964,394,049 |
|
|
|
|
Net assets represented by | | | |
Paid-in capital | | $ | 971,464,430 |
Undistributed net investment income | | | 944,150 |
Accumulated net realized losses on investments | | | (8,573,871) |
Net unrealized gains on investments | | | 559,340 |
|
|
|
|
Total net assets | | $ | 964,394,049 |
|
|
|
|
Net assets consists of | | | |
Class A | | $ | 207,060,103 |
Class B | | | 12,200,814 |
Class C | | | 11,745,755 |
Class I | | | 733,387,377 |
|
|
|
|
Total net assets | | $ | 964,394,049 |
|
|
|
|
Shares outstanding (unlimited number of shares authorized) | | | |
Class A | | | 20,654,792 |
Class B | | | 1,217,040 |
Class C | | | 1,171,679 |
Class I | | | 73,157,748 |
|
|
|
|
Net asset value per share | | | |
Class A | | $ | 10.02 |
Class A — Offering price (based on sales charge of 4.75%) | | $ | 10.52 |
Class B | | $ | 10.02 |
Class C | | $ | 10.02 |
Class I | | $ | 10.02 |
|
|
|
|
See Notes to Financial Statements
21
STATEMENT OF OPERATIONS
Year Ended April 30, 2008
Investment income | | | |
Interest | | $ | 44,412,397 |
Income from affiliate | | | 1,625,253 |
Securities lending | | | 60,242 |
Dividends | | | 53,972 |
|
|
|
|
Total investment income | | | 46,151,864 |
|
|
|
|
Expenses | | | |
Advisory fee | | | 3,312,137 |
Distribution Plan expenses | | | |
Class A | | | 629,391 |
Class B | | | 117,200 |
Class C | | | 94,584 |
Administrative services fee | | | 838,020 |
Transfer agent fees | | | 869,423 |
Trustees’ fees and expenses | | | 24,971 |
Printing and postage expenses | | | 56,645 |
Custodian and accounting fees | | | 344,268 |
Registration and filing fees | | | 52,528 |
Professional fees | | | 52,123 |
Interest expense | | | 17,754 |
Other | | | 11,005 |
|
|
|
|
Total expenses | | | 6,420,049 |
Less: Expense reductions | | | (19,990) |
Expense reimbursements | | | (97,788) |
|
|
|
|
Net expenses | | | 6,302,271 |
|
|
|
|
Net investment income | | | 39,849,593 |
|
|
|
|
Net realized and unrealized gains or losses on investments | | | |
Net realized gains or losses: | | | |
Securities | | | 9,483,645 |
Credit default swap transactions | | | 22,714 |
Total return swap transactions | | | (2,460,060) |
|
|
|
|
Net realized gains on investments | | | 7,046,299 |
Net change in unrealized gains or losses on investments | | | 472,997 |
|
|
|
|
Net realized and unrealized gains or losses on investments | | | 7,519,296 |
|
|
|
|
Net increase in net assets resulting from operations | | $ | 47,368,889 |
|
|
|
|
See Notes to Financial Statements
22
STATEMENTS OF CHANGES IN NET ASSETS
| | | Year Ended April 30, |
| | |
|
| | | 2008 | | | 2007 |
|
|
|
|
|
|
|
Operations | | | | | | | | | | | | |
Net investment income | | | | | $ | 39,849,593 | | | | | $ | 26,183,752 |
Net realized gains or losses on investments | | | | | | 7,046,299 | | | | | | (415,925) |
Net change in unrealized gains or losses on investments | | | | | | 472,997 | | | | | | 9,001,559 |
|
|
|
|
|
|
|
|
|
|
|
|
|
Net increase in net assets resulting from operations | | | | | | 47,368,889 | | | | | | 34,769,386 |
|
|
|
|
|
|
|
|
|
|
|
|
|
Distributions to shareholders from | | | | | | | | | | | | |
Net investment income | | | | | | | | | | | | |
Class A | | | | | | (10,087,979) | | | | | | (3,445,960) |
Class B | | | | | | (468,754) | | | | | | (564,283) |
Class C | | | | | | (374,996) | | | | | | (294,916) |
Class I | | | | | | (30,246,347) | | | | | | (21,740,316) |
|
|
|
|
|
|
|
|
|
|
|
|
|
Total distributions to shareholders | | | | | | (41,178,076) | | | | | | (26,045,475) |
|
|
|
|
|
|
|
|
|
|
|
|
|
| | | Shares | | | | | | Shares | | | |
Capital share transactions | | | | | | | | | | | | |
Proceeds from shares sold | | | | | | | | | | | | |
Class A | | | 1,615,301 | | | 16,164,426 | | | 859,580 | | | 8,489,247 |
Class B | | | 458,141 | | | 4,614,620 | | | 228,197 | | | 2,246,261 |
Class C | | | 692,521 | | | 6,954,001 | | | 170,228 | | | 1,688,996 |
Class I | | | 38,278,593 | | | 382,122,548 | | | 12,147,068 | | | 120,215,524 |
|
|
|
|
|
|
|
|
|
|
|
|
|
| | | | | | 409,855,595 | | | | | | 132,640,028 |
|
|
|
|
|
|
|
|
|
|
|
|
|
Net asset value of shares issued in reinvestment of distributions | | | | | | | | | | | | |
Class A | | | 767,662 | | | 7,668,531 | | | 263,381 | | | 2,608,321 |
Class B | | | 30,791 | | | 307,403 | | | 39,575 | | | 391,753 |
Class C | | | 24,717 | | | 247,292 | | | 19,966 | | | 197,719 |
Class I | | | 2,067,300 | | | 20,671,365 | | | 1,642,616 | | | 16,271,000 |
|
|
|
|
|
|
|
|
|
|
|
|
|
| | | | | | 28,894,591 | | | | | | 19,468,793 |
|
|
|
|
|
|
|
|
|
|
|
|
|
Automatic conversion of Class B shares to Class A shares | | | | | | | | | | | | |
Class A | | | 138,726 | | | 1,389,206 | | | 109,899 | | | 1,083,270 |
Class B | | | (138,726) | | | (1,389,206) | | | (109,899) | | | (1,083,270) |
|
|
|
|
|
|
|
|
|
|
|
|
|
| | | | | | 0 | | | | | | 0 |
|
|
|
|
|
|
|
|
|
|
|
|
|
Payment for shares redeemed | | | | | | | | | | | | |
Class A | | | (9,513,821) | | | (94,322,134) | | | (1,728,671) | | | (17,088,408) |
Class B | | | (402,896) | | | (4,016,244) | | | (595,371) | | | (5,881,001) |
Class C | | | (315,032) | | | (3,142,442) | | | (233,476) | | | (2,306,414) |
Class I | | | (15,253,417) | | | (152,479,467) | | | (10,262,151) | | | (101,536,649) |
|
|
|
|
|
|
|
|
|
|
|
|
|
| | | | | | (253,960,287) | | | | | | (126,812,472) |
|
|
|
|
|
|
|
|
|
|
|
|
|
Net asset value of shares issued in acquisition | | | | | | | | | | | | |
Class A | | | 20,234,248 | | | 200,202,084 | | | 0 | | | 0 |
Net increase in net assets resulting from capital share transactions | | | | | | 384,991,983 | | | | | | 25,296,349 |
|
|
|
|
|
|
|
|
|
|
|
|
|
Total increase in net assets | | | | | | 391,182,796 | | | | | | 34,020,260 |
Net assets | | | | | | | | | | | | |
Beginning of period | | | | | | 573,211,253 | | | | | | 539,190,993 |
|
|
|
|
|
|
|
|
|
|
|
|
|
End of period | | | | | $ | 964,394,049 | | | | | $ | 573,211,253 |
|
|
|
|
|
|
|
|
|
|
|
|
|
Undistributed (overdistributed) net investment income | | | | | $ | 944,150 | | | | | $ | (345,257) |
|
|
|
|
|
|
|
|
|
|
|
|
|
See Notes to Financial Statements
23
STATEMENT OF CASH FLOWS
April 30, 2008
Decrease in Cash | | | |
Cash Flows from Operating Activities: | | | |
Net increase in net assets from operations | | $ | 47,368,889 |
Adjustments to reconcile net increase in net assets from operations to net cash used in operating activities: | | | |
Purchase of investment securities (including mortgage dollar rolls) | | | (4,841,420,064) |
Proceeds from disposition of investment securities (including mortgage dollar rolls) | | | 4,318,840,814 |
Proceeds from swap transactions | | | 657,529 |
Payments made on swap transactions | | | (3,094,875) |
Purchases of short-term investment securities, net | | | (46,506,898) |
Premiums received on credit default swap transactions | | | 581,694 |
Increase in interest receivable | | | (1,852,132) |
Increase in receivable for securities sold | | | (234,353,507) |
Increase in receivable for Fund shares sold | | | (553,608) |
Increase in other assets | | | (29,663) |
Increase in payable for securities purchased | | | 408,615,229 |
Increase in payable for securities on loan | | | 9,620,437 |
Increase in payable for Fund shares redeemed | | | 2,506,231 |
Decrease in accrued expenses | | | (2,505) |
Unrealized depreciation on investments | | | 1,887,833 |
Net realized gain on investments | | | (7,046,299) |
|
|
|
|
Net cash used in operating activities | | | (344,780,895) |
|
|
|
|
Cash Flows from Financing Activities: | | | |
Increase in additional paid-in capital | | | 356,097,392 |
Cash distributions paid | | | (11,752,648) |
|
|
|
|
Net cash provided by financing activities | | | 344,344,744 |
|
|
|
|
Net decrease in cash | | $ | (436,151) |
|
|
|
|
Cash: | | | |
Beginning of period | | $ | 0 |
|
|
|
|
End of period | | $ | (436,151) |
|
|
|
|
See Notes to Financial Statements
24
NOTES TO FINANCIAL STATEMENTS
1. ORGANIZATION
Evergreen U.S. Government Fund (the “Fund”) is a diversified series of Evergreen Fixed Income Trust (the “Trust”), a Delaware statutory trust organized on September 18, 1997. The Trust is an open-end management investment company registered under the Investment Company Act of 1940, as amended (the “1940 Act”).
The Fund offers Class A, Class B, Class C and Class I shares. Class A shares are sold with a front-end sales charge. However, Class A share investments of $1 million or more are not subject to a front-end sales charge but are subject to a contingent deferred sales charge of 1.00% upon redemption within 18 months. Class B shares are sold without a front-end sales charge but are subject to a contingent deferred sales charge that is payable upon redemption and decreases depending on how long the shares have been held. Class C shares are sold without a front-end sales charge but are subject to a contingent deferred sales charge that is payable upon redemption within one year. Class I shares are sold without a front-end sales charge or contingent deferred sales charge. Each class of shares, except Class I shares, pays an ongoing distribution fee.
2. SIGNIFICANT ACCOUNTING POLICIES
The following is a summary of significant accounting policies consistently followed by the Fund in the preparation of its financial statements. The policies are in conformity with generally accepted accounting principles in the United States of America, which require management to make estimates and assumptions that affect amounts reported herein. Actual results could differ from these estimates.
a. Valuation of investments
Portfolio debt securities acquired with more than 60 days to maturity are fair valued using matrix pricing methods determined by an independent pricing service which takes into consideration such factors as similar security prices, yields, maturities, liquidity and ratings. Securities for which valuations are not readily available from an independent pricing service may be valued by brokers which use prices provided by market makers or estimates of market value obtained from yield data relating to investments or securities with similar characteristics.
Listed equity securities are usually valued at the last sales price or official closing price on the national securities exchange where the securities are principally traded.
Short-term securities with remaining maturities of 60 days or less at the time of purchase are valued at amortized cost, which approximates market value.
Investments in open-end mutual funds are valued at net asset value. Securities for which market quotations are not readily available or not reflective of current market value are valued at fair value as determined by the investment advisor in good faith, according to procedures approved by the Board of Trustees.
25
NOTES TO FINANCIAL STATEMENTS continued
b. Repurchase agreements
Securities pledged as collateral for repurchase agreements are held by the custodian bank or in a segregated account in the Fund’s name until the agreements mature. Collateral for certain tri-party repurchase agreements is held at the counterparty’s custodian in a segregated account for the benefit of the Fund and the counterparty. Each agreement requires that the market value of the collateral be sufficient to cover payments of interest and principal. However, in the event of default or bankruptcy by the other party to the agreement, retention of the collateral may be subject to legal proceedings. The Fund will only enter into repurchase agreements with banks and other financial institutions, which are deemed by the investment advisor to be creditworthy pursuant to guidelines established by the Board of Trustees. In certain instances, the Fund’s securities lending agent may provide collateral in the form of repurchase agreements.
c. Reverse repurchase agreements
To obtain short-term financing, the Fund may enter into reverse repurchase agreements with banks and other financial institutions, which are deemed by the investment advisor to be creditworthy. At the time the Fund enters into a reverse repurchase agreement, it will establish a segregated account with the custodian containing qualified assets having a value not less than the repurchase price, including accrued interest. If the counterparty to the transaction is rendered insolvent, the Fund may be delayed or limited in the repurchase of the collateral securities.
d. When-issued and delayed delivery transactions
The Fund records when-issued or delayed delivery securities as of trade date and maintains security positions such that sufficient liquid assets will be available to make payment for the securities purchased. Securities purchased on a when-issued or delayed delivery basis are marked-to-market daily and begin earning interest on the settlement date. Losses may occur on these transactions due to changes in market conditions or the failure of counterparties to perform under the contract.
e. Securities lending
The Fund may lend its securities to certain qualified brokers in order to earn additional income. The Fund receives compensation in the form of fees or interest earned on the investment of any cash collateral received. The Fund also continues to receive interest and dividends on the securities loaned. The Fund receives collateral in the form of cash or securities with a market value at least equal to the market value of the securities on loan, including accrued interest. In the event of default or bankruptcy by the borrower, the Fund could experience delays and costs in recovering the loaned securities or in gaining access to the collateral. The Fund has the right under the lending agreement to recover the securities from the borrower on demand.
f. Dollar roll transactions
The Fund may enter into dollar roll transactions with respect to mortgage-backed securities. In a dollar roll transaction, the Fund sells mortgage-backed securities to financial
26
NOTES TO FINANCIAL STATEMENTS continued
institutions and simultaneously agrees to accept substantially similar (same type, coupon and maturity) securities at a later date at an agreed upon price. The Fund will use the proceeds generated from the transactions to invest in short-term investments, which may enhance the Fund’s current yield and total return. The Fund accounts for dollar roll transactions as purchases and sales. The Fund could be exposed to risks if the counterparty defaults on its obligation to perform under the terms of the agreement, if the Fund receives inferior securities in comparison to what was sold to the counterparty at redelivery or if there are variances in paydown speed between the mortgage-related pools.
g. Credit default swaps
The Fund may enter into credit default swap contracts. Credit default swaps involve an exchange of a stream of payments for protection against the loss in value of an underlying security or index in the event of default or bankruptcy. Under the terms of the swap, one party acts as a guarantor and receives a periodic stream of payments that is a fixed percentage applied to a notional principal amount over the term of the swap. In return, the counterparty agrees to purchase the notional amount of the underlying instrument or index, at par, if a credit event occurs during the term of the swap. The Fund may enter into credit default swaps as either the guarantor or the counterparty.
Any premiums paid or received on the transactions are recorded as an asset or liability on the Statement of Assets and Liabilities and amortized. The value of the swap contract is marked-to-market daily based on quotations from an independent pricing service or market makers and any change in value is recorded as an unrealized gain or loss. Periodic payments made or received are recorded as realized gains or losses. In addition, payments received or made as a result of a credit event or termination of the contract are recognized as realized gains or losses. The Fund could be exposed to risks if the counterparty defaults on its obligation to perform, or if there are unfavorable changes in the fluctuation of interest rates or in the price of the underlying security or index.
h. Total return swaps
The Fund may enter into total return swap contracts. Total return swaps involve commitments to pay interest in exchange for a market-linked return, both based on notional amounts. To the extent the total return of the security or index underlying the transaction exceeds or falls short of the offsetting interest rate obligation, the Fund will receive a payment from, or make a payment to, the counterparty.
The value of the swap contract is marked-to-market daily based upon quotations from an independent pricing service or market makers and any change in value is recorded as an unrealized gain or loss. Periodic payments made or received are recorded as realized gains or losses. The Fund could be exposed to risks if the counterparty defaults on its obligation to perform, or if there are unfavorable changes in the fluctuation of interest rates or in the price of the underlying security or index.
27
NOTES TO FINANCIAL STATEMENTS continued
i. Security transactions and investment income
Security transactions are recorded on trade date. Realized gains and losses are computed using the specific cost of the security sold. Interest income is recorded on the accrual basis and includes accretion of discounts and amortization of premiums.
j. Federal and other taxes
The Fund intends to continue to qualify as a regulated investment company and distribute all of its taxable income, including any net capital gains (which have already been offset by available capital loss carryovers). Accordingly, no provision for federal taxes is required. The Fund has adopted the provisions of FASB Interpretation No. 48, Accounting for Uncertainty in Income Taxes (“FIN 48”) which prescribes a minimum threshold for financial statement recognition of the benefit of a tax position taken or expected to be taken in a tax return. The Fund’s financial statements have not been impacted by the adoption of FIN 48. The Fund’s income and excise tax returns and all financial records supporting those returns are subject to examination by the federal, Massachusetts and Delaware revenue authorities for all taxable years beginning after April 30, 2004.
k. Distributions
Distributions to shareholders from net investment income are accrued daily and paid monthly. Distributions from net realized gains, if any, are recorded on the ex-dividend date. Such distributions are determined in conformity with income tax regulations, which may differ from generally accepted accounting principles.
Reclassifications have been made to the Fund’s components of net assets to reflect income and gains available for distribution (or available capital loss carryovers, as applicable) under income tax regulations. The primary permanent differences causing such reclassifications are due to certain capital loss carryovers assumed as a result of acquisitions, expiration of capital loss carryovers, overdistributed net investment income and swap contracts.
During the year ended April 30, 2008, the following amounts were reclassified:
|
|
|
|
Paid-in capital | | $ | (2,528,718) |
Undistributed net investment income | | | 2,617,890 |
Accumulated net realized losses on investments | | | (89,172) |
|
|
|
|
l. Class allocations
Income, common expenses and realized and unrealized gains and losses are allocated to the classes based on the relative net assets of each class. Distribution fees, if any, are calculated daily at the class level based on the appropriate net assets of each class and the specific expense rates applicable to each class.
28
NOTES TO FINANCIAL STATEMENTS continued
3. ADVISORY FEE AND OTHER TRANSACTIONS WITH AFFILIATES
Evergreen Investment Management Company, LLC (“EIMC”), an indirect, wholly-owned subsidiary of Wachovia Corporation (“Wachovia”), is the investment advisor to the Fund and is paid an annual fee starting at 0.42% and declining to 0.35% as average daily net assets increase. For the year ended April 30, 2008, the advisory fee was equivalent to 0.39% of the Fund’s average daily net assets.
Tattersall Advisory Group, Inc., an indirect, wholly-owned subsidiary of Wachovia, is an investment sub-advisor to the Fund and is paid by EIMC for its services to the Fund.
From time to time, EIMC may voluntarily or contractually waive its fee and/or reimburse expenses in order to limit operating expenses. During the year ended April 30, 2008, EIMC voluntarily reimbursed Distribution Plan expenses (see Note 4) relating to Class A shares in the amount of $97,788.
The Fund may invest in money market funds which are advised by EIMC. Income earned on these investments is included in income from affiliate on the Statement of Operations.
Effective January 1, 2008, EIMC replaced Evergreen Investment Services, Inc. (“EIS”), an indirect, wholly-owned subsidiary of Wachovia, as the administrator to the Fund upon the assignment of the Fund’s Administrative Services Agreement from EIS to EIMC. There were no changes to the services being provided or fees being paid by the Fund. The administrator provides the Fund with facilities, equipment and personnel and is paid an annual rate determined by applying percentage rates to the aggregate average daily net assets of the Evergreen funds (excluding money market funds) starting at 0.10% and declining to 0.05% as the aggregate average daily net assets of the Evergreen funds (excluding money market funds) increase.
Evergreen Service Company, LLC (“ESC”), an indirect, wholly-owned subsidiary of Wachovia, is the transfer and dividend disbursing agent for the Fund. ESC receives account fees that vary based on the type of account held by the shareholders in the Fund. For the year ended April 30, 2008, the transfer agent fees were equivalent to an annual rate of 0.10% of the Fund’s average daily net assets.
4. DISTRIBUTION PLANS
EIS serves as distributor of the Fund’s shares. The Fund has adopted Distribution Plans, as allowed by Rule 12b-1 of the 1940 Act, for each class of shares, except Class I. Under the Distribution Plans, distribution fees are paid at an annual rate of 0.25% of the average daily net assets for Class A and 1.00% of the average daily net assets for each of Class B and Class C shares. Prior to April 1, 2008, distribution fees were paid at an annual rate of 0.30% of the average daily net assets for Class A shares.
For the year ended April 30, 2008, EIS received $4,677 from the sale of Class A shares and $24,519 and $254 in contingent deferred sales charges from redemptions of Class B and Class C shares, respectively.
29
NOTES TO FINANCIAL STATEMENTS continued
5. ACQUISITION
Effective at the close of business on May 18, 2007, the Fund acquired the net assets of Atlas U.S. Government and Mortgage Securities Fund in a tax-free exchange for Class A shares of the Fund. Shares were issued to shareholders of Atlas U.S. Government and Mortgage Securities Fund at an exchange ratio of 1.00 for Class A shares of the Fund. The acquired net assets consisted primarily of portfolio securities with unrealized depreciation of $2,360,830. The aggregate net assets of the Fund and Atlas U.S. Government and Mortgage Securities Fund immediately prior to the acquisition were $570,150,705 and $200,202,084, respectively. The aggregate net assets of the Fund immediately after the acquisition were $770,352,789.
6. INVESTMENT TRANSACTIONS
Cost of purchases and proceeds from sales of investment securities (excluding short-term securities) were as follows for the year ended April 30, 2008:
Cost of Purchases | | Proceeds from Sales |
|
|
|
U.S.
Government | | Non-U.S.
Government | | U.S.
Government | | Non-U.S.
Government |
|
|
|
|
|
|
|
$4,468,725,750 | | $173,666,971 | | $4,093,305,723 | | $97,911,356 |
|
|
|
|
|
|
|
During the year ended April 30, 2008, the Fund loaned securities to certain brokers and earned $78,648 in affiliated income relating to securities lending activity which is included in income from affiliate on the Statement of Operations. At April 30, 2008, the value of securities on loan and the total value of collateral received for securities loaned amounted to $37,281,299 and $37,981,709, respectively. Of the total value of the collateral received for securities on loan, $22,403,656 represents the market value of U.S government agency securities received as non-cash collateral.
At April 30, 2008, the Fund had the following credit default swap contracts outstanding:
Expiration | | Counterparty | | Reference
Index | | Notional
Amount | | Fixed
Payment | | Frequency
of Payments
Made | | Unrealized
Loss |
|
|
|
|
|
|
|
|
|
|
|
|
|
12/13/2049 | | UBS | | CMBX
North America
AA Index | | $10,000,000 | | 0.27% | | Quarterly | | $2,103,856 |
|
|
|
|
|
|
|
|
|
|
|
|
|
On April 30, 2008, the aggregate cost of securities for federal income tax purposes was $1,374,775,517. The gross unrealized appreciation and depreciation on securities based on tax cost was $14,131,972 and $11,474,904, respectively, with a net unrealized appreciation of $2,657,068.
As of April 30, 2008, the Fund had $8,567,743 in capital loss carryovers for federal income tax purposes with $1,572,729 expiring in 2014 and $6,995,014 expiring in 2015.
30
NOTES TO FINANCIAL STATEMENTS continued
7. INTERFUND LENDING
Pursuant to an Exemptive Order issued by the SEC, the Fund may participate in an inter-fund lending program with certain funds in the Evergreen fund family. This program allows the Fund to borrow from, or lend money to, other participating funds. During the year ended April 30, 2008, the Fund did not participate in the interfund lending program.
8. DISTRIBUTIONS TO SHAREHOLDERS
As of April 30, 2008, the components of distributable earnings on a tax basis were as follows:
Unrealized
Appreciation | | Capital Loss
Carryovers | | Temporary
Book/Tax
Differences |
|
|
|
|
|
$2,657,068 | | $8,567,743 | | $(1,159,706) |
|
|
|
|
|
The differences between the components of distributable earnings on a tax basis and the amounts reflected in the Statement of Assets and Liabilities are primarily due to wash sales and swap contracts. The temporary book/tax differences are a result of timing differences between book and tax recognition of income and/or expenses.
The tax character of distributions paid were $41,178,076 and $26,045,475 of ordinary income for the years ended April 30, 2008 and April 30, 2007, respectively.
9. EXPENSE REDUCTIONS
Through expense offset arrangements with ESC and the Fund’s custodian, a portion of fund expenses has been reduced.
10. DEFERRED TRUSTEES' FEES
Each Trustee of the Fund may defer any or all compensation related to performance of his or her duties as a Trustee. The Trustees’ deferred balances are allocated to deferral accounts, which are included in the accrued expenses for the Fund. The investment performance of the deferral accounts is based on the investment performance of certain Evergreen funds. Any gains earned or losses incurred in the deferral accounts are reported in the Fund’s Trustees’ fees and expenses. At the election of the Trustees, the deferral account will be paid either in one lump sum or in quarterly installments for up to ten years.
11. FINANCING AGREEMENT AND OTHER BORROWINGS
The Fund and certain other Evergreen funds share in an unsecured revolving credit commitment for temporary and emergency purposes, including the funding of redemptions, as permitted by each participating fund’s borrowing restrictions. Borrowings under this facility bear interest at 0.50% per annum above the Federal Funds rate. All of the participating funds are charged an annual commitment fee on the unused balance, which
31
NOTES TO FINANCIAL STATEMENTS continued
is allocated pro rata. The credit facility is for $100 million with an annual commitment fee of 0.08%. During the year ended April 30, 2008, the Fund had no borrowings.
During the year ended April 30, 2008, the Fund entered into reverse repurchase agreements that had an average daily balance outstanding of $298,384 with a weighted average interest rate of 5.95% and paid interest of $17,754.
12. REGULATORY MATTERS AND LEGAL PROCEEDINGS
Pursuant to an administrative order issued by the SEC on September 19, 2007, EIMC, EIS, ESC (collectively, the “Evergreen Entities”), Wachovia Securities, LLC and the SEC have entered into an agreement settling allegations of (i) improper short-term trading arrangements in effect prior to May 2003 involving former officers and employees of EIMC and certain broker-dealers, (ii) insufficient systems for monitoring exchanges and enforcing exchange limitations as stated in certain funds’ prospectuses, and (iii) inadequate e-mail retention practices. Under the settlement, the Evergreen Entities were censured and have paid approximately $32 million in disgorgement and penalties. This amount, along with a fine assessed by the SEC against Wachovia Securities, LLC will be distributed pursuant to a plan to be developed by an independent distribution consultant and approved by the SEC. The Evergreen Entities neither admitted nor denied the allegations and findings set forth in its settlement with the SEC.
In addition, the Evergreen funds and EIMC and certain of its affiliates are involved in various legal actions, including private litigation and class action lawsuits. EIMC does not expect that any of such legal actions currently pending or threatened will have a material adverse impact on the financial position or operations of any of the Evergreen funds or on EIMC’s ability to provide services to the Evergreen funds.
Although EIMC believes that none of the matters discussed above will have a material adverse impact on the Evergreen funds, there can be no assurance that these matters and any publicity surrounding or resulting from them will not result in reduced sales or increased redemptions of Evergreen fund shares, which could increase Evergreen fund transaction costs or operating expenses, or that they will not have other adverse consequences on the Evergreen funds.
13. NEW ACCOUNTING PRONOUNCEMENTS
In September 2006, FASB issued Statement of Financial Accounting Standards No. 157, Fair Value Measurements (“FAS 157”). FAS 157 establishes a single authoritative definition of fair value, establishes a framework for measuring fair value and expands disclosures about fair value measurements. FAS 157 applies to fair value measurements already required or permitted by existing standards. The change to current generally accepted accounting principles from the application of FAS 157 relates to the definition of fair value, the methods used to measure fair value, and the expanded disclosures about fair value measurements. Management of the Fund does not believe the adoption of FAS 157
32
NOTES TO FINANCIAL STATEMENTS continued
will materially impact the financial statement amounts, however, additional disclosures may be required about the inputs used to develop the measurements and the effect of certain of the measurements on changes in net assets for the period. FAS 157 is effective for financial statements issued for fiscal years beginning after November 15, 2007 and interim periods within those fiscal years.
In March 2008, FASB issued Statement of Financial Accounting Standards No. 161, Disclosures about Derivative Instruments and Hedging Activities (“FAS 161”), an amendment of FASB Statement No. 133. FAS 161 requires enhanced disclosures about (a) how and why a fund uses derivative instruments, (b) how derivative instruments and hedging activities are accounted for, and (c) how derivative instruments and related hedging activities affect a fund’s financial position, financial performance, and cash flows. Management of the Fund does not believe the adoption of FAS 161 will materially impact the financial statement amounts, but will require additional disclosures. This will include qualitative and quantitative disclosures on derivative positions existing at period end and the effect of using derivatives during the reporting period. FAS 161 is effective for financial statements issued for fiscal years and interim periods beginning after November 15, 2008.
33
REPORT OF INDEPENDENT REGISTERED PUBLIC ACCOUNTING FIRM
Board of Trustees and Shareholders
Evergreen Fixed Income Trust
We have audited the accompanying statement of assets and liabilities, including the schedule of investments, of the Evergreen U.S. Government Fund, a series of the Evergreen Fixed Income Trust, as of April 30, 2008 and the related statement of operations for the year then ended, statements of changes in net assets for each of the years in the two-year period then ended, statement of cash flows for the year then ended and the financial highlights for each of the years in the five-year period then ended. These financial statements and financial highlights are the responsibility of the Fund’s management. Our responsibility is to express an opinion on these financial statements and financial highlights based on our audits.
We conducted our audits in accordance with the standards of the Public Company Accounting Oversight Board (United States). Those standards require that we plan and perform the audit to obtain reasonable assurance about whether the financial statements and financial highlights are free of material misstatement. An audit includes examining, on a test basis, evidence supporting the amounts and disclosures in the financial statements. Our procedures included confirmation of securities owned as of April 30, 2008 by correspondence with the custodian and brokers, or by other appropriate auditing procedures where replies from brokers were not received. An audit also includes assessing the accounting principles used and significant estimates made by management, as well as evaluating the overall financial statement presentation. We believe that our audits provide a reasonable basis for our opinion.
In our opinion, the financial statements and financial highlights referred to above present fairly, in all material respects, the financial position of the Evergreen U.S. Government Fund as of April 30, 2008, the results of its operations, changes in its net assets, its cash flows and financial highlights for each of the years described above, in conformity with U.S. generally accepted accounting principles.

Boston, Massachusetts
June 27, 2008
34
This page left intentionally blank
35
TRUSTEES AND OFFICERS
TRUSTEES1 | | |
Charles A. Austin III
Trustee
DOB: 10/23/1934
Term of office since: 1991
Other directorships: None | | Investment Counselor, Anchor Capital Advisors, LLC. (investment advice); Director, The Andover Companies (insurance); Trustee, Arthritis Foundation of New England; Former Director, The Francis Ouimet Society (scholarship program); Former Director, Executive Vice President and Treasurer, State Street Research & Management Company (investment advice) |
|
|
|
K. Dun Gifford
Trustee
DOB: 10/23/1938
Term of office since: 1974
Other directorships: None | | Chairman and President, Oldways Preservation and Exchange Trust (education); Trustee, Chairman of the Finance Committee, Member of the Executive Committee, and Former Treasurer, Cambridge College |
|
|
|
Dr. Leroy Keith, Jr.
Trustee
DOB: 2/14/1939
Term of office since: 1983
Other directorships: Trustee,
Phoenix Fund Complex
(consisting of 53 portfolios
as of 12/31/2007) | | Managing Director, Almanac Capital Management (commodities firm); Trustee, Phoenix Fund Complex; Director, Diversapack Co. (packaging company); Former Partner, Stonington Partners, Inc. (private equity fund); Former Director, Obagi Medical Products Co.; Former Director, Lincoln Educational Services |
|
|
|
Carol A. Kosel1
Trustee
DOB: 12/25/1963
Term of office since: 2008
Other directorships: None | | Former Consultant to the Evergreen Boards of Trustees; Former Vice President and Senior Vice President, Evergreen Investments, Inc.; Former Treasurer, Evergreen Funds; Former Treasurer, Vestaur Securities Fund |
|
|
|
Gerald M. McDonnell
Trustee
DOB: 7/14/1939
Term of office since: 1988
Other directorships: None | | Former Manager of Commercial Operations, CMC Steel (steel producer) |
|
|
|
Patricia B. Norris
Trustee
DOB: 4/9/1948
Term of office since: 2006
Other directorships: None | | President and Director of Buckleys of Kezar Lake, Inc. (real estate company); Former President and Director of Phillips Pond Homes Association (home community); Former Partner, PricewaterhouseCoopers, LLP (independent registered public accounting firm) |
|
|
|
William Walt Pettit
Trustee
DOB: 8/26/1955
Term of office since: 1988
Other directorships: None | | Partner and Vice President, Kellam & Pettit, P.A. (law firm); Director, Superior Packaging Corp. (packaging company); Member, Superior Land, LLC (real estate holding company), Member, K&P Development, LLC (real estate development); Former Director, National Kidney Foundation of North Carolina, Inc. (non-profit organization) |
|
|
|
David M. Richardson
Trustee
DOB: 9/19/1941
Term of office since: 1982
Other directorships: None | | President, Richardson, Runden LLC (executive recruitment advisory services); Director, J&M Cumming Paper Co. (paper merchandising); Trustee, NDI Technologies, LLP (communications); Former Consultant, AESC (The Association of Executive Search Consultants) |
|
|
|
Dr. Russell A. Salton III
Trustee
DOB: 6/2/1947
Term of office since: 1984
Other directorships: None | | President/CEO, AccessOne MedCard, Inc. |
|
|
|
36
TRUSTEES AND OFFICERS continued
| | |
Michael S. Scofield
Trustee
DOB: 2/20/1943
Term of office since: 1984
Other directorships: None | | Retired Attorney, Law Offices of Michael S. Scofield; Former Director and Chairman, Branded Media Corporation (multi-media branding company) |
|
|
|
Richard J. Shima
Trustee
DOB: 8/11/1939
Term of office since: 1993
Other directorships: None | | Independent Consultant; Director, Hartford Hospital; Trustee, Greater Hartford YMCA; Former Director, Trust Company of CT; Former Director, Old State House Association; Former Trustee, Saint Joseph College (CT) |
|
|
|
Richard K. Wagoner, CFA2
Trustee
DOB: 12/12/1937
Term of office since: 1999
Other directorships: None | | Member and Former President, North Carolina Securities Traders Association; Member, Financial Analysts Society |
|
|
|
OFFICERS
Dennis H. Ferro3
President
DOB: 6/20/1945
Term of office since: 2003 | | Principal occupations: President and Chief Executive Officer, Evergreen Investment Company, Inc. and Executive Vice President, Wachovia Bank, N.A.; former Chief Investment Officer, Evergreen Investment Company, Inc. |
|
|
|
Kasey Phillips4
Treasurer
DOB: 12/12/1970
Term of office since: 2005 | | Principal occupations: Senior Vice President, Evergreen Investment Management Company, LLC; Former Vice President, Evergreen Investment Services, Inc.; Former Assistant Vice President, Evergreen Investment Services, Inc. |
|
|
|
Michael H. Koonce4
Secretary
DOB: 4/20/1960
Term of office since: 2000 | | Principal occupations: Senior Vice President and General Counsel, Evergreen Investment Services, Inc.; Secretary, Senior Vice President and General Counsel, Evergreen Investment Management Company, LLC and Evergreen Service Company, LLC; Senior Vice President and Assistant General Counsel, Wachovia Corporation |
|
|
|
Robert Guerin4
Chief Compliance Officer
DOB: 9/20/1965
Term of office since: 2007 | | Principal occupations: Chief Compliance Officer, Evergreen Funds and Senior Vice President of Evergreen Investments Co., Inc.; Former Managing Director and Senior Compliance Officer, Babson Capital Management LLC; Former Principal and Director, Compliance and Risk Management, State Street Global Advisors; Former Vice President and Manager, Sales Practice Compliance, Deutsche Asset Management |
|
|
|
1 | Each Trustee, except Mses. Kosel and Norris, serves until a successor is duly elected or qualified or until his or her death, resignation, retirement or removal from office. As new Trustees, Ms. Kosel’s and Ms. Norris’ initial terms end December 31, 2010 and June 30, 2009, respectively, at which times they may be re-elected by Trustees to serve until a successor is duly elected or qualified or until her death, resignation, retirement or removal from office by the Trustees. Each Trustee, except Ms. Kosel, oversaw 94 Evergreen funds as of December 31, 2007. Ms. Kosel became a Trustee on January 1, 2008. Correspondence for each Trustee may be sent to Evergreen Board of Trustees, P.O. Box 20083, Charlotte, NC 28202. |
2 | Mr. Wagoner is an “interested person” of the Fund because of his ownership of shares in Wachovia Corporation, the parent to the Fund’s investment advisor. |
3 | The address of the Officer is 401 S. Tryon Street, 20th Floor, Charlotte, NC 28288. |
4 | The address of the Officer is 200 Berkeley Street, Boston, MA 02116. |
Additional information about the Fund’s Board of Trustees and Officers can be found in the Statement of Additional Information (SAI) and is available upon request without charge by calling 800.343.2898.
37
566663 rv5 06/2008
Evergreen Institutional Motgage Portfolio

| | table of contents |
1 | | LETTER TO SHAREHOLDERS |
4 | | FUND AT A GLANCE |
5 | | PORTFOLIO MANAGER COMMENTARY |
7 | | ABOUT YOUR FUND’S EXPENSES |
8 | | FINANCIAL HIGHLIGHTS |
9 | | SCHEDULE OF INVESTMENTS |
14 | | STATEMENT OF ASSETS AND LIABILITIES |
15 | | STATEMENT OF OPERATIONS |
16 | | STATEMENTS OF CHANGES IN NET ASSETS |
17 | | NOTES TO FINANCIAL STATEMENTS |
26 | | REPORT OF INDEPENDENT REGISTERED PUBLIC ACCOUNTING FIRM |
27 | | ADDITIONAL INFORMATION |
28 | | TRUSTEES AND OFFICERS |
This annual report must be preceded or accompanied by a prospectus of the Evergreen fund contained herein. The prospectus contains more complete information, including fees and expenses, and should be read carefully before investing or sending money.
The fund will file its complete schedule of portfolio holdings with the SEC for the first and third quarters of each fiscal year on Form N-Q. The fund’s Form N-Q will be available on the SEC’s Web site at http://www.sec.gov. In addition, the fund’s Form N-Q may be reviewed and copied at the SEC’s Public Reference Room in Washington, D.C. Information on the operation of the Public Reference Room may be obtained by calling 800.SEC.0330.
A description of the fund’s proxy voting policies and procedures, as well as information regarding how the fund voted proxies relating to portfolio securities during the most recent 12-month period ended June 30, is available by visiting our Web site at EvergreenInvestments.com or by visiting the SEC’s Web site at http://www.sec.gov. The fund’s proxy voting policies and procedures are also available without charge, upon request, by calling 800.343.2898.
Mutual Funds:
| NOT FDIC INSURED | MAY LOSE VALUE | NOT BANK GUARANTEED |
Evergreen InvestmentsSM is a service mark of Evergreen Investment Management Company, LLC. Copyright 2008, Evergreen Investment Management Company, LLC.
Evergreen Investment Management Company, LLC is a subsidiary of Wachovia Corporation and is an affiliate of Wachovia Corporation’s other Broker Dealer subsidiaries.
Evergreen mutual funds are distributed by Evergreen Investment Services, Inc. 200 Berkeley Street, Boston, MA 02116
LETTER TO SHAREHOLDERS
June 2008

Dennis H. Ferro
President and Chief Executive Officer
Dear Shareholder:
We are pleased to provide the Annual Report for Evergreen Institutional Mortgage Portfolio for the twelve-month period ended April 30, 2008 (the “twelve-month period”).
The fiscal year witnessed a dramatic change in fixed income markets as problems that first surfaced in housing and the subprime mortgages raised questions about the strength of the domestic economy and the risks of credit-sensitive investments. Corporate bonds and asset-backed securities performed well early in the period, with gains in economic output, corporate profits and employment encouraging optimism. The backdrop for investing began to change, however, by the summer of 2007 amid widening worries about problems in the financials sector. Major financial institutions began to report substantial losses from their exposures to subprime mortgages and banks started to tighten their credit standards and to restrict their lending. With fears of a dramatic downturn hovering over the market, fixed income investors sought out the highest-quality securities and attempted to avoid credit risk. As a consequence, the prices of corporate bonds and many asset-backed securities fell, while Treasuries rallied in a general flight to quality over much of the period. These general trends later reversed themselves in the final month of the twelve-month period, with high yield corporate bonds and other credit-sensitive securities rallying in April 2008 following a series of actions by the U.S. Federal Reserve Board (the “Fed”) to stabilize the markets. Equities, meanwhile, tended to move in the same general direction as corporate bonds over the fiscal year. Stock prices rose very early in the period before
1
LETTER TO SHAREHOLDERS continued
falling in late 2007 and early 2008 and then rallying again in April. For the full twelve-month period, stock valuations fell across all market capitalizations, investment styles and regions. At the same time, the prices of gold, oil and other commodities surged while the U.S. dollar weakened further.
The U.S. economy grew briskly early in 2007, but then slowed significantly in late 2007 and early 2008. Economic growth decelerated as lending for ordinary consumer and commercial activity dried up, accentuating the weakening effects of declining home prices. Corporate profits, employment and other key economic indicators showed clear evidence of deterioration. Gross Domestic Product growth decelerated to a paltry 0.6% rate during the final quarter of 2007 and a marginally better 0.9% pace for the first quarter of 2008. Much of the strength early in 2008 came from exports and government spending, rather than from any noticeable improvements in consumer spending, business investment or housing. To reinvigorate the economy and stimulate lending activity, the Fed became increasingly aggressive, taking a series of steps to pour liquidity into the financial system. Starting in September 2007 and continuing through April 2008, the Fed cut the key fed funds rate seven different times, lowering the influential short-term rate from 5.25% to 2%. In March 2008, the central bank also opened its lending facilities to securities firms as well as commercial banks and intervened to help JPMorgan Chase & Co. purchase the collapsing investment bank Bear Stearns Cos. Meanwhile, Congress and the Bush administration rushed through a $168 billion fiscal stimulus bill, which included tax rebate checks, in an effort to boost growth in the second half of 2008.
During the twelve-month period, managers of Evergreen’s intermediate- and long-term bond funds paid careful attention to risk management in a changing market environment. The teams supervising the higher-credit quality funds—including Evergreen U.S.
2
LETTER TO SHAREHOLDERS continued
Government Fund, Evergreen Core Bond Fund, Evergreen Core Plus Bond Fund and Evergreen Institutional Mortgage Portfolio—monitored Fed policy and interest-rate movements as well as general macroeconomic trends in managing their portfolios. Meanwhile, the managers of Evergreen High Income Fund and Evergreen Select High Yield Bond Fund tended to position their credit-sensitive portfolios relatively conservatively during a period of growing risk aversion. After repositioning their portfolio early in the fiscal year, the managers of Evergreen Diversified Income Builder Fund maintained an emphasis on better-quality, high yield corporate bonds and also increased their exposure to dividend-paying stocks.
The experiences in the capital markets during the twelve-month period have underscored the value of a well-diversified, long-term investment strategy to help soften the effects of volatility in any one market or asset class. As always, we encourage investors to maintain diversified investment portfolios in pursuit of their long-term investment goals.
Please visit us at EvergreenInvestments.com for more information about our funds and other investment products available to you. Thank you for your continued support of Evergreen Investments.
Sincerely,

Dennis H. Ferro
President and Chief Executive Officer
Evergreen Investment Company, Inc.
Special Notice to Shareholders:
Please visit our Web site at EvergreenInvestments.com for statements from President and Chief Executive Officer, Dennis Ferro, regarding the firm’s recent settlement with the Securities and Exchange Commission (SEC) and prior settlement with the Financial Industry Regulatory Authority (FINRA).
3
FUND AT A GLANCE
as of April 30, 2008
MANAGEMENT TEAM
Investment Advisor:
• Evergreen Investment Management Company, LLC
Sub-Advisor:
• Tattersall Advisory Group, Inc.
Portfolio Managers:
• Robert A. Calhoun, CFA
• Todd C. Kuimjian, CFA
CURRENT INVESTMENT STYLE
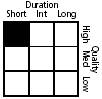
Source: Morningstar, Inc.
Morningstar’s style box is based on a portfolio date as of 3/31/2008.
The Fixed Income style box placement is based on a fund’s average effective maturity or duration and the average credit rating of the bond portfolio.
PERFORMANCE AND RETURNS
Portfolio Inception date: 6/19/2002
| | Class I |
Class inception date | | 6/19/2002 |
|
|
|
Nasdaq symbol | | EMSFX |
|
|
|
Average annual return | | |
|
|
|
1-year | | 0.14% |
|
|
|
5-year | | 3.05% |
|
|
|
Since portfolio inception | | 3.69% |
|
|
|
Past performance is no guarantee of future results. The performance quoted represents past performance and current performance may be lower or higher. The investment return and principal value of an investment will fluctuate so that investors’ shares, when redeemed, may be worth more or less than their original cost. To obtain performance information current to the most recent month-end, please go to EvergreenInvestments.com/fundperformance. Performance includes the reinvestment of income dividends and capital gain distributions. Performance shown does not reflect the deduction of taxes that a shareholder would pay on fund distributions or the redemption of fund shares.
The advisor is reimbursing the fund for a portion of other expenses. Had expenses not been reimbursed, returns would have been lower.
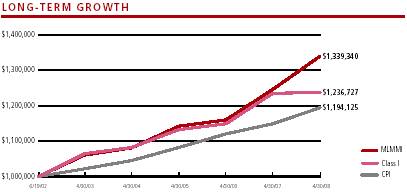
Comparison of a $1,000,000 investment in the Evergreen Institutional Mortgage Portfolio Class I shares versus a similar investment in the Merrill Lynch Mortgage Master Index† (MLMMI) and the Consumer Price Index (CPI).
The MLMMI is an unmanaged market index and does not include transaction costs associated with buying and selling securities, any mutual fund fees or expenses or any taxes. The CPI is a commonly used measure of inflation and does not represent an investment return. It is not possible to invest directly in an index.
4
PORTFOLIO MANAGER COMMENTARY
The fund’s Class I shares returned 0.14% for the twelve-month period ended April 30, 2008. During the same period, the MLMMI returned 7.50%.
The fund’s objective is to seek to maximize total return through a combination of current income and capital growth.
While the fund maintained a high credit quality, with an average credit rating of AAA, the exposure to commercial mortgage backed securities (CMBS) and pass-through securities tended to hold back results during a period when U.S. Treasuries and U.S. agency-backed securities outperformed. The fiscal year began in May 2007 amid evidence that the domestic economy was continuing to expand after weathering a housing slump earlier in the year. The Federal Reserve Board (the “Fed”) indicated it was more concerned about inflationary pressures than about any drags on the economy, and it held the key fed funds rate unchanged at the 5.25% level where it had been for more than a year. That environment began to change in June 2007 amid mounting evidence that weakness in housing and problems in subprime mortgages were becoming more of a threat to the economy. Many major financial institutions, both domestic and international, began reporting significant losses from their subprime mortgage investments. The problems in the subprime market led to a massive deleveraging of the financial system and a seizing up of the fixed income markets. Investors typically sought out higher-quality bonds, most notably Treasuries, as evidence accumulated of a growing liquidity crunch affecting lending activities. In this general flight to quality, Treasuries outperformed all other sectors of the fixed income markets for the remainder of the fiscal year as the financial markets remained mired in a liquidity crunch amid growing evidence of credit problems. To relieve this credit crunch and inject liquidity into the financial markets, the Fed, in a series of actions starting in September 2007 and continuing through the end of the fiscal year in April 2008, provided funds to financial institutions. The Fed also lowered the fed funds rate from 5.25% to 2.00% and announced a series of other policy moves to ease lending activity.
For most of the fiscal year, we kept the fund’s duration—or exposure to change in interest rates—consistent with that of the overall mortgage market and this neutral duration position had minimal impact on results. The fund typically invests in a diversified mix of mortgage bonds beyond the agency pass-
Class I shares are only offered to investment advisory clients of an investment advisor of an Evergreen fund (or its advisory affiliates) and through special arrangements entered into on behalf of Evergreen funds with certain financial services firms.
Class I shares are only available to institutional shareholders with a minimum of $1 million investment, which may be waived in certain situations.
The fund’s investment objective may be changed without a vote of the fund’s shareholders.
Asset-backed and mortgage-backed securities are generally subject to higher prepayment risks than other types of debt securities, which can limit the potential for gain in a declining interest rate environment and increase the potential for loss in a rising interest rate environment. Mortgage-backed securities may also be structured so that they are particularly sensitive to interest rates. A high rate of defaults on the mortgages held by a mortgage pool may limit the pool’s ability to make payments to the fund if the fund holds securities that are subordinate to other interest in the same mortgage pool; the risk of such defaults is generally higher in mortgage pools that include subprime mortgages.
Derivatives involve additional risks including interest rate risk, credit risk, the risk of improper valuation and the risk of non-correlation to the relevant instruments they are designed to hedge or to closely track.
The return of principal is not guaranteed due to fluctuation in the fund’s NAV caused by changes in the price of individual bonds held by the fund and the buying and selling of bonds by the fund. Bond funds have the same inflation, interest rate and credit risks as individual bonds. Generally, the value of bond funds rises when prevailing interest rates fall, and falls when interest rates rise.
U.S. government guarantees apply only to certain securities held in the fund’s portfolio and not to the fund’s shares.
†Copyright 2008. Merrill Lynch, Pierce, Fenner & Smith Incorporated. All rights reserved.
All data is as of April 30, 2008, and subject to change.
5
PORTFOLIO MANAGER COMMENTARY continued
through market. In most environments this strategy has provided additional yield to the fund and added to the overall performance relative to the market. In a liquidity crisis and flight to quality, however, these high-quality assets are often the ones that are most affected. For most major sectors of the market, yield spreads reached record levels in November. In the securitized sector (mortgage-backed securities, CMBS and asset-backed securities) the fund maintained its overweight and began to add more exposure to AAA non-agency mortgages as the spread between agency and non-agency bonds widened to record levels. As we moved into 2008, problems in the subprime market continued to weigh on investors and confidence in the financial system remained low. Financial institutions typically continued to struggle as they attempted to value the subprime mortgages held on their balance sheets and shore up capital positions. Spread sectors, which were already historically cheap, underperformed even more in the first three months of 2008 and the fund’s performance was negatively impacted. While the fund did not own any subprime mortgages, its performance nevertheless was hurt by the fallout from the subprime crisis. Investments in CMBS and non-agency pass-through mortgage securities tended to detract from results during a period in which the markets did not reward any credit risk. The Fed’s efforts to provide liquidity and shore up the financial system began to take hold in mid-March 2008 and the market tone began to improve. In the last months of the fiscal year, spreads in CMBS began to narrow significantly and the performance of the fund began to improve.
6
ABOUT YOUR FUND’S EXPENSES
The Example below is intended to describe the fees and expenses borne by shareholders and the impact of those costs on your investment.
Example
As a shareholder of the fund, you incur two types of costs: (1) transaction costs, including sales charges (loads), redemption fees and exchange fees; and (2) ongoing costs, including management fees, distribution (12b-1) fees and other fund expenses. This Example is intended to help you understand your ongoing costs (in dollars) of investing in the fund and to compare these costs with the ongoing costs of investing in other mutual funds. The Example is based on an investment of $1,000 invested at the beginning of the period and held for the entire period from November 1, 2007 to April 30, 2008.
The example illustrates your fund’s costs in two ways:
• Actual expenses
The section in the table under the heading “Actual” provides information about actual account values and actual expenses. You may use the information in these columns, together with the amount you invested, to estimate the expenses that you paid over the period. Simply divide your account value by $1,000 (for example, an $8,600 account value divided by $1,000 = 8.6), then multiply the result by the number in the appropriate column for your share class, in the column entitled “Expenses Paid During Period” to estimate the expenses you paid on your account during this period.
• Hypothetical example for comparison purposes
The section in the table under the heading “Hypothetical (5% return before expenses)” provides information about hypothetical account values and hypothetical expenses based on the fund’s actual expense ratio and an assumed rate of return of 5% per year before expenses, which is not the fund’s actual return. The hypothetical account values and expenses may not be used to estimate the actual ending account balance or expenses you paid for the period. You may use this information to compare the ongoing costs of investing in the fund and other funds. To do so, compare this 5% hypothetical example with the 5% hypothetical examples that appear in the shareholder reports of the other funds.
Please note that the expenses shown in the table are meant to highlight your ongoing costs only and do not reflect any transactional costs, such as sales charges (loads), redemption fees or exchange fees. Therefore, the section in the table under the heading “Hypothetical (5% return before expenses)” is useful in comparing ongoing costs only, and will not help you determine the relative total costs of owning different funds. In addition, if these transactional costs were included, your costs would have been higher.
| | Beginning | | Ending | | |
| | Account | | Account | | Expenses |
| | Value | | Value | | Paid During |
| | 11/1/2007 | | 4/30/2008 | | Period* |
|
|
|
|
|
|
|
Actual | | | | | | |
Class I | | | $ | 1,000.00 | | | | $ | 980.64 | | | | $ | 0.98 | |
Hypothetical
(5% return before expenses) | | | | | | | | | | | | | | | |
Class I | | | $ | 1,000.00 | | | | $ | 1,023.87 | | | | $ | 1.01 | |
|
|
|
|
|
|
|
|
|
|
|
|
|
|
|
|
* | Expenses are equal to the Fund's annualized expense ratio (0.20% for Class I), multiplied by the average account value over the period, multiplied by 182 / 366 days. |
7
FINANCIAL HIGHLIGHTS
(For a share outstanding throughout each period)
| | Year Ended April 30, |
| |
|
CLASS I | | 2008 | | 2007 | | 2006 | | 2005 | | 2004 |
|
|
|
|
|
|
|
|
|
|
|
Net asset value, beginning of period | | $ | 9.78 | | $ | 9.57 | | $ | 9.89 | | $ | 9.89 | | $ | 10.18 |
|
|
|
|
|
|
|
|
|
|
|
|
|
|
|
|
Income from investment operations | | | | | | | | | | | | | | | |
Net investment income (loss) | | | 0.49 | | | 0.48 | | | 0.43 | | | 0.35 | | | 0.35 |
Net realized and unrealized gains or losses on investments | | | (0.47) | | | 0.22 | | | (0.29) | | | 0.10 | | | (0.18) |
| |
|
|
|
|
|
|
|
|
|
|
|
|
|
|
Total from investment operations | | | 0.02 | | | 0.70 | | | 0.14 | | | 0.45 | | | 0.17 |
|
|
|
|
|
|
|
|
|
|
|
|
|
|
|
|
Distributions to shareholders from | | | | | | | | | | | | | | | |
Net investment income | | | (0.30) | | | (0.49) | | | (0.46) | | | (0.45) | | | (0.45) |
Net realized gains | | | 0 | | | 0 | | | 0 | | | 0 | | | (0.01) |
Tax basis return of capital | | | (0.20) | | | 0 | | | 0 | | | 0 | | | 0 |
| |
|
|
|
|
|
|
|
|
|
|
|
|
|
|
Total distributions to shareholders | | | (0.50) | | | (0.49) | | | (0.46) | | | (0.45) | | | (0.46) |
|
|
|
|
|
|
|
|
|
|
|
|
|
|
|
|
Net asset value, end of period | | $ | 9.30 | | $ | 9.78 | | $ | 9.57 | | $ | 9.89 | | $ | 9.89 |
|
|
|
|
|
|
|
|
|
|
|
|
|
|
|
|
Total return | | | 0.14% | | | 7.51% | | | 1.45% | | | 4.66% | | | 1.63% |
|
|
|
|
|
|
|
|
|
|
|
|
|
|
|
|
Ratios and supplemental data | | | | | | | | | | | | | | | |
Net assets, end of period (thousands) | | $ | 51,981 | | $ | 62,263 | | $ | 58,552 | | $ | 45,997 | | $ | 48,032 |
Ratios to average net assets | | | | | | | | | | | | | | | |
Expenses including waivers/reimbursements but excluding expense reductions | | | 0.20% | | | 0.20% | | | 0.20% | | | 0.20% | | | 0.20% |
Expenses excluding waivers/reimbursements and expense reductions | | | 0.23% | | | 0.23% | | | 0.21% | | | 0.24% | | | 0.28% |
Net investment income (loss) | | | 5.09% | | | 4.97% | | | 4.37% | | | 3.44% | | | 3.33% |
Portfolio turnover rate | | | 400%1 | | | 131% | | | 121% | | | 177% | | | 327% |
|
|
|
|
|
|
|
|
|
|
|
|
|
|
|
|
1 | Portfolio turnover rate includes mortgage dollar roll activity. |
See Notes to Financial Statements
8
SCHEDULE OF INVESTMENTS
April 30, 2008
| | Principal
Amount | | Value |
|
|
|
|
|
AGENCY COMMERCIAL MORTGAGE-BACKED SECURITIES 4.6% | | | | | | |
FIXED-RATE 3.9% | | | | | | |
FHLMC: | | | | | | |
6.90%, 12/01/2010 | | $ | 545,000 | | $ | 580,147 |
6.98%, 10/01/2020 | | | 433,709 | | | 460,946 |
FNMA: | | | | | | |
6.01%, 02/01/2012 | | | 316,016 | | | 331,147 |
6.79%, 07/01/2009 | | | 89,128 | | | 90,788 |
6.91%, 07/01/2009 | | | 272,148 | | | 277,457 |
7.09%, 07/01/2009 | | | 267,893 | | | 273,472 |
| | | | |
|
|
| | | | | | 2,013,957 |
| | | | |
|
|
FLOATING-RATE 0.7% | | | | | | |
FNMA: | | | | | | |
7.04%, 12/01/2010 | | | 183,908 | | | 192,901 |
7.63%, 04/01/2010 | | | 189,723 | | | 197,969 |
| | | | |
|
|
| | | | | | 390,870 |
| | | | |
|
|
Total Agency Commercial Mortgage-Backed Securities (cost $2,540,261) | | | | | | 2,404,827 |
| | | | |
|
|
AGENCY MORTGAGE-BACKED COLLATERALIZED MORTGAGE OBLIGATIONS 6.6% | | | | | | |
FIXED-RATE 6.6% | | | | | | |
FHLMC: | | | | | | |
Ser. 2991, Class QD, 5.00%, 08/15/2034 | | | 465,000 | | | 464,387 |
Ser. 3036, Class NC, 5.00%, 03/15/2031 | | | 740,000 | | | 738,487 |
Ser. 3079, Class MD, 5.00%, 03/15/2034 | | | 550,000 | | | 532,522 |
Ser. 3104, Class QD, 5.00%, 05/15/2034 | | | 550,000 | | | 529,773 |
FNMA: | | | | | | |
Ser. 2003-092, Class KH, 5.00%, 03/25/2032 | | | 570,000 | | | 565,329 |
Ser. 2004-90, Class LH, 5.00%, 04/25/2034 | | | 590,000 | | | 578,678 |
| | | | |
|
|
Total Agency Mortgage-Backed Collateralized Mortgage Obligations (cost $3,334,990) | | | | | | 3,409,176 |
| | | | |
|
|
AGENCY MORTGAGE-BACKED PASS THROUGH SECURITIES 26.4% | | | | | | |
FIXED-RATE 25.1% | | | | | | |
FHLMC, 4.50%, 04/01/2035 | | | 1,070,045 | | | 1,020,118 |
FHLMC 30 year: | | | | | | |
5.00%, TBA # | | | 1,140,000 | | | 1,120,228 |
6.00%, TBA # | | | 1,405,000 | | | 1,437,271 |
FNMA: | | | | | | |
4.06%, 06/01/2013 | | | 595,000 | | | 577,729 |
4.50%, 04/01/2019 | | | 310,607 | | | 308,624 |
4.83%, 03/01/2013 | | | 650,749 | | | 657,193 |
5.78%, 11/01/2011 | | | 770,035 | | | 800,481 |
5.85%, 09/01/2012 | | | 345,823 | | | 360,706 |
6.00%, 05/01/2011 | | | 353,394 | | | 366,272 |
See Notes to Financial Statements
9
SCHEDULE OF INVESTMENTS continued
April 30, 2008
| | Principal
Amount | | Value |
|
|
|
|
|
AGENCY MORTGAGE-BACKED PASS THROUGH SECURITIES continued | | | | | | |
FIXED-RATE continued | | | | | | |
FNMA: | | | | | | |
6.09%, 05/01/2011 | | $ | 523,313 | | $ | 543,577 |
6.15%, 05/01/2011 | | | 217,449 | | | 225,854 |
7.27%, 02/01/2010 | | | 473,829 | | | 490,973 |
FNMA 15 year, 5.00%, TBA # | | | 1,685,000 | | | 1,690,528 |
GNMA, 5.625%, 07/20/2030 | | | 117,430 | | | 118,361 |
GNMA 30 Year: | | | | | | |
5.50%, TBA # | | | 2,755,000 | | | 2,790,730 |
6.00%, TBA # | | | 500,000 | | | 513,672 |
| | | | |
|
|
| | | | | | 13,022,317 |
| | | | |
|
|
FLOATING-RATE 1.3% | | | | | | |
FNMA, 5.44%, 01/01/2036 | | | 676,845 | | | 679,589 |
| | | | |
|
|
Total Agency Mortgage-Backed Pass Through Securities (cost $13,730,564) | | | | | | 13,701,906 |
| | | | |
|
|
ASSET-BACKED SECURITIES 1.6% | | | | | | |
Deutsche Alt-A Securities, Inc., Mtge. Loan Trust: | | | | | | |
Ser. 2005-03, Class 4A5, 5.25%, 06/25/2035 | | | 190,000 | | | 171,648 |
Ser. 2006-AB2, Class A3, 6.27%, 06/25/2036 | | | 575,000 | | | 387,630 |
Morgan Stanley Mtge. Trust, Ser. 2006-2, Class 5A3, 5.50%, 02/25/2036 | | | 290,000 | | | 257,389 |
Vanderbilt Mtge. & Fin., Inc., Ser. 2002-B, Class A3, 4.70%, 10/17/2018 | | | 35,211 | | | 35,183 |
| | | | |
|
|
Total Asset-Backed Securities (cost $1,084,575) | | | | | | 851,850 |
| | | | |
|
|
COMMERCIAL MORTGAGE-BACKED SECURITIES 25.8% | | | | | | |
FIXED-RATE 20.3% | | | | | | |
Banc of America Comml. Mtge. Securities, Inc.: | | | | | | |
Ser. 2004-04, Class A6, 4.88%, 07/10/2042 | | | 1,000,000 | | | 983,203 |
Ser. 2006-4, Class AM, 5.68%, 07/10/2046 | | | 460,000 | | | 429,564 |
Ser. 2007-01, Class A4, 5.45%, 01/15/2049 | | | 405,000 | | | 394,229 |
Ser. 2007-04, Class A4, 5.94%, 07/10/2017 | | | 560,000 | | | 558,179 |
Ser. 2007-2, Class A2, 5.63%, 04/10/2049 | | | 800,000 | | | 798,378 |
Citigroup Comml. Mtge. Trust, Ser. 2008-C7, Class AJ, 6.10%, 12/10/2049 | | | 150,000 | | | 126,257 |
Cobalt Comml. Mtge. Trust, Ser. 2006-C1, Class AM, 5.25%, 08/15/2048 | | | 270,000 | | | 243,734 |
Credit Suisse First Boston Mtge. Securities Corp.: | | | | | | |
Ser. 2003-C3, Class A2, 2.84%, 05/15/2038 | | | 207,277 | | | 206,900 |
Ser. 2003-C3, Class A5, 3.94%, 05/15/2038 | | | 855,000 | | | 821,978 |
GMAC Comml. Mtge. Securities, Inc., Ser. 2004-C2, Class A4, 5.30%, 08/10/2038 | | | 760,000 | | | 765,104 |
Greenwich Capital Comml. Funding Corp., Ser. 2007-GG09, Class A4, 5.44%, 03/10/2039 | | | 395,000 | | | 384,900 |
JPMorgan Chase & Co. Comml. Mtge. Securities Corp.: | | | | | | |
Ser. 2004-CB8, Class A4, 4.40%, 01/12/2039 | | | 840,000 | | | 804,199 |
Ser. 2006-LDP9, Class A3, 5.34%, 05/15/2047 | | | 400,000 | | | 388,552 |
See Notes to Financial Statements
10
SCHEDULE OF INVESTMENTS continued
April 30, 2008
| | Principal
Amount | | Value |
|
|
|
|
|
COMMERCIAL MORTGAGE-BACKED SECURITIES continued | | | | | | |
FIXED-RATE continued | | | | | | |
JPMorgan Chase & Co. Comml. Mtge. Securities Corp.: | | | | | | |
Ser. 2007-LD12, Class A2, 5.83%, 02/15/2051 | | $ | 570,000 | | $ | 572,575 |
Ser. 2007-LD12, Class A4, 5.88%, 02/15/2051 | | | 560,000 | | | 559,758 |
LB-UBS Comml. Mtge. Trust, Ser. 2003-C3, Class A4, 4.17%, 05/15/2032 | | | 440,000 | | | 427,181 |
Merrill Lynch/Countrywide Comml. Mtge. Trust, Ser. 2006-4, Class A3, 5.17%, 12/12/2049 | | | 672,000 | | | 647,402 |
Morgan Stanley Capital I, Ser. 2002-LQ3, Class A4, 5.08%, 09/15/2037 | | | 1,205,000 | | | 1,221,879 |
Wachovia Bank Comml. Mtge. Trust, Ser. 2003-C8, Class A1, 3.44%, 11/15/2035 | | | 198,816 | | | 197,886 |
| | | | |
|
|
| | | | | | 10,531,858 |
| | | | |
|
|
FLOATING-RATE 5.5% | | | | | | |
Citigroup Comml. Mtge. Trust, Ser. 2006-C4, Class AJ, 5.92%, 03/15/2049 | | | 90,000 | | | 79,136 |
GE Comml. Mtge. Trust, Ser. 2007-C9, Class A4, 6.01%, 12/10/2049 | | | 525,000 | | | 525,937 |
Goldman Sachs Mtge. Securities Corp., Ser. 2007-GG10, Class A4, 5.99%, 08/10/2045 | | | 390,000 | | | 390,183 |
JPMorgan Chase & Co. Comml. Mtge. Securities Corp.: | | | | | | |
Ser. 2007-CB19, Class A4, 5.94%, 02/12/2049 | | | 830,000 | | | 825,820 |
Ser. 2007-LD11, Class A4, 6.01%, 06/15/2049 | | | 490,000 | | | 490,416 |
Morgan Stanley Capital I, Inc., Ser. 2007-IQ15, Class A4, 6.08%, 06/11/2049 | | | 570,000 | | | 574,001 |
| | | | |
|
|
| | | | | | 2,885,493 |
| | | | |
|
|
Total Commercial Mortgage-Backed Securities (cost $13,341,680) | | | | | | 13,417,351 |
| | | | |
|
|
U.S. TREASURY OBLIGATIONS 10.0% | | | | | | |
U.S. Treasury Notes: | | | | | | |
3.50%, 02/15/2018 ρ | | | 550,000 | | | 538,485 |
4.625%, 11/15/2009 ρ | | | 4,500,000 | | | 4,667,346 |
| | | | |
|
|
Total U.S. Treasury Obligations (cost $5,215,099) | | | | | | 5,205,831 |
| | | | |
|
|
WHOLE LOAN MORTGAGE-BACKED COLLATERALIZED MORTGAGE OBLIGATIONS 3.2% | | | |
FIXED-RATE 0.4% | | | | | | |
Banc of America Mtge. Securities, Inc., Ser. 2005-D, Class 2A6, 4.78%, 05/25/2035 | | | 230,000 | | | 217,872 |
| | | | |
|
|
FLOATING-RATE 2.8% | | | | | | |
Washington Mutual, Inc.: | | | | | | |
Ser. 2005-AR5, Class A5, 4.68%, 05/25/2035 | | | 690,000 | | | 659,333 |
Ser. 2006-OA3, Class 4AB, 4.85%, 04/25/2047 | | | 409,921 | | | 275,471 |
Wells Fargo Mtge. Backed Securities Trust, Ser. 2006-AR07, Class 2A5, 5.61%, 05/25/2036 | | | 560,000 | | | 517,807 |
| | | | |
|
|
| | | | | | 1,452,611 |
| | | | |
|
|
Total Whole Loan Mortgage-Backed Collateralized Mortgage Obligations (cost $1,851,665) | | | | | | 1,670,483 |
| | | | |
|
|
See Notes to Financial Statements
11
SCHEDULE OF INVESTMENTS continued
April 30, 2008
| | Principal
Amount | | Value |
|
|
|
|
|
WHOLE LOAN MORTGAGE-BACKED PASS THROUGH SECURITIES 18.3% | | | | | | |
FIXED-RATE 8.3% | | | | | | |
Countrywide Alternative Loan Trust, Inc.: | | | | | | |
Ser. 2005-50CB, Class 1A1, 5.50%, 11/25/2035 | | $ | 393,777 | | $ | 356,219 |
Ser. 2007-24, Class A1, 7.00%, 10/25/2037 | | | 187,493 | | | 115,897 |
Ser. 2007-26R, Class A1, 7.00%, 01/25/2037 | | | 384,890 | | | 352,351 |
First Horizon Mtge. Pass Through Trust: | | | | | | |
Ser. 2005-FA5, Class 3A1, 5.50%, 08/25/2035 | | | 530,534 | | | 483,729 |
Ser. 2007-AR2, Class 2A1, 5.89%, 07/25/2037 | | | 587,275 | | | 540,686 |
GSAA Home Equity Trust, Ser. 2007-09, Class A1A, 6.00%, 10/01/2037 | | | 307,187 | | | 291,253 |
IndyMac INDX Mtge. Loan Trust, Ser. 2007-AR7, Class 2A1, 5.81%, 06/25/2037 | | | 570,975 | | | 443,460 |
Morgan Stanley Capital I, Inc., Ser. 2007-13, Class 5A1, 5.50%, 10/25/2037 | | | 672,011 | | | 613,319 |
PHH Alternative Mtge. Trust, Ser. 2007-01, Class 21A, 6.00%, 02/25/2037 | | | 191,125 | | | 166,857 |
Residential Accredited Loans, Inc.: | | | | | | |
Ser. 2007-QS9, Class A33, 6.50%, 07/25/2037 | | | 102,883 | | | 89,080 |
Ser. 2007-QS10, Class A1, 6.50%, 09/25/2037 | | | 222,159 | | | 208,067 |
Ser. 2007-QS11, Class A1, 7.00%, 10/25/2037 | | | 395,694 | | | 337,187 |
Wells Fargo Mtge. Backed Securities Trust, Ser. 2006-AR10, Class 5A1, 5.60%, 07/25/2036 | | | 353,431 | | | 340,363 |
| | | | |
|
|
| | | | | | 4,338,468 |
| | | | |
|
|
FLOATING-RATE 10.0% | | | | | | |
American Home Mtge. Assets, Ser. 2007-1, Class A1, 4.78%, 02/25/2047 | | | 86,711 | | | 67,102 |
Bear Stearns Adjustable Rate Mtge. Trust, Ser. 2007-5, Class 1A1, 5.83%, 08/25/2047 | | | 353,277 | | | 327,655 |
Countrywide Alternative Loan Trust, Inc., Ser. 2007-A2, Class 1A1, 4.92%, 03/25/2047 | | | 558,198 | | | 439,659 |
Deutsche Securities, Inc., Ser. 2007-OA2, Class A1, 5.10%, 04/25/2047 | | | 268,447 | | | 216,862 |
IndyMac INDX Mtge. Loan Trust, Ser. 2006-AR11, Class 3A1, 5.82%, 06/25/2036 | | | 459,566 | | | 347,294 |
MASTR Reperforming Loan Trust, Ser. 2006-2, Class 1A1, 5.90%, 05/25/2046 144A | | | 420,477 | | | 415,868 |
Residential Funding Mtge. Securities, Ser. 2006-SA2, Class 2A1, 5.85%, 08/25/2036 | | | 461,461 | | | 438,966 |
Structured Adjustable Rate Mtge. Loan Trust, Ser. 2007-3, Class 3A1, 5.72%, 04/25/2037 | | | 463,689 | | | 421,371 |
Washington Mutual, Inc. Mtge. Pass-Through Cert.: | | | | | | |
Ser. 2006-AR17, Class 1A1B, 4.89%, 12/25/2046 | | | 498,440 | | | 355,682 |
Ser. 2007-HY7, Class 3A2, 5.91%, 07/25/2037 | | | 521,244 | | | 503,175 |
Washington Mutual, Inc.: | | | | | | |
Ser. 2006-AR09, Class 2A, 4.92%, 11/25/2046 | | | 199,554 | | | 159,705 |
Ser. 2006-AR12, Class 2A3, 5.75%, 10/25/2036 | | | 473,714 | | | 446,393 |
Ser. 2007-OA5, Class 1A1B, 4.83%, 06/25/2047 | | | 808,520 | | | 563,765 |
Ser. 2007-OA6, Class 1A, 4.89%, 07/25/2047 | | | 594,704 | | | 478,499 |
| | | | |
|
|
| | | | | | 5,181,996 |
| | | | |
|
|
Total Whole Loan Mortgage-Backed Pass Through Securities (cost $10,865,452) | | | 9,520,464 |
| |
|
|
See Notes to Financial Statements
12
SCHEDULE OF INVESTMENTS continued
April 30, 2008
| | Shares | | Value |
|
|
|
|
|
SHORT-TERM INVESTMENTS 25.5% | | | | | | |
MUTUAL FUND SHARES 25.5% | | | | | | |
Evergreen Institutional Money Market Fund, Class I, 2.78% q ø ## ρρ | | | | | | |
(cost $13,259,242)
| | | 13,259,242 | | $ | 13,259,242 |
| | | | |
|
|
Total Investments (cost $65,223,528) 122.0% | | | | | | 63,441,130 |
Other Assets and Liabilities (22.0%) | | | | | | (11,459,837) |
| | | | |
|
|
Net Assets 100.0% | | | | | $ | 51,981,293 |
| | | | |
|
|
# | When-issued or delayed delivery security |
ρ | All or a portion of this security is on loan. |
144A | Security that may be sold to qualified institutional buyers under Rule 144A of the Securities Act of 1933, as amended. This security has been determined to be liquid under guidelines established by the Board of Trustees, unless otherwise noted. |
q | Rate shown is the 7-day annualized yield at period end. |
ø | Evergreen Investment Management Company, LLC is the investment advisor to both the Fund and the money market fund. |
## | All or a portion of this security has been segregated for when-issued or delayed delivery securities. |
ρρ | All or a portion of this security represents investment of cash collateral received from securities on loan. |
Summary of Abbreviations |
FHLMC | Federal Home Loan Mortgage Corp. |
FNMA | Federal National Mortgage Association |
GNMA | Government National Mortgage Association |
MASTR | Mortgage Asset Securitization Transactions, Inc. |
TBA | To Be Announced |
The following table shows the percent of total investments (excluding collateral from securities on loan and segregated cash and cash equivalents) by credit quality based on Moody’s and Standard & Poor’s ratings as of April 30, 2008 (unaudited):
The following table shows the percent of total investments (excluding collateral from securities on loan and segregated cash and cash equivalents) based on effective maturity as of April 30, 2008 (unaudited):
Less than 1 year | | 4.2% |
1 to 3 year(s) | | 16.3% |
3 to 5 years | | 23.3% |
5 to 10 years | | 50.5% |
10 to 20 years | | 5.7% |
| |
|
| | 100.0% |
| |
|
See Notes to Financial Statements
13
STATEMENT OF ASSETS AND LIABILITIES
April 30, 2008
Assets | | | |
Investments in securities, at value (cost $51,964,286) including $4,724,947 of securities loaned | | $ | 50,181,888 |
Investments in affiliated money market fund, at value (cost $13,259,242) | | | 13,259,242 |
|
|
|
|
Total investments | | | 63,441,130 |
Receivable for securities sold | | | 881,579 |
Interest receivable | | | 326,007 |
Receivable for securities lending income | | | 918 |
Unrealized gains on total return swap transactions | | | 266,664 |
Unrealized gains on credit default swap transactions | | | 39,535 |
Receivable from investment advisor | | | 51 |
Prepaid expenses and other assets | | | 4,312 |
|
|
|
|
Total assets | | | 64,960,196 |
|
|
|
|
Liabilities | | | |
Dividends payable | | | 171,124 |
Payable for securities purchased | | | 7,713,326 |
Payable for Fund shares redeemed | | | 400,000 |
Unrealized losses on credit default swap transactions | | | 140,214 |
Premiums received on credit default swap transactions | | | 175,115 |
Payable for securities on loan | | | 4,367,025 |
Due to custodian bank | | | 2,486 |
Due to related parties | | | 519 |
Accrued expenses and other liabilities | | | 9,094 |
|
|
|
|
Total liabilities | | | 12,978,903 |
|
|
|
|
Net assets | | $ | 51,981,293 |
|
|
|
|
Net assets represented by | | | |
Paid-in capital | | $ | 55,198,163 |
Overdistributed net investment income | | | (338,571) |
Accumulated net realized losses on investments | | | (1,261,886) |
Net unrealized losses on investments | | | (1,616,413) |
|
|
|
|
Total net assets | | $ | 51,981,293 |
|
|
|
|
Shares outstanding (unlimited number of shares authorized) | | | |
Class I | | | 5,592,093 |
|
|
|
|
Net asset value per share | | | |
Class I | | $ | 9.30 |
|
|
|
|
See Notes to Financial Statements
14
STATEMENT OF OPERATIONS
Year Ended April 30, 2008
Investment income | | | |
Interest | | $ | 2,378,191 |
Income from affiliate | | | 540,516 |
Securities lending | | | 1,686 |
|
|
|
|
Total investment income | | | 2,920,393 |
|
|
|
|
Expenses | | | |
Administrative services fee | | | 54,969 |
Transfer agent fees | | | 2,413 |
Trustees’ fees and expenses | | | 1,906 |
Printing and postage expenses | | | 18,401 |
Custodian and accounting fees | | | 22,629 |
Registration and filing fees | | | 7,328 |
Professional fees | | | 22,119 |
Other | | | 1,017 |
|
|
|
|
Total expenses | | | 130,782 |
Less: | Expense reductions | | | (2,049) |
| Expense reimbursements | | | (18,344) |
|
|
|
|
|
Net expenses | | | 110,389 |
|
|
|
|
Net investment income | | | 2,810,004 |
|
|
|
|
Net realized and unrealized gains or losses on investments | | | |
Net realized gains or losses on: | | | |
Securities | | | 11,379 |
Credit default swap transactions | | | (80,789) |
Total return swap transactions | | | (1,255,981) |
|
|
|
|
Net realized losses on investments | | | (1,325,391) |
Net change in unrealized gains or losses on investments | | | (1,409,634) |
|
|
|
|
Net realized and unrealized gains or losses on investments | | | (2,735,025) |
|
|
|
|
Net increase in net assets resulting from operations | | $ | 74,979 |
|
|
|
|
See Notes to Financial Statements
15
STATEMENTS OF CHANGES IN NET ASSETS
| | Year Ended April 30, |
| |
|
| | 2008 | | 2007 |
|
|
|
|
|
Operations | | | | | | | | |
Net investment income | | | $ | 2,810,004 | | | $ | 2,961,541 |
Net realized gains or losses on investments | | | | (1,325,391) | | | | 294,672 |
Net change in unrealized gains or losses on investments | | | | (1,409,634) | | | | 1,150,448 |
|
|
|
|
|
|
|
|
|
Net increase in net assets resulting from operations | | | | 74,979 | | | | 4,406,661 |
|
|
|
|
|
|
|
|
|
Distributions to shareholders from | | | | | | | | |
Net investment income | | | | (1,755,285) | | | | (3,032,386) |
Tax basis return of capital | | | | (1,113,554) | | | | 0 |
|
|
|
|
|
|
|
|
|
Total distributions to shareholders | | | | (2,868,839) | | | | (3,032,386) |
|
|
|
|
|
|
|
|
|
| | Shares | | | | Shares | | |
|
|
|
|
|
|
|
|
|
Capital share transactions | | | | | | | | |
Proceeds from shares sold | | 1,393,615 | | 13,363,533 | | 3,261,841 | | 31,539,512 |
|
|
|
|
|
|
|
|
|
Net asset value of shares issued in reinvestment of distributions | | 73,555 | | 707,024 | | 82,713 | | 802,545 |
|
|
|
|
|
|
|
|
|
Payment for shares redeemed | | (2,239,001) | | (21,558,141) | | (3,097,034) | | (30,005,109) |
|
|
|
|
|
|
|
|
|
Net increase (decrease) in net assets resulting from capital share transactions | | | | (7,487,584) | | | | 2,336,948 |
|
|
|
|
|
|
|
|
|
Total increase (decrease) in net assets | | | | (10,281,444) | | | | 3,711,223 |
Net assets | | | | | | | | |
Beginning of period | | | | 62,262,737 | | | | 58,551,514 |
|
|
|
|
|
|
|
|
|
End of period | | | $ | 51,981,293 | | | $ | 62,262,737 |
|
|
|
|
|
|
|
|
|
Overdistributed net investment income | | | $ | (338,571) | | | $ | (130,238) |
|
|
|
|
|
|
|
|
|
See Notes to Financial Statements
16
NOTES TO FINANCIAL STATEMENTS
1. ORGANIZATION
Evergreen Institutional Mortgage Portfolio (the “Fund”) is a diversified series of Evergreen Fixed Income Trust (the “Trust”), a Delaware statutory trust organized on September 18, 1997. The Trust is an open-end management investment company registered under the Investment Company Act of 1940, as amended (the “1940 Act”).
The Fund offers Class I shares. Class I shares are sold without a front-end sales charge or contingent deferred sales charge.
2. SIGNIFICANT ACCOUNTING POLICIES
The following is a summary of significant accounting policies consistently followed by the Fund in the preparation of its financial statements. The policies are in conformity with generally accepted accounting principles in the United States of America, which require management to make estimates and assumptions that affect amounts reported herein. Actual results could differ from these estimates.
a. Valuation of investments
Portfolio debt securities acquired with more than 60 days to maturity are fair valued using matrix pricing methods determined by an independent pricing service which takes into consideration such factors as similar security prices, yields, maturities, liquidity and ratings. Securities for which valuations are not readily available from an independent pricing service may be valued by brokers which use prices provided by market makers or estimates of market value obtained from yield data relating to investments or securities with similar characteristics.
Short-term securities with remaining maturities of 60 days or less at the time of purchase are valued at amortized cost, which approximates market value.
Investments in open-end mutual funds are valued at net asset value. Securities for which market quotations are not readily available or not reflective of current market value are valued at fair value as determined by the investment advisor in good faith, according to procedures approved by the Board of Trustees.
b. Repurchase agreements
Securities pledged as collateral for repurchase agreements are held by the custodian bank or in a segregated account in the Fund’s name until the agreements mature. Collateral for certain tri-party repurchase agreements is held at the counterparty’s custodian in a segregated account for the benefit of the Fund and the counterparty. Each agreement requires that the market value of the collateral be sufficient to cover payments of interest and principal. However, in the event of default or bankruptcy by the other party to the agreement, retention of the collateral may be subject to legal proceedings. The Fund will only enter into repurchase agreements with banks and other financial institutions, which are deemed by the investment advisor to be creditworthy pursuant to guidelines
17
NOTES TO FINANCIAL STATEMENTS continued
established by the Board of Trustees. In certain instances, the Fund's securities lending agent may provide collateral in the form of repurchase agreements.
c. When-issued and delayed delivery transactions
The Fund records when-issued or delayed delivery securities as of trade date and maintains security positions such that sufficient liquid assets will be available to make payment for the securities purchased. Securities purchased on a when-issued or delayed delivery basis are marked-to-market daily and begin earning interest on the settlement date. Losses may occur on these transactions due to changes in market conditions or the failure of counterparties to perform under the contract.
d. Securities lending
The Fund may lend its securities to certain qualified brokers in order to earn additional income. The Fund receives compensation in the form of fees or interest earned on the investment of any cash collateral received. The Fund also continues to receive interest and dividends on the securities loaned. The Fund receives collateral in the form of cash or securities with a market value at least equal to the market value of the securities on loan, including accrued interest. In the event of default or bankruptcy by the borrower, the Fund could experience delays and costs in recovering the loaned securities or in gaining access to the collateral. The Fund has the right under the lending agreement to recover the securities from the borrower on demand.
e. Dollar roll transactions
The Fund may enter into dollar roll transactions with respect to mortgage-backed securities. In a dollar roll transaction, the Fund sells mortgage-backed securities to financial institutions and simultaneously agrees to accept substantially similar (same type, coupon and maturity) securities at a later date at an agreed upon price. The Fund will use the proceeds generated from the transactions to invest in short-term investments, which may enhance the Fund’s current yield and total return. The Fund accounts for dollar roll transactions as purchases and sales. The Fund could be exposed to risks if the counterparty defaults on its obligation to perform under the terms of the agreement, if the Fund receives inferior securities in comparison to what was sold to the counterparty at redelivery or if there are variances in paydown speed between the mortgage-related pools.
f. Credit default swaps
The Fund may enter into credit default swap contracts. Credit default swaps involve an exchange of a stream of payments for protection against the loss in value of an underlying security or index in the event of default or bankruptcy. Under the terms of the swap, one party acts as a guarantor and receives a periodic stream of payments that is a fixed percentage applied to a notional principal amount over the term of the swap. In return, the counterparty agrees to purchase the notional amount of the underlying instrument or index, at par, if a credit event occurs during the term of the swap. The Fund may enter into credit default swaps as either the guarantor or the counterparty.
18
NOTES TO FINANCIAL STATEMENTS continued
Any premiums paid or received on the transactions are recorded as an asset or liability on the Statement of Assets and Liabilities and amortized. The value of the swap contract is marked-to-market daily based on quotations from an independent pricing service or market makers and any change in value is recorded as an unrealized gain or loss. Periodic payments made or received are recorded as realized gains or losses. In addition, payments received or made as a result of a credit event or termination of the contract are recognized as realized gains or losses. The Fund could be exposed to risks if the counterparty defaults on its obligation to perform, or if there are unfavorable changes in the fluctuation of interest rates or in the price of the underlying security or index.
g. Total return swaps
The Fund may enter into total return swap contracts. Total return swaps involve commitments to pay interest in exchange for a market-linked return, both based on notional amounts. To the extent the total return of the security or index underlying the transaction exceeds or falls short of the offsetting interest rate obligation, the Fund will receive a payment from, or make a payment to, the counterparty.
The value of the swap contract is marked-to-market daily based upon quotations from an independent pricing service or market makers and any change in value is recorded as an unrealized gain or loss. Periodic payments made or received are recorded as realized gains or losses. The Fund could be exposed to risks if the counterparty defaults on its obligation to perform, or if there are unfavorable changes in the fluctuation of interest rates or in the price of the underlying security or index.
h. Security transactions and investment income
Security transactions are recorded on trade date. Realized gains and losses are computed using the specific cost of the security sold. Interest income is recorded on the accrual basis and includes accretion of discounts and amortization of premiums.
i. Federal and other taxes
The Fund intends to continue to qualify as a regulated investment company and distribute all of its taxable income, including any net capital gains (which have already been offset by available capital loss carryovers). Accordingly, no provision for federal taxes is required. The Fund has adopted the provisions of FASB Interpretation No. 48, Accounting for Uncertainty in Income Taxes (“FIN 48”) which prescribes a minimum threshold for financial statement recognition of the benefit of a tax position taken or expected to be taken in a tax return. The Fund’s financial statements have not been impacted by the adoption of FIN 48. The Fund’s income and excise tax returns and all financial records supporting those returns are subject to examination by the federal, Massachusetts and Delaware revenue authorities for all taxable years beginning after April 30, 2004.
19
NOTES TO FINANCIAL STATEMENTS continued
j. Distributions
Distributions to shareholders from net investment income are accrued daily and paid monthly. Distributions from net realized gains, if any, are recorded on the ex-dividend date. Such distributions are determined in conformity with income tax regulations, which may differ from generally accepted accounting principles.
Reclassifications have been made to the Fund’s components of net assets to reflect income and gains available for distribution (or available capital loss carryovers, as applicable) under income tax regulations. The primary permanent differences causing such reclassifications are due to mortgage paydown gains and losses and swap contracts. During the year ended April 30, 2008, the following amounts were reclassified:
|
|
|
Overdistributed net investment income | | ($1,263,052) |
Accumulated net realized losses on investments | | 1,263,052 |
|
|
|
3. ADVISORY FEE AND OTHER TRANSACTIONS WITH AFFILIATES
Evergreen Investment Management Company, LLC (“EIMC”), an indirect, wholly-owned subsidiary of Wachovia Corporation (“Wachovia”), is the investment advisor to the Fund. The Fund does not pay a fee for the investment advisory service.
Tattersall Advisory Group, Inc., an indirect, wholly-owned subsidiary of Wachovia, is an investment sub-advisor to the Fund and is paid by EIMC for its services to the Fund.
From time to time, EIMC may voluntarily or contractually waive its fee and/or reimburse expenses in order to limit operating expenses. During the year ended April 30, 2008, EIMC voluntarily reimbursed other expenses in the amount of $18,344.
The Fund may invest in money market funds which are advised by EIMC. Income earned on these investments is included in income from affiliate on the Statement of Operations.
Effective January 1, 2008, EIMC replaced Evergreen Investment Services, Inc. (“EIS”), an indirect, wholly-owned subsidiary of Wachovia, as the administrator to the Fund upon the assignment of the Fund’s Administrative Services Agreement from EIS to EIMC. There were no changes to the services being provided or fees being paid by the Fund. The administrator provides the Fund with facilities, equipment and personnel and is paid an annual rate determined by applying percentage rates to the aggregate average daily net assets of the Evergreen funds (excluding money market funds) starting at 0.10% and declining to 0.05% as the aggregate average daily net assets of the Evergreen funds (excluding money market funds) increase.
Evergreen Service Company, LLC (“ESC”), an indirect, wholly-owned subsidiary of Wachovia, is the transfer and dividend disbursing agent for the Fund. ESC receives account fees that vary based on the type of account held by the shareholders in the Fund.
20
NOTES TO FINANCIAL STATEMENTS continued
4. INVESTMENT TRANSACTIONS
Cost of purchases and proceeds from sales of investment securities (excluding short-term securities) were as follows for the year ended April 30, 2008:
Cost of Purchases | | Proceeds from Sales |
|
|
|
U.S.
Government | | Non-U.S.
Government | | U.S.
Government | | Non-U.S.
Government |
|
|
|
|
|
|
|
$155,714,709 | | $59,253,148 | | $175,582,247 | | $43,588,963 |
|
|
|
|
|
|
|
During the year ended April 30, 2008, the Fund loaned securities to certain brokers and earned $336 in affiliated income relating to securities lending activity which is included in income from affiliate on the Statement of Operations. At April 30, 2008, the value of securities on loan and the total value of collateral received for securities loaned amounted to $4,724,947 and $4,819,625, respectively. Of the total value of the collateral received for securities on loan, $452,600 represents the market value of U.S. government agency securities received as non-cash collateral.
At April 30, 2008, the Fund had the following credit default swap contracts outstanding:
Expiration | | Counterparty | | Reference Index | | Notional
Amount | | Fixed
Payments
Made
by the Fund | | Frequency
of Payments
Made | | Unrealized
Gain (Loss) |
|
|
|
|
|
|
|
|
|
|
|
|
|
|
|
12/13/2049 | | Lehman Brothers | | Markit CMBX, North America AJ.3 Index | | $ | 420,000 | | 1.47% | | Quarterly | | $ | 37,500 |
12/13/2049 | | Goldman Sachs | | Markit CMBX, North America AA.3 Index | | | 100,000 | | 0.27% | | Quarterly | | | (12,406) |
|
|
|
|
|
|
|
|
|
|
|
|
|
|
|
|
Expiration | | Counterparty | | Reference Index | | Notional
Amount | | Fixed
Payments
Received
by the Fund | | Frequency
of Payments
Received | | Unrealized
Gain (Loss) |
|
|
|
|
|
|
|
|
|
|
|
|
|
|
|
12/13/2049 | | Lehman Brothers | | Markit CMBX, North America AJ.3 Index | | $ | 50,000 | | 1.47% | | Quarterly | | $ | 2,035 |
2/17/2051 | | Goldman Sachs | | Markit CMBX, North America AA.4 Index | | | 800,000 | | 1.65% | | Quarterly | | | (102,246) |
2/17/2051 | | Lehman Brothers | | Markit CMBX, North America AA.4 Index | | | 200,000 | | 1.65% | | Quarterly | | | (25,562) |
|
|
|
|
|
|
|
|
|
|
|
|
|
|
|
21
NOTES TO FINANCIAL STATEMENTS continued
At April 30, 2008, the Fund had the following total return swap contracts outstanding:
Expiration | | Notional
Amount | | Counterparty | | Swap
Description | | Unrealized
Gain |
|
|
|
|
|
|
|
|
|
|
|
5/1/2008 | | $ | 1,000,000 | | Goldman Sachs | | Agreement dated 10/22/2007 to receive the spread return on the Lehman Brothers CMBS AAA 8.5+yr. Index multiplied by the notional amount and to pay the negative spread return. | | $ | 31,360 |
6/1/2008 | | | 700,000 | | Lehman Brothers | | Agreement dated 3/01/2008 to receive the spread return on the Lehman Brothers CMBS AAA 8.5+yr. Index plus 10 basis points multiplied by the notional amount and to pay the negative spread return. | | | 22,009 |
8/1/2008 | | | 1,500,000 | | Lehman Brothers | | Agreement dated 2/01/2008 to receive the spread return on the Lehman Brothers CMBS AAA 8.5+yr. Index multiplied by the notional amount and to pay the negative spread return. | | | 47,041 |
9/1/2008 | | | 1,000,000 | | Lehman Brothers | | Agreement dated 3/01/2008 to receive the spread return on the Lehman Brothers CMBS AAA 8.5+yr. Index plus 100 basis points multiplied by the notional amount and to pay the negative spread return. | | | 32,166 |
9/1/2008 | | | 300,000 | | Lehman Brothers | | Agreement dated 3/01/2008 to receive the spread return on the Lehman Brothers CMBS AAA 8.5+yr. Index plus 125 basis points multiplied by the notional amount and to pay the negative spread return. | | | 9,710 |
10/1/2008 | | | 1,000,000 | | Lehman Brothers | | Agreement dated 10/01/2007 to receive the spread return on the Lehman Brothers CMBS AAA 8.5+yr. Index minus 62 basis points multiplied by the notional amount and to pay the negative spread return. | | | 30,861 |
11/1/2008 | | | 2,000,000 | | Lehman Brothers | | Agreement dated 11/01/2007 to receive the spread return on the Lehman Brothers CMBS AAA 8.5+yr. Index minus 15 basis points multiplied by the notional amount and to pay the negative spread return. | | | 62,479 |
2/1/2009 | | | 1,000,000 | | Lehman Brothers | | Agreement dated 2/01/2008 to receive the spread return on the Lehman Brothers CMBS AAA 8.5+yr. Index minus 40 basis points multiplied by the notional amount and to pay the negative spread return. | | | 31,038 |
|
|
|
|
|
|
|
|
|
|
|
On April 30, 2008, the aggregate cost of securities for federal income tax purposes was $65,267,761. The gross unrealized appreciation and depreciation on securities based on tax cost was $328,832 and $2,155,463, respectively, with a net unrealized depreciation of $1,826,631.
22
NOTES TO FINANCIAL STATEMENTS continued
As of April 30, 2008, the Fund had $1,217,653 in capital loss carryovers for federal income tax purposes expiring as follows:
Expiration |
|
2012 | | 2013 | | 2014 | | 2015 | | 2016 |
|
|
|
|
|
|
|
|
|
$512,937 | | $77,895 | | $392,403 | | $213,424 | | $20,994 |
|
|
|
|
|
|
|
|
|
5. INTERFUND LENDING
Pursuant to an Exemptive Order issued by the SEC, the Fund may participate in an interfund lending program with certain funds in the Evergreen fund family. This program allows the Fund to borrow from, or lend money to, other participating funds. During the year ended April 30, 2008, the Fund did not participate in the interfund lending program.
6. DISTRIBUTIONS TO SHAREHOLDERS
As of April 30, 2008, the components of distributable earnings on a tax basis were as follows:
Unrealized
Depreciation | | Capital Loss
Carryovers | | Temporary
Book/Tax
Differences |
|
|
|
|
|
$1,826,631 | | $1,217,653 | | ($172,586) |
|
|
|
|
|
The differences between the components of distributable earnings on a tax basis and the amounts reflected in the Statement of Assets and Liabilities are primarily due to wash sales and swap contracts. The temporary book/tax differences are a result of timing differences between book and tax recognition of income and/or expenses.
The tax character of distributions paid was as follows:
| | | Year Ended April 30, |
| | |
|
| | | 2008 | | | 2007 |
|
|
|
|
|
|
|
Ordinary Income | | $ | 1,755,285 | | $ | 3,032,386 |
Return of Capital | | | 1,113,554 | | | 0 |
|
|
|
|
|
|
|
7. EXPENSE REDUCTIONS
Through expense offset arrangements with ESC and the Fund’s custodian, a portion of fund expenses has been reduced.
8. DEFERRED TRUSTEES’ FEES
Each Trustee of the Fund may defer any or all compensation related to performance of his or her duties as a Trustee. The Trustees’ deferred balances are allocated to deferral accounts, which are included in the accrued expenses for the Fund. The investment performance of the deferral accounts is based on the investment performance of certain Evergreen funds. Any gains earned or losses incurred in the deferral accounts are reported in the Fund’s Trustees’
23
NOTES TO FINANCIAL STATEMENTS continued
fees and expenses. At the election of the Trustees, the deferral account will be paid either in one lump sum or in quarterly installments for up to ten years.
9. FINANCING AGREEMENT
The Fund and certain other Evergreen funds share in an unsecured revolving credit commitment for temporary and emergency purposes, including the funding of redemptions, as permitted by each participating fund’s borrowing restrictions. Borrowings under this facility bear interest at 0.50% per annum above the Federal Funds rate. All of the participating funds are charged an annual commitment fee on the unused balance, which is allocated pro rata. The credit facility is for $100 million with an annual commitment fee of 0.08%. During the year ended April 30, 2008, the Fund had no borrowings.
10. REGULATORY MATTERS AND LEGAL PROCEEDINGS
Pursuant to an administrative order issued by the SEC on September 19, 2007, EIMC, EIS, ESC (collectively, the “Evergreen Entities”), Wachovia Securities, LLC and the SEC have entered into an agreement settling allegations of (i) improper short-term trading arrangements in effect prior to May 2003 involving former officers and employees of EIMC and certain broker-dealers, (ii) insufficient systems for monitoring exchanges and enforcing exchange limitations as stated in certain funds’ prospectuses, and (iii) inadequate e-mail retention practices. Under the settlement, the Evergreen Entities were censured and have paid approximately $32 million in disgorgement and penalties. This amount, along with a fine assessed by the SEC against Wachovia Securities, LLC will be distributed pursuant to a plan to be developed by an independent distribution consultant and approved by the SEC. The Evergreen Entities neither admitted nor denied the allegations and findings set forth in its settlement with the SEC.
In addition, the Evergreen funds and EIMC and certain of its affiliates are involved in various legal actions, including private litigation and class action lawsuits. EIMC does not expect that any of such legal actions currently pending or threatened will have a material adverse impact on the financial position or operations of any of the Evergreen funds or on EIMC’s ability to provide services to the Evergreen funds.
Although EIMC believes that none of the matters discussed above will have a material adverse impact on the Evergreen funds, there can be no assurance that these matters and any publicity surrounding or resulting from them will not result in reduced sales or increased redemptions of Evergreen fund shares, which could increase Evergreen fund transaction costs or operating expenses, or that they will not have other adverse consequences on the Evergreen funds.
11. NEW ACCOUNTING PRONOUNCEMENTS
In September 2006, FASB issued Statement of Financial Accounting Standards No. 157, Fair Value Measurements (“FAS 157”). FAS 157 establishes a single authoritative
24
NOTES TO FINANCIAL STATEMENTS continued
definition of fair value, establishes a framework for measuring fair value and expands disclosures about fair value measurements. FAS 157 applies to fair value measurements already required or permitted by existing standards. The change to current generally accepted accounting principles from the application of FAS 157 relates to the definition of fair value, the methods used to measure fair value, and the expanded disclosures about fair value measurements. Management of the Fund does not believe the adoption of FAS 157 will materially impact the financial statement amounts, however, additional disclosures may be required about the inputs used to develop the measurements and the effect of certain of the measurements on changes in net assets for the period. FAS 157 is effective for financial statements issued for fiscal years beginning after November 15, 2007 and interim periods within those fiscal years.
In March 2008, FASB issued Statement of Financial Accounting Standards No. 161, Disclosures about Derivative Instruments and Hedging Activities (“FAS 161”), an amendment of FASB Statement No. 133. FAS 161 requires enhanced disclosures about (a) how and why a fund uses derivative instruments, (b) how derivative instruments and hedging activities are accounted for, and (c) how derivative instruments and related hedging activities affect a fund’s financial position, financial performance, and cash flows. Management of the Fund does not believe the adoption of FAS 161 will materially impact the financial statement amounts, but will require additional disclosures. This will include qualitative and quantitative disclosures on derivative positions existing at period end and the effect of using derivatives during the reporting period. FAS 161 is effective for financial statements issued for fiscal years and interim periods beginning after November 15, 2008.
25
REPORT OF INDEPENDENT REGISTERED PUBLIC ACCOUNTING FIRM
Board of Trustees and Shareholders
Evergreen Fixed Income Trust
We have audited the accompanying statement of assets and liabilities, including the schedule of investments, of the Evergreen Institutional Mortgage Portfolio, a series of the Evergreen Fixed Income Trust, as of April 30, 2008 and the related statement of operations for the year then ended, statements of changes in net assets for each of the years in the two-year period then ended and the financial highlights for each of the years in the five-year period then ended. These financial statements and financial highlights are the responsibility of the Fund’s management. Our responsibility is to express an opinion on these financial statements and financial highlights based on our audits.
We conducted our audits in accordance with the standards of the Public Company Accounting Oversight Board (United States). Those standards require that we plan and perform the audit to obtain reasonable assurance about whether the financial statements and financial highlights are free of material misstatement. An audit includes examining, on a test basis, evidence supporting the amounts and disclosures in the financial statements. Our procedures included confirmation of securities owned as of April 30, 2008 by correspondence with the custodian and brokers, or by other appropriate auditing procedures where replies from brokers were not received. An audit also includes assessing the accounting principles used and significant estimates made by management, as well as evaluating the overall financial statement presentation. We believe that our audits provide a reasonable basis for our opinion.
In our opinion, the financial statements and financial highlights referred to above present fairly, in all material respects, the financial position of the Evergreen Institutional Mortgage Portfolio as of April 30, 2008, the results of its operations, changes in its net assets and financial highlights for each of the years described above, in conformity with U.S. generally accepted accounting principles.

Boston, Massachusetts
June 27, 2008
26
ADDITIONAL INFORMATION (unaudited)
FEDERAL TAX DISTRIBUTIONS
The Fund paid total distributions of $2,868,839 during the year ended April 30, 2008 of which 61.18% was from ordinary taxable income and 38.82% was from a non-taxable return of capital. Shareholders of the Fund will receive in early 2009 a Form 1099-DIV that will inform them of the tax character of this distribution as well as all other distributions made by the Fund in calendar year 2008.
27
TRUSTEES AND OFFICERS
TRUSTEES1 | | |
Charles A. Austin III
Trustee
DOB: 10/23/1934
Term of office since: 1991
Other directorships: None | | Investment Counselor, Anchor Capital Advisors, LLC. (investment advice); Director, The Andover Companies (insurance); Trustee, Arthritis Foundation of New England; Former Director, The Francis Ouimet Society (scholarship program); Former Director, Executive Vice President and Treasurer, State Street Research & Management Company (investment advice) |
|
|
|
K. Dun Gifford
Trustee
DOB: 10/23/1938
Term of office since: 1974
Other directorships: None | | Chairman and President, Oldways Preservation and Exchange Trust (education); Trustee, Chairman of the Finance Committee, Member of the Executive Committee, and Former Treasurer, Cambridge College |
|
|
|
Dr. Leroy Keith, Jr.
Trustee
DOB: 2/14/1939
Term of office since: 1983
Other directorships: Trustee,
Phoenix Fund Complex
(consisting of 53 portfolios as of 12/31/2007) | | Managing Director, Almanac Capital Management (commodities firm); Trustee, Phoenix Fund Complex; Director, Diversapack Co. (packaging company); Former Partner, Stonington Partners, Inc. (private equity fund); Former Director, Obagi Medical Products Co.; Former Director, Lincoln Educational Services |
|
|
|
Carol A. Kosel1
Trustee
DOB: 12/25/1963
Term of office since: 2008
Other directorships: None | | Former Consultant to the Evergreen Boards of Trustees; Former Vice President and Senior Vice President, Evergreen Investments, Inc.; Former Treasurer, Evergreen Funds; Former Treasurer, Vestaur Securities Fund |
|
|
|
Gerald M. McDonnell
Trustee
DOB: 7/14/1939
Term of office since: 1988
Other directorships: None | | Former Manager of Commercial Operations, CMC Steel (steel producer) |
|
|
|
Patricia B. Norris
Trustee
DOB: 4/9/1948
Term of office since: 2006
Other directorships: None | | President and Director of Buckleys of Kezar Lake, Inc. (real estate company); Former President and Director of Phillips Pond Homes Association (home community); Former Partner, PricewaterhouseCoopers, LLP (independent registered public accounting firm) |
|
|
|
William Walt Pettit
Trustee
DOB: 8/26/1955
Term of office since: 1988
Other directorships: None | | Partner and Vice President, Kellam & Pettit, P.A. (law firm); Director, Superior Packaging Corp. (packaging company); Member, Superior Land, LLC (real estate holding company), Member, K&P Development, LLC (real estate development); Former Director, National Kidney Foundation of North Carolina, Inc. (non-profit organization) |
|
|
|
David M. Richardson
Trustee
DOB: 9/19/1941
Term of office since: 1982
Other directorships: None | | President, Richardson, Runden LLC (executive recruitment advisory services); Director, J&M Cumming Paper Co. (paper merchandising); Trustee, NDI Technologies, LLP (communications); Former Consultant, AESC (The Association of Executive Search Consultants) |
|
|
|
Dr. Russell A. Salton III
Trustee
DOB: 6/2/1947
Term of office since: 1984
Other directorships: None | | President/CEO, AccessOne MedCard, Inc. |
|
|
|
28
TRUSTEES AND OFFICERS continued
Michael S. Scofield
Trustee
DOB: 2/20/1943
Term of office since: 1984
Other directorships: None | | Retired Attorney, Law Offices of Michael S. Scofield; Former Director and Chairman, Branded Media Corporation (multi-media branding company) |
|
|
|
Richard J. Shima
Trustee
DOB: 8/11/1939
Term of office since: 1993
Other directorships: None | | Independent Consultant; Director, Hartford Hospital; Trustee, Greater Hartford YMCA; Former Director, Trust Company of CT; Former Director, Old State House Association; Former Trustee, Saint Joseph College (CT) |
|
|
|
Richard K. Wagoner, CFA2
Trustee
DOB: 12/12/1937
Term of office since: 1999
Other directorships: None | | Member and Former President, North Carolina Securities Traders Association; Member, Financial Analysts Society |
|
|
|
OFFICERS
Dennis H. Ferro3
President
DOB: 6/20/1945
Term of office since: 2003 | | Principal occupations: President and Chief Executive Officer, Evergreen Investment Company, Inc. and Executive Vice President, Wachovia Bank, N.A.; former Chief Investment Officer, Evergreen Investment Company, Inc. |
|
|
|
Kasey Phillips4
Treasurer
DOB: 12/12/1970
Term of office since: 2005 | | Principal occupations: Senior Vice President, Evergreen Investment Management Company, LLC; Former Vice President, Evergreen Investment Services, Inc.; Former Assistant Vice President, Evergreen Investment Services, Inc. |
|
|
|
Michael H. Koonce4
Secretary
DOB: 4/20/1960
Term of office since: 2000 | | Principal occupations: Senior Vice President and General Counsel, Evergreen Investment Services, Inc.; Secretary, Senior Vice President and General Counsel, Evergreen Investment Management Company, LLC and Evergreen Service Company, LLC; Senior Vice President and Assistant General Counsel, Wachovia Corporation |
|
|
|
Robert Guerin4
Chief Compliance Officer
DOB: 9/20/1965
Term of office since: 2007 | | Principal occupations: Chief Compliance Officer, Evergreen Funds and Senior Vice President of Evergreen Investments Co., Inc.; Former Managing Director and Senior Compliance Officer, Babson Capital Management LLC; Former Principal and Director, Compliance and Risk Management, State Street Global Advisors; Former Vice President and Manager, Sales Practice Compliance, Deutsche Asset Management |
|
|
|
1 | Each Trustee, except Mses. Kosel and Norris, serves until a successor is duly elected or qualified or until his or her death, resignation, retirement or removal from office. As new Trustees, Ms. Kosel’s and Ms. Norris’ initial terms end December 31, 2010 and June 30, 2009, respectively, at which times they may be re-elected by Trustees to serve until a successor is duly elected or qualified or until her death, resignation, retirement or removal from office by the Trustees. Each Trustee, except Ms. Kosel, oversaw 94 Evergreen funds as of December 31, 2007. Ms. Kosel became a Trustee on January 1, 2008. Correspondence for each Trustee may be sent to Evergreen Board of Trustees, P.O. Box 20083, Charlotte, NC 28202. |
2 | Mr. Wagoner is an “interested person” of the Fund because of his ownership of shares in Wachovia Corporation, the parent to the Fund’s investment advisor. |
3 | The address of the Officer is 401 S. Tryon Street, 20th Floor, Charlotte, NC 28288. |
4 | The address of the Officer is 200 Berkeley Street, Boston, MA 02116. |
Additional information about the Fund’s Board of Trustees and Officers can be found in the Statement of Additional Information (SAI) and is available upon request without charge by calling 800.343.2898.
29

573633rv3 06/2008
Evergreen Diversified Income Builder Fund
| | table of contents |
1 | | LETTER TO SHAREHOLDERS |
4 | | FUND AT A GLANCE |
6 | | PORTFOLIO MANAGER COMMENTARY |
9 | | ABOUT YOUR FUND’S EXPENSES |
10 | | FINANCIAL HIGHLIGHTS |
14 | | SCHEDULE OF INVESTMENTS |
21 | | STATEMENT OF ASSETS AND LIABILITIES |
22 | | STATEMENT OF OPERATIONS |
23 | | STATEMENTS OF CHANGES IN NET ASSETS |
24 | | NOTES TO FINANCIAL STATEMENTS |
33 | | REPORT OF INDEPENDENT REGISTERED PUBLIC ACCOUNTING FIRM |
34 | | ADDITIONAL INFORMATION |
36 | | TRUSTEES AND OFFICERS |
This annual report must be preceded or accompanied by a prospectus of the Evergreen fund contained herein. The prospectus contains more complete information, including fees and expenses, and should be read carefully before investing or sending money.
The fund will file its complete schedule of portfolio holdings with the SEC for the first and third quarters of each fiscal year on Form N-Q. The fund’s Form N-Q will be available on the SEC’s Web site at http://www.sec.gov. In addition, the fund’s Form N-Q may be reviewed and copied at the SEC’s Public Reference Room in Washington, D.C. Information on the operation of the Public Reference Room may be obtained by calling 800.SEC.0330.
A description of the fund’s proxy voting policies and procedures, as well as information regarding how the fund voted proxies relating to portfolio securities during the most recent 12-month period ended June 30, is available by visiting our Web site at EvergreenInvestments.com or by visiting the SEC’s Web site at http://www.sec.gov. The fund’s proxy voting policies and procedures are also available without charge, upon request, by calling 800.343.2898.
| Mutual Funds: | | | | |
| NOT FDIC INSURED | | MAY LOSE VALUE | | NOT BANK GUARANTEED |
Evergreen InvestmentsSM is a service mark of Evergreen Investment Management Company, LLC. Copyright 2008, Evergreen Investment Management Company, LLC.
Evergreen Investment Management Company, LLC is a subsidiary of Wachovia Corporation and is an affiliate of Wachovia Corporation’s other Broker Dealer subsidiaries.
Evergreen mutual funds are distributed by Evergreen Investment Services, Inc. 200 Berkeley Street, Boston, MA 02116
LETTER TO SHAREHOLDERS
June 2008

Dennis H. Ferro
President and Chief Executive Officer
Dear Shareholder:
We are pleased to provide the Annual Report for Evergreen Diversified Income Builder Fund for the twelve-month period ended April 30, 2008 (the “twelve-month period”).
The fiscal year witnessed a dramatic change in fixed income markets as problems that first surfaced in housing and the subprime mortgages raised questions about the strength of the domestic economy and the risks of credit-sensitive investments. Corporate bonds and asset-backed securities performed well early in the period, with gains in economic output, corporate profits and employment encouraging optimism. The backdrop for investing began to change, however, by the summer of 2007 amid widening worries about problems in the financials sector. Major financial institutions began to report substantial losses from their exposures to subprime mortgages and banks started to tighten their credit standards and to restrict their lending. With fears of a dramatic downturn hovering over the market, fixed income investors sought out the highest-quality securities and attempted to avoid credit risk. As a consequence, the prices of corporate bonds and many asset-backed securities fell, while Treasuries rallied in a general flight to quality over much of the period. These general trends later reversed themselves in the final month of the twelve-month period, with high yield corporate bonds and other credit-sensitive securities rallying in April 2008 following a series of actions by the U.S. Federal Reserve Board (the “Fed”) to stabilize the markets. Equities, meanwhile, tended to move in the same general direction as corporate bonds over the fiscal year. Stock prices rose very early in the period before
1
LETTER TO SHAREHOLDERS continued
falling in late 2007 and early 2008 and then rallying again in April. For the full twelve-month period, stock valuations fell across all market capitalizations, investment styles and regions. At the same time, the prices of gold, oil and other commodities surged while the U.S. dollar weakened further.
The U.S. economy grew briskly early in 2007, but then slowed significantly in late 2007 and early 2008. Economic growth decelerated as lending for ordinary consumer and commercial activity dried up, accentuating the weakening effects of declining home prices. Corporate profits, employment and other key economic indicators showed clear evidence of deterioration. Gross Domestic Product growth decelerated to a paltry 0.6% rate during the final quarter of 2007 and a marginally better 0.9% pace for the first quarter of 2008. Much of the strength early in 2008 came from exports and government spending, rather than from any noticeable improvements in consumer spending, business investment or housing. To reinvigorate the economy and stimulate lending activity, the Fed became increasingly aggressive, taking a series of steps to pour liquidity into the financial system. Starting in September 2007 and continuing through April 2008, the Fed cut the key fed funds rate seven different times, lowering the influential short-term rate from 5.25% to 2%. In March 2008, the central bank also opened its lending facilities to securities firms as well as commercial banks and intervened to help JPMorgan Chase & Co. purchase the collapsing investment bank Bear Stearns Cos. Meanwhile, Congress and the Bush administration rushed through a $168 billion fiscal stimulus bill, which included tax rebate checks, in an effort to boost growth in the second half of 2008.
During the twelve-month period, managers of Evergreen’s intermediate- and long-term bond funds paid careful attention to risk management in a changing market environment. The teams supervising the higher-credit quality funds—including Evergreen U.S.
2
LETTER TO SHAREHOLDERS continued
Government Fund, Evergreen Core Bond Fund, Evergreen Core Plus Bond Fund and Evergreen Institutional Mortgage Portfolio— monitored Fed policy and interest-rate movements as well as general macroeconomic trends in managing their portfolios. Meanwhile, the managers of Evergreen High Income Fund and Evergreen Select High Yield Bond Fund tended to position their credit-sensitive portfolios relatively conservatively during a period of growing risk aversion. After repositioning their portfolio early in the fiscal year, the managers of Evergreen Diversified Income Builder Fund maintained an emphasis on better-quality, high yield corporate bonds and also increased their exposure to dividend-paying stocks.
The experiences in the capital markets during the twelve-month period have underscored the value of a well-diversified, long-term investment strategy to help soften the effects of volatility in any one market or asset class. As always, we encourage investors to maintain diversified investment portfolios in pursuit of their long-term investment goals.
Please visit us at EvergreenInvestments.com for more information about our funds and other investment products available to you. Thank you for your continued support of Evergreen Investments.
Sincerely,

Dennis H. Ferro
President and Chief Executive Officer
Evergreen Investment Company, Inc.
Special Notice to Shareholders:
Please visit our Web site at EvergreenInvestments.com for statements from President and Chief Executive Officer, Dennis Ferro, regarding the firm’s recent settlement with the Securities and Exchange Commission (SEC) and prior settlement with the Financial Industry Regulatory Authority (FINRA).
3
FUND AT A GLANCE
as of April 30, 2008
MANAGEMENT TEAM
Investment Advisor:
• Evergreen Investment Management Company, LLC
Portfolio Manager:
• Margaret D. Patel
CURRENT INVESTMENT STYLE
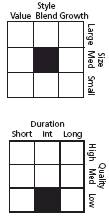
Source: Morningstar, Inc.
Morningstar’s style box is based on a portfolio date as of 3/31/2008.
The Equity style box placement is based on 10 growth and valuation measures for each fund holding and the median size of the companies in which the fund invests.
The Fixed Income style box placement is based on a fund’s average effective maturity or duration and the average credit rating of the bond portfolio.
PERFORMANCE AND RETURNS
Portfolio inception date: Inception 4/14/1987
| | Class A | | Class B | | Class C | | Class I |
Class inception date | | 4/14/1987 | | 2/1/1993 | | 2/1/1993 | | 1/13/1997 |
|
|
|
|
|
|
|
|
|
Nasdaq symbol | | EKSAX | | EKSBX | | EKSCX | | EKSYX |
|
|
|
|
|
|
|
|
|
Average annual return* | | | | | | | | |
|
|
|
|
|
|
|
|
|
1-year with sales charge | | -5.05% | | -5.81% | | -1.99% | | N/A |
|
|
|
|
|
|
|
|
|
1-year w/o sales charge | | -0.30% | | -1.02% | | -1.03% | | -0.12% |
|
|
|
|
|
|
|
|
|
5-year | | 3.44% | | 3.37% | | 3.70% | | 4.72% |
|
|
|
|
|
|
|
|
|
10-year | | 4.61% | | 4.33% | | 4.33% | | 5.48% |
|
|
|
|
|
|
|
|
|
Maximum sales charge | | 4.75% | | 5.00% | | 1.00% | | N/A |
| | Front-end | | CDSC | | CDSC | | |
|
|
|
|
|
|
|
|
|
* | Adjusted for maximum applicable sales charge, unless noted. |
Past performance is no guarantee of future results. The performance quoted represents past performance and current performance may be lower or higher. The investment return and principal value of an investment will fluctuate so that investors’ shares, when redeemed, may be worth more or less than their original cost. To obtain performance information current to the most recent month-end for Classes A, B, C or I, please go to EvergreenInvestments.com/fundperformance. The performance of each class may vary based on differences in loads, fees and expenses paid by the shareholders investing in each class. Performance includes the reinvestment of income dividends and capital gain distributions. Performance shown does not reflect the deduction of taxes that a shareholder would pay on fund distributions or the redemption of fund shares.
The fund incurs a 12b-1 fee of 0.25% for Class A and 1.00% for Classes B and C. Class I does not pay a 12b-1 fee.
The advisor is reimbursing a portion of the 12b-1 fee for Class A. Had the fee not been reimbursed, returns for Class A would have been lower. Returns reflect expense limits previously in effect for all classes, without which returns would have been lower.
4
FUND AT A GLANCE continued
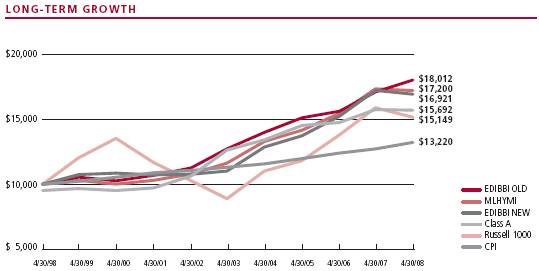
Comparison of a $10,000 investment in the Evergreen Diversified Income Builder Fund Class A shares versus a similar investment in the Evergreen Diversified Income Builder Blended Index New (EDIBBI NEW), the Evergreen Diversified Income Builder Blended Index Old (EDIBBI OLD), the Merrill Lynch High Yield Master Index† (MLHYMI), the Russell 1000 Index (Russell 1000) and the Consumer Price Index (CPI).
The EDIBBI NEW, the EDIBBI OLD, the MLHYMI and the Russell 1000 are unmanaged market indexes and do not include transaction costs associated with buying and selling securities, any mutual fund fees or expenses or any taxes. The CPI is a commonly used measure of inflation and does not represent an investment return. It is not possible to invest directly in an index.
Class I shares are only offered, subject to the minimum initial purchase requirements, in the following manner: (1) to investment advisory clients of EIMC (or its advisory affiliates), (2) to employer- or state-sponsored benefit plans, including but not limited to, retirement plans, defined benefit plans, deferred compensation plans, or savings plans, (3) to fee-based mutual fund wrap accounts, (4) through arrangements entered into on behalf of the Evergreen funds with certain financial services firms, (5) to certain institutional investors, and (6) to persons who owned Class Y shares in registered name in an Evergreen fund on or before December 31, 1994 or who owned shares of any SouthTrust fund in registered name as of March 18, 2005 or who owned shares of Vestaur Securities Fund as of May 20, 2005.
Class I shares are only available to institutional shareholders with a minimum of $1 million investment, which may be waived in certain situations.
The fund’s investment objective may be changed without a vote of the fund’s shareholders.
5
PORTFOLIO MANAGER COMMENTARY
The fund’s Class A shares returned -0.30% for the twelve-month period ended April 30, 2008, excluding any applicable sales charges. During the same period, the EDIBBI NEW returned -1.70%, the EDIBBI OLD returned 5.37%, the MLHYMI returned -0.76% and the Russell 1000 returned -4.62%.
The fund seeks high current income from investments in income-producing securities. Secondarily, the fund considers potential for growth of capital in selecting securities.
Investment Process
On June 1, 2007, just one month into its fiscal year, Evergreen Strategic Income Fund changed its name to Evergreen Diversified Income Builder Fund to reflect a new set of strategies effective on that same day. Specifically, the strategies for the fund were broadened to provide the management team with increased flexibility to invest in a wider range of income-producing securities to create a potential for increased total return. To pursue the new objective, the fund typically seeks to invest at least 80 percent of assets in a diversified portfolio of U.S. and non-U.S. income-producing securities, including debt securities of any quality, dividend-paying common and preferred stocks, convertible bonds and derivatives (such as structured notes). We do not normally expect to invest more than 25 percent of assets in common stocks.
Volatility in both fixed income and equity markets characterized much of the investment year, as problems in the subprime mortgage market rippled through many sectors of the economy, beginning in the waning months of 2007 and continuing into 2008. During this time, the fund maintained an emphasis on better-quality, high yielding corporate bonds while also focusing on equities in areas where attractive fixed income opportunities were not available. We kept our asset allocation within a fairly consistent range, with high yield bonds representing the majority of assets and the remainder of assets invested primarily in dividend paying stocks. Our fixed income investments tended to have the greatest concentrations in the Industrials, Utilities, Materials and Energy sectors. The yield spreads offered by bonds in these economically sensitive areas widened substantially over Treasury yields by the end of the fiscal year because of concerns about the effects of decelerating economic growth. Throughout the fiscal year, our bond investments tended to be in relatively better-rated bonds within the below-investment grade universe. Bond holdings generally were rated BB/Ba to B. By fiscal year’s end, we found it necessary to emphasize securities of companies
Foreign investments may contain more risk due to the inherent risks associated with changing political climates, foreign market instability and foreign currency fluctuations. Risks of international investing are magnified in emerging or developing markets.
Asset-backed and mortgage-backed securities are generally subject to higher prepayment risks than other types of debt securities, which can limit the potential for gain in a declining interest rate environment and increase the potential for loss in a rising interest rate environment. Mortgage-backed securities may also be structured so that they are particularly sensitive to interest rates.
Derivatives involve additional risks including interest rate risk, credit risk, the risk of improper valuation and the risk of non-correlation to the relevant instruments they are designed to hedge or to closely track.
High yield, lower-rated bonds may contain more risk due to the increased possibility of default.
The return of principal is not guaranteed due to fluctuation in the fund’s NAV caused by changes in the price of individual bonds held by the fund and the buying and selling of bonds by the fund. Bond funds have the same inflation, interest rate and credit risks as individual bonds. Generally, the value of bond funds rises when prevailing interest rates fall, and falls when interest rates rise.
U.S. government guarantees apply only to certain securities held in the fund’s portfolio and not to the fund’s shares.
Leverage may disproportionately increase a fund’s portfolio losses and reduce opportunities for gain when interest rates, stock prices, or currency rates are changing.
The Evergreen Diversified Income Builder Blended Index New is composed of the following indexes: MLHYMI (75%) and Russell 1000 (25%). The Evergreen Diversified Income Builder Blended Index Old was formerly composed of the following indexes: MLHYMI (50%), JPMGXUS (25%) and LBABI (25%). Given recent changes to the fund’s principal investment strategies, the fund believes that the EDIBBI NEW is a more appropriate benchmark. In future periods, the fund will compare its performance to the EDIBBI NEW.
† | Copyright 2008. Merrill Lynch, Pierce, Fenner & Smith Incorporated. All rights reserved. |
All data is as of April 30, 2008, and subject to change.
6
PORTFOLIO MANAGER COMMENTARY continued
that we thought were financially strong enough to weather a slowing economy.
Among our equity investments, we often took advantage of opportunities in economically sensitive areas such as Industrials, where we held positions in corporations such as Emerson Electric, Cooper Industries and Rockwell Automation. We believed that the stocks of these companies offered excellent growth prospects in a sector where there were few attractive high yield bonds available. Similarly, we invested in stocks of companies such as Thermo Fisher Scientific, a medical equipment company with good potential in an industry that does not offer many high yield bond opportunities. In general, we had very low exposure to stocks from the Financials sector. When we did hold Financials stocks, we focused on real estate investment trusts (REITs) of office, shopping mall, lodging and timber properties, which tended to offer higher yields than generally available in the equity market. We sought to avoid companies vulnerable to losses from their investments in structured products and residential real estate mortgages.
Contributors to performance
Our strategy emphasizing the equities of REITs in our Financials positions tended to help. Two healthy performers were Simon Property Group, owner of shopping mall properties, and Mack-Cali Realty Corp., owner of office and mixed-use properties. In our Energy equity positions, our investments in oil field services companies such as Pride International and Halliburton added to results, as they posted modest gains during a period in which the stocks of the major oil companies tended to fall. Questar, a natural gas corporation with divisions involved in exploration, pipeline development and marketing, also rose in value, supporting performance. While the more economically sensitive Industrials stocks generally did not perform well, shares of defense contractors DRS Technologies and Raytheon rose. Shares of railroad operator Norfolk Southern also gained. In basic materials, we also saw gains for Freeport-McMoRan Cooper & Gold. Currently, all of these contributors remain in the portfolio because we still believe they hold long-term value.
Detractors from performance
Our emphasis on stocks in the Industrials and other economically sensitive sectors tended to hold back performance when those groups fell out of favor because of concerns about decelerating economic growth. In addition, our positions in the convertible bonds of companies General Cable and Inverness Medical Innovations fell in sympathy with the values of the companies’ underlying stocks. We eliminated our position in one disappointing high yield investment—the bonds of Freescale Semiconductor. It declined amid concerns about increasing competition in the market for semiconductors used in wireless communications devices. Another detractor, Wesco International, Inc.—a distributor of electrical and industrial products—declined because of delays in several construction and utility projects, as well as its exposure to the beleaguered home construction industry. All of these detractors remain in the portfolio at present because we still believe they hold long-term value.
Management outlook
Although the end of the fiscal year was particularly challenging for high yield investing, we have confidence in our strategy to invest opportunistically in the bonds of economically sensitive industries and companies. When the current economic downturn ends and economic growth begins to accelerate, our investments in these bonds may offer good potential. The yields of high yielding corporate bonds increased substantially in the last several months of the fiscal year, and yield advantages over Treasuries widened significantly. We currently think corporate bonds issued by companies that are financially strong enough to withstand the present economic downdraft may perform particularly well when the economy begins to re-accelerate.
7
PORTFOLIO MANAGER COMMENTARY continued
At present, we think the outlook for equities also should improve by the end of 2008, if the momentum of the economic cycle turns upward, as we now expect. We think stock valuations of many economically sensitive companies have fallen to attractive levels, while their prospects may be improving because of sustained growth in developing markets and the prospect of improving conditions in the domestic economy later this year. At present, growth in emerging markets is generating heavy investments in basic infrastructure and industrial plants, while the U.S. economy may benefit both from the efforts of the Federal Reserve to inject more liquidity into the financial system and from the Treasury Department’s tax rebates, expected in the coming months. We think investments in many equities now make sense, especially for those investors with time horizons of a few years or more who have the patience to wait for a recovery in the markets. In our equity investments—which represented 25% of the portfolio at the end of the fiscal year—we currently expect to remain focused on sectors with the potential to grow faster than the overall economy.
This commentary reflects the views and opinions of the fund’s portfolio manager(s) on the date indicated and may include statements that constitute “forward-looking statements” under the U.S. Securities laws. Forward-looking statements include, among other things, projections, estimates, and information about possible or future results related to the fund, markets, or regulatory developments. The views expressed above are not guarantees of future performance or economic results and involve certain risks, uncertainties, and assumptions that could cause actual outcomes and results to differ materially from the views expressed herein. The views expressed above are subject to change at any time based upon economic, market, or other conditions and Evergreen undertakes no obligation to update the views expressed herein. Any discussions of specific securities should not be considered a recommendation to buy or sell those securities. The views expressed herein (including any forward-looking statements) may not be relied upon as investment advice or as an indication of the fund’s trading intent.
You should carefully consider the fund’s investment objectives, policies, risks, charges and expenses before investing. To obtain a prospectus, which contains this and other important information visit www.EvergreenInvestments.com or call 1.800.847.5397. Please read the prospectus carefully before investing.
8
ABOUT YOUR FUND’S EXPENSES
The Example below is intended to describe the fees and expenses borne by shareholders and the impact of those costs on your investment.
Example
As a shareholder of the fund, you incur two types of costs: (1) transaction costs, including sales charges (loads), redemption fees and exchange fees; and (2) ongoing costs, including management fees, distribution (12b-1) fees and other fund expenses. This Example is intended to help you understand your ongoing costs (in dollars) of investing in the fund and to compare these costs with the ongoing costs of investing in other mutual funds. The Example is based on an investment of $1,000 invested at the beginning of the period and held for the entire period from November 1, 2007 to April 30, 2008.
The example illustrates your fund’s costs in two ways:
• Actual expenses
The section in the table under the heading “Actual” provides information about actual account values and actual expenses. You may use the information in these columns, together with the amount you invested, to estimate the expenses that you paid over the period. Simply divide your account value by $1,000 (for example, an $8,600 account value divided by $1,000 = 8.6), then multiply the result by the number in the appropriate column for your share class, in the column entitled “Expenses Paid During Period” to estimate the expenses you paid on your account during this period.
• Hypothetical example for comparison purposes
The section in the table under the heading “Hypothetical (5% return before expenses)” provides information about hypothetical account values and hypothetical expenses based on the fund’s actual expense ratio and an assumed rate of return of 5% per year before expenses, which is not the fund’s actual return. The hypothetical account values and expenses may not be used to estimate the actual ending account balance or expenses you paid for the period. You may use this information to compare the ongoing costs of investing in the fund and other funds. To do so, compare this 5% hypothetical example with the 5% hypothetical examples that appear in the shareholder reports of the other funds.
Please note that the expenses shown in the table are meant to highlight your ongoing costs only and do not reflect any transactional costs, such as sales charges (loads), redemption fees or exchange fees. Therefore, the section in the table under the heading “Hypothetical (5% return before expenses)” is useful in comparing ongoing costs only, and will not help you determine the relative total costs of owning different funds. In addition, if these transactional costs were included, your costs would have been higher.
| | Beginning
Account
Value
11/1/2007 | | Ending
Account
Value
4/30/2008 | | Expenses
Paid During
Period* |
|
|
|
|
|
|
|
Actual | | | | | | |
Class A | | $ 1,000.00 | | $ 979.46 | | $ 5.27 |
Class B | | $ 1,000.00 | | $ 975.98 | | $ 8.94 |
Class C | | $ 1,000.00 | | $ 975.92 | | $ 8.94 |
Class I | | $ 1,000.00 | | $ 980.09 | | $ 4.04 |
Hypothetical | | | | | | |
(5% return before expenses) | | | | | | |
Class A | | $ 1,000.00 | | $ 1,019.54 | | $ 5.37 |
Class B | | $ 1,000.00 | | $ 1,015.81 | | $ 9.12 |
Class C | | $ 1,000.00 | | $ 1,015.81 | | $ 9.12 |
Class I | | $ 1,000.00 | | $ 1,020.79 | | $ 4.12 |
|
|
|
|
|
|
|
* | For each class of the fund, expenses are equal to the annualized expense ratio of each class (1.07% for Class A, 1.82% for Class B, 1.82% for Class C and 0.82% for Class I), multiplied by the average account value over the period, multiplied by 182 / 366 days. |
9
FINANCIAL HIGHLIGHTS
(For a share outstanding throughout each period)
| | Year Ended April 30, |
| |
|
CLASS A | | 2008 | | 2007 | | 2006 | | 2005 | | 2004 |
|
|
|
|
|
|
|
|
|
|
|
Net asset value, beginning of period | | $ | 6.40 | | $ | 6.32 | | $ | 6.53 | | $ | 6.38 | | $ | 6.50 |
|
|
|
|
|
|
|
|
|
|
|
|
|
|
|
|
Income from investment operations | | | | | | | | | | | | | | | |
Net investment income (loss) | | | 0.271 | | | 0.331 | | | 0.291 | | | 0.33 | | | 0.341 |
Net realized and unrealized gains or losses on investments | | | (0.29) | | | 0.08 | | | (0.19) | | | 0.19 | | | 0.07 |
| |
|
|
|
|
|
|
|
|
|
|
|
|
|
|
Total from investment operations | | | (0.02) | | | 0.41 | | | 0.10 | | | 0.52 | | | 0.41 |
|
|
|
|
|
|
|
|
|
|
|
|
|
|
|
|
Distributions to shareholders from | | | | | | | | | | | | | | | |
Net investment income | | | (0.26) | | | (0.31) | | | (0.31) | | | (0.35) | | | (0.37) |
Net realized gains | | | 0 | | | 0 | | | 0 | | | (0.02) | | | (0.16) |
Tax basis return of capital | | | 0 | | | (0.02) | | | 0 | | | 0 | | | 0 |
| |
|
|
|
|
|
|
|
|
|
|
|
|
|
|
Total distributions to shareholders | | | (0.26) | | | (0.33) | | | (0.31) | | | (0.37) | | | (0.53) |
|
|
|
|
|
|
|
|
|
|
|
|
|
|
|
|
Net asset value, end of period | | $ | 6.12 | | $ | 6.40 | | $ | 6.32 | | $ | 6.53 | | $ | 6.38 |
|
|
|
|
|
|
|
|
|
|
|
|
|
|
|
|
Total return2 | | | (0.30)% | | | 6.71% | | | 1.59% | | | 8.22% | | | 6.24% |
|
|
|
|
|
|
|
|
|
|
|
|
|
|
|
|
Ratios and supplemental data | | | | | | | | | | | | | | | |
Net assets, end of period (thousands) | | $ | 147,430 | | $ | 170,804 | | $ | 199,501 | | $ | 214,776 | | $ | 202,017 |
Ratios to average net assets | | | | | | | | | | | | | | | |
Expenses including waivers/reimbursements but excluding expense reductions | | | 1.11% | | | 1.16% | | | 1.17% | | | 1.12% | | | 1.21% |
Expenses excluding waivers/reimbursements and expense reductions | | | 1.16% | | | 1.20% | | | 1.18% | | | 1.12% | | | 1.21% |
Net investment income (loss) | | | 4.41% | | | 5.17% | | | 4.57% | | | 5.03% | | | 5.10% |
Portfolio turnover rate | | | 125% | | | 128% | | | 100% | | | 130% | | | 129% |
|
|
|
|
|
|
|
|
|
|
|
|
|
|
|
|
1 | Net investment income (loss) per share is based on average shares outstanding during the period. |
2 | Excluding applicable sales charges |
See Notes to Financial Statements
10
FINANCIAL HIGHLIGHTS
(For a share outstanding throughout each period)
| | Year Ended April 30, |
| |
|
CLASS B | | 2008 | | 2007 | | 2006 | | 2005 | | 2004 |
|
|
|
|
|
|
|
|
|
|
|
|
|
|
|
|
Net asset value, beginning of period | | $ | 6.42 | | $ | 6.34 | | $ | 6.55 | | $ | 6.40 | | $ | 6.52 |
|
|
|
|
|
|
|
|
|
|
|
|
|
|
|
|
Income from investment operations | | | | | | | | | | | | | | | |
Net investment income (loss) | | | 0.231 | | | 0.281 | | | 0.251 | | | 0.29 | | | 0.291 |
Net realized and unrealized gains or losses on investments | | | (0.30) | | | 0.09 | | | (0.19) | | | 0.19 | | | 0.07 |
| |
|
|
|
|
|
|
|
|
|
|
|
|
|
|
Total from investment operations | | | (0.07) | | | 0.37 | | | 0.06 | | | 0.48 | | | 0.36 |
|
|
|
|
|
|
|
|
|
|
|
|
|
|
|
|
Distributions to shareholders from | | | | | | | | | | | | | | | |
Net investment income | | | (0.21) | | | (0.27) | | | (0.27) | | | (0.31) | | | (0.32) |
Net realized gains | | | 0 | | | 0 | | | 0 | | | (0.02) | | | (0.16) |
Tax basis return of capital | | | 0 | | | (0.02) | | | 0 | | | 0 | | | 0 |
| |
|
|
|
|
|
|
|
|
|
|
|
|
|
|
Total distributions to shareholders | | | (0.21) | | | (0.29) | | | (0.27) | | | (0.33) | | | (0.48) |
|
|
|
|
|
|
|
|
|
|
|
|
|
|
|
|
Net asset value, end of period | | $ | 6.14 | | $ | 6.42 | | $ | 6.34 | | $ | 6.55 | | $ | 6.40 |
|
|
|
|
|
|
|
|
|
|
|
|
|
|
|
|
Total return2 | | | (1.02)% | | | 5.94% | | | 0.89% | | | 7.46% | | | 5.49% |
|
|
|
|
|
|
|
|
|
|
|
|
|
|
|
|
Ratios and supplemental data | | | | | | | | | | | | | | | |
Net assets, end of period (thousands) | | $ | 37,846 | | $ | 54,955 | | $ | 71,860 | | $ | 98,852 | | $ | 113,115 |
Ratios to average net assets | | | | | | | | | | | | | | | |
Expenses including waivers/reimbursements but excluding expense reductions | | | 1.86% | | | 1.90% | | | 1.87% | | | 1.83% | | | 1.91% |
Expenses excluding waivers/reimbursements and expense reductions | | | 1.86% | | | 1.90% | | | 1.87% | | | 1.83% | | | 1.91% |
Net investment income (loss) | | | 3.68% | | | 4.43% | | | 3.85% | | | 4.34% | | | 4.40% |
Portfolio turnover rate | | | 125% | | | 128% | | | 100% | | | 130% | | | 129% |
|
|
|
|
|
|
|
|
|
|
|
|
|
|
|
|
1 | Net investment income (loss) per share is based on average shares outstanding during the period. |
2 | Excluding applicable sales charges |
See Notes to Financial Statements
11
FINANCIAL HIGHLIGHTS
(For a share outstanding throughout each period)
| | Year Ended April 30, |
| |
|
CLASS C | | 2008 | | 2007 | | 2006 | | 2005 | | 2004 |
|
|
|
|
|
|
|
|
|
|
|
|
|
|
|
|
Net asset value, beginning of period | | $ | 6.41 | | $ | 6.33 | | $ | 6.54 | | $ | 6.39 | | $ | 6.51 |
|
|
|
|
|
|
|
|
|
|
|
|
|
|
|
|
Income from investment operations | | | | | | | | | | | | | | | |
Net investment income (loss) | | | 0.221 | | | 0.281 | | | 0.251 | | | 0.29 | | | 0.291 |
Net realized and unrealized gains or losses on investments | | | (0.29) | | | 0.09 | | | (0.19) | | | 0.19 | | | 0.07 |
| |
|
|
|
|
|
|
|
|
|
|
|
|
|
|
Total from investment operations | | | (0.07) | | | 0.37 | | | 0.06 | | | 0.48 | | | 0.36 |
|
|
|
|
|
|
|
|
|
|
|
|
|
|
|
|
Distributions to shareholders from | | | | | | | | | | | | | | | |
Net investment income | | | (0.21) | | | (0.27) | | | (0.27) | | | (0.31) | | | (0.32) |
Net realized gains | | | 0 | | | 0 | | | 0 | | | (0.02) | | | (0.16) |
Tax basis return of capital | | | 0 | | | (0.02) | | | 0 | | | 0 | | | 0 |
| |
|
|
|
|
|
|
|
|
|
|
|
|
|
|
Total distributions to shareholders | | | (0.21) | | | (0.29) | | | (0.27) | | | (0.33) | | | (0.48) |
|
|
|
|
|
|
|
|
|
|
|
|
|
|
|
|
Net asset value, end of period | | $ | 6.13 | | $ | 6.41 | | $ | 6.33 | | $ | 6.54 | | $ | 6.39 |
|
|
|
|
|
|
|
|
|
|
|
|
|
|
|
|
Total return2 | | | (1.03)% | | | 5.94% | | | 0.88% | | | 7.46% | | | 5.49% |
|
|
|
|
|
|
|
|
|
|
|
|
|
|
|
|
Ratios and supplemental data | | | | | | | | | | | | | | | |
Net assets, end of period (thousands) | | $ | 61,860 | | $ | 55,110 | | $ | 65,322 | | $ | 79,539 | | $ | 89,236 |
Ratios to average net assets | | | | | | | | | | | | | | | |
Expenses including waivers/reimbursements but excluding expense reductions | | | 1.85% | | | 1.90% | | | 1.88% | | | 1.83% | | | 1.91% |
Expenses excluding waivers/reimbursements and expense reductions | | | 1.85% | | | 1.90% | | | 1.88% | | | 1.83% | | | 1.91% |
Net investment income (loss) | | | 3.63% | | | 4.43% | | | 3.86% | | | 4.34% | | | 4.40% |
Portfolio turnover rate | | | 125% | | | 128% | | | 100% | | | 130% | | | 129% |
|
|
|
|
|
|
|
|
|
|
|
|
|
|
|
|
1 | Net investment income (loss) per share is based on average shares outstanding during the period. |
2 | Excluding applicable sales charges |
See Notes to Financial Statements
12
FINANCIAL HIGHLIGHTS
(For a share outstanding throughout each period)
| | Year Ended April 30, |
| |
|
CLASS I | | 2008 | | 2007 | | 2006 | | 2005 | | 2004 |
|
|
|
|
|
|
|
|
|
|
|
|
|
|
|
|
Net asset value, beginning of period | | $ | 6.30 | | $ | 6.22 | | $ | 6.43 | | $ | 6.28 | | $ | 6.40 |
|
|
|
|
|
|
|
|
|
|
|
|
|
|
|
|
Income from investment operations | | | | | | | | | | | | | | | |
Net investment income (loss) | | | 0.281 | | | 0.341 | | | 0.311 | | | 0.34 | | | 0.351 |
Net realized and unrealized gains or losses on investments | | | (0.29) | | | 0.08 | | | (0.19) | | | 0.19 | | | 0.07 |
| |
|
|
|
|
|
|
|
|
|
|
|
|
|
|
Total from investment operations | | | (0.01) | | | 0.42 | | | 0.12 | | | 0.53 | | | 0.42 |
|
|
|
|
|
|
|
|
|
|
|
|
|
|
|
|
Distributions to shareholders from | | | | | | | | | | | | | | | |
Net investment income | | | (0.27) | | | (0.32) | | | (0.33) | | | (0.36) | | | (0.38) |
Net realized gains | | | 0 | | | 0 | | | 0 | | | (0.02) | | | (0.16) |
Tax basis return of capital | | | 0 | | | (0.02) | | | 0 | | | 0 | | | 0 |
| |
|
|
|
|
|
|
|
|
|
|
|
|
|
|
Total distributions to shareholders | | | (0.27) | | | (0.34) | | | (0.33) | | | (0.38) | | | (0.54) |
|
|
|
|
|
|
|
|
|
|
|
|
|
|
|
|
Net asset value, end of period | | $ | 6.02 | | $ | 6.30 | | $ | 6.22 | | $ | 6.43 | | $ | 6.28 |
|
|
|
|
|
|
|
|
|
|
|
|
|
|
|
|
Total return | | | (0.12)% | | | 7.02% | | | 1.84% | | | 8.58% | | | 6.56% |
|
|
|
|
|
|
|
|
|
|
|
|
|
|
|
|
Ratios and supplemental data | | | | | | | | | | | | | | | |
Net assets, end of period (thousands) | | $ | 25,200 | | $ | 17,861 | | $ | 20,424 | | $ | 19,216 | | $ | 26,711 |
Ratios to average net assets | | | | | | | | | | | | | | | |
Expenses including waivers/reimbursements but excluding expense reductions | | | 0.85% | | | 0.90% | | | 0.88% | | | 0.82% | | | 0.91% |
Expenses excluding waivers/reimbursements and expense reductions | | | 0.85% | | | 0.90% | | | 0.88% | | | 0.82% | | | 0.91% |
Net investment income (loss) | | | 4.66% | | | 5.43% | | | 4.88% | | | 5.33% | | | 5.42% |
Portfolio turnover rate | | | 125% | | | 128% | | | 100% | | | 130% | | | 129% |
|
|
|
|
|
|
|
|
|
|
|
|
|
|
|
|
1 | Net investment income (loss) per share is based on average shares outstanding during the period. |
See Notes to Financial Statements
13
SCHEDULE OF INVESTMENTS
April 30, 2008
| | Principal
Amount | | Value |
|
|
|
|
|
ASSET-BACKED SECURITIES 1.0% | | | | | | |
NovaStar ABS CDO, Ltd., Ser. 2007-1A, Class A2, FRN, 3.59%, 02/08/2047 144A+» •
(cost $3,988,000) | | $ | 4,000,000 | | $ | 2,782,920 |
| | | | |
|
|
CORPORATE BONDS 61.2% | | | | | | |
CONSUMER DISCRETIONARY 0.3% | | | | | | |
Auto Components 0.2% | | | | | | |
Goodyear Tire & Rubber Co., 9.00%, 07/01/2015 ρ | | | 500,000 | | | 546,250 |
| | | | |
|
|
Textiles, Apparel & Luxury Goods 0.1% | | | | | | |
Oxford Industries, Inc., 8.875%, 06/01/2011 | | | 400,000 | | | 383,000 |
| | | | |
|
|
CONSUMER STAPLES 0.3% | | | | | | |
Household Products 0.3% | | | | | | |
Church & Dwight Co., 6.00%, 12/15/2012 ρ | | | 740,000 | | | 732,600 |
| | | | |
|
|
ENERGY 9.2% | | | | | | |
Energy Equipment & Services 2.0% | | | | | | |
Bristow Group, Inc., 7.50%, 09/15/2017 | | | 4,430,000 | | | 4,596,125 |
Dresser-Rand Group, Inc., 7.375%, 11/01/2014 | | | 692,000 | | | 695,460 |
| | | | |
|
|
| | | | | | 5,291,585 |
| | | | |
|
|
Oil, Gas & Consumable Fuels 7.2% | | | | | | |
El Paso Corp., 6.875%, 06/15/2014 | | | 2,900,000 | | | 3,021,498 |
McMoRan Exploration Co., 11.875%, 11/15/2014 | | | 6,200,000 | | | 6,603,000 |
Overseas Shipholding Group, Inc., 8.25%, 03/15/2013 | | | 750,000 | | | 782,813 |
Peabody Energy Corp.: | | | | | | |
5.875%, 04/15/2016 | | | 4,565,000 | | | 4,450,875 |
6.875%, 03/15/2013 | | | 440,000 | | | 451,000 |
Tesoro Corp., 6.50%, 06/01/2017 | | | 3,690,000 | | | 3,404,025 |
Williams Cos., 7.50%, 01/15/2031 | | | 925,000 | | | 985,125 |
| | | | |
|
|
| | | | | | 19,698,336 |
| | | | |
|
|
FINANCIALS 10.3% | | | | | | |
Consumer Finance 0.4% | | | | | | |
Qwest Capital Funding, Inc., 6.50%, 11/15/2018 | | | 1,100,000 | | | 924,000 |
| | | | |
|
|
Real Estate Investment Trusts 6.9% | | | | | | |
Host Marriott Corp.: | | | | | | |
7.125%, 11/01/2013 | | | 750,000 | | | 750,938 |
Ser. Q, 6.75%, 06/01/2016 | | | 7,638,000 | | | 7,504,335 |
Omega Healthcare Investors, Inc., 7.00%, 04/01/2014 | | | 1,000,000 | | | 981,250 |
Rouse Co., LP, 6.75%, 05/01/2013 144A ρ | | | 7,621,000 | | | 6,845,502 |
Saul Centers, Inc., 7.50%, 03/01/2014 | | | 3,000,000 | | | 2,700,000 |
| | | | |
|
|
| | | | | | 18,782,025 |
| | | | |
|
|
Real Estate Management & Development 3.0% | | | | | | |
Forest City Enterprises, Inc.: | | | | | | |
3.625%, 10/15/2011 | | | 4,000,000 | | | 3,476,400 |
6.50%, 02/01/2017 | | | 5,310,000 | | | 4,752,450 |
| | | | |
|
|
| | | | | | 8,228,850 |
| | | | |
|
|
See Notes to Financial Statements
14
SCHEDULE OF INVESTMENTS continued
April 30, 2008
| | Principal
Amount | | Value |
|
|
|
|
|
CORPORATE BONDS continued | | | | | | |
INDUSTRIALS 14.5% | | | | | | |
Aerospace & Defense 3.5% | | | | | | |
DRS Technologies, Inc.: | | | | | | |
6.625%, 02/01/2016 | | $ | 1,000,000 | | $ | 995,000 |
7.625%, 02/01/2018 ρ | | | 1,875,000 | | | 1,921,875 |
L-3 Communications Holdings, Inc.: | | | | | | |
5.875%, 01/15/2015 | | | 3,470,000 | | | 3,383,250 |
6.375%, 10/15/2015 | | | 3,160,000 | | | 3,140,250 |
| | | | |
|
|
| | | | | | 9,440,375 |
| | | | |
|
|
Commercial Services & Supplies 2.9% | | | | | | |
Allied Waste North America, Inc., 6.875%, 06/01/2017 ρ | | | 8,000,000 | | | 8,040,000 |
| | | | |
|
|
Electrical Equipment 4.2% | | | | | | |
Baldor Electric Co., 8.625%, 02/15/2017 ρ | | | 8,700,000 | | | 8,917,500 |
Belden, Inc., 7.00%, 03/15/2017 | | | 1,200,000 | | | 1,195,500 |
General Cable Corp., 7.125%, 04/01/2017 ρ | | | 1,500,000 | | | 1,470,000 |
| | | | |
|
|
| | | | | | 11,583,000 |
| | | | |
|
|
Machinery 3.9% | | | | | | |
Actuant Corp., 6.875%, 06/15/2017 144A ρ | | | 7,442,000 | | | 7,497,815 |
RBS Global, Inc., 11.75%, 08/01/2016 ρ | | | 1,000,000 | | | 965,000 |
SPX Corp., 7.625%, 12/15/2014 144A | | | 2,000,000 | | | 2,092,500 |
| | | | |
|
|
| | | | | | 10,555,315 |
| | | | |
|
|
INFORMATION TECHNOLOGY 3.0% | | | | | | |
Electronic Equipment & Instruments 0.8% | | | | | | |
Anixter International, Inc., 5.95%, 03/01/2015 | | | 1,500,000 | | | 1,329,375 |
Itron, Inc., 7.75%, 05/15/2012 | | | 1,000,000 | | | 975,410 |
| | | | |
|
|
| | | | | | 2,304,785 |
| | | | |
|
|
IT Services 2.2% | | | | | | |
Iron Mountain, Inc., 6.625%, 01/01/2016 ρ | | | 6,100,000 | | | 5,924,625 |
| | | | |
|
|
MATERIALS 9.2% | | | | | | |
Chemicals 0.1% | | | | | | |
MacDermid, Inc., 9.50%, 04/15/2017 144A | | | 291,000 | | | 279,360 |
Millenium America, Inc., 7.625%, 11/15/2026 | | | 140,000 | | | 90,650 |
| | | | |
|
|
| | | | | | 370,010 |
| | | | |
|
|
Construction Materials 0.4% | | | | | | |
Texas Industries, Inc., 7.25%, 07/15/2013 ρ | | | 1,168,000 | | | 1,162,160 |
| | | | |
|
|
Containers & Packaging 4.5% | | | | | | |
Ball Corp., 6.625%, 03/15/2018 | | | 8,000,000 | | | 8,000,000 |
Crown Holdings, Inc., 7.75%, 11/15/2015 ρ | | | 1,750,000 | | | 1,855,000 |
Greif, Inc., 6.75%, 02/01/2017 ρ | | | 1,540,000 | | | 1,536,150 |
Smurfit-Stone Container Corp., 8.375%, 07/01/2012 | | | 1,075,000 | | | 989,000 |
| | | | |
|
|
| | | | | | 12,380,150 |
| | | | |
|
|
See Notes to Financial Statements
15
SCHEDULE OF INVESTMENTS continued
April 30, 2008
| | Principal
Amount | | Value |
|
|
|
|
|
CORPORATE BONDS continued | | | | | | |
MATERIALS continued | | | | | | |
Metals & Mining 4.0% | | | | | | |
Freeport-McMoRan Copper & Gold, Inc.: | | | | | | |
8.25%, 04/01/2015 | | $ | 240,000 | | $ | 261,300 |
8.375%, 04/01/2017 | | | 235,000 | | | 260,262 |
Steel Dynamics, Inc., 7.75%, 04/15/2016 144A | | | 10,000,000 | | | 10,275,000 |
| | | | |
|
|
| | | | | | 10,796,562 |
| | | | |
|
|
Paper & Forest Products 0.2% | | | | | | |
Glatfelter, 7.125%, 05/01/2016 | | | 475,000 | | | 470,250 |
| | | | |
|
|
TELECOMMUNICATION SERVICES 0.7% | | | | | | |
Diversified Telecommunication Services 0.5% | | | | | | |
Qwest Corp., 7.875%, 09/01/2011 | | | 1,275,000 | | | 1,313,250 |
| | | | |
|
|
Wireless Telecommunication Services 0.2% | | | | | | |
Rural Cellular Corp., 8.25%, 03/15/2012 | | | 450,000 | | | 470,250 |
| | | | |
|
|
UTILITIES 13.7% | | | | | | |
Electric Utilities 9.7% | | | | | | |
Edison Mission Energy, 7.00%, 05/15/2017 | | | 8,020,000 | | | 8,140,300 |
Mirant North America, LLC, 7.375%, 12/31/2013 | | | 850,000 | | | 886,125 |
NRG Energy, Inc.: | | | | | | |
7.375%, 02/01/2016 | | | 1,500,000 | | | 1,548,750 |
7.375%, 01/15/2017 | | | 8,000,000 | | | 8,260,000 |
Reliant Energy, Inc.: | | | | | | |
6.75%, 12/15/2014 | | | 1,125,000 | | | 1,167,187 |
7.625%, 06/15/2014 | | | 6,265,000 | | | 6,546,925 |
| | | | |
|
|
| | | | | | 26,549,287 |
| | | | |
|
|
Independent Power Producers & Energy Traders 4.0% | | | | | | |
AES Corp., 7.75%, 03/01/2014 ρ | | | 1,125,000 | | | 1,158,750 |
Dynegy, Inc.: | | | | | | |
6.875%, 04/01/2011 | | | 4,400,000 | | | 4,455,000 |
7.125%, 05/15/2018 | | | 3,815,000 | | | 3,691,013 |
8.375%, 05/01/2016 ρ | | | 1,450,000 | | | 1,518,875 |
| | | | |
|
|
| | | | | | 10,823,638 |
| | | | |
|
|
Total Corporate Bonds (cost $167,454,893) | | | | | | 166,770,303 |
| | | | |
|
|
WHOLE LOAN SUBORDINATE COLLATERALIZED MORTGAGE OBLIGATIONS 0.0% | | | | | | |
FIXED-RATE 0.0% | | | | | | |
MASTR Resecuritization Trust, Ser. 2005-2, 4.75%, 03/28/2034 (cost $12,846) | | | 13,090 | | | 13,264 |
| | | | |
|
|
YANKEE OBLIGATIONS – CORPORATE 0.8% | | | | | | |
FINANCIALS 0.0% | | | | | | |
Diversified Financial Services 0.0% | | | | | | |
Preferred Term Securities XII, Ltd., FRN, 10.00%, 12/24/2033 | | | 105,000 | | | 74,689 |
| | | | |
|
|
See Notes to Financial Statements
16
SCHEDULE OF INVESTMENTS continued
April 30, 2008
| | Principal
Amount | | Value |
|
|
|
|
|
|
|
YANKEE OBLIGATIONS – CORPORATE continued | | | | | | |
MATERIALS 0.4% | | | | | | |
Metals & Mining 0.4% | | | | | | |
Novelis, Inc., 7.25%, 02/15/2015 | | $ | 1,065,000 | | $ | 979,800 |
| | | | |
|
|
TELECOMMUNICATION SERVICES 0.4% | | | | | | |
Diversified Telecommunication Services 0.4% | | | | | | |
Nordic Telecom Holdings Co., 8.875%, 05/01/2016 144A ρ | | | 1,000,000 | | | 1,027,500 |
| | | | |
|
|
Total Yankee Obligations – Corporate (cost $2,172,305) | | | | | | 2,081,989 |
| | | | |
|
|
| | | | | | |
|
|
|
|
|
|
|
| | | Shares | | | Value |
|
|
|
|
|
|
|
COMMON STOCKS 26.9% | | | | | | |
ENERGY 4.4% | | | | | | |
Energy Equipment & Services 2.0% | | | | | | |
Halliburton Co. | | | 35,000 | | | 1,606,850 |
National Oilwell Varco, Inc. * | | | 20,241 | | | 1,385,497 |
Pride International, Inc. * | | | 60,000 | | | 2,547,000 |
| | | | |
|
|
| | | | | | 5,539,347 |
| | | | |
|
|
Oil, Gas & Consumable Fuels 2.4% | | | | | | |
Marathon Oil Corp. | | | 35,000 | | | 1,594,950 |
Patriot Coal Corp. * | | | 4,000 | | | 264,200 |
Peabody Energy Corp. | | | 40,000 | | | 2,445,200 |
Tesoro Corp. | | | 35,000 | | | 879,900 |
Valero Energy Corp. | | | 25,000 | | | 1,221,250 |
| | | | |
|
|
| | | | | | 6,405,500 |
| | | | |
|
|
FINANCIALS 4.5% | | | | | | |
Capital Markets 0.3% | | | | | | |
Lazard, Ltd. ρ | | | 17,800 | | | 696,692 |
| | | | |
|
|
Real Estate Investment Trusts 4.2% | | | | | | |
General Growth Properties, Inc. | | | 18,000 | | | 737,280 |
Host Hotels & Resorts, Inc. | | | 147,300 | | | 2,533,560 |
Macerich Co. ρ | | | 11,000 | | | 804,430 |
Mack-Cali Realty Corp. ρ | | | 45,000 | | | 1,755,900 |
Plum Creek Timber Co., Inc. | | | 100,000 | | | 4,084,000 |
Simon Property Group, Inc. | | | 15,000 | | | 1,497,900 |
| | | | |
|
|
| | | | | | 11,413,070 |
| | | | |
|
|
HEALTH CARE 2.2% | | | | | | |
Life Sciences Tools & Services 2.2% | | | | | | |
Millipore Corp. * ρ | | | 15,000 | | | 1,051,500 |
PerkinElmer, Inc. | | | 90,000 | | | 2,390,400 |
Thermo Fisher Scientific, Inc. * | | | 45,000 | | | 2,604,150 |
| | | | |
|
|
| | | | | | 6,046,050 |
| | | | |
|
|
See Notes to Financial Statements
17
SCHEDULE OF INVESTMENTS continued
April 30, 2008
| | Shares | | Value |
|
|
|
|
|
|
|
COMMON STOCKS continued | | | | | | |
INDUSTRIALS 9.9% | | | | | | |
Aerospace & Defense 1.3% | | | | | | |
Boeing Co. | | | 7,000 | | $ | 594,020 |
DRS Technologies, Inc. ρ | | | 27,000 | | | 1,685,880 |
Raytheon Co. | | | 20,000 | | | 1,279,400 |
| | | | |
|
|
| | | | | | 3,559,300 |
| | | | |
|
|
Building Products 0.7% | | | | | | |
Lennox International, Inc. | | | 55,000 | | | 1,822,700 |
| | | | |
|
|
Electrical Equipment 4.6% | | | | | | |
Ametek, Inc. | | | 36,000 | | | 1,746,720 |
Cooper Industries, Inc. | | | 62,000 | | | 2,628,180 |
Emerson Electric Co. | | | 55,000 | | | 2,874,300 |
General Cable Corp. * ρ | | | 50,000 | | | 3,350,000 |
Rockwell Automation, Inc. | | | 15,000 | | | 813,450 |
Roper Industries, Inc. ρ | | | 16,500 | | | 1,024,980 |
| | | | |
|
|
| | | | | | 12,437,630 |
| | | | |
|
|
Machinery 2.7% | | | | | | |
Danaher Corp. | | | 15,000 | | | 1,170,300 |
Donaldson Co., Inc. ρ | | | 26,100 | | | 1,136,394 |
Dover Corp. | | | 25,000 | | | 1,236,750 |
IDEX Corp. ρ | | | 37,000 | | | 1,357,530 |
Pall Corp. | | | 35,000 | | | 1,216,950 |
Parker Hannifin Corp. | | | 16,800 | | | 1,341,480 |
| | | �� | |
|
|
| | | | | | 7,459,404 |
| | | | |
|
|
Road & Rail 0.6% | | | | | | |
Norfolk Southern Corp. | | | 30,000 | | | 1,787,400 |
| | | | |
|
|
INFORMATION TECHNOLOGY 2.4% | | | | | | |
Communications Equipment 0.4% | | | | | | |
CommScope, Inc. * ρ | | | 25,000 | | | 1,188,750 |
| | | | |
|
|
Electronic Equipment & Instruments 2.0% | | | | | | |
Agilent Technologies, Inc. * | | | 25,000 | | | 755,250 |
Amphenol Corp., Class A | | | 100,000 | | | 4,618,000 |
| | | | |
|
|
| | | | | | 5,373,250 |
| | | | |
|
|
MATERIALS 2.1% | | | | | | |
Chemicals 0.8% | | | | | | |
FMC Corp. ρ | | | 26,000 | | | 1,632,280 |
Huntsman Corp. | | | 19,570 | | | 440,129 |
| | | | |
|
|
| | | | | | 2,072,409 |
| | | | |
|
|
Construction Materials 0.4% | | | | | | |
Texas Industries, Inc. ρ | | | 15,200 | | | 1,176,632 |
| | | | |
|
|
See Notes to Financial Statements
18
SCHEDULE OF INVESTMENTS continued
April 30, 2008
| | Shares | | Value |
|
|
|
|
|
|
|
COMMON STOCKS continued | | | | | | |
MATERIALS continued | | | | | | |
Metals & Mining 0.4% | | | | | | |
Freeport-McMoRan Copper & Gold, Inc. | | | 10,000 | | $ | 1,137,500 |
| | | | |
|
|
Paper & Forest Products 0.5% | | | | | | |
Weyerhaeuser Co. | | | 20,000 | | | 1,277,600 |
| | | | |
|
|
UTILITIES 1.4% | | | | | | |
Electric Utilities 0.6% | | | | | | |
NRG Energy, Inc. * | | | 40,000 | | | 1,758,000 |
| | | | |
|
|
Gas Utilities 0.8% | | | | | | |
Questar Corp. | | | 18,000 | | | 1,116,540 |
Southern Union Co. | | | 40,000 | | | 1,024,800 |
| | | | |
|
|
| | | | | | 2,141,340 |
| | | | |
|
|
Total Common Stocks (cost $76,799,103) | | | | | | 73,292,574 |
| | | | |
|
|
|
|
|
|
|
|
|
| | Principal
Amount | | Value |
|
|
|
|
|
|
|
CONVERTIBLE DEBENTURES 8.4% | | | | | | |
FINANCIALS 1.0% | | | | | | |
Real Estate Investment Trusts 1.0% | | | | | | |
Alexandria Real Estate Equities, Inc., 3.70%, 01/15/2027 144A | | $ | 2,500,000 | | | 2,603,125 |
| | | | |
|
|
HEALTH CARE 4.4% | | | | | | |
Health Care Equipment & Supplies 3.8% | | | | | | |
Inverness Medical Innovations, Inc., 3.00%, 05/15/2016 144A | | | 10,000,000 | | | 10,312,500 |
| | | | |
|
|
Life Sciences Tools & Services 0.6% | | | | | | |
Millipore Corp., 3.75%, 06/01/2026 | | | 1,500,000 | | | 1,563,750 |
| | | | |
|
|
INDUSTRIALS 3.0% | | | | | | |
Electrical Equipment 3.0% | | | | | | |
General Cable Corp., 1.00%, 10/15/2012 144A | | | 7,940,000 | | | 8,307,225 |
| | | | |
|
|
Total Convertible Debentures (cost $22,344,549) | | | | | | 22,786,600 |
| | | | |
|
|
|
|
|
|
|
|
|
| | Shares | | Value |
|
|
|
|
|
|
|
SHORT-TERM INVESTMENTS 13.0% | | | | | | |
MUTUAL FUND SHARES 13.0% | | | | | | |
Evergreen Institutional Money Market Fund, Class I, 2.78% q ø ρρ (cost $35,489,731) | | | 35,489,731 | | | 35,489,731 |
| | | | |
|
|
Total Investments (cost $308,261,427) 111.3% | | | | | | 303,217,381 |
Other Assets and Liabilities (11.3%) | | | | | | (30,881,657) |
| | | | |
|
|
Net Assets 100.0% | | | | | $ | 272,335,724 |
| | | | |
|
|
See Notes to Financial Statements
19
SCHEDULE OF INVESTMENTS continued
April 30, 2008
144A | Security that may be sold to qualified institutional buyers under Rule 144A of the Securities Act of 1933, as amended. This security has been determined to be liquid under guidelines established by the Board of Trustees, unless otherwise noted. |
+ | Security is deemed illiquid and is valued using market quotations when readily available, unless otherwise noted. |
» | Security has defaulted on its payment of interest and/or principal subsequent to the date of this report and is currently valued at a fair value price of $0 as determined by the investment advisor, in good faith, according to procedures approved by the Board of Trustees. |
• | The fund has stopped accruing interest on this security. |
ρ | All or a portion of this security is on loan. |
* | Non-income producing security |
q | Rate shown is the 7-day annualized yield at period end. |
ø | Evergreen Investment Management Company, LLC is the investment advisor to both the Fund and the money market fund. |
ρρ | All or a portion of this security represents investment of cash collateral received from securities on loan. |
Summary of Abbreviations
CDO | Collateralized Debt Obligation |
MASTR | Mortgage Asset Securitization Transactions, Inc. |
The following table shows the percent of total investments (excluding equity positions and collateral from securities on loan) by credit quality based on Moody’s and Standard & Poor’s ratings as of April 30, 2008 (unaudited):
AAA | | 6.2% |
BBB | | 0.6% |
BB | | 50.2% |
B | | 37.3% |
CCC | | 4.4% |
NR | | 1.3% |
| |
|
| | 100.0% |
| |
|
The following table shows the percent of total investments (excluding equity positions and collateral from securities on loan) based on effective maturity as of April 30, 2008 (unaudited):
Less than 1 year | | 6.2% |
1 to 3 year(s) | | 2.7% |
3 to 5 years | | 10.1% |
5 to 10 years | | 76.8% |
10 to 20 years | | 2.3% |
20 to 30 years | | 1.9% |
| |
|
| | 100.0% |
| |
|
See Notes to Financial Statements
20
STATEMENT OF ASSETS AND LIABILITIES
April 30, 2008
Assets | | | |
Investments in securities, at value (cost $272,771,696) including $31,906,839 of securities loaned | | $ | 267,727,650 |
Investments in affiliated money market fund, at value (cost $35,489,731) | | | 35,489,731 |
|
|
|
|
Total investments | | | 303,217,381 |
Foreign currency, at value (cost $202,611) | | | 226,467 |
Receivable for securities sold | | | 564,527 |
Receivable for Fund shares sold | | | 626,866 |
Dividends and interest receivable | | | 3,915,754 |
Receivable for securities lending income | | | 16,249 |
Prepaid expenses and other assets | | | 59,703 |
|
|
|
|
Total assets | | | 308,626,947 |
|
|
|
|
Liabilities | | | |
Dividends payable | | | 241,051 |
Payable for securities purchased | | | 2,520,181 |
Payable for Fund shares redeemed | | | 383,361 |
Payable for securities on loan | | | 33,013,773 |
Advisory fee payable | | | 3,037 |
Distribution Plan expenses payable | | | 3,725 |
Due to other related parties | | | 10,324 |
Accrued expenses and other liabilities | | | 115,771 |
|
|
|
|
Total liabilities | | | 36,291,223 |
|
|
|
|
Net assets | | $ | 272,335,724 |
|
|
|
|
Net assets represented by | | | |
Paid-in capital | | $ | 323,732,217 |
Undistributed net investment income | | | 2,920,462 |
Accumulated net realized losses on investments | | | (49,296,765) |
Net unrealized losses on investments | | | (5,020,190) |
|
|
|
|
Total net assets | | $ | 272,335,724 |
|
|
|
|
Net assets consists of | | | |
Class A | | $ | 147,429,761 |
Class B | | | 37,845,606 |
Class C | | | 61,860,078 |
Class I | | | 25,200,279 |
|
|
|
|
Total net assets | | $ | 272,335,724 |
|
|
|
|
Shares outstanding (unlimited number of shares authorized) | | | |
Class A | | | 24,082,280 |
Class B | | | 6,162,029 |
Class C | | | 10,087,590 |
Class I | | | 4,184,497 |
|
|
|
|
Net asset value per share | | | |
Class A | | $ | 6.12 |
Class A — Offering price (based on sales charge of 4.75%) | | $ | 6.43 |
Class B | | $ | 6.14 |
Class C | | $ | 6.13 |
Class I | | $ | 6.02 |
|
|
|
|
See Notes to Financial Statements
21
STATEMENT OF OPERATIONS
Year Ended April 30, 2008
Investment income | | | |
Interest | | $ | 13,382,099 |
Dividends | | | 1,023,652 |
Income from affiliate | | | 828,681 |
Securities lending | | | 25,035 |
|
|
|
|
Total investment income | | | 15,259,467 |
|
|
|
|
Expenses | | | |
Advisory fee | | | 1,165,860 |
Distribution Plan expenses | | | |
Class A | | | 461,740 |
Class B | | | 456,313 |
Class C | | | 582,194 |
Administrative services fee | | | 275,986 |
Transfer agent fees | | | 636,787 |
Trustees’ fees and expenses | | | 14,884 |
Printing and postage expenses | | | 50,460 |
Custodian and accounting fees | | | 117,053 |
Registration and filing fees | | | 52,016 |
Professional fees | | | 40,004 |
Interest expense | | | 1,171 |
Other | | | 15,216 |
|
|
|
|
Total expenses | | | 3,869,684 |
Less: Expense reductions | | | (6,736) |
Expense reimbursements | | | (71,989) |
|
|
|
|
Net expenses | | | 3,790,959 |
|
|
|
|
Net investment income | | | 11,468,508 |
|
|
|
|
Net realized and unrealized gains or losses on investments | | | |
Net realized losses on: | | | |
Securities | | | (188,046) |
Foreign currency related transactions | | | (757,728) |
|
|
|
|
Net realized losses on investments | | | (945,774) |
Net change in unrealized gains or losses on investments | | | (12,993,879) |
|
|
|
|
Net realized and unrealized gains or losses on investments | | | (13,939,653) |
|
|
|
|
Net decrease in net assets resulting from operations | | $ | (2,471,145) |
|
|
|
|
See Notes to Financial Statements
22
STATEMENTS OF CHANGES IN NET ASSETS
| | Year Ended April 30, |
| | |
|
| | 2008 | | 2007 |
|
|
|
|
|
Operations | | | | | | | | | | |
Net investment income | | | | $ | 11,468,508 | | | | $ | 15,923,558 |
Net realized losses on investments | | | | | (945,774) | | | | | (3,220,142) |
Net change in unrealized gains or losses on investments | | | | | (12,993,879) | | | | | 7,133,625 |
|
|
|
|
|
|
|
|
|
|
|
Net increase (decrease) in net assets resulting from operations | | | | | (2,471,145) | | | | | 19,837,041 |
|
|
|
|
|
|
|
|
|
|
|
Distributions to shareholders from | | | | | | | | | | |
Net investment income | | | | | | | | | | |
Class A | | | | | (6,544,853) | | | | | (9,094,484) |
Class B | | | | | (1,588,318) | | | | | (2,627,449) |
Class C | | | | | (1,988,850) | | | | | (2,528,220) |
Class I | | | | | (771,946) | | | | | (1,045,572) |
Tax basis return of capital | | | | | | | | | | |
Class A | | | | | 0 | | | | | (519,958) |
Class B | | | | | 0 | | | | | (175,306) |
Class C | | | | | 0 | | | | | (168,861) |
Class I | | | | | 0 | | | | | (57,606) |
|
|
|
|
|
|
|
|
|
|
|
Total distributions to shareholders | | | | | (10,893,967) | | | | | (16,217,456) |
|
|
|
|
|
|
|
|
|
|
|
| | Shares | | | | | Shares | | | |
|
|
|
|
|
|
|
|
|
|
|
Capital share transactions | | | | | | | | | | |
Proceeds from shares sold | | | | | | | | | | |
Class A | | 3,907,591 | | | 24,178,154 | | 2,802,341 | | | 17,655,099 |
Class B | | 567,760 | | | 3,531,104 | | 662,966 | | | 4,199,618 |
Class C | | 3,656,310 | | | 22,584,738 | | 935,756 | | | 5,896,227 |
Class I | | 2,570,994 | | | 15,309,422 | | 724,245 | | | 4,513,577 |
|
|
|
|
|
|
|
|
|
|
|
| | | | | 65,603,418 | | | | | 32,264,521 |
|
|
|
|
|
|
|
|
|
|
|
Net asset value of shares issued in reinvestment of distributions | | | | | | | | | | |
Class A | | 768,971 | | | 4,732,934 | | 1,101,527 | | | 6,947,693 |
Class B | | 144,405 | | | 892,625 | | 242,976 | | | 1,537,222 |
Class C | | 180,525 | | | 1,111,654 | | 233,170 | | | 1,473,134 |
Class I | | 96,419 | | | 579,805 | | 86,125 | | | 534,959 |
|
|
|
|
|
|
|
|
|
|
|
| | | | | 7,317,018 | | | | | 10,493,008 |
|
|
|
|
|
|
|
|
|
|
|
Automatic conversion of Class B shares to Class A shares | | | | | | | | | | |
Class A | | 663,058 | | | 4,036,733 | | 878,428 | | | 5,528,422 |
Class B | | (660,954) | | | (4,036,733) | | (875,646) | | | (5,528,422) |
|
|
|
|
|
|
|
|
|
|
|
| | | | | 0 | | | | | 0 |
|
|
|
|
|
|
|
|
|
|
|
Payment for shares redeemed | | | | | | | | | | |
Class A | | (7,927,137) | | | (48,598,987) | | (9,675,630) | | | (60,907,111) |
Class B | | (2,443,593) | | | (15,038,878) | | (2,810,537) | | | (17,750,836) |
Class C | | (2,342,069) | | | (14,451,139) | | (2,894,878) | | | (18,242,199) |
Class I | | (1,316,454) | | | (7,860,824) | | (1,260,417) | | | (7,853,118) |
|
|
|
|
|
|
|
|
|
|
|
| | | | | (85,949,828) | | | | | (104,753,264) |
|
|
|
|
|
|
|
|
|
|
|
Net decrease in net assets resulting from capital share transactions | | | | | (13,029,392) | | | | | (61,995,735) |
|
|
|
|
|
|
|
|
|
|
|
Total decrease in net assets | | | | | (26,394,504) | | | | | (58,376,150) |
Net assets | | | | | | | | | | |
Beginning of period | | | | | 298,730,228 | | | | | 357,106,378 |
|
|
|
|
|
|
|
|
|
|
|
End of period | | | | $ | 272,335,724 | | | | $ | 298,730,228 |
|
|
|
|
|
|
|
|
|
|
|
Undistributed net investment income | | | | $ | 2,920,462 | | | | $ | 267,621 |
|
|
|
|
|
|
|
|
|
|
|
See Notes to Financial Statements
23
NOTES TO FINANCIAL STATEMENTS
1. ORGANIZATION
Evergreen Diversified Income Builder Fund (the “Fund”) is a diversified series of Evergreen Fixed Income Trust (the “Trust”), a Delaware statutory trust organized on September 18, 1997. The Trust is an open-end management investment company registered under the Investment Company Act of 1940, as amended (the “1940 Act”).
The Fund offers Class A, Class B, Class C and Class I shares. Class A shares are sold with a front-end sales charge. However, Class A share investments of $1 million or more are not subject to a front-end sales charge but are subject to a contingent deferred sales charge of 1.00% upon redemption within 18 months. Class B shares are sold without a front-end sales charge but are subject to a contingent deferred sales charge that is payable upon redemption and decreases depending on how long the shares have been held. Class C shares are sold without a front-end sales charge but are subject to a contingent deferred sales charge that is payable upon redemption within one year. Class I shares are sold without a front-end sales charge or contingent deferred sales charge. Each class of shares, except Class I shares, pays an ongoing distribution fee.
2. SIGNIFICANT ACCOUNTING POLICIES
The following is a summary of significant accounting policies consistently followed by the Fund in the preparation of its financial statements. The policies are in conformity with generally accepted accounting principles in the United States of America, which require management to make estimates and assumptions that affect amounts reported herein. Actual results could differ from these estimates.
a. Valuation of investments
Portfolio debt securities acquired with more than 60 days to maturity are fair valued using matrix pricing methods determined by an independent pricing service which takes into consideration such factors as similar security prices, yields, maturities, liquidity and ratings. Securities for which valuations are not readily available from an independent pricing service may be valued by brokers which use prices provided by market makers or estimates of market value obtained from yield data relating to investments or securities with similar characteristics.
Listed equity securities are usually valued at the last sales price or official closing price on the national securities exchange where the securities are principally traded.
Short-term securities with remaining maturities of 60 days or less at the time of purchase are valued at amortized cost, which approximates market value.
Investments in open-end mutual funds are valued at net asset value. Securities for which market quotations are not readily available or not reflective of current market value are valued at fair value as determined by the investment advisor in good faith, according to procedures approved by the Board of Trustees.
24
NOTES TO FINANCIAL STATEMENTS continued
b. Repurchase agreements
Securities pledged as collateral for repurchase agreements are held by the custodian bank or in a segregated account in the Fund’s name until the agreements mature. Collateral for certain tri-party repurchase agreements is held at the counterparty’s custodian in a segregated account for the benefit of the Fund and the counterparty. Each agreement requires that the market value of the collateral be sufficient to cover payments of interest and principal. However, in the event of default or bankruptcy by the other party to the agreement, retention of the collateral may be subject to legal proceedings. The Fund will only enter into repurchase agreements with banks and other financial institutions, which are deemed by the investment advisor to be creditworthy pursuant to guidelines established by the Board of Trustees. In certain instances, the Fund’s securities lending agent may provide collateral in the form of repurchase agreements.
c. Foreign currency translation
All assets and liabilities denominated in foreign currencies are translated into U.S. dollar amounts at the date of valuation. Purchases and sales of portfolio securities and income items denominated in foreign currencies are translated into U.S. dollar amounts on the respective dates of such transactions. The Fund does not separately account for that portion of the results of operations resulting from changes in foreign exchange rates on investments and the fluctuations arising from changes in market prices of securities held. Such fluctuations are included with the net realized and unrealized gains or losses on investments.
d. Forward foreign currency contracts
A forward foreign currency contract is an agreement between two parties to purchase or sell a specific currency for an agreed-upon price at a future date. The Fund enters into forward foreign currency contracts to facilitate transactions in foreign-denominated securities and to attempt to minimize the risk to the Fund from adverse changes in the relationship between currencies. Forward foreign currency contracts are recorded at the forward rate and marked-to-market daily. When the contracts are closed, realized gains and losses arising from such transactions are recorded as realized gains or losses on foreign currency related transactions. The Fund could be exposed to risks if the counterparties to the contracts are unable to meet the terms of their contracts or if the value of the foreign currency changes unfavorably.
e. When-issued and delayed delivery transactions
The Fund records when-issued or delayed delivery securities as of trade date and maintains security positions such that sufficient liquid assets will be available to make payment for the securities purchased. Securities purchased on a when-issued or delayed delivery basis are marked-to-market daily and begin earning interest on the settlement date. Losses may occur on these transactions due to changes in market conditions or the failure of counterparties to perform under the contract.
25
NOTES TO FINANCIAL STATEMENTS continued
f. Securities lending
The Fund may lend its securities to certain qualified brokers in order to earn additional income. The Fund receives compensation in the form of fees or interest earned on the investment of any cash collateral received. The Fund also continues to receive interest and dividends on the securities loaned. The Fund receives collateral in the form of cash or securities with a market value at least equal to the market value of the securities on loan, including accrued interest. In the event of default or bankruptcy by the borrower, the Fund could experience delays and costs in recovering the loaned securities or in gaining access to the collateral. The Fund has the right under the lending agreement to recover the securities from the borrower on demand.
g. Dollar roll transactions
The Fund may enter into dollar roll transactions with respect to mortgage-backed securities. In a dollar roll transaction, the Fund sells mortgage-backed securities to financial institutions and simultaneously agrees to accept substantially similar (same type, coupon and maturity) securities at a later date at an agreed upon price. The Fund will use the proceeds generated from the transactions to invest in short-term investments, which may enhance the Fund’s current yield and total return. The Fund accounts for dollar roll transactions as purchases and sales. The Fund could be exposed to risks if the counterparty defaults on its obligation to perform under the terms of the agreement, if the Fund receives inferior securities in comparison to what was sold to the counterparty at redelivery or if there are variances in paydown speed between the mortgage-related pools.
h. Security transactions and investment income
Security transactions are recorded on trade date. Realized gains and losses are computed using the specific cost of the security sold. Interest income is recorded on the accrual basis and includes accretion of discounts and amortization of premiums. Dividend income is recorded on the ex-dividend date.
i. Federal and other taxes
The Fund intends to continue to qualify as a regulated investment company and distribute all of its taxable income, including any net capital gains (which have already been offset by available capital loss carryovers). Accordingly, no provision for federal taxes is required. The Fund has adopted the provisions of FASB Interpretation No. 48, Accounting for Uncertainty in Income Taxes (“FIN 48”) which prescribes a minimum threshold for financial statement recognition of the benefit of a tax position taken or expected to be taken in a tax return. The Fund’s financial statements have not been impacted by the adoption of FIN 48. The Fund’s income and excise tax returns and all financial records supporting those returns are subject to examination by the federal, Massachusetts and Delaware revenue authorities for all taxable years beginning after April 30, 2004.
26
NOTES TO FINANCIAL STATEMENTS continued
j. Distributions
Distributions to shareholders from net investment income are accrued daily and paid monthly. Distributions from net realized gains, if any, are recorded on the ex-dividend date. Such distributions are determined in conformity with income tax regulations, which may differ from generally accepted accounting principles.
Reclassifications have been made to the Fund’s components of net assets to reflect income and gains available for distribution (or available capital loss carryovers, as applicable) under income tax regulations. The primary permanent differences causing such reclassifications are due to net realized foreign currency gains or losses, expiration of capital loss carryovers and premium amortization. During the year ended April 30, 2008, the following amounts were reclassified:
|
|
|
|
Paid-in capital | | $ | (6,306,504) |
Undistributed net investment income | | | 2,078,300 |
Accumulated net realized losses on investments | | | 4,228,204 |
|
|
|
|
k. Class allocations
Income, common expenses and realized and unrealized gains and losses are allocated to the classes based on the relative net assets of each class. Distribution fees, if any, are calculated daily at the class level based on the appropriate net assets of each class and the specific expense rates applicable to each class.
3. ADVISORY FEE AND OTHER TRANSACTIONS WITH AFFILIATES
Evergreen Investment Management Company, LLC (“EIMC”), an indirect, wholly-owned subsidiary of Wachovia Corporation (“Wachovia”), is the investment advisor to the Fund and is paid a fee at an annual rate of 2% of the Fund’s gross investment income plus an amount determined by applying percentage rates to the aggregate average daily net assets of the Fund and its variable annuity counterpart, Evergreen VA Diversified Income Builder Fund Fund, starting at 0.31% and declining to 0.16% as the aggregate average daily net assets increase. For the year ended April 30, 2008, the advisory fee was equivalent to 0.42% of the Fund’s average daily net assets.
Prior to June 1, 2007, Tattersall Advisory Group, Inc., an indirect, wholly-owned subsidiary of Wachovia, served as the investment sub-advisor to the Fund and was paid by EIMC for its services to the Fund.
Also, prior to June 1, 2007, First International Advisors, Inc. d/b/a Evergreen International Advisors, an indirect, wholly-owned subsidiary of Wachovia, served as the investment sub-advisor to the Fund and was paid by EIMC for its services to the Fund.
From time to time, EIMC may voluntarily or contractually waive its fee and/or reimburse expenses in order to limit operating expenses. During the year ended April 30, 2008, EIMC
27
NOTES TO FINANCIAL STATEMENTS continued
voluntarily reimbursed Distribution Plan expenses (see Note 4) relating to Class A shares in the amount of $71,989.
The Fund may invest in money market funds which are advised by EIMC. Income earned on these investments is included in income from affiliate on the Statement of Operations.
Effective January 1, 2008, EIMC replaced Evergreen Investment Services, Inc. (“EIS”), an indirect, wholly-owned subsidiary of Wachovia, as the administrator to the Fund upon the assignment of the Fund’s Administrative Services Agreement from EIS to EIMC. There were no changes to the services being provided or fees being paid by the Fund. The administrator provides the Fund with facilities, equipment and personnel and is paid an annual rate determined by applying percentage rates to the aggregate average daily net assets of the Evergreen funds (excluding money market funds) starting at 0.10% and declining to 0.05% as the aggregate average daily net assets of the Evergreen funds (excluding money market funds) increase.
Evergreen Service Company, LLC (“ESC”), an indirect, wholly-owned subsidiary of Wachovia, is the transfer and dividend disbursing agent for the Fund. ESC receives account fees that vary based on the type of account held by the shareholders in the Fund. For the year ended April 30, 2008, the transfer agent fees were equivalent to an annual rate of 0.23% of the Fund’s average daily net assets.
The Fund has placed a portion of its portfolio transactions with brokerage firms that are affiliates of Wachovia. During the year ended April 30, 2008, the Fund paid brokerage commissions of $12,351 to Wachovia Securities, LLC.
4. DISTRIBUTION PLANS
EIS serves as distributor of the Fund’s shares. The Fund has adopted Distribution Plans, as allowed by Rule 12b-1 of the 1940 Act, for each class of shares, except Class I. Under the Distribution Plans, distribution fees are paid at an annual rate of 0.25% of the average daily net assets for Class A and 1.00% of the average daily net assets for each of Class B and Class C shares. Prior to April 1, 2008, distribution fees were paid at an annual rate of 0.30% of the average daily net assets for Class A shares.
For the year ended April 30, 2008, EIS received $24,531 from the sale of Class A shares and $105,827 and $4,841 in contingent deferred sales charges from redemptions of Class B and Class C shares, respectively.
28
NOTES TO FINANCIAL STATEMENTS continued
5. INVESTMENT TRANSACTIONS
Cost of purchases and proceeds from sales of investment securities (excluding short-term securities) were as follows for the year ended April 30, 2008:
Cost of Purchases | | Proceeds from Sales |
|
|
|
U.S. Government | | Non-U.S. Government | | U.S. Government | | Non-U.S. Government |
|
|
|
|
|
|
|
$53,553,389 | | $280,613,953 | | $140,886,061 | | $235,204,659 |
|
|
|
|
|
|
|
During the year ended April 30, 2008, the Fund loaned securities to certain brokers and earned $68,904 in affiliated income relating to securities lending activity which is included in income from affiliate on the Statement of Operations. At April 30, 2008, the value of securities on loan and the total value of collateral received for securities loaned amounted to $31,906,839 and $33,013,773, respectively.
On April 30, 2008, the aggregate cost of securities for federal income tax purposes was $308,374,438. The gross unrealized appreciation and depreciation on securities based on tax cost was $7,742,795 and $12,899,852, respectively, with a net unrealized depreciation of $5,157,057.
As of April 30, 2008, the Fund had $46,173,062 in capital loss carryovers for federal income tax purposes expiring as follows:
Expiration |
|
2009 | | 2010 | | 2015 | | 2016 |
|
|
|
|
|
|
|
$14,759,243 | | $27,292,961 | | $3,090,558 | | $1,030,300 |
|
|
|
|
|
|
|
Certain portions of the capital loss carryovers of the Fund were assumed as a result of acquisitions. These losses are subject to certain limitations prescribed by the Internal Revenue Code.
For income tax purposes, capital losses incurred after October 31 within the Fund’s fiscal year are deemed to arise on the first business day of the following fiscal year. As of April 30, 2008, the Fund incurred and will elect to defer post-October losses of $3,010,692.
6. INTERFUND LENDING
Pursuant to an Exemptive Order issued by the SEC, the Fund may participate in an interfund lending program with certain funds in the Evergreen fund family. This program allows the Fund to borrow from, or lend money to, other participating funds. During the year ended April 30, 2008, the Fund did not participate in the interfund lending program.
29
NOTES TO FINANCIAL STATEMENTS continued
7. DISTRIBUTIONS TO SHAREHOLDERS
As of April 30, 2008, the components of distributable earnings on a tax basis were as follows:
Undistributed
Ordinary
Income | | Unrealized
Depreciation | | Capital Loss
Carryovers
and
Post-October
Losses | | Temporary
Book/Tax
Differences |
|
|
|
|
|
|
|
$3,184,084 | | $5,133,201 | | $49,183,754 | | $(263,622) |
|
|
|
|
|
|
|
The differences between the components of distributable earnings on a tax basis and the amounts reflected in the Statement of Assets and Liabilities are primarily due to wash sales and premium amortization. The temporary book/tax differences are a result of timing differences between book and tax recognition of income and/or expenses.
The tax character of distributions paid was as follows:
| | Year Ended April 30, |
| |
|
| | 2008 | | 2007 |
|
|
|
|
|
|
|
Ordinary Income | | $ | 10,893,967 | | $ | 15,295,725 |
Return of Capital | | | 0 | | | 921,731 |
|
|
|
|
|
|
|
8. EXPENSE REDUCTIONS
Through expense offset arrangements with ESC and the Fund’s custodian, a portion of fund expenses has been reduced.
9. DEFERRED TRUSTEES’ FEES
Each Trustee of the Fund may defer any or all compensation related to performance of his or her duties as a Trustee. The Trustees’ deferred balances are allocated to deferral accounts, which are included in the accrued expenses for the Fund. The investment performance of the deferral accounts is based on the investment performance of certain Evergreen funds. Any gains earned or losses incurred in the deferral accounts are reported in the Fund’s Trustees’ fees and expenses. At the election of the Trustees, the deferral account will be paid either in one lump sum or in quarterly installments for up to ten years.
10. FINANCING AGREEMENT
The Fund and certain other Evergreen funds share in an unsecured revolving credit commitment for temporary and emergency purposes, including the funding of redemptions, as permitted by each participating fund’s borrowing restrictions. Borrowings under this facility bear interest at 0.50% per annum above the Federal Funds rate. All of the participating funds are charged an annual commitment fee on the unused balance, which is allocated pro rata. The credit facility is for $100 million with an annual commitment fee of 0.08%.
During the year ended April 30, 2008, the Fund had average borrowings outstanding of $20,051 at an average rate of 5.84% and paid interest of $1,171.
30
NOTES TO FINANCIAL STATEMENTS continued
11. REGULATORY MATTERS AND LEGAL PROCEEDINGS
Pursuant to an administrative order issued by the SEC on September 19, 2007, EIMC, EIS, ESC (collectively, the “Evergreen Entities”), Wachovia Securities, LLC and the SEC have entered into an agreement settling allegations of (i) improper short-term trading arrangements in effect prior to May 2003 involving former officers and employees of EIMC and certain broker-dealers, (ii) insufficient systems for monitoring exchanges and enforcing exchange limitations as stated in certain funds’ prospectuses, and (iii) inadequate e-mail retention practices. Under the settlement, the Evergreen Entities were censured and have paid approximately $32 million in disgorgement and penalties. This amount, along with a fine assessed by the SEC against Wachovia Securities, LLC will be distributed pursuant to a plan to be developed by an independent distribution consultant and approved by the SEC. The Evergreen Entities neither admitted nor denied the allegations and findings set forth in its settlement with the SEC.
In addition, the Evergreen funds and EIMC and certain of its affiliates are involved in various legal actions, including private litigation and class action lawsuits. EIMC does not expect that any of such legal actions currently pending or threatened will have a material adverse impact on the financial position or operations of any of the Evergreen funds or on EIMC’s ability to provide services to the Evergreen funds.
Although EIMC believes that none of the matters discussed above will have a material adverse impact on the Evergreen funds, there can be no assurance that these matters and any publicity surrounding or resulting from them will not result in reduced sales or increased redemptions of Evergreen fund shares, which could increase Evergreen fund transaction costs or operating expenses, or that they will not have other adverse consequences on the Evergreen funds.
12. NEW ACCOUNTING PRONOUNCEMENTS
In September 2006, FASB issued Statement of Financial Accounting Standards No. 157, Fair Value Measurements (“FAS 157”). FAS 157 establishes a single authoritative definition of fair value, establishes a framework for measuring fair value and expands disclosures about fair value measurements. FAS 157 applies to fair value measurements already required or permitted by existing standards. The change to current generally accepted accounting principles from the application of FAS 157 relates to the definition of fair value, the methods used to measure fair value, and the expanded disclosures about fair value measurements. Management of the Fund does not believe the adoption of FAS 157 will materially impact the financial statement amounts, however, additional disclosures may be required about the inputs used to develop the measurements and the effect of certain of the measurements on changes in net assets for the period. FAS 157 is effective for financial statements issued for fiscal years beginning after November 15, 2007 and interim periods within those fiscal years.
In March 2008, FASB issued Statement of Financial Accounting Standards No. 161, Disclosures about Derivative Instruments and Hedging Activities (“FAS 161”),
31
NOTES TO FINANCIAL STATEMENTS continued
an amendment of FASB Statement No. 133. FAS 161 requires enhanced disclosures about (a) how and why a fund uses derivative instruments, (b) how derivative instruments and hedging activities are accounted for, and (c) how derivative instruments and related hedging activities affect a fund’s financial position, financial performance, and cash flows. Management of the Fund does not believe the adoption of FAS 161 will materially impact the financial statement amounts, but will require additional disclosures. This will include qualitative and quantitative disclosures on derivative positions existing at period end and the effect of using derivatives during the reporting period. FAS 161 is effective for financial statements issued for fiscal years and interim periods beginning after November 15, 2008.
32
REPORT OF INDEPENDENT REGISTERED PUBLIC ACCOUNTING FIRM
Board of Trustees and Shareholders
Evergreen Fixed Income Trust
We have audited the accompanying statement of assets and liabilities, including the schedule of investments, of the Evergreen Diversified Income Builder Fund, a series of the Evergreen Fixed Income Trust, as of April 30, 2008 and the related statement of operations for the year then ended, statements of changes in net assets for each of the years in the two-year period then ended and the financial highlights for each of the years in the five-year period then ended. These financial statements and financial highlights are the responsibility of the Fund’s management. Our responsibility is to express an opinion on these financial statements and financial highlights based on our audits.
We conducted our audits in accordance with the standards of the Public Company Accounting Oversight Board (United States). Those standards require that we plan and perform the audit to obtain reasonable assurance about whether the financial statements and financial highlights are free of material misstatement. An audit includes examining, on a test basis, evidence supporting the amounts and disclosures in the financial statements. Our procedures included confirmation of securities owned as of April 30, 2008 by correspondence with the custodian and brokers, or by other appropriate auditing procedures where replies from brokers were not received. An audit also includes assessing the accounting principles used and significant estimates made by management, as well as evaluating the overall financial statement presentation. We believe that our audits provide a reasonable basis for our opinion.
In our opinion, the financial statements and financial highlights referred to above present fairly, in all material respects, the financial position of the Evergreen Diversified Income Builder Fund as of April 30, 2008, the results of its operations, changes in its net assets and financial highlights for each of the years described above, in conformity with U.S. generally accepted accounting principles.

Boston, Massachusetts
June 27, 2008
33
ADDITIONAL INFORMATION (unaudited)
FEDERAL TAX DISTRIBUTIONS
For corporate shareholders, 3.67% of ordinary income dividends paid during the fiscal year ended April 30, 2008 qualified for the dividends received deduction.
With respect to dividends paid from investment company taxable income during the fiscal year ended April 30, 2008, the Fund designates 4.80% of ordinary income and any short-term capital gain distributions as Qualified Dividend Income in accordance with the Internal Revenue Code. Complete 2008 year-end tax information will be reported on your 2008 Form 1099-DIV, which shall be provided to you in early 2009.
34
This page left intentionally blank
35
TRUSTEES AND OFFICERS
TRUSTEES1 | | |
Charles A. Austin III
Trustee
DOB: 10/23/1934
Term of office since: 1991
Other directorships: None | | Investment Counselor, Anchor Capital Advisors, LLC. (investment advice); Director, The Andover Companies (insurance); Trustee, Arthritis Foundation of New England; Former Director, The Francis Ouimet Society (scholarship program); Former Director, Executive Vice President and Treasurer, State Street Research & Management Company (investment advice) |
|
|
|
K. Dun Gifford
Trustee
DOB: 10/23/1938
Term of office since: 1974
Other directorships: None | | Chairman and President, Oldways Preservation and Exchange Trust (education); Trustee, Chairman of the Finance Committee, Member of the Executive Committee, and Former Treasurer, Cambridge College |
|
|
|
Dr. Leroy Keith, Jr.
Trustee
DOB: 2/14/1939
Term of office since: 1983
Othern directorships: Trustee,
Phoenix Fund Complex
(consisting of 53 portfolios
as of 12/31/2007) | | Managing Director, Almanac Capital Management (commodities firm); Trustee, Phoenix Fund Complex; Director, Diversapack Co. (packaging company); Former Partner, Stonington Partners, Inc. (private equity fund); Former Director, Obagi Medical Products Co.; Former Director, Lincoln Educational Services |
|
|
|
Carol A. Kosel1 Trustee
DOB: 12/25/1963
Term of office since: 2008
Other directorships: None | | Former Consultant to the Evergreen Boards of Trustees; Former Vice President and Senior Vice President, Evergreen Investments, Inc.; Former Treasurer, Evergreen Funds; Former Treasurer, Vestaur Securities Fund |
|
|
|
Gerald M. McDonnell
Trustee
DOB: 7/14/1939
Term of office since: 1988
Other directorships: None | | Former Manager of Commercial Operations, CMC Steel (steel producer) |
|
|
|
Patricia B. Norris
Trustee
DOB: 4/9/1948
Term of office since: 2006
Other directorships: None | | President and Director of Buckleys of Kezar Lake, Inc. (real estate company); Former President and Director of Phillips Pond Homes Association (home community); Former Partner, PricewaterhouseCoopers, LLP (independent registered public accounting firm) |
|
|
|
William Walt Pettit
Trustee
DOB: 8/26/1955
Term of office since: 1988
Other directorships: None | | Partner and Vice President, Kellam & Pettit, P.A. (law firm); Director, Superior Packaging Corp. (packaging company); Member, Superior Land, LLC (real estate holding company), Member, K&P Development, LLC (real estate development); Former Director, National Kidney Foundation of North Carolina, Inc. (non-profit organization) |
|
|
|
David M. Richardson
Trustee
DOB: 9/19/1941
Term of office since: 1982 Other directorships: None | | President, Richardson, Runden LLC (executive recruitment advisory services); Director, J&M Cumming Paper Co. (paper merchandising); Trustee, NDI Technologies, LLP (communications); Former Consultant, AESC (The Association of Executive Search Consultants) |
|
|
|
Dr. Russell A. Salton III
Trustee
DOB: 6/2/1947
Term of office since: 1984
Other directorships: None | | President/CEO, AccessOne MedCard, Inc. |
|
|
|
36
TRUSTEES AND OFFICERS continued
Michael S. Scofield
Trustee
DOB: 2/20/1943
Term of office since: 1984
Other directorships: None | | Retired Attorney, Law Offices of Michael S. Scofield; Former Director and Chairman, Branded Media Corporation (multi-media branding company) |
|
|
|
Richard J. Shima
Trustee
DOB: 8/11/1939
Term of office since: 1993
Other directorships: None | | Independent Consultant; Director, Hartford Hospital; Trustee, Greater Hartford YMCA; Former Director, Trust Company of CT; Former Director, Old State House Association; Former Trustee, Saint Joseph College (CT) |
|
|
|
Richard K. Wagoner, CFA2
Trustee
DOB: 12/12/1937
Term of office since: 1999
Other directorships: None | | Member and Former President, North Carolina Securities Traders Association; Member, Financial Analysts Society |
|
|
|
| | |
OFFICERS | | |
Dennis H.Ferro3
President
DOB: 6/20/1945
Term of office since: 2003 | | Principal occupations: President and Chief Executive Officer, Evergreen Investment Company, Inc. and Executive Vice President, Wachovia Bank, N.A.; former Chief Investment Officer, Evergreen Investment Company, Inc. |
|
|
|
Kasey Phillips4
Treasurer
DOB: 12/12/1970
Term of office since: 2005 | | Principal occupations: Senior Vice President, Evergreen Investment Management Company, LLC; Former Vice President, Evergreen Investment Services, Inc.; Former Assistant Vice President, Evergreen Investment Services, Inc. |
|
|
|
Michael H. Koonce4
Secretary
DOB: 4/20/1960
Term of office since: 2000 | | Principal occupations: Senior Vice President and General Counsel, Evergreen Investment Services, Inc.; Secretary, Senior Vice President and General Counsel, Evergreen Investment Management Company, LLC and Evergreen Service Company, LLC; Senior Vice President and Assistant General Counsel, Wachovia Corporation |
|
|
|
Robert Guerin4
Chief Compliance Officer
DOB: 9/20/1965
Term of office since: 2007 | | Principal occupations: Chief Compliance Officer, Evergreen Funds and Senior Vice President of Evergreen Investments Co., Inc.; Former Managing Director and Senior Compliance Officer, Babson Capital Management LLC; Former Principal and Director, Compliance and Risk Management, State Street Global Advisors; Former Vice President and Manager, Sales Practice Compliance, Deutsche Asset Management |
|
|
|
1 | Each Trustee, except Mses. Kosel and Norris, serves until a successor is duly elected or qualified or until his or her death, resignation, retirement or removal from office. As new Trustees, Ms. Kosel’s and Ms. Norris’ initial terms end December 31, 2010 and June 30, 2009, respectively, at which times they may be re-elected by Trustees to serve until a successor is duly elected or qualified or until her death, resignation, retirement or removal from office by the Trustees. Each Trustee, except Ms. Kosel, oversaw 94 Evergreen funds as of December 31, 2007. Ms. Kosel became a Trustee on January 1, 2008. Correspondence for each Trustee may be sent to Evergreen Board of Trustees, P.O. Box 20083, Charlotte, NC 28202. |
2 | Mr. Wagoner is an “interested person” of the Fund because of his ownership of shares in Wachovia Corporation, the parent to the Fund’s investment advisor. |
3 | The address of the Officer is 401 S. Tryon Street, 20th Floor, Charlotte, NC 28288. |
4 | The address of the Officer is 200 Berkeley Street, Boston, MA 02116. |
Additional information about the Fund’s Board of Trustees and Officers can be found in the Statement of Additional Information (SAI) and is available upon request without charge by calling 800.343.2898.
37
566662 rv5 06/2008
Evergreen Core Plus Bond Fund

| | table of contents |
1 | | LETTER TO SHAREHOLDERS |
4 | | FUND AT A GLANCE |
5 | | PORTFOLIO MANAGER COMMENTARY |
7 | | ABOUT YOUR FUND’S EXPENSES |
8 | | FINANCIAL HIGHLIGHTS |
12 | | SCHEDULE OF INVESTMENTS |
32 | | STATEMENT OF ASSETS AND LIABILITIES |
34 | | STATEMENT OF OPERATIONS |
35 | | STATEMENTS OF CHANGES IN NET ASSETS |
36 | | NOTES TO FINANCIAL STATEMENTS |
49 | | REPORT OF INDEPENDENT REGISTERED PUBLIC ACCOUNTING FIRM |
50 | | ADDITIONAL INFORMATION |
52 | | TRUSTEES AND OFFICERS |
This annual report must be preceded or accompanied by a prospectus of the Evergreen fund contained herein. The prospectus contains more complete information, including fees and expenses, and should be read carefully before investing or sending money.
The fund will file its complete schedule of portfolio holdings with the SEC for the first and third quarters of each fiscal year on Form N-Q. The fund’s Form N-Q will be available on the SEC’s Web site at http://www.sec.gov. In addition, the fund’s Form N-Q may be reviewed and copied at the SEC’s Public Reference Room in Washington, D.C. Information on the operation of the Public Reference Room may be obtained by calling 800.SEC.0330.
A description of the fund’s proxy voting policies and procedures, as well as information regarding how the fund voted proxies relating to portfolio securities during the most recent 12-month period ended June 30, is available by visiting our Web site at EvergreenInvestments.com or by visiting the SEC’s Web site at http://www.sec.gov. The fund’s proxy voting policies and procedures are also available without charge, upon request, by calling 800.343.2898.
| Mutual Funds: | | | | |
| NOT FDIC INSURED | | MAY LOSE VALUE | | NOT BANK GUARANTEED |
Evergreen InvestmentsSM is a service mark of Evergreen Investment Management Company, LLC. Copyright 2008, Evergreen Investment Management Company, LLC.
Evergreen Investment Management Company, LLC is a subsidiary of Wachovia Corporation and is an affiliate of Wachovia Corporation’s other Broker Dealer subsidiaries.
Evergreen mutual funds are distributed by Evergreen Investment Services, Inc. 200 Berkeley Street, Boston, MA 02116
LETTER TO SHAREHOLDERS
June 2008

Dennis H. Ferro
President and Chief Executive Officer
Dear Shareholder:
We are pleased to provide the Annual Report for Evergreen Core Plus Bond Fund for the twelve-month period ended April 30, 2008 (the “twelve-month period”).
The fiscal year witnessed a dramatic change in fixed income markets as problems that first surfaced in housing and the subprime mortgages raised questions about the strength of the domestic economy and the risks of credit-sensitive investments. Corporate bonds and asset-backed securities performed well early in the period, with gains in economic output, corporate profits and employment encouraging optimism. The backdrop for investing began to change, however, by the summer of 2007 amid widening worries about problems in the financials sector. Major financial institutions began to report substantial losses from their exposures to subprime mortgages and banks started to tighten their credit standards and to restrict their lending. With fears of a dramatic downturn hovering over the market, fixed income investors sought out the highest-quality securities and attempted to avoid credit risk. As a consequence, the prices of corporate bonds and many asset-backed securities fell, while Treasuries rallied in a general flight to quality over much of the period. These general trends later reversed themselves in the final month of the twelve-month period, with high yield corporate bonds and other credit-sensitive securities rallying in April 2008 following a series of actions by the U.S. Federal Reserve Board (the “Fed”) to stabilize the markets. Equities, meanwhile, tended to move in the same general direction as corporate bonds over the fiscal year. Stock prices rose very early in the period before falling in late 2007 and early 2008
1
LETTER TO SHAREHOLDERS continued
and then rallying again in April. For the full twelve-month period, stock valuations fell across all market capitalizations, investment styles and regions. At the same time, the prices of gold, oil and other commodities surged while the U.S. dollar weakened further.
The U.S. economy grew briskly early in 2007, but then slowed significantly in late 2007 and early 2008. Economic growth decelerated as lending for ordinary consumer and commercial activity dried up, accentuating the weakening effects of declining home prices. Corporate profits, employment and other key economic indicators showed clear evidence of deterioration. Gross Domestic Product growth decelerated to a paltry 0.6% rate during the final quarter of 2007 and a marginally better 0.9% pace for the first quarter of 2008. Much of the strength early in 2008 came from exports and government spending, rather than from any noticeable improvements in consumer spending, business investment or housing. To reinvigorate the economy and stimulate lending activity, the Fed became increasingly aggressive, taking a series of steps to pour liquidity into the financial system. Starting in September 2007 and continuing through April 2008, the Fed cut the key fed funds rate seven different times, lowering the influential short-term rate from 5.25% to 2%. In March 2008, the central bank also opened its lending facilities to securities firms as well as commercial banks and intervened to help JPMorgan Chase & Co. purchase the collapsing investment bank Bear Stearns Cos. Meanwhile, Congress and the Bush administration rushed through a $168 billion fiscal stimulus bill, which included tax rebate checks, in an effort to boost growth in the second half of 2008.
During the twelve-month period, managers of Evergreen’s intermediate- and long-term bond funds paid careful attention to risk management in a changing market environment. The teams supervising the higher-credit quality funds—including Evergreen U.S. Government Fund, Evergreen Core
2
LETTER TO SHAREHOLDERS continued
Bond Fund, Evergreen Core Plus Bond Fund and Evergreen Institutional Mortgage Portfolio—monitored Fed policy and interest-rate movements as well as general macroeconomic trends in managing their portfolios. Meanwhile, the managers of Evergreen High Income Fund and Evergreen Select High Yield Bond Fund tended to position their credit-sensitive portfolios relatively conservatively during a period of growing risk aversion. After repositioning their portfolio early in the fiscal year, the managers of Evergreen Diversified Income Builder Fund maintained an emphasis on better-quality, high yield corporate bonds and also increased their exposure to dividend-paying stocks.
The experiences in the capital markets during the twelve-month period have underscored the value of a well-diversified, long-term investment strategy to help soften the effects of volatility in any one market or asset class. As always, we encourage investors to maintain diversified investment portfolios in pursuit of their long-term investment goals.
Please visit us at EvergreenInvestments.com for more information about our funds and other investment products available to you. Thank you for your continued support of Evergreen Investments.
Sincerely,

Dennis H. Ferro
President and Chief Executive Officer
Evergreen Investment Company, Inc.
Special Notice to Shareholders:
Please visit our Web site at EvergreenInvestments.com for statements from President and Chief Executive Officer, Dennis Ferro, regarding the firm’s recent settlement with the Securities and Exchange Commission (SEC) and prior settlement with the Financial Industry Regulatory Authority (FINRA).
3
FUND AT A GLANCE
as of April 30, 2008
MANAGEMENT TEAM
Investment Advisor:
• Evergreen Investment Management Company, LLC
Sub-Advisors:
• Evergreen International Advisors
• Tattersall Advisory Group, Inc.
Portfolio Managers:
• Robert A. Calhoun, CFA
• Michael Lee
• Anthony Norris
• Alex Perrin
• Peter Wilson
• Parham M. Behrooz, CFA
• Lisa Brown-Premo
• Andrew Cestone
• Todd C. Kuimjian, CFA
• Robert D. Rowe
CURRENT INVESTMENT STYLE

Source: Morningstar, Inc.
Morningstar’s style box is based on a portfolio date as of 3/31/2008.
The Fixed Income style box placement is based on a fund’s average effective maturity or duration and the average credit rating of the bond portfolio.
PERFORMANCE AND RETURNS
Portfolio inception date: 11/30/1972
| | Class A | | Class B | | Class C | | Class I | |
Class inception date | | 5/20/2005 | | 5/20/2005 | | 5/20/2005 | | 11/30/1972 | |
|
|
|
|
|
|
|
|
|
|
Nasdaq symbol | | EKDLX | | EKDMX | | EKDCX | | EKDYX | |
|
|
|
|
|
|
|
|
|
|
Average annual return* | | | | | | | | | |
|
|
|
|
|
|
|
|
|
|
1-year with sales charge | | -5.17% | | -5.91% | | -2.13% | | N/A | |
|
|
|
|
|
|
|
|
|
|
1-year w/o sales charge | | -0.44% | | -1.18% | | -1.18% | | -0.19% | |
|
|
|
|
|
|
|
|
|
|
5-year | | 3.18% | | 3.42% | | 3.74% | | 4.35% | |
|
|
|
|
|
|
|
|
|
|
10-year | | 4.74% | | 5.02% | | 5.02% | | 5.33% | |
|
|
|
|
|
|
|
|
|
|
Maximum sales charge | | 4.75% | | 5.00% | | 1.00% | | N/A | |
| | Front-end | | CDSC | | CDSC | | | |
|
|
|
|
|
|
|
|
|
|
* | Adjusted for maximum applicable sales charge, unless noted. |
Past performance is no guarantee of future results. The performance quoted represents past performance and current performance may be lower or higher. The investment return and principal value of an investment will fluctuate so that investors’ shares, when redeemed, may be worth more or less than their original cost. To obtain performance information current to the most recent month-end for Classes A, B, C or I, please go to EvergreenInvestments.com/fundperformance. The performance of each class may vary based on differences in loads, fees and expenses paid by the shareholders investing in each class. Performance includes the reinvestment of income dividends and capital gain distributions. Performance shown does not reflect the deduction of taxes that a shareholder would pay on fund distributions or the redemption of fund shares.
Historical performance shown for Class I prior to 5/23/2005 is based on the performance of the fund’s predecessor closed-end fund, Vestaur Securities Fund. Historical performance shown for Classes A, B and C prior to their inception is based on the performance of Class I. The historical returns for Classes A, B and C have not been adjusted to reflect the effect of each class’ 12b-1 fee. These fees are 0.25% for Class A and 1.00% for Classes B and C. Class I does not, and Vestaur Securities Fund did not, pay a 12b-1 fee. If these fees had been reflected, returns for Classes A, B and C would have been lower.
The advisor is waiving a portion of its advisory fee and reimbursing a portion of the 12b-1 fee for Class A. Had the fees not been waived or reimbursed, returns would have been lower.
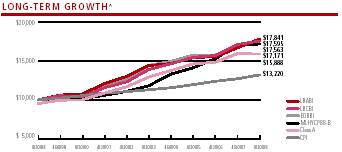
Comparison of a $10,000 investment in the Evergreen Core Plus Bond Fund Class A shares versus a similar investment in the Evergreen Diversified Bond Blended Index (EDBBI), the Lehman Brothers Aggregate Bond Index (LBABI), the Lehman Brothers Corporate Bond Index (LBCBI), the Merrill Lynch High Yield, Cash Pay, BB-B Index† (MLHYCPBB-B) and the Consumer Price Index (CPI).
The EDBBI, the LBABI, the LBCBI and the MLHYCPBB-B are unmanaged market indexes and do not include transaction costs associated with buying and selling securities, any mutual fund fees or expenses or any taxes. The CPI is a commonly used measure of inflation and do not represent an investment return. It is not possible to invest directly in an index.
^ | The fund has previously compared its performance to the EDBBI, LBCBI and the MLHYCPBB-B. Given recent changes to the fund’s principal investment strategies, the fund believes that the LBABI is a more appropriate benchmark than the EDBBI, LBCBI and the MLHYCPBB-B. In future periods, the fund will compare its performance to the LBABI. |
4
PORTFOLIO MANAGER COMMENTARY
The fund’s Class A shares returned -0.44% for the twelve-month period ended April 30, 2008, excluding any applicable sales charges. During the same period, the EDBBI returned 2.59%, the LBABI returned 6.87%, the LBCBI returned 3.06% and the MLHYCPBB-B returned 0.58%.
The fund’s objective is to seek to maximize total return through a combination of current income and capital growth.
The fund’s underperformance relative to its benchmarks was principally due to its exposure to commercial mortgage-backed securities (CMBS) and Residential Mortgage-Backed Securities (RMBS) during a period when all securitized assets significantly lagged other sectors in the fixed income markets. The fiscal year began in May 2007 amid evidence that the domestic economy was continuing to expand after weathering a housing slump earlier in the year. Corporate bonds continued to perform well as investors sought out higher yields. The Federal Reserve Board (the “Fed”) indicated it was more concerned about inflationary pressures than about any potential drags on the economy, and it held the key fed funds rate unchanged at the 5.25% level where it had been for more than a year. That environment began to change in June 2007 amid mounting evidence that weakness in housing and problems in subprime mortgages were becoming more of a threat to the economy. Many major financial institutions, both domestic and international, began reporting significant losses from their subprime mortgage investments. Problems originating in the subprime market led to a massive deleveraging of the financial system and a seizing up of the fixed income markets. Investors typically sought out higher-quality bonds, most notably Treasuries, as evidence accumulated of a growing liquidity crunch affecting lending activities. In this general flight to quality, Treasuries outperformed all other sectors of the fixed income markets for the remainder of the fiscal year as the financial markets remained mired in a liquidity crunch. To relieve this credit crunch and inject liquidity into the financial markets, the Fed, in a series of actions
Class I shares are only offered, subject to the minimum initial purchase requirements, in the following manner: (1) to investment advisory clients of EIMC (or its advisory affiliates), (2) to employer- or state-sponsored benefit plans, including but not limited to, retirement plans, defined benefit plans, deferred compensation plans, or savings plans, (3) to fee-based mutual fund wrap accounts, (4) through arrangements entered into on behalf of the Evergreen funds with certain financial services firms, (5) to certain institutional investors, and (6) to persons who owned Class Y shares in registered name in an Evergreen fund on or before December 31, 1994 or who owned shares of any SouthTrust fund in registered name as of March 18, 2005 or who owned shares of Vestaur Securities Fund as of May 20, 2005.
Class I shares are only available to institutional shareholders with a minimum of $1 million investment, which may be waived in certain situations.
The fund’s investment objective may be changed without a vote of the fund’s shareholders.
Foreign investments may contain more risk due to the inherent risks associated with changing political climates, foreign market instability and foreign currency fluctuations.
Asset-backed and mortgage-backed securities are generally subject to higher prepayment risks than other types of debt securities, which can limit the potential for gain in a declining interest rate environment and increase the potential for loss in a rising interest rate environment. Mortgage-backed securities may also be structured so that they are particularly sensitive to interest rates. A high rate of defaults on the mortgages held by a mortgage pool may limit the pool’s ability to make payments to the fund if the fund holds securities that are subordinate to other interest in the same mortgage pool; the risk of such defaults is generally higher in mortgage pools that include subprime mortgages.
Derivatives involve additional risks including interest rate risk, credit risk, the risk of improper valuation and the risk of non-correlation to the relevant instruments they are designed to hedge or to closely track.
High yield, lower-rated bonds may contain more risk due to the increased possibility of default.
The return of principal is not guaranteed due to fluctuation in the fund’s NAV caused by changes in the price of individual bonds held by the fund and the buying and selling of bonds by the fund. Bond funds have the same inflation, interest rate and credit risks as individual bonds. Generally, the value of bond funds rises when prevailing interest rates fall, and falls when interest rates rise.
U.S. government guarantees apply only to certain securities held in the fund’s portfolio and not to the fund’s shares.
The Evergreen Diversified Bond Blended Index is composed of the following indexes: LBCBI (80%) AND MLHYCPBB-B (20%).
†Copyright 2008. Merrill Lynch, Pierce, Fenner & Smith Incorporated. All rights reserved.
All data is as of April 30, 2008, and subject to change.
5
PORTFOLIO MANAGER COMMENTARY continued
starting in September 2007 and continuing through the end of the fiscal year in April 2008 provided funds to financial institutions. The Fed also lowered the fed funds rate from 5.25% to 2.00% and announced a series of other policy moves to ease lending activity.
For most of the fiscal year, we kept the fund’s duration—or exposure to change in interest rates—consistent with that of the LBABI, and this neutral duration position had minimal impact on results. The fund’s investments in Treasuries, government agency securities and international bonds all contributed positively to performance. The fund had only minimal exposure to high yield corporate bonds early in the fiscal year, but we increased the positions late in 2007 as yield spreads widened and high yield bonds appeared more attractive. This increased exposure, however, hurt relative performance during the first three months of 2008 as yield spreads widened further and Treasuries continued to outperform.
The fund typically invests in a diversified mix of bonds from all sectors of the market including corporate bonds and high-quality mortgage-backed securities (MBS), CMBS, and asset-backed securities (ABS). In most environments, this strategy has provided additional yield to the fund and added to the overall performance relative to the market. In a liquidity crisis and flight to quality, however, these high-quality assets are often the ones that are most affected. The fund held a minimal allocation to U.S Treasuries over the course of the fiscal year particularly as yield spreads widened last fall. For most major sectors of the market, yield spreads reached record levels in November 2007. As spreads widened, the fund added to its exposure in the corporate sector, where it had been underweight for most of the fiscal year. In the securitized sector (MBS, CMBS and ABS) the fund maintained its overweight position and began to add more exposure to AAA non-agency mortgages as the spread between agency and non-agency bonds widened to record levels. As we moved into 2008, problems in the subprime market continued to weigh on investors and confidence in the financial system remained low. Financial institutions typically continued to struggle as they attempted to value the subprime mortgages held on their balance sheets and shore up capital positions. Spread sectors, which were already historically cheap, underperformed even more in the first three months of 2008 and the fund’s performance was negatively impacted. While the fund did not own any subprime mortgages, its performance nevertheless was hurt by the fallout from the subprime crisis. Investments in CMBS, investment-grade corporate bonds, and ABS tended to detract from results during a period in which the markets did not reward any credit risk. The Fed’s efforts to provide liquidity and shore up the financial system began to take hold in mid-March 2008 and the market tone began to improve. In the last months of the fiscal year, spreads in CMBS and corporates in particular began to narrow significantly and the performance of the fund began to improve.
6
ABOUT YOUR FUND’S EXPENSES
The Example below is intended to describe the fees and expenses borne by shareholders and the impact of those costs on your investment.
Example
As a shareholder of the fund, you incur two types of costs: (1) transaction costs, including sales charges (loads), redemption fees and exchange fees; and (2) ongoing costs, including management fees, distribution (12b-1) fees and other fund expenses. This Example is intended to help you understand your ongoing costs (in dollars) of investing in the fund and to compare these costs with the ongoing costs of investing in other mutual funds. The Example is based on an investment of $1,000 invested at the beginning of the period and held for the entire period from November 1, 2007 to April 30, 2008.
The example illustrates your fund’s costs in two ways:
• Actual expenses
The section in the table under the heading “Actual” provides information about actual account values and actual expenses. You may use the information in these columns, together with the amount you invested, to estimate the expenses that you paid over the period. Simply divide your account value by $1,000 (for example, an $8,600 account value divided by $1,000 = 8.6), then multiply the result by the number in the appropriate column for your share class, in the column entitled “Expenses Paid During Period” to estimate the expenses you paid on your account during this period.
• Hypothetical example for comparison purposes
The section in the table under the heading “Hypothetical (5% return before expenses)” provides information about hypothetical account values and hypothetical expenses based on the fund’s actual expense ratio and an assumed rate of return of 5% per year before expenses, which is not the fund’s actual return. The hypothetical account values and expenses may not be used to estimate the actual ending account balance or expenses you paid for the period. You may use this information to compare the ongoing costs of investing in the fund and other funds. To do so, compare this 5% hypothetical example with the 5% hypothetical examples that appear in the shareholder reports of the other funds.
Please note that the expenses shown in the table are meant to highlight your ongoing costs only and do not reflect any transactional costs, such as sales charges (loads), redemption fees or exchange fees. Therefore, the section in the table under the heading “Hypothetical (5% return before expenses)” is useful in comparing ongoing costs only, and will not help you determine the relative total costs of owning different funds. In addition, if these transactional costs were included, your costs would have been higher.
| | Beginning | | Ending | | | |
| | Account | | Account | | Expenses | |
| | Value | | Value | | Paid During | |
| | 11/1/2007 | | 4/30/2008 | | Period* | |
|
|
|
|
|
|
|
|
Actual | | | | | | | | |
Class A | | $ 1,000.00 | | $ | 974.18 | | $ 4.52 | |
Class B | | $ 1,000.00 | | $ | 970.55 | | $ 8.18 | |
Class C | | $ 1,000.00 | | $ | 970.55 | | $ 8.18 | |
Class I | | $ 1,000.00 | | $ | 975.39 | | $ 3.29 | |
Hypothetical (5% return before expenses) | | | | | | | | |
Class A | | $ 1,000.00 | | $ | 1,020.29 | | $ 4.62 | |
Class B | | $ 1,000.00 | | $ | 1,016.56 | | $ 8.37 | |
Class C | | $ 1,000.00 | | $ | 1,016.56 | | $ 8.37 | |
Class I | | $ 1,000.00 | | $ | 1,021.53 | | $ 3.37 | |
|
|
|
|
|
|
|
|
|
* | For each class of the fund, expenses are equal to the annualized expense ratio of each class (0.92% for Class A, 1.67% for Class B, 1.67% for Class C and 0.67% for Class I), multiplied by the average account value over the period, multiplied by 182 / 366 days. |
7
FINANCIAL HIGHLIGHTS
(For a share outstanding throughout each period)
| | Year Ended April 30, | Year Ended
November 30, 20052, 3 |
| |
|
CLASS A | | 2008 | | 2007 | | 20061 | |
|
|
|
|
|
|
|
|
|
|
|
|
Net asset value, beginning of period | | $ | 14.45 | | $ | 14.25 | | $ | 14.53 | | $ | 14.83 |
|
|
|
|
|
|
|
|
|
|
|
|
|
Income from investment operations | | | | | | | | | | | | |
Net investment income (loss) | | | 0.74 | | | 0.81 | | | 0.33 | | | 0.414 |
Net realized and unrealized gains or losses on investments | | | (0.79) | | | 0.23 | | | (0.27) | | | (0.28) |
| |
|
|
|
|
|
|
|
|
|
|
|
Total from investment operations | | | (0.05) | | | 1.04 | | | 0.06 | | | 0.13 |
|
|
|
|
|
|
|
|
|
|
|
|
Distributions to shareholders from | | | | | | | | | | | | |
Net investment income | | | (0.51) | | | (0.83) | | | (0.34) | | | (0.43) |
Tax basis return of capital | | | (0.21) | | | (0.01) | | | 0 | | | 0 |
| |
|
|
|
|
|
|
|
|
|
|
|
Total distributions to shareholders | | | (0.72) | | | (0.84) | | | (0.34) | | | (0.43) |
|
|
|
|
|
|
|
|
|
|
|
|
|
Net asset value, end of period | | $ | 13.68 | | $ | 14.45 | | $ | 14.25 | | $ | 14.53 |
|
|
|
|
|
|
|
|
|
|
|
|
|
Total return5 | | | (0.44)% | | | 7.49% | | | 0.43% | | | 0.89% |
|
|
|
|
|
|
|
|
|
|
|
|
|
Ratios and supplemental data | | | | | | | | | | | | |
Net assets, end of period (thousands) | | $ | 171,130 | | $ | 199,442 | | $ | 213,268 | | $ | 226,450 |
Ratios to average net assets | | | | | | | | | | | | |
Expenses including waivers/reimbursements but excluding expense reductions | | | 0.92% | | | 0.94% | | | 0.96%6 | | | 0.97%6 |
Expenses excluding waivers/reimbursements and expense reductions | | | 1.14% | | | 1.16% | | | 1.19%6 | | | 1.15%6 |
Net investment income (loss) | | | 5.23% | | | 5.65% | | | 5.43%6 | | | 5.28%6 |
Portfolio turnover rate | | | 374%7 | | | 70% | | | 30% | | | 55% |
|
|
|
|
|
|
|
|
|
|
|
|
|
1 | For the five months ended April 30, 2006. The Fund changed its fiscal year end from November 30 to April 30, effective April 30, 2006. |
2 | For the period from May 20, 2005 (commencement of class operations), to November 30, 2005. |
3 | Effective at the close of business on May 20, 2005, the Fund acquired the net assets of Vestaur Securities Fund. Vestaur Securities Fund became the accounting and performance survivor in this transaction. Class A shares of Vestaur Securities Fund did not exist prior to the transaction. As a result, accounting and performance information for Class A shares commenced on May 20, 2005. |
4 | Net investment income (loss) per share is based on average shares outstanding during the period. |
5 | Excluding applicable sales charges |
7 | Portfolio turnover rate includes mortgage dollar roll activity. |
See Notes to Financial Statements
8
FINANCIAL HIGHLIGHTS
(For a share outstanding throughout each period)
| | Year Ended April 30, | Year Ended
November 30, 20052, 3 |
| |
|
CLASS B | | 2008 | | 2007 | | 20061 | |
|
|
|
|
|
|
|
|
|
|
|
|
Net asset value, beginning of period | | $ | 14.45 | | $ | 14.25 | | $ | 14.53 | | $ | 14.83 |
|
|
|
|
|
|
|
|
|
|
|
|
|
Income from investment operations | | | | | | | | | | | | |
Net investment income (loss) | | | 0.64 | | | 0.70 | | | 0.28 | | | 0.364 |
Net realized and unrealized gains or losses on investments | | | (0.80) | | | 0.23 | | | (0.26) | | | (0.28) |
| |
|
|
|
|
|
|
|
|
|
|
|
Total from investment operations | | | (0.16) | | | 0.93 | | | 0.02 | | | 0.08 |
|
|
|
|
|
|
|
|
|
|
|
|
Distributions to shareholders from | | | | | | | | | | | | |
Net investment income | | | (0.41) | | | (0.72) | | | (0.30) | | | (0.38) |
Tax basis return of capital | | | (0.21) | | | (0.01) | | | 0 | | | 0 |
| |
|
|
|
|
|
|
|
|
|
|
|
Total distributions to shareholders | | | (0.62) | | | (0.73) | | | (0.30) | | | (0.38) |
|
|
|
|
|
|
|
|
|
|
|
|
|
Net asset value, end of period | | $ | 13.67 | | $ | 14.45 | | $ | 14.25 | | $ | 14.53 |
|
|
|
|
|
|
|
|
|
|
|
|
|
Total return5 | | | (1.18)% | | | 6.71% | | | 0.14% | | | 0.52% |
|
|
|
|
|
|
|
|
|
|
|
|
|
Ratios and supplemental data | | | | | | | | | | | | |
Net assets, end of period (thousands) | | $ | 13,894 | | $ | 16,102 | | $ | 18,277 | | $ | 20,439 |
Ratios to average net assets | | | | | | | | | | | | |
Expenses including waivers/reimbursements but excluding expense reductions | | | 1.67% | | | 1.67% | | | 1.67%6 | | | 1.67%6 |
Expenses excluding waivers/reimbursements and expense reductions | | | 1.84% | | | 1.85% | | | 1.89%6 | | | 1.85%6 |
Net investment income (loss) | | | 4.49% | | | 4.91% | | | 4.72%6 | | | 4.58%6 |
Portfolio turnover rate | | | 374%7 | | | 70% | | | 30% | | | 55% |
|
|
|
|
|
|
|
|
|
|
|
|
|
1 | For the five months ended April 30, 2006. The Fund changed its fiscal year end from November 30 to April 30, effective April 30, 2006. |
2 | For the period from May 20, 2005 (commencement of class operations), to November 30, 2005. |
3 | Effective at the close of business on May 20, 2005, the Fund acquired the net assets of Vestaur Securities Fund. Vestaur Securities Fund became the accounting and performance survivor in this transaction. Class B shares of Vestaur Securities Fund did not exist prior to the transaction. As a result, accounting and performance information for Class B shares commenced on May 20, 2005. |
4 | Net investment income (loss) per share is based on average shares outstanding during the period. |
5 | Excluding applicable sales charges |
7 | Portfolio turnover rate includes mortgage dollar roll activity. |
See Notes to Financial Statements
9
FINANCIAL HIGHLIGHTS
(For a share outstanding throughout each period)
| | Year Ended April 30, | | |
| |
| | |
CLASS C | | | 2008 | | | 2007 | | | 20061 | | | Year Ended
November 30, 20052, 3 |
|
|
|
|
|
|
|
|
|
|
|
|
|
Net asset value, beginning of period | | $ | 14.45 | | $ | 14.25 | | $ | 14.53 | | $ | 14.83 |
|
|
|
|
|
|
|
|
|
|
|
|
|
Income from investment operations | | | | | | | | | | | | |
Net investment income (loss) | | | 0.63 | | | 0.70 | | | 0.28 | | | 0.364 |
Net realized and unrealized gains or losses on investments | | | (0.78) | | | 0.23 | | | (0.26) | | | (0.28) |
| |
|
|
|
|
|
|
|
|
|
|
|
Total from investment operations | | | (0.15) | | | 0.93 | | | 0.02 | | | 0.08 |
|
|
|
|
|
|
|
|
|
|
|
|
|
Distributions to shareholders from | | | | | | | | | | | | |
Net investment income | | | (0.41) | | | (0.72) | | | (0.30) | | | (0.38) |
Tax basis return of capital | | | (0.21) | | | (0.01) | | | 0 | | | 0 |
| |
|
|
|
|
|
|
|
|
|
|
|
Total distributions to shareholders | | | (0.62) | | | (0.73) | | | (0.30) | | | (0.38) |
|
|
|
|
|
|
|
|
|
|
|
|
|
Net asset value, end of period | | $ | 13.68 | | $ | 14.45 | | $ | 14.25 | | $ | 14.53 |
|
|
|
|
|
|
|
|
|
|
|
|
|
Total return5 | | | (1.18)% | | | 6.71% | | | 0.14% | | | 0.52% |
|
|
|
|
|
|
|
|
|
|
|
|
|
Ratios and supplemental data | | | | | | | | | | | | |
Net assets, end of period (thousands) | | $ | 22,140 | | $ | 24,157 | | $ | 25,972 | | $ | 27,764 |
Ratios to average net assets | | | | | | | | | | | | |
Expenses including waivers/reimbursements but excluding expense reductions | | | 1.67% | | | 1.67% | | | 1.67%6 | | | 1.67%6 |
Expenses excluding waivers/reimbursements and expense reductions | | | 1.84% | | | 1.85% | | | 1.89%6 | | | 1.85%6 |
Net investment income (loss) | | | 4.48% | | | 4.91% | | | 4.72%6 | | | 4.58%6 |
Portfolio turnover rate | | | 374%7 | | | 70% | | | 30% | | | 55% |
|
|
|
|
|
|
|
|
|
|
|
|
|
1 | For the five months ended April 30, 2006. The Fund changed its fiscal year end from November 30 to April 30, effective April 30, 2006. |
2 | For the period from May 20, 2005 (commencement of class operations), to November 30, 2005. |
3 | Effective at the close of business on May 20, 2005, the Fund acquired the net assets of Vestaur Securities Fund. Vestaur Securities Fund became the accounting and performance survivor in this transaction. Class C shares of Vestaur Securities Fund did not exist prior to the transaction. As a result, accounting and performance information for Class C shares commenced on May 20, 2005. |
4 | Net investment income (loss) per share is based on average shares outstanding during the period. |
5 | Excluding applicable sales charges |
7 | Portfolio turnover rate includes mortgage dollar roll activity. |
See Notes to Financial Statements
10
FINANCIAL HIGHLIGHTS
(For a share outstanding throughout each period)
| | Year Ended April 30, | | Year Ended November 30, |
| |
| |
|
CLASS I | | 2008 | | 2007 | | 20061 | | 20052 | | 20042 | | 20032 |
|
|
|
|
|
|
|
|
|
|
|
|
|
Net asset value, beginning of period | | $ | 14.45 | | $ | 14.25 | | $ | 14.53 | | $ | 15.14 | | $ | 15.14 | | $ | 14.27 |
|
|
|
|
|
|
|
|
|
|
|
|
|
|
|
|
|
|
|
Income from investment operations | | | | | | | | | | | | | | | | | | |
Net investment income (loss) | | | 0.76 | | | 0.83 | | | 0.34 | | | 0.793 | | | 0.93 | | | 0.95 |
Net realized and unrealized gains or losses on investments | | | (0.77) | | | 0.25 | | | (0.26) | | | (0.41) | | | 0.02 | | | 0.91 |
| |
|
|
|
|
|
|
|
|
|
|
|
Total from investment operations | | | (0.01) | | | 1.08 | | | 0.08 | | | 0.38 | | | 0.95 | | | 1.86 |
|
|
|
|
|
|
|
|
|
|
|
|
|
|
|
|
|
|
|
Distributions to shareholders from | | | | | | | | | | | | | | | | | | |
Net investment income | | | (0.55) | | | (0.87) | | | (0.36) | | | (0.86) | | | (0.95) | | | (0.99) |
Tax basis return of capital | | | (0.21) | | | (0.01) | | | 0 | | | (0.13)4 | | | 0 | | | 0 |
| |
|
|
|
|
|
|
|
|
|
|
|
Total distributions to shareholders | | | (0.76) | | | (0.88) | | | (0.36) | | | (0.99) | | | (0.95) | | | (0.99) |
|
|
|
|
|
|
|
|
|
|
|
|
|
|
|
|
|
|
|
Net asset value, end of period | | $ | 13.68 | | $ | 14.45 | | $ | 14.25 | | $ | 14.53 | | $ | 15.14 | | $ | 15.14 |
|
|
|
|
|
|
|
|
|
|
|
|
|
|
|
|
|
|
|
Total return | | | (0.19)% | | | 7.78% | | | 0.55% | | | 2.82% | | | 6.47% | | | 13.43% |
|
|
|
|
|
|
|
|
|
|
|
|
|
|
|
|
|
|
|
Ratios and supplemental data | | | | | | | | | | | | | | | | | | |
Net assets, end of period (thousands) | | $ | 48,634 | | $ | 56,478 | | $ | 61,711 | | $ | 65,893 | | $ | 97,235 | | $ | 97,277 |
Ratios to average net assets | | | | | | | | | | | | | | | | | | |
Expenses including waivers/reimbursements but excluding expense reductions | | | 0.67% | | | 0.67% | | | 0.67%5 | | | 0.79% | | | 0.94% | | | 0.91% |
Expenses excluding waivers/reimbursements and expense reductions | | | 0.84% | | | 0.85% | | | 0.89%5 | | | 0.88% | | | 0.97% | | | 0.94% |
Net investment income (loss) | | | 5.48% | | | 5.91% | | | 5.72%5 | | | 5.50% | | | 6.10% | | | 6.43% |
Portfolio turnover rate | | | 374%6 | | | 70% | | | 30% | | | 55% | | | 23% | | | 45% |
|
|
|
|
|
|
|
|
|
|
|
|
|
|
|
|
|
|
|
1 | For the five months ended April 30, 2006. The Fund changed its fiscal year end from November 30 to April 30, effective April 30, 2006. |
2 | Effective at the close of business on May 20, 2005, the Fund acquired the net assets of Vestaur Securities Fund. Vestaur Securities Fund became the accounting and performance survivor in this transaction. The financial highlights for the periods prior to May 23, 2005 are those of Vestaur Securities Fund. The per share information has been restated to give effect to this transaction. Total return performance reflects the total return of Vestaur Securities Fund based on its net asset value. |
3 | Net investment income (loss) per share is based on average shares outstanding during the period. |
4 | Return of capital relates to former Vestaur Securities Fund shareholders and is based on average shares outstanding from December 1, 2004 through May 20, 2005. |
6 | Portfolio turnover rate includes mortgage dollar roll activity. |
See Notes to Financial Statements
11
SCHEDULE OF INVESTMENTS
April 30, 2008 | | | | | | |
| | | Principal
Amount | | | Value |
|
|
|
|
|
|
|
AGENCY COMMERCIAL MORTGAGE-BACKED SECURITIES 1.4% | | | | | | |
FIXED-RATE 1.4% | | | | | | |
FHLMC, Ser. M009, Class A, 5.40%, 10/15/2021 (cost $ 3,514,181) | | $ | 3,510,671 | | $ | 3,711,937 |
| | | | |
|
|
AGENCY MORTGAGE-BACKED COLLATERALIZED MORTGAGE OBLIGATIONS 6.3% | | | | | | |
FIXED-RATE 6.3% | | | | | | |
FHLMC: | | | | | | |
Ser. 2594, Class QE, 5.00%, 08/15/2031 | | | 2,395,000 | | | 2,378,775 |
Ser. 2647, Class PC, 5.00%, 11/15/2031 | | | 2,500,000 | | | 2,487,192 |
Ser. 2695, Class BG, 4.50%, 04/15/2032 | | | 950,000 | | | 923,672 |
Ser. 2991, Class QD, 5.00%, 08/15/2034 | | | 2,550,000 | | | 2,546,641 |
Ser. 3036, Class NC, 5.00%, 03/15/2031 | | | 1,740,000 | | | 1,736,443 |
Ser. 3068, Class AK, 4.50%, 03/15/2027 | | | 335,000 | | | 328,368 |
FNMA: | | | | | | |
Ser. 2002-T12, Class A3, 7.50%, 05/25/2042 | | | 17,531 | | | 18,759 |
Ser. 2002-T19, Class A3, 7.50%, 07/25/2042 | | | 287,397 | | | 310,973 |
Ser. 2003-129, Class PW, 4.50%, 07/25/2033 | | | 2,800,000 | | | 2,799,748 |
Ser. 2003-W4, Class 4A, 7.50%, 10/25/2042 | | | 182,923 | | | 195,008 |
Ser. 2007-65, Class GV, 5.00%, 07/25/2018 | | | 2,518,407 | | | 2,520,176 |
| | | | |
|
|
Total Agency Mortgage-Backed Collateralized Mortgage Obligations (cost $15,645,539) | | | | | | 16,245,755 |
| | | | |
|
|
AGENCY MORTGAGE-BACKED PASS THROUGH SECURITIES 16.7% | | | | | | |
FIXED-RATE 16.7% | | | | | | |
FHLMC: | | | | | | |
5.00%, 09/15/2028 | | | 210,000 | | | 212,474 |
6.50%, 09/25/2043 | | | 107,025 | | | 110,241 |
7.50%, 09/01/2013-08/25/2042 | | | 163,838 | | | 172,420 |
9.00%, 12/01/2016 | | | 129,813 | | | 140,441 |
9.50%, 12/01/2022 | | | 18,129 | | | 20,042 |
FHLMC 30 year, 5.00%, TBA # | | | 14,450,000 | | | 14,199,379 |
FNMA: | | | | | | |
5.70%, 11/01/2011 ## | | | 6,444,506 | | | 6,677,862 |
6.10%, 03/01/2012 | | | 2,214,558 | | | 2,332,349 |
6.27%, 02/01/2011 | | | 3,333,271 | | | 3,467,365 |
6.45%, 09/01/2016 | | | 1,745,740 | | | 1,853,069 |
6.80%, 08/01/2009 | | | 2,978,099 | | | 3,040,039 |
7.87%, 07/01/2026 ## | | | 3,006,052 | | | 3,506,322 |
9.00%, 02/01/2025-09/01/2030 | | | 167,357 | | | 184,179 |
10.00%, 09/01/2010-04/01/2021 | | | 85,759 | | | 95,850 |
FNMA 15 year, 5.00%, TBA # | | | 2,990,000 | | | 2,999,810 |
GNMA: | | | | | | |
8.00%, 03/15/2022-08/15/2024 | | | 58,636 | | | 64,137 |
8.25%, 05/15/2020 | | | 57,026 | | | 62,351 |
8.50%, 09/15/2024-01/15/2027 | | | 59,542 | | | 65,764 |
9.00%, 12/15/2019 | | | 58,314 | | | 63,907 |
9.50%, 09/15/2019 | | | 13,937 | | | 15,490 |
10.00%, 01/15/2019-03/15/2020 | | | 29,307 | | | 33,366 |
See Notes to Financial Statements
12
SCHEDULE OF INVESTMENTS continued
April 30, 2008 | | | | | | |
| | | Principal
Amount | | | Value |
|
|
|
|
|
|
|
AGENCY MORTGAGE-BACKED PASS THROUGH SECURITIES continued | | | | | | |
FIXED-RATE continued | | | | | | |
GNMA 30 Year: | | | | | | |
5.50%, TBA # | | $ | 2,105,000 | | $ | 2,132,300 |
6.00%, TBA # | | | 1,250,000 | | | 1,284,180 |
| | | | |
|
|
Total Agency Mortgage-Backed Pass Through Securities (cost $42,123,318) | | | | | | 42,733,337 |
| | | | |
|
|
AGENCY REPERFORMING MORTGAGE-BACKED COLLATERALIZED | | | | | | |
MORTGAGE OBLIGATIONS 0.2% | | | | | | |
FNMA: | | | | | | |
Ser. 2003-W02, Class 2A9, 5.90%, 07/25/2042 | | | 161,592 | | | 165,296 |
Ser. 2003-W12, Class 1A8, 4.55%, 06/25/2043 | | | 350,000 | | | 346,838 |
| | | | |
|
|
Total Agency Reperforming Mortgage-Backed Collateralized Mortgage Obligations
(cost $491,386) | | | | | | 512,134 |
| | | | |
|
|
ASSET-BACKED SECURITIES 3.7% | | | | | | |
Acacia CDO, Ltd., Ser. 10A, Class C, FRN, 4.30%, 09/07/2046 144A | | | 1,000,000 | | | 868,810 |
American Home Mtge. Backed Investment Trust, Ser. 2005-2, Class 5A4C, 5.41%, 09/25/2035 | | | 2,000,000 | | | 1,469,860 |
Deutsche Alt-A Securities, Inc., Mtge. Loan Trust, Ser. 2006-AB2, Class A3, 6.27%, 06/25/2036 | | | 2,000,000 | | | 1,348,279 |
MASTR Asset Backed Securities Trust, Ser. 2005-AB1, Class A4, 5.65%, 10/25/2032 | | | 2,500,000 | | | 1,842,970 |
Nautilus RMBS CDO, Ltd., Ser. 2005-1A, Class A3, FRN, 4.23%, 07/07/2040 144A | | | 2,705,709 | | | 2,645,777 |
Nomura Asset Acceptance Corp., Ser. 2006-AP1, Class A2, 5.52%, 01/25/2036 | | | 2,078,000 | | | 1,406,702 |
| | | | |
|
|
Total Asset-Backed Securities (cost $11,896,465) | | | | | | 9,582,398 |
| | | | |
|
|
COMMERCIAL MORTGAGE-BACKED SECURITIES 15.0% | | | | | | |
FIXED-RATE 11.7% | | | | | | |
Banc of America Comml. Mtge. Securities, Inc., Ser. 2007-1, Class A4, 5.45%, 01/15/2049 | | | 245,000 | | | 238,484 |
Banc of America Comml. Mtge., Inc., Ser. 2000-2, Class F, 7.92%, 09/15/2032 | | | 3,000,000 | | | 3,100,650 |
Banc of America Mtge. Securities, Inc., Ser. 2003-7, Class B6, 4.75%, 09/25/2018 | | | 228,797 | | | 142,609 |
Citigroup Comml. Mtge. Trust, Ser. 2007-C6, Class C, 5.89%, 07/10/2017 | | | 855,000 | | | 615,811 |
Commercial Mtge. Pass-Through Cert., Ser. 2007-C9, Class B, 6.01%, 12/10/2049 | | | 910,000 | | | 682,786 |
Crown Castle Towers, LLC, Ser. 2006-1A, Class C, 5.47%, 11/15/2036 144A | | | 1,920,000 | | | 1,598,899 |
GE Capital Comml. Mtge. Corp., Ser. 2007-C1, Class C, 5.89%, 12/10/2049 | | | 2,500,000 | | | 1,812,979 |
Greenwich Capital Comml. Funding Corp., Ser. 2004-GG1, Class A7, 5.32%, 06/10/2036 | | | 4,000,000 | | | 4,068,308 |
GS Mtge. Securities Corp.: | | | | | | |
Ser. 2007-GG10, Class AM, 5.99%, 08/10/2045 | | | 2,700,000 | | | 2,517,956 |
Ser. 2007-GG10, Class A2, 5.78%, 08/10/2045 | | | 3,665,000 | | | 3,679,332 |
JPMorgan Chase & Co. Comml. Mtge. Securities Corp.: | | | | | | |
Ser. 2004-CB9, Class A1, 3.48%, 06/12/2041 | | | 3,327,194 | | | 3,298,620 |
Ser. 2006-LDP8, Class B, 5.52%, 05/15/2045 | | | 1,000,000 | | | 750,369 |
Ser. 2006-LDP9, Class A3, 5.34%, 05/15/2047 | | | 2,360,000 | | | 2,292,458 |
Ser. 2007-LD12, Class A2, 5.83%, 02/15/2051 | | | 3,045,000 | | | 3,058,757 |
See Notes to Financial Statements
13
SCHEDULE OF INVESTMENTS continued
April 30, 2008 | | | | | | |
| | | Principal
Amount | | | Value |
|
|
|
|
|
|
|
COMMERCIAL MORTGAGE-BACKED SECURITIES continued | | | | | | |
FIXED-RATE continued | | | | | | |
Morgan Stanley Capital I, Inc., Ser. 2001-TOP5, Class G, 6.00%, 10/15/2035 144A | | $ | 1,042,000 | | $ | 880,013 |
Prima Capital Securitization, Ltd., Ser. 2006, Class D, 5.88%, 12/28/2048 | | | 1,085,000 | | | 1,120,805 |
| | | | |
|
|
| | | | | | 29,858,836 |
| | | | |
|
|
FLOATING-RATE 3.3% | | | | | | |
Capmark, Ltd., Ser. 2006-7A, Class B, 3.09%, 08/20/2036 144A | | | 500,000 | | | 368,000 |
Citigroup Comml. Mtge. Trust, Ser. 2006-C4, Class AJ, 5.92%, 03/15/2049 | | | 450,000 | | | 395,682 |
Credit Suisse Mtge. Capital Cert., Ser. 2006-C1, Class AM, 5.74%, 02/15/2039 | | | 2,835,000 | | | 2,653,832 |
JPMorgan Chase & Co. Comml. Mtge. Securities Corp., Ser. 2007-CB19, Class A4, 5.94%, 02/12/2049 | | | 2,105,000 | | | 2,094,400 |
MASTR Reperforming Loan Trust, Ser. 2006-2, Class B3, 5.90%, 05/25/2036 144A | | | 426,472 | | | 153,905 |
Morgan Stanley Capital I, Inc., Ser. 2007-IQ15, Class A4, 6.08%, 06/11/2049 | | | 2,750,000 | | | 2,769,301 |
| | | | |
|
|
| | | | | | 8,435,120 |
| | | | |
|
|
Total Commercial Mortgage-Backed Securities (cost $40,547,894) | | | | | | 38,293,956 |
| | | | |
|
|
CORPORATE BONDS 25.0% | | | | | | |
CONSUMER DISCRETIONARY 2.8% | | | | | | |
Auto Components 0.1% | | | | | | |
Cooper Tire & Rubber Co., 7.625%, 03/15/2027 | | | 110,000 | | | 93,500 |
Goodyear Tire & Rubber Co., 9.00%, 07/01/2015 | | | 60,000 | | | 65,550 |
| | | | |
|
|
| | | | | | 159,050 |
| | | | |
|
|
Diversified Consumer Services 0.0% | | | | | | |
Service Corporation International, 6.75%, 04/01/2015 | | | 5,000 | | | 5,031 |
| | | | |
|
|
Hotels, Restaurants & Leisure 0.2% | | | | | | |
Caesars Entertainment, Inc.: | | | | | | |
7.875%, 03/15/2010 ρ | | | 70,000 | | | 66,150 |
8.125%, 05/15/2011 ρ | | | 20,000 | | | 17,025 |
Inn of the Mountain Gods Resort & Casino, 12.00%, 11/15/2010 | | | 90,000 | | | 78,300 |
Isle of Capri Casinos, Inc., 7.00%, 03/01/2014 ρ | | | 285,000 | | | 220,875 |
Pinnacle Entertainment, Inc., 8.75%, 10/01/2013 | | | 5,000 | | | 5,100 |
Pokagon Gaming Authority, 10.375%, 06/15/2014 144A ρ | | | 119,000 | | | 127,627 |
Seneca Gaming Corp., 7.25%, 05/01/2012 | | | 20,000 | | | 19,425 |
Shingle Springs Tribal Gaming Authority, 9.375%, 06/15/2015 144A | | | 120,000 | | | 106,800 |
Universal City Development Partners, Ltd., 11.75%, 04/01/2010 | | | 50,000 | | | 51,875 |
| | | | |
|
|
| | | | | | 693,177 |
| | | | |
|
|
Household Durables 0.2% | | | | | | |
Centex Corp.: | | | | | | |
4.875%, 08/15/2008 | | | 50,000 | | | 49,504 |
5.80%, 09/15/2009 | | | 15,000 | | | 14,405 |
D.R. Horton, Inc.: | | | | | | |
4.875%, 01/15/2010 | | | 25,000 | | | 23,875 |
5.00%, 01/15/2009 | | | 75,000 | | | 73,125 |
8.00%, 02/01/2009 | | | 30,000 | | | 30,000 |
See Notes to Financial Statements
14
SCHEDULE OF INVESTMENTS continued
April 30, 2008
| | | Principal
Amount | | | Value |
|
|
|
|
|
|
|
CORPORATE BONDS continued | | | | | | |
CONSUMER DISCRETIONARY continued | | | | | | |
Household Durables continued | | | | | | |
Hovnanian Enterprises, Inc.: | | | | | | |
6.00%, 01/15/2010 ρ | | $ | 20,000 | | $ | 15,700 |
6.50%, 01/15/2014 | | | 15,000 | | | 10,725 |
KB Home: | | | | | | |
7.75%, 02/01/2010 ρ | | | 40,000 | | | 39,500 |
8.625%, 12/15/2008 | | | 15,000 | | | 15,225 |
Libbey, Inc., FRN, 11.91%, 06/01/2011 | | | 55,000 | | | 55,412 |
Pulte Homes, Inc.: | | | | | | |
4.875%, 07/15/2009 | | | 115,000 | | | 111,550 |
7.875%, 08/01/2011 | | | 5,000 | | | 4,900 |
Standard Pacific Corp., 5.125%, 04/01/2009 | | | 30,000 | | | 26,850 |
| | | | |
|
|
| | | | | | 470,771 |
| | | | |
|
|
Media 0.8% | | | | | | |
Cablevision Systems Corp., Ser. B, 8.00%, 04/15/2012 | | | 80,000 | | | 80,000 |
Charter Communications, Inc., 10.875%, 09/15/2014 144A ρ | | | 185,000 | | | 196,563 |
CSC Holdings, Inc., 7.625%, 04/01/2011 | | | 150,000 | | | 151,875 |
Idearc, Inc., 8.00%, 11/15/2016 | | | 250,000 | | | 163,750 |
Lamar Media Corp.: | | | | | | |
6.625%, 08/15/2015 ρ | | | 180,000 | | | 170,550 |
7.25%, 01/01/2013 | | | 10,000 | | | 9,950 |
Mediacom Broadband, LLC, 8.50%, 10/15/2015 | | | 25,000 | | | 23,125 |
Mediacom, LLC, 7.875%, 02/15/2011 | | | 20,000 | | | 19,000 |
R.H. Donnelley Corp., Ser. A-4, 8.875%, 10/15/2017 144A | | | 130,000 | | | 84,500 |
Sinclair Broadcast Group, Inc., 8.00%, 03/15/2012 | | | 20,000 | | | 20,325 |
Time Warner, Inc., 7.625%, 04/15/2031 | | | 1,100,000 | | | 1,183,689 |
| | | | |
|
|
| | | | | | 2,103,327 |
| | | | |
|
|
Multi-line Retail 0.8% | | | | | | |
Kohl’s Corp., 6.875%, 12/15/2037 | | | 575,000 | | | 528,240 |
Macy’s, Inc.: | | | | | | |
6.375%, 03/15/2037 | | | 700,000 | | | 545,933 |
7.45%, 09/15/2011 | | | 500,000 | | | 500,733 |
Neiman Marcus Group, Inc., 9.00%, 10/15/2015 | | | 60,000 | | | 62,700 |
Target Corp., 6.50%, 10/15/2037 | | | 450,000 | | | 455,010 |
| | | | |
|
|
| | | | | | 2,092,616 |
| | | | |
|
|
Specialty Retail 0.6% | | | | | | |
American Achievement Corp., 8.25%, 04/01/2012 | | | 140,000 | | | 123,900 |
Home Depot, Inc., 5.875%, 12/16/2036 | | | 1,530,000 | | | 1,283,092 |
Payless ShoeSource, Inc., 8.25%, 08/01/2013 | | | 150,000 | | | 136,125 |
| | | | |
|
|
| | | | | | 1,543,117 |
| | | | |
|
|
Textiles, Apparel & Luxury Goods 0.1% | | | | | | |
Oxford Industries, Inc., 8.875%, 06/01/2011 | | | 245,000 | | | 234,588 |
| | | | |
|
|
See Notes to Financial Statements
15
SCHEDULE OF INVESTMENTS continued
April 30, 2008
| | | Principal
Amount | | | Value |
|
|
|
|
|
|
|
CORPORATE BONDS continued | | | | | | |
CONSUMER STAPLES 0.5% | | | | | | |
Beverages 0.0% | | | | | | |
Constellation Brands, Inc., 8.375%, 12/15/2014 | | $ | 15,000 | | $ | 15,975 |
| | | | |
|
|
Food & Staples Retailing 0.4% | | | | | | |
Ingles Markets, Inc., 8.875%, 12/01/2011 | | | 60,000 | | | 61,200 |
Rite Aid Corp., 8.125%, 05/01/2010 | | | 85,000 | | | 85,425 |
Wal-Mart Stores, Inc., 6.50%, 08/15/2037 | | | 675,000 | | | 718,776 |
| | | | |
|
|
| | | | | | 865,401 |
| | | | |
|
|
Food Products 0.1% | | | | | | |
Del Monte Foods Co.: | | | | | | |
6.75%, 02/15/2015 ρ | | | 100,000 | | | 97,000 |
8.625%, 12/15/2012 | | | 55,000 | | | 57,200 |
Pilgrim’s Pride Corp.: | | | | | | |
7.625%, 05/01/2015 | | | 5,000 | | | 4,775 |
8.375%, 05/01/2017 | | | 70,000 | | | 62,650 |
| | | | |
|
|
| | | | | | 221,625 |
| | | | |
|
|
Household Products 0.0% | | | | | | |
Church & Dwight Co., 6.00%, 12/15/2012 | | | 25,000 | | | 24,750 |
| | | | |
|
|
Personal Products 0.0% | | | | | | |
Central Garden & Pet Co., 9.125%, 02/01/2013 | | | 115,000 | | | 97,750 |
| | | | |
|
|
ENERGY 2.0% | | | | | | |
Energy Equipment & Services 0.2% | | | | | | |
Dresser-Rand Group, Inc., 7.375%, 11/01/2014 | | | 80,000 | | | 80,400 |
GulfMark Offshore, Inc., 7.75%, 07/15/2014 ρ | | | 70,000 | | | 72,800 |
Hornbeck Offshore Services, Inc., Ser. B, 6.125%, 12/01/2014 ρ | | | 225,000 | | | 219,937 |
Parker Drilling Co., 9.625%, 10/01/2013 | | | 85,000 | | | 89,675 |
PHI, Inc., 7.125%, 04/15/2013 | | | 175,000 | | | 164,500 |
| | | | |
|
|
| | | | | | 627,312 |
| | | | |
|
|
Oil, Gas & Consumable Fuels 1.8% | | | | | | |
Chesapeake Energy Corp., 6.875%, 01/15/2016 | | | 205,000 | | | 208,075 |
Clayton Williams Energy, Inc., 7.75%, 08/01/2013 | | | 55,000 | | | 51,700 |
El Paso Corp., 7.00%, 06/15/2017 | | | 20,000 | | | 20,972 |
EnCana Corp., 6.625%, 08/15/2037 | | | 1,225,000 | | | 1,255,184 |
Encore Acquisition Co.: | | | | | | |
6.00%, 07/15/2015 | | | 100,000 | | | 92,500 |
6.25%, 04/15/2014 ρ | | | 70,000 | | | 66,150 |
Exco Resources, Inc., 7.25%, 01/15/2011 | | | 105,000 | | | 105,000 |
Forbes Energy Services, LLC, 11.00%, 02/15/2015 144A | | | 140,000 | | | 140,700 |
Forest Oil Corp., 7.25%, 06/15/2019 ρ | | | 40,000 | | | 41,500 |
Frontier Oil Corp., 6.625%, 10/01/2011 | | | 30,000 | | | 30,000 |
Kinder Morgan Energy Partners, LP, 7.40%, 03/15/2031 | | | 1,125,000 | | | 1,171,210 |
Mariner Energy, Inc., 8.00%, 05/15/2017 | | | 25,000 | | | 24,688 |
See Notes to Financial Statements
16
SCHEDULE OF INVESTMENTS continued
April 30, 2008
| | | Principal
Amount | | | Value |
|
|
|
|
|
|
|
CORPORATE BONDS continued | | | | | | |
ENERGY continued | | | | | | |
Oil, Gas & Consumable Fuels continued | | | | | | |
Peabody Energy Corp.: | | | | | | |
5.875%, 04/15/2016 | | $ | 165,000 | | $ | 160,875 |
7.875%, 11/01/2026 | | | 15,000 | | | 15,563 |
Plains All American Pipeline, LP, 6.50%, 05/01/2018 144A | | | 25,000 | | | 25,579 |
Plains Exploration & Production Co., 7.75%, 06/15/2015 | | | 35,000 | | | 36,050 |
Sabine Pass LNG, LP: | | | | | | |
7.25%, 11/30/2013 | | | 210,000 | | | 195,300 |
7.50%, 11/30/2016 | | | 5,000 | | | 4,600 |
Southwestern Energy Co., 7.50%, 02/01/2018 144A | | | 10,000 | | | 10,650 |
Sunoco, Inc., 9.00%, 11/01/2024 | | | 500,000 | | | 604,396 |
Tesoro Corp.: | | | | | | |
6.50%, 06/01/2017 | | | 20,000 | | | 18,450 |
6.625%, 11/01/2015 | | | 130,000 | | | 122,850 |
Williams Cos., 7.125%, 09/01/2011 | | | 150,000 | | | 160,125 |
| | | | |
|
|
| | | | | | 4,562,117 |
| | | | |
|
|
FINANCIALS 14.5% | | | | | | |
Capital Markets 4.3% | | | | | | |
American Capital Strategies, Ltd., Ser. A, 5.92%, 09/01/2009 + o | | | 3,500,000 | | | 3,461,885 |
E*TRADE Financial Corp.: | | | | | | |
7.375%, 09/15/2013 | | | 50,000 | | | 40,875 |
8.00%, 06/15/2011 | | | 10,000 | | | 8,950 |
12.50%, 11/30/2017 144A | | | 40,000 | | | 41,550 |
Goldman Sachs Group, Inc.: | | | | | | |
5.30%, 02/14/2012 | | | 1,200,000 | | | 1,213,304 |
6.75%, 10/01/2037 | | | 1,330,000 | | | 1,307,369 |
Lehman Brothers Holdings, Inc.: | | | | | | |
6.00%, 07/19/2012 ρ | | | 900,000 | | | 909,594 |
7.00%, 09/27/2027 | | | 250,000 | | | 245,618 |
Merrill Lynch & Co., Inc., 6.05%, 08/15/2012 | | | 1,325,000 | | | 1,322,362 |
Morgan Stanley: | | | | | | |
5.625%, 01/09/2012 | | | 1,425,000 | | | 1,440,428 |
5.95%, 12/28/2017 | | | 1,125,000 | | | 1,116,395 |
| | | | |
|
|
| | | | | | 11,108,330 |
| | | | |
|
|
Commercial Banks 3.1% | | | | | | |
BankAmerica Capital II, 8.00%, 12/15/2026 | | | 1,000,000 | | | 1,019,434 |
FBOP Corp., 10.00%, 01/15/2009 144A | | | 4,000,000 | | | 4,024,800 |
National City Corp., 5.80%, 06/07/2017 | | | 1,700,000 | | | 1,409,266 |
PNC Financial Services Group, Inc., 8.70%, 12/31/2049 144A | | | 300,000 | | | 297,542 |
SunTrust Banks, Inc., 6.00%, 09/11/2017 | | | 1,300,000 | | | 1,269,408 |
| | | | |
|
|
| | | | | | 8,020,450 |
| | | | |
|
|
See Notes to Financial Statements
17
SCHEDULE OF INVESTMENTS continued
April 30, 2008
| | Principal | | |
| | Amount | | Value |
|
|
|
|
|
CORPORATE BONDS continued | | | | | | |
FINANCIALS continued | | | | | | |
Consumer Finance 2.3% | | | | | | |
American Water Capital Corp., 6.09%, 10/15/2017 144A | | $ | 850,000 | | $ | 846,949 |
Daimler Financial Services AG, 4.875%, 06/15/2010 | | | 100,000 | | | 101,054 |
Ford Motor Credit Co., LLC: | | | | | | |
5.70%, 01/15/2010 | | | 65,000 | | | 60,860 |
5.80%, 01/12/2009 | | | 5,000 | | | 4,890 |
7.375%, 10/28/2009 | | | 585,000 | | | 563,329 |
9.75%, 09/15/2010 | | | 40,000 | | | 38,880 |
General Motors Acceptance Corp., LLC: | | | | | | |
5.625%, 05/15/2009 ρ | | | 40,000 | | | 37,618 |
6.875%, 09/15/2011 | | | 425,000 | | | 354,414 |
6.875%, 08/28/2012 | | | 10,000 | | | 7,940 |
7.25%, 03/02/2011 | | | 20,000 | | | 16,976 |
7.75%, 01/19/2010 | | | 65,000 | | | 59,831 |
8.00%, 11/01/2031 | | | 200,000 | | | 151,651 |
FRN: | | | | | | |
3.75%, 09/23/2008 | | | 85,000 | | | 83,408 |
4.32%, 05/15/2009 | | | 165,000 | | | 150,576 |
MBNA Corp., Ser. A, 8.28%, 12/01/2026 | | | 1,750,000 | | | 1,778,465 |
Qwest Capital Funding, Inc., 6.50%, 11/15/2018 | | | 30,000 | | | 25,200 |
Sprint Capital Corp., 6.875%, 11/15/2028 | | | 1,835,000 | | | 1,430,151 |
Toll Corp.: | | | | | | |
8.25%, 02/01/2011 | | | 105,000 | | | 101,587 |
8.25%, 12/01/2011 | | | 20,000 | | | 19,200 |
| | | | |
|
|
| | | | | | 5,832,979 |
| | | | |
|
|
Diversified Financial Services 1.0% | | | | | | |
Citigroup, Inc.: | | | | | | |
5.50%, 08/27/2012 ρ | | | 650,000 | | | 651,760 |
FRN, 8.40%, 04/29/2049 | | | 920,000 | | | 932,264 |
JPMorgan Chase & Co., FRN, 7.90%, 12/31/2049 | | | 790,000 | | | 807,374 |
Leucadia National Corp.: | | | | | | |
7.125%, 03/15/2017 | | | 10,000 | | | 9,600 |
8.125%, 09/15/2015 | | | 180,000 | | | 184,500 |
| | | | |
|
|
| | | | | | 2,585,498 |
| | | | |
|
|
Insurance 0.5% | | | | | | |
Prudential Financial, Inc., 6.10%, 06/15/2017 | | | 1,200,000 | | | 1,219,805 |
| | | | |
|
|
Real Estate Investment Trusts 3.1% | | | | | | |
BRE Properties, Inc., 5.50%, 03/15/2017 | | | 2,400,000 | | | 2,095,745 |
Camden Property Trust, 5.00%, 06/15/2015 | | | 3,500,000 | | | 3,071,957 |
Colonial Realty, Ltd., 6.25%, 06/15/2014 | | | 1,370,000 | | | 1,249,410 |
ERP Operating, LP, 5.75%, 06/15/2017 | | | 1,000,000 | | | 939,966 |
See Notes to Financial Statements
18
SCHEDULE OF INVESTMENTS continued
April 30, 2008
| | Principal | | |
| | Amount | | Value |
|
|
|
|
|
CORPORATE BONDS continued | | | | | | |
FINANCIALS continued | | | | | | |
Real Estate Investment Trusts continued | | | | | | |
Host Marriott Corp.: | | | | | | |
7.125%, 11/01/2013 ρ | | $ | 95,000 | | $ | 95,119 |
Ser. O, 6.375%, 03/15/2015 | | | 5,000 | | | 4,825 |
Ser. Q, 6.75%, 06/01/2016 | | | 155,000 | | | 152,287 |
Omega Healthcare Investors, Inc.: | | | | | | |
7.00%, 04/01/2014 | | | 65,000 | | | 63,781 |
7.00%, 01/15/2016 | | | 100,000 | | | 97,125 |
Ventas, Inc., 7.125%, 06/01/2015 | | | 75,000 | | | 75,563 |
| | | | |
|
|
| | | | | | 7,845,778 |
| | | | |
|
|
Thrifts & Mortgage Finance 0.2% | | | | | | |
Residential Capital, LLC: | | | | | | |
FRN, 3.49%, 06/09/2008 ρ | | | 35,000 | | | 32,769 |
Step Bond: | | | | | | |
8.125%, 11/21/2008 Š | | | 55,000 | | | 45,925 |
8.375%, 06/30/2010 Š | | | 530,000 | | | 290,175 |
| | | | |
|
|
| | | | | | 368,869 |
| | | | |
|
|
HEALTH CARE 1.7% | | | | | | |
Biotechnology 0.6% | | | | | | |
Amgen, Inc., 6.375%, 06/01/2037 | | | 1,500,000 | | | 1,488,138 |
| | | | |
|
|
Health Care Providers & Services 1.1% | | | | | | |
HCA, Inc., 9.25%, 11/15/2016 | | | 385,000 | | | 414,837 |
Omnicare, Inc.: | | | | | | |
6.125%, 06/01/2013 | | | 180,000 | | | 164,700 |
6.875%, 12/15/2015 | | | 215,000 | | | 197,263 |
UnitedHealth Group, Inc., 5.375%, 03/15/2016 | | | 1,000,000 | | | 959,338 |
WellPoint, Inc., 6.375%, 06/15/2037 | | | 1,300,000 | | | 1,192,715 |
| | | | |
|
|
| | | | | | 2,928,853 |
| | | | |
|
|
INDUSTRIALS 0.7% | | | | | | |
Aerospace & Defense 0.4% | | | | | | |
Alliant Techsystems, Inc., 6.75%, 04/01/2016 ρ | | | 25,000 | | | 24,875 |
DRS Technologies, Inc., 6.625%, 02/01/2016 | | | 50,000 | | | 49,750 |
Hexcel Corp., 6.75%, 02/01/2015 | | | 70,000 | | | 69,913 |
L-3 Communications Holdings, Inc.: | | | | | | |
5.875%, 01/15/2015 | | | 635,000 | | | 619,125 |
6.375%, 10/15/2015 | | | 235,000 | | | 233,531 |
| | | | |
|
|
| | | | | | 997,194 |
| | | | |
|
|
Commercial Services & Supplies 0.1% | | | | | | |
Browning-Ferris Industries, Inc.: | | | | | | |
7.40%, 09/15/2035 | | | 90,000 | | | 82,350 |
9.25%, 05/01/2021 | | | 95,000 | | | 98,800 |
See Notes to Financial Statements
19
SCHEDULE OF INVESTMENTS continued
April 30, 2008
| | Principal
Amount | | Value |
|
|
|
|
|
CORPORATE BONDS continued | | | | | | |
INDUSTRIALS continued | | | | | | |
Commercial Services & Supplies continued | | | | | | |
Geo Group, Inc., 8.25%, 07/15/2013 | | $ | 50,000 | | $ | 51,875 |
Mobile Mini, Inc., 6.875%, 05/01/2015 | | | 55,000 | | | 46,613 |
Norcross Safety Products, LLC, Ser. B, 9.875%, 08/15/2011 | | | 65,000 | | | 68,453 |
| | | | |
|
|
| | | | | | 348,091 |
| | | | |
|
|
Machinery 0.1% | | | | | | |
Commercial Vehicle Group, Inc., 8.00%, 07/01/2013 | | | 285,000 | | | 245,812 |
| | | | |
|
|
Road & Rail 0.1% | | | | | | |
Avis Budget Car Rental, LLC, 7.75%, 05/15/2016 | | | 5,000 | | | 4,438 |
Hertz Global Holdings, Inc., 8.875%, 01/01/2014 | | | 80,000 | | | 81,000 |
Kansas City Southern: | | | | | | |
7.50%, 06/15/2009 | | | 35,000 | | | 36,050 |
9.50%, 10/01/2008 | | | 55,000 | | | 55,825 |
| | | | |
|
|
| | | | | | 177,313 |
| | | | |
|
|
Trading Companies & Distributors 0.0% | | | | | | |
United Rentals, Inc., 6.50%, 02/15/2012 | | | 40,000 | | | 37,700 |
| | | | |
|
|
INFORMATION TECHNOLOGY 0.4% | | | | | | |
Electronic Equipment & Instruments 0.2% | | | | | | |
Da-Lite Screen Co., Inc., 9.50%, 05/15/2011 | | | 145,000 | | | 138,475 |
Jabil Circuit, Inc.: | | | | | | |
5.875%, 07/15/2010 | | | 140,000 | | | 137,537 |
8.25%, 03/15/2018 144A | | | 225,000 | | | 226,125 |
Sanmina-SCI Corp.: | | | | | | |
6.75%, 03/01/2013 | | | 15,000 | | | 13,650 |
8.125%, 03/01/2016 | | | 30,000 | | | 27,750 |
FRN, 5.55%, 06/15/2010 144A | | | 29,000 | | | 28,783 |
| | | | |
|
|
| | | | | | 572,320 |
| | | | |
|
|
IT Services 0.1% | | | | | | |
First Data Corp., 9.875%, 09/24/2015 144A | | | 140,000 | | | 127,575 |
SunGard Data Systems, Inc., 4.875%, 01/15/2014 | | | 115,000 | | | 101,488 |
Unisys Corp., 6.875%, 03/15/2010 | | | 25,000 | | | 24,156 |
| | | | |
|
|
| | | | | | 253,219 |
| | | | |
|
|
Office Electronics 0.0% | | | | | | |
Xerox Corp., 6.35%, 05/15/2018 | | | 30,000 | | | 30,207 |
| | | | |
|
|
Semiconductors & Semiconductor Equipment 0.1% | | | | | | |
Freescale Semiconductor, Inc.: | | | | | | |
8.875%, 12/15/2014 | | | 5,000 | | | 4,425 |
9.125%, 12/15/2014 ρ | | | 30,000 | | | 24,825 |
Spansion, Inc., FRN, 6.20%, 06/01/2013 144A | | | 75,000 | | | 56,625 |
| | | | |
|
|
| | | | | | 85,875 |
| | | | |
|
|
See Notes to Financial Statements
20
SCHEDULE OF INVESTMENTS continued
April 30, 2008
| | Principal
Amount | | Value |
|
|
|
|
|
CORPORATE BONDS continued | | | | | | |
MATERIALS 0.7% | | | | | | |
Chemicals 0.3% | | | | | | |
ARCO Chemical Co.: | | | | | | |
9.80%, 02/01/2020 ρ | | $ | 50,000 | | $ | 44,000 |
10.25%, 11/01/2010 | | | 10,000 | | | 10,250 |
Huntsman, LLC, 11.625%, 10/15/2010 | | | 90,000 | | | 94,950 |
Koppers Holdings, Inc.: | | | | | | |
9.875%, 10/15/2013 | | | 10,000 | | | 10,650 |
Sr. Disc. Note, Step Bond, 0.00%, 11/15/2014 † | | | 95,000 | | | 83,600 |
Millenium America, Inc., 7.625%, 11/15/2026 | | | 120,000 | | | 77,700 |
Momentive Performance Materials, Inc.: | | | | | | |
9.75%, 12/01/2014 | | | 130,000 | | | 126,750 |
10.125%, 12/01/2014 | | | 50,000 | | | 47,875 |
Mosaic Co.: | | | | | | |
7.30%, 01/15/2028 | | | 55,000 | | | 53,625 |
7.875%, 12/01/2016 144A | | | 80,000 | | | 88,000 |
Tronox Worldwide, LLC,9.50%, 12/01/2012 ρ | | | 230,000 | | | 198,950 |
| | | | |
|
|
| | | | | | 836,350 |
| | | | |
|
|
Construction Materials 0.1% | | | | | | |
CPG International, Inc.: | | | | | | |
10.50%, 07/01/2013 | | | 145,000 | | | 124,700 |
FRN, 11.47%, 07/01/2012 | | | 35,000 | | | 28,613 |
| | | | |
|
|
| | | | | | 153,313 |
| | | | |
|
|
Containers & Packaging 0.1% | | | | | | |
Berry Plastics Holdings Corp.: | | | | | | |
7.57%, 02/15/2015 144A | | | 30,000 | | | 29,100 |
8.875%, 09/15/2014 ρ | | | 28,000 | | | 26,320 |
Exopack Holding Corp., 11.25%, 02/01/2014 | | | 135,000 | | | 129,600 |
Graphic Packaging International, Inc.: | | | | | | |
8.50%, 08/15/2011 ρ | | | 95,000 | | | 96,425 |
9.50%, 08/15/2013 | | | 35,000 | | | 35,000 |
Smurfit-Stone Container Corp., 8.375%, 07/01/2012 | | | 145,000 | | | 133,400 |
| | | | |
|
|
| | | | | | 449,845 |
| | | | |
|
|
Metals & Mining 0.1% | | | | | | |
Freeport-McMoRan Copper & Gold, Inc., 8.375%, 04/01/2017 | | | 140,000 | | | 155,050 |
| | | | |
|
|
Paper & Forest Products 0.1% | | | | | | |
Georgia Pacific Corp., 8.875%, 05/15/2031 | | | 100,000 | | | 98,000 |
Verso Paper Holdings, LLC, 9.125%, 08/01/2014 ρ | | | 95,000 | | | 98,562 |
| | | | |
|
|
| | | | | | 196,562 |
| | | | |
|
|
TELECOMMUNICATION SERVICES 1.0% | | | | | | |
Diversified Telecommunication Services 0.1% | | | | | | |
Citizens Communications Co., 7.875%, 01/15/2027 | | | 60,000 | | | 53,550 |
FairPoint Communications, Inc., 13.125%, 04/01/2018 144A ρ | | | 40,000 | | | 40,600 |
See Notes to Financial Statements
21
SCHEDULE OF INVESTMENTS continued
April 30, 2008
| | Principal
Amount | | Value |
|
|
|
|
|
CORPORATE BONDS continued | | | | | | |
TELECOMMUNICATION SERVICES continued | | | | | | |
Diversified Telecommunication Services continued | | | | | | |
Qwest Corp.: | | | | | | |
6.50%, 06/01/2017 | | $ | 50,000 | | $ | 47,125 |
7.50%, 06/15/2023 | | | 35,000 | | | 32,200 |
7.875%, 09/01/2011 | | | 125,000 | | | 128,750 |
8.875%, 03/15/2012 | | | 60,000 | | | 63,600 |
| | | | |
|
|
| | | | | | 365,825 |
| | | | |
|
|
Wireless Telecommunication Services 0.9% | | | | | | |
AT&T Wireless, 8.125%, 05/01/2012 | | | 1,600,000 | | | 1,777,870 |
Rural Cellular Corp., 8.25%, 03/15/2012 | | | 145,000 | | | 151,525 |
Sprint Nextel Corp.: | | | | | | |
6.375%, 05/01/2009 | | | 65,000 | | | 64,040 |
6.90%, 05/01/2019 | | | 20,000 | | | 16,530 |
Ser. D, 7.375%, 08/01/2015 | | | 110,000 | | | 88,059 |
Ser. F, 5.95%, 03/15/2014 | | | 110,000 | | | 85,900 |
| | | | |
|
|
| | | | | | 2,183,924 |
| | | | |
|
|
UTILITIES 0.7% | | | | | | |
Electric Utilities 0.7% | | | | | | |
Allegheny Energy Supply Co., 8.25%, 04/15/2012 144A | | | 155,000 | | | 165,850 |
Aquila,Inc., Step Bond, 14.875%, 07/01/2012 Š | | | 238,000 | | | 290,360 |
CMS Energy Corp.: | | | | | | |
6.55%, 07/17/2017 | | | 10,000 | | | 9,872 |
8.50%, 04/15/2011 | | | 15,000 | | | 16,139 |
Edison Mission Energy: | | | | | | |
7.00%, 05/15/2017 | | | 5,000 | | | 5,075 |
7.20%, 05/15/2019 | | | 30,000 | | | 30,375 |
Energy Future Holdings Corp.: | | | | | | |
10.875%, 11/01/2017 144A | | | 115,000 | | | 123,050 |
11.25%, 11/01/2017 144A | | | 70,000 | | | 73,675 |
Mirant Americas Generation, LLC, 8.50%, 10/01/2021 | | | 25,000 | | | 24,625 |
Mirant Mid-Atlantic, LLC, Ser. C, 10.06%, 12/30/2028 | | | 19,486 | | | 22,409 |
Mirant North America, LLC, 7.375%, 12/31/2013 ρ | | | 210,000 | | | 218,925 |
NRG Energy, Inc., 7.375%, 02/01/2016 | | | 175,000 | | | 180,688 |
Orion Power Holdings, Inc., 12.00%, 05/01/2010 | | | 240,000 | | | 265,800 |
Reliant Energy, Inc.: | | | | | | |
6.75%, 12/15/2014 | | | 265,000 | | | 274,937 |
7.875%, 06/15/2017 ρ | | | 5,000 | | | 5,238 |
| | | | |
|
|
| | | | | | 1,707,018 |
| | | | |
|
|
Independent Power Producers & Energy Traders 0.0% | | | | | | |
AES Corp., 8.00%, 10/15/2017 | | | 5,000 | | | 5,237 |
Dynegy Holdings, Inc., 7.50%, 06/01/2015 ρ | | | 15,000 | | | 15,000 |
| | | | |
|
|
| | | | | | 20,237 |
| | | | |
|
|
Total Corporate Bonds (cost $65,734,074) | | | | | | 63,931,162 |
| | | | |
|
|
See Notes to Financial Statements
22
SCHEDULE OF INVESTMENTS continued
April 30, 2008
| | Principal
Amount | | Value |
|
|
|
|
|
FOREIGN BONDS – CORPORATE (PRINCIPAL AMOUNT | | | | | | |
DENOMINATED IN CURRENCY INDICATED) 3.2% | | | | | | |
CONSUMER DISCRETIONARY 0.1% | | | | | | |
Media 0.1% | | | | | | |
Central European Media Enterprise, Ltd., 8.25%, 05/15/2012 EUR | | | 170,000 | | $ | 271,237 |
| | | | |
|
|
CONSUMER STAPLES 0.2% | | | | | | |
Beverages 0.0% | | | | | | |
Canandaigua Brands, Inc., 8.50%, 11/15/2009 GBP | | | 50,000 | | | 98,920 |
| | | | |
|
|
Food & Staples Retailing 0.2% | | | | | | |
Carrefour SA,3.625%, 05/06/2013 EUR | | | 250,000 | | | 366,205 |
| | | | |
|
|
ENERGY 0.1% | | | | | | |
Oil, Gas & Consumable Fuels 0.1% | | | | | | |
GAZPROM OAO, 6.58%, 10/31/2013 GBP | | | 65,000 | | | 118,014 |
Total SA, 4.125%, 01/25/2012 CAD | | | 100,000 | | | 100,945 |
| | | | |
|
|
| | | | | | 218,959 |
| | | | |
|
|
FINANCIALS 2.4% | | | | | | |
Capital Markets 0.1% | | | | | | |
Ahold Finance USA, Inc., 6.50%, 03/14/2017 GBP | | | 65,000 | | | 122,794 |
Morgan Stanley, 5.375%, 11/14/2013 GBP | | | 100,000 | | | 184,405 |
| | | | |
|
|
| | | | | | 307,199 |
| | | | |
|
|
Commercial Banks 1.0% | | | | | | |
Bayerische Landesbank, 10.00%, 03/31/2010 PLN | | | 270,000 | | | 128,649 |
HBOS plc, 4.125%, 01/25/2010 CAD | | | 600,000 | | | 595,473 |
Kreditanstalt für Wiederaufbau: | | | | | | |
4.95%, 10/14/2014 CAD | | | 470,000 | | | 488,754 |
6.00%, 07/15/2009 NZD | | | 530,000 | | | 404,073 |
Landwirtschaftliche Rentenbank: | | | | | | |
4.375%, 11/27/2017 EUR | | | 150,000 | | | 231,585 |
5.75%, 01/21/2015 AUD | | | 700,000 | | | 606,710 |
| | | | |
|
|
| | | | | | 2,455,244 |
| | | | |
|
|
Consumer Finance 0.5% | | | | | | |
ABB International Finance, Ltd., 6.50%, 11/30/2011 EUR | | | 250,000 | | | 404,938 |
BMW Finance Corp., 4.25%, 01/22/2014 EUR | | | 300,000 | | | 453,141 |
Toyota Motor Credit Corp., 5.125%, 01/17/2012 GBP | | | 205,000 | | | 405,149 |
Virgin Media Finance plc, 9.75%, 04/15/2014 GBP | | | 50,000 | | | 93,465 |
| | | | |
|
|
| | | | | | 1,356,693 |
| | | | |
|
|
Diversified Financial Services 0.4% | | | | | | |
Dubai Holding Commercial Operations Group, LLC, 6.00%, 02/01/2017 GBP | | | 100,000 | | | 180,421 |
European Investment Bank, 6.00%, 07/15/2009 NZD | | | 450,000 | | | 343,081 |
General Electric Capital Corp., 3.375%, 02/08/2012 EUR | | | 250,000 | | | 371,501 |
Lighthouse Group plc, 8.00%, 04/30/2014 EUR | | | 70,000 | | | 92,618 |
| | | | |
|
|
| | | | | | 987,621 |
| | | | |
|
|
See Notes to Financial Statements
23
SCHEDULE OF INVESTMENTS continued
April 30, 2008
| | Principal
Amount | | Value |
|
|
|
|
|
FOREIGN BONDS – CORPORATE (PRINCIPAL AMOUNT DENOMINATED IN CURRENCY INDICATED) continued | | | | | | |
FINANCIALS continued | | | | | | |
Thrifts & Mortgage Finance 0.4% | | | | | | |
Nykredit, 5.00%, 10/01/2038 DKK | | | 2,347,353 | | $ | 463,923 |
Totalkredit, FRN, 5.36%, 01/01/2015 DKK | | | 2,432,479 | | | 515,833 |
| | | | |
|
|
| | | | | | 979,756 |
| | | | |
|
|
INDUSTRIALS 0.1% | | | | | | |
Aerospace & Defense 0.1% | | | | | | |
Bombardier, Inc., 7.25%, 11/15/2016 EUR | | | 70,000 | | | 110,051 |
| | | | |
|
|
Machinery 0.0% | | | | | | |
Savcio Holdings, Ltd., 8.00%, 02/15/2013 EUR | | | 50,000 | | | 69,950 |
| | | | |
|
|
MATERIALS 0.0% | | | | | | |
Containers & Packaging 0.0% | | | | | | |
Owens-Illinois European Group BV, 6.875%, 03/31/2017 EUR | | | 70,000 | | | 107,328 |
| | | | |
|
|
TELECOMMUNICATION SERVICES 0.2% | | | | | | |
Diversified Telecommunication Services 0.2% | | | | | | |
France Telecom, 7.50%, 03/14/2011 GBP | | | 270,000 | | | 557,498 |
| | | | |
|
|
UTILITIES 0.1% | | | | | | |
Multi-Utilities 0.1% | | | | | | |
Veolia Environnement SA, 4.00%, 02/12/2016 EUR | | | 200,000 | | | 280,483 |
| | | | |
|
|
Total Foreign Bonds – Corporate (Principal Amount Denominated in Currency Indicated) (cost $ 7,673,795) | | | | | | 8,167,144 |
| | | | |
|
|
FOREIGN BONDS – GOVERNMENT (PRINCIPAL AMOUNT DENOMINATED IN CURRENCY INDICATED) 3.7% | | | | | | |
Australia: | | | | | | |
6.00%, 05/01/2012 AUD | | | 400,000 | | | 363,618 |
6.00%, 10/14/2015 AUD | | | 670,000 | | | 600,475 |
Brazil, 10.25%, 01/10/2028 BRL | | | 350,000 | | | 184,232 |
Brazil, 7.375%, 02/03/2015 EUR | | | 60,000 | | | 100,289 |
Denmark, 4.00%, 11/15/2017 DKK | | | 2,440,000 | | | 494,196 |
France, 4.25%, 04/25/2019 EUR | | | 755,000 | | | 1,161,447 |
Germany, 3.75%, 01/04/2017 EUR | | | 600,000 | | | 907,596 |
Hong Kong, 4.23%, 03/21/2011 HKD | | | 3,050,000 | | | 415,420 |
International Bank for Reconstruction and Development, 5.75%, 06/25/2010 RUB | | | 5,100,000 | | | 213,194 |
Malaysia, 3.87%, 04/13/2010 MYR | | | 650,000 | | | 207,660 |
Mexico: | | | | | | |
5.50%, 02/17/2020 EUR | | | 320,000 | | | 488,897 |
8.00%, 12/07/2023 MXN | | | 4,500,000 | | | 429,420 |
10.00%, 12/05/2024 MXN | | | 1,875,000 | | | 211,718 |
Morocco, 5.375%, 06/27/2017 EUR | | | 65,000 | | | 95,024 |
Netherlands, 4.00%, 07/15/2016 EUR | | | 890,000 | | | 1,366,170 |
Norway, 5.00%, 05/15/2015 NOK | | | 3,900,000 | | | 786,280 |
See Notes to Financial Statements
24
SCHEDULE OF INVESTMENTS continued
April 30, 2008
| | Principal
Amount | | Value |
|
|
|
|
|
FOREIGN BONDS – GOVERNMENT (PRINCIPAL AMOUNT DENOMINATED IN CURRENCY INDICATED) continued | | | | | | |
Philippines, 6.25%, 03/15/2016 EUR | | | 200,000 | | $ | 302,385 |
South Africa, 5.25%, 05/16/2013 EUR | | | 100,000 | | | 151,768 |
Turkey, 4.75%, 07/06/2012 EUR | | | 340,000 | | | 508,898 |
Ukraine, 4.95%, 10/13/2015 EUR | | | 50,000 | | | 68,522 |
United Kingdom, 5.00%, 03/07/2012 GBP | | | 220,000 | | | 446,311 |
| | | | |
|
|
Total Foreign Bonds – Government (Principal Amount Denominated in Currency Indicated) (cost $8,841,351) | | | | | | 9,503,520 |
| | | | |
|
|
WHOLE LOAN MORTGAGE-BACKED COLLATERALIZED MORTGAGE OBLIGATIONS 1.7% | | | | | | |
FIXED-RATE 1.7% | | | | | | |
Banc of America Mtge. Securities, Inc., Ser. 2005-D, Class 2A6, 4.78%, 05/25/2035 | | $ | 3,255,000 | | | 3,083,367 |
Deutsche Alt-A Securities, NIM, Ser. 2007-0A1, Class N1, 6.50%, 02/25/2047 144A o | | | 439,345 | | | 428,801 |
Harborview NIM Corp.: | | | | | | |
Ser. 2006-12, Class N1, 6.41%, 12/19/2036 144A o | | | 14,109 | | | 14,087 |
Ser. 2006-14, Class N2, 8.35%, 03/19/2038 144A o | | | 907,070 | | | 908,889 |
| | | | |
|
|
Total Whole Loan Mortgage-Backed Collateralized Mortgage Obligations (cost $4,522,691) | | | | | | 4,435,144 |
| | | | |
|
|
WHOLE LOAN MORTGAGE-BACKED PASS THROUGH SECURITIES 15.8% | | | | | | |
FIXED-RATE 7.0% | | | | | | |
Alternative Loan Trust, Ser. 2007-14T2, Class 2, 6.00%, 07/25/2037 | | | 1,651,784 | | | 1,112,601 |
Countrywide Alternative Loan Trust, Inc.: | | | | | | |
Ser. 2005-50CB, Class 1A1, 5.50%, 11/25/2035 | | | 1,660,040 | | | 1,501,706 |
Ser. 2007-24, Class A1, 7.00%, 10/25/2037 | | | 905,452 | | | 559,696 |
CSMC Mtge. Backed Trust, Ser. 2007-4R, Class 1A1, 5.69%, 10/26/2036 144A | | | 405,000 | | | 360,268 |
First Horizon Mtge. Pass Through Trust, Ser. 2007-AR2, Class 2A1, 5.89%, 07/25/2037 | | | 2,861,206 | | | 2,634,221 |
GSAA Home Equity Trust, Ser. 2007-10, Class A1A, 6.00%, 11/25/2037 | | | 1,363,125 | | | 1,174,850 |
GSR Mtge. Loan Trust, Ser. 2006-8F, Class 4A3, 6.50%, 09/25/2036 | | | 580,000 | | | 490,820 |
Morgan Stanley Capital I, Inc., Ser. 2007-13, Class 5A1, 5.50%, 10/25/2037 | | | 3,434,173 | | | 3,134,239 |
PHH Alternative Mtge. Trust, Ser. 2007-01, Class 21A, 6.00%, 02/25/2037 | | | 773,389 | | | 675,188 |
Residential Accredited Loans, Inc., Ser. 2007-QS10, Class A1, 6.50%, 09/25/2037 | | | 898,090 | | | 841,123 |
Washington Mutual, Inc., Ser. 2005-AR3, Class A1, 4.64%, 03/25/2035 | | | 3,056,839 | | | 2,956,715 |
Wells Fargo Mtge. Backed Securities Trust, Ser. 2006-AR10, Class 5A1, 5.60%, 07/25/2036 | | | 2,477,860 | | | 2,386,243 |
| | | | |
|
|
| | | | | | 17,827,670 |
| | | | |
|
|
FLOATING-RATE 8.8% | | | | | | |
Citigroup Mtge. Loan Trust, Inc., Ser. 2005-7, Class 2A3A, 5.18%, 09/25/2035 | | | 3,076,910 | | | 2,883,319 |
Lehman XS Trust, Ser. 2006-18N, Class A5A, 3.07%, 12/25/2036 | | | 145,000 | | | 104,799 |
MASTR Reperforming Loan Trust, Ser. 2006-2, Class 1A1, 5.90%, 05/25/2046 144A | | | 2,501,759 | | | 2,474,340 |
Merrill Lynch Countrywide Comml. Mtge. Trust, Ser. 2007-8, Class A3, 6.16%, 07/12/2017 | | | 3,530,000 | | | 3,569,267 |
See Notes to Financial Statements
25
SCHEDULE OF INVESTMENTS continued
April 30, 2008
| | Principal
Amount | | Value |
|
|
|
|
|
WHOLE LOAN MORTGAGE-BACKED PASS THROUGH SECURITIES continued | | | | | | |
FLOATING-RATE continued | | | | | | |
Residential Funding Mtge. Securities, Ser. 2007-SA3, Class 2A1, 5.78%, 07/27/2037 | | $ | 3,518,431 | | $ | 3,294,116 |
Structured Adjustable Rate Mtge. Loan Trust, Ser. 2007-3, Class 3A1, 5.72%, 04/25/2037 | | | 2,347,432 | | | 2,133,198 |
Washington Mutual, Inc. Mtge. Pass-Through Cert.: | | | | | | |
Ser. 2006-AR17, Class 1A1B, 4.89%, 12/25/2046 | | | 2,433,558 | | | 1,736,563 |
Ser. 2007-HY7, Class 3A2, 5.91%, 07/25/2037 | | | 2,885,458 | | | 2,785,430 |
Ser. 2007-OA5: | | | | | | |
Class 1A, 4.83%, 06/25/2047 | | | 2,439,392 | | | 1,956,758 |
Class 1A1B, 4.83%, 06/25/2047 | | | 2,201,230 | | | 1,534,874 |
| | | | |
|
|
| | | | | | 22,472,664 |
| | | | |
|
|
Total Whole Loan Mortgage-Backed Pass Through Securities (cost $44,280,585) | | | | | | 40,300,334 |
| | | | |
|
|
WHOLE LOAN SUBORDINATE COLLATERALIZED MORTGAGE OBLIGATIONS 1.3% | | | | | | |
FIXED-RATE 0.1% | | | | | | |
Financial Asset Securitization, Inc., Ser. 1997-NAM2, Class B-2, 7.88%, 07/25/2027 | | | 345,588 | | | 344,793 |
| | | | |
|
|
FLOATING-RATE 1.2% | | | | | | |
Harborview Mtge. Loan Trust: | | | | | | |
Ser. 2004-7, Class B4, 5.99%, 11/19/2034 | | | 2,605,009 | | | 1,917,670 |
Ser. 2005-8, Class 2B3, 6.43%, 02/19/2035 | | | 1,087,571 | | | 1,118,653 |
| | | | |
|
|
| | | | | | 3,036,323 |
| | | | |
|
|
Total Whole Loan Subordinate Collateralized Mortgage Obligations (cost $3,461,179) | | | | | | 3,381,116 |
| | | | |
|
|
YANKEE OBLIGATIONS – CORPORATE 3.5% | | | | | | |
CONSUMER DISCRETIONARY 0.0% | | | | | | |
Media 0.0% | | | | | | |
Videotron, Ltd., 9.125%, 04/15/2018 144A | | | 5,000 | | | 5,350 |
| | | | |
|
|
CONSUMER STAPLES 0.1% | | | | | | |
Beverages 0.1% | | | | | | |
Companhia Brasileira de Bebidas, 8.75%, 09/15/2013 | | | 115,000 | | | 133,975 |
| | | | |
|
|
Food Products 0.0% | | | | | | |
Sadia Overseas, Ltd., 6.875%, 05/24/2017 144A ρ | | | 100,000 | | | 102,000 |
| | | | |
|
|
ENERGY 0.3% | | | | | | |
Oil, Gas & Consumable Fuels 0.3% | | | | | | |
Connacher Oil & Gas, Ltd., 10.25%, 12/15/2015 144A | | | 45,000 | | | 47,925 |
GAZPROM OAO, 9.625%, 03/01/2013 | | | 190,000 | | | 216,505 |
Griffin Coal Mining Co., Ltd.: | | | | | | |
9.50%, 12/01/2016 144A | | | 390,000 | | | 308,100 |
9.50%, 12/01/2016 | | | 20,000 | | | 15,800 |
OPTI Canada, Inc., 7.875%, 12/15/2014 | | | 240,000 | | | 245,400 |
| | | | |
|
|
| | | | | | 833,730 |
| | | | |
|
|
See Notes to Financial Statements
26
SCHEDULE OF INVESTMENTS continued
April 30, 2008
| | Principal
Amount | | Value |
|
|
|
|
|
YANKEE OBLIGATIONS – CORPORATE continued | | | | | | |
FINANCIALS 1.0% | | | | | | |
Commercial Banks 0.1% | | | | | | |
VTB Capital SA, 7.50%, 10/12/2011 | | $ | 120,000 | | $ | 124,152 |
| | | | |
|
|
Consumer Finance 0.1% | | | | | | |
Avago Technologies Finance, Ltd.: | | | | | | |
10.125%, 12/01/2013 | | | 10,000 | | | 10,700 |
FRN, 8.58%, 06/01/2013 | | | 30,000 | | | 30,075 |
Gaz Capital SA, 6.21%, 11/22/2016 | | | 100,000 | | | 95,773 |
NXP Funding, LLC, 7.875%, 10/15/2014 | | | 5,000 | | | 4,963 |
Petroplus Finance, Ltd., 6.75%, 05/01/2014 144A ρ | | | 30,000 | | | 28,350 |
Virgin Media Finance plc, 9.125%, 08/15/2016 | | | 112,000 | | | 108,640 |
| | | | |
|
|
| | | | | | 278,501 |
| | | | |
|
|
Diversified Financial Services 0.8% | | | | | | |
Corporacion Andina De Fomento, 5.75%, 01/12/2017 | | | 55,000 | | | 53,222 |
FMG Finance Property, Ltd., 10.625%, 09/01/2016 144A | | | 240,000 | | | 274,200 |
Preferred Term Securities XII, Ltd., FRN, 10.00%, 12/24/2033 | | | 1,000,000 | | | 711,320 |
Ship Finance International, Ltd., 8.50%, 12/15/2013 | | | 130,000 | | | 131,950 |
Trapeza CDO, LLC, Ser. 2004-7A, Class B1, FRN, 4.47%, 01/25/2035 144A | | | 1,000,000 | | | 927,830 |
| | | | |
|
|
| | | | | | 2,098,522 |
| | | | |
|
|
INDUSTRIALS 0.1% | | | | | | |
Road & Rail 0.1% | | | | | | |
Kansas City Southern de Mexico: | | | | | | |
7.375%, 06/01/2014 144A | | | 120,000 | | | 114,150 |
9.375%, 05/01/2012 | | | 135,000 | | | 141,413 |
| | | | |
|
|
| | | | | | 255,563 |
| | | | |
|
|
INFORMATION TECHNOLOGY 0.1% | | | | | | |
Communications Equipment 0.1% | | | | | | |
Nortel Networks Corp., 10.125%, 07/15/2013 ρ | | | 220,000 | | | 216,700 |
| | | | |
|
|
Semiconductors & Semiconductor Equipment 0.0% | | | | | | |
Sensata Technologies, Inc., 8.00%, 05/01/2014 ρ | | | 75,000 | | | 70,313 |
| | | | |
|
|
MATERIALS 0.2% | | | | | | |
Metals & Mining 0.2% | | | | | | |
Evraz Group SA: | | | | | | |
8.875%, 04/24/2013 144A | | | 30,000 | | | 30,525 |
9.50%, 04/24/2018 144A | | | 100,000 | | | 102,494 |
Novelis, Inc., 7.25%, 02/15/2015 | | | 405,000 | | | 372,600 |
| | | | |
|
|
| | | | | | 505,619 |
| | | | |
|
|
Paper & Forest Products 0.0% | | | | | | |
Corporacion Durango SAB de CV, 10.50%, 10/05/2017 144A | | | 105,000 | | | 79,275 |
| | | | |
|
|
See Notes to Financial Statements
27
SCHEDULE OF INVESTMENTS continued
April 30, 2008
| | Principal
Amount | | Value |
|
|
|
|
|
YANKEE OBLIGATIONS – CORPORATE continued | | | | | | |
TELECOMMUNICATION SERVICES 1.5% | | | | | | |
Diversified Telecommunication Services 0.6% | | | | | | |
Telecom Italia SpA, 6.20%, 07/18/2011 | | $ | 200,000 | | $ | 201,619 |
Telefonica Emisiones, 7.05%, 06/20/2036 ρ | | | 1,000,000 | | | 1,096,645 |
Telefonos De Mexico SAB de CV, 4.75%, 01/27/2010 | | | 100,000 | | | 101,322 |
| | | | |
|
|
| | | | | | 1,399,586 |
| | | | |
|
|
Wireless Telecommunication Services 0.9% | | | | | | |
Inmarsat, plc, Sr. Disc. Note, Step Bond, 0.00%, 11/15/2012 † | | | 30,000 | | | 29,737 |
Intelsat, Ltd., 9.25%, 06/15/2016 | | | 50,000 | | | 50,687 |
Vimpel Communications: | | | | | | |
8.25%, 05/23/2016 | | | 200,000 | | | 196,490 |
8.375%, 04/30/2013 144A | | | 15,000 | | | 15,012 |
9.125%, 04/30/2018 144A | | | 100,000 | | | 100,250 |
Vodafone Group plc: | | | | | | |
5.625%, 02/27/2017 | | | 1,200,000 | | | 1,207,260 |
7.75%, 02/15/2010 | | | 700,000 | | | 739,007 |
| | | | |
|
|
| | | | | | 2,338,443 |
| | | | |
|
|
UTILITIES 0.2% | | | | | | |
Electric Utilities 0.1% | | | | | | |
Enersis SA, 7.375%, 01/15/2014 | | | 115,000 | | | 123,917 |
| | | | |
|
|
Multi-Utilities 0.1% | | | | | | |
National Power Corp.: | | | | | | |
6.875%, 11/02/2016 | | | 200,000 | | | 203,958 |
FRN, 7.34%, 08/23/2011 | | | 130,000 | | | 137,618 |
| | | | |
|
|
| | | | | | 341,576 |
| | | | |
|
|
Total Yankee Obligations – Corporate (cost $9,044,487) | | | | | | 8,907,222 |
| | | | |
|
|
YANKEE OBLIGATIONS – GOVERNMENT 1.1% | | | | | | |
Argentina, 12.25%, 06/19/2018 • | | | 159,188 | | | 46,165 |
Brazil: | | | | | | |
7.125%, 01/20/2037 | | | 370,000 | | | 423,650 |
8.25%, 01/20/2034 | | | 350,000 | | | 445,375 |
Chile, 7.125%, 01/11/2012 | | | 125,000 | | | 137,512 |
Colombia: | | | | | | |
7.375%, 01/27/2017 | | | 100,000 | | | 112,850 |
8.125%, 05/21/2024 | | | 175,000 | | | 207,812 |
Emirates of Abu Dhabi, 5.50%, 08/02/2012 | | | 200,000 | | | 210,051 |
Indonesia, 6.75%, 03/10/2014 | | | 90,000 | | | 93,150 |
Mexico, 8.375%, 01/14/2011 | | | 60,000 | | | 66,954 |
Peru: | | | | | | |
8.375%, 05/03/2016 | | | 200,000 | | | 243,400 |
8.75%, 11/21/2033 | | | 35,000 | | | 46,550 |
See Notes to Financial Statements
28
SCHEDULE OF INVESTMENTS continued
April 30, 2008
| | Principal
Amount | | Value |
|
|
|
|
|
YANKEE OBLIGATIONS – GOVERNMENT continued | | | | | | |
Russia: | | | | | | |
11.00%, 07/24/2018 | | $ | 55,000 | | $ | 79,613 |
Sr. Disc. Note, Step Bond, 7.50%, 03/31/2030 † | | | 147,750 | | | 170,144 |
Turkey, 7.00%, 09/26/2016 | | | 200,000 | | | 205,750 |
Ukraine, 6.58%, 11/21/2016 | | | 100,000 | | | 98,375 |
Venezuela, 10.75%, 09/19/2013 | | | 180,000 | | | 186,300 |
| | | | |
|
|
Total Yankee Obligations – Government (cost $2,755,653) | | | | | | 2,773,651 |
| | | | |
|
|
|
|
|
|
|
| | Shares | | Value |
|
|
|
|
|
PREFERRED STOCKS 0.8% | | | | | | |
FINANCIALS 0.8% | | | | | | |
Diversified Financial Services 0.0% | | | | | | |
First Republic Capital Corp., 10.50% 144A | | | 50 | | | 54,425 |
| | | | |
|
|
Thrifts & Mortgage Finance 0.8% | | | | | | |
Fannie Mae, Ser. S, 8.25% ρ | | | 33,750 | | | 845,100 |
Freddie Mac, Ser. Z, 8.38% ρ | | | 41,260 | | | 1,056,256 |
| | | | |
|
|
| | | | | | 1,901,356 |
| | | | |
|
|
Total Preferred Stocks (cost $1,931,527) | | | | | | 1,955,781 |
| | | | |
|
|
|
|
|
|
|
| | Principal
Amount | | Value |
|
|
|
|
|
CONVERTIBLE DEBENTURES 0.0% | | | | | | |
CONSUMER DISCRETIONARY 0.0% | | | | | | |
Media 0.0% | | | | | | |
Sinclair Broadcast Group, Inc., 3.00%, 05/15/2027 (cost $27,262) | | $ | 30,000 | | | 27,263 |
| |
|
| |
|
|
|
|
|
|
|
| | Shares | | Value |
|
|
|
|
|
MUTUAL FUND SHARES 2.1% | | | | | | |
Blackrock Core Bond Trust ρ | | | 63,250 | | | 777,975 |
Blackrock Income Opportunity Trust | | | 82,350 | | | 830,088 |
Blackrock Income Trust | | | 80,175 | | | 485,059 |
MFS Charter Income Trust | | | 108,400 | | | 919,232 |
MFS Intermediate Income Trust | | | 143,700 | | | 909,621 |
MFS Multimarket Income Trust | | | 100,954 | | | 586,543 |
Putnam Premier Income Trust | | | 105,043 | | | 653,367 |
Van Kampen Bond Fund | | | 5,325 | | | 91,111 |
| | | | |
|
|
Total Mutual Fund Shares (cost $5,072,385) | | | | | | 5,252,996 |
| | | | |
|
|
See Notes to Financial Statements
29
SCHEDULE OF INVESTMENTS continued
April 30, 2008 | | | | | | |
| | | Principal
Amount | | | Value |
|
|
|
|
|
|
|
LOANS 0.2% | | | | | | |
CONSUMER DISCRETIONARY 0.0% | | | | | | |
Idearc, Inc., FRN, 4.80%, 11/17/2014 < | | $ | 49,962 | | $ | 41,396 |
Ion Media Networks, Inc., FRN, 6.05%, 01/15/2012 < | | | 110,000 | | | 90,522 |
| | | | |
|
|
| | | | | | 131,918 |
| | | | |
|
|
INDUSTRIALS 0.1% | | | | | | |
Clarke American Corp., FRN, 5.30%, 02/28/2014 | | | 129,673 | | | 109,854 |
Neff Corp., FRN, 6.30%, 11/30/2014 < | | | 185,000 | | | 135,644 |
| | | | |
|
|
| | | | | | 245,498 |
| | | | |
|
|
MATERIALS 0.1% | | | | | | |
Wimar Co., FRN, 5.30%, 01/03/2012 | | | 160,000 | | | 151,557 |
| | | | |
|
|
UTILITIES 0.0% | | | | | | |
Energy Future Holdings Corp., FRN, 5.80%, 10/10/2014 | | | 1,063 | | | 1,015 |
| | | | |
|
|
Total Loans (cost $531,853) | | | | | | 529,988 |
| | | | |
|
|
|
|
|
|
|
|
| | Shares | | | Value |
|
|
|
|
|
|
SHORT-TERM INVESTMENTS 6.6% | | | | | |
MUTUAL FUND SHARES 6.6% | | | | | |
Evergreen Institutional Money Market Fund, Class I, 2.78% q ø ## ρρ (cost $16,826,147) | | 16,826,147 | | | 16,826,147 |
| | | |
|
|
Total Investments (cost $284,921,772) 108.3% | | | | | 277,070,985 |
Other Assets and Liabilities (8.3%) | | | | | (21,272,401) |
| | | |
|
|
Net Assets 100.0% | | | | $ | 255,798,584 |
| | | |
|
|
# | When-issued or delayed delivery security |
## | All or a portion of this security has been segregated for when-issued or delayed delivery securities. |
144A | Security that may be sold to qualified institutional buyers under Rule 144A of the Securities Act of 1933, as amended. This security has been determined to be liquid under guidelines established by the Board of Trustees, unless otherwise noted. |
ρ | All or a portion of this security is on loan. |
+ | Security is deemed illiquid. |
o | Security is valued at fair value as determined by the investment advisor in good faith, according to procedures approved by the Board of Trustees. |
† | Security initially issued in zero coupon form which converts to coupon form at a specified rate and date. An effective interest rate is applied to recognize interest income daily for the bond. This rate is based on total expected interest to be earned over the life of the bond which consists of the aggregate coupon-interest payments and discount at acquisition. The rate shown is the stated rate at the current period end. |
Š | The rate shown is the stated rate at the current period end. |
• | Security that has defaulted on payment of interest and/or principal. |
< | All or a portion of the position represents an unfunded loan commitment. |
q | Rate shown is the 7-day annualized yield at period end. |
ø | Evergreen Investment Management Company, LLC is the investment advisor to both the Fund and the money market fund. |
ρρ | All or a portion of this security represents investment of cash collateral received from securities on loan. |
See Notes to Financial Statements
30
SCHEDULE OF INVESTMENTS continued
April 30, 2008
Summary of Abbreviations
AUD | | Australian Dollar |
BRL | | Brazil Real |
CAD | | Canadian Dollar |
CDO | | Collateralized Debt Obligation |
DKK | | Danish Krone |
EUR | | Euro |
FHLMC | | Federal Home Loan Mortgage Corp. |
FNMA | | Federal National Mortgage Association |
FRN | | Floating Rate Note |
GBP | | Great British Pound |
GNMA | | Government National Mortgage Association |
HKD | | Hong Kong Dollar |
MASTR | | Mortgage Asset Securitization Transactions, Inc. |
MXN | | Mexican Peso |
MYR | | Malaysian Ringgit |
NIM | | Net Interest Margin |
NOK | | Norwegian Krone |
NZD | | New Zealand Dollar |
PLN | | Polish Zloty |
RUB | | Russian Ruble |
TBA | | To Be Announced |
The following table shows the percent of total investments (excluding equity positions, collateral from securities on loan and segregated cash and cash equivalents) by credit quality based on Moody’s and Standard & Poor’s ratings as of April 30, 2008 (unaudited):
AAA | | 53.1% |
AA | | 11.3% |
A | | 10.1% |
BBB | | 9.4% |
BB | | 11.7% |
B | | 4.1% |
CCC | | 0.2% |
NR | | 0.1% |
| |
|
| | 100.0% |
| |
|
The following table shows the percent of total investments (excluding equity positions, collateral from securities on loan and segregated cash and cash equivalents) based on effective maturity as of April 30, 2008 (unaudited):
Less than 1 year | | 9.1% |
1 to 3 year(s) | | 10.2% |
3 to 5 years | | 16.5% |
5 to 10 years | | 51.0% |
10 to 20 years | | 7.8% |
20 to 30 years | | 5.3% |
Greater than 30 years | | 0.1% |
| |
|
| | 100.0% |
| |
|
See Notes to Financial Statements
31
STATEMENT OF ASSETS AND LIABILITIES
April 30, 2008
Assets | | | |
Investments in securities, at value (cost $268,095,625) including $5,439,665 of securities loaned | | $ | 260,244,838 |
Investments in affiliated money market fund, at value (cost $16,826,147) | | | 16,826,147 |
|
|
|
|
Total investments | | | 277,070,985 |
Foreign currency, at value (cost $719,774) | | | 722,569 |
Receivable for securities sold | | | 3,620,449 |
Principal paydown receivable | | | 108,062 |
Receivable for Fund shares sold | | | 34,203 |
Dividends and interest receivable | | | 2,718,810 |
Receivable for securities lending income | | | 2,506 |
Premiums paid on credit default swap transactions | | | 357,463 |
Unrealized gains on forward foreign currency exchange contracts | | | 93,102 |
Unrealized gains on total return swap transactions | | | 1,067,061 |
Unrealized gains on credit default swap transactions | | | 1,796,079 |
Prepaid expenses and other assets | | | 184,839 |
|
|
|
|
Total assets | | | 287,776,128 |
|
|
|
|
Liabilities | | | |
Dividends payable | | | 389,001 |
Payable for securities purchased | | | 21,322,535 |
Payable for Fund shares redeemed | | | 277,317 |
Unrealized losses on credit default swap transactions | | | 2,900,803 |
Unrealized losses on forward foreign currency exchange contracts | | | 159,834 |
Premiums received on credit default swap transactions | | | 1,283,066 |
Payable for securities on loan | | | 5,556,625 |
Due to custodian bank | | | 5,137 |
Advisory fee payable | | | 1,501 |
Distribution Plan expenses payable | | | 2,141 |
Due to other related parties | | | 5,557 |
Accrued expenses and other liabilities | | | 74,027 |
|
|
|
|
Total liabilities | | | 31,977,544 |
|
|
|
|
Net assets | | $ | 255,798,584 |
|
|
|
|
Net assets represented by | | | |
Paid-in capital | | $ | 296,012,513 |
Overdistributed net investment income | | | (323,900) |
Accumulated net realized losses on investments | | | (31,940,283) |
Net unrealized losses on investments | | | (7,949,746) |
|
|
|
|
Total net assets | | $ | 255,798,584 |
|
|
|
|
Net assets consists of | | | |
Class A | | $ | 171,130,258 |
Class B | | | 13,894,369 |
Class C | | | 22,139,631 |
Class I | | | 48,634,326 |
|
|
|
|
Total net assets | | $ | 255,798,584 |
|
|
|
|
Shares outstanding (unlimited number of shares authorized) | | | |
Class A | | | 12,513,548 |
Class B | | | 1,016,622 |
Class C | | | 1,618,948 |
Class I | | | 3,556,340 |
|
|
|
|
See Notes to Financial Statements
32
STATEMENT OF ASSETS AND LIABILITIES continued
April 30, 2008
Net asset value per share | | | |
Class A | | $ | 13.68 |
Class A — Offering price (based on sales charge of 4.75%) | | $ | 14.36 |
Class B | | $ | 13.67 |
Class C | | $ | 13.68 |
Class I | | $ | 13.68 |
|
|
|
|
See Notes to Financial Statements
33
STATEMENT OF OPERATIONS
Year Ended April 30, 2008
Investment income | | | |
Interest | | $ | 16,019,881 |
Income from affiliate | | | 639,969 |
Dividends | | | 370,554 |
Securities lending | | | 12,797 |
|
|
|
|
Total investment income | | | 17,043,201 |
|
|
|
|
Expenses | | | |
Advisory fee | | | 1,200,936 |
Distribution Plan expenses | | | |
Class A | | | 550,231 |
Class B | | | 149,343 |
Class C | | | 236,016 |
Administrative services fee | | | 275,934 |
Transfer agent fees | | | 536,187 |
Trustees’ fees and expenses | | | 6,089 |
Printing and postage expenses | | | 70,251 |
Custodian and accounting fees | | | 157,305 |
Registration and filing fees | | | 54,720 |
Professional fees | | | 38,394 |
Other | | | 6,499 |
|
|
|
|
Total expenses | | | 3,281,905 |
Less: | Expense reductions | | | (10,604) |
| Fee waivers and expense reimbursements | | | (565,271) |
|
|
|
|
|
Net expenses | | | 2,706,030 |
|
|
|
|
Net investment income | | | 14,337,171 |
|
|
|
|
Net realized and unrealized gains or losses on investments | | | |
Net realized gains or losses on: | | | |
Securities | | | (1,946,888) |
Futures contracts | | | (80,021) |
Foreign currency related transactions | | | 463,541 |
Credit default swap transactions | | | (217,878) |
Total return swap transactions | | | (5,613,672) |
|
|
|
|
Net realized losses on investments | | | (7,394,918) |
Net change in unrealized gains or losses on investments | | | (8,064,904) |
|
|
|
|
Net realized and unrealized gains or losses on investments | | | (15,459,822) |
|
|
|
|
Net decrease in net assets resulting from operations | | $ | (1,122,651) |
|
|
|
|
See Notes to Financial Statements
34
STATEMENTS OF CHANGES IN NET ASSETS
| | Year Ended April 30, |
| |
|
| | 2008 | | 2007 |
|
|
|
|
|
Operations | | | | | | | | |
Net investment income | | | $ | 14,337,171 | | | $ | 17,061,576 |
Net realized losses on investments | | | | (7,394,918) | | | | (1,553,243) |
Net change in unrealized gains or losses on investments | | | | (8,064,904) | | | | 6,403,394 |
|
|
|
|
|
|
|
|
|
Net increase (decrease) in net assets resulting from operations | | | | (1,122,651) | | | | 21,911,727 |
|
|
|
|
|
|
|
|
|
Distributions to shareholders from | | | | | | | | |
Net investment income | | | | | | | | |
Class A | | | | (6,841,784) | | | | (11,787,049) |
Class B | | | | (438,612) | | | | (852,703) |
Class C | | | | (691,872) | | | | (1,242,068) |
Class I | | | | (2,077,072) | | | | (3,565,742) |
Tax return of capital | | | | | | | | |
Class A | | | | (2,666,944) | | | | (165,900) |
Class B | | | | (214,425) | | | | (13,740) |
Class C | | | | (338,870) | | | | (19,998) |
Class I | | | | (757,769) | | | | (47,948) |
|
|
|
|
|
|
|
|
|
Total distributions to shareholders | | | | (14,027,348) | | | | (17,695,148) |
|
|
|
|
|
|
|
|
|
| | Shares | | | | Shares | | |
|
|
|
|
|
|
|
|
|
Capital share transactions | | | | | | | | |
Proceeds from shares sold | | | | | | | | |
Class A | | 645,781 | | 9,130,480 | | 579,848 | | 8,326,359 |
Class B | | 207,305 | | 2,925,612 | | 169,920 | | 2,430,882 |
Class C | | 225,175 | | 3,194,094 | | 190,704 | | 2,730,653 |
Class I | | 62,125 | | 874,257 | | 44,267 | | 639,034 |
|
|
|
|
|
|
|
|
|
| | | | 16,124,443 | | | | 14,126,928 |
|
|
|
|
|
|
|
|
|
Net asset value of shares issued in reinvestment of distributions | | | | | | | | |
Class A | | 449,451 | | 6,347,504 | | 552,035 | | 7,905,712 |
Class B | | 29,046 | | 410,033 | | 35,341 | | 506,013 |
Class C | | 44,486 | | 628,139 | | 56,461 | | 808,431 |
Class I | | 108,074 | | 1,526,367 | | 130,689 | | 1,871,835 |
|
|
|
|
|
|
|
|
|
| | | | 8,912,043 | | | | 11,091,991 |
|
|
|
|
|
|
|
|
|
Automatic conversion of Class B shares to Class A shares | | | | | | | | |
Class A | | 51,162 | | 717,162 | | 69,131 | | 988,636 |
Class B | | (51,162) | | (717,162) | | (69,131) | | (988,636) |
|
|
|
|
|
|
|
|
|
| | | | 0 | | | | 0 |
|
|
|
|
|
|
|
|
|
Payment for shares redeemed | | | | | | | | |
Class A | | (2,435,890) | | (34,383,483) | | (2,368,618) | | (33,880,260) |
Class B | | (283,010) | | (3,986,296) | | (304,671) | | (4,352,055) |
Class C | | (322,517) | | (4,543,748) | | (398,516) | | (5,692,232) |
Class I | | (522,589) | | (7,353,155) | | (598,099) | | (8,560,870) |
|
|
|
|
|
|
|
|
|
| | | | (50,266,682) | | | | (52,485,417) |
|
|
|
|
|
|
|
|
|
Net decrease in net assets resulting from capital share transactions | | | | (25,230,196) | | | | (27,266,498) |
|
|
|
|
|
|
|
|
|
Total decrease in net assets | | | | (40,380,195) | | | | (23,049,919) |
Net assets | | | | | | | | |
Beginning of period | | | | 296,178,779 | | | | 319,228,698 |
|
|
|
|
|
|
|
|
|
End of period | | | $ | 255,798,584 | | | $ | 296,178,779 |
|
|
|
|
|
|
|
|
|
Overdistributed net investment income | | | $ | (323,900) | | | $ | (416,859) |
|
|
|
|
|
|
|
|
|
See Notes to Financial Statements
35
NOTES TO FINANCIAL STATEMENTS
1. ORGANIZATION
Evergreen Core Plus Bond Fund (the “Fund”) (formerly Diversified Bond Fund) is a diversified series of Evergreen Fixed Income Trust (the “Trust”), a Delaware statutory trust organized on September 18, 1997. The Trust is an open-end management investment company registered under the Investment Company Act of 1940, as amended (the “1940 Act”).
The Fund offers Class A, Class B, Class C and Class I shares. Class A shares are sold with a front-end sales charge. However, Class A share investments of $1 million or more are not subject to a front-end sales charge but are subject to a contingent deferred sales charge of 1.00% upon redemption within 18 months. Class B shares are sold without a front-end sales charge but are subject to a contingent deferred sales charge that is payable upon redemption and decreases depending on how long the shares have been held. Class C shares are sold without a front-end sales charge but are subject to a contingent deferred sales charge that is payable upon redemption within one year. Class I shares are sold without a front-end sales charge or contingent deferred sales charge. Each class of shares, except Class I shares, pays an ongoing distribution fee.
2. SIGNIFICANT ACCOUNTING POLICIES
The following is a summary of significant accounting policies consistently followed by the Fund in the preparation of its financial statements. The policies are in conformity with generally accepted accounting principles in the United States of America, which require management to make estimates and assumptions that affect amounts reported herein. Actual results could differ from these estimates.
a. Valuation of investments
Portfolio debt securities acquired with more than 60 days to maturity are fair valued using matrix pricing methods determined by an independent pricing service which takes into consideration such factors as similar security prices, yields, maturities, liquidity and ratings. Securities for which valuations are not readily available from an independent pricing service may be valued by brokers which use prices provided by market makers or estimates of market value obtained from yield data relating to investments or securities with similar characteristics.
Listed equity securities are usually valued at the last sales price or official closing price on the national securities exchange where the securities are principally traded.
Short-term securities with remaining maturities of 60 days or less at the time of purchase are valued at amortized cost, which approximates market value.
Investments in open-end mutual funds are valued at net asset value. Securities for which market quotations are not readily available or not reflective of current market value are valued at fair value as determined by the investment advisor in good faith, according to procedures approved by the Board of Trustees.
36
NOTES TO FINANCIAL STATEMENTS continued
b. Repurchase agreements
Securities pledged as collateral for repurchase agreements are held by the custodian bank or in a segregated account in the Fund’s name until the agreements mature. Collateral for certain tri-party repurchase agreements is held at the counterparty’s custodian in a segregated account for the benefit of the Fund and the counterparty. Each agreement requires that the market value of the collateral be sufficient to cover payments of interest and principal. However, in the event of default or bankruptcy by the other party to the agreement, retention of the collateral may be subject to legal proceedings. The Fund will only enter into repurchase agreements with banks and other financial institutions, which are deemed by the investment advisor to be creditworthy pursuant to guidelines established by the Board of Trustees. In certain instances, the Fund’s securities lending agent may provide collateral in the form of repurchase agreements.
c. Foreign currency translation
All assets and liabilities denominated in foreign currencies are translated into U.S. dollar amounts at the date of valuation. Purchases and sales of portfolio securities and income items denominated in foreign currencies are translated into U.S. dollar amounts on the respective dates of such transactions. The Fund does not separately account for that portion of the results of operations resulting from changes in foreign exchange rates on investments and the fluctuations arising from changes in market prices of securities held. Such fluctuations are included with the net realized and unrealized gains or losses on investments.
d. Futures contracts
In order to gain exposure to, or protect against changes in, security values, the Fund may buy and sell futures contracts. The primary risks associated with the use of futures contracts are the imperfect correlation between changes in market values of securities held by the Fund and the prices of futures contracts, and the possibility of an illiquid market.
Futures contracts are valued based upon their quoted daily settlement prices. The aggregate principal amounts of the contracts are not recorded in the financial statements. Fluctuations in the value of the contracts are recorded in the Statement of Assets and Liabilities as an asset or liability and in the Statement of Operations as unrealized gains or losses until the contracts are closed, at which point they are recorded as net realized gains or losses on futures contracts.
e. Forward foreign currency contracts
A forward foreign currency contract is an agreement between two parties to purchase or sell a specific currency for an agreed-upon price at a future date. The Fund enters into forward foreign currency contracts to facilitate transactions in foreign-denominated securities and to attempt to minimize the risk to the Fund from adverse changes in the relationship between currencies. Forward foreign currency contracts are recorded at the forward rate and marked-to-market daily. When the contracts are closed, realized gains and losses
37
NOTES TO FINANCIAL STATEMENTS continued
arising from such transactions are recorded as realized gains or losses on foreign currency related transactions. The Fund could be exposed to risks if the counterparties to the contracts are unable to meet the terms of their contracts or if the value of the foreign currency changes unfavorably.
f. When-issued and delayed delivery transactions
The Fund records when-issued or delayed delivery securities as of trade date and maintains security positions such that sufficient liquid assets will be available to make payment for the securities purchased. Securities purchased on a when-issued or delayed delivery basis are marked-to-market daily and begin earning interest on the settlement date. Losses may occur on these transactions due to changes in market conditions or the failure of counterparties to perform under the contract.
g. Loans
The Fund may purchase loans through an agent, by assignment from another holder of the loan or as a participation interest in another holder’s portion of the loan. Loans are purchased on a when-issued or delayed delivery basis. Interest income is accrued based on the terms of the securities. Fees earned on loan purchasing activities are recorded as income when earned. Loans involve interest rate risk, liquidity risk and credit risk, including the potential default or insolvency of the borrower.
h. Securities lending
The Fund may lend its securities to certain qualified brokers in order to earn additional income. The Fund receives compensation in the form of fees or interest earned on the investment of any cash collateral received. The Fund also continues to receive interest and dividends on the securities loaned. The Fund receives collateral in the form of cash or securities with a market value at least equal to the market value of the securities on loan, including accrued interest. In the event of default or bankruptcy by the borrower, the Fund could experience delays and costs in recovering the loaned securities or in gaining access to the collateral. The Fund has the right under the lending agreement to recover the securities from the borrower on demand.
i. Dollar roll transactions
The Fund may enter into dollar roll transactions with respect to mortgage-backed securities. In a dollar roll transaction, the Fund sells mortgage-backed securities to financial institutions and simultaneously agrees to accept substantially similar (same type, coupon and maturity) securities at a later date at an agreed upon price. The Fund will use the proceeds generated from the transactions to invest in short-term investments, which may enhance the Fund’s current yield and total return. The Fund accounts for dollar roll transactions as purchases and sales. The Fund could be exposed to risks if the counterparty defaults on its obligation to perform under the terms of the agreement, if the Fund receives inferior securities in comparison to what was sold to the counterparty at redelivery or if there are variances in paydown speed between the mortgage-related pools.
38
NOTES TO FINANCIAL STATEMENTS continued
j. Credit default swaps
The Fund may enter into credit default swap contracts. Credit default swaps involve an exchange of a stream of payments for protection against the loss in value of an underlying security or index in the event of default or bankruptcy. Under the terms of the swap, one party acts as a guarantor and receives a periodic stream of payments that is a fixed percentage applied to a notional principal amount over the term of the swap. In return, the counterparty agrees to purchase the notional amount of the underlying instrument or index, at par, if a credit event occurs during the term of the swap. The Fund may enter into credit default swaps as either the guarantor or the counterparty.
Any premiums paid or received on the transactions are recorded as an asset or liability on the Statement of Assets and Liabilities and amortized. The value of the swap contract is marked-to-market daily based on quotations from an independent pricing service or market makers and any change in value is recorded as an unrealized gain or loss. Periodic payments made or received are recorded as realized gains or losses. In addition, payments received or made as a result of a credit event or termination of the contract are recognized as realized gains or losses. The Fund could be exposed to risks if the counterparty defaults on its obligation to perform, or if there are unfavorable changes in the fluctuation of interest rates or in the price of the underlying security or index.
k. Total return swaps
The Fund may enter into total return swap contracts. Total return swaps involve commitments to pay interest in exchange for a market-linked return, both based on notional amounts. To the extent the total return of the security or index underlying the transaction exceeds or falls short of the offsetting interest rate obligation, the Fund will receive a payment from, or make a payment to, the counterparty.
The value of the swap contract is marked-to-market daily based upon quotations from an independent pricing service or market makers and any change in value is recorded as an unrealized gain or loss. Periodic payments made or received are recorded as realized gains or losses. The Fund could be exposed to risks if the counterparty defaults on its obligation to perform, or if there are unfavorable changes in the fluctuation of interest rates or in the price of the underlying security or index.
l. Security transactions and investment income
Security transactions are recorded on trade date. Realized gains and losses are computed using the specific cost of the security sold. Interest income is recorded on the accrual basis and includes accretion of discounts and amortization of premiums. Dividend income is recorded on the ex-dividend date.
m. Federal and other taxes
The Fund intends to continue to qualify as a regulated investment company and distribute all of its taxable income, including any net capital gains (which have already been offset by available capital loss carryovers). Accordingly, no provision for federal taxes is
39
NOTES TO FINANCIAL STATEMENTS continued
required. The Fund has adopted the provisions of FASB Interpretation No. 48, Accounting for Uncertainty in Income Taxes (“FIN 48”) which prescribes a minimum threshold for financial statement recognition of the benefit of a tax position taken or expected to be taken in a tax return. The Fund’s financial statements have not been impacted by the adoption of FIN 48. The Fund’s income and excise tax returns and all financial records supporting those returns are subject to examination by the federal, Massachusetts and Delaware revenue authorities for all taxable years beginning after April 30, 2004.
n. Distributions
Distributions to shareholders from net investment income are accrued daily and paid monthly. Distributions from net realized gains, if any, are recorded on the ex-dividend date. Such distributions are determined in conformity with income tax regulations, which may differ from generally accepted accounting principles.
Reclassifications have been made to the Fund’s components of net assets to reflect income and gains available for distribution (or available capital loss carryovers, as applicable) under income tax regulations. The primary permanent differences causing such reclassifications are due to net realized foreign currency gains or losses, expiration of capital loss carryovers, mortgage paydown gains and losses, premium amortization and swap contracts. During the year ended April 30, 2008, the following amounts were reclassified:
| | |
|
|
|
Paid-in-Capital | $ | (22,702,302) |
Overdistributed net investment income | | (4,194,872) |
Accumulated net realized losses on investments | | 26,897,174 |
|
|
|
o. Class allocations
Income, common expenses and realized and unrealized gains and losses are allocated to the classes based on the relative net assets of each class. Distribution fees, if any, are calculated daily at the class level based on the appropriate net assets of each class and the specific expense rates applicable to each class.
3. ADVISORY FEE AND OTHER TRANSACTIONS WITH AFFILIATES
Evergreen Investment Management Company, LLC (“EIMC”), an indirect, wholly-owned subsidiary of Wachovia Corporation (“Wachovia”), is the investment advisor to the Fund and is paid a fee at an annual rate of 2% of the Fund’s gross investment income plus an amount determined by applying percentage rates to the average daily net assets of the Fund, starting at 0.31% and declining to 0.16% as average daily net assets increase. For the year ended April 30, 2008, the advisory fee was equivalent to 0.43% of the Fund’s average daily net assets.
Tattersall Advisory Group, Inc., an indirect, wholly-owned subsidiary of Wachovia, is an investment sub-advisor to the Fund and is paid by EIMC for its services to the Fund.
40
NOTES TO FINANCIAL STATEMENTS continued
Effective October 1, 2007, First International Advisors, Inc. d/b/a Evergreen International Advisors, an indirect, wholly-owned subsidiary of Wachovia, also became an investment sub-advisor to the Fund and is paid by EIMC for its services to the Fund.
From time to time, EIMC may voluntarily or contractually waive its fee and/or reimburse expenses in order to limit operating expenses. During the year ended April 30, 2008, EIMC voluntarily waived its advisory fee in the amount of $479,408 and reimbursed Distribution Plan expenses (see Note 4) relating to Class A shares in the amount of $85,863.
The Fund may invest in money market funds which are advised by EIMC. Income earned on these investments is included in income from affiliate on the Statement of Operations.
Effective January 1, 2008, EIMC replaced Evergreen Investment Services, Inc. (“EIS”), an indirect, wholly-owned subsidiary of Wachovia, as the administrator to the Fund upon the assignment of the Fund’s Administrative Services Agreement from EIS to EIMC. There were no changes to the services being provided or fees being paid by the Fund. The administrator provides the Fund with facilities, equipment and personnel and is paid an annual rate determined by applying percentage rates to the aggregate average daily net assets of the Evergreen funds (excluding money market funds) starting at 0.10% and declining to 0.05% as the aggregate average daily net assets of the Evergreen funds (excluding money market funds) increase.
Evergreen Service Company, LLC (“ESC”), an indirect, wholly-owned subsidiary of Wachovia, is the transfer and dividend disbursing agent for the Fund. ESC receives account fees that vary based on the type of account held by the shareholders in the Fund. For the year ended April 30, 2008, the transfer agent fees were equivalent to an annual rate of 0.19% of the Fund’s average daily net assets.
4. DISTRIBUTION PLANS
EIS serves as distributor of the Fund’s shares. The Fund has adopted Distribution Plans, as allowed by Rule 12b-1 of the 1940 Act, for each class of shares, except Class I. Under the Distribution Plans, distribution fees are paid at an annual rate of 0.25% of the average daily net assets for Class A and 1.00% of the average daily net assets for each of Class B and Class C shares. Prior to April 1, 2008, distribution fees were paid at an annual rate of 0.30% of the average daily net assets for Class A shares.
For the year ended April 30, 2008, EIS received $3,877 from the sale of Class A shares and $35,736 and $549 in contingent deferred sales charges from redemptions of Class B and Class C shares, respectively.
41
NOTES TO FINANCIAL STATEMENTS continued
5. INVESTMENT TRANSACTIONS
Cost of purchases and proceeds from sales of investment securities (excluding short-term securities) were as follows for the year ended April 30, 2008:
Cost of Purchases | Proceeds from Sales |
|
|
U.S.
Government | Non-U.S.
Government | U.S.
Government | Non-U.S.
Government |
|
|
|
|
$614,110,567 | $444,151,602 | $555,564,396 | $507,808,916 |
|
|
|
|
At April 30, 2008, the Fund had forward foreign currency exchange contracts outstanding as follows:
Forward Foreign Currency Exchange Contracts to Buy:
Exchange
Date | Contracts
to Receive | U.S. Value at
April 30, 2008 | In Exchange for
U.S. $ | Unrealized
Gain |
|
|
|
|
|
06/10/2008 | 446,199 EUR | $693,349 | $681,345 | $12,004 |
|
|
|
|
|
Exchange
Date | Contracts to
Receive | U.S. Value at
April 30, 2008 | In Exchange
for | U.S. Value
at April 30, 2008 | Unrealized
Gain (Loss) |
|
|
|
|
|
|
05/19/2008 | 186,500,000 | JPY | $1,788,914 | 2,236,479 | NZD | $1,742,688 | $ 46,226 |
05/19/2008 | 851,321 | NZD | 663,359 | 70,938,000 | JPY | 680,440 | (17,081) |
05/19/2008 | 400,000 | NZD | 311,684 | 32,401,200 | JPY | 310,793 | 891 |
06/10/2008 | 434,879 | EUR | 675,758 | 335,000 | GBP | 662,591 | 13,167 |
06/10/2008 | 174,000,000 | JPY | 1,671,242 | 1,106,870 | EUR | 1,719,967 | (48,725) |
07/14/2008 | 137,119,000 | JPY | 1,319,554 | 1,488,806 | AUD | 1,388,804 | (69,250) |
07/16/2008 | 46,090,000 | JPY | 443,594 | 3,564,275 | HKD | 458,241 | (14,647) |
07/16/2008 | 6,720,000 | JPY | 64,677 | 34,100 | GBP | 67,268 | (2,591) |
07/22/2008 | 72,770,000 | JPY | 700,617 | 713,704 | CAD | 708,157 | (7,540) |
|
|
|
|
|
|
|
|
Forward Foreign Currency Exchange Contracts to Sell:
Exchange
Date | Contracts to
Deliver | U.S. Value at
April 30, 2008 | In Exchange
for U.S. $ | Unrealized
Gain |
|
|
|
|
|
07/01/2008 | 870,000 EUR | $1,350,480 | $1,371,294 | $20,814 |
|
|
|
|
|
During the year ended April 30, 2008, the Fund loaned securities to certain brokers and earned $11,705 in affiliated income relating to securities lending activity which is included in income from affiliate on the Statement of Operations. At April 30, 2008, the value of securities on loan and the total value of collateral received for securities loaned amounted to $5,439,665 and $5,556,625, respectively.
42
NOTES TO FINANCIAL STATEMENTS continued
At April 30, 2008, the Fund had the following credit default swap contracts outstanding:
Expiration | | Counterparty | | Reference
Debt
Obligation/Index | | Notional
Amount | | Fixed Payments
Made
by the Fund | | Frequency of
Payments
Made | | Unrealized
Gain (Loss) |
|
|
|
|
|
|
|
|
|
|
|
|
|
09/20/2012 | | Goldman Sachs | | PPG Industries, 7.05%, 09/20/2012 | | $ | 500,000 | | 0.22% | | Quarterly | | | $ | 4,960 | |
12/20/2012 | | UBS | | Dow Jones CDX, North American Investment Grade Index | | | 105,000 | | 3.75% | | Quarterly | | | | 3,583 | |
12/20/2012 | | Goldman Sachs | | Dow Jones CDX, North American Investment Grade Index | | | 40,000 | | 3.75% | | Quarterly | | | | 1,365 | |
12/20/2012 | | JPMorgan | | Dow Jones CDX, North American Investment Grade Index | | | 145,000 | | 3.75% | | Quarterly | | | | 1,836 | |
06/20/2013 | | Lehman Brothers | | Pulte Homes, Inc., 5.25%, 01/15/2014 | | | 40,000 | | 4.17% | | Quarterly | | | | (2,627) | |
06/20/2013 | | UBS | | Dow Jones CDX, North American Investment Grade Index | | | 55,000 | | 5.00% | | Quarterly | | | | (260) | |
06/20/2013 | | Bank of America | | Dow Jones CDX, North American Investment Grade Index | | | 25,000 | | 5.00% | | Quarterly | | | | (118) | |
03/15/2049 | | Morgan Stanley | | CMBX North America BBB 2 Index | | | 5,000,000 | | 0.60% | | Quarterly | | | | 1,535,654 | |
43
NOTES TO FINANCIAL STATEMENTS continued
Expiration | | Counterparty | | Reference
Debt
Obligation/Index | | Notional
Amount | | Fixed Payments
Received
by the Fund | | Frequency of
Payments
Received | | Unrealized
Gain (Loss) |
|
|
|
|
|
|
|
|
|
|
|
|
|
09/20/2008 | | CitiBank | | Goldman Sachs, 6.60%, 01/01/2012 | | $ | 500,000 | | 0.70% | | Quarterly | | | $ | 24 | |
09/20/2008 | | CitiBank | | Lehman Brothers, 6.625%, 01/18/2012 | | | 500,000 | | 1.00% | | Quarterly | | | | (1,719) | |
09/20/2008 | | JPMorgan | | Merril Lynch, 5.00%, 01/15/2015 | | | 500,000 | | 0.80% | | Quarterly | | | | (1,908) | |
09/20/2008 | | JPMorgan | | Lehman Brothers, 6.625%, 01/18/2012 | | | 500,000 | | 1.25% | | Quarterly | | | | (1,075) | |
12/20/2008 | | Goldman Sachs | | Lehman Brothers, 6.625%, 01/18/2012 | | | 500,000 | | 0.85% | | Quarterly | | | | (2,104) | |
12/20/2008 | | Lehman Brothers | | Morgan Stanley, 6.60%, 0/01/2012 | | | 500,000 | | 1.15% | | Quarterly | | | | (532) | |
03/20/2009 | | Goldman Sachs | | Morgan Stanley, 6.60%, 0/01/2012 | | | 500,000 | | 1.75% | | Quarterly | | | | 2,003 | |
03/20/2009 | | Citigroup | | AIG, 6.25%, 05/01/2036 | | | 1,000,000 | | 1.55% | | Quarterly | | | | 5,358 | |
03/20/2009 | | Lehman Brothers | | AIG, 6.25%, 05/01/2036 | | | 750,000 | | 2.25% | | Quarterly | | | | 9,247 | |
09/20/2010 | | Goldman Sachs | | Duke Realty, Ltd., 5.40%, 08/15/2014 | | | 500,000 | | 0.75% | | Quarterly | | | | (17,066) | |
09/20/2012 | | Morgan Stanley | | Duke Realty, Ltd., 5.40%, 08/15/2014 | | | 500,000 | | 0.90% | | Quarterly | | | | (29,565) | |
06/20/2012 | | Morgan Stanley | | Dow Jones CDX, North American Investment Grade Index | | | 1,000,000 | | 0.35% | | Quarterly | | | | (23,132) | |
06/20/2013 | | Lehman Brothers | | Centex Corp., 5.25%, 06/15/2015 | | | 40,000 | | 5.12% | | Quarterly | | | | 2,318 | |
12/13/2049 | | Morgan Stanley | | CMBX North America BBB 3 Index | | | 5,000,000 | | 2.00% | | Quarterly | | | | (2,083,907) | |
44
NOTES TO FINANCIAL STATEMENTS continued
Expiration | | Counterparty | | Reference
Debt
Obligation/Index | | Notional
Amount | | Fixed Payments
Received
by the Fund | | Frequency of
Payments
Received | | Unrealized
Gain (Loss) |
|
|
|
|
|
|
|
|
|
|
|
|
|
12/13/2049 | | Morgan Stanley | | CMBX North America AA Index | | $ | 200,000 | | 0.27% | | Quarterly | | | $ | (31,363) | |
12/13/2049 | | Lehman Brothers | | CMBX North America AJ 3 Index | | | 2,000,000 | | 1.47% | | Quarterly | | | | 185,158 | |
12/13/2049 | | Goldman Sachs | | CMBX North America AA 3 Index | | | 600,000 | | 0.27% | | Quarterly | | | | (67,997) | |
12/13/2049 | | Lehman Brothers | | CMBX North America AJ 3 Index | | | 800,000 | | 1.47% | | Quarterly | | | | 33,165 | |
02/17/2051 | | Lehman Brothers | | CMBX North America AA 4 Index | | | 300,000 | | 1.65% | | Quarterly | | | | 11,408 | |
02/17/2051 | | Goldman Sachs | | CMBX North America AA 4 Index | | | 4,000,000 | | 1.65% | | Quarterly | | | | (509,944) | |
02/17/2051 | | Lehman Brothers | | CMBX North America AA 4 Index | | | 1,000,000 | | 1.65% | | Quarterly | | | | (127,486) | |
|
|
|
|
|
|
|
|
|
|
|
|
|
|
|
|
|
At April 30, 2008, the Fund had the following total return swap contracts outstanding:
Expiration | | Notional
Amount | | Counterparty | | Swap
Description | | Unrealized Gain |
|
|
|
|
|
|
|
|
|
06/01/2008 | | $ | 2,000,000 | | Lehman Brothers | | Agreement dated 03/01/2008 to receive the spread return on the Lehman Brothers CMBS AAA 8.5+yr Index plus 10 basis points multiplied by the notional amount and to pay the negative spread return. | | $ | 62,882 |
08/01/2008 | | | 11,000,000 | | Lehman Brothers | | Agreement dated 02/01/2008 to receive the spread return on the Lehman Brothers CMBS AAA 8.5+yr Index multiplied by the notional amount and to pay the negative spread return. | | | 344,965 |
09/01/2008 | | | 5,000,000 | | Lehman Brothers | | Agreement dated 03/01/2008 to receive the spread return on the Lehman Brothers CMBS AAA 8.5+yr Index plus 100 basis points multiplied by the notional amount and to pay the negative spread return. | | | 160,830 |
09/01/2008 | | | 2,000,000 | | Lehman Brothers | | Agreement dated 03/01/2008 to receive the spread return on the Lehman Brothers CMBS AAA 8.5+yr Index plus 125 basis points multiplied by the notional amount and to pay the negative spread return. | | | 64,735 |
45
NOTES TO FINANCIAL STATEMENTS continued
| | Notional | | | | Swap | | Unrealized |
Expiration | | Amount | | Counterparty | | Description | | Gain |
|
|
|
|
|
|
|
|
|
10/01/2008 | | $5,000,000 | | Lehman Brothers | | Agreement dated 10/01/2007 to receive the spread return on the Lehman Brothers CMBS AAA 8.5+yr Index minus 62 basis points multiplied by the notional amount and to pay the negative spread return. | | | $154,305 |
02/01/2009 | | 9,000,000 | | Lehman Brothers | | Agreement dated 02/01/2008 to receive the spread return on the Lehman Brothers CMBS AAA 8.5+yr Index minus 40 basis points multiplied by the notional amount and to pay the negative spread return. | | | 279,344 |
|
|
|
|
|
|
|
|
|
|
On April 30, 2008, the aggregate cost of securities for federal income tax purposes was $285,225,448. The gross unrealized appreciation and depreciation on securities based on tax cost was $7,206,403 and $15,360,866, respectively, with a net unrealized depreciation of $8,154,463.
As of April 30, 2008, the Fund had $31,625,704 in capital loss carryovers for federal income tax purposes expiring as follows:
| | | | Expiration | | | | |
|
|
|
|
|
|
|
|
|
2009 | | 2010 | | 2013 | | 2015 | | 2016 |
|
|
|
|
|
|
|
|
|
$14,769,764 | | $4,586,980 | | $4,295,612 | | $3,669,132 | | $4,304,216 |
|
|
|
|
|
|
|
|
|
These losses are subject to certain limitations prescribed by the Internal Revenue Code.
For income tax purposes, capital losses incurred after October 31 within the Fund’s fiscal year are deemed to arise on the first business day of the following fiscal year. As of April 30, 2008, the Fund incurred and will elect to defer post-October losses of $10,904.
6. INTERFUND LENDING
Pursuant to an Exemptive Order issued by the SEC, the Fund may participate in an inter-fund lending program with certain funds in the Evergreen fund family. This program allows the Fund to borrow from, or lend money to, other participating funds. During the year ended April 30, 2008, the Fund did not participate in the interfund lending program.
7. DISTRIBUTIONS TO SHAREHOLDERS
As of April 30, 2008, the components of distributable earnings on a tax basis were as follows:
| | Capital Loss | | |
Unrealized | | Carryovers and | | Temporary Book/ |
Depreciation | | Post-October Losses | | Tax Differences |
|
|
|
|
|
$8,150,705 | | $31,636,608 | | $(426,616) |
|
|
|
|
|
The differences between the components of distributable earnings on a tax basis and the amounts reflected in the Statement of Assets and Liabilities are primarily due to wash
46
NOTES TO FINANCIAL STATEMENTS continued
sales, premium amortization, forward contracts and swap contracts. The temporary book/tax differences are a result of timing differences between book and tax recognition of income and/or expenses.
The tax character of distributions paid was as follows:
| | Year Ended April 30, |
| |
|
| | 2008 | | 2007 |
|
|
|
|
|
Ordinary Income | | $ | 10,049,340 | | $ | 17,447,562 |
Return of Capital | | | 3,978,008 | | | 247,586 |
|
|
|
|
|
|
|
8. EXPENSE REDUCTIONS
Through expense offset arrangements with ESC and the Fund’s custodian, a portion of fund expenses has been reduced.
9. DEFERRED TRUSTEES’ FEES
Each Trustee of the Fund may defer any or all compensation related to performance of his or her duties as a Trustee. The Trustees’ deferred balances are allocated to deferral accounts, which are included in the accrued expenses for the Fund. The investment performance of the deferral accounts is based on the investment performance of certain Evergreen funds. Any gains earned or losses incurred in the deferral accounts are reported in the Fund’s Trustees’ fees and expenses. At the election of the Trustees, the deferral account will be paid either in one lump sum or in quarterly installments for up to ten years.
10. FINANCING AGREEMENT
The Fund and certain other Evergreen funds share in an unsecured revolving credit commitment for temporary and emergency purposes, including the funding of redemptions, as permitted by each participating fund’s borrowing restrictions. Borrowings under this facility bear interest at 0.50% per annum above the Federal Funds rate. All of the participating funds are charged an annual commitment fee on the unused balance, which is allocated pro rata. The credit facility is for $100 million with an annual commitment fee of 0.08%. During the year ended April 30, 2008, the Fund had no borrowings.
11. REGULATORY MATTERS AND LEGAL PROCEEDINGS
Pursuant to an administrative order issued by the SEC on September 19, 2007, EIMC, EIS, ESC (collectively, the “Evergreen Entities”), Wachovia Securities, LLC and the SEC have entered into an agreement settling allegations of (i) improper short-term trading arrangements in effect prior to May 2003 involving former officers and employees of EIMC and certain broker-dealers, (ii) insufficient systems for monitoring exchanges and enforcing exchange limitations as stated in certain funds’ prospectuses, and (iii) inadequate e-mail retention practices. Under the settlement, the Evergreen Entities were censured and have paid approximately $32 million in disgorgement and penalties. This amount, along with a fine assessed by the SEC against Wachovia Securities, LLC will be
47
NOTES TO FINANCIAL STATEMENTS continued
distributed pursuant to a plan to be developed by an independent distribution consultant and approved by the SEC. The Evergreen Entities neither admitted nor denied the allegations and findings set forth in its settlement with the SEC.
In addition, the Evergreen funds and EIMC and certain of its affiliates are involved in various legal actions, including private litigation and class action lawsuits. EIMC does not expect that any of such legal actions currently pending or threatened will have a material adverse impact on the financial position or operations of any of the Evergreen funds or on EIMC’s ability to provide services to the Evergreen funds.
Although EIMC believes that none of the matters discussed above will have a material adverse impact on the Evergreen funds, there can be no assurance that these matters and any publicity surrounding or resulting from them will not result in reduced sales or increased redemptions of Evergreen fund shares, which could increase Evergreen fund transaction costs or operating expenses, or that they will not have other adverse consequences on the Evergreen funds.
12. NEW ACCOUNTING PRONOUNCEMENTS
In September 2006, FASB issued Statement of Financial Accounting Standards No. 157, Fair Value Measurements (“FAS 157”). FAS 157 establishes a single authoritative definition of fair value, establishes a framework for measuring fair value and expands disclosures about fair value measurements. FAS 157 applies to fair value measurements already required or permitted by existing standards. The change to current generally accepted accounting principles from the application of FAS 157 relates to the definition of fair value, the methods used to measure fair value, and the expanded disclosures about fair value measurements. Management of the Fund does not believe the adoption of FAS 157 will materially impact the financial statement amounts, however, additional disclosures may be required about the inputs used to develop the measurements and the effect of certain of the measurements on changes in net assets for the period. FAS 157 is effective for financial statements issued for fiscal years beginning after November 15, 2007 and interim periods within those fiscal years.
In March 2008, FASB issued Statement of Financial Accounting Standards No. 161, Disclosures about Derivative Instruments and Hedging Activities (“FAS 161”), an amendment of FASB Statement No. 133. FAS 161 requires enhanced disclosures about (a) how and why a fund uses derivative instruments, (b) how derivative instruments and hedging activities are accounted for, and (c) how derivative instruments and related hedging activities affect a fund’s financial position, financial performance, and cash flows. Management of the Fund does not believe the adoption of FAS 161 will materially impact the financial statement amounts, but will require additional disclosures. This will include qualitative and quantitative disclosures on derivative positions existing at period end and the effect of using derivatives during the reporting period. FAS 161 is effective for financial statements issued for fiscal years and interim periods beginning after November 15, 2008.
48
REPORT OF INDEPENDENT REGISTERED PUBLIC ACCOUNTING FIRM
Board of Trustees and Shareholders
Evergreen Fixed Income Trust
We have audited the accompanying statement of assets and liabilities, including the schedule of investments, of the Evergreen Core Plus Bond Fund, formerly Evergreen Diversified Bond Fund, a series of the Evergreen Fixed Income Trust, as of April 30, 2008 and the related statement of operations for the year then ended, statements of changes in net assets for each of the years in the two-year period then ended and the financial highlights for each of the years or periods in the five-year period then ended. These financial statements and financial highlights are the responsibility of the Fund’s management. Our responsibility is to express an opinion on these financial statements and financial highlights based on our audits.
We conducted our audits in accordance with the standards of the Public Company Accounting Oversight Board (United States). Those standards require that we plan and perform the audit to obtain reasonable assurance about whether the financial statements and financial highlights are free of material misstatement. An audit includes examining, on a test basis, evidence supporting the amounts and disclosures in the financial statements. Our procedures included confirmation of securities owned as of April 30, 2008 by correspondence with the custodian and brokers, or by other appropriate auditing procedures where replies from brokers were not received. An audit also includes assessing the accounting principles used and significant estimates made by management, as well as evaluating the overall financial statement presentation. We believe that our audits provide a reasonable basis for our opinion.
In our opinion, the financial statements and financial highlights referred to above present fairly, in all material respects, the financial position of the Evergreen Core Plus Bond Fund as of April 30, 2008, the results of its operations, changes in its net assets and financial highlights for each of the periods described above, in conformity with U.S. generally accepted accounting principles.

Boston, Massachusetts
June 27, 2008
49
ADDITIONAL INFORMATION (unaudited)
FEDERAL TAX DISTRIBUTIONS
The Fund paid total distributions of $14,027,348 during the year ended April 30, 2008 of which 71.64% was from ordinary taxable and 28.36% was from a non-taxable return of capital. Shareholders of the Fund will receive in early 2009 a Form 1099-DIV that will inform them of the tax character of this distribution as well as all other distributions made by the Fund in calendar year 2008.
50
This page left intentionally blank
51
TRUSTEES AND OFFICERS
TRUSTEES1 | | |
Charles A. Austin III
Trustee
DOB: 10/23/1934
Term of office since: 1991
Other directorships: None | | Investment Counselor, Anchor Capital Advisors, LLC. (investment advice); Director, The Andover Companies (insurance); Trustee, Arthritis Foundation of New England; Former Director, The Francis Ouimet Society (scholarship program); Former Director, Executive Vice President and Treasurer, State Street Research & Management Company (investment advice) |
|
|
|
K. Dun Gifford
Trustee
DOB: 10/23/1938
Term of office since: 1974
Other directorships: None | | Chairman and President, Oldways Preservation and Exchange Trust (education); Trustee, Chairman of the Finance Committee, Member of the Executive Committee, and Former Treasurer, Cambridge College |
|
|
|
Dr. Leroy Keith, Jr.
Trustee
DOB: 2/14/1939
Term of office since: 1983
Other directorships: Trustee,
Phoenix Fund Complex
(consisting of 53 portfolios
as of 12/31/2007) | | Managing Director, Almanac Capital Management (commodities firm); Trustee, Phoenix Fund Complex; Director, Diversapack Co. (packaging company); Former Partner, Stonington Partners, Inc. (private equity fund); Former Director, Obagi Medical Products Co.; Former Director, Lincoln Educational Services |
|
|
|
Carol A. Kosel1
Trustee
DOB: 12/25/1963
Term of office since: 2008
Other directorships: None | | Former Consultant to the Evergreen Boards of Trustees; Former Vice President and Senior Vice President, Evergreen Investments, Inc.; Former Treasurer, Evergreen Funds; Former Treasurer, Vestaur Securities Fund |
|
|
|
Gerald M. McDonnell
Trustee
DOB: 7/14/1939
Term of office since: 1988
Other directorships: None | | Former Manager of Commercial Operations, CMC Steel (steel producer) |
|
|
|
Patricia B. Norris
Trustee
DOB: 4/9/1948
Term of office since: 2006
Other directorships: None | | President and Director of Buckleys of Kezar Lake, Inc. (real estate company); Former President and Director of Phillips Pond Homes Association (home community); Former Partner, PricewaterhouseCoopers, LLP (independent registered public accounting firm) |
|
|
|
William Walt Pettit
Trustee
DOB: 8/26/1955
Term of office since: 1988
Other directorships: None | | Partner and Vice President, Kellam & Pettit, P.A. (law firm); Director, Superior Packaging Corp. (packaging company); Member, Superior Land, LLC (real estate holding company), Member, K&P Development, LLC (real estate development); Former Director, National Kidney Foundation of North Carolina, Inc. (non-profit organization) |
|
|
|
David M. Richardson
Trustee
DOB: 9/19/1941
Term of office since: 1982
Other directorships: None | | President, Richardson, Runden LLC (executive recruitment advisory services); Director, J&M Cumming Paper Co. (paper merchandising); Trustee, NDI Technologies, LLP (communications); Former Consultant, AESC (The Association of Executive Search Consultants) |
|
|
|
Dr. Russell A. Salton III
Trustee
DOB: 6/2/1947
Term of office since: 1984
Other directorships: None | | President/CEO, AccessOne MedCard, Inc. |
|
|
|
52
TRUSTEES AND OFFICERS continued
Michael S. Scofield
Trustee
DOB: 2/20/1943
Term of office since: 1984
Other directorships: None | | Retired Attorney, Law Offices of Michael S. Scofield; Former Director and Chairman, Branded Media Corporation (multi-media branding company) |
|
|
|
Richard J. Shima
Trustee
DOB: 8/11/1939
Term of office since: 1993
Other directorships: None | | Independent Consultant; Director, Hartford Hospital; Trustee, Greater Hartford YMCA; Former Director, Trust Company of CT; Former Director, Old State House Association; Former Trustee, Saint Joseph College (CT) |
|
|
|
Richard K. Wagoner, CFA2
Trustee
DOB: 12/12/1937
Term of office since: 1999
Other directorships: None | | Member and Former President, North Carolina Securities Traders Association; Member, Financial Analysts Society |
|
|
|
OFFICERS | | |
Dennis H. Ferro3
President
DOB: 6/20/1945
Term of office since: 2003 | | Principal occupations: President and Chief Executive Officer, Evergreen Investment Company, Inc. and Executive Vice President, Wachovia Bank, N.A.; former Chief Investment Officer, Evergreen Investment Company, Inc. |
|
|
|
Kasey Phillips4
Treasurer
DOB: 12/12/1970
Term of office since: 2005 | | Principal occupations: Senior Vice President, Evergreen Investment Management Company, LLC; Former Vice President, Evergreen Investment Services, Inc.; Former Assistant Vice President, Evergreen Investment Services, Inc. |
|
|
|
Michael H. Koonce4
Secretary
DOB: 4/20/1960
Term of office since: 2000 | | Principal occupations: Senior Vice President and General Counsel, Evergreen Investment Services, Inc.; Secretary, Senior Vice President and General Counsel, Evergreen Investment Management Company, LLC and Evergreen Service Company, LLC; Senior Vice President and Assistant General Counsel, Wachovia Corporation |
|
|
|
Robert Guerin4
Chief Compliance Officer
DOB: 9/20/1965
Term of office since: 2007 | | Principal occupations: Chief Compliance Officer, Evergreen Funds and Senior Vice President of Evergreen Investments Co., Inc.; Former Managing Director and Senior Compliance Officer, Babson Capital Management LLC; Former Principal and Director, Compliance and Risk Management, State Street Global Advisors; Former Vice President and Manager, Sales Practice Compliance, Deutsche Asset Management |
|
|
|
1 | Each Trustee, except Mses. Kosel and Norris, serves until a successor is duly elected or qualified or until his or her death, resignation, retirement or removal from office. As new Trustees, Ms. Kosel’s and Ms. Norris’ initial terms end December 31, 2010 and June 30, 2009, respectively, at which times they may be re-elected by Trustees to serve until a successor is duly elected or qualified or until her death, resignation, retirement or removal from office by the Trustees. Each Trustee, except Ms. Kosel, oversaw 94 Evergreen funds as of December 31, 2007. Ms. Kosel became a Trustee on January 1, 2008. Correspondence for each Trustee may be sent to Evergreen Board of Trustees, P.O. Box 20083, Charlotte, NC 28202. |
2 | Mr. Wagoner is an “interested person” of the Fund because of his ownership of shares in Wachovia Corporation, the parent to the Fund’s investment advisor. |
3 | The address of the Officer is 401 S. Tryon Street, 20th Floor, Charlotte, NC 28288. |
4 | The address of the Officer is 200 Berkeley Street, Boston, MA 02116. |
Additional information about the Fund’s Board of Trustees and Officers can be found in the Statement of Additional Information (SAI) and is available upon request without charge by calling 800.343.2898.
53

566659 rv5 06/2008
Item 2 - Code of Ethics
(a) The Registrant has adopted a code of ethics that applies to the Registrant’s principal executive officer and principal financial officer.
(b) During the period covered by this report, there were no amendments to the provisions of the code of ethics adopted in 2.(a) above.
(c) During the period covered by this report, there were no implicit or explicit waivers to the provisions of the code of ethics adopted in 2.(a) above.
Item 3 - Audit Committee Financial Expert
Charles A. Austin III and Patricia B. Norris have been determined by the Registrant’s Board of Trustees to be audit committee financial experts within the meaning of Section 407 of the Sarbanes-Oxley Act. These financial experts are independent of management.
Items 4 – Principal Accountant Fees and Services
The following table represents fees for professional audit services rendered by KPMG LLP, for the audits of each of the five series of the Registrant’s annual financial statements for the fiscal years ended April 30, 2008 and April 30, 2007, and fees billed for other services rendered by KPMG LLP.
| | 2008 | | 2007 | |
| |
| |
| |
Audit fees | | $149,300 | | $136,900 | |
Audit-related fees (1) | | 6,200 | | 0 | |
Tax fees (2) | | 8,182 | | 360 | |
Non-audit fees (3) | | 1,162,374 | | 808,367 | |
All other fees | | 0 | | 0 | |
| |
|
|
|
|
Total fees | | $1,326,056 | | $945,627 | |
| |
|
|
|
|
(1) | Audit-related fees consists primarily of fees for merger activity. |
(2) | Tax fees consists of fees for tax consultation, tax compliance and tax review. |
(3) | Non-audit fees consists of the aggregate fees for non-audit services rendered to the Fund, EIMC (not including any sub-advisor whose role is primarily portfolio management and is subcontracted with or overseen by another investment advisor) and EIS. |
Evergreen Funds
Evergreen Income Advantage Fund
Evergreen Multi-Sector Fund
Evergreen Utilities and High Income Fund
Evergreen International Balanced Income Fund
Evergreen Global Dividend Opportunity Fund
Audit and Non-Audit Services Pre-Approval Policy
I. Statement of Principles
Under the Sarbanes-Oxley Act of 2002 (the “Act”), the Audit Committee of the Board of Trustees/Directors is responsible for the appointment, compensation and oversight of the work of the independent auditor. As part of this responsibility, the Audit Committee is required to pre-approve the audit and non-audit services performed by the independent auditor in order to assure that they do not impair the auditor’s independence from the Funds. To implement these provisions of the Act, the Securities and Exchange Commission (the “SEC”) has issued rules specifying the types of services that an independent auditor may not provide to its audit client, as well as the audit committee’s administration of the
engagement of the independent auditor. Accordingly, the Audit Committee has adopted, and the Board of Trustees/Directors has ratified, the Audit and Non-Audit Services Pre Approval Policy (the “Policy”), which sets forth the procedures and the conditions pursuant to which services proposed to be performed by the independent auditor may be pre-approved.
The SEC’s rules establish two different approaches to pre-approving services, which the SEC considers to be equally valid. Proposed services either: may be pre-approved without consideration of specific case-by-case services by the Audit Committee (“general pre-approval”); or require the specific pre-approval of the Audit Committee (“specified pre-approval”). The Audit Committee believes that the combination of these two approaches in this Policy will result in an effective and efficient procedure to pre-approve services performed by the independent auditor. As set forth in this Policy, unless a type of service has received general pre-approval, it will require specific pre-approval by the Audit Committee if it is to be provided by the independent auditor. Any proposed services exceeding pre-approved cost levels or budgeted amounts will also require specific pre-approval by the Audit Committee.
For both types of pre-approval, the Audit Committee will consider whether such services are consistent with the SEC’s rules on auditor independence. The Audit Committee will also consider whether the independent auditor is best positioned to provide the most effective and efficient service, for reasons such as its familiarity with the Funds’ business people, culture, accounting systems, risk profile and other factors, and whether the service might enhance the Funds’ ability to manage or control risk or improve audit quality. All such factors will be considered as a whole, and no one factor should necessarily be determinative.
The Audit Committee is also mindful of the relationship between fees for audit and non-audit services in deciding whether to pre-approve any such services and may determine, for each fiscal year, the ratio between the total amount of fees for Audit, Audit-related and Tax services and the total amount of fees for certain permissible non-audit services classified as All Other services.
The term of any general pre-approval is 12 months from the date of pre-approval, unless the Audit Committee considers a different period and states otherwise. The Audit Committee will annually review and pre-approve the services that may be provided by the independent auditor without obtaining specific pre-approval from the Audit Committee. The Audit Committee will add or subtract to the list of general pre-approved services from time to time, based on subsequent determinations.
The purpose of this Policy is to set forth the procedures by which the Audit Committee intends to fulfill its responsibilities. It does not delegate the Audit Committee’s responsibilities to pre-approve services performed by the independent auditor to management.
The independent auditor has reviewed this Policy and believes that implementation of the policy will not adversely affect the auditor’s independence.
II. Delegation
As provided in the Act and the SEC’s rules, the Audit Committee may delegate either type of pre-approval authority to one or more of its members. The member to whom such authority is delegated must report, for informational purposes only, any pre-approval decisions of the Audit Committee at its next scheduled meeting.
III. Audit Services
The annual Audit services engagement terms and fees will be subject to the specific pre-approval of the Audit Committee. Audit services include the annual financial statement audit and other procedures required to be performed by the independent auditor to be able to form an opinion on the Funds’ financial statements. These other procedures include information systems and procedural reviews and testing performed in order to understand and place reliance on the systems of internal control, and consultations relating to the audit. Audit services also include the attestation engagement for the independent auditor’s report on management’s report on internal controls for financial reporting. The Audit Committee will monitor the Audit services engagement as necessary, but no less than on a quarterly basis, and will also
approve, if necessary, any changes in terms, conditions and fees resulting from changes in audit scope, Fund service providers or other items.
In addition to the annual Audit services engagement approved by the Audit Committee, the Audit Committee may grant general pre-approval to other Audit services, which are those services that only the independent auditor reasonably can provide. Other Audit services may include services associated with SEC registration statements, periodic reports and other documents filed with the SEC or other documents issued in connection with mergers or acquisitions.
IV. Audit-related Services
Audit-related services are assurance and related services that are reasonably related to the performance of the audit or review of the Funds’ financial statements or that are traditionally performed by the independent auditor. Because the Audit Committee believes that the provision of Audit-related services does not impair the independence of the auditor and is consistent with SEC’s rules on auditor independence, the Audit Committee may grant general pre-approval to Audit-related services. Audit-related services include, among others, due diligence services pertaining to potential business acquisitions/dispositions; accounting consultations related to accounting, financial reporting or disclosure matters not classified as “Audit services”; assistance with understanding and implementing new accounting and financial reporting guidance from rulemaking authorities; agreed-upon or expanded audit procedures related to accounting records required to respond to or comply with financial, accounting or regulatory reporting matters; and assistance with internal control reporting requirements.
V. Tax Services
The Audit Committee believes that the independent auditor can provide Tax services to the Funds such as tax compliance, tax planning and tax advice without impairing the auditor’s independence, and the SEC has stated that the independent auditor may provide such services. Hence, the Audit Committee believes it may grant general pre-approval to those Tax services that have historically been provided by the auditor, that the Audit Committee has reviewed and believes would not impair the independence of the auditor, and that are consistent with the SEC’s rules on auditor independence. The Audit Committee will not permit the retention of the independent auditor in connection with a transaction initially recommended by the independent auditor, the sole business purpose of which may be tax avoidance and the tax treatment of which may not be supported in the Internal Revenue Code and related regulations. The Audit Committee will consult with the Director of Fund Administration, the Vice President of Tax Services or outside counsel to determine that the tax planning and reporting positions are consistent with this policy.
All Tax services involving large and complex transactions must be specifically pre-approved by the Audit Committee, including: tax services proposed to be provide by the independent auditor to any executive officer or director of the Funds, in his or her individual capacity, where such services are paid for by the Funds or the investment advisor.
VI. All Other Services
The Audit Committee believes, based on the SEC’s rules prohibiting the independent auditor from providing specific non-audit services, that other types of non-audit services are permitted. Accordingly, the Audit Committee believes it may grant general pre-approval to those permissible non-audit services classified as All Other services that it believes are routine and recurring services, would not impair the independence of the auditor and are consistent with the SEC’s rules on auditor independence.
The SEC’s rules and relevant guidance should be consulted to determine the precise definitions of the SEC’s prohibited non-audit services and the applicability of exceptions to certain of the prohibitions.
VII. Pre-Approval Fee Levels or Budgeted Amounts
Pre-approval fee levels or budgeted amounts for all services to be provided by the independent auditor will be established annually by the Audit Committee. Any proposed services exceeding these levels or amounts will require specific pre-approval by the Audit Committee. The Audit Committee is mindful of the overall relationship of fees for audit and non-audit services in determining whether to pre-approve any such services. For each fiscal year, the Audit Committee may determine to ratio between the total amount of fees
for Audit, Audit-related and Tax services, and the total amount of fees for services classified as All Other services.
VIII. Procedures
All requests or applications for services to be provided by the independent auditor that do not require specific approval by the Audit Committee will be submitted to the Director of Fund Administration or Assistant Director of Fund Administration and must include a detailed description of the services to be rendered. The Director/Assistant Director of Fund Administration will determine whether such services are included within the list of services that have received the general pre-approval of the Audit Committee. The Audit Committee will be informed on a quarterly basis (or more frequent if requested by the audit committee) of any such services rendered by the independent auditor.
Request or applications to provide services that require specific approval by the Audit Committee will be submitted to the Audit Committee by both the independent auditor and the Director/Assistant Director of Fund Administration, and must include a joint statement as to whether, in their view, the request or application is consistent with the SEC’s rules on auditor independence.
The Audit Committee has designated the Chief Compliance Officer to monitor the performance of all services provided by the independent auditor and to determine whether such services are in compliance with this policy. The Chief Compliance Officer will report to the Audit Committee on a periodic basis on the results of its monitoring. Both the Chief Compliance Officer and management will immediately report to the chairman of the Audit Committee any breach of this policy that comes to the attention of the Chief Compliance Officer or any member of management.
The Audit Committee will also review the internal auditor’s annual internal audit plan to determine that the plan provides for the monitoring of the independent auditor’s services.
IX. Additional Requirements
The Audit Committee has determined to take additional measures on an annual basis to meet its responsibility to oversee the work of the independent auditor and to assure the auditor’s independence from the Funds, such as reviewing a formal written statement from the independent auditor delineating all relationships between the independent auditor and the Funds, the Funds’ investment advisor and related parties of the investment advisor, consistent with Independence Standards Board Standard No. 1, and discussing with the independent auditor its methods and procedures for ensuring independence.
Items 5 – Audit Committee of Listed Registrants
Not applicable.
Item 6 – Schedule of Investments
Please see schedule of investments contained in the Report to Stockholders included under Item 1 of this Form N-CSR.
Item 7 – Disclosure of Proxy Voting Policies and Procedures for Closed-End Management Investment Companies.
Not applicable.
Item 8 – Portfolio Managers of Closed-End Management Investment Companies.
Not applicable.
Item 9 – Purchases of Equity Securities by Closed-End Management Investment Company and Affiliated Purchasers.
Not applicable.
Item 10 – Submission of Matters to a Vote of Security Holders
There have been no material changes to the procedures by which shareholders may recommend nominees to the Registrant’s board of trustees that have been implemented since the Registrant last provided disclosure in response to the requirements of this Item.
Item 11 - Controls and Procedures
(a) | The Registrant’s principal executive officer and principal financial officer have evaluated the Registrant’s disclosure controls and procedures (as defined in Rule 30a-3(c) under the Investment Company Act of 1940) within 90 days of this filing and have concluded that the Registrant’s disclosure controls and procedures were effective, as of that date, in ensuring that information required to be disclosed by the Registrant in this Form N-CSR was recorded, processed, summarized, and reported timely. |
(b) | There has been no changes in the Registrant’s internal controls over financial reporting (as defined in Rule 30a-3(d) under the Investment Company Act of 1940) that occurred during the second fiscal quarter of the period covered by this report that has materially affected, or is reasonable likely to affect, the Registrant’s internal control over financial reporting . |
Item 12 - Exhibits
File the exhibits listed below as part of this Form. Letter or number the exhibits in the sequence indicated.
(a) | Any code of ethics, or amendment thereto, that is the subject of the disclosure required by Item 2, to the extent that the Registrant intends to satisfy the Item 2 requirements through filing of an exhibit. |
(b)(1) Separate certifications for the Registrant’s principal executive officer and principal financial officer, as required by Section 302 of the Sarbanes-Oxley Act of 2002 and Rule 30a-2(a) under the Investment Company Act of 1940, are attached as EX99.CERT.
(b)(2) Separate certifications for the Registrant’s principal executive officer and principal financial officer, as required by Section 1350 of Title 18 of United States Code, as adopted pursuant to Section 906 of the Sarbanes-Oxley Act of 2002, and Rule 30a-2(b) under the Investment Company Act of 1940, are attached as EX99.906CERT. The certifications furnished pursuant to this paragraph are not deemed to be “filed” for purposes of Section 18 of the Securities Exchange Act of 1934, or otherwise subject to the liability of that section. Such certifications are not deemed to be incorporated by reference into any filing under the Securities Act of 1933 or the Securities Exchange Act of 1934, except to the extent that the Registrant specifically incorporates them by reference.
Pursuant to the requirements of the Securities Exchange Act of 1934 and the Investment Company Act of 1940, the Registrant has duly caused this report to be signed on its behalf by the undersigned, thereunto duly authorized.
Evergreen Fixed Income Trust | | |
By:
| | | : |
|
| | |
| Dennis H. Ferro
Principal Executive Officer | | |
Date: June 30, 2008
Pursuant to the requirements of the Securities Exchange Act of 1934 and the Investment Company Act of 1940, this report has been signed below by the following persons on behalf of the Registrant and in the capacities and on the dates indicated.
By:
| | | : |
|
| | |
| Dennis H. Ferro
Principal Executive Officer | | |
Date: June 30, 2008
By:
| | | : |
|
| | |
| Kasey Phillips
Principal Financial Officer | | |
Date: June 30, 2008