| OMB APPROVAL |
OMB Number: 3235-0570 Expires: September 30, 2007 Estimated average burden hours per response: 19.4 |
UNITED STATES
SECURITIES AND EXCHANGE COMMISSION
Washington, D.C. 20549
FORM N-CSR
CERTIFIED SHAREHOLDER REPORT OF REGISTERED MANAGEMENT INVESTMENT COMPANIES
Investment Company Act file number 811-08415
[Evergreen Fixed Income Trust]
_____________________________________________________________
(Exact name of registrant as specified in charter)
200 Berkeley Street Boston, Massachusetts 02116
_____________________________________________________________
(Address of principal executive offices) (Zip code)
Michael H. Koonce, Esq. 200 Berkeley Street Boston, Massachusetts 02116
____________________________________________________________
(Name and address of agent for service)
Registrant's telephone number, including area code: (617) 210-3200
Date of fiscal year end: Registrant is making an annual filing for one of its series, Evergreen Ultra Short Opportunities Fund, for the year ended June 30, 2006. This one series has a June 30 fiscal year end.
Date of reporting period: June 30, 2006
Item 1 - Reports to Stockholders.
Evergreen Ultra Short Opportunities Fund

| | |
| | | table of contents |
| 1 | | LETTER TO SHAREHOLDERS |
| 4 | | FUND AT A GLANCE |
| 5 | | PORTFOLIO MANAGER COMMENTARY |
| 6 | | ABOUT YOUR FUND'S EXPENSES |
| 7 | | FINANCIAL HIGHLIGHTS |
| 11 | | SCHEDULE OF INVESTMENTS |
| 19 | | STATEMENT OF ASSETS AND LIABILITIES |
| 20 | | STATEMENT OF OPERATIONS |
| 21 | | STATEMENTS OF CHANGES IN NET ASSETS |
| 22 | | NOTES TO FINANCIAL STATEMENTS |
| 29 | | REPORT OF INDEPENDENT REGISTERED PUBLIC ACCOUNTING FIRM |
| 30 | | ADDITIONAL INFORMATION |
| 32 | | TRUSTEES AND OFFICERS |
This annual report must be preceded or accompanied by a prospectus of the Evergreen fund contained herein. The prospectus contains more complete information, including fees and expenses, and should be read carefully before investing or sending money.
The fund will file its complete schedule of portfolio holdings with the SEC for the first and third quarters of each fiscal year on Form N-Q. The fund's Form N-Q will be available on the SEC's Web site at http://www.sec.gov. In addition, the fund's Form N-Q may be reviewed and copied at the SEC's Public Reference Room in Washington, D.C. Information on the operation of the Public Reference Room may be obtained by calling 800.SEC.0330.
A description of the fund's proxy voting policies and procedures, as well as information regarding how the fund voted proxies relating to portfolio securities during the most recent 12-month period ended June 30, is available by visiting our Web site at EvergreenInvestments.com or by visiting the SEC's Web site at http://www.sec.gov. The fund's proxy voting policies and procedures are also available without charge, upon request, by calling 800.343.2898.
| | | | |
| Mutual Funds: | | | | |
| NOT FDIC INSURED | | MAY LOSE VALUE | | NOT BANK GUARANTEED |
Evergreen InvestmentsSM is a service mark of Evergreen Investment Management Company, LLC.
Copyright 2006, Evergreen Investment Management Company, LLC.
Evergreen Investment Management Company, LLC is a subsidiary of Wachovia Corporation
and is an affiliate of Wachovia Corporation's other Broker Dealer subsidiaries.
Evergreen mutual funds are distributed by Evergreen Investment Services, Inc.
200 Berkeley Street, Boston, MA 02116
LETTER TO SHAREHOLDERS
August 2006

Dennis H. Ferro
President and Chief
Executive Officer
Dear Shareholder,
We are pleased to provide the annual report for the Evergreen Ultra Short Opportunities Fund, covering the twelve-month period ended June 30, 2006.
A great deal of confusing and sometimes contradictory evidence emerged about the economy during the past year. The economic expansion showed remarkable durability, most notably in the first quarter of 2006 when Gross Domestic Product grew at an annualized rate of 5.6%. However, that torrid growth trajectory did not appear to be sustainable. Based on reported trends in housing, employment and retail sales, personal consumption for the second quarter was anticipated to grow at one-half the rate of the first quarter. Estimates of increases in corporate capital expenditures also were being reduced. While many observers debated whether or not short-term volatility might be an early indicator of a weakened economy, Evergreen's Investment Strategy Committee focused on a variety of signals pointing to the stamina of the economic expansion. Although the rates of increases in corporate profits, capital expenditures and personal consumption were starting to decline, all these economic indicators were still rising, at what we believed to be a more sustainable pace.
The backdrop for investing in the domestic fixed income market changed dramatically during the past twelve months as investors adjusted their expectations to shifting economic conditions. Highly influenced by the actions of the U.S. Federal Reserve Board
1
LETTER TO SHAREHOLDERS continued
("Fed") in raising short-term rates, the domestic fixed income market generated modest returns, albeit with some volatility. While the economic expansion persisted, the Fed remained vigilant against the possibility of renewed inflation resulting from rapidly rising prices for energy and basic materials as well as from increased government spending. Over the course of the twelve months, the Fed raised the target fed funds rate, hiking it at each of its eight policy meetings, up to 5.25% by June 30, 2006. Long-term interest rates, which had shown more stability than short-term rates early in the period, backed up, resulting in price erosion of many securities. This was especially evident among long-term bonds. In this environment, shorter-duration strategies tended to produce superior relative performance. Lower-quality, higher-yielding securities tended to outperform high-grade fixed income investments, although high-yield bonds slumped in the final two months of the period.
Despite the monetary and economic challenges, Evergreen's fixed income teams maintained their focus on the fundamentals while adhering to their long-term investment objectives. For example, the managers of Evergreen Adjustable Rate Fund focused on AAA-rated, adjustable-rate mortgages and maintained a relatively short duration to take advantage of higher yields in shorter-term securities. The management team for Evergreen Ultra Short Opportunities Fund emphasized both mortgage-backed securities and structured products, while shortening the fund's duration to protect net asset value as interest rates rose. The portfolio managers of Evergreen Limited Duration Fund also maintained a short duration, while pursuing a bar-belled maturity strategy. The team supervising the Evergreen Short Intermediate Bond Fund kept a relatively short duration during the first half of the year, but moved to a more neutral positioning as the period progressed in anticipation of the end of the Fed's interest-rate hikes. Managers of Evergreen Institutional Enhanced Income Fund pursued a longer-term strategy designed to generate a higher yield than a money market fund with only minimal price variability.
2
LETTER TO SHAREHOLDERS continued
Please visit our Web site, EvergreenInvestments.com, for more information about our funds and other investment products available to you. Thank you for your continued support of Evergreen Investments.
Sincerely,

Dennis H. Ferro
President and Chief Executive Officer
Evergreen Investment Company, Inc.
Notification of Investment Strategy and Concentration Policy Change:
Effective February 9, 2006, the Fund's prospectus was supplemented to include the following change:
The Fund currently invests primarily, and may invest substantially all of its assets, in commercial and residential fixed and variable rate mortgage-backed securities, including collateralized mortgage obligations ("CMOs") and other mortgage-related investments.
Effective April 3, 2006, the Fund's Statement of Additional Information was supplemented and amended to include the following change in its concentration policy:
Ultra Short Opportunities Fund will normally invest more than 25% of its total assets in mortgage-backed and other mortgage-related securities (which may include securities that are issued or guaranteed by the U.S. government or its agencies or instrumentalities).
Special Notice to Shareholders:
Please visit our Web site at EvergreenInvestments.com for a statement from President and Chief Executive Officer, Dennis Ferro, addressing NASD actions involving Evergreen Investment Services, Inc. (EIS), Evergreen's mutual fund distributor or statements from Dennis Ferro and Chairman of the Board of the Evergreen funds, Michael S. Scofield, addressing SEC actions involving the Evergreen funds.
3
FUND AT A GLANCE
as of June 30, 2006
MANAGEMENT TEAM
Investment Advisor:
• Evergreen Investment Management Company, LLC
Portfolio Managers:
• Lisa Brown-Premo
• Robert D. Rowe
CURRENT INVESTMENT STYLE

Source: Morningstar, Inc.
Morningstar's style box is based on a portfolio date as of 6/30/2006.
The Fixed income style box placement is based on a fund's average effective maturity or duration and the average credit rating of the bond portfolio.
PERFORMANCE AND RETURNS
Portfolio inception date: 5/29/2003
| | | | | | | | |
| | | Class A | | Class B | | Class C | | Class I |
| Class inception date | | 5/29/2003 | | 5/29/2003 | | 5/29/2003 | | 5/29/2003 |
|
| Nasdaq symbol | | EUBAX | | EUBBX | | EUBCX | | EUBIX |
|
| Average annual return* | | | | | | | | |
|
| 1-year with sales charge | | -0.60% | | -2.90% | | 1.01% | | N/A |
|
| 1-year w/o sales charge | | 2.71% | | 1.99% | | 1.99% | | 3.02% |
|
| Since portfolio inception | | 1.95% | | 1.44% | | 2.35% | | 3.37% |
|
| Maximum sales charge | | 3.25% | | 5.00% | | 1.00% | | N/A |
| | | Front-end | | CDSC | | CDSC | | |
|
* Adjusted for maximum applicable sales charge, unless noted.Past performance is no guarantee of future results. The performance quoted represents past performance and current performance may be lower or higher. The investment return and principal value of an investment will fluctuate so that investors' shares, when redeemed, may be worth more or less than their original cost. To obtain performance information current to the most recent month-end for Classes A, B, C or I, please go to EvergreenInvestments.com/fundperformance. The performance of each class may vary based on differences in loads, fees and expenses paid by the shareholders investing in each class. Performance includes the reinvestment of income dividends and capital gain distributions. Performance shown does not reflect the deduction of taxes that a shareholder would pay on fund distributions or the redemption of fund shares.
The fund incurs a 12b-1 fee of 0.30% for Class A and 1.00% for Classes B and C. Class I does not pay a 12b-1 fee.
The advisor is waiving a portion of its advisory fee and reimbursing a portion of the 12b-1 fee for Class A. Had the fees not been waived or reimbursed, returns would have been lower.
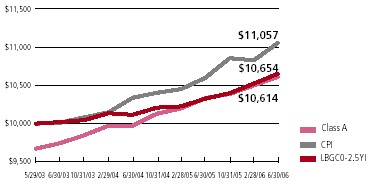
LONG-TERM GROWTH
Comparison of a $10,000 investment in the Evergreen Ultra Short Opportunities Fund Class A shares versus a similar investment in the Lehman Brothers Government/Credit 0-2.5 Year Index (LBGC0-2.5YI) and the Consumer Price Index (CPI).
The LBGC0-2.5YI is an unmanaged market index and does not include transaction costs associated with buying and selling securities, any mutual fund fees or expenses or any taxes. The CPI is a commonly used measure of inflation and does not represent an investment return. It is not possible to invest directly in an index.
4
PORTFOLIO MANAGER COMMENTARY
The fund's Class A shares returned 2.71% for the twelve-month period ended June 30, 2006, excluding any applicable sales charges. During the same period, the LBGC0-2.5YI returned 3.16%.
The fund seeks to provide current income consistent with preservation of capital and low principal fluctuation.
Our strategy is to seek the highest total return by maximizing income and minimizing price fluctuations. During the twelve-month period, interest rates rose across the U.S. yield curve. The Fed, in an effort to head off inflationary pressures, raised the fed funds rate eight different times. Due to the fact that this was a second successive year of similar rate increases, the yield curve became very flat, (the difference between short-term and long-term yields grew narrower.) In this environment, the 30-year area of the yield curve rose about 100 basis points (one percentage point), and the two-year area of the curve rose about 150 basis points. Very short maturities, such as three- and six-month securities, rose about 190 basis points. Consistent with management's long-term strategy, a large percentage of fund assets were invested in mortgage-backed securities and structured products. Both the mortgage and structured products sectors tend to offer the most compelling relative value amongst shorter duration securities, while also displaying attractive credit upgrade potential, despite their inherent complexities.
As short-term interest rates continued to rise and the yield curve flattened, we shortened duration, or sensitivity to interest rate changes, over the course of the year from 1.05 years to 0.9 years in anticipation of continuing rate increases. This tactic aided performance, but the fund trailed its new benchmark, which stood at 0.9 years throughout the fiscal year. Typically, longer duration portfolios tend to outperform when interest rates fall and shorter duration portfolios tend to outperform when rates rise.
Our allocation to floating-rate securities was held at approximately 70% of fund assets during the course of the fiscal year. Generally, floating-rate securities outperform fixed-rate securities as interest rates rise. Our strategy reflected our view that the Fed would continue to raise interest rates, and thus yields would rise across the maturity spectrum. The weighted average credit quality of the fund was stable at AA during the year. The positioning of the fund and individual security selection supported fund results.
Class I shares are only offered in the following manner: (1) to investment advisory clients of Evergreen Investment Management Company, LLC (or its advisory affiliates) when purchased by such advisor(s) on behalf of its clients, (2) through arrangements entered into on behalf of the Evergreen funds with certain financial services firms, (3) to certain institutional investors and (4) to persons who owned Class Y shares in registered name in an Evergreen fund on or before December 31, 1994 or who owned shares of any SouthTrust fund in registered name as of March 18, 2005 or shares of Vestaur Securities Fund as of May 20, 2005.
Class I shares are only available to institutional shareholders with a minimum of $1 million investment, which may be waived in certain situations.
The fund's investment objective may be changed without a vote of the fund's shareholders.
Foreign investments may contain more risk due to the inherent risks associated with changing political climates, foreign market instability and foreign currency fluctuations.
Asset-backed and mortgage-backed securities are generally subject to higher prepayment risks than other types of debt securities, which can limit the potential for gain in a declining interest rate environment and increase the potential for loss in a rising interest rate environment. Mortgage-backed securities may also be structured so that they are particularly sensitive to interest rates.
Derivatives involve additional risks including interest rate risk, credit risk, the risk of improper valuation and the risk of non-correlation to the relevant instruments they are designed to hedge or to closely track.
The return of principal is not guaranteed due to fluctuation in the fund's NAV caused by changes in the price of individual bonds held by the fund and the buying and selling of bonds by the fund. Bond funds have the same inflation, interest rate and credit risks as individual bonds. Generally, the value of bond funds rise when prevailing interest rates fall, and fall when interest rates rise.
U.S. government guarantees apply only to certain securities held in the fund's portfolio and not to the fund's shares.
All data is as of June 30, 2006, and subject to change.
5
ABOUT YOUR FUND'S EXPENSES
The Example below is intended to describe the fees and expenses borne by shareholders and the impact of those costs on your investment.
Example
As a shareholder of the fund, you incur two types of costs: (1) transaction costs, including sales charges (loads), redemption fees and exchange fees; and (2) ongoing costs, including management fees, distribution (12b-1) fees and other fund expenses. This Example is intended to help you understand your ongoing costs (in dollars) of investing in the fund and to compare these costs with the ongoing costs of investing in other mutual funds. The Example is based on an investment of $1,000 invested at the beginning of the period and held for the entire period from January 1, 2006 to June 30, 2006.
The example illustrates your fund's costs in two ways:
• Actual expenses
The section in the table under the heading "Actual" provides information about actual account values and actual expenses. You may use the information in these columns, together with the amount you invested, to estimate the expenses that you paid over the period. Simply divide your account value by $1,000 (for example, an $8,600 account value divided by $1,000 = 8.6), then multiply the result by the number in the appropriate column for your share class, in the column entitled "Expenses Paid During Period" to estimate the expenses you paid on your account during this period.
• Hypothetical example for comparison purposes
The section in the table under the heading "Hypothetical (5% return before expenses)" provides information about hypothetical account values and hypothetical expenses based on the fund's actual expense ratio and an assumed rate of return of 5% per year before expenses, which is not the fund's actual return. The hypothetical account values and expenses may not be used to estimate the actual ending account balance or expenses you paid for the period. You may use this information to compare the ongoing costs of investing in the fund and other funds. To do so, compare this 5% hypothetical example with the 5% hypothetical examples that appear in the shareholder reports of the other funds.
Please note that the expenses shown in the table are meant to highlight your ongoing costs only and do not reflect any transactional costs, such as sales charges (loads), redemption fees or exchange fees. Therefore, the section in the table under the heading "Hypothetical (5% return before expenses)" is useful in comparing ongoing costs only, and will not help you determine the relative total costs of owning different funds. In addition, if these transactional costs were included, your costs would have been higher.
| | | | | | |
| | | Beginning | | Ending | | |
| | | Account | | Account | | Expenses |
| | | Value | | Value | | Paid During |
| | | 1/1/2006 | | 6/30/2006 | | Period* |
|
| Actual | | | | | | |
| Class A | | $ 1,000.00 | | $ 1,015.56 | | $ 4.50 |
| Class B | | $ 1,000.00 | | $ 1,012.05 | | $ 8.08 |
| Class C | | $ 1,000.00 | | $ 1,012.05 | | $ 8.08 |
| Class I | | $ 1,000.00 | | $ 1,017.07 | | $ 3.15 |
| Hypothetical | | | | | | |
| (5% return | | | | | | |
| before expenses) | | | | | | |
| Class A | | $ 1,000.00 | | $ 1,020.33 | | $ 4.51 |
| Class B | | $ 1,000.00 | | $ 1,016.76 | | $ 8.10 |
| Class C | | $ 1,000.00 | | $ 1,016.76 | | $ 8.10 |
| Class I | | $ 1,000.00 | | $ 1,021.67 | | $ 3.16 |
|
|
| * For each class of the Fund, expenses are equal to the annualized expense ratio of each class |
| (0.90% for Class A, 1.62% for Class B, 1.62% for Class C and 0.63% for Class I), multiplied by |
| the average account value over the period, multiplied by 181 / 365 days. |
6
FINANCIAL HIGHLIGHTS
(For a share outstanding throughout each period)
| | | | | | | | |
| | | Year Ended June 30, |
| |
|
| CLASS A | | 2006 | | 2005 | | 2004 | | 2003 1 |
|
| Net asset value, beginning of period | | $ 9.93 | | $ 9.96 | | $ 10.05 | | $ 10.00 |
|
| Income from investment operations | | | | | | | | |
| Net investment income (loss) | | 0.45 | | 0.35 | | 0.26 | | 0.02 |
| Net realized and unrealized gains or losses on investments | | (0.19) | | 0.01 | | (0.03) | | 0.05 |
| |
| |
| |
| |
|
| Total from investment operations | | 0.26 | | 0.36 | | 0.23 | | 0.07 |
|
| Distributions to shareholders from | | | | | | | | |
| Net investment income | | (0.47) | | (0.39) | | (0.32) | | (0.02) |
|
| Net asset value, end of period | | $ 9.72 | | $ 9.93 | | $ 9.96 | | $ 10.05 |
|
| Total return 2 | | 2.71% | | 3.73% | | 2.35% | | 0.75% |
|
| Ratios and supplemental data | | | | | | | | |
| Net assets, end of period (thousands) | | $94,787 | | $124,221 | | $104,999 | | $17,872 |
| Ratios to average net assets | | | | | | | | |
Expenses including waivers/reimbursements
but excluding expense reductions | | 0.86% 3 | | 0.77% | | 0.92% | | 0.32% 4 |
Expenses excluding waivers/reimbursements
and expense reductions | | 0.90% 5 | | 0.87% | | 0.98% | | 2.93% 4 |
| Net investment income (loss) | | 4.57% | | 3.46% | | 2.58% | | 2.76% 4 |
| Portfolio turnover rate | | 31% | | 25% | | 44% | | 0% |
|
|
| 1 For the period from May 29, 2003 (commencement of class operations), to June 30, 2003. |
| 2 Excluding applicable sales charges |
| 3 The expense ratio includes interest expense. Excluding interest expense, the expense ratio would be 0.81%. |
| 4 Annualized |
| 5 The expense ratio includes interest expense. Excluding interest expense, the expense ratio would be 0.85%. |
See Notes to Financial Statements7
FINANCIAL HIGHLIGHTS
(For a share outstanding throughout each period)
| | | | | | | | |
| | | Year Ended June 30, |
| |
|
| CLASS B | | 2006 | | 2005 | | 2004 | | 2003 1 |
|
| Net asset value, beginning of period | | $ 9.93 | | $ 9.96 | | $ 10.05 | | $10.00 |
|
| Income from investment operations | | | | | | | | |
| Net investment income (loss) | | 0.38 | | 0.27 2 | | 0.19 2 | | 0.02 |
| Net realized and unrealized gains or losses on investments | | (0.19) | | 0.02 | | (0.03) | | 0.05 |
| |
| |
| |
| |
|
| Total from investment operations | | 0.19 | | 0.29 | | 0.16 | | 0.07 |
|
| Distributions to shareholders from | | | | | | | | |
| Net investment income | | (0.40) | | (0.32) | | (0.25) | | (0.02) |
|
| Net asset value, end of period | | $ 9.72 | | $ 9.93 | | $ 9.96 | | $10.05 |
|
| Total return 3 | | 1.99% | | 3.01% | | 1.65% | | 0.70% |
|
| Ratios and supplemental data | | | | | | | | |
| Net assets, end of period (thousands) | | $19,633 | | $20,052 | | $16,029 | | $3,213 |
| Ratios to average net assets | | | | | | | | |
Expenses including waivers/reimbursements
but excluding expense reductions | | 1.58% 4 | | 1.47% | | 1.62% | | 1.12% 5 |
Expenses excluding waivers/reimbursements
and expense reductions | | 1.61% 6 | | 1.57% | | 1.68% | | 5.19% 5 |
| Net investment income (loss) | | 3.88% | | 2.75% | | 1.90% | | 1.76% 5 |
| Portfolio turnover rate | | 31% | | 25% | | 44% | | 0% |
|
|
| 1 For the period from May 29, 2003 (commencement of class operations), to June 30, 2003. |
| 2 Net investment income (loss) per share is based on average shares outstanding during the period. |
| 3 Excluding applicable sales charges |
| 4 The expense ratio includes interest expense. Excluding interest expense, the expense ratio would be 1.53%. |
| 5 Annualized |
| 6 The expense ratio includes interest expense. Excluding interest expense, the expense ratio would be 1.56%. |
See Notes to Financial Statements8
FINANCIAL HIGHLIGHTS
(For a share outstanding throughout each period)
| | | | | | | | |
| | | Year Ended June 30, |
| |
|
| CLASS C | | 2006 | | 2005 | | 2004 | | 2003 1 |
|
| Net asset value, beginning of period | | $ 9.93 | | $ 9.96 | | $ 10.05 | | $ 10.00 |
|
| Income from investment operations | | | | | | | | |
| Net investment income (loss) | | 0.38 | | 0.27 | | 0.19 2 | | 0.02 |
| Net realized and unrealized gains or losses on investments | | (0.19) | | 0.02 | | (0.03) | | 0.05 |
| |
| |
| |
| |
|
| Total from investment operations | | 0.19 | | 0.29 | | 0.16 | | 0.07 |
|
| Distributions to shareholders from | | | | | | | | |
| Net investment income | | (0.40) | | (0.32) | | (0.25) | | (0.02) |
|
| Net asset value, end of period | | $ 9.72 | | $ 9.93 | | $ 9.96 | | $ 10.05 |
|
| Total return 3 | | 1.99% | | 3.01% | | 1.65% | | 0.70% |
|
| Ratios and supplemental data | | | | | | | | |
| Net assets, end of period (thousands) | | $82,184 | | $115,248 | | $135,412 | | $17,820 |
| Ratios to average net assets | | | | | | | | |
Expenses including waivers/reimbursements
but excluding expense reductions | | 1.57% 4 | | 1.47% | | 1.62% | | 1.02% 5 |
Expenses excluding waivers/reimbursements
and expense reductions | | 1.60% 6 | | 1.57% | | 1.68% | | 3.69% 5 |
| Net investment income (loss) | | 3.86% | | 2.73% | | 1.88% | | 2.09% 5 |
| Portfolio turnover rate | | 31% | | 25% | | 44% | | 0% |
|
|
| 1 For the period from May 29, 2003 (commencement of class operations), to June 30, 2003. |
| 2 Net investment income (loss) per share is based on average shares outstanding during the period. |
| 3 Excluding applicable sales charges |
| 4 The expense ratio includes interest expense. Excluding interest expense, the expense ratio would be 1.52%. |
| 5 Annualized |
| 6 The expense ratio includes interest expense. Excluding interest expense, the expense ratio would be 1.55%. |
See Notes to Financial Statements9
FINANCIAL HIGHLIGHTS
(For a share outstanding throughout each period)
| | | | | | | | |
| | | Year Ended June 30, |
| |
|
| CLASS I | | 2006 | | 2005 | | 2004 | | 2003 1 |
|
| Net asset value, beginning of period | | $ 9.93 | | $ 9.96 | | $ 10.05 | | $10.00 |
|
| Income from investment operations | | | | | | | | |
| Net investment income (loss) | | 0.48 | | 0.38 2 | | 0.29 2 | | 0.03 |
| Net realized and unrealized gains or losses on investments | | (0.19) | | 0.01 | | (0.03) | | 0.05 |
| |
| |
| |
| |
|
| Total from investment operations | | 0.29 | | 0.39 | | 0.26 | | 0.08 |
|
| Distributions to shareholders from | | | | | | | | |
| Net investment income | | (0.50) | | (0.42) | | (0.35) | | (0.03) |
|
| Net asset value, end of period | | $ 9.72 | | $ 9.93 | | $ 9.96 | | $10.05 |
|
| Total return | | 3.02% | | 4.05% | | 2.67% | | 0.77% |
|
| Ratios and supplemental data | | | | | | | | |
| Net assets, end of period (thousands) | | $474,373 | | $381,760 | | $215,930 | | $2,343 |
| Ratios to average net assets | | | | | | | | |
Expenses including waivers/reimbursements
but excluding expense reductions | | 0.58% 3 | | 0.47% | | 0.62% | | 0.07% 4 |
Expenses excluding waivers/reimbursements
and expense reductions | | 0.61% 5 | | 0.57% | | 0.68% | | 3.89% 4 |
| Net investment income (loss) | | 4.90% | | 3.80% | | 2.91% | | 2.95% 4 |
| Portfolio turnover rate | | 31% | | 25% | | 44% | | 0% |
|
|
| 1 For the period from May 29, 2003 (commencement of class operations), to June 30, 2003. |
| 2 Net investment income (loss) per share is based on average shares outstanding during the period. |
| 3 The expense ratio includes interest expense. Excluding interest expense, the expense ratio would be 0.53%. |
| 4 Annualized |
| 5 The expense ratio includes interest expense. Excluding interest expense, the expense ratio would be 0.56%. |
See Notes to Financial Statements10
SCHEDULE OF INVESTMENTS
June 30, 2006
| | | | | | | | |
| | | | | Principal | | | | |
| | | | | Amount | | | | Value |
|
| AGENCY MORTGAGE-BACKED COLLATERALIZED | | | | | | | | |
| MORTGAGE OBLIGATIONS 1.3% | | | | | | | | |
| FIXED-RATE 0.6% | | | | | | | | |
| FHLMC: | | | | | | | | |
| Ser. 1650, Class J, 6.50%, 06/15/2023 µ | | $ | | 1,613,857 | | $ | | 1,628,792 |
| Ser. 2106, Class ZD, 6.00%, 12/15/2028 µ | | | | 1,445,257 | | | | 1,464,044 |
| Ser. 2480, Class EH, 6.00%, 11/15/2031 | | | | 591,515 | | | | 590,249 |
| Ser. 2802, Class IN, IO, 5.00%, 04/15/2020 | | | | 6,507,903 | | | | 179,618 |
| Ser. 2912, Class MI, IO, 5.50%, 12/15/2020 | | | | 5,144,999 | | | | 205,543 |
| | | | | | | |
|
| | | | | | | | | 4,068,246 |
| | | | | | | |
|
| FLOATING-RATE 0.7% | | | | | | | | |
| FHLMC: | | | | | | | | |
| Ser. 1476, Class F, 4.51%, 02/15/2008 | | | | 22,286 | | | | 22,242 |
| Ser. 1607, Class FA, 4.31%, 10/15/2013 | | | | 15,402 | | | | 15,297 |
| Ser. 1625, Class FC, 4.66%, 12/15/2008 | | | | 84,479 | | | | 82,846 |
| Ser. 2395, Class FA, 5.80%, 06/15/2029 | | | | 350,754 | | | | 350,663 |
| Ser. 2431, Class F, 5.70%, 03/15/2032 | | | | 4,068 | | | | 4,156 |
| Ser. 2826, Class SC, 4.60%, 06/15/2034 | | | | 592,903 | | | | 594,605 |
| Ser. T-62, Class 1A1, 5.21%, 10/25/2044 µ | | | | 3,483,120 | | | | 3,519,971 |
| FNMA, Ser. 1993-179, Class FB, 5.11%, 10/25/2023 | | | | 186,805 | | | | 188,711 |
| | | | | | | |
|
| | | | | | | | | 4,778,491 |
| | | | | | | |
|
| Total Agency Mortgage-Backed Collateralized Mortgage Obligations | | | | | | | | |
| (cost $9,064,298) | | | | | | | | 8,846,737 |
| | | | | | | |
|
AGENCY MORTGAGE-BACKED PASS THROUGH SECURITIES 4.1% | | | | | | | | |
| FIXED-RATE 2.5% | | | | | | | | |
| FNMA: | | | | | | | | |
| 7.00%, 08/01/2033 - 11/01/2033 µ | | | | 3,696,730 | | | | 3,804,082 |
| 7.50%, 01/01/2031 - 08/01/2033 µ | | | | 3,101,839 | | | | 3,203,244 |
| 8.00%, 12/01/2008 | | | | 5,616 | | | | 5,654 |
| 10.00%, 02/01/2031 | | | | 91,311 | | | | 98,170 |
| FNMA 30 year, 6.50%, TBA # | | | | 9,220,000 | | | | 9,268,977 |
| GNMA: | | | | | | | | |
| 5.625%, 01/20/2019 | | | | 226,787 | | | | 231,790 |
| 7.50%, 03/15/2007 - 04/15/2007 | | | | 34,940 | | | | 36,368 |
| | | | | | | |
|
| | | | | | | | | 16,648,285 |
| | | | | | | |
|
| FLOATING-RATE 1.6% | | | | | | | | |
| FHLMC: | | | | | | | | |
| 5.21%, 10/01/2020 µ | | | | 986,250 | | | | 1,013,066 |
| 5.27%, 12/01/2033 ## | | | | 5,810,501 | | | | 5,851,872 |
| 6.86%, 04/01/2032 µ | | | | 2,351,270 | | | | 2,437,279 |
| FNMA: | | | | | | | | |
| 5.125%, 01/01/2018 | | | | 6,137 | | | | 6,169 |
| 5.17%, 03/01/2035 µ | | | | 1,311,046 | | | | 1,353,747 |
| | | | | | | |
|
| | | | | | | | | 10,662,133 |
| | | | | | | |
|
| Total Agency Mortgage-Backed Pass Through Securities (cost $27,751,599) | | | | | | | | 27,310,418 |
| | | | | | | |
|
See Notes to Financial Statements11
SCHEDULE OF INVESTMENTS continued
June 30, 2006
| | | | | | | | |
| | | Principal | | | | |
| | | Amount | | | | Value |
|
| AGENCY REPERFORMING MORTGAGE-BACKED PASS | | | | | | |
| THROUGH SECURITIES 2.3% | | | | | | |
| FNMA: | | | | | | |
| Ser. 2001-T4, Class A1, 7.50%, 07/25/2041 | | $ 1,717,848 | | $ | | 1,779,432 |
| Ser. 2002-W8, Class A4, 7.00%, 06/25/2017 | | 74,706 | | | | 76,732 |
| Ser. 2003-W2, Class 1A3, 7.50%, 07/25/2042 | | 1,109,249 | | | | 1,153,186 |
| Ser. 2003-W6, Class 3A, 6.50%, 09/25/2042 µ | | 6,885,270 | | | | 6,976,362 |
| Ser. 2004-T3, Class 1A3, 7.00%, 02/25/2044 | | 681,130 | | | | 693,554 |
| Ser. 2005-S001, Class 1B2, 6.17%, 09/25/2035 | | 1,999,649 | | | | 2,016,626 |
| Ser. 2005-S001, Class 1B3, 6.52%, 09/25/2035 | | 2,999,473 | | | | 2,957,961 |
| | | | | |
|
| Total Agency Reperforming Mortgage-Backed Pass Through Securities | | | | | | |
| (cost $15,914,576) | | | | | | 15,653,853 |
| | | | | |
|
| ASSET-BACKED SECURITIES 17.7% | | | | | | |
| Acacia CDO, Ltd., Ser. 8A, Class C, FRN, 6.36%, 08/10/2045144A (h) | | 4,000,000 | | | | 3,986,800 |
| American Gen. Mtge. Loan Trust, Ser. 2003-1, Class M2, 4.69%,04/25/2033 | | 11,050,000 | | | | 10,848,929 |
| C-Bass, Ltd.: | | | | | | |
| Ser. 11A, Class D, FRN, 8.03%, 09/15/2039 144A | | 3,950,000 | | | | 4,012,450 |
| Ser. 13A, Class C, FRN, 6.48%, 03/17/2040 144A | | 1,500,000 | | | | 1,508,115 |
| Ser. 13A, Class D, FRN, 7.75%, 03/17/2040 144A | | 3,760,000 | | | | 3,770,302 |
| Ser. 15A, Class C, FRN, 6.42%, 02/16/2041 144A | | 4,500,000 | | | | 4,517,775 |
| Empire Funding Home Loan Owner Trust, Ser. 1998-2, ClassM2, 7.93%, | | | | | | |
| 06/25/2024 (h) | | 208,889 | | | | 209,122 |
| Legg Mason Real Estate CDO, Ltd.: | | | | | | |
| Ser. 2006-1A, Class E, FRN, 6.15%, 03/25/2038 144A | | 1,299,000 | | | | 1,306,339 |
| Ser. 2006-1A, Class F1, FRN, 6.72%, 03/25/2038 144A | | 6,970,000 | | | | 7,038,864 |
| Long Beach Asset Holdings Corp.: | | | | | | |
| Ser. 2005-WL1, Class N1, 5.19%, 06/25/2045 144A | | 103,701 | | | | 103,639 |
| Ser. 2005-WL1, Class N2, 7.39%, 06/25/2046 144A | | 7,000,000 | | | | 7,018,620 |
| Ser. 2006-2, Class N2, 7.63%, 04/25/2046 144A | | 2,000,000 | | | | 1,996,940 |
| Marathon Real Estate CDO, Ltd., Ser. 2006-1A, Class F, 6.58%,05/25/2046 144A | | 5,000,000 | | | | 5,046,300 |
| Meritage Asset Holdings Net Interest Mtge.: | | | | | | |
| Ser. 2004-1, Class N2, 6.41%, 07/24/2034 144A | | 2,500,000 | | | | 2,495,313 |
| Ser. 2004-2, Class N4, 6.90%, 01/25/2035 144A | | 1,840,188 | | | | 1,839,038 |
| Nautilus RMBS CDO, Ltd.: | | | | | | |
| Ser. 2005-1A, Class A3, FRN, 6.51%, 05/24/2035 144A | | 9,076,037 | | | | 9,130,130 |
| Ser. 2005-2A, Class A3, FRN, 6.66%, 11/05/2040 144A | | 8,959,485 | | | | 9,000,968 |
| Newcastle Investment Corp., Ser. 3A, Class 2FL, FRN, 6.57%,09/24/2038 144A | | 8,000,000 | | | | 8,024,224 |
| Ocean Star plc: | | | | | | |
| Ser. 2004-A, Class C, FRN, 6.41%, 11/12/2018 144A | | 5,800,000 | | | | 5,881,142 |
| Ser. 2005, Class C, FRN, 5.91%, 11/12/2012 144A | | 8,000,000 | | | | 8,022,400 |
| Ser. 2005, Class D, FRN, 6.66%, 11/12/2012 144A | | 1,400,000 | | | | 1,402,968 |
| Option One CTS Adjustable Rate Mtge. Trust, Ser. 1996-1, ClassA1, 6.90%, | | | | | | |
| 04/25/2026 | | 193,548 | | | | 193,606 |
| Option One Mtge. Securities Corp. Net Interest Mtge., Ser. 2004-2A,Class N2, | | | | | | |
| 6.41%, 11/25/2034 144A (h) | | 187,475 | | | | 187,445 |
| Renaissance Home Equity Loan Trust, Ser. 2006-2, Class N, 6.29%,08/25/2036 | | | | | | |
| 144A | | 8,800,000 | | | | 8,800,000 |
| Trapeza CDO, LLC, Ser. 2004-7A, Class B1, FRN, 6.65%, 01/25/2035144A | | 12,000,000 | | | | 12,243,840 |
| | | | | |
|
| Total Asset-Backed Securities (cost $117,874,558) | | | | | | 118,585,269 |
| | | | | |
|
See Notes to Financial Statements12
SCHEDULE OF INVESTMENTS continued
June 30, 2006
| | | | | | | | |
| | | | | Principal | | | | |
| | | | | Amount | | | | Value |
|
| COMMERCIAL MORTGAGE-BACKED SECURITIES 5.7% | | | | | | |
| FIXED-RATE 1.6% | | | | | | |
| Banc of America Structural Security Trust, Ser. 2002-X1, Class A3, 5.44%, | | | | | | |
| 10/11/2033 144A | | $ 1,250,000 | | $ | | 1,241,075 |
| GS Mtge. Securities Corp., Ser. 2003-3F, Class 2A1, 4.50%, 04/25/2033 | | 930,753 | | | | 897,106 |
| NationsLink Funding Corp., Ser. 1999-1, Class F, 7.10%, 01/20/2031 144A | | 1,300,000 | | | | 1,335,102 |
| PaineWebber Mtge. Acceptance Corp., Ser. 1996-M1, Class E, 7.66%, | | | | | | |
| 01/02/2012 144A | | 7,550,000 | | | | 7,625,203 |
| | | | | |
|
| | | | | | | | | 11,098,486 |
| | | | | | | |
|
| FLOATING-RATE 4.1% | | | | | | |
| Banc of America Large Loan, Inc., Ser. 2005-BBA6, Class G, 5.62%, 01/15/2019 | | | | | | |
| 144A | | 2,000,000 | | | | 2,001,740 |
| Commercial Mtge. Pass-Through Cert., Ser. 2002-FL7, Class G, 7.05%, 11/15/2014 | | | | | | |
| 144A | | 12,500,000 | | | | 12,520,490 |
| Credit Suisse First Boston Mtge. Securities Corp.: | | | | | | |
| Ser. 2003-1, Class DB3, 6.56%, 02/25/2033 | | 3,161,696 | | | | 3,133,968 |
| Ser. 2005-CN2A, Class C, 5.73%, 11/15/2019 144A | | 4,000,000 | | | | 4,020,680 |
| GMAC Comml. Mtge. Asset Corp., Ser. 2003-SNFA, Class A, 6.05%, 01/01/2018 | | | | | | |
| 144A | | 2,637,173 | | | | 2,644,082 |
| Pure Mtge. plc, Ser. 2004-LKD, Class C, 5.81%, 02/28/2034 144A | | 3,000,000 | | | | 3,035,790 |
| | | | | |
|
| | | | | | | | | 27,356,750 |
| | | | | | | |
|
| Total Commercial Mortgage-Backed Securities (cost $38,867,979) | | | | | | 38,455,236 |
| | | | | |
|
| CORPORATE BONDS 1.5% | | | | | | |
| FINANCIALS 1.5% | | | | | | |
| Diversified Financial Services 1.5% | | | | | | |
| Emigrant Capital Trust I, FRN, 7.47%, 12/10/2033 144A | | 5,000,000 | | | | 5,069,550 |
| Regional Diversified Funding, FRN, 6.42%, 01/25/2036 144A | | 5,000,000 | | | | 5,044,050 |
| | | | | |
|
| Total Corporate Bonds (cost $10,024,753) | | | | | | 10,113,600 |
| | | | | |
|
| FOREIGN BONDS-CORPORATE (PRINCIPAL AMOUNT DENOMINATED | | | | | | |
| IN CURRENCY INDICATED) 0.9% | | | | | | |
| FINANCIALS 0.1% | | | | | | |
| Commercial Banks 0.1% | | | | | | |
| Rabobank Nederland, 6.25%, 12/28/2006 NZD | | 1,613,000 | | | | 974,235 |
| | | | | |
|
| WHOLE LOAN MORTGAGE-BACKED PASS THROUGH SECURITIES0.8% | | | | | | |
| Floating-Rate 0.8% | | | | | | |
| Crusade Global Trust, Ser. 2006-1, Class A3, 5.99%, 06/23/2038 AUD 144A (h) | | 6,734,567 | | | | 5,003,445 |
| | | | | |
|
| Total Foreign Bonds-Corporate (Principal Amount Denominated in | | | | | | |
| Currency Indicated) (cost $6,080,286) | | | | | | 5,977,680 |
| | | | | |
|
| FOREIGN BONDS-GOVERNMENT (PRINCIPAL AMOUNT DENOMINATED | | | | | | |
| IN CURRENCY INDICATED) 2.4% | | | | | | |
| Kommunalbanken AS, 6.00%, 12/12/2006 NZD | | 1,302,000 | | | | 785,769 |
| Mexico, 8.00%, 12/28/2006 MXN | | 72,500,000 | | | | 6,456,579 |
| New Zealand, 8.00%, 11/15/2006 NZD | | 14,200,000 | | | | 8,665,953 |
| | | | | |
|
| Total Foreign Bonds-Government (Principal Amount Denominated | | | | | | |
| in Currency Indicated) (cost $17,546,668) | | | | | | 15,908,301 |
| | | | | |
|
See Notes to Financial Statements13
SCHEDULE OF INVESTMENTS continued
June 30, 2006
| | | | | | |
| | | Principal | | | | |
| | | Amount | | | | Value |
|
| REPERFORMING MORTGAGE-BACKED PASS THROUGH SECURITIES 3.2% | | | | | | |
| GS Mtge. Securities Corp.: | | | | | | |
| Ser. 2001-2, Class A, 7.50%, 06/19/2032 144A | | $ 4,163,156 | | $ | | 4,314,861 |
| Ser. 2004-4, Class 1A2, 7.50%, 10/25/2044 144A | | 4,089,136 | | | | 4,236,427 |
| Nomura Asset Acceptance Corp. Reperforming Loan Trust, Ser. 2004-R2, Class A2, | | | | | | |
| 7.00%, 10/25/2034 144A | | 3,465,109 | | | | 3,564,523 |
| Washington Mutual, Inc., Ser. 2004-RP1, Class 2A, 5.47%, 01/25/2034 144A | | 9,159,750 | | | | 9,371,432 |
| | | | | |
|
| Total Reperforming Mortgage-Backed Pass Through Securities | | | | | | |
| (cost $21,918,544) | | | | | | 21,487,243 |
| | | | | |
|
| WHOLE LOAN MORTGAGE-BACKED COLLATERALIZED MORTGAGE | | | | | | |
| OBLIGATIONS 3.0% | | | | | | |
| FIXED-RATE 1.9% | | | | | | |
| ChaseFlex Trust, Ser. 2005-2, Class 5A2, 5.50%, 06/25/2035 | | 1,699,664 | | | | 1,696,044 |
| DLJ Mtge. Acceptance Corp., Ser. 1993-19, Class A7, 6.75%, 01/25/2024 | | 2,622,542 | | | | 2,623,906 |
| Residential Accredit Loans, Inc. Net Interest Mtge. Corp.: | | | | | | |
| Ser. 2006-Q04, Class N1, 6.05%, 05/25/2046 144A (h) | | 4,909,355 | | | | 4,909,355 |
| Ser. 2006-Q04, Class N2, 7.63%, 04/25/2046 144A (h) | | 1,650,000 | | | | 1,650,000 |
| Structured Asset Securities Corp., Ser. 2003-8, Class 2A3, 5.00%, 04/25/2033 | | 368,815 | | | | 369,799 |
| Washington Mutual Mtge. Securities Corp., Ser. 2003-MS4, Class LLA3, 5.00%, | | | | | | |
| 02/25/2033 | | 1,503,846 | | | | 1,474,251 |
| | | | | |
|
| | | | | | | 12,723,355 |
| | | | | |
|
| FLOATING-RATE 1.1% | | | | | | |
| Countrywide Home Loans, Ser. 2004-29, Class 3A1, 5.39%, 02/25/2035 | | 1,209,247 | | | | 1,211,738 |
| GSR Mtge. Loan Trust, Ser. 2004-3F, Class 2A10, 3.24%, 02/25/2035 | | 1,884,927 | | | | 1,732,512 |
| IndyMac Index Mtge. Loan Trust, Ser. 2004-AR14, Class AX2, IO, 0.52%, | | | | | | |
| 01/25/2035 (h) | | 103,586,137 | | | | 3,933,036 |
| Residential Accredit Loans, Inc., Ser. 2002, Class A7A, 5.72%, 09/25/2017 | | 310,363 | | | | 309,570 |
| | | | | |
|
| | | | | | | 7,186,856 |
| | | | | |
|
| Total Whole Loan Mortgage-Backed Collateralized Mortgage Obligations | | | | | | |
| (cost $21,750,094) | | | | | | 19,910,211 |
| | | | | |
|
| WHOLE LOAN MORTGAGE-BACKED PASS THROUGH SECURITIES 16.5% | | | | | | |
| FIXED-RATE 0.4% | | | | | | |
| MASTR Alternative Loan Trust, Ser. 2003-5, Class 1A1, 6.50%, 07/25/2033 | | 26,912 | | | | 27,068 |
| Structured Asset Securities Corp., Ser. 2005-RM1, Class A, IO, 5.00%, 03/25/2045 | | | | | | |
| 144A | | 10,735,875 | | | | 2,361,893 |
| | | | | |
|
| | | | | | | 2,388,961 |
| | | | | |
|
| FLOATING-RATE 16.1% | | | | | | |
| Bear Stearns Alternative Loan Trust: | | | | | | |
| Ser. 2003-5, Class 42A2, 4.39%, 12/25/2033 | | 1,944,232 | | | | 1,903,909 |
| Ser. 2003-6, Class 4A, 5.62%, 01/25/2034 | | 2,850,189 | | | | 2,819,635 |
| Countrywide Home Loans, Inc.: | | | | | | |
| Ser. 2004-2, Class 2A1, 5.30%, 02/25/2034 | | 3,232,783 | | | | 3,192,502 |
| Ser. 2004-23, Class A, 6.99%, 11/25/2034 | | 9,953,309 | | | | 10,171,784 |
| Ser. 2004-HYB8, Class 5A1, 5.88%, 01/20/2035 | | 6,456,157 | | | | 6,622,210 |
| Credit Suisse First Boston Mtge. Securities Corp.: | | | | | | |
| Ser. 2002-AR17, Class 2A1, 5.45%, 12/19/2039 | | 141,774 | | | | 140,195 |
| Ser. 2002-AR33, Class 4A1, 5.28%, 12/25/2032 | | 8,854,879 | | | | 8,789,087 |
See Notes to Financial Statements14
SCHEDULE OF INVESTMENTS continued
June 30, 2006
| | | | | | | | |
| | | | | Principal | | | | |
| | | | | Amount | | | | Value |
|
| WHOLE LOAN MORTGAGE-BACKED PASS THROUGH SECURITIES continued | | | | | | | | |
| FLOATING-RATE continued | | | | | | | | |
| Credit Suisse First Boston Mtge. Securities Corp.: | | | | | | | | |
| Ser. 2003-AR20, Class A4, 4.63%, 08/25/2033 | | $ 3,451,450 | | $ | | 3,387,253 |
| Ser. 2004-AR2, Class 3A1, 5.16%, 03/25/2034 | | 2,093,191 | | | | 2,068,010 |
| DSLA Mtge. Loan Trust: | | | | | | |
| Ser. 2005-AR1, Class X2, IO, 0.71%, 03/19/2045 (h) | | 82,313,013 | | | | 3,897,007 |
| Ser. 2005-AR2, Class X2, IO, 0.71%, 03/19/2045 | | 180,771,378 | | | | 8,586,640 |
| Guardian Savings & Loan Assn., Ser. 1990-4W, Class A, 6.64%,05/25/2020 | | 113,614 | | | | 113,683 |
| Housing Securities, Inc., Ser. 92-Sl, Class A2, 7.07%, 05/25/2016 (h) | | 200,466 | | | | 200,466 |
| IndyMac Index Mtge. Loan Trust: | | | | | | |
| Ser. 2005-AR3, Class 4A1, 5.51%, 04/25/2035 | | 2,119,124 | | | | 2,096,237 |
| Ser. 2005-AR8, Class AX2, IO, 0.78%, 04/25/2035 (h) | | 136,558,832 | | | | 4,992,932 |
| Ser. 2006-AR4, Class M6, 7.07%, 05/25/2046 | | 4,000,000 | | | | 4,025,240 |
| MASTR Adjustable Rate Mtge. Trust: | | | | | | |
| Ser. 2003-1, Class 2A3, 4.65%, 12/25/2032 | | 239,069 | | | | 236,083 |
| Ser. 2004-1, Class 4A1, 6.19%, 01/25/2034 | | 3,368,516 | | | | 3,387,379 |
| Ser. 2004-8, Class 7A1, 5.43%, 09/25/2034 | | 5,193,475 | | | | 5,128,297 |
| Merrill Lynch Mtge. Investors, Inc., Ser. 2003-A4, Class 4A,5.45%, 06/25/2033 | | 4,590,719 | | | | 4,543,618 |
| Structured Adjustable Rate Mtge. Loan Trust, Ser. 2005-7,Class 7AX, IO, 0.95%, | | | | | | |
| 03/25/2035 (h) | | 70,813,670 | | | | 1,084,334 |
| Structured Asset Securities Corp.: | | | | | | |
| Ser. 2003-15, Class 4A, 5.45%, 04/25/2033 | | 10,896,859 | | | | 10,776,775 |
| Ser. 2003-34A, Class 3A1, 4.81%, 11/25/2033 | | 1,692,773 | | | | 1,661,220 |
| Ser. 2003-34A, Class 6A, 5.13%, 11/25/2033 | | 6,464,524 | | | | 6,361,092 |
| Ser. 2003-37A, Class 5A, 5.07%, 12/25/2033 | | 6,484,938 | | | | 6,371,452 |
| Ser. 2003-37A, Class 7A, 4.80%, 12/25/2033 | | 156,092 | | | | 154,778 |
| Ser. 2003-40A, Class 5A, 5.58%, 01/25/2034 | | 5,467,299 | | | | 5,434,714 |
| | | | | |
|
| | | | | | | | | 108,146,532 |
| | | | | | | |
|
Total Whole Loan Mortgage-Backed Pass Through Securities | | | | | | |
| (cost $117,934,777) | | | | | | 110,535,493 |
| | | | | |
|
WHOLE LOAN SUBORDINATE COLLATERALIZED MORTGAGE | | | | | | |
| OBLIGATIONS 34.6% | | | | | | |
| FIXED-RATE 9.8% | | | | | | |
| Argent Net Interest Mtge. Trust, Ser. 2004-WN10, Class B,7.39%, 11/25/2034 | | | | | | |
| 144A | | 642,958 | | | | 643,247 |
| Countrywide Alternative Loan Trust: | | | | | | |
| Ser. 2002-07, Class M, 7.00%, 08/25/2032 | | 8,139,558 | | | | 8,147,616 |
| Ser. 2002-16, Class B1, 6.00%, 12/25/2032 | | 2,558,577 | | | | 2,559,421 |
| Ser. 2002-18, Class M, 6.00%, 02/25/2033 | | 4,610,774 | | | | 4,592,470 |
| Ser. 2002-28, Class M, 6.50%, 10/25/2032 | | 3,127,822 | | | | 3,166,920 |
| Countrywide Home Loans, Inc., Ser. 2002-22, Class M, 6.25%,10/25/2032 | | 2,848,418 | | | | 2,838,705 |
| MASTR Resecuritization Trust: | | | | | | |
| Ser. 2004-1, 4.75%, 07/01/2033 144A | | 5,035,410 | | | | 4,849,100 |
| Ser. 2004-2, 5.25%, 03/25/2034 144A | | 10,580,046 | | | | 10,088,391 |
| Ser. 2004-3, 5.00%, 03/25/2034 144A | | 6,982,893 | | | | 6,586,893 |
| Ser. 2005-2, 4.75%, 03/28/2034 144A | | 7,252,886 | | | | 6,957,766 |
See Notes to Financial Statements15
SCHEDULE OF INVESTMENTS continued
June 30, 2006
| | | | | | |
| | | Principal | | | | |
| | | Amount | | | | Value |
|
| WHOLE LOAN SUBORDINATE COLLATERALIZED MORTGAGE | | | | | | |
| OBLIGATIONS continued | | | | | | |
| FIXED-RATE continued | | | | | | |
| Structured Adjustable Rate Mtge. Loan Trust, Ser. 2004-8, Class B3, 4.80%, | | | | | | |
| 07/25/2034 | | $ 8,862,660 | | $ | | 8,430,162 |
| Structured Asset Securities Corp.: | | | | | | |
| Ser. 2002-17, Class B1, 6.08%, 09/25/2032 | | 1,650,238 | | | | 1,665,750 |
| Ser. 2002-17, Class B2, 6.08%, 09/25/2032 | | 3,377,859 | | | | 3,397,011 |
| Ser. 2003-08, Class 1B1, 5.00%, 04/25/2018 | | 503,636 | | | | 478,575 |
| Washington Mutual, Inc., Ser. 2002-S5, Class B3, 6.39%, 09/25/2032 | | 1,822,553 | | | | 1,844,570 |
| | | | | |
|
| | | | | | | 66,246,597 |
| | | | | |
|
| FLOATING-RATE 24.8% | | | | | | |
| Banc of America Funding Corp.: | | | | | | |
| Ser. 2005-E, Class DB1, 6.74%, 06/20/2035 | | 12,093,271 | | | | 12,413,743 |
| Ser. 2005-E, Class DB2, 6.74%, 06/20/2035 | | 3,998,106 | | | | 4,062,315 |
| Banc of America Mtge. Securities, Inc.: | | | | | | |
| Ser. 2002-G, Class 2B3, 6.66%, 07/20/2032 | | 824,804 | | | | 820,375 |
| Ser. 2002-K, Class B4, 6.13%, 10/20/2032 144A | | 472,185 | | | | 468,143 |
| Ser. 2004-G, Class B3, 4.57%, 08/25/2034 | | 4,498,309 | | | | 4,300,743 |
| Ser. 2004-H, Class B2, 4.45%, 09/25/2034 | | 3,852,405 | | | | 3,709,789 |
| Ser. 2004-H, Class B3, 4.45%, 09/25/2035 | | 2,073,840 | | | | 1,979,937 |
| Ser. 2004-I, Class B3, 4.53%, 10/25/2035 | | 1,927,817 | | | | 1,839,696 |
| Countrywide Home Loans, Inc.: | | | | | | |
| Ser. 2004-HYB8, Class 1B1, 6.40%, 01/20/2035 | | 4,203,023 | | | | 4,227,737 |
| Ser. 2004-HYB8, Class 1B2, 6.40%, 01/20/2035 | | 3,214,429 | | | | 3,156,827 |
| Ser. 2004-HYB8, Class 1M2, 6.40%, 01/20/2035 | | 2,443,525 | | | | 2,473,410 |
| Credit Suisse First Boston Mtge. Securities Corp.: | | | | | | |
| Ser. 2003-AR05, Class 1A2, 6.30%, 01/25/2033 | | 52,741 | | | | 52,806 |
| Ser. 2003-AR05, Class 2A3, 5.17%, 01/25/2033 | | 343,014 | | | | 339,639 |
| Ser. 2003-AR09, Class 1A3, 6.51%, 03/25/2033 | | 81,549 | | | | 81,833 |
| Ser. 2003-AR15, Class 2A2, 4.77%, 06/25/2033 | | 1,212,650 | | | | 1,204,549 |
| Ser. 2003-AR18, Class 2A4, 4.75%, 07/25/2033 | | 552,389 | | | | 546,191 |
| Ser. 2003-AR24, Class 2A4, 6.32%, 09/25/2033 | | 4,660,800 | | | | 4,728,335 |
| Ser. 2003-AR26, Class 9M1, 6.17%, 10/25/2033 | | 4,648,500 | | | | 4,734,590 |
| Ser. 2003-AR28, Class 6M1, 6.17%, 12/25/2033 | | 8,281,000 | | | | 8,437,014 |
| First Franklin Mtge. Loan Net Interest Mtge.: | | | | | | |
| Ser. 2003-FFH2, Class N3, 8.50%, 03/25/2034 144A | | 1,398,191 | | | | 1,402,997 |
| Ser. 2004-FFH1, Class N3, 10.00%, 04/25/2034 144A | | 1,379,537 | | | | 1,383,416 |
| Ser. 2004-FFH3, Class N2, 5.93%, 12/25/2034 144A | | 301,780 | | | | 301,686 |
| Ser. 2004-FFH3, Class N3, 8.00%, 12/25/2034 144A | | 3,200,000 | | | | 3,196,500 |
| Harborview Mtge. Loan Trust: | | | | | | |
| Ser. 2004-7, Class B2, 5.30%, 11/19/2034 | | 2,165,010�� | | | | 2,188,089 |
| Ser. 2004-7, Class B3, 5.30%, 11/19/2034 | | 5,595,838 | | | | 5,562,375 |
| Ser. 2005-8, Class 2B3, 6.49%, 02/19/2035 | | 6,986,969 | | | | 7,018,970 |
| Ser. 2005-8, Class 2B4, 6.49%, 02/19/2035 | | 5,779,222 | | | | 5,575,273 |
| Lehman Structured Securities Corp.: | | | | | | |
| Ser. 2004-2, Class M-2, 6.18%, 02/28/2033 144A | | 5,583,818 | | | | 5,536,845 |
| Ser. 2004-2, Class M-3, 6.18%, 02/28/2033 144A | | 6,999,164 | | | | 6,878,908 |
See Notes to Financial Statements16
SCHEDULE OF INVESTMENTS continued
June 30, 2006
| | | | | | |
| | | Principal | | | | |
| | | Amount | | | | Value |
|
| WHOLE LOAN SUBORDINATE COLLATERALIZED MORTGAGE | | | | | | |
| OBLIGATIONS continued | | | | | | |
| FLOATING-RATE continued | | | | | | |
| MASTR Adjustable Rate Mtge. Trust: | | | | | | |
| Ser. 2004-1, Class B3, 5.69%, 02/25/2034 | | $ 3,299,380 | | $ | | 3,271,589 |
| Ser. 2004-15, Class B3, 5.07%, 12/25/2034 | | 4,230,570 | | | | 4,117,360 |
| MortgageIT Trust: | | | | | | |
| Ser. 2005-4, Class B1, 6.42%, 10/25/2035 | | 890,980 | | | | 905,672 |
| Ser. 2005-4, Class B2, 7.07%, 10/25/2035 | | 890,980 | | | | 902,028 |
| Ser. 2005-4, Class M3, 5.89%, 10/25/2035 | | 2,672,941 | | | | 2,719,022 |
| Ser. 2005-4, Class M4, 5.97%, 10/25/2035 | | 1,430,914 | | | | 1,456,084 |
| Structured Adjustable Rate Mtge. Loan Trust: | | | | | | |
| Ser. 2004-14, Class B6, 4.87%, 10/25/2034 | | 6,338,772 | | | | 6,036,920 |
| Ser. 2004-16, Class B6, 5.27%, 11/25/2034 | | 7,498,064 | | | | 7,200,391 |
| Ser. 2005-12, Class B4, 5.55%, 06/25/2035 | | 2,727,765 | | | | 2,668,572 |
| Ser. 2005-12, Class B6, 5.55%, 06/25/2035 | | 2,860,558 | | | | 2,738,813 |
| Structured Asset Mtge. Investments, Inc., Ser. 2003-AR2, Class B1, 6.25%, | | | | | | |
| 12/19/2033 | | 2,438,664 | | | | 2,457,061 |
| Structured Asset Securities Corp.: | | | | | | |
| Ser. 2002-8A, Class B1, 7.04%, 05/25/2032 | | 3,955,539 | | | | 4,027,852 |
| Ser. 2003-22A, Class B1, 5.13%, 06/25/2033 | | 10,450,257 | | | | 10,396,752 |
| Washington Mutual, Inc.: | | | | | | |
| Ser. 2004-AR2, Class B1, 5.54%, 04/25/2044 | | 7,488,620 | | | | 7,555,643 |
| Ser. 2004-AR2, Class B2, 5.54%, 04/25/2044 | | 6,489,270 | | | | 6,527,492 |
| Ser. 2004-ARG, Class B2, 6.21%, 05/25/2044 | | 3,929,466 | | | | 3,953,554 |
| Wells Fargo Mtge. Backed Securities Trust, Ser. 2003-B, Class B1, 5.14%, | | | | | | |
| 02/25/2033 | | 690,148 | | | | 680,389 |
| | | | | |
|
| | | | | | | 166,237,925 |
| | | | | |
|
| Total Whole Loan Subordinate Collateralized Mortgage Obligations | | | | | | |
| (cost $234,124,092) | | | | | | 232,484,522 |
| | | | | |
|
| YANKEE OBLIGATIONS-CORPORATE 9.2% | | | | | | |
| FINANCIALS 9.2% | | | | | | |
| Diversified Financial Services 9.2% | | | | | | |
| Preferred Term Securities, Ltd., FRN: | | | | | | |
| 6.76%, 07/03/2032 144A | | 7,745,000 | | | | 7,844,213 |
| 6.86%, 01/03/2033 144A | | 10,000,000 | | | | 10,173,800 |
| 6.97%, 03/24/2034 144A | | 1,000,000 | | | | 1,024,310 |
| 6.97%, 06/24/2034 144A | | 16,000,000 | | | | 16,421,920 |
| 7.02%, 12/24/2033 144A | | 25,400,000 | | | | 25,995,376 |
| | | | | |
|
| Total Yankee Obligations-Corporate (cost $60,685,939) | | | | | | 61,459,619 |
| | | | | | |
|
| |
| | | Shares | | | | Value |
|
| PREFERRED STOCKS 1.4% | | | | | | |
| FINANCIALS 1.4% | | | | | | |
| Thrifts & Mortgage Finance 1.4% | | | | | | |
| Fannie Mae, Ser. O (cost $10,106,500) | | 180,000 | | | | 9,708,750 |
| | | | | |
|
See Notes to Financial Statements17
SCHEDULE OF INVESTMENTS continued
June 30, 2006
| | | | | | |
| | | Shares | | | | Value |
|
| SHORT-TERM INVESTMENTS 0.6% | | | | | | |
| MUTUAL FUND SHARES 0.6% | | | | | | |
| Evergreen Institutional Money Market Fund ø ## (cost $3,749,901) | | 3,749,901 | | $ | | 3,749,901 |
| | | | | |
|
| Total Investments (cost $713,394,564) 104.4% | | | | | | 700,186,833 |
| Other Assets and Liabilities (4.4%) | | | | | | (29,209,486) |
| | | | | |
|
| Net Assets 100.0% | | | | $ | | 670,977,347 |
| | | | | |
|
| | |
| µ | | All or a portion of this security has been segregated as collateral for reverse repurchase agreements. |
| # | | When-issued or delayed delivery security |
| ## | | All or a portion of this security has been segregated for when-issued or delayed delivery securities. |
| 144A | | Security that may be sold to qualified institutional buyers under Rule 144A of the Securities Act of 1933, as amended. |
| | | This security has been determined to be liquid under guidelines established by the Board of Trustees, unless otherwise |
| | | noted. |
| (h) | | Security is valued at fair value as determined by the investment advisor in good faith, according to procedures approved |
| | | by the Board of Trustees. |
| ø | | Evergreen Investment Management Company, LLC is the investment advisor to both the Fund and the money market |
| | | fund. |
| | |
| Summaryof Abbreviations |
| AUD | | Australian Dollar |
| CDO | | Collateralized Debt Obligation |
| FHLMC | | Federal Home Loan Mortgage Corp. |
| FNMA | | Federal National Mortgage Association |
| FRN | | Floating Rate Note |
| GNMA | | Government National Mortgage Association |
| IO | | Interest Only |
| MASTR | | Mortgage Asset Securitization Transactions, Inc. |
| MXN | | Mexican Peso |
| NZD | | New Zealand Dollar |
| TBA | | To Be Announced |
The following table shows the percent of total investments (excluding equity positions) by credit quality based on Moody's and Standard and Poor's ratings as of June 30, 2006 (unaudited):
| | |
| AAA | | 31.7% |
| AA | | 16.3% |
| A | | 29.0% |
| BBB | | 23.0% |
| |
|
| | | 100.0% |
| | |
|
The following table shows the percent of total investments (excluding equity positions) by maturity as of June 30, 2006 (unaudited):
| | |
| Less than 1 year | | 13.1% |
| 1 to 3 year(s) | | 51.3% |
| 3 to 5 years | | 20.6% |
| 5 to 10 years | | 13.4% |
| 10 to 20 years | | 0.1% |
| 20 to 30 years | | 1.5% |
| |
|
| | | 100.0% |
| | |
|
See Notes to Financial Statements18
STATEMENT OF ASSETS AND LIABILITIES
June 30, 2006
| | | | |
|
| Assets | | | | |
| Investments in securities, at value (cost $709,644,663) | | $ | | 696,436,932 |
| Investments in affiliated money market fund, at value (cost $3,749,901) | | | | 3,749,901 |
|
| Total investments | | | | 700,186,833 |
| Foreign currency, at value (cost $646,934) | | | | 638,440 |
| Principal paydown receivable | | | | 1,138,970 |
| Receivable for Fund shares sold | | | | 889,073 |
| Interest receivable | | | | 4,018,326 |
| Prepaid expenses and other assets | | | | 60,229 |
|
| Total assets | | | | 706,931,871 |
|
| Liabilities | | | | |
| Dividends payable | | | | 765,719 |
| Payable for securities purchased | | | | 9,340,815 |
| Payable for Fund shares redeemed | | | | 901,240 |
| Payable for reverse repurchase agreements | | | | 24,852,693 |
| Advisory fee payable | | | | 18,131 |
| Distribution Plan expenses payable | | | | 8,969 |
| Due to other related parties | | | | 9,502 |
| Accrued expenses and other liabilities | | | | 57,455 |
|
| Total liabilities | | | | 35,954,524 |
|
| Net assets | | $ | | 670,977,347 |
|
| Net assets represented by | | | | |
| Paid-in capital | | $ | | 691,367,593 |
| Undistributed net investment income | | | | 87,096 |
| Accumulated net realized losses on investments | | | | (7,245,344) |
| Net unrealized losses on investments | | | | (13,231,998) |
|
| Total net assets | | $ | | 670,977,347 |
|
| Net assets consists of | | | | |
| Class A | | $ | | 94,786,697 |
| Class B | | | | 19,632,884 |
| Class C | | | | 82,184,493 |
| Class I | | | | 474,373,273 |
|
| Total net assets | | $ | | 670,977,347 |
|
| Shares outstanding (unlimited number of shares authorized) | | | | |
| Class A | | | | 9,751,036 |
| Class B | | | | 2,019,799 |
| Class C | | | | 8,455,326 |
| Class I | | | | 48,804,819 |
|
| Net asset value per share | | | | |
| Class A | | $ | | 9.72 |
| Class A -- Offering price (based on sales charge of 3.25%) | | $ | | 10.05 |
| Class B | | $ | | 9.72 |
| Class C | | $ | | 9.72 |
| Class I | | $ | | 9.72 |
|
See Notes to Financial Statements19
STATEMENT OF OPERATIONS
Year Ended June 30, 2006
| | | | |
|
| Investment income | | | | |
| Interest | | $ | | 34,629,603 |
| Dividends | | | | 631,458 |
| Income from affiliate | | | | 327,117 |
|
| Total investment income | | | | 35,588,178 |
|
| Expenses | | | | |
| Advisory fee | | | | 2,332,243 |
| Distribution Plan expenses | | | | |
| Class A | | | | 332,764 |
| Class B | | | | 194,933 |
| Class C | | | | 988,786 |
| Administrative services fee | | | | 647,848 |
| Transfer agent fees | | | | 223,925 |
| Trustees' fees and expenses | | | | 9,579 |
| Printing and postage expenses | | | | 44,344 |
| Custodian and accounting fees | | | | 209,758 |
| Registration and filing fees | | | | 64,147 |
| Professional fees | | | | 45,684 |
| Interest expense | | | | 357,151 |
| Other | | | | 23,094 |
|
| Total expenses | | | | 5,474,256 |
| Less: Expense reductions | | | | (28,284) |
| Fee waivers and expense reimbursements | | | | (202,445) |
|
| Net expenses | | | | 5,243,527 |
|
| Net investment income | | | | 30,344,651 |
|
| Net realized and unrealized gains or losses on investments | | | | |
| Net realized losses on: | | | | |
| Securities | | | | (1,383,506) |
| Foreign currency related transactions | | | | (522,687) |
|
| Net realized losses on investments | | | | (1,906,193) |
| Net change in unrealized gains or losses on investments | | | | (10,753,657) |
|
| Net realized and unrealized gains or losses on investments | | | | (12,659,850) |
|
| Net increase in net assets resulting from operations | | $ | | 17,684,801 |
|
See Notes to Financial Statements20
STATEMENTS OF CHANGES IN NET ASSETS
| | | | | | | | |
| | | Year Ended June 30, |
| |
|
| | | 2006 | | 2005 |
|
| Operations | | | | | | | | |
| Net investment income | | | | $ 30,344,651 | | | | $ 18,836,791 |
| Net realized gains or losses on investments | | | | (1,906,193) | | | | 765,933 |
| Net change in unrealized gains or losses | | | | | | | | |
| on investments | | | | (10,753,657) | | | | (296,054) |
|
| Net increase in net assets resulting from | | | | | | | | |
| operations | | | | 17,684,801 | | | | 19,306,670 |
|
Distributions to shareholders from | | | | | | | | |
| Net investment income | | | | | | | | |
| Class A | | | | (5,279,217) | | | | (4,529,823) |
| Class B | | | | (794,881) | | | | (572,533) |
| Class C | | | | (4,015,583) | | | | (3,910,056) |
| Class I | | | | (21,554,228) | | | | (12,096,314) |
|
| Total distributions to shareholders | | | | (31,643,909) | | | | (21,108,726) |
|
| | | Shares | | | | Shares | | |
| Capital share transactions | | | | | | | | |
| Proceeds from shares sold | | | | | | | | |
| Class A | | 3,923,782 | | 38,559,147 | | 10,168,264 | | 101,301,333 |
| Class B | | 611,510 | | 5,990,902 | | 816,669 | | 8,132,532 |
| Class C | | 1,951,318 | | 19,170,845 | | 3,656,985 | | 36,416,945 |
| Class I | | 27,036,959 | | 265,066,528 | | 23,442,505 | | 233,352,317 |
|
| | | | | 328,787,422 | | | | 379,203,127 |
|
| Net asset value of shares issued in | | | | | | | | |
| reinvestment of distributions | | | | | | | | |
| Class A | | 375,917 | | 3,684,161 | | 309,451 | | 3,081,012 |
| Class B | | 52,271 | | 512,224 | | 38,389 | | 382,225 |
| Class C | | 258,593 | | 2,535,887 | | 277,200 | | 2,760,478 |
| Class I | | 1,629,503 | | 15,961,040 | | 813,534 | | 8,096,406 |
|
| | | | | 22,693,312 | | | | 14,320,121 |
|
| Automatic conversion of Class B shares | | | | | | | | |
| to Class A shares | | | | | | | | |
| Class A | | 30,519 | | 299,901 | | 15,438 | | 153,523 |
| Class B | | (30,519) | | (299,901) | | (15,438) | | (153,523) |
|
| | | | | 0 | | | | 0 |
|
| Payment for shares redeemed | | | | | | | | |
| Class A | | (7,085,361) | | (69,557,290) | | (8,528,675) | | (84,924,438) |
| Class B | | (632,227) | | (6,203,591) | | (430,060) | | (4,282,038) |
| Class C | | (5,357,472) | | (52,587,096) | | (5,925,618) | | (59,018,056) |
| Class I | | (18,297,811) | | (179,477,470) | | (7,497,656) | | (74,585,140) |
|
| | | | | (307,825,447) | | | | (222,809,672) |
|
| Net increase in net assets resulting from | | | | | | | | |
| capital share transactions | | | | 43,655,287 | | | | 170,713,576 |
|
| Total increase in net assets | | | | 29,696,179 | | | | 168,911,520 |
| Net assets | | | | | | | | |
| Beginning of period | | | | 641,281,168 | | | | 472,369,648 |
|
| End of period | | | | $ 670,977,347 | | | | $ 641,281,168 |
|
| Undistributed net investment income | | | | $ 87,096 | | | | $ 248,367 |
|
See Notes to Financial Statements21
NOTES TO FINANCIAL STATEMENTS
1. ORGANIZATION
Evergreen Ultra Short Opportunities Fund (the "Fund") is a diversified series of Evergreen Fixed Income Trust (the "Trust"), a Delaware statutory trust organized on September 18, 1997. The Trust is an open-end management investment company registered under the Investment Company Act of 1940, as amended (the "1940 Act").
The Fund offers Class A, Class B, Class C and Institutional ("Class I") shares. Class A shares are sold with a front-end sales charge. However, Class A share investments of $1 million or more are not subject to a front-end sales charge but will be subject to a contingent deferred sales charge of 1.00% upon redemption within one year. Class B shares are sold without a front-end sales charge but are subject to a contingent deferred sales charge that is payable upon redemption and decreases depending on how long the shares have been held. Class C shares are sold without a front-end sales charge but are subject to a contingent deferred sales charge that is payable upon redemption within one year. Class I shares are sold without a front-end sales charge or contingent deferred sales charge. Each class of shares, except Class I shares, pays an ongoing distribution fee.
2. SIGNIFICANT ACCOUNTING POLICIES
The following is a summary of significant accounting policies consistently followed by the Fund in the preparation of its financial statements. The policies are in conformity with generally accepted accounting principles in the United States of America, which require management to make estimates and assumptions that affect amounts reported herein. Actual results could differ from these estimates.
a. Valuation of investments
Portfolio debt securities acquired with more than 60 days to maturity are fair valued using matrix pricing methods determined by an independent pricing service which takes into consideration such factors as similar security prices, yields, maturities, liquidity and ratings. Securities for which valuations are not readily available from an independent pricing service may be valued by brokers which use prices provided by market makers or estimates of market value obtained from yield data relating to investments or securities with similar characteristics.
Listed equity securities are usually valued at the last sales price or official closing price on the national securities exchange where the securities are principally traded.
Short-term securities with remaining maturities of 60 days or less at the time of purchase are valued at amortized cost, which approximates market value.
Investments in other mutual funds are valued at net asset value. Securities for which market quotations are not readily available or not reflective of current market value are valued at fair value as determined by the investment advisor in good faith, according to procedures approved by the Board of Trustees.
b. Reverse repurchase agreements
To obtain short-term financing, the Fund may enter into reverse repurchase agreements with banks and other financial institutions, which are deemed by the investment advisor to be credit-
22
NOTES TO FINANCIAL STATEMENTS continued
worthy. At the time the Fund enters into a reverse repurchase agreement, it will establish a segregated account with the custodian containing qualified assets having a value not less than the repurchase price, including accrued interest. If the counterparty to the transaction is rendered insolvent, the Fund may be delayed or limited in the repurchase of the collateral securities.
c. Foreign currency translation
All assets and liabilities denominated in foreign currencies are translated into U.S. dollar amounts at the date of valuation. Purchases and sales of portfolio securities and income items denominated in foreign currencies are translated into U.S. dollar amounts on the respective dates of such transactions. The Fund does not separately account for that portion of the results of operations resulting from changes in foreign exchange rates on investments and the fluctuations arising from changes in market prices of securities held. Such fluctuations are included with the net realized and unrealized gains or losses on investments.
d. When-issued and delayed delivery transactions
The Fund records when-issued or delayed delivery securities as of trade date and maintains security positions such that sufficient liquid assets will be available to make payment for the securities purchased. Securities purchased on a when-issued or delayed delivery basis are marked-to-market daily and begin earning interest on the settlement date. Losses may occur on these transactions due to changes in market conditions or the failure of counterparties to perform under the contract.
e. Dollar roll transactions
The Fund may enter into dollar roll transactions with respect to mortgage-backed securities. In a dollar roll transaction, the Fund sells mortgage-backed securities to financial institutions and simultaneously agrees to accept substantially similar (same type, coupon and maturity) securities at a later date at an agreed upon price. The Fund will use the proceeds generated from the transactions to invest in short-term investments, which may enhance the Fund's current yield and total return. The Fund accounts for dollar roll transactions as purchases and sales. The Fund could be exposed to risks if the counterparty defaults on its obligation to perform under the terms of the agreement, if the Fund receives inferior securities in comparison to what was sold to the coun-terparty at redelivery or if there are variances in paydown speed between the mortgage-related pools.
f. Security transactions and investment income
Security transactions are recorded on trade date. Realized gains and losses are computed using the specific cost of the security sold. Interest income is recorded on the accrual basis and includes accretion of discounts and amortization of premiums. Dividend income is recorded on the ex-dividend date.
g. Federal taxes
The Fund intends to continue to qualify as a regulated investment company and distribute all of its taxable income, including any net capital gains (which have already been offset by available capital loss carryovers). Accordingly, no provision for federal taxes is required.
23
NOTES TO FINANCIAL STATEMENTS continued
h. Distributions
Distributions to shareholders from net investment income are accrued daily and paid monthly. Distributions from net realized gains, if any, are recorded on the ex-dividend date. Such distributions are determined in conformity with income tax regulations, which may differ from generally accepted accounting principles.
Reclassifications have been made to the Fund's components of net assets to reflect income and gains available for distribution (or available capital loss carryovers, as applicable) under income tax regulations. The primary permanent differences causing such reclassifications are due to net realized foreign currency gains or losses and mortgage paydown gains and losses. During the year ended June 30, 2006, the following amounts were reclassified:
| | |
|
| Undistributed net investment income | | $ 1,137,987 |
| Accumulated net realized losses on investments | | (1,137,987) |
|
i. Class allocationsIncome, common expenses and realized and unrealized gains and losses are allocated to the classes based on the relative net assets of each class. Distribution fees, if any, are calculated daily at the class level based on the appropriate net assets of each class and the specific expense rates applicable to each class.
3. ADVISORY FEE AND OTHER TRANSACTIONS WITH AFFILIATES
Evergreen Investment Management Company, LLC ("EIMC"), an indirect, wholly-owned subsidiary of Wachovia Corporation ("Wachovia"), is the investment advisor to the Fund and is paid an annual fee starting at 0.40% and declining to 0.25% as average daily net assets increase.
From time to time, EIMC may voluntarily or contractually waive its fee and/or reimburse expenses in order to limit operating expenses. During the year ended June 30, 2006, EIMC waived its advisory fee in the amount of $192,540 and reimbursed Distribution Plan expenses (see Note 4) relating to Class A shares in the amount of $9,905.
The Fund may invest in Evergreen-managed money market funds which are also advised by EIMC. Income earned on these investments is included in income from affiliate on the Statement of Operations.
Evergreen Investment Services, Inc. ("EIS"), an indirect, wholly-owned subsidiary of Wachovia, is the administrator to the Fund. As administrator, EIS provides the Fund with facilities, equipment and personnel and is paid an annual rate determined by applying percentage rates to the aggregate average daily net assets of the Evergreen funds (excluding money market funds and Evergreen Institutional Enhanced Income Fund), starting at 0.10% and declining to 0.05% as the aggregate average daily net assets of the Evergreen funds (excluding money market funds and Evergreen Institutional Enhanced Income Fund) increase.
Evergreen Service Company, LLC ("ESC"), an indirect, wholly-owned subsidiary of Wachovia, is the transfer and dividend disbursing agent for the Fund. ESC receives account fees that vary based on the type of account held by the shareholders in the Fund.
24
NOTES TO FINANCIAL STATEMENTS continued
4. DISTRIBUTION PLANS
EIS also serves as distributor of the Fund's shares. The Fund has adopted Distribution Plans, as allowed by Rule 12b-1 of the 1940 Act, for each class of shares, except Class I. Under the Distribution Plans, distribution fees are paid at an annual rate of 0.30% of the average daily net assets for Class A shares and 1.00% of the average daily net assets for each of Class B and Class C shares.
For the year ended June 30, 2006, EIS received $7,008 from the sale of Class A shares and $81,922 and $24,296 in contingent deferred sales charges from redemptions of Class B and Class C shares, respectively.
5. SECURITIES TRANSACTIONS
Cost of purchases and proceeds from sales of investment securities (excluding short-term securities and mortgage dollar roll transactions) were as follows for the year ended June 30, 2006:
| | | | | | |
| Costof Purchases | | Proceeds from Sales |
|
| U.S. | | Non-U.S. | | U.S. | | Non-U.S. |
| Government | | Government | | Government | | Government |
|
| $22,315,165 | | $335,639,505 | | $56,275,883 | | $150,821,958 |
|
On June 30, 2006, the aggregate cost of securities for federal income tax purposes was $713,394,564. The gross unrealized appreciation and depreciation on securities based on tax cost was $3,000,506 and $16,208,237, respectively, with a net unrealized depreciation of $13,207,731.As of June 30, 2006, the Fund had $5,477,862 in capital loss carryovers for federal income tax purposes with $452,371 expiring in 2012, $2,333,655 expiring in 2013 and $2,691,836 expiring in 2014.
For income tax purposes, capital and currency losses incurred after October 31 within the Fund's fiscal year are deemed to arise on the first business day of the following fiscal year. As of June 30, 2006, the Fund incurred and will elect to defer post-October capital and currency losses of $1,767,482 and $522,687, respectively.
6. INTERFUND LENDING
Pursuant to an Exemptive Order issued by the SEC, the Fund may participate in an interfund lending program with certain funds in the Evergreen fund family. This program allows the Fund to borrow from, or lend money to, other participating funds. During the year ended June 30, 2006, the Fund did not participate in the interfund lending program.
25
NOTES TO FINANCIAL STATEMENTS continued
7. DISTRIBUTIONS TO SHAREHOLDERS
As of June 30, 2006, the components of distributable earnings on a tax basis were as follows:
| | | | |
| | | | | Capital Loss |
| Undistributed | | Unrealized | | Carryovers and |
| Ordinary Income | | Depreciation | | Post-October Losses |
|
| $609,783 | | $13,231,998 | | $7,768,031 |
|
The tax character of distributions paid were $31,643,909 and $21,108,726 of ordinary income for the years ended June 30, 2006 and June 30, 2005, respectively.8. EXPENSE REDUCTIONS
Through expense offset arrangements with ESC and the Fund's custodian, a portion of fund expenses has been reduced.
9. DEFERRED TRUSTEES' FEES
Each Trustee of the Fund may defer any or all compensation related to performance of their duties as Trustees. The Trustees' deferred balances are allocated to deferral accounts, which are included in the accrued expenses for the Fund. The investment performance of the deferral accounts is based on the investment performance of certain Evergreen funds. Any gains earned or losses incurred in the deferral accounts are reported in the Fund's Trustees' fees and expenses. At the election of the Trustees, the deferral account will be paid either in one lump sum or in quarterly installments for up to ten years.
10. FINANCING AGREEMENT AND OTHER BORROWINGS
The Fund and certain other Evergreen funds share in a $150 million unsecured revolving credit commitment for temporary and emergency purposes, including the funding of redemptions, as permitted by each participating fund's borrowing restrictions. Borrowings under this facility bear interest at 0.50% per annum above the Federal Funds rate. All of the participating funds are charged an annual commitment fee of 0.09% of the unused balance, which is allocated pro rata. During the year ended June 30, 2006, the Fund had no borrowings under this agreement.
During the year ended June 30, 2006, the Fund entered into reverse repurchase agreements that had an average daily balance outstanding of $7,303,701 with a weighted average interest rate of 4.89% and paid interest of $357,151 representing 0.05% of the Fund's average daily net assets. The maximum amount outstanding under reverse repurchase agreements during the year ended June 30, 2006 was $39,139,123 (including accrued interest). At June 30, 2006, reverse repurchase agreements outstanding were as follows:
| | | | | | |
Repurchase | | | | | | Maturity |
Amount | | Counterparty | | Interest Rate | | Date |
|
| $ 15,848,266 | | Deutsche Bank | | 5.35% | | 07/05/2006 |
| 9,004,427 | | Deutsche Bank | | 5.10% | | 07/05/2006 |
|
26
NOTES TO FINANCIAL STATEMENTS continued
11. REGULATORY MATTERS AND LEGAL PROCEEDINGS
Since September 2003, governmental and self-regulatory authorities have instituted numerous ongoing investigations of various practices in the mutual fund industry, including investigations relating to revenue sharing, market-timing, late trading and record retention, among other things. The investigations cover investment advisors, distributors and transfer agents to mutual funds, as well as other firms. EIMC, EIS and ESC (collectively, "Evergreen") have received subpoenas and other requests for documents and testimony relating to these investigations, are endeavoring to comply with those requests, and are cooperating with the investigations. Evergreen is continuing its own internal review of policies, practices, procedures and personnel, and is taking remedial action where appropriate.
In connection with one of these investigations, on July 28, 2004, the staff of the Securities and Exchange Commission ("SEC") informed Evergreen that the staff intends to recommend to the SEC that it institute an enforcement action against Evergreen. The SEC staff's proposed allegations relate to (i) an arrangement pursuant to which a broker at one of EIMC's affiliated broker-dealers had been authorized, apparently by an EIMC officer (who is no longer with EIMC), to engage in short-term trading, on behalf of a client, in Evergreen Mid Cap Growth Fund (formerly Evergreen Emerging Growth Fund and prior to that, known as Evergreen Small Company Growth Fund) during the period from December 2000 through April 2003, in excess of the limitations set forth in the fund's prospectus, (ii) short-term trading from September 2001 through January 2003, by a former Evergreen portfolio manager of Evergreen Precious Metals Fund, a fund he managed at the time, (iii) the sufficiency of systems for monitoring exchanges and enforcing exchange limitations as stated in the funds' prospectuses, and (iv) the adequacy of e-mail retention practices. In connection with the activity in Evergreen Mid Cap Growth Fund, EIMC reimbursed the fund $378,905, plus an additional $25,242, representing what EIMC calculated at that time to be the client's net gain and the fees earned by EIMC and the expenses incurred by this fund on the client's account. In connection with the activity in Evergreen Precious Metals Fund, EIMC reimbursed the fund $70,878, plus an additional $3,075, representing what EIMC calculated at that time to be the portfolio manager's net gain and the fees earned by EIMC and expenses incurred by the fund on the portfolio manager's account. Evergreen is currently engaged in discussions with the staff of the SEC concerning its recommendation.
The staff of the National Association of Securities Dealers ("NASD") had notified EIS that it has made a preliminary determination to recommend that disciplinary action be brought against EIS for certain violations of the NASD's rules. The recommendation relates principally to allegations that EIS (i) arranged for fund portfolio trades to be directed to broker-dealers (including Wachovia Securities, LLC, an affiliate of EIS) that sold Evergreen fund shares during the period of January 2001 to December 2003 and (ii) provided non-cash compensation by sponsoring offsite meetings attended by Wachovia Securities, LLC brokers during that period. EIS is cooperating with the NASD staff in its review of these matters.
27
NOTES TO FINANCIAL STATEMENTS continued
Any resolution of these matters with regulatory authorities may include, but not be limited to, sanctions, penalties or injunctions regarding Evergreen, restitution to mutual fund shareholders and/or other financial penalties and structural changes in the governance or management of Evergreen's mutual fund business. Any penalties or restitution will be paid by Evergreen and not by the Evergreen funds.
In addition, the Evergreen funds and EIMC and certain of its affiliates are involved in various legal actions, including private litigation and class action lawsuits. EIMC does not expect that any of such legal actions currently pending or threatened will have a material adverse impact on the financial position or operations of any of the Evergreen funds or on EIMC's ability to provide services to the Evergreen funds.
Although Evergreen believes that neither the foregoing investigations described above nor any pending or threatened legal actions will have a material adverse impact on the Evergreen funds, there can be no assurance that these matters and any publicity surrounding or resulting from them will not result in reduced sales or increased redemptions of Evergreen fund shares, which could increase Evergreen fund transaction costs or operating expenses, or that they will not have other adverse consequences on the Evergreen funds.
28
REPORT OF INDEPENDENT REGISTERED PUBLIC ACCOUNTING FIRM
Board of Trustees and Shareholders
Evergreen Fixed Income Trust
We have audited the accompanying statement of assets and liabilities, including the schedule of investments, of the Evergreen Ultra Short Opportunities Fund, a series of Evergreen Fixed Income Trust, as of June 30, 2006, and the related statement of operations for the year then ended, statements of changes in net assets for each of the years in the two-year period then ended, and the financial highlights for each of the years or periods in the four-year period then ended. These financial statements and financial highlights are the responsibility of the Fund's management. Our responsibility is to express an opinion on these financial statements and financial highlights based on our audits.
We conducted our audits in accordance with the standards of the Public Company Accounting Oversight Board (United States). Those standards require that we plan and perform the audit to obtain reasonable assurance about whether the financial statements and financial highlights are free of material misstatement. An audit includes examining, on a test basis, evidence supporting the amounts and disclosures in the financial statements. Our procedures included confirmation of securities owned as of June 30, 2006 by correspondence with the custodian and brokers, or by other appropriate auditing procedures where replies from brokers were not received. An audit also includes assessing the accounting principles used and significant estimates made by management, as well as evaluating the overall financial statement presentation. We believe that our audits provide a reasonable basis for our opinion.
In our opinion, the financial statements and financial highlights referred to above present fairly, in all material respects, the financial position of the Evergreen Ultra Short Opportunities Fund as of June 30, 2006, the results of its operations, changes in its net assets and financial highlights for each of the years or periods described above, in conformity with U.S. generally accepted accounting principles.

Boston, Massachusetts
August 25, 2006
29
ADDITIONAL INFORMATION (unaudited)
FEDERAL TAX DISTRIBUTIONS
For corporate shareholders, 1.99% of ordinary income dividends paid during the fiscal year ended June 30, 2006 qualified for the dividends received deduction.
With respect to dividends paid from investment company taxable income during the fiscal year ended June 30, 2006, the Fund designates 2.00% of ordinary income and any short-term capital gain distributions as Qualified Dividend Income in accordance with the Internal Revenue Code. Complete 2006 year-end tax information will be reported to you on your 2006 Form 1099-DIV, which shall be provided to you in early 2007.
MEETING OF SHAREHOLDERS
On March 31, 2006, a Meeting of Shareholders for the Fund was held to consider a number of proposals. On January 31, 2006, the record date for the meeting, the Fund had 65,832,070 of shares outstanding of which 34,731,438 (52.76%) of shares were represented at the meeting.
Proposal 1 - To approve a revision to the Fund's fundamental investment policy regarding industry concentration:
| | |
| 32,972,131 | | voted "For" |
| 1,460,456 | | voted "Against" |
| 298,851 | | voted "Abstain" |
Proposal 2 - To consider and vote upon such other matters as may properly come before said meeting or adjournment thereof:
| | |
| 4,204,559 | | voted "For" |
| 30,225,941 | | voted "Against" |
| 286,708 | | voted "Abstain" |
30
This page left intentionally blank
31
TRUSTEES AND OFFICERS
| | |
| TRUSTEES 1 | | |
| Charles A. Austin III | | Investment Counselor, Anchor Capital Advisors, Inc. (investment advice); Director, The Andover |
| Trustee | | Companies (insurance); Trustee, Arthritis Foundation of New England; Former Director, The |
| DOB: 10/23/1934 | | Francis Ouimet Society; Former Trustee, Mentor Funds and Cash Resource Trust; Former |
| Term of office since: 1991 | | Investment Counselor, Appleton Partners, Inc. (investment advice); Former Director, Executive |
| Other directorships: None | | Vice President and Treasurer, State Street Research & Management Company (investment |
| | | advice) |
|
| Shirley L. Fulton | | Partner, Tin, Fulton, Greene & Owen, PLLC (law firm); Former Partner, Helms, Henderson & |
| Trustee | | Fulton, P.A. (law firm); Retired Senior Resident Superior Court Judge, 26th Judicial District, |
| DOB: 1/10/1952 | | Charlotte, NC |
| Term of office since: 2004 | | |
| Other directorships: None | | |
|
| K. Dun Gifford | | Chairman and President, Oldways Preservation and Exchange Trust (education); Trustee, |
| Trustee | | Treasurer and Chairman of the Finance Committee, Cambridge College; Former Trustee, Mentor |
| DOB: 10/23/1938 | | Funds and Cash Resource Trust |
| Term of office since: 1974 | | |
| Other directorships: None | | |
|
| Dr. Leroy Keith, Jr. | | Partner, Stonington Partners, Inc. (private equity fund); Trustee, Phoenix Funds Family; Director, |
| Trustee | | Diversapack Co.; Director, Obagi Medical Products Co.; Former Director, Lincoln Educational |
| DOB: 2/14/1939 | | Services; Former Trustee, Mentor Funds and Cash Resource Trust |
| Term of office since: 1983 | | |
| Other directorships: Trustee, The | | |
| Phoenix Group of Mutual Funds | | |
|
| Gerald M. McDonnell | | Manager of Commercial Operations, SMI Steel Co. – South Carolina (steel producer); Former |
| Trustee | | Sales and Marketing Manager, Nucor Steel Company; Former Trustee, Mentor Funds and Cash |
| DOB: 7/14/1939 | | Resource Trust |
| Term of office since: 1988 | | |
| Other directorships: None | | |
|
| Patricia B. Norris 2 | | Former Partner, PricewaterhouseCoopers LLP |
| Trustee | | |
| DOB: 4/9/1948 | | |
| Term of office since: 2006 | | |
| Other directorships: None | | |
|
| William Walt Pettit | | Vice President, Kellam & Pettit, P.A. (law firm); Director, Superior Packaging Corp.; Director, |
| Trustee | | National Kidney Foundation of North Carolina, Inc.; Former Trustee, Mentor Funds and Cash |
| DOB: 8/26/1955 | | Resource Trust |
| Term of office since: 1984 | | |
| Other directorships: None | | |
|
| David M. Richardson | | President, Richardson, Runden LLC (executive recruitment business development/consulting |
| Trustee | | company); Consultant, Kennedy Information, Inc. (executive recruitment information and |
| DOB: 9/19/1941 | | research company); Consultant, AESC (The Association of Executive Search Consultants); |
| Term of office since: 1982 | | Director, J&M Cumming Paper Co. (paper merchandising); Former Trustee, NDI Technologies, LLP |
| Other directorships: None | | (communications); Former Trustee, Mentor Funds and Cash Resource Trust |
|
| Dr. Russell A. Salton III | | President/CEO, AccessOne MedCard; Former Medical Director, Healthcare Resource Associates, |
| Trustee | | Inc.; Former Medical Director, U.S. Health Care/Aetna Health Services; Former Trustee, Mentor |
| DOB: 6/2/1947 | | Funds and Cash Resource Trust |
| Term of office since: 1984 | | |
| Other directorships: None | | |
|
32
TRUSTEES AND OFFICERS continued
| | |
| Michael S. Scofield | | Retired Attorney, Law Offices of Michael S. Scofield; Director and Chairman, Branded Media |
| Trustee | | Corporation (multi-media branding company); Former Trustee, Mentor Funds and Cash |
| DOB: 2/20/1943 | | Resource Trust |
| Term of office since: 1984 | | |
| Other directorships: None | | |
|
| Richard J. Shima | | Independent Consultant; Trustee, Saint Joseph College (CT); Director, Hartford Hospital; Trustee, |
| Trustee | | Greater Hartford YMCA; Former Director, Trust Company of CT; Former Director, Enhance |
| DOB: 8/11/1939 | | Financial Services, Inc.; Former Director, Old State House Association; Former Trustee, Mentor |
| Term of office since: 1993 | | Funds and Cash Resource Trust |
| Other directorships: None | | |
|
| Richard K. Wagoner, CFA 3 | | Member and Former President, North Carolina Securities Traders Association; Member, Financial |
| Trustee | | Analysts Society; Former Consultant to the Boards of Trustees of the Evergreen funds; Former |
| DOB: 12/12/1937 | | Trustee, Mentor Funds and Cash Resource Trust |
| Term of office since: 1999 | | |
| Other directorships: None | | |
|
| |
| OFFICERS | | |
| |
| Dennis H. Ferro 4 | | Principal occupations: President and Chief Executive Officer, Evergreen Investment Company, |
| President | | Inc. and Executive Vice President, Wachovia Bank, N.A.; former Chief Investment Officer, |
| DOB: 6/20/1945 | | Evergreen Investment Company, Inc. |
| Term of office since: 2003 | | |
|
| Kasey Phillips 5 | | Principal occupations: Senior Vice President, Evergreen Investment Services, Inc.; Former Vice |
| Treasurer | | President, Evergreen Investment Services, Inc.; Former Assistant Vice President, Evergreen |
| DOB: 12/12/1970 | | Investment Services, Inc. |
| Term of office since: 2005 | | |
|
| Michael H. Koonce 5 | | Principal occupations: Senior Vice President and General Counsel, Evergreen Investment |
| Secretary | | Services, Inc.; Senior Vice President and Assistant General Counsel, Wachovia Corporation |
| DOB: 4/20/1960 | | |
| Term of office since: 2000 | | |
|
| James Angelos 5 | | Principal occupations: Chief Compliance Officer and Senior Vice President, Evergreen Funds; |
| Chief Compliance Officer | | Former Director of Compliance, Evergreen Investment Services, Inc. |
| DOB: 9/2/1947 | | |
| Term of office since: 2004 | | |
|
|
| 1 Each Trustee serves until a successor is duly elected or qualified or until his/her death, resignation, retirement or removal from office. |
| Each Trustee oversees 91 Evergreen funds. Correspondence for each Trustee may be sent to Evergreen Board of Trustees, |
| P.O. Box 20083, Charlotte, NC 28202. |
| 2 Ms. Norris' information is as of July 1, 2006, the effective date of her trusteeship. |
| 3 Mr. Wagoner is an "interested person" of the Fund because of his ownership of shares in Wachovia Corporation, the parent to the |
| Fund's investment advisor. |
| 4 The address of the Officer is 401 S. Tryon Street, 20th Floor, Charlotte, NC 28288. |
| 5 The address of the Officer is 200 Berkeley Street, Boston, MA 02116. |
Additional information about the Fund's Board of Trustees and Officers can be found in the Statement of Additional Information (SAI) and
is available upon request without charge by calling 800.343.2898.33
566906 rv3 8/2006
Item 2 - Code of Ethics
(a) The Registrant has adopted a code of ethics that applies to the Registrant's principal executive officer and principal financial officer.
(b) During the period covered by this report, there were no amendments to the provisions of the code of ethics adopted in 2.(a) above.
(c) During the period covered by this report, there were no implicit or explicit waivers to the provisions of the code of ethics adopted in 2.(a) above.
Item 3 - Audit Committee Financial Expert
Charles A. Austin III and K. Dun Gifford have been determined by the Registrant's Board of Trustees to be audit committee financial experts within the meaning of Section 407 of the Sarbanes-Oxley Act. These financial experts are independent of management.
Items 4 – Principal Accountant Fees and Services
The following table represents fees for professional audit services rendered by KPMG LLP, for the audits of the one series of the Registrant’s annual financial statements for the fiscal years ended June 30, 2006 and June 30, 2005, and fees billed for other services rendered by KPMG LLP.
| | | 2006 | | 2005 |
| Audit fees | | $19,401 | | $17,604 |
| Audit -related fees | | 0 | | 0 |
| |
|
| Audit and audit-related fees | | 19,401 | | 17,604 |
| Tax fees | | 0 | | 0 |
| Non-audit fees (1) | | 930,575 | | 645,575 |
| All other fees | | 0 | | 0 |
| |
|
| Total fees | | $949,976 | | $663,179 |
| |
|
(1) Non-audit fees consists of the aggregate fees for non-audit services rendered to the Fund, EIMC (not including any sub-advisor whose role is primarily portfolio management and is subcontracted with or overseen by another investment advisor) and EIS.
Evergreen Funds
Evergreen Income Advantage Fund
Evergreen Managed Income Fund
Evergreen Utilities and High Income Fund
Evergreen International Balanced Income Fund
Audit and Non-Audit Services Pre-Approval Policy
I. Statement of Principles
Under the Sarbanes-Oxley Act of 2002 (the “Act”), the Audit Committee of the Board of Trustees/Directors is responsible for the appointment, compensation and oversight of the work of the independent auditor. As part of this responsibility, the Audit Committee is required to pre-approve the audit and non-audit services performed by the independent auditor in order to assure that they do not impair the auditor’s independence from the Funds. To implement these provisions of the Act, the Securities and Exchange Commission (the “SEC”) has issued rules specifying the types of services that an independent auditor may not provide to its audit client, as well as the audit committee’s administration of the engagement of the independent auditor. Accordingly, the Audit Committee has adopted, and the Board of Trustees/Directors has ratified, the Audit and Non-Audit Services Pre Approval Policy (the “Policy”), which sets forth the procedures and the conditions pursuant to which services proposed to be performed by the independent auditor may be pre-approved.
The SEC’s rules establish two different approaches to pre-approving services, which the SEC considers to be equally valid. Proposed services either: may be pre-approved without consideration of specific case-by-case services by the Audit Committee (“general pre-approval”); or require the specific pre-approval of the Audit Committee (“specified pre-approval”). The Audit Committee believes that the combination of these two approaches in this Policy will result in an effective and efficient procedure to pre-approve services performed by the independent auditor. As set forth in this Policy, unless a type of service has received general pre-approval, it will require specific pre-approval by the Audit Committee if it is to be provided by the independent auditor. Any proposed services exceeding pre-approved cost levels or budgeted amounts will also require specific pre-approval by the Audit Committee.
For both types of pre-approval, the Audit Committee will consider whether such services are consistent with the SEC’s rules on auditor independence. The Audit Committee will also consider whether the independent auditor is best positioned to provide the most effective and efficient service, for reasons such as its familiarity with the Funds’ business people, culture, accounting systems, risk profile and other factors, and whether the service might enhance the Funds’ ability to manage or control risk or improve audit quality. All such factors will be considered as a whole, and no one factor should necessarily be determinative.
The Audit Committee is also mindful of the relationship between fees for audit and non-audit services in deciding whether to pre-approve any such services and may determine, for each fiscal year, the ratio between the total amount of fees for Audit, Audit-related and Tax services and the total amount of fees for certain permissible non-audit services classified as All Other services.
The term of any general pre-approval is 12 months from the date of pre-approval, unless the Audit Committee considers a different period and states otherwise. The Audit Committee will annually review and pre-approve the services that may be provided by the independent auditor without obtaining specific pre-approval from the Audit Committee. The Audit Committee will add or subtract to the list of general pre-approved services from time to time, based on subsequent determinations.
The purpose of this Policy is to set forth the procedures by which the Audit Committee intends to fulfill its responsibilities. It does not delegate the Audit Committee’s responsibilities to pre-approve services performed by the independent auditor to management.
The independent auditor has reviewed this Policy and believes that implementation of the policy will not adversely affect the auditor’s independence.
II. Delegation
As provided in the Act and the SEC’s rules, the Audit Committee may delegate either type of pre-approval authority to one or more of its members. The member to whom such authority is delegated must report, for informational purposes only, any pre-approval decisions of the Audit Committee at its next scheduled meeting.
III. Audit Services
The annual Audit services engagement terms and fees will be subject to the specific pre-approval of the Audit Committee. Audit services include the annual financial statement audit and other procedures required to be performed by the independent auditor to be able to form an opinion on the Funds’ financial statements. These other procedures include information systems and procedural reviews and testing performed in order to understand and place reliance on the systems of internal control, and consultations relating to the audit. Audit services also include the attestation engagement for the independent auditor’s report on management’s report on internal controls for financial reporting. The Audit Committee will monitor the Audit services engagement as necessary, but no less than on a quarterly basis, and will also approve, if necessary, any changes in terms, conditions and fees resulting from changes in audit scope, Fund service providers or other items.
In addition to the annual Audit services engagement approved by the Audit Committee, the Audit Committee may grant general pre-approval to other Audit services, which are those services that only the independent auditor reasonably can provide. Other Audit services may include services associated with SEC registration statements, periodic reports and other documents filed with the SEC or other documents issued in connection with mergers or acquisitions.
IV. Audit-related Services
Audit-related services are assurance and related services that are reasonably related to the performance of the audit or review of the Funds’ financial statements or that are traditionally performed by the independent auditor. Because the Audit Committee believes that the provision of Audit-related services does not impair the independence of the auditor and is consistent with SEC’s rules on auditor independence, the Audit Committee may grant general pre-approval to Audit-related services. Audit-related services include, among others, due diligence services pertaining to potential business acquisitions/dispositions; accounting consultations related to accounting, financial reporting or disclosure matters not classified as “Audit services”; assistance with understanding and implementing new accounting and financial reporting guidance from rulemaking authorities; agreed-upon or expanded audit procedures related to accounting records required to respond to or comply with financial, accounting or regulatory reporting matters; and assistance with internal control reporting requirements.
V. Tax Services
The Audit Committee believes that the independent auditor can provide Tax services to the Funds such as tax compliance, tax planning and tax advice without impairing the auditor’s independence, and the SEC has stated that the independent auditor may provide such services. Hence, the Audit Committee believes it may grant general pre-approval to those Tax services that have historically been provided by the auditor, that the Audit Committee has reviewed and believes would not impair the independence of the auditor, and that are consistent with the SEC’s rules on auditor independence. The Audit Committee will not permit the retention of the independent auditor in connection with a transaction initially recommended by the independent auditor, the sole business purpose of which may be tax avoidance and the tax treatment of which may not be supported in the Internal Revenue Code and related regulations. The Audit Committee will consult with the Director of Fund Administration, the Vice President of Tax Services or outside counsel to determine that the tax planning and reporting positions are consistent with this policy.
All Tax services involving large and complex transactions must be specifically pre-approved by the Audit Committee, including: tax services proposed to be provide by the independent auditor to any executive officer or director of the Funds, in his or her individual capacity, where such services are paid for by the Funds or the investment advisor.
VI. All Other Services
The Audit Committee believes, based on the SEC’s rules prohibiting the independent auditor from providing specific non-audit services, that other types of non-audit services are permitted. Accordingly, the Audit Committee believes it may grant general pre-approval to those permissible non-audit services classified as All Other services that it believes are routine and recurring services, would not impair the independence of the auditor and are consistent with the SEC’s rules on auditor independence.
The SEC’s rules and relevant guidance should be consulted to determine the precise definitions of the SEC’s prohibited non-audit services and the applicability of exceptions to certain of the prohibitions.
VII. Pre-Approval Fee Levels or Budgeted Amounts
Pre-approval fee levels or budgeted amounts for all services to be provided by the independent auditor will be established annually by the Audit Committee. Any proposed services exceeding these levels or amounts will require specific pre-approval by the Audit Committee. The Audit Committee is mindful of the overall relationship of fees for audit and non-audit services in determining whether to pre-approve any such services. For each fiscal year, the Audit Committee may determine to ratio between the total amount of fees for Audit, Audit-related and Tax services, and the total amount of fees for services classified as All Other services.
VIII. Procedures
All requests or applications for services to be provided by the independent auditor that do not require specific approval by the Audit Committee will be submitted to the Director of Fund Administration or Assistant Director of Fund Administration and must include a detailed description of the services to be rendered. The Director/Assistant Director of Fund Administration will determine whether such services are included within the list of services that have received the general pre-approval of the Audit Committee. The Audit Committee will be informed on a quarterly basis (or more frequent if requested by the audit committee) of any such services rendered by the independent auditor.
Request or applications to provide services that require specific approval by the Audit Committee will be submitted to the Audit Committee by both the independent auditor and the Director/Assistant Director of Fund Administration, and must include a joint statement as to whether, in their view, the request or application is consistent with the SEC’s rules on auditor independence.
The Audit Committee has designated the Chief Compliance Officer to monitor the performance of all services provided by the independent auditor and to determine whether such services are in compliance with this policy. The Chief Compliance Officer will report to the Audit Committee on a periodic basis on the results of its monitoring. Both the Chief Compliance Officer and management will immediately report to the chairman of the Audit Committee any breach of this policy that comes to the attention of the Chief Compliance Officer or any member of management.
The Audit Committee will also review the internal auditor’s annual internal audit plan to determine that the plan provides for the monitoring of the independent auditor’s services.
IX. Additional Requirements
The Audit Committee has determined to take additional measures on an annual basis to meet its responsibility to oversee the work of the independent auditor and to assure the auditor’s independence from the Funds, such as reviewing a formal written statement from the independent auditor delineating all relationships between the independent auditor and the Funds, the Funds’ investment advisor and related parties of the investment advisor, consistent with Independence Standards Board Standard No. 1, and discussing with the independent auditor its methods and procedures for ensuring independence.
Items 5 – Audit Committee of Listed Registrants
Not applicable.
Item 6 – Schedule of Investments
Please see schedule of investments contained in the Report to Stockholders included under Item 1 of this Form N-CSR.
Item 7 – Disclosure of Proxy Voting Policies and Procedures for Closed-End Management Investment Companies.
Not applicable.
Item 8 – Portfolio Managers of Closed-End Management Investment Companies.
Not applicable.
Item 9 – Purchases of Equity Securities by Closed-End Management Investment Company and Affiliated Purchasers.
Not applicable.
Item 10 – Submission of Matters to a Vote of Security Holders
There have been no material changes to the procedures by which shareholders may recommend nominees to the Registrant’s board of trustees that have been implemented since the Registrant last provided disclosure in response to the requirements of this Item.
Item 11 - Controls and Procedures
(a) The Registrant's principal executive officer and principal financial officer have evaluated the Registrant's disclosure controls and procedures (as defined in Rule 30a-3(c) under the Investment Company Act of 1940) within 90 days of this filing and have concluded that the Registrant's disclosure controls and procedures were effective, as of that date, in ensuring that information required to be disclosed by the Registrant in this Form N-CSR was recorded, processed, summarized, and reported timely.
(b) There has been no changes in the Registrant's internal controls over financial reporting (as defined in Rule 30a-3(d) under the Investment Company Act of 1940) that occurred during the second fiscal quarter of the period covered by this report that has materially affected, or is reasonable likely to affect, the Registrant’s internal control over financial reporting .
Item 12 - Exhibits
File the exhibits listed below as part of this Form. Letter or number the exhibits in the sequence indicated.
(a) Any code of ethics, or amendment thereto, that is the subject of the disclosure required by Item 2, to the extent that the Registrant intends to satisfy the Item 2 requirements through filing of an exhibit.
(b)(1) Separate certifications for the Registrant's principal executive officer and principal financial officer, as required by Section 302 of the Sarbanes-Oxley Act of 2002 and Rule 30a-2(a) under the Investment Company Act of 1940, are attached as EX99.CERT.
(b)(2) Separate certifications for the Registrant's principal executive officer and principal financial officer, as required by Section 1350 of Title 18 of United States Code, as adopted pursuant to Section 906 of the Sarbanes-Oxley Act of 2002, and Rule 30a-2(b) under the Investment Company Act of 1940, are attached as EX99.906CERT. The certifications furnished pursuant to this paragraph are not deemed to be "filed" for purposes of Section 18 of the Securities Exchange Act of 1934, or otherwise subject to the liability of that section. Such certifications are not deemed to be incorporated by reference into any filing under the Securities Act of 1933 or the Securities Exchange Act of 1934, except to the extent that the Registrant specifically incorporates them by reference.
Pursuant to the requirements of the Securities Exchange Act of 1934 and the Investment Company Act of 1940, the Registrant has duly caused this report to be signed on its behalf by the undersigned, thereunto duly authorized.
Evergreen Fixed Income Trust
By: _______________________
Dennis H. Ferro,
Principal Executive Officer
Date: September 5, 2006
Pursuant to the requirements of the Securities Exchange Act of 1934 and the Investment Company Act of 1940, this report has been signed below by the following persons on behalf of the Registrant and in the capacities and on the dates indicated.
By: _______________________
Dennis H. Ferro,
Principal Executive Officer
Date: September 5, 2006
By: ________________________
Kasey Phillips
Principal Financial Officer
Date: September 5, 2006