|
| OMB APPROVAL |
OMB Number: 3235-0570 Expires: September 30, 2007 Estimated average burden hours per response: 19.4 |
UNITED STATES
SECURITIES AND EXCHANGE COMMISSION
Washington, D.C. 20549
FORM N-CSR
CERTIFIED SHAREHOLDER REPORT OF REGISTERED MANAGEMENT INVESTMENT COMPANIES
Investment Company Act file number 811-08415
Evergreen Fixed Income Trust
_____________________________________________________________
(Exact name of registrant as specified in charter)
200 Berkeley Street Boston, Massachusetts 02116
_____________________________________________________________
(Address of principal executive offices) (Zip code)
Michael H. Koonce, Esq. 200 Berkeley Street Boston, Massachusetts 02116
____________________________________________________________
(Name and address of agent for service)
Registrant's telephone number, including area code: (617) 210-3200
Date of fiscal year end: Registrant is making an annual filing for five of its series, Evergreen Diversified Bond Fund, Evergreen High Yield Bond Fund, Evergreen Institutional Mortgage Portfolio, Evergreen Diversified Income Builder Fund & Evergreen U.S. Government Fund, for the year ended April 30, 2007. These five series have an April 30, fiscal year end.
Date of reporting period: April 30, 2007
Item 1 - Reports to Stockholders.
Evergreen Diversified Bond Fund

| | | table of contents |
| 1 | | LETTER TO SHAREHOLDERS |
| 4 | | FUND AT A GLANCE |
| 5 | | PORTFOLIO MANAGER COMMENTARY |
| 6 | | ABOUT YOUR FUND’S EXPENSES |
| 7 | | FINANCIAL HIGHLIGHTS |
| 11 | | SCHEDULE OF INVESTMENTS |
| 23 | | STATEMENT OF ASSETS AND LIABILITIES |
| 24 | | STATEMENT OF OPERATIONS |
| 25 | | STATEMENTS OF CHANGES IN NET ASSETS |
| 27 | | NOTES TO FINANCIAL STATEMENTS |
| 37 | | REPORT OF INDEPENDENT REGISTERED PUBLIC ACCOUNTING FIRM |
| 38 | | ADDITIONAL INFORMATION |
| 40 | | TRUSTEES AND OFFICERS |
This annual report must be preceded or accompanied by a prospectus of the Evergreen fund contained herein. The prospectus contains more complete information, including fees and expenses, and should be read carefully before investing or sending money.
The fund will file its complete schedule of portfolio holdings with the SEC for the first and third quarters of each fiscal year on Form N-Q. The fund’s Form N-Q will be available on the SEC’s Web site at http://www.sec.gov. In addition, the fund’s Form N-Q may be reviewed and copied at the SEC’s Public Reference Room in Washington, D.C. Information on the operation of the Public Reference Room may be obtained by calling 800.SEC.0330.
A description of the fund’s proxy voting policies and procedures, as well as information regarding how the fund voted proxies relating to portfolio securities during the most recent 12-month period ended June 30, is available by visiting our Web site at EvergreenInvestments.com or by visiting the SEC’s Web site at http://www.sec.gov. The fund’s proxy voting policies and procedures are also available without charge, upon request, by calling 800.343.2898.
| | | | |
| Mutual Funds: | | | | |
| NOT FDIC INSURED | | MAY LOSE VALUE | | NOT BANK GUARANTEED |
Evergreen InvestmentsSM is a service mark of Evergreen Investment Management Company, LLC. Copyright 2007, Evergreen Investment Management Company, LLC.
Evergreen Investment Management Company, LLC is a subsidiary of Wachovia Corporation and is an affiliate of Wachovia Corporation’s other Broker Dealer subsidiaries.
Evergreen mutual funds are distributed by Evergreen Investment Services, Inc. 200 Berkeley Street, Boston, MA 02116
LETTER TO SHAREHOLDERS
June 2007

Dennis H. Ferro
President and Chief
Executive Officer
Dear Shareholder,
We are pleased to provide the annual report for Evergreen Diversified Bond Fund covering the twelve-month period ended April 30, 2007.
The domestic fixed-income markets generated healthy results during the twelve-month period in an environment supported by persistent growth and the prospect of stable interest rates. While the economic expansion decelerated as the period progressed, continued gains in business profits helped support the performance of corporate debt securities, including lower-quality, higher-yielding bonds, which generally outperformed high-grade and investment-grade debt. The fiscal year began on a harsh note in the spring of 2006 amid rising inflationary concerns, accompanied by anxieties about the potential economic impacts of repeated interest rate hikes by the Federal Reserve Board (the “Fed”). However, the markets were calmed in both the summer and autumn by the combination of receding commodity prices and the Fed’s policy to leave short-term interest rates unchanged. Over the full twelve-month period, the yield curve flattened — the difference between short-term yields and long-term yields narrowed. In this environment, longer-maturity bonds, especially those with maturities of 20 to 30 years, tended to outperform the overall bond market.
Solid returns in both the nation’s equity and fixed-income markets came against a backdrop of persistent economic growth during most of the period. Gross Domestic Product grew by a rate of 3.3% over 2006 then decelerated to an annualized rate of 1.3% in the first quarter of 2007. The slump in the housing industry was a major factor that contributed to the slowdown,
1
LETTER TO SHAREHOLDERS continued
which came in the face of strong employment, rising wages and gains in both personal consumption and business investment.
In this environment, the teams managing the higher-quality portfolios, including Evergreen Core Bond Fund, Evergreen U.S. Government Fund and Evergreen Institutional Mortgage Portfolio, assessed factors such as employment and inflationary trends, Fed policy, and interest-rate expectations in making their decisions. At the same time, the managers supervising Evergreen High Yield Bond Fund and Evergreen Select High Yield Bond Fund tended to position their more credit-sensitive portfolios relatively cautiously as the relative yield advantages of lower-quality corporate bonds appeared to tighten. The managers of Evergreen Diversified Bond Fund also sought opportunities in the high-yield market, while maintaining a healthy exposure to investment-grade securities. The managers of Evergreen Diversified Income Builder Fund, meanwhile, looked at broad interest-rate trends, opportunities in the credit markets, and the effects of currency fluctuations in making decisions on sector and industry allocations and individual security selections.
As always, we encourage investors to maintain diversified investment portfolios in pursuit of their long-term investment goals.
Please visit us at EvergreenInvestments.com for more information about our funds and other investment products available to you. Thank you for your continued support of Evergreen Investments.
Sincerely,

Dennis H. Ferro
President and Chief Executive Officer
Evergreen Investment Company, Inc.
2
LETTER TO SHAREHOLDERS continued
Notice to Shareholders:
The following changes are effective August 1, 2007:
• The Fund’s name will change to Evergreen Core Plus Bond Fund.
• The section of the Fund’s prospectus entitled “Investment Goal” will read as follows:
The Fund seeks to maximize total return through a combination of current income and capital growth.
• The Fund will reduce the maximum exposure to foreign securities from 50% to 30%, with a 10% allowance in investments in emerging markets; will reduce the maximum exposure to high yield bonds from 35% to 20%; and will increase the maximum exposure to non-US dollar-denominated securities from 10% to 20%. Additionally, the Fund will allow a maximum of 35% combined total exposure to high yield bonds, foreign securities and non-US dollar-denominated securities.
Special Notice to Shareholders:
Please visit our Web site at EvergreenInvestments.com for statements from President and Chief Executive Officer, Dennis Ferro, addressing NASD actions involving Evergreen Investment Services, Inc. (EIS), Evergreen’s mutual fund distributor or statements from Dennis Ferro and Chairman of the Board of the Evergreen funds, Michael S. Scofield, addressing SEC actions involving the Evergreen funds.
3
FUND AT A GLANCE
as of April 30, 2007
MANAGEMENT TEAM
Investment Advisor:
• Evergreen Investment Management Company, LLC
Sub-Advisor:
• Tattersall Advisory Group, Inc.
Portfolio Managers^:
• Robert A. Calhoun, CFA
• Parham M. Behrooz, CFA
• Lisa Brown-Premo
• Mehmet Camurdan, CFA
• Andrew Cestone
• Eric R. Harper, CFA
• Todd C. Kuimjian, CFA
• Robert D. Rowe
CURRENT INVESTMENT STYLE

Source: Morningstar, Inc.
Morningstar’s style box is based on a portfolio date as of 3/31/2007.
The Fixed income style box placement is based on a fund’s average effective maturity or duration and the average credit rating of the bond portfolio.
| PERFORMANCE AND RETURNS |
|
| Portfolio inception date: 11/30/1972 | | Class A | | Class B | | Class C | | Class I |
| Class inception date | | 5/20/2005 | | 5/20/2005 | | 5/20/2005 | | 11/30/1972 |
|
| Nasdaq symbol | | EKDLX | | EKDMX | | EKDCX | | EKDYX |
|
| Average annual return* |
|
| 1-year with sales charge | | 2.39% | | 1.71% | | 5.71% | | N/A |
|
| 1-year w/o sales charge | | 7.49% | | 6.71% | | 6.71% | | 7.78% |
|
| 5-year | | 5.36% | | 5.78% | | 6.09% | | 6.50% |
|
| 10-year | | 5.93% | | 6.30% | | 6.30% | | 6.51% |
|
| Maximum sales charge | | 4.75% | | 5.00% | | 1.00% | | N/A |
| | | Front-end | | CDSC | | CDSC | | |
|
* Adjusted for maximum applicable sales charge, unless noted.Past performance is no guarantee of future results. The performance quoted represents past performance and current performance may be lower or higher. The investment return and principal value of an investment will fluctuate so that investors’ shares, when redeemed, may be worth more or less than their original cost. To obtain performance information current to the most recent month-end for Classes A, B, C or I, please go to EvergreenInvestments.com/fundperformance. The performance of each class may vary based on differences in loads, fees and expenses paid by the shareholders investing in each class. Performance includes the reinvestment of income dividends and capital gain distributions. Performance shown does not reflect the deduction of taxes that a shareholder would pay on fund distributions or the redemption of fund shares.
Historical performance shown for Class I prior to 5/23/2005 is based on the performance of the fund’s predecessor closed-end fund, Vestaur Securities Fund. Historical performance shown for Classes A, B and C prior to their inception is based on the performance of Class I. The historical returns for Classes A, B and C have not been adjusted to reflect the effect of each class’ 12b-1 fee. These fees are 0.30% for Class A and 1.00% for Classes B and C. Class I does not, and Vestaur Securities Fund did not, pay a 12b-1 fee. If these fees had been reflected, returns for Classes A, B and C would have been lower.
The advisor is waiving a portion of its advisory fee and reimbursing a portion of the 12b-1 fee for Class A. Had the fees not been waived or reimbursed, returns would have been lower.
LONG-TERM GROWTH

Comparison of a $10,000 investment in the Evergreen Diversified Bond Fund Class A shares versus a similar investment in the Evergreen Diversified Bond Blended Index (EDBBI), the Lehman Brothers Corporate Bond Index (LBCBI), the Merrill Lynch High Yield, Cash Pay, BB-B Index† (MLHYCPBB-B) and the Consumer Price Index (CPI).
The EDBBI, the LBCBI and the MLHYCPBB-B are unmanaged market indexes and do not include transaction costs associated with buying and selling securities, any mutual fund fees or expenses or any taxes. The CPI is a commonly used measure of inflation and does not represent an investment return. It is not possible to invest directly in an index.
^ Effective May 21, 2007, Mr. Calhoun, Mr. Behrooz, Mr. Camurdan, Mr. Harper, Mr. Kuimjian, Ms. Premo and Mr. Rowe were added as portfolio managers of the Fund. Effective March 1, 2007, Mr. Cestone was added as a portfolio manager of the Fund.
4
PORTFOLIO MANAGER COMMENTARY
The fund’s Class A shares returned 7.49% for the twelve-month period ended April 30, 2007, excluding any applicable sales charges. During the same period, the EDBBI returned 8.89%, the LBCBI returned 8.27% and the MLHYCPBB-B† returned 11.41%.
The fund seeks maximum income without undue risk of principal.
The fund delivered positive returns over the twelve-month period, although it trailed its benchmarks. Throughout the fiscal year, we maintained a diversified strategy, with allocations to both investment-grade corporate bonds and the higher quality tiers of the high-yield corporate market.
In general, during the twelve-month period, corporate bonds outperformed higher quality investments, including government securities. Throughout the fiscal year, we saw continued improvement in corporate profitability despite some evidence of a deceleration in the domestic economy’s growth trajectory. Growth in Gross Domestic Product, for example, slowed from more than 3% per year to about 2% as the decline in the housing market exerted a major braking influence on the economic expansion. In general, corporate bonds, led by high-yield securities, outperformed other fixed income sectors, as corporations continued to generate improving profits. With strong cash flows, high-yield issuers generally had solid balance sheets with relatively little debt. Defaults on high-yield debts continued to decline to very low levels. In this favorable environment, the lower quality tiers of the high-yield market outperformed both the higher-quality tiers of the high-yield market and the investment-grade corporate sector.
Our lower exposure to riskier elements of the corporate bond market tended to hold back results during a period when lower-quality securities performed well. We maintained a relatively defensive positioning among our investment-grade corporate bond holdings. Although this strategy detracted from performance, we believed it made sense to be somewhat cautious after an extended period of very low corporate default rates and the increased risks to bondholders from heavy leveraged-buyout and merger-and-acquisition activity in the equity market. As the period progressed, we rotated some of the fund’s investment-grade allocation into commercial mortgage-backed securities, which we thought were less vulnerable to adverse moves in the business cycle.
We also maintained a conservative strategy in our high yield portfolio and looked for opportunities to upgrade the quality of holdings in light of evidence of some deterioration in the quality of the overall market. We did not invest in any CCC-rated bonds, and we sold any holdings whose credit ratings were downgraded to CCC. In our search for better quality, we increased our holdings in bonds that we thought were priced appropriately for their risks, which helped performance. At the same time, we reduced positions in industries where we saw less value, including bonds of gaming companies, steel companies, and broadcasting companies, which also added to results.
Class I shares are only offered in the following manner: (1) to investment advisory clients of Evergreen Investment Management Company, LLC (or its advisory affiliates) when purchased by such advisor(s) on behalf of its clients, (2) through arrangements entered into on behalf of the Evergreen funds with certain financial services firms, (3) to certain institutional investors and (4) to persons who owned Class Y shares in registered name in an Evergreen fund on or before December 31, 1994 or who owned shares of any SouthTrust fund in registered name as of March 18, 2005 or shares of Vestaur Securities Fund as of May 20, 2005.
Class I shares are only available to institutional shareholders with a minimum of $1 million investment, which may be waived in certain situations.
The fund’s investment objective may be changed without a vote of the fund’s shareholders.
Foreign investments may contain more risk due to the inherent risks associated with changing political climates, foreign market instability and foreign currency fluctuations.
Derivatives involve additional risks including interest rate risk, credit risk, the risk of improper valuation and the risk of non-correlation to the relevant instruments they are designed to hedge or to closely track.
High yield, lower-rated bonds may contain more risk due to the increased possibility of default.
The return of principal is not guaranteed due to fluctuation in the fund’s NAV caused by changes in the price of individual bonds held by the fund and the buying and selling of bonds by the fund. Bond funds have the same inflation, interest rate and credit risks as individual bonds. Generally, the value of bond funds rise when prevailing interest rates fall, and fall when interest rates rise.
U.S. government guarantees apply only to certain securities held in the fund’s portfolio and not to the fund’s shares.
The Evergreen Diversified Bond Blended Index is composed of the following indexes: LBCBI (80%) and MLHYCPBB-B (20%).
† Copyright 2007. Merrill Lynch, Pierce, Fenner & Smith Incorporated. All rights reserved.
All data is as of April 30, 2007, and subject to change.
5
ABOUT YOUR FUND’S EXPENSES
The Example below is intended to describe the fees and expenses borne by shareholders and the impact of those costs on your investment.
Example
As a shareholder of the fund, you incur two types of costs: (1) transaction costs, including sales charges (loads), redemption fees and exchange fees; and (2) ongoing costs, including management fees, distribution (12b-1) fees and other fund expenses. This Example is intended to help you understand your ongoing costs (in dollars) of investing in the fund and to compare these costs with the ongoing costs of investing in other mutual funds. The Example is based on an investment of $1,000 invested at the beginning of the period and held for the entire period from November 1, 2006 to April 30, 2007.
The example illustrates your fund’s costs in two ways:
• Actual expenses
The section in the table under the heading “Actual” provides information about actual account values and actual expenses. You may use the information in these columns, together with the amount you invested, to estimate the expenses that you paid over the period. Simply divide your account value by $1,000 (for example, an $8,600 account value divided by $1,000 = 8.6), then multiply the result by the number in the appropriate column for your share class, in the column entitled “Expenses Paid During Period” to estimate the expenses you paid on your account during this period.
• Hypothetical example for comparison purposes
The section in the table under the heading “Hypothetical (5% return before expenses)” provides information about hypothetical account values and hypothetical expenses based on the fund’s actual expense ratio and an assumed rate of return of 5% per year before expenses, which is not the fund’s actual return. The hypothetical account values and expenses may not be used to estimate the actual ending account balance or expenses you paid for the period. You may use this information to compare the ongoing costs of investing in the fund and other funds. To do so, compare this 5% hypothetical example with the 5% hypothetical examples that appear in the shareholder reports of the other funds.
Please note that the expenses shown in the table are meant to highlight your ongoing costs only and do not reflect any transactional costs, such as sales charges (loads), redemption fees or exchange fees. Therefore, the section in the table under the heading “Hypothetical (5% return before expenses)” is useful in comparing ongoing costs only, and will not help you determine the relative total costs of owning different funds. In addition, if these transactional costs were included, your costs would have been higher.
| | | Beginning | | Ending | | |
| | Account | | Account | | Expenses |
| | Value | | Value | | Paid During |
| | 11/1/2006 | | 4/30/2007 | | Period* |
|
| Actual |
| Class A | | $ 1,000.00 | | $ 1,033.02 | | $ 4.69 |
| Class B | | $ 1,000.00 | | $ 1,029.26 | | $ 8.40 |
| Class C | | $ 1,000.00 | | $ 1,029.26 | | $ 8.40 |
| Class I | | $ 1,000.00 | | $ 1,034.35 | | $ 3.38 |
| Hypothetical | | |
| (5% return | |
| before expenses) | |
| Class A | | $ 1,000.00 | | $ 1,020.18 | | $ 4.66 |
| Class B | | $ 1,000.00 | | $ 1,016.51 | | $ 8.35 |
| Class C | | $ 1,000.00 | | $ 1,016.51 | | $ 8.35 |
| Class I | | $ 1,000.00 | | $ 1,021.47 | | $ 3.36 |
|
* For each class of the Fund, expenses are equal to the annualized expense ratio of each class (0.93% for Class A, 1.67% for Class B, 1.67% for Class C and 0.67% for Class I), multiplied by the average account value over the period, multiplied by 181 / 365 days.6
| FINANCIAL HIGHLIGHTS |
|
| (For a share outstanding throughout each period) |
| | | Year Ended April 30, | | Year Ended |
|
| | November 30, |
| CLASS A | | 2007 | | 20061 | | 20052,3 |
|
| Net asset value, beginning of period | | $ 14.25 | | $ 14.53 | | $ 14.83 |
|
| Income from investment operations |
| Net investment income (loss) | | 0.81 | | 0.33 | | 0.414 |
| Net realized and unrealized gains or losses on investments | | 0.23 | | (0.27) | | (0.28) |
| |
|
| Total from investment operations | | 1.04 | | 0.06 | | 0.13 |
|
| Distributions to shareholders from |
| Net investment income | | (0.83) | | (0.34) | | (0.43) |
| Tax basis return of capital | | (0.01) | | 0 | | 0 |
| | |
| |
| |
|
| Total distributions to shareholders | | (0.84) | | (0.34) | | (0.43) |
|
| Net asset value, end of period | | $ 14.45 | | $ 14.25 | | $ 14.53 |
|
| Total return5 | | 7.49% | | 0.43% | | 0.89% |
|
| Ratios and supplemental data |
| Net assets, end of period (thousands) | | $199,442 | | $213,268 | | $226,450 |
| Ratios to average net assets |
Expenses including waivers/reimbursements
but excluding expense reductions | | 0.94% | | 0.96%6 | | 0.97%6 |
Expenses excluding waivers/reimbursements
and expense reductions | | 1.16% | | 1.19%6 | | 1.15%6 |
| Net investment income (loss) | | 5.65% | | 5.43%6 | | 5.28%6 |
| Portfolio turnover rate | | 70% | | 30% | | 55% |
|
1 For the five months ended April 30, 2006. The Fund changed its fiscal year end from November 30 to April 30, effective April 30, 2006.2 For the period from May 20, 2005 (commencement of class operations), to November 30, 2005.
3 Effective at the close of business on May 20, 2005, the Fund acquired the net assets of Vestaur Securities Fund. Vestaur Securities Fund became the accounting and performance survivor in this transaction . Class A shares of Vestaur Securities Fund did not exist prior to the transaction . As a result, accounting and performance information for Class A shares commenced on May 20, 2005.
4 Net investment income (loss) per share is based on average shares outstanding during the period.
5 Excluding applicable sales charges
6 Annualized
See Notes to Financial Statements
7
| FINANCIAL HIGHLIGHTS |
|
| (For a share outstanding throughout each period) |
| | | Year Ended April 30, | | Year Ended |
|
| | November 30, |
| CLASS B | | 2007 | | 20061 | | 20052,3 |
|
| Net asset value, beginning of period | | $ 14.25 | | $ 14.53 | | $ 14.83 |
|
| Income from investment operations |
| Net investment income (loss) | | 0.70 | | 0.28 | | 0.364 |
| Net realized and unrealized gains or losses on investments | | 0.23 | | (0.26) | | (0.28) |
| |
|
| Total from investment operations | | 0.93 | | 0.02 | | 0.08 |
|
| Distributions to shareholders from |
| Net investment income | | (0.72) | | (0.30) | | (0.38) |
| Tax basis return of capital | | (0.01) | | 0 | | 0 |
| |
|
| Total distributions to shareholders | | (0.73) | | (0.30) | | (0.38) |
|
| Net asset value, end of period | | $ 14.45 | | $ 14.25 | | $ 14.53 |
|
| Total return5 | | 6.71% | | 0.14% | | 0.52% |
|
| Ratios and supplemental data |
| Net assets, end of period (thousands) | | $16,102 | | $18,277 | | $20,439 |
| Ratios to average net assets |
Expenses including waivers/reimbursements
but excluding expense reductions | | 1.67% | | 1.67%6 | | 1.67%6 |
Expenses excluding waivers/reimbursements
and expense reductions | | 1.85% | | 1.89%6 | | 1.85%6 |
| Net investment income (loss) | | 4.91% | | 4.72%6 | | 4.58%6 |
| Portfolio turnover rate | | 70% | | 30% | | 55% |
|
1 For the five months ended April 30, 2006. The Fund changed its fiscal year end from November 30 to April 30, effective April 30, 2006.2 For the period from May 20, 2005 (commencement of class operations), to November 30, 2005.
3 Effective at the close of business on May 20, 2005, the Fund acquired the net assets of Vestaur Securities Fund. Vestaur Securities Fund became the accounting and performance survivor in this transaction . Class B shares of Vestaur Securities Fund did not exist prior to the transaction. As a result, accounting and performance information for Class B shares commenced on May 20, 2005.
4 Net investment income (loss) per share is based on average shares outstanding during the period.
5 Excluding applicable sales charges
6 Annualized
See Notes to Financial Statements
8
| FINANCIAL HIGHLIGHTS |
|
| (For a share outstanding throughout each period) |
| | | Year Ended April 30, | | Year Ended |
|
| | November 30, |
| CLASS C | | 2007 | | 20061 | | 20052,3 |
|
| Net asset value, beginning of period | | $ 14.25 | | $ 14.53 | | $ 14.83 |
|
| Income from investment operations |
| Net investment income (loss) | | 0.70 | | 0.28 | | 0.364 |
| Net realized and unrealized gains or losses on investments | | 0.23 | | (0.26) | | (0.28) |
| |
|
| Total from investment operations | | 0.93 | | 0.02 | | 0.08 |
|
| Distributions to shareholders from |
| Net investment income | | (0.72) | | (0.30) | | (0.38) |
| Tax basis return of capital | | (0.01) | | 0 | | 0 |
| | |
|
| Total distributions to shareholders | | (0.73) | | (0.30) | | (0.38) |
|
| Net asset value, end of period | | $ 14.45 | | $ 14.25 | | $ 14.53 |
|
| Total return5 | | 6.71% | | 0.14% | | 0.52% |
|
| Ratios and supplemental data |
| Net assets, end of period (thousands) | | $24,157 | | $25,972 | | $27,764 |
| Ratios to average net assets |
Expenses including waivers/reimbursements
but excluding expense reductions | | 1.67% | | 1.67%6 | | 1.67%6 |
Expenses excluding waivers/reimbursements
and expense reductions | | 1.85% | | 1.89%6 | | 1.85%6 |
| Net investment income (loss) | | 4.91% | | 4.72%6 | | 4.58%6 |
| Portfolio turnover rate | | 70% | | 30% | | 55% |
|
1 For the five months ended April 30, 2006. The Fund changed its fiscal year end from November 30 to April 30, effective April 30, 2006.2 For the period from May 20, 2005 (commencement of class operations), to November 30, 2005.
3 Effective at the close of business on May 20, 2005, the Fund acquired the net assets of Vestaur Securities Fund. Vestaur Securities Fund became the accounting and performance survivor in this transaction. Class C shares of Vestaur Securities Fund did not exist prior to the transaction. As a result, accounting and performance information for Class C shares commenced on May 20, 2005.
4 Net investment income (loss) per share is based on average shares outstanding during the period.
5 Excluding applicable sales charges
6 Annualized
See Notes to Financial Statements
9
| FINANCIAL HIGHLIGHTS |
|
| (For a share outstanding throughout each period) |
| | | Year Ended April 30, | | Year Ended November 30, |
| |
| |
|
| CLASS I | | 2007 | | 20061 | | 20052 | | 20042 | | 20032 | | 20022,3 |
|
| Net asset value, beginning of period | | $ 14.25 | | $ 14.53 | | $ 15.14 | | $ 15.14 | | $ 14.27 | | $ 14.88 |
|
| Income from investment operations |
| Net investment income (loss) | | 0.83 | | 0.34 | | 0.794 | | 0.93 | | 0.95 | | 1.00 |
Net realized and unrealized gains
or losses on investments | | 0.25 | | (0.26) | | (0.41) | | 0.02 | | 0.91 | | (0.56) |
| |
|
| Total from investment operations | | 1.08 | | 0.08 | | 0.38 | | 0.95 | | 1.86 | | 0.44 |
|
| Distributions to shareholders from |
| Net investment income | | (0.87) | | (0.36) | | (0.86) | | (0.95) | | (0.99) | | (1.05) |
| Tax basis return of capital | | (0.01) | | 0 | | (0.13)5 | | 0 | | 0 | | 0 |
| |
|
| Total distributions to shareholders | | (0.88) | | (0.36) | | (0.99) | | (0.95) | | (0.99) | | (1.05) |
|
| Net asset value, end of period | | $ 14.45 | | $ 14.25 | | $ 14.53 | | $ 15.14 | | $ 15.14 | | $ 14.27 |
|
| Total return | | 7.78% | | 0.55% | | 2.82% | | 6.47% | | 13.43% | | 3.06% |
|
| Ratios and supplemental data |
| Net assets, end of period (thousands) | | $56,478 | | $61,711 | | $65,893 | | $97,235 | | $97,277 | | $91,666 |
| Ratios to average net assets |
Expenses including waivers/reimbursements
but excluding expense reductions | | 0.67% | | 0.67%6 | | 0.79% | | 0.94% | | 0.91% | | 1.01% |
Expenses excluding waivers/reimbursements
and expense reductions | | 0.85% | | 0.89%6 | | 0.88% | | 0.97% | | 0.94% | | 1.01% |
| Net investment income (loss) | | 5.91% | | 5.72%6 | | 5.50% | | 6.10% | | 6.43% | | 6.96% |
| Portfolio turnover rate | | 70% | | 30% | | 55% | | 23% | | 45% | | 40% |
|
1 For the five months ended April 30, 2006. The Fund changed its fiscal year end from November 30 to April 30, effective April 30, 2006.2 Effective at the close of business on May 20, 2005, the Fund acquired the net assets of Vestaur Securities Fund. Vestaur Securities Fund became the accounting and performance survivor in this transaction . The financial highlights for the periods prior to May 23, 2005 are those of Vestaur Securities Fund. The per share information has been restated to give effect to this transaction . Total return performance reflects the total return of Vestaur Securities Fund based on its net asset value.
3 As required, effective December 1, 2001, the Fund has adopted the provisions of the AICPA Audit and Accounting Guide, Audits of Investment Companies, and began amortizing premium and accreting discount on its fixed-income securities . The effects of this change for the year ended November 30, 2002 were a decrease in net investment income per share of $0.03; an increase in net realized gains or losses per share of $0.03; and a decrease in the ratio of net investment income to average net assets of 0.25%.
4 Net investment income (loss) per share is based on average shares outstanding during the period.
5 Return of capital relates to former Vestaur Securities Fund shareholders and is based on average shares outstanding from December 1, 2004 through May 20, 2005.
6 Annualized
See Notes to Financial Statements
10
| SCHEDULE OF INVESTMENTS |
|
| April 30, 2007 | | Principal | | |
| | | Amount | Value |
|
| AGENCY COMMERCIAL MORTGAGE-BACKED SECURITIES 1.4% |
| FIXED-RATE 1.4% |
| FHLMC, Ser. M009, Class A, 5.40%, 10/15/2021 ## (cost $4,271,822) | | $ 4,267,554 | | $ 4,304,810 |
| |
|
| AGENCY MORTGAGE-BACKED COLLATERALIZED MORTGAGE | | |
| OBLIGATIONS 0.2% | |
| FIXED-RATE 0.2% |
| FNMA: |
| Ser. 2002-T12, Class A3, 7.50%, 05/25/2042 | | 20,807 | | | | 21,689 |
| Ser. 2002-T19, Class A3, 7.50%, 07/25/2042 | | 339,128 | | | | 353,796 |
| Ser. 2003-W4, Class 4A, 7.50%, 10/25/2042 | | 224,704 | | | | 233,798 |
| |
|
| Total Agency Mortgage-Backed Collateralized Mortgage Obligations | | |
| (cost $629,757) | | | | 609,283 |
| |
|
| AGENCY MORTGAGE-BACKED PASS THROUGH SECURITIES 0.4% |
| FIXED-RATE 0.4% |
| FHLMC: |
| 6.00%, 01/01/2032 | | 6,822 | | | | 6,919 |
| 6.50%, 09/25/2043 | | 129,519 | | | | 132,133 |
| 7.50%, 09/01/2013 - 08/25/2042 | | 204,808 | | | | 212,225 |
| 9.00%, 12/01/2016 | | 158,750 | | | | 169,180 |
| 9.50%, 12/01/2022 | | 22,715 | | | | 24,614 |
| FNMA: |
| 9.00%, 02/01/2025 - 09/01/2030 | | 248,514 | | | | 269,094 |
| 10.00%, 09/01/2010 - 04/01/2021 | | 109,794 | | | | 121,297 |
| GNMA: |
| 8.00%, 03/15/2022 - 08/15/2024 | | 87,755 | | | | 93,386 |
| 8.25%, 05/15/2020 | | 67,620 | | | | 72,258 |
| 8.50%, 09/15/2024 - 01/15/2027 | | 83,885 | | | | 90,812 |
| 9.00%, 12/15/2019 | | 60,962 | | | | 65,718 |
| 9.50%, 09/15/2019 | | 21,366 | | | | 23,348 |
| 10.00%, 01/15/2019 - 03/15/2020 | | 42,427 | | | | 47,542 |
| |
|
| Total Agency Mortgage-Backed Pass Through Securities | | |
| (cost $1,298,931) | | | | 1,328,526 |
| |
|
| AGENCY REPERFORMING MORTGAGE-BACKED PASS THROUGH | | |
| SECURITIES 0.2% | |
| FNMA: |
| Ser. 2003-W1, Class 2A, 7.50%, 12/25/2042 | | 334,021 | | | | 347,846 |
| Ser. 2003-W2, Class 1A3, 7.50%, 07/25/2042 | | 114,415 | | | | 120,185 |
| |
|
| Total Agency Reperforming Mortgage-Backed Pass Through Securities | | |
| (cost $481,109) | | | | 468,031 |
| |
|
| ASSET-BACKED SECURITIES 2.6% |
| Capmark, Ltd., Ser. 2006-7A, Class B, FRN, 5.76%, 08/20/2036 144A | | 500,000 | | | | 504,180 |
| Credit Suisse First Boston Mtge. Securities Corp., Ser. 1996-2, Class A-6, 7.18%, | | |
| 02/25/2018 | | 26,318 | | | | 26,232 |
| GE Capital Mtge. Svcs., Inc., Ser. 1999-H, Class A-7, 6.27%, 04/25/2029 | | 184,559 | | | | 184,009 |
| Nautilus RMBS CDO, Ltd., Ser. 2005-1A, Class A3, FRN, 6.85%, 07/07/2040 144A | | 3,204,082 | | | | 3,174,187 |
| Oakwood Mtge. Investors, Inc., Ser. 1996-C, Class A5, 7.35%, 04/15/2027 | | 369,407 | | | | 369,400 |
See Notes to Financial Statements11
| SCHEDULE OF INVESTMENTS continued |
|
| April 30, 2007 | | Principal | | |
| | | Amount | Value |
|
| ASSET-BACKED SECURITIES continued |
| Railcar Leasing, LLC, Ser. 1, Class A-2, 7.125%, 01/15/2013 144A | | $ 2,221,568 | | $ 2,321,928 |
| Trapeza CDO, LLC, Ser. 2004-7A, Class B1, FRN, 6.91%, 01/25/2035 144A | | 1,000,000 | | | | 1,010,160 |
| |
|
| Total Asset-Backed Securities (cost $7,734,096) | | | | 7,590,096 |
| |
|
| COMMERCIAL MORTGAGE-BACKED SECURITIES 6.9% |
| FIXED-RATE 6.5% |
| Banc of America Comml. Mtge., Inc., Ser. 2000-2, Class F, 7.92%, 09/15/2032 | | 3,000,000 | | | | 3,228,211 |
| Banc of America Mtge. Securities, Inc., Ser. 2003-7, Class B6, 4.75%, 09/25/2018 | | 246,841 | | | | 138,752 |
| Citigroup/Deutsche Bank Comml. Mtge. Trust, Ser. 2006-CD3, Class A5, 5.62%, | | |
| 10/15/2048 | | 3,000,000 | | | | 3,050,355 |
| Crown Castle Towers, LLC, Ser. 2006-1A, Class C, 5.47%, 11/15/2036 144A | | 1,870,000 | | | | 1,872,693 |
| JPMorgan Chase & Co. Comml. Mtge. Securities Corp., Ser. 2001-CIBC, Class C, | | |
| 6.63%, 03/15/2033 | | 5,000,000 | | | | 5,235,584 |
| LB-UBS Comml. Mtge. Trust, Ser. 2001-C2, Class C, 6.98%, 09/15/2034 | | 4,000,000 | | | | 4,250,246 |
| MASTR Reperforming Loan Trust, Ser. 2006-2, Class B3, 5.90%, 05/25/2036 144A | | 435,787 | | | | 415,114 |
| Morgan Stanley Capital I, Inc., Ser. 2001-TOP5, Class G, 6.00%, 10/15/2035 144A | | 1,042,000 | | | | 1,054,747 |
| |
|
| | | | | 19,245,702 |
| |
|
| FLOATING-RATE 0.4% |
| Prima Capital Securitization, Ltd., Ser. 2006, Class D, 5.88%, 12/28/2048 | | 1,085,000 | | | | 1,098,324 |
| |
|
| Total Commercial Mortgage-Backed Securities (cost $19,283,230) | | | | 20,344,026 |
| |
|
| CORPORATE BONDS 66.7% |
| CONSUMER DISCRETIONARY 6.5% |
| Auto Components 0.0% |
| ArvinMeritor, Inc., 6.80%, 02/15/2009 | | 10,000 | | | | 9,975 |
| Goodyear Tire & Rubber Co., 11.25%, 03/01/2011 | | 45,000 | | | | 49,388 |
| |
|
| | | | | 59,363 |
| |
|
| Diversified Consumer Services 0.0% |
| Service Corporation International, 6.75%, 04/01/2015 144A | | 30,000 | | | | 30,450 |
| |
|
| Hotels, Restaurants & Leisure 1.7% |
| Isle of Capri Casinos, Inc., 7.00%, 03/01/2014 | | 300,000 | | | | 297,000 |
| McDonald’s Corp., 7.31%, 09/15/2027 | | 4,200,000 | | | | 4,226,128 |
| MGM MIRAGE, 5.875%, 02/27/2014 | | 300,000 | | | | 283,125 |
| Pokagon Gaming Authority, 10.375%, 06/15/2014 144A | | 55,000 | | | | 61,875 |
| Seneca Gaming Corp., 7.25%, 05/01/2012 | | 200,000 | | | | 204,500 |
| |
|
| | | | | 5,072,628 |
| |
|
| Household Durables 0.3% |
| Centex Corp., 7.875%, 02/01/2011 | | 500,000 | | | | 527,864 |
| Hovnanian Enterprises, Inc., 6.50%, 01/15/2014 | | 300,000 | | | | 277,500 |
| |
|
| | | | | 805,364 |
| |
|
| Media 3.5% |
| Comcast Corp., 5.90%, 03/15/2016 (p) | | 2,000,000 | | | | 2,043,428 |
| Cox Communications, Inc., 7.875%, 08/15/2009 | | 2,000,000 | | | | 2,115,692 |
| CSC Holdings, Inc., 7.625%, 04/01/2011 | | 150,000 | | | | 155,438 |
| Lamar Media Corp., 6.625%, 08/15/2015 | | 500,000 | | | | 498,750 |
See Notes to Financial Statements12
| SCHEDULE OF INVESTMENTS continued |
|
| April 30, 2007 | | Principal | | |
| | | Amount | Value |
|
| CORPORATE BONDS continued |
| CONSUMER DISCRETIONARY continued |
| Media continued |
| Mediacom Broadband, LLC, 8.50%, 10/15/2015 144A | | $ 100,000 | | $ 104,500 |
| Mediacom Communications Corp., 9.50%, 01/15/2013 (p) | | 300,000 | | | | 310,500 |
| News America Holdings, Inc., 7.70%, 10/30/2025 | | 2,000,000 | | | | 2,291,374 |
| R.H. Donnelley Corp., 10.875%, 12/15/2012 (p) | | 300,000 | | | | 326,250 |
| Shaw Communications, Inc., Class B, 7.20%, 12/15/2011 | | 75,000 | | | | 79,406 |
| Time Warner, Inc., 9.125%, 01/15/2013 | | 2,000,000 | | | | 2,349,824 |
| |
|
| | | | | 10,275,162 |
| |
|
| Multi-line Retail 0.0% |
| Neiman Marcus Group, Inc., 9.00%, 10/15/2015 | | 100,000 | | | | 110,750 |
| |
|
| Specialty Retail 0.7% |
| Central Garden & Pet Co., 9.125%, 02/01/2013 | | 300,000 | | | | 314,250 |
| Home Depot, Inc., 5.875%, 12/16/2036 | | 1,500,000 | | | | 1,458,892 |
| Payless ShoeSource, Inc., 8.25%, 08/01/2013 | | 300,000 | | | | 317,250 |
| |
|
| | | | | 2,090,392 |
| |
|
| Textiles, Apparel & Luxury Goods 0.3% |
| Levi Strauss & Co., 9.75%, 01/15/2015 | | 250,000 | | | | 275,625 |
| Oxford Industries, Inc., 8.875%, 06/01/2011 | | 250,000 | | | | 260,625 |
| Warnaco Group, Inc., 8.875%, 06/15/2013 | | 275,000 | | | | 293,906 |
| |
|
| | | | | 830,156 |
| |
|
| CONSUMER STAPLES 4.5% |
| Beverages 1.0% |
| Panamerican Beverages, Inc., 7.25%, 07/01/2009 | | 500,000 | | | | 521,089 |
| Pepsi Bottling Group, Inc., 7.00%, 03/01/2029 | | 2,000,000 | | | | 2,288,002 |
| |
|
| | | | | 2,809,091 |
| |
|
| Food & Staples Retailing 1.3% |
| Alimentation Couche-Tard, Inc., 7.50%, 12/15/2013 (p) | | 500,000 | | | | 518,750 |
| Ingles Markets, Inc., 8.875%, 12/01/2011 | | 300,000 | | | | 314,250 |
| Rite Aid Corp., 8.125%, 05/01/2010 | | 300,000 | | | | 311,250 |
| Safeway, Inc., 7.25%, 02/01/2031 (p) | | 2,000,000 | | | | 2,140,734 |
| SUPERVALU, Inc., 7.50%, 11/15/2014 | | 250,000 | | | | 262,500 |
| Wal-Mart Stores, Inc., 8.85%, 01/02/2015 | | 300,000 | | | | 347,888 |
| |
|
| | | | | 3,895,372 |
| |
|
| Food Products 0.9% |
| Corn Products International, Inc., 8.45%, 08/15/2009 | | 2,000,000 | | | | 2,125,972 |
| Dean Foods Co., 6.625%, 05/15/2009 | | 250,000 | | | | 254,688 |
| Del Monte Foods Co., 6.75%, 02/15/2015 (p) | | 300,000 | | | | 302,250 |
| |
|
| | | | | 2,682,910 |
| |
|
| Household Products 1.3% |
| Church & Dwight Co., Inc., 6.00%, 12/15/2012 | | 300,000 | | | | 297,000 |
| Procter & Gamble Co., 6.875%, 09/15/2009 | | 3,500,000 | | | | 3,649,068 |
| |
|
| | | | | 3,946,068 |
| |
|
See Notes to Financial Statements13
| SCHEDULE OF INVESTMENTS continued |
|
| April 30, 2007 | | Principal | | |
| | | Amount | Value |
|
| CORPORATE BONDS continued |
| ENERGY 5.1% |
| Energy Equipment & Services 0.4% |
| Hornbeck Offshore Services, Inc., Ser. B, 6.125%, 12/01/2014 | | $ 450,000 | | $ 435,375 |
| Offshore Logistics, Inc., 6.125%, 06/15/2013 | | 300,000 | | | | 291,000 |
| PHI, Inc., 7.125%, 04/15/2013 | | 350,000 | | | | 343,875 |
| |
|
| | | | | 1,070,250 |
| |
|
| Oil, Gas & Consumable Fuels 4.7% |
| Anadarko Petroleum Corp., 5.95%, 09/15/2016 (p) | | 2,000,000 | | | | 2,019,124 |
| Chesapeake Energy Corp., 6.875%, 01/15/2016 | | 300,000 | | | | 306,750 |
| Cimarex Energy Co., 7.125%, 05/01/2017 | | 25,000 | | | | 25,375 |
| El Paso Production Holdings Co., 7.75%, 06/01/2013 | | 300,000 | | | | 317,345 |
| Exco Resources, Inc., 7.25%, 01/15/2011 | | 300,000 | | | | 302,250 |
| Ferrellgas Partners, LP, 6.75%, 05/01/2014 (p) | | 160,000 | | | | 159,600 |
| Forest Oil Corp., 7.75%, 05/01/2014 | | 175,000 | | | | 180,250 |
| Kinder Morgan Energy Partners, LP, 5.125%, 11/15/2014 (p) | | 2,500,000 | | | | 2,438,590 |
| Mariner Energy, Inc., 8.00%, 05/15/2017 # | | 25,000 | | | | 25,281 |
| New Grade Energy, Inc., 10.05%, 08/31/2007 (Q)+ | | 747,947 | | | | 747,947 |
| Pacific Energy, 6.25%, 09/15/2015 | | 3,650,000 | | | | 3,660,256 |
| Peabody Energy Corp., 6.875%, 03/15/2013 | | 300,000 | | | | 305,250 |
| Pennzoil Co., 10.125%, 11/15/2009 | | 1,500,000 | | | | 1,657,536 |
| Sabine Pass LNG, LP, 7.25%, 11/30/2013 144A | | 200,000 | | | | 205,000 |
| Sunoco, Inc., 9.00%, 11/01/2024 | | 500,000 | | | | 641,571 |
| Targa Resources, Inc., 8.50%, 11/01/2013 144A | | 100,000 | | | | 103,500 |
| Tesoro Corp., Ser. B, 6.625%, 11/01/2015 (p) | | 300,000 | | | | 307,500 |
| Williams Cos., 7.125%, 09/01/2011 | | 300,000 | | | | 316,500 |
| Williams Partners, LP, 7.25%, 02/01/2017 144A | | 275,000 | | | | 292,188 |
| |
|
| | | | | 14,011,813 |
| |
|
| FINANCIALS 29.1% |
| Capital Markets 4.8% |
| Allied Capital Corp., 6.15%, 10/13/2010 (Q) + | | 4,000,000 | | | | 3,986,800 |
| American Capital Strategies, Ltd., Ser. A, 5.92%, 09/01/2009 (Q) + | | 3,500,000 | | | | 3,480,400 |
| Goldman Sachs Group, Inc., 5.35%, 01/15/2016 (p) | | 2,000,000 | | | | 1,977,470 |
| Mellon Capital II, Ser. B, 8.00%, 01/15/2027 | | 3,500,000 | | | | 3,649,072 |
| Morgan Stanley, 3.875%, 01/15/2009 | | 1,000,000 | | | | 980,856 |
| |
|
| | | | | 14,074,598 |
| |
|
| Commercial Banks 6.2% |
| BankAmerica Capital II, 8.00%, 12/15/2026 | | 1,000,000 | | | | 1,041,455 |
| Citicorp Lease Trust, 8.04%, 12/15/2019 144A | | 3,500,000 | | | | 4,130,315 |
| FBOP Corp., 10.00%, 01/15/2009 144A | | 4,000,000 | | | | 4,220,000 |
| First Empire Capital Trust I, 8.23%, 02/01/2027 | | 4,300,000 | | | | 4,483,816 |
| First Tennessee Capital II, Ser. B, 6.30%, 04/15/2034 | | 500,000 | | | | 482,479 |
| Investors Capital Trust I, Ser. B, 9.77%, 02/01/2027 | | 885,000 | | | | 952,402 |
| TD Banknorth, Inc., 7.625%, 06/15/2011 | | 1,000,000 | | | | 1,092,654 |
| Zions Bancorp, 6.00%, 09/15/2015 | | 2,000,000 | | | | 2,042,658 |
| |
|
| | | | | 18,445,779 |
| |
|
See Notes to Financial Statements14
| SCHEDULE OF INVESTMENTS continued |
|
| April 30, 2007 | | Principal | | |
| | | Amount | Value |
|
| CORPORATE BONDS continued |
| FINANCIALS continued |
| Consumer Finance 7.5% |
| Capital One Financial Corp., 7.69%, 08/15/2036 (p) | | $ 2,000,000 | | $ 2,167,172 |
| Duke Capital, LLC, 6.25%, 02/15/2013 (p) | | 2,500,000 | | | | 2,574,970 |
| Ford Motor Credit Co., 7.375%, 10/28/2009 | | 2,000,000 | | | | 2,002,668 |
| General Motors Acceptance Corp., 6.875%, 09/15/2011 | | 300,000 | | | | 301,288 |
| HSBC American Capital Trust I, 7.81%, 12/15/2026 144A | | 2,000,000 | | | | 2,082,548 |
| HSBC Finance Corp., 7.00%, 05/15/2012 | | 2,500,000 | | | | 2,688,610 |
| International Lease Finance Corp., 5.00%, 04/15/2010 (p) | | 3,000,000 | | | | 2,995,185 |
| MBNA Corp., Ser. A, 8.28%, 12/01/2026 | | 1,750,000 | | | | 1,830,283 |
| NXP Funding, LLC, 7.875%, 10/15/2014 144A | | 200,000 | | | | 209,000 |
| Ohio National Financial Services, Inc., 6.35%, 04/01/2013 144A | | 5,000,000 | | | | 5,211,855 |
| Qwest Capital Funding, Inc., 6.50%, 11/15/2018 | | 300,000 | | | | 288,000 |
| |
|
| | | | | 22,351,579 |
| |
|
| Diversified Financial Services 3.1% |
| Arch Western Finance, LLC, 6.75%, 07/01/2013 (p) | | 250,000 | | | | 249,375 |
| ERAC USA Finance Co., 8.00%, 01/15/2011 144A | | 2,165,000 | | | | 2,351,489 |
| JPMorgan Chase & Co., Ser. V, 6.45%, 02/02/2037 (p) | | 2,000,000 | | | | 2,031,356 |
| Pemex Project Funding Master Trust, 9.25%, 03/30/2018 | | 600,000 | | | | 775,500 |
| Prudential Holdings, LLC, Ser. C, 8.70%, 12/18/2023 144A | | 3,000,000 | | | | 3,782,514 |
| |
|
| | | | | 9,190,234 |
| |
|
| Insurance 2.5% |
| Crum & Forster Holdings Corp.: |
| 7.75%, 05/01/2017 144A # | | 120,000 | | | | 121,200 |
| 10.375%, 06/15/2013 144A # | | 300,000 | | | | 330,594 |
| Nationwide Financial Services, Inc., 8.00%, 03/01/2027 | | 500,000 | | | | 519,138 |
| North Front Passthru Trust, 5.81%, 12/15/2024 144A | | 4,500,000 | | | | 4,460,161 |
| Transatlantic Holdings, Inc., 5.75%, 12/14/2015 | | 2,000,000 | | | | 2,005,916 |
| |
|
| | | | | 7,437,009 |
| |
|
| Real Estate Investment Trusts 4.5% |
| BRE Properties, Inc., 5.50%, 03/15/2017 | | 2,400,000 | | | | 2,384,263 |
| Camden Property Trust, 5.00%, 06/15/2015 | | 3,500,000 | | | | 3,395,343 |
| Colonial Realty, Ltd., 6.25%, 06/15/2014 | | 1,370,000 | | | | 1,418,846 |
| Health Care Property Investors Inc., 6.00%, 01/30/2017 | | 3,000,000 | | | | 3,016,047 |
| iStar Financial, Inc., 5.70%, 03/01/2014 | | 2,500,000 | | | | 2,494,633 |
| Thornburg Mortgage, Inc., 8.00%, 05/15/2013 | | 270,000 | | | | 270,000 |
| Ventas, Inc., 7.125%, 06/01/2015 | | 250,000 | | | | 261,250 |
| |
|
| | | | | 13,240,382 |
| |
|
| Thrifts & Mortgage Finance 0.5% |
| Dime Capital Trust I, 9.33%, 05/06/2027 | | 500,000 | | | | 524,930 |
| Washington Mutual Capital I, 8.375%, 06/01/2027 | | 850,000 | | | | 886,241 |
| |
|
| | | | | 1,411,171 |
| |
|
See Notes to Financial Statements15
| SCHEDULE OF INVESTMENTS continued |
|
| April 30, 2007 | | Principal | | |
| | | Amount | Value |
|
| CORPORATE BONDS continued |
| HEALTH CARE 4.7% |
| Health Care Providers & Services 3.0% |
| CIGNA Corp., 8.30%, 01/15/2033 | | $ 500,000 | | $ 618,016 |
| Community Health Systems, Inc., 6.50%, 12/15/2012 | | | | 40,000 | | | | 41,550 |
| HCA, Inc., 9.25%, 11/15/2016 144A | | | | 305,000 | | | | 333,212 |
| Laboratory Corporation of America Holdings, 5.625%, 12/15/2015 | | | | 2,000,000 | | | | 1,983,724 |
| Omnicare, Inc., 6.125%, 06/01/2013 | | | | 125,000 | | | | 120,938 |
| Triad Hospitals, Inc., 7.00%, 11/15/2013 | | | | 450,000 | | | | 472,500 |
| UnitedHealth Group, Inc., 5.25%, 03/15/2011 | | | | 2,000,000 | | | | 2,009,762 |
| Universal Health Services, Inc., 7.125%, 06/30/2016 | | | | 3,000,000 | | | | 3,201,075 |
| |
|
| | | | | 8,780,777 |
| |
|
| Pharmaceuticals 1.7% | | | | | | | | |
| Abbott Laboratories, 5.60%, 05/15/2011 | | | | 3,000,000 | | | | 3,062,211 |
| Teva Pharmaceutical, LLC, 5.55%, 02/01/2016 (p) | | | | 2,000,000 | | | | 1,978,692 |
| |
|
| | | | | 5,040,903 |
| |
|
| INDUSTRIALS 2.5% |
| Aerospace & Defense 0.3% |
| Hawker Beechcraft Acquisition Co., 8.50%, 04/01/2015 144A | | | | 25,000 | | | | 26,438 |
| L-3 Communications Corp.: |
| 5.875%, 01/15/2015 | | | | 180,000 | | | | 176,175 |
| 6.375%, 10/15/2015 | | | | 275,000 | | | | 275,000 |
| Lockheed Martin Corp., 8.20%, 12/01/2009 | | | | 500,000 | | | | 535,180 |
| |
|
| | | | | 1,012,793 |
| |
|
| Air Freight & Logistics 0.7% | | | | | | | | |
| FedEx Corp., 9.65%, 06/15/2012 | | | | 1,800,000 | | | | 2,142,724 |
| |
|
| Airlines 0.6% |
| Continental Airlines, Inc., Ser. 2000-2, Class A1, 7.71%, 04/02/2021 | | | | 745,675 | | | | 826,227 |
| Northwest Airlines Corp., 6.84%, 10/01/2012 | | | | 850,000 | | | | 850,531 |
| |
|
| | | | | 1,676,758 |
| |
|
| Commercial Services & Supplies 0.4% |
| Browning-Ferris, Inc., 9.25%, 05/01/2021 | | | | 95,000 | | | | 104,856 |
| Corrections Corporation of America, 6.25%, 03/15/2013 | | | | 300,000 | | | | 301,500 |
| Geo Group, Inc., 8.25%, 07/15/2013 | | | | 450,000 | | | | 473,062 |
| Mobile Mini, Inc.: |
| 6.875%, 05/01/2015 144A # | | | | 40,000 | | | | 40,200 |
| 9.50%, 07/01/2013 | | | | 162,000 | | | | 177,337 |
| |
|
| | | | | 1,096,955 |
| |
|
| Machinery 0.2% |
| Case New Holland, Inc., 9.25%, 08/01/2011 | | | | 300,000 | | | | 316,875 |
| Manitowoc Co., 7.125%, 11/01/2013 | | | | 200,000 | | | | 206,000 |
| Terex Corp., 7.375%, 01/15/2014 | | | | 100,000 | | | | 105,000 |
| |
|
| | | | | 627,875 |
| |
|
See Notes to Financial Statements16
| SCHEDULE OF INVESTMENTS continued |
|
| April 30, 2007 | | Principal | | |
| | | Amount | Value |
|
| CORPORATE BONDS continued |
| INDUSTRIALS continued |
| Road & Rail 0.3% |
| Avis Budget Car Rental, LLC, 7.625%, 05/15/2014 144A (p) | | $ 300,000 | | $ 307,500 |
| Union Pacific Corp., 6.625%, 02/01/2029 | | 500,000 | | | | 528,693 |
| |
|
| | | | | 836,193 |
| |
|
| Trading Companies & Distributors 0.0% |
| Ashtead Group plc, 9.00%, 08/15/2016 144A | | 96,000 | | | | 103,680 |
| United Rentals, Inc., 6.50%, 02/15/2012 | | 120,000 | | | | 121,800 |
| |
|
| | | | | 225,480 |
| |
|
| INFORMATION TECHNOLOGY 0.6% |
| IT Services 0.3% |
| Iron Mountain, Inc., 8.625%, 04/01/2013 | | 200,000 | | | | 207,000 |
| SunGard Data Systems, Inc., 4.875%, 01/15/2014 | | 250,000 | | | | 230,625 |
| Unisys Corp., 8.00%, 10/15/2012 | | 300,000 | | | | 305,250 |
| |
|
| | | | | 742,875 |
| |
|
| Semiconductors & Semiconductor Equipment 0.1% |
| Freescale Semiconductor, 8.875%, 12/15/2014 144A | | 215,000 | | | | 216,344 |
| |
|
| Software 0.2% |
| Intuit, Inc., 5.75%, 03/15/2017 | | 710,000 | | | | 704,408 |
| |
|
| MATERIALS 3.5% |
| Chemicals 2.3% |
| E.I. DuPont de Nemours & Co., 5.25%, 12/15/2016 | | 5,000,000 | | | | 4,912,770 |
| Equistar Chemicals, LP, 10.625%, 05/01/2011 | | 600,000 | | | | 636,000 |
| Lyondell Chemical Co., 10.50%, 06/01/2013 | | 300,000 | | | | 330,375 |
| Millenium America, Inc., 7.625%, 11/15/2026 | | 45,000 | | | | 44,663 |
| Momentive Performance, 9.75%, 12/01/2014 144A (p) | | 95,000 | | | | 100,937 |
| Mosaic Co., 7.625%, 12/01/2016 144A | | 30,000 | | | | 32,175 |
| Omnova Solutions, Inc., 11.25%, 06/01/2010 | | 195,000 | | | | 207,431 |
| Tronox Worldwide, LLC, 9.50%, 12/01/2012 | | 300,000 | | | | 322,500 |
| Westlake Chemical Corp., 6.625%, 01/15/2016 | | 300,000 | | | | 293,250 |
| |
|
| | | | | 6,880,101 |
| |
|
| Construction Materials 0.0% |
| CPG International, Inc., 10.50%, 07/01/2013 | | 100,000 | | | | 105,500 |
| |
|
| Containers & Packaging 0.2% |
| Berry Plastics Holdings Corp., 8.875%, 09/15/2014 | | 50,000 | | | | 51,750 |
| Crown Americas, Inc., 7.75%, 11/15/2015 | | 300,000 | | | | 318,750 |
| Exopack Holding Corp., 11.25%, 02/01/2014 | | 80,000 | | | | 87,000 |
| |
|
| | | | | 457,500 |
| |
|
| Metals & Mining 0.1% |
| Freeport-McMoran Copper & Gold, Inc.: |
| 8.25%, 04/01/2015 | | 130,000 | | | | 140,887 |
| 8.375%, 04/01/2017 (p) | | 110,000 | | | | 120,588 |
| |
|
| | | | | 261,475 |
| |
|
See Notes to Financial Statements17
| SCHEDULE OF INVESTMENTS continued |
|
| April 30, 2007 | | Principal | | |
| | | Amount | Value |
|
| CORPORATE BONDS continued |
| MATERIALS continued |
| Paper & Forest Products 0.9% |
| Boise Cascade, LLC, 7.125%, 10/15/2014 | | $ 300,000 | | $ 300,000 |
| Bowater, Inc., 6.50%, 06/15/2013 | | | | 90,000 | | | | 82,013 |
| Buckeye Technologies, Inc., 8.50%, 10/01/2013 | | | | 450,000 | | | | 477,562 |
| P.H. Glatfelter, 7.125%, 05/01/2016 | | | | 115,000 | | | | 116,294 |
| Plum Creek Timber Co., Inc., 5.875%, 11/15/2015 | | | | 1,500,000 | | | | 1,485,117 |
| Verso Paper Holdings, LLC, 9.125%, 08/01/2014 144A | | | | 175,000 | | | | 185,062 |
| |
|
| | | | | 2,646,048 |
| |
|
| TELECOMMUNICATION SERVICES 3.3% |
| Diversified Telecommunication Services 1.9% |
| AT&T, Inc., 5.30%, 11/15/2010 | | | | 3,000,000 | | | | 3,018,057 |
| Citizens Communications Co., 7.875%, 01/15/2027 144A | | | | 275,000 | | | | 287,375 |
| Qwest Communications International, Inc., 7.875%, 09/01/2011 | | | | 300,000 | | | | 321,000 |
| Verizon Communications, Inc., 6.125%, 01/15/2013 | | | | 2,000,000 | | | | 2,056,814 |
| |
|
| | | | | 5,683,246 |
| |
|
| Wireless Telecommunication Services 1.4% |
| AT&T Wireless, 8.125%, 05/01/2012 | | | | 800,000 | | | | 901,357 |
| Nextel Partners, Inc., 8.125%, 07/01/2011 | | | | 3,000,000 | | | | 3,130,407 |
| |
|
| | | | | 4,031,764 |
| |
|
| UTILITIES 6.9% |
| Electric Utilities 2.5% |
| Allegheny Energy Supply Co., 8.25%, 04/15/2012 144A | | | | 135,000 | | | | 147,150 |
| Aquila, Inc., 14.875%, 07/01/2012 # | | | | 28,000 | | | | 36,610 |
| CMS Energy Corp., 7.50%, 01/15/2009 | | | | 300,000 | | | | 310,125 |
| Edison International, 7.73%, 06/15/2009 | | | | 300,000 | | | | 316,500 |
| Mission Energy Holding Co., 13.50%, 07/15/2008 | | | | 15,000 | | | | 16,462 |
| NRG Energy, Inc., 7.25%, 02/01/2014 | | | | 300,000 | | | | 311,250 |
| Orion Power Holdings, Inc., 12.00%, 05/01/2010 | | | | 85,000 | | | | 98,600 |
| PPL Electric Utilities Corp., 4.30%, 06/01/2013 | | | | 535,000 | | | | 503,377 |
| Progress Energy, Inc., 6.85%, 04/15/2012 | | | | 3,000,000 | | | | 3,220,107 |
| Reliant Energy, Inc.: |
| 6.75%, 12/15/2014 | | | | 300,000 | | | | 315,750 |
| 9.25%, 07/15/2010 | | | | 140,000 | | | | 147,525 |
| Southern Co., 4.875%, 07/15/2015 | | | | 2,000,000 | | | | 1,913,770 |
| |
|
| | | | | 7,337,226 |
| |
|
| Independent Power Producers & Energy Traders 0.3% |
| AES Corp., 7.75%, 03/01/2014 | | | | 300,000 | | | | 318,750 |
| Dynegy, Inc., 8.375%, 05/01/2016 | | | | 300,000 | | | | 317,625 |
| Tenaska, Inc., 7.00%, 06/30/2021 144A | | | | 285,584 | | | | 290,319 |
| |
|
| | | | | 926,694 |
| |
|
See Notes to Financial Statements18
| SCHEDULE OF INVESTMENTS continued |
|
| April 30, 2007 | | Principal | | |
| | | Amount | Value |
|
| CORPORATE BONDS continued |
| UTILITIES continued |
| Multi-Utilities 4.1% |
| Dominion Resources, Inc.: |
| 5.95%, 06/15/2035 | | $ 3,000,000 | | $ 2,967,852 |
| 6.30%, 09/30/2066 | | 500,000 | | | | 511,693 |
| Energy East Corp., 6.75%, 07/15/2036 | | 2,500,000 | | | | 2,670,399 |
| MidAmerican Energy Holdings Co., 8.48%, 09/15/2028 | | 3,000,000 | | | | 3,863,514 |
| NiSource, Inc., 7.875%, 11/15/2010 | | 2,000,000 | | | | 2,171,796 |
| |
|
| | | | | 12,185,254 |
| |
|
| Total Corporate Bonds (cost $197,556,813) | | | | 197,459,414 |
| |
|
| FOREIGN BONDS - GOVERNMENT (PRINCIPAL AMOUNT DENOMINATED | | |
| IN CURRENCY INDICATED) 0.5% | |
| Mexico, 8.00%, 12/07/2023 MXN (cost $1,528,106) | | 16,500,000 | | | | 1,545,619 |
| |
|
| MUNICIPAL OBLIGATIONS 0.2% |
| HOUSING 0.2% |
| Virginia HDA RB, Ser. J, 6.75%, 12/01/2021 (cost $538,378) | | $ 500,000 | | | | 528,935 |
| |
|
| WHOLE LOAN SUBORDINATE COLLATERALIZED MORTGAGE | | |
| OBLIGATIONS 0.1% | |
| Financial Asset Securitization, Inc., Ser. 1997-NAM2, Class B-2, 7.88%, 07/25/2027 | |
| (cost $448,912) | | 436,997 | | | | 435,495 |
| |
|
| YANKEE OBLIGATIONS - CORPORATE 15.9% |
| CONSUMER DISCRETIONARY 0.0% |
| Media 0.0% |
| National Cable plc, 9.125%, 08/15/2016 | | 107,000 | | | | 114,757 |
| |
|
| ENERGY 2.3% |
| Oil, Gas & Consumable Fuels 2.3% |
| Canadian Natural Resources, Ltd., 6.50%, 02/15/2037 | | 2,000,000 | | | | 2,064,478 |
| ConocoPhillips Canada, 5.625%, 10/15/2016 | | 2,500,000 | | | | 2,558,775 |
| OAO Gazprom, 6.21%, 11/22/2016 144A (p) | | 2,000,000 | | | | 2,031,000 |
| |
|
| | | | | 6,654,253 |
| |
|
| FINANCIALS 10.6% |
| Commercial Banks 5.9% |
| Banco Bradesco SA, 8.75%, 10/24/2013 | | 2,000,000 | | | | 2,320,000 |
| Barclays Bank plc, 8.55%, 09/29/2049 144A | | 4,000,000 | | | | 4,489,192 |
| BOI Capital Funding, 5.57%, 02/01/2049 144A | | 1,000,000 | | | | 986,097 |
| Royal Bank of Scotland Group plc, 9.12%, 03/31/2049 | | 5,000,000 | | | | 5,523,330 |
| Standard Chartered plc, FRN, 5.50%, 07/29/2049 | | 5,000,000 | | | | 4,150,000 |
| |
|
| | | | | 17,468,619 |
| |
|
See Notes to Financial Statements19
| SCHEDULE OF INVESTMENTS continued |
|
| April 30, 2007 | | Principal | | |
| | | Amount | Value |
|
| YANKEE OBLIGATIONS - CORPORATE continued |
| FINANCIALS continued |
| Diversified Financial Services 1.5% |
| ING Groep NV, 5.78%, 12/29/2049 | | $ 1,500,000 | | $ 1,496,893 |
| Petroplus Finance Ltd.: |
| 6.75%, 05/01/2014 144A # | | 45,000 | | | | 45,450 |
| 7.00%, 05/01/2017 144A # | | 30,000 | | | | 30,413 |
| Preferred Term Securities, Ltd., FRN: |
| 6.92%, 06/24/2034 144A | | 2,000,000 | | | | 2,040,980 |
| 6.95%, 12/22/2036 144A | | 1,000,000 | | | | 1,003,340 |
| |
|
| | | | | 4,617,076 |
| |
|
| Insurance 2.5% |
| Oil Insurance, Ltd., Ser. A, 7.56%, 12/29/2049 144A | | 3,000,000 | | | | 3,159,591 |
| Zurich Regcaps Funding Trust V, 8.38%, 06/01/2037 144A | | 4,000,000 | | | | 4,176,720 |
| |
|
| | | | | 7,336,311 |
| |
|
| Real Estate Investment Trusts 0.7% |
| Westfield Group Australia, 5.70%, 10/01/2016 144A | | 2,000,000 | | | | 2,026,770 |
| |
|
| INFORMATION TECHNOLOGY 0.0% |
| Semiconductors & Semiconductor Equipment 0.0% |
| Avego Technologies, 10.125%, 12/01/2013 | | 30,000 | | | | 32,925 |
| |
|
| MATERIALS 0.9% |
| Chemicals 0.1% |
| NOVA Chemicals Corp., 6.50%, 01/15/2012 (p) | | 300,000 | | | | 289,500 |
| |
|
| Metals & Mining 0.8% |
| Alcan, Inc., 6.125%, 12/15/2033 | | 2,000,000 | | | | 1,976,550 |
| Novelis, Inc., 7.25%, 02/15/2015 | | 300,000 | | | | 317,625 |
| |
|
| | | | | 2,294,175 |
| |
|
| Paper & Forest Products 0.0% |
| Abitibi-Consolidated, Inc., 8.375%, 04/01/2015 (p) | | 70,000 | | | | 65,800 |
| |
|
| TELECOMMUNICATION SERVICES 2.1% |
| Diversified Telecommunication Services 1.8% |
| France Telecom SA, 8.50%, 03/01/2031 | | 1,000,000 | | | | 1,321,032 |
| Telefonica Emisiones, 7.05%, 06/20/2036 | | 1,000,000 | | | | 1,076,378 |
| Telefonos De Mexico SA, 5.50%, 01/27/2015 | | 3,000,000 | | | | 2,997,951 |
| |
|
| | | | | 5,395,361 |
| |
|
| Wireless Telecommunication Services 0.3% |
| Vodafone Group plc, 7.75%, 02/15/2010 | | 700,000 | | | | 746,572 |
| |
|
| Total Yankee Obligations - Corporate (cost $47,261,264) | | | | 47,042,119 |
| |
|
See Notes to Financial Statements20
| SCHEDULE OF INVESTMENTS continued |
|
| April 30, 2007 |
| | | Shares | | | | Value |
|
| PREFERRED STOCKS 3.5% |
| FINANCIALS 2.4% |
| Diversified Financial Services 1.0% |
| First Republic Capital Corp., 10.50% | | 50 | | $ 54,650 |
| General Elecetric Capital Corp., 6.00% | | 120,000 | | | | 2,990,400 |
| |
|
| | | | | 3,045,050 |
| |
|
| Real Estate Management & Development 0.4% |
| USB Realty Corp., Var. Rate Pfd. 144A | | 1,000,000 | | | | 1,011,096 |
| |
|
| Thrifts & Mortgage Finance 1.0% |
| Fannie Mae, Ser. O, Var. Rate Pfd. | | 55,000 | | | | 2,904,687 |
| |
|
| TELECOMMUNICATION SERVICES 1.1% |
| Diversified Telecommunication Services 1.1% |
| Centaur Funding Corp., 9.08% | | 2,880 | | | | 3,402,000 |
| |
|
| Total Preferred Stocks (cost $10,884,477) | | | | 10,362,833 |
| |
|
| COMMON STOCKS 0.0% |
| UTILITIES 0.0% |
| Independent Power Producers & Energy Traders 0.0% |
| Dynegy, Inc., Class A (cost $0) | | 11 | | | | 104 |
| | |
|
|
| | Principal | | |
| Amount | Value |
|
| INVESTMENTS OF CASH COLLATERAL FROM SECURITIES LOANED 4.6% |
| REPURCHASE AGREEMENTS ^ 4.6% |
| Bank of America Corp., 5.33%, dated 04/30/2007, maturing 05/01/2007, maturity | | |
| value $13,586,949 (cost $13,584,938) | | $ 13,584,938 | | | | 13,584,938 |
| |
|
| SHORT-TERM INVESTMENTS 0.1% |
| U.S. TREASURY OBLIGATIONS 0.1% |
| U.S. Treasury Bills: |
| 4.91%, 06/14/2007 † ƒ | | 75,000 | | | | 74,552 |
| 4.92%, 06/14/2007 † ƒ | | 100,000 | | | | 99,399 |
| |
|
| | | | | 173,951 |
| | |
|
|
| | Shares | | Value |
|
| MUTUAL FUND SHARES 0.0% |
| Evergreen Institutional Money Market Fund, Class I, 5.21% q (0) | | 67,382 | | | | 67,382 |
| |
|
| Total Short-Term Investments (cost $241,333) | | | | 241,333 |
| |
|
| Total Investments (cost $305,743,166) 103.3% | | | | 305,845,562 |
| Other Assets and Liabilities (3.3%) | | | | (9,666,783) |
| |
|
| Net Assets 100.0% | | $ 296,178,779 |
| |
|
See Notes to Financial Statements21
SCHEDULE OF INVESTMENTS continued
April 30, 2007
| ## | | All or a portion of this security has been segregated for when-issued or delayed delivery securities. |
| 144A | | Security that may be sold to qualified institutional buyers under Rule 144A of the Securities Act of 1933, as amended. |
| | | This security has been determined to be liquid under guidelines established by the Board of Trustees, unless otherwise |
| | noted. |
| (p) | | All or a portion of this security is on loan. |
| # | | When-issued or delayed delivery security |
| (Q) | | Security is valued at fair value as determined by the investment advisor in good faith, according to procedures approved |
| | | by the Board of Trustees. |
| + | | Security is deemed illiquid. |
| ^ | | Collateral is pooled with the collateral of other Evergreen funds and allocated on a pro-rata basis into 35 issues of high |
| | | grade short-term securities such that sufficient collateral is applied to the respective repurchase agreement. |
| † | | Rate shown represents the yield to maturity at date of purchase. |
| ƒ | | All or a portion of this security was pledged to cover initial margin requirements for open futures contracts. |
| q | | Rate shown is the 7-day annualized yield at period end. |
| (0) | | Evergreen Investment Management Company, LLC is the investment advisor to both the Fund and the money market |
| | | fund. |
Summary of Abbreviations
| CDO | | Collateralized Debt Obligation |
| FHLMC | | Federal Home Loan Mortgage Corp. |
| FNMA | | Federal National Mortgage Association |
| FRN | | Floating Rate Note |
| GNMA | | Government National Mortgage Association |
| HDA | | Housing Development Authority |
| MASTR | | Mortgage Asset Securitization Transactions, Inc. |
| MXN | | Mexican Peso |
| RB | | Revenue Bond |
The following table shows the percent of total investments (excluding collateral from securities on loan) by credit quality based on Moody’s and Standard & Poor’s ratings as of April 30, 2007 (unaudited):
| AAA | | 6.9% |
| AA | | 9.6% |
| A | | 30.8% |
| BBB | | 37.5% |
| BB | | 4.3% |
| B | | 5.7% |
| NR | | 5.2% |
| |
|
| | | 100.0% |
| | |
|
The following table shows the percent of total investments (excluding collateral from securities on loan) based on effective maturity as of April 30, 2007 (unaudited):
| Less than 1 year | | 0.8% |
| 1 to 3 year(s) | | 10.9% |
| 3 to 5 years | | 13.2% |
| 5 to 10 years | | 36.3% |
| 10 to 20 years | | 13.2% |
| 20 to 30 years | | 25.6% |
| |
|
| | | 100.0% |
| | |
|
See Notes to Financial Statements22
| STATEMENT OF ASSETS AND LIABILITIES | | | | |
|
| April 30, 2007 | | | | |
|
| Assets | | | | |
| Investments in securities, at value (cost $305,675,784) including $13,383,334 of | | | | |
| securities loaned | | $ | | 305,778,180 |
| Investments in affiliated money market fund, at value (cost $67,382) | | | | 67,382 |
|
| Total investments | | | | 305,845,562 |
| Receivable for securities sold | | | | 618,200 |
| Principal paydown receivable | | | | 9,494 |
| Receivable for Fund shares sold | | | | 87,043 |
| Interest receivable | | | | 4,654,511 |
| Receivable for daily variation margin on open futures contracts | | | | 79,063 |
| Receivable for securities lending income | | | | 1,013 |
| Credit default swap income receivable | | | | 2,740 |
| Receivable from advisor | | | | 3,293 |
| Unrealized gains on credit default swap transactions | | | | 20,636 |
| Prepaid expenses and other assets | | | | 172,944 |
|
| Total assets | | | | 311,494,499 |
|
| Liabilities | | | | |
| Dividends payable | | | | 511,384 |
| Payable for securities purchased | | | | 696,621 |
| Payable for Fund shares redeemed | | | | 423,008 |
| Unrealized losses on credit default swap transactions | | | | 928 |
| Unrealized losses on total return swap transactions | | | | 11,759 |
| Payable for securities on loan | | | | 13,584,938 |
| Credit default swap loss payable | | | | 2,873 |
| Deferred income payable | | | | 3,437 |
| Due to related parties | | | | 3,007 |
| Accrued expenses and other liabilities | | | | 77,765 |
|
| Total liabilities | | | | 15,315,720 |
|
| Net assets | | $ | | 296,178,779 |
|
| Net assets represented by | | | | |
| Paid-in capital | | $ | | 347,923,019 |
| Overdistributed net investment income | | | | (416,859) |
| Accumulated net realized losses on investments | | | | (51,442,539) |
| Net unrealized gains on investments | | | | 115,158 |
|
| Total net assets | | $ | | 296,178,779 |
|
| Net assets consists of | | | | |
| Class A | | $ | | 199,441,649 |
| Class B | | | | 16,101,514 |
| Class C | | | | 24,157,463 |
| Class I | | | | 56,478,153 |
|
| Total net assets | | $ | | 296,178,779 |
|
| Shares outstanding (unlimited number of shares authorized) | | | | |
| Class A | | | | 13,803,044 |
| Class B | | | | 1,114,443 |
| Class C | | | | 1,671,804 |
| Class I | | | | 3,908,730 |
|
| Net asset value per share | | | | |
| Class A | | $ | | 14.45 |
| Class A — Offering price (based on sales charge of 4.75%) | | $ | | 15.17 |
| Class B | | $ | | 14.45 |
| Class C | | $ | | 14.45 |
| Class I | | $ | | 14.45 |
|
See Notes to Financial Statements
23
| STATEMENT OF OPERATIONS | | | | |
|
| Year Ended April 30, 2007 | | | | |
|
| Investment income | | | | |
| Interest (net of foreign withholding taxes of $15,107) | | $ | | 19,320,164 |
| Dividends | | | | 630,182 |
| Income from affiliate | | | | 90,004 |
| Securities lending | | | | 15,752 |
|
| Total investment income | | | | 20,056,102 |
|
| Expenses | | | | |
| Advisory fee | | | | 1,361,912 |
| Distribution Plan expenses | | | | |
| Class A | | | | 612,765 |
| Class B | | | | 169,163 |
| Class C | | | | 246,182 |
| Administrative services fee | | | | 303,523 |
| Transfer agent fees | | | | 667,735 |
| Trustees’ fees and expenses | | | | 5,281 |
| Printing and postage expenses | | | | 65,997 |
| Custodian and accounting fees | | | | 98,570 |
| Registration and filing fees | | | | 51,740 |
| Professional fees | | | | 34,502 |
| Other | | | | 12,409 |
|
| Total expenses | | | | 3,629,779 |
| Less: Expense reductions | | | | (11,214) |
| Fee waivers and expense reimbursements | | | | (624,039) |
|
| Net expenses | | | | 2,994,526 |
|
| Net investment income | | | | 17,061,576 |
|
| Net realized and unrealized gains or losses on investments | | | | |
| Net realized gains or losses on: | | | | |
| Securities | | | | (1,660,602) |
| Foreign currency related transactions | | | | (426,790) |
| Futures contracts | | | | 468,441 |
| Credit default swap transactions | | | | 90,208 |
| Total return swap transactions | | | | (24,500) |
|
| Net realized losses on investments | | | | (1,553,243) |
| Net change in unrealized gains or losses on investments | | | | 6,403,394 |
|
| Net realized and unrealized gains or losses on investments | | | | 4,850,151 |
|
| Net increase in net assets resulting from operations | | $ | | 21,911,727 |
|
See Notes to Financial Statements
24
| STATEMENTS OF CHANGES IN NET ASSETS | | | | |
|
| | | Year Ended April 30, |
| |
|
| | | 2007 | | 2006 (a) |
|
| Operations | | | | | | | | |
| Net investment income | | $ | | 17,061,576 | | $ | | 7,394,482 |
| Net realized losses on investments | | | | (1,553,243) | | | | (227,633) |
| Net change in unrealized gains or | | | | | | | | |
| losses on investments | | | | 6,403,394 | | | | (5,662,815) |
|
| Net increase in net assets resulting | | | | | | | | |
| from operations | | | | 21,911,727 | | | | 1,504,034 |
|
| Distributions to shareholders from | | | | | | | | |
| Net investment income | | | | | | | | |
| Class A | | | | (11,787,049) | | | | (5,253,477) |
| Class B | | | | (852,703) | | | | (404,443) |
| Class C | | | | (1,242,068) | | | | (562,616) |
| Class I | | | | (3,565,742) | | | | (1,600,305) |
| Tax return of capital | | | | | | | | |
| Class A | | | | (165,900) | | | | 0 |
| Class B | | | | (13,740) | | | | 0 |
| Class C | | | | (19,998) | | | | 0 |
| Class I | | | | (47,948) | | | | 0 |
|
| Total distributions to shareholders | | | | (17,695,148) | | | | (7,820,841) |
|
| | | Shares | | | | Shares | | |
| Capital share transactions | | | | | | | | |
| Proceeds from shares sold | | | | | | | | |
| Class A | | 579,848 | | 8,326,359 | | 144,276 | | 2,070,261 |
| Class B | | 169,920 | | 2,430,882 | | 100,885 | | 1,459,444 |
| Class C | | 190,704 | | 2,730,653 | | 58,582 | | 844,966 |
| Class I | | 44,267 | | 639,034 | | 18,562 | | 258,081 |
|
| | | | | 14,126,928 | | | | 4,632,752 |
|
| Net asset value of shares issued in | | | | | | | | |
| reinvestment of distributions | | | | | | | | |
| Class A | | 552,035 | | 7,905,712 | | 239,055 | | 3,455,450 |
| Class B | | 35,341 | | 506,013 | | 16,371 | | 236,663 |
| Class C | | 56,461 | | 808,431 | | 25,591 | | 369,920 |
| Class I | | 130,689 | | 1,871,835 | | 55,761 | | 806,034 |
|
| | | | | 11,091,991 | | | | 4,868,067 |
|
| Automatic conversion of Class B shares | | | | | | | | |
| to Class A shares | | | | | | | | |
| Class A | | 69,131 | | 988,636 | | 61,125 | | 886,081 |
| Class B | | (69,131) | | (988,636) | | (61,125) | | (886,081) |
|
| | | | | 0 | | | | 0 |
|
| Payment for shares redeemed | | | | | | | | |
| Class A | | (2,368,618) | | (33,880,260) | | (1,062,385) | | (15,375,165) |
| Class B | | (304,671) | | (4,352,055) | | (180,144) | | (2,605,437) |
| Class C | | (398,516) | | (5,692,232) | | (172,278) | | (2,493,838) |
| Class I | | (598,099) | | (8,560,870) | | (278,405) | | (4,026,585) |
|
| | | | | (52,485,417) | | | | (24,501,025) |
|
| Net decrease in net assets resulting | | | | | | | | |
| from capital share transactions | | | | (27,266,498) | | | | (15,000,206) |
|
| Total decrease in net assets | | | | (23,049,919) | | | | (21,317,013) |
| Net assets | | | | | | | | |
| Beginning of period | | | | 319,228,698 | | | | 340,545,711 |
|
| End of period | | $ | | 296,178,779 | | $ | | 319,228,698 |
|
| Overdistributed net investment income | | $ | | (416,859) | | $ | | (394,223) |
|
(a) For the five months ended April 30, 2006. The Fund changed its fiscal year end from November 30 to April 30, effective April 30, 2006.
See Notes to Financial Statements
25
| STATEMENTS OF CHANGES IN NET ASSETS | | | | |
|
| | | Year Ended |
| | | November 30, 2005 (a) (b) |
|
| Operations | | | | |
| Net investment income | | $ | | 12,472,236 |
| Net realized gains on investments | | | | 158,052 |
| Net change in unrealized losses on investments | | | | (7,406,911) |
|
| Net increase in net assets resulting from operations | | | | 5,223,377 |
|
| Distributions to shareholders from | | | | |
| Net investment income | | | | |
| Class A | | | | (6,953,533) |
| Class B | | | | (543,738) |
| Class C | | | | (757,969) |
| Class I | | | | (5,026,549) |
| Tax return of capital | | | | |
| Class I | | | | (881,232) |
|
| Total distributions to shareholders | | | | (14,163,021) |
|
| | | Shares | | |
| Capital share transactions | | | | |
| Proceeds from shares sold | | | | |
| Class A | | 113,587 | | 1,676,634 |
| Class B | | 115,193 | | 1,706,735 |
| Class C | | 55,353 | | 827,909 |
| Class I | | 27,527 | | 416,249 |
|
| | | | | 4,627,527 |
|
| Net asset value of shares issued in reinvestment of distributions | | | | |
| Class A | | 339,379 | | 5,028,431 |
| Class B | | 24,321 | | 360,292 |
| Class C | | 37,763 | | 559,591 |
| Class I | | 72,438 | | 1,072,180 |
|
| | | | | 7,020,494 |
|
| Automatic conversion of Class B shares to Class A shares | | | | |
| Class A | | 49,845 | | 737,264 |
| Class B | | (49,845) | | (737,264) |
|
| | | | | 0 |
|
| Payment for shares redeemed | | | | |
| Class A | | (1,351,925) | | (20,009,362) |
| Class B | | (123,613) | | (1,824,435) |
| Class C | | (267,045) | | (3,957,574) |
| Class I | | (2,177,521) | | (32,439,871) |
|
| | | | | (58,231,242) |
|
| Net asset value of shares issued in acquisition | | | | |
| Class A | | 16,437,691 | | 243,734,394 |
| Class B | | 1,440,941 | | 21,365,593 |
| Class C | | 2,085,189 | | 30,912,915 |
| Class I | | 190,270 | | 2,821,118 |
|
| | | | | 298,834,020 |
|
| Net increase in net assets resulting from capital share transactions | | | | 252,250,799 |
|
| Total increase in net assets | | | | 243,311,155 |
| Net assets | | | | |
| Beginning of period | | | | 97,234,556 |
|
| End of period | | $ | | 340,545,711 |
|
| Overdistributed net investment income | | $ | | (189,584) |
|
(a) For Class A, B, and C shares, for the period from May 20, 2005 (commencement of class operations), to November 30, 2005.
(b) Effective at the close of business on May 20, 2005, the Fund acquired the net assets of Vestaur Securities Fund. Vestaur Securities Fund became the accounting and performance survivor in this transaction. The information above for the period prior to May 23, 2005 is that of Vestaur Securities Fund.
See Notes to Financial Statements
26
NOTES TO FINANCIAL STATEMENTS
1. ORGANIZATION
Evergreen Diversified Bond Fund (the “Fund”) is a diversified series of Evergreen Fixed Income Trust (the “Trust”), a Delaware statutory trust organized on September 18, 1997. The Trust is an open-end management investment company registered under the Investment Company Act of 1940, as amended (the “1940 Act”).
The Fund offers Class A, Class B, Class C, and Class I shares. Class A shares are sold with a front-end sales charge. However, Class A share investments of $1 million or more are not subject to a front-end sales charge but are subject to a contingent deferred sales charge of 1.00% upon redemption within 18 months. Prior to April 1, 2007, the 1.00% contingent deferred sales charge was applicable for redemptions made within one year. Class B shares are sold without a front-end sales charge but are subject to a contingent deferred sales charge that is payable upon redemption and decreases depending on how long the shares have been held. Class C shares are sold without a front-end sales charge but are subject to a contingent deferred sales charge that is payable upon redemption within one year. Class I shares are sold without a front-end sales charge or contingent deferred sales charge. Each class of shares, except Class I shares, pays an ongoing distribution fee.
2. SIGNIFICANT ACCOUNTING POLICIES
The following is a summary of significant accounting policies consistently followed by the Fund in the preparation of its financial statements. The policies are in conformity with generally accepted accounting principles in the United States of America, which require management to make estimates and assumptions that affect amounts reported herein. Actual results could differ from these estimates.
a. Valuation of investments
Portfolio debt securities acquired with more than 60 days to maturity are fair valued using matrix pricing methods determined by an independent pricing service which takes into consideration such factors as similar security prices, yields, maturities, liquidity and ratings. Securities for which valuations are not readily available from an independent pricing service may be valued by brokers which use prices provided by market makers or estimates of market value obtained from yield data relating to investments or securities with similar characteristics.
Listed equity securities are usually valued at the last sales price or official closing price on the national securities exchange where the securities are principally traded.
Investments of cash collateral in short-term securities are valued at amortized cost, which approximates market value.
Short-term securities with remaining maturities of 60 days or less at the time of purchase are valued at amortized cost, which approximates market value.
Investments in other mutual funds are valued at net asset value. Securities for which market quotations are not readily available or not reflective of current market value are valued at fair value as determined by the investment advisor in good faith, according to procedures approved by the Board of Trustees.
27
NOTES TO FINANCIAL STATEMENTS continued
b. Repurchase agreements
Securities pledged as collateral for repurchase agreements are held by the custodian bank or in a segregated account in the Fund’s name until the agreements mature. Collateral for certain tri-party repurchase agreements is held at the counterparty’s custodian in a segregated account for the benefit of the Fund and the counterparty. Each agreement requires that the market value of the collateral be sufficient to cover payments of interest and principal. However, in the event of default or bankruptcy by the other party to the agreement, retention of the collateral may be subject to legal proceedings. The Fund will enter into repurchase agreements with banks and other financial institutions, which are deemed by the investment advisor to be creditworthy pursuant to guidelines established by the Board of Trustees. In certain instances, the Fund’s securities lending agent may provide collateral in the form of repurchase agreements.
c. Foreign currency translation
All assets and liabilities denominated in foreign currencies are translated into U.S. dollar amounts at the date of valuation. Purchases and sales of portfolio securities and income items denominated in foreign currencies are translated into U.S. dollar amounts on the respective dates of such transactions. The Fund does not separately account for that portion of the results of operations resulting from changes in foreign exchange rates on investments and the fluctuations arising from changes in market prices of securities held. Such fluctuations are included with the net realized and unrealized gains or losses on investments.
d. Futures contracts
In order to gain exposure to, or protect against changes in, security values, the Fund may buy and sell futures contracts. The primary risks associated with the use of futures contracts are the imperfect correlation between changes in market values of securities held by the Fund and the prices of futures contracts, and the possibility of an illiquid market.
Futures contracts are valued based upon their quoted daily settlement prices. The aggregate principal amounts of the contracts are not recorded in the financial statements. Fluctuations in the value of the contracts are recorded in the Statement of Assets and Liabilities as an asset or liability and in the Statement of Operations as unrealized gains or losses until the contracts are closed, at which point they are recorded as net realized gains or losses on futures contracts.
e. When-issued and delayed delivery transactions
The Fund records when-issued or delayed delivery securities as of trade date and maintains security positions such that sufficient liquid assets will be available to make payment for the securities purchased. Securities purchased on a when-issued or delayed delivery basis are marked-to-market daily and begin earning interest on the settlement date. Losses may occur on these transactions due to changes in market conditions or the failure of counterparties to perform under the contract.
f. Securities lending
The Fund may lend its securities to certain qualified brokers in order to earn additional income. The Fund receives compensation in the form of fees or interest earned on the investment of any cash collateral received. The Fund also continues to receive interest and dividends on the secur-
28
NOTES TO FINANCIAL STATEMENTS continued
ities loaned. The Fund receives collateral in the form of cash or securities with a market value at least equal to the market value of the securities on loan, including accrued interest. In the event of default or bankruptcy by the borrower, the Fund could experience delays and costs in recovering the loaned securities or in gaining access to the collateral. The Fund has the right under the lending agreement to recover the securities from the borrower on demand.
g. Credit default swaps
The Fund may enter into credit default swaps. Credit default swaps involve an exchange of a fixed rate premium for protection against the loss in value of an underlying debt instrument in the event of default or bankruptcy. Under the terms of the swap, one party acts as a “guarantor” and receives a periodic stream of payments that is a fixed percentage applied to a notional principal amount over the term of the swap. In return, the party agrees to purchase the notional amount of the underlying instrument, at par, if a credit event occurs during the term of the swap. Periodic payments are recorded as realized gains or losses. The Fund may enter into credit default swaps as either the guarantor or the counterparty.
Swaps are marked-to-market daily based on quotations from market makers and any change in value is recorded as an unrealized gain or loss. Payments received or made as a result of a credit event or termination of the contract are recognized as realized gains or losses. The Fund could be exposed to risks if the counterparty defaults on its obligation to perform, or if there are unfavorable changes in the fluctuation of interest rates or in the price of the underlying security.
h. Total return swaps
The Fund may enter into total return swaps. Total return swaps involve commitments to pay interest in exchange for a market linked return, both based on notional amounts. To the extent the total return of the security or index underlying the transaction exceeds or falls short of the offsetting interest rate obligation, the Fund will receive a payment from, or make a payment to, the counterparty. The value of the swap agreements is marked-to-market daily based upon quotations from market makers and any change in value is recorded as an unrealized gain or loss. The Fund could be exposed to risks if the counterparty defaults on its obligation to perform, or if there are unfavorable changes in the fluctuation of interest rates or in the price of the underlying security.
i. Security transactions and investment income
Security transactions are recorded on trade date. Realized gains and losses are computed using the specific cost of the security sold. Interest income is recorded on the accrual basis and includes accretion of discounts and amortization of premiums. Dividend income is recorded on the ex-dividend date. Foreign income and capital gains realized on some securities may be subject to foreign taxes, which are accrued as applicable.
j. Federal taxes
The Fund intends to continue to qualify as a regulated investment company and distribute all of its taxable income, including any net capital gains (which have already been offset by available capital loss carryovers). Accordingly, no provision for federal taxes is required.
29
NOTES TO FINANCIAL STATEMENTS continued
k. Distributions
Distributions to shareholders from net investment income are accrued daily and paid monthly. Distributions from net realized gains, if any, are recorded on the ex-dividend date. Such distributions are determined in conformity with income tax regulations, which may differ from generally accepted accounting principles.
Reclassifications have been made to the Fund’s components of net assets to reflect income and gains available for distribution (or available capital loss carryovers, as applicable) under income tax regulations. The primary permanent differences causing such reclassifications are due to net realized foreign currency gains or losses, unutilized capital loss carryovers and consent fees from tendered bonds. During the year ended April 30, 2007, the following amounts were reclassified:
|
| Paid-in capital | | $ | | (7,135,670) |
| Overdistributed net investment income | | | | 363,350 |
| Accumulated net realized losses on investments | | | | 6,772,320 |
|
l. Class allocations
Income, common expenses and realized and unrealized gains and losses are allocated to the classes based on the relative net assets of each class. Distribution fees, if any, are calculated daily at the class level based on the appropriate net assets of each class and the specific expense rates applicable to each class.
3. ADVISORY FEE AND OTHER TRANSACTIONS WITH AFFILIATES
Evergreen Investment Management Company, LLC (“EIMC”), an indirect, wholly-owned subsidiary of Wachovia Corporation (“Wachovia”), is the investment advisor to the Fund and is paid a fee at an annual rate of 2% of the Fund’s gross investment income plus an amount determined by applying percentage rates to the average daily net assets of the Fund, starting at 0.31% and declining to 0.16% as average daily net assets increase.
Effective October 1, 2006, Tattersall Advisory Group, Inc., an indirect, wholly-owned subsidiary of Wachovia, became the investment sub-advisor to the Fund and is paid by EIMC for its services to the Fund.
From time to time, EIMC may voluntarily or contractually waive its fee and/or reimburse expenses in order to limit operating expenses. During the year ended April 30, 2007, EIMC contractually waived its advisory fee in the amount of $548,154 and voluntarily reimbursed Distribution Plan expenses (see Note 4) relating to Class A shares in the amount of $75,885.
The Fund may invest in Evergreen-managed money market funds, which are also advised by EIMC. Income earned on these investments is included in income from affiliate on the Statement of Operations.
30
NOTES TO FINANCIAL STATEMENTS continued
Evergreen Investment Services, Inc. (“EIS”), an indirect, wholly-owned subsidiary of Wachovia, is the administrator to the Fund. As administrator, EIS provides the Fund with facilities, equipment and personnel and is paid an annual rate determined by applying percentage rates to the aggregate average daily net assets of the Evergreen funds (excluding money market funds and Evergreen Institutional Enhanced Income Fund), starting at 0.10% and declining to 0.05% as the aggregate average daily net assets of the Evergreen funds (excluding money market funds and Evergreen Institutional Enhanced Income Fund) increase.
Evergreen Service Company, LLC (“ESC”), an indirect, wholly-owned subsidiary of Wachovia, is the transfer and dividend disbursing agent for the Fund. ESC receives account fees that vary based on the type of account held by the shareholders in the Fund. For the year ended April 30, 2007, the transfer agent fees were equivalent to an annual rate of 0.22% of the Fund’s average daily net assets.
4. DISTRIBUTION PLANS
EIS also serves as distributor of the Fund’s shares. The Fund has adopted Distribution Plans, as allowed by Rule 12b-1 of the 1940 Act, for each class of shares, except Class I. Under the Distribution Plans, distribution fees are paid at an annual rate of 0.30% of the average daily net assets for Class A shares and 1.00% of the average daily net assets for each of Class B and Class C shares.
For the year ended April 30, 2007, EIS received $7,598 from the sale of Class A shares and $36,222 and $20 in contingent deferred sales charges from redemptions of Class B and Class C shares, respectively.
5. ACQUISITION
Effective at the close of business on May 20, 2005, the Fund acquired the net assets of Vestaur Securities Fund in a tax-free exchange for Class I shares of the Fund at an exchange ratio of 0.93. The acquired net assets consisted primarily of portfolio securities with unrealized appreciation of $49,458. The aggregate net assets of the Fund and Vestaur Securities Fund immediately prior to the acquisition were $298,834,020 and $95,236,951, respectively. The aggregate net assets of the Fund immediately after the acquisition were $394,070,971. Vestaur Securities Fund was the accounting and performance survivor in this transaction.
31
NOTES TO FINANCIAL STATEMENTS continued
6. SECURITIES TRANSACTIONS
Cost of purchases and proceeds from sales of investment securities (excluding short-term securities and mortgage dollar roll transactions) were as follows for the year ended April 30, 2007:
| Cost of Purchases | | Proceeds from Sales |
|
| U.S. | | Non-U.S. | | U.S. | | Non-U.S. |
| Government | | Government | | Government | | Government |
|
| $14,941,094 | | $196,372,479 | | $19,136,244 | | $ 206,040,417 |
|
At April 30, 2007, the Fund had open long futures contracts outstanding as follows:
| | | | | Initial | | | | |
| | | | | Contract | | Value at | | Unrealized |
| Expiration | | Contracts | | Amount | | April 30, 2007 | | Gain (Loss) |
|
| June 2007 | | 50 U.S. Treasury | | | | | | |
| | | Notes Futures | | $ 5,379,887 | | $ 5,416,406 | | $ 36,519 |
| June 2007 | | 65 U.S. Treasury | | | | | | |
| | | Bonds Futures | | 7,295,768 | | 7,263,750 | | (32,018) |
|
During the year ended April 30, 2007, the Fund loaned securities to certain brokers. At April 30, 2007, the value of securities on loan and the total value of collateral received for securities loaned amounted to $13,383,334 and $13,584,938, respectively.
At April 30,2007, the Fund had the following open credit default swap contracts outstanding:
| | | | | | | | | Fixed | | | | |
| | | | | Reference | | | | Payments | | Frequency of | | |
| | | | | Debt | | Notional | | Made by | | Payments | | Unrealized |
| Expiration | | Counterparty | | Obligation | | Amount | | the Fund | | Made | | Gain (Loss) |
|
| 06/20/2012 | | JP Morgan | | Masco Corp., | | $ 2,00,0000 | | 0.64% | | Quarterly | | $ (928) |
| | | Chase & Co. | | 5.875%, | | | | | | | | |
| | | | | 7/1/2012 | | | | | | | | |
| 06/20/2012 | | Goldman Sachs | | Limited | | 2,000,000 | | 0.52% | | Quarterly | | 5,398 |
| | | Group, Inc. | | Brands, | | | | | | | | |
| | | | | 6.125%, | | | | | | | | |
| | | | | 12/1/2012 | | | | | | | | |
| 06/20/2012 | | Goldman Sachs | | Sara Lee, | | 2,500,000 | | 0.35% | | Quarterly | | 9,045 |
| | | Group, Inc. | | 6.125%, | | | | | | | | |
| | | | | 11/1/2032 | | | | | | | | |
|
| | | | | | | | | | | | | |
| | | | | | | | | | | | | |
| | | | | | | | | Fixed | | | | |
| | | | | Reference | | | | Payments | | Frequency of | | |
| | | | | Debt | | Notional | | Received by | | Payments | | Unrealized |
| Expiration | | Counterparty | | Obligation | | Amount | | the Fund | | Received | | Gain |
|
| 06/20/2012 | | Morgan | | Rogers Cable, | | $ 2,000,000 | | 0.46% | | Quarterly | | $ 925 |
| | | Stanley | | 5.50%, | | | | | | | | |
| | | | | 3/1/2014 | | | | | | | | |
| 06/20/2012 | | Morgan | | JC Penney, | | 2,000,000 | | 0.49% | | Quarterly | | 3,645 |
| | | Stanley | | 8.00%, | | | | | | | | |
| | | | | 3/1/2010 | | | | | | | | |
| 06/20/2012 | | Goldman Sachs | | Dow Jones | | 2,500,000 | | 0.35% | | Quarterly | | 1,623 |
| | | Group, Inc. | | North | | | | | | | | |
| | | | | America | | | | | | | | |
| | | | | Investment | | | | | | | | |
| | | | | Grade Index | | | | | | | | |
|
32
NOTES TO FINANCIAL STATEMENTS continued
At April 30, 2007, the Fund had the following open total return swap agreements:
| Notional | | | | | | | | Unrealized |
| Expiration | | Amount | | Swap Description | | Counterparty | | Loss |
|
| 09/01/2007 | | $ 5,000,000 | | Agreement dated 2/27/2007 to | | Lehman Brothers | | $ 5,782 |
| | | | | receive 30 basis points and to | | Holdings, Inc. | | |
| | | | | receive the positive spread return | | | | |
| | | | | or pay the negative spread return | | | | |
| | | | | on the Lehman Brothers CMBS | | | | |
| | | | | AAA 8.5+yr Index which are | | | | |
| | | | | multiplied by the Lehman notional | | | | |
| | | | | amount. | | | | |
| 10/01/2007 | | 5,000,000 | | Agreement dated 3/19/2007 to | | Lehman Brothers | | 5,977 |
| | | | | receive 25 basis points and to | | Holdings, Inc. | | |
| | | | | receive the positive spread return | | | | |
| | | | | or pay the negative spread return | | | | |
| | | | | on the Lehman Brothers CMBS | | | | |
| | | | | AAA 8.5+yr Index which are | | | | |
| | | | | multiplied by the Lehman notional | | | | |
| | | | | amount. | | | | |
|
On April 30, 2007, the aggregate cost of securities for federal income tax purposes was $307,016,759. The gross unrealized appreciation and depreciation on securities based on tax cost was $4,373,597 and $5,544,794, respectively, with a net unrealized depreciation of $1,171,197.
As of April 30, 2007, the Fund had $50,023,800 in capital loss carryovers for federal income tax purposes expiring as follows:
| Expiration |
|
| 2008 | | 2009 | | 2010 | | 2013 | | 2015 |
|
| $22,702,312 | | $14,769,764 | | $4,586,980 | | $4,295,612 | | $3,669,132 |
|
Certain portions of the capital loss carryovers of the Fund were assumed as a result of acquisitions. These losses are subject to certain limitations prescribed by the Internal Revenue Code. Utilization of these capital loss carryovers was limited during the year ended April 30, 2007 in accordance with income tax regulations.
7. INTERFUND LENDING
Pursuant to an Exemptive Order issued by the SEC, the Fund may participate in an interfund lending program with certain funds in the Evergreen fund family. This program allows the Fund to borrow from, or lend money to, other participating funds. During the year ended April 30, 2007, the Fund did not participate in the interfund lending program.
8. DISTRIBUTIONS TO SHAREHOLDERS
As of April 30, 2007, the components of distributable earnings on a tax basis were as follows:
| Overdistributed | | Unrealized | | Capital Loss |
| Ordinary Income | | Depreciation | | Carryovers |
|
| $549,555 | | $1,170,885 | | $50,023,800 |
|
33
NOTES TO FINANCIAL STATEMENTS continued
The differences between the components of distributable earnings on a tax basis and the amounts reflected in the Statement of Assets and Liabilities are primarily due to premium amortization.
The tax character of distributions paid was as follows:
| | | | | Year Ended April 30, | | |
| |
| | Year Ended |
| | | | | 2007 | | | | 2006(a) | | November 30, 2005 |
|
| Ordinary Income | | | | $ 17,447,562 | | | | $ 7,820,841 | | $ 14,163,021 |
| Return of Capital | | | | 247,586 | | | | 0 | | 0 |
|
(a) For the five months ended April 30, 2006. The Fund changed its fiscal year end from November 30 to April 30, effective April 30, 2006.
9. EXPENSE REDUCTIONS
Through expense offset arrangements with ESC and the Fund’s custodian, a portion of fund expenses has been reduced.
10. DEFERRED TRUSTEES’ FEES
Each Trustee of the Fund may defer any or all compensation related to performance of their duties as Trustees. The Trustees’ deferred balances are allocated to deferral accounts, which are included in the accrued expenses for the Fund. The investment performance of the deferral accounts is based on the investment performance of certain Evergreen funds. Any gains earned or losses incurred in the deferral accounts are reported in the Fund’s Trustees’ fees and expenses. At the election of the Trustees, the deferral account will be paid either in one lump sum or in quarterly installments for up to ten years.
11. FINANCING AGREEMENT
The Fund and certain other Evergreen funds share in an unsecured revolving credit commitment for temporary and emergency purposes, including the funding of redemptions, as permitted by each participating fund’s borrowing restrictions. Borrowings under this facility bear interest at 0.50% per annum above the Federal Funds rate. All of the participating funds are charged an annual commitment fee on the unused balance, which is allocated pro rata. The credit facility is for $100 million with an annual commitment fee of 0.08%. Prior to July 3, 2006, the credit facility was for $150 million with an annual commitment fee of 0.09%. During the year ended April 30, 2007, the Fund had no borrowings.
12. REGULATORY MATTERS AND LEGAL PROCEEDINGS
Since September 2003, governmental and self-regulatory authorities have instituted numerous ongoing investigations of various practices in the mutual fund industry, including investigations relating to revenue sharing, market-timing, late trading and record retention, among other things. The investigations cover investment advisors, distributors and transfer agents to mutual funds, as well as other firms. EIMC, EIS and ESC (collectively, “Evergreen”) have received subpoenas and other requests for documents and testimony relating to these investigations, are endeavoring to
34
NOTES TO FINANCIAL STATEMENTS continued
comply with those requests, and are cooperating with the investigations. Evergreen is continuing its own internal review of policies, practices, procedures and personnel, and is taking remedial action where appropriate.
In connection with one of these investigations, on July 28, 2004, the staff of the Securities and Exchange Commission (“SEC”) informed Evergreen that the staff intends to recommend to the SEC that it institute an enforcement action against Evergreen. The SEC staff’s proposed allegations relate to (i) an arrangement pursuant to which a broker at one of EIMC’s affiliated broker-dealers had been authorized, apparently by an EIMC officer (who is no longer with EIMC), to engage in short-term trading, on behalf of a client, in Evergreen Mid Cap Growth Fund (formerly Evergreen Emerging Growth Fund and prior to that, known as Evergreen Small Company Growth Fund) during the period from December 2000 through April 2003, in excess of the limitations set forth in the fund’s prospectus, (ii) short-term trading from September 2001 through January 2003, by a former Evergreen portfolio manager of Evergreen Precious Metals Fund, a fund he managed at the time, (iii) the sufficiency of systems for monitoring exchanges and enforcing exchange limitations as stated in the funds’ prospectuses, and (iv) the adequacy of e-mail retention practices. In connection with the activity in Evergreen Mid Cap Growth Fund, EIMC reimbursed the fund $378,905, plus an additional $25,242, representing what EIMC calculated at that time to be the client’s net gain and the fees earned by EIMC and the expenses incurred by this fund on the client’s account. In connection with the activity in Evergreen Precious Metals Fund, EIMC reimbursed the fund $70,878, plus an additional $3,075, representing what EIMC calculated at that time to be the portfolio manager’s net gain and the fees earned by EIMC and expenses incurred by the fund on the portfolio manager’s account. Evergreen is currently engaged in discussions with the staff of the SEC concerning its recommendation.
Any resolution of these matters with regulatory authorities may include, but not be limited to, sanctions, penalties or injunctions regarding Evergreen, restitution to mutual fund shareholders and/or other financial penalties and structural changes in the governance or management of Evergreen’s mutual fund business. Any penalties or restitution will be paid by Evergreen and not by the Evergreen funds.
EIS has entered into an agreement with the NASD settling allegations that EIS (i) arranged for Evergreen fund portfolio trades to be directed to Wachovia Securities, LLC, an affiliate of EIS that sold Evergreen fund shares, during the period of January 2001 to December 2003 and (ii) provided non-cash compensation by sponsoring offsite meetings attended by Wachovia Securities, LLC brokers during that period, where the eligibility of a broker to attend the meetings depended upon the broker meeting certain sales targets of Evergreen fund shares. Pursuant to the settlement agreement, EIS has agreed to a censure and a fine of $4,200,000. EIS neither admitted nor denied the allegations and findings set forth in its agreement with the NASD.
In addition, the Evergreen funds and EIMC and certain of its affiliates are involved in various legal actions, including private litigation and class action lawsuits. EIMC does not expect that any
35
NOTES TO FINANCIAL STATEMENTS continued
of such legal actions currently pending or threatened will have a material adverse impact on the financial position or operations of any of the Evergreen funds or on EIMC’s ability to provide services to the Evergreen funds.
Although Evergreen believes that neither the foregoing investigations described above nor any pending or threatened legal actions will have a material adverse impact on the Evergreen funds, there can be no assurance that these matters and any publicity surrounding or resulting from them will not result in reduced sales or increased redemptions of Evergreen fund shares, which could increase Evergreen fund transaction costs or operating expenses, or that they will not have other adverse consequences on the Evergreen funds.
13. NEW ACCOUNTING PRONOUNCEMENTS
In June 2006, the Financial Accounting Standards Board (“FASB”) issued FASB Interpretation No. 48, Accounting for Uncertainty in Income Taxes — an interpretation of FASB statement 109 (“FIN 48”). FIN 48 supplements FASB 109 by prescribing a recognition threshold and measurement attribute for the financial statement recognition and measurement of a tax position taken or expected to be taken in a tax return. The adoption of FIN 48 will require financial statements to be adjusted to reflect only those tax positions that are more likely than not to be sustained as of the adoption date. Management of the Fund is currently evaluating the impact that the adoption of FIN 48 will have on the financial statements. FIN 48 will become effective for fiscal years beginning after December 15, 2006.
In September 2006, FASB issued Statement of Financial Accounting Standards No. 157, Fair Value Measurements (“FAS 157”). FAS 157 establishes a single authoritative definition of fair value, establishes a framework for measuring fair value and expands disclosures about fair value measurements. FAS 157 applies to fair value measurements already required or permitted by existing standards. The change to current generally accepted accounting principles from the application of FAS 157 relates to the definition of fair value, the methods used to measure fair value, and the expanded disclosures about fair value measurements. Management of the Fund does not believe the adoption of FAS 157 will materially impact the financial statement amounts, however, additional disclosures may be required about the inputs used to develop the measurements and the effect of certain of the measurements on changes in net assets for the period. FAS 157 is effective for financial statements issued for fiscal years beginning after November 15, 2007 and interim periods within those fiscal years.
36
REPORT OF INDEPENDENT REGISTERED PUBLIC ACCOUNTING FIRM
Board of Trustees and Shareholders
Evergreen Fixed Income Trust
We have audited the accompanying statement of assets and liabilities, including the schedule of investments, of the Evergreen Diversified Bond Fund, a series of Evergreen Fixed Income Trust, as of April 30, 2007, and the related statement of operations for the year then ended, statements of changes in net assets for each of the years or periods in the two-year period then ended, and the financial highlights for each of the years or periods in the five-year period then ended. These financial statements and financial highlights are the responsibility of the Fund’s management. Our responsibility is to express an opinion on these financial statements and financial highlights based on our audits.
We conducted our audits in accordance with the standards of the Public Company Accounting Oversight Board (United States). Those standards require that we plan and perform the audit to obtain reasonable assurance about whether the financial statements and financial highlights are free of material misstatement. An audit includes examining, on a test basis, evidence supporting the amounts and disclosures in the financial statements. Our procedures included confirmation of securities owned as of April 30, 2007 by correspondence with the custodian and brokers, or by other appropriate auditing procedures where replies from brokers were not received. An audit also includes assessing the accounting principles used and significant estimates made by management, as well as evaluating the overall financial statement presentation. We believe that our audits provide a reasonable basis for our opinion.
In our opinion, the financial statements and financial highlights referred to above present fairly, in all material respects, the financial position of the Evergreen Diversified Bond Fund, as of April 30, 2007, the results of its operations, changes in its net assets and financial highlights for the years or periods described above, in conformity with U.S. generally accepted accounting principles.
Boston, Massachusetts
June 28, 2007
37
ADDITIONAL INFORMATION (unaudited)
FEDERAL TAX DISTRIBUTIONS
For corporate shareholders, 3.64% of ordinary income dividends paid during the fiscal year ended April 30, 2007 qualified for the dividends received deduction.
The Fund paid distributions of $17,695,148 during the year ended April 30, 2007 of which 98.60% was from net investment income and 1.40% was from paid-in capital. Shareholders of the Fund will receive in early 2008 a Form 1099-DIV that will inform them of the tax character of this distribution as well as all other distributions made by the Fund in calendar year 2007.
38
This page left intentionally blank
39
| TRUSTEES AND OFFICERS |
|
| TRUSTEES1 | | |
| Charles A. Austin III | | Investment Counselor, Anchor Capital Advisors, LLC. (investment advice); Director, The Andover |
| Trustee | | Companies (insurance); Trustee, Arthritis Foundation of New England; Former Director, The |
| DOB: 10/23/1934 | | Francis Ouimet Society (scholarship program); Former Director, Executive Vice President and |
| Term of office since: 1991 | | Treasurer, State Street Research & Management Company (investment advice) |
| Other directorships: None | | |
|
| K. Dun Gifford | | Chairman and President, Oldways Preservation and Exchange Trust (education); Trustee, |
| Trustee | | Treasurer and Chairman of the Finance Committee, Cambridge College |
| DOB: 10/23/1938 | | |
| Term of office since: 1974 | | |
| Other directorships: None | | |
|
| Dr. Leroy Keith, Jr. | | Partner, Stonington Partners, Inc. (private equity fund); Trustee, Phoenix Fund Complex; Director, |
| Trustee | | Diversapack Co. (packaging company); Director, Obagi Medical Products Co.; Former Director, |
| DOB: 2/14/1939 | | Lincoln Educational Services |
| Term of office since: 1983 | | |
| Other directorships: Trustee, | | |
| Phoenix Fund Complex (consisting | | |
| of 60 portfolios) | | |
|
| Gerald M. McDonnell | | Manager of Commercial Operations, CMC Steel (steel producer) |
| Trustee | | |
| DOB: 7/14/1939 | | |
| Term of office since: 1988 | | |
| Other directorships: None | | |
|
| Patricia B. Norris | | President and Director of Phillips Pond Homes Association (home community); President and |
| Trustee | | Director of Buckleys of Kezar Lake, Inc., (real estate company); Former Partner, |
| DOB: 4/9/1948 | | PricewaterhouseCoopers, LLP |
| Term of office since: 2006 | | |
| Other directorships: None | | |
|
| William Walt Pettit | | Partner and Vice President, Kellam & Pettit, P.A. (law firm); Director, Superior Packaging Corp. |
| Trustee | | (packaging company); Member, Superior Land, LLC (real estate holding company), Member, |
| DOB: 8/26/1955 | | K&P Development, LLC (real estate development); Former Director, National Kidney Foundation |
| Term of office since: 1984 | | of North Carolina, Inc. (non-profit organization) |
| Other directorships: None | | |
|
| David M. Richardson | | President, Richardson, Runden LLC (executive recruitment business development/consulting |
| Trustee | | company); Consultant, Kennedy Information, Inc. (executive recruitment information and |
| DOB: 9/19/1941 | | research company); Consultant, AESC (The Association of Executive Search Consultants); |
| Term of office since: 1982 | | Director, J&M Cumming Paper Co. (paper merchandising); Former Trustee, NDI Technologies, LLP |
| Other directorships: None | | (communications) |
|
| Dr. Russell A. Salton III | | President/CEO, AccessOne MedCard, Inc.; Former Medical Director, Healthcare Resource |
| Trustee | | Associates, Inc. |
| DOB: 6/2/1947 | | |
| Term of office since: 1984 | | |
| Other directorships: None | | |
|
| Michael S. Scofield | | Retired Attorney, Law Offices of Michael S. Scofield; Former Director and Chairman, Branded |
| Trustee | | Media Corporation (multi-media branding company) |
| DOB: 2/20/1943 | | |
| Term of office since: 1984 | | |
| Other directorships: None | | |
|
40
| TRUSTEES AND OFFICERS continued |
|
| Richard J. Shima | | Independent Consultant; Director, Hartford Hospital; Trustee, Greater Hartford YMCA; Former |
| Trustee | | Director, Trust Company of CT; Former Director, Old State House Association; Former Trustee, |
| DOB: 8/11/1939 | | Saint Joseph College (CT) |
| Term of office since: 1993 | | |
| Other directorships: None | | |
|
| Richard K. Wagoner, CFA2 | | Member and Former President, North Carolina Securities Traders Association; Member, Financial |
| Trustee | | Analysts Society |
| DOB: 12/12/1937 | | |
| Term of office since: 1999 | | |
| Other directorships: None | | |
|
| OFFICERS | | |
| Dennis H. Ferro3 | | Principal occupations: President and Chief Executive Officer, Evergreen Investment Company, |
| President | | Inc. and Executive Vice President, Wachovia Bank, N.A.; former Chief Investment Officer, |
| DOB: 6/20/1945 | | Evergreen Investment Company, Inc. |
| Term of office since: 2003 | | |
|
| Kasey Phillips4 | | Principal occupations: Senior Vice President, Evergreen Investment Services, Inc.; Former Vice |
| Treasurer | | President, Evergreen Investment Services, Inc.; Former Assistant Vice President, Evergreen |
| DOB: 12/12/1970 | | Investment Services, Inc. |
| Term of office since: 2005 | | |
|
| Michael H. Koonce4 | | Principal occupations: Senior Vice President and General Counsel, Evergreen Investment |
| Secretary | | Services, Inc.; Secretary, Senior Vice President and General Counsel, Evergreen Investment |
| DOB: 4/20/1960 | | Management Company, LLC and Evergreen Service Company, LLC; Senior Vice President and |
| Term of office since: 2000 | | Assistant General Counsel, Wachovia Corporation |
|
| Robert Guerin4, 5 | | Principal occupations: Chief Compliance Officer, Evergreen Funds and Senior Vice President |
| Chief Compliance Officer | | of Evergreen Investments Co, Inc; Former Managing Director and Senior Compliance Officer, |
| DOB: 9/20/1965 | | Babson Capital Management LLC; Former Principal and Director, Compliance and Risk |
| Term of office since: 2007 | | Management, State Street Global Advisors; Former Vice President and Manager, Sales Practice |
| | | Compliance, Deutsche Asset Management. |
|
1 Each Trustee, except Ms. Norris, serves until a successor is duly elected or qualified or until his death, resignation, retirement or removal from office. As a new Trustee, Ms. Norris’ initial term ends June 30, 2009, at which time she may be re-elected by Trustees to serve until a successor is duly elected or qualified or until her death, resignation, retirement or removal from office by the Trustees. Each Trustee oversees 94 Evergreen funds. Correspondence for each Trustee may be sent to Evergreen Board of Trustees, P.O. Box 20083, Charlotte, NC 28202.
2 Mr. Wagoner is an “interested person” of the Fund because of his ownership of shares in Wachovia Corporation, the parent to the Fund’s investment advisor.
3 The address of the Officer is 401 S. Tryon Street, 20th Floor, Charlotte, NC 28288.
4 The address of the Officer is 200 Berkeley Street, Boston, MA 02116.
5 Mr. Guerin’s information is as of June 14, 2007, the effective date of his approval by the Board of Trustees as Chief Compliance Officer of the Evergreen funds.
Additional information about the Fund’s Board of Trustees and Officers can be found in the Statement of Additional Information (SAI) and is available upon request without charge by calling 800.343.2898.
41
566659 rv4 06/2007
Evergreen High Yield Bond Fund

| | | table of contents |
| 1 | | LETTER TO SHAREHOLDERS |
| 4 | | FUND AT A GLANCE |
| 5 | | PORTFOLIO MANAGER COMMENTARY |
| 6 | | ABOUT YOUR FUND’S EXPENSES |
| 7 | | FINANCIAL HIGHLIGHTS |
| 11 | | SCHEDULE OF INVESTMENTS |
| 21 | | STATEMENT OF ASSETS AND LIABILITIES |
| 22 | | STATEMENT OF OPERATIONS |
| 23 | | STATEMENTS OF CHANGES IN NET ASSETS |
| 24 | | NOTES TO FINANCIAL STATEMENTS |
| 32 | | REPORT OF INDEPENDENT REGISTERED PUBLIC ACCOUNTING FIRM |
| 36 | | TRUSTEES AND OFFICERS |
This annual report must be preceded or accompanied by a prospectus of the Evergreen fund contained herein. The prospectus contains more complete information, including fees and expenses, and should be read carefully before investing or sending money.
The fund will file its complete schedule of portfolio holdings with the SEC for the first and third quarters of each fiscal year on Form N-Q. The fund’s Form N-Q will be available on the SEC’s Web site at http://www.sec.gov. In addition, the fund’s Form N-Q may be reviewed and copied at the SEC’s Public Reference Room in Washington, D.C. Information on the operation of the Public Reference Room may be obtained by calling 800.SEC.0330.
A description of the fund’s proxy voting policies and procedures, as well as information regarding how the fund voted proxies relating to portfolio securities during the most recent 12-month period ended June 30, is available by visiting our Web site at EvergreenInvestments.com or by visiting the SEC’s Web site at http://www.sec.gov. The fund’s proxy voting policies and procedures are also available without charge, upon request, by calling 800.343.2898.
| | | | |
| Mutual Funds: | | | | |
| NOT FDIC INSURED | | MAY LOSE VALUE | | NOT BANK GUARANTEED |
Evergreen InvestmentsSM is a service mark of Evergreen Investment Management Company, LLC. Copyright 2007, Evergreen Investment Management Company, LLC.
Evergreen Investment Management Company, LLC is a subsidiary of Wachovia Corporation and is an affiliate of Wachovia Corporation’s other Broker Dealer subsidiaries.
Evergreen mutual funds are distributed by Evergreen Investment Services, Inc. 200 Berkeley Street, Boston, MA 02116
LETTER TO SHAREHOLDERS
June 2007

Dennis H. Ferro
President and Chief
Executive Officer
Dear Shareholder,
We are pleased to provide the annual report for Evergreen High Yield Bond Fund covering the twelvemonth period ended April 30, 2007.
The domestic fixed-income markets generated healthy results during the twelve-month period in an environment supported by persistent growth and the prospect of stable interest rates. While the economic expansion decelerated as the period progressed, continued gains in business profits helped support the performance of corporate debt securities, including lower-quality, higher-yielding bonds, which generally outperformed high-grade and investment-grade debt. The fiscal year began on a harsh note in the spring of 2006 amid rising inflationary concerns, accompanied by anxieties about the potential economic impacts of repeated interest rate hikes by the Federal Reserve Board (the “Fed”). However, the markets were calmed in both the summer and autumn by the combination of receding commodity prices and the Fed’s policy to leave short-term interest rates unchanged. Over the full twelve-month period, the yield curve flattened — the difference between short-term yields and long-term yields narrowed. In this environment, longer-maturity bonds, especially those with maturities of 20 to 30 years, tended to outperform the overall bond market.
Solid returns in both the nation’s equity and fixed-income markets came against a backdrop of persistent economic growth during most of the period. Gross Domestic Product grew by a rate of 3.3% over
1
LETTER TO SHAREHOLDERS continued
2006 then decelerated to an annualized rate of 1.3% in the first quarter of 2007. The slump in the housing industry was a major factor that contributed to the slowdown, which came in the face of strong employment, rising wages and gains in both personal consumption and business investment.
In this environment, the teams managing the higher-quality portfolios, including Evergreen Core Bond Fund, Evergreen U.S. Government Fund and Evergreen Institutional Mortgage Portfolio, assessed factors such as employment and inflationary trends, Fed policy, and interest-rate expectations in making their decisions. At the same time, the managers supervising Evergreen High Yield Bond Fund and Evergreen Select High Yield Bond Fund tended to position their more credit-sensitive portfolios relatively cautiously as the relative yield advantages of lower-quality corporate bonds appeared to tighten. The managers of Evergreen Diversified Bond Fund also sought opportunities in the high-yield market, while maintaining a healthy exposure to investment-grade securities. The managers of Evergreen Diversified Income Builder Fund, meanwhile, looked at broad interest-rate trends, opportunities in the credit markets, and the effects of currency fluctuations in making decisions on sector and industry allocations and individual security selections.
As always, we encourage investors to maintain diversified investment portfolios in pursuit of their long-term investment goals.
Please visit us at EvergreenInvestments.com for more information about our funds and other investment products available to you. Thank you for your continued support of Evergreen Investments.
Sincerely,

Dennis H. Ferro
President and Chief Executive Officer
Evergreen Investment Company, Inc.
2
LETTER TO SHAREHOLDERS continued
Name and Strategy Change:
• Effective September 1, 2007, the Fund will change its name to Evergreen High Income Fund.
• Also effective September 1, 2007, the Fund will make certain changes to its investment strategy. Specifically, the Fund will reduce the minimum allocation to below investment grade bonds from 80% to 65%. Additionally, the Fund will allow a maximum of 35% of its total assets in bonds rated investment grade (or unrated securities determined to be of comparable quality).
In conjunction with these changes, the first sentence of the strategy is revised to state that the Fund normally invests at least 65% of its assets in below investment grade bonds, debentures and other income-producing obligations, but may purchase securities of any rating. Also, a sentence will be added to the strategy to state that the Fund may invest up to 35% of its total assets in bonds rated investment grade (or unrated securities determined to be of comparable quality).
Special Notice to Shareholders:
Please visit our Web site at EvergreenInvestments.com for statements from President and Chief Executive Officer, Dennis Ferro, addressing NASD actions involving Evergreen Investment Services, Inc. (EIS), Evergreen’s mutual fund distributor or statements from Dennis Ferro and Chairman of the Board of the Evergreen funds, Michael S. Scofield, addressing SEC actions involving the Evergreen funds.
3
FUND AT A GLANCE
as of April 30, 2007
MANAGEMENT TEAM
Investment Advisor:
• Evergreen Investment Management Company, LLC
Sub-Advisor:
• Tattersall Advisory Group, Inc.
Portfolio Manager^:
• Andrew Cestone
CURRENT INVESTMENT STYLE
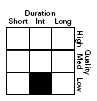
Source: Morningstar, Inc.
Morningstar’s style box is based on a portfolio date as of 3/31/2007.
The Fixed income style box placement is based on a fund’s average effective maturity or duration and the average credit rating of the bond portfolio.
^ Effective March 1, 2007, Mr. Cestone became a portfolio manager of the Fund. Effective July 2, 2007, Mr. Cestone will assume sole day-to-day management responsibility of the Fund.
PERFORMANCE AND RETURNS
Portfolio inception date: 9/11/1935
| | | Class A | | Class B | | Class C | | Class I |
| Class inception date | | 1/20/1998 | | 9/11/1935 | | 1/21/1998 | | 4/14/1998 |
|
| Nasdaq symbol | | EKHAX | | EKHBX | | EKHCX | | EKHYX |
|
| Average annual return* | | | | | | | | |
|
| 1-year with sales charge | | 4.96% | | 4.55% | | 8.55% | | N/A |
|
| 1-year w/o sales charge | | 10.35% | | 9.55% | | 9.55% | | 10.65% |
|
| 5-year | | 7.57% | | 7.53% | | 7.83% | | 8.91% |
|
| 10-year | | 5.79% | | 5.60% | | 5.60% | | 6.55% |
|
| Maximum sales charge | | 4.75% | | 5.00% | | 1.00% | | N/A |
| | | Front-end | | CDSC | | CDSC | | |
|
* Adjusted for maximum applicable sales charge, unless noted.
Past performance is no guarantee of future results. The performance quoted represents past performance and current performance may be lower or higher. The investment return and principal value of an investment will fluctuate so that investors’ shares, when redeemed, may be worth more or less than their original cost. To obtain performance information current to the most recent month-end for Classes A, B, C or I, please go to EvergreenInvestments.com/fundperformance. The performance of each class may vary based on differences in loads, fees and expenses paid by the shareholders investing in each class. Performance includes the reinvestment of income dividends and capital gain distributions. Performance shown does not reflect the deduction of taxes that a shareholder would pay on fund distributions or the redemption of fund shares.
Historical performance shown for Classes A, C and I prior to their inception is based on the performance of Class B, the original class offered. The historical returns for Classes A and I have not been adjusted to reflect the effect of each class’ 12b-1 fee. These fees are 0.30% for Class A and 1.00% for Classes B and C. Class I does not pay a 12b-1 fee. If these fees had been reflected, returns for Classes A and I would have been higher.
The advisor is reimbursing a portion of the 12b-1 fee for Class A. Had the fee not been reimbursed, returns for Class A would have been lower. Returns reflect expense limits previously in effect for all classes, without which returns would have been lower.
LONG-TERM GROWTH
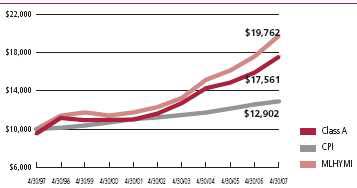
Comparison of a $10,000 investment in the Evergreen High Yield Bond Fund Class A shares versus a similar investment in the Merrill Lynch High Yield Master Index† (MLHYMI) and the Consumer Price Index (CPI).
The MLHYMI is an unmanaged market index and does not include transaction costs associated with buying and selling securities, any mutual fund fees or expenses or any taxes. The CPI is a commonly used measure of inflation and does not represent an investment return. It is not possible to invest directly in an index.
4
PORTFOLIO MANAGER COMMENTARY
The fund’s Class A shares returned 10.35% for the twelvemonth period ended April 30, 2007, excluding any applicable sales charges. During the same period, the MLHYMI† returned 12.25% .
The fund seeks high income.
The fund trailed its benchmark during the twelve-month period, mostly due to a relatively conservative portfolio positioning. High-yield corporate debt delivered solid results during the period, despite evidence that economic growth was beginning to decelerate. Growth in Gross Domestic Product, for example, slowed from more than 3% per year to about 2% as the decline in the housing market exerted a major braking influence on the economic expansion. Despite this deceleration, corporations continued to generate improving profits. With strong cash flows, high-yield issuers generally had solid balance sheets with relatively little debt. Defaults on high-yield bonds continued to decline to very low levels. In this favorable environment, the lower quality tiers of the high-yield market outperformed the higher-quality tiers. For example, CCC-rated securities produced an average return of 17.8% during the twelve-month period, while the higher-quality BB-B tier returned 11.4% .
Despite the supportive backdrop for high-yield investing, some potential causes for concern did appear on the horizon and led us to position the portfolio more cautiously. A relatively large supply of new high-yield bond issues appeared in the market and our analysis indicated that many of these new issues were of poorer quality than the existing bonds. In addition, corporations began to use proceeds from some of the newer issues for shareholder-friendly actions, such as to buy back stocks or to increase dividends, rather than to improve balance sheets. Moreover, after several years during which high-yield bonds had outperformed higher-quality fixed-income securities, the yield advantages, or spreads, of high-yield bonds over higher-quality bonds had tightened. This tightening indicated that investors were not receiving much additional compensation for taking on the additional credit risks of lower-quality holdings. Concerned about potentially rising risks, we tried to position the fund more defensively, and searched for lower-volatility bonds that were priced appropriately for their risks. For example, we increased our investments in bonds issued by cable communications companies, which were backed by solid assets and healthy cash flows and which we believed were reasonably priced. In contrast, we reduced our positions in gaming industry bonds, where we saw little value, and in steel industry bonds, where we believed heavy merger-and-acquisition activity had resulted in less reasonable valuations. We also cut back our investments in bonds issued by the theater industry, which faced increasing competition from alternative entertainment programming sources, including cable communications systems. While the fund’s average credit quality remained stable at B+, we paid close attention to the credit analysis of individual securities in an effort to ensure that fund holdings were priced appropriately for their risks. We believed that a more defensive positioning was appropriate for the changing environment. However, the focus on higher-quality high-yield bonds held back results during a period in which lower-quality bonds performed well.
In addition, our underweighted position in the automotive industry tended to detract from results, as bonds of General Motors Corp. and Ford Motor Co. both began to recover in value after they had performed poorly for quite a while. Also holding back results was our position in bonds of IMAX Corp., a leading producer of equipment and programming for large-screen movie theaters, which faced difficulty persuading theater operators to invest in its equipment. We sold our position in this company.
Our emphasis in bonds of electric generation companies helped relative performance. Producers of electric power generated strong cash flow in a period in which the nation’s plants were operating close to full capacity. In addition, consolidation within the industry lifted the prices of bonds. We did not own any bonds of TXU Corp., the Texas-based power producer that announced its intention to be acquired by a private investment fund. However, the announcement of this pending deal lifted the bond prices of several other energy producers that we did own, including Mirant Corp., Dynegy, Inc. and Reliant Energy, Inc. Our position in bonds issued by American Axle & Manufacturing Holdings, Inc. also helped performance, as this auto parts producer performed well during a period in which many other auto parts companies struggled.
Class I shares are only offered in the following manner: (1) to investment advisory clients of Evergreen Investment Management Company, LLC (or its advisory affiliates) when purchased by such advisor(s) on behalf of its clients, (2) through arrangements entered into on behalf of the Evergreen funds with certain financial services firms, (3) to certain institutional investors and (4) to persons who owned Class Y shares in registered name in an Evergreen fund on or before December 31, 1994 or who owned shares of any SouthTrust fund in registered name as of March 18, 2005 or shares of Vestaur Securities Fund as of May 20, 2005.
Class I shares are only available to institutional shareholders with a minimum of $1 million investment, which may be waived in certain situations.
The fund’s investment objective may be changed without a vote of the fund’s shareholders.
Foreign investments may contain more risk due to the inherent risks associated with changing political climates, foreign market instability and foreign currency fluctuations.
Derivatives involve additional risks including interest rate risk, credit risk, the risk of improper valuation and the risk of non-correlation to the relevant instruments they are designed to hedge or to closely track.
High yield, lower-rated bonds may contain more risk due to the increased possibility of default.
The return of principal is not guaranteed due to fluctuation in the fund’s NAV caused by changes in the price of individual bonds held by the fund and the buying and selling of bonds by the fund. Bond funds have the same inflation, interest rate and credit risks as individual bonds. Generally, the value of bond funds rise when prevailing interest rates fall, and fall when interest rates rise.
† Copyright 2007. Merrill Lynch, Pierce, Fenner & Smith Incorporated. All rights reserved.
All data is as of April 30, 2007, and subject to change.
5
ABOUT YOUR FUND’S EXPENSES
The Example below is intended to describe the fees and expenses borne by shareholders and the impact of those costs on your investment.
Example
As a shareholder of the fund, you incur two types of costs: (1) transaction costs, including sales charges (loads), redemption fees and exchange fees; and (2) ongoing costs, including management fees, distribution (12b-1) fees and other fund expenses. This Example is intended to help you understand your ongoing costs (in dollars) of investing in the fund and to compare these costs with the ongoing costs of investing in other mutual funds. The Example is based on an investment of $1,000 invested at the beginning of the period and held for the entire period from November 1, 2006 to April 30, 2007.
The example illustrates your fund’s costs in two ways:
• Actual expenses
The section in the table under the heading “Actual” provides information about actual account values and actual expenses. You may use the information in these columns, together with the amount you invested, to estimate the expenses that you paid over the period. Simply divide your account value by $1,000 (for example, an $8,600 account value divided by $1,000 = 8.6), then multiply the result by the number in the appropriate column for your share class, in the column entitled “Expenses Paid During Period” to estimate the expenses you paid on your account during this period.
• Hypothetical example for comparison purposes
The section in the table under the heading “Hypothetical (5% return before expenses)” provides information about hypothetical account values and hypothetical expenses based on the fund’s actual expense ratio and an assumed rate of return of 5% per year before expenses, which is not the fund’s actual return. The hypothetical account values and expenses may not be used to estimate the actual ending account balance or expenses you paid for the period. You may use this information to compare the ongoing costs of investing in the fund and other funds. To do so, compare this 5% hypothetical example with the 5% hypothetical examples that appear in the shareholder reports of the other funds.
Please note that the expenses shown in the table are meant to highlight your ongoing costs only and do not reflect any transactional costs, such as sales charges (loads), redemption fees or exchange fees. Therefore, the section in the table under the heading “Hypothetical (5% return before expenses)” is useful in comparing ongoing costs only, and will not help you determine the relative total costs of owning different funds. In addition, if these transactional costs were included, your costs would have been higher.
| | | Beginning | | Ending | | |
| | | Account | | Account | | Expenses |
| | | Value | | Value | | Paid During |
| | | 11/1/2006 | | 4/30/2007 | | Period* |
|
| Actual | | | | | | |
| Class A | | $ 1,000.00 | | $ 1,067.61 | | $ 5.43 |
| Class B | | $ 1,000.00 | | $ 1,063.73 | | $ 9.26 |
| Class C | | $ 1,000.00 | | $ 1,063.73 | | $ 9.26 |
| Class I | | $ 1,000.00 | | $ 1,068.97 | | $ 4.10 |
| Hypothetical | | | | | | |
| (5% return | | | | | | |
| before expenses) | | | | | | |
| Class A | | $ 1,000.00 | | $ 1,019.54 | | $ 5.31 |
| Class B | | $ 1,000.00 | | $ 1,015.82 | | $ 9.05 |
| Class C | | $ 1,000.00 | | $ 1,015.82 | | $ 9.05 |
| Class I | | $ 1,000.00 | | $ 1,020.83 | | $ 4.01 |
|
* For each class of the Fund, expenses are equal to the annualized expense ratio of each class (1.06% for Class A, 1.81% for Class B, 1.81% for Class C and 0.80% for Class I), multiplied by the average account value over the period, multiplied by 181 / 365 days.
6
FINANCIAL HIGHLIGHTS
(For a share outstanding throughout each period)
| | | Year Ended April 30, |
| |
|
| CLASS A | | 2007 | | 2006 | | | | 2005 | | 2004 | | 2003 |
|
| Net asset value, beginning of period | | $ 3.31 | | $ 3.32 | | $ 3.43 | | $ 3.30 | | $ 3.29 |
|
| Income from investment operations | | | | | | | | | | | | |
| Net investment income (loss) | | 0.241 | | 0.23 | | | | 0.24 | | 0.25 | | 0.271 |
Net realized and unrealized gains
or losses on investments | | 0.09 | | 0 | | | | (0.10) | | 0.14 | | 0.01 |
| |
|
| Total from investment operations | | 0.33 | | 0.23 | | | | 0.14 | | 0.39 | | 0.28 |
|
| Distributions to shareholders from | | | | | | | | | | | | |
| Net investment income | | (0.24) | | (0.24) | | | | (0.25) | | (0.26) | | (0.27) |
|
| Net asset value, end of period | | $ 3.40 | | $ 3.31 | | $ 3.32 | | $ 3.43 | | $ 3.30 |
|
| Total return2 | | 10.35% | | 7.01% | | | | 4.14% | | 12.25% | | 9.42% |
|
| Ratios and supplemental data | | | | | | | | | | | | |
| Net assets, end of period (thousands) | | $335,411 | | $388,523 | | $467,714 | | $530,526 | | $484,346 |
| Ratios to average net assets | | | | | | | | | | | | |
| Expenses including waivers/reimbursements | | | | | | | | | | | | |
| but excluding expense reductions | | 1.06% | | 1.04% | | | | 1.04% | | 1.01% | | 1.11% |
| Expenses excluding waivers/reimbursements | | | | | | | | | | | | |
| and expense reductions | | 1.10% | | 1.05% | | | | 1.04% | | 1.02% | | 1.11% |
| Net investment income (loss) | | 7.19% | | 6.95% | | | | 7.16% | | 7.42% | | 8.70% |
| Portfolio turnover rate | | 48% | | 67% | | | | 65% | | 71% | | 80% |
|
1 Net investment income (loss) per share is based on average shares outstanding during the period.
2 Excluding applicable sales charges
See Notes to Financial Statements
7
FINANCIAL HIGHLIGHTS
(For a share outstanding throughout each period)
| | | Year Ended April 30, |
| |
|
| CLASS B | | 2007 | | 2006 | | | | 2005 | | 2004 | | 2003 |
|
| Net asset value, beginning of period | | $ 3.31 | | $ 3.32 | | $ 3.43 | | $ 3.30 | | $ 3.29 |
|
| Income from investment operations | | | | | | | | | | | | |
| Net investment income (loss) | | 0.211 | | 0.211 | | | | 0.22 | | 0.231 | | 0.251 |
Net realized and unrealized gains
or losses on investments | | 0.09 | | (0.01)2 | | | | (0.10) | | 0.14 | | 0.01 |
| |
|
| Total from investment operations | | 0.30 | | 0.20 | | | | 0.12 | | 0.37 | | 0.26 |
|
| Distributions to shareholders from | | | | | | | | | | | | |
| Net investment income | | (0.21) | | (0.21) | | | | (0.23) | | (0.24) | | (0.25) |
|
| Net asset value, end of period | | $ 3.40 | | $ 3.31 | | $ 3.32 | | $ 3.43 | | $ 3.30 |
|
| Total return3 | | 9.55% | | 6.27% | | | | 3.42% | | 11.46% | | 8.61% |
|
| Ratios and supplemental data | | | | | | | | | | | | |
| Net assets, end of period (thousands) | | $150,609 | | $176,663 | | $211,950 | | $247,741 | | $173,002 |
| Ratios to average net assets | | | | | | | | | | | | |
| Expenses including waivers/reimbursements | | |
| but excluding expense reductions | | 1.80% | | 1.75% | | | | 1.74% | | 1.72% | | 1.84% |
| Expenses excluding waivers/reimbursements | | |
| and expense reductions | | 1.80% | | 1.75% | | | | 1.74% | | 1.72% | | 1.84% |
| Net investment income (loss) | | 6.46% | | 6.25% | | | | 6.46% | | 6.71% | | 7.99% |
| Portfolio turnover rate | | 48% | | 67% | | | | 65% | | 71% | | 80% |
|
1 Net investment income (loss) per share is based on average shares outstanding during the period.
2 The per share net realized and unrealized gains or losses is not in accord with the net realized and unrealized gains or losses for the period due to the timing of sales and redemptions of Fund shares in relation to fluctuating market values for the portfolio .
3 Excluding applicable sales charges
See Notes to Financial Statements
8
FINANCIAL HIGHLIGHTS
(For a share outstanding throughout each period)
| | | Year Ended April 30, |
| |
|
| CLASS C | | 2007 | | 2006 | | 2005 | | 2004 | | 2003 |
|
| Net asset value, beginning of period | | $ 3.31 | | $ 3.32 | | $ 3.43 | | $ 3.30 | | $ 3.29 |
|
| Income from investment operations | | | | | | | | | | | | |
| Net investment income (loss) | | 0.211 | | 0.21 | | | | 0.22 | | 0.23 | | 0.251 |
Net realized and unrealized gains
or losses on investments | | 0.09 | | (0.01)2 | | | | (0.10) | | 0.14 | | 0.01 |
| |
|
| Total from investment operations | | 0.30 | | 0.20 | | | | 0.12 | | 0.37 | | 0.26 |
|
| Distributions to shareholders from | | | | | | | | | | | | |
| Net investment income | | (0.21) | | (0.21) | | | | (0.23) | | (0.24) | | (0.25) |
|
| Net asset value, end of period | | $ 3.40 | | $ 3.31 | | $ 3.32 | | $ 3.43 | | $ 3.30 |
|
| Total return3 | | 9.55% | | 6.27% | | | | 3.42% | | 11.46% | | 8.61% |
|
| Ratios and supplemental data | | | | | | | | | | | | |
| Net assets, end of period (thousands) | | $161,941 | | $201,975 | | $281,810 | | $381,525 | | $290,914 |
| Ratios to average net assets | | | | | | | | | | | | |
| Expenses including waivers/reimbursements | | |
| but excluding expense reductions | | 1.80% | | 1.75% | | | | 1.74% | | 1.72% | | 1.85% |
| Expenses excluding waivers/reimbursements | | |
| and expense reductions | | 1.80% | | 1.75% | | | | 1.74% | | 1.72% | | 1.85% |
| Net investment income (loss) | | 6.46% | | 6.25% | | | | 6.47% | | 6.72% | | 7.98% |
| Portfolio turnover rate | | 48% | | 67% | | | | 65% | | 71% | | 80% |
|
1 Net investment income (loss) per share is based on average shares outstanding during the period.
2 The per share net realized and unrealized gains or losses is not in accord with the net realized and unrealized gains or losses for the period due to the timing of sales and redemptions of Fund shares in relation to fluctuating market values for the portfolio .
3 Excluding applicable sales charges
See Notes to Financial Statements
9
FINANCIAL HIGHLIGHTS
(For a share outstanding throughout each period)
| | | Year Ended April 30, |
| |
|
| CLASS I | | 2007 | | 2006 | | 2005 | | 2004 | | 2003 |
|
| Net asset value, beginning of period | | $ 3.31 | | $ 3.32 | | $ 3.43 | | $ 3.30 | | $ 3.29 |
|
| Income from investment operations | | | | | | | | | | | | |
| Net investment income (loss) | | 0.251 | | 0.24 | | | | 0.26 | | 0.26 | | 0.281 |
Net realized and unrealized gains or losses
on investments | | 0.09 | | 0 | | | | (0.11) | | 0.14 | | 0.01 |
| |
|
| Total from investment operations | | 0.34 | | 0.24 | | | | 0.15 | | 0.40 | | 0.29 |
|
| Distributions to shareholders from | | | | | | | | | | | | |
| Net investment income | | (0.25) | | (0.25) | | | | (0.26) | | (0.27) | | (0.28) |
|
| Net asset value, end of period | | $ 3.40 | | $ 3.31 | | $ 3.32 | | $ 3.43 | | $ 3.30 |
|
| Total return | | 10.65% | | 7.33% | | | | 4.45% | | 12.58% | | 9.69% |
|
| Ratios and supplemental data | | | | | | | | | | | | |
| Net assets, end of period (thousands) | | $27,147 | | $50,365 | | $60,412 | | $37,894 | | $49,370 |
| Ratios to average net assets | | | | | | | | | | | | |
| Expenses including waivers/reimbursements | | |
| but excluding expense reductions | | 0.80% | | 0.75% | | | | 0.74% | | 0.72% | | 0.84% |
| Expenses excluding waivers/reimbursements | | |
| and expense reductions | | 0.80% | | 0.75% | | | | 0.74% | | 0.72% | | 0.84% |
| Net investment income (loss) | | 7.42% | | 7.23% | | | | 7.46% | | 7.73% | | 9.05% |
| Portfolio turnover rate | | 48% | | 67% | | | | 65% | | 71% | | 80% |
|
1 Net investment income (loss) per share is based on average shares outstanding during the period.
See Notes to Financial Statements
10
SCHEDULE OF INVESTMENTS
April 30, 2007
| | | Principal | | | | |
| | | Amount | | | | Value |
|
| |
| CORPORATE BONDS 87.8% | | | | | | |
| CONSUMER DISCRETIONARY 22.2% | | | | | | |
| Auto Components 1.4% | | | | | | |
| American Axle & Manufacturing Holdings, Inc., 5.25%, 02/11/2014 (p) | | $ 3,425,000 | | $ | | 3,086,781 |
| ArvinMeritor, Inc., 6.80%, 02/15/2009 | | 543,000 | | | | 541,643 |
| Goodyear Tire & Rubber Co.: | | | | | | |
| 9.00%, 07/01/2015 (p) | | 2,000,000 | | | | 2,215,000 |
| 11.25%, 03/01/2011 (p) | | 980,000 | | | | 1,075,550 |
| Metaldyne Corp., 11.00%, 06/15/2012 (p) | | 2,393,000 | | | | 2,369,070 |
| |
|
| | | | | | | 9,288,044 |
| |
|
| Automobiles 1.4% | | | | | | |
| Ford Motor Co.: | | | | | | |
| 5.80%, 01/12/2009 | | 1,225,000 | | | | 1,205,045 |
| 7.45%, 07/16/2031 (p) | | 3,000,000 | | | | 2,388,750 |
| 7.875%, 06/15/2010 | | 2,770,000 | | | | 2,787,312 |
| General Motors Corp., 8.375%, 07/15/2033 (p) | | 3,000,000 | | | | 2,726,250 |
| |
|
| | | | | | | 9,107,357 |
| |
|
| Diversified Consumer Services 0.4% | | | | | | |
| Education Management, LLC, 8.75%, 06/01/2014 | | 2,100,000 | | | | 2,231,250 |
| Service Corporation International, 6.75%, 04/01/2015 144A | | 785,000 | | | | 796,775 |
| |
|
| | | | | | | 3,028,025 |
| |
|
| Hotels, Restaurants & Leisure 4.2% | | | | | | |
| Inn of the Mountain Gods Resort & Casino, 12.00%, 11/15/2010 | | 7,000,000 | | | | 7,656,250 |
| Isle of Capri Casinos, Inc., 7.00%, 03/01/2014 | | 5,860,000 | | | | 5,801,400 |
| Mandalay Resort Group, Ser. B, 10.25%, 08/01/2007 | | 6,000,000 | | | | 6,090,000 |
| MGM MIRAGE, 5.875%, 02/27/2014 | | 335,000 | | | | 316,156 |
| Outback Steakhouse, Inc., 9.625%, 05/15/2015 144A | | 732,000 | | | | 756,705 |
| Pokagon Gaming Authority, 10.375%, 06/15/2014 144A | | 3,800,000 | | | | 4,275,000 |
| Seneca Gaming Corp., 7.25%, 05/01/2012 | | 550,000 | | | | 562,375 |
| Trump Entertainment Resorts, Inc., 8.50%, 06/01/2015 | | 2,800,270 | | | | 2,831,773 |
| |
|
| | | | | | | 28,289,659 |
| |
|
| Household Durables 0.7% | | | | | | |
| Libbey, Inc., FRN, 12.35%, 06/01/2011 | | 4,000,000 | | | | 4,420,000 |
| |
|
| Leisure Equipment & Products 0.0% | | | | | | |
| Remington Arms Company, Inc., 10.50%, 02/01/2011 (p) | | 235,000 | | | | 244,400 |
| |
|
| Media 9.3% | | | | | | |
| Cablevision Systems Corp., Ser. B, 8.00%, 04/15/2012 | | 5,265,000 | | | | 5,422,950 |
| CCH I, LLC: | | | | | | |
| 11.00%, 10/01/2015 (p) | | 5,800,000 | | | | 6,188,750 |
| 13.50%, 01/15/2014 (p) | | 1,000,000 | | | | 1,022,500 |
| CCH II Capital Corp., 10.25%, 09/15/2010 | | 8,250,000 | | | | 8,827,500 |
| Dex Media East, LLC, 9.875%, 11/15/2009 | | 6,000,000 | | | | 6,277,500 |
| Lamar Media Corp., 6.625%, 08/15/2015 (p) | | 8,675,000 | | | | 8,653,312 |
| Mediacom Broadband, LLC, 8.50%, 10/15/2015 144A | | 3,000,000 | | | | 3,135,000 |
| Mediacom Communications Corp., 9.50%, 01/15/2013 (p) | | 11,250,000 | | | | 11,643,750 |
See Notes to Financial Statements
11
SCHEDULE OF INVESTMENTS continued
April 30, 2007
| | | | | Principal | | | | |
| | | | | Amount | | | | Value |
|
| |
| CORPORATE BONDS continued | | | | | | | | |
| CONSUMER DISCRETIONARY continued | | | | | | | | |
| Media continued | | | | | | | | |
| Paxson Communications Corp., FRN, 11.61%, 01/15/2013 144A | | $ | | 5,500,000 | | $ | | 5,747,500 |
| Sirius Satellite Radio, Inc., 9.625%, 08/01/2013 | | | | 1,300,000 | | | | 1,306,500 |
| XM Satellite Radio Holdings, Inc., Class A, 9.75%, 05/01/2014 (p) | | | | 1,455,000 | | | | 1,465,913 |
| Young Broadcasting, Inc., Class A, 8.75%, 01/15/2014 | | | | 3,110,000 | | | | 3,047,800 |
| |
|
| | | | | | | | | 62,738,975 |
| |
|
| Multi-line Retail 0.6% | | | | | | | | |
| Neiman Marcus Group, Inc., 9.00%, 10/15/2015 | | | | 3,500,000 | | | | 3,876,250 |
| |
|
| Specialty Retail 2.1% | | | | | | | | |
| Baker & Taylor, Inc., 11.50%, 07/01/2013 144A | | | | 4,500,000 | | | | 4,770,000 |
| Michaels Stores, Inc., 10.00%, 11/01/2014 144A (p) | | | | 2,500,000 | | | | 2,740,625 |
| Payless ShoeSource, Inc., 8.25%, 08/01/2013 | | | | 6,500,000 | | | | 6,873,750 |
| |
|
| | | | | | | | | 14,384,375 |
| |
|
| Textiles, Apparel & Luxury Goods 2.1% | | | | | | | | |
| Levi Strauss & Co., 9.75%, 01/15/2015 | | | | 3,650,000 | | | | 4,024,125 |
| Oxford Industries, Inc., 8.875%, 06/01/2011 | | | | 4,000,000 | | | | 4,170,000 |
| Unifi, Inc., 11.50%, 05/15/2014 | | | | 2,773,000 | | | | 2,800,730 |
| Warnaco Group, Inc., 8.875%, 06/15/2013 | | | | 3,000,000 | | | | 3,206,250 |
| |
|
| | | | | | | | | 14,201,105 |
| |
|
| ENERGY 13.3% | | | | | | | | |
| Energy Equipment & Services 3.4% | | | | | | | | |
| Dresser-Rand Group, Inc., 7.375%, 11/01/2014 | | | | 4,154,000 | | | | 4,257,850 |
| GulfMark Offshore, Inc., 7.75%, 07/15/2014 | | | | 3,025,000 | | | | 3,108,188 |
| Hornbeck Offshore Services, Inc., Ser. B, 6.125%, 12/01/2014 | | | | 5,575,000 | | | | 5,393,812 |
| Parker Drilling Co., 9.625%, 10/01/2013 | | | | 2,830,000 | | | | 3,084,700 |
| PHI, Inc., 7.125%, 04/15/2013 | | | | 7,000,000 | | | | 6,877,500 |
| |
|
| | | | | | | | | 22,722,050 |
| |
|
| Oil, Gas & Consumable Fuels 9.9% | | | | | | | | |
| Chesapeake Energy Corp., 6.875%, 01/15/2016 (p) | | | | 5,245,000 | | | | 5,363,012 |
| Cimarex Energy Co., 7.125%, 05/01/2017 # | | | | 600,000 | | | | 609,000 |
| Clayton Williams Energy, Inc., 7.75%, 08/01/2013 (p) | | | | 2,800,000 | | | | 2,660,000 |
| Delta Petroleum Corp., 7.00%, 04/01/2015 | | | | 1,405,000 | | | | 1,285,575 |
| El Paso Corp., 7.75%, 06/01/2013 | | | | 7,755,000 | | | | 8,203,371 |
| Encore Acquisition Co., 6.25%, 04/15/2014 (p) | | | | 9,250,000 | | | | 8,671,875 |
| Energy Partners, Ltd.: | | | | | | | | |
| 9.75%, 04/15/2014 144A | | | | 705,000 | | | | 720,862 |
| 10.48%, 04/15/2013 144A | | | | 235,000 | | | | 239,994 |
| Exco Resources, Inc., 7.25%, 01/15/2011 | | | | 8,650,000 | | | | 8,714,875 |
| Mariner Energy, Inc., 8.00%, 05/15/2017 | | | | 622,000 | | | | 628,998 |
| Overseas Shipholding Group, Inc., 8.25%, 03/15/2013 | | | | 4,400,000 | | | | 4,642,000 |
| Peabody Energy Corp.: | | | | | | | | |
| 5.875%, 04/15/2016 (p) | | | | 4,275,000 | | | | 4,114,687 |
| 6.875%, 03/15/2013 (p) | | | | 2,380,000 | | | | 2,421,650 |
See Notes to Financial Statements
12
SCHEDULE OF INVESTMENTS continued
April 30, 2007
| | | Principal | | | | |
| | | Amount | | | | Value |
|
| |
| CORPORATE BONDS continued | | | | | | |
| ENERGY continued | | | | | | |
| Oil, Gas & Consumable Fuels continued | | | | | | |
| Regency Energy Partners, LP, 8.375%, 12/15/2013 144A | | $ 1,500,000 | | $ | | 1,552,500 |
| Sabine Pass LNG, LP, 7.25%, 11/30/2013 144A | | 4,525,000 | | | | 4,638,125 |
| Targa Resources, Inc., 8.50%, 11/01/2013 144A | | 4,500,000 | | | | 4,657,500 |
| Williams Cos., Inc., 8.125%, 03/15/2012 | | 7,250,000 | | | | 7,938,750 |
| |
|
| | | | | | | 67,062,774 |
| |
|
| FINANCIALS 8.5% | | | | | | |
| Consumer Finance 5.4% | | | | | | |
| Ford Motor Credit Co.: | | | | | | |
| 5.70%, 01/15/2010 | | 3,350,000 | | | | 3,230,345 |
| 7.375%, 10/28/2009 | | 1,110,000 | | | | 1,111,481 |
| General Motors Acceptance Corp., 6.875%, 08/28/2012 | | 11,275,000 | | | | 11,279,487 |
| NXP Funding, LLC, 7.875%, 10/15/2014 144A | | 5,500,000 | | | | 5,747,500 |
| Qwest Capital Funding, Inc., 6.50%, 11/15/2018 | | 10,500,000 | | | | 10,080,000 |
| UGS Capital Corp. II, FRN, 10.35%, 06/01/2011 144A | | 4,989,685 | | | | 5,164,324 |
| |
|
| | | | | | | 36,613,137 |
| |
|
| Insurance 0.4% | | | | | | |
| Crum & Forster Holdings Corp., 7.75%, 05/01/2017 144A # | | 2,405,000 | | | | 2,429,050 |
| |
|
| Real Estate Investment Trusts 2.7% | | | | | | |
| Host Marriott Corp., Ser. J, 7.125%, 11/01/2013 | | 4,000,000 | | | | 4,140,000 |
| Omega Healthcare Investors, Inc.: | | | | | | |
| 7.00%, 04/01/2014 | | 4,450,000 | | | | 4,533,437 |
| 7.00%, 01/15/2016 | | 3,850,000 | | | | 3,912,563 |
| Thornburg Mortgage, Inc., 8.00%, 05/15/2013 | | 5,355,000 | | | | 5,355,000 |
| |
|
| | | | | | | 17,941,000 |
| |
|
| HEALTH CARE 2.4% | | | | | | |
| Health Care Providers & Services 2.4% | | | | | | |
| Community Health Systems, Inc., 6.50%, 12/15/2012 | | 980,000 | | | | 1,017,975 |
| HCA, Inc.: | | | | | | |
| 6.375%, 01/15/2015 | | 1,900,000 | | | | 1,660,125 |
| 9.25%, 11/15/2016 144A | | 7,350,000 | | | | 8,029,875 |
| HealthSouth Corp., 10.75%, 06/15/2016 144A (p) | | 2,000,000 | | | | 2,190,000 |
| Sun Healthcare Group, Inc., 9.125%, 04/15/2015 144A | | 930,000 | | | | 971,850 |
| Triad Hospitals, Inc., 7.00%, 05/15/2012 | | 2,345,000 | | | | 2,450,525 |
| |
|
| | | | | | | 16,320,350 |
| |
|
| INDUSTRIALS 8.8% | | | | | | |
| Aerospace & Defense 0.9% | | | | | | |
| DRS Technologies, Inc., 7.625%, 02/01/2018 | | 5,000,000 | | | | 5,262,500 |
| Hawker Beechcraft Acquisition Corp.: | | | | | | |
| 8.50%, 04/01/2015 144A | | 615,000 | | | | 650,363 |
| 9.75%, 04/01/2017 144A (p) | | 465,000 | | | | 499,875 |
| |
|
| | | | | | | 6,412,738 |
| |
|
See Notes to Financial Statements
13
SCHEDULE OF INVESTMENTS continued
April 30, 2007
| | | Principal | | | | |
| | | Amount | | | | Value |
|
| |
| CORPORATE BONDS continued | | | | | | |
| INDUSTRIALS continued | | | | | | |
| Airlines 0.5% | | | | | | |
| Delta Air Lines, Inc.: | | | | | | |
| 7.90%, 12/15/2009 (p) • | | $ 2,340,000 | | $ | | 1,234,350 |
| 8.30%, 12/15/2029 (p) • | | 3,460,000 | | | | 1,833,800 |
| |
|
| | | | | | | 3,068,150 |
| |
|
| Commercial Services & Supplies 1.5% | | | | | | |
| Allied Waste Industries, Inc., 9.25%, 05/01/2021 | | 2,350,000 | | | | 2,593,812 |
| ARAMARK Corp., 8.50%, 02/01/2015 144A (p) | | 2,400,000 | | | | 2,523,000 |
| Mobile Mini, Inc., 6.875%, 05/01/2015 144A # | | 1,000,000 | | | | 1,005,000 |
| West Corp., 11.00%, 10/15/2016 144A (p) | | 3,750,000 | | | | 4,096,875 |
| |
|
| | | | | | | 10,218,687 |
| |
|
| Machinery 2.3% | | | | | | |
| Case New Holland, Inc., 9.25%, 08/01/2011 | | 2,650,000 | | | | 2,799,062 |
| Commercial Vehicle Group, Inc., 8.00%, 07/01/2013 | | 5,120,000 | | | | 5,248,000 |
| RBS Global, Inc.: | | | | | | |
| 9.50%, 08/01/2014 | | 4,750,000 | | | | 5,106,250 |
| 11.75%, 08/01/2016 (p) | | 1,900,000 | | | | 2,118,500 |
| |
|
| | | | | | | 15,271,812 |
| |
|
| Marine 0.7% | | | | | | |
| Horizon Lines, LLC, Sr. Disc. Note, Step Bond, 0.00%, 04/01/2013 † | | 5,303,000 | | | | 5,070,994 |
| |
|
| Road & Rail 1.4% | | | | | | |
| Avis Budget Car Rental, 7.75%, 05/15/2016 144A (p) | | 9,500,000 | | | | 9,737,500 |
| |
|
| Trading Companies & Distributors 1.5% | | | | | | |
| Ashtead Capital, Inc., 9.00%, 08/15/2016 144A | | 4,500,000 | | | | 4,860,000 |
| Rental Service Corp., 9.50%, 12/01/2014 144A (p) | | 3,170,000 | | | | 3,383,975 |
| United Rentals, Inc., 6.50%, 02/15/2012 | | 1,590,000 | | | | 1,613,850 |
| |
|
| | | | | | | 9,857,825 |
| |
|
| INFORMATION TECHNOLOGY 2.2% | | | | | | |
| IT Services 1.5% | | | | | | |
| ipayment, Inc., 9.75%, 05/15/2014 | | 2,200,000 | | | | 2,301,750 |
| SunGard Data Systems, Inc., 9.125%, 08/15/2013 | | 7,400,000 | | | | 7,973,500 |
| |
|
| | | | | | | 10,275,250 |
| |
|
| Software 0.7% | | | | | | |
| Activant Solutions, Inc., 9.50%, 05/01/2016 | | 3,800,000 | | | | 3,781,000 |
| Harland Clarke Holdings Corp., 9.50%, 05/15/2015 144A | | 976,000 | | | | 986,980 |
| |
|
| | | | | | | 4,767,980 |
| |
|
| MATERIALS 13.1% | | | | | | |
| Chemicals 5.6% | | | | | | |
| Huntsman International, LLC: | | | | | | |
| 7.375%, 01/01/2015 144A (p) | | 4,000,000 | | | | 4,160,000 |
| 11.50%, 07/15/2012 | | 6,105,000 | | | | 6,837,600 |
See Notes to Financial Statements
14
SCHEDULE OF INVESTMENTS continued
April 30, 2007
| | | Principal | | | | |
| | | Amount | | | | Value |
|
| |
| CORPORATE BONDS continued | | | | | | |
| MATERIALS continued | | | | | | |
| Chemicals continued | | | | | | |
| Lyondell Chemical Co., 10.50%, 06/01/2013 | | $ 8,850,000 | | $ | | 9,746,063 |
| MacDermid, Inc., 9.50%, 04/15/2017 144A | | 2,006,000 | | | | 2,091,255 |
| Millenium America, Inc., 7.625%, 11/15/2026 | | 960,000 | | | | 952,800 |
| Momentive Performance, Inc., 9.75%, 12/01/2014 144A (p) | | 2,030,000 | | | | 2,156,875 |
| Mosaic Co., 7.625%, 12/01/2016 144A | | 800,000 | | | | 858,000 |
| Omnova Solutions, Inc., 11.25%, 06/01/2010 | | 4,215,000 | | | | 4,483,706 |
| Tronox Worldwide, LLC, 9.50%, 12/01/2012 | | 6,150,000 | | | | 6,611,250 |
| |
|
| | | | | | | 37,897,549 |
| |
|
| Construction Materials 0.7% | | | | | | |
| CPG International, Inc., 10.50%, 07/01/2013 | | 2,555,000 | | | | 2,695,525 |
| Dayton Superior Corp., 13.00%, 06/15/2009 | | 1,800,000 | | | | 1,854,000 |
| |
|
| | | | | | | 4,549,525 |
| |
|
| Containers & Packaging 3.8% | | | | | | |
| Berry Plastics Holding Corp., 8.875%, 09/15/2014 (p) | | 2,950,000 | | | | 3,053,250 |
| Crown Americas, Inc., 7.75%, 11/15/2015 | | 8,000,000 | | | | 8,500,000 |
| Exopack Holding Corp., 11.25%, 02/01/2014 | | 1,585,000 | | | | 1,723,687 |
| Graham Packaging Co., 9.875%, 10/15/2014 (p) | | 1,170,000 | | | | 1,216,800 |
| Owens-Brockway Glass Containers, Inc., 6.75%, 12/01/2014 (p) | | 6,500,000 | | | | 6,573,125 |
| Smurfit-Stone Container Corp., 8.375%, 07/01/2012 | | 4,500,000 | | | | 4,595,625 |
| |
|
| | | | | | | 25,662,487 |
| |
|
| Metals & Mining 1.6% | | | | | | |
| Aleris International, Inc., 9.00%, 12/15/2014 144A | | 1,400,000 | | | | 1,492,750 |
| Freeport-McMoRan Copper & Gold, Inc.: | | | | | | |
| 6.875%, 02/01/2014 (p) | | 7,050,000 | | | | 7,305,562 |
| 8.25%, 04/01/2015 (p) | | 890,000 | | | | 964,538 |
| 8.375%, 04/01/2017 (p) | | 825,000 | | | | 904,406 |
| |
|
| | | | | | | 10,667,256 |
| |
|
| Paper & Forest Products 1.4% | | | | | | |
| Bowater, Inc., 6.50%, 06/15/2013 | | 2,095,000 | | | | 1,909,069 |
| P.H. Glatfelter, 7.125%, 05/01/2016 | | 2,955,000 | | | | 2,988,244 |
| Verso Paper Holdings, LLC, 11.375%, 08/01/2016 144A | | 4,617,000 | | | | 4,963,275 |
| |
|
| | | | | | | 9,860,588 |
| |
|
| TELECOMMUNICATION SERVICES 6.9% | | | | | | |
| Diversified Telecommunication Services 3.3% | | | | | | |
| Consolidated Communications, Inc., 9.75%, 04/01/2012 | | 4,579,000 | | | | 4,876,635 |
| Level 3 Communications, Inc.: | | | | | | |
| 5.875%, 01/15/2015 | | 4,625,000 | | | | 4,526,719 |
| 6.375%, 10/15/2015 | | 6,925,000 | | | | 6,925,000 |
| Qwest Communications International, Inc., 7.875%, 09/01/2011 | | 5,425,000 | | | | 5,804,750 |
| |
|
| | | | | | | 22,133,104 |
| |
|
See Notes to Financial Statements
15
SCHEDULE OF INVESTMENTS continued
April 30, 2007
| | | Principal | | | | |
| | | Amount | | | | Value |
|
| |
| CORPORATE BONDS continued | | | | | | |
| TELECOMMUNICATION SERVICES continued | | | | | | |
| Wireless Telecommunication Services 3.6% | | | | | | |
| Centennial Communications Corp.: | | | | | | |
| 8.125%, 02/01/2014 | | $ 4,750,000 | | $ | | 4,945,937 |
| 10.00%, 01/01/2013 | | 4,800,000 | | | | 5,220,000 |
| Cricket Communications, Inc., 9.375%, 11/01/2014 144A | | 3,500,000 | | | | 3,753,750 |
| Dobson Communications Corp., 8.875%, 10/01/2013 (p) | | 3,850,000 | | | | 3,989,563 |
| MetroPCS Wireless, Inc., 9.25%, 11/01/2014 144A | | 3,200,000 | | | | 3,432,000 |
| Rural Cellular Corp.: | | | | | | |
| 8.25%, 03/15/2012 (p) | | 1,170,000 | | | | 1,240,200 |
| 9.75%, 01/15/2010 (p) | | 1,870,000 | | | | 1,940,125 |
| |
|
| | | | | | | 24,521,575 |
| |
|
| UTILITIES 10.4% | | | | | | |
| Electric Utilities 6.4% | | | | | | |
| Allegheny Energy Supply Co., LLC, 8.25%, 04/15/2012 144A | | 3,335,000 | | | | 3,635,150 |
| Aquila, Inc., 14.875%, 07/01/2012 | | 725,000 | | | | 947,937 |
| CMS Energy Corp., 8.50%, 04/15/2011 | | 310,000 | | | | 339,838 |
| Mirant North America, LLC, 7.375%, 12/31/2013 (p) | | 6,575,000 | | | | 6,985,937 |
| Mission Energy Holding Co., 13.50%, 07/15/2008 | | 385,000 | | | | 422,538 |
| NRG Energy, Inc., 7.375%, 02/01/2016 | | 13,675,000 | | | | 14,239,094 |
| Orion Power Holdings, Inc., 12.00%, 05/01/2010 | | 5,100,000 | | | | 5,916,000 |
| Reliant Energy, Inc., 6.75%, 12/15/2014 | | 10,250,000 | | | | 10,788,125 |
| |
|
| | | | | | | 43,274,619 |
| |
|
| Gas Utilities 1.2% | | | | | | |
| SEMCO Energy, Inc.: | | | | | | |
| 7.125%, 05/15/2008 | | 3,500,000 | | | | 3,548,752 |
| 7.75%, 05/15/2013 | | 4,500,000 | | | | 4,681,651 |
| |
|
| | | | | | | 8,230,403 |
| |
|
| Independent Power Producers & Energy Traders 2.8% | | | | | | |
| AES Corp., 7.75%, 03/01/2014 | | 8,460,000 | | | | 8,988,750 |
| Dynegy, Inc., 8.375%, 05/01/2016 | | 7,250,000 | | | | 7,675,938 |
| Tenaska, Inc., 7.00%, 06/30/2021 144A (p) | | 2,046,688 | | | | 2,080,620 |
| |
|
| | | | | | | 18,745,308 |
| |
|
| Total Corporate Bonds (cost $571,351,385) | | | | | | 592,889,901 |
| |
|
| YANKEE OBLIGATIONS - CORPORATE 6.0% | | | | | | |
| ENERGY 0.4% | | | | | | |
| Oil, Gas & Consumable Fuels 0.4% | | | | | | |
| OPTI Canada, Inc., 8.25%, 12/15/2014 144A | | 2,400,000 | | | | 2,550,000 |
| |
|
| FINANCIALS 1.8% | | | | | | |
| Consumer Finance 0.6% | | | | | | |
| Virgin Media Finance plc, 9.125%, 08/15/2016 | | 3,800,000 | | | | 4,075,500 |
| |
|
See Notes to Financial Statements
16
SCHEDULE OF INVESTMENTS continued
April 30, 2007
| | | Principal | | | | |
| | | Amount | | | | Value |
|
| YANKEE OBLIGATIONS - CORPORATE continued | | | | | | |
| FINANCIALS continued | | | | | | |
| Diversified Financial Services 1.2% | | | | | | |
| Petroplus Financial, Ltd.: | | | | | | |
| 6.75%, 05/01/2014 144A # | | $ 1,180,000 | | $ | | 1,191,800 |
| 7.00%, 05/01/2017 144A # | | 785,000 | | | | 795,794 |
| Preferred Term Securities XII, Ltd., FRN, 10.00%, 12/24/2033 | | 720,000 | | | | 594,353 |
| Ship Finance International, Ltd., 8.50%, 12/15/2013 | | 4,915,000 | | | | 5,087,025 |
| |
|
| | | | | | | 7,668,972 |
| |
|
| INFORMATION TECHNOLOGY 0.3% | | | | | | |
| Semiconductors & Semiconductor Equipment 0.3% | | | | | | |
| Avago Technologies, Ltd., 10.125%, 12/01/2013 | | 790,000 | | | | 867,025 |
| Magnachip Semiconductor, 8.00%, 12/15/2014 | | 2,201,000 | | | | 1,419,645 |
| |
|
| | | | | | | 2,286,670 |
| |
|
| MATERIALS 1.1% | | | | | | |
| Metals & Mining 0.9% | | | | | | |
| Novelis, Inc., 7.25%, 02/15/2015 | | 5,940,000 | | | | 6,288,975 |
| |
|
| Paper & Forest Products 0.2% | | | | | | |
| Abitibi-Consolidated, Inc., 8.375%, 04/01/2015 (p) | | 1,485,000 | | | | 1,395,900 |
| |
|
| TELECOMMUNICATION SERVICES 2.4% | | | | | | |
| Diversified Telecommunication Services 0.8% | | | | | | |
| Nordic Telecom Holdings Co., 8.875%, 05/01/2016 144A | | 4,750,000 | | | | 5,130,000 |
| |
|
| Wireless Telecommunication Services 1.6% | | | | | | |
| Intelsat, Ltd.: | | | | | | |
| 9.25%, 06/15/2016 (p) | | 3,500,000 | | | | 3,867,500 |
| 11.25%, 06/15/2016 | | 2,600,000 | | | | 2,980,250 |
| Rogers Wireless, Inc., 9.625%, 05/01/2011 | | 3,475,000 | | | | 3,996,250 |
| |
|
| | | | | | | 10,844,000 |
| |
|
| Total Yankee Obligations - Corporate (cost $37,442,807) | | | | | | 40,240,017 |
| | |
|
|
| | | Shares | | | | Value |
|
| |
| COMMON STOCKS 0.8% | | | | | | |
| CONSUMER DISCRETIONARY 0.3% | | | | | | |
| Media 0.3% | | | | | | |
| Charter Communications, Inc., Class A * (p) | | 425,000 | | | | 1,283,500 |
| Comcast Corp., Class A * | | 26,250 | | | | 699,825 |
| |
|
| | | | | | | 1,983,325 |
| |
|
| MATERIALS 0.4% | | | | | | |
| Chemicals 0.3% | | | | | | |
| Huntsman Corp. + | | 88,065 | | | | 1,726,074 |
| |
|
| Containers & Packaging 0.1% | | | | | | |
| Smurfit-Stone Container Corp. * | | 65,000 | | | | 783,250 |
| |
|
See Notes to Financial Statements
17
SCHEDULE OF INVESTMENTS continued
April 30, 2007
| | | | | | | Shares | | | | Value |
|
| COMMON STOCKS continued | | | | | | | | |
| UTILITIES 0.1% | | | | | | | | | | |
| Electric Utilities 0.1% | | | | | | | | |
| Mirant Corp., * | | | | | | 22,431 | | $ | | 1,006,479 |
| |
|
| Total Common Stocks (cost $3,416,295) | | | | | | | | 5,499,128 |
| |
|
| WARRANTS 0.0% | | | | | | | | | | |
| CONSUMER DISCRETIONARY 0.0% | | | | | | | | |
| Media 0.0% | | | | | | | | | | |
| Metricom, Inc., Expiring 02/15/2010 * + (h) (cost $318,090) | | | | 1,500 | | | | 0 |
| | |
|
|
| | | | | | | Principal | | | | |
| | | | | | | Amount | | | | Value |
|
| DEBT OBLIGATIONS 1.3% | | | | | | | | |
| Blue Grass Energy Corp. Loan, FRN, 10.32%, 12/30/2013 | | | | $ 7,000,000 | | | | 7,122,080 |
| HealthSouth Corp. Loan, 7.86%, 01/16/2011 | | | | 1,985,000 | | | | 1,989,466 |
| |
|
| Total Debt Obligations (cost $8,991,699) | | | | | | | | 9,111,546 |
| |
|
| INVESTMENTS OF CASH COLLATERAL FROM SECURITIES LOANED 11.7% | | | | | | |
| COMMERCIAL PAPER 0.6% | | | | | | | | |
| Citigroup Funding, Inc., 5.33%, 05/09/2007 | | | | 3,946,231 | | | | 3,946,231 |
| |
|
| CORPORATE BONDS 0.7% | | | | | | | | |
| Commercial Banks 0.3% | | | | | | | | |
| First Tennessee Bank, 5.33%, 05/30/2008 | | | | 2,500,002 | | | | 2,500,002 |
| |
|
| Insurance 0.4% | | | | | | | | | | |
| Metropolitan Life Global Funding, 5.31%, 05/30/2008 | | | | 2,500,000 | | | | 2,500,000 |
| |
|
| | | | | | | | | | | 5,000,002 |
| |
|
| REPURCHASE AGREEMENTS ^ 7.6% | | | | | | | | |
| Banc of America Securities, LLC, 5.32%, dated 04/30/2007, maturing 05/01/2007, | | | | | | |
| maturity value $22,028,420 | | | | 22,025,165 | | | | 22,025,165 |
| Deutsche Bank Securities, Inc., 5.34%, dated 04/30/2007, maturing 05/01/2007, | | | | | | |
| maturity value $4,000,593 | | | | 4,000,000 | | | | 4,000,000 |
| Nomura Securities International, Inc., 5.25%, dated 04/30/2007, maturing | | | | | | | | |
| 05/01/2007, maturity value $25,003,646 | | | | 25,000,000 | | | | 25,000,000 |
| |
|
| | | | | | | | | | | 51,025,165 |
| |
|
| TIME DEPOSITS 1.7% | | | | | | | | |
| Dexia Credit Local de France, 5.34%, 07/05/2007 | | | | 2,000,000 | | | | 2,000,000 |
| Royal Bank of Canada, 5.29%, 05/29/2007 | | | | 4,000,000 | | | | 4,000,000 |
| SunTrust Banks, Inc., 5.33%, 07/30/2007 | | | | 2,500,000 | | | | 2,500,000 |
| Ulster Bank, Ltd., 5.34%, 08/07/2007 | | | | 3,000,000 | | | | 3,000,000 |
| |
|
| | | | | | | | | | | 11,500,000 |
| |
|
See Notes to Financial Statements
18
SCHEDULE OF INVESTMENTS continued
April 30, 2007
| | | Principal | | | | |
| | | Amount | | | | Value |
|
| INVESTMENTS OF CASH COLLATERAL FROM SECURITIES | | | | | | |
| LOANED continued | | | | | | |
| YANKEE OBLIGATIONS - CORPORATE 1.1% | | | | | | |
| Commercial Banks 1.1% | | | | | | |
| Canadian Imperial Bank, 5.33%, 08/15/2007 | | $ 4,500,000 | | $ | | 4,500,000 |
| Natexis Banques Populaires, 5.34%, 07/09/2007 | | 2,000,000 | | | | 2,000,000 |
| Societe Generale, 5.33%, 06/19/2007 | | 1,000,000 | | | | 1,000,000 |
| |
|
| | | | | | | 7,500,000 |
| |
|
| Total Investments of Cash Collateral from Securities Loaned | | | | | | |
| (cost $78,971,398) | | | | | | 78,971,398 |
| | |
|
|
| | | Shares | | | | Value |
|
| |
| SHORT-TERM INVESTMENTS 2.6% | | | | | | |
| MUTUAL FUND SHARES 2.6% | | | | | | |
| Evergreen Institutional Money Market Fund, Class I, 5.21% ## q ø | | | | | | |
| (cost $17,213,277) | | 17,213,277 | | | | 17,213,277 |
| |
|
| Total Investments (cost $717,704,951) 110.2% | | | | | | 743,925,267 |
| Other Assets and Liabilities (10.2%) | | | | | | (68,818,903) |
| |
|
| Net Assets 100.0% | | | | $ | | 675,106,364 |
| |
|
| (p) | | All or a portion of this security is on loan. |
| • | | Security which has defaulted on payment of interest and/or principal. The Fund has stopped accruing interest on this |
| | | security. |
| 144A | | Security that may be sold to qualified institutional buyers under Rule 144A of the Securities Act of 1933, as amended. |
| | | This security has been determined to be liquid under guidelines established by the Board of Trustees, unless otherwise |
| | | noted. |
| # | | When-issued or delayed delivery security |
| † | | Security initially issued in zero coupon form which converts to coupon form at a specified rate and date. An effective |
| | | interest rate is applied to recognize interest income daily for the bond.This rate is based on total expected interest to be |
| | | earned over the life of the bond which consists of the aggregate coupon-interest payments and discount at |
| | | acquisition.The rate shown is the stated rate at the current period end. |
| * | | Non-income producing security |
| + | | Security is deemed illiquid and is valued using market quotations when readily available, unless otherwise noted. |
| (h) | | Security is valued at fair value as determined by the investment advisor in good faith, according to procedures approved |
| | | by the Board of Trustees. |
| ^ | | Collateral is pooled with the collateral of other Evergreen funds and allocated on a pro-rata basis into 73 issues of high |
| | | grade short-term securities such that sufficient collateral is applied to the respective repurchase agreement. |
| ## | | All or a portion of this security has been segregated for when-issued or delayed delivery securities. |
| q | | Rate shown is the 7-day annualized yield at period end. |
| ø | | Evergreen Investment Management Company, LLC is the investment advisor to both the Fund and the money market |
| | | fund. |
| Summary of Abbreviations |
| FRN Floating Rate Note |
See Notes to Financial Statements
19
SCHEDULE OF INVESTMENTS continued
April 30, 2007
The following table shows the percent of total investments (excluding equity positions, collateral from securities on loan and segregated cash and cash equivalents) by credit quality based on Moody’s and Standard & Poor’s ratings as of April 30, 2007 (unaudited):
| AAA | | 2.5% |
| BBB | | 1.7% |
| BB | | 24.8% |
| B | | 55.7% |
| CCC | | 14.7% |
| NR | | 0.6% |
| |
|
| | | 100.0% |
| | |
|
The following table shows the percent of total investments (excluding equity positions, collateral from securities on loan and segregated cash and cash equivalents) based on effective maturity as of April 30, 2007 (unaudited):
| Less than 1 year | | 3.4% |
| 1 to 3 year(s) | | 3.3% |
| 3 to 5 years | | 13.9% |
| 5 to 10 years | | 74.4% |
| 10 to 20 years | | 3.9% |
| 20 to 30 years | | 1.1% |
| |
|
| | | 100.0% |
| | |
|
See Notes to Financial Statements
20
STATEMENT OF ASSETS AND LIABILITIES
April 30, 2007
| Assets | | | | |
| Investments in securities, at value (cost $700,491,674) including $76,661,410 of | | | | |
| securities loaned | | $ | | 726,711,990 |
| Investments in affiliated money market fund, at value (cost $17,213,277) | | | | 17,213,277 |
|
| Total investments | | | | 743,925,267 |
| Receivable for securities sold | | | | 18,396,248 |
| Receivable for Fund shares sold | | | | 460,195 |
| Interest receivable | | | | 15,053,901 |
| Receivable for securities lending income | | | | 18,004 |
| Prepaid expenses and other assets | | | | 123,289 |
|
| Total assets | | | | 777,976,904 |
|
| Liabilities | | | | |
| Dividends payable | | | | 1,469,534 |
| Payable for securities purchased | | | | 19,848,332 |
| Payable for Fund shares redeemed | | | | 2,422,109 |
| Payable for securities on loan | | | | 78,971,398 |
| Advisory fee payable | | | | 11,517 |
| Due to other related parties | | | | 4,678 |
| Accrued expenses and other liabilities | | | | 142,972 |
|
| Total liabilities | | | | 102,870,540 |
|
| Net assets | | $ | | 675,106,364 |
|
| Net assets represented by | | | | |
| Paid-in capital | | $ | | 790,065,932 |
| Overdistributed net investment income | | | | (955,531) |
| Accumulated net realized losses on investments | | | | (140,224,353) |
| Net unrealized gains on investments | | | | 26,220,316 |
|
| Total net assets | | $ | | 675,106,364 |
|
| Net assets consists of | | | | |
| Class A | | $ | | 335,410,579 |
| Class B | | | | 150,608,508 |
| Class C | | | | 161,940,513 |
| Class I | | | | 27,146,764 |
|
| Total net assets | | $ | | 675,106,364 |
|
| Shares outstanding (unlimited number of shares authorized) | | | | |
| Class A | | | | 98,599,783 |
| Class B | | | | 44,274,985 |
| Class C | | | | 47,607,393 |
| Class I | | | | 7,981,283 |
|
| Net asset value per share | | | | |
| Class A | | $ | | 3.40 |
| Class A — Offering price (based on sales charge of 4.75%) | | $ | | 3.57 |
| Class B | | $ | | 3.40 |
| Class C | | $ | | 3.40 |
| Class I | | $ | | 3.40 |
|
See Notes to Financial Statements
21
STATEMENT OF OPERATIONS
Year Ended April 30, 2007
| Investment income | | | | |
| Interest (net foreign withholding taxes of $1,164) | | $ | | 58,651,970 |
| Income from affiliate | | | | 1,170,822 |
| Securities lending | | | | 414,205 |
| Dividends | | | | 35,806 |
|
| Total investment income | | | | 60,272,803 |
|
| Expenses | | | | |
| Advisory fee | | | | 3,171,045 |
| Distribution Plan expenses | | | | |
| Class A | | | | 1,063,877 |
| Class B | | | | 1,601,454 |
| Class C | | | | 1,769,506 |
| Administrative services fee | | | | 727,947 |
| Transfer agent fees | | | | 1,401,174 |
| Trustees’ fees and expenses | | | | 13,735 |
| Printing and postage expenses | | | | 88,801 |
| Custodian and accounting fees | | | | 208,090 |
| Registration and filing fees | | | | 124,543 |
| Professional fees | | | | 41,001 |
| Interest expense | | | | 31,616 |
| Other | | | | 28,660 |
|
| Total expenses | | | | 10,271,449 |
| Less: Expense reductions | | | | (45,762) |
| Expense reimbursements | | | | (130,969) |
|
| Net expenses | | | | 10,094,718 |
|
| Net investment income | | | | 50,178,085 |
|
| Net realized and unrealized gains or losses on investments | | | | |
| Net realized gains on investments | | | | 2,935,671 |
| Net change in unrealized gains or losses on investments | | | | 14,090,164 |
|
| Net realized and unrealized gains or losses on investments | | | | 17,025,835 |
|
| Net increase in net assets resulting from operations | | $ | | 67,203,920 |
|
See Notes to Financial Statements
22
STATEMENTS OF CHANGES IN NET ASSETS
| | | Year Ended April 30, |
| |
|
| | | 2007 | | 2006 |
|
| Operations | | | | | | | | |
| Net investment income | | $ | | 50,178,085 | | $ | | 62,351,931 |
| Net realized gains or losses on | | | | | | | | |
| investments | | | | 2,935,671 | | | | (8,091,668) |
| Net change in unrealized gains or | | | | | | | | |
| losses on investments | | | | 14,090,164 | | | | 9,546,925 |
|
| Net increase in net assets resulting | | | | | | | | |
| from operations | | | | 67,203,920 | | | | 63,807,188 |
|
| Distributions to shareholders from | | | | | | | | |
| Net investment income | | | | | | | | |
| Class A | | | | (25,511,393) | | | | (31,245,428) |
| Class B | | | | (10,353,425) | | | | (12,543,324) |
| Class C | | | | (11,450,486) | | | | (15,403,177) |
| Class I | | | | (2,935,746) | | | | (4,575,274) |
|
| Total distributions to shareholders | | | | (50,251,050) | | | | (63,767,203) |
|
| | | Shares | | | | Shares | | |
| Capital share transactions | | | | | | | | |
| Proceeds from shares sold | | | | | | | | |
| Class A | | 8,872,464 | | 29,361,786 | | 24,776,857 | | 83,068,682 |
| Class B | | 2,878,309 | | 9,532,702 | | 4,135,694 | | 13,808,738 |
| Class C | | 3,575,958 | | 11,831,397 | | 4,431,167 | | 14,748,116 |
| Class I | | 2,598,618 | | 8,626,874 | | 9,285,824 | | 31,101,831 |
|
| | | | | 59,352,759 | | | | 142,727,367 |
|
| Net asset value of shares issued in | | | | | | | | |
| reinvestment of distributions | | | | | | | | |
| Class A | | 5,100,535 | | 16,899,566 | | 6,413,132 | | 21,422,043 |
| Class B | | 1,480,905 | | 4,906,603 | | 1,806,924 | | 6,033,111 |
| Class C | | 1,774,970 | | 5,879,356 | | 2,451,404 | | 8,188,773 |
| Class I | | 418,042 | | 1,382,768 | | 494,768 | | 1,650,619 |
|
| | | | | 29,068,293 | | | | 37,294,546 |
|
| Automatic conversion of Class B | | | | | | | | |
| shares to Class A shares | | | | | | | | |
| Class A | | 1,001,277 | | 3,327,267 | | 1,188,644 | | 3,971,959 |
| Class B | | (1,001,277) | | (3,327,267) | | (1,188,644) | | (3,971,959) |
|
| | | | | 0 | | | | 0 |
|
| Payment for shares redeemed | | | | | | | | |
| Class A | | (33,580,433) | | (111,126,729) | | (56,163,187) | | (187,595,502) |
| Class B | | (12,379,615) | | (40,950,431) | | (15,347,963) | | (51,155,220) |
| Class C | | (18,676,545) | | (61,740,275) | | (30,896,580) | | (102,833,318) |
| Class I | | (10,228,849) | | (33,976,494) | | (12,796,893) | | (42,836,974) |
|
| | | | | (247,793,929) | | | | (384,421,014) |
|
| Net decrease in net assets resulting | | | | | | | | |
| from capital share transactions | | | | (159,372,877) | | | | (204,399,101) |
|
| Total decrease in net assets | | | | (142,420,007) | | | | (204,359,116) |
| Net assets | | | | | | | | |
| Beginning of period | | | | 817,526,371 | | 1,021,885,487 |
|
| End of period | | $ 675,106,364 | | $ 817,526,371 |
|
| Overdistributed net investment income | | $ | | (955,531) | | $ | | (1,742,300) |
|
See Notes to Financial Statements
23
NOTES TO FINANCIAL STATEMENTS
1. ORGANIZATION
Evergreen High Yield Bond Fund (the “Fund”) is a diversified series of Evergreen Fixed Income Trust (the “Trust”), a Delaware statutory trust organized on September 18, 1997. The Trust is an open-end management investment company registered under the Investment Company Act of 1940, as amended (the “1940 Act”).
The Fund offers Class A, Class B, Class C and Class I shares. Class A shares are sold with a front-end sales charge. However, Class A share investments of $1 million or more are not subject to a front-end sales charge but are subject to a contingent deferred sales charge of 1.00% upon redemption within 18 months. Prior to April 1, 2007, the 1.00% contingent deferred sales charge was applicable for redemptions made within one year. Class B shares are sold without a front-end sales charge but are subject to a contingent deferred sales charge that is payable upon redemption and decreases depending on how long the shares have been held. Class C shares are sold without a front-end sales charge but are subject to a contingent deferred sales charge that is payable upon redemption within one year. Class I shares are sold without a front-end sales charge or contingent deferred sales charge. Each class of shares, except Class I shares, pays an ongoing distribution fee.
2. SIGNIFICANT ACCOUNTING POLICIES
The following is a summary of significant accounting policies consistently followed by the Fund in the preparation of its financial statements. The policies are in conformity with generally accepted accounting principles in the United States of America, which require management to make estimates and assumptions that affect amounts reported herein. Actual results could differ from these estimates.
a. Valuation of investments
Portfolio debt securities acquired with more than 60 days to maturity are fair valued using matrix pricing methods determined by an independent pricing service which takes into consideration such factors as similar security prices, yields, maturities, liquidity and ratings. Securities for which valuations are not readily available from an independent pricing service may be valued by brokers which use prices provided by market makers or estimates of market value obtained from yield data relating to investments or securities with similar characteristics.
Listed equity securities are usually valued at the last sales price or official closing price on the national securities exchange where the securities are principally traded.
Foreign securities traded on an established exchange are valued at the last sales price on the exchange where the security is primarily traded. If there has been no sale, the securities are valued at the mean between bid and asked prices. Foreign securities may be valued at fair value according to procedures approved by the Board of Trustees if the closing price is not reflective of current market values due to trading or events occurring in the foreign markets between the close of the established exchange and the valuation time of the Fund. In addition, substantial changes in values in the U.S. markets subsequent to the close of a foreign market may also affect the values of securities traded in the foreign market. The value of foreign securities may be adjusted if such movements in the U.S. market exceed a specified threshold.
24
NOTES TO FINANCIAL STATEMENTS continued
Investments of cash collateral in short-term securities are valued at amortized cost, which approximates market value.
Short-term securities with remaining maturities of 60 days or less at the time of purchase are valued at amortized cost, which approximates market value.
Investments in other mutual funds are valued at net asset value. Securities for which market quotations are not readily available or not reflective of current market value are valued at fair value as determined by the investment advisor in good faith, according to procedures approved by the Board of Trustees.
b. Repurchase agreements
Securities pledged as collateral for repurchase agreements are held by the custodian bank or in a segregated account in the Fund’s name until the agreements mature. Collateral for certain tri-party repurchase agreements is held at the counterparty’s custodian in a segregated account for the benefit of the Fund and the counterparty. Each agreement requires that the market value of the collateral be sufficient to cover payments of interest and principal. However, in the event of default or bankruptcy by the other party to the agreement, retention of the collateral may be subject to legal proceedings. The Fund will enter into repurchase agreements with banks and other financial institutions, which are deemed by the investment advisor to be creditworthy pursuant to guidelines established by the Board of Trustees. In certain instances, the Fund’s securities lending agent may provide collateral in the form of repurchase agreements.
c. When-issued and delayed delivery transactions
The Fund records when-issued or delayed delivery securities as of trade date and maintains security positions such that sufficient liquid assets will be available to make payment for the securities purchased. Securities purchased on a when-issued or delayed delivery basis are marked-to-market daily and begin earning interest on the settlement date. Losses may occur on these transactions due to changes in market conditions or the failure of counterparties to perform under the contract.
d. Securities lending
The Fund may lend its securities to certain qualified brokers in order to earn additional income. The Fund receives compensation in the form of fees or interest earned on the investment of any cash collateral received. The Fund also continues to receive interest and dividends on the securities loaned. The Fund receives collateral in the form of cash or securities with a market value at least equal to the market value of the securities on loan, including accrued interest. In the event of default or bankruptcy by the borrower, the Fund could experience delays and costs in recovering the loaned securities or in gaining access to the collateral. The Fund has the right under the lending agreement to recover the securities from the borrower on demand.
e. Security transactions and investment income
Security transactions are recorded on trade date. Realized gains and losses are computed using the specific cost of the security sold. Interest income is recorded on the accrual basis and includes
25
NOTES TO FINANCIAL STATEMENTS continued
accretion of discounts and amortization of premiums. Dividend income is recorded on the ex-dividend date. Foreign income and capital gains realized on some securities may be subject to foreign taxes, which are accrued as applicable.
f. Federal taxes
The Fund intends to continue to qualify as a regulated investment company and distribute all of its taxable income, including any net capital gains (which have already been offset by available capital loss carryovers). Accordingly, no provision for federal taxes is required.
g. Distributions
Distributions to shareholders from net investment income are accrued daily and paid monthly. Distributions from net realized gains, if any, are recorded on the ex-dividend date. Such distributions are determined in conformity with income tax regulations, which may differ from generally accepted accounting principles.
Reclassifications have been made to the Fund’s components of net assets to reflect income and gains available for distribution (or available capital loss carryovers, as applicable) under income tax regulations. The primary permanent differences causing such reclassifications are due to consent fees on tendered bonds and premium amortization. During the year ended April 30, 2007, the following amounts were reclassified:
|
| Overdistributed net investment income | | $ | | 859,734 |
| Accumulated net realized losses on investments | | | | (859,734) |
|
h. Class allocations
Income, common expenses and realized and unrealized gains and losses are allocated to the classes based on the relative net assets of each class. Distribution fees, if any, are calculated daily at the class level based on the appropriate net assets of each class and the specific expense rates applicable to each class.
3. ADVISORY FEE AND OTHER TRANSACTIONS WITH AFFILIATES
Evergreen Investment Management Company, LLC (“EIMC”), an indirect, wholly-owned subsidiary of Wachovia Corporation (“Wachovia”), is the investment advisor to the Fund and is paid a fee at an annual rate of 2% of the Fund’s gross investment income plus an amount determined by applying percentage rates to the average daily net assets of the Fund, starting at 0.31% and declining to 0.16% as average daily net assets increase.
Effective October 1, 2006, Tattersall Advisory Group, Inc., an indirect, wholly-owned subsidiary of Wachovia, became the investment sub-advisor to the Fund and is paid by EIMC for its services to the Fund.
From time to time, EIMC may voluntarily or contractually waive its fee and/or reimburse expenses in order to limit operating expenses. During the year ended April 30, 2007, EIMC voluntarily reimbursed Distribution Plan expenses (see Note 4) relating to Class A shares in the amount of $130,969.
26
NOTES TO FINANCIAL STATEMENTS continued
The Fund may invest in Evergreen-managed money market funds, which are also advised by EIMC. Income earned on these investments is included in income from affiliate on the Statement of Operations.
Evergreen Investment Services, Inc. (“EIS”), an indirect, wholly-owned subsidiary of Wachovia, is the administrator to the Fund. As administrator, EIS provides the Fund with facilities, equipment and personnel and is paid an annual rate determined by applying percentage rates to the aggregate average daily net assets of the Evergreen funds (excluding money market funds and Evergreen Institutional Enhanced Income Fund), starting at 0.10% and declining to 0.05% as the aggregate average daily net assets of the Evergreen funds (excluding money market funds and Evergreen Institutional Enhanced Income Fund) increase.
Evergreen Service Company, LLC (“ESC”), an indirect, wholly-owned subsidiary of Wachovia, is the transfer and dividend disbursing agent for the Fund. ESC receives account fees that vary based on the type of account held by the shareholders in the Fund. For the year ended April 30, 2007, the transfer agent fees were equivalent to an annual rate of 0.19% of the Fund’s average daily net assets.
The Fund has placed a portion of its portfolio transactions with brokerage firms that are affiliates of Wachovia. During the year ended April 30, 2007, the Fund paid brokerage commissions of $1,005 to Wachovia Securities, LLC.
4. DISTRIBUTION PLANS
EIS also serves as distributor of the Fund’s shares. The Fund has adopted Distribution Plans, as allowed by Rule 12b-1 of the 1940 Act, for each class of shares, except Class I. Under the Distribution Plans, distribution fees are paid at an annual rate of 0.30% of the average daily net assets for Class A shares and 1.00% of the average daily net assets for each of Class B and Class C shares.
For the year ended April 30, 2007, EIS received $27,746 from the sale of Class A shares and $489,589 and $3,169 in contingent deferred sales charges from redemptions of Class B and Class C shares, respectively.
5. SECURITIES TRANSACTIONS
Cost of purchases and proceeds from sales of investment securities (excluding short-term securities) were $332,460,393 and $432,362,767, respectively, for the year ended April 30, 2007.
During the year ended April 30, 2007, the Fund loaned securities to certain brokers. At April 30, 2007, the value of securities on loan and the total value of collateral received for securities loaned (including segregated cash) amounted to $76,661,410 and $78,971,398, respectively.
On April 30, 2007, the aggregate cost of securities for federal income tax purposes was $719,953,644. The gross unrealized appreciation and depreciation on securities based on tax cost was $26,390,740 and $2,419,117, respectively, with a net unrealized appreciation of $23,971,623.
27
NOTES TO FINANCIAL STATEMENTS continued
As of April 30, 2007, the Fund had $137,359,520 in capital loss carryovers for federal income tax purposes expiring as follows:
| Expiration |
|
| 2008 | | 2009 | | 2010 | | 2011 | | 2014 | | 2015 |
|
| $19,168,229 | | $38,451,200 | | $57,513,490 | | $15,936,101 | | $1,353,885 | | $4,936,615 |
|
For income tax purposes, capital losses incurred after October 31 within the Fund’s fiscal year are deemed to arise on the first business day of the following fiscal year. As of April 30, 2007, the Fund incurred and will elect to defer post-October losses of $58,231.
6. INTERFUND LENDING
Pursuant to an Exemptive Order issued by the SEC, the Fund may participate in an interfund lending program with certain funds in the Evergreen fund family. This program allows the Fund to borrow from, or lend money to, other participating funds. During the year ended April 30, 2007, the Fund did not participate in the interfund lending program.
7. DISTRIBUTIONS TO SHAREHOLDERS
As of April 30, 2007, the components of distributable earnings on a tax basis were as follows:
| | | | | Capital Loss |
| | | | | Carryovers |
| | | | | and |
| Overdistributed | | Unrealized | | Post-October |
| Ordinary Income | | Appreciation | | Losses |
|
| $1,513,440 | | $23,971,623 | | $137,417,751 |
|
The differences between the components of distributable earnings on a tax basis and the amounts reflected in the Statement of Assets and Liabilities are primarily due to wash sales and premium amortization.
The tax character of distributions paid were $50,251,050 and $63,767,203 of ordinary income for the years ended April 30, 2007 and April 30, 2006, respectively.
8. EXPENSE REDUCTIONS
Through expense offset arrangements with ESC and the Fund’s custodian, a portion of fund expenses has been reduced.
9. DEFERRED TRUSTEES’ FEES
Each Trustee of the Fund may defer any or all compensation related to performance of their duties as Trustees. The Trustees’ deferred balances are allocated to deferral accounts, which are included in the accrued expenses for the Fund. The investment performance of the deferral accounts is based on the investment performance of certain Evergreen funds. Any gains earned or losses incurred in the deferral accounts are reported in the Fund’s Trustees’ fees and expenses. At the election of the Trustees, the deferral account will be paid either in one lump sum or in quarterly installments for up to ten years.
28
NOTES TO FINANCIAL STATEMENTS continued
10. FINANCING AGREEMENT
The Fund and certain other Evergreen funds share in an unsecured revolving credit commitment for temporary and emergency purposes, including the funding of redemptions, as permitted by each participating fund’s borrowing restrictions. Borrowings under this facility bear interest at 0.50% per annum above the Federal Funds rate. All of the participating funds are charged an annual commitment fee on the unused balance, which is allocated pro rata. The credit facility is for $100 million with an annual commitment fee of 0.08% . Prior to July 3, 2006, the credit facility was for $150 million with an annual commitment fee of 0.09% .
During the year ended April 30, 2007, the Fund had average borrowings outstanding of $540,447 at an average rate of 5.85% and paid interest of $31,616.
11. REGULATORY MATTERS AND LEGAL PROCEEDINGS
Since September 2003, governmental and self-regulatory authorities have instituted numerous ongoing investigations of various practices in the mutual fund industry, including investigations relating to revenue sharing, market-timing, late trading and record retention, among other things. The investigations cover investment advisors, distributors and transfer agents to mutual funds, as well as other firms. EIMC, EIS and ESC (collectively, “Evergreen”) have received subpoenas and other requests for documents and testimony relating to these investigations, are endeavoring to comply with those requests, and are cooperating with the investigations. Evergreen is continuing its own internal review of policies, practices, procedures and personnel, and is taking remedial action where appropriate.
In connection with one of these investigations, on July 28, 2004, the staff of the Securities and Exchange Commission (“SEC”) informed Evergreen that the staff intends to recommend to the SEC that it institute an enforcement action against Evergreen. The SEC staff’s proposed allegations relate to (i) an arrangement pursuant to which a broker at one of EIMC’s affiliated broker-dealers had been authorized, apparently by an EIMC officer (who is no longer with EIMC), to engage in short-term trading, on behalf of a client, in Evergreen Mid Cap Growth Fund (formerly Evergreen Emerging Growth Fund and prior to that, known as Evergreen Small Company Growth Fund) during the period from December 2000 through April 2003, in excess of the limitations set forth in the fund’s prospectus, (ii) short-term trading from September 2001 through January 2003, by a former Evergreen portfolio manager of Evergreen Precious Metals Fund, a fund he managed at the time, (iii) the sufficiency of systems for monitoring exchanges and enforcing exchange limitations as stated in the funds’ prospectuses, and (iv) the adequacy of e-mail retention practices. In connection with the activity in Evergreen Mid Cap Growth Fund, EIMC reimbursed the fund $378,905, plus an additional $25,242, representing what EIMC calculated at that time to be the client’s net gain and the fees earned by EIMC and the expenses incurred by this fund on the client’s account. In connection with the activity in Evergreen Precious Metals Fund, EIMC reimbursed the fund $70,878, plus an additional $3,075, representing what EIMC calculated at that time to be the portfolio manager’s net gain and the fees
29
NOTES TO FINANCIAL STATEMENTS continued
earned by EIMC and expenses incurred by the fund on the portfolio manager’s account. Evergreen is currently engaged in discussions with the staff of the SEC concerning its recommendation.
Any resolution of these matters with regulatory authorities may include, but not be limited to, sanctions, penalties or injunctions regarding Evergreen, restitution to mutual fund shareholders and/or other financial penalties and structural changes in the governance or management of Evergreen’s mutual fund business. Any penalties or restitution will be paid by Evergreen and not by the Evergreen funds.
EIS has entered into an agreement with the NASD settling allegations that EIS (i) arranged for Evergreen fund portfolio trades to be directed to Wachovia Securities, LLC, an affiliate of EIS that sold Evergreen fund shares, during the period of January 2001 to December 2003 and (ii) provided non-cash compensation by sponsoring offsite meetings attended by Wachovia Securities, LLC brokers during that period, where the eligibility of a broker to attend the meetings depended upon the broker meeting certain sales targets of Evergreen fund shares. Pursuant to the settlement agreement, EIS has agreed to a censure and a fine of $4,200,000. EIS neither admitted nor denied the allegations and findings set forth in its agreement with the NASD.
In addition, the Evergreen funds and EIMC and certain of its affiliates are involved in various legal actions, including private litigation and class action lawsuits. EIMC does not expect that any of such legal actions currently pending or threatened will have a material adverse impact on the financial position or operations of any of the Evergreen funds or on EIMC’s ability to provide services to the Evergreen funds.
Although Evergreen believes that neither the foregoing investigations described above nor any pending or threatened legal actions will have a material adverse impact on the Evergreen funds, there can be no assurance that these matters and any publicity surrounding or resulting from them will not result in reduced sales or increased redemptions of Evergreen fund shares, which could increase Evergreen fund transaction costs or operating expenses, or that they will not have other adverse consequences on the Evergreen funds.
12. NEW ACCOUNTING PRONOUNCEMENTS
In June 2006, the Financial Accounting Standards Board (“FASB”) issued FASB Interpretation No. 48, Accounting for Uncertainty in Income Taxes — an interpretation of FASB statement 109 (“FIN 48”). FIN 48 supplements FASB 109 by prescribing a recognition threshold and measurement attribute for the financial statement recognition and measurement of a tax position taken or expected to be taken in a tax return. The adoption of FIN 48 will require financial statements to be adjusted to reflect only those tax positions that are more likely than not to be sustained as of the adoption date. Management of the Fund is currently evaluating the impact that the adoption of FIN 48 will have on the financial statements. FIN 48 will become effective for fiscal years beginning after December 15, 2006.
30
NOTES TO FINANCIAL STATEMENTS continued
In September 2006, FASB issued Statement of Financial Accounting Standards No. 157, Fair Value Measurements (“FAS 157”). FAS 157 establishes a single authoritative definition of fair value, establishes a framework for measuring fair value and expands disclosures about fair value measurements. FAS 157 applies to fair value measurements already required or permitted by existing standards. The change to current generally accepted accounting principles from the application of FAS 157 relates to the definition of fair value, the methods used to measure fair value, and the expanded disclosures about fair value measurements. Management of the Fund does not believe the adoption of FAS 157 will materially impact the financial statement amounts, however, additional disclosures may be required about the inputs used to develop the measurements and the effect of certain of the measurements on changes in net assets for the period. FAS 157 is effective for financial statements issued for fiscal years beginning after November 15, 2007 and interim periods within those fiscal years.
31
REPORT OF INDEPENDENT REGISTERED PUBLIC ACCOUNTING FIRM
Board of Trustees and Shareholders
Evergreen Fixed Income Trust
We have audited the accompanying statement of assets and liabilities, including the schedule of investments, of the Evergreen High Yield Bond Fund, a series of Evergreen Fixed Income Trust, as of April 30, 2007, and the related statement of operations for the year then ended, statements of changes in net assets for each of the years in the two-year period then ended, and the financial highlights for each of the years in the five-year period then ended. These financial statements and financial highlights are the responsibility of the Fund’s management. Our responsibility is to express an opinion on these financial statements and financial highlights based on our audits.
We conducted our audits in accordance with the standards of the Public Company Accounting Oversight Board (United States). Those standards require that we plan and perform the audit to obtain reasonable assurance about whether the financial statements and financial highlights are free of material misstatement. An audit includes examining, on a test basis, evidence supporting the amounts and disclosures in the financial statements. Our procedures included confirmation of securities owned as of April 30, 2007 by correspondence with the custodian and brokers, or by other appropriate auditing procedures where replies from brokers were not received. An audit also includes assessing the accounting principles used and significant estimates made by management, as well as evaluating the overall financial statement presentation. We believe that our audits provide a reasonable basis for our opinion.
In our opinion, the financial statements and financial highlights referred to above present fairly, in all material respects, the financial position of the Evergreen High Yield Bond Fund, as of April 30, 2007, the results of its operations, changes in its net assets and financial highlights for each of the years described above, in conformity with U.S. generally accepted accounting principles.

Boston, Massachusetts
June 28, 2007
32
This page left intentionally blank
33
This page left intentionally blank
34
This page left intentionally blank
35
TRUSTEES AND OFFICERS
TRUSTEES1
| Charles A. Austin III | | Investment Counselor, Anchor Capital Advisors, LLC. (investment advice); Director, The Andover |
| Trustee | | Companies (insurance); Trustee, Arthritis Foundation of New England; Former Director, The |
| DOB: 10/23/1934 | | Francis Ouimet Society (scholarship program); Former Director, Executive Vice President and |
| Term of office since: 1991 | | Treasurer, State Street Research & Management Company (investment advice) |
| Other directorships: None | | |
|
| |
| K. Dun Gifford | | Chairman and President, Oldways Preservation and Exchange Trust (education); Trustee, |
| Trustee | | Treasurer and Chairman of the Finance Committee, Cambridge College |
| DOB: 10/23/1938 | | |
| Term of office since: 1974 | | |
| Other directorships: None | | |
|
| |
| Dr. Leroy Keith, Jr. | | Partner, Stonington Partners, Inc. (private equity fund); Trustee, Phoenix Fund Complex; Director, |
| Trustee | | Diversapack Co. (packaging company); Director, Obagi Medical Products Co.; Former Director, |
| DOB: 2/14/1939 | | Lincoln Educational Services |
| Term of office since: 1983 | | |
| Other directorships: Trustee, | | |
| Phoenix Fund Complex (consisting | | |
| of 60 portfolios) | | |
|
| |
| Gerald M. McDonnell | | Manager of Commercial Operations, CMC Steel (steel producer) |
| Trustee | | |
| DOB: 7/14/1939 | | |
| Term of office since: 1988 | | |
| Other directorships: None | | |
|
| |
| Patricia B. Norris | | President and Director of Phillips Pond Homes Association (home community); President and |
| Trustee | | Director of Buckleys of Kezar Lake, Inc., (real estate company); Former Partner, |
| DOB: 4/9/1948 | | PricewaterhouseCoopers, LLP |
| Term of office since: 2006 | | |
| Other directorships: None | | |
|
| |
| William Walt Pettit | | Partner and Vice President, Kellam & Pettit, P.A. (law firm); Director, Superior Packaging Corp. |
| Trustee | | (packaging company); Member, Superior Land, LLC (real estate holding company), Member, |
| DOB: 8/26/1955 | | K&P Development, LLC (real estate development); Former Director, National Kidney Foundation |
| Term of office since: 1984 | | of North Carolina, Inc. (non-profit organization) |
| Other directorships: None | | |
|
| |
| David M. Richardson | | President, Richardson, Runden LLC (executive recruitment business development/consulting |
| Trustee | | company); Consultant, Kennedy Information, Inc. (executive recruitment information and |
| DOB: 9/19/1941 | | research company); Consultant, AESC (The Association of Executive Search Consultants); |
| Term of office since: 1982 | | Director, J&M Cumming Paper Co. (paper merchandising); Former Trustee, NDI Technologies, LLP |
| Other directorships: None | | (communications) |
|
| |
| Dr. Russell A. Salton III | | President/CEO, AccessOne MedCard, Inc.; Former Medical Director, Healthcare Resource |
| Trustee | | Associates, Inc. |
| DOB: 6/2/1947 | | |
| Term of office since: 1984 | | |
| Other directorships: None | | |
|
| |
| Michael S. Scofield | | Retired Attorney, Law Offices of Michael S. Scofield; Former Director and Chairman, Branded |
| Trustee | | Media Corporation (multi-media branding company) |
| DOB: 2/20/1943 | | |
| Term of office since: 1984 | | |
| Other directorships: None | | |
|
36
TRUSTEES AND OFFICERS continued
| Richard J. Shima | | Independent Consultant; Director, Hartford Hospital; Trustee, Greater Hartford YMCA; Former |
| Trustee | | Director, Trust Company of CT; Former Director, Old State House Association; Former Trustee, |
| DOB: 8/11/1939 | | Saint Joseph College (CT) |
| Term of office since: 1993 | | |
| Other directorships: None | | |
|
| |
| Richard K. Wagoner, CFA2 | | Member and Former President, North Carolina Securities Traders Association; Member, Financial |
| Trustee | | Analysts Society |
| DOB: 12/12/1937 | | |
| Term of office since: 1999 | | |
| Other directorships: None | | |
|
| |
| |
| OFFICERS | | |
| |
| Dennis H. Ferro3 | | Principal occupations: President and Chief Executive Officer, Evergreen Investment Company, |
| President | | Inc. and Executive Vice President, Wachovia Bank, N.A.; former Chief Investment Officer, |
| DOB: 6/20/1945 | | Evergreen Investment Company, Inc. |
| Term of office since: 2003 | | |
|
| |
| Kasey Phillips4 | | Principal occupations: Senior Vice President, Evergreen Investment Services, Inc.; Former Vice |
| Treasurer | | President, Evergreen Investment Services, Inc.; Former Assistant Vice President, Evergreen |
| DOB: 12/12/1970 | | Investment Services, Inc. |
| Term of office since: 2005 | | |
|
| |
| Michael H. Koonce4 | | Principal occupations: Senior Vice President and General Counsel, Evergreen Investment |
| Secretary | | Services, Inc.; Secretary, Senior Vice President and General Counsel, Evergreen Investment |
| DOB: 4/20/1960 | | Management Company, LLC and Evergreen Service Company, LLC; Senior Vice President and |
| Term of office since: 2000 | | Assistant General Counsel, Wachovia Corporation |
|
| |
| Robert Guerin4, 5 | | Principal occupations: Chief Compliance Officer, Evergreen Funds and Senior Vice President of |
| Chief Compliance Officer | | Evergreen Investments Co, Inc; Former Managing Director and Senior Compliance Officer, |
| DOB: 9/20/1965 | | Babson Capital Management LLC; Former Principal and Director, Compliance and Risk |
| Term of office since: 2007 | | Management, State Street Global Advisors; Former Vice President and Manager, Sales Practice |
| | | Compliance, Deutsche Asset Management. |
1 Each Trustee, except Ms. Norris, serves until a successor is duly elected or qualified or until his death, resignation, retirement or removal from office. As a new Trustee, Ms. Norris’ initial term ends June 30, 2009, at which time she may be re-elected by Trustees to serve until a successor is duly elected or qualified or until her death, resignation, retirement or removal from office by the Trustees. Each Trustee oversees 94 Evergreen funds. Correspondence for each Trustee may be sent to Evergreen Board of Trustees, P.O. Box 20083, Charlotte, NC 28202.
2 Mr. Wagoner is an “interested person” of the Fund because of his ownership of shares in Wachovia Corporation, the parent to the Fund’s investment advisor.
3 The address of the Officer is 401 S. Tryon Street, 20th Floor, Charlotte, NC 28288.
4 The address of the Officer is 200 Berkeley Street, Boston, MA 02116.
5 Mr. Guerin’s information is as of June 14, 2007, the effective date of his approval by the Board of Trustees as Chief Compliance Officer of the Evergreen funds.
Additional information about the Fund’s Board of Trustees and Officers can be found in the Statement of Additional Information (SAI) and is available upon request without charge by calling 800.343.2898.
37

566660 rv4 06/2007
Evergreen Institutional Mortgage Portfolio

| | | table of contents |
| 1 | | LETTER TO SHAREHOLDERS |
| 4 | | FUND AT A GLANCE |
| 5 | | PORTFOLIO MANAGER COMMENTARY |
| 6 | | ABOUT YOUR FUND’S EXPENSES |
| 7 | | FINANCIAL HIGHLIGHTS |
| 8 | | SCHEDULE OF INVESTMENTS |
| 13 | | STATEMENT OF ASSETS AND LIABILITIES |
| 14 | | STATEMENT OF OPERATIONS |
| 15 | | STATEMENTS OF CHANGES IN NET ASSETS |
| 16 | | NOTES TO FINANCIAL STATEMENTS |
| 23 | | REPORT OF INDEPENDENT REGISTERED PUBLIC ACCOUNTING FIRM |
| 24 | | TRUSTEES AND OFFICERS |
This annual report must be preceded or accompanied by a prospectus of the Evergreen fund contained herein. The prospectus contains more complete information, including fees and expenses, and should be read carefully before investing or sending money.
The fund will file its complete schedule of portfolio holdings with the SEC for the first and third quarters of each fiscal year on Form N-Q. The fund’s Form N-Q will be available on the SEC’s Web site at http://www.sec.gov. In addition, the fund’s Form N-Q may be reviewed and copied at the SEC’s Public Reference Room in Washington, D.C. Information on the operation of the Public Reference Room may be obtained by calling 800.SEC.0330.
A description of the fund’s proxy voting policies and procedures, as well as information regarding how the fund voted proxies relating to portfolio securities during the most recent 12-month period ended June 30, is available by visiting our Web site at EvergreenInvestments.com or by visiting the SEC’s Web site at http://www.sec.gov. The fund’s proxy voting policies and procedures are also available without charge, upon request, by calling 800.343.2898.
| | | | |
| Mutual Funds: | | | | |
| NOT FDIC INSURED | | MAY LOSE VALUE | | NOT BANK GUARANTEED |
Evergreen InvestmentsSM is a service mark of Evergreen Investment Management Company, LLC. Copyright 2007, Evergreen Investment Management Company, LLC.
Evergreen Investment Management Company, LLC is a subsidiary of Wachovia Corporation and is an affiliate of Wachovia Corporation’s other Broker Dealer subsidiaries.
Evergreen mutual funds are distributed by Evergreen Investment Services, Inc. 200 Berkeley Street, Boston, MA 02116
LETTER TO SHAREHOLDERS
June 2007

Dennis H. Ferro
President and Chief
Executive Officer
Dear Shareholder,
We are pleased to provide the annual report for Evergreen Institutional Mortgage Portfolio covering the twelve-month period ended April 30, 2007.
The domestic fixed-income markets generated healthy results during the twelve-month period in an environment supported by persistent growth and the prospect of stable interest rates. While the economic expansion decelerated as the period progressed, continued gains in business profits helped support the performance of corporate debt securities, including lower-quality, higher-yielding bonds, which generally outperformed high-grade and investment-grade debt. The fiscal year began on a harsh note in the spring of 2006 amid rising inflationary concerns, accompanied by anxieties about the potential economic impacts of repeated interest rate hikes by the Federal Reserve Board (the “Fed”). However, the markets were calmed in both the summer and autumn by the combination of receding commodity prices and the Fed’s policy to leave short-term interest rates unchanged. Over the full twelve-month period, the yield curve flattened — the difference between short-term yields and long-term yields narrowed. In this environment, longer-maturity bonds, especially those with maturities of 20 to 30 years, tended to outperform the overall bond market.
1
LETTER TO SHAREHOLDERS continued
Solid returns in both the nation’s equity and fixed-income markets came against a backdrop of persistent economic growth during most of the period. Gross Domestic Product grew by a rate of 3.3% over 2006 then decelerated to an annualized rate of 1.3% in the first quarter of 2007. The slump in the housing industry was a major factor that contributed to the slowdown, which came in the face of strong employment, rising wages and gains in both personal consumption and business investment.
In this environment, the teams managing the higher-quality portfolios, including Evergreen Core Bond Fund, Evergreen U.S. Government Fund and Evergreen Institutional Mortgage Portfolio, assessed factors such as employment and inflationary trends, Fed policy, and interest-rate expectations in making their decisions. At the same time, the managers supervising Evergreen High Yield Bond Fund and Evergreen Select High Yield Bond Fund tended to position their more credit-sensitive portfolios relatively cautiously as the relative yield advantages of lower-quality corporate bonds appeared to tighten. The managers of Evergreen Diversified Bond Fund also sought opportunities in the high-yield market, while maintaining a healthy exposure to investment-grade securities. The managers of Evergreen Diversified Income Builder Fund, meanwhile, looked at broad interest-rate trends, opportunities in the credit markets, and the effects of currency fluctuations in making decisions on sector and industry allocations and individual security selections.
As always, we encourage investors to maintain diversified investment portfolios in pursuit of their long-term investment goals.
2
LETTER TO SHAREHOLDERS continued
Please visit us at EvergreenInvestments.com for more information about our funds and other investment products available to you. Thank you for your continued support of Evergreen Investments.
Sincerely,
 Dennis H. FerroPresident and Chief Executive OfficerEvergreen Investment Company, Inc.
Special Notice to Shareholders:
Please visit our Web site at EvergreenInvestments.com for statements from President and Chief Executive Officer, Dennis Ferro, addressing NASD actions involving Evergreen Investment Services, Inc. (EIS), Evergreen’s mutual fund distributor or statements from Dennis Ferro and Chairman of the Board of the Evergreen funds, Michael S. Scofield, addressing SEC actions involving the Evergreen funds.
3
FUND AT A GLANCE
as of April 30, 2007
MANAGEMENT TEAM
Investment Advisor:
• Evergreen Investment Management Company, LLC
Sub-Advisor:
• Tattersall Advisory Group, Inc.
Portfolio Managers:
• Robert A. Calhoun, CFA
• Mehmet Camurdan, CFA
• Todd C. Kuimjian, CFA
CURRENT INVESTMENT STYLE
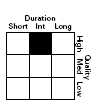
Source: Morningstar, Inc.
Morningstar’s style box is based on a portfolio date as of 3/31/2007.
The Fixed income style box placement is based on a fund’s average effective maturity or duration and the average credit rating of the bond portfolio.
PERFORMANCE AND RETURNS
Portfolio inception date: 6/19/2002
| | | Class I |
| Class inception date | | 6/19/2002 |
| Nasdaq symbol | | EMSFX |
| Average annual return | | |
| 1-year | | 7.51% |
| Since portfolio inception | | 4.44% |
Past performance is no guarantee of future results. The performance quoted represents past performance and current performance may be lower or higher. The investment return and principal value of an investment will fluctuate so that investors’ shares, when redeemed, may be worth more or less than their original cost. To obtain performance information current to the most recent month-end, please go to EvergreenInvestments.com/fundperformance. Performance includes the reinvestment of income dividends and capital gain distributions. Performance shown does not reflect the deduction of taxes that a shareholder would pay on fund distributions or the redemption of fund shares.
The advisor is reimbursing the fund for a portion of other expenses. Had expenses not been reimbursed, returns would have been lower.
LONG-TERM GROWTH
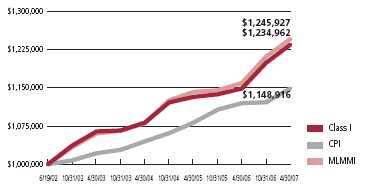
Comparison of a $1,000,000 investment in the Evergreen Institutional Mortgage Portfolio Class I shares versus a similar investment in the Merrill Lynch Mortgage Master Index† (MLMMI) and the Consumer Price Index (CPI).
The MLMMI is an unmanaged market index and does not include transaction costs associated with buying and selling securities, any mutual fund fees or expenses or any taxes. The CPI is a commonly used measure of inflation and does not represent an investment return. It is not possible to invest directly in an index.
4
PORTFOLIO MANAGER COMMENTARY
The fund’s Class I shares returned 7.51% for the twelve-month period ended April 30, 2007. During the same period, the MLMMI† returned 7.44% .
The fund seeks to maximize total return through a combination of current income and capital growth.
Mortgage-backed securities tended to do well during the period, which was marked by generally declining interest rates in the fixed-income markets. The yield on the two-year Treasury, for example, fell by 28 basis points while yields on the 10-year and 30-year Treasuries declined by 43 and 35 basis points, respectively. The Federal Reserve Board (the “Fed”) raised the fed funds rate to 5.25% in June 2006 but then left the influential short-term interest rate unchanged for the remainder of the fiscal year. Over the course of the period, market interest rate changes moved up or down as investors’ concerns changed. Rates rose when worries about inflationary pressures dominated market sentiment and fell when investors became more concerned about slowing economic growth and the possibility that the Fed might cut short-term rates. While the expansion of the economy appeared to decelerate as the fiscal year progressed, corporate profits continued to climb and the corporate bond sector turned in the best performance in the fixed-income market. Lower quality tiers of the investment-grade universe (securities rated A and BBB) outperformed other investment-grade sectors (those rated AA and above). The most notable indication of a slowdown in the economy was seen in the housing industry, which saw its largest declines at the end of 2006. This led to increased concerns about the sub-prime mortgage market, which saw rising delinquency and default rates, resulting in underperformance of lower-quality mortgage-backed securities.
In this environment, we kept the fund well diversified relative to the overall mortgage market. We emphasized investments that provided a relatively predictable cash flow while trying to protect the fund’s net asset value against changes in interest rates. While most of the mortgage market is composed of 15- and 30-year mortgage pass-through securities, we underweighted this area. In our diversification effort, we invested in commercial mortgage-backed securities, agency mortgage-backed CMOs, asset-backed securities and Fannie Mae delegated underwriting and servicing (“DUS”) securities. These are Fannie Mae securities issued under the DUS program, which is for loans on multifamily housing, typically apartment buildings. These AAA-rated securities have underlying collateral and therefore provide greater credit protection and offer a higher yield than many alternatives.
Lower-rated commercial mortgages and asset-backed securities performed poorly in the final few months of the period, particularly as problems became evident in the sub-prime mortgage market. Our exposure to these areas detracted from results. However, the fund’s emphasis on high-quality, AAA-rated mortgages added to results. Our positions in hybrid adjustable-rate mortgage securities also supported performance, as they were the best-performing part of the mortgage market during the period. Also helping performance was our exposure to the Fannie Mae DUS securities, which outperformed government agency securities.
Class I shares are only offered to investment advisory clients of an investment advisor of an Evergreen fund (or its advisory affiliates) and through special arrangements entered into on behalf of Evergreen funds with certain financial services firms.
Class I shares are only available to institutional shareholders with a minimum of $1 million investment, which may be waived in certain situations.
The fund’s investment objective may be changed without a vote of the fund’s shareholders.
Derivatives involve additional risks including interest rate risk, credit risk, the risk of improper valuation and the risk of non-correlation to the relevant instruments they are designed to hedge or to closely track.
The return of principal is not guaranteed due to fluctuation in the fund’s NAV caused by changes in the price of individual bonds held by the fund and the buying and selling of bonds by the fund. Bond funds have the same inflation, interest rate and credit risks as individual bonds. Generally, the value of bond funds rise when prevailing interest rates fall, and fall when interest rates rise.
U.S. government guarantees apply only to certain securities held in the fund’s portfolio and not to the fund’s shares.
† Copyright 2007. Merrill Lynch, Pierce, Fenner & Smith Incorporated. All rights reserved.
All data is as of April 30, 2007, and subject to change.
5
ABOUT YOUR FUND’S EXPENSES
The Example below is intended to describe the fees and expenses borne by shareholders and the impact of those costs on your investment.
Example
As a shareholder of the fund, you incur two types of costs: (1) transaction costs, including sales charges (loads), redemption fees and exchange fees; and (2) ongoing costs, including management fees, distribution (12b-1) fees and other fund expenses. This Example is intended to help you understand your ongoing costs (in dollars) of investing in the fund and to compare these costs with the ongoing costs of investing in other mutual funds. The Example is based on an investment of $1,000 invested at the beginning of the period and held for the entire period from November 1, 2006 to April 30, 2007.
The example illustrates your fund’s costs in two ways:
• Actual expenses
The section in the table under the heading “Actual” provides information about actual account values and actual expenses. You may use the information in these columns, together with the amount you invested, to estimate the expenses that you paid over the period. Simply divide your account value by $1,000 (for example, an $8,600 account value divided by $1,000 = 8.6), then multiply the result by the number in the appropriate column for your share class, in the column entitled “Expenses Paid During Period” to estimate the expenses you paid on your account during this period.
• Hypothetical example for comparison purposes
The section in the table under the heading “Hypothetical (5% return before expenses)” provides information about hypothetical account values and hypothetical expenses based on the fund’s actual expense ratio and an assumed rate of return of 5% per year before expenses, which is not the fund’s actual return. The hypothetical account values and expenses may not be used to estimate the actual ending account balance or expenses you paid for the period. You may use this information to compare the ongoing costs of investing in the fund and other funds. To do so, compare this 5% hypothetical example with the 5% hypothetical examples that appear in the shareholder reports of the other funds.
Please note that the expenses shown in the table are meant to highlight your ongoing costs only and do not reflect any transactional costs, such as sales charges (loads), redemption fees or exchange fees. Therefore, the section in the table under the heading “Hypothetical (5% return before expenses)” is useful in comparing ongoing costs only, and will not help you determine the relative total costs of owning different funds. In addition, if these transactional costs were included, your costs would have been higher.
| | | Beginning | | Ending | | |
| | | Account | | Account | | Expenses |
| | | Value | | Value | | Paid During |
| | | 11/1/2006 | | 4/30/2007 | | Period* |
| Actual | | | | | | |
| Class I | | $ 1,000.00 | | $ 1,029.69 | | $ 1.01 |
| Hypothetical | | | | | | |
| (5% return | | | | | | |
| before expenses) | | | | | | |
| Class I | | $ 1,000.00 | | $ 1,023.80 | | $ 1.00 |
* Expenses are equal to the Fund’s annualized expense ratio (0.20% for Class I), multiplied by the average account value over the period, multiplied by 181 / 365 days.
6
FINANCIAL HIGHLIGHTS
(For a share outstanding throughout each period)
| | | Year Ended April 30, |
| |
|
| CLASS I | | 2007 | | 2006 | | 2005 | | 2004 | | 20031 |
|
| Net asset value, beginning of period | | $ 9.57 | | $ 9.89 | | $ 9.89 | | $ 10.18 | | $ 10.00 |
|
| Income from investment operations | | | | | | | | | | | | |
| Net investment income (loss) | | 0.48 | | 0.43 | | 0.35 | | 0.35 | | 0.40 |
| Net realized and unrealized gains or losses on investments | | 0.22 | | (0.29) | | | | 0.10 | | (0.18) | | 0.23 |
| |
|
| Total from investment operations | | 0.70 | | 0.14 | | | | 0.45 | | 0.17 | | 0.63 |
|
| Distributions to shareholders from | | | | | | | | | | | | |
| Net investment income | | (0.49) | | (0.46) | | | | (0.45) | | (0.45) | | (0.40) |
| Net realized gains | | 0 | | 0 | | | | 0 | | (0.01) | | (0.05) |
| |
|
| Total distributions to shareholders | | (0.49) | | (0.46) | | | | (0.45) | | (0.46) | | (0.45) |
|
| Net asset value, end of period | | $ 9.78 | | $ 9.57 | | $ 9.89 | | $ 9.89 | | $ 10.18 |
|
| Total return | | 7.51% | | 1.45% | | | | 4.66% | | 1.63% | | 6.45% |
|
| Ratios and supplemental data | | | | | | | | | | | | |
| Net assets, end of period (thousands) | | $62,263 | | $58,552 | | $45,997 | | $48,032 | | $28,423 |
| Ratios to average net assets | | | | | | | | | | | | |
| Expenses including waivers/reimbursements | | | | | | | | | | | | |
| but excluding expense reductions | | 0.20% | | 0.20% | | | | 0.20% | | 0.20% | | 0.12%2 |
| Expenses excluding waivers/reimbursements | | | | | | | | | | | | |
| and expense reductions | | 0.23% | | 0.21% | | | | 0.24% | | 0.28% | | 0.45%2 |
| Net investment income (loss) | | 4.97% | | 4.37% | | | | 3.44% | | 3.33% | | 4.74%2 |
| Portfolio turnover rate | | 131% | | 121% | | | | 177% | | 327% | | 148% |
|
1 For the period from June 19, 2002 (commencement of operations), to April 30, 2003.
2 Annualized
See Notes to Financial Statements
7
SCHEDULE OF INVESTMENTS
April 30, 2007
| | | | | | | Principal | | | | |
| | | | | | | Amount | | | | Value |
|
| |
| AGENCY COMMERCIAL MORTGAGE-BACKED SECURITIES 4.1% | | | | | | | | |
| FIXED-RATE 3.6% | | | | | | | | | | |
| FHLMC: | | | | | | | | | | |
| 6.90%, 12/01/2010 | | | | $ | | 545,000 | | $ | | 578,861 |
| 6.98%, 10/01/2020 | | | | | | 439,013 | | | | 463,738 |
| FNMA: | | | | | | | | | | |
| 6.01%, 02/01/2012 | | | | | | 320,571 | | | | 332,572 |
| 6.65%, 12/01/2007 | | | | | | 219,133 | | | | 218,875 |
| 6.79%, 07/01/2009 | | | | | | 90,653 | | | | 92,629 |
| 6.91%, 07/01/2009 | | | | | | 276,336 | | | | 282,476 |
| 7.09%, 07/01/2009 | | | | | | 272,736 | | | | 280,208 |
| |
|
| | | | | | | | | | | 2,249,359 |
| |
|
| FLOATING-RATE 0.5% | | | | | | | | | | |
| FNMA, 7.25%, 12/01/2010 | | | | | | 264,671 | | | | 281,122 |
| |
|
| Total Agency Commercial Mortgage-Backed Securities | | | | | | | | | | |
| (cost $2,712,195) | | | | | | | | | | 2,530,481 |
| |
|
| AGENCY MORTGAGE-BACKED COLLATERALIZED MORTGAGE | | | | | | | | |
| OBLIGATIONS 17.1% | | | | | | | | | | |
| FIXED-RATE 17.1% | | | | | | | | | | |
| FHLMC: | | | | | | | | | | |
| Ser. 2656, Class BG, 5.00%, 10/15/2032 | | | | | | 840,000 | | | | 827,094 |
| Ser. 2748, Class LE, 4.50%, 12/15/2017 | | | | | | 710,000 | | | | 692,060 |
| Ser. 2841, Class PC, 5.50%, 07/15/2030 | | | | | | 870,000 | | | | 875,559 |
| Ser. 2856, Class PC, 5.50%, 08/15/2030 | | | | | | 565,000 | | | | 567,831 |
| Ser. 2941, Class XC, 5.00%, 12/15/2030 | | | | | | 550,000 | | | | 543,613 |
| Ser. 3015, Class EM, 5.00%, 10/15/2033 | | | | | | 515,000 | | | | 498,355 |
| Ser. 3072, Class NK, 5.00%, 05/15/2031 | | | | | | 385,643 | | | | 382,624 |
| Ser. 3079, Class MD, 5.00%, 03/15/2034 | | | | | | 550,000 | | | | 531,800 |
| Ser. 3082, Class PJ, 5.00%, 09/15/2034 | | | | | | 550,000 | | | | 531,225 |
| Ser. 3096, Class LD, 5.00%, 01/15/2034 | | | | | | 605,000 | | | | 583,593 |
| Ser. 3104, Class QD, 5.00%, 05/15/2034 | | | | | | 550,000 | | | | 530,960 |
| FNMA: | | | | | | | | | | |
| Ser. 2001-71, Class QE, 6.00%, 12/25/2016 | | | | | | 260,600 | | | | 265,375 |
| Ser. 2004-26, Class PA, 4.50%, 09/25/2025 | | | | | | 1,339,303 | | | | 1,323,866 |
| Ser. 2004-60, Class PA, 5.50%, 04/25/2034 | | | | | | 575,049 | | | | 578,765 |
| Ser. 2004-90, Class LH, 5.00%, 04/25/2034 | | | | | | 590,000 | | | | 574,134 |
| Ser. 2005-20, Class QE, 5.00%, 10/25/2030 | | | | | | 730,000 | | | | 719,885 |
| Ser. 2005-38, Class QJ, 5.50%, 03/25/2033 | | | | | | 597,789 | | | | 599,056 |
| |
|
| Total Agency Mortgage-Backed Collateralized Mortgage Obligations | | | | | | | | |
| (cost $10,523,341) | | | | | | | | | | 10,625,795 |
| |
|
See Notes to Financial Statements
8
SCHEDULE OF INVESTMENTS continued
April 30, 2007
| | | | | Principal | | | | |
| | | | | Amount | | | | Value |
|
| |
| AGENCY MORTGAGE-BACKED PASS THROUGH SECURITIES 49.6% | | | | | | | | |
| FIXED-RATE 42.7% | | | | | | | | |
| FHLMC: | | | | | | | | |
| 4.50%, 04/01/2035 | | $ | | 1,157,948 | | $ | | 1,090,097 |
| 5.00%, 04/01/2021 | | | | 822,102 | | | | 811,158 |
| 6.50%, 09/01/2019 | | | | 445,422 | | | | 456,871 |
| FHLMC 30 year, 5.50%, TBA # | | | | 2,390,000 | | | | 2,363,858 |
| FNMA: | | | | | | | | |
| 4.06%, 06/01/2013 | | | | 588,000 | | | | 556,762 |
| 4.50%, 04/01/2019 | | | | 351,084 | | | | 340,595 |
| 4.83%, 03/01/2013 | | | | 661,551 | | | | 656,454 |
| 5.43%, 04/01/2036 | | | | 633,205 | | | | 635,720 |
| 5.50%, 08/01/2035 - 09/01/2035 | | | | 2,758,817 | | | | 2,732,600 |
| 5.78%, 11/01/2011 | | | | 781,947 | | | | 803,081 |
| 5.88%, 09/01/2012 | | | | 404,475 | | | | 419,385 |
| 6.01%, 05/01/2011 | | | | 407,133 | | | | 421,080 |
| 6.09%, 05/01/2011 | | | | 532,367 | | | | 547,976 |
| 6.15%, 05/01/2011 | | | | 223,190 | | | | 229,873 |
| 6.22%, 04/01/2008 | | | | 504,927 | | | | 505,135 |
| 7.00%, 05/01/2032 | | | | 63,150 | | | | 66,023 |
| 7.27%, 02/01/2010 | | | | 480,351 | | | | 500,046 |
| 7.50%, 11/01/2029 - 12/01/2029 | | | | 22,147 | | | | 23,228 |
| 7.63%, 04/01/2010 | | | | 184,439 | | | | 193,928 |
| FNMA 15 year: | | | | | | | | |
| 5.00%, TBA # | | | | 6,305,000 | | | | 6,216,339 |
| 5.50%, TBA # | | | | 1,640,000 | | | | 1,642,562 |
| FNMA 30 year, 6.00%, TBA # | | | | 5,360,000 | | | | 5,401,872 |
| |
|
| | | | | | | | | 26,614,643 |
| |
|
| FLOATING-RATE 6.9% | | | | | | | | |
| FHLMC: | | | | | | | | |
| 5.34%, 12/01/2035 | | | | 504,698 | | | | 503,255 |
| 5.77%, 05/01/2036 | | | | 566,567 | | | | 571,823 |
| FNMA: | | | | | | | | |
| 5.32%, 09/01/2035 | | | | 357,690 | | | | 355,140 |
| 5.45%, 01/01/2036 | | | | 743,153 | | | | 749,307 |
| 5.48%, 03/01/2036 | | | | 714,416 | | | | 717,017 |
| 5.87%, 07/01/2036 | | | | 653,293 | | | | 658,429 |
| 5.93%, 11/01/2036 | | | | 534,208 | | | | 539,151 |
| GNMA, 5.50%, 07/20/2030 | | | | 169,073 | | | | 171,658 |
| |
|
| | | | | | | | | 4,265,780 |
| |
|
| Total Agency Mortgage-Backed Pass Through Securities | | | | | | | | |
| (cost $31,005,532) | | | | | | | | 30,880,423 |
| |
|
| AGENCY REPERFORMING MORTGAGE-BACKED COLLATERALIZED | | | | | | | | |
| MORTGAGE OBLIGATIONS 1.0% | | | | | | | | |
| FNMA, Ser. 2003-W19, Class 1A5, 5.50%, 11/25/2033 (cost $658,757) | | | | 632,387 | | | | 629,357 |
| |
|
See Notes to Financial Statements
9
SCHEDULE OF INVESTMENTS continued
April 30, 2007
| | | | | Principal | | | | |
| | | | | Amount | | | | Value |
|
| |
| ASSET-BACKED SECURITIES 1.9% | | | | | | | | |
| Deutsche Securities, Inc.: | | | | | | | | |
| Ser. 2005-3, Class 4A5, 5.25%, 06/25/2035 | | $ | | 190,000 | | $ | | 188,394 |
| Ser. 2006-AB2, Class A3, 6.27%, 06/25/2036 | | | | 575,000 | | | | 582,797 |
| Morgan Stanley Mtge. Trust, Ser. 2006-2, Class 5A3, 5.50%, 02/25/2036 | | | | 290,000 | | | | 283,476 |
| Vanderbilt Mtge. & Fin., Inc., Ser. 2002-B, Class A3, 4.70%, 10/17/2018 | | | | 155,291 | | | | 154,544 |
| |
|
| Total Asset-Backed Securities (cost $1,203,812) | | | | | | | | 1,209,211 |
| |
|
| COMMERCIAL MORTGAGE-BACKED SECURITIES 13.3% | | | | | | | | |
| FIXED-RATE 12.3% | | | | | | | | |
| Banc of America Comml. Mtge. Securities, Inc., Ser. 2004-4, Class A6, 4.88%, | | | | | | | | |
| 07/10/2042 | | | | 1,000,000 | | | | 976,558 |
| Citigroup/Deutsche Bank Comml. Mtge. Trust, Ser. 2006-CD3, Class A5, 5.62%, | | | | | | | | |
| 10/15/2048 | | | | 790,000 | | | | 803,260 |
| Credit Suisse First Boston Mtge. Securities Corp.: | | | | | | | | |
| Ser. 2003-C3, Class A5, 3.94%, 05/15/2038 | | | | 640,000 | | | | 598,570 |
| Ser. 2003-C5, Class A4, 4.90%, 12/15/2036 | | | | 700,000 | | | | 686,701 |
| GMAC Comml. Mtge. Securities, Inc., Ser. 2004-C2, Class A4, 5.30%, | | | | | | | | |
| 08/10/2038 | | | | 760,000 | | | | 760,775 |
| Goldman Sachs Mtge. Securities Corp. II, Ser. 2003-C1, Class A1, 2.90%, | | | | | | | | |
| 01/10/2040 | | | | 188,015 | | | | 186,442 |
| JPMorgan Chase & Co. Comml. Mtge. Securities Corp.: | | | | | | | | |
| Ser. 2004-CB8, Class A4, 4.40%, 01/12/2039 | | | | 840,000 | | | | 798,522 |
| Ser. 2006-LDP9, Class A3, 5.34%, 05/15/2047 | | | | 400,000 | | | | 397,550 |
| Ser. 2007-LDPX, Class A3, 5.42%, 05/15/2049 | | | | 735,000 | | | | 741,938 |
| LB-UBS Comml. Mtge. Trust, Ser. 2003-C3, Class A4, 4.17%, 05/15/2032 | | | | 440,000 | | | | 416,582 |
| Merrill Lynch/Countrywide Comml. Mtge. Trust, Ser. 2006-4, Class A3, 5.17%, | | | | | | | | |
| 12/12/2049 | | | | 390,000 | | | | 383,524 |
| Morgan Stanley Capital I, Inc., Ser. 2003-T11, Class A4, 5.15%, 06/13/2041 | | | | 670,000 | | | | 666,757 |
| Wachovia Bank Comml. Mtge. Trust, Ser. 2003-C8, Class A1, 3.44%, 11/15/2035 | | | | 236,456 | | | | 231,080 |
| |
|
| | | | | | | | | 7,648,259 |
| |
|
| FLOATING-RATE 1.0% | | | | | | | | |
| JPMorgan Chase & Co. Comml. Mtge. Securities Corp., Ser. 2004-PNC1, | | | | | | | | |
| Class A4, 5.54%, 06/12/2041 | | | | 605,000 | | | | 611,085 |
| |
|
| Total Commercial Mortgage-Backed Securities (cost $8,260,722) | | | | | | | | 8,259,344 |
| |
|
| U.S. TREASURY OBLIGATIONS 2.8% | | | | | | | | |
| U.S. Treasury Notes: | | | | | | | | |
| 3.00%, 02/15/2009 (p) | | | | 1,500,000 | | | | 1,457,989 |
| 4.875%, 08/15/2016 (p) | | | | 305,000 | | | | 310,695 |
| |
|
| Total U.S. Treasury Obligations (cost $1,768,962) | | | | | | | | 1,768,684 |
| |
|
| WHOLE LOAN MORTGAGE-BACKED COLLATERALIZED MORTGAGE | | | | | | | | |
| OBLIGATIONS 2.3% | | | | | | | | |
| FIXED-RATE 0.3% | | | | | | | | |
| Banc of America Mtge. Securities, Inc., Ser. 2005-D, Class 2A6, 4.78%, | | | | | | | | |
| 05/25/2035 | | | | 230,000 | | | | 227,366 |
| |
|
See Notes to Financial Statements
10
SCHEDULE OF INVESTMENTS continued
April 30, 2007
| | | | | | | Principal | | | | |
| | | | | | | Amount | | | | Value |
|
| |
| WHOLE LOAN MORTGAGE-BACKED COLLATERALIZED MORTGAGE | | | | | | | | |
| OBLIGATIONS continued | | | | | | | | | | |
| FLOATING-RATE 2.0% | | | | | | | | | | |
| Washington Mutual, Inc., Ser. 2005-AR5, Class A5, 4.67%, 05/25/2035 | | | | $ 690,000 | | $ | | 679,840 |
| Wells Fargo Mtge. Backed Securities Trust, Ser. 2006-AR07, Class 2A5, 5.61%, | | | | | | |
| 05/25/2036 | | | | | | 560,000 | | | | 563,736 |
| |
|
| | | | | | | | | | | 1,243,576 |
| |
|
| Total Whole Loan Mortgage-Backed Collateralized Mortgage Obligations | | | | | | |
| (cost $1,459,128) | | | | | | | | | | 1,470,942 |
| |
|
| WHOLE LOAN MORTGAGE-BACKED PASS THROUGH SECURITIES 3.1% | | | | | | |
| FLOATING-RATE 3.1% | | | | | | | | | | |
| IndyMac INDX Mtge. Loan Trust, Ser. 2006-AR11, Class 3A1, 5.85%, | | | | | | | | |
| 06/25/2036 | | | | | | 523,069 | | | | 527,583 |
| MASTR Reperforming Loan Trust, Ser. 2006-2, Class 1A1, 5.90%, 05/25/2046 | | | | | | |
| 144A | | | | | | 484,897 | | | | 486,395 |
| Residential Funding Mtge. Securities, Ser. 2006-SA2, Class 2A1, 5.87%, | | | | | | | | |
| 08/25/2036 | | | | | | 535,941 | | | | 538,637 |
| Wells Fargo Mtge. Backed Securities Trust, Ser. 2006-AR10, Class 5A1, 5.60%, | | | | | | |
| 07/25/2036 | | | | | | 398,020 | | | | 398,687 |
| |
|
| Total Whole Loan Mortgage-Backed Pass Through Securities | | | | | | | | |
| (cost $1,938,658) | | | | | | | | | | 1,951,302 |
| |
|
| INVESTMENTS OF CASH COLLATERAL FROM SECURITIES LOANED 2.4% | | | | | | |
| REPURCHASE AGREEMENTS ^ 2.4% | | | | | | | | |
| Bank of America Corp., 5.33%, dated 04/30/2007, maturing 05/01/2007, | | | | | | | | |
| maturity value $1,494,424 (cost $1,494,203) | | | | 1,494,203 | | | | 1,494,203 |
| | |
|
|
| | | | | | | Shares | | | | Value |
|
| |
| SHORT-TERM INVESTMENTS 27.0% | | | | | | | | |
| MUTUAL FUND SHARES 27.0% | | | | | | | | |
| Evergreen Institutional Money Market Fund, Class I, 5.21% q ø ## | | | | | | | | |
| (cost $16,788,925) | | | | | | 16,788,925 | | | | 16,788,925 |
| |
|
| Total Investments (cost $77,814,235) 124.6% | | | | | | | | 77,608,667 |
| Other Assets and Liabilities (24.6%) | | | | | | | | (15,345,930) |
| |
|
| Net Assets 100.0% | | | | | | | | $ | | 62,262,737 |
| |
|
| # | | When-issued or delayed delivery security |
| (p) | | All or a portion of this security is on loan. |
| 144A | | Security that may be sold to qualified institutional buyers under Rule 144A of the Securities Act of 1933, as amended. This |
| | | security has been determined to be liquid under guidelines established by the Board of Trustees, unless otherwise noted. |
| ^ | | Collateral is pooled with the collateral of other Evergreen funds and allocated on a pro-rata basis into 35 issues of high |
| | | grade short-term securities such that sufficient collateral is applied to the respective repurchase agreement. |
| q | | Rate shown is the 7-day annualized yield at period end. |
| ø | | Evergreen Investment Management Company, LLC is the investment advisor to both the Fund and the money market |
| | | fund. |
| ## | | All or a portion of this security has been segregated for when-issued or delayed delivery securities. |
See Notes to Financial Statements
11
SCHEDULE OF INVESTMENTS continued
April 30, 2007
| Summary of Abbreviations |
| FHLMC | | Federal Home Loan Mortgage Corp. |
| FNMA | | Federal National Mortgage Association |
| GNMA | | Government National Mortgage Association |
| MASTR | | Mortgage Asset Securitization Transactions, Inc. |
| TBA | | To Be Announced |
The following table shows the percent of total investments (excluding collateral from securities on loan and segregated cash and cash equivalents) by credit quality based on Moody’s and Standard & Poor’s ratings as of April 30, 2007 (unaudited):
The following table shows the percent of total investments (excluding collateral from securities on loan and segregated cash and cash equivalents) based on effective maturity as of April 30, 2007 (unaudited):
| Less than 1 year | | 4.2% |
| 1 to 3 year(s) | | 8.8% |
| 3 to 5 years | | 42.9% |
| 5 to 10 years | | 43.0% |
| 10 to 20 years | | 1.1% |
| |
|
| | | 100.0% |
| | |
|
See Notes to Financial Statements
12
STATEMENT OF ASSETS AND LIABILITIES
April 30, 2007
| Assets | | | | |
| Investments in securities, at value (cost $61,025,310) including $1,766,693 of securities | | | | |
| loaned | | $ | | 60,819,742 |
| Investments in affiliated money market fund, at value (cost $16,788,925) | | | | 16,788,925 |
|
| Total investments | | | | 77,608,667 |
| Receivable for securities sold | | | | 1,304,360 |
| Principal paydown receivable | | | | 15,804 |
| Receivable for Fund shares sold | | | | 1,664,599 |
| Interest receivable | | | | 302,350 |
| Receivable for securities lending income | | | | 117 |
| Receivable from investment advisor | | | | 132 |
| Prepaid expenses and other assets | | | | 2,096 |
|
| Total assets | | | | 80,898,125 |
|
| Liabilities | | | | |
| Dividends payable | | | | 159,520 |
| Payable for securities purchased | | | | 16,965,269 |
| Unrealized losses on total return swap transactions | | | | 1,211 |
| Payable for securities on loan | | | | 1,494,203 |
| Due to custodian bank | | | | 958 |
| Due to related parties | | | | 666 |
| Accrued expenses and other liabilities | | | | 13,561 |
|
| Total liabilities | | | | 18,635,388 |
|
| Net assets | | $ | | 62,262,737 |
|
| Net assets represented by | | | | |
| Paid-in capital | | $ | | 63,799,301 |
| Overdistributed net investment income | | | | (130,238) |
| Accumulated net realized losses on investments | | | | (1,199,547) |
| Net unrealized losses on investments | | | | (206,779) |
|
| Total net assets | | $ | | 62,262,737 |
|
| Shares outstanding (unlimited number of shares authorized) | | | | |
| Class I | | | | 6,363,924 |
|
| Net asset value per share | | | | |
| Class I | | $ | | 9.78 |
|
See Notes to Financial Statements
13
STATEMENT OF OPERATIONS
Year Ended April 30, 2007
| Investment income | | | | |
| Interest | | $ | | 2,477,324 |
| Income from affiliate | | | | 602,798 |
| Securities lending | | | | 598 |
|
| Total investment income | | | | 3,080,720 |
|
| Expenses | | | | |
| Administrative services fee | | | | 59,337 |
| Transfer agent fees | | | | 2,697 |
| Trustees’ fees and expenses | | | | 898 |
| Printing and postage expenses | | | | 17,600 |
| Custodian and accounting fees | | | | 20,985 |
| Registration and filing fees | | | | 13,069 |
| Professional fees | | | | 21,077 |
| Other | | | | 743 |
|
| Total expenses | | | | 136,406 |
| Less: Expense reductions | | | | (2,254) |
| Expense reimbursements | | | | (14,973) |
|
| Net expenses | | | | 119,179 |
|
| Net investment income | | | | 2,961,541 |
|
| Net realized and unrealized gains or losses on investments | | | | |
| Net realized gains on investments | | | | 294,672 |
| Net change in unrealized gains or losses on investments | | | | 1,150,448 |
|
| Net realized and unrealized gains or losses on investments | | | | 1,445,120 |
|
| Net increase in net assets resulting from operations | | $ | | 4,406,661 |
|
See Notes to Financial Statements
14
STATEMENTS OF CHANGES IN NET ASSETS
| | | Year Ended April 30, |
| |
|
| | | 2007 | | 2006 |
|
| Operations | | | | | | | | | | |
| Net investment income | | $ | | 2,961,541 | | | | $ | | 2,281,754 |
| Net realized gains or losses on | | | | | | | | | | |
| investments | | | | 294,672 | | | | | | (620,215) |
| Net change in unrealized gains or losses | | | | | | | | | | |
| on investments | | | | 1,150,448 | | | | | | (989,569) |
|
| Net increase in net assets resulting from | | | | | | | | | | |
| operations | | | | 4,406,661 | | | | | | 671,970 |
|
| Distributions to shareholders from | | | | | | | | | | |
| net investment income | | | | (3,032,386) | | | | | | (2,474,782) |
|
| | | Shares | | | | Shares | | | | |
| |
|
| Capital share transactions | | | | | | | | | | |
| Proceeds from shares sold | | 3,261,841 | | 31,539,512 | | 3,547,339 | | | | 34,596,127 |
| Net asset value of shares issued in | | | | | | | | | | |
| reinvestment of distributions | | 82,713 | | 802,545 | | 73,142 | | | | 713,879 |
| Payment for shares redeemed | | (3,097,034) | | (30,005,109) | | (2,153,232) | | | | (20,953,110) |
|
| Net increase in net assets resulting from | | | | | | | | | | |
| capital share transactions | | | | 2,336,948 | | | | | | 14,356,896 |
|
| Total increase in net assets | | | | 3,711,223 | | | | | | 12,554,084 |
| Net assets | | | | | | | | | | |
| Beginning of period | | | | 58,551,514 | | | | | | 45,997,430 |
|
| End of period | | $ | | 62,262,737 | | | | $ | | 58,551,514 |
|
| Overdistributed net investment income | | $ | | (130,238) | | | | $ | | (78,874) |
|
See Notes to Financial Statements
15
NOTES TO FINANCIAL STATEMENTS
1. ORGANIZATION
Evergreen Institutional Mortgage Portfolio (the “Fund”) is a diversified series of Evergreen Fixed Income Trust (the “Trust”), a Delaware statutory trust organized on September 18, 1997. The Trust is an open-end management investment company registered under the Investment Company Act of 1940, as amended (the “1940 Act”).
The Fund offers Class I shares. Class I shares are sold without a front-end sales charge or contingent deferred sales charge.
2. SIGNIFICANT ACCOUNTING POLICIES
The following is a summary of significant accounting policies consistently followed by the Fund in the preparation of its financial statements. The policies are in conformity with generally accepted accounting principles in the United States of America, which require management to make estimates and assumptions that affect amounts reported herein. Actual results could differ from these estimates.
a. Valuation of investments
Portfolio debt securities acquired with more than 60 days to maturity are fair valued using matrix pricing methods determined by an independent pricing service which takes into consideration such factors as similar security prices, yields, maturities, liquidity and ratings. Securities for which valuations are not readily available from an independent pricing service may be valued by brokers which use prices provided by market makers or estimates of market value obtained from yield data relating to investments or securities with similar characteristics.
Investments of cash collateral in short-term securities are valued at amortized cost, which approximates market value.
Short-term securities with remaining maturities of 60 days or less at the time of purchase are valued at amortized cost, which approximates market value.
Investments in other mutual funds are valued at net asset value. Securities for which market quotations are not readily available or not reflective of current market value are valued at fair value as determined by the investment advisor in good faith, according to procedures approved by the Board of Trustees.
b. Repurchase agreements
Securities pledged as collateral for repurchase agreements are held by the custodian bank or in a segregated account in the Fund’s name until the agreements mature. Collateral for certain tri-party repurchase agreements is held at the counterparty’s custodian in a segregated account for the benefit of the Fund and the counterparty. Each agreement requires that the market value of the collateral be sufficient to cover payments of interest and principal. However, in the event of default or bankruptcy by the other party to the agreement, retention of the collateral may be subject to legal proceedings. The Fund will enter into repurchase agreements with banks and other financial institutions, which are deemed by the investment advisor to be creditworthy
16
NOTES TO FINANCIAL STATEMENTS continued
pursuant to guidelines established by the Board of Trustees. In certain instances, the Fund’s securities lending agent may provide collateral in the form of repurchase agreements.
c. When-issued and delayed delivery transactions
The Fund records when-issued or delayed delivery securities as of trade date and maintains security positions such that sufficient liquid assets will be available to make payment for the securities purchased. Securities purchased on a when-issued or delayed delivery basis are marked-to-market daily and begin earning interest on the settlement date. Losses may occur on these transactions due to changes in market conditions or the failure of counterparties to perform under the contract.
d. Securities lending
The Fund may lend its securities to certain qualified brokers in order to earn additional income. The Fund receives compensation in the form of fees or interest earned on the investment of any cash collateral received. The Fund also continues to receive interest and dividends on the securities loaned. The Fund receives collateral in the form of cash or securities with a market value at least equal to the market value of the securities on loan, including accrued interest. In the event of default or bankruptcy by the borrower, the Fund could experience delays and costs in recovering the loaned securities or in gaining access to the collateral. The Fund has the right under the lending agreement to recover the securities from the borrower on demand.
e. Total return swaps
The Fund may enter into total return swaps. Total return swaps involve commitments to pay interest in exchange for a market linked return, both based on notional amounts. To the extent the total return of the security or index underlying the transaction exceeds or falls short of the offsetting interest rate obligation, the Fund will receive a payment from or make a payment to the counterparty. The value of the swap agreements is marked-to-market daily based upon quotations from market makers and any change in value is recorded as an unrealized gain or loss. The Fund could be exposed to risks if the counterparty defaults on its obligation to perform, or if there are unfavorable changes in the fluctuation of interest rates or in the price of the underlying security.
f. Dollar roll transactions
The Fund may enter into dollar roll transactions with respect to mortgage-backed securities. In a dollar roll transaction, the Fund sells mortgage-backed securities to financial institutions and simultaneously agrees to accept substantially similar (same type, coupon and maturity) securities at a later date at an agreed upon price. The Fund will use the proceeds generated from the transactions to invest in short-term investments, which may enhance the Fund’s current yield and total return. The Fund accounts for dollar roll transactions as purchases and sales. The Fund could be exposed to risks if the counterparty defaults on its obligation to perform under the terms of the agreement, if the Fund receives inferior securities in comparison to what was sold to the coun-terparty at redelivery or if there are variances in paydown speed between the mortgage-related pools.
17
NOTES TO FINANCIAL STATEMENTS continued
g. Security transactions and investment income
Security transactions are recorded on trade date. Realized gains and losses are computed using the specific cost of the security sold. Interest income is recorded on the accrual basis and includes accretion of discounts and amortization of premiums.
h. Federal taxes
The Fund intends to continue to qualify as a regulated investment company and distribute all of its taxable income, including any net capital gains (which have already been offset by available capital loss carryovers). Accordingly, no provision for federal taxes is required.
i. Distributions
Distributions to shareholders from net investment income are accrued daily and paid monthly. Distributions from net realized gains, if any, are recorded on the ex-dividend date. Such distributions are determined in conformity with income tax regulations, which may differ from generally accepted accounting principles.
Reclassifications have been made to the Fund’s components of net assets to reflect income and gains available for distribution (or available capital loss carryovers, as applicable) under income tax regulations. The primary permanent differences causing such reclassifications are due to mortgage paydown gains and losses. During the year ended April 30, 2007, the following amounts were reclassified:
|
| Overdistributed net investment income | | $ | | 19,481 |
| Accumulated net realized losses on investments | | | | (19,481) |
|
3. ADVISORY FEE AND OTHER TRANSACTIONS WITH AFFILIATES
Evergreen Investment Management Company, LLC (“EIMC”), an indirect, wholly-owned subsidiary of Wachovia Corporation (“Wachovia”), is the investment advisor to the Fund. The Fund does not pay a fee for the investment advisory service.
Tattersall Advisory Group, Inc., an indirect, wholly-owned subsidiary of Wachovia, is the investment sub-advisor to the Fund and is paid by EIMC for its services to the Fund.
From time to time, EIMC may voluntarily or contractually reimburse expenses in order to limit operating expenses. During the year ended April 30, 2007, EIMC voluntarily reimbursed other expenses in the amount of $14,973.
The Fund may invest in Evergreen-managed money market funds, which are also advised by EIMC. Income earned on these investments is included in income from affiliate on the Statement of Operations.
Evergreen Investment Services, Inc. (“EIS”), an indirect, wholly-owned subsidiary of Wachovia, is the administrator to the Fund. As administrator, EIS provides the Fund with facilities, equipment and personnel and is paid an annual rate determined by applying percentage rates to the aggregate average daily net assets of the Evergreen funds (excluding money market funds and
18
NOTES TO FINANCIAL STATEMENTS continued
Evergreen Institutional Enhanced Income Fund), starting at 0.10% and declining to 0.05% as the aggregate average daily net assets of the Evergreen funds (excluding money market funds and Evergreen Institutional Enhanced Income Fund) increase.
Evergreen Service Company, LLC (“ESC”), an indirect, wholly-owned subsidiary of Wachovia, is the transfer and dividend disbursing agent for the Fund. ESC receives account fees that vary based on the type of account held by the shareholders in the Fund.
4. SECURITIES TRANSACTIONS
Cost of purchases and proceeds from sales of investment securities (excluding short-term securities and mortgage dollar roll transactions) were as follows for the year ended April 30, 2007:
| Cost of Purchases | | Proceeds from Sales |
|
| U.S. | | Non-U.S. | | U.S. | | Non-U.S. |
| Government | | Government | | Government | | Government |
|
| $82,314,875 | | $12,671,232 | | $78,240,463 | | $10,490,741 |
|
During the year ended April 30, 2007, the Fund loaned securities to certain brokers. At April 30, 2007, the value of securities on loan and the total value of collateral received for securities loaned amounted to $1,766,693 and $1,813,108, respectively. Of the total value of the collateral received for securities on loan, $318,905 represents the market value of U.S. government agency securities received as non-cash collateral.
At April 30, 2007, the Fund had the following open total return swap agreement:
| | | Notional | | | | | | Unrealized |
| Expiration | | Amount | | Swap Description | | Counterparty | | Loss |
|
| 11/1/2007 | | $1,000,000 | | Agreement dated 4/23/2007 to | | Lehman Brothers | | $1,211 |
| | | | | receive 35 basis points and to | | | | |
| | | | | receive the positive spread return or | | | | |
| | | | | pay the negative spread return on | | | | |
| | | | | the Lehman Brothers CMBS AAA | | | | |
| | | | | 8.5+yr Index which are multiplied | | | | |
| | | | | by the Lehman notional amount. | | | | |
|
On April 30, 2007, the aggregate cost of securities for federal income tax purposes was $77,817,124. The gross unrealized appreciation and depreciation on securities based on tax cost was $312,239 and $520,696, respectively, with a net unrealized depreciation of $208,457.
As of April 30, 2007, the Fund had $1,196,658 in capital loss carryovers for federal income tax purposes expiring as follows:
| Expiration |
|
| 2012 | | 2013 | | | | 2014 | | 2015 |
|
| $512,937 | | $77,895 | | | | $392,403 | | $213,423 |
|
19
NOTES TO FINANCIAL STATEMENTS continued
5. INTERFUND LENDING
Pursuant to an Exemptive Order issued by the SEC, the Fund may participate in an interfund lending program with certain funds in the Evergreen fund family. This program allows the Fund to borrow from, or lend money to, other participating funds. During the year ended April 30, 2007, the Fund did not participate in the interfund lending program.
6. DISTRIBUTIONS TO SHAREHOLDERS
As of April 30, 2007, the components of distributable earnings on a tax basis were as follows:
| Overdistributed | | Unrealized | | Capital Loss |
| Ordinary Income | | Depreciation | | Carryovers |
|
| $131,449 | | $208,457 | | $1,196,658 |
|
The differences between the components of distributable earnings on a tax basis and the amounts reflected in the Statement of Assets and Liabilities are primarily due to wash sales and mark-to-market on total return swaps.
The tax character of distributions paid were $3,032,386 and $2,474,782 of ordinary income for the years ended April 30, 2007 and April 30, 2006, respectively.
7. EXPENSE REDUCTIONS
Through expense offset arrangements with ESC and the Fund’s custodian, a portion of fund expenses has been reduced.
8. DEFERRED TRUSTEES’ FEES
Each Trustee of the Fund may defer any or all compensation related to performance of their duties as Trustees. The Trustees’ deferred balances are allocated to deferral accounts, which are included in the accrued expenses for the Fund. The investment performance of the deferral accounts is based on the investment performance of certain Evergreen funds. Any gains earned or losses incurred in the deferral accounts are reported in the Fund’s Trustees’ fees and expenses. At the election of the Trustees, the deferral account will be paid either in one lump sum or in quarterly installments for up to ten years.
9. FINANCING AGREEMENT
The Fund and certain other Evergreen funds share in an unsecured revolving credit commitment for temporary and emergency purposes, including the funding of redemptions, as permitted by each participating fund’s borrowing restrictions. Borrowings under this facility bear interest at 0.50% per annum above the Federal Funds rate. All of the participating funds are charged an annual commitment fee on the unused balance, which is allocated pro rata. The credit facility is for $100 million with an annual commitment fee of 0.08% . Prior to July 3, 2006, the credit facility was for $150 million with an annual commitment fee of 0.09% .
20
NOTES TO FINANCIAL STATEMENTS continued
10. REGULATORY MATTERS AND LEGAL PROCEEDINGS
Since September 2003, governmental and self-regulatory authorities have instituted numerous ongoing investigations of various practices in the mutual fund industry, including investigations relating to revenue sharing, market-timing, late trading and record retention, among other things. The investigations cover investment advisors, distributors and transfer agents to mutual funds, as well as other firms. EIMC, EIS and ESC (collectively, “Evergreen”) have received subpoenas and other requests for documents and testimony relating to these investigations, are endeavoring to comply with those requests, and are cooperating with the investigations. Evergreen is continuing its own internal review of policies, practices, procedures and personnel, and is taking remedial action where appropriate.
In connection with one of these investigations, on July 28, 2004, the staff of the Securities and Exchange Commission (“SEC”) informed Evergreen that the staff intends to recommend to the SEC that it institute an enforcement action against Evergreen. The SEC staff’s proposed allegations relate to (i) an arrangement pursuant to which a broker at one of EIMC’s affiliated broker-dealers had been authorized, apparently by an EIMC officer (who is no longer with EIMC), to engage in short-term trading, on behalf of a client, in Evergreen Mid Cap Growth Fund (formerly Evergreen Emerging Growth Fund and prior to that, known as Evergreen Small Company Growth Fund) during the period from December 2000 through April 2003, in excess of the limitations set forth in the fund’s prospectus, (ii) short-term trading from September 2001 through January 2003, by a former Evergreen portfolio manager of Evergreen Precious Metals Fund, a fund he managed at the time, (iii) the sufficiency of systems for monitoring exchanges and enforcing exchange limitations as stated in the funds’ prospectuses, and (iv) the adequacy of e-mail retention practices. In connection with the activity in Evergreen Mid Cap Growth Fund, EIMC reimbursed the fund $378,905, plus an additional $25,242, representing what EIMC calculated at that time to be the client’s net gain and the fees earned by EIMC and the expenses incurred by this fund on the client’s account. In connection with the activity in Evergreen Precious Metals Fund, EIMC reimbursed the fund $70,878, plus an additional $3,075, representing what EIMC calculated at that time to be the portfolio manager’s net gain and the fees earned by EIMC and expenses incurred by the fund on the portfolio manager’s account. Evergreen is currently engaged in discussions with the staff of the SEC concerning its recommendation.
Any resolution of these matters with regulatory authorities may include, but not be limited to, sanctions, penalties or injunctions regarding Evergreen, restitution to mutual fund shareholders and/or other financial penalties and structural changes in the governance or management of Evergreen’s mutual fund business. Any penalties or restitution will be paid by Evergreen and not by the Evergreen funds.
EIS has entered into an agreement with the NASD settling allegations that EIS (i) arranged for Evergreen fund portfolio trades to be directed to Wachovia Securities, LLC, an affiliate of EIS that sold Evergreen fund shares, during the period of January 2001 to December 2003 and (ii) provided non-cash compensation by sponsoring offsite meetings attended by Wachovia Securities, LLC brokers during that period, where the eligibility of a broker to attend the meet-
21
NOTES TO FINANCIAL STATEMENTS continued
ings depended upon the broker meeting certain sales targets of Evergreen fund shares. Pursuant to the settlement agreement, EIS has agreed to a censure and a fine of $4,200,000. EIS neither admitted nor denied the allegations and findings set forth in its agreement with the NASD.
In addition, the Evergreen funds and EIMC and certain of its affiliates are involved in various legal actions, including private litigation and class action lawsuits. EIMC does not expect that any of such legal actions currently pending or threatened will have a material adverse impact on the financial position or operations of any of the Evergreen funds or on EIMC’s ability to provide services to the Evergreen funds.
Although Evergreen believes that neither the foregoing investigations described above nor any pending or threatened legal actions will have a material adverse impact on the Evergreen funds, there can be no assurance that these matters and any publicity surrounding or resulting from them will not result in reduced sales or increased redemptions of Evergreen fund shares, which could increase Evergreen fund transaction costs or operating expenses, or that they will not have other adverse consequences on the Evergreen funds.
11. NEW ACCOUNTING PRONOUNCEMENTS
In June 2006, the Financial Accounting Standards Board (“FASB”) issued FASB Interpretation No. 48, Accounting for Uncertainty in Income Taxes — an interpretation of FASB statement 109 (“FIN 48”). FIN 48 supplements FASB 109 by prescribing a recognition threshold and measurement attribute for the financial statement recognition and measurement of a tax position taken or expected to be taken in a tax return. The adoption of FIN 48 will require financial statements to be adjusted to reflect only those tax positions that are more likely than not to be sustained as of the adoption date. Management of the Fund is currently evaluating the impact that the adoption of FIN 48 will have on the financial statements. FIN 48 will become effective for fiscal years beginning after December 15, 2006.
In September 2006, FASB issued Statement of Financial Accounting Standards No. 157, Fair Value Measurements (“FAS 157”). FAS 157 establishes a single authoritative definition of fair value, establishes a framework for measuring fair value and expands disclosures about fair value measurements. FAS 157 applies to fair value measurements already required or permitted by existing standards. The change to current generally accepted accounting principles from the application of FAS 157 relates to the definition of fair value, the methods used to measure fair value, and the expanded disclosures about fair value measurements. Management of the Fund does not believe the adoption of FAS 157 will materially impact the financial statement amounts, however, additional disclosures may be required about the inputs used to develop the measurements and the effect of certain of the measurements on changes in net assets for the period. FAS 157 is effective for financial statements issued for fiscal years beginning after November 15, 2007 and interim periods within those fiscal years.
22
REPORT OF INDEPENDENT REGISTERED PUBLIC ACCOUNTING FIRM
Board of Trustees and Shareholders
Evergreen Fixed Income Trust
We have audited the accompanying statement of assets and liabilities, including the schedule of investments, of the Evergreen Institutional Mortgage Portfolio, a series of Evergreen Fixed Income Trust, as of April 30, 2007, and the related statement of operations for the year then ended, statements of changes in net assets for each of the years in the two-year period then ended, and the financial highlights for each of the years or periods in the five-year period then ended. These financial statements and financial highlights are the responsibility of the Fund’s management. Our responsibility is to express an opinion on these financial statements and financial highlights based on our audits.
We conducted our audits in accordance with the standards of the Public Company Accounting Oversight Board (United States). Those standards require that we plan and perform the audit to obtain reasonable assurance about whether the financial statements and financial highlights are free of material misstatement. An audit includes examining, on a test basis, evidence supporting the amounts and disclosures in the financial statements. Our procedures included confirmation of securities owned as of April 30, 2007 by correspondence with the custodian and brokers, or by other appropriate auditing procedures where replies from brokers were not received. An audit also includes assessing the accounting principles used and significant estimates made by management, as well as evaluating the overall financial statement presentation. We believe that our audits provide a reasonable basis for our opinion.
In our opinion, the financial statements and financial highlights referred to above present fairly, in all material respects, the financial position of the Evergreen Institutional Mortgage Portfolio, as of April 30, 2007, the results of its operations, changes in its net assets and financial highlights for each of the years or periods described above, in conformity with U.S. generally accepted accounting principles.

Boston, Massachusetts
June 28, 2007
23
TRUSTEES AND OFFICERS
TRUSTEES1
| Charles A. Austin III | | Investment Counselor, Anchor Capital Advisors, LLC. (investment advice); Director, The Andover |
| Trustee | | Companies (insurance); Trustee, Arthritis Foundation of New England; Former Director, The |
| DOB: 10/23/1934 | | Francis Ouimet Society (scholarship program); Former Director, Executive Vice President and |
| Term of office since: 1991 | | Treasurer, State Street Research & Management Company (investment advice) |
| Other directorships: None | | |
|
| |
| K. Dun Gifford | | Chairman and President, Oldways Preservation and Exchange Trust (education); Trustee, |
| Trustee | | Treasurer and Chairman of the Finance Committee, Cambridge College |
| DOB: 10/23/1938 | | |
| Term of office since: 1974 | | |
| Other directorships: None | | |
|
| |
| Dr. Leroy Keith, Jr. | | Partner, Stonington Partners, Inc. (private equity fund); Trustee, Phoenix Fund Complex; Director, |
| Trustee | | Diversapack Co. (packaging company); Director, Obagi Medical Products Co.; Former Director, |
| DOB: 2/14/1939 | | Lincoln Educational Services |
| Term of office since: 1983 | | |
| Other directorships: Trustee, | | |
| Phoenix Fund Complex (consisting | | |
| of 60 portfolios) | | |
|
| |
| Gerald M. McDonnell | | Manager of Commercial Operations, CMC Steel (steel producer) |
| Trustee | | |
| DOB: 7/14/1939 | | |
| Term of office since: 1988 | | |
| Other directorships: None | | |
|
| |
| Patricia B. Norris | | President and Director of Phillips Pond Homes Association (home community); President and |
| Trustee | | Director of Buckleys of Kezar Lake, Inc., (real estate company); Former Partner, |
| DOB: 4/9/1948 | | PricewaterhouseCoopers, LLP |
| Term of office since: 2006 | | |
| Other directorships: None | | |
|
| |
| William Walt Pettit | | Partner and Vice President, Kellam & Pettit, P.A. (law firm); Director, Superior Packaging Corp. |
| Trustee | | (packaging company); Member, Superior Land, LLC (real estate holding company), Member, |
| DOB: 8/26/1955 | | K&P Development, LLC (real estate development); Former Director, National Kidney Foundation |
| Term of office since: 1984 | | of North Carolina, Inc. (non-profit organization) |
| Other directorships: None | | |
|
| |
| David M. Richardson | | President, Richardson, Runden LLC (executive recruitment business development/consulting |
| Trustee | | company); Consultant, Kennedy Information, Inc. (executive recruitment information and |
| DOB: 9/19/1941 | | research company); Consultant, AESC (The Association of Executive Search Consultants); |
| Term of office since: 1982 | | Director, J&M Cumming Paper Co. (paper merchandising); Former Trustee, NDI Technologies, LLP |
| Other directorships: None | | (communications) |
|
| |
| Dr. Russell A. Salton III | | President/CEO, AccessOne MedCard, Inc.; Former Medical Director, Healthcare Resource |
| Trustee | | Associates, Inc. |
| DOB: 6/2/1947 | | |
| Term of office since: 1984 | | |
| Other directorships: None | | |
|
| |
| Michael S. Scofield | | Retired Attorney, Law Offices of Michael S. Scofield; Former Director and Chairman, Branded |
| Trustee | | Media Corporation (multi-media branding company) |
| DOB: 2/20/1943 | | |
| Term of office since: 1984 | | |
| Other directorships: None | | |
|
24
TRUSTEES AND OFFICERS continued
| Richard J. Shima | | Independent Consultant; Director, Hartford Hospital; Trustee, Greater Hartford YMCA; Former |
| Trustee | | Director, Trust Company of CT; Former Director, Old State House Association; Former Trustee, |
| DOB: 8/11/1939 | | Saint Joseph College (CT) |
| Term of office since: 1993 | | |
| Other directorships: None | | |
|
| |
| Richard K. Wagoner, CFA2 | | Member and Former President, North Carolina Securities Traders Association; Member, Financial |
| Trustee | | Analysts Society |
| DOB: 12/12/1937 | | |
| Term of office since: 1999 | | |
| Other directorships: None | | |
|
| |
| |
| OFFICERS | | |
| |
| Dennis H. Ferro3 | | Principal occupations: President and Chief Executive Officer, Evergreen Investment Company, |
| President | | Inc. and Executive Vice President, Wachovia Bank, N.A.; former Chief Investment Officer, |
| DOB: 6/20/1945 | | Evergreen Investment Company, Inc. |
| Term of office since: 2003 | | |
|
| |
| Kasey Phillips4 | | Principal occupations: Senior Vice President, Evergreen Investment Services, Inc.; Former Vice |
| Treasurer | | President, Evergreen Investment Services, Inc.; Former Assistant Vice President, Evergreen |
| DOB: 12/12/1970 | | Investment Services, Inc. |
| Term of office since: 2005 | | |
|
| |
| Michael H. Koonce4 | | Principal occupations: Senior Vice President and General Counsel, Evergreen Investment |
| Secretary | | Services, Inc.; Secretary, Senior Vice President and General Counsel, Evergreen Investment |
| DOB: 4/20/1960 | | Management Company, LLC and Evergreen Service Company, LLC; Senior Vice President and |
| Term of office since: 2000 | | Assistant General Counsel, Wachovia Corporation |
|
| |
| Robert Guerin4, 5 | | Principal occupations: Chief Compliance Officer, Evergreen Funds and Senior Vice President of |
| Chief Compliance Officer | | Evergreen Investments Co, Inc; Former Managing Director and Senior Compliance Officer, |
| DOB: 9/20/1965 | | Babson Capital Management LLC; Former Principal and Director, Compliance and Risk |
| Term of office since: 2007 | | Management, State Street Global Advisors; Former Vice President and Manager, Sales Practice |
| | | Compliance, Deutsche Asset Management. |
1 Each Trustee, except Ms. Norris, serves until a successor is duly elected or qualified or until his death, resignation, retirement or removal from office. As a new Trustee, Ms. Norris’ initial term ends June 30, 2009, at which time she may be re-elected by Trustees to serve until a successor is duly elected or qualified or until her death, resignation, retirement or removal from office by the Trustees. Each Trustee oversees 94 Evergreen funds. Correspondence for each Trustee may be sent to Evergreen Board of Trustees, P.O. Box 20083, Charlotte, NC 28202.
2 Mr. Wagoner is an “interested person” of the Fund because of his ownership of shares in Wachovia Corporation, the parent to the Fund’s investment advisor.
3 The address of the Officer is 401 S. Tryon Street, 20th Floor, Charlotte, NC 28288.
4 The address of the Officer is 200 Berkeley Street, Boston, MA 02116.
5 Mr. Guerin’s information is as of June 14, 2007, the effective date of his approval by the Board of Trustees as Chief Compliance Officer of the Evergreen funds.
Additional information about the Fund’s Board of Trustees and Officers can be found in the Statement of Additional Information (SAI) and is available upon request without charge by calling 800.343.2898.
25
573633 rv2 06/2007
Evergreen Diversified Income Builder Fund

| | | table of contents |
| 1 | | LETTER TO SHAREHOLDERS |
| 4 | | FUND AT A GLANCE |
| 5 | | PORTFOLIO MANAGER COMMENTARY |
| 6 | | ABOUT YOUR FUND’S EXPENSES |
| 7 | | FINANCIAL HIGHLIGHTS |
| 11 | | SCHEDULE OF INVESTMENTS |
| 26 | | STATEMENT OF ASSETS AND LIABILITIES |
| 27 | | STATEMENT OF OPERATIONS |
| 28 | | STATEMENTS OF CHANGES IN NET ASSETS |
| 29 | | NOTES TO FINANCIAL STATEMENTS |
| 38 | | REPORT OF INDEPENDENT REGISTERED PUBLIC ACCOUNTING FIRM |
| 39 | | ADDITIONAL INFORMATION |
| 40 | | TRUSTEES AND OFFICERS |
This annual report must be preceded or accompanied by a prospectus of the Evergreen fund contained herein. The prospectus contains more complete information, including fees and expenses, and should be read carefully before investing or sending money.
The fund will file its complete schedule of portfolio holdings with the SEC for the first and third quarters of each fiscal year on Form N-Q. The fund’s Form N-Q will be available on the SEC’s Web site at http://www.sec.gov. In addition, the fund’s Form N-Q may be reviewed and copied at the SEC’s Public Reference Room in Washington, D.C. Information on the operation of the Public Reference Room may be obtained by calling 800.SEC.0330.
A description of the fund’s proxy voting policies and procedures, as well as information regarding how the fund voted proxies relating to portfolio securities during the most recent 12-month period ended June 30, is available by visiting our Web site at EvergreenInvestments.com or by visiting the SEC’s Web site at http://www.sec.gov. The fund’s proxy voting policies and procedures are also available without charge, upon request, by calling 800.343.2898.
| | | | |
| Mutual Funds: | | | | |
| NOT FDIC INSURED | | MAY LOSE VALUE | | NOT BANK GUARANTEED |
Copyright 2007, Evergreen Investment Management Company, LLC.
Evergreen Investment Management Company, LLC is a subsidiary of Wachovia Corporation and is an affiliate of Wachovia Corporation’s other Broker Dealer subsidiaries.
Evergreen mutual funds are distributed by Evergreen Investment Services, Inc. 200 Berkeley Street, Boston, MA 02116
LETTER TO SHAREHOLDERS
June 2007

Dennis H. Ferro
President and Chief
Executive Officer
Dear Shareholder,
We are pleased to provide the annual report for Evergreen Diversified Income Builder Fund covering the twelve-month period ended April 30, 2007.
The domestic fixed-income markets generated healthy results during the twelve-month period in an environment supported by persistent growth and the prospect of stable interest rates. While the economic expansion decelerated as the period progressed, continued gains in business profits helped support the performance of corporate debt securities, including lower-quality, higher-yielding bonds, which generally outperformed high-grade and investment-grade debt. The fiscal year began on a harsh note in the spring of 2006 amid rising inflationary concerns, accompanied by anxieties about the potential economic impacts of repeated interest rate hikes by the Federal Reserve Board (the “Fed”). However, the markets were calmed in both the summer and autumn by the combination of receding commodity prices and the Fed’s policy to leave short-term interest rates unchanged. Over the full twelve-month period, the yield curve flattened — the difference between short-term yields and long-term yields narrowed. In this environment, longer-maturity bonds, especially those with maturities of 20 to 30 years, tended to outperform the overall bond market.
1
LETTER TO SHAREHOLDERS continued
Solid returns in both the nation’s equity and fixed-income markets came against a backdrop of persistent economic growth during most of the period. Gross Domestic Product grew by a rate of 3.3% over 2006 then decelerated to an annualized rate of 1.3% in the first quarter of 2007. The slump in the housing industry was a major factor that contributed to the slowdown, which came in the face of strong employment, rising wages and gains in both personal consumption and business investment.
In this environment, the teams managing the higher-quality portfolios, including Evergreen Core Bond Fund, Evergreen U.S. Government Fund and Evergreen Institutional Mortgage Portfolio, assessed factors such as employment and inflationary trends, Fed policy, and interest-rate expectations in making their decisions. At the same time, the managers supervising Evergreen High Yield Bond Fund and Evergreen Select High Yield Bond Fund tended to position their more credit-sensitive portfolios relatively cautiously as the relative yield advantages of lower-quality corporate bonds appeared to tighten. The managers of Evergreen Diversified Bond Fund also sought opportunities in the high-yield market, while maintaining a healthy exposure to investment-grade securities. The managers of Evergreen Diversified Income Builder Fund, meanwhile, looked at broad interest-rate trends, opportunities in the credit markets, and the effects of currency fluctuations in making decisions on sector and industry allocations and individual security selections.
As always, we encourage investors to maintain diversified investment portfolios in pursuit of their long-term investment goals.
2
LETTER TO SHAREHOLDERS continued
Please visit us at
EvergreenInvestments.com for more information about our funds and other investment products available to you. Thank you for your continued support of Evergreen Investments.
Sincerely,

Dennis H. Ferro
President and Chief Executive Officer
Evergreen Investment Company, Inc.
Special Notice to Shareholders:
Please visit our Web site at EvergreenInvestments.com for statements from President and Chief Executive Officer, Dennis Ferro, addressing NASD actions involving Evergreen Investment Services, Inc. (EIS), Evergreen’s mutual fund distributor or statements from Dennis Ferro and Chairman of the Board of the Evergreen funds, Michael S. Scofield, addressing SEC actions involving the Evergreen funds.
3
FUND AT A GLANCE
as of April 30, 2007
MANAGEMENT TEAM
Investment Advisor:
• Evergreen Investment Management Company, LLC
Portfolio Manager:
• Margaret D. Patel†
CURRENT INVESTMENT STYLE

Source: Morningstar, Inc.
Morningstar’s style box is based on a portfolio date as of 3/31/2007.
The Fixed income style box placement is based on a fund’s average effective maturity or duration and the average credit rating of the bond portfolio.
† Effective April 23, 2007, Margaret D. Patel became a portfolio manager of the fund. Effective June 1, 2007, Ms. Patel will assume sole day-to-day management responsibility of the fund.
4
| PERFORMANCE AND RETURNS | | | | | | | | |
|
| Portfolio inception date: 4/14/1987 | | | | | | | | |
| | | Class A | | Class B | | Class C | | Class I |
| Class inception date | | 4/14/1987 | | 2/1/1993 | | 2/1/1993 | | 1/13/1997 |
|
| Nasdaq symbol | | EKSAX | | EKSBX | | EKSCX | | EKSYX |
|
| Average annual return* | | | | | | | | |
|
| 1-year with sales charge | | 1.57% | | 0.94% | | 4.94% | | N/A |
|
| 1-year w/o sales charge | | 6.71% | | 5.94% | | 5.94% | | 7.02% |
|
| 5-year | | 7.12% | | 7.08% | | 7.39% | | 8.47% |
|
| 10-year | | 5.95% | | 5.67% | | 5.67% | | 6.83% |
|
| Maximum sales charge | | 4.75% | | 5.00% | | 1.00% | | N/A |
| | | Front-end | | CDSC | | CDSC | | |
|
* Adjusted for maximum applicable sales charge, unless noted.
Past performance is no guarantee of future results. The performance quoted represents past performance and current performance may be lower or higher. The investment return and principal value of an investment will fluctuate so that investors’ shares, when redeemed, may be worth more or less than their original cost. To obtain performance information current to the most recent month-end for Classes A, B, C or I, please go to EvergreenInvestments.com/fundperformance. The performance of each class may vary based on differences in loads, fees and expenses paid by the shareholders investing in each class. Performance includes the reinvestment of income dividends and capital gain distributions. Performance shown does not reflect the deduction of taxes that a shareholder would pay on fund distributions or the redemption of fund shares. The fund incurs a 12b-1 fee of 0.30% for Class A and 1.00% for Classes B and C. Class I does not pay a 12b-1 fee.
The advisor is reimbursing a portion of the 12b-1 fee for Class A. Had the fee not been reimbursed, returns for Class A would have been lower. Returns reflect expense limits previously in effect for all classes, without which returns would have been lower.
LONG-TERM GROWTH
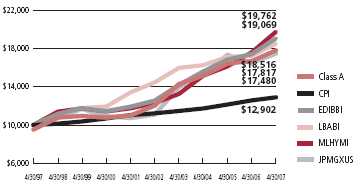
Comparison of a $10,000 investment in the Evergreen Diversified Income Builder Fund Class A shares versus a similar investment in the Evergreen Diversified Income Builder Blended Index^ (EDIBBI), the JPMorgan Global Government Bond Index Excluding U.S. (JPMGXUS), the Lehman Brothers Aggregate Bond Index (LBABI), the Merrill Lynch High Yield Master Index (MLHYMI) and the Consumer Price Index (CPI).
The EDIBBI, the JPMGXUS, the LBABI and the MLHYMI are unmanaged market indexes and do not include transaction costs associated with buying and selling securities, any mutual fund fees or expenses or any taxes. The CPI is a commonly used measure of inflation and does not represent an investment return. It is not possible to invest directly in an index.
PORTFOLIO MANAGER COMMENTARY
The fund’s Class A shares returned 6.71% for the twelve-month period ended April 30, 2007, excluding any applicable sales charges. During the same period, the EDIBBI returned 9.49%, the JPMGXUS returned 6.11%, the LBABI returned 7.36% and the MLHYMI returned 12.25% .
The fund seeks high current income from investments in income-producing securities. Secondarily, the fund considers potential for growth of capital in selecting securities.
During the fiscal year, the fund pursued a highly diversified strategy, with significant exposure to four asset classes: foreign government bonds; emerging market debt; domestic high-yield bonds; and U.S government bonds.
It was a volatile twelve-month period in the world currency markets. Global growth remained reasonably healthy, and the major central banks moved to a relatively neutral monetary stance, neither stimulative nor restrictive of economic growth, as fears of rising inflationary pressures abated somewhat in the second half of the period. Bond yields remained fairly stable, with recovery following a period of initial weakness. The U.S. dollar, which was volatile early in the fiscal year against other major currencies, returned to a weakening trend during the latter months of the period. In general, it was a good year for the emerging market debt sector of the capital markets. Aided by reasonably healthy global growth trends, the fundamentals of most emerging economies continued to improve and emerging market bonds tended to perform well relative to other fixed income classes. Despite evidence that economic growth was beginning to decelerate, corporations continued to generate improving profits. With strong cash flows, high-yield issuers generally had strong balance sheets with relatively little debt. Defaults on high-yield bonds continued to decline to very low levels. In this favorable environment, the lower quality tiers of the high-yield market outperformed the higher-quality tiers. Early in the period, the Federal Reserve Board’s two-year tightening of monetary policy concluded when the central bank raised the fed funds rate to 5.25% and then left it unchanged for the remainder of the fiscal year. As the period progressed, market interest rates trended down. Moreover, as investors anticipated stable monetary policy, interest rate volatility and yield spreads for mortgage- and asset-backed securities and corporate debt narrowed, and their returns improved relative to U.S. Treasuries.
The emerging market and U.S. government sleeves of the portfolio outperformed their benchmarks, while the international government and domestic high-yield sleeves lagged their benchmarks. The outperformance of the emerging market portfolio was the result of an overweighted position in the Euro, as well as above-benchmark exposures to Brazil, Russia, the Philippines and Mexico. The outperformance of the fund’s U.S. government sleeve was the result of the overweighting of mortgage-backed securities and a strategy of trading between different coupons based upon changes in interest rates and expected changes in principal prepayments. The underperformance of the international bond sleeve was primarily the result of the effects of currency volatility in the second quarter of 2006. The domestic high-yield portfolio trailed its benchmark principally because of our emphasis on the higher quality tiers of the high-yield market, which trailed the riskier parts of the high-yield universe during the period.
Class I shares are only offered in the following manner: (1) to investment advisory clients of Evergreen Investment Management Company, LLC (or its advisory affiliates) when purchased by such advisor(s) on behalf of its clients, (2) through arrangements entered into on behalf of the Evergreen funds with certain financial services firms, (3) to certain institutional investors and (4) to persons who owned Class Y shares in registered name in an Evergreen fund on or before December 31, 1994 or who owned shares of any SouthTrust fund in registered name as of March 18, 2005 or shares of Vestaur Securities Fund as of May 20, 2005.
Class I shares are only available to institutional shareholders with a minimum of $1 million investment, which may be waived in certain situations.
The fund’s investment objective may be changed without a vote of the fund’s shareholders.
Foreign investments may contain more risk due to the inherent risks associated with changing political climates, foreign market instability and foreign currency fluctuations. Risks of international investing are magnified in emerging or developing markets.
Asset-backed and mortgage-backed securities are generally subject to higher prepayment risks than other types of debt securities, which can limit the potential for gain in a declining interest rate environment and increase the potential for loss in a rising interest rate environment. Mortgage-backed securities may also be structured so that they are particularly sensitive to interest rates.
Derivatives involve additional risks including interest rate risk, credit risk, the risk of improper valuation and the risk of non-correlation to the relevant instruments they are designed to hedge or to closely track.
High yield, lower-rated bonds may contain more risk due to the increased possibility of default.
The return of principal is not guaranteed due to fluctuation in the fund’s NAV caused by changes in the price of individual bonds held by the fund and the buying and selling of bonds by the fund. Bond funds have the same inflation, interest rate and credit risks as individual bonds. Generally, the value of bond funds rise when prevailing interest rates fall, and fall when interest rates rise.
U.S. government guarantees apply only to certain securities held in the fund’s portfolio and not to the fund’s shares.
Leverage may disproportionately increase a fund’s portfolio losses and reduce opportunities for gain when interest rates, stock prices, or currency rates are changing.
The Evergreen Diversified Income Builder Blended Index is composed of the following indexes: MLHYMI (50%), JPMGXUS (25%) and LBABI (25%).
^ Effective June 1, 2007, Evergreen Strategic Income Blended Index changed its name to Evergreen Diversified Income Builder Blended Index.
†† Copyright2007. Merrill Lynch, Pierce, Fenner & Smith Incorporated. All rights reserved.
All data is as of April 30, 2007, and subject to change.
5
ABOUT YOUR FUND’S EXPENSES
The Example below is intended to describe the fees and expenses borne by shareholders and the impact of those costs on your investment.
Example
As a shareholder of the fund, you incur two types of costs: (1) transaction costs, including sales charges (loads), redemption fees and exchange fees; and (2) ongoing costs, including management fees, distribution (12b-1) fees and other fund expenses. This Example is intended to help you understand your ongoing costs (in dollars) of investing in the fund and to compare these costs with the ongoing costs of investing in other mutual funds. The Example is based on an investment of $1,000 invested at the beginning of the period and held for the entire period from November 1, 2006 to April 30, 2007.
The example illustrates your fund’s costs in two ways:
• Actual expenses
The section in the table under the heading “Actual” provides information about actual account values and actual expenses. You may use the information in these columns, together with the amount you invested, to estimate the expenses that you paid over the period. Simply divide your account value by $1,000 (for example, an $8,600 account value divided by $1,000 = 8.6), then multiply the result by the number in the appropriate column for your share class, in the column entitled “Expenses Paid During Period” to estimate the expenses you paid on your account during this period.
• Hypothetical example for comparison purposes
The section in the table under the heading “Hypothetical (5% return before expenses)” provides information about hypothetical account values and hypothetical expenses based on the fund’s actual expense ratio and an assumed rate of return of 5% per year before expenses, which is not the fund’s actual return. The hypothetical account values and expenses may not be used to estimate the actual ending account balance or expenses you paid for the period. You may use this information to compare the ongoing costs of investing in the fund and other funds. To do so, compare this 5% hypothetical example with the 5% hypothetical examples that appear in the shareholder reports of the other funds.
Please note that the expenses shown in the table are meant to highlight your ongoing costs only and do not reflect any transactional costs, such as sales charges (loads), redemption fees or exchange fees. Therefore, the section in the table under the heading “Hypothetical (5% return before expenses)” is useful in comparing ongoing costs only, and will not help you determine the relative total costs of owning different funds. In addition, if these transactional costs were included, your costs would have been higher.
| | | Beginning | | Ending | | |
| | | Account | | Account | | Expenses |
| | | Value | | Value | | Paid During |
| | | 11/1/2006 | | 4/30/2007 | | Period* |
|
| Actual | | | | | | |
| Class A | | $ 1,000.00 | | $ 1,043.01 | | $ 5.88 |
| Class B | | $ 1,000.00 | | $ 1,039.17 | | $ 9.66 |
| Class C | | $ 1,000.00 | | $ 1,039.19 | | $ 9.66 |
| Class I | | $ 1,000.00 | | $ 1,044.61 | | $ 4.56 |
| Hypothetical | | | | | | |
| (5% return | | | | | | |
| before expenses) | | | | | | |
| Class A | | $ 1,000.00 | | $ 1,019.04 | | $ 5.81 |
| Class B | | $ 1,000.00 | | $ 1,015.32 | | $ 9.54 |
| Class C | | $ 1,000.00 | | $ 1,015.32 | | $ 9.54 |
| Class I | | $ 1,000.00 | | $ 1,020.33 | | $ 4.51 |
|
* For each class of the Fund, expenses are equal to the annualized expense ratio of each class (1.16% for Class A, 1.91% for Class B, 1.91% for Class C and 0.90% for Class I), multiplied by the average account value over the period, multiplied by 181 / 365 days.
6
FINANCIAL HIGHLIGHTS
(For a share outstanding throughout each period)
| | | Year Ended April 30, |
| |
|
| CLASS A | | 2007 | | 2006 | | 2005 | | 2004 | | 2003 |
|
| Net asset value, beginning of period | | $ 6.32 | | $ 6.53 | | $ 6.38 | | $ 6.50 | | $ 5.83 |
|
| Income from investment operations | | | | | | | | | | | | |
| Net investment income (loss) | | 0.331 | | 0.291 | | | | 0.33 | | 0.341 | | 0.381 |
| Net realized and unrealized gains or losses on investments | | 0.08 | | (0.19) | | | | 0.19 | | 0.07 | | 0.68 |
| |
|
| Total from investment operations | | 0.41 | | 0.10 | | | | 0.52 | | 0.41 | | 1.06 |
|
| Distributions to shareholders from | | | | | | | | | | | | |
| Net investment income | | (0.31) | | (0.31) | | | | (0.35) | | (0.37) | | (0.39) |
| Net realized gains | | 0 | | 0 | | | | (0.02) | | (0.16) | | 0 |
| Tax basis return of capital | | (0.02) | | 0 | | | | 0 | | 0 | | 0 |
| |
|
| Total distributions to shareholders | | (0.33) | | (0.31) | | | | (0.37) | | (0.53) | | (0.39) |
|
| Net asset value, end of period | | $ 6.40 | | $ 6.32 | | $ 6.53 | | $ 6.38 | | $ 6.50 |
|
| Total return2 | | 6.71% | | 1.59% | | | | 8.22% | | 6.24% | | 18.79% |
|
| Ratios and supplemental data | | | | | | | | | | | | |
| Net assets, end of period (thousands) | | $170,804 | | $199,501 | | $214,776 | | $202,017 | | $173,842 |
| Ratios to average net assets | | | | | | | | | | | | |
| Expenses including waivers/reimbursements | | | | | | | | | | | | |
| but excluding expense reductions | | 1.16% | | 1.17% | | | | 1.12% | | 1.21% | | 1.19% |
| Expenses excluding waivers/reimbursements | | | | | | | | | | | | |
| and expense reductions | | 1.20% | | 1.18% | | | | 1.12% | | 1.21% | | 1.19% |
| Net investment income (loss) | | 5.17% | | 4.57% | | | | 5.03% | | 5.10% | | 6.31% |
| Portfolio turnover rate | | 128% | | 100% | | | | 130% | | 129% | | 129% |
|
1 Net investment income (loss) per share is based on average shares outstanding during the period.
2 Excluding applicable sales charges
See Notes to Financial Statements
7
FINANCIAL HIGHLIGHTS
(For a share outstanding throughout each period)
| | | Year Ended April 30, |
| |
|
| CLASS B | | 2007 | | 2006 | | 2005 | | 2004 | | 2003 |
|
| Net asset value, beginning of period | | $ 6.34 | | $ 6.55 | | $ 6.40 | | $ 6.52 | | $ 5.85 |
|
| Income from investment operations | | | | | | | | | | | | |
| Net investment income (loss) | | 0.281 | | 0.251 | | | | 0.29 | | 0.291 | | 0.34 |
| Net realized and unrealized gains or losses on investments | | 0.09 | | (0.19) | | | | 0.19 | | 0.07 | | 0.67 |
| |
|
| Total from investment operations | | 0.37 | | 0.06 | | | | 0.48 | | 0.36 | | 1.01 |
|
| Distributions to shareholders from | | | | | | | | | | | | |
| Net investment income | | (0.27) | | (0.27) | | | | (0.31) | | (0.32) | | (0.34) |
| Net realized gains | | 0 | | 0 | | | | (0.02) | | (0.16) | | 0 |
| Tax basis return of capital | | (0.02) | | 0 | | | | 0 | | 0 | | 0 |
| |
|
| Total distributions to shareholders | | (0.29) | | (0.27) | | | | (0.33) | | (0.48) | | (0.34) |
|
| Net asset value, end of period | | $ 6.42 | | $ 6.34 | | $ 6.55 | | $ 6.40 | | $ 6.52 |
|
| Total return2 | | 5.94% | | 0.89% | | | | 7.46% | | 5.49% | | 17.87% |
|
| Ratios and supplemental data | | | | | | | | | | | | |
| Net assets, end of period (thousands) | | $54,955 | | $71,860 | | $98,852 | | $113,115 | | $107,968 |
| Ratios to average net assets | | | | | | | | | | | | |
| Expenses including waivers/reimbursements | | | | | | | | | | | | |
| but excluding expense reductions | | 1.90% | | 1.87% | | | | 1.83% | | 1.91% | | 1.94% |
| Expenses excluding waivers/reimbursements | | | | | | | | | | | | |
| and expense reductions | | 1.90% | | 1.87% | | | | 1.83% | | 1.91% | | 1.94% |
| Net investment income (loss) | | 4.43% | | 3.85% | | | | 4.34% | | 4.40% | | 5.54% |
| Portfolio turnover rate | | 128% | | 100% | | | | 130% | | 129% | | 129% |
|
1 Net investment income (loss) per share is based on average shares outstanding during the period.
2 Excluding applicable sales charges
See Notes to Financial Statements
8
FINANCIAL HIGHLIGHTS
(For a share outstanding throughout each period)
| | | Year Ended April 30, |
| |
|
| CLASS C | | 2007 | | 2006 | | 2005 | | 2004 | | 2003 |
|
| Net asset value, beginning of period | | $ 6.33 | | $ 6.54 | | $ 6.39 | | $ 6.51 | | $ 5.84 |
|
| Income from investment operations | | | | | | | | | | | | |
| Net investment income (loss) | | 0.281 | | 0.251 | | | | 0.29 | | 0.291 | | 0.341 |
| Net realized and unrealized gains or losses on investments | | 0.09 | | (0.19) | | | | 0.19 | | 0.07 | | 0.67 |
| |
|
| Total from investment operations | | 0.37 | | 0.06 | | | | 0.48 | | 0.36 | | 1.01 |
|
| Distributions to shareholders from | | | | | | | | | | | | |
| Net investment income | | (0.27) | | (0.27) | | | | (0.31) | | (0.32) | | (0.34) |
| Net realized gains | | 0 | | 0 | | | | (0.02) | | (0.16) | | 0 |
| Tax basis return of capital | | (0.02) | | 0 | | | | 0 | | 0 | | 0 |
| |
|
| Total distributions to shareholders | | (0.29) | | (0.27) | | | | (0.33) | | (0.48) | | (0.34) |
|
| Net asset value, end of period | | $ 6.41 | | $ 6.33 | | $ 6.54 | | $ 6.39 | | $ 6.51 |
|
| Total return2 | | 5.94% | | 0.88% | | | | 7.46% | | 5.49% | | 17.89% |
|
| Ratios and supplemental data | | | | | | | | | | | | |
| Net assets, end of period (thousands) | | $55,110 | | $65,322 | | $79,539 | | $89,236 | | $68,207 |
| Ratios to average net assets | | | | | | | | | | | | |
| Expenses including waivers/reimbursements | | | | | | | | | | | | |
| but excluding expense reductions | | 1.90% | | 1.88% | | | | 1.83% | | 1.91% | | 1.93% |
| Expenses excluding waivers/reimbursements | | | | | | | | | | | | |
| and expense reductions | | 1.90% | | 1.88% | | | | 1.83% | | 1.91% | | 1.93% |
| Net investment income (loss) | | 4.43% | | 3.86% | | | | 4.34% | | 4.40% | | 5.66% |
| Portfolio turnover rate | | 128% | | 100% | | | | 130% | | 129% | | 129% |
|
1 Net investment income (loss) per share is based on average shares outstanding during the period.
2 Excluding applicable sales charges
See Notes to Financial Statements
9
FINANCIAL HIGHLIGHTS
(For a share outstanding throughout each period)
| | | Year Ended April 30, |
| |
|
| CLASS I | | 2007 | | 2006 | | 2005 | | 2004 | | 2003 |
|
| Net asset value, beginning of period | | $ 6.22 | | $ 6.43 | | $ 6.28 | | $ 6.40 | | $ 5.74 |
|
| Income from investment operations | | | | | | | | | | | | |
| Net investment income (loss) | | 0.341 | | 0.311 | | | | 0.34 | | 0.351 | | 0.411 |
| Net realized and unrealized gains or losses on investments | | 0.08 | | (0.19) | | | | 0.19 | | 0.07 | | 0.64 |
| |
|
| Total from investment operations | | 0.42 | | 0.12 | | | | 0.53 | | 0.42 | | 1.05 |
|
| Distributions to shareholders from | | | | | | | | | | | | |
| Net investment income | | (0.32) | | (0.33) | | | | (0.36) | | (0.38) | | (0.39) |
| Net realized gains | | 0 | | 0 | | | | (0.02) | | (0.16) | | 0 |
| Tax basis return of capital | | (0.02) | | 0 | | | | 0 | | 0 | | 0 |
| |
|
| Total distributions to shareholders | | (0.34) | | (0.33) | | | | (0.38) | | (0.54) | | (0.39) |
|
| Net asset value, end of period | | $ 6.30 | | $ 6.22 | | $ 6.43 | | $ 6.28 | | $ 6.40 |
|
| Total return | | 7.02% | | 1.84% | | | | 8.58% | | 6.56% | | 19.09% |
|
| Ratios and supplemental data | | | | | | | | | | | | |
| Net assets, end of period (thousands) | | $17,861 | | $20,424 | | $19,216 | | $26,711 | | $13,406 |
| Ratios to average net assets | | | | | | | | | | | | |
| Expenses including waivers/reimbursements but | | | | | | | | | | | | |
| excluding expense reductions | | 0.90% | | 0.88% | | | | 0.82% | | 0.91% | | 0.94% |
| Expenses excluding waivers/reimbursements | | | | | | | | | | | | |
| and expense reductions | | 0.90% | | 0.88% | | | | 0.82% | | 0.91% | | 0.94% |
| Net investment income (loss) | | 5.43% | | 4.88% | | | | 5.33% | | 5.42% | | 6.75% |
| Portfolio turnover rate | | 128% | | 100% | | | | 130% | | 129% | | 129% |
|
1 Net investment income (loss) per share is based on average shares outstanding during the period.
See Notes to Financial Statements
10
SCHEDULE OF INVESTMENTS
April 30, 2007
| | | | | | | Principal | | | | |
| | | | | | | Amount | | | | Value |
|
| |
| AGENCY COMMERCIAL MORTGAGE-BACKED SECURITIES 7.1% | | | | | | | | |
| FIXED-RATE 4.7% | | | | | | | | | | |
| FNMA: | | | | | | | | | | |
| 4.44%, 04/01/2014 | | | | $ | | 405,934 | | $ | | 390,127 |
| 5.68%, 08/01/2016 ## | | | | | | 3,433,526 | | | | 3,564,069 |
| 6.07%, 09/01/2013 ## | | | | | | 1,428,288 | | | | 1,486,291 |
| 6.18%, 06/01/2013 ## | | | | | | 1,400,295 | | | | 1,467,860 |
| 6.50%, 04/01/2017 ## | | | | | | 679,975 | | | | 741,507 |
| 7.50%, 07/01/2010 ## | | | | | | 758,255 | | | | 798,321 |
| Ser. 1998-M5, Class D, 6.35%, 06/25/2020 ## | | | | | | 1,760,000 | | | | 1,811,288 |
| Ser. 2002-M1, Class C, 6.17%, 02/25/2016 ## | | | | | | 802,226 | | | | 814,837 |
| Ser. 2003-M1, Class B, 4.91%, 07/25/2020 ## | | | | | | 3,000,000 | | | | 2,932,620 |
| |
|
| | | | | | | | | | | 14,006,920 |
| |
|
| FLOATING-RATE 2.4% | | | | | | | | | | |
| FHLMC: | | | | | | | | | | |
| 7.80%, 03/25/2036 | | | | | | 510,583 | | | | 543,676 |
| 7.85%, 03/25/2036 ## | | | | | | 3,245,200 | | | | 3,477,212 |
| FNMA: | | | | | | | | | | |
| 5.24%, 07/01/2035 ## | | | | | | 3,131,492 | | | | 3,129,080 |
| 6.70%, 04/01/2011 | | | | | | 68,050 | | | | 70,691 |
| |
|
| | | | | | | | | | | 7,220,659 |
| |
|
| Total Agency Commercial Mortgage-Backed Securities | | | | | | | | | | |
| (cost $21,359,059) | | | | | | | | | | 21,227,579 |
| |
|
| AGENCY MORTGAGE-BACKED COLLATERALIZED MORTGAGE | | | | | | | | |
| OBLIGATIONS 2.6% | | | | | | | | | | |
| FLOATING-RATE 2.6% | | | | | | | | | | |
| FHLMC: | | | | | | | | | | |
| Ser. 1307, Class A, 5.98%, 06/15/2007 | | | | | | 5,840 | | | | 5,845 |
| Ser. 1377, Class F, 5.875%, 09/15/2007 | | | | | | 4,599 | | | | 4,602 |
| Ser. 2334, Class FO, 6.29%, 07/15/2031 ## | | | | | | 1,209,973 | | | | 1,233,481 |
| Ser. 2710, Class FY, 5.72%, 10/15/2018 | | | | | | 355,641 | | | | 357,558 |
| FNMA: | | | | | | | | | | |
| Ser. 2001-61, Class FH, 5.92%, 11/18/2031 | | | | | | 415,789 | | | | 423,984 |
| Ser. 2002-67, Class FA, 6.32%, 11/25/2032 ## | | | | | | 2,107,994 | | | | 2,201,863 |
| Ser. 2002-77, Class FA, 6.32%, 10/18/2030 ## | | | | | | 3,142,655 | | | | 3,189,512 |
| Ser. 2004-W2, Class 2A2, 7.00%, 02/25/2044 | | | | | | 237,623 | | | | 248,409 |
| Ser. 2004-W2, Class 5A, 7.50%, 03/25/2044 | | | | | | 163,892 | | | | 173,073 |
| |
|
| Total Agency Mortgage-Backed Collateralized Mortgage Obligations | | | | | | | | |
| (cost $7,816,809) | | | | | | | | | | 7,838,327 |
| |
|
See Notes to Financial Statements
11
SCHEDULE OF INVESTMENTS continued
April 30, 2007
| | | | | Principal | | | | |
| | | | | Amount | | | | Value |
|
| |
| AGENCY MORTGAGE-BACKED PASS THROUGH SECURITIES 16.9% | | | | | | | | |
| FIXED-RATE 16.5% | | | | | | | | |
| FHLMC: | | | | | | | | |
| 6.00%, 04/01/2036 | | $ | | 2,991,262 | | $ | | 3,017,355 |
| 7.50%, 05/01/2009 | | | | 163,777 | | | | 166,072 |
| FHLMC 15 year, 5.50%, TBA # | | | | 8,285,000 | | | | 8,297,941 |
| FHLMC 30 year: | | | | | | | | |
| 5.00%, TBA # | | | | 1,175,000 | | | | 1,135,710 |
| 5.50%, TBA # | | | | 20,965,000 | | | | 20,735,685 |
| 6.50%, TBA # | | | | 6,750,000 | | | | 6,895,543 |
| FNMA 30 year: | | | | | | | | |
| 5.50%, TBA # | | | | 6,500,000 | | | | 6,428,903 |
| 6.50%, TBA # | | | | 2,465,000 | | | | 2,516,612 |
| GNMA: | | | | | | | | |
| 6.00%, 06/15/2031 - 09/15/2031 | | | | 95,454 | | | | 97,105 |
| 7.50%, 12/15/2030 | | | | 35,217 | | | | 36,914 |
| 8.00%, 10/15/2030 | | | | 1,712 | | | | 1,824 |
| |
|
| | | | | | | | | 49,329,664 |
| |
|
| FLOATING-RATE 0.4% | | | | | | | | |
| FNMA, 4.99%, 05/01/2035 | | | | 1,017,824 | | | | 1,011,056 |
| |
|
| Total Agency Mortgage-Backed Pass Through Securities | | | | | | | | |
| (cost $50,350,877) | | | | | | | | 50,340,720 |
| |
|
| AGENCY REPERFORMING MORTGAGE-BACKED PASS THROUGH | | | | | | | | |
| SECURITIES 0.1% | | | | | | | | |
| FIXED-RATE 0.1% | | | | | | | | |
| FNMA, Ser. 2003-W1, Class 2A, 7.50%, 12/25/2042 (cost $284,996) | | | | 275,525 | | | | 286,929 |
| |
|
| ASSET-BACKED SECURITIES 3.4% | | | | | | | | |
| C-Bass, Ltd., Ser. 11A, Class C, FRN, 6.70%, 09/15/2039 144A ## | | | | 4,315,000 | | | | 4,323,241 |
| Hertz Vehicle Financing, LLC., Ser. 2004-1A, Class A2, FRN, 2.38%, 05/25/2008 | | | | | | | | |
| 144A ## (h) | | | | 916,667 | | | | 916,667 |
| NovaStar ABS CDO, Ltd., Ser. 2007-1A, Class A2, FRN, 5.82%, 02/08/2047 | | | | | | | | |
| 144A ## | | | | 4,000,000 | | | | 3,963,520 |
| Trapeza CDO, LLC, Ser. 2004-7A, Class B1, FRN, 6.91%, 01/25/2035 144A ## | | | | 875,000 | | | | 883,890 |
| |
|
| Total Asset-Backed Securities (cost $10,091,372) | | | | | | | | 10,087,318 |
| |
|
| COMMERCIAL MORTGAGE-BACKED SECURITIES 2.9% | | | | | | | | |
| FLOATING-RATE 2.9% | | | | | | | | |
| Banc of America Large Loan, Ser. 2005-BBA6, Class G, 5.74%, 01/15/2019 | | | | | | | | |
| 144A | | | | 1,079,575 | | | | 1,080,359 |
| GMAC Comml. Mtge. Securities, Inc., Ser. 1997-C1, Class C, 6.90%, 09/15/2007 | | | | 2,300,000 | | | | 2,303,821 |
| JPMorgan Chase Comml. Mtge. Securities, Inc., Ser. 2006-FL1A, Class A2, 5.50%, | | | | | | | | |
| 02/15/2020 144A | | | | 5,394,000 | | | | 5,398,154 |
| |
|
| Total Commercial Mortgage-Backed Securities (cost $8,784,242) | | | | | | | | 8,782,334 |
| |
|
See Notes to Financial Statements
12
SCHEDULE OF INVESTMENTS continued
April 30, 2007
| | | | | Principal | | | | |
| | | | | Amount | | | | Value |
|
| |
| CORPORATE BONDS 29.9% | | | | | | | | |
| CONSUMER DISCRETIONARY 6.5% | | | | | | | | |
| Auto Components 0.5% | | | | | | | | |
| American Axle & Manufacturing Holdings, Inc., 5.25%, 02/11/2014 | | $ | | 460,000 | | $ | | 414,575 |
| ArvinMeritor, Inc., 6.80%, 02/15/2009 | | | | 81,000 | | | | 80,798 |
| Goodyear Tire & Rubber Co.: | | | | | | | | |
| 9.00%, 07/01/2015 (p) | | | | 500,000 | | | | 553,750 |
| 11.25%, 03/01/2011 | | | | 110,000 | | | | 120,725 |
| Metaldyne Corp., 11.00%, 06/15/2012 (p) | | | | 285,000 | | | | 282,150 |
| |
|
| | | | | | | | | 1,451,998 |
| |
|
| Automobiles 0.9% | | | | | | | | |
| DaimlerChrylser AG, 4.875%, 06/15/2010 | | | | 1,000,000 | | | | 991,339 |
| Ford Motor Co., 7.45%, 07/16/2031 (p) | | | | 500,000 | | | | 398,125 |
| General Motors Corp., 8.375%, 07/15/2033 (p) | | | | 1,250,000 | | | | 1,135,937 |
| |
|
| | | | | | | | | 2,525,401 |
| |
|
| Diversified Consumer Services 0.2% | | | | | | | | |
| Education Management, LLC, 8.75%, 06/01/2014 | | | | 300,000 | | | | 318,750 |
| Service Corporation International, 6.75%, 04/01/2015 144A | | | | 110,000 | | | | 111,650 |
| |
|
| | | | | | | | | 430,400 |
| |
|
| Hotels, Restaurants & Leisure 0.3% | | | | | | | | |
| Mandalay Resort Group, Ser. B, 10.25%, 08/01/2007 | | | | 1,000,000 | | | | 1,015,000 |
| |
|
| Household Durables 0.2% | | | | | | | | |
| Libbey, Inc., FRN, 12.35%, 06/01/2011 | | | | 550,000 | | | | 607,750 |
| |
|
| Leisure Equipment & Products 0.0% | | | | | | | | |
| Remington Arms Company, Inc., 10.50%, 02/01/2011 (p) | | | | 30,000 | | | | 31,200 |
| |
|
| Media 2.8% | | | | | | | | |
| AMC Entertainment, Inc., Ser. B, 8.625%, 08/15/2012 | | | | 1,500,000 | | | | 1,605,000 |
| CCH I, LLC, 11.00%, 10/01/2015 | | | | 325,000 | | | | 346,937 |
| Dex Media East, LLC, 9.875%, 11/15/2009 | | | | 1,025,000 | | | | 1,072,406 |
| Lamar Media Corp., 6.625%, 08/15/2015 | | | | 1,250,000 | | | | 1,246,875 |
| Mediacom Broadband, LLC, 8.50%, 10/15/2015 144A | | | | 550,000 | | | | 574,750 |
| Mediacom Communications Corp., 9.50%, 01/15/2013 | | | | 1,750,000 | | | | 1,811,250 |
| Paxson Communications Corp., FRN, 11.61%, 01/15/2013 144A | | | | 850,000 | | | | 888,250 |
| Sirius Satellite Radio, Inc., 9.625%, 08/01/2013 | | | | 185,000 | | | | 185,925 |
| XM Satellite Radio Holdings, Inc., Class A, 9.75%, 05/01/2014 (p) | | | | 205,000 | | | | 206,538 |
| Young Broadcasting, Inc., Class A, 8.75%, 01/15/2014 | | | | 424,000 | | | | 415,520 |
| |
|
| | | | | | | | | 8,353,451 |
| |
|
| Multi-line Retail 0.2% | | | | | | | | |
| Neiman Marcus Group, Inc., 9.00%, 10/15/2015 | | | | 500,000 | | | | 553,750 |
| |
|
| Specialty Retail 0.7% | | | | | | | | |
| Baker & Taylor, Inc., 11.50%, 07/01/2013 144A | | | | 600,000 | | | | 636,000 |
| Payless ShoeSource, Inc., 8.25%, 08/01/2013 | | | | 1,425,000 | | | | 1,506,938 |
| |
|
| | | | | | | | | 2,142,938 |
| |
|
See Notes to Financial Statements
13
SCHEDULE OF INVESTMENTS continued
April 30, 2007
| | | | | Principal | | | | |
| | | | | Amount | | | | Value |
|
| |
| CORPORATE BONDS continued | | | | | | | | |
| CONSUMER DISCRETIONARY continued | | | | | | | | |
| Textiles, Apparel & Luxury Goods 0.7% | | | | | | | | |
| Levi Strauss & Co., 9.75%, 01/15/2015 | | $ | | 775,000 | | $ | | 854,437 |
| Oxford Industries, Inc., 8.875%, 06/01/2011 | | | | 400,000 | | | | 417,000 |
| Unifi, Inc., 11.50%, 05/15/2014 | | | | 386,000 | | | | 389,860 |
| Warnaco Group, Inc., 8.875%, 06/15/2013 | | | | 385,000 | | | | 411,469 |
| |
|
| | | | | | | | | 2,072,766 |
| |
|
| CONSUMER STAPLES 0.2% | | | | | | | | |
| Food & Staples Retailing 0.2% | | | | | | | | |
| Wal-Mart Stores, Inc., 4.75%, 01/29/2013 | | | | 300,000 | | | | 574,272 |
| |
|
| ENERGY 4.0% | | | | | | | | |
| Energy Equipment & Services 0.8% | | | | | | | | |
| Dresser-Rand Group, Inc., 7.375%, 11/01/2014 | | | | 692,000 | | | | 709,300 |
| GulfMark Offshore, Inc., 7.75%, 07/15/2014 | | | | 525,000 | | | | 539,437 |
| Hornbeck Offshore Services, Inc., Ser. B, 6.125%, 12/01/2014 | | | | 620,000 | | | | 599,850 |
| Parker Drilling Co., 9.625%, 10/01/2013 | | | | 450,000 | | | | 490,500 |
| |
|
| | | | | | | | | 2,339,087 |
| |
|
| Oil, Gas & Consumable Fuels 3.2% | | | | | | | | |
| Chesapeake Energy Corp., 6.875%, 01/15/2016 | | | | 850,000 | | | | 869,125 |
| Cimarex Energy Co., 7.125%, 05/01/2017 | | | | 80,000 | | | | 81,200 |
| Clayton Williams Energy, Inc., 7.75%, 08/01/2013 (p) | | | | 375,000 | | | | 356,250 |
| Delta Petroleum Corp., 7.00%, 04/01/2015 | | | | 190,000 | | | | 173,850 |
| El Paso Corp., 7.75%, 06/01/2013 | | | | 1,000,000 | | | | 1,057,817 |
| Encore Acquisition Co., 6.25%, 04/15/2014 | | | | 1,000,000 | | | | 937,500 |
| Energy Partners, Ltd.: | | | | | | | | |
| 9.75%, 04/15/2014 144A | | | | 95,000 | | | | 97,137 |
| 10.48%, 04/15/2013 144A | | | | 30,000 | | | | 30,638 |
| Exco Resources, Inc., 7.25%, 01/15/2011 | | | | 1,000,000 | | | | 1,007,500 |
| Overseas Shipholding Group, Inc., 8.25%, 03/15/2013 | | | | 750,000 | | | | 791,250 |
| Peabody Energy Corp.: | | | | | | | | |
| 5.875%, 04/15/2016 | | | | 750,000 | | | | 721,875 |
| 6.875%, 03/15/2013 | | | | 440,000 | | | | 447,700 |
| Sabine Pass LNG, LP, 7.25%, 11/30/2013 144A | | | | 700,000 | | | | 717,500 |
| Targa Resources, Inc., 8.50%, 11/01/2013 144A | | | | 250,000 | | | | 258,750 |
| Williams Cos.: | | | | | | | | |
| 7.50%, 01/15/2031 | | | | 925,000 | | | | 985,125 |
| 8.125%, 03/15/2012 | | | | 1,000,000 | | | | 1,095,000 |
| |
|
| | | | | | | | | 9,628,217 |
| |
|
| FINANCIALS 5.7% | | | | | | | | |
| Capital Markets 0.7% | | | | | | | | |
| Goldman Sachs Group, Inc., 6.875%, 01/15/2011 | | | | 2,000,000 | | | | 2,118,284 |
| |
|
| Commercial Banks 1.1% | | | | | | | | |
| Wells Fargo & Co., 5.38%, 03/10/2008 | | | | 3,185,000 | | | | 3,187,679 |
| |
|
See Notes to Financial Statements
14
SCHEDULE OF INVESTMENTS continued
April 30, 2007
| | | | | Principal | | | | |
| | | | | Amount | | | | Value |
|
| |
| CORPORATE BONDS continued | | | | | | | | |
| FINANCIALS continued | | | | | | | | |
| Consumer Finance 2.6% | | | | | | | | |
| Ashtead Capital, Inc., 9.00%, 08/15/2016 144A | | $ | | 700,000 | | $ | | 756,000 |
| CCH II Capital Corp., 10.25%, 09/15/2010 | | | | 1,500,000 | | | | 1,605,000 |
| Ford Motor Credit Co., 5.70%, 01/15/2010 | | | | 1,000,000 | | | | 964,282 |
| General Electric Capital Corp., 6.125%, 02/22/2011 | | | | 1,190,000 | | | | 1,233,473 |
| General Motors Acceptance Corp., 6.875%, 08/28/2012 | | | | 1,500,000 | | | | 1,500,597 |
| NXP Funding, LLC, 7.875%, 10/15/2014 144A | | | | 800,000 | | | | 836,000 |
| Qwest Capital Funding, Inc., 6.50%, 11/15/2018 | | | | 1,100,000 | | | | 1,056,000 |
| |
|
| | | | | | | | | 7,951,352 |
| |
|
| Insurance 0.5% | | | | | | | | |
| Crum & Forster Holdings Corp.: | | | | | | | | |
| 7.75%, 05/01/2017 144A | | | | 320,000 | | | | 323,200 |
| 10.375%, 06/15/2013 | | | | 1,050,000 | | | | 1,157,079 |
| |
|
| | | | | | | | | 1,480,279 |
| |
|
| Real Estate Investment Trusts 0.8% | | | | | | | | |
| Host Marriott Corp., Ser. J, 7.125%, 11/01/2013 | | | | 750,000 | | | | 776,250 |
| Omega Healthcare Investors, Inc., 7.00%, 04/01/2014 | | | | 1,000,000 | | | | 1,018,750 |
| Thornburg Mortgage, Inc., 8.00%, 05/15/2013 | | | | 765,000 | | | | 765,000 |
| |
|
| | | | | | | | | 2,560,000 |
| |
|
| HEALTH CARE 1.2% | | | | | | | | |
| Health Care Equipment & Supplies 0.5% | | | | | | | | |
| Universal Hospital Services, Inc., 10.125%, 11/01/2011 | | | | 1,300,000 | | | | 1,399,250 |
| |
|
| Health Care Providers & Services 0.7% | | | | | | | | |
| Community Health Systems, Inc., 6.50%, 12/15/2012 | | | | 140,000 | | | | 145,425 |
| HCA, Inc.: | | | | | | | | |
| 6.25%, 02/15/2013 (p) | | | | 20,000 | | | | 18,450 |
| 9.25%, 11/15/2016 144A | | | | 1,100,000 | | | | 1,201,750 |
| HealthSouth Corp., 10.75%, 06/15/2016 144A | | | | 300,000 | | | | 328,500 |
| Sun Healthcare Group, Inc., 9.125%, 04/15/2015 144A | | | | 135,000 | | | | 141,075 |
| Tenet Healthcare Corp., 7.375%, 02/01/2013 (p) | | | | 50,000 | | | | 47,250 |
| Triad Hospitals, Inc., 7.00%, 05/15/2012 | | | | 320,000 | | | | 334,400 |
| |
|
| | | | | | | | | 2,216,850 |
| |
|
| INDUSTRIALS 1.7% | | | | | | | | |
| Aerospace & Defense 0.4% | | | | | | | | |
| DRS Technologies, Inc., 7.625%, 02/01/2018 | | | | 1,000,000 | | | | 1,052,500 |
| Hawker Beechcraft Acquisition Corp.: | | | | | | | | |
| 8.50%, 04/01/2015 144A | | | | 90,000 | | | | 95,175 |
| 9.75%, 04/01/2017 144A (p) | | | | 70,000 | | | | 75,250 |
| |
|
| | | | | | | | | 1,222,925 |
| |
|
See Notes to Financial Statements
15
SCHEDULE OF INVESTMENTS continued
April 30, 2007
| | | | | Principal | | | | |
| | | | | Amount | | | | Value |
|
| |
| CORPORATE BONDS continued | | | | | | | | |
| INDUSTRIALS continued | | | | | | | | |
| Airlines 0.1% | | | | | | | | |
| Delta Air Lines, Inc.: | | | | | | | | |
| 7.90%, 12/15/2009 (p) • | | $ | | 345,000 | | $ | | 181,988 |
| 8.30%, 12/15/2029 (p) • | | | | 460,000 | | | | 243,800 |
| |
|
| | | | | | | | | 425,788 |
| |
|
| Commercial Services & Supplies 0.2% | | | | | | | | |
| ARAMARK Corp., 8.50%, 02/01/2015 144A (p) | | | | 375,000 | | | | 394,219 |
| Mobile Mini, Inc., 6.875%, 05/01/2015 144A | | | | 135,000 | | | | 135,675 |
| |
|
| | | | | | | | | 529,894 |
| |
|
| Machinery 0.7% | | | | | | | | |
| Commercial Vehicle Group, Inc., 8.00%, 07/01/2013 | | | | 875,000 | | | | 896,875 |
| RBS Global, Inc., 11.75%, 08/01/2016 (p) | | | | 1,000,000 | | | | 1,115,000 |
| |
|
| | | | | | | | | 2,011,875 |
| |
|
| Trading Companies & Distributors 0.3% | | | | | | | | |
| Rental Service Corp., 9.50%, 12/01/2014 144A (p) | | | | 525,000 | | | | 560,437 |
| United Rentals, Inc., 6.50%, 02/15/2012 | | | | 225,000 | | | | 228,375 |
| |
|
| | | | | | | | | 788,812 |
| |
|
| INFORMATION TECHNOLOGY 1.0% | | | | | | | | |
| IT Services 0.7% | | | | | | | | |
| ipayment, Inc., 9.75%, 05/15/2014 | | | | 90,000 | | | | 94,163 |
| SunGard Data Systems, Inc.: | | | | | | | | |
| 9.125%, 08/15/2013 | | | | 1,475,000 | | | | 1,589,312 |
| 10.25%, 08/15/2015 | | | | 400,000 | | | | 442,000 |
| |
|
| | | | | | | | | 2,125,475 |
| |
|
| Semiconductors & Semiconductor Equipment 0.3% | | | | | | | | |
| Freescale Semiconductor, Inc., 8.875%, 12/15/2014 144A | | | | 825,000 | | | | 830,156 |
| |
|
| MATERIALS 4.0% | | | | | | | | |
| Chemicals 1.6% | | | | | | | | |
| Huntsman International, LLC: | | | | | | | | |
| 7.375%, 01/01/2015 144A (p) | | | | 575,000 | | | | 598,000 |
| 11.50%, 07/15/2012 | | | | 924,000 | | | | 1,034,880 |
| Lyondell Chemical Co., 10.50%, 06/01/2013 | | | | 800,000 | | | | 881,000 |
| MacDermid, Inc., 9.50%, 04/15/2017 144A | | | | 291,000 | | | | 303,367 |
| Millenium America, Inc., 7.625%, 11/15/2026 | | | | 140,000 | | | | 138,950 |
| Momentive Performance, Inc., 9.75%, 12/01/2014 144A (p) | | | | 285,000 | | | | 302,813 |
| Omnova Solutions, Inc., 11.25%, 06/01/2010 | | | | 595,000 | | | | 632,931 |
| Tronox Worldwide, LLC, 9.50%, 12/01/2012 | | | | 975,000 | | | | 1,048,125 |
| |
|
| | | | | | | | | 4,940,066 |
| |
|
| Construction Materials 0.2% | | | | | | | | |
| CPG International, Inc., 10.50%, 07/01/2013 | | | | 375,000 | | | | 395,625 |
| Dayton Superior Corp., 13.00%, 06/15/2009 | | | | 90,000 | | | | 92,700 |
| |
|
| | | | | | | | | 488,325 |
| |
|
See Notes to Financial Statements
16
SCHEDULE OF INVESTMENTS continued
April 30, 2007
| | | | | Principal | | | | |
| | | | | Amount | | | | Value |
|
| |
| CORPORATE BONDS continued | | | | | | | | |
| MATERIALS continued | | | | | | | | |
| Containers & Packaging 1.3% | | | | | | | | |
| Crown Americas, Inc., 7.75%, 11/15/2015 | | $ | | 1,000,000 | | $ | | 1,062,500 |
| Exopack Holding Corp., 11.25%, 02/01/2014 | | | | 230,000 | | | | 250,125 |
| Graham Packaging Co., 9.875%, 10/15/2014 (p) | | | | 160,000 | | | | 166,400 |
| Owens-Brockway Glass Containers, Inc., 6.75%, 12/01/2014 (p) | | | | 1,200,000 | | | | 1,213,500 |
| Smurfit-Stone Container Corp., 8.375%, 07/01/2012 | | | | 1,075,000 | | | | 1,097,844 |
| |
|
| | | | | | | | | 3,790,369 |
| |
|
| Metals & Mining 0.4% | | | | | | | | |
| Freeport-McMoRan Copper & Gold, Inc.: | | | | | | | | |
| 8.25%, 04/01/2015 | | | | 130,000 | | | | 140,888 |
| 8.375%, 04/01/2017 | | | | 120,000 | | | | 131,550 |
| 10.125%, 02/01/2010 | | | | 1,000,000 | | | | 1,050,630 |
| |
|
| | | | | | | | | 1,323,068 |
| |
|
| Paper & Forest Products 0.5% | | | | | | | | |
| Bowater, Inc., 6.50%, 06/15/2013 (p) | | | | 305,000 | | | | 277,931 |
| P.H. Glatfelter Co., 7.125%, 05/01/2016 | | | | 400,000 | | | | 404,500 |
| Verso Paper Holdings, LLC, 11.375%, 08/01/2016 144A | | | | 630,000 | | | | 677,250 |
| |
|
| | | | | | | | | 1,359,681 |
| |
|
| TELECOMMUNICATION SERVICES 2.5% | | | | | | | | |
| Diversified Telecommunication Services 0.9% | | | | | | | | |
| Level 3 Communications, Inc.: | | | | | | | | |
| 5.875%, 01/15/2015 | | | | 345,000 | | | | 337,669 |
| 6.375%, 10/15/2015 | | | | 1,000,000 | | | | 1,000,000 |
| Qwest Communications International, Inc., 7.875%, 09/01/2011 | | | | 1,200,000 | | | | 1,284,000 |
| |
|
| | | | | | | | | 2,621,669 |
| |
|
| Wireless Telecommunication Services 1.6% | | | | | | | | |
| Centennial Communications Corp.: | | | | | | | | |
| 8.125%, 02/01/2014 | | | | 959,000 | | | | 998,559 |
| 10.00%, 01/01/2013 | | | | 1,175,000 | | | | 1,277,812 |
| Dobson Communications Corp., 8.875%, 10/01/2013 (p) | | | | 1,175,000 | | | | 1,217,594 |
| MetroPCS Wireless, Inc., 9.25%, 11/01/2014 144A | | | | 500,000 | | | | 536,250 |
| Rural Cellular Corp.: | | | | | | | | |
| 8.25%, 03/15/2012 | | | | 450,000 | | | | 477,000 |
| 9.75%, 01/15/2010 (p) | | | | 270,000 | | | | 280,125 |
| |
|
| | | | | | | | | 4,787,340 |
| |
|
| UTILITIES 3.1% | | | | | | | | |
| Electric Utilities 1.7% | | | | | | | | |
| Allegheny Energy Supply Co., LLC, 8.25%, 04/15/2012 144A | | | | 475,000 | | | | 517,750 |
| CMS Energy Corp., 8.50%, 04/15/2011 | | | | 40,000 | | | | 43,850 |
| Mirant North America, LLC, 7.375%, 12/31/2013 (p) | | | | 750,000 | | | | 796,875 |
| Mission Energy Holding Co., 13.50%, 07/15/2008 | | | | 60,000 | | | | 65,850 |
| NRG Energy, Inc., 7.375%, 02/01/2016 | | | | 1,500,000 | | | | 1,561,875 |
See Notes to Financial Statements
17
SCHEDULE OF INVESTMENTS continued
April 30, 2007
| | | | | | | Principal | | | | |
| | | | | | | Amount | | | | Value |
|
| |
| CORPORATE BONDS continued | | | | | | | | |
| UTILITIES continued | | | | | | | | | | |
| Electric Utilities continued | | | | | | | | | | |
| Orion Power Holdings, Inc., 12.00%, 05/01/2010 | | $ | | 800,000 | | $ | | 928,000 |
| Reliant Energy, Inc., 6.75%, 12/15/2014 | | | | 1,075,000 | | | | 1,131,438 |
| |
|
| | | | | | | | | | | 5,045,638 |
| |
|
| Gas Utilities 0.5% | | | | | | | | | | |
| SEMCO Energy, Inc., 7.75%, 05/15/2013 | | | | 1,350,000 | | | | 1,404,495 |
| |
|
| Independent Power Producers & Energy Traders 0.9% | | | | | | | | |
| AES Corp., 7.75%, 03/01/2014 | | | | | | 1,000,000 | | | | 1,062,500 |
| Dynegy, Inc., 8.375%, 05/01/2016 | | | | 1,350,000 | | | | 1,429,312 |
| Tenaska, Inc., 7.00%, 06/30/2021 144A | | | | 333,182 | | | | 338,706 |
| |
|
| | | | | | | | | | | 2,830,518 |
| |
|
| Total Corporate Bonds (cost $85,779,370) | | | | | | | | 89,166,018 |
| |
|
| FOREIGN BONDS - CORPORATE (PRINCIPAL AMOUNT DENOMINATED | | | | | | | | |
| IN CURRENCY INDICATED) 10.1% | | | | | | | | |
| CONSUMER DISCRETIONARY 0.3% | | | | | | | | |
| Household Durables 0.1% | | | | | | | | | | |
| Taylor Woodrow plc, 6.625%, 02/07/2012 GBP | | | | 100,000 | | | | 203,625 |
| |
|
| Media 0.2% | | | | | | | | | | |
| Central European Media Enterprise, Ltd., 8.25%, 05/15/2012 EUR | | | | 400,000 | | | | 597,423 |
| |
|
| CONSUMER STAPLES 0.3% | | | | | | | | | | |
| Tobacco 0.3% | | | | | | | | | | |
| British American Tobacco plc, 5.75%, 12/09/2013 GBP | | | | 500,000 | | | | 983,815 |
| |
|
| ENERGY 0.4% | | | | | | | | | | |
| Oil, Gas & Consumable Fuels 0.4% | | | | | | | | |
| Transco plc, 7.00%, 12/15/2008 AUD | | | | 1,500,000 | | | | 1,252,346 |
| |
|
| FINANCIALS 8.4% | | | | | | | | | | |
| Capital Markets 0.7% | | | | | | | | | | |
| Goldman Sachs Group, Inc., 5.25%, 12/15/2015 GBP | | | | 650,000 | | | | 1,241,072 |
| Morgan Stanley, 5.375%, 11/14/2013 GBP | | | | 460,000 | | | | 893,754 |
| |
|
| | | | | | | | | | | 2,134,826 |
| |
|
| Commercial Banks 3.0% | | | | | | | | | | |
| Australia & New Zealand Banking Group, Ltd., 6.00%, 03/01/2010 AUD | | | | 1,500,000 | | | | 1,227,218 |
| Eurofima, 5.50%, 09/15/2009 AUD | | | | 55,000 | | | | 44,880 |
| European Investment Bank: | | | | | | | | | | |
| 5.75%, 09/15/2009 AUD | | | | | | 100,000 | | | | 82,182 |
| 6.75%, 11/17/2008 NZD | | | | | | 4,550,000 | | | | 3,323,881 |
| Kreditanstalt für Wiederaufbau, 4.95%, 10/14/2014 CAD | | | | 2,665,000 | | | | 2,485,859 |
| National Australia Bank, Ltd., 5.50%, 01/15/2010 AUD | | | | 1,500,000 | | | | 1,213,347 |
| NV Bank Nerderlandse Gemeenten, 5.00%, 07/16/2010 AUD | | | | 880,000 | | | | 703,554 |
| |
|
| | | | | | | | | | | 9,080,921 |
| |
|
See Notes to Financial Statements
18
SCHEDULE OF INVESTMENTS continued
April 30, 2007
| | | Principal | | | | |
| | | Amount | | | | Value |
|
| |
| FOREIGN BONDS - CORPORATE (PRINCIPAL AMOUNT DENOMINATED | | | | | | |
| IN CURRENCY INDICATED) continued | | | | | | |
| FINANCIALS continued | | | | | | |
| Consumer Finance 1.0% | | | | | | |
| General Electric Capital Corp., 5.25%, 12/10/2013 GBP | | 570,000 | | $ | | 1,108,162 |
| KfW International Finance, Inc., 6.25%, 12/17/2007 NZD | | 2,380,000 | | | | 1,743,503 |
| |
|
| | | | | | | 2,851,665 |
| |
|
| Diversified Financial Services 0.4% | | | | | | |
| Citigroup, Inc., 6.00%, 02/23/2009 AUD | | 1,354,000 | | | | 1,116,235 |
| |
|
| Thrifts & Mortgage Finance 3.3% | | | | | | |
| Nykredit, 5.00%, 10/01/2035 DKK | | 29,424,181 | | | | 5,344,457 |
| Realkredit Danmark AS, 4.00%, 10/01/2035 DKK | | 7,696,900 | | | | 1,291,071 |
| Totalkredit, FRN, 4.39%, 01/01/2015 DKK | | 17,014,479 | | | | 3,178,382 |
| |
|
| | | | | | | 9,813,910 |
| |
|
| INDUSTRIALS 0.1% | | | | | | |
| Machinery 0.1% | | | | | | |
| Savcio Holdings, Ltd., 8.00%, 02/15/2013 EUR | | 150,000 | | | | 217,426 |
| |
|
| TELECOMMUNICATION SERVICES 0.6% | | | | | | |
| Diversified Telecommunication Services 0.6% | | | | | | |
| France Telecom, 7.50%, 03/14/2011 GBP 144A | | 900,000 | | | | 1,898,510 |
| |
|
| Total Foreign Bonds - Corporate (Principal Amount Denominated in | | | | | | |
| Currency Indicated) (cost $27,870,427) | | | | | | 30,150,702 |
| |
|
| FOREIGN BONDS - GOVERNMENT (PRINCIPAL AMOUNT DENOMINATED | | | | | | |
| IN CURRENCY INDICATED) 17.9% | | | | | | |
| Australia, 7.00%, 12/01/2010 AUD | | 4,650,000 | | | | 3,958,931 |
| Brazil, 9.50%, 10/05/2007 EUR | | 120,000 | | | | 167,319 |
| Canada: | | | | | | |
| 4.60%, 09/15/2011 CAD | | 3,300,000 | | | | 3,022,531 |
| 4.75%, 07/27/2011 CAD | | 960,000 | | | | 875,661 |
| 5.00%, 06/01/2014 CAD | | 5,785,000 | | | | 5,494,563 |
| 5.25%, 11/30/2011 CAD | | 1,100,000 | | | | 1,026,614 |
| Germany: | | | | | | |
| 3.50%, 10/14/2011 EUR | | 3,250,000 | | | | 4,320,046 |
| 3.75%, 01/04/2017 EUR | | 4,100,000 | | | | 5,400,624 |
| Hong Kong, 4.23%, 03/21/2011 HKD | | 23,750,000 | | | | 3,058,026 |
| Korea: | | | | | | |
| 4.75%, 06/10/2009 KRW | | 1,355,600,000 | | | | 1,446,945 |
| 5.25%, 09/10/2015 KRW | | 1,100,000,000 | | | | 1,191,651 |
| Mexico: | | | | | | |
| 5.50%, 02/17/2020 EUR | | 1,120,000 | | | | 1,619,242 |
| 10.00%, 12/05/2024 MXN | | 28,750,000 | | | | 3,199,796 |
| Norway: | | | | | | |
| 4.25%, 05/19/2017 NOK | | 1,810,000 | | | | 291,857 |
| 5.00%, 05/15/2015 NOK | | 26,000,000 | | | | 4,428,735 |
See Notes to Financial Statements
19
SCHEDULE OF INVESTMENTS continued
April 30, 2007
| | | | | Principal | | | | |
| | | | | Amount | | | | Value |
|
| |
| FOREIGN BONDS - GOVERNMENT (PRINCIPAL AMOUNT DENOMINATED | | | | | | | | |
| IN CURRENCY INDICATED) continued | | | | | | | | |
| Philippines, 6.25%, 03/15/2016 EUR | | | | 680,000 | | $ | | 974,892 |
| Poland, 4.75%, 04/25/2012 PLN | | | | 8,255,000 | | | | 2,939,279 |
| Romania, 8.50%, 05/08/2012 EUR | | | | 115,000 | | | | 184,875 |
| South Africa, 5.25%, 05/16/2013 EUR | | | | 235,000 | | | | 330,090 |
| Turkey, 4.75%, 07/06/2012 EUR | | | | 1,330,000 | | | | 1,768,532 |
| Ukraine, 4.95%, 10/13/2015 EUR | | | | 120,000 | | | | 155,723 |
| United Kingdom: | | | | | | | | |
| 1.25%, 11/22/2017 GBP | | | | 2,397,788 | | | | 4,516,808 |
| 5.00%, 03/07/2012 GBP | | | | 850,000 | | | | 1,681,249 |
| FRN, 5.73%, 08/16/2013 GBP | | | | 300,000 | | | | 1,371,101 |
| |
|
| Total Foreign Bonds - Government (Principal Amount Denominated in | | | | | | | | |
| Currency Indicated) (cost $52,207,178) | | | | | | | | 53,425,090 |
| |
|
| U.S. TREASURY OBLIGATIONS 4.1% | | | | | | | | |
| U.S. Treasury Bonds, 4.50%, 02/15/2036 (p) | | $ | | 5,125,000 | | | | 4,861,545 |
| U.S. Treasury Notes: | | | | | | | | |
| 2.00%, 01/15/2016 (p) | | | | 3,473,032 | | | | 3,423,517 |
| 4.00%, 02/15/2014 ## | | | | 1,000,000 | | | | 967,540 |
| 4.625%, 11/15/2016 (p) | | | | 2,900,000 | | | | 2,899,095 |
| |
|
| Total U.S. Treasury Obligations (cost $12,147,969) | | | | | | | | 12,151,697 |
| |
|
| WHOLE LOAN MORTGAGE-BACKED COLLATERALIZED MORTGAGE | | | | | | | | |
| OBLIGATIONS 2.8% | | | | | | | | |
| FIXED-RATE 2.5% | | | | | | | | |
| Countrywide Home Loans, Inc.: | | | | | | | | |
| Ser. 2006-18, Class 2A5, 6.00%, 12/25/2036 | | | | 1,600,000 | | | | 1,613,344 |
| Ser. 2006-J1, Class 1A5, 5.75%, 02/25/2036 | | | | 1,400,000 | | | | 1,381,338 |
| Credit Suisse First Boston Mtge. Securities Corp., Ser. 2002-26, Class 4A1, | | | | | | | | |
| 7.00%, 10/25/2017 | | | | 352,252 | | | | 357,792 |
| Credit Suisse Mtge. Capital Cert., Ser. 2006-9, Class 4A1, 6.00%, 11/25/2036 | | | | 1,531,265 | | | | 1,539,243 |
| Structured Asset Securities Corp.: | | | | | | | | |
| Ser. 2004-20, Class 5A-1, 6.25%, 11/25/2034 | | | | 1,626,365 | | | | 1,636,783 |
| Ser. 2005-RM1, Class A, IO, 5.00%, 03/25/2045 144A | | | | 4,137,427 | | | | 880,335 |
| |
|
| | | | | | | | | 7,408,835 |
| |
|
| FLOATING-RATE 0.3% | | | | | | | | |
| MASTR Adjustable Rate Mtge. Trust, Ser. 2005-1, Class 7A3, 4.83%, 02/25/2035 | | | | 1,030,591 | | | | 1,028,695 |
| |
|
| Total Whole Loan Mortgage-Backed Collateralized Mortgage Obligations | | | | | | | | |
| (cost $8,400,690) | | | | | | | | 8,437,530 |
| |
|
| WHOLE LOAN MORTGAGE-BACKED PASS THROUGH SECURITIES 0.2% | | | | | | | | |
| FLOATING-RATE 0.2% | | | | | | | | |
| Bear Stearns Adjustable Rate Mtge. Trust, Ser. 2004-10, Class 12A3, 4.65%, | | | | | | | | |
| 01/25/2035 (cost $570,072) | | | | 570,339 | | | | 567,208 |
| |
|
See Notes to Financial Statements
20
SCHEDULE OF INVESTMENTS continued
April 30, 2007
| | | | | Principal | | | | |
| | | | | Amount | | | | Value |
|
| |
| WHOLE LOAN SUBORDINATE COLLATERALIZED MORTGAGE | | | | | | | | |
| OBLIGATIONS 0.7% | | | | | | | | |
| FIXED-RATE 0.4% | | | | | | | | |
| MASTR Resecuritization Trust: | | | | | | | | |
| Ser. 2004-3, 5.00%, 03/25/2034 | | $ | | 552,113 | | $ | | 533,998 |
| Ser. 2005-2, 4.75%, 03/28/2034 | | | | 600,077 | | | | 585,213 |
| |
|
| | | | | | | | | 1,119,211 |
| |
|
| FLOATING-RATE 0.3% | | | | | | | | |
| Harborview Mtge. Loan Trust, Ser. 2005-8, Class 2B3, 7.36%, 02/19/2035 | | | | 1,002,510 | | | | 1,006,439 |
| |
|
| Total Whole Loan Subordinate Collateralized Mortgage Obligations | | | | | | | | |
| (cost $2,143,217) | | | | | | | | 2,125,650 |
| |
|
| YANKEE OBLIGATIONS - CORPORATE 7.0% | | | | | | | | |
| CONSUMER STAPLES 0.2% | | | | | | | | |
| Beverages 0.2% | | | | | | | | |
| Companhia Brasileira de Bebidas, 8.75%, 09/15/2013 | | | | 430,000 | | | | 504,175 |
| |
|
| ENERGY 0.2% | | | | | | | | |
| Oil, Gas & Consumable Fuels 0.2% | | | | | | | | |
| OAO Gazprom: | | | | | | | | |
| 9.625%, 03/01/2013 | | | | 160,000 | | | | 191,264 |
| 9.625%, 03/01/2013 144A | | | | 430,000 | | | | 513,635 |
| |
|
| | | | | | | | | 704,899 |
| |
|
| FINANCIALS 3.2% | | | | | | | | |
| Commercial Banks 1.0% | | | | | | | | |
| Bank of Moscow, 7.34%, 05/13/2013 | | | | 2,000,000 | | | | 2,108,400 |
| Kazkommerts International BV, 7.00%, 11/03/2009 | | | | 900,000 | | | | 911,250 |
| |
|
| | | | | | | | | 3,019,650 |
| |
|
| Consumer Finance 0.4% | | | | | | | | |
| Virgin Media Finance plc, 9.125%, 08/15/2016 | | | | 1,000,000 | | | | 1,072,500 |
| |
|
| Diversified Financial Services 1.8% | | | | | | | | |
| HBOS Treasury Services plc, 5.25%, 09/19/2011 | | | | 2,300,000 | | | | 2,325,192 |
| Preferred Term Securities XII, Ltd., FRN: | | | | | | | | |
| 5.95%, 06/24/2034 144A | | | | 875,000 | | | | 881,396 |
| 6.92%, 06/24/2034 144A | | | | 220,000 | | | | 224,508 |
| 6.97%, 12/24/2033 144A | | | | 800,000 | | | | 816,248 |
| 7.45%, 04/03/2032 144A | | | | 244,669 | | | | 247,323 |
| 10.00%, 12/24/2033 | | | | 105,000 | | | | 86,677 |
| Ship Finance International, Ltd., 8.50%, 12/15/2013 | | | | 865,000 | | | | 895,275 |
| |
|
| | | | | | | | | 5,476,619 |
| |
|
See Notes to Financial Statements
21
SCHEDULE OF INVESTMENTS continued
April 30, 2007
| | | | | | | Principal | | | | |
| | | | | | | Amount | | | | Value |
|
| |
| YANKEE OBLIGATIONS - CORPORATE continued | | | | | | | | |
| MATERIALS 0.4% | | | | | | | | | | |
| Metals & Mining 0.3% | | | | | | | | | | |
| Novelis, Inc., 7.25%, 02/15/2015 | | | | $ | | 1,065,000 | | $ | | 1,127,569 |
| |
|
| Paper & Forest Products 0.1% | | | | | | | | | | |
| Abitibi-Consolidated, Inc., 8.375%, 04/01/2015 (p) | | | | 215,000 | | | | 202,100 |
| |
|
| TELECOMMUNICATION SERVICES 2.6% | | | | | | | | |
| Diversified Telecommunication Services 0.4% | | | | | | | | |
| Nordic Telecom Holdings Co., 8.875%, 05/01/2016 144A | | | | 1,000,000 | | | | 1,080,000 |
| |
|
| Wireless Telecommunication Services 2.2% | | | | | | | | |
| Intelsat, Ltd.: | | | | | | | | | | |
| 9.25%, 06/15/2016 | | | | | | 500,000 | | | | 552,500 |
| 11.25%, 06/15/2016 | | | | | | 375,000 | | | | 429,844 |
| Rogers Wireless, Inc.: | | | | | | | | | | |
| 6.375%, 03/01/2014 | | | | | | 465,000 | | | | 482,437 |
| 9.625%, 05/01/2011 | | | | | | 745,000 | | | | 856,750 |
| Vimpel Communications, 8.25%, 05/23/2016 | | | | 400,000 | | | | 428,100 |
| Vodafone Group plc, FRN, 5.41%, 06/29/2007 | | | | 3,915,000 | | | | 3,915,172 |
| |
|
| | | | | | | | | | | 6,664,803 |
| |
|
| UTILITIES 0.4% | | | | | | | | | | |
| Electric Utilities 0.2% | | | | | | | | | | |
| Enersis SA, 7.375%, 01/15/2014 | | | | | | 475,000 | | | | 516,400 |
| |
|
| Multi-Utilities 0.2% | | | | | | | | | | |
| National Power Corp., FRN, 9.61%, 08/23/2011 144A | | | | 500,000 | | | | 561,218 |
| |
|
| Total Yankee Obligations - Corporate (cost $20,257,953) | | | | | | | | 20,929,933 |
| |
|
| YANKEE OBLIGATIONS - GOVERNMENT 5.2% | | | | | | | | |
| Argentina, 12.25%, 06/19/2018 • | | | | | | 615,525 | | | | 210,817 |
| Brazil: | | | | | | | | | | |
| 7.125%, 01/20/2037 | | | | | | 1,460,000 | | | | 1,654,180 |
| 8.25%, 01/20/2034 | | | | | | 1,985,000 | | | | 2,556,680 |
| Colombia: | | | | | | | | | | |
| 7.375%, 01/27/2017 | | | | | | 290,000 | | | | 319,580 |
| 7.375%, 09/18/2037 | | | | | | 460,000 | | | | 515,430 |
| 8.125%, 05/21/2024 | | | | | | 680,000 | | | | 814,980 |
| Indonesia, 6.75%, 03/10/2014 | | | | | | 350,000 | | | | 365,750 |
| Jamaica, 11.75%, 05/15/2011 | | | | | | 145,000 | | | | 179,438 |
| Mexico: | | | | | | | | | | |
| 6.625%, 03/03/2015 | | | | | | 565,000 | | | | 613,872 |
| 6.75%, 09/27/2034 | | | | | | 260,000 | | | | 290,550 |
| 8.375%, 01/14/2011 | | | | | | 770,000 | | | | 853,930 |
| Panama, 9.625%, 02/08/2011 | | | | | | 450,000 | | | | 515,250 |
| Peru: | | | | | | | | | | |
| 8.375%, 05/03/2016 | | | | | | 120,000 | | | | 144,120 |
| 8.75%, 11/21/2033 | | | | | | 145,000 | | | | 195,533 |
| 9.125%, 01/15/2008 | | | | | | 425,000 | | | | 436,688 |
See Notes to Financial Statements
22
SCHEDULE OF INVESTMENTS continued
April 30, 2007
| | | | | | | Principal | | | | |
| | | | | | | Amount | | | | Value |
|
| |
| YANKEE OBLIGATIONS - GOVERNMENT continued | | | | | | | | |
| Philippines, 8.00%, 01/15/2016 | | $ | | 788,000 | | $ | | 892,410 |
| Russia: | | | | | | | | | | |
| 11.00%, 07/24/2018 | | | | 750,000 | | | | 1,081,350 |
| Sr. Disc. Note, Step Bond, 5.00%, 03/31/2030 † | | | | 594,750 | | | | 675,814 |
| Turkey, 7.00%, 09/26/2016 | | | | 850,000 | | | | 873,375 |
| Ukraine, 6.58%, 11/21/2016 | | | | 300,000 | | | | 305,265 |
| Uruguay, 7.50%, 03/15/2015 | | | | 630,000 | | | | 686,700 |
| Venezuela: | | | | | | | | | | |
| 7.65%, 04/21/2025 | | | | 455,000 | | | | 478,660 |
| 10.75%, 09/19/2013 | | | | 710,000 | | | | 867,265 |
| |
|
| Total Yankee Obligations - Government (cost $14,609,207) | | | | | | | | 15,527,637 |
| | |
|
|
| | | | | | | Shares | | | | Value |
|
| |
| COMMON STOCKS 0.1% | | | | | | | | |
| MATERIALS 0.1% | | | | | | | | | | |
| Chemicals 0.1% | | | | | | | | | | |
| Huntsman Corp. (cost $137,985) | | | | 19,570 | | | | 383,572 |
| | |
|
|
| | | | | | | Principal | | | | |
| | | | | | | Amount | | | | Value |
|
| |
| INVESTMENTS OF CASH COLLATERAL FROM SECURITIES LOANED 5.5% | | | | | | |
| CORPORATE BONDS 0.3% | | | | | | | | |
| Commercial Banks 0.3% | | | | | | | | |
| Canadian Imperial Bank of Commerce, FRN, 5.33, 08/15/2007 | | $ | | 1,000,000 | | | | 1,000,000 |
| |
|
| REPURCHASE AGREEMENTS ^ 5.2% | | | | | | | | |
| Bank of America Corp., 5.33%, dated 04/30/2007 maturing 05/01/2007; | | | | | | | | |
| maturity value is $15,469,461 | | | | 15,467,171 | | | | 15,467,171 |
| |
|
| Total Investments of Cash Collateral from Securities Loaned | | | | | | | | |
| (cost $16,467,171) | | | | | | | | 16,467,171 |
| | |
|
|
| | | | | | | Shares | | | | Value |
|
| |
| SHORT-TERM INVESTMENTS 2.3% | | | | | | | | |
| MUTUAL FUND SHARES 2.3% | | | | | | | | |
| Evergreen Institutional Money Market Fund, Class I, 5.21% q ø ## | | | | | | | | |
| (cost $6,906,280) | | | | | | 6,906,280 | | | | 6,906,280 |
| |
|
| Total Investments (cost $346,184,874) 118.8% | | | | | | | | 354,801,695 |
| Other Assets and Liabilities (18.8%) | | | | | | | | (56,071,467) |
| |
|
| Net Assets 100.0% | | | | | | | | $ | | 298,730,228 |
| |
|
See Notes to Financial Statements
23
SCHEDULE OF INVESTMENTS continued
April 30, 2007
| ## | | All or a portion of this security has been segregated for when-issued or delayed delivery securities. |
| # | | When-issued or delayed delivery security |
| 144A | | Security that may be sold to qualified institutional buyers under Rule 144A of the Securities Act of 1933, as amended. |
| | | This security has been determined to be liquid under guidelines established by the Board of Trustees, unless otherwise |
| | | noted. |
| (h) | | Security is valued at fair value as determined by the investment advisor in good faith, according to procedures approved |
| | | by the Board of Trustees. |
| (p) | | All or a portion of this security is on loan. |
| • | | Security which has defaulted on payment of interest and/or principal. The Fund has stopped accruing interest on this |
| | | security. |
| † | | Security initially issued in zero coupon form which converts to coupon form at a specified rate and date. An effective |
| | | interest rate is applied to recognize interest income daily for the bond. This rate is based on total expected interest to |
| | | be earned over the life of the bond which consists of the aggregate coupon-interest payments and discount at |
| | | acquisition. The rate shown is the stated rate at the current period end. |
| ^ | | Collateralized by U.S. government agency obligations at period end. |
| q | | Rate shown is the 7-day annualized yield at period end. |
| ø | | Evergreen Investment Management Company, LLC is the investment advisor to both the Fund and the money market |
| | | fund. |
| Summary of Abbreviations |
| AUD | | Australian Dollar |
| CAD | | Canadian Dollar |
| CDO | | Collateralized Debt Obligation |
| DKK | | Danish Krone |
| EUR | | Euro |
| FHLMC | | Federal Home Loan Mortgage Corp. |
| FNMA | | Federal National Mortgage Association |
| FRN | | Floating Rate Note |
| GBP | | Great British Pound |
| GNMA | | Government National Mortgage Association |
| HKD | | Hong Kong Dollar |
| IO | | Interest Only |
| KRW | | Republic of Korea Won |
| MASTR | | Mortgage Asset Securitization Transactions, Inc. |
| MXN | | Mexican Peso |
| NOK | | Norwegian Krone |
| NZD | | New Zealand Dollar |
| PLN | | Polish Zloty |
| TBA | | To Be Announced |
The following table shows the percent of total investments (excluding equity positions, collateral from securities on loan and segregated cash and cash equivalents) by credit quality based on Moody’s and Standard & Poor’s ratings as of April 30, 2007 (unaudited):
| AAA | | 53.5% |
| AA | | 5.3% |
| A | | 7.8% |
| BBB | | 3.8% |
| BB | | 11.0% |
| B | | 14.7% |
| CCC | | 3.7% |
| Lower than CCC | | 0.1% |
| NR | | 0.1% |
| |
|
| | | 100.0% |
| | |
|
See Notes to Financial Statements
24
SCHEDULE OF INVESTMENTS continued
April 30, 2007
The following table shows the percent of total investments (excluding equity positions, collateral from securities on loan and segregated cash and cash equivalents) based on effective maturity as of April 30, 2007 (unaudited):
| Less than 1 year | | 8.8% |
| 1 to 3 year(s) | | 8.8% |
| 3 to 5 years | | 18.3% |
| 5 to 10 years | | 51.6% |
| 10 to 20 years | | 5.8% |
| 20 to 30 years | | 6.7% |
| |
|
| | | 100.0% |
| | |
|
See Notes to Financial Statements
25
STATEMENT OF ASSETS AND LIABILITIES
April 30, 2007
| Assets | | | | |
| Investments in securities, at value (cost $339,278,594) including $21,771,727 of securities | | | | |
| loaned | | $ | | 347,895,415 |
| Investments in affiliated money market fund, at value (cost $6,906,280) | | | | 6,906,280 |
|
| Total investments | | | | 354,801,695 |
| Cash | | | | 669,894 |
| Foreign currency, at value (cost $1,873,298) | | | | 1,886,853 |
| Receivable for securities sold | | | | 26,614,503 |
| Receivable for Fund shares sold | | | | 454,531 |
| Dividends and interest receivable | | | | 4,708,835 |
| Unrealized gains on forward foreign currency exchange contracts | | | | 856,738 |
| Receivable for securities lending income | | | | 3,168 |
| Prepaid expenses and other assets | | | | 42,632 |
|
| Total assets | | | | 390,038,849 |
|
| Liabilities | | | | |
| Dividends payable | | | | 409,564 |
| Payable for securities purchased | | | | 72,149,201 |
| Payable for Fund shares redeemed | | | | 599,562 |
| Unrealized losses on forward foreign currency exchange contracts | | | | 1,556,254 |
| Payable for securities on loan | | | | 16,467,171 |
| Payable for closed forward foreign currency exchange contracts | | | | 37,796 |
| Advisory fee payable | | | | 3,074 |
| Due to other related parties | | | | 309 |
| Accrued expenses and other liabilities | | | | 85,690 |
|
| Total liabilities | | | | 91,308,621 |
|
| Net assets | | $ | | 298,730,228 |
|
| Net assets represented by | | | | |
| Paid-in capital | | $ | | 343,068,113 |
| Undistributed net investment income | | | | 267,621 |
| Accumulated net realized losses on investments | | | | (52,579,195) |
| Net unrealized gains on investments | | | | 7,973,689 |
|
| Total net assets | | $ | | 298,730,228 |
|
| Net assets consists of | | | | |
| Class A | | $ | | 170,804,405 |
| Class B | | | | 54,955,419 |
| Class C | | | | 55,109,898 |
| Class I | | | | 17,860,506 |
|
| Total net assets | | $ | | 298,730,228 |
|
| Shares outstanding (unlimited number of shares authorized) | | | | |
| Class A | | | | 26,669,797 |
| Class B | | | | 8,554,411 |
| Class C | | | | 8,592,824 |
| Class I | | | | 2,833,538 |
|
| Net asset value per share | | | | |
| Class A | | $ | | 6.40 |
| Class A — Offering price (based on sales charge of 4.75%) | | $ | | 6.72 |
| Class B | | $ | | 6.42 |
| Class C | | $ | | 6.41 |
| Class I | | $ | | 6.30 |
|
See Notes to Financial Statements
26
STATEMENT OF OPERATIONS
Year Ended April 30, 2007
| Investment income | | | | |
| Interest (net of foreign withholding taxes of $12,859) | | $ | | 19,943,300 |
| Income from affiliate | | | | 480,617 |
| Securities lending | | | | 89,512 |
| Dividends | | | | 1,957 |
|
| Total investment income | | | | 20,515,386 |
|
| Expenses | | | | |
| Advisory fee | | | | 1,437,989 |
| Distribution Plan expenses | | | | |
| Class A | | | | 548,858 |
| Class B | | | | 618,885 |
| Class C | | | | 595,022 |
| Administrative services fee | | | | 322,907 |
| Transfer agent fees | | | | 734,111 |
| Trustees’ fees and expenses | | | | 11,728 |
| Printing and postage expenses | | | | 52,111 |
| Custodian and accounting fees | | | | 224,693 |
| Registration and filing fees | | | | 83,248 |
| Professional fees | | | | 35,409 |
| Other | | | | 10,635 |
|
| Total expenses | | | | 4,675,596 |
| Less: Expense reductions | | | | (16,477) |
| Expense reimbursements | | | | (67,291) |
|
| Net expenses | | | | 4,591,828 |
|
| Net investment income | | | | 15,923,558 |
|
| Net realized and unrealized gains or losses on investments | | | | |
| Net realized gains or losses on: | | | | |
| Securities | | | | 2,274,670 |
| Foreign currency related transactions | | | | (5,494,812) |
|
| Net realized losses on investments | | | | (3,220,142) |
| Net change in unrealized gains or losses on investments | | | | 7,133,625 |
|
| Net realized and unrealized gains or losses on investments | | | | 3,913,483 |
|
| Net increase in net assets resulting from operations | | $ | | 19,837,041 |
|
See Notes to Financial Statements
27
STATEMENTS OF CHANGES IN NET ASSETS
| | | Year Ended April 30, |
| |
|
| | | 2007 | | 2006 |
|
| Operations | | | | | | | | |
| Net investment income | | $ | | 15,923,558 | | $ | | 16,841,934 |
| Net realized losses on investments | | | | (3,220,142) | | | | (2,684,856) |
| Net change in unrealized gains or losses | | | | | | | | |
| on investments | | | | 7,133,625 | | | | (9,450,598) |
|
| Net increase in net assets resulting from | | | | | | | | |
| operations | | | | 19,837,041 | | | | 4,706,480 |
|
| Distributions to shareholders from | | | | | | | | |
| Net investment income | | | | | | | | |
| Class A | | | | (9,094,484) | | | | (10,259,354) |
| Class B | | | | (2,627,449) | | | | (3,600,563) |
| Class C | | | | (2,528,220) | | | | (3,058,183) |
| Class I | | | | (1,045,572) | | | | (1,005,662) |
| Tax basis return of capital | | | | | | | | |
| Class A | | | | (519,958) | | | | 0 |
| Class B | | | | (175,306) | | | | 0 |
| Class C | | | | (168,861) | | | | 0 |
| Class I | | | | (57,606) | | | | 0 |
|
| Total distributions to shareholders | | | | (16,217,456) | | | | (17,923,762) |
|
| | | Shares | | | | Shares | | |
| Capital share transactions | | | | | | | | |
| Proceeds from shares sold | | | | | | | | |
| Class A | | 2,802,341 | | 17,655,099 | | 5,909,652 | | 38,042,740 |
| Class B | | 662,966 | | 4,199,618 | | 1,455,763 | | 9,426,705 |
| Class C | | 935,756 | | 5,896,227 | | 1,747,244 | | 11,243,339 |
| Class I | | 724,245 | | 4,513,577 | | 1,006,362 | | 6,306,547 |
|
| | | | | 32,264,521 | | | | 65,019,331 |
|
| Net asset value of shares issued in | | | | | | | | |
| reinvestment of distributions | | | | | | | | |
| Class A | | 1,101,527 | | 6,947,693 | | 1,157,135 | | 7,418,556 |
| Class B | | 242,976 | | 1,537,222 | | 316,069 | | 2,034,399 |
| Class C | | 233,170 | | 1,473,134 | | 254,695 | | 1,636,184 |
| Class I | | 86,125 | | 534,959 | | 70,747 | | 446,231 |
|
| | | | | 10,493,008 | | | | 11,535,370 |
|
| Automatic conversion of Class B shares | | | | | | | | |
| to Class A shares | | | | | | | | |
| Class A | | 878,428 | | 5,528,422 | | 1,206,997 | | 7,694,908 |
| Class B | | (875,646) | | (5,528,422) | | (1,203,221) | | (7,694,908) |
|
| | | | | 0 | | | | 0 |
|
| Payment for shares redeemed | | | | | | | | |
| Class A | | (9,675,630) | | (60,907,111) | | (9,585,798) | | (61,312,812) |
| Class B | | (2,810,537) | | (17,750,836) | | (4,319,432) | | (27,783,628) |
| Class C | | (2,894,878) | | (18,242,199) | | (3,838,291) | | (24,601,769) |
| Class I | | (1,260,417) | | (7,853,118) | | (780,011) | | (4,915,699) |
|
| | | | | (104,753,264) | | | | (118,613,908) |
|
| Net decrease in net assets resulting from | | | | | | | | |
| capital share transactions | | | | (61,995,735) | | | | (42,059,207) |
|
| Total decrease in net assets | | | | (58,376,150) | | | | (55,276,489) |
| Net assets | | | | | | | | |
| Beginning of period | | | | 357,106,378 | | | | 412,382,867 |
|
| End of period | | $ 298,730,228 | | $ 357,106,378 |
|
| Undistributed net investment income | | $ | | 267,621 | | $ | | 2,095,367 |
|
See Notes to Financial Statements
28
NOTES TO FINANCIAL STATEMENTS
1. ORGANIZATION
Evergreen Diversified Income Builder Fund (the “Fund”) (formerly, Evergreen Strategic Income Fund) is a diversified series of Evergreen Fixed Income Trust (the “Trust”), a Delaware statutory trust organized on September 18, 1997. The Trust is an open-end management investment company registered under the Investment Company Act of 1940, as amended (the “1940 Act”).
The Fund offers Class A, Class B, Class C and Class I. Class A shares are sold with a front-end sales charge. However, Class A share investments of $1 million or more are not subject to a front-end sales charge but are subject to a contingent deferred sales charge of 1.00% upon redemption within 18 months. Prior to April 1, 2007, the 1.00% contingent deferred sales charge was applicable for redemptions made within one year. Class B shares are sold without a front-end sales charge but are subject to a contingent deferred sales charge that is payable upon redemption and decreases depending on how long the shares have been held. Class C shares are sold without a front-end sales charge but are subject to a contingent deferred sales charge that is payable upon redemption within one year. Class I shares are sold without a front-end sales charge or contingent deferred sales charge. Each class of shares, except Class I shares, pays an ongoing distribution fee.
2. SIGNIFICANT ACCOUNTING POLICIES
The following is a summary of significant accounting policies consistently followed by the Fund in the preparation of its financial statements. The policies are in conformity with generally accepted accounting principles in the United States of America, which require management to make estimates and assumptions that affect amounts reported herein. Actual results could differ from these estimates.
a. Valuation of investments
Portfolio debt securities acquired with more than 60 days to maturity are fair valued using matrix pricing methods determined by an independent pricing service which takes into consideration such factors as similar security prices, yields, maturities, liquidity and ratings. Securities for which valuations are not readily available from an independent pricing service may be valued by brokers which use prices provided by market makers or estimates of market value obtained from yield data relating to investments or securities with similar characteristics.
Listed equity securities are usually valued at the last sales price or official closing price on the national securities exchange where the securities are principally traded.
Investments of cash collateral in short-term securities are valued at amortized cost, which approximates market value.
Short-term securities with remaining maturities of 60 days or less at the time of purchase are valued at amortized cost, which approximates market value.
Investments in other mutual funds are valued at net asset value. Securities for which market quotations are not readily available or not reflective of current market value are valued at fair value as determined by the investment advisor in good faith, according to procedures approved by the Board of Trustees.
29
NOTES TO FINANCIAL STATEMENTS continued
b. Repurchase agreements
Securities pledged as collateral for repurchase agreements are held by the custodian bank or in a segregated account in the Fund’s name until the agreements mature. Collateral for certain tri-party repurchase agreements is held at the counterparty’s custodian in a segregated account for the benefit of the Fund and the counterparty. Each agreement requires that the market value of the collateral be sufficient to cover payments of interest and principal. However, in the event of default or bankruptcy by the other party to the agreement, retention of the collateral may be subject to legal proceedings. The Fund will enter into repurchase agreements with banks and other financial institutions, which are deemed by the investment advisor to be creditworthy pursuant to guidelines established by the Board of Trustees. In certain instances, the Fund’s securities lending agent may provide collateral in the form of repurchase agreements.
c. Foreign currency translation
All assets and liabilities denominated in foreign currencies are translated into U.S. dollar amounts at the date of valuation. Purchases and sales of portfolio securities and income items denominated in foreign currencies are translated into U.S. dollar amounts on the respective dates of such transactions. The Fund does not separately account for that portion of the results of operations resulting from changes in foreign exchange rates on investments and the fluctuations arising from changes in market prices of securities held. Such fluctuations are included with the net realized and unrealized gains or losses on investments.
d. Forward foreign currency contracts
A forward foreign currency contract is an agreement between two parties to purchase or sell a specific currency for an agreed-upon price at a future date. The Fund enters into forward foreign currency contracts to facilitate transactions in foreign-denominated securities and to attempt to minimize the risk to the Fund from adverse changes in the relationship between currencies. Forward foreign currency contracts are recorded at the forward rate and marked-to-market daily. When the contracts are closed, realized gains and losses arising from such transactions are recorded as realized gains or losses on foreign currency related transactions. The Fund could be exposed to risks if the counterparties to the contracts are unable to meet the terms of their contracts or if the value of the foreign currency changes unfavorably.
e. When-issued and delayed delivery transactions
The Fund records when-issued or delayed delivery securities as of trade date and maintains security positions such that sufficient liquid assets will be available to make payment for the securities purchased. Securities purchased on a when-issued or delayed delivery basis are marked-to-market daily and begin earning interest on the settlement date. Losses may occur on these transactions due to changes in market conditions or the failure of counterparties to perform under the contract.
f. Securities lending
The Fund may lend its securities to certain qualified brokers in order to earn additional income. The Fund receives compensation in the form of fees or interest earned on the investment of any
30
NOTES TO FINANCIAL STATEMENTS continued
cash collateral received. The Fund also continues to receive interest and dividends on the securities loaned. The Fund receives collateral in the form of cash or securities with a market value at least equal to the market value of the securities on loan, including accrued interest. In the event of default or bankruptcy by the borrower, the Fund could experience delays and costs in recovering the loaned securities or in gaining access to the collateral. The Fund has the right under the lending agreement to recover the securities from the borrower on demand.
g. Dollar roll transactions
The Fund may enter into dollar roll transactions with respect to mortgage-backed securities. In a dollar roll transaction, the Fund sells mortgage-backed securities to financial institutions and simultaneously agrees to accept substantially similar (same type, coupon and maturity) securities at a later date at an agreed upon price. The Fund will use the proceeds generated from the transactions to invest in short-term investments, which may enhance the Fund’s current yield and total return. The Fund accounts for dollar roll transactions as purchases and sales. The Fund could be exposed to risks if the counterparty defaults on its obligation to perform under the terms of the agreement, if the Fund receives inferior securities in comparison to what was sold to the coun-terparty at redelivery or if there are variances in paydown speed between the mortgage-related pools.
h. Security transactions and investment income
Security transactions are recorded on trade date. Realized gains and losses are computed using the specific cost of the security sold. Interest income is recorded on the accrual basis and includes accretion of discounts and amortization of premiums. Dividend income is recorded on the ex-dividend date or in the case of certain foreign securities, when the Fund becomes aware of such dividends. Foreign income and capital gains realized on some securities may be subject to foreign taxes, which are accrued as applicable.
i. Federal taxes
The Fund intends to continue to qualify as a regulated investment company and distribute all of its taxable income, including any net capital gains (which have already been offset by available capital loss carryovers). Accordingly, no provision for federal taxes is required.
j. Distributions
Distributions to shareholders from net investment income are accrued daily and paid monthly. Distributions from net realized gains, if any, are recorded on the ex-dividend date. Such distributions are determined in conformity with income tax regulations, which may differ from generally accepted accounting principles.
Reclassifications have been made to the Fund’s components of net assets to reflect income and gains available for distribution (or available capital loss carryovers, as applicable) under income tax regulations. The primary permanent differences causing such reclassifications are due to net
31
NOTES TO FINANCIAL STATEMENTS continued
realized foreign currency gains or losses, premium amortization and consent fees. During the year ended April 30, 2007, the following amounts were reclassified:
|
| Undistributed net investment income | | $ (2,455,579) |
| Accumulated net realized losses on investments | | 2,455,579 |
|
k. Class allocations
Income, common expenses and realized and unrealized gains and losses are allocated to the classes based on the relative net assets of each class. Distribution fees, if any, are calculated daily at the class level based on the appropriate net assets of each class and the specific expense rates applicable to each class.
3. ADVISORY FEE AND OTHER TRANSACTIONS WITH AFFILIATES
Evergreen Investment Management Company, LLC (“EIMC”), an indirect, wholly-owned subsidiary of Wachovia Corporation (“Wachovia”), is the investment advisor to the Fund and is paid a fee at an annual rate of 2% of the Fund’s gross investment income plus an amount determined by applying percentage rates to the aggregate average daily net assets of the Fund and its variable annuity counterpart, Evergreen VA Diversified Income Builder Fund, starting at 0.31% and declining to 0.16% as the aggregate average daily net assets increase.
Effective October 1, 2006, Tattersall Advisory Group, Inc., (“TAG”) an indirect, wholly-owned subsidiary of Wachovia, became the investment sub-advisor to the fixed income portion of the Fund and is paid by EIMC for its services to the Fund.
First International Advisors, Inc. d/b/a Evergreen International Advisors (“FIA”), an indirect, wholly-owned subsidiary of Wachovia, is also an investment sub-advisor to the Fund and is paid by EIMC for its services to the Fund.
From time to time, EIMC may voluntarily or contractually waive its fee and/or reimburse expenses in order to limit operating expenses. During the year ended April 30, 2007, EIMC voluntarily reimbursed Distribution Plan expenses (see Note 4) relating to Class A shares in the amount of $67,291.
The Fund may invest in Evergreen-managed money market funds, which are also advised by EIMC. Income earned on these investments is included in income from affiliate on the Statement of Operations.
Evergreen Investment Services, Inc. (“EIS”), an indirect, wholly-owned subsidiary of Wachovia, is the administrator to the Fund. As administrator, EIS provides the Fund with facilities, equipment and personnel and is paid an annual rate determined by applying percentage rates to the aggregate average daily net assets of the Evergreen funds (excluding money market funds and Evergreen Institutional Enhanced Income Fund), starting at 0.10% and declining to 0.05% as the aggregate average daily net assets of the Evergreen funds (excluding money market funds and Evergreen Institutional Enhanced Income Fund) increase.
32
NOTES TO FINANCIAL STATEMENTS continued
Evergreen Service Company, LLC (“ESC”), an indirect, wholly-owned subsidiary of Wachovia, is the transfer and dividend disbursing agent for the Fund. ESC receives account fees that vary based on the type of account held by the shareholders in the Fund. For the year ended April 30, 2007, the transfer agent fees were equivalent to an annual rate of 0.23% of the Fund’s average daily net assets.
4. DISTRIBUTION PLANS
EIS also serves as distributor of the Fund’s shares. The Fund has adopted Distribution Plans, as allowed by Rule 12b-1 of the 1940 Act, for each class of shares, except Class I. Under the Distribution Plans, distribution fees are paid at an annual rate of 0.30% of the average daily net assets for Class A shares and 1.00% of the average daily net assets for each of Class B and Class C shares.
For the year ended April 30, 2007, EIS received $7,940 from the sale of Class A shares and $167,907 and $2,028 in contingent deferred sales charges from redemptions of Class B and Class C shares, respectively.
5. SECURITIES TRANSACTIONS
Cost of purchases and proceeds from sales of investment securities (excluding short-term securities and mortgage dollar roll transactions) were as follows for the year ended April 30, 2007:
| Cost of Purchases | | Proceeds from Sales |
|
| U.S. | | Non-U.S. | | U.S. | | Non-U.S. |
| Government | | Government | | Government | | Government |
|
| $203,767,065 | | $225,962,691 | | $191,304,716 | | $235,029,681 |
|
At April 30, 2007, the Fund had forward foreign currency exchange contracts outstanding as follows:
Forward Foreign Currency Exchange Contracts to Buy:
| Exchange | | Contracts | | U.S. Value at | | In Exchange for | | | | Unrealized |
| Date | | to Receive | | April 30, 2007 | | U.S. $ | | | | Gain |
|
| 5/23/2007 | | 1,888,000 EUR | | $ 2,581,199 | | $ 2,491,707 | | $ | | 89,492 |
| 5/31/2007 | | 10,669,098 EUR | | 14,591,236 | | 14,099,000 | | | | 492,236 |
| 6/01/2007 | | 2,570,700 EUR | | 3,515,852 | | 3,395,792 | | | | 120,060 |
|
| Exchange | | Contracts | | U.S. Value at | | | | U.S. Value at | | | | Unrealized |
| Date | | to Receive | | April 30, 2007 | | In Exchange for | | April 30, 2007 | | | | Gain (Loss) |
|
| 6/05/2007 | | 589,974,187 JPY | | $ | | 4,964,023 | | 7,375,000 NZD | | $ 5,457,978 | | $ | | (493,955) |
| 6/14/2007 | | 6,200,000 AUD | | | | 5,149,467 | | 592,955,600 JPY | | 4,994,517 | | | | 154,950 |
| 6/14/2007 | | 1,128,172,311 JPY | | | | 9,502,696 | | 12,411,000 AUD | | 10,308,070 | | | | (805,374) |
| 6/14/2007 | | 10,850,091 EUR | | | | 14,845,861 | | 7,443,000 GBP | | 14,883,241 | | | | (37,380) |
| 7/20/2007 | | 606,221,200 JPY | | | | 5,129,184 | | 5,840,000 CAD | | 5,281,104 | | | | (151,920) |
| 7/20/2007 | | 603,542,100 JPY | | | | 5,106,518 | | 6,200,000 AUD | | 5,144,559 | | | | (38,041) |
|
33
NOTES TO FINANCIAL STATEMENTS continued
Forward Foreign Currency Exchange Contracts to Sell:
| Exchange | | Contracts | | U.S. Value at | | In Exchange for | | Unrealized |
| Date | | to Deliver | | April 30, 2007 | | U.S. $ | | Loss |
|
| 5/31/2007 | | 752,831 EUR | | $1,029,584 | | 1,000,000 | | $29,584 |
|
During the year ended April 30, 2007, the Fund loaned securities to certain brokers. At April 30, 2007, the value of securities on loan and the total value of collateral received for securities loaned amounted to $21,771,727 and $22,812,476, respectively. Of the total value of the collateral received for securities on loan, $6,345,305 represents the market value of U.S. government agency securities received as non-cash collateral.
On April 30, 2007, the aggregate cost of securities for federal income tax purposes was $347,007,022. The gross unrealized appreciation and depreciation on securities based on tax cost was $9,015,206 and $1,220,533, respectively, with a net unrealized appreciation of $7,794,673.
As of April 30, 2007, the Fund had $51,449,266 in capital loss carryovers for federal income tax purposes expiring as follows:
| Expiration |
|
| 2008 | | 2009 | | 2010 | | 2015 |
|
| $6,306,504 | | $14,759,243 | | $27,292,961 | | $3,090,558 |
|
Certain portions of the capital loss carryovers of the Fund were assumed as a result of acquisitions. These losses are subject to certain limitations prescribed by the Internal Revenue Code.
For income tax purposes, capital losses incurred after October 31 within the Fund’s fiscal year are deemed to arise on the first business day of the following fiscal year. As of April 30, 2007, the Fund incurred and will elect to defer post-October losses of $307,781.
6. INTERFUND LENDING
Pursuant to an Exemptive Order issued by the SEC, the Fund may participate in an interfund lending program with certain funds in the Evergreen fund family. This program allows the Fund to borrow from, or lend money to, other participating funds. During the year ended April 30, 2007, the Fund did not participate in the interfund lending program.
7. DISTRIBUTIONS TO SHAREHOLDERS
As of April 30, 2007, the components of distributable earnings on a tax basis were as follows:
| | | | | Capital Loss |
| Overdistributed | | Unrealized | | Carryovers and |
| Ordinary Income | | Appreciation | | Post-October Losses |
|
| $431,895 | | $7,851,057 | | $51,757,047 |
|
34
NOTES TO FINANCIAL STATEMENTS continued
The differences between the components of distributable earnings on a tax basis and the amounts reflected in the Statement of Assets and Liabilities are primarily due to wash sales, premium amortization and foreign currency losses.
The tax character of distributions paid was as follows:
| | | Year Ended April 30 |
| |
|
| | | 2007 | | 2006 |
|
| Ordinary Income | | $ | | 15,295,725 | | $ 17,923,762 |
| Return of Capital | | | | 921,731 | | 0 |
|
8. EXPENSE REDUCTIONS
Through expense offset arrangements with ESC and the Fund’s custodian, a portion of fund expenses has been reduced.
9. DEFERRED TRUSTEES’ FEES
Each Trustee of the Fund may defer any or all compensation related to performance of their duties as Trustees. The Trustees’ deferred balances are allocated to deferral accounts, which are included in the accrued expenses for the Fund. The investment performance of the deferral accounts is based on the investment performance of certain Evergreen funds. Any gains earned or losses incurred in the deferral accounts are reported in the Fund’s Trustees’ fees and expenses. At the election of the Trustees, the deferral account will be paid either in one lump sum or in quarterly installments for up to ten years.
10. FINANCING AGREEMENT
The Fund and certain other Evergreen funds share in an unsecured revolving credit commitment for temporary and emergency purposes, including the funding of redemptions, as permitted by each participating fund’s borrowing restrictions. Borrowings under this facility bear interest at 0.50% per annum above the Federal Funds rate. All of the participating funds are charged an annual commitment fee on the unused balance, which is allocated pro rata. The credit facility is for $100 million with an annual commitment fee of 0.08% . Prior to July 3, 2006, the credit facility was for $150 million with an annual commitment fee of 0.09% . During the year ended April 30, 2007, the Fund had no borrowings.
11. REGULATORY MATTERS AND LEGAL PROCEEDINGS
Since September 2003, governmental and self-regulatory authorities have instituted numerous ongoing investigations of various practices in the mutual fund industry, including investigations relating to revenue sharing, market-timing, late trading and record retention, among other things. The investigations cover investment advisors, distributors and transfer agents to mutual funds, as well as other firms. EIMC, EIS and ESC (collectively, “Evergreen”) have received subpoenas and other requests for documents and testimony relating to these investigations, are endeavoring to comply with those requests, and are cooperating with the investigations. Evergreen is continuing its own internal review of policies, practices, procedures and personnel, and is taking remedial action where appropriate.
35
NOTES TO FINANCIAL STATEMENTS continued
In connection with one of these investigations, on July 28, 2004, the staff of the Securities and Exchange Commission (“SEC”) informed Evergreen that the staff intends to recommend to the SEC that it institute an enforcement action against Evergreen. The SEC staff’s proposed allegations relate to (i) an arrangement pursuant to which a broker at one of EIMC’s affiliated broker-dealers had been authorized, apparently by an EIMC officer (who is no longer with EIMC), to engage in short-term trading, on behalf of a client, in Evergreen Mid Cap Growth Fund (formerly Evergreen Emerging Growth Fund and prior to that, known as Evergreen Small Company Growth Fund) during the period from December 2000 through April 2003, in excess of the limitations set forth in the fund’s prospectus, (ii) short-term trading from September 2001 through January 2003, by a former Evergreen portfolio manager of Evergreen Precious Metals Fund, a fund he managed at the time, (iii) the sufficiency of systems for monitoring exchanges and enforcing exchange limitations as stated in the funds’ prospectuses, and (iv) the adequacy of e-mail retention practices. In connection with the activity in Evergreen Mid Cap Growth Fund, EIMC reimbursed the fund $378,905, plus an additional $25,242, representing what EIMC calculated at that time to be the client’s net gain and the fees earned by EIMC and the expenses incurred by this fund on the client’s account. In connection with the activity in Evergreen Precious Metals Fund, EIMC reimbursed the fund $70,878, plus an additional $3,075, representing what EIMC calculated at that time to be the portfolio manager’s net gain and the fees earned by EIMC and expenses incurred by the fund on the portfolio manager’s account. Evergreen is currently engaged in discussions with the staff of the SEC concerning its recommendation.
Any resolution of these matters with regulatory authorities may include, but not be limited to, sanctions, penalties or injunctions regarding Evergreen, restitution to mutual fund shareholders and/or other financial penalties and structural changes in the governance or management of Evergreen’s mutual fund business. Any penalties or restitution will be paid by Evergreen and not by the Evergreen funds.
EIS has entered into an agreement with the NASD settling allegations that EIS (i) arranged for Evergreen fund portfolio trades to be directed to Wachovia Securities, LLC, an affiliate of EIS that sold Evergreen fund shares, during the period of January 2001 to December 2003 and (ii) provided non-cash compensation by sponsoring offsite meetings attended by Wachovia Securities, LLC brokers during that period, where the eligibility of a broker to attend the meetings depended upon the broker meeting certain sales targets of Evergreen fund shares. Pursuant to the settlement agreement, EIS has agreed to a censure and a fine of $4,200,000. EIS neither admitted nor denied the allegations and findings set forth in its agreement with the NASD.
In addition, the Evergreen funds and EIMC and certain of its affiliates are involved in various legal actions, including private litigation and class action lawsuits. EIMC does not expect that any of such legal actions currently pending or threatened will have a material adverse impact on the financial position or operations of any of the Evergreen funds or on EIMC’s ability to provide services to the Evergreen funds.
36
NOTES TO FINANCIAL STATEMENTS continued
Although Evergreen believes that neither the foregoing investigations described above nor any pending or threatened legal actions will have a material adverse impact on the Evergreen funds, there can be no assurance that these matters and any publicity surrounding or resulting from them will not result in reduced sales or increased redemptions of Evergreen fund shares, which could increase Evergreen fund transaction costs or operating expenses, or that they will not have other adverse consequences on the Evergreen funds.
12. NEW ACCOUNTING PRONOUNCEMENTS
In June 2006, the Financial Accounting Standards Board (“FASB”) issued FASB Interpretation No. 48, Accounting for Uncertainty in Income Taxes — an interpretation of FASB statement 109 (“FIN 48”). FIN 48 supplements FASB 109 by prescribing a recognition threshold and measurement attribute for the financial statement recognition and measurement of a tax position taken or expected to be taken in a tax return. The adoption of FIN 48 will require financial statements to be adjusted to reflect only those tax positions that are more likely than not to be sustained as of the adoption date. Management of the Fund is currently evaluating the impact that the adoption of FIN 48 will have on the financial statements. FIN 48 will become effective for fiscal years beginning after December 15, 2006.
In September 2006, FASB issued Statement of Financial Accounting Standards No. 157, Fair Value Measurements (“FAS 157”). FAS 157 establishes a single authoritative definition of fair value, establishes a framework for measuring fair value and expands disclosures about fair value measurements. FAS 157 applies to fair value measurements already required or permitted by existing standards. The change to current generally accepted accounting principles from the application of FAS 157 relates to the definition of fair value, the methods used to measure fair value, and the expanded disclosures about fair value measurements. Management of the Fund does not believe the adoption of FAS 157 will materially impact the financial statement amounts, however, additional disclosures may be required about the inputs used to develop the measurements and the effect of certain of the measurements on changes in net assets for the period. FAS 157 is effective for financial statements issued for fiscal years beginning after November 15, 2007 and interim periods within those fiscal years.
13. SUBSEQUENT EVENT
Effective June 1, 2007, TAG and FIA no longer serve as investment sub-advisors to the Fund.
37
REPORT OF INDEPENDENT REGISTERED PUBLIC ACCOUNTING FIRM
Board of Trustees and Shareholders
Evergreen Fixed Income Trust
We have audited the accompanying statement of assets and liabilities, including the schedule of investments, of the Evergreen Diversified Income Builder Fund, formerly Evergreen Strategic Income Fund, a series of Evergreen Fixed Income Trust, as of April 30, 2007, and the related statement of operations for the year then ended, statements of changes in net assets for each of the years in the two-year period then ended, and the financial highlights for each of the years in the five-year period then ended. These financial statements and financial highlights are the responsibility of the Fund’s management. Our responsibility is to express an opinion on these financial statements and financial highlights based on our audits.
We conducted our audits in accordance with the standards of the Public Company Accounting Oversight Board (United States). Those standards require that we plan and perform the audit to obtain reasonable assurance about whether the financial statements and financial highlights are free of material misstatement. An audit includes examining, on a test basis, evidence supporting the amounts and disclosures in the financial statements. Our procedures included confirmation of securities owned as of April 30, 2007 by correspondence with the custodian and brokers, or by other appropriate auditing procedures where replies from brokers were not received. An audit also includes assessing the accounting principles used and significant estimates made by management, as well as evaluating the overall financial statement presentation. We believe that our audits provide a reasonable basis for our opinion.
In our opinion, the financial statements and financial highlights referred to above present fairly, in all material respects, the financial position of the Evergreen Diversified Income Builder Fund, as of April 30, 2007, the results of its operations, changes in its net assets and financial highlights for each of the years described above, in conformity with U.S. generally accepted accounting principles.

Boston, Massachusetts
June 28, 2007
38
ADDITIONAL INFORMATION (unaudited)
Federal Tax Distributions
The Fund paid distributions of $16,217,456 during the year ended April 30, 2007 of which 94.32% was from net investment income and 5.68% was from paid-in capital. Shareholders of the Fund will receive in early 2008 a Form 1099-DIV that will inform them of the tax character of these distributions as well as all other distributions made by the Fund in calendar year 2007.
39
TRUSTEES AND OFFICERS
TRUSTEES1
| Charles A. Austin III | | Investment Counselor, Anchor Capital Advisors, LLC. (investment advice); Director, The Andover |
| Trustee | | Companies (insurance); Trustee, Arthritis Foundation of New England; Former Director, The |
| DOB: 10/23/1934 | | Francis Ouimet Society (scholarship program); Former Director, Executive Vice President and |
| Term of office since: 1991 | | Treasurer, State Street Research & Management Company (investment advice) |
| Other directorships: None | | |
|
| |
| K. Dun Gifford | | Chairman and President, Oldways Preservation and Exchange Trust (education); Trustee, |
| Trustee | | Treasurer and Chairman of the Finance Committee, Cambridge College |
| DOB: 10/23/1938 | | |
| Term of office since: 1974 | | |
| Other directorships: None | | |
|
| |
| Dr. Leroy Keith, Jr. | | Partner, Stonington Partners, Inc. (private equity fund); Trustee, Phoenix Fund Complex; Director, |
| Trustee | | Diversapack Co. (packaging company); Director, Obagi Medical Products Co.; Former Director, |
| DOB: 2/14/1939 | | Lincoln Educational Services |
| Term of office since: 1983 | | |
| Other directorships: Trustee, | | |
| Phoenix Fund Complex (consisting | | |
| of 60 portfolios) | | |
|
| |
| Gerald M. McDonnell | | Manager of Commercial Operations, CMC Steel (steel producer) |
| Trustee | | |
| DOB: 7/14/1939 | | |
| Term of office since: 1988 | | |
| Other directorships: None | | |
|
| |
| Patricia B. Norris | | President and Director of Phillips Pond Homes Association (home community); President and |
| Trustee | | Director of Buckleys of Kezar Lake, Inc., (real estate company); Former Partner, |
| DOB: 4/9/1948 | | PricewaterhouseCoopers, LLP |
| Term of office since: 2006 | | |
| Other directorships: None | | |
|
| |
| William Walt Pettit | | Partner and Vice President, Kellam & Pettit, P.A. (law firm); Director, Superior Packaging Corp. |
| Trustee | | (packaging company); Member, Superior Land, LLC (real estate holding company), Member, |
| DOB: 8/26/1955 | | K&P Development, LLC (real estate development); Former Director, National Kidney Foundation |
| Term of office since: 1984 | | of North Carolina, Inc. (non-profit organization) |
| Other directorships: None | | |
|
| |
| David M. Richardson | | President, Richardson, Runden LLC (executive recruitment business development/consulting |
| Trustee | | company); Consultant, Kennedy Information, Inc. (executive recruitment information and |
| DOB: 9/19/1941 | | research company); Consultant, AESC (The Association of Executive Search Consultants); |
| Term of office since: 1982 | | Director, J&M Cumming Paper Co. (paper merchandising); Former Trustee, NDI Technologies, LLP |
| Other directorships: None | | (communications) |
|
| |
| Dr. Russell A. Salton III | | President/CEO, AccessOne MedCard, Inc.; Former Medical Director, Healthcare Resource |
| Trustee | | Associates, Inc. |
| DOB: 6/2/1947 | | |
| Term of office since: 1984 | | |
| Other directorships: None | | |
|
| |
| Michael S. Scofield | | Retired Attorney, Law Offices of Michael S. Scofield; Former Director and Chairman, Branded |
| Trustee | | Media Corporation (multi-media branding company) |
| DOB: 2/20/1943 | | |
| Term of office since: 1984 | | |
| Other directorships: None | | |
|
40
TRUSTEES AND OFFICERS continued
| Richard J. Shima | | Independent Consultant; Director, Hartford Hospital; Trustee, Greater Hartford YMCA; Former |
| Trustee | | Director, Trust Company of CT; Former Director, Old State House Association; Former Trustee, |
| DOB: 8/11/1939 | | Saint Joseph College (CT) |
| Term of office since: 1993 | | |
| Other directorships: None | | |
|
| |
| Richard K. Wagoner, CFA2 | | Member and Former President, North Carolina Securities Traders Association; Member, Financial |
| Trustee | | Analysts Society |
| DOB: 12/12/1937 | | |
| Term of office since: 1999 | | |
| Other directorships: None | | |
|
| |
| |
| OFFICERS | | |
| |
| Dennis H. Ferro3 | | Principal occupations: President and Chief Executive Officer, Evergreen Investment Company, |
| President | | Inc. and Executive Vice President, Wachovia Bank, N.A.; former Chief Investment Officer, |
| DOB: 6/20/1945 | | Evergreen Investment Company, Inc. |
| Term of office since: 2003 | | |
|
| |
| Kasey Phillips4 | | Principal occupations: Senior Vice President, Evergreen Investment Services, Inc.; Former Vice |
| Treasurer | | President, Evergreen Investment Services, Inc.; Former Assistant Vice President, Evergreen |
| DOB: 12/12/1970 | | Investment Services, Inc. |
| Term of office since: 2005 | | |
|
| |
| Michael H. Koonce4 | | Principal occupations: Senior Vice President and General Counsel, Evergreen Investment |
| Secretary | | Services, Inc.; Secretary, Senior Vice President and General Counsel, Evergreen Investment |
| DOB: 4/20/1960 | | Management Company, LLC and Evergreen Service Company, LLC; Senior Vice President and |
| Term of office since: 2000 | | Assistant General Counsel, Wachovia Corporation |
|
| |
| Robert Guerin4, 5 | | Principal occupations: Chief Compliance Officer, Evergreen Funds and Senior Vice President of |
| Chief Compliance Officer | | Evergreen Investments Co, Inc; Former Managing Director and Senior Compliance Officer, |
| DOB: 9/20/1965 | | Babson Capital Management LLC; Former Principal and Director, Compliance and Risk |
| Term of office since: 2007 | | Management, State Street Global Advisors; Former Vice President and Manager, Sales Practice |
| | | Compliance, Deutsche Asset Management. |
1 Each Trustee, except Ms. Norris, serves until a successor is duly elected or qualified or until his death, resignation, retirement or removal from office. As a new Trustee, Ms. Norris’ initial term ends June 30, 2009, at which time she may be re-elected by Trustees to serve until a successor is duly elected or qualified or until her death, resignation, retirement or removal from office by the Trustees. Each Trustee oversees 94 Evergreen funds. Correspondence for each Trustee may be sent to Evergreen Board of Trustees, P.O. Box 20083, Charlotte, NC 28202.
2 Mr. Wagoner is an “interested person” of the Fund because of his ownership of shares in Wachovia Corporation, the parent to the Fund’s investment advisor.
3 The address of the Officer is 401 S. Tryon Street, 20th Floor, Charlotte, NC 28288.
4 The address of the Officer is 200 Berkeley Street, Boston, MA 02116.
5 Mr. Guerin’s information is as of June 14, 2007, the effective date of his approval by the Board of Trustees as Chief Compliance Officer of the Evergreen funds.
Additional information about the Fund’s Board of Trustees and Officers can be found in the Statement of Additional Information (SAI) and is available upon request without charge by calling 800.343.2898.
41

566662 rv4 06/2007
Evergreen U.S. Government Fund
| | | table of contents |
| 1 | | LETTER TO SHAREHOLDERS |
| 4 | | FUND AT A GLANCE |
| 5 | | PORTFOLIO MANAGER COMMENTARY |
| 6 | | ABOUT YOUR FUND’S EXPENSES |
| 7 | | FINANCIAL HIGHLIGHTS |
| 11 | | SCHEDULE OF INVESTMENTS |
| 18 | | STATEMENT OF ASSETS AND LIABILITIES |
| 19 | | STATEMENT OF OPERATIONS |
| 20 | | STATEMENTS OF CHANGES IN NET ASSETS |
| 21 | | STATEMENT OF CASH FLOWS |
| 22 | | NOTES TO FINANCIAL STATEMENTS |
| 30 | | REPORT OF INDEPENDENT REGISTERED PUBLIC ACCOUNTING FIRM |
| 32 | | TRUSTEES AND OFFICERS |
This annual report must be preceded or accompanied by a prospectus of the Evergreen fund contained herein. The prospectus contains more complete information, including fees and expenses, and should be read carefully before investing or sending money.
The fund will file its complete schedule of portfolio holdings with the SEC for the first and third quarters of each fiscal year on Form N-Q. The fund’s Form N-Q will be available on the SEC’s Web site at http://www.sec.gov. In addition, the fund’s Form N-Q may be reviewed and copied at the SEC’s Public Reference Room in Washington, D.C. Information on the operation of the Public Reference Room may be obtained by calling 800.SEC.0330.
A description of the fund’s proxy voting policies and procedures, as well as information regarding how the fund voted proxies relating to portfolio securities during the most recent 12-month period ended June 30, is available by visiting our Web site at EvergreenInvestments.com or by visiting the SEC’s Web site at http://www.sec.gov. The fund’s proxy voting policies and procedures are also available without charge, upon request, by calling 800.343.2898.
| | | | |
| Mutual Funds: | | | | |
| NOT FDIC INSURED | | MAY LOSE VALUE | | NOT BANK GUARANTEED |
Evergreen InvestmentsSM is a service mark of Evergreen Investment Management Company, LLC. Copyright 2007, Evergreen Investment Management Company, LLC.
Evergreen Investment Management Company, LLC is a subsidiary of Wachovia Corporation and is an affiliate of Wachovia Corporation’s other Broker Dealer subsidiaries.
Evergreen mutual funds are distributed by Evergreen Investment Services, Inc. 200 Berkeley Street, Boston, MA 02116
LETTER TO SHAREHOLDERS
June 2007

Dennis H. Ferro
President and Chief
Executive Officer
Dear Shareholder,
We are pleased to provide the annual report for Evergreen U.S. Government Fund covering the twelve-month period ended April 30, 2007.
The domestic fixed-income markets generated healthy results during the twelve-month period in an environment supported by persistent growth and the prospect of stable interest rates. While the economic expansion decelerated as the period progressed, continued gains in business profits helped support the performance of corporate debt securities, including lower-quality, higher-yielding bonds, which generally outperformed high-grade and investment-grade debt. The fiscal year began on a harsh note in the spring of 2006 amid rising inflationary concerns, accompanied by anxieties about the potential economic impacts of repeated interest rate hikes by the Federal Reserve Board (the “Fed”). However, the markets were calmed in both the summer and autumn by the combination of receding commodity prices and the Fed’s policy to leave short-term interest rates unchanged. Over the full twelve-month period, the yield curve flattened — the difference between short-term yields and long-term yields narrowed. In this environment, longer-maturity bonds, especially those with maturities of 20 to 30 years, tended to outperform the overall bond market.
1
LETTER TO SHAREHOLDERS continued
Solid returns in both the nation’s equity and fixed-income markets came against a backdrop of persistent economic growth during most of the period. Gross Domestic Product grew by a rate of 3.3% over 2006 then decelerated to an annualized rate of 1.3% in the first quarter of 2007. The slump in the housing industry was a major factor that contributed to the slowdown, which came in the face of strong employment, rising wages and gains in both personal consumption and business investment.
In this environment, the teams managing the higher-quality portfolios, including Evergreen Core Bond Fund, Evergreen U.S. Government Fund and Evergreen Institutional Mortgage Portfolio, assessed factors such as employment and inflationary trends, Fed policy, and interest-rate expectations in making their decisions. At the same time, the managers supervising Evergreen High Yield Bond Fund and Evergreen Select High Yield Bond Fund tended to position their more credit-sensitive portfolios relatively cautiously as the relative yield advantages of lower-quality corporate bonds appeared to tighten. The managers of Evergreen Diversified Bond Fund also sought opportunities in the high-yield market, while maintaining a healthy exposure to investment-grade securities. The managers of Evergreen Diversified Income Builder Fund, meanwhile, looked at broad interest-rate trends, opportunities in the credit markets, and the effects of currency fluctuations in making decisions on sector and industry allocations and individual security selections.
As always, we encourage investors to maintain diversified investment portfolios in pursuit of their long-term investment goals.
2
LETTER TO SHAREHOLDERS continued
Please visit us at EvergreenInvestments.com for more information about our funds and other investment products available to you. Thank you for your continued support of Evergreen Investments.
Sincerely,

Dennis H. Ferro
President and Chief Executive Officer
Evergreen Investment Company, Inc.
Special Notice to Shareholders:
Please visit our Web site at EvergreenInvestments.com for statements from President and Chief Executive Officer, Dennis Ferro, addressing NASD actions involving Evergreen Investment Services, Inc. (EIS), Evergreen’s mutual fund distributor or statements from Dennis Ferro and Chairman of the Board of the Evergreen funds, Michael S. Scofield, addressing SEC actions involving the Evergreen funds.
3
FUND AT A GLANCE
as of April 30, 2007
MANAGEMENT TEAM
Investment Advisor:
• Evergreen Investment Management Company, LLC
Sub-Advisor:
• Tattersall Advisory Group, Inc.
Portfolio Managers:
• Lisa Brown-Premo
• Karen DiMeglio
CURRENT INVESTMENT STYLE

Source: Morningstar, Inc.
Morningstar’s style box is based on a portfolio date as of 3/31/2007.
The Fixed income style box placement is based on a fund’s average effective maturity or duration and the average credit rating of the bond portfolio.
PERFORMANCE AND RETURNS
Portfolio inception date: 1/11/1993
| | | Class A | | Class B | | Class C | | Class I |
| Class inception date | | 1/11/1993 | | 1/11/1993 | | 9/2/1994 | | 9/2/1993 |
|
| Nasdaq symbol | | EUSAX | | EUSBX | | EUSCX | | EUSYX |
|
| Average annual return* |
|
| 1-year with sales charge | | 1.31% | | 0.60% | | 4.60% | | N/A |
|
| 1-year w/o sales charge | | 6.37% | | 5.60% | | 5.60% | | 6.66% |
|
| 5-year | | 3.01% | | 2.93% | | 3.28% | | 4.32% |
|
| 10-year | | 4.83% | | 4.58% | | 4.58% | | 5.62% |
|
| Maximum sales charge | | 4.75% | | 5.00% | | 1.00% | | N/A |
| | | Front-end | | CDSC | | CDSC | | |
|
* Adjusted for maximum applicable sales charge, unless noted.
Past performance is no guarantee of future results. The performance quoted represents past performance and current performance may be lower or higher. The investment return and principal value of an investment will fluctuate so that investors’ shares, when redeemed, may be worth more or less than their original cost. To obtain performance information current to the most recent month-end for Classes A, B, C or I, please go to EvergreenInvestments.com/fundperformance. The performance of each class may vary based on differences in loads, fees and expenses paid by the shareholders investing in each class. Performance includes the reinvestment of income dividends and capital gain distributions. Performance shown does not reflect the deduction of taxes that a shareholder would pay on fund distributions or the redemption of fund shares.
The fund incurs a 12b-1 fee of 0.30% for Class A and 1.00% for Classes B and C. Class I does not pay a 12b-1 fee.
The advisor is reimbursing a portion of the 12b-1 fee for Class A. Had the fee not been reimbursed, returns for Class A would have been lower. Returns reflect expense limits previously in effect for all classes, without which returns would have been lower.
LONG-TERM GROWTH

Comparison of a $10,000 investment in the Evergreen U.S. Government Fund Class A shares versus a similar investment in the Lehman Brothers Intermediate Government Bond Index (LBITGBI) and the Consumer Price Index (CPI).
The LBITGBI is an unmanaged market index and does not include transaction costs associated with buying and selling securities, any mutual fund fees or expenses or any taxes. The CPI is a commonly used measure of inflation and does not represent an investment return. It is not possible to invest directly in an index.
4
PORTFOLIO MANAGER COMMENTARY
The fund’s Class A shares returned 6.37% for the twelve-month period ended April 30, 2007, excluding any applicable sales charges. During the same period, the LBITGBI returned 6.11% .
The fund seeks to achieve a high level of current income consistent with stability of principal.
The twelve-month period was a time of transition for the U.S government bond market. Early in the period, the two-year tightening of monetary policy by the Federal Reserve Board (the “Fed”) concluded when the central bank raised the fed funds rate to 5.25% and then left it unchanged for the remainder of the fiscal year. The Fed indicated its wish to target a more neutral level of interest where real rates (the rate of interest after adjusting for inflation) approximately equaled the real growth of the economy.
By the end of 2006, economic indicators suggested that economic growth had decelerated toward the Fed’s target range. However, these indicators also suggested that growth might be slowing too quickly because of the influence of sharp declines in the housing and home financing industries. Weakness in the housing industry led to an expectation among some investors that the Fed would have to lower the fed funds rate to prevent the economy from entering a recession. Counterbalancing the housing slowdown and stress in the sub-prime mortgage industry were continued growth in corporate earnings and ample liquidity for corporate strategic financing. As a result of these competing influences, interest rates traded in a narrow range from the third quarter of 2006 to the end of the fiscal year. The narrow range of interest rates and the decline in volatility allowed pass-though mortgage-backed securities to appreciate in price and outperform other U.S. government securities. Within the mortgage-backed sector, adjustable-rate and premium coupon securities performed well. In addition, the strength in corporate earnings allowed corporate debt and high-quality non-U.S. government mortgage-backed securities to outperform U.S. government securities late in 2006. This relative performance changed somewhat during the period as some non-government mortgage-backed securities performed poorly because of concerns about the sub-prime mortgage industry, which detracted from results. In the final three months of the period, a modest spread widening occurred in non-U.S. government mortgages which led to the poor performance by our holdings in that sector.
During the first part of the fiscal year, we established a short duration relative to the benchmark. During the middle part of the year, when the Fed left short-term interest rates unchanged, we moved to a more neutral duration. The fund’s duration contributed to performance during the first quarter of the year, but did not have a major influence on relative results later in the period. The fund’s overweight position in mortgage-backed securities was a major contributor to performance. Within our allocation to mortgages, we increased our investments in premium coupon and adjustable-rate holdings to take advantage of the higher yields that were available. The fund also purchased delegated underwriting and servicing (“DUS”) mortgage-backed securities to increase income. DUS securities are backed by U.S. government agencies and provide financing for multifamily housing. These securities had a yield advantage over U.S. government agency securities and contributed positively to performance during the period.
Class I shares are only offered in the following manner: (1) to investment advisory clients of Evergreen Investment Management Company, LLC (or its advisory affiliates) when purchased by such advisor(s) on behalf of its clients, (2) through arrangements entered into on behalf of the Evergreen funds with certain financial services firms, (3) to certain institutional investors and (4) to persons who owned Class Y shares in registered name in an Evergreen fund on or before December 31, 1994 or who owned shares of any SouthTrust fund in registered name as of March 18, 2005 or shares of Vestaur Securities Fund as of May 20, 2005.
Class I shares are only available to institutional shareholders with a minimum of $1 million investment, which may be waived in certain situations.
The fund’s investment objective may be changed without a vote of the fund’s shareholders.
Asset-backed and mortgage-backed securities are generally subject to higher prepayment risks than other types of debt securities, which can limit the potential for gain in a declining interest rate environment and increase the potential for loss in a rising interest rate environment. Mortgage-backed securities may also be structured so that they are particularly sensitive to interest rates.
Derivatives involve additional risks including interest rate risk, credit risk, the risk of improper valuation and the risk of non-correlation to the relevant instruments they are designed to hedge or to closely track.
The return of principal is not guaranteed due to fluctuation in the fund’s NAV caused by changes in the price of individual bonds held by the fund and the buying and selling of bonds by the fund. Bond funds have the same inflation, interest rate and credit risks as individual bonds. Generally, the value of bond funds rise when prevailing interest rates fall, and fall when interest rates rise.
U.S. government guarantees apply only to certain securities held in the fund’s portfolio and not to the fund’s shares.
Leverage may disproportionately increase a fund’s portfolio losses and reduce opportunities for gain when interest rates, stock prices, or currency rates are changing.
All data is as of April 30, 2007, and subject to change.
5
ABOUT YOUR FUND’S EXPENSES
The Example below is intended to describe the fees and expenses borne by shareholders and the impact of those costs on your investment.
Example
As a shareholder of the fund, you incur two types of costs: (1) transaction costs, including sales charges (loads), redemption fees and exchange fees; and (2) ongoing costs, including management fees, distribution (12b-1) fees and other fund expenses. This Example is intended to help you understand your ongoing costs (in dollars) of investing in the fund and to compare these costs with the ongoing costs of investing in other mutual funds. The Example is based on an investment of $1,000 invested at the beginning of the period and held for the entire period from November 1, 2006 to April 30, 2007.
The example illustrates your fund’s costs in two ways:
• Actual expenses
The section in the table under the heading “Actual” provides information about actual account values and actual expenses. You may use the information in these columns, together with the amount you invested, to estimate the expenses that you paid over the period. Simply divide your account value by $1,000 (for example, an $8,600 account value divided by $1,000 = 8.6), then multiply the result by the number in the appropriate column for your share class, in the column entitled “Expenses Paid During Period” to estimate the expenses you paid on your account during this period.
• Hypothetical example for comparison purposes
The section in the table under the heading “Hypothetical (5% return before expenses)” provides information about hypothetical account values and hypothetical expenses based on the fund’s actual expense ratio and an assumed rate of return of 5% per year before expenses, which is not the fund’s actual return. The hypothetical account values and expenses may not be used to estimate the actual ending account balance or expenses you paid for the period. You may use this information to compare the ongoing costs of investing in the fund and other funds. To do so, compare this 5% hypothetical example with the 5% hypothetical examples that appear in the shareholder reports of the other funds.
Please note that the expenses shown in the table are meant to highlight your ongoing costs only and do not reflect any transactional costs, such as sales charges (loads), redemption fees or exchange fees. Therefore, the section in the table under the heading “Hypothetical (5% return before expenses)” is useful in comparing ongoing costs only, and will not help you determine the relative total costs of owning different funds. In addition, if these transactional costs were included, your costs would have been higher.
| | | Beginning | | Ending | | |
| | Account | | Account | | Expenses |
| | Value | | Value | | Paid During |
| | 11/1/2006 | | 4/30/2007 | | Period* |
|
| Actual |
| Class A | | $ 1,000.00 | | $ 1,025.98 | | $ 4.72 |
| Class B | | $ 1,000.00 | | $ 1,022.24 | | $ 8.47 |
| Class C | | $ 1,000.00 | | $ 1,022.24 | | $ 8.47 |
| Class I | | $ 1,000.00 | | $ 1,027.29 | | $ 3.47 |
| Hypothetical | | |
| (5% return | |
| before expenses) | |
| Class A | | $ 1,000.00 | | $ 1,020.13 | | $ 4.71 |
| Class B | | $ 1,000.00 | | $ 1,016.41 | | $ 8.45 |
| Class C | | $ 1,000.00 | | $ 1,016.41 | | $ 8.45 |
| Class I | | $ 1,000.00 | | $ 1,021.37 | | $ 3.46 |
|
* For each class of the Fund, expenses are equal to the annualized expense ratio of each class (0.94% for Class A, 1.69% for Class B, 1.69% for Class C and 0.69% for Class I), multiplied by the average account value over the period, multiplied by 181 / 365 days.
6
| FINANCIAL HIGHLIGHTS |
|
| (For a share outstanding throughout each period) |
| | | Year Ended April 30, |
|
|
| CLASS A | | 2007 | | 2006 | | 2005 | | 2004 | | 2003 |
|
| Net asset value, beginning of period | | $ 9.81 | | $ 10.09 | | $ 9.96 | | $ 10.22 | | $ 9.75 |
|
| Income from investment operations |
| Net investment income (loss) | | 0.44 | | 0.321 | | 0.241 | | 0.191 | | 0.39 |
| Net realized and unrealized gains or losses on investments | | 0.17 | | (0.24) | | 0.19 | | (0.16) | | 0.43 |
| |
|
| Total from investment operations | | 0.61 | | 0.08 | | 0.43 | | 0.03 | | 0.82 |
|
| Distributions to shareholders from |
| Net investment income | | (0.45) | | (0.36) | | (0.30) | | (0.29) | | (0.35) |
|
| Net asset value, end of period | | $ 9.97 | | $ 9.81 | | $ 10.09 | | $ 9.96 | | $ 10.22 |
|
| Total return2 | | 6.37% | | 0.82% | | 4.37% | | 0.30% | | 8.50% |
|
| Ratios and supplemental data |
| Net assets, end of period (thousands) | | $73,875 | | $77,581 | | $93,826 | | $109,172 | | $146,427 |
| Ratios to average net assets |
| Expenses including waivers/reimbursements but excluding | | |
| expense reductions | | 0.95% | | 0.98% | | 1.00% | | 1.01% | | 0.95% |
| Expenses excluding waivers/reimbursements and expense | | |
| reductions | | 0.99% | | 0.99% | | 1.00% | | 1.01% | | 0.95% |
| Net investment income (loss) | | 4.60% | | 3.18% | | 2.38% | | 1.86% | | 3.81% |
| Portfolio turnover rate | | 97% | | 53% | | 110% | | 55% | | 129% |
|
1 Net investment income (loss) per share is based on average shares outstanding during the period.
2 Excluding applicable sales charges
See Notes to Financial Statements
7
| FINANCIAL HIGHLIGHTS |
|
| (For a share outstanding throughout each period) |
| | | Year Ended April 30, |
|
|
| CLASS B | | 2007 | | 2006 | | 2005 | | 2004 | | 2003 |
|
| Net asset value, beginning of period | | $ 9.81 | | $ 10.09 | | $ 9.96 | | $ 10.22 | | $ 9.75 |
|
| Income from investment operations |
| Net investment income (loss) | | 0.381 | | 0.241 | | 0.171 | | 0.121 | | 0.31 |
| Net realized and unrealized gains or losses on investments | | 0.16 | | (0.23) | | 0.19 | | (0.16) | | 0.43 |
| |
|
| Total from investment operations | | 0.54 | | 0.01 | | 0.36 | | (0.04) | | 0.74 |
|
| Distributions to shareholders from |
| Net investment income | | (0.38) | | (0.29) | | (0.23) | | (0.22) | | (0.27) |
|
| Net asset value, end of period | | $ 9.97 | | $ 9.81 | | $ 10.09 | | $ 9.96 | | $ 10.22 |
|
| Total return2 | | 5.60% | | 0.12% | | 3.64% | | (0.40%) | | 7.69% |
|
| Ratios and supplemental data |
| Net assets, end of period (thousands) | | $12,653 | | $16,747 | | $25,452 | | $37,270 | | $59,362 |
| Ratios to average net assets |
| Expenses including waivers/reimbursements but excluding | | |
| expense reductions | | 1.69% | | 1.69% | | 1.70% | | 1.71% | | 1.70% |
| Expenses excluding waivers/reimbursements and expense | | |
| reductions | | 1.69% | | 1.69% | | 1.70% | | 1.71% | | 1.70% |
| Net investment income (loss) | | 3.83% | | 2.45% | | 1.67% | | 1.16% | | 3.04% |
| Portfolio turnover rate | | 97% | | 53% | | 110% | | 55% | | 129% |
|
1 Net investment income (loss) per share is based on average shares outstanding during the period.
2 Excluding applicable sales charges
See Notes to Financial Statements
8
| FINANCIAL HIGHLIGHTS |
|
| (For a share outstanding throughout each period) |
| | | Year Ended April 30, |
| |
|
| CLASS C | | 2007 | | 2006 | | 2005 | | 2004 | | 2003 |
|
| Net asset value, beginning of period | | $ 9.81 | | $10.09 | | $ 9.96 | | $ 10.22 | | $ 9.75 |
|
| Income from investment operations |
| Net investment income (loss) | | 0.381 | | 0.251 | | 0.171 | | 0.121 | | 0.31 |
| Net realized and unrealized gains or losses on investments | | 0.16 | | (0.24) | | 0.19 | | (0.16) | | 0.43 |
| |
|
| Total from investment operations | | 0.54 | | 0.01 | | 0.36 | | (0.04) | | 0.74 |
|
| Distributions to shareholders from |
| Net investment income | | (0.38) | | (0.29) | | (0.23) | | (0.22) | | (0.27) |
|
| Net asset value, end of period | | $ 9.97 | | $ 9.81 | | $10.09 | | $ 9.96 | | $ 10.22 |
|
| Total return2 | | 5.60% | | 0.12% | | 3.64% | | (0.40%) | | 7.69% |
|
| Ratios and supplemental data |
| Net assets, end of period (thousands) | | $7,669 | | $7,973 | | $9,820 | | $14,207 | | $26,013 |
| Ratios to average net assets |
| Expenses including waivers/reimbursements but excluding | | |
| expense reductions | | 1.69% | | 1.69% | | 1.70% | | 1.71% | | 1.70% |
| Expenses excluding waivers/reimbursements and expense | | |
reductions | | 1.69% | | 1.69% | | 1.70% | | 1.71% | | 1.70% | | Net investment income (loss) | | 3.86% | | 2.47% | | 1.67% | | 1.17% | | 2.99% |
| Portfolio turnover rate | | 97% | | 53% | | 110% | | 55% | | 129% |
|
1 Net investment income (loss) per share is based on average shares outstanding during the period.
2 Excluding applicable sales charges
See Notes to Financial Statements
9
| FINANCIAL HIGHLIGHTS |
|
| (For a share outstanding throughout each period) |
| | | Year Ended April 30, |
| |
|
| CLASS I | | 2007 | | 2006 | | 2005 | | 2004 | | 2003 |
|
| Net asset value, beginning of period | | $ 9.81 | | $ 10.09 | | $ 9.96 | | $ 10.22 | | $ 9.75 |
|
| Income from investment operations |
| Net investment income (loss) | | 0.47 | | 0.351 | | 0.271 | | 0.221 | | 0.41 |
| Net realized and unrealized gains or losses on investments | | 0.17 | | (0.24) | | 0.19 | | (0.16) | | 0.43 |
| |
|
| Total from investment operations | | 0.64 | | 0.11 | | 0.46 | | 0.06 | | 0.84 |
|
| Distributions to shareholders from |
| Net investment income | | (0.48) | | (0.39) | | (0.33) | | (0.32) | | (0.37) |
|
| Net asset value, end of period | | $ 9.97 | | $ 9.81 | | $ 10.09 | | $ 9.96 | | $ 10.22 |
|
| Total return | | 6.66% | | 1.12% | | 4.68% | | 0.60% | | 8.77% |
|
| Ratios and supplemental data |
| Net assets, end of period (thousands) | | $479,015 | | $436,890 | | $436,431 | | $427,356 | | $489,565 |
| Ratios to average net assets |
| Expenses including waivers/reimbursements but excluding | | |
| expense reductions | | 0.69% | | 0.69% | | 0.70% | | 0.71% | | 0.70% |
| Expenses excluding waivers/reimbursements and expense | | |
| reductions | | 0.69% | | 0.69% | | 0.70% | | 0.71% | | 0.70% |
| Net investment income (loss) | | 4.88% | | 3.48% | | 2.69% | | 2.15% | | 4.02% |
|
| Portfolio turnover rate | | 97% | | 53% | | 110% | | 55% | | 129% |
|
1 Net investment income (loss) per share is based on average shares outstanding during the period.
See Notes to Financial Statements
10
| SCHEDULE OF INVESTMENTS |
|
| April 30, 2007 | | Principal | | |
| | Amount | Value |
|
| AGENCY COMMERCIAL MORTGAGE-BACKED SECURITIES 19.9% |
| FIXED-RATE 18.3% |
| FNMA: |
| 4.125%, 12/25/2025 ## | | $ 10,174,288 | | $ 10,021,614 |
| 4.75%, 07/01/2012 | | 977,229 | | | | 969,495 |
| 5.08%, 02/01/2016 - 03/01/2016 ## | | 11,322,723 | | | | 11,214,270 |
| 5.15%, 11/01/2017 | | 4,223,171 | | | | 4,163,159 |
| 5.31%, 04/01/2016 | | 3,200,000 | | | | 3,233,792 |
| 5.37%, 12/01/2024 | | 921,864 | | | | 918,361 |
| 5.48%, 04/01/2010 | | 1,027,489 | | | | 1,030,187 |
| 5.50%, 04/01/2016 | | 7,680,000 | | | | 7,780,531 |
| 5.55%, 05/01/2016 | | 3,300,000 | | | | 3,394,050 |
| 5.64%, 12/01/2013 | | 3,000,000 | | | | 3,070,500 |
| 5.65%, 08/01/2022 | | 1,609,481 | | | | 1,637,245 |
| 5.66%, 12/01/2016 | | 1,732,000 | | | | 1,783,440 |
| 5.67%, 03/01/2016 - 11/01/2021 ## | | 12,765,820 | | | | 13,156,369 |
| 5.68%, 08/01/2016 - 04/01/2021 | | 8,408,842 | | | | 8,722,407 |
| 5.70%, 03/01/2016 | | 1,043,315 | | | | 1,077,473 |
| 5.75%, 05/01/2021 | | 3,935,327 | | | | 4,114,722 |
| 5.95%, 06/01/2024 | | 1,981,996 | | | | 2,070,452 |
| 6.07%, 09/01/2013 | | 1,451,178 | | | | 1,510,110 |
| 6.08%, 01/01/2019 ## | | 8,342,200 | | | | 8,520,973 |
| 6.18%, 06/01/2013 ## | | 7,747,799 | | | | 8,121,631 |
| 6.20%, 06/01/2007 | | 240,272 | | | | 239,681 |
| 6.32%, 08/01/2012 | | 2,972,379 | | | | 3,113,983 |
| 6.35%, 08/01/2009 - 10/01/2009 | | 1,130,348 | | | | 1,154,190 |
| 6.80%, 04/01/2017 | | 613,726 | | | | 630,812 |
| 6.90%, 08/01/2007 | | 808,719 | | | | 807,142 |
| 6.99%, 09/01/2014 | | 362,278 | | | | 372,316 |
| 7.35%, 07/01/2007 | | 24,265 | | | | 24,353 |
| 7.48%, 01/01/2025 | | 1,172,756 | | | | 1,256,561 |
| Ser. 2002-M1, Class C, 6.17%, 02/25/2016 | | 624,666 | | | | 634,486 |
| |
|
| | | | | 104,744,305 |
| |
|
| FLOATING-RATE 1.6% |
| FHLMC, 5.83%, 03/01/2037 | | 9,413,498 | | | | 9,502,173 |
| |
|
| Total Agency Commercial Mortgage-Backed Securities | | |
| (cost $109,013,306) | | | | 114,246,478 |
| |
|
| AGENCY MORTGAGE-BACKED COLLATERALIZED MORTGAGE | | |
| OBLIGATIONS 29.1% | |
| FIXED-RATE 1.7% |
| FHLMC: |
| Ser. 2262, Class Z, 7.50%, 10/15/2030 | | 341,104 | | | | 360,939 |
| Ser. 2367, Class BC, 6.00%, 04/15/2016 | | 38,754 | | | | 38,746 |
| Ser. H012, Class A2, 2.50%, 11/15/2008 | | 403,283 | | | | 400,162 |
See Notes to Financial Statements11
| SCHEDULE OF INVESTMENTS continued |
|
| April 30, 2007 | | Principal | | |
| | Amount | Value |
|
| AGENCY MORTGAGE-BACKED COLLATERALIZED MORTGAGE | | |
| OBLIGATIONS continued | |
| FIXED-RATE continued |
| FNMA: |
| Ser. 2002-W4, Class A4, 6.25%, 05/25/2042 | | $ 2,934,146 | | $ 2,991,597 |
| Ser. 2002-W5, Class A7, 6.25%, 08/25/2030 | | | | 4,692,611 | | | | 4,698,810 |
| GNMA: |
| Ser. 2002-25, Class B, 6.21%, 03/16/2021 | | | | 504,356 | | | | 509,838 |
| Ser. 2002-26, Class C, 6.00%, 02/16/2024 | | | | 625,009 | | | | 633,164 |
| |
|
| | | | | 9,633,256 |
| |
|
| FLOATING-RATE 27.4% |
| FHLMC: |
| Ser. 06, Class B, 5.975%, 03/25/2023 | | | | 762,800 | | | | 764,649 |
| Ser. 1220, Class A, 5.73%, 02/15/2022 | | | | 389,824 | | | | 390,144 |
| Ser. 1370, Class JA, 6.53%, 09/15/2022 | | | | 296,309 | | | | 296,650 |
| Ser. 1498, Class I, 6.53%, 04/15/2023 | | | | 183,156 | | | | 185,505 |
| Ser. 1533, Class FA, 6.48%, 06/15/2023 | | | | 63,583 | | | | 64,444 |
| Ser. 1616, Class FB, 5.28%, 11/15/2008 | | | | 627,002 | | | | 625,428 |
| Ser. 1671, Class TA, 5.875%, 02/15/2024 | | | | 690,490 | | | | 695,056 |
| Ser. 1687, Class FA, 5.43%, 02/15/2009 | | | | 2,794,476 | | | | 2,787,210 |
| Ser. 1699, Class FB, 6.375%, 03/15/2024 | | | | 1,078,155 | | | | 1,105,928 |
| Ser. 1939, Class FB, 6.375%, 04/15/2027 | | | | 444,647 | | | | 453,592 |
| Ser. 2005-S001, Class 1A2, 5.47%, 09/25/2035 | | | | 4,732,515 | | | | 4,796,073 |
| Ser. 2030, Class F, 5.82%, 02/15/2028 | | | | 938,178 | | | | 945,768 |
| Ser. 2181, Class PF, 5.72%, 05/15/2029 | | | | 446,850 | | | | 450,363 |
| Ser. 2315, Class FD, 5.82%, 04/15/2027 | | | | 327,277 | | | | 330,049 |
| Ser. 2334, Class FO, 6.29%, 07/15/2031 ## | | | | 12,847,257 | | | | 13,096,864 |
| Ser. 2380, Class FL, 5.92%, 11/15/2031 ## | | | | 14,496,157 | | | | 14,857,691 |
| Ser. 2388, Class FG, 5.82%, 12/31/2031 | | | | 744,149 | | | | 774,331 |
| Ser. 2395, Class FD, 5.92%, 05/15/2029 | | | | 1,397,397 | | | | 1,456,954 |
| Ser. 2401, CL FA, 5.97%, 07/15/2029 | | | | 1,288,689 | | | | 1,314,753 |
| Ser. 2481, Class FE, 6.32%, 03/15/2032 ## | | | | 8,778,787 | | | | 9,022,398 |
| Ser. 2691, Class FC, 6.02%, 10/15/2033 | | | | 2,377,542 | | | | 2,381,822 |
| Ser. T67, Class 1A1, 7.87%, 03/25/2036 ## | | | | 31,555,965 | | | | 33,812,024 |
| Ser. T67, Class 2A1, 7.80%, 03/25/2036 | | | | 9,827,786 | | | | 10,464,765 |
| FNMA: |
| Ser. 1991, Class F, 6.19%, 05/25/2021 | | | | 701,441 | | | | 715,449 |
| Ser. 1991, Class F, 6.64%, 11/25/2021 | | | | 154,193 | | | | 158,382 |
| Ser. 1991 Class FA, 6.24%, 04/25/2021 | | | | 31,147 | | | | 31,275 |
| Ser. 1993-221, Class FH, 6.44%, 12/25/2008 ## | | | | 1,548,027 | | | | 1,558,785 |
| Ser. 1994, Class F, 5.94%, 02/25/2024 | | | | 494,439 | | | | 500,262 |
| Ser. 1997-34, Class F, 5.99%, 10/25/2023 | | | | 3,172,941 | | | | 3,231,514 |
| Ser. 1997-49, Class F, 5.84%, 06/17/2027 | | | | 469,597 | | | | 474,631 |
| Ser. 1999-49, Class F, 5.72%, 05/25/2018 | | | | 933,056 | | | | 940,078 |
| Ser. 2000-32, Class FM, 5.77%, 10/18/2030 | | | | 471,983 | | | | 476,924 |
| Ser. 2001-53, Class CF, 5.72%, 10/25/2031 | | | | 83,566 | | | | 83,676 |
| Ser. 2002-07, Class FB, 5.72%, 02/25/2028 | | | | 306,317 | | | | 311,062 |
See Notes to Financial Statements12
| SCHEDULE OF INVESTMENTS continued |
|
| April 30, 2007 | | Principal | | |
| | Amount | Value |
|
| AGENCY MORTGAGE-BACKED COLLATERALIZED MORTGAGE | | |
| OBLIGATIONS continued | |
| FLOATING-RATE continued |
| FNMA: |
| Ser. 2002-13, Class FE, 6.22%, 02/27/2031 | | $ 1,309,989 | | $ 1,361,721 |
| Ser. 2002-41, Class F, 5.87%, 07/25/2032 | | | | 3,542,714 | | | | 3,601,544 |
| Ser. 2002-67, Class FA, 6.32%, 11/25/2032 | | | | 7,210,403 | | | | 7,531,483 |
| Ser. 2002-68, Class FN, 5.77%, 10/18/2032 | | | | 4,545,834 | | | | 4,582,444 |
| Ser. 2002-77, Class F, 5.92%, 12/25/2032 | | | | 7,361,839 | | | | 7,518,425 |
| Ser. 2002-77, Class FA, 6.32%, 10/18/2030 | | | | 7,332,862 | | | | 7,442,195 |
| Ser. 2002-77, Class FG, 5.87%, 12/18/2032 | | | | 1,557,213 | | | | 1,578,983 |
| Ser. 2002-W5, Class A27, 5.82%, 11/25/2030 | | | | 3,163,301 | | | | 3,217,140 |
| Ser. 2003-11, Class DF, 5.77%, 02/25/2033 | | | | 2,884,367 | | | | 2,908,849 |
| Ser. 2003-11, Class FE, 5.82%, 12/25/2033 | | | | 616,543 | | | | 617,870 |
| Ser. 2003-24, Class FL, 5.77%, 04/25/2018 | | | | 3,092,968 | | | | 3,125,850 |
| Ser. G93, Class FH, 6.49%, 04/25/2023 | | | | 155,565 | | | | 160,294 |
| GNMA: |
| Ser. 1999, Class FA, 5.77%, 11/16/2029 | | | | 1,121,496 | | | | 1,127,978 |
| Ser. 1999-40, Class FL, 5.92%, 02/17/2029 | | | | 224,341 | | | | 227,184 |
| Ser. 2000-36, Class FG, 5.82%, 11/20/2030 | | | | 418,728 | | | | 422,050 |
| Ser. 2001-21, Class FB, 5.72%, 01/16/2027 | | | | 575,546 | | | | 579,772 |
| Ser. 2001-22, Class FG, 5.67%, 05/16/2031 | | | | 948,297 | | | | 955,702 |
| Ser. 2002-15, Class F, 5.87%, 02/16/2032 | | | | 698,882 | | | | 694,647 |
| |
|
| | | | | 157,208,630 |
| |
|
| Total Agency Mortgage-Backed Collateralized Mortgage Obligations | | |
| (cost $180,530,653) | | | | 166,841,886 |
| |
|
| AGENCY MORTGAGE-BACKED PASS THROUGH SECURITIES 63.5% |
| FIXED-RATE 45.9% |
| FHLMC: |
| 6.50%, 04/01/2022 - 09/01/2028 | | | 1,104,796 | | | | 1,135,002 |
| 7.50%, 05/01/2027 - 08/01/2028 | | | 734,528 | | | | 771,458 |
| 8.00%, 08/01/2023 - 11/01/2028 | | | 239,759 | | | | 253,774 |
| 9.00%, 01/01/2017 | | | 76,013 | | | | 81,214 |
| 9.50%, 09/01/2020 | | | 52,855 | | | | 57,273 |
| 10.50%, 12/01/2019 | | | 151,420 | | | | 169,847 |
| FHLMC 15 year, 5.50%, TBA # | | | 10,800,000 | | | | 10,816,870 |
| FHLMC 30 year: |
| 5.00%, TBA # | | | 20,000,000 | | | | 19,331,240 |
| 5.50%, TBA # | | | 53,300,000 | | | | 52,717,005 |
| 6.00%, TBA # | | | 33,600,000 | | | | 33,873,000 |
| 6.50%, TBA # | | | 56,775,000 | | | | 57,999,183 |
| FNMA: |
| 4.00%, 10/01/2018 | | | 8,626,875 | | | | 8,194,091 |
| 4.12%, 09/01/2010 | | | 1,421,730 | | | | 1,395,183 |
| 4.98%, 01/01/2020 | | | 988,116 | | | | 977,849 |
| 5.12%, 01/01/2016 | | | 2,538,165 | | | | 2,529,865 |
| 5.39%, 01/01/2024 | | | 3,860,232 | | | | 3,883,972 |
See Notes to Financial Statements13
| SCHEDULE OF INVESTMENTS continued |
|
| April 30, 2007 | Principal | | |
| | Amount | Value |
|
| AGENCY MORTGAGE-BACKED PASS THROUGH SECURITIES continued |
| FIXED-RATE continued |
| FNMA: |
| 5.55%, 09/01/2019 | | $ 6,923,656 | | $ 6,927,879 |
| 5.70%, 09/01/2017 | | | | 1,462,021 | | | | 1,513,979 |
| 5.75%, 02/01/2009 | | | | 1,779,077 | | | | 1,801,778 |
| 6.00%, 02/01/2008 | | | | 27,840 | | | | 27,794 |
| 6.50%, 01/01/2024 | | | | 164,943 | | | | 169,516 |
| 7.00%, 11/01/2026 - 02/01/2032 | | | | 189,864 | | | | 198,566 |
| 7.50%, 07/01/2023 - 06/01/2031 | | | | 1,686,811 | | | | 1,770,045 |
| 8.00%, 08/01/2020 - 02/01/2030 | | | | 1,357,120 | | | | 1,439,334 |
| 8.50%, 07/01/2029 - 08/01/2029 | | | | 68,247 | | | | 73,605 |
| 9.50%, 02/01/2023 | | | | 41,370 | | | | 44,783 |
| 11.00%, 01/01/2016 | | | | 48,985 | | | | 52,458 |
| 11.25%, 02/01/2016 | | | | 92,369 | | | | 101,910 |
| FNMA 15 year, 6.00%, TBA # | | | | 9,750,000 | | | | 9,905,396 |
| FNMA 30 year: |
| 5.50%, TBA # | | | | 20,000,000 | | | | 19,781,240 |
| 6.00%, TBA # | | | | 5,500,000 | | | | 5,542,966 |
| 6.50%, TBA # | | | | 11,190,000 | | | | 11,424,296 |
| GNMA: |
| 6.00%, 02/15/2009 - 08/20/2034 | | | | 4,994,511 | | | | 5,051,498 |
| 6.50%, 12/15/2025 - 09/20/2033 | | | | 669,469 | | | | 690,345 |
| 7.00%, 12/15/2022 - 05/15/2032 | | | | 581,303 | | | | 609,797 |
| 7.34%, 10/20/2021 - 09/20/2022 | | | | 591,477 | | | | 620,729 |
| 7.50%, 02/15/2022 - 06/15/2032 | | | | 545,669 | | | | 571,534 |
| 10.00%, 12/15/2018 | | | | 69,155 | | | | 77,217 |
| Ser. 2002-53, Class B, 5.55%, 05/16/2026 | | | | 824,299 | | | | 829,261 |
| |
|
| | | | | 263,412,752 |
| |
|
| FLOATING-RATE 17.6% |
| FNMA: |
| 5.19%, 10/01/2035 | | | | 3,354,602 | | | | 3,333,159 |
| 5.49%, 02/01/2037 ## | | | | 21,926,786 | | | | 21,953,824 |
| 5.64%, 07/01/2032 | | | | 4,668,993 | | | | 4,798,622 |
| 5.65%, 11/01/2030 | | | | 673,878 | | | | 692,727 |
| 5.66%, 01/01/2038 | | | | 2,430,856 | | | | 2,430,856 |
| 5.77%, 11/01/2033 | | | | 4,594,536 | | | | 4,696,324 |
| 6.21%, 04/01/2029 - 10/01/2041 ## | | | | 8,145,193 | | | | 8,310,387 |
| 6.26%, 09/01/2041 ## | | | | 10,112,594 | | | | 10,240,373 |
| 6.41%, 06/01/2040 - 01/01/2041 ## | | | | 12,504,682 | | | | 12,744,803 |
| 6.92%, 01/01/2011 | | | | 24,944 | | | | 25,172 |
| 7.16%, 11/01/2018 | | | | 325,009 | | | | 334,109 |
| 7.20%, 05/01/2030 | | | | 370,521 | | | | 386,253 |
| 7.21%, 07/01/2025 | | | | 389,770 | | | | 405,092 |
See Notes to Financial Statements
14
| SCHEDULE OF INVESTMENTS continued |
|
| April 30, 2007 | | Principal | | |
| | Amount | Value |
|
| AGENCY MORTGAGE-BACKED PASS THROUGH SECURITIES continued |
| FLOATING-RATE continued |
| SBA: |
| 5.58%, 08/25/2031 | | $ 1,030,470 | | $ 1,037,972 |
| 5.60%, 09/25/2030 - 11/25/2030 | | | | 1,667,720 | | | | 1,677,855 |
| 5.625%, 03/25/2027 - 03/25/2035 | | | | 4,330,716 | | | | 4,371,259 |
| 5.66%, 10/25/2029 - 11/25/2029 ## | | | | 14,474,668 | | | | 14,611,548 |
| 5.68%, 10/25/2031 | | | | 8,490,514 | | | | 8,621,947 |
| |
|
| | | | | 100,672,282 |
| |
|
| Total Agency Mortgage-Backed Pass Through Securities | | |
| (cost $352,800,493) | | | | 364,085,034 |
| |
|
| AGENCY REPERFORMING MORTGAGE-BACKED PASS THROUGH | | |
| SECURITIES 2.5% | |
| FHLMC, Ser. T-60, Class 1A-1, 6.50%, 03/25/2044 | | | | 1,230,728 | | | | 1,259,342 |
| FNMA: |
| Ser. 2002-T1, Class A3, 7.50%, 11/25/2031 | | | | 2,638,115 | | | | 2,764,903 |
| Ser. 2002-T16, Class A1, 6.50%, 07/25/2042 | | | | 4,233,871 | | | | 4,352,165 |
| Ser. 2002-W3, Class A5, 7.50%, 01/25/2028 | | | | 442,680 | | | | 464,341 |
| Ser. 2002-W8, Class A4, 7.00%, 06/25/2017 | | | | 1,653,078 | | | | 1,718,275 |
| Ser. 2003-W1, Class 1A-1, 6.50%, 12/25/2042 | | | | 2,111,386 | | | | 2,175,656 |
| Ser. 2004-T1, Class 1A-2, 6.50%, 01/25/2044 | | | | 1,616,330 | | | | 1,660,572 |
| |
|
| Total Agency Reperforming Mortgage-Backed Pass Through Securities | | |
| (cost $14,588,423) | | | | 14,395,254 |
| |
|
| ASSET-BACKED SECURITIES 0.7% |
| NovaStar Mortage Inc., Ser. 2007, Class A2, FRN, 5.82%, 02/08/2047 144A | | |
| (cost $3,988,018) | | | | 4,000,000 | | | | 3,963,520 |
| |
|
| COMMERCIAL MORTGAGE-BACKED SECURITIES 2.1% |
| FLOATING-RATE 2.1% |
| Credit Suisse First Boston Mtge. Securities: |
| Ser. 2004-TF2A, Class H, 6.02%, 11/15/2019 144A | | | | 1,900,000 | | | | 1,901,406 |
| Ser. 2004-TF2A, Class J, 6.27%, 11/15/2019 144A | | | | 1,828,000 | | | | 1,829,338 |
| Ser. 2005-TFLA, Class J, 6.27%, 02/15/2020 144A | | | | 961,000 | | | | 961,835 |
| GMAC Comml. Mtge. Securities Inc., Ser. 1997-C1, Class C, 6.90%, 09/15/2007 | | | | 3,900,000 | | | | 3,906,479 |
| Prima Capital Securitization, Ltd., Ser. 2006, Class D, 5.88%, 12/28/2048 | | | | 3,618,000 | | | | 3,662,429 |
| |
|
| Total Commercial Mortgage-Backed Securities (cost $12,219,797) | | | | 12,261,487 |
| |
|
| U.S. TREASURY OBLIGATIONS 2.8% |
| U.S. Treasury Notes: |
| 4.00%, 02/15/2014 (p) | | | | 7,000,000 | | | | 6,772,780 |
| 4.625%, 11/15/2016 (p) | | | | 9,250,000 | | | | 9,247,114 |
| |
|
| Total U.S. Treasury Obligations (cost $16,042,864) | | | | 16,019,894 |
| |
|
See Notes to Financial Statements15
| SCHEDULE OF INVESTMENTS continued |
|
| April 30, 2007 | | Principal | | |
| | Amount | Value |
|
| WHOLE LOAN MORTGAGE-BACKED COLLATERALIZED MORTGAGE | | |
| OBLIGATIONS 5.8% | |
| FIXED-RATE 5.8% |
| Countrywide Alternative Loan Trust: |
| Ser. 2004-1T1, Class A6, 5.75%, 02/25/2034 | | $ 5,000,000 | | $ 4,978,600 |
| Ser. 2005-46CB, Class A14, 5.50%, 10/25/2035 | | | | 10,000,000 | | | | 9,748,100 |
| Countrywide Home Loans, Inc., Ser. 2006-18, Class 2A5, 6.00%, 12/25/2036 | | | | 4,050,000 | | | | 4,083,777 |
| Credit Suisse Mtge. Capital Cert., Ser. 2006-9, Class 4A1, 6.00%, | | |
| 11/25/2036 ## | | | | 9,364,642 | | | | 9,413,432 |
| Residential Accredit Loans, Inc., Ser. 2006-QS4, Class A4, 6.00%, 04/25/2036 ## | | | | 5,000,000 | | | | 5,046,600 |
| |
|
| Total Whole Loan Mortgage-Backed Collateralized Mortgage | | |
| Obligations (cost $33,343,989) | | | | 33,270,509 |
| |
|
| WHOLE LOAN SUBORDINATE COLLATERALIZED MORTGAGE | | |
| OBLIGATIONS 2.0% | |
| FIXED-RATE 2.0% |
| Countrywide Alternative Loan Trust, Ser. 2004-2CB, Class M, 5.67%, | | |
| 03/25/2034 ## (cost $11,196,345) | | | | 11,229,683 | | | | 11,116,713 |
| |
|
| YANKEE OBLIGATIONS - CORPORATE 0.9% |
| FINANCIALS 0.9% |
| Diversified Financial Services 0.9% |
| Preferred Term Securities, Ltd., FRN: |
| 6.97%, 12/24/2033 144A | | | | 3,600,000 | | | | 3,673,116 |
| 7.45%, 04/03/2032 144A | | | | 1,490,425 | | | | 1,506,596 |
| |
|
| Total Yankee Obligations - Corporate (cost $5,184,548) | | | | | | | | 5,179,712 |
| |
|
| INVESTMENTS OF CASH COLLATERAL FROM SECURITIES LOANED 1.0% |
| REPURCHASE AGREEMENTS ^ 1.0% |
| Bank of America Corp., 5.33%, dated 04/30/07, maturing 05/01/07, maturity | | | |
| value $5,958,498 (cost $5,957,616) | | | | 5,957,616 | | | | 5,957,616 |
| | |
|
|
| Shares | | Value |
|
| SHORT-TERM INVESTMENTS 9.0% |
| MUTUAL FUND SHARES 9.0% |
| Evergreen Institutional U.S. Government Money Market Fund, Class I, | | |
| 4.99% q (O) ## (cost $51,333,544) | | | | 51,333,544 | | | | 51,333,544 |
| |
|
| Total Investments (cost $796,199,596) 139.3% | | | | 798,671,647 |
| Other Assets and Liabilities (39.3%) | | | | (225,460,394) |
| |
|
| Net Assets 100.0% | | $ | | 573,211,253 |
| |
|
See Notes to Financial Statements16
SCHEDULE OF INVESTMENTS continued
April 30, 2007
| ## | | All or a portion of this security has been segregated for when-issued or delayed delivery securities. |
| # | | When-issued or delayed delivery security |
| 144A | | Security that may be sold to qualified institutional buyers under Rule 144A of the Securities Act of 1933, as amended. |
| | | This security has been determined to be liquid under guidelines established by the Board of Trustees, unless otherwise |
| | noted. |
| (p) | | All or a portion of this security is on loan. |
| ^ | | Collateralized by U.S. government agency obligations at period end. |
| q | | Rate shown is the 7-day annualized yield at period end. |
| (O) | | Evergreen Investment Management Company, LLC is the investment advisor to both the Fund and the money market |
| | | fund. |
Summary of Abbreviations
| FHLMC | | Federal Home Loan Mortgage Corp. |
| FNMA | | Federal National Mortgage Association |
| FRN | | Floating Rate Note |
| GNMA | | Government National Mortgage Association |
| SBA | | Small Business Administration |
| TBA | | To Be Announced |
The following table shows the percent of total investments (excluding segregated cash and cash equivalents and collateral from securities on loan) by maturity as of April 30, 2007 (unaudited):
| Less than 1 year | | 9.2% |
| 1 to 3 year(s) | | 14.1% |
| 3 to 5 years | | 31.9% |
| 5 to 10 years | | 41.8% |
| 10 to 20 years | | 3.0% |
| |
|
| | | 100.0% |
The following table shows the percent of total investments (excluding segregated cash and cash equivalents and collateral from securities on loan) by credit quality based on Moody’s and Standard & Poor’s ratings as of April 30, 2007 (unaudited):
| AAA | | 97.5% |
| AA | | 1.4% |
| A | | 1.1% |
| |
|
| | | 100.0% |
See Notes to Financial Statements17
| STATEMENT OF ASSETS AND LIABILITIES |
|
| April 30, 2007 |
|
| Assets |
| Investments in securities, at value (cost $744,866,052) including $15,053,732 of securities | | |
| loaned | | $ 747,338,103 |
| Investments in affiliated money market fund, at value (cost $51,333,544) | | | | 51,333,544 |
|
| Total investments | | | | 798,671,647 |
| Receivable for securities sold | | | | 163,504,876 |
| Principal paydown receivable | | | | 983 |
| Receivable for Fund shares sold | | | | 922,328 |
| Interest receivable | | | | 3,209,243 |
| Prepaid expenses and other assets | | | | 22,468 |
|
| Total assets | | | | 966,331,545 |
|
| Liabilities |
| Dividends payable | | | | 580,615 |
| Payable for securities purchased | | | | 385,466,789 |
| Payable for Fund shares redeemed | | | | 975,434 |
| Unrealized losses on total return swap transactions | | | | 24,878 |
| Payable for securities on loan | | | | 5,957,616 |
| Advisory fee payable | | | | 4,454 |
| Due to other related parties | | | | 7,320 |
| Accrued expenses and other liabilities | | | | 103,186 |
|
| Total liabilities | | | | 393,120,292 |
|
| Net assets | | $ 573,211,253 |
|
| Net assets represented by |
| Paid-in capital | | $ 586,640,335 |
| Overdistributed net investment income | | | | (345,257) |
| Accumulated net realized losses on investments | | | | (15,530,998) |
| Net unrealized gains on investments | | | | 2,447,173 |
|
| Total net assets | | $ 573,211,253 |
|
| Net assets consists of |
| Class A | | $ 73,874,631 |
| Class B | | | | 12,653,368 |
| Class C | | | | 7,668,556 |
| Class I | | | | 479,014,698 |
|
| Total net assets | | $ 573,211,253 |
|
| Shares outstanding (unlimited number of shares authorized) |
| Class A | | | | 7,412,676 |
| Class B | | | | 1,269,730 |
| Class C | | | | 769,473 |
| Class I | | | | 48,065,272 |
|
| Net asset value per share |
| Class A | | $ 9.97 |
| Class A — Offering price (based on sales charge of 4.75%) | | $ 10.47 |
| Class B | | $ 9.97 |
| Class C | | $ 9.97 |
| Class I | | $ 9.97 |
|
See Notes to Financial Statements18
| STATEMENT OF OPERATIONS |
|
| Year Ended April 30, 2007 |
|
| Investment income |
| Interest | | $ 29,240,603 |
| Income from affiliate | | | | 1,079,825 |
| Securities lending | | | | 23,304 |
|
| Total investment income | | | | 30,343,732 |
|
| Expenses |
| Advisory fee | | | | 2,220,338 |
| Distribution Plan expenses |
| Class A | | | | 225,962 |
| Class B | | | | 147,266 |
| Class C | | | | 76,738 |
| Administrative services fee | | | | 543,711 |
| Transfer agent fees | | | | 619,224 |
| Trustees’ fees and expenses | | | | 20,144 |
| Printing and postage expenses | | | | 43,523 |
| Custodian and accounting fees | | | | 182,255 |
| Registration and filing fees | | | | 64,977 |
| Professional fees | | | | 35,454 |
| Interest expense | | | | 6,962 |
| Other | | | | 15,040 |
|
| Total expenses | | | | 4,201,594 |
| Less: Expense reductions | | | | (13,589) |
| Expense reimbursements | | | | (28,025) |
|
| Net expenses | | | | 4,159,980 |
|
| Net investment income | | | | 26,183,752 |
|
| Net realized and unrealized gains or losses on investments |
| Net realized losses on: |
| Securities | | | | (376,270) |
| Total return swap transactions | | | | (39,655) |
|
| Net realized losses on investments | | | | (415,925) |
| Net change in unrealized gains or losses on investments | | | | 9,001,559 |
|
| Net realized and unrealized gains or losses on investments | | | | 8,585,634 |
|
| Net increase in net assets resulting from operations | | $ 34,769,386 |
|
See Notes to Financial Statements19
| STATEMENTS OF CHANGES IN NET ASSETS |
|
| | | Year Ended April 30, |
| |
|
| | | 2007 | | 2006 |
|
| Operations |
| Net investment income | | $ 26,183,752 | | $ 18,621,898 |
| Net realized losses on investments | | (415,925) | | (4,671,940) |
| Net change in unrealized gains or losses | | |
| on investments | | 9,001,559 | | (8,160,401) |
|
| Net increase in net assets resulting from | | |
| operations | | 34,769,386 | | 5,789,557 |
|
| Distributions to shareholders from |
| Net investment income |
| Class A | | (3,445,960) | | (3,120,195) |
| Class B | | (564,283) | | (614,218) |
| Class C | | (294,916) | | (255,138) |
| Class I | | (21,740,316) | | (17,139,364) |
|
| Total distributions to shareholders | | (26,045,475) | | (21,128,915) |
|
| | | Shares | | | | Shares | | |
| Capital share transactions |
| Proceeds from shares sold |
| Class A | | 859,580 | | 8,489,247 | | 507,784 | | 5,065,300 |
| Class B | | 228,197 | | 2,246,261 | | 109,329 | | 1,090,670 |
| Class C | | 170,228 | | 1,688,996 | | 90,706 | | 901,624 |
| Class I | | 12,147,068 | | 120,215,524 | | 9,381,313 | | 93,471,908 |
|
| | | 132,640,028 | | 100,529,502 |
|
| Net asset value of shares issued in | | |
| reinvestment of distributions | |
| Class A | | 263,381 | | 2,608,321 | | 235,117 | | 2,344,733 |
| Class B | | 39,575 | | 391,753 | | 43,251 | | 431,481 |
| Class C | | 19,966 | | 197,719 | | 17,962 | | 179,149 |
| Class I | | 1,642,616 | | 16,271,000 | | 1,305,273 | | 13,012,139 |
|
| | | 19,468,793 | | 15,967,502 |
|
| Automatic conversion of Class B shares | | |
| to Class A shares | |
| Class A | | 109,899 | | 1,083,270 | | 193,273 | | 1,926,643 |
| Class B | | (109,899) | | (1,083,270) | | (193,273) | | (1,926,643) |
|
| | | 0 | | 0 |
|
| Payment for shares redeemed |
| Class A | | (1,728,671) | | (17,088,408) | | (2,329,972) | | (23,251,180) |
| Class B | | (595,371) | | (5,881,001) | | (775,496) | | (7,741,833) |
| Class C | | (233,476) | | (2,306,414) | | (269,482) | | (2,692,909) |
| Class I | | (10,262,151) | | (101,536,649) | | (9,418,352) | | (93,809,678) |
|
| | | (126,812,472) | | (127,495,600) |
|
| Net increase (decrease) in net assets | | |
| resulting from capital share transactions | | 25,296,349 | | (10,998,596) |
|
| Total increase (decrease) in net assets | | 34,020,260 | | (26,337,954) |
| Net assets |
| Beginning of period | | 539,190,993 | | 565,528,947 |
|
| End of period | | $ 573,211,253 | | $ 539,190,993 |
|
| Overdistributed net investment income | | $ (345,257) | | $ (112,583) |
|
See Notes to Financial Statements20
| STATEMENT OF CASH FLOWS |
|
| Increase in Cash |
| Cash Flows from Operating Activities: |
| Net increase in net assets from operations | | $ 34,769,386 |
| Adjustments to reconcile net increase in net assets from operations to net cash | | |
| provided by operating activities: | |
| Purchase of investment securities (including mortgage dollar rolls) | | | | (3,424,893,114) |
| Proceeds from disposition of investment securities (including mortgage dollar rolls) | | | | 3,393,203,756 |
| Sales of short-term investment securities, net | | | | 53,711,784 |
| Decrease in interest receivable | | | | 11,548 |
| Increase in receivable for securities sold | | | | (163,494,223) |
| Decrease in receivable for Fund shares sold | | | | 721,811 |
| Decrease in other assets | | | | 24,736 |
| Increase in payable for securities purchased | | | | 114,623,478 |
| Increase in payable for Fund shares redeemed | | | | 532,010 |
| Decrease in accrued expenses | | | | (2,313) |
| Unrealized appreciation on investments | | | | (9,001,559) |
| Net realized loss from investments | | | | 415,925 |
|
| Net cash provided by operating activities | | | | 623,225 |
|
| Cash Flows from Financing Activities: |
| Increase in additional paid-in capital | | | | 5,827,556 |
| Cash distributions paid | | | | (6,450,781) |
|
| Net cash used in financing activities | | | | (623,225) |
|
| Net increase in cash | | $ 0 |
|
| Cash: |
| Beginning of period | | $ 0 |
|
| End of period | | $ 0 |
|
See Notes to Financial Statements21
NOTES TO FINANCIAL STATEMENTS
1. ORGANIZATION
Evergreen U.S. Government Fund (the “Fund”) is a diversified series of Evergreen Fixed Income Trust (the “Trust”), a Delaware statutory trust organized on September 18, 1997. The Trust is an open-end management investment company registered under the Investment Company Act of 1940, as amended (the “1940 Act”).
The Fund offers Class A, Class B, Class C and Class I shares. Class A shares are sold with a front-end sales charge. However, Class A share investments of $1 million or more are not subject to a front-end sales charge but are subject to a contingent deferred sales charge of 1.00% upon redemption within 18 months. Prior to April 1, 2007, the 1.00% contingent deferred sales charge was applicable for redemptions made within one year. Class B shares are sold without a front-end sales charge but are subject to a contingent deferred sales charge that is payable upon redemption and decreases depending on how long the shares have been held. Class C shares are sold without a front-end sales charge but are subject to a contingent deferred sales charge that is payable upon redemption within one year. Class I shares are sold without a front-end sales charge or contingent deferred sales charge. Each class of shares, except Class I shares, pays an ongoing distribution fee.
2. SIGNIFICANT ACCOUNTING POLICIES
The following is a summary of significant accounting policies consistently followed by the Fund in the preparation of its financial statements. The policies are in conformity with generally accepted accounting principles in the United States of America, which require management to make estimates and assumptions that affect amounts reported herein. Actual results could differ from these estimates.
a. Valuation of investments
Portfolio debt securities acquired with more than 60 days to maturity are fair valued using matrix pricing methods determined by an independent pricing service which takes into consideration such factors as similar security prices, yields, maturities, liquidity and ratings. Securities for which valuations are not readily available from an independent pricing service may be valued by brokers which use prices provided by market makers or estimates of market value obtained from yield data relating to investments or securities with similar characteristics.
Investments of cash collateral in short-term securities are valued at amortized cost, which approximates market value.
Short-term securities with remaining maturities of 60 days or less at the time of purchase are valued at amortized cost, which approximates market value.
Investments in other mutual funds are valued at net asset value. Securities for which market quotations are not readily available or not reflective of current market value are valued at fair value as determined by the investment advisor in good faith, according to procedures approved by the Board of Trustees.
22
NOTES TO FINANCIAL STATEMENTS continued
b. Repurchase agreements
Securities pledged as collateral for repurchase agreements are held by the custodian bank or in a segregated account in the Fund’s name until the agreements mature. Collateral for certain tri-party repurchase agreements is held at the counterparty’s custodian in a segregated account for the benefit of the Fund and the counterparty. Each agreement requires that the market value of the collateral be sufficient to cover payments of interest and principal. However, in the event of default or bankruptcy by the other party to the agreement, retention of the collateral may be subject to legal proceedings. The Fund will enter into repurchase agreements with banks and other financial institutions, which are deemed by the investment advisor to be creditworthy pursuant to guidelines established by the Board of Trustees. In certain instances, the Fund’s securities lending agent may provide collateral in the form of repurchase agreements.
c. Reverse repurchase agreements
To obtain short-term financing, the Fund may enter into reverse repurchase agreements with banks and other financial institutions, which are deemed by the investment advisor to be credit-worthy. At the time the Fund enters into a reverse repurchase agreement, it will establish a segregated account with the custodian containing qualified assets having a value not less than the repurchase price, including accrued interest. If the counterparty to the transaction is rendered insolvent, the Fund may be delayed or limited in the repurchase of the collateral securities.
d. When-issued and delayed delivery transactions
The Fund records when-issued or delayed delivery securities as of trade date and maintains security positions such that sufficient liquid assets will be available to make payment for the securities purchased. Securities purchased on a when-issued or delayed delivery basis are marked-to-market daily and begin earning interest on the settlement date. Losses may occur on these transactions due to changes in market conditions or the failure of counterparties to perform under the contract.
e. Securities lending
The Fund may lend its securities to certain qualified brokers in order to earn additional income. The Fund receives compensation in the form of fees or interest earned on the investment of any cash collateral received. The Fund also continues to receive interest and dividends on the securities loaned including accrued interest. The Fund receives collateral in the form of cash or securities with a market value at least equal to the market value of the securities on loan, including accrued interest. In the event of default or bankruptcy by the borrower, the Fund could experience delays and costs in recovering the loaned securities or in gaining access to the collateral. The Fund has the right under the lending agreement to recover the securities from the borrower on demand.
f. Dollar roll transactions
The Fund may enter into dollar roll transactions with respect to mortgage-backed securities. In a dollar roll transaction, the Fund sells mortgage-backed securities to financial institutions and simultaneously agrees to accept substantially similar (same type, coupon and maturity) securities at a later date at an agreed upon price. The Fund will use the proceeds generated from the trans-
23
NOTES TO FINANCIAL STATEMENTS continued
actions to invest in short-term investments, which may enhance the Fund’s current yield and total return. The Fund accounts for dollar roll transactions as purchases and sales. The Fund could be exposed to risks if the counterparty defaults on its obligation to perform under the terms of the agreement, if the Fund receives inferior securities in comparison to what was sold to the coun-terparty at redelivery or if there are variances in paydown speed between the mortgage-related pools.
g. Total return swaps
The Fund may enter into total return swaps. Total return swaps involve commitments to pay interest in exchange for a market linked return, both based on notional amounts. To the extent the total return of the security or index underlying the transaction exceeds or falls short of the offsetting interest rate obligation, the Fund will receive a payment from or make a payment to the counterparty. The value of the swap agreements is marked-to-market daily based upon quotations from market makers and any change in value is recorded as an unrealized gain or loss. The Fund could be exposed to risks if the counterparty defaults on its obligation to perform, or if there are unfavorable changes in the fluctuation of interest rates or in the price of the underlying security.
h. Security transactions and investment income
Security transactions are recorded on trade date. Realized gains and losses are computed using the specific cost of the security sold. Interest income is recorded on the accrual basis and includes accretion of discounts and amortization of premiums.
i. Federal taxes
The Fund intends to continue to qualify as a regulated investment company and distribute all of its taxable income, including any net capital gains (which have already been offset by available capital loss carryovers). Accordingly, no provision for federal taxes is required.
j. Distributions
Distributions to shareholders from net investment income are accrued daily and paid monthly. Distributions from net realized gains, if any, are recorded on the ex-dividend date. Such distributions are determined in conformity with income tax regulations, which may differ from generally accepted accounting principles.
Reclassifications have been made to the Fund’s components of net assets to reflect income and gains available for distribution (or available capital loss carryovers, as applicable) under income tax regulations. The primary permanent differences causing such reclassifications are due to expiration of capital loss carryovers, mortgage paydown gains and losses and premium amortization. During the year ended April 30, 2007, the following amounts were reclassified:
|
|
Paid-in capital | | $ (1,278,383) | | Overdistributed net investment income | | (370,951) |
| Accumulated net realized losses on investments | | 1,649,334 |
|
24
NOTES TO FINANCIAL STATEMENTS continued
k. Class allocations
Income, common expenses and realized and unrealized gains and losses are allocated to the classes based on the relative net assets of each class. Distribution fees, if any, are calculated daily at the class level based on the appropriate net assets of each class and the specific expense rates applicable to each class.
3. ADVISORY FEE AND OTHER TRANSACTIONS WITH AFFILIATES
Evergreen Investment Management Company, LLC (“EIMC”), an indirect, wholly-owned subsidiary of Wachovia Corporation (“Wachovia”), is the investment advisor to the Fund and is paid an annual fee starting at 0.42% and declining to 0.35% as average daily net assets increase.
Effective October 1, 2006, Tattersall Advisory Group, Inc., an indirect, wholly-owned subsidiary of Wachovia, became the investment sub-advisor to the Fund and is paid by EIMC for its services to the Fund.
From time to time, EIMC may voluntarily or contractually waive its fee and/or reimburse expenses in order to limit operating expenses. During the year ended April 30, 2007, EIMC voluntarily reimbursed Distribution Plan expenses (see Note 4) relating to Class A shares in the amount of $28,025.
The Fund may invest in Evergreen-managed money market funds, which are also advised by EIMC. Income earned on these investments is included in income from affiliate on the Statement of Operations.
Evergreen Investment Services, Inc. (“EIS”), an indirect, wholly-owned subsidiary of Wachovia, is the administrator to the Fund. As administrator, EIS provides the Fund with facilities, equipment and personnel and is paid an annual rate determined by applying percentage rates to the aggregate average daily net assets of the Evergreen funds (excluding money market funds and Evergreen Institutional Enhanced Income Fund), starting at 0.10% and declining to 0.05% as the aggregate average daily net assets of the Evergreen funds (excluding money market funds and Evergreen Institutional Enhanced Income Fund) increase.
Evergreen Service Company, LLC (“ESC”), an indirect, wholly-owned subsidiary of Wachovia, is the transfer and dividend disbursing agent for the Fund. ESC receives account fees that vary based on the type of account held by the shareholders in the Fund. For the year ended April 30, 2007, the transfer agent fees were equivalent to an annual rate of 0.11% of the Fund’s average daily net assets.
4. DISTRIBUTION PLANS
EIS also serves as distributor of the Fund’s shares. The Fund has adopted Distribution Plans, as allowed by Rule 12b-1 of the 1940 Act, for each class of shares, except Class I. Under the Distribution Plans, distribution fees are paid at an annual rate of 0.30% of the average daily net assets for Class A shares and 1.00% of the average daily net assets for each of Class B and Class C shares.
25
NOTES TO FINANCIAL STATEMENTS continued
For the year ended April 30, 2007, EIS received $3,887 from the sale of Class A shares and $62,895 and $633 in contingent deferred sales charges from redemptions of Class B and Class C shares, respectively.
5. SECURITIES TRANSACTIONS
Cost of purchases and proceeds from sales of investment securities (excluding short-term securities and mortgage dollar roll transactions) were as follows for the year ended April 30, 2007:
| Cost of Purchases | | Proceeds from Sales |
|
| U.S. | | Non-U.S. | | U.S. | | Non-U.S. |
| Government | | Government | | Government | | Government |
|
| $923,733,882 | | $83,975,175 | | $656,809,827 | | $60,158,649 |
|
During the year ended April 30, 2007, the Fund loaned securities to certain brokers. At April 30, 2007, the value of securities on loan and the total value of collateral received for securities loaned amounted to $15,053,732 and $15,315,510, respectively. Of the total value of the collateral received for securities on loan, $9,357,894 represents the market value of U.S. government agency securities received as non-cash collateral.At April 30, 2007, the Fund had the following open total return swap agreements:
| | | Notional | | Swap | | | | Unrealized |
| Expiration | | Amount | | Description | | Counterparty | | Losses |
|
| 05/01/2007 | | $ 10,000,000 | | Agreement dated 11/07/2007 to | | Lehman Brothers | | $11,564 |
| | | receive 30 basis points and to | | Holdings, Inc. | | |
| | receive the positive spread return or | | |
| | pay the negative spread return on | |
| | the Lehman Brothers CMBS AAA | |
| | 8.5+yr Index which are multiplied | |
| | by the notional amount. | |
| | | | | | | | | |
| 08/01/2007 | | 10,000,000 | | Agreement dated 01/26/2007 to | | Lehman Brothers | | 13,314 |
| | | receive 7.5 basis points and to | | Holdings, Inc. | | |
| | receive the positive spread return or | | |
| | pay the negative spread return on | |
| | the Lehman Brothers CMBS AAA | |
| | 8.5+yr Index which are multiplied | |
| | by the notional amount. | |
|
On April 30, 2007, the aggregate cost of securities for federal income tax purposes was $796,251,620. The gross unrealized appreciation and depreciation on securities based on tax cost was $4,518,233 and $2,098,206, respectively, with a net unrealized appreciation of $2,420,027.As of April 30, 2007, the Fund had $15,528,730 in capital loss carryovers for federal income tax purposes expiring as follows:
| Expiration |
|
| 2008 | | 2009 | | 2010 | | 2014 | | 2015 |
|
| $4,853,705 | | $437,595 | | $1,202 | | $3,241,214 | | $6,995,014 |
|
26
NOTES TO FINANCIAL STATEMENTS continued
6. INTERFUND LENDING
Pursuant to an Exemptive Order issued by the SEC, the Fund may participate in an interfund lending program with certain funds in the Evergreen fund family. This program allows the Fund to borrow from, or lend money to, other participating funds. During the year ended April 30, 2007, the Fund did not participate in the interfund lending program.
7. DISTRIBUTIONS TO SHAREHOLDERS
As of April 30, 2007, the components of distributable earnings on a tax basis were as follows:
| Overdistributed | | Unrealized | | Capital Loss |
| Ordinary Income | | Appreciation | | Carryovers |
|
| $320,379 | | $2,420,027 | | $15,528,730 |
|
The tax character of distributions paid were $26,045,475 and $21,128,915 of ordinary income for the years ended April 30, 2007 and April 30, 2006, respectively.8. EXPENSE REDUCTIONS
Through expense offset arrangements with ESC and the Fund’s custodian, a portion of fund expenses has been reduced.
9. DEFERRED TRUSTEES’ FEES
Each Trustee of the Fund may defer any or all compensation related to performance of their duties as Trustees. The Trustees’ deferred balances are allocated to deferral accounts, which are included in the accrued expenses for the Fund. The investment performance of the deferral accounts is based on the investment performance of certain Evergreen funds. Any gains earned or losses incurred in the deferral accounts are reported in the Fund’s Trustees’ fees and expenses. At the election of the Trustees, the deferral account will be paid either in one lump sum or in quarterly installments for up to ten years.
10. FINANCING AGREEMENT AND OTHER BORROWINGS
The Fund and certain other Evergreen funds share in an unsecured revolving credit commitment for temporary and emergency purposes, including the funding of redemptions, as permitted by each participating fund’s borrowing restrictions. Borrowings under this facility bear interest at 0.50% per annum above the Federal Funds rate. All of the participating funds are charged an annual commitment fee on the unused balance, which is allocated pro rata. The credit facility is for $100 million with an annual commitment fee of 0.08% . Prior to July 3, 2006, the credit facility was for $150 million with an annual commitment fee of 0.09% . During the year ended April 30, 2007, the Fund had no borrowings.
During the year ended April 30, 2007, the Fund entered into reverse repurchase agreements that had an average daily balance outstanding of $131,859 with a weighted average interest rate of 5.28 % and paid interest of $6,962.
27
NOTES TO FINANCIAL STATEMENTS continued
11. REGULATORY MATTERS AND LEGAL PROCEEDINGS
Since September 2003, governmental and self-regulatory authorities have instituted numerous ongoing investigations of various practices in the mutual fund industry, including investigations relating to revenue sharing, market-timing, late trading and record retention, among other things. The investigations cover investment advisors, distributors and transfer agents to mutual funds, as well as other firms. EIMC, EIS and ESC (collectively, “Evergreen”) have received subpoenas and other requests for documents and testimony relating to these investigations, are endeavoring to comply with those requests, and are cooperating with the investigations. Evergreen is continuing its own internal review of policies, practices, procedures and personnel, and is taking remedial action where appropriate.
In connection with one of these investigations, on July 28, 2004, the staff of the Securities and Exchange Commission (“SEC”) informed Evergreen that the staff intends to recommend to the SEC that it institute an enforcement action against Evergreen. The SEC staff’s proposed allegations relate to (i) an arrangement pursuant to which a broker at one of EIMC’s affiliated broker-dealers had been authorized, apparently by an EIMC officer (who is no longer with EIMC), to engage in short-term trading, on behalf of a client, in Evergreen Mid Cap Growth Fund (formerly Evergreen Emerging Growth Fund and prior to that, known as Evergreen Small Company Growth Fund) during the period from December 2000 through April 2003, in excess of the limitations set forth in the fund’s prospectus, (ii) short-term trading from September 2001 through January 2003, by a former Evergreen portfolio manager of Evergreen Precious Metals Fund, a fund he managed at the time, (iii) the sufficiency of systems for monitoring exchanges and enforcing exchange limitations as stated in the funds’ prospectuses, and (iv) the adequacy of e-mail retention practices. In connection with the activity in Evergreen Mid Cap Growth Fund, EIMC reimbursed the fund $378,905, plus an additional $25,242, representing what EIMC calculated at that time to be the client’s net gain and the fees earned by EIMC and the expenses incurred by this fund on the client’s account. In connection with the activity in Evergreen Precious Metals Fund, EIMC reimbursed the fund $70,878, plus an additional $3,075, representing what EIMC calculated at that time to be the portfolio manager’s net gain and the fees earned by EIMC and expenses incurred by the fund on the portfolio manager’s account. Evergreen is currently engaged in discussions with the staff of the SEC concerning its recommendation.
Any resolution of these matters with regulatory authorities may include, but not be limited to, sanctions, penalties or injunctions regarding Evergreen, restitution to mutual fund shareholders and/or other financial penalties and structural changes in the governance or management of Evergreen’s mutual fund business. Any penalties or restitution will be paid by Evergreen and not by the Evergreen funds.
EIS has entered into an agreement with the NASD settling allegations that EIS (i) arranged for Evergreen fund portfolio trades to be directed to Wachovia Securities, LLC, an affiliate of EIS that sold Evergreen fund shares, during the period of January 2001 to December 2003 and (ii) provided non-cash compensation by sponsoring offsite meetings attended by Wachovia
28
NOTES TO FINANCIAL STATEMENTS continued
Securities, LLC brokers during that period, where the eligibility of a broker to attend the meetings depended upon the broker meeting certain sales targets of Evergreen fund shares. Pursuant to the settlement agreement, EIS has agreed to a censure and a fine of $4,200,000. EIS neither admitted nor denied the allegations and findings set forth in its agreement with the NASD.
In addition, the Evergreen funds and EIMC and certain of its affiliates are involved in various legal actions, including private litigation and class action lawsuits. EIMC does not expect that any of such legal actions currently pending or threatened will have a material adverse impact on the financial position or operations of any of the Evergreen funds or on EIMC’s ability to provide services to the Evergreen funds.
Although Evergreen believes that neither the foregoing investigations described above nor any pending or threatened legal actions will have a material adverse impact on the Evergreen funds, there can be no assurance that these matters and any publicity surrounding or resulting from them will not result in reduced sales or increased redemptions of Evergreen fund shares, which could increase Evergreen fund transaction costs or operating expenses, or that they will not have other adverse consequences on the Evergreen funds.
12. NEW ACCOUNTING PRONOUNCEMENTS
In June 2006, the Financial Accounting Standards Board (“FASB”) issued FASB Interpretation No. 48, Accounting for Uncertainty in Income Taxes — an interpretation of FASB statement 109 (“FIN 48”). FIN 48 supplements FASB 109 by prescribing a recognition threshold and measurement attribute for the financial statement recognition and measurement of a tax position taken or expected to be taken in a tax return. The adoption of FIN 48 will require financial statements to be adjusted to reflect only those tax positions that are more likely than not to be sustained as of the adoption date. Management of the Fund is currently evaluating the impact that the adoption of FIN 48 will have on the financial statements. FIN 48 will become effective for fiscal years beginning after December 15, 2006.
In September 2006, FASB issued Statement of Financial Accounting Standards No. 157, Fair Value Measurements (“FAS 157”). FAS 157 establishes a single authoritative definition of fair value, establishes a framework for measuring fair value and expands disclosures about fair value measurements. FAS 157 applies to fair value measurements already required or permitted by existing standards. The change to current generally accepted accounting principles from the application of FAS 157 relates to the definition of fair value, the methods used to measure fair value, and the expanded disclosures about fair value measurements. Management of the Fund does not believe the adoption of FAS 157 will materially impact the financial statement amounts, however, additional disclosures may be required about the inputs used to develop the measurements and the effect of certain of the measurements on changes in net assets for the period. FAS 157 is effective for financial statements issued for fiscal years beginning after November 15, 2007 and interim periods within those fiscal years.
29
REPORT OF INDEPENDENT REGISTERED PUBLIC ACCOUNTING FIRM
Board of Trustees and Shareholders
Evergreen Fixed Income Trust
We have audited the accompanying statement of assets and liabilities, including the schedule of investments, of the Evergreen U.S. Government Fund, a series of Evergreen Fixed Income Trust, as of April 30, 2007, and the related statement of operations and statement of cash flows for the year then ended, statements of changes in net assets for each of the years in the two-year period then ended, and the financial highlights for each of the years in the five-year period then ended. These financial statements and financial highlights are the responsibility of the Fund’s management. Our responsibility is to express an opinion on these financial statements and financial highlights based on our audits.
We conducted our audits in accordance with the standards of the Public Company Accounting Oversight Board (United States). Those standards require that we plan and perform the audit to obtain reasonable assurance about whether the financial statements and financial highlights are free of material misstatement. An audit includes examining, on a test basis, evidence supporting the amounts and disclosures in the financial statements. Our procedures included confirmation of securities owned as of April 30, 2007 by correspondence with the custodian and brokers, or by other appropriate auditing procedures where replies from brokers were not received. An audit also includes assessing the accounting principles used and significant estimates made by management, as well as evaluating the overall financial statement presentation. We believe that our audits provide a reasonable basis for our opinion.
In our opinion, the financial statements and financial highlights referred to above present fairly, in all material respects, the financial position of the Evergreen U.S. Government Fund, as of April 30, 2007, the results of its operations, its cash flows, changes in its net assets and financial highlights for each of the years described above, in conformity with U.S. generally accepted accounting principles.
Boston, Massachusetts
June 28, 2007
30
This page left intentionally blank
31
| TRUSTEES AND OFFICERS |
|
| TRUSTEES1 |
| Charles A. Austin III | | Investment Counselor, Anchor Capital Advisors, LLC. (investment advice); Director, The Andover |
| Trustee | | Companies (insurance); Trustee, Arthritis Foundation of New England; Former Director, The |
| DOB: 10/23/1934 | | Francis Ouimet Society (scholarship program); Former Director, Executive Vice President and |
| Term of office since: 1991 | | Treasurer, State Street Research & Management Company (investment advice) |
| Other directorships: None | | |
|
| K. Dun Gifford | | Chairman and President, Oldways Preservation and Exchange Trust (education); Trustee, |
| Trustee | | Treasurer and Chairman of the Finance Committee, Cambridge College |
| DOB: 10/23/1938 | | |
| Term of office since: 1974 | |
| Other directorships: None | |
|
| Dr. Leroy Keith, Jr. | | Partner, Stonington Partners, Inc. (private equity fund); Trustee, Phoenix Fund Complex; Director, |
| Trustee | | Diversapack Co. (packaging company); Director, Obagi Medical Products Co.; Former Director, |
| DOB: 2/14/1939 | | Lincoln Educational Services |
| Term of office since: 1983 | | |
| Other directorships: Trustee, | |
| Phoenix Fund Complex (consisting | |
| of 60 portfolios) | |
|
| Gerald M. McDonnell | | Manager of Commercial Operations, CMC Steel (steel producer) |
| Trustee | | |
| DOB: 7/14/1939 | |
| Term of office since: 1988 | |
| Other directorships: None | |
|
| Patricia B. Norris | | President and Director of Phillips Pond Homes Association (home community); President and |
| Trustee | | Director of Buckleys of Kezar Lake, Inc., (real estate company); Former Partner, |
| DOB: 4/9/1948 | | PricewaterhouseCoopers, LLP |
| Term of office since: 2006 | | |
| Other directorships: None | |
|
| William Walt Pettit | | Partner and Vice President, Kellam & Pettit, P.A. (law firm); Director, Superior Packaging Corp. |
| Trustee | | (packaging company); Member, Superior Land, LLC (real estate holding company), Member, |
| DOB: 8/26/1955 | | K&P Development, LLC (real estate development); Former Director, National Kidney Foundation |
| Term of office since: 1984 | | of North Carolina, Inc. (non-profit organization) |
| Other directorships: None | | |
|
| David M. Richardson | | President, Richardson, Runden LLC (executive recruitment business development/consulting |
| Trustee | | company); Consultant, Kennedy Information, Inc. (executive recruitment information and |
| DOB: 9/19/1941 | | research company); Consultant, AESC (The Association of Executive Search Consultants); |
| Term of office since: 1982 | | Director, J&M Cumming Paper Co. (paper merchandising); Former Trustee, NDI Technologies, LLP |
| Other directorships: None | | (communications) |
|
| Dr. Russell A. Salton III | | President/CEO, AccessOne MedCard, Inc.; Former Medical Director, Healthcare Resource |
| Trustee | | Associates, Inc. |
| DOB: 6/2/1947 | | |
| Term of office since: 1984 | |
| Other directorships: None | |
|
| Michael S. Scofield | | Retired Attorney, Law Offices of Michael S. Scofield; Former Director and Chairman, Branded |
| Trustee | | Media Corporation (multi-media branding company) |
| DOB: 2/20/1943 | | |
| Term of office since: 1984 | |
| Other directorships: None | |
|
32
| TRUSTEES AND OFFICERS continued |
|
| Richard J. Shima | | Independent Consultant; Director, Hartford Hospital; Trustee, Greater Hartford YMCA; Former |
| Trustee | | Director, Trust Company of CT; Former Director, Old State House Association; Former Trustee, |
| DOB: 8/11/1939 | | Saint Joseph College (CT) |
| Term of office since: 1993 | | |
| Other directorships: None | |
|
| Richard K. Wagoner, CFA2 | | Member and Former President, North Carolina Securities Traders Association; Member, Financial |
| Trustee | | Analysts Society |
| DOB: 12/12/1937 | | |
| Term of office since: 1999 | |
| Other directorships: None | |
|
| OFFICERS |
| Dennis H. Ferro3 | | Principal occupations: President and Chief Executive Officer, Evergreen Investment Company, |
| President | | Inc. and Executive Vice President, Wachovia Bank, N.A.; former Chief Investment Officer, |
| DOB: 6/20/1945 | | Evergreen Investment Company, Inc. |
| Term of office since: 2003 | | |
|
| Kasey Phillips4 | | Principal occupations: Senior Vice President, Evergreen Investment Services, Inc.; Former Vice |
| Treasurer | | President, Evergreen Investment Services, Inc.; Former Assistant Vice President, Evergreen |
| DOB: 12/12/1970 | | Investment Services, Inc. |
| Term of office since: 2005 | | |
|
| Michael H. Koonce4 | | Principal occupations: Senior Vice President and General Counsel, Evergreen Investment |
| Secretary | | Services, Inc.; Secretary, Senior Vice President and General Counsel, Evergreen Investment |
| DOB: 4/20/1960 | | Management Company, LLC and Evergreen Service Company, LLC; Senior Vice President and |
| Term of office since: 2000 | | Assistant General Counsel, Wachovia Corporation |
|
| Robert Guerin4, 5 | | Principal occupations: Chief Compliance Officer, Evergreen Funds and Senior Vice President of |
| Chief Compliance Officer | | Evergreen Investments Co, Inc; Former Managing Director and Senior Compliance Officer, |
| DOB: 9/20/1965 | | Babson Capital Management LLC; Former Principal and Director, Compliance and Risk |
| Term of office since: 2007 | | Management, State Street Global Advisors; Former Vice President and Manager, Sales Practice |
| | | Compliance, Deutsche Asset Management. |
|
1 Each Trustee, except Ms. Norris, serves until a successor is duly elected or qualified or until his death, resignation, retirement or removal from office. As a new Trustee, Ms. Norris’ initial term ends June 30, 2009, at which time she may be re-elected by Trustees to serve until a successor is duly elected or qualified or until her death, resignation, retirement or removal from office by the Trustees. Each Trustee oversees 94 Evergreen funds. Correspondence for each Trustee may be sent to Evergreen Board of Trustees, P.O. Box 20083, Charlotte, NC 28202.
2 Mr. Wagoner is an “interested person” of the Fund because of his ownership of shares in Wachovia Corporation, the parent to the Fund’s investment advisor.
3 The address of the Officer is 401 S. Tryon Street, 20th Floor, Charlotte, NC 28288.
4 The address of the Officer is 200 Berkeley Street, Boston, MA 02116.
5 Mr. Guerin’s information is as of June 14, 2007, the effective date of his approval by the Board of Trustees as Chief Compliance Officer of the Evergreen funds.
Additional information about the Fund’s Board of Trustees and Officers can be found in the Statement of Additional Information (SAI) and is available upon request without charge by calling 800.343.2898.
33
566663 rv4 06/2007
Item 2 - Code of Ethics
(a) The Registrant has adopted a code of ethics that applies to the Registrant's principal executive officer and principal financial officer.
(b) During the period covered by this report, there were no amendments to the provisions of the code of ethics adopted in 2.(a) above.
(c) During the period covered by this report, there were no implicit or explicit waivers to the provisions of the code of ethics adopted in 2.(a) above.
Item 3 - Audit Committee Financial Expert
Charles A. Austin III and Patricia B. Norris have been determined by the Registrant's Board of Trustees to be audit committee financial experts within the meaning of Section 407 of the Sarbanes-Oxley Act. These financial experts are independent of management.
Items 4 – Principal Accountant Fees and Services
The following table represents fees for professional audit services rendered by KPMG LLP, for the audits of each of the 5 series of the Registrant’s annual financial statements for the fiscal years ended April 30, 2007 and April 30, 2006, and fees billed for other services rendered by KPMG LLP.
| | | | |
| | | 2007 | | 2006 |
| Audit fees | | $136,900 | | $122,200 |
| Audit -related fees | | 0 | | 0 |
| |
|
| Audit and audit-related fees | | 136,900 | | 122,200 |
| Tax fees (1) | | 360 | | 7,667 |
| Non-audit fees (2) | | 808,367 | | 950,575 |
| |
|
| Total fees | | $945,627 | | $1,080,442 |
| |
|
(1) Tax fees consists of fees for tax consultation, tax compliance and tax review. (2) Non-audit fees consists of the aggregate fees for non-audit services rendered to the Fund, EIMC (not including any sub-advisor whose role is primarily portfolio management and is subcontracted with or overseen by another investment advisor) and EIS.
Evergreen Funds
Evergreen Income Advantage Fund
Evergreen Managed Income Fund
Evergreen Utilities and High Income Fund
Evergreen International Balanced Income Fund
Evergreen Global Dividend Opportunity Fund
Audit and Non-Audit Services Pre-Approval Policy
I. Statement of Principles
Under the Sarbanes-Oxley Act of 2002 (the “Act”), the Audit Committee of the Board of Trustees/Directors is responsible for the appointment, compensation and oversight of the work of the independent auditor. As part of this responsibility, the Audit Committee is required to pre-approve the audit and non-audit services performed by the independent auditor in order to assure that they do not impair the auditor’s independence from the Funds. To implement these provisions of the Act, the Securities and Exchange Commission (the “SEC”) has issued rules specifying the types of services that an independent auditor may not provide to its audit client, as well as the audit committee’s administration of the engagement of the independent auditor. Accordingly, the Audit Committee has adopted, and the Board of Trustees/Directors has ratified, the Audit and Non-Audit Services Pre Approval Policy (the “Policy”), which sets forth the procedures and the conditions pursuant to which services proposed to be performed by the independent auditor may be pre-approved.
The SEC’s rules establish two different approaches to pre-approving services, which the SEC considers to be equally valid. Proposed services either: may be pre-approved without consideration of specific case-by-case services by the Audit Committee (“general pre-approval”); or require the specific pre-approval of the Audit Committee (“specified pre-approval”). The Audit Committee believes that the combination of these two approaches in this Policy will result in an effective and efficient procedure to pre-approve services performed by the independent auditor. As set forth in this Policy, unless a type of service has received general pre-approval, it will require specific pre-approval by the Audit Committee if it is to be provided by the independent auditor. Any proposed services exceeding pre-approved cost levels or budgeted amounts will also require specific pre-approval by the Audit Committee.
For both types of pre-approval, the Audit Committee will consider whether such services are consistent with the SEC’s rules on auditor independence. The Audit Committee will also consider whether the independent auditor is best positioned to provide the most effective and efficient service, for reasons such as its familiarity with the Funds’ business people, culture, accounting systems, risk profile and other factors, and whether the service might enhance the Funds’ ability to manage or control risk or improve audit quality. All such factors will be considered as a whole, and no one factor should necessarily be determinative.
The Audit Committee is also mindful of the relationship between fees for audit and non-audit services in deciding whether to pre-approve any such services and may determine, for each fiscal year, the ratio between the total amount of fees for Audit, Audit-related and Tax services and the total amount of fees for certain permissible non-audit services classified as All Other services.
The term of any general pre-approval is 12 months from the date of pre-approval, unless the Audit Committee considers a different period and states otherwise. The Audit Committee will annually review and pre-approve the services that may be provided by the independent auditor without obtaining specific pre-approval from the Audit Committee. The Audit Committee will add or subtract to the list of general pre-approved services from time to time, based on subsequent determinations.
The purpose of this Policy is to set forth the procedures by which the Audit Committee intends to fulfill its responsibilities. It does not delegate the Audit Committee’s responsibilities to pre-approve services performed by the independent auditor to management.
The independent auditor has reviewed this Policy and believes that implementation of the policy will not adversely affect the auditor’s independence.
II. Delegation
As provided in the Act and the SEC’s rules, the Audit Committee may delegate either type of pre-approval authority to one or more of its members. The member to whom such authority is delegated must report, for informational purposes only, any pre-approval decisions of the Audit Committee at its next scheduled meeting.
III. Audit Services
The annual Audit services engagement terms and fees will be subject to the specific pre-approval of the Audit Committee. Audit services include the annual financial statement audit and other procedures required to be performed by the independent auditor to be able to form an opinion on the Funds’ financial statements. These other procedures include information systems and procedural reviews and testing performed in order to understand and place reliance on the systems of internal control, and consultations relating to the audit. Audit services also include the attestation engagement for the independent auditor’s report on management’s report on internal controls for financial reporting. The Audit Committee will monitor the Audit services engagement as necessary, but no less than on a quarterly basis, and will also approve, if necessary, any changes in terms, conditions and fees resulting from changes in audit scope, Fund service providers or other items.
In addition to the annual Audit services engagement approved by the Audit Committee, the Audit Committee may grant general pre-approval to other Audit services, which are those services that only the independent auditor reasonably can provide. Other Audit services may include services associated with SEC registration statements, periodic reports and other documents filed with the SEC or other documents issued in connection with mergers or acquisitions.
IV. Audit-related Services
Audit-related services are assurance and related services that are reasonably related to the performance of the audit or review of the Funds’ financial statements or that are traditionally performed by the independent auditor. Because the Audit Committee believes that the provision of Audit-related services does not impair the independence of the auditor and is consistent with SEC’s rules on auditor independence, the Audit Committee may grant general pre-approval to Audit-related services. Audit-related services include, among others, due diligence services pertaining to potential business acquisitions/dispositions; accounting consultations related to accounting, financial reporting or disclosure matters not classified as “Audit services”; assistance with understanding and implementing new accounting and financial reporting guidance from rulemaking authorities; agreed-upon or expanded audit procedures related to accounting records required to respond to or comply with financial, accounting or regulatory reporting matters; and assistance with internal control reporting requirements.
V. Tax Services
The Audit Committee believes that the independent auditor can provide Tax services to the Funds such as tax compliance, tax planning and tax advice without impairing the auditor’s independence, and the SEC has stated that the independent auditor may provide such services. Hence, the Audit Committee believes it may grant general pre-approval to those Tax services that have historically been provided by the auditor, that the Audit Committee has reviewed and believes would not impair the independence of the auditor, and that are consistent with the SEC’s rules on auditor independence. The Audit Committee will not permit the retention of the independent auditor in connection with a transaction initially recommended by the independent auditor, the sole business purpose of which may be tax avoidance and the tax treatment of which may not be supported in the Internal Revenue Code and related regulations. The Audit Committee will consult with the Director of Fund Administration, the Vice President of Tax Services or outside counsel to determine that the tax planning and reporting positions are consistent with this policy.
All Tax services involving large and complex transactions must be specifically pre-approved by the Audit Committee, including: tax services proposed to be provide by the independent auditor to any executive officer or director of the Funds, in his or her individual capacity, where such services are paid for by the Funds or the investment advisor.
VI. All Other Services
The Audit Committee believes, based on the SEC’s rules prohibiting the independent auditor from providing specific non-audit services, that other types of non-audit services are permitted. Accordingly, the Audit Committee believes it may grant general pre-approval to those permissible non-audit services classified as All Other services that it believes are routine and recurring services, would not impair the independence of the auditor and are consistent with the SEC’s rules on auditor independence.
The SEC’s rules and relevant guidance should be consulted to determine the precise definitions of the SEC’s prohibited non-audit services and the applicability of exceptions to certain of the prohibitions.
VII. Pre-Approval Fee Levels or Budgeted Amounts
Pre-approval fee levels or budgeted amounts for all services to be provided by the independent auditor will be established annually by the Audit Committee. Any proposed services exceeding these levels or amounts will require specific pre-approval by the Audit Committee. The Audit Committee is mindful of the overall relationship of fees for audit and non-audit services in determining whether to pre-approve any such services. For each fiscal year, the Audit Committee may determine to ratio between the total amount of fees for Audit, Audit-related and Tax services, and the total amount of fees for services classified as All Other services.
VIII. Procedures
All requests or applications for services to be provided by the independent auditor that do not require specific approval by the Audit Committee will be submitted to the Director of Fund Administration or Assistant Director of Fund Administration and must include a detailed description of the services to be rendered. The Director/Assistant Director of Fund Administration will determine whether such services are included within the list of services that have received the general pre-approval of the Audit Committee. The Audit Committee will be informed on a quarterly basis (or more frequent if requested by the audit committee) of any such services rendered by the independent auditor.
Request or applications to provide services that require specific approval by the Audit Committee will be submitted to the Audit Committee by both the independent auditor and the Director/Assistant Director of Fund Administration, and must include a joint statement as to whether, in their view, the request or application is consistent with the SEC’s rules on auditor independence.
The Audit Committee has designated the Chief Compliance Officer to monitor the performance of all services provided by the independent auditor and to determine whether such services are in compliance with this policy. The Chief Compliance Officer will report to the Audit Committee on a periodic basis on the results of its monitoring. Both the Chief Compliance Officer and management will immediately report to the chairman of the Audit Committee any breach of this policy that comes to the attention of the Chief Compliance Officer or any member of management.
The Audit Committee will also review the internal auditor’s annual internal audit plan to determine that the plan provides for the monitoring of the independent auditor’s services.
IX. Additional Requirements
The Audit Committee has determined to take additional measures on an annual basis to meet its responsibility to oversee the work of the independent auditor and to assure the auditor’s independence from the Funds, such as reviewing a formal written statement from the independent auditor delineating all relationships between the independent auditor and the Funds, the Funds’ investment advisor and related parties of the investment advisor, consistent with Independence Standards Board Standard No. 1, and discussing with the independent auditor its methods and procedures for ensuring independence.
Items 5 – Audit Committee of Listed Registrants
Not applicable.
Item 6 – Schedule of Investments
Please see schedule of investments contained in the Report to Stockholders included under Item 1 of this Form N-CSR.
Item 7 – Disclosure of Proxy Voting Policies and Procedures for Closed-End Management Investment Companies.
Not applicable.
Item 8 – Portfolio Managers of Closed-End Management Investment Companies.
Not applicable.
Item 9 – Purchases of Equity Securities by Closed-End Management Investment Company and Affiliated Purchasers.
Not applicable.
Item 10 – Submission of Matters to a Vote of Security Holders
There have been no material changes to the procedures by which shareholders may recommend nominees to the Registrant’s board of trustees that have been implemented since the Registrant last provided disclosure in response to the requirements of this Item.
Item 11 - Controls and Procedures
(a) The Registrant's principal executive officer and principal financial officer have evaluated the Registrant's disclosure controls and procedures (as defined in Rule 30a-3(c) under the Investment Company Act of 1940) within 90 days of this filing and have concluded that the Registrant's disclosure controls and procedures were effective, as of that date, in ensuring that information required to be disclosed by the Registrant in this Form N-CSR was recorded, processed, summarized, and reported timely.
(b) There has been no changes in the Registrant's internal controls over financial reporting (as defined in Rule 30a-3(d) under the Investment Company Act of 1940) that occurred during the second fiscal quarter of the period covered by this report that has materially affected, or is reasonable likely to affect, the Registrant’s internal control over financial reporting .
Item 12 - Exhibits
File the exhibits listed below as part of this Form. Letter or number the exhibits in the sequence indicated.
(a) Any code of ethics, or amendment thereto, that is the subject of the disclosure required by Item 2, to the extent that the Registrant intends to satisfy the Item 2 requirements through filing of an exhibit.
(b)(1) Separate certifications for the Registrant's principal executive officer and principal financial officer, as required by Section 302 of the Sarbanes-Oxley Act of 2002 and Rule 30a-2(a) under the Investment Company Act of 1940, are attached as EX99.CERT.
(b)(2) Separate certifications for the Registrant's principal executive officer and principal financial officer, as required by Section 1350 of Title 18 of United States Code, as adopted pursuant to Section 906 of the Sarbanes-Oxley Act of 2002, and Rule 30a-2(b) under the Investment Company Act of 1940, are attached as EX99.906CERT. The certifications furnished pursuant to this paragraph are not deemed to be "filed" for purposes of Section 18 of the Securities Exchange Act of 1934, or otherwise subject to the liability of that section. Such certifications are not deemed to be incorporated by reference into any filing under the Securities Act of 1933 or the Securities Exchange Act of 1934, except to the extent that the Registrant specifically incorporates them by reference.
Pursuant to the requirements of the Securities Exchange Act of 1934 and the Investment Company Act of 1940, the Registrant has duly caused this report to be signed on its behalf by the undersigned, thereunto duly authorized.
Evergreen Fixed Income Trust
By: _______________________
Dennis H. Ferro,
Principal Executive Officer
Date: June 29, 2007
Pursuant to the requirements of the Securities Exchange Act of 1934 and the Investment Company Act of 1940, this report has been signed below by the following persons on behalf of the Registrant and in the capacities and on the dates indicated.
By:
_______________________
Dennis H. Ferro,
Principal Executive Officer
Date: June 29, 2007
By:
________________________
Kasey Phillips
Principal Financial Officer
Date: June 29, 2007