Source: Morningstar, Inc.
Morningstar’s style box is based on a portfolio date as of 3/31/2008.
The Fixed Income style box placement is based on a fund’s average effective maturity or duration and the average credit rating of the bond portfolio.
The advisor is waiving a portion of its advisory fee and reimbursing a portion of the 12b-1 fee for Class A. Had the fees not been waived or reimbursed, returns would have been lower.
PORTFOLIO MANAGER COMMENTARY
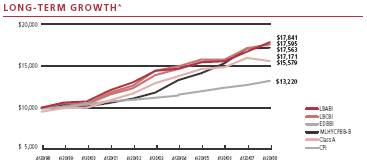
The fund’s Class A shares returned -2.38% for the twelve-month period ended April 30, 2008, excluding any applicable sales charges. During the same period, the EDBBI returned 2.59%, the LBABI returned 6.87%, the LBCBI returned 3.06% and the MLHYCPBB-B returned 0.58%.
The fund’s objective is to seek to maximize total return through a combination of current income and capital growth.
The fund’s underperformance relative to its benchmarks was principally due to its exposure to commercial mortgage-backed securities (CMBS) and Residential Mortgage-Backed Securities (RMBS) during a period when all securitized assets significantly lagged other sectors in the fixed income markets. The fiscal year began in May 2007 amid evidence that the domestic economy was continuing to expand after weathering a housing slump earlier in the year. Corporate bonds continued to perform well as investors sought out higher yields. The Federal Reserve Board (the “Fed”) indicated it was more concerned about inflationary pressures than about any potential drags on the economy, and it held the key fed funds rate unchanged at the 5.25% level where it had been for more than a year. That environment began to change in June 2007 amid mounting evidence that weakness in housing and problems in subprime mortgages were becoming more of a threat to the economy. Many major financial institutions, both domestic and international, began reporting significant losses from their subprime mortgage investments. Problems originating in the subprime market led to a massive deleveraging of the financial system and a seizing up of the fixed income markets. Investors typically sought out higher-quality bonds, most notably Treasuries, as evidence accumulated of a growing liquidity crunch affecting lending activities. In this general flight to quality, Treasuries outperformed all other sectors of the fixed income markets for the remainder of the fiscal year as the financial markets remained mired in a liquidity crunch. To relieve this credit crunch and inject liquidity into the financial markets, the Fed, in a series of actions
Class I shares are only offered, subject to the minimum initial purchase requirements, in the following manner: (1) to investment advisory clients of EIMC (or its advisory affiliates), (2) to employer- or state-sponsored benefit plans, including but not limited to, retirement plans, defined benefit plans, deferred compensation plans, or savings plans, (3) to fee-based mutual fund wrap accounts, (4) through arrangements entered into on behalf of the Evergreen funds with certain financial services firms, (5) to certain institutional investors, and (6) to persons who owned Class Y shares in registered name in an Evergreen fund on or before December 31, 1994 or who owned shares of any SouthTrust fund in registered name as of March 18, 2005 or who owned shares of Vestaur Securities Fund as of May 20, 2005.
Class I shares are only available to institutional shareholders with a minimum of $1 million investment, which may be waived in certain situations.
The fund’s investment objective may be changed without a vote of the fund’s shareholders.
Foreign investments may contain more risk due to the inherent risks associated with changing political climates, foreign market instability and foreign currency fluctuations.
Asset-backed and mortgage-backed securities are generally subject to higher prepayment risks than other types of debt securities, which can limit the potential for gain in a declining interest rate environment and increase the potential for loss in a rising interest rate environment. Mortgage-backed securities may also be structured so that they are particularly sensitive to interest rates. A high rate of defaults on the mortgages held by a mortgage pool may limit the pool’s ability to make payments to the fund if the fund holds securities that are subordinate to other interest in the same mortgage pool; the risk of such defaults is generally higher in mortgage pools that include subprime mortgages.
Derivatives involve additional risks including interest rate risk, credit risk, the risk of improper valuation and the risk of non-correlation to the relevant instruments they are designed to hedge or to closely track.
High yield, lower-rated bonds may contain more risk due to the increased possibility of default.
The return of principal is not guaranteed due to fluctuation in the fund’s NAV caused by changes in the price of individual bonds held by the fund and the buying and selling of bonds by the fund. Bond funds have the same inflation, interest rate and credit risks as individual bonds. Generally, the value of bond funds rises when prevailing interest rates fall, and falls when interest rates rise.
U.S. government guarantees apply only to certain securities held in the fund’s portfolio and not to the fund’s shares.
The Evergreen Diversified Bond Blended Index is composed of the following indexes: LBCBI (80%) AND MLHYCPBB-B (20%).
† | Copyright 2008. Merrill Lynch, Pierce, Fenner & Smith Incorporated. All rights reserved. |
All data is as of April 30, 2008, and subject to change.
5
PORTFOLIO MANAGER COMMENTARY continued
starting in September 2007 and continuing through the end of the fiscal year in April 2008 provided funds to financial institutions. The Fed also lowered the fed funds rate from 5.25% to 2.00% and announced a series of other policy moves to ease lending activity.
For most of the fiscal year, we kept the fund’s duration—or exposure to change in interest rates—consistent with that of the LBABI, and this neutral duration position had minimal impact on results. The fund’s investments in Treasuries, government agency securities and international bonds all contributed positively to performance. The fund had only minimal exposure to high yield corporate bonds early in the fiscal year, but we increased the positions late in 2007 as yield spreads widened and high yield bonds appeared more attractive. This increased exposure, however, hurt relative performance during the first three months of 2008 as yield spreads widened further and Treasuries continued to outperform.
The fund typically invests in a diversified mix of bonds from all sectors of the market including corporate bonds and high-quality mortgage-backed securities (MBS), CMBS, and asset-backed securities (ABS). In most environments, this strategy has provided additional yield to the fund and added to the overall performance relative to the market. In a liquidity crisis and flight to quality, however, these high-quality assets are often the ones that are most affected. The fund held a minimal allocation to U.S Treasuries over the course of the fiscal year particularly as yield spreads widened last fall. For most major sectors of the market, yield spreads reached record levels in November 2007. As spreads widened, the fund added to its exposure in the corporate sector, where it had been underweight for most of the fiscal year. In the securitized sector (MBS, CMBS and ABS) the fund maintained its overweight position and began to add more exposure to AAA nonagency mortgages as the spread between agency and non-agency bonds widened to record levels. As we moved into 2008, problems in the subprime market continued to weigh on investors and confidence in the financial system remained low. Financial institutions typically continued to struggle as they attempted to value the subprime mortgages held on their balance sheets and shore up capital positions. Spread sectors, which were already historically cheap, underperformed even more in the first three months of 2008 and the fund’s performance was negatively impacted. While the fund did not own any subprime mortgages, its performance nevertheless was hurt by the fallout from the subprime crisis. Investments in CMBS, investment-grade corporate bonds, and ABS tended to detract from results during a period in which the markets did not reward any credit risk. The Fed’s efforts to provide liquidity and shore up the financial system began to take hold in mid-March 2008 and the market tone began to improve. In the last months of the fiscal year, spreads in CMBS and corporates in particular began to narrow significantly and the performance of the fund began to improve.
6
ABOUT YOUR FUND’S EXPENSES
The Example below is intended to describe the fees and expenses borne by shareholders and the impact of those costs on your investment.
Example
As a shareholder of the fund, you incur two types of costs: (1) transaction costs, including sales charges (loads), redemption fees and exchange fees; and (2) ongoing costs, including management fees, distribution (12b-1) fees and other fund expenses. This Example is intended to help you understand your ongoing costs (in dollars) of investing in the fund and to compare these costs with the ongoing costs of investing in other mutual funds. The Example is based on an investment of $1,000 invested at the beginning of the period and held for the entire period from November 1, 2007 to April 30, 2008.
The example illustrates your fund’s costs in two ways:
• Actual expenses
The section in the table under the heading “Actual” provides information about actual account values and actual expenses. You may use the information in these columns, together with the amount you invested, to estimate the expenses that you paid over the period. Simply divide your account value by $1,000 (for example, an $8,600 account value divided by $1,000 = 8.6), then multiply the result by the number in the appropriate column for your share class, in the column entitled “Expenses Paid During Period” to estimate the expenses you paid on your account during this period.
• Hypothetical example for comparison purposes
The section in the table under the heading “Hypothetical (5% return before expenses)” provides information about hypothetical account values and hypothetical expenses based on the fund’s actual expense ratio and an assumed rate of return of 5% per year before expenses, which is not the fund’s actual return. The hypothetical account values and expenses may not be used to estimate the actual ending account balance or expenses you paid for the period. You may use this information to compare the ongoing costs of investing in the fund and other funds. To do so, compare this 5% hypothetical example with the 5% hypothetical examples that appear in the shareholder reports of the other funds.
Please note that the expenses shown in the table are meant to highlight your ongoing costs only and do not reflect any transactional costs, such as sales charges (loads), redemption fees or exchange fees. Therefore, the section in the table under the heading “Hypothetical (5% return before expenses)” is useful in comparing ongoing costs only, and will not help you determine the relative total costs of owning different funds. In addition, if these transactional costs were included, your costs would have been higher.
| Beginning
Account
Value
11/1/2007 | Ending
Account
Value
4/30/2008 | Expenses
Paid During
Period* |
|
|
|
|
|
|
Actual | | | | | |
Class A | $1,000.00 | | $ | 974.18 | | $4.52 |
Class B | $1,000.00 | | $ | 970.55 | | $8.18 |
Class C | $1,000.00 | | $ | 970.55 | | $8.18 |
Class I | $1,000.00 | | $ | 975.39 | | $3.29 |
Hypothetical | | | | | | |
(5% return before expenses) | | | | | | |
Class A | $1,000.00 | | $ | 1,020.29 | | $4.62 |
Class B | $1,000.00 | | $ | 1,016.56 | | $8.37 |
Class C | $1,000.00 | | $ | 1,016.56 | | $8.37 |
Class I | $1,000.00 | | $ | 1,021.53 | | $3.37 |
|
|
|
|
|
|
* | For each class of the fund, expenses are equal to the annualized expense ratio of each class (0.92% for Class A, 1.67% for Class B, 1.67% for Class C and 0.67% for Class I), multiplied by the average account value over the period, multiplied by 182 / 366 days. |
7
FINANCIAL HIGHLIGHTS
(For a share outstanding throughout each period)
| | Year Ended April 30, | | | |
| |
| | | |
CLASS A | | Restated
2008† | | 2007 | | 20061 | | Year Ended
November 30, 20052, 3 | |
|
|
|
|
|
|
|
|
| |
Net asset value, beginning of period | | $ | 14.45 | | $ | 14.25 | | $ | 14.53 | | $ | 14.83 | |
|
|
|
|
|
|
|
|
|
|
|
|
| |
Income from investment operations | | | | | | | | | | | | | |
Net investment income (loss) | | | 0.74 | | | 0.81 | | | 0.33 | | | 0.41 | 4 |
Net realized and unrealized gains or losses on investments | | | (1.07 | ) | | 0.23 | | | (0.27 | ) | | (0.28 | ) |
| |
|
|
|
|
|
|
|
|
|
|
| |
Total from investment operations | | | (0.33 | ) | | 1.04 | | | 0.06 | | | 0.13 | |
|
|
|
|
|
|
|
|
|
|
|
|
| |
Distributions to shareholders from | | | | | | | | | | | | | |
Net investment income | | | (0.51 | ) | | (0.83 | ) | | (0.34 | ) | | (0.43 | ) |
Tax basis return of capital | | | (0.21 | ) | | (0.01 | ) | | 0 | | | 0 | |
| |
|
|
|
|
|
|
|
|
|
|
| |
Total distributions to shareholders | | | (0.72 | ) | | (0.84 | ) | | (0.34 | ) | | (0.43 | ) |
|
|
|
|
|
|
|
|
|
|
|
|
| |
Net asset value, end of period | | $ | 13.40 | | $ | 14.45 | | $ | 14.25 | | $ | 14.53 | |
|
|
|
|
|
|
|
|
|
|
|
|
| |
Total return5 | | | (2.38 | )% | | 7.49 | % | | 0.43 | % | | 0.89 | % |
|
|
|
|
|
|
|
|
|
|
|
|
| |
Ratios and supplemental data | | | | | | | | | | | | | |
Net assets, end of period (thousands) | | $ | 167,732 | | $ | 199,442 | | $ | 213,268 | | $ | 226,450 | |
Ratios to average net assets | | | | | | | | | | | | | |
Expenses including waivers/reimbursements but excluding expense reductions | | | 0.92 | % | | 0.94 | % | | 0.96 | %6 | | 0.97 | %6 |
Expenses excluding waivers/reimbursements and expense reductions | | | 1.15 | % | | 1.16 | % | | 1.19 | %6 | | 1.15 | %6 |
Net investment income (loss) | | | 5.23 | % | | 5.65 | % | | 5.43 | %6 | | 5.28 | %6 |
Portfolio turnover rate | | | 374 | %7 | | 70 | % | | 30 | % | | 55 | % |
|
|
|
|
|
|
|
|
|
|
|
|
| |
1 | For the five months ended April 30, 2006. The Fund changed its fiscal year end from November 30 to April 30, effective April 30, 2006. |
2 | For the period from May 20, 2005 (commencement of class operations), to November 30, 2005. |
3 | Effective at the close of business on May 20, 2005, the Fund acquired the net assets of Vestaur Securities Fund. Vestaur Securities Fund became the accounting and performance survivor in this transaction. Class A shares of Vestaur Securities Fund did not exist prior to the transaction. As a result, accounting and performance information for Class A shares commenced on May 20, 2005. |
4 | Net investment income (loss) per share is based on average shares outstanding during the period. |
5 | Excluding applicable sales charges |
7 | Portfolio turnover rate includes mortgage dollar roll activity. |
† | Certain amounts for the year ended April 30, 2008 have been restated (See Note 13). |
See Notes to Financial Statements
8
FINANCIAL HIGHLIGHTS
(For a share outstanding throughout each period)
| | Year Ended April 30, | | | |
| |
| | | |
CLASS B | | Restated
2008† | | 2007 | | 20061 | | Year Ended
November 30, 20052, 3 | |
|
|
|
|
|
|
|
|
| |
Net asset value, beginning of period | | $ | 14.45 | | $ | 14.25 | | $ | 14.53 | | $ | 14.83 | |
|
|
|
|
|
|
|
|
|
|
|
|
| |
Income from investment operations | | | | | | | | | | | | | |
Net investment income (loss) | | | 0.64 | | | 0.70 | | | 0.28 | | | 0.36 | 4 |
Net realized and unrealized gains or losses on investments | | | (1.07 | ) | | 0.23 | | | (0.26 | ) | | (0.28 | ) |
| |
|
|
|
|
|
|
|
|
|
|
| |
Total from investment operations | | | (0.43 | ) | | 0.93 | | | 0.02 | | | 0.08 | |
|
|
|
|
|
|
|
|
|
|
|
|
| |
Distributions to shareholders from | | | | | | | | | | | | | |
Net investment income | | | (0.41 | ) | | (0.72 | ) | | (0.30 | ) | | (0.38 | ) |
Tax basis return of capital | | | (0.21 | ) | | (0.01 | ) | | 0 | | | 0 | |
| |
|
|
|
|
|
|
|
|
|
|
| |
Total distributions to shareholders | | | (0.62 | ) | | (0.73 | ) | | (0.30 | ) | | (0.38 | ) |
|
|
|
|
|
|
|
|
|
|
|
|
| |
Net asset value, end of period | | $ | 13.40 | | $ | 14.45 | | $ | 14.25 | | $ | 14.53 | |
|
|
|
|
|
|
|
|
|
|
|
|
| |
Total return5 | | | (3.18 | )% | | 6.71 | % | | 0.14 | % | | 0.52 | % |
|
|
|
|
|
|
|
|
|
|
|
|
| |
Ratios and supplemental data | | | | | | | | | | | | | |
Net assets, end of period (thousands) | | $ | 13,618 | | $ | 16,102 | | $ | 18,277 | | $ | 20,439 | |
Ratios to average net assets | | | | | | | | | | | | | |
Expenses including waivers/reimbursements but excluding expense reductions | | | 1.67 | % | | 1.67 | % | | 1.67 | %6 | | 1.67 | %6 |
Expenses excluding waivers/reimbursements and expense reductions | | | 1.85 | % | | 1.85 | % | | 1.89 | %6 | | 1.85 | %6 |
Net investment income (loss) | | | 4.49 | % | | 4.91 | % | | 4.72 | %6 | | 4.58 | %6 |
Portfolio turnover rate | | | 374 | %7 | | 70 | % | | 30 | % | | 55 | % |
|
|
|
|
|
|
|
|
|
|
|
|
| |
1 | For the five months ended April 30, 2006. The Fund changed its fiscal year end from November 30 to April 30, effective April 30, 2006. |
2 | For the period from May 20, 2005 (commencement of class operations), to November 30, 2005. |
3 | Effective at the close of business on May 20, 2005, the Fund acquired the net assets of Vestaur Securities Fund. Vestaur Securities Fund became the accounting and performance survivor in this transaction. Class B shares of Vestaur Securities Fund did not exist prior to the transaction. As a result, accounting and performance information for Class B shares commenced on May 20, 2005. |
4 | Net investment income (loss) per share is based on average shares outstanding during the period. |
5 | Excluding applicable sales charges |
7 | Portfolio turnover rate includes mortgage dollar roll activity. |
† | Certain amounts for the year ended April 30, 2008 have been restated (See Note 13). |
See Notes to Financial Statements
9
FINANCIAL HIGHLIGHTS
(For a share outstanding throughout each period)
| | Year Ended April 30, | | | |
| |
| | | |
CLASS C | | Restated
2008† | | 2007 | | 20061 | | Year Ended
November 30, 20052, 3 | |
|
|
|
|
|
|
|
|
| |
Net asset value, beginning of period | | $ | 14.45 | | $ | 14.25 | | $ | 14.53 | | $ | 14.83 | |
|
|
|
|
|
|
|
|
|
|
|
|
| |
Income from investment operations | | | | | | | | | | | | | |
Net investment income (loss) | | | 0.63 | | | 0.70 | | | 0.28 | | | 0.36 | 4 |
Net realized and unrealized gains or losses on investments | | | (1.06 | ) | | 0.23 | | | (0.26 | ) | | (0.28 | ) |
| |
|
|
|
|
|
|
|
|
|
|
| |
Total from investment operations | | | (0.43 | ) | | 0.93 | | | 0.02 | | | 0.08 | |
|
|
|
|
|
|
|
|
|
|
|
|
| |
Distributions to shareholders from | | | | | | | | | | | | | |
Net investment income | | | (0.41 | ) | | (0.72 | ) | | (0.30 | ) | | (0.38 | ) |
Tax basis return of capital | | | (0.21 | ) | | (0.01 | ) | | 0 | | | 0 | |
| |
|
|
|
|
|
|
|
|
|
|
| |
Total distributions to shareholders | | | (0.62 | ) | | (0.73 | ) | | (0.30 | ) | | (0.38 | ) |
|
|
|
|
|
|
|
|
|
|
|
|
| |
Net asset value, end of period | | $ | 13.40 | | $ | 14.45 | | $ | 14.25 | | $ | 14.53 | |
|
|
|
|
|
|
|
|
|
|
|
|
| |
Total return5 | | | (3.11 | )% | | 6.71 | % | | 0.14 | % | | 0.52 | % |
|
|
|
|
|
|
|
|
|
|
|
|
| |
Ratios and supplemental data | | | | | | | | | | | | | |
Net assets, end of period (thousands) | | $ | 21,699 | | $ | 24,157 | | $ | 25,972 | | $ | 27,764 | |
Ratios to average net assets | | | | | | | | | | | | | |
Expenses including waivers/reimbursements but excluding expense reductions | | | 1.67 | % | | 1.67 | % | | 1.67 | %6 | | 1.67 | %6 |
Expenses excluding waivers/reimbursements and expense reductions | | | 1.85 | % | | 1.85 | % | | 1.89 | %6 | | 1.85 | %6 |
Net investment income (loss) | | | 4.48 | % | | 4.91 | % | | 4.72 | %6 | | 4.58 | %6 |
Portfolio turnover rate | | | 374 | %7 | | 70 | % | | 30 | % | | 55 | % |
|
|
|
|
|
|
|
|
|
|
|
|
| |
1 | For the five months ended April 30, 2006. The Fund changed its fiscal year end from November 30 to April 30, effective April 30, 2006. |
2 | For the period from May 20, 2005 (commencement of class operations), to November 30, 2005. |
3 | Effective at the close of business on May 20, 2005, the Fund acquired the net assets of Vestaur Securities Fund. Vestaur Securities Fund became the accounting and performance survivor in this transaction. Class C shares of Vestaur Securities Fund did not exist prior to the transaction. As a result, accounting and performance information for Class C shares commenced on May 20, 2005. |
4 | Net investment income (loss) per share is based on average shares outstanding during the period. |
5 | Excluding applicable sales charges |
7 | Portfolio turnover rate includes mortgage dollar roll activity. |
† | Certain amounts for the year ended April 30, 2008 have been restated (See Note 13). |
See Notes to Financial Statements
10
FINANCIAL HIGHLIGHTS
(For a share outstanding throughout each period)
| | Year Ended April 30, | | Year Ended November 30, | |
| |
| |
| |
CLASS I | | Restated
2008† | | 2007 | | 20061 | | 20052 | | 20042 | | 20032 | |
|
|
|
|
|
|
|
|
|
|
|
|
| |
Net asset value, beginning of period | | $ | 14.45 | | $ | 14.25 | | $ | 14.53 | | $ | 15.14 | | $ | 15.14 | | $ | 14.27 | |
|
|
|
|
|
|
|
|
|
|
|
|
|
|
|
|
|
|
| |
Income from investment operations | | | | | | | | | | | | | | | | | | | |
Net investment income (loss) | | | 0.76 | | | 0.83 | | | 0.34 | | | 0.79 | 3 | | 0.93 | | | 0.95 | |
Net realized and unrealized gains or losses on investments | | | (1.05 | ) | | 0.25 | | | (0.26 | ) | | (0.41 | ) | | 0.02 | | | 0.91 | |
| |
|
|
|
|
|
|
|
|
|
|
|
|
|
|
|
|
| |
Total from investment operations | | | (0.29 | ) | | 1.08 | | | 0.08 | | | 0.38 | | | 0.95 | | | 1.86 | |
|
|
|
|
|
|
|
|
|
|
|
|
|
|
|
|
|
|
| |
Distributions to shareholders from | | | | | | | | | | | | | | | | | | | |
Net investment income | | | (0.55 | ) | | (0.87 | ) | | (0.36 | ) | | (0.86 | ) | | (0.95 | ) | | (0.99 | ) |
Tax basis return of capital | | | (0.21 | ) | | (0.01 | ) | | 0 | | | (0.13 | )4 | | 0 | | | 0 | |
�� | |
|
|
|
|
|
|
|
|
|
|
|
|
|
|
|
|
| |
Total distributions to shareholders | | | (0.76 | ) | | (0.88 | ) | | (0.36 | ) | | (0.99 | ) | | (0.95 | ) | | (0.99 | ) |
|
|
|
|
|
|
|
|
|
|
|
|
|
|
|
|
|
|
| |
Net asset value, end of period | | $ | 13.40 | | $ | 14.45 | | $ | 14.25 | | $ | 14.53 | | $ | 15.14 | | $ | 15.14 | |
|
|
|
|
|
|
|
|
|
|
|
|
|
|
|
|
|
|
| |
Total return | | | (2.13 | )% | | 7.78 | % | | 0.55 | % | | 2.82 | % | | 6.47 | % | | 13.43 | % |
|
|
|
|
|
|
|
|
|
|
|
|
|
|
|
|
|
|
| |
Ratios and supplemental data | | | | | | | | | | | | | | | | | | | |
Net assets, end of period (thousands) | | $ | 47,668 | | $ | 56,478 | | $ | 61,711 | | $ | 65,893 | | $ | 97,235 | | $ | 97,277 | |
Ratios to average net assets | | | | | | | | | | | | | | | | | | | |
Expenses including waivers/reimbursements but excluding expense reductions | | | 0.67 | % | | 0.67 | % | | 0.67 | %5 | | 0.79 | % | | 0.94 | % | | 0.91 | % |
Expenses excluding waivers/reimbursements and expense reductions | | | 0.85 | % | | 0.85 | % | | 0.89 | %5 | | 0.88 | % | | 0.97 | % | | 0.94 | % |
Net investment income (loss) | | | 5.48 | % | | 5.91 | % | | 5.72 | %5 | | 5.50 | % | | 6.10 | % | | 6.43 | % |
Portfolio turnover rate | | | 374 | %6 | | 70 | % | | 30 | % | | 55 | % | | 23 | % | | 45 | % |
|
|
|
|
|
|
|
|
|
|
|
|
|
|
|
|
|
|
| |
1 | For the five months ended April 30, 2006. The Fund changed its fiscal year end from November 30 to April 30, effective April 30, 2006. |
2 | Effective at the close of business on May 20, 2005, the Fund acquired the net assets of Vestaur Securities Fund. Vestaur Securities Fund became the accounting and performance survivor in this transaction. The financial highlights for the periods prior to May 23, 2005 are those of Vestaur Securities Fund. The per share information has been restated to give effect to this transaction. Total return performance reflects the total return of Vestaur Securities Fund based on its net asset value. |
3 | Net investment income (loss) per share is based on average shares outstanding during the period. |
4 | Return of capital relates to former Vestaur Securities Fund shareholders and is based on average shares outstanding from December 1, 2004 through May 20, 2005. |
6 | Portfolio turnover rate includes mortgage dollar roll activity. |
† | Certain amounts for the year ended April 30, 2008 have been restated (See Note 13). |
See Notes to Financial Statements
11
SCHEDULE OF INVESTMENTS
April 30, 2008 (As restated. See Note 13)
| | | Principal
Amount | | | Value | |
|
|
|
|
|
|
| |
AGENCY COMMERCIAL MORTGAGE-BACKED SECURITIES 1.5% | | | | | | | |
FIXED-RATE 1.5% | | | | | | | |
FHLMC, Ser. M009, Class A, 5.40%, 10/15/2021 (cost $3,514,181) | | $ | 3,510,671 | | $ | 3,711,937 | |
| | | | |
|
| |
AGENCY MORTGAGE-BACKED COLLATERALIZED MORTGAGE | | | | | | | |
OBLIGATIONS 6.5% | | | | | | | |
FIXED-RATE 6.5% | | | | | | | |
FHLMC: | | | | | | | |
Ser. 2594, Class QE, 5.00%, 08/15/2031 | | | 2,395,000 | | | 2,378,775 | |
Ser. 2647, Class PC, 5.00%, 11/15/2031 | | | 2,500,000 | | | 2,487,192 | |
Ser. 2695, Class BG, 4.50%, 04/15/2032 | | | 950,000 | | | 923,672 | |
Ser. 2991, Class QD, 5.00%, 08/15/2034 | | | 2,550,000 | | | 2,546,641 | |
Ser. 3036, Class NC, 5.00%, 03/15/2031 | | | 1,740,000 | | | 1,736,443 | |
Ser. 3068, Class AK, 4.50%, 03/15/2027 | | | 335,000 | | | 328,368 | |
FNMA: | | | | | | | |
Ser. 2002-T12, Class A3, 7.50%, 05/25/2042 | | | 17,531 | | | 18,759 | |
Ser. 2002-T19, Class A3, 7.50%, 07/25/2042 | | | 287,397 | | | 310,973 | |
Ser. 2003-129, Class PW, 4.50%, 07/25/2033 | | | 2,800,000 | | | 2,799,748 | |
Ser. 2003-W4, Class 4A, 7.50%, 10/25/2042 | | | 182,923 | | | 195,008 | |
Ser. 2007-65, Class GV, 5.00%, 07/25/2018 | | | 2,518,407 | | | 2,520,176 | |
| | | | |
|
| |
Total Agency Mortgage-Backed Collateralized Mortgage Obligations (cost $15,645,539) | | | | | | 16,245,755 | |
| | | | |
|
| |
AGENCY MORTGAGE-BACKED PASS THROUGH SECURITIES 17.0% | | | | | | | |
FIXED-RATE 17.0% | | | | | | | |
FHLMC: | | | | | | | |
5.00%, 09/15/2028 | | | 210,000 | | | 212,474 | |
6.50%, 09/25/2043 | | | 107,025 | | | 110,241 | |
7.50%, 09/01/2013-08/25/2042 | | | 163,838 | | | 172,420 | |
9.00%, 12/01/2016 | | | 129,813 | | | 140,441 | |
9.50%, 12/01/2022 | | | 18,129 | | | 20,042 | |
FHLMC 30 year, 5.00%, TBA # | | | 14,450,000 | | | 14,199,379 | |
FNMA: | | | | | | | |
5.70%, 11/01/2011 ## | | | 6,444,506 | | | 6,677,862 | |
6.10%, 03/01/2012 | | | 2,214,558 | | | 2,332,349 | |
6.27%, 02/01/2011 | | | 3,333,271 | | | 3,467,365 | |
6.45%, 09/01/2016 | | | 1,745,740 | | | 1,853,069 | |
6.80%, 08/01/2009 | | | 2,978,099 | | | 3,040,039 | |
7.87%, 07/01/2026 ## | | | 3,006,052 | | | 3,506,322 | |
9.00%, 02/01/2025-09/01/2030 | | | 167,357 | | | 184,179 | |
10.00%, 09/01/2010-04/01/2021 | | | 85,759 | | | 95,850 | |
FNMA 15 year, 5.00%, TBA # | | | 2,990,000 | | | 2,999,810 | |
GNMA: | | | | | | | |
8.00%, 03/15/2022-08/15/2024 | | | 58,636 | | | 64,137 | |
8.25%, 05/15/2020 | | | 57,026 | | | 62,351 | |
8.50%, 09/15/2024-01/15/2027 | | | 59,542 | | | 65,764 | |
9.00%, 12/15/2019 | | | 58,314 | | | 63,907 | |
9.50%, 09/15/2019 | | | 13,937 | | | 15,490 | |
10.00%, 01/15/2019-03/15/2020 | | | 29,307 | | | 33,366 | |
See Notes to Financial Statements
12
SCHEDULE OF INVESTMENTS continued
April 30, 2008 (As restated. See Note 13)
| | | Principal
Amount | | | Value | |
|
|
|
|
|
|
| |
AGENCY MORTGAGE-BACKED PASS THROUGH SECURITIES continued | | | | | | | |
FIXED-RATE continued | | | | | | | |
GNMA 30 Year: | | | | | | | |
5.50%, TBA # | | $ | 2,105,000 | | $ | 2,132,300 | |
6.00%, TBA # | | | 1,250,000 | | | 1,284,180 | |
| | | | |
|
| |
Total Agency Mortgage-Backed Pass Through Securities (cost $42,123,318) | | | | | | 42,733,337 | |
| | | | |
|
| |
AGENCY REPERFORMING MORTGAGE-BACKED COLLATERALIZED MORTGAGE OBLIGATIONS 0.2% | | | | | | | |
FNMA: | | | | | | | |
Ser. 2003-W02, Class 2A9, 5.90%, 07/25/2042 | | | 161,592 | | | 165,296 | |
Ser. 2003-W12, Class 1A8, 4.55%, 06/25/2043 | | | 350,000 | | | 346,838 | |
| | | | |
|
| |
Total Agency Reperforming Mortgage-Backed Collateralized Mortgage Obligations (cost $491,386) | | | 512,134 | |
| | | | |
|
| |
ASSET-BACKED SECURITIES 2.9% | | | | | | | |
Acacia CDO, Ltd., Ser. 10A, Class C, FRN, 4.30%, 09/07/2046 144A ¯ | | | 1,000,000 | | | 0 | |
American Home Mtge. Backed Investment Trust, Ser. 2005-2, Class 5A4C, 5.41%, 09/25/2035 | | | 2,000,000 | | | 1,469,860 | |
Deutsche Alt-A Securities, Inc., Mtge. Loan Trust, Ser. 2006-AB2, Class A3, 6.27%, 06/25/2036 | | | 2,000,000 | | | 1,348,279 | |
MASTR Asset Backed Securities Trust, Ser. 2005-AB1, Class A4, 5.65%, 10/25/2032 | | | 2,500,000 | | | 1,842,970 | |
Nautilus RMBS CDO, Ltd., Ser. 2005-1A, Class A3, FRN, 4.23%, 07/07/2040 144A ¯ | | | 2,705,709 | | | 1,215,674 | |
Nomura Asset Acceptance Corp., Ser. 2006-AP1, Class A2, 5.52%, 01/25/2036 | | | 2,078,000 | | | 1,406,702 | |
| | | | |
|
| |
Total Asset-Backed Securities (cost $11,896,465) | | | | | | 7,283,485 | |
| | | | |
|
| |
COMMERCIAL MORTGAGE-BACKED SECURITIES 15.3% | | | | | | | |
FIXED-RATE 11.9% | | | | | | | |
Banc of America Comml. Mtge. Securities, Inc., Ser. 2007-1, Class A4, 5.45%, 01/15/2049 | | | 245,000 | | | 238,484 | |
Banc of America Comml. Mtge., Inc., Ser. 2000-2, Class F, 7.92%, 09/15/2032 | | | 3,000,000 | | | 3,100,650 | |
Banc of America Mtge. Securities, Inc., Ser. 2003-7, Class B6, 4.75%, 09/25/2018 | | | 228,797 | | | 142,609 | |
Citigroup Comml. Mtge. Trust, Ser. 2007-C6, Class C, 5.89%, 07/10/2017 | | | 855,000 | | | 615,811 | |
Commercial Mtge. Pass-Through Cert., Ser. 2007-C9, Class B, 6.01%, 12/10/2049 | | | 910,000 | | | 682,786 | |
Crown Castle Towers, LLC, Ser. 2006-1A, Class C, 5.47%, 11/15/2036 144A | | | 1,920,000 | | | 1,598,899 | |
GE Capital Comml. Mtge. Corp., Ser. 2007-C1, Class C, 5.89%, 12/10/2049 | | | 2,500,000 | | | 1,812,979 | |
Greenwich Capital Comml. Funding Corp., Ser. 2004-GG1, Class A7, 5.32%, 06/10/2036 | | | 4,000,000 | | | 4,068,308 | |
GS Mtge. Securities Corp.: | | | | | | | |
Ser. 2007-GG10, Class AM, 5.99%, 08/10/2045 | | | 2,700,000 | | | 2,517,956 | |
Ser. 2007-GG10, Class A2, 5.78%, 08/10/2045 | | | 3,665,000 | | | 3,679,332 | |
JPMorgan Chase & Co. Comml. Mtge. Securities Corp.: | | | | | | | |
Ser. 2004-CB9, Class A1, 3.48%, 06/12/2041 | | | 3,327,194 | | | 3,298,620 | |
Ser. 2006-LDP8, Class B, 5.52%, 05/15/2045 | | | 1,000,000 | | | 750,369 | |
Ser. 2006-LDP9, Class A3, 5.34%, 05/15/2047 | | | 2,360,000 | | | 2,292,458 | |
Ser. 2007-LD12, Class A2, 5.83%, 02/15/2051 | | | 3,045,000 | | | 3,058,757 | |
See Notes to Financial Statements
13
SCHEDULE OF INVESTMENTS continued
April 30, 2008 (As restated. See Note 13)
| | | Principal
Amount | | | Value | |
|
|
|
|
|
|
| |
COMMERCIAL MORTGAGE-BACKED SECURITIES continued | | | | | | | |
FIXED-RATE continued | | | | | | | |
Morgan Stanley Capital I, Inc., Ser. 2001-TOP5, Class G, 6.00%, 10/15/2035 144A | | $ | 1,042,000 | | $ | 880,013 | |
Prima Capital Securitization, Ltd., Ser. 2006, Class D, 5.88%, 12/28/2048 | | | 1,085,000 | | | 1,120,805 | |
| | | | |
|
| |
| | | | | | 29,858,836 | |
| | | | |
|
| |
FLOATING-RATE 3.4% | | | | | | | |
Capmark, Ltd., Ser. 2006-7A, Class B, 3.09%, 08/20/2036 144A | | | 500,000 | | | 368,000 | |
Citigroup Comml. Mtge. Trust, Ser. 2006-C4, Class AJ, 5.92%, 03/15/2049 | | | 450,000 | | | 395,682 | |
Credit Suisse Mtge. Capital Cert., Ser. 2006-C1, Class AM, 5.74%, 02/15/2039 | | | 2,835,000 | | | 2,653,832 | |
JPMorgan Chase & Co. Comml. Mtge. Securities Corp., Ser. 2007-CB19, Class A4, 5.94%, 02/12/2049 | | | 2,105,000 | | | 2,094,400 | |
MASTR Reperforming Loan Trust, Ser. 2006-2, Class B3, 5.90%, 05/25/2036 144A | | | 426,472 | | | 153,905 | |
Morgan Stanley Capital I, Inc., Ser. 2007-IQ15, Class A4, 6.08%, 06/11/2049 | | | 2,750,000 | | | 2,769,301 | |
| | | | |
|
| |
| | | | | | 8,435,120 | |
| | | | |
|
| |
Total Commercial Mortgage-Backed Securities (cost $40,547,894) | | | | | | 38,293,956 | |
| | | | |
|
| |
CORPORATE BONDS 25.5% | | | | | | | |
CONSUMER DISCRETIONARY 2.9% | | | | | | | |
Auto Components 0.1% | | | | | | | |
Cooper Tire & Rubber Co., 7.625%, 03/15/2027 | | | 110,000 | | | 93,500 | |
Goodyear Tire & Rubber Co., 9.00%, 07/01/2015 | | | 60,000 | | | 65,550 | |
| | | | |
|
| |
| | | | | | 159,050 | |
| | | | |
|
| |
Diversified Consumer Services 0.0% | | | | | | | |
Service Corporation International, 6.75%, 04/01/2015 | | | 5,000 | | | 5,031 | |
| | | | |
|
| |
Hotels, Restaurants & Leisure 0.3% | | | | | | | |
Caesars Entertainment, Inc.: | | | | | | | |
7.875%, 03/15/2010 ρ | | | 70,000 | | | 66,150 | |
8.125%, 05/15/2011 ρ | | | 20,000 | | | 17,025 | |
Inn of the Mountain Gods Resort & Casino, 12.00%, 11/15/2010 | | | 90,000 | | | 78,300 | |
Isle of Capri Casinos, Inc., 7.00%, 03/01/2014 ρ | | | 285,000 | | | 220,875 | |
Pinnacle Entertainment, Inc., 8.75%, 10/01/2013 | | | 5,000 | | | 5,100 | |
Pokagon Gaming Authority, 10.375%, 06/15/2014 144A ρ | | | 119,000 | | | 127,627 | |
Seneca Gaming Corp., 7.25%, 05/01/2012 | | | 20,000 | | | 19,425 | |
Shingle Springs Tribal Gaming Authority, 9.375%, 06/15/2015 144A | | | 120,000 | | | 106,800 | |
Universal City Development Partners, Ltd., 11.75%, 04/01/2010 | | | 50,000 | | | 51,875 | |
| | | | |
|
| |
| | | | | | 693,177 | |
| | | | |
|
| |
Household Durables 0.2% | | | | | | | |
Centex Corp.: | | | | | | | |
4.875%, 08/15/2008 | | | 50,000 | | | 49,504 | |
5.80%, 09/15/2009 | | | 15,000 | | | 14,405 | |
D.R. Horton, Inc.: | | | | | | | |
4.875%, 01/15/2010 | | | 25,000 | | | 23,875 | |
5.00%, 01/15/2009 | | | 75,000 | | | 73,125 | |
8.00%, 02/01/2009 | | | 30,000 | | | 30,000 | |
See Notes to Financial Statements
14
SCHEDULE OF INVESTMENTS continued
April 30, 2008 (As restated. See Note 13)
| | Principal
Amount | | Value | |
|
|
|
|
| |
CORPORATE BONDS continued | | | | | | | |
CONSUMER DISCRETIONARY continued | | | | | | | |
Household Durables continued | | | | | | | |
Hovnanian Enterprises, Inc.: | | | | | | | |
6.00%, 01/15/2010 ρ | | $ | 20,000 | | $ | 15,700 | |
6.50%, 01/15/2014 | | | 15,000 | | | 10,725 | |
KB Home: | | | | | | | |
7.75%, 02/01/2010 ρ | | | 40,000 | | | 39,500 | |
8.625%, 12/15/2008 | | | 15,000 | | | 15,225 | |
Libbey, Inc., FRN, 11.91%, 06/01/2011 | | | 55,000 | | | 55,412 | |
Pulte Homes, Inc.: | | | | | | | |
4.875%, 07/15/2009 | | | 115,000 | | | 111,550 | |
7.875%, 08/01/2011 | | | 5,000 | | | 4,900 | |
Standard Pacific Corp., 5.125%, 04/01/2009 | | | 30,000 | | | 26,850 | |
| | | | |
|
| |
| | | | | | 470,771 | |
| | | | |
|
| |
Media 0.8% | | | | | | | |
Cablevision Systems Corp., Ser. B, 8.00%, 04/15/2012 | | | 80,000 | | | 80,000 | |
Charter Communications, Inc., 10.875%, 09/15/2014 144A ρ | | | 185,000 | | | 196,563 | |
CSC Holdings, Inc., 7.625%, 04/01/2011 | | | 150,000 | | | 151,875 | |
Idearc, Inc., 8.00%, 11/15/2016 | | | 250,000 | | | 163,750 | |
Lamar Media Corp.: | | | | | | | |
6.625%, 08/15/2015 ρ | | | 180,000 | | | 170,550 | |
7.25%, 01/01/2013 | | | 10,000 | | | 9,950 | |
Mediacom Broadband, LLC, 8.50%, 10/15/2015 | | | 25,000 | | | 23,125 | |
Mediacom, LLC, 7.875%, 02/15/2011 | | | 20,000 | | | 19,000 | |
R.H. Donnelley Corp., Ser. A-4, 8.875%, 10/15/2017 144A | | | 130,000 | | | 84,500 | |
Sinclair Broadcast Group, Inc., 8.00%, 03/15/2012 | | | 20,000 | | | 20,325 | |
Time Warner, Inc., 7.625%, 04/15/2031 | | | 1,100,000 | | | 1,183,689 | |
| | | | |
|
| |
| | | | | | 2,103,327 | |
| | | | |
|
| |
Multi-line Retail 0.8% | | | | | | | |
Kohl’s Corp., 6.875%, 12/15/2037 | | | 575,000 | | | 528,240 | |
Macy’s, Inc.: | | | | | | | |
6.375%, 03/15/2037 | | | 700,000 | | | 545,933 | |
7.45%, 09/15/2011 | | | 500,000 | | | 500,733 | |
Neiman Marcus Group, Inc., 9.00%, 10/15/2015 | | | 60,000 | | | 62,700 | |
Target Corp., 6.50%, 10/15/2037 | | | 450,000 | | | 455,010 | |
| | | | |
|
| |
| | | | | | 2,092,616 | |
| | | | |
|
| |
Specialty Retail 0.6% | | | | | | | |
American Achievement Corp., 8.25%, 04/01/2012 | | | 140,000 | | | 123,900 | |
Home Depot, Inc., 5.875%, 12/16/2036 | | | 1,530,000 | | | 1,283,092 | |
Payless ShoeSource, Inc., 8.25%, 08/01/2013 | | | 150,000 | | | 136,125 | |
| | | | |
|
| |
| | | | | | 1,543,117 | |
| | | | |
|
| |
Textiles, Apparel & Luxury Goods 0.1% | | | | | | | |
Oxford Industries, Inc., 8.875%, 06/01/2011 | | | 245,000 | | | 234,588 | |
| | | | |
|
| |
See Notes to Financial Statements
15
SCHEDULE OF INVESTMENTS continued
April 30, 2008 (As restated. See Note 13)
| | Principal
Amount | | Value | |
|
|
|
|
| |
CORPORATE BONDS continued | | | | | | | |
CONSUMER STAPLES 0.5% | | | | | | | |
Beverages 0.0% | | | | | | | |
Constellation Brands, Inc., 8.375%, 12/15/2014 | | $ | 15,000 | | $ | 15,975 | |
| | | | |
|
| |
Food & Staples Retailing 0.4% | | | | | | | |
Ingles Markets, Inc., 8.875%, 12/01/2011 | | | 60,000 | | | 61,200 | |
Rite Aid Corp., 8.125%, 05/01/2010 | | | 85,000 | | | 85,425 | |
Wal-Mart Stores, Inc., 6.50%, 08/15/2037 | | | 675,000 | | | 718,776 | |
| | | | |
|
| |
| | | | | | 865,401 | |
| | | | |
|
| |
Food Products 0.1% | | | | | | | |
Del Monte Foods Co.: | | | | | | | |
6.75%, 02/15/2015 ρ | | | 100,000 | | | 97,000 | |
8.625%, 12/15/2012 | | | 55,000 | | | 57,200 | |
Pilgrim’s Pride Corp.: | | | | | | | |
7.625%, 05/01/2015 | | | 5,000 | | | 4,775 | |
8.375%, 05/01/2017 | | | 70,000 | | | 62,650 | |
| | | | |
|
| |
| | | | | | 221,625 | |
| | | | |
|
| |
Household Products 0.0% | | | | | | | |
Church & Dwight Co., 6.00%, 12/15/2012 | | | 25,000 | | | 24,750 | |
| | | | |
|
| |
Personal Products 0.0% | | | | | | | |
Central Garden & Pet Co., 9.125%, 02/01/2013 | | | 115,000 | | | 97,750 | |
| | | | |
|
| |
ENERGY 2.1% | | | | | | | |
Energy Equipment & Services 0.3% | | | | | | | |
Dresser-Rand Group, Inc., 7.375%, 11/01/2014 | | | 80,000 | | | 80,400 | |
GulfMark Offshore, Inc., 7.75%, 07/15/2014 ρ | | | 70,000 | | | 72,800 | |
Hornbeck Offshore Services, Inc., Ser. B, 6.125%, 12/01/2014 ρ | | | 225,000 | | | 219,937 | |
Parker Drilling Co., 9.625%, 10/01/2013 | | | 85,000 | | | 89,675 | |
PHI, Inc., 7.125%, 04/15/2013 | | | 175,000 | | | 164,500 | |
| | | | |
|
| |
| | | | | | 627,312 | |
| | | | |
|
| |
Oil, Gas & Consumable Fuels 1.8% | | | | | | | |
Chesapeake Energy Corp., 6.875%, 01/15/2016 | | | 205,000 | | | 208,075 | |
Clayton Williams Energy, Inc., 7.75%, 08/01/2013 | | | 55,000 | | | 51,700 | |
El Paso Corp., 7.00%, 06/15/2017 | | | 20,000 | | | 20,972 | |
EnCana Corp., 6.625%, 08/15/2037 | | | 1,225,000 | | | 1,255,184 | |
Encore Acquisition Co.: | | | | | | | |
6.00%, 07/15/2015 | | | 100,000 | | | 92,500 | |
6.25%, 04/15/2014 ρ | | | 70,000 | | | 66,150 | |
Exco Resources, Inc., 7.25%, 01/15/2011 | | | 105,000 | | | 105,000 | |
Forbes Energy Services, LLC, 11.00%, 02/15/2015 144A | | | 140,000 | | | 140,700 | |
Forest Oil Corp., 7.25%, 06/15/2019 ρ | | | 40,000 | | | 41,500 | |
Frontier Oil Corp., 6.625%, 10/01/2011 | | | 30,000 | | | 30,000 | |
Kinder Morgan Energy Partners, LP, 7.40%, 03/15/2031 | | | 1,125,000 | | | 1,171,210 | |
Mariner Energy, Inc., 8.00%, 05/15/2017 | | | 25,000 | | | 24,688 | |
See Notes to Financial Statements
16
SCHEDULE OF INVESTMENTS continued
April 30, 2008 (As restated. See Note 13)
| | Principal
Amount | | Value | |
|
|
|
|
| |
CORPORATE BONDS continued | | | | | | | |
ENERGY continued | | | | | | | |
Oil, Gas & Consumable Fuels continued | | | | | | | |
Peabody Energy Corp.: | | | | | | | |
5.875%, 04/15/2016 | | $ | 165,000 | | $ | 160,875 | |
7.875%, 11/01/2026 | | | 15,000 | | | 15,563 | |
Plains All American Pipeline, LP, 6.50%, 05/01/2018 144A | | | 25,000 | | | 25,579 | |
Plains Exploration & Production Co., 7.75%, 06/15/2015 | | | 35,000 | | | 36,050 | |
Sabine Pass LNG, LP: | | | | | | | |
7.25%, 11/30/2013 | | | 210,000 | | | 195,300 | |
7.50%, 11/30/2016 | | | 5,000 | | | 4,600 | |
Southwestern Energy Co., 7.50%, 02/01/2018 144A | | | 10,000 | | | 10,650 | |
Sunoco, Inc., 9.00%, 11/01/2024 | | | 500,000 | | | 604,396 | |
Tesoro Corp.: | | | | | | | |
6.50%, 06/01/2017 | | | 20,000 | | | 18,450 | |
6.625%, 11/01/2015 | | | 130,000 | | | 122,850 | |
Williams Cos., 7.125%, 09/01/2011 | | | 150,000 | | | 160,125 | |
| | | | |
|
| |
| | | | | | 4,562,117 | |
| | | | |
|
| |
FINANCIALS 14.7% | | | | | | | |
Capital Markets 4.4% | | | | | | | |
American Capital Strategies, Ltd., Ser. A, 5.92%, 09/01/2009 + o | | | 3,500,000 | | | 3,461,885 | |
E*TRADE Financial Corp.: | | | | | | | |
7.375%, 09/15/2013 | | | 50,000 | | | 40,875 | |
8.00%, 06/15/2011 | | | 10,000 | | | 8,950 | |
12.50%, 11/30/2017 144A | | | 40,000 | | | 41,550 | |
Goldman Sachs Group, Inc.: | | | | | | | |
5.30%, 02/14/2012 | | | 1,200,000 | | | 1,213,304 | |
6.75%, 10/01/2037 | | | 1,330,000 | | | 1,307,369 | |
Lehman Brothers Holdings, Inc.: | | | | | | | |
6.00%, 07/19/2012 ρ | | | 900,000 | | | 909,594 | |
7.00%, 09/27/2027 | | | 250,000 | | | 245,618 | |
Merrill Lynch & Co., Inc., 6.05%, 08/15/2012 | | | 1,325,000 | | | 1,322,362 | |
Morgan Stanley: | | | | | | | |
5.625%, 01/09/2012 | | | 1,425,000 | | | 1,440,428 | |
5.95%, 12/28/2017 | | | 1,125,000 | | | 1,116,395 | |
| | | | |
|
| |
| | | | | | 11,108,330 | |
| | | | |
|
| |
Commercial Banks 3.2% | | | | | | | |
BankAmerica Capital II, 8.00%, 12/15/2026 | | | 1,000,000 | | | 1,019,434 | |
FBOP Corp., 10.00%, 01/15/2009 144A | | | 4,000,000 | | | 4,024,800 | |
National City Corp., 5.80%, 06/07/2017 | | | 1,700,000 | | | 1,409,266 | |
PNC Financial Services Group, Inc., 8.70%, 12/31/2049 144A | | | 300,000 | | | 297,542 | |
SunTrust Banks, Inc., 6.00%, 09/11/2017 | | | 1,300,000 | | | 1,269,408 | |
| | | | |
|
| |
| | | | | | 8,020,450 | |
| | | | |
|
| |
See Notes to Financial Statements
17
SCHEDULE OF INVESTMENTS continued
April 30, 2008 (As restated. See Note 13)
| | | Principal
Amount | | | Value | |
|
|
|
|
|
|
| |
CORPORATE BONDS continued | | | | | | | |
FINANCIALS continued | | | | | | | |
Consumer Finance 2.3% | | | | | | | |
American Water Capital Corp., 6.09%, 10/15/2017 144A | | $ | 850,000 | | $ | 846,949 | |
Daimler Financial Services AG, 4.875%, 06/15/2010 | | | 100,000 | | | 101,054 | |
Ford Motor Credit Co., LLC: | | | | | | | |
5.70%, 01/15/2010 | | | 65,000 | | | 60,860 | |
5.80%, 01/12/2009 | | | 5,000 | | | 4,890 | |
7.375%, 10/28/2009 | | | 585,000 | | | 563,329 | |
9.75%, 09/15/2010 | | | 40,000 | | | 38,880 | |
General Motors Acceptance Corp., LLC: | | | | | | | |
5.625%, 05/15/2009 ρ | | | 40,000 | | | 37,618 | |
6.875%, 09/15/2011 | | | 425,000 | | | 354,414 | |
6.875%, 08/28/2012 | | | 10,000 | | | 7,940 | |
7.25%, 03/02/2011 | | | 20,000 | | | 16,976 | |
7.75%, 01/19/2010 | | | 65,000 | | | 59,831 | |
8.00%, 11/01/2031 | | | 200,000 | | | 151,651 | |
FRN: | | | | | | | |
3.75%, 09/23/2008 | | | 85,000 | | | 83,408 | |
4.32%, 05/15/2009 | | | 165,000 | | | 150,576 | |
MBNA Corp., Ser. A, 8.28%, 12/01/2026 | | | 1,750,000 | | | 1,778,465 | |
Qwest Capital Funding, Inc., 6.50%, 11/15/2018 | | | 30,000 | | | 25,200 | |
Sprint Capital Corp., 6.875%, 11/15/2028 | | | 1,835,000 | | | 1,430,151 | |
Toll Corp.: | | | | | | | |
8.25%, 02/01/2011 | | | 105,000 | | | 101,587 | |
8.25%, 12/01/2011 | | | 20,000 | | | 19,200 | |
| | | | |
|
| |
| | | | | | 5,832,979 | |
| | | | |
|
| |
Diversified Financial Services 1.0% | | | | | | | |
Citigroup, Inc.: | | | | | | | |
5.50%, 08/27/2012 ρ | | | 650,000 | | | 651,760 | |
FRN, 8.40%, 04/29/2049 | | | 920,000 | | | 932,264 | |
JPMorgan Chase & Co., FRN, 7.90%, 12/31/2049 | | | 790,000 | | | 807,374 | |
Leucadia National Corp.: | | | | | | | |
7.125%, 03/15/2017 | | | 10,000 | | | 9,600 | |
8.125%, 09/15/2015 | | | 180,000 | | | 184,500 | |
| | | | |
|
| |
| | | | | | 2,585,498 | |
| | | | |
|
| |
Insurance 0.5% | | | | | | | |
Prudential Financial, Inc., 6.10%, 06/15/2017 | | | 1,200,000 | | | 1,219,805 | |
| | | | |
|
| |
Real Estate Investment Trusts 3.1% | | | | | | | |
BRE Properties, Inc., 5.50%, 03/15/2017 | | | 2,400,000 | | | 2,095,745 | |
Camden Property Trust, 5.00%, 06/15/2015 | | | 3,500,000 | | | 3,071,957 | |
Colonial Realty, Ltd., 6.25%, 06/15/2014 | | | 1,370,000 | | | 1,249,410 | |
ERP Operating, LP, 5.75%, 06/15/2017 | | | 1,000,000 | | | 939,966 | |
See Notes to Financial Statements
18
SCHEDULE OF INVESTMENTS continued
April 30, 2008 (As restated. See Note 13)
| | | Principal
Amount | | | Value | |
|
|
|
|
|
|
| |
CORPORATE BONDS continued | | | | | | | |
FINANCIALS continued | | | | | | | |
Real Estate Investment Trusts continued | | | | | | | |
Host Marriott Corp.: | | | | | | | |
7.125%, 11/01/2013 ρ | | $ | 95,000 | | $ | 95,119 | |
Ser. O, 6.375%, 03/15/2015 | | | 5,000 | | | 4,825 | |
Ser. Q, 6.75%, 06/01/2016 | | | 155,000 | | | 152,287 | |
Omega Healthcare Investors, Inc.: | | | | | | | |
7.00%, 04/01/2014 | | | 65,000 | | | 63,781 | |
7.00%, 01/15/2016 | | | 100,000 | | | 97,125 | |
Ventas, Inc., 7.125%, 06/01/2015 | | | 75,000 | | | 75,563 | |
| | | | |
|
| |
| | | | | | 7,845,778 | |
| | | | |
|
| |
Thrifts & Mortgage Finance 0.2% | | | | | | | |
Residential Capital, LLC: | | | | | | | |
FRN, 3.49%, 06/09/2008 ρ | | | 35,000 | | | 32,769 | |
Step Bond: | | | | | | | |
8.125%, 11/21/2008 Š | | | 55,000 | | | 45,925 | |
8.375%, 06/30/2010 Š | | | 530,000 | | | 290,175 | |
| | | | |
|
| |
| | | | | | 368,869 | |
| | | | |
|
| |
HEALTH CARE 1.8% | | | | | | | |
Biotechnology 0.6% | | | | | | | |
Amgen, Inc., 6.375%, 06/01/2037 | | | 1,500,000 | | | 1,488,138 | |
| | | | |
|
| |
Health Care Providers & Services 1.2% | | | | | | | |
HCA, Inc., 9.25%, 11/15/2016 | | | 385,000 | | | 414,837 | |
Omnicare, Inc.: | | | | | | | |
6.125%, 06/01/2013 | | | 180,000 | | | 164,700 | |
6.875%, 12/15/2015 | | | 215,000 | | | 197,263 | |
UnitedHealth Group, Inc., 5.375%, 03/15/2016 | | | 1,000,000 | | | 959,338 | |
WellPoint, Inc., 6.375%, 06/15/2037 | | | 1,300,000 | | | 1,192,715 | |
| | | | |
|
| |
| | | | | | 2,928,853 | |
| | | | |
|
| |
INDUSTRIALS 0.7% | | | | | | | |
Aerospace & Defense 0.4% | | | | | | | |
Alliant Techsystems, Inc., 6.75%, 04/01/2016 ρ | | | 25,000 | | | 24,875 | |
DRS Technologies, Inc., 6.625%, 02/01/2016 | | | 50,000 | | | 49,750 | |
Hexcel Corp., 6.75%, 02/01/2015 | | | 70,000 | | | 69,913 | |
L-3 Communications Holdings, Inc.: | | | | | | | |
5.875%, 01/15/2015 | | | 635,000 | | | 619,125 | |
6.375%, 10/15/2015 | | | 235,000 | | | 233,531 | |
| | | | |
|
| |
| | | | | | 997,194 | |
| | | | |
|
| |
Commercial Services & Supplies 0.1% | | | | | | | |
Browning-Ferris Industries, Inc.: | | | | | | | |
7.40%, 09/15/2035 | | | 90,000 | | | 82,350 | |
9.25%, 05/01/2021 | | | 95,000 | | | 98,800 | |
See Notes to Financial Statements
19
SCHEDULE OF INVESTMENTS continued
April 30, 2008 (As restated. See Note 13)
| | | Principal
Amount | | | Value | |
|
|
|
|
|
|
| |
CORPORATE BONDS continued | | | | | | | |
INDUSTRIALS continued | | | | | | | |
Commercial Services & Supplies continued | | | | | | | |
Geo Group, Inc., 8.25%, 07/15/2013 | | $ | 50,000 | | $ | 51,875 | |
Mobile Mini, Inc., 6.875%, 05/01/2015 | | | 55,000 | | | 46,613 | |
Norcross Safety Products, LLC, Ser. B, 9.875%, 08/15/2011 | | | 65,000 | | | 68,453 | |
| | | | |
|
| |
| | | | | | 348,091 | |
| | | | |
|
| |
Machinery 0.1% | | | | | | | |
Commercial Vehicle Group, Inc., 8.00%, 07/01/2013 | | | 285,000 | | | 245,812 | |
| | | | |
|
| |
Road & Rail 0.1% | | | | | | | |
Avis Budget Car Rental, LLC, 7.75%, 05/15/2016 | | | 5,000 | | | 4,438 | |
Hertz Global Holdings, Inc., 8.875%, 01/01/2014 | | | 80,000 | | | 81,000 | |
Kansas City Southern: | | | | | | | |
7.50%, 06/15/2009 | | | 35,000 | | | 36,050 | |
9.50%, 10/01/2008 | | | 55,000 | | | 55,825 | |
| | | | |
|
| |
| | | | | | 177,313 | |
| | | | |
|
| |
Trading Companies & Distributors 0.0% | | | | | | | |
United Rentals, Inc., 6.50%, 02/15/2012 | | | 40,000 | | | 37,700 | |
| | | | |
|
| |
INFORMATION TECHNOLOGY 0.4% | | | | | | | |
Electronic Equipment & Instruments 0.2% | | | | | | | |
Da-Lite Screen Co., Inc., 9.50%, 05/15/2011 | | | 145,000 | | | 138,475 | |
Jabil Circuit, Inc.: | | | | | | | |
5.875%, 07/15/2010 | | | 140,000 | | | 137,537 | |
8.25%, 03/15/2018 144A | | | 225,000 | | | 226,125 | |
Sanmina-SCI Corp.: | | | | | | | |
6.75%, 03/01/2013 | | | 15,000 | | | 13,650 | |
8.125%, 03/01/2016 | | | 30,000 | | | 27,750 | |
FRN, 5.55%, 06/15/2010 144A | | | 29,000 | | | 28,783 | |
| | | | |
|
| |
| | | | | | 572,320 | |
| | | | |
|
| |
IT Services 0.1% | | | | | | | |
First Data Corp., 9.875%, 09/24/2015 144A | | | 140,000 | | | 127,575 | |
SunGard Data Systems, Inc., 4.875%, 01/15/2014 | | | 115,000 | | | 101,488 | |
Unisys Corp., 6.875%, 03/15/2010 | | | 25,000 | | | 24,156 | |
| | | | |
|
| |
| | | | | | 253,219 | |
| | | | |
|
| |
Office Electronics 0.0% | | | | | | | |
Xerox Corp., 6.35%, 05/15/2018 | | | 30,000 | | | 30,207 | |
| | | | |
|
| |
Semiconductors & Semiconductor Equipment 0.1% | | | | | | | |
Freescale Semiconductor, Inc.: | | | | | | | |
8.875%, 12/15/2014 | | | 5,000 | | | 4,425 | |
9.125%, 12/15/2014 ρ | | | 30,000 | | | 24,825 | |
Spansion, Inc., FRN, 6.20%, 06/01/2013 144A | | | 75,000 | | | 56,625 | |
| | | | |
|
| |
| | | | | | 85,875 | |
| | | | |
|
| |
See Notes to Financial Statements
20
SCHEDULE OF INVESTMENTS continued
April 30, 2008 (As restated. See Note 13)
| | Principal
Amount | | Value | |
|
|
|
|
| |
CORPORATE BONDS continued | | | | | | | |
MATERIALS 0.7% | | | | | | | |
Chemicals 0.3% | | | | | | | |
ARCO Chemical Co.: | | | | | | | |
9.80%, 02/01/2020 ρ | | $ | 50,000 | | $ | 44,000 | |
10.25%, 11/01/2010 | | | 10,000 | | | 10,250 | |
Huntsman, LLC, 11.625%, 10/15/2010 | | | 90,000 | | | 94,950 | |
Koppers Holdings, Inc.: | | | | | | | |
9.875%, 10/15/2013 | | | 10,000 | | | 10,650 | |
Sr. Disc. Note, Step Bond, 0.00%, 11/15/2014 † | | | 95,000 | | | 83,600 | |
Millenium America, Inc., 7.625%, 11/15/2026 | | | 120,000 | | | 77,700 | |
Momentive Performance Materials, Inc.: | | | | | | | |
9.75%, 12/01/2014 | | | 130,000 | | | 126,750 | |
10.125%, 12/01/2014 | | | 50,000 | | | 47,875 | |
Mosaic Co.: | | | | | | | |
7.30%, 01/15/2028 | | | 55,000 | | | 53,625 | |
7.875%, 12/01/2016 144A | | | 80,000 | | | 88,000 | |
Tronox Worldwide, LLC, 9.50%, 12/01/2012 ρ | | | 230,000 | | | 198,950 | |
| | | | |
|
| |
| | | | | | 836,350 | |
| | | | |
|
| |
Construction Materials 0.1% | | | | | | | |
CPG International, Inc.: | | | | | | | |
10.50%, 07/01/2013 | | | 145,000 | | | 124,700 | |
FRN, 11.47%, 07/01/2012 | | | 35,000 | | | 28,613 | |
| | | | |
|
| |
| | | | | | 153,313 | |
| | | | |
|
| |
Containers & Packaging 0.1% | | | | | | | |
Berry Plastics Holdings Corp.: | | | | | | | |
7.57%, 02/15/2015 144A | | | 30,000 | | | 29,100 | |
8.875%, 09/15/2014 ρ | | | 28,000 | | | 26,320 | |
Exopack Holding Corp., 11.25%, 02/01/2014 | | | 135,000 | | | 129,600 | |
Graphic Packaging International, Inc.: | | | | | | | |
8.50%, 08/15/2011 ρ | | | 95,000 | | | 96,425 | |
9.50%, 08/15/2013 | | | 35,000 | | | 35,000 | |
Smurfit-Stone Container Corp., 8.375%, 07/01/2012 | | | 145,000 | | | 133,400 | |
| | | | |
|
| |
| | | | | | 449,845 | |
| | | | |
|
| |
Metals & Mining 0.1% | | | | | | | |
Freeport-McMoRan Copper & Gold, Inc., 8.375%, 04/01/2017 | | | 140,000 | | | 155,050 | |
| | | | |
|
| |
Paper & Forest Products 0.1% | | | | | | | |
Georgia Pacific Corp., 8.875%, 05/15/2031 | | | 100,000 | | | 98,000 | |
Verso Paper Holdings, LLC, 9.125%, 08/01/2014 ρ | | | 95,000 | | | 98,562 | |
| | | | |
|
| |
| | | | | | 196,562 | |
| | | | |
|
| |
TELECOMMUNICATION SERVICES 1.0% | | | | | | | |
Diversified Telecommunication Services 0.1% | | | | | | | |
Citizens Communications Co., 7.875%, 01/15/2027 | | | 60,000 | | | 53,550 | |
FairPoint Communications, Inc., 13.125%, 04/01/2018 144A ρ | | | 40,000 | | | 40,600 | |
See Notes to Financial Statements
21
SCHEDULE OF INVESTMENTS continued
April 30, 2008 (As restated. See Note 13)
| | Principal
Amount | | Value | |
|
|
|
|
| |
CORPORATE BONDS continued | | | | | | | |
TELECOMMUNICATION SERVICES continued | | | | | | | |
Diversified Telecommunication Services continued | | | | | | | |
Qwest Corp.: | | | | | | | |
6.50%, 06/01/2017 | | $ | 50,000 | | $ | 47,125 | |
7.50%, 06/15/2023 | | | 35,000 | | | 32,200 | |
7.875%, 09/01/2011 | | | 125,000 | | | 128,750 | |
8.875%, 03/15/2012 | | | 60,000 | | | 63,600 | |
| | | | |
|
| |
| | | | | | 365,825 | |
| | | | |
|
| |
Wireless Telecommunication Services 0.9% | | | | | | | |
AT&T Wireless, 8.125%, 05/01/2012 | | | 1,600,000 | | | 1,777,870 | |
Rural Cellular Corp., 8.25%, 03/15/2012 | | | 145,000 | | | 151,525 | |
Sprint Nextel Corp.: | | | | | | | |
6.375%, 05/01/2009 | | | 65,000 | | | 64,040 | |
6.90%, 05/01/2019 | | | 20,000 | | | 16,530 | |
Ser. D, 7.375%, 08/01/2015 | | | 110,000 | | | 88,059 | |
Ser. F, 5.95%, 03/15/2014 | | | 110,000 | | | 85,900 | |
| | | | |
|
| |
| | | | | | 2,183,924 | |
| | | | |
|
| |
UTILITIES 0.7% | | | | | | | |
Electric Utilities 0.7% | | | | | | | |
Allegheny Energy Supply Co., 8.25%, 04/15/2012 144A | | | 155,000 | | | 165,850 | |
Aquila, Inc., Step Bond, 14.875%, 07/01/2012 Š | | | 238,000 | | | 290,360 | |
CMS Energy Corp.: | | | | | | | |
6.55%, 07/17/2017 | | | 10,000 | | | 9,872 | |
8.50%, 04/15/2011 | | | 15,000 | | | 16,139 | |
Edison Mission Energy: | | | | | | | |
7.00%, 05/15/2017 | | | 5,000 | | | 5,075 | |
7.20%, 05/15/2019 | | | 30,000 | | | 30,375 | |
Energy Future Holdings Corp.: | | | | | | | |
10.875%, 11/01/2017 144A | | | 115,000 | | | 123,050 | |
11.25%, 11/01/2017 144A | | | 70,000 | | | 73,675 | |
Mirant Americas Generation, LLC, 8.50%, 10/01/2021 | | | 25,000 | | | 24,625 | |
Mirant Mid-Atlantic, LLC, Ser. C, 10.06%, 12/30/2028 | | | 19,486 | | | 22,409 | |
Mirant North America, LLC, 7.375%, 12/31/2013 ρ | | | 210,000 | | | 218,925 | |
NRG Energy, Inc., 7.375%, 02/01/2016 | | | 175,000 | | | 180,688 | |
Orion Power Holdings, Inc., 12.00%, 05/01/2010 | | | 240,000 | | | 265,800 | |
Reliant Energy, Inc.: | | | | | | | |
6.75%, 12/15/2014 | | | 265,000 | | | 274,937 | |
7.875%, 06/15/2017 ρ | | | 5,000 | | | 5,238 | |
| | | | |
|
| |
| | | | | | 1,707,018 | |
| | | | |
|
| |
Independent Power Producers & Energy Traders 0.0% | | | | | | | |
AES Corp., 8.00%, 10/15/2017 | | | 5,000 | | | 5,237 | |
Dynegy Holdings, Inc., 7.50%, 06/01/2015 ρ | | | 15,000 | | | 15,000 | |
| | | | |
|
| |
| | | | | | 20,237 | |
| | | | |
|
| |
Total Corporate Bonds (cost $65,734,074) | | | | | | 63,931,162 | |
| | | | |
|
| |
See Notes to Financial Statements
22
SCHEDULE OF INVESTMENTS continued
April 30, 2008 (As restated. See Note 13)
| | Principal
Amount | | Value | |
|
|
|
|
| |
FOREIGN BONDS – CORPORATE (PRINCIPAL AMOUNT DENOMINATED IN CURRENCY INDICATED) 3.3% | | | | | | | |
CONSUMER DISCRETIONARY 0.1% | | | | | | | |
Media 0.1% | | | | | | | |
Central European Media Enterprise, Ltd., 8.25%, 05/15/2012 EUR | | | 170,000 | | $ | 271,237 | |
| | | | |
|
| |
CONSUMER STAPLES 0.2% | | | | | | | |
Beverages 0.0% | | | | | | | |
Canandaigua Brands, Inc., 8.50%, 11/15/2009 GBP | | | 50,000 | | | 98,920 | |
| | | | |
|
| |
Food & Staples Retailing 0.2% | | | | | | | |
Carrefour SA, 3.625%, 05/06/2013 EUR | | | 250,000 | | | 366,205 | |
| | | | |
|
| |
ENERGY 0.1% | | | | | | | |
Oil, Gas & Consumable Fuels 0.1% | | | | | | | |
GAZPROM OAO, 6.58%, 10/31/2013 GBP | | | 65,000 | | | 118,014 | |
Total SA, 4.125%, 01/25/2012 CAD | | | 100,000 | | | 100,945 | |
| | | | |
|
| |
| | | | | | 218,959 | |
| | | | |
|
| |
FINANCIALS 2.4% | | | | | | | |
Capital Markets 0.1% | | | | | | | |
Ahold Finance USA, Inc., 6.50%, 03/14/2017 GBP | | | 65,000 | | | 122,794 | |
Morgan Stanley, 5.375%, 11/14/2013 GBP | | | 100,000 | | | 184,405 | |
| | | | |
|
| |
| | | | | | 307,199 | |
| | | | |
|
| |
Commercial Banks 1.0% | | | | | | | |
Bayerische Landesbank, 10.00%, 03/31/2010 PLN | | | 270,000 | | | 128,649 | |
HBOS plc, 4.125%, 01/25/2010 CAD | | | 600,000 | | | 595,473 | |
Kreditanstalt für Wiederaufbau: | | | | | | | |
4.95%, 10/14/2014 CAD | | | 470,000 | | | 488,754 | |
6.00%, 07/15/2009 NZD | | | 530,000 | | | 404,073 | |
Landwirtschaftliche Rentenbank: | | | | | | | |
4.375%, 11/27/2017 EUR | | | 150,000 | | | 231,585 | |
5.75%, 01/21/2015 AUD | | | 700,000 | | | 606,710 | |
| | | | |
|
| |
| | | | | | 2,455,244 | |
| | | | |
|
| |
Consumer Finance 0.5% | | | | | | | |
ABB International Finance, Ltd., 6.50%, 11/30/2011 EUR | | | 250,000 | | | 404,938 | |
BMW Finance Corp., 4.25%, 01/22/2014 EUR | | | 300,000 | | | 453,141 | |
Toyota Motor Credit Corp., 5.125%, 01/17/2012 GBP | | | 205,000 | | | 405,149 | |
Virgin Media Finance plc, 9.75%, 04/15/2014 GBP | | | 50,000 | | | 93,465 | |
| | | | |
|
| |
| | | | | | 1,356,693 | |
| | | | |
|
| |
Diversified Financial Services 0.4% | | | | | | | |
Dubai Holding Commercial Operations Group, LLC, 6.00%, 02/01/2017 GBP | | | 100,000 | | | 180,421 | |
European Investment Bank, 6.00%, 07/15/2009 NZD | | | 450,000 | | | 343,081 | |
General Electric Capital Corp., 3.375%, 02/08/2012 EUR | | | 250,000 | | | 371,501 | |
Lighthouse Group plc, 8.00%, 04/30/2014 EUR | | | 70,000 | | | 92,618 | |
| | | | |
|
| |
| | | | | | 987,621 | |
| | | | |
|
| |
See Notes to Financial Statements
23
SCHEDULE OF INVESTMENTS continued
April 30, 2008 (As restated. See Note 13)
| | Principal
Amount | | | Value | |
|
|
|
|
|
| |
FOREIGN BONDS – CORPORATE (PRINCIPAL AMOUNT DENOMINATED IN CURRENCY INDICATED) continued | | | | | | |
FINANCIALS continued | | | | | | |
Thrifts & Mortgage Finance 0.4% | | | | | | |
Nykredit, 5.00%, 10/01/2038 DKK | | 2,347,353 | | $ | 463,923 | |
Totalkredit, FRN, 5.36%, 01/01/2015 DKK | | 2,432,479 | | | 515,833 | |
| | | |
|
| |
| | | | | 979,756 | |
| | | |
|
| |
INDUSTRIALS 0.1% | | | | | | |
Aerospace & Defense 0.1% | | | | | | |
Bombardier, Inc., 7.25%, 11/15/2016 EUR | | 70,000 | | | 110,051 | |
| | | |
|
| |
Machinery 0.0% | | | | | | |
Savcio Holdings, Ltd., 8.00%, 02/15/2013 EUR | | 50,000 | | | 69,950 | |
| | | |
|
| |
MATERIALS 0.1% | | | | | | |
Containers & Packaging 0.1% | | | | | | |
Owens-Illinois European Group BV, 6.875%, 03/31/2017 EUR | | 70,000 | | | 107,328 | |
| | | |
|
| |
TELECOMMUNICATION SERVICES 0.2% | | | | | | |
Diversified Telecommunication Services 0.2% | | | | | | |
France Telecom, 7.50%, 03/14/2011 GBP | | 270,000 | | | 557,498 | |
| | | |
|
| |
UTILITIES 0.1% | | | | | | |
Multi-Utilities 0.1% | | | | | | |
Veolia Environnement SA, 4.00%, 02/12/2016 EUR | | 200,000 | | | 280,483 | |
| | | |
|
| |
Total Foreign Bonds – Corporate (Principal Amount Denominated in Currency Indicated) (cost $7,673,795) | | | 8,167,144 | |
| | | |
|
| |
FOREIGN BONDS – GOVERNMENT (PRINCIPAL AMOUNT DENOMINATED IN CURRENCY INDICATED) 3.8% | | | | | | |
Australia: | | | | | | |
6.00%, 05/01/2012 AUD | | 400,000 | | | 363,618 | |
6.00%, 10/14/2015 AUD | | 670,000 | | | 600,475 | |
Brazil, 10.25%, 01/10/2028 BRL | | 350,000 | | | 184,232 | |
Brazil, 7.375%, 02/03/2015 EUR | | 60,000 | | | 100,289 | |
Denmark, 4.00%, 11/15/2017 DKK | | 2,440,000 | | | 494,196 | |
France, 4.25%, 04/25/2019 EUR | | 755,000 | | | 1,161,447 | |
Germany, 3.75%, 01/04/2017 EUR | | 600,000 | | | 907,596 | |
Hong Kong, 4.23%, 03/21/2011 HKD | | 3,050,000 | | | 415,420 | |
International Bank for Reconstruction and Development, 5.75%, 06/25/2010 RUB | | 5,100,000 | | | 213,194 | |
Malaysia, 3.87%, 04/13/2010 MYR | | 650,000 | | | 207,660 | |
Mexico: | | | | | | |
5.50%, 02/17/2020 EUR | | 320,000 | | | 488,897 | |
8.00%, 12/07/2023 MXN | | 4,500,000 | | | 429,420 | |
10.00%, 12/05/2024 MXN | | 1,875,000 | | | 211,718 | |
Morocco, 5.375%, 06/27/2017 EUR | | 65,000 | | | 95,024 | |
Netherlands, 4.00%, 07/15/2016 EUR | | 890,000 | | | 1,366,170 | |
Norway, 5.00%, 05/15/2015 NOK | | 3,900,000 | | | 786,280 | |
See Notes to Financial Statements
24
SCHEDULE OF INVESTMENTS continued
April 30, 2008 (As restated. See Note 13)
| | | Principal
Amount | | | Value | |
|
|
|
|
|
|
| |
FOREIGN BONDS – GOVERNMENT (PRINCIPAL AMOUNT DENOMINATED IN CURRENCY INDICATED) continued | | | | | | | |
Philippines, 6.25%, 03/15/2016 EUR | | | 200,000 | | $ | 302,385 | |
South Africa, 5.25%, 05/16/2013 EUR | | | 100,000 | | | 151,768 | |
Turkey, 4.75%, 07/06/2012 EUR | | | 340,000 | | | 508,898 | |
Ukraine, 4.95%, 10/13/2015 EUR | | | 50,000 | | | 68,522 | |
United Kingdom, 5.00%, 03/07/2012 GBP | | | 220,000 | | | 446,311 | |
| | | | |
|
| |
Total Foreign Bonds – Government (Principal Amount Denominated in Currency Indicated) (cost $8,841,351) | | | | | | 9,503,520 | |
| | | | |
|
| |
WHOLE LOAN MORTGAGE-BACKED COLLATERALIZED MORTGAGE OBLIGATIONS 1.6% | | | | | | | |
FIXED-RATE 1.6% | | | | | | | |
Banc of America Mtge. Securities, Inc., Ser. 2005-D, Class 2A6, 4.78%, 05/25/2035 | | $ | 3,255,000 | | | 3,083,367 | |
Deutsche Alt-A Securities, NIM, Ser. 2007-0A1, Class N1, 6.50%, 02/25/2047 144A o | | | 439,345 | | | 428,801 | |
Harborview NIM Corp.: | | | | | | | |
Ser. 2006-12, Class N1, 6.41%, 12/19/2036 144A o | | | 14,109 | | | 14,087 | |
Ser. 2006-14, Class N2, 8.35%, 03/19/2038 144A o ¯ | | | 907,070 | | | 464,874 | |
| | | | |
|
| |
Total Whole Loan Mortgage-Backed Collateralized Mortgage Obligations (cost $4,522,691) | | | | | | 3,991,129 | |
| | | | |
|
| |
WHOLE LOAN MORTGAGE-BACKED PASS THROUGH SECURITIES 16.1% | | | | | | | |
FIXED-RATE 7.1% | | | | | | | |
Alternative Loan Trust, Ser. 2007-14T2, Class 2, 6.00%, 07/25/2037 | | | 1,651,784 | | | 1,112,601 | |
Countrywide Alternative Loan Trust, Inc.: | | | | | | | |
Ser. 2005-50CB, Class 1A1, 5.50%, 11/25/2035 | | | 1,660,040 | | | 1,501,706 | |
Ser. 2007-24, Class A1, 7.00%, 10/25/2037 | | | 905,452 | | | 559,696 | |
CSMC Mtge. Backed Trust, Ser. 2007-4R, Class 1A1, 5.69%, 10/26/2036 144A | | | 405,000 | | | 360,268 | |
First Horizon Mtge. Pass Through Trust, Ser. 2007-AR2, Class 2A1, 5.89%, 07/25/2037 | | | 2,861,206 | | | 2,634,221 | |
GSAA Home Equity Trust, Ser. 2007-10, Class A1A, 6.00%, 11/25/2037 | | | 1,363,125 | | | 1,174,850 | |
GSR Mtge. Loan Trust, Ser. 2006-8F, Class 4A3, 6.50%, 09/25/2036 | | | 580,000 | | | 490,820 | |
Morgan Stanley Capital I, Inc., Ser. 2007-13, Class 5A1, 5.50%, 10/25/2037 | | | 3,434,173 | | | 3,134,239 | |
PHH Alternative Mtge. Trust, Ser. 2007-01, Class 21A, 6.00%, 02/25/2037 | | | 773,389 | | | 675,188 | |
Residential Accredited Loans, Inc., Ser. 2007-QS10, Class A1, 6.50%, 09/25/2037 | | | 898,090 | | | 841,123 | |
Washington Mutual, Inc., Ser. 2005-AR3, Class A1, 4.64%, 03/25/2035 | | | 3,056,839 | | | 2,956,715 | |
Wells Fargo Mtge. Backed Securities Trust, Ser. 2006-AR10, Class 5A1, 5.60%, 07/25/2036 | | | 2,477,860 | | | 2,386,243 | |
| | | | |
|
| |
| | | | | | 17,827,670 | |
| | | | |
|
| |
FLOATING-RATE 9.0% | | | | | | | |
Citigroup Mtge. Loan Trust, Inc., Ser. 2005-7, Class 2A3A, 5.18%, 09/25/2035 | | | 3,076,910 | | | 2,883,319 | |
Lehman XS Trust, Ser. 2006-18N, Class A5A, 3.07%, 12/25/2036 | | | 145,000 | | | 104,799 | |
MASTR Reperforming Loan Trust, Ser. 2006-2, Class 1A1, 5.90%, 05/25/2046 144A | | | 2,501,759 | | | 2,474,340 | |
Merrill Lynch Countrywide Comml. Mtge. Trust, Ser. 2007-8,Class A3, 6.16%, 07/12/2017 | | | 3,530,000 | | | 3,569,267 | |
See Notes to Financial Statements
25
SCHEDULE OF INVESTMENTS continued
April 30, 2008 (As restated. See Note 13)
| | | Principal
Amount | | | Value | |
|
|
|
|
|
|
| |
WHOLE LOAN MORTGAGE-BACKED PASS THROUGH SECURITIES continued | | | | | | | |
FLOATING-RATE continued | | | | | | | |
Residential Funding Mtge. Securities, Ser. 2007-SA3, Class 2A1, 5.78%, 07/27/2037 | | $ | 3,518,431 | | $ | 3,294,116 | |
Structured Adjustable Rate Mtge. Loan Trust, Ser. 2007-3, Class 3A1, 5.72%, 04/25/2037 | | | 2,347,432 | | | 2,133,198 | |
Washington Mutual, Inc. Mtge. Pass-Through Cert.: | | | | | | | |
Ser. 2006-AR17, Class 1A1B, 4.89%, 12/25/2046 | | | 2,433,558 | | | 1,736,563 | |
Ser. 2007-HY7, Class 3A2, 5.91%, 07/25/2037 | | | 2,885,458 | | | 2,785,430 | |
Ser. 2007-OA5: | | | | | | | |
Class 1A, 4.83%, 06/25/2047 | | | 2,439,392 | | | 1,956,758 | |
Class 1A1B, 4.83%, 06/25/2047 | | | 2,201,230 | | | 1,534,874 | |
| | | | |
|
| |
| | | | | | 22,472,664 | |
| | | | |
|
| |
Total Whole Loan Mortgage-Backed Pass Through Securities (cost $44,280,585) | | | | | | 40,300,334 | |
| | | | |
|
| |
WHOLE LOAN SUBORDINATE COLLATERALIZED MORTGAGE OBLIGATIONS 0.4% | | | | | | | |
FIXED-RATE 0.1% | | | | | | | |
Financial Asset Securitization, Inc., Ser. 1997-NAM2, Class B-2, 7.88%, 07/25/2027 | | | 345,588 | | | 344,793 | |
| | | | |
|
| |
FLOATING-RATE 0.3% | | | | | | | |
Harborview Mtge. Loan Trust: | | | | | | | |
Ser. 2004-7, Class B4, 5.99%, 11/19/2034 ¯ | | | 2,605,009 | | | 621,034 | |
Ser. 2005-8, Class 2B3, 6.43%, 02/19/2035 ¯ | | | 1,087,571 | | | 77,435 | |
| | | | |
|
| |
| | | | | | 698,469 | |
| | | | |
|
| |
Total Whole Loan Subordinate Collateralized Mortgage Obligations (cost $3,461,179) | | | | | | 1,043,262 | |
| | | | |
|
| |
YANKEE OBLIGATIONS – CORPORATE 3.5% | | | | | | | |
CONSUMER DISCRETIONARY 0.0% | | | | | | | |
Media 0.0% | | | | | | | |
Videotron, Ltd., 9.125%, 04/15/2018 144A | | | 5,000 | | | 5,350 | |
| | | | |
|
| |
CONSUMER STAPLES 0.1% | | | | | | | |
Beverages 0.1% | | | | | | | |
Companhia Brasileira de Bebidas, 8.75%, 09/15/2013 | | | 115,000 | | | 133,975 | |
| | | | |
|
| |
Food Products 0.0% | | | | | | | |
Sadia Overseas, Ltd., 6.875%, 05/24/2017 144A ρ | | | 100,000 | | | 102,000 | |
| | | | |
|
| |
ENERGY 0.3% | | | | | | | |
Oil, Gas & Consumable Fuels 0.3% | | | | | | | |
Connacher Oil & Gas, Ltd., 10.25%, 12/15/2015 144A | | | 45,000 | | | 47,925 | |
GAZPROM OAO, 9.625%, 03/01/2013 | | | 190,000 | | | 216,505 | |
Griffin Coal Mining Co., Ltd.: | | | | | | | |
9.50%, 12/01/2016 144A | | | 390,000 | | | 308,100 | |
9.50%, 12/01/2016 | | | 20,000 | | | 15,800 | |
OPTI Canada, Inc., 7.875%, 12/15/2014 | | | 240,000 | | | 245,400 | |
| | | | |
|
| |
| | | | | | 833,730 | |
| | | | |
|
| |
See Notes to Financial Statements
26
SCHEDULE OF INVESTMENTS continued
April 30, 2008 (As restated. See Note 13)
| | Principal
Amount | | Value | |
|
|
|
|
| |
YANKEE OBLIGATIONS – CORPORATE continued | | | | | | | |
FINANCIALS 1.0% | | | | | | | |
Commercial Banks 0.1% | | | | | | | |
VTB Capital SA, 7.50%, 10/12/2011 | | $ | 120,000 | | $ | 124,152 | |
| | | | |
|
| |
Consumer Finance 0.1% | | | | | | | |
Avago Technologies Finance, Ltd.: | | | | | | | |
10.125%, 12/01/2013 | | | 10,000 | | | 10,700 | |
FRN, 8.58%, 06/01/2013 | | | 30,000 | | | 30,075 | |
Gaz Capital SA, 6.21%, 11/22/2016 | | | 100,000 | | | 95,773 | |
NXP Funding, LLC, 7.875%, 10/15/2014 | | | 5,000 | | | 4,963 | |
Petroplus Finance, Ltd., 6.75%, 05/01/2014 144A ρ | | | 30,000 | | | 28,350 | |
Virgin Media Finance plc, 9.125%, 08/15/2016 | | | 112,000 | | | 108,640 | |
| | | | |
|
| |
| | | | | | 278,501 | |
| | | | |
|
| |
Diversified Financial Services 0.8% | | | | | | | |
Corporacion Andina De Fomento, 5.75%, 01/12/2017 | | | 55,000 | | | 53,222 | |
FMG Finance Property, Ltd., 10.625%, 09/01/2016 144A | | | 240,000 | | | 274,200 | |
Preferred Term Securities XII, Ltd., FRN, 10.00%, 12/24/2033 | | | 1,000,000 | | | 711,320 | |
Ship Finance International, Ltd., 8.50%, 12/15/2013 | | | 130,000 | | | 131,950 | |
Trapeza CDO, LLC, Ser. 2004-7A, Class B1, FRN, 4.47%, 01/25/2035 144A | | | 1,000,000 | | | 927,830 | |
| | | | |
|
| |
| | | | | | 2,098,522 | |
| | | | |
|
| |
INDUSTRIALS 0.1% | | | | | | | |
Road & Rail 0.1% | | | | | | | |
Kansas City Southern de Mexico: | | | | | | | |
7.375%, 06/01/2014 144A | | | 120,000 | | | 114,150 | |
9.375%, 05/01/2012 | | | 135,000 | | | 141,413 | |
| | | | |
|
| |
| | | | | | 255,563 | |
| | | | |
|
| |
INFORMATION TECHNOLOGY 0.1% | | | | | | | |
Communications Equipment 0.1% | | | | | | | |
Nortel Networks Corp., 10.125%, 07/15/2013 ρ | | | 220,000 | | | 216,700 | |
| | | | |
|
| |
Semiconductors & Semiconductor Equipment 0.0% | | | | | | | |
Sensata Technologies, Inc., 8.00%, 05/01/2014 ρ | | | 75,000 | | | 70,313 | |
| | | | |
|
| |
MATERIALS 0.2% | | | | | | | |
Metals & Mining 0.2% | | | | | | | |
Evraz Group SA: | | | | | | | |
8.875%, 04/24/2013 144A | | | 30,000 | | | 30,525 | |
9.50%, 04/24/2018 144A | | | 100,000 | | | 102,494 | |
Novelis, Inc., 7.25%, 02/15/2015 | | | 405,000 | | | 372,600 | |
| | | | |
|
| |
| | | | | | 505,619 | |
| | | | |
|
| |
Paper & Forest Products 0.0% | | | | | | | |
Corporacion Durango SAB de CV, 10.50%, 10/05/2017 144A | | | 105,000 | | | 79,275 | |
| | | | |
|
| |
See Notes to Financial Statements
27
SCHEDULE OF INVESTMENTS continued
April 30, 2008 (As restated. See Note 13)
| | Principal
Amount | | Value | |
|
|
|
|
| |
YANKEE OBLIGATIONS – CORPORATE continued | | | | | | | |
TELECOMMUNICATION SERVICES 1.5% | | | | | | | |
Diversified Telecommunication Services 0.6% | | | | | | | |
Telecom Italia SpA, 6.20%, 07/18/2011 | | $ | 200,000 | | $ | 201,619 | |
Telefonica Emisiones, 7.05%, 06/20/2036 ρ | | | 1,000,000 | | | 1,096,645 | |
Telefonos De Mexico SAB de CV, 4.75%, 01/27/2010 | | | 100,000 | | | 101,322 | |
| | | | |
|
| |
| | | | | | 1,399,586 | |
| | | | |
|
| |
Wireless Telecommunication Services 0.9% | | | | | | | |
Inmarsat, plc, Sr. Disc. Note, Step Bond, 0.00%, 11/15/2012 † | | | 30,000 | | | 29,737 | |
Intelsat, Ltd., 9.25%, 06/15/2016 | | | 50,000 | | | 50,687 | |
Vimpel Communications: | | | | | | | |
8.25%, 05/23/2016 | | | 200,000 | | | 196,490 | |
8.375%, 04/30/2013 144A | | | 15,000 | | | 15,012 | |
9.125%, 04/30/2018 144A | | | 100,000 | | | 100,250 | |
Vodafone Group plc: | | | | | | | |
5.625%, 02/27/2017 | | | 1,200,000 | | | 1,207,260 | |
7.75%, 02/15/2010 | | | 700,000 | | | 739,007 | |
| | | | |
|
| |
| | | | | | 2,338,443 | |
| | | | |
|
| |
UTILITIES 0.2% | | | | | | | |
Electric Utilities 0.1% | | | | | | | |
Enersis SA, 7.375%, 01/15/2014 | | | 115,000 | | | 123,917 | |
| | | | |
|
| |
Multi-Utilities 0.1% | | | | | | | |
National Power Corp.: | | | | | | | |
6.875%, 11/02/2016 | | | 200,000 | | | 203,958 | |
FRN, 7.34%, 08/23/2011 | | | 130,000 | | | 137,618 | |
| | | | |
|
| |
| | | | | | 341,576 | |
| | | | |
|
| |
Total Yankee Obligations – Corporate (cost $9,044,487) | | | | | | 8,907,222 | |
| | | | |
|
| |
YANKEE OBLIGATIONS – GOVERNMENT 1.1% | | | | | | | |
Argentina, 12.25%, 06/19/2018 • | | | 159,188 | | | 46,165 | |
Brazil: | | | | | | | |
7.125%, 01/20/2037 | | | 370,000 | | | 423,650 | |
8.25%, 01/20/2034 | | | 350,000 | | | 445,375 | |
Chile, 7.125%, 01/11/2012 | | | 125,000 | | | 137,512 | |
Colombia: | | | | | | | |
7.375%, 01/27/2017 | | | 100,000 | | | 112,850 | |
8.125%, 05/21/2024 | | | 175,000 | | | 207,812 | |
Emirates of Abu Dhabi, 5.50%, 08/02/2012 | | | 200,000 | | | 210,051 | |
Indonesia, 6.75%, 03/10/2014 | | | 90,000 | | | 93,150 | |
Mexico, 8.375%, 01/14/2011 | | | 60,000 | | | 66,954 | |
Peru: | | | | | | | |
8.375%, 05/03/2016 | | | 200,000 | | | 243,400 | |
8.75%, 11/21/2033 | | | 35,000 | | | 46,550 | |
See Notes to Financial Statements
28
SCHEDULE OF INVESTMENTS continued
April 30, 2008 (As restated. See Note 13)
| | Principal
Amount | | Value | |
|
|
|
|
| |
YANKEE OBLIGATIONS – GOVERNMENT continued | | | | | | | |
Russia: | | | | | | | |
11.00%, 07/24/2018 | | $ | 55,000 | | $ | 79,613 | |
Sr. Disc. Note, Step Bond, 7.50%, 03/31/2030 † | | | 147,750 | | | 170,144 | |
Turkey, 7.00%, 09/26/2016 | | | 200,000 | | | 205,750 | |
Ukraine, 6.58%, 11/21/2016 | | | 100,000 | | | 98,375 | |
Venezuela, 10.75%, 09/19/2013 | | | 180,000 | | | 186,300 | |
| | | | |
|
| |
Total Yankee Obligations – Government (cost $2,755,653) | | | | | | 2,773,651 | |
| | | | |
|
| |
| | | | | | | |
|
|
|
|
|
|
| |
| | Shares | | Value | |
|
|
|
|
| |
PREFERRED STOCKS 0.8% | | | | | | | |
FINANCIALS 0.8% | | | | | | | |
Diversified Financial Services 0.0% | | | | | | | |
First Republic Capital Corp., 10.50% 144A | | | 50 | | | 54,425 | |
| | | | |
|
| |
Thrifts & Mortgage Finance 0.8% | | | | | | | |
Fannie Mae, Ser. S, 8.25% ρ | | | 33,750 | | | 845,100 | |
Freddie Mac, Ser. Z, 8.38% ρ | | | 41,260 | | | 1,056,256 | |
| | | | |
|
| |
| | | | | | 1,901,356 | |
| | | | |
|
| |
Total Preferred Stocks (cost $1,931,527) | | | | | | 1,955,781 | |
| | | | |
|
| |
| | | | | | | |
|
|
|
|
| |
| | Principal
Amount | | Value | |
|
|
|
|
| |
CONVERTIBLE DEBENTURES 0.0% | | | | | | | |
CONSUMER DISCRETIONARY 0.0% | | | | | | | |
Media 0.0% | | | | | | | |
Sinclair Broadcast Group, Inc., 3.00%, 05/15/2027 (cost $27,262) | | $ | 30,000 | | | 27,263 | |
| | | | |
|
| |
| | | | | | | |
|
|
|
|
|
|
| |
| | Shares | | Value | |
|
|
|
|
| |
MUTUAL FUND SHARES 2.1% | | | | | | | |
Blackrock Core Bond Trust ρ | | | 63,250 | | | 777,975 | |
Blackrock Income Opportunity Trust | | | 82,350 | | | 830,088 | |
Blackrock Income Trust | | | 80,175 | | | 485,059 | |
MFS Charter Income Trust | | | 108,400 | | | 919,232 | |
MFS Intermediate Income Trust | | | 143,700 | | | 909,621 | |
MFS Multimarket Income Trust | | | 100,954 | | | 586,543 | |
Putnam Premier Income Trust | | | 105,043 | | | 653,367 | |
Van Kampen Bond Fund | | | 5,325 | | | 91,111 | |
| | | | |
|
| |
Total Mutual Fund Shares (cost $5,072,385) | | | | | | 5,252,996 | |
| | | | |
|
| |
See Notes to Financial Statements
29
SCHEDULE OF INVESTMENTS continued
April 30, 2008 (As restated. See Note 13)
| | | Principal
Amount | | | Value | |
|
|
|
|
|
|
| |
LOANS 0.2% | | | | | | | |
CONSUMER DISCRETIONARY 0.0% | | | | | | | |
Idearc, Inc., FRN, 4.80%, 11/17/2014 < | | $ | 49,962 | | $ | 41,396 | |
Ion Media Networks, Inc., FRN, 6.05%, 01/15/2012 < | | | 110,000 | | | 90,522 | |
| | | | |
|
| |
| | | | | | 131,918 | |
| | | | |
|
| |
INDUSTRIALS 0.1% | | | | | | | |
Clarke American Corp., FRN, 5.30%, 02/28/2014 | | | 129,673 | | | 109,854 | |
Neff Corp., FRN, 6.30%, 11/30/2014 < | | | 185,000 | | | 135,644 | |
| | | | |
|
| |
| | | | | | 245,498 | |
| | | | |
|
| |
MATERIALS 0.1% | | | | | | | |
Wimar Co., FRN, 5.30%, 01/03/2012 | | | 160,000 | | | 151,557 | |
| | | | |
|
| |
UTILITIES 0.0% | | | | | | | |
Energy Future Holdings Corp., FRN, 5.80%, 10/10/2014 | | | 1,063 | | | 1,015 | |
| | | | |
|
| |
Total Loans (cost $531,853) | | | | | | 529,988 | |
| | | | |
|
| |
| | | | | | | |
|
|
|
|
|
|
| |
| | | Shares | | | Value | |
|
|
|
|
|
|
| |
SHORT-TERM INVESTMENTS 6.7% | | | | | | | |
MUTUAL FUND SHARES 6.7% | | | | | | | |
Evergreen Institutional Money Market Fund, Class I, 2.78% q ø ## ρρ (cost $16,826,147) | | | 16,826,147 | | | 16,826,147 | |
| | | | |
|
| |
Total Investments (cost $284,921,772) 108.5% | | | | | | 271,990,203 | |
Other Assets and Liabilities (8.5%) | | | | | | (21,272,401 | ) |
| | | | |
|
| |
Net Assets 100.0% | | | | | $ | 250,717,802 | |
| | | | |
|
| |
# | When-issued or delayed delivery security |
## | All or a portion of this security has been segregated for when-issued or delayed delivery securities. |
144A | Security that may be sold to qualified institutional buyers under Rule 144A of the Securities Act of 1933, as amended. This security has been determined to be liquid under guidelines established by the Board of Trustees, unless otherwise noted. |
ρ | All or a portion of this security is on loan. |
+ | Security is deemed illiquid. |
o | Security is valued at fair value as determined by the investment advisor in good faith, according to procedures approved by the Board of Trustees. |
† | Security initially issued in zero coupon form which converts to coupon form at a specified rate and date. An effective interest rate is applied to recognize interest income daily for the bond. This rate is based on total expected interest to be earned over the life of the bond which consists of the aggregate coupon-interest payments and discount at acquisition. The rate shown is the stated rate at the current period end. |
Š | The rate shown is the stated rate at the current period end. |
• | Security that has defaulted on payment of interest and/or principal. |
< | All or a portion of the position represents an unfunded loan commitment. |
q | Rate shown is the 7-day annualized yield at period end. |
ø | Evergreen Investment Management Company, LLC is the investment advisor to both the Fund and the money market fund. |
ρρ | All or a portion of this security represents investment of cash collateral received from securities on loan. |
¯ | As restated. See Note 13 |
See Notes to Financial Statements
30
SCHEDULE OF INVESTMENTS continued
April 30, 2008 (As restated. See Note 13)
Summary of Abbreviations
AUD | Australian Dollar |
BRL | Brazil Real |
CAD | Canadian Dollar |
CDO | Collateralized Debt Obligation |
DKK | Danish Krone |
EUR | Euro |
FHLMC | Federal Home Loan Mortgage Corp. |
FNMA | Federal National Mortgage Association |
FRN | Floating Rate Note |
GBP | Great British Pound |
GNMA | Government National Mortgage Association |
HKD | Hong Kong Dollar |
MASTR | Mortgage Asset Securitization Transactions, Inc. |
MXN | Mexican Peso |
MYR | Malaysian Ringgit |
NIM | Net Interest Margin |
NOK | Norwegian Krone |
NZD | New Zealand Dollar |
PLN | Polish Zloty |
RUB | Russian Ruble |
TBA | To Be Announced |
The following table shows the percent of total investments (excluding equity positions, collateral from securities on loan and segregated cash and cash equivalents) by credit quality based on Moody’s and Standard & Poor’s ratings as of April 30, 2008 (unaudited):
AAA | | 54.1 | % |
AA | | 11.5 | % |
A | | 9.7 | % |
BBB | | 8.7 | % |
BB | | 11.5 | % |
B | | 4.2 | % |
CCC | | 0.2 | % |
NR | | 0.1 | % |
| |
| |
| | 100.0 | % |
| |
| |
The following table shows the percent of total investments (excluding equity positions, collateral from securities on loan and segregated cash and cash equivalents) based on effective maturity as of April 30, 2008 (unaudited):
Less than 1 year | | 9.1 | % |
1 to 3 year(s) | | 10.3 | % |
3 to 5 years | | 16.3 | % |
5 to 10 years | | 50.9 | % |
10 to 20 years | | 7.9 | % |
20 to 30 years | | 5.4 | % |
Greater than 30 years | | 0.1 | % |
| |
| |
| | 100.0 | % |
| |
| |
See Notes to Financial Statements
31
STATEMENT OF ASSETS AND LIABILITIES
April 30, 2008 As restated. See Note 13
Assets | | | | |
Investments in securities, at value (cost $268,095,625) including $5,439,665 of securities loaned | | $ | 255,164,056 | |
Investments in affiliated money market fund, at value (cost $16,826,147) | | | 16,826,147 | |
|
|
|
| |
Total investments | | | 271,990,203 | |
Foreign currency, at value (cost $719,774) | | | 722,569 | |
Receivable for securities sold | | | 3,620,449 | |
Principal paydown receivable | | | 108,062 | |
Receivable for Fund shares sold | | | 34,203 | |
Dividends and interest receivable | | | 2,718,810 | |
Receivable for securities lending income | | | 2,506 | |
Premiums paid on credit default swap transactions | | | 357,463 | |
Unrealized gains on forward foreign currency exchange contracts | | | 93,102 | |
Unrealized gains on total return swap transactions | | | 1,067,061 | |
Unrealized gains on credit default swap transactions | | | 1,796,079 | |
Prepaid expenses and other assets | | | 184,839 | |
|
|
|
| |
Total assets | | | 282,695,346 | |
|
|
|
| |
Liabilities | | | | |
Dividends payable | | | 389,001 | |
Payable for securities purchased | | | 21,322,535 | |
Payable for Fund shares redeemed | | | 277,317 | |
Unrealized losses on credit default swap transactions | | | 2,900,803 | |
Unrealized losses on forward foreign currency exchange contracts | | | 159,834 | |
Premiums received on credit default swap transactions | | | 1,283,066 | |
Payable for securities on loan | | | 5,556,625 | |
Due to custodian bank | | | 5,137 | |
Advisory fee payable | | | 1,501 | |
Distribution Plan expenses payable | | | 2,141 | |
Due to other related parties | | | 5,557 | |
Accrued expenses and other liabilities | | | 74,027 | |
|
|
|
| |
Total liabilities | | | 31,977,544 | |
|
|
|
| |
Net assets | | $ | 250,717,802 | |
|
|
|
| |
Net assets represented by | | | | |
Paid-in capital | | $ | 296,012,513 | |
Overdistributed net investment income | | | (323,900 | ) |
Accumulated net realized losses on investments | | | (31,940,283 | ) |
Net unrealized losses on investments | | | (13,030,528 | ) |
|
|
|
| |
Total net assets | | $ | 250,717,802 | |
|
|
|
| |
Net assets consists of | | | | |
Class A | | $ | 167,732,209 | |
Class B | | | 13,618,429 | |
Class C | | | 21,699,500 | |
Class I | | | 47,667,664 | |
|
|
|
| |
Total net assets | | $ | 250,717,802 | |
|
|
|
| |
Shares outstanding (unlimited number of shares authorized) | | | | |
Class A | | | 12,513,548 | |
Class B | | | 1,016,622 | |
Class C | | | 1,618,948 | |
Class I | | | 3,556,340 | |
|
|
|
| |
See Notes to Financial Statements
32
STATEMENT OF ASSETS AND LIABILITIES continued
April 30, 2008 As restated. See Note 13
Net asset value per share | | | | |
Class A | | $ | 13.40 | |
Class A — Offering price (based on sales charge of 4.75%) | | $ | 14.07 | |
Class B | | $ | 13.40 | |
Class C | | $ | 13.40 | |
Class I | | $ | 13.40 | |
|
|
|
| |
See Notes to Financial Statements
33
STATEMENT OF OPERATIONS
Year Ended April 30, 2008 As restated. See Note 13
Investment income | | | | |
Interest | | $ | 16,019,881 | |
Income from affiliate | | | 639,969 | |
Dividends | | | 370,554 | |
Securities lending | | | 12,797 | |
|
|
|
| |
Total investment income | | | 17,043,201 | |
|
|
|
| |
Expenses | | | | |
Advisory fee | | | 1,200,936 | |
Distribution Plan expenses | | | | |
Class A | | | 550,231 | |
Class B | | | 149,343 | |
Class C | | | 236,016 | |
Administrative services fee | | | 275,934 | |
Transfer agent fees | | | 536,187 | |
Trustees’ fees and expenses | | | 6,089 | |
Printing and postage expenses | | | 70,251 | |
Custodian and accounting fees | | | 157,305 | |
Registration and filing fees | | | 54,720 | |
Professional fees | | | 38,394 | |
Other | | | 6,499 | |
|
|
|
| |
Total expenses | | | 3,281,905 | |
Less: Expense reductions | | | (10,604 | ) |
Fee waivers and expense reimbursements | | | (565,271 | ) |
|
|
|
| |
Net expenses | | | 2,706,030 | |
|
|
|
| |
Net investment income | | | 14,337,171 | |
|
|
|
| |
Net realized and unrealized gains or losses on investments | | | | |
Net realized gains or losses on: | | | | |
Securities | | | (1,946,888 | ) |
Futures contracts | | | (80,021 | ) |
Foreign currency related transactions | | | 463,541 | |
Credit default swap transactions | | | (217,878 | ) |
Total return swap transactions | | | (5,613,672 | ) |
|
|
|
| |
Net realized losses on investments | | | (7,394,918 | ) |
Net change in unrealized gains or losses on investments | | | (13,145,686 | ) |
|
|
|
| |
Net realized and unrealized gains or losses on investments | | | (20,540,604 | ) |
|
|
|
| |
Net decrease in net assets resulting from operations | | $ | (6,203,433 | ) |
|
|
|
| |
See Notes to Financial Statements
34
STATEMENTS OF CHANGES IN NET ASSETS
| | Year Ended April 30, | |
| |
| |
| | Restated | | | |
| | 2008 | | 2007 | |
|
|
|
|
| |
Operations | | | | | | | | | | | |
Net investment income | | | | $ | 14,337,171 | | | | $ | 17,061,576 | |
Net realized losses on investments | | | | | (7,394,918 | ) | | | | (1,553,243 | ) |
Net change in unrealized gains or losses on investments | | | | | (13,145,686 | ) | | | | 6,403,394 | |
|
|
|
|
|
|
|
|
|
|
| |
Net increase (decrease) in net assets resulting from operations | | | | | (6,203,433 | ) | | | | 21,911,727 | |
|
|
|
|
|
|
|
|
|
|
| |
Distributions to shareholders from | | | | | | | | | | | |
Net investment income | | | | | | | | | | | |
Class A | | | | | (6,841,784 | ) | | | | (11,787,049 | ) |
Class B | | | | | (438,612 | ) | | | | (852,703 | ) |
Class C | | | | | (691,872 | ) | | | | (1,242,068 | ) |
Class I | | | | | (2,077,072 | ) | | | | (3,565,742 | ) |
Tax return of capital | | | | | | | | | | | |
Class A | | | | | (2,666,944 | ) | | | | (165,900 | ) |
Class B | | | | | (214,425 | ) | | | | (13,740 | ) |
Class C | | | | | (338,870 | ) | | | | (19,998 | ) |
Class I | | | | | (757,769 | ) | | | | (47,948 | ) |
|
|
|
|
|
|
|
|
|
|
| |
Total distributions to shareholders | | | | | (14,027,348 | ) | | | | (17,695,148 | ) |
|
|
|
|
|
|
|
|
|
|
| |
| | Shares | | | | | Shares | | | | |
|
|
|
|
|
|
|
|
|
|
| |
Capital share transactions | | | | | | | | | | | |
Proceeds from shares sold | | | | | | | | | | | |
Class A | | 645,781 | | | 9,130,480 | | 579,848 | | | 8,326,359 | |
Class B | | 207,305 | | | 2,925,612 | | 169,920 | | | 2,430,882 | |
Class C | | 225,175 | | | 3,194,094 | | 190,704 | | | 2,730,653 | |
Class I | | 62,125 | | | 874,257 | | 44,267 | | | 639,034 | |
|
|
|
|
|
|
|
|
|
|
| |
| | | | | 16,124,443 | | | | | 14,126,928 | |
|
|
|
|
|
|
|
|
|
|
| |
Net asset value of shares issued in reinvestment of distributions | | | | | | | | | | | |
Class A | | 449,451 | | | 6,347,504 | | 552,035 | | | 7,905,712 | |
Class B | | 29,046 | | | 410,033 | | 35,341 | | | 506,013 | |
Class C | | 44,486 | | | 628,139 | | 56,461 | | | 808,431 | |
Class I | | 108,074 | | | 1,526,367 | | 130,689 | | | 1,871,835 | |
|
|
|
|
|
|
|
|
|
|
| |
| | | | | 8,912,043 | | | | | 11,091,991 | |
|
|
|
|
|
|
|
|
|
|
| |
Automatic conversion of Class B shares to Class A shares | | | | | | | | | | | |
Class A | | 51,162 | | | 717,162 | | 69,131 | | | 988,636 | |
Class B | | (51,162 | ) | | (717,162 | ) | (69,131 | ) | | (988,636 | ) |
|
|
|
|
|
|
|
|
|
|
| |
| | | | | 0 | | | | | 0 | |
|
|
|
|
|
|
|
|
|
|
| |
Payment for shares redeemed | | | | | | | | | | | |
Class A | | (2,435,890 | ) | | (34,383,483 | ) | (2,368,618 | ) | | (33,880,260 | ) |
Class B | | (283,010 | ) | | (3,986,296 | ) | (304,671 | ) | | (4,352,055 | ) |
Class C | | (322,517 | ) | | (4,543,748 | ) | (398,516 | ) | | (5,692,232 | ) |
Class I | | (522,589 | ) | | (7,353,155 | ) | (598,099 | ) | | (8,560,870 | ) |
|
|
|
|
|
|
|
|
|
|
| |
| | | | | (50,266,682 | ) | | | | (52,485,417 | ) |
|
|
|
|
|
|
|
|
|
|
| |
Net decrease in net assets resulting from capital share transactions | | | | | (25,230,196 | ) | | | | (27,266,498 | ) |
|
|
|
|
|
|
|
|
|
|
| |
Total decrease in net assets | | | | | (45,460,977 | ) | | | | (23,049,919 | ) |
Net assets | | | | | | | | | | | |
Beginning of period | | | | | 296,178,779 | | | | | 319,228,698 | |
|
|
|
|
|
|
|
|
|
|
| |
End of period | | | | $ | 250,717,802 | | | | $ | 296,178,779 | |
|
|
|
|
|
|
|
|
|
|
| |
Overdistributed net investment income | | | | $ | (323,900 | ) | | | $ | (416,859 | ) |
|
|
|
|
|
|
|
|
|
|
| |
See Notes to Financial Statements
35
NOTES TO FINANCIAL STATEMENTS
1. ORGANIZATION
Evergreen Core Plus Bond Fund (the “Fund”) (formerly Diversified Bond Fund) is a diversified series of Evergreen Fixed Income Trust (the “Trust”), a Delaware statutory trust organized on September 18, 1997. The Trust is an open-end management investment company registered under the Investment Company Act of 1940, as amended (the “1940 Act”).
The Fund offers Class A, Class B, Class C and Class I shares. Class A shares are sold with a front-end sales charge. However, Class A share investments of $1 million or more are not subject to a front-end sales charge but are subject to a contingent deferred sales charge of 1.00% upon redemption within 18 months. Class B shares are sold without a front-end sales charge but are subject to a contingent deferred sales charge that is payable upon redemption and decreases depending on how long the shares have been held. Class C shares are sold without a front-end sales charge but are subject to a contingent deferred sales charge that is payable upon redemption within one year. Class I shares are sold without a front-end sales charge or contingent deferred sales charge. Each class of shares, except Class I shares, pays an ongoing distribution fee.
2. SIGNIFICANT ACCOUNTING POLICIES
The following is a summary of significant accounting policies consistently followed by the Fund in the preparation of its financial statements. The policies are in conformity with generally accepted accounting principles in the United States of America, which require management to make estimates and assumptions that affect amounts reported herein. Actual results could differ from these estimates.
a. Valuation of investments
Portfolio debt securities acquired with more than 60 days to maturity are fair valued using matrix pricing methods determined by an independent pricing service which takes into consideration such factors as similar security prices, yields, maturities, liquidity and ratings. Securities for which valuations are not readily available from an independent pricing service may be valued by brokers which use prices provided by market makers or estimates of market value obtained from yield data relating to investments or securities with similar characteristics.
Listed equity securities are usually valued at the last sales price or official closing price on the national securities exchange where the securities are principally traded.
Short-term securities with remaining maturities of 60 days or less at the time of purchase are valued at amortized cost, which approximates market value.
Investments in open-end mutual funds are valued at net asset value. Securities for which market quotations are not readily available or not reflective of current market value are valued at fair value as determined by the investment advisor in good faith, according to procedures approved by the Board of Trustees.
36
NOTES TO FINANCIAL STATEMENTS continued
b. Repurchase agreements
Securities pledged as collateral for repurchase agreements are held by the custodian bank or in a segregated account in the Fund’s name until the agreements mature. Collateral for certain tri-party repurchase agreements is held at the counterparty’s custodian in a segregated account for the benefit of the Fund and the counterparty. Each agreement requires that the market value of the collateral be sufficient to cover payments of interest and principal. However, in the event of default or bankruptcy by the other party to the agreement, retention of the collateral may be subject to legal proceedings. The Fund will only enter into repurchase agreements with banks and other financial institutions, which are deemed by the investment advisor to be creditworthy pursuant to guidelines established by the Board of Trustees. In certain instances, the Fund’s securities lending agent may provide collateral in the form of repurchase agreements.
c. Foreign currency translation
All assets and liabilities denominated in foreign currencies are translated into U.S. dollar amounts at the date of valuation. Purchases and sales of portfolio securities and income items denominated in foreign currencies are translated into U.S. dollar amounts on the respective dates of such transactions. The Fund does not separately account for that portion of the results of operations resulting from changes in foreign exchange rates on investments and the fluctuations arising from changes in market prices of securities held. Such fluctuations are included with the net realized and unrealized gains or losses on investments.
d. Futures contracts
In order to gain exposure to, or protect against changes in, security values, the Fund may buy and sell futures contracts. The primary risks associated with the use of futures contracts are the imperfect correlation between changes in market values of securities held by the Fund and the prices of futures contracts, and the possibility of an illiquid market.
Futures contracts are valued based upon their quoted daily settlement prices. The aggregate principal amounts of the contracts are not recorded in the financial statements. Fluctuations in the value of the contracts are recorded in the Statement of Assets and Liabilities as an asset or liability and in the Statement of Operations as unrealized gains or losses until the contracts are closed, at which point they are recorded as net realized gains or losses on futures contracts.
e. Forward foreign currency contracts
A forward foreign currency contract is an agreement between two parties to purchase or sell a specific currency for an agreed-upon price at a future date. The Fund enters into forward foreign currency contracts to facilitate transactions in foreign-denominated securities and to attempt to minimize the risk to the Fund from adverse changes in the relationship between currencies. Forward foreign currency contracts are recorded at the forward rate and marked-to-market daily. When the contracts are closed, realized gains and losses
37
NOTES TO FINANCIAL STATEMENTS continued
arising from such transactions are recorded as realized gains or losses on foreign currency related transactions. The Fund could be exposed to risks if the counterparties to the contracts are unable to meet the terms of their contracts or if the value of the foreign currency changes unfavorably.
f. When-issued and delayed delivery transactions
The Fund records when-issued or delayed delivery securities as of trade date and maintains security positions such that sufficient liquid assets will be available to make payment for the securities purchased. Securities purchased on a when-issued or delayed delivery basis are marked-to-market daily and begin earning interest on the settlement date. Losses may occur on these transactions due to changes in market conditions or the failure of counterparties to perform under the contract.
g. Loans
The Fund may purchase loans through an agent, by assignment from another holder of the loan or as a participation interest in another holder’s portion of the loan. Loans are purchased on a when-issued or delayed delivery basis. Interest income is accrued based on the terms of the securities. Fees earned on loan purchasing activities are recorded as income when earned. Loans involve interest rate risk, liquidity risk and credit risk, including the potential default or insolvency of the borrower.
h. Securities lending
The Fund may lend its securities to certain qualified brokers in order to earn additional income. The Fund receives compensation in the form of fees or interest earned on the investment of any cash collateral received. The Fund also continues to receive interest and dividends on the securities loaned. The Fund receives collateral in the form of cash or securities with a market value at least equal to the market value of the securities on loan, including accrued interest. In the event of default or bankruptcy by the borrower, the Fund could experience delays and costs in recovering the loaned securities or in gaining access to the collateral. The Fund has the right under the lending agreement to recover the securities from the borrower on demand.
i. Dollar roll transactions
The Fund may enter into dollar roll transactions with respect to mortgage-backed securities. In a dollar roll transaction, the Fund sells mortgage-backed securities to financial institutions and simultaneously agrees to accept substantially similar (same type, coupon and maturity) securities at a later date at an agreed upon price. The Fund will use the proceeds generated from the transactions to invest in short-term investments, which may enhance the Fund’s current yield and total return. The Fund accounts for dollar roll transactions as purchases and sales. The Fund could be exposed to risks if the counterparty defaults on its obligation to perform under the terms of the agreement, if the Fund receives inferior securities in comparison to what was sold to the counterparty at redelivery or if there are variances in paydown speed between the mortgage-related pools.
38
NOTES TO FINANCIAL STATEMENTS continued
j. Credit default swaps
The Fund may enter into credit default swap contracts. Credit default swaps involve an exchange of a stream of payments for protection against the loss in value of an underlying security or index in the event of default or bankruptcy. Under the terms of the swap, one party acts as a guarantor and receives a periodic stream of payments that is a fixed percentage applied to a notional principal amount over the term of the swap. In return, the counterparty agrees to purchase the notional amount of the underlying instrument or index, at par, if a credit event occurs during the term of the swap. The Fund may enter into credit default swaps as either the guarantor or the counterparty.
Any premiums paid or received on the transactions are recorded as an asset or liability on the Statement of Assets and Liabilities and amortized. The value of the swap contract is marked-to-market daily based on quotations from an independent pricing service or market makers and any change in value is recorded as an unrealized gain or loss. Periodic payments made or received are recorded as realized gains or losses. In addition, payments received or made as a result of a credit event or termination of the contract are recognized as realized gains or losses. The Fund could be exposed to risks if the counterparty defaults on its obligation to perform, or if there are unfavorable changes in the fluctuation of interest rates or in the price of the underlying security or index.
k. Total return swaps
The Fund may enter into total return swap contracts. Total return swaps involve commitments to pay interest in exchange for a market-linked return, both based on notional amounts. To the extent the total return of the security or index underlying the transaction exceeds or falls short of the offsetting interest rate obligation, the Fund will receive a payment from, or make a payment to, the counterparty.
The value of the swap contract is marked-to-market daily based upon quotations from an independent pricing service or market makers and any change in value is recorded as an unrealized gain or loss. Periodic payments made or received are recorded as realized gains or losses. The Fund could be exposed to risks if the counterparty defaults on its obligation to perform, or if there are unfavorable changes in the fluctuation of interest rates or in the price of the underlying security or index.
l. Security transactions and investment income
Security transactions are recorded on trade date. Realized gains and losses are computed using the specific cost of the security sold. Interest income is recorded on the accrual basis and includes accretion of discounts and amortization of premiums. Dividend income is recorded on the ex-dividend date.
m. Federal and other taxes
The Fund intends to continue to qualify as a regulated investment company and distribute all of its taxable income, including any net capital gains (which have already been offset by available capital loss carryovers). Accordingly, no provision for federal taxes is
39
NOTES TO FINANCIAL STATEMENTS continued
required. The Fund has adopted the provisions of FASB Interpretation No. 48, Accounting for Uncertainty in Income Taxes (“FIN 48”) which prescribes a minimum threshold for financial statement recognition of the benefit of a tax position taken or expected to be taken in a tax return. The Fund’s financial statements have not been impacted by the adoption of FIN 48. The Fund’s income and excise tax returns and all financial records supporting those returns are subject to examination by the federal, Massachusetts and Delaware revenue authorities for all taxable years beginning after April 30, 2004.
n. Distributions
Distributions to shareholders from net investment income are accrued daily and paid monthly. Distributions from net realized gains, if any, are recorded on the ex-dividend date. Such distributions are determined in conformity with income tax regulations, which may differ from generally accepted accounting principles.
Reclassifications have been made to the Fund’s components of net assets to reflect income and gains available for distribution (or available capital loss carryovers, as applicable) under income tax regulations. The primary permanent differences causing such reclassifications are due to net realized foreign currency gains or losses, expiration of capital loss carryovers, mortgage paydown gains and losses, premium amortization and swap contracts. During the year ended April 30, 2008, the following amounts were reclassified:
| | | |
|
|
| |
Paid-in-Capital | $ | (22,702,302 | ) |
Overdistributed net investment income | | (4,194,872 | ) |
Accumulated net realized losses on investments | | 26,897,174 | |
|
|
| |
o. Class allocations
Income, common expenses and realized and unrealized gains and losses are allocated to the classes based on the relative net assets of each class. Distribution fees, if any, are calculated daily at the class level based on the appropriate net assets of each class and the specific expense rates applicable to each class.
3. ADVISORY FEE AND OTHER TRANSACTIONS WITH AFFILIATES
Evergreen Investment Management Company, LLC (“EIMC”), an indirect, wholly-owned subsidiary of Wachovia Corporation (“Wachovia”), is the investment advisor to the Fund and is paid a fee at an annual rate of 2% of the Fund’s gross investment income plus an amount determined by applying percentage rates to the average daily net assets of the Fund, starting at 0.31% and declining to 0.16% as average daily net assets increase. For the year ended April 30, 2008, the advisory fee was equivalent to 0.43% of the Fund’s average daily net assets.
Tattersall Advisory Group, Inc., an indirect, wholly-owned subsidiary of Wachovia, is an investment sub-advisor to the Fund and is paid by EIMC for its services to the Fund.
40
NOTES TO FINANCIAL STATEMENTS continued
Effective October 1, 2007, First International Advisors, Inc. d/b/a Evergreen International Advisors, an indirect, wholly-owned subsidiary of Wachovia, also became an investment sub-advisor to the Fund and is paid by EIMC for its services to the Fund.
From time to time, EIMC may voluntarily or contractually waive its fee and/or reimburse expenses in order to limit operating expenses. During the year ended April 30, 2008, EIMC voluntarily waived its advisory fee in the amount of $479,408 and reimbursed Distribution Plan expenses (see Note 4) relating to Class A shares in the amount of $85,863.
The Fund may invest in money market funds which are advised by EIMC. Income earned on these investments is included in income from affiliate on the Statement of Operations.
Effective January 1, 2008, EIMC replaced Evergreen Investment Services, Inc. (“EIS”), an indirect, wholly-owned subsidiary of Wachovia, as the administrator to the Fund upon the assignment of the Fund’s Administrative Services Agreement from EIS to EIMC. There were no changes to the services being provided or fees being paid by the Fund. The administrator provides the Fund with facilities, equipment and personnel and is paid an annual rate determined by applying percentage rates to the aggregate average daily net assets of the Evergreen funds (excluding money market funds) starting at 0.10% and declining to 0.05% as the aggregate average daily net assets of the Evergreen funds (excluding money market funds) increase. For the year ended April 30, 2008, the administrative services fee was equivalent to an annual rate of 0.10% of the Fund’s average daily net assets.
Evergreen Service Company, LLC (“ESC”), an indirect, wholly-owned subsidiary of Wachovia, is the transfer and dividend disbursing agent for the Fund. ESC receives account fees that vary based on the type of account held by the shareholders in the Fund. For the year ended April 30, 2008, the transfer agent fees were equivalent to an annual rate of 0.19% of the Fund’s average daily net assets.
4. DISTRIBUTION PLANS
EIS serves as distributor of the Fund’s shares. The Fund has adopted Distribution Plans, as allowed by Rule 12b-1 of the 1940 Act, for each class of shares, except Class I. Under the Distribution Plans, distribution fees are paid at an annual rate of 0.25% of the average daily net assets for Class A and 1.00% of the average daily net assets for each of Class B and Class C shares. Prior to April 1, 2008, distribution fees were paid at an annual rate of 0.30% of the average daily net assets for Class A shares.
For the year ended April 30, 2008, EIS received $3,877 from the sale of Class A shares and $35,736 and $549 in contingent deferred sales charges from redemptions of Class B and Class C shares, respectively.
41
NOTES TO FINANCIAL STATEMENTS continued
5. INVESTMENT TRANSACTIONS
Cost of purchases and proceeds from sales of investment securities (excluding short-term securities) were as follows for the year ended April 30, 2008:
Cost of Purchases | Proceeds from Sales |
|
|
U.S.
Government | Non-U.S.
Government | U.S.
Government | Non-U.S.
Government |
|
|
|
|
$614,110,567 | $444,151,602 | $555,564,396 | $507,808,916 |
|
|
|
|
At April 30, 2008, the Fund had forward foreign currency exchange contracts outstanding as follows: Forward Foreign Currency Exchange Contracts to Buy:
Forward Foreign Currency Exchange Contracts to Buy:
Exchange
Date | Contracts
to Receive | U.S. Value at
April 30, 2008 | In Exchange for
U.S. $ | Unrealized
Gain |
|
|
|
|
|
06/10/2008 | 446,199 EUR | $693,349 | $681,345 | $12,004 |
|
|
|
|
|
| Exchange
Date | | Contracts to
Receive | | U.S. Value at
April 30, 2008 | | In Exchange
for | | U.S. Value
at April 30, 2008 | | Unrealized
Gain (Loss) | |
|
|
|
|
|
|
|
|
|
|
|
|
|
05/19/2008 | | 186,500,000 | JPY | | $ | 1,788,914 | | 2,236,479 | NZD | | $ | 1,742,688 | | $ | 46,226 | |
05/19/2008 | | 851,321 | NZD | | | 663,359 | | 70,938,000 | JPY | | | 680,440 | | | (17,081 | ) |
05/19/2008 | | 400,000 | NZD | | | 311,684 | | 32,401,200 | JPY | | | 310,793 | | | 891 | |
06/10/2008 | | 434,879 | EUR | | | 675,758 | | 335,000 | GBP | | | 662,591 | | | 13,167 | |
06/10/2008 | | 174,000,000 | JPY | | | 1,671,242 | | 1,106,870 | EUR | | | 1,719,967 | | | (48,725 | ) |
07/14/2008 | | 137,119,000 | JPY | | | 1,319,554 | | 1,488,806 | AUD | | | 1,388,804 | | | (69,250 | ) |
07/16/2008 | | 46,090,000 | JPY | | | 443,594 | | 3,564,275 | HKD | | | 458,241 | | | (14,647 | ) |
07/16/2008 | | 6,720,000 | JPY | | | 64,677 | | 34,100 | GBP | | | 67,268 | | | (2,591 | ) |
07/22/2008 | | 72,770,000 | JPY | | | 700,617 | | 713,704 | CAD | | | 708,157 | | | (7,540 | ) |
|
|
|
|
|
|
|
|
|
|
|
|
|
|
|
|
|
Forward Foreign Currency Exchange Contracts to Sell:
Exchange
Date | Contracts to
Deliver | U.S. Value at
April 30, 2008 | In Exchange
for U.S. $ | Unrealized
Gain |
|
|
|
|
|
07/01/2008 | 870,000 EUR | $1,350,480 | $1,371,294 | $20,814 |
|
|
|
|
|
During the year ended April 30, 2008, the Fund loaned securities to certain brokers and earned $11,705 in affiliated income relating to securities lending activity which is included in income from affiliate on the Statement of Operations. At April 30, 2008, the value of securities on loan and the total value of collateral received for securities loaned amounted to $5,439,665 and $5,556,625, respectively.
42
NOTES TO FINANCIAL STATEMENTS continued
At April 30, 2008, the Fund had the following credit default swap contracts outstanding:
Expiration | | Counterparty | | Reference
Debt
Obligation/Index | | Notional
Amount | | Fixed Payments
Made
by the Fund | | Frequency of
Payments
Made | | Unrealized
Gain (Loss) |
|
|
|
|
|
|
|
|
|
|
|
|
|
09/20/2012 | | Goldman Sachs | | PPG | | $ | 500,000 | | 0.22% | | Quarterly | | $ | 4,960 | |
| | | | Industries, | | | | | | | | | | | |
| | | | 7.05%, | | | | | | | | | | | |
| | | | 09/20/2012 | | | | | | | | | | | |
12/20/2012 | | UBS | | Dow Jones | | | 105,000 | | 3.75% | | Quarterly | | | 3,583 | |
| | | | CDX, North | | | | | | | | | | | |
| | | | American | | | | | | | | | | | |
| | | | Investment | | | | | | | | | | | |
| | | | Grade Index | | | | | | | | | | | |
12/20/2012 | | Goldman Sachs | | Dow Jones | | | 40,000 | | 3.75% | | Quarterly | | | 1,365 | |
| | | | CDX, North | | | | | | | | | | | |
| | | | American | | | | | | | | | | | |
| | | | Investment | | | | | | | | | | | |
| | | | Grade Index | | | | | | | | | | | |
12/20/2012 | | JPMorgan | | Dow Jones | | | 145,000 | | 3.75% | | Quarterly | | | 1,836 | |
| | | | CDX, North | | | | | | | | | | | |
| | | | American | | | | | | | | | | | |
| | | | Investment | | | | | | | | | | | |
| | | | Grade Index | | | | | | | | | | | |
06/20/2013 | | Lehman | | Pulte Homes, | | | 40,000 | | 4.17% | | Quarterly | | | (2,627 | ) |
| | Brothers | | Inc., 5.25%, | | | | | | | | | | | |
| | | | 01/15/2014 | | | | | | | | | | | |
06/20/2013 | | UBS | | Dow Jones | | | 55,000 | | 5.00% | | Quarterly | | | (260 | ) |
| | | | CDX, North | | | | | | | | | | | |
| | | | American | | | | | | | | | | | |
| | | | Investment | | | | | | | | | | | |
| | | | Grade Index | | | | | | | | | | | |
06/20/2013 | | Bank of | | Dow Jones | | | 25,000 | | 5.00% | | Quarterly | | | (118 | ) |
| | America | | CDX, North | | | | | | | | | | | |
| | | | American | | | | | | | | | | | |
| | | | Investment | | | | | | | | | | | |
| | | | Grade Index | | | | | | | | | | | |
03/15/2049 | | Morgan Stanley | | CMBX North | | | 5,000,000 | | 0.60% | | Quarterly | | | 1,535,654 | |
| | | | America BBB 2 | | | | | | | | | | | |
| | | | Index | | | | | | | | | | | |
|
|
|
|
|
|
|
|
|
|
|
|
|
|
|
|
43
NOTES TO FINANCIAL STATEMENTS continued
Expiration | | Counterparty | | Reference
Debt
Obligation/Index | | Notional
Amount | | Fixed Payments
Received
by the Fund | | Frequency of
Payments
Received | | Unrealized
Gain (Loss) |
|
|
|
|
|
|
|
|
|
|
|
|
|
09/20/2008 | | CitiBank | | Goldman Sachs, | | $ | 500,000 | | 0.70% | | Quarterly | | $ | 24 | |
| | | | 6.60%, | | | | | | | | | | | |
| | | | 01/01/2012 | | | | | | | | | | | |
09/20/2008 | | CitiBank | | Lehman | | | 500,000 | | 1.00% | | Quarterly | | | (1,719 | ) |
| | | | Brothers, | | | | | | | | | | | |
| | | | 6.625%, | | | | | | | | | | | |
| | | | 01/18/2012 | | | | | | | | | | | |
09/20/2008 | | JPMorgan | | Merril Lynch, | | | 500,000 | | 0.80% | | Quarterly | | | (1,908 | ) |
| | | | 5.00%, | | | | | | | | | | | |
| | | | 01/15/2015 | | | | | | | | | | | |
09/20/2008 | | JPMorgan | | Lehman | | | 500,000 | | 1.25% | | Quarterly | | | (1,075 | ) |
| | | | Brothers, | | | | | | | | | | | |
| | | | 6.625%, | | | | | | | | | | | |
| | | | 01/18/2012 | | | | | | | | | | | |
12/20/2008 | | Goldman Sachs | | Lehman | | | 500,000 | | 0.85% | | Quarterly | | | (2,104 | ) |
| | | | Brothers, | | | | | | | | | | | |
| | | | 6.625%, | | | | | | | | | | | |
| | | | 01/18/2012 | | | | | | | | | | | |
12/20/2008 | | Lehman | | Morgan Stanley, | | | 500,000 | | 1.15% | | Quarterly | | | (532 | ) |
| | Brothers | | 6.60%, | | | | | | | | | | | |
| | | | 04/01/2012 | | | | | | | | | | | |
03/20/2009 | | Goldman Sachs | | Morgan Stanley, | | | 500,000 | | 1.75% | | Quarterly | | | 2,003 | |
| | | | 6.60%, | | | | | | | | | | | |
| | | | 04/01/2012 | | | | | | | | | | | |
03/20/2009 | | Citigroup | | AIG, 6.25%, | | | 1,000,000 | | 1.55% | | Quarterly | | | 5,358 | |
| | | | 05/01/2036 | | | | | | | | | | | |
03/20/2009 | | Lehman | | AIG, 6.25%, | | | 750,000 | | 2.25% | | Quarterly | | | 9,247 | |
| | Brothers | | 05/01/2036 | | | | | | | | | | | |
09/20/2010 | | Goldman Sachs | | Duke Realty, | | | 500,000 | | 0.75% | | Quarterly | | | (17,066 | ) |
| | | | Ltd., 5.40%, | | | | | | | | | | | |
| | | | 08/15/2014 | | | | | | | | | | | |
09/20/2012 | | Morgan Stanley | | Duke Realty, | | | 500,000 | | 0.90% | | Quarterly | | | (29,565 | ) |
| | | | Ltd., 5.40%, | | | | | | | | | | | |
| | | | 08/15/2014 | | | | | | | | | | | |
06/20/2012 | | Morgan Stanley | | Dow Jones | | | 1,000,000 | | 0.35% | | Quarterly | | | (23,132 | ) |
| | | | CDX, North | | | | | | | | | | | |
| | | | American | | | | | | | | | | | |
| | | | Investment | | | | | | | | | | | |
| | | | Grade Index | | | | | | | | | | | |
06/20/2013 | | Lehman | | Centex Corp., | | | 40,000 | | 5.12% | | Quarterly | | | 2,318 | |
| | Brothers | | 5.25%, | | | | | | | | | | | |
| | | | 06/15/2015 | | | | | | | | | | | |
12/13/2049 | | Morgan Stanley | | CMBX North | | | 5,000,000 | | 2.00% | | Quarterly | | | (2,083,907 | ) |
| | | | America BBB 3 | | | | | | | | | | | |
| | | | Index | | | | | | | | | | | |
|
|
|
|
|
|
|
|
|
|
|
|
|
|
|
|
44
NOTES TO FINANCIAL STATEMENTS continued
Expiration | | Counterparty | | Reference
Debt
Obligation/Index | | Notional
Amount | | Fixed Payments
Received
by the Fund | | Frequency of
Payments
Received | | Unrealized
Gain (Loss) |
|
|
|
|
|
|
|
|
|
|
|
|
|
12/13/2049 | | Morgan Stanley | | CMBX North | | $ | 200,000 | | 0.27% | | Quarterly | | $ | (31,363 | ) |
| | | | America AA | | | | | | | | | | | |
| | | | Index | | | | | | | | | | | |
12/13/2049 | | Lehman | | CMBX North | | | 2,000,000 | | 1.47% | | Quarterly | | | 185,158 | |
| | Brothers | | America AJ 3 | | | | | | | | | | | |
| | | | Index | | | | | | | | | | | |
12/13/2049 | | Goldman Sachs | | CMBX North | | | 600,000 | | 0.27% | | Quarterly | | | (67,997 | ) |
| | | | America AA 3 | | | | | | | | | | | |
| | | | Index | | | | | | | | | | | |
12/13/2049 | | Lehman | | CMBX North | | | 800,000 | | 1.47% | | Quarterly | | | 33,165 | |
| | Brothers | | America AJ 3 | | | | | | | | | | | |
| | | | Index | | | | | | | | | | | |
02/17/2051 | | Lehman | | CMBX North | | | 300,000 | | 1.65% | | Quarterly | | | 11,408 | |
| | Brothers | | America AA 4 | | | | | | | | | | | |
| | | | Index | | | | | | | | | | | |
02/17/2051 | | Goldman Sachs | | CMBX North | | | 4,000,000 | | 1.65% | | Quarterly | | | (509,944 | ) |
| | | | America AA 4 | | | | | | | | | | | |
| | | | Index | | | | | | | | | | | |
02/17/2051 | | Lehman | | CMBX North | | | 1,000,000 | | 1.65% | | Quarterly | | | (127,486 | ) |
| | Brothers | | America AA 4 | | | | | | | | | | | |
| | | | Index | | | | | | | | | | | |
|
|
|
|
|
|
|
|
|
|
|
|
|
|
|
|
At April 30, 2008, the Fund had the following total return swap contracts outstanding:
Expiration | | Notional
Amount | | Counterparty | | Swap
Description | | Unrealized
Gain |
|
06/01/2008 | | $ | 2,000,000 | | Lehman Brothers | | Agreement dated 03/01/2008 to receive the spread return on the Lehman Brothers CMBS AAA 8.5+yr Index plus 10 basis points multiplied by the notional amount and to pay the negative spread return. | | $ | 62,882 | |
08/01/2008 | | | 11,000,000 | | Lehman Brothers | | Agreement dated 02/01/2008 to receive the spread return on the Lehman Brothers CMBS AAA 8.5+yr Index multiplied by the notional amount and to pay the negative spread return. | | | 344,965 | |
09/01/2008 | | | 5,000,000 | | Lehman Brothers | | Agreement dated 03/01/2008 to receive the spread return on the Lehman Brothers CMBS AAA 8.5+yr Index plus 100 basis points multiplied by the notional amount and to pay the negative spread return. | | | 160,830 | |
09/01/2008 | | | 2,000,000 | | Lehman Brothers | | Agreement dated 03/01/2008 to receive the spread return on the Lehman Brothers CMBS AAA 8.5+yr Index plus 125 basis points multiplied by the notional amount and to pay the negative spread return. | | | 64,735 | |
45
NOTES TO FINANCIAL STATEMENTS continued
Expiration | | Notional
Amount | | Counterparty | | Swap
Description | | Unrealized
Gain |
|
|
|
|
|
|
|
|
|
10/01/2008 | | $ | 5,000,000 | | Lehman Brothers | | Agreement dated 10/01/2007 to receive the spread return on the Lehman Brothers CMBS AAA 8.5+yr Index minus 62 basis points multiplied by the notional amount and to pay the negative spread return. | | $ | 154,305 | |
02/01/2009 | | | 9,000,000 | | Lehman Brothers | | Agreement dated 02/01/2008 to receive the spread return on the Lehman Brothers CMBS AAA 8.5+yr Index minus 40 basis points multiplied by the notional amount and to pay the negative spread return. | | | 279,344 | |
|
|
|
|
|
|
|
|
|
|
|
|
On April 30, 2008, the aggregate cost of securities for federal income tax purposes was $285,225,448. The gross unrealized appreciation and depreciation on securities based on tax cost was $7,206,403 and $20,441,648, respectively, with a net unrealized depreciation of $13,235,245.
As of April 30, 2008, the Fund had $31,625,704 in capital loss carryovers for federal income tax purposes expiring as follows:
| | | | Expiration | | | | |
|
|
|
|
|
|
|
|
|
2009 | | 2010 | | 2013 | | 2015 | | 2016 |
|
|
|
|
|
|
|
|
|
$14,769,764 | | $4,586,980 | | $4,295,612 | | $3,669,132 | | $4,304,216 |
|
|
|
|
|
|
|
|
|
These losses are subject to certain limitations prescribed by the Internal Revenue Code.
For income tax purposes, capital losses incurred after October 31 within the Fund’s fiscal year are deemed to arise on the first business day of the following fiscal year. As of April 30, 2008, the Fund incurred and will elect to defer post-October losses of $10,904.
6. INTERFUND LENDING
Pursuant to an Exemptive Order issued by the SEC, the Fund may participate in an interfund lending program with certain funds in the Evergreen fund family. This program allows the Fund to borrow from, or lend money to, other participating funds. During the year ended April 30, 2008, the Fund did not participate in the interfund lending program.
7. DISTRIBUTIONS TO SHAREHOLDERS
As of April 30, 2008, the components of distributable earnings on a tax basis were as follows:
Restated
Unrealized
Depreciation | | Capital Loss
Carryovers and
Post-October Losses | | Temporary Book/
Tax Differences |
|
|
|
|
|
$13,231,487 | | $31,636,608 | | $(426,616) |
|
|
|
|
|
The differences between the components of distributable earnings on a tax basis and the amounts reflected in the Statement of Assets and Liabilities are primarily due to wash
46
NOTES TO FINANCIAL STATEMENTS continued
sales, premium amortization, forward contracts and swap contracts. The temporary book/tax differences are a result of timing differences between book and tax recognition of income and/or expenses.
The tax character of distributions paid was as follows:
| | Year Ended April 30, |
| |
|
| | 2008 | | 2007 |
|
|
|
|
|
Ordinary Income | | $ | 10,049,340 | | $ | 17,447,562 |
Return of Capital | | | 3,978,008 | | | 247,586 |
|
|
|
|
|
|
|
8. EXPENSE REDUCTIONS
Through expense offset arrangements with ESC and the Fund’s custodian, a portion of fund expenses has been reduced.
9. DEFERRED TRUSTEES’ FEES
Each Trustee of the Fund may defer any or all compensation related to performance of his or her duties as a Trustee. The Trustees’ deferred balances are allocated to deferral accounts, which are included in the accrued expenses for the Fund. The investment performance of the deferral accounts is based on the investment performance of certain Evergreen funds. Any gains earned or losses incurred in the deferral accounts are reported in the Fund’s Trustees’ fees and expenses. At the election of the Trustees, the deferral account will be paid either in one lump sum or in quarterly installments for up to ten years.
10. FINANCING AGREEMENT
The Fund and certain other Evergreen funds share in an unsecured revolving credit commitment for temporary and emergency purposes, including the funding of redemptions, as permitted by each participating fund’s borrowing restrictions. Borrowings under this facility bear interest at 0.50% per annum above the Federal Funds rate. All of the participating funds are charged an annual commitment fee on the unused balance, which is allocated pro rata. The credit facility is for $100 million with an annual commitment fee of 0.08%. During the year ended April 30, 2008, the Fund had no borrowings.
11. REGULATORY MATTERS AND LEGAL PROCEEDINGS
Pursuant to an administrative order issued by the SEC on September 19, 2007, EIMC, EIS, ESC (collectively, the “Evergreen Entities”), Wachovia Securities, LLC and the SEC have entered into an agreement settling allegations of (i) improper short-term trading arrangements in effect prior to May 2003 involving former officers and employees of EIMC and certain broker-dealers, (ii) insufficient systems for monitoring exchanges and enforcing exchange limitations as stated in certain funds’ prospectuses, and (iii) inadequate e-mail retention practices. Under the settlement, the Evergreen Entities were censured and have paid approximately $32 million in disgorgement and penalties. This amount, along with a fine assessed by the SEC against Wachovia Securities, LLC will be
47
NOTES TO FINANCIAL STATEMENTS continued
distributed pursuant to a plan to be developed by an independent distribution consultant and approved by the SEC. The Evergreen Entities neither admitted nor denied the allegations and findings set forth in its settlement with the SEC.
In addition, the Evergreen funds and EIMC and certain of its affiliates are involved in various legal actions, including private litigation and class action lawsuits. EIMC does not expect that any of such legal actions currently pending or threatened will have a material adverse impact on the financial position or operations of any of the Evergreen funds or on EIMC’s ability to provide services to the Evergreen funds.
Although EIMC believes that none of the matters discussed above will have a material adverse impact on the Evergreen funds, there can be no assurance that these matters and any publicity surrounding or resulting from them will not result in reduced sales or increased redemptions of Evergreen fund shares, which could increase Evergreen fund transaction costs or operating expenses, or that they will not have other adverse consequences on the Evergreen funds.
12. NEW ACCOUNTING PRONOUNCEMENTS
In September 2006, FASB issued Statement of Financial Accounting Standards No. 157, Fair Value Measurements (“FAS 157”). FAS 157 establishes a single authoritative definition of fair value, establishes a framework for measuring fair value and expands disclosures about fair value measurements. FAS 157 applies to fair value measurements already required or permitted by existing standards. The change to current generally accepted accounting principles from the application of FAS 157 relates to the definition of fair value, the methods used to measure fair value, and the expanded disclosures about fair value measurements. Management of the Fund does not believe the adoption of FAS 157 will materially impact the financial statement amounts, however, additional disclosures may be required about the inputs used to develop the measurements and the effect of certain of the measurements on changes in net assets for the period. FAS 157 is effective for financial statements issued for fiscal years beginning after November 15, 2007 and interim periods within those fiscal years.
In March 2008, FASB issued Statement of Financial Accounting Standards No. 161, Disclosures about Derivative Instruments and Hedging Activities (“FAS 161”), an amendment of FASB Statement No. 133. FAS 161 requires enhanced disclosures about (a) how and why a fund uses derivative instruments, (b) how derivative instruments and hedging activities are accounted for, and (c) how derivative instruments and related hedging activities affect a fund’s financial position, financial performance, and cash flows. Management of the Fund does not believe the adoption of FAS 161 will materially impact the financial statement amounts, but will require additional disclosures. This will include qualitative and quantitative disclosures on derivative positions existing at period end and the effect of using derivatives during the reporting period. FAS 161 is effective for financial statements issued for fiscal years and interim periods beginning after November 15, 2008.
48
NOTES TO FINANCIAL STATEMENTS continued
13. RESTATEMENT INFORMATION
In connection with an internal investigation by management, and separate investigations by the SEC and the Secretary of the Commonwealth, Securities Division, of the Commonwealth of Massachusetts (which were settled June 8, 2009, see Note 14), into the circumstances surrounding the drop in net asset value of the Evergreen Ultra Short Opportunities Fund in May and June 2008, management of the Fund determined that certain structured mortgage backed investments held by the Fund were valued inaccurately for the period from July 2, 2007 to December 31, 2008. Accordingly, the Fund has restated its financial statements and the Financial Highlights for the year ended April 30, 2008. EIMC has agreed as part of the settlement to make certain reimbursement payments to shareholders in the Fund impacted by the inaccurate prices during the period.
The principal effect of this restatement is to decrease the net assets of the Fund at April 30, 2008 and the Fund’s net asset values per share at April 30, 2008. The restatement also results in a decrease to the Fund’s total return for the year ended April 30, 2008.
The effects of the restatement by line item for the periods presented in these restated financial statements are as follows:
| | Previously | | | |
| | Reported | | Restated | |
|
|
|
|
| |
Class A Financial Highlights for the year ended April 30, 2008 | | | | | | | |
Net realized and unrealized gains or losses on investments | | $ | (0.79 | ) | $ | (1.07 | ) |
Net asset value, end of period | | $ | 13.68 | | $ | 13.40 | |
Total return | | | (0.44 | )% | | (2.38 | )% |
Net assets, end of period (thousands) | | $ | 171,130 | | $ | 167,732 | |
Expenses excluding waivers/reimbursements and expense reductions | | | 1.14 | % | | 1.15 | % |
Class B Financial Highlights for the year ended April 30, 2008 | | | | | | | |
Net realized and unrealized gains or losses on investments | | $ | (0.80 | ) | $ | (1.07 | ) |
Net asset value, end of period | | $ | 13.67 | | $ | 13.40 | |
Total return | | | (1.18 | )% | | (3.18 | )% |
Net assets, end of period (thousands) | | $ | 13,894 | | $ | 13,618 | |
Expenses excluding waivers/reimbursements and expense reductions | | | 1.84 | % | | 1.85 | % |
Class C Financial Highlights for the year ended April 30, 2008 | | | | | | | |
Net realized and unrealized gains or losses on investments | | $ | (0.78 | ) | $ | (1.06 | ) |
Net asset value, end of period | | $ | 13.68 | | $ | 13.40 | |
Total return | | | (1.18 | )% | | (3.11 | )% |
Net assets, end of period (thousands) | | $ | 22,140 | | $ | 21,699 | |
Expenses excluding waivers/reimbursements and expense reductions | | | 1.84 | % | | 1.85 | % |
Class I Financial Highlights for the year ended April 30, 2008 | | | | | | | |
Net realized and unrealized gains or losses on investments | | $ | (0.77 | ) | $ | (1.05 | ) |
Net asset value, end of period | | $ | 13.68 | | $ | 13.40 | |
Total return | | | (0.19 | )% | | (2.13 | )% |
Net assets, end of period (thousands) | | $ | 48,634 | | $ | 47,668 | |
Expenses excluding waivers/reimbursements and expense reductions | | | 0.84 | % | | 0.85 | % |
Schedule of Investments as of April 30, 2008 | | | | | | | |
Acacia CDO, Ltd., Ser. 10A, Class C, FRN, 4.30%, 09/07/2046 144A | | $ | 868,810 | | $ | 0 | |
Nautilus RMBS CDO, Ltd., Ser. 2005-1A Class A3, FRN 4.23%, 07/07/2040 144A | | $ | 2,645,777 | | $ | 1,215,674 | |
Harborview NIM Corp., Ser. 2006-14, Class N2, 8.35%, 03/19/2038 144A | | $ | 908,889 | | $ | 464,874 | |
Harborview Mtge. Loan Trust, Ser. 2004-7, Class B4, 5.99%, 11/19/2034 | | $ | 1,917,670 | | $ | 621,034 | |
Harborview Mtge. Loan Trust, Ser. 2005-8, Class 2B3, 6.43%, 02/19/2035 | | $ | 1,118,653 | | $ | 77,435 | |
Total Investments | | $ | 277,070,985 | | $ | 271,990,203 | |
Net Assets | | $ | 255,798,584 | | $ | 250,717,802 | |
49
NOTES TO FINANCIAL STATEMENTS continued
| | Previously | | | |
| | Reported | | Restated | |
|
|
|
|
| |
Statement of Assets and Liabilities as of April 30, 2008 | | | | | | | |
Investments in securities, at value | | $ | 260,244,838 | | $ | 255,164,056 | |
Total investments | | $ | 277,070,985 | | $ | 271,990,203 | |
Total assets | | $ | 287,776,128 | | $ | 282,695,346 | |
Net assets represented by | | | | | | | |
Net unrealized losses on investments | | $ | (7,949,746 | ) | $ | (13,030,528 | ) |
Total net assets | | $ | 255,798,584 | | $ | 250,717,802 | |
Net assets consists of | | | | | | | |
Class A | | $ | 171,130,258 | | $ | 167,732,209 | |
Class B | | $ | 13,894,369 | | $ | 13,618,429 | |
Class C | | $ | 22,139,631 | | $ | 21,699,500 | |
Class I | | $ | 48,634,326 | | $ | 47,667,664 | |
Net asset value per share | | | | | | | |
Class A | | $ | 13.68 | | $ | 13.40 | |
Class A offering price | | $ | 14.36 | | $ | 14.07 | |
Class B | | $ | 13.67 | | $ | 13.40 | |
Class C | | $ | 13.68 | | $ | 13.40 | |
Class I | | $ | 13.68 | | $ | 13.40 | |
Statement of Operations for the year ended April 30, 2008 | | | | | | | |
Net change in unrealized gains or losses on investments | | $ | (8,064,904 | ) | $ | (13,145,686 | ) |
Net realized and unrealized gains or losses on investments | | $ | (15,459,822 | ) | $ | (20,540,604 | ) |
Net decrease in net assets resulting from operations | | $ | (1,122,651 | ) | $ | (6,203,433 | ) |
Statement of Changes in Net Assets for the year ended April 30, 2008 | | | | | | | |
Net change in unrealized gains or losses on investments | | $ | (8,064,904 | ) | $ | (13,145,686 | ) |
Net decrease in net assets resulting from operations | | $ | (1,122,651 | ) | $ | (6,203,433 | ) |
Total decrease in net assets | | $ | (40,380,195 | ) | $ | (45,460,977 | ) |
Net assets end of period | | $ | 255,798,584 | | $ | 250,717,802 | |
|
|
|
|
|
|
| |
14. SUBSEQUENT EVENT
On June 8, 2009, EIMC and EIS reached final settlements with the SEC and the Securities Division of the Secretary of the Commonwealth of Massachusetts primarily relating to the liquidation of Evergreen Ultra Short Opportunities Fund (“Ultra Short Fund”). The claims settled include the following: first, that during the period February 2007 through Ultra Short Fund’s liquidation on June 18, 2008, Ultra Short Fund’s former portfolio management team failed to properly take into account readily-available information in valuing certain non-agency residential mortgage-backed securities held by the Ultra Short Fund, resulting in the Ultra Short Fund’s net asset value (“NAV”) being overstated during the period; second, that EIMC and EIS acted inappropriately when, in an effort to explain the decline in Ultra Short Fund’s NAV, certain information regarding the decline was communicated to some, but not all, shareholders and financial intermediaries; third, that the Ultra Short Fund portfolio management team did not adhere to regulatory requirements for affiliated cross trades in executing trades with other Evergreen funds; and finally, that from at least September 2007 to August 2008, EIS did not preserve certain text and instant messages transmitted via personal digital assistant devices. In settling these matters, EIMC and EIS have agreed to payments totaling $41.125 million, up to $40.125 million of which will be distributed to eligible shareholders of Ultra Short Fund pursuant to a methodology and plan approved by the regulators. EIMC and EIS neither admitted nor denied the regulators’ conclusions.
50
REPORT OF INDEPENDENT REGISTERED PUBLIC ACCOUNTING FIRM
Board of Trustees and Shareholders
Evergreen Fixed Income Trust
We have audited the accompanying statement of assets and liabilities, including the schedule of investments, of the Evergreen Core Plus Bond Fund, formerly Evergreen Diversified Bond Fund, a series of the Evergreen Fixed Income Trust, as of April 30, 2008 and the related statement of operations for the year then ended, statements of changes in net assets for each of the years in the two-year period then ended and the financial highlights for each of the years or periods in the five-year period then ended. These financial statements and financial highlights are the responsibility of the Fund’s management. Our responsibility is to express an opinion on these financial statements and financial highlights based on our audits.
We conducted our audits in accordance with the standards of the Public Company Accounting Oversight Board (United States). Those standards require that we plan and perform the audit to obtain reasonable assurance about whether the financial statements and financial highlights are free of material misstatement. An audit includes examining, on a test basis, evidence supporting the amounts and disclosures in the financial statements. Our procedures included confirmation of securities owned as of April 30, 2008 by correspondence with the custodian and brokers, or by other appropriate auditing procedures where replies from brokers were not received. An audit also includes assessing the accounting principles used and significant estimates made by management, as well as evaluating the overall financial statement presentation. We believe that our audits provide a reasonable basis for our opinion.
In our opinion, the financial statements and financial highlights referred to above present fairly, in all material respects, the financial position of the Evergreen Core Plus Bond Fund as of April 30, 2008, the results of its operations, changes in its net assets and financial highlights for each of the periods described above, in conformity with U.S. generally accepted accounting principles.
As discussed in Note 13, the Evergreen Core Plus Bond Fund has restated its financial statements and financial highlights as of and for the year ended April 30, 2008.

Boston, Massachusetts
June 27, 2008, except for Notes 13 and 14 as to which the date is June 11, 2009
51
ADDITIONAL INFORMATION (unaudited)
FEDERAL TAX DISTRIBUTIONS
The Fund paid total distributions of $14,027,348 during the year ended April 30, 2008 of which 71.64% was from ordinary taxable and 28.36% was from a non-taxable return of capital. Shareholders of the Fund will receive in early 2009 a Form 1099-DIV that will inform them of the tax character of this distribution as well as all other distributions made by the Fund in calendar year 2008.
SPECIAL MEETING OF SHAREHOLDERS
On February 12, 2009, a Special Meeting of Shareholders for the Fund was held to consider a number of proposals. On December 1, 2008, the record date for the meeting, the Fund had $165,652,581 of net assets outstanding of which $91,806,172 (55.42%) of net assets were represented at the meeting.
Proposal 1a — To consider and act upon a new investment advisory agreement with Evergreen Investment Management Company, LLC:
|
|
|
|
Net assets voted “For” | | $ | 83,568,661 |
Net assets voted “Against” | | $ | 3,019,103 |
Net assets voted “Abstain” | | $ | 5,218,408 |
|
|
|
|
Proposal 1b — To consider and act upon a new sub-advisory agreement with First International Advisors, LLC:
|
|
|
|
Net assets voted “For” | | $ | 82,790,188 |
Net assets voted “Against” | | $ | 3,590,032 |
Net assets voted “Abstain” | | $ | 5,425,835 |
|
|
|
|
Proposal 1c — To consider and act upon a new sub-advisory agreement with Tattersall Advisory Group, Inc.:
|
|
|
|
Net assets voted “For” | | $ | 82,268,266 |
Net assets voted “Against” | | $ | 3,523,920 |
Net assets voted “Abstain” | | $ | 6,013,917 |
|
|
|
|
52
This page left intentionally blank
53
This page left intentionally blank
54
This page left intentionally blank
55
TRUSTEES AND OFFICERS
TRUSTEES1 | | |
Charles A. Austin III
Trustee
DOB: 10/23/1934
Term of office since: 1991
Other directorships: None | | Investment Counselor, Anchor Capital Advisors, LLC. (investment advice); Director, The Andover Companies (insurance); Trustee, Arthritis Foundation of New England; Former Director, The Francis Ouimet Society (scholarship program); Former Director, Executive Vice President and Treasurer, State Street Research & Management Company (investment advice) |
|
|
|
K. Dun Gifford
Trustee
DOB: 10/23/1938
Term of office since: 1974
Other directorships: None | | Chairman and President, Oldways Preservation and Exchange Trust (education); Trustee, Chairman of the Finance Committee, Member of the Executive Committee, and Former Treasurer, Cambridge College |
|
|
|
Dr. Leroy Keith, Jr.
Trustee
DOB: 2/14/1939
Term of office since: 1983
Other directorships: Trustee,
Phoenix Fund Complex
(consisting of 53 portfolios
as of 12/31/2007) | | Managing Director, Almanac Capital Management (commodities firm); Trustee, Phoenix Fund Complex; Director, Diversapack Co. (packaging company); Former Partner, Stonington Partners, Inc. (private equity fund); Former Director, Obagi Medical Products Co.; Former Director, Lincoln Educational Services |
|
|
|
Carol A. Kosel1
Trustee
DOB: 12/25/1963
Term of office since: 2008
Other directorships: None | | Former Consultant to the Evergreen Boards of Trustees; Former Vice President and Senior Vice President, Evergreen Investments, Inc.; Former Treasurer, Evergreen Funds; Former Treasurer, Vestaur Securities Fund |
|
|
|
Gerald M. McDonnell
Trustee
DOB: 7/14/1939
Term of office since: 1988
Other directorships: None | | Former Manager of Commercial Operations, CMC Steel (steel producer) |
|
|
|
Patricia B. Norris
Trustee
DOB: 4/9/1948
Term of office since: 2006
Other directorships: None | | President and Director of Buckleys of Kezar Lake, Inc. (real estate company); Former President and Director of Phillips Pond Homes Association (home community); Former Partner, PricewaterhouseCoopers, LLP (independent registered public accounting firm) |
|
|
|
William Walt Pettit
Trustee
DOB: 8/26/1955
Term of office since: 1988
Other directorships: None | | Partner and Vice President, Kellam & Pettit, P.A. (law firm); Director, Superior Packaging Corp. (packaging company); Member, Superior Land, LLC (real estate holding company), Member, K&P Development, LLC (real estate development); Former Director, National Kidney Foundation of North Carolina, Inc. (non-profit organization) |
|
|
|
David M. Richardson
Trustee
DOB: 9/19/1941
Term of office since: 1982
Other directorships: None | | President, Richardson, Runden LLC (executive recruitment advisory services); Director, J&M Cumming Paper Co. (paper merchandising); Trustee, NDI Technologies, LLP (communications); Former Consultant, AESC (The Association of Executive Search Consultants) |
|
|
|
Dr. Russell A. Salton III
Trustee
DOB: 6/2/1947
Term of office since: 1984
Other directorships: None | | President/CEO, AccessOne MedCard, Inc. |
|
|
|
56
TRUSTEES AND OFFICERS continued
Michael S. Scofield
Trustee
DOB: 2/20/1943
Term of office since: 1984
Other directorships: None | | Retired Attorney, Law Offices of Michael S. Scofield; Former Director and Chairman, Branded Media Corporation (multi-media branding company) |
|
|
|
Richard J. Shima
Trustee
DOB: 8/11/1939
Term of office since: 1993
Other directorships: None | | Independent Consultant; Director, Hartford Hospital; Trustee, Greater Hartford YMCA; Former Director, Trust Company of CT; Former Director, Old State House Association; Former Trustee, Saint Joseph College (CT) |
|
|
|
Richard K. Wagoner, CFA2
Trustee
DOB: 12/12/1937
Term of office since: 1999
Other directorships: None | | Member and Former President, North Carolina Securities Traders Association; Member, Financial Analysts Society |
|
|
|
| | |
OFFICERS | | |
| | |
Dennis H. Ferro3
President
DOB: 6/20/1945
Term of office since: 2003 | | Principal occupations: President and Chief Executive Officer, Evergreen Investment Company, Inc. and Executive Vice President, Wachovia Bank, N.A.; former Chief Investment Officer, Evergreen Investment Company, Inc. |
|
|
|
Kasey Phillips4
Treasurer
DOB: 12/12/1970
Term of office since: 2005 | | Principal occupations: Senior Vice President, Evergreen Investment Management Company, LLC; Former Vice President, Evergreen Investment Services, Inc.; Former Assistant Vice President, Evergreen Investment Services, Inc. |
|
|
|
Michael H. Koonce4
Secretary
DOB: 4/20/1960
Term of office since: 2000 | | Principal occupations: Senior Vice President and General Counsel, Evergreen Investment Services, Inc.; Secretary, Senior Vice President and General Counsel, Evergreen Investment Management Company, LLC and Evergreen Service Company, LLC; Senior Vice President and Assistant General Counsel, Wachovia Corporation |
|
|
|
Robert Guerin4
Chief Compliance Officer
DOB: 9/20/1965
Term of office since: 2007 | | Principal occupations: Chief Compliance Officer, Evergreen Funds and Senior Vice President of Evergreen Investments Co., Inc.; Former Managing Director and Senior Compliance Officer, Babson Capital Management LLC; Former Principal and Director, Compliance and Risk Management, State Street Global Advisors; Former Vice President and Manager, Sales Practice Compliance, Deutsche Asset Management |
|
|
|
1 | Each Trustee, except Mses. Kosel and Norris, serves until a successor is duly elected or qualified or until his or her death, resignation, retirement or removal from office. As new Trustees, Ms. Kosel’s and Ms. Norris’ initial terms end December 31, 2010 and June 30, 2009, respectively, at which times they may be re-elected by Trustees to serve until a successor is duly elected or qualified or until her death, resignation, retirement or removal from office by the Trustees. Each Trustee, except Ms. Kosel, oversaw 94 Evergreen funds as of December 31, 2007. Ms. Kosel became a Trustee on January 1, 2008. Correspondence for each Trustee may be sent to Evergreen Board of Trustees, P.O. Box 20083, Charlotte, NC 28202. |
2 | Mr. Wagoner is an “interested person” of the Fund because of his ownership of shares in Wachovia Corporation, the parent to the Fund’s investment advisor. |
3 | The address of the Officer is 401 S. Tryon Street, 20th Floor, Charlotte, NC 28288. |
4 | The address of the Officer is 200 Berkeley Street, Boston, MA 02116. |
Additional information about the Fund’s Board of Trustees and Officers can be found in the Statement of Additional Information (SAI) and is available upon request without charge by calling 800.343.2898.
57

566659 rv5 06/2008
Item 2 - Code of Ethics
(a) The Registrant has adopted a code of ethics that applies to the Registrant’s principal executive officer and principal financial officer.
(b) During the period covered by this report, there were no amendments to the provisions of the code of ethics adopted in 2.(a) above.
(c) During the period covered by this report, there were no implicit or explicit waivers to the provisions of the code of ethics adopted in 2.(a) above.
Item 3 - Audit Committee Financial Expert
Charles A. Austin III and Patricia B. Norris have been determined by the Registrant’s Board of Trustees to be audit committee financial experts within the meaning of Section 407 of the Sarbanes-Oxley Act. These financial experts are independent of management.
Items 4 – Principal Accountant Fees and Services
The following table represents fees for professional audit services rendered by KPMG LLP, for the audits of each of the five series of the Registrant’s annual financial statements for the fiscal years ended April 30, 2008 and April 30, 2007, and fees billed for other services rendered by KPMG LLP.
| | 2008 | | 2007 | |
| |
| |
| |
Audit fees | | $ | 149,300 | | $ | 136,900 | |
Audit-related fees (1) | | | 6,200 | | | 0 | |
Tax fees (2) | | | 8,182 | | | 360 | |
Non-audit fees (3) | | | 1,162,374 | | | 808,367 | |
All other fees | | | 0 | | | 0 | |
(1) | Audit-related fees consists primarily of fees for merger activity. |
(2) | Tax fees consists of fees for tax consultation, tax compliance and tax review. |
(3) | Non-audit fees consists of the aggregate fees for non-audit services rendered to the Fund, EIMC (not including any sub-advisor whose role is primarily portfolio management and is subcontracted with or overseen by another investment advisor) and EIS. |
Evergreen Funds
Evergreen Income Advantage Fund
Evergreen Multi-Sector Income Fund
Evergreen Utilities and High Income Fund
Evergreen International Balanced Income Fund
Evergreen Global Dividend Opportunity Fund
Audit and Non-Audit Services Pre-Approval Policy
I. Statement of Principles
Under the Sarbanes-Oxley Act of 2002 (the “Act”), the Audit Committee of the Board of Trustees/Directors is responsible for the appointment, compensation and oversight of the work of the independent auditor. As part of this responsibility, the Audit Committee is required to pre-approve the audit and non-audit services performed by the independent auditor in order to assure that they do not impair the auditor’s independence from the Funds. To implement these provisions of the Act, the Securities and Exchange Commission (the “SEC”) has issued rules specifying the types of services that an independent auditor may not provide to its audit client, as well as the audit committee’s administration of the engagement of the independent auditor. Accordingly, the Audit Committee has adopted, and the Board of Trustees/Directors has ratified, the Audit and Non-Audit Services Pre Approval Policy (the “Policy”),
which sets forth the procedures and the conditions pursuant to which services proposed to be performed by the independent auditor may be pre-approved.
The SEC’s rules establish two different approaches to pre-approving services, which the SEC considers to be equally valid. Proposed services either: may be pre-approved without consideration of specific case-by-case services by the Audit Committee (“general pre-approval”); or require the specific pre-approval of the Audit Committee (“specified pre-approval”). The Audit Committee believes that the combination of these two approaches in this Policy will result in an effective and efficient procedure to pre-approve services performed by the independent auditor. As set forth in this Policy, unless a type of service has received general pre-approval, it will require specific pre-approval by the Audit Committee if it is to be provided by the independent auditor. Any proposed services exceeding pre-approved cost levels or budgeted amounts will also require specific pre-approval by the Audit Committee.
For both types of pre-approval, the Audit Committee will consider whether such services are consistent with the SEC’s rules on auditor independence. The Audit Committee will also consider whether the independent auditor is best positioned to provide the most effective and efficient service, for reasons such as its familiarity with the Funds’ business people, culture, accounting systems, risk profile and other factors, and whether the service might enhance the Funds’ ability to manage or control risk or improve audit quality. All such factors will be considered as a whole, and no one factor should necessarily be determinative.
The Audit Committee is also mindful of the relationship between fees for audit and non-audit services in deciding whether to pre-approve any such services and may determine, for each fiscal year, the ratio between the total amount of fees for Audit, Audit-related and Tax services and the total amount of fees for certain permissible non-audit services classified as All Other services.
The term of any general pre-approval is 12 months from the date of pre-approval, unless the Audit Committee considers a different period and states otherwise. The Audit Committee will annually review and pre-approve the services that may be provided by the independent auditor without obtaining specific pre-approval from the Audit Committee. The Audit Committee will add or subtract to the list of general pre-approved services from time to time, based on subsequent determinations.
The purpose of this Policy is to set forth the procedures by which the Audit Committee intends to fulfill its responsibilities. It does not delegate the Audit Committee’s responsibilities to pre-approve services performed by the independent auditor to management.
The independent auditor has reviewed this Policy and believes that implementation of the policy will not adversely affect the auditor’s independence.
II. Delegation
As provided in the Act and the SEC’s rules, the Audit Committee may delegate either type of pre-approval authority to one or more of its members. The member to whom such authority is delegated must report, for informational purposes only, any pre-approval decisions of the Audit Committee at its next scheduled meeting.
III. Audit Services
The annual Audit services engagement terms and fees will be subject to the specific pre-approval of the Audit Committee. Audit services include the annual financial statement audit and other procedures required to be performed by the independent auditor to be able to form an opinion on the Funds’ financial statements. These other procedures include information systems and procedural reviews and testing performed in order to understand and place reliance on the systems of internal control, and consultations relating to the audit. Audit services also include the attestation engagement for the independent auditor’s report on management’s report on internal controls for financial reporting. The Audit Committee will monitor the Audit services engagement as necessary, but no less than on a quarterly basis, and will also approve, if necessary, any changes in terms, conditions and fees resulting from changes in audit scope, Fund service providers or other items.
In addition to the annual Audit services engagement approved by the Audit Committee, the Audit Committee may grant general pre-approval to other Audit services, which are those services that only the independent auditor reasonably can provide. Other Audit services may include services associated with SEC registration statements, periodic reports and other documents filed with the SEC or other documents issued in connection with mergers or acquisitions.
IV. Audit-related Services
Audit-related services are assurance and related services that are reasonably related to the performance of the audit or review of the Funds’ financial statements or that are traditionally performed by the independent auditor. Because the Audit Committee believes that the provision of Audit-related services does not impair the independence of the auditor and is consistent with SEC’s rules on auditor independence, the Audit Committee may grant general pre-approval to Audit-related services. Audit-related services include, among others, due diligence services pertaining to potential business acquisitions/dispositions; accounting consultations related to accounting, financial reporting or disclosure matters not classified as “Audit services”; assistance with understanding and implementing new accounting and financial reporting guidance from rulemaking authorities; agreed-upon or expanded audit procedures related to accounting records required to respond to or comply with financial, accounting or regulatory reporting matters; and assistance with internal control reporting requirements.
V. Tax Services
The Audit Committee believes that the independent auditor can provide Tax services to the Funds such as tax compliance, tax planning and tax advice without impairing the auditor’s independence, and the SEC has stated that the independent auditor may provide such services. Hence, the Audit Committee believes it may grant general pre-approval to those Tax services that have historically been provided by the auditor, that the Audit Committee has reviewed and believes would not impair the independence of the auditor, and that are consistent with the SEC’s rules on auditor independence. The Audit Committee will not permit the retention of the independent auditor in connection with a transaction initially recommended by the independent auditor, the sole business purpose of which may be tax avoidance and the tax treatment of which may not be supported in the Internal Revenue Code and related regulations. The Audit Committee will consult with the Director of Fund Administration, the Vice President of Tax Services or outside counsel to determine that the tax planning and reporting positions are consistent with this policy.
All Tax services involving large and complex transactions must be specifically pre-approved by the Audit Committee, including: tax services proposed to be provide by the independent auditor to any executive officer or director of the Funds, in his or her individual capacity, where such services are paid for by the Funds or the investment advisor.
VI. All Other Services
The Audit Committee believes, based on the SEC’s rules prohibiting the independent auditor from providing specific non-audit services, that other types of non-audit services are permitted. Accordingly, the Audit Committee believes it may grant general pre-approval to those permissible non-audit services classified as All Other services that it believes are routine and recurring services, would not impair the independence of the auditor and are consistent with the SEC’s rules on auditor independence.
The SEC’s rules and relevant guidance should be consulted to determine the precise definitions of the SEC’s prohibited non-audit services and the applicability of exceptions to certain of the prohibitions.
VII. Pre-Approval Fee Levels or Budgeted Amounts
Pre-approval fee levels or budgeted amounts for all services to be provided by the independent auditor will be established annually by the Audit Committee. Any proposed services exceeding these levels or amounts will require specific pre-approval by the Audit Committee. The Audit Committee is mindful of the overall relationship of fees for audit and non-audit services in determining whether to pre-approve any such services. For each fiscal year, the Audit Committee may determine to ratio between the total amount of fees for Audit, Audit-related and Tax services, and the total amount of fees for services classified as All Other services.
VIII. Procedures
All requests or applications for services to be provided by the independent auditor that do not require specific approval by the Audit Committee will be submitted to the Director of Fund Administration or Assistant Director of Fund Administration and must include a detailed description of the services to be rendered. The Director/Assistant Director of Fund Administration will determine whether such services are included within the list of services that have received the general pre-approval of the Audit Committee. The Audit Committee will be informed on a quarterly basis (or more frequent if requested by the audit committee) of any such services rendered by the independent auditor.
Request or applications to provide services that require specific approval by the Audit Committee will be submitted to the Audit Committee by both the independent auditor and the Director/Assistant Director of Fund Administration, and must include a joint statement as to whether, in their view, the request or application is consistent with the SEC’s rules on auditor independence.
The Audit Committee has designated the Chief Compliance Officer to monitor the performance of all services provided by the independent auditor and to determine whether such services are in compliance with this policy. The Chief Compliance Officer will report to the Audit Committee on a periodic basis on the results of its monitoring. Both the Chief Compliance Officer and management will immediately report to the chairman of the Audit Committee any breach of this policy that comes to the attention of the Chief Compliance Officer or any member of management.
The Audit Committee will also review the internal auditor’s annual internal audit plan to determine that the plan provides for the monitoring of the independent auditor’s services.
IX. Additional Requirements
The Audit Committee has determined to take additional measures on an annual basis to meet its responsibility to oversee the work of the independent auditor and to assure the auditor’s independence from the Funds, such as reviewing a formal written statement from the independent auditor delineating all relationships between the independent auditor and the Funds, the Funds’ investment advisor and related parties of the investment advisor, consistent with Independence Standards Board Standard No. 1, and discussing with the independent auditor its methods and procedures for ensuring independence.
Items 5 – Audit Committee of Listed Registrants
On January 1, 2009, Patricia B. Norris replaced Charles A. Austin III as chair of the Audit Committee.
Item 6 – Schedule of Investments
Please see schedule of investments contained in the Report to Stockholders included under Item 1 of this Form N-CSR.
Item 7 – Disclosure of Proxy Voting Policies and Procedures for Closed-End Management Investment Companies.
Not applicable.
Item 8 – Portfolio Managers of Closed-End Management Investment Companies.
Not applicable.
Item 9 – Purchases of Equity Securities by Closed-End Management Investment Company and Affiliated Purchasers.
Not applicable.
Item 10 – Submission of Matters to a Vote of Security Holders
There have been no material changes to the procedures by which shareholders may recommend nominees to the Registrant’s board of trustees that have been implemented since the Registrant last provided disclosure in response to the requirements of this Item.
Item 11 - Controls and Procedures
(a) | The Registrant’s principal executive officer and principal financial officer have evaluated the Registrant’s disclosure controls and procedures (as defined in Rule 30a-3(c) under the Investment Company Act of 1940) within 90 days of this filing and have concluded that the Registrant’s disclosure controls and procedures were effective, as of that date, in ensuring that information required to be disclosed by the Registrant in this Form N-CSR was recorded, processed, summarized, and reported timely. |
(b) | The Registrant’s valuation controls and monitoring, and information and communication controls over valuations were strengthened subsequent to April 30, 2008 but prior to the filing date of this restated report to include the following. |
In cases where a security is valued using models developed or applied internally by a portfolio manager, the portfolio manager’s supervisor reviews and approve the model before its use. Further, representatives of the Registrant’s advisor periodically perform sample tests of the operating effectiveness of these models and the values generated and provide the results to the adviser’s senior management
The Valuation Committee that is responsible for monitoring the valuation of the Registrant’s investments added to its membership the Chief Investment Officer of the Registrant’s advisor (the “CIO”). The CIO has extensive experience with and knowledge of fixed income investments. The CIO co-chairs the Valuation Committee.
The Valuation Committee receives additional comparison vendor reporting for cases where a change is made in the pricing vendor for a particular security at the request of the portfolio management team. The Valuation Committee considers the reasons for and the appropriateness of these changes.
Representatives of the Registrant’s advisor have increased the frequency with which they run tests that compare the fair value provided by a pricing vendor used for a particular investment with inputs from one or more other pricing vendors, when available. Results are shared with portfolio management to determine if price challenges or other measures may be appropriate.
Additional training and education was provided to individuals performing subsequent sales testing and additional levels of review and reporting were added for situations where the price at which a particular investment is sold deviates by more than a certain amount from the price at which the investment was valued prior to its sale.
Item 12 - Exhibits
File the exhibits listed below as part of this Form. Letter or number the exhibits in the sequence indicated.
(a) | Any code of ethics, or amendment thereto, that is the subject of the disclosure required by Item 2, to the extent that the Registrant intends to satisfy the Item 2 requirements through filing of an exhibit. |
(b)(1) | Separate certifications for the Registrant’s principal executive officer and principal financial officer, as required by Section 302 of the Sarbanes-Oxley Act of 2002 and Rule 30a-2(a) under the Investment Company Act of 1940, are attached as EX99.CERT. |
(b)(2) | Separate certifications for the Registrant’s principal executive officer and principal financial officer, as required by Section 1350 of Title 18 of United States Code, as adopted pursuant to Section 906 of the Sarbanes-Oxley Act of 2002, and Rule 30a-2(b) under the Investment Company Act of 1940, are attached as EX99.906CERT. The certifications furnished pursuant to this paragraph are not deemed to be “filed” for purposes of Section 18 of the Securities Exchange Act of 1934, or otherwise subject to the liability of that section. Such certifications are not deemed to be incorporated by reference into any filing under the Securities Act of 1933 or the Securities Exchange Act of 1934, except to the extent that the Registrant specifically incorporates them by reference. |
Pursuant to the requirements of the Securities Exchange Act of 1934 and the Investment Company Act of 1940, the Registrant has duly caused this report to be signed on its behalf by the undersigned, thereunto duly authorized.
Evergreen Fixed Income Trust
By: | /s/ W. Douglas Munn | | | |
|
| | | |
| W. Douglas Munn
Principal Executive Officer | | | |
Date: June 11, 2009
Pursuant to the requirements of the Securities Exchange Act of 1934 and the Investment Company Act of 1940, this report has been signed below by the following persons on behalf of the Registrant and in the capacities and on the dates indicated.
By: | /s/ W. Douglas Munn | | | |
|
| | | |
| W. Douglas Munn
Principal Executive Officer | | | |
Date: June 11, 2009
By: | /s/ Kasey Phillips | | | |
|
| | | |
| Kasey Phillips
Principal Financial Officer | | | |
Date: June 11, 2009