UNITED STATES
SECURITIES AND EXCHANGE COMMISSION
Washington, D.C. 20549
FORM N-CSR
CERTIFIED SHAREHOLDER REPORT OF REGISTERED
MANAGEMENT INVESTMENT COMPANIES
Investment Company Act file number 811-08789
VALIC Company II
(Exact name of registrant as specified in charter)
2929 Allen Parkway, Houston, TX 77019
(Address of principal executive offices) (Zip code)
John T. Genoy
President
The Variable Annuity Life Insurance Company
2929 Allen Parkway
Houston, TX 77019
(Name and address of agent for service)
Registrant’s telephone number, including area code: (201) 324-6414
Date of fiscal year end: August 31
Date of reporting period: August 31, 2015
Item 1. Reports to Stockholders

VALIC Company II
Annual Report, August 31, 2015
SAVING :INVESTING :PLANNING
VALIC Company II
ANNUAL REPORT AUGUST 31, 2014
TABLE OF CONTENTS
VALIC Company II
PRESIDENT’S LETTER
Dear Valued Investor:
We are pleased to provide you with the following Annual Report for VALIC Company II. The report contains the investment portfolio information and the financial statements of VALIC Company II for the twelve-month period ending August 31, 2015. We encourage you to carefully read this report and hope you find it informative and helpful.
Domestically, the total return for the S&P 500® Index*, widely regarded as the best single gauge of the U.S. equity market, ended up 0.48%. The MSCI EAFE Index (net)**, designed to measure the equity market performance of developed foreign markets (Europe, Australasia, Far East), excluding the U.S. and Canada, declined -7.47%. The domestic bond market experienced respectable returns, with the Barclays U.S. Aggregate Bond Index***, a broad measure of the bond market, rising 1.56%.
Due to signs of a steeper than expected economic slowdown in China, U.S. stocks fell in August, igniting global market volatility. The S&P 500® Index suffered its sharpest monthly decline in over three years. Additionally, most of the major indices entered correction territory—defined as a drop of 10% from the most recent peak. With falling oil prices and weakening economies elsewhere, the U.S. dollar continued to strengthen. Job growth and job creation have begun to pick up pace. Additionally, U.S. companies reported an upward trend in corporate margins and profits along with renewed merger and acquisition activity, both signs of a strengthening domestic economy.
Towards the end of the period, reports began to show a slowdown in Chinese exports, as well as a drop in manufacturing. In August, the Chinese government announced it would permit the yuan to fall against the U.S. dollar, in an effort to make Chinese goods cheaper in overseas markets. Global markets reacted negatively to the Chinese devaluation of its currency.
The bond market picked up steam over the period, as equities faltered.
Planning for your financial future in such an uncertain world should be a top priority. Your investment with VALIC Company II is an important step to help you reach your long-term financial goals. Another important step, we believe, is to meet with your financial advisor periodically to ensure that you maintain a diversified portfolio appropriate for your goals and risk tolerance.
We appreciate being part of your investment program and thank you for your ongoing confidence in us. We look forward to helping you meet your investment goals in the years ahead.
Sincerely,

John T. Genoy, President
VALIC Company II
| * | The S&P 500® Index is an index of the stocks of 500 major large-cap U.S. corporations, chosen for market size, liquidity, and industry group representation. It is a market-value weighted index, with each stock’s percentage in the Index in proportion to its market value. |
| ** | The MSCI EAFE Index (net) is a free float-adjusted market capitalization index that is designed to measure the equity market performance of developed markets, excluding the U.S. and Canada. The index is comprised of the MSCI country indices that represent developed markets outside of North America, Europe, Australasia and the Far East. Net total return indices reinvest dividends after the deduction of withholding taxes, using (for international indices) a tax rate applicable to non-resident institutional investors who do not benefit from double taxation treaties. |
| *** | The Barclays U.S. Aggregate Bond Index is a broad based benchmark that measures the investment grade, U.S. dollar-denominated, fixed-rate taxable bond market that includes Treasuries, government-related and corporate securities, MBS (agency fixed-rate and hybrid ARM pass throughs), ABS, and CMBC (agency and non-agency). |
Indices are not managed and an investor cannot invest directly into an index. Past performance of an index does not guarantee the future performance of any investment.
1
VALIC Company II
EXPENSE EXAMPLE — August 31, 2015 (unaudited)
Disclosure of Fund Expenses in Shareholder Reports
As a shareholder of a Fund in VALIC Company II (“VC II”), you incur ongoing costs, including management fees and other Fund expenses. This Example is intended to help you understand your ongoing costs (in dollars) of investing in the Funds and to compare these costs with the ongoing costs of investing in other mutual funds. The Example is based on an investment of $1,000 invested at March 1, 2015 and held until August 31, 2015. Shares of VC II are currently issued and redeemed only in connection with investments in and payments under variable annuity contracts and variable life insurance policies (“Variable Contracts”), qualified retirement plans (the “Plans”) and Individual Retirement Plan Accounts (“IRA”) offered by The Variable Annuity Life Insurance Company (“VALIC”), the investment adviser to VC II and other life insurance companies affiliated with VALIC. The fees and expenses associated with the Variable Contracts, Plans and IRA’s are not included in these Examples, and had such fees and expenses been included, your costs would have been higher. Please see your Variable Contract prospectus or Plan/IRA documents for more details on the fees associated with the Variable Contract, Plans or IRA’s.
Actual Expenses
The “Actual” section of the table provides information about your actual account values and actual expenses. You may use the information in these columns, together with the amount you invested, to estimate the expenses that you paid over the period. Simply divide your account value by $1,000 (for example, an $8,600 account value divided by $1,000 = 8.6), then multiply the result by the number in the column under the heading entitled “Expenses Paid During the Six Months Ended August 31, 2015” to estimate the expenses you paid on your account during this period. The “Expenses Paid During the Six Months Ended August 31, 2015” column and the “Annualized Expense Ratio” column do not include fees and expenses that may be charged by the Variable Contracts, Plans and IRA’s, in which the Funds are offered. Had these fees and expenses been included, the “Expenses Paid During the Six Months Ended August 31, 2015” column would have been higher and the “Ending Account Value” column would have been lower.
Hypothetical Example for Comparison Purposes
The “Hypothetical” section of the table provides information about hypothetical account values and hypothetical expenses based on each Fund’s actual expense ratio and an annual rate of return of 5% before expenses, which is not the Fund’s actual return. The hypothetical account values and expenses may not be used to estimate the actual ending account balance or expenses you paid for the period. You may use this information to compare the ongoing costs of investing in the Funds and other funds. To do so, compare this 5% hypothetical example with the 5% hypothetical examples that appear in the shareholder reports of other funds. The “Expenses Paid During the Six Months Ended August 31, 2015” column and the “Annualized Expense Ratio” column do not include fees and expenses that may be charged by the Variable Contracts, Plans or IRA’s in which the Funds are offered. Had these fees and expenses been included, the “Expenses Paid During the Six Months Ended August 31, 2015” column would have been higher and the “Ending Account Value” column would have been lower.
Please note that the expenses shown in the table are meant to highlight your ongoing costs only and do not reflect any fees and expenses that may be charged by the Variable Contracts, Plans or IRA’s. Please refer to your Variable Contract prospectus or Plan/IRA document for more information. Therefore, the “hypothetical” example is useful in comparing ongoing costs and will not help you determine the relative total costs of owning different funds. In addition, if these fees and expenses were included, your costs would have been higher.
2
VALIC Company II
EXPENSE EXAMPLE — August 31, 2015 (unaudited) — (continued)
| | | | | | | | | | | | | | | | | | | | | | | | | | | | |
| | | Actual
| | | Hypothetical
| |
Fund
| | Beginning
Account Value
at March 1,
2015
| | | Ending
Account Value
Using Actual
Return at
August 31,
2015
| | | Expenses Paid
During the Six
Months Ended
August 31,
2015*
| | | Beginning
Account Value
at March 1,
2015
| | | Ending
Account Value
Using a
Hypothetical
5% Annual
Return at
March 1,
2015
| | | Expenses Paid
During the
Six Months Ended
August 31,
2015*
| | | Annualized
Expense
Ratio
| |
Aggressive Growth Lifestyle# | | $ | 1,000.00 | | | $ | 951.71 | | | $ | 0.49 | | | $ | 1,000.00 | | | $ | 1,024.70 | | | $ | 0.51 | | | | 0.10 | % |
Capital Appreciation# | | $ | 1,000.00 | | | $ | 968.79 | | | $ | 4.22 | | | $ | 1,000.00 | | | $ | 1,020.92 | | | $ | 4.33 | | | | 0.85 | % |
Conservative Growth Lifestyle# | | $ | 1,000.00 | | | $ | 966.16 | | | $ | 0.50 | | | $ | 1,000.00 | | | $ | 1,024.70 | | | $ | 0.51 | | | | 0.10 | % |
Core Bond# | | $ | 1,000.00 | | | $ | 988.42 | | | $ | 3.86 | | | $ | 1,000.00 | | | $ | 1,021.32 | | | $ | 3.92 | | | | 0.77 | % |
High Yield Bond# | | $ | 1,000.00 | | | $ | 976.13 | | | $ | 4.78 | | | $ | 1,000.00 | | | $ | 1,020.37 | | | $ | 4.89 | | | | 0.96 | % |
International Opportunities# | | $ | 1,000.00 | | | $ | 999.16 | | | $ | 5.04 | | | $ | 1,000.00 | | | $ | 1,020.16 | | | $ | 5.09 | | | | 1.00 | % |
Large Cap Value# | | $ | 1,000.00 | | | $ | 940.02 | | | $ | 3.96 | | | $ | 1,000.00 | | | $ | 1,021.12 | | | $ | 4.13 | | | | 0.81 | % |
Mid Cap Growth# | | $ | 1,000.00 | | | $ | 961.51 | | | $ | 4.20 | | | $ | 1,000.00 | | | $ | 1,020.92 | | | $ | 4.33 | | | | 0.85 | % |
Mid Cap Value# | | $ | 1,000.00 | | | $ | 944.35 | | | $ | 5.15 | | | $ | 1,000.00 | | | $ | 1,019.91 | | | $ | 5.35 | | | | 1.05 | % |
Moderate Growth Lifestyle# | | $ | 1,000.00 | | | $ | 959.11 | | | $ | 0.49 | | | $ | 1,000.00 | | | $ | 1,024.70 | | | $ | 0.51 | | | | 0.10 | % |
Money Market II# | | $ | 1,000.00 | | | $ | 1,000.05 | | | $ | 0.76 | | | $ | 1,000.00 | | | $ | 1,024.45 | | | $ | 0.77 | | | | 0.15 | % |
Small Cap Growth# | | $ | 1,000.00 | | | $ | 969.17 | | | $ | 5.76 | | | $ | 1,000.00 | | | $ | 1,019.36 | | | $ | 5.90 | | | | 1.16 | % |
Small Cap Value# | | $ | 1,000.00 | | | $ | 937.46 | | | $ | 4.64 | | | $ | 1,000.00 | | | $ | 1,020.42 | | | $ | 4.84 | | | | 0.95 | % |
Socially Responsible# | | $ | 1,000.00 | | | $ | 949.68 | | | $ | 2.75 | | | $ | 1,000.00 | | | $ | 1,022.38 | | | $ | 2.85 | | | | 0.56 | % |
Strategic Bond | | $ | 1,000.00 | | | $ | 978.49 | | | $ | 4.39 | | | $ | 1,000.00 | | | $ | 1,020.77 | | | $ | 4.48 | | | | 0.88 | % |
| * | Expenses are equal to each Fund‘s annualized expense ratio multiplied by the average account value over the period, multiplied by 184 days then divided by 365 days (to reflect the one-half year period) . These ratios do not reflect fees and expenses associated with the Variable Contracts, Plans or IRA‘s. If such fees and expenses had been included, the expenses would have been higher. Please refer to your Variable Contract prospectus for details on the expenses that apply to the Variable Contracts or your Plan/IRA document for details on the administration fees charged by your Plan sponsor. |
| # | During the stated period, the investment adviser waived a portion of or all fees and assumed a portion of or all expenses for the Fund. As a result, if these fees and expenses had not been waived or assumed, the “Actual/Hypothetical Ending Account Value” would have been lower and the “Actual/Hypothetical Expenses Paid During the Six Months Ended August 31, 2015” and the “Annualized Expense Ratio” would have been higher. |
3
VALIC Company II Aggressive Growth Lifestyle Fund
PORTFOLIO PROFILE — August 31, 2015 (unaudited)
Industry Allocation*
| | | | |
Domestic Equity Investment Companies | | | 44.3 | % |
Domestic Fixed Income Investment Companies | | | 24.2 | |
International Equity Investment Companies | | | 24.2 | |
Real Estate Investment Companies | | | 7.3 | |
| | |
|
|
|
| | | | 100.0 | % |
| | |
|
|
|
| * | Calculated as a percentage of net assets |
4
VALIC Company II Aggressive Growth Lifestyle Fund
PORTFOLIO OF INVESTMENTS — August 31, 2015
| | | | | | | | |
| | |
| Security Description | | Shares | | | Value (Note 2) | |
| |
AFFILIATED REGISTERED INVESTMENT COMPANIES#(1) — 100.0% | |
Domestic Equity Investment Companies — 44.3% | |
VALIC Co. I Blue Chip Growth Fund | | | 1,467,575 | | | $ | 25,770,615 | |
VALIC Co. I Dividend Value Fund | | | 547,394 | | | | 6,809,583 | |
VALIC Co. I Mid Cap Index Fund | | | 783,452 | | | | 20,824,165 | |
VALIC Co. I Mid Cap Strategic Growth Fund | | | 436,489 | | | | 6,281,073 | |
VALIC Co. I Nasdaq-100 Index Fund | | | 1,598,407 | | | | 15,744,312 | |
VALIC Co. I Science & Technology Fund | | | 521,914 | | | | 12,927,808 | |
VALIC Co. I Small Cap Index Fund | | | 1,274,770 | | | | 25,240,442 | |
VALIC Co. I Small Cap Special Values Fund | | | 597,399 | | | | 7,706,450 | |
VALIC Co. I Stock Index Fund | | | 548,972 | | | | 18,884,635 | |
VALIC Co. I Value Fund | | | 122,755 | | | | 1,751,711 | |
VALIC Co. II Capital Appreciation Fund | | | 950,120 | | | | 15,534,457 | |
VALIC Co. II Large Cap Value Fund | | | 367,057 | | | | 6,269,332 | |
VALIC Co. II Mid Cap Growth Fund | | | 883,288 | | | | 7,781,765 | |
VALIC Co. II Mid Cap Value Fund | | | 1,280,872 | | | | 27,948,619 | |
VALIC Co. II Small Cap Growth Fund | | | 696,251 | | | | 10,659,610 | |
VALIC Co. II Small Cap Value Fund | | | 1,083,136 | | | | 15,174,736 | |
| | | | | | |
|
|
|
Total Domestic Equity Investment Companies | | | | | | | | |
(cost $196,973,340) | | | | | | | 225,309,313 | |
| | | | | | |
|
|
|
Domestic Fixed Income Investment Companies — 24.2% | |
VALIC Co. I Capital Conservation Fund | | | 1,225,637 | | | | 12,084,780 | |
VALIC Co. I Government Securities Fund | | | 1,084,219 | | | | 11,720,409 | |
VALIC Co. I Inflation Protected Fund | | | 573,971 | | | | 6,147,229 | |
VALIC Co. II Core Bond Fund | | | 4,034,797 | | | | 44,100,331 | |
VALIC Co. II High Yield Bond Fund | | | 2,842,361 | | | | 21,033,471 | |
VALIC Co. II Strategic Bond Fund | | | 2,564,029 | | | | 28,204,318 | |
| | | | | | |
|
|
|
Total Domestic Fixed Income Investment Companies | | | | | | | | |
(cost $126,882,763) | | | | | | | 123,290,538 | |
| | | | | | |
|
|
|
| | | | | | | | |
| | |
| Security Description | | Shares | | | Value (Note 2) | |
| |
| | | | | | | | | |
International Equity Investment Companies — 24.2% | |
VALIC Co. I Emerging Economies Fund | | | 1,317,764 | | | $ | 8,512,756 | |
VALIC Co. I Foreign Value Fund | | | 2,714,606 | | | | 25,055,812 | |
VALIC Co. I International Equities Index Fund | | | 8,220,648 | | | | 53,598,627 | |
VALIC Co. I International Growth Fund | | | 2,017,894 | | | | 26,111,544 | |
VALIC Co. II International Opportunities Fund | | | 659,452 | | | | 9,944,537 | |
| | | | | | |
|
|
|
Total International Equity Investment Companies | | | | | | | | |
(cost $132,421,215) | | | | | | | 123,223,276 | |
| | | | | | |
|
|
|
Real Estate Investment Companies — 7.3% | |
VALIC Co. I Global Real Estate Fund
(cost $37,960,261) | | | 4,595,835 | | | | 37,088,386 | |
| | | | | | |
|
|
|
TOTAL INVESTMENTS | | | | | | | | |
(cost $494,237,579)(2) | | | 100.0 | % | | | 508,911,513 | |
Liabilities in excess of other assets | | | (0.0 | ) | | | (21,461 | ) |
| | |
|
|
| |
|
|
|
NET ASSETS | | | 100.0 | % | | $ | 508,890,052 | |
| | |
|
|
| |
|
|
|
| # | The Aggressive Growth Lifestyle Fund invests in various VALIC Company I or VALIC Company II Funds, some of which are not presented in this report. Additional information on the underlying funds including such fund’s prospectuses and shareholder reports is available at our website, www.valic.com. |
| (2) | See Note 5 for cost of investments on a tax basis. |
The following is a summary of the inputs used to value the Fund’s net assets as of August 31, 2015 (see Note 2):
| | | | | | | | | | | | | | | | |
| | | Level 1 - Unadjusted Quoted
Prices
| | | Level 2 - Other Observable
Inputs
| | | Level 3 - Significant
Unobservable Inputs
| | | Total
| |
ASSETS: | | | | | | | | | | | | | | | | |
Investments at Value:* | | | | | | | | | | | | | | | | |
Affiliated Registered Investment Companies | | $ | 508,911,513 | | | $ | — | | | $ | — | | | $ | 508,911,513 | |
| | |
|
|
| |
|
|
| |
|
|
| |
|
|
|
| * | For a detailed presentation of investments, please refer to the Portfolio of Investments. |
The Fund’s policy is to recognize transfers between Levels as of the end of the reporting period. There were no transfers between Levels during the reporting period.
See Notes to Financial Statements
5
VALIC Company II Capital Appreciation Fund
PORTFOLIO PROFILE — August 31, 2015 (unaudited)
Industry Allocation*
| | | | |
Medical — Biomedical/Gene | | | 6.9 | % |
Computers | | | 6.6 | |
Web Portals/ISP | | | 4.5 | |
Beverages — Non-alcoholic | | | 4.4 | |
Medical — Drugs | | | 3.3 | |
Internet Content — Entertainment | | | 3.2 | |
Applications Software | | | 3.2 | |
Food — Misc./Diversified | | | 3.1 | |
Finance — Credit Card | | | 3.0 | |
E-Commerce/Products | | | 2.8 | |
Telephone — Integrated | | | 2.2 | |
Apparel Manufacturers | | | 2.1 | |
Instruments — Controls | | | 2.0 | |
Medical — Generic Drugs | | | 1.9 | |
Retail — Drug Store | | | 1.9 | |
Investment Management/Advisor Services | | | 1.9 | |
E-Commerce/Services | | | 1.9 | |
Television | | | 1.9 | |
Enterprise Software/Service | | | 1.8 | |
Cable/Satellite TV | | | 1.8 | |
Athletic Footwear | | | 1.8 | |
Retail — Building Products | | | 1.8 | |
Medical — HMO | | | 1.5 | |
Retail — Restaurants | | | 1.5 | |
Cosmetics & Toiletries | | | 1.5 | |
Aerospace/Defense | | | 1.5 | |
Building Products — Cement | | | 1.4 | |
Finance — Other Services | | | 1.4 | |
Retail — Discount | | | 1.3 | |
Networking Products | | | 1.3 | |
Diagnostic Equipment | | | 1.3 | |
Medical — Wholesale Drug Distribution | | | 1.3 | |
Insurance Brokers | | | 1.2 | |
Time Deposits | | | 1.2 | |
Retail — Perfume & Cosmetics | | | 1.2 | |
Computer Services | | | 1.2 | |
Computer Software | | | 1.2 | |
Electronic Forms | | | 1.2 | |
Transport — Services | | | 1.1 | |
Advertising Agencies | | | 1.1 | |
Oil — Field Services | | | 1.1 | |
Aerospace/Defense — Equipment | | | 1.1 | |
Electronic Components — Semiconductors | | | 1.1 | |
Medical Instruments | | | 1.0 | |
Medical Information Systems | | | 1.0 | |
Registered Investment Companies | | | 1.0 | |
Agricultural Operations | | | 1.0 | |
Auto — Cars/Light Trucks | | | 1.0 | |
Chemicals — Diversified | | | 1.0 | |
Metal Processors & Fabrication | | | 0.9 | |
Auto/Truck Parts & Equipment — Original | | | 0.9 | |
Retail — Apparel/Shoe | | | 0.8 | |
Internet Content — Information/News | | | 0.8 | |
Internet Application Software | | | 0.7 | |
Computer Data Security | | | 0.6 | |
| | |
|
|
|
| | | | 101.4 | % |
| | |
|
|
|
| * | Calculated as a percentage of net assets |
6
VALIC Company II Capital Appreciation Fund
PORTFOLIO OF INVESTMENTS — August 31, 2015
| | | | | | | | |
| | |
| Security Description | | Shares | | | Value
(Note 2) | |
| |
COMMON STOCKS — 99.2% | |
Advertising Agencies — 1.1% | |
Interpublic Group of Cos., Inc. | | | 48,721 | | | $ | 919,852 | |
| | | | | | |
|
|
|
Aerospace/Defense — 1.5% | |
Raytheon Co. | | | 11,739 | | | | 1,203,952 | |
| | | | | | |
|
|
|
Aerospace/Defense-Equipment — 1.1% | |
United Technologies Corp. | | | 9,692 | | | | 887,884 | |
| | | | | | |
|
|
|
Agricultural Operations — 1.0% | |
Archer-Daniels-Midland Co. | | | 17,826 | | | | 801,992 | |
| | | | | | |
|
|
|
Apparel Manufacturers — 2.1% | |
Hanesbrands, Inc. | | | 34,307 | | | | 1,032,984 | |
Under Armour, Inc., Class A† | | | 6,815 | | | | 651,037 | |
| | | | | | |
|
|
|
| | | | | | | | 1,684,021 | |
| | | | | | |
|
|
|
Applications Software — 3.2% | |
Citrix Systems, Inc.† | | | 8,605 | | | | 586,086 | |
Intuit, Inc. | | | 10,048 | | | | 861,616 | |
Salesforce.com, Inc.† | | | 16,858 | | | | 1,169,271 | |
| | | | | | |
|
|
|
| | | | | | | | 2,616,973 | |
| | | | | | |
|
|
|
Athletic Footwear — 1.8% | |
NIKE, Inc., Class B | | | 13,134 | | | | 1,467,724 | |
| | | | | | |
|
|
|
Auto - Cars/Light Trucks — 1.0% | |
Tesla Motors, Inc.†# | | | 3,198 | | | | 796,494 | |
| | | | | | |
|
|
|
Auto/Truck Parts & Equipment - Original — 0.9% | |
Delphi Automotive PLC | | | 9,438 | | | | 712,758 | |
| | | | | | |
|
|
|
Beverages - Non-alcoholic — 4.4% | |
Coca-Cola Enterprises, Inc. | | | 26,107 | | | | 1,344,249 | |
PepsiCo, Inc. | | | 24,693 | | | | 2,294,721 | |
| | | | | | |
|
|
|
| | | | | | | | 3,638,970 | |
| | | | | | |
|
|
|
Building Products - Cement — 1.4% | |
Martin Marietta Materials, Inc. | | | 7,060 | | | | 1,184,668 | |
| | | | | | |
|
|
|
Cable/Satellite TV — 1.8% | |
Comcast Corp., Class A | | | 26,121 | | | | 1,471,396 | |
| | | | | | |
|
|
|
Chemicals - Diversified — 1.0% | |
Dow Chemical Co. | | | 18,100 | | | | 792,056 | |
| | | | | | |
|
|
|
Computer Data Security — 0.6% | |
Fortinet, Inc.† | | | 12,187 | | | | 513,560 | |
| | | | | | |
|
|
|
Computer Services — 1.2% | |
Cognizant Technology Solutions Corp., Class A† | | | 15,920 | | | | 1,002,005 | |
| | | | | | |
|
|
|
Computer Software — 1.2% | |
Akamai Technologies, Inc.† | | | 13,797 | | | | 983,864 | |
| | | | | | |
|
|
|
Computers — 6.6% | |
Apple, Inc. | | | 47,851 | | | | 5,395,679 | |
| | | | | | |
|
|
|
Cosmetics & Toiletries — 1.5% | |
Estee Lauder Cos., Inc., Class A | | | 15,274 | | | | 1,218,407 | |
| | | | | | |
|
|
|
Diagnostic Equipment — 1.3% | |
Danaher Corp. | | | 11,970 | | | | 1,041,629 | |
| | | | | | |
|
|
|
E-Commerce/Products — 2.8% | |
Amazon.com, Inc.† | | | 4,511 | | | | 2,313,647 | |
| | | | | | |
|
|
|
E-Commerce/Services — 1.9% | |
Priceline Group, Inc.† | | | 1,232 | | | | 1,538,324 | |
| | | | | | |
|
|
|
Electronic Components - Semiconductors — 1.1% | |
Avago Technologies, Ltd. | | | 6,943 | | | | 874,610 | |
| | | | | | |
|
|
|
Electronic Forms — 1.2% | |
Adobe Systems, Inc.† | | | 12,274 | | | | 964,368 | |
| | | | | | |
|
|
|
| | | | | | | | |
| | |
| Security Description | | Shares | | | Value
(Note 2) | |
| |
| | | | | | | | | |
Enterprise Software/Service — 1.8% | |
Oracle Corp. | | | 40,308 | | | $ | 1,495,024 | |
| | | | | | |
|
|
|
Finance - Credit Card — 3.0% | |
Visa, Inc., Class A | | | 34,052 | | | | 2,427,908 | |
| | | | | | |
|
|
|
Finance - Other Services — 1.4% | |
Intercontinental Exchange, Inc. | | | 4,893 | | | | 1,117,610 | |
| | | | | | |
|
|
|
Food - Misc./Diversified — 3.1% | |
ConAgra Foods, Inc. | | | 27,748 | | | | 1,156,537 | |
Mondelez International, Inc., Class A | | | 32,973 | | | | 1,396,736 | |
| | | | | | |
|
|
|
| | | | | | | | 2,553,273 | |
| | | | | | |
|
|
|
Instruments - Controls — 2.0% | |
Honeywell International, Inc. | | | 16,580 | | | | 1,645,897 | |
| | | | | | |
|
|
|
Insurance Brokers — 1.2% | |
Marsh & McLennan Cos., Inc. | | | 19,042 | | | | 1,023,127 | |
| | | | | | |
|
|
|
Internet Application Software — 0.7% | |
Splunk, Inc.† | | | 8,759 | | | | 542,795 | |
| | | | | | |
|
|
|
Internet Content - Entertainment — 3.2% | |
Facebook, Inc., Class A† | | | 29,326 | | | | 2,622,624 | |
| | | | | | |
|
|
|
Internet Content - Information/News — 0.8% | |
LinkedIn Corp., Class A† | | | 3,687 | | | | 665,872 | |
| | | | | | |
|
|
|
Investment Management/Advisor Services — 1.9% | |
Ameriprise Financial, Inc. | | | 6,377 | | | | 718,496 | |
BlackRock, Inc. | | | 2,787 | | | | 842,984 | |
| | | | | | |
|
|
|
| | | | | | | | 1,561,480 | |
| | | | | | |
|
|
|
Medical Information Systems — 1.0% | |
Cerner Corp.† | | | 13,426 | | | | 829,190 | |
| | | | | | |
|
|
|
Medical Instruments — 1.0% | |
Boston Scientific Corp.† | | | 49,897 | | | | 835,276 | |
| | | | | | |
|
|
|
Medical - Biomedical/Gene — 6.9% | |
Alexion Pharmaceuticals, Inc.† | | | 5,780 | | | | 995,258 | |
Biogen, Inc.† | | | 5,073 | | | | 1,508,203 | |
Illumina, Inc.† | | | 4,802 | | | | 948,923 | |
Regeneron Pharmaceuticals, Inc.† | | | 2,280 | | | | 1,170,780 | |
Vertex Pharmaceuticals, Inc.† | | | 8,350 | | | | 1,064,792 | |
| | | | | | |
|
|
|
| | | | | | | | 5,687,956 | |
| | | | | | |
|
|
|
Medical - Drugs — 3.3% | |
AbbVie, Inc. | | | 22,980 | | | | 1,434,182 | |
Bristol-Myers Squibb Co. | | | 20,379 | | | | 1,211,939 | |
Mallinckrodt PLC† | | | 940 | | | | 81,065 | |
| | | | | | |
|
|
|
| | | | | | | | 2,727,186 | |
| | | | | | |
|
|
|
Medical - Generic Drugs — 1.9% | |
Allergan PLC† | | | 5,244 | | | | 1,592,813 | |
| | | | | | |
|
|
|
Medical - HMO — 1.5% | |
UnitedHealth Group, Inc. | | | 10,670 | | | | 1,234,519 | |
| | | | | | |
|
|
|
Medical - Wholesale Drug Distribution — 1.3% | |
Cardinal Health, Inc. | | | 12,551 | | | | 1,032,571 | |
| | | | | | |
|
|
|
Metal Processors & Fabrication — 0.9% | |
Precision Castparts Corp. | | | 3,189 | | | | 734,267 | |
| | | | | | |
|
|
|
Networking Products — 1.3% | |
Cisco Systems, Inc. | | | 40,517 | | | | 1,048,580 | |
| | | | | | |
|
|
|
Oil - Field Services — 1.1% | |
Schlumberger, Ltd. | | | 11,631 | | | | 899,890 | |
| | | | | | |
|
|
|
Retail - Apparel/Shoe — 0.8% | |
lululemon athletica, Inc.† | | | 10,547 | | | | 675,113 | |
| | | | | | |
|
|
|
7
VALIC Company II Capital Appreciation Fund
PORTFOLIO OF INVESTMENTS — August 31, 2015 (continued)
| | | | | | | | |
| | |
| Security Description | | Shares | | | Value
(Note 2) | |
| |
COMMON STOCKS (continued) | |
Retail - Building Products — 1.8% | |
Home Depot, Inc. | | | 12,484 | | | $ | 1,453,887 | |
| | | | | | |
|
|
|
Retail - Discount — 1.3% | |
Dollar Tree, Inc.† | | | 14,383 | | | | 1,096,848 | |
| | | | | | |
|
|
|
Retail - Drug Store — 1.9% | |
CVS Health Corp. | | | 15,499 | | | | 1,587,098 | |
| | | | | | |
|
|
|
Retail - Perfume & Cosmetics — 1.2% | |
Ulta Salon Cosmetics & Fragrance, Inc.† | | | 6,413 | | | | 1,013,831 | |
| | | | | | |
|
|
|
Retail - Restaurants — 1.5% | |
McDonald’s Corp. | | | 12,975 | | | | 1,232,884 | |
| | | | | | |
|
|
|
Telephone - Integrated — 2.2% | |
Verizon Communications, Inc. | | | 38,535 | | | | 1,772,995 | |
| | | | | | |
|
|
|
Television — 1.9% | |
AMC Networks, Inc., Class A† | | | 9,725 | | | | 703,896 | |
CBS Corp., Class B | | | 18,139 | | | | 820,608 | |
| | | | | | |
|
|
|
| | | | | | | | 1,524,504 | |
| | | | | | |
|
|
|
Transport - Services — 1.1% | |
FedEx Corp. | | | 6,283 | | | | 946,283 | |
| | | | | | |
|
|
|
Web Portals/ISP — 4.5% | |
Google, Inc., Class A† | | | 2,842 | | | | 1,841,105 | |
Google, Inc., Class C† | | | 2,965 | | | | 1,833,111 | |
| | | | | | |
|
|
|
| | | | | | | | 3,674,216 | |
| | | | | | |
|
|
|
Total Long-Term Investment Securities | | | | | | | | |
(cost $65,622,820) | | | | | | | 81,280,350 | |
| | | | | | |
|
|
|
| | | | | | | | |
| | |
| Security Description | | Principal
Amount | | | Value
(Note 2) | |
| |
SHORT-TERM INVESTMENT SECURITIES — 2.2% | | | | | | | | |
Registered Investment Companies — 1.0% | | | | | | | | |
State Street Navigator Securities Lending Prime Portfolio 0.21%(1)(3) | | | 810,693 | | | $ | 810,693 | |
| | | | | | |
|
|
|
Time Deposits — 1.2% | |
Euro Time Deposit with State Street Bank and Trust Co. 0.01% due 09/01/2015 | | | 1,021,000 | | | | 1,021,000 | |
| | | | | | |
|
|
|
Total Short-Term Investment Securities | | | | | | | | |
(cost $1,831,693) | | | | | | | 1,831,693 | |
| | | | | | |
|
|
|
TOTAL INVESTMENTS | | | | | | | | |
(cost $67,454,513)(2) | | | 101.4 | % | | | 83,112,043 | |
Liabilities in excess of other assets | | | (1.4 | ) | | | (1,151,312 | ) |
| | |
|
|
| |
|
|
|
NET ASSETS | | | 100.0 | % | | $ | 81,960,731 | |
| | |
|
|
| |
|
|
|
| † | Non-income producing security |
| # | The security or a portion thereof is out on loan (see Note 2) |
| (1) | At August 31, 2015, the Fund had loaned securities with a total value of $796,494. This was secured by collateral of $810,693 which was received in cash and subsequently invested in short-term investments currently valued at $810,693 as reported in the Portfolio of Investments. |
| (2) | See Note 5 for cost of investments on a tax basis. |
| (3) | The rate shown is the 7-day yield as of August 31, 2015. |
The following is a summary of the inputs used to value the Fund’s net assets as of August 31, 2015 (see Note 2):
| | | | | | | | | | | | | | | | |
| | | Level 1 - Unadjusted Quoted
Prices
| | | Level 2 - Other Observable
Inputs
| | | Level 3 - Significant
Unobservable Inputs
| | | Total
| |
ASSETS: | | | | | | | | | | | | | | | | |
Investments at Value:* | | | | | | | | | | | | | | | | |
Common Stocks: | | $ | 81,280,350 | | | $ | — | | | $ | — | | | $ | 81,280,350 | |
Short-Term Investment Securities: | | | | | | | | | | | | | | | | |
Registered Investment Companies | | | 810,693 | | | | — | | | | — | | | | 810,693 | |
Time Deposits | | | — | | | | 1,021,000 | | | | — | | | | 1,021,000 | |
| | |
|
|
| |
|
|
| |
|
|
| |
|
|
|
Total Investments at Value | | $ | 82,091,043 | | | $ | 1,021,000 | | | $ | — | | | $ | 83,112,043 | |
| | |
|
|
| |
|
|
| |
|
|
| |
|
|
|
| * | For a detailed presentation of investments, please refer to the Portfolio of Investments. |
The Fund’s policy is to recognize transfers between Levels as of the end of the reporting period. There were no transfers between Levels during the reporting period.
See Notes to Financial Statements
8
VALIC Company II Conservative Growth Lifestyle Fund
PORTFOLIO PROFILE — August 31, 2015 (unaudited)
Industry Allocation*
| | | | |
Domestic Fixed Income Investment Companies | | | 62.9 | % |
International Equity Investment Companies | | | 18.5 | |
Domestic Equity Investment Companies | | | 14.8 | |
Real Estate Investment Companies | | | 3.4 | |
International Fixed Income Investment Companies | | | 0.4 | |
| | |
|
|
|
| | | | 100.0 | % |
| | |
|
|
|
| * | Calculated as a percentage of net assets |
9
VALIC Company II Conservative Growth Lifestyle Fund
PORTFOLIO OF INVESTMENTS — August 31, 2015
| | | | | | | | |
| | |
| Security Description | | Shares | | | Value
(Note 2) | |
| |
AFFILIATED REGISTERED INVESTMENT COMPANIES#(1) — 100.0% | |
Domestic Equity Investment Companies — 14.8% | |
VALIC Co. I Blue Chip Growth Fund | | | 469,343 | | | $ | 8,241,659 | |
VALIC Co. I Mid Cap Index Fund | | | 119,384 | | | | 3,173,232 | |
VALIC Co. I Mid Cap Strategic Growth Fund | | | 132,301 | | | | 1,903,817 | |
VALIC Co. I Nasdaq-100 Index Fund | | | 344,596 | | | | 3,394,272 | |
VALIC Co. I Science & Technology Fund | | | 127,350 | | | | 3,154,469 | |
VALIC Co. I Small Cap Index Fund | | | 319,677 | | | | 6,329,604 | |
VALIC Co. I Small Cap Special Values Fund | | | 151,013 | | | | 1,948,066 | |
VALIC Co. I Stock Index Fund | | | 76,516 | | | | 2,632,147 | |
VALIC Co. I Value Fund | | | 10,965 | | | | 156,467 | |
VALIC Co. II Capital Appreciation Fund | | | 201,032 | | | | 3,286,866 | |
VALIC Co. II Large Cap Value Fund | | | 92,861 | | | | 1,586,068 | |
VALIC Co. II Mid Cap Growth Fund | | | 223,055 | | | | 1,965,116 | |
VALIC Co. II Mid Cap Value Fund | | | 294,508 | | | | 6,426,175 | |
VALIC Co. II Small Cap Growth Fund | | | 110,059 | | | | 1,685,011 | |
VALIC Co. II Small Cap Value Fund | | | 171,238 | | | | 2,399,050 | |
| | | | | | |
|
|
|
Total Domestic Equity Investment Companies | | | | | | | | |
(cost $44,179,141) | | | | | | | 48,282,019 | |
| | | | | | |
|
|
|
Domestic Fixed Income Investment Companies — 62.9% | |
VALIC Co. I Capital Conservation Fund | | | 1,548,569 | | | | 15,268,887 | |
VALIC Co. I Government Securities Fund | | | 679,110 | | | | 7,341,182 | |
VALIC Co. I Inflation Protected Fund | | | 937,987 | | | | 10,045,842 | |
VALIC Co. II Core Bond Fund | | | 6,423,582 | | | | 70,209,752 | |
VALIC Co. II High Yield Bond Fund | | | 4,614,474 | | | | 34,147,106 | |
VALIC Co. II Strategic Bond Fund | | | 6,169,939 | | | | 67,869,332 | |
| | | | | | |
|
|
|
Total Domestic Fixed Income Investment Companies | | | | | | | | |
(cost $210,306,981) | | | | | | | 204,882,101 | |
| | | | | | |
|
|
|
| | | | | | | | |
| | |
| Security Description | | Shares | | | Value
(Note 2) | |
| |
| | | | | | | | | |
International Equity Investment Companies — 18.5% | |
VALIC Co. I Emerging Economies Fund | | | 428,290 | | | $ | 2,766,752 | |
VALIC Co. I Foreign Value Fund | | | 1,285,478 | | | | 11,864,958 | |
VALIC Co. I International Equities Index Fund | | | 4,413,840 | | | | 28,778,237 | |
VALIC Co. I International Growth Fund | | | 1,023,720 | | | | 13,246,930 | |
VALIC Co. II International Opportunities Fund | | | 241,798 | | | | 3,646,319 | |
| | | | | | |
|
|
|
Total International Equity Investment Companies | | | | | | | | |
(cost $65,813,336) | | | | | | | 60,303,196 | |
| | | | | | |
|
|
|
International Fixed Income Investment Companies — 0.4% | |
VALIC Co. I International Government Bond Fund
(cost $1,449,136) | | | 121,873 | | | | 1,355,226 | |
| | | | | | |
|
|
|
Real Estate Investment Companies — 3.4% | |
VALIC Co. I Global Real Estate Fund
(cost $11,805,741) | | | 1,357,864 | | | | 10,957,965 | |
| | | | | | |
|
|
|
TOTAL INVESTMENTS | | | | | | | | |
(cost $333,554,335)(2) | | | 100.0 | % | | | 325,780,507 | |
Other assets less liabilities | | | 0.0 | | | | 16,497 | |
| | |
|
|
| |
|
|
|
NET ASSETS — | | | 100.0 | % | | $ | 325,797,004 | |
| | |
|
|
| |
|
|
|
| # | The Conservative Growth Lifestyle Fund invests in various VALIC Company I or VALIC Company II Funds, some of which are not presented in this report. Additional information on the underlying funds including such fund’s prospectuses and shareholder reports is available at our website, www.valic.com. |
| (2) | See Note 5 for cost of investments on a tax basis. |
The following is a summary of the inputs used to value the Fund’s net assets as of August 31, 2015 (see Note 2):
| | | | | | | | | | | | | | | | |
| | | Level 1 - Unadjusted Quoted
Prices
| | | Level 2 - Other Observable
Inputs
| | | Level 3 - Significant
Unobservable Inputs
| | | Total
| |
ASSETS: | | | | | | | | | | | | | | | | |
Investments at Value:* | | | | | | | | | | | | | | | | |
Affiliated Registered Investment Companies | | $ | 325,780,507 | | | $ | — | | | $ | — | | | $ | 325,780,507 | |
| | |
|
|
| |
|
|
| |
|
|
| |
|
|
|
| * | For a detailed presentation of investments, please refer to the Portfolio of Investments |
The Fund’s policy is to recognize transfers between Levels as of the end of the reporting period. There were no transfers between Levels during the reporting period.
See Notes to Financial Statements
10
VALIC Company II Core Bond Fund
PORTFOLIO PROFILE — August 31, 2015 (unaudited)
Industry Allocation*
| | | | |
United States Treasury Notes | | | 18.9 | % |
Federal National Mtg. Assoc. | | | 18.0 | |
Federal Home Loan Mtg. Corp. | | | 8.4 | |
Time Deposits | | | 7.9 | |
Diversified Financial Services | | | 5.6 | |
Diversified Banking Institutions | | | 5.2 | |
United States Treasury Bonds | | | 5.0 | |
Banks — Commercial | | | 3.1 | |
Government National Mtg. Assoc. | | | 2.8 | |
Registered Investment Companies | | | 1.7 | |
Oil Companies — Exploration & Production | | | 1.6 | |
Telephone — Integrated | | | 1.6 | |
Electric — Integrated | | | 1.3 | |
Pipelines | | | 1.1 | |
Insurance — Multi-line | | | 1.0 | |
Auto — Cars/Light Trucks | | | 0.8 | |
Oil Companies — Integrated | | | 0.8 | |
Paper & Related Products | | | 0.8 | |
Savings & Loans/Thrifts | | | 0.7 | |
Banks — Super Regional | | | 0.7 | |
Medical — Drugs | | | 0.7 | |
Insurance — Life/Health | | | 0.6 | |
Diversified Manufacturing Operations | | | 0.6 | |
Real Estate Investment Trusts | | | 0.5 | |
Medical Labs & Testing Services | | | 0.5 | |
Sovereign | | | 0.5 | |
Cable/Satellite TV | | | 0.5 | |
Finance — Other Services | | | 0.5 | |
Computers | | | 0.4 | |
Multimedia | | | 0.4 | |
Medical — Generic Drugs | | | 0.4 | |
Insurance — Mutual | | | 0.4 | |
Machinery — Farming | | | 0.3 | |
Cellular Telecom | | | 0.3 | |
Telecom Services | | | 0.3 | |
Medical — Hospitals | | | 0.3 | |
Aerospace/Defense | | | 0.3 | |
Municipal Bonds & Notes | | | 0.3 | |
Aerospace/Defense — Equipment | | | 0.3 | |
Banks — Fiduciary | | | 0.3 | |
Airlines | | | 0.3 | |
Finance — Credit Card | | | 0.2 | |
Coatings/Paint | | | 0.2 | |
Casino Hotels | | | 0.2 | |
Finance — Consumer Loans | | | 0.2 | |
Retail — Discount | | | 0.2 | |
Brewery | | | 0.2 | |
Diversified Minerals | | | 0.2 | |
Finance — Leasing Companies | | | 0.2 | |
Printing — Commercial | | | 0.2 | |
Auto — Heavy Duty Trucks | | | 0.2 | |
Publishing — Periodicals | | | 0.2 | |
Finance — Auto Loans | | | 0.2 | |
Beverages — Non-alcoholic | | | 0.2 | |
Real Estate Management/Services | | | 0.2 | |
Chemicals — Specialty | | | 0.2 | |
Electronic Components — Semiconductors | | | 0.2 | |
Building Products — Cement | | | 0.2 | |
Gambling (Non-Hotel) | | | 0.2 | |
Food — Dairy Products | | | 0.2 | |
Building — Residential/Commercial | | | 0.2 | |
Tools — Hand Held | | | 0.1 | |
Electronic Components — Misc. | | | 0.1 | |
Medical — HMO | | | 0.1 | |
Steel — Producers | | | 0.1 | |
Retail — Drug Store | | | 0.1 | |
Internet Connectivity Services | | | 0.1 | |
Consumer Products — Misc. | | | 0.1 | |
Independent Power Producers | | | 0.1 | |
Banks — Money Center | | | 0.1 | |
| | | | |
Beverages — Wine/Spirits | | | 0.1 | |
Building Products — Wood | | | 0.1 | |
Enterprise Software/Service | | | 0.1 | |
Commercial Services — Finance | | | 0.1 | |
Satellite Telecom | | | 0.1 | |
Distribution/Wholesale | | | 0.1 | |
Steel Pipe & Tube | | | 0.1 | |
Retail — Restaurants | | | 0.1 | |
Networking Products | | | 0.1 | |
Containers — Metal/Glass | | | 0.1 | |
Publishing — Newspapers | | | 0.1 | |
Investment Management/Advisor Services | | | 0.1 | |
SupraNational Banks | | | 0.1 | |
Retail — Regional Department Stores | | | 0.1 | |
Transport — Rail | | | 0.1 | |
Gold Mining | | | 0.1 | |
Machinery — General Industrial | | | 0.1 | |
Electric — Distribution | | | 0.1 | |
Oil — Field Services | | | 0.1 | |
Disposable Medical Products | | | 0.1 | |
Electric — Generation | | | 0.1 | |
Medical Products | | | 0.1 | |
Medical — Biomedical/Gene | | | 0.1 | |
Agricultural Chemicals | | | 0.1 | |
Chemicals — Plastics | | | 0.1 | |
Oil Refining & Marketing | | | 0.1 | |
Wire & Cable Products | | | 0.1 | |
Schools | | | 0.1 | |
Finance — Mortgage Loan/Banker | | | 0.1 | |
Trucking/Leasing | | | 0.1 | |
Specified Purpose Acquisitions | | | 0.1 | |
Telecommunication Equipment | | | 0.1 | |
Finance — Investment Banker/Broker | | | 0.1 | |
Food — Retail | | | 0.1 | |
Travel Services | | | 0.1 | |
Cruise Lines | | | 0.1 | |
Retail — Appliances | | | 0.1 | |
Metal — Copper | | | 0.1 | |
Theaters | | | 0.1 | |
Steel — Specialty | | | 0.1 | |
Music | | | 0.1 | |
Cosmetics & Toiletries | | | 0.1 | |
Rental Auto/Equipment | | | 0.1 | |
Auto/Truck Parts & Equipment — Original | | | 0.1 | |
Real Estate Operations & Development | | | 0.1 | |
Building & Construction — Misc. | | | 0.1 | |
Batteries/Battery Systems | | | 0.1 | |
Advertising Agencies | | | 0.1 | |
Tennessee Valley Authority | | | 0.1 | |
Diversified Operations | | | 0.1 | |
Gas — Distribution | | | 0.1 | |
| | |
|
|
|
| | | | 105.7 | % |
| | |
|
|
|
Credit Quality†#
| | | | |
Aaa | | | 58.6 | % |
Aa | | | 3.3 | |
A | | | 9.6 | |
Baa | | | 13.5 | |
Ba | | | 6.4 | |
B | | | 5.0 | |
Caa | | | 1.5 | |
Not Rated@ | | | 2.1 | |
| | |
|
|
|
| | | | 100.0 | % |
| | |
|
|
|
| * | Calculated as a percentage of net assets |
| # | Calculated as a percentage of total debt issues |
| @ | Represents debt issues that either have no rating, or the rating is unavailable from the data source. |
11
VALIC Company II Core Bond Fund
PORTFOLIO OF INVESTMENTS — August 31, 2015
| | | | | | | | |
| | |
| Security Description | |
Principal
Amount | | | Value
(Note 2) | |
| |
ASSET BACKED SECURITIES — 5.2% | |
Diversified Financial Services — 5.2% | |
American Express Credit Account Master Trust
Series 2014-3, Class A
1.49% due 04/15/2020 | | $ | 422,000 | | | $ | 424,886 | |
AmeriCredit Automobile Receivables Trust
Series 2015-2,Class C
2.40% due 01/08/2021 | | | 1,145,000 | | | | 1,136,904 | |
AmeriCredit Automobile Receivables Trust
Series 2013-3, Class D
3.00% due 07/08/2019 | | | 1,050,000 | | | | 1,067,866 | |
Applebee’s Funding LLC/IHOP Funding LLC
Series 2014-1, Class A2
4.28% due 09/05/2044* | | | 771,000 | | | | 785,412 | |
Asset Backed Securities Corp. Home Equity Loan Trust FRS
Series 2004-HE7, Class M2
1.77% due 10/25/2034 | | | 1,098,559 | | | | 1,026,399 | |
Avis Budget Rental Car Funding AESOP LLC
Series 2014-1A, Class A
2.46% due 07/20/2020* | | | 950,000 | | | | 955,091 | |
B2R Mtg. Trust
Series 2015-1,Class A1
2.52% due 05/15/2048* | | | 1,000,709 | | | | 990,246 | |
BA Credit Card Trust
Series 2015-A2,Class A
1.36% due 09/15/2020 | | | 1,217,000 | | | | 1,214,870 | |
Capital Auto Receivables Asset Trust
Series 2015-2, Class A2
1.39% due 09/20/2018 | | | 1,166,000 | | | | 1,160,877 | |
CarMax Auto Owner Trust
Series 2014-2, Class C
2.08% due 01/15/2020 | | | 652,000 | | | | 653,494 | |
Chase Issuance Trust FRS
Series 2014-A5, Class A5
0.57% due 04/15/2021 | | | 1,446,000 | | | | 1,446,421 | |
Citibank Credit Card Issuance Trust
Series 2014-A2, Class A2
1.02% due 02/22/2019 | | | 1,400,000 | | | | 1,399,359 | |
Citigroup Commercial Mtg. Trust
Series 2014-GC19, Class A2
2.79% due 03/10/2047(1) | | | 1,478,000 | | | | 1,512,167 | |
Citigroup Commercial Mtg. Trust
Series 2014-GC23, Class A2
2.85% due 07/10/2047(1) | | | 1,460,000 | | | | 1,494,951 | |
Commercial Mtg. Trust
Series 2014-UBS2, Class A2
2.82% due 03/10/2047(1) | | | 1,282,000 | | | | 1,312,796 | |
Commercial Mtg. Trust
Series 2015-CR22, Class A2
2.86% due 03/10/2048(1) | | | 2,729,000 | | | | 2,786,478 | |
Commercial Mtg. Trust
Series 2015-DC1, Class A2
2.87% due 02/10/2048(1) | | | 1,778,000 | | | | 1,824,205 | |
Core Industrial Trust
Series 2015-1, Class A
3.04% due 02/10/2034*(1) | | | 2,784,000 | | | | 2,790,531 | |
Countrywide Home Loan Mtg. Pass Through Trust
Series 2005-6, Class 1A11
5.25% due 02/25/2026(2) | | | 76,341 | | | | 77,110 | |
DB Master Finance LLC
Series 2015-1A, Class A2II
3.98% due 02/20/2045* | | | 661,675 | | | | 662,091 | |
Dell Equipment Finance Trust
Series 2015-1,Class A3
1.30% due 03/23/2020* | | | 1,179,000 | | | | 1,174,525 | |
| | | | | | | | |
| | |
| Security Description | |
Principal
Amount | | | Value
(Note 2) | |
| |
| | | | | | | | | |
Diversified Financial Services (continued) | |
First Franklin Mtg. Loan Trust FRS
Series 2006-FF15, Class A5
0.36% due 11/25/2036 | | $ | 1,586,945 | | | $ | 1,385,971 | |
Ford Credit Auto Owner Trust
Series 2014-C,Class B
1.97% due 04/15/2020 | | | 1,001,000 | | | | 1,009,757 | |
Ford Credit Auto Owner Trust
Series 2015-1, Class A
2.12% due 07/15/2026* | | | 900,000 | | | | 897,910 | |
Ford Credit Floorplan Master Owner Trust
Series 2014-4, Class A1
1.40% due 08/15/2019 | | | 1,521,000 | | | | 1,519,832 | |
GS Mtg. Securities Trust
Series 2015-GC28, Class A2
2.90% due 02/10/2048(1) | | | 61,000 | | | | 62,461 | |
GS Mtg. Securities Trust
Series 2013-GC14, Class A2
3.00% due 08/10/2046(1) | | | 3,200,000 | | | | 3,305,056 | |
Hyundai Auto Lease Securitization Trust
Series 2015-B, Class A3
1.40% due 11/15/2018* | | | 170,000 | | | | 170,013 | |
Invitation Homes Trust FRS
Series 2014-SFR1, Class A
1.20% due 06/17/2031* | | | 1,495,000 | | | | 1,474,101 | |
JPMBB Commercial Mtg. Securities Trust
Series 2013-C15, Class A2
2.98% due 11/15/2045(1) | | | 2,152,000 | | | | 2,214,223 | |
LB-UBS Commercial Mtg. Trust
Series 2007-C1, Class A4
5.42% due 02/15/2040(1) | | | 953,127 | | | | 991,886 | |
Morgan Stanley Bank of America Merrill Lynch Trust
Series 2013-C9, Class A2
1.97% due 05/15/2046(1) | | | 2,000,000 | | | | 2,008,028 | |
Morgan Stanley Bank of America Merrill Lynch Trust
Series 2015-C23, Class A2
2.98% due 07/15/2050(1) | | | 1,000,000 | | | | 1,027,046 | |
Morgan Stanley Bank of America Merrill Lynch Trust
Series 2014-C19, Class A2
3.10% due 12/15/2047(1) | | | 1,112,000 | | | | 1,149,164 | |
Nissan Auto Lease Trust
Series 2014-A, Class A4
1.04% due 10/15/2019 | | | 350,000 | | | | 350,139 | |
NRP Mtg. Trust VRS
Series 2013-1, Class A1
3.25% due 07/25/2043*(2) | | | 1,982,895 | | | | 1,956,207 | |
Santander Drive Auto Receivables Trust
Series 2014-5, Class C
2.46% due 06/15/2020 | | | 1,000,000 | | | | 1,005,569 | |
Sierra Timeshare Receivables Funding LLC
Series 2014-2A, Class A
2.05% due 06/20/2031* | | | 497,179 | | | | 500,367 | |
Sierra Timeshare Receivables Funding LLC
Series 2015-2A, Class A
2.43% due 06/20/2032* | | | 827,686 | | | | 829,082 | |
Wachovia Bank Commercial Mtg. Trust VRS
Series 2006-C23, Class AM
5.47% due 01/15/2045(1) | | | 2,161,000 | | | | 2,177,951 | |
Wells Fargo Commercial Mtg. Trust
Series BH3-C26, Class A2
2.66% due 02/15/2048(1) | | | 2,400,000 | | | | 2,434,560 | |
Wells Fargo Mtg. Backed Securities Trust FRS
Series 2004-X, Class 1A3
2.63% due 11/25/2034(2) | | | 401,375 | | | | 403,033 | |
12
VALIC Company II Core Bond Fund
PORTFOLIO OF INVESTMENTS — August 31, 2015 — (continued)
| | | | | | | | |
| | |
| Security Description | |
Principal
Amount | | | Value
(Note 2) | |
| |
ASSET BACKED SECURITIES (continued) | |
Diversified Financial Services (continued) | |
Wendys Funding LLC
Series 2015-1A, Class A2I
3.37% due 06/15/2045* | | $ | 949,000 | | | $ | 946,206 | |
Wendys Funding LLC
Series 2015-1A, Class A23
4.50% due 06/15/2045* | | | 949,000 | | | | 943,593 | |
WF-RBS Commercial Mtg. Trust
Series 2014-C21, Class A2
2.92% due 08/15/2047(1) | | | 1,161,000 | | | | 1,192,487 | |
| | | | | | |
|
|
|
Total Asset Backed Securities | | | | | | | | |
(cost $56,205,434) | | | | | | | 55,851,321 | |
| | | | | | |
|
|
|
U.S. CORPORATE BONDS & NOTES — 26.1% | |
Advertising Agencies — 0.1% | |
Interpublic Group of Cos., Inc.
Senior Notes
4.20% due 04/15/2024 | | | 581,000 | | | | 578,345 | |
| | | | | | |
|
|
|
Advertising Services — 0.0% | |
Visant Corp.
Company Guar. Notes
10.00% due 10/01/2017 | | | 296,000 | | | | 241,240 | |
| | | | | | |
|
|
|
Aerospace/Defense — 0.3% | |
BAE Systems Holdings, Inc.
Company Guar. Notes
3.80% due 10/07/2024* | | | 1,457,000 | | | | 1,463,559 | |
BAE Systems Holdings, Inc.
Company Guar. Notes
4.75% due 10/07/2044* | | | 202,000 | | | | 199,284 | |
Boeing Co.
Senior Notes
0.95% due 05/15/2018 | | | 1,467,000 | | | | 1,444,182 | |
| | | | | | |
|
|
|
| | | | | | | | 3,107,025 | |
| | | | | | |
|
|
|
Aerospace/Defense - Equipment — 0.3% | |
Harris Corp.
Senior Notes
3.83% due 04/27/2025 | | | 274,000 | | | | 265,016 | |
Harris Corp.
Senior Notes
4.85% due 04/27/2035 | | | 1,004,000 | | | | 961,838 | |
Harris Corp.
Senior Notes
5.05% due 04/27/2045 | | | 950,000 | | | | 900,711 | |
Moog, Inc.
Company Guar. Notes
5.25% due 12/01/2022* | | | 254,000 | | | | 256,540 | |
Orbital ATK, Inc.
Company Guar. Notes
5.25% due 10/01/2021 | | | 419,000 | | | | 427,380 | |
| | | | | | |
|
|
|
| | | | | | | | 2,811,485 | |
| | | | | | |
|
|
|
Airlines — 0.2% | |
Allegiant Travel Co.
Company Guar. Notes
5.50% due 07/15/2019 | | | 693,000 | | | | 705,128 | |
Atlas Air, Inc. Pass Through Certs.
Series 1999-1, Class A-1
7.20% due 07/02/2020 | | | 16,027 | | | | 16,267 | |
Atlas Air, Inc. Pass Through Certs.
Series 1999-1, Class B
7.63% due 07/02/2016(3) | | | 45,115 | | | | 45,566 | |
| | | | | | | | |
| | |
| Security Description | |
Principal
Amount | | | Value
(Note 2) | |
| |
| | | | | | | | | |
Airlines (continued) | |
United Airlines Pass Through Trust Pass Through Certs.
Series 2014-2, Class B
4.63% due 03/03/2024 | | $ | 920,000 | | | $ | 920,000 | |
| | | | | | |
|
|
|
| | | | | | | | 1,686,961 | |
| | | | | | |
|
|
|
Alternative Waste Technology — 0.0% | |
ADS Waste Holdings, Inc.
Company Guar. Notes
8.25% due 10/01/2020 | | | 469,000 | | | | 485,415 | |
| | | | | | |
|
|
|
Apparel Manufacturers — 0.0% | |
Quiksilver, Inc./QS Wholesale, Inc.
Company Guar. Notes
10.00% due 08/01/2020(14) | | | 460,000 | | | | 110,400 | |
| | | | | | |
|
|
|
Auto - Cars/Light Trucks — 0.6% | |
American Honda Finance Corp.
Senior Notes
1.20% due 07/14/2017 | | | 1,381,000 | | | | 1,376,052 | |
Daimler Finance North America LLC
Company Guar. Notes
1.38% due 08/01/2017* | | | 1,461,000 | | | | 1,449,994 | |
Daimler Finance North America LLC
Company Guar. Notes
2.45% due 05/18/2020* | | | 1,689,000 | | | | 1,677,224 | |
Daimler Finance North America LLC
Company Guar. Notes
2.63% due 09/15/2016* | | | 587,000 | | | | 595,401 | |
Ford Motor Credit Co. LLC
Senior Notes
1.50% due 01/17/2017 | | | 698,000 | | | | 694,654 | |
Toyota Motor Credit Corp.
Senior Notes
1.55% due 07/13/2018 | | | 698,000 | | | | 695,049 | |
| | | | | | |
|
|
|
| | | | | | | | 6,488,374 | |
| | | | | | |
|
|
|
Auto - Heavy Duty Trucks — 0.2% | |
JB Poindexter & Co., Inc.
Senior Notes
9.00% due 04/01/2022* | | | 318,000 | | | | 345,030 | |
PACCAR Financial Corp.
Senior Notes
2.20% due 09/15/2019 | | | 1,540,000 | | | | 1,551,724 | |
| | | | | | |
|
|
|
| | | | | | | | 1,896,754 | |
| | | | | | |
|
|
|
Auto/Truck Parts & Equipment - Original — 0.1% | |
Affinia Group, Inc.
Company Guar. Notes
7.75% due 05/01/2021 | | | 353,000 | | | | 374,180 | |
Omega US Sub LLC
Senior Notes
8.75% due 07/15/2023* | | | 298,000 | | | | 272,670 | |
| | | | | | |
|
|
|
| | | | | | | | 646,850 | |
| | | | | | |
|
|
|
Banks - Commercial — 0.7% | |
Discover Bank
Senior Notes
3.10% due 06/04/2020 | | | 452,000 | | | | 451,268 | |
Fifth Third Bank
Senior Notes
2.88% due 10/01/2021 | | | 1,423,000 | | | | 1,414,523 | |
First Tennessee Bank NA
Senior Notes
2.95% due 12/01/2019 | | | 979,000 | | | | 982,485 | |
KeyBank NA
Senior Notes
2.25% due 03/16/2020 | | | 1,256,000 | | | | 1,243,592 | |
13
VALIC Company II Core Bond Fund
PORTFOLIO OF INVESTMENTS — August 31, 2015 — (continued)
| | | | | | | | |
| | |
| Security Description | |
Principal
Amount | | | Value
(Note 2) | |
| |
U.S. CORPORATE BONDS & NOTES (continued) | |
Banks - Commercial (continued) | |
PNC Bank NA
Senior Notes
1.13% due 01/27/2017 | | $ | 1,460,000 | | | $ | 1,454,512 | |
Regions Financial Corp.
Sub. Notes
7.38% due 12/10/2037 | | | 1,841,000 | | | | 2,300,867 | |
| | | | | | |
|
|
|
| | | | | | | | 7,847,247 | |
| | | | | | |
|
|
|
Banks - Fiduciary — 0.2% | |
Citizens Financial Group, Inc.
Sub. Notes
4.15% due 09/28/2022* | | | 1,570,000 | | | | 1,584,835 | |
| | | | | | |
|
|
|
Banks - Money Center — 0.0% | |
Comerica Bank
Sub. Notes
4.00% due 07/27/2025 | | | 283,000 | | | | 284,372 | |
| | | | | | |
|
|
|
Banks - Super Regional — 0.4% | |
Bank of America NA
Senior Notes
1.65% due 03/26/2018 | | | 850,000 | | | | 845,857 | |
Wells Fargo & Co.
Senior Notes
1.40% due 09/08/2017 | | | 1,402,000 | | | | 1,400,019 | |
Wells Fargo & Co.
Sub. Notes
4.10% due 06/03/2026 | | | 983,000 | | | | 987,796 | |
Wells Fargo & Co.
Sub. Notes
4.30% due 07/22/2027 | | | 900,000 | | | | 914,969 | |
| | | | | | |
|
|
|
| | | | | | | | 4,148,641 | |
| | | | | | |
|
|
|
Batteries/Battery Systems — 0.1% | |
EnerSys
Company Guar. Notes
5.00% due 04/30/2023* | | | 605,000 | | | | 583,825 | |
| | | | | | |
|
|
|
Brewery — 0.2% | |
Anheuser-Busch InBev Worldwide, Inc.
Company Guar. Notes
1.38% due 07/15/2017 | | | 2,222,000 | | | | 2,228,035 | |
| | | | | | |
|
|
|
Broadcast Services/Program — 0.0% | |
Clear Channel Worldwide Holdings, Inc.
Company Guar. Notes
6.50% due 11/15/2022 | | | 417,000 | | | | 421,379 | |
| | | | | | |
|
|
|
Building & Construction - Misc. — 0.1% | |
Weekley Homes LLC/Weekley Finance Corp.
Senior Notes
6.00% due 02/01/2023 | | | 650,000 | | | | 604,500 | |
| | | | | | |
|
|
|
Building Products - Cement — 0.2% | |
Cemex Finance LLC
Senior Sec. Notes
6.00% due 04/01/2024*# | | | 750,000 | | | | 712,500 | |
Vulcan Materials Co.
Senior Notes
4.50% due 04/01/2025 | | | 953,000 | | | | 936,322 | |
| | | | | | |
|
|
|
| | | | | | | | 1,648,822 | |
| | | | | | |
|
|
|
Building Products - Wood — 0.1% | |
Masco Corp.
Senior Notes
4.45% due 04/01/2025 | | | 1,336,000 | | | | 1,335,853 | |
| | | | | | |
|
|
|
| | | | | | | | |
| | |
| Security Description | |
Principal
Amount | | | Value
(Note 2) | |
| |
| | | | | | | | | |
Building - Residential/Commercial — 0.1% | |
Meritage Homes Corp.
Company Guar. Notes
7.00% due 04/01/2022 | | $ | 500,000 | | | $ | 533,750 | |
| | | | | | |
|
|
|
Cable/Satellite TV — 0.4% | |
Cable One, Inc.
Company Guar. Notes
5.75% due 06/15/2022* | | | 425,000 | | | | 429,250 | |
CCO Safari II LLC
Senior Sec. Notes
4.91% due 07/23/2025* | | | 2,215,000 | | | | 2,193,944 | |
CCO Safari II LLC
Senior Sec. Notes
6.38% due 10/23/2035* | | | 569,000 | | | | 579,633 | |
CCO Safari II LLC
Senior Sec. Notes
6.48% due 10/23/2045* | | | 556,000 | | | | 565,589 | |
DISH DBS Corp.
Company Guar. Notes
5.00% due 03/15/2023 | | | 500,000 | | | | 441,565 | |
| | | | | | |
|
|
|
| | | | | | | | 4,209,981 | |
| | | | | | |
|
|
|
Casino Hotels — 0.2% | |
Boyd Gaming Corp.
Company Guar. Notes
6.88% due 05/15/2023 | | | 339,000 | | | | 348,322 | |
Caesars Entertainment Resort
Properties LLC
Senior Sec. Notes
8.00% due 10/01/2020 | | | 508,000 | | | | 501,650 | |
Caesars Entertainment Resort Properties LLC
Sec. Notes
11.00% due 10/01/2021# | | | 773,000 | | | | 717,924 | |
Downstream Development Authority of the Quapaw Tribe of Oklahoma
Senior Sec. Notes
10.50% due 07/01/2019* | | | 300,000 | | | | 308,250 | |
Golden Nugget Escrow, Inc.
Senior Notes
8.50% due 12/01/2021* | | | 463,000 | | | | 475,732 | |
Seminole Hard Rock Entertainment, Inc./Seminole Hard Rock International LLC
Company Guar. Notes
5.88% due 05/15/2021* | | | 175,000 | | | | 173,688 | |
| | | | | | |
|
|
|
| | | | | | | | 2,525,566 | |
| | | | | | |
|
|
|
Cellular Telecom — 0.3% | |
Sprint Corp.
Company Guar. Notes
7.13% due 06/15/2024 | | | 719,000 | | | | 664,852 | |
Sprint Corp.
Company Guar. Notes
7.25% due 09/15/2021 | | | 783,000 | | | | 761,468 | |
Sprint Corp.
Company Guar. Notes
7.63% due 02/15/2025 | | | 1,088,000 | | | | 1,015,240 | |
T-Mobile USA, Inc.
Company Guar. Notes
6.38% due 03/01/2025 | | | 200,000 | | | | 204,400 | |
T-Mobile USA, Inc.
Company Guar. Notes
6.50% due 01/15/2024 | | | 840,000 | | | | 863,100 | |
| | | | | | |
|
|
|
| | | | | | | | 3,509,060 | |
| | | | | | |
|
|
|
14
VALIC Company II Core Bond Fund
PORTFOLIO OF INVESTMENTS — August 31, 2015 — (continued)
| | | | | | | | |
| | |
| Security Description | |
Principal
Amount | | | Value
(Note 2) | |
| |
U.S. CORPORATE BONDS & NOTES (continued) | |
Chemicals - Diversified — 0.0% | |
Eco Services Operations LLC/Eco Finance Corp.
Senior Notes
8.50% due 11/01/2022* | | $ | 455,000 | | | $ | 434,525 | |
| | | | | | |
|
|
|
Chemicals - Specialty — 0.2% | |
Chemtura Corp.
Company Guar. Notes
5.75% due 07/15/2021 | | | 596,000 | | | | 597,490 | |
Lubrizol Corp.
Company Guar. Notes
6.50% due 10/01/2034 | | | 550,000 | | | | 688,106 | |
Tronox Finance LLC
Company Guar. Notes
7.50% due 03/15/2022* | | | 497,000 | | | | 400,085 | |
| | | | | | |
|
|
|
| | | | | | | | 1,685,681 | |
| | | | | | |
|
|
|
Coal — 0.0% | |
SunCoke Energy Partners LP/SunCoke Energy Partners Finance Corp.
Company Guar. Notes
7.38% due 02/01/2020* | | | 509,000 | | | | 461,918 | |
| | | | | | |
|
|
|
Coatings/Paint — 0.2% | |
RPM International, Inc.
Senior Notes
5.25% due 06/01/2045 | | | 1,691,000 | | | | 1,635,751 | |
Sherwin-Williams Co.
Senior Notes
4.55% due 08/01/2045 | | | 453,000 | | | | 462,887 | |
Valspar Corp.
Senior Notes
3.95% due 01/15/2026 | | | 444,000 | | | | 447,420 | |
| | | | | | |
|
|
|
| | | | | | | | 2,546,058 | |
| | | | | | |
|
|
|
Commercial Services - Finance — 0.1% | |
Global Cash Access, Inc.
Senior Notes
10.00% due 01/15/2022* | | | 559,000 | | | | 528,255 | |
Harland Clarke Holdings Corp.
Senior Sec. Notes
6.88% due 03/01/2020* | | | 270,000 | | | | 249,075 | |
Harland Clarke Holdings Corp.
Senior Notes
9.25% due 03/01/2021* | | | 642,000 | | | | 534,465 | |
| | | | | | |
|
|
|
| | | | | | | | 1,311,795 | |
| | | | | | |
|
|
|
Computer Services — 0.0% | |
Leidos, Inc.
Company Guar. Notes
7.13% due 07/01/2032# | | | 64,000 | | | | 67,023 | |
| | | | | | |
|
|
|
Computers — 0.4% | |
Apple, Inc.
Senior Notes
2.85% due 05/06/2021 | | | 1,509,000 | | | | 1,535,851 | |
Apple, Inc.
Senior Notes
3.45% due 02/09/2045 | | | 257,000 | | | | 217,526 | |
Dell, Inc.
Senior Notes
4.63% due 04/01/2021# | | | 278,000 | | | | 271,745 | |
Dell, Inc.
Senior Notes
7.10% due 04/15/2028 | | | 218,000 | | | | 218,000 | |
| | | | | | | | |
| | |
| Security Description | |
Principal
Amount | | | Value
(Note 2) | |
| |
| | | | | | | | | |
Computers (continued) | |
Hewlett-Packard Co.
Senior Notes
6.00% due 09/15/2041 | | $ | 2,321,000 | | | $ | 2,325,881 | |
| | | | | | |
|
|
|
| | | | | | | | 4,569,003 | |
| | | | | | |
|
|
|
Consumer Products - Misc. — 0.0% | |
Kimberly-Clark Corp.
Senior Notes
1.85% due 03/01/2020 | | | 358,000 | | | | 353,810 | |
| | | | | | |
|
|
|
Containers - Metal/Glass — 0.1% | |
Ball Corp.
Company Guar. Notes
5.00% due 03/15/2022 | | | 323,000 | | | | 327,845 | |
Crown Cork & Seal Co., Inc.
Senior Notes
7.38% due 12/15/2026 | | | 743,000 | | | | 822,872 | |
| | | | | | |
|
|
|
| | | | | | | | 1,150,717 | |
| | | | | | |
|
|
|
Containers - Paper/Plastic — 0.0% | |
Consolidated Container Co.
LLC/Consolidated Container Capital, Inc.
Company Guar. Notes
10.13% due 07/15/2020* | | | 454,000 | | | | 394,980 | |
| | | | | | |
|
|
|
Cosmetics & Toiletries — 0.1% | |
First Quality Finance Co., Inc.
Senior Notes
4.63% due 05/15/2021* | | | 711,000 | | | | 668,340 | |
| | | | | | |
|
|
|
Data Processing/Management — 0.0% | |
First Data Corp.
Senior Sec. Notes
5.38% due 08/15/2023# | | | 125,000 | | | | 126,563 | |
| | | | | | |
|
|
|
Decision Support Software — 0.0% | |
MSCI, Inc.
Company Guar. Notes
5.75% due 08/15/2025* | | | 133,000 | | | | 135,660 | |
| | | | | | |
|
|
|
Dialysis Centers — 0.0% | |
DaVita HealthCare Partners, Inc.
Company Guar. Notes
5.13% due 07/15/2024 | | | 500,000 | | | | 497,813 | |
| | | | | | |
|
|
|
Disposable Medical Products — 0.1% | |
Sterigenics-Nordion Holdings LLC
Senior Notes
6.50% due 05/15/2023* | | | 582,000 | | | | 593,628 | |
| | | | | | |
|
|
|
Distribution/Wholesale — 0.1% | |
H&E Equipment Services, Inc.
Company Guar. Notes
7.00% due 09/01/2022# | | | 700,000 | | | | 696,500 | |
LKQ Corp.
Company Guar. Notes
4.75% due 05/15/2023 | | | 622,000 | | | | 596,342 | |
| | | | | | |
|
|
|
| | | | | | | | 1,292,842 | |
| | | | | | |
|
|
|
Diversified Banking Institutions — 2.6% | |
Bank of America Corp.
Senior Notes
2.60% due 01/15/2019 | | | 1,226,000 | | | | 1,234,280 | |
Bank of America Corp.
Sub. Notes
3.95% due 04/21/2025 | | | 1,028,000 | | | | 995,140 | |
Bank of America Corp.
Sub. Notes
4.25% due 10/22/2026 | | | 1,231,000 | | | | 1,211,869 | |
15
VALIC Company II Core Bond Fund
PORTFOLIO OF INVESTMENTS — August 31, 2015 — (continued)
| | | | | | | | |
| | |
| Security Description | |
Principal
Amount | | | Value
(Note 2) | |
| |
U.S. CORPORATE BONDS & NOTES (continued) | |
Diversified Banking Institutions (continued) | |
Bank of America Corp.
Sub. Notes
7.25% due 10/15/2025 | | $ | 75,000 | | | $ | 91,525 | |
Citigroup, Inc.
Sub. Notes
3.88% due 03/26/2025 | | | 743,000 | | | | 717,939 | |
Citigroup, Inc.
Sub. Notes
4.40% due 06/10/2025 | | | 2,809,000 | | | | 2,824,916 | |
Citigroup, Inc.
Sub. Notes
6.00% due 10/31/2033 | | | 592,000 | | | | 673,138 | |
Goldman Sachs Group, Inc.
Senior Notes
2.55% due 10/23/2019 | | | 1,381,000 | | | | 1,384,185 | |
Goldman Sachs Group, Inc.
Senior Notes
3.63% due 01/22/2023 | | | 1,226,000 | | | | 1,232,444 | |
Goldman Sachs Group, Inc.
Sub. Notes
5.15% due 05/22/2045 | | | 713,000 | | | | 704,846 | |
Goldman Sachs Group, Inc.
Senior Notes
6.13% due 02/15/2033 | | | 1,176,000 | | | | 1,399,131 | |
Goldman Sachs Group, Inc.
Sub. Notes
6.75% due 10/01/2037 | | | 2,140,000 | | | | 2,553,108 | |
JPMorgan Chase & Co.
Senior Notes
2.20% due 10/22/2019 | | | 1,766,000 | | | | 1,751,708 | |
JPMorgan Chase & Co.
Senior Notes
3.25% due 09/23/2022 | | | 572,000 | | | | 568,164 | |
JPMorgan Chase & Co.
Sub. Notes
4.13% due 12/15/2026 | | | 1,180,000 | | | | 1,172,383 | |
JPMorgan Chase & Co.
Sub. Notes
4.95% due 06/01/2045 | | | 565,000 | | | | 565,737 | |
Merrill Lynch & Co., Inc.
Sub. Notes
6.11% due 01/29/2037 | | | 1,581,000 | | | | 1,795,360 | |
Morgan Stanley
Senior Notes
1.88% due 01/05/2018 | | | 1,088,000 | | | | 1,088,117 | |
Morgan Stanley
Senior Notes
2.80% due 06/16/2020 | | | 633,000 | | | | 635,275 | |
Morgan Stanley
Sub. Notes
4.10% due 05/22/2023 | | | 2,714,000 | | | | 2,724,289 | |
Morgan Stanley
Senior Notes
4.75% due 03/22/2017 | | | 1,208,000 | | | | 1,267,374 | |
Morgan Stanley
Sub. Notes
5.00% due 11/24/2025 | | | 1,462,000 | | | | 1,539,169 | |
| | | | | | |
|
|
|
| | | | | | | | 28,130,097 | |
| | | | | | |
|
|
|
Diversified Financial Services — 0.4% | |
General Electric Capital Corp.
Company Guar. Notes
1.25% due 05/15/2017 | | | 1,830,000 | | | | 1,831,846 | |
| | | | | | | | |
| | |
| Security Description | |
Principal
Amount | | | Value
(Note 2) | |
| |
| | |
Diversified Financial Services (continued) | |
General Electric Capital Corp.
Company Guar. Notes
5.88% due 01/14/2038 | | $ | 1,061,000 | | | $ | 1,288,151 | |
USAA Capital Corp.
Senior Notes
2.13% due 06/03/2019* | | | 1,623,000 | | | | 1,623,154 | |
| | | | | | |
|
|
|
| | | | | | | | 4,743,151 | |
| | | | | | |
|
|
|
Diversified Manufacturing Operations — 0.4% | |
General Electric Co.
Senior Notes
2.70% due 10/09/2022 | | | 882,000 | | | | 862,343 | |
Ingersoll-Rand Global Holding Co., Ltd.
Company Guar. Notes
5.75% due 06/15/2043 | | | 1,206,000 | | | | 1,319,670 | |
Textron, Inc.
Senior Notes
4.63% due 09/21/2016 | | | 1,070,000 | | | | 1,104,370 | |
Trinity Industries, Inc.
Company Guar. Notes
4.55% due 10/01/2024 | | | 777,000 | | | | 729,731 | |
| | | | | | |
|
|
|
| | | | | | | | 4,016,114 | |
| | | | | | |
|
|
|
Diversified Operations — 0.1% | |
MUFG Americas Holdings Corp.
Senior Notes
1.63% due 02/09/2018 | | | 535,000 | | | | 533,363 | |
| | | | | | |
|
|
|
E-Commerce/Services — 0.0% | |
Netflix, Inc.
Senior Notes
5.38% due 02/01/2021 | | | 481,000 | | | | 496,633 | |
| | | | | | |
|
|
|
Electric - Generation — 0.0% | |
Terraform Global Operating LLC
Company Guar. Notes
9.75% due 08/15/2022* | | | 424,000 | | | | 397,500 | |
| | | | | | |
|
|
|
Electric - Integrated — 1.2% | |
AES Corp.
Senior Notes
4.88% due 05/15/2023 | | | 530,000 | | | | 492,900 | |
AES Corp.
Senior Notes
5.50% due 03/15/2024 | | | 424,000 | | | | 404,920 | |
Arizona Public Service Co.
Senior Notes
2.20% due 01/15/2020 | | | 549,000 | | | | 548,521 | |
Dominion Resources, Inc.
Senior Notes
5.25% due 08/01/2033 | | | 1,389,000 | | | | 1,487,077 | |
Entergy Arkansas, Inc.
1st Mtg. Bonds
4.95% due 12/15/2044 | | | 814,000 | | | | 816,765 | |
Entergy Louisiana LLC
1st Mtg. Bonds
4.95% due 01/15/2045 | | | 726,000 | | | | 732,465 | |
Exelon Corp.
Senior Notes
4.95% due 06/15/2035 | | | 479,000 | | | | 482,450 | |
Exelon Corp.
Senior Notes
5.10% due 06/15/2045 | | | 490,000 | | | | 488,332 | |
16
VALIC Company II Core Bond Fund
PORTFOLIO OF INVESTMENTS — August 31, 2015 — (continued)
| | | | | | | | |
| | |
| Security Description | |
Principal
Amount | | | Value
(Note 2) | |
| |
U.S. CORPORATE BONDS & NOTES (continued) | |
Electric - Integrated (continued) | |
Exelon Generation Co. LLC
Senior Notes
2.95% due 01/15/2020 | | $ | 745,000 | | | $ | 746,494 | |
FirstEnergy Corp.
Senior Notes
7.38% due 11/15/2031 | | | 826,000 | | | | 988,664 | |
Georgia Power Co.
Senior Notes
3.00% due 04/15/2016 | | | 265,000 | | | | 268,442 | |
Mirant Mid Atlantic LLC Pass Through Trust
Pass Through Certs.
10.06% due 12/30/2028 | | | 705,389 | | | | 728,314 | |
South Carolina Electric & Gas Co.
1st Mtg. Bonds
5.10% due 06/01/2065 | | | 606,000 | | | | 620,042 | |
Southern California Edison Co.
1st Mtg. Bonds
1.13% due 05/01/2017 | | | 1,426,000 | | | | 1,419,883 | |
Southern Co.
Senior Notes
1.30% due 08/15/2017 | | | 1,185,000 | | | | 1,175,763 | |
Talen Energy Supply LLC
Senior Notes
6.50% due 06/01/2025# | | | 500,000 | | | | 463,750 | |
Trans-Allegheny Interstate Line Co.
Senior Notes
3.85% due 06/01/2025* | | | 580,000 | | | | 577,584 | |
| | | | | | |
|
|
|
| | | | | | | | 12,442,366 | |
| | | | | | |
|
|
|
Electronic Components - Misc. — 0.1% | |
Corning, Inc.
Senior Notes
1.50% due 05/08/2018 | | | 667,000 | | | | 664,235 | |
Corning, Inc.
Senior Notes
2.90% due 05/15/2022 | | | 667,000 | | | | 664,206 | |
| | | | | | |
|
|
|
| | | | | | | | 1,328,441 | |
| | | | | | |
|
|
|
Electronic Components - Semiconductors — 0.2% | |
Intel Corp.
Senior Notes
1.35% due 12/15/2017 | | | 1,120,000 | | | | 1,118,368 | |
Micron Technology, Inc.
Senior Notes
5.63% due 01/15/2026* | | | 600,000 | | | | 544,500 | |
| | | | | | |
|
|
|
| | | | | | | | 1,662,868 | |
| | | | | | |
|
|
|
Electronics - Military — 0.0% | |
L-3 Communications Corp.
Company Guar. Notes
3.95% due 05/28/2024 | | | 290,000 | | | | 277,068 | |
| | | | | | |
|
|
|
Energy - Alternate Sources — 0.0% | |
TerraForm Power Operating LLC
Company Guar. Notes
5.88% due 02/01/2023* | | | 301,000 | | | | 285,950 | |
| | | | | | |
|
|
|
Enterprise Software/Service — 0.1% | |
Infor US, Inc.
Senior Sec. Notes
5.75% due 08/15/2020* | | | 375,000 | | | | 375,938 | |
Oracle Corp.
Senior Notes
3.90% due 05/15/2035 | | | 1,004,000 | | | | 944,785 | |
| | | | | | |
|
|
|
| | | | | | | | 1,320,723 | |
| | | | | | |
|
|
|
| | | | | | | | |
| | |
| Security Description | |
Principal
Amount | | | Value
(Note 2) | |
| |
| | |
Finance - Auto Loans — 0.2% | |
Ally Financial, Inc.
Senior Notes
5.13% due 09/30/2024 | | $ | 1,175,000 | | | $ | 1,186,750 | |
Credit Acceptance Corp.
Company Guar. Notes
7.38% due 03/15/2023* | | | 600,000 | | | | 615,000 | |
| | | | | | |
|
|
|
| | | | | | | | 1,801,750 | |
| | | | | | |
|
|
|
Finance - Commercial — 0.0% | |
Jefferies Finance LLC/JFIN Co-Issuer Corp.
Senior Notes
6.88% due 04/15/2022* | | | 223,000 | | | | 209,397 | |
Jefferies Finance LLC/JFIN Co-Issuer Corp.
Senior Notes
7.38% due 04/01/2020* | | | 220,000 | | | | 215,094 | |
| | | | | | |
|
|
|
| | | | | | | | 424,491 | |
| | | | | | |
|
|
|
Finance - Consumer Loans — 0.2% | |
Enova International, Inc.
Company Guar. Notes
9.75% due 06/01/2021 | | | 991,000 | | | | 822,530 | |
OneMain Financial Holdings, Inc.
Company Guar. Notes
6.75% due 12/15/2019* | | | 514,000 | | | | 537,130 | |
Synchrony Financial
Senior Notes
4.25% due 08/15/2024 | | | 1,135,000 | | | | 1,117,565 | |
| | | | | | |
|
|
|
| | | | | | | | 2,477,225 | |
| | | | | | |
|
|
|
Finance - Credit Card — 0.2% | |
American Express Credit Corp.
Senior Notes
1.55% due 09/22/2017 | | | 409,000 | | | | 408,364 | |
American Express Credit Corp.
Senior Notes
2.38% due 05/26/2020 | | | 1,100,000 | | | | 1,091,976 | |
Discover Financial Services
Senior Notes
3.75% due 03/04/2025 | | | 1,177,000 | | | | 1,117,079 | |
| | | | | | |
|
|
|
| | | | | | | | 2,617,419 | |
| | | | | | |
|
|
|
Finance - Investment Banker/Broker — 0.1% | |
Lehman Brothers Holdings, Inc.
Escrow Notes
6.75% due 12/28/2017†(4) | | | 179,000 | | | | 18 | |
Lehman Brothers Holdings, Inc.
Escrow Notes
7.50% due 05/11/2038†(4) | | | 230,000 | | | | 23 | |
TD Ameritrade Holding Corp.
Senior Notes
2.95% due 04/01/2022 | | | 754,000 | | | | 749,201 | |
| | | | | | |
|
|
|
| | | | | | | | 749,242 | |
| | | | | | |
|
|
|
Finance - Leasing Companies — 0.1% | |
Air Lease Corp.
Senior Notes
4.75% due 03/01/2020# | | | 793,000 | | | | 839,613 | |
| | | | | | |
|
|
|
Finance - Mortgage Loan/Banker — 0.1% | |
Quicken Loans, Inc.
Company Guar. Notes
5.75% due 05/01/2025* | | | 850,000 | | | | 828,750 | |
| | | | | | |
|
|
|
17
VALIC Company II Core Bond Fund
PORTFOLIO OF INVESTMENTS — August 31, 2015 — (continued)
| | | | | | | | |
| | |
| Security Description | |
Principal
Amount | | | Value
(Note 2) | |
| |
U.S. CORPORATE BONDS & NOTES (continued) | |
Finance - Other Services — 0.4% | |
National Rural Utilities Cooperative Finance Corp.
Senior Notes
0.95% due 04/24/2017 | | $ | 558,000 | | | $ | 556,245 | |
National Rural Utilities Cooperative Finance Corp.
Collateral Trust Bonds
1.10% due 01/27/2017 | | | 2,209,000 | | | | 2,211,306 | |
National Rural Utilities Cooperative Finance Corp.
Collateral Trust Bonds
2.00% due 01/27/2020 | | | 1,116,000 | | | | 1,093,978 | |
| | | | | | |
|
|
|
| | | | | | | | 3,861,529 | |
| | | | | | |
|
|
|
Firearms & Ammunition — 0.0% | |
FGI Operating Co. LLC/FGI Finance, Inc.
Sec. Notes
7.88% due 05/01/2020 | | | 451,000 | | | | 346,143 | |
| | | | | | |
|
|
|
Food - Dairy Products — 0.1% | |
Dean Foods Co.
Company Guar. Notes
6.50% due 03/15/2023* | | | 600,000 | | | | 606,000 | |
| | | | | | |
|
|
|
Food - Flour & Grain — 0.0% | |
Post Holdings, Inc.
Company Guar. Notes
7.75% due 03/15/2024*# | | | 370,000 | | | | 382,025 | |
| | | | | | |
|
|
|
Food - Meat Products — 0.0% | |
JBS USA LLC/JBS USA Finance, Inc.
Senior Notes
5.88% due 07/15/2024* | | | 475,000 | | | | 473,219 | |
| | | | | | |
|
|
|
Food - Misc./Diversified — 0.0% | |
Darling Ingredients, Inc.
Company Guar. Notes
5.38% due 01/15/2022 | | | 391,000 | | | | 386,113 | |
| | | | | | |
|
|
|
Food - Retail — 0.1% | |
SUPERVALU, Inc.
Senior Notes
7.75% due 11/15/2022 | | | 710,000 | | | | 734,850 | |
| | | | | | |
|
|
|
Food - Wholesale/Distribution — 0.0% | |
C&S Group Enterprises LLC
Senior Sec. Notes
5.38% due 07/15/2022* | | | 281,000 | | | | 259,925 | |
| | | | | | |
|
|
|
Gambling (Non-Hotel) — 0.1% | |
Scientific Games International, Inc.
Senior Sec. Notes
7.00% due 01/01/2022* | | | 258,000 | | | | 263,805 | |
Scientific Games International, Inc.
Company Guar. Notes
10.00% due 12/01/2022 | | | 500,000 | | | | 458,750 | |
Waterford Gaming LLC/Waterford Gaming Financial Corp.
Escrow Notes
8.63% due 09/15/2014*†(3)(4) | | | 5,195 | | | | 51 | |
| | | | | | |
|
|
|
| | | | | | | | 722,606 | |
| | | | | | |
|
|
|
Gas - Distribution — 0.1% | |
Dominion Gas Holdings LLC
Senior Notes
4.80% due 11/01/2043 | | | 516,000 | | | | 512,891 | |
| | | | | | |
|
|
|
Hotels/Motels — 0.0% | |
Interval Acquisition Corp.
Company Guar. Notes
5.63% due 04/15/2023* | | | 350,000 | | | | 345,625 | |
| | | | | | |
|
|
|
| | | | | | | | |
| | |
| Security Description | |
Principal
Amount | | | Value
(Note 2) | |
| |
| | |
Independent Power Producers — 0.1% | |
Dynegy, Inc.
Company Guar. Notes
7.38% due 11/01/2022 | | $ | 425,000 | | | $ | 439,875 | |
GenOn Energy, Inc.
Senior Notes
9.50% due 10/15/2018 | | | 406,000 | | | | 390,267 | |
NRG Energy, Inc.
Company Guar. Notes
6.25% due 07/15/2022 | | | 585,000 | | | | 570,375 | |
| | | | | | |
|
|
|
| | | | | | | | 1,400,517 | |
| | | | | | |
|
|
|
Industrial Gases — 0.0% | |
Airgas, Inc.
Senior Notes
3.05% due 08/01/2020 | | | 352,000 | | | | 352,869 | |
| | | | | | |
|
|
|
Insurance - Life/Health — 0.5% | |
CNO Financial Group, Inc.
Senior Notes
5.25% due 05/30/2025 | | | 229,000 | | | | 236,156 | |
Pacific LifeCorp
Senior Notes
6.00% due 02/10/2020* | | | 552,000 | | | | 621,359 | |
Pricoa Global Funding I
Senior Sec. Notes
1.35% due 08/18/2017* | | | 1,429,000 | | | | 1,426,496 | |
Pricoa Global Funding I
Senior Sec. Notes
1.60% due 05/29/2018* | | | 2,493,000 | | | | 2,473,188 | |
Principal Financial Group, Inc.
Company Guar. Notes
1.85% due 11/15/2017 | | | 360,000 | | | | 361,468 | |
| | | | | | |
|
|
|
| | | | | | | | 5,118,667 | |
| | | | | | |
|
|
|
Insurance - Multi-line — 0.6% | |
Assurant, Inc.
Senior Notes
6.75% due 02/15/2034 | | | 2,184,000 | | | | 2,550,139 | |
Metropolitan Life Global Funding I
Sec. Notes
1.30% due 04/10/2017* | | | 3,355,000 | | | | 3,358,157 | |
| | | | | | |
|
|
|
| | | | | | | | 5,908,296 | |
| | | | | | |
|
|
|
Insurance - Mutual — 0.4% | |
Massachusetts Mutual Life Insurance Co.
Sub. Notes
4.50% due 04/15/2065* | | | 700,000 | | | | 637,448 | |
MassMutual Global Funding II
Senior Sec. Notes
2.00% due 04/05/2017* | | | 1,511,000 | | | | 1,529,162 | |
MassMutual Global Funding II
Senior Sec. Notes
2.50% due 10/17/2022* | | | 483,000 | | | | 465,795 | |
New York Life Global Funding
Sec. Notes
1.65% due 05/15/2017* | | | 1,394,000 | | | | 1,401,840 | |
| | | | | | |
|
|
|
| | | | | | | | 4,034,245 | |
| | | | | | |
|
|
|
Internet Connectivity Services — 0.1% | |
Cogent Communications Group, Inc.
Senior Sec. Notes
5.38% due 03/01/2022* | | | 633,000 | | | | 612,428 | |
18
VALIC Company II Core Bond Fund
PORTFOLIO OF INVESTMENTS — August 31, 2015 — (continued)
| | | | | | | | |
| | |
| Security Description | |
Principal
Amount | | | Value
(Note 2) | |
| |
U.S. CORPORATE BONDS & NOTES (continued) | |
Internet Connectivity Services (continued) | |
Zayo Group LLC/Zayo Capital, Inc.
Company Guar. Notes
6.00% due 04/01/2023* | | $ | 842,000 | | | $ | 840,905 | |
| | | | | | |
|
|
|
| | | | | | | | 1,453,333 | |
| | | | | | |
|
|
|
Investment Management/Advisor Services — 0.1% | |
Drawbridge Special Opportunities Fund LP/Drawbridge Special Opportunities Finance
Senior Notes
5.00% due 08/01/2021* | | | 343,000 | | | | 335,282 | |
National Financial Partners Corp.
Senior Notes
9.00% due 07/15/2021* | | | 823,000 | | | | 806,540 | |
| | | | | | |
|
|
|
| | | | | | | | 1,141,822 | |
| | | | | | |
|
|
|
Machinery - Farming — 0.3% | |
John Deere Capital Corp.
Senior Notes
1.13% due 06/12/2017 | | | 1,638,000 | | | | 1,635,636 | |
John Deere Capital Corp.
Senior Notes
1.55% due 12/15/2017 | | | 1,975,000 | | | | 1,984,662 | |
| | | | | | |
|
|
|
| | | | | | | | 3,620,298 | |
| | | | | | |
|
|
|
Marine Services — 0.0% | |
Great Lakes Dredge & Dock Corp.
Company Guar. Notes
7.38% due 02/01/2019 | | | 126,000 | | | | 126,630 | |
| | | | | | |
|
|
|
Medical Labs & Testing Services — 0.5% | |
Laboratory Corp. of America Holdings
Senior Notes
3.20% due 02/01/2022 | | | 292,000 | | | | 285,643 | |
Laboratory Corp. of America Holdings
Senior Notes
3.60% due 02/01/2025 | | | 945,000 | | | | 905,070 | |
Laboratory Corp. of America Holdings
Senior Notes
4.70% due 02/01/2045 | | | 484,000 | | | | 441,796 | |
Roche Holdings, Inc.
Company Guar. Notes
1.35% due 09/29/2017* | | | 2,037,000 | | | | 2,040,398 | |
Roche Holdings, Inc.
Company Guar. Notes
2.25% due 09/30/2019* | | | 1,595,000 | | | | 1,605,345 | |
| | | | | | |
|
|
|
| | | | | | | | 5,278,252 | |
| | | | | | |
|
|
|
Medical Products — 0.1% | |
Becton Dickinson and Co.
Senior Notes
3.13% due 11/08/2021 | | | 431,000 | | | | 425,883 | |
Universal Hospital Services, Inc.
Sec. Notes
7.63% due 08/15/2020 | | | 519,000 | | | | 500,510 | |
| | | | | | |
|
|
|
| | | | | | | | 926,393 | |
| | | | | | |
|
|
|
Medical - Biomedical/Gene — 0.1% | |
Celgene Corp.
Senior Notes
5.00% due 08/15/2045 | | | 889,000 | | | | 897,085 | |
| | | | | | |
|
|
|
Medical - Drugs — 0.3% | |
Baxalta, Inc.
Senior Notes
3.60% due 06/23/2022* | | | 900,000 | | | | 899,401 | |
| | | | | | | | |
| | |
| Security Description | |
Principal
Amount | | | Value
(Note 2) | |
| |
| | |
Medical - Drugs (continued) | |
Baxalta, Inc.
Senior Notes
4.00% due 06/23/2025* | | $ | 483,000 | | | $ | 480,192 | |
Endo Finance LLC
Company Guar. Notes
5.75% due 01/15/2022* | | | 392,000 | | | | 400,820 | |
Forest Laboratories, Inc.
Company Guar. Notes
4.88% due 02/15/2021* | | | 1,079,000 | | | | 1,152,972 | |
Quintiles Transnational Corp.
Company Guar. Notes
4.88% due 05/15/2023* | | | 500,000 | | | | 510,000 | |
| | | | | | |
|
|
|
| | | | | | | | 3,443,385 | |
| | | | | | |
|
|
|
Medical - Generic Drugs — 0.1% | |
Mylan, Inc.
Company Guar. Notes
5.40% due 11/29/2043 | | | 518,000 | | | | 510,977 | |
| | | | | | |
|
|
|
Medical - HMO — 0.1% | |
UnitedHealth Group, Inc.
Senior Notes
1.40% due 12/15/2017 | | | 894,000 | | | | 889,913 | |
UnitedHealth Group, Inc.
Senior Notes
3.35% due 07/15/2022 | | | 633,000 | | | | 647,877 | |
| | | | | | |
|
|
|
| | | | | | | | 1,537,790 | |
| | | | | | |
|
|
|
Medical - Hospitals — 0.3% | |
Capella Healthcare, Inc.
Company Guar. Notes
9.25% due 07/01/2017 | | | 117,000 | | | | 120,218 | |
HCA, Inc.
Senior Sec. Notes
3.75% due 03/15/2019 | | | 195,000 | | | | 195,975 | |
HCA, Inc.
Senior Sec. Notes
4.75% due 05/01/2023 | | | 260,000 | | | | 263,572 | |
HCA, Inc.
Company Guar. Notes
5.38% due 02/01/2025 | | | 95,000 | | | | 96,425 | |
HCA, Inc.
Company Guar. Notes
7.50% due 11/15/2095 | | | 700,000 | | | | 686,000 | |
IASIS Healthcare LLC/IASIS Capital Corp.
Company Guar. Notes
8.38% due 05/15/2019 | | | 760,000 | | | | 787,656 | |
Tenet Healthcare Corp.
Senior Sec. Notes
4.75% due 06/01/2020 | | | 600,000 | | | | 611,625 | |
Tenet Healthcare Corp.
Senior Notes
6.75% due 06/15/2023 | | | 337,000 | | | | 347,110 | |
| | | | | | |
|
|
|
| | | | | | | | 3,108,581 | |
| | | | | | |
|
|
|
Metal - Copper — 0.1% | |
Freeport-McMoRan, Inc.
Company Guar. Notes
2.30% due 11/14/2017 | | | 572,000 | | | | 531,960 | |
| | | | | | |
|
|
|
Multimedia — 0.4% | |
21st Century Fox America, Inc.
Company Guar. Notes
4.75% due 09/15/2044 | | | 634,000 | | | | 608,100 | |
19
VALIC Company II Core Bond Fund
PORTFOLIO OF INVESTMENTS — August 31, 2015 — (continued)
| | | | | | | | |
| | |
| Security Description | |
Principal
Amount | | | Value
(Note 2) | |
| |
U.S. CORPORATE BONDS & NOTES (continued) | |
Multimedia (continued) | |
Time Warner, Inc.
Company Guar. Notes
3.60% due 07/15/2025 | | $ | 2,486,000 | | | $ | 2,406,010 | |
Viacom, Inc.
Senior Notes
4.85% due 12/15/2034 | | | 491,000 | | | | 413,006 | |
Viacom, Inc.
Senior Notes
5.25% due 04/01/2044 | | | 993,000 | | | | 855,485 | |
| | | | | | |
|
|
|
| | | | | | | | 4,282,601 | |
| | | | | | |
|
|
|
Music — 0.1% | |
WMG Acquisition Corp.
Senior Sec. Notes
6.00% due 01/15/2021* | | | 234,000 | | | | 238,680 | |
WMG Acquisition Corp.
Company Guar. Notes
6.75% due 04/15/2022* | | | 455,000 | | | | 434,525 | |
| | | | | | |
|
|
|
| | | | | | | | 673,205 | |
| | | | | | |
|
|
|
Networking Products — 0.1% | |
Cisco Systems, Inc.
Senior Notes
2.13% due 03/01/2019 | | | 1,162,000 | | | | 1,170,519 | |
| | | | | | |
|
|
|
Oil & Gas Drilling — 0.0% | |
Summit Midstream Holdings LLC/Summit Midstream Finance Corp.
Company Guar. Notes
5.50% due 08/15/2022 | | | 186,000 | | | | 164,610 | |
| | | | | | |
|
|
|
Oil Companies - Exploration & Production — 1.3% | |
Anadarko Petroleum Corp.
Senior Notes
6.45% due 09/15/2036 | | | 2,582,000 | | | | 2,906,284 | |
Atlas Energy Holdings Operating Co. LLC/Atlas Resource Finance Corp.
Company Guar. Notes
7.75% due 01/15/2021 | | | 515,000 | | | | 274,739 | |
Carrizo Oil & Gas, Inc.
Company Guar. Notes
6.25% due 04/15/2023 | | | 500,000 | | | | 450,000 | |
Denbury Resources, Inc.
Company Guar. Notes
5.50% due 05/01/2022 | | | 525,000 | | | | 374,062 | |
EP Energy LLC/Everest Acquisition Finance, Inc.
Company Guar. Notes
7.75% due 09/01/2022 | | | 469,000 | | | | 431,480 | |
EV Energy Partners LP/EV Energy Finance Corp.
Company Guar. Notes
8.00% due 04/15/2019 | | | 890,000 | | | | 640,800 | |
Halcon Resources Corp.
Sec. Notes
8.63% due 02/01/2020*# | | | 298,000 | | | | 261,495 | |
Halcon Resources Corp.
Company Guar. Notes
9.75% due 07/15/2020# | | | 200,000 | | | | 73,000 | |
Hess Corp.
Senior Notes
5.60% due 02/15/2041 | | | 461,000 | | | | 445,380 | |
Hess Corp.
Senior Notes
7.88% due 10/01/2029 | | | 461,000 | | | | 553,117 | |
| | | | | | | | |
| | |
| Security Description | |
Principal
Amount | | | Value
(Note 2) | |
| |
| | |
Oil Companies - Exploration & Production (continued) | |
Hilcorp Energy I LP/Hilcorp Finance Co.
Senior Notes
5.00% due 12/01/2024* | | $ | 436,000 | | | $ | 377,184 | |
Legacy Reserves LP/Legacy Reserves Finance Corp. Company Guar. Notes
6.63% due 12/01/2021 | | | 364,000 | | | | 254,800 | |
Memorial Production Partners LP/Memorial Production Finance Corp.
Company Guar. Notes
7.63% due 05/01/2021 | | | 585,000 | | | | 391,950 | |
Newfield Exploration Co.
Senior Notes
5.38% due 01/01/2026 | | | 989,000 | | | | 919,770 | |
Noble Energy, Inc.
Senior Notes
3.90% due 11/15/2024 | | | 648,000 | | | | 612,179 | |
Noble Energy, Inc.
Senior Notes
5.05% due 11/15/2044 | | | 553,000 | | | | 492,758 | |
Northern Oil and Gas, Inc.
Senior Notes
8.00% due 06/01/2020# | | | 614,000 | | | | 466,640 | |
Oasis Petroleum, Inc.
Company Guar. Notes
6.88% due 03/15/2022 | | | 350,000 | | | | 290,500 | |
Occidental Petroleum Corp.
Senior Notes
3.50% due 06/15/2025 | | | 454,000 | | | | 453,392 | |
Penn Virginia Corp.
Company Guar. Notes
7.25% due 04/15/2019# | | | 377,000 | | | | 97,077 | |
Rex Energy Corp.
Company Guar. Notes
6.25% due 08/01/2022 | | | 520,000 | | | | 275,600 | |
Rice Energy, Inc.
Company Guar. Notes
7.25% due 05/01/2023*# | | | 500,000 | | | | 465,000 | |
Sanchez Energy Corp.
Company Guar. Notes
6.13% due 01/15/2023# | | | 419,000 | | | | 314,250 | |
SM Energy Co.
Senior Notes
5.63% due 06/01/2025 | | | 281,000 | | | | 249,387 | |
Southwestern Energy Co.
Senior Notes
3.30% due 01/23/2018 | | | 292,000 | | | | 291,113 | |
Southwestern Energy Co.
Senior Notes
4.95% due 01/23/2025# | | | 1,371,000 | | | | 1,259,518 | |
| | | | | | |
|
|
|
| | | | | | | | 13,621,475 | |
| | | | | | |
|
|
|
Oil Companies - Integrated — 0.4% | |
Chevron Corp.
Senior Notes
1.37% due 03/02/2018 | | | 1,193,000 | | | | 1,188,595 | |
Chevron Corp.
Senior Notes
1.96% due 03/03/2020 | | | 656,000 | | | | 649,018 | |
ConocoPhillips Co.
Company Guar. Notes
1.50% due 05/15/2018 | | | 469,000 | | | | 466,555 | |
Exxon Mobil Corp.
Senior Notes
1.31% due 03/06/2018 | | | 1,240,000 | | | | 1,239,273 | |
20
VALIC Company II Core Bond Fund
PORTFOLIO OF INVESTMENTS — August 31, 2015 — (continued)
| | | | | | | | |
| | |
| Security Description | |
Principal
Amount | | | Value
(Note 2) | |
| |
U.S. CORPORATE BONDS & NOTES (continued) | |
Oil Companies - Integrated (continued) | |
Marathon Oil Corp.
Senior Notes
6.60% due 10/01/2037 | | $ | 822,000 | | | $ | 862,383 | |
| | | | | | |
|
|
|
| | | | | | | | 4,405,824 | |
| | | | | | |
|
|
|
Oil Refining & Marketing — 0.1% | |
Calumet Specialty Products Partner LP/ Calumet Finance Corp.
Company Guar. Notes
6.50% due 04/15/2021 | | | 246,000 | | | | 232,470 | |
Murphy Oil USA, Inc.
Company Guar. Notes
6.00% due 08/15/2023 | | | 620,000 | | | | 638,600 | |
| | | | | | |
|
|
|
| | | | | | | | 871,070 | |
| | | | | | |
|
|
|
Oil - Field Services — 0.1% | |
Freeport-McMoran Oil & Gas LLC/FCX Oil & Gas, Inc.
Company Guar. Notes
6.63% due 05/01/2021 | | | 414,000 | | | | 380,880 | |
Freeport-McMoran Oil & Gas LLC/FCX Oil & Gas, Inc.
Company Guar. Notes
6.88% due 02/15/2023 | | | 680,000 | | | | 610,300 | |
| | | | | | |
|
|
|
| | | | | | | | 991,180 | |
| | | | | | |
|
|
|
Paper & Related Products — 0.8% | |
Clearwater Paper Corp.
Company Guar. Notes
4.50% due 02/01/2023 | | | 670,000 | | | | 636,500 | |
Domtar Corp.
Company Guar. Notes
6.75% due 02/15/2044 | | | 1,205,000 | | | | 1,288,580 | |
Georgia-Pacific LLC
Senior Notes
3.60% due 03/01/2025* | | | 2,152,000 | | | | 2,121,975 | |
Georgia-Pacific LLC
Senior Notes
3.73% due 07/15/2023* | | | 2,790,000 | | | | 2,816,433 | |
Georgia-Pacific LLC
Company Guar. Notes
5.40% due 11/01/2020* | | | 697,000 | | | | 779,628 | |
PH Glatfelter Co.
Company Guar. Notes
5.38% due 10/15/2020 | | | 430,000 | | | | 435,375 | |
| | | | | | |
|
|
|
| | | | | | | | 8,078,491 | |
| | | | | | |
|
|
|
Pipelines — 1.1% | |
Access Midstream Partners LP/ACMP Finance Corp.
Senior Notes
4.88% due 05/15/2023 | | | 796,000 | | | | 749,816 | |
Columbia Pipeline Group, Inc.
Company Guar. Notes
2.45% due 06/01/2018* | | | 245,000 | | | | 245,034 | |
Columbia Pipeline Group, Inc.
Company Guar. Notes
4.50% due 06/01/2025* | | | 1,181,000 | | | | 1,126,973 | |
Energy Transfer Partners LP
Senior Notes
4.90% due 03/15/2035 | | | 1,133,000 | | | | 962,396 | |
Energy Transfer Partners LP
Senior Notes
5.15% due 03/15/2045 | | | 426,000 | | | | 359,008 | |
Energy Transfer Partners LP
Senior Notes
6.63% due 10/15/2036 | | | 1,894,000 | | | | 1,901,055 | |
| | | | | | | | |
| | |
| Security Description | |
Principal
Amount | | | Value
(Note 2) | |
| |
| | |
Pipelines (continued) | |
EnLink Midstream Partners LP
Senior Notes
5.05% due 04/01/2045 | | $ | 556,000 | | | $ | 465,130 | |
Genesis Energy LP/Genesis Energy Finance Corp.
Company Guar. Notes
5.63% due 06/15/2024 | | | 314,000 | | | | 281,030 | |
Genesis Energy LP/Genesis Energy Finance Corp.
Company Guar. Notes
5.75% due 02/15/2021 | | | 250,000 | | | | 235,000 | |
Genesis Energy LP/Genesis Energy Finance Corp.
Company Guar. Notes
6.00% due 05/15/2023 | | | 500,000 | | | | 457,500 | |
Kinder Morgan Energy Partners LP
Company Guar. Notes
4.70% due 11/01/2042 | | | 479,000 | | | | 357,055 | |
Kinder Morgan Energy Partners LP
Company Guar. Notes
6.50% due 04/01/2020 | | | 1,848,000 | | | | 2,052,217 | |
Kinder Morgan, Inc.
Company Guar. Notes
5.00% due 02/15/2021* | | | 1,322,000 | | | | 1,364,312 | |
Rose Rock Midstream LP/Rose Rock Finance Corp.
Company Guar. Notes
5.63% due 07/15/2022 | | | 387,000 | | | | 352,170 | |
Sabine Pass Liquefaction LLC
Senior Sec. Notes
5.63% due 04/15/2023 | | | 225,000 | | | | 218,531 | |
Sabine Pass Liquefaction LLC
Senior Sec. Notes
6.25% due 03/15/2022 | | | 117,000 | | | | 117,585 | |
Tesoro Logistics LP/Tesoro Logistics Finance Corp.
Company Guar. Notes
5.88% due 10/01/2020 | | | 384,000 | | | | 384,960 | |
Williams Partners LP
Senior Notes
4.00% due 09/15/2025 | | | 438,000 | | | | 391,158 | |
| | | | | | |
|
|
|
| | | | | | | | 12,020,930 | |
| | | | | | |
|
|
|
Printing - Commercial — 0.1% | |
Multi-Color Corp.
Company Guar. Notes
6.13% due 12/01/2022* | | | 799,000 | | | | 813,981 | |
Quad/Graphics, Inc.
Company Guar. Notes
7.00% due 05/01/2022 | | | 525,000 | | | | 488,250 | |
| | | | | | |
|
|
|
| | | | | | | | 1,302,231 | |
| | | | | | |
|
|
|
Publishing - Newspapers — 0.1% | |
Lee Enterprises, Inc.
Senior Sec. Notes
9.50% due 03/15/2022* | | | 493,000 | | | | 474,512 | |
McClatchy Co.
Senior Sec. Notes
9.00% due 12/15/2022# | | | 740,000 | | | | 668,775 | |
| | | | | | |
|
|
|
| | | | | | | | 1,143,287 | |
| | | | | | |
|
|
|
Publishing - Periodicals — 0.2% | |
Expo Event Transco, Inc.
Senior Notes
9.00% due 06/15/2021* | | | 953,000 | | | | 957,765 | |
Time, Inc.
Company Guar. Notes
5.75% due 04/15/2022* | | | 930,000 | | | | 888,150 | |
| | | | | | |
|
|
|
| | | | | | | | 1,845,915 | |
| | | | | | |
|
|
|
21
VALIC Company II Core Bond Fund
PORTFOLIO OF INVESTMENTS — August 31, 2015 — (continued)
| | | | | | | | |
| | |
| Security Description | |
Principal
Amount | | | Value
(Note 2) | |
| |
U.S. CORPORATE BONDS & NOTES (continued) | |
Radio — 0.0% | |
Sirius XM Radio, Inc.
Company Guar. Notes
5.38% due 04/15/2025* | | $ | 500,000 | | | $ | 493,750 | |
| | | | | | |
|
|
|
Real Estate Investment Trusts — 0.5% | |
Communications Sales & Leasing, Inc.
Company Guar. Notes
8.25% due 10/15/2023* | | | 380,000 | | | | 345,800 | |
Communications Sales & Leasing, Inc./CSL Capital LLC
Senior Sec. Notes
6.00% due 04/15/2023* | | | 320,000 | | | | 300,800 | |
CTR Partnership LP/CareTrust Capital Corp.
Company Guar. Notes
5.88% due 06/01/2021 | | | 497,000 | | | | 503,213 | |
DuPont Fabros Technology LP
Company Guar. Notes
5.63% due 06/15/2023 | | | 500,000 | | | | 492,500 | |
ESH Hospitality, Inc.
Company Guar. Notes
5.25% due 05/01/2025* | | | 497,000 | | | | 482,090 | |
HCP, Inc.
Senior Notes
3.75% due 02/01/2016 | | | 330,000 | | | | 333,654 | |
iStar Financial, Inc.
Senior Notes
5.00% due 07/01/2019 | | | 500,000 | | | | 485,000 | |
Omega Healthcare Investors, Inc.
Company Guar. Notes
4.50% due 04/01/2027* | | | 1,327,000 | | | | 1,276,421 | |
Omega Healthcare Investors, Inc.
Company Guar. Notes
4.95% due 04/01/2024 | | | 1,084,000 | | | | 1,116,619 | |
RHP Hotel Properties LP/RHP Finance Corp.
Company Guar. Notes
5.00% due 04/15/2023* | | | 261,000 | | | | 258,390 | |
| | | | | | |
|
|
|
| | | | | | | | 5,594,487 | |
| | | | | | |
|
|
|
Real Estate Management/Services — 0.2% | |
American Campus Communities Operating Partnership LP
Company Guar. Notes
4.13% due 07/01/2024 | | | 756,000 | | | | 751,887 | |
Kennedy-Wilson, Inc.
Company Guar. Notes
5.88% due 04/01/2024 | | | 1,000,000 | | | | 973,000 | |
| | | | | | |
|
|
|
| | | | | | | | 1,724,887 | |
| | | | | | |
|
|
|
Real Estate Operations & Development — 0.1% | |
Greystar Real Estate Partners LLC
Senior Sec. Notes
8.25% due 12/01/2022* | | | 604,000 | | | | 629,670 | |
| | | | | | |
|
|
|
Rental Auto/Equipment — 0.1% | |
United Rentals North America, Inc.
Senior Sec. Notes
4.63% due 07/15/2023 | | | 300,000 | | | | 295,125 | |
United Rentals North America, Inc.
Company Guar. Notes
5.50% due 07/15/2025 | | | 375,000 | | | | 361,875 | |
| | | | | | |
|
|
|
| | | | | | | | 657,000 | |
| | | | | | |
|
|
|
Retail - Appliances — 0.1% | |
Conn’s, Inc.
Company Guar. Notes
7.25% due 07/15/2022# | | | 725,000 | | | | 688,830 | |
| | | | | | |
|
|
|
| | | | | | | | |
| | |
| Security Description | |
Principal
Amount | | | Value
(Note 2) | |
| |
| | |
Retail - Computer Equipment — 0.0% | |
GameStop Corp.
Company Guar. Notes
5.50% due 10/01/2019*# | | $ | 419,000 | | | $ | 432,618 | |
| | | | | | |
|
|
|
Retail - Discount — 0.2% | |
Costco Wholesale Corp.
Senior Notes
2.25% due 02/15/2022 | | | 1,248,000 | | | | 1,210,865 | |
Dollar General Corp.
Company Guar. Notes
4.13% due 07/15/2017 | | | 985,000 | | | | 1,018,806 | |
| | | | | | |
|
|
|
| | | | | | | | 2,229,671 | |
| | | | | | |
|
|
|
Retail - Drug Store — 0.1% | |
CVS Pass-Through Trust
Pass Through Certs.
4.70% due 01/10/2036* | | | 569,620 | | | | 591,405 | |
CVS Pass-Through Trust
Pass Through Certs.
5.77% due 01/10/2033* | | | 290,911 | | | | 329,398 | |
CVS Pass-Through Trust
Pass Through Certs.
5.93% due 01/10/2034* | | | 505,023 | | | | 566,254 | |
| | | | | | |
|
|
|
| | | | | | | | 1,487,057 | |
| | | | | | |
|
|
|
Retail - Regional Department Stores — 0.1% | |
Bon-Ton Department Stores, Inc.
Sec. Notes
8.00% due 06/15/2021 | | | 616,000 | | | | 400,400 | |
Kohl’s Corp.
Senior Notes
5.55% due 07/17/2045# | | | 645,000 | | | | 609,814 | |
| | | | | | |
|
|
|
| | | | | | | | 1,010,214 | |
| | | | | | |
|
|
|
Retail - Restaurants — 0.1% | |
Landry’s, Inc.
Company Guar. Notes
9.38% due 05/01/2020* | | | 511,000 | | | | 546,131 | |
PF Chang’s China Bistro, Inc.
Company Guar. Notes
10.25% due 06/30/2020*# | | | 673,000 | | | | 673,000 | |
| | | | | | |
|
|
|
| | | | | | | | 1,219,131 | |
| | | | | | |
|
|
|
Satellite Telecom — 0.0% | |
Hughes Satellite Systems Corp.
Company Guar. Notes
7.63% due 06/15/2021 | | | 333,000 | | | | 364,219 | |
| | | | | | |
|
|
|
Savings & Loans/Thrifts — 0.7% | |
Astoria Financial Corp.
Senior Notes
5.00% due 06/19/2017 | | | 1,520,000 | | | | 1,588,152 | |
First Niagara Financial Group, Inc.
Senior Notes
6.75% due 03/19/2020 | | | 2,927,000 | | | | 3,227,533 | |
First Niagara Financial Group, Inc.
Sub. Notes
7.25% due 12/15/2021 | | | 2,210,000 | | | | 2,478,391 | |
| | | | | | |
|
|
|
| | | | | | | | 7,294,076 | |
| | | | | | |
|
|
|
Schools — 0.1% | |
President and Fellows of Harvard College
Notes
3.62% due 10/01/2037 | | | 360,000 | | | | 349,201 | |
22
VALIC Company II Core Bond Fund
PORTFOLIO OF INVESTMENTS — August 31, 2015 — (continued)
| | | | | | | | |
| | |
| Security Description | |
Principal
Amount | | | Value
(Note 2) | |
| |
U.S. CORPORATE BONDS & NOTES (continued) | |
Schools (continued) | |
University of Pennsylvania
Senior Notes
4.67% due 09/01/2112 | | $ | 516,000 | | | $ | 496,313 | |
| | | | | | |
|
|
|
| | | | | | | | 845,514 | |
| | | | | | |
|
|
|
Semiconductor Equipment — 0.0% | |
Entegris, Inc.
Company Guar. Notes
6.00% due 04/01/2022* | | | 72,000 | | | | 72,900 | |
| | | | | | |
|
|
|
Specified Purpose Acquisitions — 0.1% | |
Opal Acquisition, Inc.
Senior Notes
8.88% due 12/15/2021* | | | 815,000 | | | | 798,700 | |
| | | | | | |
|
|
|
Steel Pipe & Tube — 0.1% | |
Valmont Industries, Inc.
Company Guar. Notes
5.25% due 10/01/2054 | | | 1,394,000 | | | | 1,229,321 | |
| | | | | | |
|
|
|
Steel - Producers — 0.1% | |
AK Steel Corp.
Company Guar. Notes
8.38% due 04/01/2022 | | | 507,000 | | | | 316,875 | |
AK Steel Corp.
Senior Sec. Notes
8.75% due 12/01/2018# | | | 400,000 | | | | 400,000 | |
Steel Dynamics, Inc.
Company Guar. Notes
5.13% due 10/01/2021 | | | 377,000 | | | | 369,648 | |
| | | | | | |
|
|
|
| | | | | | | | 1,086,523 | |
| | | | | | |
|
|
|
Steel - Specialty — 0.1% | |
Allegheny Technologies, Inc.
Senior Notes
5.95% due 01/15/2021 | | | 743,000 | | | | 676,130 | |
| | | | | | |
|
|
|
Telecom Services — 0.0% | |
Altice US Finance I Corp
Senior Sec. Notes
5.38% due 07/15/2023* | | | 500,000 | | | | 495,000 | |
| | | | | | |
|
|
|
Telecommunication Equipment — 0.1% | |
CommScope Technologies Finance LLC
Senior Sec. Notes
6.00% due 06/15/2025* | | | 500,000 | | | | 486,250 | |
Plantronics, Inc.
Company Guar. Notes
5.50% due 05/31/2023* | | | 300,000 | | | | 301,500 | |
| | | | | | |
|
|
|
| | | | | | | | 787,750 | |
| | | | | | |
|
|
|
Telephone - Integrated — 1.4% | |
AT&T, Inc.
Senior Notes
3.00% due 06/30/2022 | | | 2,175,000 | | | | 2,088,600 | |
AT&T, Inc.
Senior Notes
3.40% due 05/15/2025 | | | 615,000 | | | | 586,087 | |
AT&T, Inc.
Senior Notes
4.35% due 06/15/2045 | | | 1,170,000 | | | | 1,000,606 | |
AT&T, Inc.
Senior Notes
4.50% due 05/15/2035 | | | 1,507,000 | | | | 1,384,567 | |
AT&T, Inc.
Senior Notes
4.75% due 05/15/2046 | | | 539,000 | | | | 491,307 | |
| | | | | | | | |
| | |
| Security Description | |
Principal
Amount | | | Value
(Note 2) | |
| |
| | |
Telephone - Integrated (continued) | |
AT&T, Inc.
Senior Notes
5.80% due 02/15/2019 | | $ | 542,000 | | | $ | 599,795 | |
Century Telephone Enterprise, Inc.
Senior Notes
6.88% due 01/15/2028 | | | 241,000 | | | | 215,695 | |
CenturyLink, Inc.
Senior Notes
5.63% due 04/01/2025* | | | 490,000 | | | | 437,570 | |
CenturyLink, Inc.
Senior Notes
5.80% due 03/15/2022 | | | 443,000 | | | | 420,296 | |
Consolidated Communications, Inc.
Company Guar. Notes
6.50% due 10/01/2022* | | | 334,000 | | | | 308,950 | |
Frontier Communications Corp.
Senior Notes
8.50% due 04/15/2020 | | | 403,000 | | | | 414,083 | |
Frontier Communications Corp.
Senior Notes
9.25% due 07/01/2021 | | | 292,000 | | | | 300,030 | |
Verizon Communications, Inc.
Senior Notes
3.00% due 11/01/2021 | | | 1,121,000 | | | | 1,104,935 | |
Verizon Communications, Inc.
Senior Notes
4.40% due 11/01/2034 | | | 469,000 | | | | 432,486 | |
Verizon Communications, Inc.
Senior Notes
4.50% due 09/15/2020 | | | 130,000 | | | | 139,652 | |
Verizon Communications, Inc.
Senior Notes
4.67% due 03/15/2055 | | | 2,797,000 | | | | 2,423,648 | |
Verizon Communications, Inc.
Senior Notes
4.86% due 08/21/2046 | | | 2,221,000 | | | | 2,093,048 | |
Verizon Communications, Inc.
Senior Notes
6.40% due 09/15/2033 | | | 65,000 | | | | 74,535 | |
| | | | | | |
|
|
|
| | | | | | | | 14,515,890 | |
| | | | | | |
|
|
|
Theaters — 0.1% | |
Carmike Cinemas, Inc.
Sec. Notes
6.00% due 06/15/2023* | | | 300,000 | | | | 306,750 | |
National CineMedia LLC
Senior Sec. Notes
6.00% due 04/15/2022 | | | 365,000 | | | | 373,213 | |
| | | | | | |
|
|
|
| | | | | | | | 679,963 | |
| | | | | | |
|
|
|
Transport - Rail — 0.1% | |
Union Pacific Corp.
Senior Notes
3.88% due 02/01/2055 | | | 685,000 | | | | 595,636 | |
| | | | | | |
|
|
|
Travel Services — 0.1% | |
Sabre GLBL, Inc.
Senior Sec. Notes
5.38% due 04/15/2023* | | | 714,000 | | | | 699,720 | |
| | | | | | |
|
|
|
Trucking/Leasing — 0.1% | |
Penske Truck Leasing Co. LP/PTL Finance Corp.
Senior Notes
3.05% due 01/09/2020* | | | 803,000 | | | | 804,906 | |
| | | | | | |
|
|
|
23
VALIC Company II Core Bond Fund
PORTFOLIO OF INVESTMENTS — August 31, 2015 — (continued)
| | | | | | | | |
| | |
| Security Description | |
Principal
Amount | | | Value
(Note 2) | |
| |
U.S. CORPORATE BONDS & NOTES (continued) | |
Wire & Cable Products — 0.1% | |
General Cable Corp.
Company Guar. Notes
5.75% due 10/01/2022 | | $ | 962,000 | | | $ | 860,990 | |
| | | | | | |
|
|
|
Total U.S. Corporate Bonds & Notes | | | | | | | | |
(cost $286,363,267) | | | | | | | 277,749,752 | |
| | | | | | |
|
|
|
FOREIGN CORPORATE BONDS & NOTES — 7.7% | |
Agricultural Chemicals — 0.1% | |
Consolidated Energy Finance SA
Company Guar. Notes
6.75% due 10/15/2019* | | | 890,000 | | | | 878,697 | |
| | | | | | |
|
|
|
Airlines — 0.1% | |
Air Canada
Senior Sec. Notes
6.75% due 10/01/2019* | | | 600,000 | | | | 633,000 | |
| | | | | | |
|
|
|
Auto - Cars/Light Trucks — 0.2% | |
Hyundai Capital Services, Inc.
Senior Notes
4.38% due 07/27/2016* | | | 1,513,000 | | | | 1,554,064 | |
Volkswagen International Finance NV
Company Guar. Notes
2.38% due 03/22/2017* | | | 655,000 | | | | 665,022 | |
| | | | | | |
|
|
|
| | | | | | | | 2,219,086 | |
| | | | | | |
|
|
|
Banks - Commercial — 2.2% | |
Abbey National Treasury Services PLC
Company Guar. Notes
1.38% due 03/13/2017 | | | 47,000 | | | | 46,962 | |
ANZ New Zealand Int’l, Ltd.
Company Guar. Notes
1.13% due 03/24/2016* | | | 2,290,000 | | | | 2,295,691 | |
Bank of Tokyo-Mitsubishi UFJ, Ltd.
Senior Notes
1.45% due 09/08/2017* | | | 1,421,000 | | | | 1,411,479 | |
BPCE SA
Sub. Notes
4.50% due 03/15/2025* | | | 1,450,000 | | | | 1,407,067 | |
Cooperatieve Centrale Raiffeisen-Boerenleenbank BA
Senior Notes
1.70% due 03/19/2018 | | | 377,000 | | | | 374,743 | |
Credit Suisse
Senior Notes
1.70% due 04/27/2018 | | | 1,116,000 | | | | 1,108,535 | |
Credit Suisse
Sub. Notes
5.40% due 01/14/2020 | | | 2,576,000 | | | | 2,844,074 | |
Credit Suisse Group Funding Guernsey, Ltd.
Company Guar. Notes
4.88% due 05/15/2045* | | | 1,048,000 | | | | 1,023,586 | |
Credit Suisse New York
Senior Notes
3.00% due 10/29/2021 | | | 513,000 | | | | 510,537 | |
DBS Group Holdings, Ltd.
Senior Notes
2.25% due 07/16/2019* | | | 1,529,000 | | | | 1,532,665 | |
ING Bank NV
Senior Notes
4.00% due 03/15/2016* | | | 998,000 | | | | 1,014,197 | |
Intesa Sanpaolo SpA
Sub. Notes
5.02% due 06/26/2024* | | | 1,542,000 | | | | 1,507,219 | |
| | | | | | | | |
| | |
| Security Description | |
Principal
Amount | | | Value
(Note 2) | |
| |
| | |
Banks - Commercial (continued) | |
Kookmin Bank
Senior Notes
1.63% due 07/14/2017*# | | $ | 1,906,000 | | | $ | 1,897,282 | |
National Australia Bank, Ltd.
Senior Notes
2.75% due 03/09/2017 | | | 1,396,000 | | | | 1,429,283 | |
National Bank of Canada
Company Guar. Notes
1.45% due 11/07/2017 | | | 2,515,000 | | | | 2,503,620 | |
Rabobank Nederland Bank
Guar. Notes
5.25% due 08/04/2045 | | | 802,000 | | | | 822,823 | |
Standard Chartered PLC
Senior Notes
2.25% due 04/17/2020* | | | 1,770,000 | | | | 1,745,719 | |
Standard Chartered PLC
Senior Notes
3.20% due 04/17/2025* | | | 434,000 | | | | 408,134 | |
| | | | | | |
|
|
|
| | | | | | | | 23,883,616 | |
| | | | | | |
|
|
|
Banks - Money Center — 0.1% | |
ABN AMRO Bank NV
Sub. Notes
4.75% due 07/28/2025* | | | 519,000 | | | | 519,800 | |
Mizuho Bank, Ltd.
Company Guar. Notes
2.45% due 04/16/2019* | | | 591,000 | | | | 593,447 | |
| | | | | | |
|
|
|
| | | | | | | | 1,113,247 | |
| | | | | | |
|
|
|
Beverages - Non-alcoholic — 0.2% | |
Coca-Cola Femsa SAB de CV
Company Guar. Notes
2.38% due 11/26/2018 | | | 1,764,000 | | | | 1,779,170 | |
| | | | | | |
|
|
|
Beverages - Wine/Spirits — 0.1% | |
Diageo Capital PLC
Company Guar. Notes
5.75% due 10/23/2017 | | | 1,243,000 | | | | 1,350,602 | |
| | | | | | |
|
|
|
Building - Residential/Commercial — 0.1% | |
Mattamy Group Corp.
Senior Notes
6.50% due 11/15/2020*# | | | 629,000 | | | | 606,985 | |
| | | | | | |
|
|
|
Cable/Satellite TV — 0.1% | |
Numericable Group SA
Senior Sec. Notes
6.00% due 05/15/2022* | | | 323,000 | | | | 323,000 | |
Unitymedia Hessen GmbH & Co KG / Unitymedia NRW GmbH
Senior Sec. Notes
5.00% due 01/15/2025* | | | 275,000 | | | | 268,813 | |
| | | | | | |
|
|
|
| | | | | | | | 591,813 | |
| | | | | | |
|
|
|
Chemicals - Diversified — 0.0% | |
NOVA Chemicals Corp.
Senior Notes
5.00% due 05/01/2025* | | | 425,000 | | | | 425,000 | |
| | | | | | |
|
|
|
Chemicals - Plastics — 0.1% | |
Mexichem SAB de CV
Company Guar. Notes
5.88% due 09/17/2044* | | | 982,000 | | | | 871,525 | |
| | | | | | |
|
|
|
24
VALIC Company II Core Bond Fund
PORTFOLIO OF INVESTMENTS — August 31, 2015 — (continued)
| | | | | | | | |
| | |
| Security Description | |
Principal
Amount | | | Value
(Note 2) | |
| |
FOREIGN CORPORATE BONDS & NOTES (continued) | |
Consumer Products - Misc. — 0.1% | |
Kimberly-Clark de Mexico SAB de CV
Senior Notes
3.25% due 03/12/2025* | | $ | 1,100,000 | | | $ | 1,063,898 | |
| | | | | | |
|
|
|
Cruise Lines — 0.1% | |
Royal Caribbean Cruises, Ltd.
Senior Notes
5.25% due 11/15/2022 | | | 263,000 | | | | 273,520 | |
Royal Caribbean Cruises, Ltd.
Senior Notes
7.50% due 10/15/2027 | | | 20,000 | | | | 23,200 | |
Viking Cruises, Ltd.
Senior Notes
6.25% due 05/15/2025* | | | 400,000 | | | | 394,000 | |
| | | | | | |
|
|
|
| | | | | | | | 690,720 | |
| | | | | | |
|
|
|
Disposable Medical Products — 0.0% | |
ConvaTec Finance International SA
Senior Notes
8.25% due 01/15/2019*(13) | | | 400,000 | | | | 394,000 | |
| | | | | | |
|
|
|
Diversified Banking Institutions — 1.0% | |
Credit Agricole SA
Sub. Notes
4.38% due 03/17/2025* | | | 1,207,000 | | | | 1,171,944 | |
Deutsche Bank AG
Senior Notes
1.88% due 02/13/2018 | | | 3,745,000 | | | | 3,726,649 | |
Deutsche Bank AG
Sub. Notes
4.50% due 04/01/2025 | | | 1,564,000 | | | | 1,514,041 | |
HSBC Holdings PLC
Sub. Notes
4.25% due 08/18/2025 | | | 783,000 | | | | 775,756 | |
UBS AG
Senior Notes
1.80% due 03/26/2018 | | | 2,222,000 | | | | 2,214,438 | |
UBS AG
Sub. Notes
5.13% due 05/15/2024 | | | 1,007,000 | | | | 1,007,000 | |
UBS AG
Sub. Notes
7.63% due 08/17/2022 | | | 335,000 | | | | 389,805 | |
| | | | | | |
|
|
|
| | | | | | | | 10,799,633 | |
| | | | | | |
|
|
|
Diversified Manufacturing Operations — 0.2% | |
Ingersoll-Rand Luxembourg Finance SA
Company Guar. Notes
4.65% due 11/01/2044 | | | 432,000 | | | | 403,430 | |
Siemens Financieringsmaatschappij NV
Company Guar. Notes
4.40% due 05/27/2045* | | | 1,645,000 | | | | 1,646,497 | |
| | | | | | |
|
|
|
| | | | | | | | 2,049,927 | |
| | | | | | |
|
|
|
Diversified Minerals — 0.2% | |
Anglo American Capital PLC
Company Guar. Notes
4.13% due 04/15/2021*# | | | 596,000 | | | | 555,731 | |
Anglo American Capital PLC
Company Guar. Notes
4.88% due 05/14/2025* | | | 493,000 | | | | 445,107 | |
FMG Resources August 2006 Pty, Ltd.
Company Guar. Notes
6.88% due 04/01/2022*# | | | 358,000 | | | | 221,960 | |
| | | | | | | | |
| | |
| Security Description | |
Principal
Amount | | | Value
(Note 2) | |
| |
| | |
Diversified Minerals (continued) | |
FMG Resources August 2006 Pty, Ltd.
Senior Sec. Notes
9.75% due 03/01/2022*# | | $ | 277,000 | | | $ | 253,109 | |
Teck Resources, Ltd.
Company Guar. Notes
2.50% due 02/01/2018 | | | 850,000 | | | | 726,750 | |
| | | | | | |
|
|
|
| | | | | | | | 2,202,657 | |
| | | | | | |
|
|
|
Electric - Generation — 0.1% | |
Electricite de France SA
Senior Notes
6.00% due 01/22/2114* | | | 522,000 | | | | 552,353 | |
| | | | | | |
|
|
|
Electronic Components - Misc. — 0.0% | |
Flextronics International, Ltd.
Company Guar. Notes
4.75% due 06/15/2025* | | | 330,000 | | | | 319,245 | |
| | | | | | |
|
|
|
Finance - Leasing Companies — 0.1% | |
Aircastle, Ltd.
Senior Notes
4.63% due 12/15/2018 | | | 68,000 | | | | 69,870 | |
Aircastle, Ltd.
Senior Notes
5.50% due 02/15/2022 | | | 256,000 | | | | 264,960 | |
Aircastle, Ltd.
Senior Notes
6.25% due 12/01/2019 | | | 323,000 | | | | 350,455 | |
Fly Leasing, Ltd.
Senior Notes
6.75% due 12/15/2020 | | | 650,000 | | | | 669,500 | |
| | | | | | |
|
|
|
| | | | | | | | 1,354,785 | |
| | | | | | |
|
|
|
Gambling (Non-Hotel) — 0.1% | |
International Game Technology PLC
Senior Sec. Notes
6.50% due 02/15/2025* | | | 929,000 | | | | 880,228 | |
| | | | | | |
|
|
|
Gold Mining — 0.1% | |
Goldcorp, Inc.
Senior Notes
5.45% due 06/09/2044 | | | 743,000 | | | | 655,831 | |
Kinross Gold Corp.
Company Guar. Notes
5.95% due 03/15/2024 | | | 400,000 | | | | 339,502 | |
| | | | | | |
|
|
|
| | | | | | | | 995,333 | |
| | | | | | |
|
|
|
Insurance - Multi-line — 0.2% | |
XLIT, Ltd.
Company Guar. Notes
4.45% due 03/31/2025 | | | 563,000 | | | | 555,994 | |
XLIT, Ltd.
Company Guar. Notes
5.50% due 03/31/2045 | | | 1,264,000 | | | | 1,175,760 | |
| | | | | | |
|
|
|
| | | | | | | | 1,731,754 | |
| | | | | | |
|
|
|
Machinery - General Industrial — 0.1% | |
ATS Automation Tooling Systems, Inc.
Senior Notes
6.50% due 06/15/2023* | | | 987,000 | | | | 994,402 | |
| | | | | | |
|
|
|
Medical - Drugs — 0.4% | |
Endo Finance LLC
Company Guar. Notes
6.00% due 07/15/2023* | | | 435,000 | | | | 452,400 | |
25
VALIC Company II Core Bond Fund
PORTFOLIO OF INVESTMENTS — August 31, 2015 — (continued)
| | | | | | | | |
| | |
| Security Description | |
Principal
Amount | | | Value
(Note 2) | |
| |
FOREIGN CORPORATE BONDS & NOTES (continued) | |
Medical - Drugs (continued) | |
Grifols Worldwide Operations, Ltd.
Company Guar. Notes
5.25% due 04/01/2022 | | $ | 999,000 | | | $ | 1,015,234 | |
Takeda Pharmaceutical Co., Ltd.
Senior Notes
1.63% due 03/17/2017* | | | 1,458,000 | | | | 1,463,428 | |
Valeant Pharmaceuticals International, Inc.
Company Guar. Notes
5.63% due 12/01/2021* | | | 170,000 | | | | 172,975 | |
Valeant Pharmaceuticals International, Inc.
Company Guar. Notes
5.88% due 05/15/2023* | | | 636,000 | | | | 648,720 | |
| | | | | | |
|
|
|
| | | | | | | | 3,752,757 | |
| | | | | | |
|
|
|
Medical - Generic Drugs — 0.3% | |
Actavis Funding SCS
Company Guar. Notes
3.00% due 03/12/2020 | | | 1,112,000 | | | | 1,107,348 | |
Actavis Funding SCS
Company Guar. Notes
3.80% due 03/15/2025 | | | 711,000 | | | | 688,092 | |
Actavis Funding SCS
Company Guar. Notes
3.85% due 06/15/2024 | | | 984,000 | | | | 959,148 | |
Perrigo Finance PLC
Company Guar. Notes
3.50% due 12/15/2021 | | | 992,000 | | | | 968,252 | |
| | | | | | |
|
|
|
| | | | | | | | 3,722,840 | |
| | | | | | |
|
|
|
Metal - Copper — 0.0% | |
First Quantum Minerals, Ltd.
Company Guar. Notes
7.25% due 05/15/2022*# | | | 219,000 | | | | 152,753 | |
| | | | | | |
|
|
|
Oil Companies - Exploration & Production — 0.3% | |
Anadarko Finance Co.
Company Guar. Notes
7.50% due 05/01/2031 | | | 681,000 | | | | 835,004 | |
Baytex Energy Corp.
Company Guar. Notes
5.13% due 06/01/2021* | | | 101,000 | | | | 86,052 | |
Baytex Energy Corp.
Company Guar. Notes
5.63% due 06/01/2024* | | | 480,000 | | | | 400,570 | |
MEG Energy Corp.
Company Guar. Notes
6.38% due 01/30/2023* | | | 222,000 | | | | 178,710 | |
MEG Energy Corp.
Company Guar. Notes
6.50% due 03/15/2021* | | | 475,000 | | | | 396,862 | |
Talisman Energy, Inc.
Senior Notes
5.50% due 05/15/2042 | | | 1,527,000 | | | | 1,285,308 | |
| | | | | | |
|
|
|
| | | | | | | | 3,182,506 | |
| | | | | | |
|
|
|
Oil Companies - Integrated — 0.4% | |
BP Capital Markets PLC
Company Guar. Notes
1.38% due 11/06/2017 | | | 1,793,000 | | | | 1,784,878 | |
BP Capital Markets PLC
Company Guar. Notes
3.54% due 11/04/2024 | | | 711,000 | | | | 696,759 | |
| | | | | | | | |
| | |
| Security Description | |
Principal
Amount | | | Value
(Note 2) | |
| |
| | | | | | | | | |
Oil Companies - Integrated (continued) | |
BP Capital Markets PLC
Company Guar. Notes
4.74% due 03/11/2021 | | $ | 588,000 | | | $ | 643,875 | |
Petroleos Mexicanos
Company Guar. Notes
5.50% due 06/27/2044 | | | 263,000 | | | | 227,561 | |
Shell International Finance BV
Company Guar. Notes
2.13% due 05/11/2020 | | | 902,000 | | | | 896,034 | |
| | | | | | |
|
|
|
| | | | | | | | 4,249,107 | |
| | | | | | |
|
|
|
Paper & Related Products — 0.0% | |
Cascades, Inc.
Senior Notes
5.75% due 07/15/2023* | | | 500,000 | | | | 483,750 | |
| | | | | | |
|
|
|
Printing - Commercial — 0.1% | |
Cimpress NV
Company Guar. Notes
7.00% due 04/01/2022* | | | 740,000 | | | | 735,375 | |
| | | | | | |
|
|
|
Satellite Telecom — 0.1% | |
Intelsat Jackson Holdings SA
Company Guar. Notes
5.50% due 08/01/2023 | | | 1,075,000 | | | | 946,000 | |
| | | | | | |
|
|
|
Security Services — 0.0% | |
Garda World Security Corp.
Company Guar. Notes
7.25% due 11/15/2021* | | | 358,000 | | | | 334,730 | |
| | | | | | |
|
|
|
Steel - Producers — 0.0% | |
ArcelorMittal
Senior Notes
7.00% due 02/25/2022 | | | 236,000 | | | | 235,410 | |
ArcelorMittal
Senior Notes
7.50% due 03/01/2041(6) | | | 211,000 | | | | 193,593 | |
| | | | | | |
|
|
|
| | | | | | | | 429,003 | |
| | | | | | |
|
|
|
SupraNational Banks — 0.1% | |
North American Development Bank
Senior Notes
2.30% due 10/10/2018 | | | 1,002,000 | | | | 1,019,786 | |
| | | | | | |
|
|
|
Telecom Services — 0.2% | |
Altice Financing SA
Senior Sec. Notes
6.50% due 01/15/2022* | | | 573,000 | | | | 574,432 | |
Altice SA
Company Guar. Notes
7.75% due 05/15/2022* | | | 593,000 | | | | 578,175 | |
Virgin Media Secured Finance PLC
Senior Sec. Notes
5.25% due 01/15/2026* | | | 500,000 | | | | 485,000 | |
| | | | | | |
|
|
|
| | | | | | | | 1,637,607 | |
| | | | | | |
|
|
|
Telephone - Integrated — 0.2% | |
Telecom Italia Capital SA
Company Guar. Notes
7.72% due 06/04/2038 | | | 1,934,000 | | | | 2,204,760 | |
| | | | | | |
|
|
|
Transport - Rail — 0.0% | |
Canadian Pacific Railway Co.
Senior Notes
4.80% due 08/01/2045 | | | 404,000 | | | | 406,073 | |
| | | | | | |
|
|
|
Total Foreign Corporate Bonds & Notes | | | | | | | | |
(cost $83,191,450) | | | | | | | 81,638,723 | |
| | | | | | |
|
|
|
26
VALIC Company II Core Bond Fund
PORTFOLIO OF INVESTMENTS — August 31, 2015 — (continued)
| | | | | | | | |
| | |
| Security Description | |
Principal
Amount | | | Value
(Note 2) | |
| |
FOREIGN GOVERNMENT OBLIGATIONS — 0.6% | |
Electric - Distribution — 0.1% | |
Hydro-Quebec
Government Guar. Notes
1.38% due 06/19/2017 | | $ | 986,000 | | | $ | 992,902 | |
| | | | | | |
|
|
|
Sovereign — 0.5% | |
Government of Canada
Senior Notes
0.88% due 02/14/2017 | | | 956,000 | | | | 958,363 | |
United Mexican States
Senior Notes
3.50% due 01/21/2021 | | | 2,407,000 | | | | 2,440,097 | |
United Mexican States
Senior Notes
3.60% due 01/30/2025 | | | 983,000 | | | | 963,340 | |
United Mexican States
Senior Bonds
4.75% due 03/08/2044 | | | 938,000 | | | | 874,685 | |
| | | | | | |
|
|
|
| | | | | | | | 5,236,485 | |
| | | | | | |
|
|
|
Total Foreign Government Obligations | | | | | | | | |
(cost $6,135,566) | | | | 6,229,387 | |
| | | | | | |
|
|
|
U.S. GOVERNMENT AGENCIES — 29.3% | |
Federal Home Loan Mtg. Corp. — 8.4% | |
1.89% due 02/01/2037 FRS | | | 473,723 | | | | 498,503 | |
2.50% due 01/01/2028 | | | 1,116,579 | | | | 1,144,554 | |
2.50% due 04/01/2028 | | | 2,373,970 | | | | 2,433,496 | |
2.53% due 11/01/2037 FRS | | | 3,119,003 | | | | 3,345,610 | |
3.00% due 08/01/2027 | | | 484,473 | | | | 503,066 | |
3.00% due 10/01/2042 | | | 2,175,602 | | | | 2,197,750 | |
3.00% due 11/01/2042 | | | 1,813,281 | | | | 1,823,296 | |
3.00% due 02/01/2043 | | | 4,285,395 | | | | 4,316,642 | |
3.00% due 04/01/2043 | | | 4,130,923 | | | | 4,159,789 | |
3.00% due 05/01/2043 | | | 845,133 | | | | 853,751 | |
3.00% due 08/01/2043 | | | 8,511,933 | | | | 8,555,166 | |
3.00% due 07/01/2045 | | | 2,644,513 | | | | 2,653,713 | |
3.50% due 02/01/2042 | | | 564,683 | | | | 585,208 | |
3.50% due 03/01/2042 | | | 742,349 | | | | 771,815 | |
3.50% due 04/01/2042 | | | 2,557,593 | | | | 2,658,880 | |
3.50% due 08/01/2042 | | | 8,457,570 | | | | 8,794,457 | |
3.50% due 09/01/2043 | | | 2,543,679 | | | | 2,647,303 | |
3.50% due 03/01/2045 | | | 9,053,676 | | | | 9,383,547 | |
3.50% due 07/01/2045 | | | 3,797,552 | | | | 3,936,776 | |
3.50% due 08/01/2045 | | | 3,430,087 | | | | 3,563,016 | |
4.00% due 03/01/2023 | | | 1,085,344 | | | | 1,135,598 | |
4.00% due 09/01/2040 | | | 410,316 | | | | 436,687 | |
4.00% due 10/01/2043 | | | 7,770,635 | | | | 8,251,832 | |
4.50% due 11/01/2018 | | | 34,866 | | | | 36,275 | |
4.50% due 02/01/2019 | | | 40,824 | | | | 42,419 | |
4.50% due 01/01/2039 | | | 56,600 | | | | 61,308 | |
4.50% due 12/01/2039 | | | 1,358,332 | | | | 1,500,742 | |
5.00% due 10/01/2033 | | | 4,493 | | | | 4,926 | |
5.00% due 07/01/2040 | | | 1,171,923 | | | | 1,294,347 | |
5.00% due 11/01/2043 | | | 4,965,357 | | | | 5,472,022 | |
5.50% due 11/01/2018 | | | 19,872 | | | | 20,673 | |
5.50% due 11/01/2032 | | | 21,769 | | | | 24,225 | |
5.50% due 07/01/2034 | | | 39,687 | | | | 44,149 | |
5.50% due 02/01/2035 | | | 79,199 | | | | 88,124 | |
5.50% due 07/01/2035 | | | 2,107 | | | | 2,354 | |
5.50% due 01/01/2036 | | | 437,916 | | | | 491,283 | |
5.50% due 05/01/2037 | | | 72,723 | | | | 80,929 | |
6.00% due 07/01/2035 | | | 95,806 | | | | 108,104 | |
6.00% due 03/01/2040 | | | 361,784 | | | | 408,968 | |
6.50% due 12/01/2032 | | | 152,652 | | | | 174,448 | |
6.50% due 02/01/2036 | | | 23,954 | | | | 27,530 | |
| | | | | | | | |
| | |
| Security Description | |
Principal
Amount | | | Value
(Note 2) | |
| |
| | | | | | | | | |
Federal Home Loan Mtg. Corp. (continued) | |
6.50% due 09/01/2036 | | $ | 441 | | | $ | 504 | |
6.50% due 05/01/2037 | | | 100,986 | | | | 117,557 | |
7.00% due 11/01/2016 | | | 656 | | | | 667 | |
Federal Home Loan Mtg. Corp. REMIC | | | | | | | | |
Series 3964, Class MD 2.00% due 01/15/2041(2) | | | 644,484 | | | | 649,425 | |
Series 3572, Class JS | | | | | | | | |
6.60% due 09/15/2039 FRS(2)(7)(8) | | | 2,326,928 | | | | 381,642 | |
Federal Home Loan Mtg. Corp. Structured Agency Credit Risk | | | | | | | | |
Series 2014-HQ1, Class M1 | | | | | | | | |
1.85% due 08/25/2024 FRS(2) | | | 2,662,271 | | | | 2,670,742 | |
Series 2014-DN1, Class M2 | | | | | | | | |
2.40% due 02/25/2024 FRS(2) | | | 1,580,000 | | | | 1,590,398 | |
| | | | | | |
|
|
|
| | | | | | | | 89,944,216 | |
| | | | | | |
|
|
|
Federal National Mtg. Assoc. — 18.0% | |
1.91% due 09/01/2035 FRS | | | 2,877,827 | | | | 3,029,846 | |
2.19% due 05/01/2037 FRS | | | 795,010 | | | | 841,359 | |
2.32% due 05/01/2040 FRS | | | 2,995,861 | | | | 3,195,521 | |
2.33% due 07/01/2039 FRS | | | 1,986,735 | | | | 2,097,438 | |
2.40% due 06/01/2034 FRS | | | 2,445,303 | | | | 2,609,541 | |
2.49% due 11/01/2036 FRS | | | 1,280,969 | | | | 1,371,923 | |
2.50% due 02/01/2028 | | | 2,313,301 | | | | 2,370,728 | |
2.50% due 04/01/2028 | | | 585,869 | | | | 600,431 | |
2.50% due September 15 TBA | | | 6,310,000 | | | | 6,407,528 | |
2.55% due 08/01/2035 FRS | | | 1,661,705 | | | | 1,781,568 | |
2.97% due 10/01/2040 FRS | | | 871,795 | | | | 928,541 | |
3.00% due 10/01/2027 | | | 334,456 | | | | 347,994 | |
3.00% due 11/01/2027 | | | 2,378,162 | | | | 2,474,423 | |
3.00% due 01/01/2028 | | | 3,285,680 | | | | 3,413,942 | |
3.00% due 03/01/2042 | | | 3,938,819 | | | | 3,980,086 | |
3.00% due 12/01/2042 | | | 3,952,770 | | | | 3,993,579 | |
3.00% due 05/01/2043 | | | 4,691,224 | | | | 4,736,109 | |
3.00% due 02/01/2045 | | | 3,361,077 | | | | 3,383,695 | |
3.00% due September 30 TBA | | | 3,388,000 | | | | 3,407,057 | |
3.00% due September 15 TBA | | | 3,962,000 | | | | 4,112,788 | |
3.21% due 10/01/2040 FRS | | | 1,725,601 | | | | 1,841,715 | |
3.50% due 08/01/2026 | | | 2,268,334 | | | | 2,396,918 | |
3.50% due 09/01/2026 | | | 2,096,440 | | | | 2,216,675 | |
3.50% due 08/01/2027 | | | 363,154 | | | | 383,263 | |
3.50% due 10/01/2028 | | | 4,370,893 | | | | 4,616,234 | |
3.50% due 12/01/2041 | | | 631,800 | | | | 656,026 | |
3.50% due 03/01/2042 | | | 906,567 | | | | 942,756 | |
3.50% due 08/01/2042 | | | 5,535,609 | | | | 5,763,300 | |
3.50% due 09/01/2042 | | | 821,836 | | | | 854,614 | |
3.50% due 02/01/2043 | | | 3,890,707 | | | | 4,080,767 | |
3.50% due 03/01/2043 | | | 1,729,734 | | | | 1,796,060 | |
3.50% due 08/01/2043 | | | 8,335,154 | | | | 8,662,346 | |
3.50% due September 30 TBA | | | 4,689,000 | | | | 4,863,775 | |
4.00% due 11/01/2025 | | | 169,560 | | | | 180,633 | |
4.00% due 04/01/2039 | | | 2,330,991 | | | | 2,479,932 | |
4.00% due 06/01/2039 | | | 719,311 | | | | 778,041 | |
4.00% due 09/01/2040 | | | 205,046 | | | | 219,074 | |
4.00% due 10/01/2040 | | | 467,277 | | | | 499,327 | |
4.00% due 12/01/2040 | | | 3,382,998 | | | | 3,616,302 | |
4.00% due 10/01/2041 | | | 1,954,997 | | | | 2,088,771 | |
4.00% due 11/01/2041 | | | 2,325,230 | | | | 2,479,184 | |
4.00% due 10/01/2043 | | | 5,718,408 | | | | 6,093,145 | |
4.00% due 12/01/2043 | | | 635,140 | | | | 685,470 | |
4.00% due 10/01/2044 | | | 9,416,248 | | | | 10,037,000 | |
4.00% due 11/01/2044 | | | 2,863,488 | | | | 3,052,321 | |
4.00% due September 30 TBA | | | 10,833,000 | | | | 11,515,565 | |
4.50% due 06/01/2018 | | | 4,879 | | | | 5,070 | |
4.50% due 10/01/2024 | | | 845,195 | | | | 908,089 | |
27
VALIC Company II Core Bond Fund
PORTFOLIO OF INVESTMENTS — August 31, 2015 — (continued)
| | | | | | | | |
| | |
| Security Description | |
Principal
Amount | | | Value
(Note 2) | |
| |
U.S. GOVERNMENT AGENCIES (continued) | |
Federal National Mtg. Assoc. (continued) | |
4.50% due 03/01/2025 | | $ | 1,267,348 | | | $ | 1,365,282 | |
4.50% due 06/01/2039 | | | 308,191 | | | | 336,321 | |
4.50% due 09/01/2039 | | | 1,728,608 | | | | 1,877,303 | |
4.50% due 01/01/2040 | | | 799,716 | | | | 883,555 | |
4.50% due 02/01/2040 | | | 1,520,338 | | | | 1,688,196 | |
4.50% due 05/01/2040 | | | 571,133 | | | | 633,611 | |
4.50% due 08/01/2040 | | | 662,205 | | | | 727,944 | |
4.50% due 11/01/2040 | | | 607,116 | | | | 659,926 | |
4.50% due 12/01/2040 | | | 626,076 | | | | 680,613 | |
4.50% due 05/01/2041 | | | 1,564,921 | | | | 1,699,541 | |
4.50% due 07/01/2041 | | | 870,972 | | | | 946,980 | |
4.50% due 03/01/2042 | | | 6,033,131 | | | | 6,560,553 | |
4.50% due September 30 TBA | | | 8,462,000 | | | | 9,170,692 | |
5.00% due 03/15/2016 | | | 248,000 | | | | 254,165 | |
5.00% due 09/01/2018 | | | 3,272 | | | | 3,419 | |
5.00% due 10/01/2018 | | | 2,928 | | | | 3,060 | |
5.00% due 03/01/2020 | | | 6,263 | | | | 6,675 | |
5.00% due 06/01/2022 | | | 162,892 | | | | 175,979 | |
5.00% due 10/01/2024 | | | 372,407 | | | | 393,640 | |
5.00% due 09/01/2033 | | | 1,177,568 | | | | 1,304,849 | |
5.00% due 04/01/2040 | | | 722,202 | | | | 802,225 | |
5.00% due 05/01/2040 | | | 1,251,707 | | | | 1,384,226 | |
5.00% due 06/01/2040 | | | 5,957,790 | | | | 6,585,376 | |
5.00% due 07/01/2040 | | | 2,413,500 | | | | 2,666,954 | |
5.00% due September 30 TBA | | | 1,500,000 | | | | 1,654,541 | |
5.50% due 12/01/2029 | | | 305,506 | | | | 341,554 | |
5.50% due 12/01/2033 | | | 64,960 | | | | 73,110 | |
5.50% due 07/01/2037 | | | 77,645 | | | | 86,777 | |
5.50% due 08/01/2037 | | | 2,870,680 | | | | 3,209,687 | |
5.50% due 06/01/2038 | | | 377,207 | | | | 426,070 | |
5.50% due 09/01/2039 | | | 1,071,205 | | | | 1,209,903 | |
6.00% due 09/01/2016 | | | 2,165 | | | | 2,169 | |
6.00% due 12/01/2016 | | | 1,252 | | | | 1,278 | |
6.00% due 08/01/2034 | | | 52,077 | | | | 59,303 | |
6.00% due 11/01/2035 | | | 99,172 | | | | 112,324 | |
6.00% due 06/01/2036 | | | 131,034 | | | | 148,493 | |
6.00% due 12/01/2036 | | | 229,293 | | | | 259,300 | |
6.00% due 10/01/2037 | | | 14,491 | | | | 16,346 | |
6.00% due 07/01/2038 | | | 1,087,167 | | | | 1,229,684 | |
6.00% due 09/01/2038 | | | 590,158 | | | | 667,341 | |
6.00% due 11/01/2038 | | | 362,483 | | | | 408,832 | |
6.50% due 02/01/2017 | | | 2,055 | | | | 2,099 | |
Fannie Mae Connecticut Avenue
Securities FRS | | | | | | | | |
Series 2014-C01, Class M1
| | | | | | | | |
1.80% due 01/25/2024(2) | | | 1,690,348 | | | | 1,695,253 | |
Federal National Mtg. Assoc. REMIC | | | | | | | | |
Series 2011-117, Class MA | | | | | | | | |
2.00% due 08/25/2040(2) | | | 926,172 | | | | 928,531 | |
| | | | | | |
|
|
|
| | | | | | | | 192,140,150 | |
| | | | | | |
|
|
|
Government National Mtg. Assoc. — 2.8% | |
3.00% due 02/20/2045 | | | 3,591,454 | | | | 3,649,652 | |
3.00% due 05/20/2045 | | | 2,575,896 | | | | 2,617,637 | |
3.00% due September 30 TBA | | | 2,686,000 | | | | 2,725,502 | |
3.50% due 03/20/2045 | | | 2,854,169 | | | | 2,980,394 | |
3.50% due 04/20/2045 | | | 8,322,107 | | | | 8,690,150 | |
3.50% due September 30 TBA | | | 2,711,000 | | | | 2,826,323 | |
4.00% due 03/20/2044 | | | 1,727,419 | | | | 1,834,575 | |
4.50% due 05/15/2039 | | | 920,761 | | | | 1,017,584 | |
5.00% due 05/15/2034 | | | 369,770 | | | | 410,640 | |
5.00% due 01/15/2040 | | | 641,305 | | | | 719,982 | |
5.50% due 12/15/2039 | | | 1,008,111 | | | | 1,133,329 | |
| | | | | | | | |
| | |
| Security Description | |
Principal
Amount | | | Value
(Note 2) | |
| |
| | | | | | | | | |
Government National Mtg. Assoc. (continued) | |
6.00% due 10/15/2039 | | $ | 941,142 | | | $ | 1,057,382 | |
7.00% due 09/15/2028 | | | 4,243 | | | | 4,358 | |
| | | | | | |
|
|
|
| | | | | | | | 29,667,508 | |
| | | | | | |
|
|
|
Tennessee Valley Authority — 0.1% | |
Tennessee Valley Authority | | | | | | | | |
1.75% due 10/15/2018 | | | 565,000 | | | | 573,884 | |
| | | | | | |
|
|
|
Total U.S. Government Agencies | | | | | | | | |
(cost $309,383,951) | | | | | | | 312,325,758 | |
| | | | | | |
|
|
|
U.S. GOVERNMENT TREASURIES — 23.9% | |
United States Treasury Bonds — 5.0% | |
2.50% due 02/15/2045 | | | 8,000,000 | | | | 7,277,504 | |
2.75% due 11/15/2042 | | | 176,000 | | | | 169,324 | |
2.88% due 05/15/2043 | | | 1,300,000 | | | | 1,280,872 | |
3.00% due 05/15/2045 | | | 1,210,000 | | | | 1,223,990 | |
3.13% due 11/15/2041 | | | 3,426,000 | | | | 3,567,100 | |
3.13% due 02/15/2042 | | | 8,027,000 | | | | 8,344,002 | |
3.13% due 02/15/2043 | | | 3,700,000 | | | | 3,826,610 | |
3.13% due 08/15/2044 | | | 2,010,000 | | | | 2,079,355 | |
3.63% due 08/15/2043 | | | 2,000,000 | | | | 2,272,708 | |
3.63% due 02/15/2044 | | | 2,677,000 | | | | 3,039,929 | |
3.75% due 08/15/2041 | | | 152,000 | | | | 176,324 | |
3.75% due 11/15/2043 | | | 5,000,000 | | | | 5,811,330 | |
3.88% due 08/15/2040 | | | 588,000 | | | | 692,424 | |
4.25% due 11/15/2040 | | | 3,000,000 | | | | 3,741,132 | |
4.38% due 05/15/2041 | | | 1,901,000 | | | | 2,423,355 | |
4.50% due 02/15/2036 | | | 3,610,000 | | | | 4,662,683 | |
4.63% due 02/15/2040 | | | 284,000 | | | | 372,591 | |
5.25% due 11/15/2028 | | | 1,575,000 | | | | 2,079,328 | |
8.13% due 08/15/2019 | | | 158,000 | | | | 199,343 | |
| | | | | | |
|
|
|
| | | | | | | | 53,239,904 | |
| | | | | | |
|
|
|
United States Treasury Notes — 18.9% | |
0.13% due 04/15/2018 TIPS(9) | | | 2,267,809 | | | | 2,265,832 | |
0.38% due 11/15/2015 | | | 76,000 | | | | 76,035 | |
0.50% due 01/31/2017 | | | 3,450,000 | | | | 3,446,001 | |
0.50% due 03/31/2017 | | | 15,000,000 | | | | 14,970,510 | |
0.50% due 04/30/2017 | | | 20,000,000 | | | | 19,948,960 | |
0.50% due 07/31/2017 | | | 7,436,000 | | | | 7,402,211 | |
0.63% due 08/31/2017 | | | 11,203,000 | | | | 11,177,031 | |
0.75% due 12/31/2017 | | | 351,000 | | | | 349,848 | |
0.88% due 12/31/2016 | | | 5,005,000 | | | | 5,026,016 | |
0.88% due 02/28/2017 | | | 7,000,000 | | | | 7,027,069 | |
1.00% due 08/31/2016 | | | 3,656,000 | | | | 3,676,042 | |
1.00% due 05/31/2018 | | | 4,000,000 | | | | 3,998,072 | |
1.25% due 10/31/2015 | | | 2,407,000 | | | | 2,411,701 | |
1.25% due 11/30/2018 | | | 19,634,000 | | | | 19,680,022 | |
1.25% due 01/31/2020 | | | 1,000,000 | | | | 990,898 | |
1.38% due 06/30/2018 | | | 4,000,000 | | | | 4,037,864 | |
1.38% due 07/31/2018 | | | 4,800,000 | | | | 4,842,062 | |
1.38% due 12/31/2018 | | | 2,002,000 | | | | 2,012,975 | |
1.38% due 03/31/2020 | | | 3,064,000 | | | | 3,048,521 | |
1.38% due 04/30/2020 | | | 1,554,000 | | | | 1,545,117 | |
1.50% due 06/30/2016 | | | 158,000 | | | | 159,485 | |
1.50% due 08/31/2018 | | | 7,000,000 | | | | 7,082,943 | |
1.50% due 01/31/2019 | | | 14,000,000 | | | | 14,122,318 | |
1.50% due 01/31/2022 | | | 6,280,000 | | | | 6,136,408 | |
1.63% due 12/31/2019 | | | 584,000 | | | | 588,213 | |
1.63% due 08/15/2022 | | | 2,038,000 | | | | 1,995,410 | |
1.75% due 03/31/2022 | | | 558,000 | | | | 552,805 | |
1.75% due 05/15/2023 | | | 10,200,000 | | | | 9,980,200 | |
2.00% due 11/15/2021 | | | 1,001,000 | | | | 1,009,512 | |
2.00% due 07/31/2022 | | | 492,000 | | | | 494,402 | |
28
VALIC Company II Core Bond Fund
PORTFOLIO OF INVESTMENTS — August 31, 2015 — (continued)
| | | | | | | | |
| | |
| Security Description | | Shares/
Principal
Amount | | | Value
(Note 2) | |
| |
U.S. GOVERNMENT TREASURIES (continued) | |
United States Treasury Notes. (continued) | |
2.00% due 02/15/2025 | | $ | 664,000 | | | $ | 652,371 | |
2.00% due 08/15/2025 | | | 1,619,000 | | | | 1,590,119 | |
2.13% due 12/31/2021 | | | 473,000 | | | | 480,218 | |
2.13% due 05/15/2025 | | | 2,209,000 | | | | 2,191,655 | |
2.25% due 11/15/2024 | | | 20,000,000 | | | | 20,101,040 | |
2.38% due 05/31/2018 | | | 5,631,000 | | | | 5,837,472 | |
2.75% due 12/31/2017 | | | 2,267,000 | | | | 2,364,499 | |
3.00% due 02/28/2017 | | | 830,000 | | | | 859,547 | |
3.13% due 05/15/2019 | | | 262,000 | | | | 279,160 | |
3.13% due 05/15/2021 | | | 2,199,000 | | | | 2,362,208 | |
3.38% due 11/15/2019 | | | 1,099,000 | | | | 1,185,718 | |
3.50% due 05/15/2020 | | | 3,472,000 | | | | 3,779,373 | |
3.63% due 08/15/2019 | | | 78,000 | | | | 84,763 | |
| | | | | | |
|
|
|
| | | | | | | | 201,822,626 | |
| | | | | | |
|
|
|
Total U.S. Government Treasuries | |
(cost $251,651,575) | | | | | | | 255,062,530 | |
| | | | | | |
|
|
|
MUNICIPAL BONDS & NOTES — 0.3% | |
Ohio State University Revenue Bonds
Series A
4.80% due 06/01/2111 | | | 1,057,000 | | | | 1,018,631 | |
Port Authority of New York & New Jersey Revenue Bonds Series 168
4.93% due 10/01/2051 | | | 861,000 | | | | 931,525 | |
Port Authority of New York & New Jersey Revenue Bonds Series 174
4.46% due 10/01/2062 | | | 1,010,000 | | | | 993,466 | |
| | | | | | |
|
|
|
Total Municipal Bonds & Notes | |
(cost $2,917,374) | | | | | | | 2,943,622 | |
| | | | | | |
|
|
|
COMMON STOCKS — 0.0% | |
Power Converter/Supply Equipment — 0.0% | |
TPT Acquisition, Inc.†(3)(4) | | | 2,970 | | | | 0 | |
| | | | | | |
|
|
|
Television — 0.0% | |
ION Media Networks, Inc.†(3)(4) | | | 79 | | | | 49,322 | |
| | | | | | |
|
|
|
Total Common Stocks | |
(cost $44,551) | | | | | | | 49,322 | |
| | | | | | |
|
|
|
PREFERRED SECURITIES — 0.1% | |
Electric - Integrated — 0.0% | |
Entergy Louisiana LLC
4.70% | | | 22,875 | | | | 536,190 | |
| | | | | | |
|
|
|
Sovereign Agency — 0.0% | |
Federal Home Loan Mtg. Corp. FRS†
Series Z
8.38% | | | 6,900 | | | | 33,879 | |
| | | | | | |
|
|
|
Telecom Services — 0.1% | |
Qwest Corp.
6.13% | | | 44,275 | | | | 1,102,890 | |
| | | | | | |
|
|
|
Total Preferred Securities | |
(cost $1,785,164) | | | | | | | 1,672,959 | |
| | | | | | |
|
|
|
PREFERRED SECURITIES/CAPITAL SECURITIES — 2.9% | |
Banks - Commercial — 0.2% | |
Nordea Bank AB VRS
6.13% due 09/23/2024*(10) | | | 698,000 | | | | 691,020 | |
Standard Chartered PLC VRS
6.50% due 04/02/2020*#(10) | | | 1,213,000 | | | | 1,189,597 | |
| | | | | | |
|
|
|
| | | | | | | | 1,880,617 | |
| | | | | | |
|
|
|
| | | | | | | | |
| | |
| Security Description | |
Principal
Amount | | | Value
(Note 2) | |
| |
| | | | | | | | | |
Banks - Fiduciary — 0.1% | |
Bank of New York Mellon Corp. FRS
Series E
4.95% due 06/20/2020(10) | | $ | 1,073,000 | | | $ | 1,063,611 | |
| | | | | | |
|
|
|
Banks - Super Regional — 0.3% | |
Capital One Financial Corp. FRS
Series E
5.55% due 06/01/2020(10) | | | 574,000 | | | | 570,235 | |
Fifth Third Bancorp FRS
Series J
4.90% due 09/30/2019(10) | | | 1,253,000 | | | | 1,174,687 | |
Wells Fargo & Co. FRS
Series U
5.88% due 06/15/2025(10) | | | 945,000 | | | | 967,444 | |
Wells Fargo Capital X
5.95% due 12/01/2086 | | | 393,000 | | | | 394,965 | |
| | | | | | |
|
|
|
| | | | | | | | 3,107,331 | |
| | | | | | |
|
|
|
Diversified Banking Institutions — 1.6% | |
BAC Capital Trust XIII FRS
Series F
4.00% due 09/21/2015(10) | | | 822,000 | | | | 644,037 | |
Bank of America Corp. FRS
Series AA
6.10% due 03/17/2025(10) | | | 1,712,000 | | | | 1,671,340 | |
BNP Paribas SA VRS
7.38% due 08/19/2025*(10) | | | 927,000 | | | | 949,248 | |
Citigroup, Inc. FRS
Series N
5.80% due 11/15/2019(10) | | | 1,751,000 | | | | 1,735,118 | |
Credit Agricole SA VRS
6.63% due 09/23/2019*#(10) | | | 1,181,000 | | | | 1,158,032 | |
Credit Suisse Group AG VRS
6.25% due 12/18/2024*(10) | | | 1,298,000 | | | | 1,246,080 | |
Credit Suisse Group AG VRS
7.50% due 12/11/2023*(10) | | | 1,037,000 | | | | 1,095,850 | |
Deutsche Bank AG VRS
7.50% due 04/30/2025#(10) | | | 2,400,000 | | | | 2,361,000 | |
Goldman Sachs Group, Inc. FRS
Series M
5.38% due 05/10/2020(10) | | | 604,000 | | | | 591,542 | |
HSBC Holdings PLC VRS
6.38% due 03/30/2025(10) | | | 660,000 | | | | 655,875 | |
JPMorgan Chase & Co. FRS
Series U
6.13% due 04/30/2024(10) | | | 1,669,000 | | | | 1,669,000 | |
JPMorgan Chase & Co. FRS
Series 1
7.90% due 04/30/2018(10) | | | 773,000 | | | | 811,650 | |
Royal Bank of Scotland Group PLC VRS(10)
8.00% due 08/10/2025 | | | 425,000 | | | | 434,031 | |
Societe Generale SA VRS
6.00% due 01/27/2020*#(10) | | | 1,997,000 | | | | 1,884,765 | |
| | | | | | |
|
|
|
| | | | | | | | 16,907,568 | |
| | | | | | |
|
|
|
Electric - Integrated — 0.1% | |
Dominion Resources, Inc. FRS
5.75% due 10/01/2054 | | | 714,000 | | | | 736,848 | |
| | | | | | |
|
|
|
Finance - Investment Banker/Broker — 0.0% | |
Lehman Brothers Holdings Capital Trust VII Escrow Security
5.86% due 11/30/2056†(4) | | | 148,000 | | | | 15 | |
| | | | | | |
|
|
|
29
VALIC Company II Core Bond Fund
PORTFOLIO OF INVESTMENTS — August 31, 2015 — (continued)
| | | | | | | | |
| | |
| Security Description | | Shares/
Principal
Amount | | | Value
(Note 2) | |
| |
PREFERRED SECURITIES/CAPITAL SECURITIES (continued) | |
Finance - Other Services — 0.1% | |
National Rural Utilities Cooperative Finance Corp. FRS
4.75% due 04/30/2043 | | $ | 777,000 | | | $ | 769,075 | |
| | | | | | |
|
|
|
Financial Guarantee Insurance — 0.0% | |
Assured Guaranty Municipal Holdings, Inc. FRS
6.40% due 12/15/2066* | | | 484,000 | | | | 356,950 | |
| | | | | | |
|
|
|
Food - Dairy Products — 0.1% | |
Land O’Lakes Capital Trust I
7.45% due 03/15/2028* | | | 860,000 | | | | 903,000 | |
| | | | | | |
|
|
|
Insurance - Life/Health — 0.1% | |
Prudential Financial, Inc. FRS
5.38% due 05/15/2045 | | | 387,000 | | | | 382,766 | |
Prudential Financial, Inc. FRS
5.63% due 06/15/2043 | | | 871,000 | | | | 894,082 | |
| | | | | | |
|
|
|
| | | | | | | | 1,276,848 | |
| | | | | | |
|
|
|
Insurance - Multi-line — 0.2% | |
MetLife Capital Trust IV
7.88% due 12/15/2067* | | | 577,000 | | | | 719,807 | |
MetLife, Inc.
6.40% due 12/15/2066 | | | 1,052,000 | | | | 1,155,885 | |
| | | | | | |
|
|
|
| | | | | | | | 1,875,692 | |
| | | | | | |
|
|
|
Pipelines — 0.0% | |
TransCanada Trust FRS
5.63% due 05/20/2075 | | | 490,000 | | | | 468,930 | |
| | | | | | |
|
|
|
Tools - Hand Held — 0.1% | |
Stanley Black & Decker, Inc. FRS
5.75% due 12/15/2053 | | | 1,727,000 | | | | 1,850,049 | |
| | | | | | |
|
|
|
Total Preferred Securities/Capital Securities | |
(cost $31,013,701) | | | | | | | 31,196,534 | |
| | | | | | |
|
|
|
Total Long-Term Investment Securities | |
(cost $1,028,692,033) | | | | | | | 1,024,719,908 | |
| | | | | | |
|
|
|
SHORT-TERM INVESTMENT SECURITIES — 9.6% | |
Registered Investment Companies — 1.7% | |
State Street Navigator Securities Lending Prime Portfolio 0.21%(5)(11) | | | 18,479,285 | | | | 18,479,285 | |
| | | | | | |
|
|
|
Time Deposits — 7.9% | |
Euro Time Deposit with State Street Bank and Trust Co. 0.01% due 09/01/2015 | | | 83,694,000 | | | | 83,694,000 | |
| | | | | | |
|
|
|
Total Short-Term Investment Securities | |
(cost $102,173,285) | | | | | | | 102,173,285 | |
| | | | | | |
|
|
|
TOTAL INVESTMENTS | |
(cost $1,130,865,318)(12) | | | 105.7 | % | | | 1,126,893,193 | |
Liabilities in excess of other assets | | | (5.7 | ) | | | (61,090,302 | ) |
| | |
|
|
| |
|
|
|
NET ASSETS | | | 100.0 | % | | $ | 1,065,802,891 | |
| | |
|
|
| |
|
|
|
| * | Securities exempt from registration under Rule 144A of the Securities Act of 1933. These securities may be sold in transactions exempt from registration, normally to qualified institutional buyers. The Fund has no right to demand registration of these securities. At August 31, 2015, the aggregate value of these securities was $136,888,709 representing 12.8% of net assets. Unless otherwise indicated, these securities are not considered to be illiquid. |
| # | The security or a portion thereof is out on loan (see Note 2) |
| † | Non-income producing security |
| (1) | | Commercial Mortgage Backed Security |
| (2) | | Collateralized Mortgage Obligation |
| (3) | | Fair valued security. Securities are classified as Level 3 based on the securities valuation inputs; see Note 2. |
| (4) | | Illiquid security. At August 31, 2015, the aggregate value of these securities was $49,429 representing 0.0% of net assets. |
| (5) | | The rate shown is the 7-day yield as of August 31, 2015. |
| (6) | | “Step-up” security where the rate increases (“steps-up”) at a predetermined rate. The rate reflected is as of August 31, 2015. |
| (8) | | Inverse Floating Rate Security that pays interest that varies inversely to changes in the market interest rates. The interest rate shown is the current interest rate at August 31, 2015. |
| (9) | | Principal amount of security is adjusted for inflation. |
| (10) | | Perpetual maturity — maturity date reflects the next call date. |
| (11) | | At August 31, 2015, the Fund had loaned securities with a total value of $18,089,256. This was secured by collateral of $18,479,285, which was received in cash and subsequently invested in short-term investments currently valued at $18,479,285 as reported in the Portfolio of Investments. |
| (12) | | See Note 5 for cost of investments on a tax basis. |
| (13) | | “Payment-in-kind” (PIK) security. Income may be paid in additional securities or cash at the discretion of the issuer. The security is currently paying interest in cash at the coupon rate listed. |
| (14) | Subsequent to August 31, 2015, security in default of interest and company has filed for Chapter 11 bankruptcy protection. |
REMIC—Real Estate Mortgage Investment Conduit
TBA—Securities purchased on a forward commitment basis with an approximate principal amount and no definite maturity date. The actual principal amount and maturity date will be determined upon settlement date.
TIPS—Treasury Inflation Protected Security
FRS—Floating Rate Security
VRS—Variable Rate Security
The rates shown on FRS and VRS are the current interest rates at August 31, 2015 and unless noted otherwise are the original maturity dates.
30
VALIC Company II Core Bond Fund
PORTFOLIO OF INVESTMENTS — August 31, 2015 — (continued)
The following is a summary of the inputs used to value the Fund’s net assets as of August 31, 2015 (see Note 2):
| | | | | | | | | | | | | | | | |
| | | Level 1 - Unadjusted Quoted
Prices
| | | Level 2 - Other Observable
Inputs
| | | Level 3 - Significant
Unobservable Inputs
| | | Total
| |
ASSETS: | | | | | | | | | | | | | | | | |
Investments at Value:* | | | | | | | | | | | | | | | | |
Asset Backed Securities | | | | | | | | | | | | | | | | |
Diversified Financial Services | | $ | — | | | $ | 55,851,321 | | | $ | 0 | | | $ | 55,851,321 | |
U.S. Corporate Bonds & Notes: | | | | | | | | | | | | | | | | |
Airlines | | | — | | | | 1,641,395 | | | | 45,566 | | | | 1,686,961 | |
Gambling (Non-Hotel) | | | — | | | | 722,555 | | | | 51 | | | | 722,606 | |
Other Industries | | | — | | | | 275,340,185 | | | | — | | | | 275,340,185 | |
Foreign Corporate Bonds & Notes | | | — | | | | 81,638,723 | | | | — | | | | 81,638,723 | |
Foreign Government Obligations | | | — | | | | 6,229,387 | | | | — | | | | 6,229,387 | |
U.S. Government Agencies | | | — | | | | 312,325,758 | | | | — | | | | 312,325,758 | |
U.S. Government Treasuries | | | — | | | | 255,062,530 | | | | — | | | | 255,062,530 | |
Municipal Bonds & Notes | | | — | | | | 2,943,622 | | | | — | | | | 2,943,622 | |
Common Stocks | | | — | | | | — | | | | 49,322 | | | | 49,322 | |
Preferred Securities | | | 1,672,959 | | | | — | | | | — | | | | 1,672,959 | |
Preferred Securities/Capital Securities | | | — | | | | 31,196,534 | | | | — | | | | 31,196,534 | |
Short-Term Investment Securities: | | | | | | | | | | | | | | | | |
Registered Investment Companies | | | 18,479,285 | | | | — | | | | — | | | | 18,479,285 | |
Time Deposits | | | — | | | | 83,694,000 | | | | — | | | | 83,694,000 | |
| | |
|
|
| |
|
|
| |
|
|
| |
|
|
|
Total Investments at Value | | $ | 20,152,244 | | | $ | 1,106,646,010 | | | $ | 94,939 | | | $ | 1,126,893,193 | |
| | |
|
|
| |
|
|
| |
|
|
| |
|
|
|
| * | For a detailed presentation of investments, please refer to the Portfolio of Investments. |
The Fund’s policy is to recognize transfers between Levels as of the end of the reporting period. There were no material transfers between Levels during the reporting period.
At the beginning and end of the reporting period, Level 3 investments were not considered a material portion of the Fund.
See Notes to Financial Statements
31
VALIC Company II High Yield Bond Fund
PORTFOLIO PROFILE — August 31, 2015 (unaudited)
Industry Allocation*
| | | | |
Oil Companies — Exploration & Production | | | 7.5 | % |
Registered Investment Companies | | | 7.1 | |
Medical — Hospitals | | | 6.7 | |
Cellular Telecom | | | 5.8 | |
Repurchase Agreements | | | 5.7 | |
Cable/Satellite TV | | | 5.4 | |
Medical — Drugs | | | 4.1 | |
Data Processing/Management | | | 3.6 | |
Building & Construction Products — Misc. | | | 3.3 | |
Diversified Banking Institutions | | | 3.3 | |
Television | | | 3.2 | |
Telephone — Integrated | | | 2.6 | |
Building — Residential/Commercial | | | 2.3 | |
Steel — Producers | | | 2.1 | |
Telecom Services | | | 2.0 | |
Banks — Commercial | | | 1.9 | |
Containers — Metal/Glass | | | 1.6 | |
Auto — Cars/Light Trucks | | | 1.6 | |
Electric — Integrated | | | 1.6 | |
Telecommunication Equipment | | | 1.5 | |
Entertainment Software | | | 1.5 | |
Enterprise Software/Service | | | 1.4 | |
Electronic Components — Semiconductors | | | 1.4 | |
Finance — Leasing Companies | | | 1.3 | |
Semiconductor Equipment | | | 1.2 | |
Diagnostic Kits | | | 1.2 | |
Pipelines | | | 1.2 | |
Building Products — Cement | | | 1.2 | |
Independent Power Producers | | | 1.1 | |
Internet Connectivity Services | | | 1.0 | |
Office Automation & Equipment | | | 1.0 | |
Finance — Other Services | | | 0.9 | |
Satellite Telecom | | | 0.9 | |
Soap & Cleaning Preparation | | | 0.8 | |
Medical — HMO | | | 0.8 | |
Disposable Medical Products | | | 0.8 | |
Insurance — Multi-line | | | 0.7 | |
Multimedia | | | 0.7 | |
Food — Catering | | | 0.6 | |
Retail — Leisure Products | | | 0.6 | |
Computer Services | | | 0.6 | |
Retail — Discount | | | 0.6 | |
Applications Software | | | 0.6 | |
Printing — Commercial | | | 0.6 | |
Chemicals — Diversified | | | 0.6 | |
Medical — Outpatient/Home Medical | | | 0.5 | |
Forestry | | | 0.5 | |
Broadcast Services/Program | | | 0.5 | |
Retail — Arts & Crafts | | | 0.5 | |
Radio | | | 0.4 | |
Specified Purpose Acquisitions | | | 0.4 | |
Auto/Truck Parts & Equipment — Original | | | 0.4 | |
Machinery — General Industrial | | | 0.4 | |
Machinery — Farming | | | 0.4 | |
Finance — Auto Loans | | | 0.4 | |
Retail — Major Department Stores | | | 0.3 | |
Decision Support Software | | | 0.3 | |
Oil & Gas Drilling | | | 0.3 | |
Theaters | | | 0.3 | |
Retail — Apparel/Shoe | | | 0.3 | |
Metal Processors & Fabrication | | | 0.3 | |
Insurance — Life/Health | | | 0.3 | |
Funeral Services & Related Items | | | 0.3 | |
Retail — Restaurants | | | 0.3 | |
Shipbuilding | | | 0.3 | |
Insurance — Property/Casualty | | | 0.2 | |
E-Commerce/Products | | | 0.2 | |
Physicians Practice Management | | | 0.2 | |
Rental Auto/Equipment | | | 0.2 | |
| | | | |
Food — Retail | | | 0.2 | |
X-Ray Equipment | | | 0.1 | |
Computer Software | | | 0.1 | |
Medical Labs & Testing Services | | | 0.1 | |
Real Estate Investment Trusts | | | 0.1 | |
Beverages — Wine/Spirits | | | 0.1 | |
Distribution/Wholesale | | | 0.1 | |
Casino Services | | | 0.1 | |
| | |
|
|
|
| | | | 105.3 | % |
| | |
|
|
|
Credit Quality†#
| | | | |
Baa | | | 1.0 | % |
Ba | | | 28.6 | |
B | | | 51.0 | |
Caa | | | 16.9 | |
Not Rated@ | | | 2.5 | |
| | |
|
|
|
| | | | 100.0 | % |
| | |
|
|
|
| * | Calculated as a percentage of net assets |
| # | Calculated as a percentage of total debt issues, excluding short-term securities. |
| @ | Represents debt issues that either have no rating, or the rating is unavailable from the data source. |
32
VALIC Company II High Yield Bond Fund
PORTFOLIO OF INVESTMENTS — August 31, 2015
| | | | | | | | |
| | |
| Security Description | |
Principal
Amount(17) | | | Value
(Note 2) | |
| |
CONVERTIBLE BONDS & NOTES — 0.3% | |
Building - Residential/Commercial — 0.1% | |
M/I Homes, Inc.
Company Guar. Notes
3.00% due 03/01/2018 | | $ | 330,000 | | | $ | 328,762 | |
| | | | | | |
|
|
|
Medical - Drugs — 0.0% | |
Savient Pharmaceuticals, Inc.
Escrow Notes
4.75% due 02/01/2018†(1)(2) | | | 1,620,000 | | | | 0 | |
| | | | | | |
|
|
|
Oil Companies - Exploration & Production — 0.2% | |
Cobalt International Energy, Inc.
Senior Notes
2.63% due 12/01/2019 | | | 1,465,000 | | | | 1,052,969 | |
| | | | | | |
|
|
|
Total Convertible Bonds & Notes | | | | | | | | |
(cost $2,744,632) | | | | | | | 1,381,731 | |
| | | | | | |
|
|
|
U.S. CORPORATE BONDS & NOTES — 72.2% | |
Applications Software — 0.6% | |
Emdeon, Inc.
Company Guar. Notes
6.00% due 02/15/2021* | | | 1,390,000 | | | | 1,369,150 | |
Emdeon, Inc.
Company Guar. Notes
11.00% due 12/31/2019 | | | 1,285,000 | | | | 1,379,769 | |
| | | | | | |
|
|
|
| | | | | | | | 2,748,919 | |
| | | | | | |
|
|
|
Auto - Cars/Light Trucks — 1.6% | |
Chrysler Group LLC/CG Co-Issuer, Inc.
Sec. Notes
8.25% due 06/15/2021 | | | 3,805,000 | | | | 4,081,623 | |
General Motors Co.
Senior Notes
4.88% due 10/02/2023 | | | 2,370,000 | | | | 2,413,407 | |
General Motors Co.
Senior Notes
6.25% due 10/02/2043 | | | 845,000 | | | | 904,996 | |
| | | | | | |
|
|
|
| | | | | | | | 7,400,026 | |
| | | | | | |
|
|
|
Auto/Truck Parts & Equipment - Original — 0.4% | |
ZF North America Capital, Inc.
Company Guar. Notes
4.50% due 04/29/2022* | | | 550,000 | | | | 532,813 | |
ZF North America Capital, Inc.
Company Guar. Notes
4.75% due 04/29/2025* | | | 1,565,000 | | | | 1,482,837 | |
| | | | | | |
|
|
|
| | | | | | | | 2,015,650 | |
| | | | | | |
|
|
|
Banks - Commercial — 0.6% | |
CIT Group, Inc.
Senior Notes
5.50% due 02/15/2019* | | | 975,000 | | | | 1,024,969 | |
CIT Group, Inc.
Senior Notes
6.63% due 04/01/2018* | | | 1,491,000 | | | | 1,595,370 | |
| | | | | | |
|
|
|
| | | | | | | | 2,620,339 | |
| | | | | | |
|
|
|
Beverages - Wine/Spirits — 0.1% | |
Constellation Brands, Inc.
Company Guar. Notes
4.25% due 05/01/2023 | | | 430,000 | | | | 432,580 | |
| | | | | | |
|
|
|
Broadcast Services/Program — 0.5% | |
Liberty Media LLC
Senior Notes
8.25% due 02/01/2030 | | | 2,245,000 | | | | 2,278,675 | |
| | | | | | |
|
|
|
| | | | | | | | |
| | |
| Security Description | |
Principal
Amount(17) | | | Value
(Note 2) | |
| |
| | | | | | | | | |
Building & Construction Products - Misc. — 3.3% | |
Associated Materials LLC/AMH New Finance, Inc.
Senior Sec. Notes
9.13% due 11/01/2017 | | $ | 610,000 | | | $ | 516,975 | |
Builders FirstSource, Inc.
Company Guar. Notes
10.75% due 08/15/2023* | | | 3,235,000 | | | | 3,283,525 | |
Building Materials Corp.
Senior Notes
5.38% due 11/15/2024* | | | 4,810,000 | | | | 4,810,000 | |
Nortek, Inc.
Company Guar. Notes
8.50% due 04/15/2021 | | | 3,185,000 | | | | 3,411,931 | |
Ply Gem Industries Inc.
Company Guar. Notes
6.50% due 02/01/2022 | | | 3,615,000 | | | | 3,565,294 | |
| | | | | | |
|
|
|
| | | | | | | | 15,587,725 | |
| | | | | | |
|
|
|
Building Products - Cement — 0.6% | |
Cemex Finance LLC
Senior Sec. Notes
6.00% due 04/01/2024*# | | | 2,755,000 | | | | 2,617,250 | |
| | | | | | |
|
|
|
Building Products - Wood — 0.0% | |
Masco Corp.
Senior Notes
7.75% due 08/01/2029 | | | 145,000 | | | | 162,400 | |
| | | | | | |
|
|
|
Building - Residential/Commercial — 2.2% | |
K Hovnanian Enterprises, Inc.
Company Guar. Notes
8.00% due 11/01/2019* | | | 705,000 | | | | 542,850 | |
KB Home
Company Guar. Notes
4.75% due 05/15/2019 | | | 445,000 | | | | 437,213 | |
KB Home
Company Guar. Notes
7.00% due 12/15/2021 | | | 2,230,000 | | | | 2,252,300 | |
KB Home
Company Guar. Notes
7.50% due 09/15/2022 | | | 2,255,000 | | | | 2,322,650 | |
KB Home
Company Guar. Notes
8.00% due 03/15/2020 | | | 1,461,000 | | | | 1,574,227 | |
Lennar Corp.
Company Guar. Notes
4.75% due 11/15/2022 | | | 2,721,000 | | | | 2,707,395 | |
Pulte Group, Inc.
Company Guar. Notes
6.38% due 05/15/2033 | | | 285,000 | | | | 296,400 | |
Ryland Group, Inc.
Company Guar. Notes
5.38% due 10/01/2022 | | | 390,000 | | | | 392,925 | |
| | | | | | |
|
|
|
| | | | | | | | 10,525,960 | |
| | | | | | |
|
|
|
Cable/Satellite TV — 4.8% | |
CCO Holdings LLC/CCO Holdings Capital Corp.
Company Guar. Notes
5.13% due 02/15/2023 | | | 150,000 | | | | 149,625 | |
CCO Holdings LLC/CCO Holdings Capital Corp.
Company Guar. Notes
5.13% due 05/01/2023* | | | 3,350,000 | | | | 3,350,000 | |
CCO Holdings LLC/CCO Holdings Capital Corp.
Company Guar. Notes
5.25% due 09/30/2022 | | | 665,000 | | | | 670,320 | |
33
VALIC Company II High Yield Bond Fund
PORTFOLIO OF INVESTMENTS — August 31, 2015 — (continued)
| | | | | | | | |
| | |
| Security Description | |
Principal
Amount(17) | | | Value
(Note 2) | |
| |
U.S. CORPORATE BONDS & NOTES (continued) | |
Cable/Satellite TV (continued) | |
CCO Holdings LLC/CCO Holdings Capital Corp.
Company Guar. Notes
5.75% due 09/01/2023 | | $ | 715,000 | | | $ | 729,157 | |
CCO Holdings LLC/CCO Holdings Capital Corp.
Company Guar. Notes
6.63% due 01/31/2022 | | | 2,240,000 | | | | 2,357,600 | |
CCO Safari II LLC
Senior Sec. Notes
4.91% due 07/23/2025* | | | 845,000 | | | | 836,968 | |
Cequel Communications Holdings I LLC/Cequel
Capital Corp.
Senior Notes
5.13% due 12/15/2021* | | | 3,405,000 | | | | 3,119,831 | |
Cequel Communications Holdings I LLC/Cequel
Capital Corp.
Senior Notes
5.13% due 12/15/2021* | | | 1,650,000 | | | | 1,511,813 | |
DISH DBS Corp.
Company Guar. Notes
5.00% due 03/15/2023 | | | 2,070,000 | | | | 1,828,079 | |
DISH DBS Corp.
Company Guar. Notes
6.75% due 06/01/2021 | | | 3,576,000 | | | | 3,589,946 | |
DISH DBS Corp.
Company Guar. Notes
7.88% due 09/01/2019 | | | 2,710,000 | | | | 2,937,369 | |
Harron Communications LP/Harron Finance Corp.
Senior Notes
9.13% due 04/01/2020* | | | 1,286,000 | | | | 1,382,450 | |
| | | | | | |
|
|
|
| | | | | | | | 22,463,158 | |
| | | | | | |
|
|
|
Cellular Telecom — 5.8% | |
Sprint Communications
Company Guar. Notes
7.00% due 03/01/2020* | | | 2,955,000 | | | | 3,138,801 | |
Sprint Communications
Company Guar. Notes
9.00% due 11/15/2018* | | | 1,955,000 | | | | 2,177,381 | |
Sprint Corp.
Company Guar. Notes
7.25% due 09/15/2021 | | | 5,585,000 | | | | 5,431,413 | |
Sprint Corp.
Company Guar. Notes
7.88% due 09/15/2023 | | | 4,165,000 | | | | 4,003,606 | |
Syniverse Holdings, Inc.
Company Guar. Notes
9.13% due 01/15/2019 | | | 3,270,000 | | | | 2,836,725 | |
T-Mobile USA, Inc.
Company Guar. Notes
6.13% due 01/15/2022 | | | 1,315,000 | | | | 1,356,094 | |
T-Mobile USA, Inc.
Company Guar. Notes
6.50% due 01/15/2024 | | | 370,000 | | | | 380,175 | |
T-Mobile USA, Inc.
Company Guar. Notes
6.63% due 11/15/2020 | | | 2,565,000 | | | | 2,654,775 | |
T-Mobile USA, Inc.
Company Guar. Notes
6.63% due 04/28/2021 | | | 2,275,000 | | | | 2,377,375 | |
T-Mobile USA, Inc.
Company Guar. Notes
6.73% due 04/28/2022 | | | 2,450,000 | | | | 2,572,500 | |
| | | | | | | | |
| | |
| Security Description | |
Principal
Amount(17) | | | Value
(Note 2) | |
| |
| | |
Cellular Telecom (continued) | |
T-Mobile USA, Inc.
Company Guar. Notes
6.84% due 04/28/2023# | | $ | 220,000 | | | $ | 230,450 | |
| | | | | | |
|
|
|
| | | | | | | | 27,159,295 | |
| | | | | | |
|
|
|
Computer Services — 0.6% | |
SunGard Data Systems, Inc.
Company Guar. Notes
6.63% due 11/01/2019 | | | 1,680,000 | | | | 1,743,000 | |
SunGard Data Systems, Inc.
Company Guar. Notes
7.38% due 11/15/2018 | | | 570,000 | | | | 586,387 | |
SunGard Data Systems, Inc.
Company Guar. Notes
7.63% due 11/15/2020 | | | 525,000 | | | | 549,938 | |
| | | | | | |
|
|
|
| | | | | | | | 2,879,325 | |
| | | | | | |
|
|
|
Computer Software — 0.1% | |
SS&C Technologies Holdings, Inc.
Company Guar. Notes
5.88% due 07/15/2023* | | | 515,000 | | | | 531,068 | |
| | | | | | |
|
|
|
Containers - Metal/Glass — 0.8% | |
Owens-Brockway Glass Container, Inc.
Company Guar. Notes
5.88% due 08/15/2023*# | | | 2,665,000 | | | | 2,711,637 | |
Owens-Brockway Glass Container, Inc.
Company Guar. Notes
6.38% due 08/15/2025*# | | | 1,200,000 | | | | 1,227,000 | |
| | | | | | |
|
|
|
| | | | | | | | 3,938,637 | |
| | | | | | |
|
|
|
Data Processing/Management — 3.6% | |
Audatex North America, Inc.
Company Guar. Notes
6.00% due 06/15/2021* | | | 4,021,000 | | | | 3,926,346 | |
Audatex North America, Inc.
Company Guar. Notes
6.13% due 11/01/2023* | | | 925,000 | | | | 916,805 | |
First Data Corp.
Senior Sec. Notes
5.38% due 08/15/2023# | | | 3,580,000 | | | | 3,624,750 | |
First Data Corp.
Senior Sec. Notes
7.38% due 06/15/2019* | | | 1,250,000 | | | | 1,296,375 | |
First Data Corp.
Sec. Notes
8.25% due 01/15/2021* | | | 5,302,000 | | | | 5,580,355 | |
First Data Corp.
Sec. Notes
8.75% due 01/15/2022* | | | 1,383,000 | | | | 1,455,607 | |
| | | | | | |
|
|
|
| | | | | | | | 16,800,238 | |
| | | | | | |
|
|
|
Decision Support Software — 0.3% | |
MSCI, Inc.
Company Guar. Notes
5.25% due 11/15/2024* | | | 1,550,000 | | | | 1,577,125 | |
| | | | | | |
|
|
|
Diagnostic Kits — 1.2% | |
Alere, Inc.
Company Guar. Notes
6.38% due 07/01/2023# | | | 2,860,000 | | | | 2,931,500 | |
Alere, Inc.
Company Guar. Notes
6.50% due 06/15/2020 | | | 2,555,000 | | | | 2,649,765 | |
| | | | | | |
|
|
|
| | | | | | | | 5,581,265 | |
| | | | | | |
|
|
|
34
VALIC Company II High Yield Bond Fund
PORTFOLIO OF INVESTMENTS — August 31, 2015 — (continued)
| | | | | | | | |
| | |
| Security Description | |
Principal
Amount(17) | | | Value
(Note 2) | |
| |
U.S. CORPORATE BONDS & NOTES (continued) | |
Disposable Medical Products — 0.8% | |
Sterigenics-Nordion Holdings LLC
Senior Notes
6.50% due 05/15/2023* | | $ | 3,625,000 | | | $ | 3,697,427 | |
| | | | | | |
|
|
|
Distribution/Wholesale — 0.1% | |
American Builders & Contractors Supply Co., Inc.
Senior Notes
5.63% due 04/15/2021* | | | 335,000 | | | | 334,163 | |
| | | | | | |
|
|
|
E-Commerce/Services — 0.0% | |
IAC/InterActiveCorp.
Company Guar. Notes
4.75% due 12/15/2022 | | | 150,000 | | | | 139,500 | |
| | | | | | |
|
|
|
Electric - Integrated — 1.2% | |
DPL, Inc.
Senior Notes
7.25% due 10/15/2021 | | | 1,095,000 | | | | 1,129,219 | |
GenOn Americas Generation LLC
Senior Notes
9.13% due 05/01/2031# | | | 1,565,000 | | | | 1,314,600 | |
Mirant Americas Generation LLC
Senior Notes
8.50% due 10/01/2021 | | | 2,735,000 | | | | 2,379,450 | |
Texas Competitive Electric Holdings Co. LLC/TCEH Finance, Inc.
Senior Sec. Notes
11.50% due 10/01/2020†*(3)(6) | | | 1,680,000 | | | | 772,800 | |
| | | | | | |
|
|
|
| | | | | | | | 5,596,069 | |
| | | | | | |
|
|
|
Electronic Components - Semiconductors — 1.1% | |
Freescale Semiconductor, Inc.
Senior Sec. Notes
6.00% due 01/15/2022* | | | 4,795,000 | | | | 5,010,775 | |
| | | | | | |
|
|
|
Enterprise Software/Service — 1.4% | |
Infor Software Parent LLC/Infor Software Parent, Inc.
Company Guar. Notes
7.13% due 05/01/2021#(5) | | | 3,000,000 | | | | 2,718,750 | |
Infor US, Inc.
Senior Sec. Notes
5.75% due 08/15/2020* | | | 165,000 | | | | 165,412 | |
Infor US, Inc.
Company Guar. Notes
6.50% due 05/15/2022* | | | 4,000,000 | | | | 3,750,000 | |
| | | | | | |
|
|
|
| | | | | | | | 6,634,162 | |
| | | | | | |
|
|
|
Entertainment Software — 1.5% | |
Activision Blizzard, Inc.
Company Guar. Notes
5.63% due 09/15/2021* | | | 5,920,000 | | | | 6,223,400 | |
Activision Blizzard, Inc.
Company Guar. Notes
6.13% due 09/15/2023* | | | 875,000 | | | | 940,625 | |
| | | | | | |
|
|
|
| | | | | | | | 7,164,025 | |
| | | | | | |
|
|
|
Finance - Auto Loans — 0.4% | |
GMAC LLC
Sub. Notes
8.00% due 12/31/2018 | | | 1,475,000 | | | | 1,637,250 | |
| | | | | | |
|
|
|
Finance - Leasing Companies — 0.7% | |
International Lease Finance Corp.
Senior Notes
5.88% due 08/15/2022 | | | 2,950,000 | | | | 3,182,312 | |
| | | | | | |
|
|
|
| | | | | | | | |
| | |
| Security Description | |
Principal
Amount(17) | | | Value
(Note 2) | |
| |
| | | | | | | | | |
Finance - Other Services — 0.9% | |
Nationstar Mortgage LLC/Nationstar Capital Corp
Company Guar. Notes
6.50% due 06/01/2022 | | $ | 1,425,000 | | | $ | 1,204,125 | |
Nationstar Mtg. LLC/Nationstar Capital Corp.
Company Guar. Notes
6.50% due 08/01/2018 | | | 2,400,000 | | | | 2,304,000 | |
Nationstar Mtg. LLC/Nationstar Capital Corp.
Company Guar. Notes
6.50% due 07/01/2021 | | | 955,000 | | | | 841,594 | |
| | | | | | |
|
|
|
| | | | | | | | 4,349,719 | |
| | | | | | |
|
|
|
Food - Catering — 0.6% | |
Aramark Services, Inc.
Company Guar. Notes
5.75% due 03/15/2020 | | | 2,905,000 | | | | 3,012,122 | |
| | | | | | |
|
|
|
Food - Retail — 0.2% | |
Albertson’s Holdings LLC/Saturn Acquisition Merger Sub, Inc.
Sec. Notes
7.75% due 10/15/2022* | | | 663,000 | | | | 710,239 | |
| | | | | | |
|
|
|
Funeral Services & Related Items — 0.3% | |
Service Corp. International
Senior Notes
4.50% due 11/15/2020 | | | 1,255,000 | | | | 1,286,375 | |
| | | | | | |
|
|
|
Independent Power Producers — 1.1% | |
Dynegy, Inc.
Company Guar. Notes
5.88% due 06/01/2023 | | | 2,110,000 | | | | 2,015,050 | |
Dynegy, Inc.
Company Guar. Notes
7.38% due 11/01/2022 | | | 1,675,000 | | | | 1,733,625 | |
Dynegy, Inc.
Company Guar. Notes
7.63% due 11/01/2024 | | | 1,140,000 | | | | 1,186,512 | |
| | | | | | |
|
|
|
| | | | | | | | 4,935,187 | |
| | | | | | |
|
|
|
Insurance - Life/Health — 0.3% | |
CNO Financial Group, Inc.
Senior Notes
4.50% due 05/30/2020 | | | 350,000 | | | | 360,500 | |
CNO Financial Group, Inc.
Senior Notes
5.25% due 05/30/2025 | | | 920,000 | | | | 948,750 | |
| | | | | | |
|
|
|
| | | | | | | | 1,309,250 | |
| | | | | | |
|
|
|
Internet Connectivity Services — 1.0% | |
Zayo Group LLC/Zayo Capital, Inc.
Company Guar. Notes
6.00% due 04/01/2023* | | | 3,765,000 | | | | 3,760,105 | |
Zayo Group LLC/Zayo Capital, Inc.
Company Guar. Notes
6.38% due 05/15/2025* | | | 985,000 | | | | 975,150 | |
Zayo Group LLC/Zayo Capital, Inc.
Company Guar. Notes
10.13% due 07/01/2020 | | | 130,000 | | | | 143,000 | |
| | | | | | |
|
|
|
| | | | | | | | 4,878,255 | |
| | | | | | |
|
|
|
Machinery - Farming — 0.4% | |
Case New Holland Industrial, Inc.
Company Guar. Notes
7.88% due 12/01/2017 | | | 1,595,000 | | | | 1,728,820 | |
| | | | | | |
|
|
|
35
VALIC Company II High Yield Bond Fund
PORTFOLIO OF INVESTMENTS — August 31, 2015 — (continued)
| | | | | | | | |
| | |
| Security Description | |
Principal
Amount(17) | | | Value
(Note 2) | |
| |
U.S. CORPORATE BONDS & NOTES (continued) | |
Medical Labs & Testing Services — 0.1% | |
inVentiv Health, Inc.
Senior Sec. Notes
9.00% due 01/15/2018* | | $ | 470,000 | | | $ | 488,800 | |
| | | | | | |
|
|
|
Medical - Drugs — 1.8% | |
Endo Finance LLC
Company Guar. Notes
6.00% due 02/01/2025* | | | 4,170,000 | | | | 4,284,675 | |
PRA Holdings, Inc.
Senior Notes
9.50% due 10/01/2023* | | | 1,599,000 | | | | 1,782,885 | |
Quintiles Transnational Corp.
Company Guar. Notes
4.88% due 05/15/2023* | | | 890,000 | | | | 907,800 | |
Valeant Pharmaceuticals International
Company Guar. Notes
6.13% due 04/15/2025* | | | 1,240,000 | | | | 1,277,200 | |
| | | | | | |
|
|
|
| | | | | | | | 8,252,560 | |
| | | | | | |
|
|
|
Medical - HMO — 0.8% | |
MPH Acquisition Holdings LLC
Company Guar. Notes
6.63% due 04/01/2022* | | | 1,420,000 | | | | 1,459,050 | |
WellCare Health Plans, Inc.
Senior Notes
5.75% due 11/15/2020 | | | 2,165,000 | | | | 2,270,544 | |
| | | | | | |
|
|
|
| | | | | | | | 3,729,594 | |
| | | | | | |
|
|
|
Medical - Hospitals — 6.7% | |
CHS/Community Health Systems, Inc.
Senior Sec. Notes
5.13% due 08/15/2018 | | | 996,000 | | | | 1,019,655 | |
CHS/Community Health Systems, Inc.
Company Guar. Notes
6.88% due 02/01/2022# | | | 6,735,000 | | | | 7,158,025 | |
CHS/Community Health Systems, Inc.
Company Guar. Notes
7.13% due 07/15/2020 | | | 2,010,000 | | | | 2,125,575 | |
HCA Holdings, Inc.
Senior Notes
6.25% due 02/15/2021 | | | 5,000,000 | | | | 5,425,000 | |
HCA, Inc.
Company Guar. Notes
5.38% due 02/01/2025 | | | 690,000 | | | | 700,350 | |
HCA, Inc.
Senior Sec. Notes
5.88% due 03/15/2022 | | | 2,150,000 | | | | 2,338,125 | |
HCA, Inc.
Senior Sec. Notes
6.50% due 02/15/2020 | | | 1,275,000 | | | | 1,408,875 | |
HCA, Inc.
Company Guar. Notes
7.50% due 11/15/2095 | | | 1,820,000 | | | | 1,783,600 | |
Tenet Healthcare Corp.
Senior Sec. Notes
4.75% due 06/01/2020 | | | 2,365,000 | | | | 2,410,822 | |
Tenet Healthcare Corp.
Senior Notes
5.00% due 03/01/2019 | | | 4,245,000 | | | | 4,237,529 | |
Tenet Healthcare Corp.
Senior Notes
6.75% due 06/15/2023 | | | 505,000 | | | | 520,150 | |
| | | | | | | | |
| | |
| Security Description | |
Principal
Amount(17) | | | Value
(Note 2) | |
| |
| | | | | | | | | |
Medical - Hospitals (continued) | |
Tenet Healthcare Corp.
Senior Notes
8.13% due 04/01/2022 | | $ | 1,965,000 | | | $ | 2,176,238 | |
| | | | | | |
|
|
|
| | | | | | | | 31,303,944 | |
| | | | | | |
|
|
|
Medical - Outpatient/Home Medical — 0.5% | |
Amsurg Corp.
Company Guar. Notes
5.63% due 07/15/2022 | | | 2,470,000 | | | | 2,520,956 | |
| | | | | | |
|
|
|
Office Automation & Equipment — 1.0% | | | | | | | | |
CDW LLC/CDW Finance Corp.
Company Guar. Notes
5.00% due 09/01/2023 | | | 675,000 | | | | 666,563 | |
CDW LLC/CDW Finance Corp.
Company Guar. Notes
6.00% due 08/15/2022 | | | 3,870,000 | | | | 4,058,662 | |
| | | | | | |
|
|
|
| | | | | | | | 4,725,225 | |
| | | | | | |
|
|
|
Oil Companies - Exploration & Production — 6.3% | | | | | | | | |
Antero Resources Corp.
Company Guar. Notes
5.38% due 11/01/2021 | | | 1,315,000 | | | | 1,209,800 | |
Antero Resources Corp.
Company Guar. Notes
5.63% due 06/01/2023* | | | 995,000 | | | | 905,450 | |
Antero Resources Corp.
Company Guar. Notes
6.00% due 12/01/2020 | | | 1,390,000 | | | | 1,327,450 | |
Blue Racer Midstream LLC/Blue Racer Finance Corp.
Company Guar. Notes
6.13% due 11/15/2022* | | | 2,705,000 | | | | 2,650,900 | |
Bonanza Creek Energy, Inc.
Company Guar. Notes
6.75% due 04/15/2021 | | | 2,920,000 | | | | 2,160,800 | |
Concho Resources, Inc.
Company Guar. Notes
5.50% due 10/01/2022 | | | 2,780,000 | | | | 2,731,350 | |
Diamondback Energy, Inc.
Company Guar. Notes
7.63% due 10/01/2021 | | | 3,275,000 | | | | 3,438,750 | |
EP Energy LLC/Everest Acquisition Finance, Inc.
Company Guar. Notes
9.38% due 05/01/2020 | | | 2,168,000 | | | | 2,099,708 | |
Laredo Petroleum, Inc.
Company Guar. Notes
5.63% due 01/15/2022 | | | 1,165,000 | | | | 1,048,500 | |
Laredo Petroleum, Inc.
Company Guar. Notes
6.25% due 03/15/2023 | | | 1,380,000 | | | | 1,262,700 | |
Laredo Petroleum, Inc.
Company Guar. Notes
7.38% due 05/01/2022 | | | 575,000 | | | | 560,625 | |
Matador Resources Co.
Company Guar. Notes
6.88% due 04/15/2023* | | | 400,000 | | | | 386,000 | |
Noble Energy, Inc.
Company Guar. Notes
5.63% due 05/01/2021 | | | 1,635,000 | | | | 1,650,565 | |
Noble Energy, Inc.
Company Guar. Notes
5.88% due 06/01/2022 | | | 1,635,000 | | | | 1,656,468 | |
QEP Resources, Inc.
Senior Notes
5.25% due 05/01/2023 | | | 1,551,000 | | | | 1,341,925 | |
36
VALIC Company II High Yield Bond Fund
PORTFOLIO OF INVESTMENTS — August 31, 2015 — (continued)
| | | | | | | | |
| | |
| Security Description | |
Principal
Amount(17) | | | Value
(Note 2) | |
| |
U.S. CORPORATE BONDS & NOTES (continued) | |
Oil Companies - Exploration & Production (continued) | | | | | | | | |
QEP Resources, Inc.
Senior Notes
5.38% due 10/01/2022 | | $ | 206,000 | | | $ | 177,675 | |
QEP Resources, Inc.
Senior Notes
6.80% due 03/01/2020 | | | 245,000 | | | | 237,650 | |
Range Resources Corp.
Company Guar. Notes
5.00% due 08/15/2022# | | | 1,135,000 | | | | 1,047,037 | |
Rice Energy, Inc.
Company Guar. Notes
7.25% due 05/01/2023*# | | | 555,000 | | | | 516,150 | |
RSP Permian, Inc.
Company Guar. Notes
6.63% due 10/01/2022* | | | 1,340,000 | | | | 1,313,200 | |
WPX Energy, Inc.
Senior Notes
5.25% due 09/15/2024# | | | 1,260,000 | | | | 1,034,586 | |
WPX Energy, Inc.
Senior Notes
6.00% due 01/15/2022 | | | 1,090,000 | | | | 921,050 | |
| | | | | | |
|
|
|
| | | | | | | | 29,678,339 | |
| | | | | | |
|
|
|
Physicians Practice Management — 0.2% | | | | | | | | |
Envision Healthcare Corp.
Company Guar. Notes
5.13% due 07/01/2022* | | | 860,000 | | | | 871,825 | |
| | | | | | |
|
|
|
Pipelines — 1.2% | | | | | | | | |
Energy Transfer Equity LP
Senior Sec. Notes
5.50% due 06/01/2027 | | | 3,545,000 | | | | 3,296,850 | |
Energy Transfer Equity LP
Senior Sec. Notes
7.50% due 10/15/2020 | | | 1,350,000 | | | | 1,446,214 | |
Kinder Morgan, Inc.
Company Guar. Notes
6.50% due 09/15/2020 | | | 740,000 | | | | 816,503 | |
| | | | | | |
|
|
|
| | | | | | | | 5,559,567 | |
| | | | | | |
|
|
|
Printing - Commercial — 0.6% | | | | | | | | |
Quad/Graphics, Inc.
Company Guar. Notes
7.00% due 05/01/2022 | | | 2,950,000 | | | | 2,743,500 | |
| | | | | | |
|
|
|
Radio — 0.4% | | | | | | | | |
Sirius XM Radio, Inc.
Company Guar. Notes
4.25% due 05/15/2020* | | | 555,000 | | | | 553,957 | |
Sirius XM Radio, Inc.
Company Guar. Notes
4.63% due 05/15/2023* | | | 1,560,000 | | | | 1,485,900 | |
Sirius XM Radio, Inc.
Senior Sec. Notes
5.25% due 08/15/2022* | | | 60,000 | | | | 63,000 | |
| | | | | | |
|
|
|
| | | | | | | | 2,102,857 | |
| | | | | | |
|
|
|
Real Estate Investment Trusts — 0.1% | | | | | | | | |
Equinix, Inc.
Senior Notes
4.88% due 04/01/2020 | | | 75,000 | | | | 76,688 | |
Equinix, Inc.
Senior Notes
5.38% due 04/01/2023 | | | 410,000 | | | | 411,025 | |
| | | | | | |
|
|
|
| | | | | | | | 487,713 | |
| | | | | | |
|
|
|
| | | | | | | | |
| | |
| Security Description | |
Principal
Amount(17) | | | Value
(Note 2) | |
| |
| | | | | | | | | |
Rental Auto/Equipment — 0.2% | | | | | | | | |
Hertz Corp.
Company Guar. Notes
5.88% due 10/15/2020# | | $ | 500,000 | | | $ | 505,180 | |
Hertz Corp.
Company Guar. Notes
6.25% due 10/15/2022# | | | 325,000 | | | | 330,688 | |
| | | | | | |
|
|
|
| | | | | | | | 835,868 | |
| | | | | | |
|
|
|
Retail - Apparel/Shoe — 0.3% | | | | | | | | |
Chinos Intermediate Holdings, Inc.
Senior Notes
7.75% due 05/01/2019*(5) | | | 1,550,000 | | | | 658,750 | |
L Brands, Inc.
Senior Notes
6.95% due 03/01/2033 | | | 651,000 | | | | 680,295 | |
| | | | | | |
|
|
|
| | | | | | | | 1,339,045 | |
| | | | | | |
|
|
|
Retail - Arts & Crafts — 0.5% | | | | | | | | |
Michaels Stores, Inc.
Company Guar. Notes
5.88% due 12/15/2020* | | | 2,050,000 | | | | 2,147,375 | |
| | | | | | |
|
|
|
Retail - Discount — 0.6% | | | | | | | | |
99 Cents Only Stores
Company Guar. Notes
11.00% due 12/15/2019 | | | 1,760,000 | | | | 1,438,800 | |
Family Tree Escrow LLC
Company Guar. Notes
5.25% due 03/01/2020* | | | 235,000 | | | | 246,162 | |
Family Tree Escrow LLC
Company Guar. Notes
5.75% due 03/01/2023* | | | 1,130,000 | | | | 1,183,675 | |
| | | | | | |
|
|
|
| | | | | | | | 2,868,637 | |
| | | | | | |
|
|
|
Retail - Leisure Products — 0.6% | | | | | | | | |
Party City Holdings, Inc.
Company Guar. Notes
6.13% due 08/15/2023* | | | 1,760,000 | | | | 1,772,100 | |
Party City Holdings, Inc.
Company Guar. Notes
8.88% due 08/01/2020 | | | 1,055,000 | | | | 1,124,894 | |
| | | | | | |
|
|
|
| | | | | | | | 2,896,994 | |
| | | | | | |
|
|
|
Retail - Restaurants — 0.3% | | | | | | | | |
CEC Entertainment, Inc.
Company Guar. Notes
8.00% due 02/15/2022# | | | 1,270,000 | | | | 1,270,000 | |
| | | | | | |
|
|
|
Rubber/Plastic Products — 0.0% | | | | | | | | |
Venture Holdings Co. LLC
Company Guar. Notes
11.00% due 06/01/2007†(1)(2)(4)(7) | | | 50,000 | | | | 0 | |
| | | | | | |
|
|
|
Satellite Telecom — 0.3% | | | | | | | | |
DigitalGlobe, Inc.
Company Guar. Notes
5.25% due 02/01/2021* | | | 1,570,000 | | | | 1,507,200 | |
| | | | | | |
|
|
|
Semiconductor Equipment — 0.8% | | | | | | | | |
Entegris, Inc.
Company Guar. Notes
6.00% due 04/01/2022* | | | 3,810,000 | | | | 3,857,625 | |
| | | | | | |
|
|
|
Shipbuilding — 0.3% | | | | | | | | |
Huntington Ingalls Industries, Inc.
Company Guar. Notes
7.13% due 03/15/2021 | | | 1,180,000 | | | | 1,249,325 | |
| | | | | | |
|
|
|
37
VALIC Company II High Yield Bond Fund
PORTFOLIO OF INVESTMENTS — August 31, 2015 — (continued)
| | | | | | | | |
| | |
| Security Description | |
Principal
Amount(17) | | | Value
(Note 2) | |
| |
U.S. CORPORATE BONDS & NOTES (continued) | |
Soap & Cleaning Preparation — 0.8% | | | | | | | | |
Sun Products Corp.
Senior Notes
7.75% due 03/15/2021# | | $ | 4,195,000 | | | $ | 3,775,500 | |
| | | | | | |
|
|
|
Specified Purpose Acquisitions — 0.4% | | | | | | | | |
Argos Merger Sub, Inc.
Senior Notes
7.13% due 03/15/2023* | | | 2,005,000 | | | | 2,100,237 | |
| | | | | | |
|
|
|
Steel - Producers — 1.7% | | | | | | | | |
AK Steel Corp.
Company Guar. Notes
7.63% due 05/15/2020# | | | 2,060,000 | | | | 1,349,300 | |
AK Steel Corp.
Company Guar. Notes
7.63% due 10/01/2021 | | | 2,620,000 | | | | 1,644,050 | |
AK Steel Corp.
Company Guar. Notes
8.38% due 04/01/2022# | | | 1,360,000 | | | | 850,000 | |
Steel Dynamics, Inc.
Company Guar. Notes
5.13% due 10/01/2021 | | | 915,000 | | | | 897,158 | |
Steel Dynamics, Inc.
Company Guar. Notes
5.50% due 10/01/2024 | | | 1,005,000 | | | | 976,106 | |
United States Steel Corp.
Senior Notes
7.38% due 04/01/2020# | | | 2,291,000 | | | | 2,084,581 | |
| | | | | | |
|
|
|
| | | | | | | | 7,801,195 | |
| | | | | | |
|
|
|
Telecommunication Equipment — 1.5% | | | | | | | | |
Alcatel-Lucent USA, Inc.
Senior Notes
6.45% due 03/15/2029 | | | 4,680,000 | | | | 4,893,502 | |
Alcatel-Lucent USA, Inc.
Senior Notes
6.50% due 01/15/2028 | | | 490,000 | | | | 509,600 | |
Alcatel-Lucent USA, Inc.
Company Guar. Notes
6.75% due 11/15/2020* | | | 1,710,000 | | | | 1,825,425 | |
| | | | | | |
|
|
|
| | | | | | | | 7,228,527 | |
| | | | | | |
|
|
|
Telephone - Integrated — 2.2% | | | | | | | | |
Level 3 Financing, Inc.
Company Guar. Notes
5.13% due 05/01/2023* | | | 455,000 | | | | 443,625 | |
Level 3 Financing, Inc.
Company Guar. Notes
5.38% due 08/15/2022 | | | 2,175,000 | | | | 2,182,699 | |
Level 3 Financing, Inc.
Company Guar. Notes
6.13% due 01/15/2021 | | | 340,000 | | | | 356,150 | |
Level 3 Financing, Inc.
Company Guar. Notes
7.00% due 06/01/2020 | | | 2,009,000 | | | | 2,114,473 | |
Level 3 Financing, Inc.
Company Guar. Notes
8.63% due 07/15/2020 | | | 2,947,000 | | | | 3,122,346 | |
Windstream Services LLC
Company Guar. Notes
7.75% due 10/15/2020# | | | 2,465,000 | | | | 2,193,850 | |
| | | | | | |
|
|
|
| | | | | | | | 10,413,143 | |
| | | | | | |
|
|
|
| | | | | | | | |
| | |
| Security Description | |
Principal
Amount(17) | | | Value
(Note 2) | |
| |
| | | | | | | | | |
Television — 2.5% | | | | | | | | |
Gannett Co., Inc.
Company Guar. Notes
4.88% due 09/15/2021* | | $ | 1,540,000 | | | $ | 1,520,750 | |
Gannett Co., Inc.
Company Guar. Notes
5.13% due 10/15/2019 | | | 3,685,000 | | | | 3,804,762 | |
Gannett Co., Inc.
Company Guar. Notes
5.50% due 09/15/2024* | | | 705,000 | | | | 697,950 | |
Gannett Co., Inc.
Company Guar. Notes
6.38% due 10/15/2023 | | | 1,360,000 | | | | 1,424,600 | |
Gray Television, Inc.
Company Guar. Notes
7.50% due 10/01/2020 | | | 815,000 | | | | 842,751 | |
Tribune Media Co.
Company Guar. Notes
5.88% due 07/15/2022* | | | 3,510,000 | | | | 3,536,325 | |
| | | | | | |
|
|
|
| | | | | | | | 11,827,138 | |
| | | | | | |
|
|
|
Theaters — 0.3% | | | | | | | | |
Carmike Cinemas, Inc.
Sec. Notes
6.00% due 06/15/2023* | | | 1,485,000 | | | | 1,518,412 | |
| | | | | | |
|
|
|
X-Ray Equipment — 0.1% | | | | | | | | |
Hologic, Inc.
Company Guar. Notes
5.25% due 07/15/2022* | | | 660,000 | | | | 672,375 | |
| | | | | | |
|
|
|
Total U.S. Corporate Bonds & Notes | | | | | | | | |
(cost $344,153,795) | | | | | | | 338,698,761 | |
| | | | | | |
|
|
|
FOREIGN CORPORATE BONDS & NOTES — 12.1% | | | | | | | | |
Building Products - Cement — 0.6% | | | | | | | | |
Cemex SAB de CV
Senior Sec. Notes
5.70% due 01/11/2025* | | | 1,830,000 | | | | 1,715,625 | |
Cemex SAB de CV
Senior Sec. Notes
6.13% due 05/05/2025* | | | 1,135,000 | | | | 1,083,925 | |
| | | | | | |
|
|
|
| | | | | | | | 2,799,550 | |
| | | | | | |
|
|
|
Cable/Satellite TV — 0.6% | | | | | | | | |
Unitymedia Hessen GmbH & Co. KG
Senior Sec. Notes
5.50% due 01/15/2023* | | | 2,735,000 | | | | 2,810,213 | |
| | | | | | |
|
|
|
Chemicals - Diversified — 0.6% | | | | | | | | |
INEOS Group Holdings SA
Sec. Notes
5.88% due 02/15/2019# | | | 230,000 | | | | 227,988 | |
INEOS Group Holdings SA
Sec. Notes
6.13% due 08/15/2018# | | | 2,305,000 | | | | 2,307,881 | |
| | | | | | |
|
|
|
| | | | | | | | 2,535,869 | |
| | | | | | |
|
|
|
Containers - Metal/Glass — 0.8% | | | | | | | | |
Ardagh Finance Holdings SA
Senior Notes
8.63% due 06/15/2019*(8) | | | 1,072,526 | | | | 1,131,515 | |
Ardagh Packaging Finance PLC/Ardagh Holdings USA, Inc.
Company Guar. Notes
6.00% due 06/30/2021*# | | | 2,495,000 | | | | 2,475,788 | |
38
VALIC Company II High Yield Bond Fund
PORTFOLIO OF INVESTMENTS — August 31, 2015 — (continued)
| | | | | | | | |
| | |
| Security Description | |
Principal
Amount(17) | | | Value
(Note 2) | |
| |
FOREIGN CORPORATE BONDS & NOTES (continued) | |
Containers - Metal/Glass (continued) | | | | | | | | |
Ardagh Packaging Finance PLC/Ardagh MP Holdings
USA, Inc.
Senior Notes
7.00% due 11/15/2020* | | $ | 140,294 | | | $ | 141,697 | |
| | | | | | |
|
|
|
| | | | | | | | 3,749,000 | |
| | | | | | |
|
|
|
Finance - Leasing Companies — 0.6% | | | | | | | | |
AerCap Ireland Capital, Ltd./AerCap Global Aviation Trust
Company Guar. Notes
4.50% due 05/15/2021 | | | 2,950,000 | | | | 2,997,937 | |
| | | | | | |
|
|
|
Forestry — 0.5% | | | | | | | | |
Tembec Industries, Inc.
Senior Sec. Notes
9.00% due 12/15/2019* | | | 3,820,000 | | | | 2,444,800 | |
| | | | | | |
|
|
|
Medical - Drugs — 2.3% | | | | | | | | |
Endo Finance LLC
Company Guar. Notes
6.00% due 07/15/2023* | | | 585,000 | | | | 608,400 | |
Grifols Worldwide Operations, Ltd.
Company Guar. Notes
5.25% due 04/01/2022 | | | 905,000 | | | | 919,706 | |
Valeant Pharmaceuticals International, Inc.
Company Guar. Notes
5.50% due 03/01/2023* | | | 2,725,000 | | | | 2,762,469 | |
Valeant Pharmaceuticals International, Inc.
Company Guar. Notes
5.88% due 05/15/2023* | | | 6,505,000 | | | | 6,635,100 | |
| | | | | | |
|
|
|
| | | | | | | | 10,925,675 | |
| | | | | | |
|
|
|
Multimedia — 0.4% | | | | | | | | |
Quebecor Media, Inc.
Senior Notes
5.75% due 01/15/2023 | | | 1,995,000 | | | | 2,014,950 | |
| | | | | | |
|
|
|
Oil & Gas Drilling — 0.3% | | | | | | | | |
Paragon Offshore PLC
Company Guar. Notes
6.75% due 07/15/2022*# | | | 3,290,000 | | | | 658,000 | |
Seadrill, Ltd.
Senior Notes
6.13% due 09/15/2017* | | | 1,110,000 | | | | 899,100 | |
| | | | | | |
|
|
|
| | | | | | | | 1,557,100 | |
| | | | | | |
|
|
|
Oil Companies - Exploration & Production — 1.0% | | | | | | | | |
MEG Energy Corp.
Company Guar. Notes
6.38% due 01/30/2023* | | | 480,000 | | | | 386,400 | |
MEG Energy Corp.
Company Guar. Notes
7.00% due 03/31/2024* | | | 1,735,000 | | | | 1,418,363 | |
Tullow Oil PLC
Company Guar. Notes
6.00% due 11/01/2020* | | | 1,220,000 | | | | 902,800 | |
Tullow Oil PLC
Company Guar. Notes
6.25% due 04/15/2022* | | | 2,465,000 | | | | 1,793,287 | |
| | | | | | |
|
|
|
| | | | | | | | 4,500,850 | |
| | | | | | |
|
|
|
Satellite Telecom — 0.6% | | | | | | | | |
Intelsat Jackson Holdings SA
Company Guar. Notes
6.63% due 12/15/2022# | | | 590,000 | | | | 516,250 | |
Intelsat Jackson Holdings SA
Company Guar. Notes
7.25% due 10/15/2020 | | | 1,000,000 | | | | 961,250 | |
| | | | | | | | |
| | |
| Security Description | |
Principal
Amount(17) | | | Value
(Note 2) | |
| |
| | | | | | | | | |
Satellite Telecom (continued) | | | | | | | | |
Intelsat Jackson Holdings SA
Company Guar. Notes
7.50% due 04/01/2021 | | $ | 1,325,000 | | | $ | 1,283,594 | |
| | | | | | |
|
|
|
| | | | | | | | 2,761,094 | |
| | | | | | |
|
|
|
Semiconductor Equipment — 0.4% | | | | | | | | |
Sensata Technologies BV
Company Guar. Notes
5.00% due 10/01/2025* | | | 1,230,000 | | | | 1,193,100 | |
Sensata Technologies BV
Company Guar. Notes
5.63% due 11/01/2024* | | | 710,000 | | | | 727,750 | |
| | | | | | |
|
|
|
| | | | | | | | 1,920,850 | |
| | | | | | |
|
|
|
Special Purpose Entity — 0.0% | | | | | | | | |
Hellas Telecommunications Luxembourg II SCA FRS
Sub. Notes
8.46% due 01/15/2015†*(1)(2)(4)(9) | | | 925,000 | | | | 0 | |
| | | | | | |
|
|
|
Steel - Producers — 0.4% | | | | | | | | |
ArcelorMittal
Senior Notes
7.50% due 03/01/2041 | | | 720,000 | | | | 660,600 | |
ArcelorMittal
Senior Notes
7.75% due 10/15/2039 | | | 1,210,000 | | | | 1,122,275 | |
| | | | | | |
|
|
|
| | | | | | | | 1,782,875 | |
| | | | | | |
|
|
|
Telecom Services — 2.0% | | | | | | | | |
Altice Financing SA
Senior Sec. Notes
6.50% due 01/15/2022* | | | 985,000 | | | | 987,462 | |
Altice Financing SA
Senior Sec. Notes
6.63% due 02/15/2023* | | | 335,000 | | | | 333,325 | |
Altice Financing SA
Senior Sec. Notes
7.88% due 12/15/2019* | | | 750,000 | | | | 783,750 | |
Altice Finco SA
Senior Sec. Notes
8.13% due 01/15/2024* | | | 300,000 | | | | 303,000 | |
Altice Finco SA
Senior Sec. Notes
9.88% due 12/15/2020* | | | 535,000 | | | | 587,163 | |
UPCB Finance V, Ltd.
Senior Sec. Notes
7.25% due 11/15/2021* | | | 490,500 | | | | 526,674 | |
UPCB Finance VI, Ltd.
Senior Sec. Notes
6.88% due 01/15/2022* | | | 1,057,500 | | | | 1,124,916 | |
Wind Acquisition Finance SA
Senior Sec. Notes
4.00% due 07/15/2020* | | EUR | 2,245,000 | | | | 2,541,901 | |
Wind Acquisition Finance SA
Senior Sec. Notes
4.75% due 07/15/2020* | | | 1,940,000 | | | | 1,954,550 | |
Wind Acquisition Finance SA
Senior Sec. Notes
6.50% due 04/30/2020* | | | 220,000 | | | | 231,550 | |
| | | | | | |
|
|
|
| | | | | | | | 9,374,291 | |
| | | | | | |
|
|
|
Telephone - Integrated — 0.4% | | | | | | | | |
SoftBank Group Corp.
Company Guar. Notes
4.50% due 04/15/2020* | | | 1,710,000 | | | | 1,710,684 | |
| | | | | | |
|
|
|
39
VALIC Company II High Yield Bond Fund
PORTFOLIO OF INVESTMENTS — August 31, 2015 — (continued)
| | | | | | | | |
| | |
| Security Description | | Shares/
Principal
Amount(17) | | | Value
(Note 2) | |
| |
FOREIGN CORPORATE BONDS & NOTES (continued) | |
Television — 0.6% | | | | | | | | |
Videotron, Ltd.
Company Guar. Notes
5.00% due 07/15/2022 | | $ | 2,720,000 | | | $ | 2,716,600 | |
| | | | | | |
|
|
|
Total Foreign Corporate Bonds & Notes | | | | | | | | |
(cost $63,733,901) | | | | | | | 56,602,338 | |
| | | | | | |
|
|
|
LOANS(2)(10)(11) — 2.1% | | | | | | | | |
Building - Residential/Commercial — 0.0% | | | | | | | | |
TOUSA, Inc.
Escrow Loans
12.25% due 08/15/2013†(1) | | | 2,037,810 | | | | 0 | |
| | | | | | |
|
|
|
E-Commerce/Products — 0.2% | | | | | | | | |
Lands’ End, Inc. FRS
BTL-B
4.25% due 04/04/2021 | | | 1,026,302 | | | | 971,779 | |
| | | | | | |
|
|
|
Electric - Integrated — 0.4% | | | | | | | | |
Texas Competitive Electric Holdings Co. LLC FRS
BTL
4.66% due 10/10/2017†(3)(6) | | | 3,873,748 | | | | 1,748,029 | |
| | | | | | |
|
|
|
Electronic Components - Semiconductors — 0.3% | |
Freescale Semiconductor Inc FRS
Tranche 5
5.00% due 01/15/2021 | | | 1,296,900 | | | | 1,298,154 | |
| | | | | | |
|
|
|
Insurance - Property/Casualty — 0.2% | | | | | | | | |
Asurion LLC FRS
2nd Lien
8.50% due 03/03/2021 | | | 1,090,000 | | | | 1,069,563 | |
| | | | | | |
|
|
|
Machinery - General Industrial — 0.4% | | | | | | | | |
Gardner Denver, Inc. FRS
BTL
4.25% due 07/30/2020 | | | 1,847,100 | | | | 1,759,747 | |
| | | | | | |
|
|
|
Metal Processors & Fabrication — 0.3% | | | | | | | | |
Crosby US Acquisition Corp. FRS
1st Lien
3.75% due 11/23/2020 | | | 1,497,200 | | | | 1,317,536 | |
| | | | | | |
|
|
|
Retail - Major Department Stores — 0.3% | | | | | | | | |
Neiman Marcus Group, LTD. LLC FRS
BTL
4.25% due 10/25/2020 | | | 1,621,876 | | | | 1,603,124 | |
| | | | | | |
|
|
|
Total Loans | | | | | | | | |
(cost $12,184,335) | | | | | | | 9,767,932 | |
| | | | | | |
|
|
|
COMMON STOCKS†(1)(2) — 0.0% | | | | | | | | |
Food - Misc./Diversified — 0.0% | | | | | | | | |
Wornick Co | | | 3,444 | | | | 16,586 | |
| | | | | | |
|
|
|
Multimedia — 0.0% | | | | | | | | |
Haights Cross Communication, Inc. | | | 10,439 | | | | 0 | |
| | | | | | |
|
|
|
Total Common Stocks | | | | | | | | |
(cost $99,564) | | | | | | | 16,586 | |
| | | | | | |
|
|
|
MEMBERSHIP INTEREST CERTIFICATES†(2)(12) — 0.1% | |
Casino Services — 0.1% | | | | | | | | |
Herbst Gaming, Inc. | | | | | | | | |
(cost $232,701) | | | 23,439 | | | | 281,269 | |
| | | | | | |
|
|
|
PREFERRED SECURITIES — 0.7% | | | | | | | | |
Diversified Banking Institutions — 0.7% | | | | | | | | |
Citigroup Capital XIII FRS
7.88% | | | 75 | | | | 1,916 | |
| | | | | | | | |
| | |
| Security Description | | Shares/
Principal
Amount(17) | | | Value
(Note 2) | |
| |
| | | | | | | | | |
Diversified Banking Institutions (continued) | | | | | | | | |
GMAC Capital Trust I FRS
Series 2
8.13% | | | 134,000 | | | $ | 3,421,020 | |
| | | | | | |
|
|
|
Total Preferred Securities | | | | | | | | |
(cost $3,455,209) | | | | | | | 3,422,936 | |
| | | | | | |
|
|
|
PREFERRED SECURITIES/CAPITAL SECURITIES — 4.9% | |
Banks - Commercial — 1.3% | | | | | | | | |
Banco Bilbao Vizcaya Argentaria SA VRS
7.00% due 02/19/2019(13) | | | EUR 3,200,000 | | | | 3,635,050 | |
Banco Bilbao Vizcaya Argentaria SA VRS
9.00% due 05/19/2018(13) | | | 1,000,000 | | | | 1,073,000 | |
ING Groep NV VRS
6.00% due 04/16/2020#(13) | | | 755,000 | | | | 731,406 | |
ING Groep NV VRS
6.50% due 04/16/2025#(13) | | | 600,000 | | | | 575,625 | |
| | | | | | |
|
|
|
| | | | | | | | 6,015,081 | |
| | | | | | |
|
|
|
Diversified Banking Institutions — 2.6% | | | | | | | | |
Barclays PLC FRS
6.63% due 09/15/2019(13) | | | 1,034,000 | | | | 1,009,390 | |
Barclays PLC FRS
8.25% due 12/15/2018(13) | | | 2,595,000 | | | | 2,752,631 | |
Credit Agricole SA FRS
7.88% due 01/23/2024*(13) | | | 775,000 | | | | 788,974 | |
Credit Suisse Group AG VRS
7.50% due 12/11/2023*(13) | | | 1,395,000 | | | | 1,474,166 | |
Royal Bank of Scotland Group PLC FRS
6.99% due 10/05/2017*(13) | | | 1,690,000 | | | | 1,977,300 | |
Royal Bank of Scotland Group PLC FRS
7.50% due 08/10/2020(13) | | | 2,515,000 | | | | 2,521,287 | |
Royal Bank of Scotland Group PLC FRS
7.64% due 09/30/2017(13) | | | 500,000 | | | | 529,375 | |
Societe Generale SA VRS
8.25% due 11/29/2018(13) | | | 875,000 | | | | 929,250 | |
| | | | | | |
|
|
|
| | | | | | | | 11,982,373 | |
| | | | | | |
|
|
|
Insurance - Multi-line — 0.7% | | | | | | | | |
Hartford Financial Services Group, Inc. FRS
8.13% due 06/15/2068 | | | 3,170,000 | | | | 3,542,475 | |
| | | | | | |
|
|
|
Multimedia — 0.3% | | | | | | | | |
NBCUniversal Enterprise, Inc.
5.25% due 03/19/2021*(13) | | | 1,260,000 | | | | 1,329,666 | |
| | | | | | |
|
|
|
Total Preferred Securities/Capital Securities | | | | | | | | |
(cost $22,582,524) | | | | | | | 22,869,595 | |
| | | | | | |
|
|
|
WARRANTS†(1)(2)(12) — 0.1% | | | | | | | | |
Television — 0.1% | | | | | | | | |
ION Media Networks, Inc.
Expires 12/18/2016
(strike price $0.01) | | | 310 | | | | 193,537 | |
ION Media Networks, Inc.
Expires 12/18/2016
(strike price $0.01) | | | 306 | | | | 191,040 | |
| | | | | | |
|
|
|
Total Warrants | | | | | | | | |
(cost $0) | | | | | | | 384,577 | |
| | | | | | |
|
|
|
Total Long-Term Investment Securities | | | | | | | | |
(cost $449,186,661) | | | | | | | 433,425,725 | |
| | | | | | |
|
|
|
SHORT-TERM INVESTMENT SECURITIES — 7.1% | |
Registered Investment Companies — 7.1% | | | | | | | | |
State Street Navigator Securities Lending
Prime Portfolio 0.21%(14)(15) | | | | | | | | |
(cost $33,550,848) | | | 33,550,848 | | | | 33,550,848 | |
| | | | | | |
|
|
|
40
VALIC Company II High Yield Bond Fund
PORTFOLIO OF INVESTMENTS — August 31, 2015 — (continued)
| | | | | | | | |
| | |
| Security Description | |
Principal
Amount(17) | | | Value
(Note 2) | |
| |
REPURCHASE AGREEMENTS — 5.7% | | | | | | | | |
Agreement with State Street Bank and Trust Co., bearing interest at 0.00%, dated 08/31/2015, to be repurchased 09/01/2015 in the amount of $26,536,000 collateralized by $26,680,000 of United States Treasury Notes, bearing interest at 1.38% due 09/30/2018 and having an approximate value of $27,066,807 | | | | | | | | |
(cost $26,536,000) | | | 26,536,000 | | | $ | 26,536,000 | |
| | | | | | |
|
|
|
TOTAL INVESTMENTS | | | | | | | | |
(cost $509,273,509)(16) | | | 105.3 | % | | | 493,512,573 | |
Liabilities in excess of other assets | | | (5.3 | ) | | | (24,658,070 | ) |
| | |
|
|
| |
|
|
|
NET ASSETS | | | 100.0 | % | | $ | 468,854,503 | |
| | |
|
|
| |
|
|
|
| † | Non-income producing security |
| * | Securities exempt from registration under Rule 144A of the Securities Act of 1933. These securities may be sold in transactions exempt from registration, normally to qualified institutional buyers. The Fund has no right to demand registration of these securities. At August 31, 2015, the aggregate value of these securities was $183,002,982 representing 39.0% of net assets. Unless otherwise indicated, these securities are not considered to be illiquid. |
| # | The security or a portion thereof is out on loan (see Note 2) |
| (1) | Fair valued security. Securities are classified as Level 3 based on the securities valuation inputs; see Note 2. |
| (2) | Illiquid security. At August 31, 2015, the aggregate value of these securities was $10,450,364 representing 2.2% of net assets. |
| (3) | Company has filed for Chapter 11 bankruptcy protection. |
| (4) | Security in default of principal and interest at maturity. |
| (5) | PIK (“Payment-in-Kind”) security — Income may be paid in additional securities or cash at the discretion of the issuer. The security is currently paying interest in cash at the coupon rate listed. |
| (6) | Security in default of interest. |
| (7) | Company has filed for Chapter 11 bankruptcy. |
| (8) | PIK (“Payment-in-Kind”) security — Income may be paid in additional securities or cash at the discretion of the issuer. The security is currently paying interest in the form of additional securities at the coupon rate listed. |
| (9) | Company has filed for bankruptcy protection in the country of issuance. |
| (10) | Senior loans in the Fund are generally subject to mandatory and/or optional prepayment. Because of these mandatory prepayment conditions and because there may be significant economic incentives for a borrower to prepay, prepayments may occur. As a result, the actual remaining maturity may be substantially less than the stated maturities shown. |
| (11) | The Fund invests in senior loans which generally pay interest at rates which are periodically re-determined by reference to a base lending rate plus a premium. These base lending rates are generally either the lending rate offered by one or more major European banks, such as the London Inter-Bank Offer Rate (“LIBOR”) or the prime rate offered by one or more major United States banks, or the certificate of deposit rate. Senior loans are generally considered to be restrictive in that the Fund/Portfolio is ordinarily contractually obligated to receive approval from the Agent Bank and/or borrower prior to the disposition of a senior loan. |
| (12) | Denotes a restricted security that: (a) cannot be offered for public sale without first being registered, or being able to take advantage of an exemption from registration, under the Securities Act of 1933, as amended (the “1933 Act”); (b) is subject to a contractual restriction on public sales; or (c) is otherwise subject to a restriction on sales by operation of applicable law. Restricted securities are valued pursuant to Note 2. Certain restricted securities held by the Fund may not be sold except in exempt transactions or in a public offering registered under the 1933 Act. The Fund has no right to demand registration of these securities. The risk of investing in certain restricted securities is greater than the risk of investing in the securities of widely held, publicly traded companies. To the extent applicable, lack of a secondary market and resale restrictions may result in the inability of a Fund to sell a security at a fair price and may substantially delay the sale of the security. In addition, certain restricted securities may exhibit greater price volatility than securities for which secondary markets exist. As of August 31, 2015, the Fund held the following restricted securities: |
| | | | | | | | | | | | | | | | | | | | | | | | |
Description
| | Acquisition
Date
| | | Shares/
Principal
Amount
| | | Acquisition
Cost
| | | Value
| | | Value
Per Share
| | | % of
Net Assets
| |
Membership Interest Certificate | | | | | | | | | | | | | | | | | | | | | | | | |
Herbst Gaming, Inc. | | | 03/26/2008 | | | | 23,439 | | | $ | 232,701 | | | $ | 281,269 | | | $ | 12.00 | | | | 0.06 | % |
Warrants | | | | | | | | | | | | | | | | | | | | | | | | |
ION Media Networks, Inc.
Expires 12/18/2016
(Strike price $0.01) | | | 11/11/2010 | | | | 310 | | | | – | | | | 193,537 | | | | 624.31 | | | | 0.04 | |
ION Media Networks, Inc.
Expires 12/18/2016
(Strike price $0.01) | | | 03/01/2011 | | | | 306 | | | | – | | | | 191,040 | | | | 624.31 | | | | 0.04 | |
| | | | | | | | | | | | | | |
|
|
| | | | | |
|
|
|
| | | | | | | | | | | | | | | $ | 665,846 | | | | | | | | 0.14 | % |
| | | | | | | | | | | | | | |
|
|
| | | | | |
|
|
|
| (13) | Perpetual maturity — maturity date reflects the next call date. |
| (14) | At August 31, 2015, the Fund had loaned securities with a total value of $34,137,917. This was secured by collateral of $33,550,848, which was received in cash and subsequently invested in short-term investments currently valued at $33,550,848 as reported in the Portfolio of Investments. Additional collateral of $1,212,188 was received in the form of fixed income pooled securities, which the Fund cannot sell or repledge and accordingly are not reflected in the Fund’s assets and liabilities. |
| | The components of the fixed income pooled securities referenced above are as follows: |
| | | | | | |
Securities
| | Coupon Range
| | Maturity Date Range
| | Value as of
August 31, 2015
|
United States Treasury Notes/Bonds | | 3.50% to 5.25% | | 11/15/2028 to 02/15/2039 | | $1,212,188 |
| (15) | The rate shown is the 7-day yield as of August 31, 2015. |
| (16) | See Note 5 for cost of investments on a tax basis. |
| (17) | Denominated in United States dollars unless otherwise indicated. |
BTL—Bank Term Loan
EUR—Euro Dollar
FRS—Floating Rate Security
VRS—Variable Rate Security
The rates shown on FRS and VRS are the current interest rates at August 31, 2015 and unless noted otherwise, the dates shown are the original maturity dates.
| | | | | | | | | | | | | | | | | | | | | | | | | | | | |
| Forward Foreign Currency Contracts | |
| Counterparty | | Contract to Deliver | | | In Exchange For | | | Delivery Date | | | Unrealized
Appreciation | | | Unrealized
Depreciation | |
HSBC Bank USA | | | EUR | | | | 1,458,000 | | | | USD | | | | 1,670,868 | | | | 09/30/2015 | | | $ | 34,106 | | | $ | – | |
Morgan Stanley and Co. International PLC | | | EUR | | | | 1,457,000 | | | | USD | | | | 1,670,153 | | | | 09/30/2015 | | | | 34,514 | | | | – | |
Royal Bank of Scotland PLC | | | EUR | | | | 1,458,000 | | | | USD | | | | 1,672,390 | | | | 09/30/2015 | | | | 35,629 | | | | – | |
State Street Bank and Trust Company | | | EUR | | | | 1,458,000 | | | | USD | | | | 1,671,600 | | | | 09/30/2015 | | | | 34,838 | | | | – | |
| | | | | | | | | | | | | | | | | | | | | | |
|
|
| |
|
|
|
Net Unrealized Appreciation/(Depreciation) | | | | | | | | | | | | | | | | | | | | | | $ | 139,087 | | | $ | – | |
| | | | | | | | | | | | | | | | | | | | | | |
|
|
| |
|
|
|
EUR—Euro Dollars
USD—United States Dollar
41
VALIC Company II High Yield Bond Fund
PORTFOLIO OF INVESTMENTS — August 31, 2015 — (continued)
| | | | | | | | | | | | | | | | | | | | | | | | | | | | | | | | |
| Centrally Cleared Credit Default Swaps on Credit Indicies — Sell Protection(1) | |
| Reference Obligation | | Fixed Deal
Receive Rate | | | Termination
Date | | | Counterparty | | | Implied Credit
Spread at
August 31,
2015(2) | | | Notional
Amount(3) | | | Value at
August,
2015(4) | | | Upfront
Premiums Paid/
(Received) | | | Unrealized
Appreciation/
(Depreciation) | |
Markit CDX North America High Yield Index | | | 5.00 | % | | | 12/20/2019 | | | | Goldman Sachs Corp. | | | | 0.3910 | % | | $ | 6,989,400 | | | $ | 214,944 | | | $ | 176,616 | | | $ | 38,328 | |
Markit CDX North America High Yield Index | | | 5.00 | % | | | 06/20/2020 | | | | Goldman Sachs Corp. | | | | 0.3402 | % | | | 3,506,550 | | | | 315,779 | | | | 432,029 | | | | (116,250 | ) |
| | | | | | | | | | | | | | | | | | | | | | |
|
|
| |
|
|
| |
|
|
|
| | | | | | | | | | | | | | | | | | | | | | | $ | 530,723 | | | $ | 608,645 | | | $ | (77,922 | ) |
| | | | | | | | | | | | | | | | | | | | | | |
|
|
| |
|
|
| |
|
|
|
| (1) | If the Fund is a seller of protection and a credit event occurs, as defined under the terms of that particular swap agreement, the Fund will either (i) pay to the buyer of protection an amount equal to the notional amount of the swap and take delivery of the referenced obligation or (ii) pay a net settlement amount in the form of cash or securities equal to the notional amount of the swap less the recovery value of the referenced obligation. |
| (2) | Implied credit spreads, represented in absolute terms, utilized in determining the market value of credit default swap agreements on corporate issues or sovereign issues of an emerging country as of period end serve as an indicator of the current status of the payment/performance risk and represent the likelihood or risk of default for the credit derivative. The implied credit spread of a particular referenced entity reflects the cost of buying/selling protection and may include upfront payments required to be made to enter into the agreement. Wider credit spreads represent a deterioration of the referenced entity’s credit soundness and a greater likelihood or risk of default or other credit event occurring as defined under the terms of the agreement. A credit spread identified as “Defaulted” indicates a credit event has occurred for the referenced entity or obligation. |
| (3) | The maximum potential amount the Fund could be required to make as a seller of credit protection or receive as a buyer of credit protection if a credit event occurs as defined under the terms of that particular swap agreement. |
| (4) | The quoted market prices and resulting values for credit default swap agreements on asset-backed securities and credit indices serve as an indicator of the current status of the payment/performance risk and represent the likelihood of an expected liability (or profit) for the credit derivative should the notional amount of the swap agreement have been closed/sold as of the period end. Increasing market values, in absolute terms when compared to the notional amount of the swap, represent a deterioration of the referenced entity’s credit soundness and a greater likelihood or risk of default or other credit event occurring as defined under the terms of the agreement. |
The following is a summary of the inputs used to value the Fund’s net assets as of August 31, 2015 (see Note 2):
| | | | | | | | | | | | | | | | |
| | | Level 1 - Unadjusted Quoted
Prices
| | | Level 2 - Other Observable
Inputs
| | | Level 3 - Significant
Unobservable Inputs
| | | Total
| |
ASSETS: | | | | | | | | | | | | | | | | |
Investments at Value:* | | | | | | | | | | | | | | | | |
Convertible Bonds & Notes: | | | | | | | | | | | | | | | | |
Medical-Drugs | | $ | — | | | $ | — | | | $ | 0 | | | $ | 0 | |
Other Industries | | | — | | | | 1,381,731 | | | | — | | | | 1,381,731 | |
U.S. Corporate Bonds & Notes: | | | | | | | | | | | | | | | | |
Rubber/Plastic Products | | | — | | | | — | | | | 0 | | | | 0 | |
Other Industries | | | — | | | | 338,698,761 | | | | — | | | | 338,698,761 | |
Foreign Corporate Bonds & Notes: | | | | | | | | | | | | | | | | |
Special Purpose Entity | | | — | | | | — | | | | 0 | | | | 0 | |
Other Industries | | | — | | | | 56,602,338 | | | | — | | | | 56,602,338 | |
Loans: | | | | | | | | | | | | | | | | |
Building-Residential/Commercial | | | — | | | | — | | | | 0 | | | | 0 | |
Other Industries | | | — | | | | 9,767,932 | | | | — | | | | 9,767,932 | |
Common Stocks | | | — | | | | — | | | | 16,586 | | | | 16,586 | |
Membership Interest Certificates | | | — | | | | 281,269 | | | | — | | | | 281,269 | |
Preferred Securities | | | 3,422,936 | | | | — | | | | — | | | | 3,422,936 | |
Preferred Securities/Capital Securities | | | — | | | | 22,869,595 | | | | — | | | | 22,869,595 | |
Warrants | | | — | | | | — | | | | 384,577 | | | | 384,577 | |
Short-Term Investment Securities | | | 33,550,848 | | | | — | | | | — | | | | 33,550,848 | |
Repurchase Agreements | | | — | | | | 26,536,000 | | | | — | | | | 26,536,000 | |
| | |
|
|
| |
|
|
| |
|
|
| |
|
|
|
Total Investments at Value | | $ | 36,973,784 | | | $ | 456,137,626 | | | $ | 401,163 | | | $ | 493,512,573 | |
| | |
|
|
| |
|
|
| |
|
|
| |
|
|
|
Other Financial Instruments:+ | | | | | | | | | | | | | | | | |
Forward Foreign Currency Contracts | | $ | — | | | $ | 139,087 | | | $ | — | | | $ | 139,087 | |
Centrally Cleared Credit Default Swaps on Credit Indicies - Sell Protection | | | — | | | | 38,328 | | | | — | | | | 38,328 | |
| | |
|
|
| |
|
|
| |
|
|
| |
|
|
|
Total Other Financial Instruments | | $ | — | | | $ | 177,415 | | | $ | — | | | $ | 177,415 | |
| | |
|
|
| |
|
|
| |
|
|
| |
|
|
|
LIABILITIES: | | | | | | | | | | | | | | | | |
Other Financial Instruments:+ | | | | | | | | | | | | | | | | |
Centrally Cleared Credit Default Swaps on Credit Indicies - Sell Protection | | $ | — | | | $ | 116,250 | | | $ | — | | | $ | 116,250 | |
| | |
|
|
| |
|
|
| |
|
|
| |
|
|
|
| * | For a detailed presentation of investments, please refer to the Portfolio of Investments. |
| + | Other financial instruments are derivative instruments, not reflected in the Portfolio of Investments, such as futures, forward, swap and written option contracts, which are valued at the unrealized appreciation (depreciation) on the instrument. |
The Fund’s policy is to recognize transfers between Levels as of the end of the reporting period. There were no transfers between Levels during the reporting period.
At the beginning and end of the reporting period, Level 3 investments were not considered a material portion of the Fund.
See Notes to Financial Statements
42
VALIC Company II International Opportunities Fund
PORTFOLIO PROFILE — August 31, 2015 (unaudited)
Industry Allocation*
| | | | |
Registered Investment Companies | | | 5.9 | % |
Building — Residential/Commercial | | | 3.8 | |
Banks — Commercial | | | 3.8 | |
Auto/Truck Parts & Equipment — Original | | | 2.8 | |
Medical Labs & Testing Services | | | 2.6 | |
Real Estate Investment Trusts | | | 2.3 | |
Food — Misc./Diversified | | | 2.0 | |
Retail — Apparel/Shoe | | | 1.9 | |
Diversified Operations/Commercial Services | | | 1.8 | |
Building & Construction Products — Misc. | | | 1.7 | |
Computer Services | | | 1.6 | |
Computers — Integrated Systems | | | 1.6 | |
Human Resources | | | 1.6 | |
E-Commerce/Services | | | 1.6 | |
Finance — Other Services | | | 1.5 | |
Containers — Paper/Plastic | | | 1.5 | |
Building & Construction — Misc. | | | 1.5 | |
Repurchase Agreements | | | 1.5 | |
Real Estate Operations & Development | | | 1.4 | |
Chemicals — Diversified | | | 1.3 | |
Electronic Components — Misc. | | | 1.3 | |
Medical Products | | | 1.3 | |
Funeral Services & Related Items | | | 1.3 | |
Retail — Restaurants | | | 1.3 | |
Metal Processors & Fabrication | | | 1.3 | |
Energy — Alternate Sources | | | 1.2 | |
Investment Management/Advisor Services | | | 1.2 | |
Wireless Equipment | | | 1.2 | |
Casino Hotels | | | 1.2 | |
Retail — Discount | | | 1.2 | |
Commercial Services | | | 1.1 | |
Electronic Measurement Instruments | | | 1.1 | |
Cosmetics & Toiletries | | | 1.0 | |
Insurance — Property/Casualty | | | 1.0 | |
Machinery — General Industrial | | | 1.0 | |
Soap & Cleaning Preparation | | | 1.0 | |
Chemicals — Specialty | | | 1.0 | |
Gambling (Non-Hotel) | | | 1.0 | |
Electronic Components — Semiconductors | | | 1.0 | |
Fisheries | | | 0.9 | |
Machine Tools & Related Products | | | 0.9 | |
Retail — Drug Store | | | 0.9 | |
Leisure Products | | | 0.9 | |
Transport — Services | | | 0.9 | |
Applications Software | | | 0.9 | |
E-Commerce/Products | | | 0.8 | |
Entertainment Software | | | 0.8 | |
Home Furnishings | | | 0.8 | |
Advertising Sales | | | 0.8 | |
Beverages — Non-alcoholic | | | 0.8 | |
Medical — Biomedical/Gene | | | 0.8 | |
Medical — Drugs | | | 0.7 | |
Food — Catering | | | 0.7 | |
Transactional Software | | | 0.7 | |
Private Equity | | | 0.7 | |
Dental Supplies & Equipment | | | 0.7 | |
Enterprise Software/Service | | | 0.7 | |
Wire & Cable Products | | | 0.6 | |
Television | | | 0.6 | |
Casino Services | | | 0.6 | |
Consulting Services | | | 0.6 | |
Apparel Manufacturers | | | 0.6 | |
Retail — Convenience Store | | | 0.6 | |
Diversified Financial Services | | | 0.6 | |
Satellite Telecom | | | 0.6 | |
Electric — Integrated | | | 0.5 | |
Investment Companies | | | 0.5 | |
Retail — Pet Food & Supplies | | | 0.5 | |
Hotels/Motels | | | 0.5 | |
| | | | |
Exchange — Traded Funds | | | 0.5 | |
Food — Dairy Products | | | 0.5 | |
Computer Software | | | 0.5 | |
Batteries/Battery Systems | | | 0.5 | |
Insurance Brokers | | | 0.4 | |
Retail — Misc./Diversified | | | 0.4 | |
Real Estate Management/Services | | | 0.4 | |
Food — Wholesale/Distribution | | | 0.4 | |
Telecommunication Equipment | | | 0.4 | |
Electric — Generation | | | 0.4 | |
Cellular Telecom | | | 0.4 | |
Drug Delivery Systems | | | 0.4 | |
Coatings/Paint | | | 0.4 | |
Aerospace/Defense | | | 0.4 | |
Veterinary Products | | | 0.4 | |
Gas — Distribution | | | 0.4 | |
Photo Equipment & Supplies | | | 0.3 | |
Oil Refining & Marketing | | | 0.3 | |
Oil Companies — Exploration & Production | | | 0.3 | |
Electric Products — Misc. | | | 0.3 | |
Finance — Investment Banker/Broker | | | 0.3 | |
Transport — Truck | | | 0.3 | |
Respiratory Products | | | 0.3 | |
Oil — Field Services | | | 0.3 | |
Telephone — Integrated | | | 0.3 | |
Cable/Satellite TV | | | 0.3 | |
Food — Meat Products | | | 0.3 | |
Rubber/Plastic Products | | | 0.3 | |
Auto — Cars/Light Trucks | | | 0.3 | |
Insurance — Multi-line | | | 0.3 | |
Diversified Manufacturing Operations | | | 0.3 | |
Insurance — Life/Health | | | 0.3 | |
Distribution/Wholesale | | | 0.2 | |
Semiconductor Components — Integrated Circuits | | | 0.2 | |
Retail — Automobile | | | 0.2 | |
Airlines | | | 0.2 | |
Explosives | | | 0.2 | |
Food — Flour & Grain | | | 0.2 | |
Food — Retail | | | 0.2 | |
Footwear & Related Apparel | | | 0.2 | |
Food — Confectionery | | | 0.2 | |
Advertising Services | | | 0.2 | |
Semiconductor Equipment | | | 0.2 | |
Tobacco | | | 0.2 | |
Lighting Products & Systems | | | 0.2 | |
Engineering/R&D Services | | | 0.2 | |
Finance — Credit Card | | | 0.2 | |
Electronic Connectors | | | 0.2 | |
Finance — Auto Loans | | | 0.2 | |
Diversified Minerals | | | 0.2 | |
Instruments — Controls | | | 0.2 | |
Broadcast Services/Program | | | 0.1 | |
Building — Maintenance & Services | | | 0.1 | |
Retail — Home Furnishings | | | 0.1 | |
Rental Auto/Equipment | | | 0.1 | |
Auto/Truck Parts & Equipment — Replacement | | | 0.1 | |
Schools | | | 0.1 | |
Metal — Iron | | | 0.1 | |
Hazardous Waste Disposal | | | 0.1 | |
Internet Content — Information/News | | | 0.1 | |
Gold Mining | | | 0.1 | |
Retail — Building Products | | | 0.1 | |
Chemicals — Plastics | | | 0.1 | |
Aerospace/Defense — Equipment | | | 0.1 | |
Brewery | | | 0.1 | |
Forestry | | | 0.1 | |
Medical Instruments | | | 0.1 | |
Building — Heavy Construction | | | 0.1 | |
Diversified Operations | | | 0.1 | |
43
VALIC Company II International Opportunities Fund
PORTFOLIO PROFILE — August 31, 2015 (unaudited) — (continued)
Industry Allocation* (continued)
| | | | |
MRI/Medical Diagnostic Imaging | | | 0.1 | % |
Beverages — Wine/Spirits | | | 0.1 | |
Consumer Products — Misc. | | | 0.1 | |
Transport — Marine | | | 0.1 | |
Electronic Parts Distribution | | | 0.1 | |
Office Supplies & Forms | | | 0.1 | |
Machinery — Pumps | | | 0.1 | |
Computer Aided Design | | | 0.1 | |
Finance — Consumer Loans | | | 0.1 | |
Bicycle Manufacturing | | | 0.1 | |
Instruments — Scientific | | | 0.1 | |
Industrial Gases | | | 0.1 | |
Computers | | | 0.1 | |
Office Automation & Equipment | | | 0.1 | |
Telecom Services | | | 0.1 | |
| | |
|
|
|
| | | | 105.3 | % |
| | |
|
|
|
| * | Calculated as a percentage of net assets |
Country Allocation*
| | | | |
United Kingdom | | | 23.6 | % |
Japan | | | 20.0 | |
United States | | | 8.6 | |
Germany | | | 7.7 | |
Ireland | | | 5.8 | |
France | | | 4.2 | |
Canada | | | 3.3 | |
Switzerland | | | 3.2 | |
Australia | | | 3.0 | |
Italy | | | 2.1 | |
Bermuda | | | 2.0 | |
Denmark | | | 1.7 | |
Sweden | | | 1.6 | |
Luxembourg | | | 1.6 | |
Spain | | | 1.5 | |
South Korea | | | 1.4 | |
Netherlands | | | 1.4 | |
Taiwan | | | 1.1 | |
Austria | | | 0.9 | |
Curacao | | | 0.9 | |
Faroe Islands | | | 0.8 | |
Belgium | | | 0.8 | |
Cayman Islands | | | 0.8 | |
Brazil | | | 0.7 | |
Finland | | | 0.7 | |
Thailand | | | 0.7 | |
Mexico | | | 0.7 | |
Singapore | | | 0.6 | |
Isle of Man | | | 0.5 | |
Portugal | | | 0.4 | |
Israel | | | 0.4 | |
Philippines | | | 0.4 | |
Norway | | | 0.4 | |
South Africa | | | 0.3 | |
Malaysia | | | 0.3 | |
Hong Kong | | | 0.3 | |
New Zealand | | | 0.3 | |
China | | | 0.2 | |
Panama | | | 0.1 | |
Indonesia | | | 0.1 | |
Turkey | | | 0.1 | |
Colombia | | | 0.1 | |
| | |
|
|
|
| | | | 105.3 | % |
| | |
|
|
|
| * | Calculated as a percentage of net assets |
44
VALIC Company II International Opportunities Fund
PORTFOLIO OF INVESTMENTS — August 31, 2015
| | | | | | | | |
| | |
| Security Description | |
Shares | | | Value
(Note 2) | |
| |
COMMON STOCKS — 96.4% | |
Australia — 3.0% | |
Ansell, Ltd.(1) | | | 96,571 | | | $ | 1,519,159 | |
Aristocrat Leisure, Ltd.(1) | | | 595,839 | | | | 3,557,545 | |
Austbrokers Holdings, Ltd.(1) | | | 211,327 | | | | 1,361,220 | |
Computershare, Ltd.(1) | | | 121,116 | | | | 848,965 | |
DuluxGroup, Ltd.(1) | | | 172,029 | | | | 686,648 | |
Echo Entertainment Group, Ltd.(1) | | | 1,972,262 | | | | 6,898,590 | |
Iluka Resources, Ltd.#(1) | | | 168,550 | | | | 885,449 | |
Orica, Ltd.#(1) | | | 110,515 | | | | 1,240,045 | |
Qube Holdings, Ltd.#(1) | | | 50,046 | | | | 78,297 | |
Sonic Healthcare, Ltd.(1) | | | 41,461 | | | | 609,202 | |
| | | | | | |
|
|
|
| | | | | | | | 17,685,120 | |
| | | | | | |
|
|
|
Austria — 0.9% | |
BUWOG AG#(1) | | | 76,292 | | | | 1,610,426 | |
Mayr-Melnhof Karton AG(1) | | | 7,701 | | | | 904,640 | |
Wienerberger AG(1) | | | 178,642 | | | | 3,168,785 | |
| | | | | | |
|
|
|
| | | | | | | | 5,683,851 | |
| | | | | | |
|
|
|
Belgium — 0.8% | |
D’Ieteren SA(1) | | | 17,684 | | | | 651,613 | |
Ontex Group NV(1) | | | 136,140 | | | | 4,243,533 | |
| | | | | | |
|
|
|
| | | | | | | | 4,895,146 | |
| | | | | | |
|
|
|
Bermuda — 2.0% | |
Cafe de Coral Holdings, Ltd.(1) | | | 262,000 | | | | 833,230 | |
China Resources Gas Group, Ltd.(1) | | | 822,000 | | | | 2,162,406 | |
Credicorp, Ltd. | | | 10,586 | | | | 1,164,248 | |
Dairy Farm International Holdings, Ltd.(1) | | | 156,600 | | | | 1,018,114 | |
Esprit Holdings, Ltd.#(1) | | | 407,350 | | | | 339,534 | |
First Pacific Co., Ltd.(1) | | | 1,292,250 | | | | 836,624 | |
Global Brands Group Holding, Ltd.†(1) | | | 252,000 | | | | 47,560 | |
Hiscox, Ltd.(1) | | | 205,182 | | | | 2,827,398 | |
Midland Holdings, Ltd.†(1) | | | 2,146,000 | | | | 865,006 | |
Pacific Basin Shipping, Ltd.#(1) | | | 1,160,049 | | | | 362,102 | |
Peace Mark Holdings, Ltd.†(4)(5) | | | 686,000 | | | | 0 | |
Shangri-La Asia, Ltd.(1) | | | 584,000 | | | | 571,526 | |
VTech Holdings, Ltd.#(1) | | | 65,449 | | | | 757,410 | |
| | | | | | |
|
|
|
| | | | | | | | 11,785,158 | |
| | | | | | |
|
|
|
Brazil — 0.7% | |
Alupar Investimento SA | | | 71,200 | | | | 286,830 | |
Brasil Insurance Participacoes e Administracao SA | | | 92,016 | | | | 24,865 | |
Estacio Participacoes SA | | | 92,322 | | | | 317,443 | |
Fibria Celulose SA | | | 46,655 | | | | 658,919 | |
GAEC Educacao SA | | | 64,322 | | | | 202,190 | |
Iguatemi Empresa de Shopping Centers SA | | | 47,484 | | | | 269,717 | |
Kroton Educacional SA | | | 123,988 | | | | 296,752 | |
Linx SA | | | 30,500 | | | | 366,590 | |
Localiza Rent a Car SA | | | 43,378 | | | | 268,044 | |
LPS Brasil Consultoria de Imoveis SA | | | 83,700 | | | | 73,623 | |
M. Dias Branco SA | | | 21,200 | | | | 370,027 | |
Mills Estruturas e Servicos de Engenharia SA† | | | 91,300 | | | | 123,356 | |
Odontoprev SA | | | 135,914 | | | | 366,520 | |
Qualicorp SA | | | 110,637 | | | | 520,749 | |
TOTVS SA | | | 38,695 | | | | 338,227 | |
| | | | | | |
|
|
|
| | | | | | | | 4,483,852 | |
| | | | | | |
|
|
|
Canada — 3.3% | |
Agnico Eagle Mines, Ltd.# | | | 29,946 | | | | 733,399 | |
Alimentation Couche-Tard, Inc., Class B | | | 37,629 | | | | 1,594,570 | |
Concordia Healthcare Corp. | | | 57,155 | | | | 4,421,736 | |
Descartes Systems Group, Inc.† | | | 213,147 | | | | 3,687,463 | |
Dollarama, Inc. | | | 52,683 | | | | 3,008,169 | |
Linamar Corp. | | | 25,123 | | | | 1,319,740 | |
| | | | | | | | |
| | |
| Security Description | |
Shares | | | Value
(Note 2) | |
| |
| | |
Canada (continued) | |
Maple Leaf Foods, Inc. | | | 87,259 | | | $ | 1,480,405 | |
MEG Energy Corp.†# | | | 26,491 | | | | 238,008 | |
Stantec, Inc. | | | 17,596 | | | | 412,482 | |
TORC Oil & Gas, Ltd.# | | | 74,767 | | | | 354,058 | |
Tourmaline Oil Corp.† | | | 9,843 | | | | 249,143 | |
Tricon Capital Group, Inc. | | | 263,875 | | | | 2,286,542 | |
| | | | | | |
|
|
|
| | | | | | | | 19,785,715 | |
| | | | | | |
|
|
|
Cayman Islands — 0.8% | |
51job, Inc. ADR† | | | 37,375 | | | | 1,002,024 | |
Ajisen China Holdings, Ltd.(1) | | | 815,000 | | | | 316,199 | |
Shenguan Holdings Group, Ltd.(1) | | | 768,000 | | | | 107,956 | |
Stella International Holdings, Ltd.(1) | | | 467,500 | | | | 1,144,999 | |
Sunny Optical Technology Group Co., Ltd.#(1) | | | 871,000 | | | | 1,461,979 | |
Want Want China Holdings, Ltd.#(1) | | | 956,000 | | | | 768,689 | |
| | | | | | |
|
|
|
| | | | | | | | 4,801,846 | |
| | | | | | |
|
|
|
China — 0.2% | |
Guangzhou Automobile Group Co., Ltd.(1) | | | 1,576,000 | | | | 1,116,658 | |
Wumart Stores, Inc.†(1) | | | 331,000 | | | | 178,536 | |
| | | | | | |
|
|
|
| | | | | | | | 1,295,194 | |
| | | | | | |
|
|
|
Colombia — 0.1% | |
Bancolombia SA ADR# | | | 9,722 | | | | 335,409 | |
| | | | | | |
|
|
|
Denmark — 1.7% | |
Carlsberg A/S, Class B(1) | | | 8,884 | | | | 668,442 | |
Christian Hansen Holding A/S(1) | | | 19,131 | | | | 959,986 | |
DSV A/S(1) | | | 68,357 | | | | 2,437,048 | |
Jyske Bank A/S†(1) | | | 43,170 | | | | 2,408,485 | |
Sydbank A/S(1) | | | 54,823 | | | | 2,082,256 | |
TDC A/S(1) | | | 160,910 | | | | 1,016,181 | |
William Demant Holding A/S†(1) | | | 3,644 | | | | 295,515 | |
| | | | | | |
|
|
|
| | | | | | | | 9,867,913 | |
| | | | | | |
|
|
|
Faroe Islands — 0.8% | |
Bakkafrost P/F(1) | | | 166,203 | | | | 5,050,691 | |
| | | | | | |
|
|
|
Finland — 0.7% | |
Huhtamaki Oyj(1) | | | 129,820 | | | | 4,211,641 | |
Tikkurila Oyj(1) | | | 8,810 | | | | 153,123 | |
| | | | | | |
|
|
|
| | | | | | | | 4,364,764 | |
| | | | | | |
|
|
|
France — 4.2% | |
Cap Gemini SA(1) | | | 9,514 | | | | 850,947 | |
Christian Dior SE(1) | | | 12,477 | | | | 2,304,652 | |
Dassault Systemes(1) | | | 6,442 | | | | 446,527 | |
Edenred(1) | | | 18,347 | | | | 388,301 | |
Elior Participations SCA*(1) | | | 43,351 | | | | 878,382 | |
Eutelsat Communications SA(1) | | | 32,265 | | | | 969,880 | |
Faiveley Transport SA(1) | | | 1,844 | | | | 192,313 | |
Havas SA(1) | | | 132,728 | | | | 1,119,726 | |
Ingenico Group(1) | | | 39,378 | | | | 4,850,007 | |
Legrand SA(1) | | | 14,115 | | | | 810,746 | |
Neopost SA#(1) | | | 9,956 | | | | 342,528 | |
Saft Groupe SA(1) | | | 77,288 | | | | 2,823,623 | |
SEB SA(1) | | | 2,370 | | | | 220,343 | |
Societe BIC SA(1) | | | 2,988 | | | | 472,847 | |
Sodexo SA(1) | | | 22,450 | | | | 1,966,329 | |
Technip SA(1) | | | 13,996 | | | | 761,579 | |
Teleperformance(1) | | | 53,607 | | | | 3,769,333 | |
Virbac SA#(1) | | | 9,489 | | | | 2,178,824 | |
| | | | | | |
|
|
|
| | | | | | | | 25,346,887 | |
| | | | | | |
|
|
|
Germany — 7.6% | |
Amadeus Fire AG(1) | | | 11,089 | | | | 1,045,647 | |
45
VALIC Company II International Opportunities Fund
PORTFOLIO OF INVESTMENTS — August 31, 2015 — (continued)
| | | | | | | | |
| | |
| Security Description | |
Shares | | | Value
(Note 2) | |
| |
COMMON STOCKS (continued) | |
Germany (continued) | |
Aurelius AG(1) | | | 85,306 | | | $ | 4,134,052 | |
Beiersdorf AG(1) | | | 16,114 | | | | 1,334,225 | |
Brenntag AG(1) | | | 30,541 | | | | 1,699,205 | |
CTS Eventim AG & Co. KGaA(1) | | | 151,858 | | | | 5,309,958 | |
Deutsche Wohnen AG (BR)(1) | | | 49,038 | | | | 1,286,751 | |
Drillisch AG(1) | | | 52,791 | | | | 2,388,121 | |
ElringKlinger AG(1) | | | 16,328 | | | | 391,444 | |
Fuchs Petrolub SE(1) (Preference Shares) | | | 36,481 | | | | 1,574,045 | |
GEA Group AG(1) | | | 45,370 | | | | 1,773,163 | |
Gerry Weber International AG#(1) | | | 17,551 | | | | 388,344 | |
Henkel AG & Co. KGaA(1) (Preference Shares) | | | 15,967 | | | | 1,671,705 | |
Infineon Technologies AG(1) | | | 86,398 | | | | 945,607 | |
Krones AG(1) | | | 25,589 | | | | 2,740,184 | |
KUKA AG#(1) | | | 49,265 | | | | 3,926,020 | |
LEG Immobilien AG(1) | | | 10,845 | | | | 813,991 | |
MTU Aero Engines AG(1) | | | 9,408 | | | | 843,516 | |
Nordex SE†(1) | | | 254,846 | | | | 7,357,138 | |
Pfeiffer Vacuum Technology AG(1) | | | 4,219 | | | | 446,561 | |
ProSiebenSat.1 Media SE(1) | | | 9,695 | | | | 472,299 | |
Stroeer SE(1) | | | 20,265 | | | | 1,193,541 | |
Symrise AG(1) | | | 52,497 | | | | 3,168,839 | |
TAG Immobilien AG(1) | | | 14,335 | | | | 163,972 | |
| | | | | | |
|
|
|
| | | | | | | | 45,068,328 | |
| | | | | | |
|
|
|
Hong Kong — 0.3% | |
Techtronic Industries Co., Ltd.(1) | | | 528,500 | | | | 1,917,384 | |
| | | | | | |
|
|
|
Indonesia — 0.1% | |
PT Semen Indonesia Persero Tbk(1) | | | 258,500 | | | | 170,243 | |
PT XL Axiata Tbk†(1) | | | 1,203,000 | | | | 256,478 | |
| | | | | | |
|
|
|
| | | | | | | | 426,721 | |
| | | | | | |
|
|
|
Ireland — 5.8% | |
DCC PLC(1) | | | 28,402 | | | | 2,110,113 | |
Fleetmatics Group PLC†# | | | 80,400 | | | | 3,598,704 | |
Glanbia PLC(1) | | | 116,793 | | | | 2,339,719 | |
Greencore Group PLC(1) | | | 1,079,046 | | | | 4,910,991 | |
Hibernia REIT PLC(1) | | | 1,081,779 | | | | 1,608,300 | |
ICON PLC† | | | 128,600 | | | | 9,902,200 | |
Kerry Group PLC, Class A(1) | | | 17,678 | | | | 1,312,078 | |
Kingspan Group PLC(1) | | | 152,297 | | | | 3,730,980 | |
Paddy Power PLC (ISE)(1) | | | 8,760 | | | | 962,326 | |
Paddy Power PLC (LSE)(1) | | | 27,345 | | | | 3,011,989 | |
XL Group PLC | | | 29,010 | | | | 1,081,783 | |
| | | | | | |
|
|
|
| | | | | | | | 34,569,183 | |
| | | | | | |
|
|
|
Isle of Man — 0.5% | |
Playtech PLC(1) | | | 217,622 | | | | 2,858,647 | |
| | | | | | |
|
|
|
Israel — 0.4% | |
Bezeq The Israeli Telecommunication Corp., Ltd.(1) | | | 366,547 | | | | 658,297 | |
Mellanox Technologies, Ltd.† | | | 38,000 | | | | 1,536,720 | |
| | | | | | |
|
|
|
| | | | | | | | 2,195,017 | |
| | | | | | |
|
|
|
Italy — 2.1% | |
A2A SpA(1) | | | 2,490,088 | | | | 3,062,100 | |
Banca Generali SpA(1) | | | 65,024 | | | | 1,949,415 | |
Brembo SpA(1) | | | 99,676 | | | | 4,123,591 | |
Cerved Information Solutions SpA(1) | | | 106,345 | | | | 874,548 | |
Davide Campari — Milano SpA(1) | | | 74,965 | | | | 558,164 | |
Ei Towers SpA(1) | | | 27,104 | | | | 1,660,502 | |
Infrastrutture Wireless Italiane SpA†*(1) | | | 123,500 | | | | 570,080 | |
| | | | | | |
|
|
|
| | | | | | | | 12,798,400 | |
| | | | | | |
|
|
|
Japan — 20.0% | |
ABC-Mart, Inc.(1) | | | 104,300 | | | | 6,317,521 | |
| | | | | | | | |
| | |
| Security Description | |
Shares | | | Value
(Note 2) | |
| |
| | |
Japan (continued) | |
AEON Financial Service Co., Ltd.#(1) | | | 44,500 | | | $ | 1,007,181 | |
Ain Pharmaciez, Inc.(1) | | | 85,500 | | | | 3,937,433 | |
Air Water, Inc.(1) | | | 23,000 | | | | 366,659 | |
Alps Electric Co., Ltd.(1) | | | 144,500 | | | | 4,503,796 | |
Asante, Inc.(1) | | | 5,300 | | | | 72,521 | |
Bank of Yokohama, Ltd.(1) | | | 62,000 | | | | 378,009 | |
Brother Industries, Ltd.(1) | | | 79,100 | | | | 1,077,669 | |
Calsonic Kansei Corp.(1) | | | 680,000 | | | | 4,735,740 | |
Chiba Bank, Ltd.(1) | | | 155,000 | | | | 1,126,272 | |
Coca-Cola East Japan Co., Ltd.(1) | | | 12,400 | | | | 224,001 | |
Coca-Cola West Co., Ltd.(1) | | | 22,700 | | | | 465,765 | |
Cosmos Pharmaceutical Corp.(1) | | | 6,600 | | | | 843,599 | |
Daikin Industries, Ltd.(1) | | | 3,900 | | | | 231,858 | |
Daiseki Co., Ltd.(1) | | | 45,200 | | | | 786,150 | |
Daiwa Securities Group, Inc.#(1) | | | 146,000 | | | | 1,011,145 | |
FamilyMart Co., Ltd.#(1) | | | 7,900 | | | | 365,375 | |
Fuji Seal International, Inc.(1) | | | 35,000 | | | | 1,192,913 | |
Fujikura, Ltd.(1) | | | 772,000 | | | | 3,812,110 | |
Glory, Ltd.(1) | | | 5,800 | | | | 151,175 | |
Gurunavi, Inc.#(1) | | | 219,300 | | | | 3,523,702 | |
Haseko Corp.(1) | | | 494,200 | | | | 5,839,932 | |
Hirose Electric Co., Ltd.#(1) | | | 5,100 | | | | 580,383 | |
Hisamitsu Pharmaceutical Co., Inc.#(1) | | | 4,400 | | | | 151,588 | |
Hogy Medical Co., Ltd.#(1) | | | 3,100 | | | | 149,978 | |
Iriso Electronics Co., Ltd.#(1) | | | 9,150 | | | | 412,674 | |
Japan Exchange Group, Inc.#(1) | | | 6,800 | | | | 210,802 | |
Japan Pure Chemical Co., Ltd.(1) | | | 2,500 | | | | 48,039 | |
Jeol, Ltd.(1) | | | 61,000 | | | | 368,819 | |
JGC Corp.#(1) | | | 28,060 | | | | 409,375 | |
Kakaku.com, Inc.#(1) | | | 17,600 | | | | 278,921 | |
Kansai Paint Co., Ltd.#(1) | | | 63,000 | | | | 980,312 | |
Keyence Corp.(1) | | | 900 | | | | 416,615 | |
Kintetsu World Express, Inc.(1) | | | 8,300 | | | | 310,058 | |
Kobayashi Pharmaceutical Co., Ltd.(1) | | | 24,500 | | | | 1,898,847 | |
Koito Manufacturing Co., Ltd.#(1) | | | 44,000 | | | | 1,504,065 | |
Konica Minolta, Inc.(1) | | | 67,000 | | | | 735,247 | |
KYORIN Holdings, Inc.(1) | | | 23,000 | | | | 406,343 | |
Lawson, Inc.#(1) | | | 18,500 | | | | 1,317,262 | |
Matsumotokiyoshi Holdings Co., Ltd.(1) | | | 70,100 | | | | 3,361,287 | |
Milbon Co., Ltd.(1) | | | 14,700 | | | | 526,891 | |
Miraca Holdings, Inc.(1) | | | 25,900 | | | | 1,107,916 | |
MonotaRO Co., Ltd.(1) | | | 5,900 | | | | 297,692 | |
Nakanishi, Inc.(1) | | | 28,400 | | | | 1,114,371 | |
NEC Corp.(1) | | | 185,000 | | | | 582,792 | |
NGK Spark Plug Co., Ltd.#(1) | | | 32,300 | | | | 792,220 | |
Nihon Kohden Corp.#(1) | | | 31,800 | | | | 632,397 | |
Nippon Television Holdings, Inc.(1) | | | 37,200 | | | | 643,627 | |
Nitori Holdings Co., Ltd.(1) | | | 10,700 | | | | 849,021 | |
Nomura Research Institute, Ltd.(1) | | | 45,200 | | | | 1,830,073 | |
NTN Corp.#(1) | | | 1,335,000 | | | | 6,934,239 | |
OBIC Business Consultants Co., Ltd.(1) | | | 20,200 | | | | 978,887 | |
OBIC Co., Ltd.(1) | | | 105,800 | | | | 4,700,072 | |
Omron Corp.(1) | | | 6,300 | | | | 236,197 | |
Park24 Co., Ltd.(1) | | | 19,600 | | | | 385,323 | |
Proto Corp.(1) | | | 34,700 | | | | 507,188 | |
Rakuten, Inc.#(1) | | | 7,300 | | | | 104,097 | |
Saint Marc Holdings Co., Ltd.†(1) | | | 73,000 | | | | 2,246,932 | |
Santen Pharmaceutical Co., Ltd.(1) | | | 115,000 | | | | 1,791,504 | |
Seria Co., Ltd.#(1) | | | 22,400 | | | | 1,077,041 | |
Shimamura Co., Ltd.#(1) | | | 3,200 | | | | 295,193 | |
Shimano, Inc.(1) | | | 2,800 | | | | 375,226 | |
Shimizu Corp.(1) | | | 910,000 | | | | 8,887,839 | |
Shiseido Co., Ltd.#(1) | | | 9,400 | | | | 196,326 | |
Shizuoka Bank, Ltd.#(1) | | | 63,000 | | | | 662,177 | |
46
VALIC Company II International Opportunities Fund
PORTFOLIO OF INVESTMENTS — August 31, 2015 — (continued)
| | | | | | | | |
| | |
| Security Description | |
Shares | | | Value
(Note 2) | |
| |
COMMON STOCKS (continued) | |
Japan (continued) | |
SK Kaken Co., Ltd.(1) | | | 4,000 | | | $ | 394,967 | |
Sony Financial Holdings, Inc.#(1) | | | 53,500 | | | | 999,288 | |
Stanley Electric Co., Ltd.#(1) | | | 51,500 | | | | 1,000,428 | |
Start Today Co., Ltd.(1) | | | 157,500 | | | | 4,785,054 | |
Sundrug Co., Ltd.(1) | | | 17,100 | | | | 957,621 | |
Suruga Bank, Ltd.(1) | | | 251,400 | | | | 4,803,993 | |
Temp Holdings Co., Ltd.(1) | | | 166,600 | | | | 7,427,206 | |
Terumo Corp.#(1) | | | 22,400 | | | | 612,012 | |
Toshiba Plant Systems & Services Corp.(1) | | | 18,000 | | | | 196,231 | |
Tsumura & Co.(1) | | | 4,000 | | | | 88,835 | |
Unicharm Corp.#(1) | | | 70,100 | | | | 1,414,401 | |
USS Co., Ltd.(1) | | | 70,900 | | | | 1,255,250 | |
Welcia Holdings Co., Ltd.#(1) | | | 4,000 | | | | 191,149 | |
Yamato Holdings Co., Ltd.#(1) | | | 90,300 | | | | 1,761,094 | |
| | | | | | |
|
|
|
| | | | | | | | 119,153,911 | |
| | | | | | |
|
|
|
Jersey — 0.0% | |
Wolseley PLC(1) | | | 4,557 | | | | 291,561 | |
| | | | | | |
|
|
|
Luxembourg — 1.6% | |
B&M European Value Retail SA(1) | | | 276,301 | | | | 1,362,876 | |
Grand City Properties SA#(1) | | | 224,602 | | | | 3,969,823 | |
SAF-Holland SA(1) | | | 181,189 | | | | 2,570,324 | |
Samsonite International SA(1) | | | 178,500 | | | | 555,017 | |
SES SA FDR(1) | | | 31,089 | | | | 919,658 | |
| | | | | | |
|
|
|
| | | | | | | | 9,377,698 | |
| | | | | | |
|
|
|
Malaysia — 0.3% | |
Astro Malaysia Holdings Bhd(1) | | | 1,406,400 | | | | 973,738 | |
Public Bank Bhd(1) | | | 229,100 | | | | 980,164 | |
| | | | | | �� |
|
|
|
| | | | | | | | 1,953,902 | |
| | | | | | |
|
|
|
Mexico — 0.7% | |
Bolsa Mexicana de Valores SAB de CV# | | | 357,134 | | | | 546,995 | |
Concentradora Fibra Danhos SA de CV | | | 246,008 | | | | 486,045 | |
Concentradora Fibra Hotelera Mexicana SA de CV | | | 530,713 | | | | 516,808 | |
Controladora Vuela Cia de Aviacion SAB de CV ADR† | | | 39,619 | | | | 528,518 | |
Genomma Lab Internacional SAB de CV, Class B†# | | | 516,239 | | | | 422,378 | |
Grupo Lala SAB de CV# | | | 238,576 | | | | 544,472 | |
Prologis Property Mexico SA de CV | | | 329,124 | | | | 516,899 | |
Promotora y Operadora de Infraestructura SAB de CV† | | | 59,033 | | | | 630,406 | |
| | | | | | |
|
|
|
| | | | | | | | 4,192,521 | |
| | | | | | |
|
|
|
Netherlands — 1.4% | |
Aalberts Industries NV(1) | | | 14,614 | | | | 453,355 | |
ASM International NV(1) | | | 27,561 | | | | 1,036,302 | |
Brunel International NV#(1) | | | 17,853 | | | | 311,727 | |
Euronext NV*(1) | | | 112,152 | | | | 5,128,098 | |
IMCD Group NV(1) | | | 12,920 | | | | 479,964 | |
Koninklijke Vopak NV#(1) | | | 6,893 | | | | 282,731 | |
Sensata Technologies Holding NV† | | | 9,819 | | | | 465,421 | |
| | | | | | |
|
|
|
| | | | | | | | 8,157,598 | |
| | | | | | |
|
|
|
New Zealand — 0.3% | |
Fisher & Paykel Healthcare Corp., Ltd.(1) | | | 373,611 | | | | 1,715,544 | |
| | | | | | |
|
|
|
Norway — 0.4% | |
Aker Solutions ASA(1) | | | 86,780 | | | | 361,151 | |
Europris ASA†*(1) | | | 102,690 | | | | 502,476 | |
Marine Harvest ASA(1) | | | 75,567 | | | | 909,010 | |
Storebrand ASA†(1) | | | 103,976 | | | | 356,141 | |
| | | | | | |
|
|
|
| | | | | | | | 2,128,778 | |
| | | | | | |
|
|
|
Panama — 0.1% | |
Copa Holdings SA, Class A# | | | 14,097 | | | | 722,753 | |
| | | | | | |
|
|
|
| | | | | | | | |
| | |
| Security Description | |
Shares | | | Value
(Note 2) | |
| |
| | |
Philippines — 0.4% | |
BDO Unibank, Inc.(1) | | | 571,940 | | | $ | 1,200,388 | |
Jollibee Foods Corp.(1) | | | 41,060 | | | | 168,103 | |
Security Bank Corp.(1) | | | 278,230 | | | | 779,874 | |
| | | | | | |
|
|
|
| | | | | | | | 2,148,365 | |
| | | | | | |
|
|
|
Portugal — 0.4% | |
CTT-Correios de Portugal SA(1) | | | 223,187 | | | | 2,307,326 | |
| | | | | | |
|
|
|
Singapore — 0.6% | |
Ascendas India Trust(1) | | | 2,103,300 | | | | 1,320,349 | |
Super Group, Ltd.#(1) | | | 2,211,200 | | | | 1,227,633 | |
Venture Corp., Ltd.(1) | | | 135,563 | | | | 769,610 | |
| | | | | | |
|
|
|
| | | | | | | | 3,317,592 | |
| | | | | | |
|
|
|
South Africa — 0.3% | |
Clicks Group, Ltd.(1) | | | 150,739 | | | | 1,040,584 | |
Woolworths Holdings, Ltd.(1) | | | 140,373 | | | | 1,050,939 | |
| | | | | | |
|
|
|
| | | | | | | | 2,091,523 | |
| | | | | | |
|
|
|
South Korea — 1.4% | |
CJ O Shopping Co., Ltd.(1) | | | 4,117 | | | | 690,877 | |
E-Mart Co., Ltd.(1) | | | 2,542 | | | | 490,269 | |
LG Household & Health Care, Ltd.(1) | | | 2,670 | | | | 1,809,206 | |
Osstem Implant Co., Ltd.†(1) | | | 54,177 | | | | 2,965,956 | |
Samsung Fire & Marine Insurance Co., Ltd.(1) | | | 6,571 | | | | 1,489,480 | |
Seoul Semiconductor Co., Ltd.†#(1) | | | 50,523 | | | | 603,761 | |
TK Corp.†(1) | | | 54,556 | | | | 481,626 | |
| | | | | | |
|
|
|
| | | | | | | | 8,531,175 | |
| | | | | | |
|
|
|
Spain — 1.5% | |
Amadeus IT Holding SA, Class A(1) | | | 104,398 | | | | 4,350,928 | |
Atresmedia Corp. de Medios de Comunicacion SA(1) | | | 169,230 | | | | 2,506,238 | |
Cellnex Telecom SAU†*(1) | | | 68,583 | | | | 1,216,400 | |
Viscofan SA(1) | | | 15,820 | | | | 922,034 | |
| | | | | | |
|
|
|
| | | | | | | | 8,995,600 | |
| | | | | | |
|
|
|
Sweden — 1.6% | |
AAK AB(1) | | | 51,343 | | | | 3,402,572 | |
NetEnt AB#(1) | | | 112,035 | | | | 5,088,213 | |
Saab AB, Series B#(1) | | | 12,037 | | | | 307,258 | |
Swedish Match AB(1) | | | 35,106 | | | | 1,035,310 | |
| | | | | | |
|
|
|
| | | | | | | | 9,833,353 | |
| | | | | | |
|
|
|
Switzerland — 3.2% | |
Burckhardt Compression Holding AG(1) | | | 2,028 | | | | 699,598 | |
Coca-Cola HBC AG CDI(1) | | | 19,327 | | | | 392,026 | |
DKSH Holding AG(1) | | | 3,075 | | | | 186,945 | |
Geberit AG(1) | | | 4,814 | | | | 1,527,391 | |
Julius Baer Group, Ltd.(1) | | | 9,675 | | | | 470,066 | |
Leonteq AG(1) | | | 14,085 | | | | 3,235,414 | |
Lonza Group AG†(1) | | | 3,481 | | | | 475,281 | |
Sika AG (BR)†(1) | | | 495 | | | | 1,633,834 | |
Sonova Holding AG(1) | | | 13,667 | | | | 1,777,622 | |
Temenos Group AG(1) | | | 15,342 | | | | 542,583 | |
U-Blox AG(1) | | | 21,254 | | | | 4,132,141 | |
Ypsomed Holding AG(1) | | | 35,437 | | | | 3,842,737 | |
| | | | | | |
|
|
|
| | | | | | | | 18,915,638 | |
| | | | | | |
|
|
|
Taiwan — 1.1% | |
Advantech Co., Ltd.(1) | | | 55,235 | | | | 351,626 | |
Chroma ATE, Inc.(1) | | | 638,000 | | | | 1,054,491 | |
Cub Elecparts, Inc.(1) | | | 81,000 | | | | 841,427 | |
E.Sun Financial Holding Co., Ltd.(1) | | | 2,958,747 | | | | 1,759,890 | |
Siliconware Precision Industries Co., Ltd.(1) | | | 1,262,000 | | | | 1,546,076 | |
47
VALIC Company II International Opportunities Fund
PORTFOLIO OF INVESTMENTS — August 31, 2015 — (continued)
| | | | | | | | |
| | |
| Security Description | |
Shares | | | Value
(Note 2) | |
| |
COMMON STOCKS (continued) | |
Taiwan (continued) | |
Yuanta Financial Holding Co., Ltd.(1) | | | 2,491,807 | | | $ | 999,420 | |
| | | | | | |
|
|
|
| | | | | | | | 6,552,930 | |
| | | | | | |
|
|
|
Thailand — 0.7% | |
AEON Thana Sinsap Thailand PCL | | | 161,200 | | | | 382,257 | |
Glow Energy PCL | | | 605,000 | | | | 1,666,725 | |
Minor International PCL | | | 661,670 | | | | 489,169 | |
Minor International PCL NVDR(1) | | | 302,700 | | | | 223,042 | |
Precious Shipping PCL | | | 873,250 | | | | 175,405 | |
PTT Global Chemical PCL | | | 872,100 | | | | 1,386,796 | |
| | | | | | |
|
|
|
| | | | | | | | 4,323,394 | |
| | | | | | |
|
|
|
Turkey — 0.1% | |
Ford Otomotiv Sanayi AS(1) | | | 17,530 | | | | 177,537 | |
Tofas Turk Otomobil Fabrikasi AS(1) | | | 35,962 | | | | 222,860 | |
| | | | | | |
|
|
|
| | | | | | | | 400,397 | |
| | | | | | |
|
|
|
United Kingdom — 23.6% | |
Abcam PLC(1) | | | 33,217 | | | | 294,159 | |
Aberdeen Asset Management PLC(1) | | | 239,205 | | | | 1,158,933 | |
Admiral Group PLC(1) | | | 21,421 | | | | 505,913 | |
Amlin PLC(1) | | | 154,029 | | | | 1,210,516 | |
Ashtead Group PLC(1) | | | 31,484 | | | | 454,049 | |
AVEVA Group PLC#(1) | | | 12,239 | | | | 405,630 | |
Babcock International Group PLC(1) | | | 57,437 | | | | 847,146 | |
Bellway PLC(1) | | | 386,983 | | | | 14,641,972 | |
Betfair Group PLC(1) | | | 21,400 | | | | 1,074,603 | |
Booker Group PLC(1) | | | 996,087 | | | | 2,574,669 | |
Britvic PLC(1) | | | 50,285 | | | | 513,415 | |
Bunzl PLC(1) | | | 371,982 | | | | 9,845,811 | |
Burberry Group PLC(1) | | | 30,584 | | | | 658,079 | |
Cairn Energy PLC†(1) | | | 103,805 | | | | 240,860 | |
Capita PLC(1) | | | 31,270 | | | | 588,351 | |
Clinigen Group PLC(1) | | | 205,213 | | | | 2,228,841 | |
Cobham PLC(1) | | | 157,533 | | | | 675,989 | |
Compass Group PLC(1) | | | 162,867 | | | | 2,569,167 | |
Croda International PLC(1) | | | 83,320 | | | | 3,669,777 | |
Derwent London PLC(1) | | | 74,191 | | | | 4,075,725 | |
Dialog Semiconductor PLC†(1) | | | 49,500 | | | | 2,371,579 | |
Dignity PLC(1) | | | 203,799 | | | | 7,556,291 | |
Domino’s Pizza Group PLC(1) | | | 247,044 | | | | 3,255,342 | |
Electrocomponents PLC(1) | | | 87,398 | | | | 245,031 | |
Elementis PLC(1) | | | 219,748 | | | | 793,821 | |
Essentra PLC(1) | | | 53,769 | | | | 697,684 | |
Exova Group PLC(1) | | | 200,615 | | | | 534,921 | |
Fevertree Drinks PLC(1) | | | 476,344 | | | | 3,143,292 | |
Foxtons Group PLC(1) | | | 146,530 | | | | 537,124 | |
GKN PLC(1) | | | 144,692 | | | | 640,203 | |
Great Portland Estates PLC(1) | | | 404,658 | | | | 5,106,605 | |
Halma PLC(1) | | | 408,583 | | | | 4,702,358 | |
Hargreaves Lansdown PLC(1) | | | 67,274 | | | | 1,151,198 | |
Howden Joinery Group PLC(1) | | | 684,419 | | | | 5,014,275 | |
ICAP PLC(1) | | | 119,641 | | | | 826,764 | |
IG Group Holdings PLC(1) | | | 113,884 | | | | 1,256,791 | |
IMI PLC(1) | | | 35,939 | | | | 568,675 | |
Inchcape PLC(1) | | | 65,208 | | | | 724,484 | |
Intertek Group PLC(1) | | | 48,008 | | | | 1,863,798 | |
Jardine Lloyd Thompson Group PLC(1) | | | 89,227 | | | | 1,440,863 | |
John Wood Group PLC(1) | | | 57,685 | | | | 561,175 | |
Ladbrokes PLC(1) | | | 92,247 | | | | 140,398 | |
Laird PLC(1) | | | 408,074 | | | | 2,377,864 | |
Liberty Global PLC, Class A† | | | 10,172 | | | | 489,477 | |
Liberty Global PLC, Class C† | | | 25,095 | | | | 1,126,013 | |
LSL Property Services PLC(1) | | | 116,184 | | | | 590,018 | |
| | | | | | | | |
| | |
| Security Description | | Shares/
Principal
Amount | | | Value
(Note 2) | |
| |
| | |
United Kingdom (continued) | |
Meggitt PLC(1) | | | 142,494 | | | $ | 1,035,468 | |
Micro Focus International PLC(1) | | | 117,191 | | | | 2,342,470 | |
Mitie Group PLC(1) | | | 137,894 | | | | 626,282 | |
Next PLC(1) | | | 35,712 | | | | 4,342,929 | |
Pets at Home Group PLC(1) | | | 698,691 | | | | 3,215,418 | |
Poundland Group PLC(1) | | | 78,531 | | | | 413,100 | |
Premier Farnell PLC(1) | | | 135,234 | | | | 270,646 | |
PZ Cussons PLC(1) | | | 24,436 | | | | 118,344 | |
Rathbone Brothers PLC(1) | | | 52,818 | | | | 1,760,829 | |
Redrow PLC(1) | | | 252,298 | | | | 1,861,029 | |
Rightmove PLC(1) | | | 59,339 | | | | 3,377,561 | |
Rotork PLC(1) | | | 128,680 | | | | 409,767 | |
RPC Group PLC(1) | | | 299,434 | | | | 2,993,721 | |
Savills PLC(1) | | | 216,051 | | | | 2,975,999 | |
Schroders PLC(1) | | | 69,826 | | | | 3,013,000 | |
Segro PLC(1) | | | 93,430 | | | | 595,953 | |
Smith & Nephew PLC(1) | | | 51,062 | | | | 903,777 | |
Smiths Group PLC(1) | | | 20,249 | | | | 348,288 | |
Spectris PLC(1) | | | 58,309 | | | | 1,619,132 | |
Spirax-Sarco Engineering PLC(1) | | | 16,815 | | | | 811,963 | |
Stagecoach Group PLC(1) | | | 421,775 | | | | 2,343,820 | |
Tate & Lyle PLC(1) | | | 29,493 | | | | 242,806 | |
Travis Perkins PLC(1) | | | 23,347 | | | | 727,938 | |
Victrex PLC(1) | | | 28,865 | | | | 788,543 | |
Virgin Money Holdings UK PLC(1) | | | 488,880 | | | | 3,178,838 | |
Whitbread PLC(1) | | | 34,766 | | | | 2,536,944 | |
William Hill PLC(1) | | | 107,614 | | | | 590,590 | |
Zoopla Property Group PLC*(1) | | | 336,852 | | | | 1,357,003 | |
| | | | | | |
|
|
|
| | | | | | | | 140,751,807 | |
| | | | | | |
|
|
|
United States — 0.7% | |
Cognizant Technology Solutions Corp., Class A† | | | 25,220 | | | | 1,587,347 | |
EPAM Systems, Inc.† | | | 20,927 | | | | 1,477,655 | |
Gran Tierra Energy, Inc.† | | | 369,066 | | | | 917,335 | |
| | | | | | |
|
|
|
| | | | | | | | 3,982,337 | |
| | | | | | |
|
|
|
Total Common Stocks | | | | | | | | |
(cost $498,266,281) | | | | | | | 575,060,929 | |
| | | | | | |
|
|
|
EXCHANGE-TRADED FUNDS — 0.5% | |
United States — 0.5% | |
iShares MSCI EAFE Small-Cap ETF
(cost $2,746,708) | | | 59,300 | | | | 2,909,258 | |
| | | | | | |
|
|
|
EQUITY CERTIFICATES — 1.0% | |
Merrill Lynch — Bajaj Electricals, Ltd.† | | | 269,441 | | | | 1,030,949 | |
Merrill Lynch — CESC, Ltd.† | | | 95,248 | | | | 750,736 | |
Merrill Lynch — Shriram Transport Finance Co., Ltd.† | | | 80,918 | | | | 990,979 | |
Merrill Lynch — Dabur India, Ltd.† | | | 328,288 | | | | 1,348,462 | |
Merrill Lynch — Federal Bank Ltd.† | | | 1,357,704 | | | | 1,254,052 | |
Deutsche Bank AG London-MOIL, Ltd.† | | | 255,038 | | | | 799,164 | |
| | | | | | |
|
|
|
Total Equity Certificates | | | | | | | | |
(cost $5,956,786) | | | | | | | 6,174,342 | |
| | | | | | |
|
|
|
WARRANTS — 0.0% | |
Minor International PCL
Expires 11/03/2017
(strike price THB 36.36)† | | $ | 54,140 | | | | 4,048 | |
Precious Shipping PCL
Expires 06/15/2015
(strike price THB 17.50)† | | | 27,795 | | | | 2,171 | |
| | | | | | |
|
|
|
Total Warrants | | | | | | | | |
(cost $0) | | | | | | | 6,219 | |
| | | | | | |
|
|
|
Total Long-Term Investment Securities | | | | | | | | |
(cost $506,969,775) | | | | | | | 584,150,748 | |
| | | | | | |
|
|
|
48
VALIC Company II International Opportunities Fund
PORTFOLIO OF INVESTMENTS — August 31, 2015 — (continued)
| | | | | | | | |
| | |
| Security Description | | Shares/
Principal
Amount | | | Value
(Note 2) | |
| |
SHORT-TERM INVESTMENT SECURITIES — 5.9% | |
Registered Investment Companies — 5.9% | |
State Street Navigator Securities Lending Prime Portfolio 0.21%(2)(6)
(cost $34,825,193) | | | 34,825,193 | | | $ | 34,825,193 | |
| | | | | | |
|
|
|
REPURCHASE AGREEMENTS — 1.5% | |
Agreement with State Street Bank & Trust Co., bearing interest at 0.00%, dated 08/31/2015, to be repurchased 09/01/2015 in the amount $8,687,000 collateralized by $8,685,000 of United States Treasury Notes, bearing interest at 1.90% due 06/30/2020 and having an approximate value of $8,865,778 (cost $8,687,000) | | $ | 8,687,000 | | | | 8,687,000 | |
| | | | | | |
|
|
|
TOTAL INVESTMENTS | | | | | | | | |
(cost $550,481,968)(3) | | | 105.3 | % | | | 627,662,941 | |
Liabilities in excess of other assets | | | (5.3 | ) | | | (31,361,649 | ) |
| | |
|
|
| |
|
|
|
NET ASSETS — | | | 100.0 | % | | $ | 596,301,292 | |
| | |
|
|
| |
|
|
|
| # | The security or a portion thereof is out on loan (see Note 2) |
| † | Non-income producing security |
| * | Securities exempt from registration under Rule 144A of the Securities Act of 1933. These securities may be sold in transactions exempt from registration, normally to qualified institutional buyers. The Fund has no right to demand registration of these securities. At August 31, 2015, the aggregate value of these securities was $9,652,439 representing 1.6% of net assets. Unless otherwise indicated, these securities are not considered to be illiquid. |
| (1) | Security was valued using fair value procedures at August 31, 2015. The aggregate value of these securities was $517,091,400 representing 86.7% of net assets. Securities are classified as Level 2 based on the securities valuation inputs. See Note 2 regarding fair value pricing for foreign equity securities. |
| (2) | | At August 31, 2015, the Fund had loaned securities with a total value of $33,176,743. This was secured by collateral of $34,825,193, which was received in cash and subsequently invested in short-term investments currently valued at $34,825,193 as reported in the Portfolio of Investments. Additional collateral of $44,699 was received in the form of fixed income pooled securities, which the Fund cannot sell or repledge and accordingly, is not reflected in the Fund’s assets and liabilities. |
The components of the fixed income pooled securities referenced above are as follows:
| | | | | | | | |
Securities
| | Coupon Range
| | Maturity Date Range
| | Value as of
August 31, 2015
| |
Federal Home Loan Mtg. Corp. | | 3.50% to 3.50% | | 11/01/2034 to 12/15/2040 | | $ | 241 | |
Federal National Mtg. Assoc. | | 3.00% to 4.00% | | 01/25/2032 to 02/25/2044 | | | 918 | |
Government National Mtg. Assoc. | | 0.40% to 4.00% | | 04/20/2039 to 12/16/2052 | | | 898 | |
United States Treasury Notes/Bonds | | 1.38% to 4.75% | | 02/28/2019 to 02/15/2044 | | | 42,642 | |
| (3) | | See Note 5 for cost of investments on a tax basis. |
| (4) | | Fair valued security. Securities are classified as Level 3 based on the securities valuation inputs; see Note 2. |
| (5) | | Illiquid security. At August 31, 2015, the aggregate value of these securities was $0 representing 0.0% of net assets. |
| (6) | The rate shown is the 7-day yield as of August 31, 2015. |
ADR—American Depositary Receipt
BR—Bearer Shares
CDI—Chess Depositary Interest
FDR—Federal Depositary Receipt
ISE—Irish Stock Exchange
LSE—London Stock Exchange
NVDR—Non-Voting Depositary Receipt
The following is a summary of the inputs used to value the Fund’s net assets as of August 31, 2015 (see Note 2):
| | | | | | | | | | | | | | | | |
| | | Level 1 - Unadjusted Quoted
Prices
| | | Level 2 - Other Observable
Inputs
| | | Level 3- Significant
Unobservable Inputs
| | | Total
| |
ASSETS: | | | | | | | | | | | | | | | | |
Investments at Value:* | | | | | | | | | | | | | | | | |
Common Stocks: | | | | | | | | | | | | | | | | |
Bermuda | | | 1,164,248 | | | $ | 10,620,910 | | | $ | 0 | | | $ | 11,785,158 | |
Brazil | | | 4,483,852 | | | | — | | | | — | | | | 4,483,852 | |
Canada | | | 19,785,715 | | | | — | | | | — | | | | 19,785,715 | |
Cayman Islands | | | 1,002,024 | | | | 3,799,822 | | | | — | | | | 4,801,846 | |
Colombia | | | 335,409 | | | | — | | | | — | | | | 335,409 | |
Ireland | | | 14,582,687 | | | | 19,986,496 | | | | — | | | | 34,569,183 | |
Israel | | | 1,536,720 | | | | 658,297 | | | | — | | | | 2,195,017 | |
Mexico | | | 4,192,521 | | | | — | | | | — | | | | 4,192,521 | |
Netherland | | | 465,421 | | | | 7,692,177 | | | | — | | | | 8,157,598 | |
Panama | | | 722,753 | | | | — | | | | — | | | | 722,753 | |
Thailand | | | 4,100,352 | | | | 223,042 | | | | — | | | | 4,323,394 | |
United Kingdom | | | 1,615,490 | | | | 139,136,317 | | | | — | | | | 140,751,807 | |
United States | | | 3,982,337 | | | | — | | | | — | | | | 3,982,337 | |
Other Countries | | | — | | | | 334,974,339 | | | | — | | | | 334,974,339 | |
Exchange Traded-Funds | | | 2,909,258 | | | | — | | | | — | | | | 2,909,258 | |
Equity Certificates | | | — | | | | 6,174,342 | | | | — | | | | 6,174,342 | |
Warrants | | | 6,219 | | | | — | | | | — | | | | 6,219 | |
Short-Term Investment Securities: | | | | | | | | | | | | | | | | |
Registered Investment Companies | | | 34,825,193 | | | | — | | | | — | | | | 34,825,193 | |
Repurchase Agreements | | | — | | | | 8,687,000 | | | | — | | | | 8,687,000 | |
| | |
|
|
| |
|
|
| |
|
|
| |
|
|
|
Total Investments at Value | | $ | 95,710,199 | | | $ | 531,952,742 | | | $ | 0 | | | $ | 627,662,941 | |
| | |
|
|
| |
|
|
| |
|
|
| |
|
|
|
| * | For a detailed presentation of investments, please refer to the Portfolio of Investments. |
The Fund’s policy is to recognize transfers between Levels as of the end of the reporting period. Securities currently valued at $335,294,685 were transferred from Level 1 to Level 2 due to foreign equity securities whose values were previously adjusted for fair value pricing procedures for foreign equity securities. There were no additional material transfers between Levels during the reporting period.
At the beginning and the end of the reporting period Level 3 investments in securities were not considered a material portion of the Fund.
See Notes to Financial Statements
49
VALIC Company II Large Cap Value Fund
PORTFOLIO PROFILE — August 31, 2015 (unaudited)
Industry Allocation*
| | | | |
Medical — Drugs | | | 9.6 | % |
Diversified Banking Institutions | | | 8.9 | |
Oil Companies — Exploration & Production | | | 7.4 | |
Banks — Super Regional | | | 4.2 | |
Insurance — Multi-line | | | 3.9 | |
Beverages — Non-alcoholic | | | 3.2 | |
Food — Misc./Diversified | | | 3.0 | |
Telephone — Integrated | | | 2.8 | |
Insurance — Reinsurance | | | 2.6 | |
Networking Products | | | 2.5 | |
Insurance — Life/Health | | | 2.4 | |
Finance — Investment Banker/Broker | | | 2.3 | |
Retail — Drug Store | | | 2.2 | |
Aerospace/Defense | | | 2.2 | |
Building Products — Cement | | | 2.0 | |
Enterprise Software/Service | | | 2.0 | |
Oil-Field Services | | | 1.6 | |
Web Portals/ISP | | | 1.6 | |
Oil Refining & Marketing | | | 1.5 | |
Aerospace/Defense — Equipment | | | 1.5 | |
Commercial Paper | | | 1.4 | |
Electronic Components — Semiconductors | | | 1.4 | |
Instruments — Controls | | | 1.3 | |
Advertising Agencies | | | 1.3 | |
Cruise Lines | | | 1.2 | |
Medical — Wholesale Drug Distribution | | | 1.2 | |
Agricultural Chemicals | | | 1.1 | |
Medical — HMO | | | 1.1 | |
Brewery | | | 1.0 | |
Real Estate Investment Trusts | | | 1.0 | |
Cosmetics & Toiletries | | | 0.9 | |
Television | | | 0.8 | |
Computers | | | 0.8 | |
Semiconductor Equipment | | | 0.8 | |
Applications Software | | | 0.7 | |
Containers — Paper/Plastic | | | 0.7 | |
Airlines | | | 0.7 | |
Retail — Discount | | | 0.7 | |
Computers — Memory Devices | | | 0.6 | |
Retail — Apparel/Shoe | | | 0.6 | |
Registered Investment Companies | | | 0.6 | |
Multimedia | | | 0.6 | |
Building & Construction Products — Misc. | | | 0.6 | |
Gold Mining | | | 0.6 | |
Pharmacy Services | | | 0.5 | |
Medical Instruments | | | 0.5 | |
Cellular Telecom | | | 0.5 | |
Transport — Rail | | | 0.5 | |
Finance — Mortgage Loan/Banker | | | 0.5 | |
Insurance Brokers | | | 0.5 | |
Electronic Security Devices | | | 0.5 | |
Finance — Credit Card | | | 0.4 | |
Electric — Distribution | | | 0.4 | |
Semiconductor Components — Integrated Circuits | | | 0.4 | |
Insurance — Property/Casualty | | | 0.4 | |
Banks — Commercial | | | 0.4 | |
Instruments — Scientific | | | 0.4 | |
Oil Companies — Integrated | | | 0.4 | |
Retail — Office Supplies | | | 0.4 | |
Medical Labs & Testing Services | | | 0.4 | |
Diversified Operations | | | 0.3 | |
Retail — Catalog Shopping | | | 0.3 | |
Electronic Measurement Instruments | | | 0.3 | |
Non-Hazardous Waste Disposal | | | 0.3 | |
Medical Products | | | 0.3 | |
Food — Wholesale/Distribution | | | 0.3 | |
Pipelines | | | 0.3 | |
Diversified Manufacturing Operations | | | 0.3 | |
Banks — Fiduciary | | | 0.3 | |
| | | | |
Metal Processors & Fabrication | | | 0.2 | |
Electric Products — Misc. | | | 0.2 | |
Time Deposits | | | 0.2 | |
Medical — Generic Drugs | | | 0.2 | |
Computer Services | | | 0.2 | |
Cable/Satellite TV | | | 0.2 | |
Medical — Biomedical/Gene | | | 0.2 | |
Food — Confectionery | | | 0.2 | |
| | |
|
|
|
| | | | 100.5 | % |
| | |
|
|
|
| * | Calculated as a percentage of net assets. |
50
VALIC Company II Large Cap Value Fund
PORTFOLIO OF INVESTMENTS — August 31, 2015
| | | | | | | | |
| | |
| Security Description | | Shares | | | Value
(Note 2) | |
| |
COMMON STOCKS — 98.3% | |
Advertising Agencies — 1.3% | |
Interpublic Group of Cos., Inc. | | | 87,107 | | | $ | 1,644,580 | |
Omnicom Group, Inc. | | | 12,381 | | | | 829,280 | |
| | | | | | |
|
|
|
| | | | | | | | 2,473,860 | |
| | | | | | |
|
|
|
Aerospace/Defense — 2.2% | |
Northrop Grumman Corp. | | | 12,815 | | | | 2,098,328 | |
Raytheon Co. | | | 17,668 | | | | 1,812,030 | |
Rockwell Collins, Inc. | | | 4,000 | | | | 327,400 | |
| | | | | | |
|
|
|
| | | | | | | | 4,237,758 | |
| | | | | | |
|
|
|
Aerospace/Defense - Equipment — 1.5% | |
United Technologies Corp. | | | 31,466 | | | | 2,882,600 | |
| | | | | | |
|
|
|
Agricultural Chemicals — 1.1% | |
CF Industries Holdings, Inc. | | | 17,932 | | | | 1,028,938 | |
Mosaic Co. | | | 26,942 | | | | 1,100,042 | |
| | | | | | |
|
|
|
| | | | | | | | 2,128,980 | |
| | | | | | |
|
|
|
Airlines — 0.7% | |
Delta Air Lines, Inc. | | | 31,137 | | | | 1,363,178 | |
| | | | | | |
|
|
|
Applications Software — 0.7% | |
Citrix Systems, Inc.† | | | 9,824 | | | | 669,112 | |
Microsoft Corp. | | | 18,063 | | | | 786,102 | |
| | | | | | |
|
|
|
| | | | | | | | 1,455,214 | |
| | | | | | |
|
|
|
Banks - Commercial — 0.4% | |
CIT Group, Inc. | | | 17,377 | | | | 754,857 | |
| | | | | | |
|
|
|
Banks - Fiduciary — 0.3% | |
State Street Corp. | | | 7,129 | | | | 512,718 | |
| | | | | | |
|
|
|
Banks - Super Regional — 4.2% | |
Capital One Financial Corp. | | | 30,869 | | | | 2,400,065 | |
Fifth Third Bancorp | | | 54,376 | | | | 1,083,170 | |
PNC Financial Services Group, Inc. | | | 27,980 | | | | 2,549,537 | |
US Bancorp | | | 18,877 | | | | 799,441 | |
Wells Fargo & Co. | | | 23,952 | | | | 1,277,360 | |
| | | | | | |
|
|
|
| | | | | | | | 8,109,573 | |
| | | | | | |
|
|
|
Beverages - Non-alcoholic — 3.2% | |
Coca-Cola Enterprises, Inc. | | | 34,950 | | | | 1,799,575 | |
PepsiCo, Inc. | | | 46,577 | | | | 4,328,401 | |
| | | | | | |
|
|
|
| | | | | | | | 6,127,976 | |
| | | | | | |
|
|
|
Brewery — 1.0% | |
Molson Coors Brewing Co., Class B | | | 28,729 | | | | 1,956,158 | |
| | | | | | |
|
|
|
Building & Construction Products - Misc. — 0.6% | |
Owens Corning | | | 24,522 | | | | 1,086,079 | |
| | | | | | |
|
|
|
Building Products - Cement — 2.0% | |
Martin Marietta Materials, Inc. | | | 8,516 | | | | 1,428,985 | |
Vulcan Materials Co. | | | 26,096 | | | | 2,443,107 | |
| | | | | | |
|
|
|
| | | | | | | | 3,872,092 | |
| | | | | | |
|
|
|
Cable/Satellite TV — 0.2% | |
Comcast Corp., Class A | | | 5,633 | | | | 317,307 | |
| | | | | | |
|
|
|
Cellular Telecom — 0.5% | |
Vodafone Group PLC ADR | | | 29,803 | | | | 1,027,607 | |
| | | | | | |
|
|
|
Computer Services — 0.2% | |
Accenture PLC, Class A | | | 3,412 | | | | 321,649 | |
| | | | | | |
|
|
|
Computers — 0.8% | |
Apple, Inc. | | | 6,352 | | | | 716,252 | |
Hewlett-Packard Co. | | | 31,338 | | | | 879,344 | |
| | | | | | |
|
|
|
| | | | | | | | 1,595,596 | |
| | | | | | |
|
|
|
| | | | | | | | |
| | |
| Security Description | | Shares | | | Value
(Note 2) | |
| |
| | | | | | | | | |
Computers - Memory Devices — 0.6% | |
EMC Corp. | | | 49,762 | | | $ | 1,237,581 | |
| | | | | | |
|
|
|
Containers - Paper/Plastic — 0.7% | |
Packaging Corp. of America | | | 20,890 | | | | 1,401,928 | |
| | | | | | |
|
|
|
Cosmetics & Toiletries — 0.9% | |
Procter & Gamble Co. | | | 24,664 | | | | 1,743,005 | |
| | | | | | |
|
|
|
Cruise Lines — 1.2% | |
Carnival Corp. | | | 47,983 | | | | 2,362,203 | |
| | | | | | |
|
|
|
Diversified Banking Institutions — 8.9% | |
Citigroup, Inc. | | | 111,296 | | | | 5,952,110 | |
Goldman Sachs Group, Inc. | | | 7,604 | | | | 1,434,115 | |
JPMorgan Chase & Co. | | | 108,621 | | | | 6,962,606 | |
Morgan Stanley | | | 81,303 | | | | 2,800,888 | |
| | | | | | |
|
|
|
| | | | | | | | 17,149,719 | |
| | | | | | |
|
|
|
Diversified Manufacturing Operations — 0.3% | |
General Electric Co. | | | 21,632 | | | | 536,906 | |
| | | | | | |
|
|
|
Diversified Operations — 0.3% | |
Leucadia National Corp. | | | 31,629 | | | | 678,758 | |
| | | | | | |
|
|
|
Electric Products - Misc. — 0.2% | |
Emerson Electric Co. | | | 9,329 | | | | 445,180 | |
| | | | | | |
|
|
|
Electric - Distribution — 0.4% | |
PPL Corp. | | | 25,197 | | | | 780,855 | |
| | | | | | |
|
|
|
Electronic Components - Semiconductors — 1.4% | |
Microchip Technology, Inc.# | | | 26,599 | | | | 1,130,458 | |
Texas Instruments, Inc. | | | 32,799 | | | | 1,569,104 | |
| | | | | | |
|
|
|
| | | | | | | | 2,699,562 | |
| | | | | | |
|
|
|
Electronic Measurement Instruments — 0.3% | |
Agilent Technologies, Inc. | | | 18,065 | | | | 655,940 | |
| | | | | | |
|
|
|
Electronic Security Devices — 0.5% | |
Tyco International PLC | | | 24,974 | | | | 906,306 | |
| | | | | | |
|
|
|
Enterprise Software/Service — 2.0% | |
Oracle Corp. | | | 103,837 | | | | 3,851,314 | |
| | | | | | |
|
|
|
Finance - Credit Card — 0.4% | |
American Express Co. | | | 5,456 | | | | 418,584 | |
Discover Financial Services | | | 8,041 | | | | 432,043 | |
| | | | | | |
|
|
|
| | | | | | | | 850,627 | |
| | | | | | |
|
|
|
Finance - Investment Banker/Broker — 2.3% | |
Charles Schwab Corp. | | | 50,265 | | | | 1,527,051 | |
E*TRADE Financial Corp.† | | | 60,171 | | | | 1,581,895 | |
TD Ameritrade Holding Corp. | | | 40,206 | | | | 1,345,293 | |
| | | | | | |
|
|
|
| | | | | | | | 4,454,239 | |
| | | | | | |
|
|
|
Finance - Mortgage Loan/Banker — 0.5% | |
FNF Group | | | 28,001 | | | | 1,019,516 | |
| | | | | | |
|
|
|
Food - Confectionery — 0.2% | |
Hershey Co. | | | 3,370 | | | | 301,682 | |
| | | | | | |
|
|
|
Food - Misc./Diversified — 3.0% | |
ConAgra Foods, Inc. | | | 36,244 | | | | 1,510,650 | |
General Mills, Inc. | | | 7,178 | | | | 407,423 | |
Kellogg Co. | | | 27,163 | | | | 1,800,364 | |
Mondelez International, Inc., Class A | | | 33,955 | | | | 1,438,334 | |
Unilever PLC ADR | | | 14,000 | | | | 564,340 | |
| | | | | | |
|
|
|
| | | | | | | | 5,721,111 | |
| | | | | | |
|
|
|
Food - Wholesale/Distribution — 0.3% | |
Sysco Corp. | | | 15,263 | | | | 608,536 | |
| | | | | | |
|
|
|
51
VALIC Company II Large Cap Value Fund
PORTFOLIO OF INVESTMENTS — August 31, 2015 — (continued)
| | | | | | | | |
| | |
| Security Description | | Shares | | | Value
(Note 2) | |
| |
COMMON STOCKS (continued) | |
Gold Mining — 0.6% | |
Newmont Mining Corp. | | | 63,066 | | | $ | 1,076,537 | |
| | | | | | |
|
|
|
Instruments - Controls — 1.3% | |
Honeywell International, Inc. | | | 25,790 | | | | 2,560,173 | |
| | | | | | |
|
|
|
Instruments - Scientific — 0.4% | |
Thermo Fisher Scientific, Inc. | | | 6,000 | | | | 752,220 | |
| | | | | | |
|
|
|
Insurance Brokers — 0.5% | |
Marsh & McLennan Cos., Inc. | | | 16,893 | | | | 907,661 | |
| | | | | | |
|
|
|
Insurance - Life/Health — 2.4% | |
Prudential Financial, Inc. | | | 57,619 | | | | 4,649,853 | |
| | | | | | |
|
|
|
Insurance - Multi-line — 3.9% | |
ACE, Ltd. | | | 13,640 | | | | 1,393,462 | |
Allstate Corp. | | | 9,145 | | | | 532,971 | |
Hartford Financial Services Group, Inc. | | | 41,118 | | | | 1,889,372 | |
MetLife, Inc. | | | 17,400 | | | | 871,740 | |
Voya Financial, Inc. | | | 68,640 | | | | 2,957,011 | |
| | | | | | |
|
|
|
| | | | | | | | 7,644,556 | |
| | | | | | |
|
|
|
Insurance - Property/Casualty — 0.4% | |
Chubb Corp. | | | 6,397 | | | | 772,822 | |
| | | | | | |
|
|
|
Insurance - Reinsurance — 2.6% | |
Berkshire Hathaway, Inc., Class B† | | | 37,270 | | | | 4,995,671 | |
| | | | | | |
|
|
|
Medical Instruments — 0.5% | |
Boston Scientific Corp.† | | | 61,948 | | | | 1,037,010 | |
| | | | | | |
|
|
|
Medical Labs & Testing Services — 0.4% | |
Laboratory Corp. of America Holdings† | | | 5,883 | | | | 693,076 | |
| | | | | | |
|
|
|
Medical Products — 0.3% | |
Stryker Corp. | | | 6,436 | | | | 634,911 | |
| | | | | | |
|
|
|
Medical - Biomedical/Gene — 0.2% | |
Amgen, Inc. | | | 1,995 | | | | 302,801 | |
| | | | | | |
|
|
|
Medical - Drugs — 9.6% | |
AbbVie, Inc. | | | 22,490 | | | | 1,403,601 | |
Baxalta, Inc. | | | 9,955 | | | | 349,918 | |
Bristol-Myers Squibb Co. | | | 16,577 | | | | 985,834 | |
Eli Lilly & Co. | | | 25,256 | | | | 2,079,832 | |
Johnson & Johnson | | | 15,191 | | | | 1,427,650 | |
Merck & Co., Inc. | | | 91,090 | | | | 4,905,196 | |
Novartis AG ADR | | | 12,351 | | | | 1,200,764 | |
Pfizer, Inc. | | | 172,868 | | | | 5,569,807 | |
Zoetis, Inc. | | | 13,580 | | | | 609,335 | |
| | | | | | |
|
|
|
| | | | | | | | 18,531,937 | |
| | | | | | |
|
|
|
Medical - Generic Drugs — 0.2% | |
Teva Pharmaceutical Industries, Ltd. ADR | | | 5,193 | | | | 334,481 | |
| | | | | | |
|
|
|
Medical - HMO — 1.1% | |
Anthem, Inc. | | | 7,394 | | | | 1,042,923 | |
UnitedHealth Group, Inc. | | | 8,854 | | | | 1,024,408 | |
| | | | | | |
|
|
|
| | | | | | | | 2,067,331 | |
| | | | | | |
|
|
|
Medical - Wholesale Drug Distribution — 1.2% | |
Cardinal Health, Inc. | | | 20,785 | | | | 1,709,982 | |
McKesson Corp. | | | 2,766 | | | | 546,506 | |
| | | | | | |
|
|
|
| | | | | | | | 2,256,488 | |
| | | | | | |
|
|
|
Metal Processors & Fabrication — 0.2% | |
Precision Castparts Corp. | | | 1,944 | | | | 447,606 | |
| | | | | | |
|
|
|
Multimedia — 0.6% | |
Time Warner, Inc. | | | 11,612 | | | | 825,613 | |
Walt Disney Co. | | | 3,179 | | | | 323,877 | |
| | | | | | |
|
|
|
| | | | | | | | 1,149,490 | |
| | | | | | |
|
|
|
| | | | | | | | |
| | |
| Security Description | | Shares | | | Value
(Note 2) | |
| |
| | | | | | | | | |
Networking Products — 2.5% | |
Cisco Systems, Inc. | | | 189,927 | | | $ | 4,915,311 | |
| | | | | | |
|
|
|
Non-Hazardous Waste Disposal — 0.3% | |
Republic Services, Inc. | | | 15,543 | | | | 636,952 | |
| | | | | | |
|
|
|
Oil Companies - Exploration & Production — 7.4% | |
Anadarko Petroleum Corp. | | | 26,012 | | | | 1,861,939 | |
Cimarex Energy Co. | | | 5,415 | | | | 598,412 | |
EOG Resources, Inc. | | | 51,021 | | | | 3,995,454 | |
Occidental Petroleum Corp. | | | 108,594 | | | | 7,928,448 | |
| | | | | | |
|
|
|
| | | | | | | | 14,384,253 | |
| | | | | | |
|
|
|
Oil Companies - Integrated — 0.4% | |
Chevron Corp. | | | 3,221 | | | | 260,869 | |
Royal Dutch Shell PLC ADR | | | 9,017 | | | | 477,179 | |
| | | | | | |
|
|
|
| | | | | | | | 738,048 | |
| | | | | | |
|
|
|
Oil Refining & Marketing — 1.5% | |
Phillips 66 | | | 37,722 | | | | 2,982,679 | |
| | | | | | |
|
|
|
Oil-Field Services — 1.6% | |
Schlumberger, Ltd. | | | 40,700 | | | | 3,148,959 | |
| | | | | | |
|
|
|
Pharmacy Services — 0.5% | |
Express Scripts Holding Co.† | | | 12,468 | | | | 1,042,325 | |
| | | | | | |
|
|
|
Pipelines — 0.3% | |
Enterprise Products Partners LP | | | 19,952 | | | | 560,851 | |
| | | | | | |
|
|
|
Real Estate Investment Trusts — 1.0% | |
AvalonBay Communities, Inc. | | | 2,495 | | | | 411,825 | |
Communications Sales & Leasing, Inc†. | | | 49,186 | | | | 988,639 | |
Weyerhaeuser Co. | | | 19,230 | | | | 537,286 | |
| | | | | | |
|
|
|
| | | | | | | | 1,937,750 | |
| | | | | | |
|
|
|
Retail - Apparel/Shoe — 0.6% | |
PVH Corp. | | | 10,023 | | | | 1,192,537 | |
| | | | | | |
|
|
|
Retail - Catalog Shopping — 0.3% | |
Liberty Interactive Corp., Class A† | | | 24,773 | | | | 669,862 | |
| | | | | | |
|
|
|
Retail - Discount — 0.7% | |
Target Corp. | | | 6,509 | | | | 505,815 | |
Wal-Mart Stores, Inc. | | | 12,006 | | | | 777,148 | |
| | | | | | |
|
|
|
| | | | | | | | 1,282,963 | |
| | | | | | |
|
|
|
Retail - Drug Store — 2.2% | |
CVS Health Corp. | | | 33,408 | | | | 3,420,979 | |
Rite Aid Corp.† | | | 109,646 | | | | 904,580 | |
| | | | | | |
|
|
|
| | | | | | | | 4,325,559 | |
| | | | | | |
|
|
|
Retail - Office Supplies — 0.4% | |
Staples, Inc. | | | 51,551 | | | | 732,540 | |
| | | | | | |
|
|
|
Semiconductor Components - Integrated Circuits — 0.4% | |
Analog Devices, Inc. | | | 7,715 | | | | 430,960 | |
QUALCOMM, Inc. | | | 6,171 | | | | 349,155 | |
| | | | | | |
|
|
|
| | | | | | | | 780,115 | |
| | | | | | |
|
|
|
Semiconductor Equipment — 0.8% | |
Applied Materials, Inc. | | | 90,726 | | | | 1,459,328 | |
| | | | | | |
|
|
|
Telephone - Integrated — 2.8% | |
AT&T, Inc. | | | 107,108 | | | | 3,555,986 | |
Verizon Communications, Inc. | | | 39,836 | | | | 1,832,854 | |
| | | | | | |
|
|
|
| | | | | | | | 5,388,840 | |
| | | | | | |
|
|
|
Television — 0.8% | |
CBS Corp., Class B | | | 35,375 | | | | 1,600,365 | |
| | | | | | |
|
|
|
52
VALIC Company II Large Cap Value Fund
PORTFOLIO OF INVESTMENTS — August 31, 2015 — (continued)
| | | | | | | | |
| | |
| Security Description | | Shares/
Principal
Amount | | | Value
(Note 2) | |
| |
COMMON STOCKS (continued) | |
Transport - Rail — 0.5% | |
CSX Corp. | | | 20,147 | | | $ | 551,625 | |
Union Pacific Corp. | | | 5,535 | | | | 474,571 | |
| | | | | | |
|
|
|
| | | | | | | | 1,026,196 | |
| | | | | | |
|
|
|
Web Portals/ISP — 1.6% | |
Google, Inc., Class A† | | | 4,697 | | | | 3,042,811 | |
| | | | | | |
|
|
|
Total Long-Term Investment Securities | | | | | | | | |
(cost $178,011,389) | | | | | | | 190,291,038 | |
| | | | | | |
|
|
|
SHORT-TERM INVESTMENT SECURITIES — 2.2% | |
Commercial Paper — 1.4% | |
BNP Paribas SA NY
1.78% due 09/01/2015 | | $ | 2,700,000 | | | | 2,700,000 | |
| | | | | | |
|
|
|
Registered Investment Companies — 0.6% | |
State Street Navigator Securities Lending Prime Portfolio 0.21%(1)(2) | | | 1,177,006 | | | | 1,177,006 | |
| | | | | | |
|
|
|
Time Deposits — 0.2% | |
Euro Time Deposit with State Street Bank and Trust Co.
0.01% due 09/01/2015 | | | 405,000 | | | | 405,000 | |
| | | | | | |
|
|
|
Total Short-Term Investment Securities | | | | | | | | |
(cost $4,282,006) | | | | | | | 4,282,006 | |
| | | | | | |
|
|
|
TOTAL INVESTMENTS | | | | | | | | |
(cost $182,293,395)(3) | | | 100.5 | % | | | 194,573,044 | |
Liabilities in excess of other assets | | | (0.5 | ) | | | (971,082 | ) |
| | |
|
|
| |
|
|
|
NET ASSETS | | | 100.0 | % | | $ | 193,601,962 | |
| | |
|
|
| |
|
|
|
| † | Non-income producing security |
| # | The security or a portion thereof is out on loan (see Note 2) |
| (1) | At August 31, 2015, the Fund had loaned securities with a total value of $1,130,458. This was secured by collateral of $1,177,006, which was received in cash and subsequently invested in short-term investments currently valued at $1,177,006 as reported in the Portfolio of Investments. |
| (2) | The rate shown is the 7-day yield as of August 31, 2015. |
| (3) | See Note 5 for cost of investments on a tax basis. |
ADR—American Depositary Receipt
The following is a summary of the inputs used to value the Fund’s net assets as of August 31, 2015 (see Note 2):
| | | | | | | | | | | | | | | | |
| | | Level 1 - Unadjusted Quoted
Prices
| | | Level 2 - Other Observable
Inputs
| | | Level 3 - Significant
Unobservable Inputs
| | | Total
| |
ASSETS: | | | | | | | | | | | | | | | | |
Investments at Value:* | | | | | | | | | | | | | | | | |
Common Stocks | | $ | 190,291,038 | | | $ | — | | | $ | — | | | $ | 190,291,038 | |
Short-Term Investment Securities: | | | | | | | | | | | | | | | | |
Registered Investment Companies | | | 1,177,006 | | | | — | | | | — | | | | 1,177,006 | |
Other Short-Term Investment Securities | | | — | | | | 3,105,000 | | | | — | | | | 3,105,000 | |
| | |
|
|
| |
|
|
| |
|
|
| |
|
|
|
Total Investments at Value | | $ | 191,468,044 | | | $ | 3,105,000 | | | $ | — | | | $ | 194,573,044 | |
| | |
|
|
| |
|
|
| |
|
|
| |
|
|
|
| * | For a detailed presentation of investments, please refer to the Portfolio of Investments. |
The Fund’s policy is to recognize transfers between Levels as of the end of the reporting period. There were no transfers between Levels during the reporting period.
See Notes to Financial Statements
53
VALIC Company II Mid Cap Growth Fund
PORTFOLIO PROFILE — August 31, 2015 (unaudited)
Industry Allocation*
| | | | |
Commercial Services — Finance | | | 5.8 | % |
Commercial Services | | | 5.3 | |
Medical — Biomedical/Gene | | | 5.2 | |
Applications Software | | | 3.4 | |
Medical — Drugs | | | 3.3 | |
Apparel Manufacturers | | | 2.9 | |
Building — Heavy Construction | | | 2.8 | |
Auto/Truck Parts & Equipment — Original | | | 2.7 | |
Electronic Security Devices | | | 2.7 | |
Retail — Apparel/Shoe | | | 2.7 | |
Registered Investment Companies | | | 2.6 | |
Retail — Restaurants | | | 2.5 | |
Beverages — Wine/Spirits | | | 2.3 | |
Diversified Manufacturing Operations | | | 2.3 | |
Machinery — General Industrial | | | 2.0 | |
Computer Software | | | 2.0 | |
Athletic Equipment | | | 2.0 | |
Finance — Other Services | | | 1.9 | |
Finance — Credit Card | | | 1.9 | |
Hotels/Motels | | | 1.8 | |
Electronic Components — Semiconductors | | | 1.8 | |
Theaters | | | 1.7 | |
Diagnostic Kits | | | 1.7 | |
Networking Products | | | 1.7 | |
Entertainment Software | | | 1.7 | |
Real Estate Management/Services | | | 1.7 | |
Consulting Services | | | 1.7 | |
Coatings/Paint | | | 1.6 | |
Medical Instruments | | | 1.5 | |
Telecom Services | | | 1.5 | |
Distribution/Wholesale | | | 1.4 | |
Physicians Practice Management | | | 1.4 | |
Enterprise Software/Service | | | 1.3 | |
Transport — Truck | | | 1.3 | |
Internet Content — Information/News | | | 1.3 | |
Airlines | | | 1.3 | |
Food — Retail | | | 1.3 | |
Cruise Lines | | | 1.3 | |
Lighting Products & Systems | | | 1.3 | |
Cable/Satellite TV | | | 1.2 | |
Veterinary Diagnostics | | | 1.2 | |
Finance — Investment Banker/Broker | | | 1.2 | |
Retail — Arts & Crafts | | | 1.2 | |
Retail — Automobile | | | 1.2 | |
Dental Supplies & Equipment | | | 1.2 | |
Building Products — Cement | | | 1.2 | |
Resorts/Theme Parks | | | 1.1 | |
Medical — Hospitals | | | 1.0 | |
Audio/Video Products | | | 1.0 | |
Shipbuilding | | | 1.0 | |
Repurchase Agreements | | | 0.9 | |
Industrial Automated/Robotic | | | 0.8 | |
Computer Services | | | 0.8 | |
Oil Companies — Exploration & Production | | | 0.7 | |
Auto — Cars/Light Trucks | | | 0.5 | |
Building & Construction Products — Misc. | | | 0.4 | |
| | |
|
|
|
| | | | 103.2 | % |
| | |
|
|
|
| * | Calculated as a percentage of net assets |
54
VALIC Company II Mid Cap Growth Fund
PORTFOLIO OF INVESTMENTS — August 31, 2015
| | | | | | | | |
| | |
| Security Description | | Shares | | | Value (Note 2) | |
| |
COMMON STOCKS — 99.7% | |
Airlines — 1.3% | |
Delta Air Lines, Inc. | | | 44,520 | | | $ | 1,949,086 | |
| | | | | | |
|
|
|
Apparel Manufacturers — 2.9% | |
Columbia Sportswear Co. | | | 32,009 | | | | 1,964,392 | |
Under Armour, Inc., Class A† | | | 25,360 | | | | 2,422,641 | |
| | | | | | |
|
|
|
| | | | | | | | 4,387,033 | |
| | | | | | |
|
|
|
Applications Software — 3.4% | |
ServiceNow, Inc.† | | | 35,990 | | | | 2,553,851 | |
Tableau Software, Inc., Class A† | | | 28,030 | | | | 2,639,585 | |
| | | | | | |
|
|
|
| | | | | | | | 5,193,436 | |
| | | | | | |
|
|
|
Athletic Equipment — 2.0% | |
Jarden Corp.† | | | 59,170 | | | | 3,037,788 | |
| | | | | | |
|
|
|
Audio/Video Products — 1.0% | |
Harman International Industries, Inc. | | | 15,950 | | | | 1,558,953 | |
| | | | | | |
|
|
|
Auto - Cars/Light Trucks — 0.5% | |
Tesla Motors, Inc.†# | | | 3,200 | | | | 796,992 | |
| | | | | | |
|
|
|
Auto/Truck Parts & Equipment - Original — 2.7% | |
Delphi Automotive PLC | | | 35,620 | | | | 2,690,023 | |
WABCO Holdings, Inc.† | | | 13,270 | | | | 1,530,296 | |
| | | | | | |
|
|
|
| | | | | | | | 4,220,319 | |
| | | | | | |
|
|
|
Beverages - Wine/Spirits — 2.3% | |
Constellation Brands, Inc., Class A | | | 27,740 | | | | 3,550,720 | |
| | | | | | |
|
|
|
Building & Construction Products - Misc. — 0.4% | |
Builders FirstSource, Inc.† | | | 40,287 | | | | 596,650 | |
| | | | | | |
|
|
|
Building Products - Cement — 1.2% | |
Vulcan Materials Co. | | | 19,110 | | | | 1,789,078 | |
| | | | | | |
|
|
|
Building - Heavy Construction — 2.8% | |
SBA Communications Corp., Class A† | | | 36,930 | | | | 4,365,126 | |
| | | | | | |
|
|
|
Cable/Satellite TV — 1.2% | |
Liberty Global PLC, Class C† | | | 42,480 | | | | 1,906,078 | |
| | | | | | |
|
|
|
Coatings/Paint — 1.6% | |
Axalta Coating Systems, Ltd.† | | | 86,012 | | | | 2,510,690 | |
| | | | | | |
|
|
|
Commercial Services — 5.3% | |
Aramark | | | 60,370 | | | | 1,891,996 | |
CoStar Group, Inc.† | | | 16,161 | | | | 2,861,143 | |
ServiceMaster Global Holdings, Inc.† | | | 99,003 | | | | 3,482,926 | |
| | | | | | |
|
|
|
| | | | | | | | 8,236,065 | |
| | | | | | |
|
|
|
Commercial Services - Finance — 5.8% | |
McGraw Hill Financial, Inc. | | | 40,220 | | | | 3,900,938 | |
SEI Investments Co. | | | 54,590 | | | | 2,761,162 | |
Vantiv, Inc., Class A† | | | 52,710 | | | | 2,321,348 | |
| | | | | | |
|
|
|
| | | | | | | | 8,983,448 | |
| | | | | | |
|
|
|
Computer Services — 0.8% | |
EPAM Systems, Inc.† | | | 16,753 | | | | 1,182,929 | |
| | | | | | |
|
|
|
Computer Software — 2.0% | |
Akamai Technologies, Inc.† | | | 42,610 | | | | 3,038,519 | |
| | | | | | |
|
|
|
Consulting Services — 1.7% | |
Verisk Analytics, Inc.† | | | 35,501 | | | | 2,594,413 | |
| | | | | | |
|
|
|
Cruise Lines — 1.3% | |
Norwegian Cruise Line Holdings, Ltd.† | | | 33,450 | | | | 1,926,720 | |
| | | | | | |
|
|
|
Dental Supplies & Equipment — 1.2% | |
Align Technology, Inc.† | | | 32,500 | | | | 1,839,500 | |
| | | | | | |
|
|
|
Diagnostic Kits — 1.7% | |
Alere, Inc.† | | | 51,610 | | | | 2,682,172 | |
| | | | | | |
|
|
|
| | | | | | | | |
| | |
| Security Description | | Shares | | | Value (Note 2) | |
| |
| | | | | | | | | |
Distribution/Wholesale — 1.4% | |
HD Supply Holdings, Inc.† | | | 67,065 | | | $ | 2,213,145 | |
| | | | | | |
|
|
|
Diversified Manufacturing Operations — 2.3% | |
Carlisle Cos., Inc. | | | 34,850 | | | | 3,509,395 | |
| | | | | | |
|
|
|
Electronic Components-Semiconductors — 1.8% | |
Ambarella, Inc.†# | | | 14,930 | | | | 1,427,756 | |
Avago Technologies, Ltd. | | | 10,690 | | | | 1,346,619 | |
| | | | | | |
|
|
|
| | | | | | | | 2,774,375 | |
| | | | | | |
|
|
|
Electronic Security Devices — 2.7% | |
Allegion PLC | | | 39,010 | | | | 2,325,386 | |
TASER International, Inc.†# | | | 77,510 | | | | 1,813,734 | |
| | | | | | |
|
|
|
| | | | | | | | 4,139,120 | |
| | | | | | |
|
|
|
Enterprise Software/Service — 1.3% | |
Workday, Inc., Class A† | | | 29,390 | | | | 2,064,941 | |
| | | | | | |
|
|
|
Entertainment Software — 1.7% | |
Electronic Arts, Inc.† | | | 39,370 | | | | 2,604,326 | |
| | | | | | |
|
|
|
Finance - Credit Card — 1.9% | |
Alliance Data Systems Corp.† | | | 11,160 | | | | 2,870,240 | |
| | | | | | |
|
|
|
Finance - Investment Banker/Broker — 1.2% | |
Raymond James Financial, Inc. | | | 35,160 | | | | 1,863,128 | |
| | | | | | |
|
|
|
Finance - Other Services — 1.9% | |
Intercontinental Exchange, Inc. | | | 12,730 | | | | 2,907,659 | |
| | | | | | |
|
|
|
Food - Retail — 1.3% | |
Kroger Co. | | | 56,100 | | | | 1,935,450 | |
| | | | | | |
|
|
|
Hotels/Motels — 1.8% | |
Hilton Worldwide Holdings, Inc. | | | 112,879 | | | | 2,802,786 | |
| | | | | | |
|
|
|
Industrial Automated/Robotic — 0.8% | |
Cognex Corp. | | | 36,450 | | | | 1,296,162 | |
| | | | | | |
|
|
|
Internet Content - Information/News — 1.3% | |
LinkedIn Corp., Class A† | | | 11,370 | | | | 2,053,422 | |
| | | | | | |
|
|
|
Lighting Products & Systems — 1.3% | |
Acuity Brands, Inc. | | | 9,880 | | | | 1,925,316 | |
| | | | | | |
|
|
|
Machinery - General Industrial — 2.0% | |
Wabtec Corp. | | | 32,690 | | | | 3,130,394 | |
| | | | | | |
|
|
|
Medical Instruments — 1.5% | |
Edwards Lifesciences Corp.† | | | 16,860 | | | | 2,375,237 | |
| | | | | | |
|
|
|
Medical - Biomedical/Gene — 5.2% | |
Alnylam Pharmaceuticals, Inc.† | | | 9,550 | | | | 982,790 | |
BioMarin Pharmaceutical, Inc.† | | | 19,620 | | | | 2,535,689 | |
Incyte Corp.† | | | 18,770 | | | | 2,180,886 | |
Medivation, Inc.† | | | 12,560 | | | | 1,106,034 | |
Vertex Pharmaceuticals, Inc.† | | | 9,460 | | | | 1,206,339 | |
| | | | | | |
|
|
|
| | | | | | | | 8,011,738 | |
| | | | | | |
|
|
|
Medical - Drugs — 3.3% | |
Endo International PLC† | | | 27,360 | | | | 2,106,720 | |
Zoetis, Inc. | | | 67,280 | | | | 3,018,854 | |
| | | | | | |
|
|
|
| | | | | | | | 5,125,574 | |
| | | | | | |
|
|
|
Medical - Hospitals — 1.0% | |
Community Health Systems, Inc.† | | | 29,240 | | | | 1,570,188 | |
| | | | | | |
|
|
|
Networking Products — 1.7% | | | | | | | | |
Palo Alto Networks, Inc.† | | | 16,100 | | | | 2,643,942 | |
| | | | | | |
|
|
|
Oil Companies-Exploration & Production — 0.7% | | | | | | | | |
Diamondback Energy, Inc.† | | | 16,090 | | | | 1,098,786 | |
| | | | | | |
|
|
|
Physicians Practice Management — 1.4% | | | | | | | | |
Envision Healthcare Holdings, Inc.† | | | 53,094 | | | | 2,175,261 | |
| | | | | | |
|
|
|
55
VALIC Company II Mid Cap Growth Fund
PORTFOLIO OF INVESTMENTS — August 31, 2015 (continued)
| | | | | | | | |
| | |
| Security Description | | Shares | | |
Value (Note 2) | |
| |
COMMON STOCKS (continued) | |
Real Estate Management/Services — 1.7% | | | | | | | | |
CBRE Group, Inc., Class A† | | | 81,160 | | | $ | 2,598,743 | |
| | | | | | |
|
|
|
Resort/Theme Parks — 1.1% | | | | | | | | |
Vail Resorts, Inc. | | | 16,040 | | | | 1,730,876 | |
| | | | | | |
|
|
|
Retail - Apparel/Shoe — 2.7% | | | | | | | | |
lululemon athletica, Inc.† | | | 32,440 | | | | 2,076,484 | |
Men’s Wearhouse, Inc. | | | 35,793 | | | | 2,020,515 | |
| | | | | | |
|
|
|
| | | | | | | | 4,096,999 | |
| | | | | | |
|
|
|
Retail - Arts & Crafts — 1.2% | | | | | | | | |
Michaels Cos., Inc.† | | | 70,296 | | | | 1,842,458 | |
| | | | | | |
|
|
|
Retail - Automobile — 1.2% | | | | | | | | |
Lithia Motors, Inc., Class A | | | 17,280 | | | | 1,842,048 | |
| | | | | | |
|
|
|
Retail - Restaurants — 2.5% | | | | | | | | |
Chipotle Mexican Grill, Inc.† | | | 2,840 | | | | 2,016,428 | |
Dave & Buster’s Entertainment, Inc.† | | | 51,170 | | | | 1,762,295 | |
| | | | | | |
|
|
|
| | | | | | | | 3,778,723 | |
| | | | | | |
|
|
|
Shipbuilding — 1.0% | | | | | | | | |
Huntington Ingalls Industries, Inc. | | | 13,370 | | | | 1,505,195 | |
| | | | | | |
|
|
|
Telecom Services — 1.5% | | | | | | | | |
Level 3 Communications, Inc.† | | | 50,920 | | | | 2,277,652 | |
| | | | | | |
|
|
|
Theaters — 1.7% | | | | | | | | |
Cinemark Holdings, Inc. | | | 75,580 | | | | 2,686,869 | |
| | | | | | |
|
|
|
Transport - Truck — 1.3% | | | | | | | | |
Old Dominion Freight Line, Inc.† | | | 31,050 | | | | 2,064,515 | |
| | | | | | |
|
|
|
Veterinary Diagnostics — 1.2% | | | | | | | | |
VCA, Inc.† | | | 34,120 | | | | 1,889,566 | |
| | | | | | |
|
|
|
Total Long-Term Investment Securities | | | | | | | | |
(cost $144,600,554) | | | | | | | 153,749,944 | |
| | | | | | |
|
|
|
| | | | | | | | |
| | |
| Security Description | | Principal Amount | | |
Value (Note 2) | |
| |
SHORT-TERM INVESTMENT SECURITIES — 2.6% | | | | | | | | |
Registered Investment Companies — 2.6% | | | | | | | | |
State Street Navigator Securities Lending Prime Portfolio 0.21%(1)(3)
(cost $4,036,052) | | | 4,036,052 | | | $ | 4,036,052 | |
| | | | | | |
|
|
|
REPURCHASE AGREEMENTS — 0.9% | | | | | | | | |
Agreement with State Street Bank & Trust Co., bearing interest at 0.00%, dated 08/31/2015, to be repurchased 09/01/2015 in the amount $1,405,000 collateralized by $1,405,000 of United States Treasury Notes, bearing interest at 1.88% due 06/30/2020 and having an approximate value of $1,434,245 (cost $1,405,000) | | $ | 1,405,000 | | | | 1,405,000 | |
| | | | | | |
|
|
|
TOTAL INVESTMENTS | | | | | | | | |
(cost $150,041,606)(2) | | | 103.2 | % | | | 159,190,996 | |
Liabilities in excess of other assets | | | (3.2 | ) | | | (4,900,004 | ) |
| | |
|
|
| |
|
|
|
NET ASSETS | | | 100.0 | % | | $ | 154,290,992 | |
| | |
|
|
| |
|
|
|
| † | Non-income producing security |
| # | The security or a portion thereof is out on loan (see Note 2) |
| (1) | At August 31, 2015, the Fund had loaned securities with a total value of $3,921,108. This was secured by collateral of $4,036,052, which was received in cash and subsequently invested in short-term investments currently valued at $4,036,052 as reported in the Portfolio of Investments. |
| (2) | See Note 5 for cost of investments on a tax basis. |
| (3) | The rate shown is the 7-day yield as of August 31, 2015. |
The following is a summary of the inputs used to value the Fund’s net assets as of August 31, 2015 (see Note 2):
| | | | | | | | | | | | | | | | |
| | | Level 1 - Unadjusted Quoted
Prices
| | | Level 2 - Other Observable
Inputs
| | | Level 3 - Significant
Unobservable Inputs
| | | Total
| |
ASSETS: | | | | | | | | | | | | | | | | |
Investments at Value:* | | | | | | | | | | | | | | | | |
Common Stocks | | $ | 153,749,944 | | | $ | — | | | $ | — | | | $ | 153,749,944 | |
Short-Term Investment Securities | | | 4,036,052 | | | | — | | | | — | | | | 4,036,052 | |
Repurchase Agreements | | | — | | | | 1,405,000 | | | | — | | | | 1,405,000 | |
| | |
|
|
| |
|
|
| |
|
|
| |
|
|
|
Total Investments at Value | | $ | 157,785,996 | | | $ | 1,405,000 | | | $ | — | | | $ | 159,190,996 | |
| | |
|
|
| |
|
|
| |
|
|
| |
|
|
|
| * | For a detailed presentation of investments, please refer to the Portfolio of Investments. |
The Fund’s policy is to recognize transfers between Levels as of the end of the reporting period. There were no transfers between Levels during the reporting period.
See Notes to Financial Statements
56
VALIC Company II Mid Cap Value Fund
PORTFOLIO PROFILE — August 31, 2015 (unaudited)
Industry Allocation*
| | | | |
Real Estate Investment Trusts | | | 8.1 | % |
Banks — Commercial | | | 4.9 | |
Electric — Integrated | | | 4.9 | |
Oil Companies — Exploration & Production | | | 4.4 | |
Commercial Services — Finance | | | 2.9 | |
Banks — Super Regional | | | 2.8 | |
Registered Investment Companies | | | 2.7 | |
Insurance — Life/Health | | | 2.6 | |
Aerospace/Defense — Equipment | | | 2.4 | |
Electronic Components — Semiconductors | | | 2.4 | |
Diversified Manufacturing Operations | | | 2.3 | |
Finance — Investment Banker/Broker | | | 2.0 | |
Building — Residential/Commercial | | | 2.0 | |
Insurance — Reinsurance | | | 2.0 | |
Medical — Drugs | | | 1.9 | |
Containers — Paper/Plastic | | | 1.8 | |
Home Decoration Products | | | 1.8 | |
Electronic Parts Distribution | | | 1.8 | |
Insurance — Multi-line | | | 1.7 | |
Human Resources | | | 1.5 | |
Power Converter/Supply Equipment | | | 1.5 | |
Chemicals — Specialty | | | 1.4 | |
Computers — Memory Devices | | | 1.4 | |
Insurance — Property/Casualty | | | 1.4 | |
Entertainment Software | | | 1.3 | |
Insurance Brokers | | | 1.3 | |
Auto/Truck Parts & Equipment — Original | | | 1.2 | |
Consulting Services | | | 1.2 | |
Distribution/Wholesale | | | 1.1 | |
Applications Software | | | 1.1 | |
Oil Refining & Marketing | | | 1.0 | |
Finance — Credit Card | | | 1.0 | |
Retail — Apparel/Shoe | | | 0.9 | |
Advertising Agencies | | | 0.9 | |
Gas — Distribution | | | 0.9 | |
Medical Labs & Testing Services | | | 0.9 | |
Cruise Lines | | | 0.9 | |
Computer Services | | | 0.9 | |
Medical Instruments | | | 0.9 | |
Medical Products | | | 0.9 | |
Repurchase Agreements | | | 0.9 | |
E-Commerce/Services | | | 0.9 | |
Electronic Components — Misc. | | | 0.8 | |
Aerospace/Defense | | | 0.8 | |
Food — Misc./Diversified | | | 0.8 | |
Building & Construction Products — Misc. | | | 0.8 | |
Chemicals — Diversified | | | 0.7 | |
Beverages — Wine/Spirits | | | 0.7 | |
Shipbuilding | | | 0.7 | |
Containers — Metal/Glass | | | 0.7 | |
Telecommunication Equipment | | | 0.7 | |
Medical — Wholesale Drug Distribution | | | 0.6 | |
Real Estate Operations & Development | | | 0.6 | |
Multimedia | | | 0.6 | |
Athletic Equipment | | | 0.6 | |
Data Processing/Management | | | 0.6 | |
Building Products — Wood | | | 0.6 | |
Retirement/Aged Care | | | 0.6 | |
Instruments — Controls | | | 0.5 | |
Tools — Hand Held | | | 0.5 | |
Decision Support Software | | | 0.5 | |
Coatings/Paint | | | 0.5 | |
Apparel Manufacturers | | | 0.5 | |
Finance — Consumer Loans | | | 0.4 | |
Recreational Vehicles | | | 0.4 | |
Computers — Periphery Equipment | | | 0.4 | |
Wireless Equipment | | | 0.4 | |
Banks — Fiduciary | | | 0.4 | |
Finance — Auto Loans | | | 0.4 | |
| | | | |
Research & Development | | | 0.4 | |
Building Products — Doors & Windows | | | 0.3 | |
Office Supplies & Forms | | | 0.3 | |
Semiconductor Components — Integrated Circuits | | | 0.3 | |
Beverages — Non-alcoholic | | | 0.3 | |
Transport — Rail | | | 0.3 | |
Airlines | | | 0.3 | |
Savings & Loans/Thrifts | | | 0.3 | |
Paper & Related Products | | | 0.3 | |
Food — Meat Products | | | 0.2 | |
Electric — Distribution | | | 0.2 | |
Motorcycle/Motor Scooter | | | 0.2 | |
Rubber — Tires | | | 0.2 | |
Engineering/R&D Services | | | 0.2 | |
Dialysis Centers | | | 0.2 | |
Consumer Products — Misc. | | | 0.2 | |
Chemicals — Plastics | | | 0.2 | |
Retail — Regional Department Stores | | | 0.2 | |
Metal Processors & Fabrication | | | 0.2 | |
Television | | | 0.2 | |
Steel — Producers | | | 0.1 | |
Theaters | | | 0.1 | |
| | |
|
|
|
| | | | 101.8% | |
| | |
|
|
|
| * | Calculated as a percentage of net assets. |
57
VALIC Company II Mid Cap Value Fund
PORTFOLIO OF INVESTMENTS — August 31, 2015
| | | | | | | | |
| | |
| Security Description | | Shares | | | Value
(Note 2) | |
| |
COMMON STOCKS — 98.2% | |
Advertising Agencies — 0.9% | |
Interpublic Group of Cos., Inc. | | | 251,100 | | | $ | 4,740,768 | |
Omnicom Group, Inc. | | | 59,076 | | | | 3,956,910 | |
| | | | | | |
|
|
|
| | | | | | | | 8,697,678 | |
| | | | | | |
|
|
|
Aerospace/Defense — 0.8% | |
Esterline Technologies Corp.† | | | 65,636 | | | | 5,363,118 | |
Raytheon Co. | | | 22,595 | | | | 2,317,343 | |
| | | | | | |
|
|
|
| | | | | | | | 7,680,461 | |
| | | | | | |
|
|
|
Aerospace/Defense - Equipment — 2.4% | |
Curtiss-Wright Corp. | | | 105,235 | | | | 6,914,992 | |
Harris Corp. | | | 58,557 | | | | 4,498,348 | |
Moog, Inc., Class A† | | | 104,868 | | | | 6,617,171 | |
Orbital ATK, Inc. | | | 61,169 | | | | 4,631,105 | |
| | | | | | |
|
|
|
| | | | | | | | 22,661,616 | |
| | | | | | |
|
|
|
Airlines — 0.3% | |
Delta Air Lines, Inc. | | | 55,247 | | | | 2,418,714 | |
| | | | | | |
|
|
|
Apparel Manufacturers — 0.5% | |
Global Brands Group Holding, Ltd.†(4) | | | 24,042,000 | | | | 4,537,447 | |
| | | | | | |
|
|
|
Applications Software — 1.1% | |
Check Point Software Technologies, Ltd.† | | | 24,500 | | | | 1,911,245 | |
Verint Systems, Inc.† | | | 151,757 | | | | 8,093,201 | |
| | | | | | |
|
|
|
| | | | | | | | 10,004,446 | |
| | | | | | |
|
|
|
Athletic Equipment — 0.6% | |
Performance Sports Group Ltd† | | | 425,200 | | | | 5,519,096 | |
| | | | | | |
|
|
|
Auto/Truck Parts & Equipment - Original — 1.2% | |
Lear Corp. | | | 67,162 | | | | 6,903,582 | |
Tenneco, Inc.† | | | 48,616 | | | | 2,287,383 | |
WABCO Holdings, Inc.† | | | 20,556 | | | | 2,370,518 | |
| | | | | | |
|
|
|
| | | | | | | | 11,561,483 | |
| | | | | | |
|
|
|
Banks - Commercial — 4.9% | |
BankUnited, Inc. | | | 218,774 | | | | 7,797,105 | |
BB&T Corp. | | | 165,656 | | | | 6,116,020 | |
CIT Group, Inc. | | | 120,900 | | | | 5,251,896 | |
East West Bancorp, Inc. | | | 124,546 | | | | 5,032,904 | |
IBERIABANK Corp. | | | 109,878 | | | | 6,691,570 | |
South State Corp. | | | 67,900 | | | | 5,102,685 | |
Zions Bancorporation | | | 337,293 | | | | 9,781,497 | |
| | | | | | |
|
|
|
| | | | | | | | 45,773,677 | |
| | | | | | |
|
|
|
Banks - Fiduciary — 0.4% | |
State Street Corp. | | | 47,484 | | | | 3,415,049 | |
| | | | | | |
|
|
|
Banks - Super Regional — 2.8% | |
Comerica, Inc. | | | 193,621 | | | | 8,519,324 | |
Fifth Third Bancorp | | | 336,756 | | | | 6,708,180 | |
Huntington Bancshares, Inc. | | | 499,395 | | | | 5,448,399 | |
SunTrust Banks, Inc. | | | 124,497 | | | | 5,025,944 | |
| | | | | | |
|
|
|
| | | | | | | | 25,701,847 | |
| | | | | | |
|
|
|
Beverages - Non-alcoholic — 0.3% | |
Coca-Cola Enterprises, Inc. | | | 50,328 | | | | 2,591,389 | |
| | | | | | |
|
|
|
Beverages - Wine/Spirits — 0.7% | |
Constellation Brands, Inc., Class A | | | 48,535 | | | | 6,212,480 | |
Treasury Wine Estates, Ltd.#(4) | | | 146,023 | | | | 615,307 | |
| | | | | | |
|
|
|
| | | | | | | | 6,827,787 | |
| | | | | | |
|
|
|
Building & Construction Products - Misc. — 0.8% | |
Louisiana-Pacific Corp.† | | | 426,190 | | | | 7,006,564 | |
| | | | | | |
|
|
|
Building Products - Doors & Windows — 0.3% | |
Sanwa Holdings Corp(4) | | | 376,300 | | | | 2,863,176 | |
| | | | | | |
|
|
|
| | | | | | | | |
| | |
| Security Description | | Shares | | | Value
(Note 2) | |
| |
| | | | | | | | | |
Building Products - Wood — 0.6% | |
Masco Corp. | | | 205,311 | | | $ | 5,385,308 | |
| | | | | | |
|
|
|
Building - Residential/Commercial — 2.0% | |
D.R. Horton, Inc. | | | 164,400 | | | | 4,992,828 | |
Lennar Corp., Class A | | | 154,453 | | | | 7,861,658 | |
PulteGroup, Inc. | | | 108,300 | | | | 2,240,727 | |
Toll Brothers, Inc.† | | | 91,769 | | | | 3,392,700 | |
| | | | | | |
|
|
|
| | | | | | | | 18,487,913 | |
| | | | | | |
|
|
|
Chemicals - Diversified — 0.7% | |
Celanese Corp., Series A | | | 63,754 | | | | 3,866,043 | |
Huntsman Corp. | | | 182,500 | | | | 3,016,725 | |
| | | | | | |
|
|
|
| | | | | | | | 6,882,768 | |
| | | | | | |
|
|
|
Chemicals - Plastics — 0.2% | |
PolyOne Corp. | | | 50,473 | | | | 1,638,858 | |
| | | | | | |
|
|
|
Chemicals - Specialty — 1.4% | |
Cabot Corp. | | | 128,500 | | | | 4,352,295 | |
Methanex Corp. | | | 211,849 | | | | 8,634,965 | |
| | | | | | |
|
|
|
| | | | | | | | 12,987,260 | |
| | | | | | |
|
|
|
Coatings/Paint — 0.5% | |
Valspar Corp. | | | 62,435 | | | | 4,576,486 | |
| | | | | | |
|
|
|
Commercial Services - Finance — 2.9% | |
Equifax, Inc. | | | 65,901 | | | | 6,451,708 | |
Global Payments, Inc. | | | 23,368 | | | | 2,602,962 | |
H&R Block, Inc. | | | 128,564 | | | | 4,373,747 | |
McGraw Hill Financial, Inc. | | | 32,707 | | | | 3,172,252 | |
Moody’s Corp. | | | 24,486 | | | | 2,505,163 | |
SEI Investments Co. | | | 81,818 | | | | 4,138,354 | |
Total System Services, Inc. | | | 76,264 | | | | 3,495,179 | |
| | | | | | |
|
|
|
| | | | | | | | 26,739,365 | |
| | | | | | |
|
|
|
Computer Services — 0.9% | |
Amdocs, Ltd. | | | 148,432 | | | | 8,491,795 | |
| | | | | | |
|
|
|
Computers - Memory Devices — 1.4% | |
Brocade Communications Systems, Inc. | | | 104,988 | | | | 1,118,122 | |
Seagate Technology PLC# | | | 53,263 | | | | 2,737,718 | |
Western Digital Corp. | | | 109,915 | | | | 9,008,634 | |
| | | | | | |
|
|
|
| | | | | | | | 12,864,474 | |
| | | | | | |
|
|
|
Computers - Periphery Equipment — 0.4% | |
Synaptics, Inc.† | | | 51,900 | | | | 3,637,671 | |
| | | | | | |
|
|
|
Consulting Services — 1.2% | |
Booz Allen Hamilton Holding Corp. | | | 191,900 | | | | 5,123,730 | |
Towers Watson & Co., Class A | | | 50,984 | | | | 6,053,330 | |
| | | | | | |
|
|
|
| | | | | | | | 11,177,060 | |
| | | | | | |
|
|
|
Consumer Products - Misc. — 0.2% | |
Samsonite International SA(4) | | | 530,700 | | | | 1,650,125 | |
| | | | | | |
|
|
|
Containers - Metal/Glass — 0.7% | |
Crown Holdings, Inc.† | | | 125,836 | | | | 6,237,691 | |
| | | | | | |
|
|
|
Containers - Paper/Plastic — 1.8% | |
Bemis Co., Inc. | | | 97,500 | | | | 4,135,950 | |
Graphic Packaging Holding Co. | | | 599,469 | | | | 8,452,513 | |
Packaging Corp. of America | | | 67,031 | | | | 4,498,450 | |
| | | | | | |
|
|
|
| | | | | | | | 17,086,913 | |
| | | | | | |
|
|
|
Cruise Lines — 0.9% | |
Norwegian Cruise Line Holdings, Ltd.† | | | 147,814 | | | | 8,514,086 | |
| | | | | | |
|
|
|
Data Processing/Management — 0.6% | |
Fidelity National Information Services, Inc. | | | 79,103 | | | | 5,462,853 | |
| | | | | | |
|
|
|
Decision Support Software — 0.5% | |
MSCI, Inc. | | | 76,300 | | | | 4,617,676 | |
| | | | | | |
|
|
|
58
VALIC Company II Mid Cap Value Fund
PORTFOLIO OF INVESTMENTS — August 31, 2015 — (continued)
| | | | | | | | |
| | |
| Security Description | | Shares | | | Value
(Note 2) | |
| |
COMMON STOCKS (continued) | |
Dialysis Centers — 0.2% | |
DaVita HealthCare Partners, Inc.† | | | 24,154 | | | $ | 1,827,009 | |
| | | | | | |
|
|
|
Distribution/Wholesale — 1.1% | |
Rexel SA(4) | | | 227,389 | | | | 3,484,429 | |
WESCO International, Inc.†# | | | 119,966 | | | | 6,714,497 | |
| | | | | | |
|
|
|
| | | | | | | | 10,198,926 | |
| | | | | | |
|
|
|
Diversified Manufacturing Operations — 2.3% | |
Barnes Group, Inc. | | | 229,614 | | | | 8,869,989 | |
Carlisle Cos., Inc. | | | 30,847 | | | | 3,106,293 | |
Ingersoll-Rand PLC | | | 64,483 | | | | 3,565,265 | |
Parker-Hannifin Corp.# | | | 38,239 | | | | 4,116,810 | |
Textron, Inc. | | | 49,976 | | | | 1,939,069 | |
| | | | | | |
|
|
|
| | | | | | | | 21,597,426 | |
| | | | | | |
|
|
|
E-Commerce/Services — 0.9% | |
Expedia, Inc. | | | 57,666 | | | | 6,631,014 | |
IAC/InterActiveCorp | | | 19,954 | | | | 1,392,789 | |
| | | | | | |
|
|
|
| | | | | | | | 8,023,803 | |
| | | | | | |
|
|
|
Electric - Distribution — 0.2% | |
PG&E Corp. | | | 44,050 | | | | 2,183,999 | |
| | | | | | |
|
|
|
Electric - Integrated — 4.9% | |
AES Corp. | | | 285,067 | | | | 3,420,804 | |
Alliant Energy Corp. | | | 136,992 | | | | 7,763,337 | |
Ameren Corp. | | | 60,655 | | | | 2,443,790 | |
American Electric Power Co., Inc. | | | 108,377 | | | | 5,883,787 | |
Edison International | | | 96,140 | | | | 5,622,267 | |
FirstEnergy Corp. | | | 46,268 | | | | 1,478,725 | |
Great Plains Energy, Inc. | | | 271,224 | | | | 6,758,902 | |
Portland General Electric Co. | | | 180,000 | | | | 6,217,200 | |
Westar Energy, Inc. | | | 154,490 | | | | 5,646,610 | |
| | | | | | |
|
|
|
| | | | | | | | 45,235,422 | |
| | | | | | |
|
|
|
Electronic Components - Misc. — 0.8% | |
Flextronics International, Ltd.† | | | 174,027 | | | | 1,829,024 | |
Jabil Circuit, Inc. | | | 181,138 | | | | 3,505,020 | |
TE Connectivity, Ltd. | | | 41,739 | | | | 2,474,705 | |
| | | | | | |
|
|
|
| | | | | | | | 7,808,749 | |
| | | | | | |
|
|
|
Electronic Components - Semiconductors — 2.4% | |
Avago Technologies, Ltd. | | | 38,548 | | | | 4,855,891 | |
Microsemi Corp.† | | | 367,074 | | | | 11,658,270 | |
ON Semiconductor Corp.† | | | 141,205 | | | | 1,349,214 | |
Qorvo, Inc.† | | | 84,723 | | | | 4,702,974 | |
| | | | | | |
|
|
|
| | | | | | | | 22,566,349 | |
| | | | | | |
|
|
|
Electronic Parts Distribution — 1.8% | |
Arrow Electronics, Inc.† | | | 234,078 | | | | 13,089,642 | |
Avnet, Inc. | | | 86,200 | | | | 3,654,880 | |
| | | | | | |
|
|
|
| | | | | | | | 16,744,522 | |
| | | | | | |
|
|
|
Engineering/R&D Services — 0.2% | |
Fluor Corp. | | | 40,223 | | | | 1,834,973 | |
| | | | | | |
|
|
|
Entertainment Software — 1.3% | |
Activision Blizzard, Inc. | | | 317,840 | | | | 9,099,759 | |
NetEase, Inc. ADR | | | 23,820 | | | | 2,648,308 | |
| | | | | | |
|
|
|
| | | | | | | | 11,748,067 | |
| | | | | | |
|
|
|
Finance - Auto Loans — 0.4% | |
Ally Financial, Inc.† | | | 154,923 | | | | 3,386,617 | |
| | | | | | |
|
|
|
Finance - Consumer Loans — 0.4% | |
Navient Corp. | | | 171,112 | | | | 2,188,522 | |
SLM Corp.† | | | 201,810 | | | | 1,711,349 | |
| | | | | | |
|
|
|
| | | | | | | | 3,899,871 | |
| | | | | | |
|
|
|
| | | | | | | | |
| | |
| Security Description | | Shares | | | Value
(Note 2) | |
| |
| | | | | | | | | |
Finance - Credit Card — 1.0% | |
Alliance Data Systems Corp.† | | | 14,098 | | | $ | 3,625,864 | |
Discover Financial Services | | | 102,301 | | | | 5,496,633 | |
| | | | | | |
|
|
|
| | | | | | | | 9,122,497 | |
| | | | | | |
|
|
|
Finance - Investment Banker/Broker — 2.0% | |
Charles Schwab Corp. | | | 79,942 | | | | 2,428,638 | |
Raymond James Financial, Inc. | | | 136,841 | | | | 7,251,205 | |
TD Ameritrade Holding Corp. | | | 263,879 | | | | 8,829,391 | |
| | | | | | |
|
|
|
| | | | | | | | 18,509,234 | |
| | | | | | |
|
|
|
Finance - Other Services — 0.0% | |
Solar Cayman, Ltd.†*(5)(6) | | | 120,200 | | | | 8,414 | |
| | | | | | |
|
|
|
Food - Meat Products — 0.2% | |
Tyson Foods, Inc., Class A | | | 53,351 | | | | 2,255,680 | |
| | | | | | |
|
|
|
Food - Misc./Diversified — 0.8% | |
Ingredion, Inc. | | | 81,300 | | | | 7,019,442 | |
| | | | | | |
|
|
|
Gas - Distribution — 0.9% | |
UGI Corp. | | | 251,356 | | | | 8,566,212 | |
| | | | | | |
|
|
|
Home Decoration Products — 1.8% | |
Newell Rubbermaid, Inc. | | | 400,500 | | | | 16,873,065 | |
| | | | | | |
|
|
|
Human Resources — 1.5% | |
ManpowerGroup, Inc. | | | 60,950 | | | | 5,296,555 | |
Robert Half International, Inc. | | | 171,319 | | | | 8,742,409 | |
| | | | | | |
|
|
|
| | | | | | | | 14,038,964 | |
| | | | | | |
|
|
|
Instruments - Controls — 0.5% | |
Sensata Technologies Holding NV† | | | 102,900 | | | | 4,877,460 | |
| | | | | | |
|
|
|
Insurance Brokers — 1.3% | |
Aon PLC | | | 69,909 | | | | 6,532,297 | |
Marsh & McLennan Cos., Inc. | | | 96,333 | | | | 5,175,972 | |
| | | | | | |
|
|
|
| | | | | | | | 11,708,269 | |
| | | | | | |
|
|
|
Insurance - Life/Health — 2.6% | |
CNO Financial Group, Inc. | | | 219,700 | | | | 3,930,433 | |
Symetra Financial Corp. | | | 97,204 | | | | 3,059,010 | |
Torchmark Corp. | | | 64,983 | | | | 3,798,906 | |
Unum Group | | | 405,228 | | | | 13,591,347 | |
| | | | | | |
|
|
|
| | | | | | | | 24,379,696 | |
| | | | | | |
|
|
|
Insurance - Multi-line — 1.7% | |
Allstate Corp. | | | 33,052 | | | | 1,926,270 | |
Loews Corp. | | | 69,275 | | | | 2,525,074 | |
XL Group PLC | | | 299,566 | | | | 11,170,816 | |
| | | | | | |
|
|
|
| | | | | | | | 15,622,160 | |
| | | | | | |
|
|
|
Insurance - Property/Casualty — 1.4% | |
Alleghany Corp.† | | | 9,647 | | | | 4,532,064 | |
Hanover Insurance Group, Inc. | | | 66,400 | | | | 5,238,960 | |
WR Berkley Corp. | | | 50,917 | | | | 2,763,775 | |
| | | | | | |
|
|
|
| | | | | | | | 12,534,799 | |
| | | | | | |
|
|
|
Insurance - Reinsurance — 2.0% | |
Argo Group International Holdings, Ltd. | | | 95,730 | | | | 5,358,965 | |
Reinsurance Group of America, Inc. | | | 141,976 | | | | 12,902,779 | |
| | | | | | |
|
|
|
| | | | | | | | 18,261,744 | |
| | | | | | |
|
|
|
Medical Instruments — 0.9% | |
Boston Scientific Corp.† | | | 204,995 | | | | 3,431,616 | |
Bruker Corp.† | | | 86,391 | | | | 1,587,867 | |
St. Jude Medical, Inc. | | | 48,298 | | | | 3,419,981 | |
| | | | | | |
|
|
|
| | | | | | | | 8,439,464 | |
| | | | | | |
|
|
|
59
VALIC Company II Mid Cap Value Fund
PORTFOLIO OF INVESTMENTS — August 31, 2015 — (continued)
| | | | | | | | |
| | |
| Security Description | | Shares | | |
Value
(Note 2) | |
| |
COMMON STOCKS (continued) | |
Medical Labs & Testing Services — 0.9% | |
ICON PLC† | | | 66,337 | | | $ | 5,107,949 | |
Laboratory Corp. of America Holdings† | | | 29,001 | | | | 3,416,608 | |
| | | | | | |
|
|
|
| | | | | | | | 8,524,557 | |
| | | | | | |
|
|
|
Medical Products — 0.9% | |
Becton Dickinson and Co. | | | 20,946 | | | | 2,953,805 | |
Zimmer Biomet Holdings, Inc. | | | 49,964 | | | | 5,174,272 | |
| | | | | | |
|
|
|
| | | | | | | | 8,128,077 | |
| | | | | | |
|
|
|
Medical - Drugs — 1.9% | |
Almirall SA(4) | | | 365,065 | | | | 7,149,914 | |
Ono Pharmaceutical Co., Ltd.#(4) | | | 67,700 | | | | 8,618,273 | |
UCB SA(4) | | | 23,927 | | | | 1,804,348 | |
| | | | | | |
|
|
|
| | | | | | | | 17,572,535 | |
| | | | | | |
|
|
|
Medical - Wholesale Drug Distribution — 0.6% | |
Cardinal Health, Inc. | | | 70,409 | | | | 5,792,548 | |
| | | | | | |
|
|
|
Metal Processors & Fabrication — 0.2% | |
Timken Co. | | | 48,589 | | | | 1,542,701 | |
| | | | | | |
|
|
|
Motorcycle/Motor Scooter — 0.2% | |
Harley-Davidson, Inc. | | | 35,780 | | | | 2,005,469 | |
| | | | | | |
|
|
|
Multimedia — 0.6% | |
Markit Ltd† | | | 69,000 | | | | 1,972,020 | |
Quebecor, Inc., Class B# | | | 177,000 | | | | 3,794,010 | |
| | | | | | |
|
|
|
| | | | | | | | 5,766,030 | |
| | | | | | |
|
|
|
Office Supplies & Forms — 0.3% | |
Avery Dennison Corp. | | | 45,824 | | | | 2,661,458 | |
| | | | | | |
|
|
|
Oil Companies - Exploration & Production — 4.4% | |
Cobalt International Energy, Inc.† | | | 409,865 | | | | 3,283,019 | |
Diamondback Energy, Inc.† | | | 187,807 | | | | 12,825,340 | |
Energen Corp. | | | 140,682 | | | | 7,315,464 | |
EQT Corp. | | | 39,326 | | | | 3,060,349 | |
Kosmos Energy, Ltd.† | | | 142,967 | | | | 1,000,769 | |
Newfield Exploration Co.† | | | 161,227 | | | | 5,370,471 | |
Parsley Energy, Inc., Class A† | | | 108,191 | | | | 1,860,885 | |
QEP Resources, Inc. | | | 262,240 | | | | 3,681,850 | |
Rice Energy, Inc.† | | | 72,155 | | | | 1,403,415 | |
RSP Permian, Inc.† | | | 59,573 | | | | 1,426,178 | |
| | | | | | |
|
|
|
| | | | | | | | 41,227,740 | |
| | | | | | |
|
|
|
Oil Refining & Marketing — 1.0% | |
HollyFrontier Corp. | | | 69,400 | | | | 3,252,084 | |
Marathon Petroleum Corp. | | | 85,219 | | | | 4,031,711 | |
Western Refining, Inc. | | | 49,358 | | | | 2,123,381 | |
| | | | | | |
|
|
|
| | | | | | | | 9,407,176 | |
| | | | | | |
|
|
|
Oil-Field Services — 0.0% | |
Trican Well Service, Ltd.† | | | 266,800 | | | | 373,147 | |
| | | | | | |
|
|
|
Paper & Related Products — 0.3% | |
International Paper Co. | | | 54,963 | | | | 2,371,104 | |
| | | | | | |
|
|
|
Power Converter/Supply Equipment — 1.5% | |
Generac Holdings, Inc.†# | | | 144,500 | | | | 4,467,940 | |
Hubbell, Inc., Class B | | | 93,261 | | | | 9,202,063 | |
| | | | | | |
|
|
|
| | | | | | | | 13,670,003 | |
| | | | | | |
|
|
|
Real Estate Investment Trusts — 8.1% | |
American Assets Trust, Inc. | | | 189,235 | | | | 7,289,332 | |
American Homes 4 Rent, Class A | | | 144,028 | | | | 2,301,567 | |
Blackstone Mortgage Trust, Inc., Class A | | | 216,600 | | | | 5,997,654 | |
Boston Properties, Inc. | | | 62,975 | | | | 7,140,105 | |
Douglas Emmett, Inc. | | | 80,839 | | | | 2,233,582 | |
Equity LifeStyle Properties, Inc. | | | 138,000 | | | | 7,694,880 | |
| | | | | | | | |
| | |
| Security Description | | Shares/
Principal
Amount | | | Value
(Note 2) | |
| |
| | |
Real Estate Investment Trusts (continued) | |
Equity Residential | | | 90,017 | | | $ | 6,413,711 | |
Essex Property Trust, Inc. | | | 19,974 | | | | 4,286,820 | |
Extra Space Storage, Inc. | | | 109,400 | | | | 8,038,712 | |
Kilroy Realty Corp. | | | 38,760 | | | | 2,513,974 | |
Kimco Realty Corp. | | | 168,395 | | | | 3,881,505 | |
LaSalle Hotel Properties | | | 54,833 | | | | 1,725,046 | |
PS Business Parks, Inc. | | | 21,300 | | | | 1,554,048 | |
Regency Centers Corp. | | | 80,112 | | | | 4,751,443 | |
SL Green Realty Corp. | | | 93,455 | | | | 9,673,527 | |
| | | | | | |
|
|
|
| | | | | | | | 75,495,906 | |
| | | | | | |
|
|
|
Real Estate Operations & Development — 0.6% | |
Forest City Enterprises, Inc., Class A† | | | 267,955 | | | | 5,769,071 | |
| | | | | | |
|
|
|
Recreational Vehicles — 0.4% | |
Brunswick Corp. | | | 76,779 | | | | 3,816,684 | |
| | | | | | |
|
|
|
Research & Development — 0.4% | |
WuXi PharmaTech Cayman, Inc. ADR† | | | 79,600 | | | | 3,363,896 | |
| | | | | | |
|
|
|
Retail - Apparel/Shoe — 0.9% | |
DSW, Inc., Class A | | | 217,700 | | | | 6,463,513 | |
Foot Locker, Inc. | | | 32,000 | | | | 2,265,280 | |
| | | | | | |
|
|
|
| | | | | | | | 8,728,793 | |
| | | | | | |
|
|
|
Retail - Regional Department Stores — 0.2% | |
Macy’s, Inc. | | | 27,225 | | | | 1,595,657 | |
| | | | | | |
|
|
|
Retirement/Aged Care — 0.6% | |
Brookdale Senior Living, Inc.† | | | 195,829 | | | | 5,369,631 | |
| | | | | | |
|
|
|
Rubber - Tires — 0.2% | |
Goodyear Tire & Rubber Co. | | | 63,800 | | | | 1,899,326 | |
| | | | | | |
|
|
|
Savings & Loans/Thrifts — 0.3% | |
EverBank Financial Corp. | | | 120,500 | | | | 2,383,490 | |
| | | | | | |
|
|
|
Semiconductor Components - Integrated Circuits — 0.3% | |
NXP Semiconductors NV† | | | 31,080 | | | | 2,630,922 | |
| | | | | | |
|
|
|
Shipbuilding — 0.7% | |
Huntington Ingalls Industries, Inc. | | | 56,441 | | | | 6,354,128 | |
| | | | | | |
|
|
|
Steel - Producers — 0.1% | |
Reliance Steel & Aluminum Co. | | | 21,800 | | | | 1,267,016 | |
| | | | | | |
|
|
|
Telecommunication Equipment — 0.7% | |
ARRIS Group, Inc.† | | | 233,100 | | | | 6,158,502 | |
| | | | | | |
|
|
|
Television — 0.2% | |
CBS Corp., Class B | | | 31,134 | | | | 1,408,502 | |
| | | | | | |
|
|
|
Theaters — 0.1% | |
AMC Entertainment Holdings, Inc., Class A | | | 33,300 | | | | 965,034 | |
| | | | | | |
|
|
|
Tools - Hand Held — 0.5% | |
Stanley Black & Decker, Inc. | | | 45,504 | | | | 4,619,566 | |
| | | | | | |
|
|
|
Transport - Rail — 0.3% | |
Genesee & Wyoming, Inc., Class A† | | | 36,400 | | | | 2,489,033 | |
| | | | | | |
|
|
|
Wireless Equipment — 0.4% | |
Motorola Solutions, Inc. | | | 55,313 | | | | 3,585,389 | |
| | | | | | |
|
|
|
Total Long-Term Investment Securities | | | | | | | | |
(cost $819,986,062) | | | | | | | 909,914,656 | |
| | | | | | |
|
|
|
SHORT-TERM INVESTMENT SECURITIES — 2.7% | |
Registered Investment Companies — 2.7% | |
SSgA Money Market Fund 0.00%(7) | | | 8,846,992 | | | | 8,846,992 | |
State Street Navigator Securities Lending Prime Portfolio 0.21%(1)(7) | | | 16,186,605 | | | | 16,186,605 | |
| | | | | | |
|
|
|
Total Short-Term Investment Securities | | | | | | | | |
(cost $25,033,597) | | | | | | | 25,033,597 | |
| | | | | | |
|
|
|
60
VALIC Company II Mid Cap Value Fund
PORTFOLIO OF INVESTMENTS — August 31, 2015 — (continued)
| | | | | | | | |
| | |
| Security Description | |
Principal
Amount | | | Value
(Note 2) | |
| |
REPURCHASE AGREEMENTS — 0.9% | |
Agreement with State Street Bank and Trust Co., bearing interest at 0.00%, dated 08/31/2015, to be repurchased 09/01/2015 in the amount $8,127,000 collateralized by $8,205,000 of United States Treasury Notes, bearing interest at 2.00% due 06/30/2020 and having an approximate value of $8,375,787 (cost $8,127,000) | | | 8,127,000 | | | $ | 8,127,000 | |
| | | | | | |
|
|
|
TOTAL INVESTMENTS | | | | | | | | |
(cost $853,146,659)(3) | | | 101.8 | % | | | 943,075,253 | |
Liabilities in excess of other assets | | | (1.8 | ) | | | (16,494,945 | ) |
| | |
|
|
| |
|
|
|
NET ASSETS | | | 100.0 | % | | $ | 926,580,308 | |
| | |
|
|
| |
|
|
|
| † | Non-income producing security |
| * | Securities exempt from registration under Rule 144A of the Securities Act of 1933. These securities may be sold in transactions exempt from registration, normally to qualified institutional buyers. The Portfolio has no right to demand registration of these securities. At August 31, 2015, the aggregate value of these securities was $8,414 representing 0.0% of net assets. Unless otherwise indicated, these securities are not considered to be illiquid. |
| # | The security or a portion thereof is out on loan (see Note 2) |
| (1) | At August 31, 2015, the Fund had loaned securities with a total value of $15,860,302. This was secured by collateral of $16,186,605, which was received in cash and subsequently invested in short-term investments currently valued at $16,186,605 as reported in the Portfolio of Investments. |
| (3) | See Note 5 for cost of investments on a tax basis. |
| (4) | Security was valued using fair value procedures at August 31, 2015. The aggregate value of these securities was $30,723,019 representing 3.3% of net assets. Securities are classified as Level 2 based on the securities valuation inputs. See Note 2 regarding fair value pricing for foreign equity securities. |
| (5) | Fair valued security. Securities are classified as Level 3 based on the securities valuation inputs; See Note 2. |
| (6) | Illiquid security, At August 31, 2015, the aggregate value of these securities was $8,414 representing 0.0% of net assets. |
| (7) | The rate shown is the 7-day yield as of August 31, 2015. |
ADR—American Depositary Receipt
The following is a summary of the inputs used to value the Fund’s net assets as of August 31, 2015 (see Note 2):
| | | | | | | | | | | | | | | | |
| | | Level 1 - Unadjusted Quoted
Prices
| | | Level 2 - Other Observable
Inputs
| | | Level 3 - Significant
Unobservable Inputs
| | | Total
| |
ASSETS: | | | | | | | | | | | | | | | | |
Investments at Value:* | | | | | | | | | | | | | | | | |
Common Stocks: | | | | | | | | | | | | | | | | |
Apparel Manufacturers | | $ | — | | | $ | 4,537,447 | | | $ | — | | | $ | 4,537,447 | |
Beverages - Wine/Spirits | | | 6,212,480 | | | | 615,307 | | | | — | | | | 6,827,787 | |
Building Products - Door & Windows | | | — | | | | 2,863,176 | | | | — | | | | 2,863,176 | |
Consumer Products - Misc. | | | — | | | | 1,650,125 | | | | — | | | | 1,650,125 | |
Distribution/Wholesale | | | 6,714,497 | | | | 3,484,429 | | | | — | | | | 10,198,926 | |
Finance - Other Services | | | — | | | | — | | | | 8,414 | | | | 8,414 | |
Medical - Drugs | | | — | | | | 17,572,535 | | | | — | | | | 17,572,535 | |
Other Industries | | | 866,256,246 | | | | — | | | | — | | | | 866,256,246 | |
Short-Term Investment Securities | | | 25,033,597 | | | | — | | | | — | | | | 25,033,597 | |
Repurchase Agreements | | | — | | | | 8,127,000 | | | | — | | | | 8,127,000 | |
| | |
|
|
| |
|
|
| |
|
|
| |
|
|
|
Total Investments at Value | | $ | 904,216,820 | | | $ | 38,850,019 | | | $ | 8,414 | | | $ | 943,075,253 | |
| | |
|
|
| |
|
|
| |
|
|
| |
|
|
|
| * | For a detailed presentation of investments, please refer to the Portfolio of Investments. |
The Fund’s policy is to recognize transfers between Levels as of the end of the reporting period. Securities currently valued at $23,322,397 were transferred from Level 1 to Level 2 due to foreign equity securities whose values were adjusted for fair value pricing procedures for foreign equity securities. There were no additional transfers between Levels during the reporting period.
At the beginning and end of reporting period, Level 3 investments were not considered a material portion of the Fund.
See Notes to Financial Statements
61
VALIC Company II Moderate Growth Lifestyle Fund
PORTFOLIO PROFILE — August 31, 2015 (unaudited)
Industry Allocation*
| | | | |
Domestic Fixed Income Investment Companies | | | 41.8 | % |
Domestic Equity Investment Companies | | | 32.6 | |
International Equity Investment Companies | | | 19.3 | |
Real Estate Investment Trusts | | | 6.1 | |
International Fixed Income Investment Companies | | | 0.2 | |
| | |
|
|
|
| | | | 100.0 | % |
| | |
|
|
|
| * | Calculated as a percentage of net assets |
62
VALIC Company II Moderate Growth Lifestyle Fund
PORTFOLIO OF INVESTMENTS — August 31, 2015
| | | | | | | | |
| | |
| Security Description | | Shares | | | Value
(Note 2) | |
| |
AFFILIATED REGISTERED INVESTMENT COMPANIES#(1) — 100.0% | |
Domestic Equity Investment Companies — 32.6% | |
VALIC Co. I Blue Chip Growth Fund | | | 1,803,588 | | | $ | 31,670,997 | |
VALIC Co. I Dividend Value Fund | | | 612,732 | | | | 7,622,383 | |
VALIC Co. I Mid Cap Index Fund | | | 949,497 | | | | 25,237,619 | |
VALIC Co. I Mid Cap Strategic Growth Fund | | | 543,460 | | | | 7,820,393 | |
VALIC Co. I Nasdaq-100 Index Fund | | | 1,841,572 | | | | 18,139,486 | |
VALIC Co. I Science & Technology Fund | | | 477,393 | | | | 11,825,025 | |
VALIC Co. I Small Cap Index Fund | | | 1,858,138 | | | | 36,791,126 | |
VALIC Co. I Small Cap Special Values Fund | | | 684,576 | | | | 8,831,029 | |
VALIC Co. I Stock Index Fund | | | 457,489 | | | | 15,737,605 | |
VALIC Co. I Value Fund | | | 109,067 | | | | 1,556,381 | |
VALIC Co. II Capital Appreciation Fund | | | 1,109,547 | | | | 18,141,101 | |
VALIC Co. II Large Cap Value Fund | | | 430,182 | | | | 7,347,510 | |
VALIC Co. II Mid Cap Growth Fund | | | 1,065,480 | | | | 9,386,882 | |
VALIC Co. II Mid Cap Value Fund | | | 1,722,218 | | | | 37,578,792 | |
VALIC Co. II Small Cap Growth Fund | | | 552,968 | | | | 8,465,933 | |
VALIC Co. II Small Cap Value Fund | | | 992,913 | | | | 13,910,709 | |
| | | | | | |
|
|
|
Total Domestic Equity Investment Companies | | | | | | | | |
(cost $228,315,309) | | | | | | | 260,062,971 | |
| | | | | | |
|
|
|
Domestic Fixed Income Investment Companies — 41.8% | |
VALIC Co. I Capital Conservation Fund | | | 3,423,924 | | | | 33,759,892 | |
VALIC Co. I Government Securities Fund | | | 1,676,030 | | | | 18,117,881 | |
VALIC Co. I Inflation Protected Fund | | | 1,312,812 | | | | 14,060,219 | |
VALIC Co. II Core Bond Fund | | | 12,848,757 | | | | 140,436,913 | |
VALIC Co. II High Yield Bond Fund | | | 5,149,185 | | | | 38,103,971 | |
VALIC Co. II Strategic Bond Fund | | | 8,132,904 | | | | 89,461,946 | |
| | | | | | |
|
|
|
Total Domestic Fixed Income Investment Companies | | | | | | | | |
(cost $341,168,035) | | | | | | | 333,940,822 | |
| | | | | | |
|
|
|
| | | | | | | | |
| | |
| Security Description | | Shares | | | Value
(Note 2) | |
| |
| | | | | | | | | |
International Equity Investment Companies — 19.3% | |
VALIC Co. I Emerging Economies Fund | | | 1,330,908 | | | $ | 8,597,667 | |
VALIC Co. I Foreign Value Fund | | | 3,201,974 | | | | 29,554,223 | |
VALIC Co. I International Equities Index Fund | | | 10,912,759 | | | | 71,151,189 | |
VALIC Co. I International Growth Fund | | | 2,706,901 | | | | 35,027,294 | |
VALIC Co. II International Opportunities Fund | | | 639,448 | | | | 9,642,877 | |
| | | | | | |
|
|
|
Total International Equity Investment Companies | | | | | | | | |
(cost $165,714,731) | | | | | | | 153,973,250 | |
| | | | | | |
|
|
|
International Fixed Income Investment Companies — 0.2% | |
VALIC Co. I International Government Bond Fund | | | | | | | | |
(cost $1,789,549) | | | 150,495 | | | | 1,673,500 | |
| | | | | | |
|
|
|
Real Estate Investment Trusts — 6.1% | |
VALIC Co. I Global Real Estate Fund | | | | | | | | |
(cost $51,001,943) | | | 6,052,209 | | | | 48,841,329 | |
| | | | | | |
|
|
|
TOTAL INVESTMENTS | | | | | | | | |
(cost $787,989,567)(2) | | | 100.0 | % | | | 798,491,872 | |
Liabilities in excess of other assets | | | 0.0 | | | | (47,793 | ) |
| | |
|
|
| |
|
|
|
NET ASSETS | | | 100.0 | % | | $ | 798,444,079 | |
| | |
|
|
| |
|
|
|
| # | The Moderate Growth Lifestyle Fund invests in various VALIC Company I or VALIC Company II Funds, some of which are not presented in this report. Additional information on the underlying funs including such fund’s prospectuses and shareholder reports is available at our website, www.valic.com. |
| (2) | See Note 5 for cost of investments on a tax basis. |
The following is a summary of the inputs used to value the Fund’s net assets as of August 31, 2015 (see Note 2):
| | | | | | | | | | | | | | | | |
| | | Level 1 - Unadjusted Quoted
Prices
| | | Level 2 - Other Observable
Inputs
| | | Level 3 - Significant
Unobservable Inputs
| | | Total
| |
ASSETS: | | | | | | | | | | | | | | | | |
Investments at Value:* | | | | | | | | | | | | | | | | |
Affiliated Registered Investment Companies | | $ | 798,491,872 | | | $ | — | | | $ | — | | | $ | 798,491,872 | |
| | |
|
|
| |
|
|
| |
|
|
| |
|
|
|
| * | For a detailed presentation of investments, please refer to the Portfolio of Investments. |
The Fund’s policy is to recognize transfers between Levels as of the end of the reporting period. There were no transfers between Levels during the reporting period.
See Notes to Financial Statements
63
VALIC Company II Money Market II Fund
PORTFOLIO PROFILE — August 31, 2015 (unaudited)
Industry Allocation†
| | | | |
U.S. Government Agencies | | | 59.6 | % |
Foreign Bank | | | 15.9 | |
Money Center Banks | | | 8.4 | |
Commercial Banks-Canadian | | | 4.8 | |
U.S. Government Treasuries | | | 5.8 | |
Commercial Banks | | | 2.0 | |
Domestic Bank | | | 2.3 | |
Repurchase Agreement | | | 1.5 | |
Super-Regional Banks — US | | | 1.7 | |
Finance | | | 0.6 | |
| | |
|
|
|
| | | | 102.6 | % |
| | |
|
|
|
Credit Quality@#
| † | Calculated as a percentage of net assets. |
| @ | Source: Standard & Poor’s |
| # | Calculated as a percentage of total debt issues. |
Weighted Average days to Maturity — 38.2 days
64
VALIC Company II Money Market II Fund
PORTFOLIO OF INVESTMENTS — August 31, 2015
| | | | | | | | |
| | |
| Security Description | | Principal
Amount | | | Value
(Note 2) | |
| |
SHORT-TERM INVESTMENT SECURITIES —101.1% | |
Certificates of Deposit — 16.9% | |
Nordea Bank Finland PLC NY FRS
0.27% due 11/23/2015 | | $ | 3,000,000 | | | $ | 3,000,000 | |
Nordea Bank Finland PLC NY FRS
0.46% due 01/29/2016 | | | 3,300,000 | | | | 3,301,966 | |
Rabobank Nederland NV NY FRS
0.30% due 10/20/2015 | | | 3,600,000 | | | | 3,600,000 | |
Royal Bank of Canada NY FRS
0.28% due 12/03/2015 | | | 3,500,000 | | | | 3,500,000 | |
Royal Bank of Canada NY FRS
0.40% due 06/03/2016 | | | 3,800,000 | | | | 3,800,000 | |
Svenska Handelsbanken NY FRS
0.29% due 12/09/2015 | | | 3,250,000 | | | | 3,250,000 | |
Svenska Handelsbanken NY
0.31% due 11/24/2015 | | | 2,850,000 | | | | 2,850,033 | |
Wells Fargo Bank NA FRS
0.27% due 09/01/2015 | | | 3,750,000 | | | | 3,750,000 | |
| | | | | | |
|
|
|
Total Certificates of Deposit | | | | | | | | |
(amortized cost $27,051,999) | | | | | | | 27,051,999 | |
| | | | | | |
|
|
|
Commercial Paper — 14.5% | |
BNP Paribas SA NY
0.16% due 09/02/2015 | | | 6,500,000 | | | | 6,499,978 | |
Credit Agricole Corporate and Investment Bank NY
0.16% due 09/01/2015 | | | 6,400,000 | | | | 6,400,000 | |
Lloyds Bank PLC
0.12% due 09/02/2015 | | | 7,000,000 | | | | 6,999,977 | |
State Street Corp.
0.40% due 12/21/2015 | | | 3,250,000 | | | | 3,245,992 | |
| | | | | | |
|
|
|
Total Commercial Paper | | | | | | | | |
(amortized cost $23,145,947) | | | | | | | 23,145,947 | |
| | | | | | |
|
|
|
Corporate Notes — 4.3% | |
Bank of America NA
0.27% due 09/02/2015 | | | 2,800,000 | | | | 2,800,009 | |
General Electric Capital Corp. FRS
0.48% due 01/08/2016 | | | 500,000 | | | | 500,361 | |
General Electric Capital Corp. FRS
0.88% due 01/08/2016 | | | 500,000 | | | | 500,982 | |
JPMorgan Chase Bank NA FRS
0.44% due 06/07/2016 | | | 2,700,000 | | | | 2,700,000 | |
Royal Bank of Canada
0.80% due 10/30/2015 | | | 400,000 | | | | 400,236 | |
| | | | | | |
|
|
|
Total Corporate Notes | | | | | | | | |
(amortized cost $6,901,588) | | | | | | | 6,901,588 | |
| | | | | | |
|
|
|
U.S. Government Agencies — 59.6% | |
Federal Farm Credit Bank | | | | | | | | |
0.14% due 11/20/2015 FRS | | | 3,250,000 | | | | 3,249,963 | |
0.16% due 10/05/2015 | | | 1,500,000 | | | | 1,499,773 | |
Federal Home Loan Bank | | | | | | | | |
0.01% due 09/02/2015 | | | 10,000,000 | | | | 9,999,997 | |
0.04% due 09/02/2015 | | | 3,000,000 | | | | 2,999,997 | |
0.05% due 09/02/2015 | | | 2,500,000 | | | | 2,499,997 | |
0.06% due 09/01/2015 | | | 2,500,000 | | | | 2,500,000 | |
0.06% due 09/03/2015 | | | 2,500,000 | | | | 2,499,992 | |
0.06% due 09/16/2015 | | | 3,000,000 | | | | 2,999,925 | |
0.06% due 09/21/2015 | | | 3,000,000 | | | | 2,999,900 | |
0.07% due 10/06/2015 | | | 2,000,000 | | | | 1,999,864 | |
0.08% due 10/23/2015 | | | 3,000,000 | | | | 2,999,653 | |
| | | | | | | | |
| | |
| Security Description | | Principal
Amount | | | Value
(Note 2) | |
| |
| | | | | | | | | |
U.S. Government Agencies (continued) | |
0.10% due 09/01/2015 | | $ | 4,300,000 | | | $ | 4,300,000 | |
0.10% due 10/23/2015 | | | 3,300,000 | | | | 3,299,547 | |
0.13% due 10/09/2015 | | | 1,000,000 | | | | 999,863 | |
0.14% due 09/08/2015 | | | 1,750,000 | | | | 1,749,952 | |
0.14% due 12/03/2015 | | | 3,000,000 | | | | 2,998,954 | |
0.15% due 07/22/2016 FRS | | | 3,000,000 | | | | 3,000,064 | |
0.16% due 08/19/2016 FRS | | | 3,000,000 | | | | 3,000,142 | |
0.17% due 11/12/2015 | | | 3,000,000 | | | | 2,998,980 | |
0.17% due 11/23/2015 | | | 1,000,000 | | | | 999,608 | |
0.17% due 09/02/2016 FRS(3) | | | 3,000,000 | | | | 3,000,030 | |
0.18% due 12/09/2015 | | | 1,350,000 | | | | 1,349,332 | |
0.18% due 01/26/2016 | | | 3,000,000 | | | | 2,997,795 | |
0.19% due 12/08/2015 | | | 1,500,000 | | | | 1,499,245 | |
0.20% due 01/20/2016 | | | 3,700,000 | | | | 3,697,102 | |
0.20% due 01/22/2016 | | | 750,000 | | | | 749,404 | |
0.20% due 01/26/2016 | | | 1,750,000 | | | | 1,748,571 | |
0.22% due 10/07/2015 FRS | | | 4,250,000 | | | | 4,250,316 | |
0.29% due 02/02/2016 | | | 2,750,000 | | | | 2,746,587 | |
0.35% due 06/09/2016 | | | 1,350,000 | | | | 1,346,299 | |
Federal Home Loan Mtg. Corp. | | | | | | | | |
0.11% due 10/22/2015 | | | 2,000,000 | | | | 1,999,702 | |
0.12% due 10/30/2015 | | | 2,000,000 | | | | 1,999,607 | |
0.18% due 10/16/2015 FRS | | | 3,100,000 | | | | 3,100,198 | |
Federal National Mtg. Assoc. | | | | | | | | |
0.25% due 02/02/2016 | | | 2,250,000 | | | | 2,247,642 | |
0.26% due 02/08/2016 | | | 2,000,000 | | | | 1,997,689 | |
2.13% due 10/21/2015 | | | 1,000,000 | | | | 1,002,647 | |
| | | | | | |
|
|
|
Total U.S. Government Agencies | | | | | | | | |
(amortized cost $95,328,337) | | | | | | | 95,328,337 | |
| | | | | | |
|
|
|
U.S. Government Treasuries — 5.8% | |
United States Treasury Bills | | | | | | | | |
0.03% due 09/03/2015 | | | 3,750,000 | | | | 3,749,994 | |
0.05% due 09/03/2015 | | | 2,500,000 | | | | 2,499,993 | |
0.08% due 09/17/2015 | | | 3,000,000 | | | | 2,999,890 | |
| | | | | | |
|
|
|
Total U.S. Government Treasuries | | | | | | | | |
(amortized cost $9,249,877) | | | | | | | 9,249,877 | |
| | | | | | |
|
|
|
Total Short-Term Investment Securities — 101.1% | | | | | | | | |
(amortized cost $161,677,748) | | | | | | | 161,677,748 | |
| | | | | | |
|
|
|
REPURCHASE AGREEMENTS — 1.5% | |
State Street Bank and Trust Co. Joint Repurchase Agreement(1)
(cost $2,464,000) | | | 2,464,000 | | | | 2,464,000 | |
| | | | | | |
|
|
|
TOTAL INVESTMENTS | | | | | | | | |
(amortized cost $164,141,748)(2) | | | 102.6 | % | | | 164,141,748 | |
Liabilities in excess of other assets | | | (2.6 | ) | | | (4,236,378 | ) |
| | |
|
|
| |
|
|
|
NET ASSETS | | | 100.0 | % | | $ | 159,905,370 | |
| | |
|
|
| |
|
|
|
| (1) | | See Note 2 for details of Joint Repurchase Agreements. |
| (2) | | See Note 5 for cost of investments on a tax basis. |
| (3) | | The security’s effective maturity date is less than one year. |
FRS—Floating Rate Security.
The rates shown on FRS are the current interest rates at August 31, 2015 and unless stated otherwise, the dates are the original maturity dates.
65
VALIC Company II Money Market II Fund
PORTFOLIO OF INVESTMENTS — August 31, 2015 — (continued)
The following is a summary of the inputs used to value the Fund’s net assets as of August 31, 2015 (see Note 2):
| | | | | | | | | | | | | | | | |
| | | Level 1 - Unadjusted Quoted
Prices
| | | Level 2 - Other Observable
Inputs
| | | Level 3 - Significant
Unobservable Inputs
| | | Total
| |
ASSETS: | | | | | | | | | | | | | | | | |
Investments at Value:* | | | | | | | | | | | | | | | | |
Short-Term Investment Securities | | $ | — | | | $ | 161,677,748 | | | $ | — | | | $ | 161,677,748 | |
Repurchase Agreements | | | — | | | | 2,464,000 | | | | — | | | | 2,464,000 | |
| | |
|
|
| |
|
|
| |
|
|
| |
|
|
|
Total Investments at Value | | $ | — | | | $ | 164,141,748 | | | $ | — | | | $ | 164,141,748 | |
| | |
|
|
| |
|
|
| |
|
|
| |
|
|
|
| * | For a detailed presentation of investments, please refer to the Portfolio of Investments. |
The Fund’s policy is to recognize transfers between Levels as of the end of the reporting period. There were no transfers between Levels during the reporting period.
See Notes to Financial Statements
66
VALIC Company II Small Cap Growth Fund
PORTFOLIO PROFILE — August 31, 2015 (unaudited)
Industry Allocation*
| | | | |
Registered Investment Companies | | | 19.1 | % |
Medical — Biomedical/Gene | | | 6.2 | |
Medical — Drugs | | | 5.3 | |
Enterprise Software/Service | | | 5.2 | |
Applications Software | | | 3.5 | |
Electronic Components — Semiconductors | | | 3.3 | |
Retail — Automobile | | | 3.2 | |
Distribution/Wholesale | | | 3.1 | |
Banks — Commercial | | | 2.5 | |
Time Deposits | | | 2.3 | |
E-Commerce/Services | | | 2.2 | |
Building & Construction Products — Misc. | | | 2.1 | |
Computer Software | | | 2.0 | |
Lighting Products & Systems | | | 2.0 | |
Therapeutics | | | 2.0 | |
Retail — Apparel/Shoe | | | 1.9 | |
Computer Services | | | 1.9 | |
Educational Software | | | 1.6 | |
Medical — Hospitals | | | 1.6 | |
Medical Products | | | 1.5 | |
Medical — HMO | | | 1.5 | |
Building Products — Air & Heating | | | 1.4 | |
Machinery — General Industrial | | | 1.4 | |
Commercial Services | | | 1.3 | |
Diversified Manufacturing Operations | | | 1.2 | |
Investment Management/Advisor Services | | | 1.2 | |
Footwear & Related Apparel | | | 1.2 | |
Oil Field Machinery & Equipment | | | 1.2 | |
Building Products — Cement | | | 1.2 | |
Savings & Loans/Thrifts | | | 1.1 | |
Computers — Memory Devices | | | 1.1 | |
Telecom Equipment — Fiber Optics | | | 1.1 | |
MRI/Medical Diagnostic Imaging | | | 1.0 | |
Medical Imaging Systems | | | 1.0 | |
Drug Delivery Systems | | | 1.0 | |
Semiconductor Components — Integrated Circuits | | | 1.0 | |
Patient Monitoring Equipment | | | 1.0 | |
Food — Misc./Diversified | | | 1.0 | |
Real Estate Investment Trusts | | | 0.9 | |
Advanced Materials | | | 0.9 | |
Internet Telephone | | | 0.9 | |
Real Estate Management/Services | | | 0.9 | |
Diagnostic Equipment | | | 0.9 | |
Energy — Alternate Sources | | | 0.9 | |
Insurance — Property/Casualty | | | 0.8 | |
Web Hosting/Design | | | 0.8 | |
Casino Hotels | | | 0.8 | |
Semiconductor Equipment | | | 0.8 | |
Retail — Pet Food & Supplies | | | 0.8 | |
Aerospace/Defense — Equipment | | | 0.8 | |
Machinery — Pumps | | | 0.8 | |
Oil Refining & Marketing | | | 0.8 | |
E-Marketing/Info | | | 0.8 | |
Building Products — Doors & Windows | | | 0.7 | |
Transport — Truck | | | 0.7 | |
Retail — Misc./Diversified | | | 0.7 | |
Steel Pipe & Tube | | | 0.7 | |
Retail — Vitamins & Nutrition Supplements | | | 0.7 | |
Internet Application Software | | | 0.6 | |
E-Services/Consulting | | | 0.6 | |
Resorts/Theme Parks | | | 0.6 | |
Finance — Investment Banker/Broker | | | 0.6 | |
Networking Products | | | 0.6 | |
Investment Companies | | | 0.6 | |
Airlines | | | 0.6 | |
Transport — Services | | | 0.5 | |
Computer Data Security | | | 0.5 | |
Building — Residential/Commercial | | | 0.5 | |
Internet Security | | | 0.5 | |
| | | | |
Oil Companies — Exploration & Production | | | 0.5 | |
Internet Connectivity Services | | | 0.5 | |
Instruments — Scientific | | | 0.5 | |
Internet Incubators | | | 0.4 | |
Healthcare Safety Devices | | | 0.4 | |
Retail — Discount | | | 0.4 | |
Medical Labs & Testing Services | | | 0.4 | |
Electronic Measurement Instruments | | | 0.4 | |
Research & Development | | | 0.3 | |
| | |
|
|
|
| | | | 119.5 | % |
| | |
|
|
|
| * | Calculated as a percentage of net assets |
67
VALIC Company II Small Cap Growth Fund
PORTFOLIO OF INVESTMENTS — August 31, 2015
| | | | | | | | |
| | |
| Security Description | | Shares | | | Value
(Note 2) | |
| |
COMMON STOCKS — 98.1% | |
Advanced Materials — 0.9% | |
Hexcel Corp. | | | 21,354 | | | $ | 1,030,544 | |
| | | | | | |
|
|
|
Aerospace/Defense - Equipment — 0.8% | |
HEICO Corp. | | | 16,636 | | | | 846,772 | |
| | | | | | |
|
|
|
Airlines — 0.6% | |
Spirit Airlines, Inc.† | | | 12,115 | | | | 620,894 | |
| | | | | | |
|
|
|
Applications Software — 3.5% | |
Demandware, Inc.† | | | 20,666 | | | | 1,152,956 | |
HubSpot, Inc.† | | | 14,392 | | | | 680,598 | |
Imperva, Inc.† | | | 22,001 | | | | 1,310,819 | |
Tableau Software, Inc., Class A† | | | 7,034 | | | | 662,392 | |
| | | | | | |
|
|
|
| | | | | | | | 3,806,765 | |
| | | | | | |
|
|
|
Banks - Commercial — 2.5% | |
PrivateBancorp, Inc. | | | 25,708 | | | | 973,048 | |
Signature Bank† | | | 7,022 | | | | 937,367 | |
Texas Capital Bancshares, Inc.† | | | 16,255 | | | | 875,494 | |
| | | | | | |
|
|
|
| | | | | | | | 2,785,909 | |
| | | | | | |
|
|
|
Building & Construction Products - Misc. — 2.1% | |
Caesarstone Sdot-Yam, Ltd.# | | | 16,884 | | | | 671,814 | |
Fortune Brands Home & Security, Inc. | | | 12,790 | | | | 612,002 | |
Trex Co., Inc.†# | | | 25,748 | | | | 999,280 | |
| | | | | | |
|
|
|
| | | | | | | | 2,283,096 | |
| | | | | | |
|
|
|
Building Products - Air & Heating — 1.4% | |
Lennox International, Inc. | | | 13,150 | | | | 1,552,226 | |
| | | | | | |
|
|
|
Building Products - Cement — 1.2% | |
Eagle Materials, Inc. | | | 15,651 | | | | 1,280,721 | |
| | | | | | |
|
|
|
Building Products - Doors & Windows — 0.7% | |
Masonite International Corp.† | | | 12,490 | | | | 824,964 | |
| | | | | | |
|
|
|
Building - Residential/Commercial — 0.5% | |
TRI Pointe Group, Inc.† | | | 40,282 | | | | 559,114 | |
| | | | | | |
|
|
|
Casino Hotels — 0.8% | |
Boyd Gaming Corp.† | | | 53,791 | | | | 866,035 | |
| | | | | | |
|
|
|
Commercial Services — 1.3% | |
CoStar Group, Inc.† | | | 8,073 | | | | 1,429,244 | |
| | | | | | |
|
|
|
Computer Data Security — 0.5% | |
Fortinet, Inc.† | | | 14,003 | | | | 590,086 | |
| | | | | | |
|
|
|
Computer Services — 1.9% | |
Barracuda Networks, Inc.† | | | 32,313 | | | | 849,509 | |
Fleetmatics Group PLC†# | | | 26,732 | | | | 1,196,524 | |
| | | | | | |
|
|
|
| | | | | | | | 2,046,033 | |
| | | | | | |
|
|
|
Computer Software — 2.0% | |
Cornerstone OnDemand, Inc.† | | | 27,912 | | | | 997,575 | |
Envestnet, Inc.† | | | 38,546 | | | | 1,203,791 | |
| | | | | | |
|
|
|
| | | | | | | | 2,201,366 | |
| | | | | | |
|
|
|
Computers - Memory Devices — 1.1% | |
Nimble Storage, Inc.†# | | | 45,659 | | | | 1,217,269 | |
| | | | | | |
|
|
|
Diagnostic Equipment — 0.9% | |
GenMark Diagnostics, Inc.†# | | | 94,605 | | | | 978,216 | |
| | | | | | |
|
|
|
Distribution/Wholesale — 3.1% | |
Pool Corp. | | | 24,182 | | | | 1,685,002 | |
Watsco, Inc. | | | 14,522 | | | | 1,778,364 | |
| | | | | | |
|
|
|
| | | | | | | | 3,463,366 | |
| | | | | | |
|
|
|
Diversified Manufacturing Operations — 1.2% | |
Carlisle Cos., Inc. | | | 13,397 | | | | 1,349,078 | |
| | | | | | |
|
|
|
| | | | | | | | |
| | |
| Security Description | | Shares | | | Value
(Note 2) | |
| |
| | | | | | | | | |
Drug Delivery Systems — 1.0% | |
Nektar Therapeutics†# | | | 40,548 | | | $ | 448,055 | |
Revance Therapeutics, Inc.†# | | | 21,857 | | | | 661,393 | |
| | | | | | |
|
|
|
| | | | | | | | 1,109,448 | |
| | | | | | |
|
|
|
E-Commerce/Services — 2.2% | |
GrubHub, Inc.† | | | 32,139 | | | | 850,077 | |
Wayfair, Inc., Class A†# | | | 41,798 | | | | 1,559,065 | |
| | | | | | |
|
|
|
| | | | | | | | 2,409,142 | |
| | | | | | |
|
|
|
E-Marketing/Info — 0.8% | |
Marketo, Inc.† | | | 29,587 | | | | 828,732 | |
| | | | | | |
|
|
|
E-Services/Consulting — 0.6% | |
Shopify, Inc., Class A†# | | | 25,190 | | | | 693,733 | |
| | | | | | |
|
|
|
Educational Software — 1.6% | |
2U, Inc.†# | | | 51,671 | | | | 1,806,935 | |
| | | | | | |
|
|
|
Electronic Components - Semiconductors — 3.3% | |
Cavium, Inc.† | | | 16,296 | | | | 1,108,454 | |
Inphi Corp.† | | | 54,707 | | | | 1,298,744 | |
Monolithic Power Systems, Inc. | | | 26,596 | | | | 1,279,002 | |
| | | | | | |
|
|
|
| | | | | | | | 3,686,200 | |
| | | | | | |
|
|
|
Electronic Measurement Instruments — 0.4% | |
Fitbit, Inc., Class A†# | | | 12,160 | | | | 419,398 | |
| | | | | | |
|
|
|
Energy - Alternate Sources — 0.9% | |
SolarCity Corp.†# | | | 8,110 | | | | 391,551 | |
Sunrun, Inc.† | | | 46,300 | | | | 550,044 | |
| | | | | | |
|
|
|
| | | | | | | | 941,595 | |
| | | | | | |
|
|
|
Enterprise Software/Service — 5.2% | |
Benefitfocus, Inc.†# | | | 15,757 | | | | 577,967 | |
Evolent Health, Inc., Class A†# | | | 33,390 | | | | 567,630 | |
Guidewire Software, Inc.† | | | 32,203 | | | | 1,800,470 | |
Proofpoint, Inc.† | | | 23,517 | | | | 1,324,948 | |
Veeva Systems, Inc., Class A†# | | | 57,464 | | | | 1,488,317 | |
| | | | | | |
|
|
|
| | | | | | | | 5,759,332 | |
| | | | | | |
|
|
|
Finance - Investment Banker/Broker — 0.6% | |
Evercore Partners, Inc., Class A | | | 12,850 | | | | 673,083 | |
| | | | | | |
|
|
|
Food - Misc./Diversified — 1.0% | |
Diamond Foods, Inc.† | | | 35,505 | | | | 1,071,186 | |
| | | | | | |
|
|
|
Footwear & Related Apparel — 1.2% | |
Wolverine World Wide, Inc. | | | 49,538 | | | | 1,335,049 | |
| | | | | | |
|
|
|
Healthcare Safety Devices — 0.4% | |
Unilife Corp.†# | | | 373,392 | | | | 455,538 | |
| | | | | | |
|
|
|
Instruments - Scientific — 0.5% | |
Fluidigm Corp.†# | | | 40,865 | | | | 498,144 | |
| | | | | | |
|
|
|
Insurance - Property/Casualty — 0.8% | |
AmTrust Financial Services, Inc. | | | 15,424 | | | | 896,906 | |
| | | | | | |
|
|
|
Internet Application Software — 0.6% | |
Zendesk, Inc.† | | | 34,050 | | | | 704,154 | |
| | | | | | |
|
|
|
Internet Connectivity Services — 0.5% | |
Boingo Wireless, Inc.† | | | 66,882 | | | | 504,959 | |
| | | | | | |
|
|
|
Internet Incubators — 0.4% | |
HomeAway, Inc.† | | | 16,054 | | | | 460,589 | |
| | | | | | |
|
|
|
Internet Security — 0.5% | |
Rapid7, Inc.†# | | | 25,000 | | | | 527,250 | |
| | | | | | |
|
|
|
Internet Telephone — 0.9% | |
RingCentral, Inc., Class A† | | | 59,687 | | | | 1,027,213 | |
| | | | | | |
|
|
|
68
VALIC Company II Small Cap Growth Fund
PORTFOLIO OF INVESTMENTS — August 31, 2015 — (continued)
| | | | | | | | |
| | |
| Security Description | | Shares | | | Value
(Note 2) | |
| |
COMMON STOCKS (continued) | |
Investment Companies — 0.6% | |
PennantPark Investment Corp.# | | | 84,889 | | | $ | 645,156 | |
| | | | | | |
|
|
|
Investment Management/Advisor Services — 1.2% | |
Financial Engines, Inc.# | | | 41,267 | | | | 1,339,527 | |
| | | | | | |
|
|
|
Lighting Products & Systems — 2.0% | |
Acuity Brands, Inc. | | | 11,211 | | | | 2,184,688 | |
| | | | | | |
|
|
|
Machinery - General Industrial — 1.4% | |
Middleby Corp.† | | | 13,692 | | | | 1,486,267 | |
| | | | | | |
|
|
|
Machinery - Pumps — 0.8% | |
Graco, Inc. | | | 12,127 | | | | 836,642 | |
| | | | | | |
|
|
|
Medical Imaging Systems — 1.0% | |
Novadaq Technologies, Inc.†# | | | 96,476 | | | | 1,114,298 | |
| | | | | | |
|
|
|
Medical Labs & Testing Services — 0.4% | |
Invitae Corp.†# | | | 28,147 | | | | 287,381 | |
Teladoc, Inc.†# | | | 5,400 | | | | 138,996 | |
| | | | | | |
|
|
|
| | | | | | | | 426,377 | |
| | | | | | |
|
|
|
Medical Products — 1.5% | |
K2M Group Holdings, Inc.† | | | 43,398 | | | | 921,340 | |
Syneron Medical, Ltd.† | | | 81,850 | | | | 772,664 | |
| | | | | | |
|
|
|
| | | | | | | | 1,694,004 | |
| | | | | | |
|
|
|
Medical - Biomedical/Gene — 6.2% | |
Acceleron Pharma, Inc.† | | | 17,394 | | | | 504,078 | |
Bellicum Pharmaceuticals, Inc.†# | | | 16,151 | | | | 275,536 | |
Coherus Biosciences, Inc.† | | | 32,455 | | | | 895,758 | |
Exact Sciences Corp.†# | | | 22,450 | | | | 496,370 | |
Halozyme Therapeutics, Inc.† | | | 43,707 | | | | 763,124 | |
Insmed, Inc.† | | | 46,109 | | | | 1,126,904 | |
Intrexon Corp.†# | | | 11,515 | | | | 512,417 | |
Kite Pharma, Inc.†# | | | 14,464 | | | | 769,051 | |
Puma Biotechnology, Inc.† | | | 4,448 | | | | 408,860 | |
Sage Therapeutics, Inc.† | | | 13,261 | | | | 716,227 | |
Versartis, Inc.†# | | | 25,837 | | | | 335,106 | |
| | | | | | |
|
|
|
| | | | | | | | 6,803,431 | |
| | | | | | |
|
|
|
Medical - Drugs — 5.3% | |
ACADIA Pharmaceuticals, Inc.† | | | 24,410 | | | | 894,138 | |
Anacor Pharmaceuticals, Inc.† | | | 2,880 | | | | 375,581 | |
Chimerix, Inc.† | | | 19,132 | | | | 936,320 | |
FibroGen, Inc.† | | | 24,820 | | | | 608,090 | |
Horizon Pharma PLC† | | | 34,234 | | | | 1,000,317 | |
Ignyta, Inc.†# | | | 43,259 | | | | 591,783 | |
Keryx Biopharmaceuticals, Inc.†# | | | 46,890 | | | | 289,780 | |
NantKwest, Inc.† | | | 6,980 | | | | 119,498 | |
Sagent Pharmaceuticals, Inc.† | | | 29,509 | | | | 589,590 | |
TherapeuticsMD, Inc.†# | | | 74,230 | | | | 455,030 | |
| | | | | | |
|
|
|
| | | | | | | | 5,860,127 | |
| | | | | | |
|
|
|
Medical - HMO — 1.5% | |
WellCare Health Plans, Inc.† | | | 18,479 | | | | 1,675,491 | |
| | | | | | |
|
|
|
Medical - Hospitals — 1.6% | |
Acadia Healthcare Co., Inc.† | | | 24,563 | | | | 1,793,836 | |
| | | | | | |
|
|
|
MRI/Medical Diagnostic Imaging — 1.0% | |
Surgical Care Affiliates, Inc.† | | | 30,827 | | | | 1,126,727 | |
| | | | | | |
|
|
|
Networking Products — 0.6% | |
Ruckus Wireless, Inc.† | | | 58,452 | | | | 661,677 | |
| | | | | | |
|
|
|
Oil Companies - Exploration & Production — 0.5% | |
Laredo Petroleum, Inc.†# | | | 51,363 | | | | 523,389 | |
| | | | | | |
|
|
|
Oil Field Machinery & Equipment — 1.2% | |
Dril-Quip, Inc.† | | | 11,311 | | | | 779,780 | |
| | | | | | | | |
| | |
| Security Description | | Shares | | | Value
(Note 2) | |
| |
| | | | | | | | | |
Oil Field Machinery & Equipment (continued) | |
Forum Energy Technologies, Inc.† | | | 33,233 | | | $ | 522,423 | |
| | | | | | |
|
|
|
| | | | | | | | 1,302,203 | |
| | | | | | |
|
|
|
Oil Refining & Marketing — 0.8% | |
Delek US Holdings, Inc. | | | 26,968 | | | | 829,536 | |
| | | | | | |
|
|
|
Patient Monitoring Equipment — 1.0% | |
Insulet Corp.† | | | 36,279 | | | | 1,077,849 | |
| | | | | | |
|
|
|
Real Estate Investment Trusts — 0.9% | |
CubeSmart | | | 21,010 | | | | 531,343 | |
Highwoods Properties, Inc. | | | 13,295 | | | | 504,412 | |
| | | | | | |
|
|
|
| | | | | | | | 1,035,755 | |
| | | | | | |
|
|
|
Real Estate Management/Services — 0.9% | |
RE/MAX Holdings, Inc., Class A | | | 27,139 | | | �� | 995,459 | |
| | | | | | |
|
|
|
Research & Development — 0.3% | |
Arrowhead Research Corp.†# | | | 50,901 | | | | 301,843 | |
| | | | | | |
|
|
|
Resort/Theme Parks — 0.6% | |
Vail Resorts, Inc. | | | 6,329 | | | | 682,962 | |
| | | | | | |
|
|
|
Retail - Apparel/Shoe — 1.9% | |
Kate Spade & Co.† | | | 34,158 | | | | 647,636 | |
Men’s Wearhouse, Inc. | | | 24,917 | | | | 1,406,564 | |
| | | | | | |
|
|
|
| | | | | | | | 2,054,200 | |
| | | | | | |
|
|
|
Retail - Automobile — 3.2% | |
Lithia Motors, Inc., Class A | | | 15,610 | | | | 1,664,026 | |
Penske Automotive Group, Inc. | | | 18,005 | | | | 911,053 | |
Rush Enterprises, Inc., Class A† | | | 36,310 | | | | 926,631 | |
| | | | | | |
|
|
|
| | | | | | | | 3,501,710 | |
| | | | | | |
|
|
|
Retail - Discount — 0.4% | |
Ollie’s Bargain Outlet Holdings, Inc.† | | | 24,150 | | | | 432,043 | |
| | | | | | |
|
|
|
Retail - Misc./Diversified — 0.7% | |
Container Store Group, Inc.† | | | 47,717 | | | | 806,894 | |
| | | | | | |
|
|
|
Retail - Pet Food & Supplies — 0.8% | |
Freshpet, Inc.†# | | | 65,195 | | | | 846,883 | |
| | | | | | |
|
|
|
Retail - Vitamins & Nutrition Supplements — 0.7% | |
Vitamin Shoppe, Inc.† | | | 20,259 | | | | 725,272 | |
| | | | | | |
|
|
|
Savings & Loans/Thrifts — 1.1% | |
BofI Holding, Inc.†# | | | 10,750 | | | | 1,245,280 | |
| | | | | | |
|
|
|
Semiconductor Components - Integrated Circuits — 1.0% | |
M/A-COM Technology Solutions Holdings, Inc†. | | | 37,226 | | | | 1,098,539 | |
| | | | | | |
|
|
|
Semiconductor Equipment — 0.8% | |
MKS Instruments, Inc. | | | 25,178 | | | | 848,499 | |
| | | | | | |
|
|
|
Steel Pipe & Tube — 0.7% | |
Advanced Drainage Systems, Inc.# | | | 26,416 | | | | 750,479 | |
| | | | | | |
|
|
|
Telecom Equipment - Fiber Optics — 1.1% | |
Ciena Corp.† | | | 52,971 | | | | 1,184,432 | |
| | | | | | |
|
|
|
Therapeutics — 2.0% | |
Axovant Sciences, Ltd.†# | | | 22,320 | | | | 268,286 | |
Esperion Therapeutics, Inc.†# | | | 3,270 | | | | 156,797 | |
Nevro Corp.† | | | 14,548 | | | | 655,096 | |
Portola Pharmaceuticals, Inc.† | | | 23,244 | | | | 1,096,187 | |
| | | | | | |
|
|
|
| | | | | | | | 2,176,366 | |
| | | | | | |
|
|
|
Transport - Services — 0.5% | |
XPO Logistics, Inc.†# | | | 16,988 | | | | 596,279 | |
| | | | | | |
|
|
|
Transport - Truck — 0.7% | |
Old Dominion Freight Line, Inc.† | | | 12,363 | | | | 822,016 | |
| | | | | | |
|
|
|
69
VALIC Company II Small Cap Growth Fund
PORTFOLIO OF INVESTMENTS — August 31, 2015 — (continued)
| | | | | | | | |
| | |
| Security Description | | Shares/
Principal
Amount | | | Value
(Note 2) | |
| |
COMMON STOCKS (continued) | |
Web Hosting/Design — 0.8% | |
GoDaddy, Inc., Class A†# | | | 35,131 | | | $ | 881,085 | |
| | | | | | |
|
|
|
Total Long-Term Investment Securities | | | | | | | | |
(cost $96,256,115) | | | | | | | 107,907,505 | |
| | | | | | |
|
|
|
SHORT-TERM INVESTMENT SECURITIES — 21.4% | |
Registered Investment Companies — 19.1% | |
State Street Navigator Securities Lending Prime Portfolio 0.21%(1)(2) | | | 21,019,855 | | | | 21,019,855 | |
| | | | | | |
|
|
|
Time Deposits — 2.3% | |
Euro Time Deposit with State Street Bank and Trust Co.
0.01% due 09/01/2015 | | $ | 2,574,000 | | | | 2,574,000 | |
| | | | | | |
|
|
|
Total Short-Term Investment Securities | | | | | | | | |
(cost $23,593,855) | | | | | | | 23,593,855 | |
| | | | | | |
|
|
|
TOTAL INVESTMENTS | | | | | | | | |
(cost $119,849,970)(3) | | | 119.5 | % | | | 131,501,360 | |
Liabilities in excess of other assets | | | (19.5 | ) | | | (21,472,238 | ) |
| | |
|
|
| |
|
|
|
NET ASSETS | | | 100.0 | % | | $ | 110,029,122 | |
| | |
|
|
| |
|
|
|
| † | Non-income producing security |
| # | The security or a portion thereof is out on loan (see Note 2) |
| (1) | At August 31, 2015, the Fund had loaned securities with a total value of $19,953,510. This was secured by collateral of $21,019,855, which was received in cash and subsequently invested in short-term investments currently valued at $21,019,855 as reported in the Portfolio of Investments. |
| (2) | The rate shown is the 7-day yield as of August 31, 2015. |
| (3) | See Note 5 for cost of investments on a tax basis. |
The following is a summary of the inputs used to value the Fund’s net assets as of August 31, 2015 (see Note 2):
| | | | | | | | | | | | | | | | |
| | | Level 1 - Unadjusted Quoted
Prices
| | | Level 2 - Other Observable
Inputs
| | | Level 3 - Significant
Unobservable Inputs
| | | Total
| |
ASSETS: | | | | | | | | | | | | | | | | |
Investments at Value:* | | | | | | | | | | | | | | | | |
Common Stocks | | $ | 107,907,505 | | | $ | — | | | $ | — | | | $ | 107,907,505 | |
Short-Term Investment Securities: | | | | | | | | | | | | | | | | |
Registered Investment Companies | | | 21,019,855 | | | | — | | | | — | | | | 21,019,855 | |
Time Deposits | | | — | | | | 2,574,000 | | | | — | | | | 2,574,000 | |
| | |
|
|
| |
|
|
| |
|
|
| |
|
|
|
Total Investments at Value | | $ | 128,927,360 | | | $ | 2,574,000 | | | $ | — | | | $ | 131,501,360 | |
| | |
|
|
| |
|
|
| |
|
|
| |
|
|
|
| * | For a detailed presentation of investments, please refer to the Portfolio of Investments. |
The Fund’s policy is to recognize transfers between Levels as of the end of the reporting period. There were no transfers between Levels during the reporting period.
See Notes to Financial Statements
70
VALIC Company II Small Cap Value Fund
PORTFOLIO PROFILE — August 31, 2015 (unaudited)
Industry Allocation*
| | | | |
Real Estate Investment Trusts | | | 13.1 | % |
Banks — Commercial | | | 12.2 | |
Registered Investment Companies | | | 9.8 | |
Oil Companies — Exploration & Production | | | 4.0 | |
Electric — Integrated | | | 2.7 | |
Retail — Apparel/Shoe | | | 2.6 | |
Human Resources | | | 2.3 | |
Repurchase Agreements | | | 2.1 | |
Insurance — Reinsurance | | | 1.9 | |
Machinery — General Industrial | | | 1.8 | |
Distribution/Wholesale | | | 1.7 | |
Insurance — Life/Health | | | 1.6 | |
Finance — Consumer Loans | | | 1.6 | |
Engineering/R&D Services | | | 1.4 | |
Electronic Components — Misc. | | | 1.4 | |
Investment Management/Advisor Services | | | 1.2 | |
Gas — Distribution | | | 1.2 | |
Medical — Biomedical/Gene | | | 1.2 | |
Resorts/Theme Parks | | | 1.2 | |
Oil Field Machinery & Equipment | | | 1.1 | |
Auction Houses/Art Dealers | | | 1.1 | |
Savings & Loans/Thrifts | | | 1.1 | |
Transport — Truck | | | 1.1 | |
Medical Products | | | 1.0 | |
Computer Services | | | 1.0 | |
Commercial Services — Finance | | | 1.0 | |
Food — Dairy Products | | | 0.9 | |
Beverages — Wine/Spirits | | | 0.8 | |
Finance — Mortgage Loan/Banker | | | 0.8 | |
Medical Instruments | | | 0.8 | |
Medical Sterilization Products | | | 0.8 | |
Oil — Field Services | | | 0.8 | |
Food — Misc./Diversified | | | 0.7 | |
Food — Flour & Grain | | | 0.7 | |
Hotels/Motels | | | 0.7 | |
Electronic Components — Semiconductors | | | 0.7 | |
Energy — Alternate Sources | | | 0.7 | |
Aerospace/Defense — Equipment | | | 0.7 | |
Real Estate Operations & Development | | | 0.7 | |
Diversified Manufacturing Operations | | | 0.7 | |
Housewares | | | 0.7 | |
Rubber — Tires | | | 0.7 | |
Entertainment Software | | | 0.7 | |
Environmental Consulting & Engineering | | | 0.7 | |
Medical — Outpatient/Home Medical | | | 0.6 | |
Containers — Metal/Glass | | | 0.6 | |
Consulting Services | | | 0.6 | |
Networking Products | | | 0.6 | |
Web Hosting/Design | | | 0.6 | |
Insurance — Property/Casualty | | | 0.6 | |
Retail — Home Furnishings | | | 0.5 | |
Finance — Investment Banker/Broker | | | 0.5 | |
Retail — Restaurants | | | 0.5 | |
Paper & Related Products | | | 0.5 | |
Computer Software | | | 0.5 | |
Tobacco | | | 0.5 | |
Computers | | | 0.5 | |
Food — Baking | | | 0.5 | |
Gambling (Non-Hotel) | | | 0.5 | |
Steel — Producers | | | 0.5 | |
Telecom Services | | | 0.4 | |
Retail — Discount | | | 0.4 | |
Retail — Regional Department Stores | | | 0.4 | |
Office Supplies & Forms | | | 0.4 | |
Wireless Equipment | | | 0.4 | |
Consumer Products — Misc. | | | 0.4 | |
Semiconductor Equipment | | | 0.4 | |
MRI/Medical Diagnostic Imaging | | | 0.4 | |
Transport — Services | | | 0.4 | |
| | | | |
Insurance — Multi-line | | | 0.4 | |
Semiconductor Components — Integrated Circuits | | | 0.3 | |
Containers — Paper/Plastic | | | 0.3 | |
Transport — Air Freight | | | 0.3 | |
Water | | | 0.3 | |
Auto/Truck Parts & Equipment — Replacement | | | 0.3 | |
Enterprise Software/Service | | | 0.3 | |
Telephone — Integrated | | | 0.3 | |
Medical — HMO | | | 0.3 | |
Retail — Hair Salons | | | 0.3 | |
Building — Residential/Commercial | | | 0.3 | |
Banks — Mortgage | | | 0.2 | |
Food — Wholesale/Distribution | | | 0.2 | |
Diagnostic Kits | | | 0.2 | |
Airlines | | | 0.2 | |
Chemicals — Specialty | | | 0.2 | |
Printing — Commercial | | | 0.2 | |
Building & Construction Products — Misc. | | | 0.2 | |
Data Processing/Management | | | 0.2 | |
Engines — Internal Combustion | | | 0.2 | |
Schools | | | 0.2 | |
Web Portals/ISP | | | 0.2 | |
Electric — Generation | | | 0.2 | |
Computer Aided Design | | | 0.2 | |
Machinery — Farming | | | 0.2 | |
Publishing — Periodicals | | | 0.2 | |
Chemicals — Diversified | | | 0.2 | |
Retail — Pawn Shops | | | 0.2 | |
Home Furnishings | | | 0.2 | |
Electric — Distribution | | | 0.2 | |
Machinery — Construction & Mining | | | 0.2 | |
Oil & Gas Drilling | | | 0.2 | |
Independent Power Producers | | | 0.2 | |
Telecommunication Equipment | | | 0.2 | |
Building & Construction — Misc. | | | 0.1 | |
Agricultural Chemicals | | | 0.1 | |
Lasers — System/Components | | | 0.1 | |
Footwear & Related Apparel | | | 0.1 | |
Travel Services | | | 0.1 | |
Medical — Drugs | | | 0.1 | |
Textile — Apparel | | | 0.1 | |
Therapeutics | | | 0.1 | |
Auto/Truck Parts & Equipment — Original | | | 0.1 | |
Internet Application Software | | | 0.1 | |
Food — Retail | | | 0.1 | |
Wire & Cable Products | | | 0.1 | |
Metal — Iron | | | 0.1 | |
Steel Pipe & Tube | | | 0.1 | |
Radio | | | 0.1 | |
Office Furnishings — Original | | | 0.1 | |
Athletic Equipment | | | 0.1 | |
Power Converter/Supply Equipment | | | 0.1 | |
Recreational Centers | | | 0.1 | |
Auto — Truck Trailers | | | 0.1 | |
Commercial Services | | | 0.1 | |
Finance — Other Services | | | 0.1 | |
Publishing — Books | | | 0.1 | |
Industrial Automated/Robotic | | | 0.1 | |
Respiratory Products | | | 0.1 | |
Security Services | | | 0.1 | |
Oil Refining & Marketing | | | 0.1 | |
Multimedia | | | 0.1 | |
Transport — Equipment & Leasing | | | 0.1 | |
Retail — Toy Stores | | | 0.1 | |
Building — Maintenance & Services | | | 0.1 | |
Electronic Parts Distribution | | | 0.1 | |
Satellite Telecom | | | 0.1 | |
Building Products — Light Fixtures | | | 0.1 | |
| | |
|
|
|
| | | | 109.3 | % |
| | |
|
|
|
| * | Calculated as a percentage of net assets |
71
VALIC Company II Small Cap Value Fund
PORTFOLIO OF INVESTMENTS — August 31, 2015
| | | | | | | | |
| | |
| Security Description | | Shares | | | Value
(Note 2) | |
| |
COMMON STOCKS — 97.4% | |
Aerospace/Defense — 0.0% | |
National Presto Industries, Inc. | | | 2,800 | | | $ | 229,740 | |
| | | | | | |
|
|
|
Aerospace/Defense - Equipment — 0.7% | |
AAR Corp. | | | 103,900 | | | | 2,527,887 | |
Moog, Inc., Class A† | | | 15,700 | | | | 990,670 | |
| | | | | | |
|
|
|
| | | | | | | | 3,518,557 | |
| | | | | | |
|
|
|
Agricultural Chemicals — 0.1% | |
Intrepid Potash, Inc.†# | | | 88,600 | | | | 700,826 | |
| | | | | | |
|
|
|
Airlines — 0.2% | |
Alaska Air Group, Inc. | | | 15,200 | | | | 1,137,872 | |
| | | | | | |
|
|
|
Athletic Equipment — 0.1% | |
Nautilus, Inc.† | | | 30,200 | | | | 461,456 | |
| | | | | | |
|
|
|
Auction Houses/Art Dealers — 1.1% | |
KAR Auction Services, Inc. | | | 148,450 | | | | 5,498,588 | |
| | | | | | |
|
|
|
Audio/Video Products — 0.0% | |
VOXX International Corp.† | | | 16,100 | | | | 124,775 | |
| | | | | | |
|
|
|
Auto - Truck Trailers — 0.1% | |
Wabash National Corp.† | | | 33,700 | | | | 412,151 | |
| | | | | | |
|
|
|
Auto/Truck Parts & Equipment - Original — 0.1% | |
Accuride Corp.† | | | 14,900 | | | | 50,511 | |
Dana Holding Corp. | | | 28,000 | | | | 491,120 | |
| | | | | | |
|
|
|
| | | | | | | | 541,631 | |
| | | | | | |
|
|
|
Auto/Truck Parts & Equipment - Replacement — 0.3% | |
Douglas Dynamics, Inc. | | | 67,900 | | | | 1,508,738 | |
| | | | | | |
|
|
|
Banks - Commercial — 12.2% | |
1st Source Corp. | | | 19,720 | | | | 590,417 | |
American National Bankshares, Inc. | | | 1,100 | | | | 25,993 | |
BancFirst Corp. | | | 11,740 | | | | 709,918 | |
BancorpSouth, Inc. | | | 68,200 | | | | 1,620,432 | |
Bank of Hawaii Corp. | | | 29,880 | | | | 1,854,353 | |
Banner Corp. | | | 11,200 | | | | 497,392 | |
BBCN Bancorp, Inc. | | | 64,520 | | | | 938,766 | |
Capital Bank Financial Corp., Class A† | | | 42,400 | | | | 1,304,648 | |
Cascade Bancorp† | | | 15,201 | | | | 82,237 | |
Cathay General Bancorp Class B | | | 37,660 | | | | 1,115,866 | |
Central Pacific Financial Corp. | | | 92,600 | | | | 1,920,524 | |
Century Bancorp, Inc., Class A | | | 1,518 | | | | 63,285 | |
Chemical Financial Corp. | | | 13,200 | | | | 421,608 | |
Citizens & Northern Corp. | | | 3,500 | | | | 69,930 | |
City Holding Co. | | | 26,400 | | | | 1,257,168 | |
CoBiz Financial, Inc. | | | 17,800 | | | | 229,264 | |
Columbia Banking System, Inc. | | | 9,973 | | | | 302,282 | |
Community Bank System, Inc. | | | 24,780 | | | | 883,655 | |
Community Trust Bancorp, Inc. | | | 22,318 | | | | 783,362 | |
Customers Bancorp, Inc.† | | | 30,700 | | | | 752,457 | |
East West Bancorp, Inc. | | | 2,273 | | | | 91,852 | |
Financial Institutions, Inc. | | | 12,700 | | | | 314,579 | |
First BanCorp† | | | 233,100 | | | | 934,731 | |
First Bancorp | | | 5,500 | | | | 93,610 | |
First Busey Corp. | | | 75,680 | | | | 484,352 | |
First Citizens BancShares, Inc., Class A | | | 1,540 | | | | 365,257 | |
First Commonwealth Financial Corp. | | | 232,300 | | | | 2,055,855 | |
First Community Bancshares, Inc. | | | 8,400 | | | | 148,764 | |
First Financial Bancorp | | | 20,698 | | | | 381,671 | |
First Financial Bankshares, Inc.# | | | 13,860 | | | | 431,600 | |
First Interstate BancSystem, Inc. | | | 16,900 | | | | 450,892 | |
FirstMerit Corp. | | | 171,450 | | | | 3,079,242 | |
FNB Corp. | | | 84,940 | | | | 1,066,846 | |
Fulton Financial Corp. | | | 53,800 | | | | 654,208 | |
Glacier Bancorp, Inc. | | | 38,700 | | | | 1,006,587 | |
| | | | | | | | |
| | |
| Security Description | | Shares | | | Value
(Note 2) | |
| |
| | |
Banks - Commercial (continued) | |
Great Southern Bancorp, Inc. | | | 6,700 | | | $ | 269,809 | |
Guaranty Bancorp | | | 4,800 | | | | 76,992 | |
Hancock Holding Co. | | | 180,221 | | | | 5,060,606 | |
Heartland Financial USA, Inc. | | | 9,840 | | | | 357,881 | |
Heritage Financial Corp. | | | 4,439 | | | | 78,659 | |
Kearny Financial Corp.† | | | 3,627 | | | | 41,167 | |
Lakeland Bancorp, Inc. | | | 11,273 | | | | 124,679 | |
Lakeland Financial Corp. | | | 5,080 | | | | 208,737 | |
MainSource Financial Group, Inc. | | | 30,500 | | | | 631,655 | |
MB Financial, Inc. | | | 21,820 | | | | 718,751 | |
Metro Bancorp, Inc. | | | 10,700 | | | | 306,448 | |
National Penn Bancshares, Inc. | | | 8,600 | | | | 103,329 | |
OFG Bancorp# | | | 102,800 | | | | 888,192 | |
Pacific Continental Corp. | | | 14,300 | | | | 184,756 | |
PacWest Bancorp | | | 28,400 | | | | 1,210,976 | |
Preferred Bank | | | 3,200 | | | | 98,080 | |
Republic Bancorp, Inc., Class A | | | 3,600 | | | | 89,964 | |
S&T Bancorp, Inc. | | | 3,980 | | | | 119,082 | |
Sierra Bancorp | | | 3,120 | | | | 53,040 | |
Simmons First National Corp., Class A | | | 13,720 | | | | 601,896 | |
Southside Bancshares, Inc. | | | 3,182 | | | | 82,859 | |
Southwest Bancorp, Inc. | | | 23,280 | | | | 388,310 | |
State Bank Financial Corp. | | | 10,500 | | | | 212,100 | |
Stock Yards Bancorp, Inc. | | | 2,300 | | | | 81,052 | |
Suffolk Bancorp | | | 3,120 | | | | 83,179 | |
TCF Financial Corp. | | | 80,440 | | | | 1,248,429 | |
Tompkins Financial Corp. | | | 7,248 | | | | 380,448 | |
TriState Capital Holdings, Inc.† | | | 3,600 | | | | 45,108 | |
Trustmark Corp. | | | 26,300 | | | | 605,689 | |
UMB Financial Corp. | | | 34,160 | | | | 1,712,441 | |
Umpqua Holdings Corp. | | | 263,014 | | | | 4,394,964 | |
Union Bankshares Corp. | | | 76,819 | | | | 1,812,928 | |
Valley National Bancorp | | | 13,816 | | | | 130,699 | |
Washington Trust Bancorp, Inc. | | | 6,980 | | | | 269,498 | |
Webster Financial Corp. | | | 20,400 | | | | 721,752 | |
WesBanco, Inc. | | | 2,791 | | | | 85,935 | |
West Bancorporation, Inc. | | | 7,580 | | | | 136,667 | |
Westamerica Bancorporation# | | | 67,224 | | | | 3,034,491 | |
Western Alliance Bancorp† | | | 2,832 | | | | 86,433 | |
Wilshire Bancorp, Inc. | | | 118,600 | | | | 1,266,648 | |
Zions Bancorporation | | | 155,130 | | | | 4,498,770 | |
| | | | | | |
|
|
|
| | | | | | | | 59,486,702 | |
| | | | | | |
|
|
|
Banks - Mortgage — 0.2% | |
Walker & Dunlop, Inc.† | | | 49,200 | | | | 1,197,036 | |
| | | | | | |
|
|
|
Beverages - Wine/Spirits — 0.8% | |
Treasury Wine Estates, Ltd. ADR | | | 962,150 | | | | 4,079,516 | |
| | | | | | |
|
|
|
Building & Construction Products-Misc. — 0.2% | |
Gibraltar Industries, Inc.† | | | 61,480 | | | | 1,007,657 | |
| | | | | | |
|
|
|
Building & Construction-Misc. — 0.1% | |
Comfort Systems USA, Inc. | | | 25,600 | | | | 709,632 | |
| | | | | | |
|
|
|
Building Products - Light Fixtures — 0.1% | |
LSI Industries, Inc. | | | 25,700 | | | | 243,893 | |
| | | | | | |
|
|
|
Building - Maintenance & Services — 0.1% | |
ABM Industries, Inc. | | | 8,700 | | | | 278,487 | |
| | | | | | |
|
|
|
Building - Residential/Commercial — 0.3% | |
KB Home# | | | 35,600 | | | | 521,540 | |
MDC Holdings, Inc. | | | 7,000 | | | | 199,430 | |
Ryland Group, Inc. | | | 12,500 | | | | 540,500 | |
| | | | | | |
|
|
|
| | | | | | | | 1,261,470 | |
| | | | | | |
|
|
|
72
VALIC Company II Small Cap Value Fund
PORTFOLIO OF INVESTMENTS — August 31, 2015 — (continued)
| | | | | | | | |
| | |
| Security Description | | Shares | | | Value
(Note 2) | |
| |
COMMON STOCKS (continued) | |
Casino Services — 0.0% | |
Scientific Games Corp., Class A†# | | | 2,400 | | | $ | 26,448 | |
| | | | | | |
|
|
|
Chemicals - Diversified — 0.2% | |
Olin Corp.# | | | 40,600 | | | | 810,376 | |
| | | | | | |
|
|
|
Chemicals - Specialty — 0.2% | |
KMG Chemicals, Inc. | | | 3,100 | | | | 62,620 | |
Minerals Technologies, Inc. | | | 3,160 | | | | 169,976 | |
OM Group, Inc. | | | 23,700 | | | | 793,950 | |
| | | | | | |
|
|
|
| | | | | | | | 1,026,546 | |
| | | | | | |
|
|
|
Coffee — 0.0% | |
Farmer Bros. Co.† | | | 2,000 | | | | 45,720 | |
| | | | | | |
|
|
|
Commercial Services — 0.1% | |
RPX Corp.† | | | 29,800 | | | | 410,346 | |
| | | | | | |
|
|
|
Commercial Services - Finance — 1.0% | |
Everi Holdings, Inc.† | | | 11,120 | | | | 57,490 | |
EVERTEC, Inc. | | | 243,800 | | | | 4,412,780 | |
MoneyGram International, Inc.† | | | 40,800 | | | | 356,592 | |
| | | | | | |
|
|
|
| | | | | | | | 4,826,862 | |
| | | | | | |
|
|
|
Computer Aided Design — 0.2% | |
Aspen Technology, Inc.† | | | 23,000 | | | | 871,010 | |
| | | | | | |
|
|
|
Computer Services — 1.0% | |
Convergys Corp. | | | 72,500 | | | | 1,638,500 | |
Insight Enterprises, Inc.† | | | 56,902 | | | | 1,440,190 | |
Sykes Enterprises, Inc.† | | | 22,700 | | | | 570,905 | |
Unisys Corp.† | | | 94,200 | | | | 1,240,614 | |
| | | | | | |
|
|
|
| | | | | | | | 4,890,209 | |
| | | | | | |
|
|
|
Computer Software — 0.5% | |
Avid Technology, Inc.†# | | | 283,060 | | | | 2,352,229 | |
| | | | | | |
|
|
|
Computers — 0.5% | |
Wincor Nixdorf AG ADR | | | 280,000 | | | | 2,296,000 | |
| | | | | | |
|
|
|
Consulting Services — 0.6% | |
CRA International, Inc.† | | | 5,000 | | | | 113,600 | |
FTI Consulting, Inc.† | | | 71,600 | | | | 2,853,976 | |
| | | | | | |
|
|
|
| | | | | | | | 2,967,576 | |
| | | | | | |
|
|
|
Consumer Products - Misc. — 0.4% | |
Central Garden & Pet Co., Class A† | | | 110,560 | | | | 1,398,584 | |
CSS Industries, Inc. | | | 18,900 | | | | 500,472 | |
| | | | | | |
|
|
|
| | | | | | | | 1,899,056 | |
| | | | | | |
|
|
|
Containers - Metal/Glass — 0.6% | |
Silgan Holdings, Inc. | | | 57,000 | | | | 2,984,520 | |
| | | | | | |
|
|
|
Containers - Paper/Plastic — 0.3% | |
Graphic Packaging Holding Co. | | | 115,010 | | | | 1,621,641 | |
| | | | | | |
|
|
|
Data Processing/Management — 0.2% | |
Fair Isaac Corp. | | | 11,620 | | | | 994,323 | |
| | | | | | |
|
|
|
Diagnostic Equipment — 0.0% | |
Affymetrix, Inc.† | | | 18,500 | | | | 172,605 | |
| | | | | | |
|
|
|
Diagnostic Kits — 0.2% | |
Meridian Bioscience, Inc. | | | 24,400 | | | | 466,772 | |
Quidel Corp.† | | | 34,400 | | | | 708,296 | |
| | | | | | |
|
|
|
| | | | | | | | 1,175,068 | |
| | | | | | |
|
|
|
Distribution/Wholesale — 1.7% | |
Beacon Roofing Supply, Inc.† | | | 90,000 | | | | 3,262,500 | |
Essendant, Inc. | | | 140,700 | | | | 4,854,150 | |
| | | | | | |
|
|
|
| | | | | | | | 8,116,650 | |
| | | | | | |
|
|
|
| | | | | | | | |
| | |
| Security Description | | Shares | | | Value
(Note 2) | |
| |
| | |
Diversified Manufacturing Operations — 0.7% | |
Actuant Corp., Class A | | | 134,500 | | | $ | 2,883,680 | |
Federal Signal Corp. | | | 36,400 | | | | 515,060 | |
Tredegar Corp. | | | 6,960 | | | | 100,850 | |
| | | | | | |
|
|
|
| | | | | | | | 3,499,590 | |
| | | | | | |
|
|
|
Drug Delivery Systems — 0.0% | |
Revance Therapeutics, Inc.†# | | | 4,700 | | | | 142,222 | |
| | | | | | |
|
|
|
Electric - Distribution — 0.2% | |
EnerNOC, Inc.†# | | | 75,600 | | | | 706,104 | |
Spark Energy, Inc., Class A# | | | 4,100 | | | | 63,550 | |
| | | | | | |
|
|
|
| | | | | | | | 769,654 | |
| | | | | | |
|
|
|
Electric - Generation — 0.2% | |
Atlantic Power Corp.# | | | 392,900 | | | | 923,315 | |
| | | | | | |
|
|
|
Electric - Integrated — 2.7% | |
Avista Corp. | | | 62,780 | | | | 1,970,664 | |
El Paso Electric Co. | | | 54,200 | | | | 1,918,680 | |
NorthWestern Corp. | | | 39,318 | | | | 2,030,382 | |
PNM Resources, Inc. | | | 25,900 | | | | 663,299 | |
Portland General Electric Co. | | | 69,600 | | | | 2,403,984 | |
Unitil Corp. | | | 9,400 | | | | 338,494 | |
Westar Energy, Inc. | | | 97,940 | | | | 3,579,707 | |
| | | | | | |
|
|
|
| | | | | | | | 12,905,210 | |
| | | | | | |
|
|
|
Electronic Components - Misc. — 1.4% | |
Benchmark Electronics, Inc.† | | | 89,921 | | | | 1,921,612 | |
Jabil Circuit, Inc. | | | 155,000 | | | | 2,999,250 | |
Sanmina Corp.† | | | 50,400 | | | | 969,696 | |
Stoneridge, Inc.† | | | 29,500 | | | | 360,195 | |
Vishay Intertechnology, Inc. | | | 51,000 | | | | 503,880 | |
| | | | | | |
|
|
|
| | | | | | | | 6,754,633 | |
| | | | | | |
|
|
|
Electronic Components - Semiconductors — 0.7% | |
Amkor Technology, Inc.† | | | 142,600 | | | | 770,040 | |
Fairchild Semiconductor International, Inc.† | | | 69,500 | | | | 945,200 | |
IXYS Corp. | | | 12,000 | | | | 141,480 | |
Rovi Corp.† | | | 154,100 | | | | 1,705,887 | |
| | | | | | |
|
|
|
| | | | | | | | 3,562,607 | |
| | | | | | |
|
|
|
Electronic Parts Distribution — 0.1% | |
Tech Data Corp.† | | | 3,900 | | | | 254,436 | |
| | | | | | |
|
|
|
Energy - Alternate Sources — 0.7% | |
First Solar, Inc.† | | | 18,800 | | | | 899,392 | |
REX American Resources Corp.†# | | | 49,100 | | | | 2,632,742 | |
| | | | | | |
|
|
|
| | | | | | | | 3,532,134 | |
| | | | | | |
|
|
|
Engineering/R&D Services — 1.4% | |
Argan, Inc. | | | 45,800 | | | | 1,793,070 | |
EMCOR Group, Inc. | | | 98,498 | | | | 4,539,773 | |
VSE Corp. | | | 12,400 | | | | 513,112 | |
| | | | | | |
|
|
|
| | | | | | | | 6,845,955 | |
| | | | | | |
|
|
|
Engines - Internal Combustion — 0.2% | |
Briggs & Stratton Corp. | | | 49,000 | | | | 979,020 | |
| | | | | | |
|
|
|
Enterprise Software/Service — 0.3% | |
Benefitfocus, Inc.†# | | | 8,300 | | | | 304,444 | |
MedAssets, Inc.† | | | 55,700 | | | | 1,176,384 | |
| | | | | | |
|
|
|
| | | | | | | | 1,480,828 | |
| | | | | | |
|
|
|
Entertainment Software — 0.7% | |
Take-Two Interactive Software, Inc.† | | | 108,900 | | | | 3,172,257 | |
| | | | | | |
|
|
|
Environmental Consulting & Engineering — 0.7% | |
Tetra Tech, Inc. | | | 121,700 | | | | 3,161,766 | |
| | | | | | |
|
|
|
73
VALIC Company II Small Cap Value Fund
PORTFOLIO OF INVESTMENTS — August 31, 2015 — (continued)
| | | | | | | | |
| | |
| Security Description | | Shares | | | Value
(Note 2) | |
| |
COMMON STOCKS (continued) | |
Finance - Consumer Loans — 1.6% | |
Encore Capital Group, Inc.†# | | | 69,900 | | | $ | 2,840,037 | |
Nelnet, Inc., Class A | | | 20,100 | | | | 756,765 | |
Ocwen Financial Corp.†# | | | 535,130 | | | | 3,981,367 | |
| | | | | | |
|
|
|
| | | | | | | | 7,578,169 | |
| | | | | | |
|
|
|
Finance - Investment Banker/Broker — 0.5% | |
Cowen Group, Inc., Class A† | | | 131,900 | | | | 697,751 | |
INTL. FCStone, Inc.† | | | 4,100 | | | | 108,486 | |
Investment Technology Group, Inc. | | | 55,300 | | | | 908,026 | |
Oppenheimer Holdings, Inc., Class A | | | 10,200 | | | | 203,490 | |
Stifel Financial Corp.† | | | 15,800 | | | | 736,280 | |
| | | | | | |
|
|
|
| | | | | | | | 2,654,033 | |
| | | | | | |
|
|
|
Finance - Leasing Companies — 0.0% | |
Marlin Business Services Corp. | | | 9,100 | | | | 124,852 | |
| | | | | | |
|
|
|
Finance - Mortgage Loan/Banker — 0.8% | |
Arlington Asset Investment Corp., Class A# | | | 18,800 | | | | 313,020 | |
CoreLogic, Inc.† | | | 97,400 | | | | 3,696,330 | |
| | | | | | |
|
|
|
| | | | | | | | 4,009,350 | |
| | | | | | |
|
|
|
Finance - Other Services — 0.1% | |
BGC Partners, Inc., Class A | | | 44,200 | | | | 387,634 | |
| | | | | | |
|
|
|
Financial Guarantee Insurance — 0.0% | |
MGIC Investment Corp.† | | | 18,700 | | | | 197,472 | |
| | | | | | |
|
|
|
Food - Baking — 0.5% | |
Flowers Foods, Inc. | | | 98,800 | | | | 2,293,148 | |
| | | | | | |
|
|
|
Food - Canned — 0.0% | |
Seneca Foods Corp., Class A† | | | 1,600 | | | | 47,168 | |
| | | | | | |
|
|
|
Food - Dairy Products — 0.9% | |
Dean Foods Co. | | | 267,920 | | | | 4,409,963 | |
| | | | | | |
|
|
|
Food - Flour & Grain — 0.7% | |
Post Holdings, Inc.† | | | 55,327 | | | | 3,611,747 | |
| | | | | | |
|
|
|
Food - Misc./Diversified — 0.7% | |
Blue Buffalo Pet Products, Inc.† | | | 9,400 | | | | 240,170 | |
J&J Snack Foods Corp. | | | 19,050 | | | | 2,170,938 | |
Pinnacle Foods, Inc. | | | 27,500 | | | | 1,233,100 | |
| | | | | | |
|
|
|
| | | | | | | | 3,644,208 | |
| | | | | | |
|
|
|
Food - Retail — 0.1% | |
Smart & Final Stores, Inc.† | | | 33,100 | | | | 539,530 | |
| | | | | | |
|
|
|
Food - Wholesale/Distribution — 0.2% | |
Fresh Del Monte Produce, Inc. | | | 18,800 | | | | 744,292 | |
SpartanNash Co. | | | 15,400 | | | | 435,820 | |
| | | | | | |
|
|
|
| | | | | | | | 1,180,112 | |
| | | | | | |
|
|
|
Footwear & Related Apparel — 0.1% | |
Iconix Brand Group, Inc.†# | | | 48,000 | | | | 666,720 | |
| | | | | | |
|
|
|
Gambling (Non-Hotel) — 0.5% | |
Isle of Capri Casinos, Inc.† | | | 122,980 | | | | 2,270,211 | |
| | | | | | |
|
|
|
Gas - Distribution — 1.2% | |
AGL Resources, Inc. | | | 15,459 | | | | 942,844 | |
Chesapeake Utilities Corp. | | | 5,600 | | | | 275,912 | |
Laclede Group, Inc. | | | 32,400 | | | | 1,715,256 | |
Northwest Natural Gas Co. | | | 26,100 | | | | 1,147,878 | |
Piedmont Natural Gas Co., Inc. | | | 8,360 | | | | 322,529 | |
Southwest Gas Corp. | | | 27,440 | | | | 1,511,670 | |
| | | | | | |
|
|
|
| | | | | | | | 5,916,089 | |
| | | | | | |
|
|
|
Home Furnishings — 0.2% | |
Leggett & Platt, Inc. | | | 17,398 | | | | 772,819 | |
| | | | | | |
|
|
|
| | | | | | | | |
| | |
| Security Description | | Shares | | | Value
(Note 2) | |
| |
| | |
Hotels/Motels — 0.7% | |
Interval Leisure Group, Inc. | | | 179,370 | | | $ | 3,598,162 | |
| | | | | | |
|
|
|
Housewares — 0.7% | |
NACCO Industries, Inc., Class A | | | 5,000 | | | | 263,200 | |
Tupperware Brands Corp. | | | 60,050 | | | | 3,076,362 | |
| | | | | | |
|
|
|
| | | | | | | | 3,339,562 | |
| | | | | | |
|
|
|
Human Resources — 2.3% | |
AMN Healthcare Services, Inc.† | | | 95,721 | | | | 3,216,226 | |
Barrett Business Services, Inc. | | | 28,000 | | | | 998,200 | |
Cross Country Healthcare, Inc.† | | | 90,000 | | | | 1,250,100 | |
Korn/Ferry International | | | 64,500 | | | | 2,197,515 | |
Monster Worldwide, Inc.† | | | 69,400 | | | | 504,538 | |
Resources Connection, Inc. | | | 193,500 | | | | 3,036,015 | |
| | | | | | |
|
|
|
| | | | | | | | 11,202,594 | |
| | | | | | |
|
|
|
Identification Systems — 0.0% | |
Checkpoint Systems, Inc. | | | 17,100 | | | | 138,168 | |
| | | | | | |
|
|
|
Independent Power Producers — 0.2% | |
Ormat Technologies, Inc.# | | | 21,100 | | | | 742,720 | |
| | | | | | |
|
|
|
Industrial Automated/Robotic — 0.1% | |
Hurco Cos., Inc. | | | 11,700 | | | | 360,828 | |
| | | | | | |
|
|
|
Instruments - Controls — 0.0% | |
Watts Water Technologies, Inc., Class A | | | 3,760 | | | | 206,236 | |
| | | | | | |
|
|
|
Insurance - Life/Health — 1.6% | |
American Equity Investment Life Holding Co. | | | 28,598 | | | | 693,787 | |
CNO Financial Group, Inc. | | | 173,520 | | | | 3,104,273 | |
Primerica, Inc. | | | 19,800 | | | | 841,302 | |
StanCorp Financial Group, Inc. | | | 11,658 | | | | 1,325,631 | |
Symetra Financial Corp. | | | 57,600 | | | | 1,812,672 | |
| | | | | | |
|
|
|
| | | | | | | | 7,777,665 | |
| | | | | | |
|
|
|
Insurance - Multi-line — 0.4% | |
Horace Mann Educators Corp. | | | 42,780 | | | | 1,421,152 | |
Kemper Corp. | | | 7,100 | | | | 251,482 | |
United Fire Group, Inc. | | | 3,100 | | | | 102,920 | |
| | | | | | |
|
|
|
| | | | | | | | 1,775,554 | |
| | | | | | |
|
|
|
Insurance - Property/Casualty — 0.6% | |
Arch Capital Group, Ltd.† | | | 6,226 | | | | 425,111 | |
Global Indemnity PLC† | | | 2,100 | | | | 56,364 | |
Hallmark Financial Services, Inc.† | | | 13,300 | | | | 152,817 | |
Navigators Group, Inc.† | | | 6,500 | | | | 494,325 | |
ProAssurance Corp. | | | 31,980 | | | | 1,542,396 | |
| | | | | | |
|
|
|
| | | | | | | | 2,671,013 | |
| | | | | | |
|
|
|
Insurance - Reinsurance — 1.9% | |
Argo Group International Holdings, Ltd. | | | 22,428 | | | | 1,255,519 | |
Endurance Specialty Holdings, Ltd. | | | 55,350 | | | | 3,528,563 | |
Essent Group, Ltd.† | | | 155,220 | | | | 4,158,344 | |
Maiden Holdings, Ltd. | | | 16,700 | | | | 239,311 | |
| | | | | | |
|
|
|
| | | | | | | | 9,181,737 | |
| | | | | | |
|
|
|
Internet Application Software — 0.1% | |
Bazaarvoice, Inc.†# | | | 104,200 | | | | 540,798 | |
| | | | | | |
|
|
|
Internet Incubators — 0.0% | |
ModusLink Global Solutions, Inc.†# | | | 9,700 | | | | 30,555 | |
| | | | | | |
|
|
|
Investment Management/Advisor Services — 1.2% | |
Artisan Partners Asset Management, Inc., Class A | | | 63,243 | | | | 2,584,741 | |
Janus Capital Group, Inc. | | | 12,160 | | | | 180,941 | |
Virtus Investment Partners, Inc. | | | 28,400 | | | | 3,267,704 | |
| | | | | | |
|
|
|
| | | | | | | | 6,033,386 | |
| | | | | | |
|
|
|
74
VALIC Company II Small Cap Value Fund
PORTFOLIO OF INVESTMENTS — August 31, 2015 — (continued)
| | | | | | | | |
| | |
| Security Description | | Shares | | | Value
(Note 2) | |
| |
COMMON STOCKS (continued) | |
Lasers - System/Components — 0.1% | |
Coherent, Inc.† | | | 11,640 | | | $ | 678,612 | |
| | | | | | |
|
|
|
Machinery - Construction & Mining — 0.2% | |
Hyster-Yale Materials Handling, Inc. | | | 12,560 | | | | 763,146 | |
| | | | | | |
|
|
|
Machinery - Farming — 0.2% | |
AGCO Corp. | | | 17,360 | | | | 851,334 | |
| | | | | | |
|
|
|
Machinery - General Industrial — 1.8% | |
DXP Enterprises, Inc.† | | | 9,500 | | | | 282,625 | |
IDEX Corp. | | | 43,200 | | | | 3,103,056 | |
Kadant, Inc. | | | 24,000 | | | | 1,067,760 | |
Manitowoc Co., Inc.# | | | 248,450 | | | | 4,243,526 | |
| | | | | | |
|
|
|
| | | | | | | | 8,696,967 | |
| | | | | | |
|
|
|
Medical Instruments — 0.8% | |
Integra LifeSciences Holdings Corp.† | | | 51,000 | | | | 3,058,980 | |
SurModics, Inc.† | | | 37,000 | | | | 841,750 | |
| | | | | | |
|
|
|
| | | | | | | | 3,900,730 | |
| | | | | | |
|
|
|
Medical Products — 1.0% | |
Haemonetics Corp.† | | | 98,350 | | | | 3,551,418 | |
Halyard Health, Inc.† | | | 7,300 | | | | 229,512 | |
Orthofix International NV† | | | 21,400 | | | | 802,072 | |
Rockwell Medical, Inc.†# | | | 29,300 | | | | 350,721 | |
| | | | | | |
|
|
|
| | | | | | | | 4,933,723 | |
| | | | | | |
|
|
|
Medical Sterilization Products — 0.8% | |
STERIS Corp. | | | 60,650 | | | | 3,884,633 | |
| | | | | | |
|
|
|
Medical - Biomedical/Gene — 1.2% | |
Applied Genetic Technologies Corp.† | | | 1,300 | | | | 21,359 | |
Ardelyx, Inc.† | | | 6,200 | | | | 117,676 | |
Avalanche Biotechnologies, Inc.† | | | 1,400 | | | | 14,644 | |
Bio-Rad Laboratories, Inc., Class A† | | | 13,345 | | | | 1,859,359 | |
Charles River Laboratories International, Inc.† | | | 23,800 | | | | 1,639,582 | |
Epizyme, Inc.†# | | | 2,400 | | | | 48,000 | |
Idera Pharmaceuticals, Inc.†# | | | 214,300 | | | | 647,186 | |
Insmed, Inc.† | | | 8,100 | | | | 197,964 | |
Karyopharm Therapeutics, Inc.†# | | | 1,100 | | | | 15,246 | |
Kite Pharma, Inc.†# | | | 2,000 | | | | 106,340 | |
MacroGenics, Inc.† | | | 2,700 | | | | 71,145 | |
Medicines Co.† | | | 15,500 | | | | 635,500 | |
Sage Therapeutics, Inc.† | | | 900 | | | | 48,609 | |
Ultragenyx Pharmaceutical, Inc.† | | | 2,200 | | | | 245,564 | |
Verastem, Inc.†# | | | 6,800 | | | | 41,412 | |
| | | | | | |
|
|
|
| | | | | | | | 5,709,586 | |
| | | | | | |
|
|
|
Medical - Drugs — 0.1% | |
Dicerna Pharmaceuticals, Inc.† | | | 3,200 | | | | 35,104 | |
Immune Design Corp.†# | | | 2,700 | | | | 43,038 | |
Radius Health, Inc.† | | | 8,100 | | | | 492,966 | |
ZS Pharma, Inc.†# | | | 1,500 | | | | 76,740 | |
| | | | | | |
|
|
|
| | | | | | | | 647,848 | |
| | | | | | |
|
|
|
Medical - Generic Drugs — 0.0% | |
Amphastar Pharmaceuticals, Inc.†# | | | 15,500 | | | | 199,485 | |
| | | | | | |
|
|
|
Medical - HMO — 0.3% | |
Centene Corp.† | | | 22,900 | | | | 1,413,388 | |
| | | | | | |
|
|
|
Medical - Hospitals — 0.0% | |
Select Medical Holdings Corp. | | | 10,200 | | | | 131,580 | |
| | | | | | |
|
|
|
Medical - Outpatient/Home Medical — 0.6% | |
Addus HomeCare Corp.† | | | 700 | | | | 20,118 | |
Amsurg Corp.† | | | 38,450 | | | | 3,015,249 | |
| | | | | | |
|
|
|
| | | | | | | | 3,035,367 | |
| | | | | | |
|
|
|
| | | | | | | | |
| | |
| Security Description | | Shares | | | Value
(Note 2) | |
| |
| | |
Metal - Iron — 0.1% | |
Cliffs Natural Resources, Inc.# | | | 124,300 | | | $ | 493,471 | |
| | | | | | |
|
|
|
MRI/Medical Diagnostic Imaging — 0.4% | |
Alliance HealthCare Services, Inc.† | | | 8,500 | | | | 121,720 | |
Surgical Care Affiliates, Inc.† | | | 45,900 | | | | 1,677,645 | |
| | | | | | |
|
|
|
| | | | | | | | 1,799,365 | |
| | | | | | |
|
|
|
Multimedia — 0.1% | |
E.W. Scripps Co., Class A | | | 17,978 | | | | 314,975 | |
| | | | | | |
|
|
|
Networking Products — 0.6% | |
Black Box Corp. | | | 37,980 | | | | 584,892 | |
NETGEAR, Inc.† | | | 29,100 | | | | 884,058 | |
Polycom, Inc.† | | | 124,700 | | | | 1,341,772 | |
| | | | | | |
|
|
|
| | | | | | | | 2,810,722 | |
| | | | | | |
|
|
|
Office Furnishings - Original — 0.1% | |
HNI Corp. | | | 10,120 | | | | 473,009 | |
| | | | | | |
|
|
|
Office Supplies & Forms — 0.4% | |
ACCO Brands Corp.† | | | 265,100 | | | | 2,014,760 | |
| | | | | | |
|
|
|
Oil & Gas Drilling — 0.2% | |
Atwood Oceanics, Inc.# | | | 22,200 | | | | 424,242 | |
North Atlantic Drilling, Ltd.# | | | 154,300 | | | | 134,087 | |
Parker Drilling Co.† | | | 56,300 | | | | 189,731 | |
| | | | | | |
|
|
|
| | | | | | | | 748,060 | |
| | | | | | |
|
|
|
Oil Companies - Exploration & Production — 4.0% | |
Approach Resources, Inc.†# | | | 54,300 | | | | 139,008 | |
Bill Barrett Corp.†# | | | 330,100 | | | | 1,805,647 | |
Cobalt International Energy, Inc.† | | | 231,859 | | | | 1,857,191 | |
Diamondback Energy, Inc.† | | | 59,500 | | | | 4,063,255 | |
Gastar Exploration, Inc.†# | | | 68,000 | | | | 112,200 | |
Halcon Resources Corp.†# | | | 376,000 | | | | 432,400 | |
Jones Energy, Inc., Class A†# | | | 42,100 | | | | 249,653 | |
Laredo Petroleum, Inc.†# | | | 269,113 | | | | 2,742,261 | |
Oasis Petroleum, Inc.†# | | | 259,950 | | | | 2,901,042 | |
Penn Virginia Corp.†# | | | 154,700 | | | | 190,281 | |
Rex Energy Corp.†# | | | 166,700 | | | | 575,115 | |
RSP Permian, Inc.† | | | 138,550 | | | | 3,316,887 | |
SandRidge Energy, Inc.†# | | | 89,200 | | | | 47,553 | |
Stone Energy Corp.† | | | 13,120 | | | | 74,390 | |
Unit Corp.† | | | 48,400 | | | | 735,680 | |
W&T Offshore, Inc.# | | | 50,300 | | | | 179,571 | |
| | | | | | |
|
|
|
| | | | | | | | 19,422,134 | |
| | | | | | |
|
|
|
Oil Field Machinery & Equipment — 1.1% | |
Dril-Quip, Inc.† | | | 44,930 | | | | 3,097,474 | |
Forum Energy Technologies, Inc.† | | | 157,250 | | | | 2,471,970 | |
| | | | | | |
|
|
|
| | | | | | | | 5,569,444 | |
| | | | | | |
|
|
|
Oil Refining & Marketing — 0.1% | |
Adams Resources & Energy, Inc. | | | 800 | | | | 36,488 | |
Alon USA Energy, Inc. | | | 16,700 | | | | 309,618 | |
| | | | | | |
|
|
|
| | | | | | | | 346,106 | |
| | | | | | |
|
|
|
Oil-Field Services — 0.8% | |
Gulfmark Offshore, Inc., Class A# | | | 38,700 | | | | 349,461 | |
Helix Energy Solutions Group, Inc.† | | | 134,640 | | | | 935,748 | |
Key Energy Services, Inc.† | | | 464,500 | | | | 330,352 | |
Pioneer Energy Services Corp.† | | | 238,440 | | | | 789,237 | |
SEACOR Holdings, Inc.† | | | 22,000 | | | | 1,419,220 | |
| | | | | | |
|
|
|
| | | | | | | | 3,824,018 | |
| | | | | | |
|
|
|
Paper & Related Products — 0.5% | |
Domtar Corp. | | | 23,040 | | | | 926,438 | |
P.H. Glatfelter Co. | | | 3,100 | | | | 55,986 | |
75
VALIC Company II Small Cap Value Fund
PORTFOLIO OF INVESTMENTS — August 31, 2015 — (continued)
| | | | | | | | |
| | |
| Security Description | | Shares | | | Value
(Note 2) | |
| |
COMMON STOCKS (continued) | |
Paper & Related Products (continued) | |
Schweitzer-Mauduit International, Inc. | | | 39,800 | | | $ | 1,406,134 | |
| | | | | | |
|
|
|
| | | | | | | | 2,388,558 | |
| | | | | | |
|
|
|
Poultry — 0.0% | |
Sanderson Farms, Inc.# | | | 1,000 | | | | 69,040 | |
| | | | | | |
|
|
|
Power Converter/Supply Equipment — 0.1% | |
Advanced Energy Industries, Inc.† | | | 18,416 | | | | 446,956 | |
| | | | | | |
|
|
|
Precious Metals — 0.0% | |
Coeur Mining, Inc.†# | | | 48,900 | | | | 164,304 | |
| | | | | | |
|
|
|
Printing - Commercial — 0.2% | |
Ennis, Inc. | | | 15,200 | | | | 248,216 | |
Quad/Graphics, Inc. | | | 52,700 | | | | 760,988 | |
| | | | | | |
|
|
|
| | | | | | | | 1,009,204 | |
| | | | | | |
|
|
|
Publishing - Books — 0.1% | |
Houghton Mifflin Harcourt Co.† | | | 16,300 | | | | 368,054 | |
| | | | | | |
|
|
|
Publishing - Periodicals — 0.2% | |
Time, Inc. | | | 39,800 | | | | 826,646 | |
| | | | | | |
|
|
|
Racetracks — 0.0% | |
Speedway Motorsports, Inc. | | | 7,400 | | | | 143,190 | |
| | | | | | |
|
|
|
Radio — 0.1% | |
Entercom Communications Corp., Class A† | | | 32,940 | | | | 362,999 | |
Saga Communications, Inc., Class A | | | 1,666 | | | | 58,160 | |
Townsquare Media, Inc.† | | | 4,600 | | | | 52,854 | |
| | | | | | |
|
|
|
| | | | | | | | 474,013 | |
| | | | | | |
|
|
|
Real Estate Investment Trusts — 13.1% | |
American Assets Trust, Inc. | | | 4,200 | | | | 161,784 | |
Anworth Mtg. Asset Corp. | | | 433,040 | | | | 2,178,191 | |
Apartment Investment & Management Co., Class A | | | 35,779 | | | | 1,289,117 | |
Ashford Hospitality Prime, Inc. | | | 28,792 | | | | 398,193 | |
Ashford Hospitality Trust, Inc. | | | 119,380 | | | | 924,001 | |
Capstead Mtg. Corp. | | | 197,700 | | | | 2,060,034 | |
CBL & Associates Properties, Inc. | | | 76,440 | | | | 1,137,427 | |
Cedar Realty Trust, Inc. | | | 50,000 | | | | 313,000 | |
Chambers Street Properties | | | 88,200 | | | | 597,114 | |
Chesapeake Lodging Trust | | | 103,516 | | | | 2,992,648 | |
CoreSite Realty Corp. | | | 52,500 | | | | 2,556,225 | |
CubeSmart | | | 100,060 | | | | 2,530,517 | |
CyrusOne, Inc. | | | 8,000 | | | | 253,280 | |
CYS Investments, Inc. | | | 369,100 | | | | 2,882,671 | |
DCT Industrial Trust, Inc. | | | 86,860 | | | | 2,789,075 | |
DiamondRock Hospitality Co. | | | 58,034 | | | | 682,480 | |
DuPont Fabros Technology, Inc. | | | 12,600 | | | | 336,798 | |
Education Realty Trust, Inc. | | | 15,966 | | | | 467,006 | |
EPR Properties | | | 13,700 | | | | 697,193 | |
Equity Commonwealth† | | | 95,500 | | | | 2,453,395 | |
FelCor Lodging Trust, Inc. | | | 129,300 | | | | 1,043,451 | |
First Industrial Realty Trust, Inc. | | | 22,918 | | | | 444,380 | |
First Potomac Realty Trust | | | 88,800 | | | | 933,288 | |
Franklin Street Properties Corp. | | | 29,500 | | | | 307,095 | |
Getty Realty Corp. | | | 26,400 | | | | 416,064 | |
Gladstone Commercial Corp. | | | 13,300 | | | | 191,520 | |
Government Properties Income Trust# | | | 62,400 | | | | 988,416 | |
Highwoods Properties, Inc. | | | 10,600 | | | | 402,164 | |
Home Properties, Inc. | | | 12,000 | | | | 890,520 | |
Hospitality Properties Trust | | | 28,940 | | | | 744,337 | |
Ladder Capital Corp., Class A | | | 163,500 | | | | 2,547,330 | |
LaSalle Hotel Properties | | | 14,478 | | | | 455,478 | |
LTC Properties, Inc. | | | 17,920 | | | | 730,957 | |
Mack-Cali Realty Corp. | | | 163,890 | | | | 3,069,660 | |
Mid-America Apartment Communities, Inc. | | | 2,577 | | | | 202,526 | |
New Residential Investment Corp. | | | 213,000 | | | | 3,016,080 | |
| | | | | | | | |
| | |
| Security Description | | Shares | | | Value
(Note 2) | |
| |
| | |
Real Estate Investment Trusts (continued) | |
Parkway Properties, Inc. | | | 249,000 | | | $ | 3,944,160 | |
Pebblebrook Hotel Trust | | | 23,400 | | | | 890,604 | |
Pennsylvania Real Estate Investment Trust | | | 54,580 | | | | 1,082,867 | |
PennyMac Mortgage Investment Trust | | | 235,950 | | | | 3,555,766 | |
Potlatch Corp. | | | 55,500 | | | | 1,832,610 | |
PS Business Parks, Inc. | | | 6,500 | | | | 474,240 | |
QTS Realty Trust, Inc., Class A | | | 5,700 | | | | 229,083 | |
RAIT Financial Trust | | | 172,000 | | | | 892,680 | |
Redwood Trust, Inc. | | | 267,130 | | | | 3,897,427 | |
Saul Centers, Inc. | | | 2,200 | | | | 108,548 | |
Strategic Hotels & Resorts, Inc.† | | | 13,800 | | | | 186,162 | |
Sunstone Hotel Investors, Inc. | | | 79,508 | | | | 1,099,596 | |
Taubman Centers, Inc. | | | 2,500 | | | | 172,475 | |
Urstadt Biddle Properties, Inc., Class A | | | 14,200 | | | | 254,606 | |
Washington Real Estate Investment Trust# | | | 44,500 | | | | 1,094,700 | |
WP GLIMCHER, Inc. | | | 1,053 | | | | 12,752 | |
| | | | | | |
|
|
|
| | | | | | | | 63,811,691 | |
| | | | | | |
|
|
|
Real Estate Operations & Development — 0.7% | |
Alexander & Baldwin, Inc. | | | 37,300 | | | | 1,261,859 | |
Forestar Group, Inc.† | | | 84,800 | | | | 1,096,464 | |
St. Joe Co.†# | | | 65,500 | | | | 1,142,975 | |
| | | | | | |
|
|
|
| | | | | | | | 3,501,298 | |
| | | | | | |
|
|
|
Recreational Centers — 0.1% | |
Steiner Leisure, Ltd.† | | | 7,000 | | | | 445,690 | |
| | | | | | |
|
|
|
Recreational Vehicles — 0.0% | |
MCBC Holdings, Inc.† | | | 11,300 | | | | 168,370 | |
| | | | | | |
|
|
|
Resorts/Theme Parks — 1.2% | |
SeaWorld Entertainment, Inc.# | | | 226,400 | | | | 4,029,920 | |
Six Flags Entertainment Corp. | | | 36,000 | | | | 1,618,920 | |
| | | | | | |
|
|
|
| | | | | | | | 5,648,840 | |
| | | | | | |
|
|
|
Respiratory Products — 0.1% | |
Inogen, Inc.† | | | 7,300 | | | | 359,817 | |
| | | | | | |
|
|
|
Retail - Apparel/Shoe — 2.6% | |
Abercrombie & Fitch Co., Class A# | | | 84,500 | | | | 1,678,170 | |
Ascena Retail Group, Inc.† | | | 237,490 | | | | 2,866,504 | |
Children’s Place, Inc. | | | 49,400 | | | | 2,960,048 | |
DSW, Inc., Class A | | | 142,890 | | | | 4,242,404 | |
Guess?, Inc.# | | | 39,800 | | | | 879,978 | |
| | | | | | |
|
|
|
| | | | | | | | 12,627,104 | |
| | | | | | |
|
|
|
Retail - Discount — 0.4% | |
Big Lots, Inc. | | | 42,973 | | | | 2,062,274 | |
Ollie’s Bargain Outlet Holdings, Inc.† | | | 3,900 | | | | 69,771 | |
| | | | | | |
|
|
|
| | | | | | | | 2,132,045 | |
| | | | | | |
|
|
|
Retail - Hair Salons — 0.3% | |
Regis Corp.† | | | 125,100 | | | | 1,356,084 | |
| | | | | | |
|
|
|
Retail - Home Furnishings — 0.5% | |
Pier 1 Imports, Inc.# | | | 261,000 | | | | 2,656,980 | |
| | | | | | |
|
|
|
Retail - Leisure Products — 0.0% | |
Party City Holdco, Inc.†# | | | 6,100 | | | | 103,334 | |
| | | | | | |
|
|
|
Retail - Pawn Shops — 0.2% | |
Cash America International, Inc. | | | 28,500 | | | | 786,600 | |
| | | | | | |
|
|
|
Retail - Regional Department Stores — 0.4% | |
Dillard’s, Inc., Class A | | | 22,640 | | | | 2,094,426 | |
| | | | | | |
|
|
|
Retail - Restaurants — 0.5% | |
Bob Evans Farms, Inc. | | | 21,800 | | | | 985,142 | |
Bojangles’, Inc.†# | | | 1,700 | | | | 35,394 | |
Dave & Buster’s Entertainment, Inc.† | | | 10,600 | | | | 365,064 | |
76
VALIC Company II Small Cap Value Fund
PORTFOLIO OF INVESTMENTS — August 31, 2015 — (continued)
| | | | | | | | |
| | |
| Security Description | | Shares | | | Value
(Note 2) | |
| |
COMMON STOCKS (continued) | |
Retail - Restaurants (continued) | |
Fogo De Chao, Inc.† | | | 2,200 | | | $ | 42,284 | |
Jack in the Box, Inc. | | | 3,400 | | | | 265,812 | |
Ruby Tuesday, Inc.† | | | 11,600 | | | | 76,328 | |
Ruth’s Hospitality Group, Inc. | | | 49,672 | | | | 798,726 | |
| | | | | | |
|
|
|
| | | | | | | | 2,568,750 | |
| | | | | | |
|
|
|
Retail - Toy Stores — 0.1% | |
Build-A-Bear Workshop, Inc.† | | | 14,700 | | | | 288,120 | |
| | | | | | |
|
|
|
Rubber - Tires — 0.7% | |
Cooper Tire & Rubber Co. | | | 84,400 | | | | 3,257,840 | |
| | | | | | |
|
|
|
Rubber/Plastic Products — 0.0% | |
Myers Industries, Inc. | | | 13,958 | | | | 199,041 | |
| | | | | | |
|
|
|
Satellite Telecom — 0.1% | |
Intelsat SA†# | | | 25,300 | | | | 244,651 | |
| | | | | | |
|
|
|
Savings & Loans/Thrifts — 1.1% | |
BankFinancial Corp. | | | 4,400 | | | | 54,120 | |
Beneficial Bancorp, Inc.† | | | 51,858 | | | | 645,114 | |
Brookline Bancorp, Inc. | | | 13,700 | | | | 144,535 | |
Charter Financial Corp. | | | 49,900 | | | | 626,245 | |
Flushing Financial Corp. | | | 27,900 | | | | 556,605 | |
Fox Chase Bancorp, Inc. | | | 4,900 | | | | 84,574 | |
Northfield Bancorp, Inc. | | | 112,800 | | | | 1,688,616 | |
OceanFirst Financial Corp. | | | 10,220 | | | | 188,252 | |
Oritani Financial Corp. | | | 11,200 | | | | 168,896 | |
Sterling Bancorp | | | 24,320 | | | | 341,210 | |
Territorial Bancorp, Inc. | | | 2,900 | | | | 75,284 | |
United Financial Bancorp, Inc. | | | 17,600 | | | | 220,880 | |
Waterstone Financial, Inc. | | | 4,700 | | | | 60,536 | |
WSFS Financial Corp. | | | 13,874 | | | | 381,951 | |
| | | | | | |
|
|
|
| | | | | | | | 5,236,818 | |
| | | | | | |
|
|
|
Schools — 0.2% | |
K12, Inc.† | | | 73,800 | | | | 975,636 | |
| | | | | | |
|
|
|
Security Services — 0.1% | |
Ascent Capital Group, Inc., Class A† | | | 12,400 | | | | 348,192 | |
| | | | | | |
|
|
|
Semiconductor Components - Integrated Circuits — 0.3% | |
Cypress Semiconductor Corp. | | | 151,922 | | | | 1,519,220 | |
Pericom Semiconductor Corp. | | | 14,200 | | | | 172,956 | |
| | | | | | |
|
|
|
| | | | | | | | 1,692,176 | |
| | | | | | |
|
|
|
Semiconductor Equipment — 0.4% | |
Cohu, Inc. | | | 60,609 | | | | 587,907 | |
Ultra Clean Holdings, Inc.† | | | 61,700 | | | | 418,943 | |
Xcerra Corp.† | | | 128,700 | | | | 805,662 | |
| | | | | | |
|
|
|
| | | | | | | | 1,812,512 | |
| | | | | | |
|
|
|
Steel Pipe & Tube — 0.1% | |
Mueller Water Products, Inc., Class A | | | 53,640 | | | | 480,078 | |
| | | | | | |
|
|
|
Steel - Producers — 0.5% | |
Schnitzer Steel Industries, Inc., Class A | | | 66,300 | | | | 1,147,653 | |
Worthington Industries, Inc. | | | 42,540 | | | | 1,088,599 | |
| | | | | | |
|
|
|
| | | | | | | | 2,236,252 | |
| | | | | | |
|
|
|
Telecom Equipment - Fiber Optics — 0.0% | |
Harmonic, Inc.† | | | 22,200 | | | | 128,094 | |
| | | | | | |
|
|
|
Telecom Services — 0.4% | |
EarthLink Holdings Corp. | | | 113,200 | | | | 949,748 | |
FairPoint Communications, Inc.† | | | 14,000 | | | | 229,040 | |
Vonage Holdings Corp.† | | | 158,300 | | | | 878,565 | |
West Corp. | | | 3,368 | | | | 81,977 | |
| | | | | | |
|
|
|
| | | | | | | | 2,139,330 | |
| | | | | | |
|
|
|
| | | | | | | | |
| | |
| Security Description | | Shares | | | Value
(Note 2) | |
| |
| | |
Telecommunication Equipment — 0.2% | |
Comtech Telecommunications Corp. | | | 27,400 | | | $ | 731,032 | |
| | | | | | |
|
|
|
Telephone - Integrated — 0.3% | |
Cincinnati Bell, Inc.† | | | 385,600 | | | | 1,322,608 | |
Windstream Holdings, Inc.# | | | 16,400 | | | | 117,916 | |
| | | | | | |
|
|
|
| | | | | | | | 1,440,524 | |
| | | | | | |
|
|
|
Textile - Apparel — 0.1% | |
Unifi, Inc.† | | | 21,400 | | | | 621,242 | |
| | | | | | |
|
|
|
Therapeutics — 0.1% | |
Agios Pharmaceuticals, Inc.†# | | | 3,700 | | | | 319,680 | |
Cara Therapeutics, Inc.† | | | 7,600 | | | | 144,096 | |
Zafgen, Inc.†# | | | 2,700 | | | | 98,604 | |
| | | | | | |
|
|
|
| | | | | | | | 562,380 | |
| | | | | | |
|
|
|
Tobacco — 0.5% | |
Universal Corp.# | | | 47,700 | | | | 2,347,317 | |
| | | | | | |
|
|
|
Transport - Air Freight — 0.3% | |
Atlas Air Worldwide Holdings, Inc.† | | | 38,100 | | | | 1,573,911 | |
| | | | | | |
|
|
|
Transport - Equipment & Leasing — 0.1% | |
AMERCO | | | 800 | | | | 299,648 | |
| | | | | | |
|
|
|
Transport - Marine — 0.0% | |
Frontline, Ltd.†# | | | 38,800 | | | | 103,208 | |
| | | | | | |
|
|
|
Transport - Services — 0.4% | |
Matson, Inc. | | | 47,500 | | | | 1,789,800 | |
| | | | | | |
|
|
|
Transport - Truck — 1.1% | |
ArcBest Corp. | | | 39,220 | | | | 1,132,673 | |
Landstar System, Inc. | | | 47,550 | | | | 3,147,810 | |
P.A.M. Transportation Services, Inc.† | | | 9,082 | | | | 350,838 | |
USA Truck, Inc.† | | | 29,200 | | | | 576,700 | |
| | | | | | |
|
|
|
| | | | | | | | 5,208,021 | |
| | | | | | |
|
|
|
Travel Services — 0.1% | |
Liberty TripAdvisor Holdings, Inc., Class A† | | | 25,600 | | | | 649,472 | |
| | | | | | |
|
|
|
Water — 0.3% | |
American States Water Co. | | | 29,400 | | | | 1,109,850 | |
California Water Service Group | | | 20,260 | | | | 417,964 | |
| | | | | | |
|
|
|
| | | | | | | | 1,527,814 | |
| | | | | | |
|
|
|
Web Hosting/Design — 0.6% | |
Endurance International Group Holdings, Inc.†# | | | 180,000 | | | | 2,752,200 | |
| | | | | | |
|
|
|
Web Portals/ISP — 0.2% | |
Blucora, Inc.† | | | 67,600 | | | | 943,696 | |
| | | | | | |
|
|
|
Wire & Cable Products — 0.1% | |
General Cable Corp. | | | 34,100 | | | | 496,155 | |
| | | | | | |
|
|
|
Wireless Equipment — 0.4% | |
InterDigital, Inc. | | | 40,300 | | | | 1,993,640 | |
| | | | | | |
|
|
|
Total Long-Term Investment Securities | | | | | | | | |
(cost $452,987,986) | | | | | | | 474,663,999 | |
| | | | | | |
|
|
|
SHORT-TERM INVESTMENT SECURITIES — 9.8% | |
Registered Investment Companies — 9.8% | |
State Street Navigator Securities Lending Prime Portfolio 0.21%(1)(3)
(cost $47,599,278) | | | 47,599,278 | | | | 47,599,278 | |
| | | | | | |
|
|
|
77
VALIC Company II Small Cap Value Fund
PORTFOLIO OF INVESTMENTS — August 31, 2015 — (continued)
| | | | | | | | |
| | |
| Security Description | | Principal
Amount | | | Value
(Note 2) | |
| |
REPURCHASE AGREEMENTS — 2.1% | |
Agreement with State Street Bank & Trust Co., bearing interest at 0.00%, dated 08/31/2015, to be repurchased 09/01/2015 in the amount $10,426,000 collateralized by $10,425,000 of United States Treasury Notes, bearing interest at 2.00% due 06/30/2020 and having an approximate value of $10,641,996 (cost $10,426,000) | | $ | 10,426,000 | | | $ | 10,426,000 | |
| | | | | | |
|
|
|
TOTAL INVESTMENTS | | | | | | | | |
(cost $511,013,264)(2) | | | 109.3 | % | | | 532,689,277 | |
Liabilities in excess of other assets | | | (9.3 | ) | | | (45,532,363 | ) |
| | |
|
|
| |
|
|
|
NET ASSETS | | | 100.0 | % | | $ | 487,156,914 | |
| | |
|
|
| |
|
|
|
| † | Non-income producing security |
| # | The security or a portion thereof is out on loan (see Note 2) |
| (1) | | At August 31, 2015, the Fund had loaned securities with a total value of $47,113,505. This was secured by collateral of $47,599,278, which was received in cash and subsequently invested in short-term investments currently valued at $47,599,278 as reported in the Portfolio of Investments. |
| (2) | | See Note 5 for cost of investments on a tax basis. |
| (3) | The rate shown is the 7-day yield as of August 31, 2015. |
ADR—American Depositary Receipt
| | | | | | | | | | | | | | | | | | | | | | |
| Futures Contracts | | | | | | | | | | | | |
Number of
Contracts | | | Type | | Description | | Expiration
Month | | | Value at
Trade Date | | | Value as of
August 31, 2015 | | | Unrealized
Appreciation
(Depreciation) | |
| | 65 | | | Long | | Russell 2000 E-Mini Index | | | September 2015 | | | $ | 7,982,840 | | | $ | 7,523,750 | | | $ | (459,090 | ) |
| | | | | | | | | | | | | | | | | | | | |
|
|
|
The following is a summary of the inputs used to value the Fund’s net assets as of August 31, 2015 (see Note 2):
| | | | | | | | | | | | | | | | |
| | | Level 1 - Unadjusted Quoted
Prices
| | | Level 2 - Other Observable
Inputs
| | | Level 3 - Significant
Unobservable Inputs
| | | Total
| |
ASSETS: | | | | | | | | | | | | | | | | |
Investments at Value:* | | | | | | | | | | | | | | | | |
Common Stocks | | $ | 474,663,999 | | | $ | — | | | $ | — | | | $ | 474,663,999 | |
Short-Term Investment Securities | | | 47,599,278 | | | | — | | | | — | | | | 47,599,278 | |
Repurchase Agreements | | | — | | | | 10,426,000 | | | | — | | | | 10,426,000 | |
| | |
|
|
| |
|
|
| |
|
|
| |
|
|
|
Total Investments at Value | | $ | 522,263,277 | | | $ | 10,426,000 | | | $ | — | | | $ | 532,689,277 | |
| | |
|
|
| |
|
|
| |
|
|
| |
|
|
|
LIABILITIES: | | | | | | | | | | | | | | | | |
Other Financial Instruments:+ | | | | | | | | | | | | | | | | |
Futures Contracts | | $ | 459,090 | | | $ | — | | | $ | — | | | $ | 459,090 | |
| | |
|
|
| |
|
|
| |
|
|
| |
|
|
|
| * | For a detailed presentation of investments, please refer to the Portfolio of Investments. |
| + | Other financial instruments are derivative instruments, not reflected in the Portfolio of Investments, such as futures, forward, swap and written option contracts, which are valued at the unrealized appreciation (depreciation) on the instrument. |
The Fund’s policy is to recognize transfers between Levels as of the end of the reporting period. There were no transfers between Levels during the reporting period.
See Notes to Financial Statements
78
VALIC Company II Socially Responsible Fund
PORTFOLIO PROFILE — August 31, 2015 — (unaudited)
Industry Allocation*
| | | | |
Medical — Drugs | | | 5.8 | % |
Web Portals/ISP | | | 3.7 | |
Medical — Biomedical/Gene | | | 3.6 | |
Real Estate Investment Trusts | | | 3.3 | |
Banks — Super Regional | | | 3.2 | |
Applications Software | | | 3.0 | |
U.S. Government Treasuries | | | 2.5 | |
Retail — Restaurants | | | 2.5 | |
Multimedia | | | 2.4 | |
Electronic Components — Semiconductors | | | 2.4 | |
Cosmetics & Toiletries | | | 2.1 | |
Repurchase Agreements | | | 2.1 | |
Commercial Services — Finance | | | 2.1 | |
Finance — Credit Card | | | 2.0 | |
Electric — Integrated | | | 2.0 | |
Beverages — Non-alcoholic | | | 1.9 | |
Food — Misc./Diversified | | | 1.9 | |
Medical — HMO | | | 1.8 | |
Insurance — Multi-line | | | 1.8 | |
Insurance — Reinsurance | | | 1.7 | |
Diversified Manufacturing Operations | | | 1.7 | |
Retail — Building Products | | | 1.7 | |
Pipelines | | | 1.7 | |
Cable/Satellite TV | | | 1.7 | |
E-Commerce/Products | | | 1.5 | |
Retail — Drug Store | | | 1.5 | |
Oil Companies — Exploration & Production | | | 1.4 | |
Retail — Discount | | | 1.2 | |
Internet Content — Entertainment | | | 1.1 | |
Medical — Generic Drugs | | | 1.1 | |
Networking Products | | | 1.1 | |
Semiconductor Components — Integrated Circuits | | | 1.0 | |
Enterprise Software/Service | | | 1.0 | |
Banks — Fiduciary | | | 1.0 | |
Transport — Services | | | 1.0 | |
Computers — Memory Devices | | | 0.9 | |
Medical — Wholesale Drug Distribution | | | 0.9 | |
Oil — Field Services | | | 0.9 | |
Investment Management/Advisor Services | | | 0.9 | |
Transport — Rail | | | 0.8 | |
Oil Refining & Marketing | | | 0.8 | |
Insurance — Life/Health | | | 0.8 | |
Gas — Distribution | | | 0.8 | |
Diagnostic Equipment | | | 0.7 | |
Chemicals — Diversified | | | 0.7 | |
E-Commerce/Services | | | 0.7 | |
Diversified Banking Institutions | | | 0.7 | |
Auto/Truck Parts & Equipment — Original | | | 0.7 | |
Banks — Commercial | | | 0.7 | |
Auto — Cars/Light Trucks | | | 0.7 | |
Computer Services | | | 0.6 | |
Food — Retail | | | 0.6 | |
Finance — Other Services | | | 0.5 | |
Telephone — Integrated | | | 0.5 | |
Chemicals — Specialty | | | 0.5 | |
Machinery — Construction & Mining | | | 0.5 | |
Registered Investment Companies | | | 0.5 | |
Consumer Products — Misc. | | | 0.5 | |
Data Processing/Management | | | 0.5 | |
Medical Products | | | 0.5 | |
Athletic Footwear | | | 0.5 | |
Electronic Components — Misc. | | | 0.5 | |
Pharmacy Services | | | 0.5 | |
Electric Products — Misc. | | | 0.4 | |
Industrial Gases | | | 0.4 | |
Oil Companies — Integrated | | | 0.4 | |
Instruments — Scientific | | | 0.4 | |
Non-Hazardous Waste Disposal | | | 0.4 | |
Computers | | | 0.4 | |
| | | | |
Retail — Major Department Stores | | | 0.4 | |
Machinery — Farming | | | 0.3 | |
Food — Wholesale/Distribution | | | 0.3 | |
Auto — Heavy Duty Trucks | | | 0.3 | |
Advertising Agencies | | | 0.3 | |
Insurance — Property/Casualty | | | 0.3 | |
Semiconductor Equipment | | | 0.3 | |
Finance — Investment Banker/Broker | | | 0.3 | |
Steel — Producers | | | 0.3 | |
Office Automation & Equipment | | | 0.2 | |
Electronic Forms | | | 0.2 | |
Agricultural Chemicals | | | 0.2 | |
Agricultural Operations | | | 0.2 | |
Retail — Regional Department Stores | | | 0.2 | |
Retail — Apparel/Shoe | | | 0.2 | |
Industrial Automated/Robotic | | | 0.2 | |
Oil Field Machinery & Equipment | | | 0.2 | |
Airlines | | | 0.2 | |
Tools — Hand Held | | | 0.2 | |
Medical — Hospitals | | | 0.2 | |
Television | | | 0.2 | |
Medical Instruments | | | 0.2 | |
Paper & Related Products | | | 0.2 | |
Engines — Internal Combustion | | | 0.2 | |
Coatings/Paint | | | 0.2 | |
Hotels/Motels | | | 0.2 | |
Apparel Manufacturers | | | 0.1 | |
Advertising Services | | | 0.1 | |
Distribution/Wholesale | | | 0.1 | |
Machinery — General Industrial | | | 0.1 | |
Internet Security | | | 0.1 | |
Home Decoration Products | | | 0.1 | |
Oil & Gas Drilling | | | 0.1 | |
Motorcycle/Motor Scooter | | | 0.1 | |
Appliances | | | 0.1 | |
Entertainment Software | | | 0.1 | |
Insurance Brokers | | | 0.1 | |
Medical Information Systems | | | 0.1 | |
Savings & Loans/Thrifts | | | 0.1 | |
Telecom Services | | | 0.1 | |
Cruise Lines | | | 0.1 | |
Retail — Office Supplies | | | 0.1 | |
Wireless Equipment | | | 0.1 | |
Electronic Measurement Instruments | | | 0.1 | |
Telecommunication Equipment | | | 0.1 | |
| | |
|
|
|
| | | | 100.4 | % |
| | |
|
|
|
| * | Calculated as a percentage of net assets |
79
VALIC Company II Socially Responsible Fund
PORTFOLIO OF INVESTMENTS — August 31, 2015 (unaudited)
| | | | | | | | |
| | |
| Security Description | | Shares | | |
Value
(Note 2) | |
| |
COMMON STOCKS — 95.3% | |
Advertising Agencies — 0.3% | |
Interpublic Group of Cos., Inc. | | | 12,204 | | | $ | 230,411 | |
Omnicom Group, Inc. | | | 26,872 | | | | 1,799,887 | |
| | | | | | |
|
|
|
| | | | | | | | 2,030,298 | |
| | | | | | |
|
|
|
Advertising Services — 0.1% | |
Nielsen Holdings PLC | | | 22,844 | | | | 1,033,234 | |
| | | | | | |
|
|
|
Agricultural Chemicals — 0.2% | |
CF Industries Holdings, Inc. | | | 11,405 | | | | 654,419 | |
Mosaic Co. | | | 24,573 | | | | 1,003,315 | |
| | | | | | |
|
|
|
| | | | | | | | 1,657,734 | |
| | | | | | |
|
|
|
Agricultural Operations — 0.2% | |
Archer-Daniels-Midland Co. | | | 35,463 | | | | 1,595,480 | |
| | | | | | |
|
|
|
Airlines — 0.2% | |
Delta Air Lines, Inc. | | | 28,016 | | | | 1,226,540 | |
Southwest Airlines Co. | | | 4,938 | | | | 181,225 | |
| | | | | | |
|
|
|
| | | | | | | | 1,407,765 | |
| | | | | | |
|
|
|
Apparel Manufacturers — 0.1% | |
VF Corp. | | | 14,829 | | | | 1,074,064 | |
| | | | | | |
|
|
|
Appliances — 0.1% | |
Whirlpool Corp. | | | 4,351 | | | | 731,403 | |
| | | | | | |
|
|
|
Applications Software — 3.0% | |
Citrix Systems, Inc.† | | | 3,558 | | | | 242,336 | |
Intuit, Inc. | | | 19,219 | | | | 1,648,029 | |
Microsoft Corp. | | | 397,894 | | | | 17,316,347 | |
Red Hat, Inc.† | | | 1,310 | | | | 94,595 | |
Salesforce.com, Inc.† | | | 30,739 | | | | 2,132,057 | |
| | | | | | |
|
|
|
| | | | | | | | 21,433,364 | |
| | | | | | |
|
|
|
Athletic Footwear — 0.5% | |
NIKE, Inc., Class B | | | 30,354 | | | | 3,392,059 | |
| | | | | | |
|
|
|
Audio/Video Products — 0.0% | |
Harman International Industries, Inc. | | | 2,132 | | | | 208,382 | |
| | | | | | |
|
|
|
Auto - Cars/Light Trucks — 0.7% | |
Ford Motor Co. | | | 341,193 | | | | 4,732,347 | |
| | | | | | |
|
|
|
Auto - Heavy Duty Trucks — 0.3% | |
PACCAR, Inc. | | | 36,270 | | | | 2,138,842 | |
| | | | | | |
|
|
|
Auto/Truck Parts & Equipment - Original — 0.7% | |
BorgWarner, Inc. | | | 18,620 | | | | 812,577 | |
Delphi Automotive PLC | | | 29,597 | | | | 2,235,165 | |
Johnson Controls, Inc. | | | 43,570 | | | | 1,792,470 | |
| | | | | | |
|
|
|
| | | | | | | | 4,840,212 | |
| | | | | | |
|
|
|
Banks - Commercial — 0.7% | |
BB&T Corp. | | | 65,206 | | | | 2,407,406 | |
M&T Bank Corp. | | | 13,947 | | | | 1,649,093 | |
Regions Financial Corp. | | | 74,610 | | | | 715,510 | |
| | | | | | |
|
|
|
| | | | | | | | 4,772,009 | |
| | | | | | |
|
|
|
Banks - Fiduciary — 1.0% | |
Bank of New York Mellon Corp. | | | 116,409 | | | | 4,633,078 | |
Northern Trust Corp. | | | 18,835 | | | | 1,315,436 | |
State Street Corp. | | | 17,379 | | | | 1,249,898 | |
| | | | | | |
|
|
|
| | | | | | | | 7,198,412 | |
| | | | | | |
|
|
|
Banks - Super Regional — 3.2% | |
Capital One Financial Corp. | | | 36,905 | | | | 2,869,364 | |
Comerica, Inc. | | | 30,552 | | | | 1,344,288 | |
Fifth Third Bancorp | | | 155,600 | | | | 3,099,552 | |
Huntington Bancshares, Inc. | | | 42,795 | | | | 466,894 | |
KeyCorp | | | 51,718 | | | | 710,605 | |
| | | | | | | | |
| | |
| Security Description | | Shares | | |
Value
(Note 2) | |
| |
| | | | | | | | | |
Banks - Super Regional (continued) | |
PNC Financial Services Group, Inc. | | | 56,667 | | | $ | 5,163,497 | |
SunTrust Banks, Inc. | | | 46,114 | | | | 1,861,622 | |
US Bancorp | | | 189,458 | | | | 8,023,546 | |
| | | | | | |
|
|
|
| | | | | | | | 23,539,368 | |
| | | | | | |
|
|
|
Beverages - Non-alcoholic — 1.9% | |
Coca-Cola Enterprises, Inc. | | | 17,913 | | | | 922,340 | |
Dr Pepper Snapple Group, Inc. | | | 15,893 | | | | 1,219,470 | |
Monster Beverage Corp.† | | | 5,396 | | | | 747,130 | |
PepsiCo, Inc. | | | 118,909 | | | | 11,050,214 | |
| | | | | | |
|
|
|
| | | | | | | | 13,939,154 | |
| | | | | | |
|
|
|
Building Products - Cement — 0.0% | |
Vulcan Materials Co. | | | 1,917 | | | | 179,470 | |
| | | | | | |
|
|
|
Building Products - Wood — 0.0% | |
Masco Corp. | | | 12,078 | | | | 316,806 | |
| | | | | | |
|
|
|
Cable/Satellite TV — 1.7% | |
Comcast Corp., Class A | | | 148,713 | | | | 8,377,003 | |
Time Warner Cable, Inc. | | | 19,487 | | | | 3,624,972 | |
| | | | | | |
|
|
|
| | | | | | | | 12,001,975 | |
| | | | | | |
|
|
|
Chemicals - Diversified — 0.7% | |
Eastman Chemical Co. | | | 19,559 | | | | 1,417,245 | |
LyondellBasell Industries NV, Class A | | | 17,200 | | | | 1,468,536 | |
PPG Industries, Inc. | | | 23,186 | | | | 2,209,394 | |
| | | | | | |
|
|
|
| | | | | | | | 5,095,175 | |
| | | | | | |
|
|
|
Chemicals - Specialty — 0.5% | |
Ecolab, Inc. | | | 22,148 | | | | 2,417,233 | |
International Flavors & Fragrances, Inc. | | | 8,059 | | | | 882,863 | |
Sigma-Aldrich Corp. | | | 3,139 | | | | 437,608 | |
| | | | | | |
|
|
|
| | | | | | | | 3,737,704 | |
| | | | | | |
|
|
|
Coatings/Paint — 0.2% | |
Sherwin-Williams Co. | | | 4,657 | | | | 1,191,307 | |
| | | | | | |
|
|
|
Coffee — 0.0% | |
Keurig Green Mountain, Inc. | | | 4,570 | | | | 258,662 | |
| | | | | | |
|
|
|
Commercial Services - Finance — 2.1% | |
Automatic Data Processing, Inc. | | | 44,099 | | | | 3,409,735 | |
H&R Block, Inc. | | | 2,355 | | | | 80,117 | |
MasterCard, Inc., Class A | | | 57,145 | | | | 5,278,484 | |
McGraw Hill Financial, Inc. | | | 16,048 | | | | 1,556,495 | |
Moody’s Corp. | | | 9,373 | | | | 958,952 | |
PayPal Holdings, Inc.† | | | 63,362 | | | | 2,217,670 | |
Western Union Co.# | | | 88,478 | | | | 1,631,534 | |
| | | | | | |
|
|
|
| | | | | | | | 15,132,987 | |
| | | | | | |
|
|
|
Computer Aided Design — 0.0% | |
Autodesk, Inc.† | | | 4,946 | | | | 231,226 | |
| | | | | | |
|
|
|
Computer Services — 0.6% | |
Accenture PLC, Class A | | | 28,857 | | | | 2,720,349 | |
Cognizant Technology Solutions Corp., Class A† | | | 24,122 | | | | 1,518,239 | |
Teradata Corp.† | | | 3,325 | | | | 97,190 | |
| | | | | | |
|
|
|
| | | | | | | | 4,335,778 | |
| | | | | | |
|
|
|
Computer Software — 0.0% | |
Akamai Technologies, Inc.† | | | 3,402 | | | | 242,597 | |
| | | | | | |
|
|
|
Computers — 0.4% | |
Hewlett-Packard Co. | | | 106,712 | | | | 2,994,339 | |
| | | | | | |
|
|
|
Computers - Memory Devices — 0.9% | | | | | | | | |
EMC Corp. | | | 153,484 | | | | 3,817,147 | |
NetApp, Inc. | | | 7,026 | | | | 224,551 | |
SanDisk Corp. | | | 9,401 | | | | 512,919 | |
80
VALIC Company II Socially Responsible Fund
PORTFOLIO OF INVESTMENTS — August 31, 2015 (unaudited) — (continued)
| | | | | | | | |
| | |
| Security Description | | Shares | | |
Value
(Note 2) | |
| |
COMMON STOCKS (continued) | |
Computers - Memory Devices (continued) | | | | | | | | |
Seagate Technology PLC# | | | 19,573 | | | $ | 1,006,052 | |
Western Digital Corp. | | | 13,380 | | | | 1,096,625 | |
| | | | | | |
|
|
|
| | | | | | | | 6,657,294 | |
| | | | | | |
|
|
|
Consumer Products - Misc. — 0.5% | |
Kimberly-Clark Corp. | | | 33,770 | | | | 3,597,518 | |
| | | | | | |
|
|
|
Cosmetics & Toiletries — 2.1% | |
Colgate-Palmolive Co. | | | 90,365 | | | | 5,675,826 | |
Procter & Gamble Co. | | | 140,267 | | | | 9,912,669 | |
| | | | | | |
|
|
|
| | | | | | | | 15,588,495 | |
| | | | | | |
|
|
|
Cruise Lines — 0.1% | |
Royal Caribbean Cruises, Ltd. | | | 5,489 | | | | 483,910 | |
| | | | | | |
|
|
|
Data Processing/Management — 0.5% | | | | | | | | |
Fidelity National Information Services, Inc. | | | 27,919 | | | | 1,928,086 | |
Fiserv, Inc.† | | | 16,641 | | | | 1,418,978 | |
Paychex, Inc. | | | 4,220 | | | | 188,465 | |
| | | | | | |
|
|
|
| | | | | | | | 3,535,529 | |
| | | | | | |
|
|
|
Diagnostic Equipment — 0.7% | |
Danaher Corp. | | | 61,390 | | | | 5,342,158 | |
| | | | | | |
|
|
|
Dialysis Centers — 0.0% | |
DaVita HealthCare Partners, Inc.† | | | 3,620 | | | | 273,817 | |
| | | | | | |
|
|
|
Distribution/Wholesale — 0.1% | |
Fastenal Co.# | | | 15,084 | | | | 581,337 | |
WW Grainger, Inc. | | | 1,982 | | | | 442,858 | |
| | | | | | |
|
|
|
| | | | | | | | 1,024,195 | |
| | | | | | |
|
|
|
Diversified Banking Institutions — 0.7% | |
Goldman Sachs Group, Inc. | | | 25,999 | | | | 4,903,411 | |
| | | | | | |
|
|
|
Diversified Manufacturing Operations — 1.7% | |
3M Co. | | | 47,331 | | | | 6,727,629 | |
Eaton Corp. PLC | | | 41,717 | | | | 2,380,372 | |
Illinois Tool Works, Inc. | | | 26,621 | | | | 2,250,273 | |
Parker-Hannifin Corp. | | | 7,312 | | | | 787,210 | |
Pentair PLC | | | 7,249 | | | | 400,797 | |
| | | | | | |
|
|
|
| | | | | | | | 12,546,281 | |
| | | | | | |
|
|
|
E-Commerce/Products — 1.5% | |
Amazon.com, Inc.† | | | 18,318 | | | | 9,395,119 | |
eBay, Inc.† | | | 63,362 | | | | 1,717,744 | |
| | | | | | |
|
|
|
| | | | | | | | 11,112,863 | |
| | | | | | |
|
|
|
E-Commerce/Services — 0.7% | |
Expedia, Inc. | | | 2,780 | | | | 319,672 | |
Netflix, Inc.† | | | 15,407 | | | | 1,772,267 | |
Priceline Group, Inc.† | | | 2,304 | | | | 2,876,867 | |
| | | | | | |
|
|
|
| | | | | | | | 4,968,806 | |
| | | | | | |
|
|
|
Electric Products - Misc. — 0.4% | |
AMETEK, Inc. | | | 3,247 | | | | 174,754 | |
Emerson Electric Co. | | | 64,491 | | | | 3,077,510 | |
| | | | | | |
|
|
|
| | | | | | | | 3,252,264 | |
| | | | | | |
|
|
|
Electric - Integrated — 2.0% | |
AES Corp. | | | 49,232 | | | | 590,784 | |
CMS Energy Corp. | | | 58,662 | | | | 1,922,940 | |
Consolidated Edison, Inc. | | | 93,693 | | | | 5,894,227 | |
Eversource Energy | | | 74,663 | | | | 3,527,080 | |
Pepco Holdings, Inc. | | | 8,769 | | | | 201,512 | |
TECO Energy, Inc. | | | 20,371 | | | | 429,217 | |
WEC Energy Group, Inc. | | | 38,347 | | | | 1,827,234 | |
| | | | | | |
|
|
|
| | | | | | | | 14,392,994 | |
| | | | | | |
|
|
|
| | | | | | | | |
| | |
| Security Description | | Shares | | |
Value
(Note 2) | |
| |
| | | | | | | | | |
Electronic Components - Misc. — 0.5% | |
Corning, Inc. | | | 75,556 | | | $ | 1,300,319 | |
Garmin, Ltd.# | | | 15,409 | | | | 579,532 | |
TE Connectivity, Ltd. | | | 23,655 | | | | 1,402,505 | |
| | | | | | |
|
|
|
| | | | | | | | 3,282,356 | |
| | | | | | |
|
|
|
Electronic Components - Semiconductors — 2.4% | |
Altera Corp. | | | 14,621 | | | | 709,849 | |
Avago Technologies, Ltd. | | | 14,259 | | | | 1,796,206 | |
Broadcom Corp., Class A | | | 31,476 | | | | 1,626,365 | |
Intel Corp. | | | 270,103 | | | | 7,708,740 | |
Microchip Technology, Inc.# | | | 7,483 | | | | 318,027 | |
Micron Technology, Inc.† | | | 39,222 | | | | 643,633 | |
NVIDIA Corp. | | | 14,931 | | | | 335,649 | |
Texas Instruments, Inc. | | | 86,464 | | | | 4,136,438 | |
| | | | | | |
|
|
|
| | | | | | | | 17,274,907 | |
| | | | | | |
|
|
|
Electronic Forms — 0.2% | |
Adobe Systems, Inc.† | | | 21,188 | | | | 1,664,741 | |
| | | | | | |
|
|
|
Electronic Measurement Instruments — 0.1% | |
Agilent Technologies, Inc. | | | 10,958 | | | | 397,885 | |
| | | | | | |
|
|
|
Engines - Internal Combustion — 0.2% | |
Cummins, Inc. | | | 10,180 | | | | 1,239,415 | |
| | | | | | |
|
|
|
Enterprise Software/Service — 1.0% | | | | | | | | |
CA, Inc. | | | 27,903 | | | | 761,473 | |
Oracle Corp. | | | 178,768 | | | | 6,630,505 | |
| | | | | | |
|
|
|
| | | | | | | | 7,391,978 | |
| | | | | | |
|
|
|
Entertainment Software — 0.1% | |
Electronic Arts, Inc.† | | | 10,628 | | | | 703,042 | |
| | | | | | |
|
|
|
Finance - Credit Card — 2.0% | |
Alliance Data Systems Corp.† | | | 3,988 | | | | 1,025,674 | |
American Express Co. | | | 57,742 | | | | 4,429,966 | |
Discover Financial Services | | | 32,069 | | | | 1,723,067 | |
Visa, Inc., Class A | | | 104,863 | | | | 7,476,732 | |
| | | | | | |
|
|
|
| | | | | | | | 14,655,439 | |
| | | | | | |
|
|
|
Finance - Investment Banker/Broker — 0.3% | |
Charles Schwab Corp. | | | 62,836 | | | | 1,908,958 | |
| | | | | | |
|
|
|
Finance - Other Services — 0.5% | |
CME Group, Inc. | | | 24,376 | | | | 2,302,069 | |
Intercontinental Exchange, Inc. | | | 6,614 | | | | 1,510,704 | |
| | | | | | |
|
|
|
| | | | | | | | 3,812,773 | |
| | | | | | |
|
|
|
Food - Misc./Diversified — 1.9% | |
Campbell Soup Co.# | | | 1,778 | | | | 85,326 | |
ConAgra Foods, Inc. | | | 12,812 | | | | 534,004 | |
General Mills, Inc. | | | 81,087 | | | | 4,602,498 | |
Kellogg Co. | | | 9,848 | | | | 652,726 | |
Kraft Heinz Co. | | | 38,883 | | | | 2,825,239 | |
Mondelez International, Inc., Class A | | | 120,559 | | | | 5,106,879 | |
| | | | | | |
|
|
|
| | | | | | | | 13,806,672 | |
| | | | | | |
|
|
|
Food - Retail — 0.6% | |
Kroger Co. | | | 105,180 | | | | 3,628,710 | |
Whole Foods Market, Inc. | | | 13,342 | | | | 437,084 | |
| | | | | | |
|
|
|
| | | | | | | | 4,065,794 | |
| | | | | | |
|
|
|
Food - Wholesale/Distribution — 0.3% | |
Sysco Corp. | | | 59,026 | | | | 2,353,367 | |
| | | | | | |
|
|
|
Gas - Distribution — 0.8% | |
AGL Resources, Inc. | | | 27,053 | | | | 1,649,962 | |
CenterPoint Energy, Inc. | | | 22,382 | | | | 416,753 | |
NiSource, Inc. | | | 36,845 | | | | 618,628 | |
81
VALIC Company II Socially Responsible Fund
PORTFOLIO OF INVESTMENTS — August 31, 2015 (unaudited) — (continued)
| | | | | | | | |
| | |
| Security Description | | Shares | | |
Value
(Note 2) | |
| |
COMMON STOCKS (continued) | |
Gas - Distribution (continued) | |
Sempra Energy | | | 30,985 | | | $ | 2,938,927 | |
| | | | | | |
|
|
|
| | | | | | | | 5,624,270 | |
| | | | | | |
|
|
|
Home Decoration Products — 0.1% | |
Newell Rubbermaid, Inc. | | | 22,192 | | | | 934,949 | |
| | | | | | |
|
|
|
Hotels/Motels — 0.2% | |
Marriott International, Inc., Class A | | | 6,919 | | | | 488,897 | |
Starwood Hotels & Resorts Worldwide, Inc. | | | 8,905 | | | | 636,440 | |
| | | | | | |
|
|
|
| | | | | | | | 1,125,337 | |
| | | | | | |
|
|
|
Industrial Automated/Robotic — 0.2% | |
Rockwell Automation, Inc. | | | 13,285 | | | | 1,485,662 | |
| | | | | | |
|
|
|
Industrial Gases — 0.4% | |
Air Products & Chemicals, Inc. | | | 19,598 | | | | 2,734,509 | |
Airgas, Inc. | | | 5,209 | | | | 502,773 | |
| | | | | | |
|
|
|
| | | | | | | | 3,237,282 | |
| | | | | | |
|
|
|
Instruments - Scientific — 0.4% | |
Thermo Fisher Scientific, Inc. | | | 24,913 | | | | 3,123,343 | |
| | | | | | |
|
|
|
Insurance Brokers — 0.1% | |
Aon PLC | | | 1,065 | | | | 99,513 | |
Marsh & McLennan Cos., Inc. | | | 10,268 | | | | 551,700 | |
| | | | | | |
|
|
|
| | | | | | | | 651,213 | |
| | | | | | |
|
|
|
Insurance - Life/Health — 0.8% | |
Aflac, Inc. | | | 35,412 | | | | 2,075,143 | |
Principal Financial Group, Inc. | | | 11,542 | | | | 581,140 | |
Prudential Financial, Inc. | | | 36,920 | | | | 2,979,444 | |
| | | | | | |
|
|
|
| | | | | | | | 5,635,727 | |
| | | | | | |
|
|
|
Insurance - Multi-line — 1.8% | |
ACE, Ltd. | | | 27,968 | | | | 2,857,211 | |
Allstate Corp. | | | 37,523 | | | | 2,186,840 | |
Cincinnati Financial Corp. | | | 6,024 | | | | 315,236 | |
Hartford Financial Services Group, Inc. | | | 20,221 | | | | 929,155 | |
Loews Corp. | | | 55,265 | | | | 2,014,409 | |
MetLife, Inc. | | | 84,849 | | | | 4,250,935 | |
XL Group PLC | | | 4,633 | | | | 172,765 | |
| | | | | | |
|
|
|
| | | | | | | | 12,726,551 | |
| | | | | | |
|
|
|
Insurance - Property/Casualty — 0.3% | |
Travelers Cos., Inc. | | | 20,300 | | | | 2,020,865 | |
| | | | | | |
|
|
|
Insurance - Reinsurance — 1.7% | |
Berkshire Hathaway, Inc., Class B† | | | 93,802 | | | | 12,573,220 | |
| | | | | | |
|
|
|
Internet Content - Entertainment — 1.1% | |
Facebook, Inc., Class A† | | | 92,128 | | | | 8,239,007 | |
| | | | | | |
|
|
|
Internet Security — 0.1% | |
Symantec Corp. | | | 45,635 | | | | 935,061 | |
| | | | | | |
|
|
|
Investment Management/Advisor Services — 0.9% | |
Ameriprise Financial, Inc. | | | 12,211 | | | | 1,375,813 | |
BlackRock, Inc. | | | 9,792 | | | | 2,961,786 | |
Franklin Resources, Inc. | | | 20,511 | | | | 832,337 | |
Invesco, Ltd. | | | 13,676 | | | | 466,488 | |
T. Rowe Price Group, Inc. | | | 7,505 | | | | 539,460 | |
| | | | | | |
|
|
|
| | | | | | | | 6,175,884 | |
| | | | | | |
|
|
|
Machinery - Construction & Mining — 0.5% | |
Caterpillar, Inc. | | | 47,630 | | | | 3,640,837 | |
| | | | | | |
|
|
|
Machinery - Farming — 0.3% | |
Deere & Co. | | | 30,086 | | | | 2,460,433 | |
| | | | | | |
|
|
|
Machinery - General Industrial — 0.1% | |
Roper Technologies, Inc. | | | 6,157 | | | | 997,988 | |
| | | | | | |
|
|
|
| | | | | | | | |
| | |
| Security Description | | Shares | | |
Value
(Note 2) | |
| |
| | | | | | | | | |
Medical Information Systems — 0.1% | |
Cerner Corp.† | | | 9,543 | | | $ | 589,376 | |
| | | | | | |
|
|
|
Medical Instruments — 0.2% | |
Boston Scientific Corp.† | | | 9,723 | | | | 162,763 | |
Edwards Lifesciences Corp.† | | | 2,108 | | | | 296,975 | |
Intuitive Surgical, Inc.† | | | 889 | | | | 454,235 | |
St. Jude Medical, Inc. | | | 6,253 | | | | 442,775 | |
| | | | | | |
|
|
|
| | | | | | | | 1,356,748 | |
| | | | | | |
|
|
|
Medical Products — 0.5% | |
Baxter International, Inc. | | | 31,938 | | | | 1,228,016 | |
Becton Dickinson and Co. | | | 7,289 | | | | 1,027,895 | |
Stryker Corp. | | | 12,524 | | | | 1,235,492 | |
| | | | | | |
|
|
|
| | | | | | | | 3,491,403 | |
| | | | | | |
|
|
|
Medical - Biomedical/Gene — 3.6% | |
Alexion Pharmaceuticals, Inc.† | | | 8,732 | | | | 1,503,563 | |
Amgen, Inc. | | | 44,423 | | | | 6,742,523 | |
Biogen, Inc.† | | | 10,724 | | | | 3,188,245 | |
Celgene Corp.† | | | 37,522 | | | | 4,430,598 | |
Gilead Sciences, Inc. | | | 68,865 | | | | 7,235,646 | |
Regeneron Pharmaceuticals, Inc.† | | | 3,452 | | | | 1,772,602 | |
Vertex Pharmaceuticals, Inc.† | | | 9,364 | | | | 1,194,097 | |
| | | | | | |
|
|
|
| | | | | | | | 26,067,274 | |
| | | | | | |
|
|
|
Medical - Drugs — 5.8% | |
Abbott Laboratories | | | 138,952 | | | | 6,293,136 | |
AbbVie, Inc. | | | 171,651 | | | | 10,712,739 | |
Baxalta, Inc. | | | 31,938 | | | | 1,122,621 | |
Bristol-Myers Squibb Co. | | | 88,683 | | | | 5,273,978 | |
Endo International PLC† | | | 6,372 | | | | 490,644 | |
Johnson & Johnson | | | 176,549 | | | | 16,592,075 | |
Zoetis, Inc. | | | 33,254 | | | | 1,492,107 | |
| | | | | | |
|
|
|
| | | | | | | | 41,977,300 | |
| | | | | | |
|
|
|
Medical - Generic Drugs — 1.1% | |
Allergan PLC† | | | 21,366 | | | | 6,489,709 | |
Mylan NV† | | | 12,336 | | | | 611,742 | |
Perrigo Co. PLC | | | 5,566 | | | | 1,018,411 | |
| | | | | | |
|
|
|
| | | | | | | | 8,119,862 | |
| | | | | | |
|
|
|
Medical - HMO — 1.8% | |
Aetna, Inc. | | | 14,848 | | | | 1,700,393 | |
Anthem, Inc. | | | 10,810 | | | | 1,524,751 | |
Cigna Corp. | | | 11,462 | | | | 1,613,735 | |
Humana, Inc. | | | 7,755 | | | | 1,417,536 | |
UnitedHealth Group, Inc. | | | 58,632 | | | | 6,783,722 | |
| | | | | | |
|
|
|
| | | | | | | | 13,040,137 | |
| | | | | | |
|
|
|
Medical - Hospitals — 0.2% | |
HCA Holdings, Inc.† | | | 16,244 | | | | 1,407,055 | |
| | | | | | |
|
|
|
Medical - Wholesale Drug Distribution — 0.9% | |
AmerisourceBergen Corp. | | | 20,567 | | | | 2,057,523 | |
Cardinal Health, Inc. | | | 20,920 | | | | 1,721,088 | |
McKesson Corp. | | | 12,746 | | | | 2,518,355 | |
| | | | | | |
|
|
|
| | | | | | | | 6,296,966 | |
| | | | | | |
|
|
|
Motorcycle/Motor Scooter — 0.1% | |
Harley-Davidson, Inc. | | | 13,181 | | | | 738,795 | |
| | | | | | |
|
|
|
Multimedia — 2.4% | |
Time Warner, Inc. | | | 49,528 | | | | 3,521,441 | |
Twenty-First Century Fox, Inc., Class A | | | 90,223 | | | | 2,471,208 | |
Viacom, Inc., Class B | | | 32,225 | | | | 1,313,813 | |
Walt Disney Co. | | | 100,359 | | | | 10,224,575 | |
| | | | | | |
|
|
|
| | | | | | | | 17,531,037 | |
| | | | | | |
|
|
|
82
VALIC Company II Socially Responsible Fund
PORTFOLIO OF INVESTMENTS — August 31, 2015 (unaudited) — (continued)
| | | | | | | | |
| | |
| Security Description | | Shares | | |
Value
(Note 2) | |
| |
COMMON STOCKS (continued) | |
Networking Products — 1.1% | |
Cisco Systems, Inc. | | | 305,307 | | | $ | 7,901,345 | |
| | | | | | |
|
|
|
Non-Hazardous Waste Disposal — 0.4% | |
Republic Services, Inc. | | | 42,928 | | | | 1,759,189 | |
Waste Management, Inc. | | | 25,579 | | | | 1,280,485 | |
| | | | | | |
|
|
|
| | | | | | | | 3,039,674 | |
| | | | | | |
|
|
|
Office Automation & Equipment — 0.2% | |
Pitney Bowes, Inc. | | | 13,968 | | | | 276,706 | |
Xerox Corp. | | | 140,125 | | | | 1,425,071 | |
| | | | | | |
|
|
|
| | | | | | | | 1,701,777 | |
| | | | | | |
|
|
|
Oil & Gas Drilling — 0.1% | |
Ensco PLC, Class A | | | 48,960 | | | | 886,666 | |
| | | | | | |
|
|
|
Oil Companies - Exploration & Production — 1.4% | |
Anadarko Petroleum Corp. | | | 28,974 | | | | 2,073,959 | |
Apache Corp. | | | 38,248 | | | | 1,730,340 | |
Cabot Oil & Gas Corp. | | | 11,446 | | | | 270,927 | |
Chesapeake Energy Corp.# | | | 35,208 | | | | 274,974 | |
Devon Energy Corp. | | | 34,331 | | | | 1,464,560 | |
EOG Resources, Inc. | | | 30,897 | | | | 2,419,544 | |
EQT Corp. | | | 7,872 | | | | 612,599 | |
Noble Energy, Inc. | | | 7,726 | | | | 258,126 | |
Pioneer Natural Resources Co. | | | 6,458 | | | | 794,721 | |
| | | | | | |
|
|
|
| | | | | | | | 9,899,750 | |
| | | | | | |
|
|
|
Oil Companies - Integrated — 0.4% | |
Marathon Oil Corp. | | | 108,246 | | | | 1,871,573 | |
Murphy Oil Corp. | | | 41,807 | | | | 1,296,017 | |
| | | | | | |
|
|
|
| | | | | | | | 3,167,590 | |
| | | | | | |
|
|
|
Oil Field Machinery & Equipment — 0.2% | |
National Oilwell Varco, Inc. | | | 33,660 | | | | 1,424,828 | |
| | | | | | |
|
|
|
Oil Refining & Marketing — 0.8% | |
Marathon Petroleum Corp. | | | 19,530 | | | | 923,964 | |
Phillips 66 | | | 42,027 | | | | 3,323,075 | |
Valero Energy Corp. | | | 30,306 | | | | 1,798,358 | |
| | | | | | |
|
|
|
| | | | | | | | 6,045,397 | |
| | | | | | |
|
|
|
Oil - Field Services — 0.9% | |
Baker Hughes, Inc. | | | 18,793 | | | | 1,052,408 | |
Schlumberger, Ltd. | | | 66,857 | | | | 5,172,726 | |
| | | | | | |
|
|
|
| | | | | | | | 6,225,134 | |
| | | | | | |
|
|
|
Paper & Related Products — 0.2% | |
International Paper Co. | | | 31,337 | | | | 1,351,878 | |
| | | | | | |
|
|
|
Pharmacy Services — 0.5% | |
Express Scripts Holding Co.† | | | 39,140 | | | | 3,272,104 | |
| | | | | | |
|
|
|
Pipelines — 1.7% | |
Columbia Pipeline Group, Inc. | | | 36,845 | | | | 934,389 | |
Kinder Morgan, Inc. | | | 121,187 | | | | 3,927,671 | |
ONEOK, Inc. | | | 25,861 | | | | 931,255 | |
Spectra Energy Corp. | | | 125,039 | | | | 3,634,884 | |
Williams Cos., Inc. | | | 54,892 | | | | 2,645,794 | |
| | | | | | |
|
|
|
| | | | | | | | 12,073,993 | |
| | | | | | |
|
|
|
Publishing - Newspapers — 0.0% | |
News Corp., Class A† | | | 11,319 | | | | 154,278 | |
| | | | | | |
|
|
|
Real Estate Investment Trusts — 3.3% | |
American Tower Corp. | | | 34,884 | | | | 3,215,956 | |
AvalonBay Communities, Inc. | | | 3,894 | | | | 642,744 | |
Boston Properties, Inc. | | | 4,161 | | | | 471,774 | |
Crown Castle International Corp. | | | 46,061 | | | | 3,841,027 | |
Equity Residential | | | 31,050 | | | | 2,212,312 | |
| | | | | | | | |
| | |
| Security Description | | Shares | | |
Value
(Note 2) | |
| |
| | | | | | | | | |
Real Estate Investment Trusts (continued) | |
General Growth Properties, Inc. | | | 19,039 | | | $ | 483,210 | |
HCP, Inc. | | | 44,743 | | | | 1,658,176 | |
Health Care REIT, Inc. | | | 17,455 | | | | 1,105,774 | |
Host Hotels & Resorts, Inc. | | | 48,343 | | | | 857,121 | |
Macerich Co. | | | 4,196 | | | | 319,651 | |
Prologis, Inc. | | | 21,297 | | | | 809,286 | |
Public Storage | | | 5,377 | | | | 1,082,229 | |
Simon Property Group, Inc. | | | 26,848 | | | | 4,814,383 | |
Ventas, Inc. | | | 10,682 | | | | 587,724 | |
Vornado Realty Trust | | | 12,768 | | | | 1,113,242 | |
Weyerhaeuser Co. | | | 20,390 | | | | 569,697 | |
| | | | | | |
|
|
|
| | | | | | | | 23,784,306 | |
| | | | | | |
|
|
|
Real Estate Management/Services — 0.0% | |
CBRE Group, Inc., Class A† | | | 2,702 | | | | 86,518 | |
| | | | | | |
|
|
|
Rental Auto/Equipment — 0.0% | |
United Rentals, Inc.† | | | 2,286 | | | | 158,488 | |
| | | | | | |
|
|
|
Retail - Apparel/Shoe — 0.2% | |
Gap, Inc. | | | 15,872 | | | | 520,760 | |
L Brands, Inc. | | | 11,680 | | | | 979,952 | |
| | | | | | |
|
|
|
| | | | | | | | 1,500,712 | |
| | | | | | |
|
|
|
Retail - Automobile — 0.0% | |
CarMax, Inc.† | | | 3,681 | | | | 224,541 | |
| | | | | | |
|
|
|
Retail - Building Products — 1.7% | |
Home Depot, Inc. | | | 78,570 | | | | 9,150,262 | |
Lowe’s Cos., Inc. | | | 44,259 | | | | 3,061,395 | |
| | | | | | |
|
|
|
| | | | | | | | 12,211,657 | |
| | | | | | |
|
|
|
Retail - Consumer Electronics — 0.0% | |
Best Buy Co., Inc. | | | 7,266 | | | | 266,953 | |
| | | | | | |
|
|
|
Retail - Discount — 1.2% | |
Costco Wholesale Corp. | | | 37,184 | | | | 5,207,619 | |
Target Corp. | | | 45,281 | | | | 3,518,787 | |
| | | | | | |
|
|
|
| | | | | | | | 8,726,406 | |
| | | | | | |
|
|
|
Retail - Drug Store — 1.5% | |
CVS Health Corp. | | | 67,391 | | | | 6,900,838 | |
Walgreens Boots Alliance, Inc. | | | 46,192 | | | | 3,997,918 | |
| | | | | | |
|
|
|
| | | | | | | | 10,898,756 | |
| | | | | | |
|
|
|
Retail - Jewelry — 0.0% | |
Tiffany & Co. | | | 1,850 | | | | 152,163 | |
| | | | | | |
|
|
|
Retail - Major Department Stores — 0.4% | |
TJX Cos., Inc. | | | 39,846 | | | | 2,801,971 | |
| | | | | | |
|
|
|
Retail - Office Supplies — 0.1% | |
Staples, Inc. | | | 30,753 | | | | 437,000 | |
| | | | | | |
|
|
|
Retail - Regional Department Stores — 0.2% | |
Kohl’s Corp. | | | 3,340 | | | | 170,440 | |
Macy’s, Inc. | | | 23,549 | | | | 1,380,207 | |
| | | | | | |
|
|
|
| | | | | | | | 1,550,647 | |
| | | | | | |
|
|
|
Retail - Restaurants — 2.5% | |
Chipotle Mexican Grill, Inc.† | | | 725 | | | | 514,757 | |
Darden Restaurants, Inc. | | | 6,709 | | | | 456,279 | |
McDonald’s Corp. | | | 108,826 | | | | 10,340,646 | |
Starbucks Corp. | | | 78,825 | | | | 4,312,516 | |
Yum! Brands, Inc. | | | 29,101 | | | | 2,321,387 | |
| | | | | | |
|
|
|
| | | | | | | | 17,945,585 | |
| | | | | | |
|
|
|
Rubber - Tires — 0.0% | |
Goodyear Tire & Rubber Co. | | | 4,867 | | | | 144,891 | |
| | | | | | |
|
|
|
83
VALIC Company II Socially Responsible Fund
PORTFOLIO OF INVESTMENTS — August 31, 2015 (unaudited) — (continued)
| | | | | | | | |
| | |
| Security Description | | Shares | | |
Value
(Note 2) | |
| |
COMMON STOCKS (continued) | |
Savings & Loans/Thrifts — 0.1% | |
People’s United Financial, Inc. | | | 33,927 | | | $ | 525,869 | |
| | | | | | |
|
|
|
Semiconductor Components - Integrated Circuits — 1.0% | |
Analog Devices, Inc. | | | 37,420 | | | | 2,090,281 | |
QUALCOMM, Inc. | | | 93,801 | | | | 5,307,261 | |
| | | | | | |
|
|
|
| | | | | | | | 7,397,542 | |
| | | | | | |
|
|
|
Semiconductor Equipment — 0.3% | |
Applied Materials, Inc. | | | 64,853 | | | | 1,043,160 | |
KLA-Tencor Corp. | | | 17,343 | | | | 869,058 | |
| | | | | | |
|
|
|
| | | | | | | | 1,912,218 | |
| | | | | | |
|
|
|
Steel - Producers — 0.3% | |
Nucor Corp. | | | 41,655 | | | | 1,803,245 | |
| | | | | | |
|
|
|
Telecom Services — 0.1% | |
Level 3 Communications, Inc.† | | | 10,841 | | | | 484,918 | |
| | | | | | |
|
|
|
Telecommunication Equipment — 0.1% | |
Juniper Networks, Inc. | | | 13,654 | | | | 351,044 | |
| | | | | | |
|
|
|
Telephone - Integrated — 0.5% | |
AT&T, Inc. | | | 59,878 | | | | 1,987,949 | |
CenturyLink, Inc. | | | 46,675 | | | | 1,262,092 | |
Frontier Communications Corp.# | | | 110,966 | | | | 562,598 | |
| | | | | | |
|
|
|
| | | | | | | | 3,812,639 | |
| | | | | | |
|
|
|
Television — 0.2% | |
CBS Corp., Class B | | | 30,146 | | | | 1,363,805 | |
| | | | | | |
|
|
|
Tools - Hand Held — 0.2% | |
Stanley Black & Decker, Inc. | | | 13,862 | | | | 1,407,270 | |
| | | | | | |
|
|
|
Toys — 0.0% | |
Mattel, Inc.# | | | 13,206 | | | | 309,417 | |
| | | | | | |
|
|
|
Transport - Rail — 0.8% | |
CSX Corp. | | | 28,533 | | | | 781,233 | |
Norfolk Southern Corp. | | | 10,465 | | | | 815,328 | |
Union Pacific Corp. | | | 53,201 | | | | 4,561,454 | |
| | | | | | |
|
|
|
| | | | | | | | 6,158,015 | |
| | | | | | |
|
|
|
Transport - Services — 1.0% | |
FedEx Corp. | | | 10,442 | | | | 1,572,670 | |
United Parcel Service, Inc., Class B | | | 56,811 | | | | 5,547,594 | |
| | | | | | |
|
|
|
| | | | | | | | 7,120,264 | |
| | | | | | |
|
|
|
Vitamins & Nutrition Products — 0.0% | |
Mead Johnson Nutrition Co. | | | 4,160 | | | | 325,894 | |
| | | | | | |
|
|
|
Web Portals/ISP — 3.7% | |
Google, Inc., Class A† | | | 14,296 | | | | 9,261,235 | |
Google, Inc., Class C† | | | 26,767 | | | | 16,548,698 | |
Yahoo!, Inc.† | | | 40,009 | | | | 1,289,890 | |
| | | | | | |
|
|
|
| | | | | | | | 27,099,823 | |
| | | | | | |
|
|
|
| | | | | | | | |
| | |
| Security Description | | Shares/
Principal
Amount | | | Value
(Note 2) | |
| |
| | | | | | | | | |
Wireless Equipment — 0.1% | |
Motorola Solutions, Inc. | | | 6,303 | | | $ | 408,560 | |
| | | | | | |
|
|
|
Total Long-Term Investment Securities | | | | | | | | |
(cost $571,067,779) | | | | | | | 692,398,128 | |
| | | | | | |
|
|
|
SHORT-TERM INVESTMENT SECURITIES — 3.0% | |
Registered Investment Companies — 0.5% | |
State Street Navigator Securities Lending Prime Portfolio 0.21%(1)(4) | | | 3,600,710 | | | | 3,600,710 | |
| | | | | | |
|
|
|
U.S. Government Treasuries — 2.5% | | | | | | | | |
United States Treasury Bills | | | | | | | | |
0.03% due 09/03/2015 | | $ | 5,000,000 | | | | 5,000,000 | |
0.02% due 09/10/2015(2) | | | 3,200,000 | | | | 3,199,997 | |
0.04% due 09/17/2015 | | | 10,000,000 | | | | 10,000,010 | |
| | | | | | |
|
|
|
| | | | | | | | 18,200,007 | |
| | | | | | |
|
|
|
Total Short-Term Investment Securities | | | | | | | | |
(cost $21,800,536) | | | | | | | 21,800,717 | |
| | | | | | |
|
|
|
REPURCHASE AGREEMENTS — 2.1% | |
State Street Bank & Trust Co. Joint Repurchase Agreement(3)
(cost $15,260,000) | | | 15,260,000 | | | | 15,260,000 | |
| | | | | | |
|
|
|
TOTAL INVESTMENTS | | | | | | | | |
(cost $608,128,315)(5) | | | 100.4 | % | | | 729,458,845 | |
Liabilities in excess of other assets | | | (0.4 | ) | | | (2,998,831 | ) |
| | |
|
|
| |
|
|
|
NET ASSETS | | | 100.0 | % | | $ | 726,460,014 | |
| | |
|
|
| |
|
|
|
| † | Non-income producing security |
| # | The security or a portion thereof is out on loan (see Note 2) |
| (1) | At August 31, 2015, the Fund had loaned securities with a total value of $4,095,900. This was secured by collateral of $3,600,710 which was received in cash and subsequently invested in short-term investments currently valued at $3,600,710 as reported in the Portfolio of Investments. Additional collateral of $574,978 was received in the form of fixed income pooled securities, which the Fund cannot sell or repledge and accordingly are not reflected in the Fund’s assets and liabilities. |
The components of the fixed income pooled securities referenced above are as follows:
| | | | | | | | |
Securities
| | Coupon Range
| | Maturity Date Range
| | Value as of
August 31, 2015
| |
United States Treasury Notes/Bonds | | 0.12% to 8.88% | | 11/15/2015 to 05/15/2044 | | $ | 574,978 | |
| (2) | The security or a portion thereof was pledged as collateral to cover margin requirements for open futures contracts. |
| (3) | See Note 2 for details of Joint Repurchase Agreements. |
| (4) | The rate shown is the 7-day yield as of August 31, 2015. |
| (5) | See Note 5 for cost of investments on a tax basis. |
| | | | | | | | | | | | | | | | | | | | | | |
| Futures Contracts | |
Number of
Contracts | | | Type | | Description | | Expiration
Month | | | Value at
Trade Date | | | Value as of
August 31, 2015 | | | Unrealized
Appreciation
(Depreciation) | |
| | 344 | | | Long | | S&P 500 E-Mini Index | | | September 2015 | | | | 35,918,122 | | | | 33,870,240 | | | $ | (2,047,882 | ) |
| | | | | | | | | | | | | | | | | | | | |
|
|
|
84
VALIC Company II Socially Responsible Fund
PORTFOLIO OF INVESTMENTS — August 31, 2015 (unaudited) — (continued)
The following is a summary of the inputs used to value the Fund’s net assets as of August 31, 2015 (see Note 2):
| | | | | | | | | | | | | | | | |
| | | Level 1 - Unadjusted Quoted
Prices
| | | Level 2 - Other Observable
Inputs
| | | Level 3 - Significant
Unobservable Inputs
| | | Total
| |
ASSETS: | | | | | | | | | | | | | | | | |
Investments at Value:* | | | | | | | | | | | | | | | | |
Common Stocks | | $ | 692,398,128 | | | $ | — | | | $ | — | | | $ | 692,398,128 | |
Short-Term Investment Securities: | | | | | | | | | | | | | | | | |
Registered Investment Companies | | | 3,600,710 | | | | — | | | | — | | | | 3,600,710 | |
U.S. Government Treasuries | | | — | | | | 18,200,007 | | | | — | | | | 18,200,007 | |
Repurchase Agreements | | | — | | | | 15,260,000 | | | | — | | | | 15,260,000 | |
| | |
|
|
| |
|
|
| |
|
|
| |
|
|
|
Total Investments at Value | | $ | 695,998,838 | | | $ | 33,460,007 | | | $ | — | | | $ | 729,458,845 | |
| | |
|
|
| |
|
|
| |
|
|
| |
|
|
|
LIABILITIES: | | | | | | | | | | | | | | | | |
Other Financial Instruments:+ | | | | | | | | | | | | | | | | |
Open Futures Contracts | | $ | 2,047,882 | | | $ | — | | | $ | — | | | $ | 2,047,882 | |
| | |
|
|
| |
|
|
| |
|
|
| |
|
|
|
| * | For a detailed presentation of investments, please refer to the Portfolio of Investments. |
| + | Other financial instruments are derivative instruments, not reflected in the Portfolio of Investments, such as futures, forward, swap and written option contracts, which are valued at the unrealized appreciation (depreciation) on the instrument. |
The Fund’s policy is to recognize transfers between Levels as of the end of the reporting period. There were no transfers between Levels during the reporting period.
See Notes to Financial Statements
85
VALIC Company II Strategic Bond Fund
PORTFOLIO PROFILE — August 31, 2015 (unaudited)
Industry Allocation*
| | | | |
United States Treasury Notes | | | 10.0 | % |
Sovereign | | | 10.0 | |
Diversified Banking Institutions | | | 5.9 | |
Banks — Commercial | | | 5.3 | |
Registered Investment Companies | | | 4.6 | |
Time Deposits | | | 3.9 | |
Oil Companies — Exploration & Production | | | 3.3 | |
Federal National Mtg. Assoc. | | | 2.7 | |
Electric — Integrated | | | 2.5 | |
Telephone — Integrated | | | 2.4 | |
Pipelines | | | 1.8 | |
Medical — Drugs | | | 1.6 | |
Oil Companies — Integrated | | | 1.5 | |
Medical — Hospitals | | | 1.3 | |
Cellular Telecom | | | 1.2 | |
Real Estate Investment Trusts | | | 1.2 | |
Federal Home Loan Mtg. Corp. | | | 1.2 | |
Diversified Financial Services | | | 1.1 | |
Paper & Related Products | | | 1.0 | |
Telecom Services | | | 0.9 | |
Casino Hotels | | | 0.9 | |
United States Treasury Bonds | | | 0.9 | |
Cable/Satellite TV | | | 0.9 | |
Insurance — Multi-line | | | 0.8 | |
Auto — Cars/Light Trucks | | | 0.8 | |
Airlines | | | 0.8 | |
Diversified Manufacturing Operations | | | 0.7 | |
Printing — Commercial | | | 0.6 | |
Finance — Consumer Loans | | | 0.6 | |
Finance — Leasing Companies | | | 0.6 | |
Aerospace/Defense — Equipment | | | 0.6 | |
Banks — Money Center | | | 0.6 | |
Food — Retail | | | 0.6 | |
Publishing — Periodicals | | | 0.6 | |
Real Estate Operations & Development | | | 0.6 | |
Steel — Producers | | | 0.5 | |
Commercial Services — Finance | | | 0.5 | |
Banks — Super Regional | | | 0.5 | |
Insurance — Life/Health | | | 0.5 | |
Savings & Loans/Thrifts | | | 0.5 | |
Independent Power Producers | | | 0.5 | |
Investment Management/Advisor Services | | | 0.5 | |
Chemicals — Specialty | | | 0.5 | |
Internet Connectivity Services | | | 0.5 | |
Computers | | | 0.5 | |
Finance — Auto Loans | | | 0.5 | |
Oil Refining & Marketing | | | 0.5 | |
Distribution/Wholesale | | | 0.4 | |
Diversified Minerals | | | 0.4 | |
Containers — Metal/Glass | | | 0.4 | |
Aerospace/Defense | | | 0.4 | |
Retail — Restaurants | | | 0.4 | |
Publishing — Newspapers | | | 0.4 | |
Satellite Telecom | | | 0.4 | |
Finance — Other Services | | | 0.4 | |
Chemicals — Diversified | | | 0.4 | |
Electronic Components — Semiconductors | | | 0.4 | |
Building Products — Cement | | | 0.4 | |
Electric — Distribution | | | 0.4 | |
Disposable Medical Products | | | 0.3 | |
Food — Dairy Products | | | 0.3 | |
Auto/Truck Parts & Equipment — Original | | | 0.3 | |
Insurance — Mutual | | | 0.3 | |
Medical — Generic Drugs | | | 0.3 | |
Multimedia | | | 0.3 | |
Telecommunication Equipment | | | 0.3 | |
Gambling (Non-Hotel) | | | 0.3 | |
Municipal Bonds & Notes | | | 0.2 | |
Airport Development/Maintenance | | | 0.3 | |
Machinery — Farming | | | 0.3 | |
| | | | |
Government National Mtg. Assoc. | | | 0.3 | |
Medical Labs & Testing Services | | | 0.3 | |
Specified Purpose Acquisitions | | | 0.3 | |
Brewery | | | 0.3 | |
Agricultural Chemicals | | | 0.3 | |
Beverages — Wine/Spirits | | | 0.3 | |
Gold Mining | | | 0.3 | |
Wire & Cable Products | | | 0.3 | |
Theaters | | | 0.3 | |
Containers — Paper/Plastic | | | 0.3 | |
Retail — Appliances | | | 0.3 | |
Building Societies | | | 0.3 | |
Alternative Waste Technology | | | 0.3 | |
Oil & Gas Drilling | | | 0.3 | |
Coal | | | 0.3 | |
Food — Meat Products | | | 0.3 | |
E-Commerce/Services | | | 0.2 | |
Sovereign Agency | | | 0.2 | |
Banks — Special Purpose | | | 0.2 | |
Finance — Mortgage Loan/Banker | | | 0.2 | |
Music | | | 0.2 | |
Real Estate Management/Services | | | 0.2 | |
Finance — Commercial | | | 0.2 | |
Auto — Heavy Duty Trucks | | | 0.2 | |
Medical Products | | | 0.2 | |
Rental Auto/Equipment | | | 0.2 | |
SupraNational Banks | | | 0.2 | |
Food — Misc./Diversified | | | 0.2 | |
Metal — Iron | | | 0.2 | |
Finance — Credit Card | | | 0.2 | |
Machinery — General Industrial | | | 0.2 | |
Electric — Generation | | | 0.2 | |
Building — Residential/Commercial | | | 0.2 | |
Enterprise Software/Service | | | 0.2 | |
Batteries/Battery Systems | | | 0.2 | |
Insurance — Reinsurance | | | 0.2 | |
Retail — Computer Equipment | | | 0.2 | |
Retail — Regional Department Stores | | | 0.2 | |
Food — Wholesale/Distribution | | | 0.2 | |
Publishing — Books | | | 0.2 | |
Coatings/Paint | | | 0.2 | |
Banks — Fiduciary | | | 0.2 | |
Travel Services | | | 0.2 | |
Retail — Discount | | | 0.2 | |
Building & Construction — Misc. | | | 0.2 | |
Financial Guarantee Insurance | | | 0.2 | |
Cosmetics & Toiletries | | | 0.2 | |
Security Services | | | 0.2 | |
Dialysis Centers | | | 0.2 | |
Networking Products | | | 0.2 | |
Retail — Drug Store | | | 0.2 | |
Oil — Field Services | | | 0.2 | |
Semiconductor Components — Integrated Circuits | | | 0.2 | |
Petrochemicals | | | 0.1 | |
Transport — Rail | | | 0.1 | |
Cruise Lines | | | 0.1 | |
Broadcast Services/Program | | | 0.1 | |
Hotels/Motels | | | 0.1 | |
Food — Flour & Grain | | | 0.1 | |
Beverages — Non-alcoholic | | | 0.1 | |
Gas — Transportation | | | 0.1 | |
Energy — Alternate Sources | | | 0.1 | |
Tools — Hand Held | | | 0.1 | |
Electronic Components — Misc. | | | 0.1 | |
Medical — HMO | | | 0.1 | |
Advertising Services | | | 0.1 | |
Metal — Copper | | | 0.1 | |
Firearms & Ammunition | | | 0.1 | |
Radio | | | 0.1 | |
86
VALIC Company II Strategic Bond Fund
PORTFOLIO PROFILE — August 31, 2015 (unaudited) — (continued)
Industry Allocation (continued)
| | | | |
Consumer Products — Misc. | | | 0.1 | % |
Foreign Government Obligations | | | 0.1 | |
Steel Pipe & Tube | | | 0.1 | |
Building Products — Wood | | | 0.1 | |
Transport — Marine | | | 0.1 | |
Schools | | | 0.1 | |
Metal — Diversified | | | 0.1 | |
Computer Services | | | 0.1 | |
Steel — Specialty | | | 0.1 | |
Chemicals — Plastics | | | 0.1 | |
Building — Heavy Construction | | | 0.1 | |
Trucking/Leasing | | | 0.1 | |
Medical — Biomedical/Gene | | | 0.1 | |
Appliances | | | 0.1 | |
Retail — Major Department Stores | | | 0.1 | |
Machinery — Construction & Mining | | | 0.1 | |
Transport — Services | | | 0.1 | |
Finance — Investment Banker/Broker | | | 0.1 | |
Electric — Transmission | | | 0.1 | |
Tennessee Valley Authority | | | 0.1 | |
| | |
|
|
|
| | | | 103.8 | % |
| | |
|
|
|
Credit Quality†#
| | | | |
Aaa | | | 18.3 | % |
Aa | | | 3.7 | |
A | | | 13.2 | |
Baa | | | 18.9 | |
Ba | | | 15.8 | |
B | | | 19.9 | |
Caa | | | 6.1 | |
Ca | | | 0.1 | |
Not Rated@ | | | 4.0 | |
| | |
|
|
|
| | | | 100.0 | % |
| | |
|
|
|
| # | Calculated as a percentage of total debt issues. |
| @ | Represents debt issues that either have no rating, or the rating is unavailable from the data source. |
87
VALIC Company II Strategic Bond Fund
PORTFOLIO OF INVESTMENTS — August 31, 2015
| | | | | | | | |
| | |
| Security Description | | Principal Amount(6) | | | Value
(Note 2) | |
| |
ASSET BACKED SECURITIES — 0.7% | | | | | | | | |
Diversified Financial Services — 0.7% | |
American Express Credit Account Master Trust
Series 2014-3, Class A
1.49% due 04/15/2020 | | $ | 100,000 | | | $ | 100,684 | |
AmeriCredit Automobile Receivables Trust
Series 2013-3, Class D
3.00% due 07/08/2019 | | | 115,000 | | | | 116,957 | |
Applebee’s Funding LLC/IHOP Funding LLC
Series 2014-1, Class A2
4.28% due 09/05/2044* | | | 87,000 | | | | 88,626 | |
Asset Backed Securities Corp. Home Equity Loan Trust FRS Series 2004-HE7, Class M2
1.77% due 10/25/2034 | | | 160,452 | | | | 149,912 | |
B2R Mtg. Trust
Series 2015-1,Class A1
2.52% due 05/15/2048* | | | 108,104 | | | | 106,974 | |
BA Credit Card Trust
Series 2015-A2,Class A
1.36% due 09/15/2020 | | | 134,000 | | | | 133,766 | |
CarMax Auto Owner Trust
Series 2014-2, Class C
2.08% due 01/15/2020 | | | 54,000 | | | | 54,124 | |
Chase Issuance Trust FRS
Series 2014-A5, Class A5
0.57% due 04/15/2021 | | | 241,000 | | | | 241,070 | |
Citibank Credit Card Issuance Trust
Series 2014-A2, Class A2
1.02% due 02/22/2019 | | | 174,000 | | | | 173,920 | |
Citigroup Commercial Mtg. Trust
Series 2014-GC19, Class A2
2.79% due 03/10/2047(1) | | | 226,000 | | | | 231,224 | |
Citigroup Commercial Mtg. Trust
Series 2014-GC23, Class A2
2.85% due 07/10/2047(1) | | | 172,000 | | | | 176,118 | |
Citigroup Commercial Mtg. Trust
Series 2013-GC17, Class A2
2.96% due 11/10/2046(1) | | | 619,000 | | | | 637,015 | |
Commercial Mtg. Trust
Series 2014-UBS2, Class A2
2.82% due 03/10/2047(1) | | | 298,000 | | | | 305,159 | |
Commercial Mtg. Trust
Series 2015-DC1, Class A2
2.87% due 02/10/2048(1) | | | 80,000 | | | | 82,079 | |
Core Industrial Trust
Series 2015-1, Class A
3.04% due 02/10/2034*(1) | | | 207,000 | | | | 207,486 | |
Countrywide Home Loan Mtg. Pass Through Trust
Series 2005-6, Class 1A11
5.25% due 02/25/2026(2) | | | 121,177 | | | | 122,397 | |
DB Master Finance LLC
Series 2015-1A, Class A2II
3.98% due 02/20/2045* | | | 67,660 | | | | 67,703 | |
Dell Equipment Finance Trust
Series 2015-1,Class A3
1.30% due 03/23/2020* | | | 134,000 | | | | 133,491 | |
First Franklin Mtg. Loan Trust FRS
Series 2006-FF15, Class A5
0.36% due 11/25/2036 | | | 181,513 | | | | 158,526 | |
Ford Credit Auto Owner Trust
Series 2014-C,Class B
1.97% due 04/15/2020 | | | 119,000 | | | | 120,041 | |
Ford Credit Auto Owner Trust
Series 2015-2, Class A
2.44% due 01/15/2027* | | | 120,000 | | | | 120,843 | |
Ford Credit Floorplan Master Owner Trust
Series 2014-4, Class A1
1.40% due 08/15/2019 | | | 171,000 | | | | 170,869 | |
| | | | | | | | |
| | |
| Security Description | | Principal Amount(6) | | | Value
(Note 2) | |
| |
| | | | | | | | | |
Diversified Financial Services (continued) | |
GS Mtg. Securities Trust
Series 2015-GC28, Class A2
2.90% due 02/10/2048(1) | | $ | 75,000 | | | $ | 76,796 | |
JPMBB Commercial Mtg. Securities Trust
Series 2013-C15, Class A2
2.98% due 11/15/2045(1) | | | 365,000 | | | | 375,554 | |
Morgan Stanley Bank of America Merrill Lynch Trust
Series 2014-C19, Class A2
3.10% due 12/15/2047(1) | | | 229,000 | | | | 236,653 | |
Nissan Auto Lease Trust
Series 2014-A, Class A4
1.04% due 10/15/2019 | | | 295,000 | | | | 295,117 | |
Santander Drive Auto Receivables Trust
Series 2014-5, Class C
2.46% due 06/15/2020 | | | 242,000 | | | | 243,348 | |
Sierra Timeshare Receivables Funding LLC
Series 2014-2A, Class A
2.05% due 06/20/2031* | | | 56,572 | | | | 56,935 | |
Sierra Timeshare Receivables Funding LLC
Series 2015-2A, Class A
2.43% due 06/20/2032* | | | 92,894 | | | | 93,051 | |
Wells Fargo Commercial Mtg. Trust
Series BH3-C26, Class A2
2.66% due 02/15/2048(1) | | | 200,000 | | | | 202,880 | |
Wendys Funding LLC
Series 2015-1A, Class A2I
3.37% due 06/15/2045* | | | 110,000 | | | | 109,676 | |
Wendys Funding LLC
Series 2015-1A, Class A23
4.50% due 06/15/2045* | | | 110,000 | | | | 109,373 | |
WF-RBS Commercial Mtg. Trust
Series 2014-C21, Class A2
2.92% due 08/15/2047(1) | | | 234,000 | | | | 240,346 | |
| | | | | | |
|
|
|
Total Asset Backed Securities | | | | | | | | |
(cost $5,749,317) | | | | | | | 5,738,713 | |
| | | | | | |
|
|
|
U.S. CORPORATE BONDS & NOTES — 42.1% | |
Advertising Agencies — 0.0% | |
Interpublic Group of Cos., Inc.
Senior Notes
4.20% due 04/15/2024 | | | 358,000 | | | | 356,364 | |
| | | | | | |
|
|
|
Advertising Services — 0.1% | |
Visant Corp.
Company Guar. Notes
10.00% due 10/01/2017 | | | 1,145,000 | | | | 933,175 | |
| | | | | | |
|
|
|
Aerospace/Defense — 0.2% | |
BAE Systems Holdings, Inc.
Company Guar. Notes
3.80% due 10/07/2024* | | | 876,000 | | | | 879,944 | |
BAE Systems Holdings, Inc.
Company Guar. Notes
4.75% due 10/07/2044* | | | 134,000 | | | | 132,198 | |
Boeing Co.
Senior Notes
0.95% due 05/15/2018 | | | 588,000 | | | | 578,854 | |
| | | | | | |
|
|
|
| | | | | | | | 1,590,996 | |
| | | | | | |
|
|
|
Aerospace/Defense - Equipment — 0.6% | |
Harris Corp.
Senior Notes
3.83% due 04/27/2025 | | | 161,000 | | | | 155,721 | |
Harris Corp.
Senior Notes
4.85% due 04/27/2035 | | | 587,000 | | | | 562,350 | |
88
VALIC Company II Strategic Bond Fund
PORTFOLIO OF INVESTMENTS — August 31, 2015 — (continued)
| | | | | | | | |
| | |
| Security Description | | Principal Amount(6) | | | Value
(Note 2) | |
| |
U.S. CORPORATE BONDS & NOTES (continued) | | | | | | | | |
Aerospace/Defense - Equipment (continued) | |
Harris Corp.
Senior Notes
5.05% due 04/27/2045 | | $ | 556,000 | | | $ | 527,153 | |
Moog, Inc.
Company Guar. Notes
5.25% due 12/01/2022* | | | 1,488,000 | | | | 1,502,880 | |
Orbital ATK, Inc.
Company Guar. Notes
5.25% due 10/01/2021 | | | 1,750,000 | | | | 1,785,000 | |
| | | | | | |
|
|
|
| | | | | | | | 4,533,104 | |
| | | | | | |
|
|
|
Airlines — 0.5% | |
Allegiant Travel Co.
Company Guar. Notes
5.50% due 07/15/2019 | | | 1,288,000 | | | | 1,310,540 | |
Atlas Air, Inc.
Pass Through Certs.
Series 1999-1, Class A-1
7.20% due 07/02/2020 | | | 26,974 | | | | 27,379 | |
Atlas Air, Inc.
Pass Through Certs.
Series 1999-1, Class B
7.63% due 07/02/2016(3) | | | 57,228 | | | | 57,800 | |
United Airlines Pass Through Trust
Pass Through Certs.
Series 2014-2, Class B
4.63% due 03/03/2024 | | | 1,200,000 | | | | 1,200,000 | |
United Airlines Pass Through Trust
Pass Through Certs.
Series 2013-1, Class B
5.38% due 02/15/2023 | | | 1,256,211 | | | | 1,287,616 | |
| | | | | | |
|
|
|
| | | | | | | | 3,883,335 | |
| | | | | | |
|
|
|
Alternative Waste Technology — 0.3% | |
ADS Waste Holdings, Inc.
Company Guar. Notes
8.25% due 10/01/2020 | | | 1,899,000 | | | | 1,965,465 | |
| | | | | | |
|
|
|
Apparel Manufacturers — 0.0% | |
Quiksilver, Inc./QS Wholesale, Inc.
Company Guar. Notes
10.00% due 08/01/2020(20) | | | 1,121,000 | | | | 269,040 | |
| | | | | | |
|
|
|
Auto - Cars/Light Trucks — 0.4% | |
American Honda Finance Corp.
Senior Notes
1.20% due 07/14/2017 | | | 898,000 | | | | 894,782 | |
Daimler Finance North America LLC
Company Guar. Notes
2.45% due 05/18/2020* | | | 994,000 | | | | 987,070 | |
Daimler Finance North America LLC
Company Guar. Notes
2.63% due 09/15/2016* | | | 344,000 | | | | 348,923 | |
Ford Motor Credit Co. LLC
Senior Notes
1.50% due 01/17/2017 | | | 479,000 | | | | 476,704 | |
Toyota Motor Credit Corp.
Senior Notes
1.55% due 07/13/2018 | | | 402,000 | | | | 400,301 | |
| | | | | | |
|
|
|
| | | | | | | | 3,107,780 | |
| | | | | | |
|
|
|
Auto - Heavy Duty Trucks — 0.2% | |
JB Poindexter & Co., Inc.
Senior Notes
9.00% due 04/01/2022* | | | 1,675,000 | | | | 1,817,375 | |
| | | | | | |
|
|
|
| | | | | | | | |
| | |
| Security Description | | Principal Amount(6) | | | Value
(Note 2) | |
| |
| | | | | | | | | |
Auto/Truck Parts & Equipment - Original — 0.2% | |
Affinia Group, Inc.
Company Guar. Notes
7.75% due 05/01/2021 | | $ | 1,100,000 | | | $ | 1,166,000 | |
Omega US Sub LLC
Senior Notes
8.75% due 07/15/2023* | | | 834,000 | | | | 763,110 | |
| | | | | | |
|
|
|
| | | | | | | | 1,929,110 | |
| | | | | | |
|
|
|
Banks - Commercial — 0.5% | |
Discover Bank
Senior Notes
3.10% due 06/04/2020 | | | 268,000 | | | | 267,566 | |
First Tennessee Bank NA
Senior Notes
2.95% due 12/01/2019 | | | 674,000 | | | | 676,399 | |
KeyBank NA
Senior Notes
2.25% due 03/16/2020 | | | 783,000 | | | | 775,265 | |
PNC Bank NA
Senior Notes
1.13% due 01/27/2017 | | | 792,000 | | | | 789,023 | |
Regions Financial Corp.
Sub. Notes
7.38% due 12/10/2037 | | | 937,000 | | | | 1,171,055 | |
Woori Bank
Senior Note
4.75% due 04/30/2024 | | | 550,000 | | | | 564,882 | |
| | | | | | |
|
|
|
| | | | | | | | 4,244,190 | |
| | | | | | |
|
|
|
Banks - Fiduciary — 0.1% | |
Citizens Financial Group, Inc.
Sub. Notes
4.15% due 09/28/2022* | | | 842,000 | | | | 849,956 | |
| | | | | | |
|
|
|
Banks - Money Center — 0.0% | |
Comerica Bank
Sub. Notes
4.00% due 07/27/2025 | | | 41,000 | | | | 41,199 | |
| | | | | | |
|
|
|
Banks - Super Regional — 0.3% | |
Bank of America NA
Senior Notes
1.65% due 03/26/2018 | | | 503,000 | | | | 500,548 | |
Wells Fargo & Co.
Senior Notes
1.40% due 09/08/2017 | | | 898,000 | | | | 896,731 | |
Wells Fargo & Co.
Sub. Notes
4.10% due 06/03/2026 | | | 372,000 | | | | 373,815 | |
Wells Fargo & Co.
Sub. Notes
4.30% due 07/22/2027 | | | 518,000 | | | | 526,616 | |
| | | | | | |
|
|
|
| | | | | | | | 2,297,710 | |
| | | | | | |
|
|
|
Batteries/Battery Systems — 0.2% | |
EnerSys
Company Guar. Notes
5.00% due 04/30/2023* | | | 1,628,000 | | | | 1,571,020 | |
| | | | | | |
|
|
|
Brewery — 0.2% | | | | | | | | |
Anheuser-Busch InBev Worldwide, Inc.
Company Guar. Notes
1.38% due 07/15/2017 | | | 1,644,000 | | | | 1,648,465 | |
| | | | | | |
|
|
|
Broadcast Services/Program — 0.1% | | | | | | | | |
Clear Channel Worldwide Holdings, Inc.
Company Guar. Notes
6.50% due 11/15/2022 | | | 1,113,000 | | | | 1,124,687 | |
| | | | | | |
|
|
|
89
VALIC Company II Strategic Bond Fund
PORTFOLIO OF INVESTMENTS — August 31, 2015 — (continued)
| | | | | | | | |
| | |
| Security Description | | Principal Amount(6) | | | Value
(Note 2) | |
| |
U.S. CORPORATE BONDS & NOTES (continued) | | | | | | | | |
Building & Construction - Misc. — 0.2% | |
Weekley Homes LLC/Weekley Finance Corp.
Senior Notes
6.00% due 02/01/2023 | | $ | 1,466,000 | | | $ | 1,363,380 | |
| | | | | | |
|
|
|
Building Products - Cement — 0.3% | |
Cemex Finance LLC
Senior Sec. Notes
6.00% due 04/01/2024*# | | | 1,674,000 | | | | 1,590,300 | |
Vulcan Materials Co.
Senior Notes
4.50% due 04/01/2025 | | | 563,000 | | | | 553,147 | |
| | | | | | |
|
|
|
| | | | | | | | 2,143,447 | |
| | | | | | |
|
|
|
Building Products - Wood — 0.1% | |
Masco Corp.
Senior Notes
4.45% due 04/01/2025 | | | 789,000 | | | | 788,913 | |
| | | | | | |
|
|
|
Cable/Satellite TV — 0.6% | |
Cable One, Inc.
Company Guar. Notes
5.75% due 06/15/2022* | | | 1,191,000 | | | | 1,202,910 | |
CCO Safari II LLC
Senior Sec. Notes
4.91% due 07/23/2025* | | | 1,273,000 | | | | 1,260,899 | |
CCO Safari II LLC
Senior Sec. Notes
6.38% due 10/23/2035* | | | 328,000 | | | | 334,129 | |
CCO Safari II LLC
Senior Sec. Notes
6.48% due 10/23/2045* | | | 320,000 | | | | 325,519 | |
DISH DBS Corp.
Company Guar. Notes
5.00% due 03/15/2023 | | | 1,000,000 | | | | 883,130 | |
DISH DBS Corp.
Company Guar. Notes
5.88% due 11/15/2024 | | | 643,000 | | | | 585,934 | |
| | | | | | |
|
|
|
| | | | | | | | 4,592,521 | |
| | | | | | |
|
|
|
Casino Hotels — 0.9% | |
Boyd Gaming Corp.
Company Guar. Notes
6.88% due 05/15/2023 | | | 898,000 | | | | 922,695 | |
Caesars Entertainment Resort Properties LLC
Senior Sec. Notes
8.00% due 10/01/2020(5) | | | 1,361,000 | | | | 1,343,988 | |
Caesars Entertainment Resort Properties LLC
Sec. Notes
11.00% due 10/01/2021#(5) | | | 2,054,000 | | | | 1,907,652 | |
Downstream Development Authority of the Quapaw Tribe of Oklahoma
Senior Sec. Notes
10.50% due 07/01/2019* | | | 1,103,000 | | | | 1,133,333 | |
Golden Nugget Escrow, Inc.
Senior Notes
8.50% due 12/01/2021* | | | 1,441,000 | | | | 1,480,627 | |
Seminole Hard Rock Entertainment, Inc./Seminole Hard Rock International LLC
Company Guar. Notes
5.88% due 05/15/2021* | | | 600,000 | | | | 595,500 | |
| | | | | | |
|
|
|
| | | | | | | | 7,383,795 | |
| | | | | | |
|
|
|
Cellular Telecom — 1.1% | |
Sprint Corp.
Company Guar. Notes
7.13% due 06/15/2024 | | | 3,317,000 | | | | 3,067,197 | |
| | | | | | | | |
| | |
| Security Description | | Principal Amount(6) | | | Value
(Note 2) | |
| |
| | | | | | | | | |
Cellular Telecom (continued) | |
Sprint Corp.
Company Guar. Notes
7.25% due 09/15/2021 | | $ | 1,806,000 | | | $ | 1,756,335 | |
Sprint Corp.
Company Guar. Notes
7.63% due 02/15/2025 | | | 2,323,000 | | | | 2,167,649 | |
T-Mobile USA, Inc.
Company Guar. Notes
6.38% due 03/01/2025 | | | 600,000 | | | | 613,200 | |
T-Mobile USA, Inc.
Company Guar. Notes
6.50% due 01/15/2024 | | | 1,050,000 | | | | 1,078,875 | |
| | | | | | |
|
|
|
| | | | | | | | 8,683,256 | |
| | | | | | |
|
|
|
Chemicals - Diversified — 0.2% | |
Eco Services Operations LLC/Eco Finance Corp.
Senior Notes
8.50% due 11/01/2022* | | | 1,485,000 | | | | 1,418,175 | |
| | | | | | |
|
|
|
Chemicals - Specialty — 0.4% | |
Chemtura Corp.
Company Guar. Notes
5.75% due 07/15/2021 | | | 1,565,000 | | | | 1,568,912 | |
Lubrizol Corp.
Company Guar. Notes
6.50% due 10/01/2034 | | | 319,000 | | | | 399,102 | |
Tronox Finance LLC
Company Guar. Notes
7.50% due 03/15/2022* | | | 1,584,000 | | | | 1,275,120 | |
| | | | | | |
|
|
|
| | | | | | | | 3,243,134 | |
| | | | | | |
|
|
|
Coal — 0.2% | |
SunCoke Energy Partners LP/SunCoke Energy Partners Finance Corp.
Company Guar. Notes
7.38% due 02/01/2020* | | | 1,349,000 | | | | 1,224,218 | |
| | | | | | |
|
|
|
Coatings/Paint — 0.2% | |
RPM International, Inc.
Senior Notes
5.25% due 06/01/2045 | | | 991,000 | | | | 958,622 | |
Sherwin-Williams Co.
Senior Notes
4.55% due 08/01/2045 | | | 260,000 | | | | 265,675 | |
Valspar Corp.
Senior Notes
3.95% due 01/15/2026 | | | 255,000 | | | | 256,964 | |
| | | | | | |
|
|
|
| | | | | | | | 1,481,261 | |
| | | | | | |
|
|
|
Commercial Services - Finance — 0.5% | |
Global Cash Access, Inc.
Senior Notes
10.00% due 01/15/2022* | | | 1,481,000 | | | | 1,399,545 | |
Harland Clarke Holdings Corp.
Senior Sec. Notes
6.88% due 03/01/2020* | | | 946,000 | | | | 872,685 | |
Harland Clarke Holdings Corp.
Senior Notes
9.25% due 03/01/2021*# | | | 2,099,000 | | | | 1,747,417 | |
| | | | | | |
|
|
|
| | | | | | | | 4,019,647 | |
| | | | | | |
|
|
|
Computer Services — 0.1% | |
Compiler Finance Sub, Inc.
Senior Notes
7.00% due 05/01/2021* | | | 713,000 | | | | 481,275 | |
Leidos, Inc.
Company Guar. Notes
7.13% due 07/01/2032# | | | 175,000 | | | | 183,265 | �� |
| | | | | | |
|
|
|
| | | | | | | | 664,540 | |
| | | | | | |
|
|
|
90
VALIC Company II Strategic Bond Fund
PORTFOLIO OF INVESTMENTS — August 31, 2015 — (continued)
| | | | | | | | |
| | |
| Security Description | | Principal
Amount(6) | | | Value
(Note 2) | |
| |
U.S. CORPORATE BONDS & NOTES (continued) | | | | | | | | |
Computers — 0.5% | |
Apple, Inc.
Senior Notes
2.85% due 05/06/2021 | | $ | 874,000 | | | $ | 889,552 | |
Apple, Inc.
Senior Notes
3.45% due 02/09/2045 | | | 147,000 | | | | 124,421 | |
Dell, Inc.
Senior Notes
4.63% due 04/01/2021# | | | 618,000 | | | | 604,095 | |
Dell, Inc.
Senior Notes
7.10% due 04/15/2028 | | | 705,000 | | | | 705,000 | |
Hewlett-Packard Co.
Senior Notes
6.00% due 09/15/2041 | | | 1,358,000 | | | | 1,360,856 | |
| | | | | | |
|
|
|
| | | | | | | | 3,683,924 | |
| | | | | | |
|
|
|
Consumer Products - Misc. — 0.0% | |
Kimberly-Clark Corp.
Senior Notes
1.85% due 03/01/2020 | | | 224,000 | | | | 221,379 | |
| | | | | | |
|
|
|
Containers - Metal/Glass — 0.4% | | | | | | | | |
Ball Corp.
Company Guar. Notes
5.00% due 03/15/2022 | | | 507,000 | | | | 514,605 | |
Crown Cork & Seal Co., Inc.
Senior Notes
7.38% due 12/15/2026 | | | 2,457,000 | | | | 2,721,127 | |
| | | | | | |
|
|
|
| | | | | | | | 3,235,732 | |
| | | | | | |
|
|
|
Containers - Paper/Plastic — 0.3% | |
Consolidated Container Co. LLC/Consolidated Container Capital, Inc.
Company Guar. Notes
10.13% due 07/15/2020* | | | 1,406,000 | | | | 1,223,220 | |
Graphic Packaging International, Inc.
Company Guar. Notes
4.88% due 11/15/2022 | | | 773,000 | | | | 776,865 | |
| | | | | | |
|
|
|
| | | | | | | | 2,000,085 | |
| | | | | | |
|
|
|
Cosmetics & Toiletries — 0.2% | |
Colgate-Palmolive Co. FRS
Senior Notes
0.21% due 05/14/2019 | | EUR | 500,000 | | | | 561,493 | |
First Quality Finance Co., Inc.
Senior Notes
4.63% due 05/15/2021* | | | 822,000 | | | | 772,680 | |
| | | | | | |
|
|
|
| | | | | | | | 1,334,173 | |
| | | | | | |
|
|
|
Data Processing/Management — 0.0% | |
First Data Corp.
Senior Sec. Notes
5.38% due 08/15/2023#* | | | 350,000 | | | | 354,375 | |
| | | | | | |
|
|
|
Decision Support Software — 0.0% | | | | | | | | |
MSCI, Inc.
Company Guar. Notes
5.75% due 08/15/2025* | | | 373,000 | | | | 380,460 | |
| | | | | | |
|
|
|
Dialysis Centers — 0.2% | | | | | | | | |
DaVita HealthCare Partners, Inc.
Company Guar. Notes
5.13% due 07/15/2024 | | | 1,325,000 | | | | 1,319,203 | |
| | | | | | |
|
|
|
| | | | | | | | |
| | |
| Security Description | | Principal
Amount(6) | | | Value
(Note 2) | |
| |
| | | | | | | | | |
Disposable Medical Products — 0.2% | |
Sterigenics-Nordion Holdings LLC
Senior Notes
6.50% due 05/15/2023* | | $ | 1,861,000 | | | $ | 1,898,183 | |
| | | | | | |
|
|
|
Distribution/Wholesale — 0.4% | | | | | | | | |
H&E Equipment Services, Inc.
Company Guar. Notes
7.00% due 09/01/2022# | | | 1,786,000 | | | | 1,777,070 | |
LKQ Corp.
Company Guar. Notes
4.75% due 05/15/2023 | | | 1,828,000 | | | | 1,752,595 | |
| | | | | | |
|
|
|
| | | | | | | | 3,529,665 | |
| | | | | | |
|
|
|
Diversified Banking Institutions — 2.4% | |
Bank of America Corp.
Senior Notes
2.50% due 07/27/2020 | | EUR | 355,000 | | | | 425,286 | |
Bank of America Corp.
Senior Notes
2.60% due 01/15/2019 | | | 755,000 | | | | 760,099 | |
Bank of America Corp.
Sub. Notes
3.95% due 04/21/2025 | | | 603,000 | | | | 583,725 | |
Bank of America Corp.
Sub. Notes
4.25% due 10/22/2026 | | | 788,000 | | | | 775,754 | |
Bank of America Corp.
Senior Notes
7.00% due 07/31/2028 | | GBP | 200,000 | | | | 411,706 | |
Bank of America Corp.
Sub. Notes
7.25% due 10/15/2025 | | | 49,000 | | | | 59,797 | |
Citigroup, Inc.
Senior Notes
1.75% due 05/01/2018 | | | 1,330,000 | | | | 1,317,648 | |
Citigroup, Inc.
Sub. Notes
3.88% due 03/26/2025 | | | 244,000 | | | | 235,770 | |
Citigroup, Inc.
Sub. Notes
4.40% due 06/10/2025 | | | 675,000 | | | | 678,825 | |
Citigroup, Inc.
Senior Notes
5.15% due 05/21/2026 | | GBP | 60,000 | | | | 106,120 | |
Citigroup, Inc.
Sub. Notes
6.00% due 10/31/2033 | | | 344,000 | | | | 391,148 | |
Goldman Sachs Group, Inc.
Senior Notes
2.55% due 10/23/2019 | | | 917,000 | | | | 919,115 | |
Goldman Sachs Group, Inc.
Senior Notes
3.63% due 01/22/2023 | | | 713,000 | | | | 716,748 | |
Goldman Sachs Group, Inc.
Sub. Notes
5.15% due 05/22/2045 | | | 421,000 | | | | 416,185 | |
Goldman Sachs Group, Inc.
Senior Notes
6.13% due 02/15/2033 | | | 736,000 | | | | 875,646 | |
Goldman Sachs Group, Inc.
Sub. Notes
6.75% due 10/01/2037 | | | 1,176,000 | | | | 1,403,016 | |
JPMorgan Chase & Co.
Senior Notes
2.20% due 10/22/2019 | | | 1,020,000 | | | | 1,011,745 | |
91
VALIC Company II Strategic Bond Fund
PORTFOLIO OF INVESTMENTS — August 31, 2015 — (continued)
| | | | | | | | |
| | |
| Security Description | | Principal Amount(6) | | | Value
(Note 2) | |
| |
U.S. CORPORATE BONDS & NOTES (continued) | | | | | | | | |
Diversified Banking Institutions (continued) | |
JPMorgan Chase & Co.
Senior Notes
3.25% due 09/23/2022 | | $ | 471,000 | | | $ | 467,841 | |
JPMorgan Chase & Co.
Sub. Notes
4.13% due 12/15/2026 | | | 791,000 | | | | 785,894 | |
JPMorgan Chase & Co.
Sub. Notes
4.95% due 06/01/2045 | | | 340,000 | | | | 340,444 | |
Merrill Lynch & Co., Inc.
Sub. Notes
6.11% due 01/29/2037 | | | 748,000 | | | | 849,418 | |
Morgan Stanley
Senior Notes
1.88% due 01/05/2018 | | | 701,000 | | | | 701,076 | |
Morgan Stanley
Senior Notes
2.80% due 06/16/2020 | | | 368,000 | | | | 369,323 | |
Morgan Stanley
Sub. Notes
4.10% due 05/22/2023 | | | 975,000 | | | | 978,696 | |
Morgan Stanley
Senior Notes
4.75% due 03/22/2017 | | | 1,722,000 | | | | 1,806,638 | |
Morgan Stanley
Sub. Notes
5.00% due 11/24/2025 | | | 629,000 | | | | 662,200 | |
Morgan Stanley
Senior Notes
6.50% due 12/28/2018 | | EUR | 500,000 | | | | 665,942 | |
| | | | | | |
|
|
|
| | | | | | | | 18,715,805 | |
| | | | | | |
|
|
|
Diversified Financial Services — 0.4% | |
General Electric Capital Corp.
Company Guar. Notes
1.25% due 05/15/2017 | | | 1,879,000 | | | | 1,880,896 | |
General Electric Capital Corp.
Company Guar. Notes
4.88% due 09/18/2037 | | GBP | 183,000 | | | | 310,673 | |
USAA Capital Corp.
Senior Notes
2.13% due 06/03/2019* | | | 721,000 | | | | 721,068 | |
| | | | | | |
|
|
|
| | | | | | | | 2,912,637 | |
| | | | | | |
|
|
|
Diversified Manufacturing Operations — 0.5% | |
3M Co. FRS
Senior Notes
0.21% due 05/15/2020 | | EUR | 1,000,000 | | | | 1,116,746 | |
General Electric Co.
Senior Notes
2.70% due 10/09/2022 | | | 644,000 | | | | 629,647 | |
Ingersoll-Rand Global Holding Co., Ltd.
Company Guar. Notes
5.75% due 06/15/2043 | | | 802,000 | | | | 877,592 | |
Textron, Inc.
Senior Notes
4.63% due 09/21/2016 | | | 630,000 | | | | 650,236 | |
Trinity Industries, Inc.
Company Guar. Notes
4.55% due 10/01/2024 | | | 503,000 | | | | 472,400 | |
| | | | | | |
|
|
|
| | | | | | | | 3,746,621 | |
| | | | | | |
|
|
|
| | | | | | | | |
| | |
| Security Description | | Principal Amount(6) | | | Value
(Note 2) | |
| |
| | | | | | | | | |
Diversified Operations — 0.0% | |
MUFG Americas Holdings Corp.
Senior Notes
1.63% due 02/09/2018 | | $ | 332,000 | | | $ | 330,984 | |
| | | | | | |
|
|
|
E-Commerce/Services — 0.1% | |
Netflix, Inc.
Senior Notes
5.38% due 02/01/2021 | | | 1,094,000 | | | | 1,129,555 | |
| | | | | | |
|
|
|
Electric - Generation — 0.2% | | | | | | | | |
NRG REMA LLC
Pass Through Certs.
9.24% due 07/02/2017 | | | 156,705 | | | | 163,365 | |
Terraform Global Operating LLC
Company Guar. Notes
9.75% due 08/15/2022* | | | 1,189,000 | | | | 1,114,687 | |
| | | | | | |
|
|
|
| | | | | | | | 1,278,052 | |
| | | | | | |
|
|
|
Electric - Integrated — 1.7% | |
AES Corp.
Senior Notes
4.88% due 05/15/2023 | | | 1,425,000 | | | | 1,325,250 | |
AES Corp.
Senior Notes
5.50% due 03/15/2024 | | | 1,805,000 | | | | 1,723,775 | |
Arizona Public Service Co.
Senior Notes
2.20% due 01/15/2020 | | | 352,000 | | | | 351,693 | |
Dominion Resources, Inc.
Senior Notes
5.25% due 08/01/2033 | | | 901,000 | | | | 964,620 | |
Entergy Arkansas, Inc.
1st Mtg. Bonds
4.95% due 12/15/2044 | | | 544,000 | | | | 545,847 | |
Entergy Louisiana LLC
1st Mtg. Bonds
4.95% due 01/15/2045 | | | 491,000 | | | | 495,372 | |
Exelon Corp.
Senior Notes
4.95% due 06/15/2035 | | | 278,000 | | | | 280,002 | |
Exelon Corp.
Senior Notes
5.10% due 06/15/2045 | | | 285,000 | | | | 284,030 | |
Exelon Generation Co. LLC
Senior Notes
2.95% due 01/15/2020 | | | 477,000 | | | | 477,956 | |
FirstEnergy Corp.
Senior Notes
7.38% due 11/15/2031 | | | 543,000 | | | | 649,933 | |
Georgia Power Co.
Senior Notes
3.00% due 04/15/2016 | | | 153,000 | | | | 154,987 | |
Mirant Mid Atlantic LLC Pass Through Trust
Pass Through Certs.
9.13% due 06/30/2017 | | | 99,675 | | | | 103,662 | |
Mirant Mid Atlantic LLC Pass Through Trust
Pass Through Certs.
10.06% due 12/30/2028 | | | 1,861,877 | | | | 1,922,388 | |
South Carolina Electric & Gas Co.
1st Mtg. Bonds
5.10% due 06/01/2065 | | | 356,000 | | | | 364,249 | |
Southern California Edison Co.
1st Mtg. Bonds
1.13% due 05/01/2017 | | | 895,000 | | | | 891,161 | |
92
VALIC Company II Strategic Bond Fund
PORTFOLIO OF INVESTMENTS — August 31, 2015 — (continued)
| | | | | | | | |
| | |
| Security Description | | Principal Amount(6) | | | Value
(Note 2) | |
| |
U.S. CORPORATE BONDS & NOTES (continued) | | | | | | | | |
Electric - Integrated (continued) | |
Southern Co.
Senior Notes
1.30% due 08/15/2017 | | $ | 769,000 | | | $ | 763,006 | |
Talen Energy Supply LLC
Senior Notes
6.50% due 06/01/2025#* | | | 1,600,000 | | | | 1,484,000 | |
Trans-Allegheny Interstate Line Co.
Senior Notes
3.85% due 06/01/2025* | | | 388,000 | | | | 386,384 | |
| | | | | | |
|
|
|
| | | | | | | | 13,168,315 | |
| | | | | | |
|
|
|
Electronic Components - Misc. — 0.1% | |
Corning, Inc.
Senior Notes
1.50% due 05/08/2018 | | | 392,000 | | | | 390,375 | |
Corning, Inc.
Senior Notes
2.90% due 05/15/2022 | | | 392,000 | | | | 390,358 | |
| | | | | | |
|
|
|
| | | | | | | | 780,733 | |
| | | | | | |
|
|
|
Electronic Components - Semiconductors — 0.4% | |
Intel Corp.
Senior Notes
1.35% due 12/15/2017 | | | 1,403,000 | | | | 1,400,956 | |
Micron Technology, Inc.
Senior Notes
5.63% due 01/15/2026* | | | 1,500,000 | | | | 1,361,250 | |
| | | | | | |
|
|
|
| | | | | | | | 2,762,206 | |
| | | | | | |
|
|
|
Electronics - Military — 0.0% | |
L-3 Communications Corp.
Company Guar. Notes
3.95% due 05/28/2024 | | | 172,000 | | | | 164,330 | |
| | | | | | |
|
|
|
Energy - Alternate Sources — 0.1% | | | | | | | | |
TerraForm Power Operating LLC
Company Guar. Notes
5.88% due 02/01/2023* | | | 1,039,000 | | | | 987,050 | |
| | | | | | |
|
|
|
Enterprise Software/Service — 0.2% | | | | | | | | |
Infor US, Inc.
Senior Sec. Notes
5.75% due 08/15/2020* | | | 1,028,000 | | | | 1,030,570 | |
Oracle Corp.
Senior Notes
3.90% due 05/15/2035 | | | 587,000 | | | | 552,379 | |
| | | | | | |
|
|
|
| | | | | | | | 1,582,949 | |
| | | | | | |
|
|
|
Finance - Auto Loans — 0.5% | |
Ally Financial, Inc.
Senior Notes
5.13% due 09/30/2024 | | | 1,724,000 | | | | 1,741,240 | |
Credit Acceptance Corp.
Company Guar. Notes
7.38% due 03/15/2023* | | | 1,850,000 | | | | 1,896,250 | |
| | | | | | |
|
|
|
| | | | | | | | 3,637,490 | |
| | | | | | |
|
|
|
Finance - Commercial — 0.2% | |
Jefferies Finance LLC/JFIN Co-Issuer Corp.
Senior Notes
6.88% due 04/15/2022* | | | 1,403,000 | | | | 1,317,417 | |
Jefferies Finance LLC/JFIN Co-Issuer Corp.
Senior Notes
7.38% due 04/01/2020* | | | 513,000 | | | | 501,560 | |
| | | | | | |
|
|
|
| | | | | | | | 1,818,977 | |
| | | | | | |
|
|
|
| | | | | | | | |
| | |
| Security Description | | Principal Amount(6) | | | Value
(Note 2) | |
| |
| | | | | | | | | |
Finance - Consumer Loans — 0.6% | |
Enova International, Inc.
Company Guar. Notes
9.75% due 06/01/2021# | | $ | 2,643,000 | | | $ | 2,193,690 | |
OneMain Financial Holdings, Inc.
Company Guar. Notes
6.75% due 12/15/2019* | | | 1,898,000 | | | | 1,983,410 | |
Synchrony Financial
Senior Notes
4.25% due 08/15/2024 | | | 698,000 | | | | 687,278 | |
| | | | | | |
|
|
|
| | | | | | | | 4,864,378 | |
| | | | | | |
|
|
|
Finance - Credit Card — 0.2% | |
American Express Credit Corp.
Senior Notes
1.55% due 09/22/2017 | | | 371,000 | | | | 370,423 | |
American Express Credit Corp.
Senior Notes
2.38% due 05/26/2020 | | | 645,000 | | | | 640,295 | |
Discover Financial Services
Senior Notes
3.75% due 03/04/2025 | | | 719,000 | | | | 682,396 | |
| | | | | | |
|
|
|
| | | | | | | | 1,693,114 | |
| | | | | | |
|
|
|
Finance - Investment Banker/Broker — 0.1% | |
Lehman Brothers Holdings, Inc.
Escrow Notes
5.50% due 04/04/2016† | | | 97,000 | | | | 10,117 | |
Lehman Brothers Holdings, Inc.
Escrow Notes
6.75% due 12/28/2017†(10) | | | 111,000 | | | | 11 | |
Lehman Brothers Holdings, Inc.
Escrow Notes
7.50% due 05/11/2038†(10) | | | 143,000 | | | | 15 | |
TD Ameritrade Holding Corp.
Senior Notes
2.95% due 04/01/2022 | | | 460,000 | | | | 457,072 | |
| | | | | | |
|
|
|
| | | | | | | | 467,215 | |
| | | | | | |
|
|
|
Finance - Mortgage Loan/Banker — 0.2% | |
Quicken Loans, Inc.
Company Guar. Notes
5.75% due 05/01/2025* | | | 1,925,000 | | | | 1,876,875 | |
| | | | | | |
|
|
|
Finance - Other Services — 0.3% | | | | | | | | |
National Rural Utilities Cooperative Finance Corp.
Senior Notes
0.95% due 04/24/2017 | | | 327,000 | | | | 325,972 | |
National Rural Utilities Cooperative Finance Corp.
Collateral Trust Bonds
1.10% due 01/27/2017 | | | 1,285,000 | | | | 1,286,341 | |
National Rural Utilities Cooperative Finance Corp.
Collateral Trust Bonds
2.00% due 01/27/2020 | | | 656,000 | | | | 643,055 | |
| | | | | | |
|
|
|
| | | | | | | | 2,255,368 | |
| | | | | | |
|
|
|
Firearms & Ammunition — 0.1% | |
FGI Operating Co. LLC/FGI Finance, Inc.
Sec. Notes
7.88% due 05/01/2020 | | | 1,170,000 | | | | 897,975 | |
| | | | | | |
|
|
|
Food - Dairy Products — 0.1% | | | | | | | | |
Dean Foods Co.
Company Guar. Notes
6.50% due 03/15/2023* | | | 900,000 | | | | 909,000 | |
| | | | | | |
|
|
|
93
VALIC Company II Strategic Bond Fund
PORTFOLIO OF INVESTMENTS — August 31, 2015 — (continued)
| | | | | | | | |
| | |
| Security Description | | Principal Amount(6) | | | Value
(Note 2) | |
| |
U.S. CORPORATE BONDS & NOTES (continued) | | | | | | | | |
Food - Flour & Grain — 0.1% | |
Post Holdings, Inc.
Company Guar. Notes
7.75% due 03/15/2024*# | | $ | 1,019,000 | | | $ | 1,052,118 | |
| | | | | | |
|
|
|
Food - Meat Products — 0.2% | | | | | | | | |
JBS USA LLC/JBS USA Finance, Inc.
Senior Notes
5.88% due 07/15/2024* | | | 1,200,000 | | | | 1,195,500 | |
| | | | | | |
|
|
|
Food - Misc./Diversified — 0.2% | | | | | | | | |
Darling Ingredients, Inc.
Company Guar. Notes
5.38% due 01/15/2022 | | | 1,535,000 | | | | 1,515,813 | |
| | | | | | |
|
|
|
Food - Retail — 0.3% | | | | | | | | |
SUPERVALU, Inc.
Senior Notes
7.75% due 11/15/2022 | | | 1,949,000 | | | | 2,017,215 | |
| | | | | | |
|
|
|
Food - Wholesale/Distribution — 0.2% | | | | | | | | |
C&S Group Enterprises LLC
Senior Sec. Notes
5.38% due 07/15/2022* | | | 1,619,000 | | | | 1,497,575 | |
| | | | | | |
|
|
|
Gambling (Non-Hotel) — 0.2% | | | | | | | | |
Scientific Games International, Inc.
Senior Sec. Notes
7.00% due 01/01/2022* | | | 912,000 | | | | 932,520 | |
Scientific Games International, Inc.
Company Guar. Notes
10.00% due 12/01/2022 | | | 892,000 | | | | 818,410 | |
Waterford Gaming LLC/Waterford Gaming Financial Corp.
Escrow Notes
8.63% due 09/15/2014*†(3)(10) | | | 271,413 | | | | 2,660 | |
| | | | | | |
|
|
|
| | | | | | | | 1,753,590 | |
| | | | | | |
|
|
|
Gas-Distribution — 0.0% | | | | | | | | |
Dominion Gas Holdings LLC
Senior Notes
4.80% due 11/01/2043 | | | 312,000 | | | | 310,120 | |
| | | | | | |
|
|
|
Hotels/Motels — 0.1% | | | | | | | | |
Interval Acquisition Corp.
Company Guar. Notes
5.63% due 04/15/2023* | | | 1,110,000 | | | | 1,096,125 | |
| | | | | | |
|
|
|
Independent Power Producers — 0.5% | | | | | | | | |
Dynegy, Inc.
Company Guar. Notes
7.38% due 11/01/2022 | | | 1,500,000 | | | | 1,552,500 | |
GenOn Energy, Inc.
Senior Notes
9.50% due 10/15/2018 | | | 1,253,000 | | | | 1,204,446 | |
NRG Energy, Inc.
Company Guar. Notes
6.25% due 07/15/2022 | | | 1,262,000 | | | | 1,230,450 | |
| | | | | | |
|
|
|
| | | | | | | | 3,987,396 | |
| | | | | | |
|
|
|
Industrial Gases — 0.0% | | | | | | | | |
Airgas, Inc.
Senior Notes
3.05% due 08/01/2020 | | | 202,000 | | | | 202,499 | |
| | | | | | |
|
|
|
Insurance - Life/Health — 0.2% | | | | | | | | |
CNO Financial Group, Inc.
Senior Notes
5.25% due 05/30/2025 | | | 734,000 | | | | 756,938 | |
Pacific LifeCorp
Senior Notes
6.00% due 02/10/2020* | | | 305,000 | | | | 343,323 | |
| | | | | | | | |
| | |
| Security Description | | Principal Amount(6) | | | Value
(Note 2) | |
| |
| | | | | | | | | |
Insurance - Life/Health (continued) | |
Pricoa Global Funding I
Senior Sec. Notes
1.35% due 08/18/2017* | | $ | 784,000 | | | $ | 782,626 | |
| | | | | | |
|
|
|
| | | | | | | | 1,882,887 | |
| | | | | | |
|
|
|
Insurance - Multi-line — 0.5% | |
Assurant, Inc.
Senior Notes
6.75% due 02/15/2034 | | | 1,266,000 | | | | 1,478,240 | |
Metropolitan Life Global Funding I
Sec. Notes
1.30% due 04/10/2017* | | | 2,093,000 | | | | 2,094,969 | |
| | | | | | |
|
|
|
| | | | | | | | 3,573,209 | |
| | | | | | |
|
|
|
Insurance - Mutual — 0.3% | |
Massachusetts Mutual Life Insurance Co.
Sub. Notes
4.50% due 04/15/2065* | | | 411,000 | | | | 374,273 | |
MassMutual Global Funding II
Senior Sec. Notes
2.00% due 04/05/2017* | | | 1,130,000 | | | | 1,143,583 | |
MassMutual Global Funding II
Senior Sec. Notes
2.50% due 10/17/2022* | | | 387,000 | | | | 373,214 | |
New York Life Global Funding
Sec. Notes
1.65% due 05/15/2017*# | | | 801,000 | | | | 805,505 | |
| | | | | | |
|
|
|
| | | | | | | | 2,696,575 | |
| | | | | | |
|
|
|
Internet Connectivity Services — 0.5% | |
Cogent Communications Group, Inc.
Senior Sec. Notes
5.38% due 03/01/2022* | | | 2,046,000 | | | | 1,979,505 | |
Zayo Group LLC/Zayo Capital, Inc.
Company Guar. Notes
6.00% due 04/01/2023* | | | 1,813,000 | | | | 1,810,643 | |
| | | | | | |
|
|
|
| | | | | | | | 3,790,148 | |
| | | | | | |
|
|
|
Investment Management/Advisor Services — 0.4% | |
Drawbridge Special Opportunities Fund LP/Drawbridge Special Opportunities Finance
Senior Notes
5.00% due 08/01/2021* | | | 1,645,000 | | | | 1,607,987 | |
National Financial Partners Corp.
Senior Notes
9.00% due 07/15/2021* | | | 1,821,000 | | | | 1,784,580 | |
| | | | | | |
|
|
|
| | | | | | | | 3,392,567 | |
| | | | | | |
|
|
|
Machinery - Farming — 0.3% | |
John Deere Capital Corp.
Senior Notes
1.13% due 06/12/2017 | | | 1,055,000 | | | | 1,053,478 | |
John Deere Capital Corp.
Senior Notes
1.55% due 12/15/2017 | | | 1,193,000 | | | | 1,198,836 | |
| | | | | | |
|
|
|
| | | | | | | | 2,252,314 | |
| | | | | | |
|
|
|
Marine Services — 0.0% | |
Great Lakes Dredge & Dock Corp.
Company Guar. Notes
7.38% due 02/01/2019 | | | 329,000 | | | | 330,645 | |
| | | | | | |
|
|
|
Medical Labs & Testing Services — 0.3% | | | | | | | | |
Laboratory Corp. of America Holdings
Senior Notes
3.20% due 02/01/2022 | | | 187,000 | | | | 182,929 | |
94
VALIC Company II Strategic Bond Fund
PORTFOLIO OF INVESTMENTS — August 31, 2015 — (continued)
| | | | | | | | |
| | |
| Security Description | | Principal Amount(6) | | | Value
(Note 2) | |
| |
U.S. CORPORATE BONDS & NOTES (continued) | | | | | | | | |
Medical Labs & Testing Services (continued) | |
Laboratory Corp. of America Holdings
Senior Notes
3.60% due 02/01/2025 | | $ | 605,000 | | | $ | 579,436 | |
Laboratory Corp. of America Holdings
Senior Notes
4.70% due 02/01/2045 | | | 310,000 | | | | 282,968 | |
Roche Holdings, Inc.
Company Guar. Notes
1.35% due 09/29/2017* | | | 1,121,000 | | | | 1,122,870 | |
| | | | | | |
|
|
|
| | | | | | | | 2,168,203 | |
| | | | | | |
|
|
|
Medical Products — 0.2% | | | | | | | | |
Becton Dickinson and Co.
Senior Notes
3.13% due 11/08/2021 | | | 422,000 | | | | 416,989 | |
Universal Hospital Services, Inc.
Sec. Notes
7.63% due 08/15/2020 | | | 1,413,000 | | | | 1,362,662 | |
| | | | | | |
|
|
|
| | | | | | | | 1,779,651 | |
| | | | | | |
|
|
|
Medical - Biomedical/Gene — 0.1% | |
Celgene Corp.
Senior Notes
5.00% due 08/15/2045 | | | 509,000 | | | | 513,629 | |
| | | | | | |
|
|
|
Medical - Drugs — 0.7% | | | | | | | | |
Baxalta, Inc.
Senior Notes
3.60% due 06/23/2022* | | | 518,000 | | | | 517,655 | |
Baxalta, Inc.
Senior Notes
4.00% due 06/23/2025* | | | 281,000 | | | | 279,367 | |
Endo Finance LLC
Company Guar. Notes
5.75% due 01/15/2022* | | | 1,218,000 | | | | 1,245,405 | |
Forest Laboratories, Inc.
Company Guar. Notes
4.88% due 02/15/2021* | | | 702,000 | | | | 750,126 | |
Merck & Co., Inc.
Senior Notes
1.88% due 10/15/2026 | | EUR | 900,000 | | | | 1,020,102 | |
Quintiles Transnational Corp.
Company Guar. Notes
4.88% due 05/15/2023* | | | 1,600,000 | | | | 1,632,000 | |
| | | | | | |
|
|
|
| | | | | | | | 5,444,655 | |
| | | | | | |
|
|
|
Medical - Generic Drugs — 0.0% | |
Mylan, Inc.
Company Guar. Notes
5.40% due 11/29/2043 | | | 308,000 | | | | 303,824 | |
| | | | | | |
|
|
|
Medical - HMO — 0.1% | | | | | | | | |
UnitedHealth Group, Inc.
Senior Notes
1.40% due 12/15/2017 | | | 598,000 | | | | 595,266 | |
UnitedHealth Group, Inc.
Senior Notes
3.35% due 07/15/2022 | | | 362,000 | | | | 370,508 | |
| | | | | | |
|
|
|
| | | | | | | | 965,774 | |
| | | | | | |
|
|
|
Medical - Hospitals — 1.3% | |
Capella Healthcare, Inc.
Company Guar. Notes
9.25% due 07/01/2017 | | | 500,000 | | | | 513,750 | |
HCA, Inc.
Senior Sec. Notes
4.75% due 05/01/2023 | | | 850,000 | | | | 861,679 | |
| | | | | | | | |
| | |
| Security Description | | Principal Amount(6) | | | Value
(Note 2) | |
| |
| | | | | | | | | |
Medical - Hospitals (continued) | |
HCA, Inc.
Company Guar. Notes
7.19% due 11/15/2015 | | $ | 400,000 | | | $ | 403,896 | |
HCA, Inc.
Company Guar. Notes
7.50% due 11/15/2095 | | | 2,632,000 | | | | 2,579,360 | |
IASIS Healthcare LLC/IASIS Capital Corp.
Company Guar. Notes
8.38% due 05/15/2019 | | | 1,625,000 | | | | 1,684,134 | |
Tenet Healthcare Corp.
Senior Sec. Notes
4.75% due 06/01/2020 | | | 1,899,000 | | | | 1,935,793 | |
Tenet Healthcare Corp.
Senior Notes
6.75% due 06/15/2023 | | | 1,079,000 | | | | 1,111,370 | |
Tenet Healthcare Corp.
Senior Notes
6.88% due 11/15/2031 | | | 958,000 | | | | 886,150 | |
| | | | | | |
|
|
|
| | | | | | | | 9,976,132 | |
| | | | | | |
|
|
|
Metal - Copper — 0.0% | |
Freeport-McMoRan, Inc.
Company Guar. Notes
2.30% due 11/14/2017 | | | 393,000 | | | | 365,490 | |
| | | | | | |
|
|
|
Multimedia — 0.3% | | | | | | | | |
21st Century Fox America, Inc.
Company Guar. Notes
4.75% due 09/15/2044 | | | 363,000 | | | | 348,171 | |
Time Warner, Inc.
Company Guar. Notes
3.60% due 07/15/2025 | | | 1,470,000 | | | | 1,422,701 | |
Viacom, Inc.
Senior Notes
4.85% due 12/15/2034 | | | 288,000 | | | | 242,252 | |
Viacom, Inc.
Senior Notes
5.25% due 04/01/2044 | | | 580,000 | | | | 499,679 | |
| | | | | | |
|
|
|
| | | | | | | | 2,512,803 | |
| | | | | | |
|
|
|
Music — 0.2% | |
Gibson Brands, Inc.
Senior Sec. Notes
8.88% due 08/01/2018* | | | 342,000 | | | | 324,900 | |
WMG Acquisition Corp.
Senior Sec. Notes
6.00% due 01/15/2021* | | | 745,000 | | | | 759,900 | |
WMG Acquisition Corp.
Company Guar. Notes
6.75% due 04/15/2022* | | | 817,000 | | | | 780,235 | |
| | | | | | |
|
|
|
| | | | | | | | 1,865,035 | |
| | | | | | |
|
|
|
Networking Products — 0.2% | |
Cisco Systems, Inc.
Senior Notes
2.13% due 03/01/2019 | | | 1,293,000 | | | | 1,302,479 | |
| | | | | | |
|
|
|
Oil & Gas Drilling — 0.1% | | | | | | | | |
Summit Midstream Holdings LLC/Summit Midstream Finance Corp.
Company Guar. Notes
5.50% due 08/15/2022 | | | 609,000 | | | | 538,965 | |
| | | | | | |
|
|
|
Oil Companies - Exploration & Production — 2.5% | | | | | | | | |
Anadarko Petroleum Corp.
Senior Notes
6.45% due 09/15/2036 | | | 1,452,000 | | | | 1,634,362 | |
95
VALIC Company II Strategic Bond Fund
PORTFOLIO OF INVESTMENTS — August 31, 2015 — (continued)
| | | | | | | | |
| | |
| Security Description | | Principal Amount(6) | | | Value
(Note 2) | |
| |
U.S. CORPORATE BONDS & NOTES (continued) | | | | | | | | |
Oil Companies - Exploration & Production (continued) | |
Atlas Energy Holdings Operating Co. LLC/Atlas Resource Finance Corp.
Company Guar. Notes
7.75% due 01/15/2021 | | $ | 1,169,000 | | | $ | 623,631 | |
Carrizo Oil & Gas, Inc.
Company Guar. Notes
6.25% due 04/15/2023 | | | 1,600,000 | | | | 1,440,000 | |
Chaparral Energy, Inc.
Company Guar. Notes
8.25% due 09/01/2021 | | | 635,000 | | | | 288,925 | |
Denbury Resources, Inc.
Company Guar. Notes
5.50% due 05/01/2022 | | | 1,625,000 | | | | 1,157,812 | |
EP Energy LLC/Everest Acquisition Finance, Inc.
Company Guar. Notes
7.75% due 09/01/2022 | | | 875,000 | | | | 805,000 | |
EV Energy Partners LP/EV Energy Finance Corp.
Company Guar. Notes
8.00% due 04/15/2019 | | | 1,630,000 | | | | 1,173,600 | |
Halcon Resources Corp.
Sec. Notes
8.63% due 02/01/2020*# | | | 955,000 | | | | 838,012 | |
Halcon Resources Corp.
Company Guar. Notes
9.75% due 07/15/2020# | | | 1,000,000 | | | | 365,000 | |
Hess Corp.
Senior Notes
5.60% due 02/15/2041 | | | 320,000 | | | | 309,158 | |
Hess Corp.
Senior Notes
7.88% due 10/01/2029 | | | 230,000 | | | | 275,959 | |
Hilcorp Energy I LP/Hilcorp Finance Co.
Senior Notes
5.00% due 12/01/2024* | | | 1,179,000 | | | | 1,019,953 | |
Legacy Reserves LP/Legacy Reserves Finance Corp.
Company Guar. Notes
6.63% due 12/01/2021 | | | 1,147,000 | | | | 802,900 | |
Memorial Production Partners LP/Memorial Production Finance Corp.
Company Guar. Notes
7.63% due 05/01/2021 | | | 760,000 | | | | 509,200 | |
Newfield Exploration Co.
Senior Notes
5.38% due 01/01/2026 | | | 1,588,000 | | | | 1,476,840 | |
Noble Energy, Inc.
Senior Notes
3.90% due 11/15/2024 | | | 439,000 | | | | 414,732 | |
Noble Energy, Inc.
Senior Notes
5.05% due 11/15/2044 | | | 370,000 | | | | 329,693 | |
Northern Oil and Gas, Inc.
Senior Notes
8.00% due 06/01/2020# | | | 1,517,000 | | | | 1,152,920 | |
Oasis Petroleum, Inc.
Company Guar. Notes
6.88% due 03/15/2022 | | | 900,000 | | | | 747,000 | |
Occidental Petroleum Corp.
Senior Notes
3.50% due 06/15/2025 | | | 264,000 | | | | 263,646 | |
Penn Virginia Corp.
Company Guar. Notes
7.25% due 04/15/2019# | | | 1,010,000 | | | | 260,075 | |
Rex Energy Corp.
Company Guar. Notes
6.25% due 08/01/2022 | | | 1,126,000 | | | | 596,780 | |
| | | | | | | | |
| | |
| Security Description | | Principal Amount(6) | | | Value
(Note 2) | |
| |
| | | | | | | | | |
Oil Companies - Exploration & Production (continued) | |
Sanchez Energy Corp.
Company Guar. Notes
6.13% due 01/15/2023# | | $ | 1,372,000 | | | $ | 1,029,000 | |
SM Energy Co.
Senior Notes
5.63% due 06/01/2025 | | | 899,000 | | | | 797,863 | |
Southwestern Energy Co.
Senior Notes
3.30% due 01/23/2018 | | | 187,000 | | | | 186,432 | |
Southwestern Energy Co.
Senior Notes
4.95% due 01/23/2025# | | | 871,000 | | | | 800,176 | |
| | | | | | |
|
|
|
| | | | | | | | 19,298,669 | |
| | | | | | |
|
|
|
Oil Companies - Integrated — 0.3% | |
Chevron Corp.
Senior Notes
1.37% due 03/02/2018 | | | 748,000 | | | | 745,238 | |
Chevron Corp.
Senior Notes
1.96% due 03/03/2020 | | | 412,000 | | | | 407,615 | |
ConocoPhillips Co.
Company Guar. Notes
1.50% due 05/15/2018 | | | 276,000 | | | | 274,561 | |
Exxon Mobil Corp.
Senior Notes
1.31% due 03/06/2018 | | | 757,000 | | | | 756,557 | |
Marathon Oil Corp.
Senior Notes
6.60% due 10/01/2037 | | | 517,000 | | | | 542,399 | |
| | | | | | |
|
|
|
| | | | | | | | 2,726,370 | |
| | | | | | |
|
|
|
Oil Refining & Marketing — 0.4% | |
Calumet Specialty Products Partner LP/ Calumet
Finance Corp.
Company Guar. Notes
6.50% due 04/15/2021 | | | 1,144,000 | | | | 1,081,080 | |
Murphy Oil USA, Inc.
Company Guar. Notes
6.00% due 08/15/2023 | | | 1,168,000 | | | | 1,203,040 | |
Reliance Holdings USA, Inc.
Company Guar. Notes
5.40% due 02/14/2022 | | | 500,000 | | | | 542,514 | |
| | | | | | |
|
|
|
| | | | | | | | 2,826,634 | |
| | | | | | |
|
|
|
Oil - Field Services — 0.2% | |
Bristow Group, Inc.
Company Guar. Notes
6.25% due 10/15/2022 | | | 698,000 | | | | 614,240 | |
Freeport-McMoran Oil & Gas LLC/FCX Oil & Gas, Inc.
Company Guar. Notes
6.63% due 05/01/2021 | | | 236,000 | | | | 217,120 | |
Freeport-McMoran Oil & Gas LLC/FCX Oil & Gas, Inc.
Company Guar. Notes
6.88% due 02/15/2023 | | | 392,000 | | | | 351,820 | |
| | | | | | |
|
|
|
| | | | | | | | 1,183,180 | |
| | | | | | |
|
|
|
Paper & Related Products — 0.7% | |
Domtar Corp.
Company Guar. Notes
6.75% due 02/15/2044 | | | 805,000 | | | | 860,836 | |
Georgia-Pacific LLC
Senior Notes
3.60% due 03/01/2025* | | | 1,443,000 | | | | 1,422,867 | |
Georgia-Pacific LLC
Senior Notes
3.73% due 07/15/2023* | | | 1,569,000 | | | | 1,583,865 | |
96
VALIC Company II Strategic Bond Fund
PORTFOLIO OF INVESTMENTS — August 31, 2015 — (continued)
| | | | | | | | |
| | |
| Security Description | | Principal Amount(6) | | | Value
(Note 2) | |
| |
U.S. CORPORATE BONDS & NOTES (continued) | | | | | | | | |
Paper & Related Products (continued) | |
Georgia-Pacific LLC
Company Guar. Notes
5.40% due 11/01/2020* | | $ | 447,000 | | | $ | 499,991 | |
PH Glatfelter Co.
Company Guar. Notes
5.38% due 10/15/2020 | | | 917,000 | | | | 928,462 | |
| | | | | | |
|
|
|
| | | | | | | | 5,296,021 | |
| | | | | | |
|
|
|
Pipelines — 1.7% | |
Columbia Pipeline Group, Inc.
Company Guar. Notes
2.45% due 06/01/2018* | | | 144,000 | | | | 144,020 | |
Columbia Pipeline Group, Inc.
Company Guar. Notes
4.50% due 06/01/2025* | | | 692,000 | | | | 660,343 | |
Energy Transfer Equity LP
Senior Sec. Notes
7.50% due 10/15/2020 | | | 1,105,000 | | | | 1,183,753 | |
Energy Transfer Partners LP
Senior Notes
4.90% due 03/15/2035 | | | 674,000 | | | | 572,511 | |
Energy Transfer Partners LP
Senior Notes
5.15% due 03/15/2045 | | | 254,000 | | | | 214,056 | |
Energy Transfer Partners LP
Senior Notes
6.63% due 10/15/2036 | | | 1,048,000 | | | | 1,051,904 | |
EnLink Midstream Partners LP
Senior Notes
5.05% due 04/01/2045 | | | 342,000 | | | | 286,105 | |
Genesis Energy LP/Genesis Energy Finance Corp.
Company Guar. Notes
5.63% due 06/15/2024 | | | 937,000 | | | | 838,615 | |
Genesis Energy LP/Genesis Energy Finance Corp.
Company Guar. Notes
5.75% due 02/15/2021 | | | 1,000,000 | | | | 940,000 | |
Genesis Energy LP/Genesis Energy Finance Corp.
Company Guar. Notes
6.00% due 05/15/2023 | | | 933,000 | | | | 853,695 | |
Kinder Morgan Energy Partners LP
Company Guar. Notes
4.70% due 11/01/2042 | | | 270,000 | | | | 201,263 | |
Kinder Morgan Energy Partners LP
Company Guar. Notes
6.50% due 04/01/2020 | | | 959,000 | | | | 1,064,976 | |
Kinder Morgan, Inc.
Company Guar. Notes
5.00% due 02/15/2021* | | | 860,000 | | | | 887,525 | |
Rose Rock Midstream LP/Rose Rock Finance Corp.
Company Guar. Notes
5.63% due 07/15/2022 | | | 1,174,000 | | | | 1,068,340 | |
Sabine Pass Liquefaction LLC
Senior Sec. Notes
5.63% due 04/15/2023(5) | | | 825,000 | | | | 801,281 | |
Sabine Pass Liquefaction LLC
Senior Sec. Notes
6.25% due 03/15/2022 | | | 737,000 | | | | 740,685 | |
Tesoro Logistics LP/Tesoro Logistics Finance Corp.
Company Guar. Notes
5.88% due 10/01/2020 | | | 783,000 | | | | 784,958 | |
Tesoro Logistics LP/Tesoro Logistics Finance Corp.
Company Guar. Notes
6.13% due 10/15/2021 | | | 1,077,000 | | | | 1,079,693 | |
| | | | | | | | |
| | |
| Security Description | | Principal Amount(6) | | | Value
(Note 2) | |
| |
| | | | | | | | | |
Pipelines (continued) | |
Williams Partners LP
Senior Notes
4.00% due 09/15/2025 | | $ | 250,000 | | | $ | 223,264 | |
| | | | | | |
|
|
|
| | | | | | | | 13,596,987 | |
| | | | | | |
|
|
|
Printing - Commercial — 0.4% | |
Multi-Color Corp.
Company Guar. Notes
6.13% due 12/01/2022* | | | 1,767,000 | | | | 1,800,131 | |
Quad/Graphics, Inc.
Company Guar. Notes
7.00% due 05/01/2022 | | | 1,725,000 | | | | 1,604,250 | |
| | | | | | |
|
|
|
| | | | | | | | 3,404,381 | |
| | | | | | |
|
|
|
Publishing - Newspapers — 0.4% | |
Lee Enterprises, Inc.
Senior Sec. Notes
9.50% due 03/15/2022* | | | 1,537,000 | | | | 1,479,362 | |
McClatchy Co.
Senior Sec. Notes
9.00% due 12/15/2022# | | | 1,681,000 | | | | 1,519,204 | |
| | | | | | |
|
|
|
| | | | | | | | 2,998,566 | |
| | | | | | |
|
|
|
Publishing - Periodicals — 0.6% | |
Expo Event Transco, Inc.
Senior Notes
9.00% due 06/15/2021* | | | 2,955,000 | | | | 2,969,775 | |
Time, Inc.
Company Guar. Notes
5.75% due 04/15/2022* | | | 1,420,000 | | | | 1,356,100 | |
| | | | | | |
|
|
|
| | | | | | | | 4,325,875 | |
| | | | | | |
|
|
|
Radio — 0.1% | |
Sirius XM Radio, Inc.
Company Guar. Notes
5.38% due 04/15/2025* | | | 908,000 | | | | 896,650 | |
| | | | | | |
|
|
|
Real Estate Investment Trusts — 1.2% | | | | | | | | |
Communications Sales & Leasing, Inc.
Company Guar. Notes
8.25% due 10/15/2023* | | | 670,000 | | | | 609,700 | |
Communications Sales & Leasing, Inc./CSL Capital LLC
Senior Sec. Notes
6.00% due 04/15/2023* | | | 854,000 | | | | 802,760 | |
CTR Partnership LP/CareTrust Capital Corp.
Company Guar. Notes
5.88% due 06/01/2021 | | | 1,344,000 | | | | 1,360,800 | |
DuPont Fabros Technology LP
Company Guar. Notes
5.63% due 06/15/2023 | | | 1,400,000 | | | | 1,379,000 | |
ESH Hospitality, Inc.
Company Guar. Notes
5.25% due 05/01/2025* | | | 1,601,000 | | | | 1,552,970 | |
iStar Financial, Inc.
Senior Notes
5.00% due 07/01/2019 | | | 1,526,000 | | | | 1,480,220 | |
Omega Healthcare Investors, Inc.
Company Guar. Notes
4.50% due 04/01/2027* | | | 788,000 | | | | 757,965 | |
Omega Healthcare Investors, Inc.
Company Guar. Notes
4.95% due 04/01/2024 | | | 676,000 | | | | 696,342 | |
RHP Hotel Properties LP/RHP Finance Corp.
Company Guar. Notes
5.00% due 04/15/2023* | | | 835,000 | | | | 826,650 | |
| | | | | | |
|
|
|
| | | | | | | | 9,466,407 | |
| | | | | | |
|
|
|
97
VALIC Company II Strategic Bond Fund
PORTFOLIO OF INVESTMENTS — August 31, 2015 — (continued)
| | | | | | | | |
| | |
| Security Description | | Principal Amount(6) | | | Value
(Note 2) | |
| |
U.S. CORPORATE BONDS & NOTES (continued) | | | | | | | | |
Real Estate Management/Services — 0.2% | |
American Campus Communities Operating
Partnership LP
Company Guar. Notes
4.13% due 07/01/2024 | | $ | 458,000 | | | $ | 455,508 | |
Kennedy-Wilson, Inc.
Company Guar. Notes
5.88% due 04/01/2024 | | | 1,406,000 | | | | 1,368,038 | |
| | | | | | |
|
|
|
| | | | | | | | 1,823,546 | |
| | | | | | |
|
|
|
Real Estate Operations & Development — 0.3% | |
Greystar Real Estate Partners LLC
Senior Sec. Notes
8.25% due 12/01/2022* | | | 1,903,000 | | | | 1,983,878 | |
| | | | | | |
|
|
|
Rental Auto/Equipment — 0.2% | | | | | | | | |
United Rentals North America, Inc.
Senior Sec. Notes
4.63% due 07/15/2023 | | | 825,000 | | | | 811,594 | |
United Rentals North America, Inc.
Company Guar. Notes
5.50% due 07/15/2025 | | | 1,000,000 | | | | 965,000 | |
| | | | | | |
|
|
|
| | | | | | | | 1,776,594 | |
| | | | | | |
|
|
|
Retail - Appliances — 0.3% | |
Conn’s, Inc.
Company Guar. Notes
7.25% due 07/15/2022# | | | 2,105,000 | | | | 1,999,982 | |
| | | | | | |
|
|
|
Retail - Computer Equipment — 0.2% | | | | | | | | |
GameStop Corp.
Company Guar. Notes
5.50% due 10/01/2019*# | | | 1,477,000 | | | | 1,525,003 | |
| | | | | | |
|
|
|
Retail-Discount — 0.2% | | | | | | | | |
Costco Wholesale Corp.
Senior Notes
2.25% due 02/15/2022 | | | 775,000 | | | | 751,939 | |
Dollar General Corp.
Company Guar. Notes
4.13% due 07/15/2017 | | | 641,000 | | | | 663,000 | |
| | | | | | |
|
|
|
| | | | | | | | 1,414,939 | |
| | | | | | |
|
|
|
Retail - Drug Store — 0.2% | |
CVS Pass-Through Trust
Pass Through Certs.
4.70% due 01/10/2036* | | | 370,492 | | | | 384,662 | |
CVS Pass-Through Trust
Pass Through Certs.
5.77% due 01/10/2033* | | | 238,018 | | | | 269,507 | |
CVS Pass-Through Trust
Pass Through Certs.
5.93% due 01/10/2034* | | | 505,935 | | | | 567,277 | |
| | | | | | |
|
|
|
| | | | | | | | 1,221,446 | |
| | | | | | |
|
|
|
Retail - Regional Department Stores — 0.2% | |
Bon-Ton Department Stores, Inc.
Sec. Notes
8.00% due 06/15/2021 | | | 1,790,000 | | | | 1,163,500 | |
Kohl’s Corp.
Senior Notes
5.55% due 07/17/2045# | | | 371,000 | | | | 350,761 | |
| | | | | | |
|
|
|
| | | | | | | | 1,514,261 | |
| | | | | | |
|
|
|
Retail - Restaurants — 0.4% | |
Landry’s, Inc.
Company Guar. Notes
9.38% due 05/01/2020* | | | 1,300,000 | | | | 1,389,375 | |
| | | | | | | | |
| | |
| Security Description | | Principal Amount(6) | | | Value
(Note 2) | |
| |
| | | | | | | | | |
Retail - Restaurants (continued) | |
PF Chang’s China Bistro, Inc.
Company Guar. Notes
10.25% due 06/30/2020*# | | $ | 1,791,000 | | | $ | 1,791,000 | |
| | | | | | |
|
|
|
| | | | | | | | 3,180,375 | |
| | | | | | |
|
|
|
Rubber/Plastic Products — 0.0% | |
Venture Holdings Co. LLC
Company Guar. Notes
11.00% due 06/01/2007†(3)(4)(10)(16) | | | 25,000 | | | | 0 | |
| | | | | | |
|
|
|
Satellite Telecom — 0.1% | |
Hughes Satellite Systems Corp.
Company Guar. Notes
7.63% due 06/15/2021 | | | 729,000 | | | | 797,344 | |
| | | | | | |
|
|
|
Savings & Loans/Thrifts — 0.5% | | | | | | | | |
Astoria Financial Corp.
Senior Notes
5.00% due 06/19/2017 | | | 799,000 | | | | 834,825 | |
First Niagara Financial Group, Inc.
Senior Notes
6.75% due 03/19/2020 | | | 1,512,000 | | | | 1,667,246 | |
First Niagara Financial Group, Inc.
Sub. Notes
7.25% due 12/15/2021 | | | 1,358,000 | | | | 1,522,921 | |
| | | | | | |
|
|
|
| | | | | | | | 4,024,992 | |
| | | | | | |
|
|
|
Schools — 0.1% | |
President and Fellows of Harvard College
Notes
3.62% due 10/01/2037 | | | 233,000 | | | | 226,010 | |
University of Pennsylvania
Senior Notes
4.67% due 09/01/2112 | | | 521,000 | | | | 501,123 | |
| | | | | | |
|
|
|
| | | | | | | | 727,133 | |
| | | | | | |
|
|
|
Specified Purpose Acquisitions — 0.3% | |
Opal Acquisition, Inc.
Senior Notes
8.88% due 12/15/2021* | | | 2,152,000 | | | | 2,108,960 | |
| | | | | | |
|
|
|
Steel Pipe & Tube — 0.1% | | | | | | | | |
Valmont Industries, Inc.
Company Guar. Notes
5.25% due 10/01/2054 | | | 905,000 | | | | 798,089 | |
| | | | | | |
|
|
|
Steel - Producers — 0.4% | | | | | | | | |
AK Steel Corp.
Company Guar. Notes
8.38% due 04/01/2022 | | | 1,649,000 | | | | 1,030,625 | |
AK Steel Corp.
Senior Sec. Notes
8.75% due 12/01/2018# | | | 1,000,000 | | | | 1,000,000 | |
Steel Dynamics, Inc.
Company Guar. Notes
5.13% due 10/01/2021 | | | 1,214,000 | | | | 1,190,327 | |
| | | | | | |
|
|
|
| | | | | | | | 3,220,952 | |
| | | | | | |
|
|
|
Steel - Specialty — 0.1% | |
Allegheny Technologies, Inc.
Senior Notes
5.95% due 01/15/2021 | | | 499,000 | | | | 454,090 | |
| | | | | | |
|
|
|
Telecom Services — 0.2% | | | | | | | | |
Altice US Finance I Corp
Senior Sec. Notes
5.38% due 07/15/2023* | | | 1,600,000 | | | | 1,584,000 | |
| | | | | | |
|
|
|
98
VALIC Company II Strategic Bond Fund
PORTFOLIO OF INVESTMENTS — August 31, 2015 — (continued)
| | | | | | | | |
| | |
| Security Description | | Principal
Amount(6) | | | Value
(Note 2) | |
| |
U.S. CORPORATE BONDS & NOTES (continued) | | | | | | | | |
Telecommunication Equipment — 0.3% | |
CommScope Technologies Finance LLC
Senior Sec. Notes
6.00% due 06/15/2025* | | $ | 1,400,000 | | | $ | 1,361,500 | |
Plantronics, Inc.
Company Guar. Notes
5.50% due 05/31/2023* | | | 1,000,000 | | | | 1,005,000 | |
| | | | | | |
|
|
|
| | | | | | | | 2,366,500 | |
| | | | | | |
|
|
|
Telephone - Integrated — 1.6% | |
AT&T, Inc.
Senior Notes
3.00% due 06/30/2022 | | | 1,274,000 | | | | 1,223,392 | |
AT&T, Inc.
Senior Notes
3.40% due 05/15/2025 | | | 359,000 | | | | 342,122 | |
AT&T, Inc.
Senior Notes
4.35% due 06/15/2045 | | | 701,000 | | | | 599,508 | |
AT&T, Inc.
Senior Notes
4.50% due 05/15/2035 | | | 881,000 | | | | 809,425 | |
AT&T, Inc.
Senior Notes
4.75% due 05/15/2046 | | | 319,000 | | | | 290,774 | |
AT&T, Inc.
Senior Notes
5.80% due 02/15/2019 | | | 310,000 | | | | 343,056 | |
Century Telephone Enterprise, Inc.
Senior Notes
6.88% due 01/15/2028 | | | 536,000 | | | | 479,720 | |
CenturyLink, Inc.
Senior Notes
5.63% due 04/01/2025* | | | 1,570,000 | | | | 1,402,010 | |
CenturyLink, Inc.
Senior Notes
5.80% due 03/15/2022 | | | 628,000 | | | | 595,815 | |
Consolidated Communications, Inc.
Company Guar. Notes
6.50% due 10/01/2022* | | | 1,046,000 | | | | 967,550 | |
Frontier Communications Corp.
Senior Notes
8.13% due 10/01/2018 | | | 510,000 | | | | 550,800 | |
Frontier Communications Corp.
Senior Notes
9.25% due 07/01/2021 | | | 574,000 | | | | 589,785 | |
Verizon Communications, Inc.
Senior Notes
3.00% due 11/01/2021 | | | 764,000 | | | | 753,051 | |
Verizon Communications, Inc.
Senior Notes
4.40% due 11/01/2034 | | | 313,000 | | | | 288,631 | |
Verizon Communications, Inc.
Senior Notes
4.50% due 09/15/2020 | | | 85,000 | | | | 91,311 | |
Verizon Communications, Inc.
Senior Notes
4.67% due 03/15/2055 | | | 1,326,000 | | | | 1,149,002 | |
Verizon Communications, Inc.
Senior Notes
4.75% due 02/17/2034 | | GBP | 550,000 | | | | 883,671 | |
Verizon Communications, Inc.
Senior Notes
4.86% due 08/21/2046 | | | 1,436,000 | | | | 1,353,272 | |
| | | | | | | | |
| | |
| Security Description | | Principal
Amount(6) | | | Value
(Note 2) | |
| |
| | | | | | | | | |
Telephone - Integrated (continued) | |
Verizon Communications, Inc.
Senior Notes
6.40% due 09/15/2033 | | $ | 51,000 | | | $ | 58,481 | |
| | | | | | |
|
|
|
| | | | | | | | 12,771,376 | |
| | | | | | |
|
|
|
Theaters — 0.3% | |
Carmike Cinemas, Inc.
Sec. Notes
6.00% due 06/15/2023* | | | 800,000 | | | | 818,000 | |
National CineMedia LLC
Senior Sec. Notes
6.00% due 04/15/2022 | | | 1,177,000 | | | | 1,203,482 | |
| | | | | | |
|
|
|
| | | | | | | | 2,021,482 | |
| | | | | | |
|
|
|
Transport - Rail — 0.0% | |
Union Pacific Corp.
Senior Notes
3.88% due 02/01/2055 | | | 430,000 | | | | 373,903 | |
| | | | | | |
|
|
|
Travel Services — 0.2% | | | | | | | | |
Sabre GLBL, Inc.
Senior Sec. Notes
5.38% due 04/15/2023* | | | 1,484,000 | | | | 1,454,320 | |
| | | | | | |
|
|
|
Trucking/Leasing — 0.1% | | | | | | | | |
Penske Truck Leasing Co. LP/PTL Finance Corp. Senior Notes
3.05% due 01/09/2020* | | | 536,000 | | | | 537,272 | |
| | | | | | |
|
|
|
Wire & Cable Products — 0.3% | | | | | | | | |
General Cable Corp.
Company Guar. Notes
5.75% due 10/01/2022 | | | 2,267,000 | | | | 2,028,965 | |
| | | | | | |
|
|
|
Total U.S. Corporate Bonds & Notes | | | | | | | | |
(cost $346,977,711) | | | | | | | 331,118,144 | |
| | | | | | |
|
|
|
FOREIGN CORPORATE BONDS & NOTES — 22.2% | | | | | | | | |
Aerospace/Defense — 0.1% | | | | | | | | |
BAE Systems PLC
Senior Notes
4.13% due 06/08/2022 | | GBP | 450,000 | | | | 730,437 | |
| | | | | | |
|
|
|
Agricultural Chemicals — 0.3% | | | | | | | | |
Consolidated Energy Finance SA
Company Guar. Notes
6.75% due 10/15/2019* | | | 2,100,000 | | | | 2,073,330 | |
| | | | | | |
|
|
|
Airlines — 0.3% | | | | | | | | |
Air Canada
Senior Sec. Notes
6.75% due 10/01/2019* | | | 1,410,000 | | | | 1,487,550 | |
Latam Airlines Group SA
Senior Notes
7.25% due 06/09/2020* | | | 600,000 | | | | 586,200 | |
| | | | | | |
|
|
|
| | | | | | | | 2,073,750 | |
| | | | | | |
|
|
|
Airport Development/Maintenance — 0.3% | | | | | | | | |
Heathrow Funding, Ltd.
Senior Sec. Notes
1.88% due 05/23/2024 | | EUR | 1,400,000 | | | | 1,617,827 | |
Heathrow Funding, Ltd.
Senior Sec. Notes
6.75% due 12/03/2028 | | GBP | 325,000 | | | | 647,865 | |
| | | | | | |
|
|
|
| | | | | | | | 2,265,692 | |
| | | | | | |
|
|
|
Appliances — 0.1% | | | | | | | | |
Arcelik AS
Senior Notes
5.00% due 04/03/2023 | | | 550,000 | | | | 507,971 | |
| | | | | | |
|
|
|
99
VALIC Company II Strategic Bond Fund
PORTFOLIO OF INVESTMENTS — August 31, 2015 — (continued)
| | | | | | | | |
| | |
| Security Description | | Principal
Amount(6) | | | Value
(Note 2) | |
| |
FOREIGN CORPORATE BONDS & NOTES (continued) | | | | | | | | |
Auto - Cars/Light Trucks — 0.4% | | | | | | | | |
BMW Finance NV
Company Guar. Notes
2.63% due 01/17/2024 | | EUR | 735,000 | | | $ | 911,902 | |
BMW Finance NV
Company Guar. Notes
3.38% due 12/14/2018 | | GBP | 250,000 | | | | 401,621 | |
Daimler AG
Senior Notes
2.75% due 12/04/2020 | | GBP | 100,000 | | | | 155,881 | |
Hyundai Capital Services, Inc.
Senior Notes
4.38% due 07/27/2016* | | | 950,000 | | | | 975,784 | |
Volkswagen International Finance NV
Company Guar. Notes
2.38% due 03/22/2017* | | | 413,000 | | | | 419,319 | |
| | | | | | |
|
|
|
| | | | | | | | 2,864,507 | |
| | | | | | |
|
|
|
Auto/Truck Parts & Equipment - Original — 0.1% | |
Tenedora Nemak SA de CV
Senior Notes
5.50% due 02/28/2023#* | | | 400,000 | | | | 399,000 | |
Tupy Overseas SA
Company Guar. Notes
6.63% due 07/17/2024# | | | 450,000 | | | | 425,812 | |
| | | | | | |
|
|
|
| | | | | | | | 824,812 | |
| | | | | | |
|
|
|
Banks - Commercial — 4.5% | | | | | | | | |
Abbey National Treasury Services PLC
Company Guar. Notes
1.13% due 01/14/2022 | | EUR | 950,000 | | | | 1,044,705 | |
Abbey National Treasury Services PLC
Company Guar. Notes
1.38% due 03/13/2017 | | | 71,000 | | | | 70,943 | |
Abbey National Treasury Services PLC
Company Guar. Notes
3.88% due 10/15/2029 | | GBP | 150,000 | | | | 239,128 | |
ADCB Finance Cayman, Ltd.
Company Guar. Notes
4.50% due 03/06/2023 | | | 500,000 | | | | 508,125 | |
ANZ New Zealand Int’l, Ltd.
Company Guar. Notes
1.13% due 03/24/2016* | | | 1,318,000 | | | | 1,321,275 | |
Banco ABC Brasil SA
Senior Notes
8.50% due 03/28/2016*(10) | | BRL | 3,200,000 | | | | 846,180 | |
Banco de Bogota SA
Sub. Notes
5.38% due 02/19/2023 | | | 500,000 | | | | 501,250 | |
Banco de Credito del Peru/Panama
Senior Notes
5.38% due 09/16/2020 | | | 450,000 | | | | 486,000 | |
Bank of Ireland
Senior Notes
2.75% due 06/05/2016 | | EUR | 800,000 | | | | 910,253 | |
Bank of Tokyo-Mitsubishi UFJ, Ltd.
Senior Notes
1.45% due 09/08/2017* | | | 890,000 | | | | 884,037 | |
Banque Federative du Credit Mutuel SA
Sub. Notes
5.00% due 09/30/2015 | | EUR | 700,000 | | | | 788,231 | |
Barclays Bank PLC
Senior Notes
2.13% due 02/24/2021 | | EUR | 300,000 | | | | 354,247 | |
Barclays Bank PLC
Senior Notes
2.25% due 06/10/2024 | | EUR | 550,000 | | | | 645,818 | |
| | | | | | | | |
| | |
| Security Description | | Principal
Amount(6) | | | Value
(Note 2) | |
| |
| | | | | | | | | |
Banks - Commercial (continued) | |
BPCE SA
Senior Notes
1.38% due 05/22/2019 | | EUR | 600,000 | | | $ | 688,664 | |
BPCE SA
Sub. Notes
4.50% due 03/15/2025* | | | 740,000 | | | | 718,089 | |
BPCE SA
Sub. Notes
4.63% due 07/18/2023 | | EUR | 300,000 | | | | 383,776 | |
Cooperatieve Centrale Raiffeisen-Boerenleenbank BA
Senior Notes
5.25% due 05/23/2041 | | GBP | 190,000 | | | | 352,053 | |
Cooperatieve Centrale Raiffeisen-Boerenleenbank BA/Netherlands
Senior Notes
4.55% due 08/30/2029 | | GBP | 200,000 | | | | 347,459 | |
Credit Suisse
Senior Notes
1.70% due 04/27/2018 | | | 653,000 | | | | 648,632 | |
Credit Suisse
Sub. Notes
5.40% due 01/14/2020 | | | 1,418,000 | | | | 1,565,566 | |
Credit Suisse AG VRS
Sub. Notes
5.75% due 09/18/2025 | | EUR | 800,000 | | | | 1,009,265 | |
Credit Suisse Group Funding Guernsey, Ltd.
Company Guar. Notes
4.88% due 05/15/2045* | | | 696,000 | | | | 679,786 | |
Credit Suisse New York
Senior Notes
3.00% due 10/29/2021 | | | 377,000 | | | | 375,190 | |
DBS Group Holdings, Ltd.
Senior Notes
2.25% due 07/16/2019* | | | 998,000 | | | | 1,000,392 | |
Hana Bank
Sub. Notes
4.38% due 09/30/2024* | | | 235,000 | | | | 239,484 | |
HBOS PLC FRS
Sub. Notes
4.50% due 03/18/2030 | | EUR | 500,000 | | | | 621,358 | |
ICICI Bank, Ltd.
Senior Notes
5.75% due 11/16/2020 | | | 350,000 | | | | 389,856 | |
ING Bank NV
Senior Notes
4.00% due 03/15/2016* | | | 585,000 | | | | 594,495 | |
ING Bank NV
Senior Notes
5.38% due 04/15/2021 | | GBP | 300,000 | | | | 528,064 | |
Intesa Sanpaolo SpA
Senior Notes
2.00% due 06/18/2021 | | EUR | 350,000 | | | | 397,223 | |
Intesa Sanpaolo SpA
Senior Notes
3.50% due 01/17/2022 | | EUR | 1,400,000 | | | | 1,719,350 | |
Intesa Sanpaolo SpA
Sub. Notes
5.02% due 06/26/2024* | | | 863,000 | | | | 843,534 | |
Kookmin Bank
Senior Notes
1.63% due 07/14/2017* | | | 1,239,000 | | | | 1,233,333 | |
Malayan Banking Bhd VRS
Sub. Notes
3.25% due 09/20/2022 | | | 500,000 | | | | 499,636 | |
100
VALIC Company II Strategic Bond Fund
PORTFOLIO OF INVESTMENTS — August 31, 2015 — (continued)
| | | | | | | | |
| | |
| Security Description | | Principal
Amount(6) | | | Value
(Note 2) | |
| |
FOREIGN CORPORATE BONDS & NOTES (continued) | | | | | | | | |
Banks - Commercial (continued) | |
National Australia Bank, Ltd.
Senior Notes
2.75% due 03/09/2017 | | $ | 540,000 | | | $ | 552,875 | |
National Australia Bank, Ltd.
Senior Notes
2.75% due 08/08/2022 | | EUR | 700,000 | | | | 861,436 | |
National Bank of Canada
Company Guar. Notes
1.45% due 11/07/2017 | | | 1,085,000 | | | | 1,080,090 | |
Nordea Bank AB
Senior Notes
2.13% due 11/13/2019 | | GBP | 150,000 | | | | 231,156 | |
Oversea-Chinese Banking Corp., Ltd. VRS
Sub. Notes
4.00% due 10/15/2024* | | | 280,000 | | | | 285,814 | |
PKO Bank Polski SA
Senior Notes
4.63% due 09/26/2022* | | | 650,000 | | | | 671,749 | |
Rabobank Nederland
Bank Guar. Notes
5.25% due 08/04/2045 | | | 308,000 | | | | 315,997 | |
Sberbank of Russia Via SB Capital SA
Senior Notes
6.13% due 02/07/2022 | | | 650,000 | | | | 625,073 | |
Siam Commercial Bank PCL
Senior Notes
3.50% due 04/07/2019* | | | 200,000 | | | | 204,194 | |
Skandinaviska Enskilda Banken AB
Senior Notes
1.88% due 11/14/2019 | | EUR | 700,000 | | | | 820,986 | |
Standard Chartered Bank
Sub. Notes
5.88% due 09/26/2017 | | EUR | 850,000 | | | | 1,047,936 | |
Standard Chartered PLC
Senior Notes
1.63% due 06/13/2021 | | EUR | 900,000 | | | | 1,020,454 | |
Standard Chartered PLC
Senior Notes
2.25% due 04/17/2020* | | | 1,043,000 | | | | 1,028,692 | |
Standard Chartered PLC
Senior Notes
3.20% due 04/17/2025*# | | | 256,000 | | | | 240,742 | |
Standard Chartered PLC
Sub. Notes
3.63% due 11/23/2022 | | EUR | 800,000 | | | | 918,759 | |
Svenska Handelsbanken AB VRS
Sub. Notes
2.66% due 01/15/2024 | | EUR | 950,000 | | | | 1,100,796 | |
Svenska Handelsbanken AB
Senior Notes
3.00% due 11/20/2020 | | GBP | 375,000 | | | | 595,701 | |
Turkiye Is Bankasi
Senior Notes
5.00% due 04/30/2020* | | | 250,000 | | | | 248,090 | |
Zenith Bank PLC
Senior Notes
6.25% due 04/22/2019* | | | 450,000 | | | | 407,250 | |
| | | | | | |
|
|
|
| | | | | | | | 35,693,187 | |
| | | | | | |
|
|
|
Banks - Money Center — 0.6% | | | | | | | | |
ABN AMRO Bank NV
Senior Notes
2.50% due 11/29/2023 | | EUR | 375,000 | | | | 452,763 | |
ABN AMRO Bank NV
Senior Notes
4.13% due 03/28/2022 | | EUR | 600,000 | | | | 792,637 | |
| | | | | | | | |
| | |
| Security Description | | Principal
Amount(6) | | | Value
(Note 2) | |
| |
| | | | | | | | | |
Banks - Money Center (continued) | |
ABN AMRO Bank NV
Sub. Notes
4.75% due 07/28/2025* | | $ | 296,000 | | | $ | 296,456 | |
Bank of Scotland PLC
Sub. Notes
6.38% due 08/16/2019 | | GBP | 275,000 | | | | 474,007 | |
Lloyds Bank PLC
Senior Notes
6.50% due 09/17/2040 | | GBP | 230,000 | | | | 490,237 | |
Lloyds Bank PLC VRS
Sub. Notes
11.88% due 12/16/2021 | | EUR | 950,000 | | | | 1,209,382 | |
Mizuho Bank, Ltd.
Company Guar. Notes
2.45% due 04/16/2019* | | | 385,000 | | | | 386,594 | |
National Westminster Bank PLC
Sub. Notes
7.88% due 09/09/2015 | | GBP | 210,000 | | | | 322,237 | |
| | | | | | |
|
|
|
| | | | | | | | 4,424,313 | |
| | | | | | |
|
|
|
Banks - Special Purpose — 0.2% | | | | | | | | |
Bank Nederlandse Gemeenten NV
Senior Notes
1.88% due 12/07/2018 | | GBP | 350,000 | | | | 545,314 | |
Bank Nederlandse Gemeenten NV
Senior Notes
2.63% due 09/01/2020 | | EUR | 800,000 | | | | 1,000,969 | |
Burgan Finance No. 1 Jersey, Ltd.
Company Guar. Notes
7.88% due 09/29/2020 | | | 350,000 | | | | 352,625 | |
| | | | | | |
|
|
|
| | | | | | | | 1,898,908 | |
| | | | | | |
|
|
|
Beverages - Non-alcoholic — 0.1% | | | | | | | | |
Coca-Cola Femsa SAB de CV
Company Guar. Notes
2.38% due 11/26/2018 | | | 1,006,000 | | | | 1,014,652 | |
| | | | | | |
|
|
|
Beverages - Wine/Spirits — 0.3% | | | | | | | | |
Diageo Capital PLC
Company Guar. Notes
5.75% due 10/23/2017 | | | 823,000 | | | | 894,244 | |
Pernod Ricard SA
Senior Notes
2.00% due 06/22/2020 | | EUR | 1,000,000 | | | | 1,167,508 | |
| | | | | | |
|
|
|
| | | | | | | | 2,061,752 | |
| | | | | | |
|
|
|
Brewery — 0.1% | | | | | | | | |
Anadolu Efes Biracilik Ve Malt Sanayii AS
Senior Notes
3.38% due 11/01/2022 | | | 500,000 | | | | 426,398 | |
| | | | | | |
|
|
|
Building Products - Cement — 0.1% | | | | | | | | |
West China Cement, Ltd.
Company Guar. Notes
6.50% due 09/11/2019 | | | 480,000 | | | | 471,606 | |
| | | | | | |
|
|
|
Building Societies — 0.2% | | | | | | | | |
Nationwide Building Society
Sub. Notes
6.75% due 07/22/2020 | | EUR | 1,100,000 | | | | 1,510,214 | |
| | | | | | |
|
|
|
Building - Heavy Construction — 0.1% | | | | | | | | |
Alam Synergy Pte, Ltd.
Company Guar. Notes
6.95% due 03/27/2020 | | | 470,000 | | | | 404,200 | |
101
VALIC Company II Strategic Bond Fund
PORTFOLIO OF INVESTMENTS — August 31, 2015 — (continued)
| | | | | | | | |
| | |
| Security Description | | Principal Amount(6) | | | Value
(Note 2) | |
| |
FOREIGN CORPORATE BONDS & NOTES (continued) | | | | | | | | |
Building - Heavy Construction (continued) | |
Empresas ICA SAB de CV
Company Guar. Notes
8.88% due 05/29/2024* | | $ | 325,000 | | | $ | 142,188 | |
| | | | | | |
|
|
|
| | | | | | | | 546,388 | |
| | | | | | |
|
|
|
Building - Residential/Commercial — 0.2% | |
Mattamy Group Corp.
Senior Notes
6.50% due 11/15/2020*# | | | 1,650,000 | | | | 1,592,250 | |
| | | | | | |
|
|
|
Cable/Satellite TV — 0.3% | | | | | | | | |
Numericable Group SA
Senior Sec. Notes
6.00% due 05/15/2022* | | | 1,246,000 | | | | 1,246,000 | |
Unitymedia Hessen GmbH & Co KG / Unitymedia NRW GmbH
Senior Sec. Notes
5.00% due 01/15/2025* | | | 900,000 | | | | 879,750 | |
| | | | | | |
|
|
|
| | | | | | | | 2,125,750 | |
| | | | | | |
|
|
|
Cellular Telecom — 0.1% | | | | | | | | |
Empresa Nacional de Telecomunicaciones SA
Senior Notes
4.88% due 10/30/2024 | | | 700,000 | | | | 692,768 | |
Mobile Telesystems OJSC via MTS International Funding, Ltd.
Senior Notes
5.00% due 05/30/2023 | | | 350,000 | | | | 304,500 | |
Mobile Telesystems OJSC via MTS International Funding, Ltd.
Senior Notes
8.63% due 06/22/2020 | | | 200,000 | | | | 211,394 | |
| | | | | | |
|
|
|
| | | | | | | | 1,208,662 | |
| | | | | | |
|
|
|
Chemicals - Diversified — 0.2% | | | | | | | | |
NOVA Chemicals Corp.
Senior Notes
5.00% due 05/01/2025* | | | 1,500,000 | | | | 1,500,000 | |
| | | | | | |
|
|
|
Chemicals - Plastics — 0.1% | | | | | | | | |
Mexichem SAB de CV
Company Guar. Notes
5.88% due 09/17/2044* | | | 640,000 | | | | 568,000 | |
| | | | | | |
|
|
|
Chemicals - Specialty — 0.1% | | | | | | | | |
OCP SA
Senior Notes
4.50% due 10/22/2025* | | | 600,000 | | | | 564,900 | |
| | | | | | |
|
|
|
Coal — 0.1% | | | | | | | | |
Indo Energy Finance BV
Senior Sec. Notes
7.00% due 05/07/2018 | | | 700,000 | | | | 448,000 | |
| | | | | | |
|
|
|
Commercial Services - Finance — 0.0% | | | | | | | | |
Experian Finance PLC
Company Guar. Notes
4.75% due 11/23/2018 | | GBP | 200,000 | | | | 332,964 | |
| | | | | | |
|
|
|
Consumer Products - Misc. — 0.1% | | | | | | | | |
Kimberly-Clark de Mexico SAB de CV
Senior Notes
3.25% due 03/12/2025* | | | 671,000 | | | | 648,978 | |
| | | | | | |
|
|
|
Cruise Lines — 0.1% | | | | | | | | |
Royal Caribbean Cruises, Ltd.
Senior Notes
7.50% due 10/15/2027 | | | 65,000 | | | | 75,400 | |
Viking Cruises, Ltd.
Senior Notes
6.25% due 05/15/2025* | | | 1,100,000 | | | | 1,083,500 | |
| | | | | | |
|
|
|
| | | | | | | | 1,158,900 | |
| | | | | | |
|
|
|
| | | | | | | | |
| | |
| Security Description | | Principal
Amount(6) | | | Value
(Note 2) | |
| |
| | | | | | | | | |
Diamonds/Precious Stones — 0.0% | | | | | | | | |
Petra Diamonds US Treasury PLC
Sec. Notes
8.25% due 05/31/2020* | | $ | 200,000 | | | $ | 198,500 | |
| | | | | | |
|
|
|
Disposable Medical Products — 0.1% | |
ConvaTec Finance International SA
Senior Notes
8.25% due 01/15/2019*(18) | | | 1,100,000 | | | | 1,083,500 | |
| | | | | | |
|
|
|
Diversified Banking Institutions — 1.8% | | | | | | | | |
BNP Paribas SA
Senior Notes
2.88% due 09/26/2023 | | EUR | 700,000 | | | | 861,696 | |
Credit Agricole SA
Senior Notes
3.13% due 02/05/2026 | | EUR | 900,000 | | | | 1,126,078 | |
Credit Agricole SA
Sub. Notes
4.38% due 03/17/2025* | | | 719,000 | | | | 698,117 | |
Credit Agricole SA
Senior Notes
5.50% due 12/17/2021 | | GBP | 400,000 | | | | 712,122 | |
Deutsche Bank AG
Senior Notes
1.88% due 02/13/2018 | | | 2,160,000 | | | | 2,149,416 | |
Deutsche Bank AG
Sub. Notes
4.50% due 04/01/2025 | | | 918,000 | | | | 888,676 | |
HSBC Holdings PLC
Sub. Notes
4.25% due 08/18/2025 | | | 448,000 | | | | 443,855 | |
HSBC Holdings PLC
Senior Notes
6.50% due 05/20/2024 | | GBP | 250,000 | | | | 474,415 | |
Royal Bank of Scotland Group PLC
Senior Notes
1.63% due 06/25/2019 | | EUR | 1,150,000 | | | | 1,294,342 | |
Royal Bank of Scotland PLC
Senior Notes
6.88% due 05/17/2025 | | GBP | 100,000 | | | | 195,571 | |
Royal Bank of Scotland PLC VRS
Sub. Notes
10.50% due 03/16/2022 | | EUR | 1,175,000 | | | | 1,493,134 | |
Societe Generale SA
Senior Notes
5.00% due 12/20/2018 | | GBP | 395,000 | | | | 664,310 | |
UBS AG
Senior Notes
1.80% due 03/26/2018 | | | 1,197,000 | | | | 1,192,927 | |
UBS AG VRS
Sub. Notes
4.75% due 02/12/2026 | | EUR | 1,000,000 | | | | 1,200,785 | |
UBS AG
Sub. Notes
5.13% due 05/15/2024 | | | 453,000 | | | | 453,000 | |
UBS AG FRS
Sub. Notes
5.25% due 06/21/2021 | | GBP | 180,000 | | | | 281,998 | |
UBS AG
Sub. Notes
7.63% due 08/17/2022 | | | 295,000 | | | | 343,261 | |
| | | | | | |
|
|
|
| | | | | | | | 14,473,703 | |
| | | | | | |
|
|
|
Diversified Manufacturing Operations — 0.2% | | | | | | | | |
Ingersoll-Rand Luxembourg Finance SA
Company Guar. Notes
4.65% due 11/01/2044 | | | 293,000 | | | | 273,623 | |
102
VALIC Company II Strategic Bond Fund
PORTFOLIO OF INVESTMENTS — August 31, 2015 — (continued)
| | | | | | | | |
| | |
| Security Description | | Principal
Amount(6) | | | Value
(Note 2) | |
| |
FOREIGN CORPORATE BONDS & NOTES (continued) | | | | | | | | |
Diversified Manufacturing Operations (continued) | |
Siemens Financieringsmaatschappij NV
Company Guar. Notes
4.40% due 05/27/2045* | | $ | 965,000 | | | $ | 965,878 | |
| | | | | | |
|
|
|
| | | | | | | | 1,239,501 | |
| | | | | | |
|
|
|
Diversified Minerals — 0.4% | |
Anglo American Capital PLC
Company Guar. Notes
2.88% due 11/20/2020 | | EUR | 700,000 | | | | 779,517 | |
Anglo American Capital PLC
Company Guar. Notes
4.13% due 04/15/2021*# | | | 367,000 | | | | 342,203 | |
Anglo American Capital PLC
Company Guar. Notes
4.88% due 05/14/2025* | | | 290,000 | | | | 261,828 | |
FMG Resources August 2006 Pty, Ltd.
Company Guar. Notes
6.88% due 04/01/2022*# | | | 1,194,000 | | | | 740,280 | |
FMG Resources August 2006 Pty, Ltd.
Senior Sec. Notes
9.75% due 03/01/2022*# | | | 554,000 | | | | 506,218 | |
Teck Resources, Ltd.
Company Guar. Notes
2.50% due 02/01/2018 | | | 486,000 | | | | 415,530 | |
Volcan Cia Minera SAA
Company Guar. Notes
5.38% due 02/02/2022* | | | 460,000 | | | | 415,794 | |
| | | | | | |
|
|
|
| | | | | 3,461,370 | |
| | | | | | |
|
|
|
Diversified Operations — 0.0% | | | | | | | | |
Hutchison Whampoa International 14, Ltd.
Company Guar. Notes
3.63% due 10/31/2024* | | | 300,000 | | | | 294,575 | |
| | | | | | |
|
|
|
Electric - Distribution — 0.1% | | | | | | | | |
State Grid Overseas Investment 2014, Ltd.
Company Guar. Notes
4.13% due 05/07/2024* | | | 300,000 | | | | 316,204 | |
Vattenfall AB
Senior Notes
6.88% due 04/15/2039 | | GBP | 150,000 | | | | 319,438 | |
| | | | | | |
|
|
|
| | | | | 635,642 | |
| | | | | | |
|
|
|
Electric - Generation — 0.0% | | | | | | | | |
Electricite de France SA
Senior Notes
6.00% due 01/22/2114* | | | 334,000 | | | | 353,421 | |
| | | | | | |
|
|
|
Electric - Integrated — 0.7% | | | | | | | | |
Colbun SA
Senior Notes
4.50% due 07/10/2024# | | | 1,000,000 | | | | 992,181 | |
Empresas Publicas de Medellin ESP
Senior Notes
8.38% due 02/01/2021 | | COP | 294,000,000 | | | | 100,098 | |
Enel Finance International NV
Company Guar. Notes
5.00% due 09/14/2022 | | EUR | 1,400,000 | | | | 1,933,281 | |
Enel Finance International NV
Company Guar. Notes
5.63% due 08/14/2024 | | GBP | 175,000 | | | | 310,276 | |
GDF Suez
Senior Notes
2.38% due 05/19/2026 | | EUR | 1,100,000 | | | | 1,315,173 | |
Scottish Power UK PLC
Senior Notes
8.38% due 02/20/2017 | | GBP | 500,000 | | | | 839,897 | |
| | | | | | | | |
| | |
| Security Description | | Principal
Amount(6) | | | Value
(Note 2) | |
| |
| | | | | | | | | |
Electric - Integrated (continued) | |
SSE PLC
Senior Notes
5.00% due 10/01/2018 | | GBP | 150,000 | | | $ | 250,060 | |
| | | | | | |
|
|
|
| | | | | 5,740,966 | |
| | | | | | |
|
|
|
Electric - Transmission — 0.1% | |
National Grid Electricity Transmission PLC
Senior Notes
6.50% due 07/27/2028 | | GBP | 222,000 | | | | 452,053 | |
| | | | | | |
|
|
|
Electronic Components - Misc. — 0.0% | | | | | | | | |
Flextronics International, Ltd.
Company Guar. Notes
4.75% due 06/15/2025* | | | 192,000 | | | | 185,743 | |
| | | | | | |
|
|
|
Engineering/R&D Services — 0.0% | | | | | | | | |
ABB Finance BV
Company Guar. Notes
2.63% due 03/26/2019 | | EUR | 300,000 | | | | 360,306 | |
| | | | | | |
|
|
|
Finance - Leasing Companies — 0.6% | | | | | | | | |
Aircastle, Ltd.
Senior Notes
4.63% due 12/15/2018 | | | 328,000 | | | | 337,020 | |
Aircastle, Ltd.
Senior Notes
5.50% due 02/15/2022 | | | 962,000 | | | | 995,670 | |
Aircastle, Ltd.
Senior Notes
6.25% due 12/01/2019 | | | 1,146,000 | | | | 1,243,410 | |
Fly Leasing, Ltd.
Senior Notes
6.75% due 12/15/2020 | | | 2,100,000 | | | | 2,163,000 | |
| | | | | | |
|
|
|
| | | | | 4,739,100 | |
| | | | | | |
|
|
|
Food - Meat Products — 0.1% | | | | | | | | |
BRF SA
Senior Notes
3.95% due 05/22/2023* | | | 200,000 | | | | 188,500 | |
BRF SA
Senior Notes
7.75% due 05/22/2018*(10) | | BRL | 1,000,000 | | | | 234,376 | |
| | | | | | |
|
|
|
| | | | | 422,876 | |
| | | | | | |
|
|
|
Food - Misc./Diversified — 0.0% | | | | | | | | |
Nestle Finance International, Ltd.
Company Guar. Notes
2.25% due 11/30/2023 | | GBP | 135,000 | | | | 204,237 | |
| | | | | | |
|
|
|
Food - Retail — 0.3% | | | | | | | | |
Carrefour SA
Senior Notes
4.00% due 04/09/2020 | | EUR | 700,000 | | | | 893,798 | |
Cencosud SA
Company Guar. Notes
5.15% due 02/12/2025 | | | 600,000 | | | | 599,567 | |
Tesco PLC
Senior Notes
5.88% due 09/12/2016 | | EUR | 750,000 | | | | 884,401 | |
| | | | | | |
|
|
|
| | | | | 2,377,766 | |
| | | | | | |
|
|
|
Gambling (Non-Hotel) — 0.1% | | | | | | | | |
International Game Technology PLC
Senior Sec. Notes
6.50% due 02/15/2025* | | | 578,000 | | | | 547,655 | |
| | | | | | |
|
|
|
Gas - Transportation — 0.1% | | | | | | | | |
National Grid Gas PLC
Senior Notes
6.00% due 06/07/2017 | | GBP | 500,000 | | | | 827,081 | |
103
VALIC Company II Strategic Bond Fund
PORTFOLIO OF INVESTMENTS — August 31, 2015 — (continued)
| | | | | | | | |
| | |
| Security Description | | Principal
Amount(6) | | | Value
(Note 2) | |
| |
FOREIGN CORPORATE BONDS & NOTES (continued) | | | | | | | | |
Gas - Transportation (continued) | |
National Grid Gas PLC
Senior Notes
6.00% due 05/13/2038 | | GBP | 90,000 | | | $ | 183,976 | |
| | | | | | |
|
|
|
| | | | | 1,011,057 | |
| | | | | | |
|
|
|
Gold Mining — 0.3% | |
AngloGold Ashanti Holdings PLC
Company Guar. Notes
5.38% due 04/15/2020 | | | 525,000 | | | | 489,562 | |
Gold Fields Orogen Holding BVI, Ltd.
Company Guar. Notes
4.88% due 10/07/2020 | | | 700,000 | | | | 595,000 | |
Goldcorp, Inc.
Senior Notes
5.45% due 06/09/2044 | | | 490,000 | | | | 432,513 | |
Kinross Gold Corp.
Company Guar. Notes
5.95% due 03/15/2024 | | | 249,000 | | | | 211,340 | |
Polyus Gold International, Ltd.
Company Guar. Notes
5.63% due 04/29/2020* | | | 350,000 | | | | 330,750 | |
| | | | | | |
|
|
|
| | | | | 2,059,165 | |
| | | | | | |
|
|
|
Industrial Gases — 0.0% | | | | | | | | |
Linde Finance BV
Company Guar. Notes
5.88% due 04/24/2023 | | GBP | 125,000 | | | | 233,480 | |
| | | | | | |
|
|
|
Insurance - Multi-line — 0.1% | | | | | | | | |
XLIT, Ltd.
Company Guar. Notes
4.45% due 03/31/2025 | | | 331,000 | | | | 326,881 | |
XLIT, Ltd.
Company Guar. Notes
5.50% due 03/31/2045 | | | 742,000 | | | | 690,201 | |
| | | | | | |
|
|
|
| | | | | 1,017,082 | |
| | | | | | |
|
|
|
Investment Management/Advisor Services — 0.1% | |
China Cinda Finance 2015 I, Ltd.
Company Guar. Notes
4.25% due 04/23/2025* | | | 600,000 | | | | 562,564 | |
| | | | | | |
|
|
|
Machinery - Construction & Mining — 0.1% | | | | | | | | |
Ferreycorp SAA
Company Guar. Notes
4.88% due 04/26/2020 | | | 500,000 | | | | 475,000 | |
| | | | | | |
|
|
|
Machinery - General Industrial — 0.2% | | | | | | | | |
Alstom SA
Senior Notes
3.00% due 07/08/2019 | | EUR | 700,000 | | | | 832,955 | |
ATS Automation Tooling Systems, Inc.
Senior Notes
6.50% due 06/15/2023* | | | 800,000 | | | | 806,000 | |
| | | | | | |
|
|
|
| | | | | 1,638,955 | |
| | | | | | |
|
|
|
Medical - Drugs — 0.9% | | | | | | | | |
Bayer AG FRS
Jr. Sub. Notes
2.38% due 04/02/2075 | | EUR | 750,000 | | | | 802,731 | |
Endo Finance LLC
Company Guar. Notes
6.00% due 07/15/2023* | | | 966,000 | | | | 1,004,640 | |
Grifols Worldwide Operations, Ltd.
Company Guar. Notes
5.25% due 04/01/2022 | | | 2,029,000 | | | | 2,061,971 | |
| | | | | | | | |
| | |
| Security Description | | Principal
Amount(6) | | | Value
(Note 2) | |
| |
| | | | | | | | | |
Medical - Drugs (continued) | |
Roche Finance Europe BV
Company Guar. Notes
5.38% due 08/29/2023 | | GBP | 225,000 | | | $ | 419,784 | |
Valeant Pharmaceuticals International, Inc.
Company Guar. Notes
5.63% due 12/01/2021* | | | 568,000 | | | | 577,940 | |
Valeant Pharmaceuticals International, Inc.
Company Guar. Notes
5.88% due 05/15/2023* | | | 2,120,000 | | | | 2,162,400 | |
| | | | | | |
|
|
|
| | | | | | | | 7,029,466 | |
| | | | | | |
|
|
|
Medical - Generic Drugs — 0.3% | | | | | | | | |
Actavis Funding SCS
Company Guar. Notes
3.00% due 03/12/2020 | | | 654,000 | | | | 651,264 | |
Actavis Funding SCS
Company Guar. Notes
3.80% due 03/15/2025 | | | 433,000 | | | | 419,049 | |
Actavis Funding SCS
Company Guar. Notes
3.85% due 06/15/2024 | | | 577,000 | | | | 562,427 | |
Perrigo Finance PLC
Company Guar. Notes
3.50% due 12/15/2021 | | | 667,000 | | | | 651,032 | |
| | | | | | |
|
|
|
| | | | | 2,283,772 | |
| | | | | | |
|
|
|
Metal - Copper — 0.1% | | | | | | | | |
First Quantum Minerals, Ltd.
Company Guar. Notes
7.25% due 05/15/2022*# | | | 769,000 | | | | 536,378 | |
| | | | | | |
|
|
|
Metal - Diversified — 0.1% | | | | | | | | |
Glencore Finance Europe SA
Company Guar. Notes
3.75% due 04/01/2026 | | EUR | 650,000 | | | | 695,030 | |
| | | | | | |
|
|
|
Metal - Iron — 0.2% | | | | | | | | |
OJSC Novolipetsk Steel via Steel Funding, Ltd.
Senior Notes
4.45% due 02/19/2018 | | | 400,000 | | | | 382,736 | |
OJSC Novolipetsk Steel via Steel Funding, Ltd.
Senior Notes
4.95% due 09/26/2019 | | | 500,000 | | | | 472,500 | |
Samarco Mineracao SA
Senior Notes
4.13% due 11/01/2022* | | | 300,000 | | | | 256,875 | |
Vale SA
Senior Notes
4.38% due 03/24/2018 | | EUR | 500,000 | | | | 590,532 | |
| | | | | | |
|
|
|
| | | | | 1,702,643 | |
| | | | | | |
|
|
|
Oil & Gas Drilling — 0.2% | | | | | | | | |
Offshore Drilling Holding SA
Senior Sec. Notes
8.63% due 09/20/2020(5) | | | 450,000 | | | | 355,500 | |
Pacific Drilling SA
Senior Sec. Notes
5.38% due 06/01/2020* | | | 1,472,000 | | | | 1,059,840 | |
| | | | | | |
|
|
|
| | | | | 1,415,340 | |
| | | | | | |
|
|
|
Oil Companies - Exploration & Production — 0.8% | | | | | | | | |
Anadarko Finance Co.
Company Guar. Notes
7.50% due 05/01/2031 | | | 644,000 | | | | 789,637 | |
Baytex Energy Corp.
Company Guar. Notes
5.13% due 06/01/2021* | | | 1,163,000 | | | | 990,876 | |
104
VALIC Company II Strategic Bond Fund
PORTFOLIO OF INVESTMENTS — August 31, 2015 — (continued)
| | | | | | | | |
| | |
| Security Description | | Principal
Amount(6) | | | Value
(Note 2) | |
| |
FOREIGN CORPORATE BONDS & NOTES (continued) | | | | | | | | |
Oil Companies - Exploration & Production (continued) | | | | | | | | |
Gazprom OAO Via Gaz Capital SA
Senior Notes
6.00% due 01/23/2021* | | $ | 250,000 | | | $ | 243,242 | |
KazMunayGas National Co. JSC
Senior Notes
6.38% due 04/09/2021 | | | 750,000 | | | | 759,825 | |
MEG Energy Corp.
Company Guar. Notes
6.50% due 03/15/2021* | | | 1,495,000 | | | | 1,249,072 | |
MIE Holdings Corp.
Company Guar. Notes
7.50% due 04/25/2019* | | | 660,000 | | | | 376,200 | |
Novatek OAO via Novatek Finance, Ltd.
Senior Notes
6.60% due 02/03/2021 | | | 350,000 | | | | 337,610 | |
Pertamina Persero PT
Senior Notes
4.88% due 05/03/2022* | | | 600,000 | | | | 581,280 | |
Sinopec Group Overseas Development 2014, Ltd.
Company Guar. Notes
4.38% due 04/10/2024* | | | 450,000 | | | | 469,314 | |
Talisman Energy, Inc.
Senior Notes
5.50% due 05/15/2042 | | | 951,000 | | | | 800,477 | |
| | | | | | |
|
|
|
| | | | | 6,597,533 | |
| | | | | | |
|
|
|
Oil Companies - Integrated — 1.1% | | | | | | | | |
BP Capital Markets PLC
Company Guar. Notes
1.38% due 11/06/2017 | | | 1,340,000 | | | | 1,333,930 | |
BP Capital Markets PLC
Company Guar. Notes
2.97% due 02/27/2026 | | EUR | 700,000 | | | | 856,860 | |
BP Capital Markets PLC
Company Guar. Notes
3.54% due 11/04/2024 | | | 477,000 | | | | 467,446 | |
BP Capital Markets PLC
Company Guar. Notes
4.33% due 12/10/2018 | | GBP | 150,000 | | | | 247,001 | |
BP Capital Markets PLC
Company Guar. Notes
4.74% due 03/11/2021 | | | 410,000 | | | | 448,961 | |
Ecopetrol SA
Senior Notes
4.13% due 01/16/2025 | | | 640,000 | | | | 563,968 | |
ENI Finance International SA
Company Guar. Notes
5.00% due 01/27/2019 | | GBP | 75,000 | | | | 125,581 | |
Pacific Rubiales Energy Corp.
Company Guar. Notes
5.13% due 03/28/2023 | | | 600,000 | | | | 300,000 | |
Petrobras Global Finance BV
Company Guar. Notes
5.38% due 01/27/2021 | | | 500,000 | | | | 440,750 | |
Petroleos de Venezuela SA
Company Guar. Notes
5.38% due 04/12/2027 | | | 300,000 | | | | 100,200 | |
Petroleos de Venezuela SA
Company Guar. Notes
8.50% due 11/02/2017 | | | 1,080,000 | | | | 742,284 | |
Petroleos Mexicanos
Company Guar. Notes
5.50% due 06/27/2044 | | | 127,000 | | | | 109,887 | |
| | | | | | | | |
| | |
| Security Description | | Principal
Amount(6) | | | Value
(Note 2) | |
| |
| | | | | | | | | |
Oil Companies-Integrated (continued) | |
Petronas Capital, Ltd.
Company Guar. Notes
3.50% due 03/18/2025 | | $ | 500,000 | | | $ | 482,259 | |
Petronas Capital, Ltd.
Company Guar. Notes
5.25% due 08/12/2019 | | | 300,000 | | | | 325,917 | |
Sasol Financing International PLC
Company Guar. Notes
4.50% due 11/14/2022 | | | 600,000 | | | | 592,200 | |
Shell International Finance BV
Company Guar. Notes
2.13% due 05/11/2020 | | | 529,000 | | | | 525,501 | |
Total Capital International SA
Company Guar. Notes
2.13% due 11/19/2021 | | EUR | 500,000 | | | | 596,156 | |
Total Capital International SA
Company Guar. Notes
2.25% due 12/17/2020 | | GBP | 135,000 | | | | 205,541 | |
| | | | | | |
|
|
|
| | | | | 8,464,442 | |
| | | | | | |
|
|
|
Oil Refining & Marketing — 0.1% | | | | | | | | |
Reliance Industries, Ltd.
Senior Notes
4.13% due 01/28/2025* | | | 250,000 | | | | 243,607 | |
Thai Oil PCL
Senior Notes
3.63% due 01/23/2023* | | | 200,000 | | | | 195,776 | |
| | | | | | |
|
|
|
| | | | | 439,383 | |
| | | | | | |
|
|
|
Paper & Related Products — 0.3% | | | | | | | | |
Cascades, Inc.
Senior Notes
5.75% due 07/15/2023* | | | 1,600,000 | | | | 1,548,000 | |
Celulosa Arauco y Constitucion SA
Senior Notes
4.50% due 08/01/2024 | | | 200,000 | | | | 199,851 | |
Inversiones CMPC SA
Notes
4.38% due 05/15/2023 | | | 250,000 | | | | 246,200 | |
Inversiones CMPC SA
Company Guar. Notes
4.50% due 04/25/2022 | | | 500,000 | | | | 501,200 | |
Klabin Finance SA
Company Guar. Notes
5.25% due 07/16/2024* | | | 200,000 | | | | 188,900 | |
| | | | | | |
|
|
|
| | | | | 2,684,151 | |
| | | | | | |
|
|
|
Petrochemicals — 0.1% | | | | | | | | |
Alpek SAB de CV
Company Guar. Notes
5.38% due 08/08/2023* | | | 700,000 | | | | 731,500 | |
Braskem Finance, Ltd.
Company Guar. Notes
5.75% due 04/15/2021 | | | 550,000 | | | | 497,750 | |
| | | | | | |
|
|
|
| | | | | 1,229,250 | |
| | | | | | |
|
|
|
Pipelines — 0.1% | |
Transportadora de Gas Internacional SA ESP
Senior Notes
5.70% due 03/20/2022* | | | 600,000 | | | | 611,100 | |
| | | | | | |
|
|
|
Printing - Commercial — 0.2% | | | | | | | | |
Cimpress NV
Company Guar. Notes
7.00% due 04/01/2022* | | | 1,570,000 | | | | 1,560,187 | |
| | | | | | |
|
|
|
105
VALIC Company II Strategic Bond Fund
PORTFOLIO OF INVESTMENTS — August 31, 2015 — (continued)
| | | | | | | | |
| | |
| Security Description | | Principal
Amount(6) | | | Value
(Note 2) | |
| |
FOREIGN CORPORATE BONDS & NOTES (continued) | | | | | | | | |
Real Estate Operations & Development — 0.3% | | | | | | | | |
China Overseas Finance Cayman VI, Ltd.
Company Guar. Notes
4.25% due 05/08/2019 | | $ | 550,000 | | | $ | 565,977 | |
Country Garden Holdings Co., Ltd.
Company Guar. Notes
7.25% due 04/04/2021* | | | 200,000 | | | | 201,000 | |
Country Garden Holdings Co., Ltd.
Company Guar. Notes
7.50% due 01/10/2023* | | | 200,000 | | | | 197,000 | |
Shimao Property Holdings, Ltd.
Company Guar. Notes
6.63% due 01/14/2020 | | | 700,000 | | | | 694,750 | |
Yuzhou Properties Co., Ltd.
Company Guar. Notes
8.63% due 01/24/2019 | | | 450,000 | | | | 438,750 | |
| | | | | | |
|
|
|
| | | | | 2,097,477 | |
| | | | | | |
|
|
|
Retail - Major Department Stores — 0.1% | | | | | | | | |
LS Finance 2022, Ltd.
Company Guar. Notes
4.25% due 10/16/2022 | | | 500,000 | | | | 501,139 | |
| | | | | | |
|
|
|
Satellite Telecom — 0.3% | | | | | | | | |
Intelsat Jackson Holdings SA
Company Guar. Notes
5.50% due 08/01/2023 | | | 2,500,000 | | | | 2,200,000 | |
| | | | | | |
|
|
|
Security Services — 0.2% | | | | | | | | |
Garda World Security Corp.
Company Guar. Notes
7.25% due 11/15/2021* | | | 1,423,000 | | | | 1,330,505 | |
| | | | | | |
|
|
|
Sovereign — 0.3% | | | | | | | | |
Federal Republic of Germany
Bonds
6.25% due 01/04/2030 | | EUR | 1,200,000 | | | | 2,275,519 | |
| | | | | | |
|
|
|
Sovereign Agency — 0.2% | | | | | | | | |
City of Kyiv Via Kyiv Finance PLC
Senior Notes
9.38% due 07/11/2016* | | | 780,000 | | | | 530,400 | |
Japan Bank for International Cooperation
Government Guar. Notes
2.63% due 12/15/2020 | | GBP | 375,000 | | | | 596,052 | |
| | | | | | |
|
|
|
| | | | | | | | 1,126,452 | |
| | | | | | |
|
|
|
Special Purpose Entity — 0.0% | | | | | | | | |
Hellas Telecommunications Luxembourg II SCA FRS
Sub. Notes
6.26% due 01/15/2015*†(3)(4)(10)(17) | | | 560,000 | | | | 0 | |
| | | | | | |
|
|
|
Steel-Producers — 0.1% | | | | | | | | |
ArcelorMittal
Senior Notes
7.00% due 02/25/2022# | | | 1,162,000 | | | | 1,159,095 | |
| | | | | | |
|
|
|
Steel - Specialty — 0.0% | | | | | | | | |
GTL Trade Finance, Inc.
Company Guar. Notes
7.25% due 04/16/2044* | | | 200,000 | | | | 163,340 | |
| | | | | | |
|
|
|
Sugar — 0.0% | | | | | | | | |
Cosan Luxembourg SA
Company Guar. Notes
9.50% due 03/14/2018*(10) | | BRL | 1,600,000 | | | | 379,414 | |
| | | | | | |
|
|
|
SupraNational Banks — 0.2% | | | | | | | | |
European Investment Bank
Senior Notes
2.63% due 03/15/2035 | | EUR | 700,000 | | | | 930,518 | |
| | | | | | | | |
| | |
| Security Description | | Principal
Amount(6) | | | Value
(Note 2) | |
| |
| | | | | | | | | |
SupraNational Banks (continued) | | | | | | | | |
European Investment Bank
Senior Notes
4.63% due 10/12/2054 | | GBP | 45,000 | | | $ | 99,075 | |
North American Development Bank
Senior Notes
2.30% due 10/10/2018 | | | 711,000 | | | | 723,621 | |
| | | | | | |
|
|
|
| | | | | 1,753,214 | |
| | | | | | |
|
|
|
Telecom Services — 0.6% | | | | | | | | |
Altice Financing SA
Senior Sec. Notes
6.50% due 01/15/2022* | | | 1,704,000 | | | | 1,708,260 | |
Altice SA
Company Guar. Notes
7.75% due 05/15/2022* | | | 1,582,000 | | | | 1,542,450 | |
Bharti Airtel International Netherlands BV
Company Guar. Notes
5.35% due 05/20/2024 | | | 550,000 | | | | 587,422 | |
Bharti Airtel, Ltd.
Senior Notes
4.38% due 06/10/2025* | | | 450,000 | | | | 448,137 | |
Virgin Media Secured Finance PLC
Senior Sec. Notes
5.25% due 01/15/2026* | | | 850,000 | | | | 824,500 | |
| | | | | | |
|
|
|
| | | | | 5,110,769 | |
| | | | | | |
|
|
|
Telephone - Integrated — 0.6% | | | | | | | | |
British Telecom PLC
Senior Notes
6.63% due 06/23/2017 | | GBP | 250,000 | | | | 415,583 | |
Empresa de Telecomunicaciones de Bogota
Senior Notes
7.00% due 01/17/2023* | | COP | 640,000,000 | | | | 192,758 | |
Koninklijke KPN NV
Senior Notes
5.75% due 09/17/2029 | | GBP | 250,000 | | | | 435,433 | |
Oi SA
Senior Notes
5.75% due 02/10/2022 | | | 600,000 | | | | 432,000 | |
Oi SA
Senior Notes
9.75% due 09/15/2016*(10) | | BRL | 530,000 | | | | 128,604 | |
Orange SA
Senior Notes
7.25% due 11/10/2020 | | GBP | 75,000 | | | | 140,751 | |
Orange SA
Senior Notes
8.00% due 12/20/2017 | | GBP | 240,000 | | | | 417,881 | |
Telecom Italia Capital SA
Company Guar. Notes
7.72% due 06/04/2038 | | | 1,120,000 | | | | 1,276,800 | |
Telecom Italia SpA
Senior Notes
3.25% due 01/16/2023 | | EUR | 700,000 | | | | 784,847 | |
Telefonica Emisiones SAU
Company Guar. Notes
4.69% due 11/11/2019 | | EUR | 300,000 | | | | 387,233 | |
Telefonica Emisiones SAU
Company Guar. Notes
4.75% due 02/07/2017 | | EUR | 400,000 | | | | 475,970 | |
| | | | | | |
|
|
|
| | | | | 5,087,860 | |
| | | | | | |
|
|
|
106
VALIC Company II Strategic Bond Fund
PORTFOLIO OF INVESTMENTS — August 31, 2015 — (continued)
| | | | | | | | |
| | |
| Security Description | | Principal
Amount(6) | | | Value
(Note 2) | |
| |
FOREIGN CORPORATE BONDS & NOTES (continued) | | | | | | | | |
Television — 0.0% | | | | | | | | |
Myriad International Holdings BV
Company Guar. Notes
5.50% due 07/21/2025* | | $ | 200,000 | | | $ | 198,500 | |
| | | | | | |
|
|
|
Transport - Marine — 0.1% | | | | | | | | |
PT Pelabuhan Indonesia II
Senior Notes
4.25% due 05/05/2025* | | | 875,000 | | | | 776,562 | |
| | | | | | |
|
|
|
Transport - Rail — 0.1% | | | | | | | | |
Canadian Pacific Railway Co.
Senior Notes
4.80% due 08/01/2045 | | | 231,000 | | | | 232,185 | |
Kazakhstan Temir Zholy Finance BV
Company Guar. Notes
6.95% due 07/10/2042 | | | 670,000 | | | | 579,215 | |
| | | | | | |
|
|
|
| | | | | 811,400 | |
| | | | | | |
|
|
|
Transport - Services — 0.1% | | | | | | | | |
Transnet SOC, Ltd.
Senior Notes
4.00% due 07/26/2022* | | | 500,000 | | | | 469,000 | |
| | | | | | |
|
|
|
Total Foreign Corporate Bonds & Notes | | | | | | | | |
(cost $185,430,436) | | | | | | | 173,993,459 | |
| | | | | | |
|
|
|
FOREIGN GOVERNMENT OBLIGATIONS — 9.9% | |
Electric - Distribution — 0.1% | | | | | | | | |
Hydro-Quebec
Government Guar. Notes
1.38% due 06/19/2017 | | | 553,000 | | | | 556,871 | |
| | | | | | |
|
|
|
Foreign Government Obligations — 0.1% | | | | | | | | |
Instituto de Credito Oficial
Government Guar. Notes
4.88% due 02/01/2018 EUR | | | 700,000 | | | | 867,739 | |
| | | | | | |
|
|
|
Sovereign — 9.6% | | | | | | | | |
Commonwealth of Jamaica
Senior Notes
8.00% due 06/24/2019 | | | 275,000 | | | | 301,125 | |
Commonwealth of Jamaica
Senior Notes
8.00% due 03/15/2039 | | | 250,000 | | | | 268,750 | |
Dominican Republic
Senior Bonds
5.50% due 01/27/2025* | | | 1,420,000 | | | | 1,405,800 | |
Dominican Republic
Senior Notes
5.88% due 04/18/2024* | | | 390,000 | | | | 395,850 | |
Dominican Republic
Senior Bonds
5.88% due 04/18/2024 | | | 495,000 | | | | 502,425 | |
Dominican Republic
Senior Notes
6.60% due 01/28/2024* | | | 309,000 | | | | 325,223 | |
Dominican Republic
Senior Bonds
7.45% due 04/30/2044 | | | 600,000 | | | | 636,000 | |
Dominican Republic
Senior Notes
7.50% due 05/06/2021 | | | 320,000 | | | | 353,200 | |
Dominican Republic
Senior Notes
8.63% due 04/20/2027 | | | 600,000 | | | | 712,500 | |
Federal Republic of Germany
Bonds
0.50% due 02/15/2025 | | EUR | 1,125,000 | | | | 1,234,798 | |
| | | | | | | | |
| | |
| Security Description | | Principal
Amount(6) | | | Value
(Note 2) | |
| |
| | | | | | | | | |
Sovereign (continued) | | | | | | | | |
Federal Republic of Germany
Bonds
1.75% due 02/15/2024 | | EUR | 1,100,000 | | | $ | 1,354,581 | |
Federal Republic of Germany
Bonds
2.50% due 08/15/2046 | | EUR | 170,000 | | | | 237,847 | |
Federative Republic of Brazil
Senior Notes
4.88% due 01/22/2021 | | | 1,025,000 | | | | 1,042,937 | |
Federative Republic of Brazil
Senior Notes
5.63% due 01/07/2041 | | | 417,000 | | | | 371,130 | |
Federative Republic of Brazil
Senior Notes
7.13% due 01/20/2037 | | | 3,000 | | | | 3,173 | |
Federative Republic of Brazil
Senior Notes
12.50% due 01/05/2016 | | BRL | 1,200,000 | | | | 326,218 | |
Government of Canada
Senior Notes
0.88% due 02/14/2017 | | | 553,000 | | | | 554,367 | |
Government of Romania
Senior Notes
4.38% due 08/22/2023 | | | 1,400,000 | | | | 1,459,220 | |
Government of Romania
Senior Notes
4.88% due 01/22/2024 | | | 1,100,000 | | | | 1,186,625 | |
Government of Romania
Senior Notes
6.13% due 01/22/2044 | | | 590,000 | | | | 688,471 | |
Kingdom of Spain
Senior Notes
5.25% due 04/06/2029 | | GBP | 440,000 | | | | 769,975 | |
Lebanese Republic
Senior Notes
4.00% due 12/31/2017 | | | 283,250 | | | | 280,418 | |
Lebanese Republic
Senior Notes
5.00% due 10/12/2017 | | | 150,000 | | | | 150,563 | |
Lebanese Republic
Senior Notes
6.60% due 11/27/2026 | | | 1,250,000 | | | | 1,254,125 | |
Oriental Republic of Uruguay
Senior Notes
5.10% due 06/18/2050 | | | 1,230,000 | | | | 1,126,987 | |
Oriental Republic of Uruguay
Senior Notes
7.88% due 01/15/2033 | | | 980,000 | | | | 1,277,675 | |
Plurinational State of Bolivia
Senior Notes
5.95% due 08/22/2023* | | | 340,000 | | | | 351,900 | |
Republic of Armenia
Senior Notes
6.00% due 09/30/2020 | | | 1,250,000 | | | | 1,191,125 | |
Republic of Armenia
Notes
7.15% due 03/26/2025* | | | 720,000 | | | | 688,464 | |
Republic of Armenia
Notes
7.15% due 03/26/2025 | | | 1,200,000 | | | | 1,147,440 | |
Republic of Costa Rica
Senior Notes
7.16% due 03/12/2045
7.16% due 03/12/2045* | | | 460,000 | | | | 431,250 | |
107
VALIC Company II Strategic Bond Fund
PORTFOLIO OF INVESTMENTS — August 31, 2015 — (continued)
| | | | | | | | |
| | |
| Security Description | | Principal
Amount(6) | | | Value
(Note 2) | |
| |
FOREIGN GOVERNMENT OBLIGATIONS (continued) | | | | | | | | |
Sovereign (continued) | | | | | | | | |
Republic of Croatia
Senior Notes
5.50% due 04/04/2023* | | $ | 500,000 | | | $ | 515,625 | |
Republic of Croatia
Senior Bonds
6.00% due 01/26/2024 | | | 600,000 | | | | 640,128 | |
Republic of Croatia
Senior Notes
6.25% due 04/27/2017 | | | 1,210,000 | | | | 1,270,655 | |
Republic of El Salvador
Senior Notes
5.88% due 01/30/2025 | | | 1,150,000 | | | | 1,076,687 | |
Republic of El Salvador
Senior Notes
7.63% due 02/01/2041 | | | 1,120,000 | | | | 1,060,080 | |
Republic of Guatemala
Senior Notes
4.88% due 02/13/2028 | | | 1,500,000 | | | | 1,436,250 | |
Republic of Hungary
Senior Notes
4.00% due 03/25/2019 | | | 500,000 | | | | 519,426 | |
Republic of Hungary
Senior Notes
5.75% due 11/22/2023 | | | 1,280,000 | | | | 1,427,200 | |
Republic of Hungary
Senior Notes
7.63% due 03/29/2041 | | | 270,000 | | | | 368,069 | |
Republic of Indonesia
Senior Notes
3.75% due 04/25/2022 | | | 400,000 | | | | 383,520 | |
Republic of Indonesia
Senior Notes
5.25% due 01/17/2042 | | | 700,000 | | | | 649,250 | |
Republic of Indonesia
Senior Notes
5.88% due 01/15/2024* | | | 575,000 | | | | 618,125 | |
Republic of Indonesia
Senior Notes
8.50% due 10/12/2035 | | | 560,000 | | | | 721,700 | |
Republic of Italy
Senior Notes
5.25% due 12/07/2034 | | GBP | 275,000 | | | | 475,137 | |
Republic of Italy
Senior Notes
6.00% due 08/04/2028 | | GBP | 135,000 | | | | 250,852 | |
Republic of Ivory Coast
Senior Notes
5.38% due 07/23/2024 | | | 600,000 | | | | 542,100 | |
Republic of Ivory Coast
Senior Notes
6.38% due 03/03/2028 | | | 500,000 | | | | 465,650 | |
Republic of Kazakhstan
Senior Notes
3.88% due 10/14/2024* | | | 600,000 | | | | 547,800 | |
Republic of Kazakhstan
Senior Notes
4.88% due 10/14/2044 | | | 1,420,000 | | | | 1,144,861 | |
Republic of Kazakhstan
Notes
5.13% due 07/21/2025* | | | 730,000 | | | | 712,662 | |
Republic of Kazakhstan
6.50% due 07/21/2045* | | | 470,000 | | | | 453,550 | |
Republic of Kenya
Senior Notes
6.88% due 06/24/2024* | | | 1,370,000 | | | | 1,325,064 | |
| | | | | | | | |
| | |
| Security Description | | Principal Amount(6) | | | Value
(Note 2) | |
| |
| | | | | | | | | |
Sovereign (continued) | | | | | | | | |
Republic of Lithuania
Senior Notes
5.13% due 09/14/2017 | | $ | 430,000 | | | $ | 462,009 | |
Republic of Lithuania
Senior Notes
6.63% due 02/01/2022 | | | 1,000,000 | | | | 1,202,626 | |
Republic of Panama
Senior Notes
6.70% due 01/26/2036 | | | 930,000 | | | | 1,132,275 | |
Republic of Paraguay
Notes
6.10% due 08/11/2044* | | | 600,000 | | | | 603,000 | |
Republic of Paraguay
Notes
6.10% due 08/11/2044 | | | 1,250,000 | | | | 1,256,250 | |
Republic of Peru
Senior Notes
4.13% due 08/25/2027 | | | 377,000 | | | | 374,173 | |
Republic of Peru
Senior Notes
6.55% due 03/14/2037 | | | 1,000,000 | | | | 1,190,000 | |
Republic of Peru
Senior Notes
7.35% due 07/21/2025 | | | 850,000 | | | | 1,079,500 | |
Republic of Peru
Senior Notes
8.75% due 11/21/2033 | | | 740,000 | | | | 1,078,550 | |
Republic of Poland
Senior Notes
3.00% due 03/17/2023 | | | 1,840,000 | | | | 1,827,672 | |
Republic of Poland
Senior Notes
4.00% due 01/22/2024 | | | 2,300,000 | | | | 2,419,609 | |
Republic of Poland
Senior Notes
5.00% due 03/23/2022 | | | 1,700,000 | | | | 1,897,098 | |
Republic of Senegal
Bonds
6.25% due 07/30/2024 | | | 1,160,000 | | | | 1,072,371 | |
Republic of Serbia
Senior Notes
7.25% due 09/28/2021 | | | 1,000,000 | | | | 1,129,824 | |
Republic of South Africa
Senior Notes
5.38% due 07/24/2044 | | | 450,000 | | | | 436,662 | |
Republic of South Africa
Senior Notes
5.88% due 09/16/2025 | | | 830,000 | | | | 896,214 | |
Republic of the Philippines
Senior Notes
4.00% due 01/15/2021 | | | 1,325,000 | | | | 1,429,344 | |
Republic of the Philippines
4.20% due 01/21/2024 | | | 1,100,000 | | | | 1,210,000 | |
Republic of the Philippines
Senior Notes
7.75% due 01/14/2031 | | | 260,000 | | | | 376,350 | |
Republic of the Philippines
Senior Notes
9.50% due 02/02/2030 | | | 740,000 | | | | 1,202,500 | |
Republic of Turkey
Senior Notes
3.25% due 03/23/2023 | | | 1,730,000 | | | | 1,575,805 | |
Republic of Turkey
Senior Notes
4.88% due 04/16/2043 | | | 580,000 | | | | 509,646 | |
108
VALIC Company II Strategic Bond Fund
PORTFOLIO OF INVESTMENTS — August 31, 2015 — (continued)
| | | | | | | | |
| | |
| Security Description | | Principal
Amount(6) | | | Value
(Note 2) | |
| |
FOREIGN GOVERNMENT OBLIGATIONS (continued) | | | | | | | | |
Sovereign (continued) | |
Republic of Turkey
Senior Notes
11.88% due 01/15/2030 | | $ | 900,000 | | | $ | 1,474,992 | |
Republic of Venezuela
Senior Notes
7.00% due 12/01/2018 | | | 650,000 | | | | 247,650 | |
Republic of Venezuela
Senior Bonds
7.65% due 04/21/2025 | | | 55,000 | | | | 19,415 | |
Republic of Venezuela
Senior Notes
9.00% due 05/07/2023 | | | 550,000 | | | | 201,025 | |
Republic of Venezuela
Senior Notes
9.38% due 01/13/2034 | | | 420,000 | | | | 155,190 | |
Republic of Venezuela
Senior Bonds
11.75% due 10/21/2026 | | | 820,000 | | | | 339,070 | |
Republic of Venezuela
Senior Bonds
11.95% due 08/05/2031 | | | 655,000 | | | | 271,170 | |
Republic of Venezuela
Senior Bonds
12.75% due 08/23/2022# | | | 1,100,000 | | | | 512,600 | |
Republic of Zambia
Notes
5.38% due 09/20/2022 | | | 390,000 | | | | 311,875 | |
Republic of Zambia
Senior Notes
8.50% due 04/14/2024 | | | 1,200,000 | | | | 1,097,256 | |
United Kingdom Gilt Treasury Bonds
4.50% due 09/07/2034 | | GBP | 425,000 | | | | 857,202 | |
United Mexican States
Senior Notes
3.60% due 01/30/2025 | | | 1,767,000 | | | | 1,731,660 | |
United Mexican States
Senior Notes
4.00% due 10/02/2023 | | | 1,780,000 | | | | 1,806,700 | |
United Mexican States
Senior Bonds
4.75% due 03/08/2044 | | | 1,354,000 | | | | 1,262,605 | |
United Mexican States
Senior Notes
5.63% due 01/15/2017 | | | 340,000 | | | | 360,400 | |
United Mexican States
Senior Notes
6.05% due 01/11/2040 | | | 1,500,000 | | | | 1,680,000 | |
| | | | | | |
|
|
|
| | | | | | | | 75,324,841 | |
| | | | | | |
|
|
|
Sovereign Agency — 0.1% | |
Republic of Mozambique
Government Guar. Notes
6.31% due 09/11/2020 | | | 1,500,000 | | | | 1,348,470 | |
| | | | | | |
|
|
|
Total Foreign Government Obligations | | | | | | | | |
(cost $82,644,780) | | | | | | | 78,097,921 | |
| | | | | | |
|
|
|
U.S. GOVERNMENT AGENCIES — 4.3% | |
Federal Home Loan Mtg. Corp. — 1.2% | |
1.89% due 02/01/2037 FRS | | | 51,942 | | | | 54,659 | |
2.50% due 01/01/2028 | | | 346,719 | | | | 355,406 | |
2.50% due 04/01/2028 | | | 764,581 | | | | 783,753 | |
2.53% due 11/01/2037 FRS | | | 334,358 | | | | 358,651 | |
3.00% due 04/01/2043 | | | 635,203 | | | | 640,495 | |
3.00% due 08/01/2043 | | | 862,028 | | | | 866,096 | |
3.00% due 07/01/2045 | | | 280,207 | | | | 281,181 | |
3.50% due 02/01/2042 | | | 564,683 | | | | 585,207 | |
| | | | | | | | |
| | |
| Security Description | | Principal Amount(6) | | | Value
(Note 2) | |
| |
| | | | | | | | | |
Federal Home Loan Mtg. Corp. (continued) | | | | | | | | |
3.50% due 03/01/2042 | | $ | 428,446 | | | $ | 445,453 | |
3.50% due 04/01/2042 | | | 814,753 | | | | 847,020 | |
3.50% due 08/01/2042 | | | 773,688 | | | | 804,873 | |
3.50% due 09/01/2043 | | | 89,037 | | | | 92,664 | |
3.50% due 03/01/2045 | | | 981,897 | | | | 1,017,673 | |
3.50% due 07/01/2045 | | | 311,553 | | | | 322,975 | |
3.50% due 08/01/2045 | | | 379,461 | | | | 394,166 | |
4.00% due 09/01/2040 | | | 164,214 | | | | 174,767 | |
4.00% due 10/01/2043 | | | 45,710 | | | | 48,540 | |
4.50% due 02/01/2020 | | | 23,246 | | | | 24,190 | |
4.50% due 08/01/2020 | | | 13,640 | | | | 14,172 | |
4.50% due 03/01/2023 | | | 91,514 | | | | 96,288 | |
4.50% due 01/01/2039 | | | 28,300 | | | | 30,654 | |
4.50% due 12/01/2039 | | | 39,951 | | | | 44,139 | |
5.00% due 05/01/2034 | | | 126,285 | | | | 139,812 | |
5.50% due 06/01/2022 | | | 47,256 | | | | 51,413 | |
5.50% due 07/01/2035 | | | 35,643 | | | | 39,825 | |
6.00% due 03/01/2040 | | | 115,931 | | | | 131,051 | |
6.50% due 02/01/2036 | | | 17,734 | | | | 20,382 | |
Federal Home Loan Mtg. Corp. REMIC | | | | | | | | |
Series 3964, Class MD
2.00% due 01/15/2041(2) | | | 81,502 | | | | 82,127 | |
Series 3572, Class JS FRS
6.60% due 09/15/2039 (2)(7)(8) | | | 386,747 | | | | 63,431 | |
Federal Home Loan Mtg. Corp. | | | | | | | | |
Structured Agency Credit RiskFRS
Series 2014-HQ1, Class M1
1.85% due 08/25/2024(2) | | | 414,396 | | | | 415,715 | |
Series 2014-DN1, Class M2
2.40% due 02/25/2024(2) | | | 167,000 | | | | 168,099 | |
| | | | | | |
|
|
|
| | | | | | | | 9,394,877 | |
| | | | | | |
|
|
|
Federal National Mtg. Assoc. — 2.7% | |
1.91% due 09/01/2035 FRS | | | 301,956 | | | | 317,907 | |
2.19% due 05/01/2037 FRS | | | 87,337 | | | | 92,428 | |
2.32% due 05/01/2040 FRS | | | 321,167 | | | | 342,571 | |
2.33% due 07/01/2039 FRS | | | 230,754 | | | | 243,612 | |
2.40% due 06/01/2034 FRS | | | 261,688 | | | | 279,265 | |
2.49% due 11/01/2036 FRS | | | 150,472 | | | | 161,156 | |
2.50% due September 15 TBA | | | 101,000 | | | | 102,561 | |
2.55% due 08/01/2035 FRS | | | 188,731 | | | | 202,345 | |
2.97% due 10/01/2040 FRS | | | 95,452 | | | | 101,665 | |
3.00% due 10/01/2027 | | | 417,837 | | | | 434,788 | |
3.00% due 12/01/2027 | | | 376,886 | | | | 391,598 | |
3.00% due 03/01/2042 | | | 644,268 | | | | 651,018 | |
3.00% due 12/01/2042 | | | 240,996 | | | | 243,494 | |
3.00% due 05/01/2043 | | | 508,994 | | | | 513,864 | |
3.00% due 02/01/2045 | | | 349,428 | | | | 351,780 | |
3.00% due September 15 TBA | | | 900,000 | | | | 934,253 | |
3.00% due September 30 TBA | | | 1,602,000 | | | | 1,611,011 | |
3.21% due 10/01/2040 FRS | | | 189,916 | | | | 202,695 | |
3.50% due 09/01/2026 | | | 419,288 | | | | 443,335 | |
3.50% due 08/01/2027 | | | 156,065 | | | | 164,706 | |
3.50% due 10/01/2028 | | | 397,574 | | | | 421,132 | |
3.50% due 06/01/2042 | | | 334,182 | | | | 347,404 | |
3.50% due 07/01/2042 | | | 135,076 | | | | 138,528 | |
3.50% due 08/01/2042 | | | 1,225,045 | | | | 1,265,127 | |
3.50% due 09/01/2042 | | | 821,836 | | | | 854,614 | |
3.50% due September 30 TBA | | | 257,000 | | | | 266,579 | |
4.00% due 11/01/2025 | | | 220,208 | | | | 234,589 | |
4.00% due 06/01/2039 | | | 479,540 | | | | 518,694 | |
4.00% due 09/01/2040 | | | 452,937 | | | | 483,691 | |
4.00% due 12/01/2040 | | | 60,142 | | | | 64,290 | |
4.00% due 11/01/2041 | | | 544,429 | | | | 580,395 | |
4.00% due 01/01/2042 | | | 427,993 | | | | 456,919 | |
4.00% due 10/01/2043 | | | 24,582 | | | | 26,193 | |
109
VALIC Company II Strategic Bond Fund
PORTFOLIO OF INVESTMENTS — August 31, 2015 — (continued)
| | | | | | | | |
| | |
| Security Description | | Principal Amount(6) | | | Value
(Note 2) | |
| |
U.S. GOVERNMENT AGENCIES (continued) | |
Federal National Mtg. Assoc. (continued) | |
4.00% due 12/01/2043 | | $ | 427,992 | | | $ | 461,907 | |
4.00% due 10/01/2044 | | | 796,260 | | | | 848,747 | |
4.00% due 11/01/2044 | | | 268,452 | | | | 286,155 | |
4.00% due September 30 TBA | | | 1,226,000 | | | | 1,303,248 | |
4.50% due 06/01/2019 | | | 22,440 | | | | 23,370 | |
4.50% due 01/01/2039 | | | 29,552 | | | | 32,091 | |
4.50% due 11/01/2040 | | | 114,084 | | | | 124,007 | |
4.50% due 05/01/2041 | | | 162,442 | | | | 176,416 | |
4.50% due 07/01/2041 | | | 100,315 | | | | 109,069 | |
4.50% due 03/01/2042 | | | 505,667 | | | | 549,873 | |
4.50% due September 30 TBA | | | 1,200,000 | | | | 1,300,500 | |
5.00% due 03/15/2016 | | | 163,000 | | | | 167,052 | |
5.00% due 01/01/2023 | | | 80,294 | | | | 86,736 | |
5.00% due 04/01/2023 | | | 60,263 | | | | 64,783 | |
5.00% due 03/01/2037 | | | 16,761 | | | | 18,470 | |
5.00% due 05/01/2040 | | | 535,125 | | | | 592,068 | |
5.00% due 06/01/2040 | | | 130,567 | | | | 144,321 | |
5.00% due 07/01/2040 | | | 197,207 | | | | 217,966 | |
5.00% due September 30 TBA | | | 200,000 | | | | 220,605 | |
5.50% due 08/01/2037 | | | 491,526 | | | | 549,572 | |
5.50% due 06/01/2038 | | | 70,360 | | | | 79,474 | |
6.00% due 02/01/2032 | | | 3,689 | | | | 4,165 | |
6.00% due 10/01/2034 | | | 145 | | | | 164 | |
6.00% due 10/01/2037 | | | 19,067 | | | | 21,508 | |
6.00% due 09/01/2038 | | | 128,476 | | | | 145,387 | |
6.00% due 11/01/2038 | | | 39,400 | | | | 44,438 | |
6.00% due 06/01/2040 | | | 33,412 | | | | 37,775 | |
6.50% due 11/01/2037 | | | 91,046 | | | | 109,415 | |
Fannie Mae Connecticut Avenue Securities FRS
Series 2014-C01, Class M1
1.80% due 01/25/2024(2) | | | 376,201 | | | | 377,293 | |
Federal National Mtg. Assoc. REMIC
Series 2011-117, Class MA
2.00% due 08/25/2040(2) | | | 184,313 | | | | 184,782 | |
| | | | | | |
|
|
|
| | | | | | | | 21,725,564 | |
| | | | | | |
|
|
|
Government National Mtg. Assoc. — 0.3% | |
3.00% due 02/20/2045 | | | 388,082 | | | | 394,371 | |
3.00% due 05/20/2045 | | | 272,660 | | | | 277,079 | |
3.00% due September 30 TBA | | | 281,000 | | | | 285,133 | |
3.50% due 03/20/2045 | | | 308,689 | | | | 322,340 | |
3.50% due 04/20/2045 | | | 446,581 | | | | 466,331 | |
3.50% due September 30 TBA | | | 274,000 | | | | 285,656 | |
4.00% due 03/20/2044 | | | 157,038 | | | | 166,779 | |
| | | | | | |
|
|
|
| | | | | | | | 2,197,689 | |
| | | | | | |
|
|
|
Tennessee Valley Authority — 0.1% | |
Tennessee Valley Authority
1.75% due 10/15/2018 | | | 395,000 | | | | 401,211 | |
| | | | | | |
|
|
|
Total U.S. Government Agencies | | | | | | | | |
(cost $33,466,266) | | | | | | | 33,719,341 | |
| | | | | | |
|
|
|
U.S. GOVERNMENT TREASURIES — 10.9% | |
United States Treasury Bonds — 0.9% | |
3.00% due 11/15/2044 | | | 657,000 | | | | 663,159 | |
3.00% due 05/15/2045 | | | 706,000 | | | | 714,163 | |
3.13% due 11/15/2041 | | | 595,000 | | | | 619,505 | |
3.13% due 02/15/2043 | | | 1,486,000 | | | | 1,536,849 | |
3.13% due 08/15/2044 | | | 253,000 | | | | 261,730 | |
3.38% due 05/15/2044 | | | 50,000 | | | | 54,220 | |
4.50% due 02/15/2036 | | | 2,400,000 | | | | 3,099,845 | |
5.25% due 11/15/2028 | | | 67,000 | | | | 88,454 | |
| | | | | | |
|
|
|
| | | | | | | | 7,037,925 | |
| | | | | | |
|
|
|
| | | | | | | | |
| | |
| Security Description | | Principal
Amount(6) | | | Value
(Note 2) | |
| |
| | | | | | | | | |
United States Treasury Notes — 10.0% | |
1.50% due 01/31/2022 | | $ | 191,000 | | | $ | 186,633 | |
0.13% due 04/15/2018 TIPS(9) | | | 1,560,732 | | | | 1,559,371 | |
0.50% due 11/30/2016 | | | 8,000,000 | | | | 7,997,184 | |
0.50% due 01/31/2017 | | | 10,000,000 | | | | 9,988,410 | |
0.50% due 04/30/2017 | | | 8,000,000 | | | | 7,979,584 | |
0.50% due 07/31/2017 | | | 17,500,000 | | | | 17,420,480 | |
0.63% due 08/31/2017 | | | 21,759,000 | | | | 21,708,563 | |
0.75% due 01/15/2017 | | | 897,600 | | | | 899,669 | |
1.25% due 11/30/2018 | | | 2,936,000 | | | | 2,942,882 | |
1.38% due 07/31/2018 | | | 57,000 | | | | 57,499 | |
1.38% due 03/31/2020 | | | 1,737,000 | | | | 1,728,225 | |
1.38% due 04/30/2020 | | | 947,000 | | | | 941,587 | |
1.63% due 08/15/2022 | | | 191,000 | | | | 187,008 | |
1.75% due 03/31/2022 | | | 328,000 | | | | 324,946 | |
2.00% due 07/31/2022 | | | 282,000 | | | | 283,377 | |
2.00% due 02/15/2025 | | | 591,000 | | | | 580,650 | |
2.00% due 08/15/2025 | | | 937,000 | | | | 920,285 | |
2.13% due 12/31/2021 | | | 348,000 | | | | 353,310 | |
2.13% due 05/15/2025 | | | 713,000 | | | | 707,401 | |
2.38% due 08/15/2024 | | | 685,000 | | | | 696,533 | |
2.75% due 02/15/2024 | | | 650,000 | | | | 682,517 | |
3.63% due 08/15/2019 | | | 52,000 | | | | 56,509 | |
| | | | | | |
|
|
|
| | | | | | | | 78,202,623 | |
| | | | | | |
|
|
|
Total U.S. Government Treasuries | | | | | | | | |
(cost $85,051,185) | | | | | | | 85,240,548 | |
| | | | | | |
|
|
|
LOANS(11)(12) — 0.8% | |
Aerospace/Defense — 0.1% | | | | | | | | |
Vencore Inc FRS
BTL-1st Lien
10.00% due 11/23/2019 | | | 913,250 | | | | 909,065 | |
| | | | | | |
|
|
|
E-Commerce/Services — 0.1% | |
Rentpath, Inc. FRS
BTL-2nd Lien
10.00% due 12/17/2022 | | | 1,202,597 | | | | 1,134,950 | |
| | | | | | |
|
|
|
Electric - Distribution — 0.2% | |
Cedar Bay Generating Co. LP FRS
BTL
6.25% due 04/23/2020 | | | 1,265,622 | | | | 1,270,368 | |
| | | | | | |
|
|
|
Oil Companies - Exploration & Production — 0.0% | |
American Energy-Marcellus LLC FRS
BTL-2nd Lien
8.50% due 08/04/2021 | | | 298,693 | | | | 79,154 | |
| | | | | | |
|
|
|
Publishing - Books — 0.2% | |
Cengage Learning Acquisitions, Inc. FRS
BTL-1st Lien
8.25% due 03/31/2020 | | | 1,496,222 | | | | 1,493,416 | |
| | | | | | |
|
|
|
Semiconductor Components - Integrated Circuits — 0.2% | |
SunEdison Semiconductor, Ltd. FRS
BTL-1st Lien
6.50% due 05/27/2019 | | | 1,159,024 | | | | 1,156,127 | |
| | | | | | |
|
|
|
Total Loans | | | | | | | | |
(cost $6,260,917) | | | | | | | 6,043,080 | |
| | | | | | |
|
|
|
110
VALIC Company II Strategic Bond Fund
PORTFOLIO OF INVESTMENTS — August 31, 2015 — (continued)
| | | | | | | | |
| | |
| Security Description | | Shares/
Principal
Amount(6) | | | Value
(Note 2) | |
| |
MUNICIPAL BONDS & NOTES — 0.2% | |
Ohio State University
Revenue Bonds
Series A
4.80% due 06/01/2111 | | $ | 488,000 | | | $ | 470,286 | |
Port Authority of New York & New Jersey
Revenue Bonds
Series 168
4.93% due 10/01/2051 | | | 438,000 | | | | 473,877 | |
Port Authority of New York & New Jersey
Revenue Bonds
Series 174
4.46% due 10/01/2062 | | | 815,000 | | | | 801,658 | |
| | | | | | |
|
|
|
Total Municipal Bonds & Notes | | | | | | | | |
(cost $1,736,094) | | | | | | | 1,745,821 | |
| | | | | | |
|
|
|
COMMON STOCKS — 0.0% | |
Power Converter/Supply Equipment — 0.0% | |
TPT Acquisition, Inc.†(3)(10) | | | 14,640 | | | | 0 | |
| | | | | | |
|
|
|
Television — 0.0% | |
ION Media Networks, Inc.†(3)(10) | | | 316 | | | | 197,286 | |
| | | | | | |
|
|
|
Total Common Stocks | | | | | | | | |
(cost $219,603) | | | | | | | 197,286 | |
| | | | | | |
|
|
|
PREFERRED SECURITIES — 0.1% | |
Electric - Integrated — 0.0% | |
Entergy Louisiana LLC
4.70%# | | | 14,575 | | | | 341,638 | |
| | | | | | |
|
|
|
Sovereign Agency — 0.0% | |
Federal Home Loan Mtg. Corp. FRS
Series Z
8.38%# | | | 5,100 | | | | 25,041 | |
| | | | | | |
|
|
|
Telecom Services — 0.1% | |
Qwest Corp.
6.13%# | | | 28,275 | | | | 704,330 | |
| | | | | | |
|
|
|
Total Preferred Securities | | | | | | | | |
(cost $1,149,917) | | | | | | | 1,071,009 | |
| | | | | | |
|
|
|
PREFERRED SECURITIES/CAPITAL SECURITIES — 4.2% | |
Banks - Commercial — 0.3% | |
Danske Bank A/S FRS
5.56% due 03/13/2017(13) | | GBP | 150,000 | | | | 232,910 | |
Danske Bank A/S VRS
5.75% due 05/06/2020(13) | | EUR | 250,000 | | | | 284,613 | |
HSBC Bank Capital Funding LP FRS
5.84% due 03/30/2025(13) | | GBP | 350,000 | | | | 585,922 | |
Standard Chartered Bank VRS
8.10% due 05/11/2016(13) | | GBP | 275,000 | | | | 431,482 | |
Standard Chartered PLC VRS
6.50% due 04/02/2020*#(13) | | | 719,000 | | | | 705,128 | |
| | | | | | |
|
|
|
| | | | | | | | 2,240,055 | |
| | | | | | |
|
|
|
Banks - Fiduciary — 0.1% | |
Bank of New York Mellon Corp. FRS
Series E
4.95% due 06/20/2020(13) | | | 628,000 | | | | 622,505 | |
| | | | | | |
|
|
|
Banks - Super Regional — 0.2% | |
Capital One Financial Corp. FRS
Series E
5.55% due 06/01/2020(13) | | | 338,000 | | | | 335,783 | |
Fifth Third Bancorp FRS
Series J
4.90% due 09/30/2019(13) | | | 798,000 | | | | 748,125 | |
Wells Fargo & Co. FRS
Series U
5.88% due 06/15/2025(13) | | | 605,000 | | | | 619,369 | |
| | | | | | | | |
| | |
| Security Description | | Principal
Amount(6) | | | Value
(Note 2) | |
| |
| | | | | | | | | |
Banks - Super Regional (continued) | |
Wells Fargo Capital X
5.95% due 12/01/2086 | | $ | 276,000 | | | $ | 277,380 | |
| | | | | | |
|
|
|
| | | | | | | | 1,980,657 | |
| | | | | | |
|
|
|
Building Societies — 0.1% | |
Nationwide Building Society VRS
6.88% due 06/20/2019(13) | | GBP | 315,000 | | | | 482,062 | |
| | | | | | |
|
|
|
Diversified Banking Institutions — 1.7% | |
Bank of America Corp. FRS
Series AA
6.10% due 03/17/2025(13) | | | 1,033,000 | | | | 1,008,466 | |
BNP Paribas SA VRS
7.38% due 08/19/2025*(13) | | | 548,000 | | | | 561,152 | |
Citigroup, Inc. FRS
Series N
5.80% due 11/15/2019(13) | | | 1,011,000 | | | | 1,001,830 | |
Citigroup, Inc. FRS
5.95% due 05/15/2025(13) | | | 1,238,000 | | | | 1,183,838 | |
Credit Agricole SA VRS
6.63% due 09/23/2019*#(13) | | | 767,000 | | | | 752,083 | |
Credit Suisse Group AG VRS
6.25% due 12/18/2024*(13) | | | 833,000 | | | | 799,680 | |
Credit Suisse Group AG VRS
7.50% due 12/11/2023*(13) | | | 680,000 | | | | 718,590 | |
Deutsche Bank AG VRS
7.50% due 04/30/2025#(13) | | | 1,600,000 | | | | 1,574,000 | |
Goldman Sachs Group, Inc. FRS
Series M
5.38% due 05/10/2020(13) | | | 355,000 | | | | 347,678 | |
HSBC Holdings PLC VRS
6.38% due 03/30/2025(13) | | | 381,000 | | | | 378,619 | |
JPMorgan Chase & Co. FRS
Series U
6.13% due 04/30/2024(13) | | | 1,967,000 | | | | 1,967,000 | |
JPMorgan Chase & Co. FRS
Series 1
7.90% due 04/30/2018(13) | | | 484,000 | | | | 508,200 | |
Royal Bank of Scotland Group PLC VRS
8.00% due 08/10/2025(13) | | | 245,000 | | | | 250,206 | |
Societe Generale SA VRS
6.00% due 01/27/2020*#(13) | | | 1,111,000 | | | | 1,048,560 | |
Societe Generale SA FRS
7.00% due 12/19/2017(13) | | EUR | 500,000 | | | | 617,183 | |
UBS Group AG VRS
5.75% due 02/19/2022(13) | | EUR | 500,000 | | | | 580,224 | |
| | | | | | |
|
|
|
| | | | | | | | 13,297,309 | |
| | | | | | |
|
|
|
Electric - Integrated — 0.1% | |
Dominion Resources, Inc. FRS
5.75% due 10/01/2054 | | | 462,000 | | | | 476,784 | |
| | | | | | |
|
|
|
Finance-Investment Banker/Broker — 0.0% | |
Lehman Brothers Holdings Capital Trust VII
Escrow Security
5.86% due 11/30/2056(10)† | | | 101,000 | | | | 10 | |
| | | | | | |
|
|
|
Finance-Other Services — 0.1% | |
National Rural Utilities Cooperative Finance Corp. FRS
4.75% due 04/30/2043 | | | 683,000 | | | | 676,033 | |
| | | | | | |
|
|
|
Financial Guarantee Insurance — 0.2% | |
Assured Guaranty Municipal Holdings, Inc. FRS
6.40% due 12/15/2066*# | | | 1,835,000 | | | | 1,353,313 | |
| | | | | | |
|
|
|
Food-Dairy Products — 0.2% | |
Land O’Lakes Capital Trust I
7.45% due 03/15/2028* | | | 1,800,000 | | | | 1,890,000 | |
| | | | | | |
|
|
|
111
VALIC Company II Strategic Bond Fund
PORTFOLIO OF INVESTMENTS — August 31, 2015 — (continued)
| | | | | | | | |
| | |
| Security Description | | Principal
Amount(6) | | | Value
(Note 2) | |
| |
PREFERRED SECURITIES/CAPITAL SECURITIES (continued) | |
Insurance - Life/Health — 0.3% | |
Prudential Financial, Inc. FRS
5.38% due 05/15/2045 | | $ | 227,000 | | | $ | 224,517 | |
Prudential Financial, Inc. FRS
5.63% due 06/15/2043 | | | 1,923,000 | | | | 1,973,959 | |
| | | | | | |
|
|
|
| | | | | | | | 2,198,476 | |
| | | | | | |
|
|
|
Insurance - Multi-line — 0.2% | |
AXA SA VRS
3.88% due 10/08/2025(13) | | EUR | 600,000 | | | | 659,488 | |
MetLife Capital Trust IV
7.88% due 12/15/2067* | | | 337,000 | | | | 420,408 | |
MetLife, Inc.
6.40% due 12/15/2066 | | | 755,000 | | | | 829,556 | |
| | | | | | |
|
|
|
| | | | | | | | 1,909,452 | |
| | | | | | |
|
|
|
Insurance - Reinsurance — 0.2% | |
Muenchener Rueckversicherungs-Gesellschaft AG FRS
5.77% due 06/12/2017(13) | | EUR | 750,000 | | | | 901,033 | |
Muenchener Rueckversicherungs-Gesellschaft AG VRS
7.63% due 06/21/2028 | | GBP | 375,000 | | | | 647,208 | |
| | | | | | |
|
|
|
| | | | | | | | 1,548,241 | |
| | | | | | |
|
|
|
Oil Companies - Integrated — 0.1% | |
TOTAL SA VRS
2.25% due 02/26/2026(13) | | EUR | 625,000 | | | | 680,935 | |
| | | | | | |
|
|
|
Pipelines — 0.0% | |
TransCanada Trust FRS
5.63% due 05/20/2075 | | | 287,000 | | | | 274,659 | |
| | | | | | |
|
|
|
Telephone - Integrated — 0.2% | |
Orange SA VRS
4.25% due 02/07/2020(13) | | EUR | 700,000 | | | | 823,995 | |
Telefonica Europe BV VRS
4.20% due 12/14/2019(13) | | EUR | 500,000 | | | | 569,913 | |
Telefonica Europe BV VRS
6.75% due 11/26/2020(13) | | GBP | 200,000 | | | | 322,920 | |
| | | | | | |
|
|
|
| | | | | | | | 1,716,828 | |
| | | | | | |
|
|
|
Tools - Hand Held — 0.1% | |
Stanley Black & Decker, Inc. FRS
5.75% due 12/15/2053 | | | 909,000 | | | | 973,767 | |
| | | | | | |
|
|
|
Total Preferred Securities/Capital Securities | | | | | | | | |
(cost $32,453,000) | | | | | | | 32,321,086 | |
| | | | | | |
|
|
|
Total Long-Term Investment Securities | | | | | | | | |
(cost $781,139,226) | | | | | | | 749,286,408 | |
| | | | | | |
|
|
|
SHORT-TERM INVESTMENT SECURITIES — 8.5% | |
Registered Investment Companies — 4.6% | |
State Street Navigator Securities Lending Prime Portfolio 0.21%(14)(19) | | | 35,855,363 | | | | 35,855,363 | |
| | | | | | |
|
|
|
Time Deposits — 3.9% | |
Euro Time Deposit with State Street Bank and Trust Co. 0.01% due 09/01/2015 | | | 30,623,000 | | | | 30,623,000 | |
| | | | | | |
|
|
|
Total Short-Term Investment Securities | | | | | | | | |
(cost $66,478,363) | | | | | | | 66,478,363 | |
| | | | | | |
|
|
|
TOTAL INVESTMENTS | | | | | | | | |
(cost $847,617,589)(15) | | | 103.8 | % | | | 815,764,771 | |
Liabilities in excess of other assets | | | (3.8 | ) | | | (30,129,854 | ) |
| | |
|
|
| |
|
|
|
NET ASSETS | | | 100.0 | % | | $ | 785,634,917 | |
| | |
|
|
| |
|
|
|
| * | Securities exempt from registration under Rule 144A of the Securities Act of 1933. These securities may be sold in transactions exempt from registration, normally to qualified institutional buyers. The Fund has no right to demand registration of these securities. At August 31, 2015, the aggregate value of these securities was $187,663,667 representing 23.9% of net assets. Unless otherwise indicated, these securities are not considered to be illiquid. |
| # | The security or a portion thereof is out on loan (see Note 2) |
| † | Non-income producing security |
| (1) | Commercial Mortgage Backed Security |
| (2) | Collateralized Mortgage Obligation |
| (3) | Fair valued security. Securities are classified as Level 3 based on the securities valuation inputs; see Note 2. |
| (4) | Security in default of interest and principal at maturity. |
| (5) | “Step-up” security where the rate increases (“steps-up”) at a predetermined rate. Rate shown reflects the increased rate. |
| (6) | Denominated in United States Dollars unless otherwise indicated. |
| (8) | Inverse Floating Rate Security that pays interest that varies inversely to changes in the market interest rates. The interest rate shown is the current interest rate at August 31, 2015. |
| (9) | Principal amount of security is adjusted for inflation. |
| (10) | Illiquid security. At August 31, 2015, the aggregate value of these securities was $1,788,556 representing 0.2% of net assets. |
| (11) | Senior loans in the Fund are generally subject to mandatory and/or optional prepayment. Because of these mandatory prepayment conditions and because there may be significant economic incentives for a borrower to prepay, prepayments may occur. As a result, the actual remaining maturity may be substantially less than the stated maturities shown. |
| (12) | The Fund invests in senior loans which generally pay interest at rates which are periodically re-determined by reference to a base lending rate plus a premium. These base lending rates are generally either the lending rate offered by one or more major European banks, such as the London Inter-Bank Offer Rate (“LIBOR”) or the prime rate offered by one or more major United States banks, or the certificate of deposit rate. Senior loans are generally considered to be restrictive in that the Fund is ordinarily contractually obligated to receive approval from the Agent Bank and/or borrower prior to the disposition of a senior loan. |
| (13) | Perpetual maturity — maturity date reflects the next call date. |
| (14) | At August 31, 2015, the Fund had loaned securities with a total value of $35,051,653. This was secured by collateral of $35,855,363, which was received in cash and subsequently invested in short-term investments currently valued at $35,855,363 as reported in the Portfolio of Investments. |
| (15) | See Note 5 for cost of investments on a tax basis. |
| (16) | Company has filed for Chapter 11 bankruptcy. |
| (17) | Company has filed for bankruptcy protection in the country or issuance. |
| (18) | “Payment-in-Kind” (PIK) security. Income may be paid in additional securities or cash at the discretion of the issuer. The security is currently paying interest in cash at the coupon rate listed. |
| (19) | The rate shown is the 7-day yield as of August 31, 2015. |
| (20) | Subsequent to August 31, 2015, security is in default of interest and company has filed for Chapter 11 bankruptcy protection. |
BTL—Bank Term Loan
REMIC—Real Estate Mortgage Investment Conduit
TBA—Securities purchased on a forward commitment basis with an approximate principal amount and no definite maturity date. The actual principal and maturity date will be determined upon settlement date.
TIPS—Treasury Inflation Protected Security
FRS—Floating Rate Security
VRS—Variable Rate Security
The rates shown on FRS and VRS are the current interest rates at August 31, 2015 and unless noted otherwise, the dates are the original maturity dates.
Currency Legend
BRL—Brazilian Real
COP—Columbian Peso
EUR—Euro
GBP—British Pound
112
VALIC Company II Strategic Bond Fund
PORTFOLIO OF INVESTMENTS — August 31, 2015 — (continued)
| | | | | | | | | | | | | | | | | | | | | | | | | | | | |
| Forward Foreign Currency Contracts | |
| Counterparty | | Contract to Deliver | | | In Exchange For | | | Delivery
Date | | | Unrealized
Appreciation | | | Unrealized
Depreciation | |
JPMorgan Chase Bank N.A | | | EUR | | | | 31,400,000 | | | | USD | | | | 34,289,065 | | | | 09/01/2015 | | | $ | – | | | $ | (946,463 | ) |
| | | | EUR | | | | 23,950,000 | | | | USD | | | | 26,793,584 | | | | 09/21/2015 | | | | – | | | | (89,305 | ) |
| | | | EUR | | | | 27,900,000 | | | | USD | | | | 31,772,241 | | | | 10/02/2015 | | | | 450,569 | | | | – | |
| | | | GBP | | | | 14,816,992 | | | | USD | | | | 23,103,480 | | | | 09/01/2015 | | | | 366,804 | | | | – | |
| | | | GBP | | | | 15,088,755 | | | | USD | | | | 23,350,000 | | | | 10/02/2015 | | | | 200,225 | | | | – | |
| | | | USD | | | | 1,967,944 | | | | EUR | | | | 1,760,000 | | | | 09/01/2015 | | | | 7,041 | | | | – | |
| | | | | | | | | | | | | | | | | | | | | | |
|
|
| |
|
|
|
Net Unrealized Appreciation/(Depreciation) | | | | | | | | | | | | | | | | | | | | | | $ | 1,024,639 | | | $ | (1,035,768 | ) |
| | | | | | | | | | | | | | | | | | | | | | |
|
|
| |
|
|
|
EUR—Euro Dollar
GBP—Pound Sterling
USD—United States Dollar
The following is a summary of the inputs used to value the Fund’s net assets as of August 31, 2015 (see Note 2):
| | | | | | | | | | | | | | | | |
| | | Level 1 - Unadjusted Quoted
Prices
| | | Level 2 - Other Observable
Inputs
| | | Level 3 - Significant
Unobservable Inputs
| | | Total
| |
ASSETS: | | | | | | | | | | | | | | | | |
Investments at Value:* | | | | | | | | | | | | | | | | |
Asset Backed Securities | | $ | — | | | $ | 5,738,713 | | | $ | — | | | $ | 5,738,713 | |
U.S. Corporate Bonds & Notes: | | | | | | | | | | | | | | | | |
Airlines | | | — | | | | 3,825,535 | | | | 57,800 | | | | 3,883,335 | |
Gambling (Non-Hotel) | | | — | | | | 1,750,930 | | | | 2,660 | | | | 1,753,590 | |
Rubber/Plastic Products | | | — | | | | — | | | | 0 | | | | 0 | |
Other Industries | | | — | | | | 325,481,219 | | | | — | | | | 325,481,219 | |
Foreign Corporate Bonds & Notes: | | | | | | | | | | | | | | | | |
Special Purpose Entity | | | — | | | | — | | | | 0 | | | | 0 | |
Other Industries | | | — | | | | 173,993,459 | | | | — | | | | 173,993,459 | |
Foreign Government Obligations | | | — | | | | 78,097,921 | | | | — | | | | 78,097,921 | |
U.S. Government Agencies | | | — | | | | 33,719,341 | | | | — | | | | 33,719,341 | |
U.S. Government Treasuries | | | — | | | | 85,240,548 | | | | — | | | | 85,240,548 | |
Loans | | | — | | | | 6,043,080 | | | | — | | | | 6,043,080 | |
Municipal Bonds & Notes | | | — | | | | 1,745,821 | | | | — | | | | 1,745,821 | |
Common Stocks | | | — | | | | — | | | | 197,286 | | | | 197,286 | |
Preferred Securities | | | 1,071,009 | | | | — | | | | — | | | | 1,071,009 | |
Preferred Securities/Capital Securities | | | — | | | | 32,321,086 | | | | — | | | | 32,321,086 | |
Short-Term Investment Securities: | | | | | | | | | | | | | | | | |
Registered Investment Companies | | | 35,855,363 | | | | — | | | | — | | | | 35,855,363 | |
Time Deposits | | | — | | | | 30,623,000 | | | | — | | | | 30,623,000 | |
| | |
|
|
| |
|
|
| |
|
|
| |
|
|
|
Total Investments at Value | | $ | 36,926,372 | | | $ | 778,580,653 | | | $ | 257,746 | | | $ | 815,764,771 | |
| | |
|
|
| |
|
|
| |
|
|
| |
|
|
|
Other Financial Instruments:+ | | | | | | | | | | | | | | | | |
Forward Foreign Currency Contracts | | $ | — | | | $ | 1,024,639 | | | $ | — | | | $ | 1,024,639 | |
| | |
|
|
| |
|
|
| |
|
|
| |
|
|
|
LIABILITIES: | | | | | | | | | | | | | | | | |
Other Financial Instruments:+ | | | | | | | | | | | | | | | | |
Forward Foreign Currency Contracts | | $ | — | | | $ | 1,035,768 | | | $ | — | | | $ | 1,035,768 | |
| | |
|
|
| |
|
|
| |
|
|
| |
|
|
|
| * | For a detailed presentation of investments, please refer to the Portfolio of Investments. |
| + | Other financial instruments are derivative instruments, not reflected in the Portfolio of Investments, such as futures, forward, swap and written option contracts, which are valued at the unrealized appreciation (depreciation) on the instrument. |
The Fund’s policy is to recognize transfers between Levels as of the end of the reporting period. There were no material transfers between Levels during the reporting period.
At the beginning and end of the reporting period, Level 3 investments were not considered a material portion of the Fund.
See Notes to Financial Statements
113
VALIC Company II
STATEMENTS OF ASSETS AND LIABILITIES — August 31, 2015
| | | | | | | | | | | | | | | | | | | | |
| | | AGGRESSIVE
GROWTH
LIFESTYLE FUND | | | CAPITAL
APPRECIATION
FUND | | | CONSERVATIVE
GROWTH
LIFESTYLE FUND | | | CORE BOND
FUND | | | HIGH YIELD
BOND FUND | |
ASSETS: | | | | | | | | | | | | | | | | | | | | |
Investments at value (unaffiliated)*† | | $ | – | | | $ | 83,112,043 | | | $ | – | | | $ | 1,126,893,193 | | | $ | 466,976,573 | |
Investments at value (affiliated)* | | | 508,911,513 | | | | – | | | | 325,780,507 | | | | – | | | | – | |
Repurchase agreements (cost approximates value) | | | – | | | | – | | | | – | | | | – | | | | 26,536,000 | |
| | |
|
|
| |
|
|
| |
|
|
| |
|
|
| |
|
|
|
Total investments | | | 508,911,513 | | | | 83,112,043 | | | | 325,780,507 | | | | 1,126,893,193 | | | | 493,512,573 | |
| | |
|
|
| |
|
|
| |
|
|
| |
|
|
| |
|
|
|
Cash | | | 77,777 | | | | 16 | | | | 91,608 | | | | 334 | | | | 177 | |
Foreign cash* | | | – | | | | – | | | | – | | | | – | | | | 113,225 | |
Due from broker | | | – | | | | – | | | | – | | | | – | | | | – | |
Receivable for: | | | | | | | | | | | | | | | | | | | | |
Trust shares sold | | | 69,015 | | | | 5,049 | | | | 231,154 | | | | 221,751 | | | | 55,810 | |
Dividends and interest | | | – | | | | 68,631 | | | | – | | | | 7,103,804 | | | | 7,851,473 | |
Investments sold | | | 510,582 | | | | 416,138 | | | | – | | | | 11,523,028 | | | | 730,744 | |
Payments on swap contracts | | | – | | | | – | | | | – | | | | – | | | | 104,256 | |
Securities lending income | | | – | | | | 399 | | | | – | | | | 11,396 | | | | 12,888 | |
Prepaid expenses and other assets | | | 11,080 | | | | 8,850 | | | | 8,274 | | | | 21,606 | | | | 15,719 | |
Due from investment adviser for expense reimbursements/fee waivers | | | 11,741 | | | | 9,014 | | | | 6,696 | | | | 24,534 | | | | 5,171 | |
Unrealized appreciation on forward foreign currency contracts | | | – | | | | – | | | | – | | | | – | | | | 139,087 | |
Swap premiums paid | | | – | | | | – | | | | – | | | | – | | | | 608,645 | |
Unrealized appreciation on swap contracts | | | – | | | | – | | | | – | | | | – | | | | 38,328 | |
| | |
|
|
| |
|
|
| |
|
|
| |
|
|
| |
|
|
|
TOTAL ASSETS | | | 509,591,708 | | | | 83,620,140 | | | | 326,118,239 | | | | 1,145,799,646 | | | | 503,188,096 | |
| | |
|
|
| |
|
|
| |
|
|
| |
|
|
| |
|
|
|
LIABILITIES: | | | | | | | | | | | | | | | | | | | | |
Payable for: | | | | | | | | | | | | | | | | | | | | |
Trust shares reaquired | | | 579,597 | | | | 13,268 | | | | 122,072 | | | | 846,559 | | | | 94,693 | |
Investments purchased | | | – | | | | 722,803 | | | | 109,082 | | | | 59,840,396 | | | | – | |
Investment advisory and management fees | | | 44,650 | | | | 39,814 | | | | 28,207 | | | | 393,907 | | | | 246,150 | |
Shareholder services | | | – | | | | 18,097 | | | | – | | | | 227,613 | | | | 99,908 | |
Administrative service fees | | | – | | | | 4,886 | | | | – | | | | 61,455 | | | | 26,975 | |
Transfer agent fees and expenses | | | 250 | | | | 500 | | | | 250 | | | | 500 | | | | 500 | |
Trustees’ fees and expenses | | | 9,058 | | | | 4,431 | | | | 6,056 | | | | 18,812 | | | | 12,479 | |
Other accrued expenses | | | 68,101 | | | | 44,917 | | | | 55,568 | | | | 128,228 | | | | 79,970 | |
Variation margin on futures contracts | | | – | | | | – | | | | – | | | | – | | | | – | |
Accrued foreign tax on capital gains | | | – | | | | – | | | | – | | | | – | | | | – | |
Collateral upon return of securities loaned | | | – | | | | 810,693 | | | | – | | | | 18,479,285 | | | | 33,550,848 | |
Due to broker | | | – | | | | – | | | | – | | | | – | | | | 105,820 | |
Unrealized depreciation on forward foreign currency contracts | | | – | | | | – | | | | – | | | | – | | | | – | |
Unrealized depreciation on swap contracts | | | – | | | | – | | | | – | | | | – | | | | 116,250 | |
| | |
|
|
| |
|
|
| |
|
|
| |
|
|
| |
|
|
|
TOTAL LIABILITIES | | | 701,656 | | | | 1,659,409 | | | | 321,235 | | | | 79,996,755 | | | | 34,333,593 | |
| | |
|
|
| |
|
|
| |
|
|
| |
|
|
| |
|
|
|
NET ASSETS | | $ | 508,890,052 | | | $ | 81,960,731 | | | $ | 325,797,004 | | | $ | 1,065,802,891 | | | $ | 468,854,503 | |
| | |
|
|
| |
|
|
| |
|
|
| |
|
|
| |
|
|
|
NET ASSETS REPRESENTED BY: | | | | | | | | | | | | | | | | | | | | |
Trust shares at par value of $0.01 per share | | $ | 477,068 | | | $ | 50,142 | | | $ | 272,701 | | | $ | 974,895 | | | $ | 633,316 | |
Additional paid in capital | | | 448,580,121 | | | | 58,831,252 | | | | 312,983,315 | | | | 1,044,194,388 | | | | 493,709,001 | |
Accumulated undistributed net investment income (loss) | | | 10,732,462 | | | | 312,853 | | | | 8,949,690 | | | | 23,521,691 | | | | 22,676,199 | |
Accumulated undistributed net realized gain (loss) on investments, swap contracts, futures contracts, options contracts, securities sold short, foreign exchange transactions and capital gain distributions from underlying funds | | | 34,426,467 | | | | 7,108,954 | | | | 11,365,126 | | | | 1,084,042 | | | | (32,464,654 | ) |
Unrealized appreciation (depreciation) on investments | | | 14,673,934 | | | | 15,657,530 | | | | (7,773,828 | ) | | | (3,972,125 | ) | | | (15,760,936 | ) |
Unrealized appreciation (depreciation) on swap, futures contracts and options contracts | | | – | | | | – | | | | – | | | | – | | | | (77,922 | ) |
Unrealized foreign exchange gain (loss) on other assets and liabilities | | | – | | | | – | | | | – | | | | – | | | | 139,499 | |
Accrued capital gains tax on unrealized appreciation (depreciation) | | | – | | | | – | | | | – | | | | – | | | | – | |
| | |
|
|
| |
|
|
| |
|
|
| |
|
|
| |
|
|
|
NET ASSETS | | $ | 508,890,052 | | | $ | 81,960,731 | | | $ | 325,797,004 | | | $ | 1,065,802,891 | | | $ | 468,854,503 | |
| | |
|
|
| |
|
|
| |
|
|
| |
|
|
| |
|
|
|
| | | | – | | | | – | | | | – | | | | – | | | | – | |
SHARES OF BENEFICIAL INTEREST: | | | | | | | | | | | | | | | | | | | | |
Authorized (Par value $0.01 per share) | | | 1,000,000,000 | | | | 1,000,000,000 | | | | 1,000,000,000 | | | | 1,000,000,000 | | | | 1,000,000,000 | |
Outstanding | | | 47,706,771 | | | | 5,014,189 | | | | 27,270,134 | | | | 97,489,499 | | | | 63,331,621 | |
NET ASSET VALUE, OFFERING AND REDEMPTION PRICE PER SHARE | | $ | 10.67 | | | $ | 16.35 | | | $ | 11.95 | | | $ | 10.93 | | | $ | 7.40 | |
| | |
|
|
| |
|
|
| |
|
|
| |
|
|
| |
|
|
|
* Cost | | | | | | | | | | | | | | | | | | | | |
Investments (unaffiliated) | | $ | – | | | $ | 67,454,513 | | | $ | – | | | $ | 1,130,865,318 | | | $ | 482,737,509 | |
| | |
|
|
| |
|
|
| |
|
|
| |
|
|
| |
|
|
|
Investments (affiliated) | | $ | 494,237,579 | | | $ | – | | | $ | 333,554,335 | | | $ | – | | | $ | – | |
| | |
|
|
| |
|
|
| |
|
|
| |
|
|
| |
|
|
|
Foreign cash | | $ | – | | | $ | – | | | $ | – | | | $ | – | | | $ | 112,952 | |
| | |
|
|
| |
|
|
| |
|
|
| |
|
|
| |
|
|
|
† Including securities on loan | | $ | – | | | $ | 796,494 | | | $ | – | | | $ | 18,089,256 | | | $ | 34,137,917 | |
| | |
|
|
| |
|
|
| |
|
|
| |
|
|
| |
|
|
|
See Notes to Financial Statements
114
VALIC Company II
STATEMENTS OF ASSETS AND LIABILITIES — August 31, 2015 — (continued)
| | | | | | | | | | | | | | | | | | | | |
| | | INTERNATIONAL
OPPORTUNITIES
FUND | | | LARGE CAP
VALUE FUND | | | MID CAP
GROWTH FUND | | | MID CAP
VALUE FUND | | | MODERATE
GROWTH
LIFESTYLE FUND | |
ASSETS: | | | | | | | | | | | | | | | | | | | | |
Investments at value (unaffiliated)*† | | $ | 618,975,941 | | | $ | 194,573,044 | | | $ | 157,785,996 | | | $ | 934,948,253 | | | $ | – | |
Investments at value (affiliated)* | | | – | | | | – | | | | – | | | | – | | | | 798,491,872 | |
Repurchase agreements (cost approximates value) | | | 8,687,000 | | | | – | | | | 1,405,000 | | | | 8,127,000 | | | | – | |
| | |
|
|
| |
|
|
| |
|
|
| |
|
|
| |
|
|
|
Total investments | | | 627,662,941 | | | | 194,573,044 | | | | 159,190,996 | | | | 943,075,253 | | | | 798,491,872 | |
| | |
|
|
| |
|
|
| |
|
|
| |
|
|
| |
|
|
|
Cash | | | 3,045,151 | | | | 1,246 | | | | 632 | | | | 984 | | | | 88,955 | |
Foreign cash* | | | 1,582,244 | | | | – | | | | – | | | | 229,148 | | | | – | |
Due from broker | | | – | | | | – | | | | – | | | | – | | | | – | |
Receivable for: | | | | | | | | | | | | | | | | | | | | |
Trust shares sold | | | 91,449 | | | | 3,655 | | | | 12,149 | | | | 11,076 | | | | 21,697 | |
Dividends and interest | | | 1,154,254 | | | | 353,625 | | | | 81,599 | | | | 931,475 | | | | – | |
Investments sold | | | 4,951,405 | | | | 392,265 | | | | 2,036,070 | | | | 2,985,045 | | | | 1,639,147 | |
Payments on swap contracts | | | – | | | | – | | | | – | | | | – | | | | – | |
Securities lending income | | | 15,908 | | | | 414 | | | | 3,126 | | | | 4,499 | | | | – | |
Prepaid expenses and other assets | | | 30,455 | | | | 31,165 | | | | 21,907 | | | | 36,711 | | | | 15,748 | |
Due from investment adviser for expense reimbursements/fee waivers | | | 87,468 | | | | 7,548 | | | | 37,507 | | | | 18,634 | | | | 18,025 | |
Unrealized appreciation on forward foreign currency contracts | | | – | | | | – | | | | – | | | | – | | | | – | |
Swap premiums paid | | | – | | | | – | | | | – | | | | – | | | | – | |
Unrealized appreciation on swap contracts | | | – | | | | – | | | | – | | | | – | | | | – | |
| | |
|
|
| |
|
|
| |
|
|
| |
|
|
| |
|
|
|
TOTAL ASSETS | | | 638,621,275 | | | | 195,362,962 | | | | 161,383,986 | | | | 947,292,825 | | | | 800,275,444 | |
| | |
|
|
| |
|
|
| |
|
|
| |
|
|
| |
|
|
|
LIABILITIES: | | | | | | | | | | | | | | | | | | | | |
Payable for: | | | | | | | | | | | | | | | | | | | | |
Trust shares reaquired | | | 125,238 | | | | 62,563 | | | | 391,721 | | | | 587,197 | | | | 1,660,845 | |
Investments purchased | | | 6,591,785 | | | | 313,937 | | | | 2,462,563 | | | | 2,975,034 | | | | – | |
Investment advisory and management fees | | | 429,958 | | | | 85,809 | | | | 101,962 | | | | 564,186 | | | | 69,781 | |
Shareholder services | | | 131,708 | | | | 42,905 | | | | 34,140 | | | | 203,929 | | | | – | |
Administrative service fees | | | 35,561 | | | | 11,584 | | | | 9,218 | | | | 55,061 | | | | – | |
Transfer agent fees and expenses | | | 377 | | | | 374 | | | | 438 | | | | 561 | | | | 250 | |
Trustees’ fees and expenses | | | 25,361 | | | | 10,566 | | | | 7,791 | | | | 32,163 | | | | 14,015 | |
Other accrued expenses | | | 108,434 | | | | 56,256 | | | | 49,109 | | | | 107,781 | | | | 86,474 | |
Variation margin on futures contracts | | | – | | | | – | | | | – | | | | – | | | | – | |
Accrued foreign tax on capital gains | | | 46,367 | | | | – | | | | – | | | | – | | | | – | |
Collateral upon return of securities loaned | | | 34,825,194 | | | | 1,177,006 | | | | 4,036,052 | | | | 16,186,605 | | | | – | |
Due to broker | | | – | | | | – | | | | – | | | | – | | | | – | |
Unrealized depreciation on forward foreign currency contracts | | | – | | | | – | | | | – | | | | – | | | | – | |
Unrealized depreciation on swap contracts | | | – | | | | – | | | | – | | | | – | | | | – | |
| | |
|
|
| |
|
|
| |
|
|
| |
|
|
| |
|
|
|
TOTAL LIABILITIES | | | 42,319,983 | | | | 1,761,000 | | | | 7,092,994 | | | | 20,712,517 | | | | 1,831,365 | |
| | |
|
|
| |
|
|
| |
|
|
| |
|
|
| |
|
|
|
NET ASSETS | | $ | 596,301,292 | | | $ | 193,601,962 | | | $ | 154,290,992 | | | $ | 926,580,308 | | | $ | 798,444,079 | |
| | |
|
|
| |
|
|
| |
|
|
| |
|
|
| |
|
|
|
NET ASSETS REPRESENTED BY: | | | | | | | | | | | | | | | | | | | | |
Trust shares at par value of $0.01 per share | | $ | 395,480 | | | $ | 113,334 | | | $ | 175,074 | | | $ | 424,601 | | | $ | 566,551 | |
Additional paid in capital | | | 641,384,492 | | | | 207,468,541 | | | | 137,439,279 | | | | 708,023,466 | | | | 728,133,426 | |
Accumulated undistributed net investment income (loss) | | | 3,066,471 | | | | 2,423,104 | | | | (441,272 | ) | | | 2,691,890 | | | | 18,164,593 | |
Accumulated undistributed net realized gain (loss) on investments, swap contracts, futures contracts, options contracts, securities sold short, foreign exchange transactions and capital gain distributions from underlying funds | | | (125,614,185 | ) | | | (28,682,666 | ) | | | 7,968,521 | | | | 125,513,782 | | | | 41,077,204 | |
Unrealized appreciation (depreciation) on investments | | | 77,180,973 | | | | 12,279,649 | | | | 9,149,390 | | | | 89,928,594 | | | | 10,502,305 | |
Unrealized appreciation (depreciation) on swap, futures contracts and options contracts | | | – | | | | – | | | | – | | | | – | | | | – | |
Unrealized foreign exchange gain (loss) on other assets and liabilities | | | (65,572 | ) | | | – | | | | – | | | | (2,025 | ) | | | – | |
Accrued capital gains tax on unrealized appreciation (depreciation) | | | (46,367 | ) | | | – | | | | – | | | | – | | | | – | |
| | |
|
|
| |
|
|
| |
|
|
| |
|
|
| |
|
|
|
NET ASSETS | | $ | 596,301,292 | | | $ | 193,601,962 | | | $ | 154,290,992 | | | $ | 926,580,308 | | | $ | 798,444,079 | |
| | |
|
|
| |
|
|
| |
|
|
| |
|
|
| |
|
|
|
| | | | – | | | | – | | | | – | | | | – | | | | – | |
SHARES OF BENEFICIAL INTEREST: | | | | | | | | | | | | | | | | | | | | |
Authorized (Par value $0.01 per share) | | | 1,000,000,000 | | | | 1,000,000,000 | | | | 1,000,000,000 | | | | 1,000,000,000 | | | | 1,000,000,000 | |
Outstanding | | | 39,547,983 | | | | 11,333,382 | | | | 17,507,359 | | | | 42,460,082 | | | | 56,655,073 | |
NET ASSET VALUE, OFFERING AND REDEMPTION PRICE PER SHARE | | $ | 15.08 | | | $ | 17.08 | | | $ | 8.81 | | | $ | 21.82 | | | $ | 14.09 | |
| | |
|
|
| |
|
|
| |
|
|
| |
|
|
| |
|
|
|
* Cost | | | | | | | | | | | | | | | | | | | | |
Investments (unaffiliated) | | $ | 541,794,968 | | | $ | 182,293,395 | | | $ | 148,636,606 | | | $ | 845,019,659 | | | $ | – | |
| | |
|
|
| |
|
|
| |
|
|
| |
|
|
| |
|
|
|
Investments (affiliated) | | $ | – | | | $ | – | | | $ | – | | | $ | – | | | $ | 787,989,567 | |
| | |
|
|
| |
|
|
| |
|
|
| |
|
|
| |
|
|
|
Foreign cash | | $ | 1,602,182 | | | $ | – | | | $ | – | | | $ | 228,444 | | | $ | – | |
| | |
|
|
| |
|
|
| |
|
|
| |
|
|
| |
|
|
|
†Including securities on loan | | $ | 33,176,743 | | | $ | 1,130,458 | | | $ | 3,921,108 | | | $ | 15,860,302 | | | $ | – | |
| | |
|
|
| |
|
|
| |
|
|
| |
|
|
| |
|
|
|
See Notes to Financial Statements
115
VALIC Company II
STATEMENTS OF ASSETS AND LIABILITIES — August 31, 2015 — (continued)
| | | | | | | | | | | | | | | | | | | | |
| | | MONEY
MARKET II
FUND | | | SMALL CAP
GROWTH FUND | | | SMALL CAP
VALUE FUND | | | SOCIALLY
RESPONSIBLE
FUND | | | STRATEGIC
BOND FUND | |
ASSETS: | | | | | | | | | | | | | | | | | | | | |
Investments at value (unaffiliated)*† | | $ | 161,677,748 | | | $ | 131,501,360 | | | $ | 522,263,277 | | | $ | 714,198,845 | | | $ | 815,764,771 | |
Investments at value (affiliated)* | | | – | | | | – | | | | – | | | | – | | | | – | |
Repurchase agreements (cost approximates value) | | | 2,464,000 | | | | – | | | | 10,426,000 | | | | 15,260,000 | | | | – | |
| | |
|
|
| |
|
|
| |
|
|
| |
|
|
| |
|
|
|
Total investments | | | 164,141,748 | | | | 131,501,360 | | | | 532,689,277 | | | | 729,458,845 | | | | 815,764,771 | |
| | |
|
|
| |
|
|
| |
|
|
| |
|
|
| |
|
|
|
Cash | | | 800 | | | | 264 | | | | 768 | | | | 568 | | | | 1,164,851 | |
Foreign cash* | | | – | | | | – | | | | – | | | | – | | | | 1,690,064 | |
Due from broker | | | – | | | | – | | | | 395,000 | | | | – | | | | – | |
Receivable for: | | | | | | | | | | | | | | | | | | | | |
Trust shares sold | | | 44,879 | | | | 3,549 | | | | 10,104 | | | | 91,950 | | | | 6,343 | |
Dividends and interest | | | 24,426 | | | | 32,419 | | | | 412,351 | | | | 1,438,210 | | | | 10,535,409 | |
Investments sold | | | – | | | | 342,638 | | | | 4,293,853 | | | | – | | | | 4,661,986 | |
Payments on swap contracts | | | – | | | | – | | | | – | | | | – | | | | – | |
Securities lending income | | | – | | | | 40,168 | | | | 71,216 | | | | 2,619 | | | | 24,351 | |
Prepaid expenses and other assets | | | 16,759 | | | | 8,887 | | | | 24,414 | | | | 32,278 | | | | 23,473 | |
Due from investment adviser for expense reimbursements/fee waivers | | | 59,280 | | | | 5,015 | | | | 37,949 | | | | 28,451 | | | | – | |
Unrealized appreciation on forward foreign currency contracts | | | – | | | | – | | | | – | | | | – | | | | 1,024,639 | |
Swap premiums paid | | | – | | | | – | | | | – | | | | – | | | | – | |
Unrealized appreciation on swap contracts | | | – | | | | – | | | | – | | | | – | | | | – | |
| | |
|
|
| |
|
|
| |
|
|
| |
|
|
| |
|
|
|
TOTAL ASSETS | | | 164,287,892 | | | | 131,934,300 | | | | 537,934,932 | | | | 731,052,921 | | | | 834,895,887 | |
| | |
|
|
| |
|
|
| |
|
|
| |
|
|
| |
|
|
|
LIABILITIES: | | | | | | | | | | | | | | | | | | | | |
Payable for: | | | | | | | | | | | | | | | | | | | | |
Trust shares reaquired | | | 238,431 | | | | 181,345 | | | | 197,389 | | | | 154,848 | | | | 221,594 | |
Investments purchased | | | 3,999,893 | | | | 538,745 | | | | 2,424,622 | | | | – | | | | 11,453,190 | |
Investment advisory and management fees | | | 33,890 | | | | 82,854 | | | | 279,662 | | | | 161,184 | | | | 341,167 | |
Shareholder services | | | 33,890 | | | | 24,565 | | | | 105,929 | | | | 161,184 | | | | 168,304 | |
Administrative service fees | | | 9,150 | | | | 6,633 | | | | 28,601 | | | | 43,520 | | | | 45,442 | |
Transfer agent fees and expenses | | | 188 | | | | 500 | | | | 438 | | | | 249 | | | | 685 | |
Trustees’ fees and expenses | | | 12,726 | | | | 4,654 | | | | 17,497 | | | | 28,922 | | | | 21,483 | |
Other accrued expenses | | | 54,354 | | | | 46,027 | | | | 82,352 | | | | 89,690 | | | | 117,974 | |
Variation margin on futures contracts | | | – | | | | – | | | | 42,250 | | | | 352,600 | | | | – | |
Accrued foreign tax on capital gains | | | – | | | | – | | | | – | | | | – | | | | – | |
Collateral upon return of securities loaned | | | – | | | | 21,019,855 | | | | 47,599,278 | | | | 3,600,710 | | | | 35,855,363 | |
Due to broker | | | – | | | | – | | | | – | | | | – | | | | – | |
Unrealized depreciation on forward foreign currency contracts | | | – | | | | – | | | | – | | | | – | | | | 1,035,768 | |
Unrealized depreciation on swap contracts | | | – | | | | – | | | | – | | | | – | | | | – | |
| | |
|
|
| |
|
|
| |
|
|
| |
|
|
| |
|
|
|
TOTAL LIABILITIES | | | 4,382,522 | | | | 21,905,178 | | | | 50,778,018 | | | | 4,592,907 | | | | 49,260,970 | |
| | |
|
|
| |
|
|
| |
|
|
| |
|
|
| |
|
|
|
NET ASSETS | | $ | 159,905,370 | | | $ | 110,029,122 | | | $ | 487,156,914 | | | $ | 726,460,014 | | | $ | 785,634,917 | |
| | |
|
|
| |
|
|
| |
|
|
| |
|
|
| |
|
|
|
NET ASSETS REPRESENTED BY: | | | | | | | | | | | | | | | | | | | | |
Trust shares at par value of $0.01 per share | | $ | 1,598,823 | | | $ | 71,851 | | | $ | 347,837 | | | $ | 391,534 | | | $ | 714,277 | |
Additional paid in capital | | | 158,312,735 | | | | 89,078,841 | | | | 406,396,943 | | | | 550,042,639 | | | | 790,332,275 | |
Accumulated undistributed net investment income (loss) | | | (5,309 | ) | | | (146,258 | ) | | | 5,782,520 | | | | 9,947,965 | | | | 31,439,551 | |
Accumulated undistributed net realized gain (loss) on investments, swap contracts, futures contracts, options contracts, securities sold short, foreign exchange transactions and capital gain distributions from underlying funds | | | (879 | ) | | | 9,373,298 | | | | 53,412,668 | | | | 46,795,228 | | | | (4,288,175 | ) |
Unrealized appreciation (depreciation) on investments | | | – | | | | 11,651,390 | | | | 21,676,013 | | | | 121,330,530 | | | | (31,852,818 | ) |
Unrealized appreciation (depreciation) on swap, futures contracts and options contracts | | | – | | | | – | | | | (459,090 | ) | | | (2,047,882 | ) | | | – | |
Unrealized foreign exchange gain (loss) on other assets and liabilities | | | – | | | | – | | | | 23 | | | | – | | | | (710,193 | ) |
Accrued capital gains tax on unrealized appreciation (depreciation) | | | – | | | | – | | | | – | | | | – | | | | – | |
| | |
|
|
| |
|
|
| |
|
|
| |
|
|
| |
|
|
|
NET ASSETS | | $ | 159,905,370 | | | $ | 110,029,122 | | | $ | 487,156,914 | | | $ | 726,460,014 | | | $ | 785,634,917 | |
| | |
|
|
| |
|
|
| |
|
|
| |
|
|
| |
|
|
|
| | | | – | | | | – | | | | – | | | | – | | | | – | |
SHARES OF BENEFICIAL INTEREST: | | | | | | | | | | | | | | | | | | | | |
Authorized (Par value $0.01 per share) | | | 1,000,000,000 | | | | 1,000,000,000 | | | | 1,000,000,000 | | | | 1,000,000,000 | | | | 1,000,000,000 | |
Outstanding | | | 159,882,337 | | | | 7,185,139 | | | | 34,783,686 | | | | 39,153,350 | | | | 71,427,673 | |
NET ASSET VALUE, OFFERING AND REDEMPTION PRICE PER SHARE | | $ | 1.00 | | | $ | 15.31 | | | $ | 14.01 | | | $ | 18.55 | | | $ | 11.00 | |
| | |
|
|
| |
|
|
| |
|
|
| |
|
|
| |
|
|
|
* Cost | | | | | | | | | | | | | | | | | | | | |
Investments (unaffiliated) | | $ | 161,677,748 | | | $ | 119,849,970 | | | $ | 500,587,264 | | | $ | 592,868,315 | | | $ | 847,617,589 | |
| | |
|
|
| |
|
|
| |
|
|
| |
|
|
| |
|
|
|
Investments (affiliated) | | $ | – | | | $ | – | | | $ | – | | | $ | – | | | $ | – | |
| | |
|
|
| |
|
|
| |
|
|
| |
|
|
| |
|
|
|
Foreign cash | | $ | – | | | $ | – | | | $ | – | | | $ | – | | | $ | 1,724,177 | |
| | |
|
|
| |
|
|
| |
|
|
| |
|
|
| |
|
|
|
†Including securities on loan | | $ | – | | | $ | 19,953,510 | | | $ | 47,113,505 | | | $ | 4,095,900 | | | $ | 35,051,653 | |
| | |
|
|
| |
|
|
| |
|
|
| |
|
|
| |
|
|
|
See Notes to Financial Statements
116
VALIC Company II
STATEMENTS OF OPERATIONS — For the Year Ended August 31, 2015
| | | | | | | | | | | | | | | | | | | | |
| | | AGGRESSIVE
GROWTH
LIFESTYLE FUND | | | CAPITAL
APPRECIATION
FUND | | | CONSERVATIVE
GROWTH
LIFESTYLE FUND | | | CORE BOND
FUND | | | HIGH YIELD
BOND FUND | |
INVESTMENT INCOME: | | | | | | | | | | | | | | | | | | | | |
Dividends (unaffiliated) | | $ | – | | | $ | 1,037,473 | | | $ | – | | | $ | 105,871 | | | $ | 312,063 | |
Dividends (affiliated) | | | 9,518,459 | | | | – | | | | 8,434,095 | | | | – | | | | – | |
Securities lending income | | | – | | | | 2,277 | | | | – | | | | 115,422 | | | | 280,441 | |
Interest (unaffiliated) | | | – | | | | 93 | | | | – | | | | 28,863,813 | | | | 25,305,464 | |
| | |
|
|
| |
|
|
| |
|
|
| |
|
|
| |
|
|
|
Total investment income* | | | 9,518,459 | | | | 1,039,843 | | | | 8,434,095 | | | | 29,085,106 | | | | 25,897,968 | |
| | |
|
|
| |
|
|
| |
|
|
| |
|
|
| |
|
|
|
EXPENSES: | | | | | | | | | | | | | | | | | | | | |
Investment advisory and management fees | | | 526,620 | | | | 473,992 | | | | 331,237 | | | | 4,404,726 | | | | 2,683,023 | |
Administrative service fee | | | – | | | | 58,172 | | | | – | | | | 684,235 | | | | 293,403 | |
Shareholder services fee | | | – | | | | 215,451 | | | | – | | | | 2,534,204 | | | | 1,086,676 | |
Transfer agent fees and expenses | | | 1,527 | | | | 3,055 | | | | 1,527 | | | | 3,055 | | | | 3,055 | |
Custodian and accounting fees | | | 11,967 | | | | 18,793 | | | | 11,967 | | | | 81,892 | | | | 39,436 | |
Reports to shareholders | | | 71,570 | | | | 11,476 | | | | 44,678 | | | | 136,666 | | | | 57,764 | |
Audit and tax fees | | | 29,121 | | | | 32,287 | | | | 29,121 | | | | 44,257 | | | | 38,983 | |
Legal fees | | | 21,974 | | | | 9,115 | | | | 16,323 | | | | 36,760 | | | | 20,628 | |
Trustees’ fees and expenses | | | 43,631 | | | | 7,171 | | | | 27,423 | | | | 82,887 | | | | 35,742 | |
Interest expense | | | – | | | | 4 | | | | – | | | | – | | | | – | |
Other expenses | | | 12,968 | | | | 13,676 | | | | 12,482 | | | | 26,103 | | | | 20,811 | |
| | |
|
|
| |
|
|
| |
|
|
| |
|
|
| |
|
|
|
Total expenses before fee waivers, expense reimbursements, and fees paid indirectly | | | 719,378 | | | | 843,192 | | | | 474,758 | | | | 8,034,785 | | | | 4,279,521 | |
| | |
|
|
| |
|
|
| |
|
|
| |
|
|
| |
|
|
|
Fees waived and expenses reimbursed by investment advisor (Note 3) | | | (192,758 | ) | | | (110,660 | ) | | | (143,523 | ) | | | (229,444 | ) | | | (106,683 | ) |
Fees paid indirectly (Note 7) | | | – | | | | (8,178 | ) | | | – | | | | – | | | | – | |
| | |
|
|
| |
|
|
| |
|
|
| |
|
|
| |
|
|
|
Net expenses | | | 526,620 | | | | 724,354 | | | | 331,235 | | | | 7,805,341 | | | | 4,172,838 | |
| | |
|
|
| |
|
|
| |
|
|
| |
|
|
| |
|
|
|
Net investment income (loss) | | | 8,991,839 | | | | 315,489 | | | | 8,102,860 | | | | 21,279,765 | | | | 21,725,130 | |
| | |
|
|
| |
|
|
| |
|
|
| |
|
|
| |
|
|
|
NET REALIZED AND UNREALIZED GAIN (LOSS) ON INVESTMENTS AND FOREIGN CURRENCIES: | | | | | | | | | | | | | | | | | | | | |
Net realized gain (loss) on investments (unaffiliated)** | | | – | | | | 7,776,997 | | | | – | | | | 4,636,578 | | | | (6,186,294 | ) |
Net realized gain (loss) on investments (affiliated) | | | 21,614,246 | | | | – | | | | 8,507,162 | | | | – | | | | – | |
Net realized gain (loss) from capital gain distributions from underlying funds (affiliated) | | | 18,237,532 | | | | – | | | | 5,130,048 | | | | – | | | | – | |
Net realized gain (loss) on futures and swap contracts | | | – | | | | – | | | | – | | | | – | | | | 12,308 | |
Net realized foreign exchange gain (loss) on other assets and liabilities | | | – | | | | – | | | | – | | | | – | | | | 1,238,366 | |
Net increase from payment by affiliates (Note 3) | | | – | | | | – | | | | – | | | | – | | | | – | |
| | |
|
|
| |
|
|
| |
|
|
| |
|
|
| |
|
|
|
Net realized gain (loss) on investments and foreign currencies | | | 39,851,778 | | | | 7,776,997 | | | | 13,637,210 | | | | 4,636,578 | | | | (4,935,620 | ) |
| | |
|
|
| |
|
|
| |
|
|
| |
|
|
| |
|
|
|
Change in unrealized appreciation (depreciation) on investments (unaffiliated) | | | – | | | | (5,274,921 | ) | | | – | | | | (20,905,735 | ) | | | (26,121,675 | ) |
Change in unrealized appreciation (depreciation) on investments (affiliated) | | | (65,046,407 | ) | | | – | | | | (30,536,532 | ) | | | – | | | | – | |
Change in unrealized appreciation (depreciation) on futures and swap contracts | | | – | | | | – | | | | – | | | | – | | | | (77,508 | ) |
Change in unrealized foreign exchange gain (loss) on other assets and liabilities | | | – | | | | – | | | | – | | | | – | | | | 88,888 | |
Change in accrued capital gains tax on unrealized appreciation (depreciation) | | | – | | | | – | | | | – | | | | – | | | | – | |
| | |
|
|
| |
|
|
| |
|
|
| |
|
|
| |
|
|
|
Net unrealized gain (loss) on investments and foreign currencies | | | (65,046,407 | ) | | | (5,274,921 | ) | | | (30,536,532 | ) | | | (20,905,735 | ) | | | (26,110,295 | ) |
| | |
|
|
| |
|
|
| |
|
|
| |
|
|
| |
|
|
|
Net realized and unrealized gain (loss) on investments and foreign currencies | | | (25,194,629 | ) | | | 2,502,076 | | | | (16,899,322 | ) | | | (16,269,157 | ) | | | (31,045,915 | ) |
| | |
|
|
| |
|
|
| |
|
|
| |
|
|
| |
|
|
|
NET INCREASE (DECREASE) IN NET ASSETS RESULTING FROM OPERATIONS | | $ | (16,202,790 | ) | | $ | 2,817,565 | | | $ | (8,796,462 | ) | | $ | 5,010,608 | | | $ | (9,320,785 | ) |
| | |
|
|
| |
|
|
| |
|
|
| |
|
|
| |
|
|
|
* Net of foreign withholding taxes on interest and dividends of | | $ | – | | | $ | – | | | $ | – | | | $ | (1,352 | ) | | $ | 1,665 | |
| | |
|
|
| |
|
|
| |
|
|
| |
|
|
| |
|
|
|
** Net of foreign withholding taxes on capital gains of | | $ | – | | | $ | – | | | $ | – | | | $ | – | | | $ | – | |
| | |
|
|
| |
|
|
| |
|
|
| |
|
|
| |
|
|
|
See Notes to Financial Statements
117
VALIC Company II
STATEMENTS OF OPERATIONS — For the Year Ended August 31, 2015 — (continued)
| | | | | | | | | | | | | | | | | | | | |
| | | INTERNATIONAL
OPPORTUNITIES
FUND | | | LARGE CAP
VALUE FUND | | | MID CAP
GROWTH FUND | | | MID CAP
VALUE FUND | | | MODERATE
GROWTH
LIFESTYLE FUND | |
INVESTMENT INCOME: | | | | | | | | | | | | | | | | | | | | |
Dividends (unaffiliated) | | $ | 11,651,752 | | | $ | 4,033,239 | | | $ | 924,269 | | | $ | 12,511,294 | | | $ | – | |
Dividends (affiliated) | | | – | | | | – | | | | – | | | | – | | | | 16,553,017 | |
Securities lending income | | | 246,720 | | | | 5,544 | | | | 18,366 | | | | 94,327 | | | | – | |
Interest (unaffiliated) | | | 930 | | | | 2,393 | | | | – | | | | 37 | | | | – | |
| | |
|
|
| |
|
|
| |
|
|
| |
|
|
| |
|
|
|
Total investment income* | | | 11,899,402 | | | | 4,041,176 | | | | 942,635 | | | | 12,605,658 | | | | 16,553,017 | |
| | |
|
|
| |
|
|
| |
|
|
| |
|
|
| |
|
|
|
EXPENSES: | | | | | | | | | | | | | | | | | | | | |
Investment advisory and management fees | | | 4,807,761 | | | | 1,052,249 | | | | 1,186,799 | | | | 6,563,495 | | | | 817,442 | |
Administrative service fee | | | 397,217 | | | | 142,054 | | | | 107,209 | | | | 640,055 | | | | – | |
Shareholder services fee | | | 1,471,175 | | | | 526,124 | | | | 397,071 | | | | 2,370,575 | | | | – | |
Transfer agent fees and expenses | | | 2,293 | | | | 2,387 | | | | 2,673 | | | | 3,469 | | | | 1,527 | |
Custodian and accounting fees | | | 169,249 | | | | 15,189 | | | | 15,484 | | | | 64,857 | | | | 11,967 | |
Reports to shareholders | | | 78,636 | | | | 27,963 | | | | 21,005 | | | | 182,183 | | | | 110,141 | |
Audit and tax fees | | | 36,255 | | | | 32,198 | | | | 32,298 | | | | 34,189 | | | | 29,121 | |
Legal fees | | | 29,848 | | | | 12,681 | | | | 13,254 | | | | 34,079 | | | | 30,403 | |
Trustees’ fees and expenses | | | 49,007 | | | | 17,768 | | | | 13,215 | | | | 79,267 | | | | 67,722 | |
Interest expense | | | 139 | | | | 406 | | | | – | | | | – | | | | – | |
Other expenses | | | 99,118 | | | | 17,384 | | | | 16,528 | | | | 37,401 | | | | 17,164 | |
| | |
|
|
| |
|
|
| |
|
|
| |
|
|
| |
|
|
|
Total expenses before fee waivers, expense reimbursements, and fees paid indirectly | | | 7,140,698 | | | | 1,846,403 | | | | 1,805,536 | | | | 10,009,570 | | | | 1,085,487 | |
| | |
|
|
| |
|
|
| |
|
|
| |
|
|
| |
|
|
|
Fees waived and expenses reimbursed by investment advisor (Note 3) | | | (1,255,810 | ) | | | (141,716 | ) | | | (455,490 | ) | | | (57,473 | ) | | | (268,046 | ) |
Fees paid indirectly (Note 7) | | | (56,324 | ) | | | (24,537 | ) | | | (19,985 | ) | | | (3,036 | ) | | | – | |
| | |
|
|
| |
|
|
| |
|
|
| |
|
|
| |
|
|
|
Net expenses | | | 5,828,564 | | | | 1,680,150 | | | | 1,330,061 | | | | 9,949,061 | | | | 817,441 | |
| | |
|
|
| |
|
|
| |
|
|
| |
|
|
| |
|
|
|
Net investment income (loss) | | | 6,070,838 | | | | 2,361,026 | | | | (387,426 | ) | | | 2,656,597 | | | | 15,735,576 | |
| | |
|
|
| |
|
|
| |
|
|
| |
|
|
| |
|
|
|
NET REALIZED AND UNREALIZED GAIN (LOSS) ON INVESTMENTS AND FOREIGN CURRENCIES: | | | | | | | | | | | | | | | | | | | | |
Net realized gain (loss) on investments (unaffiliated)** | | | (282,587 | ) | | | 31,300,746 | | | | 8,030,479 | | | | 127,970,531 | | | | – | |
Net realized gain (loss) on investments (affiliated) | | | – | | | | – | | | | – | | | | – | | | | 25,169,573 | |
Net realized gain (loss) from capital gain distributions from underlying funds (affiliated) | | | – | | | | – | | | | – | | | | – | | | | 21,634,471 | |
Net realized gain (loss) on futures and swap contracts | | | – | | | | – | | | | – | | | | – | | | | – | |
Net realized foreign exchange gain (loss) on other assets and liabilities | | | (371,718 | ) | | | (266 | ) | | | – | | | | (19,297 | ) | | | – | |
Net increase from payment by affiliates (Note 3) | | | – | | | | – | | | | – | | | | – | | | | – | |
| | |
|
|
| |
|
|
| |
|
|
| |
|
|
| |
|
|
|
Net realized gain (loss) on investments and foreign currencies | | | (654,305 | ) | | | 31,300,480 | | | | 8,030,479 | | | | 127,951,234 | | | | 46,804,044 | |
| | |
|
|
| |
|
|
| |
|
|
| |
|
|
| |
|
|
|
Change in unrealized appreciation (depreciation) on investments (unaffiliated) | | | (12,843,571 | ) | | | (36,780,637 | ) | | | (5,236,025 | ) | | | (166,475,203 | ) | | | – | |
Change in unrealized appreciation (depreciation) on investments (affiliated) | | | – | | | | – | | | | – | | | | – | | | | (84,010,113 | ) |
Change in unrealized appreciation (depreciation) on futures and swap contracts | | | – | | | | – | | | | – | | | | – | | | | – | |
Change in unrealized foreign exchange gain (loss) on other assets and liabilities | | | (51,726 | ) | | | – | | | | – | | | | (1,427 | ) | | | – | |
Change in accrued capital gains tax on unrealized appreciation (depreciation) | | | 123,541 | | | | – | | | | – | | | | – | | | | – | |
| | |
|
|
| |
|
|
| |
|
|
| |
|
|
| |
|
|
|
Net unrealized gain (loss) on investments and foreign currencies | | | (12,771,756 | ) | | | (36,780,637 | ) | | | (5,236,025 | ) | | | (166,476,630 | ) | | | (84,010,113 | ) |
| | |
|
|
| |
|
|
| |
|
|
| |
|
|
| |
|
|
|
Net realized and unrealized gain (loss) on investments and foreign currencies | | | (13,426,061 | ) | | | (5,480,157 | ) | | | 2,794,454 | | | | (38,525,396 | ) | | | (37,206,069 | ) |
| | |
|
|
| |
|
|
| |
|
|
| |
|
|
| |
|
|
|
NET INCREASE (DECREASE) IN NET ASSETS RESULTING FROM OPERATIONS | | $ | (7,355,223 | ) | | $ | (3,119,131 | ) | | $ | 2,407,028 | | | $ | (35,868,799 | ) | | $ | (21,470,493 | ) |
| | |
|
|
| |
|
|
| |
|
|
| |
|
|
| |
|
|
|
* Net of foreign withholding taxes on interest and dividends of | | $ | 820,679 | | | $ | 18,317 | | | $ | 604 | | | $ | 134,074 | | | $ | – | |
| | |
|
|
| |
|
|
| |
|
|
| |
|
|
| |
|
|
|
** Net of foreign withholding taxes on capital gains of | | $ | 54,475 | | | $ | – | | | $ | – | | | $ | – | | | $ | – | |
| | |
|
|
| |
|
|
| |
|
|
| |
|
|
| |
|
|
|
See Notes to Financial Statements
118
VALIC Company II
STATEMENTS OF OPERATIONS — For the Year Ended August 31, 2015 — (continued)
| | | | | | | | | | | | | | | | | | | | |
| | | MONEY
MARKET II
FUND | | | SMALL CAP
GROWTH
FUND | | | SMALL CAP
VALUE FUND | | | SOCIALLY
RESPONSIBLE
FUND | | | STRATEGIC
BOND FUND | |
INVESTMENT INCOME: | | | | | | | | | | | | | | | | | | | | |
Dividends (unaffiliated) | | $ | – | | | $ | 480,555 | | | $ | 10,291,924 | | | $ | 13,897,973 | | | $ | 154,672 | |
Dividends (affiliated) | | | – | | | | – | | | | – | | | | – | | | | – | |
Securities lending income | | | – | | | | 568,668 | | | | 468,229 | | | | 64,241 | | | | 287,310 | |
Interest (unaffiliated) | | | 260,224 | | | | 176 | | | | 146 | | | | 4,804 | | | | 35,511,785 | |
| | |
|
|
| |
|
|
| |
|
|
| |
|
|
| |
|
|
|
Total investment income* | | | 260,224 | | | | 1,049,399 | | | | 10,760,299 | | | | 13,967,018 | | | | 35,953,767 | |
| | |
|
|
| |
|
|
| |
|
|
| |
|
|
| |
|
|
|
EXPENSES: | | | | | | | | | | | | | | | | | | | | |
Investment advisory and management fees | | | 407,022 | | | | 973,453 | | | | 3,596,400 | | | | 1,826,138 | | | | 4,009,578 | |
Administrative service fee | | | 109,896 | | | | 77,916 | | | | 368,280 | | | | 493,057 | | | | 533,937 | |
Shareholder services fee | | | 407,022 | | | | 288,579 | | | | 1,364,000 | | | | 1,826,138 | | | | 1,977,544 | |
Transfer agent fees and expenses | | | 1,146 | | | | 3,055 | | | | 2,673 | | | | 1,559 | | | | 4,264 | |
Custodian and accounting fees | | | 12,663 | | | | 16,188 | | | | 62,055 | | | | 25,516 | | | | 109,910 | |
Reports to shareholders | | | 21,427 | | | | 15,443 | | | | 73,637 | | | | 100,734 | | | | 107,708 | |
Audit and tax fees | | | 38,156 | | | | 32,383 | | | | 33,040 | | | | 32,996 | | | | 44,255 | |
Legal fees | | | 12,366 | | | | 9,998 | | | | 22,283 | | | | 28,764 | | | | 29,790 | |
Trustees’ fees and expenses | | | 13,484 | | | | 9,305 | | | | 45,875 | | | | 59,865 | | | | 65,509 | |
Interest expense | | | – | | | | – | | | | – | | | | – | | | | – | |
Other expenses | | | 14,040 | | | | 15,984 | | | | 34,105 | | | | 27,950 | | | | 27,658 | |
| | |
|
|
| |
|
|
| |
|
|
| |
|
|
| |
|
|
|
Total expenses before fee waivers, expense reimbursements, and fees paid indirectly | | | 1,037,222 | | | | 1,442,304 | | | | 5,602,348 | | | | 4,422,717 | | | | 6,910,153 | |
| | |
|
|
| |
|
|
| |
|
|
| |
|
|
| |
|
|
|
Fees waived and expenses reimbursed by investment advisor (Note 3) | | | (793,297 | ) | | | (103,294 | ) | | | (419,148 | ) | | | (332,169 | ) | | | – | |
Fees paid indirectly (Note 7) | | | – | | | | (6,995 | ) | | | (18,972 | ) | | | – | | | | – | |
| | |
|
|
| |
|
|
| |
|
|
| |
|
|
| |
|
|
|
Net expenses | | | 243,925 | | | | 1,332,015 | | | | 5,164,228 | | | | 4,090,548 | | | | 6,910,153 | |
| | |
|
|
| |
|
|
| |
|
|
| |
|
|
| |
|
|
|
Net investment income (loss) | | | 16,299 | | | | (282,616 | ) | | | 5,596,071 | | | | 9,876,470 | | | | 29,043,614 | |
| | |
|
|
| |
|
|
| |
|
|
| |
|
|
| |
|
|
|
NET REALIZED AND UNREALIZED GAIN (LOSS) ON INVESTMENTS AND FOREIGN CURRENCIES: | | | | | | | | | | | | | | | | | | | | |
Net realized gain (loss) on investments (unaffiliated)** | | | 3,813 | | | | 11,007,459 | | | | 57,142,877 | | | | 69,548,035 | | | | (8,990,726 | ) |
Net realized gain (loss) on investments (affiliated) | | | – | | | | – | | | | – | | | | – | | | | – | |
Net realized gain (loss) from capital gain distributions from underlying funds (affiliated) | | | – | | | | – | | | | – | | | | – | | | | – | |
Net realized gain (loss) on futures and swap contracts | | | – | | | | – | | | | 217,017 | | | | 3,479,829 | | | | – | |
Net realized foreign exchange gain (loss) on other assets and liabilities | | | – | | | | – | | | | (539 | ) | | | – | | | | 7,446,661 | |
Net increase from payment by affiliates (Note 3) | | | 273,451 | | | | – | | | | – | | | | – | | | | – | |
| | |
|
|
| |
|
|
| |
|
|
| |
|
|
| |
|
|
|
Net realized gain (loss) on investments and foreign currencies | | | 277,264 | | | | 11,007,459 | | | | 57,359,355 | | | | 73,027,864 | | | | (1,544,065 | ) |
| | |
|
|
| |
|
|
| |
|
|
| |
|
|
| |
|
|
|
Change in unrealized appreciation (depreciation) on investments (unaffiliated) | | | – | | | | (4,864,720 | ) | | | (78,622,085 | ) | | | (74,589,608 | ) | | | (44,817,577 | ) |
Change in unrealized appreciation (depreciation) on investments (affiliated) | | | – | | | | – | | | | – | | | | – | | | | – | |
Change in unrealized appreciation (depreciation) on futures and swap contracts | | | – | | | | – | | | | (518,606 | ) | | | (2,708,171 | ) | | | – | |
Change in unrealized foreign exchange gain (loss) on other assets and liabilities | | | – | | | | – | | | | 12 | | | | – | | | | (683,639 | ) |
Change in accrued capital gains tax on unrealized appreciation (depreciation) | | | – | | | | – | | | | – | | | | – | | | | – | |
| | |
|
|
| |
|
|
| |
|
|
| |
|
|
| |
|
|
|
Net unrealized gain (loss) on investments and foreign currencies | | | – | | | | (4,864,720 | ) | | | (79,140,679 | ) | | | (77,297,779 | ) | | | (45,501,216 | ) |
| | |
|
|
| |
|
|
| |
|
|
| |
|
|
| |
|
|
|
Net realized and unrealized gain (loss) on investments and foreign currencies | | | 277,264 | | | | 6,142,739 | | | | (21,781,324 | ) | | | (4,269,915 | ) | | | (47,045,281 | ) |
| | |
|
|
| |
|
|
| |
|
|
| |
|
|
| |
|
|
|
NET INCREASE (DECREASE) IN NET ASSETS RESULTING FROM OPERATIONS | | $ | 293,563 | | | $ | 5,860,123 | | | $ | (16,185,253 | ) | | $ | 5,606,555 | | | $ | (18,001,667 | ) |
| | |
|
|
| |
|
|
| |
|
|
| |
|
|
| |
|
|
|
* Net of foreign withholding taxes on interest and dividends of | | $ | – | | | $ | – | | | $ | 20,747 | | | $ | 3,489 | | | $ | (1,094 | ) |
| | |
|
|
| |
|
|
| |
|
|
| |
|
|
| |
|
|
|
** Net of foreign withholding taxes on capital gains of | | $ | – | | | $ | – | | | $ | – | | | $ | – | | | $ | – | |
| | |
|
|
| |
|
|
| |
|
|
| |
|
|
| |
|
|
|
See Notes to Financial Statements
119
VALIC Company II
STATEMENTS OF CHANGES IN NET ASSETS
| | | | | | | | | | | | | | | | | | | | | | | | | | | | | | | | |
| | | AGGRESSIVE GROWTH
LIFESTYLE FUND
| | | CAPITAL APPRECIATION
FUND
| | | CONSERVATIVE GROWTH
LIFESTYLE FUND
| | | CORE BOND
FUND
| |
| | | For the
Year Ended
August 31,
2015
| | | For the
Year Ended
August 31,
2014
| | | For the
Year Ended
August 31,
2015
| | | For the
Year Ended
August 31,
2014
| | | For the
Year Ended
August 31,
2015
| | | For the
Year Ended
August 31,
2014
| | | For the
Year Ended
August 31,
2015
| | | For the
Year Ended
August 31,
2014
| |
INCREASE (DECREASE) IN NET ASSETS | | | | | | | | | | | | | | | | | | | | | | | | | | | | | | | | |
OPERATIONS: | | | | | | | | | | | | | | | | | | | | | | | | | | | | | | | | |
Net investment income (loss) | | $ | 8,991,839 | | | $ | 7,266,347 | | | $ | 315,489 | | | $ | 255,143 | | | $ | 8,102,860 | | | $ | 6,625,902 | | | $ | 21,279,765 | | | $ | 19,972,850 | |
Net realized gain (loss) on investments and foreign currencies | | | 39,851,778 | | | | 40,365,176 | | | | 7,776,997 | | | | 9,294,789 | | | | 13,637,210 | | | | 14,720,914 | | | | 4,636,578 | | | | 5,232,221 | |
Net unrealized gain (loss) on investments and foreign currencies | | | (65,046,407 | ) | | | 30,661,574 | | | | (5,274,921 | ) | | | 7,595,048 | | | | (30,536,532 | ) | | | 14,470,364 | | | | (20,905,735 | ) | | | 30,471,351 | |
| | |
|
|
| |
|
|
| |
|
|
| |
|
|
| |
|
|
| |
|
|
| |
|
|
| |
|
|
|
Net increase (decrease) in net assets resulting from operations | | | (16,202,790 | ) | | | 78,293,097 | | | | 2,817,565 | | | | 17,144,980 | | | | (8,796,462 | ) | | | 35,817,180 | | | | 5,010,608 | | | | 55,676,422 | |
| | |
|
|
| |
|
|
| |
|
|
| |
|
|
| |
|
|
| |
|
|
| |
|
|
| |
|
|
|
DISTRIBUTIONS TO SHAREHOLDERS FROM: | | | | | | | | | | | | | | | | | | | | | | | | | | | | | | | | |
Net investment income | | | (8,425,229 | ) | | | (4,505,168 | ) | | | (272,960 | ) | | | (366,049 | ) | | | (7,273,159 | ) | | | (5,887,996 | ) | | | (21,848,211 | ) | | | (17,230,746 | ) |
Net realized gain on securities | | | (37,983,763 | ) | | | (4,182,865 | ) | | | – | | | | – | | | | (14,630,677 | ) | | | (7,929,644 | ) | | | – | | | | (6,638,175 | ) |
| | |
|
|
| |
|
|
| |
|
|
| |
|
|
| |
|
|
| |
|
|
| |
|
|
| |
|
|
|
Total distributions to shareholders | | | (46,408,992 | ) | | | (8,688,033 | ) | | | (272,960 | ) | | | (366,049 | ) | | | (21,903,836 | ) | | | (13,817,640 | ) | | | (21,848,211 | ) | | | (23,868,921 | ) |
| | |
|
|
| |
|
|
| |
|
|
| |
|
|
| |
|
|
| |
|
|
| |
|
|
| |
|
|
|
Net increase (decrease) in net assets resulting from capital share transactions (Note 6) | | | 59,388,848 | | | | 43,375,246 | | | | (7,797,869 | ) | | | 340,301 | | | | 33,733,531 | | | | 38,403,796 | | | | 135,941,613 | | | | 142,107,878 | |
| | |
|
|
| |
|
|
| |
|
|
| |
|
|
| |
|
|
| |
|
|
| |
|
|
| |
|
|
|
TOTAL INCREASE (DECREASE) IN NET ASSETS | | | (3,222,934 | ) | | | 112,980,310 | | | | (5,253,264 | ) | | | 17,119,232 | | | | 3,033,233 | | | | 60,403,336 | | | | 119,104,010 | | | | 173,915,379 | |
NET ASSETS: | | | | | | | | | | | | | | | | | | | | | | | | | | | | | | | | |
Beginning of period | | | 512,112,986 | | | | 399,132,676 | | | | 87,213,995 | | | | 70,094,763 | | | | 322,763,771 | | | | 262,360,435 | | | | 946,698,881 | | | | 772,783,502 | |
| | |
|
|
| |
|
|
| |
|
|
| |
|
|
| |
|
|
| |
|
|
| |
|
|
| |
|
|
|
End of period† | | $ | 508,890,052 | | | $ | 512,112,986 | | | $ | 81,960,731 | | | $ | 87,213,995 | | | $ | 325,797,004 | | | $ | 322,763,771 | | | $ | 1,065,802,891 | | | $ | 946,698,881 | |
| | |
|
|
| |
|
|
| |
|
|
| |
|
|
| |
|
|
| |
|
|
| |
|
|
| |
|
|
|
† Includes accumulated undistributed net investment income (loss) of | | $ | 10,732,462 | | | $ | 8,420,125 | | | $ | 312,853 | | | $ | 270,269 | | | $ | 8,949,690 | | | $ | 7,269,682 | | | $ | 23,521,691 | | | $ | 21,877,895 | |
| | |
|
|
| |
|
|
| |
|
|
| |
|
|
| |
|
|
| |
|
|
| |
|
|
| |
|
|
|
See Notes to Financial Statements
120
VALIC Company II
STATEMENTS OF CHANGES IN NET ASSETS — (continued)
| | | | | | | | | | | | | | | | | | | | | | | | | | | | | | | | |
| | | HIGH YIELD BOND FUND
| | | INTERNATIONAL
OPPORTUNITIES FUND
| | | LARGE CAP VALUE FUND
| | | MID CAP GROWTH FUND
| |
| | | For the
Year Ended
August 31,
2015
| | | For the
Year Ended
August 31,
2014
| | | For the
Year Ended
August 31,
2015
| | | For the
Year Ended
August 31,
2014
| | | For the
Year Ended
August 31,
2015
| | | For the
Year Ended
August 31,
2014
| | | For the
Year Ended
August 31,
2015
| | | For the
Year Ended
August 31,
2014
| |
INCREASE (DECREASE) IN NET ASSETS | | | | | | | | | | | | | | | | | | | | | | | | | | | | | | | | |
OPERATIONS: | | | | | | | | | | | | | | | | | | | | | | | | | | | | | | | | |
Net investment income (loss) | | $ | 21,725,130 | | | $ | 20,878,918 | | | $ | 6,070,838 | | | $ | 6,049,714 | | | $ | 2,361,026 | | | $ | 2,754,960 | | | $ | (387,426 | ) | | $ | (702,251 | ) |
Net realized gain (loss) on investments and foreign currencies | | | (4,935,620 | ) | | | 2,708,958 | | | | (654,305 | ) | | | 52,160,268 | | | | 31,300,480 | | | | 24,613,024 | | | | 8,030,479 | | | | 24,004,493 | |
Net unrealized gain (loss) on investments and foreign currencies | | | (26,110,295 | ) | | | 10,455,035 | | | | (12,771,756 | ) | | | 13,692,136 | | | | (36,780,637 | ) | | | 14,546,846 | | | | (5,236,025 | ) | | | (4,477,511 | ) |
| | |
|
|
| |
|
|
| |
|
|
| |
|
|
| |
|
|
| |
|
|
| |
|
|
| |
|
|
|
Net increase (decrease) in net assets resulting from operations | | | (9,320,785 | ) | | | 34,042,911 | | | | (7,355,223 | ) | | | 71,902,118 | | | | (3,119,131 | ) | | | 41,914,830 | | | | 2,407,028 | | | | 18,824,731 | |
| | |
|
|
| |
|
|
| |
|
|
| |
|
|
| |
|
|
| |
|
|
| |
|
|
| |
|
|
|
DISTRIBUTIONS TO SHAREHOLDERS FROM: | | | | | | | | | | | | | | | | | | | | | | | | | | | | | | | | |
Net investment income | | | (21,285,525 | ) | | | (19,808,145 | ) | | | (7,671,663 | ) | | | (7,277,253 | ) | | | (2,722,460 | ) | | | (2,408,346 | ) | | | – | | | | (105,680 | ) |
Net realized gain on securities | | | – | | | | – | | | | – | | | | – | | | | – | | | | – | | | | (23,091,400 | ) | | | (13,615,676 | ) |
| | |
|
|
| |
|
|
| |
|
|
| |
|
|
| |
|
|
| |
|
|
| |
|
|
| |
|
|
|
Total distributions to shareholders | | | (21,285,525 | ) | | | (19,808,145 | ) | | | (7,671,663 | ) | | | (7,277,253 | ) | | | (2,722,460 | ) | | | (2,408,346 | ) | | | (23,091,400 | ) | | | (13,721,356 | ) |
| | |
|
|
| |
|
|
| |
|
|
| |
|
|
| |
|
|
| |
|
|
| |
|
|
| |
|
|
|
Net increase (decrease) in net assets resulting from capital share transactions (Note 6) | | | 79,002,086 | | | | 64,473,241 | | | | 24,697,553 | | | | (2,497,342 | ) | | | (22,009,185 | ) | | | (6,561,412 | ) | | | 11,702,600 | | | | 25,584,912 | |
| | |
|
|
| |
|
|
| |
|
|
| |
|
|
| |
|
|
| |
|
|
| |
|
|
| |
|
|
|
TOTAL INCREASE (DECREASE) IN NET ASSETS | | | 48,395,776 | | | | 78,708,007 | | | | 9,670,667 | | | | 62,127,523 | | | | (27,850,776 | ) | | | 32,945,072 | | | | (8,981,772 | ) | | | 30,688,287 | |
NET ASSETS: | | | | | | | | | | | | | | | | | | | | | | | | | | | | | | | | |
Beginning of period | | | 420,458,727 | | | | 341,750,720 | | | | 586,630,625 | | | | 524,503,102 | | | | 221,452,738 | | | | 188,507,666 | | | | 163,272,764 | | | | 132,584,477 | |
| | |
|
|
| |
|
|
| |
|
|
| |
|
|
| |
|
|
| |
|
|
| |
|
|
| |
|
|
|
End of period† | | $ | 468,854,503 | | | $ | 420,458,727 | | | $ | 596,301,292 | | | $ | 586,630,625 | | | $ | 193,601,962 | | | $ | 221,452,738 | | | $ | 154,290,992 | | | $ | 163,272,764 | |
| | |
|
|
| |
|
|
| |
|
|
| |
|
|
| |
|
|
| |
|
|
| |
|
|
| |
|
|
|
† Includes accumulated undistributed net investment income (loss) of | | $ | 22,676,199 | | | $ | 21,045,526 | | | $ | 3,066,471 | | | $ | 4,866,863 | | | $ | 2,423,104 | | | $ | 2,784,804 | | | $ | (441,272 | ) | | $ | (581,977 | ) |
| | |
|
|
| |
|
|
| |
|
|
| |
|
|
| |
|
|
| |
|
|
| |
|
|
| |
|
|
|
See Notes to Financial Statements
121
VALIC Company II
STATEMENTS OF CHANGES IN NET ASSETS — (continued)
| | | | | | | | | | | | | | | | | | | | | | | | | | | | | | | | |
| | | MID CAP VALUE FUND
| | | MODERATE GROWTH
LIFESTYLE FUND
| | | MONEY MARKET II FUND
| | | SMALL CAP GROWTH FUND
| |
| | | For the
Year Ended
August 31,
2015
| | | For the
Year Ended
August 31,
2014
| | | For the
Year Ended
August 31,
2015
| | | For the
Year Ended
August 31,
2014
| | | For the
Year Ended
August 31,
2015
| | | For the
Year Ended
August 31,
2014
| | | For the
Year Ended
August 31,
2015
| | | For the
Year Ended
August 31,
2014
| |
INCREASE (DECREASE) IN NET ASSETS | | | | | | | | | | | | | | | | | | | | | | | | | | | | | | | | |
OPERATIONS: | | | | | | | | | | | | | | | | | | | | | | | | | | | | | | | | |
Net investment income (loss) | | $ | 2,656,597 | | | $ | 2,075,776 | | | $ | 15,735,576 | | | $ | 13,141,023 | | | $ | 16,299 | | | $ | 18,269 | | | $ | (282,616 | ) | | $ | (952,646 | ) |
Net realized gain (loss) on investments and foreign currencies | | | 127,951,234 | | | | 93,532,985 | | | | 46,804,044 | | | | 49,550,508 | | | | 277,264 | | | | 3,813 | | | | 11,007,459 | | | | 12,662,998 | |
Net unrealized gain (loss) on investments and foreign currencies | | | (166,476,630 | ) | | | 103,385,564 | | | | (84,010,113 | ) | | | 42,200,607 | | | | – | | | | – | | | | (4,864,720 | ) | | | (1,491,826 | ) |
| | |
|
|
| |
|
|
| |
|
|
| |
|
|
| |
|
|
| |
|
|
| |
|
|
| |
|
|
|
Net increase (decrease) in net assets resulting from operations | | | (35,868,799 | ) | | | 198,994,325 | | | | (21,470,493 | ) | | | 104,892,138 | | | | 293,563 | | | | 22,082 | | | | 5,860,123 | | | | 10,218,526 | |
| | |
|
|
| |
|
|
| |
|
|
| |
|
|
| |
|
|
| |
|
|
| |
|
|
| |
|
|
|
DISTRIBUTIONS TO SHAREHOLDERS FROM: | | | | | | | | | | | | | | | | | | | | | | | | | | | | | | | | |
Net investment income | | | (1,930,590 | ) | | | (2,838,127 | ) | | | (14,788,242 | ) | | | (9,639,062 | ) | | | (16,299 | ) | | | (18,269 | ) | | | – | | | | – | |
Net realized gain on securities | | | (92,970,632 | ) | | | (56,626,113 | ) | | | (46,494,498 | ) | | | (18,691,684 | ) | | | – | | | | – | | | | (12,307,025 | ) | | | (9,287,508 | ) |
| | |
|
|
| |
|
|
| |
|
|
| |
|
|
| |
|
|
| |
|
|
| |
|
|
| |
|
|
|
Total distributions to shareholders | | | (94,901,222 | ) | | | (59,464,240 | ) | | | (61,282,740 | ) | | | (28,330,746 | ) | | | (16,299 | ) | | | (18,269 | ) | | | (12,307,025 | ) | | | (9,287,508 | ) |
| | |
|
|
| |
|
|
| |
|
|
| |
|
|
| |
|
|
| |
|
|
| |
|
|
| |
|
|
|
Net increase (decrease) in net assets resulting from capital share transactions (Note 6) | | | 87,759,775 | | | | (29,550,216 | ) | | | 82,676,287 | | | | 115,774,643 | | | | (10,947,206 | ) | | | (15,238,959 | ) | | | 2,568,967 | | | | 10,950,877 | |
| | |
|
|
| |
|
|
| |
|
|
| |
|
|
| |
|
|
| |
|
|
| |
|
|
| |
|
|
|
TOTAL INCREASE (DECREASE) IN NET ASSETS | | | (43,010,246 | ) | | | 109,979,869 | | | | (76,946 | ) | | | 192,336,035 | | | | (10,669,942 | ) | | | (15,235,146 | ) | | | (3,877,935 | ) | | | 11,881,895 | |
NET ASSETS: | | | | | | | | | | | | | | | | | | | | | | | | | | | | | | | | |
Beginning of period | | | 969,590,554 | | | | 859,610,685 | | | | 798,521,025 | | | | 606,184,990 | | | | 170,575,312 | | | | 185,810,458 | | | | 113,907,057 | | | | 102,025,162 | |
| | |
|
|
| |
|
|
| |
|
|
| |
|
|
| |
|
|
| |
|
|
| |
|
|
| |
|
|
|
End of period† | | $ | 926,580,308 | | | $ | 969,590,554 | | | $ | 798,444,079 | | | $ | 798,521,025 | | | $ | 159,905,370 | | | $ | 170,575,312 | | | $ | 110,029,122 | | | $ | 113,907,057 | |
| | |
|
|
| |
|
|
| |
|
|
| |
|
|
| |
|
|
| |
|
|
| |
|
|
| |
|
|
|
† Includes accumulated undistributed net investment income (loss) of | | $ | 2,691,890 | | | $ | 2,090,378 | | | $ | 18,164,593 | | | $ | 14,780,356 | | | $ | (5,309 | ) | | $ | (5,309 | ) | | $ | (146,258 | ) | | $ | (599,835 | ) |
| | |
|
|
| |
|
|
| |
|
|
| |
|
|
| |
|
|
| |
|
|
| |
|
|
| |
|
|
|
See Notes to Financial Statements
122
VALIC Company II
STATEMENTS OF CHANGES IN NET ASSETS — (continued)
| | | | | | | | | | | | | | | | | | | | | | | | |
| | | SMALL CAP VALUE FUND
| | | SOCIALLY RESPONSIBLE FUND
| | | STRATEGIC BOND FUND
| |
| | | For the
Year Ended
August 31,
2015
| | | For the
Year Ended
August 31,
2014
| | | For the
Year Ended
August 31,
2015
| | | For the
Year Ended
August 31,
2014
| | | For the
Year Ended
August 31,
2015
| | | For the
Year Ended
August 31,
2014
| |
INCREASE (DECREASE) IN NET ASSETS | | | | | | | | | | | | | | | | | | | | | | | | |
OPERATIONS: | | | | | | | | | | | | | | | | | | | | | | | | |
Net investment income (loss) | | $ | 5,596,071 | | | $ | 2,987,328 | | | $ | 9,876,470 | | | $ | 8,252,065 | | | $ | 29,043,614 | | | $ | 29,797,722 | |
Net realized gain (loss) on investments and foreign currencies | | | 57,359,355 | | | | 70,154,050 | | | | 73,027,864 | | | | 59,138,385 | | | | (1,544,065 | ) | | | 6,453,534 | |
Net unrealized gain (loss) on investments and foreign currencies | | | (79,140,679 | ) | | | 17,689,920 | | | | (77,297,779 | ) | | | 82,346,790 | | | | (45,501,216 | ) | | | 32,063,862 | |
| | |
|
|
| |
|
|
| |
|
|
| |
|
|
| |
|
|
| |
|
|
|
Net increase (decrease) in net assets resulting from operations | | | (16,185,253 | ) | | | 90,831,298 | | | | 5,606,555 | | | | 149,737,240 | | | | (18,001,667 | ) | | | 68,315,118 | |
| | |
|
|
| |
|
|
| |
|
|
| |
|
|
| |
|
|
| |
|
|
|
DISTRIBUTIONS TO SHAREHOLDERS FROM: | | | | | | | | | | | | | | | | | | | | | | | | |
Net investment income | | | (3,145,608 | ) | | | (5,081,303 | ) | | | (8,278,684 | ) | | | (8,877,502 | ) | | | (28,288,148 | ) | | | (27,105,883 | ) |
Net realized gain on securities | | | (69,462,612 | ) | | | (54,119,437 | ) | | | – | | | | – | | | | (7,182,384 | ) | | | (7,156,730 | ) |
| | |
|
|
| |
|
|
| |
|
|
| |
|
|
| |
|
|
| |
|
|
|
Total distributions to shareholders | | | (72,608,220 | ) | | | (59,200,740 | ) | | | (8,278,684 | ) | | | (8,877,502 | ) | | | (35,470,532 | ) | | | (34,262,613 | ) |
| | |
|
|
| |
|
|
| |
|
|
| |
|
|
| |
|
|
| |
|
|
|
Net increase (decrease) in net assets resulting from capital share transactions (Note 6) | | | 17,780,355 | | | | 19,173,971 | | | | 49,897,512 | | | | (40,997,190 | ) | | | 84,015,260 | | | | 31,636,802 | |
| | |
|
|
| |
|
|
| |
|
|
| |
|
|
| |
|
|
| |
|
|
|
TOTAL INCREASE (DECREASE) IN NET ASSETS | | | (71,013,118 | ) | | | 50,804,529 | | | | 47,225,383 | | | | 99,862,548 | | | | 30,543,061 | | | | 65,689,307 | |
NET ASSETS: | | | | | | | | | | | | | | | | | | | | | | | | |
Beginning of period | | | 558,170,032 | | | | 507,365,503 | | | | 679,234,631 | | | | 579,372,083 | | | | 755,091,856 | | | | 689,402,549 | |
| | |
|
|
| |
|
|
| |
|
|
| |
|
|
| |
|
|
| |
|
|
|
End of period† | | $ | 487,156,914 | | | $ | 558,170,032 | | | $ | 726,460,014 | | | $ | 679,234,631 | | | $ | 785,634,917 | | | $ | 755,091,856 | |
| | |
|
|
| |
|
|
| |
|
|
| |
|
|
| |
|
|
| |
|
|
|
† Includes accumulated undistributed net investment income (loss) of | | $ | 5,782,520 | | | $ | 2,561,908 | | | $ | 9,947,965 | | | $ | 8,341,402 | | | $ | 31,439,551 | | | $ | 28,340,832 | |
| | |
|
|
| |
|
|
| |
|
|
| |
|
|
| |
|
|
| |
|
|
|
See Notes to Financial Statements
123
VALIC Company II
NOTES TO FINANCIAL STATEMENTS
Note 1 — Organization
VALIC Company II (the “Series” or “VC II”) was organized as a Delaware business trust on May 6, 1998, by The Variable Annuity Life Insurance Company (“VALIC” or the “Adviser”). VALIC, the investment adviser to VC II, is an indirect wholly-owned subsidiary of American International Group, Inc. (“AIG”). VC II is registered under the Investment Company Act of 1940, as amended (the “1940 Act”), as an open-end, management investment company. The Series consists of 15 separate mutual funds (collectively the “Funds” or each a “Fund”), each of which issues its own class of shares of beneficial interest:
| | |
| Aggressive Growth Lifestyle Fund* | | Mid Cap Value Fund |
| Capital Appreciation Fund | | Moderate Growth Lifestyle Fund* |
| Conservative Growth Lifestyle Fund* | | Money Market II Fund |
| Core Bond Fund | | Small Cap Growth Fund |
| High Yield Bond Fund | | Small Cap Value Fund |
| International Opportunities Fund | | Socially Responsible Fund |
| Large Cap Value Fund | | Strategic Bond Fund |
| Mid Cap Growth Fund | | |
| * | The Lifestyle Funds represent “Fund of Funds” which invest in either the VALIC Company I (“VC I”) or VC II mutual funds. |
Each Fund is diversified as defined by the 1940 Act.
Indemnifications. Under VC II’s organizational documents, its officers and trustees are indemnified against certain liabilities arising out of the performance of their duties to the Funds. In addition, in the normal course of business, VC II enters into contracts that contain the obligation to indemnify others. The Funds’ maximum exposure under these arrangements is unknown. Currently, however, VC II expects the risk of loss to be remote.
Note 2 — Significant Accounting Policies
The preparation of financial statements in accordance with U.S. generally accepted accounting principles (“GAAP”) requires management to make estimates and assumptions that affect the reported amounts and disclosures in the financial statements. Actual results could differ from those estimates and those differences could be significant. The following is a summary of significant accounting policies consistently followed by the Series in the preparation of its financial statements:
A. Security Valuation
In accordance with the authoritative guidance on fair value measurements and disclosures under GAAP, the Funds disclose the fair value of their investments in a hierarchy that prioritizes the inputs to valuation techniques used to measure the fair value. In accordance with GAAP, fair value is defined as the price that the Funds would receive upon selling an asset or transferring a liability in a timely transaction to an independent third party in the principal or most advantageous market. GAAP establishes a three-tier hierarchy to provide more transparency around the inputs used to measure fair value and to establish classification of fair value measurements for disclosure purposes. Inputs refer broadly to the assumptions that market participants would use in pricing the asset or liability, including assumptions about risk. Inputs may be observable or unobservable. Observable inputs are inputs that reflect the assumptions market participants would use in pricing the asset or liability developed based on market data obtained from sources independent of the reporting entity. Unobservable inputs are inputs that reflect the reporting entity’s own assumptions about the assumptions market participants would use in pricing the asset or liability developed based on the best information available in the circumstances. The three-tiers are as follows:
Level 1 — Unadjusted quoted prices in active markets for identical securities
Level 2 — Other significant observable inputs (including quoted prices for similar securities, interest rates, prepayment speeds, credit risk, referenced indices, quoted prices in inactive markets, adjusted quoted prices in active markets, adjusted quoted prices on foreign equity securities that were adjusted in accordance with pricing procedures approved by the Board of Trustees (the “Board”) , etc.)
Level 3 — Significant unobservable inputs (includes inputs that reflect the Funds’ own assumptions about the assumptions market participants would use in pricing the security, developed based on the best information available under the circumstances)
Changes in valuation techniques may result in transfers in or out of an investment’s assigned Level within the hierarchy. The methodology used for valuing investments is not necessarily an indication of the risk associated with investing in those investments and the determination of the significance of a particular input to the fair value measurement in its entirety requires judgment and consideration of factors specific to each security.
The availability of observable inputs can vary from security to security and is affected by a wide variety of factors, including, for example, the type of security, whether the security is recently issued and not yet established in the marketplace, the liquidity of markets, and other characteristics particular to the security. To the extent that valuation is based on models or inputs that are less observable or unobservable in the market, the determination of fair value requires more judgment. Accordingly, the degree of judgment exercised in determining fair value is greatest for instruments categorized in Level 3.
The summary of the Funds’ assets and liabilities classified in the fair value hierarchy as of August 31, 2015, is reported on a schedule following the Portfolio of Investments.
Stocks are generally valued based upon closing sales prices reported on recognized securities exchanges on which the securities are principally traded and are generally categorized as Level 1. Stocks listed on the NASDAQ are valued using the NASDAQ Official Closing Price (“NOCP”). Generally, the NOCP will be the last sale price unless the reported trade for the stock is outside the range of the bid/ask price. In such cases, the NOCP will be normalized to the nearer of the bid or ask price. For listed securities having no sales reported and for unlisted securities, such securities will be valued based upon the last reported bid price.
124
VALIC Company II
NOTES TO FINANCIAL STATEMENTS — (continued)
As of the close of regular trading on the New York Stock Exchange (“NYSE”), securities traded primarily on security exchanges outside the United States are valued at the last sale price on such exchanges on the day of valuation, or if there is no sale on the day of valuation, at the last-reported bid price. If a security’s price is available from more than one exchange, the Funds use the exchange that is the primary market for the security. Such securities are generally categorized as Level 1. However, depending on the foreign market, closing prices may be up to 15 hours old when they are used to price a Fund’s shares, and a Fund may determine that certain closing prices do not reflect the fair value of the security. This determination will be based on review of a number of factors, including developments in foreign markets, the performance of U.S. securities markets, and the performance of instruments trading in U.S. markets that represent foreign securities and baskets of foreign securities. If a Fund determines that closing prices do not reflect the fair value of the securities, the Fund will adjust the previous closing prices in accordance with pricing procedures approved by the Board to reflect what it believes to be the fair value of the securities as of the close of regular trading on the NYSE. The Funds may also fair value securities in other situations, for example, when a particular foreign market is closed but a Fund is open. For foreign equity securities and foreign equity futures contracts, the Funds use an outside pricing service to provide it with closing market prices and information used for adjusting those prices, and when so adjusted, such securities and futures are generally categorized as Level 2.
Bonds, debentures and other debt securities are valued at evaluated bid prices obtained for the day of valuation from a Board-approved pricing service, and are generally categorized as Level 2. The pricing service may use valuation models or matrix pricing which considers information with respect to comparable bond and note transactions, quotations from bond dealers, or by reference to other securities that are considered comparable in such characteristics as rating, interest rate, and maturity date, option adjusted spread models, prepayments projections, interest rate spreads, and yield curves to determine current value. If a price is unavailable from a Board-approved pricing service, the securities may be priced at the mean of two independent quotes obtained from brokers.
Senior floating rate loans (“Loans”) are valued at the average of available bids in the market for such Loans, as provided by a Board-approved loan pricing service, and are generally categorized as Level 2.
Investments in registered investment companies that do not trade on an exchange are valued at the end of day net asset value per share. Investments in registered investment companies that trade on an exchange are valued at the last sales price or official closing price as of the close of the customary trading session on the exchange where the security is principally traded. Registered investment companies are generally categorized as Level 1.
Futures contracts traded on national securities exchanges are valued at the quoted daily settlement price established by the exchange on which they trade reported by a Board-approved pricing service, and are generally categorized as Level 1. Swap contracts traded on national securities exchanges are valued at the closing price of the exchange on which they are traded or if a closing price of the exchange is not available, the swap will be valued using a mid valuation provided by a Board-approved pricing service, and are generally categorized as Level 2. Swap contracts traded in the over-the-counter (“OTC”) market are valued at a mid valuation provided by a Board-approved pricing service, and are generally categorized as Level 2. Forward foreign currency contracts (“forward contracts”) are valued at the 4:00 p.m. Eastern Time forward rate and are generally categorized as Level 2.
For the Money Market II Fund, securities are valued at amortized cost, which approximates market value and are generally categorized as Level 2. The amortized cost method involves valuing a security at its cost on the date of purchase and thereafter assuming a constant amortization to maturity of any discount or premium. In accordance with Rule 2a-7 under the 1940 Act, the Board has adopted procedures intended to stabilize the Money Market II Fund’s net asset value per share at $1.00. These procedures include the determination, at such intervals as the Board deems appropriate and reasonable in light of current market conditions, of the extent, if any, to which the Money Market II Fund market-based net asset value per share deviates from the Fund’s amortized cost per share. The calculation of such deviation is referred to as “shadow pricing.” For purposes of these market-based valuations, securities for which market quotations are not readily available are fair valued, as determined pursuant to procedures adopted in good faith by the Board.
Other securities are valued on the basis of last sale or bid price (if a last sale price is not available) which is, in the opinion of the Adviser, the broadest and most representative market, that may be either a securities exchange or OTC market, and are generally categorized as Level 1 or Level 2.
The Board is responsible for the share valuation process and has adopted policies and procedures (the “PRC Procedures”) for valuing the securities and other assets held by the Funds, including procedures for the fair valuation of securities and other assets for which market quotations are not readily available or are unreliable. The PRC Procedures provide for the establishment of a pricing review committee, which is responsible for, among other things, making certain determinations in connection with the Series’ fair valuation procedures. Securities for which market quotations are not readily available or the values of which may be significantly impacted by the occurrence of developments or significant events are generally categorized as Level 3. There is no single standard for making fair value determinations, which may result in prices that vary from those of other funds.
B. Derivative Instruments
Forward Foreign Currency Contracts: Certain Funds may enter into forward contracts for various purposes, including to facilitate settlement of foreign currency denominated portfolio transactions, to attempt to protect securities and related receivables and payables against changes in future foreign exchange rates, to hedge portfolio exposure to benchmark currency allocations, to manage and/or gain exposure to certain foreign currencies or to enhance total return. During the year ended August 31, 2015, the High Yield Bond Fund and Strategic Bond Fund used forward contracts to attempt to protect securities and related receivables and payables against changes in future foreign exchange rates. As of August 31, 2015, the High Yield Bond Fund and Strategic Bond Fund had open forward contracts, which are reported on a schedule following each Fund’s Portfolio of Investments.
A forward contract is an agreement between two parties to buy or sell currency at a set price on a future date. The market value of the contract will fluctuate with changes in currency exchange rates. The contract is marked-to-market daily using the forward rate and the cumulative change in market value is recorded by a Fund as unrealized appreciation or depreciation. On the settlement date, a Fund records either realized gains or losses equal to the difference between the value of the contract at the time it was opened and the value at the time it was closed.
125
VALIC Company II
NOTES TO FINANCIAL STATEMENTS — (continued)
Risks to the Funds of entering into forward contracts include counterparty risk, market risk and illiquidity risk. Counterparty risk arises upon entering into these contracts from the potential inability of counterparties to meet the terms of their contracts. If the counterparty defaults, a Fund’s loss will generally consist of the net amount of contractual payments that the Fund has not yet received though the Fund’s maximum exposure due to counterparty risk could extend to the notional amount of the contract. Market risk is the risk that the value of the forward contract will depreciate due to unfavorable changes in the exchange rates. These contracts may involve market risk in excess of the unrealized appreciation or depreciation reported on the Statements of Assets and Liabilities. Illiquidity risk arises because the secondary market for forwards may have less liquidity relative to markets for other securities. Currency transactions are also subject to risks different from those of other portfolio transactions. Because currency control is of great importance to the issuing governments and influences economic planning and policy, purchases and sales of currency and related instruments can be adversely affected by government exchange controls, limitations or restrictions on repatriation of currency, and manipulations or exchange restrictions imposed by governments.
Futures: Certain Funds may enter into futures contracts for various purposes, including to increase or decrease exposure to equity or bond markets, to hedge against changes in interest rates, prices of stocks, bonds or other instruments, or currency rates, to manage duration and yield curve positioning or to enhance income or total return. During the year ended August 31, 2015, the Small Cap Value Fund and Socially Responsible Fund used equity futures contracts to equitize cash, providing exposure to equity markets. As of August 31, 2015, the following Funds had open futures contracts: Small Cap Value Fund and Socially Responsible Fund, which are reported on a schedule following each Fund’s Portfolio of Investments.
Common futures contracts include interest rate futures, single stock futures, stock index futures and currency futures. An interest rate futures contract is a contract to buy or sell specified debt securities at a future time for a fixed price. A single stock futures contract is a contract to buy a single stock at a future time for a fixed price. A stock index futures contract is similar in economic effect to a single stock futures contract, except that rather than being based on a specific security it is based on a specified index of stocks and not the stocks themselves. A currency futures contract is a contract to buy or sell a specific foreign currency at a future time for a fixed price.
A futures contract is an agreement between two parties to buy and sell a financial instrument at a set price on a future date. Upon entering into a futures transaction, a Fund will be required to segregate an initial margin payment of cash or other liquid securities with the futures commission merchant (the “broker”). Subsequent payments are made or received by the Fund as a result of changes in the value of the contract and/or changes in the value of the initial margin requirement. Such receipts or payments are recorded in the Statements of Assets and Liabilities as variation margin for changes in the value of the contracts and as due to/from broker for the changes in the value of the initial margin requirement. When a contract is closed, the Funds record a realized gain or loss equal to the difference between the value of the contract at the time it was opened and the value at the time it was closed.
The primary risk to the Funds of entering into futures contracts is market risk. Market risk is the risk that there will be an unfavorable change in the interest rate, value or currency rate of the underlying security(ies). Futures contracts involve, to varying degrees, risk of loss in excess of the variation margin disclosed on the Statements of Assets and Liabilities. There may also be trading restrictions or limitations imposed by an exchange, and government regulations may restrict trading in futures contracts. While the Funds will generally only purchase exchange-traded futures, due to market conditions, there may not always be a liquid secondary market for a futures contract and, as a result, a Fund may be unable to close out its futures contracts at a time which is advantageous. In addition, if a Fund has insufficient cash to meet margin requirements, the Fund may need to sell other investments, including at disadvantageous times. There is generally minimal counterparty risk to the Funds since the futures contracts are generally exchange-traded.
At August 31, 2015, the amount shown in the Statements of Assets and Liabilities as due from broker for the Small Cap Value Fund includes an amount set aside for margin requirements for open futures contracts.
Swap Contracts: Certain Funds may enter into credit default, interest rate, equity and/or total return swap contracts. Swap contracts are privately negotiated in the OTC market and may be entered into as a bilateral contract or a centrally cleared contract (“centrally cleared swaps”). In a centrally cleared swap, immediately following execution of the swap contract, the swap contract is novated to a central counterparty (the “CCP”) and a Fund faces the CCP through a broker. Upon entering into a centrally cleared swap, the Funds are required to deposit initial margin with the broker in the form of cash or securities in an amount that varies depending on the size and risk profile of the particular swap. Securities deposited as initial margin are designated on the Portfolio of Investments and cash deposited is recorded on the Statements of Assets and Liabilities as due from broker. Unlike a bilateral swap contract, for centrally cleared swaps, the Funds have no credit exposure to the counterparty as the CCP stands between the Funds and the counterparty. Swaps are marked-to-market daily based upon quotations from market makers or are calculated using standard models and current market data. Changes in value are recorded as an unrealized gain (loss). The daily change in valuation of swap contracts, if any, is recorded as unrealized appreciation (depreciation) on swap contracts. When the swap is terminated, the Funds will record a realized gain or loss equal to the difference between the proceeds from (or cost of) the closing transaction and the Funds’ basis in the contract, if any. Generally, the basis of the contracts is the premium received or paid. The Funds amortize upfront payments and receipts on the swap contracts on a daily basis. Net periodic payments made or received by the Funds are included as part of realized gain (loss).
Credit Default Swap Agreements: Certain Funds may enter into credit default swap agreements (“credit default swaps”) for various purposes, including managing credit risk (i.e., hedging), enhancing returns, a substitute for physical securities or speculation. During the year ended August 31, 2015, the High Yield Bond Fund used credit default swaps to manage credit risk (i.e., hedging). As of August 31, 2015, the High Yield Bond Fund had open credit default swaps, which are reported on a schedule following the Fund’s Portfolio of Investments.
Credit default swaps are generally contracts in which one party makes periodic fixed-rate payments or a one time premium payment (referred to as the buyer of protection) to another party (the seller of protection) in exchange for the right to receive a specified payment in the event of a default or other credit event for the referenced entity, obligation or index. As a seller of protection on credit default swaps, a Fund will generally receive from the buyer of protection a fixed rate of income throughout the term of the swap provided that there is no credit event. As the seller, a Fund would effectively add leverage to its Fund because, in addition to its total net assets, a Fund would be subject to investment exposure on the notional amount of the swap. If a Fund is a seller of protection and a credit event occurs, as defined under the terms of that particular swap agreement, a Fund will either (i) pay to the buyer of protection an amount equal to the notional amount of the swap and take delivery of the referenced obligation, other deliverable obligations or underlying securities comprising the referenced index or (ii) pay a net settlement amount in the form of cash or securities equal to the notional amount of the swap less the recovery value of the referenced obligation or underlying securities comprising the referenced index. As a buyer of protection on credit default swaps, a Fund will make periodic payments, similar to an insurance premium and the seller of protection agrees to compensate the Fund for future potential losses as a result of a credit event on the reference bond or other asset. A Fund effectively transfers the credit event risk of the reference bond or asset from it to the seller of protection. If a Fund is a buyer of protection and a credit event
126
VALIC Company II
NOTES TO FINANCIAL STATEMENTS — (continued)
occurs, as defined under the terms of that particular swap agreement, the Fund will either (i) receive from the seller of protection an amount equal to the notional amount of the swap and deliver the referenced obligation, other deliverable obligations or underlying securities comprising the referenced index or (ii) receive a net settlement amount in the form of cash or securities equal to the notional amount of the swap less the recovery value of the referenced obligation or underlying securities comprising the referenced index. Recovery values are assumed by market makers considering either industry standard recovery rates or entity specific factors and considerations until a credit event occurs. If a credit event has occurred, the recovery value is determined by a facilitated auction whereby a minimum number of allowable broker bids, together with a specified valuation method, are used to calculate the settlement value.
Credit default swaps on corporate issues or sovereign issues of an emerging market country are contracts in which the buyer of protection makes periodic fixed payments or a one time premium payment to the seller of protection in exchange for the right to receive a specified payment in the event of a default or other credit event. If a credit event occurs and cash settlement is not elected, a variety of other deliverable obligations may be delivered in lieu of the specific referenced obligation. The ability to deliver other obligations may result in a cheapest-to deliver option (the buyer of protection’s right to choose the deliverable obligation with the lowest value following a credit event). A Fund may use credit default swaps on corporate issues or sovereign issues of an emerging market country to provide a measure of protection against defaults of the issuers (i.e., to reduce credit risk where a Fund owns or has exposure to the referenced obligation) or to take a speculative credit position with an active long or short position with respect to the likelihood of a particular issuer’s default.
Credit default swaps on asset-backed securities are contracts in which the buyer of protection makes periodic fixed-rate payments or a one time premium payment to the seller of protection in exchange for the right to receive a specified payment in the event of a default or other credit event. Unlike credit default swaps on corporate issues or sovereign issues of an emerging market country, deliverable obligations in most instances would be limited to the specific referenced obligation as performance for asset-backed securities can vary across deals. Prepayments, principal paydowns, and other writedown or loss events on the underlying mortgage loans will reduce the outstanding principal balance of the referenced obligation. These reductions may be temporary or permanent as defined under the terms of the swap agreement and the notional amount for the swap agreement will be adjusted by corresponding amounts. A Fund may use credit default swaps on asset-backed securities to provide a measure of protection against defaults of the referenced obligation or to take a speculative credit position with an active long or short position with respect to the likelihood of a particular referenced obligation’s default.
Credit default swaps on credit indices are generally contracts in which the buyer of protection makes periodic fixed-rate payments or a one time premium payment to the seller of protection in exchange for the right to receive a specified payment in the event of a write-down, principal shortfall, interest shortfall or default of all or part of the referenced entities comprising the credit index. A credit index is a list of a basket of credit instruments or exposures designed to be representative of some part of the credit market as a whole. These indices are made up of reference credits that are judged by a poll of dealers to be the most liquid entities in the credit default swap market based on the sector of the index. Components of the indices may include, but are not limited to, investment grade securities, high yield securities, asset backed securities, emerging markets, and/or various credit ratings within each sector. Credit indices are traded using credit default swaps with standardized terms including a fixed spread and standard maturity dates. An index credit default swap references all the names in the index, and if there is a default, the credit event is settled based on that name’s weight in the index. The composition of the indices changes periodically, usually every six months, and for most indices, each name has an equal weight in the index. A Fund may use credit default swaps on credit indices to hedge a Fund of credit default swaps or bonds which is less expensive than it would be to enter into many credit default swaps to achieve a similar effect. Credit-default swaps on indices are used for protecting investors owning bonds against default, and also to speculate on changes in credit quality.
Implied credit spreads, represented in absolute terms, utilized in determining the market value of credit default swaps on corporate issues or sovereign issues of an emerging market country as of period end are disclosed in the footnotes to the Portfolio of Investments and serve as an indicator of the current status of the payment/performance risk and represent the likelihood or risk of default for the credit derivative. The implied credit spread of a particular referenced entity reflects the cost of buying/selling protection and may include upfront payments required to be made to enter into the agreement. For credit default swaps on asset-based securities and credit indices, the quoted market prices and resulting values serve as the indicator of the current status of the payment/performance risk. Wider credit spreads and increasing market values, in absolute terms when compared to the notional amount of the swap, represent a deterioration of the referenced entity’s credit soundness and a greater likelihood or risk of default or other credit event occurring as defined under the terms of the agreement. The maximum potential amount of future payments (undiscounted) that a Fund as a seller of protection could be required to make under a credit default swap would be an amount equal to the notional amount of the agreement. Notional amounts of all credit default swaps outstanding as of August 31, 2015, for which a Fund is the seller of protection, if any, are disclosed on a schedule following the Fund’s Portfolio of Investments. These potential amounts would be partially offset by any recovery values of the respective referenced obligations, upfront payments received upon entering into the agreement, or net amounts received from the settlement of buy protection credit default swaps entered into by a Fund for the same referenced entity or entities.
At August 31, 2015, the due to broker amount as disclosed in the Statements of Assets and Liabilities for the High Yield Bond Fund includes amounts set aside as collateral for open swap contracts.
Risks of Entering into Swap Agreements: Risks to the Funds of entering into credit default swaps, equity swaps and interest rate swaps, include credit risk, market risk, counterparty risk, liquidity risk and documentation risk. By entering into swap agreements, the Funds may be exposed to risk of potential loss due to unfavorable changes in interest rates, the price of the underlying security or index, or the underlying referenced asset’s perceived or actual credit, that the counterparty may default on its obligation to perform or the possibility that there is no liquid market for these agreements. There is also the risk that the parties may disagree as to the meaning of contractual terms in the swap agreement. In addition, to the extent that the sub-adviser does not accurately analyze and predict the underlying economic factors influencing the value of the swap, the Fund may suffer a loss.
Master Agreements: Certain Funds that hold derivative instruments and other financial instruments may be a party to ISDA (International Swaps and Derivatives Association, Inc.) Master Agreements or similar agreements (“Master Agreements”) with certain counterparties that govern such instruments. Master Agreements may contain provisions regarding, among other things, the parties’ general obligations, representations, agreements, collateral requirements, events of default and early termination. Collateral can be in the form of cash or securities as agreed to by a Fund and applicable counterparty. Collateral requirements are generally determined based on a Fund’s net position with each counterparty. Master Agreements may also include certain provisions that require a Fund to post additional collateral upon the occurrence of certain events, such as when a
127
VALIC Company II
NOTES TO FINANCIAL STATEMENTS — (continued)
Fund’s net assets fall below a specified level. In addition, Master Agreements typically specify certain standard termination events, such as failure of a party to pay or deliver, credit support defaults and other events of default. Termination events applicable to a Fund may also occur upon a decline in a Fund’s net assets below a specified level over a certain period of time. Additional termination events applicable to counterparties may occur upon a decline in a counterparty’s long-term and short-term credit ratings below a specified level, or upon a decline in the ratings of a counterparty’s credit support provider. Upon the occurrence of a termination event, the other party may elect to terminate early and cause settlement of all instruments outstanding pursuant to a particular Master Agreement, including the payment of any losses and costs resulting from such early termination, as reasonably determined by the terminating party. Any decision by one or more of a Fund’s counterparties to elect early termination could cause a Fund to accelerate the payment of liabilities, which settlement amounts could be in excess of the amount of assets that are already posted as collateral. Typically, the Master Agreement will permit a single net payment in the event of default. Note, however, that bankruptcy or insolvency laws of a particular jurisdiction may impose restrictions on or prohibitions against the right of offset in bankruptcy, insolvency or other events. As a result, the early termination with respect to derivative instruments subject to Master Agreements that are in a net liability position could be material to a Fund’s financial statements. See additional information on specific types of derivative instruments and other financial instruments as disclosed in the Notes to Financial Statements. The Funds do not offset derivative assets and derivative liabilities that are subject to netting arrangements in the Statements of Assets and Liabilities.
The following tables represent the value of derivatives held as of August 31, 2015, by their primary underlying risk exposure and respective location on the Statements of Assets and Liabilities and the effect of derivatives on the Statements of Operations for the year ended August 31, 2015. For a detailed presentation of derivatives held as of August 31, 2015, please refer to each Fund’s Portfolio of Investments.
| | | | | | | | | | | | | | | | |
| | | Asset Derivatives
| |
| | | Equity
Contracts
| | | Credit
Contracts
| | | Foreign
Exchange
Contracts
| | | Total
| |
Fund
| | Futures
Contracts(1)(6)
| | | Swap
Contracts(2)
| | | Foreign
Forward
Exchange
Contracts(3)
| | |
High Yield Bond | | $ | — | | | $ | 38,328 | | | $ | 139,087 | | | $ | 177,415 | |
Small Cap Value | | | — | | | | — | | | | — | | | | — | |
Socially Responsible | | | — | | | | — | | | | — | | | | — | |
Strategic Bond | | | — | | | | — | | | | 1,024,639 | | | | 1,024,639 | |
| |
| | | Liability Derivatives
| |
| | | Equity
Contracts
| | | Credit
Contracts
| | | Foreign
Exchange
Contracts
| | | Total
| |
Fund
| | Futures
Contracts(1)(6)
| | | Swap
Contracts(4)
| | | Foreign
Forward
Exchange
Contracts(5)
| | |
High Yield Bond | | $ | — | | | $ | 116,250 | | | $ | — | | | $ | 116,250 | |
Small Cap Value | | | 42,250 | | | | — | | | | — | | | | 42,250 | |
Socially Responsible | | | 352,600 | | | | — | | | | — | | | | 352,600 | |
Strategic Bond | | | — | | | | — | | | | 1,035,768 | | | | 1,035,768 | |
Statement of Assets and Liabilities Location:
| (1) | Variation margin on futures contracts |
| (2) | Unrealized appreciation on swap contracts |
| (3) | Unrealized appreciation on forward foreign currency contracts |
| (4) | Unrealized depreciation on swap contracts |
| (5) | Unrealized depreciation on forward foreign currency contracts |
| (6) | The variation margin on futures contracts is included in the cumulative appreciation (depreciation) as reported on each Portfolio’s Portfolio of Investments in the following amounts: |
| | | | |
Fund
| | Cumulative
Appreciation
(Depreciation)
| |
Small Cap Value | | $ | (459,090 | ) |
Socially Responsible | | | (2,047,882 | ) |
128
VALIC Company II
NOTES TO FINANCIAL STATEMENTS — (continued)
| | | | | | | | | | | | | | | | |
| | | Realized Gain (Loss) on Derivatives Recognized in Statement of
Operations
| |
| | | Equity
Contracts
| | | Credit
Contracts
| | | Foreign
Exchange
Contracts
| | | Total
| |
Fund
| | Futures
Contracts(1)
| | | Swap
Contracts(1)
| | | Foreign
Forward
Exchange
Contracts(2)
| | |
High Yield Bond | | $ | — | | | $ | 12,308 | | | $ | 1,309,251 | | | $ | 1,321,559 | |
Small Cap Value | | | 217,017 | | | | — | | | | — | | | | 217,017 | |
Socially Responsible | | | 3,479,829 | | | | — | | | | — | | | | 3,479,829 | |
Strategic Bond | | | — | | | | — | | | | 8,575,038 | | | | 8,575,038 | |
| |
| | | Change in Unrealized Appreciation (Depreciation) on Derivatives
Recognized in Statement of Operations
| |
| | | Equity
Contracts
| | | Credit
Contracts
| | | Foreign
Exchange
Contracts
| | | Total
| |
Fund
| | Futures
Contracts(3)
| | | Swap
Contracts(3)
| | | Foreign
Forward
Exchange
Contracts(4)
| | |
High Yield Bond | | $ | — | | | $ | (77,508 | ) | | $ | 86,971 | | | $ | 9,463 | |
Small Cap Value | | | (518,606 | ) | | | — | | | | — | | | | (518,606 | ) |
Socially Responsible | | | (2,708,171 | ) | | | — | | | | — | | | | (2,708,171 | ) |
Strategic Bond | | | — | | | | — | | | | (11,129 | ) | | | (11,129 | ) |
Statement of Operations Location:
| (1) | Net realized gain (loss) on futures and swap contracts |
| (2) | Net realized foreign exchange gain (loss) on other assets and liabilities |
| (3) | Change in unrealized appreciation (depreciation) on futures and swap contracts |
| (4) | Change in unrealized foreign exchange gain (loss) on other assets and liabilities |
The following table represents the average monthly balances of derivatives held during the year ended August 31, 2015.
| | | | | | | | | | | | | | | | |
| | | Average Amount Outstanding During the Year
| |
Fund
| | Futures
Contracts(1)
| | | Credit Swap
Contracts(2)
| | | Foreign Forward
Exchange
Contracts(2)
| | | Total
| |
High Yield Bond | | $ | — | | | $ | 10,516,671 | | | $ | 8,016,515 | | | $ | 18,533,186 | |
Small Cap Value | | | 6,702,330 | | | | — | | | | — | | | | 6,702,330 | |
Socially Responsible | | | 41,407,048 | | | | — | | | | — | | | | 41,407,048 | |
Strategic Bond | | | — | | | | — | | | | 85,217,586 | | | | 85,217,586 | |
| (1) | Amounts represent values in US dollars. |
| (2) | Amounts represent notional amounts in US dollars. |
The following tables set forth the Funds’ derivative assets and liabilities by counterparty, net of amounts available for offset under Master Agreements and net of the related collateral pledged/(received) as of August 31, 2015. The repurchase agreements held by the Funds and securities on loan as of August 31, 2015, are also subject to Master Agreements but are not included in the following tables. See the Portfolio of Investments of each Fund and the Notes to the Financial Statements for more information about the Funds’ holdings in repurchase agreements and securities on loan.
129
VALIC Company II
NOTES TO FINANCIAL STATEMENTS — (continued)
| | | | | | | | | | | | | | | | | | | | | | | | | | | | | | | | | | | | | | | | | | | | |
| | | High Yield Bond Fund
| | | | | | | | | | |
| | | Derivative Assets(1)
| | | Derivative Liabilities(1)
| | | | | | | | | | |
| Counterparty | | Forward
Foreign
Currency
Contracts
| | | OTC
Swaps
| | | Options
Purchased
| | | Total
| | | Forward
Foreign
Currency
Contracts
| | | OTC
Swaps
| | | Options
Written
| | | Total
| | | Net
Derivative
Assets
(Liabilities)
| | | Collateral
Pledged/
(Received)(2)
| | | Net
Amount(3)
| |
HSBC BankUSA | | $ | 34,106 | | | $ | — | | | $ | — | | | $ | 34,106 | | | $ | — | | | $ | — | | | $ | — | | | $ | — | | | $ | 34,106 | | | $ | — | | | $ | 34,106 | |
Morgan Stanley and Co. International PLC | | | 34,514 | | | | — | | | | — | | | | 34,514 | | | | — | | | | — | | | | — | | | | — | | | | 34,514 | | | | — | | | | 34,514 | |
Royal Bank of Scotland PLC | | | 35,629 | | | | — | | | | — | | | | 35,629 | | | | — | | | | — | | | | — | | | | — | | | | 35,629 | | | | — | | | | 35,629 | |
State Street Bank & Trust Company | | | 34,838 | | | | — | | | | — | | | | 34,838 | | | | — | | | | — | | | | — | | | | — | | | | 34,838 | | | | — | | | | 34,838 | |
| | |
|
|
| |
|
|
| |
|
|
| |
|
|
| |
|
|
| |
|
|
| |
|
|
| |
|
|
| |
|
|
| |
|
|
| |
|
|
|
Total | | | $139,087 | | | $ | — | | | $ | — | | | $ | 139,087 | | | $ | — | | | $ | — | | | $ | — | | | $ | — | | | $ | 139,087 | | | $ | — | | | $ | 139,087 | |
| | |
|
|
| |
|
|
| |
|
|
| |
|
|
| |
|
|
| |
|
|
| |
|
|
| |
|
|
| |
|
|
| |
|
|
| |
|
|
|
| (1) | Gross amounts of recognized assets and liabilities not offset in the Statements of Assets and Liabilities. |
| (2) | For each respective counterparty, collateral pledged or (received) is limited to an amount not to exceed 100% of the net amount of the derivative asset/liability in the table above. |
| (3) | Net amount represents the net amount due (to)/from counterparty in the event of a default based on the contractual set-off rights under the agreement. |
C. Stripped Mortgage-Backed Securities
Stripped Mortgage-Backed Securities (“SMBS”) are multiple-class mortgage-backed securities. SMBS are often structured with two classes that receive different proportions of the interest and principal distributions on a pool of mortgage assets. SMBS have greater market volatility than other types of U.S. government securities in which a Fund invests. A common type of SMBS has one class receiving some of the interest and all or most of the principal (the “principal only” class) from the mortgage pool, while the other class will receive all or most of the interest (the “interest only” class). The yield to maturity on an interest only class is extremely sensitive not only to changes in prevailing interest rates, but also to the rate of principal payments, including principal prepayments, on the underlying pool of mortgage assets, and a rapid rate of principal payment may have a material adverse effect on a Fund‘s yield.
D. Mortgage-Backed Dollar Rolls
During the year ended August 31, 2015, the Core Bond Fund and the Strategic Bond Fund entered into dollar rolls using “to be announced” (“TBA”) mortgage-backed securities (“TBA Rolls”). TBA Roll transactions involve the sale of mortgage or other asset backed securities with the commitment to purchase substantially similar securities on a specified future date. The Funds’ policy is to record the components of TBA Rolls as purchase/sale transactions. Any difference between the purchase and sale price is recorded as a realized gain or loss on the date the transaction is entered into. The Core Bond and the Strategic Bond Fund had TBA Rolls outstanding at period end, which are included in receivable for investments sold and payable for investments purchased in the Statements of Assets and Liabilities. TBA Roll transactions involve the risk that the market value of the securities held by a Fund may decline below the price of the securities that the Fund has sold but is obligated to repurchase under the agreement. In the event that the buyer of securities in a TBA Roll transaction files bankruptcy or becomes insolvent, a Fund‘s use of the proceeds from the sale of the securities may be restricted pending a determination by the other party, or its trustee or receiver, whether to enforce the Fund‘s obligation to repurchase the securities. The return earned by a Fund with the proceeds of the TBA Roll transaction may not exceed the transaction costs.
E. When-Issued Securities and Forward Commitments
Certain Funds may purchase or sell when-issued securities, including TBA securities that have been authorized, but not yet issued in the market. In addition, a Fund may purchase or sell securities on a forward commitment basis. A forward commitment involves entering into a contract to purchase or sell securities, typically on an extended settlement basis, for a fixed price at a future date. The Funds may engage in when-issued or forward commitment transactions in order to secure what is considered to be an advantageous price and yield at the time of entering into the obligation. The purchase of securities on a when-issued or forward commitment basis involves a risk of loss if the value of the security to be purchased declines before the settlement date. Conversely, the sale of securities on a when-issued or forward commitment basis involves the risk that the value of the securities sold may increase before the settlement date. For the year ended August 31, 2015, the Core Bond Fund and the Strategic Bond Fund purchased and/or sold when-issued securities.
130
VALIC Company II
NOTES TO FINANCIAL STATEMENTS — (continued)
F. Inflation-Indexed Bonds
Certain Funds may purchase inflation-indexed bonds. Inflation-indexed bonds are fixed income securities whose principal value is adjusted periodically according to the rate of inflation. Two structures are common. The U.S. Treasury and certain other issuers use a structure that reflects inflation in the principal value of the bond. Other issuers pay out any inflation related accruals as part of a semiannual coupon. The value of inflation-indexed bonds is expected to change in response to changes in real interest rates. Real interest rates, in turn, are tied to the relationship between nominal interest rates (i.e., stated interest rates) and the rate of inflation. Therefore, if the rate of inflation rises at a faster rate than nominal interest rates, real interest rates (i.e., nominal interest rates minus inflation) might decline, leading to an increase in value of inflation-indexed bonds. In contrast, if nominal interest rates increase at a faster rate than inflation, real interest rates might rise, leading to a decrease in value of inflation-indexed bonds. There can be no assurance, however, that the value of inflation-indexed bonds will be directly correlated to changes in nominal interest rates, and short-term increases in inflation may lead to a decline in their value. Coupon payments received from inflation-indexed bonds are recorded in the Statements of Operations as interest income. In addition, any increase or decrease in the principal amount of an inflation-indexed bond will be recorded in the Statements of Operations as an increase or decrease to interest income, even though principal is not paid until maturity.
G. Repurchase Agreements
The Funds, along with other affiliated registered investment companies, pursuant to procedures adopted by the Board and applicable guidance from the Securities and Exchange Commission (“SEC”), may transfer uninvested cash balances into a single joint account, the daily aggregate balance of which is invested in one or more repurchase agreements collateralized by U.S. Treasury or federal agency obligations.
In a repurchase agreement, the seller of a security agrees to repurchase the security at a mutually agreed-upon time and price, which reflects the effective rate of return for the term of the agreement. For repurchase agreements and joint repurchase agreements, the Series’ custodian takes possession of the collateral pledged for investments in such repurchase agreements (“repo” or collectively “repos”). The underlying collateral is valued daily on a mark to market basis, plus accrued interest to ensure that the value, at the time the agreement is entered into, is equal to at least 102% of the repurchase price, including accrued interest. In the event of default of the obligation to repurchase, a Fund has the right to liquidate the collateral and apply the proceeds in satisfaction of the obligation. If the seller defaults and the value of the collateral declines or if bankruptcy proceedings are commenced with respect to the seller of the security, realization of the collateral by a Fund may be delayed or limited.
As of August 31, 2015, the following Funds held an undivided interest in the joint repurchase agreement with State Street Bank and Trust Co.:
| | | | | | | | |
Fund
| | Percentage
Ownership
| | | Principal
Amount
| |
Money Market II | | | 0.89 | % | | $ | 2,464,000 | |
Socially Responsible | | | 5.54 | | | | 15,260,000 | |
As of such date, the repurchase agreement in that joint account and the collateral thereof were as follows:
State Street Bank and Trust Co., dated August 31, 2015, bearing interest at a rate of 0.00% per annum, with a principal amount of $275,458,000, a repurchase price of $275,458,000 and maturity date of September 1, 2015. The repurchase agreement is collateralized by the following:
| | | | | | | | | | | | | | | | |
Type of Collateral
| | Interest
Rate
| | | Maturity
Date
| | | Principal
Amount
| | | Market
Value
| |
U.S. Treasury Notes | | | 2.25 | % | | | 07/31/2021 | | | $ | 146,460,000 | | | $ | 150,948,267 | |
U.S. Treasury Bonds | | | 8.00 | | | | 11/15/2021 | | | | 44,305,000 | | | | 61,654,971 | |
U.S. Treasury Bonds | | | 8.13 | | | | 08/15/2021 | | | | 50,000,000 | | | | 68,364,150 | |
H. Investment Securities Loaned
To realize additional income, a Fund, except for Aggressive Growth Lifestyle Fund, Conservative Growth Lifestyle Fund, Moderate Growth Lifestyle Fund, and the Money Market II Fund, may lend portfolio securities with a value of up to 30% of its total assets. Securities lending arrangements are generally governed by master securities lending authorization agreements which typically provide the securities lending agent with the right to make loans of a Fund’s available securities to an approved list of borrowers. These master securities lending agreements are considered to be Master Agreements as discussed in the Notes to the Financial Statements. Loans made pursuant to these agreements will be continuously secured by collateral in an amount at least equal to the market value of the securities loaned. Such collateral will be cash, U.S. government securities, or other collateral as deemed appropriate. A Fund may use the cash collateral received to invest in short-term investments. The description of the short-term investments made with cash collateral from securities lending is included in the applicable Fund’s Portfolio of Investments. Loans by a Fund will only be made to broker-dealers deemed by the securities lending agent to be creditworthy and will not be made unless, in the judgment of VALIC, the consideration to be earned from such loans would justify the risk. It is the Series’ policy to obtain additional collateral from or return excess collateral to the borrower by the end of the next business day. Therefore, the value of the collateral may be temporarily more or less than the value of the securities on loan. Each Fund receives income from the investment of cash collateral, in addition to lending fees and rebates paid by the borrower, less expenses associated with the loan. In the event of a borrower default, including if the borrower fails to maintain the requisite amount of collateral, the securities lending agent will terminate all outstanding loans to that particular borrower and the lending Fund is permitted to use the collateral to replace the securities while holding the borrower liable for any excess of replacement cost over collateral. The securities lending agent is also required to indemnify a Fund against certain losses resulting from a borrower default. Although risk is mitigated by the collateral and indemnification, the risks in lending fund securities, as with other extensions of secured credit, include possible delays in receiving additional collateral or in the recovery of the securities or possible loss of rights in the collateral should the borrower fail financially as well as risk of loss in the value of collateral or the value of the investments made with the collateral. Income and fees are recorded in the Statements of Operations as securities lending income. Loans
131
VALIC Company II
NOTES TO FINANCIAL STATEMENTS — (continued)
of securities are terminable at any time and the borrower, after notice, is required to return borrowed securities within the standard time period for settlement of securities transactions.
I. Securities Transactions, Investment Income, Expenses, Dividends and Distributions to Shareholders
Security transactions are recorded on a trade date basis. Realized gains and losses on the sale of investments are calculated on the identified cost basis. For financial statement purposes, the Funds amortize all premiums and accrete all discounts on fixed income securities.
Interest income is accrued daily from settlement date except when collection is not expected. Dividend income is recorded on the ex-dividend date except for certain dividends from foreign securities, which are recorded as soon as a Fund is informed after the ex-dividend date. Paydown gains and losses on mortgage and asset-backed securities are recorded as components of interest income on the Statement of Operations. For the Lifestyle Funds, distributions from income from the Underlying Funds, if any, are recorded to income on the ex-dividend date. Distributions from net realized capital gains from the Underlying Funds, if any, are recorded to realized gains on the ex-dividend date.
Funds which earn foreign income and capital gains may be subject to foreign withholding taxes and capital gains taxes at various rates. Under applicable foreign law, a withholding of tax may be imposed on interest, dividends, and capital gains from the sale of foreign securities at various rates. India, Thailand, and certain other countries’ tax regulations require that taxes be paid on capital gains realized by a Fund.
Distributions received from Real Estate Investment Trusts (“REIT”) investments are recharacterized based on information provided by the REIT into the following categories: ordinary income, long-term and short-term capital gains, and return of capital. If information is not available on a timely basis from the REIT, the recharacterization will be based on available information which may include the previous year’s allocation. If new or additional information becomes available from the REIT at a later date, a recharacterization will be made in the following year. The amount recharacterized as ordinary income is recorded as dividend income and the amount recharacterized as capital gain is recorded as realized gain in the Statement of Operations. The amount recharacterized as return of capital is recorded as a reduction to the cost of investments in the Statement of Assets and Liabilities. These recharacterizations are reflected in the accompanying financial statements.
Expenses common to all Funds are allocated among the Funds based upon relative net assets or other appropriate allocation methods. In all other respects, expenses are charged to each Fund as incurred on a specific identification basis. For the Lifestyle Funds, the expenses included in the accompanying financial statements reflect the expenses of the Lifestyle Funds and do not include any expenses associated with the underlying Funds.
Dividends from net investment income, if any, are normally paid annually, except for the Money Market II Fund, which declares daily and pays monthly. Distributions from net realized capital gains, if any, are normally declared and paid annually. The Funds record dividends and distributions to their shareholders on the ex-dividend date.
The amount of dividends and distributions from net investment income and net realized capital gains are determined in accordance with federal income tax regulations, which may differ from GAAP. These “book/tax” differences are either considered temporary or permanent in nature. To the extent these differences are permanent in nature, such amounts are reclassified within the capital accounts at fiscal year end based on their federal tax-basis treatment; temporary differences do not require reclassification. Net assets are not affected by these reclassifications.
Each Fund is considered a separate entity for tax purposes and intends to comply with the requirements of the Internal Revenue Code, as amended, applicable to regulated investment companies and distribute all of its taxable income, including any net capital gains on investments, to its shareholders. Each Fund also intends to distribute sufficient net investment income and net capital gains, if any, so that it will not be subject to excise tax on undistributed income and gains. Therefore, no federal income tax or excise tax provision is required.
The Funds recognize the tax benefits of uncertain tax positions only when the position is more likely than not to be sustained, assuming examination by tax authorities. Management has analyzed each Fund’s tax positions and concluded that no liability for unrecognized tax benefits should be recorded related to uncertain tax positions taken on returns filed for open tax years 2012 — 2014 or expected to be taken in each Fund’s 2015 tax return. The Funds are not aware of any tax provisions for which it is reasonably possible that the total amounts of unrecognized tax benefits will change materially in the next twelve months. The Funds file U.S. federal and certain state income tax returns. With few exceptions, the Funds are no longer subject to U.S. federal and state tax examinations by tax authorities for tax returns ending before 2012.
J. Foreign Currency Translation
The books and records of the Funds are maintained in U.S. dollars. Assets and liabilities denominated in foreign currencies and commitments under forward foreign currency contracts are translated into U.S. dollars based on the exchange rate of such currencies against U.S. dollars on the date of valuation.
The Funds do not isolate that portion of the results of operations arising as a result of changes in the foreign exchange rates from the changes in the market prices of securities held at the end of the period. Similarly, the Funds do not isolate the effect of changes in foreign exchange rates from the changes in the market prices of portfolio securities sold during the period.
Realized foreign exchange gains and losses on other assets and liabilities and change in unrealized foreign exchange gains and losses on other assets and liabilities located in the Statements of Operations include realized foreign exchange gains and losses from currency gains or losses between the trade and the settlement dates of securities transactions, the difference between the amounts of interest, dividends and foreign withholding taxes recorded on the Funds’ books and the U.S. dollar equivalent amounts actually received or paid and changes in the unrealized foreign exchange gains and losses relating to the other assets and liabilities arising as a result of changes in the exchange rates and realized gains and losses on forward foreign currency contracts.
K. New Accounting Pronouncement
In June 2014, the Financial Accounting Standards Board issued Accounting Standards Update (ASU) No. 2014-11, Transfers and Servicing (Topic 860), Repurchase-to-Maturity Transactions, Repurchase Financings, and Disclosures. The ASU changes the accounting for certain repurchase agreements and expands disclosure requirements related to repurchase agreements, securities lending, repurchase-to-maturity and similar transactions. The ASU is effective for interim and annual reporting periods beginning after December 15, 2014. All required changes to accounting policies have been made in accordance with ASU No. 2014-11.
132
VALIC Company II
NOTES TO FINANCIAL STATEMENTS — (continued)
L. Money Market Fund Regulatory Matters
Changes in the laws and regulations applicable to and governing money market funds, such as Rule 2a-7 under the Investment Company Act of 1940, as amended, can impact the Money Market II Fund. On July 23, 2014, the SEC voted to amend Rule 2a-7 and other rules and forms related to money market funds. These amendments will affect the manner in which the Fund and other money market funds are structured and operated, and may impact Fund expenses, returns and liquidity. The degree to which a money market fund will be impacted by the rule amendments will depend upon the fund’s portfolio composition and/or the shareholders who qualify to invest in the fund. The amendments have staggered compliance dates. The majority of the amendments take effect in 2016. As a result of these amendments, the Fund may be required to take certain steps that will impact and may adversely affect the Fund. The precise nature of such impact and effects have not yet been determined.
Note 3 — Advisory Fees and Other Transactions with Affiliates
VALIC, serves as investment adviser to VC II. Certain officers and trustees of VC II are officers and directors of VALIC or affiliates of VALIC. VALIC receives from VC II a monthly fee based on each Fund’s average daily net asset value at the following annual rates:
| | |
| Aggressive Growth Lifestyle Fund | | 0.10% |
| Capital Appreciation Fund | | 0.55% on first $1 billion |
| | | 0.525% on assets over $1 billion |
| Conservative Growth Lifestyle Fund | | 0.10% |
| Core Bond Fund | | 0.50% on the first $200 million |
| | | 0.45% on the next $300 million |
| | | 0.40% on assets over $500 million |
| High Yield Bond Fund | | 0.65% on the first $150 million |
| | | 0.60% on the next $350 million |
| | | 0.55% on assets over $500 million |
| International Opportunities Fund | | 0.90% on the first $100 million |
| | | 0.80% on the next $650 million |
| | | 0.75% on assets over $750 million |
| Large Cap Value Fund | | 0.50% on the first $500 million |
| | | 0.475% on assets over $500 million |
| Mid Cap Growth Fund | | 0.80% on the first $50 million |
| | | 0.75% on the next $50 million |
| | | 0.70% on the next $150 million |
| | | 0.65% on the next $250 million |
| | | 0.60% on assets over $500 million |
| Mid Cap Value Fund | | 0.75% on the first $100 million |
| | | 0.725% on the next $150 million |
| | | 0.70% on the next $250 million |
| | | 0.675% on the next $250 million |
| | | 0.65% on assets over $750 million |
| Moderate Growth Lifestyle Fund | | 0.10% |
| Money Market II Fund | | 0.25% |
| Small Cap Growth Fund | | 0.85% on the first $100 million |
| | | 0.80% on assets over $100 million |
| Small Cap Value Fund | | 0.75% on the first $50 million |
| | | 0.65% on assets over $50 million |
| Socially Responsible Fund | | 0.25% on the first $1 billion |
| | | 0.24% on assets over $1 billion |
| Strategic Bond Fund | | 0.60% on the first $200 million |
| | | 0.50% on the next $300 million |
| | | 0.45% on assets over $500 million |
VALIC has entered into sub-advisory agreements with the following:
Janus Capital Management, LLC (“Janus”)—subadviser for a portion of the Large Cap Value Fund.
J.P. Morgan Investment Management, Inc. (“JPMIM”)—subadviser for the Small Cap Growth Fund and a portion of the Small Cap Value Fund.
Metropolitan West Capital Management, LLC (“MetWest Capital”)—subadviser for a portion of the Small Cap Value Fund.
Massachusetts Financial Services Company (“MFS”)—subadviser for a portion of the International Opportunities Fund.
PineBridge Investments, LLC (“PineBridge”)—subadviser for the Strategic Bond Fund, Core Bond Fund, Aggressive, Moderate and Conservative Growth Lifestyle Funds.
Robeco Investment Management, Inc. (“Robeco”)—subadviser for a portion of the Mid Cap Value Fund.
133
VALIC Company II
NOTES TO FINANCIAL STATEMENTS — (continued)
SunAmerica Asset Management, LLC (“SunAmerica”)—subadviser for the Money Market II Fund and the Socially Responsible Fund
The Boston Company Asset Management, LLC (“The Boston Co.”)—subadviser for the Capital Appreciation Fund and a portion of the Large Cap Value Fund.
Tocqueville Asset Management LP (“Tocqueville”)—subadviser for a portion of the Mid Cap Value Fund.(1)
UBS Global Asset Management (Americas), Inc. (“UBS Global”)—subadviser for a portion of the International Opportunities Fund.
Wellington Management Company LLP—subadviser for the High Yield Bond Fund and a portion of the Mid Cap Value Fund.
Wells Capital Management, Inc. (“Wells Capital”)—subadviser for the Mid Cap Growth Fund.
| (1) | Effective March 13, 2015, Tocqueville is no longer a subadviser of the Mid Cap Value Fund. |
The subadvisers are compensated for their services by VALIC.
VALIC has contractually agreed to waive fees and/or reimburse expenses, if necessary, to keep annual operating expenses at or below the following percentages of each Fund’s average daily net assets through December 31, 2016. For the purposes of waived fee and/or reimbursed expense calculations, annual fund operating expenses shall not include extraordinary expenses, as determined under generally accepted accounting principles, litigation, or acquired fund fees and expenses, brokerage commissions and other transactional expenses relating to the purchase and sale of portfolio securities, interest, taxes and governmental fees, and other expenses not incurred in the ordinary course of a Fund’s business. The contractual expense waivers and fee reimbursements will continue until December 31, 2016, subject to termination by the Board, including a majority of the Trustees who are not deemed to be interested persons of the Fund or VALIC as defined by Section 2(a)(19) of the 1940 Act (“the Disinterested Trustees”).
| | | | |
Fund
| | Maximum Expense
Limitation
| |
Aggressive Growth Lifestyle | | | 0.10 | % |
Capital Appreciation | | | 0.85 | % |
Conservative Growth Lifestyle | | | 0.10 | % |
Core Bond | | | 0.77 | % |
High Yield Bond | | | 0.96 | % |
International Opportunities | | | 1.00 | % |
Large Cap Value | | | 0.81 | % |
Mid Cap Growth | | | 0.85 | % |
Mid Cap Value | | | 1.05 | % |
Moderate Growth Lifestyle | | | 0.10 | % |
Money Market II | | | 0.55 | % |
Small Cap Growth | | | 1.16 | % |
Small Cap Value | | | 0.95 | % |
Socially Responsible | | | 0.56 | % |
Strategic Bond | | | 0.89 | % |
For the year ended August 31, 2015, pursuant to the contractual expense limitations in the above table, VALIC waived fees and/or reimbursed expenses as follows:
| | | | |
Fund
| | Amount
| |
Aggressive Growth Lifestyle | | $ | 192,758 | |
Capital Appreciation | | | 110,660 | |
Conservative Growth Lifestyle | | | 143,523 | |
Core Bond | | | 229,444 | |
High Yield Bond | | | 106,683 | |
International Opportunities | | | 1,255,810 | |
Large Cap Value | | | 141,716 | |
Mid Cap Growth` | | | 455,490 | |
Mid Cap Value | | | 57,473 | |
Moderate Growth Lifestyle | | | 268,046 | |
Money Market II | | | 141,773 | |
Small Cap Growth | | | 103,294 | |
Small Cap Value | | | 419,148 | |
Socially Responsible | | | 332,169 | |
VALIC may also voluntarily waive fees and/or reimburse expenses to avoid a negative yield on the Money Market II Fund. The voluntary waivers and/or reimbursements may be terminated at any time at the option of VALIC. The exact amount of the voluntary waivers and/or reimbursements may change on a day-to-day basis. There is no guarantee that the Money Market II Fund will be able to avoid a negative yield. For the year ended August 31, 2015, VALIC voluntarily waived fees and/or reimbursed expenses of $651,524 for the Money Market II Fund.
VC II, on behalf of each Fund, other than the Lifestyle Funds, has entered into an Administrative Services Agreement with SunAmerica (“Administrator”), an affiliate of the Adviser. SunAmerica receives from each Fund in the Series and VCI, other than the Lifestyle Funds, an annual fee of 0.06% based upon each Fund’s average daily net assets, plus the following Accounting Basis Point Fee†: 0.0075% on the first $75 billion; 0.0060% on the next $25 billion; and 0.0050% in excess of $100 billion. Pursuant to the
134
VALIC Company II
NOTES TO FINANCIAL STATEMENTS — (continued)
Administrative Services Agreement, SunAmerica provides administrative services to the Funds, regulatory reporting, internal legal and compliance services, fund accounting and related portfolio accounting services, all necessary office space, equipment, personnel, compensation and facilities for handling the affairs of the Funds and other services. Without limiting the generality of the foregoing, the Administrator (or its appointed service provider): assists with the preparation of prospectuses, statements of additional information, registration statements, and proxy materials; develops and prepares communications to shareholders, including the annual and semi-annual reports to shareholders; coordinates and supervises the preparation and filing of Fund tax returns; assists with the design, development, and operation of the Funds; prepares the Funds’ financial statements; determines the net asset value of the Funds’ shares; supervises the Funds’ transfer agent with respect to the payment of dividends and other distributions to shareholders; and calculates performance data of the Funds. For the year ended August 31, 2015, the Administrator earned fees as reflected in the Statements of Operations based upon the aforementioned rate.
Effective September 1, 2014, VC II, on behalf of each Fund, entered into a Transfer Agency and Services Agreement with VALIC Retirement Services Company (“VRSCO”), an affiliate of VALIC. VRSCO receives from the Series and VC I an annual fee of $132,510, which is allocated to each Fund in the Series and VC I based on shareholder accounts. Under this agreement, VRSCO provides services which include the issuance and redemption of shares, acting as dividend disbursing agent, and certain shareholder reporting services including confirmation of transactions, statements of account and tax reporting. In addition to the above, VRSCO provides “Blue Sky” registration and reporting in applicable states for each Fund that is sold outside of a variable annuity or variable [universal] life contract in order to effect and maintain, as the case may be, including but not limited to, the qualification of shares for sale under the applicable securities laws of such jurisdictions to qualified plans. Prior to September 1, 2014, VALIC provided the aforementioned services to the Series and VC I under a substantially similar agreement for the same annual fee. For the year ended August 31, 2015, VRSCO earned fees as reflected in the Statement of Operations based upon the aforementioned rate.
VC II, on behalf of each Fund, other than the Lifestyle Funds, has entered into a Shareholder Services Agreement with VALIC. Under the agreement, VALIC provides record keeping, account maintenance, and other administrative and shareholder services for contract owners and participants. VALIC receives from each Fund, other than the Lifestyle Funds, an annual fee of 0.25% based on average daily net assets of the Fund. For the year ended August 31, 2015, VALIC earned fees as reflected in the Statements of Operations based upon the aforementioned rate.
On January 23, 2001, the Board ratified a Deferred Compensation Plan for its independent trustees who are not officers, directors, or employees of VALIC, or an affiliate of VALIC. The effective date of the plan was January 1, 2001. The first deferred payment was made in March of 2001. Under the deferred compensation plan, Trustees may elect to defer all or a portion of their compensation. Amounts deferred may be invested in up to three different affiliated mutual funds that are specified in the plan as selected by the trustees. Obligations under the deferred compensation plan represents unsecured claims against the general assets of the Funds. For the year ended August 31, 2015, VC II has deferred $19,400 of trustee compensation.
As a result of losses on medium-term notes issued by Cheyne Finance LLC, that were previously held in the Money Market II Fund, VALIC made capital contributions to the Money Market II Fund of $273,451 during the period ended August 31, 2015.
At August 31, 2015, VALIC, through its insurance company separate accounts, owned over five percent of the outstanding shares of the following Funds:
| | | | |
Fund
| | VALIC
| |
Aggressive Growth Lifestyle | | | 100.00 | % |
Capital Appreciation | | | 100.00 | % |
Conservative Growth Lifestyle | | | 100.00 | % |
Core Bond | | | 100.00 | % |
High Yield Bond | | | 99.97 | % |
International Opportunities | | | 100.00 | % |
Large Cap Value | | | 100.00 | % |
Mid Cap Growth | | | 100.00 | % |
Mid Cap Value | | | 99.76 | % |
Moderate Growth Lifestyle | | | 100.00 | % |
Money Market II | | | 100.00 | % |
Small Cap Growth | | | 100.00 | % |
Small Cap Value | | | 100.00 | % |
Socially Responsible | | | 100.00 | % |
Strategic Bond | | | 99.94 | % |
135
| † | Accounting Basis Point Fee is calculated based upon all assets in all registered management investment companies managed and/or administered by the Administrator and VALIC, other than “funds-of-funds” and “feeder funds.” |
VALIC Company II
NOTES TO FINANCIAL STATEMENTS — (continued)
As disclosed in the Portfolio of Investments, certain Funds own shares of various VC I or VC II Funds and securities issued by AIG or an affiliate thereof. During the year ended August 31, 2015, transactions in these securities were as follows:
Aggressive Growth Lifestyle Fund
| | | | | | | | | | | | | | | | | | | | | | | | | | | | | | | | |
Security
| | Income
| | | Capital Gain
Distribution
Received
| | | Value at
08/31/2014
| | | Cost of
Purchases†
| | | Proceeds from
Sales
| | | Realized
Gain/(Loss)
| | | Change in
Unrealized
Gain/(Loss)
| | | Value at
08/31/2015
| |
VALIC Co. I Blue Chip Growth Fund | | $ | — | | | $ | 2,341,885 | | | $ | 29,450,418 | | | $ | 2,341,885 | | | $ | 5,514,616 | | | $ | 2,867,525 | | | $ | (3,374,597 | ) | | $ | 25,770,615 | |
VALIC Co. I Capital Conservation Fund | | | 196,986 | | | | — | | | | — | | | | 12,322,688 | | | | 139,739 | | | | 280 | | | | (98,449 | ) | | | 12,084,780 | |
VALIC Co. I Dividend Value Fund | | | 205,138 | | | | 623,659 | | | | 24,064,385 | | | | 828,797 | | | | 17,538,537 | | | | 4,854,236 | | | | (5,399,298 | ) | | | 6,809,583 | |
VALIC Co. I Emerging Economies Fund | | | 293,247 | | | | — | | | | 26,219,503 | | | | 293,247 | | | | 13,660,338 | | | | 5,083 | | | | (4,344,739 | ) | | | 8,512,756 | |
VALIC Co. I Foreign Value Fund | | | 699,031 | | | | — | | | | 34,303,227 | | | | 5,558,766 | | | | 7,962,946 | | | | 593,042 | | | | (7,436,277 | ) | | | 25,055,812 | |
VALIC Co. I Global Real Estate Fund | | | 1,017,552 | | | | 1,025,886 | | | | 28,522,503 | | | | 14,247,986 | | | | 2,947,558 | | | | 1,250,225 | | | | (3,984,770 | ) | | | 37,088,386 | |
VALIC Co. I Government Securities Fund | | | 280,731 | | | | — | | | | 3,554,689 | | | | 9,532,768 | | | | 1,260,919 | | | | (79,835 | ) | | | (26,294 | ) | | | 11,720,409 | |
VALIC Co. I Inflation Protected Fund | | | 244,629 | | | | 24,350 | | | | 1,235,949 | | | | 12,062,523 | | | | 6,610,235 | | | | (218,828 | ) | | | (322,180 | ) | | | 6,147,229 | |
VALIC Co. I International Equities Index Fund | | | 1,530,714 | | | | — | | | | 31,812,058 | | | | 26,517,353 | | | | — | | | | — | | | | (4,730,784 | ) | | | 53,598,627 | |
VALIC Co. I International Government Bond Fund | | | 29,803 | | | | 3,181 | | | | — | | | | 1,275,600 | | | | 1,217,505 | | | | (58,095 | ) | | | — | | | | — | |
VALIC Co. I International Growth Fund | | | 397,637 | | | | 176,322 | | | | 21,927,119 | | | | 6,214,755 | | | | — | | | | — | | | | (2,030,330 | ) | | | 26,111,544 | |
VALIC Co. I Mid Cap Index Fund | | | 237,688 | | | | 1,295,781 | | | | 25,593,715 | | | | 1,533,468 | | | | 4,534,202 | | | | 514,131 | | | | (2,282,947 | ) | | | 20,824,165 | |
VALIC Co. I Mid Cap Strategic Growth Fund | | | — | | | | 917,639 | | | | 6,513,673 | | | | 1,057,986 | | | | 218,371 | | | | 56,916 | | | | (1,129,131 | ) | | | 6,281,073 | |
VALIC Co. I Nasdaq-100 Index Fund | | | 145,962 | | | | 175,461 | | | | 18,034,846 | | | | 321,423 | | | | 3,208,756 | | | | 1,293,402 | | | | (696,603 | ) | | | 15,744,312 | |
VALIC Co. I Science & Technology Fund | | | — | | | | 1,322,854 | | | | 18,497,800 | | | | 1,322,854 | | | | 5,838,922 | | | | 2,953,666 | | | | (4,007,590 | ) | | | 12,927,808 | |
VALIC Co. I Small Cap Index Fund | | | 162,855 | | | | 838,980 | | | | 19,731,706 | | | | 11,769,627 | | | | 4,604,001 | | | | 822,434 | | | | (2,479,324 | ) | | | 25,240,442 | |
VALIC Co. I Small Cap Special Values Fund | | | 75,187 | | | | 597,057 | | | | 8,708,436 | | | | 672,245 | | | | 867,423 | | | | 327,163 | | | | (1,133,971 | ) | | | 7,706,450 | |
VALIC Co. I Stock Index Fund | | | 592,406 | | | | 1,332,886 | | | | 61,608,422 | | | | 33,022,648 | | | | 73,094,258 | | | | 5,002,038 | | | | (7,654,215 | ) | | | 18,884,635 | |
VALIC Co. I Value Fund | | | 26,932 | | | | — | | | | 1,792,600 | | | | 26,932 | | | | — | | | | — | | | | (67,821 | ) | | | 1,751,711 | |
VALIC Co. II Capital Appreciation Fund | | | 50,685 | | | | — | | | | 16,032,354 | | | | 50,685 | | | | 1,013,833 | | | | 640,696 | | | | (175,445 | ) | | | 15,534,457 | |
VALIC Co. II Core Bond Fund | | | 927,519 | | | | — | | | | 29,046,205 | | | | 24,352,804 | | | | 8,446,459 | | | | (65,657 | ) | | | (786,562 | ) | | | 44,100,331 | |
VALIC Co. II High Yield Bond Fund | | | 1,032,754 | | | | — | | | | 13,785,216 | | | | 11,617,691 | | | | 2,945,641 | | | | 86,032 | | | | (1,509,827 | ) | | | 21,033,471 | |
VALIC Co. II International Opportunities Fund | | | 127,379 | | | | — | | | | 7,252,270 | | | | 2,998,859 | | | | — | | | | — | | | | (306,592 | ) | | | 9,944,537 | |
VALIC Co. II Large Cap Value Fund | | | 87,077 | | | | — | | | | 7,047,372 | | | | 87,077 | | | | 694,931 | | | | 228,169 | | | | (398,355 | ) | | | 6,269,332 | |
VALIC Co. II Mid Cap Growth Fund | | | — | | | | 1,189,362 | | | | 7,688,350 | | | | 1,189,362 | | | | 33,475 | | | | 8,303 | | | | (1,070,775 | ) | | | 7,781,765 | |
VALIC Co. II Mid Cap Value Fund | | | 60,515 | | | | 2,914,191 | | | | 29,737,808 | | | | 2,974,706 | | | | 731,660 | | | | 331,179 | | | | (4,363,414 | ) | | | 27,948,619 | |
VALIC Co. II Small Cap Growth Fund | | | — | | | | 1,176,390 | | | | 7,598,566 | | | | 3,788,012 | | | | 88,412 | | | | 20,012 | | | | (658,568 | ) | | | 10,659,610 | |
VALIC Co. II Small Cap Value Fund | | | 91,777 | | | | 2,026,667 | | | | 16,694,674 | | | | 2,118,445 | | | | 976,841 | | | | 183,546 | | | | (2,845,088 | ) | | | 15,174,736 | |
VALIC Co. II Strategic Bond Fund | | | 1,004,255 | | | | 254,981 | | | | 15,674,422 | | | | 14,522,052 | | | | 258,278 | | | | (1,417 | ) | | | (1,732,461 | ) | | | 28,204,318 | |
| | |
|
|
| |
|
|
| |
|
|
| |
|
|
| |
|
|
| |
|
|
| |
|
|
| |
|
|
|
| | | $ | 9,518,459 | | | $ | 18,237,532 | | | $ | 512,128,286 | | | $ | 204,623,244 | | | $ | 164,407,856 | | | $ | 21,614,246 | | | $ | (65,046,407 | ) | | $ | 508,911,513 | |
| | |
|
|
| |
|
|
| |
|
|
| |
|
|
| |
|
|
| |
|
|
| |
|
|
| |
|
|
|
136
VALIC Company II
NOTES TO FINANCIAL STATEMENTS — (continued)
| | | | | | | | | | | | | | | | | | | | | | | | | | | | | | | | |
Conservative Growth Lifestyle Fund | |
Security
| | Income
| | | Capital Gain
Distribution
Received
| | | Value at
08/31/2014
| | | Cost of
Purchases†
| | | Proceeds from
Sales
| | | Realized
Gain/(Loss)
| | | Change in
Unrealized
Gain/(Loss)
| | | Value at
08/31/2015
| |
VALIC Co. I Blue Chip Growth Fund | | $ | — | | | $ | 855,840 | | | $ | 11,306,890 | | | $ | 855,840 | | | $ | 3,755,981 | | | $ | 1,532,191 | | | $ | (1,697,281 | ) | | $ | 8,241,659 | |
VALIC Co. I Capital Conservation Fund | | | 272,779 | | | | — | | | | 6,215,151 | | | | 13,340,289 | | | | 4,145,837 | | | | 6,388 | | | | (147,104 | ) | | | 15,268,887 | |
VALIC Co. I Dividend Value Fund | | | 32,532 | | | | 98,904 | | | | 4,716,328 | | | | 227,128 | | | | 4,892,824 | | | | 1,013,095 | | | | (1,063,727 | ) | | | — | |
VALIC Co. I Emerging Economies Fund | | | 78,843 | | | | — | | | | 9,985,987 | | | | 78,843 | | | | 5,699,019 | | | | (476,884 | ) | | | (1,122,175 | ) | | | 2,766,752 | |
VALIC Co. I Foreign Value Fund | | | 331,020 | | | | — | | | | 12,256,224 | | | | 6,615,723 | | | | 3,789,558 | | | | 201,732 | | | | (3,419,163 | ) | | | 11,864,958 | |
VALIC Co. I Global Real Estate Fund | | | 300,641 | | | | 303,104 | | | | 8,869,435 | | | | 4,707,905 | | | | 1,775,410 | | | | 308,550 | | | | (1,152,515 | ) | | | 10,957,965 | |
VALIC Co. I Government Securities Fund | | | 177,264 | | | | — | | | | 5,834,309 | | | | 2,414,155 | | | | 855,320 | | | | (43,005 | ) | | | (8,957 | ) | | | 7,341,182 | |
VALIC Co. I Inflation Protected Fund | | | 247,475 | | | | 24,634 | | | | 14,064,662 | | | | 272,109 | | | | 3,457,644 | | | | 101,626 | | | | (934,911 | ) | | | 10,045,842 | |
VALIC Co. I International Equities Index Fund | | | 870,698 | | | | — | | | | 11,456,813 | | | | 19,772,162 | | | | — | | | | — | | | | (2,450,738 | ) | | | 28,778,237 | |
VALIC Co. I International Government Bond Fund | | | 76,613 | | | | 8,176 | | | | — | | | | 3,279,118 | | | | 1,716,973 | | | | (113,009 | ) | | | (93,910 | ) | | | 1,355,226 | |
VALIC Co. I International Growth Fund | | | 189,358 | | | | 83,966 | | | | 7,616,819 | | | | 6,621,726 | | | | — | | | | — | | | | (991,615 | ) | | | 13,246,930 | |
VALIC Co. I Mid Cap Index Fund | | | 41,333 | | | | 225,331 | | | | 11,192,240 | | | | 266,663 | | | | 7,988,848 | | | | 1,223,982 | | | | (1,520,805 | ) | | | 3,173,232 | |
VALIC Co. I Mid Cap Strategic Growth Fund | | | — | | | | 278,140 | | | | 2,036,364 | | | | 377,995 | | | | 185,162 | | | | 5,909 | | | | (331,289 | ) | | | 1,903,817 | |
VALIC Co. I Nasdaq-100 Index Fund | | | 38,416 | | | | 46,180 | | | | 4,362,899 | | | | 84,597 | | | | 1,213,932 | | | | 483,900 | | | | (323,192 | ) | | | 3,394,272 | |
VALIC Co. I Science & Technology Fund | | | — | | | | 501,136 | | | | 5,832,940 | | | | 501,136 | | | | 2,866,470 | | | | 1,029,636 | | | | (1,342,773 | ) | | | 3,154,469 | |
VALIC Co. I Small Cap Index Fund | | | 34,025 | | | | 175,285 | | | | 6,295,890 | | | | 3,581,879 | | | | 3,131,620 | | | | 297,568 | | | | (714,113 | ) | | | 6,329,604 | |
VALIC Co. I Small Cap Special Values Fund | | | 19,006 | | | | 150,926 | | | | 2,184,338 | | | | 169,933 | | | | 201,068 | | | | 63,268 | | | | (268,405 | ) | | | 1,948,066 | |
VALIC Co. I Stock Index Fund | | | 136,435 | | | | 306,974 | | | | 23,216,977 | | | | 14,182,298 | | | | 34,111,826 | | | | 925,215 | | | | (1,580,517 | ) | | | 2,632,147 | |
VALIC Co. I Value Fund | | | 2,405 | | | | — | | | | 160,119 | | | | 2,405 | | | | — | | | | — | | | | (6,057 | ) | | | 156,467 | |
VALIC Co. II Capital Appreciation Fund | | | 10,724 | | | | — | | | | 3,182,328 | | | | 10,724 | | | | — | | | | — | | | | 93,814 | | | | 3,286,866 | |
VALIC Co. II Core Bond Fund | | | 1,458,530 | | | | — | | | | 69,802,743 | | | | 23,895,090 | | | | 22,473,468 | | | | 152,476 | | | | (1,167,089 | ) | | | 70,209,752 | |
VALIC Co. II High Yield Bond Fund | | | 1,676,641 | | | | — | | | | 28,007,537 | | | | 11,562,408 | | | | 3,071,805 | | | | 224,008 | | | | (2,575,042 | ) | | | 34,147,106 | |
VALIC Co. II International Opportunities Fund | | | 46,705 | | | | — | | | | 1,813,850 | | | | 1,896,581 | | | | — | | | | — | | | | (64,112 | ) | | | 3,646,319 | |
VALIC Co. II Large Cap Value Fund | | | 22,029 | | | | — | | | | 1,915,831 | | | | 22,029 | | | | 311,912 | | | | 102,411 | | | | (142,291 | ) | | | 1,586,068 | |
VALIC Co. II Mid Cap Growth Fund | | | — | | | | 300,348 | | | | 2,069,301 | | | | 372,032 | | | | 209,075 | | | | 51,857 | | | | (318,999 | ) | | | 1,965,116 | |
VALIC Co. II Mid Cap Value Fund | | | 13,914 | | | | 670,055 | | | | 10,182,224 | | | | 683,969 | | | | 3,510,047 | | | | 1,351,554 | | | | (2,281,525 | ) | | | 6,426,175 | |
VALIC Co. II Small Cap Growth Fund | | | — | | | | 185,957 | | | | 1,301,649 | | | | 527,438 | | | | 43,817 | | | | 6,874 | | | | (107,133 | ) | | | 1,685,011 | |
VALIC Co. II Small Cap Value Fund | | | 14,510 | | | | 320,406 | | | | 2,792,011 | | | | 334,916 | | | | 305,735 | | | | 57,820 | | | | (479,962 | ) | | | 2,399,050 | |
VALIC Co. II Strategic Bond Fund | | | 2,342,199 | | | | 594,686 | | | | 54,074,938 | | | | 18,119,340 | | | | — | | | | — | | | | (4,324,946 | ) | | | 67,869,332 | |
| | |
|
|
| |
|
|
| |
|
|
| |
|
|
| |
|
|
| |
|
|
| |
|
|
| |
|
|
|
| | | $ | 8,434,095 | | | $ | 5,130,048 | | | $ | 322,746,797 | | | $ | 134,776,431 | | | $ | 109,713,351 | | | $ | 8,507,162 | | | $ | (30,536,532 | ) | | $ | 325,780,507 | |
| | |
|
|
| |
|
|
| |
|
|
| |
|
|
| |
|
|
| |
|
|
| |
|
|
| |
|
|
|
Moderate Growth Lifestyle Fund
| | | | | | | | | | | | | | | | | | | | | | | | | | | | | | | | |
Security
| | Income
| | | Capital Gain
Distribution
Received
| | | Value at
08/31/2014
| | | Cost of
Purchases†
| | | Proceeds
from Sales
| | | Realized
Gain/(Loss)
| | | Change in
Unrealized
Gain/(Loss)
| | | Value at
08/31/2015
| |
VALIC Co. I Blue Chip Growth Fund | | $ | — | | | $ | 2,878,078 | | | $ | 35,829,697 | | | $ | 2,878,078 | | | $ | 6,406,593 | | | $ | 2,558,765 | | | $ | (3,188,950 | ) | | $ | 31,670,997 | |
VALIC Co. I Capital Conservation Fund | | | 596,214 | | | | — | | | | 7,689,338 | | | | 27,356,970 | | | | 808,369 | | | | 8,795 | | | | (486,842 | ) | | | 33,759,892 | |
VALIC Co. I Dividend Value Fund | | | 199,088 | | | | 605,267 | | | | 23,494,727 | | | | 804,355 | | | | 16,224,287 | | | | 4,538,403 | | | | (4,990,815 | ) | | | 7,622,383 | |
VALIC Co. I Emerging Economies Fund | | | 283,333 | | | | — | | | | 32,678,889 | | | | 283,333 | | | | 19,141,681 | | | | (925,952 | ) | | | (4,296,922 | ) | | | 8,597,667 | |
VALIC Co. I Foreign Value Fund | | | 824,532 | | | | — | | | | 43,812,815 | | | | 2,672,287 | | | | 8,934,050 | | | | 671,120 | | | | (8,667,949 | ) | | | 29,554,223 | |
VALIC Co. I Global Real Estate Fund | | | 1,162,535 | | | | 1,172,056 | | | | 33,320,496 | | | | 23,278,388 | | | | 4,459,945 | | | | 1,563,661 | | | | (4,861,271 | ) | | | 48,841,329 | |
VALIC Co. I Government Securities Fund | | | 436,983 | | | | — | | | | 10,286,451 | | | | 10,064,401 | | | | 2,092,585 | | | | (127,569 | ) | | | (12,817 | ) | | | 18,117,881 | |
VALIC Co. I Inflation Protected Fund | | | 419,286 | | | | 41,736 | | | | 13,528,944 | | | | 9,481,535 | | | | 7,763,218 | | | | (6,928 | ) | | | (1,180,114 | ) | | | 14,060,219 | |
VALIC Co. I International Equities Index Fund | | | 2,205,618 | | | | — | | | | 43,599,935 | | | | 35,993,989 | | | | 2,373,256 | | | | 294,981 | | | | (6,364,460 | ) | | | 71,151,189 | |
VALIC Co. I International Government Bond Fund | | | 93,278 | | | | 9,955 | | | | — | | | | 3,992,403 | | | | 2,065,481 | | | | (137,373 | ) | | | (116,049 | ) | | | 1,673,500 | |
VALIC Co. I International Growth Fund | | | 472,079 | | | | 209,332 | | | | 24,623,586 | | | | 12,894,661 | | | | — | | | | — | | | | (2,490,953 | ) | | | 35,027,294 | |
VALIC Co. I Mid Cap Index Fund | | | 282,674 | | | | 1,541,027 | | | | 35,647,770 | | | | 3,440,441 | | | | 11,652,012 | | | | 1,668,312 | | | | (3,866,892 | ) | | | 25,237,619 | |
VALIC Co. I Mid Cap Strategic Growth Fund | | | — | | | | 1,142,528 | | | | 7,759,261 | | | | 1,391,089 | | | | — | | | | — | | | | (1,329,957 | ) | | | 7,820,393 | |
VALIC Co. I Nasdaq-100 Index Fund | | | 189,454 | | | | 227,742 | | | | 21,532,019 | | | | 417,196 | | | | 4,576,607 | | | | 1,875,794 | | | | (1,108,916 | ) | | | 18,139,486 | |
VALIC Co. I Science & Technology Fund | | | — | | | | 1,646,316 | | | | 23,871,246 | | | | 1,646,314 | | | | 12,680,910 | | | | 6,203,065 | | | | (7,214,690 | ) | | | 11,825,025 | |
VALIC Co. I Small Cap Index Fund | | | 227,683 | | | | 1,172,955 | | | | 25,065,962 | | | | 19,669,592 | | | | 5,484,716 | | | | 977,284 | | | | (3,436,996 | ) | | | 36,791,126 | |
VALIC Co. I Small Cap Special Values Fund | | | 86,159 | | | | 684,184 | | | | 9,604,265 | | | | 770,343 | | | | 614,144 | | | | 206,239 | | | | (1,135,674 | ) | | | 8,831,029 | |
VALIC Co. I Stock Index Fund | | | 598,533 | | | | 1,346,673 | | | | 77,469,900 | | | | 40,966,440 | | | | 99,632,579 | | | | 4,701,518 | | | | (7,767,674 | ) | | | 15,737,605 | |
VALIC Co. I Value Fund | | | 23,928 | | | | — | | | | 1,592,710 | | | | 23,928 | | | | — | | | | — | | | | (60,257 | ) | | | 1,556,381 | |
137
VALIC Company II
NOTES TO FINANCIAL STATEMENTS — (continued)
Moderate Growth Lifestyle Fund (continued)
| | | | | | | | | | | | | | | | | | | | | | | | | | | | | | | | |
Security
| | Income
| | | Capital Gain
Distribution
Received
| | | Value at
08/31/2014
| | | Cost of
Purchases†
| | | Proceeds
from Sales
| | | Realized
Gain/(Loss)
| | | Change in
Unrealized
Gain/(Loss)
| | | Value at
08/31/2015
| |
VALIC Co. II Capital Appreciation Fund | | $ | 59,189 | | | $ | — | | | $ | 18,201,444 | | | $ | 59,189 | | | $ | 646,950 | | | $ | 396,117 | | | $ | 131,301 | | | $ | 18,141,101 | |
VALIC Co. II Core Bond Fund | | | 2,934,474 | | | | — | | | | 122,951,710 | | | | 53,542,932 | | | | 33,675,014 | | | | (350,756 | ) | | | (2,031,959 | ) | | | 140,436,913 | |
VALIC Co. II High Yield Bond Fund | | | 1,870,925 | | | | — | | | | 38,747,948 | | | | 5,980,662 | | | | 3,961,316 | | | | 271,378 | | | | (2,934,701 | ) | | | 38,103,971 | |
VALIC Co. II International Opportunities Fund | | | 123,515 | | | | — | | | | 7,517,787 | | | | 2,295,308 | | | | — | | | | — | | | | (170,218 | ) | | | 9,642,877 | |
VALIC Co. II Large Cap Value Fund | | | 102,052 | | | | — | | | | 7,463,917 | | | | 102,052 | | | | — | | | | — | | | | (218,459 | ) | | | 7,347,510 | |
VALIC Co. II Mid Cap Growth Fund | | | — | | | | 1,434,688 | | | | 9,183,345 | | | | 1,484,883 | | | | — | | | | — | | | | (1,281,346 | ) | | | 9,386,882 | |
VALIC Co. II Mid Cap Value Fund | | | 81,366 | | | | 3,918,325 | | | | 40,025,573 | | | | 3,999,692 | | | | 1,024,307 | | | | 454,438 | | | | (5,876,604 | ) | | | 37,578,792 | |
VALIC Co. II Small Cap Growth Fund | | | — | | | | 934,296 | | | | 7,444,821 | | | | 1,531,883 | | | | — | | | | — | | | | (510,771 | ) | | | 8,465,933 | |
VALIC Co. II Small Cap Value Fund | | | 84,133 | | | | 1,857,850 | | | | 15,542,952 | | | | 1,941,982 | | | | 1,130,767 | | | | 211,847 | | | | (2,655,305 | ) | | | 13,910,709 | |
VALIC Co. II Strategic Bond Fund | | | 3,195,986 | | | | 811,463 | | | | 60,063,908 | | | | 36,145,446 | | | | 979,989 | | | | 116,434 | | | | (5,883,853 | ) | | | 89,461,946 | |
| | |
|
|
| |
|
|
| |
|
|
| |
|
|
| |
|
|
| |
|
|
| |
|
|
| |
|
|
|
| | | $ | 16,553,017 | | | $ | 21,634,471 | | | $ | 798,551,416 | | | $ | 305,109,772 | | | $ | 246,328,776 | | | $ | 25,169,573 | | | $ | (84,010,113 | ) | | $ | 798,491,872 | |
| | |
|
|
| |
|
|
| |
|
|
| |
|
|
| |
|
|
| |
|
|
| |
|
|
| |
|
|
|
| † | Includes reinvestment of distributions paid. |
Note 4 — Purchases and Sales of Investment Securities
The cost of purchases and proceeds from sales and maturities of long-term investments during the year ended August 31, 2015 were as follows:
| | | | | | | | | | | | | | | | |
Fund
| | Purchases of
Investment
Securities
(Excluding U.S.
Government
Securities)
| | | Sales of
Investment
Securities
(Excluding U.S.
Government
Securities)
| | | Purchase of
U.S.
Government
Securities
| | | Sales of U.S.
Government
Securities
| |
Aggressive Growth Lifestyle Fund | | $ | 176,867,253 | | | $ | 164,407,856 | | | $ | — | | | $ | — | |
Capital Appreciation Fund | | | 37,010,006 | | | | 44,005,182 | | | | — | | | | — | |
Conservative Growth Lifestyle Fund | | | 121,212,288 | | | | 109,713,351 | | | | — | | | | — | |
Core Bond Fund | | | 667,928,816 | | | | 592,093,941 | | | | 971,441,620 | | | | 891,692,023 | |
High Yield Bond Fund | | | 218,180,071 | | | | 145,572,738 | | | | — | | | | — | |
International Opportunities Fund | | | 366,304,802 | | | | 338,125,426 | | | | — | | | | — | |
Large Cap Value Fund | | | 149,401,024 | | | | 171,488,825 | | | | — | | | | — | |
Mid Cap Growth Fund | | | 160,721,090 | | | | 172,840,030 | | | | — | | | | — | |
Mid Cap Value Fund | | | 548,156,040 | | | | 510,370,840 | | | | — | | | | — | |
Moderate Growth Lifestyle Fund | | | 266,922,284 | | | | 246,328,776 | | | | — | | | | — | |
Money Market II Fund | | | — | | | | — | | | | — | | | | — | |
Small Cap Growth Fund | | | 54,893,414 | | | | 64,339,227 | | | | — | | | | — | |
Small Cap Value Fund | | | 264,628,710 | | | | 302,989,878 | | | | — | | | | 700,000 | |
Socially Responsible Fund | | | 256,714,699 | | | | 213,611,263 | | | | — | | | | — | |
Strategic Bond Fund | | | 820,468,409 | | | | 727,654,157 | | | | 271,515,237 | | | | 266,439,008 | |
138
VALIC Company II
NOTES TO FINANCIAL STATEMENTS — (continued)
Note 5 — Federal Income Taxes
The following details the tax basis of distributions as well as the components of distributable earnings. The tax basis components of distributable earnings differ from the amounts reflected in the Statements of Assets and Liabilities by temporary book/tax differences primarily arising from wash sales, post October losses, investments in passive foreign investment companies, treatment of deferred compensation, late year ordinary losses, straddles, investments in partnerships, treatment of defaulted securities and derivative transactions.
The information in the following table is presented on the basis of cost for federal income tax purposes at August 31, 2015.
| | | | | | | | | | | | | | | | |
Fund
| | Identified Cost
of Investments
Owned
| | | Gross
Unrealized
Appreciation
| | | Gross
Unrealized
Depreciation
| | | Net Unrealized
Appreciation
(Depreciation)
| |
Aggressive Growth Lifesyle | | $ | 496,673,667 | | | $ | 31,895,093 | | | $ | (19,657,247 | ) | | $ | 12,237,846 | |
Capital Appreciation | | | 67,454,607 | | | | 17,940,960 | | | | (2,283,524 | ) | | | 15,657,436 | |
Conservative Growth Lifestyle | | | 335,190,206 | | | | 5,300,150 | | | | (14,709,849 | ) | | | (9,409,699 | ) |
Core Bond | | | 1,131,626,906 | | | | 11,854,798 | | | | (16,588,511 | ) | | | (4,733,713 | ) |
High Yield Bond | | | 509,589,335 | | | | 7,889,573 | | | | (23,966,335 | ) | | | (16,076,762 | ) |
International Opportunities | | | 554,906,584 | | | | 105,762,494 | | | | (33,006,137 | ) | | | 72,756,357 | |
Large Cap Value | | | 182,898,100 | | | | 20,772,438 | | | | (9,097,494 | ) | | | 11,674,944 | |
Mid Cap Growth | | | 150,069,063 | | | | 14,717,064 | | | | (5,595,131 | ) | | | 9,121,933 | |
Mid Cap Value | | | 854,673,698 | | | | 123,700,468 | | | | (35,298,913 | ) | | | 88,401,555 | |
Moderate Growth Lifestyle | | | 791,331,158 | | | | 35,948,483 | | | | (28,787,769 | ) | | | 7,160,714 | |
Money Market | | | 164,141,748 | | | | — | | | | — | | | | — | |
Small Cap Growth | | | 120,381,400 | | | | 19,466,582 | | | | (8,346,622 | ) | | | 11,119,960 | |
Small Cap Value | | | 515,793,321 | | | | 71,192,745 | | | | (54,296,789 | ) | | | 16,895,956 | |
Socially Responsible | | | 609,368,233 | | | | 148,338,232 | | | | (28,247,620 | ) | | | 120,090,612 | |
Strategic Bond | | | 848,004,716 | | | | 5,333,402 | | | | (37,573,347 | ) | | | (32,239,945 | ) |
The tax character of distributions paid may differ from the Statement of Changes in Net Assets due to short-term gains treated as ordinary income distributions for tax purposes. The tax basis of distributable earnings at August 31, 2015 and the tax character of distributions paid during the year ended August 31, 2015 were as follows:
| | | | | | | | | | | | | | | | | | | | |
| | | Distributable Earnings
| | | Tax Distributions
| |
Fund
| | Ordinary
Income
| | | Long-
Term Gains/
Capital and
Other Losses
| | | Unrealized
Appreciation
(Depreciation)@
| | | Ordinary
Income
| | | Long-Term
Capital
Gains
| |
Aggressive Growth Lifestyle | | $ | 13,270,729 | | | $ | 34,330,762 | | | $ | 12,237,846 | | | $ | 10,015,465 | | | $ | 36,393,527 | |
Capital Appreciation | | | 315,770 | | | | 7,803,191 | | | | 15,657,436 | | | | 272,960 | | | | — | |
Conservative Growth Lifestyle | | | 9,991,705 | | | | 11,963,320 | | | | (9,409,699 | ) | | | 12,368,253 | | | | 9,535,583 | |
Core Bond | | | 26,673,576 | | | | — | | | | (4,733,713 | ) | | | 21,848,211 | | | | — | |
High Yield Bond | | | 23,145,260 | | | | (25,316,663 | ) | | | (16,076,350 | ) | | | 21,285,525 | | | | — | |
International Opportunities | | | 6,570,283 | | | | (111,391,478 | ) | | | 72,644,592 | | | | 7,671,663 | | | | — | |
Large Cap Value | | | 2,377,606 | | | | (28,025,879 | ) | | | 11,674,944 | | | | 2,722,460 | | | | — | |
Mid Cap Growth | | | — | | | | 9,306,137 | | | | 9,121,933 | | | | 5,454,990 | | | | 17,636,410 | |
Mid Cap Value | | | 2,720,801 | | | | 130,587,634 | | | | 88,399,530 | | | | 10,189,508 | | | | 84,711,714 | |
Moderate Growth Lifestyle | | | 21,298,906 | | | | 41,294,498 | | | | 7,160,714 | | | | 18,139,636 | | | | 43,143,104 | |
Money Market II | | | 2,293 | | | | (879 | ) | | | — | | | | 16,299 | | | | — | |
Small Cap Growth | | | 65,807 | | | | 9,838,498 | | | | 11,119,960 | | | | 421,402 | | | | 11,885,623 | |
Small Cap Value | | | 11,017,596 | | | | 52,510,354 | | | | 16,895,979 | | | | 14,057,722 | | | | 58,550,498 | |
Socially Responsible | | | 9,965,112 | | | | 45,987,263 | | | | 120,090,612 | | | | 8,278,684 | | | | — | |
Strategic Bond | | | 32,224,009 | | | | 917,775 | | | | (32,280,498 | ) | | | 33,663,602 | | | | 1,806,930 | |
| @ | Unrealized appreciation (depreciation) includes amounts for derivatives and other assets and liabilities denominated in foreign currency. |
139
VALIC Company II
NOTES TO FINANCIAL STATEMENTS — (continued)
The tax character of distributions paid during the year ended August 31, 2014 were as follows:
| | | | | | | | |
| | | Tax Distributions
| |
Fund
| | Ordinary
Income
| | | Long-Term
Capital Gains
| |
Aggressive Growth Lifestyle | | $ | 5,633,754 | | | $ | 3,054,279 | |
Capital Appreciation | | | 366,049 | | | | — | |
Conservative Growth Lifestyle | | | 9,716,705 | | | | 4,100,935 | |
Core Bond | | | 20,149,056 | | | | 3,719,865 | |
High Yield Bond | | | 19,808,145 | | | | — | |
International Opportunities | | | 7,277,253 | | | | — | |
Large Cap Value | | | 2,408,346 | | | | — | |
Mid Cap Growth | | | 3,684,162 | | | | 10,037,194 | |
Mid Cap Value | | | 3,091,142 | | | | 56,373,098 | |
Moderate Growth Lifestyle | | | 16,065,393 | | | | 12,265,353 | |
Money Market II | | | 18,269 | | | | — | |
Small Cap Growth | | | 3,069,905 | | | | 6,217,603 | |
Small Cap Value | | | 20,660,300 | | | | 38,540,440 | |
Socially Responsible | | | 8,877,502 | | | | — | |
Strategic Bond | | | 30,465,101 | | | | 3,797,512 | |
As of August 31, 2015, for Federal income tax purposes, the Funds indicated below have capital loss carryforwards, which expire in the year indicated, which are available to offset future capital gains, if any:
| | | | | | | | | | | | | | | | |
| | | Capital Loss
Carryforward†
| | | Unlimited†
| |
Fund
| | 2017
| | | 2018
| | | ST
| | | LT
| |
Aggressive Growth Lifestyle | | $ | — | | | $ | — | | | $ | — | | | $ | — | |
Capital Appreciation | | | — | | | | — | | | | — | | | | — | |
Conservative Growth Lifestyle | | | — | | | | — | | | | — | | | | — | |
Core Bond | | | — | | | | — | | | | — | | | | — | |
High Yield Bond | | | — | | | | 25,316,663 | | | | — | | | | — | |
International Opportunities | | | — | | | | 111,391,478 | | | | — | | | | — | |
Large Cap Value | | | — | | | | 28,025,879 | | | | — | | | | — | |
Mid Cap Growth | | | — | | | | — | | | | — | | | | — | |
Mid Cap Value | | | — | | | | — | | | | — | | | | — | |
Moderate Growth Lifestyle | | | — | | | | — | | | | — | | | | — | |
Money Market II | | | 879 | | | | — | | | | — | | | | — | |
Small Cap Growth | | | — | | | | — | | | | — | | | | — | |
Small Cap Value | | | — | | | | — | | | | — | | | | — | |
Socially Responsible | | | — | | | | — | | | | — | | | | — | |
Strategic Bond | | | — | | | | — | | | | — | | | | — | |
| † | On December 22, 2010, the Regulated Investment Company Modernization Act of 2010 (the “Act”) was enacted, which changed various technical rules governing the tax treatment of regulated investment companies. The changes are generally effective for taxable years beginning after the date of enactment. Under the Act, the fund will be permitted to carry forward capital losses incurred in taxable years beginning after the date of enactment for an unlimited period. However, any losses incurred during those future taxable years will be required to be utilized prior to the losses incurred in pre-enactment taxable years, which carry an expiration date. As a result of this ordering rule, pre-enactment capital loss carryforwards may be more likely to expire unused. Additionally, post-enactment capital losses that are carried forward will retain their character as either short-term or long-term losses rather than being considered all short-term as under previous law. |
140
VALIC Company II
NOTES TO FINANCIAL STATEMENTS — (continued)
The Funds indicated below utilized capital loss carryforwards, which offset net taxable gains realized in the current year. Additionally, the Funds indicated the following capital loss carryforwards expired during the current year.
| | | | |
Fund
| | Capital Loss
Carryforward
Utilized
| |
Aggressive Growth Lifestyle | | $ | — | |
Capital Appreciation | | | 667,686 | |
Conservative Growth Lifestyle | | | — | |
Core Bond | | | 35,629 | |
High Yield Bond | | | 1,017,627 | |
International Opportunities | | | 13,367,277 | |
Large Cap Value | | | 31,264,117 | |
Mid Cap Growth | | | — | |
Mid Cap Value | | | — | |
Moderate Growth Lifestyle | | | — | |
Money Market II | | | 277,264 | |
Small Cap Growth | | | — | |
Small Cap Value | | | — | |
Socially Responsible | | | 23,868,603 | |
Strategic Bond | | | — | |
Under the current tax law, capital losses realized after October 31 and late year ordinary losses may be deferred and treated as occurring on the first day of the following year. For the fiscal year ended August 31, 2015, the Funds elected to defer late year ordinary losses and post October capital losses as follows:
| | | | | | | | | | | | |
Fund
| | Deferred Late Year
Ordinary Loss
| | | Deferred Post-October
Short-Term Capital Loss
| | | Deferred Post-October
Long-Term Capital Loss
| |
Aggressive Growth Lifestyle | | $ | — | | | $ | — | | | $ | — | |
Capital Appreciation | | | — | | | | 694,142 | | | | — | |
Conservative Growth Lifestyle | | | — | | | | — | | | | — | |
Core Bond | | | — | | | | — | | | | 1,293,043 | |
High Yield Bond | | | — | | | | 5,228,467 | | | | 1,658,483 | |
International Opportunities | | | — | | | | 13,274,551 | | | | — | |
Large Cap Value | | | 147 | | | | — | | | | — | |
Mid Cap Growth | | | 436,220 | | | | 1,310,158 | | | | — | |
Mid Cap Value | | | — | | | | 3,555,225 | | | | — | |
Moderate Growth Lifestyle | | | — | | | | — | | | | — | |
Money Market II | | | — | | | | — | | | | — | |
Small Cap Growth | | | 142,552 | | | | — | | | | — | |
Small Cap Value | | | — | | | | — | | | | — | |
Socially Responsible | | | — | | | | — | | | | — | |
Strategic Bond | | | — | | | | 1,648,092 | | | | 4,553,719 | |
141
VALIC Company II
NOTES TO FINANCIAL STATEMENTS — (continued)
For the period ended August 31, 2015, the reclassifications to the components of net assets arising from book/tax differences resulted in increases (decreases) that were primarily due to tax treatment of net investment losses, principal paydown adjustments, non-deductible expenses, disposition of passive foreign investment companies securities, and foreign currency transactions as follows:
| | | | | | | | | | | | |
Fund
| | Accumulated
Undistributed Net
Investment Income
(Loss)
| | | Accumulated
Undistributed Net
Realized Gain
(Loss)
| | | Capital
Paid-in
| |
Aggressive Growth Lifestyle | | $ | 1,745,727 | | | $ | (1,745,727 | ) | | $ | — | |
Capital Appreciation | | | 55 | | | | (55 | ) | | | — | |
Conservative Growth Lifestyle | | | 850,307 | | | | (850,307 | ) | | | — | |
Core Bond | | | 2,212,242 | | | | (2,212,242 | ) | | | — | |
High Yield Bond | | | 1,191,068 | | | | (1,191,068 | ) | | | — | |
International Opportunities | | | (199,567 | ) | | | 199,567 | | | | — | |
Large Cap Value | | | (266 | ) | | | 266 | | | | — | |
Mid Cap Growth | | | 528,131 | | | | (17 | ) | | | (528,114 | ) |
Mid Cap Value | | | (124,495 | ) | | | 124,495 | | | | — | |
Moderate Growth Lifestyle | | | 2,436,903 | | | | (2,436,903 | ) | | | — | |
Money Market II | | | — | | | | — | | | | — | |
Small Cap Growth | | | 736,193 | | | | (736,193 | ) | | | — | |
Small Cap Value | | | 770,149 | | | | (770,149 | ) | | | — | |
Socially Responsible | | | 8,777 | | | | (8,777 | ) | | | — | |
Strategic Bond | | | 2,343,253 | | | | (2,343,253 | ) | | | — | |
Note 6 — Capital Share Transactions
Transactions in capital shares of each class of each Fund were as follows:
| | | | | | | | | | | | | | | | | | | | | | | | | | | | | | | | |
| | | Aggressive Growth Lifestyle Fund
| | | Capital Appreciation
| |
| | | For the year ended
August 31, 2015
| | | For the year ended
August 31, 2014
| | | For the year ended
August 31, 2015
| | | For the year ended
August 31, 2014
| |
| | | Shares
| | | Amount
| | | Shares
| | | Amount
| | | Shares
| | | Amount
| | | Shares
| | | Amount
| |
Shares sold | | | 4,203,033 | | | $ | 49,369,747 | | | | 5,312,915 | | | $ | 60,672,814 | | | | 121,463 | | | $ | 2,010,124 | | | | 530,162 | | | $ | 7,936,110 | |
Reinvested dividends | | | 4,096,116 | | | | 46,408,992 | | | | 754,169 | | | | 8,688,033 | | | | 16,113 | | | | 272,960 | | | | 24,918 | | | | 366,049 | |
Shares redeemed | | | (3,138,018 | ) | | | (36,389,891 | ) | | | (2,276,432 | ) | | | (25,985,601 | ) | | | (614,048 | ) | | | (10,080,953 | ) | | | (533,978 | ) | | | (7,961,858 | ) |
| | |
|
|
| |
|
|
| |
|
|
| |
|
|
| |
|
|
| |
|
|
| |
|
|
| |
|
|
|
Net increase (decrease) | | | 5,161,131 | | | $ | 59,388,848 | | | | 3,790,652 | | | $ | 43,375,246 | | | | (476,472 | ) | | $ | (7,797,869 | ) | | | 21,102 | | | $ | 340,301 | |
| | |
|
|
| |
|
|
| |
|
|
| |
|
|
| |
|
|
| |
|
|
| |
|
|
| |
|
|
|
| | |
| | | Conservative Growth Lifestyle
| | | Core Bond Fund
| |
| | | For the year ended
August 31, 2015
| | | For the year ended
August 31, 2014
| | | For the year ended
August 31, 2015
| | | For the year ended
August 31, 2014
| |
| | | Shares
| | | Amount
| | | Shares
| | | Amount
| | | Shares
| | | Amount
| | | Shares
| | | Amount
| |
Shares sold | | | 3,147,465 | | | $ | 40,276,173 | | | | 4,658,795 | | | $ | 60,332,672 | | | | 21,593,664 | | | $ | 241,380,387 | | | | 20,630,749 | | | $ | 225,040,721 | |
Reinvested dividends | | | 1,760,759 | | | | 21,903,836 | | | | 1,086,292 | | | | 13,817,640 | | | | 1,989,819 | | | | 21,848,211 | | | | 2,187,802 | | | | 23,868,921 | |
Shares redeemed | | | (2,238,876 | ) | | | (28,446,478 | ) | | | (2,766,588 | ) | | | (35,746,516 | ) | | | (11,457,616 | ) | | | (127,286,985 | ) | | | (9,744,877 | ) | | | (106,801,764 | ) |
| | |
|
|
| |
|
|
| |
|
|
| |
|
|
| |
|
|
| |
|
|
| |
|
|
| |
|
|
|
Net increase (decrease) | | | 2,669,348 | | | $ | 33,733,531 | | | | 2,978,499 | | | $ | 38,403,796 | | | | 12,125,867 | | | $ | 135,941,613 | | | | 13,073,674 | | | $ | 142,107,878 | |
| | |
|
|
| |
|
|
| |
|
|
| |
|
|
| |
|
|
| |
|
|
| |
|
|
| |
|
|
|
| | |
| | | High Yield Bond
| | | International Opportunities
| |
| | | For the year ended
August 31, 2015
| | | For the year ended
August 31, 2014
| | | For the year ended
August 31, 2015
| | | For the year ended
August 31, 2014
| |
| | | Shares
| | | Amount
| | | Shares
| | | Amount
| | | Shares
| | | Amount
| | | Shares
| | | Amount
| |
Shares sold | | | 14,049,866 | | | $ | 108,511,346 | | | | 9,347,766 | | | $ | 73,669,111 | | | | 6,282,779 | | | $ | 93,309,500 | | | | 2,815,032 | | | $ | 43,705,488 | |
Reinvested dividends | | | 2,789,715 | | | | 21,285,525 | | | | 2,529,776 | | | | 19,808,145 | | | | 486,781 | | | | 7,671,663 | | | | 468,291 | | | | 7,277,253 | |
Shares redeemed | | | (6,525,984 | ) | | | (50,794,785 | ) | | | (3,660,135 | ) | | | (29,004,015 | ) | | | (5,072,832 | ) | | | (76,283,610 | ) | | | (3,495,458 | ) | | | (53,480,083 | ) |
| | |
|
|
| |
|
|
| |
|
|
| |
|
|
| |
|
|
| |
|
|
| |
|
|
| |
|
|
|
Net increase (decrease) | | | 10,313,597 | | | $ | 79,002,086 | | | | 8,217,407 | | | $ | 64,473,241 | | | | 1,696,728 | | | $ | 24,697,553 | | | | (212,135 | ) | | $ | (2,497,342 | ) |
| | |
|
|
| |
|
|
| |
|
|
| |
|
|
| |
|
|
| |
|
|
| |
|
|
| |
|
|
|
142
VALIC Company II
NOTES TO FINANCIAL STATEMENTS — (continued)
| | | | | | | | | | | | | | | | | | | | | | | | | | | | | | | | |
| | |
| | | Large Cap Value
| | | Mid Cap Growth
| |
| | | For the year ended
August 31, 2015
| | | For the year ended
August 31, 2014
| | | For the year ended
August 31, 2015
| | | For the year ended
August 31, 2014
| |
| | | Shares
| | | Amount
| | | Shares
| | | Amount
| | | Shares
| | | Amount
| | | Shares
| | | Amount
| |
Shares sold | | | 690,649 | | | $ | 12,355,120 | | | | 676,522 | | | $ | 10,912,016 | | | | 1,428,370 | | | $ | 14,011,065 | | | | 2,692,078 | | | $ | 28,583,502 | |
Reinvested dividends | | | 149,750 | | | | 2,722,460 | | | | 146,404 | | | | 2,408,346 | | | | 2,477,618 | | | | 23,091,400 | | | | 1,462,832 | | | | 13,721,356 | |
Shares redeemed | | | (2,103,773 | ) | | | (37,086,765 | ) | | | (1,221,278 | ) | | | (19,881,774 | ) | | | (2,516,951 | ) | | | (25,399,865 | ) | | | (1,622,168 | ) | | | (16,719,946 | ) |
| | |
|
|
| |
|
|
| |
|
|
| |
|
|
| |
|
|
| |
|
|
| |
|
|
| |
|
|
|
Net increase (decrease) | | | (1,263,374 | ) | | $ | (22,009,185 | ) | | | (398,352 | ) | | $ | (6,561,412 | ) | | | 1,389,037 | | | $ | 11,702,600 | | | | 2,532,742 | | | $ | 25,584,912 | |
| | |
|
|
| |
|
|
| |
|
|
| |
|
|
| |
|
|
| |
|
|
| |
|
|
| |
|
|
|
| | |
| | | Mid Cap Value
| | | Moderate Growth Lifestyle
| |
| | | For the year ended
August 31, 2015
| | | For the year ended
August 31, 2014
| | | For the year ended
August 31, 2015
| | | For the year ended
August 31, 2014
| |
| | | Shares
| | | Amount
| | | Shares
| | | Amount
| | | Shares
| | | Amount
| | | Shares
| | | Amount
| |
Shares sold | | | 3,049,044 | | | $ | 71,884,895 | | | | 1,003,285 | | | $ | 24,230,539 | | | | 5,164,163 | | | $ | 78,788,402 | | | | 7,866,117 | | | $ | 119,215,315 | |
Reinvested dividends | | | 4,081,773 | | | | 94,901,222 | | | | 2,490,127 | | | | 59,464,240 | | | | 4,137,930 | | | | 61,282,740 | | | | 1,884,947 | | | | 28,330,746 | |
Shares redeemed | | | (3,222,063 | ) | | | (79,026,342 | ) | | | (4,628,540 | ) | | | (113,244,995 | ) | | | (3,799,310 | ) | | | (57,394,855 | ) | | | (2,103,273 | ) | | | (31,771,418 | ) |
| | |
|
|
| |
|
|
| |
|
|
| |
|
|
| |
|
|
| |
|
|
| |
|
|
| |
|
|
|
Net increase (decrease) | | | 3,908,754 | | | $ | 87,759,775 | | | | (1,135,128 | ) | | $ | (29,550,216 | ) | | | 5,502,783 | | | $ | 82,676,287 | | | | 7,647,791 | | | $ | 115,774,643 | |
| | |
|
|
| |
|
|
| |
|
|
| |
|
|
| |
|
|
| |
|
|
| |
|
|
| |
|
|
|
| | |
| | | Money Market II
| | | Small Cap Growth
| |
| | | For the year ended
August 31, 2015
| | | For the year ended
August 31, 2014
| | | For the year ended
August 31, 2015
| | | For the year ended
August 31, 2014
| |
| | | Shares
| | | Amount
| | | Shares
| | | Amount
| | | Shares
| | | Amount
| | | Shares
| | | Amount
| |
Shares sold | | | 64,201,569 | | | $ | 64,201,569 | | | | 66,853,797 | | | $ | 66,853,797 | | | | 801,542 | | | $ | 13,419,432 | | | | 1,505,200 | | | $ | 26,235,149 | |
Reinvested dividends | | | 16,299 | | | | 16,299 | | | | 18,269 | | | | 18,269 | | | | 772,084 | | | | 12,307,025 | | | | 623,323 | | | | 9,287,508 | |
Shares redeemed | | | (75,165,074 | ) | | | (75,165,074 | ) | | | (82,111,024 | ) | | | (82,111,025 | ) | | | (1,389,764 | ) | | | (23,157,490 | ) | | | (1,460,726 | ) | | | (24,571,780 | ) |
| | |
|
|
| |
|
|
| |
|
|
| |
|
|
| |
|
|
| |
|
|
| |
|
|
| |
|
|
|
Net increase (decrease) | | | (10,947,206 | ) | | $ | (10,947,206 | ) | | | (15,238,958 | ) | | $ | (15,238,959 | ) | | | 183,862 | | | $ | 2,568,967 | | | | 667,797 | | | $ | 10,950,877 | |
| | |
|
|
| |
|
|
| |
|
|
| |
|
|
| |
|
|
| |
|
|
| |
|
|
| |
|
|
|
| | |
| | | Small Cap Value
| | | Socially Responsible
| |
| | | For the year ended
August 31, 2015
| | | For the year ended
August 31, 2014
| | | For the year ended
August 31, 2015
| | | For the year ended
August 31, 2014
| |
| | | Shares
| | | Amount
| | | Shares
| | | Amount
| | | Shares
| | | Amount
| | | Shares
| | | Amount
| |
Shares sold | | | 2,479,534 | | | $ | 40,547,760 | | | | 1,002,396 | | | $ | 17,183,239 | | | | 5,383,674 | | | $ | 103,811,338 | | | | 712,133 | | | $ | 11,918,108 | |
Reinvested dividends | | | 4,792,622 | | | | 72,608,220 | | | | 3,777,967 | | | | 59,200,740 | | | | 422,597 | | | | 8,278,684 | | | | 516,434 | | | | 8,877,502 | |
Shares redeemed | | | (6,004,887 | ) | | | (95,375,625 | ) | | | (3,308,871 | ) | | | (57,210,008 | ) | | | (3,257,382 | ) | | | (62,192,510 | ) | | | (3,663,969 | ) | | | (61,792,800 | ) |
| | |
|
|
| |
|
|
| |
|
|
| |
|
|
| |
|
|
| |
|
|
| |
|
|
| |
|
|
|
Net increase (decrease) | | | 1,267,269 | | | $ | 17,780,355 | | | | 1,471,492 | | | $ | 19,173,971 | | | | 2,548,889 | | | $ | 49,897,512 | | | | (2,435,402 | ) | | $ | (40,997,190 | ) |
| | |
|
|
| |
|
|
| |
|
|
| |
|
|
| |
|
|
| |
|
|
| |
|
|
| |
|
|
|
| | | |
| | | Strategic Bond Fund
| | | | | | | |
| | | For the year ended
August 31, 2015
| | | For the year ended
August 31, 2014
| | | | | | | |
| | | Shares
| | | Amount
| | | Shares
| | | Amount
| | | | | | | | | | | | | |
Shares sold | | | 8,532,991 | | | $ | 98,799,263 | | | | 5,328,835 | | | $ | 61,800,255 | | | | | | | | | | | | | | | | | |
Reinvested dividends | | | 3,147,341 | | | | 35,470,532 | | | | 2,971,606 | | | | 34,262,613 | | | | | | | | | | | | | | | | | |
Shares redeemed | | | (4,401,538 | ) | | | (50,254,535 | ) | | | (5,549,987 | ) | | | (64,426,066 | ) | | | | | | | | | | | | | | | | |
| | |
|
|
| |
|
|
| |
|
|
| |
|
|
| | | | | | | | | | | | | | | | |
Net increase (decrease) | | | 7,278,794 | | | $ | 84,015,260 | | | | 2,750,454 | | | $ | 31,636,802 | | | | | | | | | | | | | | | | | |
| | |
|
|
| |
|
|
| |
|
|
| |
|
|
| | | | | | | | | | | | | | | | |
Note 7 — Expense Reductions
Through expense offset arrangements resulting from broker commission recapture, a portion of the expenses of the Funds set forth below have been reduced. For the year ended August 31, 2015, the amount of expense reductions received by each Fund used to offset non-affiliated expenses were as follows:
| | | | |
Fund
| | Amount
| |
Capital Appreciation | | $ | 8,178 | |
International Opportunities | | | 56,324 | |
Large Cap Value | | | 24,537 | |
Mid Cap Growth | | | 19,985 | |
Mid Cap Value | | | 3,036 | |
Small Cap Growth | | | 6,995 | |
Small Cap Value | | | 18,972 | |
143
VALIC Company II
NOTES TO FINANCIAL STATEMENTS — (continued)
Note 8 — Investment Concentration
The High Yield Bond Fund’s investment in high yield securities, whether rated or unrated, may be considered speculative and subject to greater market fluctuations and risk of loss of income and principal than lower-yielding, higher-rated, fixed-income securities. The risk of loss due to default by the issuer may be significantly greater for the holders of high yield securities, because such securities are generally unsecured and are often subordinated to other creditors of the issuer.
The Funds may invest in obligations issued by agencies and instrumentalities of the U.S. Government that may vary in the level of support they receive from the government. The government may choose not to provide financial support to government sponsored agencies or instrumentalities if it is not legally obligated to do so. In this case, if the issuer defaulted, the fund holding securities of such issuer might not be able to recover its investments from the U.S. Government. As a result of the Core Bond Fund, Money Market II Fund and Strategic Bond Fund’s concentration in such investments, it may be subject to risks associated with the U.S. Government agencies or instrumentalities. At August 31, 2015, the Funds had 29.3%, 59.6%, and 4.3%, respectively, of their net assets invested in such securities.
Some of the Funds may invest internationally, including in “emerging market” countries. Emerging market securities involve risks not typically associated with investing in securities of issuers in more developed markets. These investments are subject to various risk factors including market, credit, exchange rate and sovereign risk. The markets in which these securities trade can be volatile and at times illiquid. These securities may be denominated in currencies other than U.S. dollars. While investing internationally may reduce portfolio risk by increasing the diversification of portfolio investments, the value of the investment may be affected by fluctuating currency values, changing local and regional economic, political and social conditions, and greater market volatility. These risks are primary risks of the International Opportunities Fund. At August 31, 2015, the International Opportunities Fund had 23.6% and 20.0% of its net assets invested in equity securities domiciled in United Kingdom and Japan, respectively.
Each Fund, except the Money Market II Fund, the Lifestyle Funds and the Small Cap Value Fund, may invest in international bonds, which include U.S. dollar-denominated bonds issued by foreign corporations for which the primary trading market is in the United States (“Yankee Bonds”), or for which the primary trading market is abroad (“Euro Bonds”). International bonds may involve special risks and considerations not typically associated with investing in U.S. companies, including differences in accounting, auditing and financial reporting standards; generally higher commission rates on foreign portfolio transactions; the possibility of nationalization, expropriation or confiscatory taxation; adverse changes in investment or exchange control regulations (which may include suspension of the ability to transfer currency from a country); and political instability which could affect U.S. investments in foreign countries. As a result of the Strategic Bond Fund’s concentration in such investments, it may be subject to risks associated with the international bonds. At August 31, 2015, the Strategic Bond Fund had 32.1% of its net assets invested in such securities.
Note 9 — Line of Credit
VCII, along with certain other funds managed by the Adviser, has access to an $85 million committed unsecured line of credit and a $40 million uncommitted unsecured line of credit. The committed and uncommitted lines of credit are renewable on an annual basis with State Street Bank and Trust Company, the Funds’ custodian. Prior to October 9, 2015, interest on the committed line of credit was payable at the higher of the Federal Funds Rate plus 125 basis points or the Overnight London Interbank Offered Rate plus 125 basis points. There was also a commitment fee of 15 basis points per annum on the daily unused portion of the committed line of credit and a one-time closing fee of 5 basis points on the uncommitted line of credit. Borrowings under the line of credit will commence when the respective Portfolio’s cash shortfall exceeds $100,000.
Effective October 9, 2015, the interest payable under the committed line of credit is the higher of the Federal Funds Rate (but not less than zero) plus 125 basis points or the One-Month London Interbank Offered Rate (but not less than zero) plus 125 basis points. In addition, the commitment fee on the daily unused portion of the committed line of credit increases to 20 basis points per annum.
For the year ended August 31, 2015, the following Funds had borrowings:
| | | | | | | | | | | | | | | | |
Fund
| | Days
Outstanding
| | | Interest
Charges
| | | Average
Debt
Utilized
| | | Weighted
Average
Interest
| |
Capital Appreciation | | | 1 | | | $ | 4 | | | $ | 115,421 | | | | 1.38 | % |
International Opportunities | | | 4 | | | | 139 | | | | 925,316 | | | | 1.35 | % |
Large Cap Value | | | 36 | | | | 406 | | | | 296,397 | | | | 1.37 | % |
At August 31, 2015, there were no borrowings outstanding.
Note 10 — Interfund Lending Agreement
Pursuant to the exemptive relief granted by the SEC, the Funds are permitted to participate in an interfund lending program among investment companies advised by VALIC or an affiliate. The interfund lending program allows the participating Funds to borrow money from and lend money to each other for temporary or emergency purposes. An interfund loan will be made under this facility only if the participating Funds receive a more favorable interest rate than would otherwise be available from a typical bank for a comparable transaction.
For the year ended August 31, 2015, none of the Funds participated in this program.
144
VALIC Company II
NOTES TO FINANCIAL STATEMENTS — (continued)
Note 11 — Security Transactions with Affiliated Portfolios
The Funds are permitted to transfer securities by purchasing from and/or selling to other affiliated funds under certain conditions approved by the Board. The affiliated funds involved in such transactions must have a common investment adviser or investment advisers which are affiliated persons of each other, common Trustees, and/or common officers in compliance with Rule 17a-7 of the 1940 Act. Pursuant to the Act, such a transaction must be either a purchase or a sale, for no consideration other than cash payment against prompt delivery of the security at the current market price. No brokerage commission or fee (except for customary transfer fees), or other remuneration is paid in connection with such transactions.
For the year ended August 31, 2015, the following Funds engaged in security transactions with affiliated Funds:
| | | | | | | | | | | | |
Fund
| | Cost of
Purchases
| | | Proceeds
from Sales
| | | Realized
Gain/
Loss
| |
International Opportunities | | $ | 93,252 | | | $ | 103,550 | | | $ | 1,429 | |
For the year ended August 31, 2015, the following Funds incurred brokerage commissions with affiliated brokers which are affiliates of a sub-advisor:
| | | | | | | | | | | | |
Affiliated Broker
| | International
Opportunities
| | | Large Cap
Value
| | | Small Cap
Value
| |
UBS AG | | $ | 36,161 | | | $ | — | | | $ | — | |
Pershing, LLC | | | — | | | | 209 | | | | — | |
J.P. Morgan Clearing Corp. | | | — | | | | — | | | | 19,428 | |
ConvergEx Execution Solutions LLC | | | — | | | | 65 | | | | — | |
145
VALIC Company II
FINANCIAL HIGHLIGHTS
Per share data is for a share of beneficial interest outstanding throughout the period. Total return includes reinvestment of distributions on the reinvestment date.
| | | | | | | | | | | | | | | | | | | | | | | | | | | | | | | | | | | | | | | | |
| | | Aggressive Growth Lifestyle Fund
| | | Capital Appreciation Fund
| |
| | | Year Ended August 31,
| | | Year Ended August 31,
| |
| | | 2015
| | | 2014
| | | 2013
| | | 2012
| | | 2011
| | | 2015
| | | 2014
| | | 2013
| | | 2012
| | | 2011
| |
| | | | | | | | | | |
PER SHARE DATA | | | | | | | | | | | | | | | | | | | | | | | | | | | | | | | | | | | | | | | | |
Net asset value at beginning of period | | $ | 12.04 | | | $ | 10.30 | | | $ | 9.22 | | | $ | 8.44 | | | $ | 7.41 | | | $ | 15.88 | | | $ | 12.82 | | | $ | 10.92 | | | $ | 9.37 | | | $ | 8.01 | |
| | |
|
|
| |
|
|
|
Income (loss) from investment operations: | | | | | | | | | | | | | | | | | | | | | | | | | | | | | | | | | | | | | | | | |
Net investment income (loss)(d) | | | 0.20 | | | | 0.18 | | | | 0.11 | | | | 0.14 | | | | 0.19 | | | | 0.06 | | | | 0.05 | | | | 0.07 | | | | 0.05 | | | | 0.05 | |
Net realized and unrealized gain (loss) on investments and foreign currencies | | | (0.52 | ) | | | 1.77 | | | | 1.10 | | | | 0.79 | | | | 1.02 | | | | 0.46 | | | | 3.08 | | | | 1.88 | | | | 1.55 | | | | 1.35 | |
Net increase from payments by affiliates | | | – | | | | – | | | | – | | | | – | | | | – | | | | – | | | | – | | | | – | | | | – | | | | – | |
| | |
|
|
| |
|
|
|
Total income (loss) from investment operations | | | (0.32 | ) | | | 1.95 | | | | 1.21 | | | | 0.93 | | | | 1.21 | | | | 0.52 | | | | 3.13 | | | | 1.95 | | | | 1.60 | | | | 1.40 | |
| | |
|
|
| |
|
|
|
Distributions from: | | | | | | | | | | | | | | | | | | | | | | | | | | | | | | | | | | | | | | | | |
Net investment income | | | (0.19 | ) | | | (0.11 | ) | | | (0.13 | ) | | | (0.15 | ) | | | (0.18 | ) | | | (0.05 | ) | | | (0.07 | ) | | | (0.05 | ) | | | (0.05 | ) | | | (0.04 | ) |
Net realized gain on securities | | | (0.86 | ) | | | (0.10 | ) | | | – | | | | – | | | | – | | | | – | | | | – | | | | – | | | | – | | | | – | |
| | |
|
|
| |
|
|
|
Total distributions | | | (1.05 | ) | | | (0.21 | ) | | | (0.13 | ) | | | (0.15 | ) | | | (0.18 | ) | | | (0.05 | ) | | | (0.07 | ) | | | (0.05 | ) | | | (0.05 | ) | | | (0.04 | ) |
| | |
|
|
| |
|
|
|
Net asset value at end of period | | $ | 10.67 | | | $ | 12.04 | | | $ | 10.30 | | | $ | 9.22 | | | $ | 8.44 | | | $ | 16.35 | | | $ | 15.88 | | | $ | 12.82 | | | $ | 10.92 | | | $ | 9.37 | |
| | |
|
|
| |
|
|
|
TOTAL RETURN(a) | | | (3.17 | )% | | | 19.03 | % | | | 13.21 | % | | | 11.15 | % | | | 16.33 | % | | | 3.28 | % | | | 24.43 | % | | | 17.93 | % | | | 17.13 | % | | | 17.41 | % |
| | |
|
|
| |
|
|
|
| | | | | | | | | | |
RATIOS/SUPPLEMENTAL DATA | | | | | | | | | | | | | | | | | | | | | | | | | | | | | | | | | | | | | | | | |
Ratio of expenses to average net assets(b) | | | 0.10 | %(e) | | | 0.10 | %(e) | | | 0.10 | %(e) | | | 0.10 | %(e) | | | 0.10 | %(e) | | | 0.85 | % | | | 0.85 | % | | | 0.85 | % | | | 0.85 | % | | | 0.85 | % |
Ratio of expenses to average net assets(c) | | | 0.14 | %(e) | | | 0.14 | %(e) | | | 0.15 | %(e) | | | 0.16 | %(e) | | | 0.18 | %(e) | | | 0.98 | % | | | 0.99 | % | | | 1.01 | % | | | 1.07 | % | | | 1.03 | % |
Ratio of expense reductions to average net assets | | | – | | | | – | | | | – | | | | – | | | | – | | | | 0.01 | % | | | 0.01 | % | | | 0.01 | % | | | 0.01 | % | | | – | |
Ratio of net investment income (loss) to average net assets(b) | | | 1.71 | %(e) | | | 1.56 | %(e) | | | 1.11 | %(e) | | | 1.62 | %(e) | | | 2.26 | %(e) | | | 0.36 | % | | | 0.31 | % | | | 0.58 | % | | | 0.53 | % | | | 0.48 | % |
Ratio of net investment income (loss) to average net assets(c) | | | 1.67 | %(e) | | | 1.52 | %(e) | | | 1.06 | %(e) | | | 1.55 | %(e) | | | 2.18 | %(e) | | | 0.23 | % | | | 0.17 | % | | | 0.42 | % | | | 0.32 | % | | | 0.29 | % |
Portfolio turnover rate | | | 31 | % | | | 32 | % | | | 41 | % | | | 44 | % | | | 62 | % | | | 44 | % | | | 44 | % | | | 44 | % | | | 119 | % | | | 52 | % |
Number of shares outstanding at end of period (000’s) | | | 47,707 | | | | 42,546 | | | | 38,755 | | | | 34,029 | | | | 21,941 | | | | 5,014 | | | | 5,491 | | | | 5,470 | | | | 5,443 | | | | 4,674 | |
Net assets at the end of period (000’s) | | $ | 508,890 | | | $ | 512,113 | | | $ | 399,133 | | | $ | 313,655 | | | $ | 185,211 | | | $ | 81,961 | | | $ | 87,214 | | | $ | 70,095 | | | $ | 59,413 | | | $ | 43,798 | |
| (a) | Total return includes, if any, expense reimbursements and expense reductions. The effect of fees and charges incurred at the separate account level are not reflected in these performance figures. If such expenses had been included, the total return would have been lower for each period presented. |
| (b) | Includes expense reimbursements, but excludes expense reductions. |
| (c) | Excludes expense reimbursements and expense reductions. |
| (d) | The per share amounts are calculated using the average share method. |
| (e) | Does not include underlying fund expenses that the Fund bears indirectly. |
See Notes to Financial Statements
146
VALIC Company II
FINANCIAL HIGHLIGHTS — (continued)
Per share data is for a share of beneficial interest outstanding throughout the period. Total return includes reinvestment of distributions on the reinvestment date.
| | | | | | | | | | | | | | | | | | | | | | | | | | | | | | | | | | | | | | | | |
| | | Conservative Growth Lifestyle Fund
| | | Core Bond Fund
| |
| | | Year Ended August 31,
| | | Year Ended August 31,
| |
| | | 2015
| | | 2014
| | | 2013
| | | 2012
| | | 2011
| | | 2015
| | | 2014
| | | 2013
| | | 2012
| | | 2011
| |
| | | | | | | | | | |
PER SHARE DATA | | | | | | | | | | | | | | | | | | | | | | | | | | | | | | | | | | | | | | | | |
Net asset value at beginning of period | | $ | 13.12 | | | $ | 12.13 | | | $ | 12.02 | | | $ | 11.22 | | | $ | 10.31 | | | $ | 11.09 | | | $ | 10.69 | | | $ | 11.41 | | | $ | 10.90 | | | $ | 10.68 | |
| | |
|
|
| |
|
|
|
Income (loss) from investment operations: | | | | | | | | | | | | | | | | | | | | | | | | | | | | | | | | | | | | | | | | |
Net investment income (loss)(d) | | | 0.31 | | | | 0.29 | | | | 0.26 | | | | 0.29 | | | | 0.34 | | | | 0.23 | | | | 0.24 | | | | 0.23 | | | | 0.30 | | | | 0.38 | |
Net realized and unrealized gain (loss) on investments and foreign currencies | | | (0.62 | ) | | | 1.31 | | | | 0.32 | | | | 0.86 | | | | 0.87 | | | | (0.16 | ) | | | 0.44 | | | | (0.43 | ) | | | 0.56 | | | | 0.13 | |
Net increase from payments by affiliates | | | – | | | | – | | | | – | | | | – | | | | – | | | | – | | | | – | | | | – | | | | – | | | | – | |
| | |
|
|
| |
|
|
|
Total income (loss) from investment operations | | | (0.31 | ) | | | 1.60 | | | | 0.58 | | | | 1.15 | | | | 1.21 | | | | 0.07 | | | | 0.68 | | | | (0.20 | ) | | | 0.86 | | | | 0.51 | |
| | |
|
|
| |
|
|
|
Distributions from: | | | | | | | | | | | | | | | | | | | | | | | | | | | | | | | | | | | | | | | | |
Net investment income | | | (0.29 | ) | | | (0.26 | ) | | | (0.24 | ) | | | (0.27 | ) | | | (0.30 | ) | | | (0.23 | ) | | | (0.20 | ) | | | (0.32 | ) | | | (0.30 | ) | | | (0.29 | ) |
Net realized gain on securities | | | (0.57 | ) | | | (0.35 | ) | | | (0.23 | ) | | | (0.08 | ) | | | – | | | | – | | | | (0.08 | ) | | | (0.20 | ) | | | (0.05 | ) | | | – | |
| | |
|
|
| |
|
|
|
Total distributions | | | (0.86 | ) | | | (0.61 | ) | | | (0.47 | ) | | | (0.35 | ) | | | (0.30 | ) | | | (0.23 | ) | | | (0.28 | ) | | | (0.52 | ) | | | (0.35 | ) | | | (0.29 | ) |
| | |
|
|
| |
|
|
|
Net asset value at end of period | | $ | 11.95 | | | $ | 13.12 | | | $ | 12.13 | | | $ | 12.02 | | | $ | 11.22 | | | $ | 10.93 | | | $ | 11.09 | | | $ | 10.69 | | | $ | 11.41 | | | $ | 10.90 | |
| | |
|
|
| |
|
|
|
TOTAL RETURN(a) | | | (2.65 | )% | | | 13.34 | % | | | 4.93 | % | | | 10.50 | % | | | 11.82 | % | | | 0.62 | % | | | 6.44 | % | | | (1.95 | )% | | | 8.08 | % | | | 4.89 | % |
| | |
|
|
| |
|
|
|
| | | | | | | | | | |
RATIOS/SUPPLEMENTAL DATA | | | | | | | | | | | | | | | | | | | | | | | | | | | | | | | | | | | | | | | | |
Ratio of expenses to average net assets(b) | | | 0.10 | %(e) | | | 0.10 | %(e) | | | 0.10 | %(e) | | | 0.10 | %(e) | | | 0.10 | %(e) | | | 0.77 | % | | | 0.77 | % | | | 0.77 | % | | | 0.77 | % | | | 0.77 | % |
Ratio of expenses to average net assets(c) | | | 0.14 | %(e) | | | 0.15 | %(e) | | | 0.16 | %(e) | | | 0.18 | %(e) | | | 0.20 | %(e) | | | 0.79 | % | | | 0.80 | % | | | 0.84 | % | | | 0.86 | % | | | 0.88 | % |
Ratio of expense reductions to average net assets | | | – | | | | – | | | | – | | | | – | | | | – | | | | – | | | | – | | | | – | | | | – | | | | – | |
Ratio of net investment income (loss) to average net assets(b) | | | 2.45 | %(e) | | | 2.26 | %(e) | | | 2.12 | %(e) | | | 2.59 | %(e) | | | 3.05 | %(e) | | | 2.10 | % | | | 2.24 | % | | | 2.12 | % | | | 2.79 | % | | | 3.65 | % |
Ratio of net investment income (loss) to average net assets(c) | | | 2.40 | %(e) | | | 2.22 | %(e) | | | 2.06 | %(e) | | | 2.51 | %(e) | | | 2.95 | %(e) | | | 2.08 | % | | | 2.21 | % | | | 2.05 | % | | | 2.70 | % | | | 3.53 | % |
Portfolio turnover rate | | | 33 | % | | | 31 | % | | | 53 | % | | | 36 | % | | | 66 | % | | | 153 | % | | | 169 | % | | | 175 | % | | | 177 | % | | | 161 | % |
Number of shares outstanding at end of period (000’s) | | | 27,270 | | | | 24,601 | | | | 21,622 | | | | 16,819 | | | | 10,665 | | | | 97,489 | | | | 85,364 | | | | 72,290 | | | | 55,895 | | | | 39,745 | |
Net assets at the end of period (000’s) | | $ | 325,797 | | | $ | 322,764 | | | $ | 262,360 | | | $ | 202,134 | | | $ | 119,710 | | | $ | 1,065,803 | | | $ | 946,699 | | | $ | 772,784 | | | $ | 637,701 | | | $ | 433,168 | |
| (a) | Total return includes, if any, expense reimbursements and expense reductions. The effect of fees and charges incurred at the separate account level are not reflected in these performance figures. If such expenses had been included, the total return would have been lower for each period presented. |
| (b) | Includes expense reimbursements, but excludes expense reductions. |
| (c) | Excludes expense reimbursements and expense reductions. |
| (d) | The per share amounts are calculated using the average share method. |
| (e) | Does not include underlying fund expenses that the Fund bears indirectly. |
See Notes to Financial Statements
147
VALIC Company II
FINANCIAL HIGHLIGHTS — (continued)
Per share data is for a share of beneficial interest outstanding throughout the period. Total return includes reinvestment of distributions on the reinvestment date.
| | | | | | | | | | | | | | | | | | | | | | | | | | | | | | | | | | | | | | | | |
| | | High Yield Bond Fund
| | | International Opportunities Fund
| |
| | | Year Ended August 31,
| | | Year Ended August 31,
| |
| | | 2015
| | | 2014
| | | 2013
| | | 2012
| | | 2011
| | | 2015
| | | 2014
| | | 2013
| | | 2012
| | | 2011
| |
| | | | | | | | | | |
PER SHARE DATA | | | | | | | | | | | | | | | | | | | | | | | | | | | | | | | | | | | | | | | | |
Net asset value at beginning of period | | $ | 7.93 | | | $ | 7.63 | | | $ | 7.64 | | | $ | 7.28 | | | $ | 7.36 | | | $ | 15.50 | | | $ | 13.78 | | | $ | 11.87 | | | $ | 12.47 | | | $ | 11.23 | |
| | |
|
|
| |
|
|
|
Income (loss) from investment operations: | | | | | | | | | | | | | | | | | | | | | | | | | | | | | | | | | | | | | | | | |
Net investment income (loss)(d) | | | 0.38 | | | | 0.41 | | | | 0.44 | | | | 0.46 | | | | 0.56 | | | | 0.16 | | | | 0.16 | | | | 0.14 | | | | 0.20 | | | | 0.16 | |
Net realized and unrealized gain (loss) on investments and foreign currencies | | | (0.53 | ) | | | 0.28 | | | | (0.03 | ) | | | 0.45 | | | | (0.05 | ) | | | (0.38 | ) | | | 1.75 | | | | 2.04 | | | | (0.59 | ) | | | 1.21 | |
Net increase from payments by affiliates | | | – | | | | – | | | | – | | | | – | | | | – | | | | – | | | | – | | | | – | | | | – | | | | – | |
| | |
|
|
| |
|
|
|
Total income (loss) from investment operations | | | (0.15 | ) | | | 0.69 | | | | 0.41 | | | | 0.91 | | | | 0.51 | | | | (0.22 | ) | | | 1.91 | | | | 2.18 | | | | (0.39 | ) | | | 1.37 | |
| | |
|
|
| |
|
|
|
Distributions from: | | | | | | | | | | | | | | | | | | | | | | | | | | | | | | | | | | | | | | | | |
Net investment income | | | (0.38 | ) | | | (0.39 | ) | | | (0.42 | ) | | | (0.55 | ) | | | (0.59 | ) | | | (0.20 | ) | | | (0.19 | ) | | | (0.27 | ) | | | (0.21 | ) | | | (0.13 | ) |
Net realized gain on securities | | | – | | | | – | | | | – | | | | – | | | | – | | | | – | | | | – | | | | – | | | | – | | | | – | |
| | |
|
|
| |
|
|
|
Total distributions | | | (0.38 | ) | | | (0.39 | ) | | | (0.42 | ) | | | (0.55 | ) | | | (0.59 | ) | | | (0.20 | ) | | | (0.19 | ) | | | (0.27 | ) | | | (0.21 | ) | | | (0.13 | ) |
| | |
|
|
| |
|
|
|
Net asset value at end of period | | $ | 7.40 | | | $ | 7.93 | | | $ | 7.63 | | | $ | 7.64 | | | $ | 7.28 | | | $ | 15.08 | | | $ | 15.50 | | | $ | 13.78 | | | $ | 11.87 | | | $ | 12.47 | |
| | |
|
|
| |
|
|
|
TOTAL RETURN(a) | | | (2.02 | )% | | | 9.10 | % | | | 5.46 | % | | | 13.18 | % | | | 7.00 | % | | | (1.50 | )% | | | 13.88 | % | | | 18.58 | % | | | (2.95 | )% | | | 12.14 | % |
| | |
|
|
| |
|
|
|
| | | | | | | | | | |
RATIOS/SUPPLEMENTAL DATA | | | | | | | | | | | | | | | | | | | | | | | | | | | | | | | | | | | | | | | | |
Ratio of expenses to average net assets(b) | | | 0.96 | % | | | 0.96 | % | | | 0.96 | % | | | 0.96 | % | | | 0.96 | % | | | 1.00 | % | | | 1.00 | % | | | 1.00 | % | | | 1.00 | % | | | 1.00 | % |
Ratio of expenses to average net assets(c) | | | 0.98 | % | | | 0.99 | % | | | 1.01 | % | | | 1.02 | % | | | 1.03 | % | | | 1.21 | % | | | 1.21 | % | | | 1.31 | % | | | 1.31 | % | | | 1.28 | % |
Ratio of expense reductions to average net assets | | | – | | | | – | | | | – | | | | – | | | | – | | | | 0.01 | % | | | 0.00 | % | | | – | | | | – | | | | – | |
Ratio of net investment income (loss) to average net assets(b) | | | 5.00 | % | | | 5.25 | % | | | 5.77 | % | | | 6.26 | % | | | 7.48 | % | | | 1.02 | % | | | 1.05 | % | | | 1.08 | % | | | 1.70 | % | | | 1.18 | % |
Ratio of net investment income (loss) to average net assets(c) | | | 4.97 | % | | | 5.22 | % | | | 5.73 | % | | | 6.20 | % | | | 7.42 | % | | | 0.81 | % | | | 0.84 | % | | | 0.76 | % | | | 1.39 | % | | | 0.91 | % |
Portfolio turnover rate | | | 36 | % | | | 37 | % | | | 34 | % | | | 38 | % | | | 47 | % | | | 59 | % | | | 72 | % | | | 62 | % | | | 164 | % | | | 66 | % |
Number of shares outstanding at end of period (000’s) | | | 63,332 | | | | 53,018 | | | | 44,801 | | | | 37,281 | | | | 36,022 | | | | 39,548 | | | | 37,851 | | | | 38,063 | | | | 41,554 | | | | 46,945 | |
Net assets at the end of period (000’s) | | $ | 468,855 | | | $ | 420,459 | | | $ | 341,751 | | | $ | 284,818 | | | $ | 262,380 | | | $ | 596,301 | | | $ | 586,631 | | | $ | 524,503 | | | $ | 493,207 | | | $ | 585,357 | |
| (a) | Total return includes, if any, expense reimbursements and expense reductions. The effect of fees and charges incurred at the separate account level are not reflected in these performance figures. If such expenses had been included, the total return would have been lower for each period presented. |
| (b) | Includes expense reimbursements, but excludes expense reductions. |
| (c) | Excludes expense reimbursements and expense reductions. |
| (d) | The per share amounts are calculated using the average share method. |
See Notes to Financial Statements
148
VALIC Company II
FINANCIAL HIGHLIGHTS — (continued)
Per share data is for a share of beneficial interest outstanding throughout the period. Total return includes reinvestment of distributions on the reinvestment date.
| | | | | | | | | | | | | | | | | | | | | | | | | | | | | | | | | | | | | | | | |
| | | Large Cap Value Fund
| | | Mid Cap Growth Fund
| |
| | | Year Ended August 31,
| | | Year Ended August 31,
| |
| | | 2015
| | | 2014
| | | 2013
| | | 2012
| | | 2011
| | | 2015
| | | 2014
| | | 2013
| | | 2012
| | | 2011
| |
| | | | | | | | | | |
PER SHARE DATA | | | | | | | | | | | | | | | | | | | | | | | | | | | | | | | | | | | | | | | | |
Net asset value at beginning of period | | $ | 17.58 | | | $ | 14.51 | | | $ | 11.67 | | | $ | 10.41 | | | $ | 9.26 | | | $ | 10.13 | | | $ | 9.76 | | | $ | 8.45 | | | $ | 7.93 | | | $ | 6.28 | |
| | |
|
|
| |
|
|
|
Income (loss) from investment operations: | | | | | | | | | | | | | | | | | | | | | | | | | | | | | | | | | | | | | | | | |
Net investment income (loss)(d) | | | 0.20 | | | | 0.22 | | | | 0.19 | | | | 0.15 | | | | 0.11 | | | | (0.02 | ) | | | (0.05 | ) | | | 0.00 | | | | 0.00 | | | | (0.02 | ) |
Net realized and unrealized gain (loss) on investments and foreign currencies | | | (0.46 | ) | | | 3.04 | | | | 2.81 | | | | 1.22 | | | | 1.18 | | | | 0.27 | | | | 1.33 | | | | 1.42 | | | | 0.52 | | | | 1.67 | |
Net increase from payments by affiliates | | | – | | | | – | | | | – | | | | – | | | | – | | | | – | | | | – | | | | – | | | | – | | | | – | |
| | |
|
|
| |
|
|
|
Total income (loss) from investment operations | | | (0.26 | ) | | | 3.26 | | | | 3.00 | | | | 1.37 | | | | 1.29 | | | | 0.25 | | | | 1.28 | | | | 1.42 | | | | 0.52 | | | | 1.65 | |
| | |
|
|
| |
|
|
|
Distributions from: | | | | | | | | | | | | | | | | | | | | | | | | | | | | | | | | | | | | | | | | |
Net investment income | | | (0.24 | ) | | | (0.19 | ) | | | (0.16 | ) | | | (0.11 | ) | | | (0.14 | ) | | | – | | | | (0.01 | ) | | | (0.01 | ) | | | – | | | | – | |
Net realized gain on securities | | | – | | | | – | | | | – | | | | – | | | | – | | | | (1.57 | ) | | | (0.90 | ) | | | (0.10 | ) | | | – | | | | – | |
| | |
|
|
| |
|
|
|
Total distributions | | | (0.24 | ) | | | (0.19 | ) | | | (0.16 | ) | | | (0.11 | ) | | | (0.14 | ) | | | (1.57 | ) | | | (0.91 | ) | | | (0.11 | ) | | | – | | | | – | |
| | |
|
|
| |
|
|
|
Net asset value at end of period | | $ | 17.08 | | | $ | 17.58 | | | $ | 14.51 | | | $ | 11.67 | | | $ | 10.41 | | | $ | 8.81 | | | $ | 10.13 | | | $ | 9.76 | | | $ | 8.45 | | | $ | 7.93 | |
| | |
|
|
| |
|
|
|
TOTAL RETURN(a) | | | (1.56 | )% | | | 22.55 | % | | | 26.02 | % | | | 13.30 | % | | | 13.84 | % | | | 1.66 | % | | | 13.86 | % | | | 17.06 | % | | | 6.56 | % | | | 26.27 | % |
| | |
|
|
| |
|
|
|
| | | | | | | | | | |
RATIOS/SUPPLEMENTAL DATA | | | | | | | | | | | | | | | | | | | | | | | | | | | | | | | | | | | | | | | | |
Ratio of expenses to average net assets(b) | | | 0.81 | % | | | 0.81 | % | | | 0.81 | % | | | 0.81 | % | | | 0.81 | % | | | 0.85 | % | | | 0.85 | % | | | 0.85 | % | | | 0.85 | % | | | 0.85 | % |
Ratio of expenses to average net assets(c) | | | 0.88 | % | | | 0.88 | % | | | 0.91 | % | | | 0.93 | % | | | 0.93 | % | | | 1.14 | % | | | 1.17 | % | | | 1.18 | % | | | 1.18 | % | | | 1.19 | % |
Ratio of expense reductions to average net assets | | | 0.01 | % | | | 0.01 | % | | | 0.01 | % | | | 0.02 | % | | | 0.01 | % | | | 0.01 | % | | | 0.01 | % | | | 0.01 | % | | | 0.03 | % | | | 0.02 | % |
Ratio of net investment income (loss) to average net assets(b) | | | 1.11 | % | | | 1.31 | % | | | 1.40 | % | | | 1.33 | % | | | 0.98 | % | | | (0.26 | )% | | | (0.47 | )% | | | 0.02 | % | | | 0.02 | % | | | (0.32 | )% |
Ratio of net investment income (loss) to average net assets(c) | | | 1.04 | % | | | 1.24 | % | | | 1.30 | % | | | 1.21 | % | | | 0.86 | % | | | (0.54 | )% | | | (0.79 | )% | | | (0.30 | )% | | | (0.31 | )% | | | (0.66 | )% |
Portfolio turnover rate | | | 72 | % | | | 54 | % | | | 53 | % | | | 62 | % | | | 65 | % | | | 102 | % | | | 175 | % | | | 112 | % | | | 131 | % | | | 206 | % |
Number of shares outstanding at end of period (000’s) | | | 11,333 | | | | 12,597 | | | | 12,995 | | | | 12,913 | | | | 14,543 | | | | 17,507 | | | | 16,118 | | | | 13,586 | | | | 16,888 | | | | 20,333 | |
Net assets at the end of period (000’s) | | $ | 193,602 | | | $ | 221,453 | | | $ | 188,508 | | | $ | 150,682 | | | $ | 151,360 | | | $ | 154,291 | | | $ | 163,273 | | | $ | 132,584 | | | $ | 142,785 | | | $ | 161,271 | |
| (a) | Total return includes, if any, expense reimbursements and expense reductions. The effect of fees and charges incurred at the separate account level are not reflected in these performance figures. If such expenses had been included, the total return would have been lower for each period presented. |
| (b) | Includes expense reimbursements, but excludes expense reductions. |
| (c) | Excludes expense reimbursements and expense reductions. |
| (d) | The per share amounts are calculated using the average share method. |
See Notes to Financial Statements
149
VALIC Company II
FINANCIAL HIGHLIGHTS — (continued)
Per share data is for a share of beneficial interest outstanding throughout the period. Total return includes reinvestment of distributions on the reinvestment date.
| | | | | | | | | | | | | | | | | | | | | | | | | | | | | | | | | | | | | | | | |
| | | Mid Cap Value Fund
| | | Moderate Growth Lifestyle Fund
| |
| | | Year Ended August 31,
| | | Year Ended August 31,
| |
| | | 2015
| | | 2014
| | | 2013
| | | 2012
| | | 2011
| | | 2015
| | | 2014
| | | 2013
| | | 2012
| | | 2011
| |
| | | | | | | | | | |
PER SHARE DATA | | | | | | | | | | | | | | | | | | | | | | | | | | | | | | | | | | | | | | | | |
Net asset value at beginning of period | | $ | 25.15 | | | $ | 21.66 | | | $ | 17.31 | | | $ | 15.28 | | | $ | 13.61 | | | $ | 15.61 | | | $ | 13.93 | | | $ | 13.10 | | | $ | 12.04 | | | $ | 10.81 | |
| | |
|
|
| |
|
|
|
Income (loss) from investment operations: | | | | | | | | | | | | | | | | | | | | | | | | | | | | | | | | | | | | | | | | |
Net investment income (loss)(d) | | | 0.07 | | | | 0.05 | | | | 0.07 | | | | 0.06 | | | | 0.04 | | | | 0.29 | | | | 0.28 | | | | 0.21 | | | | 0.24 | | | | 0.30 | |
Net realized and unrealized gain (loss) on investments and foreign currencies | | | (0.82 | ) | | | 5.06 | | | | 4.35 | | | | 2.05 | | | | 1.74 | | | | (0.65 | ) | | | 1.99 | | | | 1.04 | | | | 1.06 | | | | 1.23 | |
Net increase from payments by affiliates | | | – | | | | – | | | | – | | | | – | | | | – | | | | – | | | | – | | | | – | | | | – | | | | – | |
| | |
|
|
| |
|
|
|
Total income (loss) from investment operations | | | (0.75 | ) | | | 5.11 | | | | 4.42 | | | | 2.11 | | | | 1.78 | | | | (0.36 | ) | | | 2.27 | | | | 1.25 | | | | 1.30 | | | | 1.53 | |
| | |
|
|
| |
|
|
|
Distributions from: | | | | | | | | | | | | | | | | | | | | | | | | | | | | | | | | | | | | | | | | |
Net investment income | | | (0.05 | ) | | | (0.08 | ) | | | (0.07 | ) | | | (0.08 | ) | | | (0.11 | ) | | | (0.28 | ) | | | (0.20 | ) | | | (0.21 | ) | | | (0.24 | ) | | | (0.30 | ) |
Net realized gain on securities | | | (2.53 | ) | | | (1.54 | ) | | | – | | | | – | | | | – | | | | (0.88 | ) | | | (0.39 | ) | | | (0.21 | ) | | | – | | | | – | |
| | |
|
|
| |
|
|
|
Total distributions | | | (2.58 | ) | | | (1.62 | ) | | | (0.07 | ) | | | (0.08 | ) | | | (0.11 | ) | | | (1.16 | ) | | | (0.59 | ) | | | (0.42 | ) | | | (0.24 | ) | | | (0.30 | ) |
| | |
|
|
| |
|
|
|
Net asset value at end of period | | $ | 21.82 | | | $ | 25.15 | | | $ | 21.66 | | | $ | 17.31 | | | $ | 15.28 | | | $ | 14.09 | | | $ | 15.61 | | | $ | 13.93 | | | $ | 13.10 | | | $ | 12.04 | |
| | |
|
|
| |
|
|
|
TOTAL RETURN(a) | | | (3.61 | )% | | | 23.97 | % | | | 25.64 | % | | | 13.85 | % | | | 12.98 | % | | | (2.68 | )% | | | 16.46 | % | | | 9.76 | % | | | 11.00 | % | | | 14.20 | % |
| | |
|
|
| |
|
|
|
| | | | | | | | | | |
RATIOS/SUPPLEMENTAL DATA | | | | | | | | | | | | | | | | | | | | | | | | | | | | | | | | | | | | | | | | |
Ratio of expenses to average net assets(b) | | | 1.05 | % | | | 1.05 | % | | | 1.05 | % | | | 1.05 | % | | | 1.05 | % | | | 0.10 | %(e) | | | 0.10 | %(e) | | | 0.10 | %(e) | | | 0.10 | %(e) | | | 0.10 | %(e) |
Ratio of expenses to average net assets(c) | | | 1.06 | % | | | 1.05 | % | | | 1.08 | % | | | 1.11 | % | | | 1.15 | % | | | 0.13 | %(e) | | | 0.13 | %(e) | | | 0.14 | %(e) | | | 0.16 | %(e) | | | 0.17 | %(e) |
Ratio of expense reductions to average net assets | | | 0.00 | % | | | 0.00 | % | | | 0.00 | % | | | 0.01 | % | | | 0.02 | % | | | – | | | | – | | | | – | | | | – | | | | – | |
Ratio of net investment income (loss) to average net assets(b) | | | 0.28 | % | | | 0.22 | % | | | 0.37 | % | | | 0.39 | % | | | 0.23 | % | | | 1.92 | %(e) | | | 1.84 | %(e) | | | 1.55 | %(e) | | | 1.99 | %(e) | | | 2.47 | %(e) |
Ratio of net investment income (loss) to average net assets(c) | | | 0.27 | % | | | 0.22 | % | | | 0.34 | % | | | 0.33 | % | | | 0.13 | % | | | 1.89 | %(e) | | | 1.81 | %(e) | | | 1.50 | %(e) | | | 1.93 | %(e) | | | 2.41 | %(e) |
Portfolio turnover rate | | | 56 | % | | | 29 | % | | | 46 | % | | | 70 | % | | | 108 | % | | | 30 | % | | | 27 | % | | | 36 | % | | | 36 | % | | | 58 | % |
Number of shares outstanding at end of period (000’s) | | | 42,460 | | | | 38,551 | | | | 39,686 | | | | 40,101 | | | | 40,315 | | | | 56,655 | | | | 51,152 | | | | 43,504 | | | | 34,532 | | | | 23,286 | |
Net assets at the end of period (000’s) | | $ | 926,580 | | | $ | 969,591 | | | $ | 859,611 | | | $ | 694,095 | | | $ | 615,965 | | | $ | 798,444 | | | $ | 798,521 | | | $ | 606,185 | | | $ | 452,347 | | | $ | 280,436 | |
| (a) | Total return includes, if any, expense reimbursements and expense reductions. The effect of fees and charges incurred at the separate account level are not reflected in these performance figures. If such expenses had been included, the total return would have been lower for each period presented. |
| (b) | Includes expense reimbursements, but excludes expense reductions. |
| (c) | Excludes expense reimbursements and expense reductions. |
| (d) | The per share amounts are calculated using the average share method. |
| (e) | Does not include underlying fund expenses that the Fund bears indirectly. |
See Notes to Financial Statements
150
VALIC Company II
FINANCIAL HIGHLIGHTS — (continued)
Per share data is for a share of beneficial interest outstanding throughout the period. Total return includes reinvestment of distributions on the reinvestment date.
| | | | | | | | | | | | | | | | | | | | | | | | | | | | | | | | | | | | | | | | |
| | | Money Market II Fund
| | | Small Cap Growth Fund
| |
| | | Year Ended August 31,
| | | Year Ended August 31,
| |
| | | 2015
| | | 2014
| | | 2013
| | | 2012
| | | 2011
| | | 2015
| | | 2014
| | | 2013
| | | 2012
| | | 2011
| |
| | | | | | | | | | |
PER SHARE DATA | | | | | | | | | | | | | | | | | | | | | | | | | | | | | | | | | | | | | | | | |
Net asset value at beginning of period | | $ | 1.00 | | | $ | 1.00 | | | $ | 1.00 | | | $ | 1.00 | | | $ | 1.00 | | | $ | 16.27 | | | $ | 16.11 | | | $ | 13.47 | | | $ | 12.87 | | | $ | 10.20 | |
| | |
|
|
| |
|
|
|
Income (loss) from investment operations: | | | | | | | | | | | | | | | | | | | | | | | | | | | | | | | | | | | | | | | | |
Net investment income (loss)(d) | | | 0.00 | | | | 0.00 | | | | 0.00 | | | | 0.00 | | | | 0.00 | | | | (0.04 | ) | | | (0.14 | ) | | | (0.09 | ) | | | (0.07 | ) | | | (0.10 | ) |
Net realized and unrealized gain (loss) on investments and foreign currencies | | | 0.00 | | | | 0.00 | | | | 0.00 | | | | 0.00 | | | | (0.00 | ) | | | 0.97 | | | | 1.68 | | | | 3.92 | | | | 1.66 | | | | 2.77 | |
Net increase from payments by affiliates | | | 0.00 | | | | – | | | | – | | | | – | | | | 0.00 | | | | – | | | | – | | | | – | | | | – | | | | – | |
| | |
|
|
| |
|
|
|
Total income (loss) from investment operations | | | 0.00 | | | | 0.00 | | | | 0.00 | | | | 0.00 | | | | 0.00 | | | | 0.93 | | | | 1.54 | | | | 3.83 | | | | 1.59 | | | | 2.67 | |
| | |
|
|
| |
|
|
|
Distributions from: | | | | | | | | | | | | | | | | | | | | | | | | | | | | | | | | | | | | | | | | |
Net investment income | | | (0.00 | ) | | | (0.00 | ) | | | (0.00 | ) | | | (0.00 | ) | | | (0.00 | ) | | | – | | | | – | | | | – | | | | – | | | | – | |
Net realized gain on securities | | | – | | | | – | | | | – | | | | – | | | | – | | | | (1.89 | ) | | | (1.38 | ) | | | (1.19 | ) | | | (0.99 | ) | | | – | |
| | |
|
|
| |
|
|
|
Total distributions | | | (0.00 | ) | | | (0.00 | ) | | | (0.00 | ) | | | (0.00 | ) | | | (0.00 | ) | | | (1.89 | ) | | | (1.38 | ) | | | (1.19 | ) | | | (0.99 | ) | | | – | |
| | |
|
|
| |
|
|
|
Net asset value at end of period | | $ | 1.00 | | | $ | 1.00 | | | $ | 1.00 | | | $ | 1.00 | | | $ | 1.00 | | | $ | 15.31 | | | $ | 16.27 | | | $ | 16.11 | | | $ | 13.47 | | | $ | 12.87 | |
| | |
|
|
| |
|
|
|
TOTAL RETURN(a) | | | 0.01 | %(f) | | | 0.01 | % | | | 0.01 | % | | | 0.01 | % | | | 0.01 | %(e) | | | 5.26 | % | | | 10.33 | % | | | 31.19 | % | | | 13.13 | % | | | 26.18 | % |
| | |
|
|
| |
|
|
|
| | | | | | | | | | |
RATIOS/SUPPLEMENTAL DATA | | | | | | | | | | | | | | | | | | | | | | | | | | | | | | | | | | | | | | | | |
Ratio of expenses to average net assets(b) | | | 0.15 | % | | | 0.15 | % | | | 0.20 | % | | | 0.19 | % | | | 0.20 | % | | | 1.16 | % | | | 1.16 | % | | | 1.16 | % | | | 1.16 | % | | | 1.16 | % |
Ratio of expenses to average net assets(c) | | | 0.64 | % | | | 0.63 | % | | | 0.65 | % | | | 0.65 | % | | | 0.65 | % | | | 1.25 | % | | | 1.26 | % | | | 1.31 | % | | | 1.33 | % | | | 1.32 | % |
Ratio of expense reduction to average net assets | | | – | | | | – | | | | – | | | | – | | | | – | | | | 0.01 | % | | | 0.00 | % | | | 0.01 | % | | | 0.01 | % | | | 0.01 | % |
Ratio of net investment income (loss) to average net assets(b) | | | 0.01 | % | | | 0.01 | % | | | 0.01 | % | | | 0.01 | % | | | 0.01 | % | | | (0.25 | )% | | | (0.83 | )% | | | (0.65 | )% | | | (0.52 | )% | | | (0.76 | )% |
Ratio of net investment income (loss) to average net assets(c) | | | (0.48 | )% | | | (0.47 | )% | | | (0.44 | )% | | | (0.45 | )% | | | (0.44 | )% | | | (0.34 | )% | | | (0.93 | )% | | | (0.80 | )% | | | (0.69 | )% | | | (0.92 | )% |
Portfolio turnover rate | | | N/A | | | | N/A | | | | N/A | | | | N/A | | | | N/A | | | | 49 | % | | | 63 | % | | | 68 | % | | | 63 | % | | | 79 | % |
Number of shares outstanding at end of period (000’s) | | | 159,882 | | | | 170,830 | | | | 186,069 | | | | 187,696 | | | | 214,677 | | | | 7,185 | | | | 7,001 | | | | 6,333 | | | | 6,026 | | | | 6,124 | |
Net assets at the end of period (000’s) | | $ | 159,905 | | | $ | 170,575 | | | $ | 185,810 | | | $ | 187,430 | | | $ | 214,407 | | | $ | 110,029 | | | $ | 113,907 | | | $ | 102,025 | | | $ | 81,161 | | | $ | 78,839 | |
| (a) | Total return includes, if any, expense reimbursements and expense reductions. The effect of fees and charges incurred at the separate account level are not reflected in these performance figures. If such expenses had been included, the total return would have been lower for each period presented. |
| (b) | Includes expense reimbursements, but excludes expense reductions. |
| (c) | Excludes expense reimbursements and expense reductions. |
| (d) | The per share amounts are calculated using the average share method. |
| (e) | The Fund’s performance figure was increased by less than 0.01% from the effect of payments by an affiliate. |
| (f) | The Fund’s performance figure was increased by less than 0.01% from the effect of payments by an affiliate (See Note 3). |
See Notes to Financial Statements
151
VALIC Company II
FINANCIAL HIGHLIGHTS — (continued)
Per share data is for a share of beneficial interest outstanding throughout the period. Total return includes reinvestment of distributions on the reinvestment date.
| | | | | | | | | | | | | | | | | | | | | | | | | | | | | | | | | | | | | | | | |
| | | Small Cap Value Fund
| | | Socially Responsible Fund
| |
| | | Year Ended August 31,
| | | Year Ended August 31,
| |
| | | 2015
| | | 2014
| | | 2013
| | | 2012
| | | 2011
| | | 2015
| | | 2014
| | | 2013
| | | 2012
| | | 2011
| |
| | | | | | | | | | |
PER SHARE DATA | | | | | | | | | | | | | | | | | | | | | | | | | | | | | | | | | | | | | | | | |
Net asset value at beginning of period | | $ | 16.65 | | | $ | 15.83 | | | $ | 12.68 | | | $ | 12.41 | | | $ | 10.27 | | | $ | 18.56 | | | $ | 14.84 | | | $ | 12.53 | | | $ | 10.92 | | | $ | 9.34 | |
| | |
|
|
| |
|
|
|
Income (loss) from investment operations: | | | | | | | | | | | | | | | | | | | | | | | | | | | | | | | | | | | | | | | | |
Net investment income (loss)(d) | | | 0.17 | | | | 0.09 | | | | 0.13 | | | | 0.07 | | | | 0.04 | | | | 0.26 | | | | 0.22 | | | | 0.21 | | | | 0.16 | | | | 0.13 | |
Net realized and unrealized gain (loss) on investments and foreign currencies | | | (0.56 | ) | | | 2.70 | | | | 3.33 | | | | 0.71 | | | | 2.23 | | | | (0.05 | ) | | | 3.74 | | | | 2.31 | | | | 1.60 | | | | 1.57 | |
Net increase from payments by affiliates | | | – | | | | – | | | | – | | | | 0.00 | | | | – | | | | – | | | | – | | | | – | | | | – | | | | – | |
| | |
|
|
| |
|
|
|
Total income (loss) from investment operations | | | (0.39 | ) | | | 2.79 | | | | 3.46 | | | | 0.78 | | | | 2.27 | | | | 0.21 | | | | 3.96 | | | | 2.52 | | | | 1.76 | | | | 1.70 | |
| | |
|
|
| |
|
|
|
Distributions from: | | | | | | | | | | | | | | | | | | | | | | | | | | | | | | | | | | | | | | | | |
Net investment income | | | (0.10 | ) | | | (0.17 | ) | | | (0.07 | ) | | | (0.12 | ) | | | (0.13 | ) | | | (0.22 | ) | | | (0.24 | ) | | | (0.21 | ) | | | (0.15 | ) | | | (0.12 | ) |
Net realized gain on securities | | | (2.15 | ) | | | (1.80 | ) | | | (0.24 | ) | | | (0.39 | ) | | | – | | | | – | | | | – | | | | – | | | | – | | | | – | |
| | |
|
|
| |
|
|
|
Total distributions | | | (2.25 | ) | | | (1.97 | ) | | | (0.31 | ) | | | (0.51 | ) | | | (0.13 | ) | | | (0.22 | ) | | | (0.24 | ) | | | (0.21 | ) | | | (0.15 | ) | | | (0.12 | ) |
| | |
|
|
| |
|
|
|
Net asset value at end of period | | $ | 14.01 | | | $ | 16.65 | | | $ | 15.83 | | | $ | 12.68 | | | $ | 12.41 | | | $ | 18.55 | | | $ | 18.56 | | | $ | 14.84 | | | $ | 12.53 | | | $ | 10.92 | |
| | |
|
|
| |
|
|
|
TOTAL RETURN(a) | | | (3.38 | )% | | | 18.39 | % | | | 27.78 | % | | | 6.58 | %(f) | | | 22.06 | % | | | 1.06 | % | | | 26.82 | % | | | 20.40 | % | | | 16.34 | % | | | 18.19 | %(e) |
| | |
|
|
| |
|
|
|
| | | | | | | | | | |
RATIOS/SUPPLEMENTAL DATA | | | | | | | | | | | | | | | | | | | | | | | | | | | | | | | | | | | | | | | | |
Ratio of expenses to average net assets(b) | | | 0.95 | % | | | 0.95 | % | | | 0.95 | % | | | 0.95 | % | | | 0.95 | % | | | 0.56 | % | | | 0.56 | % | | | 0.56 | % | | | 0.56 | % | | | 0.56 | % |
Ratio of expenses to average net assets(c) | | | 1.03 | % | | | 1.03 | % | | | 1.05 | % | | | 1.08 | % | | | 1.07 | % | | | 0.61 | % | | | 0.61 | % | | | 0.62 | % | | | 0.63 | % | | | 0.63 | % |
Ratio of expense reductions to average net assets | | | 0.00 | % | | | 0.01 | % | | | 0.01 | % | | | 0.01 | % | | | 0.01 | % | | | – | | | | – | | | | – | | | | – | | | | – | |
Ratio of net investment income (loss) to average net assets(b) | | | 1.02 | % | | | 0.54 | % | | | 0.91 | % | | | 0.58 | % | | | 0.33 | % | | | 1.35 | % | | | 1.29 | % | | | 1.56 | % | | | 1.39 | % | | | 1.19 | % |
Ratio of net investment income (loss) to average net assets(c) | | | 0.95 | % | | | 0.46 | % | | | 0.81 | % | | | 0.46 | % | | | 0.21 | % | | | 1.31 | % | | | 1.25 | % | | | 1.49 | % | | | 1.33 | % | | | 1.12 | % |
Portfolio turnover rate | | | 50 | % | | | 47 | % | | | 81 | % | | | 96 | % | | | 116 | % | | | 31 | % | | | 26 | % | | | 39 | % | | | 44 | % | | | 81 | % |
Number of shares outstanding at end of period (000’s) | | | 34,784 | | | | 33,516 | | | | 32,045 | | | | 32,052 | | | | 32,626 | | | | 39,153 | | | | 36,604 | | | | 39,040 | | | | 47,833 | | | | 60,129 | |
Net assets at the end of period (000’s) | | $ | 487,157 | | | $ | 558,170 | | | $ | 507,366 | | | $ | 406,471 | | | $ | 404,748 | | | $ | 726,460 | | | $ | 679,235 | | | $ | 579,372 | | | $ | 599,500 | | | $ | 656,395 | |
| (a) | Total return includes, if any, expense reimbursements and expense reductions. The effect of fees and charges incurred at the separate account level are not reflected in these performance figures. If such expenses had been included, the total return would have been lower for each period presented. |
| (b) | Includes expense reimbursements, but excludes expense reductions. |
| (c) | Excludes expense reimbursements and expense reductions. |
| (d) | The per share amounts are calculated using the average share method. |
| (e) | The Fund’s performance figure was increased by less than 0.01% from gains realized on the disposal of investments in violation of investment restrictions. |
| (f) | The Fund’s performance figure was decreased by less than 0.01% from losses realized on the disposal of investments in violation of investment restrictions. |
See Notes to Financial Statements
152
VALIC Company II
FINANCIAL HIGHLIGHTS — (continued)
Per share data is for a share of beneficial interest outstanding throughout the period. Total return includes reinvestment of distributions on the reinvestment date.
| | | | | | | | | | | | | | | | | | | | |
| | | Strategic Bond Fund
| |
| | | Year Ended August 31,
| |
| | | 2015
| | | 2014
| | | 2013
| | | 2012
| | | 2011
| |
| | | | | |
PER SHARE DATA | | | | | | | | | | | | | | | | | | | | |
Net asset value at beginning of period | | $ | 11.77 | | | $ | 11.23 | | | $ | 11.78 | | | $ | 11.31 | | | $ | 11.22 | |
| | |
|
|
|
Income (loss) from investment operations: | | | | | | | | | | | | | | | | | | | | |
Net investment income (loss)(d) | | | 0.42 | | | | 0.48 | | | | 0.46 | | | | 0.49 | | | | 0.60 | |
Net realized and unrealized gain (loss) on investments and foreign currencies | | | (0.68 | ) | | | 0.62 | | | | (0.44 | ) | | | 0.58 | | | | 0.09 | |
Net increase from payments by affiliates | | | – | | | | – | | | | – | | | | – | | | | – | |
| | |
|
|
|
Total income (loss) from investment operations | | | (0.26 | ) | | | 1.10 | | | | 0.02 | | | | 1.07 | | | | 0.69 | |
| | |
|
|
|
Distributions from: | | | | | | | | | | | | | | | | | | | | |
Net investment income | | | (0.41 | ) | | | (0.44 | ) | | | (0.46 | ) | | | (0.60 | ) | | | (0.60 | ) |
Net realized gain on securities | | | (0.10 | ) | | | (0.12 | ) | | | (0.11 | ) | | | – | | | | – | |
| | |
|
|
|
Total distributions | | | (0.51 | ) | | | (0.56 | ) | | | (0.57 | ) | | | (0.60 | ) | | | (0.60 | ) |
| | |
|
|
|
Net asset value at end of period | | $ | 11.00 | | | $ | 11.77 | | | $ | 11.23 | | | $ | 11.78 | | | $ | 11.31 | |
| | |
|
|
|
TOTAL RETURN(a) | | | (2.32 | )% | | | 9.89 | % | | | 0.03 | % | | | 9.97 | % | | | 6.36 | % |
| | |
|
|
|
| | | | | |
RATIOS/SUPPLEMENTAL DATA | | | | | | | | | | | | | | | | | | | | |
Ratio of expenses to average net assets | | | 0.87 | % | | | 0.88 | % | | | 0.89 | %(b) | | | 0.89 | %(b) | | | 0.89 | %(b) |
Ratio of expenses to average net assets | | | 0.87 | % | | | 0.88 | % | | | 0.91 | %(c) | | | 0.93 | %(c) | | | 0.95 | %(c) |
Ratio of expense reductions to average net assets | | | – | | | | – | | | | – | | | | – | | | | – | |
Ratio of net investment income (loss) to average net assets(b) | | | 3.67 | % | | | 4.11 | % | | | 4.00 | % | | | 4.39 | % | | | 5.33 | % |
Ratio of net investment income (loss) to average net assets(c) | | | 3.67 | % | | | 4.11 | % | | | 3.98 | % | | | 4.35 | % | | | 5.27 | % |
Portfolio turnover rate | | | 132 | % | | | 150 | % | | | 164 | % | | | 191 | % | | | 144 | % |
Number of shares outstanding at end of period (000’s) | | | 71,428 | | | | 64,149 | | | | 61,398 | | | | 53,061 | | | | 44,277 | |
Net assets at the end of period (000’s) | | $ | 785,635 | | | $ | 755,092 | | | $ | 689,403 | | | $ | 624,863 | | | $ | 500,792 | |
| (a) | Total return includes, if any, expense reimbursements and expense reductions. The effect of fees and charges incurred at the separate account level are not reflected in these performance figures. If such expenses had been included, the total return would have been lower for each period presented. |
| (b) | Includes expense reimbursements, but excludes expense reductions. |
| (c) | Excludes expense reimbursements and expense reductions. |
| (d) | The per share amounts are calculated using the average share method. |
See Notes to Financial Statements
153
VALIC Company II
REPORT OF INDEPENDENT REGISTERED PUBLIC ACCOUNTING FIRM
To the Board of Trustees and Shareholders of
VALIC Company II:
In our opinion, the accompanying statements of assets and liabilities, including the portfolios of investments, and the related statements of operations and of changes in net assets and the financial highlights present fairly, in all material respects, the financial position of each of the fifteen funds constituting VALIC Company II (the “Series’’) at August 31, 2015, the results of each of their operations for the year then ended, the changes in each of their net assets for each of the two years in the period then ended and the financial highlights for each of the five years then ended, in conformity with accounting principles generally accepted in the United States of America. These financial statements and financial highlights (hereafter referred to as “financial statements”) are the responsibility of the Series’ management. Our responsibility is to express an opinion on these financial statements based on our audits. We conducted our audits of these financial statements in accordance with the standards of the Public Company Accounting Oversight Board (United States). Those standards require that we plan and perform the audits to obtain reasonable assurance about whether the financial statements are free of material misstatement. An audit includes examining, on a test basis, evidence supporting the amounts and disclosures in the financial statements, assessing the accounting principles used and significant estimates made by management, and evaluating the overall financial statement presentation. We believe that our audits, which included confirmation of securities at August 31, 2015 by correspondence with the custodian, transfer agent, and brokers, and the application of alternative auditing procedures where securities purchased had not been received, provide a reasonable basis for our opinion expressed above.
PricewaterhouseCoopers LLP
Houston, Texas
October 28, 2015
154
VALIC Company II
APPROVAL OF ADVISORY AGREEMENTS (unaudited)
Approval at August 2015 meeting
At an in-person meeting held on August 3-4, 2015, the Board of Trustees (the “Board”) of VALIC Company II (“VC II”), including the Trustees that are not interested persons of VC II, as such term is defined in the Investment Company Act of 1940, as amended (the “1940 Act”) (the “Independent Trustees”), approved the Investment Advisory Agreement with respect to each series of VC II (each a “Fund,” and collectively, the “Funds”) between The Variable Annuity Life Insurance Company (“VALIC”) and VC II (the “Advisory Agreement”) and the Investment Sub-Advisory Agreements between VALIC and each of the following sub-advisers of VC II (collectively, the “Sub-advisory Agreements”): Janus Capital Management, LLC (“Janus”), Perkins Investment Management, LLC (“Perkins”), J.P. Morgan Investment Management, Inc. (“JPMIM”), Massachusetts Financial Services Company (“MFS”), Metropolitan West Capital Management, LLC (“Metropolitan West”), PineBridge Investments, LLC (“PineBridge”), Robeco Investment Management, Inc. (“Robeco”), SunAmerica Asset Management, LLC (“SAAMCo”), The Boston Company Asset Management, Inc. (“TBCAM”), UBS Global Asset Management (“UBS”), Wells Capital Management Incorporated (“Wells Capital”) and Wellington Management Company, LLP (“Wellington”) (collectively referred to as the “Sub-advisers”). The Advisory Agreement and Sub-advisory Agreements are collectively referred to as the “Advisory Contracts.” Prior to the August 3-4, 2015 meeting at which the Advisory Contracts were approved, the Board also discussed and considered information regarding the proposed continuation of the Advisory Contracts at an in-person meeting held on July 13, 2015.
In connection with the approval of the Advisory Contracts, the Board received materials relating to certain factors the Board considered in determining to renew such Advisory Contracts. Those factors included: (1) the nature, extent and quality of services provided by VALIC and the Sub-advisers; (2) the advisory fee and sub-advisory fees charged in connection with VALIC’s and the Sub-advisers’ management of each Fund, compared to advisory fee rates and sub-advisory fee rates of a group of funds with similar investment objectives (respectively, the “Expense Group/Universe” and the “Subadvisory Expense Group/Universe”), as selected by an independent third-party provider of investment company data; (3) the investment performance of the Funds compared to performance of comparable funds as selected by an independent third-party provider of investment company data (“Performance Group/Universe”) and against each Fund’s benchmarks; (4) the costs of services and the benefits potentially derived by VALIC, the Sub-advisers and their respective affiliates; (5) a comparison of advisory fee schedules and performance with respect to other mutual funds and accounts with similar investment strategies and/or objectives to the Funds, as applicable, and which are advised or managed by VALIC or SAAMCo, an affiliated Sub-Adviser; (6) whether the Funds will benefit from possible economies of scale from engaging VALIC and the Sub-advisers; (7) the profitability of VALIC, the Sub-advisers and their respective affiliates, including amounts retained by VALIC after payment of sub-advisory fees; (8) the terms of the Advisory Contracts; (9) information regarding VALIC’s and the Sub-advisers’ compliance and regulatory history; and (10) information about the services VALIC provides in connection with the oversight of the Sub-advisers.
The Independent Trustees were separately represented by counsel that is independent of VALIC in connection with their consideration of approval of the Advisory Contracts. The matters discussed below were also considered separately by the Independent Trustees in an executive session at an in-person special meeting held on July 13, 2015 and executive sessions held during the August 2015 meeting during which such independent counsel provided guidance to the Independent Trustees. Following the July 13, 2015 meeting, the Independent Trustees submitted questions and requests for additional information to management, and considered management’s responses thereto at the August 2015 meeting. The continuation of all Advisory Contracts were approved at the August 2015 meeting for a one-year term beginning September 1, 2015 and ending August 31, 2016.
Nature, Extent and Quality of Services. The Board considered the nature, extent and quality of services to be provided to the Funds by VALIC and the Sub-advisers. The Board reviewed information provided by VALIC relating to its operations and personnel. The Board also took into account their knowledge of VALIC’s management and the quality of the performance of VALIC’s duties, through Board meetings, discussions and reports during the preceding year and through VALIC’s long history of service to VC II. The Board considered that VALIC is responsible for the management of the day-to-day operations of VC II, including but not limited to, general supervision of and coordination of the services provided by the Sub-advisers, and is also responsible for monitoring and reviewing the activities of the Sub-advisers and other third-party service providers. The Board also noted that VALIC’s and the Sub-advisers’ management of VC II is subject to the oversight of the Board, and must be made in accordance with the investment objectives, policies and restrictions set forth in VC II’s prospectus and statement of additional information. The Board noted that VALIC monitors the performance of the Funds and from time-to-time recommends Sub-adviser changes and/or other changes designed to improve the performance of the Funds.
The Board noted that VALIC personnel meet on a regular basis to discuss the performance of VC II, as well as the positioning of the insurance products, employer-sponsored retirement plans and the Funds generally vis-à-vis competitors. The Board also considered VALIC’s financial condition and whether it had the financial wherewithal to provide the services under the Advisory Agreement with respect to each Fund. The Board also considered VALIC’s risk management processes.
With respect to the services provided by the Sub-advisers, the Board considered information provided to them regarding the services provided by each Sub-adviser, including information presented throughout the previous year. The Board noted that each Sub-adviser (i) determines the securities to be purchased or sold on behalf of the Funds it manages as may be necessary in connection therewith; (ii) provides VALIC with records concerning its activities, which VALIC or the Funds are required to maintain; and (iii) renders regular reports to VALIC and to officers and Trustees of VC II concerning its discharge of the foregoing responsibilities. The Board reviewed each Sub-adviser’s history and investment experience as well as information regarding the qualifications, background and responsibilities of the Sub-adviser’s investment and compliance personnel who provide services to the Funds. The Board also took into account the financial condition of each Sub-adviser. The Board also reviewed each Sub-adviser’s brokerage practices and considered each Sub-adviser’s risk management processes.
The Board reviewed VALIC’s and SAAMCo’s compliance program and personnel. The Board noted that SAAMCo is an affiliated company of VALIC and serves as the administrator to the Funds, as well as sub-advises certain VALIC Company I and VC II Funds. The Board also considered VALIC’s and each Sub-adviser’s regulatory history, including information regarding whether it was currently involved in any regulatory actions or investigations as well as material litigation.
The Board concluded that the scope and quality of the advisory services provided by VALIC and the Sub-advisers were satisfactory and that there was a reasonable basis on which to conclude that each would provide a high quality of investment services to the Funds.
155
VALIC Company II
APPROVAL OF ADVISORY AGREEMENTS (unaudited) — (continued)
Fees and Expenses; Investment Performance. The Board received and reviewed information regarding each Fund’s total expenses, advisory and sub-advisory fees, and other expenses compared against the expenses and fees of the funds in its Expense Group/Universe and Subadvisory Expense Universe and, in some cases as noted below, the Subadvisory Expense Group. The Board noted that VALIC negotiates the sub-advisory fees with each of the unaffiliated Sub-advisers at arms-length. The Board also considered that the sub-advisory fees are paid by VALIC out of its advisory fees it receives from the Funds and is not paid by the Funds, and that sub-advisory fees may vary widely within the Subadvisory Expense Group/Universe for various reasons, including market pricing demands, existing relationships, experience and success, and individual client needs. The Board noted the affiliation of SAAMCo with VALIC, noting any potential conflicts of interest. The Board also noted that VALIC annually waives a portion of its advisory fee and/or reimburses the expenses of each of the Funds.
The Sub-advisers provided and the Board also considered expense information of comparable accounts managed by the Sub-advisers, as applicable, which accounts may include one or more of the following types of accounts: retail mutual funds, mutual funds sold through variable annuity and variable insurance products, and other institutional-type accounts.
The total expense information, advisory fee information, and sub-advisory fee information considered by the Board, among other fee and expense data, is summarized below. Expense ratio data included in the independent third-party report was based on unaudited data from the semi-annual report dated February 28, 2015.
The Board received and reviewed information prepared by management and by an independent third-party regarding the Funds’ investment performance compared against their benchmarks and their respective Performance Groups/Universes. The Board noted that performance information provided by the independent third-party was for the period ended April 30, 2015, and that the benchmark information provided by management was for the period ended June 30, 2015. The Board also noted that it regularly reviews the performance of the Funds throughout the year. The Board further noted that, although it monitors the Funds’ performance closely, it generally attaches more importance to performance over relatively long periods of time, typically three to five years. The Board considered the following expense and performance information in its evaluation of each Fund:
| | • | | Aggressive Growth Lifestyle Fund (sub-advised by PineBridge). The Fund’s total net expenses were equal to the medians of its Expense Group/Universe. The Fund’s actual management fees were above the medians of its Expense Group/Universe. The Fund’s sub-advisory fees were above the median of its Subadvisory Expense Universe. The Board took into account management’s discussion of the Fund’s expenses and noted that the expense limitation on total expenses was extended contractually through December 31, 2016. |
The Fund outperformed its Lipper index for the one-, three- and five-year periods. The Fund underperformed its blended benchmark for the one-, three- and five-year periods. In addition, the Fund’s performance was above the median of its Performance Group for the one- and five-year periods and below the median of its Performance Group for the three-year period, and the Fund’s performance was above the median of its Performance Universe for the one-, three- and five-year periods.
| | • | | Capital Appreciation Fund (sub-advised by TBCAM). The Fund’s total net expenses were below the medians of is Expense Group/Universe. The Fund’s actual management fees were below the medians of its Expense Group/Universe. The Fund’s sub-advisory fees were below the medians of its Subadvisory Expense Group/Universe. The expense limitation on total expenses was also extended contractually through December 31, 2016. |
The Fund underperformed its Lipper index and benchmark for the one-, three- and five-year periods. In addition, the Fund’s performance was below the median of its Performance Group for the one-year period, above the median of its Performance Group for the three-year period, and equal to the median of its Performance Group for the five-year period. The Fund’s performance was below the median of its Performance Universe for the one-, three- and five-year periods. The Board took into account management’s discussion of the Fund’s performance and continued monitoring of the Fund.
| | • | | Conservative Growth Lifestyle Fund (sub-advised by PineBridge). The Fund’s total net expenses were equal to the median of its Expense Group and above the median of its Expense Universe. The Fund’s actual management fees were above the medians of the its Expense Group/Universe. The Fund’s sub-advisory fees were above the median of its Subadvisory Expense Universe. The Board took into account management’s discussion of the Fund’s expenses and noted the expense limitation on total expenses was extended contractually through December 31, 2016. |
The Fund outperformed its Lipper index for the one-, three- and five-year periods. The Fund underperformed its blended benchmark for the one-year period and outperformed its blended benchmark for the three- and five-year periods. In addition, the Fund’s performance was below the median of its Performance Group for the one-year period and above the median of its Performance Group for the three- and five-year periods, and above the median of its Performance Universe for the one-, three- and five- year periods.
| | • | | Core Bond Fund (sub-advised by PineBridge). The Fund’s total net expenses were below the medians of its Expense Group/Universe. The Fund’s actual management fees were below the medians of its Expense Group/Universe. The Fund’s sub-advisory fees were above the medians of its Subadvisory Expense Group/Universe. The expense limitation on total expenses was also extended contractually through December 31, 2016. |
The Fund outperformed its Lipper index for the one-, three- and five-year periods. The Fund underperformed its benchmark for the one-year period and outperformed its benchmark for the three- and five-year periods. In addition, the Fund’s performance was above the medians of its Performance Group/Universe for the one-, three- and five-year periods.
| | • | | High Yield Bond Fund (sub-advised by Wellington). The Fund’s total net expenses were above the medians of its Expense Group/Universe. The Fund’s actual management fees were below the median of its Expense Group and above the median of its Expense Universe. The Fund’s sub-advisory fees were above the medians of its Subadvisory Expense Group/Universe. The Board took into account management’s discussion of the Fund’s expenses and noted that the expense limitation on total expenses was extended contractually through December 31, 2016. |
156
VALIC Company II
APPROVAL OF ADVISORY AGREEMENTS (unaudited) — (continued)
The Fund underperformed its Lipper peer index for the one- and five-year periods and outperformed its Lipper peer index for the three-year period. The Fund outperformed its benchmark for the one-year period and underperformed its benchmark for the three- and five-year periods. In addition, the Fund’s performance equaled the median of the Performance Group for the one-year period and was below the median of the Performance Group for the three- and five-year periods, and the Fund’s performance was above the median of its Performance Universe for the one-year period and was below the median of its Performance Universe for the three- and five-year periods. The Board took into account management’s discussion of the Fund’s performance, including management’s continued monitoring of the Fund. The Board also noted the Fund’s more recent improved performance.
| | • | | International Opportunities Fund (sub-advised by MFS and UBS). The Fund’s total net expenses were below the medians of its Expense Group/Universe. The Fund’s actual management fees were equal to the median of its Expense Group and below the median of its Expense Universe. The Fund’s sub-advisory fees were above the medians of its Subadvisory Expense Group/Universe. The Board took into account management’s discussion of the Fund’s expenses and noted that the expense limitation on total expenses was extended contractually through December 31, 2016. |
The Fund outperformed its benchmark for the one-year period and underperformed its benchmark for the three- and five-year periods. In addition, the Fund’s performance was below the medians of its Performance Group/Universe for the one-, three-, and five-year periods. The Board took account of management’s discussion of the Fund’s performance.
| | • | | Large-Cap Value Fund (sub-advised by Janus/Perkins and TBCAM). The Fund’s total net expenses were below the medians of its Expense Group/Universe. The Fund’s actual management fees were below the medians of its Expense Group/Universe. The Fund’s sub-advisory fees were below the median of its Subadvisory Expense Universe. The Board noted that the expense limitation on total expenses was also extended contractually through December 31, 2016. |
The Fund outperformed its Lipper peer index for the one- and three-year periods and underperformed its Lipper peer index for the five-year period. In addition, the Fund outperformed its benchmark for the one- and three-year periods and underperformed its benchmark for the five-year period. The Fund’s performance was above the median of its Performance Group for the one-, three- and five-year periods. In addition, the Fund’s performance was above the median of its Performance Universe for the one- and three-year periods and equal to the median for the five-year period.
| | • | | Mid-Cap Growth Fund (sub-advised by Wells Capital). The Fund’s total net expenses were below the medians of its Expense Group/Universe. The Fund’s actual management fees were below the medians of its Expense Group/Universe. The Fund’s sub-advisory fees were below the medians of its Subadvisory Expense Group/Universe. The Board noted that the expense limitation on total expenses was also extended contractually through December 31, 2016. |
The Fund underperformed its Lipper peer index for the one-, three- and five-year periods. The Fund underperformed its benchmark for the one-, three- and five-year periods. The Fund underperformed the medians of its Performance Group/Universe for the one-, three- and five-year periods. The Board took into account that Wells Capital replaced the Fund’s previous sub-adviser in December 2013, and as a result, the Fund’s intermediate- and long-term performance in part reflects that of the Fund’s previous sub-adviser. The Board also took into account management’s discussion of the Fund’s performance.
| | • | | Mid-Cap Value Fund (sub-advised by Wellington and Robeco). The Fund’s total net expenses were above the median of its Expense Group and below the median of its Expense Universe. The Fund’s actual management fees were below the medians of its Expense Group/Universe. The Fund’s sub-advisory fees were above the medians of its Subadvisory Expense Group/Universe. The Board took into account management’s discussion of the Fund’s expenses and noted that the expense limitation on total expenses was also extended contractually through December 31, 2016. |
The Fund underperformed its Lipper peer index for the one-, three- and five-year periods. The Fund underperformed its benchmark for the one-, three- and five-year periods. The Fund’s performance was below the medians of its Performance Group/Universe for the one-, three- and five-year periods. The Board took into account management’s discussion of the Fund’s performance, including recent actions taken to improve the Fund’s performance and management’s continued monitoring of the Fund.
| | • | | Moderate Growth Lifestyle Fund (sub-advised by PineBridge). The Fund’s total net expenses were equal to the median of its Expense Group and below the median of its Expense Universe. The Fund’s actual management fees were equal to the median of the Fund’s Expense Group and above the median of its Expense Universe. The Fund’s sub-advisory fees were above the medians of its Subadvisory Expense Group/Universe. The Board took into account management’s discussion of the Fund’s expenses and noted that the expense limitation on total expenses was extended contractually through December 31, 2016. |
The Fund outperformed its Lipper peer index for the one-, three- and five-year periods. The Fund underperformed its blended benchmark for the one-year period and outperformed its blended benchmark for the three- and five-year periods. In addition, the Fund’s performance was above the medians of its Performance Group/Universe for the one-, three- and five-year periods.
| | • | | Money Market II Fund (sub-advised by SAAMCo). The Fund’s total net expenses were above the median of its Expense Group and below the median of its Expense Universe. The Fund’s actual management fees were above the medians of its Expense Group/Universe. The Fund’s sub-advisory fees were below the median of its Subadvisory Expense Universe. The Board took into account management’s discussion of the Fund’s expenses and noted that the expense limitation on total expenses was extended contractually through December 31, 2016. |
The Fund outperformed its Lipper peer index for the one-, three- and five-year periods. The Fund underperformed its benchmark for the one-, three- and five-year periods. In addition, the Fund’s performance was equal to the median of its Performance Group for the one-, three-, and five-year periods. The Fund’s performance was above the median of its Performance Universe for the one- and three-year periods and equal to the median of its Performance Universe for the five-year period. The Board took into account management’s discussion of the Fund’s performance and noted the relatively narrow range of returns in the Performance Group/Universe.
| | • | | Small-Cap Growth Fund (sub-advised by JPMIM). The Fund’s total net expenses were below the median of its Expense Group and above the median of its Expense Universe. The Fund’s actual management fees were above the medians of the Fund’s Expense Group/Universe. The Fund’s sub-advisory fees were above the medians of |
157
VALIC Company II
APPROVAL OF ADVISORY AGREEMENTS (unaudited) — (continued)
| | its Subadvisory Expense Group/Universe. The Board took into account management’s discussion of the Fund’s expenses and noted that the expense limitation on total expenses was extended contractually through December 31, 2016. |
The Fund underperformed its Lipper peer index for the one-year period and outperformed its Lipper peer index for the three- and five-year periods. The Fund outperformed its benchmark for the one-year period and underperformed its benchmark for the three- and five-year periods. In addition, the Fund’s performance was below the median of its Performance Group for the one-year period and above the median of its Performance Group for the three- and five-year periods. The Fund’s performance was below the median of its Performance Universe for the one-, three- and five-year periods. The Board took into account management’s discussion of the Fund’s performance and management’s continued monitoring of the Fund.
| | • | | Small-Cap Value Fund (sub-advised by JPMIM and Metropolitan West). The Fund’s total net expenses were below the medians of its Expense Group/Universe. The Fund’s actual management fees were below the medians of its Expense Group/Universe. The Fund’s sub-advisory fees were equal to the median of its Subadvisory Expense Group and above the median of its Subadvisory Expense Universe. The expense limitation on total expenses was also extended contractually through December 31, 2016. |
The Fund outperformed its Lipper peer index for the one- and three-year periods and underperformed its Lipper peer index for the five-year period. The Fund outperformed its benchmark for the one- and three-year periods and underperformed its benchmark for the five-year period. In addition, the Fund’s performance was above the median of its Performance Group for the one-year period and below the median of its Performance Group for the three- and five-year periods. The Fund’s performance was above the median of its Performance Universe for the one- and three-year periods and below the median of its Performance Universe for the five-year period. The Board took into account management’s discussion of the Fund’s performance, including management’s continued monitoring of the Fund, and also noted that the Fund’s long-term performance, in part, reflects that of the Fund’s previous sub-adviser, which was replaced in December 2012.
| | • | | Socially Responsible Fund (sub-advised by SAAMCo). The Fund’s total net expenses were below the medians of its Expense Group/Universe. The Fund’s actual management fees were below the medians of its Expense Group/Universe. The Fund’s sub-advisory fees were also below the medians of its Subadvisory Expense Group/Universe. The expense limitation on total expenses was also extended contractually through December 31, 2016. |
The Fund outperformed its Lipper peer index for the one-, three- and five-year periods. The Fund also outperformed its benchmark for the one-, three- and five-year periods. In addition, the Fund’s performance was above the medians of its Performance Group/Universe for the one-, three- and five-year periods.
| | • | | Strategic Bond Fund (sub-advised by PineBridge). The Fund’s total net expenses were equal to the medians of its Expense Group/Universe. The Fund’s actual management fees were below the medians of the Fund’s Expense Group/Universe. The Fund’s sub-advisory fees were above the medians of its Subadvisory Expense Group/Universe. The Board noted that the expense limitation on total expenses was extended contractually through December 31, 2016. |
The Fund outperformed its Lipper peer index for the one-, three- and five-year periods. The Fund underperformed its benchmark for the one-year period and outperformed its benchmark for the three- and five-year periods. In addition, the Fund’s performance was above the medians of its Performance Group/Universe for the one-, three- and five-year periods.
The Board considered management’s discussion of each Fund’s expenses and performance and concluded that each Fund’s overall performance was satisfactory in light of the circumstances or was being appropriately addressed by management. The Board further concluded that the advisory fee and sub-advisory fee for each Fund are fair and reasonable in light of the usual and customary charges made for services of the same nature and quality and the other factors considered.
Cost of Services and Indirect Benefits/Profitability. The Board was provided information related to the cost of services and profits realized in connection with the Advisory Agreement. The Board considered the costs that are borne by the Funds. For its services, VALIC receives a fee, payable monthly from each Fund in an amount that is calculated as a percentage of the average daily net assets of the respective Fund.
The Board noted that VALIC reviewed a number of factors in determining appropriate fee levels for the Funds as well as the fee VALIC pays each Sub-adviser. Such factors include review of (1) style class peers primarily within the variable annuity and qualified plan universe; (2) key competitor analysis; (3) fund analysis; (4) product suitability; and (5) special considerations such as competitor sub-account characteristics, uniqueness of the product and prestige of the manager.
The Board considered that VALIC, or its affiliates, will receive benefits in addition to the advisory fee to be paid by the Funds, which include transfer agency fees, administrative services fees, and sub-advisory fees. The Board considered that the transfer agency fees are paid by the Funds for the provision of recordkeeping and shareholder services to contract owners and participants. The transfer agency services are provided at cost, and the payment for such services is allocated to each Fund based on the number of accounts serviced. The Board also noted that VC II pays SAAMCo, an affiliate of VALIC, an annual fee based on each Fund’s average daily net assets, for the provision of certain accounting and administrative services. Out of the fee SAAMCo receives from the Funds, SAAMCo compensates VALIC for certain administrative services, and the Funds’ custodian, State Street Bank and Trust Company, for calculation of the daily net asset value. The Board also noted that SAAMCo receives sub-advisory fees for those Funds for which it serves as sub-adviser. The Board also considered that VC II pays VALIC an annual fee of 0.25% on average daily net assets of each Fund (other than the Lifestyle Funds) pursuant to a Shareholder Services Agreement.
The Board also considered that VALIC may exclude from its taxable income a portion of the ordinary dividends paid by underlying U.S. equities in the Funds to the same extent the Funds receive certain dividends with respect to shares of stock issued by domestic corporations, subject to applicable tax laws and regulations. In addition, it was noted that VALIC may receive foreign tax credits with respect to certain foreign securities held or to be held in certain Funds that benefit VALIC. These benefits can be material.
In considering the profitability to VALIC and its affiliates in connection with their relationship with the Funds, the Board reviewed information provided by VALIC setting forth the revenues and other benefits, both direct and indirect, received by VALIC and its affiliates attributable to managing each Fund, the cost of providing such services, and the resulting profitability to VALIC and its affiliates from these relationships. The Board also reviewed VALIC’s profitability on a Fund-by-Fund basis. The Board received and reviewed
158
VALIC Company II
APPROVAL OF ADVISORY AGREEMENTS (unaudited) — (continued)
information prepared by VALIC that reflects an allocation of costs that result in a reasonable determination of profitability of VALIC and its affiliates, as adviser, as transfer agent and/or as shareholder servicing agent, as applicable. In addition, the Board considered the profitability of SAAMCo in its role as the administrator of the Funds and as sub-adviser to certain Funds. The Board concluded that the profitability to VALIC and its affiliates from their relationship with the Funds was reasonable.
In considering the profitability to the Sub-advisers in connection with their relationship to the Funds, the Trustees noted that the fees under the Sub-Advisory Agreements are paid by VALIC out of the advisory fees that VALIC receives under the Advisory Agreement. With respect to the unaffiliated Sub-advisers, the Board also relied on the ability of VALIC to negotiate the Sub-Advisory Agreements and the fees thereunder at arm’s length.
For each of the above reasons, the Trustees determined that the profitability to the Sub-advisers from their relationship with the Funds was not a material factor in their deliberations with respect to consideration of approval of the Investment Sub-Advisory Agreements.
Economies of Scale. The Board noted that the advisory fee rate and sub-advisory fee rates payable to VALIC and each of the Sub-advisers with respect to most of the Funds contain breakpoints, which allow the Funds to participate in any economies of scale. The Board also took into account management’s discussion of the Funds’ advisory fee and sub-advisory fee structure, including with respect to the Funds that do not currently have breakpoints. The Board also considered the effect of each Fund’s growth and size on its performance and fees, noting that if the Funds’ assets increase over time, the Funds may realize other economies of scale if assets increase proportionally more than expenses. The Board concluded that no changes to the advisory fee structure of the Funds were necessary.
For similar reasons as stated above with respect to the Sub-advisers’ profitability and the costs of their providing services, the Board concluded that the potential for economies of scale in the Sub-advisers’ management of the Funds are not a material factor to the approval of the Sub-advisory Agreements, although it was noted that most of the Funds have breakpoints at the sub-advisory fee level.
Terms of the Advisory Contracts. The Board reviewed the terms of the Advisory Contracts including the duties and responsibilities undertaken. The Board also reviewed the terms of payment for services rendered by VALIC and the Sub-advisers and noted that VALIC would compensate the Sub-advisers out of the advisory fees it receives from the Funds. The Board noted that the Sub-Advisory Agreements provide that each Sub-adviser will pay all of its own expenses in connection with the performance of their respective duties as well as the cost of maintaining the staff and personnel as necessary for it to perform its obligations. The Board also considered the termination and liability provisions of the Advisory Contracts and other terms contained therein. The Board concluded that the terms of each of the Advisory Contracts were reasonable.
Compliance. The Board reviewed VALIC’s and the Sub-advisers’ compliance personnel and regulatory history, including information whether it was currently involved in any regulatory actions or investigations. In addition, the Board reviewed information concerning each entities’ compliance staff that would be responsible for providing compliance functions on behalf of the Funds and concluded that there was no information provided that would have a material adverse effect on their abilities to provide services to the Funds.
Conclusions. In reaching its decision to approve the Advisory Contracts, the Board did not identify any single factor as being controlling, but based its recommendation on each of the factors it considered. Each Trustee may have contributed different weight to the various factors. Based upon the materials reviewed, the representations made and the considerations described above, and as part of their deliberations, the Board, including the Independent Trustees, concluded that VALIC and each Sub-adviser possess the capability and resources to perform the duties required of them under their respective Advisory Contracts.
Further, based upon its review of the Advisory Contracts, the materials provided, and the considerations described above, the Board, including the Independent Trustees, concluded that (1) the terms of the Advisory Contracts are reasonable, fair and in the best interests of each of the Funds and its respective shareholders, and (2) the fee rates payable under the Advisory Contracts are fair and reasonable in light of the usual and customary charges made for services of the same nature and quality.
159
VALIC Company II
TRUSTEES AND OFFICERS INFORMATION — August 31, 2015 (unaudited)
| | | | | | | | | | | | | | |
Name, Age
and Address*
| | Position
Held With
VALIC Complex | | Term of Office
and Length of
Time Served(4) | | | Principal Occupation(s) During Past 5 Years | | Number of
Funds in
Fund Complex
Overseen by
Director(2) | | | Other Directorships
Held by Trustee(3) |
Independent Directors | | | | | | | | | | | | | | |
Thomas J. Brown
Age: 69 | | Trustee | |
| 2005-
Present |
| | Retired, Chief Compliance Officer & Chief Financial Officer, American General Asset Management, an investment adviser (since 2006). | | | 49 | | | Trustee, Virtus Series Fund (2011-Present). |
Dr. Judith L. Craven
Age: 69 | | Trustee | |
| 1998-
Present |
| | Retired Administrator, Proprietor JAE & Associates LLC, Physician Consulting since (2003); and President, United way, fundraiser (since 1998) | | | 77 | | | Director, A.G. Belo Corporation, (1992-2013); Director SYSCO Corporation, a food marketing and distribution company (1996-Present). Director, Luby’s Inc., a restaurant chain (1998-Present); Director, Hotel-Downtown (1998-2011). |
William F. Devin
Age: 76 | | Chairman and Trustee(5) | |
| 2001-
Present |
| | Retired, Executive Vice President, Fidelity Management Resources, a broker-dealer (since 1996). | | | 77 | | | Director, Boston Options Exchange (2001-2011). |
Dr. Timothy J. Ebner
Age: 65 | | Trustee | |
| 1998-
Present |
| | Professor and Head, Department of Neuroscience Medical School (1980-Present), and Visscher Chair of Physiology, University of Minnesota (1999-2013); Scientific Director, Society for Research on the Cerabellum (2008-Present). President, Association of Medical School Neuroscience Department Chairpersons (2012-2014). | | | 49 | | | Trustee, Minnesota Medical Foundation (2003-Present). |
Judge Gustavo E. Gonzales, Jr.
Age: 74 | | Trustee | |
| 1998-
Present |
| | Semi-Retired Attorney At Law, Criminal Defense and General Practice (2004-2014). Retired Municipal Court Judge, Dallas, TX (since 2004). | | | 49 | | | None. |
Kenneth J. Lavery
Age: 65 | | Trustee | |
| 2001-
Present |
| | Retired, Vice President, Massachusetts Capital Resources Co. (1982-2013). | | | 49 | | | None. |
Dr. John E. Maupin, Jr.
Age: 68 | | Trustee | |
| 1998-
Present |
| | Retired, President Morehouse School of Medicine, Atlanta Georgia (2006-2014). | | | 49 | | | Director, LifePoint Hospitals, Inc., hospital management (1999-Present); Director, HealthSouth, Corporation, rehabilitation health care services (2004-Present); Director, Regions Financials Inc., bank holding company (2007-Present). |
Interested Directors | | | | | | | | | | | | | | |
Peter A. Harbeck(1)
Age: 61 | | Trustee | |
| 2001-
Present |
| | President (1995-Present), CEO and Director (1992-Present), SAAMCo (1997-Present); Director, AIG Capital Services, Inc. (“ACS”) (1993-Present); Chairman (2004-Present), President and CEO, Advisor Group, Inc. (2013-Present) | | | 137 | | | None. |
Officers | | | | | | | | | | | | | | |
John T. Genoy
Age: 46 | | President and Principal Executive Officer | |
| 2014-
Present |
| | Chief Financial Officer (2002-Present), Senior Vice President, (2003-Present) and Chief Operating Officer (2006-Present) and Director (2014-Present), SAAMCo. | | | N/A | | | N/A |
John Packs
Age: 59 | | Vice President and Senior Investment Officer | |
| 2001-
Present |
| | Senior Investment Officer, VALIC (2001-2013). Senior Vice President, SAAMCo (2008-Present). | | | N/A | | | N/A |
160
VALIC Company II
TRUSTEES AND OFFICERS INFORMATION — August 31, 2015 (unaudited) — (continued)
| | | | | | | | | | | | | | |
Name, Age
and Address*
| | Position
Held With
VALIC Complex | | Term of Office
and Length of
Time Served(4) | | | Principal Occupation(s) During Past 5 Years | | Number of
Funds in
Fund Complex
Overseen by
Director(2) | | | Other Directorships
Held by Trustee(3) |
Officers | | | | | | | | | | | | | | |
Gregory R. Kingston
Age: 49 | | Treasurer and Principal Financial Officer | |
| 2000-
Present |
| | Vice President (2001-2014) and Head of Mutual Fund Administration, SAAMCo (2014-Present). | |
| N/A
|
| | N/A
|
Kathleen Fuentes
Age: 46 | | Vice President, Chief Legal Officer and Secretary | |
| 2015-
Present |
| | Vice President and Deputy General Counsel, SAAMCo (2006-Present). | | | N/A | | | N/A |
Gregory N. Bressler
Age: 48 | | Vice President | |
| 2005-
Present |
| | Senior Vice President, General Counsel (2005-Present) and Assistant Secretary (2013-Present), SAAMCo. | | | N/A | | | N/A |
Katherine Stoner
Age: 58 | | Vice President and Chief Compliance Officer | |
| 2011-
Present
|
| | Vice President, SAAMCo (May 2011-Present); Vice President, The Variable Annuity Life Insurance Company (“VALIC”) and Western National Life Insurance Company (“WNL”) (2006-2011); Deputy General Counsel and Secretary, VALIC and WNL (2007-2011); Vice President, VALIC Financial Advisors, Inc. and VALIC Retirement Services Company (2010-2011). | | | N/A | | | Director, American General Distributors, Inc. (2006-2011) |
Matthew J. Hackethal
Age: 43 | | Anti-Money Laundering (“AML”) Compliance Officer | |
| 2007-
Present |
| | Chief Compliance Officer (2007-Present) and Vice President (2011-Present), SAAMCo; AML Compliance Officer, SunAmerica Fund Complex (2006-Present). | | | N/A | | | N/A |
Thomas M. Ward
Age: 48 | | Vice President | |
| 2008-
Present |
| | Vice President (2009-2013), VALIC and VALIC Financial Advisers, Inc. | | | N/A | | | N/A |
Shawn Parry
Age: 43 | | Vice President and Assistant Treasurer | |
| 2014-
Present |
| | Vice President (2014-Present) and Assistant Vice President (2005-2014), SAAMCo; and Product Manager (2009- 2010), Invesco Advisers, Inc. | | | N/A | | | N/A |
Donna McManus
Age: 54 | | Vice President and Assistant Treasurer | |
| 2014-
Present |
| | Vice President, SAAMCo (2014-Present); Managing Director, BNY Mellon (2009- 2014). | | | N/A | | | N/A |
| * | The business address for each Trustee and Officer is 2929 Allen Parkway, Houston, TX, 77019. |
| (1) | Interested Trustee, as defined within the Investment Company Act of 1940 (the “1940 Act”), because of current employment with SAAMCo, an affiliated company with VALIC. |
| (2) | The “Fund Complex” consists of all registered investment company portfolios for which VALIC or an affiliated person of VALIC serves as investment adviser or administrator. The “Fund Complex” includes the SunAmerica Specialty Series (7 funds), SunAmerica Equity Funds (2 funds), SunAmerica Income Funds (3 funds), SunAmerica Money Market Funds, Inc. (1 fund), SunAmerica Senior Floating Rate Fund, Inc. (1 fund), SunAmerica Series, Inc. (6 portfolios), Anchor Series Trust (8 portfolios), Seasons Series Trust (20 portfolios), SunAmerica Series Trust (40 portfolios), VALIC Company I (34 funds) and VALIC Company II (15 funds). |
| (3) | Directorships of companies required to report to the Securities and Exchange Commission under the Securities Exchange Act of 1934 (i.e. “public companies”) or other investment companies registered under the 1940 Act. |
| (4) | Trustees serve until their successors are duly elected and qualified. |
| (5) | Effective July 27, 2005, Mr. Devin became Chairman of the Board. |
Additional Information concerning the Trustees and Officers is contained in the Statement of Additional Information and is available without charge by calling 1-800-448-2542.
161
VALIC Company II
SHAREHOLDERS TAX INFORMATION — August 31, 2015 (unaudited)
Certain tax information regarding the VALIC Company II is required to be provided to the shareholders based upon each Fund’s income and capital gain distributions for the taxable year ended August 31, 2015.
During the year ended August 31, 2015, the Funds paid the following long-term capital gains along with the percentage of ordinary income dividends that qualified for the 70% dividends received deductions for corporations:
| | | | | | | | | | | | | | | | |
Fund
| | Net
Long-Term
Capital Gains
| | | Foreign
Tax Credit
| | | Foreign
Source Income
| | | Qualifing % for the
70% Dividends
Received Deduction
| |
Aggressive Growth Lifestyle* | | $ | 36,393,527 | | | $ | 183,957 | | | $ | 2,993,550 | | | | 28.50 | % |
Capital Appreciation | | | — | | | | — | | | | — | | | | 100.00 | |
Conservative Growth Lifestyle* | | | 9,535,583 | | | | 77,326 | | | | 1,291,041 | | | | 7.37 | |
Core Bond | | | — | | | | — | | | | — | | | | 0.13 | |
High Yield Bond | | | — | | | | — | | | | — | | | | — | |
International Opportunities* | | | — | | | | 490,553 | | | | 10,516,346 | | | | 0.11 | |
Large Cap Value | | | — | | | | — | | | | — | | | | 100.00 | |
Mid Cap Growth | | | 17,636,410 | | | | — | | | | — | | | | 8.43 | |
Mid Cap Value | | | 84,711,714 | | | | — | | | | — | | | | 89.23 | |
Moderate Growth Lifestyle* | | | 43,143,104 | | | | 219,334 | | | | 3,674,473 | | | | 18.82 | |
Money Market II | | | — | | | | — | | | | — | | | | — | |
Small Cap Growth | | | 11,885,623 | | | | — | | | | — | | | | 68.83 | |
Small Cap Value | | | 58,550,498 | | | | — | | | | — | | | | 39.72 | |
Socially Responsible | | | — | | | | — | | | | — | | | | 100.00 | |
Strategic Bond | | | 1,806,930 | | | | — | | | | — | | | | 0.21 | |
| * | The Funds make an election under the Internal Revenue Code Section 853 to pass through foreign taxes paid to the shareholders. |
162
VALIC Company II
COMPARISONS: FUNDS VS. INDEXES (unaudited)
In the following pages, we have included graphs that compare each Fund’s performance with certain market indices. These graphs show the hypothetical growth of a $10,000 investment in each Fund versus the same $10,000 investment in comparable market indices. Descriptions of these market indices are provided below the individual graphs. It is important to note that the VC II Funds are professionally managed mutual funds while the indices are not available for investment and are unmanaged.
Please note that the graphs and tables that accompany the following investment comments include all fund expenses, but do not reflect the charges imposed by the variable annuity contracts or variable life insurance policies (collectively, the “Contracts”), qualifying employer-sponsored retirement plans (the “Plans”), or Individual Retirement Accounts (“IRAs”). All dividends are assumed to be reinvested. No expenses are deducted from the performance of the indices.
Investments in stocks and bonds are subject to risk, including stock market and interest rate fluctuations. Investments in non-U.S. stocks are subject to additional risks, including political and social instability, differing securities regulations and accounting standards, and limited public information. Mortgage-backed securities are subject to prepayment, which can result in reinvestment of principal at lower yields. Money market instruments generally offer stability and income, but an investment in these securities, like investments in other portfolios, are not guaranteed by the U.S. government or any other federal government entity. Lower rated high yield, high-risk securities generally involve more credit risk. These securities may also be subject to greater market price fluctuations than lower yielding, higher rated debt securities. The common stocks of medium-sized companies may be more volatile than those of larger, more established companies. Investing in real estate involves special risks, which may not be associated with investing in stocks, including possible declines in real estate values, adverse economic conditions, and changes in interest rates. Investments in small capitalization and emerging growth companies involve greater than average risk. Such securities may have limited marketability and the issuers may have limited product lines, markets and financial resources. The value of such investments may fluctuate more widely than investments in larger, more established companies. The technology industry can be significantly affected by obsolescence, short product cycles, falling prices and profits, and competition from new market participants. Funding choices that primarily invest in one sector are more volatile than those that diversify across many industry sectors and companies.
163
VALIC Company II Aggressive Growth Lifestyle Fund
COMPARISON: FUND VS. INDEX (unaudited)
MANAGEMENT OVERVIEW
A discussion with PineBridge Investments, LLC
For the twelve-month period ended August 31, 2015, the Aggressive Growth Lifestyle Fund returned -3.17%, compared to 0.48% for the S&P 500® Index and -0.57% for the Fund’s Blended Index.**
The Aggressive Growth Lifestyle Fund allocates its assets among a combination of the Funds of VC II and VALIC Company I. The Fund does not select specific sectors, securities, or countries and thus these factors do not influence performance. Rather, the key indicators of performance are asset allocation and manager selection.
Over the past twelve months, the Fund’s asset allocation was a negative contributor to performance. The Fund began the twelve month period with an overweight to US equities, a significant overweight to international equities, a large underweight to fixed income, and a modest underweight to global real estate. In late 2014, the Fund started reducing US equities exposure and increased exposure to both fixed income and global real estate. In the same period, international equities exposure was modestly reduced. As 2015 progressed, the US equities exposure was reduced to an underweight, as the international equities and fixed income exposure increased. The twelve month period closed with an underweight to US equities, a significant overweight to international equities, and modest underweights to both global real estate and fixed income. The cumulative impact of these asset allocation decisions resulted in underperformance versus both the S&P 500 and the Fund’s Blended Index.
Fund selection was also a detractor from performance. The Foreign Value Fund, Emerging Economies Fund and International Equities Fund were the top detractors. The top funds contributing to returns were the Blue Chip Growth Fund, Stock Index Fund and the NASDAQ-100 Fund.
164
VALIC Company II Aggressive Growth Lifestyle Fund
COMPARISON: FUND VS. INDEX (unaudited) — (continued)
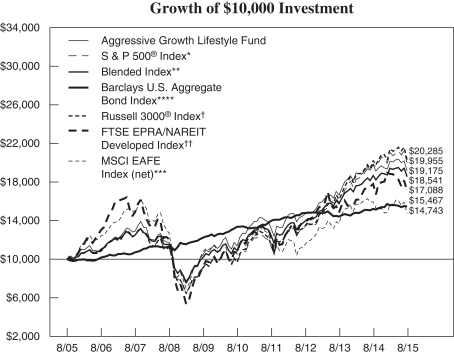
For the year ended August 31, 2015, the Aggressive Growth Lifestyle Fund returned -3.17% compared to 0.48% for the S&P 500® Index and -0.57% for the Blended Index.
| * | The S&P 500® Index is an index of the stocks of 500 major large-cap U.S. corporations, chosen for market size, liquidity, and industry group representation. It is a market-value weighted index, with each stock’s percentage in the Index in proportion to its market value. |
| ** | The Fund’s Blended Index consists of the Russell 3000® Index (54%), MSCI EAFE Index (net) (13%), the Barclays U.S. Aggregate Bond Index (25%) and the FTSE/EPRA NAREIT Developed Index (8%). |
| *** | The MSCI EAFE Index (net) is a free float-adjusted market capitalization index that is designed to measure the equity market performance of developed markets, excluding the US & Canada. The Index consists of 22 developed market country indices. The net index approximates the minimum possible dividend reinvestment and assumes that the dividend is reinvested after the deduction of withholding tax, applying the rate to non-resident individuals who do not benefit from double taxation treaties. |
| **** | The Barclays U.S. Aggregate Bond Index is an unmanaged index that measures the investment grade, U.S. dollar-denominated, fixed-rate taxable bond market, including Treasuries, government-related and corporate securities, mortgage- and asset-backed securities and commercial mortgage-backed securities. |
| † | The Russell 3000® Index follows the 3,000 largest U.S. companies, based on total market capitalization. |
| †† | The FTSE EPRA/NAREIT Developed Index is a global market capitalization weighted index composed of listed real estate securities in the North American, European and Asian real estate markets. |
| | | | |
| Average Annual Total Return as of August 31, 2015 |
| 1 Year | | 5 Years | | 10 Years |
| -3.17% | | 11.03% | | 6.73% |
Past performance is not predictive of future performance. The performance data quoted represents past performance; past performance does not guarantee future results; the investment return and principal value of an investment will fluctuate so that an investor’s shares, when redeemed, may be worth more or less than their original cost; current performance may be lower or higher than the performance data quoted.
The Fund’s returns reflect investment management fees and other Fund expenses. Charges imposed by the Variable Contracts, Plans or IRAs that invest in the Fund are not included in the Fund’s returns.
165
VALIC Company II Capital Appreciation Fund
COMPARISON: FUND VS. INDEX (unaudited)
MANAGEMENT OVERVIEW
A discussion with The Boston Company Asset Management, LLC
The Capital Appreciation Fund posted a return of 3.28% for the twelve-month period ended August 31, 2015, compared to a return of 4.26% for the Russell 1000® Growth Index.
The industrials and consumer discretionary sectors detracted most from relative results. Relative returns in the industrials sector were hurt by exposure to United Technologies Corp. In the commercial services & supplies segment, Tyco International PLC was a significant detractor.
Performance in the consumer discretionary sector was weighed by the internet & catalog retail and media segments, notably Netflix Inc. and CBS Corp.
The Fund benefited from stock selection in information technology. Visa, Inc. and Fortinet, a computer network security company, were among the top contributors.
Ulta Salon, a beauty retailer, and United Healthcare were among the individual top contributors overall.
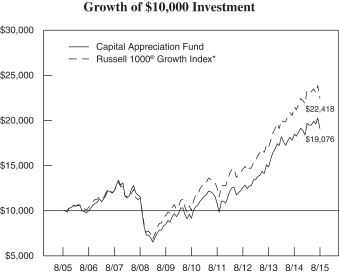
For the year ended August 31, 2015, the Capital Appreciation Fund returned 3.28% compared to 4.26% for the Russell 1000® Growth Index.
| * | The Russell 1000® Growth Index measures the performance of those Russell 1000 companies with higher price-to-book ratios and higher forecasted growth values. |
| | | | |
| Average Annual Total Return as of August 31, 2015 |
| 1 Year | | 5 Years | | 10 Years |
| 3.28% | | 15.83% | | 6.67% |
Past performance is not predictive of future performance. The performance data quoted represents past performance; past performance does not guarantee future results; the investment return and principal value of an investment will fluctuate so that an investor’s shares, when redeemed, may be worth more or less than their original cost; current performance may be lower or higher than the performance data quoted.
The Fund’s returns reflect investment management fees and other Fund expenses. Charges imposed by the Variable Contracts, Plans or IRAs that invest in the Fund are not included in the Fund’s returns.
166
VALIC Company II Conservative Growth Lifestyle Fund
COMPARISON: FUND VS. INDEX (unaudited)
MANAGEMENT OVERVIEW
A discussion with PineBridge Investments, LLC
For the twelve-month period ended August 31, 2015, the Conservative Growth Lifestyle Fund returned -2.65%, compared to 0.48% for the S&P 500® Index and 0.51% for the Fund’s Blended Index.**
The Conservative Growth Lifestyle Fund allocates its assets among a combination of the Funds of VC II and VALIC Company I. The Fund does not select specific sectors, securities, or countries and thus these factors do not influence performance. Rather, the key indicators of performance are asset allocation and manager selection.
Over the past twelve months, the Fund’s asset allocation was a negative contributor to performance. The Fund began the twelve month period with overweights to both US equities and international equities, an underweight to fixed income, and a benchmark weight to global real estate. In late 2014, the Fund started reducing US equities exposure and increased exposure to both international equities and global real estate. As 2015 progressed, the US equities exposure was reduced to an underweight, as the international equities and fixed income exposure increased. The twelve month period closed with an underweight to US equities, a significant overweight to international equities, an underweight to fixed income, and a benchmark weight to global real estate. The cumulative impact of these asset allocation decisions resulted in underperformance versus both the S&P 500 and the Fund’s Blended Index.
Fund selection was also a detractor from performance. The Foreign Value Fund, International Equities Fund and the Emerging Economies Fund were the top detractors. The top funds contributing to returns were the Blue Chip Growth Fund, Core Bond Fund and the Stock Index Fund.
167
VALIC Company II Conservative Growth Lifestyle Fund
COMPARISON: FUND VS. INDEX (unaudited) — (continued)
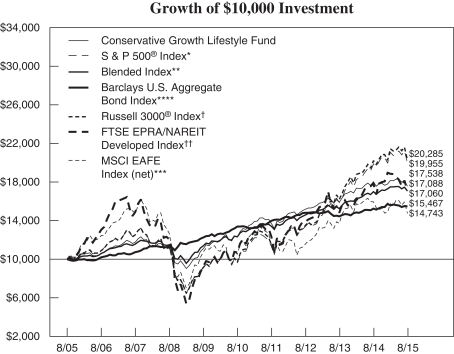
For the year ended August 31, 2015, the Conservative Growth Lifestyle Fund returned -2.65% compared to 0.48% for the S&P 500® Index and 0.51% for the Blended Index.
| * | The S&P 500® Index is an index of the stocks of 500 major large-cap U.S. corporations, chosen for market size, liquidity, and industry group representation. It is a market-value weighted index, with each stock’s percentage in the Index in proportion to its market value. |
| ** | The Fund’s Blended Index consists of the Russell 3000® Index (24%), MSCI EAFE Index (net) (8%), the Barclays U.S. Aggregate Bond Index (65%) and the FTSE EPRA/NAREIT Developed Index (3%). |
| *** | The MSCI EAFE Index (net) is a free float-adjusted market capitalization index that is designed to measure the equity market performance of developed markets, excluding the US & Canada. The Index consists of 22 developed market country indices. The net index approximates the minimum possible dividend reinvestment and assumes that the dividend is reinvested after the deduction of withholding tax, applying the rate to non-resident individuals who do not benefit from double taxation treaties. |
| **** | The Barclays U.S. Aggregate Bond Index is an unmanaged index that measures the investment grade, U.S. dollar-denominated, fixed-rate taxable bond market, including Treasuries, government-related and corporate securities, mortgage- and asset-backed securities and commercial mortgage-backed securities. |
| † | The Russell 3000® Index follows the 3,000 largest U.S. companies, based on total market capitalization. |
| †† | The FTSE EPRA/NAREIT Developed Index is a global market capitalization weighted index composed of listed real estate securities in the North American, European and Asian real estate markets. |
| | | | |
| Average Annual Total Return as of August 31, 2015 |
| 1 Year | | 5 Years | | 10 Years |
| -2.65% | | 7.42% | | 5.78% |
Past performance is not predictive of future performance. The performance data quoted represents past performance; past performance does not guarantee future results; the investment return and principal value of an investment will fluctuate so that an investor’s shares, when redeemed, may be worth more or less than their original cost; current performance may be lower or higher than the performance data quoted.
The Fund’s returns reflect investment management fees and other Fund expenses. Charges imposed by the Variable Contracts, Plans or IRAs that invest in the Fund are not included in the Fund’s returns.
168
VALIC Company II Core Bond Fund
COMPARISON: FUND VS. INDEX (unaudited)
MANAGEMENT OVERVIEW
A discussion with PineBridge Investments, LLC
The Core Bond Fund posted a return of 0.62% for the twelve-month period ended August 31, 2015, compared to a return of 1.56% for the Barclays U.S. Aggregate Bond Index.
Sector selection hurt the portfolio over the course of the year. An underweight to Treasuries was among the largest detractors from excess returns. Overweight allocations to the energy, basic industry and communications sectors also detracted from performance.
Security selection benefited the Fund over the course of the year. Selections made in the banking and Agency MBS sectors were the largest contributors. In addition, the Fund’s longer duration position versus the benchmark and overweight to the longer end of the yield curve contributed to returns during the year as longer term interest rates declined.
At the individual security level the top 3 contributors were:
Quest Corp 6.13% due 5/25/2053, Medtronic Inc 4.63% due 3/15/2045 and DB Deutsche Bank 7.50% due 4/30/2025
The bottom 3 contributors were:
Energy Transfer Partners 6.63% due 10/15/2036, Sandridge Energy, Inc 7.50% due 2/15/2023 and Halcon Resources Corp. 9.75% due 7/15/2020
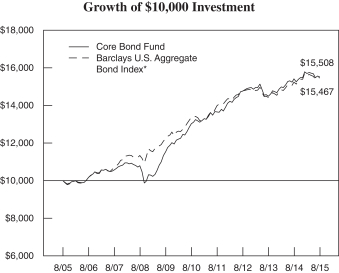
For the year ended August 31, 2015, the Core Bond Fund returned 0.62% compared to 1.56% for the Barclays U.S. Aggregate Bond Index.
| * | The Barclays U.S. Aggregate Bond Index is an unmanaged index that measures the investment grade, U.S. dollar-denominated, fixed-rate taxable bond market, including Treasuries, government-related and corporate securities, mortgage- and asset-backed securities and commercial mortgage-backed securities. |
| | | | |
| Average Annual Total Return as of August 31, 2015 |
| 1 Year | | 5 Years | | 10 Years |
| 0.62% | | 3.55% | | 4.49% |
Past performance is not predictive of future performance. The performance data quoted represents past performance; past performance does not guarantee future results; the investment return and principal value of an investment will fluctuate so that an investor’s shares, when redeemed, may be worth more or less than their original cost; current performance may be lower or higher than the performance data quoted.
The Fund’s returns reflect investment management fees and other Fund expenses. Charges imposed by the Variable Contracts, Plans or IRAs that invest in the Fund are not included in the Fund’s returns.
169
VALIC Company II High Yield Bond Fund
COMPARISON: FUND VS. INDEX (unaudited)
MANAGEMENT OVERVIEW
A discussion with Wellington Management Company LLP
The High Yield Bond Fund posted a return of -2.02% for the twelve-month period ended August 31, 2015, compared to its benchmark, the Citigroup High-Yield Market Index, which returned -3.78%.
The credit spread (yield over treasuries) on the Citigroup High Yield Market Index widened during the twelve month period ended August 31, 2015. The best performing industries of the Citigroup High Yield Market Index were restaurants, retail – food and drug, and airlines. The worst performing industries were oil and gas producers, metals & mining, and oil equipment.
Both security selection and sector allocation contributed to relative performance of the fund over the 12-month period. Security selection was strong in the energy, technology, and financial services sectors. These results were partially offset by weak security selection in the environmental, utilities, and paper sectors. In terms of sector allocation, an underweight to the poor performing energy sector drove the majority of relative outperformance. Overweight allocations to health care and cable satellite also aided relative performance, while underweight allocations to the food & beverage, gaming, and packaging sectors partially offset this positive relative performance.
Not owning Linn Energy, Peabody Energy, and Samson Investment were the top contributors to relative performance during the period. Positions in Abengoa Greenfield, AK Steel Corp., and FMG Resources were the top detractors from relative performance.
The Fund held Canadian dollar and Euro currency forwards during the period to hedge Canadian dollar and Euro based holdings. These holdings contributed modestly to relative performance. Lastly, the Fund sold protection on a credit default swap and closed out the position during the period. The Fund also bought and sold protection on a credit default swap index to tactically manage credit exposure at the overall portfolio level. These positions did not have a material impact on performance.
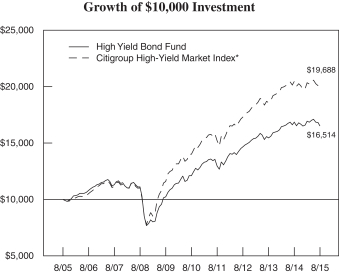
For the year ended August 31, 2015, the High Yield Bond Fund returned -2.02% compared to -3.78% for the Citigroup High-Yield Market Index.
| * | The Citigroup High-Yield Market Index measures the performance of below investment grade debt issued by corporations domiciled in the U.S or Canada. All of the bonds in such index are publicly placed, have a fixed coupon, and are nonconvertible. |
| | | | |
| Average Annual Total Return as of August 31, 2015 |
| 1 Year | | 5 Years | | 10 Years |
| -2.02% | | 6.42% | | 5.14% |
Past performance is not predictive of future performance. The performance data quoted represents past performance; past performance does not guarantee future results; the investment return and principal value of an investment will fluctuate so that an investor’s shares, when redeemed, may be worth more or less than their original cost; current performance may be lower or higher than the performance data quoted.
The Fund’s returns reflect investment management fees and other Fund expenses. Charges imposed by the Variable Contracts, Plans or IRAs that invest in the Fund are not included in the Fund’s returns.
170
VALIC Company II International Opportunities Fund
COMPARISON: FUND VS. INDEX (unaudited)
MANAGEMENT OVERVIEW
The International Opportunities Fund posted a return of -1.50% for the twelve-month period ended August 31, 2015, compared to a return of -1.84% for the MSCI EAFE Small Cap Index (net).
A discussion with MFS Investment Management – regarding their portion of the Fund
For the twelve month period ended August 31, 2015, the Fund lagged the benchmark with stock selection being the greatest detractor. Looking at the impact of stock selection by sector, materials were the sole contributor, while financials was the leading detractor.
From a sector perspective, allocations to industrials, consumer staples and energy contributed while allocations to cash, autos and housing and leisure were the greatest detractors.
The top three individual contributors were residential property developer Bellway PLC funeral home operator Dignity PLC and Japanese technology company OBIC. The top three detractors were Gran Tierra Energy, airline company Copa Holdings and India’s Federal Bank, Ltd.
A discussion with UBS Global Asset Management – regarding their portion of the Fund
For the twelve month period ended August 31, 2015, the Fund outperformed the benchmark with stock selection within information technology and industrials contributed positively to performance over the time period. From a country perspective, Germany, Ireland and Australia were the largest contributors to performance, driven by both country allocation and stock selection. Stock selection within the United Kingdom and Japan also boosted performance. Key individual contributors included Alps Electric Co, Ltd., Bellway PLC and ICON PLC.
Stock selection within materials was the key detractor from performance from a sector perspective. On a country basis, allocations to Canada, Taiwan and Korea weighed on performance during the period. Key individual detractors included Parex Resources, Inc., Opera Software ASA., and Nippo Corp.
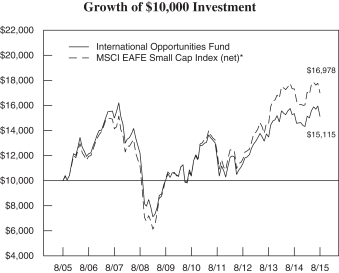
For the year ended August 31, 2015, the International Opportunities Fund returned -1.50% compared to -1.84% for the MSCI EAFE Small Cap Index (net).
| * | The MSCI EAFE Small Cap Index (net) is an unmanaged index considered representative of small-cap stocks of Europe, Australasia and the Far East. The net index approximates the minimum possible dividend reinvestment and assumes that the dividend is reinvested after the deduction of withholding tax, applying the rate to non-resident individuals who do not benefit from double taxation treaties. |
| | | | |
| Average Annual Total Return as of August 31, 2015 |
| 1 Year | | 5 Years | | 10 Years |
| -1.50% | | 7.70% | | 4.22% |
Past performance is not predictive of future performance. The performance data quoted represents past performance; past performance does not guarantee future results; the investment return and principal value of an investment will fluctuate so that an investor’s shares, when redeemed, may be worth more or less than their original cost; current performance may be lower or higher than the performance data quoted.
The Fund’s returns reflect investment management fees and other Fund expenses. Charges imposed by the Variable Contracts, Plans or IRAs that invest in the Fund are not included in the Fund’s returns.
171
VALIC Company II Large Cap Value Fund
COMPARISON: FUND VS. INDEX (unaudited)
MANAGEMENT OVERVIEW
The Large Cap Value Fund posted a return of -1.56% for the twelve-month period ended August 31, 2015, compared to a return of -3.48% for the Russell 1000® Value Index.
A discussion with Janus Capital Management, LLC and Perkins Investment, LLC – regarding their portion of the Fund
Overall, sector allocation was the primary contributor to the Fund’s outperformance. The sector contributing the most overall was information technology, primarily due to stock selection. Energy holdings were also large relative contributors, due to a relative underweight. An overweight in healthcare was another large contributor, but that was mostly offset by negative stock selection in the sector.
In addition to the healthcare stock selection, stock selection in consumer discretionary and a sector underweight to financials were notable detractors.
Individually, Chubb Corporation, Pfizer, Inc., and CVS Corp. were leading contributors to returns. Royal Dutch Shell Petroleum, Whiting Petroleum Corp., and Anadarko Petroleum Corporation were large detractors from performance.
A discussion with The Boston Company Asset Management, LLC – regarding their portion of the Fund
The Fund’s outperformance came from positive results in both stock selection and sector allocation. On a sector basis, energy, materials, and consumer staples delivered the strongest relative results. Relative outperformance in all three of these sectors was fueled by stock selection. An overweight and positive stock selection in the strong healthcare sector resulted in further additions to relative performance.
Stock selection in utilities, telecommunication services, and financials detracted the most from relative performance.
Large individual contributions came from not owning energy firms Exxon Mobil Corp. and Chevron Corp., and owning a position in Vulcan Materials Co. Among the largest detractors were Occidental Petroleum Corp., Anadarko Petroleum Corp., and Schlumberger NV, all in the energy sector.
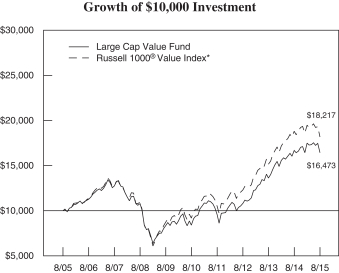
For the year ended August 31, 2015, the Large Cap Value Fund returned -1.56% as compared to -3.48% for the Russell 1000® Value Index.
| * | The Russell 1000® Value Index measures the performance of those Russell 1000 companies with lower price-to-book ratios and lower forecasted growth values. |
| | | | |
| Average Annual Total Return as of August 31, 2015 |
| 1 Year | | 5 Years | | 10 Years |
| -1.56% | | 14.44% | | 5.12% |
Past performance is not predictive of future performance. The performance data quoted represents past performance; past performance does not guarantee future results; the investment return and principal value of an investment will fluctuate so that an investor’s shares, when redeemed, may be worth more or less than their original cost; current performance may be lower or higher than the performance data quoted.
The Fund’s returns reflect investment management fees and other Fund expenses. Charges imposed by the Variable Contracts, Plans or IRAs that invest in the Fund are not included in the Fund’s returns.
172
VALIC Company II Mid Cap Growth Fund
COMPARISON: FUND VS. INDEX (unaudited)
MANAGEMENT OVERVIEW
A discussion with Wells Capital Investment Management (WellsCap)
The Mid Cap Growth Fund posted a return of 1.66% for the twelve-month period ended August 31, 2015, compared to a return of 2.46% for the Russell Midcap ® Growth Index.
Stock selection in healthcare and energy, in addition to an underweight in consumer staples contributed to the Fund’s underperformance. On the positive side, selection in the materials and consumer staples sectors, and an overweight to the strong healthcare sector added to relative performance.
Energy positions Nabors Industries, Ltd. and Antero Resources Corp. were top relative detractors, in addition to information technology holding Yelp, Inc. Strong individual contributors to the fund included BioMarin Pharmaceutical, Inc., information technology holding Palo Alto Networks, Inc., and consumer staples position Constellation Brands, Inc.
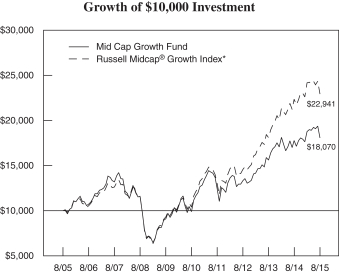
For the year ended August 31, 2015, the Mid Cap Growth Fund returned 1.66% compared to 2.46% for the Russell Midcap® Growth Index.
| * | The Russell Midcap® Growth Index measures the performance of those Russell Midcap® companies with higher price-to-book ratios and high forecasted growth values. The stocks are also members of the Russell 1000® Growth Index. |
| | | | |
| Average Annual Total Return as of August 31, 2015 |
| 1 Year | | 5 Years | | 10 Years |
| 1.66% | | 12.76% | | 6.10% |
Past performance is not predictive of future performance. The performance data quoted represents past performance; past performance does not guarantee future results; the investment return and principal value of an investment will fluctuate so that an investor’s shares, when redeemed, may be worth more or less than their original cost; current performance may be lower or higher than the performance data quoted.
The Fund’s returns reflect investment management fees and other Fund expenses. Charges imposed by the Variable Contracts, Plans or IRAs that invest in the Fund are not included in the Fund’s returns.
173
VALIC Company II Mid Cap Value Fund
COMPARISON: FUND VS. INDEX (unaudited)
MANAGEMENT OVERVIEW
The Mid Cap Value Fund posted a return of -3.61% for the twelve-month period ended August 31, 2015, compared to a return of -2.54% for the Russell Midcap® Value Index.
A discussion with Tocqueville Asset Management, LP – regarding their portion of the Fund - for the period beginning September 1, 2014 and ending March 16, 2015.
Stock selection in utilities, lack of exposure to the strong-performing health care sector, and overweighting the weak materials sector were significant contributors to the Fund’s underperformance versus the benchmark. An underweight to the utilities sector was a modest contribution to performance.
Significant individual detractors included industrials holding Harsco Corporation and materials positions Eastman Chemical Co. and Carpenter Technology Corp. Individual contributors included consumer discretionary holding Staples, Inc., materials holding Sealed Air Corp., and information technology position Fairchild Semiconductor International, Inc.
A discussion with Wellington Management Company LLP – regarding their portion of the Fund
Overall, stock selection was the primary contributor to the Fund’s outperformance versus the benchmark. Strong stock selection in the information technology, financials, and consumer discretionary sectors were significant factors contributing to the outperformance.
On the negative side, stock selection in materials and industrials were large detractors. Sector allocation detracted from relative results. The Fund’s underweight to health care, the top performing sector in the index, proved to be a significant detractor.
Top relative individual contributors included consumer discretionary holding Norwegian Cruise Lines, Ono Pharmaceutical, and financials position Extra Space Storage. Top relative detractors to performance included materials holding Methanex Corp. and energy positions Trican Well Services, Ltd. and QEP Resources.
A discussion with Robeco Investment Management, Inc. – regarding their portion of the Fund
The Fund was able to add value primarily through security selection, leading to outperformance versus the benchmark. Stock selection in the energy, basic industries, and technology sectors provided strong contributions to performance. Underexposure to the strong-performing health care sector was a large area of weakness for the period, along with stock selection in the finance and consumer durables sectors.
Important individual contributions included consumer non-durables holding Constellation Brands, Inc. Class A, a position in Avago Technologies, Ltd., and not holding weak-performing benchmark name Whiting Petroleum Corp.
Some individual detractors were capital goods position Flowserve Corp., and not holding strong benchmark performers Hartford Financial Services Group, Inc. and health care company Cigna Corp.
174
VALIC Company II Mid Cap Value Fund
COMPARISON: FUND VS. INDEX (unaudited) — (continued)
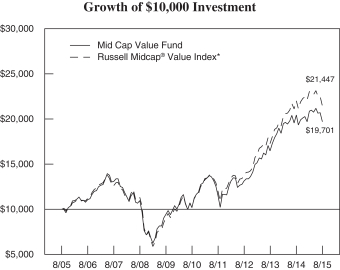
For the year ended August 31, 2015, the Mid Cap Value Fund returned -3.61% compared to -2.54% for the Russell Midcap® Value Index.
| * | The Russell Midcap® Value Index measures the performance of the mid-cap value segment of the U.S. equity universe. It includes those Russell Midcap Index companies with lower price-to-book ratios and lower forecasted growth values. The Russell Midcap® Value Index is constructed to provide a comprehensive and unbiased barometer of the mid-cap value market. The index is completely reconstituted annually to ensure larger stocks do not distort the performance and characteristics of the true mid-cap value market. |
| | | | |
| Average Annual Total Return as of August 31, 2015 |
| 1 Year | | 5 Years | | 10 Years |
| -3.61% | | 14.07% | | 7.02% |
Past performance is not predictive of future performance. The performance data quoted represents past performance; past performance does not guarantee future results; the investment return and principal value of an investment will fluctuate so that an investor’s shares, when redeemed, may be worth more or less than their original cost; current performance may be lower or higher than the performance data quoted.
The Fund’s returns reflect investment management fees and other Fund expenses. Charges imposed by the Variable Contracts, Plans or IRAs that invest in the Fund are not included in the Fund’s returns.
175
VALIC Company II Moderate Growth Lifestyle Fund
COMPARISON: FUND VS. INDEX (unaudited)
Management Overview
A discussion with PineBridge Investments, LLC
For the twelve-month period ended August 31, 2015, the Moderate Growth Lifestyle Fund returned -2.68%, compared to 0.48% for the S&P 500® Index and 0.05% for the Fund’s Blended Index.**
The Moderate Growth Lifestyle Fund allocates its assets among a combination of the Funds of VCII and VALIC Company I. The Fund does not select specific sectors, securities, or countries and thus these factors do not influence performance. Rather, the key indicators of performance are asset allocation and manager selection.
Over the past twelve months, the Fund’s asset allocation was a negative contributor to performance. The Fund began the twelve month period with an overweight to US equities, a significant overweight to international equities, a large underweight to fixed income, and a modest underweight to global real estate. In late 2014, the Fund started reducing US equities exposure and increased exposure to both fixed income and global real estate. In the same period, international equities exposure was modestly reduced. As 2015 progressed, the US equities exposure was reduced to an underweight, as the international equities and fixed income exposure increased. The twelve month period closed with an underweight to US equities, a significant overweight to international equities, an underweight to fixed income, and a modest overweight to global real estate. The cumulative impact of these asset allocation decisions resulted in underperformance versus both the S&P 500 and the Fund’s Blended Index.
Fund selection was also a detractor from performance. The Foreign Value Fund, the Emerging Economies Fund and International Equities Fund were the top detractors. The top funds contributing to returns were the Blue Chip Growth Fund, Stock Index Fund and the NASDAQ-100 Index Fund.
176
VALIC Company II Moderate Growth Lifestyle Fund
COMPARISON: FUND VS. INDEX (unaudited) — (continued)
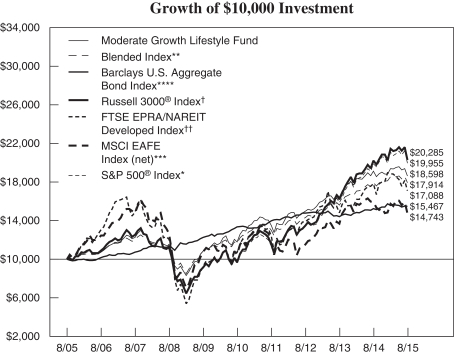
For the year ended August 31, 2015, the Moderate Growth Lifestyle Fund returned -2.68% compared to 0.48% for the S&P 500® Index and 0.05% for the Blended Index.
| * | The S&P 500® Index is an index of the stocks of 500 major large-cap U.S. corporations, chosen for market size, liquidity, and industry group representation. It is a market-value weighted index, with each stock’s percentage in the Index in proportion to its market value. |
| ** | The Blended Index consists of the Russell 3000® Index (40%), MSCI EAFE Index (net) (10%), the Barclays U.S. Aggregate Bond Index (45%) and the FTSE EPRA/NAREIT Developed Index (5%). |
| *** | The MSCI EAFE Index (net) is a free float-adjusted market capitalization index that is designed to measure the equity market performance of developed markets, excluding the US & Canada. The Index consists of 22 developed market country indices. The net index approximates the minimum possible dividend reinvestment and assumes that the dividend is reinvested after the deduction of withholding tax, applying the rate to non-resident individuals who do not benefit from double taxation treaties. |
| **** | The Barclays U.S. Aggregate Bond Index is an unmanaged index that measures the investment grade, U.S. dollar-denominated, fixed-rate taxable bond market, including Treasuries, government-related and corporate securities, mortgage- and asset-backed securities and commercial mortgage-backed securities. |
| † | The Russell 3000® Index follows the 3,000 largest U.S. companies, based on total market capitalization. |
| †† | The FTSE EPRA/NAREIT Developed Index is a global market capitalization weighted index composed of listed real estate securities in the North American, European and Asian real estate markets. |
| | | | |
| Average Annual Total Return as of August 31, 2015 |
| 1 Year | | 5 Years | | 10 Years |
| -2.68% | | 9.54% | | 6.40% |
Past performance is not predictive of future performance. The performance data quoted represents past performance; past performance does not guarantee future results; the investment return and principal value of an investment will fluctuate so that an investor’s shares, when redeemed, may be worth more or less than their original cost; current performance may be lower or higher than the performance data quoted.
The Fund’s returns reflect investment management fees and other Fund expenses. Charges imposed by the Variable Contracts, Plans or IRAs that invest in the Fund are not included in the Fund’s returns.
177
VALIC Company II Money Market II Fund
COMPARISON: FUND VS. INDEX (unaudited)
MANAGEMENT OVERVIEW
A discussion with SunAmerica Asset Management, LLC
The Money Market II Fund posted a return of 0.01% for the twelve-month period ended August 31, 2015, compared to a return of 0.02% for the Citigroup 3 Month Treasury Bill Index.
Fund performance was mostly affected by historically low interest rates that persisted during the fiscal period ended August 31, 2015. Yield on money market securities increased steadily throughout the twelve-month period, with one-month certificates of deposit (CDs) yielding approximately 0.17% on August 31, 2015, up from roughly 0.09% from the prior year.
The Fund’s investment strategy helped provide current income while seeking to provide liquidity, protection of capital and current income. Interest rate risk was navigated by adjusting the Fund’s weighted average maturity as market conditions shifted. Potential credit risk was mitigated by buying high quality, creditworthy names. Throughout the annual period, the Fund was focused primarily on investments in government agency securities and U.S. Treasury securities, with lesser allocations to shorter-term repurchase agreements, commercial paper and certificates of deposit.
Given the low yield environment that existed throughout the fiscal period, the Fund employed a barbell investment strategy, with greater weightings in fixed-rate securities at the short-term end of the yield curve and in longer-dated floating-rate securities at the long-term end of the yield curve. This strategy enabled us to provide a cushion of liquidity in the near term, i.e. one-to-seven days, and to garner the relatively higher yield available from investments with longer-dated maturities, i.e. greater than 30 days.
Throughout the annual period, the Fund maintained a weighted average maturity below the 60-day maximum mandated by the SEC. The Fund’s weighted average maturity was in a range between 38 to 59 days for most of the annual period. In the last months of the annual period, we kept constant the Fund’s weighted average maturity while maintaining the quality and liquidity of the portfolio. As of August 31, 2015, the Fund’s weighted average maturity stood at approximately 38 days.
| | | | |
| Average Annual Total Return as of August 31, 2015 |
| 1 Year | | 5 Years | | 10 Years |
| 0.01% | | 0.01% | | 1.28% |
Past performance is not predictive of future performance. The performance data quoted represents past performance; past performance does not guarantee future results; the investment return and principal value of an investment will fluctuate so that an investor’s shares, when redeemed, may be worth more or less than their original cost; current performance may be lower or higher than the performance data quoted.
The Fund’s returns reflect investment management fees and other Fund expenses. Charges imposed by the Variable Contracts, Plans or IRAs that invest in the Fund are not included in the Fund’s returns.
178
VALIC Company II Small Cap Growth Fund
COMPARISON: FUND VS. INDEX (unaudited)
MANAGEMENT OVERVIEW
A discussion with J.P. Morgan Investment Management, Inc.
The Small Cap Growth Fund posted a return of 5.26% for the twelve-month period ended August 31, 2015, compared to a return of 5.11% for the Russell 2000 Growth Index.
Stock selection was the primary driver of outperformance during the period. Selection in the materials and processing, technology, and energy sectors were large contributors to performance. Stock selection in the healthcare, consumer discretionary, and financial services sectors were large detractors from performance.
At the stock level, large contributors were healthcare holding Receptos, Inc., industrials holding Acuity Brands, Inc., and technology position 2U, Inc. Among the biggest detractors were energy holdings Oasis Petroleum and Forum Energy Technologies, and healthcare position Fluidigm Corporation.
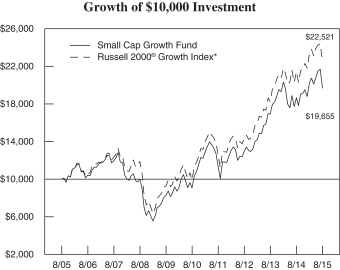
For the year ended August 31, 2015, the Small Cap Growth Fund returned 5.26% compared to 5.11% for the Russell 2000® Growth Index.
| * | The Russell 2000® Growth Index measures the performance of those Russell 2000® companies with higher price-to-book ratios and higher forecasted growth values. |
| | | | |
| Average Annual Total Return as of August 31, 2015 |
| 1 Year | | 5 Years | | 10 Years |
| 5.26% | | 16.81% | | 6.99% |
Past performance is not predictive of future performance. The performance data quoted represents past performance; past performance does not guarantee future results; the investment return and principal value of an investment will fluctuate so that an investor’s shares, when redeemed, may be worth more or less than their original cost; current performance may be lower or higher than the performance data quoted.
The Fund’s returns reflect investment management fees and other Fund expenses. Charges imposed by the Variable Contracts, Plans or IRAs that invest in the Fund are not included in the Fund’s returns.
179
VALIC Company II Small Cap Value Fund
COMPARISON: FUND VS. INDEX (unaudited)
MANAGEMENT OVERVIEW
The Small Cap Value Fund posted a return of -3.38% for the twelve-month period ended August 31, 2015, compared to a return of -4.95% for the Russell 2000® Value Index.
A discussion with J.P. Morgan Investment Management Inc. – regarding their portion of the Fund
Overall, stock selection was the primary contributor to the Fund’s outperformance versus the benchmark. Strong stock selection in the industrial cyclical, services and systems, and pharmaceutical sectors contributed the most to results. Alternatively, stock selection in the energy, finance, and software and services sectors were large detractors from performance.
At the individual stock level, positions in health services & systems holding Thoratec Corp., semiconductors holding Spansion, Inc., and Auspex Pharmaceuticals were large contributors to performance.
Larger individual detractors from performance included positions in consumer cyclical holding Iconix Brand Group, energy holding Penn Virginia Corp., and Cloud Peak Energy, Inc.
A discussion with Metropolitan West Capital Management, LLC. – regarding their portion of the Fund
During the period, security selection accounted for nearly all of the outperformance versus the benchmark. Stock selection in the industrials, health care, and materials sectors added the most value relative to the Russell 2000® Value Index.
Security selection and an underweight in the financials sector subtracted the most value relative to the index. Additionally, an overweight to the weak energy sector was a large detractor.
AMN Healthcare Services, Inc., consumer discretionary holding Office Depot, Inc., and industrials holding KAR Auction Services, Inc. were among the top contributors to relative return.
Oasis Petroleum, Inc. and Energy XXI, Ltd. were among the largest detractors, along with Ocwen Financial Corp.
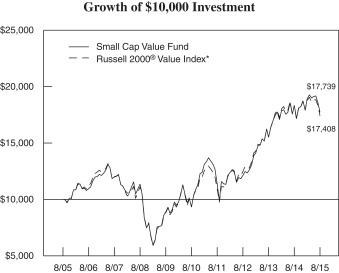
For the year ended August 31, 2015, the Small Cap Value Fund returned -3.38% compared to -4.95% for the Russell 2000® Value Index.
| * | The Russell 2000® Value Index measures the performance of those Russell 2000® companies with lower price-to-book ratios and lower forecasted growth values. |
| | | | |
| Average Annual Total Return as of August 31, 2015 |
| 1 Year | | 5 Years | | 10 Years |
| -3.38% | | 13.71% | | 5.90% |
Past performance is not predictive of future performance. The performance data quoted represents past performance; past performance does not guarantee future results; the investment return and principal value of an investment will fluctuate so that an investor’s shares, when redeemed, may be worth more or less than their original cost; current performance may be lower or higher than the performance data quoted.
The Fund’s returns reflect investment management fees and other Fund expenses. Charges imposed by the Variable Contracts, Plans or IRAs that invest in the Fund are not included in the Fund’s returns.
180
VALIC Company II Socially Responsible Fund
COMPARISON: FUND VS. INDEX (unaudited)
MANAGEMENT OVERVIEW
A discussion with SunAmerica Asset Management, LLC
The Socially Responsible Fund posted a return of 1.06% for the twelve-month period ended August 31, 2015, compared to its benchmark, the S&P 500 Index, which returned 0.48%.
The Socially Responsible Fund is passively managed to track the S&P 500 Index, while investing in socially compliant companies.
Allocation decisions were the primary source of outperformance during the period, particularly an underweight allocation to the energy sector. Positioning decisions among materials, financials, consumer discretionary, and healthcare companies also had a beneficial impact.
Gains were slightly offset, however, by security selection within the energy, financial, and consumer staples groups.
Among individual holdings, Apple, Inc., Amazon.com, Inc., Visa, Inc. Class A, UnitedHealth Group, Inc., and AbbVie, Inc. assisted the Fund’s performance the most during the fiscal period. Primary detractors included Apache Corp., Procter & Gamble Co., QUALCOMM, Inc., Intel Corp., and Murphy Oil Corp.
The Fund utilizes equity future contracts to keep its cash position fully exposed to the market. The exposure to these equity futures had a positive effect on total return.
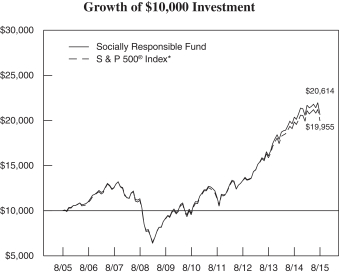
For the year ended August 31, 2015, the Socially Responsible Fund returned 1.06% compared to 0.48% for the S&P 500® Index.
| * | The S&P 500® Index is an index of the stocks of 500 major large-cap U.S. corporations, chosen for market size, liquidity, and industry group representation. It is a market-value weighted index, with each stock’s percentage in the Index in proportion to its market value. |
| | | | |
| Average Annual Total Return as of August 31, 2015 |
| 1 Year | | 5 Years | | 10 Years |
| 1.06% | | 16.23% | | 7.50% |
Past performance is not predictive of future performance. The performance data quoted represents past performance; past performance does not guarantee future results; the investment return and principal value of an investment will fluctuate so that an investor’s shares, when redeemed, may be worth more or less than their original cost; current performance may be lower or higher than the performance data quoted.
The Fund’s returns reflect investment management fees and other Fund expenses. Charges imposed by the Variable Contracts, Plans or IRAs that invest in the Fund are not included in the Fund’s returns.
181
VALIC Company II Strategic Bond Fund
COMPARISON: FUND VS. INDEX (unaudited)
MANAGEMENT OVERVIEW
A discussion with PineBridge Investments, LLC
The Strategic Bond Fund posted a return of -2.32% for the twelve-month period ended August 31, 2015, compared to its benchmark, the Barclays U.S. Aggregate Bond Index, which returned 1.56%.
Sector selection detracted from performance versus that of the benchmark index during the year. Overweight allocations to energy, basic industry, communications and sovereign sectors were the largest detractors. An underweight allocation to US Treasuries also detracted from performance as credit spreads moved wider and interest rates moved lower. The Fund benefitted from overweight allocations to financials and cash.
Security selection detracted from performance versus that of the benchmark index during the year. The Fund benefitted from strong security selections among consumer non-cyclical, communications and banking names. However, this did not fully offset selections made among energy and technology names.
The Fund’s longer duration profile versus that of the benchmark contributed positively during the year as longer term interest rates declined.
The top three individual contributors were Escrow Leiner Health Products 5.50% due 4/4/2016, Paris Las Vegas Holding LLC 11.00% due 10/1/2021 and Universal Hospital Services 7.63% due 8/15/2020.
The largest individual detractors were Halcon Resources Corp. 9.75% due 7/15/2020, FMG Finance PTY Ltd 6.88% due 4/1/2022 and Penn Virginia Corp. 7.25% due 4/15/2019.
Currency forwards were the only derivatives utilized during this period. Currency forwards were only used to hedge non-dollar positions and not for speculative purposes and contributed positively to the Fund’s total return.
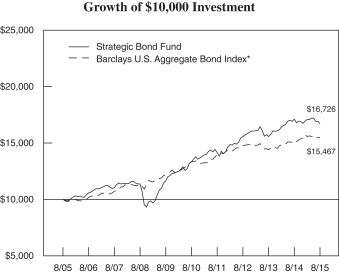
For the year ended August 31, 2015, the Strategic Bond Fund returned -2.32% compared to 1.56% for the Barclays U.S. Aggregate Bond Index.
| * | The Barclays U.S. Aggregate Bond Index is an unmanaged index that measures the investment grade, U.S. dollar-denominated, fixed-rate taxable bond market, including Treasuries, government-related and corporate securities, mortgage- and asset-backed securities and commercial mortgage-backed securities. |
| | | | |
| Average Annual Total Return as of August 31, 2015 |
| 1 Year | | 5 Years | | 10 Years |
| -2.32% | | 4.66% | | 5.28% |
Past performance is not predictive of future performance. The performance data quoted represents past performance; past performance does not guarantee future results; the investment return and principal value of an investment will fluctuate so that an investor’s shares, when redeemed, may be worth more or less than their original cost; current performance may be lower or higher than the performance data quoted.
The Fund’s returns reflect investment management fees and other Fund expenses. Charges imposed by the Variable Contracts, Plans or IRAs that invest in the Fund are not included in the Fund’s returns.
182
VALIC Company II
BOARD OF TRUSTEES
Thomas J. Brown
Judith L. Craven
William F. Devin
Timothy J. Ebner
Gustavo E. Gonzales, Jr.
Peter A. Harbeck
Kenneth J. Lavery
John E. Maupin, Jr.
CUSTODIAN
State Street Bank and Trust Company
225 Franklin Street
Boston, Massachusetts 02110
INVESTMENT ADVISER
The Variable Annuity
Life Insurance Company (VALIC)
2929 Allen Parkway
Houston, Texas 77019
INVESTMENT SUBADVISERS
J.P. Morgan Investment Management, Inc.
270 Park Avenue
New York, New York 10017
Janus Capital Management, LLC
151 Detroit Street
Denver, Colorado 80206
Massachusetts Financial Services Company
111 Huntington Avenue
Boston, MA 02199
Metropolitan West Capital Management, LLC
610 Newport Center Drive, Suite 100
Newport Beach, CA 92660
PineBridge Investments, LLC
399 Park Avenue
New York, New York 10022
Robeco Investment Management, Inc.
909 Third Avenue, 32nd Floor
New York, New York 10022
SunAmerica Asset Management, LLC
Haborside Financial Center
3200 Plaza 5
Jersey City, New Jersey 07311
The Boston Company Asset Management, LLC
BNY Mellon Center
201 Washington St.
Boston, Massachusetts 02108
UBS Global Asset Management (Americas), Inc.
1285 Avenue of the Americas
New York, NY 10019
Wellington Management Company LLP
280 Congress Street
Boston, Massachusetts 02210
Wells Capital Management, Inc.
525 Market St.
10th Floor
San Francisco, CA 94105
INDEPENDENT REGISTERED PUBLIC ACCOUNTING FIRM
PricewaterhouseCoopers LLP
1201 Louisiana Street, Suite 2900
Houston, Texas 77002
TRANSFER AND SHAREHOLDER SERVICE AGENT
VALIC Retirement
Services Company (VRSCO)
2929 Allen Parkway
Houston, Texas 77019
OFFICERS
John T. Genoy
President and Principal Executive Officer
John Packs,
Vice President and Senior Investment Officer
Gregory R. Kingston,
Treasurer and Principal Financial Officer
Kathleen Fuentes,
Vice President, Chief Legal Officer and Secretary
Gregory N. Bressler,
Vice President
Katherine Stoner,
Vice President and Chief Compliance Officer
Thomas M. Ward,
Vice President
Shawn Parry,
Vice President and Assistant Treasurer
Donna McManus,
Vice President and Assistant Treasurer
Daniel Subea
Assistant Treasurer
Louis O. Ducote II,
Assistant Secretary
Shana L. Walker,
Assistant Secretary
Matthew J. Hackethal,
Anti-Money Laundering Compliance Officer
DISCLOSURE OF QUARTERLY FUND PORTFOLIO HOLDINGS
VC II is required to file its complete schedule of portfolio holdings with the U.S. Securities and Exchange Commission for its first and third fiscal quarters on Form N-Q. VC II’s Forms N-Q are available on the U.S. Securities and Exchange Commission’s website at www.sec.gov. You can also review and obtain copies of Forms N-Q at the U.S. Securities and Exchange Commission’s Public Reference Room in Washington, DC (information on the operation of the Public Reference Room may be obtained by calling 1-800-SEC-0330).
VOTING PROXIES ON VALIC COMPANY II PORTFOLIO SECURITIES
A description of the policies and procedures that VC II uses to determine how to vote proxies related to securities held in the Fund’s portfolios, which is available in VC II’s Statement of Additional Information, may be obtained without charge upon request, by calling 800-448-2542. This information is also available from the EDGAR database on the U.S. Securities and Exchange Commission’s website at http://www.sec.gov.
PROXY VOTING RECORD ON VALIC COMPANY II PORTFOLIO SECURITIES
Information regarding how VC II voted proxies relating to securities held in the VC II Funds portfolios during the most recent twelve month period ended June 30, is available, once filed with the U.S. Securities and Exchange Commission without charge, upon request, by calling 800-448-2542 or on the U.S. Securities and Exchange Commission’s website at http://www.sec.gov.
This report is for the information of the shareholders and variable contract owners investing in VC II. It is authorized for distribution to other persons only when preceded or accompanied by an effective prospectus which contains information on how to purchase shares and other pertinent information.
If you would like further information about this material or products issued by VALIC or American General Life Insurance Company, please contact your financial professional.
183
VALIC.com — Account access
| | |
You will need to create an online security profile with a unique user ID and password. With your PIN, you can also access your account via the 24-hour VALIC automated phone line at 1-800-448-2542. Easy and secure Sign up for PersonalDeliver- ® ® today! CLICK VALIC.com CALL 1-800-448-2542 VISIT your VALIC financial advisor 
| | Manage your account online! > Print and download account transaction confirmations and tax statements > View transaction history and download it to Quicken using Direct ConnectSM > Use the Account Aggregation feature to display information from other accounts in addition to your VALIC accounts > Easily manage your personal profile to update your contact information (phone, address, email), update your beneficiaries, reset your password, and more With VALIC.com, you can initiate account transactions including: > Change allocation > Transfer money among investment options > Rebalance account to your desired allocation mix > Change contributions Start exploring VALIC.com today! > Visit VALIC.com > Click “Register for online access” > Click “Register for individual access,” and follow the steps to create a security profile PersonalDeliver- ® > It’s easy to sign up > Simply visit VALIC.com today to get started Please note: Email delivery is not accessible to certain VALIC annuity contract owners. Sign up today at VALIC.com We know privacy is important to you, so please be assured that your email address and other information you share with us is kept private and never sold. Review our Privacy Policy online for more information. Securities and investment advisory services offered through VALIC Financial Advisors, Inc., member FINRA, SIPC and an SEC-registered investment advisor. Annuities issued by The Variable Annuity Life Insurance Company. Variable annuities distributed by its affiliate, AIG Capital Services, Inc., member FINRA. Copyright © The Variable Annuity Life Insurance Company. All rights reserved. VC 23800 (10/2015) J97033 EE |
| |
| |
| |
| |
| |
| |
| |
| |
| |
| |
| |
| |
| |
| |
| |
| |
| |
| |
| |
| |
| |
| |
| |
| |
| |
| |
| |
| |
| |
| |
| |
| |
| |
| |
| |
| |
| |
| | |
VALIC Company II P.O. Box 3206 Houston, TX 77253-3206 | | PRST STD U.S. POSTAGE PAID LANCASTER, PA PERMIT NO. 1765 |
VC 11288 (08/2015) J74500
VALIC Company II (“the registrant”) has adopted a Code of Ethics applicable to its Principal Executive and Principal Accounting Officers pursuant to Section 406 of the Sarbanes-Oxley Act of 2002. During the fiscal year ended 2015, there were no reportable amendments, waivers, or implicit waivers to a provision of the Code of Ethics that applies to the registrant’s Principle Executive and Principal Accounting Officers.
| Item 3. | Audit Committee Financial Expert. |
The registrant’s Board of Trustees has determined that Thomas J. Brown, the Chairman of the registrant’s Audit Committee, qualifies as an audit committee financial expert, as defined in instructions to Item 3(b) of Form N-CSR. Mr. Brown is considered to be “independent” for purposes of Item 3(a)(2) of Form N-CSR.
| Item 4. | Principal Accountant Fees and Services. |
(a) - (d) Aggregate fees billed to the registrant for the last two fiscal years for professional services rendered by the registrant’s principal accountant were as follows:
| | | | | | | | |
| | | 2014 | | | 2015 | |
(a) Audit Fees | | $ | 382,400 | | | $ | 397,420 | |
(b) Audit-Related Fees | | $ | 0 | | | $ | 0 | |
(c) Tax Fees | | $ | 0 | | | $ | 0 | |
(d) All Other Fees | | $ | 0 | | | $ | 0 | |
Audit Fees include amounts related to the audit of the registrant’s annual financial statements and services normally provided by the principal accountant in connection with statutory and regulatory filings.
Aggregate fees billed to the investment adviser and Adviser Affiliates (as defined below in Item 4(e)) that are required to be pre-approved pursuant to paragraph (c)(7)(ii) of Rule 2-01 of Regulation S-X for the last two fiscal years for services rendered by the registrant’s principal accountant were as follows:
| | | | | | | | |
| | | 2014 | | | 2015 | |
(b) Audit-Related Fees | | $ | 0 | | | $ | 0 | |
(c) Tax Fees | | $ | 0 | | | $ | 0 | |
(d) All Other Fees | | $ | 370,415 | | | $ | 236,770 | |
All other fees are for professional services rendered by the registrant’s principal accountant for services associated with issuing a SSAE16 report and Third Party Assurance report.
| | (e) (1) | The registrant’s audit committee pre-approves all audit services provided by the registrant’s principal accountant for the registrant and all non-audit services provided by the registrant’s principal accountant for the |
| | registrant, its investment adviser and any entity controlling, controlled by, or under common control with the investment adviser (“Adviser Affiliates”) that provides ongoing services to the registrant, if the engagement by the investment adviser or Adviser Affiliate relates directly to the operations and financial reporting of the registrant. The audit committee has not presently established any pre-approval policies and procedures that permit the pre-approval of the above services other than by the full audit committee. Certain de minimis exceptions are allowed for non-audit services in accordance with Rule 2-01(c)(7)(i)(C) of Regulation S-X as set forth in the registrant's audit committee charter. |
| | (2) | No services included in (b) - (d) above in connection with fees billed to the registrant or the investment adviser or Adviser Affiliates were approved pursuant to paragraph (c)(7)(i)(C) of Rule 2-01 of Regulation S-X. |
| | (g) | The aggregate fees billed for the most recent fiscal year and the preceding fiscal year by the registrant’s principal accountant for non-audit services rendered to the registrant, its investment adviser, and Adviser Affiliates that provides ongoing services to the registrant for 2014 and 2015 were $542,947 and $297,640, respectively. |
| | (h) | Non-audit services rendered to the registrant’s investment adviser and any Adviser Affiliates that provides ongoing services to the registrant that were not pre-approved pursuant to paragraph (c)(7)(ii) of Rule 2-01 of Regulation S-X were considered by the registrant’s audit committee as to whether they were compatible with maintaining the principal accountant’s independence. |
| Item 5. | Audit Committee of Listed Registrants. |
Not applicable.
Included in Item 1 to the Form.
| Item 7. | Disclosure of Proxy Voting Policies and Procedures for Closed-End Management Investment Companies. |
Not applicable.
| Item 8. | Portfolio Managers of Closed-End Management Investment Companies. |
Not applicable.
| Item 9. | Purchases of Equity Securities by Closed-End Management Investment Company and Affiliated Purchasers. |
Not applicable.
| Item 10. | Submission of Matters to a Vote of Security Holders. |
There were no material changes to the procedures by which shareholders may recommend nominees to the registrant’s Board of Trustees that were implemented after the registrant last provided disclosure in response to the requirements of Item 407(c)(2)(iv) of Regulation S-K (17 CFR 229.407) (as required by 22(b)(15)) of Schedule 14A (17 CFR 240.14a-101), or this Item 10.
| Item 11. | Controls and Procedures. |
| | (a) | An evaluation was performed within 90 days of the filing of this report, under the supervision and with the participation of the registrant’s management, including the President and Treasurer, of the effectiveness of the design and operation of the registrant’s disclosure controls and procedures (as defined under Rule 30a-3(c) under the Investment Company Act of 1940 (17 CFR 270.30a-3(c))). Based on that evaluation, the registrant’s management, including the President and Treasurer, concluded that the registrant’s disclosure controls and procedures are effective. |
| | (b) | There was no change in the registrant’s internal control over financial reporting (as defined in Rule 30a-3(d) under the Investment Company Act of 1940 (17 CFR 270.3a-3(d))) that occurred during the registrant’s last fiscal quarter of the period covered by this report that has materially affected, or is reasonably likely to materially affect, the registrant’s internal control over financial reporting. |
| | (a) | (1) Code of Ethics applicable to its Principal Executive and Principal Accounting Officers pursuant to Section 406 of the Sarbanes-Oxley Act of 2002 attached hereto as Exhibit 99.406.Code of Ethics. |
| | | (2) Certifications pursuant to Rule 30a-2(a) under the Investment Company Act of 1940 (17 CFR 270.30a-2(a)) attached hereto as Exhibit 99.CERT. |
| | (b) | Certification pursuant to Rule 30a-2 (b) under the Investment Company Act of 1940 (17 CFR 270.30a-2 (a)) and Section 906 of the Sarbanes-Oxley Act of 2002 attached hereto as Exhibit 99.906.CERT. |
SIGNATURES
Pursuant to the requirements of the Securities Exchange Act of 1934 and the Investment Company Act of 1940, the registrant has duly caused this report to be signed on its behalf by the undersigned, thereunto duly authorized.
| | |
| VALIC Company II |
| |
| By: | | /s/ John T. Genoy |
| | John T. Genoy |
| | President |
Date: November 6, 2015
Pursuant to the requirements of the Securities Exchange Act of 1934 and the Investment Company Act of 1940, this report has been signed below by the following persons on behalf of the registrant and in the capacities and on the dates indicated.
| | |
| By: | | /s/ John T. Genoy |
| | John T. Genoy |
| | President |
Date: November 6, 2015
| | |
| By: | | /s/ Gregory R. Kingston |
| | Gregory R. Kingston |
| | Treasurer |
Date: November 6, 2015